Penetration of Mutual Funds in India: Opportunities and Challenges

1
RISK AND RETURN ANALYSIS OF EQUITY LINKED SAVINGS SCHEMES OF
MUTUAL FUNDS IN INDIA
Authors
1. N.S.Santhi,
Assistant Professor
Department of Business Administration
KSR College of Engineering
Tiruchengode – 637 215
Ph: 95004 66527
E-Mail: [email protected]
2. Dr. K. Balanaga Gurunathan,
Professor, Dept. of Management Studies,
KSR College of Technology,
Tiruchengode – 637 215,
Hand Phone: +91 94865 95663.
E-Mail: [email protected]
2
A RESEARCH PAPER
RISK AND RETURN ANALYSIS OF EQUITY LINKED SAVINGS SCHEMES OF
MUTUAL FUNDS IN INDIA
ABSTRACT
In this paper, an attempt has been made to evaluate the
performance of all 32 growth oriented open ended Equity Linked
Savings schemes of tax saving mutual funds in India.
Performance has been analysed on the basis of monthly return
compared to Indian stock market bench mark S&P CNX NIFTY. For
this purpose, risk-adjusted performance measures suggested by
Sharpe, Treynor and Jenson have been used. Last five years Net
Asset Value of Tax saving schemes from 2006-07 to 2010-11 has
been employed. It is found that no fund performed well during
the entire study period. All the schemes follow the same
patter in its return and moves along with the stock market
index S&P CNX NIFTY. Invariably all the fund has given
negative return during 2008-09 but it is higher than stock
market index. The average return of all theschemes is higher
and average risk is lower than the benchmark S&P CNX NIFTY.

3
Keywords : Performance measures, Equity Linked Savings
Scheme,Risk adjusted return.
4
RISK AND RETURN ANALYSIS OF EQUITY LINKED SAVINGS SCHEMES OF
MUTUAL FUNDS IN INDIA
1.Introduction
Majority tax assessee likes to save their money without
paying tax. To escape from paying tax they have to invest
required amount in to tax shielded avenue. Along with tax
exemption they expect return out of it. Tax saving mutual fund
is one of the avenue which provides market related return with
tax exemption. Investors can avail tax exemption of Rs.
1,00,000 by investing into tax saving mutual funds.
Mutual fund industry is emerged in 1964 in India and
developed enormously. It is an general idea that through
diversified portfolio mutual funds could give returns with low
risk than the market risk and the volatility of the mutual
fund market is less than the stock market. An investor, who is
invested into stock market need to monitor the market on
regular basis. Whereas, those who invested into mutual fund no
need to watch the market movement for reducing the loss. The
fund manager of every Asset Management Company takes care of
the investors’ money. They diversify the investors’ money into

5
various sectors like oil, bank, automobile, Information
Technology, agriculture, etc., The return from this
diversified portfolio distributed to all the investor. Hence
mutual fund provides nominal return with lower risk.
India has 32 open ended ELSS of tax saving mutual funds.
This study evauates the performance of tax saving mutual
funds for the past five years from 2006-07 to 2010-11. The
study utilize the benchmark index S&P CNX NIFTY to compare
mutual fund performance.
The rest of the paper is organized as summarizing the
related literature on mutual fund performance, presenting data
and methodology, results of the tax saving mutual funds
performance analyses and final section discusses the
conclusion of this paper.
2. Review of Lieterature
William F. Sharpe (1966) 1, made an attempt to measure and
predict the performance of mutual funds by a simple measure
like average return and risk and identified that good
performance of funds is associated with low expense ratio.
1 William Sharpe, F.” Mutual Fund Performance”, The Journal of Business,Vol. 39, No.1, pp.119-138, 1966.
6
Eugene F. Fama and Kenneth R. French (1992)2, identified
five common risk factors in the returns on stock and bonds.
There are three stock market factors such as overall market
factor, factors related to firm size and book-to-market
equity. There are two bond-market factors, related to maturity
and default risks. Stock returns are linked to both stock-
market factors and bond market returns.
Sitkin and Pablo(1992)3, defined risk perception as risk
assessment in uncertainty and it depends on the familiarity
with organizational and management system. The authors also
developed a model of determinants of risk behaviour and
identified personal risk preferences and past experiences are
the important risk factors and social influence also affects
the individual’s perception.
John N. Sorros(2003)4, evaluated the risk and return of 16
equity Mutual funds operating in the Greek Financial market
over the period of 1995-1999. The study revealed that all
sixteen mutual funds showed lower total risk, and risk-return
coefficient than the General Index of the Athens Stock
Exchange (ASE) and there was a variation in return in all
sixteen mutual funds.
2 Eugene Fama, F. and Kenneth French, R. “Common Risk Factors in theReturns on Stocks and Bonds”, Journal of financial Economics, Vol. 33, pp.3-56, 1992.3 Sitkin, S.B. and Pablo, Reconceptualizing the Determinants of RiskBehaviour, Academy of Management Review 17, No. 1, pp. 9-39, 1992.4 John Sorros, N. “Return and Risk Analysis : A case study of EquityMutual Funds Operating in the Greek Financial Market”, Managerial Finance,Vol. 29, No 9, pp. 21-28, 2003.

7
Hossein Varamini Svetlana Kalash(2008)5, made a this study
to test the efficient market hypothesis for different market
capitalization and investment styles of mutual funds. The
results of the study for the entire period of 1994-2007
indicated that small cap funds have provided the highest risk-
adjusted return for the entire period whereas growth funds
have exhibited lower returns. The author found that the mutual
funds market is not always efficient, which makes it possible
for an investor or a mutual fund manger to earn excess return
on a risk-adjusted basis.
Viviane Y. Naimy (2008)6, compared the return of eight
different US equity funds with the NYSE composite Index for
the period of 2000-2007 and found that both the returns are
relatively moving together. The article also criticized that
investors need to be aware of problems and issues of mutual
funds and have to reconsider other investment alternatives for
better returns.
Mukhopadhyay J.N. and Veena Viswanathan(2009)7, examined
whether mutual funds could actually impart more value than the
stock market and protect the interest of the investors during
the downturn. It was found that during the sharp downturn the
5 Hossein Varamini Svetlana Kalash, “Testing Market Efficiency for DifferentMarket Capitalization Funds”, American Journal of Business, Vol. 23, Issue.2, pp.17-27, 2008.6 Viviane Naimy ,Y.” Equity Mutual Funds Versus Market Performance :Illusion or Reality?”, The Business Review, Vol. 11, No. 1, pp.71-75, 2008.7 Mukhopadhyay, J.N. and Veena Viswanathan, “Mutual fund schemes in India– Can they Protect the Interest of the Retail Investors?”, Journal ofBusiness Management, Vol. 1, No. 1-2, pp. 81-98, 2009.

8
schemes not only gave negative returns but also underperformed
the index.
Kavitha Chavali and Shefali Jain (2009)8, evaluated the
performance of 16 equity-linked schemes using risk and return
and compared their performance with its benchmark S&P CNX
Nifty. It has been found in the article that majority of the
investors were aware of mutual funds, its risk and return
proportion.
Zakri Y. Bello (2009)9, examined five factors namely
default risk premium, term premium, monetary conditions,
federal fund premium, market risk premium and confirms that
mutual fund returns can be strongly predicted by analyzing
these factors.
3.Data
Thirty Two Indian based tax saving mutual funds has been
obtained for the purpose of study. Daily returns of these
funds are obtained from the first financial year 2006-07 to
2010-11. Daily returns of all the schemes were collected from
Association of Mutual Fund Industries (AMFI) reports and
company reports. The proxy used in this study for the risk-
8 Kavitha Chavali and Shefali Jain, “Investment Performance of Equity-Linked Saving Schemes- An Empirical Study”, India Journal of Finance, pp.15-22, 2009.9 Zakri Bello ,Y. “On the predictability of Mutual fund Returns”, Journalof Business & Economic Studies, Vol. 15, No.1 pp. 70-81, 2009.

9
free rate of return is the average yield(3.5 per cent) on post
office savings scheme.
4.Methodology
This study estimates risk-return profiles for tax saving
mutual funds that have been varied from five-year period to
one-year period. Daily returns are used for computing Annual
returns and measures of return and risk. Mean returns are
calculated by averaging the monthly returns over the relevant
time period.
NAV return is the change in the net asset value of mutual
fund over a given time period.
NAV Return = Current value of units – Previous value of units
X 100 ----- Formula (1)
Previous value of units
Total risk measures by the standard deviation of returns.
Systematic (market) risk is estimated by beta. Risk premium
related to the total risk is measures by Sharpe index. Fund’s
performance in relation to the market performance is measured
by Treynor index. Jensen’s Alpha is used to compare the actual

10
or realized return of the portfolio with the predicted or
calculated return. The market benchmark used here is S&P CNX
NIFTY.
The standard deviation is a measure of variability which
is used as the standard measure of the total risk of
individual assets and the residual risk of portfolios of
assets. This can be calculated by using the formula
----------
Formula (2)
σ = Standard Deviation
Xi = Each data value
µ = Mean value of data
N = Sample Size
Sharpe measures developed by William Sharpe are referred
to as the Sharpe ratio of the reward variability ratio. It is
the ratio of the reward or risk premium to the variability of
return or risk as measured by the standard deviation of
return. The index assigns the highest values to assets that

11
have best risk-adjusted average rate of return. The formula
for calculating Sharpe ratio may be stated as :
Sharpe Ratio (SR) = rp – rf ---------- ---------- Formula (3) p
Where, rp = Realised return on the portfolio
rf = Risk free rate of return
p = Standard deviation of the portfolio
Treynor Ratio is the performance measure developed by
Jack Treynor is referred to as Treynor ratio or reward to
volatility ratio. It is the ratio of the reward or risk
premium to the volatility of return as measured by the
portfolio beta. The formula for calculating Treynor ratio may
be stated as :
Treynor ratio (TR) = rp – rf
--------- ---------- Formula (4)
p
Where, rp = Realised return on the portfolio
rf = Risk free rate of return
p = Portfolio Beta

12
Jensen Ratio is another type of risk adjusted performance
measure has been developed by Michael Jensen and is referred
to as the Jensen measure or ratio. This ratio attempts to
measure the differential between the actual return earned on a
portfolio and the return expected from the portfolio given its
level of risk. The formula for calculating Jensen ratio may be
stated as :
Jensen Ratio (JR) = rp – rf + p (rm - rf)
---------- Formula (5)
Where, rp = Realised return on the portfolio
rf = Risk free rate of return
p = Portfolio Beta
rm = Market Return
The higher Sharpe, Treynor and Jenson perform shows the
better performance of the funds in the market. The highest
standard deviation has high volatility in the market.

13
5.Results of the study
Thirty Two equity linked savings Schemes annualized
monthly return has been identified in Table I with bench mark
S&P CNX NIFTY. From Table 1, it is evident that all the
schemes performed well during the financial year 2009-11.
Five schemes has performed well and produced more than two per
cent monthly average return. 11 schemes performed modertately,
produced more then one per cent monthly average return. 16
schemes underfperformed and produced lesser than one per cent
monthly average return. ICICI Prudential Tax Plan performed
well and produced maximum of 6.39 per cent of average monthly
return during the period 2009-10. Average monthly return of
all the schemes during the year 2009-10 is higher than the
risk free market return (3.5 per cent). All the schemes under
performed, produced negative return during the year 2008-09
and it is higher than the stock market indices of S&P CNX
Nifty ( -0.15 per cent), the performance decline in 2008-09 is
due to the global economic crises. All the schemes performed
better during the year 2007-08 than 2006-07.

14
Chart 1 reveales that there was ups and downs in the
return of mutual funds from 2006-11. It is understood that
most of the schemes does not performed well during 2006-07 and
it is good during 2007-08 and does not performed well during
2008-09 and performed well in 2009-10 and performance is
declined in 2010-11. From the past it can be expected that the
performance of 2011-12 could be better than 2010-11.

15
Table 1 Annualized Monthly Average Return of Tax Saving Mutual funds
S.No Schemes
Monthly Average Return(in %)
2006-07
2007-08
2008-09
2009-10
2010-11
1.SBI Magnum Tax gain Scheme 1993
1.96 1.96-
3.40 4.96-
0.29
2.Canara Robeco Equity Tax saver
0.34 0.75-
2.53 5.91 0.47
3.HDFC TaxSaver -
0.20 1.96-
2.87 5.81 0.53
4.LICMF Tax plan -
0.75 1.79-
3.40 4.00 0.64
5.Sahara Tax Gain -
0.40 2.93-
2.63 4.98 0.37
6.Franklin India Tax shield -
0.87 2.53-
2.52 4.80 0.66
7.ICICI Prudential Tax Plan -
0.45 1.68-
3.07 6.39 0.41
8.UTI - ETSP-Growth -
1.06 2.52-
3.19 4.13 0.09
9.Escorts Tax Plan
2.39 2.66-
5.57 4.12-
0.28
10.HDFC Long Term Advantage Fund -
0.20 1.60-
3.16 5.31 0.92
11.ING Tax Savings Fund
0.01 0.65-
4.42 5.48 0.66
12. Sundaram Tax saver OE- App -
1.30 2.84-
2.83 4.27-
0.10
13. Reliance Tax Saver (ELSS) Fund -
0.33 1.08-
2.48 4.55 0.69
14. L&T Tax Saver Fund -
0.32 0.94-
4.30 6.08-
0.03
15. Kotak Tax Saver-Scheme 0.72 1.85-
3.85 4.77 0.03
16. BNP Paribas Tax Advantage Plan-
0.75 3.28-
4.97 4.00-
0.07
17. Fidelity Tax Advantage Fund 0.33 2.30-
2.40 4.89 0.9118. DWS Tax Saving Fund NA 3.10 - 4.15 -

16
3.44 0.49
19. Birla Sun Life Tax Plan NA 1.72-
3.24 4.59 0.21
20. HSBC Tax Saver Equity Fund NA 1.83-
2.33 4.65-
0.10
21. Religare Tax Plan NA 2.12-
3.23 5.35 0.29
22. DSP Black Rock Tax Saver Fund NA 3.20-
3.14 5.23 0.17
23. Taurus Tax Shield NA 4.52-
2.40 5.03 0.33
24.Birla Sun Life Relief 96
NA NA-
3.63 5.47-
0.32
25. JM Tax Gain Fund - NA NA-
6.38 4.08-
0.81
26.Bharti AXA Tax Advantage Fund-ECO Plan NA NA NA 5.98
-0.81
27.Bharti AXA Tax Advantage Fund-Regular Plan NA NA NA 5.95
-0.81
28. IDFC Tax Advantage (ELSS) Fund NA NA NA 4.28 0.1629. Quantum Tax Saving Fund NA NA NA 4.72 0.81
30.JPMorgan India Tax Advantage Fund NA NA NA 3.90 0.65
31. Edelweiss ELSS Fund NA NA NA 3.65 0.2732. Axis Tax Saver Fund NA NA NA NA 1.56 Bench Mark
S&P CNX NIFTY0.05
4 0.13-
0.15 0.240.04
5Source : Historical NAV report from 1-April-2006 to 31-March-2011, Association of mutual funds in India (AMFI)

17
Source : Historical NAV report from 1-April-2006 to 31-March-2011, Association of mutual funds in India (AMFI)
Chart-1 All schemes Annualized Monthly AverageReturn

18
The scheme with higher standard deviation is higher risk.
Table 2 revealed standard deviation of all selected tax saving
mutual funds. It shows that all the schemes had highest
volatility during the period 2008-09. The scheme with lowest
standard deviation is Escorts Tax Plan with the standard
deviation value of 8.09 in the year of 2008-09.
The average market risk of all schemes is lower during
the period 2010-11. It can be noted that many mutual funds
volatility is higher than stock market volatility. Generally
it is said that mutual funds are risk diversified but it is
proofed that market risk of mutual funds are goes along with
the stock market index even some mutual funds volatility is
higher than the stock market. Other than mutual fund features
like diversification of fund, fund managed
by AMC, no entry and exit charges, etc., all mutual funds are
not risk less instrument for the retail investors.
Sharpe ratio measures the total risk of the funds on the
basis of return per unit of total risk. While a high and
positive Sharpe Ratio shows a superior risk-adjusted
performance of a fund, a low and negative Sharpe Ratio is an
indication of unfavorable performance. Table 3 revealed Sharpe

19
ratio of selected Equity linked Savings Schemes of mutual
funds. It is generally assumed that people will prefere for
'more return' and 'less risk'. Risk in the context of the
Sharpe Ratio is return volatility. An investor would rank
portfolios by their Sharpe Ratios. portfolios with higher
sharp and lower volatilities are preferred than portfolios
with lower sharpe and higher volatilities.
Table 3 reveals that no fund has given positive sharpe
value during the period 2008-09. The highest Sharpe measure
obtained (0.84) is by ICICI Prudential Tax Plan during 2009-
10, the lowest Sharpe measure obtained (-0.69) is by Escorts
Tax Plan during 2008-09. In comparison, the Sharpe measure of
benchmark S&P CNX NIFTY is lower than all schemes during the
period of study.

20
Table 2 Standard Deviation of Tax Saving Mutual Funds
S.No Schemes
Standard Deviation2006-07
2007-08
2008-09
2009-10
2010-11
1.SBI Magnum Tax gain Scheme 1993 6.2
46.52
10.81
8.74
4.69
2.Canara Robeco Equity Tax saver 6.6
79.90
11.78
9.25
1.55
3.HDFC TaxSaver 6.9
37.74
10.97
7.71
1.77
4.LICMF Tax plan 7.5
58.59
10.92
9.09
0.83
5.Sahara Tax Gain 5.7
28.19
9.90 9.12
1.21
6.Franklin India Tax shield 5.5
67.62
10.22
6.60
2.20
7.ICICI Prudential Tax Plan 7.7
17.98
12.45
7.53
1.38
8.UTI - ETSP-Growth 6.4
87.62
9.59 7.37
0.30
9.Escorts Tax Plan 5.3
38.73
8.09 8.74
0.91
10.HDFC Long Term Advantage Fund 5.4
56.55
10.30
7.50
4.74
11.ING Tax Savings Fund 7.9
18.09
13.18
9.45
4.73
12. Sundaram Tax saver OE- App 7.43
8.92
8.64 9.55
5.00
13. Reliance Tax Saver (ELSS) Fund 7.04
8.60
8.97 7.26
5.25
14. L&T Tax Saver Fund 6.23
7.36
13.46
9.70
5.13
15. Kotak Tax Saver-Scheme7.60
7.89
11.20
9.31
4.84
16. BNP Paribas Tax Advantage Plan 8.52
9.83
10.33
7.02
5.26

21
17. Fidelity Tax Advantage Fund5.99
7.33
9.92 6.97
4.53
18. DWS Tax Saving Fund NA9.44
11.21
6.89
5.12
19. Birla Sun Life Tax Plan NA8.33
10.38
8.70
4.42
20. HSBC Tax Saver Equity Fund NA8.33
8.63 7.66
5.16
21. Religare Tax Plan NA6.36
10.44
7.22
4.43
22. DSP Black Rock Tax Saver Fund NA9.72
10.22
7.64
4.77
23. Taurus Tax Shield NA6.85
11.88
11.05
4.98
24.Birla Sun Life Relief 96
NA NA12.58
9.93
1.05
25. JM Tax Gain Fund - NA NA14.25
8.38
4.87
26.Bharti AXA Tax Advantage Fund-ECO Plan NA NA NA
11.53
5.47
27.Bharti AXA Tax Advantage Fund-Regular Plan NA NA NA
11.57
5.47
28. IDFC Tax Advantage (ELSS) Fund NA NA NA7.10
5.03
29. Quantum Tax Saving Fund NA NA NA6.63
4.45
30.JPMorgan India Tax Advantage Fund NA NA NA
7.29
4.74
31. Edelweiss ELSS Fund NA NA NA7.75
4.65
32. Axis Tax Saver Fund NA NA NA NA 3.59Bench Mark
S&P CNX NIFTY6.641
8.759
12.09
9.267
5.539
Source : Historical NAV report from 1-April-2006 to 31-March-2011, Association of mutual funds in India (AMFI)

22
Table 3 Shows Sharpe ratio of Tax Saving Mutual Funds
S.No
Schemes SHARPE RATIO2006-07
2007-08
2008-09
2009-10
2010-11
1.
SBI Magnum Tax gain Scheme 19930.31
0.29
-0.32
0.56
-0.07
2.
Canara Robeco Equity Tax saver 0.05
0.07
-0.22
0.63
0.28
3.
HDFC TaxSaver -0.03
0.25
-0.26
0.75
0.28
4.
LICMF Tax plan -0.10
0.20
-0.31
0.44
0.73
5.
Sahara Tax Gain -0.08
0.35
-0.27
0.54
0.27
6.
Franklin India Tax shield -0.16
0.33
-0.25
0.72
0.29
7.
ICICI Prudential Tax Plan -0.06
0.21
-0.25
0.84
0.28
8.
UTI - ETSP-Growth -0.17
0.33
-0.34
0.56
0.18
9.
Escorts Tax Plan0.44
0.30
-0.69
0.47
-0.34
10.
HDFC Long Term Advantage Fund -0.04
0.24
-0.31
0.70
0.19
11.
ING Tax Savings Fund 0.00
0.08
-0.34
0.58
0.13

23
12.Sundaram Tax saver OE- App
-0.05
0.31
-0.33
0.44
0.21
13.Reliance Tax Saver (ELSS) Fund
-0.02
0.12
-0.28
0.62
0.12
14.L&T Tax Saver Fund
-0.01
0.12
-0.32
0.62
-0.01
15.Kotak Tax Saver-Scheme0.03
0.23
-0.35
0.51
0.00
16.BNP Paribas Tax Advantage Plan
-0.03
0.33
-0.48
0.57
-0.02
17.Fidelity Tax Advantage Fund0.01
0.31
-0.25
0.70
0.19
18.DWS Tax Saving Fund NA0.32
-0.31
0.60
-0.10
19.Birla Sun Life Tax Plan NA0.20
-0.32
0.52
0.04
20.HSBC Tax Saver Equity Fund NA0.22
-0.27
0.60
-0.03
21.Religare Tax Plan NA0.33
-0.31
0.74
0.06
22.DSP Black Rock Tax Saver Fund NA0.33
-0.31
0.68
0.03
23.Taurus Tax Shield NA0.66
-0.20
0.45
0.06
24.
Birla Sun Life Relief 96
NA NA
-0.29
0.55
-0.33
25.JM Tax Gain Fund - NA NA -0.4
0.48
-0.1

24
5 7
26.Bharti AXA Tax Advantage Fund-ECO Plan NA NA NA
0.52
-0.16
27.Bharti AXA Tax Advantage Fund-Regular Plan NA NA NA
0.51
-0.16
28.IDFC Tax Advantage (ELSS) Fund NA NA NA0.60
0.02
29.Quantum Tax Saving Fund NA NA NA0.71
0.17
30.JPMorgan India Tax Advantage Fund NA NA NA
0.53
0.13
31.Edelweiss ELSS Fund NA NA NA0.47
0.05
32.Axis Tax Saver Fund NA NA NA NA0.42
Bench Mark
S&P CNX NIFTY0.01
0.05
-0.07
0.11
0.01
Source : Historical NAV report from 1-April-2006 to 31-March-2011, Association of mutual funds in India (AMFI)

25
Treynor is a measurement of the returns earned in excess
of that which could have been earned on an investment that has
no diversifiable risk per each unit of market risk assumed.
Table 4 shows Treynor meausre of Equity Linked tax Saving
Fund. The higher the Treynor Ratio, the better the
performance under analysis. From analysis it is noted that
all the schemes are performed well than the stock market index
S&P SNX Nifty during the entire period of study.
Alpha is a risk-adjusted measure return on an investment.
It is the return in excess of the compensation for the risk
borne. The alpha measure shows the level of risk associated
with the return. If alpha(αi ) < 0, the investment has earned
too little for its risk (or, was too risky for the return), If
alpha(αi ) = 0, the investment has earned a return adequate
for the risk taken and if alpha(αi ) > 0, the investment has a
return in excess of the reward for the assumed risk.
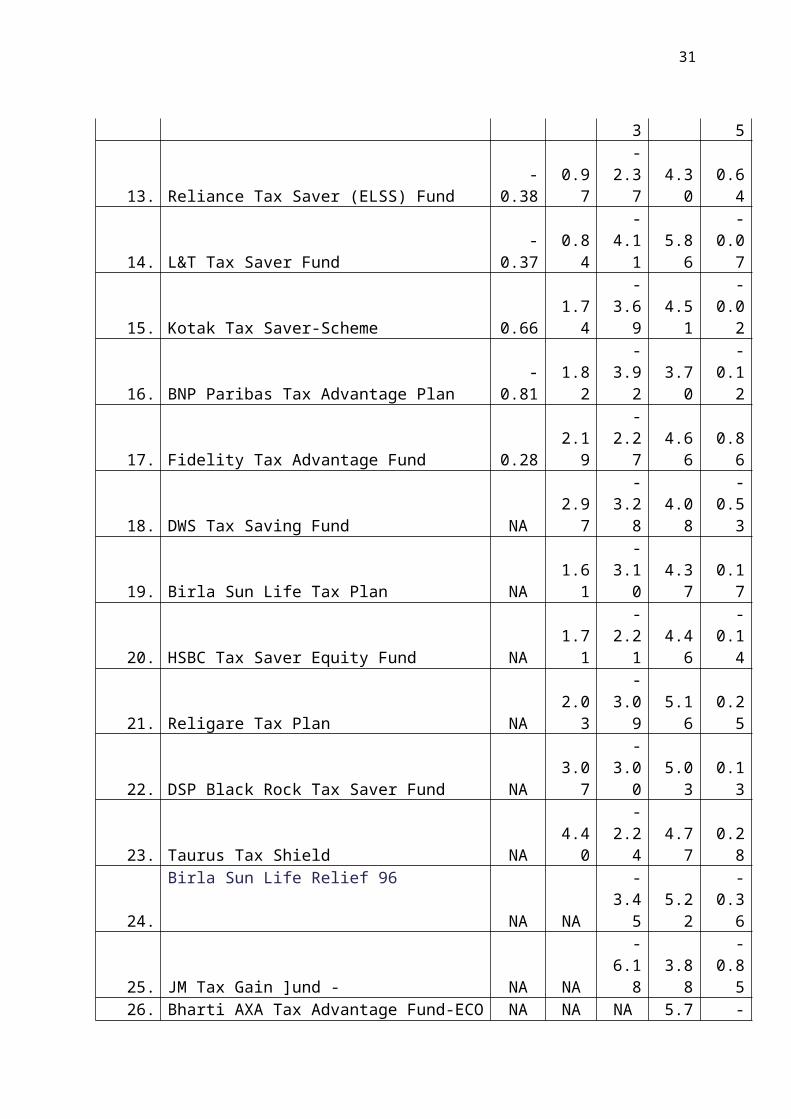
Table 5 shows Alpha measures of Equity Linked tax Saving
Fund for the year 2006-07 to 2010-11. It is noted that the
stock market has equivalent return for the risk. Stock market
alpha is zero for the entire study period. It can be said
that 2009-10 is glorious time for the investor, invariably all

26
the mutual funds are produced better return during this peiod.
ICICI Prudential Tax Plan seems to be a good plan, it has
given highest alpha measure of 6.19 with the comparision of
all other tax saving mutual funds during the period of 2006-
11.

27
Table 4 Shows Treynor ratio of Tax Saving Mutual Funds
S.NoSchemes
TREYNOR RATIO2006-07
2007-08
2008-09
2009-10
2010-11
1.SBI Magnum Tax gain Scheme 1993 1.9
22.75
-3.46 5.45
-0.43
2.Canara Robeco Equity Tax saver 0.2
90.76
-2.40 6.06 0.75
3.
HDFC TaxSaver -0.21
2.32
-2.93 7.19 0.77
4.
LICMF Tax plan -0.66
1.95
-3.44 4.18 0.78
5.
Sahara Tax Gain -0.48
3.28
-2.92 5.20 0.51
6.
Franklin India Tax shield -1.06
2.96
-2.70 6.99 0.85
7.
ICICI Prudential Tax Plan -0.47
2.12
-2.83 8.12 0.53
8.
UTI - ETSP-Growth -1.04
3.02
-3.64 5.35 0.07
9.Escorts Tax Plan 4.0
32.95
-7.76 4.87
-0.42
10.
HDFC Long Term Advantage Fund -0.29
2.32
-3.43 6.75 1.20
11.
ING Tax Savings Fund -0.02
0.83
-3.69 5.53 0.85
12.Sundaram Tax saver OE- App
-2.14
2.88
-3.81 4.25
-0.18
13.Reliance Tax Saver (ELSS) Fund -0.3
1.24
-3.15
6.22 0.83

28
5
14.L&T Tax Saver Fund
-0.39
1.18
-3.50 6.09
-0.08
15.Kotak Tax Saver-Scheme0.61
2.24
-3.75 4.88
-0.01
16.BNP Paribas Tax Advantage Plan
-0.60
1.85
-13.20 5.47
-0.13
17.Fidelity Tax Advantage Fund0.31
2.89
-2.64 6.76 1.24
18.DWS Tax Saving Fund NA2.94
-3.33 5.75
-0.70
19.Birla Sun Life Tax Plan NA2.01
-3.39 5.01 0.25
20.HSBC Tax Saver Equity Fund NA2.05
-2.94 5.86
-0.16
21.Religare Tax Plan NA3.40
-3.39 7.04 0.39
22.DSP Black Rock Tax Saver Fund NA3.33
-3.35 6.48 0.19
23.Taurus Tax Shield NA4.64
-2.29 4.43 0.42
24.Birla Sun Life Relief 96
NA NA-
3.21 5.21-
0.44
25.JM Tax Gain ]und - NA NA-
5.12 4.93-
1.15
26.Bharti AXA Tax Advantage Fund-ECO Plan NA NA NA 5.10
-1.04
27.Bharti AXA Tax Advantage Fund-Regular Plan NA NA NA 5.05
-1.04
28.IDFC Tax Advantage (ELSS) Fund NA NA NA 5.95 0.1729.Quantum Tax Saving Fund NA NA NA 6.98 1.13
30.JPMorgan India Tax Advantage Fund NA NA NA 5.65 0.81
31.Edelweiss ELSS Fund NA NA NA 4.50 0.35
32.Axis Tax Saver Fund NA NA NA NA-
7.43 Bench Mark S&P CNX NIFTY 0.0 0.0 - 0.20 0.01

29
2 90.18
6 53Source : Historical NAV report from 1-April-2006 to 31-March-2011, Association of mutual funds in India (AMFI)

30
Table 5 Shows Alpha ratio of Tax Saving Mutual Funds
S.NoSchemes
ALPHA RATIO
2006-07
2007-08
2008-09
2009-10
2010-11
1.
SBI Magnum Tax gain Scheme 1993
1.901.86
-3.2
54.74
-0.33
2.
Canara Robeco Equity Tax saver
0.280.63
-2.3
75.67
0.43
3.
HDFC TaxSaver-
0.261.85
-2.7
25.61
0.49
4.
LICMF Tax plan-
0.811.68
-3.2
54.74
-0.33
5.
Sahara Tax Gain-
0.452.82
-2.5
04.75
0.32
6.
Franklin India Tax shield-
0.922.42
-2.3
84.63
0.62
7.
ICICI Prudential Tax Plan -
0.511.58
-2.9
06.19
0.37
8.
UTI - ETSP-Growth -
1.112.41
-3.0
63.94
0.05
9.
Escorts Tax Plan
2.342.55
-5.4
73.91
-0.32
10.
HDFC Long Term Advantage Fund -
0.261.50
-3.0
25.12
0.88
11.
ING Tax Savings Fund -
0.050.55
-4.2
35.25
0.62
12. Sundaram Tax saver OE- App -1.35
2.72
-2.7
4.10
-0.1
31
3 5
13. Reliance Tax Saver (ELSS) Fund -
0.380.97
-2.3
74.30
0.64
14. L&T Tax Saver Fund -
0.370.84
-4.1
15.86
-0.07
15. Kotak Tax Saver-Scheme 0.661.74
-3.6
94.51
-0.02
16. BNP Paribas Tax Advantage Plan -
0.811.82
-3.9
23.70
-0.12
17. Fidelity Tax Advantage Fund 0.282.19
-2.2
74.66
0.86
18. DWS Tax Saving Fund NA2.97
-3.2
84.08
-0.53
19. Birla Sun Life Tax Plan NA1.61
-3.1
04.37
0.17
20. HSBC Tax Saver Equity Fund NA1.71
-2.2
14.46
-0.14
21. Religare Tax Plan NA2.03
-3.0
95.16
0.25
22. DSP Black Rock Tax Saver Fund NA3.07
-3.0
05.03
0.13
23. Taurus Tax Shield NA4.40
-2.2
44.77
0.28
24.
Birla Sun Life Relief 96
NA NA
-3.4
55.22
-0.36
25. JM Tax Gain ]und - NA NA
-6.1
83.88
-0.85
26. Bharti AXA Tax Advantage Fund-ECO NA NA NA 5.7 -

32
Plan 10.86
27.Bharti AXA Tax Advantage Fund-Regular Plan NA NA NA
5.68
-0.86
28. IDFC Tax Advantage (ELSS) Fund NA NA NA4.10
0.12
29. Quantum Tax Saving Fund NA NA NA4.55
0.76
30. JPMorgan India Tax Advantage Fund NA NA NA3.72
0.61
31. Edelweiss ELSS Fund NA NA NA3.45
0.23
32. Axis Tax Saver Fund NA NA NA NA1.53
Bench Mark
S&P CNX NIFTY 0.000.00
0.00
0.00
0.00
Source : Historical NAV report from 1-April-2006 to 31-March-2011, Association of mutual funds in India (AMFI)
There are various tools help investors to measure the
performance of mutual funds, decision cannot be taken by
referring the results of one tool. It is necessary to use
number of tools to evaluate the performance.

33
NAV return shows the actual return on the investment over
a period of time. The past performance will not guarantee the
future, still it is important to analyse the past data to
forecast the future. The Annualized monthly return of Taurus
Tax Shield-Growth Option and Fidelity Tax Advantage Fund-
Growth Option is good during the period of study.
Standard deviation is a tool that shows the volatility
of the fund. It is advisable not to invest in a fund which is
unstable. From the sample data, it is analysed that Escorts
Tax Plan-Growth, HDFC Long Term Advantage Fund - Growth Option
has lower volatility during the period of study than all other
schemes.
Sharpe ratio measures total risk of a portfolio, it is
useful measure to analyse investment area that are in similar
type. Higher sharpe ratio shows better performance with lower
market risk. Taurus Tax Shield-Growth Option and Religare Tax
Plan – Growth plan adjusted with market return and produced
better sharpe ratio during the study period.
Treynor ratio uses systematic risk, higher the treynor
ratio, better the performance under analysis. Taurus Tax

34
Shield-Growth Option and Religare Tax Plan – Growth performed
well in the study period.
Alpha ratio is the difference between the average
realized return of a portfolio manager with private
information and the expected return of the passive strategy
based upon public information only with equal systematic risk.
Taurus Tax Shield-Growth Option and Fidelity Tax Advantage
Fund-Growth Option does better during the period of study.

35
6. Conclusion
This paper evaluated the risk-adjusted performance of tax
saving mutual funds in India. Analyzing the seasonality of
funds return and benchmark return volatility in terms of the
mean adjusted. Yearly standard deviation from the daily return
obtained from AMFI reports and NSE reports. Examining the fund
volatility, it is found that the highest volatility occurs in
the period of 2008-09. Risk- Adjusted performance is measure
by Sharpe, Treynor and Alpha. From these measures it is found
that there are certain schemes which underperform than the
benchmark index that show a strong negative risk–return
relation. There are certain schemes that outperform than the
benchmark index with positive risk-return relation.
Investor who wants to invest into tax saving mutual
funds needs to make two decisions. One is which fund to hold
and how much money to invest each. This study helps the
investors to choose the suitable schemes for investment. It
can also be stated the past performance of the funds does not
reflect in future. Most of the schemes performed well in the
initial period. This study analysis shows all the tax saving
36
mutual funds is having volatility but not all the schemes
volatility is lesser than the benchmark S&P CNX NIFTY. Most of
the schemes are given higher return than the benchmark S&P CNX
NIFTY. All the schemes are performed in same pattern towards
market. Eventhough the fund movements are similar, the degree
of change is not same in all theschemes. Investors’ interest
and keen updation of the market will help them to attain their
expected return from the Equity Linked Savings Schmes of tax
saving mutual funds.

37
References
Eugene Fama, F. and Kenneth French, R. “Common Risk
Factors in the Returns on Stocks and Bonds”, Journal of
financial Economics, Vol. 33, pp. 3-56, 1992.
Hossein Varamini Svetlana Kalash, “Testing Market
Efficiency for Different Market Capitalization Funds”,
American Journal of Business, Vol. 23, Issue. 2, pp.17-
27, 2008.
John Sorros, N. “Return and Risk Analysis : A case study
of Equity Mutual Funds Operating in the Greek Financial
Market”, Managerial Finance, Vol. 29, No 9, pp. 21-28,
2003.
Kavitha Chavali and Shefali Jain, “Investment
Performance of Equity-Linked Saving Schemes- An Empirical
Study”, India Journal of Finance, pp. 15-22, 2009.
Mukhopadhyay, J.N. and Veena Viswanathan, “Mutual fund
schemes in India – Can they Protect the Interest of the
Retail Investors?”, Journal of Business Management, Vol.
1, No. 1-2, pp. 81-98, 2009.

38
Sitkin, S.B. and Pablo, Reconceptualizing the
Determinants of Risk Behaviour, Academy of Management
Review 17, No. 1, pp. 9-39, 1992.
Viviane Naimy ,Y.” Equity Mutual Funds Versus Market
Performance : Illusion or Reality?”, The Business Review,
Vol. 11, No. 1, pp.71-75, 2008.
Zakri Bello ,Y. “On the predictability of Mutual fund
Returns”, Journal of Business & Economic Studies, Vol.
15, No.1 pp. 70-81, 2009.
William Sharpe, F.” Mutual Fund Performance”, The Journal
of Business, Vol. 39, No.1, pp.119-138, 1966.

39
Websites
Daily Net Asset Value of all the schemes are collected from
Association of mutual funds in India website
www.amfiindia.com, assessed from 1 April 2006 to31 March
2011.
Post office savings schemes risk free interest rate is
collected from www.indiapost.gov.in on 15 June 2011.
Benchmark S&P CNX NIFTY daily returns obtained from
www.nseindia.com, assessed on 16 June 2011.
Copyright © 2022 FDOKUMEN