The Tocqueville Trust Mutual Funds Semi-Annual Report - Sprott
79
The Tocqueville Trust Mutual Funds Semi-Annual Report April 30, 2019 The Tocqueville Fund The Tocqueville Opportunity Fund The Tocqueville Gold Fund The Tocqueville Phoenix Fund The Tocqueville Select Fund Beginning on January 1, 2021, as permitted by regulations adopted by the U.S. Securities and Exchange Commission, paper copies of the Funds’ annual and semiannual shareholder reports will no longer be sent by mail, unless you specifically request paper copies of the reports. Instead, the reports will be made available on the Funds’ website (http://tocquevillefunds.com/mutual-funds/ download-information-literature-center), and you will be notified by mail each time a report is posted and provided with a website link to access the report. If you already elected to receive shareholder reports electronically, you will not be affected by this change and you need not take any action. You may elect to receive shareholder reports and other communications from the Funds electronically anytime by contacting your financial intermediary (such as a broker-dealer or a bank) or, if you are a direct investor, by calling 1-800-697-3863, or by enrolling at www.tocquevillefunds.com. You may elect to receive all future reports in paper free of charge. If you invest through a financial intermediary, you can contact your financial intermediary to request that you continue to receive paper copies of your shareholder reports. If you invest directly with the Funds, you can call 1-800-697-3863 to let the Funds know you wish to continue receiving paper copies of your shareholder reports. Your election to receive reports in paper will apply to all funds held in your account if you invest through your financial intermediary or all Funds held with the Fund complex if you invest directly with the Funds.
-
Upload
khangminh22 -
Category
Documents
-
view
0 -
download
0
Transcript of The Tocqueville Trust Mutual Funds Semi-Annual Report - Sprott

The Tocqueville TrustMutual Funds
Semi-Annual Report
April 30, 2019
The Tocqueville Fund
The Tocqueville Opportunity Fund
The Tocqueville Gold Fund
The Tocqueville Phoenix Fund
The Tocqueville Select FundBeginning on January 1, 2021, as permitted by regulations adopted by the U.S.Securities and Exchange Commission, paper copies of the Funds’ annual and
semiannual shareholder reports will no longer be sent by mail, unless youspecifically request paper copies of the reports. Instead, the reports will be made
available on the Funds’ website (http://tocquevillefunds.com/mutual-funds/download-information-literature-center), and you will be notified by mail each
time a report is posted and provided with a website link to access the report.
If you already elected to receive shareholder reports electronically, you will not beaffected by this change and you need not take any action. You may elect to
receive shareholder reports and other communications from the Fundselectronically anytime by contacting your financial intermediary (such as a
broker-dealer or a bank) or, if you are a direct investor, by calling1-800-697-3863, or by enrolling at www.tocquevillefunds.com.
You may elect to receive all future reports in paper free of charge. If you investthrough a financial intermediary, you can contact your financial intermediary torequest that you continue to receive paper copies of your shareholder reports. If
you invest directly with the Funds, you can call 1-800-697-3863 to let the Fundsknow you wish to continue receiving paper copies of your shareholder reports.
Your election to receive reports in paper will apply to all funds held in youraccount if you invest through your financial intermediary or all Funds held with
the Fund complex if you invest directly with the Funds.

This report is not authorized for distribution to prospective investors unless preceded oraccompanied by a currently effective prospectus of The Tocqueville Trust. Please call1-800-697-FUND (3863) for a free prospectus. Read it carefully before you invest.
You are invited to visit our website @ www.tocquevillefunds.com

Chairman’s Letter
Dear Fellow Shareholder,
As of this writing, equity markets continue to focus on international trade issues andtheir possible impact on global growth. The interest rate panic that was behind thecalendar 2018 fourth quarter sell-off has subsided, with rates falling to three-year lows,and a chastened FED vowing not to raise short-term rates any further, any time soon. Thegood news on rates triggered a powerful rally in equities in the first calendar quarter of2019, but growing pessimism on trade, particularly with China, the world’s second largesteconomy, has brought equities down to earth more recently. Still, equities have generatedsolid returns in the first half of our fiscal year, as the strong U.S. economy has more thanoffset the trade concerns as well as the ongoing political shenanigans in our nation’scapital.
Gold prices, always a good barometer of investor confidence in government, haveremained depressed, signaling greater optimism in political developments than, perhaps,our national media suggests. Record low unemployment, productivity gains, and risingwage rates, along with respectable earnings reports, are, no doubt, instrumental in thisbrighter outlook, and certainly of greater importance to investors than the political dramaunleashed by the recent elections and the warring factions in Washington. Of course,should the latter get much worse, or the former no better, this could change over thecourse of the next six months, but our crystal ball is too cloudy to make that call. Rather,we think that the volatility in the markets that shows up in response to temporal issuesgives our analysts and our managers an opportunity to find attractive long-terminvestments at attractive prices, so we welcome it. The equity markets continue, in ourview, to be the preferred place to invest for the long term and the best place to preservecapital against the rapaciousness of taxes and the ongoing depreciation of currencies.
As co-investors with all of our shareholders, the portfolio managers of all our fundsand I thank you for your continued support.
Sincerely,
Robert W. KleinschmidtChairman
Semi-Annual Report 1

The Tocqueville Fund
Dear Fellow Shareholder,The six-month period ended April 30, 2019 was a positive one for equity markets
overall bookended by periods of volatility. Investors initially fled equity markets towardthe end of calendar 2018 as concerns over the Federal Reserve’s interest rate policy, inparticular, coupled with the Trump Administration’s aggressive trade policies, began toupset global commercial activity and exacerbated some signs of weakness that had beenpercolating since the prior spring, caused markets to doubt the growth narrative. When,in December, the Fed signaled that it might be more data dependent (and thereforedovish) in its interest rate posture and the Trump Administration reinforced the notionthat trade negotiations were progressing, markets rallied strongly. Prior concerns returnedto the forefront at the end of the period when it became more apparent, through heatedrhetoric and additional tariffs, that, trade talks were still stuck on the crucial issues ofintellectual property, technology transfers and the restructuring of the Chinese economy.Still, the more enlightened Fed policy, as well as better than feared earnings data wasenough for the S&P to gain 9.76% for the period.
During the same period, the Fund returned 11.50%. All sectors were positivecontributors, but the strongest sectors for the Fund were Information Technology,Consumer Staples and Industrials while the weakest were Real Estate, Energy andUtilities. The top performing individual names were Microsoft, Procter & Gamble,Applied Materials, Noble Energy and Amazon while the laggards were Apple, Haliburton,Biogen, Pioneer Natural Resources and Pfizer.
Over the past six months, we added a few new names to the portfolio. One of these wasNvidia, a manufacturer of graphics processing units (GPUs) typically used in video games butincreasingly in other applications requiring rapid calculations like machine learning orautonomous vehicles. Nvidia’s shares had fallen out of favor because of concerns about aslowdown in demand for gaming equipment due to new game formats, an inventory overhangfrom cryptocurrencies where GPUs had been used for “mining”, and the overall China tradefears. Our view is that this slowdown is a temporary blip, that inventories will be cleared overtime and that the secular trends are likely to continue indefinitely. Hence, we believed that theshares were trading at a significant discount to intrinsic value.
Another new purchase was Raytheon, the defense contractor. Raytheon’s shares hadbeen under pressure because of concerns that defense spending would not be as favorable asexpected with the Democrats winning in the mid-term elections, as well as the Trumpadministration proposing a budget that was less than expected. Policies of militarydisengagement also contributed to weakness in Defense names. Our view is that the worldremains a dangerous place, that Raytheon is less vulnerable than the other large defensecontractors to budget pressures and it is well positioned for the sorts of spending that islikely to be a priority for the military in the future, namely cyber security and missiletechnology. The business has a strong balance sheet, generates consistent returns on capitaland was trading at an attractive valuation considering the overall quality of the company.
We also added United Technologies, a multi-industry conglomerate with traditionallyattractive returns on capital that has seen its valuation compress because of concerns over
2 April 30, 2019

China and recent performance issues at its Pratt and Whitney aerospace division. Our viewis that the pending separation into three distinct companies focused on aerospace, HVACequipment and elevators, with a high service component brought on by investor activism,will be value enhancing as the individual businesses receive higher ratings over time.
Other positions that were added or increased include Biogen, Capital One,Constellation Brands, FedEx, Nektar Therapeutics, Noble Energy, Parker Hannifin,Schlumberger, Vulcan Materials, Walt Disney and Weyerhaeuser.
A variety of positions were reduced or eliminated during the period as theyapproached our valuation targets, in order to make room for an idea with a better riskreward profile, in response to a change in circumstances or to investors’ desire forliquidity. Of those sold or reduced for fundamental reasons, Goldcorp was sold followingits announced merger with Newmont Mining and Boeing was reduced following thecrash of two of its 737 Max jets that called into question the prospects of the 737 Max jetsplatform and potential related liabilities. Other sales included Apple, Automated DataProcessing, Bank of New York, Brighthouse Financial, Facebook, Fluor, Halliburton,Ionis Pharmaceuticals, Johnson & Johnson, JPMorgan Chase, McDonald’s, Merck,Nektar Therapeutics, Nextera Energy and Pioneer Natural Resources.
Our view is that in spite of markets still being near their highs, equities represent themore attractive asset class relative to fixed income. The trade disputes have definitely raisedquestions about sustainability of global growth, but domestic corporate earnings havegenerally been better than expected even in the face of supply chain challenges, rising laborcosts and the recovery in energy prices. If the trade situation resolves itself eventually, whichwe suspect it will, it will likely be a positive for equity markets, certainly for those sectorsexposed to China such as technology, industrials, and agriculture, and likely bring backconcerns of rates moving up to the detriment of bonds. Conversely, if the trade disputedrags on and begins more materially to impact the domestic economy, the Fed has some,but not much room to maneuver. The Fed could cut rates again, but that might give rise toconcerns about credit quality and a looming recession that could weigh on both equity andfixed income investors. With rates as low as they are, rate reductions may have a limitedeffect, forcing the Fed to other, non-traditional, measures to prevent a recession. Onbalance, however, we think that is an unlikely scenario. In the meantime, while we await aresolution to these macro and geopolitical factors, we will continue to focus our efforts onlooking for opportunities where quality companies get oversold and fall out of favor due tothese or other temporary concerns. As long-term, value-oriented investors, it is preciselyconcerns such as these that give us the chance to own good companies at great prices.
Sincerely,
Robert W. KleinschmidtPortfolio Manager
Peter ShawnDirector of Research
Semi-Annual Report 3

The Tocqueville Fund
(Unaudited)
$41,602
$34,450
The Tocqueville Fund (Net Asset Value)
S&P 500 Total Return Stock Index
$0
$10,000
$20,000
$30,000
$50,000
$40,000
4/30/09 4/30/10 4/30/11 4/30/12 4/30/13 4/30/14 4/30/15 4/30/194/30/16 4/30/17 4/30/18
This chart assumes an initial gross investment of $10,000 made on 4/30/09. Returns shown donot reflect the deduction of taxes that a shareholder would pay on fund distributions or theredemption of fund shares. Performance reflects fee waivers in effect. In the absence of feewaivers, total return would be reduced. Returns shown include the reinvestment of alldividends and other distributions. Past performance is not predictive of future performance.Investment return and principal value will fluctuate so that your shares, when redeemed, maybe worth more or less than their original cost.
The Standard & Poor’s 500 Total Return Stock Index (S&P 500) is a capital-weighted index,representing the aggregate market value of the common equity of 500 stocks primarily tradedon the New York Stock Exchange. Returns assume the reinvestment of all dividends.
AVERAGE ANNUAL RATE OF RETURN (%)FOR YEARS ENDED APRIL 30, 2019
1 Year 3 Year 5 Year 10 Year
The Tocqueville Fund 12.63% 12.50% 8.66% 13.17%Standard & Poor’s 500 Total Return Stock Index 13.49% 14.87% 11.63% 15.32%
4 April 30, 2019

The Tocqueville Opportunity Fund
Dear Fellow Shareholder,
We are pleased to provide this investment overview for the first six-month period ofthe fiscal year 2019 for the Tocqueville Opportunity Fund. The end of this fiscal year(October 2019) will mark the ninth consecutive year of management of the Fund as agrowth fund. During the six-month period ended April 30, 2019, the Fund appreciated18.11%, and outperformed the SMID cap growth benchmark, the Russell 2500® GrowthTotal Return Index, which gained 11.86%.
Investors will recall that the passage of the Tax Cuts and Jobs Act of 2017 at the endof 2017 set the stage for a strong start for 2018 financial markets. But early on in 2018,the Administration adopted a serious new trade policy with regard to U.S. tradingpartners, with a particular focus on Chinese trade. Against a background of targeted, firstround tariffs, Fed tightening, and increased evidence of slowing housing and capitalinvestment, the broad market struggled throughout most of 2018 to recover its peak levelin January, only to be done in late in the year by interest rate fears. Although the earlymonths of 2019 have been characterized with ongoing trade concerns and the recentimposition of another round of significant tariff increases, markets have acted moresanguinely due to evidence of sustained growth in the U.S., low inflation, and a 10 yearTreasury yield which closed at 2.50% on April 30, 2019, versus a peak in November2018 at nearly 3.25%.
Over the past six months, investments in Technology, Communication Services, andIndustrials provided the leading contributions to the Fund’s absolute and relative (versusthe Fund’s benchmark) performances. Relative to the benchmark, Healthcare investmentsdetracted the most; investments in Utilities, Materials, and Real Estate also providednegative attributed returns—the Fund held no investments in Real Estate or Utilities overthe six months and consequently surrendered an insignificant 0.10% of relativeperformance—it lost 0.02% on the relative Materials investments. On the positive side,the Fund gained 8.98% of relative gains on investments in Technology, CommunicationServices and Industrials. The Fund had no Energy investments during the sixmonths, adding to relative performance. On a relative basis, the top ten performersincluded eight Technology issues, one Internet issue and one Healthcare investment(SAGE Therapeutics); the largest detractors included Nvidia, Sarepta Therapeutics, andSTAAR Surgical. Investments in Shopify, ServiceNow and Workday were the leadingdrivers of absolute and relative performance respectively for the Fund during the period.With a high concentration of investment in the top 100 names at nearly 87%, the Fundbenefitted significantly from the fact that 21 issues gained 50% or more in price duringthe period; only two issues fell 50% or more—Roku (-51.8%) and Inogen (-53.95%)—insignificant at less than 0.15% of investments.
At the close of the first six months of fiscal year 2019, the Fund had maintained itslargest commitments in Technology holdings. The overall allocation to Technology
Semi-Annual Report 5

investments was relatively unchanged from the start of the fiscal year on October 31,2018. We continue to believe that certain Technology investments are benefitting fromthe secular shift of spending from on-premise hardware and software capital spending tohybrid- cloud, edge, and public cloud business models—enabling increased productivity,competitiveness and lower total cost of ownership. Current and future drivers of thismassive, digital transformation of business models include: Artificial Intelligence, MachineLearning, 5G applications (Autonomous Driving), Natural Language Processing, etc. TheFund increased its exposure to the Industrials sector to a slightly overweight exposure froma significant underweight position when the fiscal period commenced. The Industrialsector was heavily oversold in late 2018, investments have been targeted with low/noChina exposure and include holdings in: aerospace and defense, business services,distribution, and equipment. Funding for the increase in Industrials was provided byreducing Healthcare holdings—now moved to an underweight position. Investments havebeen tilted to Biotechnology companies with approved products, and toward Services andSpecialty Medical investments. During the last election cycle (2015-2016), Healthcareinvestments significantly underperformed the broad markets and did not regain theirbeginning of election cycle price levels for two years.
The Fund benefitted from seven takeovers during the past six months after a dryspell from mid-2018—the total number of takeovers in the Fund is nearly 110 since late2010. The current period takeovers included: Esterline, Apptio, Loxo Oncology, UltimateSoftware, Spark Therapeutics, Worldpay, WellCare Health Plans, and Ingersoll-Rand.Often, Fund holdings are buyers of other existing holdings—Transdigm and FidelityNational were acquirers. The SMID capitalization and Mid-capitalization segmentscontinue to provide the most attractive opportunities for takeovers and consolidation; asteady economy and good industrial and tax policy should encourage continued activity.
The Top 10 and Top 25 positions comprised approximately 32% and 45% of theFund’s holdings at the end of the period. Approximately 87% of the Fund’s holdings wereinvested in the Top 100 positions. Smaller positions continue to serve a critical role in theFund’s outperformance of its benchmark—providing a foothold in new, rapid expandingopportunities and minimizing risk in more binary outcome situations.
The Fund’s investments are well placed in competitively advantaged companies—many,like the Top 3 holdings—Shopify, ServiceNow and Workday—are long-term investmentsmade years ago which have continued to execute at the highest level and drive significantexcess returns. We believe that these companies are led by smart, vested, and visionarymanagements competing in very large and expanding markets. Substitution, innovation,obsolescence, and digital transformation represent a major threat to many legacy businessmodels and disruption is an ever-present risk to many mature companies. We continue to seekto identify the leading, strategic opportunities while avoiding the value traps of fadingcompanies. As always, we appreciate your continued confidence in our efforts.
Sincerely,
Thomas R. VandeventerPortfolio Manager
6 April 30, 2019

The Tocqueville Opportunity Fund
(Unaudited)
$45,178$42,182
$37,383
The Tocqueville Opportunity Fund (Net Asset Value)
Russell 2500 Growth Total Return Index
Russell 2000 Total Return Index
$0
$10,000
$20,000
$30,000
$50,000
$40,000
4/30/09 4/30/10 4/30/11 4/30/12 4/30/13 4/30/14 4/30/15 4/30/194/30/16 4/30/17 4/30/18
This chart assumes an initial gross investment of $10,000 made on 4/30/09. Returns shown donot reflect the deduction of taxes that a shareholder would pay on fund distributions or theredemption of fund shares. Returns shown include the reinvestment of all dividends and otherdistributions. Past performance is not predictive of future performance. Investment return andprincipal value will fluctuate so that your shares, when redeemed, may be worth more or lessthan their original cost.
The chart and table reflect The Opportunity Fund’s performance achieved prior to the changeseffected in 2010 to its investment strategy.
The Russell 2500 Growth Total Return Index is an unmanaged index that measures theperformance of the small to mid-cap growth segment of the U.S. equity universe. It includesthose Russell 2500 companies with higher price-to-book ratios and higher forecasted growthvalues. Returns assume the reinvestment of all dividends
The Russell 2000 Total Return Index is an unmanaged index that measures the performanceof the 2,000 smallest companies in the Russell 3000 Index. Returns include the reinvestment ofall dividends.
AVERAGE ANNUAL RATE OF RETURN (%)FOR YEARS ENDED APRIL 30, 2019
1 Year 3 Year 5 Year 10 Year
The Tocqueville Opportunity Fund 16.53% 20.84% 12.99% 15.48%Russell 2500 Growth Total Return Index 12.02% 16.56% 11.27% 16.28%Russell 2000 Total Return Index 4.61% 13.60% 8.63% 14.10%
Semi-Annual Report 7

The Tocqueville Gold Fund
Dear Fellow Shareholder,
During the first half of the Fund’s 2019 fiscal year—November 1st through April30th—gold markets recovered from their mid-summer and autumn correction especiallyas the U.S. Federal Reserve’s posture on interest rates caused broader markets to swoon atthe end of 2018. The government shutdown and ongoing China-U.S. trade war rhetoricalso provided support for gold in early 2019 even as the U.S. dollar rose, and as U.S.equity markets rebounded to record levels. For the period, the Tocqueville Gold Fundrose 5.31%, while the Philadelphia Stock Exchange Gold and Silver Index increased11.46%.
In our quarterly investment letters, we have expanded on the investment case forprecious metal exposure. The main thesis being that government sponsored currencies willultimately become debased when debt and credit become so massive that economicgrowth cannot effectively pay for the interest on those liabilities or even pay back theobligations that fed that growth. Because gold has been considered a standard of valuethroughout millennia it is a form of insurance and a hedge to the destruction of financialassets that would get swamped by enormous debt loads.
The Fund invests not only in gold bullion but also in precious metal miningcompanies that create value in ways that are not solely dependent on rising metal prices.We are constantly monitoring activities and developments in the global precious metalssector for underappreciated value creation opportunities. Those investment opportunitiespresent themselves through the potential for geologic discovery, as well as in minedevelopment and/or through improved efficiencies brought on by productionenhancement projects. Corporate strategies can also create compelling investmentsituations whether it is through financial structuring or mergers, acquisitions and jointventures. Exposure to various stages of resource development and mining activity allowsthe Fund to diversify risk while also capturing different elements of value enhancement.
Approximately 72% of the Fund’s assets are gold mining equities focused on golddiscovery, mine project development or production, while approximately 13% of theFund is exposed to silver mining stocks. Silver has numerous industrial applications but isalso considered a monetary metal similar to gold. Often the metals appear together, andmining companies will mine both to improve margins, but companies where the majorityof the revenues come from silver production are considered silver mining companies.Generally, silver mining companies have greater leverage to the movement in metal prices.
The largest single position in the Fund is the 97,849 ounces of gold bullion thatmakes up about 15% of the Fund’s assets. That gold is stored outside the financial systemin a secure vault that is monitored and audited on a regular basis. The Fund’s directownership and exposure to physical gold helped reduce the Fund’s volatility during theperiod. In order to maintain the 15% exposure on gold bullion, approximately
8 April 30, 2019

21,000 ounces were sold during the reporting period. The Fund’s gold bullion positionwas the largest contributor to positive performance during the first half of the year.
The precious metal stocks that contributed the most to performance during theperiod included Mag Silver Corp., Wheaton Precious Metals Corp., Detour GoldCorporation, and Franco-Nevada Corporation. After some delays, Mag Silver received thego ahead for its mine development project with joint venture partner, Fresnillo, whichwas well received by the market. Wheaton Precious Metals received a favorable courtdecision regarding its tax status in Canada that had been overhanging the stock for anextended period. Detour Gold Corporation was re-rated by the broader market as itrestructured its board of directors in response to investor activism. Franco-NevadaCorporation benefitted from the royalty model it has applied to the oil and gas sector.
Corvus Gold Inc., Pan American Silver Corp., Jaguar Mining Inc., IAMGOLDCorporation, and Gold Standard Ventures Corp. corrected during the period, whichdampened the Fund’s performance. In the case of Corvus Gold, Pan American and GoldStandard Ventures, those three stocks corrected from a period of outperformance duringcalendar 2018. Jaguar Mining and IAMGOLD experienced mining challenges at theirunderground mines which delayed some mining activity and will result in less goldproduction this year than what was originally expected.
Several positions were eliminated because they were either fully valued or presentedlimited value creation opportunities, such as Barrick Gold which became fully valued afterit closed its merger with Randgold. The GoGold position was eliminated because of itslimited options for value creation. GoldCorp was also sold during the period as its stockfully reflected the value of the Newmont bid for the company.
New names added during the period included Wesdome Gold Mines Ltd. andAngloGold Ashanti Limited. Wesdome has identified gold ore zones at its operating EagleRiver mine which should extend the mine-life of that operation and which will alsoprovide the capital from its operating cash flow to restart Wesdome’s idled Kiena minecomplex where high-grade ore zones are also being discovered. AngloGold Ashanti hadbeen undervalued by the market, but new management has been successfully restructuringthe company to improve its geographic and operating risk exposure.
Currently, precious metals and related mining stocks have consolidated into arelatively narrow trading range and appear poised to breakout to higher levels as theyawait direction from the broader markets. For the remainder of 2019, we expect the U.S.Federal Reserve to keep interest rates low with a bias to lowering them while marketvolatility is likely to intensify along with the trade war. Low interest rates and continuedvolatility should be constructive for precious metal markets.
Over the past ten years, the spring and early summer months have tended to befavorable periods to increase exposure to precious metals and the related mining stocks.With the recent consolidation of the gold price below $1,300 per ounce and the ultra-cheap valuations in the gold mining sector, the coming months should present a similaropportunity.
Semi-Annual Report 9

Sincerely,
John C. Hathaway Douglas B. Groh Ryan McIntyrePortfolio Manager Portfolio Manager Portfolio Manager
10 April 30, 2019

The Tocqueville Gold Fund—Investor Class
(Unaudited)
$41,602
$9,494
$0
$20,000
$30,000
$10,000
$40,000
$50,000
4/30/09 4/30/10 4/30/11 4/30/12 4/30/13 4/30/14 4/30/15 4/30/16 4/30/17 4/30/194/30/18
The Tocqueville Gold Fund—Investor Class (Net Asset Value)
S&P 500 Total Return Stock IndexPhiladelphia Stock Exchange Gold and Silver Index
$6,648
This chart assumes an initial gross investment of $10,000 made on 4/30/09. Returns shown donot reflect the deduction of taxes that a shareholder would pay on fund distributions or theredemption of fund shares. Returns shown include the reinvestment of all dividends and otherdistributions. Past performance is not predictive of future performance. Investment return andprincipal value will fluctuate so that your shares, when redeemed, may be worth more or lessthan their original cost. The Fund imposes a 2% redemption fee on shares held 90 days or less.
In 2009, 2010, and 2016 the performance of The Tocqueville Gold Fund—Investor Classwas achieved during a period of unusually favorable market conditions. Such performance maynot be sustainable.
The Philadelphia Stock Exchange Gold and Silver Index is an unmanaged capitalization-weighted index which includes the leading companies involved in the mining of gold andsilver. Returns include the reinvestment of all dividends.
The Standard & Poor’s 500 Total Return Stock Index (S&P 500) is a capital-weighted index,representing the aggregate market value of the common equity of 500 stocks primarily tradedon the New York Stock Exchange. Returns include the reinvestment of all dividends.
AVERAGE ANNUAL RATE OF RETURN (%)FOR YEARS ENDED APRIL 30, 2019
1 Year 3 Year 5 Year 10 Year
The Tocqueville Gold Fund—Investor Class �12.34% �8.55% �4.94% �0.52%Philadelphia Stock Exchange Gold and Silver Index �11.41% �7.81% �4.25% �4.00%Standard & Poor’s 500 Total Return Stock Index 13.49% 14.87% 11.63% 15.32%
Semi-Annual Report 11

The Tocqueville Gold Fund—Institutional Class
(Unaudited)
$1,018,131
$934,005
$0
$975,000
$1,000,000
$950,000
$925,000
$1,050,000
$1,025,000
$1,100,000
$1,075,000
4/8/19 4/30/19
The Tocqueville Gold Fund—Institutional Class (Net Asset Value)
S&P 500 Total Return Stock IndexPhiladelphia Stock Exchange Gold and Silver Index
$916,877
This chart assumes an initial gross investment of $1,000,000 made on 4/8/19 (commencementof operations for Institutional Class). Returns shown do not reflect the deduction of taxes that ashareholder would pay on fund distributions or the redemption of fund shares. Returns showninclude the reinvestment of all dividends and other distributions. Past performance is notpredictive of future performance. Investment return and principal value will fluctuate so thatyour shares, when redeemed, may be worth more or less than their original cost. The Fundimposes a 2% redemption fee on shares held 90 days or less.
The Philadelphia Stock Exchange Gold and Silver Index is an unmanaged capitalization-weighted index which includes the leading companies involved in the mining of gold andsilver. Returns include the reinvestment of all dividends.
The Standard & Poor’s 500 Total Return Stock Index (S&P 500) is a capital-weighted index,representing the aggregate market value of the common equity of 500 stocks primarily tradedon the New York Stock Exchange. Returns include the reinvestment of all dividends.
TOTAL RETURN (%)FOR PERIOD ENDED APRIL 30, 2019
Since Inception(April 8, 2019)
The Tocqueville Gold Fund—Institutional Class �6.60%Philadelphia Stock Exchange Gold and Silver Index �8.31%Standard & Poor’s 500 Total Return Stock Index 1.81%
12 April 30, 2019

The Tocqueville Phoenix Fund
Dear Fellow Shareholder,
For the six months ended April 30, 2019, the Fund’s net asset value increased11.00% versus an increase of 6.06% for the Russell 2000 Index (“Russell 2000”) and anincrease of 9.76% for the Standard & Poor’s 500 Index (“S&P 500”), each on a totalreturn basis. Owing to the smaller average market capitalization of companies in theRussell 2000, we view it as the more appropriately comparative index to the Fund. TheFund’s net asset value as of April 30, 2019 was $20.89 per share. The net asset valueamounted to $208,763,744 of which 89.4% was invested in equities, and the balance incash and equivalents.
Domestic equities posted solid returns for the six-month period, but the path towardrealizing those returns was not without its challenges, particularly during the first coupleof months of the period. While indices eked out gains in November 2018 thanks to a latemonth rally, trading for the bulk of the month was bearish, in particular among theso-called FAANG stocks, which entered bear market territory. And then came December2018, when a convergence of negative news drove market declines of historic proportionsand the return of hyper-volatility. During the month of December, the Russell 2000dropped 11.9% and was down 10.5% through the two months ended December 31,2018. U.S. stocks then rebounded meaningfully in the first calendar quarter of 2019.President Trump delayed an anticipated increase in tariffs on Chinese imports andmarkets rallied on hopes that a resolution to the U.S./China trade war may be morelikely. A deceleration in the rate of growth of the U.S. economy prompted the FederalReserve Board to delay any incremental rate hikes for the time being, further encouraginginvestors. Lastly, fourth quarter earnings reports were generally in-line or slightly betterthan expected, which also seemed to embolden market bulls despite the more cautiousforward outlook issued by a number of companies.
Despite continued headwinds from the market’s predilection for growth and scale,we outperformed for the six-month period. As we mentioned in the 2018 Annual Report,when markets are in opposition to our investment approach, stock picking is critical tosuccess, and our stock selection contributed favorably to our relative performance for thissix-month period. As we have also written in the past, sector allocation is a by-product ofour bottom-up investment process. Nonetheless, our inadvertent sector weightings alsoadded to our relative return for the period, as we were overweight (and outperformed) thestrongest sector within the Russell 2000, Information Technology, which contributedabout 540 basis points to our absolute return and 230 basis points to our performancerelative to the Russell 2000. We also had relatively little exposure to both Energy andHealthcare, both of which were particularly weak during the period, which also benefitedour relative performance.
Semi-Annual Report 13

For the entire six-month period, our top contributor was US Concrete Inc., which rosesteadily off its lows on an improved outlook for 2019, as well as hopes for an expandedinfrastructure budget out of the Washington D.C. Flex Ltd., Fabrinet, Tegna Inc. andLumentum Holdings, were also among our top performing holdings, with each addingabout 100 basis points to performance.
In contrast, Cars.com, PolyOne Corporation and Greenbrier Companies Inc. werethe largest detractors to our performance. Cars surprised investors to the downside withmediocre guidance for 2019 and while their strategic review remains ongoing, theprotracted process has likely dampened some enthusiasm that a takeout is likely.PolyOne’s shares traded off after the company reported earnings that were in line withexpectations but warned of a slowdown in their end markets and cautioned on thepotential impact of tariffs to their business. Greenbrier, which we ultimately exited duringthe period, weakened as investors became more concerned about its ability to meetexpectations for 2019, as its guidance relies on an exceptionally strong second half of theyear.
We opportunistically put capital to work following December’s correction, and weadded a number of new positions to the portfolio during the six-month period, the largestof which included Loews Corporation, Louisiana Pacific Corporation, Stanley Black &Decker Inc, and Tile Shop Holdings Inc. The largest portfolio deletions includedDucommun Incorporated, Electronics for Imaging Inc. (which announced it was beingacquired), Hanesbrands Inc, and Minerals Technologies.
Sincerely,
J. Dennis Delafield Joshua Kaufthal James MaxwellPortfolio Manager Portfolio Manager Portfolio Manager
14 April 30, 2019

The Tocqueville Phoenix Fund
(Unaudited)
$41,602
$37,383
$25,859
The Tocqueville Phoenix Fund (Net Asset Value)
Russell 2000 Total Return Index
S&P 500 Total Return Stock Index
$0
$10,000
$20,000
$30,000
$50,000
$40,000
4/30/09 4/30/10 4/30/11 4/30/12 4/30/13 4/30/14 4/30/15 4/30/194/30/16 4/30/17 4/30/18
This chart assumes an initial gross investment of $10,000 made on 4/30/09. On February 15,2019, The Delafield Fund’s name changed to The Tocqueville Phoenix Fund. Since theTocqueville Phoenix Fund did not commence operations until 9/28/09, returns prior to thatdate are those of the Predecessor Fund. The Tocqueville Phoenix Fund assumed the net assetvalue and performance history of the Predecessor Fund (See Footnote 1 to the FinancialStatements). Returns shown do not reflect the deduction of taxes that a shareholder would payon fund distributions or the redemption of fund shares. Performance reflects fee waivers ineffect. In the absence of fee waivers, total return would be reduced. Returns shown include thereinvestment of all dividends and other distributions. Past performance is not predictive offuture performance. Investment return and principal value will fluctuate so that your shares,when redeemed, may be worth more or less than their original cost.
The Russell 2000 Total Return Index is an unmanaged index that measures the performanceof the 2,000 smallest companies in the Russell 3000 Index, which represent approximately10% of the total market capitalization of the Russell 3000 Index. Returns include thereinvestment of all dividends.
The Standard & Poor’s 500 Total Return Stock Index (S&P 500) is a capital-weighted index,representing the aggregate market value of the common equity of 500 stocks primarily tradedon the New York Stock Exchange. Returns include the reinvestment of all dividends.
AVERAGE ANNUAL RATE OF RETURN (%)FOR YEARS ENDED APRIL 30, 2019
1 Year 3 Year 5 Year 10 Year
The Tocqueville Phoenix Fund* 3.23% 7.05% 0.43% 9.97%Russell 2000 Total Return Index 4.61% 13.60% 8.63% 14.10%Standard & Poor’s 500 Total Return Stock Index 13.49% 14.87% 11.63% 15.32%
* Prior to February 15, 2019, the Fund’s name was The Delafield Fund.
Semi-Annual Report 15

The Tocqueville Select Fund
Dear Fellow Shareholder,
For the six months ended April 30, 2019, the Fund’s net asset value increased11.19% versus increases of 8.76% for the Russell 2500 Index (“Russell 2500”) and 6.06%for the Russell 2000 Index (“Russell 2000”), each on a total return basis. The Fund’s netasset value as of April 30, 2019 was $12.12 per share. The net asset value amounted to$40,313,535 of which 93.6% was invested in equities, and the balance in cash andequivalents.
Domestic equities managed to put up solid returns for the six-month period, but notwithout a good bit of volatility intra-period. While indices eked out gains in November2018 thanks to a late month rally, trading for the bulk of the month was bearish, inparticular among the so-called FAANG stocks, which entered bear market territory. Andthen came December 2018, when a convergence of negative news drove market declinesof historic proportions and the return of hyper-volatility. During the month ofDecember, the Russell 2500 dropped nearly 11% and was down roughly 9.3% throughthe two months ended December 31, 2018. U.S. stocks then rebounded meaningfully inthe first calendar quarter of 2019. President Trump delayed an anticipated increase intariffs on Chinese imports and markets rallied on hopes that a resolution to the U.S./China trade war may be more likely. A deceleration in the rate of growth in the U.S.economy prompted the Federal Reserve Board to delay any incremental rate hikes for thetime being, further encouraging investors. Lastly, fourth quarter earnings reports weregenerally in-line or slightly better than expected, which also seemed to embolden marketbulls despite the more cautious forward outlook issued by a number of companies.
As we have discussed in the past, stock picking is critical to our success, in particularduring times such as these, when our value strategy is in opposition to the market’spreference. Stock selection did contribute favorably to our relative performance for thissix-month period, with the selection effect representing roughly one third of our relativeoutperformance for the period. Sector allocation also added to our relative return for theperiod, although inadvertently, as sector weighting has always been a by-product of ourbottom-up investment process. During the period we were overweight (andoutperformed) the strongest sector within the Russell 2500, Information Technology,which contributed about 800 basis points to our absolute return. Our relative lack ofexposure to Energy also benefited our relative performance, as it was the weakest sector inthe Russell 2500.
Not surprisingly given our aforementioned strength in Information Technologyduring the period, three of our top four contributors came from within that sector,including Epam Systems Inc., Fabrinet and Flex Lt. In contrast, Tile Shop Holdings,Harsco and Cars.com were the largest detractors to our performance.
16 April 30, 2019

We added a number of new positions to the portfolio during the period, includingCross Country Healthcare Inc, PVH Corp and Solaris Oilfield Infrastructure Inc. Wealso exited four investments, Apogee Enterprises Inc, Gentex Corp., MineralsTechnologies Inc, and Trueblue Inc.
Sincerely,
J. Dennis Delafield Joshua KaufthalPortfolio Manager Portfolio Manager
Donald Wang James MaxwellPortfolio Manager Portfolio Manager
Semi-Annual Report 17

The Tocqueville Select Fund
(Unaudited)
$40,347$37,383
$28,069
The Tocqueville Select Fund (Net Asset Value)
Russell 2500 Total Return Index
Russell 2000 Total Return Index
$0
$10,000
$20,000
$30,000
$50,000
$40,000
4/30/09 4/30/10 4/30/11 4/30/12 4/30/13 4/30/14 4/30/15 4/30/194/30/16 4/30/17 4/30/18
This chart assumes an initial gross investment of $10,000 made on 4/30/09. Since TheTocqueville Select Fund did not commence operations until 9/28/09, returns from the periodfrom September 29, 2008 to September 27, 2009 are those of the Class Y Shares of thePredecessor Fund (See Footnote 1 to the Financial Statements). Prior to that period, returnsshown are those of a limited partnership managed by the adviser. Returns shown do not reflect thededuction of taxes that a shareholder would pay on fund distributions or the redemption of fundshares. Performance reflects fee waivers in effect. In the absence of fee waivers, total return wouldbe reduced. Returns shown include the reinvestment of all dividends and other distributions. Pastperformance is not predictive of future performance. Investment return and principal value willfluctuate so that your shares, when redeemed, may be worth more or less than their original cost.
In 2013 the performance of The Tocqueville Select Fund was achieved during a period ofunusually favorable market conditions. Such performance may not be sustainable.
The Russell 2500 Total Return Index is an unmanaged index that measures the performanceof the 2,500 smallest companies in the Russell 3000 Index. Returns include the reinvestment ofall dividends.
The Russell 2000 Total Return Index is an unmanaged index that measures the performanceof the 2,000 smallest companies in the Russell 3000 Index. Returns include the reinvestment ofall dividends.
AVERAGE ANNUAL RATE OF RETURN (%)FOR YEARS ENDED APRIL 30, 2019
1 Year 3 Year 5 Year 10 Year
The Tocqueville Select Fund 6.32% 4.83% 1.78% 10.87%Russell 2500 Total Return Index 7.89% 13.31% 9.04% 14.97%Russell 2000 Total Return Index 4.61% 13.60% 8.63% 14.10%
18 April 30, 2019

Expense Example—April 30, 2019 (Unaudited)
As a shareholder of The Tocqueville Trust (the “Funds”), you incur ongoing costs,including management fees; distribution fees; and other Fund expenses. This example isintended to help you understand your ongoing costs (in dollars) of investing in the Fundsand to compare costs with the ongoing costs of investing in other mutual funds.
The Example is based on an investment of $1,000 invested at the beginning of theperiod and held the entire period (November 1, 2018-April 30, 2019). For The ToquevilleGold Fund—Institutional Class, the example is based on an investment of $1,000 investedon April 8, 2019, the commencement of operations and held through April 30, 2019.
Actual Expenses
The first line of the table below provides information about actual account valuesand actual expenses. You may use the information in this line, together with the amountyou invested, to estimate the expenses that you paid over the period. Simply divide youraccount value by $1,000 (for example, an $8,600 account value divided by $1,000 = 8.6),then multiply the result by the number in the first line under the heading entitled“Expenses Paid During Period” to estimate the expenses you paid on your account duringthis period.
Hypothetical Example for Comparison Purposes
The second line of the table below provides information about hypothetical accountvalues and hypothetical expenses based on the Funds’ actual expense ratios and anassumed rate of return of 5% per year before expenses, which is not the Funds’ actualreturn. The hypothetical account values and expenses may not be used to estimate theactual ending account balance or expenses you paid for the period. You may use thisinformation to compare the ongoing costs of investing in the Funds and other funds. Todo so, compare this 5% hypothetical example with the 5% hypothetical examples thatappear in the shareholder reports of the other funds.
Please note that the expenses shown in the table are meant to highlight your ongoingcosts only and do not reflect any transactional costs, such as sales charges (loads),redemption fees, or exchange fees. Therefore, the second line of the table is useful incomparing ongoing costs only, and will not help you determine the relative costs ofowning different funds. In addition, if these transactional costs were included, your costswould have been higher.
Semi-Annual Report 19

Expense Example Tables (Unaudited)
The Tocqueville Fund
BeginningAccount Value
November 1, 2018
EndingAccount Value
April 30,2019
Expenses PaidDuring Period*
November 1, 2018 -April 30, 2019
Actual $1,000.00 $1,115.00 $6.56Hypothetical (5% return before expenses) 1,000.00 1,018.60 6.26
* Expenses are equal to the Fund’s annualized six-month expense ratio (including interest expense) of 1.25%for The Tocqueville Fund, multiplied by the average account value over the period, multiplied by 181/365 toreflect the one-half year period.
The Tocqueville Opportunity Fund
BeginningAccount Value
November 1, 2018
EndingAccount Value
April 30,2019
Expenses PaidDuring Period*
November 1, 2018 -April 30, 2019
Actual $1,000.00 $1,181.10 $6.81Hypothetical (5% return before expenses) 1,000.00 1,018.55 6.31
* Expenses are equal to the Fund’s annualized six-month expense ratio (including interest expense) of 1.26%for The Tocqueville Opportunity Fund, multiplied by the average account value over the period, multipliedby 181/365 to reflect the one-half year period.
The Tocqueville Gold Fund—Investor Class
BeginningAccount Value
November 1, 2018
EndingAccount Value
April 30,2019
Expenses PaidDuring Period*
November 1, 2018 -April 30, 2019
Actual $1,000.00 $1,053.10 $7.58Hypothetical (5% return before expenses) 1,000.00 1,017.41 7.45
* Expenses are equal to the Fund’s annualized six-month expense ratio (including interest expense) of 1.49%for The Tocqueville Gold Fund Investor Class, multiplied by the average account value over the period,multiplied by 181/365 to reflect the one-half year period.
The Tocqueville Gold Fund—Institutional Class
BeginningAccount ValueApril 8, 2019
EndingAccount Value
April 30,2019
Expenses PaidDuring Period*April 8, 2019 -April 30, 2019
Actual $1,000.00 $ 934.00 $0.78Hypothetical (5% return before expenses) 1,000.00 1,018.20 6.66
* Actual expenses are equal to the Fund’s annualized six-month expense ratio of 1.33% for The TocquevilleGold Fund Institutional Class multiplied by the average value over the period, multiplied by 22/365 to reflectthe period. Hypothetical expenses are equal to the Fund’s annualized six-month expense ratio of 1.33% forThe Tocqueville Gold Fund Institutional Class multiplied by the average value over the period, multiplied by181/365 for comparison purposes.
20 April 30, 2019

The Tocqueville Phoenix Fund
BeginningAccount Value
November 1, 2018
EndingAccount Value
April 30,2019
Expenses PaidDuring Period*
November 1, 2018 -April 30, 2019
Actual $1,000.00 $1,110.00 $6.54Hypothetical (5% return before expenses) 1,000.00 1,018.60 6.26
* Expenses are equal to the Fund’s annualized six-month expense ratio of 1.25% for The Tocqueville PhoenixFund, multiplied by the average account value over the period, multiplied by 181/365 to reflect the one-halfyear period.
The Tocqueville Select Fund
BeginningAccount Value
November 1, 2018
EndingAccount Value
April 30,2019
Expenses PaidDuring Period*
November 1, 2018 -April 30, 2019
Actual $1,000.00 $1,111.90 $6.55Hypothetical (5% return before expenses) 1,000.00 1,018.60 6.26
* Expenses are equal to the Fund’s annualized six-month expense ratio of 1.25% for The Tocqueville SelectFund, multiplied by the average account value over the period, multiplied by 181/365 to reflect the one-halfyear period.
Semi-Annual Report 21

The Tocqueville FundFinancial Highlights
Per share operating performance(For a share outstandingthroughout the period)
Six MonthsEnded
April 30,2019
Years Ended October 31,
2018 2017 2016 2015 2014
(Unaudited)Net asset value, beginning of
period $ 35.84 $ 38.60 $ 33.72 $ 32.91 $ 34.18 $ 30.67
Operations:Net investment income (1) 0.22 0.35 0.37 0.42 0.37 0.28Net realized and unrealized gain
(loss) 3.55 0.45 6.40 1.07 (0.19) 3.78
Total from investmentoperations * 3.77 0.80 6.77 1.49 0.18 4.06
Distributions to shareholders:Dividends from net investment
income (0.34) (0.33) (0.39) (0.35) (0.25) (0.30)Distributions from net realized
gains (2.59) (3.23) (1.50) (0.33) (1.20) (0.25)
Total distributions (2.93) (3.56) (1.89) (0.68) (1.45) (0.55)
Change in net asset value for theperiod 0.84 (2.76) 4.88 0.81 (1.27) 3.51
Net asset value, end of period $ 36.68 $ 35.84 $ 38.60 $ 33.72 $ 32.91 $ 34.18
* Includes redemption fees pershare of N/A N/A N/A N/A 0.00(2) 0.00(2)
Total Return 11.5% 2.0% 20.9% 4.6% 0.5% 13.4%Ratios/supplemental dataNet assets, end of period (000) $281,790 $272,043 $293,637 $283,126 $309,267 $380,561Ratio to average net assets:
Expenses before waiver/reimbursement 1.29% 1.26% 1.27% 1.27% 1.29% 1.25%
Expenses after waiver/reimbursement 1.25% 1.25% 1.26%(3) 1.24%(3) 1.25% 1.24%
Net investment income beforewaiver/reimbursement 1.19% 0.91% 0.97% 1.18% 0.91% 0.84%
Net investment income afterwaiver/reimbursement 1.23% 0.92% 0.98% 1.21% 0.95% 0.85%
Portfolio turnover rate 9% 19% 10% 12% 15% 19%
(1) Net investment income per share is calculated using the ending balance prior to consideration oradjustment for permanent book-to-tax differences.
(2) Represents less than $0.01.(3) Includes 0.01% of interest expense which is not included in the Fund’s operating expense cap.
The Accompanying Notes are an Integral Part of these Financial Statements.
22 April 30, 2019

The Tocqueville Opportunity FundFinancial Highlights
Per share operating performance(For a share outstandingthroughout the period)
Six MonthsEnded
April 30,2019
Years Ended October 31,
2018 2017 2016 2015 2014
(Unaudited)Net asset value, beginning of
period $ 26.60 $ 26.12 $ 19.14 $ 21.41 $ 22.78 $ 21.29
Operations:Net investment loss (1) (0.11) (0.29) (0.37) (0.29) (0.15) (0.22)Net realized and unrealized gain
(loss) 4.39 1.63 7.35 (1.98) 1.98 2.80
Total from investmentoperations * 4.28 1.34 6.98 (2.27) 1.83 2.58
Distributions to shareholders:Dividends from net investment
income — — — — — —Distributions from net realized
gains (2.49) (0.86) — — (3.20) (1.09)
Total distributions (2.49) (0.86) — — (3.20) (1.09)
Change in net asset value for theperiod 1.79 0.48 6.98 (2.27) (1.37) 1.49
Net asset value, end of period $ 28.39 $ 26.60 $ 26.12 $ 19.14 $ 21.41 $ 22.78
* Includes redemption fees pershare of N/A N/A N/A N/A 0.00(2) 0.00(2)
Total Return 18.1% 5.3% 36.5% �10.6% 9.1% 12.6%Ratios/supplemental dataNet assets, end of period (000) $93,986 $82,106 $77,773 $92,958 $153,456 $80,324Ratio to average net assets:
Expenses before waiver/reimbursement 1.40% 1.33% 1.38% 1.38% 1.31% 1.30%
Expenses after waiver/reimbursement 1.26%(3) 1.26%(3) 1.30%(3)(4) 1.38% 1.31% 1.30%
Net investment income beforewaiver/reimbursement (1.18)% (1.13)% (1.05)% (0.94)% (0.95)% (0.90)%
Net investment income afterwaiver/reimbursement (1.04)% (1.06)% (0.97)%(4) (0.94)% (0.95)% (0.90)%
Portfolio turnover rate 93% 151% 133% 108% 101% 92%
(1) Net investment loss per share is calculated using the ending balance prior to consideration or adjustmentfor permanent book-to-tax differences.
(2) Represents less than $0.01.(3) Includes interest expense of 0.01% for the six months ended April 30, 2019, 0.01% for the year ended
October 31, 2018 and 0.05% for the year ended October 31, 2017. Interest expense is not included in theFund’s operating expense cap.
(4) Expense waiver of 1.25% was implemented on November 1, 2016.
The Accompanying Notes are an Integral Part of these Financial Statements.
Semi-Annual Report 23

The Tocqueville Gold Fund—Investor ClassFinancial Highlights
Per share operating performance(For a share outstandingthroughout the period)
Six MonthsEnded
April 30,2019
Years Ended October 31,
2018 2017 2016 2015 2014
(Unaudited)Net asset value, beginning of
period $ 29.01 $ 35.64 $ 39.32 $ 26.04 $ 30.38 $ 38.01
Operations:Net investment loss (1) (0.16) (0.38) (0.39) (0.33) (0.27) (0.08)Net realized and unrealized gain
(loss) 1.70 (6.25) (3.29) 13.61 (4.07) (7.55)
Total from investmentoperations * 1.54 (6.63) (3.68) 13.28 (4.34) (7.63)
Distributions to shareholders:Dividends from net investment
income — — — — — —Distributions from net realized
gains — — — — — —
Total distributions — — — — — —
Change in net asset value for theperiod 1.54 (6.63) (3.68) 13.28 (4.34) (7.63)
Net asset value, end of period $ 30.55 $ 29.01 $ 35.64 $ 39.32 $ 26.04 $ 30.38
* Includes redemption fees pershare of 0.01 0.00(2) 0.01 0.01 0.01 0.02
Total Return 5.3% �18.6% �9.4% 51.0% �14.3% �20.1%Ratios/supplemental dataNet assets, end of period (000) $835,981 $859,394 $1,153,287 $1,365,282 $947,367 $1,138,557Ratio to average net assets:
Expense 1.49% 1.42% 1.38% 1.39% 1.43% 1.36%Net investment loss (0.73)% (0.88)% (0.95)% (0.91)% (0.84)% (0.78)%
Portfolio turnover rate 9% 9% 14% 15% 11% 10%
(1) Net investment loss per share is calculated using the ending balance prior to consideration or adjustmentfor permanent book-to-tax differences.
(2) Represents less than $0.01.
The Accompanying Notes are an Integral Part of these Financial Statements.
24 April 30, 2019

The Tocqueville Gold Fund—Institutional ClassFinancial Highlights
Per share operating performance(For a share outstanding throughout the period)
April 8, 2019(1)through
April 30, 2019
(Unaudited)Net asset value, beginning of period (1) $32.73
Operations:Net investment income (2) 0.00(3)Net realized and unrealized loss (2.16)
Total from investment operations * (2.16)
Distributions to shareholders:Dividends from net investment income —Distributions from net realized gains —
Total distributions —
Change in net asset value for the period (2.16)
Net asset value, end of period $30.57
* Includes redemption fees per share ofTotal Return �6.6%Ratios/supplemental dataNet assets, end of period (000) $ 20Ratio to average net assets:
Expense 1.33%Net investment loss 0.90%
Portfolio turnover rate 9%
(1) Institutional Class shares commenced operations on April 8, 2019.(2) Net investment income per share is calculated using the ending balance prior to consideration or
adjustment for permanent book-to-tax differences.(3) Represents less than $0.01.
The Accompanying Notes are an Integral Part of these Financial Statements.
Semi-Annual Report 25

The Tocqueville Phoenix FundFinancial Highlights
Per share operating performance(For a share outstandingthroughout the period)
Six MonthsEnded
April 30,2019
Years Ended October 31,
2018 2017 2016 2015 2014
(Unaudited)Net asset value, beginning of
period $ 20.20 $ 26.40 $ 26.47 $ 28.64 $ 36.40 $ 37.13
Operations:Net investment loss (1) (0.01) (0.14) (0.15) (0.15) (0.14) (0.10)Net realized and unrealized gain
(loss) 2.05 (2.27) 4.91 0.78 (3.99) 0.70
Total from investment operations * 2.04 (2.41) 4.76 0.63 (4.13) 0.60
Distributions to shareholders:Dividends from net investment
income 0.00(2) — — — — —Distributions from net realized
gains (1.35) (3.79) (4.83) (2.80) (3.63) (1.33)
Total distributions (1.35) (3.79) (4.83) (2.80) (3.63) (1.33)
Change in net asset value for theperiod 0.69 (6.20) (0.07) (2.17) (7.76) (0.73)
Net asset value, end of period $ 20.89 $ 20.20 $ 26.40 $ 26.47 $ 28.64 $ 36.40
* Includes redemption fees pershare of N/A N/A N/A N/A 0.00(2) 0.00(2)
Total Return 11.0% (10.6)% 19.0% 3.3% (12.3)% 1.6%Ratios/supplemental dataNet assets, end of period (000) $208,764 $237,119 $373,353 $400,827 $674,525 $1,475,139Ratio to average net assets:
Expenses before waiver/reimbursement 1.40% 1.32% 1.31% 1.29% 1.25% 1.21%
Expenses after waiver/reimbursement 1.25% 1.25% 1.25%(3) 1.29% 1.25% 1.21%
Net investment income beforewaiver/reimbursement (0.23)% (0.55)% (0.55)% (0.33)% (0.15)% (0.24)%
Net investment income afterwaiver/reimbursement (0.08)% (0.48)% (0.49)%(3) (0.33)% (0.15)% (0.24)%
Portfolio turnover rate 23% 40% 36% 39% 19% 34%
(1) Net investment loss per share is calculated using the ending balance prior to consideration or adjustmentfor permanent book-to-tax differences.
(2) Represents less than $0.01.(3) Expense waiver of 1.25% was implemented on November 1, 2016.
The Accompanying Notes are an Integral Part of these Financial Statements.
26 April 30, 2019

The Tocqueville Select FundFinancial Highlights
Per share operating performance(For a share outstandingthroughout the period)
Six MonthsEnded
April 30,2019
Years Ended October 31,
2018 2017 2016 2015 2014
(Unaudited)Net asset value, beginning of period $ 10.90 $ 11.87 $ 11.43 $ 12.08 $ 14.90 $ 15.57
Operations:Net investment loss (1) (0.01) (0.05) (0.06) (0.07) (0.08) (0.07)Net realized and unrealized gain
(loss) 1.23 (0.70) 1.12 (0.18) (1.00) 0.94
Total from investment operations * 1.22 (0.75) 1.06 (0.25) (1.08) 0.87
Distributions to shareholders:Dividends from net investment
income — — — — — —Distributions from net realized
gains — (0.22) (0.62) (0.40) (1.74) (1.54)
Total distributions — (0.22) (0.62) (0.40) (1.74) (1.54)
Change in net asset value for theperiod 1.22 (0.97) 0.44 (0.65) (2.82) (0.67)
Net asset value, end of period $ 12.12 $ 10.90 $ 11.87 $ 11.43 $ 12.08 $ 14.90
* Includes redemption fees pershare of N/A N/A N/A N/A 0.00(2) 0.00(2)
Total Return 11.2% (6.4)% 8.9% (1.9)% (8.0)% 6.1%Ratios/supplemental dataNet assets, end of period (000) $40,314 $39,225 $49,453 $63,812 $81,813 $108,060Ratio to average net assets:
Expenses before waiver/reimbursement 1.44% 1.37% 1.37% 1.37% 1.36% 1.32%
Expenses after waiver/reimbursement 1.25% 1.25% 1.25%(3) 1.37% 1.36% 1.32%
Net investment income beforewaiver/reimbursement (0.34)% (0.50)% (0.47)% (0.45)% (0.52)% (0.50)%
Net investment income afterwaiver/reimbursement (0.15)% (0.38)% (0.35)%(3) (0.45)% (0.52)% (0.50)%
Portfolio turnover rate 15% 27% 24% 32% 43% 32%
(1) Net investment loss per share is calculated using the ending balance prior to consideration or adjustmentfor permanent book-to-tax differences.
(2) Represents less than $0.01.(3) Expense waiver of 1.25% was implemented on November 1, 2016.
The Accompanying Notes are an Integral Part of these Financial Statements.
Semi-Annual Report 27

The Tocqueville FundSchedule of Investments as of April 30, 2019
(Unaudited)
Common Stocks—96.2% Shares Value
Automobiles & Components—1.3%Ford Motor Co. 350,000 $ 3,657,500
Banks—1.1%Bank of America Corp. 100,000 3,058,000
Capital Goods—8.5%Arconic, Inc. 175,000 3,759,000Caterpillar, Inc. 25,000 3,485,500Illinois Tool Works, Inc. 40,000 6,225,200Parker-Hannifin Corp. 15,000 2,716,200Raytheon Co. 10,000 1,775,900The Boeing Co. 10,000 3,776,900United Technologies Corp. 15,000 2,139,150
23,877,850
Commercial & Professional Services—1.2%Steelcase, Inc.—Class A 200,000 3,458,000
Consumer Services—2.1%McDonald’s Corp. 30,000 5,927,100
Diversified Financials—2.6%Capital One Financial Corp. 25,000 2,320,750The Bank of New York
Mellon Corp. 100,000 4,966,000
7,286,750
Energy—6.7%Exxon Mobil Corp. 100,000 8,028,000Noble Energy, Inc. 200,000 5,412,000Schlumberger Ltd.(a) 125,000 5,335,000
18,775,000
Food & Staples Retailing—3.3%Walmart, Inc. 90,000 9,255,600
Food, Beverage & Tobacco—4.7%Campbell Soup Co. 100,000 3,869,000Constellation Brands, Inc.—
Class A 10,000 2,116,700The Coca-Cola Co. 150,000 7,359,000
13,344,700
Health Care Equipment & Services—1.4%Abbott Laboratories 50,000 3,978,000
Household & Personal Products—6.4%Colgate-Palmolive Co. 100,000 7,279,000
Common Stocks—96.2% Shares Value
The Procter & Gamble Co. 100,000 $10,648,000
17,927,000
Insurance—2.6%Aflac, Inc. 100,000 5,038,000MetLife, Inc. 50,000 2,306,500
7,344,500
Materials—7.2%BHP Group Ltd.—ADR(a) 50,000 2,647,500Dow, Inc.(b) 33,333 1,890,981DowDuPont, Inc. 100,000 3,845,000Nutrien Ltd.(a) 40,000 2,167,200Sonoco Products Co. 75,000 4,729,500Vulcan Materials Co. 40,000 5,044,400
20,324,581
Media & Entertainment—7.1%Alphabet, Inc.—Class A(b) 7,000 8,392,720Facebook, Inc.—Class A(b) 25,000 4,835,000The Walt Disney Co. 50,000 6,848,500
20,076,220
Pharmaceuticals, Biotechnology & LifeSciences—9.8%
Biogen, Inc.(b) 12,500 2,865,500Ionis Pharmaceuticals, Inc.(b) 40,000 2,973,200Johnson & Johnson 40,000 5,648,000Merck & Co., Inc. 100,000 7,871,000Pfizer, Inc. 200,000 8,122,000
27,479,700
Retailing—3.4%Amazon.com, Inc.(b) 5,000 9,632,600
Semiconductors & SemiconductorEquipment—7.6%
Applied Materials, Inc. 150,000 6,610,500Intel Corp. 150,000 7,656,000NVIDIA Corp. 15,000 2,715,000QUALCOMM, Inc. 50,000 4,306,500
21,288,000
Software & Services—7.6%Automatic Data Processing,
Inc. 50,000 8,219,500
The Accompanying Footnotes are an Integral Part of these Financial Statements.
28 April 30, 2019

The Tocqueville FundSchedule of Investments as of April 30, 2019
(Unaudited)
Common Stocks—96.2% Shares Value
Microsoft Corp. 100,000 $ 13,060,000
21,279,500
Technology Hardware & Equipment—2.8%Apple, Inc. 40,000 8,026,800Bio-key International,
Inc.(b)(c)(d)(Originally acquired09/16/05, Cost $0) 1,963 —
8,026,800
Telecommunication Services—2.0%Verizon Communications,
Inc. 100,000 5,719,000
Transportation—3.4%Delta Air Lines, Inc. 100,000 5,829,000FedEx Corp. 10,000 1,894,600Kansas City Southern 15,000 1,847,100
9,570,700
Utilities—3.4%NextEra Energy, Inc. 50,000 9,722,000
Total Common Stocks(Cost $133,055,425) 271,009,101
Preferred Stock—0.0%Health Care Equipment & Supplies—0.0%Velico Medical, Inc.(b)(c)(d)
(Originally acquired10/13/16, Cost $0) 400,000 1,600
Total Preferred Stock(Cost $0) 1,600
Real Estate Investment Trust (REIT)—2.4%Real Estate—2.4%Weyerhaeuser Co. 250,000 6,700,000
Total Real Estate Investment Trust(Cost $4,725,263) 6,700,000
Exchange-Traded Fund (ETF)—1.0%Metals and Mining—1.0%SPDR S&P Metals &
Mining ETF 100,000 2,883,000
Total Exchange-Traded Fund(Cost $1,495,845) 2,883,000
Short-Term Investment—0.0% Shares Value
Money Market Fund—0.0%STIT-Treasury
Portfolio—Institutional Class,2.319%(e) 472 $ 472
Total Short-Term Investment(Cost $472) 472
Total Investments(Cost $139,277,005)—99.6% 280,594,173
Other Assets in Excess ofLiabilities—0.4% 1,196,093
Total Net Assets—100.0% $281,790,266
Percentages are stated as a percent of net assets.ADR American Depository Receipt(a) Foreign issued Security. Foreign Concentration
(including ADR’s) was as follows: Australia 0.9%;Canada 0.8%; Curacao 1.9%.
(b) Non-income producing security.(c) Denotes a security that is either fully or partially
restricted to resale. The aggregate value of restrictedsecurities as of April 30, 2019 was $1,600 whichrepresented 0.0% of net assets.
(d) Security is fair valued using procedures approvedby the Board of Trustees which includes significantunobservable inputs and is deemed a Level 3security. See Footnote 2. The aggregate value of fairvalue securities as of April 30, 2019 was $1,600which represented 0.0% of net assets.
(e) Rate listed is the 7-day effective yield.
The Global Industry Classification Standard (GICS®)was developed by and/or is the exclusive property ofMSCI, Inc. and Standard & Poor Financial ServicesLLC (“S&P”). GICS is a service mark of MSCI andS&P and has been licensed for use by U.S. BankGlobal Fund Services.
The Accompanying Footnotes are an Integral Part of these Financial Statements.
Semi-Annual Report 29

The Tocqueville Opportunity FundSchedule of Investments as of April 30, 2019
(Unaudited)
Common Stocks—99.1% Shares Value
Automobiles & Components—0.0%Delphi Technologies PLC(a) 1 $ 22
Capital Goods—13.3%Allison Transmission Holdings,
Inc. 1,000 46,860AMETEK, Inc. 4,000 352,680AO Smith Corp. 5,500 289,135Cummins, Inc. 1,400 232,806Emerson Electric Co. 4,000 283,960Fastenal Co. 6,000 423,300Fortive Corp. 7,500 647,550Gardner Denver Holdings, Inc.(b) 4,500 151,875Graco, Inc. 5,000 256,250Harris Corp. 4,500 758,250HD Supply Holdings, Inc.(b) 4,000 182,760HEICO Corp. 3,843 405,552Hexcel Corp. 2,000 141,420Honeywell International, Inc. 4,000 694,520Hubbell, Inc. 2,500 319,000Huntington Ingalls Industries,
Inc. 1,000 222,580IDEX Corp. 2,500 391,650Ingersoll-Rand PLC(a) 4,500 551,745Lennox International, Inc. 1,300 352,885Lincoln Electric Holdings, Inc. 3,000 261,810Masco Corp. 6,500 253,890Nordson Corp. 2,500 364,875Parker-Hannifin Corp. 1,500 271,620PGT Innovations, Inc.(b) 15,000 219,900RBC Bearings, Inc.(b) 500 68,775Rockwell Automation, Inc. 3,500 632,485Sensata Technologies Holding
PLC(a)(b) 4,500 224,730SiteOne Landscape Supply,
Inc.(b) 8,000 538,400Spirit AeroSystems Holdings,
Inc.—Class A 3,000 260,700The Middleby Corp.(b) 2,000 264,260TransDigm Group, Inc.(b) 1,500 723,780Trex Co., Inc.(b) 2,000 138,540United Rentals, Inc.(b) 2,500 352,300United Technologies Corp. 1,500 213,915Wabtec Corp. 500 37,035Watsco, Inc. 1,500 237,705
Common Stocks—99.1% Shares Value
Welbilt, Inc.(b) 7,500 $ 126,225Woodward, Inc. 3,500 381,150Xylem, Inc. 3,000 250,200
12,527,073
Commercial & Professional Services—3.9%Cintas Corp. 3,000 651,420Copart, Inc.(b) 7,000 471,240CoStar Group, Inc.(b) 1,500 744,375Equifax, Inc. 2,500 314,875Robert Half International, Inc. 3,000 186,270TransUnion 8,500 592,025Verisk Analytics, Inc. 5,000 705,700
3,665,905
Consumer Durables & Apparel—2.0%Leggett & Platt, Inc. 500 19,680Lululemon Athletica, Inc.(b) 5,500 969,925NIKE, Inc.—Class B 8,000 702,640Roku, Inc.(b) 3,000 190,770
1,883,015
Consumer Services—1.5%Domino’s Pizza, Inc. 1,000 270,580Planet Fitness, Inc.—Class A(b) 6,500 492,050Restaurant Brands International
LP 37 2,430Starbucks Corp. 4,000 310,720Vail Resorts, Inc. 1,500 343,275
1,419,055
Diversified Financials—1.8%Cboe Global Markets, Inc. 1,500 152,415FactSet Research Systems, Inc. 400 110,348MarketAxess Holdings, Inc. 1,000 278,330MSCI, Inc. 1,500 338,070S&P Global, Inc. 3,500 772,310SEI Investments Co. 500 27,225
1,678,698
Health Care Equipment & Services—5.7%ABIOMED, Inc.(b) 1,300 360,633Align Technology, Inc.(b) 1,750 568,190Boston Scientific Corp.(b) 1,000 37,120DexCom, Inc.(b) 3,000 363,210Glaukos Corp.(b) 4,000 288,520IDEXX Laboratories, Inc.(b) 3,500 812,000
The Accompanying Footnotes are an Integral Part of these Financial Statements.
30 April 30, 2019

The Tocqueville Opportunity FundSchedule of Investments as of April 30, 2019
(Unaudited)
Common Stocks—99.1% Shares Value
Inogen, Inc.(b) 200 $ 17,460Insulet Corp.(b) 4,500 388,125Intuitive Surgical, Inc.(b) 1,500 765,945iRhythm Technologies, Inc.(b) 5,000 381,550Medidata Solutions, Inc.(b) 2,500 225,850STAAR Surgical Co.(b) 1,500 48,720Veeva Systems, Inc.—Class A(b) 7,000 979,090WellCare Health Plans, Inc.(b) 500 129,175
5,365,588
Materials—2.3%Eagle Materials, Inc. 3,500 318,185Ingevity Corp.(b) 1,500 172,515Martin Marietta Materials, Inc. 2,000 443,800Summit Materials, Inc.—
Class A(b) 7,000 122,640The Sherwin-Williams Co. 500 227,415Vulcan Materials Co. 6,500 819,715Worthington Industries, Inc. 500 20,065
2,124,335
Media & Entertainment—2.6%Discovery, Inc.—Class A(b) 7,500 231,750Facebook, Inc.—Class A(b) 7,500 1,450,500IAC/InterActiveCorp(b) 2,000 449,680Live Nation Entertainment,
Inc.(b) 2,000 130,680Match Group, Inc. 2,500 151,000Spotify Technology SA(a)(b) 500 67,885
2,481,495
Pharmaceuticals, Biotechnology & LifeSciences—12.4%
ACADIA Pharmaceuticals,Inc.(b) 10,000 240,500
Acceleron Pharma, Inc.(b) 2,000 81,460Aerie Pharmaceuticals, Inc.(b) 500 19,075Agios Pharmaceuticals, Inc.(b) 2,000 111,840Amarin Corp. PLC—ADR(a)(b) 50,000 935,000Array BioPharma, Inc.(b) 5,000 113,050Atara Biotherapeutics, Inc.(b) 7,500 252,000Audentes Therapeutics, Inc.(b) 3,500 132,265Bluebird Bio, Inc.(b) 4,500 638,235Cellectis SA—ADR(a)(b) 2,500 49,350CRISPR Therapeutics AG(a)(b) 500 20,095Editas Medicine, Inc.(b) 500 12,375
Common Stocks—99.1% Shares Value
Galapagos NV(a)(b) 4,000 $ 457,839Genfit(a)(b) 500 12,595Genmab A/S(a)(b) 5,000 830,041Global Blood Therapeutics,
Inc.(b) 1,500 83,100GW Pharmaceuticals PLC—
ADR(a)(b) 4,000 677,240Hua Medicine(a)(b) 22,000 19,771Illumina, Inc.(b) 1,000 312,000Immunomedics, Inc.(b) 10,000 160,200Intellia Therapeutics, Inc.(b) 5,000 76,900Intra-Cellular Therapies,
Inc.(b) 12,500 164,625Iovance Biotherapeutics,
Inc.(b) 30,000 342,000Madrigal Pharmaceuticals,
Inc.(b) 500 53,040Neurocrine Biosciences, Inc.(b) 5,500 397,320Pacira BioSciences, Inc.(b) 2,500 99,550PRA Health Sciences, Inc.(b) 500 48,410REGENXBIO, Inc.(b) 9,000 453,600Sage Therapeutics, Inc.(b) 16,500 2,775,795Sarepta Therapeutics, Inc.(b) 9,500 1,110,930Seattle Genetics, Inc.(b) 2,500 169,450Viking Therapeutics, Inc.(b) 45,000 352,350Voyager Therapeutics, Inc.(b) 12,000 253,200Xencor, Inc.(b) 2,500 76,775Zogenix, Inc.(b) 2,500 97,475
11,629,451
Retailing—5.3%Alibaba Group Holding Ltd.—
ADR(a)(b) 300 55,671Amazon.com, Inc.(b) 1,300 2,504,476Etsy, Inc.(b) 2,000 135,080Expedia Group, Inc. 2,000 259,680Five Below, Inc.(b) 2,000 292,780Pool Corp. 1,500 275,610The Home Depot, Inc. 4,500 916,650Ulta Beauty, Inc.(b) 700 244,286Wayfair, Inc.—Class A(b) 1,800 291,870
4,976,103
The Accompanying Footnotes are an Integral Part of these Financial Statements.
Semi-Annual Report 31

The Tocqueville Opportunity FundSchedule of Investments as of April 30, 2019
(Unaudited)
Common Stocks—99.1% Shares Value
Semiconductors & SemiconductorEquipment—0.6%
Advanced Micro Devices,Inc.(b) 1,500 $ 41,445
ams AG(a) 4,000 168,762Micron Technology, Inc.(b) 1,000 42,060NVIDIA Corp. 1,500 271,500
523,767
Software & Services—47.1%Adobe, Inc.(b) 4,500 1,301,625ANSYS, Inc.(b) 1,500 293,700Appian Corp.(b) 2,000 72,180Aspen Technology, Inc.(b) 2,000 243,820Atlassian Corp. PLC—
Class A(a)(b) 3,500 385,525Cadence Design Systems,
Inc.(b) 5,000 346,900Cloudera, Inc.(b) 1,500 16,695Coupa Software, Inc.(b) 15,500 1,601,615DocuSign, Inc.(b) 2,000 113,340Dropbox, Inc.—Class A(b) 500 12,190EPAM Systems, Inc.(b) 1,000 179,360Euronet Worldwide, Inc.(b) 2,500 374,725Fair Isaac Corp.(b) 1,500 419,625Fidelity National Information
Services, Inc. 1,500 173,895Fiserv, Inc.(b) 4,000 348,960Fortinet, Inc.(b) 4,500 420,390Gartner, Inc.(b) 1,000 158,970Global Payments, Inc. 3,500 511,245GoDaddy, Inc.—Class A(b) 6,000 489,000Guidewire Software, Inc.(b) 2,500 266,250Mastercard, Inc.—Class A 1,000 254,240MongoDB, Inc.(b) 2,500 352,300New Relic, Inc.(b) 23,000 2,420,520Nutanix, Inc.—Class A(b) 5,000 215,950Okta, Inc.(b) 21,000 2,184,630Palo Alto Networks, Inc.(b) 3,500 870,905Paycom Software, Inc.(b) 10,500 2,126,565Paylocity Holding Corp.(b) 17,500 1,689,625PayPal Holdings, Inc.(b) 18,000 2,029,860Pegasystems, Inc. 500 37,505Proofpoint, Inc.(b) 2,000 250,840PTC, Inc.(b) 500 45,235
Common Stocks—99.1% Shares Value
RealPage, Inc.(b) 500 $ 32,605ServiceNow, Inc.(b) 17,000 4,615,670Shopify, Inc.—Class A(a)(b) 19,000 4,627,070Splunk, Inc.(b) 9,000 1,242,360Square, Inc.—Class A(b) 8,500 618,970SS&C Technologies Holdings,
Inc. 2,000 135,320Tableau Software, Inc.—
Class A(b) 3,000 365,430Talend SA—ADR(a)(b) 1,000 49,580Tencent Holdings Ltd.(a) 3,000 148,379The Trade Desk, Inc.—
Class A(b) 2,000 442,960Total System Services, Inc. 11,000 1,124,640Twilio, Inc.—Class A(b) 20,000 2,742,800Tyler Technologies, Inc.(b) 1,000 231,910Upland Software, Inc.(b) 3,000 139,470WEX, Inc.(b) 2,000 420,600Wix.com Ltd.(a)(b) 3,500 469,560Workday, Inc.—Class A(b) 19,500 4,009,785Worldpay, Inc.—Class A(b) 3,000 351,630Zendesk, Inc.(b) 16,000 1,404,480Zscaler, Inc.(b) 13,000 888,030
44,269,434
Technology Hardware & Equipment—0.2%II-VI, Inc.(b) 500 19,920Lumentum Holdings, Inc.(b) 3,000 185,910Viavi Solutions, Inc.(b) 1,000 13,300
219,130
Transportation—0.4%Kansas City Southern 3,000 369,420Knight-Swift Transportation
Holdings, Inc. 500 16,675
386,095
Total Common Stocks(Cost $61,066,466) 93,149,166
Real Estate Investment Trust (REIT)—0.0%Real Estate—0.0%Equinix, Inc. 1 455
Total Real Estate Investment Trust(Cost $297) 455
The Accompanying Footnotes are an Integral Part of these Financial Statements.
32 April 30, 2019

The Tocqueville Opportunity FundSchedule of Investments as of April 30, 2019
(Unaudited)
Exchange-TradedFund (ETF)—0.5% Shares Value
Funds, Trusts, and Other Financial Vehicles—0.5%Direxion Daily
Financial Bull 3XShares 6,500 $481,845
Total Exchange-Traded Fund(Cost $478,990) 481,845
Purchased CallOptions—0.2% Contracts
NotionalAmount
Health Care Equipment & Services—0.0%WellCare Health
Plans, Inc.Expiration:May 2019,Exercise Price$270.00(b) 100 2,700,000 21,000
Media & Entertainment—0.1%Alphabet, Inc.
Expiration:May 2019,Exercise Price$1,275.00(b) 40 5,100,000 600
Netflix, Inc.Expiration:May 2019,Exercise Price$375.00(b) 75 2,812,500 72,000
72,600
Pharmaceuticals, Biotechnology & LifeSciences—0.0%
HeronTherapeutics,Inc. Expiration:May 2019,Exercise Price$30.00(b) 250 750,000 12,500
Purchased CallOptions—0.2% Contracts
NotionalAmount Value
Technology Hardware & Equipment—0.1%Apple, Inc.
Expiration:May 2019,Exercise Price$207.50(b) 150 3,112,500 $ 33,000
Total Purchased Call Options(Cost $291,534) 139,100
Short-TermInvestment—0.8% Shares
Money Market Fund—0.8%STIT-Treasury
Portfolio—Institutional Class,2.319%(c) 746,755 746,755
Total Short-Term Investment(Cost $746,755) 746,755
Total Investments(Cost $62,584,042)—100.6% 94,517,321
Liabilities in Excess of OtherAssets—(0.6)% (531,559)
Total Net Assets—100.0% $93,985,762
Percentages are stated as a percent of net assets.ADR American Depository Receipt(a) Foreign issued Security. Foreign Concentration
(including ADR’s) was as follows: Austria 0.2%;Belgium 0.5%; Canada 4.9%; Cayman Islands0.2%; Denmark 0.9%; France 0.1%; Ireland 0.6%;Israel 0.5%; Jersey 0.0%; Luxembourg 0.1%;Switzerland 0.0%; United Kingdom 2.4%.
(b) Non-income producing security.(c) Rate listed is the 7-day effective yield.
The Accompanying Footnotes are an Integral Part of these Financial Statements.
Semi-Annual Report 33

The Tocqueville Gold FundSchedule of Investments as of April 30, 2019
(Unaudited)
Common Stocks—81.8% Shares Value
Gold Related Securities—71.4%Australia—5.6%Evolution Mining Ltd. 5,193,374 $11,678,813Newcrest Mining Ltd. 654,300 11,535,835Northern Star Resources
Ltd. 3,187,500 18,403,165West African Resources
Ltd.(a) 27,400,000 5,311,799
46,929,612
Canada—55.2%Agnico Eagle Mines Ltd. 82,200 3,403,902Agnico Eagle Mines
Ltd.(b) 501,485 20,767,625Alacer Gold Corp.(a) 3,000,000 7,949,541Alamos Gold, Inc.—
Class A 3,545,800 16,487,970Almaden Minerals Ltd.—
Class B(a)(c) 5,600,619 2,884,547Argonaut Gold, Inc.(a)(c) 2,837,000 3,663,514ATAC Resources
Ltd.(a)(c) 9,784,891 1,570,316B2Gold Corp.(a) 8,730,700 23,747,504Barkerville Gold Mines
Ltd.(a)(c)(d)(e)(Originally acquired03/29/2019,Cost 4,579,639) 17,000,000 4,601,179
Barkerville Gold MinesLtd.(a)(b)(c) 7,110,000 1,963,648
Corvus Gold, Inc.(a)(c) 3,226,901 4,001,357Corvus Gold, Inc.(a)(b)(c) 17,279,330 21,152,572Detour Gold Corp.(a) 4,591,140 40,781,194East Asia Minerals
Corp.(a)(c) 13,290,993 570,450Falco Resources Ltd.(a)(c) 16,222,300 2,906,137Franco-Nevada Corp.(a) 539,900 38,684,035Gold Standard Ventures
Corp.(a) 7,011,700 7,379,635IAMGOLD Corp.(a) 5,059,000 15,328,770International Tower Hill
Mines Ltd.(a)(c) 5,738,836 2,641,586International Tower Hill
Mines Ltd.(a)(b)(c) 20,331,298 9,409,125Jaguar Mining, Inc.(a)(c) 64,330,707 5,522,155
Common Stocks—81.8% Shares Value
Kinross Gold Corp.(a) 4,234,167 $ 13,464,651Novagold Resources,
Inc.(a) 2,831,300 11,325,200NuLegacy Gold
Corp.(a)(c) 28,556,090 2,131,529OceanaGold Corp. 4,431,459 12,541,029OceanaGold Corp.(b) 2,404,400 6,748,185Osisko Gold Royalties
Ltd. 24,340 275,042Osisko Gold Royalties
Ltd.(b) 2,014,400 22,764,810Osisko Mining, Inc.(a) 7,704,239 15,987,001Pan American Silver
Corp. 2,237,798 28,442,413Premier Gold Mines
Ltd.(a)(c) 8,630,160 10,822,325Rockhaven Resources
Ltd.(a) 4,631,500 362,997SEMAFO, Inc.(a)(c) 10,563,000 28,620,449Strategic Metals
Ltd.(a)(c) 10,113,400 2,189,211Torex Gold Resources,
Inc.(a)(c) 2,093,400 20,016,761Trifecta Gold Ltd.(a)(c) 2,325,199 82,442Wesdome Gold Mines
Ltd.(a) 2,482,700 7,838,935Wheaton Precious Metals
Corp. 1,602,375 34,739,490Yamana Gold, Inc. 3,524,000 7,717,560
461,486,792
Peru—1.6%Cia de Minas
Buenaventura SAA—ADR 798,100 12,937,201
South Africa—2.3%AngloGold Ashanti
Ltd.— ADR 1,612,800 19,031,040
United Kingdom—2.0%Fresnillo PLC 1,742,300 17,012,456
United States—4.7%Contango ORE, Inc.(a) 263,200 6,619,480
The Accompanying Footnotes are an Integral Part of these Financial Statements.
34 April 30, 2019

The Tocqueville Gold FundSchedule of Investments as of April 30, 2019
(Unaudited)
Common Stocks—81.8% Shares Value
Electrum Ltd.(a)(d)(e)(Originally acquired12/21/07,Cost $13,065,361) 2,127,287 $ 106,364
Newmont GoldcorpCorp. 502,700 15,613,862
Royal Gold, Inc. 198,700 17,298,822
39,638,528
Total Gold Related Securities 597,035,629
Other Precious Metals Related Securities—9.5%Canada—8.2%Bear Creek Mining
Corp.(a)(c) 7,413,200 7,746,869Ivanhoe Mines Ltd.—
Class A(a) 7,882,379 19,180,828MAG Silver Corp.(a)(c) 2,773,600 27,264,488MAG Silver Corp.(a)(c) 1,432,665 14,073,204Nickel Creek Platinum
Ltd.(a)(c) 12,379,201 462,014
68,727,403
United States—1.3%Sunshine Mining &
Refining(a)(d)(e)(Originally acquired03/15/11,Cost $21,353,108) 2,300,212 10,350,954
Total Other Precious Metals RelatedSecurities 79,078,357
Other Securities—0.9%United States—0.9%Gold Bullion
InternationalLLC(a)(c)(d)(e)(Originally acquired05/12/10,Cost $5,000,000) 5,000,000 6,893,000
I-Pulse, Inc.(a)(d)(e)(Originally acquired10/09/07,Cost $175,524) 74,532 804,945
Total Other Securities 7,697,945
Total Common Stocks(Cost $919,894,804) 683,811,931
Private Fund—2.0% Shares Value
Gold Related Security—2.0%Tocqueville Bullion
Reserve LP(a)(c)(d)(e)(Originally acquired11/28/11,Cost $25,000,000) 13,806 $ 16,882,835
Total Private Fund(Cost $25,000,000) 16,882,835
Gold Bullion—15.0% Ounces
Gold Bullion(a) 97,849 125,594,459
Total Gold Bullion(Cost $44,489,086) 125,594,459
Warrants—0.1% Shares
Gold Related Securities—0.1%Canada—0.1%Almaden Minerals Ltd.
Expiration: 08/08/2019,Exercise Price: CAD$2.00(a)(c)(d)(e)(Originally acquired02/03/17, Cost $0) 79,585 42
East Asia Minerals Corp.Expiration: 03/10/2020,Exercise Price: CAD$0.15(a)(c)(d)(e)(Originally acquired03/04/15, Cost $0) 4,617,560 185,778
East Asia Minerals Corp.Expiration: 03/08/2022,Exercise Price: CAD$0.50(a)(c)(d)(e)(Originally acquired03/03/17, Cost $0) 3,321,250 148,746
East Asia Minerals Corp.Expiration: 12/05/2019,Exercise Price: CAD$0.50(a)(c)(d)(e)(Originally acquired12/05/14, Cost $0) 976,493 —
The Accompanying Footnotes are an Integral Part of these Financial Statements.
Semi-Annual Report 35

The Tocqueville Gold FundSchedule of Investments as of April 30, 2019
(Unaudited)
Warrants—0.1% Shares Value
Osisko Gold Royalties Ltd.Expiration: 02/18/2022,Exercise Price: CAD$36.50 (a) 274,000 $ 136,008
Total Gold Related Securities 470,574
Other Precious Metals Related Security—0.0%Canada—0.0%Nickel Creek Platinum Ltd.
Expiration: 08/08/2022,Exercise Price: CAD$0.35(a)(c)(d)(e)(Originally acquired08/04/17, Cost $0) 6,189,601 36,037
Total Warrants(Cost $1) 506,611
Short-Term Investment—0.9%Money Market Fund—0.9%STIT—Treasury
Portfolio—Institutional Class,2.319%(f) 7,793,357 7,793,357
Total Short-Term Investment(Cost $7,793,357) 7,793,357
Total Investments(Cost $997,177,248)—99.8% 834,589,193
Other Assets in Excess ofLiabilities—0.2% 1,411,899
Total Net Assets—100.0% $836,001,092
Percentages are stated as a percent of net assets.ADR American Depository Receipt(a) Non-income producing security.(b) Denotes an issue that is traded on a foreign
exchange when a company is listed more than once.(c) Affiliated company. See Footnote 8.(d) Denotes a security that is either fully or partially
restricted to resale. The value of restricted securitiesas of April 30, 2019 was $40,009,880, whichrepresented 4.8% of net assets.
(e) Security is fair valued using procedures approvedby the Board of Trustees which includes significantunobservable inputs and is deemed either a Level 2or 3 security. See Footnote 2. The aggregate valueof fair valued securities as of April 30, 2019 was$40,009,880, which represented 4.8% of net assets.
(f)Rate listed is the 7-day effective yield.
The Accompanying Footnotes are an Integral Part of these Financial Statements.
36 April 30, 2019

The Tocqueville Phoenix FundSchedule of Investments as of April 30, 2019
(Unaudited)
Common Stocks—89.4% Shares Value
Auto Components—3.7%Garrett Motion, Inc.(a) 234,200 $ 4,402,960Gentex Corp. 100,000 2,303,000Visteon Corp.(a) 16,000 1,056,320
7,762,280
Building Products—2.7%Apogee Enterprises, Inc. 140,000 5,642,000
Chemicals—12.9%Eastman Chemical Co. 110,000 8,676,800GCP Applied Technologies,
Inc.(a) 105,000 3,022,950HB Fuller Co. 122,500 5,998,825PolyOne Corp. 156,682 4,330,690WR Grace & Co. 65,000 4,912,700
26,941,965
Commercial Services & Supplies—1.3%Team, Inc.(a) 160,000 2,704,000
Communications Equipment—2.7%Lumentum Holdings, Inc.(a) 91,000 5,639,270
Construction & Engineering—1.1%Aegion Corp.(a) 120,000 2,389,200
Construction Materials—3.9%U.S. Concrete, Inc.(a) 175,000 8,247,750
Diversified Telecommunication Services—0.5%CenturyLink, Inc. 85,000 970,700
Electrical Equipment—3.4%Acuity Brands, Inc. 48,000 7,023,840
Electronic Equipment, Instruments &Components—16.8%
Avnet, Inc. 80,000 3,888,800Fabrinet(a)(b) 75,000 4,539,000Flex Ltd.(a)(b) 775,000 8,556,000Plexus Corp.(a) 97,500 5,867,550TTM Technologies, Inc.(a) 925,000 12,247,000
35,098,350
Energy Equipment & Services—1.7%McDermott International,
Inc.(a)(b) 312,500 2,528,128Solaris Oilfield Infrastructure,
Inc.—Class A 60,000 1,019,400
3,547,528
Common Stocks—89.4% Shares Value
Food Products—0.5%Landec Corp.(a) 90,000 $ 945,900
Health Care Providers & Services—0.8%Cross Country Healthcare,
Inc.(a) 225,000 1,586,250
Household Durables—3.9%Mohawk Industries, Inc.(a) 38,800 5,286,500Newell Brands, Inc. 205,000 2,947,900
8,234,400
Insurance—2.2%Loews Corp. 90,000 4,616,100
Interactive Media & Services—2.2%Cars.com, Inc.(a) 222,200 4,623,982
Machinery—9.1%Crane Co. 72,500 6,166,125Harsco Corp.(a) 330,000 7,471,200REV Group, Inc. 245,000 3,109,050Stanley Black & Decker, Inc. 15,300 2,242,980
18,989,355
Media—2.9%TEGNA, Inc. 375,000 5,970,000
Metals & mining—2.0%Commercial Metals Co. 245,000 4,236,050
Paper & Forest Products—1.0%Louisiana-Pacific Corp. 82,000 2,054,100
Professional Services—2.2%TrueBlue, Inc.(a) 190,000 4,590,400
Semiconductors & SemiconductorEquipment—0.8%
ams AG(b) 38,000 1,603,239
Specialty Retail—0.7%Tile Shop Holdings, Inc. 300,000 1,458,000
Technology Hardware, Storage &Peripherals—0.9%
Hewlett Packard EnterpriseCo. 125,000 1,976,250
Textiles, Apparel & Luxury Goods—3.4%PVH Corp. 55,100 7,107,349
The Accompanying Footnotes are an Integral Part of these Financial Statements.
Semi-Annual Report 37

The Tocqueville Phoenix FundSchedule of Investments as of April 30, 2019
(Unaudited)
Common Stocks—89.4% Shares Value
Trading Companies & Distributors—6.1%Rush Enterprises, Inc.—
Class A 124,400 $ 5,275,804WESCO International,
Inc.(a) 129,100 7,389,684
12,665,488
Total Common Stocks(Cost $150,910,307) 186,623,746
Short-Term Investments—11.3%Money Market Fund—5.0%STIT-Treasury
Portfolio—Institutional Class,2.319%(c) 10,400,000 10,400,000
Money Market Deposit Account—6.3%U.S. Bank Money
Market DepositAccount, 0.300% 13,220,798 13,220,798
Total Short-Term Investments(Cost $23,620,798) 23,620,798
Total Investments(Cost $174,531,105)—100.7% 210,244,544
Liabilities in Excess of OtherAssets—(0.7)% (1,480,800)
Total Net Assets—100.0% $208,763,744
Percentages are stated as a percent of net assets.(a) Non-income producing security.(b) Foreign issued security. Foreign concentration was
as follows: Austria 0.8%; Cayman Islands 2.2%;Panama 1.2%; Singapore 4.1%.
(c) Rate listed is the 7-day effective yield.
The Accompanying Footnotes are an Integral Part of these Financial Statements.
38 April 30, 2019

The Tocqueville Select FundSchedule of Investments as of April 30, 2019
(Unaudited)
Common Stocks—93.6% Shares Value
Chemicals—8.7%Eastman Chemical Co. 21,500 $1,695,920WR Grace & Co. 24,200 1,829,036
3,524,956
Commercial Services & Supplies—3.2%Team, Inc.(a) 76,100 1,286,090
Electrical Equipment—3.9%Acuity Brands, Inc. 10,700 1,565,731
Electronic Equipment, Instruments &Components—13.4%
Fabrinet(a)(b) 29,600 1,791,392Flex Ltd.(a)(b) 161,500 1,782,960TTM Technologies, Inc.(a) 138,100 1,828,444
5,402,796
Energy Equipment & Services—4.5%Solaris Oilfield Infrastructure,
Inc.—Class A 107,000 1,817,930
Health Care Providers & Services—2.8%Cross Country Healthcare,
Inc.(a) 160,000 1,128,000
Household Durables—6.3%Mohawk Industries, Inc.(a) 11,000 1,498,750Newell Brands, Inc. 73,100 1,051,178
2,549,928
Interactive Media & Services—3.4%Cars.com, Inc.(a) 65,733 1,367,903
IT Services—7.2%EPAM Systems, Inc.(a) 16,300 2,923,568
Machinery—10.1%Harsco Corp.(a) 84,200 1,906,288Stanley Black & Decker, Inc. 14,650 2,147,690
4,053,978
Media—5.4%TEGNA, Inc. 136,000 2,165,120
Professional Services—4.8%ICF International, Inc. 24,800 1,931,176
Software—6.2%j2 Global, Inc. 28,400 2,488,408
Common Stocks—93.6% Shares Value
Specialty Retail—3.5%Tile Shop Holdings, Inc. 294,000 $ 1,428,840
Textiles, Apparel & Luxury Goods—4.5%PVH Corp. 14,000 1,805,860
Trading Companies & Distributors—5.7%WESCO International,
Inc.(a) 40,300 2,306,772
Total Common Stocks(Cost $28,795,644) 37,747,056
Short-Term Investments—6.5%Money Market Fund—5.0%STIT-Treasury Portfolio—
Institutional Class,2.319%(c) 2,000,000 2,000,000
Money Market Deposit Account—1.5%U.S. Bank Money Market
Deposit Account,0.300% 603,765 603,765
Total Short-Term Investments(Cost $2,603,765) 2,603,765
Total Investments(Cost $31,399,409)—100.1% 40,350,821
Liabilities in Excess of OtherAssets—(0.1)% (37,286)
Total Net Assets—100.0% $40,313,535
Percentages are stated as a percent of net assets.(a) Non-income producing security.(b) Foreign issued security. Foreign concentration was
as follows: Cayman Islands 4.4%; Singapore 4.4%.(c) Rate listed is the 7-day effective yield.
The Accompanying Footnotes are an Integral Part of these Financial Statements.
Semi-Annual Report 39

Percent of Total Investments
The Tocqueville FundAllocation of Portfolio Holdings
April 30, 2019(Unaudited)
0.0%Preferred Stock1.0%
2.4%Real Estate InvestmentTrust (REIT)
3.5%Utilities
6.7%Energy
6.3%Financials
Exchange-Traded Fund (ETF)
0.0%Short-Term Investment
6.9%Consumer Discretionary
9.2%Communication Services
InformationTechnology
18.0%
Health Care11.2%
ConsumerStaples14.4%
Industrials13.2%
Materials7.2%
The Tocqueville Opportunity FundAllocation of Portfolio Holdings
April 30, 2019(Unaudited)
0.1%
0.0%Real Estate InvestmentTrust (REIT)
0.5%Exchange-Traded Fund (ETF)
0.8%Short-Term Investment
1.8%Financials
2.3%Materials
2.6%Communication Services
Purchased Call Options
ConsumerDiscretionary
8.8%
Information Technology47.6%
Health Care18.0%
Industrials17.5%
40 April 30, 2019

Percent of Total Investments
The Tocqueville Gold FundAllocation of Portfolio Holdings
April 30, 2019(Unaudited)
0.0%Other Precious MetalsRelated Warrant
0.9%Short-Term Investment0.1%Gold Related Warrants
0.9%Other Common Stocks2.0%Private Fund
9.5%Other Precious MetalsRelated Common Stocks
Gold Bullion15.1%
Gold RelatedCommon Stocks
71.5%
The Tocqueville Phoenix FundAllocation of Portfolio Holdings
April 30, 2019(Unaudited)
Consumer Staples
Health Care
Energy
Financials
Communication Services
0.4%
0.8%
1.7%
2.2%
5.5%
ConsumerDiscretionary
11.7%
Short-TermInvestments
11.2%
InformationTechnology
21.1%
Materials19.7%
Industrials25.7%
Semi-Annual Report 41

Percent of Total Investments
The Tocqueville Select FundAllocation of Portfolio Holdings
April 30, 2019(Unaudited)
Communication Services
2.8%Health Care
Energy 4.5%
6.5%Short-Term Investments
8.7%Materials
8.8%
ConsumerDiscretionary
14.3%
InformationTechnology
26.8%
Industrials27.6%
42 April 30, 2019

The Toqueville TrustStatements of Assets & Liabilities
April 30, 2019(Unaudited)
TheTocqueville
Fund
TheTocquevilleOpportunity
Fund
TheTocquevilleGold Fund
TheTocqueville
PhoenixFund
TheTocquevilleSelect Fund
Assets:Investments, at value (1)
Unaffiliated issuers $280,594,173 $94,517,321 $636,146,877 $210,244,544 $40,350,821Affiliated issuers — — 198,442,316 — —
Foreign currencies, at value (2) — — 895,017 — —Receivable for investments sold 2,581,271 812,986 — — —Receivable for Fund shares sold 17,443 113,016 1,914,639 28,322 2,181Dividends, interest and other
receivables 307,586 8,795 808,045 60,458 4,219Other assets 18,096 15,969 49,941 21,978 10,644
Total Assets 283,518,569 95,468,087 838,256,835 210,355,302 40,367,865
Liabilities:Payable for investments purchased 1,067,320 1,346,544 — 1,036,298 —Payable for loans outstanding 237,000 — — — —Payable for foreign currencies
purchased — — — — —Payable for Fund shares redeemed 117,713 45,835 1,143,014 294,386 10,000Payable to Adviser (see Note 10) 152,985 31,035 642,427 109,432 16,751Payable to Administrator 39,615 12,234 105,796 26,776 1,802Payable to Trustees 13,708 5,828 35,658 14,108 2,067Accrued distribution fee 42,777 12,596 38,016 23,541 5,502Accrued expenses and other
liabilities 57,185 28,253 290,832 87,017 18,208
Total Liabilities 1,728,303 1,482,325 2,255,743 1,591,558 54,330
Net Assets $281,790,266 $93,985,762 $836,001,092 $208,763,744 $40,313,535
The Accompanying Notes are an Integral Part of these Financial Statements.
Semi-Annual Report 43

The Toqueville TrustStatements of Assets & Liabilities
April 30, 2019(Unaudited)
TheTocqueville
Fund
TheTocquevilleOpportunity
Fund
TheTocquevilleGold Fund
TheTocqueville
PhoenixFund
TheTocquevilleSelect Fund
Net assets consist of:Paid in capital $124,316,081 $60,869,321 $1,433,950,890 $171,298,848 $33,261,197Total distributable earnings 157,474,185 33,116,441 (597,949,798) 37,464,896 7,052,338
Net assets $281,790,266 $93,985,762 $ 836,001,092 $208,763,744 $40,313,535
Investor ClassNet assets $281,790,266 $93,985,762 $ 835,981,000 $208,763,744 $40,313,535Shares of beneficial interest
outstanding (unlimited sharesof $0.01 par value authorized) 7,682,086 3,310,454 27,361,453 9,995,300 3,325,670
Net asset value, offering andredemption price per share $ 36.68 $ 28.39 $ 30.55 $ 20.89 $ 12.12
Institutional ClassNet assets $ — $ — $ 20,092 $ — $ —Shares of beneficial interest
outstanding (unlimited sharesof $0.01 par value authorized) — — 657 — —
Net asset value, offering andredemption price per share $ — $ — $ 30.57 $ — $ —
(1) Cost of investmentsUnaffiliated issuers $139,277,005 $62,584,042 $ 603,597,165 $174,531,105 $31,399,409Affiliated issuers $ — $ — $ 393,580,083 $ — $ —
(2) Cost of foreign currencies $ — $ — $ 895,017 $ — $ —
The Accompanying Notes are an Integral Part of these Financial Statements.
44 April 30, 2019

The Tocqueville TrustStatements of Operations
(Unaudited)
TheTocqueville
Fund
TheTocquevilleOpportunity
Fund
TheTocquevilleGold Fund
TheTocqueville
PhoenixFund
TheTocquevilleSelect Fund
Investment Income:Dividends* $3,247,463 $ 92,225 $ 3,084,413 $1,105,860 $191,350Interest 31,939 759 163,270 133,903 20,129
Total investment income 3,279,402 92,984 3,247,683 1,239,763 211,479
Expenses:Investment Adviser’s fee (See Note 4) 991,321 307,400 3,835,966 845,873 154,133Distribution (12b-1) fees—Investor
Class Only (See Note 4) 330,441 102,467 1,072,034 264,336 48,167Administration fees (See Note 4) 198,264 61,480 597,129 158,601 28,900Transfer agent and shareholder services
fees 35,169 13,870 321,986 59,596 7,902Legal fees 30,531 8,766 114,668 29,646 4,489Trustee fees and expenses 29,731 9,787 91,808 26,294 4,569Other expenses (See Note 10) 22,694 23,052 47,657 15,119 6,148Fund accounting fees 15,962 10,803 50,038 14,912 2,790Blue sky fees 13,531 12,233 20,003 12,450 12,489Audit fees 13,133 5,536 43,375 10,896 4,101Printing and mailing expense 8,908 3,165 54,629 20,425 1,598Custody fees 6,971 8,428 87,590 14,425 1,144Insurance expense 3,713 1,011 13,091 3,762 543Registration fees 1,686 1,249 3,434 1,342 530Interest expense 1,348 5,533 23,883 — —
Total expenses before waiver 1,703,403 574,780 6,377,291 1,477,677 277,503Less: Fees waived (See Note 4) (49,853) (56,913) — (158,362) (36,670)
Net expenses 1,653,550 517,867 6,377,291 1,319,315 240,833
Net Investment Income (Loss) 1,625,852 (424,883) (3,129,608) (79,552) (29,354)
The Accompanying Notes are an Integral Part of these Financial Statements.
Semi-Annual Report 45

The Tocqueville TrustStatements of Operations
(Unaudited)
TheTocqueville
Fund
TheTocquevilleOpportunity
Fund
TheTocquevilleGold Fund
TheTocqueville
PhoenixFund
TheTocquevilleSelect Fund
Realized and Unrealized Gain (Loss):Net realized gain (loss) on:
InvestmentsUnaffiliated issuers $14,951,183 $ 3,349,669 $(33,295,334) $ 1,967,031 $2,410,279Affililiated issuers — — (366,326) — —
Foreign currency translation — (4,813) (137,082) (674) —Written Option — 4,761 — — —
14,951,183 3,349,617 (33,798,742) 1,966,357 2,410,279Net change in unrealized
appreciation (depreciation) on:Investments 12,872,077 11,582,600 71,897,337 19,289,772 1,654,351Foreign currency translation (33) 4,041 6,467,483 (14,814) —
12,872,044 11,586,641 78,364,820 19,274,958 1,654,351Net gain on investments and
foreign currency 27,823,227 14,936,258 44,566,078 21,241,315 4,064,630
Net Increase in Net Assets Resultingfrom Operations $29,449,079 $14,511,375 $ 41,436,470 $21,161,763 $4,035,276
* Net of foreign taxes withheld of: $ 5,460 $ 58 $ 194,247 $ — $ —
The Accompanying Notes are an Integral Part of these Financial Statements.
46 April 30, 2019

The
Toc
quev
ille
Tru
st
Stat
emen
tsof
Cha
nges
inN
etA
sset
s The
Toc
quev
ille
Fund
The
Toc
quev
ille
Opp
ortu
nity
Fund
For
the
Per
iod
End
edA
pril
30,
2019
(Una
udit
ed)
For
the
Yea
rE
nded
Oct
ober
31,
2018
For
the
Per
iod
End
edA
pril
30,
2019
(Una
udit
ed)
For
the
Yea
rE
nded
Oct
ober
31,
2018
Ope
rati
ons:
Net
inve
stm
enti
ncom
e(l
oss)
$1,
625,
852
$2,
674,
174
$(4
24,8
83)
$(9
28,4
00)
Net
real
ized
gain
onsa
leof
inve
stm
ents
and
fore
ign
curr
ency
14,9
51,1
8321
,495
,197
3,34
9,61
79,
080,
674
Net
chan
gein
unre
aliz
edap
prec
iati
on(d
epre
ciat
ion)
12,8
72,0
44(1
7,84
2,65
3)11
,586
,641
(4,5
54,1
60)
Net
incr
ease
inne
tass
ets
resu
lting
from
oper
atio
ns29
,449
,079
6,32
6,71
814
,511
,375
3,59
8,11
4
Net
divi
dend
san
ddi
stri
buti
ons
tosh
areh
olde
rs(2
1,89
4,50
5)(2
6,82
8,33
5)(7
,593
,052
)(2
,589
,302
)
Tot
aldi
vide
nds
and
dist
ribu
tion
s(2
1,89
4,50
5)(2
6,82
8,33
5)(7
,593
,052
)(2
,589
,302
)Fu
ndsh
are
tran
sact
ions
:Sh
ares
sold
5,89
2,02
014
,681
,016
5,73
9,06
116
,112
,469
Shar
esis
sued
toho
lder
sin
rein
vest
men
tofd
ivid
ends
20,8
84,8
7725
,480
,630
7,25
2,92
72,
468,
524
Shar
esre
deem
ed(2
4,58
4,67
9)(4
1,25
3,73
5)(8
,030
,306
)(1
5,25
7,53
0)
Net
incr
ease
(dec
reas
e)2,
192,
218
(1,0
92,0
89)
4,96
1,68
23,
323,
463
Net
incr
ease
(dec
reas
e)in
neta
sset
s9,
746,
792
(21,
593,
706)
11,8
80,0
054,
332,
275
Net
Ass
ets:
Beg
inni
ngof
peri
od27
2,04
3,47
429
3,63
7,18
082
,105
,757
77,7
73,4
82
End
ofpe
riod
$281
,790
,266
$272
,043
,474
$93,
985,
762
$82
,105
,757
The
Acc
ompa
nyin
gN
otes
are
anIn
tegr
alPa
rtof
thes
eFi
nanc
ialS
tate
men
ts.
Semi-Annual Report 47

The
Toc
quev
ille
Tru
st
Stat
emen
tsof
Cha
nges
inN
etA
sset
s
The
Toc
quev
ille
Gol
dFu
ndT
heT
ocqu
evill
eP
hoen
ixFu
ndT
heT
ocqu
evill
eSe
lect
Fund
For
the
Per
iod
End
edA
pril
30,
2019
(Una
udit
ed)
For
the
Yea
rE
nded
Oct
ober
31,
2018
For
the
Per
iod
End
edA
pril
30,
2019
(Una
udit
ed)
For
the
Yea
rE
nded
Oct
ober
31,
2018
For
the
Per
iod
End
edA
pril
30,
2019
(Una
udit
ed)
For
the
Yea
rE
nded
Oct
ober
31,
2018
Ope
rati
ons:
Net
inve
stm
entl
oss
$(3
,129
,608
)$(8
,974
,770
)$(7
9,55
2)$
(1,5
07,5
10)
$(2
9,35
4)$
(173
,063
)N
etre
aliz
edga
in(l
oss)
onsa
leof
inve
stm
ents
and
fore
ign
curr
ency
(33,
798,
742)
5,53
5,32
21,
966,
357
21,6
17,5
582,
410,
279
(4,1
28,1
84)
Net
chan
gein
unre
aliz
edap
prec
iati
on(d
epre
ciat
ion)
78,3
64,8
20(1
91,4
16,1
94)
19,2
74,9
58(4
8,17
2,81
7)1,
654,
351
1,59
0,29
6
Net
incr
ease
(dec
reas
e)in
neta
sset
sre
sulti
ngfr
omop
erat
ions
41,4
36,4
70(1
94,8
55,6
42)
21,1
61,7
63(2
8,06
2,76
9)4,
035,
276
(2,7
10,9
51)
Net
divi
dend
san
ddi
stri
buti
ons
tosh
areh
olde
rs—
Inve
stor
Cla
ss—
—(1
4,88
5,32
2)(5
1,94
7,18
8)—
(903
,727
)N
etdi
vide
nds
and
dist
ribu
tion
sto
shar
ehol
ders
—In
stit
utio
nalC
lass
——
——
——
Tot
aldi
vide
nds
and
dist
ribu
tion
s—
—(1
4,88
5,32
2)(5
1,94
7,18
8)—
(903
,727
)Fu
ndsh
are
tran
sact
ions
:Sh
ares
sold
—In
vest
orC
lass
128,
600,
850
213,
886,
198
3,93
0,12
814
,347
,640
1,06
6,82
32,
787,
932
Shar
esso
ld—
Inst
itut
iona
lCla
ss19
,893
——
——
—Sh
ares
issu
edto
hold
ers
inre
inve
stm
ento
fdiv
iden
ds—
Inve
stor
Cla
ss—
—13
,333
,981
50,0
48,4
22—
890,
838
Shar
esis
sued
toho
lder
sin
rein
vest
men
tofd
ivid
ends
—In
stit
utio
nalC
lass
——
——
——
Shar
esre
deem
ed—
Inve
stor
Cla
ss*
(193
,450
,450
)(3
12,9
23,4
63)
(51,
895,
599)
(120
,620
,354
)(4
,013
,168
)(1
0,29
2,01
6)Sh
ares
rede
emed
—In
stit
utio
nalC
lass
*—
——
——
—
Net
decr
ease
(64,
829,
707)
(99,
037,
265)
(34,
631,
490)
(56,
224,
292)
(2,9
46,3
45)
(6,6
13,2
46)
Net
incr
ease
(dec
reas
e)in
neta
sset
s(2
3,39
3,23
7)(2
93,8
92,9
07)
(28,
355,
049)
(136
,234
,249
)1,
088,
931
(10,
227,
924)
Net
Ass
ets:
Beg
inni
ngof
peri
od85
9,39
4,32
91,
153,
287,
236
237,
118,
793
373,
353,
042
39,2
24,6
0449
,452
,528
End
ofpe
riod
**$
836,
001,
092
$85
9,39
4,32
9$2
08,7
63,7
44$
237,
118,
793
$40,
313,
535
$39
,224
,604
*N
etof
rede
mpt
ion
fees
of:
$14
9,03
5$
67,3
78$
—$
—$
—$
—
The
Acc
ompa
nyin
gN
otes
are
anIn
tegr
alPa
rtof
thes
eFi
nanc
ialS
tate
men
ts.
48 April 30, 2019

The Tocqueville TrustNotes to Financial Statements
(Unaudited)
1. ORGANIZATION
The Tocqueville Trust (the “Trust”) is a Massachusetts business trust registeredunder the Investment Company Act of 1940 and organized on September 17, 1986,consisting of five separate funds (each, a “Fund” or, collectively, the “Funds”). Each Fundis an open-end management investment company with a different investment objective.The Tocqueville Fund, The Tocqueville Opportunity Fund (the “Opportunity Fund”),The Tocqueville Phoenix Fund and The Tocqueville Select Fund (the “Select Fund”) areclassified as diversified investment companies. The Tocqueville Gold Fund (the “GoldFund”) is classified as a non-diversified investment company. The Tocqueville Fund’sinvestment objective is long-term capital appreciation which it seeks to achieve byinvesting primarily in securities of United States issuers. The Opportunity Fund’sinvestment objective is to achieve long-term capital appreciation which it seeks to achieveby investing in the common stocks of small and mid-cap companies which have thepotential to deliver superior long term earnings growth. The Gold Fund’s investmentobjective is long-term capital appreciation which it seeks to achieve by investing in gold,securities of companies located throughout the world that are engaged in mining orprocessing gold (“gold related securities”), other precious metals and securities ofcompanies located throughout the world that are engaged in mining or processing suchother precious metals (“other precious metal securities”). The Tocqueville Phoenix Fund’sinvestment objectives are to seek long-term preservation of capital (sufficient growth tooutpace inflation over an extended period of time) and growth of capital which it seeks toachieve by investing primarily in the equity securities of domestic companies. TheTocqueville Select Fund’s investment objective is to achieve long-term capitalappreciation by investing in a focused group of common stocks issued primarily by smalland mid-sized U.S. companies. Current income is a secondary objective for TheTocqueville Select Fund.
Effective April 8, 2019, The Tocqueville Gold Fund issued Institutional class shares,and renamed the existing class as Investor class.
The Tocqueville Phoenix Fund (formerly known as The Delafield Fund), a series ofthe Trust, commenced operations on September 28, 2009 as successor to Delafield Fund,Inc. The predecessor Delafield Fund, Inc. commenced operations on November 19,1993. The Delafield Fund changed its name to The Tocqueville Phoenix Fund onFebruary 15, 2019.
The Tocqueville Select Fund, a series of the Trust, commenced operations onSeptember 28, 2009 as successor to the Delafield Select Fund, a series of Natixis FundsTrust II. The predecessor Delafield Select Fund commenced operations on September 29,2008 for Class A and Class C shares and on September 26, 2008 for Class Y shares. Priorto September 29, 2008, the predecessor Delafield Select Fund operated as a Delaware
Semi-Annual Report 49

limited partnership using substantially the same investment objectives and investmentpolicies as the predecessor fund. The limited partnership was incepted in July 1998.
2. SIGNIFICANT ACCOUNTING POLICIES
The following is a summary of significant accounting principles followed by theTrust in the preparation of its financial statements.
a) Security valuation and security transactions
Investments in securities, including foreign securities, traded on an exchange orquoted on the over-the-counter market are valued at the last sale price or, if no saleoccurred during the day, at the mean between closing bid and asked prices, as lastreported by a pricing service approved by the Trustees. Securities that are principallytraded on the National Association of Securities Dealers Automated Quotation NationalMarket (“NASDAQ”) are generally valued at the NASDAQ Official Closing Price(“NOCP”). If there is no NASDAQ Official Closing Price for a NASDAQ-listed securityor sale price available for an over-the-counter security, the mean of the latest bid andasked quotations from NASDAQ will be used. Investments in gold will be valued at thespot price of gold determined based on the mean of the last bid and asked price at theclose of the New York Commodity Exchange. When market quotations for securities arenot readily available, or when restricted securities or other assets are being valued, suchassets are valued at fair value as determined in good faith by or under proceduresapproved by the Trustees. Money market funds are valued at market price. Money marketdeposit accounts are reflected at cost as this is a cash instrument. Fixed income securitiesare valued at market price. Fixed Income securities, such as corporate bonds, convertiblebonds and U.S. government agency issues for which market quotations are not readilyavailable may be valued based on information supplied by independent pricing servicesusing matrix pricing formulas and/or independent broker bid quotations.
Trading in securities on foreign securities exchanges normally is completed beforethe calculation of the Funds’ net asset value. Trading on these foreign exchanges may nottake place on all days on which there is regular trading on the New York Stock Exchange(“NYSE”), or may take place on days on which there is no regular trading on the NYSE.Similarly, the Funds may hold securities traded in domestic markets where the marketmay close early on a given day prior to calculation of the Funds’ net asset value. Eventsaffecting the value of such securities held by the Funds that occur between the close oftrading in the security and the close of trading on the NYSE normally will not be reflectedin the Funds’ calculation of the net asset value. However, significant events will be closelymonitored, and where it is determined that an adjustment should be made to thesecurity’s value because significant interim events may materially affect the value of thesecurity, the security will be priced at its fair value in accordance with the proceduresapproved by the Trustees.
Investment and shareholder transactions are recorded on trade date. Dividendincome is recognized on the ex-dividend date. Interest income is recognized on an accrual
50 April 30, 2019

basis and includes, where applicable, the amortization of premiums and accretion ofdiscounts. Net realized gains and losses from sales of securities are determined on thespecific identification cost method.
b) Restricted and illiquid securities
The Funds may invest in securities that are subject to legal or contractual restrictionson resale or are illiquid. A security may be considered illiquid if it lacks a readily availablemarket or if its valuation has not changed for a certain period of time. Disposal of thesesecurities may involve time consuming negotiations and expense, and a prompt sale at thecurrent valuation may be difficult.
c) Fair Valuation Measurements
The Trust has adopted authoritative fair valuation accounting standards whichestablish an authoritative definition of fair value and set out a hierarchy for measuring fairvalue. These standards require additional disclosures about the various inputs andvaluation techniques used to develop the measurements of fair value and a discussion inchanges in valuation techniques and related inputs during the period. These inputs aresummarized in the three broad levels listed below.
Level 1 - Quoted prices in active markets for identical securities.Level 2 - Other significant observable inputs (including quoted prices for similar
securities, interest rates, prepayment speeds, credit risk, etc.).Level 3 - Significant unobservable inputs (including the Fund’s own assumptions in
determining the fair value of investments).
When using the market quotations or closing price provided by the pricing servicefor equity investments, including common stocks, preferred stocks, foreign issuedcommon stocks, exchange-traded funds, closed end mutual funds and real estateinvestment trusts, which are traded on an exchange are valued at the last sale pricereported by the exchange on which the securities are primarily traded on the day ofvaluation and when the market is considered active, the security will be classified as aLevel 1 security. When using the mean between the latest bid and ask price, the securitywill be classified as Level 2. Gold bullion is valued at the mean of the closing bid and askprices from the New York Mercantile Exchange and is classified as a Level 2.
Investment in mutual funds, including money market funds, are generally priced atthe ending net asset value (NAV) provided by the service agent of the funds and will beclassified as Level 1 securities.
Debt securities, such as corporate bonds, convertible bonds, commercial paper,money market deposit accounts and U.S. government agency issues for which marketquotations are not readily available may be valued based on information supplied byindependent pricing services using matrix pricing formulas and/or independent broker bidquotations and are classified as Level 2. Warrants and rights for which the underlyingsecurity is registered and equities which are subject to a required holding period, but have
Semi-Annual Report 51

a comparable public issue, are valued in good faith by the adviser pursuant to proceduresestablished under the general supervision and responsibility of the Funds’ Board ofTrustees. These securities will generally be classified as Level 2 securities. If the warrant orright is exchange traded and the official closing price of the exchange is used, theseinstruments are classified as Level 1 securities. Options can diverge from the prices of theirunderlying instruments. These are valued at the composite last price reported by theexchange on which the options are primarily traded on the day of the valuation and areclassified as Level 1. If there is no composite last price on a given day the mean betweenthe latest bid and ask price will be used. These contracts are classified as Level 2.
Any securities or other assets for which market quotations are not readily availableare valued at fair value as determined in good faith by the Adviser pursuant to proceduresestablished under the general supervision and responsibility of the Funds’ Board ofTrustees and will be classified as Level 3 securities. In determining fair value, a Fund willseek to assign a value to the security which it believes represents the amount that the Fundcould reasonably expect to receive upon its current sale. With respect to securities that areactively traded on U.S. exchanges, the Funds expect that market quotations will generallybe available and that fair value might be used only in limited circumstances, such as whentrading for a security is halted during the trading day.
For securities traded principally on foreign exchanges, the Funds may use fair valuepricing if an event occurs after the close of trading of the principal foreign exchange onwhich a security is traded, but before calculation of a Fund’s NAV, which a Fund believesaffects the value of the security since its last market quotation. Such events may involvesituations relating to a single issuer (such as news related to the issuer announced after theclose of the principal foreign exchange), or situations relating to sectors of the market orthe markets in general (such as significant fluctuations in the U.S. or foreign markets orsignificant changes in exchange rates, natural disasters, armed conflicts, or governmentalactions).
In determining whether a significant event has occurred with respect to securitiestraded principally in foreign markets, the Funds may engage a third party fair valueservice provider to systematically recommend the adjustment of closing market prices ofnon-U.S. securities based upon changes in a designated U.S. securities market indexoccurring from the time of close of the relevant foreign market and the close of the NYSE.Fair value pricing may also be used to value restricted securities held by the Funds orsecurities with little or no trading activity for extended periods of time. Fair value pricinginvolves judgments that are inherently subjective and inexact and it is not possible todetermine with certainty when, and to what extent, an event will affect a market price. Asa result, there can be no assurance that fair value pricing will reflect actual market valueand it is possible that the fair value determined for a security may differ materially fromthe value that could be realized upon the sale of the security.
52 April 30, 2019

The following is a summary of the inputs used, as of April 30, 2019, involving theFunds’ assets and liabilities carried at fair value. The inputs of methodology used forvaluing securities may not be an indication of the risk associated with investing in thosesecurities.Description Level 1 Level 2 Level 3 Total
The Tocqueville Fund*Assets
Common Stocks $271,009,101 $ — $ — $271,009,101Preferred Stock — — 1,600 1,600Real Estate Investment Trust (REIT) 6,700,000 — — 6,700,000Exchange-Traded Fund (ETF) 2,883,000 — — 2,883,000Money Market Fund 472 — — 472
Total Assets $280,592,573 $ — $1,600 $280,594,173
The Tocqueville Opportunity Fund* Level 1 Level 2 Level 3 Total
AssetsCommon Stocks
Automobiles & Components $ 22 $ — $ — $ 22Capital Goods 12,527,073 — — 12,527,073Commercial & Professional Services 3,665,905 — — 3,665,905Consumer Durables & Apparel 1,883,015 — — 1,883,015Consumer Services 1,416,625 2,430 — 1,419,055Diversified Financials 1,678,698 — — 1,678,698Health Care Equipment & Services 5,365,588 — — 5,365,588Materials 2,124,335 — — 2,124,335Media & Entertainment 2,481,495 — — 2,481,495Pharmaceuticals, Biotechnology & Life Sciences 11,629,451 — — 11,629,451Retailing 4,976,103 — — 4,976,103Semiconductors & Semiconductor Equipment 523,767 — — 523,767Software & Services 44,269,434 — — 44,269,434Technology Hardware & Equipment 219,130 — — 219,130Transportation 386,095 — — 386,095
Total Common Stocks 93,146,736 2,430 — 93,149,166Real Estate Investment Trust (REIT) 455 — — 455Exchange-Traded Fund (ETF) 481,845 — — 481,845Purchased Call Options 139,100 — — 139,100Money Market Fund 746,755 — — 746,755
Total Assets $ 94,514,891 $2,430 $ — $ 94,517,321
Semi-Annual Report 53

The Tocqueville Gold Fund* Level 1 Level 2 Level 3 Total
AssetsCommon Stocks
Gold Related $585,055,714 $ 11,873,551 $ 106,364 $597,035,629Other Precious Metals Related 68,727,403 — 10,350,954 79,078,357Other — — 7,697,945 7,697,945
Total Common Stocks 653,783,117 11,873,551 18,155,263 683,811,931Private Fund ^ — — 16,882,835 16,882,835Gold Bullion — 125,594,459 — 125,594,459Warrants — 506,611 — 506,611Money Market Fund 7,793,357 — — 7,793,357
Total Assets $661,576,474 $137,974,621 $35,038,098 $834,589,193
The Tocqueville Phoenix Fund* Level 1 Level 2 Level 3 Total
AssetsCommon Stocks $186,623,746 $ — $ — $186,623,746Money Market Fund 10,400,000 — — 10,400,000Money Market Deposit Account — 13,220,798 — 13,220,798
Total Assets $197,023,746 $ 13,220,798 $ — $210,244,544
The Tocqueville Select Fund* Level 1 Level 2 Level 3 Total
AssetsCommon Stocks $ 37,747,056 $ — $ — $ 37,747,056Money Market Fund 2,000,000 — — 2,000,000Money Market Deposit Account — 603,765 — 603,765
Total Assets $ 39,747,056 $ 603,765 $ — $ 40,350,821
* For further information regarding portfolio characteristics, please see the accompanying Schedules ofInvestments.
^ The Gold Fund currently invests in a private fund that primarily invests in physical gold and is subject toredemption restrictions. This private fund investment can only be disposed of with notice given 24 hoursin advance of redemption. Due to the elapsed time, the investment of the Gold Fund is not subject to anyredemption fees going forward.
54 April 30, 2019

Bel
owis
are
conc
iliat
ion
that
deta
ilsth
eac
tivi
tyof
secu
riti
esin
Leve
l3du
ring
the
curr
entf
isca
lper
iod:
The
Toc
quev
ille
Fund
The
Toc
quev
ille
Gol
dFu
nd
Beg
inni
ngB
alan
ce—
Nov
embe
r1,
2018
$1,6
00$3
4,10
4,45
8Pu
rcha
ses
——
Sale
s—
—R
ealiz
edga
ins
——
Rea
lized
loss
es—
—C
hang
ein
unre
aliz
edap
prec
iati
on—
933,
640
Tra
nsfe
rsin
/(ou
t)of
Leve
l3—
—
End
ing
Bal
ance
—A
pril
30,2
019
$1,6
00$3
5,03
8,09
8
Semi-Annual Report 55

As of April 30, 2019 the change in unrealized appreciation on positions still held forsecurities that were considered Level 3 was $933,640.
The following table summarizes quantitative information about significantunobservable valuation inputs for Level 3 fair value measurement as of April 30, 2019.
FundType ofSecurity Industry
FairValue at
4/30/2019Valuation
TechniquesUnobservable
Inputs Range
The TocquevilleFund
PreferredStock
Health CareEquipment &Supplies
$ 1,600 Latestcompanyvaluation
Financingprices
$0.004
TheTocquevilleGold Fund
CommonStock
Gold Related 106,364 Latestcompanyvaluation
Financingprices
$0.05
OtherPreciousMetalsRelated
10,350,954 Latestcompanyfinancingprice
Financingprices
$4.50
Other 7,697,945 Latestcompanyfinancingprice
Financingprices
$1.38-$10.80
PrivateFund
Gold Related 16,882,835 Latest pricechange ofcomparableproxyinvestment
Adviserdeemedcomparableproxyinvestment
$1,153.57-$1,280.08
The significant unobservable inputs used in the fair value measurement of theTocqueville Fund’s preferred stock and the Gold Fund’s common stocks are the mostrecent financing prices of the portfolio company, which approximate the companies’ valuein the market place. The significant unobservable inputs used for the private fund is thelatest price change of an Adviser deemed comparable proxy investment.
Significant changes in the companies’ ability to receive financing for new projects inthe future would be an indication of the companies’ financial position and market value.Significant changes in the latest price change of the comparable proxy investment or achange in the adviser deemed comparable proxy investment could impact the value of thesecurity.
The Trust’s valuation procedures have been adopted by the Trust’s Board ofTrustees, which has established a Valuation Committee to oversee the valuation process.The Valuation Committee meets on an as needed basis to evaluate changes in thevaluation of portfolio securities. The full findings and valuations are then reviewedquarterly by the Independent Trustees.
Derivative Instruments and Hedging Activities
The Funds’ Adviser may use derivative instruments, such as options, as a means tomanage exposure to different types of risk, including market risk and exchange rate risk,
56 April 30, 2019

and to gain exposure to underlying securities. The Trust has adopted disclosure standardsin order to enable the investor to understand how and why an entity used derivatives, howderivatives are accounted for, and how derivatives affect an entity’s results of operationsand financial position.
In the Opportunity Fund, the Adviser used options to gain exposure to theunderlying equity security and to earn premium income.
Balance Sheet—Values of Derivative Instruments as of April 30, 2019.
The Tocqueville Opportunity FundAsset Derivatives Liability Derivatives
Derivatives not accounted for as hedging instrumentsBalance Sheet
Location ValueBalance Sheet
Location Value
Purchased Options Investments,at Value $139,100
Investments,at Value $—
Total $139,100 $—
The Effect of Derivative Instruments on the Statement of Operations for the periodended April 30, 2019.
The Tocqueville Opportunity Fund
Net Realized Losson Investments
Net Change inUnrealized
Appreciation onInvestments
Purchased Options $(218,904) $410,365Written Option (4,761) —
Total $(223,665) $410,365
Derivatives Risk
The risks of using the types of derivatives in which the Funds may engage includethe risk that movements in the value of the derivative may not fully offset or complementinstruments currently held in the Funds in the manner intended by the Adviser; the riskthat the counterparty to a derivative contract may fail to comply with their obligations tothe Fund; the risk that the derivative may not possess a liquid secondary market at a timewhen the Fund would look to disengage the position; the risk that additional capital fromthe Fund may be called upon to fulfill the conditions of the derivative contract; and therisk that the cost of the derivative contracts may reduce the overall returns experienced bythe Funds. The measurement of risks associated with these instruments is meaningfulonly when all related offsetting transactions are considered. The Fund may enter intowritten call options to hedge against changes in the value of equities. The Fund’s optioncomponent of the overall investment strategy is often referred to as a “buy-write” strategy(also called a “covered call” strategy), in which the Adviser (as defined below) writes (sells)
Semi-Annual Report 57

a call option contract while at the same time owning an equivalent number of shares ofthe underlying stock to generate moderate current income. The writing of call options isintended to reduce the volatility of the portfolio and to earn premium income. Writtencall options expose the Fund to minimal counterparty credit risk since they are exchangetraded and the exchange’s clearing house guarantees the options against default. As thewriter of a call option, the Fund has the obligation to sell the security at the exercise priceduring the exercise period in the event the option is exercised. The use of options do notcreate leverage in the Funds.
The average monthly value of purchased options in the Opportunity Fund duringthe period ended April 30, 2019 was $305,017.
Transactions in options in the Opportunity Fund during the period ended April 30,2019 were as follows:
NotionalAmount Contracts
Outstanding, beginning of period: $ 21,937,500 1,170Options purchased 73,872,500 3,005Options terminated in closing transactions (47,560,000) (1,815)Options exercised — —Options expired (33,775,000) (1,745)
Outstanding, end of period: $ 14,475,000 615
e) Foreign currency translation
Investments and other assets and liabilities denominated in foreign currencies aretranslated to U.S. dollars at the prevailing rates of exchange, in accordance with theTrust’s Portfolio Securities Valuation and Foreign Exchange Contracts Procedures. TheTocqueville Fund, The Tocqueville Opportunity Fund, and The Tocqueville Gold Fund,and The Tocqueville Phoenix Fund have engaged in transactions in securitiesdenominated in foreign currencies and, as a result, entered into foreign exchangetransactions. These Funds are exposed to additional market risk as a result of changes inthe value of the underlying currency in relation to the U.S. dollar. Risks include potentialinability of counterparties to meet the terms of their obligations. The value of foreigncurrencies are marked-to-market on a daily basis, which reflects the changes in the marketvalue of the contract at the close of each day’s trading, resulting in daily unrealized gainsand/or losses. When the transactions are settled or the contracts are closed, the Fundsrecognize a realized gain or loss.
The Funds isolate that portion of the results of operations resulting from changes inforeign exchange rates on investments from the fluctuations arising from changes inmarket prices of securities held. Such fluctuations are reflected as net realized andunrealized gain or loss on foreign currency translation.
Reported net realized foreign exchange gains or losses arise from sales of foreigncurrencies, currency gains or losses realized between the trade and settlement dates onsecurities transactions, the differences between the amounts of dividends, interest, and
58 April 30, 2019

foreign withholding taxes recorded on the Fund’s books, and the U.S. dollar equivalent ofthe amounts actually received or paid. Net unrealized foreign exchange gains and lossesarise from changes in the value of assets and liabilities other than investments in securitiesat the end of the fiscal year, resulting from changes in the exchange rates.
f) Dividends and distributions to shareholders
Dividends to shareholders are recorded on the ex-dividend date. Dividends from netinvestment income are declared and paid annually by the Funds. Distributions of netrealized capital gains, if any, will be declared and paid at least annually. Income andcapital gain distributions are determined in accordance with income tax regulations whichmay differ from generally accepted accounting principles. Permanent differences betweenfinancial and tax reporting may result in reclassification to capital stock.
g) Allocation of Income, Expenses and Gains/Losses
Income, expenses (other than those deemed attributable to a specific share class), andgains and losses of the Fund are allocated daily to each class of shares based upon the ratioof net assets represented by each class as a percentage of the net assets of the Fund.Expenses deemed directly attributable to a class of shares are recorded by the specific class.Most Fund expenses are allocated by class based on relative net assets.
h) Use of estimates
The preparation of financial statements in conformity with accounting principlesgenerally accepted in the United States of America requires management to makeestimates and assumptions that affect the reported amounts of assets and liabilities anddisclosure of contingent assets and liabilities at the date of the financial statements and thereported amounts of revenues and expenses during the reporting year. Actual results coulddiffer from those estimates.
i) Indemnification
In the normal course of business the Funds enter into contracts that contain generalindemnification clauses. The Funds’ maximum exposure under these arrangements isunknown, as this would involve future claims against a Fund that have not yet occurred.Based on experience, the Funds expect the risk of loss to be remote.
j) Subsequent events evaluation
The Board of Trustees approved a $135,000,000 umbrella line of credit (the “Line”)for The Tocqueville Fund, The Tocqueville Opportunity Fund, The Tocqueville GoldFund, The Tocqueville Phoenix Fund, and the Tocqueville Select Fund on March 21,2019. The Line is for temporary emergency and extraordinary purposes, including themeeting of redemption requests that otherwise might require the untimely disposition ofsecurities. The Line is secured by the Trust’s assets. The line is effective May 25, 2019and has a one-year term. The interest rate is prime rate minus 0.50%.
Semi-Annual Report 59

In preparing these financial statements, the Trust has evaluated events andtransactions for potential recognition or disclosure resulting from subsequent eventsthrough the date financial statements were available to be issued. This evaluation did notresult in any subsequent events, other than those noted above, that necessitated disclosureand/or adjustments.
3. FEDERAL INCOME TAX
There is no tax liability resulting from unrecognized tax benefits relating to uncertainincome tax positions taken or expected to be taken on the tax return for the fiscalyear-end October 31, 2018, or for any other tax years which are open for exam. As ofOctober 31, 2018, open tax years include the tax years ended October 31, 2015 through2018. The Trust is also not aware of any tax positions for which it is reasonably possiblethat the total amounts of unrecognized tax benefits will significantly change in the nextsix months. The Funds recognize interest and penalties, if any, related to unrecognized taxbenefits as income tax expense in the Statement of Operations. During the year, theFunds did not incur any interest or penalties.
Provision for federal income taxes or excise taxes has not been made since the Fundshave elected to be taxed as Regulated Investment Companies and intend to distributesubstantially all taxable income to shareholders and otherwise comply with the provisionsof the Internal Revenue Code applicable to Regulated Investment Companies.Distributions from net realized gains for book purposes may include short-term capitalgains which are included as ordinary income to shareholders for tax purposes.Additionally, accounting principles generally accepted in the United States of Americarequire that certain components of net assets relating to permanent differences bereclassified between financial and tax reporting. These reclassifications have no effect onnet assets or net asset value per share. For the year ended October 31, 2018, the followingtable shows the reclassifications made:
UndistributedNet InvestmentIncome/(Loss)
Accumulated NetRealized
Gain/(Loss) Paid In Capital
Tocqueville Fund $ (255,910) $(2,077,060) $ 2,332,970Opportunity Fund 914,313 (1,636,210) 721,897Gold Fund 16,829,513 (2,321,521) (14,507,992)Phoenix Fund 2,127,124 (6,885,940) 4,758,816Select Fund 38,440 36 (38,476)
The permanent differences primarily relate to net operating losses, foreign currencyreclasses, the usage of tax equalization, Partnerships, and PFICs.
60 April 30, 2019

As
ofO
ctob
er31
,201
8,th
eco
mpo
nent
sof
accu
mul
ated
earn
ings
(los
ses)
for
inco
me
tax
purp
oses
wer
eas
follo
ws:
Toc
quev
ille
Fund
Opp
ortu
nity
Fund
Gol
dFu
ndP
hoen
ixFu
ndSe
lect
Fund
Tax
cost
ofIn
vest
men
ts$1
42,2
47,1
83$6
2,67
4,59
6$1
,113
,608
,673
$221
,615
,767
$32,
057,
578
Unr
ealiz
edA
ppre
ciat
ion
129,
677,
022
23,4
19,4
5516
4,35
6,47
634
,648
,434
9,87
1,40
0U
nrea
lized
Dep
reci
atio
n(1
,231
,931
)(4
,167
,667
)(4
18,5
38,8
82)
(18,
279,
499)
(2,5
83,1
36)
Net
unre
aliz
edap
prec
iati
on(d
epre
ciat
ion)
128,
445,
091
19,2
51,7
88(2
54,1
82,4
06)
16,3
68,9
357,
288,
264
Und
istr
ibut
edop
erat
ing
inco
me
2,11
4,64
5—
—49
,879
—U
ndis
trib
uted
long
-ter
mga
ins
19,3
59,8
737,
593,
051
—14
,769
,641
—
Dis
trib
utab
leea
rnin
gs21
,474
,518
7,59
3,05
1—
14,8
19,5
20—
Oth
erac
cum
ulat
edga
in/(
loss
)2
(646
,721
)(3
85,2
03,8
62)
—(4
,271
,202
)
Tot
alac
cum
ulat
edga
in/(
loss
)$1
49,9
19,6
11$2
6,19
8,11
8$
(639
,386
,268
)$
31,1
88,4
55$
3,01
7,06
2
Semi-Annual Report 61
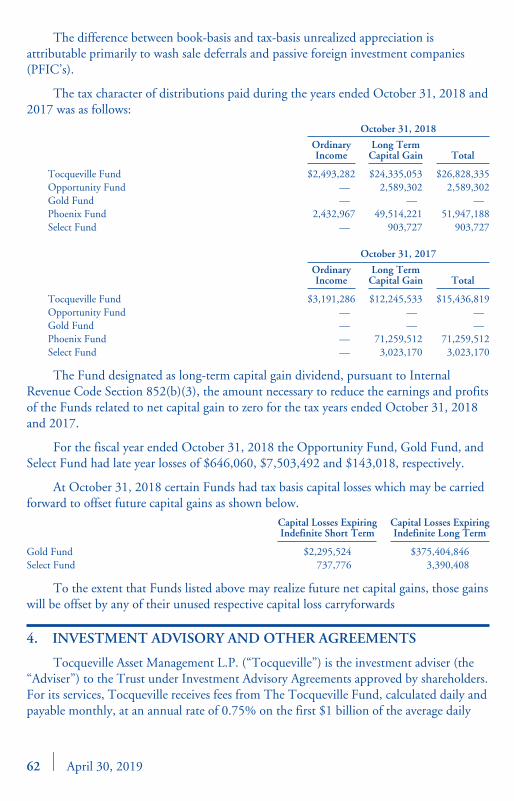
The difference between book-basis and tax-basis unrealized appreciation isattributable primarily to wash sale deferrals and passive foreign investment companies(PFIC’s).
The tax character of distributions paid during the years ended October 31, 2018 and2017 was as follows:
October 31, 2018
OrdinaryIncome
Long TermCapital Gain Total
Tocqueville Fund $2,493,282 $24,335,053 $26,828,335Opportunity Fund — 2,589,302 2,589,302Gold Fund — — —Phoenix Fund 2,432,967 49,514,221 51,947,188Select Fund — 903,727 903,727
October 31, 2017
OrdinaryIncome
Long TermCapital Gain Total
Tocqueville Fund $3,191,286 $12,245,533 $15,436,819Opportunity Fund — — —Gold Fund — — —Phoenix Fund — 71,259,512 71,259,512Select Fund — 3,023,170 3,023,170
The Fund designated as long-term capital gain dividend, pursuant to InternalRevenue Code Section 852(b)(3), the amount necessary to reduce the earnings and profitsof the Funds related to net capital gain to zero for the tax years ended October 31, 2018and 2017.
For the fiscal year ended October 31, 2018 the Opportunity Fund, Gold Fund, andSelect Fund had late year losses of $646,060, $7,503,492 and $143,018, respectively.
At October 31, 2018 certain Funds had tax basis capital losses which may be carriedforward to offset future capital gains as shown below.
Capital Losses ExpiringIndefinite Short Term
Capital Losses ExpiringIndefinite Long Term
Gold Fund $2,295,524 $375,404,846Select Fund 737,776 3,390,408
To the extent that Funds listed above may realize future net capital gains, those gainswill be offset by any of their unused respective capital loss carryforwards
4. INVESTMENT ADVISORY AND OTHER AGREEMENTS
Tocqueville Asset Management L.P. (“Tocqueville”) is the investment adviser (the“Adviser”) to the Trust under Investment Advisory Agreements approved by shareholders.For its services, Tocqueville receives fees from The Tocqueville Fund, calculated daily andpayable monthly, at an annual rate of 0.75% on the first $1 billion of the average daily
62 April 30, 2019

net assets of the Fund, and 0.65% of the average daily net assets in excess of $1 billion.Tocqueville receives fees from The Tocqueville Opportunity Fund, calculated daily andpayable monthly, at an annual rate of 0.75% on the first $500 million of the average dailynet assets of the Fund, and 0.65% of the average daily net assets in excess of $500 million.Tocqueville receives fees from The Tocqueville Gold Fund, calculated daily and payablemonthly, at an annual rate of 1.00% on the first $500 million of the average daily netassets of the Fund, 0.75% of the average daily net assets in excess of $500 million but notexceeding $1 billion, and 0.65% of the average daily net assets in excess of $1 billion.Tocqueville receives fees from The Tocqueville Phoenix Fund, calculated daily andpayable monthly, at an annual rate of 0.80% on the first $250 million of net assets of theFund; 0.75% on the next $250 million of net assets of the Fund; 0.70% on the next $500million of net assets of the Fund; and 0.65% on all net assets of the Fund over $1 billion.Tocqueville receives fees from The Tocqueville Select Fund, calculated daily and payablemonthly, at an annual rate of 0.80% on all net assets of the Fund.
With respect to The Tocqueville Fund, The Tocqueville Opportunity Fund, TheTocqueville Phoenix Fund and The Tocqueville Select Fund, the Adviser hascontractually agreed to waive its advisory fees and/or reimburse expenses in order toensure that The Tocqueville Fund’s total annual operating expenses do not exceed 1.25%of its average daily net assets (excluding taxes, interest expense, acquired fund fees andexpenses, or extraordinary expenses such as litigation). The Expense LimitationAgreements will remain in effect until March 1, 2020 for each Fund. For the six monthsended April 30, 2019, the Adviser waived $49,853, $56,913, $158,362, and $36,670 ofthe advisory fee for The Tocqueville Fund, The Tocqueville Opportunity Fund, TheTocqueville Phoenix Fund, and The Tocqueville Select Fund respectively. Such amountsare not subject to recoupment by the Adviser.
Pursuant to an Administrative Services Agreement, each Fund pays to the Adviser afee computed and paid monthly at an annual rate of 0.15% on the first $400 million ofthe average daily net assets of each Fund; 0.13% on the next $600 million of the averagedaily net assets of each Fund; and 0.12% on all the average daily net assets of each Fundover $1 billion. For the six months ended April 30, 2019, the Adviser has made paymentsof $39,774, $12,398, $129,262, $31,730, $4,717, to U.S. Bancorp Fund Services, LLCfor services provided under a Sub-Administration Agreement for The Tocqueville Fund,The Tocqueville Opportunity Fund, The Tocqueville Gold Fund, The TocquevillePhoenix Fund and The Tocqueville Select Fund, respectively.
Tocqueville Securities, L.P. (the “Distributor”), an affiliate of Tocqueville, acts asdistributor for shares of the Trust. The Tocqueville Fund, The Tocqueville OpportunityFund, The Tocqueville Gold Fund—Investor Class, The Tocqueville Phoenix Fund, andThe Tocqueville Select Fund adopted a distribution and service plan pursuant toRule 12b-1 of the 1940 Act. Pursuant to the plans, each Fund pays to the Distributordistribution and service fees of 0.25% per annum of its average daily net assets.
Commissions earned by the Distributor for services rendered as a registeredbroker-dealer in securities transactions for The Tocqueville Fund, The Tocqueville
Semi-Annual Report 63

Opportunity Fund, The Tocqueville Gold Fund, The Tocqueville Phoenix Fund and TheTocqueville Select Fund for the six months ended April 30, 2019, were $1,575, $19,739,$0, $2,349, $2,407, respectively.
5. CAPITAL SHARE TRANSACTIONS.
Transactions in capital shares for each Fund were as follows:For the Six Months
EndedApril 30, 2019
(unaudited)
For the YearEnded
October 31, 2018
The Tocqueville Fund Shares Shares
Shares sold 177,473 400,145Shares issued to holders in reinvestment dividends 638,291 705,639Shares redeemed (724,358) (1,122,176)
Net increase (decrease) 91,406 (16,392)
The Tocqueville Opportunity FundShares sold 236,598 566,780Shares issued to holders in reinvestment dividends 310,884 97,416Shares redeemed (323,553) (555,070)
Net increase 223,929 109,126
The Tocqueville Gold Fund—Investor ClassShares sold 59,238,421 6,517,002Shares issued to holders in reinvestment dividends — —Shares redeemed (61,499,771) (9,256,841)
Net decrease (2,261,350) (2,739,839)
The Tocqueville Gold Fund—Institutional ClassShares sold 657Shares issued to holders in reinvestment dividends —Shares redeemed —
Net increase 657
The Tocqueville Phoenix FundShares sold 211,797 621,501Shares issued to holders in reinvestment dividends 722,709 2,222,399Shares redeemed (2,678,795) (5,243,871)
Net decrease (1,744,289) (2,399,971)
The Tocqueville Select FundShares sold 94,920 233,208Shares issued to holders in reinvestment dividends — 76,796Shares redeemed (369,252) (875,383)
Net decrease (274,332) (565,379)
64 April 30, 2019

6.FU
ND
SHA
RE
TR
AN
SAC
TIO
NS
Eac
hFu
ndcu
rren
tlyof
fers
only
one
clas
sof
shar
esof
bene
ficia
lint
eres
twit
hth
eex
cept
ion
ofT
heT
ocqu
evill
eG
old
Fund
.Are
dem
ptio
nfe
eof
2.00
%is
impo
sed
onre
dem
ptio
nsof
shar
eshe
ld90
days
orfe
wer
for
The
Toc
quev
ille
Gol
dFu
nd.T
his
fee
isre
tain
edby
the
Fund
and
iscr
edit
edto
paid
inca
pita
l.R
edem
ptio
nsto
whi
chth
efe
eap
plie
sin
clud
ere
dem
ptio
nsof
shar
esre
sulti
ngfr
oman
exch
ange
mad
epu
rsua
ntto
the
Exc
hang
ePr
ivile
ge,a
sde
fined
inth
eT
rust
’sPr
ospe
ctus
date
dFe
brua
ry15
,201
9.Fo
ra
mor
ede
taile
dde
scri
ptio
nof
whe
nth
ere
dem
ptio
nfe
edo
esno
tapp
ly,p
leas
ese
eth
eT
rust
’sPr
ospe
ctus
.
7.IN
VE
STM
EN
TT
RA
NSA
CT
ION
S
Purc
hase
san
dsa
les
ofin
vest
men
tsec
urit
ies
(exc
ludi
ngsh
ort-
term
inst
rum
ents
)fo
rth
epe
riod
ende
dA
pril
30,2
019
are
sum
mar
ized
belo
w.
Toc
quev
ille
Fund
Opp
ortu
nity
Fund
Gol
dFu
ndP
hoen
ixFu
ndSe
lect
Fund
Purc
hase
s:$2
5,10
4,01
9$7
8,54
4,99
9$
72,0
12,6
04$4
7,88
4,52
7$5
,499
,704
Sale
s:$3
6,74
8,20
0$8
1,24
0,01
8$1
15,2
44,7
13$3
9,37
3,73
3$8
,235
,951
U.S
.Gov
ernm
entS
ecur
ity
Purc
hase
s:$
—$
—$
—$
—$
—
U.S
.Gov
ernm
entS
ecur
ity
Sale
s:$
—$
—$
—$
—$
—
Semi-Annual Report 65

8.T
RA
NSA
CT
ION
SW
ITH
AFF
ILIA
TE
S(U
naud
ited
)*
The
follo
win
gis
suer
sar
eaf
filia
ted
wit
hth
eFu
nds;
that
is,t
heA
dvis
erha
dco
ntro
lof5
%or
mor
eof
the
outs
tand
ing
voti
ngse
curi
ties
duri
ngth
epe
riod
from
Nov
embe
r1,
2018
thro
ugh
Apr
il30
,201
9.A
sde
fined
inSe
ctio
n(2
)(a)
(3)
ofth
eIn
vest
men
tCom
pany
Act
of19
40;s
uch
issu
esar
e:
Nov
embe
r1,
2018
Add
itio
nsR
educ
tion
sA
pril
30,
2019
Div
iden
dIn
com
eR
ealiz
edG
ain/
(Los
s)
Cha
nge
inG
ross
Unr
ealiz
edA
ppre
ciat
ion/
(Dep
reci
atio
n)
Apr
il30
,201
9
Issu
erN
ame
Shar
eB
alan
ceC
ost
Shar
eB
alan
ceC
ost
Shar
eB
alan
ceC
ost
Shar
eB
alan
ceV
alue
Cos
t
The
Toc
quev
ille
Gol
dFu
ndA
lmad
enM
iner
als
Ltd.
—C
lass
B5,
607,
319
$4,
657,
349
—$
—(6
,700
)$(7
,992
)5,
600,
619
$—$
(2,5
36)
$38
,725
$2,
884,
547
$4,
649,
357
Alm
aden
Min
eral
sLt
d.W
arra
nt74
0,74
1—
——
(740
,741
)—
——
——
——
Alm
aden
Min
eral
sLt
d.W
arra
nt79
,585
——
——
—79
,585
——
(1,1
01)
42—
Arg
onau
tGol
d,In
c.2,
837,
000
12,7
10,6
13—
——
—2,
837,
000
——
883,
515
3,66
3,51
412
,710
,613
AT
AC
Res
ourc
esLt
d.9,
784,
891
31,2
31,8
36—
——
—9,
784,
891
——
(1,1
79,8
15)
1,57
0,31
631
,231
,836
Bar
kerv
ille
Gol
dM
ines
Ltd.
7,11
0,00
04,
926,
516
——
——
7,11
0,00
0—
—(3
04,7
25)
1,96
3,64
84,
926,
516
Bar
kerv
ille
Gol
dM
ines
Ltd.
——
17,0
00,0
004,
579,
639
——
17,0
00,0
00—
—21
,541
4,60
1,17
94,
579,
639
Bea
rC
reek
Min
ing
Cor
p.7,
413,
200
28,7
61,1
81—
——
—7,
413,
200
——
538,
926
7,74
6,86
928
,761
,181
Cor
vus
Gol
d,In
c.3,
226,
901
2,21
2,90
4—
——
—3,
226,
901
——
(2,3
78,2
26)
4,00
1,35
72,
212,
904
Cor
vus
Gol
d,In
c.15
,317
,930
12,9
75,6
841,
961,
400
2,56
4,58
8—
—17
,279
,330
——
(11,
315,
985)
21,1
52,5
7215
,540
,272
Eas
tA
sia
Min
eral
sC
orp.
13,2
90,9
9322
,796
,021
——
——
13,2
90,9
93—
—(2
87,7
17)
570,
450
22,7
96,0
21E
ast
Asi
aM
iner
als
Cor
p.W
arra
nt97
6,49
3—
——
——
976,
493
——
——
—E
ast
Asi
aM
iner
als
Cor
p.W
arra
nt3,
321,
250
——
——
—3,
321,
250
——
(65,
699)
148,
746
—E
ast
Asi
aM
iner
als
Cor
p.W
arra
nt4,
617,
560
——
——
—4,
617,
560
——
(106
,053
)18
5,77
8—
Falc
oR
esou
rces
Ltd.
16,2
22,3
0011
,973
,054
——
——
16,2
22,3
00—
—(1
,098
,760
)2,
906,
137
11,9
73,0
54G
old
Bul
lion
Inte
rnat
iona
lLLC
5,00
0,00
05,
000,
000
——
——
5,00
0,00
0—
——
6,89
3,00
05,
000,
000
Inte
rnat
iona
lTow
erH
illM
ines
Ltd.
5,73
8,83
620
,953
,121
——
——
5,73
8,83
6—
—(8
4,36
1)2,
641,
586
20,9
53,1
21In
tern
atio
nalT
ower
Hill
Min
esLt
d.20
,331
,298
44,4
53,3
58—
——
—20
,331
,298
——
142,
705
9,40
9,12
544
,453
,358
Jagu
arM
inin
g,In
c.64
,330
,707
8,12
7,88
7—
——
—64
,330
,707
——
(4,4
95,5
40)
5,52
2,15
58,
127,
887
MA
GSi
lver
Cor
p.2,
661,
600
29,5
36,7
0632
4,00
02,
935,
632
(212
,000
)(2
,237
,978
)2,
773,
600
—(7
56,8
48)
7,53
6,39
427
,264
,488
30,2
34,3
60M
AG
Silv
erC
orp.
1,43
2,66
515
,000
,003
——
——
1,43
2,66
5—
—3,
778,
084
14,0
73,2
0415
,000
,003
Nic
kelC
reek
Plat
inum
12,3
79,2
012,
544,
342
——
——
12,3
79,2
01—
—(6
19,3
85)
462,
014
2,54
4,34
2N
icke
lCre
ekPl
atin
umW
arra
nt6,
189,
601
——
——
—6,
189,
601
——
(157
,204
)36
,037
—N
uLeg
acy
Gol
dC
orp.
28,5
56,0
906,
158,
205
——
——
28,5
56,0
90—
—(1
,556
,067
)2,
131,
529
6,15
8,20
5Pr
emie
rG
old
Min
esLt
d.8,
630,
160
15,7
82,5
21—
——
—8,
630,
160
——
(453
,360
)10
,822
,325
15,7
82,5
21SE
MA
FO,I
nc.
11,3
00,0
0043
,116
,829
——
(737
,000
)(1
,082
,606
)10,
563,
000
—39
3,05
85,
069,
055
28,6
20,4
4942
,034
,223
Stra
tegi
cM
etal
sLt
d.10
,113
,400
14,5
57,3
09—
——
—10
,113
,400
——
(461
,192
)2,
189,
211
14,5
57,3
09
66 April 30, 2019

Nov
embe
r1,
2018
Add
itio
nsR
educ
tion
sA
pril
30,
2019
Div
iden
dIn
com
eR
ealiz
edG
ain/
(Los
s)
Cha
nge
inG
ross
Unr
ealiz
edA
ppre
ciat
ion/
(Dep
reci
atio
n)
Apr
il30
,201
9
Issu
erN
ame
Shar
eB
alan
ceC
ost
Shar
eB
alan
ceC
ost
Shar
eB
alan
ceC
ost
Shar
eB
alan
ceV
alue
Cos
t
Toc
quev
ille
Bul
lion
Res
erve
LP—
Cla
ssG
(a)
13,8
06$
25,0
00,0
00—
$—
—$
—13
,806
$—$
—$
769,
671
$16
,882
,835
$25
,000
,000
Tor
exG
old
Res
ourc
es,I
nc.
1,67
8,10
020
,058
,180
415,
300
4,29
5,18
1—
—2,
093,
400
——
437,
734
20,0
16,7
6124
,353
,361
Tri
fect
aG
old
Ltd.
2,32
5,19
9—
——
——
2,32
5,19
9—
—(2
7,95
0)82
,442
—
$382
,533
,619
$14,
375,
040
$(3,
328,
576)
$—$(
366,
326)
$(5,
376,
790)
$198
,442
,316
$393
,580
,083
*A
llaf
filia
tes
liste
dar
ene
ithe
rm
ajor
ity-
owne
dsu
bsid
iari
esor
othe
rco
ntro
lled
com
pani
es.
(a)
Toc
quev
ille
Bul
lion
Res
erve
(“T
BR
”)is
aD
elaw
are
Lim
ited
Part
ners
hip
crea
ted
for
the
purp
ose
ofow
ning
phys
ical
gold
.The
Gen
eral
Part
ner
ofT
BR
isT
ER
AM
anag
emen
tLLC
(“T
era”
),a
Del
awar
eLi
mit
edLi
abili
tyC
ompa
ny,w
hich
iseq
ually
owne
dan
dm
anag
edby
Toc
quev
ille
Part
ners
IILL
C(“
TP2
”),a
Del
awar
eLi
mit
edLi
abili
tyC
ompa
ny,a
ndE
ides
isR
ealA
sset
sLL
C(“
Eid
esis
”),a
Del
awar
eLi
mit
edLi
abili
tyC
ompa
ny.T
heM
anag
ing
Mem
ber
ofT
P2is
Rob
ertK
lein
schm
idt,
Pres
iden
toft
heT
rust
,who
has
a51
%pa
rtic
ipat
ing
perc
enta
gein
TP2
and
the
sole
Non
-Man
agin
gM
embe
ris
John
Hat
haw
ay,c
o-po
rtfo
liom
anag
erof
the
Toc
quev
ille
Gol
dFu
nd,w
hoha
sa
49%
part
icip
atin
gpe
rcen
tage
.
Semi-Annual Report 67

9. LINE OF CREDIT
The Tocqueville Trust has a $300,000,000 line of credit (the “Line”), which isuncommitted, with U.S. Bank NA. The Line is for temporary emergency or extraordinarypurposes, including the meeting of redemption requests that otherwise might require theuntimely disposition of securities. The Line is secured by the Trust’s assets. The Line hasa one year term and is reviewed annually by the Board of Trustees. The interest rate as ofApril 30, 2019 was 5.00%. During the period ended April 30, 2019, the TocquevilleFund’s maximum borrowing was $820,000 and average borrowing was $64,585, theOpportunity Fund’s maximum borrowing was $2,037,000 and average borrowing was$209,463, and the Gold Fund’s maximum borrowing was $20,690,000 and averageborrowing was $1,013,789. This borrowing resulted in interest expenses of $1,348,$5,533 and $23,883, respectively. The Tocqueville Phoenix Fund and The Select Funddid not use the Line.
10. OTHER EXPENSES
Other expenses include reimbursement to the Adviser for compensation of theTrust’s Chief Compliance Officer. For the period ended April 30, 2019, reimbursementto the Adviser for compensation of the Trust’s Chief Compliance Officer from the Fundsamounted to $11,169, $3,470, $36,557, $7,100, $1,679 for the Tocqueville Fund,Opportunity Fund, Gold Fund, Phoenix Fund, and Select Fund respectively.
68 April 30, 2019

AD
DIT
ION
AL
INFO
RM
AT
ION
(UN
AU
DIT
ED
)
1.A
DD
ITIO
NA
LD
ISC
LOSU
RE
RE
GA
RD
ING
FUN
DT
RU
STE
ES
AN
DO
FFIC
ER
S
Inde
pend
ent
Tru
stee
s
Nam
ean
dA
geP
osit
ion(
s)H
eld
wit
hth
eT
rust
Ter
mof
Off
ice
and
Leng
thof
Tim
eSe
rved
(1)
Pri
ncip
alO
ccup
atio
n(s)
Dur
ing
Pas
tFi
veY
ears
Num
ber
ofFu
nds
inFu
ndC
ompl
exO
vers
een
By
Tru
stee
Oth
erD
irec
tors
hips
Hel
dby
Tru
stee
Cha
rles
W.C
aulk
ins
Yea
rof
Bir
th:1
956
Tru
stee
;M
embe
rof
Aud
itC
omm
itte
e;M
embe
rof
Gov
erna
nce
and
Nom
inat
ing
Com
mit
tee
Inde
finit
eT
erm
,Si
nce
2003
Priv
ate
Inve
stor
dba
Plan
BPa
rtne
rsfr
omJa
nuar
y20
12–
pres
ent.
5N
one
Ale
xand
erD
ougl
asY
ear
ofB
irth
:194
7T
rust
ee;
Mem
ber
ofA
udit
Com
mit
tee;
Mem
ber
ofG
over
nanc
ean
dN
omin
atin
gC
omm
itte
e
Inde
finit
eT
erm
,Si
nce
2010
Ret
ired
.For
mer
ly,P
resi
dent
,CE
Oan
dow
ner
ofSp
auld
ing
Law
Prin
ting
,Inc
.fro
m19
92to
Nov
embe
r20
14.
5N
one
Semi-Annual Report 69

AD
DIT
ION
AL
INFO
RM
AT
ION
(UN
AU
DIT
ED
)
Inde
pend
ent
Tru
stee
s
Nam
ean
dA
geP
osit
ion(
s)H
eld
wit
hth
eT
rust
Ter
mof
Off
ice
and
Leng
thof
Tim
eSe
rved
(1)
Pri
ncip
alO
ccup
atio
n(s)
Dur
ing
Pas
tFi
veY
ears
Num
ber
ofFu
nds
inFu
ndC
ompl
exO
vers
een
By
Tru
stee
Oth
erD
irec
tors
hips
Hel
dby
Tru
stee
Cha
rles
F.G
auvi
nY
ear
ofB
irth
:195
6T
rust
ee;
Mem
ber
ofA
udit
Com
mit
tee;
Mem
ber
ofG
over
nanc
ean
dN
omin
atin
gC
omm
itte
e
Inde
finit
eT
erm
,Si
nce
Febr
uary
2015
Chi
efD
evel
opm
entO
ffic
er,W
oods
Hol
eO
cean
ogra
phic
Inst
itut
ion,
from
Febr
uary
2016
–pr
esen
t;E
xecu
tive
Dir
ecto
r,M
aine
Aud
ubon
,fro
mA
ugus
t201
4–
Janu
ary
2016
;Chi
efD
evel
opm
entO
ffic
er,C
arne
gie
End
owm
entf
orIn
tern
atio
nalP
eace
,fro
mSe
ptem
ber
2011
–M
ay20
14.
5D
irec
tor,
Bio
qual
,Inc
.,Ju
ly19
92–
pres
ent.
Jam
esW
.Ger
ard
Yea
rof
Bir
th:1
961
Tru
stee
;M
embe
rof
Aud
itC
omm
itte
e;M
embe
rof
Gov
erna
nce
and
Nom
inat
ing
Com
mit
tee
Inde
finit
eT
erm
,Si
nce
2001
Man
agin
gD
irec
tor,
Hyc
roft
Adv
isor
s,fr
omJa
nuar
y20
10-p
rese
nt;M
anag
ing
Dir
ecto
r,de
Vis
sche
r&
Co.
,LLC
from
Janu
ary
2013
topr
esen
t;T
heC
hart
Gro
upfr
omJa
nuar
y20
01to
pres
ent.
5Pr
esid
ent,
Am
eric
anO
vers
eas
Mem
oria
lDay
Ass
ocia
tion
,199
8to
pres
ent;
Tru
stee
,Sa
lisbu
rySc
hool
,200
5to
pres
ent;
Dir
ecto
r,A
mer
ican
Frie
nds
ofB
lera
ucou
rt,1
992
topr
esen
t;Pr
esid
ent,
Litt
leB
aby
Face
Foun
dati
on,M
arch
2015
topr
esen
t.
Will
iam
J.N
olan
III
Yea
rof
Bir
th:1
947
Tru
stee
;Cha
irof
Aud
itC
omm
itte
e;M
embe
rof
Gov
erna
nce
and
Nom
inat
ing
Com
mit
tee
Inde
finit
eT
erm
,Si
nce
Dec
embe
r20
06
Ret
ired
.Exe
cuti
veV
ice
Pres
iden
t&T
reas
urer
Pain
eWeb
ber
Inc.
1997
–20
01.
5T
rust
ee,A
diro
ndac
kM
useu
m,B
lue
Mt.
Lake
,NY
1996
to20
17(T
reas
urer
,20
00to
2013
;Exe
cuti
veC
omm
itte
e,20
00–
2017
).
70 April 30, 2019

AD
DIT
ION
AL
INFO
RM
AT
ION
(UN
AU
DIT
ED
)
Inte
rest
edT
rust
ees(2
)an
dO
ffic
ers
Nam
ean
dA
geP
osit
ion(
s)H
eld
wit
hth
eT
rust
Ter
mof
Off
ice
and
Leng
thof
Tim
eSe
rved
(1)
Pri
ncip
alO
ccup
atio
n(s)
Dur
ing
Pas
tFi
veY
ears
Num
ber
ofFu
nds
inFu
ndC
ompl
exO
vers
een
By
Tru
stee
Oth
erD
irec
tors
hips
Hel
dby
Tru
stee
Hel
enB
alk
Yea
rof
Bir
th:1
972
Tre
asur
erIn
defin
ite
Ter
m,
Sinc
e20
14C
ontr
olle
r/
Tre
asur
erof
Toc
quev
ille
Ass
etM
anag
emen
tfro
mJa
nuar
y20
14to
pres
ent;
Man
ager
/St
affA
ccou
ntan
tat
Pegg
&Pe
ggLL
Pfr
omA
ugus
t199
5to
Janu
ary
2014
.
N/A
N/A
Rob
ertW
.Kle
insc
hmid
tY
ear
ofB
irth
:194
9C
hair
man
,Pr
esid
ent,
and
Tru
stee
Inde
finit
eT
erm
,C
hair
man
Sinc
e20
16,a
ndPr
esid
enta
ndT
rust
eeSi
nce
1991
Pres
iden
tand
Chi
efIn
vest
men
tOff
icer
ofT
ocqu
evill
eA
sset
Man
agem
ent;
Dir
ecto
r,T
ocqu
evill
eM
anag
emen
tCor
pora
tion
,the
Gen
eral
Part
ner
ofT
ocqu
evill
eA
sset
Man
agem
entL
.P.a
ndT
ocqu
evill
eSe
curi
ties
L.P.
from
Janu
ary
1994
topr
esen
t.
5Pr
esid
enta
ndD
irec
tor,
Toc
quev
ille
Man
agem
entC
orpo
rati
on,t
heG
ener
alPa
rtne
rof
Toc
quev
ille
Ass
etM
anag
emen
tL.
P.an
dT
ocqu
evill
eSe
curi
ties
L.P.
Step
han
Yev
akY
ear
ofB
irth
:195
9A
nti-
Mon
eyLa
unde
ring
Com
plia
nce
Off
icer
Inde
finit
eT
erm
,Si
nce
2018
Dep
uty
Chi
efC
ompl
ianc
eO
ffic
er,
Toc
quev
ille
Secu
riti
es,L
.P.f
rom
Aug
ust
2011
topr
esen
t;D
eput
yC
hief
Com
plia
nce
Off
icer
,Toc
quev
ille
Ass
etM
anag
emen
tfro
mA
ugus
t201
1to
pres
ent.
Ant
i-M
oney
Laun
deri
ngC
ompl
ianc
eO
ffic
erto
both
enti
ties
from
Mar
ch20
18to
pres
ent.
N/A
N/A
Cle
oK
otis
Yea
rof
Bir
th:1
975
Secr
etar
yIn
defin
ite
Ter
m,
Sinc
e20
10D
irec
tor
ofO
pera
tion
s,th
eD
elaf
ield
Gro
upof
Toc
quev
ille
Ass
etM
anag
emen
tL.
P.,2
009
topr
esen
t.
N/A
N/A
Semi-Annual Report 71

AD
DIT
ION
AL
INFO
RM
AT
ION
(UN
AU
DIT
ED
)
Inte
rest
edT
rust
ees(2
)an
dO
ffic
ers
Nam
ean
dA
geP
osit
ion(
s)H
eld
wit
hth
eT
rust
Ter
mof
Off
ice
and
Leng
thof
Tim
eSe
rved
(1)
Pri
ncip
alO
ccup
atio
n(s)
Dur
ing
Pas
tFi
veY
ears
Num
ber
ofFu
nds
inFu
ndC
ompl
exO
vers
een
By
Tru
stee
Oth
erD
irec
tors
hips
Hel
dby
Tru
stee
Tho
mas
Pand
ick
Yea
rof
Bir
th:1
947
Chi
efC
ompl
ianc
eO
ffic
er
Inde
finit
eT
erm
,Si
nce
2004
Chi
efC
ompl
ianc
eO
ffic
er(O
ctob
er20
04–
pres
ent)
Toc
quev
ille
Ass
etM
anag
emen
tL.P
.N
/AN
/A
(1)
Eac
hT
rust
eew
illho
ldof
fice
for
anin
defin
ite
term
unti
lthe
earl
iest
of(i
)th
ene
xtm
eeti
ngof
shar
ehol
ders
,ifa
ny,c
alle
dfo
rth
epu
rpos
eof
cons
ider
ing
the
elec
tion
orre
-ele
ctio
nof
such
Tru
stee
and
unti
lthe
elec
tion
and
qual
ifica
tion
ofhi
sor
her
succ
esso
r,if
any,
elec
ted
atsu
chm
eeti
ng,o
r(i
i)th
eda
tea
Tru
stee
resi
gns
orre
tire
s,or
aT
rust
eeis
rem
oved
byth
eB
oard
ofT
rust
ees
orsh
areh
olde
rs,i
nac
cord
ance
wit
hth
eT
rust
’sB
y-La
ws,
asam
ende
d,an
dA
gree
men
tand
Dec
lara
tion
ofT
rust
,as
amen
ded.
Eac
hof
ficer
will
hold
offic
efo
ran
inde
finit
ete
rmun
tilt
heda
tehe
orsh
ere
sign
sor
reti
res
orun
tilh
isor
her
succ
esso
ris
elec
ted
and
qual
ifies
.
(2)
“Int
eres
ted
pers
on”
ofth
eT
rust
asde
fined
inth
e19
40A
ct.M
r.K
lein
schm
idti
sco
nsid
ered
“int
eres
ted
pers
on”
beca
use
ofhi
saf
filia
tion
wit
hth
eA
dvis
or.
The
Stat
emen
tofA
ddit
iona
lInf
orm
atio
nin
clud
esad
diti
onal
info
rmat
ion
abou
tth
eT
rust
ees
and
isav
aila
ble
free
ofch
arge
byca
lling
the
Fund
sto
llfr
eeat
1-80
0-35
5-73
07.
72 April 30, 2019

2. PROXY VOTING POLICIES AND PROCEDURES
A description of the policies and procedures that The Tocqueville Trust uses todetermine how to vote proxies relating to portfolio securities is available without chargeupon request by calling 1-800-355-7307. Information regarding how The TocquevilleTrust voted proxies relating to portfolio securities during the most recent 12-monthperiod ended June 30 is available by calling 1-800-355-7307 and it is also available on theSEC’s web site at http://www.sec.gov.
3. SHAREHOLDER REPORTS AND QUARTERLY PORTFOLIODISCLOSURE
The Tocqueville Trust is required to file its complete schedule of portfolio holdingswith the SEC for its first and third fiscal quarters on Form N-PORT. The Trust’sForm N-PORT will be available without charge, upon request on the SEC’s website(http://www.sec.gov). You can also obtain copies of Form N-PORT by (i) visiting theSEC’s Public Reference Room in Washington, DC (information on the operation of thePublic Reference Room may be obtained by calling 1-202-551-8090); (ii) sending yourrequest and a duplicating fee to the SEC’s Public Reference Room, Washington, DC20549-1520; or (iii) sending your request electronically to publicinfosec.gov. Quarterlyportfolio holdings are also available on the website of The Tocqueville Funds,www.tocquevillefunds.com.
4. SHAREHOLDER NOTIFICATION OF FEDERAL TAX STATUS
For the fiscal year ended October 31, 2018, certain dividends paid by the Fundsmay be subject to a maximum tax rate of 15%, as provided for by the Jobs and GrowthTax Relief Reconciliation Act of 2003. The percentage of dividends declared fromordinary income designated as qualified dividend income was as follows:
Tocqueville Fund 100.00%Opportunity Fund 0.00%Gold Fund 0.00%Phoenix Fund 100.00%Select Fund 0.00%
For corporate shareholders, the percent of ordinary income distributions qualifyingfor the corporate dividends received deduction for the fiscal year ended October 31, 2018was as follows:
Tocqueville Fund 100.00%Opportunity Fund 0.00%Gold Fund 0.00%Phoenix Fund 100.00%Select Fund 0.00%
Semi-Annual Report 73

For the year ended October 31, 2018, the funds designate the following percent ofordinary distributions paid as interest-related dividends under the Internal Revenue CodeSection 871(k)(1)(c):
Tocqueville Fund 0.08%Opportunity Fund 0.00%Gold Fund 0.00%Phoenix Fund 3.95%Select Fund 0.00%
The percentage of taxable ordinary income distributions that are designated as short-term capital gain distributions under Internal Revenue Section 871(k)(2)(C) for eachFund were as follows.
Tocqueville Fund 0.00%Opportunity Fund 0.00%Gold Fund 0.00%Phoenix Fund 100.00%Select Fund 0.00%
74 April 30, 2019

Investment Adviser
Tocqueville Asset Management L.P.40 W. 57th St., 19th Floor
New York, NY 10019(212) 698-0800
www.tocqueville.com
Distributor
Tocqueville Securities, L.P.40 W. 57th St., 19th Floor
New York, NY 10019(212) 698-0800
Shareholders’ Servicing and Transfer Agent
U.S. Bank Global Fund Services615 East Michigan Street
Milwaukee, WI 53202
Custodian
U.S. Bank, N.A.Custody Operations
1555 River Center Drive, Suite 302Milwaukee, WI 53212
Board of Trustees
Robert W. Kleinschmidt—ChairmanCharles W. CaulkinsAlexander DouglasCharles F. GauvinJames W. Gerard
William J. Nolan III
Independent Registered Public Accounting Firm
Grant Thornton LLP171 North Clark St., Suite 200
Chicago, IL 60601

Toc
quev
ille
Fund
sc/
oU
SB
anco
rpFu
ndSe
rvic
es,L
LCP.
O.B
ox70
1M
ilwau
kee,
WI
5320
1-07
01
ww
w.t
ocqu
evill
efun
ds.c
om
TQ
-SE
MI
Toc
quev
ille
Sem
i-A
nnua
lRep
ort4
/30/
2019

PR
SR
T S
TD
U.S
. PO
STA
GE
PAID
LAN
CA
STE
R,
PAP
ER
MIT
1793
Toc
quev
ille
Fund
sc/
oU
SB
anco
rpFu
ndSe
rvic
es,L
LCP.
O.B
ox70
1M
ilwau
kee,
WI
5320
1-07
01
ww
w.t
ocqu
evill
efun
ds.c
om
TQ
-SE
MI
Toc
quev
ille
Sem
i-A
nnua
lRep
ort4
/30/
2019