DEA models for ethical and non ethical mutual funds with negative data
23
Department of Applied Mathematics, University of Venice WORKING PAPER SERIES Antonella Basso, Stefania Funari DEA models for ethical and non ethical mutual funds with negative data Working Paper n. 153/2007 June 2007 ISSN: 1828-6887
-
Upload
independent -
Category
Documents
-
view
5 -
download
0
Transcript of DEA models for ethical and non ethical mutual funds with negative data
Department of Applied Mathematics, University of Venice
WORKING PAPER SERIES
Antonella Basso, Stefania Funari
DEA models for ethical and non ethical mutual funds with negative data
Working Paper n. 153/2007 June 2007
ISSN: 1828-6887

This Working Paper is published under the auspices of the Department of Applied Mathematics of the Ca’ Foscari University of Venice. Opinions expressed herein are those of the authors and not those of the Department. The Working Paper series is designed to divulge preliminary or incomplete work, circulated to favour discussion and comments. Citation of this paper should consider its provisional nature.

DEA models for ethical and non ethical
mutual funds with negative data
Antonella Basso Stefania Funari
<[email protected]> <[email protected]>Dept. of Applied Mathematics and SSAV Dept. of Applied Mathematics
University of Venice University of Venice
(November 2006)
Abstract. This paper tackles the problem of the presence of negative average rates ofreturns in the evaluation of the performance of mutual funds using a DEA approach. Wepresent some extensions of DEA models for the evaluation of the performance of mutualfunds that enable to compute the performance measure also in the presence of negative ratesof returns. These extensions regard a model that can be used for investments in mutualfunds which have profitability as main objective and two models specifically formulated forethical mutual funds that include also the ethical objective among the outputs and differin the way the ethical goal is pursued by investors.
The models proposed are applied to the European market of ethical mutual funds. Inorder to do so, a measure of the ethical level which takes into account the main sociallyresponsible features of each fund is built.
Keywords: Data envelopment analysis, Performance evaluation, Mutual funds, ethicalinvestment.
JEL Classification Numbers: C6, G1.
MathSci Classification Numbers: 90B50, 90B90.
Correspondence to:
Antonella Basso Dept. of Applied Mathematics, University of VeniceDorsoduro 3825/e30123 Venezia, Italy
Phone: [++39] (041)-234-6914Fax: [++39] (041)-522-1756E-mail: [email protected]
1 Introduction
In this paper we tackle the problem of the presence of negative average rates of returnsin the evaluation of the performance of mutual funds using a data envelopment analysis(DEA) approach.
DEA models have been proposed in the literature in order to compare the performanceof mutual funds by taking into consideration different aspects of the investment process:first of all, profitability and riskiness, but also initial and exit fees, and possible furtherobjectives such as those which drive socially responsible investments. Along this line, wefind the models proposed in Murthi et al. (1997), Morey and Morey (1999), Basso andFunari (2001, 2005a) and some generalizations to the measurement of the performance ofethical mutual funds proposed in Basso and Funari (2003).
However, a problem may arise with these models, due to the assumption, implicitly madein DEA approaches, that all the input and output values are non negative. As a matterof fact, in slump periods of the business cycle the average rate of return of most stocks isnegative, and that of many mutual funds as well, so that one of the output variables maywell take negative values.
In this contribution we present some extensions of the DEA models for the evaluationof the performance of mutual funds that enable to compute the performance measure alsoin the presence of negative rates of returns. These extensions regard a model that can beused for investments in mutual funds which have profitability as main objective and twomodels, specifically formulated for ethical mutual funds, that include the ethical objectiveamong the outputs.
The two models for ethical funds differ in the way the ethical goal is assumed to bepursued by investors: the first model is appropriate in the case in which investors try tomaximize both the return and the ethical level of the investment at the same time, whereasthe second one is more appropriate when investors choose the ethical level a priori and tryto maximize the return of their investment while satisfying the desired ethical level.
The models proposed are applied to the European market of ethical mutual funds. Inorder to do so, we have built a measure of the ethical level which takes into account themain socially responsible features of each fund. The analysis carried out concerns the mainethical equity funds of the Western European market, as well as a set of non ethical equityfunds included for comparison. On average, in the period considered in the analysis theethical funds turn out to perform somewhat better than the non ethical funds if a modelthat takes the ethical level into account is used, while they are overcome by the non ethicalfunds if the ethical goal is not explicitly considered.
The paper is organized as follows. Section 2 tackles the problem of the presence ofnegative mean returns in computing a performance indicator for mutual funds with a DEAmodel and presents an adjusted model that ensures the positivity of the output values.Section 3 presents a method to build an ethical measure for mutual funds starting fromavailable information on the ethical features of the funds. Sections 4 and 5 propose twogeneralizations of the DEA models for ethical funds while Section 6 discusses the connectionsamong the DEA performance measures obtained. In Section 7 we present the results of theanalysis carried out on the European market. Finally, Section 8 gives some concluding
1
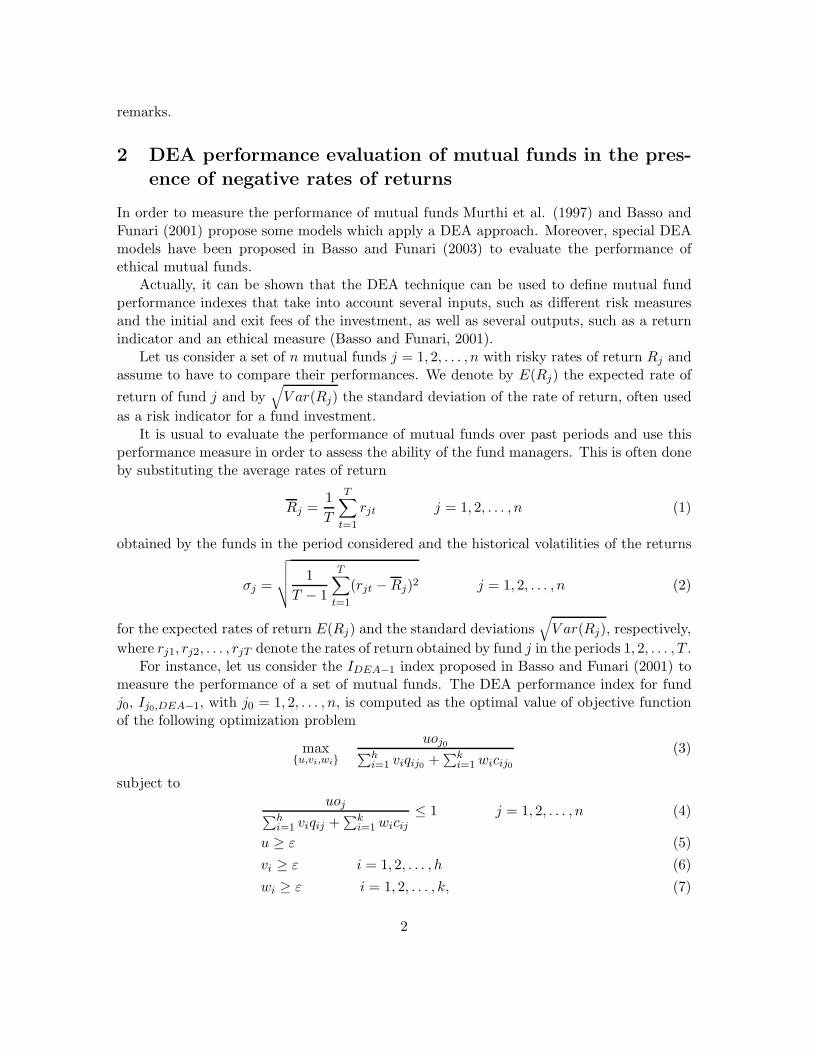
remarks.
2 DEA performance evaluation of mutual funds in the pres-
ence of negative rates of returns
In order to measure the performance of mutual funds Murthi et al. (1997) and Basso andFunari (2001) propose some models which apply a DEA approach. Moreover, special DEAmodels have been proposed in Basso and Funari (2003) to evaluate the performance ofethical mutual funds.
Actually, it can be shown that the DEA technique can be used to define mutual fundperformance indexes that take into account several inputs, such as different risk measuresand the initial and exit fees of the investment, as well as several outputs, such as a returnindicator and an ethical measure (Basso and Funari, 2001).
Let us consider a set of n mutual funds j = 1, 2, . . . , n with risky rates of return Rj andassume to have to compare their performances. We denote by E(Rj) the expected rate of
return of fund j and by√
V ar(Rj) the standard deviation of the rate of return, often used
as a risk indicator for a fund investment.It is usual to evaluate the performance of mutual funds over past periods and use this
performance measure in order to assess the ability of the fund managers. This is often doneby substituting the average rates of return
Rj =1
T
T∑
t=1
rjt j = 1, 2, . . . , n (1)
obtained by the funds in the period considered and the historical volatilities of the returns
σj =
√
√
√
√
1
T − 1
T∑
t=1
(rjt − Rj)2 j = 1, 2, . . . , n (2)
for the expected rates of return E(Rj) and the standard deviations√
V ar(Rj), respectively,
where rj1, rj2, . . . , rjT denote the rates of return obtained by fund j in the periods 1, 2, . . . , T .For instance, let us consider the IDEA−1 index proposed in Basso and Funari (2001) to
measure the performance of a set of mutual funds. The DEA performance index for fundj0, Ij0,DEA−1, with j0 = 1, 2, . . . , n, is computed as the optimal value of objective functionof the following optimization problem
max{u,vi,wi}
uoj0∑h
i=1 viqij0 +∑k
i=1 wicij0
(3)
subject touoj
∑hi=1 viqij +
∑ki=1 wicij
≤ 1 j = 1, 2, . . . , n (4)
u ≥ ε (5)
vi ≥ ε i = 1, 2, . . . , h (6)
wi ≥ ε i = 1, 2, . . . , k, (7)
2
whereoj is a return measure of fund j, set equal to either Rj or
the average excess return Rj − r, where r is the risklessrate of return
q1j, . . . , qhj are h risk measures for fund j, such as the historicalvolatility σj and the β index
c1j , . . . , ckj are k initial and exit costs for fund ju is the weight assigned to the return measure oj
vi is the weight assigned to the risk measure i (i = 1, 2, ..., h)wi is the weight assigned to the cost i (i = 1, 2, ..., k)ε > 0 is a non-Archimedean infinitesimal.
If we let an asterisk denotes the optimal values of the variables, we have
Ij0,DEA−1 =u∗oj0
∑hi=1 v∗i qij0 +
∑ki=1 w∗
i cij0
. (8)
It is common in classical DEA models to assume that all the input and output valuesare non negative (see for example Cooper et al., 2000). This is indeed a crucial assumptionin the measurement of performance with the DEA technique. On the other hand, whensome output variables may take negative values, the DEA performance measure may givenon satisfactory results; for some examples on this subject see Basso and Funari (2005b).
Actually, if we use in the DEA analysis as return indicator the average excess returnobserved in the period considered, its value is negative for all funds which obtain a rate ofreturn lower than the riskless interest rate. On the other hand, if we use as return indicatorthe average rate of return, this often turns out to be negative for many mutual funds in theslump periods of the business cycle.
In order to ensure the positivity of all data, one might change the definition of the returnindicator oj in such a way as it is always positive under all circumstances and thus it canbe directly used as an output variable in a DEA model.
To this purpose, it would be sufficient to use a suitable DEA model which is translationinvariant. A model is said translation invariant if the optimal value of the objective function,which represents the DEA efficiency measure, is invariant for translations of the originalinput and output values consequent to an addition of a constant to the original data.
A DEA model which has such a property is the additive model (on additive DEA modelssee e.g. Cooper et al., 2000, Section 4.3), and actually this model is often used in orderto tackle the problem of negative data in DEA analysis. In particular, it can be proved(see Ali and Seiford, 1990, and Lovell and Pastor, 1995) that the additive model is indeedtranslation invariant, while the basic CCR DEA model is not.
However, an additive DEA model discriminates between efficient and inefficient DMUs,but it cannot gauge the depth of eventual inefficiencies: indeed, the efficiency measure givenby an additive model does not provide a radial efficiency measure such as that given by thebasic CCR model.
Another approach, proposed in Silva Portela et al. (2003), treats the problem of negativedata in DEA models by modifying the efficiency measure used, but neither this approachis directly connected to radial efficiency.
3
For this reason we prefer to take into consideration a return indicator which is financiallymeaningful and cannot take negative values: this can be found in the capitalization factorU j = 1 + Rj, which gives the final value of a unit initial investment at the end of a unitperiod. This quantity cannot become negative, since in the worst case we may at most loseall the capital invested in a mutual fund.
Let us consider as risk measure the historical volatility σj and let us take into consid-eration among the inputs the initial and exit fees f I
j and fEj , respectively. Moreover, since
the output is represented by the final value of the investment, we include among the inputsalso the initial capital invested in the mutual fund; in the comparison analysis, the sameinitial capital C0 = 1 is assumed to be invested in all the funds under examination.
With these choices, the DEA model (3)–(7) is modified as follows
max{u,vi}
uU j0
v1C0 + v2σj0 + v3f Ij0
+ v4fEj0
(9)
subject to
u1U j
v1C0 + v2σj + v3f Ij + v4fE
j
≤ 1 j = 1, 2, . . . , n (10)
u ≥ ε, (11)
vi ≥ ε i = 1, 2, 3, 4. (12)
The DEA performance measure for fund j0, Ij0,DEA−S, is the optimal value of theobjective function (9)
Ij0,DEA−S =u∗U j0
v∗1C0 + v∗2σj0 + v∗3fIj0
+ v∗4fEj0
(13)
and lies in the interval [0, 1].It can be proved that the funds with a DEA performance measure equal to 1 exhibit
the so called radial efficiency or technical efficiency, since we cannot reduce all inputs in thesame proportion (thus maintaining the proportion of the input factors) without reducingalso the outputs. If, in addition, it is not possible to reduce any input or increase any outputwithout worsening the value of some other inputs or outputs, then the fund is said to beefficient in the sense of Pareto-Koopmans. In order to check the Pareto-Koopmans efficiencyit is possible to solve a two-phase linear programming problem equivalent to the DEA-Sproblem (9)–(12) (see for example Cooper et al., 2000, 2006); indeed, from a computationalpoint of view, this is the most convenient way to solve the DEA fractional programmingproblem (9)–(12).
Of course, a different optimization problem has to be solved for each fund j0 = 1, 2, . . . , nin the set of funds compared, in turn.
4
3 How to define an ethical measure for mutual funds
Let us now turn our attention to the evaluation of the performance of ethical mutual funds.First of all, in order to evaluate the performance of ethical mutual funds we need to
build an ethical measure which can be used as an output variable to be taken into accounttogether with the return indicator.
Various consultant agencies and research institutes analyze the ethical nature of mutualfunds. For example, in the ‘SRI Funds Service’ the European Social Investment Forum(EUROSIF) together with Avanzi rating agency and Morningstar, give some basic infor-mation regarding the socially responsible profile of European ethical mutual funds. Suchinformation is organized in various sections; in particular, the funds are analyzed on thebasis of the most important questions taken into consideration in order to define negativeand positive ethical screening.
Actually, one of the most important strategies applied by socially responsible mutualfunds is ethical screening. According to such a strategy, the assets included in the mutualfund portfolios are selected on the basis of social and environmental grounds. The selectioncan be carried out either with a negative screening, by excluding from the portfolios theassets of the companies with a profile that is bad according to a socially responsible criterion,or with a positive screening, by including in the fund portfolio investments in companieswhich are selected on the ground of their ethically and socially responsible behaviour.
The most important information on the ethical screening used by the SRI Funds Servicetakes into consideration a set of features which can be either present or absent in the ethicalprofile of each fund:
a. Negative screening issues: 1. firearms; 2. weapons and military contracting; 3.nuclear energy; 4. tobacco; 5. gambling; 6. human rights and ELO fundamentalconventions violations; 7. child labour; 8. oppressive regimes; 9. pornography; 10.alcohol; 11. animal testing; 12. factory farming; 13. furs; 14. excessive environmentalimpact and natural resources consumption; 15. GMO; 16. products dangerous tohealth/environment; 17. others.
b. Positive screening issues: 1. products beneficial for the environment and qualityof life; 2. customers, product safety, advertisement competition; 3. environmentalservices and technologies; 4. environmental policies, reports, management systems; 5.environmental performances; 6. employees policies, reports, management systems; 7.employees performances; 8. suppliers and measures to avoid human rights violations;9. communities and bribery; 10. corporate governance; 11. others.
Another important information on the ethical behaviour of mutual funds is the presenceor absence of an ethical committee which has the function of defining the guidelines of thesocially responsible investments and controlling the actions of the fund management in thisrespect.
We have used such information in order to define an ethical measure by assigning eachethical feature a weight and then computing their weighted sum.
5

More precisely, let us consider n mutual funds and let sN and sP be the number ofnegative and positive screening issues taken into account, respectively. Moreover, let sN
j
and sPj be the number of negative and positive screening features presented by fund j, with
j = 1, 2, . . . , n. Then
Nj =sNj
sNand Pj =
sPj
sP(14)
represent the quota of the positive and negative screening issues which are present in theethical profile of fund j, respectively. Moreover, let
Cj =
1 if fund j has an ethical committee with full powers1/2 if fund j has an ethical committee with partial powers0 if fund j does not have an ethical committee.
(15)
An ethical measure defined in the real interval [0, L] can be computed as follows:
ej = ωNNj + ωP Pj + ωCCj (16)
where ωN , ωP and ωC are positive weights assigned to the negative and positive screeningand to the ethical committee, respectively, and L = ωN + ωP + ωC .
By construction, fund j has a zero ethical measure if and only if it has no ethical profile,so that ej = 0 for non ethical funds.
4 A DEA model for ethical funds with non negative outputs
In Section 3 we have defined a real measure of the ethical level for mutual funds; thismeasure can be used as an additional output variable in a DEA model. The manner inwhich the DEA-S model (9)–(12) can be extended to handle an ethical objective dependson the actual ethical goal pursuits by investors.
If investors choose the mutual fund in which to invest their money by trying to maximizeboth the return and the ethical level of the investment simultaneously, then we can resortto the following two-output DEA-SE model
max{ur ,vi}
u1U j0 + u2ej0
v1C0 + v2σj0 + v3f Ij0
+ v4fEj0
(17)
subject to
u1U j + u2ej
v1C0 + v2σj + v3fIj + v4f
Ej
≤ 1 j = 1, 2, . . . , n (18)
ur ≥ ε r = 1, 2 (19)
vi ≥ ε i = 1, 2, 3, 4, (20)
which is a direct extension of model (9)–(12).
6
According to this model, the DEA performance measure for fund j0, Ij0,DEA−SE, is theoptimal value of the objective function (17)
Ij0,DEA−SE =u∗
1U j0 + u∗2ej0
v∗1C0 + v∗2σj0 + v∗3fIj0
+ v∗4fEj0
. (21)
However, if investors choose the ethical level they desire a priori and then try to maximizethe return of their investment by choosing the best mutual fund among all the funds thatsatisfy the required ethical level, model (17)–(20) is not appropriate. Actually, in this casethe output ej has to be considered as exogenously fixed, beyond the discretionary controlof the managers of fund j.
On the other hand, it is known that the presence of an exogenously fixed output has amajor consequence in the formulation of a DEA model, as pointed out in Banker and Morey(1986) and, as concerns the performance of ethical mutual funds, in Basso and Funari (2003).In next section we derive a more appropriate model for the case of non negative outputswhen the ethical level is exogenously chosen by investors.
5 A DEA model for ethical funds with non negative outputs
and exogenously fixed ethical levels
In order to see how the basic DEA model (17)–(20) has to be modified to take into accountthe presence of an exogenously fixed output, let us observe that this model is equivalent tothe following linear programming problem (for the derivation see for example Cooper et al.,2000) in output-oriented form
min{ur ,vi}
v1C0 + v2σj0 + v3fIj0
+ v4fEj0
(22)
subject to
u1U j0 + u2ej0 = 1 (23)
−u1U j − u2ej + v1C0 + v2σj + v3fIj + v4f
Ej ≥ 0 j = 1, . . . , n (24)
ur ≥ ε r = 1, 2 (25)
vi ≥ ε i = 1, 2, 3, 4. (26)
The DEA performance measure for the ethical fund j0, Ij0,DEA−SE, coincides with thereciprocal of the optimal value of the linear objective function (22).
The dual of this linear problem can be written as
max z0 + εs+1 + εs+
2 + ε4
∑
i=1
s−i (27)
subject to
U j0z0 −n
∑
j=1
U jλj + s+1 = 0 (28)
7
ej0z0 −n
∑
j=1
ejλj + s+2 = 0 (29)
n∑
j=1
C0λj + s−1 = C0 (30)
n∑
j=1
σjλj + s−2 = σj0 (31)
n∑
j=1
f Ij λj + s−3 = f I
j0(32)
n∑
j=1
fEj λj + s−4 = fE
j0(33)
λj ≥ 0 j = 1, 2, . . . , n (34)
s+r ≥ 0 r = 1, 2 (35)
s−i ≥ 0 i = 1, 2, 3, 4 (36)
z0 unconstrained, (37)
where z0 is the dual variable associated with the equality constraint (23), λj (with j =1, 2, . . . , n) are the dual variables associated with the mutual funds constraints (24) and s+
r
(with r = 1, 2) and s−i (with r = 1, 2, 3, 4) are the dual variables connected with the outputand input weight constraints (25) and (26), respectively.
It is known that the optimal solution of this dual problem enables to identify for eachinefficient fund a composite unit made up of a linear combination of the efficient funds,i.e. the funds for which constraint (24) is satisfied as equality and which therefore get anefficiency value equal to 1. Actually, from the complementary conditions of duality in linearprogramming we have that only the optimal value of the dual variables λj associated tothese efficient funds can have a strictly positive optimal value, the others being null.
A composite unit is defined as a linear combination of the set of funds {F1, F2, . . . , Fn }considered in the analysis with coefficients given by the optimal values of the dual variablesλj , namely
∑nj=1 λ∗
jFj . In a composite unit only the efficient funds can have a strictlypositive coefficient, while the coefficients of the other funds are bound to be null.
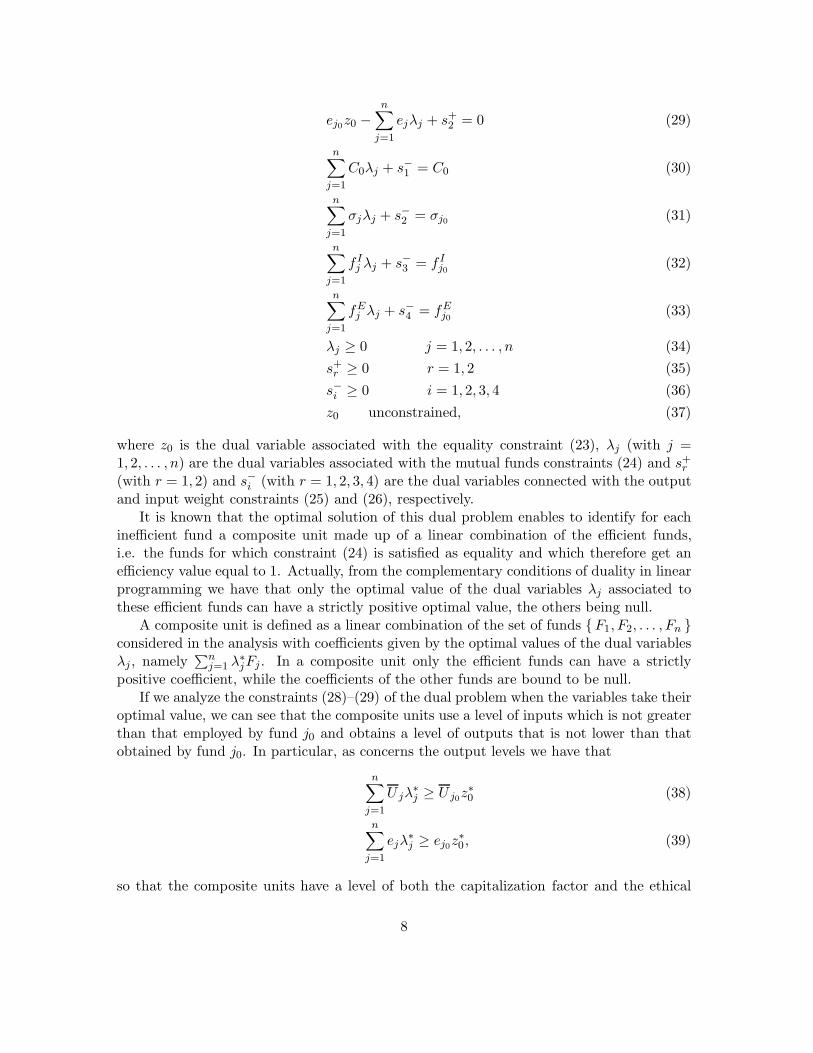
If we analyze the constraints (28)–(29) of the dual problem when the variables take theiroptimal value, we can see that the composite units use a level of inputs which is not greaterthan that employed by fund j0 and obtains a level of outputs that is not lower than thatobtained by fund j0. In particular, as concerns the output levels we have that
n∑
j=1
U jλ∗j ≥ U j0z
∗0 (38)
n∑
j=1
ejλ∗j ≥ ej0z
∗0 , (39)
so that the composite units have a level of both the capitalization factor and the ethical
8

indicator that is not lower than that of fund j0 multiplied by the optimal value z∗0 of thedual variable z0.
If fund j0 is radially efficient, then no other fund or combination of funds can increaseboth outputs without augmenting the value of the inputs and z∗0 = 1 (and all the more sofor the Pareto-Koopmans efficiency). On the contrary, if fund j0 is not radially efficientthen the optimal value of the objective function of both primal and dual linear problems isgreater than 1 and, given the non-Archimedean nature of ε (which is positive and smallerthan any positive valued real number), z∗0 will be greater than 1, too. In such a case thecomposite units give for both the capitalization factor and the ethical indicator a valuehigher than that of fund j0.
However, when investors choose the ethical level they desire a priori, we have that aconstraint is actually imposed on the fund chosen; indeed, in this case investors choose thefund that maximizes the return of their investment among all the funds that satisfy therequired ethical level. Formally, this entails that the ethical level has to be considered asan exogenously fixed output, so that a composite unit is required to have an ethical levelnot lower than that of fund j0
n∑
j=1
ejλ∗j ≥ ej0 (40)
and constraint (29) of the dual problem has to be substituted by the following constraint
n∑
j=1
ejλj − s+2 = ej0. (41)
Moreover, following the suggestion of Banker and Morey (1986), we relax the constrainton the weight u2 in the primal problem to a pure non negativity constraint; this entailsthat the coefficient of the slack variable s+
2 in the objective function of the dual problemvanishes.
The dual problem in the case of an exogenously fixed ethical level can therefore bewritten as follows
max z0 + εs+1 + ε
4∑
i=1
s−i (42)
subject to
U j0z0 −n
∑
j=1
U jλj + s+1 = 0 (43)
n∑
j=1
ejλj − s+2 = ej0 (44)
n∑
j=1
C0λj + s−1 = C0 (45)
n∑
j=1
σjλj + s−2 = σj0 (46)
9

n∑
j=1
f Ij λj + s−3 = f I
j0(47)
n∑
j=1
fEj λj + s−4 = fE
j0(48)
λj ≥ 0 j = 1, 2, . . . , n (49)
s+r ≥ 0 r = 1, 2 (50)
s−i ≥ 0 i = 1, 2, 3, 4 (51)
z0 unconstrained. (52)
Let us observe that from the dual of the dual problem (42)–(52) we can reconstruct theequivalent fractional programming problem DEA-SEef
max{ur ,vi}
u1U j0
v1C0 + v2σj0 + v3f Ij0
+ v4fEj0− u2ej0
(53)
subject to
u1U j
v1C0 + v2σj + v3f Ij + v4fE
j − u2ej
≤ 1 j = 1, 2, . . . , n (54)
u1 ≥ ε, u2 ≥ 0 (55)
vi ≥ ε i = 1, 2, 3, 4. (56)
The DEA performance measure for fund j0, Ij0,DEA−SEef , is the optimal value of theobjective function (53) and coincides with the reciprocal of the optimal value of the objectivefunction (42) of the linear dual problem (42)–(52).
If we compare the DEA model for ethical funds (42)–(52) with the exogenously fixedDEA model proposed in Basso and Funari (2003), it is apparent that the differences betweenthe two models lie in the expedient used to tackle the case of negative average rates ofreturns, which has lead to a special choice for the return indicator and to the use of theinitial capital as an additional input.
6 Connections among the efficiency measures
We may wonder which relation exists between the DEA scores obtained with the two modelsfor ethical mutual funds (17)–(20) and (53)–(56), and the one obtained with the DEA model(9)–(12) which ignores the ethical objective. The following theorems 1 and 2 answer thisquestion.
Theorem 1 Let Ij0,DEA−S, Ij0,DEA−SEef and Ij0,DEA−SE be the DEA performance mea-sures for fund j0 obtained by solving the DEA problems (9)–(12), (53)–(56) and (17)–(20),respectively. The following inequalities hold:
Ij0,DEA−S ≤ Ij0,DEA−SEef ≤ Ij0,DEA−SE. (57)
10
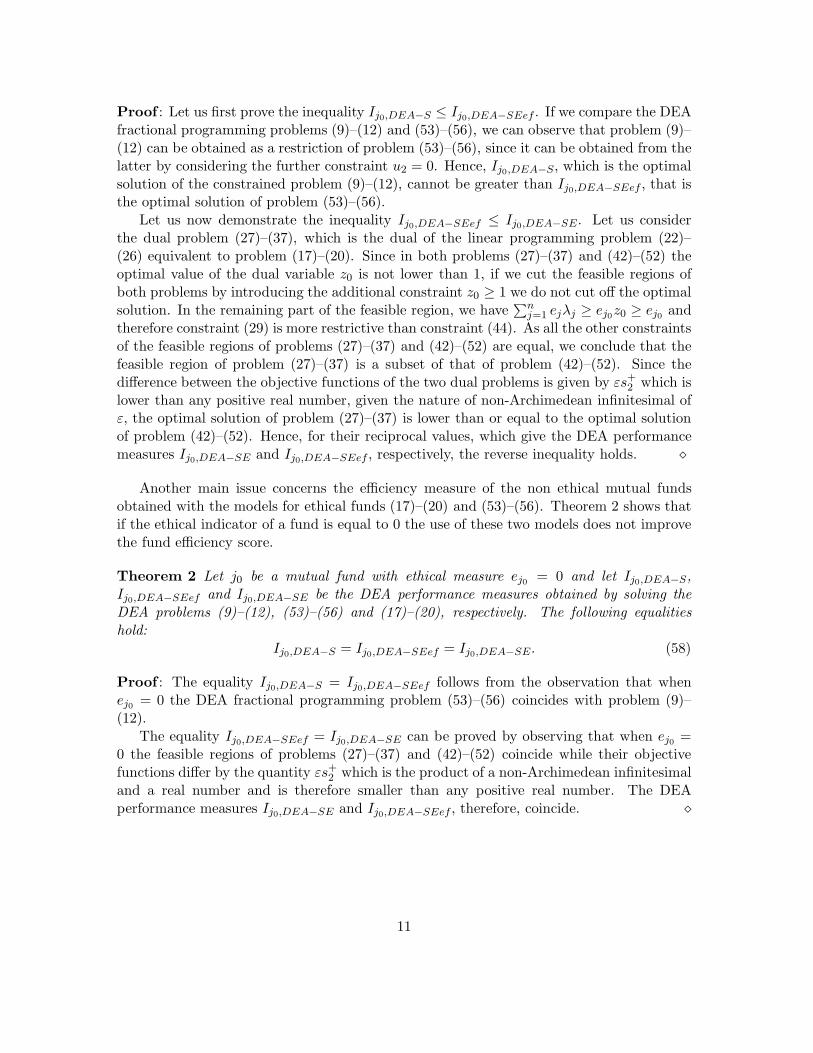
Proof : Let us first prove the inequality Ij0,DEA−S ≤ Ij0,DEA−SEef . If we compare the DEAfractional programming problems (9)–(12) and (53)–(56), we can observe that problem (9)–(12) can be obtained as a restriction of problem (53)–(56), since it can be obtained from thelatter by considering the further constraint u2 = 0. Hence, Ij0,DEA−S, which is the optimalsolution of the constrained problem (9)–(12), cannot be greater than Ij0,DEA−SEef , that isthe optimal solution of problem (53)–(56).
Let us now demonstrate the inequality Ij0,DEA−SEef ≤ Ij0,DEA−SE. Let us considerthe dual problem (27)–(37), which is the dual of the linear programming problem (22)–(26) equivalent to problem (17)–(20). Since in both problems (27)–(37) and (42)–(52) theoptimal value of the dual variable z0 is not lower than 1, if we cut the feasible regions ofboth problems by introducing the additional constraint z0 ≥ 1 we do not cut off the optimalsolution. In the remaining part of the feasible region, we have
∑nj=1 ejλj ≥ ej0z0 ≥ ej0 and
therefore constraint (29) is more restrictive than constraint (44). As all the other constraintsof the feasible regions of problems (27)–(37) and (42)–(52) are equal, we conclude that thefeasible region of problem (27)–(37) is a subset of that of problem (42)–(52). Since thedifference between the objective functions of the two dual problems is given by εs+
2 which islower than any positive real number, given the nature of non-Archimedean infinitesimal ofε, the optimal solution of problem (27)–(37) is lower than or equal to the optimal solutionof problem (42)–(52). Hence, for their reciprocal values, which give the DEA performancemeasures Ij0,DEA−SE and Ij0,DEA−SEef , respectively, the reverse inequality holds. ⋄
Another main issue concerns the efficiency measure of the non ethical mutual fundsobtained with the models for ethical funds (17)–(20) and (53)–(56). Theorem 2 shows thatif the ethical indicator of a fund is equal to 0 the use of these two models does not improvethe fund efficiency score.
Theorem 2 Let j0 be a mutual fund with ethical measure ej0 = 0 and let Ij0,DEA−S,Ij0,DEA−SEef and Ij0,DEA−SE be the DEA performance measures obtained by solving theDEA problems (9)–(12), (53)–(56) and (17)–(20), respectively. The following equalitieshold:
Ij0,DEA−S = Ij0,DEA−SEef = Ij0,DEA−SE. (58)
Proof : The equality Ij0,DEA−S = Ij0,DEA−SEef follows from the observation that whenej0 = 0 the DEA fractional programming problem (53)–(56) coincides with problem (9)–(12).
The equality Ij0,DEA−SEef = Ij0,DEA−SE can be proved by observing that when ej0 =0 the feasible regions of problems (27)–(37) and (42)–(52) coincide while their objectivefunctions differ by the quantity εs+
2 which is the product of a non-Archimedean infinitesimaland a real number and is therefore smaller than any positive real number. The DEAperformance measures Ij0,DEA−SE and Ij0,DEA−SEef , therefore, coincide. ⋄
11
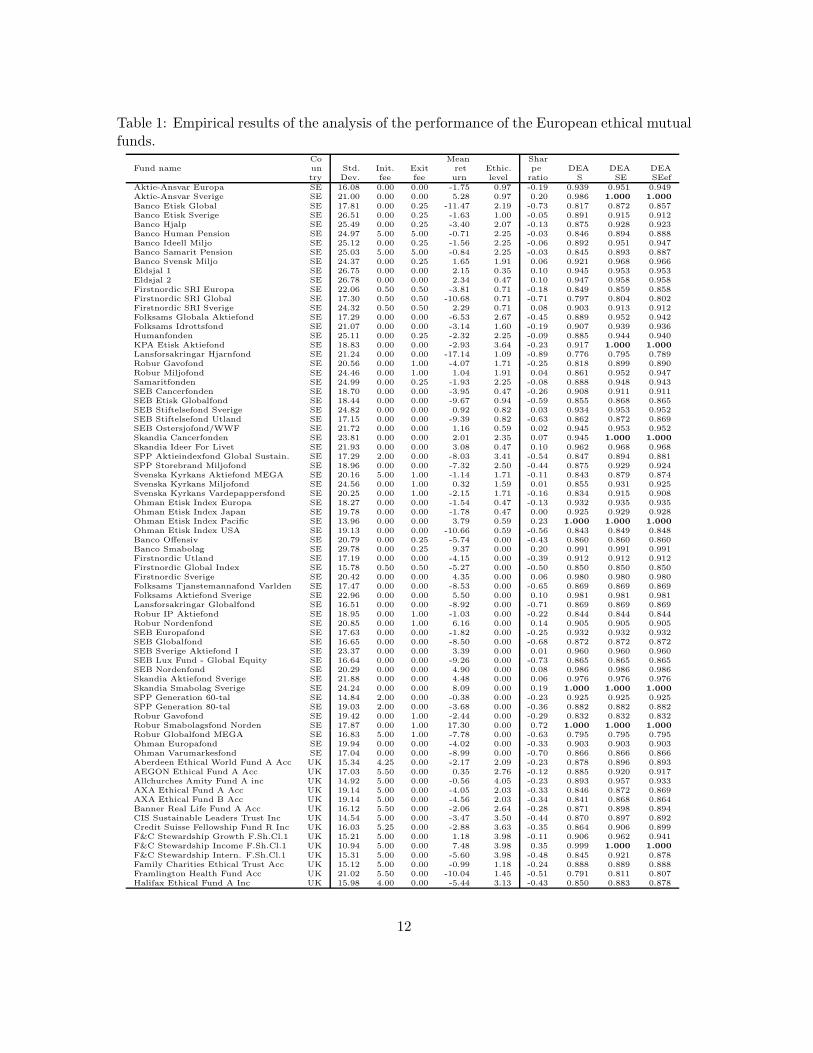
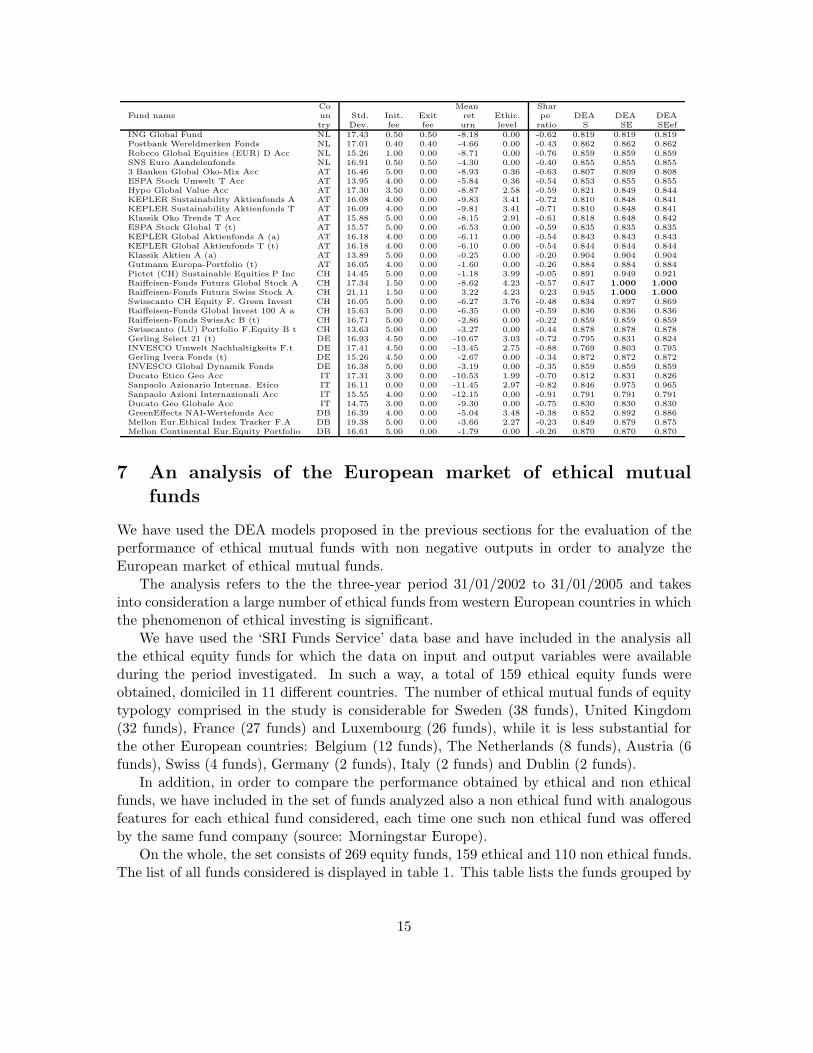
Table 1: Empirical results of the analysis of the performance of the European ethical mutualfunds.
Co Mean SharFund name un Std. Init. Exit ret Ethic. pe DEA DEA DEA
try Dev. fee fee urn level ratio S SE SEefAktie-Ansvar Europa SE 16.08 0.00 0.00 -1.75 0.97 -0.19 0.939 0.951 0.949Aktie-Ansvar Sverige SE 21.00 0.00 0.00 5.28 0.97 0.20 0.986 1.000 1.000
Banco Etisk Global SE 17.81 0.00 0.25 -11.47 2.19 -0.73 0.817 0.872 0.857Banco Etisk Sverige SE 26.51 0.00 0.25 -1.63 1.00 -0.05 0.891 0.915 0.912Banco Hjalp SE 25.49 0.00 0.25 -3.40 2.07 -0.13 0.875 0.928 0.923Banco Human Pension SE 24.97 5.00 5.00 -0.71 2.25 -0.03 0.846 0.894 0.888Banco Ideell Miljo SE 25.12 0.00 0.25 -1.56 2.25 -0.06 0.892 0.951 0.947Banco Samarit Pension SE 25.03 5.00 5.00 -0.84 2.25 -0.03 0.845 0.893 0.887Banco Svensk Miljo SE 24.37 0.00 0.25 1.65 1.91 0.06 0.921 0.968 0.966Eldsjal 1 SE 26.75 0.00 0.00 2.15 0.35 0.10 0.945 0.953 0.953Eldsjal 2 SE 26.78 0.00 0.00 2.34 0.47 0.10 0.947 0.958 0.958Firstnordic SRI Europa SE 22.06 0.50 0.50 -3.81 0.71 -0.18 0.849 0.859 0.858Firstnordic SRI Global SE 17.30 0.50 0.50 -10.68 0.71 -0.71 0.797 0.804 0.802Firstnordic SRI Sverige SE 24.32 0.50 0.50 2.29 0.71 0.08 0.903 0.913 0.912Folksams Globala Aktiefond SE 17.29 0.00 0.00 -6.53 2.67 -0.45 0.889 0.952 0.942Folksams Idrottsfond SE 21.07 0.00 0.00 -3.14 1.60 -0.19 0.907 0.939 0.936Humanfonden SE 25.11 0.00 0.25 -2.32 2.25 -0.09 0.885 0.944 0.940KPA Etisk Aktiefond SE 18.83 0.00 0.00 -2.93 3.64 -0.23 0.917 1.000 1.000
Lansforsakringar Hjarnfond SE 21.24 0.00 0.00 -17.14 1.09 -0.89 0.776 0.795 0.789Robur Gavofond SE 20.56 0.00 1.00 -4.07 1.71 -0.25 0.818 0.899 0.890Robur Miljofond SE 24.46 0.00 1.00 1.04 1.91 0.04 0.861 0.952 0.947Samaritfonden SE 24.99 0.00 0.25 -1.93 2.25 -0.08 0.888 0.948 0.943SEB Cancerfonden SE 18.70 0.00 0.00 -3.95 0.47 -0.26 0.908 0.911 0.911SEB Etisk Globalfond SE 18.44 0.00 0.00 -9.67 0.94 -0.59 0.855 0.868 0.865SEB Stiftelsefond Sverige SE 24.82 0.00 0.00 0.92 0.82 0.03 0.934 0.953 0.952SEB Stiftelsefond Utland SE 17.15 0.00 0.00 -9.39 0.82 -0.63 0.862 0.872 0.869SEB Ostersjofond/WWF SE 21.72 0.00 0.00 1.16 0.59 0.02 0.945 0.953 0.952Skandia Cancerfonden SE 23.81 0.00 0.00 2.01 2.35 0.07 0.945 1.000 1.000
Skandia Ideer For Livet SE 21.93 0.00 0.00 3.08 0.47 0.10 0.962 0.968 0.968SPP Aktieindexfond Global Sustain. SE 17.29 2.00 0.00 -8.03 3.41 -0.54 0.847 0.894 0.881SPP Storebrand Miljofond SE 18.96 0.00 0.00 -7.32 2.50 -0.44 0.875 0.929 0.924Svenska Kyrkans Aktiefond MEGA SE 20.16 5.00 1.00 -1.14 1.71 -0.11 0.843 0.879 0.874Svenska Kyrkans Miljofond SE 24.56 0.00 1.00 0.32 1.59 0.01 0.855 0.931 0.925Svenska Kyrkans Vardepappersfond SE 20.25 0.00 1.00 -2.15 1.71 -0.16 0.834 0.915 0.908Ohman Etisk Index Europa SE 18.27 0.00 0.00 -1.54 0.47 -0.13 0.932 0.935 0.935Ohman Etisk Index Japan SE 19.78 0.00 0.00 -1.78 0.47 0.00 0.925 0.929 0.928Ohman Etisk Index Pacific SE 13.96 0.00 0.00 3.79 0.59 0.23 1.000 1.000 1.000
Ohman Etisk Index USA SE 19.13 0.00 0.00 -10.66 0.59 -0.56 0.843 0.849 0.848Banco Offensiv SE 20.79 0.00 0.25 -5.74 0.00 -0.43 0.860 0.860 0.860Banco Smabolag SE 29.78 0.00 0.25 9.37 0.00 0.20 0.991 0.991 0.991Firstnordic Utland SE 17.19 0.00 0.00 -4.15 0.00 -0.39 0.912 0.912 0.912Firstnordic Global Index SE 15.78 0.50 0.50 -5.27 0.00 -0.50 0.850 0.850 0.850Firstnordic Sverige SE 20.42 0.00 0.00 4.35 0.00 0.06 0.980 0.980 0.980Folksams Tjanstemannafond Varlden SE 17.47 0.00 0.00 -8.53 0.00 -0.65 0.869 0.869 0.869Folksams Aktiefond Sverige SE 22.96 0.00 0.00 5.50 0.00 0.10 0.981 0.981 0.981Lansforsakringar Globalfond SE 16.51 0.00 0.00 -8.92 0.00 -0.71 0.869 0.869 0.869Robur IP Aktiefond SE 18.95 0.00 1.00 -1.03 0.00 -0.22 0.844 0.844 0.844Robur Nordenfond SE 20.85 0.00 1.00 6.16 0.00 0.14 0.905 0.905 0.905SEB Europafond SE 17.63 0.00 0.00 -1.82 0.00 -0.25 0.932 0.932 0.932SEB Globalfond SE 16.65 0.00 0.00 -8.50 0.00 -0.68 0.872 0.872 0.872SEB Sverige Aktiefond I SE 23.37 0.00 0.00 3.39 0.00 0.01 0.960 0.960 0.960SEB Lux Fund - Global Equity SE 16.64 0.00 0.00 -9.26 0.00 -0.73 0.865 0.865 0.865SEB Nordenfond SE 20.29 0.00 0.00 4.90 0.00 0.08 0.986 0.986 0.986Skandia Aktiefond Sverige SE 21.88 0.00 0.00 4.48 0.00 0.06 0.976 0.976 0.976Skandia Smabolag Sverige SE 24.24 0.00 0.00 8.09 0.00 0.19 1.000 1.000 1.000
SPP Generation 60-tal SE 14.84 2.00 0.00 -0.38 0.00 -0.23 0.925 0.925 0.925SPP Generation 80-tal SE 19.03 2.00 0.00 -3.68 0.00 -0.36 0.882 0.882 0.882Robur Gavofond SE 19.42 0.00 1.00 -2.44 0.00 -0.29 0.832 0.832 0.832Robur Smabolagsfond Norden SE 17.87 0.00 1.00 17.30 0.00 0.72 1.000 1.000 1.000
Robur Globalfond MEGA SE 16.83 5.00 1.00 -7.78 0.00 -0.63 0.795 0.795 0.795Ohman Europafond SE 19.94 0.00 0.00 -4.02 0.00 -0.33 0.903 0.903 0.903Ohman Varumarkesfond SE 17.04 0.00 0.00 -8.99 0.00 -0.70 0.866 0.866 0.866Aberdeen Ethical World Fund A Acc UK 15.34 4.25 0.00 -2.17 2.09 -0.23 0.878 0.896 0.893AEGON Ethical Fund A Acc UK 17.03 5.50 0.00 0.35 2.76 -0.12 0.885 0.920 0.917Allchurches Amity Fund A inc UK 14.92 5.00 0.00 -0.56 4.05 -0.23 0.893 0.957 0.933AXA Ethical Fund A Acc UK 19.14 5.00 0.00 -4.05 2.03 -0.33 0.846 0.872 0.869AXA Ethical Fund B Acc UK 19.14 5.00 0.00 -4.56 2.03 -0.34 0.841 0.868 0.864Banner Real Life Fund A Acc UK 16.12 5.50 0.00 -2.06 2.64 -0.28 0.871 0.898 0.894CIS Sustainable Leaders Trust Inc UK 14.54 5.00 0.00 -3.47 3.50 -0.44 0.870 0.897 0.892Credit Suisse Fellowship Fund R Inc UK 16.03 5.25 0.00 -2.88 3.63 -0.35 0.864 0.906 0.899F&C Stewardship Growth F.Sh.Cl.1 UK 15.21 5.00 0.00 1.18 3.98 -0.11 0.906 0.962 0.941F&C Stewardship Income F.Sh.Cl.1 UK 10.94 5.00 0.00 7.48 3.98 0.35 0.999 1.000 1.000
F&C Stewardship Intern. F.Sh.Cl.1 UK 15.31 5.00 0.00 -5.60 3.98 -0.48 0.845 0.921 0.878Family Charities Ethical Trust Acc UK 15.12 5.00 0.00 -0.99 1.18 -0.24 0.888 0.889 0.888Framlington Health Fund Acc UK 21.02 5.50 0.00 -10.04 1.45 -0.51 0.791 0.811 0.807Halifax Ethical Fund A Inc UK 15.98 4.00 0.00 -5.44 3.13 -0.43 0.850 0.883 0.878
12

Co Mean SharFund name un Std. Init. Exit ret Ethic. pe DEA DEA DEA
try Dev. fee fee urn level ratio S SE SEefHenderson Ethical Fund A Inc UK 16.67 5.00 0.00 -9.88 4.22 -0.69 0.797 0.916 0.866Henderson Global Care Growth Fund UK 16.89 4.50 0.00 -9.45 4.70 -0.65 0.806 1.000 0.933Henderson Global Care Income Fund UK 13.92 4.50 0.00 -2.93 4.70 -0.33 0.879 1.000 1.000
Insight Investment Europ. Ethical F. UK 14.39 5.25 0.00 0.22 3.19 -0.19 0.904 0.925 0.922Insight Investment Evergreen Fund UK 15.12 5.25 0.00 -3.98 2.89 -0.35 0.861 0.884 0.879Jupiter Ecology Fund Inc UK 19.10 5.00 0.00 -7.17 4.70 -0.43 0.818 1.000 0.956Jupiter Environmental Opportunities F. UK 16.33 5.25 0.00 0.53 4.35 -0.12 0.892 0.990 0.984Legal & General Ethical Trust Acc UK 18.03 0.00 0.00 -2.03 2.03 -0.23 0.929 0.969 0.968Morley Sustain.Future Abs.Growth F.1 UK 19.73 4.00 0.00 -5.59 3.62 -0.32 0.840 0.890 0.883Morley Sustain.Future Eur.Growth F.1 UK 15.89 4.00 0.00 -1.84 3.62 -0.20 0.883 0.922 0.918Morley Sustain.Fut. Global Growth F.1 UK 15.47 4.00 0.00 -10.74 3.62 -0.82 0.804 0.859 0.835Morley Sustain.Future UK Growth F.1 UK 16.52 4.00 0.00 -2.27 3.62 -0.30 0.877 0.918 0.914Old Mutual Ethical Fund A Acc UK 16.30 4.00 0.00 -0.85 2.95 -0.21 0.890 0.922 0.918Prudential Ethical Trust Acc UK 16.09 4.75 0.00 -0.65 1.29 -0.19 0.883 0.895 0.893Scottish Widows Environ. Investor UK 17.68 5.00 0.00 -10.82 2.85 -0.76 0.786 0.824 0.817Scottish Widows Ethical Fund Acc UK 13.76 5.00 0.00 -4.03 2.24 -0.50 0.870 0.875 0.872Sovereign Ethical Fund Inc UK 16.74 5.50 0.00 -3.56 2.41 -0.36 0.853 0.881 0.877Standard Life UK Ethical Fund R Acc UK 15.08 4.00 0.00 0.24 3.92 -0.16 0.904 0.952 0.941AEGON UK Equity Fund A Acc UK 14.07 5.50 0.00 1.26 0.00 -0.18 0.916 0.916 0.916Allchurches UK Equity Growth Fund UK 14.16 5.00 0.00 5.47 0.00 0.10 0.953 0.953 0.953AXA UK Equity Income A Acc UK 15.36 5.00 0.00 6.32 0.00 0.15 0.951 0.951 0.951CIS UK Growth Trust Inc UK 13.86 5.00 0.00 1.38 0.00 -0.19 0.919 0.919 0.919Credit Suisse UK Mid 250 Fund R UK 16.94 5.25 0.00 5.39 0.00 0.08 0.931 0.931 0.931F&C UK Growth & Income F.Sh.Cl.1 UK 14.57 5.00 0.00 2.59 0.00 -0.10 0.924 0.924 0.924F&C UK Equity Income Share Cl.1 UK 13.82 5.00 0.00 3.10 0.00 -0.07 0.935 0.935 0.935F&C UK Global Growth F.Share Cl.1 UK 15.23 5.00 0.00 -5.14 0.00 -0.52 0.850 0.850 0.850Family Asset Trust Acc UK 14.20 6.00 0.00 2.14 0.00 -0.13 0.923 0.923 0.923Halifax International Growth Fund A UK 16.67 4.00 0.00 -1.04 0.00 -0.22 0.888 0.888 0.888Henderson International Fund A Acc UK 16.95 5.00 0.00 -3.34 0.00 -0.34 0.854 0.854 0.854Insight Invest.UK Equity Inc.Port.F.A UK 12.55 5.25 0.00 7.15 0.00 0.24 0.982 0.982 0.982Insight Investment Global Equity F.A UK 17.82 5.25 0.00 -2.27 0.00 -0.27 0.859 0.859 0.859Jupiter Global Opportunities Fund Inc UK 14.44 5.25 0.00 8.51 0.00 0.39 0.978 0.978 0.978Jupiter UK Smaller Companies Fund UK 17.46 5.25 0.00 13.75 0.00 0.52 1.000 1.000 1.000
Legal & General Equity Trust E UK 14.52 0.00 5.00 0.91 0.00 -0.20 0.954 0.954 0.954Morley European Focus Fund 1 Acc UK 18.75 5.00 0.00 5.51 0.00 0.09 0.930 0.930 0.930Morley Global Theme Fund 1 Acc UK 14.49 5.00 0.00 -2.73 0.00 -0.36 0.877 0.877 0.877Morley UK Focus Fund 1 Acc UK 18.01 5.00 0.00 7.59 0.00 0.20 0.948 0.948 0.948Old Mutual UK Equity Acc UK 13.63 3.00 0.00 4.66 0.00 0.04 0.962 0.962 0.962Prudential UK Growth Trust Inc UK 14.85 5.50 0.00 -0.02 0.00 -0.27 0.898 0.898 0.898Scottish Widows UK Equity Income UK 12.01 5.00 0.00 5.13 0.00 0.10 0.968 0.968 0.968Scottish Widows UK Growth Fund UK 12.53 5.00 0.00 3.86 0.00 0.00 0.952 0.952 0.952Sovereign UK Growth Fund Inc UK 15.71 5.50 0.00 2.12 0.00 -0.12 0.911 0.911 0.911Standard Life UK Equity Growth F.R UK 14.34 4.00 0.00 3.12 0.00 -0.05 0.932 0.932 0.932CA-AM Activaleurs Durables FR 20.12 0.00 0.00 -7.94 3.04 -0.43 0.865 0.935 0.929CLAM Euro Develop. Durable C FR 20.74 2.00 0.00 -5.36 2.46 -0.29 0.861 0.892 0.889Credit Mutuel Valeurs Ethiques C FR 19.82 2.75 0.00 -4.77 1.70 -0.28 0.860 0.881 0.878Ecureuil 1 2 3Futur D FR 19.48 2.00 0.00 -5.31 1.59 -0.31 0.865 0.881 0.878Epargne Ethique Actions FR 19.16 2.00 0.00 -6.31 3.33 -0.37 0.857 0.897 0.892Ethiciel C FR 19.72 2.50 0.00 -2.36 1.91 -0.15 0.885 0.907 0.905Ethique et Partage C FR 16.92 0.00 0.00 -7.21 2.86 -0.50 0.883 0.968 0.961Etoile Environnement C FR 22.22 2.00 0.00 -6.48 1.05 -0.30 0.848 0.863 0.861Etoile Partenaires FR 21.50 2.00 0.00 -4.20 1.05 -0.20 0.869 0.883 0.882Euro-Mid-Cap Active Investors C FR 20.02 5.00 0.00 -8.93 2.51 -0.49 0.803 0.836 0.830Europe Croissance Develop.Durable FR 19.20 5.00 0.25 -3.90 2.09 -0.25 0.838 0.867 0.863Europe Gouvernance C FR 19.07 3.00 0.50 -4.52 1.18 -0.29 0.826 0.843 0.840EuroSocietale C FR 21.67 3.00 0.50 -3.36 1.64 -0.16 0.837 0.859 0.856Federal Actions Ethiques FR 22.40 3.00 0.00 -5.85 0.55 -0.27 0.846 0.853 0.852Generation Ethique C FR 22.42 3.00 0.00 -7.22 2.40 -0.34 0.833 0.866 0.861HSBC AM Valeurs Responsables FR 19.16 3.00 0.00 -3.66 1.95 -0.24 0.869 0.892 0.889Insertion-Emplois D FR 17.54 0.00 0.00 -6.27 1.48 -0.42 0.890 0.917 0.914IXIS Euro 21 FR 21.89 2.00 0.00 -5.87 2.35 -0.28 0.854 0.886 0.882Macif Croissance Durable C FR 18.24 4.00 2.00 -2.77 2.82 -0.21 0.829 0.888 0.881Macif Croissance Durable Europe C FR 19.49 2.00 0.00 -6.12 2.82 -0.36 0.858 0.891 0.886MAM Actions Environnement C FR 15.16 2.00 1.00 -4.69 0.66 -0.40 0.837 0.839 0.838MAM Actions Ethique C FR 27.35 2.00 1.00 -6.24 2.31 -0.19 0.799 0.857 0.847MG Croissance Durable Europe FR 19.48 2.00 0.00 -6.78 2.82 -0.40 0.852 0.885 0.880Objectif Ethique Socialement Resp. FR 17.13 4.00 1.00 -2.57 1.77 -0.21 0.837 0.868 0.863Robeco Hommes Terre Expansion FR 15.68 3.00 0.50 -10.14 4.02 -0.76 0.791 0.903 0.856Sarasin Euro Mid-Caps Exp.Dur.C FR 22.29 2.00 0.00 4.11 1.91 0.19 0.944 0.971 0.970SGAM Invest Develop. Durable C FR 18.65 5.00 0.00 -5.59 2.82 -0.36 0.832 0.869 0.864CA-AM Actions Euroland C FR 19.11 2.50 0.00 -4.80 0.00 -0.39 0.865 0.865 0.865CLAM Actions Euro C FR 19.49 5.00 0.00 -3.18 0.00 -0.29 0.853 0.853 0.853Credit Mutuel Europe Actions C FR 16.64 2.75 0.00 -5.13 0.00 -0.47 0.866 0.866 0.866Ecureuil Actions Europeennes D FR 18.83 2.00 0.00 -3.47 0.00 -0.32 0.884 0.884 0.884Ecofi European Stocks C FR 16.26 4.00 0.00 -5.15 0.00 -0.48 0.852 0.852 0.852Amplitude Europe C FR 18.33 2.50 0.00 -5.40 0.00 -0.44 0.862 0.862 0.862MAM Actions Europe C FR 18.50 2.00 1.00 -3.48 0.00 -0.32 0.823 0.823 0.823Etoile Index Euro C FR 20.87 2.00 0.00 -4.44 0.00 -0.33 0.869 0.869 0.869Groupama Euro Stock C FR 18.25 2.75 0.00 -0.82 0.00 -0.19 0.900 0.900 0.900Federal Epargne Actions FR 16.62 1.00 0.00 0.91 0.00 -0.10 0.945 0.945 0.945
13
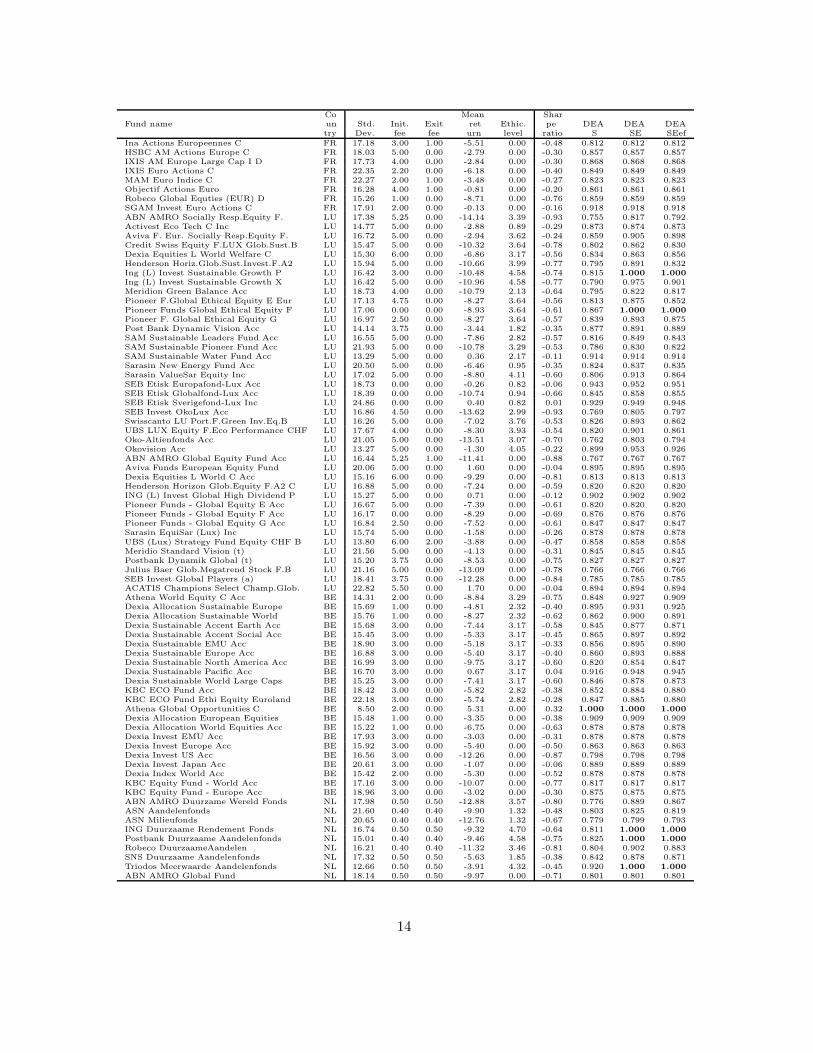
Co Mean SharFund name un Std. Init. Exit ret Ethic. pe DEA DEA DEA
try Dev. fee fee urn level ratio S SE SEefIna Actions Europeennes C FR 17.18 3.00 1.00 -5.51 0.00 -0.48 0.812 0.812 0.812HSBC AM Actions Europe C FR 18.03 5.00 0.00 -2.79 0.00 -0.30 0.857 0.857 0.857IXIS AM Europe Large Cap I D FR 17.73 4.00 0.00 -2.84 0.00 -0.30 0.868 0.868 0.868IXIS Euro Actions C FR 22.35 2.20 0.00 -6.18 0.00 -0.40 0.849 0.849 0.849MAM Euro Indice C FR 22.27 2.00 1.00 -3.48 0.00 -0.27 0.823 0.823 0.823Objectif Actions Euro FR 16.28 4.00 1.00 -0.81 0.00 -0.20 0.861 0.861 0.861Robeco Global Equties (EUR) D FR 15.26 1.00 0.00 -8.71 0.00 -0.76 0.859 0.859 0.859SGAM Invest Euro Actions C FR 17.91 2.00 0.00 -0.13 0.00 -0.16 0.918 0.918 0.918ABN AMRO Socially Resp.Equity F. LU 17.38 5.25 0.00 -14.14 3.39 -0.93 0.755 0.817 0.792Activest Eco Tech C Inc LU 14.77 5.00 0.00 -2.88 0.89 -0.29 0.873 0.874 0.873Aviva F. Eur. Socially Resp.Equity F. LU 16.72 5.00 0.00 -2.94 3.62 -0.24 0.859 0.905 0.898Credit Swiss Equity F.LUX Glob.Sust.B LU 15.47 5.00 0.00 -10.32 3.64 -0.78 0.802 0.862 0.830Dexia Equities L World Welfare C LU 15.30 6.00 0.00 -6.86 3.17 -0.56 0.834 0.863 0.856Henderson Horiz.Glob.Sust.Invest.F.A2 LU 15.94 5.00 0.00 -10.66 3.99 -0.77 0.795 0.891 0.832Ing (L) Invest Sustainable Growth P LU 16.42 3.00 0.00 -10.48 4.58 -0.74 0.815 1.000 1.000
Ing (L) Invest Sustainable Growth X LU 16.42 5.00 0.00 -10.96 4.58 -0.77 0.790 0.975 0.901Meridion Green Balance Acc LU 18.73 4.00 0.00 -10.79 2.13 -0.64 0.795 0.822 0.817Pioneer F.Global Ethical Equity E Eur LU 17.13 4.75 0.00 -8.27 3.64 -0.56 0.813 0.875 0.852Pioneer Funds Global Ethical Equity F LU 17.06 0.00 0.00 -8.93 3.64 -0.61 0.867 1.000 1.000
Pioneer F. Global Ethical Equity G LU 16.97 2.50 0.00 -8.27 3.64 -0.57 0.839 0.893 0.875Post Bank Dynamic Vision Acc LU 14.14 3.75 0.00 -3.44 1.82 -0.35 0.877 0.891 0.889SAM Sustainable Leaders Fund Acc LU 16.55 5.00 0.00 -7.86 2.82 -0.57 0.816 0.849 0.843SAM Sustainable Pioneer Fund Acc LU 21.93 5.00 0.00 -10.78 3.29 -0.53 0.786 0.830 0.822SAM Sustainable Water Fund Acc LU 13.29 5.00 0.00 0.36 2.17 -0.11 0.914 0.914 0.914Sarasin New Energy Fund Acc LU 20.50 5.00 0.00 -6.46 0.95 -0.35 0.824 0.837 0.835Sarasin ValueSar Equity Inc LU 17.02 5.00 0.00 -8.80 4.11 -0.60 0.806 0.913 0.864SEB Etisk Europafond-Lux Acc LU 18.73 0.00 0.00 -0.26 0.82 -0.06 0.943 0.952 0.951SEB Etisk Globalfond-Lux Acc LU 18.39 0.00 0.00 -10.74 0.94 -0.66 0.845 0.858 0.855SEB Etisk Sverigefond-Lux Inc LU 24.86 0.00 0.00 0.40 0.82 0.01 0.929 0.949 0.948SEB Invest OkoLux Acc LU 16.86 4.50 0.00 -13.62 2.99 -0.93 0.769 0.805 0.797Swisscanto LU Port.F.Green Inv.Eq.B LU 16.26 5.00 0.00 -7.02 3.76 -0.53 0.826 0.893 0.862UBS LUX Equity F.Eco Performance CHF LU 17.67 4.00 0.00 -8.30 3.93 -0.54 0.820 0.901 0.861Oko-Altienfonds Acc LU 21.05 5.00 0.00 -13.51 3.07 -0.70 0.762 0.803 0.794Okovision Acc LU 13.27 5.00 0.00 -1.30 4.05 -0.22 0.899 0.953 0.926ABN AMRO Global Equity Fund Acc LU 16.44 5.25 1.00 -11.41 0.00 -0.88 0.767 0.767 0.767Aviva Funds European Equity Fund LU 20.06 5.00 0.00 1.60 0.00 -0.04 0.895 0.895 0.895Dexia Equities L World C Acc LU 15.16 6.00 0.00 -9.29 0.00 -0.81 0.813 0.813 0.813Henderson Horizon Glob.Equity F.A2 C LU 16.88 5.00 0.00 -7.24 0.00 -0.59 0.820 0.820 0.820ING (L) Invest Global High Dividend P LU 15.27 5.00 0.00 0.71 0.00 -0.12 0.902 0.902 0.902Pioneer Funds - Global Equity E Acc LU 16.67 5.00 0.00 -7.39 0.00 -0.61 0.820 0.820 0.820Pioneer Funds - Global Equity F Acc LU 16.17 0.00 0.00 -8.29 0.00 -0.69 0.876 0.876 0.876Pioneer Funds - Global Equity G Acc LU 16.84 2.50 0.00 -7.52 0.00 -0.61 0.847 0.847 0.847Sarasin EquiSar (Lux) Inc LU 15.74 5.00 0.00 -1.58 0.00 -0.26 0.878 0.878 0.878UBS (Lux) Strategy Fund Equity CHF B LU 13.80 6.00 2.00 -3.88 0.00 -0.47 0.858 0.858 0.858Meridio Standard Vision (t) LU 21.56 5.00 0.00 -4.13 0.00 -0.31 0.845 0.845 0.845Postbank Dynamik Global (t) LU 15.20 3.75 0.00 -8.53 0.00 -0.75 0.827 0.827 0.827Julius Baer Glob.Megatrend Stock F.B LU 21.16 5.00 0.00 -13.09 0.00 -0.78 0.766 0.766 0.766SEB Invest Global Players (a) LU 18.41 3.75 0.00 -12.28 0.00 -0.84 0.785 0.785 0.785ACATIS Champions Select Champ.Glob. LU 22.82 5.50 0.00 1.70 0.00 -0.04 0.894 0.894 0.894Athena World Equity C Acc BE 14.31 2.00 0.00 -8.84 3.29 -0.75 0.848 0.927 0.909Dexia Allocation Sustainable Europe BE 15.69 1.00 0.00 -4.81 2.32 -0.40 0.895 0.931 0.925Dexia Allocation Sustainable World BE 15.76 1.00 0.00 -8.27 2.32 -0.62 0.862 0.900 0.891Dexia Sustainable Accent Earth Acc BE 15.68 3.00 0.00 -7.44 3.17 -0.58 0.845 0.877 0.871Dexia Sustainable Accent Social Acc BE 15.45 3.00 0.00 -5.33 3.17 -0.45 0.865 0.897 0.892Dexia Sustainable EMU Acc BE 18.90 3.00 0.00 -5.18 3.17 -0.33 0.856 0.895 0.890Dexia Sustainable Europe Acc BE 16.88 3.00 0.00 -5.40 3.17 -0.40 0.860 0.893 0.888Dexia Sustainable North America Acc BE 16.99 3.00 0.00 -9.75 3.17 -0.60 0.820 0.854 0.847Dexia Sustainable Pacific Acc BE 16.70 3.00 0.00 0.67 3.17 0.04 0.916 0.948 0.945Dexia Sustainable World Large Caps BE 15.25 3.00 0.00 -7.41 3.17 -0.60 0.846 0.878 0.873KBC ECO Fund Acc BE 18.42 3.00 0.00 -5.82 2.82 -0.38 0.852 0.884 0.880KBC ECO Fund Ethi Equity Euroland BE 22.18 3.00 0.00 -5.74 2.82 -0.28 0.847 0.885 0.880Athena Global Opportunities C BE 8.50 2.00 0.00 5.31 0.00 0.32 1.000 1.000 1.000
Dexia Allocation European Equities BE 15.48 1.00 0.00 -3.35 0.00 -0.38 0.909 0.909 0.909Dexia Allocation World Equities Acc BE 15.22 1.00 0.00 -6.75 0.00 -0.63 0.878 0.878 0.878Dexia Invest EMU Acc BE 17.93 3.00 0.00 -3.03 0.00 -0.31 0.878 0.878 0.878Dexia Invest Europe Acc BE 15.92 3.00 0.00 -5.40 0.00 -0.50 0.863 0.863 0.863Dexia Invest US Acc BE 16.56 3.00 0.00 -12.26 0.00 -0.87 0.798 0.798 0.798Dexia Invest Japan Acc BE 20.61 3.00 0.00 -1.07 0.00 -0.06 0.889 0.889 0.889Dexia Index World Acc BE 15.42 2.00 0.00 -5.30 0.00 -0.52 0.878 0.878 0.878KBC Equity Fund - World Acc BE 17.16 3.00 0.00 -10.07 0.00 -0.77 0.817 0.817 0.817KBC Equity Fund - Europe Acc BE 18.96 3.00 0.00 -3.02 0.00 -0.30 0.875 0.875 0.875ABN AMRO Duurzame Wereld Fonds NL 17.98 0.50 0.50 -12.88 3.57 -0.80 0.776 0.889 0.867ASN Aandelenfonds NL 21.60 0.40 0.40 -9.90 1.32 -0.48 0.803 0.825 0.819ASN Milieufonds NL 20.65 0.40 0.40 -12.76 1.32 -0.67 0.779 0.799 0.793ING Duurzaame Rendement Fonds NL 16.74 0.50 0.50 -9.32 4.70 -0.64 0.811 1.000 1.000
Postbank Duurzaame Aandelenfonds NL 15.01 0.40 0.40 -9.46 4.58 -0.75 0.825 1.000 1.000
Robeco DuurzaameAandelen NL 16.21 0.40 0.40 -11.32 3.46 -0.81 0.804 0.902 0.883SNS Duurzaame Aandelenfonds NL 17.32 0.50 0.50 -5.63 1.85 -0.38 0.842 0.878 0.871Triodos Meerwaarde Aandelenfonds NL 12.66 0.50 0.50 -3.91 4.32 -0.45 0.920 1.000 1.000
ABN AMRO Global Fund NL 18.14 0.50 0.50 -9.97 0.00 -0.71 0.801 0.801 0.801
14
Co Mean SharFund name un Std. Init. Exit ret Ethic. pe DEA DEA DEA
try Dev. fee fee urn level ratio S SE SEefING Global Fund NL 17.43 0.50 0.50 -8.18 0.00 -0.62 0.819 0.819 0.819Postbank Wereldmerken Fonds NL 17.01 0.40 0.40 -4.66 0.00 -0.43 0.862 0.862 0.862Robeco Global Equities (EUR) D Acc NL 15.26 1.00 0.00 -8.71 0.00 -0.76 0.859 0.859 0.859SNS Euro Aandelenfonds NL 16.91 0.50 0.50 -4.30 0.00 -0.40 0.855 0.855 0.8553 Banken Global Oko-Mix Acc AT 16.46 5.00 0.00 -8.93 0.36 -0.63 0.807 0.809 0.808ESPA Stock Umwelt T Acc AT 13.95 4.00 0.00 -5.84 0.36 -0.54 0.853 0.855 0.855Hypo Global Value Acc AT 17.30 3.50 0.00 -8.87 2.58 -0.59 0.821 0.849 0.844KEPLER Sustainability Aktienfonds A AT 16.08 4.00 0.00 -9.83 3.41 -0.72 0.810 0.848 0.841KEPLER Sustainability Aktienfonds T AT 16.09 4.00 0.00 -9.81 3.41 -0.71 0.810 0.848 0.841Klassik Oko Trends T Acc AT 15.88 5.00 0.00 -8.15 2.91 -0.61 0.818 0.848 0.842ESPA Stock Global T (t) AT 15.57 5.00 0.00 -6.53 0.00 -0.59 0.835 0.835 0.835KEPLER Global Aktienfonds A (a) AT 16.18 4.00 0.00 -6.11 0.00 -0.54 0.843 0.843 0.843KEPLER Global Aktienfonds T (t) AT 16.18 4.00 0.00 -6.10 0.00 -0.54 0.844 0.844 0.844Klassik Aktien A (a) AT 13.89 5.00 0.00 -0.25 0.00 -0.20 0.904 0.904 0.904Gutmann Europa-Portfolio (t) AT 16.05 4.00 0.00 -1.60 0.00 -0.26 0.884 0.884 0.884Pictet (CH) Sustainable Equities P Inc CH 14.45 5.00 0.00 -1.18 3.99 -0.05 0.891 0.949 0.921Raiffeisen-Fonds Futura Global Stock A CH 17.34 1.50 0.00 -8.62 4.23 -0.57 0.847 1.000 1.000
Raiffeisen-Fonds Futura Swiss Stock A CH 21.11 1.50 0.00 3.22 4.23 0.23 0.945 1.000 1.000
Swisscanto CH Equity F. Green Invest CH 16.05 5.00 0.00 -6.27 3.76 -0.48 0.834 0.897 0.869Raiffeisen-Fonds Global Invest 100 A a CH 15.63 5.00 0.00 -6.35 0.00 -0.59 0.836 0.836 0.836Raiffeisen-Fonds SwissAc B (t) CH 16.71 5.00 0.00 -2.86 0.00 -0.22 0.859 0.859 0.859Swisscanto (LU) Portfolio F.Equity B t CH 13.63 5.00 0.00 -3.27 0.00 -0.44 0.878 0.878 0.878Gerling Select 21 (t) DE 16.93 4.50 0.00 -10.67 3.03 -0.72 0.795 0.831 0.824INVESCO Umwelt Nachhaltigkeits F.t DE 17.41 4.50 0.00 -13.45 2.75 -0.88 0.769 0.803 0.795Gerling Ivera Fonds (t) DE 15.26 4.50 0.00 -2.67 0.00 -0.34 0.872 0.872 0.872INVESCO Global Dynamik Fonds DE 16.38 5.00 0.00 -3.19 0.00 -0.35 0.859 0.859 0.859Ducato Etico Geo Acc IT 17.31 3.00 0.00 -10.53 1.99 -0.70 0.812 0.831 0.826Sanpaolo Azionario Internaz. Etico IT 16.11 0.00 0.00 -11.45 2.97 -0.82 0.846 0.975 0.965Sanpaolo Azioni Internazionali Acc IT 15.55 4.00 0.00 -12.15 0.00 -0.91 0.791 0.791 0.791Ducato Geo Globale Acc IT 14.75 3.00 0.00 -9.30 0.00 -0.75 0.830 0.830 0.830GreenEffects NAI-Wertefonds Acc DB 16.39 4.00 0.00 -5.04 3.48 -0.38 0.852 0.892 0.886Mellon Eur.Ethical Index Tracker F.A DB 19.38 5.00 0.00 -3.66 2.27 -0.23 0.849 0.879 0.875Mellon Continental Eur.Equity Portfolio DB 16.61 5.00 0.00 -1.79 0.00 -0.26 0.870 0.870 0.870
7 An analysis of the European market of ethical mutual
funds
We have used the DEA models proposed in the previous sections for the evaluation of theperformance of ethical mutual funds with non negative outputs in order to analyze theEuropean market of ethical mutual funds.
The analysis refers to the the three-year period 31/01/2002 to 31/01/2005 and takesinto consideration a large number of ethical funds from western European countries in whichthe phenomenon of ethical investing is significant.
We have used the ‘SRI Funds Service’ data base and have included in the analysis allthe ethical equity funds for which the data on input and output variables were availableduring the period investigated. In such a way, a total of 159 ethical equity funds wereobtained, domiciled in 11 different countries. The number of ethical mutual funds of equitytypology comprised in the study is considerable for Sweden (38 funds), United Kingdom(32 funds), France (27 funds) and Luxembourg (26 funds), while it is less substantial forthe other European countries: Belgium (12 funds), The Netherlands (8 funds), Austria (6funds), Swiss (4 funds), Germany (2 funds), Italy (2 funds) and Dublin (2 funds).
In addition, in order to compare the performance obtained by ethical and non ethicalfunds, we have included in the set of funds analyzed also a non ethical fund with analogousfeatures for each ethical fund considered, each time one such non ethical fund was offeredby the same fund company (source: Morningstar Europe).
On the whole, the set consists of 269 equity funds, 159 ethical and 110 non ethical funds.The list of all funds considered is displayed in table 1. This table lists the funds grouped by
15
country (SE=Sweden, UK=United Kingdom, FR=France, LU=Luxembourg, BE=Belgium,NL=The Netherlands, AT=Austria, CH=Switzerland, DE=Germany, IT=Italy, DB=Dublin),arranging the ethical funds first (those with a strictly positive value for the ethical level).
Table 1 reports also the relevant data for each fund and the results of the analysiscarried out. In particular, the table reports the rate of return and the volatility of eachfund, computed as per cent values on an annual base, the initial and exit fees and the ethicalmeasure (16), computed by using the weights ωN = ωP = 2 and ωC = 1 (notice that thischoice of the weights stresses the screening activity of the ethical funds). In the analysis,the initial capital invested has been set equal to 1 for each fund.
The last columns of table 1 show the performance measure obtained using the Sharperatio (see Sharpe, 1966)
Ij,Sharpe =Rj − r
σj
(59)
and the DEA performance measures IDEA−S, IDEA−SE and IDEA−SEef .From table 1 it can be seen that 79% of the funds analyzed exhibit a negative average
rate of return in the period considered in our analysis, and for no less that 86% of the fundsthe observed excess return is negative. This clearly shows that it is necessary to use a DEAmodel which is able to cope with such cases.
On the other hand, the negativity of the observed excess return entails the negativity ofthe Sharpe ratio and this can be misleading. Indeed, only when the excess return is positive,the (positive) value of the Sharpe ratio decreases with the risk indicator σj , as we wouldexpect for a performance indicator; on the contrary, when the excess return is negative, the(negative) value of the Sharpe ratio increases with the value of the standard deviation.
The values stressed in boldface in the last three columns of table 1 indicate the fundsthat are efficient in the sense of Pareto-Koopmans, namely the funds with a DEA scoreequal to 1 and for which it is not possible to reduce any input or increase any outputwithout worsening the value of some other inputs or outputs; they can be identified bysolving a convenient two-phase linear programming problem equivalent to the original DEAproblem (see for example Cooper et al., 2006). The efficient funds are 5 for the DEA-Smodel, 4 non ethical funds and only 1 ethical fund (Ohman Etisk Index Pacific). Thenumber of efficient ethical funds increases considerably when the ethical objective is takeninto account; actually, in the ethical models DEA-SEef and DEA-SE a good 13 ethicalfunds turn out to be efficient.
Of course, as stated by theorem 2, the non ethical funds do not change their efficiencyscore when the ethical models are used and neither does the number of efficient funds.
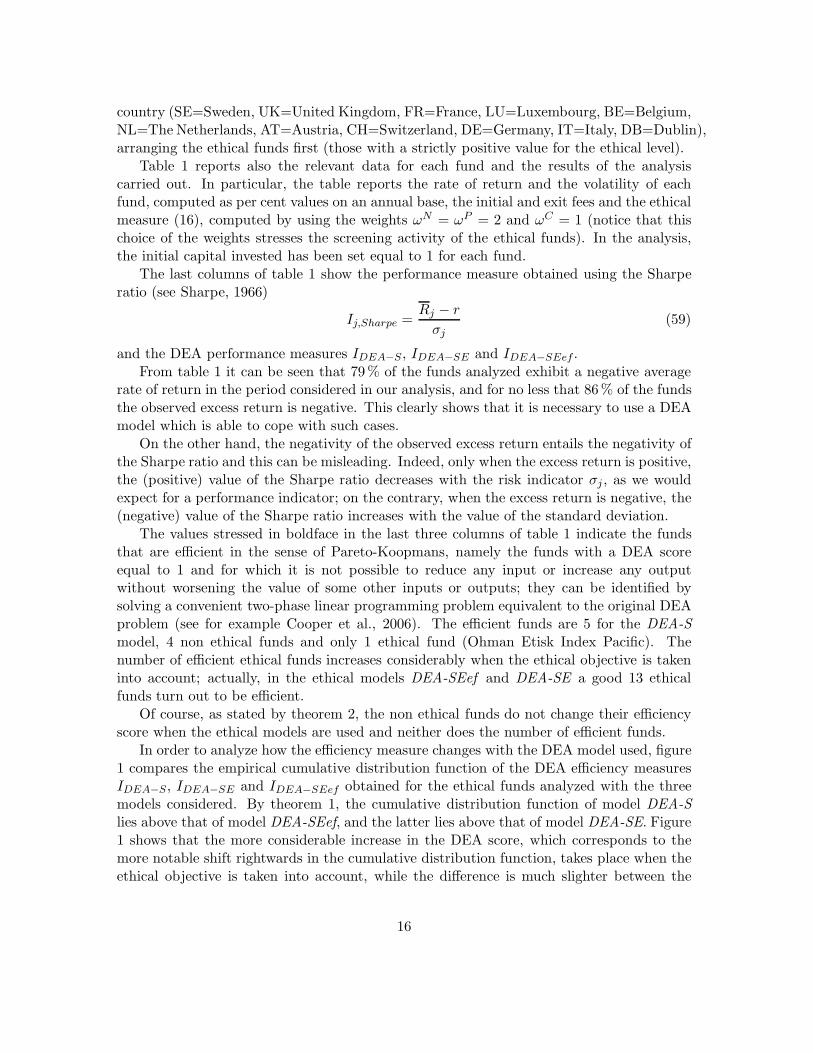
In order to analyze how the efficiency measure changes with the DEA model used, figure1 compares the empirical cumulative distribution function of the DEA efficiency measuresIDEA−S, IDEA−SE and IDEA−SEef obtained for the ethical funds analyzed with the threemodels considered. By theorem 1, the cumulative distribution function of model DEA-Slies above that of model DEA-SEef, and the latter lies above that of model DEA-SE. Figure1 shows that the more considerable increase in the DEA score, which corresponds to themore notable shift rightwards in the cumulative distribution function, takes place when theethical objective is taken into account, while the difference is much slighter between the
16
Cumulative distribution function of DEA score of ethical funds
0
0.1
0.2
0.3
0.4
0.5
0.6
0.7
0.8
0.9
1
0.7 0.75 0.8 0.85 0.9 0.95 1
DEA score
Cu
mu
lati
ve d
istr
ibu
tio
n
DEA-SDEA-SEDEA-SEef
Figure 1: Empirical cumulative distribution function of the DEA efficiency measuresIDEA−S, IDEA−SE and IDEA−SEef for the European ethical funds analyzed.
two ethical models. Actually, the average DEA score of the ethical funds is equal to 0.857for the DEA-S model, 0.894 for the DEA-SEef model and 0.903 for the DEA-SE one. Asregards the non ethical funds, their average DEA score is equal to 0.884, which is higherthan the average score of the ethical funds when the ethical measure is not considered, whileit is lower than that of the ethical funds in the models that take the ethical measure intoaccount.
The comparison of the DEA efficiency measures between ethical and non ethical fundsis highlighted in figure 2, which compares the empirical cumulative distribution functionsof the DEA efficiency measures IDEA−S, IDEA−SE and IDEA−SEef for the ethical and nonethical mutual funds. It can be noticed that the non ethical funds obtain a sensibly higherefficiency score than the ethical funds when the only output variable taken into considerationis the capitalization factor, i.e. in the DEA-S model. The improvement in the efficiencyscore obtained by the ethical funds when the ethical indicator is included in the set ofoutputs causes the dominance to reverse in the ethical models, so that with these modelsthe highest efficiency scores are obtained by the ethical funds.
8 Conclusions
In this paper we have proposed an extension to some DEA models for the evaluation ofmutual fund performance which enables to tackle the problem of negative data that oftenoccurs with the DEA models suggested by the literature in slump periods of the businesscycle.
17

Cumulative distribution function of DEA-S efficiency score
0
0.1
0.2
0.3
0.4
0.5
0.6
0.7
0.8
0.9
1
0.7 0.75 0.8 0.85 0.9 0.95 1
DEA-S score
Cu
mu
lati
ve d
istr
ibu
tio
nEthical fundsNon ethical funds
Cumulative distribution function of DEA-SEef efficiency score
0
0.1
0.2
0.3
0.4
0.5
0.6
0.7
0.8
0.9
1
0.7 0.75 0.8 0.85 0.9 0.95 1
DEA-SEef score
Cu
mu
lati
ve d
istr
ibu
tio
n
Ethical fundsNon ethical funds
Cumulative distribution function of DEA-SE efficiency score
0
0.1
0.2
0.3
0.4
0.5
0.6
0.7
0.8
0.9
1
0.7 0.75 0.8 0.85 0.9 0.95 1
DEA-SE score
Cu
mu
lati
ve d
istr
ibu
tio
n
Ethical fundsNon ethical funds
Figure 2: Comparison of the empirical cumulative distribution functions of the DEA effi-ciency measures IDEA−S, IDEA−SEef and IDEA−SE for the ethical and non ethical Europeanmutual funds.
18

The first extension leads to a basic model for the measurement of the performance ofgeneral mutual funds with a pure investment goal. The second extension considers a model,applicable to ethical investments, which includes also an ethical objective among the outputsof the mutual funds. The third extension is applicable to ethical mutual funds in the casein which investors fix a priori the ethical level desired and maximize the investment returnby considering an ethical level as an exogenously fixed output.
The investigation carried out on data from the European market of ethical mutualfunds shows that the highest values of the performance measure are generally obtained bythe ethical funds if we use a model that takes the ethical level into account. On the contrary,the performance score obtained by the ethical funds is generally lower than that of the nonethical funds when the only output variable taken into consideration is the capitalizationfactor.
References
[1] Ali AI, Seiford LM. Translation invariance in data enveloment analysis. OperationsResearch Letters 1990; 9; 403–405.
[2] Banker RD, Morey RC. Efficiency analysis for exogenously fixed inputs and outputs.Operations Research 1986; 34; 513–521.
[3] Basso A, Funari S. A data envelopment analysis approach to measure the mutual fundperformance. European Journal of Operational Research 2001; 135; 477–492.
[4] Basso A, Funari S. Measuring the performance of ethical mutual funds: A DEA ap-proach. Journal of the Operational Research Society 2003; 54; 521–531.
[5] Basso A, Funari S. A generalized performance attribution technique for mutual funds.Central European Journal of Operations Research 2005a; 13; 65–84.
[6] Basso A, Funari S. Performance evaluation of ethical mutual funds in slump periods.Rendiconti per gli Studi Economici Quantitativi 2005b; 2005; 89–105.
[7] Cooper WW, Seiford LM, Tone K. Data envelopment analysis: A comprehensive textwith models, applications, references and DEA-Solver Software. Kluwer Academic Pub-lishers: Boston; 2000.
[8] Cooper WW, Seiford LM, Tone K. Introduction to Data Envelopment Analysis and itsuses. Springer: New York; 2006.
[9] Lovell CAK, Pastor JT. Units invariant and translation invariant DEA models. Oper-ations Research Letters 1995; 18; 147–151.
[10] Morey MR, Morey, RC. Mutual fund performance appraisals: a multi-horizon perspec-tive with endogenous benchmarking. Omega 1999; 27; 241–258.
19
[11] Murthi BPS, Choi YK, Desai P. Efficiency of mutual funds and portfolio performancemeasurement: A non-parametric approach. European Journal of Operational Research1997; 98; 408–418.
[12] Sharpe WF. Mutual fund performance. Journal of Business 1966; 34; 119–138.
[13] Silva Portela MCA, Thanassoulis E, Simpson G. A directional distance approach todeal with negative data in DEA: an application to bank branches. Aston BusinessSchool Research Papers; RP0306; 2003.
20