Green Indexes of Companies and Ethical Funds
22
Green Indexes of Companies and Ethical Funds Paper Assignment ENP-20806 Research Area: Environmental Management and Industry (theme investigation) Research Topic: the green indexes of companies. Authors: Borneman, Merlijn Huisman, Theo Liesdek, Boaz Togni, Federico Division of tasks Lead Editor: Federico Togni Documentalist: Theo Huisman Copy editor: Boaz Liesdek Presenter: Merlijn Borneman
-
Upload
independent -
Category
Documents
-
view
2 -
download
0
Transcript of Green Indexes of Companies and Ethical Funds

Green Indexes of
Companies and Ethical Funds
Paper Assignment ENP-20806
Research Area: Environmental Management and Industry (theme investigation)
Research Topic: the green indexes of companies.
Authors:
Borneman, Merlijn
Huisman, Theo
Liesdek, Boaz
Togni, Federico
Division of tasks
Lead Editor: Federico Togni Documentalist: Theo Huisman
Copy editor: Boaz Liesdek Presenter: Merlijn Borneman

2
Table of contents:
1.0 Abstract ..............................................................................................................................................2
2.0 Introduction ........................................................................................................................................2
3.0 Features of Green Index of Companies .............................................................................................7
3.1 Why to join them? (Companies point of view) ...........................................................................10
3.2 Why to invest in them? (Investors point of view) ....................................................................... 11
4.0 The Dow Jones Sustainability Index ................................................................................................13
4.1 Brief history ................................................................................................................................13
4.2 Requirements ..............................................................................................................................14
4.3 Performances and effects of membership on companies ............................................................16
5.0 Conclusion ........................................................................................................................................19
6.0 References list ..................................................................................................................................20

3
1.0 Abstract
In the last years, the academic interest in ethical mutual funds and green indexes of companies has
increased considerably, growing hand in hand with their success among the savers (Bauer, Derwall,
Otten 2007). The aim of this paper is to analyse the GI phenomenon employing a funnel structure.
Initially we will give a general overlook of green indexes and ethical funds and then we will focus on
one singular instance of them. Indeed the analysis of Dow Jones Sustainability index will let us have
both a clear example of how GI select the companies in the process of constructing portfolios, and an
idea of the Green Indexes performances. Eventually we will give some personal evaluations about the
green indexes theme and the future development of the sector.
2.0 Introduction
We shall begin this giving a precise definition of the subject we are going to discus in this paper. In fact,
the main theme of our research will be on Socially responsible investing (SRI), that is
the investment strategy which seeks to consider both financial return and social good: “Socially
responsible investing (SRI) is an investment process that considers the social and environmental
consequences of investments, both positive and negative, within the context of rigorous financial
analysis. It is a process of identifying and investing in companies that meet certain baseline standards
or criteria of Corporate Social Responsibility (CSR) and is increasingly practiced internationally”
(Social Investment Forum, 2001). SRI is realized by savers through the investment in ethical investment
products (such as socially responsible, green, environmental and sustainable mutual funds and indexes).
There is a slight different between funds and indexes: a fund is a type of professionally managed
collective investment vehicle that pools money from many investors to purchase securities (Fink,
Matthew 2008); while an index is a passively managed fund with the aim to replay the financial
performance of the chosen market index without trying to obtain an extra-yield. However in this paper
we will use these terms as synonymises.
Nowadays these products are growing rapidly in both their size and variety since their creation few
decades ago (O’Rourke, 2003). Most SRI funds did not exist prior to 1996, with a 218 percent growth
in the number of funds since then (Barnett, Salomon 2006). The history of green indexes of companies
begin in the first eighty, but actually, we have to wait the 1990 for the appearance of the first significant
ethical fund. Indeed in this year we have the public recognition of Dsi400 (Domini Social Index 400),
introduced by the American analysis and sustainability research company Kinder Lyndeberg Domini
(known today as Msci Kld 400 Social Index) (Borghesi, Vercelli 2008). In the years after, several similar
funds followed it (as illustrated in Figure 1 Barnett, Salomon 2006).

4
Figure 1: increasing of number of Ethical Funds from 1971 to 1999 (Barnett, Salomon 2006).
Some examples are: FTSE4Good created by the British Research Institute Eris, active at the London
stock exchange and consequently focused mostly on European companies (Di Turi 2010), TIAA-CREF
Social Choice Equity (TICRX), Portfolio 21 (PORTX), Parnassus Equity Income (PRBLX) and
especially from 2001, the Dow Jones Sustainability Index (DJSI) that we are going to analyze hereinafter
in this paper.
An interesting query to answer to is why these indexes were created and who push the financial sector
in this direction. Apparently the was born to answer to the demand of savers with particular ethical
sensibility to the extent that they could bear a part of the profit margin guaranteed by conventional funds
in exchange for greater transparency and a strong ethical way of thinking within the company. Another
explanation that probably overlap the precedent is the purpose of satisfy the answer of those institutional
investors (such as pension funds insurance funds, and separate accounts) oriented towards a long-term
horizon instead of short-term speculative (but risky) investments (Borghesi, Vercelli 2008).
Anyway as many studies confirm (Consolandi et al. 2008; O’Rourke 2003) , hand in hand with the good
performances of ethical investment products, even many others savers shift from conventional to ethical
and green founds determining thus the proven gradual increasing of the sector (figure 2, Renneboog et
al. 2008B).
Figure 2: SRI assets under management (Renneboog et al. 2008B).

5
This phenomenon is well described by the data (Renneboog et al. 2008B): In the US, the professionally
managed assets of SRI portfolios, reached $2.3 trillion in 2005, growing by 1200% from $162 billion a
decade earlier. Currently, SRI assets represent about 10% of total assets under management in the US
(SIF, 2005). Although the European SRI market is still in an early stage of development, it is also
growing rapidly. In 2005, SRI assets in Europe amounted to $1.4 trillion, representing 10–15% of
European funds under management (Eurosif, 2006), as an example, in UK, SRI affects assets for more
than 67 billion € managed by the 34 main ethical funds (Borghesi, Vercelli 2008). If there are no doubt
about the swelling of ethical investment products, the issue about their actual performances is much
more debatable. Indeed the academic literature is full of examples of both positive and negative trend
performance about Green Indexes in comparison with the conventional ones. Following we will try to
give an objective overview of the debate.
Starting from a theoretical point of view, we can say that, as several studies confirmed (Schmidheiny,
Zorraquin, 1996), in the long period there is no conflict between specific purposes of the company and
sustainability and wellbeing of stakeholders. Thus, a company that invest in CSR should show (at least
in the long run) positive financial performances in terms of risk and return.
Many sources seem to confirm this principle. Just to give some examples Margolis and Walsh (2001)
find out that corporate social performance (treated as an independent variable in most studies) can be
used to predict or precede financial performance. In fact approximately 50% of the studies found a
positive relationship between the two, 25% found no relationship, 20% had mixed results and 5% had a
negative relationship (Margolis, Walsh, 2001). Moreover, Orlitzky, Schmidt and Rynes found that the
relationship between social and financial performance is rather positive in a wide variety of contexts
and sectors (Orlitzky, Schmidt, Rynes, 2003).
On the contrary, other authors underline how there is a trade-off between social and financial
performances. In particular, the liberal view suggests a negative link as social responsibility involves
costs and therefore worsens a firm's competitive position (Friedman, 1970). Related is the opinion that
social constraints on companies and socially responsible behaviour may conflict with value
maximization (Brummer, 1991; Jensen, 2001). Preston and O'Bannon (1997) argue that an accumulation
of funds to invest in social performance can lead to poorer financial performance due to negative
synergy. Thus, according to several authors the average performances of ethical funds would be worse
than the average funds ones: <<The evidence suggests that ethical funds generally underperform when
compared with the market because they restrict their choice to a narrow, and therefore riskier, range of
investments >> (Hogget, Nahan 2002). Another motivation given to justify the presumed lower average
profit from Green indexes is that investors pay a price for ethics; a result of it should be that SRI funds
in the US, the UK, and in many continental European and Asia-Pacific countries underperform their
domestic benchmarks by −2.2% to −6.5% (Renneboog et al. 2008A).
Actually, more recent studies deny the existence of this trade-off between social and financial
performance, since CSR care do not damage financial returns (Scholtens 2008). However, despite a
positive and significant interaction between financial and social performance, it appears that financial
performance in general terms precedes social performance much more often than the other way around
(Scholtens 2008). An apparently different explanation of this phenomenon is given by Lopez, Garcia
and Rodriguez, according to whom sustainability practices have a negative impact on performance
during the first years they are applied. In fact in order to implement CSR practices companies in the first
moment have to allocate resources or invest in in training, safety, pollution prevention, new technologies
or recycling. But on the longer term these practices begin to influence firm performance positively both
in economic and financial terms (López, Garcia, and Rodriguez 2007).
Definitively we can find an explanation capable to maintain both these theories. Indeed a firm need
resources to launch an incisive CSR revolution, so good previous financial performance are needed, and

6
they are consumed during the improvement causing an immediate drop effect on returns. But in the
following periods these investment turn to be useful increasing firm’s performances.

7
3.0 Features of Green Index of Companies
There is a huge number of different approaches to ethical or socially responsible investment.
In reality, there is presently no one commonly agreed definition of what constitutes an ethical
investment, but the main method that fund managers use to decide if an investment may be labelled as
ethical or sustainable is a process called “screening”.
The screening method is very subjective; indeed almost every ethical fund has his own screening
strategies and methods to select companies suitable to be included into the fund. Screens can be positive
or negative, and a fund can use one of the two, or both the screens together for the companies’ selection.
The empirical evidence demonstrate positive screens are much more employed by green indexes in
comparison with negative-one (see figure 3)
Figure 3: SRI Funds Screens Employed (Eurekahedge 2010)
Negative screening is the process where companies are excluded or 'screened out' from investments
because of their involvement in certain activities deemed to be negative. The justification of negative
screens is that an ethical investor might want to avoid companies investing in arms manufacture, tobacco
or nuclear energy (which.co.uk 2013). Most ethical retail funds employ negative screens based also on
factors like: animal testing, unsustainable farming techniques, and human rights abuses besides those
quoted previously (see figure 4). However, the screening approach does not inevitably preclude entire
sectors. For instance, a company may be included if it is involved in the manufacture of armaments, but
excluded if it exports these arms to countries ruled by oppressive regimes (ethicalinvestment.co.uk
2013).

8
Figure 4: Criteria Distribution of Negative Screens Employed (Eurekahedge 2010)
On the contrary, positive screening is the strategy that includes (or “screen in”) companies that take
social responsibility seriously and make positive contributions to society and to environment since a
responsible investor may want to support a company involved in projects with a positive social or
environmental impact, such as renewable energy or waste management (which.co.uk 2013). In the graph
below (figure 5) we can see the main criteria of evaluation in positive screening.
Figure 5: Criteria Distribution of Positive Screens Employed (Eurekahedge 2010)
In the selection of companies, when all other factors are equal, usually the approach used from the
Ethical funds is the “preference” or “best-of-sector”. This method applies social, environmental and
ethical guidelines to choose between similar companies all satisfying the screening requirements. This
way it is possible to invest in a gas and oil company which is the best of its sector according to low
records of pollution and good ethical conditions (which.co.uk 2013).

9
Another method of selection is shareholder activism. This investment strategy is based on the attempt
to influence corporate behavior not excluding, preferring or including companies, but through the
encouragement to companies to adopt social and environmental best practices. This achievement can be
reached thanks to the action of active investor or fund managers making pressure through the vote at
annual general assemblies or through meetings with the target company senior management
(which.co.uk 2013). Therefore, paradoxically ethical funds can choose to invest in less sustainable
companies, with the idea to improve their CSR. An example could be an investment in a non-virtuous
company to encourage it to reduce carbon emissions or to improve the conditions of workers in supply
chain.
However not all the Green Indexes would include in their list company who do not really deserve it
showing a true interest in sustainability and environmental issues. Indeed ethical funds can be classified
according to their shade of green, depending on the strictness of the criteria they choose to apply.
Therefore, we can distinguish three grade of greenness for indexes (ethicalinvestment.co.uk 2013):
- Light green funds, whose fund managers have a less restrictive mandate since they can in
companies involved in animal testing, pesticides and the fur trade, but usually exclude
armaments, alcohol, tobacco, gambling, pornography or nuclear energy. However, they
generally utilise a "preference" strategy instead of excluding an entire sector.
- Medium Green Ethical Funds. They apply stricter criteria than light green, but may still allow
some exposure to companies with poor workplace relations, or companies liable for ozone
depleting chemicals. Most of the investments tends to be made in European and American SME.
- Dark green ethical funds always apply strict ethical criteria. Therefore, they do not use just
negative screening like lighter green indexes, but typically invest only in companies which
actively seek to improve our environment or benefit the community (using both positive and
negative screening, see Figure 6). However, a possible negative outcome of such a strict
selection is the likelihood to limit the performance because of the restriction of their choice to
a narrow, and consequently riskier, range of investments (Hogget, Nahan 2002). In fact since
these ethical funds exclude several industries, their diversification (variety of different funds
invested in) may be lower than other more mainstream funds, and this increases the risk of major
fluctuations (Which.co.uk 2013).

10
Figure 6: Criteria Distribution – Positive and Negative Screening SRI Funds
In order to understand the underlying motivation of both firms and stakeholders to engage in Socially
responsible Investment (SRI) we will analyze what factors play a role in this decision making.
SRI indexes focus mainly on companies with the highest Corporate Social Responsibility (CSR) scores.
This means that there is an important connection between CSR scores and the possible engagement in
SRI indexes. This provides incentives to the board of companies to further intensify their social
responsibility standards, which will provide higher CSR scores (Consolandi, Jaiswal-Dale, Poggiani, &
Vercelli, 2008). In fact, the growing sensibility from the investors towards the corporations’ activities
(and not just in the financial statement report) has strengthened in the last years the engagement of
companies in CSR.
3.1 Why join them? (Companies’ point of view)
Now a crucial point of the issue is: why should a company engage itself to be included in SRI indexes?
As we already said, ethical funds were born in order to satisfy the demand of savers who wanted to
invest just in companies that develop their business respecting specific environmental and social
criteria. Basing on this point, we can say that companies get advantages from being included in these
funds since their membership represents a sort of quality certification of the environmental and social
engagement and a recognition of their activity (Borsa Italiana, 2013). This reward guarantees to the
companies who are member of these indexes a good visibility towards the investors and an image
coming back on the brands in terms of CSR, recognisability and reputation. Furthermore, from a merely
financial point of view, belonging to an ethical fund extends the chances for a responsible company to
get financial resources from the market (Okpedia, 2013). Classic literature states that CSR often is
associated with costs, but pays off in the long term. In the end, companies benefit from this long-term
investment (Burke & Logsdon, 1996).
Although, even if it is likely to pay off in the end, it may also not always be in the interest of both the
company and the shareholders to invest in such activities. Nonetheless, Bovenberg (2002) argues that
social considerations of corporate stakeholders (including consumers, employees and shareholders) may
incite corporations to care for public goods such as the natural environment, even when such social
considerations do not yield a direct benefit to the stakeholders (Bovenberg, 2002).
Under the assumption that stakeholders’ behavior plays an important role in the company’s decision
making, Mohr, Webb, & Harris (2001) states that there CSR play an important role especially to
orientate the choice of a big group of responsible consumers. This would be the main motivation for
companies to engage in CSR, since an active commitment toward environmental and social issues helps
gaining consumer trust. In other words we assume that this investment in CSR leads to higher CSR
scores which will lead companies to joining SRI indexes and attract in this way more savers.
Another motivation is feel good sentiment, meaning that the investors accept less than optimal financial
performance to satisfy their personal values of social responsibility (Renneboog, Ter Horst, & Zhang,
2008-A). Which makes the managers engage in CSR and SRI, following the preference of their
investors. Indeed, according to a Which.com money survey in February and March 2010, 42% of
members would accept a slightly lower rate of return if they knew the provider was investing ethically,
indicating that many consumers are keen to take a more socially responsible approach to investing
(which.co.uk 2013-A).
In addition, reductions of costs of conflicts is an incentive to use CSR. By being socially responsible,
the potential conflicts between firms and society are being minimized. This good understanding between
11
corporations and society goes hand in hand with shareholder value-maximization (Renneboog et al.,
2008-A).
So, in competitive markets CSR is related to profit maximization, because only the consumers who care
about CSR are willing to buy these ethical products, which leads to no negative welfare effect on those
who are not convinced of the importance of social responsibility (Renneboog et al., 2008-A).
Social and environmental lobbyists are a reason for companies to implement or improve CSR strategies.
Lobbyists putting pressure on companies could encourage them to higher their standards on CSR, being
for instance less polluting. Furthermore, reputation is a possible motivation to invest in CSR, which
affects the title of being a good citizen and responsible manager. (Renneboog et al., 2008-A)
Finally, another incentive for a company to apply for a high level of CSR could be the possibility to
Attract motivated workers who would be glad to work for an social responsible company; since, as many
studies (Vroom 1964; Steers, Porter 1991) confirms, motivated people are always more creative and
productive in the workplace.
3.2 Why to invest in them? (Investors point of view)
Although exist several possible motivations for savers to invest in green companies, we can reduce this
range to two main drives: the performance or the ethic.
As we already showed previously on this paper, the debate about better SRI performances in comparison
with conventional investment is far to be solved since in the academic word many points of views coexist
and still there isn’t a universally shared assessment about it. Therefore even if many savers are surely
convinced that Green Indexes will grant them more profit we cannot assume the performance as the
main reason for them to invest in ethical funds. All the more so since Renneboog, Ter Horst & Zhang
(2008-A) underline in their study as “SRI investors are unable to identify the funds that will outperform
in the future, whereas they show some fund-selection ability in identifying funds that will perform
poorly” (Renneboog, Ter Horst & Zhang 2008-A).
In reverse, ethic surely represents the very first input for a saver to target his investments toward SRI.
However it is not a free-standing variable but is influenced by others factors. Säve-Söderbergh (2010)
states that “ethical screening is not sensitive to income, but rather to education.” meaning that ethical
behavior is not being influenced by wealth or income but rather by the importance of ethics for someone,
which is positively correlated with education.
On the contrary, prestige is not a motivation for savers to invest in green indexes according to Säve-
Söderbergh (2010), because investing in environmental and social responsible companies is not visible
for others. However, Burke & Logsdon, 1996 states that social-pressure, which goes hand in hand with
reputation, could play a role in making these kind of decisions. For instance, this social pressure (likely
to be practiced by environmental activists, stakeholders associations and lobbyists) can play an
important role in order to orientate the investment toward ethical funds when the investors are major or
institutional investors constantly in the spotlights, (Renneboog et al., 2008-A).

12
4.0 Dow Jones Sustainability Indexes
The Dow Jones Sustainability Indexes (DJSI) are a family of indexes evaluating the sustainability
performance of the main 2,500 companies listed on the Dow Jones Global Total Stock Market Index.
These indexes represent the longest-running global sustainability benchmarks worldwide and have
turned out to be the key reference point in sustainability investing for both private savers and companies.
4.1 Brief history
DJSI were launched in September 1999, as a collaboration with the Dow Jones Indexes and SAM, an
investment company focused on sustainability investing on global scale.

13
The Dow Jones Sustainability Indexes exists out of different indexes, those indexes include different
locations on the world (DJSI North America, DJSI Asia Pacific, DJSI Korea, the DJSI Europe index
just to give some examples). The most important and overlapping index is the DJSI World index, for
this index are already 1052 companies analysed. The sum of companies in the DJSI is still raising, in
1999, when the Dow Jones Sustainability Indexes were launched, there were just around 480 companies
analysed, so ever since the number it is almost tripled. (Wikipedia 2013) Furthermore, hand in hand
with it, also the assets amount of the DJSI is steadily rising as shown in the graph below (figure 7).
Figure 7: DJSI assets (RobecoSAM, 2013).
4.2 Requirements
To become a part of the Dow Jones Sustainability Indexes, a company needs to act on a specific level
of sustainability. This level is be tested by the RobecoSAM corporate sustainability assessment system
(CSA). This score is be calculated annually and is useful for a company to know its sustainability score
(RobecoSAM, 2013) In the same way selection criteria evolve each year so companies must continue
to make improvements to their long-term sustainability plans in order to remain on the Index.

14
Figure 8: RobeccoSAM’s CSA process (Sustainability-Indices 2013).
The CSA is split up in three guidelines as criteria (weight 33% each) to evaluate the company
sustainability rate; these take into account different aspects of sustainability, respectively: economic,
environmental and social.
- The economic dimension is about “corporate governance”, “risk & crisis management” and
“codes of conduct/compliance/anti-corruption & bribery”.
- “Environmental performance” and “environmental reporting” are the main topics of the
environmental dimension.
- The social dimension is about “human capital development”, “talent attraction & retention”,
”labour practice indicators”, “corporate citizenship” and ”social reporting”.
Every dimension also contain a part with industry specific criteria (RobecoSAM, 2007); moreover, long-
term vision and risk management are real important parts from the CSA.

15
Figure 9: RobeccoSAM’s CSA dimensions of sustainability (Sustainability-Indices 2013).
SAM employs four sources of information to measure corporate sustainability: company questionnaire,
company documentation, media and stakeholder analysis, and contact with companies (see Figure 10).
Figure 10: DJSI data providing system (Wikipedia 2013)
The main critique to this system of evaluation is that DJSI mainly relies on data provided by the
companies themselves; therefore, the credibility of the information may be questioned, given the self-
interest of the companies to disclose favourable data (Wikipedia 2013). Other critiques are represented
by the choice of DJSI to include only large companies (while other indices include also smaller
companies) and the flaw that even though in theory the three dimensions of sustainability should have
the same weight, in practice the economic criteria assumes a prominence whereas social and
environmental one play a subordinate role. As a proof of that a survey conducted among sustainability
experts found that “only 48 percent considered the DJSI as highly trusted” (Windolph 2011)

16
4.3 DJSI Performances and effects of membership on companies
Several studies have been executed on difference in performance of sustainability indices and
conventional indices. The majority of these studies only concluded on the short term performance of
these indices because of the relatively novelty of sustainable indices. However, now we will try to point
out the DJSI trend of the last years in absolute terms and in comparison with the DJ index with the
assistance of data and information from different studies.
Under the assumption that DJSI represent for savers the Social Responsable investiment per excellence
being the major ethical index, we assume that the following subject about DJSI may be extended almost
to all the ethical funds.
Therefore, analysing first ethical investment products in general, we can infer that, although in the first
years after their creation (1990-1998) there was a significant positive spread between ethical and
conventional funds’ performances, in the following years (1999-2004) this gap was closed (Figure 11
Borghesi, Vercelli 2006).
Figure 11: Dow Jones Sustainability index and General Index values (normalized at 100) (Borghesi,
Vercelli 2006)
This slowing down of the ethical investment products, represented in this case by the DJSI, was due to
several reasons, but the most important is surely the financial collapse of many high tech companies
(which had a significant weight in the Sustainable Indexes portfolios) because of their overvaluation in
the stock market. A second explanation could be the boosting of the company active sectors excluded
by negative screens in many ethical funds. It’s the case of weaponry and fossil fuel companies (increased
as a consequence of temporary geopolitical and military issues (Borghesi, Vercelli 2006)) and gaming
and alcoholic companies (see Figure 12 Hogget, Nahan 2002).

17
Figure 12: percentage return of Alcoholic Beverages and Gaming and Casino sector in comparison
with S&P 500 (Hogget, Nahan 2002)
However, from that time, after a new lapse characterized by a new light pro-bias for DJSI (2004-2008)
followed by a time interval of new balance due to the international crisis (2008-2009), the last tendency
(2009-2010) seemed to show a new superiority of ethical indexes performances and DJSI in particular
compared to conventional ones, in our case the DJ index (Figure 13, Dziedzic 2011).
Figure 13: Dow Jones Sustainability index and General Index growth rate (Dziedzic 2011)
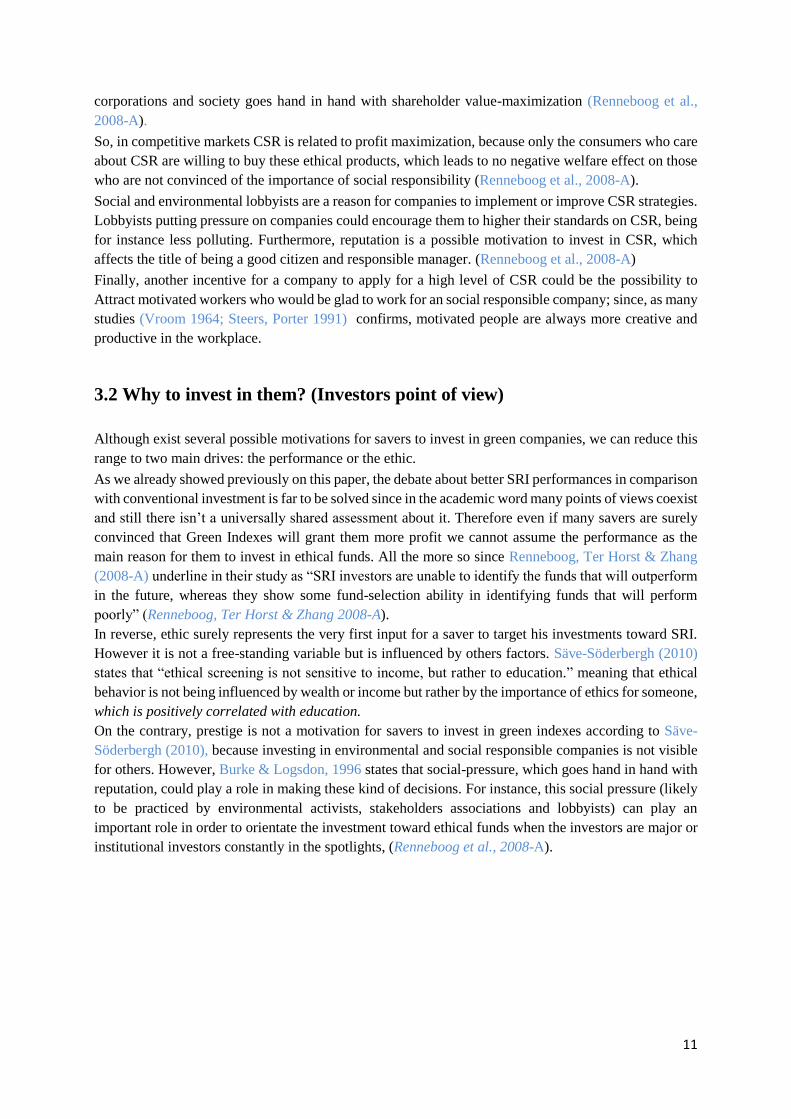
But actually, other sources (S&P/DJI 2012) show how in the latest period (2010-2013) performance
growth of the ordinary Dow Jones Indexes on average was bigger than of the Sustainability Indexes as
displayed in Figure 14.
18
Figure 14: Short-term performance statistics, comparison between DJSI and DJI (S&P/DJI 2012)
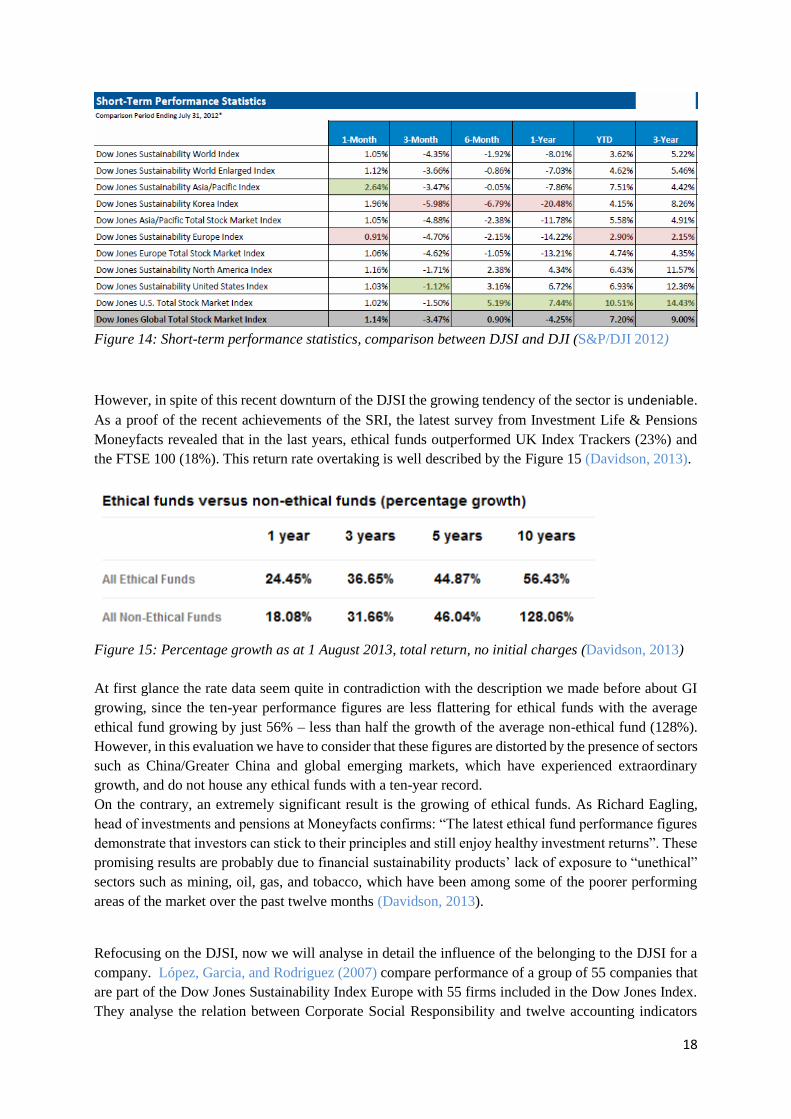
However, in spite of this recent downturn of the DJSI the growing tendency of the sector is undeniable.
As a proof of the recent achievements of the SRI, the latest survey from Investment Life & Pensions
Moneyfacts revealed that in the last years, ethical funds outperformed UK Index Trackers (23%) and
the FTSE 100 (18%). This return rate overtaking is well described by the Figure 15 (Davidson, 2013).
Figure 15: Percentage growth as at 1 August 2013, total return, no initial charges (Davidson, 2013)
At first glance the rate data seem quite in contradiction with the description we made before about GI
growing, since the ten-year performance figures are less flattering for ethical funds with the average
ethical fund growing by just 56% – less than half the growth of the average non-ethical fund (128%).
However, in this evaluation we have to consider that these figures are distorted by the presence of sectors
such as China/Greater China and global emerging markets, which have experienced extraordinary
growth, and do not house any ethical funds with a ten-year record.
On the contrary, an extremely significant result is the growing of ethical funds. As Richard Eagling,
head of investments and pensions at Moneyfacts confirms: “The latest ethical fund performance figures
demonstrate that investors can stick to their principles and still enjoy healthy investment returns”. These
promising results are probably due to financial sustainability products’ lack of exposure to “unethical”
sectors such as mining, oil, gas, and tobacco, which have been among some of the poorer performing
areas of the market over the past twelve months (Davidson, 2013).
Refocusing on the DJSI, now we will analyse in detail the influence of the belonging to the DJSI for a
company. López, Garcia, and Rodriguez (2007) compare performance of a group of 55 companies that
are part of the Dow Jones Sustainability Index Europe with 55 firms included in the Dow Jones Index.
They analyse the relation between Corporate Social Responsibility and twelve accounting indicators

19
including total assets, sales, consumption of resources and emissions to air. Outcome of their research
is that sustainability practices have a negative impact on performance, but only during the first years
they are applied (i.e. from 1998 to 2004), on the longer term these practices begin to influence
performance positively.
Other research studies the effects on the stock value upon inclusion and exclusion of the Dow Jones
Sustainability Index. Consolandi et al. (2009) discover that the expected return is lower than the actual
return (the cumulated actual return is positive) before announcement of inclusion in the DJSI (due to
information leakages). Around the day of the effective inclusion the cumulated actual return (CAR)
reaches a peak and begins to diminish. Exclusion from the DJSI leads to decreasing or even negative
CAR due to loss of the status of CSR excellence. Furthermore Consolandi et al. find that the negative
impact of deletion is bigger than the positive impact of inclusion due to stronger reaction to negative
new. Robinson, Kleffner, and Bertels (2011) also found a positive influence of inclusion because upon
inclusion more investors will become aware of the added stock which results in a permanent increase in
stock value. Contrary to Consolandi et al., Robinson, Kleffner, and Bertels (2011) find that the response
to addition to the DJSI is bigger than response to deletion. This tendency is underlined by Chen,
Noronha, and Singal (2004) who investigated the influence of deletion and inclusion to the S&P 500
Index.
Ortas and Moneva (2011) note that companies can be in- or excluded from the index due to changes in
their market capitalisation or other financial issues. But companies can also be excluded although their
social and environmental performance is good. If for example a company is involved in a highly
competitive DJSI sector and has a good environmental and social performance but slightly lower than
its competitors it will not be included in the DJSI. Therefore Ortas and Moneva advice DJSI to disclose
why companies are in- or excluded from the DJSI-Stoxx index.
5.0 Conclusion
This paper underlines how socially responsible investing is becoming more and more prevalent in the
last years. This issue is confirmed by the increasing number of savers investing in Green Indexes of
companies and in ethical funds in general. Indeed investors feeling is rapidly changing from
“maximising profits” to “maximising profits while investing in an ethical manner” (Eurekahedge 2010).
However, in our research, we figure out that a likewise swelling in performances do not correspond to
the increasing of SRI assets and investors. In fact, even though in some period the average performances
of ethical funds showed higher returns, in general the data we obtained didn’t display a clear tendency
for SRI to perform better than conventional investments. Because of that we hold to be true that the
increasing of the sector is due mostly to ethical reasons instead of the belief from the investors to get
more profits. About the DJSI case study, in this paper we examine on one hand index requirements and
how the inclusion/exclusion has an impact on companies, and on the other hand the flows of its selection
system. Therefore in the future we expect an increase of number of ethical funds since SRI funds
industry will attract more and more capital, but also a changing in screening criteria in according with
the rising demand of investors and legislatures.

20
6.0 References list
Barnett M.L., Salomon R.M. (2006). Beyond dichotomy: the curvilinear relationship between social
responsibility and financial performance. Strategic Management Journal. 27, 1101–1122.
Bauer R., Derwall J., Otten R. (2007). The Ethical Mutual Fund Performance Debate: New Evidence
from Canada. Journal of Business Ethics. 70, 111–124.
Borghesi S., Vercelli A. (2006). La sostenibilità dello sviluppo globale. Rivista Internazionale di Scienze
Sociali. 114 (4), 613-616.
Borghesi S., Vercelli A. (2008). Global Sustainability: Social and Environmental Conditions. Ed.
Palgrave Macmillan.7(4), 168-182.
Borsa Italiana (2012). Gli indici etici: La misura delle performance delle aziende che investono sull'etica.
Retrieved from Borsa Italiana Web Site, on 30 September 2013. Available at:
http://www.borsaitaliana.it/notizie/sotto-la-lente/indici-etici170.htm
Bovenberg L. (2002). Norms, values, and technological change. The Economist, 50 (5), 521–553.
Brummer, J.J. (1991). Corporate Responsibility and Legitimacy: An Interdisciplinary Analysis. New
York, Greenwood Press.
Burke, L., & Logsdon, J. M. (1996). How corporate social responsibility pays off. Long range planning,
29(4), 495-502.
Chen, H., Noronha, G., & Singal, V. (2004). The price response to S&P 500 index additions and
deletions: Evidence of asymmetry and a new explanation. The Journal of Finance, 59(4), 1901-1930.
Consolandi C., Jaiswal-Dale A., Poggiani E., Vercelli A. (2009). Global Standards and Ethical Stock
Indexes: The Case of the Dow Jones Sustainability Stoxx Index. Journal of Business Ethics. 87, 1s, 185-
197.
Davidson S. (2013). Ethical funds outperform market average. Retrieved from Everyinvestor Web Site,
on 25 September 2013. Available at: http://www.everyinvestor.co.uk/news/2013/08/14/ethical-funds-
outperform-market-average-5487/.
Di Turi A. (2010). Indici etici, il “benchmark” della finanza etica. Retrieved from ABC Risparmio Web
Site, on 23 September 2013. Available at: http://www.abcrisparmio.it/guide/investimento-sicuro/indici-
etici-benchmark-finanza-etica.
Dziedzic T. (2011). It Pays to be Bullish on CSR. Retrieved from Exchanges.nyx Web Site, on 25
September 2013. Available at: http://exchanges.nyx.com/tdziedzic/it-pays-be-bullish-csr

21
Ethicalinvestment.co.uk (2013). Ethical Screening. Retrieved from ethicalinvestment.co.uk Web Site,
on 03 October 2013. Available at: http://www.ethicalinvestment.co.uk/Ethical_screening.htm
Eurekahedge (2010). Key Trends in Socially Responsible Investment Funds. Retrieved from
Eurekahedge - Hedge Fund Indices Web Site, on 07 October 2013. Available at:
http://eurekahedge.blogspot.nl/2010/07/2010-key-trends-in-socially-responsible.html
European Sustainable and Responsible Investment Forum (Eurosif) (2003, 2005, 2006). Socially
Responsible Investment Among European Institutional Investors. Retrieved from Eurosif Web Site, on
24 September 2013. Available at: <http://www.eurosif.org>.
Fink, Matthew P. (2008). The Rise of Mutual Funds. Oxford University Press.
Friedman M. (1970). The social responsibility of business is to increase its profits. New York Times
Magazine, 13 September: 32–3.
Hogget J., Nahan M. (2002). Ethical Investment - Deconstructing the Myth. IPA Review, 54(3), 3–6.
López, M. V., Garcia, A., & Rodriguez, L. (2007). Sustainable development and corporate performance:
A study based on the Dow Jones sustainability index. Journal of Business Ethics, 75(3), 285-300.
Margolis J.D., Walsh J.P. (2001). People and profits? The search for a link between a company's social
and financial performance. Lawrence Elbaum, Mahwah, N.J.
Mohr L. A., Webb D. J., Harris K. E. (2001). Do Consumers Expect Companies to be Socially
Responsible? The Impact of Corporate Social Responsibility on Buying Behavior. Journal of Consumer
Affairs, 35(1), 45-72.
O’Rourke A. (2003). The message and methods of ethical investment. Journal of Cleaner Production.
11, 683–693.
Okpedia (2013). Indici Etici. Retrieved from okpedia Web Site, on 30 September 2013. Available at:
http://www.okpedia.it/indici_etici
Orlitzky M., Schmidt F.L., Rynes S.L. (2003). Corporate social and financial performance: a meta-
analysis. Organization Studies 24, 403–441.
Ortas, E., and J. M. Moneva. 2011. "Sustainability stock exchange indexes and investor expectations:
Multivariate evidence from DJSI-Stoxx." Revista Espanola de Financiacion y Contabilidad no. 40
(151):395-416.
Preston, L.E., O'Bannon, D.P. (1997). The corporate social-financial performance relationship: A
typology and analysis. Business and Society 36, 419–429.
Renneboog, Ter Horst, Zhang, (2008-A). The price of ethics and stakeholder governance: The
performance of socially responsible mutual funds. Journal of Corporate Finance. 14, 302–322.

22
Renneboog Ter Horst, Zhang (2008-B). Socially responsible investments: Institutional aspects,
performance, and investor behaviour. Journal of Banking & Finance. 32, 1723–1742.
RobecoSAM (2007). Annual Review, september 2007.
RobecoSAM (2013). Dow Jones Sustainability world guidebook.
Robinson M., Kleffner A., Bertels S. (2011). Signaling Sustainability Leadership:
Empirical Evidence of the Value of DJSI Membership. no. 101 (3):493-505. doi: 10.1007/s10551-
011-0735-y.
Säve-Söderbergh, J. (2010). Who lets ethics guide his economic decision-making? An empirical
analysis of individual investments in ethical funds. Economics Letters, 107(2), 270-272. doi:
10.1016/j.econlet.2010.02.003
Schmidheiny, Zorraquin (1996). Financing change: The financial community, eco-efficiency, and
sustainable development. Cambridge Mass: the MIT Press.
Scholtens B. (2008). A note on the interaction between corporate social responsibility and financial
performance. Ecological Economics. S 68, 46–55.
S&P/DJI (2012). Dow Jones Indexes Analytics & Research. Retrieved from djindexes Web Site, on 07
October 2013. Available at:
http://www.djindexes.com/mdsidx/downloads/analytics_info/Dow_Jones_Sustainability_Indexes_Ana
lytics.pdf
Social Investment Forum (2001, 2003, 2005). Report on responsible investing trends in the US.
Social Investment Forum (2001). Report on socially responsible investing trends in the United States.
SIF Industry Research Program. Retrieved from Socialinvest Web Site, on 24 September 2013. Available
at: http://www.socialinvest.org/areas/research/trends/2001-Trends.htm.
Steers, R. M., & Porter, L. W. (1991). Motivation and work behavior.
Sustainability-Indices (2013). Corporate Sustainability Assessment. Retrieved from Sustainability-
Indices Web Site, on 04 October 2013. Available at: http://www.sustainability-
indices.com/sustainability-assessment/corporate-sustainability-assessment.jsp
Vroom, V. H. (1964). Work and motivation.
Which.co.uk (2013) Ethical investments. Retrieved from Which Web Site, on 04 October 2013.
Available at:
http://www.which.co.uk/money/savings-and-investments/guides/ethical-investments/how-does-
ethical-investment-work/
Wikipedia (2013). Dow Jones Sustainability Index. Retrieved from Wikipedia Web Site, on 04 October
2013. Available at: http://en.wikipedia.org/wiki/Dow_Jones_Sustainability_Index
Windolph S.E. (2011). Assessing Corporate Sustainability Through Ratings: Challenges and Their
Causes. Journal of Environmental Sustainability. 1-2011