Dimensional Funds II PLC
113
Dimensional Funds II PLC Semi-Annual Report & Accounts 31 May 2010 Authorised and Regulated by the Financial Services Authority
-
Upload
khangminh22 -
Category
Documents
-
view
1 -
download
0
Transcript of Dimensional Funds II PLC
Dimensional Funds II PLC
Semi-Annual Report & Accounts
31 May 2010
Authorised and Regulated by the Financial Services Authority

DIMENSIONAL FUNDS II PLC
Table of Contents Page
General Information..................................................................................................................................................................................................2
Investment Manager’s Reports .................................................................................................................................................................................3
Balance Sheet ...........................................................................................................................................................................................................8
Profit and Loss Account .........................................................................................................................................................................................13
Statement of Changes in Net Assets Attributable to Holders of Redeemable Shares .............................................................................................16
Portfolio of Investments .........................................................................................................................................................................................19
Notes to the Financial Statements...........................................................................................................................................................................79
Statement of Portfolio Changes ............................................................................................................................................................................104
DIMENSIONAL FUNDS II PLC
2
General Information
Board of Directors†: Peter Blessing (Irish)* David G. Booth (American)* Dermot S.L. Butler (Canadian)* Richard Eustice (American)* David Martin (American)* Catherine L. Newell (American)* David Salisbury (British)* Andrew Cain (British)* Eduardo Repetto (American)*
Administrator: BNY Mellon Investment Servicing (International) Limited¹ Riverside Two Sir John Rogerson’s Quay Grand Canal Dock Dublin 2 Ireland
Investment Manager: Dimensional Fund Advisors Limited 7 Down Street London W1J 7AJ England
Custodian: BNY Mellon International Bank Limited² Riverside Two Sir John Rogerson’s Quay Grand Canal Dock Dublin 2 Ireland
Investment Sub-Advisor: (Emerging Markets Targeted Value Fund, Global Core Equity Fund and Global Targeted Value Fund) Dimensional Fund Advisors LP Palisades West 6300 Bee Cave Road, Building 1 Austin, TX 78746 USA
Stockbrokers: Davy Stockbrokers 49 Dawson Street Dublin 2 Ireland
Investment Sub-Advisor: (Emerging Markets Targeted Value Fund, Global Core Equity Fund, Global Targeted Value Fund and Pacific Basin Value Fund) DFA Australia Limited Level 43, Gateway 1 Macquarie Place Sydney NSW 2000 Australia
Legal Advisers in Ireland: Matheson Ormsby Prentice 70 Sir John Rogerson’s Quay Dublin 2 Ireland
Independent Auditors: PricewaterhouseCoopers One Spencer Dock North Wall Quay Dublin 1 Ireland
Secretary: Matsack Trust Limited 70 Sir John Rogerson’s Quay Dublin 2 Ireland
Registered Office: 70 Sir John Rogerson’s Quay Dublin 2 Ireland
* Non-executive Director.
¹ Effective 1 July 2010 BNY Mellon Investment Servicing (International) Limited acquired PNC Global Investment Servicing (Europe) Limited.
² Effective 1 July 2010 BNY Mellon International Bank Limited acquired PNC International Bank Limited.
† Effective 9 March 2010 Andrew Cain was appointed as a Director of the Company. Garrett Quigley resigned as a Director of the Company effective 2 June 2010.Effective 6 July 2010 Eduardo Repetto was appointed as a Director of the Company.
DIMENSIONAL FUNDS II PLC
3
Investment Manager’s Reports
Emerging Markets Targeted Value Fund The Emerging Markets Targeted Value Fund was launched on 23 April 2007 with the inception of the Class A Shares which are denominated in U.S. Dollars and the inception of the Class D Shares which are denominated in Sterling. The Class B Shares which, are denominated in Euro commenced trading on 12 May 2008. The Class C Shares which, are denominated in sterling commenced trading on 9 July 2008.
The Emerging Markets Targeted Value Fund has been invested in a broad range of mid cap and small companies with high book-to-market ratios across the Emerging Markets region and as at 31 May 2010 had holdings in 1,518 companies. This reflects our approach of delivering highly diversified exposure to the Emerging Markets companies. The weighted average book-to-market ratio of the holdings in the Fund at 31 May 2010 was 0.85 compared to 0.85 for the MSCI Emerging Markets SMID Value Index. The weighted average market capitalisation of the holdings in the Fund at 31 May 2010 was $2,091 million compared to $1,671 million for the MSCI Emerging Markets SMID Value Index. The dividend yield of the Fund at 31 May 2010 was 2.04% which compares to 2.63% for the MSCI Emerging Markets SMID Value Index.
Over six months to 31 May 2010, the total return of the Emerging Markets Targeted Value Fund in U.S. dollars (the Base Currency of the Fund) was 1.5%. This compares to a total return of 2.3% for the MSCI Emerging Markets SMID Value Index, and also, to a total return of (2.9%) for the MSCI Emerging Markets Value Index.
Total return over six months and from inception for each class is shown in the Performance Information table. The portfolio is fully invested and is well positioned to capture the returns of Emerging Markets small and mid-cap value companies.
The Investment Committee of the Advisor, having reviewed the Israeli market, has reclassified Israel as a developed market, the fund will therefore remove its exposure to Israel from the second quarter of 2010 onwards.
European Value Fund The European Value Fund was launched on 12 September 2007 with the inception of the Class A Shares which are denominated in U.S. Dollars. The Class B Shares which are denominated in Euro began trading on 13 September 2007. The Class D Shares which are denominated in Sterling commenced trading on 20 May 2008. The Class C Shares, which are denominated in Sterling commenced trading on 19 February 2009.
The European Value Fund has been invested in a broad range of large cap value companies across the European region and as at 31 May 2010 had holdings in 146 companies. This reflects our approach of delivering highly diversified exposure to value companies. The weighted average market capitalisation of the holdings in the Fund at 31 May 2010 was €30,627 million compared to €51,601 million for the MSCI Europe Large Value Index. The dividend yield of the Fund at 31 May 2010 was 3.58% which compares to 5.07% for the MSCI Europe Large Value Index. The weighted average book-to-market ratio of the holdings in the Fund at 31 May 2010 was 1.04 which compares with the MSCI Europe Large Value Index with a value of 0.86. This reflects our intentional bias towards high book-to-market companies compared to the index since we believe that companies with high book-to-market ratios deliver the strongest long term returns.
Over six months to 31 May 2010 the total return of the European Value Fund in Euro (the Base Currency of the Fund) was 0.3%, the total return of the U.S. dollar class was (18.1%). This compares to Euro and U.S. dollar total returns of (0.3%) and (18.5%) respectively for the MSCI Europe Large Value Index.
Total return over six months and from inception for each class is shown in the Performance Information table. The portfolio is fully invested and is well positioned to capture the returns of European large-cap value companies.
DIMENSIONAL FUNDS II PLC
4
Investment Manager’s Reports (continued)
Global Core Equity Fund The Global Core Equity Fund was launched on 3 September 2008 with the inception of the A Class Shares which are denominated in U.S. Dollars. The Class B Shares which are denominated in Euro, the Class C Shares and Class D Shares which are denominated in Sterling each commenced trading on 3 September 2008.
The Global Core Equity Fund has been invested in a broad range of companies with increased exposure to companies with high book-to-market ratios and smaller market capitalizations across developed world markets. As at 31 May 2010 the Fund had exposure to 7,691 companies, this reflects our approach of delivering highly diversified exposure to securities. The weighted average market capitalisation of the holdings in the Fund at 31 May 2010 was $37,810 million compared to $56,280 million for the MSCI World Index. The dividend yield of the Fund at 31 May 2010 was 2.43% which compares to 2.65% for the MSCI World Index. The weighted average book-to-market ratio of the holdings in the Fund at 31 May 2010 was 0.70 which compares with the MSCI World Index with a value of 0.61. This reflects our intentional bias towards high book-to-market companies compared to the index since we believe that companies with high book-to-market ratios deliver the strongest long term returns.
Over six months to 31 May 2010, the total return of the Global Core Equity Fund in U.S. dollars (the Base Currency of the Fund) was -3.3%. This compares to total return of -6.0% for the MSCI World Index.
Total return over six months and from inception for each class is shown in the Performance Information table. The portfolio is fully invested and is well positioned to capture the returns of Global market.
The Investment Committee of the Advisor, having reviewed the Israeli market, has recommended that the fund invest in companies with exposure to Israel on approved exchanges from the second quarter of 2010 onwards.
Global Targeted Value Fund The Global Targeted Value Fund was launched on 6 February 2008 with the inception of the A Class Shares which are denominated in U.S. Dollars. The Class D Shares which are denominated in Sterling began trading on 18 March 2008. The Class B Shares which are denominated in Euro began trading on 12 May 2008. The Class C Shares which are denominated in Sterling commenced trading on 5 September 2008.
The Global Targeted Value Fund has been invested in a broad range of small and mid-cap companies with high book-to-market ratios across developed world markets and as at 31 May 2010 had holdings in 3,111 companies. This reflects our approach of delivering highly diversified exposure to small and mid-cap companies. The weighted average market capitalisation of the holdings in the Fund at 31 May 2010 was $2,017 million compared to $3,359 million for the MSCI World Small and Mid Cap Value Index. The dividend yield of the fund at 31 May 2010 was 1.63% which compares to 2.82% for the MSCI World Small and Mid Cap Value Index. The weighted average book-to-market ratio of the holdings in the Fund at 31 May 2010 was 0.98 which compares with the MSCI World Small and Mid Cap Value Index with a value of 0.90. This reflects our intentional bias towards high book-to-market companies compared to the index since we believe that companies with high book-to-market ratios deliver the strongest long term returns.
Over six months to 31 May 2010, the total return of the Global Targeted Value Fund in U.S. dollars (the Base Currency of the fund) was 2.9%. This compares to total return of 2.9% for the MSCI World Small and Mid Cap Value Index.
Total return over six months and from inception for each class is shown in the Performance Information table. The portfolio is fully invested and is well positioned to capture the returns of Global small-cap value companies.
The Investment Committee of the Advisor, having reviewed the Israeli market, has recommended that the fund invest in companies with exposure to Israel on approved exchanges from the second quarter of 2010 onwards.
DIMENSIONAL FUNDS II PLC
5
Investment Manager’s Reports (continued)
Pacific Basin Value Fund The Pacific Basin Value Fund was launched on 18 September 2007 with the inception of the Class A Shares which are denominated in U.S. Dollars. The Class B Shares which are denominated in Euro commenced trading on 29 October 2008. The Class D Shares which are denominated in Sterling commenced trading on 26 November 2008. The Class C Shares which are denominated in Sterling commenced trading on 19 February 2009. The Pacific Basin Value Fund has been invested in a broad range of large cap value companies across the Pacific Basin region and as at 31 May 2010 had holdings in 211 companies. This reflects our approach of delivering highly diversified exposure to value companies. The weighted average market capitalisation of the holdings in the Fund at 31 May 2010 was $15,705 million compared to $35,595 million for the MSCI Pacific Large Value Index. The dividend yield of the Fund at 31 May 2010 was 2.68% which compares to 3.46% for the MSCI Pacific Large Value Index. The weighted average book-to-market ratio of the holdings in the Fund at 31 May 2010 was 1.12 which compares with the MSCI Pacific Large Value Index with a value of 0.86. This reflects our intentional bias towards high book-to-market companies compared to the index since we believe that companies with high book-to-market ratios deliver the strongest long term returns. Over six months to 31 May 2010, the total return of the Pacific Basin Value Fund in U.S. dollars (the Base Currency of the Fund) was (0.3%). This compares to total return of -3.6% for the MSCI Pacific Large Value Index. Total return over six months and from inception is shown in the Performance Information table. The portfolio is fully invested and is well positioned to capture the returns of Pacific Basin large-cap value companies.
DIMENSIONAL FUNDS II PLC
6
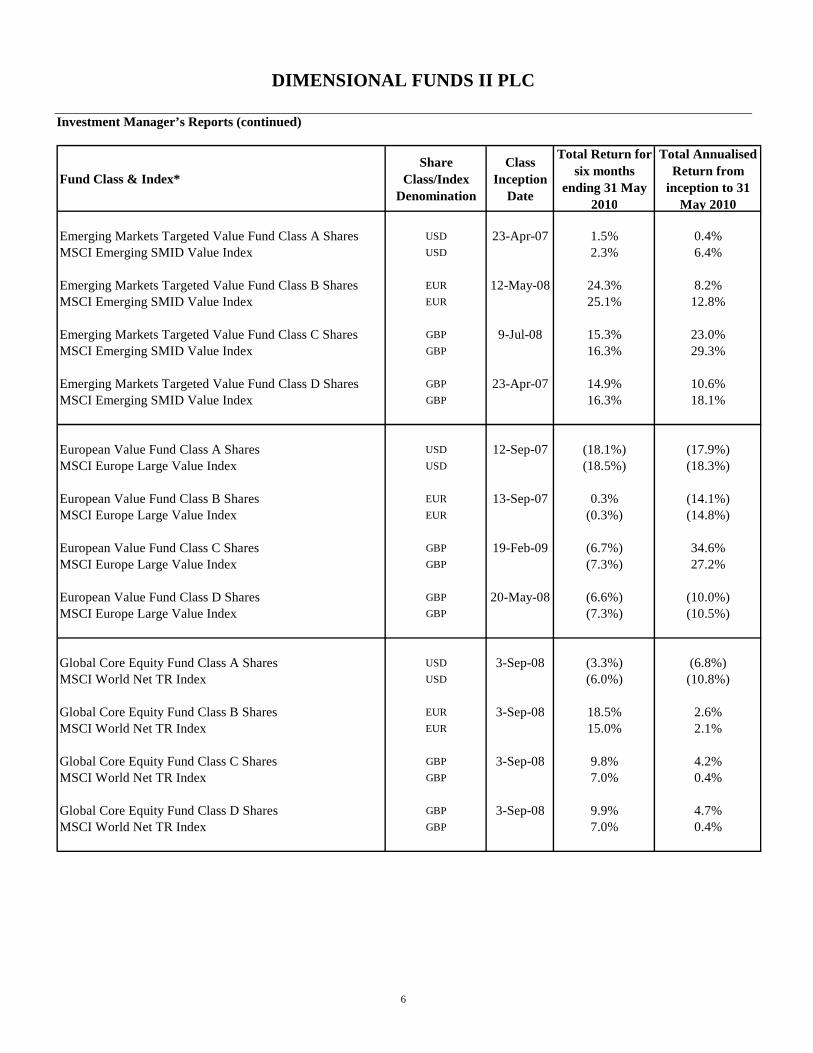
Investment Manager’s Reports (continued)
Fund Class & Index*Share
Class/Index Denomination
Class Inception
Date
Total Return for six months
ending 31 May 2010
Total Annualised Return from
inception to 31 May 2010
Emerging Markets Targeted Value Fund Class A Shares USD 23-Apr-07 1.5% 0.4%MSCI Emerging SMID Value Index USD 2.3% 6.4%
Emerging Markets Targeted Value Fund Class B Shares EUR 12-May-08 24.3% 8.2%MSCI Emerging SMID Value Index EUR 25.1% 12.8%
Emerging Markets Targeted Value Fund Class C Shares GBP 9-Jul-08 15.3% 23.0%MSCI Emerging SMID Value Index GBP 16.3% 29.3%
Emerging Markets Targeted Value Fund Class D Shares GBP 23-Apr-07 14.9% 10.6%MSCI Emerging SMID Value Index GBP 16.3% 18.1%
European Value Fund Class A Shares USD 12-Sep-07 (18.1%) (17.9%)MSCI Europe Large Value Index USD (18.5%) (18.3%)
European Value Fund Class B Shares EUR 13-Sep-07 0.3% (14.1%)MSCI Europe Large Value Index EUR (0.3%) (14.8%)
European Value Fund Class C Shares GBP 19-Feb-09 (6.7%) 34.6%MSCI Europe Large Value Index GBP (7.3%) 27.2%
European Value Fund Class D Shares GBP 20-May-08 (6.6%) (10.0%)MSCI Europe Large Value Index GBP (7.3%) (10.5%)
Global Core Equity Fund Class A Shares USD 3-Sep-08 (3.3%) (6.8%)MSCI World Net TR Index USD (6.0%) (10.8%)
Global Core Equity Fund Class B Shares EUR 3-Sep-08 18.5% 2.6%MSCI World Net TR Index EUR 15.0% 2.1%
Global Core Equity Fund Class C Shares GBP 3-Sep-08 9.8% 4.2%MSCI World Net TR Index GBP 7.0% 0.4%
Global Core Equity Fund Class D Shares GBP 3-Sep-08 9.9% 4.7%MSCI World Net TR Index GBP 7.0% 0.4%
DIMENSIONAL FUNDS II PLC
7
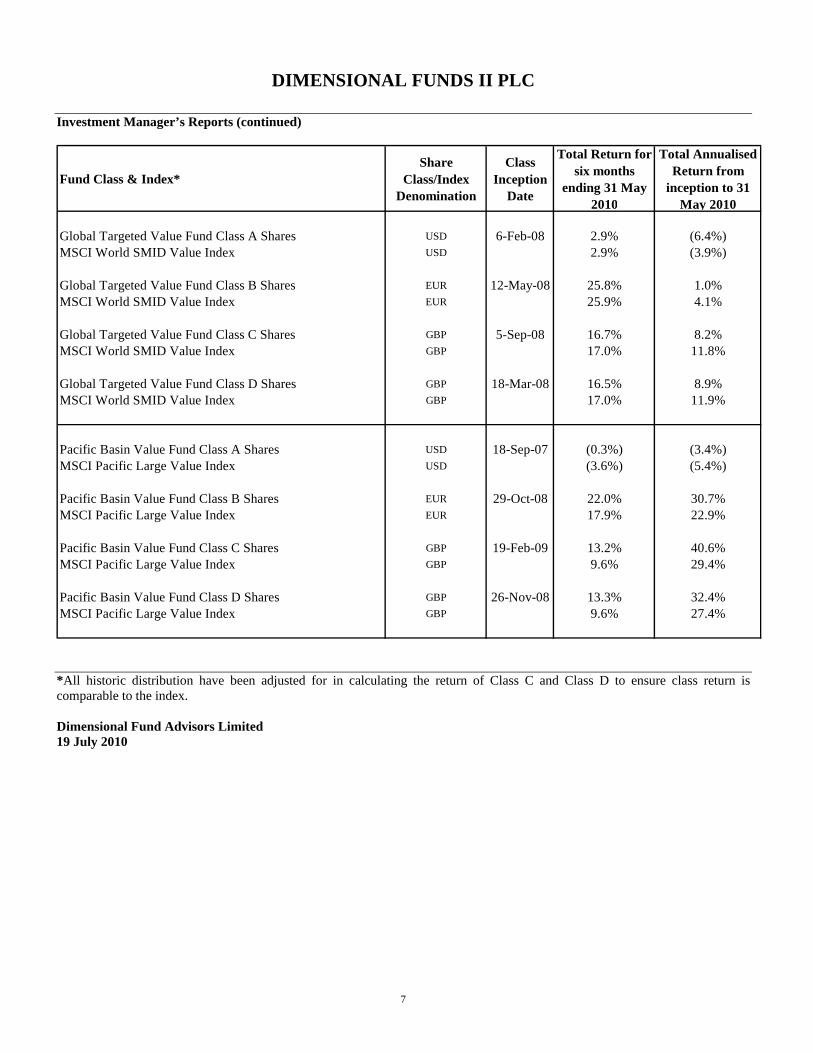
Investment Manager’s Reports (continued)
Fund Class & Index*Share
Class/Index Denomination
Class Inception
Date
Total Return for six months
ending 31 May 2010
Total Annualised Return from
inception to 31 May 2010
Global Targeted Value Fund Class A Shares USD 6-Feb-08 2.9% (6.4%)MSCI World SMID Value Index USD 2.9% (3.9%)
Global Targeted Value Fund Class B Shares EUR 12-May-08 25.8% 1.0%MSCI World SMID Value Index EUR 25.9% 4.1%
Global Targeted Value Fund Class C Shares GBP 5-Sep-08 16.7% 8.2%MSCI World SMID Value Index GBP 17.0% 11.8%
Global Targeted Value Fund Class D Shares GBP 18-Mar-08 16.5% 8.9%MSCI World SMID Value Index GBP 17.0% 11.9%
Pacific Basin Value Fund Class A Shares USD 18-Sep-07 (0.3%) (3.4%)MSCI Pacific Large Value Index USD (3.6%) (5.4%)
Pacific Basin Value Fund Class B Shares EUR 29-Oct-08 22.0% 30.7%MSCI Pacific Large Value Index EUR 17.9% 22.9%
Pacific Basin Value Fund Class C Shares GBP 19-Feb-09 13.2% 40.6%MSCI Pacific Large Value Index GBP 9.6% 29.4%
Pacific Basin Value Fund Class D Shares GBP 26-Nov-08 13.3% 32.4%MSCI Pacific Large Value Index GBP 9.6% 27.4%
*All historic distribution have been adjusted for in calculating the return of Class C and Class D to ensure class return is comparable to the index. Dimensional Fund Advisors Limited 19 July 2010
DIMENSIONAL FUNDS II PLC
8
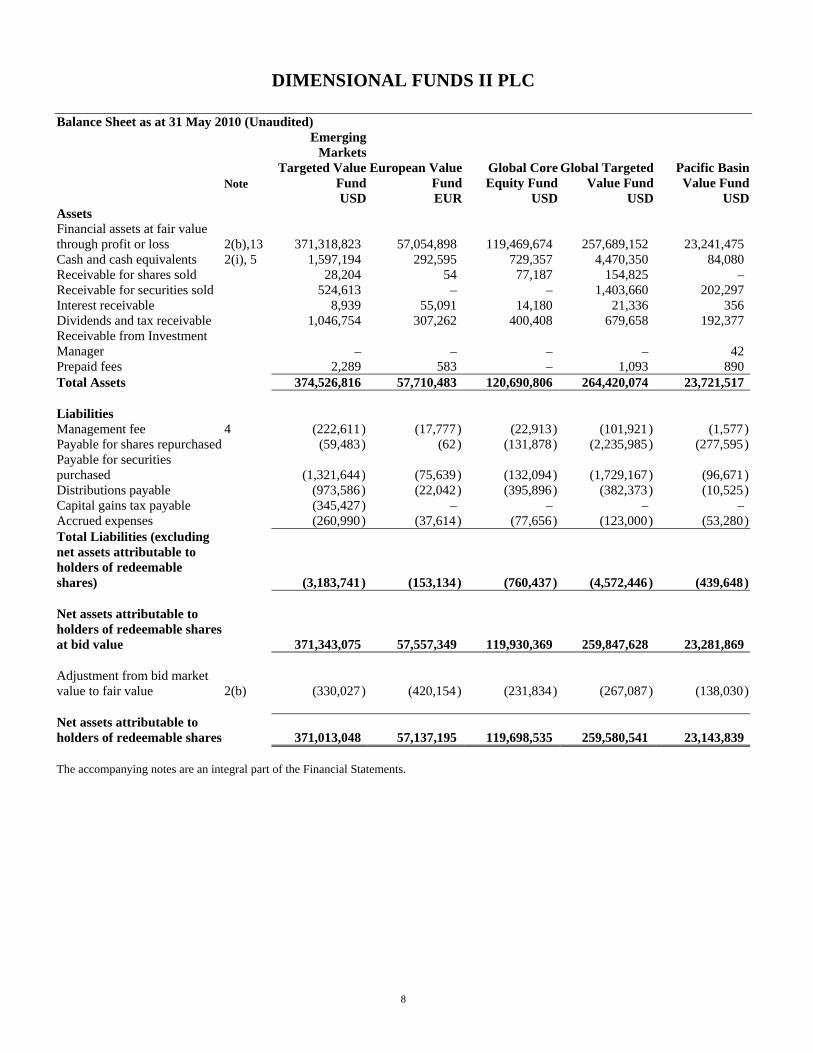
Balance Sheet as at 31 May 2010 (Unaudited)
Note
Emerging Markets
Targeted Value Fund
European Value Fund
Global Core Equity Fund
Global Targeted Value Fund
Pacific Basin Value Fund
USD EUR USD USD USD Assets Financial assets at fair value through profit or loss 2(b),13 371,318,823 57,054,898 119,469,674 257,689,152 23,241,475 Cash and cash equivalents 2(i), 5 1,597,194 292,595 729,357 4,470,350 84,080 Receivable for shares sold 28,204 54 77,187 154,825 – Receivable for securities sold 524,613 – – 1,403,660 202,297 Interest receivable 8,939 55,091 14,180 21,336 356 Dividends and tax receivable 1,046,754 307,262 400,408 679,658 192,377 Receivable from Investment Manager – – – – 42 Prepaid fees 2,289 583 – 1,093 890 Total Assets 374,526,816 57,710,483 120,690,806 264,420,074 23,721,517 Liabilities Management fee 4 (222,611 ) (17,777 ) (22,913 ) (101,921 ) (1,577 ) Payable for shares repurchased (59,483 ) (62 ) (131,878 ) (2,235,985 ) (277,595 ) Payable for securities purchased (1,321,644 ) (75,639 ) (132,094 ) (1,729,167 ) (96,671 ) Distributions payable (973,586 ) (22,042 ) (395,896 ) (382,373 ) (10,525 ) Capital gains tax payable (345,427 ) – – – – Accrued expenses (260,990 ) (37,614 ) (77,656 ) (123,000 ) (53,280 ) Total Liabilities (excluding net assets attributable to holders of redeemable shares) (3,183,741 ) (153,134 ) (760,437 ) (4,572,446 ) (439,648 ) Net assets attributable to holders of redeemable shares at bid value 371,343,075 57,557,349 119,930,369 259,847,628 23,281,869 Adjustment from bid market value to fair value 2(b) (330,027 ) (420,154 ) (231,834 ) (267,087 ) (138,030 ) Net assets attributable to holders of redeemable shares 371,013,048 57,137,195 119,698,535 259,580,541 23,143,839 The accompanying notes are an integral part of the Financial Statements. ** Global Core Equity Fund launched on 3 September 2008.
DIMENSIONAL FUNDS II PLC
9
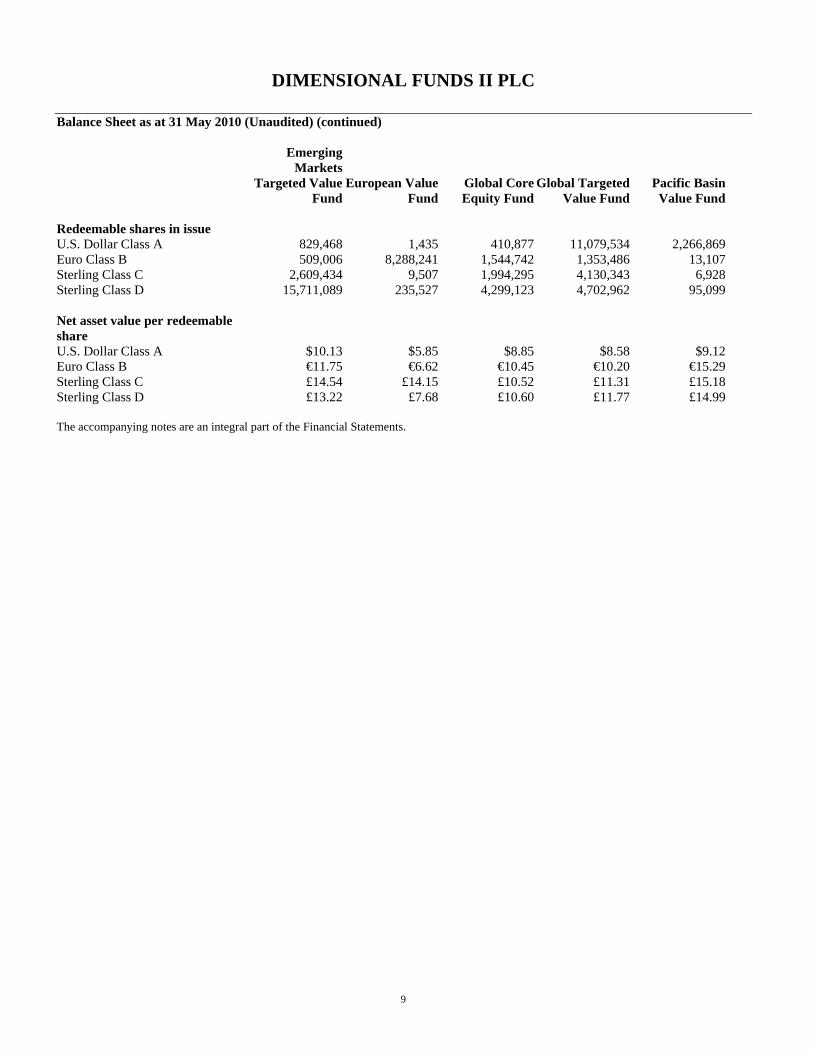
Balance Sheet as at 31 May 2010 (Unaudited) (continued)
Emerging Markets
Targeted Value Fund
European Value Fund
Global Core Equity Fund
Global Targeted Value Fund
Pacific Basin Value Fund
Redeemable shares in issue U.S. Dollar Class A 829,468 1,435 410,877 11,079,534 2,266,869 Euro Class B 509,006 8,288,241 1,544,742 1,353,486 13,107 Sterling Class C 2,609,434 9,507 1,994,295 4,130,343 6,928 Sterling Class D 15,711,089 235,527 4,299,123 4,702,962 95,099 Net asset value per redeemable share U.S. Dollar Class A $10.13 $5.85 $8.85 $8.58 $9.12 Euro Class B €11.75 €6.62 €10.45 €10.20 €15.29 Sterling Class C £14.54 £14.15 £10.52 £11.31 £15.18 Sterling Class D £13.22 £7.68 £10.60 £11.77 £14.99 The accompanying notes are an integral part of the Financial Statements. Global Core Equity Fund launched on 3 September 2008.
DIMENSIONAL FUNDS II PLC
10
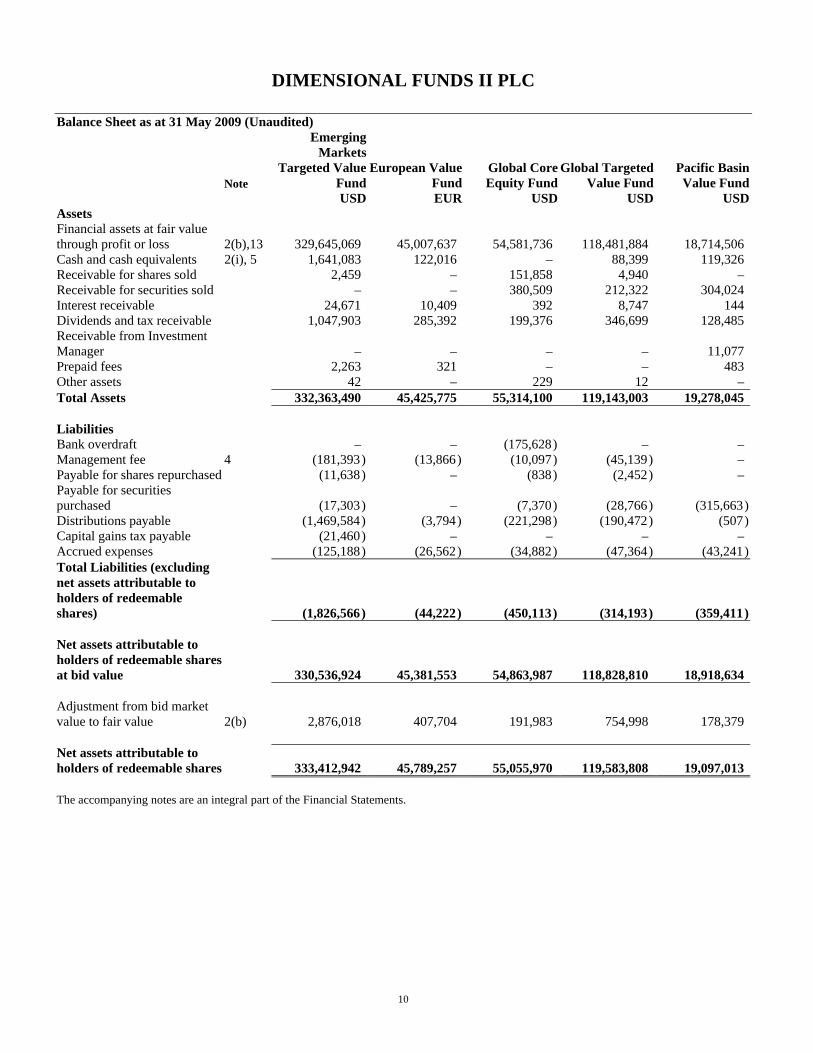
Balance Sheet as at 31 May 2009 (Unaudited)
Note
Emerging Markets
Targeted Value Fund
European Value Fund
Global Core Equity Fund
Global Targeted Value Fund
Pacific Basin Value Fund
USD EUR USD USD USD Assets Financial assets at fair value through profit or loss 2(b),13 329,645,069 45,007,637 54,581,736 118,481,884 18,714,506 Cash and cash equivalents 2(i), 5 1,641,083 122,016 – 88,399 119,326 Receivable for shares sold 2,459 – 151,858 4,940 – Receivable for securities sold – – 380,509 212,322 304,024 Interest receivable 24,671 10,409 392 8,747 144 Dividends and tax receivable 1,047,903 285,392 199,376 346,699 128,485 Receivable from Investment Manager – – – – 11,077 Prepaid fees 2,263 321 – – 483 Other assets 42 – 229 12 – Total Assets 332,363,490 45,425,775 55,314,100 119,143,003 19,278,045 Liabilities Bank overdraft – – (175,628 ) – – Management fee 4 (181,393 ) (13,866 ) (10,097 ) (45,139 ) – Payable for shares repurchased (11,638 ) – (838 ) (2,452 ) – Payable for securities purchased (17,303 ) – (7,370 ) (28,766 ) (315,663 ) Distributions payable (1,469,584 ) (3,794 ) (221,298 ) (190,472 ) (507 ) Capital gains tax payable (21,460 ) – – – – Accrued expenses (125,188 ) (26,562 ) (34,882 ) (47,364 ) (43,241 ) Total Liabilities (excluding net assets attributable to holders of redeemable shares) (1,826,566 ) (44,222 ) (450,113 ) (314,193 ) (359,411 ) Net assets attributable to holders of redeemable shares at bid value 330,536,924 45,381,553 54,863,987 118,828,810 18,918,634 Adjustment from bid market value to fair value 2(b) 2,876,018 407,704 191,983 754,998 178,379 Net assets attributable to holders of redeemable shares 333,412,942 45,789,257 55,055,970 119,583,808 19,097,013 The accompanying notes are an integral part of the Financial Statements.

DIMENSIONAL FUNDS II PLC
11
Balance Sheet as at 31 May 2009 (Unaudited) (continued)
Emerging Markets
Targeted Value Fund
European Value Fund
Global Core Equity Fund
Global Targeted Value Fund
Pacific Basin Value Fund
Redeemable shares in issue* U.S. Dollar Class A 100 1,435 262,114 9,497,617 2,280,311 Euro Class B 170,213 8,110,499 731,811 348,397 4,879 Sterling Class C 49,280 1,819 362,385 206,591 1,726 Sterling Class D 22,449,919 43,409 2,951,771 3,368,941 3,726 Net asset value per redeemable share* U.S. Dollar Class A $7.73 $5.70 $7.72 $6.97 $8.29 Euro Class B €7.78 €5.60 €7.90 €7.20 €12.06 Sterling Class C £10.03 £12.63 £8.31 £8.30 £12.53 Sterling Class D £9.11 £6.86 £8.38 £8.64 £12.37 The accompanying notes are an integral part of the Financial Statements. * European Value Fund Class C and Pacific Basin Value Fund Class C launched on 19 February 2009.
Class C in Emerging Markets Targeted Value Fund launched on 9 July 2008. Class D in European Value Fund launched on 20 May 2008. Class A, B, C and D in Global Core Equity Fund launched on 3 September 2008. Class A in Global Targeted Value Fund launched on 6 February 2008, Class B launched in Global Targeted Value Fund launched on 12 May 2008, Class C in Global Targeted Value Fund launched on 5 September 2008 and Class D in Global Targeted Value Fund launched on 18 March 2008.
DIMENSIONAL FUNDS II PLC
12
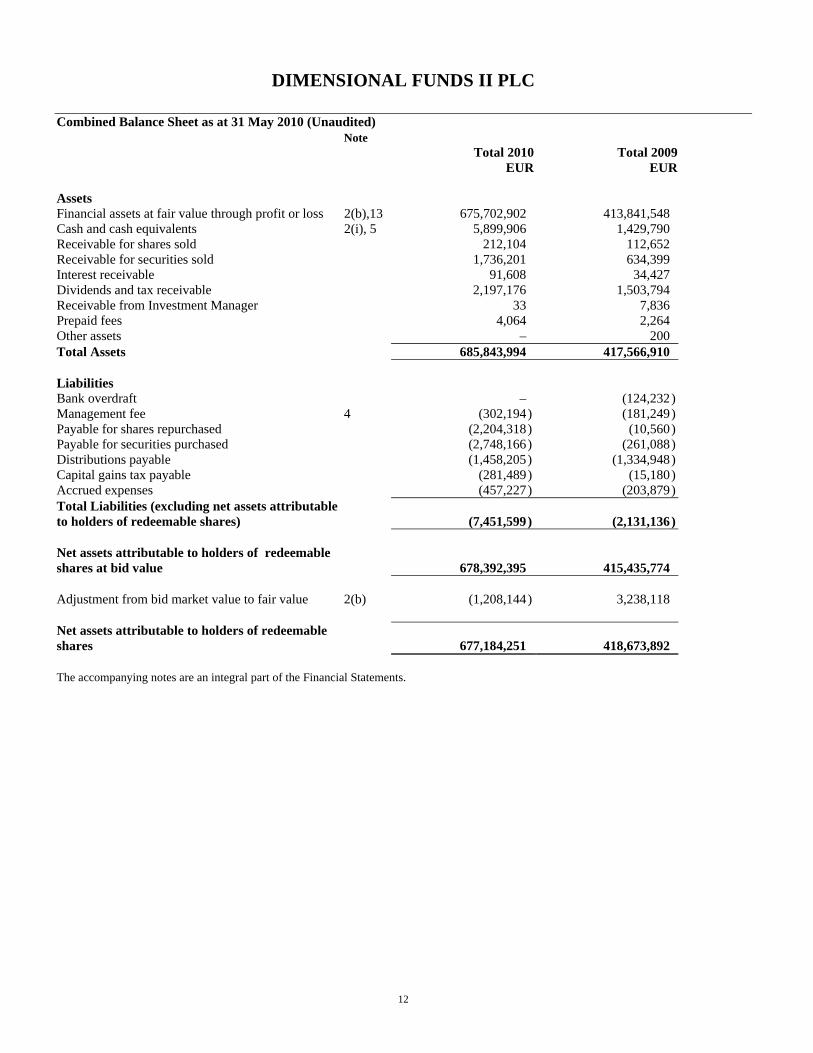
Combined Balance Sheet as at 31 May 2010 (Unaudited) Note Total 2010 Total 2009 EUR EUR Assets Financial assets at fair value through profit or loss 2(b),13 675,702,902 413,841,548 Cash and cash equivalents 2(i), 5 5,899,906 1,429,790 Receivable for shares sold 212,104 112,652 Receivable for securities sold 1,736,201 634,399 Interest receivable 91,608 34,427 Dividends and tax receivable 2,197,176 1,503,794 Receivable from Investment Manager 33 7,836 Prepaid fees 4,064 2,264 Other assets – 200 Total Assets 685,843,994 417,566,910 Liabilities Bank overdraft – (124,232 ) Management fee 4 (302,194 ) (181,249 ) Payable for shares repurchased (2,204,318 ) (10,560 ) Payable for securities purchased (2,748,166 ) (261,088 ) Distributions payable (1,458,205 ) (1,334,948 ) Capital gains tax payable (281,489 ) (15,180 ) Accrued expenses (457,227 ) (203,879 ) Total Liabilities (excluding net assets attributable to holders of redeemable shares) (7,451,599 ) (2,131,136 ) Net assets attributable to holders of redeemable shares at bid value 678,392,395 415,435,774 Adjustment from bid market value to fair value 2(b) (1,208,144 ) 3,238,118 Net assets attributable to holders of redeemable shares 677,184,251 418,673,892 The accompanying notes are an integral part of the Financial Statements.
DIMENSIONAL FUNDS II PLC
13
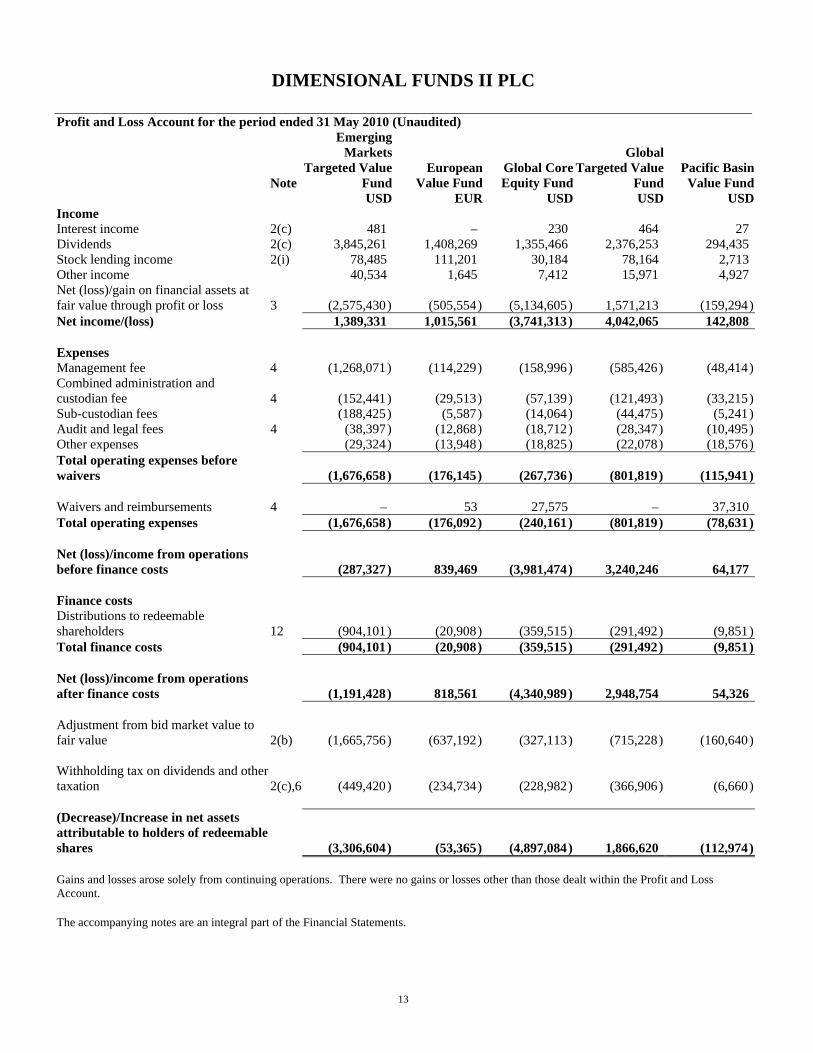
Profit and Loss Account for the period ended 31 May 2010 (Unaudited)
Note
Emerging Markets
Targeted Value Fund
European Value Fund
Global Core Equity Fund
Global Targeted Value
Fund Pacific Basin Value Fund
USD EUR USD USD USD Income Interest income 2(c) 481 – 230 464 27 Dividends 2(c) 3,845,261 1,408,269 1,355,466 2,376,253 294,435 Stock lending income 2(i) 78,485 111,201 30,184 78,164 2,713 Other income 40,534 1,645 7,412 15,971 4,927 Net (loss)/gain on financial assets at fair value through profit or loss 3 (2,575,430 ) (505,554 ) (5,134,605 ) 1,571,213 (159,294 ) Net income/(loss) 1,389,331 1,015,561 (3,741,313 ) 4,042,065 142,808 Expenses Management fee 4 (1,268,071 ) (114,229 ) (158,996 ) (585,426 ) (48,414 ) Combined administration and custodian fee 4 (152,441 ) (29,513 ) (57,139 ) (121,493 ) (33,215 ) Sub-custodian fees (188,425 ) (5,587 ) (14,064 ) (44,475 ) (5,241 ) Audit and legal fees 4 (38,397 ) (12,868 ) (18,712 ) (28,347 ) (10,495 ) Other expenses (29,324 ) (13,948 ) (18,825 ) (22,078 ) (18,576 ) Total operating expenses before waivers (1,676,658 ) (176,145 ) (267,736 ) (801,819 ) (115,941 ) Waivers and reimbursements 4 – 53 27,575 – 37,310 Total operating expenses (1,676,658 ) (176,092 ) (240,161 ) (801,819 ) (78,631 ) Net (loss)/income from operations before finance costs (287,327 ) 839,469 (3,981,474 ) 3,240,246 64,177 Finance costs Distributions to redeemable shareholders 12 (904,101 ) (20,908 ) (359,515 ) (291,492 ) (9,851 ) Total finance costs (904,101 ) (20,908 ) (359,515 ) (291,492 ) (9,851 ) Net (loss)/income from operations after finance costs (1,191,428 ) 818,561 (4,340,989 ) 2,948,754 54,326 Adjustment from bid market value to fair value 2(b) (1,665,756 ) (637,192 ) (327,113 ) (715,228 ) (160,640 ) Withholding tax on dividends and other taxation 2(c),6 (449,420 ) (234,734 ) (228,982 ) (366,906 ) (6,660 ) (Decrease)/Increase in net assets attributable to holders of redeemable shares (3,306,604 ) (53,365 ) (4,897,084 ) 1,866,620 (112,974 ) Gains and losses arose solely from continuing operations. There were no gains or losses other than those dealt within the Profit and Loss Account. The accompanying notes are an integral part of the Financial Statements.
DIMENSIONAL FUNDS II PLC
14
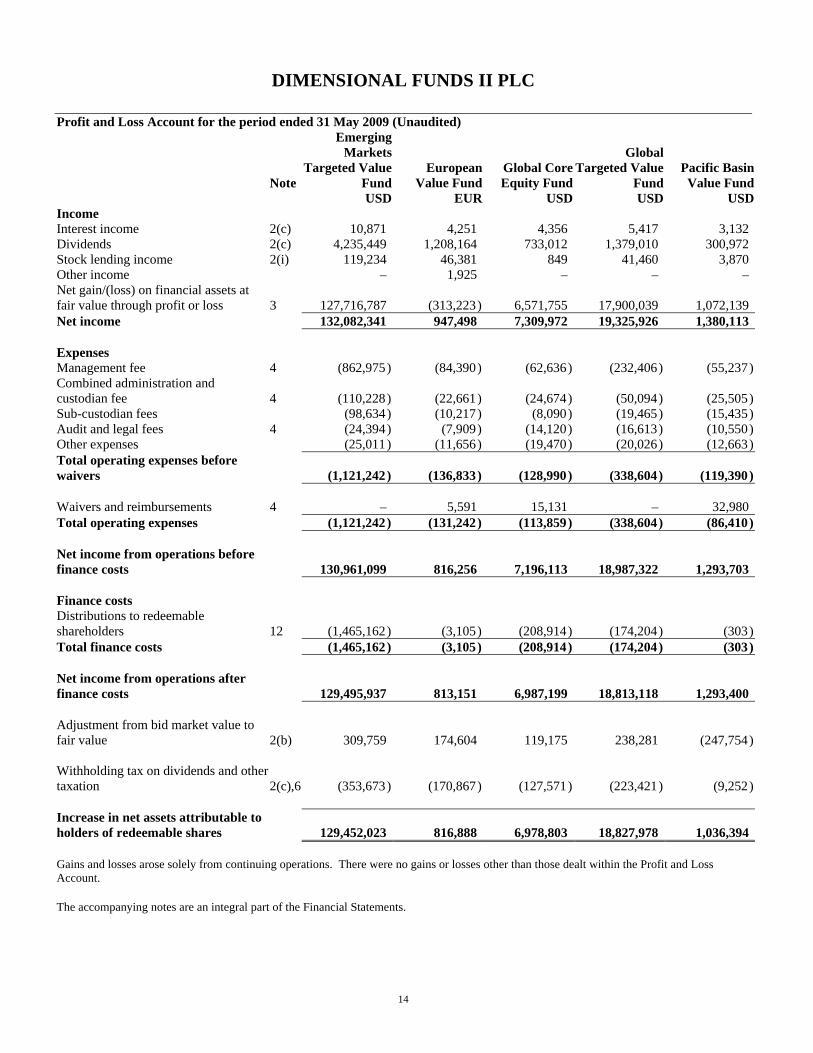
Profit and Loss Account for the period ended 31 May 2009 (Unaudited)
Note
Emerging Markets
Targeted Value Fund
European Value Fund
Global Core Equity Fund
Global Targeted Value
Fund Pacific Basin Value Fund
USD EUR USD USD USD Income Interest income 2(c) 10,871 4,251 4,356 5,417 3,132 Dividends 2(c) 4,235,449 1,208,164 733,012 1,379,010 300,972 Stock lending income 2(i) 119,234 46,381 849 41,460 3,870 Other income – 1,925 – – – Net gain/(loss) on financial assets at fair value through profit or loss 3 127,716,787 (313,223 ) 6,571,755 17,900,039 1,072,139 Net income 132,082,341 947,498 7,309,972 19,325,926 1,380,113 Expenses Management fee 4 (862,975 ) (84,390 ) (62,636 ) (232,406 ) (55,237 ) Combined administration and custodian fee 4 (110,228 ) (22,661 ) (24,674 ) (50,094 ) (25,505 ) Sub-custodian fees (98,634 ) (10,217 ) (8,090 ) (19,465 ) (15,435 ) Audit and legal fees 4 (24,394 ) (7,909 ) (14,120 ) (16,613 ) (10,550 ) Other expenses (25,011 ) (11,656 ) (19,470 ) (20,026 ) (12,663 ) Total operating expenses before waivers (1,121,242 ) (136,833 ) (128,990 ) (338,604 ) (119,390 ) Waivers and reimbursements 4 – 5,591 15,131 – 32,980 Total operating expenses (1,121,242 ) (131,242 ) (113,859 ) (338,604 ) (86,410 ) Net income from operations before finance costs 130,961,099 816,256 7,196,113 18,987,322 1,293,703 Finance costs Distributions to redeemable shareholders 12 (1,465,162 ) (3,105 ) (208,914 ) (174,204 ) (303 ) Total finance costs (1,465,162 ) (3,105 ) (208,914 ) (174,204 ) (303 ) Net income from operations after finance costs 129,495,937 813,151 6,987,199 18,813,118 1,293,400 Adjustment from bid market value to fair value 2(b) 309,759 174,604 119,175 238,281 (247,754 ) Withholding tax on dividends and other taxation 2(c),6 (353,673 ) (170,867 ) (127,571 ) (223,421 ) (9,252 ) Increase in net assets attributable to holders of redeemable shares 129,452,023 816,888 6,978,803 18,827,978 1,036,394 Gains and losses arose solely from continuing operations. There were no gains or losses other than those dealt within the Profit and Loss Account. The accompanying notes are an integral part of the Financial Statements.
DIMENSIONAL FUNDS II PLC
15
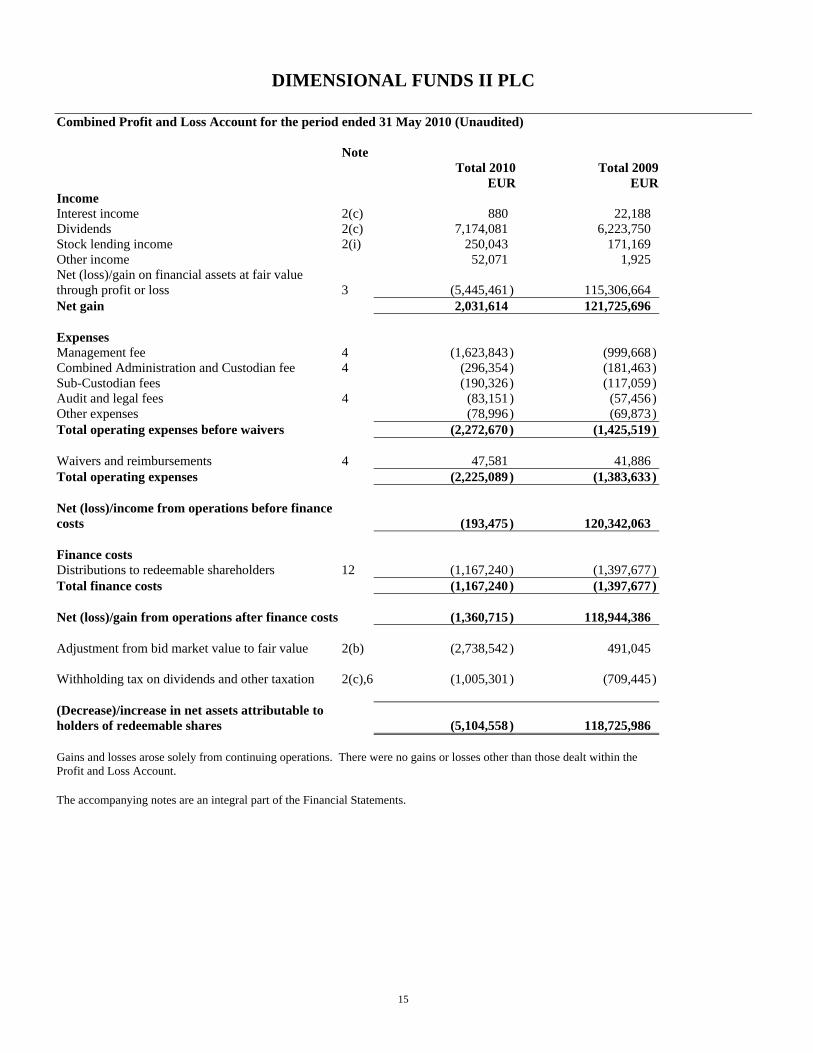
Combined Profit and Loss Account for the period ended 31 May 2010 (Unaudited) Note Total 2010 Total 2009 EUR EUR Income Interest income 2(c) 880 22,188 Dividends 2(c) 7,174,081 6,223,750 Stock lending income 2(i) 250,043 171,169 Other income 52,071 1,925 Net (loss)/gain on financial assets at fair value through profit or loss 3 (5,445,461 ) 115,306,664 Net gain 2,031,614 121,725,696 Expenses Management fee 4 (1,623,843 ) (999,668 ) Combined Administration and Custodian fee 4 (296,354 ) (181,463 ) Sub-Custodian fees (190,326 ) (117,059 ) Audit and legal fees 4 (83,151 ) (57,456 ) Other expenses (78,996 ) (69,873 ) Total operating expenses before waivers (2,272,670 ) (1,425,519 ) Waivers and reimbursements 4 47,581 41,886 Total operating expenses (2,225,089 ) (1,383,633 ) Net (loss)/income from operations before finance costs (193,475 ) 120,342,063 Finance costs Distributions to redeemable shareholders 12 (1,167,240 ) (1,397,677 ) Total finance costs (1,167,240 ) (1,397,677 ) Net (loss)/gain from operations after finance costs (1,360,715 ) 118,944,386 Adjustment from bid market value to fair value 2(b) (2,738,542 ) 491,045 Withholding tax on dividends and other taxation 2(c),6 (1,005,301 ) (709,445 ) (Decrease)/increase in net assets attributable to holders of redeemable shares (5,104,558 ) 118,725,986 Gains and losses arose solely from continuing operations. There were no gains or losses other than those dealt within the Profit and Loss Account. The accompanying notes are an integral part of the Financial Statements.
DIMENSIONAL FUNDS II PLC
16
Statement of Changes in Net Assets Attributable to Holders of Redeemable Shares For the period ended 31 May 2010 (Unaudited)
Emerging Markets
Targeted Value Fund
European Value Fund
Global Core Equity Fund
Global Targeted
Value Fund Pacific Basin Value Fund
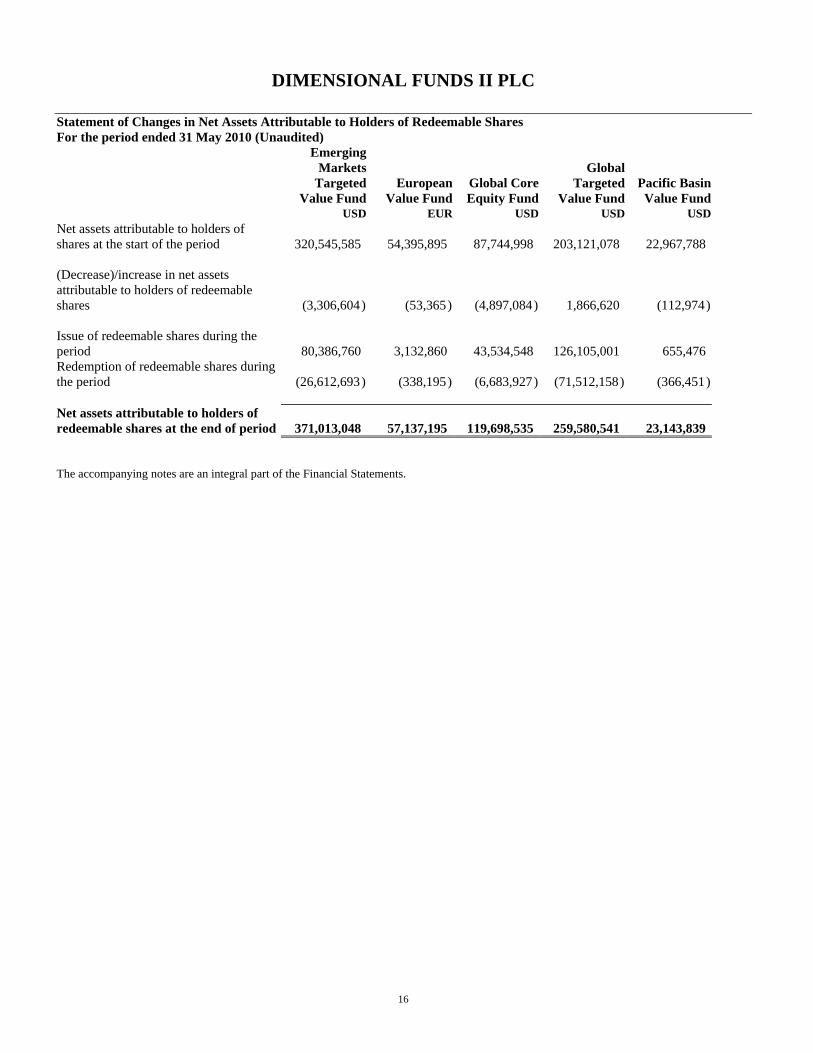
USD EUR USD USD USD Net assets attributable to holders of shares at the start of the period 320,545,585 54,395,895 87,744,998 203,121,078 22,967,788 (Decrease)/increase in net assets attributable to holders of redeemable shares (3,306,604 ) (53,365 ) (4,897,084 ) 1,866,620 (112,974 ) Issue of redeemable shares during the period 80,386,760 3,132,860 43,534,548 126,105,001 655,476 Redemption of redeemable shares during the period (26,612,693 ) (338,195 ) (6,683,927 ) (71,512,158 ) (366,451 ) Net assets attributable to holders of redeemable shares at the end of period 371,013,048 57,137,195 119,698,535 259,580,541 23,143,839 The accompanying notes are an integral part of the Financial Statements.
DIMENSIONAL FUNDS II PLC
17
Statement of Changes in Net Assets Attributable to Holders of Redeemable Shares For the period ended 31 May 2009 (Unaudited)
Emerging Markets
Targeted Value Fund
European Value Fund
Global Core Equity Fund
Global Targeted
Value Fund Pacific Basin Value Fund
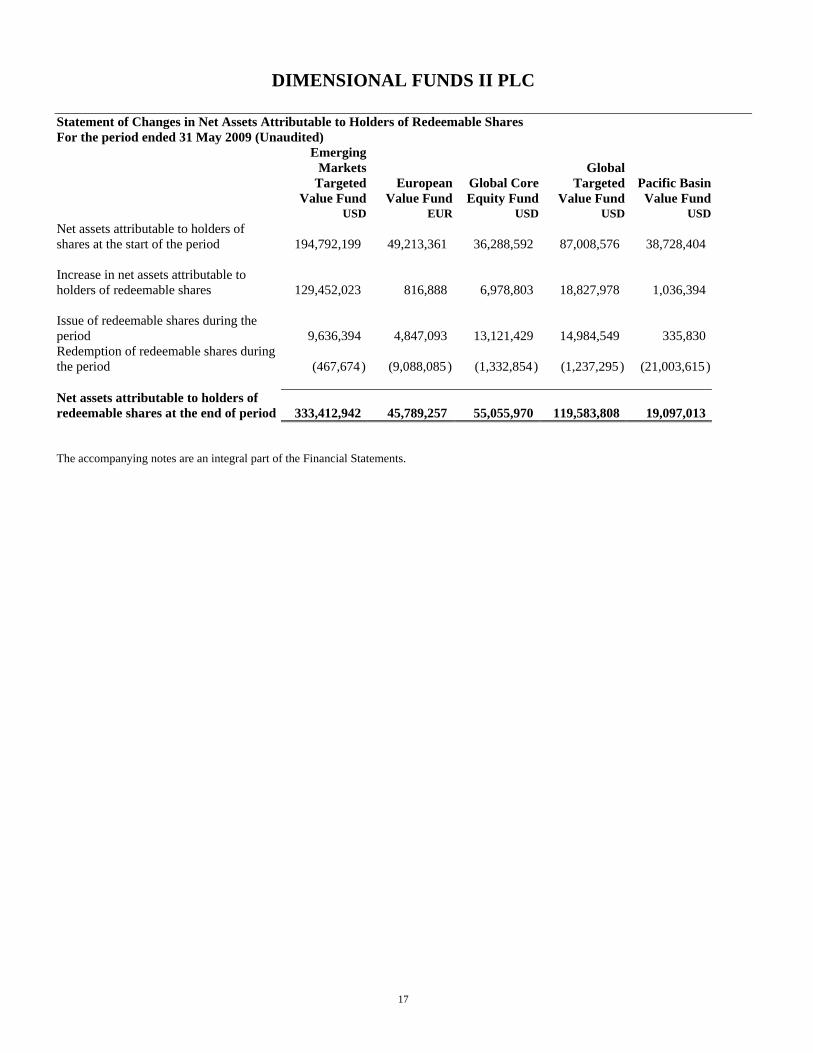
USD EUR USD USD USD Net assets attributable to holders of shares at the start of the period 194,792,199 49,213,361 36,288,592 87,008,576 38,728,404 Increase in net assets attributable to holders of redeemable shares 129,452,023 816,888 6,978,803 18,827,978 1,036,394 Issue of redeemable shares during the period 9,636,394 4,847,093 13,121,429 14,984,549 335,830 Redemption of redeemable shares during the period (467,674 ) (9,088,085 ) (1,332,854 ) (1,237,295 ) (21,003,615 ) Net assets attributable to holders of redeemable shares at the end of period 333,412,942 45,789,257 55,055,970 119,583,808 19,097,013 The accompanying notes are an integral part of the Financial Statements. ** Global Core Equity Fund launched on 3 September 2008.
DIMENSIONAL FUNDS II PLC
18
Statement of Changes in Net Assets Attributable to Holders of Redeemable Shares For the period ended 31 May 2010 (Unaudited)
Total 31 May 2010
Total 31 May 2009
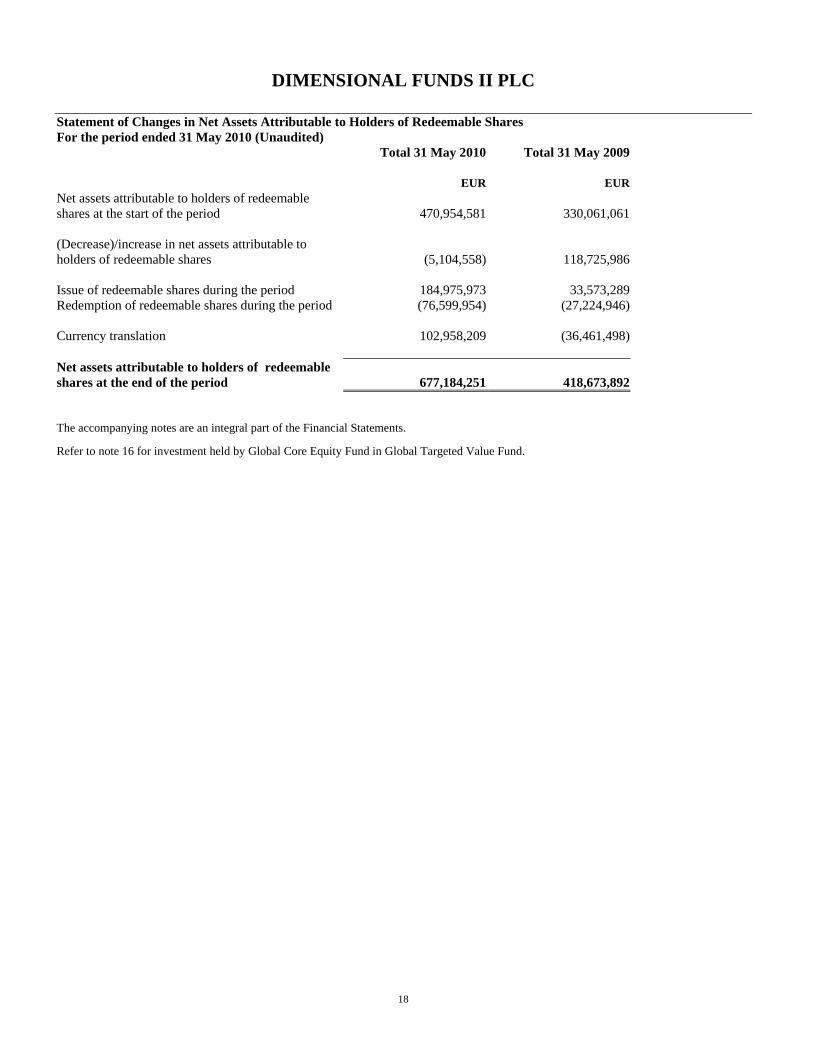
EUR EUR Net assets attributable to holders of redeemable shares at the start of the period 470,954,581 330,061,061 (Decrease)/increase in net assets attributable to holders of redeemable shares (5,104,558) 118,725,986 Issue of redeemable shares during the period 184,975,973 33,573,289 Redemption of redeemable shares during the period (76,599,954) (27,224,946) Currency translation 102,958,209 (36,461,498) Net assets attributable to holders of redeemable shares at the end of the period 677,184,251 418,673,892 The accompanying notes are an integral part of the Financial Statements. Refer to note 16 for investment held by Global Core Equity Fund in Global Targeted Value Fund.
DIMENSIONAL FUNDS II PLC
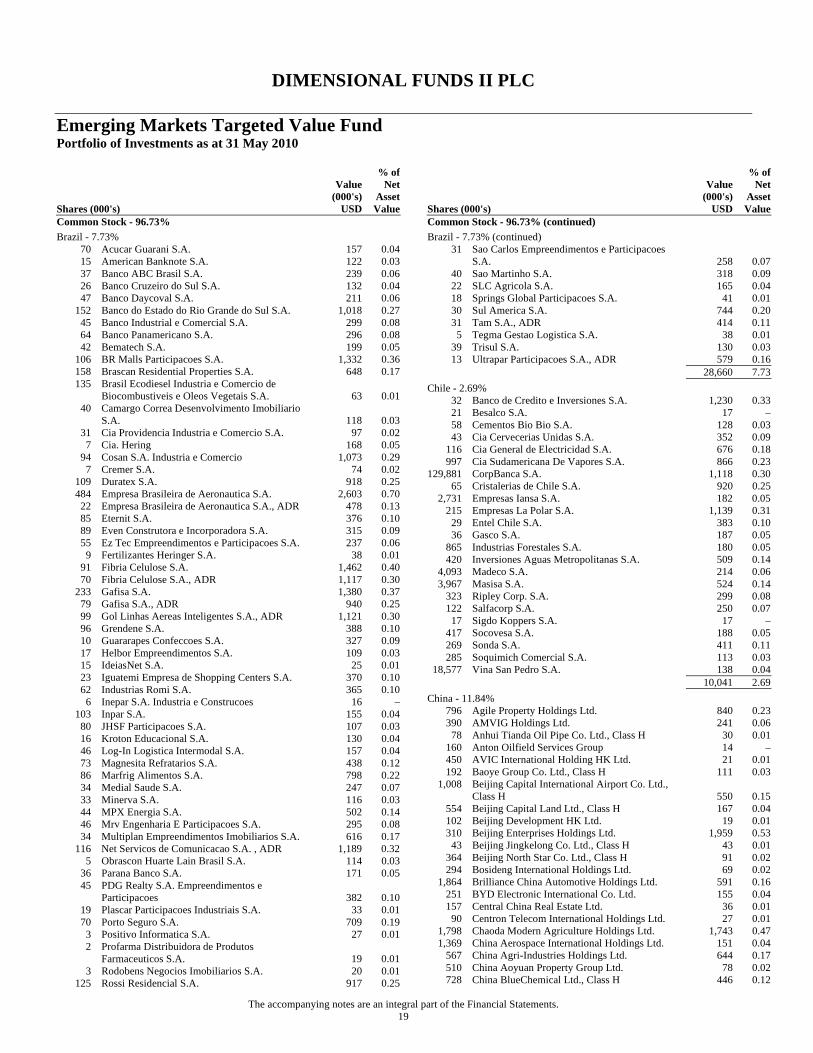
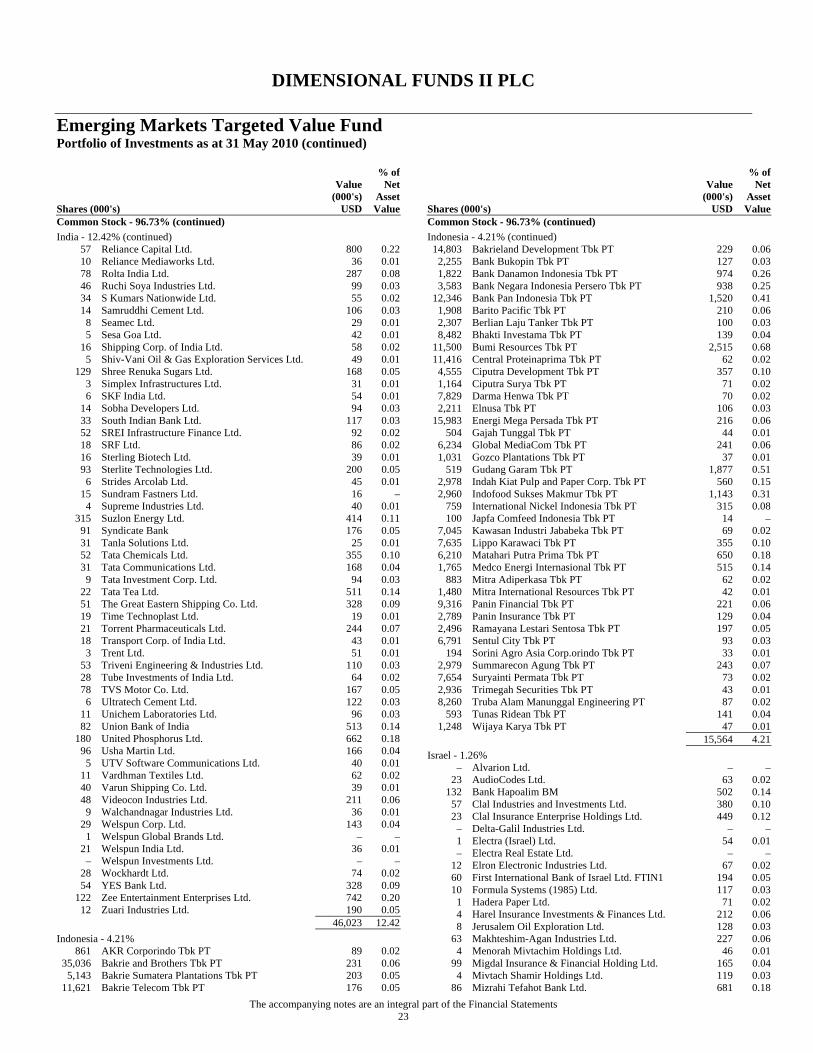
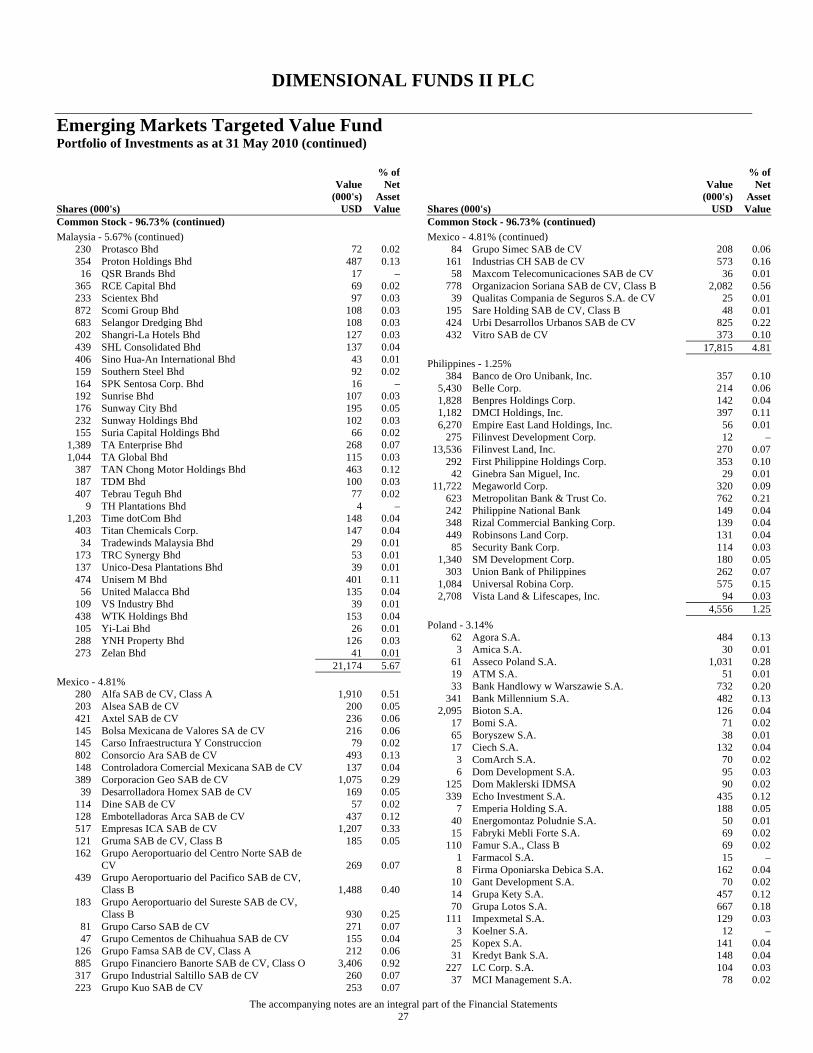
Emerging Markets Targeted Value Fund Portfolio of Investments as at 31 May 2010
The accompanying notes are an integral part of the Financial Statements. 19
Shares (000's)
Value (000's)
USD
% of Net
Asset Value
Common Stock - 96.73% Brazil - 7.73%
70 Acucar Guarani S.A. 157 0.04 15 American Banknote S.A. 122 0.03 37 Banco ABC Brasil S.A. 239 0.06 26 Banco Cruzeiro do Sul S.A. 132 0.04 47 Banco Daycoval S.A. 211 0.06
152 Banco do Estado do Rio Grande do Sul S.A. 1,018 0.27 45 Banco Industrial e Comercial S.A. 299 0.08 64 Banco Panamericano S.A. 296 0.08 42 Bematech S.A. 199 0.05
106 BR Malls Participacoes S.A. 1,332 0.36 158 Brascan Residential Properties S.A. 648 0.17 135 Brasil Ecodiesel Industria e Comercio de
Biocombustiveis e Oleos Vegetais S.A. 63 0.01 40 Camargo Correa Desenvolvimento Imobiliario
S.A. 118 0.03 31 Cia Providencia Industria e Comercio S.A. 97 0.02
7 Cia. Hering 168 0.05 94 Cosan S.A. Industria e Comercio 1,073 0.29
7 Cremer S.A. 74 0.02 109 Duratex S.A. 918 0.25 484 Empresa Brasileira de Aeronautica S.A. 2,603 0.70
22 Empresa Brasileira de Aeronautica S.A., ADR 478 0.13 85 Eternit S.A. 376 0.10 89 Even Construtora e Incorporadora S.A. 315 0.09 55 Ez Tec Empreendimentos e Participacoes S.A. 237 0.06
9 Fertilizantes Heringer S.A. 38 0.01 91 Fibria Celulose S.A. 1,462 0.40 70 Fibria Celulose S.A., ADR 1,117 0.30
233 Gafisa S.A. 1,380 0.37 79 Gafisa S.A., ADR 940 0.25 99 Gol Linhas Aereas Inteligentes S.A., ADR 1,121 0.30 96 Grendene S.A. 388 0.10 10 Guararapes Confeccoes S.A. 327 0.09 17 Helbor Empreendimentos S.A. 109 0.03 15 IdeiasNet S.A. 25 0.01 23 Iguatemi Empresa de Shopping Centers S.A. 370 0.10 62 Industrias Romi S.A. 365 0.10
6 Inepar S.A. Industria e Construcoes 16 – 103 Inpar S.A. 155 0.04
80 JHSF Participacoes S.A. 107 0.03 16 Kroton Educacional S.A. 130 0.04 46 Log-In Logistica Intermodal S.A. 157 0.04 73 Magnesita Refratarios S.A. 438 0.12 86 Marfrig Alimentos S.A. 798 0.22 34 Medial Saude S.A. 247 0.07 33 Minerva S.A. 116 0.03 44 MPX Energia S.A. 502 0.14 46 Mrv Engenharia E Participacoes S.A. 295 0.08 34 Multiplan Empreendimentos Imobiliarios S.A. 616 0.17
116 Net Servicos de Comunicacao S.A. , ADR 1,189 0.32 5 Obrascon Huarte Lain Brasil S.A. 114 0.03
36 Parana Banco S.A. 171 0.05 45 PDG Realty S.A. Empreendimentos e
Participacoes 382 0.10 19 Plascar Participacoes Industriais S.A. 33 0.01 70 Porto Seguro S.A. 709 0.19
3 Positivo Informatica S.A. 27 0.01 2 Profarma Distribuidora de Produtos
Farmaceuticos S.A. 19 0.01 3 Rodobens Negocios Imobiliarios S.A. 20 0.01
125 Rossi Residencial S.A. 917 0.25
Shares (000's)
Value (000's)
USD
% of Net
Asset Value
Common Stock - 96.73% (continued) Brazil - 7.73% (continued)
31 Sao Carlos Empreendimentos e Participacoes S.A. 258 0.07
40 Sao Martinho S.A. 318 0.09 22 SLC Agricola S.A. 165 0.04 18 Springs Global Participacoes S.A. 41 0.01 30 Sul America S.A. 744 0.20 31 Tam S.A., ADR 414 0.11
5 Tegma Gestao Logistica S.A. 38 0.01 39 Trisul S.A. 130 0.03 13 Ultrapar Participacoes S.A., ADR 579 0.16
28,660 7.73 Chile - 2.69%
32 Banco de Credito e Inversiones S.A. 1,230 0.33 21 Besalco S.A. 17 – 58 Cementos Bio Bio S.A. 128 0.03 43 Cia Cervecerias Unidas S.A. 352 0.09
116 Cia General de Electricidad S.A. 676 0.18 997 Cia Sudamericana De Vapores S.A. 866 0.23
129,881 CorpBanca S.A. 1,118 0.30 65 Cristalerias de Chile S.A. 920 0.25
2,731 Empresas Iansa S.A. 182 0.05 215 Empresas La Polar S.A. 1,139 0.31
29 Entel Chile S.A. 383 0.10 36 Gasco S.A. 187 0.05
865 Industrias Forestales S.A. 180 0.05 420 Inversiones Aguas Metropolitanas S.A. 509 0.14
4,093 Madeco S.A. 214 0.06 3,967 Masisa S.A. 524 0.14
323 Ripley Corp. S.A. 299 0.08 122 Salfacorp S.A. 250 0.07
17 Sigdo Koppers S.A. 17 – 417 Socovesa S.A. 188 0.05 269 Sonda S.A. 411 0.11 285 Soquimich Comercial S.A. 113 0.03
18,577 Vina San Pedro S.A. 138 0.04 10,041 2.69 China - 11.84%
796 Agile Property Holdings Ltd. 840 0.23 390 AMVIG Holdings Ltd. 241 0.06
78 Anhui Tianda Oil Pipe Co. Ltd., Class H 30 0.01 160 Anton Oilfield Services Group 14 – 450 AVIC International Holding HK Ltd. 21 0.01 192 Baoye Group Co. Ltd., Class H 111 0.03
1,008 Beijing Capital International Airport Co. Ltd., Class H 550 0.15
554 Beijing Capital Land Ltd., Class H 167 0.04 102 Beijing Development HK Ltd. 19 0.01 310 Beijing Enterprises Holdings Ltd. 1,959 0.53
43 Beijing Jingkelong Co. Ltd., Class H 43 0.01 364 Beijing North Star Co. Ltd., Class H 91 0.02 294 Bosideng International Holdings Ltd. 69 0.02
1,864 Brilliance China Automotive Holdings Ltd. 591 0.16 251 BYD Electronic International Co. Ltd. 155 0.04 157 Central China Real Estate Ltd. 36 0.01
90 Centron Telecom International Holdings Ltd. 27 0.01 1,798 Chaoda Modern Agriculture Holdings Ltd. 1,743 0.47 1,369 China Aerospace International Holdings Ltd. 151 0.04
567 China Agri-Industries Holdings Ltd. 644 0.17 510 China Aoyuan Property Group Ltd. 78 0.02 728 China BlueChemical Ltd., Class H 446 0.12
DIMENSIONAL FUNDS II PLC
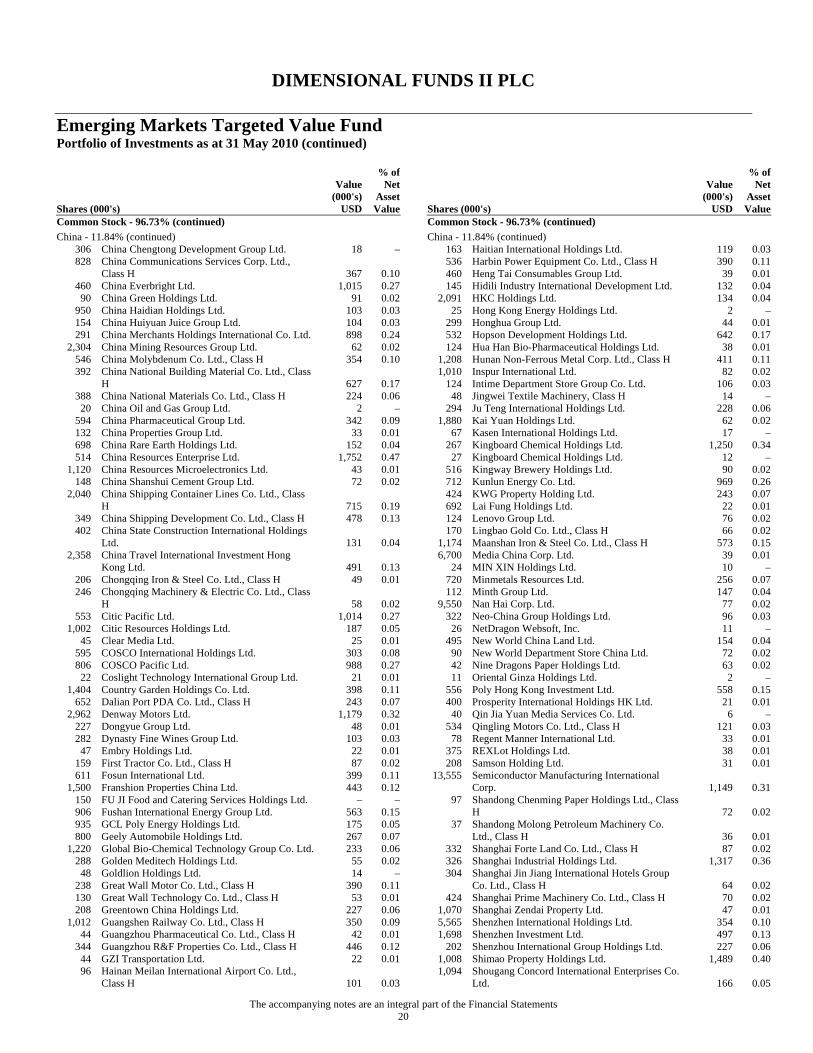
Emerging Markets Targeted Value Fund Portfolio of Investments as at 31 May 2010 (continued)
The accompanying notes are an integral part of the Financial Statements 20
Shares (000's)
Value (000's)
USD
% of Net
Asset Value
Common Stock - 96.73% (continued) China - 11.84% (continued)
306 China Chengtong Development Group Ltd. 18 – 828 China Communications Services Corp. Ltd.,
Class H 367 0.10 460 China Everbright Ltd. 1,015 0.27
90 China Green Holdings Ltd. 91 0.02 950 China Haidian Holdings Ltd. 103 0.03 154 China Huiyuan Juice Group Ltd. 104 0.03 291 China Merchants Holdings International Co. Ltd. 898 0.24
2,304 China Mining Resources Group Ltd. 62 0.02 546 China Molybdenum Co. Ltd., Class H 354 0.10 392 China National Building Material Co. Ltd., Class
H 627 0.17 388 China National Materials Co. Ltd., Class H 224 0.06
20 China Oil and Gas Group Ltd. 2 – 594 China Pharmaceutical Group Ltd. 342 0.09 132 China Properties Group Ltd. 33 0.01 698 China Rare Earth Holdings Ltd. 152 0.04 514 China Resources Enterprise Ltd. 1,752 0.47
1,120 China Resources Microelectronics Ltd. 43 0.01 148 China Shanshui Cement Group Ltd. 72 0.02
2,040 China Shipping Container Lines Co. Ltd., Class H 715 0.19
349 China Shipping Development Co. Ltd., Class H 478 0.13 402 China State Construction International Holdings
Ltd. 131 0.04 2,358 China Travel International Investment Hong
Kong Ltd. 491 0.13 206 Chongqing Iron & Steel Co. Ltd., Class H 49 0.01 246 Chongqing Machinery & Electric Co. Ltd., Class
H 58 0.02 553 Citic Pacific Ltd. 1,014 0.27
1,002 Citic Resources Holdings Ltd. 187 0.05 45 Clear Media Ltd. 25 0.01
595 COSCO International Holdings Ltd. 303 0.08 806 COSCO Pacific Ltd. 988 0.27
22 Coslight Technology International Group Ltd. 21 0.01 1,404 Country Garden Holdings Co. Ltd. 398 0.11
652 Dalian Port PDA Co. Ltd., Class H 243 0.07 2,962 Denway Motors Ltd. 1,179 0.32
227 Dongyue Group Ltd. 48 0.01 282 Dynasty Fine Wines Group Ltd. 103 0.03
47 Embry Holdings Ltd. 22 0.01 159 First Tractor Co. Ltd., Class H 87 0.02 611 Fosun International Ltd. 399 0.11
1,500 Franshion Properties China Ltd. 443 0.12 150 FU JI Food and Catering Services Holdings Ltd. – – 906 Fushan International Energy Group Ltd. 563 0.15 935 GCL Poly Energy Holdings Ltd. 175 0.05 800 Geely Automobile Holdings Ltd. 267 0.07
1,220 Global Bio-Chemical Technology Group Co. Ltd. 233 0.06 288 Golden Meditech Holdings Ltd. 55 0.02
48 Goldlion Holdings Ltd. 14 – 238 Great Wall Motor Co. Ltd., Class H 390 0.11 130 Great Wall Technology Co. Ltd., Class H 53 0.01 208 Greentown China Holdings Ltd. 227 0.06
1,012 Guangshen Railway Co. Ltd., Class H 350 0.09 44 Guangzhou Pharmaceutical Co. Ltd., Class H 42 0.01
344 Guangzhou R&F Properties Co. Ltd., Class H 446 0.12 44 GZI Transportation Ltd. 22 0.01 96 Hainan Meilan International Airport Co. Ltd.,
Class H 101 0.03
Shares (000's)
Value (000's)
USD
% of Net
Asset Value
Common Stock - 96.73% (continued) China - 11.84% (continued)
163 Haitian International Holdings Ltd. 119 0.03 536 Harbin Power Equipment Co. Ltd., Class H 390 0.11 460 Heng Tai Consumables Group Ltd. 39 0.01 145 Hidili Industry International Development Ltd. 132 0.04
2,091 HKC Holdings Ltd. 134 0.04 25 Hong Kong Energy Holdings Ltd. 2 –
299 Honghua Group Ltd. 44 0.01 532 Hopson Development Holdings Ltd. 642 0.17 124 Hua Han Bio-Pharmaceutical Holdings Ltd. 38 0.01
1,208 Hunan Non-Ferrous Metal Corp. Ltd., Class H 411 0.11 1,010 Inspur International Ltd. 82 0.02
124 Intime Department Store Group Co. Ltd. 106 0.03 48 Jingwei Textile Machinery, Class H 14 –
294 Ju Teng International Holdings Ltd. 228 0.06 1,880 Kai Yuan Holdings Ltd. 62 0.02
67 Kasen International Holdings Ltd. 17 – 267 Kingboard Chemical Holdings Ltd. 1,250 0.34
27 Kingboard Chemical Holdings Ltd. 12 – 516 Kingway Brewery Holdings Ltd. 90 0.02 712 Kunlun Energy Co. Ltd. 969 0.26 424 KWG Property Holding Ltd. 243 0.07 692 Lai Fung Holdings Ltd. 22 0.01 124 Lenovo Group Ltd. 76 0.02 170 Lingbao Gold Co. Ltd., Class H 66 0.02
1,174 Maanshan Iron & Steel Co. Ltd., Class H 573 0.15 6,700 Media China Corp. Ltd. 39 0.01
24 MIN XIN Holdings Ltd. 10 – 720 Minmetals Resources Ltd. 256 0.07 112 Minth Group Ltd. 147 0.04
9,550 Nan Hai Corp. Ltd. 77 0.02 322 Neo-China Group Holdings Ltd. 96 0.03
26 NetDragon Websoft, Inc. 11 – 495 New World China Land Ltd. 154 0.04
90 New World Department Store China Ltd. 72 0.02 42 Nine Dragons Paper Holdings Ltd. 63 0.02 11 Oriental Ginza Holdings Ltd. 2 –
556 Poly Hong Kong Investment Ltd. 558 0.15 400 Prosperity International Holdings HK Ltd. 21 0.01
40 Qin Jia Yuan Media Services Co. Ltd. 6 – 534 Qingling Motors Co. Ltd., Class H 121 0.03
78 Regent Manner International Ltd. 33 0.01 375 REXLot Holdings Ltd. 38 0.01 208 Samson Holding Ltd. 31 0.01
13,555 Semiconductor Manufacturing International Corp. 1,149 0.31
97 Shandong Chenming Paper Holdings Ltd., Class H 72 0.02
37 Shandong Molong Petroleum Machinery Co. Ltd., Class H 36 0.01
332 Shanghai Forte Land Co. Ltd., Class H 87 0.02 326 Shanghai Industrial Holdings Ltd. 1,317 0.36 304 Shanghai Jin Jiang International Hotels Group
Co. Ltd., Class H 64 0.02 424 Shanghai Prime Machinery Co. Ltd., Class H 70 0.02
1,070 Shanghai Zendai Property Ltd. 47 0.01 5,565 Shenzhen International Holdings Ltd. 354 0.10 1,698 Shenzhen Investment Ltd. 497 0.13
202 Shenzhou International Group Holdings Ltd. 227 0.06 1,008 Shimao Property Holdings Ltd. 1,489 0.40 1,094 Shougang Concord International Enterprises Co.
Ltd. 166 0.05
DIMENSIONAL FUNDS II PLC
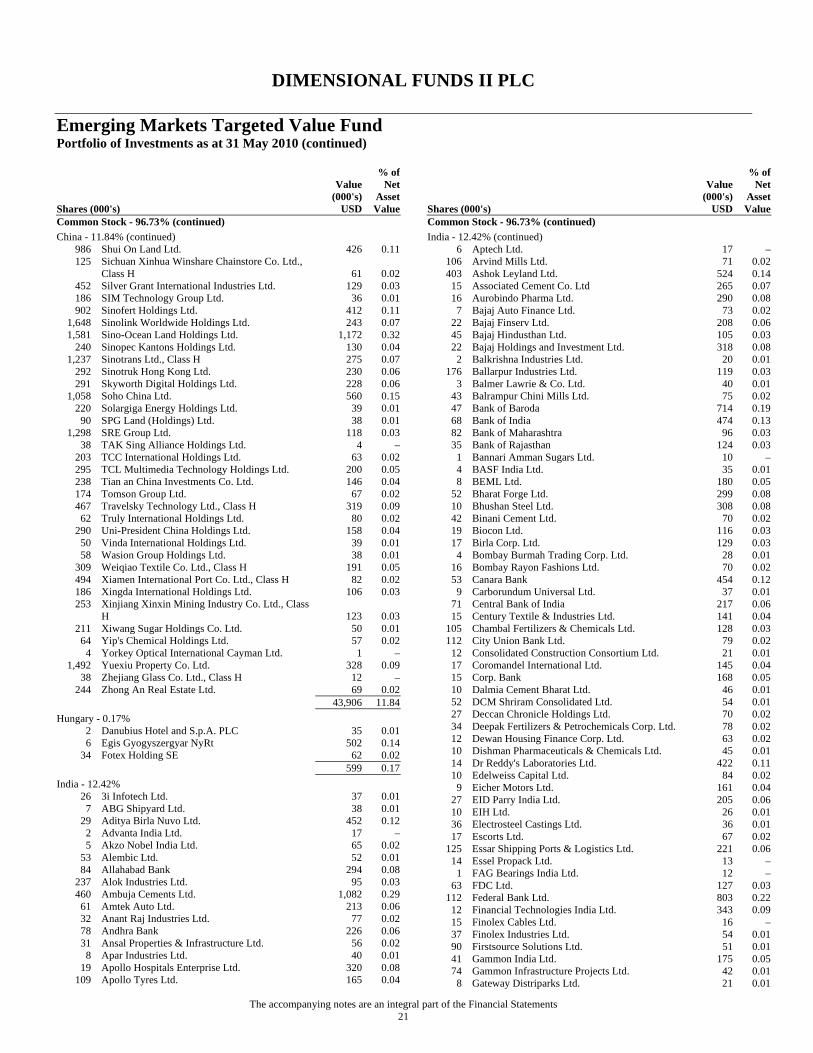
Emerging Markets Targeted Value Fund Portfolio of Investments as at 31 May 2010 (continued)
The accompanying notes are an integral part of the Financial Statements 21
Shares (000's)
Value (000's)
USD
% of Net
Asset Value
Common Stock - 96.73% (continued) China - 11.84% (continued)
986 Shui On Land Ltd. 426 0.11 125 Sichuan Xinhua Winshare Chainstore Co. Ltd.,
Class H 61 0.02 452 Silver Grant International Industries Ltd. 129 0.03 186 SIM Technology Group Ltd. 36 0.01 902 Sinofert Holdings Ltd. 412 0.11
1,648 Sinolink Worldwide Holdings Ltd. 243 0.07 1,581 Sino-Ocean Land Holdings Ltd. 1,172 0.32
240 Sinopec Kantons Holdings Ltd. 130 0.04 1,237 Sinotrans Ltd., Class H 275 0.07
292 Sinotruk Hong Kong Ltd. 230 0.06 291 Skyworth Digital Holdings Ltd. 228 0.06
1,058 Soho China Ltd. 560 0.15 220 Solargiga Energy Holdings Ltd. 39 0.01
90 SPG Land (Holdings) Ltd. 38 0.01 1,298 SRE Group Ltd. 118 0.03
38 TAK Sing Alliance Holdings Ltd. 4 – 203 TCC International Holdings Ltd. 63 0.02 295 TCL Multimedia Technology Holdings Ltd. 200 0.05 238 Tian an China Investments Co. Ltd. 146 0.04 174 Tomson Group Ltd. 67 0.02 467 Travelsky Technology Ltd., Class H 319 0.09
62 Truly International Holdings Ltd. 80 0.02 290 Uni-President China Holdings Ltd. 158 0.04
50 Vinda International Holdings Ltd. 39 0.01 58 Wasion Group Holdings Ltd. 38 0.01
309 Weiqiao Textile Co. Ltd., Class H 191 0.05 494 Xiamen International Port Co. Ltd., Class H 82 0.02 186 Xingda International Holdings Ltd. 106 0.03 253 Xinjiang Xinxin Mining Industry Co. Ltd., Class
H 123 0.03 211 Xiwang Sugar Holdings Co. Ltd. 50 0.01
64 Yip's Chemical Holdings Ltd. 57 0.02 4 Yorkey Optical International Cayman Ltd. 1 –
1,492 Yuexiu Property Co. Ltd. 328 0.09 38 Zhejiang Glass Co. Ltd., Class H 12 –
244 Zhong An Real Estate Ltd. 69 0.02 43,906 11.84 Hungary - 0.17%
2 Danubius Hotel and S.p.A. PLC 35 0.01 6 Egis Gyogyszergyar NyRt 502 0.14
34 Fotex Holding SE 62 0.02 599 0.17 India - 12.42%
26 3i Infotech Ltd. 37 0.01 7 ABG Shipyard Ltd. 38 0.01
29 Aditya Birla Nuvo Ltd. 452 0.12 2 Advanta India Ltd. 17 – 5 Akzo Nobel India Ltd. 65 0.02
53 Alembic Ltd. 52 0.01 84 Allahabad Bank 294 0.08
237 Alok Industries Ltd. 95 0.03 460 Ambuja Cements Ltd. 1,082 0.29
61 Amtek Auto Ltd. 213 0.06 32 Anant Raj Industries Ltd. 77 0.02 78 Andhra Bank 226 0.06 31 Ansal Properties & Infrastructure Ltd. 56 0.02
8 Apar Industries Ltd. 40 0.01 19 Apollo Hospitals Enterprise Ltd. 320 0.08
109 Apollo Tyres Ltd. 165 0.04
Shares (000's)
Value (000's)
USD
% of Net
Asset Value
Common Stock - 96.73% (continued) India - 12.42% (continued)
6 Aptech Ltd. 17 – 106 Arvind Mills Ltd. 71 0.02 403 Ashok Leyland Ltd. 524 0.14
15 Associated Cement Co. Ltd 265 0.07 16 Aurobindo Pharma Ltd. 290 0.08
7 Bajaj Auto Finance Ltd. 73 0.02 22 Bajaj Finserv Ltd. 208 0.06 45 Bajaj Hindusthan Ltd. 105 0.03 22 Bajaj Holdings and Investment Ltd. 318 0.08
2 Balkrishna Industries Ltd. 20 0.01 176 Ballarpur Industries Ltd. 119 0.03
3 Balmer Lawrie & Co. Ltd. 40 0.01 43 Balrampur Chini Mills Ltd. 75 0.02 47 Bank of Baroda 714 0.19 68 Bank of India 474 0.13 82 Bank of Maharashtra 96 0.03 35 Bank of Rajasthan 124 0.03
1 Bannari Amman Sugars Ltd. 10 – 4 BASF India Ltd. 35 0.01 8 BEML Ltd. 180 0.05
52 Bharat Forge Ltd. 299 0.08 10 Bhushan Steel Ltd. 308 0.08 42 Binani Cement Ltd. 70 0.02 19 Biocon Ltd. 116 0.03 17 Birla Corp. Ltd. 129 0.03
4 Bombay Burmah Trading Corp. Ltd. 28 0.01 16 Bombay Rayon Fashions Ltd. 70 0.02 53 Canara Bank 454 0.12
9 Carborundum Universal Ltd. 37 0.01 71 Central Bank of India 217 0.06 15 Century Textile & Industries Ltd. 141 0.04
105 Chambal Fertilizers & Chemicals Ltd. 128 0.03 112 City Union Bank Ltd. 79 0.02
12 Consolidated Construction Consortium Ltd. 21 0.01 17 Coromandel International Ltd. 145 0.04 15 Corp. Bank 168 0.05 10 Dalmia Cement Bharat Ltd. 46 0.01 52 DCM Shriram Consolidated Ltd. 54 0.01 27 Deccan Chronicle Holdings Ltd. 70 0.02 34 Deepak Fertilizers & Petrochemicals Corp. Ltd. 78 0.02 12 Dewan Housing Finance Corp. Ltd. 63 0.02 10 Dishman Pharmaceuticals & Chemicals Ltd. 45 0.01 14 Dr Reddy's Laboratories Ltd. 422 0.11 10 Edelweiss Capital Ltd. 84 0.02
9 Eicher Motors Ltd. 161 0.04 27 EID Parry India Ltd. 205 0.06 10 EIH Ltd. 26 0.01 36 Electrosteel Castings Ltd. 36 0.01 17 Escorts Ltd. 67 0.02
125 Essar Shipping Ports & Logistics Ltd. 221 0.06 14 Essel Propack Ltd. 13 –
1 FAG Bearings India Ltd. 12 – 63 FDC Ltd. 127 0.03
112 Federal Bank Ltd. 803 0.22 12 Financial Technologies India Ltd. 343 0.09 15 Finolex Cables Ltd. 16 – 37 Finolex Industries Ltd. 54 0.01 90 Firstsource Solutions Ltd. 51 0.01 41 Gammon India Ltd. 175 0.05 74 Gammon Infrastructure Projects Ltd. 42 0.01
8 Gateway Distriparks Ltd. 21 0.01
DIMENSIONAL FUNDS II PLC
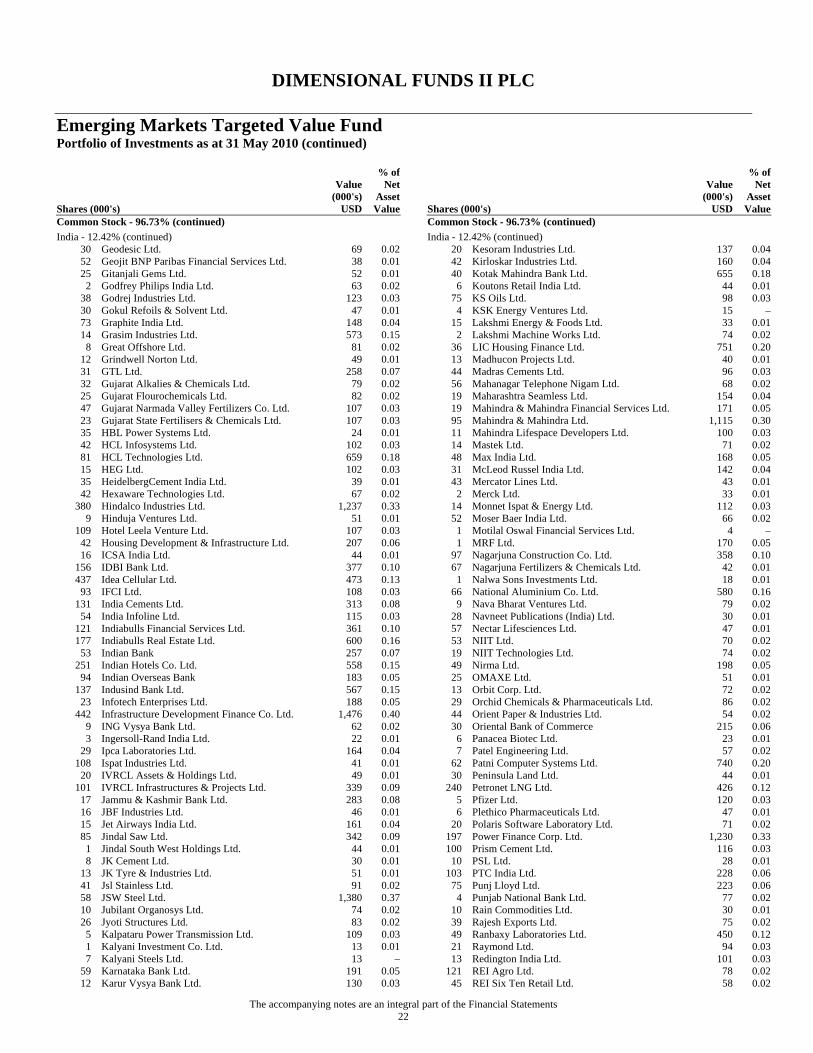
Emerging Markets Targeted Value Fund Portfolio of Investments as at 31 May 2010 (continued)
The accompanying notes are an integral part of the Financial Statements 22
Shares (000's)
Value (000's)
USD
% of Net
Asset Value
Common Stock - 96.73% (continued) India - 12.42% (continued)
30 Geodesic Ltd. 69 0.02 52 Geojit BNP Paribas Financial Services Ltd. 38 0.01 25 Gitanjali Gems Ltd. 52 0.01
2 Godfrey Philips India Ltd. 63 0.02 38 Godrej Industries Ltd. 123 0.03 30 Gokul Refoils & Solvent Ltd. 47 0.01 73 Graphite India Ltd. 148 0.04 14 Grasim Industries Ltd. 573 0.15
8 Great Offshore Ltd. 81 0.02 12 Grindwell Norton Ltd. 49 0.01 31 GTL Ltd. 258 0.07 32 Gujarat Alkalies & Chemicals Ltd. 79 0.02 25 Gujarat Flourochemicals Ltd. 82 0.02 47 Gujarat Narmada Valley Fertilizers Co. Ltd. 107 0.03 23 Gujarat State Fertilisers & Chemicals Ltd. 107 0.03 35 HBL Power Systems Ltd. 24 0.01 42 HCL Infosystems Ltd. 102 0.03 81 HCL Technologies Ltd. 659 0.18 15 HEG Ltd. 102 0.03 35 HeidelbergCement India Ltd. 39 0.01 42 Hexaware Technologies Ltd. 67 0.02
380 Hindalco Industries Ltd. 1,237 0.33 9 Hinduja Ventures Ltd. 51 0.01
109 Hotel Leela Venture Ltd. 107 0.03 42 Housing Development & Infrastructure Ltd. 207 0.06 16 ICSA India Ltd. 44 0.01
156 IDBI Bank Ltd. 377 0.10 437 Idea Cellular Ltd. 473 0.13
93 IFCI Ltd. 108 0.03 131 India Cements Ltd. 313 0.08
54 India Infoline Ltd. 115 0.03 121 Indiabulls Financial Services Ltd. 361 0.10 177 Indiabulls Real Estate Ltd. 600 0.16
53 Indian Bank 257 0.07 251 Indian Hotels Co. Ltd. 558 0.15
94 Indian Overseas Bank 183 0.05 137 Indusind Bank Ltd. 567 0.15
23 Infotech Enterprises Ltd. 188 0.05 442 Infrastructure Development Finance Co. Ltd. 1,476 0.40
9 ING Vysya Bank Ltd. 62 0.02 3 Ingersoll-Rand India Ltd. 22 0.01
29 Ipca Laboratories Ltd. 164 0.04 108 Ispat Industries Ltd. 41 0.01
20 IVRCL Assets & Holdings Ltd. 49 0.01 101 IVRCL Infrastructures & Projects Ltd. 339 0.09
17 Jammu & Kashmir Bank Ltd. 283 0.08 16 JBF Industries Ltd. 46 0.01 15 Jet Airways India Ltd. 161 0.04 85 Jindal Saw Ltd. 342 0.09
1 Jindal South West Holdings Ltd. 44 0.01 8 JK Cement Ltd. 30 0.01
13 JK Tyre & Industries Ltd. 51 0.01 41 Jsl Stainless Ltd. 91 0.02 58 JSW Steel Ltd. 1,380 0.37 10 Jubilant Organosys Ltd. 74 0.02 26 Jyoti Structures Ltd. 83 0.02
5 Kalpataru Power Transmission Ltd. 109 0.03 1 Kalyani Investment Co. Ltd. 13 0.01 7 Kalyani Steels Ltd. 13 –
59 Karnataka Bank Ltd. 191 0.05 12 Karur Vysya Bank Ltd. 130 0.03
Shares (000's)
Value (000's)
USD
% of Net
Asset Value
Common Stock - 96.73% (continued) India - 12.42% (continued)
20 Kesoram Industries Ltd. 137 0.04 42 Kirloskar Industries Ltd. 160 0.04 40 Kotak Mahindra Bank Ltd. 655 0.18
6 Koutons Retail India Ltd. 44 0.01 75 KS Oils Ltd. 98 0.03
4 KSK Energy Ventures Ltd. 15 – 15 Lakshmi Energy & Foods Ltd. 33 0.01
2 Lakshmi Machine Works Ltd. 74 0.02 36 LIC Housing Finance Ltd. 751 0.20 13 Madhucon Projects Ltd. 40 0.01 44 Madras Cements Ltd. 96 0.03 56 Mahanagar Telephone Nigam Ltd. 68 0.02 19 Maharashtra Seamless Ltd. 154 0.04 19 Mahindra & Mahindra Financial Services Ltd. 171 0.05 95 Mahindra & Mahindra Ltd. 1,115 0.30 11 Mahindra Lifespace Developers Ltd. 100 0.03 14 Mastek Ltd. 71 0.02 48 Max India Ltd. 168 0.05 31 McLeod Russel India Ltd. 142 0.04 43 Mercator Lines Ltd. 43 0.01
2 Merck Ltd. 33 0.01 14 Monnet Ispat & Energy Ltd. 112 0.03 52 Moser Baer India Ltd. 66 0.02
1 Motilal Oswal Financial Services Ltd. 4 – 1 MRF Ltd. 170 0.05
97 Nagarjuna Construction Co. Ltd. 358 0.10 67 Nagarjuna Fertilizers & Chemicals Ltd. 42 0.01
1 Nalwa Sons Investments Ltd. 18 0.01 66 National Aluminium Co. Ltd. 580 0.16
9 Nava Bharat Ventures Ltd. 79 0.02 28 Navneet Publications (India) Ltd. 30 0.01 57 Nectar Lifesciences Ltd. 47 0.01 53 NIIT Ltd. 70 0.02 19 NIIT Technologies Ltd. 74 0.02 49 Nirma Ltd. 198 0.05 25 OMAXE Ltd. 51 0.01 13 Orbit Corp. Ltd. 72 0.02 29 Orchid Chemicals & Pharmaceuticals Ltd. 86 0.02 44 Orient Paper & Industries Ltd. 54 0.02 30 Oriental Bank of Commerce 215 0.06
6 Panacea Biotec Ltd. 23 0.01 7 Patel Engineering Ltd. 57 0.02
62 Patni Computer Systems Ltd. 740 0.20 30 Peninsula Land Ltd. 44 0.01
240 Petronet LNG Ltd. 426 0.12 5 Pfizer Ltd. 120 0.03 6 Plethico Pharmaceuticals Ltd. 47 0.01
20 Polaris Software Laboratory Ltd. 71 0.02 197 Power Finance Corp. Ltd. 1,230 0.33 100 Prism Cement Ltd. 116 0.03
10 PSL Ltd. 28 0.01 103 PTC India Ltd. 228 0.06
75 Punj Lloyd Ltd. 223 0.06 4 Punjab National Bank Ltd. 77 0.02
10 Rain Commodities Ltd. 30 0.01 39 Rajesh Exports Ltd. 75 0.02 49 Ranbaxy Laboratories Ltd. 450 0.12 21 Raymond Ltd. 94 0.03 13 Redington India Ltd. 101 0.03
121 REI Agro Ltd. 78 0.02 45 REI Six Ten Retail Ltd. 58 0.02
DIMENSIONAL FUNDS II PLC
Emerging Markets Targeted Value Fund Portfolio of Investments as at 31 May 2010 (continued)
The accompanying notes are an integral part of the Financial Statements 23
Shares (000's)
Value (000's)
USD
% of Net
Asset Value
Common Stock - 96.73% (continued) India - 12.42% (continued)
57 Reliance Capital Ltd. 800 0.22 10 Reliance Mediaworks Ltd. 36 0.01 78 Rolta India Ltd. 287 0.08 46 Ruchi Soya Industries Ltd. 99 0.03 34 S Kumars Nationwide Ltd. 55 0.02 14 Samruddhi Cement Ltd. 106 0.03
8 Seamec Ltd. 29 0.01 5 Sesa Goa Ltd. 42 0.01
16 Shipping Corp. of India Ltd. 58 0.02 5 Shiv-Vani Oil & Gas Exploration Services Ltd. 49 0.01
129 Shree Renuka Sugars Ltd. 168 0.05 3 Simplex Infrastructures Ltd. 31 0.01 6 SKF India Ltd. 54 0.01
14 Sobha Developers Ltd. 94 0.03 33 South Indian Bank Ltd. 117 0.03 52 SREI Infrastructure Finance Ltd. 92 0.02 18 SRF Ltd. 86 0.02 16 Sterling Biotech Ltd. 39 0.01 93 Sterlite Technologies Ltd. 200 0.05
6 Strides Arcolab Ltd. 45 0.01 15 Sundram Fastners Ltd. 16 –
4 Supreme Industries Ltd. 40 0.01 315 Suzlon Energy Ltd. 414 0.11
91 Syndicate Bank 176 0.05 31 Tanla Solutions Ltd. 25 0.01 52 Tata Chemicals Ltd. 355 0.10 31 Tata Communications Ltd. 168 0.04
9 Tata Investment Corp. Ltd. 94 0.03 22 Tata Tea Ltd. 511 0.14 51 The Great Eastern Shipping Co. Ltd. 328 0.09 19 Time Technoplast Ltd. 19 0.01 21 Torrent Pharmaceuticals Ltd. 244 0.07 18 Transport Corp. of India Ltd. 43 0.01
3 Trent Ltd. 51 0.01 53 Triveni Engineering & Industries Ltd. 110 0.03 28 Tube Investments of India Ltd. 64 0.02 78 TVS Motor Co. Ltd. 167 0.05
6 Ultratech Cement Ltd. 122 0.03 11 Unichem Laboratories Ltd. 96 0.03 82 Union Bank of India 513 0.14
180 United Phosphorus Ltd. 662 0.18 96 Usha Martin Ltd. 166 0.04
5 UTV Software Communications Ltd. 40 0.01 11 Vardhman Textiles Ltd. 62 0.02 40 Varun Shipping Co. Ltd. 39 0.01 48 Videocon Industries Ltd. 211 0.06
9 Walchandnagar Industries Ltd. 36 0.01 29 Welspun Corp. Ltd. 143 0.04
1 Welspun Global Brands Ltd. – – 21 Welspun India Ltd. 36 0.01
– Welspun Investments Ltd. – – 28 Wockhardt Ltd. 74 0.02 54 YES Bank Ltd. 328 0.09
122 Zee Entertainment Enterprises Ltd. 742 0.20 12 Zuari Industries Ltd. 190 0.05
46,023 12.42 Indonesia - 4.21%
861 AKR Corporindo Tbk PT 89 0.02 35,036 Bakrie and Brothers Tbk PT 231 0.06
5,143 Bakrie Sumatera Plantations Tbk PT 203 0.05 11,621 Bakrie Telecom Tbk PT 176 0.05
Shares (000's)
Value (000's)
USD
% of Net
Asset Value
Common Stock - 96.73% (continued) Indonesia - 4.21% (continued) 14,803 Bakrieland Development Tbk PT 229 0.06
2,255 Bank Bukopin Tbk PT 127 0.03 1,822 Bank Danamon Indonesia Tbk PT 974 0.26 3,583 Bank Negara Indonesia Persero Tbk PT 938 0.25
12,346 Bank Pan Indonesia Tbk PT 1,520 0.41 1,908 Barito Pacific Tbk PT 210 0.06 2,307 Berlian Laju Tanker Tbk PT 100 0.03 8,482 Bhakti Investama Tbk PT 139 0.04
11,500 Bumi Resources Tbk PT 2,515 0.68 11,416 Central Proteinaprima Tbk PT 62 0.02
4,555 Ciputra Development Tbk PT 357 0.10 1,164 Ciputra Surya Tbk PT 71 0.02 7,829 Darma Henwa Tbk PT 70 0.02 2,211 Elnusa Tbk PT 106 0.03
15,983 Energi Mega Persada Tbk PT 216 0.06 504 Gajah Tunggal Tbk PT 44 0.01
6,234 Global MediaCom Tbk PT 241 0.06 1,031 Gozco Plantations Tbk PT 37 0.01
519 Gudang Garam Tbk PT 1,877 0.51 2,978 Indah Kiat Pulp and Paper Corp. Tbk PT 560 0.15 2,960 Indofood Sukses Makmur Tbk PT 1,143 0.31
759 International Nickel Indonesia Tbk PT 315 0.08 100 Japfa Comfeed Indonesia Tbk PT 14 –
7,045 Kawasan Industri Jababeka Tbk PT 69 0.02 7,635 Lippo Karawaci Tbk PT 355 0.10 6,210 Matahari Putra Prima Tbk PT 650 0.18 1,765 Medco Energi Internasional Tbk PT 515 0.14
883 Mitra Adiperkasa Tbk PT 62 0.02 1,480 Mitra International Resources Tbk PT 42 0.01 9,316 Panin Financial Tbk PT 221 0.06 2,789 Panin Insurance Tbk PT 129 0.04 2,496 Ramayana Lestari Sentosa Tbk PT 197 0.05 6,791 Sentul City Tbk PT 93 0.03
194 Sorini Agro Asia Corp.orindo Tbk PT 33 0.01 2,979 Summarecon Agung Tbk PT 243 0.07 7,654 Suryainti Permata Tbk PT 73 0.02 2,936 Trimegah Securities Tbk PT 43 0.01 8,260 Truba Alam Manunggal Engineering PT 87 0.02
593 Tunas Ridean Tbk PT 141 0.04 1,248 Wijaya Karya Tbk PT 47 0.01
15,564 4.21 Israel - 1.26%
– Alvarion Ltd. – – 23 AudioCodes Ltd. 63 0.02
132 Bank Hapoalim BM 502 0.14 57 Clal Industries and Investments Ltd. 380 0.10 23 Clal Insurance Enterprise Holdings Ltd. 449 0.12
– Delta-Galil Industries Ltd. – – 1 Electra (Israel) Ltd. 54 0.01 – Electra Real Estate Ltd. – –
12 Elron Electronic Industries Ltd. 67 0.02 60 First International Bank of Israel Ltd. FTIN1 194 0.05 10 Formula Systems (1985) Ltd. 117 0.03
1 Hadera Paper Ltd. 71 0.02 4 Harel Insurance Investments & Finances Ltd. 212 0.06 8 Jerusalem Oil Exploration Ltd. 128 0.03
63 Makhteshim-Agan Industries Ltd. 227 0.06 4 Menorah Mivtachim Holdings Ltd. 46 0.01
99 Migdal Insurance & Financial Holding Ltd. 165 0.04 4 Mivtach Shamir Holdings Ltd. 119 0.03
86 Mizrahi Tefahot Bank Ltd. 681 0.18
DIMENSIONAL FUNDS II PLC
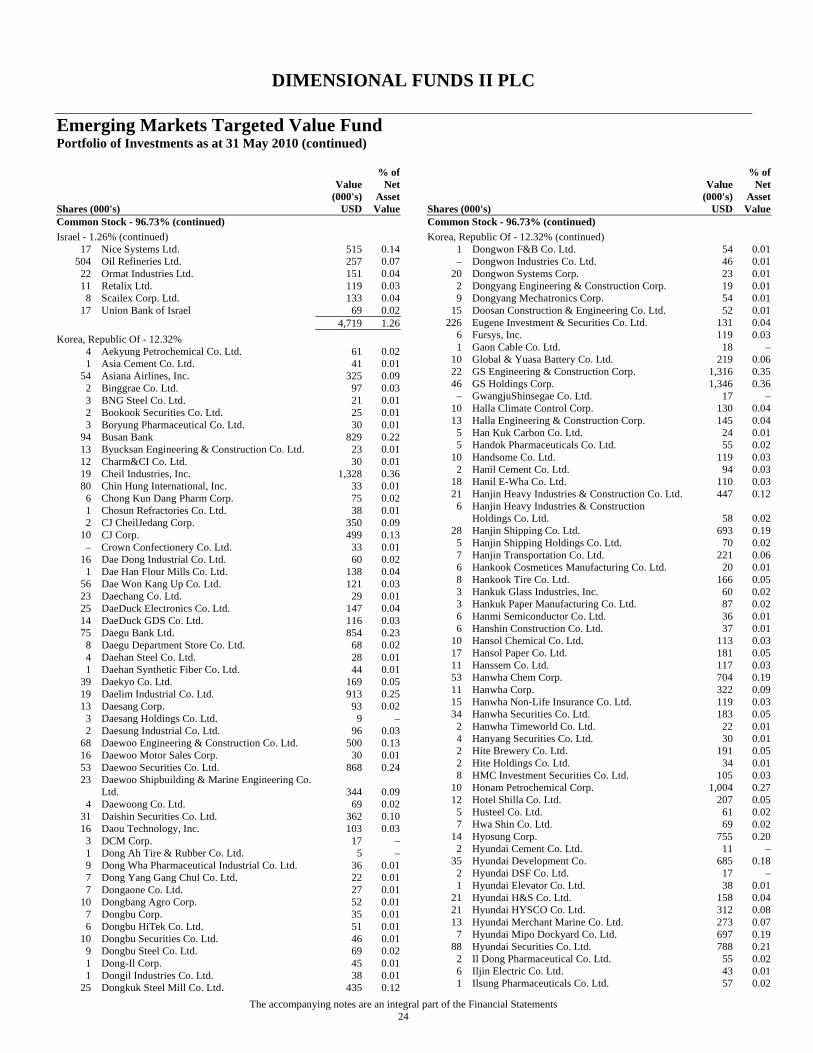
Emerging Markets Targeted Value Fund Portfolio of Investments as at 31 May 2010 (continued)
The accompanying notes are an integral part of the Financial Statements 24
Shares (000's)
Value (000's)
USD
% of Net
Asset Value
Common Stock - 96.73% (continued) Israel - 1.26% (continued)
17 Nice Systems Ltd. 515 0.14 504 Oil Refineries Ltd. 257 0.07
22 Ormat Industries Ltd. 151 0.04 11 Retalix Ltd. 119 0.03
8 Scailex Corp. Ltd. 133 0.04 17 Union Bank of Israel 69 0.02
4,719 1.26 Korea, Republic Of - 12.32%
4 Aekyung Petrochemical Co. Ltd. 61 0.02 1 Asia Cement Co. Ltd. 41 0.01
54 Asiana Airlines, Inc. 325 0.09 2 Binggrae Co. Ltd. 97 0.03 3 BNG Steel Co. Ltd. 21 0.01 2 Bookook Securities Co. Ltd. 25 0.01 3 Boryung Pharmaceutical Co. Ltd. 30 0.01
94 Busan Bank 829 0.22 13 Byucksan Engineering & Construction Co. Ltd. 23 0.01 12 Charm&CI Co. Ltd. 30 0.01 19 Cheil Industries, Inc. 1,328 0.36 80 Chin Hung International, Inc. 33 0.01
6 Chong Kun Dang Pharm Corp. 75 0.02 1 Chosun Refractories Co. Ltd. 38 0.01 2 CJ CheilJedang Corp. 350 0.09
10 CJ Corp. 499 0.13 – Crown Confectionery Co. Ltd. 33 0.01
16 Dae Dong Industrial Co. Ltd. 60 0.02 1 Dae Han Flour Mills Co. Ltd. 138 0.04
56 Dae Won Kang Up Co. Ltd. 121 0.03 23 Daechang Co. Ltd. 29 0.01 25 DaeDuck Electronics Co. Ltd. 147 0.04 14 DaeDuck GDS Co. Ltd. 116 0.03 75 Daegu Bank Ltd. 854 0.23
8 Daegu Department Store Co. Ltd. 68 0.02 4 Daehan Steel Co. Ltd. 28 0.01 1 Daehan Synthetic Fiber Co. Ltd. 44 0.01
39 Daekyo Co. Ltd. 169 0.05 19 Daelim Industrial Co. Ltd. 913 0.25 13 Daesang Corp. 93 0.02
3 Daesang Holdings Co. Ltd. 9 – 2 Daesung Industrial Co. Ltd. 96 0.03
68 Daewoo Engineering & Construction Co. Ltd. 500 0.13 16 Daewoo Motor Sales Corp. 30 0.01 53 Daewoo Securities Co. Ltd. 868 0.24 23 Daewoo Shipbuilding & Marine Engineering Co.
Ltd. 344 0.09 4 Daewoong Co. Ltd. 69 0.02
31 Daishin Securities Co. Ltd. 362 0.10 16 Daou Technology, Inc. 103 0.03
3 DCM Corp. 17 – 1 Dong Ah Tire & Rubber Co. Ltd. 5 – 9 Dong Wha Pharmaceutical Industrial Co. Ltd. 36 0.01 7 Dong Yang Gang Chul Co. Ltd. 22 0.01 7 Dongaone Co. Ltd. 27 0.01
10 Dongbang Agro Corp. 52 0.01 7 Dongbu Corp. 35 0.01 6 Dongbu HiTek Co. Ltd. 51 0.01
10 Dongbu Securities Co. Ltd. 46 0.01 9 Dongbu Steel Co. Ltd. 69 0.02 1 Dong-Il Corp. 45 0.01 1 Dongil Industries Co. Ltd. 38 0.01
25 Dongkuk Steel Mill Co. Ltd. 435 0.12
Shares (000's)
Value (000's)
USD
% of Net
Asset Value
Common Stock - 96.73% (continued) Korea, Republic Of - 12.32% (continued)
1 Dongwon F&B Co. Ltd. 54 0.01 – Dongwon Industries Co. Ltd. 46 0.01
20 Dongwon Systems Corp. 23 0.01 2 Dongyang Engineering & Construction Corp. 19 0.01 9 Dongyang Mechatronics Corp. 54 0.01
15 Doosan Construction & Engineering Co. Ltd. 52 0.01 226 Eugene Investment & Securities Co. Ltd. 131 0.04
6 Fursys, Inc. 119 0.03 1 Gaon Cable Co. Ltd. 18 –
10 Global & Yuasa Battery Co. Ltd. 219 0.06 22 GS Engineering & Construction Corp. 1,316 0.35 46 GS Holdings Corp. 1,346 0.36
– GwangjuShinsegae Co. Ltd. 17 – 10 Halla Climate Control Corp. 130 0.04 13 Halla Engineering & Construction Corp. 145 0.04
5 Han Kuk Carbon Co. Ltd. 24 0.01 5 Handok Pharmaceuticals Co. Ltd. 55 0.02
10 Handsome Co. Ltd. 119 0.03 2 Hanil Cement Co. Ltd. 94 0.03
18 Hanil E-Wha Co. Ltd. 110 0.03 21 Hanjin Heavy Industries & Construction Co. Ltd. 447 0.12
6 Hanjin Heavy Industries & Construction Holdings Co. Ltd. 58 0.02
28 Hanjin Shipping Co. Ltd. 693 0.19 5 Hanjin Shipping Holdings Co. Ltd. 70 0.02 7 Hanjin Transportation Co. Ltd. 221 0.06 6 Hankook Cosmetices Manufacturing Co. Ltd. 20 0.01 8 Hankook Tire Co. Ltd. 166 0.05 3 Hankuk Glass Industries, Inc. 60 0.02 3 Hankuk Paper Manufacturing Co. Ltd. 87 0.02 6 Hanmi Semiconductor Co. Ltd. 36 0.01 6 Hanshin Construction Co. Ltd. 37 0.01
10 Hansol Chemical Co. Ltd. 113 0.03 17 Hansol Paper Co. Ltd. 181 0.05 11 Hanssem Co. Ltd. 117 0.03 53 Hanwha Chem Corp. 704 0.19 11 Hanwha Corp. 322 0.09 15 Hanwha Non-Life Insurance Co. Ltd. 119 0.03 34 Hanwha Securities Co. Ltd. 183 0.05
2 Hanwha Timeworld Co. Ltd. 22 0.01 4 Hanyang Securities Co. Ltd. 30 0.01 2 Hite Brewery Co. Ltd. 191 0.05 2 Hite Holdings Co. Ltd. 34 0.01 8 HMC Investment Securities Co. Ltd. 105 0.03
10 Honam Petrochemical Corp. 1,004 0.27 12 Hotel Shilla Co. Ltd. 207 0.05
5 Husteel Co. Ltd. 61 0.02 7 Hwa Shin Co. Ltd. 69 0.02
14 Hyosung Corp. 755 0.20 2 Hyundai Cement Co. Ltd. 11 –
35 Hyundai Development Co. 685 0.18 2 Hyundai DSF Co. Ltd. 17 – 1 Hyundai Elevator Co. Ltd. 38 0.01
21 Hyundai H&S Co. Ltd. 158 0.04 21 Hyundai HYSCO Co. Ltd. 312 0.08 13 Hyundai Merchant Marine Co. Ltd. 273 0.07
7 Hyundai Mipo Dockyard Co. Ltd. 697 0.19 88 Hyundai Securities Co. Ltd. 788 0.21
2 Il Dong Pharmaceutical Co. Ltd. 55 0.02 6 Iljin Electric Co. Ltd. 43 0.01 1 Ilsung Pharmaceuticals Co. Ltd. 57 0.02
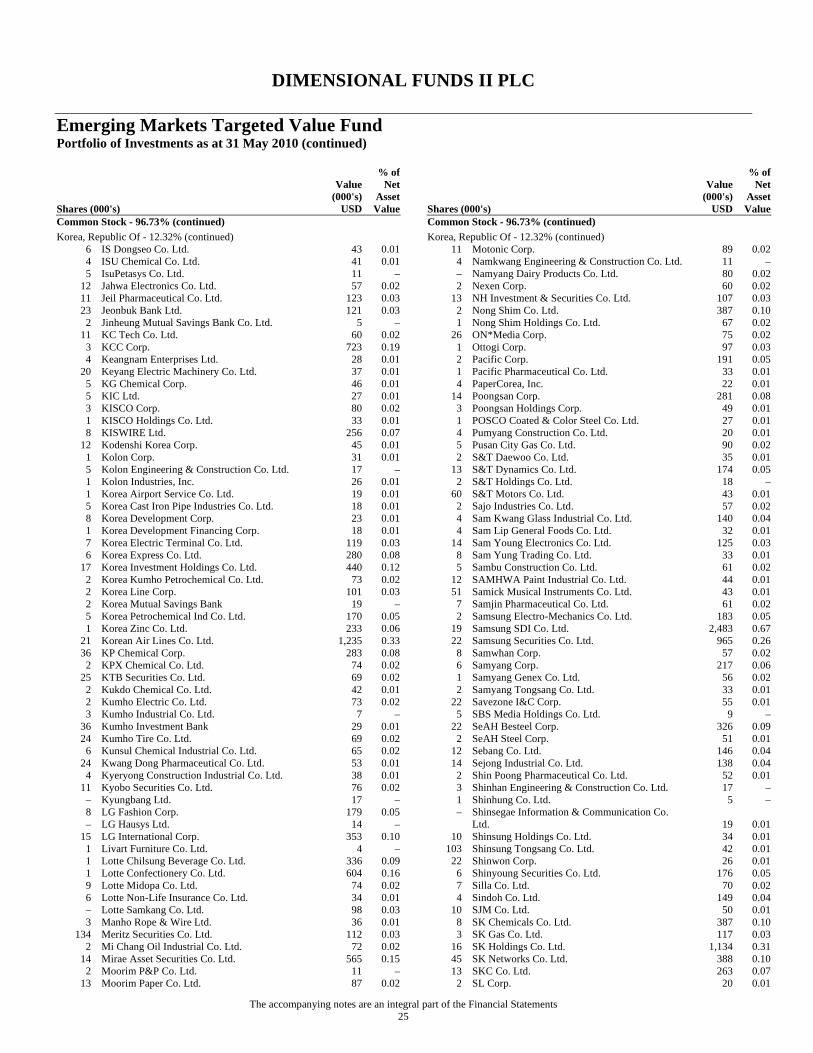
DIMENSIONAL FUNDS II PLC
Emerging Markets Targeted Value Fund Portfolio of Investments as at 31 May 2010 (continued)
The accompanying notes are an integral part of the Financial Statements 25
Shares (000's)
Value (000's)
USD
% of Net
Asset Value
Common Stock - 96.73% (continued) Korea, Republic Of - 12.32% (continued)
6 IS Dongseo Co. Ltd. 43 0.01 4 ISU Chemical Co. Ltd. 41 0.01 5 IsuPetasys Co. Ltd. 11 –
12 Jahwa Electronics Co. Ltd. 57 0.02 11 Jeil Pharmaceutical Co. Ltd. 123 0.03 23 Jeonbuk Bank Ltd. 121 0.03
2 Jinheung Mutual Savings Bank Co. Ltd. 5 – 11 KC Tech Co. Ltd. 60 0.02
3 KCC Corp. 723 0.19 4 Keangnam Enterprises Ltd. 28 0.01
20 Keyang Electric Machinery Co. Ltd. 37 0.01 5 KG Chemical Corp. 46 0.01 5 KIC Ltd. 27 0.01 3 KISCO Corp. 80 0.02 1 KISCO Holdings Co. Ltd. 33 0.01 8 KISWIRE Ltd. 256 0.07
12 Kodenshi Korea Corp. 45 0.01 1 Kolon Corp. 31 0.01 5 Kolon Engineering & Construction Co. Ltd. 17 – 1 Kolon Industries, Inc. 26 0.01 1 Korea Airport Service Co. Ltd. 19 0.01 5 Korea Cast Iron Pipe Industries Co. Ltd. 18 0.01 8 Korea Development Corp. 23 0.01 1 Korea Development Financing Corp. 18 0.01 7 Korea Electric Terminal Co. Ltd. 119 0.03 6 Korea Express Co. Ltd. 280 0.08
17 Korea Investment Holdings Co. Ltd. 440 0.12 2 Korea Kumho Petrochemical Co. Ltd. 73 0.02 2 Korea Line Corp. 101 0.03 2 Korea Mutual Savings Bank 19 – 5 Korea Petrochemical Ind Co. Ltd. 170 0.05 1 Korea Zinc Co. Ltd. 233 0.06
21 Korean Air Lines Co. Ltd. 1,235 0.33 36 KP Chemical Corp. 283 0.08
2 KPX Chemical Co. Ltd. 74 0.02 25 KTB Securities Co. Ltd. 69 0.02
2 Kukdo Chemical Co. Ltd. 42 0.01 2 Kumho Electric Co. Ltd. 73 0.02 3 Kumho Industrial Co. Ltd. 7 –
36 Kumho Investment Bank 29 0.01 24 Kumho Tire Co. Ltd. 69 0.02
6 Kunsul Chemical Industrial Co. Ltd. 65 0.02 24 Kwang Dong Pharmaceutical Co. Ltd. 53 0.01
4 Kyeryong Construction Industrial Co. Ltd. 38 0.01 11 Kyobo Securities Co. Ltd. 76 0.02
– Kyungbang Ltd. 17 – 8 LG Fashion Corp. 179 0.05 – LG Hausys Ltd. 14 –
15 LG International Corp. 353 0.10 1 Livart Furniture Co. Ltd. 4 – 1 Lotte Chilsung Beverage Co. Ltd. 336 0.09 1 Lotte Confectionery Co. Ltd. 604 0.16 9 Lotte Midopa Co. Ltd. 74 0.02 6 Lotte Non-Life Insurance Co. Ltd. 34 0.01 – Lotte Samkang Co. Ltd. 98 0.03 3 Manho Rope & Wire Ltd. 36 0.01
134 Meritz Securities Co. Ltd. 112 0.03 2 Mi Chang Oil Industrial Co. Ltd. 72 0.02
14 Mirae Asset Securities Co. Ltd. 565 0.15 2 Moorim P&P Co. Ltd. 11 –
13 Moorim Paper Co. Ltd. 87 0.02
Shares (000's)
Value (000's)
USD
% of Net
Asset Value
Common Stock - 96.73% (continued) Korea, Republic Of - 12.32% (continued)
11 Motonic Corp. 89 0.02 4 Namkwang Engineering & Construction Co. Ltd. 11 – – Namyang Dairy Products Co. Ltd. 80 0.02 2 Nexen Corp. 60 0.02
13 NH Investment & Securities Co. Ltd. 107 0.03 2 Nong Shim Co. Ltd. 387 0.10 1 Nong Shim Holdings Co. Ltd. 67 0.02
26 ON*Media Corp. 75 0.02 1 Ottogi Corp. 97 0.03 2 Pacific Corp. 191 0.05 1 Pacific Pharmaceutical Co. Ltd. 33 0.01 4 PaperCorea, Inc. 22 0.01
14 Poongsan Corp. 281 0.08 3 Poongsan Holdings Corp. 49 0.01 1 POSCO Coated & Color Steel Co. Ltd. 27 0.01 4 Pumyang Construction Co. Ltd. 20 0.01 5 Pusan City Gas Co. Ltd. 90 0.02 2 S&T Daewoo Co. Ltd. 35 0.01
13 S&T Dynamics Co. Ltd. 174 0.05 2 S&T Holdings Co. Ltd. 18 –
60 S&T Motors Co. Ltd. 43 0.01 2 Sajo Industries Co. Ltd. 57 0.02 4 Sam Kwang Glass Industrial Co. Ltd. 140 0.04 4 Sam Lip General Foods Co. Ltd. 32 0.01
14 Sam Young Electronics Co. Ltd. 125 0.03 8 Sam Yung Trading Co. Ltd. 33 0.01 5 Sambu Construction Co. Ltd. 61 0.02
12 SAMHWA Paint Industrial Co. Ltd. 44 0.01 51 Samick Musical Instruments Co. Ltd. 43 0.01
7 Samjin Pharmaceutical Co. Ltd. 61 0.02 2 Samsung Electro-Mechanics Co. Ltd. 183 0.05
19 Samsung SDI Co. Ltd. 2,483 0.67 22 Samsung Securities Co. Ltd. 965 0.26
8 Samwhan Corp. 57 0.02 6 Samyang Corp. 217 0.06 1 Samyang Genex Co. Ltd. 56 0.02 2 Samyang Tongsang Co. Ltd. 33 0.01
22 Savezone I&C Corp. 55 0.01 5 SBS Media Holdings Co. Ltd. 9 –
22 SeAH Besteel Corp. 326 0.09 2 SeAH Steel Corp. 51 0.01
12 Sebang Co. Ltd. 146 0.04 14 Sejong Industrial Co. Ltd. 138 0.04
2 Shin Poong Pharmaceutical Co. Ltd. 52 0.01 3 Shinhan Engineering & Construction Co. Ltd. 17 – 1 Shinhung Co. Ltd. 5 – – Shinsegae Information & Communication Co.
Ltd. 19 0.01 10 Shinsung Holdings Co. Ltd. 34 0.01
103 Shinsung Tongsang Co. Ltd. 42 0.01 22 Shinwon Corp. 26 0.01
6 Shinyoung Securities Co. Ltd. 176 0.05 7 Silla Co. Ltd. 70 0.02 4 Sindoh Co. Ltd. 149 0.04
10 SJM Co. Ltd. 50 0.01 8 SK Chemicals Co. Ltd. 387 0.10 3 SK Gas Co. Ltd. 117 0.03
16 SK Holdings Co. Ltd. 1,134 0.31 45 SK Networks Co. Ltd. 388 0.10 13 SKC Co. Ltd. 263 0.07
2 SL Corp. 20 0.01
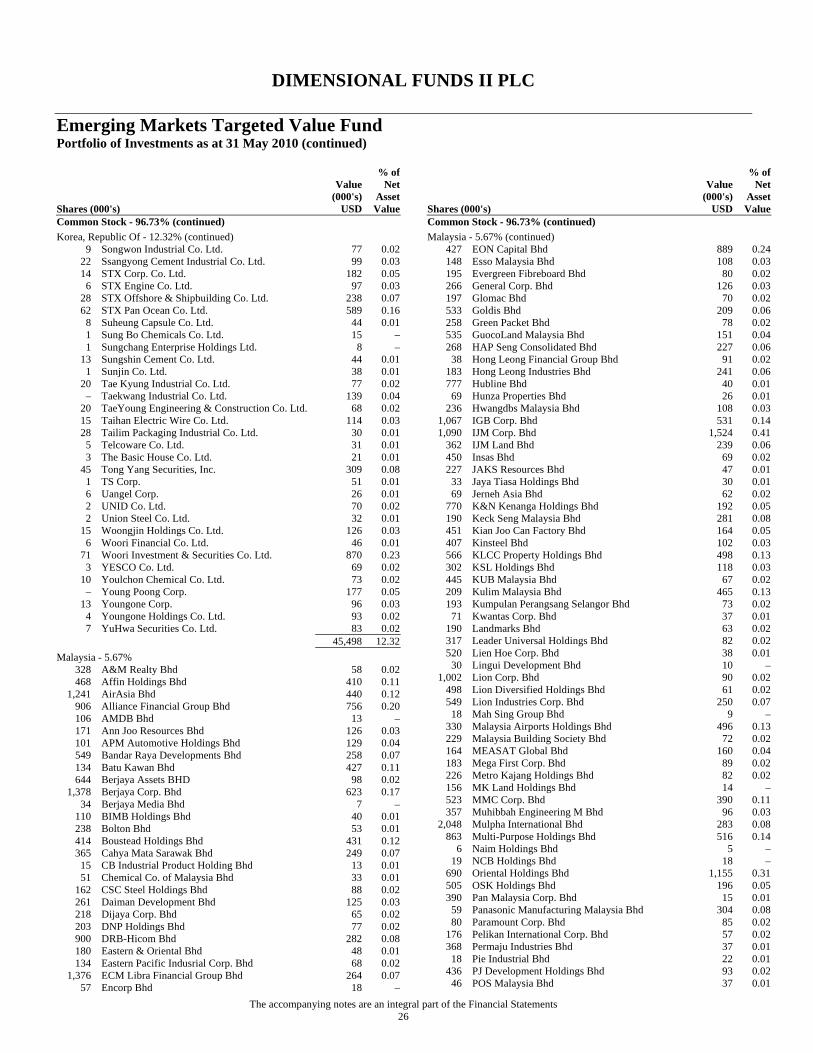
DIMENSIONAL FUNDS II PLC
Emerging Markets Targeted Value Fund Portfolio of Investments as at 31 May 2010 (continued)
The accompanying notes are an integral part of the Financial Statements 26
Shares (000's)
Value (000's)
USD
% of Net
Asset Value
Common Stock - 96.73% (continued) Korea, Republic Of - 12.32% (continued)
9 Songwon Industrial Co. Ltd. 77 0.02 22 Ssangyong Cement Industrial Co. Ltd. 99 0.03 14 STX Corp. Co. Ltd. 182 0.05
6 STX Engine Co. Ltd. 97 0.03 28 STX Offshore & Shipbuilding Co. Ltd. 238 0.07 62 STX Pan Ocean Co. Ltd. 589 0.16
8 Suheung Capsule Co. Ltd. 44 0.01 1 Sung Bo Chemicals Co. Ltd. 15 – 1 Sungchang Enterprise Holdings Ltd. 8 –
13 Sungshin Cement Co. Ltd. 44 0.01 1 Sunjin Co. Ltd. 38 0.01
20 Tae Kyung Industrial Co. Ltd. 77 0.02 – Taekwang Industrial Co. Ltd. 139 0.04
20 TaeYoung Engineering & Construction Co. Ltd. 68 0.02 15 Taihan Electric Wire Co. Ltd. 114 0.03 28 Tailim Packaging Industrial Co. Ltd. 30 0.01
5 Telcoware Co. Ltd. 31 0.01 3 The Basic House Co. Ltd. 21 0.01
45 Tong Yang Securities, Inc. 309 0.08 1 TS Corp. 51 0.01 6 Uangel Corp. 26 0.01 2 UNID Co. Ltd. 70 0.02 2 Union Steel Co. Ltd. 32 0.01
15 Woongjin Holdings Co. Ltd. 126 0.03 6 Woori Financial Co. Ltd. 46 0.01
71 Woori Investment & Securities Co. Ltd. 870 0.23 3 YESCO Co. Ltd. 69 0.02
10 Youlchon Chemical Co. Ltd. 73 0.02 – Young Poong Corp. 177 0.05
13 Youngone Corp. 96 0.03 4 Youngone Holdings Co. Ltd. 93 0.02 7 YuHwa Securities Co. Ltd. 83 0.02
45,498 12.32 Malaysia - 5.67%
328 A&M Realty Bhd 58 0.02 468 Affin Holdings Bhd 410 0.11
1,241 AirAsia Bhd 440 0.12 906 Alliance Financial Group Bhd 756 0.20 106 AMDB Bhd 13 – 171 Ann Joo Resources Bhd 126 0.03 101 APM Automotive Holdings Bhd 129 0.04 549 Bandar Raya Developments Bhd 258 0.07 134 Batu Kawan Bhd 427 0.11 644 Berjaya Assets BHD 98 0.02
1,378 Berjaya Corp. Bhd 623 0.17 34 Berjaya Media Bhd 7 –
110 BIMB Holdings Bhd 40 0.01 238 Bolton Bhd 53 0.01 414 Boustead Holdings Bhd 431 0.12 365 Cahya Mata Sarawak Bhd 249 0.07
15 CB Industrial Product Holding Bhd 13 0.01 51 Chemical Co. of Malaysia Bhd 33 0.01
162 CSC Steel Holdings Bhd 88 0.02 261 Daiman Development Bhd 125 0.03 218 Dijaya Corp. Bhd 65 0.02 203 DNP Holdings Bhd 77 0.02 900 DRB-Hicom Bhd 282 0.08 180 Eastern & Oriental Bhd 48 0.01 134 Eastern Pacific Indusrial Corp. Bhd 68 0.02
1,376 ECM Libra Financial Group Bhd 264 0.07 57 Encorp Bhd 18 –
Shares (000's)
Value (000's)
USD
% of Net
Asset Value
Common Stock - 96.73% (continued) Malaysia - 5.67% (continued)
427 EON Capital Bhd 889 0.24 148 Esso Malaysia Bhd 108 0.03 195 Evergreen Fibreboard Bhd 80 0.02 266 General Corp. Bhd 126 0.03 197 Glomac Bhd 70 0.02 533 Goldis Bhd 209 0.06 258 Green Packet Bhd 78 0.02 535 GuocoLand Malaysia Bhd 151 0.04 268 HAP Seng Consolidated Bhd 227 0.06
38 Hong Leong Financial Group Bhd 91 0.02 183 Hong Leong Industries Bhd 241 0.06 777 Hubline Bhd 40 0.01
69 Hunza Properties Bhd 26 0.01 236 Hwangdbs Malaysia Bhd 108 0.03
1,067 IGB Corp. Bhd 531 0.14 1,090 IJM Corp. Bhd 1,524 0.41
362 IJM Land Bhd 239 0.06 450 Insas Bhd 69 0.02 227 JAKS Resources Bhd 47 0.01
33 Jaya Tiasa Holdings Bhd 30 0.01 69 Jerneh Asia Bhd 62 0.02
770 K&N Kenanga Holdings Bhd 192 0.05 190 Keck Seng Malaysia Bhd 281 0.08 451 Kian Joo Can Factory Bhd 164 0.05 407 Kinsteel Bhd 102 0.03 566 KLCC Property Holdings Bhd 498 0.13 302 KSL Holdings Bhd 118 0.03 445 KUB Malaysia Bhd 67 0.02 209 Kulim Malaysia Bhd 465 0.13 193 Kumpulan Perangsang Selangor Bhd 73 0.02
71 Kwantas Corp. Bhd 37 0.01 190 Landmarks Bhd 63 0.02 317 Leader Universal Holdings Bhd 82 0.02 520 Lien Hoe Corp. Bhd 38 0.01
30 Lingui Development Bhd 10 – 1,002 Lion Corp. Bhd 90 0.02
498 Lion Diversified Holdings Bhd 61 0.02 549 Lion Industries Corp. Bhd 250 0.07
18 Mah Sing Group Bhd 9 – 330 Malaysia Airports Holdings Bhd 496 0.13 229 Malaysia Building Society Bhd 72 0.02 164 MEASAT Global Bhd 160 0.04 183 Mega First Corp. Bhd 89 0.02 226 Metro Kajang Holdings Bhd 82 0.02 156 MK Land Holdings Bhd 14 – 523 MMC Corp. Bhd 390 0.11 357 Muhibbah Engineering M Bhd 96 0.03
2,048 Mulpha International Bhd 283 0.08 863 Multi-Purpose Holdings Bhd 516 0.14
6 Naim Holdings Bhd 5 – 19 NCB Holdings Bhd 18 –
690 Oriental Holdings Bhd 1,155 0.31 505 OSK Holdings Bhd 196 0.05 390 Pan Malaysia Corp. Bhd 15 0.01
59 Panasonic Manufacturing Malaysia Bhd 304 0.08 80 Paramount Corp. Bhd 85 0.02
176 Pelikan International Corp. Bhd 57 0.02 368 Permaju Industries Bhd 37 0.01
18 Pie Industrial Bhd 22 0.01 436 PJ Development Holdings Bhd 93 0.02
46 POS Malaysia Bhd 37 0.01
DIMENSIONAL FUNDS II PLC
Emerging Markets Targeted Value Fund Portfolio of Investments as at 31 May 2010 (continued)
The accompanying notes are an integral part of the Financial Statements 27
Shares (000's)
Value (000's)
USD
% of Net
Asset Value
Common Stock - 96.73% (continued) Malaysia - 5.67% (continued)
230 Protasco Bhd 72 0.02 354 Proton Holdings Bhd 487 0.13
16 QSR Brands Bhd 17 – 365 RCE Capital Bhd 69 0.02 233 Scientex Bhd 97 0.03 872 Scomi Group Bhd 108 0.03 683 Selangor Dredging Bhd 108 0.03 202 Shangri-La Hotels Bhd 127 0.03 439 SHL Consolidated Bhd 137 0.04 406 Sino Hua-An International Bhd 43 0.01 159 Southern Steel Bhd 92 0.02 164 SPK Sentosa Corp. Bhd 16 – 192 Sunrise Bhd 107 0.03 176 Sunway City Bhd 195 0.05 232 Sunway Holdings Bhd 102 0.03 155 Suria Capital Holdings Bhd 66 0.02
1,389 TA Enterprise Bhd 268 0.07 1,044 TA Global Bhd 115 0.03
387 TAN Chong Motor Holdings Bhd 463 0.12 187 TDM Bhd 100 0.03 407 Tebrau Teguh Bhd 77 0.02
9 TH Plantations Bhd 4 – 1,203 Time dotCom Bhd 148 0.04
403 Titan Chemicals Corp. 147 0.04 34 Tradewinds Malaysia Bhd 29 0.01
173 TRC Synergy Bhd 53 0.01 137 Unico-Desa Plantations Bhd 39 0.01 474 Unisem M Bhd 401 0.11
56 United Malacca Bhd 135 0.04 109 VS Industry Bhd 39 0.01 438 WTK Holdings Bhd 153 0.04 105 Yi-Lai Bhd 26 0.01 288 YNH Property Bhd 126 0.03 273 Zelan Bhd 41 0.01
21,174 5.67 Mexico - 4.81%
280 Alfa SAB de CV, Class A 1,910 0.51 203 Alsea SAB de CV 200 0.05 421 Axtel SAB de CV 236 0.06 145 Bolsa Mexicana de Valores SA de CV 216 0.06 145 Carso Infraestructura Y Construccion 79 0.02 802 Consorcio Ara SAB de CV 493 0.13 148 Controladora Comercial Mexicana SAB de CV 137 0.04 389 Corporacion Geo SAB de CV 1,075 0.29
39 Desarrolladora Homex SAB de CV 169 0.05 114 Dine SAB de CV 57 0.02 128 Embotelladoras Arca SAB de CV 437 0.12 517 Empresas ICA SAB de CV 1,207 0.33 121 Gruma SAB de CV, Class B 185 0.05 162 Grupo Aeroportuario del Centro Norte SAB de
CV 269 0.07 439 Grupo Aeroportuario del Pacifico SAB de CV,
Class B 1,488 0.40 183 Grupo Aeroportuario del Sureste SAB de CV,
Class B 930 0.25 81 Grupo Carso SAB de CV 271 0.07 47 Grupo Cementos de Chihuahua SAB de CV 155 0.04
126 Grupo Famsa SAB de CV, Class A 212 0.06 885 Grupo Financiero Banorte SAB de CV, Class O 3,406 0.92 317 Grupo Industrial Saltillo SAB de CV 260 0.07 223 Grupo Kuo SAB de CV 253 0.07
Shares (000's)
Value (000's)
USD
% of Net
Asset Value
Common Stock - 96.73% (continued) Mexico - 4.81% (continued)
84 Grupo Simec SAB de CV 208 0.06 161 Industrias CH SAB de CV 573 0.16
58 Maxcom Telecomunicaciones SAB de CV 36 0.01 778 Organizacion Soriana SAB de CV, Class B 2,082 0.56
39 Qualitas Compania de Seguros S.A. de CV 25 0.01 195 Sare Holding SAB de CV, Class B 48 0.01 424 Urbi Desarrollos Urbanos SAB de CV 825 0.22 432 Vitro SAB de CV 373 0.10
17,815 4.81 Philippines - 1.25%
384 Banco de Oro Unibank, Inc. 357 0.10 5,430 Belle Corp. 214 0.06 1,828 Benpres Holdings Corp. 142 0.04 1,182 DMCI Holdings, Inc. 397 0.11 6,270 Empire East Land Holdings, Inc. 56 0.01
275 Filinvest Development Corp. 12 – 13,536 Filinvest Land, Inc. 270 0.07
292 First Philippine Holdings Corp. 353 0.10 42 Ginebra San Miguel, Inc. 29 0.01
11,722 Megaworld Corp. 320 0.09 623 Metropolitan Bank & Trust Co. 762 0.21 242 Philippine National Bank 149 0.04 348 Rizal Commercial Banking Corp. 139 0.04 449 Robinsons Land Corp. 131 0.04
85 Security Bank Corp. 114 0.03 1,340 SM Development Corp. 180 0.05
303 Union Bank of Philippines 262 0.07 1,084 Universal Robina Corp. 575 0.15 2,708 Vista Land & Lifescapes, Inc. 94 0.03
4,556 1.25 Poland - 3.14%
62 Agora S.A. 484 0.13 3 Amica S.A. 30 0.01
61 Asseco Poland S.A. 1,031 0.28 19 ATM S.A. 51 0.01 33 Bank Handlowy w Warszawie S.A. 732 0.20
341 Bank Millennium S.A. 482 0.13 2,095 Bioton S.A. 126 0.04
17 Bomi S.A. 71 0.02 65 Boryszew S.A. 38 0.01 17 Ciech S.A. 132 0.04
3 ComArch S.A. 70 0.02 6 Dom Development S.A. 95 0.03
125 Dom Maklerski IDMSA 90 0.02 339 Echo Investment S.A. 435 0.12
7 Emperia Holding S.A. 188 0.05 40 Energomontaz Poludnie S.A. 50 0.01 15 Fabryki Mebli Forte S.A. 69 0.02
110 Famur S.A., Class B 69 0.02 1 Farmacol S.A. 15 – 8 Firma Oponiarska Debica S.A. 162 0.04
10 Gant Development S.A. 70 0.02 14 Grupa Kety S.A. 457 0.12 70 Grupa Lotos S.A. 667 0.18
111 Impexmetal S.A. 129 0.03 3 Koelner S.A. 12 –
25 Kopex S.A. 141 0.04 31 Kredyt Bank S.A. 148 0.04
227 LC Corp. S.A. 104 0.03 37 MCI Management S.A. 78 0.02
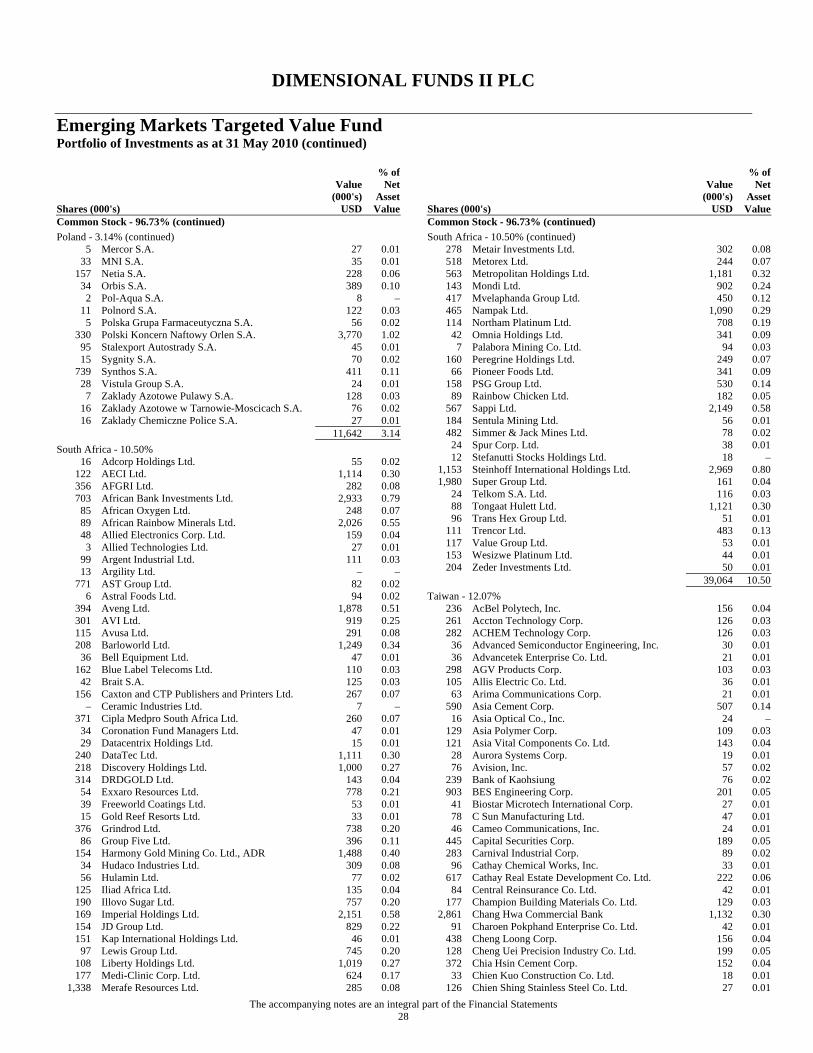
DIMENSIONAL FUNDS II PLC
Emerging Markets Targeted Value Fund Portfolio of Investments as at 31 May 2010 (continued)
The accompanying notes are an integral part of the Financial Statements 28
Shares (000's)
Value (000's)
USD
% of Net
Asset Value
Common Stock - 96.73% (continued) Poland - 3.14% (continued)
5 Mercor S.A. 27 0.01 33 MNI S.A. 35 0.01
157 Netia S.A. 228 0.06 34 Orbis S.A. 389 0.10
2 Pol-Aqua S.A. 8 – 11 Polnord S.A. 122 0.03
5 Polska Grupa Farmaceutyczna S.A. 56 0.02 330 Polski Koncern Naftowy Orlen S.A. 3,770 1.02
95 Stalexport Autostrady S.A. 45 0.01 15 Sygnity S.A. 70 0.02
739 Synthos S.A. 411 0.11 28 Vistula Group S.A. 24 0.01
7 Zaklady Azotowe Pulawy S.A. 128 0.03 16 Zaklady Azotowe w Tarnowie-Moscicach S.A. 76 0.02 16 Zaklady Chemiczne Police S.A. 27 0.01
11,642 3.14 South Africa - 10.50%
16 Adcorp Holdings Ltd. 55 0.02 122 AECI Ltd. 1,114 0.30 356 AFGRI Ltd. 282 0.08 703 African Bank Investments Ltd. 2,933 0.79
85 African Oxygen Ltd. 248 0.07 89 African Rainbow Minerals Ltd. 2,026 0.55 48 Allied Electronics Corp. Ltd. 159 0.04
3 Allied Technologies Ltd. 27 0.01 99 Argent Industrial Ltd. 111 0.03 13 Argility Ltd. – –
771 AST Group Ltd. 82 0.02 6 Astral Foods Ltd. 94 0.02
394 Aveng Ltd. 1,878 0.51 301 AVI Ltd. 919 0.25 115 Avusa Ltd. 291 0.08 208 Barloworld Ltd. 1,249 0.34
36 Bell Equipment Ltd. 47 0.01 162 Blue Label Telecoms Ltd. 110 0.03
42 Brait S.A. 125 0.03 156 Caxton and CTP Publishers and Printers Ltd. 267 0.07
– Ceramic Industries Ltd. 7 – 371 Cipla Medpro South Africa Ltd. 260 0.07
34 Coronation Fund Managers Ltd. 47 0.01 29 Datacentrix Holdings Ltd. 15 0.01
240 DataTec Ltd. 1,111 0.30 218 Discovery Holdings Ltd. 1,000 0.27 314 DRDGOLD Ltd. 143 0.04
54 Exxaro Resources Ltd. 778 0.21 39 Freeworld Coatings Ltd. 53 0.01 15 Gold Reef Resorts Ltd. 33 0.01
376 Grindrod Ltd. 738 0.20 86 Group Five Ltd. 396 0.11
154 Harmony Gold Mining Co. Ltd., ADR 1,488 0.40 34 Hudaco Industries Ltd. 309 0.08 56 Hulamin Ltd. 77 0.02
125 Iliad Africa Ltd. 135 0.04 190 Illovo Sugar Ltd. 757 0.20 169 Imperial Holdings Ltd. 2,151 0.58 154 JD Group Ltd. 829 0.22 151 Kap International Holdings Ltd. 46 0.01
97 Lewis Group Ltd. 745 0.20 108 Liberty Holdings Ltd. 1,019 0.27 177 Medi-Clinic Corp. Ltd. 624 0.17
1,338 Merafe Resources Ltd. 285 0.08
Shares (000's)
Value (000's)
USD
% of Net
Asset Value
Common Stock - 96.73% (continued) South Africa - 10.50% (continued)
278 Metair Investments Ltd. 302 0.08 518 Metorex Ltd. 244 0.07 563 Metropolitan Holdings Ltd. 1,181 0.32 143 Mondi Ltd. 902 0.24 417 Mvelaphanda Group Ltd. 450 0.12 465 Nampak Ltd. 1,090 0.29 114 Northam Platinum Ltd. 708 0.19
42 Omnia Holdings Ltd. 341 0.09 7 Palabora Mining Co. Ltd. 94 0.03
160 Peregrine Holdings Ltd. 249 0.07 66 Pioneer Foods Ltd. 341 0.09
158 PSG Group Ltd. 530 0.14 89 Rainbow Chicken Ltd. 182 0.05
567 Sappi Ltd. 2,149 0.58 184 Sentula Mining Ltd. 56 0.01 482 Simmer & Jack Mines Ltd. 78 0.02
24 Spur Corp. Ltd. 38 0.01 12 Stefanutti Stocks Holdings Ltd. 18 –
1,153 Steinhoff International Holdings Ltd. 2,969 0.80 1,980 Super Group Ltd. 161 0.04
24 Telkom S.A. Ltd. 116 0.03 88 Tongaat Hulett Ltd. 1,121 0.30 96 Trans Hex Group Ltd. 51 0.01
111 Trencor Ltd. 483 0.13 117 Value Group Ltd. 53 0.01 153 Wesizwe Platinum Ltd. 44 0.01 204 Zeder Investments Ltd. 50 0.01
39,064 10.50 Taiwan - 12.07%
236 AcBel Polytech, Inc. 156 0.04 261 Accton Technology Corp. 126 0.03 282 ACHEM Technology Corp. 126 0.03
36 Advanced Semiconductor Engineering, Inc. 30 0.01 36 Advancetek Enterprise Co. Ltd. 21 0.01
298 AGV Products Corp. 103 0.03 105 Allis Electric Co. Ltd. 36 0.01
63 Arima Communications Corp. 21 0.01 590 Asia Cement Corp. 507 0.14
16 Asia Optical Co., Inc. 24 – 129 Asia Polymer Corp. 109 0.03 121 Asia Vital Components Co. Ltd. 143 0.04
28 Aurora Systems Corp. 19 0.01 76 Avision, Inc. 57 0.02
239 Bank of Kaohsiung 76 0.02 903 BES Engineering Corp. 201 0.05
41 Biostar Microtech International Corp. 27 0.01 78 C Sun Manufacturing Ltd. 47 0.01 46 Cameo Communications, Inc. 24 0.01
445 Capital Securities Corp. 189 0.05 283 Carnival Industrial Corp. 89 0.02
96 Cathay Chemical Works, Inc. 33 0.01 617 Cathay Real Estate Development Co. Ltd. 222 0.06
84 Central Reinsurance Co. Ltd. 42 0.01 177 Champion Building Materials Co. Ltd. 129 0.03
2,861 Chang Hwa Commercial Bank 1,132 0.30 91 Charoen Pokphand Enterprise Co. Ltd. 42 0.01
438 Cheng Loong Corp. 156 0.04 128 Cheng Uei Precision Industry Co. Ltd. 199 0.05 372 Chia Hsin Cement Corp. 152 0.04
33 Chien Kuo Construction Co. Ltd. 18 0.01 126 Chien Shing Stainless Steel Co. Ltd. 27 0.01
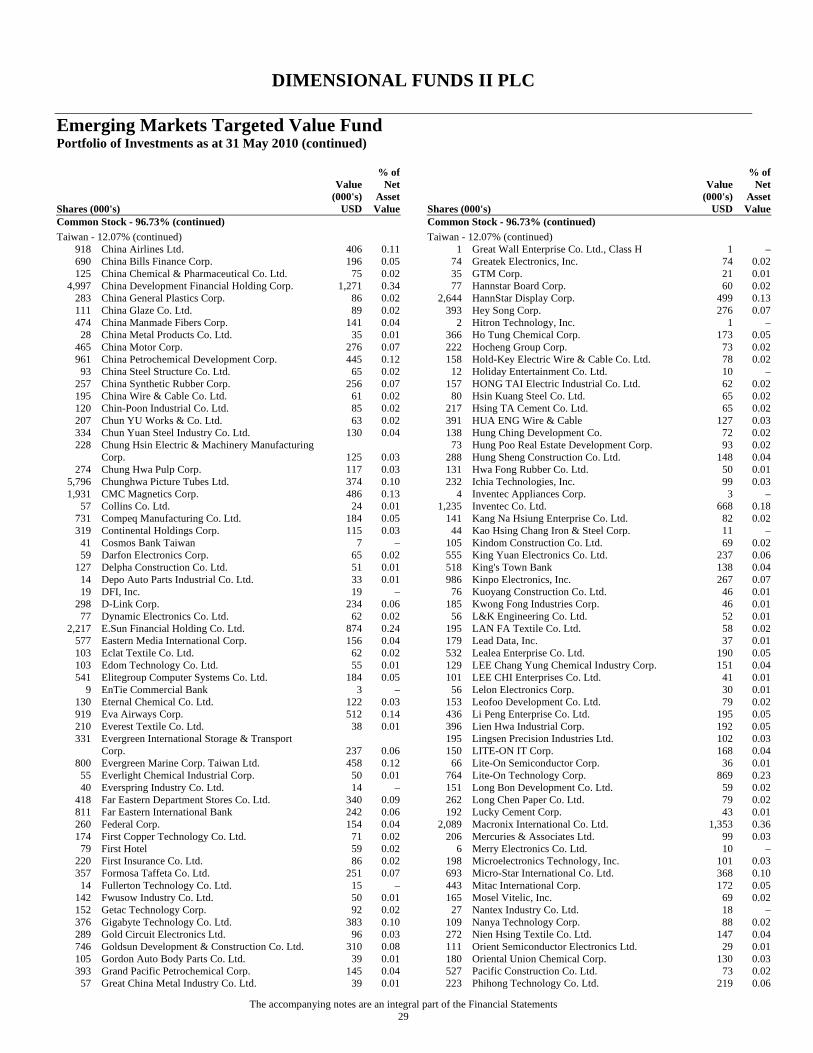
DIMENSIONAL FUNDS II PLC
Emerging Markets Targeted Value Fund Portfolio of Investments as at 31 May 2010 (continued)
The accompanying notes are an integral part of the Financial Statements 29
Shares (000's)
Value (000's)
USD
% of Net
Asset Value
Common Stock - 96.73% (continued) Taiwan - 12.07% (continued)
918 China Airlines Ltd. 406 0.11 690 China Bills Finance Corp. 196 0.05 125 China Chemical & Pharmaceutical Co. Ltd. 75 0.02
4,997 China Development Financial Holding Corp. 1,271 0.34 283 China General Plastics Corp. 86 0.02 111 China Glaze Co. Ltd. 89 0.02 474 China Manmade Fibers Corp. 141 0.04
28 China Metal Products Co. Ltd. 35 0.01 465 China Motor Corp. 276 0.07 961 China Petrochemical Development Corp. 445 0.12
93 China Steel Structure Co. Ltd. 65 0.02 257 China Synthetic Rubber Corp. 256 0.07 195 China Wire & Cable Co. Ltd. 61 0.02 120 Chin-Poon Industrial Co. Ltd. 85 0.02 207 Chun YU Works & Co. Ltd. 63 0.02 334 Chun Yuan Steel Industry Co. Ltd. 130 0.04 228 Chung Hsin Electric & Machinery Manufacturing
Corp. 125 0.03 274 Chung Hwa Pulp Corp. 117 0.03
5,796 Chunghwa Picture Tubes Ltd. 374 0.10 1,931 CMC Magnetics Corp. 486 0.13
57 Collins Co. Ltd. 24 0.01 731 Compeq Manufacturing Co. Ltd. 184 0.05 319 Continental Holdings Corp. 115 0.03
41 Cosmos Bank Taiwan 7 – 59 Darfon Electronics Corp. 65 0.02
127 Delpha Construction Co. Ltd. 51 0.01 14 Depo Auto Parts Industrial Co. Ltd. 33 0.01 19 DFI, Inc. 19 –
298 D-Link Corp. 234 0.06 77 Dynamic Electronics Co. Ltd. 62 0.02
2,217 E.Sun Financial Holding Co. Ltd. 874 0.24 577 Eastern Media International Corp. 156 0.04 103 Eclat Textile Co. Ltd. 62 0.02 103 Edom Technology Co. Ltd. 55 0.01 541 Elitegroup Computer Systems Co. Ltd. 184 0.05
9 EnTie Commercial Bank 3 – 130 Eternal Chemical Co. Ltd. 122 0.03 919 Eva Airways Corp. 512 0.14 210 Everest Textile Co. Ltd. 38 0.01 331 Evergreen International Storage & Transport
Corp. 237 0.06 800 Evergreen Marine Corp. Taiwan Ltd. 458 0.12
55 Everlight Chemical Industrial Corp. 50 0.01 40 Everspring Industry Co. Ltd. 14 –
418 Far Eastern Department Stores Co. Ltd. 340 0.09 811 Far Eastern International Bank 242 0.06 260 Federal Corp. 154 0.04 174 First Copper Technology Co. Ltd. 71 0.02
79 First Hotel 59 0.02 220 First Insurance Co. Ltd. 86 0.02 357 Formosa Taffeta Co. Ltd. 251 0.07
14 Fullerton Technology Co. Ltd. 15 – 142 Fwusow Industry Co. Ltd. 50 0.01 152 Getac Technology Corp. 92 0.02 376 Gigabyte Technology Co. Ltd. 383 0.10 289 Gold Circuit Electronics Ltd. 96 0.03 746 Goldsun Development & Construction Co. Ltd. 310 0.08 105 Gordon Auto Body Parts Co. Ltd. 39 0.01 393 Grand Pacific Petrochemical Corp. 145 0.04
57 Great China Metal Industry Co. Ltd. 39 0.01
Shares (000's)
Value (000's)
USD
% of Net
Asset Value
Common Stock - 96.73% (continued) Taiwan - 12.07% (continued)
1 Great Wall Enterprise Co. Ltd., Class H 1 – 74 Greatek Electronics, Inc. 74 0.02 35 GTM Corp. 21 0.01 77 Hannstar Board Corp. 60 0.02
2,644 HannStar Display Corp. 499 0.13 393 Hey Song Corp. 276 0.07
2 Hitron Technology, Inc. 1 – 366 Ho Tung Chemical Corp. 173 0.05 222 Hocheng Group Corp. 73 0.02 158 Hold-Key Electric Wire & Cable Co. Ltd. 78 0.02
12 Holiday Entertainment Co. Ltd. 10 – 157 HONG TAI Electric Industrial Co. Ltd. 62 0.02
80 Hsin Kuang Steel Co. Ltd. 65 0.02 217 Hsing TA Cement Co. Ltd. 65 0.02 391 HUA ENG Wire & Cable 127 0.03 138 Hung Ching Development Co. 72 0.02
73 Hung Poo Real Estate Development Corp. 93 0.02 288 Hung Sheng Construction Co. Ltd. 148 0.04 131 Hwa Fong Rubber Co. Ltd. 50 0.01 232 Ichia Technologies, Inc. 99 0.03
4 Inventec Appliances Corp. 3 – 1,235 Inventec Co. Ltd. 668 0.18
141 Kang Na Hsiung Enterprise Co. Ltd. 82 0.02 44 Kao Hsing Chang Iron & Steel Corp. 11 –
105 Kindom Construction Co. Ltd. 69 0.02 555 King Yuan Electronics Co. Ltd. 237 0.06 518 King's Town Bank 138 0.04 986 Kinpo Electronics, Inc. 267 0.07
76 Kuoyang Construction Co. Ltd. 46 0.01 185 Kwong Fong Industries Corp. 46 0.01
56 L&K Engineering Co. Ltd. 52 0.01 195 LAN FA Textile Co. Ltd. 58 0.02 179 Lead Data, Inc. 37 0.01 532 Lealea Enterprise Co. Ltd. 190 0.05 129 LEE Chang Yung Chemical Industry Corp. 151 0.04 101 LEE CHI Enterprises Co. Ltd. 41 0.01
56 Lelon Electronics Corp. 30 0.01 153 Leofoo Development Co. Ltd. 79 0.02 436 Li Peng Enterprise Co. Ltd. 195 0.05 396 Lien Hwa Industrial Corp. 192 0.05 195 Lingsen Precision Industries Ltd. 102 0.03 150 LITE-ON IT Corp. 168 0.04
66 Lite-On Semiconductor Corp. 36 0.01 764 Lite-On Technology Corp. 869 0.23 151 Long Bon Development Co. Ltd. 59 0.02 262 Long Chen Paper Co. Ltd. 79 0.02 192 Lucky Cement Corp. 43 0.01
2,089 Macronix International Co. Ltd. 1,353 0.36 206 Mercuries & Associates Ltd. 99 0.03
6 Merry Electronics Co. Ltd. 10 – 198 Microelectronics Technology, Inc. 101 0.03 693 Micro-Star International Co. Ltd. 368 0.10 443 Mitac International Corp. 172 0.05 165 Mosel Vitelic, Inc. 69 0.02
27 Nantex Industry Co. Ltd. 18 – 109 Nanya Technology Corp. 88 0.02 272 Nien Hsing Textile Co. Ltd. 147 0.04 111 Orient Semiconductor Electronics Ltd. 29 0.01 180 Oriental Union Chemical Corp. 130 0.03 527 Pacific Construction Co. Ltd. 73 0.02 223 Phihong Technology Co. Ltd. 219 0.06
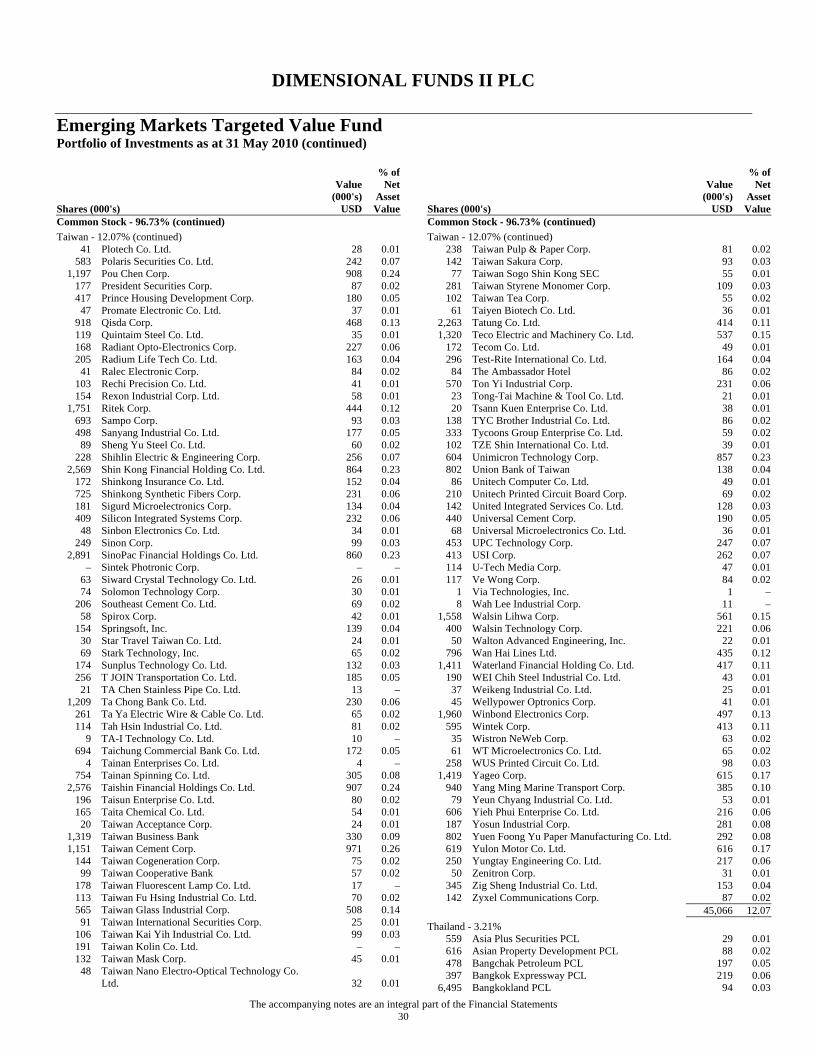
DIMENSIONAL FUNDS II PLC
Emerging Markets Targeted Value Fund Portfolio of Investments as at 31 May 2010 (continued)
The accompanying notes are an integral part of the Financial Statements 30
Shares (000's)
Value (000's)
USD
% of Net
Asset Value
Common Stock - 96.73% (continued) Taiwan - 12.07% (continued)
41 Plotech Co. Ltd. 28 0.01 583 Polaris Securities Co. Ltd. 242 0.07
1,197 Pou Chen Corp. 908 0.24 177 President Securities Corp. 87 0.02 417 Prince Housing Development Corp. 180 0.05
47 Promate Electronic Co. Ltd. 37 0.01 918 Qisda Corp. 468 0.13 119 Quintaim Steel Co. Ltd. 35 0.01 168 Radiant Opto-Electronics Corp. 227 0.06 205 Radium Life Tech Co. Ltd. 163 0.04
41 Ralec Electronic Corp. 84 0.02 103 Rechi Precision Co. Ltd. 41 0.01 154 Rexon Industrial Corp. Ltd. 58 0.01
1,751 Ritek Corp. 444 0.12 693 Sampo Corp. 93 0.03 498 Sanyang Industrial Co. Ltd. 177 0.05
89 Sheng Yu Steel Co. Ltd. 60 0.02 228 Shihlin Electric & Engineering Corp. 256 0.07
2,569 Shin Kong Financial Holding Co. Ltd. 864 0.23 172 Shinkong Insurance Co. Ltd. 152 0.04 725 Shinkong Synthetic Fibers Corp. 231 0.06 181 Sigurd Microelectronics Corp. 134 0.04 409 Silicon Integrated Systems Corp. 232 0.06
48 Sinbon Electronics Co. Ltd. 34 0.01 249 Sinon Corp. 99 0.03
2,891 SinoPac Financial Holdings Co. Ltd. 860 0.23 – Sintek Photronic Corp. – –
63 Siward Crystal Technology Co. Ltd. 26 0.01 74 Solomon Technology Corp. 30 0.01
206 Southeast Cement Co. Ltd. 69 0.02 58 Spirox Corp. 42 0.01
154 Springsoft, Inc. 139 0.04 30 Star Travel Taiwan Co. Ltd. 24 0.01 69 Stark Technology, Inc. 65 0.02
174 Sunplus Technology Co. Ltd. 132 0.03 256 T JOIN Transportation Co. Ltd. 185 0.05
21 TA Chen Stainless Pipe Co. Ltd. 13 – 1,209 Ta Chong Bank Co. Ltd. 230 0.06
261 Ta Ya Electric Wire & Cable Co. Ltd. 65 0.02 114 Tah Hsin Industrial Co. Ltd. 81 0.02
9 TA-I Technology Co. Ltd. 10 – 694 Taichung Commercial Bank Co. Ltd. 172 0.05
4 Tainan Enterprises Co. Ltd. 4 – 754 Tainan Spinning Co. Ltd. 305 0.08
2,576 Taishin Financial Holdings Co. Ltd. 907 0.24 196 Taisun Enterprise Co. Ltd. 80 0.02 165 Taita Chemical Co. Ltd. 54 0.01
20 Taiwan Acceptance Corp. 24 0.01 1,319 Taiwan Business Bank 330 0.09 1,151 Taiwan Cement Corp. 971 0.26
144 Taiwan Cogeneration Corp. 75 0.02 99 Taiwan Cooperative Bank 57 0.02
178 Taiwan Fluorescent Lamp Co. Ltd. 17 – 113 Taiwan Fu Hsing Industrial Co. Ltd. 70 0.02 565 Taiwan Glass Industrial Corp. 508 0.14
91 Taiwan International Securities Corp. 25 0.01 106 Taiwan Kai Yih Industrial Co. Ltd. 99 0.03 191 Taiwan Kolin Co. Ltd. – – 132 Taiwan Mask Corp. 45 0.01
48 Taiwan Nano Electro-Optical Technology Co. Ltd. 32 0.01
Shares (000's)
Value (000's)
USD
% of Net
Asset Value
Common Stock - 96.73% (continued) Taiwan - 12.07% (continued)
238 Taiwan Pulp & Paper Corp. 81 0.02 142 Taiwan Sakura Corp. 93 0.03
77 Taiwan Sogo Shin Kong SEC 55 0.01 281 Taiwan Styrene Monomer Corp. 109 0.03 102 Taiwan Tea Corp. 55 0.02
61 Taiyen Biotech Co. Ltd. 36 0.01 2,263 Tatung Co. Ltd. 414 0.11 1,320 Teco Electric and Machinery Co. Ltd. 537 0.15
172 Tecom Co. Ltd. 49 0.01 296 Test-Rite International Co. Ltd. 164 0.04
84 The Ambassador Hotel 86 0.02 570 Ton Yi Industrial Corp. 231 0.06
23 Tong-Tai Machine & Tool Co. Ltd. 21 0.01 20 Tsann Kuen Enterprise Co. Ltd. 38 0.01
138 TYC Brother Industrial Co. Ltd. 86 0.02 333 Tycoons Group Enterprise Co. Ltd. 59 0.02 102 TZE Shin International Co. Ltd. 39 0.01 604 Unimicron Technology Corp. 857 0.23 802 Union Bank of Taiwan 138 0.04
86 Unitech Computer Co. Ltd. 49 0.01 210 Unitech Printed Circuit Board Corp. 69 0.02 142 United Integrated Services Co. Ltd. 128 0.03 440 Universal Cement Corp. 190 0.05
68 Universal Microelectronics Co. Ltd. 36 0.01 453 UPC Technology Corp. 247 0.07 413 USI Corp. 262 0.07 114 U-Tech Media Corp. 47 0.01 117 Ve Wong Corp. 84 0.02
1 Via Technologies, Inc. 1 – 8 Wah Lee Industrial Corp. 11 –
1,558 Walsin Lihwa Corp. 561 0.15 400 Walsin Technology Corp. 221 0.06
50 Walton Advanced Engineering, Inc. 22 0.01 796 Wan Hai Lines Ltd. 435 0.12
1,411 Waterland Financial Holding Co. Ltd. 417 0.11 190 WEI Chih Steel Industrial Co. Ltd. 43 0.01
37 Weikeng Industrial Co. Ltd. 25 0.01 45 Wellypower Optronics Corp. 41 0.01
1,960 Winbond Electronics Corp. 497 0.13 595 Wintek Corp. 413 0.11
35 Wistron NeWeb Corp. 63 0.02 61 WT Microelectronics Co. Ltd. 65 0.02
258 WUS Printed Circuit Co. Ltd. 98 0.03 1,419 Yageo Corp. 615 0.17
940 Yang Ming Marine Transport Corp. 385 0.10 79 Yeun Chyang Industrial Co. Ltd. 53 0.01
606 Yieh Phui Enterprise Co. Ltd. 216 0.06 187 Yosun Industrial Corp. 281 0.08 802 Yuen Foong Yu Paper Manufacturing Co. Ltd. 292 0.08 619 Yulon Motor Co. Ltd. 616 0.17 250 Yungtay Engineering Co. Ltd. 217 0.06
50 Zenitron Corp. 31 0.01 345 Zig Sheng Industrial Co. Ltd. 153 0.04 142 Zyxel Communications Corp. 87 0.02
45,066 12.07 Thailand - 3.21%
559 Asia Plus Securities PCL 29 0.01 616 Asian Property Development PCL 88 0.02 478 Bangchak Petroleum PCL 197 0.05 397 Bangkok Expressway PCL 219 0.06
6,495 Bangkokland PCL 94 0.03
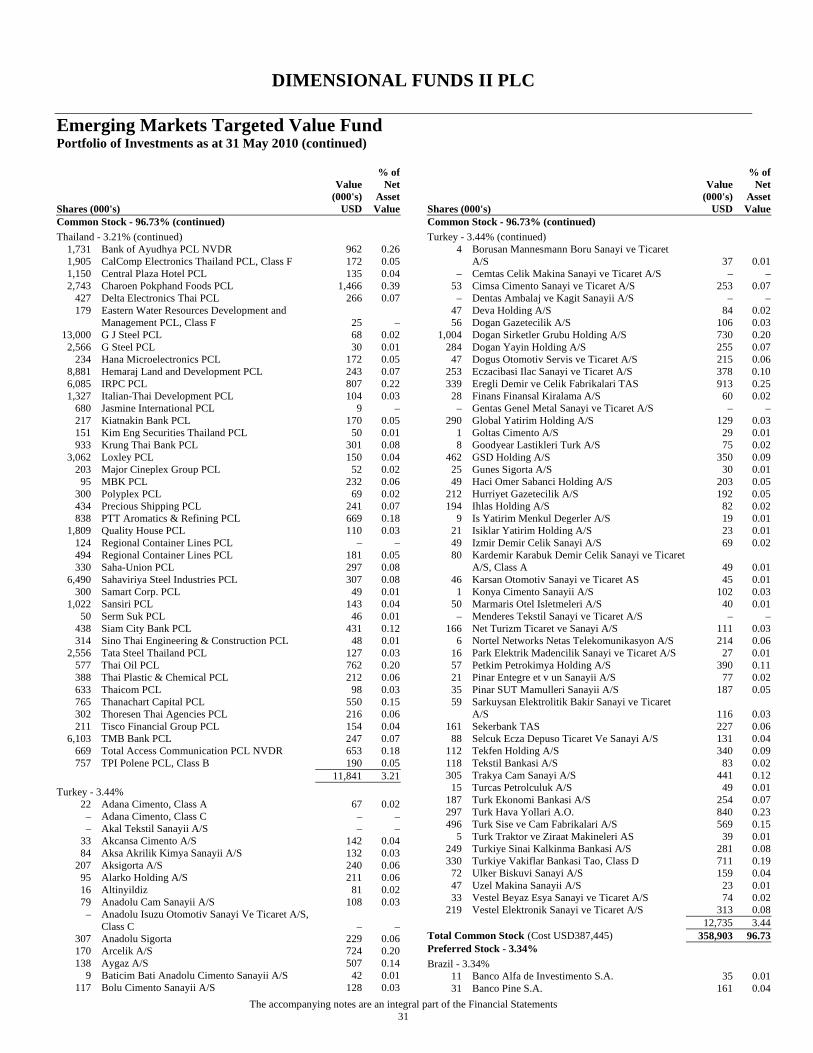
DIMENSIONAL FUNDS II PLC
Emerging Markets Targeted Value Fund Portfolio of Investments as at 31 May 2010 (continued)
The accompanying notes are an integral part of the Financial Statements 31
Shares (000's)
Value (000's)
USD
% of Net
Asset Value
Common Stock - 96.73% (continued) Thailand - 3.21% (continued)
1,731 Bank of Ayudhya PCL NVDR 962 0.26 1,905 CalComp Electronics Thailand PCL, Class F 172 0.05 1,150 Central Plaza Hotel PCL 135 0.04 2,743 Charoen Pokphand Foods PCL 1,466 0.39
427 Delta Electronics Thai PCL 266 0.07 179 Eastern Water Resources Development and
Management PCL, Class F 25 – 13,000 G J Steel PCL 68 0.02
2,566 G Steel PCL 30 0.01 234 Hana Microelectronics PCL 172 0.05
8,881 Hemaraj Land and Development PCL 243 0.07 6,085 IRPC PCL 807 0.22 1,327 Italian-Thai Development PCL 104 0.03
680 Jasmine International PCL 9 – 217 Kiatnakin Bank PCL 170 0.05 151 Kim Eng Securities Thailand PCL 50 0.01 933 Krung Thai Bank PCL 301 0.08
3,062 Loxley PCL 150 0.04 203 Major Cineplex Group PCL 52 0.02
95 MBK PCL 232 0.06 300 Polyplex PCL 69 0.02 434 Precious Shipping PCL 241 0.07 838 PTT Aromatics & Refining PCL 669 0.18
1,809 Quality House PCL 110 0.03 124 Regional Container Lines PCL – – 494 Regional Container Lines PCL 181 0.05 330 Saha-Union PCL 297 0.08
6,490 Sahaviriya Steel Industries PCL 307 0.08 300 Samart Corp. PCL 49 0.01
1,022 Sansiri PCL 143 0.04 50 Serm Suk PCL 46 0.01
438 Siam City Bank PCL 431 0.12 314 Sino Thai Engineering & Construction PCL 48 0.01
2,556 Tata Steel Thailand PCL 127 0.03 577 Thai Oil PCL 762 0.20 388 Thai Plastic & Chemical PCL 212 0.06 633 Thaicom PCL 98 0.03 765 Thanachart Capital PCL 550 0.15 302 Thoresen Thai Agencies PCL 216 0.06 211 Tisco Financial Group PCL 154 0.04
6,103 TMB Bank PCL 247 0.07 669 Total Access Communication PCL NVDR 653 0.18 757 TPI Polene PCL, Class B 190 0.05
11,841 3.21 Turkey - 3.44%
22 Adana Cimento, Class A 67 0.02 – Adana Cimento, Class C – – – Akal Tekstil Sanayii A/S – –
33 Akcansa Cimento A/S 142 0.04 84 Aksa Akrilik Kimya Sanayii A/S 132 0.03
207 Aksigorta A/S 240 0.06 95 Alarko Holding A/S 211 0.06 16 Altinyildiz 81 0.02 79 Anadolu Cam Sanayii A/S 108 0.03
– Anadolu Isuzu Otomotiv Sanayi Ve Ticaret A/S, Class C – –
307 Anadolu Sigorta 229 0.06 170 Arcelik A/S 724 0.20 138 Aygaz A/S 507 0.14
9 Baticim Bati Anadolu Cimento Sanayii A/S 42 0.01 117 Bolu Cimento Sanayii A/S 128 0.03
Shares (000's)
Value (000's)
USD
% of Net
Asset Value
Common Stock - 96.73% (continued) Turkey - 3.44% (continued)
4 Borusan Mannesmann Boru Sanayi ve Ticaret A/S 37 0.01
– Cemtas Celik Makina Sanayi ve Ticaret A/S – – 53 Cimsa Cimento Sanayi ve Ticaret A/S 253 0.07
– Dentas Ambalaj ve Kagit Sanayii A/S – – 47 Deva Holding A/S 84 0.02 56 Dogan Gazetecilik A/S 106 0.03
1,004 Dogan Sirketler Grubu Holding A/S 730 0.20 284 Dogan Yayin Holding A/S 255 0.07
47 Dogus Otomotiv Servis ve Ticaret A/S 215 0.06 253 Eczacibasi Ilac Sanayi ve Ticaret A/S 378 0.10 339 Eregli Demir ve Celik Fabrikalari TAS 913 0.25
28 Finans Finansal Kiralama A/S 60 0.02 – Gentas Genel Metal Sanayi ve Ticaret A/S – –
290 Global Yatirim Holding A/S 129 0.03 1 Goltas Cimento A/S 29 0.01 8 Goodyear Lastikleri Turk A/S 75 0.02
462 GSD Holding A/S 350 0.09 25 Gunes Sigorta A/S 30 0.01 49 Haci Omer Sabanci Holding A/S 203 0.05
212 Hurriyet Gazetecilik A/S 192 0.05 194 Ihlas Holding A/S 82 0.02
9 Is Yatirim Menkul Degerler A/S 19 0.01 21 Isiklar Yatirim Holding A/S 23 0.01 49 Izmir Demir Celik Sanayi A/S 69 0.02 80 Kardemir Karabuk Demir Celik Sanayi ve Ticaret
A/S, Class A 49 0.01 46 Karsan Otomotiv Sanayi ve Ticaret AS 45 0.01
1 Konya Cimento Sanayii A/S 102 0.03 50 Marmaris Otel Isletmeleri A/S 40 0.01
– Menderes Tekstil Sanayi ve Ticaret A/S – – 166 Net Turizm Ticaret ve Sanayi A/S 111 0.03
6 Nortel Networks Netas Telekomunikasyon A/S 214 0.06 16 Park Elektrik Madencilik Sanayi ve Ticaret A/S 27 0.01 57 Petkim Petrokimya Holding A/S 390 0.11 21 Pinar Entegre et v un Sanayii A/S 77 0.02 35 Pinar SUT Mamulleri Sanayii A/S 187 0.05 59 Sarkuysan Elektrolitik Bakir Sanayi ve Ticaret
A/S 116 0.03 161 Sekerbank TAS 227 0.06
88 Selcuk Ecza Depuso Ticaret Ve Sanayi A/S 131 0.04 112 Tekfen Holding A/S 340 0.09 118 Tekstil Bankasi A/S 83 0.02 305 Trakya Cam Sanayi A/S 441 0.12
15 Turcas Petrolculuk A/S 49 0.01 187 Turk Ekonomi Bankasi A/S 254 0.07 297 Turk Hava Yollari A.O. 840 0.23 496 Turk Sise ve Cam Fabrikalari A/S 569 0.15
5 Turk Traktor ve Ziraat Makineleri AS 39 0.01 249 Turkiye Sinai Kalkinma Bankasi A/S 281 0.08 330 Turkiye Vakiflar Bankasi Tao, Class D 711 0.19
72 Ulker Biskuvi Sanayi A/S 159 0.04 47 Uzel Makina Sanayii A/S 23 0.01 33 Vestel Beyaz Esya Sanayi ve Ticaret A/S 74 0.02
219 Vestel Elektronik Sanayi ve Ticaret A/S 313 0.08 12,735 3.44 Total Common Stock (Cost USD387,445) 358,903 96.73 Preferred Stock - 3.34% Brazil - 3.34%
11 Banco Alfa de Investimento S.A. 35 0.01 31 Banco Pine S.A. 161 0.04
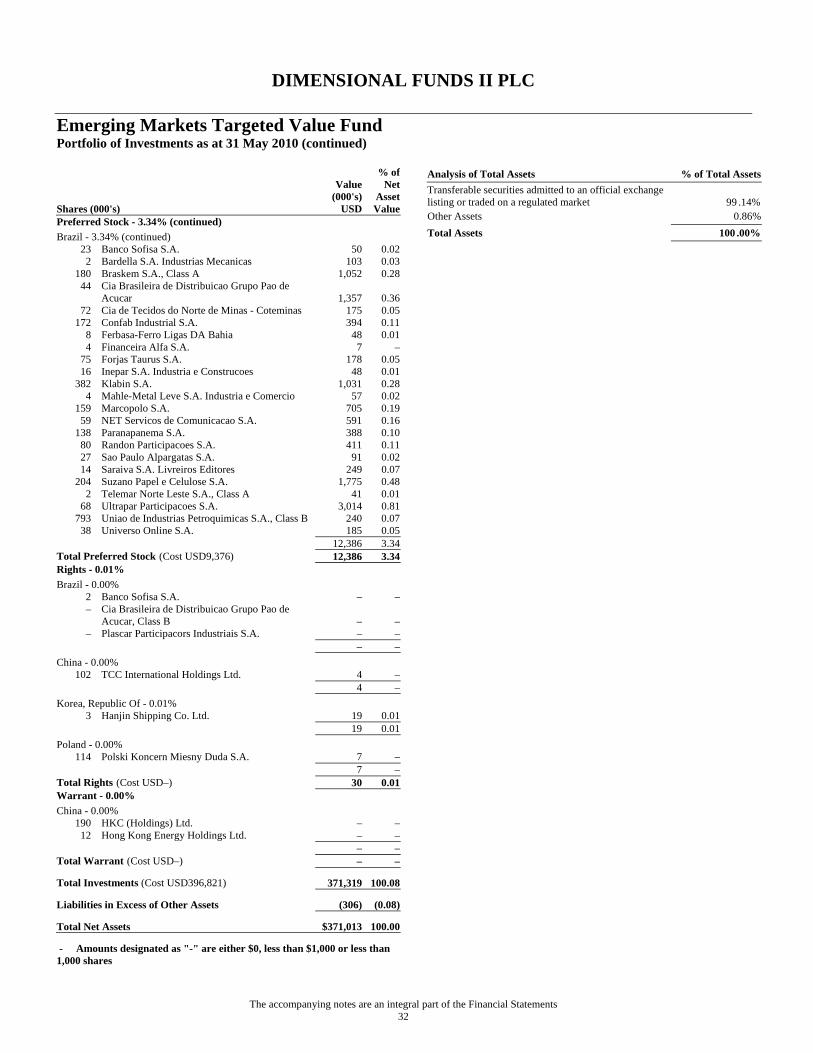
DIMENSIONAL FUNDS II PLC
Emerging Markets Targeted Value Fund Portfolio of Investments as at 31 May 2010 (continued)
The accompanying notes are an integral part of the Financial Statements 32
Shares (000's)
Value (000's)
USD
% of Net
Asset Value
Preferred Stock - 3.34% (continued) Brazil - 3.34% (continued)
23 Banco Sofisa S.A. 50 0.02 2 Bardella S.A. Industrias Mecanicas 103 0.03
180 Braskem S.A., Class A 1,052 0.28 44 Cia Brasileira de Distribuicao Grupo Pao de
Acucar 1,357 0.36 72 Cia de Tecidos do Norte de Minas - Coteminas 175 0.05
172 Confab Industrial S.A. 394 0.11 8 Ferbasa-Ferro Ligas DA Bahia 48 0.01 4 Financeira Alfa S.A. 7 –
75 Forjas Taurus S.A. 178 0.05 16 Inepar S.A. Industria e Construcoes 48 0.01
382 Klabin S.A. 1,031 0.28 4 Mahle-Metal Leve S.A. Industria e Comercio 57 0.02
159 Marcopolo S.A. 705 0.19 59 NET Servicos de Comunicacao S.A. 591 0.16
138 Paranapanema S.A. 388 0.10 80 Randon Participacoes S.A. 411 0.11 27 Sao Paulo Alpargatas S.A. 91 0.02 14 Saraiva S.A. Livreiros Editores 249 0.07
204 Suzano Papel e Celulose S.A. 1,775 0.48 2 Telemar Norte Leste S.A., Class A 41 0.01
68 Ultrapar Participacoes S.A. 3,014 0.81 793 Uniao de Industrias Petroquimicas S.A., Class B 240 0.07
38 Universo Online S.A. 185 0.05 12,386 3.34 Total Preferred Stock (Cost USD9,376) 12,386 3.34 Rights - 0.01% Brazil - 0.00%
2 Banco Sofisa S.A. – – – Cia Brasileira de Distribuicao Grupo Pao de
Acucar, Class B – – – Plascar Participacors Industriais S.A. – –
– – China - 0.00%
102 TCC International Holdings Ltd. 4 – 4 – Korea, Republic Of - 0.01%
3 Hanjin Shipping Co. Ltd. 19 0.01 19 0.01 Poland - 0.00%
114 Polski Koncern Miesny Duda S.A. 7 – 7 – Total Rights (Cost USD–) 30 0.01 Warrant - 0.00% China - 0.00%
190 HKC (Holdings) Ltd. – – 12 Hong Kong Energy Holdings Ltd. – –
– – Total Warrant (Cost USD–) – –
Total Investments (Cost USD396,821) 371,319 100.08
Liabilities in Excess of Other Assets (306) (0.08)
Total Net Assets $371,013 100.00
- Amounts designated as "-" are either $0, less than $1,000 or less than 1,000 shares
Analysis of Total Assets % of Total Assets Transferable securities admitted to an official exchange listing or traded on a regulated market 99 .14% Other Assets 0.86% Total Assets 100 .00%

DIMENSIONAL FUNDS II PLC
European Value Fund Portfolio of Investments as at 31 May 2010
The accompanying notes are an integral part of the Financial Statements. 33
Shares (000's)
Value (000's)
EUR
% of Net
Asset Value
Common Stock - 99.72% Austria - 0.09%
2 Erste Group Bank AG 53 0.09 53 0.09 Belgium - 1.35%
70 Ageas 146 0.25 4 KBC Groupe NV 139 0.24 1 Solvay S.A. 70 0.12
16 UCB S.A. 419 0.74 774 1.35 Denmark - 2.20%
– AP Moller - Maersk A/S, Class B 493 0.86 4 Carlsberg A/S, Class B 263 0.46 3 Danisco A/S 157 0.27
18 Danske Bank A/S 302 0.53 1 Jyske Bank A/S 28 0.05 – Rockwool International A/S, Class B 14 0.03
1,257 2.20 Finland - 2.12%
4 Fortum Oyj 81 0.14 3 Metso Oyj 87 0.15
10 Neste Oil Oyj 129 0.23 5 Outokumpu Oyj 63 0.11
60 Stora Enso Oyj, Class R 361 0.63 47 UPM-Kymmene Oyj 490 0.86
1,211 2.12 France - 15.61%
9 Air France-KLM 88 0.15 61 AXA S.A. 820 1.44 23 BNP Paribas S.A. 1,061 1.86
6 Cap Gemini S.A. 225 0.40 3 Casino Guichard Perrachon S.A. 182 0.32 9 Cie Generale de Geophysique-Veritas 158 0.28 4 Cie Generale des Etablissements Michelin, Class B 228 0.40 – Ciments Francais S.A. 31 0.06 2 CNP Assurances 112 0.20
27 Compagnie de St-Gobain 851 1.49 42 Credit Agricole S.A. 370 0.65 34 GDF Suez 868 1.52 34 Groupe Eurotunnel S.A. 216 0.38
2 Lafarge S.A. 110 0.19 13 Lagardere SCA 348 0.61 41 Natixis 148 0.26 17 Peugeot S.A. 337 0.59
5 Pinault - Printerps - Redoute 455 0.80 17 Renault S.A. 497 0.87
2 Rexel S.A. 27 0.05 10 Safran S.A. 229 0.40
7 SCOR SE 103 0.18 10 Societe Generale 348 0.61 61 Vivendi S.A. 1,086 1.90
8,898 15.61 Germany - 14.82%
20 Allianz SE 1,580 2.77 23 Bayerische Motoren Werke AG 863 1.51 25 Commerzbank AG 143 0.25 60 Daimler AG 2,392 4.19 18 Deutsche Bank AG 877 1.53 24 Deutsche Lufthansa AG 257 0.45
1 Deutsche Postbank AG 23 0.04
Shares (000's)
Value (000's)
EUR
% of Net
Asset Value
Common Stock - 99.72% (continued) Germany - 14.82% (continued)
76 Deutsche Telekom AG 688 1.20 1 Fraport AG Frankfurt Airport Services Worldwide 44 0.08 – Hannover Rueckversicherung AG 15 0.03 3 HeidelbergCement AG 121 0.21 9 Muenchener Rueckversicherungs AG 884 1.55 5 Salzgitter AG 265 0.46 4 Suedzucker AG 61 0.11
11 ThyssenKrupp AG 248 0.44 8,461 14.82 Greece - 0.28%
6 Alpha Bank A.E. 28 0.05 8 EFG Eurobank Ergasias S.A. 33 0.06
11 Hellenic Petroleum S.A. 65 0.11 3 National Bank of Greece S.A. 33 0.06
159 0.28 Ireland - 0.73%
23 CRH PLC 419 0.73 419 0.73 Italy - 3.91%
185 Banca Monte dei Paschi di Siena S.p.A. 166 0.29 18 Banco Popolare SC 80 0.14
2 Buzzi Unicem S.p.A. 21 0.04 32 Fiat S.p.A. 276 0.48
366 Intesa Sanpaolo S.p.A. 780 1.36 1 Italcementi S.p.A. 8 0.01
404 Telecom Italia S.p.A. 389 0.68 181 UniCredit Italiano S.p.A. 308 0.54
29 Unione di Banche Italiane SCPA 212 0.37 2,240 3.91 Netherlands - 8.41%
63 Aegon NV 294 0.51 11 Akzo Nobel NV 478 0.84 61 ArcelorMittal 1,510 2.64 24 European Aeronautic Defence and Space Co. NV 387 0.68 62 ING Groep NV 402 0.70
9 Koninklijke DSM NV 287 0.50 48 Koninklijke Philips Electronics NV 1,179 2.06 43 STMicroelectronics NV 275 0.48
4,812 8.41 Norway - 1.79%
24 DnB NOR ASA 192 0.34 25 Marine Harvest ASA 16 0.03 50 Norsk Hydro ASA 246 0.43 61 Orkla ASA 343 0.60 16 Storebrand ASA 71 0.12 15 Telenor ASA 151 0.27
1,019 1.79 Portugal - 0.07%
3 Banco BPI S.A. 4 0.01 18 Banco Comercial Portugues S.A., Class R 11 0.02
7 Banco Espirito Santo S.A. 23 0.04 38 0.07 Spain - 7.04%
1 Acciona S.A. 72 0.12 78 Banco Bilbao Vizcaya Argentaria S.A. 671 1.17 34 Banco de Sabadell S.A. 117 0.20
6 Banco Espanol de Credito S.A. 39 0.07

DIMENSIONAL FUNDS II PLC
European Value Fund Portfolio of Investments as at 31 May 2010 (continued)
The accompanying notes are an integral part of the Financial Statements 34
Shares (000's)
Value (000's)
EUR
% of Net
Asset Value
Common Stock - 99.72% (continued) Spain - 7.04% (continued)
34 Banco Popular Espanol S.A. 142 0.25 246 Banco Santander S.A. 2,065 3.61
5 Criteria Caixacorp S.A. 18 0.03 4 EDP Renovaveis S.A. 20 0.04 8 Iberdrola Renovables S.A. 20 0.03
52 Repsol YPF S.A. 870 1.52 4,034 7.04 Sweden - 5.21%
139 Nordea Bank AB 931 1.63 63 Skandinaviska Enskilda Banken AB, Class A 266 0.47
9 SSAB AB, Class B 92 0.16 19 SSAB Svenskt Stal AB, Class A 227 0.40 70 Svenska Cellulosa AB, Class B 664 1.16 23 Svenska Handelsbanken AB, Class A 448 0.78 25 Swedbank AB, Class A 182 0.32 13 Tele2 AB, Class B 158 0.28
1 TeliaSonera AB 6 0.01 2,974 5.21 Switzerland - 12.24%
8 Adecco S.A. 313 0.55 2 Baloise Holding AG 97 0.17
38 Credit Suisse Group AG 1,221 2.14 28 Holcim Ltd. 1,423 2.49 51 Novartis AG 1,887 3.30
1 Swiss Life Holding AG 58 0.10 13 Swiss Reinsurance Co. Ltd. 420 0.73 60 UBS AG 649 1.14
6 Zurich Financial Services AG 928 1.62 6,996 12.24 United Kingdom - 23.85%
27 Associated British Foods PLC 305 0.53 124 Aviva PLC 467 0.82 286 Barclays PLC 1,028 1.80
69 BP PLC 403 0.70 58 British Airways PLC 136 0.24 18 Carnival PLC 560 0.98 12 EasyJet PLC 55 0.10
– HSBC Holdings PLC – – 116 International Power PLC 398 0.70
8 Investec PLC 49 0.09 135 J Sainsbury PLC 514 0.90
13 Kazakhmys PLC 178 0.31 249 Kingfisher PLC 655 1.15 296 Legal & General Group PLC 275 0.48
2 Mondi PLC 11 0.02 19 Old Mutual PLC 25 0.04 42 Pearson PLC 472 0.82
5 Resolution Ltd. 3 – 69 Rexam PLC 256 0.45
589 Royal Bank of Scotland Group PLC 324 0.57 100 Royal Dutch Shell PLC, Class B 2,068 3.62 148 RSA Insurance Group PLC 204 0.36
– Standard Chartered PLC – – 80 Standard Life PLC 171 0.30 46 Thomas Cook Group PLC 113 0.20 12 Travis Perkins PLC 109 0.19
1,938 Vodafone Group PLC 3,154 5.52 11 Whitbread PLC 175 0.30
207 WM Morrison Supermarkets PLC 646 1.13
Shares (000's)
Value (000's)
EUR
% of Net
Asset Value
Common Stock - 99.72% (continued) United Kingdom - 23.85% (continued)
11 Wolseley PLC 215 0.37 55 Xstrata PLC 662 1.16
13,631 23.85 Total Common Stock (Cost EUR72,232) 56,976 99.72 Preferred Stock - 0.14% Germany - 0.14%
2 Porsche Automobil Holding SE 79 0.14 79 0.14 Total Preferred Stock (Cost EUR112) 79 0.14
Total Investments (Cost EUR72,344) 57,055 99.86
Other Assets in Excess of Liabilities 82 0.14
Total Net Assets €57,137 100.00
- Amounts designated as "-" are either €0, less than €1,000 or less than 1,000 shares
Analysis of Total Assets % of Total Assets Transferable securities admitted to an official exchange listing or traded on a regulated market 98 .86% Other Assets 1.14% Total Assets 100 .00%
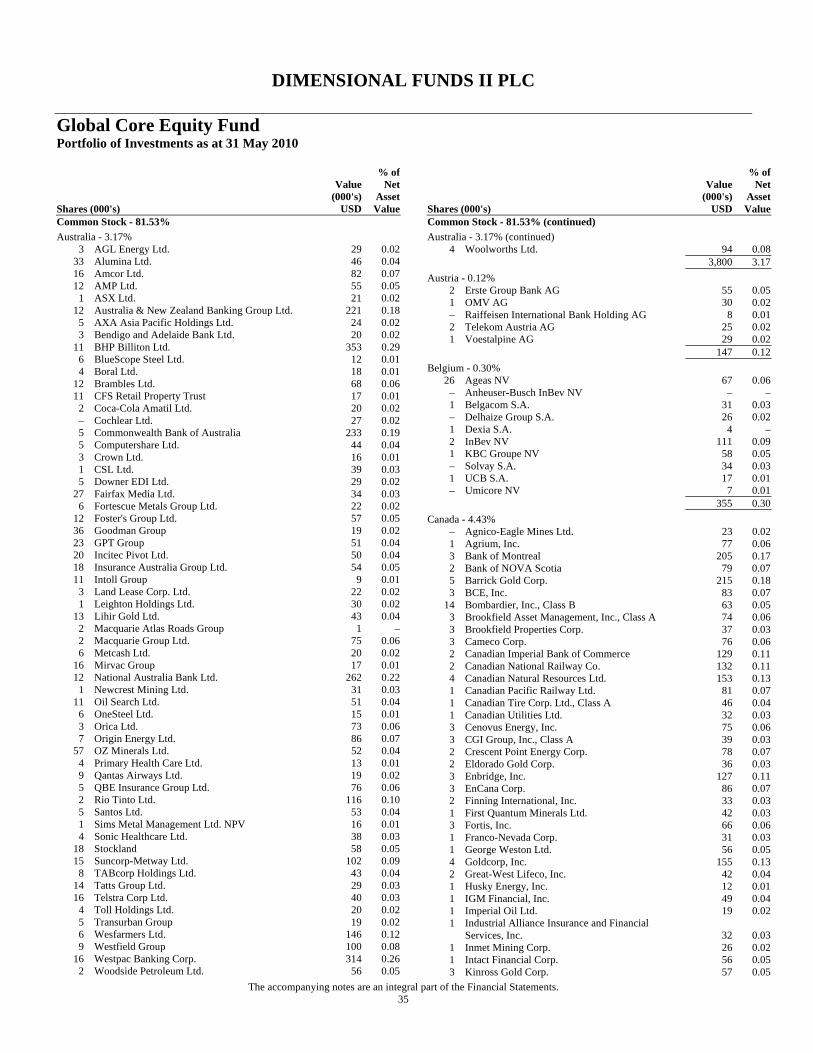
DIMENSIONAL FUNDS II PLC
Global Core Equity Fund Portfolio of Investments as at 31 May 2010
The accompanying notes are an integral part of the Financial Statements. 35
Shares (000's)
Value (000's)
USD
% of Net
Asset Value
Common Stock - 81.53% Australia - 3.17%
3 AGL Energy Ltd. 29 0.02 33 Alumina Ltd. 46 0.04 16 Amcor Ltd. 82 0.07 12 AMP Ltd. 55 0.05
1 ASX Ltd. 21 0.02 12 Australia & New Zealand Banking Group Ltd. 221 0.18
5 AXA Asia Pacific Holdings Ltd. 24 0.02 3 Bendigo and Adelaide Bank Ltd. 20 0.02
11 BHP Billiton Ltd. 353 0.29 6 BlueScope Steel Ltd. 12 0.01 4 Boral Ltd. 18 0.01
12 Brambles Ltd. 68 0.06 11 CFS Retail Property Trust 17 0.01
2 Coca-Cola Amatil Ltd. 20 0.02 – Cochlear Ltd. 27 0.02 5 Commonwealth Bank of Australia 233 0.19 5 Computershare Ltd. 44 0.04 3 Crown Ltd. 16 0.01 1 CSL Ltd. 39 0.03 5 Downer EDI Ltd. 29 0.02
27 Fairfax Media Ltd. 34 0.03 6 Fortescue Metals Group Ltd. 22 0.02
12 Foster's Group Ltd. 57 0.05 36 Goodman Group 19 0.02 23 GPT Group 51 0.04 20 Incitec Pivot Ltd. 50 0.04 18 Insurance Australia Group Ltd. 54 0.05 11 Intoll Group 9 0.01
3 Land Lease Corp. Ltd. 22 0.02 1 Leighton Holdings Ltd. 30 0.02
13 Lihir Gold Ltd. 43 0.04 2 Macquarie Atlas Roads Group 1 – 2 Macquarie Group Ltd. 75 0.06 6 Metcash Ltd. 20 0.02
16 Mirvac Group 17 0.01 12 National Australia Bank Ltd. 262 0.22
1 Newcrest Mining Ltd. 31 0.03 11 Oil Search Ltd. 51 0.04
6 OneSteel Ltd. 15 0.01 3 Orica Ltd. 73 0.06 7 Origin Energy Ltd. 86 0.07
57 OZ Minerals Ltd. 52 0.04 4 Primary Health Care Ltd. 13 0.01 9 Qantas Airways Ltd. 19 0.02 5 QBE Insurance Group Ltd. 76 0.06 2 Rio Tinto Ltd. 116 0.10 5 Santos Ltd. 53 0.04 1 Sims Metal Management Ltd. NPV 16 0.01 4 Sonic Healthcare Ltd. 38 0.03
18 Stockland 58 0.05 15 Suncorp-Metway Ltd. 102 0.09
8 TABcorp Holdings Ltd. 43 0.04 14 Tatts Group Ltd. 29 0.03 16 Telstra Corp Ltd. 40 0.03
4 Toll Holdings Ltd. 20 0.02 5 Transurban Group 19 0.02 6 Wesfarmers Ltd. 146 0.12 9 Westfield Group 100 0.08
16 Westpac Banking Corp. 314 0.26 2 Woodside Petroleum Ltd. 56 0.05
Shares (000's)
Value (000's)
USD
% of Net
Asset Value
Common Stock - 81.53% (continued) Australia - 3.17% (continued)
4 Woolworths Ltd. 94 0.08 3,800 3.17 Austria - 0.12%
2 Erste Group Bank AG 55 0.05 1 OMV AG 30 0.02 – Raiffeisen International Bank Holding AG 8 0.01 2 Telekom Austria AG 25 0.02 1 Voestalpine AG 29 0.02
147 0.12 Belgium - 0.30%
26 Ageas NV 67 0.06 – Anheuser-Busch InBev NV – – 1 Belgacom S.A. 31 0.03 – Delhaize Group S.A. 26 0.02 1 Dexia S.A. 4 – 2 InBev NV 111 0.09 1 KBC Groupe NV 58 0.05 – Solvay S.A. 34 0.03 1 UCB S.A. 17 0.01 – Umicore NV 7 0.01
355 0.30 Canada - 4.43%
– Agnico-Eagle Mines Ltd. 23 0.02 1 Agrium, Inc. 77 0.06 3 Bank of Montreal 205 0.17 2 Bank of NOVA Scotia 79 0.07 5 Barrick Gold Corp. 215 0.18 3 BCE, Inc. 83 0.07
14 Bombardier, Inc., Class B 63 0.05 3 Brookfield Asset Management, Inc., Class A 74 0.06 3 Brookfield Properties Corp. 37 0.03 3 Cameco Corp. 76 0.06 2 Canadian Imperial Bank of Commerce 129 0.11 2 Canadian National Railway Co. 132 0.11 4 Canadian Natural Resources Ltd. 153 0.13 1 Canadian Pacific Railway Ltd. 81 0.07 1 Canadian Tire Corp. Ltd., Class A 46 0.04 1 Canadian Utilities Ltd. 32 0.03 3 Cenovus Energy, Inc. 75 0.06 3 CGI Group, Inc., Class A 39 0.03 2 Crescent Point Energy Corp. 78 0.07 2 Eldorado Gold Corp. 36 0.03 3 Enbridge, Inc. 127 0.11 3 EnCana Corp. 86 0.07 2 Finning International, Inc. 33 0.03 1 First Quantum Minerals Ltd. 42 0.03 3 Fortis, Inc. 66 0.06 1 Franco-Nevada Corp. 31 0.03 1 George Weston Ltd. 56 0.05 4 Goldcorp, Inc. 155 0.13 2 Great-West Lifeco, Inc. 42 0.04 1 Husky Energy, Inc. 12 0.01 1 IGM Financial, Inc. 49 0.04 1 Imperial Oil Ltd. 19 0.02 1 Industrial Alliance Insurance and Financial
Services, Inc. 32 0.03 1 Inmet Mining Corp. 26 0.02 1 Intact Financial Corp. 56 0.05 3 Kinross Gold Corp. 57 0.05
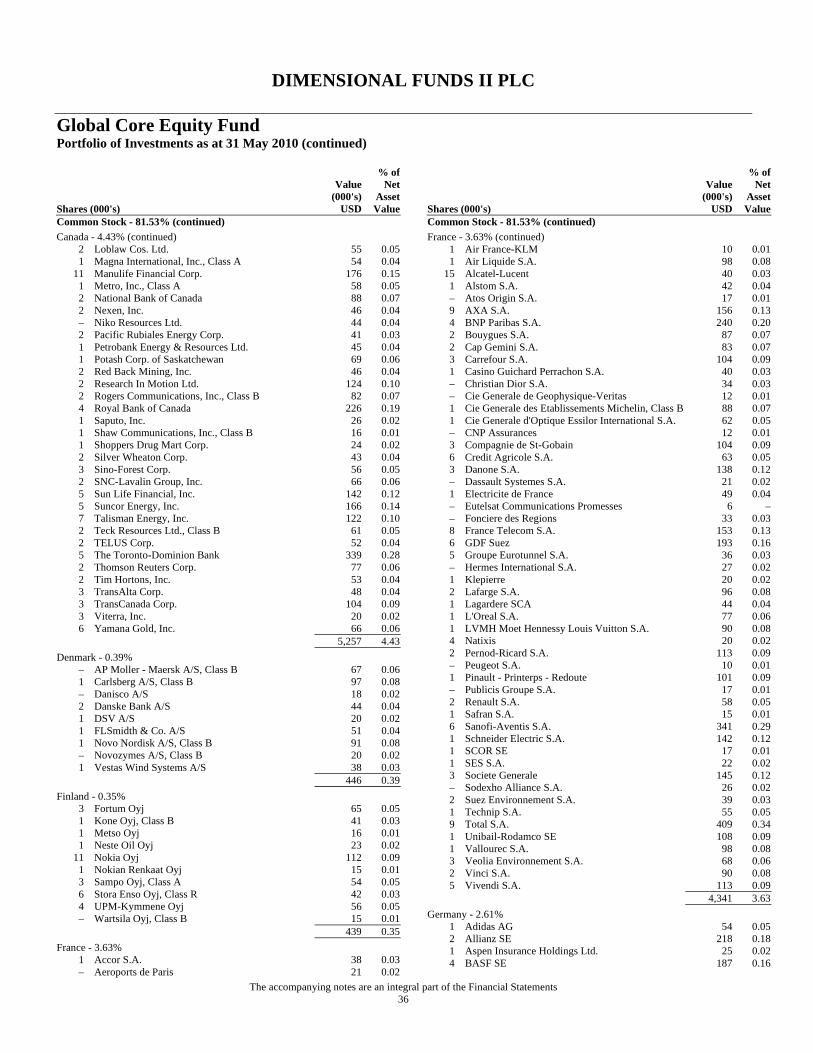
DIMENSIONAL FUNDS II PLC
Global Core Equity Fund Portfolio of Investments as at 31 May 2010 (continued)
The accompanying notes are an integral part of the Financial Statements 36
Shares (000's)
Value (000's)
USD
% of Net
Asset Value
Common Stock - 81.53% (continued) Canada - 4.43% (continued)
2 Loblaw Cos. Ltd. 55 0.05 1 Magna International, Inc., Class A 54 0.04
11 Manulife Financial Corp. 176 0.15 1 Metro, Inc., Class A 58 0.05 2 National Bank of Canada 88 0.07 2 Nexen, Inc. 46 0.04 – Niko Resources Ltd. 44 0.04 2 Pacific Rubiales Energy Corp. 41 0.03 1 Petrobank Energy & Resources Ltd. 45 0.04 1 Potash Corp. of Saskatchewan 69 0.06 2 Red Back Mining, Inc. 46 0.04 2 Research In Motion Ltd. 124 0.10 2 Rogers Communications, Inc., Class B 82 0.07 4 Royal Bank of Canada 226 0.19 1 Saputo, Inc. 26 0.02 1 Shaw Communications, Inc., Class B 16 0.01 1 Shoppers Drug Mart Corp. 24 0.02 2 Silver Wheaton Corp. 43 0.04 3 Sino-Forest Corp. 56 0.05 2 SNC-Lavalin Group, Inc. 66 0.06 5 Sun Life Financial, Inc. 142 0.12 5 Suncor Energy, Inc. 166 0.14 7 Talisman Energy, Inc. 122 0.10 2 Teck Resources Ltd., Class B 61 0.05 2 TELUS Corp. 52 0.04 5 The Toronto-Dominion Bank 339 0.28 2 Thomson Reuters Corp. 77 0.06 2 Tim Hortons, Inc. 53 0.04 3 TransAlta Corp. 48 0.04 3 TransCanada Corp. 104 0.09 3 Viterra, Inc. 20 0.02 6 Yamana Gold, Inc. 66 0.06
5,257 4.43 Denmark - 0.39%
– AP Moller - Maersk A/S, Class B 67 0.06 1 Carlsberg A/S, Class B 97 0.08 – Danisco A/S 18 0.02 2 Danske Bank A/S 44 0.04 1 DSV A/S 20 0.02 1 FLSmidth & Co. A/S 51 0.04 1 Novo Nordisk A/S, Class B 91 0.08 – Novozymes A/S, Class B 20 0.02 1 Vestas Wind Systems A/S 38 0.03
446 0.39 Finland - 0.35%
3 Fortum Oyj 65 0.05 1 Kone Oyj, Class B 41 0.03 1 Metso Oyj 16 0.01 1 Neste Oil Oyj 23 0.02
11 Nokia Oyj 112 0.09 1 Nokian Renkaat Oyj 15 0.01 3 Sampo Oyj, Class A 54 0.05 6 Stora Enso Oyj, Class R 42 0.03 4 UPM-Kymmene Oyj 56 0.05 – Wartsila Oyj, Class B 15 0.01
439 0.35 France - 3.63%
1 Accor S.A. 38 0.03 – Aeroports de Paris 21 0.02
Shares (000's)
Value (000's)
USD
% of Net
Asset Value
Common Stock - 81.53% (continued) France - 3.63% (continued)
1 Air France-KLM 10 0.01 1 Air Liquide S.A. 98 0.08
15 Alcatel-Lucent 40 0.03 1 Alstom S.A. 42 0.04 – Atos Origin S.A. 17 0.01 9 AXA S.A. 156 0.13 4 BNP Paribas S.A. 240 0.20 2 Bouygues S.A. 87 0.07 2 Cap Gemini S.A. 83 0.07 3 Carrefour S.A. 104 0.09 1 Casino Guichard Perrachon S.A. 40 0.03 – Christian Dior S.A. 34 0.03 – Cie Generale de Geophysique-Veritas 12 0.01 1 Cie Generale des Etablissements Michelin, Class B 88 0.07 1 Cie Generale d'Optique Essilor International S.A. 62 0.05 – CNP Assurances 12 0.01 3 Compagnie de St-Gobain 104 0.09 6 Credit Agricole S.A. 63 0.05 3 Danone S.A. 138 0.12 – Dassault Systemes S.A. 21 0.02 1 Electricite de France 49 0.04 – Eutelsat Communications Promesses 6 – – Fonciere des Regions 33 0.03 8 France Telecom S.A. 153 0.13 6 GDF Suez 193 0.16 5 Groupe Eurotunnel S.A. 36 0.03 – Hermes International S.A. 27 0.02 1 Klepierre 20 0.02 2 Lafarge S.A. 96 0.08 1 Lagardere SCA 44 0.04 1 L'Oreal S.A. 77 0.06 1 LVMH Moet Hennessy Louis Vuitton S.A. 90 0.08 4 Natixis 20 0.02 2 Pernod-Ricard S.A. 113 0.09 – Peugeot S.A. 10 0.01 1 Pinault - Printerps - Redoute 101 0.09 – Publicis Groupe S.A. 17 0.01 2 Renault S.A. 58 0.05 1 Safran S.A. 15 0.01 6 Sanofi-Aventis S.A. 341 0.29 1 Schneider Electric S.A. 142 0.12 1 SCOR SE 17 0.01 1 SES S.A. 22 0.02 3 Societe Generale 145 0.12 – Sodexho Alliance S.A. 26 0.02 2 Suez Environnement S.A. 39 0.03 1 Technip S.A. 55 0.05 9 Total S.A. 409 0.34 1 Unibail-Rodamco SE 108 0.09 1 Vallourec S.A. 98 0.08 3 Veolia Environnement S.A. 68 0.06 2 Vinci S.A. 90 0.08 5 Vivendi S.A. 113 0.09
4,341 3.63 Germany - 2.61%
1 Adidas AG 54 0.05 2 Allianz SE 218 0.18 1 Aspen Insurance Holdings Ltd. 25 0.02 4 BASF SE 187 0.16
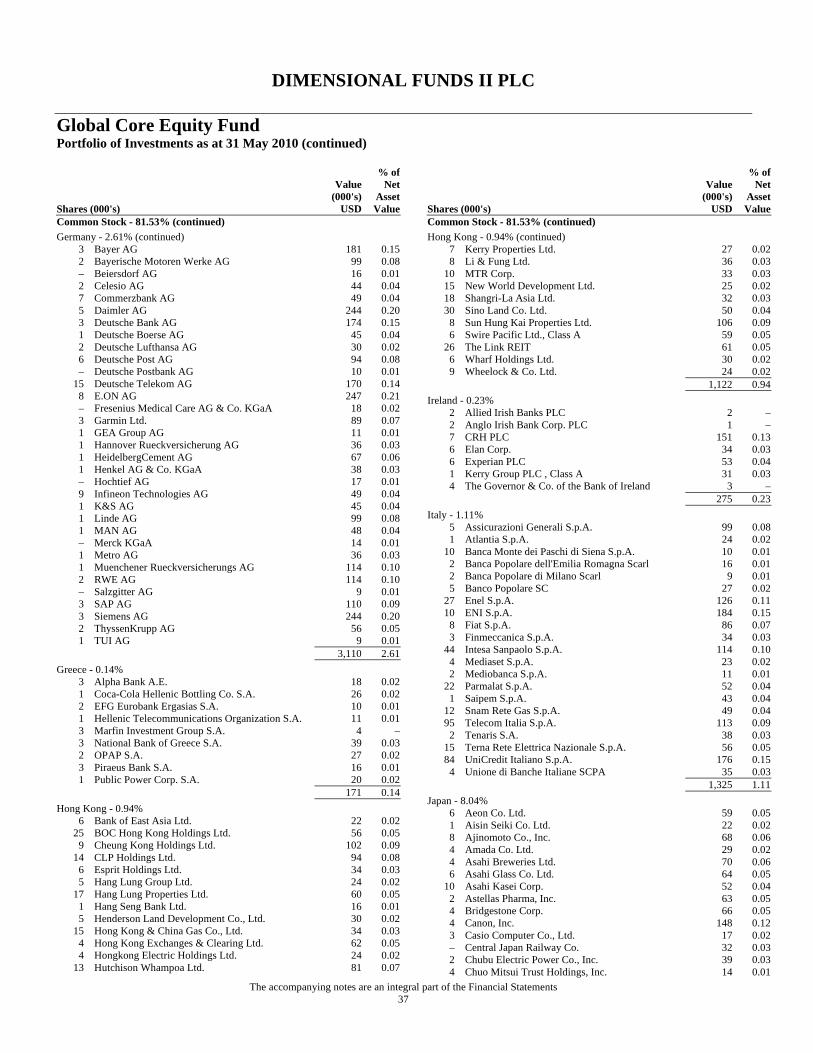
DIMENSIONAL FUNDS II PLC
Global Core Equity Fund Portfolio of Investments as at 31 May 2010 (continued)
The accompanying notes are an integral part of the Financial Statements 37
Shares (000's)
Value (000's)
USD
% of Net
Asset Value
Common Stock - 81.53% (continued) Germany - 2.61% (continued)
3 Bayer AG 181 0.15 2 Bayerische Motoren Werke AG 99 0.08 – Beiersdorf AG 16 0.01 2 Celesio AG 44 0.04 7 Commerzbank AG 49 0.04 5 Daimler AG 244 0.20 3 Deutsche Bank AG 174 0.15 1 Deutsche Boerse AG 45 0.04 2 Deutsche Lufthansa AG 30 0.02 6 Deutsche Post AG 94 0.08 – Deutsche Postbank AG 10 0.01
15 Deutsche Telekom AG 170 0.14 8 E.ON AG 247 0.21 – Fresenius Medical Care AG & Co. KGaA 18 0.02 3 Garmin Ltd. 89 0.07 1 GEA Group AG 11 0.01 1 Hannover Rueckversicherung AG 36 0.03 1 HeidelbergCement AG 67 0.06 1 Henkel AG & Co. KGaA 38 0.03 – Hochtief AG 17 0.01 9 Infineon Technologies AG 49 0.04 1 K&S AG 45 0.04 1 Linde AG 99 0.08 1 MAN AG 48 0.04 – Merck KGaA 14 0.01 1 Metro AG 36 0.03 1 Muenchener Rueckversicherungs AG 114 0.10 2 RWE AG 114 0.10 – Salzgitter AG 9 0.01 3 SAP AG 110 0.09 3 Siemens AG 244 0.20 2 ThyssenKrupp AG 56 0.05 1 TUI AG 9 0.01
3,110 2.61 Greece - 0.14%
3 Alpha Bank A.E. 18 0.02 1 Coca-Cola Hellenic Bottling Co. S.A. 26 0.02 2 EFG Eurobank Ergasias S.A. 10 0.01 1 Hellenic Telecommunications Organization S.A. 11 0.01 3 Marfin Investment Group S.A. 4 – 3 National Bank of Greece S.A. 39 0.03 2 OPAP S.A. 27 0.02 3 Piraeus Bank S.A. 16 0.01 1 Public Power Corp. S.A. 20 0.02
171 0.14 Hong Kong - 0.94%
6 Bank of East Asia Ltd. 22 0.02 25 BOC Hong Kong Holdings Ltd. 56 0.05
9 Cheung Kong Holdings Ltd. 102 0.09 14 CLP Holdings Ltd. 94 0.08
6 Esprit Holdings Ltd. 34 0.03 5 Hang Lung Group Ltd. 24 0.02
17 Hang Lung Properties Ltd. 60 0.05 1 Hang Seng Bank Ltd. 16 0.01 5 Henderson Land Development Co., Ltd. 30 0.02
15 Hong Kong & China Gas Co., Ltd. 34 0.03 4 Hong Kong Exchanges & Clearing Ltd. 62 0.05 4 Hongkong Electric Holdings Ltd. 24 0.02
13 Hutchison Whampoa Ltd. 81 0.07
Shares (000's)
Value (000's)
USD
% of Net
Asset Value
Common Stock - 81.53% (continued) Hong Kong - 0.94% (continued)
7 Kerry Properties Ltd. 27 0.02 8 Li & Fung Ltd. 36 0.03
10 MTR Corp. 33 0.03 15 New World Development Ltd. 25 0.02 18 Shangri-La Asia Ltd. 32 0.03 30 Sino Land Co. Ltd. 50 0.04
8 Sun Hung Kai Properties Ltd. 106 0.09 6 Swire Pacific Ltd., Class A 59 0.05
26 The Link REIT 61 0.05 6 Wharf Holdings Ltd. 30 0.02 9 Wheelock & Co. Ltd. 24 0.02
1,122 0.94 Ireland - 0.23%
2 Allied Irish Banks PLC 2 – 2 Anglo Irish Bank Corp. PLC 1 – 7 CRH PLC 151 0.13 6 Elan Corp. 34 0.03 6 Experian PLC 53 0.04 1 Kerry Group PLC , Class A 31 0.03 4 The Governor & Co. of the Bank of Ireland 3 –
275 0.23 Italy - 1.11%
5 Assicurazioni Generali S.p.A. 99 0.08 1 Atlantia S.p.A. 24 0.02
10 Banca Monte dei Paschi di Siena S.p.A. 10 0.01 2 Banca Popolare dell'Emilia Romagna Scarl 16 0.01 2 Banca Popolare di Milano Scarl 9 0.01 5 Banco Popolare SC 27 0.02
27 Enel S.p.A. 126 0.11 10 ENI S.p.A. 184 0.15
8 Fiat S.p.A. 86 0.07 3 Finmeccanica S.p.A. 34 0.03
44 Intesa Sanpaolo S.p.A. 114 0.10 4 Mediaset S.p.A. 23 0.02 2 Mediobanca S.p.A. 11 0.01
22 Parmalat S.p.A. 52 0.04 1 Saipem S.p.A. 43 0.04
12 Snam Rete Gas S.p.A. 49 0.04 95 Telecom Italia S.p.A. 113 0.09
2 Tenaris S.A. 38 0.03 15 Terna Rete Elettrica Nazionale S.p.A. 56 0.05 84 UniCredit Italiano S.p.A. 176 0.15
4 Unione di Banche Italiane SCPA 35 0.03 1,325 1.11 Japan - 8.04%
6 Aeon Co. Ltd. 59 0.05 1 Aisin Seiki Co. Ltd. 22 0.02 8 Ajinomoto Co., Inc. 68 0.06 4 Amada Co. Ltd. 29 0.02 4 Asahi Breweries Ltd. 70 0.06 6 Asahi Glass Co. Ltd. 64 0.05
10 Asahi Kasei Corp. 52 0.04 2 Astellas Pharma, Inc. 63 0.05 4 Bridgestone Corp. 66 0.05 4 Canon, Inc. 148 0.12 3 Casio Computer Co., Ltd. 17 0.02 – Central Japan Railway Co. 32 0.03 2 Chubu Electric Power Co., Inc. 39 0.03 4 Chuo Mitsui Trust Holdings, Inc. 14 0.01
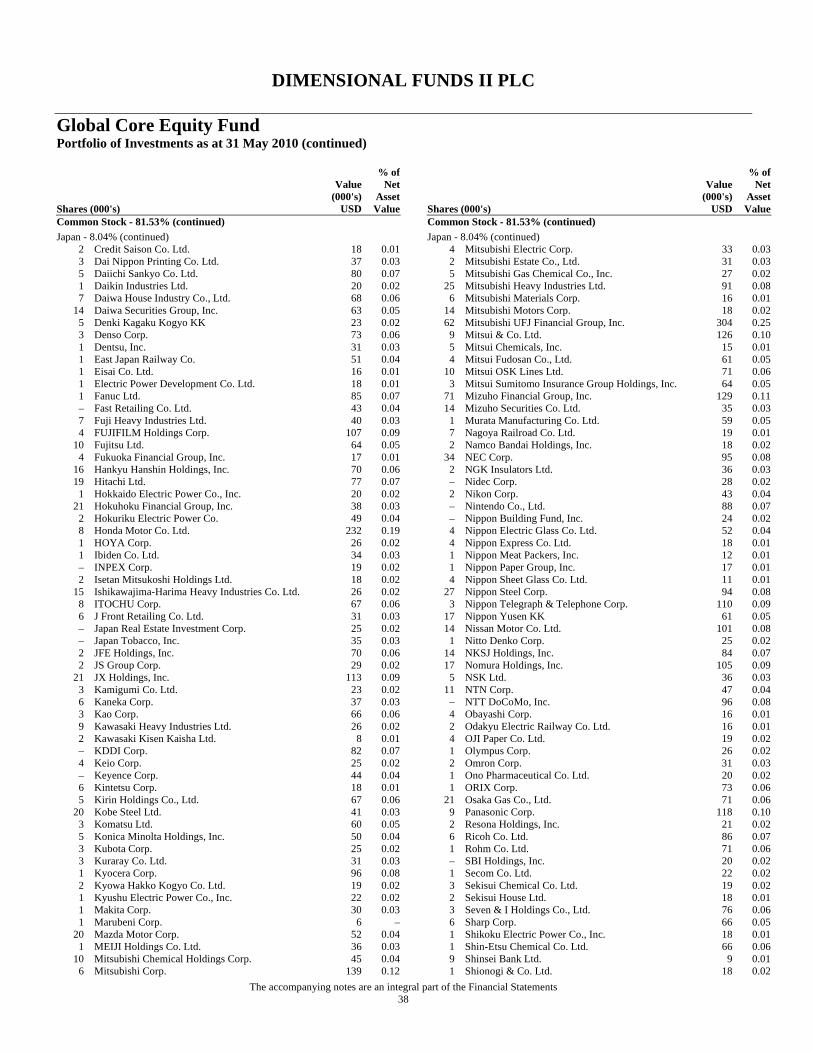
DIMENSIONAL FUNDS II PLC
Global Core Equity Fund Portfolio of Investments as at 31 May 2010 (continued)
The accompanying notes are an integral part of the Financial Statements 38
Shares (000's)
Value (000's)
USD
% of Net
Asset Value
Common Stock - 81.53% (continued) Japan - 8.04% (continued)
2 Credit Saison Co. Ltd. 18 0.01 3 Dai Nippon Printing Co. Ltd. 37 0.03 5 Daiichi Sankyo Co. Ltd. 80 0.07 1 Daikin Industries Ltd. 20 0.02 7 Daiwa House Industry Co., Ltd. 68 0.06
14 Daiwa Securities Group, Inc. 63 0.05 5 Denki Kagaku Kogyo KK 23 0.02 3 Denso Corp. 73 0.06 1 Dentsu, Inc. 31 0.03 1 East Japan Railway Co. 51 0.04 1 Eisai Co. Ltd. 16 0.01 1 Electric Power Development Co. Ltd. 18 0.01 1 Fanuc Ltd. 85 0.07 – Fast Retailing Co. Ltd. 43 0.04 7 Fuji Heavy Industries Ltd. 40 0.03 4 FUJIFILM Holdings Corp. 107 0.09
10 Fujitsu Ltd. 64 0.05 4 Fukuoka Financial Group, Inc. 17 0.01
16 Hankyu Hanshin Holdings, Inc. 70 0.06 19 Hitachi Ltd. 77 0.07
1 Hokkaido Electric Power Co., Inc. 20 0.02 21 Hokuhoku Financial Group, Inc. 38 0.03
2 Hokuriku Electric Power Co. 49 0.04 8 Honda Motor Co. Ltd. 232 0.19 1 HOYA Corp. 26 0.02 1 Ibiden Co. Ltd. 34 0.03 – INPEX Corp. 19 0.02 2 Isetan Mitsukoshi Holdings Ltd. 18 0.02
15 Ishikawajima-Harima Heavy Industries Co. Ltd. 26 0.02 8 ITOCHU Corp. 67 0.06 6 J Front Retailing Co. Ltd. 31 0.03 – Japan Real Estate Investment Corp. 25 0.02 – Japan Tobacco, Inc. 35 0.03 2 JFE Holdings, Inc. 70 0.06 2 JS Group Corp. 29 0.02
21 JX Holdings, Inc. 113 0.09 3 Kamigumi Co. Ltd. 23 0.02 6 Kaneka Corp. 37 0.03 3 Kao Corp. 66 0.06 9 Kawasaki Heavy Industries Ltd. 26 0.02 2 Kawasaki Kisen Kaisha Ltd. 8 0.01 – KDDI Corp. 82 0.07 4 Keio Corp. 25 0.02 – Keyence Corp. 44 0.04 6 Kintetsu Corp. 18 0.01 5 Kirin Holdings Co., Ltd. 67 0.06
20 Kobe Steel Ltd. 41 0.03 3 Komatsu Ltd. 60 0.05 5 Konica Minolta Holdings, Inc. 50 0.04 3 Kubota Corp. 25 0.02 3 Kuraray Co. Ltd. 31 0.03 1 Kyocera Corp. 96 0.08 2 Kyowa Hakko Kogyo Co. Ltd. 19 0.02 1 Kyushu Electric Power Co., Inc. 22 0.02 1 Makita Corp. 30 0.03 1 Marubeni Corp. 6 –
20 Mazda Motor Corp. 52 0.04 1 MEIJI Holdings Co. Ltd. 36 0.03
10 Mitsubishi Chemical Holdings Corp. 45 0.04 6 Mitsubishi Corp. 139 0.12
Shares (000's)
Value (000's)
USD
% of Net
Asset Value
Common Stock - 81.53% (continued) Japan - 8.04% (continued)
4 Mitsubishi Electric Corp. 33 0.03 2 Mitsubishi Estate Co., Ltd. 31 0.03 5 Mitsubishi Gas Chemical Co., Inc. 27 0.02
25 Mitsubishi Heavy Industries Ltd. 91 0.08 6 Mitsubishi Materials Corp. 16 0.01
14 Mitsubishi Motors Corp. 18 0.02 62 Mitsubishi UFJ Financial Group, Inc. 304 0.25
9 Mitsui & Co. Ltd. 126 0.10 5 Mitsui Chemicals, Inc. 15 0.01 4 Mitsui Fudosan Co., Ltd. 61 0.05
10 Mitsui OSK Lines Ltd. 71 0.06 3 Mitsui Sumitomo Insurance Group Holdings, Inc. 64 0.05
71 Mizuho Financial Group, Inc. 129 0.11 14 Mizuho Securities Co. Ltd. 35 0.03
1 Murata Manufacturing Co. Ltd. 59 0.05 7 Nagoya Railroad Co. Ltd. 19 0.01 2 Namco Bandai Holdings, Inc. 18 0.02
34 NEC Corp. 95 0.08 2 NGK Insulators Ltd. 36 0.03 – Nidec Corp. 28 0.02 2 Nikon Corp. 43 0.04 – Nintendo Co., Ltd. 88 0.07 – Nippon Building Fund, Inc. 24 0.02 4 Nippon Electric Glass Co. Ltd. 52 0.04 4 Nippon Express Co. Ltd. 18 0.01 1 Nippon Meat Packers, Inc. 12 0.01 1 Nippon Paper Group, Inc. 17 0.01 4 Nippon Sheet Glass Co. Ltd. 11 0.01
27 Nippon Steel Corp. 94 0.08 3 Nippon Telegraph & Telephone Corp. 110 0.09
17 Nippon Yusen KK 61 0.05 14 Nissan Motor Co. Ltd. 101 0.08
1 Nitto Denko Corp. 25 0.02 14 NKSJ Holdings, Inc. 84 0.07 17 Nomura Holdings, Inc. 105 0.09
5 NSK Ltd. 36 0.03 11 NTN Corp. 47 0.04
– NTT DoCoMo, Inc. 96 0.08 4 Obayashi Corp. 16 0.01 2 Odakyu Electric Railway Co. Ltd. 16 0.01 4 OJI Paper Co. Ltd. 19 0.02 1 Olympus Corp. 26 0.02 2 Omron Corp. 31 0.03 1 Ono Pharmaceutical Co. Ltd. 20 0.02 1 ORIX Corp. 73 0.06
21 Osaka Gas Co., Ltd. 71 0.06 9 Panasonic Corp. 118 0.10 2 Resona Holdings, Inc. 21 0.02 6 Ricoh Co. Ltd. 86 0.07 1 Rohm Co. Ltd. 71 0.06 – SBI Holdings, Inc. 20 0.02 1 Secom Co. Ltd. 22 0.02 3 Sekisui Chemical Co. Ltd. 19 0.02 2 Sekisui House Ltd. 18 0.01 3 Seven & I Holdings Co., Ltd. 76 0.06 6 Sharp Corp. 66 0.05 1 Shikoku Electric Power Co., Inc. 18 0.01 1 Shin-Etsu Chemical Co. Ltd. 66 0.06 9 Shinsei Bank Ltd. 9 0.01 1 Shionogi & Co. Ltd. 18 0.02
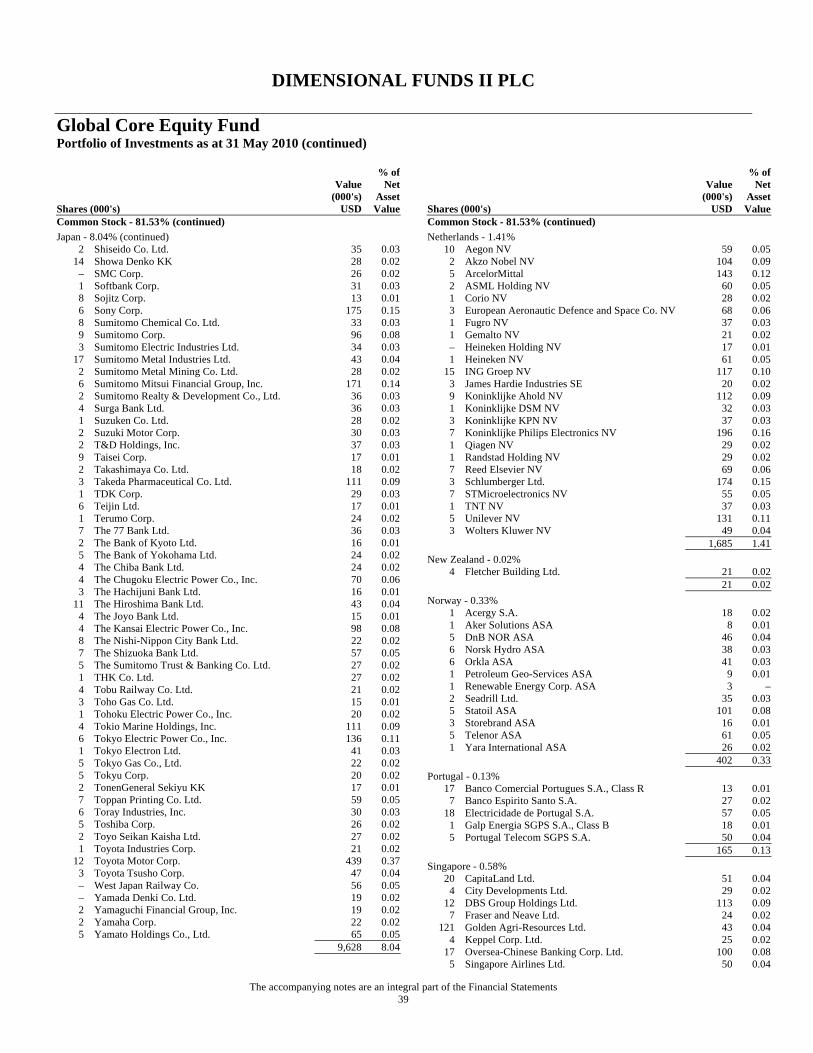
DIMENSIONAL FUNDS II PLC
Global Core Equity Fund Portfolio of Investments as at 31 May 2010 (continued)
The accompanying notes are an integral part of the Financial Statements 39
Shares (000's)
Value (000's)
USD
% of Net
Asset Value
Common Stock - 81.53% (continued) Japan - 8.04% (continued)
2 Shiseido Co. Ltd. 35 0.03 14 Showa Denko KK 28 0.02
– SMC Corp. 26 0.02 1 Softbank Corp. 31 0.03 8 Sojitz Corp. 13 0.01 6 Sony Corp. 175 0.15 8 Sumitomo Chemical Co. Ltd. 33 0.03 9 Sumitomo Corp. 96 0.08 3 Sumitomo Electric Industries Ltd. 34 0.03
17 Sumitomo Metal Industries Ltd. 43 0.04 2 Sumitomo Metal Mining Co. Ltd. 28 0.02 6 Sumitomo Mitsui Financial Group, Inc. 171 0.14 2 Sumitomo Realty & Development Co., Ltd. 36 0.03 4 Surga Bank Ltd. 36 0.03 1 Suzuken Co. Ltd. 28 0.02 2 Suzuki Motor Corp. 30 0.03 2 T&D Holdings, Inc. 37 0.03 9 Taisei Corp. 17 0.01 2 Takashimaya Co. Ltd. 18 0.02 3 Takeda Pharmaceutical Co. Ltd. 111 0.09 1 TDK Corp. 29 0.03 6 Teijin Ltd. 17 0.01 1 Terumo Corp. 24 0.02 7 The 77 Bank Ltd. 36 0.03 2 The Bank of Kyoto Ltd. 16 0.01 5 The Bank of Yokohama Ltd. 24 0.02 4 The Chiba Bank Ltd. 24 0.02 4 The Chugoku Electric Power Co., Inc. 70 0.06 3 The Hachijuni Bank Ltd. 16 0.01
11 The Hiroshima Bank Ltd. 43 0.04 4 The Joyo Bank Ltd. 15 0.01 4 The Kansai Electric Power Co., Inc. 98 0.08 8 The Nishi-Nippon City Bank Ltd. 22 0.02 7 The Shizuoka Bank Ltd. 57 0.05 5 The Sumitomo Trust & Banking Co. Ltd. 27 0.02 1 THK Co. Ltd. 27 0.02 4 Tobu Railway Co. Ltd. 21 0.02 3 Toho Gas Co. Ltd. 15 0.01 1 Tohoku Electric Power Co., Inc. 20 0.02 4 Tokio Marine Holdings, Inc. 111 0.09 6 Tokyo Electric Power Co., Inc. 136 0.11 1 Tokyo Electron Ltd. 41 0.03 5 Tokyo Gas Co., Ltd. 22 0.02 5 Tokyu Corp. 20 0.02 2 TonenGeneral Sekiyu KK 17 0.01 7 Toppan Printing Co. Ltd. 59 0.05 6 Toray Industries, Inc. 30 0.03 5 Toshiba Corp. 26 0.02 2 Toyo Seikan Kaisha Ltd. 27 0.02 1 Toyota Industries Corp. 21 0.02
12 Toyota Motor Corp. 439 0.37 3 Toyota Tsusho Corp. 47 0.04 – West Japan Railway Co. 56 0.05 – Yamada Denki Co. Ltd. 19 0.02 2 Yamaguchi Financial Group, Inc. 19 0.02 2 Yamaha Corp. 22 0.02 5 Yamato Holdings Co., Ltd. 65 0.05
9,628 8.04
Shares (000's)
Value (000's)
USD
% of Net
Asset Value
Common Stock - 81.53% (continued) Netherlands - 1.41%
10 Aegon NV 59 0.05 2 Akzo Nobel NV 104 0.09 5 ArcelorMittal 143 0.12 2 ASML Holding NV 60 0.05 1 Corio NV 28 0.02 3 European Aeronautic Defence and Space Co. NV 68 0.06 1 Fugro NV 37 0.03 1 Gemalto NV 21 0.02 – Heineken Holding NV 17 0.01 1 Heineken NV 61 0.05
15 ING Groep NV 117 0.10 3 James Hardie Industries SE 20 0.02 9 Koninklijke Ahold NV 112 0.09 1 Koninklijke DSM NV 32 0.03 3 Koninklijke KPN NV 37 0.03 7 Koninklijke Philips Electronics NV 196 0.16 1 Qiagen NV 29 0.02 1 Randstad Holding NV 29 0.02 7 Reed Elsevier NV 69 0.06 3 Schlumberger Ltd. 174 0.15 7 STMicroelectronics NV 55 0.05 1 TNT NV 37 0.03 5 Unilever NV 131 0.11 3 Wolters Kluwer NV 49 0.04
1,685 1.41 New Zealand - 0.02%
4 Fletcher Building Ltd. 21 0.02 21 0.02 Norway - 0.33%
1 Acergy S.A. 18 0.02 1 Aker Solutions ASA 8 0.01 5 DnB NOR ASA 46 0.04 6 Norsk Hydro ASA 38 0.03 6 Orkla ASA 41 0.03 1 Petroleum Geo-Services ASA 9 0.01 1 Renewable Energy Corp. ASA 3 – 2 Seadrill Ltd. 35 0.03 5 Statoil ASA 101 0.08 3 Storebrand ASA 16 0.01 5 Telenor ASA 61 0.05 1 Yara International ASA 26 0.02
402 0.33 Portugal - 0.13%
17 Banco Comercial Portugues S.A., Class R 13 0.01 7 Banco Espirito Santo S.A. 27 0.02
18 Electricidade de Portugal S.A. 57 0.05 1 Galp Energia SGPS S.A., Class B 18 0.01 5 Portugal Telecom SGPS S.A. 50 0.04
165 0.13 Singapore - 0.58%
20 CapitaLand Ltd. 51 0.04 4 City Developments Ltd. 29 0.02
12 DBS Group Holdings Ltd. 113 0.09 7 Fraser and Neave Ltd. 24 0.02
121 Golden Agri-Resources Ltd. 43 0.04 4 Keppel Corp. Ltd. 25 0.02
17 Oversea-Chinese Banking Corp. Ltd. 100 0.08 5 Singapore Airlines Ltd. 50 0.04
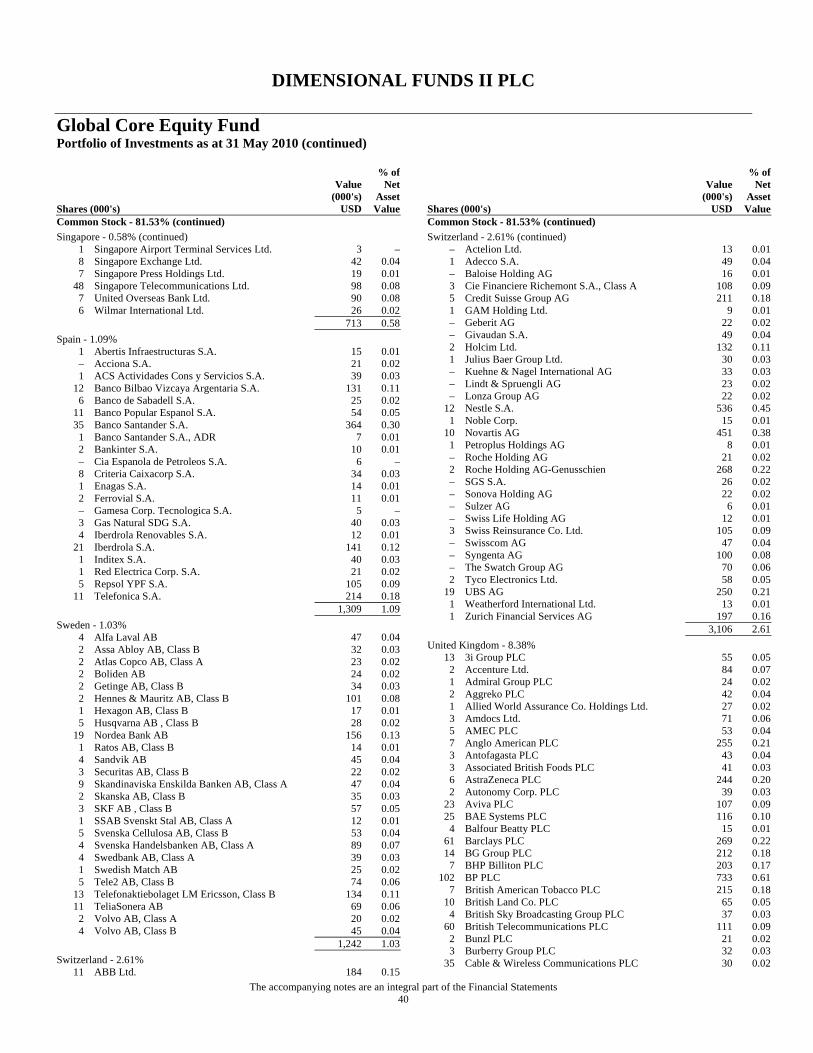
DIMENSIONAL FUNDS II PLC
Global Core Equity Fund Portfolio of Investments as at 31 May 2010 (continued)
The accompanying notes are an integral part of the Financial Statements 40
Shares (000's)
Value (000's)
USD
% of Net
Asset Value
Common Stock - 81.53% (continued) Singapore - 0.58% (continued)
1 Singapore Airport Terminal Services Ltd. 3 – 8 Singapore Exchange Ltd. 42 0.04 7 Singapore Press Holdings Ltd. 19 0.01
48 Singapore Telecommunications Ltd. 98 0.08 7 United Overseas Bank Ltd. 90 0.08 6 Wilmar International Ltd. 26 0.02
713 0.58 Spain - 1.09%
1 Abertis Infraestructuras S.A. 15 0.01 – Acciona S.A. 21 0.02 1 ACS Actividades Cons y Servicios S.A. 39 0.03
12 Banco Bilbao Vizcaya Argentaria S.A. 131 0.11 6 Banco de Sabadell S.A. 25 0.02
11 Banco Popular Espanol S.A. 54 0.05 35 Banco Santander S.A. 364 0.30
1 Banco Santander S.A., ADR 7 0.01 2 Bankinter S.A. 10 0.01 – Cia Espanola de Petroleos S.A. 6 – 8 Criteria Caixacorp S.A. 34 0.03 1 Enagas S.A. 14 0.01 2 Ferrovial S.A. 11 0.01 – Gamesa Corp. Tecnologica S.A. 5 – 3 Gas Natural SDG S.A. 40 0.03 4 Iberdrola Renovables S.A. 12 0.01
21 Iberdrola S.A. 141 0.12 1 Inditex S.A. 40 0.03 1 Red Electrica Corp. S.A. 21 0.02 5 Repsol YPF S.A. 105 0.09
11 Telefonica S.A. 214 0.18 1,309 1.09 Sweden - 1.03%
4 Alfa Laval AB 47 0.04 2 Assa Abloy AB, Class B 32 0.03 2 Atlas Copco AB, Class A 23 0.02 2 Boliden AB 24 0.02 2 Getinge AB, Class B 34 0.03 2 Hennes & Mauritz AB, Class B 101 0.08 1 Hexagon AB, Class B 17 0.01 5 Husqvarna AB , Class B 28 0.02
19 Nordea Bank AB 156 0.13 1 Ratos AB, Class B 14 0.01 4 Sandvik AB 45 0.04 3 Securitas AB, Class B 22 0.02 9 Skandinaviska Enskilda Banken AB, Class A 47 0.04 2 Skanska AB, Class B 35 0.03 3 SKF AB , Class B 57 0.05 1 SSAB Svenskt Stal AB, Class A 12 0.01 5 Svenska Cellulosa AB, Class B 53 0.04 4 Svenska Handelsbanken AB, Class A 89 0.07 4 Swedbank AB, Class A 39 0.03 1 Swedish Match AB 25 0.02 5 Tele2 AB, Class B 74 0.06
13 Telefonaktiebolaget LM Ericsson, Class B 134 0.11 11 TeliaSonera AB 69 0.06
2 Volvo AB, Class A 20 0.02 4 Volvo AB, Class B 45 0.04
1,242 1.03 Switzerland - 2.61%
11 ABB Ltd. 184 0.15
Shares (000's)
Value (000's)
USD
% of Net
Asset Value
Common Stock - 81.53% (continued) Switzerland - 2.61% (continued)
– Actelion Ltd. 13 0.01 1 Adecco S.A. 49 0.04 – Baloise Holding AG 16 0.01 3 Cie Financiere Richemont S.A., Class A 108 0.09 5 Credit Suisse Group AG 211 0.18 1 GAM Holding Ltd. 9 0.01 – Geberit AG 22 0.02 – Givaudan S.A. 49 0.04 2 Holcim Ltd. 132 0.11 1 Julius Baer Group Ltd. 30 0.03 – Kuehne & Nagel International AG 33 0.03 – Lindt & Spruengli AG 23 0.02 – Lonza Group AG 22 0.02
12 Nestle S.A. 536 0.45 1 Noble Corp. 15 0.01
10 Novartis AG 451 0.38 1 Petroplus Holdings AG 8 0.01 – Roche Holding AG 21 0.02 2 Roche Holding AG-Genusschien 268 0.22 – SGS S.A. 26 0.02 – Sonova Holding AG 22 0.02 – Sulzer AG 6 0.01 – Swiss Life Holding AG 12 0.01 3 Swiss Reinsurance Co. Ltd. 105 0.09 – Swisscom AG 47 0.04 – Syngenta AG 100 0.08 – The Swatch Group AG 70 0.06 2 Tyco Electronics Ltd. 58 0.05
19 UBS AG 250 0.21 1 Weatherford International Ltd. 13 0.01 1 Zurich Financial Services AG 197 0.16
3,106 2.61 United Kingdom - 8.38%
13 3i Group PLC 55 0.05 2 Accenture Ltd. 84 0.07 1 Admiral Group PLC 24 0.02 2 Aggreko PLC 42 0.04 1 Allied World Assurance Co. Holdings Ltd. 27 0.02 3 Amdocs Ltd. 71 0.06 5 AMEC PLC 53 0.04 7 Anglo American PLC 255 0.21 3 Antofagasta PLC 43 0.04 3 Associated British Foods PLC 41 0.03 6 AstraZeneca PLC 244 0.20 2 Autonomy Corp. PLC 39 0.03
23 Aviva PLC 107 0.09 25 BAE Systems PLC 116 0.10
4 Balfour Beatty PLC 15 0.01 61 Barclays PLC 269 0.22 14 BG Group PLC 212 0.18
7 BHP Billiton PLC 203 0.17 102 BP PLC 733 0.61
7 British American Tobacco PLC 215 0.18 10 British Land Co. PLC 65 0.05
4 British Sky Broadcasting Group PLC 37 0.03 60 British Telecommunications PLC 111 0.09
2 Bunzl PLC 21 0.02 3 Burberry Group PLC 32 0.03
35 Cable & Wireless Communications PLC 30 0.02
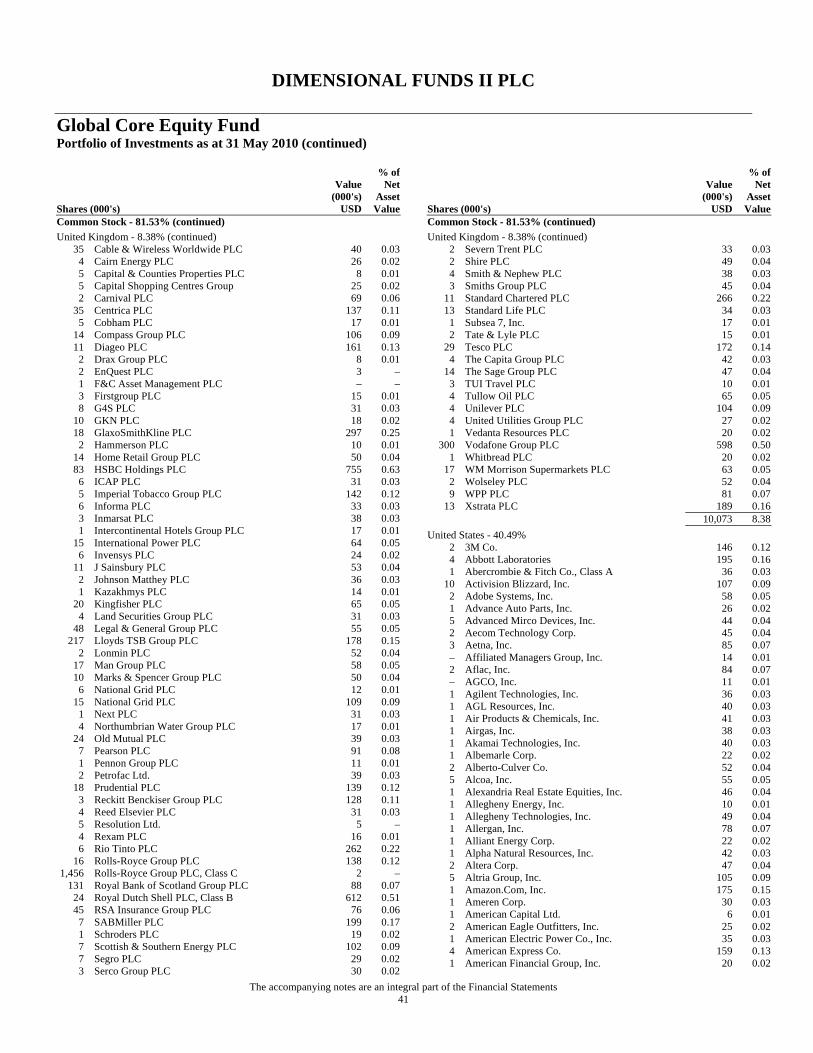
DIMENSIONAL FUNDS II PLC
Global Core Equity Fund Portfolio of Investments as at 31 May 2010 (continued)
The accompanying notes are an integral part of the Financial Statements 41
Shares (000's)
Value (000's)
USD
% of Net
Asset Value
Common Stock - 81.53% (continued) United Kingdom - 8.38% (continued)
35 Cable & Wireless Worldwide PLC 40 0.03 4 Cairn Energy PLC 26 0.02 5 Capital & Counties Properties PLC 8 0.01 5 Capital Shopping Centres Group 25 0.02 2 Carnival PLC 69 0.06
35 Centrica PLC 137 0.11 5 Cobham PLC 17 0.01
14 Compass Group PLC 106 0.09 11 Diageo PLC 161 0.13
2 Drax Group PLC 8 0.01 2 EnQuest PLC 3 – 1 F&C Asset Management PLC – – 3 Firstgroup PLC 15 0.01 8 G4S PLC 31 0.03
10 GKN PLC 18 0.02 18 GlaxoSmithKline PLC 297 0.25
2 Hammerson PLC 10 0.01 14 Home Retail Group PLC 50 0.04 83 HSBC Holdings PLC 755 0.63
6 ICAP PLC 31 0.03 5 Imperial Tobacco Group PLC 142 0.12 6 Informa PLC 33 0.03 3 Inmarsat PLC 38 0.03 1 Intercontinental Hotels Group PLC 17 0.01
15 International Power PLC 64 0.05 6 Invensys PLC 24 0.02
11 J Sainsbury PLC 53 0.04 2 Johnson Matthey PLC 36 0.03 1 Kazakhmys PLC 14 0.01
20 Kingfisher PLC 65 0.05 4 Land Securities Group PLC 31 0.03
48 Legal & General Group PLC 55 0.05 217 Lloyds TSB Group PLC 178 0.15
2 Lonmin PLC 52 0.04 17 Man Group PLC 58 0.05 10 Marks & Spencer Group PLC 50 0.04
6 National Grid PLC 12 0.01 15 National Grid PLC 109 0.09
1 Next PLC 31 0.03 4 Northumbrian Water Group PLC 17 0.01
24 Old Mutual PLC 39 0.03 7 Pearson PLC 91 0.08 1 Pennon Group PLC 11 0.01 2 Petrofac Ltd. 39 0.03
18 Prudential PLC 139 0.12 3 Reckitt Benckiser Group PLC 128 0.11 4 Reed Elsevier PLC 31 0.03 5 Resolution Ltd. 5 – 4 Rexam PLC 16 0.01 6 Rio Tinto PLC 262 0.22
16 Rolls-Royce Group PLC 138 0.12 1,456 Rolls-Royce Group PLC, Class C 2 –
131 Royal Bank of Scotland Group PLC 88 0.07 24 Royal Dutch Shell PLC, Class B 612 0.51 45 RSA Insurance Group PLC 76 0.06
7 SABMiller PLC 199 0.17 1 Schroders PLC 19 0.02 7 Scottish & Southern Energy PLC 102 0.09 7 Segro PLC 29 0.02 3 Serco Group PLC 30 0.02
Shares (000's)
Value (000's)
USD
% of Net
Asset Value
Common Stock - 81.53% (continued) United Kingdom - 8.38% (continued)
2 Severn Trent PLC 33 0.03 2 Shire PLC 49 0.04 4 Smith & Nephew PLC 38 0.03 3 Smiths Group PLC 45 0.04
11 Standard Chartered PLC 266 0.22 13 Standard Life PLC 34 0.03
1 Subsea 7, Inc. 17 0.01 2 Tate & Lyle PLC 15 0.01
29 Tesco PLC 172 0.14 4 The Capita Group PLC 42 0.03
14 The Sage Group PLC 47 0.04 3 TUI Travel PLC 10 0.01 4 Tullow Oil PLC 65 0.05 4 Unilever PLC 104 0.09 4 United Utilities Group PLC 27 0.02 1 Vedanta Resources PLC 20 0.02
300 Vodafone Group PLC 598 0.50 1 Whitbread PLC 20 0.02
17 WM Morrison Supermarkets PLC 63 0.05 2 Wolseley PLC 52 0.04 9 WPP PLC 81 0.07
13 Xstrata PLC 189 0.16 10,073 8.38 United States - 40.49%
2 3M Co. 146 0.12 4 Abbott Laboratories 195 0.16 1 Abercrombie & Fitch Co., Class A 36 0.03
10 Activision Blizzard, Inc. 107 0.09 2 Adobe Systems, Inc. 58 0.05 1 Advance Auto Parts, Inc. 26 0.02 5 Advanced Mirco Devices, Inc. 44 0.04 2 Aecom Technology Corp. 45 0.04 3 Aetna, Inc. 85 0.07 – Affiliated Managers Group, Inc. 14 0.01 2 Aflac, Inc. 84 0.07 – AGCO, Inc. 11 0.01 1 Agilent Technologies, Inc. 36 0.03 1 AGL Resources, Inc. 40 0.03 1 Air Products & Chemicals, Inc. 41 0.03 1 Airgas, Inc. 38 0.03 1 Akamai Technologies, Inc. 40 0.03 1 Albemarle Corp. 22 0.02 2 Alberto-Culver Co. 52 0.04 5 Alcoa, Inc. 55 0.05 1 Alexandria Real Estate Equities, Inc. 46 0.04 1 Allegheny Energy, Inc. 10 0.01 1 Allegheny Technologies, Inc. 49 0.04 1 Allergan, Inc. 78 0.07 1 Alliant Energy Corp. 22 0.02 1 Alpha Natural Resources, Inc. 42 0.03 2 Altera Corp. 47 0.04 5 Altria Group, Inc. 105 0.09 1 Amazon.Com, Inc. 175 0.15 1 Ameren Corp. 30 0.03 1 American Capital Ltd. 6 0.01 2 American Eagle Outfitters, Inc. 25 0.02 1 American Electric Power Co., Inc. 35 0.03 4 American Express Co. 159 0.13 1 American Financial Group, Inc. 20 0.02

DIMENSIONAL FUNDS II PLC
Global Core Equity Fund Portfolio of Investments as at 31 May 2010 (continued)
The accompanying notes are an integral part of the Financial Statements 42
Shares (000's)
Value (000's)
USD
% of Net
Asset Value
Common Stock - 81.53% (continued) United States - 40.49% (continued)
– American National Insurance Co. 42 0.04 2 American Tower Corp., Class A 73 0.06 2 American Water Works Co., Inc. 47 0.04 1 Ameriprise Financial, Inc. 24 0.02 2 AmerisourceBergen Corp. 50 0.04 1 AMETEK, Inc. 49 0.04 3 Amgen, Inc. 135 0.11 1 Amphenol Corp., Class A 21 0.02 2 AMR Corp. 15 0.01 3 Anadarko Petroleum Corp. 162 0.14 2 Analog Devices, Inc. 50 0.04 1 AOL, Inc. 12 0.01 2 AON Corp. 75 0.06 1 Apache Corp. 107 0.09 1 Apollo Group, Inc., Class A 69 0.06 2 Apple, Inc. 540 0.45 4 Applied Materials, Inc. 48 0.04 – Aptargroup, Inc. 16 0.01 2 Arch Coal, Inc. 39 0.03 4 Archer-Daniels-Midland Co. 96 0.08 – Ascent Media Corp., Class A 1 – 1 Associated Banc-Corp. 16 0.01 – Assurant, Inc. 14 0.01
21 AT&T, Inc. 518 0.43 1 Atmos Energy Corp. 13 0.01 1 Atwood Oceanics, Inc. 22 0.02 1 Autodesk, Inc. 18 0.02 2 Automatic Data Processing, Inc. 68 0.06 1 AutoNation, Inc. 24 0.02 – AutoZone, Inc. 57 0.05 1 AvalonBay Communities, Inc. 49 0.04 1 Avery Dennison Corp. 24 0.02 – Aviat Networks, Inc. – – 1 Avnet, Inc. 20 0.02 2 Avon Products, Inc. 61 0.05 2 AVX Corp. 27 0.02 2 Baker Hughes, Inc. 94 0.08 – Ball Corp. 15 0.01 1 BancorpSouth, Inc. 15 0.01
54 Bank of America Corp. 851 0.71 2 Baxter International, Inc. 80 0.07 4 BB&T Corp. 109 0.09 2 BE Aerospace, Inc. 46 0.04 1 Beckman Coulter, Inc. 29 0.03 1 Becton Dickinson & Co. 64 0.05 1 Bed Bath & Beyond, Inc. 45 0.04 1 Bemis Co., Inc. 15 0.01 1 Best Buy Co., Inc. 59 0.05 2 Biogen Idec, Inc. 81 0.07 1 Bio-Rad Laboratories, Inc., Class A 47 0.04 – BlackRock, Inc. 34 0.03 1 BMC Software, Inc. 41 0.03 1 BOK Financial Corp. 25 0.02 1 BorgWarner, Inc. 19 0.02 1 Boston Properties, Inc. 69 0.06 7 Boston Scientific Corp. 45 0.04 7 Bristol-Myers Squibb Co. 158 0.13 1 Broadcom Corp., Class A 31 0.03 8 Brocade Communications Systems, Inc. 44 0.04 – Brown-Forman Corp., Class B 25 0.02
Shares (000's)
Value (000's)
USD
% of Net
Asset Value
Common Stock - 81.53% (continued) United States - 40.49% (continued)
1 Bucyrus International, Inc. 37 0.03 1 Bunge Ltd. 54 0.05 3 CA, Inc. 63 0.05 1 Cablevision Systems Corp., Class A 32 0.03 1 Cabot Oil & Gas Corp. 35 0.03 4 Calpine Corp. 56 0.05 – Cameron International Corp. 15 0.01 1 Campbell Soup Co. 32 0.03 4 Capital One Financial Corp. 157 0.13 3 Cardinal Health, Inc. 93 0.08 3 CareFusion Corp. 66 0.06 1 Carmax, Inc. 28 0.02 4 Carnival Corp. 159 0.13 2 Caterpillar, Inc. 105 0.09 3 CB Richard Ellis Group, Inc., Class A 47 0.04 6 CBS Corp., Class B 90 0.07 1 Celanese Corp. 40 0.03 2 Celgene Corp. 121 0.10 2 CenterPoint Energy, Inc. 31 0.03 1 Central European Distribution Corp. 33 0.03 2 CenturyTel, Inc. 65 0.05 1 Cephalon, Inc. 53 0.04 – Cerner Corp. 25 0.02 1 CH Robinson Worldwide, Inc. 58 0.05 – Charles River Laboratories International, Inc. 10 0.01 3 Charles Schwab Corp. 52 0.04 6 Chesapeake Energy Corp. 143 0.12 9 Chevron Corp. 667 0.56 3 Chubb Corp. 125 0.10 – Church & Dwight, Inc. 26 0.02 1 CIGNA Corp. 47 0.04 – Cimarex Energy Co. 29 0.02 1 Cincinnati Financial Corp. 19 0.02 1 Cintas Corp. 36 0.03
17 Cisco Systems, Inc. 384 0.32 99 Citigroup, Inc. 394 0.33
– Citrix Systems, Inc. 17 0.01 – City National Corp. 6 – 1 Cliffs Natural Resources, Inc. 56 0.05 1 Clorox Co. 69 0.06 – CME Group, Inc. 111 0.09 2 CMS Energy Corp. 31 0.03 1 CNA Financial Corp. 26 0.02 1 CNX Gas Corp. 27 0.02 1 Coach, Inc. 29 0.02 1 Coca-Cola Enterprises, Inc. 31 0.03 1 Cognizant Technology Solutions Corp., Class A 35 0.03 2 Colgate-Palmolive Co. 187 0.16
18 Comcast Corp., Class A 334 0.28 6 Comcast Corp., Special Class A, Class A 105 0.09 1 Comerica, Inc. 38 0.03 1 Commerce Bancshares, Inc. 24 0.02 2 CommScope, Inc. 42 0.04 1 Community Health Systems, Inc. 23 0.02 2 Computer Sciences Corp. 110 0.09 4 ConAgra Foods, Inc. 85 0.07 1 Concho Resources, Inc. 52 0.04 8 ConocoPhillips 401 0.34 1 Consol Energy, Inc. 33 0.03 2 Consolidated Edison, Inc. 89 0.07
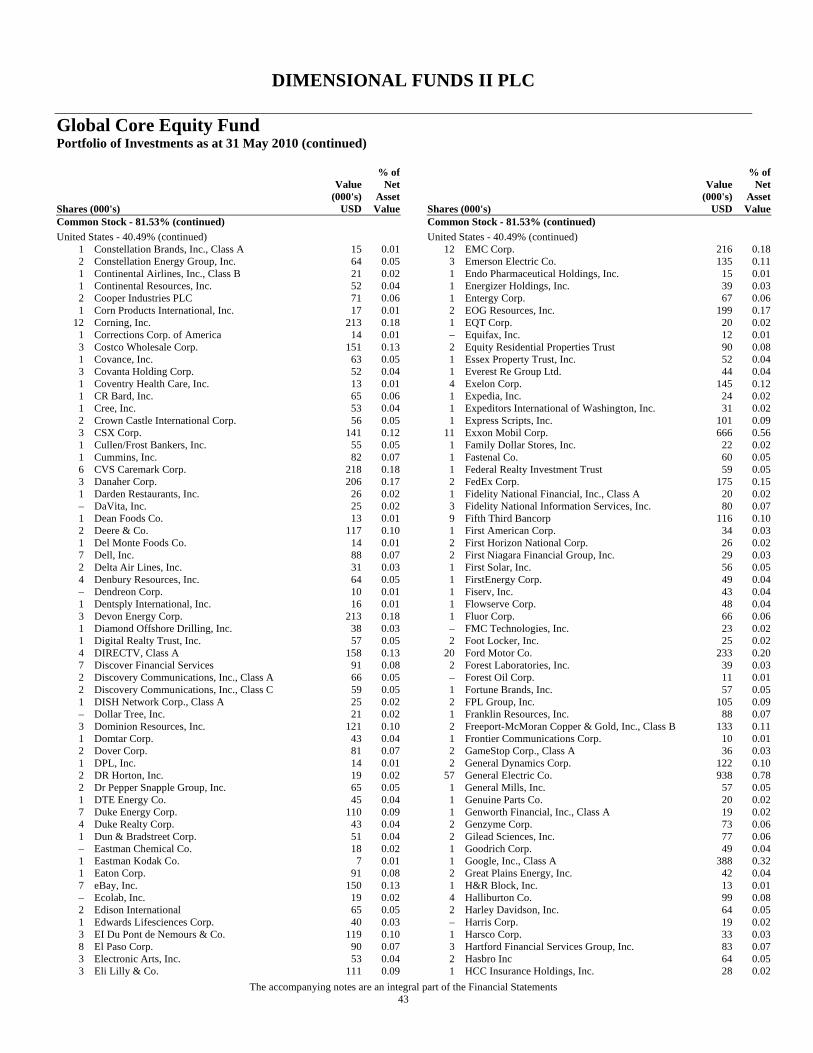
DIMENSIONAL FUNDS II PLC
Global Core Equity Fund Portfolio of Investments as at 31 May 2010 (continued)
The accompanying notes are an integral part of the Financial Statements 43
Shares (000's)
Value (000's)
USD
% of Net
Asset Value
Common Stock - 81.53% (continued) United States - 40.49% (continued)
1 Constellation Brands, Inc., Class A 15 0.01 2 Constellation Energy Group, Inc. 64 0.05 1 Continental Airlines, Inc., Class B 21 0.02 1 Continental Resources, Inc. 52 0.04 2 Cooper Industries PLC 71 0.06 1 Corn Products International, Inc. 17 0.01
12 Corning, Inc. 213 0.18 1 Corrections Corp. of America 14 0.01 3 Costco Wholesale Corp. 151 0.13 1 Covance, Inc. 63 0.05 3 Covanta Holding Corp. 52 0.04 1 Coventry Health Care, Inc. 13 0.01 1 CR Bard, Inc. 65 0.06 1 Cree, Inc. 53 0.04 2 Crown Castle International Corp. 56 0.05 3 CSX Corp. 141 0.12 1 Cullen/Frost Bankers, Inc. 55 0.05 1 Cummins, Inc. 82 0.07 6 CVS Caremark Corp. 218 0.18 3 Danaher Corp. 206 0.17 1 Darden Restaurants, Inc. 26 0.02 – DaVita, Inc. 25 0.02 1 Dean Foods Co. 13 0.01 2 Deere & Co. 117 0.10 1 Del Monte Foods Co. 14 0.01 7 Dell, Inc. 88 0.07 2 Delta Air Lines, Inc. 31 0.03 4 Denbury Resources, Inc. 64 0.05 – Dendreon Corp. 10 0.01 1 Dentsply International, Inc. 16 0.01 3 Devon Energy Corp. 213 0.18 1 Diamond Offshore Drilling, Inc. 38 0.03 1 Digital Realty Trust, Inc. 57 0.05 4 DIRECTV, Class A 158 0.13 7 Discover Financial Services 91 0.08 2 Discovery Communications, Inc., Class A 66 0.05 2 Discovery Communications, Inc., Class C 59 0.05 1 DISH Network Corp., Class A 25 0.02 – Dollar Tree, Inc. 21 0.02 3 Dominion Resources, Inc. 121 0.10 1 Domtar Corp. 43 0.04 2 Dover Corp. 81 0.07 1 DPL, Inc. 14 0.01 2 DR Horton, Inc. 19 0.02 2 Dr Pepper Snapple Group, Inc. 65 0.05 1 DTE Energy Co. 45 0.04 7 Duke Energy Corp. 110 0.09 4 Duke Realty Corp. 43 0.04 1 Dun & Bradstreet Corp. 51 0.04 – Eastman Chemical Co. 18 0.02 1 Eastman Kodak Co. 7 0.01 1 Eaton Corp. 91 0.08 7 eBay, Inc. 150 0.13 – Ecolab, Inc. 19 0.02 2 Edison International 65 0.05 1 Edwards Lifesciences Corp. 40 0.03 3 EI Du Pont de Nemours & Co. 119 0.10 8 El Paso Corp. 90 0.07 3 Electronic Arts, Inc. 53 0.04 3 Eli Lilly & Co. 111 0.09
Shares (000's)
Value (000's)
USD
% of Net
Asset Value
Common Stock - 81.53% (continued) United States - 40.49% (continued)
12 EMC Corp. 216 0.18 3 Emerson Electric Co. 135 0.11 1 Endo Pharmaceutical Holdings, Inc. 15 0.01 1 Energizer Holdings, Inc. 39 0.03 1 Entergy Corp. 67 0.06 2 EOG Resources, Inc. 199 0.17 1 EQT Corp. 20 0.02 – Equifax, Inc. 12 0.01 2 Equity Residential Properties Trust 90 0.08 1 Essex Property Trust, Inc. 52 0.04 1 Everest Re Group Ltd. 44 0.04 4 Exelon Corp. 145 0.12 1 Expedia, Inc. 24 0.02 1 Expeditors International of Washington, Inc. 31 0.02 1 Express Scripts, Inc. 101 0.09
11 Exxon Mobil Corp. 666 0.56 1 Family Dollar Stores, Inc. 22 0.02 1 Fastenal Co. 60 0.05 1 Federal Realty Investment Trust 59 0.05 2 FedEx Corp. 175 0.15 1 Fidelity National Financial, Inc., Class A 20 0.02 3 Fidelity National Information Services, Inc. 80 0.07 9 Fifth Third Bancorp 116 0.10 1 First American Corp. 34 0.03 2 First Horizon National Corp. 26 0.02 2 First Niagara Financial Group, Inc. 29 0.03 1 First Solar, Inc. 56 0.05 1 FirstEnergy Corp. 49 0.04 1 Fiserv, Inc. 43 0.04 1 Flowserve Corp. 48 0.04 1 Fluor Corp. 66 0.06 – FMC Technologies, Inc. 23 0.02 2 Foot Locker, Inc. 25 0.02
20 Ford Motor Co. 233 0.20 2 Forest Laboratories, Inc. 39 0.03 – Forest Oil Corp. 11 0.01 1 Fortune Brands, Inc. 57 0.05 2 FPL Group, Inc. 105 0.09 1 Franklin Resources, Inc. 88 0.07 2 Freeport-McMoran Copper & Gold, Inc., Class B 133 0.11 1 Frontier Communications Corp. 10 0.01 2 GameStop Corp., Class A 36 0.03 2 General Dynamics Corp. 122 0.10
57 General Electric Co. 938 0.78 1 General Mills, Inc. 57 0.05 1 Genuine Parts Co. 20 0.02 1 Genworth Financial, Inc., Class A 19 0.02 2 Genzyme Corp. 73 0.06 2 Gilead Sciences, Inc. 77 0.06 1 Goodrich Corp. 49 0.04 1 Google, Inc., Class A 388 0.32 2 Great Plains Energy, Inc. 42 0.04 1 H&R Block, Inc. 13 0.01 4 Halliburton Co. 99 0.08 2 Harley Davidson, Inc. 64 0.05 – Harris Corp. 19 0.02 1 Harsco Corp. 33 0.03 3 Hartford Financial Services Group, Inc. 83 0.07 2 Hasbro Inc 64 0.05 1 HCC Insurance Holdings, Inc. 28 0.02
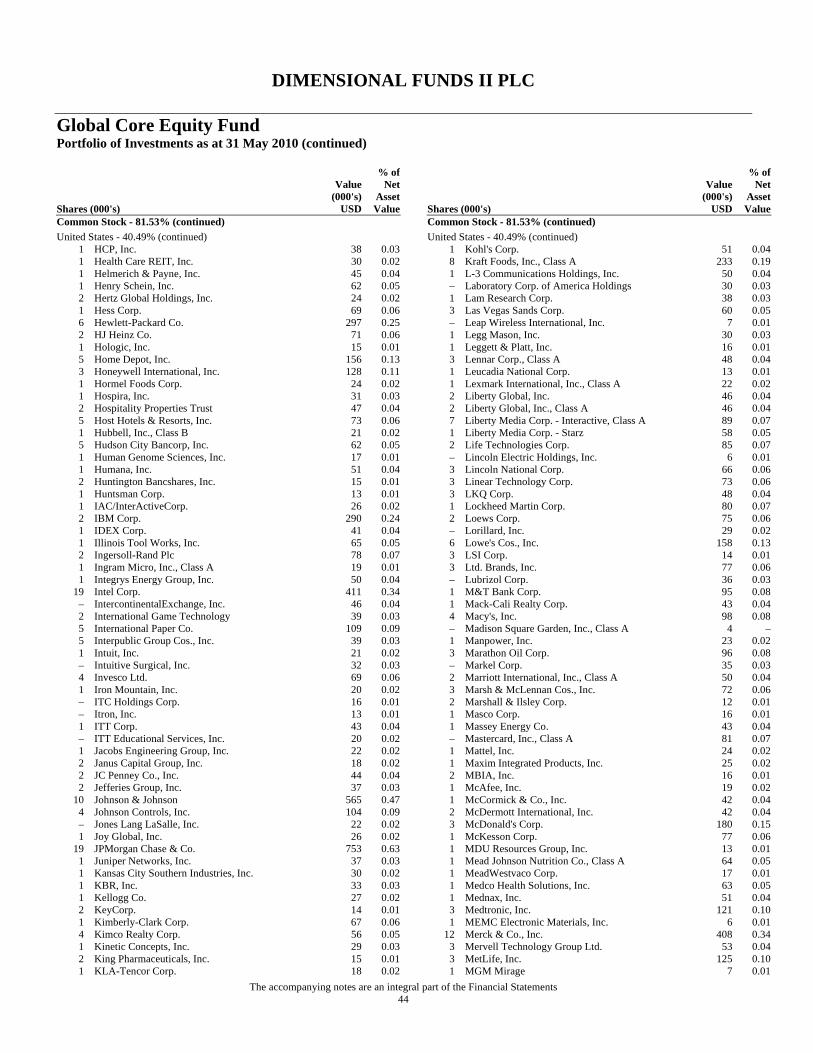
DIMENSIONAL FUNDS II PLC
Global Core Equity Fund Portfolio of Investments as at 31 May 2010 (continued)
The accompanying notes are an integral part of the Financial Statements 44
Shares (000's)
Value (000's)
USD
% of Net
Asset Value
Common Stock - 81.53% (continued) United States - 40.49% (continued)
1 HCP, Inc. 38 0.03 1 Health Care REIT, Inc. 30 0.02 1 Helmerich & Payne, Inc. 45 0.04 1 Henry Schein, Inc. 62 0.05 2 Hertz Global Holdings, Inc. 24 0.02 1 Hess Corp. 69 0.06 6 Hewlett-Packard Co. 297 0.25 2 HJ Heinz Co. 71 0.06 1 Hologic, Inc. 15 0.01 5 Home Depot, Inc. 156 0.13 3 Honeywell International, Inc. 128 0.11 1 Hormel Foods Corp. 24 0.02 1 Hospira, Inc. 31 0.03 2 Hospitality Properties Trust 47 0.04 5 Host Hotels & Resorts, Inc. 73 0.06 1 Hubbell, Inc., Class B 21 0.02 5 Hudson City Bancorp, Inc. 62 0.05 1 Human Genome Sciences, Inc. 17 0.01 1 Humana, Inc. 51 0.04 2 Huntington Bancshares, Inc. 15 0.01 1 Huntsman Corp. 13 0.01 1 IAC/InterActiveCorp. 26 0.02 2 IBM Corp. 290 0.24 1 IDEX Corp. 41 0.04 1 Illinois Tool Works, Inc. 65 0.05 2 Ingersoll-Rand Plc 78 0.07 1 Ingram Micro, Inc., Class A 19 0.01 1 Integrys Energy Group, Inc. 50 0.04
19 Intel Corp. 411 0.34 – IntercontinentalExchange, Inc. 46 0.04 2 International Game Technology 39 0.03 5 International Paper Co. 109 0.09 5 Interpublic Group Cos., Inc. 39 0.03 1 Intuit, Inc. 21 0.02 – Intuitive Surgical, Inc. 32 0.03 4 Invesco Ltd. 69 0.06 1 Iron Mountain, Inc. 20 0.02 – ITC Holdings Corp. 16 0.01 – Itron, Inc. 13 0.01 1 ITT Corp. 43 0.04 – ITT Educational Services, Inc. 20 0.02 1 Jacobs Engineering Group, Inc. 22 0.02 2 Janus Capital Group, Inc. 18 0.02 2 JC Penney Co., Inc. 44 0.04 2 Jefferies Group, Inc. 37 0.03
10 Johnson & Johnson 565 0.47 4 Johnson Controls, Inc. 104 0.09 – Jones Lang LaSalle, Inc. 22 0.02 1 Joy Global, Inc. 26 0.02
19 JPMorgan Chase & Co. 753 0.63 1 Juniper Networks, Inc. 37 0.03 1 Kansas City Southern Industries, Inc. 30 0.02 1 KBR, Inc. 33 0.03 1 Kellogg Co. 27 0.02 2 KeyCorp. 14 0.01 1 Kimberly-Clark Corp. 67 0.06 4 Kimco Realty Corp. 56 0.05 1 Kinetic Concepts, Inc. 29 0.03 2 King Pharmaceuticals, Inc. 15 0.01 1 KLA-Tencor Corp. 18 0.02
Shares (000's)
Value (000's)
USD
% of Net
Asset Value
Common Stock - 81.53% (continued) United States - 40.49% (continued)
1 Kohl's Corp. 51 0.04 8 Kraft Foods, Inc., Class A 233 0.19 1 L-3 Communications Holdings, Inc. 50 0.04 – Laboratory Corp. of America Holdings 30 0.03 1 Lam Research Corp. 38 0.03 3 Las Vegas Sands Corp. 60 0.05 – Leap Wireless International, Inc. 7 0.01 1 Legg Mason, Inc. 30 0.03 1 Leggett & Platt, Inc. 16 0.01 3 Lennar Corp., Class A 48 0.04 1 Leucadia National Corp. 13 0.01 1 Lexmark International, Inc., Class A 22 0.02 2 Liberty Global, Inc. 46 0.04 2 Liberty Global, Inc., Class A 46 0.04 7 Liberty Media Corp. - Interactive, Class A 89 0.07 1 Liberty Media Corp. - Starz 58 0.05 2 Life Technologies Corp. 85 0.07 – Lincoln Electric Holdings, Inc. 6 0.01 3 Lincoln National Corp. 66 0.06 3 Linear Technology Corp. 73 0.06 3 LKQ Corp. 48 0.04 1 Lockheed Martin Corp. 80 0.07 2 Loews Corp. 75 0.06 – Lorillard, Inc. 29 0.02 6 Lowe's Cos., Inc. 158 0.13 3 LSI Corp. 14 0.01 3 Ltd. Brands, Inc. 77 0.06 – Lubrizol Corp. 36 0.03 1 M&T Bank Corp. 95 0.08 1 Mack-Cali Realty Corp. 43 0.04 4 Macy's, Inc. 98 0.08 – Madison Square Garden, Inc., Class A 4 – 1 Manpower, Inc. 23 0.02 3 Marathon Oil Corp. 96 0.08 – Markel Corp. 35 0.03 2 Marriott International, Inc., Class A 50 0.04 3 Marsh & McLennan Cos., Inc. 72 0.06 2 Marshall & Ilsley Corp. 12 0.01 1 Masco Corp. 16 0.01 1 Massey Energy Co. 43 0.04 – Mastercard, Inc., Class A 81 0.07 1 Mattel, Inc. 24 0.02 1 Maxim Integrated Products, Inc. 25 0.02 2 MBIA, Inc. 16 0.01 1 McAfee, Inc. 19 0.02 1 McCormick & Co., Inc. 42 0.04 2 McDermott International, Inc. 42 0.04 3 McDonald's Corp. 180 0.15 1 McKesson Corp. 77 0.06 1 MDU Resources Group, Inc. 13 0.01 1 Mead Johnson Nutrition Co., Class A 64 0.05 1 MeadWestvaco Corp. 17 0.01 1 Medco Health Solutions, Inc. 63 0.05 1 Mednax, Inc. 51 0.04 3 Medtronic, Inc. 121 0.10 1 MEMC Electronic Materials, Inc. 6 0.01
12 Merck & Co., Inc. 408 0.34 3 Mervell Technology Group Ltd. 53 0.04 3 MetLife, Inc. 125 0.10 1 MGM Mirage 7 0.01
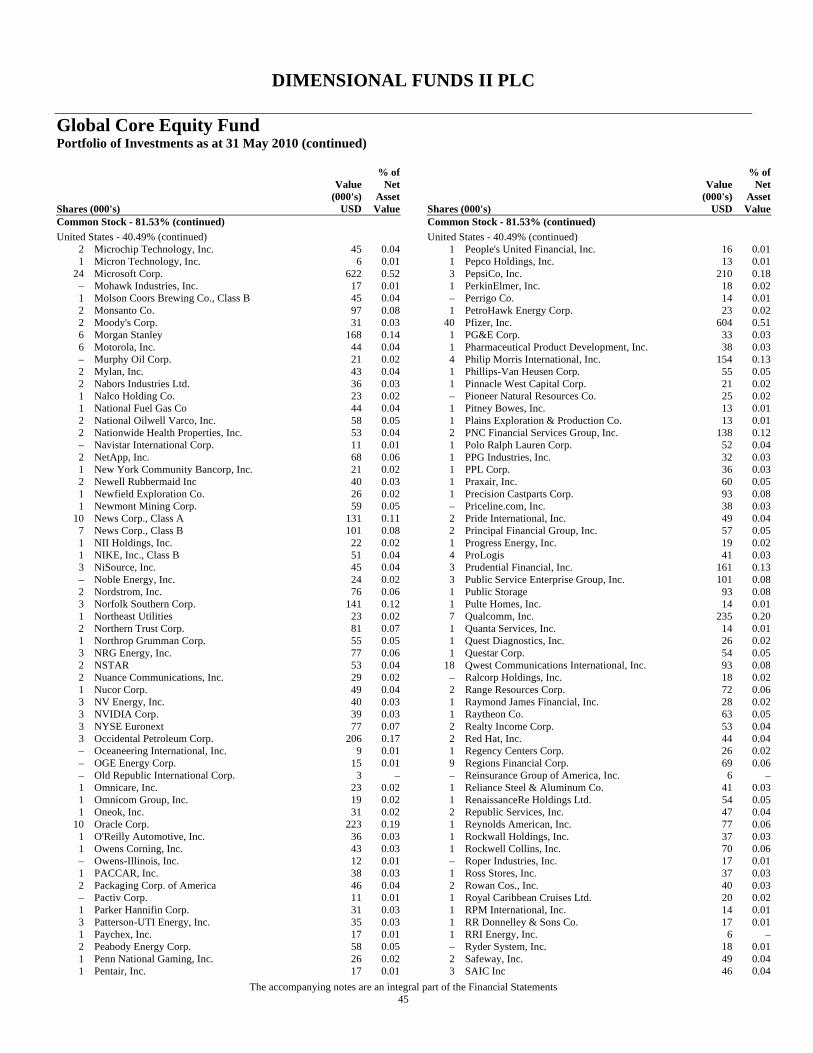
DIMENSIONAL FUNDS II PLC
Global Core Equity Fund Portfolio of Investments as at 31 May 2010 (continued)
The accompanying notes are an integral part of the Financial Statements 45
Shares (000's)
Value (000's)
USD
% of Net
Asset Value
Common Stock - 81.53% (continued) United States - 40.49% (continued)
2 Microchip Technology, Inc. 45 0.04 1 Micron Technology, Inc. 6 0.01
24 Microsoft Corp. 622 0.52 – Mohawk Industries, Inc. 17 0.01 1 Molson Coors Brewing Co., Class B 45 0.04 2 Monsanto Co. 97 0.08 2 Moody's Corp. 31 0.03 6 Morgan Stanley 168 0.14 6 Motorola, Inc. 44 0.04 – Murphy Oil Corp. 21 0.02 2 Mylan, Inc. 43 0.04 2 Nabors Industries Ltd. 36 0.03 1 Nalco Holding Co. 23 0.02 1 National Fuel Gas Co 44 0.04 2 National Oilwell Varco, Inc. 58 0.05 2 Nationwide Health Properties, Inc. 53 0.04 – Navistar International Corp. 11 0.01 2 NetApp, Inc. 68 0.06 1 New York Community Bancorp, Inc. 21 0.02 2 Newell Rubbermaid Inc 40 0.03 1 Newfield Exploration Co. 26 0.02 1 Newmont Mining Corp. 59 0.05
10 News Corp., Class A 131 0.11 7 News Corp., Class B 101 0.08 1 NII Holdings, Inc. 22 0.02 1 NIKE, Inc., Class B 51 0.04 3 NiSource, Inc. 45 0.04 – Noble Energy, Inc. 24 0.02 2 Nordstrom, Inc. 76 0.06 3 Norfolk Southern Corp. 141 0.12 1 Northeast Utilities 23 0.02 2 Northern Trust Corp. 81 0.07 1 Northrop Grumman Corp. 55 0.05 3 NRG Energy, Inc. 77 0.06 2 NSTAR 53 0.04 2 Nuance Communications, Inc. 29 0.02 1 Nucor Corp. 49 0.04 3 NV Energy, Inc. 40 0.03 3 NVIDIA Corp. 39 0.03 3 NYSE Euronext 77 0.07 3 Occidental Petroleum Corp. 206 0.17 – Oceaneering International, Inc. 9 0.01 – OGE Energy Corp. 15 0.01 – Old Republic International Corp. 3 – 1 Omnicare, Inc. 23 0.02 1 Omnicom Group, Inc. 19 0.02 1 Oneok, Inc. 31 0.02
10 Oracle Corp. 223 0.19 1 O'Reilly Automotive, Inc. 36 0.03 1 Owens Corning, Inc. 43 0.03 – Owens-Illinois, Inc. 12 0.01 1 PACCAR, Inc. 38 0.03 2 Packaging Corp. of America 46 0.04 – Pactiv Corp. 11 0.01 1 Parker Hannifin Corp. 31 0.03 3 Patterson-UTI Energy, Inc. 35 0.03 1 Paychex, Inc. 17 0.01 2 Peabody Energy Corp. 58 0.05 1 Penn National Gaming, Inc. 26 0.02 1 Pentair, Inc. 17 0.01
Shares (000's)
Value (000's)
USD
% of Net
Asset Value
Common Stock - 81.53% (continued) United States - 40.49% (continued)
1 People's United Financial, Inc. 16 0.01 1 Pepco Holdings, Inc. 13 0.01 3 PepsiCo, Inc. 210 0.18 1 PerkinElmer, Inc. 18 0.02 – Perrigo Co. 14 0.01 1 PetroHawk Energy Corp. 23 0.02
40 Pfizer, Inc. 604 0.51 1 PG&E Corp. 33 0.03 1 Pharmaceutical Product Development, Inc. 38 0.03 4 Philip Morris International, Inc. 154 0.13 1 Phillips-Van Heusen Corp. 55 0.05 1 Pinnacle West Capital Corp. 21 0.02 – Pioneer Natural Resources Co. 25 0.02 1 Pitney Bowes, Inc. 13 0.01 1 Plains Exploration & Production Co. 13 0.01 2 PNC Financial Services Group, Inc. 138 0.12 1 Polo Ralph Lauren Corp. 52 0.04 1 PPG Industries, Inc. 32 0.03 1 PPL Corp. 36 0.03 1 Praxair, Inc. 60 0.05 1 Precision Castparts Corp. 93 0.08 – Priceline.com, Inc. 38 0.03 2 Pride International, Inc. 49 0.04 2 Principal Financial Group, Inc. 57 0.05 1 Progress Energy, Inc. 19 0.02 4 ProLogis 41 0.03 3 Prudential Financial, Inc. 161 0.13 3 Public Service Enterprise Group, Inc. 101 0.08 1 Public Storage 93 0.08 1 Pulte Homes, Inc. 14 0.01 7 Qualcomm, Inc. 235 0.20 1 Quanta Services, Inc. 14 0.01 1 Quest Diagnostics, Inc. 26 0.02 1 Questar Corp. 54 0.05
18 Qwest Communications International, Inc. 93 0.08 – Ralcorp Holdings, Inc. 18 0.02 2 Range Resources Corp. 72 0.06 1 Raymond James Financial, Inc. 28 0.02 1 Raytheon Co. 63 0.05 2 Realty Income Corp. 53 0.04 2 Red Hat, Inc. 44 0.04 1 Regency Centers Corp. 26 0.02 9 Regions Financial Corp. 69 0.06 – Reinsurance Group of America, Inc. 6 – 1 Reliance Steel & Aluminum Co. 41 0.03 1 RenaissanceRe Holdings Ltd. 54 0.05 2 Republic Services, Inc. 47 0.04 1 Reynolds American, Inc. 77 0.06 1 Rockwall Holdings, Inc. 37 0.03 1 Rockwell Collins, Inc. 70 0.06 – Roper Industries, Inc. 17 0.01 1 Ross Stores, Inc. 37 0.03 2 Rowan Cos., Inc. 40 0.03 1 Royal Caribbean Cruises Ltd. 20 0.02 1 RPM International, Inc. 14 0.01 1 RR Donnelley & Sons Co. 17 0.01 1 RRI Energy, Inc. 6 – – Ryder System, Inc. 18 0.01 2 Safeway, Inc. 49 0.04 3 SAIC Inc 46 0.04
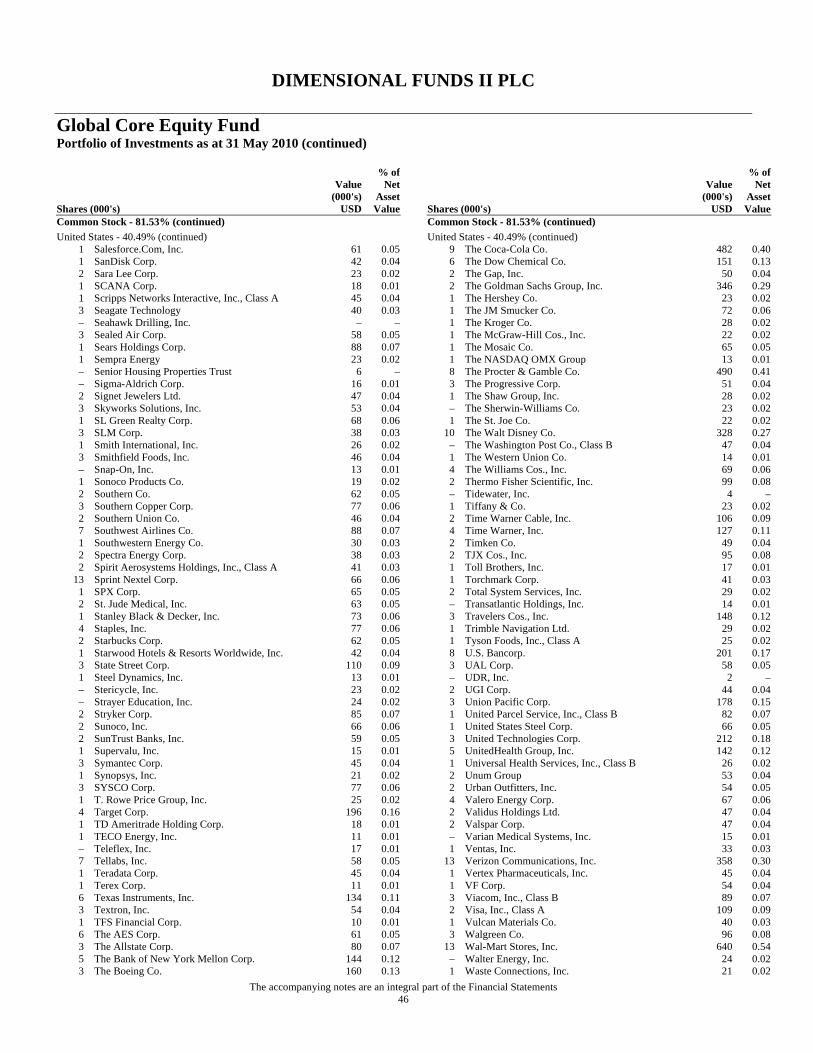
DIMENSIONAL FUNDS II PLC
Global Core Equity Fund Portfolio of Investments as at 31 May 2010 (continued)
The accompanying notes are an integral part of the Financial Statements 46
Shares (000's)
Value (000's)
USD
% of Net
Asset Value
Common Stock - 81.53% (continued) United States - 40.49% (continued)
1 Salesforce.Com, Inc. 61 0.05 1 SanDisk Corp. 42 0.04 2 Sara Lee Corp. 23 0.02 1 SCANA Corp. 18 0.01 1 Scripps Networks Interactive, Inc., Class A 45 0.04 3 Seagate Technology 40 0.03 – Seahawk Drilling, Inc. – – 3 Sealed Air Corp. 58 0.05 1 Sears Holdings Corp. 88 0.07 1 Sempra Energy 23 0.02 – Senior Housing Properties Trust 6 – – Sigma-Aldrich Corp. 16 0.01 2 Signet Jewelers Ltd. 47 0.04 3 Skyworks Solutions, Inc. 53 0.04 1 SL Green Realty Corp. 68 0.06 3 SLM Corp. 38 0.03 1 Smith International, Inc. 26 0.02 3 Smithfield Foods, Inc. 46 0.04 – Snap-On, Inc. 13 0.01 1 Sonoco Products Co. 19 0.02 2 Southern Co. 62 0.05 3 Southern Copper Corp. 77 0.06 2 Southern Union Co. 46 0.04 7 Southwest Airlines Co. 88 0.07 1 Southwestern Energy Co. 30 0.03 2 Spectra Energy Corp. 38 0.03 2 Spirit Aerosystems Holdings, Inc., Class A 41 0.03
13 Sprint Nextel Corp. 66 0.06 1 SPX Corp. 65 0.05 2 St. Jude Medical, Inc. 63 0.05 1 Stanley Black & Decker, Inc. 73 0.06 4 Staples, Inc. 77 0.06 2 Starbucks Corp. 62 0.05 1 Starwood Hotels & Resorts Worldwide, Inc. 42 0.04 3 State Street Corp. 110 0.09 1 Steel Dynamics, Inc. 13 0.01 – Stericycle, Inc. 23 0.02 – Strayer Education, Inc. 24 0.02 2 Stryker Corp. 85 0.07 2 Sunoco, Inc. 66 0.06 2 SunTrust Banks, Inc. 59 0.05 1 Supervalu, Inc. 15 0.01 3 Symantec Corp. 45 0.04 1 Synopsys, Inc. 21 0.02 3 SYSCO Corp. 77 0.06 1 T. Rowe Price Group, Inc. 25 0.02 4 Target Corp. 196 0.16 1 TD Ameritrade Holding Corp. 18 0.01 1 TECO Energy, Inc. 11 0.01 – Teleflex, Inc. 17 0.01 7 Tellabs, Inc. 58 0.05 1 Teradata Corp. 45 0.04 1 Terex Corp. 11 0.01 6 Texas Instruments, Inc. 134 0.11 3 Textron, Inc. 54 0.04 1 TFS Financial Corp. 10 0.01 6 The AES Corp. 61 0.05 3 The Allstate Corp. 80 0.07 5 The Bank of New York Mellon Corp. 144 0.12 3 The Boeing Co. 160 0.13
Shares (000's)
Value (000's)
USD
% of Net
Asset Value
Common Stock - 81.53% (continued) United States - 40.49% (continued)
9 The Coca-Cola Co. 482 0.40 6 The Dow Chemical Co. 151 0.13 2 The Gap, Inc. 50 0.04 2 The Goldman Sachs Group, Inc. 346 0.29 1 The Hershey Co. 23 0.02 1 The JM Smucker Co. 72 0.06 1 The Kroger Co. 28 0.02 1 The McGraw-Hill Cos., Inc. 22 0.02 1 The Mosaic Co. 65 0.05 1 The NASDAQ OMX Group 13 0.01 8 The Procter & Gamble Co. 490 0.41 3 The Progressive Corp. 51 0.04 1 The Shaw Group, Inc. 28 0.02 – The Sherwin-Williams Co. 23 0.02 1 The St. Joe Co. 22 0.02
10 The Walt Disney Co. 328 0.27 – The Washington Post Co., Class B 47 0.04 1 The Western Union Co. 14 0.01 4 The Williams Cos., Inc. 69 0.06 2 Thermo Fisher Scientific, Inc. 99 0.08 – Tidewater, Inc. 4 – 1 Tiffany & Co. 23 0.02 2 Time Warner Cable, Inc. 106 0.09 4 Time Warner, Inc. 127 0.11 2 Timken Co. 49 0.04 2 TJX Cos., Inc. 95 0.08 1 Toll Brothers, Inc. 17 0.01 1 Torchmark Corp. 41 0.03 2 Total System Services, Inc. 29 0.02 – Transatlantic Holdings, Inc. 14 0.01 3 Travelers Cos., Inc. 148 0.12 1 Trimble Navigation Ltd. 29 0.02 1 Tyson Foods, Inc., Class A 25 0.02 8 U.S. Bancorp. 201 0.17 3 UAL Corp. 58 0.05 – UDR, Inc. 2 – 2 UGI Corp. 44 0.04 3 Union Pacific Corp. 178 0.15 1 United Parcel Service, Inc., Class B 82 0.07 1 United States Steel Corp. 66 0.05 3 United Technologies Corp. 212 0.18 5 UnitedHealth Group, Inc. 142 0.12 1 Universal Health Services, Inc., Class B 26 0.02 2 Unum Group 53 0.04 2 Urban Outfitters, Inc. 54 0.05 4 Valero Energy Corp. 67 0.06 2 Validus Holdings Ltd. 47 0.04 2 Valspar Corp. 47 0.04 – Varian Medical Systems, Inc. 15 0.01 1 Ventas, Inc. 33 0.03
13 Verizon Communications, Inc. 358 0.30 1 Vertex Pharmaceuticals, Inc. 45 0.04 1 VF Corp. 54 0.04 3 Viacom, Inc., Class B 89 0.07 2 Visa, Inc., Class A 109 0.09 1 Vulcan Materials Co. 40 0.03 3 Walgreen Co. 96 0.08
13 Wal-Mart Stores, Inc. 640 0.54 – Walter Energy, Inc. 24 0.02 1 Waste Connections, Inc. 21 0.02
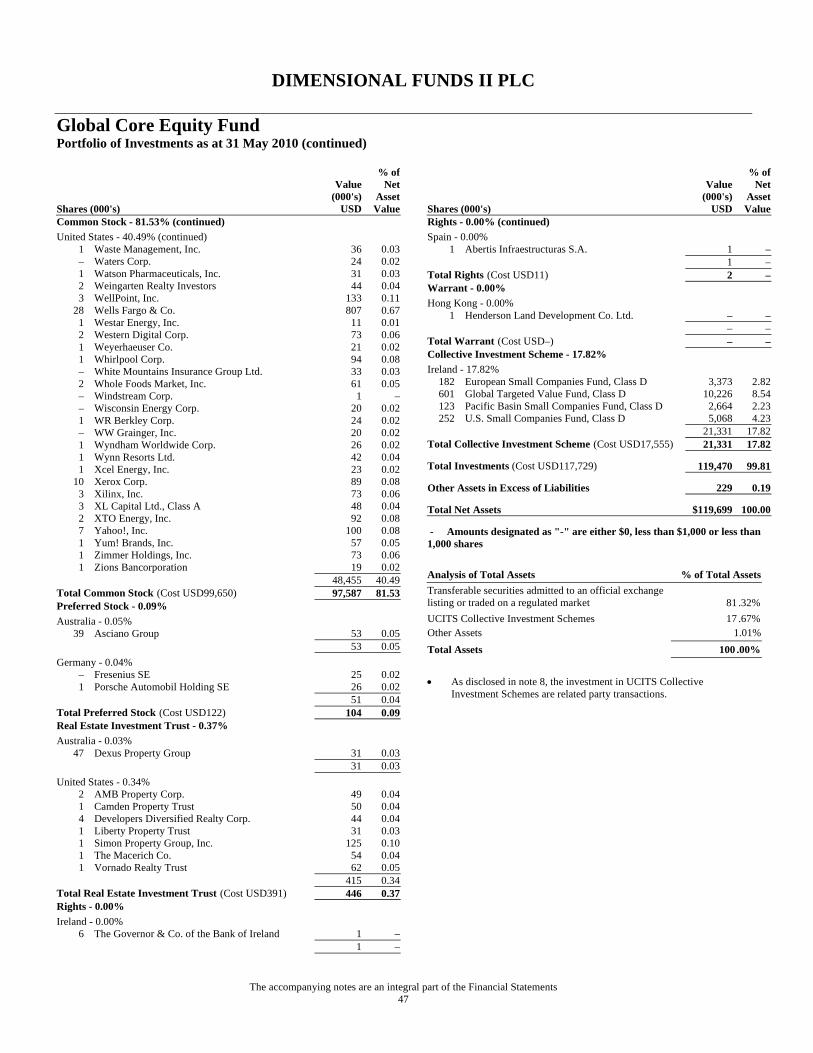
DIMENSIONAL FUNDS II PLC
Global Core Equity Fund Portfolio of Investments as at 31 May 2010 (continued)
The accompanying notes are an integral part of the Financial Statements 47
Shares (000's)
Value (000's)
USD
% of Net
Asset Value
Common Stock - 81.53% (continued) United States - 40.49% (continued)
1 Waste Management, Inc. 36 0.03 – Waters Corp. 24 0.02 1 Watson Pharmaceuticals, Inc. 31 0.03 2 Weingarten Realty Investors 44 0.04 3 WellPoint, Inc. 133 0.11
28 Wells Fargo & Co. 807 0.67 1 Westar Energy, Inc. 11 0.01 2 Western Digital Corp. 73 0.06 1 Weyerhaeuser Co. 21 0.02 1 Whirlpool Corp. 94 0.08 – White Mountains Insurance Group Ltd. 33 0.03 2 Whole Foods Market, Inc. 61 0.05 – Windstream Corp. 1 – – Wisconsin Energy Corp. 20 0.02 1 WR Berkley Corp. 24 0.02 – WW Grainger, Inc. 20 0.02 1 Wyndham Worldwide Corp. 26 0.02 1 Wynn Resorts Ltd. 42 0.04 1 Xcel Energy, Inc. 23 0.02
10 Xerox Corp. 89 0.08 3 Xilinx, Inc. 73 0.06 3 XL Capital Ltd., Class A 48 0.04 2 XTO Energy, Inc. 92 0.08 7 Yahoo!, Inc. 100 0.08 1 Yum! Brands, Inc. 57 0.05 1 Zimmer Holdings, Inc. 73 0.06 1 Zions Bancorporation 19 0.02
48,455 40.49 Total Common Stock (Cost USD99,650) 97,587 81.53 Preferred Stock - 0.09% Australia - 0.05%
39 Asciano Group 53 0.05 53 0.05 Germany - 0.04%
– Fresenius SE 25 0.02 1 Porsche Automobil Holding SE 26 0.02
51 0.04 Total Preferred Stock (Cost USD122) 104 0.09 Real Estate Investment Trust - 0.37% Australia - 0.03%
47 Dexus Property Group 31 0.03 31 0.03 United States - 0.34%
2 AMB Property Corp. 49 0.04 1 Camden Property Trust 50 0.04 4 Developers Diversified Realty Corp. 44 0.04 1 Liberty Property Trust 31 0.03 1 Simon Property Group, Inc. 125 0.10 1 The Macerich Co. 54 0.04 1 Vornado Realty Trust 62 0.05
415 0.34 Total Real Estate Investment Trust (Cost USD391) 446 0.37 Rights - 0.00% Ireland - 0.00%
6 The Governor & Co. of the Bank of Ireland 1 – 1 –
Shares (000's)
Value (000's)
USD
% of Net
Asset Value
Rights - 0.00% (continued) Spain - 0.00%
1 Abertis Infraestructuras S.A. 1 – 1 – Total Rights (Cost USD11) 2 – Warrant - 0.00% Hong Kong - 0.00%
1 Henderson Land Development Co. Ltd. – – – – Total Warrant (Cost USD–) – – Collective Investment Scheme - 17.82% Ireland - 17.82%
182 European Small Companies Fund, Class D 3,373 2.82 601 Global Targeted Value Fund, Class D 10,226 8.54 123 Pacific Basin Small Companies Fund, Class D 2,664 2.23 252 U.S. Small Companies Fund, Class D 5,068 4.23
21,331 17.82 Total Collective Investment Scheme (Cost USD17,555) 21,331 17.82
Total Investments (Cost USD117,729) 119,470 99.81
Other Assets in Excess of Liabilities 229 0.19
Total Net Assets $119,699 100.00
- Amounts designated as "-" are either $0, less than $1,000 or less than 1,000 shares
Analysis of Total Assets % of Total Assets Transferable securities admitted to an official exchange listing or traded on a regulated market 81 .32% UCITS Collective Investment Schemes 17 .67% Other Assets 1.01% Total Assets 100 .00%
• As disclosed in note 8, the investment in UCITS Collective
Investment Schemes are related party transactions.
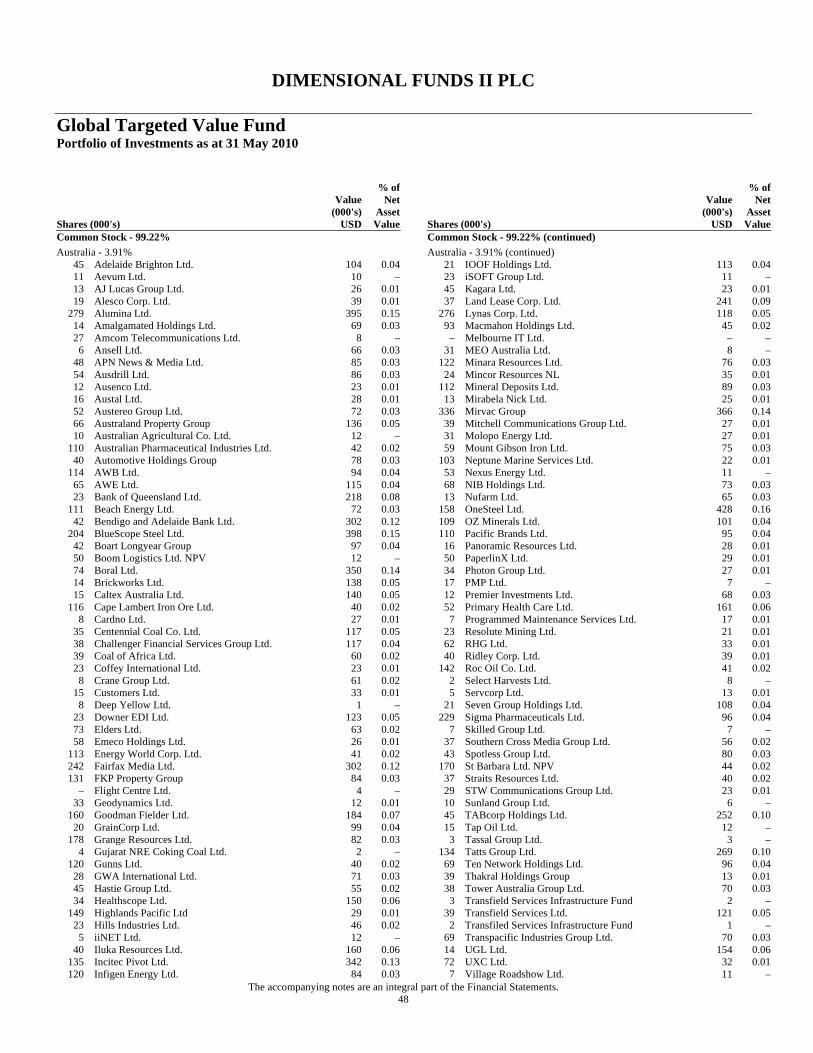
DIMENSIONAL FUNDS II PLC
Global Targeted Value Fund Portfolio of Investments as at 31 May 2010
The accompanying notes are an integral part of the Financial Statements. 48
Shares (000's)
Value (000's)
USD
% of Net
Asset Value
Common Stock - 99.22% Australia - 3.91%
45 Adelaide Brighton Ltd. 104 0.04 11 Aevum Ltd. 10 – 13 AJ Lucas Group Ltd. 26 0.01 19 Alesco Corp. Ltd. 39 0.01
279 Alumina Ltd. 395 0.15 14 Amalgamated Holdings Ltd. 69 0.03 27 Amcom Telecommunications Ltd. 8 –
6 Ansell Ltd. 66 0.03 48 APN News & Media Ltd. 85 0.03 54 Ausdrill Ltd. 86 0.03 12 Ausenco Ltd. 23 0.01 16 Austal Ltd. 28 0.01 52 Austereo Group Ltd. 72 0.03 66 Australand Property Group 136 0.05 10 Australian Agricultural Co. Ltd. 12 –
110 Australian Pharmaceutical Industries Ltd. 42 0.02 40 Automotive Holdings Group 78 0.03
114 AWB Ltd. 94 0.04 65 AWE Ltd. 115 0.04 23 Bank of Queensland Ltd. 218 0.08
111 Beach Energy Ltd. 72 0.03 42 Bendigo and Adelaide Bank Ltd. 302 0.12
204 BlueScope Steel Ltd. 398 0.15 42 Boart Longyear Group 97 0.04 50 Boom Logistics Ltd. NPV 12 – 74 Boral Ltd. 350 0.14 14 Brickworks Ltd. 138 0.05 15 Caltex Australia Ltd. 140 0.05
116 Cape Lambert Iron Ore Ltd. 40 0.02 8 Cardno Ltd. 27 0.01
35 Centennial Coal Co. Ltd. 117 0.05 38 Challenger Financial Services Group Ltd. 117 0.04 39 Coal of Africa Ltd. 60 0.02 23 Coffey International Ltd. 23 0.01
8 Crane Group Ltd. 61 0.02 15 Customers Ltd. 33 0.01
8 Deep Yellow Ltd. 1 – 23 Downer EDI Ltd. 123 0.05 73 Elders Ltd. 63 0.02 58 Emeco Holdings Ltd. 26 0.01
113 Energy World Corp. Ltd. 41 0.02 242 Fairfax Media Ltd. 302 0.12 131 FKP Property Group 84 0.03
– Flight Centre Ltd. 4 – 33 Geodynamics Ltd. 12 0.01
160 Goodman Fielder Ltd. 184 0.07 20 GrainCorp Ltd. 99 0.04
178 Grange Resources Ltd. 82 0.03 4 Gujarat NRE Coking Coal Ltd. 2 –
120 Gunns Ltd. 40 0.02 28 GWA International Ltd. 71 0.03 45 Hastie Group Ltd. 55 0.02 34 Healthscope Ltd. 150 0.06
149 Highlands Pacific Ltd 29 0.01 23 Hills Industries Ltd. 46 0.02
5 iiNET Ltd. 12 – 40 Iluka Resources Ltd. 160 0.06
135 Incitec Pivot Ltd. 342 0.13 120 Infigen Energy Ltd. 84 0.03
Shares (000's)
Value (000's)
USD
% of Net
Asset Value
Common Stock - 99.22% (continued) Australia - 3.91% (continued)
21 IOOF Holdings Ltd. 113 0.04 23 iSOFT Group Ltd. 11 – 45 Kagara Ltd. 23 0.01 37 Land Lease Corp. Ltd. 241 0.09
276 Lynas Corp. Ltd. 118 0.05 93 Macmahon Holdings Ltd. 45 0.02
– Melbourne IT Ltd. – – 31 MEO Australia Ltd. 8 –
122 Minara Resources Ltd. 76 0.03 24 Mincor Resources NL 35 0.01
112 Mineral Deposits Ltd. 89 0.03 13 Mirabela Nick Ltd. 25 0.01
336 Mirvac Group 366 0.14 39 Mitchell Communications Group Ltd. 27 0.01 31 Molopo Energy Ltd. 27 0.01 59 Mount Gibson Iron Ltd. 75 0.03
103 Neptune Marine Services Ltd. 22 0.01 53 Nexus Energy Ltd. 11 – 68 NIB Holdings Ltd. 73 0.03 13 Nufarm Ltd. 65 0.03
158 OneSteel Ltd. 428 0.16 109 OZ Minerals Ltd. 101 0.04 110 Pacific Brands Ltd. 95 0.04
16 Panoramic Resources Ltd. 28 0.01 50 PaperlinX Ltd. 29 0.01 34 Photon Group Ltd. 27 0.01 17 PMP Ltd. 7 – 12 Premier Investments Ltd. 68 0.03 52 Primary Health Care Ltd. 161 0.06
7 Programmed Maintenance Services Ltd. 17 0.01 23 Resolute Mining Ltd. 21 0.01 62 RHG Ltd. 33 0.01 40 Ridley Corp. Ltd. 39 0.01
142 Roc Oil Co. Ltd. 41 0.02 2 Select Harvests Ltd. 8 – 5 Servcorp Ltd. 13 0.01
21 Seven Group Holdings Ltd. 108 0.04 229 Sigma Pharmaceuticals Ltd. 96 0.04
7 Skilled Group Ltd. 7 – 37 Southern Cross Media Group Ltd. 56 0.02 43 Spotless Group Ltd. 80 0.03
170 St Barbara Ltd. NPV 44 0.02 37 Straits Resources Ltd. 40 0.02 29 STW Communications Group Ltd. 23 0.01 10 Sunland Group Ltd. 6 – 45 TABcorp Holdings Ltd. 252 0.10 15 Tap Oil Ltd. 12 –
3 Tassal Group Ltd. 3 – 134 Tatts Group Ltd. 269 0.10
69 Ten Network Holdings Ltd. 96 0.04 39 Thakral Holdings Group 13 0.01 38 Tower Australia Group Ltd. 70 0.03
3 Transfield Services Infrastructure Fund 2 – 39 Transfield Services Ltd. 121 0.05
2 Transfiled Services Infrastructure Fund 1 – 69 Transpacific Industries Group Ltd. 70 0.03 14 UGL Ltd. 154 0.06 72 UXC Ltd. 32 0.01
7 Village Roadshow Ltd. 11 –
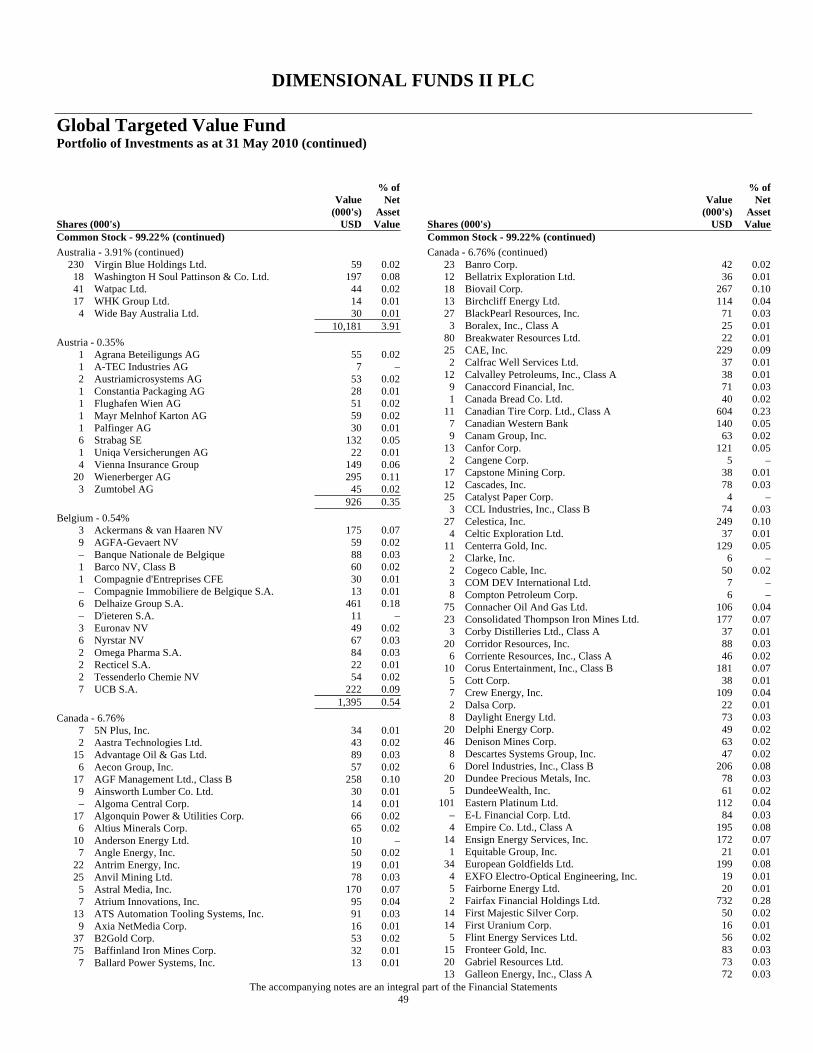
DIMENSIONAL FUNDS II PLC
Global Targeted Value Fund Portfolio of Investments as at 31 May 2010 (continued)
The accompanying notes are an integral part of the Financial Statements 49
Shares (000's)
Value (000's)
USD
% of Net
Asset Value
Common Stock - 99.22% (continued) Australia - 3.91% (continued)
230 Virgin Blue Holdings Ltd. 59 0.02 18 Washington H Soul Pattinson & Co. Ltd. 197 0.08 41 Watpac Ltd. 44 0.02 17 WHK Group Ltd. 14 0.01
4 Wide Bay Australia Ltd. 30 0.01 10,181 3.91 Austria - 0.35%
1 Agrana Beteiligungs AG 55 0.02 1 A-TEC Industries AG 7 – 2 Austriamicrosystems AG 53 0.02 1 Constantia Packaging AG 28 0.01 1 Flughafen Wien AG 51 0.02 1 Mayr Melnhof Karton AG 59 0.02 1 Palfinger AG 30 0.01 6 Strabag SE 132 0.05 1 Uniqa Versicherungen AG 22 0.01 4 Vienna Insurance Group 149 0.06
20 Wienerberger AG 295 0.11 3 Zumtobel AG 45 0.02
926 0.35 Belgium - 0.54%
3 Ackermans & van Haaren NV 175 0.07 9 AGFA-Gevaert NV 59 0.02 – Banque Nationale de Belgique 88 0.03 1 Barco NV, Class B 60 0.02 1 Compagnie d'Entreprises CFE 30 0.01 – Compagnie Immobiliere de Belgique S.A. 13 0.01 6 Delhaize Group S.A. 461 0.18 – D'ieteren S.A. 11 – 3 Euronav NV 49 0.02 6 Nyrstar NV 67 0.03 2 Omega Pharma S.A. 84 0.03 2 Recticel S.A. 22 0.01 2 Tessenderlo Chemie NV 54 0.02 7 UCB S.A. 222 0.09
1,395 0.54 Canada - 6.76%
7 5N Plus, Inc. 34 0.01 2 Aastra Technologies Ltd. 43 0.02
15 Advantage Oil & Gas Ltd. 89 0.03 6 Aecon Group, Inc. 57 0.02
17 AGF Management Ltd., Class B 258 0.10 9 Ainsworth Lumber Co. Ltd. 30 0.01 – Algoma Central Corp. 14 0.01
17 Algonquin Power & Utilities Corp. 66 0.02 6 Altius Minerals Corp. 65 0.02
10 Anderson Energy Ltd. 10 – 7 Angle Energy, Inc. 50 0.02
22 Antrim Energy, Inc. 19 0.01 25 Anvil Mining Ltd. 78 0.03
5 Astral Media, Inc. 170 0.07 7 Atrium Innovations, Inc. 95 0.04
13 ATS Automation Tooling Systems, Inc. 91 0.03 9 Axia NetMedia Corp. 16 0.01
37 B2Gold Corp. 53 0.02 75 Baffinland Iron Mines Corp. 32 0.01
7 Ballard Power Systems, Inc. 13 0.01
Shares (000's)
Value (000's)
USD
% of Net
Asset Value
Common Stock - 99.22% (continued) Canada - 6.76% (continued)
23 Banro Corp. 42 0.02 12 Bellatrix Exploration Ltd. 36 0.01 18 Biovail Corp. 267 0.10 13 Birchcliff Energy Ltd. 114 0.04 27 BlackPearl Resources, Inc. 71 0.03
3 Boralex, Inc., Class A 25 0.01 80 Breakwater Resources Ltd. 22 0.01 25 CAE, Inc. 229 0.09
2 Calfrac Well Services Ltd. 37 0.01 12 Calvalley Petroleums, Inc., Class A 38 0.01
9 Canaccord Financial, Inc. 71 0.03 1 Canada Bread Co. Ltd. 40 0.02
11 Canadian Tire Corp. Ltd., Class A 604 0.23 7 Canadian Western Bank 140 0.05 9 Canam Group, Inc. 63 0.02
13 Canfor Corp. 121 0.05 2 Cangene Corp. 5 –
17 Capstone Mining Corp. 38 0.01 12 Cascades, Inc. 78 0.03 25 Catalyst Paper Corp. 4 –
3 CCL Industries, Inc., Class B 74 0.03 27 Celestica, Inc. 249 0.10
4 Celtic Exploration Ltd. 37 0.01 11 Centerra Gold, Inc. 129 0.05
2 Clarke, Inc. 6 – 2 Cogeco Cable, Inc. 50 0.02 3 COM DEV International Ltd. 7 – 8 Compton Petroleum Corp. 6 –
75 Connacher Oil And Gas Ltd. 106 0.04 23 Consolidated Thompson Iron Mines Ltd. 177 0.07
3 Corby Distilleries Ltd., Class A 37 0.01 20 Corridor Resources, Inc. 88 0.03
6 Corriente Resources, Inc., Class A 46 0.02 10 Corus Entertainment, Inc., Class B 181 0.07
5 Cott Corp. 38 0.01 7 Crew Energy, Inc. 109 0.04 2 Dalsa Corp. 22 0.01 8 Daylight Energy Ltd. 73 0.03
20 Delphi Energy Corp. 49 0.02 46 Denison Mines Corp. 63 0.02
8 Descartes Systems Group, Inc. 47 0.02 6 Dorel Industries, Inc., Class B 206 0.08
20 Dundee Precious Metals, Inc. 78 0.03 5 DundeeWealth, Inc. 61 0.02
101 Eastern Platinum Ltd. 112 0.04 – E-L Financial Corp. Ltd. 84 0.03 4 Empire Co. Ltd., Class A 195 0.08
14 Ensign Energy Services, Inc. 172 0.07 1 Equitable Group, Inc. 21 0.01
34 European Goldfields Ltd. 199 0.08 4 EXFO Electro-Optical Engineering, Inc. 19 0.01 5 Fairborne Energy Ltd. 20 0.01 2 Fairfax Financial Holdings Ltd. 732 0.28
14 First Majestic Silver Corp. 50 0.02 14 First Uranium Corp. 16 0.01
5 Flint Energy Services Ltd. 56 0.02 15 Fronteer Gold, Inc. 83 0.03 20 Gabriel Resources Ltd. 73 0.03 13 Galleon Energy, Inc., Class A 72 0.03
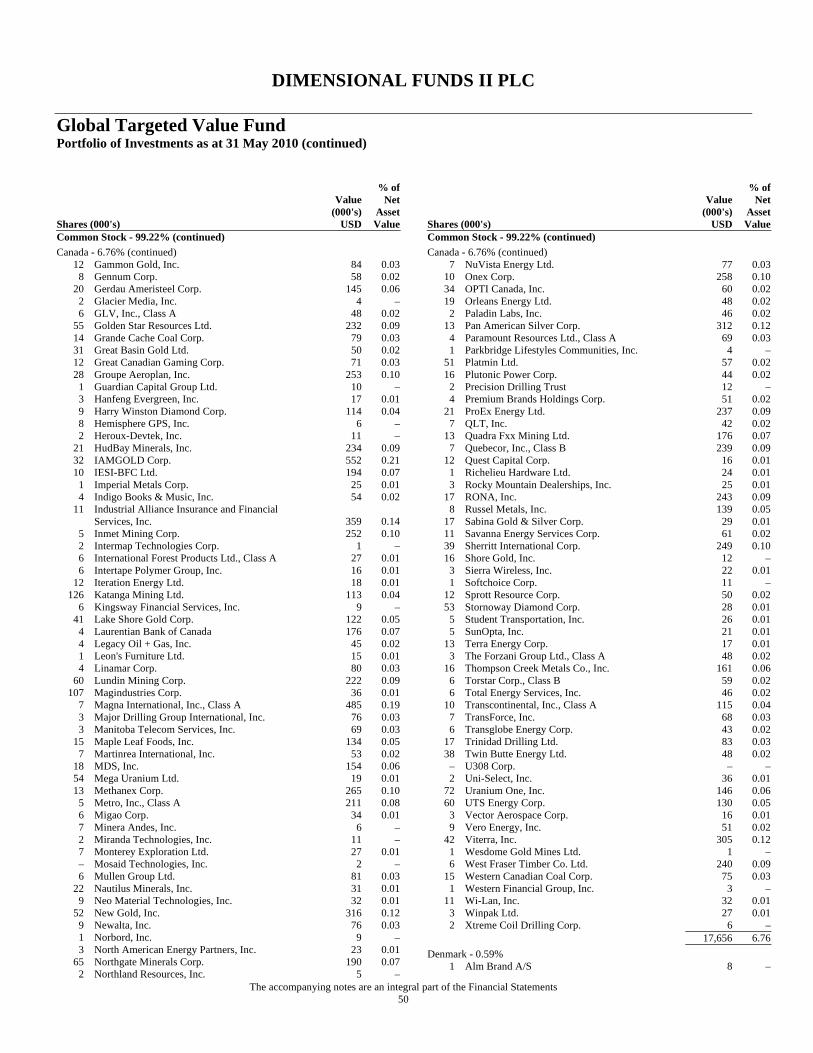
DIMENSIONAL FUNDS II PLC
Global Targeted Value Fund Portfolio of Investments as at 31 May 2010 (continued)
The accompanying notes are an integral part of the Financial Statements 50
Shares (000's)
Value (000's)
USD
% of Net
Asset Value
Common Stock - 99.22% (continued) Canada - 6.76% (continued)
12 Gammon Gold, Inc. 84 0.03 8 Gennum Corp. 58 0.02
20 Gerdau Ameristeel Corp. 145 0.06 2 Glacier Media, Inc. 4 – 6 GLV, Inc., Class A 48 0.02
55 Golden Star Resources Ltd. 232 0.09 14 Grande Cache Coal Corp. 79 0.03 31 Great Basin Gold Ltd. 50 0.02 12 Great Canadian Gaming Corp. 71 0.03 28 Groupe Aeroplan, Inc. 253 0.10
1 Guardian Capital Group Ltd. 10 – 3 Hanfeng Evergreen, Inc. 17 0.01 9 Harry Winston Diamond Corp. 114 0.04 8 Hemisphere GPS, Inc. 6 – 2 Heroux-Devtek, Inc. 11 –
21 HudBay Minerals, Inc. 234 0.09 32 IAMGOLD Corp. 552 0.21 10 IESI-BFC Ltd. 194 0.07
1 Imperial Metals Corp. 25 0.01 4 Indigo Books & Music, Inc. 54 0.02
11 Industrial Alliance Insurance and Financial Services, Inc. 359 0.14
5 Inmet Mining Corp. 252 0.10 2 Intermap Technologies Corp. 1 – 6 International Forest Products Ltd., Class A 27 0.01 6 Intertape Polymer Group, Inc. 16 0.01
12 Iteration Energy Ltd. 18 0.01 126 Katanga Mining Ltd. 113 0.04
6 Kingsway Financial Services, Inc. 9 – 41 Lake Shore Gold Corp. 122 0.05
4 Laurentian Bank of Canada 176 0.07 4 Legacy Oil + Gas, Inc. 45 0.02 1 Leon's Furniture Ltd. 15 0.01 4 Linamar Corp. 80 0.03
60 Lundin Mining Corp. 222 0.09 107 Magindustries Corp. 36 0.01
7 Magna International, Inc., Class A 485 0.19 3 Major Drilling Group International, Inc. 76 0.03 3 Manitoba Telecom Services, Inc. 69 0.03
15 Maple Leaf Foods, Inc. 134 0.05 7 Martinrea International, Inc. 53 0.02
18 MDS, Inc. 154 0.06 54 Mega Uranium Ltd. 19 0.01 13 Methanex Corp. 265 0.10
5 Metro, Inc., Class A 211 0.08 6 Migao Corp. 34 0.01 7 Minera Andes, Inc. 6 – 2 Miranda Technologies, Inc. 11 – 7 Monterey Exploration Ltd. 27 0.01 – Mosaid Technologies, Inc. 2 – 6 Mullen Group Ltd. 81 0.03
22 Nautilus Minerals, Inc. 31 0.01 9 Neo Material Technologies, Inc. 32 0.01
52 New Gold, Inc. 316 0.12 9 Newalta, Inc. 76 0.03 1 Norbord, Inc. 9 – 3 North American Energy Partners, Inc. 23 0.01
65 Northgate Minerals Corp. 190 0.07 2 Northland Resources, Inc. 5 –
Shares (000's)
Value (000's)
USD
% of Net
Asset Value
Common Stock - 99.22% (continued) Canada - 6.76% (continued)
7 NuVista Energy Ltd. 77 0.03 10 Onex Corp. 258 0.10 34 OPTI Canada, Inc. 60 0.02 19 Orleans Energy Ltd. 48 0.02
2 Paladin Labs, Inc. 46 0.02 13 Pan American Silver Corp. 312 0.12
4 Paramount Resources Ltd., Class A 69 0.03 1 Parkbridge Lifestyles Communities, Inc. 4 –
51 Platmin Ltd. 57 0.02 16 Plutonic Power Corp. 44 0.02
2 Precision Drilling Trust 12 – 4 Premium Brands Holdings Corp. 51 0.02
21 ProEx Energy Ltd. 237 0.09 7 QLT, Inc. 42 0.02
13 Quadra Fxx Mining Ltd. 176 0.07 7 Quebecor, Inc., Class B 239 0.09
12 Quest Capital Corp. 16 0.01 1 Richelieu Hardware Ltd. 24 0.01 3 Rocky Mountain Dealerships, Inc. 25 0.01
17 RONA, Inc. 243 0.09 8 Russel Metals, Inc. 139 0.05
17 Sabina Gold & Silver Corp. 29 0.01 11 Savanna Energy Services Corp. 61 0.02 39 Sherritt International Corp. 249 0.10 16 Shore Gold, Inc. 12 –
3 Sierra Wireless, Inc. 22 0.01 1 Softchoice Corp. 11 –
12 Sprott Resource Corp. 50 0.02 53 Stornoway Diamond Corp. 28 0.01
5 Student Transportation, Inc. 26 0.01 5 SunOpta, Inc. 21 0.01
13 Terra Energy Corp. 17 0.01 3 The Forzani Group Ltd., Class A 48 0.02
16 Thompson Creek Metals Co., Inc. 161 0.06 6 Torstar Corp., Class B 59 0.02 6 Total Energy Services, Inc. 46 0.02
10 Transcontinental, Inc., Class A 115 0.04 7 TransForce, Inc. 68 0.03 6 Transglobe Energy Corp. 43 0.02
17 Trinidad Drilling Ltd. 83 0.03 38 Twin Butte Energy Ltd. 48 0.02
– U308 Corp. – – 2 Uni-Select, Inc. 36 0.01
72 Uranium One, Inc. 146 0.06 60 UTS Energy Corp. 130 0.05
3 Vector Aerospace Corp. 16 0.01 9 Vero Energy, Inc. 51 0.02
42 Viterra, Inc. 305 0.12 1 Wesdome Gold Mines Ltd. 1 – 6 West Fraser Timber Co. Ltd. 240 0.09
15 Western Canadian Coal Corp. 75 0.03 1 Western Financial Group, Inc. 3 –
11 Wi-Lan, Inc. 32 0.01 3 Winpak Ltd. 27 0.01 2 Xtreme Coil Drilling Corp. 6 –
17,656 6.76 Denmark - 0.59%
1 Alm Brand A/S 8 –

DIMENSIONAL FUNDS II PLC
Global Targeted Value Fund Portfolio of Investments as at 31 May 2010 (continued)
The accompanying notes are an integral part of the Financial Statements 51
Shares (000's)
Value (000's)
USD
% of Net
Asset Value
Common Stock - 99.22% (continued) Denmark - 0.59% (continued)
2 Amagerbanken A/S 7 – 1 Auriga Industries A/S, Class B 18 0.01 3 Bang & Olufsen A/S, Class B 30 0.01 1 Capinordic A/S – – 6 Danisco A/S 356 0.14 – Dfds A/S 27 0.01 2 DS Norden A/S 84 0.03 1 East Asiatic Co. Ltd. A/S 29 0.01
26 GN Store Nord A/S 202 0.08 4 Greentech Energy Systems A/S 10 – 6 Jyske Bank A/S Registered 176 0.07 3 NKT Holding A/S 116 0.04 1 Nordjyske Bank A/S 9 – – PER Aarsleff A/S, Class B 20 0.01 – Ringkjoebing Landbobank A/S 44 0.02 1 Rockwool International A/S, Class B 81 0.03 1 Schouw & Co. 23 0.01 1 Sjaelso Gruppen A/S 2 – 1 Solar A/S, Class B 51 0.02 4 Spar Nord Bank A/S 36 0.01 8 Sydbank A/S 172 0.07 2 TK Development A/S 9 – 2 Torm A/S 15 0.01 2 Vestjysk Bank A/S 22 0.01
1,547 0.59 Finland - 1.45%
3 Ahlstrom Oyj 47 0.02 12 Amer Sports Oyj, Class A 115 0.04
1 Atria PLC 18 0.01 7 Cargotec Oyj, Class B 181 0.07 4 Cramo Oyj, Class B 54 0.02 6 Elektrobit Corp. 8 –
12 Finnair Oyj 58 0.02 3 Finnlines Oyj 32 0.01 5 Fiskars Oyj ABP, Class A 66 0.03 2 HKScan Oyj 24 0.01 9 Huhtamaki Oyj, Class B 93 0.04
10 Kemira Oyj, Class B 110 0.04 8 Kesko Oyj, Class B 254 0.10 1 Lannen Tehtaat Oyj 22 0.01 1 Lemminkainen Oyj 16 0.01 9 Metso Oyj 271 0.10
16 M-real Oyj, Class B 50 0.02 14 Outokumpu Oyj 225 0.09
2 PKC Group Oyj 29 0.01 14 Pohjola Bank PLC, Class A 136 0.05 13 Raisio PLC, Class V 41 0.02
3 Rapala VMC Oyj 22 0.01 7 Rautaruukki Oyj 117 0.05
15 Ruukki Group Oyj 23 0.01 11 Sanoma Oyj 198 0.08
2 Stockmann Oyj ABP, Class A 53 0.02 3 Stockmann Oyj ABP, Class B 94 0.04
59 Stora Enso Oyj, Class R 440 0.17 4 Tieto Oyj 81 0.03 2 Tikkurila Oyj 43 0.02
51 UPM-Kymmene Oyj 658 0.25 8 YIT Oyj 140 0.05
Shares (000's)
Value (000's)
USD
% of Net
Asset Value
Common Stock - 99.22% (continued) Finland - 1.45% (continued) 3,719 1.45 France - 2.47%
18 Air France-KLM 222 0.09 18 Altran Technologies S.A. 75 0.03
8 Arkema S.A. 279 0.11 8 Atos Origin S.A. 340 0.13 – Bonduelle S.C.A. 31 0.01 1 Bongrain S.A. 39 0.01 3 Bourbon S.A. 119 0.05 1 Boursorama 13 –
20 Cie Generale de Geophysique-Veritas 464 0.18 1 Ciments Francais S.A. 73 0.03 5 Club Mediterranee 62 0.02 1 Compagnie Plastic-Omnium S.A. 33 0.01 – Esso S.A. Francaise 39 0.02
12 Etablissements Maurel et Prom S.A. 142 0.06 2 Euler Hermes S.A. 157 0.06 3 Euro Disney SCA - Registered 14 0.01 9 GFI Informatique 31 0.01 1 Groupe Crit S.A. 16 0.01 9 Groupe Eurotunnel S.A. 69 0.03 3 Groupe Steria SCA 100 0.04 – Guyenne et Gascogne S.A. 37 0.01 2 Haulotte Group S.A. 25 0.01
57 Havas S.A. 255 0.10 2 IPSOS 78 0.03 2 JC Decaux S.A. 47 0.02 1 Korian 20 0.01
14 Lagardere SCA 451 0.17 – LDC S.A. 20 0.01 – LISI 19 0.01 1 Manitou BF S.A. 19 0.01 2 Mersen S.A. 64 0.02 4 Nexans S.A. 251 0.10 3 Nexity S.A. Group, Class B 91 0.04 – Norbert Dentressangle 24 0.01 3 NRJ Group 22 0.01 1 Orco Property Group 5 – 1 Parrot S.A. 17 0.01
16 Peugeot S.A. 382 0.15 – Pierre & Vacances Group 27 0.01 3 Rallye S.A. 88 0.03
13 Rexel S.A. 177 0.07 1 Sa des Ciments Vicat 54 0.02
11 Safran S.A. 304 0.12 – Sartorius Stedim Biotech 11 –
20 SCOR SE 395 0.15 – Seche Environnement S.A. 17 0.01 2 Sequana 30 0.01 1 Societe BIC S.A. 70 0.03
16 Soitec S.A. 147 0.06 – Sperian Protection S.A. 66 0.03 – Sucriere de Pithiviers-Le-Vieil 6 – 6 Teleperformance S.A. 161 0.06 1 Theolia S.A. 4 – 3 Trigano S.A. 55 0.02 8 Valeo S.A. 233 0.09 2 Viel et Compagnie S.A. 8 –
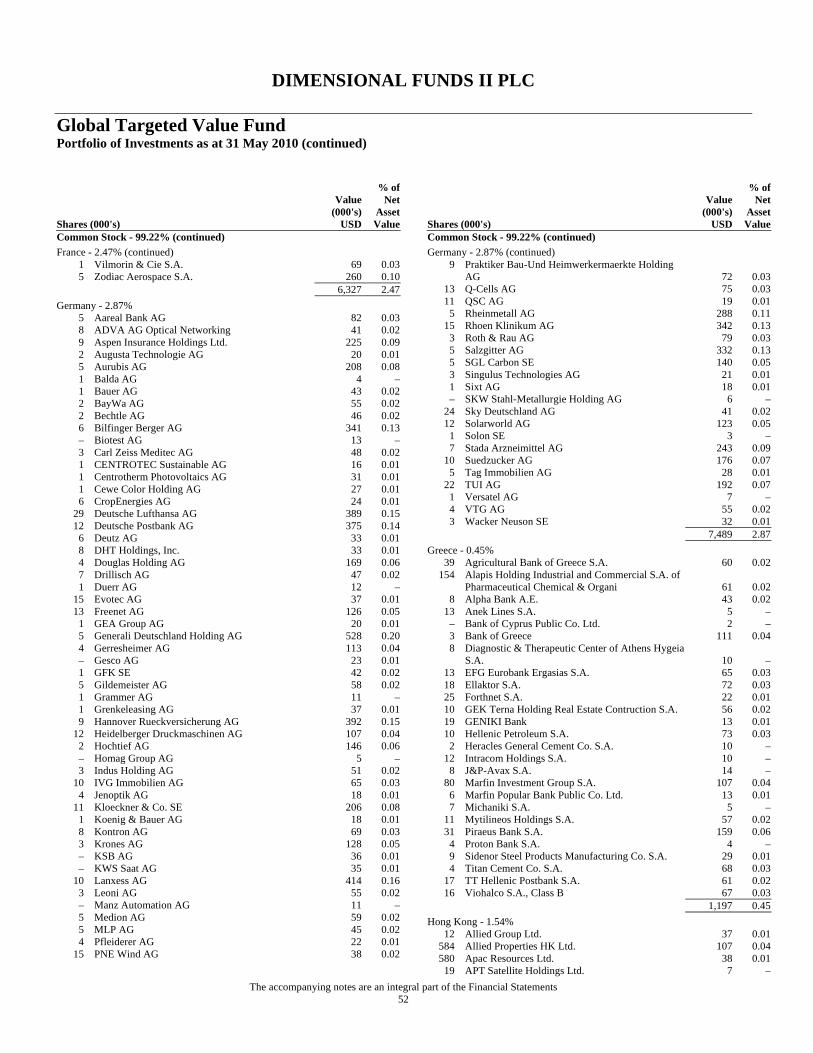
DIMENSIONAL FUNDS II PLC
Global Targeted Value Fund Portfolio of Investments as at 31 May 2010 (continued)
The accompanying notes are an integral part of the Financial Statements 52
Shares (000's)
Value (000's)
USD
% of Net
Asset Value
Common Stock - 99.22% (continued) France - 2.47% (continued)
1 Vilmorin & Cie S.A. 69 0.03 5 Zodiac Aerospace S.A. 260 0.10
6,327 2.47 Germany - 2.87%
5 Aareal Bank AG 82 0.03 8 ADVA AG Optical Networking 41 0.02 9 Aspen Insurance Holdings Ltd. 225 0.09 2 Augusta Technologie AG 20 0.01 5 Aurubis AG 208 0.08 1 Balda AG 4 – 1 Bauer AG 43 0.02 2 BayWa AG 55 0.02 2 Bechtle AG 46 0.02 6 Bilfinger Berger AG 341 0.13 – Biotest AG 13 – 3 Carl Zeiss Meditec AG 48 0.02 1 CENTROTEC Sustainable AG 16 0.01 1 Centrotherm Photovoltaics AG 31 0.01 1 Cewe Color Holding AG 27 0.01 6 CropEnergies AG 24 0.01
29 Deutsche Lufthansa AG 389 0.15 12 Deutsche Postbank AG 375 0.14
6 Deutz AG 33 0.01 8 DHT Holdings, Inc. 33 0.01 4 Douglas Holding AG 169 0.06 7 Drillisch AG 47 0.02 1 Duerr AG 12 –
15 Evotec AG 37 0.01 13 Freenet AG 126 0.05
1 GEA Group AG 20 0.01 5 Generali Deutschland Holding AG 528 0.20 4 Gerresheimer AG 113 0.04 – Gesco AG 23 0.01 1 GFK SE 42 0.02 5 Gildemeister AG 58 0.02 1 Grammer AG 11 – 1 Grenkeleasing AG 37 0.01 9 Hannover Rueckversicherung AG 392 0.15
12 Heidelberger Druckmaschinen AG 107 0.04 2 Hochtief AG 146 0.06 – Homag Group AG 5 – 3 Indus Holding AG 51 0.02
10 IVG Immobilien AG 65 0.03 4 Jenoptik AG 18 0.01
11 Kloeckner & Co. SE 206 0.08 1 Koenig & Bauer AG 18 0.01 8 Kontron AG 69 0.03 3 Krones AG 128 0.05 – KSB AG 36 0.01 – KWS Saat AG 35 0.01
10 Lanxess AG 414 0.16 3 Leoni AG 55 0.02 – Manz Automation AG 11 – 5 Medion AG 59 0.02 5 MLP AG 45 0.02 4 Pfleiderer AG 22 0.01
15 PNE Wind AG 38 0.02
Shares (000's)
Value (000's)
USD
% of Net
Asset Value
Common Stock - 99.22% (continued) Germany - 2.87% (continued)
9 Praktiker Bau-Und Heimwerkermaerkte Holding AG 72 0.03
13 Q-Cells AG 75 0.03 11 QSC AG 19 0.01
5 Rheinmetall AG 288 0.11 15 Rhoen Klinikum AG 342 0.13
3 Roth & Rau AG 79 0.03 5 Salzgitter AG 332 0.13 5 SGL Carbon SE 140 0.05 3 Singulus Technologies AG 21 0.01 1 Sixt AG 18 0.01 – SKW Stahl-Metallurgie Holding AG 6 –
24 Sky Deutschland AG 41 0.02 12 Solarworld AG 123 0.05
1 Solon SE 3 – 7 Stada Arzneimittel AG 243 0.09
10 Suedzucker AG 176 0.07 5 Tag Immobilien AG 28 0.01
22 TUI AG 192 0.07 1 Versatel AG 7 – 4 VTG AG 55 0.02 3 Wacker Neuson SE 32 0.01
7,489 2.87 Greece - 0.45%
39 Agricultural Bank of Greece S.A. 60 0.02 154 Alapis Holding Industrial and Commercial S.A. of
Pharmaceutical Chemical & Organi 61 0.02 8 Alpha Bank A.E. 43 0.02
13 Anek Lines S.A. 5 – – Bank of Cyprus Public Co. Ltd. 2 – 3 Bank of Greece 111 0.04 8 Diagnostic & Therapeutic Center of Athens Hygeia
S.A. 10 – 13 EFG Eurobank Ergasias S.A. 65 0.03 18 Ellaktor S.A. 72 0.03 25 Forthnet S.A. 22 0.01 10 GEK Terna Holding Real Estate Contruction S.A. 56 0.02 19 GENIKI Bank 13 0.01 10 Hellenic Petroleum S.A. 73 0.03
2 Heracles General Cement Co. S.A. 10 – 12 Intracom Holdings S.A. 10 –
8 J&P-Avax S.A. 14 – 80 Marfin Investment Group S.A. 107 0.04
6 Marfin Popular Bank Public Co. Ltd. 13 0.01 7 Michaniki S.A. 5 –
11 Mytilineos Holdings S.A. 57 0.02 31 Piraeus Bank S.A. 159 0.06
4 Proton Bank S.A. 4 – 9 Sidenor Steel Products Manufacturing Co. S.A. 29 0.01 4 Titan Cement Co. S.A. 68 0.03
17 TT Hellenic Postbank S.A. 61 0.02 16 Viohalco S.A., Class B 67 0.03
1,197 0.45 Hong Kong - 1.54%
12 Allied Group Ltd. 37 0.01 584 Allied Properties HK Ltd. 107 0.04 580 Apac Resources Ltd. 38 0.01
19 APT Satellite Holdings Ltd. 7 –
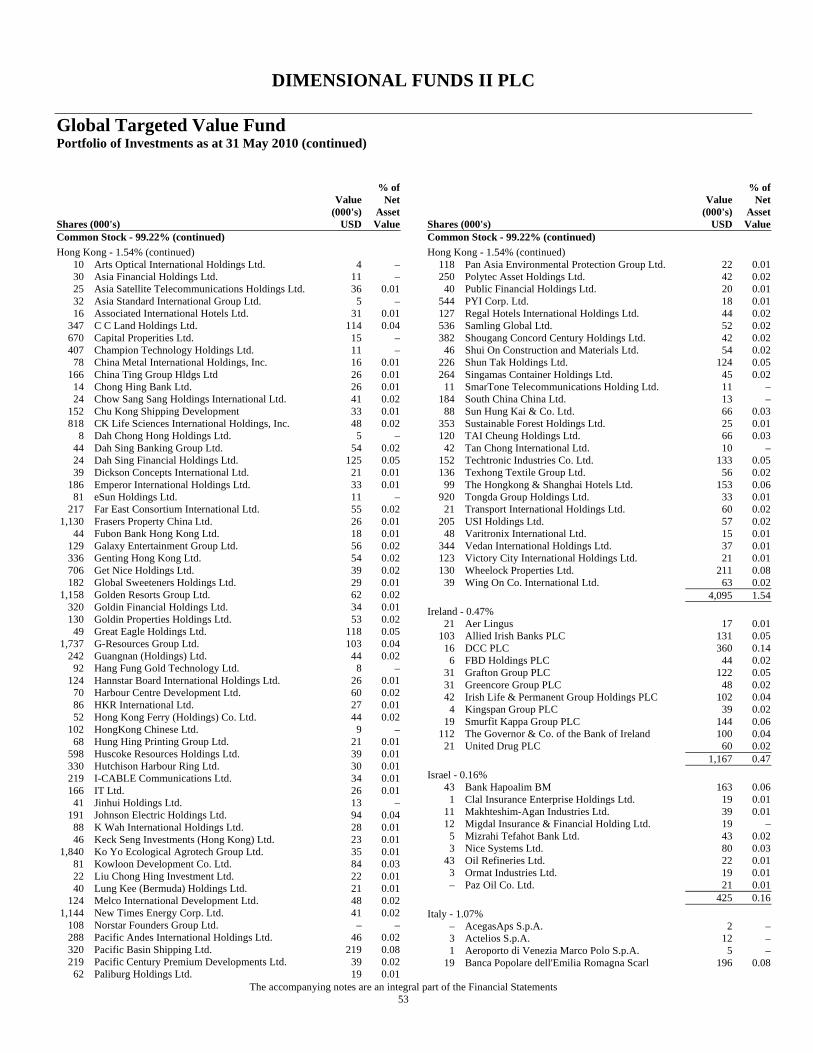
DIMENSIONAL FUNDS II PLC
Global Targeted Value Fund Portfolio of Investments as at 31 May 2010 (continued)
The accompanying notes are an integral part of the Financial Statements 53
Shares (000's)
Value (000's)
USD
% of Net
Asset Value
Common Stock - 99.22% (continued) Hong Kong - 1.54% (continued)
10 Arts Optical International Holdings Ltd. 4 – 30 Asia Financial Holdings Ltd. 11 – 25 Asia Satellite Telecommunications Holdings Ltd. 36 0.01 32 Asia Standard International Group Ltd. 5 – 16 Associated International Hotels Ltd. 31 0.01
347 C C Land Holdings Ltd. 114 0.04 670 Capital Properities Ltd. 15 – 407 Champion Technology Holdings Ltd. 11 –
78 China Metal International Holdings, Inc. 16 0.01 166 China Ting Group Hldgs Ltd 26 0.01
14 Chong Hing Bank Ltd. 26 0.01 24 Chow Sang Sang Holdings International Ltd. 41 0.02
152 Chu Kong Shipping Development 33 0.01 818 CK Life Sciences International Holdings, Inc. 48 0.02
8 Dah Chong Hong Holdings Ltd. 5 – 44 Dah Sing Banking Group Ltd. 54 0.02 24 Dah Sing Financial Holdings Ltd. 125 0.05 39 Dickson Concepts International Ltd. 21 0.01
186 Emperor International Holdings Ltd. 33 0.01 81 eSun Holdings Ltd. 11 –
217 Far East Consortium International Ltd. 55 0.02 1,130 Frasers Property China Ltd. 26 0.01
44 Fubon Bank Hong Kong Ltd. 18 0.01 129 Galaxy Entertainment Group Ltd. 56 0.02 336 Genting Hong Kong Ltd. 54 0.02 706 Get Nice Holdings Ltd. 39 0.02 182 Global Sweeteners Holdings Ltd. 29 0.01
1,158 Golden Resorts Group Ltd. 62 0.02 320 Goldin Financial Holdings Ltd. 34 0.01 130 Goldin Properties Holdings Ltd. 53 0.02
49 Great Eagle Holdings Ltd. 118 0.05 1,737 G-Resources Group Ltd. 103 0.04
242 Guangnan (Holdings) Ltd. 44 0.02 92 Hang Fung Gold Technology Ltd. 8 –
124 Hannstar Board International Holdings Ltd. 26 0.01 70 Harbour Centre Development Ltd. 60 0.02 86 HKR International Ltd. 27 0.01 52 Hong Kong Ferry (Holdings) Co. Ltd. 44 0.02
102 HongKong Chinese Ltd. 9 – 68 Hung Hing Printing Group Ltd. 21 0.01
598 Huscoke Resources Holdings Ltd. 39 0.01 330 Hutchison Harbour Ring Ltd. 30 0.01 219 I-CABLE Communications Ltd. 34 0.01 166 IT Ltd. 26 0.01
41 Jinhui Holdings Ltd. 13 – 191 Johnson Electric Holdings Ltd. 94 0.04
88 K Wah International Holdings Ltd. 28 0.01 46 Keck Seng Investments (Hong Kong) Ltd. 23 0.01
1,840 Ko Yo Ecological Agrotech Group Ltd. 35 0.01 81 Kowloon Development Co. Ltd. 84 0.03 22 Liu Chong Hing Investment Ltd. 22 0.01 40 Lung Kee (Bermuda) Holdings Ltd. 21 0.01
124 Melco International Development Ltd. 48 0.02 1,144 New Times Energy Corp. Ltd. 41 0.02
108 Norstar Founders Group Ltd. – – 288 Pacific Andes International Holdings Ltd. 46 0.02 320 Pacific Basin Shipping Ltd. 219 0.08 219 Pacific Century Premium Developments Ltd. 39 0.02
62 Paliburg Holdings Ltd. 19 0.01
Shares (000's)
Value (000's)
USD
% of Net
Asset Value
Common Stock - 99.22% (continued) Hong Kong - 1.54% (continued)
118 Pan Asia Environmental Protection Group Ltd. 22 0.01 250 Polytec Asset Holdings Ltd. 42 0.02
40 Public Financial Holdings Ltd. 20 0.01 544 PYI Corp. Ltd. 18 0.01 127 Regal Hotels International Holdings Ltd. 44 0.02 536 Samling Global Ltd. 52 0.02 382 Shougang Concord Century Holdings Ltd. 42 0.02
46 Shui On Construction and Materials Ltd. 54 0.02 226 Shun Tak Holdings Ltd. 124 0.05 264 Singamas Container Holdings Ltd. 45 0.02
11 SmarTone Telecommunications Holding Ltd. 11 – 184 South China China Ltd. 13 –
88 Sun Hung Kai & Co. Ltd. 66 0.03 353 Sustainable Forest Holdings Ltd. 25 0.01 120 TAI Cheung Holdings Ltd. 66 0.03
42 Tan Chong International Ltd. 10 – 152 Techtronic Industries Co. Ltd. 133 0.05 136 Texhong Textile Group Ltd. 56 0.02
99 The Hongkong & Shanghai Hotels Ltd. 153 0.06 920 Tongda Group Holdings Ltd. 33 0.01
21 Transport International Holdings Ltd. 60 0.02 205 USI Holdings Ltd. 57 0.02
48 Varitronix International Ltd. 15 0.01 344 Vedan International Holdings Ltd. 37 0.01 123 Victory City International Holdings Ltd. 21 0.01 130 Wheelock Properties Ltd. 211 0.08
39 Wing On Co. International Ltd. 63 0.02 4,095 1.54 Ireland - 0.47%
21 Aer Lingus 17 0.01 103 Allied Irish Banks PLC 131 0.05
16 DCC PLC 360 0.14 6 FBD Holdings PLC 44 0.02
31 Grafton Group PLC 122 0.05 31 Greencore Group PLC 48 0.02 42 Irish Life & Permanent Group Holdings PLC 102 0.04
4 Kingspan Group PLC 39 0.02 19 Smurfit Kappa Group PLC 144 0.06
112 The Governor & Co. of the Bank of Ireland 100 0.04 21 United Drug PLC 60 0.02
1,167 0.47 Israel - 0.16%
43 Bank Hapoalim BM 163 0.06 1 Clal Insurance Enterprise Holdings Ltd. 19 0.01
11 Makhteshim-Agan Industries Ltd. 39 0.01 12 Migdal Insurance & Financial Holding Ltd. 19 –
5 Mizrahi Tefahot Bank Ltd. 43 0.02 3 Nice Systems Ltd. 80 0.03
43 Oil Refineries Ltd. 22 0.01 3 Ormat Industries Ltd. 19 0.01 – Paz Oil Co. Ltd. 21 0.01
425 0.16 Italy - 1.07%
– AcegasAps S.p.A. 2 – 3 Actelios S.p.A. 12 – 1 Aeroporto di Venezia Marco Polo S.p.A. 5 –
19 Banca Popolare dell'Emilia Romagna Scarl 196 0.08
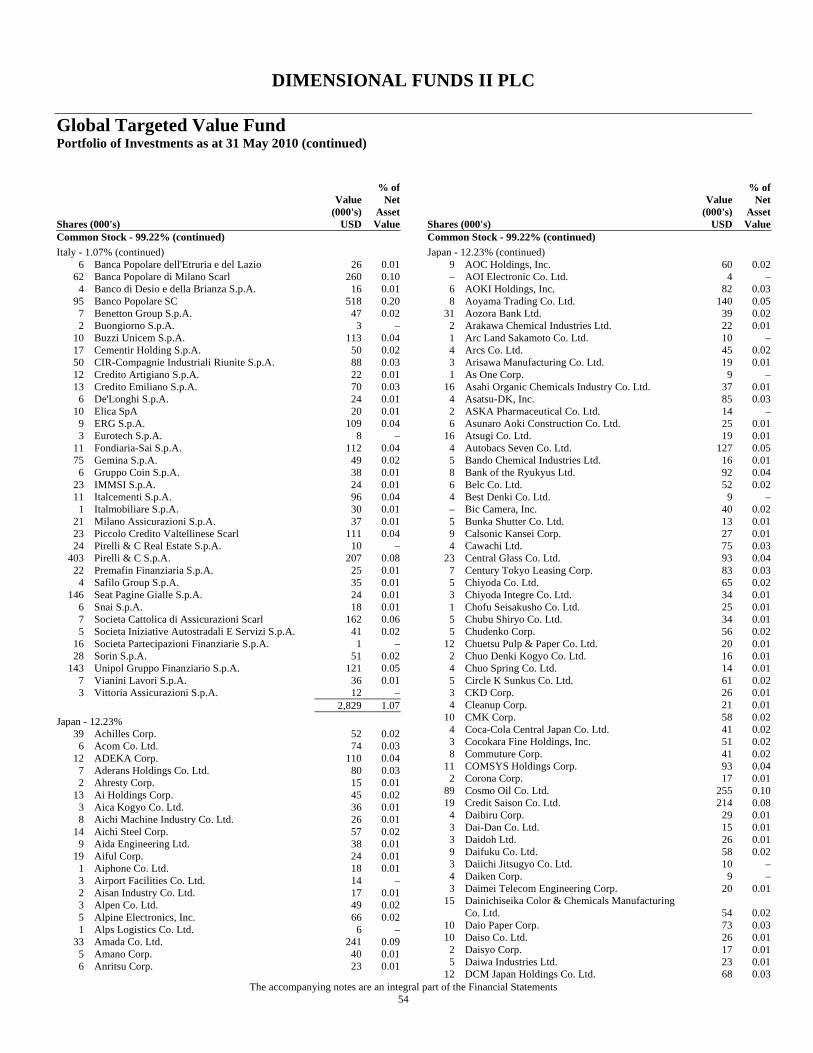
DIMENSIONAL FUNDS II PLC
Global Targeted Value Fund Portfolio of Investments as at 31 May 2010 (continued)
The accompanying notes are an integral part of the Financial Statements 54
Shares (000's)
Value (000's)
USD
% of Net
Asset Value
Common Stock - 99.22% (continued) Italy - 1.07% (continued)
6 Banca Popolare dell'Etruria e del Lazio 26 0.01 62 Banca Popolare di Milano Scarl 260 0.10
4 Banco di Desio e della Brianza S.p.A. 16 0.01 95 Banco Popolare SC 518 0.20
7 Benetton Group S.p.A. 47 0.02 2 Buongiorno S.p.A. 3 –
10 Buzzi Unicem S.p.A. 113 0.04 17 Cementir Holding S.p.A. 50 0.02 50 CIR-Compagnie Industriali Riunite S.p.A. 88 0.03 12 Credito Artigiano S.p.A. 22 0.01 13 Credito Emiliano S.p.A. 70 0.03
6 De'Longhi S.p.A. 24 0.01 10 Elica SpA 20 0.01
9 ERG S.p.A. 109 0.04 3 Eurotech S.p.A. 8 –
11 Fondiaria-Sai S.p.A. 112 0.04 75 Gemina S.p.A. 49 0.02
6 Gruppo Coin S.p.A. 38 0.01 23 IMMSI S.p.A. 24 0.01 11 Italcementi S.p.A. 96 0.04
1 Italmobiliare S.p.A. 30 0.01 21 Milano Assicurazioni S.p.A. 37 0.01 23 Piccolo Credito Valtellinese Scarl 111 0.04 24 Pirelli & C Real Estate S.p.A. 10 –
403 Pirelli & C S.p.A. 207 0.08 22 Premafin Finanziaria S.p.A. 25 0.01
4 Safilo Group S.p.A. 35 0.01 146 Seat Pagine Gialle S.p.A. 24 0.01
6 Snai S.p.A. 18 0.01 7 Societa Cattolica di Assicurazioni Scarl 162 0.06 5 Societa Iniziative Autostradali E Servizi S.p.A. 41 0.02
16 Societa Partecipazioni Finanziarie S.p.A. 1 – 28 Sorin S.p.A. 51 0.02
143 Unipol Gruppo Finanziario S.p.A. 121 0.05 7 Vianini Lavori S.p.A. 36 0.01 3 Vittoria Assicurazioni S.p.A. 12 –
2,829 1.07 Japan - 12.23%
39 Achilles Corp. 52 0.02 6 Acom Co. Ltd. 74 0.03
12 ADEKA Corp. 110 0.04 7 Aderans Holdings Co. Ltd. 80 0.03 2 Ahresty Corp. 15 0.01
13 Ai Holdings Corp. 45 0.02 3 Aica Kogyo Co. Ltd. 36 0.01 8 Aichi Machine Industry Co. Ltd. 26 0.01
14 Aichi Steel Corp. 57 0.02 9 Aida Engineering Ltd. 38 0.01
19 Aiful Corp. 24 0.01 1 Aiphone Co. Ltd. 18 0.01 3 Airport Facilities Co. Ltd. 14 – 2 Aisan Industry Co. Ltd. 17 0.01 3 Alpen Co. Ltd. 49 0.02 5 Alpine Electronics, Inc. 66 0.02 1 Alps Logistics Co. Ltd. 6 –
33 Amada Co. Ltd. 241 0.09 5 Amano Corp. 40 0.01 6 Anritsu Corp. 23 0.01
Shares (000's)
Value (000's)
USD
% of Net
Asset Value
Common Stock - 99.22% (continued) Japan - 12.23% (continued)
9 AOC Holdings, Inc. 60 0.02 – AOI Electronic Co. Ltd. 4 – 6 AOKI Holdings, Inc. 82 0.03 8 Aoyama Trading Co. Ltd. 140 0.05
31 Aozora Bank Ltd. 39 0.02 2 Arakawa Chemical Industries Ltd. 22 0.01 1 Arc Land Sakamoto Co. Ltd. 10 – 4 Arcs Co. Ltd. 45 0.02 3 Arisawa Manufacturing Co. Ltd. 19 0.01 1 As One Corp. 9 –
16 Asahi Organic Chemicals Industry Co. Ltd. 37 0.01 4 Asatsu-DK, Inc. 85 0.03 2 ASKA Pharmaceutical Co. Ltd. 14 – 6 Asunaro Aoki Construction Co. Ltd. 25 0.01
16 Atsugi Co. Ltd. 19 0.01 4 Autobacs Seven Co. Ltd. 127 0.05 5 Bando Chemical Industries Ltd. 16 0.01 8 Bank of the Ryukyus Ltd. 92 0.04 6 Belc Co. Ltd. 52 0.02 4 Best Denki Co. Ltd. 9 – – Bic Camera, Inc. 40 0.02 5 Bunka Shutter Co. Ltd. 13 0.01 9 Calsonic Kansei Corp. 27 0.01 4 Cawachi Ltd. 75 0.03
23 Central Glass Co. Ltd. 93 0.04 7 Century Tokyo Leasing Corp. 83 0.03 5 Chiyoda Co. Ltd. 65 0.02 3 Chiyoda Integre Co. Ltd. 34 0.01 1 Chofu Seisakusho Co. Ltd. 25 0.01 5 Chubu Shiryo Co. Ltd. 34 0.01 5 Chudenko Corp. 56 0.02
12 Chuetsu Pulp & Paper Co. Ltd. 20 0.01 2 Chuo Denki Kogyo Co. Ltd. 16 0.01 4 Chuo Spring Co. Ltd. 14 0.01 5 Circle K Sunkus Co. Ltd. 61 0.02 3 CKD Corp. 26 0.01 4 Cleanup Corp. 21 0.01
10 CMK Corp. 58 0.02 4 Coca-Cola Central Japan Co. Ltd. 41 0.02 3 Cocokara Fine Holdings, Inc. 51 0.02 8 Commuture Corp. 41 0.02
11 COMSYS Holdings Corp. 93 0.04 2 Corona Corp. 17 0.01
89 Cosmo Oil Co. Ltd. 255 0.10 19 Credit Saison Co. Ltd. 214 0.08
4 Daibiru Corp. 29 0.01 3 Dai-Dan Co. Ltd. 15 0.01 3 Daidoh Ltd. 26 0.01 9 Daifuku Co. Ltd. 58 0.02 3 Daiichi Jitsugyo Co. Ltd. 10 – 4 Daiken Corp. 9 – 3 Daimei Telecom Engineering Corp. 20 0.01
15 Dainichiseika Color & Chemicals Manufacturing Co. Ltd. 54 0.02
10 Daio Paper Corp. 73 0.03 10 Daiso Co. Ltd. 26 0.01
2 Daisyo Corp. 17 0.01 5 Daiwa Industries Ltd. 23 0.01
12 DCM Japan Holdings Co. Ltd. 68 0.03
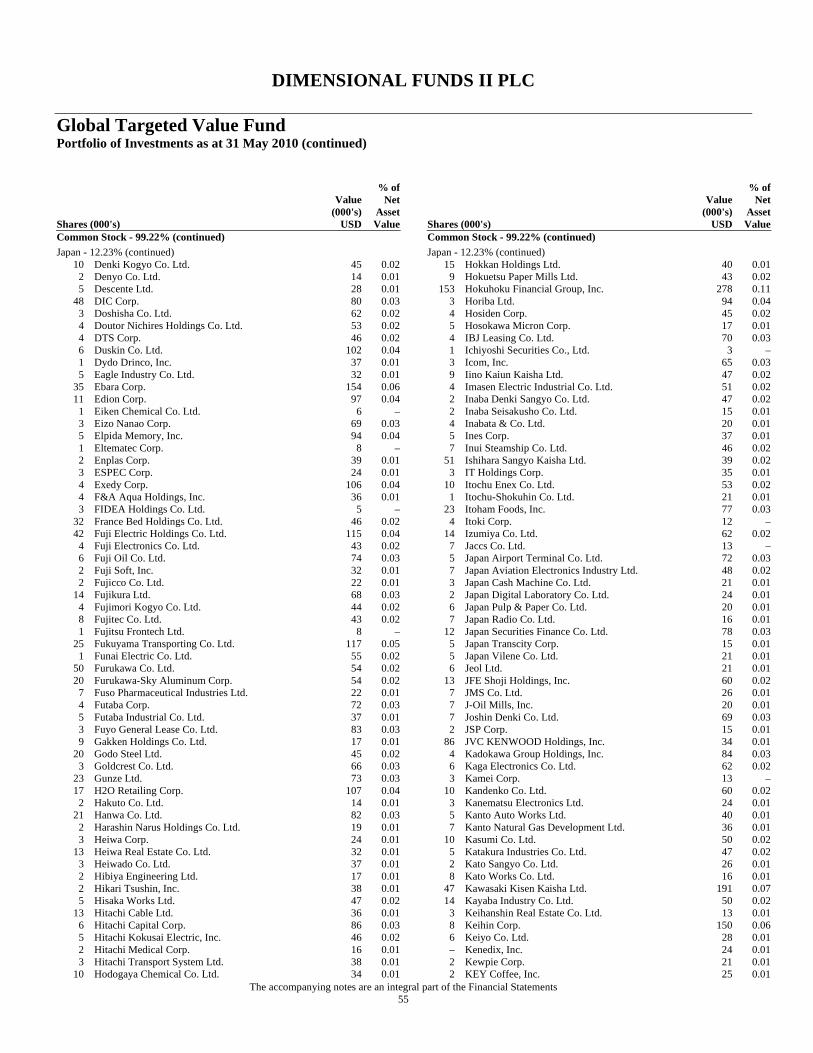
DIMENSIONAL FUNDS II PLC
Global Targeted Value Fund Portfolio of Investments as at 31 May 2010 (continued)
The accompanying notes are an integral part of the Financial Statements 55
Shares (000's)
Value (000's)
USD
% of Net
Asset Value
Common Stock - 99.22% (continued) Japan - 12.23% (continued)
10 Denki Kogyo Co. Ltd. 45 0.02 2 Denyo Co. Ltd. 14 0.01 5 Descente Ltd. 28 0.01
48 DIC Corp. 80 0.03 3 Doshisha Co. Ltd. 62 0.02 4 Doutor Nichires Holdings Co. Ltd. 53 0.02 4 DTS Corp. 46 0.02 6 Duskin Co. Ltd. 102 0.04 1 Dydo Drinco, Inc. 37 0.01 5 Eagle Industry Co. Ltd. 32 0.01
35 Ebara Corp. 154 0.06 11 Edion Corp. 97 0.04
1 Eiken Chemical Co. Ltd. 6 – 3 Eizo Nanao Corp. 69 0.03 5 Elpida Memory, Inc. 94 0.04 1 Eltematec Corp. 8 – 2 Enplas Corp. 39 0.01 3 ESPEC Corp. 24 0.01 4 Exedy Corp. 106 0.04 4 F&A Aqua Holdings, Inc. 36 0.01 3 FIDEA Holdings Co. Ltd. 5 –
32 France Bed Holdings Co. Ltd. 46 0.02 42 Fuji Electric Holdings Co. Ltd. 115 0.04
4 Fuji Electronics Co. Ltd. 43 0.02 6 Fuji Oil Co. Ltd. 74 0.03 2 Fuji Soft, Inc. 32 0.01 2 Fujicco Co. Ltd. 22 0.01
14 Fujikura Ltd. 68 0.03 4 Fujimori Kogyo Co. Ltd. 44 0.02 8 Fujitec Co. Ltd. 43 0.02 1 Fujitsu Frontech Ltd. 8 –
25 Fukuyama Transporting Co. Ltd. 117 0.05 1 Funai Electric Co. Ltd. 55 0.02
50 Furukawa Co. Ltd. 54 0.02 20 Furukawa-Sky Aluminum Corp. 54 0.02
7 Fuso Pharmaceutical Industries Ltd. 22 0.01 4 Futaba Corp. 72 0.03 5 Futaba Industrial Co. Ltd. 37 0.01 3 Fuyo General Lease Co. Ltd. 83 0.03 9 Gakken Holdings Co. Ltd. 17 0.01
20 Godo Steel Ltd. 45 0.02 3 Goldcrest Co. Ltd. 66 0.03
23 Gunze Ltd. 73 0.03 17 H2O Retailing Corp. 107 0.04
2 Hakuto Co. Ltd. 14 0.01 21 Hanwa Co. Ltd. 82 0.03
2 Harashin Narus Holdings Co. Ltd. 19 0.01 3 Heiwa Corp. 24 0.01
13 Heiwa Real Estate Co. Ltd. 32 0.01 3 Heiwado Co. Ltd. 37 0.01 2 Hibiya Engineering Ltd. 17 0.01 2 Hikari Tsushin, Inc. 38 0.01 5 Hisaka Works Ltd. 47 0.02
13 Hitachi Cable Ltd. 36 0.01 6 Hitachi Capital Corp. 86 0.03 5 Hitachi Kokusai Electric, Inc. 46 0.02 2 Hitachi Medical Corp. 16 0.01 3 Hitachi Transport System Ltd. 38 0.01
10 Hodogaya Chemical Co. Ltd. 34 0.01
Shares (000's)
Value (000's)
USD
% of Net
Asset Value
Common Stock - 99.22% (continued) Japan - 12.23% (continued)
15 Hokkan Holdings Ltd. 40 0.01 9 Hokuetsu Paper Mills Ltd. 43 0.02
153 Hokuhoku Financial Group, Inc. 278 0.11 3 Horiba Ltd. 94 0.04 4 Hosiden Corp. 45 0.02 5 Hosokawa Micron Corp. 17 0.01 4 IBJ Leasing Co. Ltd. 70 0.03 1 Ichiyoshi Securities Co., Ltd. 3 – 3 Icom, Inc. 65 0.03 9 Iino Kaiun Kaisha Ltd. 47 0.02 4 Imasen Electric Industrial Co. Ltd. 51 0.02 2 Inaba Denki Sangyo Co. Ltd. 47 0.02 2 Inaba Seisakusho Co. Ltd. 15 0.01 4 Inabata & Co. Ltd. 20 0.01 5 Ines Corp. 37 0.01 7 Inui Steamship Co. Ltd. 46 0.02
51 Ishihara Sangyo Kaisha Ltd. 39 0.02 3 IT Holdings Corp. 35 0.01
10 Itochu Enex Co. Ltd. 53 0.02 1 Itochu-Shokuhin Co. Ltd. 21 0.01
23 Itoham Foods, Inc. 77 0.03 4 Itoki Corp. 12 –
14 Izumiya Co. Ltd. 62 0.02 7 Jaccs Co. Ltd. 13 – 5 Japan Airport Terminal Co. Ltd. 72 0.03 7 Japan Aviation Electronics Industry Ltd. 48 0.02 3 Japan Cash Machine Co. Ltd. 21 0.01 2 Japan Digital Laboratory Co. Ltd. 24 0.01 6 Japan Pulp & Paper Co. Ltd. 20 0.01 7 Japan Radio Co. Ltd. 16 0.01
12 Japan Securities Finance Co. Ltd. 78 0.03 5 Japan Transcity Corp. 15 0.01 5 Japan Vilene Co. Ltd. 21 0.01 6 Jeol Ltd. 21 0.01
13 JFE Shoji Holdings, Inc. 60 0.02 7 JMS Co. Ltd. 26 0.01 7 J-Oil Mills, Inc. 20 0.01 7 Joshin Denki Co. Ltd. 69 0.03 2 JSP Corp. 15 0.01
86 JVC KENWOOD Holdings, Inc. 34 0.01 4 Kadokawa Group Holdings, Inc. 84 0.03 6 Kaga Electronics Co. Ltd. 62 0.02 3 Kamei Corp. 13 –
10 Kandenko Co. Ltd. 60 0.02 3 Kanematsu Electronics Ltd. 24 0.01 5 Kanto Auto Works Ltd. 40 0.01 7 Kanto Natural Gas Development Ltd. 36 0.01
10 Kasumi Co. Ltd. 50 0.02 5 Katakura Industries Co. Ltd. 47 0.02 2 Kato Sangyo Co. Ltd. 26 0.01 8 Kato Works Co. Ltd. 16 0.01
47 Kawasaki Kisen Kaisha Ltd. 191 0.07 14 Kayaba Industry Co. Ltd. 50 0.02
3 Keihanshin Real Estate Co. Ltd. 13 0.01 8 Keihin Corp. 150 0.06 6 Keiyo Co. Ltd. 28 0.01 – Kenedix, Inc. 24 0.01 2 Kewpie Corp. 21 0.01 2 KEY Coffee, Inc. 25 0.01
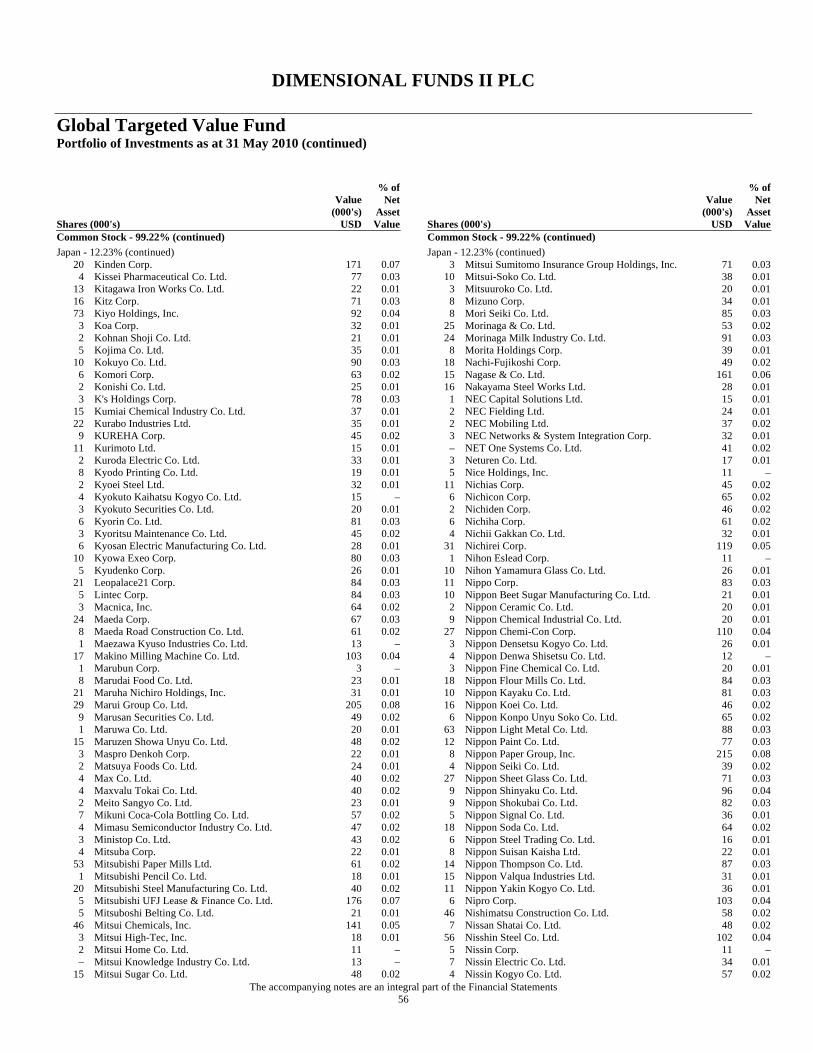
DIMENSIONAL FUNDS II PLC
Global Targeted Value Fund Portfolio of Investments as at 31 May 2010 (continued)
The accompanying notes are an integral part of the Financial Statements 56
Shares (000's)
Value (000's)
USD
% of Net
Asset Value
Common Stock - 99.22% (continued) Japan - 12.23% (continued)
20 Kinden Corp. 171 0.07 4 Kissei Pharmaceutical Co. Ltd. 77 0.03
13 Kitagawa Iron Works Co. Ltd. 22 0.01 16 Kitz Corp. 71 0.03 73 Kiyo Holdings, Inc. 92 0.04
3 Koa Corp. 32 0.01 2 Kohnan Shoji Co. Ltd. 21 0.01 5 Kojima Co. Ltd. 35 0.01
10 Kokuyo Co. Ltd. 90 0.03 6 Komori Corp. 63 0.02 2 Konishi Co. Ltd. 25 0.01 3 K's Holdings Corp. 78 0.03
15 Kumiai Chemical Industry Co. Ltd. 37 0.01 22 Kurabo Industries Ltd. 35 0.01
9 KUREHA Corp. 45 0.02 11 Kurimoto Ltd. 15 0.01
2 Kuroda Electric Co. Ltd. 33 0.01 8 Kyodo Printing Co. Ltd. 19 0.01 2 Kyoei Steel Ltd. 32 0.01 4 Kyokuto Kaihatsu Kogyo Co. Ltd. 15 – 3 Kyokuto Securities Co. Ltd. 20 0.01 6 Kyorin Co. Ltd. 81 0.03 3 Kyoritsu Maintenance Co. Ltd. 45 0.02 6 Kyosan Electric Manufacturing Co. Ltd. 28 0.01
10 Kyowa Exeo Corp. 80 0.03 5 Kyudenko Corp. 26 0.01
21 Leopalace21 Corp. 84 0.03 5 Lintec Corp. 84 0.03 3 Macnica, Inc. 64 0.02
24 Maeda Corp. 67 0.03 8 Maeda Road Construction Co. Ltd. 61 0.02 1 Maezawa Kyuso Industries Co. Ltd. 13 –
17 Makino Milling Machine Co. Ltd. 103 0.04 1 Marubun Corp. 3 – 8 Marudai Food Co. Ltd. 23 0.01
21 Maruha Nichiro Holdings, Inc. 31 0.01 29 Marui Group Co. Ltd. 205 0.08
9 Marusan Securities Co. Ltd. 49 0.02 1 Maruwa Co. Ltd. 20 0.01
15 Maruzen Showa Unyu Co. Ltd. 48 0.02 3 Maspro Denkoh Corp. 22 0.01 2 Matsuya Foods Co. Ltd. 24 0.01 4 Max Co. Ltd. 40 0.02 4 Maxvalu Tokai Co. Ltd. 40 0.02 2 Meito Sangyo Co. Ltd. 23 0.01 7 Mikuni Coca-Cola Bottling Co. Ltd. 57 0.02 4 Mimasu Semiconductor Industry Co. Ltd. 47 0.02 3 Ministop Co. Ltd. 43 0.02 4 Mitsuba Corp. 22 0.01
53 Mitsubishi Paper Mills Ltd. 61 0.02 1 Mitsubishi Pencil Co. Ltd. 18 0.01
20 Mitsubishi Steel Manufacturing Co. Ltd. 40 0.02 5 Mitsubishi UFJ Lease & Finance Co. Ltd. 176 0.07 5 Mitsuboshi Belting Co. Ltd. 21 0.01
46 Mitsui Chemicals, Inc. 141 0.05 3 Mitsui High-Tec, Inc. 18 0.01 2 Mitsui Home Co. Ltd. 11 – – Mitsui Knowledge Industry Co. Ltd. 13 –
15 Mitsui Sugar Co. Ltd. 48 0.02
Shares (000's)
Value (000's)
USD
% of Net
Asset Value
Common Stock - 99.22% (continued) Japan - 12.23% (continued)
3 Mitsui Sumitomo Insurance Group Holdings, Inc. 71 0.03 10 Mitsui-Soko Co. Ltd. 38 0.01
3 Mitsuuroko Co. Ltd. 20 0.01 8 Mizuno Corp. 34 0.01 8 Mori Seiki Co. Ltd. 85 0.03
25 Morinaga & Co. Ltd. 53 0.02 24 Morinaga Milk Industry Co. Ltd. 91 0.03
8 Morita Holdings Corp. 39 0.01 18 Nachi-Fujikoshi Corp. 49 0.02 15 Nagase & Co. Ltd. 161 0.06 16 Nakayama Steel Works Ltd. 28 0.01
1 NEC Capital Solutions Ltd. 15 0.01 2 NEC Fielding Ltd. 24 0.01 2 NEC Mobiling Ltd. 37 0.02 3 NEC Networks & System Integration Corp. 32 0.01 – NET One Systems Co. Ltd. 41 0.02 3 Neturen Co. Ltd. 17 0.01 5 Nice Holdings, Inc. 11 –
11 Nichias Corp. 45 0.02 6 Nichicon Corp. 65 0.02 2 Nichiden Corp. 46 0.02 6 Nichiha Corp. 61 0.02 4 Nichii Gakkan Co. Ltd. 32 0.01
31 Nichirei Corp. 119 0.05 1 Nihon Eslead Corp. 11 –
10 Nihon Yamamura Glass Co. Ltd. 26 0.01 11 Nippo Corp. 83 0.03 10 Nippon Beet Sugar Manufacturing Co. Ltd. 21 0.01
2 Nippon Ceramic Co. Ltd. 20 0.01 9 Nippon Chemical Industrial Co. Ltd. 20 0.01
27 Nippon Chemi-Con Corp. 110 0.04 3 Nippon Densetsu Kogyo Co. Ltd. 26 0.01 4 Nippon Denwa Shisetsu Co. Ltd. 12 – 3 Nippon Fine Chemical Co. Ltd. 20 0.01
18 Nippon Flour Mills Co. Ltd. 84 0.03 10 Nippon Kayaku Co. Ltd. 81 0.03 16 Nippon Koei Co. Ltd. 46 0.02
6 Nippon Konpo Unyu Soko Co. Ltd. 65 0.02 63 Nippon Light Metal Co. Ltd. 88 0.03 12 Nippon Paint Co. Ltd. 77 0.03
8 Nippon Paper Group, Inc. 215 0.08 4 Nippon Seiki Co. Ltd. 39 0.02
27 Nippon Sheet Glass Co. Ltd. 71 0.03 9 Nippon Shinyaku Co. Ltd. 96 0.04 9 Nippon Shokubai Co. Ltd. 82 0.03 5 Nippon Signal Co. Ltd. 36 0.01
18 Nippon Soda Co. Ltd. 64 0.02 6 Nippon Steel Trading Co. Ltd. 16 0.01 8 Nippon Suisan Kaisha Ltd. 22 0.01
14 Nippon Thompson Co. Ltd. 87 0.03 15 Nippon Valqua Industries Ltd. 31 0.01 11 Nippon Yakin Kogyo Co. Ltd. 36 0.01
6 Nipro Corp. 103 0.04 46 Nishimatsu Construction Co. Ltd. 58 0.02
7 Nissan Shatai Co. Ltd. 48 0.02 56 Nisshin Steel Co. Ltd. 102 0.04
5 Nissin Corp. 11 – 7 Nissin Electric Co. Ltd. 34 0.01 4 Nissin Kogyo Co. Ltd. 57 0.02
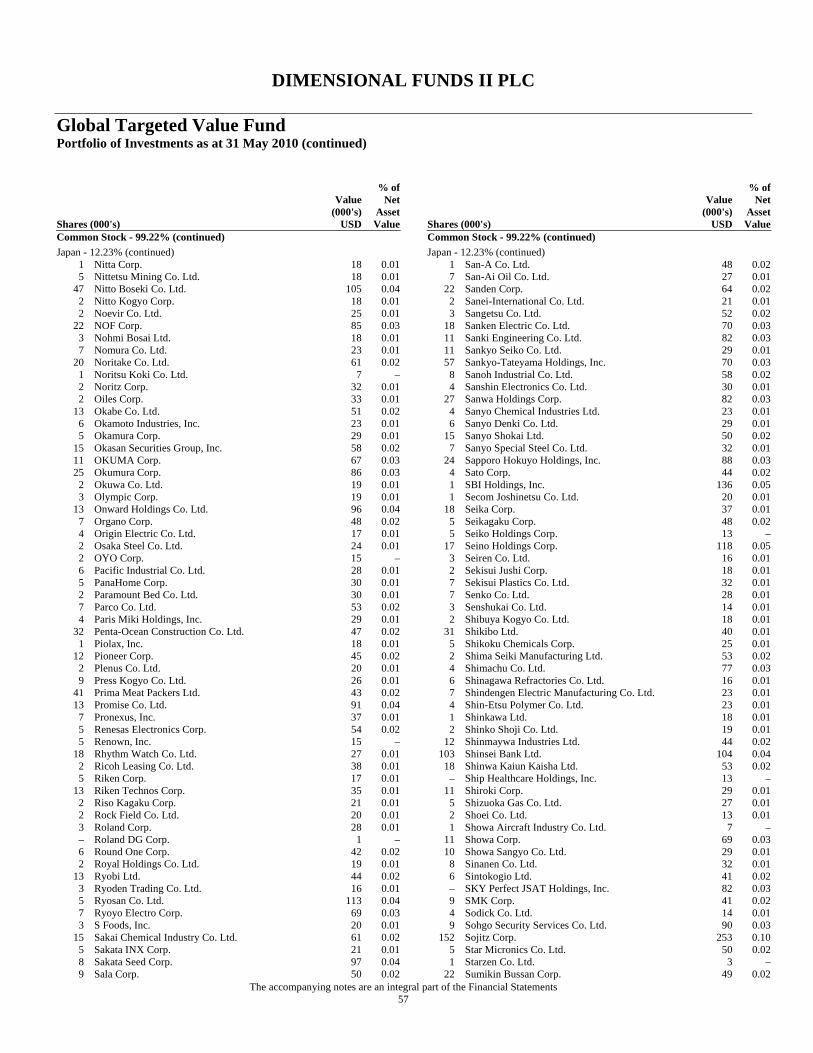
DIMENSIONAL FUNDS II PLC
Global Targeted Value Fund Portfolio of Investments as at 31 May 2010 (continued)
The accompanying notes are an integral part of the Financial Statements 57
Shares (000's)
Value (000's)
USD
% of Net
Asset Value
Common Stock - 99.22% (continued) Japan - 12.23% (continued)
1 Nitta Corp. 18 0.01 5 Nittetsu Mining Co. Ltd. 18 0.01
47 Nitto Boseki Co. Ltd. 105 0.04 2 Nitto Kogyo Corp. 18 0.01 2 Noevir Co. Ltd. 25 0.01
22 NOF Corp. 85 0.03 3 Nohmi Bosai Ltd. 18 0.01 7 Nomura Co. Ltd. 23 0.01
20 Noritake Co. Ltd. 61 0.02 1 Noritsu Koki Co. Ltd. 7 – 2 Noritz Corp. 32 0.01 2 Oiles Corp. 33 0.01
13 Okabe Co. Ltd. 51 0.02 6 Okamoto Industries, Inc. 23 0.01 5 Okamura Corp. 29 0.01
15 Okasan Securities Group, Inc. 58 0.02 11 OKUMA Corp. 67 0.03 25 Okumura Corp. 86 0.03
2 Okuwa Co. Ltd. 19 0.01 3 Olympic Corp. 19 0.01
13 Onward Holdings Co. Ltd. 96 0.04 7 Organo Corp. 48 0.02 4 Origin Electric Co. Ltd. 17 0.01 2 Osaka Steel Co. Ltd. 24 0.01 2 OYO Corp. 15 – 6 Pacific Industrial Co. Ltd. 28 0.01 5 PanaHome Corp. 30 0.01 2 Paramount Bed Co. Ltd. 30 0.01 7 Parco Co. Ltd. 53 0.02 4 Paris Miki Holdings, Inc. 29 0.01
32 Penta-Ocean Construction Co. Ltd. 47 0.02 1 Piolax, Inc. 18 0.01
12 Pioneer Corp. 45 0.02 2 Plenus Co. Ltd. 20 0.01 9 Press Kogyo Co. Ltd. 26 0.01
41 Prima Meat Packers Ltd. 43 0.02 13 Promise Co. Ltd. 91 0.04
7 Pronexus, Inc. 37 0.01 5 Renesas Electronics Corp. 54 0.02 5 Renown, Inc. 15 –
18 Rhythm Watch Co. Ltd. 27 0.01 2 Ricoh Leasing Co. Ltd. 38 0.01 5 Riken Corp. 17 0.01
13 Riken Technos Corp. 35 0.01 2 Riso Kagaku Corp. 21 0.01 2 Rock Field Co. Ltd. 20 0.01 3 Roland Corp. 28 0.01 – Roland DG Corp. 1 – 6 Round One Corp. 42 0.02 2 Royal Holdings Co. Ltd. 19 0.01
13 Ryobi Ltd. 44 0.02 3 Ryoden Trading Co. Ltd. 16 0.01 5 Ryosan Co. Ltd. 113 0.04 7 Ryoyo Electro Corp. 69 0.03 3 S Foods, Inc. 20 0.01
15 Sakai Chemical Industry Co. Ltd. 61 0.02 5 Sakata INX Corp. 21 0.01 8 Sakata Seed Corp. 97 0.04 9 Sala Corp. 50 0.02
Shares (000's)
Value (000's)
USD
% of Net
Asset Value
Common Stock - 99.22% (continued) Japan - 12.23% (continued)
1 San-A Co. Ltd. 48 0.02 7 San-Ai Oil Co. Ltd. 27 0.01
22 Sanden Corp. 64 0.02 2 Sanei-International Co. Ltd. 21 0.01 3 Sangetsu Co. Ltd. 52 0.02
18 Sanken Electric Co. Ltd. 70 0.03 11 Sanki Engineering Co. Ltd. 82 0.03 11 Sankyo Seiko Co. Ltd. 29 0.01 57 Sankyo-Tateyama Holdings, Inc. 70 0.03
8 Sanoh Industrial Co. Ltd. 58 0.02 4 Sanshin Electronics Co. Ltd. 30 0.01
27 Sanwa Holdings Corp. 82 0.03 4 Sanyo Chemical Industries Ltd. 23 0.01 6 Sanyo Denki Co. Ltd. 29 0.01
15 Sanyo Shokai Ltd. 50 0.02 7 Sanyo Special Steel Co. Ltd. 32 0.01
24 Sapporo Hokuyo Holdings, Inc. 88 0.03 4 Sato Corp. 44 0.02 1 SBI Holdings, Inc. 136 0.05 1 Secom Joshinetsu Co. Ltd. 20 0.01
18 Seika Corp. 37 0.01 5 Seikagaku Corp. 48 0.02 5 Seiko Holdings Corp. 13 –
17 Seino Holdings Corp. 118 0.05 3 Seiren Co. Ltd. 16 0.01 2 Sekisui Jushi Corp. 18 0.01 7 Sekisui Plastics Co. Ltd. 32 0.01 7 Senko Co. Ltd. 28 0.01 3 Senshukai Co. Ltd. 14 0.01 2 Shibuya Kogyo Co. Ltd. 18 0.01
31 Shikibo Ltd. 40 0.01 5 Shikoku Chemicals Corp. 25 0.01 2 Shima Seiki Manufacturing Ltd. 53 0.02 4 Shimachu Co. Ltd. 77 0.03 6 Shinagawa Refractories Co. Ltd. 16 0.01 7 Shindengen Electric Manufacturing Co. Ltd. 23 0.01 4 Shin-Etsu Polymer Co. Ltd. 23 0.01 1 Shinkawa Ltd. 18 0.01 2 Shinko Shoji Co. Ltd. 19 0.01
12 Shinmaywa Industries Ltd. 44 0.02 103 Shinsei Bank Ltd. 104 0.04
18 Shinwa Kaiun Kaisha Ltd. 53 0.02 – Ship Healthcare Holdings, Inc. 13 –
11 Shiroki Corp. 29 0.01 5 Shizuoka Gas Co. Ltd. 27 0.01 2 Shoei Co. Ltd. 13 0.01 1 Showa Aircraft Industry Co. Ltd. 7 –
11 Showa Corp. 69 0.03 10 Showa Sangyo Co. Ltd. 29 0.01
8 Sinanen Co. Ltd. 32 0.01 6 Sintokogio Ltd. 41 0.02 – SKY Perfect JSAT Holdings, Inc. 82 0.03 9 SMK Corp. 41 0.02 4 Sodick Co. Ltd. 14 0.01 9 Sohgo Security Services Co. Ltd. 90 0.03
152 Sojitz Corp. 253 0.10 5 Star Micronics Co. Ltd. 50 0.02 1 Starzen Co. Ltd. 3 –
22 Sumikin Bussan Corp. 49 0.02
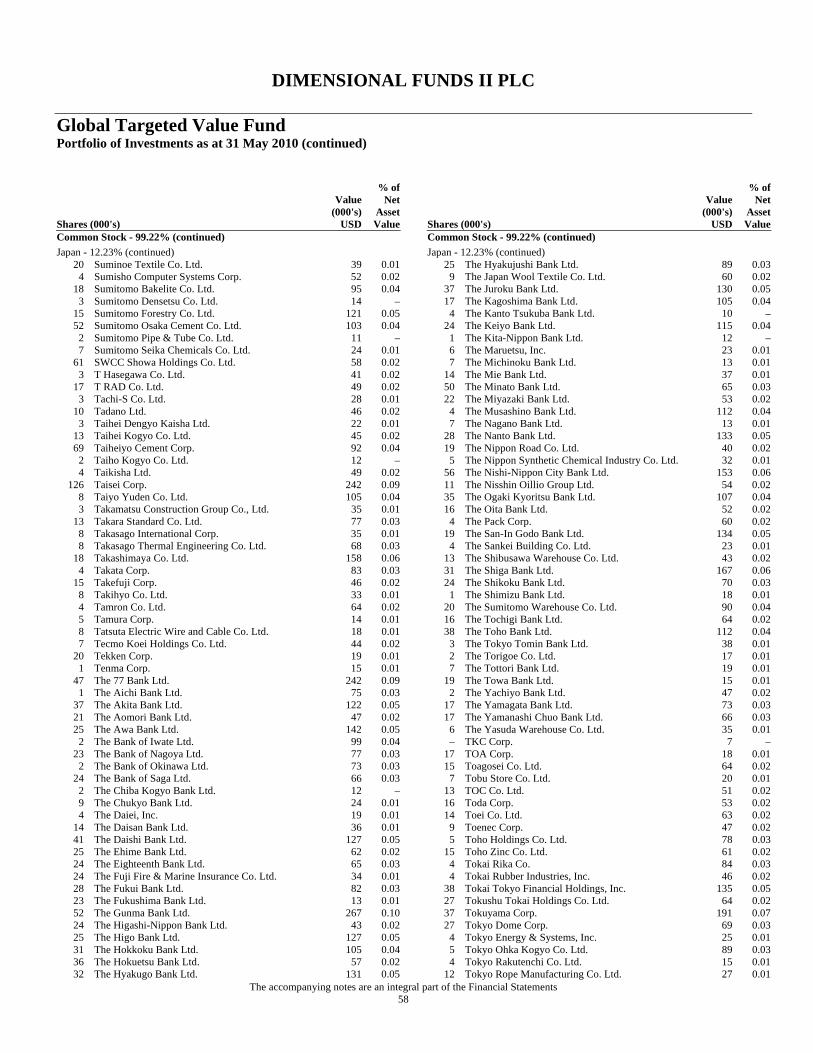
DIMENSIONAL FUNDS II PLC
Global Targeted Value Fund Portfolio of Investments as at 31 May 2010 (continued)
The accompanying notes are an integral part of the Financial Statements 58
Shares (000's)
Value (000's)
USD
% of Net
Asset Value
Common Stock - 99.22% (continued) Japan - 12.23% (continued)
20 Suminoe Textile Co. Ltd. 39 0.01 4 Sumisho Computer Systems Corp. 52 0.02
18 Sumitomo Bakelite Co. Ltd. 95 0.04 3 Sumitomo Densetsu Co. Ltd. 14 –
15 Sumitomo Forestry Co. Ltd. 121 0.05 52 Sumitomo Osaka Cement Co. Ltd. 103 0.04
2 Sumitomo Pipe & Tube Co. Ltd. 11 – 7 Sumitomo Seika Chemicals Co. Ltd. 24 0.01
61 SWCC Showa Holdings Co. Ltd. 58 0.02 3 T Hasegawa Co. Ltd. 41 0.02
17 T RAD Co. Ltd. 49 0.02 3 Tachi-S Co. Ltd. 28 0.01
10 Tadano Ltd. 46 0.02 3 Taihei Dengyo Kaisha Ltd. 22 0.01
13 Taihei Kogyo Co. Ltd. 45 0.02 69 Taiheiyo Cement Corp. 92 0.04
2 Taiho Kogyo Co. Ltd. 12 – 4 Taikisha Ltd. 49 0.02
126 Taisei Corp. 242 0.09 8 Taiyo Yuden Co. Ltd. 105 0.04 3 Takamatsu Construction Group Co., Ltd. 35 0.01
13 Takara Standard Co. Ltd. 77 0.03 8 Takasago International Corp. 35 0.01 8 Takasago Thermal Engineering Co. Ltd. 68 0.03
18 Takashimaya Co. Ltd. 158 0.06 4 Takata Corp. 83 0.03
15 Takefuji Corp. 46 0.02 8 Takihyo Co. Ltd. 33 0.01 4 Tamron Co. Ltd. 64 0.02 5 Tamura Corp. 14 0.01 8 Tatsuta Electric Wire and Cable Co. Ltd. 18 0.01 7 Tecmo Koei Holdings Co. Ltd. 44 0.02
20 Tekken Corp. 19 0.01 1 Tenma Corp. 15 0.01
47 The 77 Bank Ltd. 242 0.09 1 The Aichi Bank Ltd. 75 0.03
37 The Akita Bank Ltd. 122 0.05 21 The Aomori Bank Ltd. 47 0.02 25 The Awa Bank Ltd. 142 0.05
2 The Bank of Iwate Ltd. 99 0.04 23 The Bank of Nagoya Ltd. 77 0.03
2 The Bank of Okinawa Ltd. 73 0.03 24 The Bank of Saga Ltd. 66 0.03
2 The Chiba Kogyo Bank Ltd. 12 – 9 The Chukyo Bank Ltd. 24 0.01 4 The Daiei, Inc. 19 0.01
14 The Daisan Bank Ltd. 36 0.01 41 The Daishi Bank Ltd. 127 0.05 25 The Ehime Bank Ltd. 62 0.02 24 The Eighteenth Bank Ltd. 65 0.03 24 The Fuji Fire & Marine Insurance Co. Ltd. 34 0.01 28 The Fukui Bank Ltd. 82 0.03 23 The Fukushima Bank Ltd. 13 0.01 52 The Gunma Bank Ltd. 267 0.10 24 The Higashi-Nippon Bank Ltd. 43 0.02 25 The Higo Bank Ltd. 127 0.05 31 The Hokkoku Bank Ltd. 105 0.04 36 The Hokuetsu Bank Ltd. 57 0.02 32 The Hyakugo Bank Ltd. 131 0.05
Shares (000's)
Value (000's)
USD
% of Net
Asset Value
Common Stock - 99.22% (continued) Japan - 12.23% (continued)
25 The Hyakujushi Bank Ltd. 89 0.03 9 The Japan Wool Textile Co. Ltd. 60 0.02
37 The Juroku Bank Ltd. 130 0.05 17 The Kagoshima Bank Ltd. 105 0.04
4 The Kanto Tsukuba Bank Ltd. 10 – 24 The Keiyo Bank Ltd. 115 0.04
1 The Kita-Nippon Bank Ltd. 12 – 6 The Maruetsu, Inc. 23 0.01 7 The Michinoku Bank Ltd. 13 0.01
14 The Mie Bank Ltd. 37 0.01 50 The Minato Bank Ltd. 65 0.03 22 The Miyazaki Bank Ltd. 53 0.02
4 The Musashino Bank Ltd. 112 0.04 7 The Nagano Bank Ltd. 13 0.01
28 The Nanto Bank Ltd. 133 0.05 19 The Nippon Road Co. Ltd. 40 0.02
5 The Nippon Synthetic Chemical Industry Co. Ltd. 32 0.01 56 The Nishi-Nippon City Bank Ltd. 153 0.06 11 The Nisshin Oillio Group Ltd. 54 0.02 35 The Ogaki Kyoritsu Bank Ltd. 107 0.04 16 The Oita Bank Ltd. 52 0.02
4 The Pack Corp. 60 0.02 19 The San-In Godo Bank Ltd. 134 0.05
4 The Sankei Building Co. Ltd. 23 0.01 13 The Shibusawa Warehouse Co. Ltd. 43 0.02 31 The Shiga Bank Ltd. 167 0.06 24 The Shikoku Bank Ltd. 70 0.03
1 The Shimizu Bank Ltd. 18 0.01 20 The Sumitomo Warehouse Co. Ltd. 90 0.04 16 The Tochigi Bank Ltd. 64 0.02 38 The Toho Bank Ltd. 112 0.04
3 The Tokyo Tomin Bank Ltd. 38 0.01 2 The Torigoe Co. Ltd. 17 0.01 7 The Tottori Bank Ltd. 19 0.01
19 The Towa Bank Ltd. 15 0.01 2 The Yachiyo Bank Ltd. 47 0.02
17 The Yamagata Bank Ltd. 73 0.03 17 The Yamanashi Chuo Bank Ltd. 66 0.03
6 The Yasuda Warehouse Co. Ltd. 35 0.01 – TKC Corp. 7 –
17 TOA Corp. 18 0.01 15 Toagosei Co. Ltd. 64 0.02
7 Tobu Store Co. Ltd. 20 0.01 13 TOC Co. Ltd. 51 0.02 16 Toda Corp. 53 0.02 14 Toei Co. Ltd. 63 0.02
9 Toenec Corp. 47 0.02 5 Toho Holdings Co. Ltd. 78 0.03
15 Toho Zinc Co. Ltd. 61 0.02 4 Tokai Rika Co. 84 0.03 4 Tokai Rubber Industries, Inc. 46 0.02
38 Tokai Tokyo Financial Holdings, Inc. 135 0.05 27 Tokushu Tokai Holdings Co. Ltd. 64 0.02 37 Tokuyama Corp. 191 0.07 27 Tokyo Dome Corp. 69 0.03
4 Tokyo Energy & Systems, Inc. 25 0.01 5 Tokyo Ohka Kogyo Co. Ltd. 89 0.03 4 Tokyo Rakutenchi Co. Ltd. 15 0.01
12 Tokyo Rope Manufacturing Co. Ltd. 27 0.01
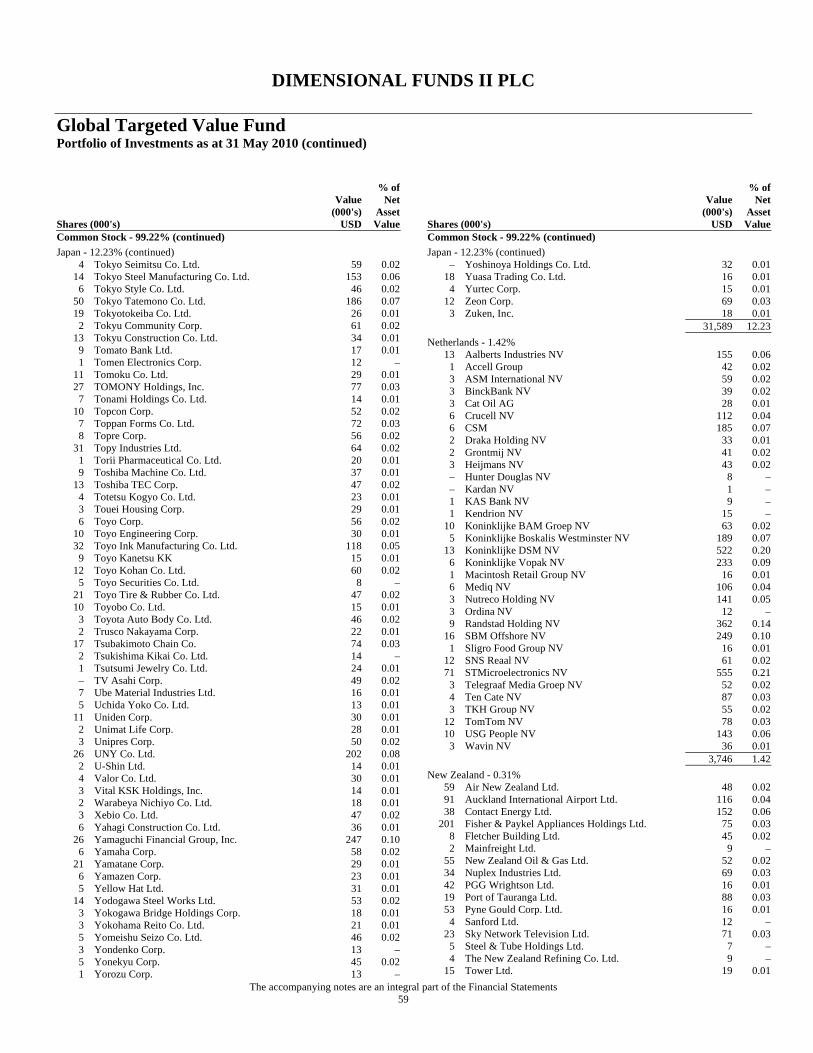
DIMENSIONAL FUNDS II PLC
Global Targeted Value Fund Portfolio of Investments as at 31 May 2010 (continued)
The accompanying notes are an integral part of the Financial Statements 59
Shares (000's)
Value (000's)
USD
% of Net
Asset Value
Common Stock - 99.22% (continued) Japan - 12.23% (continued)
4 Tokyo Seimitsu Co. Ltd. 59 0.02 14 Tokyo Steel Manufacturing Co. Ltd. 153 0.06
6 Tokyo Style Co. Ltd. 46 0.02 50 Tokyo Tatemono Co. Ltd. 186 0.07 19 Tokyotokeiba Co. Ltd. 26 0.01
2 Tokyu Community Corp. 61 0.02 13 Tokyu Construction Co. Ltd. 34 0.01
9 Tomato Bank Ltd. 17 0.01 1 Tomen Electronics Corp. 12 –
11 Tomoku Co. Ltd. 29 0.01 27 TOMONY Holdings, Inc. 77 0.03
7 Tonami Holdings Co. Ltd. 14 0.01 10 Topcon Corp. 52 0.02
7 Toppan Forms Co. Ltd. 72 0.03 8 Topre Corp. 56 0.02
31 Topy Industries Ltd. 64 0.02 1 Torii Pharmaceutical Co. Ltd. 20 0.01 9 Toshiba Machine Co. Ltd. 37 0.01
13 Toshiba TEC Corp. 47 0.02 4 Totetsu Kogyo Co. Ltd. 23 0.01 3 Touei Housing Corp. 29 0.01 6 Toyo Corp. 56 0.02
10 Toyo Engineering Corp. 30 0.01 32 Toyo Ink Manufacturing Co. Ltd. 118 0.05
9 Toyo Kanetsu KK 15 0.01 12 Toyo Kohan Co. Ltd. 60 0.02
5 Toyo Securities Co. Ltd. 8 – 21 Toyo Tire & Rubber Co. Ltd. 47 0.02 10 Toyobo Co. Ltd. 15 0.01
3 Toyota Auto Body Co. Ltd. 46 0.02 2 Trusco Nakayama Corp. 22 0.01
17 Tsubakimoto Chain Co. 74 0.03 2 Tsukishima Kikai Co. Ltd. 14 – 1 Tsutsumi Jewelry Co. Ltd. 24 0.01 – TV Asahi Corp. 49 0.02 7 Ube Material Industries Ltd. 16 0.01 5 Uchida Yoko Co. Ltd. 13 0.01
11 Uniden Corp. 30 0.01 2 Unimat Life Corp. 28 0.01 3 Unipres Corp. 50 0.02
26 UNY Co. Ltd. 202 0.08 2 U-Shin Ltd. 14 0.01 4 Valor Co. Ltd. 30 0.01 3 Vital KSK Holdings, Inc. 14 0.01 2 Warabeya Nichiyo Co. Ltd. 18 0.01 3 Xebio Co. Ltd. 47 0.02 6 Yahagi Construction Co. Ltd. 36 0.01
26 Yamaguchi Financial Group, Inc. 247 0.10 6 Yamaha Corp. 58 0.02
21 Yamatane Corp. 29 0.01 6 Yamazen Corp. 23 0.01 5 Yellow Hat Ltd. 31 0.01
14 Yodogawa Steel Works Ltd. 53 0.02 3 Yokogawa Bridge Holdings Corp. 18 0.01 3 Yokohama Reito Co. Ltd. 21 0.01 5 Yomeishu Seizo Co. Ltd. 46 0.02 3 Yondenko Corp. 13 – 5 Yonekyu Corp. 45 0.02 1 Yorozu Corp. 13 –
Shares (000's)
Value (000's)
USD
% of Net
Asset Value
Common Stock - 99.22% (continued) Japan - 12.23% (continued)
– Yoshinoya Holdings Co. Ltd. 32 0.01 18 Yuasa Trading Co. Ltd. 16 0.01
4 Yurtec Corp. 15 0.01 12 Zeon Corp. 69 0.03
3 Zuken, Inc. 18 0.01 31,589 12.23 Netherlands - 1.42%
13 Aalberts Industries NV 155 0.06 1 Accell Group 42 0.02 3 ASM International NV 59 0.02 3 BinckBank NV 39 0.02 3 Cat Oil AG 28 0.01 6 Crucell NV 112 0.04 6 CSM 185 0.07 2 Draka Holding NV 33 0.01 2 Grontmij NV 41 0.02 3 Heijmans NV 43 0.02 – Hunter Douglas NV 8 – – Kardan NV 1 – 1 KAS Bank NV 9 – 1 Kendrion NV 15 –
10 Koninklijke BAM Groep NV 63 0.02 5 Koninklijke Boskalis Westminster NV 189 0.07
13 Koninklijke DSM NV 522 0.20 6 Koninklijke Vopak NV 233 0.09 1 Macintosh Retail Group NV 16 0.01 6 Mediq NV 106 0.04 3 Nutreco Holding NV 141 0.05 3 Ordina NV 12 – 9 Randstad Holding NV 362 0.14
16 SBM Offshore NV 249 0.10 1 Sligro Food Group NV 16 0.01
12 SNS Reaal NV 61 0.02 71 STMicroelectronics NV 555 0.21
3 Telegraaf Media Groep NV 52 0.02 4 Ten Cate NV 87 0.03 3 TKH Group NV 55 0.02
12 TomTom NV 78 0.03 10 USG People NV 143 0.06
3 Wavin NV 36 0.01 3,746 1.42 New Zealand - 0.31%
59 Air New Zealand Ltd. 48 0.02 91 Auckland International Airport Ltd. 116 0.04 38 Contact Energy Ltd. 152 0.06
201 Fisher & Paykel Appliances Holdings Ltd. 75 0.03 8 Fletcher Building Ltd. 45 0.02 2 Mainfreight Ltd. 9 –
55 New Zealand Oil & Gas Ltd. 52 0.02 34 Nuplex Industries Ltd. 69 0.03 42 PGG Wrightson Ltd. 16 0.01 19 Port of Tauranga Ltd. 88 0.03 53 Pyne Gould Corp. Ltd. 16 0.01
4 Sanford Ltd. 12 – 23 Sky Network Television Ltd. 71 0.03
5 Steel & Tube Holdings Ltd. 7 – 4 The New Zealand Refining Co. Ltd. 9 –
15 Tower Ltd. 19 0.01
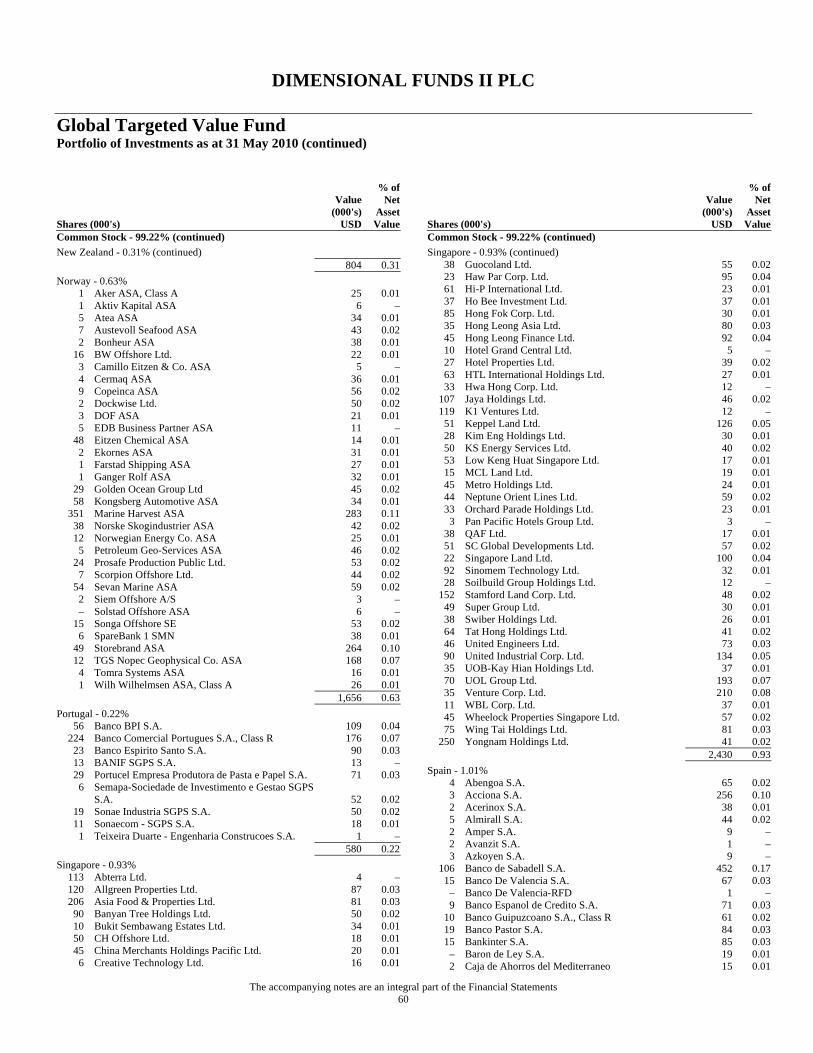
DIMENSIONAL FUNDS II PLC
Global Targeted Value Fund Portfolio of Investments as at 31 May 2010 (continued)
The accompanying notes are an integral part of the Financial Statements 60
Shares (000's)
Value (000's)
USD
% of Net
Asset Value
Common Stock - 99.22% (continued) New Zealand - 0.31% (continued) 804 0.31 Norway - 0.63%
1 Aker ASA, Class A 25 0.01 1 Aktiv Kapital ASA 6 – 5 Atea ASA 34 0.01 7 Austevoll Seafood ASA 43 0.02 2 Bonheur ASA 38 0.01
16 BW Offshore Ltd. 22 0.01 3 Camillo Eitzen & Co. ASA 5 – 4 Cermaq ASA 36 0.01 9 Copeinca ASA 56 0.02 2 Dockwise Ltd. 50 0.02 3 DOF ASA 21 0.01 5 EDB Business Partner ASA 11 –
48 Eitzen Chemical ASA 14 0.01 2 Ekornes ASA 31 0.01 1 Farstad Shipping ASA 27 0.01 1 Ganger Rolf ASA 32 0.01
29 Golden Ocean Group Ltd 45 0.02 58 Kongsberg Automotive ASA 34 0.01
351 Marine Harvest ASA 283 0.11 38 Norske Skogindustrier ASA 42 0.02 12 Norwegian Energy Co. ASA 25 0.01
5 Petroleum Geo-Services ASA 46 0.02 24 Prosafe Production Public Ltd. 53 0.02
7 Scorpion Offshore Ltd. 44 0.02 54 Sevan Marine ASA 59 0.02
2 Siem Offshore A/S 3 – – Solstad Offshore ASA 6 –
15 Songa Offshore SE 53 0.02 6 SpareBank 1 SMN 38 0.01
49 Storebrand ASA 264 0.10 12 TGS Nopec Geophysical Co. ASA 168 0.07
4 Tomra Systems ASA 16 0.01 1 Wilh Wilhelmsen ASA, Class A 26 0.01
1,656 0.63 Portugal - 0.22%
56 Banco BPI S.A. 109 0.04 224 Banco Comercial Portugues S.A., Class R 176 0.07
23 Banco Espirito Santo S.A. 90 0.03 13 BANIF SGPS S.A. 13 – 29 Portucel Empresa Produtora de Pasta e Papel S.A. 71 0.03
6 Semapa-Sociedade de Investimento e Gestao SGPS S.A. 52 0.02
19 Sonae Industria SGPS S.A. 50 0.02 11 Sonaecom - SGPS S.A. 18 0.01
1 Teixeira Duarte - Engenharia Construcoes S.A. 1 – 580 0.22 Singapore - 0.93%
113 Abterra Ltd. 4 – 120 Allgreen Properties Ltd. 87 0.03 206 Asia Food & Properties Ltd. 81 0.03
90 Banyan Tree Holdings Ltd. 50 0.02 10 Bukit Sembawang Estates Ltd. 34 0.01 50 CH Offshore Ltd. 18 0.01 45 China Merchants Holdings Pacific Ltd. 20 0.01
6 Creative Technology Ltd. 16 0.01
Shares (000's)
Value (000's)
USD
% of Net
Asset Value
Common Stock - 99.22% (continued) Singapore - 0.93% (continued)
38 Guocoland Ltd. 55 0.02 23 Haw Par Corp. Ltd. 95 0.04 61 Hi-P International Ltd. 23 0.01 37 Ho Bee Investment Ltd. 37 0.01 85 Hong Fok Corp. Ltd. 30 0.01 35 Hong Leong Asia Ltd. 80 0.03 45 Hong Leong Finance Ltd. 92 0.04 10 Hotel Grand Central Ltd. 5 – 27 Hotel Properties Ltd. 39 0.02 63 HTL International Holdings Ltd. 27 0.01 33 Hwa Hong Corp. Ltd. 12 –
107 Jaya Holdings Ltd. 46 0.02 119 K1 Ventures Ltd. 12 –
51 Keppel Land Ltd. 126 0.05 28 Kim Eng Holdings Ltd. 30 0.01 50 KS Energy Services Ltd. 40 0.02 53 Low Keng Huat Singapore Ltd. 17 0.01 15 MCL Land Ltd. 19 0.01 45 Metro Holdings Ltd. 24 0.01 44 Neptune Orient Lines Ltd. 59 0.02 33 Orchard Parade Holdings Ltd. 23 0.01
3 Pan Pacific Hotels Group Ltd. 3 – 38 QAF Ltd. 17 0.01 51 SC Global Developments Ltd. 57 0.02 22 Singapore Land Ltd. 100 0.04 92 Sinomem Technology Ltd. 32 0.01 28 Soilbuild Group Holdings Ltd. 12 –
152 Stamford Land Corp. Ltd. 48 0.02 49 Super Group Ltd. 30 0.01 38 Swiber Holdings Ltd. 26 0.01 64 Tat Hong Holdings Ltd. 41 0.02 46 United Engineers Ltd. 73 0.03 90 United Industrial Corp. Ltd. 134 0.05 35 UOB-Kay Hian Holdings Ltd. 37 0.01 70 UOL Group Ltd. 193 0.07 35 Venture Corp. Ltd. 210 0.08 11 WBL Corp. Ltd. 37 0.01 45 Wheelock Properties Singapore Ltd. 57 0.02 75 Wing Tai Holdings Ltd. 81 0.03
250 Yongnam Holdings Ltd. 41 0.02 2,430 0.93 Spain - 1.01%
4 Abengoa S.A. 65 0.02 3 Acciona S.A. 256 0.10 2 Acerinox S.A. 38 0.01 5 Almirall S.A. 44 0.02 2 Amper S.A. 9 – 2 Avanzit S.A. 1 – 3 Azkoyen S.A. 9 –
106 Banco de Sabadell S.A. 452 0.17 15 Banco De Valencia S.A. 67 0.03
– Banco De Valencia-RFD 1 – 9 Banco Espanol de Credito S.A. 71 0.03
10 Banco Guipuzcoano S.A., Class R 61 0.02 19 Banco Pastor S.A. 84 0.03 15 Bankinter S.A. 85 0.03
– Baron de Ley S.A. 19 0.01 2 Caja de Ahorros del Mediterraneo 15 0.01
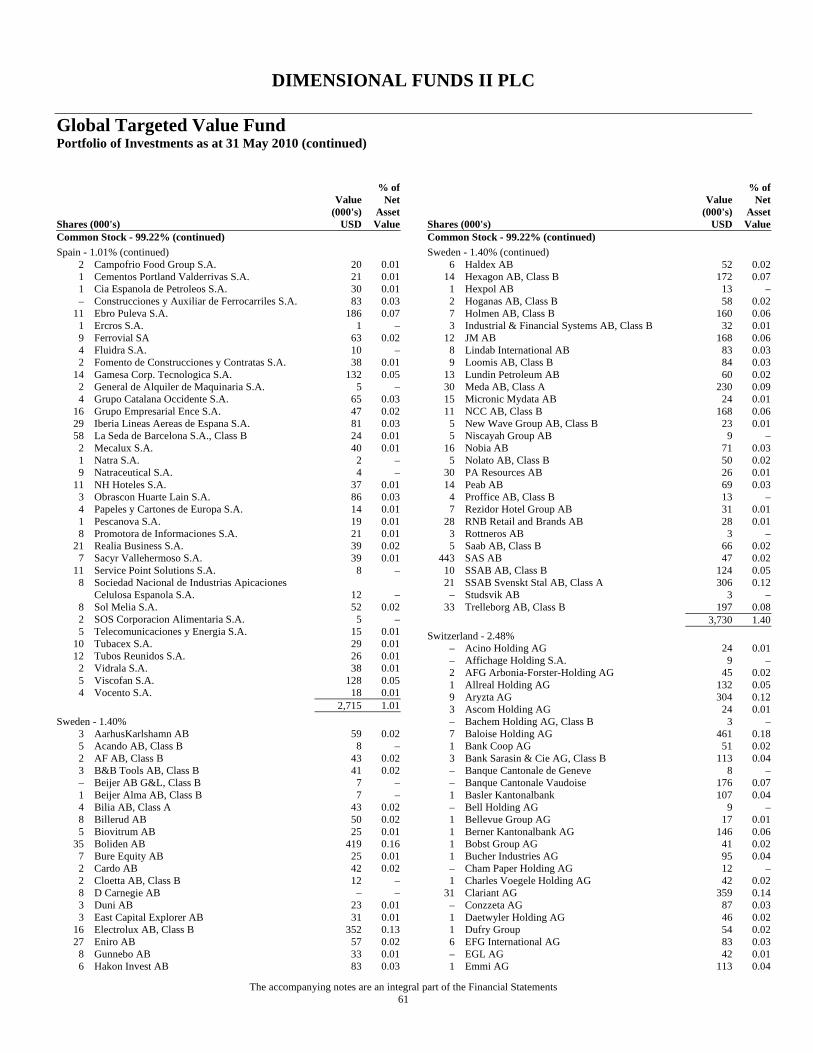
DIMENSIONAL FUNDS II PLC
Global Targeted Value Fund Portfolio of Investments as at 31 May 2010 (continued)
The accompanying notes are an integral part of the Financial Statements 61
Shares (000's)
Value (000's)
USD
% of Net
Asset Value
Common Stock - 99.22% (continued) Spain - 1.01% (continued)
2 Campofrio Food Group S.A. 20 0.01 1 Cementos Portland Valderrivas S.A. 21 0.01 1 Cia Espanola de Petroleos S.A. 30 0.01 – Construcciones y Auxiliar de Ferrocarriles S.A. 83 0.03
11 Ebro Puleva S.A. 186 0.07 1 Ercros S.A. 1 – 9 Ferrovial SA 63 0.02 4 Fluidra S.A. 10 – 2 Fomento de Construcciones y Contratas S.A. 38 0.01
14 Gamesa Corp. Tecnologica S.A. 132 0.05 2 General de Alquiler de Maquinaria S.A. 5 – 4 Grupo Catalana Occidente S.A. 65 0.03
16 Grupo Empresarial Ence S.A. 47 0.02 29 Iberia Lineas Aereas de Espana S.A. 81 0.03 58 La Seda de Barcelona S.A., Class B 24 0.01
2 Mecalux S.A. 40 0.01 1 Natra S.A. 2 – 9 Natraceutical S.A. 4 –
11 NH Hoteles S.A. 37 0.01 3 Obrascon Huarte Lain S.A. 86 0.03 4 Papeles y Cartones de Europa S.A. 14 0.01 1 Pescanova S.A. 19 0.01 8 Promotora de Informaciones S.A. 21 0.01
21 Realia Business S.A. 39 0.02 7 Sacyr Vallehermoso S.A. 39 0.01
11 Service Point Solutions S.A. 8 – 8 Sociedad Nacional de Industrias Apicaciones
Celulosa Espanola S.A. 12 – 8 Sol Melia S.A. 52 0.02 2 SOS Corporacion Alimentaria S.A. 5 – 5 Telecomunicaciones y Energia S.A. 15 0.01
10 Tubacex S.A. 29 0.01 12 Tubos Reunidos S.A. 26 0.01
2 Vidrala S.A. 38 0.01 5 Viscofan S.A. 128 0.05 4 Vocento S.A. 18 0.01
2,715 1.01 Sweden - 1.40%
3 AarhusKarlshamn AB 59 0.02 5 Acando AB, Class B 8 – 2 AF AB, Class B 43 0.02 3 B&B Tools AB, Class B 41 0.02 – Beijer AB G&L, Class B 7 – 1 Beijer Alma AB, Class B 7 – 4 Bilia AB, Class A 43 0.02 8 Billerud AB 50 0.02 5 Biovitrum AB 25 0.01
35 Boliden AB 419 0.16 7 Bure Equity AB 25 0.01 2 Cardo AB 42 0.02 2 Cloetta AB, Class B 12 – 8 D Carnegie AB – – 3 Duni AB 23 0.01 3 East Capital Explorer AB 31 0.01
16 Electrolux AB, Class B 352 0.13 27 Eniro AB 57 0.02
8 Gunnebo AB 33 0.01 6 Hakon Invest AB 83 0.03
Shares (000's)
Value (000's)
USD
% of Net
Asset Value
Common Stock - 99.22% (continued) Sweden - 1.40% (continued)
6 Haldex AB 52 0.02 14 Hexagon AB, Class B 172 0.07
1 Hexpol AB 13 – 2 Hoganas AB, Class B 58 0.02 7 Holmen AB, Class B 160 0.06 3 Industrial & Financial Systems AB, Class B 32 0.01
12 JM AB 168 0.06 8 Lindab International AB 83 0.03 9 Loomis AB, Class B 84 0.03
13 Lundin Petroleum AB 60 0.02 30 Meda AB, Class A 230 0.09 15 Micronic Mydata AB 24 0.01 11 NCC AB, Class B 168 0.06
5 New Wave Group AB, Class B 23 0.01 5 Niscayah Group AB 9 –
16 Nobia AB 71 0.03 5 Nolato AB, Class B 50 0.02
30 PA Resources AB 26 0.01 14 Peab AB 69 0.03
4 Proffice AB, Class B 13 – 7 Rezidor Hotel Group AB 31 0.01
28 RNB Retail and Brands AB 28 0.01 3 Rottneros AB 3 – 5 Saab AB, Class B 66 0.02
443 SAS AB 47 0.02 10 SSAB AB, Class B 124 0.05 21 SSAB Svenskt Stal AB, Class A 306 0.12
– Studsvik AB 3 – 33 Trelleborg AB, Class B 197 0.08
3,730 1.40 Switzerland - 2.48%
– Acino Holding AG 24 0.01 – Affichage Holding S.A. 9 – 2 AFG Arbonia-Forster-Holding AG 45 0.02 1 Allreal Holding AG 132 0.05 9 Aryzta AG 304 0.12 3 Ascom Holding AG 24 0.01 – Bachem Holding AG, Class B 3 – 7 Baloise Holding AG 461 0.18 1 Bank Coop AG 51 0.02 3 Bank Sarasin & Cie AG, Class B 113 0.04 – Banque Cantonale de Geneve 8 – – Banque Cantonale Vaudoise 176 0.07 1 Basler Kantonalbank 107 0.04 – Bell Holding AG 9 – 1 Bellevue Group AG 17 0.01 1 Berner Kantonalbank AG 146 0.06 1 Bobst Group AG 41 0.02 1 Bucher Industries AG 95 0.04 – Cham Paper Holding AG 12 – 1 Charles Voegele Holding AG 42 0.02
31 Clariant AG 359 0.14 – Conzzeta AG 87 0.03 1 Daetwyler Holding AG 46 0.02 1 Dufry Group 54 0.02 6 EFG International AG 83 0.03 – EGL AG 42 0.01 1 Emmi AG 113 0.04
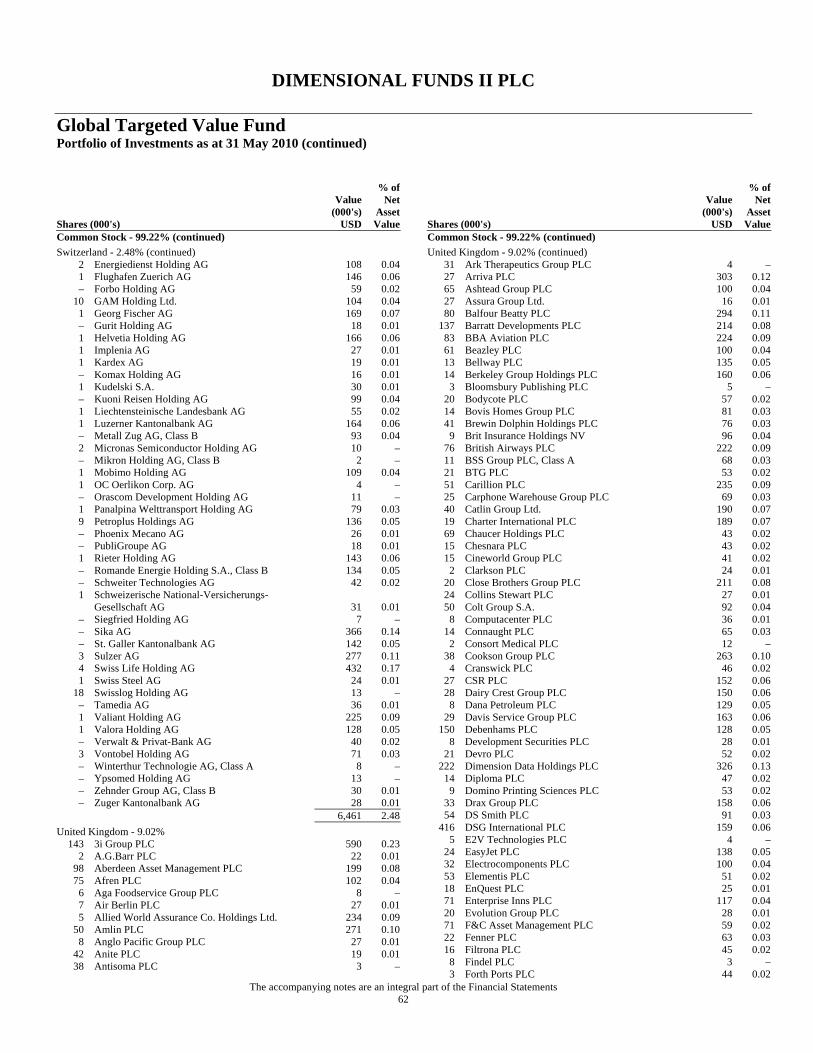
DIMENSIONAL FUNDS II PLC
Global Targeted Value Fund Portfolio of Investments as at 31 May 2010 (continued)
The accompanying notes are an integral part of the Financial Statements 62
Shares (000's)
Value (000's)
USD
% of Net
Asset Value
Common Stock - 99.22% (continued) Switzerland - 2.48% (continued)
2 Energiedienst Holding AG 108 0.04 1 Flughafen Zuerich AG 146 0.06 – Forbo Holding AG 59 0.02
10 GAM Holding Ltd. 104 0.04 1 Georg Fischer AG 169 0.07 – Gurit Holding AG 18 0.01 1 Helvetia Holding AG 166 0.06 1 Implenia AG 27 0.01 1 Kardex AG 19 0.01 – Komax Holding AG 16 0.01 1 Kudelski S.A. 30 0.01 – Kuoni Reisen Holding AG 99 0.04 1 Liechtensteinische Landesbank AG 55 0.02 1 Luzerner Kantonalbank AG 164 0.06 – Metall Zug AG, Class B 93 0.04 2 Micronas Semiconductor Holding AG 10 – – Mikron Holding AG, Class B 2 – 1 Mobimo Holding AG 109 0.04 1 OC Oerlikon Corp. AG 4 – – Orascom Development Holding AG 11 – 1 Panalpina Welttransport Holding AG 79 0.03 9 Petroplus Holdings AG 136 0.05 – Phoenix Mecano AG 26 0.01 – PubliGroupe AG 18 0.01 1 Rieter Holding AG 143 0.06 – Romande Energie Holding S.A., Class B 134 0.05 – Schweiter Technologies AG 42 0.02 1 Schweizerische National-Versicherungs-
Gesellschaft AG 31 0.01 – Siegfried Holding AG 7 – – Sika AG 366 0.14 – St. Galler Kantonalbank AG 142 0.05 3 Sulzer AG 277 0.11 4 Swiss Life Holding AG 432 0.17 1 Swiss Steel AG 24 0.01
18 Swisslog Holding AG 13 – – Tamedia AG 36 0.01 1 Valiant Holding AG 225 0.09 1 Valora Holding AG 128 0.05 – Verwalt & Privat-Bank AG 40 0.02 3 Vontobel Holding AG 71 0.03 – Winterthur Technologie AG, Class A 8 – – Ypsomed Holding AG 13 – – Zehnder Group AG, Class B 30 0.01 – Zuger Kantonalbank AG 28 0.01
6,461 2.48 United Kingdom - 9.02%
143 3i Group PLC 590 0.23 2 A.G.Barr PLC 22 0.01
98 Aberdeen Asset Management PLC 199 0.08 75 Afren PLC 102 0.04
6 Aga Foodservice Group PLC 8 – 7 Air Berlin PLC 27 0.01 5 Allied World Assurance Co. Holdings Ltd. 234 0.09
50 Amlin PLC 271 0.10 8 Anglo Pacific Group PLC 27 0.01
42 Anite PLC 19 0.01 38 Antisoma PLC 3 –
Shares (000's)
Value (000's)
USD
% of Net
Asset Value
Common Stock - 99.22% (continued) United Kingdom - 9.02% (continued)
31 Ark Therapeutics Group PLC 4 – 27 Arriva PLC 303 0.12 65 Ashtead Group PLC 100 0.04 27 Assura Group Ltd. 16 0.01 80 Balfour Beatty PLC 294 0.11
137 Barratt Developments PLC 214 0.08 83 BBA Aviation PLC 224 0.09 61 Beazley PLC 100 0.04 13 Bellway PLC 135 0.05 14 Berkeley Group Holdings PLC 160 0.06
3 Bloomsbury Publishing PLC 5 – 20 Bodycote PLC 57 0.02 14 Bovis Homes Group PLC 81 0.03 41 Brewin Dolphin Holdings PLC 76 0.03
9 Brit Insurance Holdings NV 96 0.04 76 British Airways PLC 222 0.09 11 BSS Group PLC, Class A 68 0.03 21 BTG PLC 53 0.02 51 Carillion PLC 235 0.09 25 Carphone Warehouse Group PLC 69 0.03 40 Catlin Group Ltd. 190 0.07 19 Charter International PLC 189 0.07 69 Chaucer Holdings PLC 43 0.02 15 Chesnara PLC 43 0.02 15 Cineworld Group PLC 41 0.02
2 Clarkson PLC 24 0.01 20 Close Brothers Group PLC 211 0.08 24 Collins Stewart PLC 27 0.01 50 Colt Group S.A. 92 0.04
8 Computacenter PLC 36 0.01 14 Connaught PLC 65 0.03
2 Consort Medical PLC 12 – 38 Cookson Group PLC 263 0.10
4 Cranswick PLC 46 0.02 27 CSR PLC 152 0.06 28 Dairy Crest Group PLC 150 0.06
8 Dana Petroleum PLC 129 0.05 29 Davis Service Group PLC 163 0.06
150 Debenhams PLC 128 0.05 8 Development Securities PLC 28 0.01
21 Devro PLC 52 0.02 222 Dimension Data Holdings PLC 326 0.13
14 Diploma PLC 47 0.02 9 Domino Printing Sciences PLC 53 0.02
33 Drax Group PLC 158 0.06 54 DS Smith PLC 91 0.03
416 DSG International PLC 159 0.06 5 E2V Technologies PLC 4 –
24 EasyJet PLC 138 0.05 32 Electrocomponents PLC 100 0.04 53 Elementis PLC 51 0.02 18 EnQuest PLC 25 0.01 71 Enterprise Inns PLC 117 0.04 20 Evolution Group PLC 28 0.01 71 F&C Asset Management PLC 59 0.02 22 Fenner PLC 63 0.03 16 Filtrona PLC 45 0.02
8 Findel PLC 3 – 3 Forth Ports PLC 44 0.02
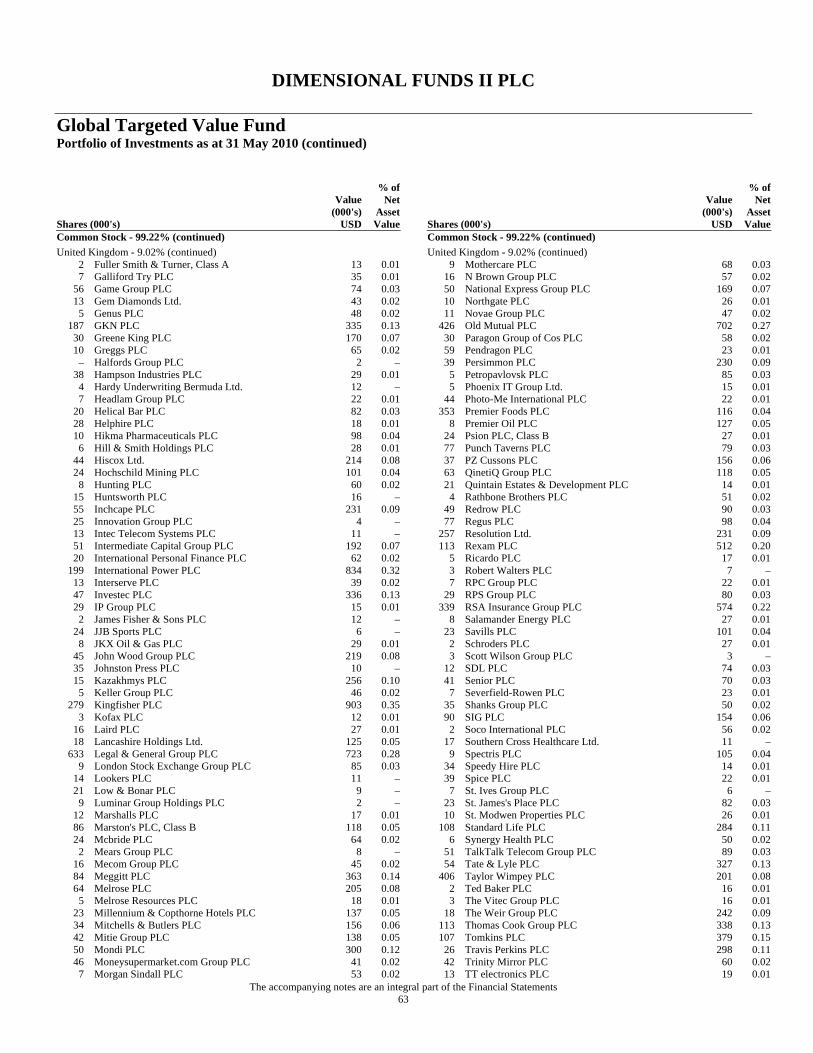
DIMENSIONAL FUNDS II PLC
Global Targeted Value Fund Portfolio of Investments as at 31 May 2010 (continued)
The accompanying notes are an integral part of the Financial Statements 63
Shares (000's)
Value (000's)
USD
% of Net
Asset Value
Common Stock - 99.22% (continued) United Kingdom - 9.02% (continued)
2 Fuller Smith & Turner, Class A 13 0.01 7 Galliford Try PLC 35 0.01
56 Game Group PLC 74 0.03 13 Gem Diamonds Ltd. 43 0.02
5 Genus PLC 48 0.02 187 GKN PLC 335 0.13
30 Greene King PLC 170 0.07 10 Greggs PLC 65 0.02
– Halfords Group PLC 2 – 38 Hampson Industries PLC 29 0.01
4 Hardy Underwriting Bermuda Ltd. 12 – 7 Headlam Group PLC 22 0.01
20 Helical Bar PLC 82 0.03 28 Helphire PLC 18 0.01 10 Hikma Pharmaceuticals PLC 98 0.04
6 Hill & Smith Holdings PLC 28 0.01 44 Hiscox Ltd. 214 0.08 24 Hochschild Mining PLC 101 0.04
8 Hunting PLC 60 0.02 15 Huntsworth PLC 16 – 55 Inchcape PLC 231 0.09 25 Innovation Group PLC 4 – 13 Intec Telecom Systems PLC 11 – 51 Intermediate Capital Group PLC 192 0.07 20 International Personal Finance PLC 62 0.02
199 International Power PLC 834 0.32 13 Interserve PLC 39 0.02 47 Investec PLC 336 0.13 29 IP Group PLC 15 0.01
2 James Fisher & Sons PLC 12 – 24 JJB Sports PLC 6 –
8 JKX Oil & Gas PLC 29 0.01 45 John Wood Group PLC 219 0.08 35 Johnston Press PLC 10 – 15 Kazakhmys PLC 256 0.10
5 Keller Group PLC 46 0.02 279 Kingfisher PLC 903 0.35
3 Kofax PLC 12 0.01 16 Laird PLC 27 0.01 18 Lancashire Holdings Ltd. 125 0.05
633 Legal & General Group PLC 723 0.28 9 London Stock Exchange Group PLC 85 0.03
14 Lookers PLC 11 – 21 Low & Bonar PLC 9 –
9 Luminar Group Holdings PLC 2 – 12 Marshalls PLC 17 0.01 86 Marston's PLC, Class B 118 0.05 24 Mcbride PLC 64 0.02
2 Mears Group PLC 8 – 16 Mecom Group PLC 45 0.02 84 Meggitt PLC 363 0.14 64 Melrose PLC 205 0.08
5 Melrose Resources PLC 18 0.01 23 Millennium & Copthorne Hotels PLC 137 0.05 34 Mitchells & Butlers PLC 156 0.06 42 Mitie Group PLC 138 0.05 50 Mondi PLC 300 0.12 46 Moneysupermarket.com Group PLC 41 0.02
7 Morgan Sindall PLC 53 0.02
Shares (000's)
Value (000's)
USD
% of Net
Asset Value
Common Stock - 99.22% (continued) United Kingdom - 9.02% (continued)
9 Mothercare PLC 68 0.03 16 N Brown Group PLC 57 0.02 50 National Express Group PLC 169 0.07 10 Northgate PLC 26 0.01 11 Novae Group PLC 47 0.02
426 Old Mutual PLC 702 0.27 30 Paragon Group of Cos PLC 58 0.02 59 Pendragon PLC 23 0.01 39 Persimmon PLC 230 0.09
5 Petropavlovsk PLC 85 0.03 5 Phoenix IT Group Ltd. 15 0.01
44 Photo-Me International PLC 22 0.01 353 Premier Foods PLC 116 0.04
8 Premier Oil PLC 127 0.05 24 Psion PLC, Class B 27 0.01 77 Punch Taverns PLC 79 0.03 37 PZ Cussons PLC 156 0.06 63 QinetiQ Group PLC 118 0.05 21 Quintain Estates & Development PLC 14 0.01
4 Rathbone Brothers PLC 51 0.02 49 Redrow PLC 90 0.03 77 Regus PLC 98 0.04
257 Resolution Ltd. 231 0.09 113 Rexam PLC 512 0.20
5 Ricardo PLC 17 0.01 3 Robert Walters PLC 7 – 7 RPC Group PLC 22 0.01
29 RPS Group PLC 80 0.03 339 RSA Insurance Group PLC 574 0.22
8 Salamander Energy PLC 27 0.01 23 Savills PLC 101 0.04
2 Schroders PLC 27 0.01 3 Scott Wilson Group PLC 3 –
12 SDL PLC 74 0.03 41 Senior PLC 70 0.03
7 Severfield-Rowen PLC 23 0.01 35 Shanks Group PLC 50 0.02 90 SIG PLC 154 0.06
2 Soco International PLC 56 0.02 17 Southern Cross Healthcare Ltd. 11 –
9 Spectris PLC 105 0.04 34 Speedy Hire PLC 14 0.01 39 Spice PLC 22 0.01
7 St. Ives Group PLC 6 – 23 St. James's Place PLC 82 0.03 10 St. Modwen Properties PLC 26 0.01
108 Standard Life PLC 284 0.11 6 Synergy Health PLC 50 0.02
51 TalkTalk Telecom Group PLC 89 0.03 54 Tate & Lyle PLC 327 0.13
406 Taylor Wimpey PLC 201 0.08 2 Ted Baker PLC 16 0.01 3 The Vitec Group PLC 16 0.01
18 The Weir Group PLC 242 0.09 113 Thomas Cook Group PLC 338 0.13 107 Tomkins PLC 379 0.15
26 Travis Perkins PLC 298 0.11 42 Trinity Mirror PLC 60 0.02 13 TT electronics PLC 19 0.01
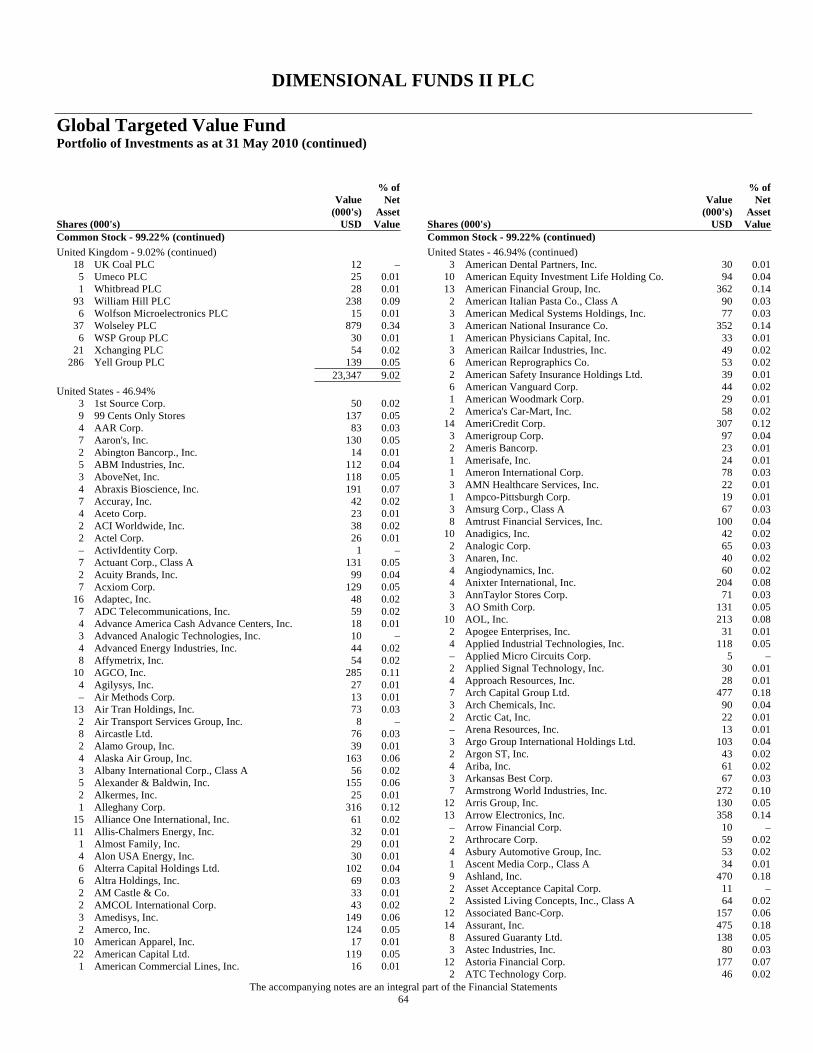
DIMENSIONAL FUNDS II PLC
Global Targeted Value Fund Portfolio of Investments as at 31 May 2010 (continued)
The accompanying notes are an integral part of the Financial Statements 64
Shares (000's)
Value (000's)
USD
% of Net
Asset Value
Common Stock - 99.22% (continued) United Kingdom - 9.02% (continued)
18 UK Coal PLC 12 – 5 Umeco PLC 25 0.01 1 Whitbread PLC 28 0.01
93 William Hill PLC 238 0.09 6 Wolfson Microelectronics PLC 15 0.01
37 Wolseley PLC 879 0.34 6 WSP Group PLC 30 0.01
21 Xchanging PLC 54 0.02 286 Yell Group PLC 139 0.05
23,347 9.02 United States - 46.94%
3 1st Source Corp. 50 0.02 9 99 Cents Only Stores 137 0.05 4 AAR Corp. 83 0.03 7 Aaron's, Inc. 130 0.05 2 Abington Bancorp., Inc. 14 0.01 5 ABM Industries, Inc. 112 0.04 3 AboveNet, Inc. 118 0.05 4 Abraxis Bioscience, Inc. 191 0.07 7 Accuray, Inc. 42 0.02 4 Aceto Corp. 23 0.01 2 ACI Worldwide, Inc. 38 0.02 2 Actel Corp. 26 0.01 – ActivIdentity Corp. 1 – 7 Actuant Corp., Class A 131 0.05 2 Acuity Brands, Inc. 99 0.04 7 Acxiom Corp. 129 0.05
16 Adaptec, Inc. 48 0.02 7 ADC Telecommunications, Inc. 59 0.02 4 Advance America Cash Advance Centers, Inc. 18 0.01 3 Advanced Analogic Technologies, Inc. 10 – 4 Advanced Energy Industries, Inc. 44 0.02 8 Affymetrix, Inc. 54 0.02
10 AGCO, Inc. 285 0.11 4 Agilysys, Inc. 27 0.01 – Air Methods Corp. 13 0.01
13 Air Tran Holdings, Inc. 73 0.03 2 Air Transport Services Group, Inc. 8 – 8 Aircastle Ltd. 76 0.03 2 Alamo Group, Inc. 39 0.01 4 Alaska Air Group, Inc. 163 0.06 3 Albany International Corp., Class A 56 0.02 5 Alexander & Baldwin, Inc. 155 0.06 2 Alkermes, Inc. 25 0.01 1 Alleghany Corp. 316 0.12
15 Alliance One International, Inc. 61 0.02 11 Allis-Chalmers Energy, Inc. 32 0.01
1 Almost Family, Inc. 29 0.01 4 Alon USA Energy, Inc. 30 0.01 6 Alterra Capital Holdings Ltd. 102 0.04 6 Altra Holdings, Inc. 69 0.03 2 AM Castle & Co. 33 0.01 2 AMCOL International Corp. 43 0.02 3 Amedisys, Inc. 149 0.06 2 Amerco, Inc. 124 0.05
10 American Apparel, Inc. 17 0.01 22 American Capital Ltd. 119 0.05
1 American Commercial Lines, Inc. 16 0.01
Shares (000's)
Value (000's)
USD
% of Net
Asset Value
Common Stock - 99.22% (continued) United States - 46.94% (continued)
3 American Dental Partners, Inc. 30 0.01 10 American Equity Investment Life Holding Co. 94 0.04 13 American Financial Group, Inc. 362 0.14
2 American Italian Pasta Co., Class A 90 0.03 3 American Medical Systems Holdings, Inc. 77 0.03 3 American National Insurance Co. 352 0.14 1 American Physicians Capital, Inc. 33 0.01 3 American Railcar Industries, Inc. 49 0.02 6 American Reprographics Co. 53 0.02 2 American Safety Insurance Holdings Ltd. 39 0.01 6 American Vanguard Corp. 44 0.02 1 American Woodmark Corp. 29 0.01 2 America's Car-Mart, Inc. 58 0.02
14 AmeriCredit Corp. 307 0.12 3 Amerigroup Corp. 97 0.04 2 Ameris Bancorp. 23 0.01 1 Amerisafe, Inc. 24 0.01 1 Ameron International Corp. 78 0.03 3 AMN Healthcare Services, Inc. 22 0.01 1 Ampco-Pittsburgh Corp. 19 0.01 3 Amsurg Corp., Class A 67 0.03 8 Amtrust Financial Services, Inc. 100 0.04
10 Anadigics, Inc. 42 0.02 2 Analogic Corp. 65 0.03 3 Anaren, Inc. 40 0.02 4 Angiodynamics, Inc. 60 0.02 4 Anixter International, Inc. 204 0.08 3 AnnTaylor Stores Corp. 71 0.03 3 AO Smith Corp. 131 0.05
10 AOL, Inc. 213 0.08 2 Apogee Enterprises, Inc. 31 0.01 4 Applied Industrial Technologies, Inc. 118 0.05 – Applied Micro Circuits Corp. 5 – 2 Applied Signal Technology, Inc. 30 0.01 4 Approach Resources, Inc. 28 0.01 7 Arch Capital Group Ltd. 477 0.18 3 Arch Chemicals, Inc. 90 0.04 2 Arctic Cat, Inc. 22 0.01 – Arena Resources, Inc. 13 0.01 3 Argo Group International Holdings Ltd. 103 0.04 2 Argon ST, Inc. 43 0.02 4 Ariba, Inc. 61 0.02 3 Arkansas Best Corp. 67 0.03 7 Armstrong World Industries, Inc. 272 0.10
12 Arris Group, Inc. 130 0.05 13 Arrow Electronics, Inc. 358 0.14
– Arrow Financial Corp. 10 – 2 Arthrocare Corp. 59 0.02 4 Asbury Automotive Group, Inc. 53 0.02 1 Ascent Media Corp., Class A 34 0.01 9 Ashland, Inc. 470 0.18 2 Asset Acceptance Capital Corp. 11 – 2 Assisted Living Concepts, Inc., Class A 64 0.02
12 Associated Banc-Corp. 157 0.06 14 Assurant, Inc. 475 0.18
8 Assured Guaranty Ltd. 138 0.05 3 Astec Industries, Inc. 80 0.03
12 Astoria Financial Corp. 177 0.07 2 ATC Technology Corp. 46 0.02
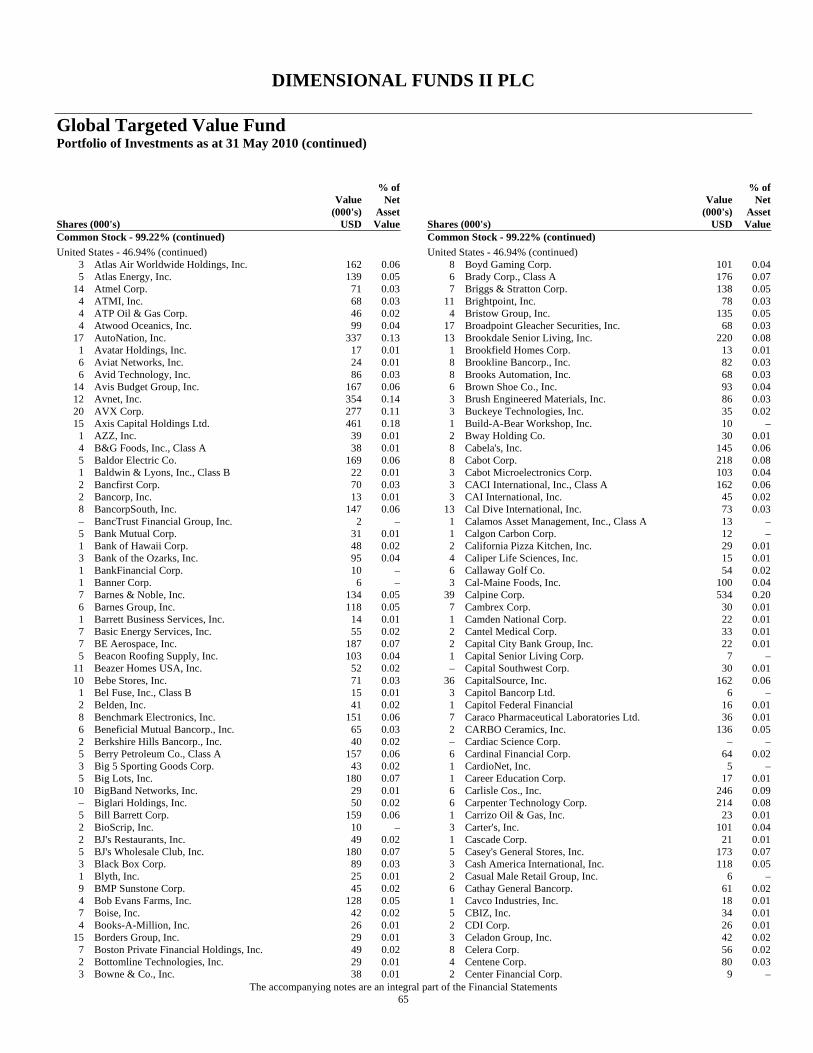
DIMENSIONAL FUNDS II PLC
Global Targeted Value Fund Portfolio of Investments as at 31 May 2010 (continued)
The accompanying notes are an integral part of the Financial Statements 65
Shares (000's)
Value (000's)
USD
% of Net
Asset Value
Common Stock - 99.22% (continued) United States - 46.94% (continued)
3 Atlas Air Worldwide Holdings, Inc. 162 0.06 5 Atlas Energy, Inc. 139 0.05
14 Atmel Corp. 71 0.03 4 ATMI, Inc. 68 0.03 4 ATP Oil & Gas Corp. 46 0.02 4 Atwood Oceanics, Inc. 99 0.04
17 AutoNation, Inc. 337 0.13 1 Avatar Holdings, Inc. 17 0.01 6 Aviat Networks, Inc. 24 0.01 6 Avid Technology, Inc. 86 0.03
14 Avis Budget Group, Inc. 167 0.06 12 Avnet, Inc. 354 0.14 20 AVX Corp. 277 0.11 15 Axis Capital Holdings Ltd. 461 0.18
1 AZZ, Inc. 39 0.01 4 B&G Foods, Inc., Class A 38 0.01 5 Baldor Electric Co. 169 0.06 1 Baldwin & Lyons, Inc., Class B 22 0.01 2 Bancfirst Corp. 70 0.03 2 Bancorp, Inc. 13 0.01 8 BancorpSouth, Inc. 147 0.06 – BancTrust Financial Group, Inc. 2 – 5 Bank Mutual Corp. 31 0.01 1 Bank of Hawaii Corp. 48 0.02 3 Bank of the Ozarks, Inc. 95 0.04 1 BankFinancial Corp. 10 – 1 Banner Corp. 6 – 7 Barnes & Noble, Inc. 134 0.05 6 Barnes Group, Inc. 118 0.05 1 Barrett Business Services, Inc. 14 0.01 7 Basic Energy Services, Inc. 55 0.02 7 BE Aerospace, Inc. 187 0.07 5 Beacon Roofing Supply, Inc. 103 0.04
11 Beazer Homes USA, Inc. 52 0.02 10 Bebe Stores, Inc. 71 0.03
1 Bel Fuse, Inc., Class B 15 0.01 2 Belden, Inc. 41 0.02 8 Benchmark Electronics, Inc. 151 0.06 6 Beneficial Mutual Bancorp., Inc. 65 0.03 2 Berkshire Hills Bancorp., Inc. 40 0.02 5 Berry Petroleum Co., Class A 157 0.06 3 Big 5 Sporting Goods Corp. 43 0.02 5 Big Lots, Inc. 180 0.07
10 BigBand Networks, Inc. 29 0.01 – Biglari Holdings, Inc. 50 0.02 5 Bill Barrett Corp. 159 0.06 2 BioScrip, Inc. 10 – 2 BJ's Restaurants, Inc. 49 0.02 5 BJ's Wholesale Club, Inc. 180 0.07 3 Black Box Corp. 89 0.03 1 Blyth, Inc. 25 0.01 9 BMP Sunstone Corp. 45 0.02 4 Bob Evans Farms, Inc. 128 0.05 7 Boise, Inc. 42 0.02 4 Books-A-Million, Inc. 26 0.01
15 Borders Group, Inc. 29 0.01 7 Boston Private Financial Holdings, Inc. 49 0.02 2 Bottomline Technologies, Inc. 29 0.01 3 Bowne & Co., Inc. 38 0.01
Shares (000's)
Value (000's)
USD
% of Net
Asset Value
Common Stock - 99.22% (continued) United States - 46.94% (continued)
8 Boyd Gaming Corp. 101 0.04 6 Brady Corp., Class A 176 0.07 7 Briggs & Stratton Corp. 138 0.05
11 Brightpoint, Inc. 78 0.03 4 Bristow Group, Inc. 135 0.05
17 Broadpoint Gleacher Securities, Inc. 68 0.03 13 Brookdale Senior Living, Inc. 220 0.08
1 Brookfield Homes Corp. 13 0.01 8 Brookline Bancorp., Inc. 82 0.03 8 Brooks Automation, Inc. 68 0.03 6 Brown Shoe Co., Inc. 93 0.04 3 Brush Engineered Materials, Inc. 86 0.03 3 Buckeye Technologies, Inc. 35 0.02 1 Build-A-Bear Workshop, Inc. 10 – 2 Bway Holding Co. 30 0.01 8 Cabela's, Inc. 145 0.06 8 Cabot Corp. 218 0.08 3 Cabot Microelectronics Corp. 103 0.04 3 CACI International, Inc., Class A 162 0.06 3 CAI International, Inc. 45 0.02
13 Cal Dive International, Inc. 73 0.03 1 Calamos Asset Management, Inc., Class A 13 – 1 Calgon Carbon Corp. 12 – 2 California Pizza Kitchen, Inc. 29 0.01 4 Caliper Life Sciences, Inc. 15 0.01 6 Callaway Golf Co. 54 0.02 3 Cal-Maine Foods, Inc. 100 0.04
39 Calpine Corp. 534 0.20 7 Cambrex Corp. 30 0.01 1 Camden National Corp. 22 0.01 2 Cantel Medical Corp. 33 0.01 2 Capital City Bank Group, Inc. 22 0.01 1 Capital Senior Living Corp. 7 – – Capital Southwest Corp. 30 0.01
36 CapitalSource, Inc. 162 0.06 3 Capitol Bancorp Ltd. 6 – 1 Capitol Federal Financial 16 0.01 7 Caraco Pharmaceutical Laboratories Ltd. 36 0.01 2 CARBO Ceramics, Inc. 136 0.05 – Cardiac Science Corp. – – 6 Cardinal Financial Corp. 64 0.02 1 CardioNet, Inc. 5 – 1 Career Education Corp. 17 0.01 6 Carlisle Cos., Inc. 246 0.09 6 Carpenter Technology Corp. 214 0.08 1 Carrizo Oil & Gas, Inc. 23 0.01 3 Carter's, Inc. 101 0.04 1 Cascade Corp. 21 0.01 5 Casey's General Stores, Inc. 173 0.07 3 Cash America International, Inc. 118 0.05 2 Casual Male Retail Group, Inc. 6 – 6 Cathay General Bancorp. 61 0.02 1 Cavco Industries, Inc. 18 0.01 5 CBIZ, Inc. 34 0.01 2 CDI Corp. 26 0.01 3 Celadon Group, Inc. 42 0.02 8 Celera Corp. 56 0.02 4 Centene Corp. 80 0.03 2 Center Financial Corp. 9 –

DIMENSIONAL FUNDS II PLC
Global Targeted Value Fund Portfolio of Investments as at 31 May 2010 (continued)
The accompanying notes are an integral part of the Financial Statements 66
Shares (000's)
Value (000's)
USD
% of Net
Asset Value
Common Stock - 99.22% (continued) United States - 46.94% (continued)
2 Centerstate Banks, Inc. 23 0.01 5 Central European Distribution Corp. 138 0.05 4 Central Garden & Pet Co. 42 0.02 6 Central Garden & Pet Co., Class A 56 0.02 3 Central Pacific Financial Corp. 7 –
10 Century Aluminum Co. 101 0.04 2 Ceradyne, Inc. 47 0.02 2 Ceva, Inc. 21 0.01 – Charles River Laboratories International, Inc. 7 –
19 Charming Shoppes, Inc. 84 0.03 5 Chart Industries, Inc. 92 0.04 6 Checkpoint Systems, Inc. 127 0.05 1 Chemed Corp. 63 0.02 3 Chemical Financial Corp. 61 0.02
24 Chico's FAS, Inc. 291 0.11 4 Chiquita Brands International, Inc. 52 0.02 2 Christopher & Banks Corp. 17 0.01 2 Churchill Downs, Inc. 71 0.03
12 Ciber, Inc. 35 0.01 6 Cimarex Energy Co. 434 0.17
19 Cincinnati Financial Corp. 504 0.19 11 Cinemark Holdings, Inc. 182 0.07
2 CIRCOR International, Inc. 54 0.02 4 Cirrus Logic, Inc. 61 0.02 2 Citi Trends, Inc. 60 0.02 4 Citizens Republic Bancorp., Inc. 5 – 3 Citizens, Inc. 20 0.01 1 City Holding Co. 45 0.02 6 City National Corp. 351 0.14 2 Clarcor, Inc. 76 0.03 1 Clayton Williams Energy, Inc. 64 0.03 – Clean Harbors, Inc. 19 0.01 7 Clear Channel Outdoor Holdings, Inc., Class A 61 0.02 1 Clearwater Paper Corp. 86 0.03 1 Clifton Savings Bancorp., Inc. 13 – 4 CNA Surety Corp. 67 0.03
20 CNO Financial Group, Inc. 110 0.04 3 CoBiz Financial, Inc. 17 0.01 1 Coca-Cola Bottling Co. Consolidated 45 0.02 8 Coeur d'Alene Mines Corp. 123 0.05 9 Cogent, Inc. 81 0.03 5 Cognex Corp. 90 0.03 3 Coherent, Inc. 105 0.04 2 Cohu, Inc. 22 0.01 8 Coldwater Creek, Inc. 50 0.02 2 Colfax Corp. 27 0.01 6 Collective Brands, Inc. 137 0.05 4 Columbia Banking System, Inc. 91 0.04 4 Columbia Sportswear Co. 208 0.08 2 Columbus McKinnon Corp. 24 0.01
16 Comerica, Inc. 612 0.24 5 Comfort Systems USA, Inc. 54 0.02
10 Commercial Metals Co. 154 0.06 5 Community Bank System, Inc. 121 0.05 2 Community Health Systems, Inc. 87 0.03 1 Community Trust Bancorp., Inc. 25 0.01 9 Complete Production Services, Inc. 113 0.04 2 CompuCredit Holdings Corp. 9 –
20 Compuware Corp. 167 0.07
Shares (000's)
Value (000's)
USD
% of Net
Asset Value
Common Stock - 99.22% (continued) United States - 46.94% (continued)
5 Comstock Resources, Inc. 152 0.06 2 Comtech Telecommunications Corp. 58 0.02 3 Conmed Corp. 66 0.03 2 Conn's, Inc. 12 – 1 Consolidated Graphics, Inc. 33 0.01 1 Consolidated-Tomoka Land Co. 23 0.01
21 Constellation Brands, Inc., Class A 343 0.13 – Constellation Brands, Inc., Class B 3 – 2 Contango Oil & Gas Co. 121 0.05
15 Continucare Corp. 56 0.02 16 Convergys Corp. 180 0.07
1 Con-Way, Inc. 20 0.01 1 Core-Mark Holding Co., Inc. 22 0.01 6 Corn Products International, Inc. 189 0.07 3 Cornell Cos., Inc. 81 0.03
11 Corrections Corp. of America 227 0.09 – CoStar Group, Inc. 16 0.01 1 Courier Corp. 9 – 2 Covanta Holding Corp. 32 0.01
17 Coventry Health Care, Inc. 360 0.14 9 Cowen Group, Inc., Class A 44 0.02 1 CPI International, Inc. 19 0.01 2 CRA International, Inc. 40 0.02 6 Crane Co. 198 0.08 4 Cray, Inc. 19 0.01 2 Credit Acceptance Corp. 72 0.03 1 Crimson Exploration, Inc. 2 –
14 CROCS, Inc. 149 0.06 2 Cross Country Healthcare, Inc. 18 0.01 5 Crosstex Energy, Inc. 35 0.01 2 Cubic Corp. 72 0.03 5 Curtiss-Wright Corp. 174 0.07 2 Cutera, Inc. 16 0.01
11 CVB Financial Corp. 111 0.04 10 CVR Energy, Inc. 79 0.03
1 Cybersource Corp. 28 0.01 3 Cymer, Inc. 103 0.04 2 Cypress Bioscience, Inc. 9 –
13 Cypress Semiconductor Corp. 150 0.06 6 Cytec Industries, Inc. 244 0.09 6 Daktronics, Inc. 48 0.02
21 Dana Holding Corp. 226 0.09 1 Danvers Bancorp., Inc. 21 0.01 6 Darling International, Inc. 44 0.02 1 Dawson Geophysical Co. 22 0.01 1 DDi Corp. 11 – 4 DealerTrack Holdings, Inc. 64 0.02
24 Del Monte Foods Co. 346 0.13 5 Delek U.S. Holdings, Inc. 31 0.01 7 Delphi Financial Group, Inc., Class A 171 0.07 7 Denbury Resources, Inc. 111 0.04 2 DG FastChannel, Inc. 85 0.03 7 Diebold,inc. 213 0.08 2 Digi International, Inc. 18 0.01 4 Digital River, Inc. 96 0.04 8 Dillard's, Inc., Class A 226 0.09 5 Dime Community Bancshares, Inc. 60 0.02 3 DineEquity, Inc. 105 0.04 4 Diodes, Inc. 87 0.03
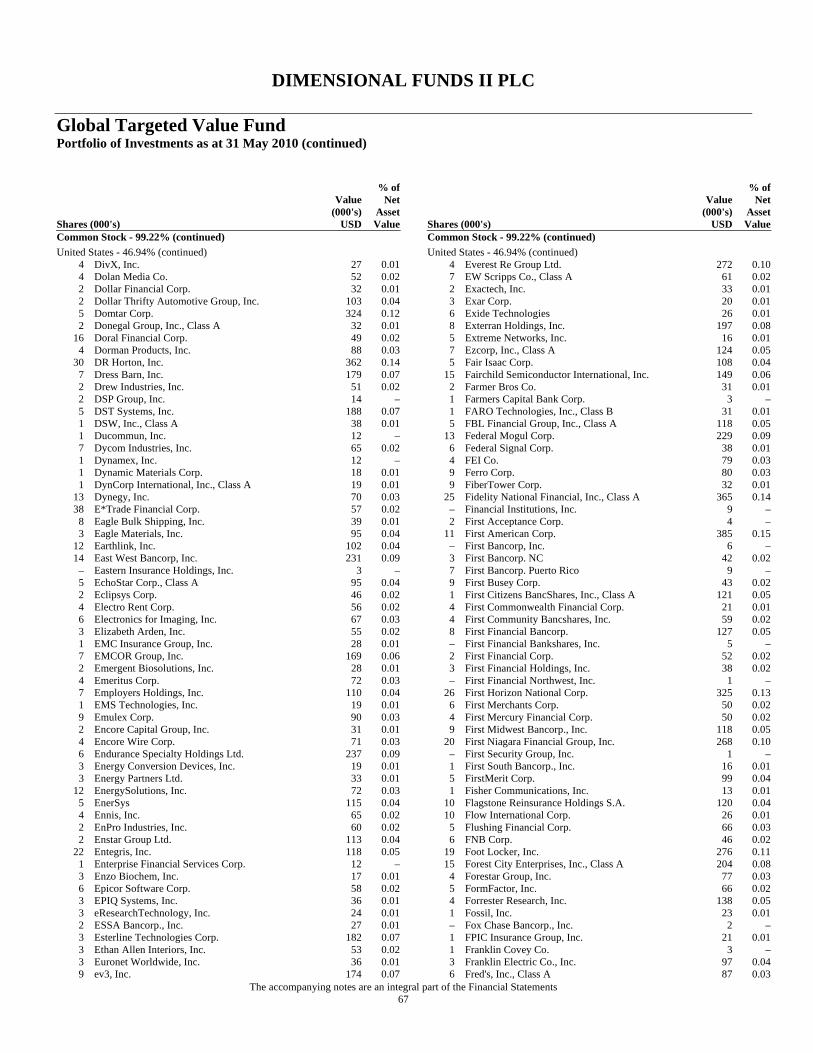
DIMENSIONAL FUNDS II PLC
Global Targeted Value Fund Portfolio of Investments as at 31 May 2010 (continued)
The accompanying notes are an integral part of the Financial Statements 67
Shares (000's)
Value (000's)
USD
% of Net
Asset Value
Common Stock - 99.22% (continued) United States - 46.94% (continued)
4 DivX, Inc. 27 0.01 4 Dolan Media Co. 52 0.02 2 Dollar Financial Corp. 32 0.01 2 Dollar Thrifty Automotive Group, Inc. 103 0.04 5 Domtar Corp. 324 0.12 2 Donegal Group, Inc., Class A 32 0.01
16 Doral Financial Corp. 49 0.02 4 Dorman Products, Inc. 88 0.03
30 DR Horton, Inc. 362 0.14 7 Dress Barn, Inc. 179 0.07 2 Drew Industries, Inc. 51 0.02 2 DSP Group, Inc. 14 – 5 DST Systems, Inc. 188 0.07 1 DSW, Inc., Class A 38 0.01 1 Ducommun, Inc. 12 – 7 Dycom Industries, Inc. 65 0.02 1 Dynamex, Inc. 12 – 1 Dynamic Materials Corp. 18 0.01 1 DynCorp International, Inc., Class A 19 0.01
13 Dynegy, Inc. 70 0.03 38 E*Trade Financial Corp. 57 0.02
8 Eagle Bulk Shipping, Inc. 39 0.01 3 Eagle Materials, Inc. 95 0.04
12 Earthlink, Inc. 102 0.04 14 East West Bancorp, Inc. 231 0.09
– Eastern Insurance Holdings, Inc. 3 – 5 EchoStar Corp., Class A 95 0.04 2 Eclipsys Corp. 46 0.02 4 Electro Rent Corp. 56 0.02 6 Electronics for Imaging, Inc. 67 0.03 3 Elizabeth Arden, Inc. 55 0.02 1 EMC Insurance Group, Inc. 28 0.01 7 EMCOR Group, Inc. 169 0.06 2 Emergent Biosolutions, Inc. 28 0.01 4 Emeritus Corp. 72 0.03 7 Employers Holdings, Inc. 110 0.04 1 EMS Technologies, Inc. 19 0.01 9 Emulex Corp. 90 0.03 2 Encore Capital Group, Inc. 31 0.01 4 Encore Wire Corp. 71 0.03 6 Endurance Specialty Holdings Ltd. 237 0.09 3 Energy Conversion Devices, Inc. 19 0.01 3 Energy Partners Ltd. 33 0.01
12 EnergySolutions, Inc. 72 0.03 5 EnerSys 115 0.04 4 Ennis, Inc. 65 0.02 2 EnPro Industries, Inc. 60 0.02 2 Enstar Group Ltd. 113 0.04
22 Entegris, Inc. 118 0.05 1 Enterprise Financial Services Corp. 12 – 3 Enzo Biochem, Inc. 17 0.01 6 Epicor Software Corp. 58 0.02 3 EPIQ Systems, Inc. 36 0.01 3 eResearchTechnology, Inc. 24 0.01 2 ESSA Bancorp., Inc. 27 0.01 3 Esterline Technologies Corp. 182 0.07 3 Ethan Allen Interiors, Inc. 53 0.02 3 Euronet Worldwide, Inc. 36 0.01 9 ev3, Inc. 174 0.07
Shares (000's)
Value (000's)
USD
% of Net
Asset Value
Common Stock - 99.22% (continued) United States - 46.94% (continued)
4 Everest Re Group Ltd. 272 0.10 7 EW Scripps Co., Class A 61 0.02 2 Exactech, Inc. 33 0.01 3 Exar Corp. 20 0.01 6 Exide Technologies 26 0.01 8 Exterran Holdings, Inc. 197 0.08 5 Extreme Networks, Inc. 16 0.01 7 Ezcorp, Inc., Class A 124 0.05 5 Fair Isaac Corp. 108 0.04
15 Fairchild Semiconductor International, Inc. 149 0.06 2 Farmer Bros Co. 31 0.01 1 Farmers Capital Bank Corp. 3 – 1 FARO Technologies, Inc., Class B 31 0.01 5 FBL Financial Group, Inc., Class A 118 0.05
13 Federal Mogul Corp. 229 0.09 6 Federal Signal Corp. 38 0.01 4 FEI Co. 79 0.03 9 Ferro Corp. 80 0.03 9 FiberTower Corp. 32 0.01
25 Fidelity National Financial, Inc., Class A 365 0.14 – Financial Institutions, Inc. 9 – 2 First Acceptance Corp. 4 –
11 First American Corp. 385 0.15 – First Bancorp, Inc. 6 – 3 First Bancorp. NC 42 0.02 7 First Bancorp. Puerto Rico 9 – 9 First Busey Corp. 43 0.02 1 First Citizens BancShares, Inc., Class A 121 0.05 4 First Commonwealth Financial Corp. 21 0.01 4 First Community Bancshares, Inc. 59 0.02 8 First Financial Bancorp. 127 0.05 – First Financial Bankshares, Inc. 5 – 2 First Financial Corp. 52 0.02 3 First Financial Holdings, Inc. 38 0.02 – First Financial Northwest, Inc. 1 –
26 First Horizon National Corp. 325 0.13 6 First Merchants Corp. 50 0.02 4 First Mercury Financial Corp. 50 0.02 9 First Midwest Bancorp., Inc. 118 0.05
20 First Niagara Financial Group, Inc. 268 0.10 – First Security Group, Inc. 1 – 1 First South Bancorp., Inc. 16 0.01 5 FirstMerit Corp. 99 0.04 1 Fisher Communications, Inc. 13 0.01
10 Flagstone Reinsurance Holdings S.A. 120 0.04 10 Flow International Corp. 26 0.01
5 Flushing Financial Corp. 66 0.03 6 FNB Corp. 46 0.02
19 Foot Locker, Inc. 276 0.11 15 Forest City Enterprises, Inc., Class A 204 0.08
4 Forestar Group, Inc. 77 0.03 5 FormFactor, Inc. 66 0.02 4 Forrester Research, Inc. 138 0.05 1 Fossil, Inc. 23 0.01 – Fox Chase Bancorp., Inc. 2 – 1 FPIC Insurance Group, Inc. 21 0.01 1 Franklin Covey Co. 3 – 3 Franklin Electric Co., Inc. 97 0.04 6 Fred's, Inc., Class A 87 0.03
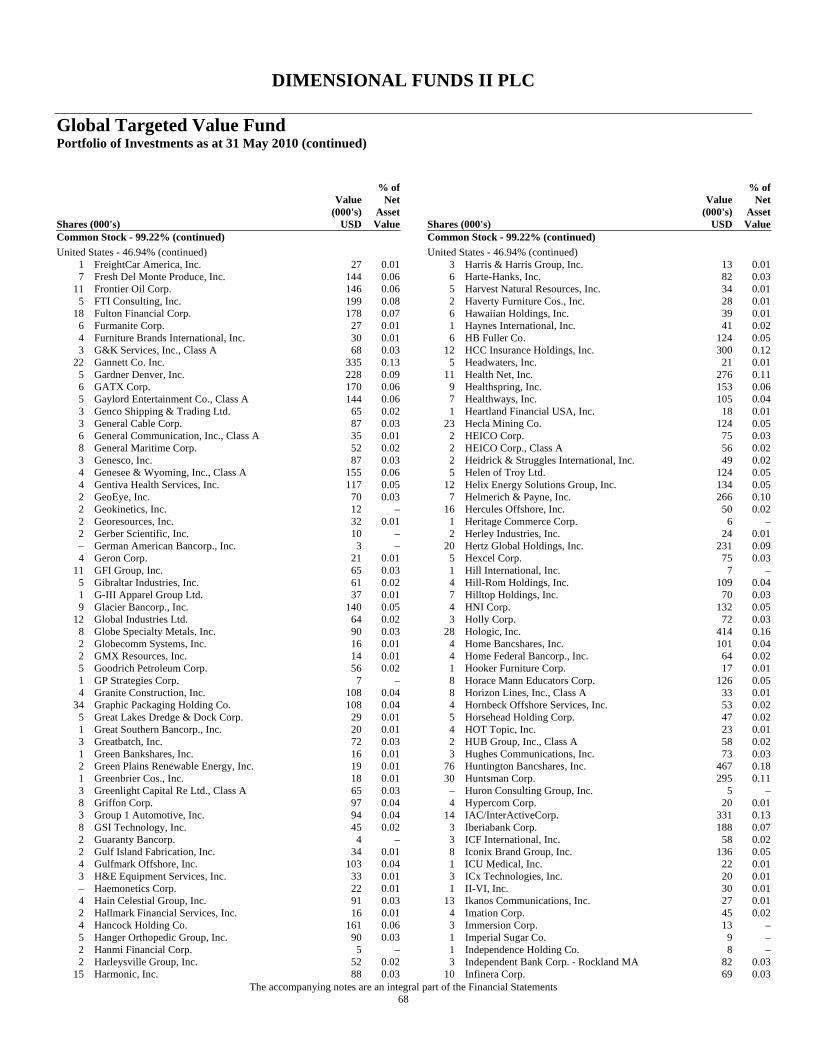
DIMENSIONAL FUNDS II PLC
Global Targeted Value Fund Portfolio of Investments as at 31 May 2010 (continued)
The accompanying notes are an integral part of the Financial Statements 68
Shares (000's)
Value (000's)
USD
% of Net
Asset Value
Common Stock - 99.22% (continued) United States - 46.94% (continued)
1 FreightCar America, Inc. 27 0.01 7 Fresh Del Monte Produce, Inc. 144 0.06
11 Frontier Oil Corp. 146 0.06 5 FTI Consulting, Inc. 199 0.08
18 Fulton Financial Corp. 178 0.07 6 Furmanite Corp. 27 0.01 4 Furniture Brands International, Inc. 30 0.01 3 G&K Services, Inc., Class A 68 0.03
22 Gannett Co. Inc. 335 0.13 5 Gardner Denver, Inc. 228 0.09 6 GATX Corp. 170 0.06 5 Gaylord Entertainment Co., Class A 144 0.06 3 Genco Shipping & Trading Ltd. 65 0.02 3 General Cable Corp. 87 0.03 6 General Communication, Inc., Class A 35 0.01 8 General Maritime Corp. 52 0.02 3 Genesco, Inc. 87 0.03 4 Genesee & Wyoming, Inc., Class A 155 0.06 4 Gentiva Health Services, Inc. 117 0.05 2 GeoEye, Inc. 70 0.03 2 Geokinetics, Inc. 12 – 2 Georesources, Inc. 32 0.01 2 Gerber Scientific, Inc. 10 – – German American Bancorp., Inc. 3 – 4 Geron Corp. 21 0.01
11 GFI Group, Inc. 65 0.03 5 Gibraltar Industries, Inc. 61 0.02 1 G-III Apparel Group Ltd. 37 0.01 9 Glacier Bancorp., Inc. 140 0.05
12 Global Industries Ltd. 64 0.02 8 Globe Specialty Metals, Inc. 90 0.03 2 Globecomm Systems, Inc. 16 0.01 2 GMX Resources, Inc. 14 0.01 5 Goodrich Petroleum Corp. 56 0.02 1 GP Strategies Corp. 7 – 4 Granite Construction, Inc. 108 0.04
34 Graphic Packaging Holding Co. 108 0.04 5 Great Lakes Dredge & Dock Corp. 29 0.01 1 Great Southern Bancorp., Inc. 20 0.01 3 Greatbatch, Inc. 72 0.03 1 Green Bankshares, Inc. 16 0.01 2 Green Plains Renewable Energy, Inc. 19 0.01 1 Greenbrier Cos., Inc. 18 0.01 3 Greenlight Capital Re Ltd., Class A 65 0.03 8 Griffon Corp. 97 0.04 3 Group 1 Automotive, Inc. 94 0.04 8 GSI Technology, Inc. 45 0.02 2 Guaranty Bancorp. 4 – 2 Gulf Island Fabrication, Inc. 34 0.01 4 Gulfmark Offshore, Inc. 103 0.04 3 H&E Equipment Services, Inc. 33 0.01 – Haemonetics Corp. 22 0.01 4 Hain Celestial Group, Inc. 91 0.03 2 Hallmark Financial Services, Inc. 16 0.01 4 Hancock Holding Co. 161 0.06 5 Hanger Orthopedic Group, Inc. 90 0.03 2 Hanmi Financial Corp. 5 – 2 Harleysville Group, Inc. 52 0.02
15 Harmonic, Inc. 88 0.03
Shares (000's)
Value (000's)
USD
% of Net
Asset Value
Common Stock - 99.22% (continued) United States - 46.94% (continued)
3 Harris & Harris Group, Inc. 13 0.01 6 Harte-Hanks, Inc. 82 0.03 5 Harvest Natural Resources, Inc. 34 0.01 2 Haverty Furniture Cos., Inc. 28 0.01 6 Hawaiian Holdings, Inc. 39 0.01 1 Haynes International, Inc. 41 0.02 6 HB Fuller Co. 124 0.05
12 HCC Insurance Holdings, Inc. 300 0.12 5 Headwaters, Inc. 21 0.01
11 Health Net, Inc. 276 0.11 9 Healthspring, Inc. 153 0.06 7 Healthways, Inc. 105 0.04 1 Heartland Financial USA, Inc. 18 0.01
23 Hecla Mining Co. 124 0.05 2 HEICO Corp. 75 0.03 2 HEICO Corp., Class A 56 0.02 2 Heidrick & Struggles International, Inc. 49 0.02 5 Helen of Troy Ltd. 124 0.05
12 Helix Energy Solutions Group, Inc. 134 0.05 7 Helmerich & Payne, Inc. 266 0.10
16 Hercules Offshore, Inc. 50 0.02 1 Heritage Commerce Corp. 6 – 2 Herley Industries, Inc. 24 0.01
20 Hertz Global Holdings, Inc. 231 0.09 5 Hexcel Corp. 75 0.03 1 Hill International, Inc. 7 – 4 Hill-Rom Holdings, Inc. 109 0.04 7 Hilltop Holdings, Inc. 70 0.03 4 HNI Corp. 132 0.05 3 Holly Corp. 72 0.03
28 Hologic, Inc. 414 0.16 4 Home Bancshares, Inc. 101 0.04 4 Home Federal Bancorp., Inc. 64 0.02 1 Hooker Furniture Corp. 17 0.01 8 Horace Mann Educators Corp. 126 0.05 8 Horizon Lines, Inc., Class A 33 0.01 4 Hornbeck Offshore Services, Inc. 53 0.02 5 Horsehead Holding Corp. 47 0.02 4 HOT Topic, Inc. 23 0.01 2 HUB Group, Inc., Class A 58 0.02 3 Hughes Communications, Inc. 73 0.03
76 Huntington Bancshares, Inc. 467 0.18 30 Huntsman Corp. 295 0.11
– Huron Consulting Group, Inc. 5 – 4 Hypercom Corp. 20 0.01
14 IAC/InterActiveCorp. 331 0.13 3 Iberiabank Corp. 188 0.07 3 ICF International, Inc. 58 0.02 8 Iconix Brand Group, Inc. 136 0.05 1 ICU Medical, Inc. 22 0.01 3 ICx Technologies, Inc. 20 0.01 1 II-VI, Inc. 30 0.01
13 Ikanos Communications, Inc. 27 0.01 4 Imation Corp. 45 0.02 3 Immersion Corp. 13 – 1 Imperial Sugar Co. 9 – 1 Independence Holding Co. 8 – 3 Independent Bank Corp. - Rockland MA 82 0.03
10 Infinera Corp. 69 0.03
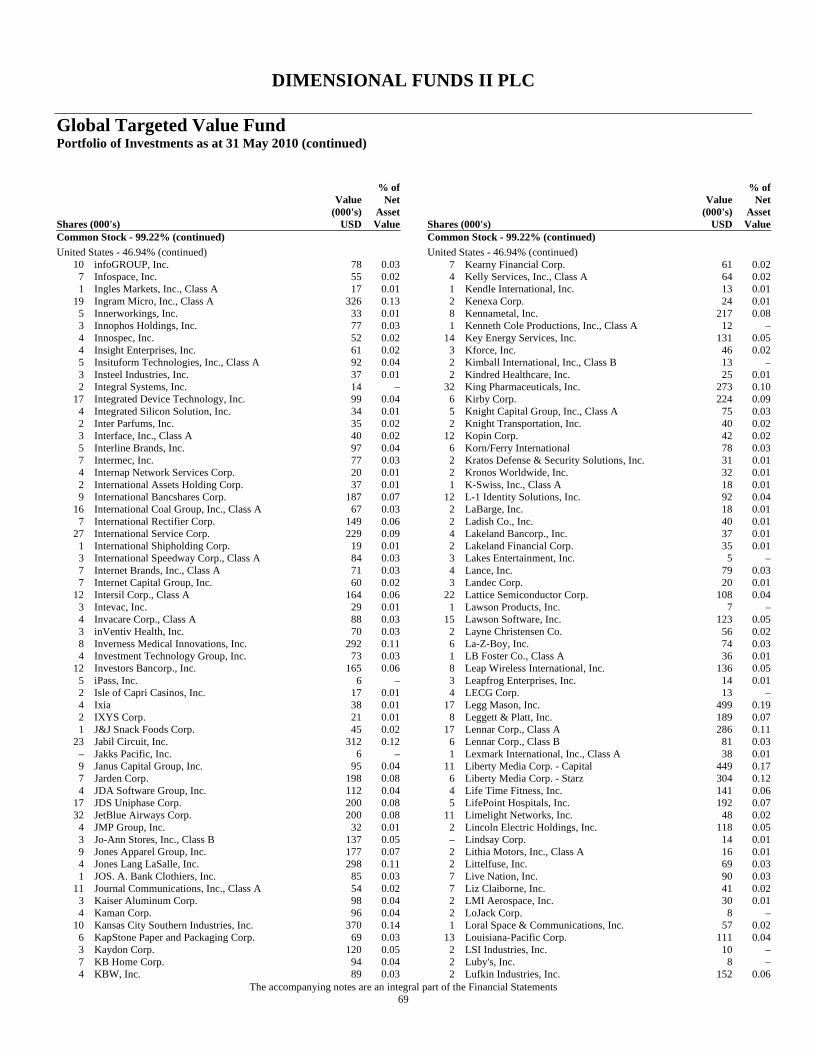
DIMENSIONAL FUNDS II PLC
Global Targeted Value Fund Portfolio of Investments as at 31 May 2010 (continued)
The accompanying notes are an integral part of the Financial Statements 69
Shares (000's)
Value (000's)
USD
% of Net
Asset Value
Common Stock - 99.22% (continued) United States - 46.94% (continued)
10 infoGROUP, Inc. 78 0.03 7 Infospace, Inc. 55 0.02 1 Ingles Markets, Inc., Class A 17 0.01
19 Ingram Micro, Inc., Class A 326 0.13 5 Innerworkings, Inc. 33 0.01 3 Innophos Holdings, Inc. 77 0.03 4 Innospec, Inc. 52 0.02 4 Insight Enterprises, Inc. 61 0.02 5 Insituform Technologies, Inc., Class A 92 0.04 3 Insteel Industries, Inc. 37 0.01 2 Integral Systems, Inc. 14 –
17 Integrated Device Technology, Inc. 99 0.04 4 Integrated Silicon Solution, Inc. 34 0.01 2 Inter Parfums, Inc. 35 0.02 3 Interface, Inc., Class A 40 0.02 5 Interline Brands, Inc. 97 0.04 7 Intermec, Inc. 77 0.03 4 Internap Network Services Corp. 20 0.01 2 International Assets Holding Corp. 37 0.01 9 International Bancshares Corp. 187 0.07
16 International Coal Group, Inc., Class A 67 0.03 7 International Rectifier Corp. 149 0.06
27 International Service Corp. 229 0.09 1 International Shipholding Corp. 19 0.01 3 International Speedway Corp., Class A 84 0.03 7 Internet Brands, Inc., Class A 71 0.03 7 Internet Capital Group, Inc. 60 0.02
12 Intersil Corp., Class A 164 0.06 3 Intevac, Inc. 29 0.01 4 Invacare Corp., Class A 88 0.03 3 inVentiv Health, Inc. 70 0.03 8 Inverness Medical Innovations, Inc. 292 0.11 4 Investment Technology Group, Inc. 73 0.03
12 Investors Bancorp., Inc. 165 0.06 5 iPass, Inc. 6 – 2 Isle of Capri Casinos, Inc. 17 0.01 4 Ixia 38 0.01 2 IXYS Corp. 21 0.01 1 J&J Snack Foods Corp. 45 0.02
23 Jabil Circuit, Inc. 312 0.12 – Jakks Pacific, Inc. 6 – 9 Janus Capital Group, Inc. 95 0.04 7 Jarden Corp. 198 0.08 4 JDA Software Group, Inc. 112 0.04
17 JDS Uniphase Corp. 200 0.08 32 JetBlue Airways Corp. 200 0.08
4 JMP Group, Inc. 32 0.01 3 Jo-Ann Stores, Inc., Class B 137 0.05 9 Jones Apparel Group, Inc. 177 0.07 4 Jones Lang LaSalle, Inc. 298 0.11 1 JOS. A. Bank Clothiers, Inc. 85 0.03
11 Journal Communications, Inc., Class A 54 0.02 3 Kaiser Aluminum Corp. 98 0.04 4 Kaman Corp. 96 0.04
10 Kansas City Southern Industries, Inc. 370 0.14 6 KapStone Paper and Packaging Corp. 69 0.03 3 Kaydon Corp. 120 0.05 7 KB Home Corp. 94 0.04 4 KBW, Inc. 89 0.03
Shares (000's)
Value (000's)
USD
% of Net
Asset Value
Common Stock - 99.22% (continued) United States - 46.94% (continued)
7 Kearny Financial Corp. 61 0.02 4 Kelly Services, Inc., Class A 64 0.02 1 Kendle International, Inc. 13 0.01 2 Kenexa Corp. 24 0.01 8 Kennametal, Inc. 217 0.08 1 Kenneth Cole Productions, Inc., Class A 12 –
14 Key Energy Services, Inc. 131 0.05 3 Kforce, Inc. 46 0.02 2 Kimball International, Inc., Class B 13 – 2 Kindred Healthcare, Inc. 25 0.01
32 King Pharmaceuticals, Inc. 273 0.10 6 Kirby Corp. 224 0.09 5 Knight Capital Group, Inc., Class A 75 0.03 2 Knight Transportation, Inc. 40 0.02
12 Kopin Corp. 42 0.02 6 Korn/Ferry International 78 0.03 2 Kratos Defense & Security Solutions, Inc. 31 0.01 2 Kronos Worldwide, Inc. 32 0.01 1 K-Swiss, Inc., Class A 18 0.01
12 L-1 Identity Solutions, Inc. 92 0.04 2 LaBarge, Inc. 18 0.01 2 Ladish Co., Inc. 40 0.01 4 Lakeland Bancorp., Inc. 37 0.01 2 Lakeland Financial Corp. 35 0.01 3 Lakes Entertainment, Inc. 5 – 4 Lance, Inc. 79 0.03 3 Landec Corp. 20 0.01
22 Lattice Semiconductor Corp. 108 0.04 1 Lawson Products, Inc. 7 –
15 Lawson Software, Inc. 123 0.05 2 Layne Christensen Co. 56 0.02 6 La-Z-Boy, Inc. 74 0.03 1 LB Foster Co., Class A 36 0.01 8 Leap Wireless International, Inc. 136 0.05 3 Leapfrog Enterprises, Inc. 14 0.01 4 LECG Corp. 13 –
17 Legg Mason, Inc. 499 0.19 8 Leggett & Platt, Inc. 189 0.07
17 Lennar Corp., Class A 286 0.11 6 Lennar Corp., Class B 81 0.03 1 Lexmark International, Inc., Class A 38 0.01
11 Liberty Media Corp. - Capital 449 0.17 6 Liberty Media Corp. - Starz 304 0.12 4 Life Time Fitness, Inc. 141 0.06 5 LifePoint Hospitals, Inc. 192 0.07
11 Limelight Networks, Inc. 48 0.02 2 Lincoln Electric Holdings, Inc. 118 0.05 – Lindsay Corp. 14 0.01 2 Lithia Motors, Inc., Class A 16 0.01 2 Littelfuse, Inc. 69 0.03 7 Live Nation, Inc. 90 0.03 7 Liz Claiborne, Inc. 41 0.02 2 LMI Aerospace, Inc. 30 0.01 2 LoJack Corp. 8 – 1 Loral Space & Communications, Inc. 57 0.02
13 Louisiana-Pacific Corp. 111 0.04 2 LSI Industries, Inc. 10 – 2 Luby's, Inc. 8 – 2 Lufkin Industries, Inc. 152 0.06
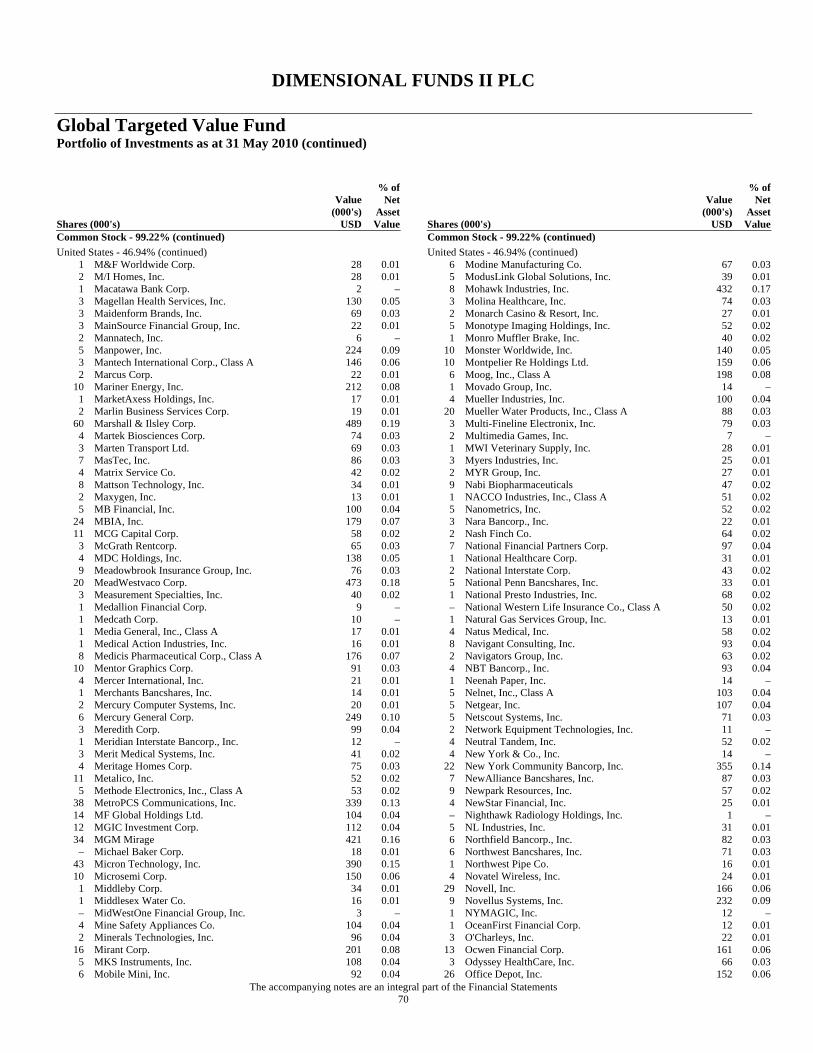
DIMENSIONAL FUNDS II PLC
Global Targeted Value Fund Portfolio of Investments as at 31 May 2010 (continued)
The accompanying notes are an integral part of the Financial Statements 70
Shares (000's)
Value (000's)
USD
% of Net
Asset Value
Common Stock - 99.22% (continued) United States - 46.94% (continued)
1 M&F Worldwide Corp. 28 0.01 2 M/I Homes, Inc. 28 0.01 1 Macatawa Bank Corp. 2 – 3 Magellan Health Services, Inc. 130 0.05 3 Maidenform Brands, Inc. 69 0.03 3 MainSource Financial Group, Inc. 22 0.01 2 Mannatech, Inc. 6 – 5 Manpower, Inc. 224 0.09 3 Mantech International Corp., Class A 146 0.06 2 Marcus Corp. 22 0.01
10 Mariner Energy, Inc. 212 0.08 1 MarketAxess Holdings, Inc. 17 0.01 2 Marlin Business Services Corp. 19 0.01
60 Marshall & Ilsley Corp. 489 0.19 4 Martek Biosciences Corp. 74 0.03 3 Marten Transport Ltd. 69 0.03 7 MasTec, Inc. 86 0.03 4 Matrix Service Co. 42 0.02 8 Mattson Technology, Inc. 34 0.01 2 Maxygen, Inc. 13 0.01 5 MB Financial, Inc. 100 0.04
24 MBIA, Inc. 179 0.07 11 MCG Capital Corp. 58 0.02
3 McGrath Rentcorp. 65 0.03 4 MDC Holdings, Inc. 138 0.05 9 Meadowbrook Insurance Group, Inc. 76 0.03
20 MeadWestvaco Corp. 473 0.18 3 Measurement Specialties, Inc. 40 0.02 1 Medallion Financial Corp. 9 – 1 Medcath Corp. 10 – 1 Media General, Inc., Class A 17 0.01 1 Medical Action Industries, Inc. 16 0.01 8 Medicis Pharmaceutical Corp., Class A 176 0.07
10 Mentor Graphics Corp. 91 0.03 4 Mercer International, Inc. 21 0.01 1 Merchants Bancshares, Inc. 14 0.01 2 Mercury Computer Systems, Inc. 20 0.01 6 Mercury General Corp. 249 0.10 3 Meredith Corp. 99 0.04 1 Meridian Interstate Bancorp., Inc. 12 – 3 Merit Medical Systems, Inc. 41 0.02 4 Meritage Homes Corp. 75 0.03
11 Metalico, Inc. 52 0.02 5 Methode Electronics, Inc., Class A 53 0.02
38 MetroPCS Communications, Inc. 339 0.13 14 MF Global Holdings Ltd. 104 0.04 12 MGIC Investment Corp. 112 0.04 34 MGM Mirage 421 0.16
– Michael Baker Corp. 18 0.01 43 Micron Technology, Inc. 390 0.15 10 Microsemi Corp. 150 0.06
1 Middleby Corp. 34 0.01 1 Middlesex Water Co. 16 0.01 – MidWestOne Financial Group, Inc. 3 – 4 Mine Safety Appliances Co. 104 0.04 2 Minerals Technologies, Inc. 96 0.04
16 Mirant Corp. 201 0.08 5 MKS Instruments, Inc. 108 0.04 6 Mobile Mini, Inc. 92 0.04
Shares (000's)
Value (000's)
USD
% of Net
Asset Value
Common Stock - 99.22% (continued) United States - 46.94% (continued)
6 Modine Manufacturing Co. 67 0.03 5 ModusLink Global Solutions, Inc. 39 0.01 8 Mohawk Industries, Inc. 432 0.17 3 Molina Healthcare, Inc. 74 0.03 2 Monarch Casino & Resort, Inc. 27 0.01 5 Monotype Imaging Holdings, Inc. 52 0.02 1 Monro Muffler Brake, Inc. 40 0.02
10 Monster Worldwide, Inc. 140 0.05 10 Montpelier Re Holdings Ltd. 159 0.06
6 Moog, Inc., Class A 198 0.08 1 Movado Group, Inc. 14 – 4 Mueller Industries, Inc. 100 0.04
20 Mueller Water Products, Inc., Class A 88 0.03 3 Multi-Fineline Electronix, Inc. 79 0.03 2 Multimedia Games, Inc. 7 – 1 MWI Veterinary Supply, Inc. 28 0.01 3 Myers Industries, Inc. 25 0.01 2 MYR Group, Inc. 27 0.01 9 Nabi Biopharmaceuticals 47 0.02 1 NACCO Industries, Inc., Class A 51 0.02 5 Nanometrics, Inc. 52 0.02 3 Nara Bancorp., Inc. 22 0.01 2 Nash Finch Co. 64 0.02 7 National Financial Partners Corp. 97 0.04 1 National Healthcare Corp. 31 0.01 2 National Interstate Corp. 43 0.02 5 National Penn Bancshares, Inc. 33 0.01 1 National Presto Industries, Inc. 68 0.02 – National Western Life Insurance Co., Class A 50 0.02 1 Natural Gas Services Group, Inc. 13 0.01 4 Natus Medical, Inc. 58 0.02 8 Navigant Consulting, Inc. 93 0.04 2 Navigators Group, Inc. 63 0.02 4 NBT Bancorp., Inc. 93 0.04 1 Neenah Paper, Inc. 14 – 5 Nelnet, Inc., Class A 103 0.04 5 Netgear, Inc. 107 0.04 5 Netscout Systems, Inc. 71 0.03 2 Network Equipment Technologies, Inc. 11 – 4 Neutral Tandem, Inc. 52 0.02 4 New York & Co., Inc. 14 –
22 New York Community Bancorp, Inc. 355 0.14 7 NewAlliance Bancshares, Inc. 87 0.03 9 Newpark Resources, Inc. 57 0.02 4 NewStar Financial, Inc. 25 0.01 – Nighthawk Radiology Holdings, Inc. 1 – 5 NL Industries, Inc. 31 0.01 6 Northfield Bancorp., Inc. 82 0.03 6 Northwest Bancshares, Inc. 71 0.03 1 Northwest Pipe Co. 16 0.01 4 Novatel Wireless, Inc. 24 0.01
29 Novell, Inc. 166 0.06 9 Novellus Systems, Inc. 232 0.09 1 NYMAGIC, Inc. 12 – 1 OceanFirst Financial Corp. 12 0.01 3 O'Charleys, Inc. 22 0.01
13 Ocwen Financial Corp. 161 0.06 3 Odyssey HealthCare, Inc. 66 0.03
26 Office Depot, Inc. 152 0.06
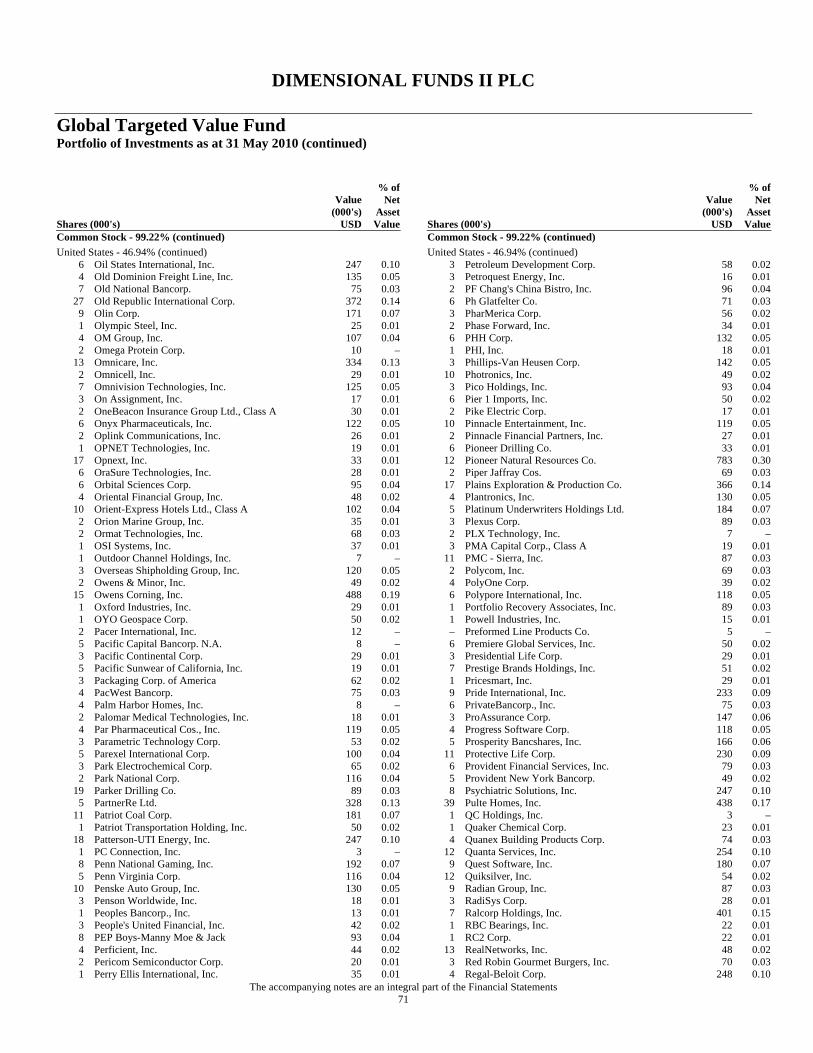
DIMENSIONAL FUNDS II PLC
Global Targeted Value Fund Portfolio of Investments as at 31 May 2010 (continued)
The accompanying notes are an integral part of the Financial Statements 71
Shares (000's)
Value (000's)
USD
% of Net
Asset Value
Common Stock - 99.22% (continued) United States - 46.94% (continued)
6 Oil States International, Inc. 247 0.10 4 Old Dominion Freight Line, Inc. 135 0.05 7 Old National Bancorp. 75 0.03
27 Old Republic International Corp. 372 0.14 9 Olin Corp. 171 0.07 1 Olympic Steel, Inc. 25 0.01 4 OM Group, Inc. 107 0.04 2 Omega Protein Corp. 10 –
13 Omnicare, Inc. 334 0.13 2 Omnicell, Inc. 29 0.01 7 Omnivision Technologies, Inc. 125 0.05 3 On Assignment, Inc. 17 0.01 2 OneBeacon Insurance Group Ltd., Class A 30 0.01 6 Onyx Pharmaceuticals, Inc. 122 0.05 2 Oplink Communications, Inc. 26 0.01 1 OPNET Technologies, Inc. 19 0.01
17 Opnext, Inc. 33 0.01 6 OraSure Technologies, Inc. 28 0.01 6 Orbital Sciences Corp. 95 0.04 4 Oriental Financial Group, Inc. 48 0.02
10 Orient-Express Hotels Ltd., Class A 102 0.04 2 Orion Marine Group, Inc. 35 0.01 2 Ormat Technologies, Inc. 68 0.03 1 OSI Systems, Inc. 37 0.01 1 Outdoor Channel Holdings, Inc. 7 – 3 Overseas Shipholding Group, Inc. 120 0.05 2 Owens & Minor, Inc. 49 0.02
15 Owens Corning, Inc. 488 0.19 1 Oxford Industries, Inc. 29 0.01 1 OYO Geospace Corp. 50 0.02 2 Pacer International, Inc. 12 – 5 Pacific Capital Bancorp. N.A. 8 – 3 Pacific Continental Corp. 29 0.01 5 Pacific Sunwear of California, Inc. 19 0.01 3 Packaging Corp. of America 62 0.02 4 PacWest Bancorp. 75 0.03 4 Palm Harbor Homes, Inc. 8 – 2 Palomar Medical Technologies, Inc. 18 0.01 4 Par Pharmaceutical Cos., Inc. 119 0.05 3 Parametric Technology Corp. 53 0.02 5 Parexel International Corp. 100 0.04 3 Park Electrochemical Corp. 65 0.02 2 Park National Corp. 116 0.04
19 Parker Drilling Co. 89 0.03 5 PartnerRe Ltd. 328 0.13
11 Patriot Coal Corp. 181 0.07 1 Patriot Transportation Holding, Inc. 50 0.02
18 Patterson-UTI Energy, Inc. 247 0.10 1 PC Connection, Inc. 3 – 8 Penn National Gaming, Inc. 192 0.07 5 Penn Virginia Corp. 116 0.04
10 Penske Auto Group, Inc. 130 0.05 3 Penson Worldwide, Inc. 18 0.01 1 Peoples Bancorp., Inc. 13 0.01 3 People's United Financial, Inc. 42 0.02 8 PEP Boys-Manny Moe & Jack 93 0.04 4 Perficient, Inc. 44 0.02 2 Pericom Semiconductor Corp. 20 0.01 1 Perry Ellis International, Inc. 35 0.01
Shares (000's)
Value (000's)
USD
% of Net
Asset Value
Common Stock - 99.22% (continued) United States - 46.94% (continued)
3 Petroleum Development Corp. 58 0.02 3 Petroquest Energy, Inc. 16 0.01 2 PF Chang's China Bistro, Inc. 96 0.04 6 Ph Glatfelter Co. 71 0.03 3 PharMerica Corp. 56 0.02 2 Phase Forward, Inc. 34 0.01 6 PHH Corp. 132 0.05 1 PHI, Inc. 18 0.01 3 Phillips-Van Heusen Corp. 142 0.05
10 Photronics, Inc. 49 0.02 3 Pico Holdings, Inc. 93 0.04 6 Pier 1 Imports, Inc. 50 0.02 2 Pike Electric Corp. 17 0.01
10 Pinnacle Entertainment, Inc. 119 0.05 2 Pinnacle Financial Partners, Inc. 27 0.01 6 Pioneer Drilling Co. 33 0.01
12 Pioneer Natural Resources Co. 783 0.30 2 Piper Jaffray Cos. 69 0.03
17 Plains Exploration & Production Co. 366 0.14 4 Plantronics, Inc. 130 0.05 5 Platinum Underwriters Holdings Ltd. 184 0.07 3 Plexus Corp. 89 0.03 2 PLX Technology, Inc. 7 – 3 PMA Capital Corp., Class A 19 0.01
11 PMC - Sierra, Inc. 87 0.03 2 Polycom, Inc. 69 0.03 4 PolyOne Corp. 39 0.02 6 Polypore International, Inc. 118 0.05 1 Portfolio Recovery Associates, Inc. 89 0.03 1 Powell Industries, Inc. 15 0.01 – Preformed Line Products Co. 5 – 6 Premiere Global Services, Inc. 50 0.02 3 Presidential Life Corp. 29 0.01 7 Prestige Brands Holdings, Inc. 51 0.02 1 Pricesmart, Inc. 29 0.01 9 Pride International, Inc. 233 0.09 6 PrivateBancorp., Inc. 75 0.03 3 ProAssurance Corp. 147 0.06 4 Progress Software Corp. 118 0.05 5 Prosperity Bancshares, Inc. 166 0.06
11 Protective Life Corp. 230 0.09 6 Provident Financial Services, Inc. 79 0.03 5 Provident New York Bancorp. 49 0.02 8 Psychiatric Solutions, Inc. 247 0.10
39 Pulte Homes, Inc. 438 0.17 1 QC Holdings, Inc. 3 – 1 Quaker Chemical Corp. 23 0.01 4 Quanex Building Products Corp. 74 0.03
12 Quanta Services, Inc. 254 0.10 9 Quest Software, Inc. 180 0.07
12 Quiksilver, Inc. 54 0.02 9 Radian Group, Inc. 87 0.03 3 RadiSys Corp. 28 0.01 7 Ralcorp Holdings, Inc. 401 0.15 1 RBC Bearings, Inc. 22 0.01 1 RC2 Corp. 22 0.01
13 RealNetworks, Inc. 48 0.02 3 Red Robin Gourmet Burgers, Inc. 70 0.03 4 Regal-Beloit Corp. 248 0.10
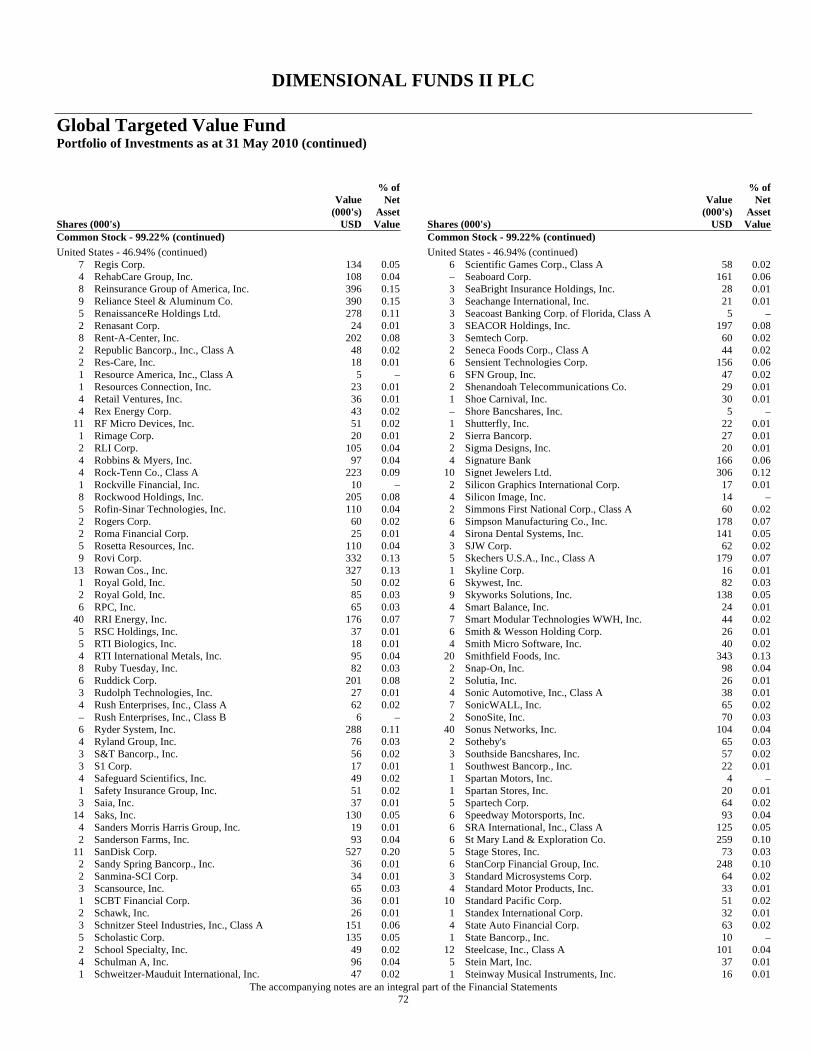
DIMENSIONAL FUNDS II PLC
Global Targeted Value Fund Portfolio of Investments as at 31 May 2010 (continued)
The accompanying notes are an integral part of the Financial Statements 72
Shares (000's)
Value (000's)
USD
% of Net
Asset Value
Common Stock - 99.22% (continued) United States - 46.94% (continued)
7 Regis Corp. 134 0.05 4 RehabCare Group, Inc. 108 0.04 8 Reinsurance Group of America, Inc. 396 0.15 9 Reliance Steel & Aluminum Co. 390 0.15 5 RenaissanceRe Holdings Ltd. 278 0.11 2 Renasant Corp. 24 0.01 8 Rent-A-Center, Inc. 202 0.08 2 Republic Bancorp., Inc., Class A 48 0.02 2 Res-Care, Inc. 18 0.01 1 Resource America, Inc., Class A 5 – 1 Resources Connection, Inc. 23 0.01 4 Retail Ventures, Inc. 36 0.01 4 Rex Energy Corp. 43 0.02
11 RF Micro Devices, Inc. 51 0.02 1 Rimage Corp. 20 0.01 2 RLI Corp. 105 0.04 4 Robbins & Myers, Inc. 97 0.04 4 Rock-Tenn Co., Class A 223 0.09 1 Rockville Financial, Inc. 10 – 8 Rockwood Holdings, Inc. 205 0.08 5 Rofin-Sinar Technologies, Inc. 110 0.04 2 Rogers Corp. 60 0.02 2 Roma Financial Corp. 25 0.01 5 Rosetta Resources, Inc. 110 0.04 9 Rovi Corp. 332 0.13
13 Rowan Cos., Inc. 327 0.13 1 Royal Gold, Inc. 50 0.02 2 Royal Gold, Inc. 85 0.03 6 RPC, Inc. 65 0.03
40 RRI Energy, Inc. 176 0.07 5 RSC Holdings, Inc. 37 0.01 5 RTI Biologics, Inc. 18 0.01 4 RTI International Metals, Inc. 95 0.04 8 Ruby Tuesday, Inc. 82 0.03 6 Ruddick Corp. 201 0.08 3 Rudolph Technologies, Inc. 27 0.01 4 Rush Enterprises, Inc., Class A 62 0.02 – Rush Enterprises, Inc., Class B 6 – 6 Ryder System, Inc. 288 0.11 4 Ryland Group, Inc. 76 0.03 3 S&T Bancorp., Inc. 56 0.02 3 S1 Corp. 17 0.01 4 Safeguard Scientifics, Inc. 49 0.02 1 Safety Insurance Group, Inc. 51 0.02 3 Saia, Inc. 37 0.01
14 Saks, Inc. 130 0.05 4 Sanders Morris Harris Group, Inc. 19 0.01 2 Sanderson Farms, Inc. 93 0.04
11 SanDisk Corp. 527 0.20 2 Sandy Spring Bancorp., Inc. 36 0.01 2 Sanmina-SCI Corp. 34 0.01 3 Scansource, Inc. 65 0.03 1 SCBT Financial Corp. 36 0.01 2 Schawk, Inc. 26 0.01 3 Schnitzer Steel Industries, Inc., Class A 151 0.06 5 Scholastic Corp. 135 0.05 2 School Specialty, Inc. 49 0.02 4 Schulman A, Inc. 96 0.04 1 Schweitzer-Mauduit International, Inc. 47 0.02
Shares (000's)
Value (000's)
USD
% of Net
Asset Value
Common Stock - 99.22% (continued) United States - 46.94% (continued)
6 Scientific Games Corp., Class A 58 0.02 – Seaboard Corp. 161 0.06 3 SeaBright Insurance Holdings, Inc. 28 0.01 3 Seachange International, Inc. 21 0.01 3 Seacoast Banking Corp. of Florida, Class A 5 – 3 SEACOR Holdings, Inc. 197 0.08 3 Semtech Corp. 60 0.02 2 Seneca Foods Corp., Class A 44 0.02 6 Sensient Technologies Corp. 156 0.06 6 SFN Group, Inc. 47 0.02 2 Shenandoah Telecommunications Co. 29 0.01 1 Shoe Carnival, Inc. 30 0.01 – Shore Bancshares, Inc. 5 – 1 Shutterfly, Inc. 22 0.01 2 Sierra Bancorp. 27 0.01 2 Sigma Designs, Inc. 20 0.01 4 Signature Bank 166 0.06
10 Signet Jewelers Ltd. 306 0.12 2 Silicon Graphics International Corp. 17 0.01 4 Silicon Image, Inc. 14 – 2 Simmons First National Corp., Class A 60 0.02 6 Simpson Manufacturing Co., Inc. 178 0.07 4 Sirona Dental Systems, Inc. 141 0.05 3 SJW Corp. 62 0.02 5 Skechers U.S.A., Inc., Class A 179 0.07 1 Skyline Corp. 16 0.01 6 Skywest, Inc. 82 0.03 9 Skyworks Solutions, Inc. 138 0.05 4 Smart Balance, Inc. 24 0.01 7 Smart Modular Technologies WWH, Inc. 44 0.02 6 Smith & Wesson Holding Corp. 26 0.01 4 Smith Micro Software, Inc. 40 0.02
20 Smithfield Foods, Inc. 343 0.13 2 Snap-On, Inc. 98 0.04 2 Solutia, Inc. 26 0.01 4 Sonic Automotive, Inc., Class A 38 0.01 7 SonicWALL, Inc. 65 0.02 2 SonoSite, Inc. 70 0.03
40 Sonus Networks, Inc. 104 0.04 2 Sotheby's 65 0.03 3 Southside Bancshares, Inc. 57 0.02 1 Southwest Bancorp., Inc. 22 0.01 1 Spartan Motors, Inc. 4 – 1 Spartan Stores, Inc. 20 0.01 5 Spartech Corp. 64 0.02 6 Speedway Motorsports, Inc. 93 0.04 6 SRA International, Inc., Class A 125 0.05 6 St Mary Land & Exploration Co. 259 0.10 5 Stage Stores, Inc. 73 0.03 6 StanCorp Financial Group, Inc. 248 0.10 3 Standard Microsystems Corp. 64 0.02 4 Standard Motor Products, Inc. 33 0.01
10 Standard Pacific Corp. 51 0.02 1 Standex International Corp. 32 0.01 4 State Auto Financial Corp. 63 0.02 1 State Bancorp., Inc. 10 –
12 Steelcase, Inc., Class A 101 0.04 5 Stein Mart, Inc. 37 0.01 1 Steinway Musical Instruments, Inc. 16 0.01
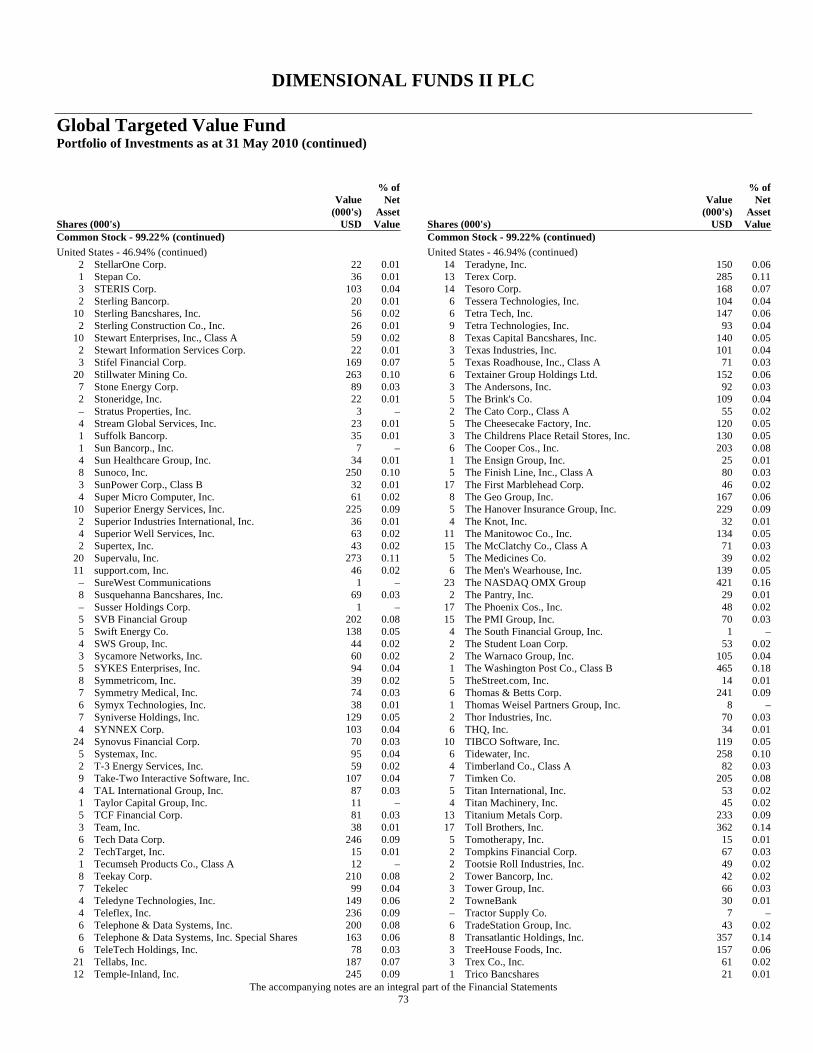
DIMENSIONAL FUNDS II PLC
Global Targeted Value Fund Portfolio of Investments as at 31 May 2010 (continued)
The accompanying notes are an integral part of the Financial Statements 73
Shares (000's)
Value (000's)
USD
% of Net
Asset Value
Common Stock - 99.22% (continued) United States - 46.94% (continued)
2 StellarOne Corp. 22 0.01 1 Stepan Co. 36 0.01 3 STERIS Corp. 103 0.04 2 Sterling Bancorp. 20 0.01
10 Sterling Bancshares, Inc. 56 0.02 2 Sterling Construction Co., Inc. 26 0.01
10 Stewart Enterprises, Inc., Class A 59 0.02 2 Stewart Information Services Corp. 22 0.01 3 Stifel Financial Corp. 169 0.07
20 Stillwater Mining Co. 263 0.10 7 Stone Energy Corp. 89 0.03 2 Stoneridge, Inc. 22 0.01 – Stratus Properties, Inc. 3 – 4 Stream Global Services, Inc. 23 0.01 1 Suffolk Bancorp. 35 0.01 1 Sun Bancorp., Inc. 7 – 4 Sun Healthcare Group, Inc. 34 0.01 8 Sunoco, Inc. 250 0.10 3 SunPower Corp., Class B 32 0.01 4 Super Micro Computer, Inc. 61 0.02
10 Superior Energy Services, Inc. 225 0.09 2 Superior Industries International, Inc. 36 0.01 4 Superior Well Services, Inc. 63 0.02 2 Supertex, Inc. 43 0.02
20 Supervalu, Inc. 273 0.11 11 support.com, Inc. 46 0.02
– SureWest Communications 1 – 8 Susquehanna Bancshares, Inc. 69 0.03 – Susser Holdings Corp. 1 – 5 SVB Financial Group 202 0.08 5 Swift Energy Co. 138 0.05 4 SWS Group, Inc. 44 0.02 3 Sycamore Networks, Inc. 60 0.02 5 SYKES Enterprises, Inc. 94 0.04 8 Symmetricom, Inc. 39 0.02 7 Symmetry Medical, Inc. 74 0.03 6 Symyx Technologies, Inc. 38 0.01 7 Syniverse Holdings, Inc. 129 0.05 4 SYNNEX Corp. 103 0.04
24 Synovus Financial Corp. 70 0.03 5 Systemax, Inc. 95 0.04 2 T-3 Energy Services, Inc. 59 0.02 9 Take-Two Interactive Software, Inc. 107 0.04 4 TAL International Group, Inc. 87 0.03 1 Taylor Capital Group, Inc. 11 – 5 TCF Financial Corp. 81 0.03 3 Team, Inc. 38 0.01 6 Tech Data Corp. 246 0.09 2 TechTarget, Inc. 15 0.01 1 Tecumseh Products Co., Class A 12 – 8 Teekay Corp. 210 0.08 7 Tekelec 99 0.04 4 Teledyne Technologies, Inc. 149 0.06 4 Teleflex, Inc. 236 0.09 6 Telephone & Data Systems, Inc. 200 0.08 6 Telephone & Data Systems, Inc. Special Shares 163 0.06 6 TeleTech Holdings, Inc. 78 0.03
21 Tellabs, Inc. 187 0.07 12 Temple-Inland, Inc. 245 0.09
Shares (000's)
Value (000's)
USD
% of Net
Asset Value
Common Stock - 99.22% (continued) United States - 46.94% (continued)
14 Teradyne, Inc. 150 0.06 13 Terex Corp. 285 0.11 14 Tesoro Corp. 168 0.07
6 Tessera Technologies, Inc. 104 0.04 6 Tetra Tech, Inc. 147 0.06 9 Tetra Technologies, Inc. 93 0.04 8 Texas Capital Bancshares, Inc. 140 0.05 3 Texas Industries, Inc. 101 0.04 5 Texas Roadhouse, Inc., Class A 71 0.03 6 Textainer Group Holdings Ltd. 152 0.06 3 The Andersons, Inc. 92 0.03 5 The Brink's Co. 109 0.04 2 The Cato Corp., Class A 55 0.02 5 The Cheesecake Factory, Inc. 120 0.05 3 The Childrens Place Retail Stores, Inc. 130 0.05 6 The Cooper Cos., Inc. 203 0.08 1 The Ensign Group, Inc. 25 0.01 5 The Finish Line, Inc., Class A 80 0.03
17 The First Marblehead Corp. 46 0.02 8 The Geo Group, Inc. 167 0.06 5 The Hanover Insurance Group, Inc. 229 0.09 4 The Knot, Inc. 32 0.01
11 The Manitowoc Co., Inc. 134 0.05 15 The McClatchy Co., Class A 71 0.03
5 The Medicines Co. 39 0.02 6 The Men's Wearhouse, Inc. 139 0.05
23 The NASDAQ OMX Group 421 0.16 2 The Pantry, Inc. 29 0.01
17 The Phoenix Cos., Inc. 48 0.02 15 The PMI Group, Inc. 70 0.03
4 The South Financial Group, Inc. 1 – 2 The Student Loan Corp. 53 0.02 2 The Warnaco Group, Inc. 105 0.04 1 The Washington Post Co., Class B 465 0.18 5 TheStreet.com, Inc. 14 0.01 6 Thomas & Betts Corp. 241 0.09 1 Thomas Weisel Partners Group, Inc. 8 – 2 Thor Industries, Inc. 70 0.03 6 THQ, Inc. 34 0.01
10 TIBCO Software, Inc. 119 0.05 6 Tidewater, Inc. 258 0.10 4 Timberland Co., Class A 82 0.03 7 Timken Co. 205 0.08 5 Titan International, Inc. 53 0.02 4 Titan Machinery, Inc. 45 0.02
13 Titanium Metals Corp. 233 0.09 17 Toll Brothers, Inc. 362 0.14
5 Tomotherapy, Inc. 15 0.01 2 Tompkins Financial Corp. 67 0.03 2 Tootsie Roll Industries, Inc. 49 0.02 2 Tower Bancorp, Inc. 42 0.02 3 Tower Group, Inc. 66 0.03 2 TowneBank 30 0.01 – Tractor Supply Co. 7 – 6 TradeStation Group, Inc. 43 0.02 8 Transatlantic Holdings, Inc. 357 0.14 3 TreeHouse Foods, Inc. 157 0.06 3 Trex Co., Inc. 61 0.02 1 Trico Bancshares 21 0.01
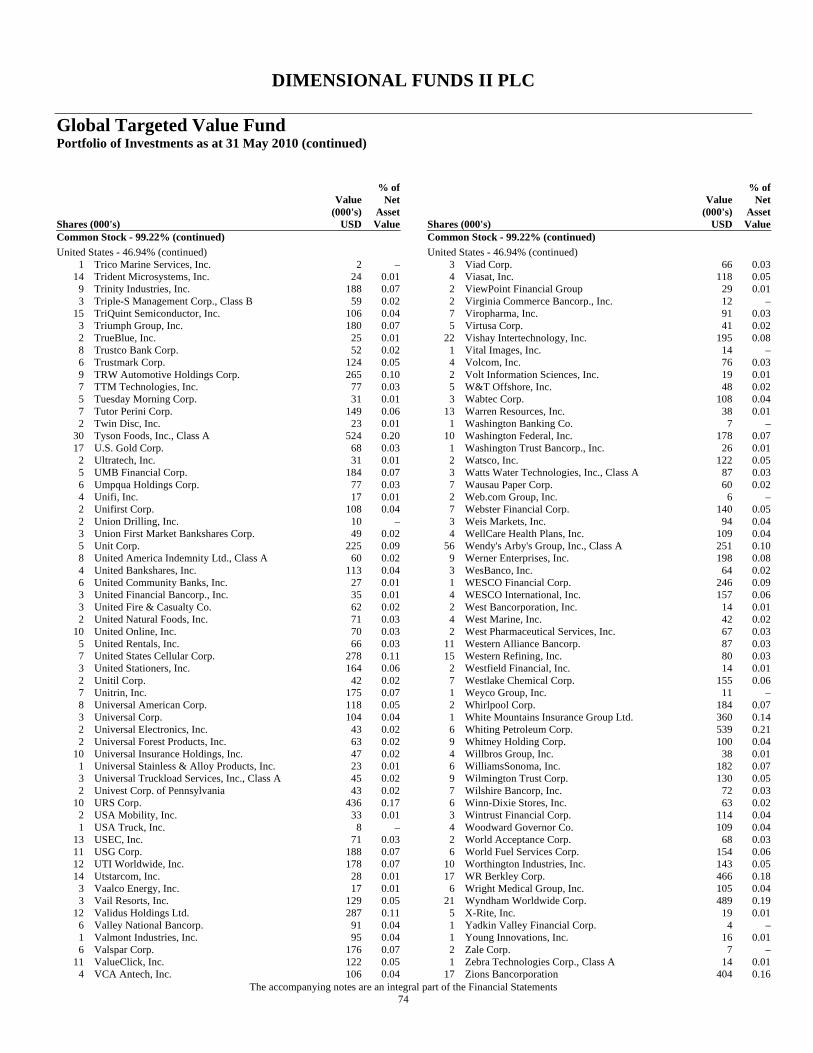
DIMENSIONAL FUNDS II PLC
Global Targeted Value Fund Portfolio of Investments as at 31 May 2010 (continued)
The accompanying notes are an integral part of the Financial Statements 74
Shares (000's)
Value (000's)
USD
% of Net
Asset Value
Common Stock - 99.22% (continued) United States - 46.94% (continued)
1 Trico Marine Services, Inc. 2 – 14 Trident Microsystems, Inc. 24 0.01
9 Trinity Industries, Inc. 188 0.07 3 Triple-S Management Corp., Class B 59 0.02
15 TriQuint Semiconductor, Inc. 106 0.04 3 Triumph Group, Inc. 180 0.07 2 TrueBlue, Inc. 25 0.01 8 Trustco Bank Corp. 52 0.02 6 Trustmark Corp. 124 0.05 9 TRW Automotive Holdings Corp. 265 0.10 7 TTM Technologies, Inc. 77 0.03 5 Tuesday Morning Corp. 31 0.01 7 Tutor Perini Corp. 149 0.06 2 Twin Disc, Inc. 23 0.01
30 Tyson Foods, Inc., Class A 524 0.20 17 U.S. Gold Corp. 68 0.03
2 Ultratech, Inc. 31 0.01 5 UMB Financial Corp. 184 0.07 6 Umpqua Holdings Corp. 77 0.03 4 Unifi, Inc. 17 0.01 2 Unifirst Corp. 108 0.04 2 Union Drilling, Inc. 10 – 3 Union First Market Bankshares Corp. 49 0.02 5 Unit Corp. 225 0.09 8 United America Indemnity Ltd., Class A 60 0.02 4 United Bankshares, Inc. 113 0.04 6 United Community Banks, Inc. 27 0.01 3 United Financial Bancorp., Inc. 35 0.01 3 United Fire & Casualty Co. 62 0.02 2 United Natural Foods, Inc. 71 0.03
10 United Online, Inc. 70 0.03 5 United Rentals, Inc. 66 0.03 7 United States Cellular Corp. 278 0.11 3 United Stationers, Inc. 164 0.06 2 Unitil Corp. 42 0.02 7 Unitrin, Inc. 175 0.07 8 Universal American Corp. 118 0.05 3 Universal Corp. 104 0.04 2 Universal Electronics, Inc. 43 0.02 2 Universal Forest Products, Inc. 63 0.02
10 Universal Insurance Holdings, Inc. 47 0.02 1 Universal Stainless & Alloy Products, Inc. 23 0.01 3 Universal Truckload Services, Inc., Class A 45 0.02 2 Univest Corp. of Pennsylvania 43 0.02
10 URS Corp. 436 0.17 2 USA Mobility, Inc. 33 0.01 1 USA Truck, Inc. 8 –
13 USEC, Inc. 71 0.03 11 USG Corp. 188 0.07 12 UTI Worldwide, Inc. 178 0.07 14 Utstarcom, Inc. 28 0.01
3 Vaalco Energy, Inc. 17 0.01 3 Vail Resorts, Inc. 129 0.05
12 Validus Holdings Ltd. 287 0.11 6 Valley National Bancorp. 91 0.04 1 Valmont Industries, Inc. 95 0.04 6 Valspar Corp. 176 0.07
11 ValueClick, Inc. 122 0.05 4 VCA Antech, Inc. 106 0.04
Shares (000's)
Value (000's)
USD
% of Net
Asset Value
Common Stock - 99.22% (continued) United States - 46.94% (continued)
3 Viad Corp. 66 0.03 4 Viasat, Inc. 118 0.05 2 ViewPoint Financial Group 29 0.01 2 Virginia Commerce Bancorp., Inc. 12 – 7 Viropharma, Inc. 91 0.03 5 Virtusa Corp. 41 0.02
22 Vishay Intertechnology, Inc. 195 0.08 1 Vital Images, Inc. 14 – 4 Volcom, Inc. 76 0.03 2 Volt Information Sciences, Inc. 19 0.01 5 W&T Offshore, Inc. 48 0.02 3 Wabtec Corp. 108 0.04
13 Warren Resources, Inc. 38 0.01 1 Washington Banking Co. 7 –
10 Washington Federal, Inc. 178 0.07 1 Washington Trust Bancorp., Inc. 26 0.01 2 Watsco, Inc. 122 0.05 3 Watts Water Technologies, Inc., Class A 87 0.03 7 Wausau Paper Corp. 60 0.02 2 Web.com Group, Inc. 6 – 7 Webster Financial Corp. 140 0.05 3 Weis Markets, Inc. 94 0.04 4 WellCare Health Plans, Inc. 109 0.04
56 Wendy's Arby's Group, Inc., Class A 251 0.10 9 Werner Enterprises, Inc. 198 0.08 3 WesBanco, Inc. 64 0.02 1 WESCO Financial Corp. 246 0.09 4 WESCO International, Inc. 157 0.06 2 West Bancorporation, Inc. 14 0.01 4 West Marine, Inc. 42 0.02 2 West Pharmaceutical Services, Inc. 67 0.03
11 Western Alliance Bancorp. 87 0.03 15 Western Refining, Inc. 80 0.03
2 Westfield Financial, Inc. 14 0.01 7 Westlake Chemical Corp. 155 0.06 1 Weyco Group, Inc. 11 – 2 Whirlpool Corp. 184 0.07 1 White Mountains Insurance Group Ltd. 360 0.14 6 Whiting Petroleum Corp. 539 0.21 9 Whitney Holding Corp. 100 0.04 4 Willbros Group, Inc. 38 0.01 6 WilliamsSonoma, Inc. 182 0.07 9 Wilmington Trust Corp. 130 0.05 7 Wilshire Bancorp, Inc. 72 0.03 6 Winn-Dixie Stores, Inc. 63 0.02 3 Wintrust Financial Corp. 114 0.04 4 Woodward Governor Co. 109 0.04 2 World Acceptance Corp. 68 0.03 6 World Fuel Services Corp. 154 0.06
10 Worthington Industries, Inc. 143 0.05 17 WR Berkley Corp. 466 0.18
6 Wright Medical Group, Inc. 105 0.04 21 Wyndham Worldwide Corp. 489 0.19
5 X-Rite, Inc. 19 0.01 1 Yadkin Valley Financial Corp. 4 – 1 Young Innovations, Inc. 16 0.01 2 Zale Corp. 7 – 1 Zebra Technologies Corp., Class A 14 0.01
17 Zions Bancorporation 404 0.16
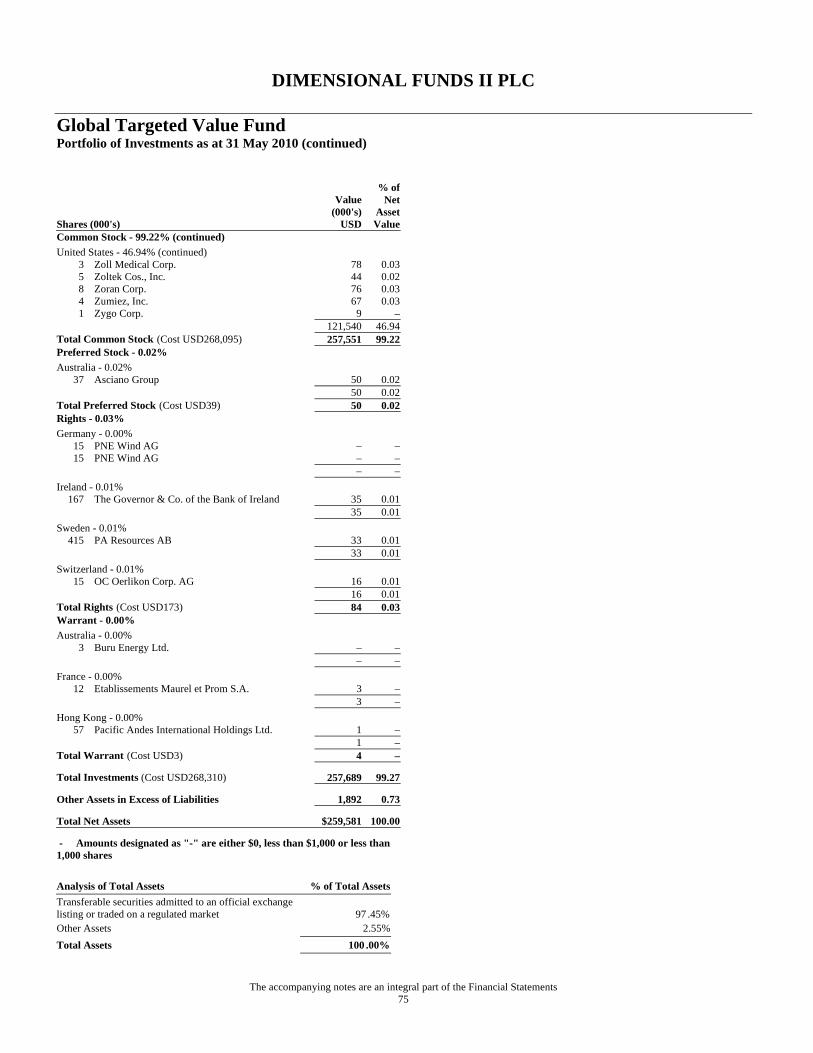
DIMENSIONAL FUNDS II PLC
Global Targeted Value Fund Portfolio of Investments as at 31 May 2010 (continued)
The accompanying notes are an integral part of the Financial Statements 75
Shares (000's)
Value (000's)
USD
% of Net
Asset Value
Common Stock - 99.22% (continued) United States - 46.94% (continued)
3 Zoll Medical Corp. 78 0.03 5 Zoltek Cos., Inc. 44 0.02 8 Zoran Corp. 76 0.03 4 Zumiez, Inc. 67 0.03 1 Zygo Corp. 9 –
121,540 46.94 Total Common Stock (Cost USD268,095) 257,551 99.22 Preferred Stock - 0.02% Australia - 0.02%
37 Asciano Group 50 0.02 50 0.02 Total Preferred Stock (Cost USD39) 50 0.02 Rights - 0.03% Germany - 0.00%
15 PNE Wind AG – – 15 PNE Wind AG – –
– – Ireland - 0.01%
167 The Governor & Co. of the Bank of Ireland 35 0.01 35 0.01 Sweden - 0.01%
415 PA Resources AB 33 0.01 33 0.01 Switzerland - 0.01%
15 OC Oerlikon Corp. AG 16 0.01 16 0.01 Total Rights (Cost USD173) 84 0.03 Warrant - 0.00% Australia - 0.00%
3 Buru Energy Ltd. – – – – France - 0.00%
12 Etablissements Maurel et Prom S.A. 3 – 3 – Hong Kong - 0.00%
57 Pacific Andes International Holdings Ltd. 1 – 1 – Total Warrant (Cost USD3) 4 –
Total Investments (Cost USD268,310) 257,689 99.27
Other Assets in Excess of Liabilities 1,892 0.73
Total Net Assets $259,581 100.00
- Amounts designated as "-" are either $0, less than $1,000 or less than 1,000 shares
Analysis of Total Assets % of Total Assets Transferable securities admitted to an official exchange listing or traded on a regulated market 97 .45% Other Assets 2.55% Total Assets 100 .00%
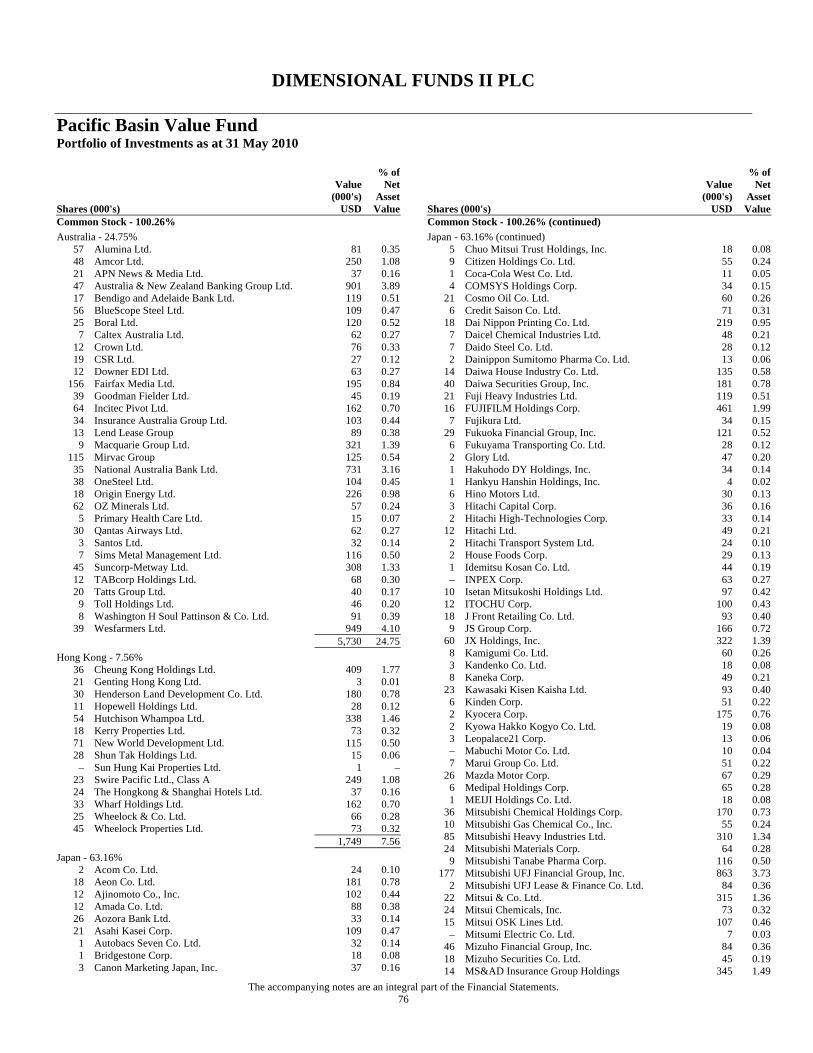
DIMENSIONAL FUNDS II PLC
Pacific Basin Value Fund Portfolio of Investments as at 31 May 2010
The accompanying notes are an integral part of the Financial Statements. 76
Shares (000's)
Value (000's)
USD
% of Net
Asset Value
Common Stock - 100.26% Australia - 24.75%
57 Alumina Ltd. 81 0.35 48 Amcor Ltd. 250 1.08 21 APN News & Media Ltd. 37 0.16 47 Australia & New Zealand Banking Group Ltd. 901 3.89 17 Bendigo and Adelaide Bank Ltd. 119 0.51 56 BlueScope Steel Ltd. 109 0.47 25 Boral Ltd. 120 0.52
7 Caltex Australia Ltd. 62 0.27 12 Crown Ltd. 76 0.33 19 CSR Ltd. 27 0.12 12 Downer EDI Ltd. 63 0.27
156 Fairfax Media Ltd. 195 0.84 39 Goodman Fielder Ltd. 45 0.19 64 Incitec Pivot Ltd. 162 0.70 34 Insurance Australia Group Ltd. 103 0.44 13 Lend Lease Group 89 0.38
9 Macquarie Group Ltd. 321 1.39 115 Mirvac Group 125 0.54
35 National Australia Bank Ltd. 731 3.16 38 OneSteel Ltd. 104 0.45 18 Origin Energy Ltd. 226 0.98 62 OZ Minerals Ltd. 57 0.24
5 Primary Health Care Ltd. 15 0.07 30 Qantas Airways Ltd. 62 0.27
3 Santos Ltd. 32 0.14 7 Sims Metal Management Ltd. 116 0.50
45 Suncorp-Metway Ltd. 308 1.33 12 TABcorp Holdings Ltd. 68 0.30 20 Tatts Group Ltd. 40 0.17
9 Toll Holdings Ltd. 46 0.20 8 Washington H Soul Pattinson & Co. Ltd. 91 0.39
39 Wesfarmers Ltd. 949 4.10 5,730 24.75 Hong Kong - 7.56%
36 Cheung Kong Holdings Ltd. 409 1.77 21 Genting Hong Kong Ltd. 3 0.01 30 Henderson Land Development Co. Ltd. 180 0.78 11 Hopewell Holdings Ltd. 28 0.12 54 Hutchison Whampoa Ltd. 338 1.46 18 Kerry Properties Ltd. 73 0.32 71 New World Development Ltd. 115 0.50 28 Shun Tak Holdings Ltd. 15 0.06
– Sun Hung Kai Properties Ltd. 1 – 23 Swire Pacific Ltd., Class A 249 1.08 24 The Hongkong & Shanghai Hotels Ltd. 37 0.16 33 Wharf Holdings Ltd. 162 0.70 25 Wheelock & Co. Ltd. 66 0.28 45 Wheelock Properties Ltd. 73 0.32
1,749 7.56 Japan - 63.16%
2 Acom Co. Ltd. 24 0.10 18 Aeon Co. Ltd. 181 0.78 12 Ajinomoto Co., Inc. 102 0.44 12 Amada Co. Ltd. 88 0.38 26 Aozora Bank Ltd. 33 0.14 21 Asahi Kasei Corp. 109 0.47
1 Autobacs Seven Co. Ltd. 32 0.14 1 Bridgestone Corp. 18 0.08 3 Canon Marketing Japan, Inc. 37 0.16
Shares (000's)
Value (000's)
USD
% of Net
Asset Value
Common Stock - 100.26% (continued) Japan - 63.16% (continued)
5 Chuo Mitsui Trust Holdings, Inc. 18 0.08 9 Citizen Holdings Co. Ltd. 55 0.24 1 Coca-Cola West Co. Ltd. 11 0.05 4 COMSYS Holdings Corp. 34 0.15
21 Cosmo Oil Co. Ltd. 60 0.26 6 Credit Saison Co. Ltd. 71 0.31
18 Dai Nippon Printing Co. Ltd. 219 0.95 7 Daicel Chemical Industries Ltd. 48 0.21 7 Daido Steel Co. Ltd. 28 0.12 2 Dainippon Sumitomo Pharma Co. Ltd. 13 0.06
14 Daiwa House Industry Co. Ltd. 135 0.58 40 Daiwa Securities Group, Inc. 181 0.78 21 Fuji Heavy Industries Ltd. 119 0.51 16 FUJIFILM Holdings Corp. 461 1.99
7 Fujikura Ltd. 34 0.15 29 Fukuoka Financial Group, Inc. 121 0.52
6 Fukuyama Transporting Co. Ltd. 28 0.12 2 Glory Ltd. 47 0.20 1 Hakuhodo DY Holdings, Inc. 34 0.14 1 Hankyu Hanshin Holdings, Inc. 4 0.02 6 Hino Motors Ltd. 30 0.13 3 Hitachi Capital Corp. 36 0.16 2 Hitachi High-Technologies Corp. 33 0.14
12 Hitachi Ltd. 49 0.21 2 Hitachi Transport System Ltd. 24 0.10 2 House Foods Corp. 29 0.13 1 Idemitsu Kosan Co. Ltd. 44 0.19 – INPEX Corp. 63 0.27
10 Isetan Mitsukoshi Holdings Ltd. 97 0.42 12 ITOCHU Corp. 100 0.43 18 J Front Retailing Co. Ltd. 93 0.40
9 JS Group Corp. 166 0.72 60 JX Holdings, Inc. 322 1.39
8 Kamigumi Co. Ltd. 60 0.26 3 Kandenko Co. Ltd. 18 0.08 8 Kaneka Corp. 49 0.21
23 Kawasaki Kisen Kaisha Ltd. 93 0.40 6 Kinden Corp. 51 0.22 2 Kyocera Corp. 175 0.76 2 Kyowa Hakko Kogyo Co. Ltd. 19 0.08 3 Leopalace21 Corp. 13 0.06 – Mabuchi Motor Co. Ltd. 10 0.04 7 Marui Group Co. Ltd. 51 0.22
26 Mazda Motor Corp. 67 0.29 6 Medipal Holdings Corp. 65 0.28 1 MEIJI Holdings Co. Ltd. 18 0.08
36 Mitsubishi Chemical Holdings Corp. 170 0.73 10 Mitsubishi Gas Chemical Co., Inc. 55 0.24 85 Mitsubishi Heavy Industries Ltd. 310 1.34 24 Mitsubishi Materials Corp. 64 0.28
9 Mitsubishi Tanabe Pharma Corp. 116 0.50 177 Mitsubishi UFJ Financial Group, Inc. 863 3.73
2 Mitsubishi UFJ Lease & Finance Co. Ltd. 84 0.36 22 Mitsui & Co. Ltd. 315 1.36 24 Mitsui Chemicals, Inc. 73 0.32 15 Mitsui OSK Lines Ltd. 107 0.46
– Mitsumi Electric Co. Ltd. 7 0.03 46 Mizuho Financial Group, Inc. 84 0.36 18 Mizuho Securities Co. Ltd. 45 0.19 14 MS&AD Insurance Group Holdings 345 1.49
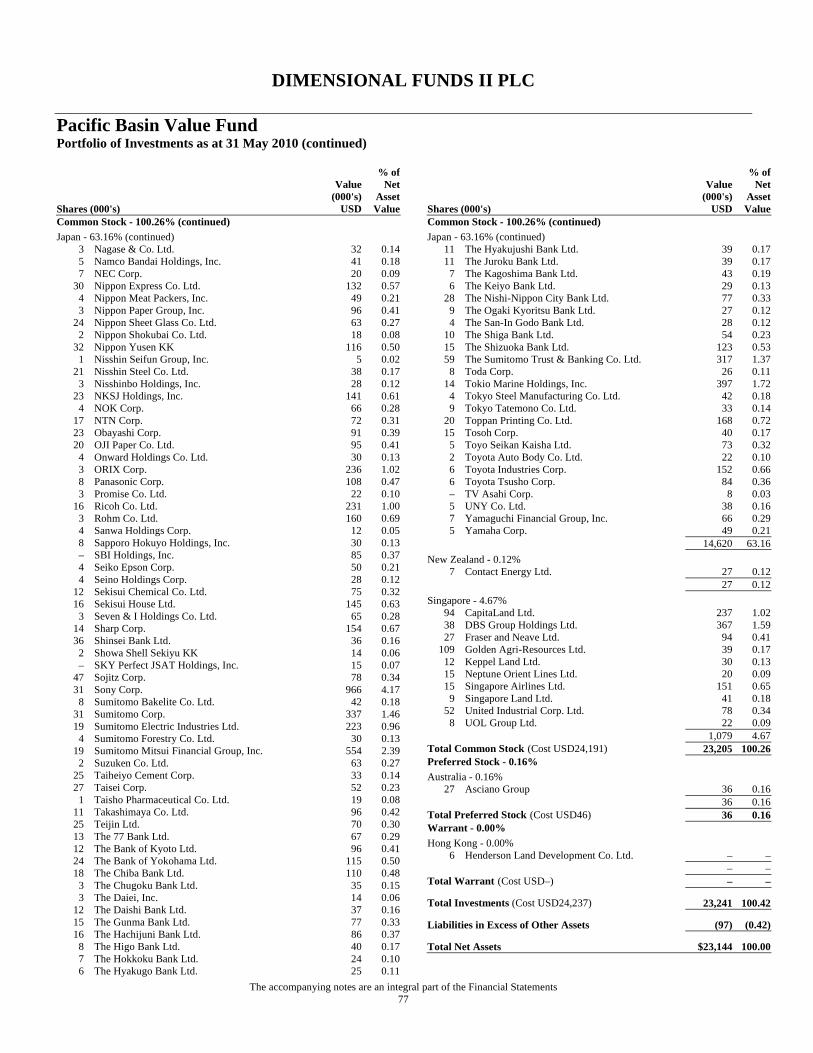
DIMENSIONAL FUNDS II PLC
Pacific Basin Value Fund Portfolio of Investments as at 31 May 2010 (continued)
The accompanying notes are an integral part of the Financial Statements 77
Shares (000's)
Value (000's)
USD
% of Net
Asset Value
Common Stock - 100.26% (continued) Japan - 63.16% (continued)
3 Nagase & Co. Ltd. 32 0.14 5 Namco Bandai Holdings, Inc. 41 0.18 7 NEC Corp. 20 0.09
30 Nippon Express Co. Ltd. 132 0.57 4 Nippon Meat Packers, Inc. 49 0.21 3 Nippon Paper Group, Inc. 96 0.41
24 Nippon Sheet Glass Co. Ltd. 63 0.27 2 Nippon Shokubai Co. Ltd. 18 0.08
32 Nippon Yusen KK 116 0.50 1 Nisshin Seifun Group, Inc. 5 0.02
21 Nisshin Steel Co. Ltd. 38 0.17 3 Nisshinbo Holdings, Inc. 28 0.12
23 NKSJ Holdings, Inc. 141 0.61 4 NOK Corp. 66 0.28
17 NTN Corp. 72 0.31 23 Obayashi Corp. 91 0.39 20 OJI Paper Co. Ltd. 95 0.41
4 Onward Holdings Co. Ltd. 30 0.13 3 ORIX Corp. 236 1.02 8 Panasonic Corp. 108 0.47 3 Promise Co. Ltd. 22 0.10
16 Ricoh Co. Ltd. 231 1.00 3 Rohm Co. Ltd. 160 0.69 4 Sanwa Holdings Corp. 12 0.05 8 Sapporo Hokuyo Holdings, Inc. 30 0.13 – SBI Holdings, Inc. 85 0.37 4 Seiko Epson Corp. 50 0.21 4 Seino Holdings Corp. 28 0.12
12 Sekisui Chemical Co. Ltd. 75 0.32 16 Sekisui House Ltd. 145 0.63
3 Seven & I Holdings Co. Ltd. 65 0.28 14 Sharp Corp. 154 0.67 36 Shinsei Bank Ltd. 36 0.16
2 Showa Shell Sekiyu KK 14 0.06 – SKY Perfect JSAT Holdings, Inc. 15 0.07
47 Sojitz Corp. 78 0.34 31 Sony Corp. 966 4.17
8 Sumitomo Bakelite Co. Ltd. 42 0.18 31 Sumitomo Corp. 337 1.46 19 Sumitomo Electric Industries Ltd. 223 0.96
4 Sumitomo Forestry Co. Ltd. 30 0.13 19 Sumitomo Mitsui Financial Group, Inc. 554 2.39
2 Suzuken Co. Ltd. 63 0.27 25 Taiheiyo Cement Corp. 33 0.14 27 Taisei Corp. 52 0.23
1 Taisho Pharmaceutical Co. Ltd. 19 0.08 11 Takashimaya Co. Ltd. 96 0.42 25 Teijin Ltd. 70 0.30 13 The 77 Bank Ltd. 67 0.29 12 The Bank of Kyoto Ltd. 96 0.41 24 The Bank of Yokohama Ltd. 115 0.50 18 The Chiba Bank Ltd. 110 0.48
3 The Chugoku Bank Ltd. 35 0.15 3 The Daiei, Inc. 14 0.06
12 The Daishi Bank Ltd. 37 0.16 15 The Gunma Bank Ltd. 77 0.33 16 The Hachijuni Bank Ltd. 86 0.37
8 The Higo Bank Ltd. 40 0.17 7 The Hokkoku Bank Ltd. 24 0.10 6 The Hyakugo Bank Ltd. 25 0.11
Shares (000's)
Value (000's)
USD
% of Net
Asset Value
Common Stock - 100.26% (continued) Japan - 63.16% (continued)
11 The Hyakujushi Bank Ltd. 39 0.17 11 The Juroku Bank Ltd. 39 0.17
7 The Kagoshima Bank Ltd. 43 0.19 6 The Keiyo Bank Ltd. 29 0.13
28 The Nishi-Nippon City Bank Ltd. 77 0.33 9 The Ogaki Kyoritsu Bank Ltd. 27 0.12 4 The San-In Godo Bank Ltd. 28 0.12
10 The Shiga Bank Ltd. 54 0.23 15 The Shizuoka Bank Ltd. 123 0.53 59 The Sumitomo Trust & Banking Co. Ltd. 317 1.37
8 Toda Corp. 26 0.11 14 Tokio Marine Holdings, Inc. 397 1.72
4 Tokyo Steel Manufacturing Co. Ltd. 42 0.18 9 Tokyo Tatemono Co. Ltd. 33 0.14
20 Toppan Printing Co. Ltd. 168 0.72 15 Tosoh Corp. 40 0.17
5 Toyo Seikan Kaisha Ltd. 73 0.32 2 Toyota Auto Body Co. Ltd. 22 0.10 6 Toyota Industries Corp. 152 0.66 6 Toyota Tsusho Corp. 84 0.36 – TV Asahi Corp. 8 0.03 5 UNY Co. Ltd. 38 0.16 7 Yamaguchi Financial Group, Inc. 66 0.29 5 Yamaha Corp. 49 0.21
14,620 63.16 New Zealand - 0.12%
7 Contact Energy Ltd. 27 0.12 27 0.12 Singapore - 4.67%
94 CapitaLand Ltd. 237 1.02 38 DBS Group Holdings Ltd. 367 1.59 27 Fraser and Neave Ltd. 94 0.41
109 Golden Agri-Resources Ltd. 39 0.17 12 Keppel Land Ltd. 30 0.13 15 Neptune Orient Lines Ltd. 20 0.09 15 Singapore Airlines Ltd. 151 0.65
9 Singapore Land Ltd. 41 0.18 52 United Industrial Corp. Ltd. 78 0.34
8 UOL Group Ltd. 22 0.09 1,079 4.67 Total Common Stock (Cost USD24,191) 23,205 100.26 Preferred Stock - 0.16% Australia - 0.16%
27 Asciano Group 36 0.16 36 0.16 Total Preferred Stock (Cost USD46) 36 0.16 Warrant - 0.00% Hong Kong - 0.00%
6 Henderson Land Development Co. Ltd. – – – – Total Warrant (Cost USD–) – –
Total Investments (Cost USD24,237) 23,241 100.42
Liabilities in Excess of Other Assets (97) (0.42)
Total Net Assets $23,144 100.00
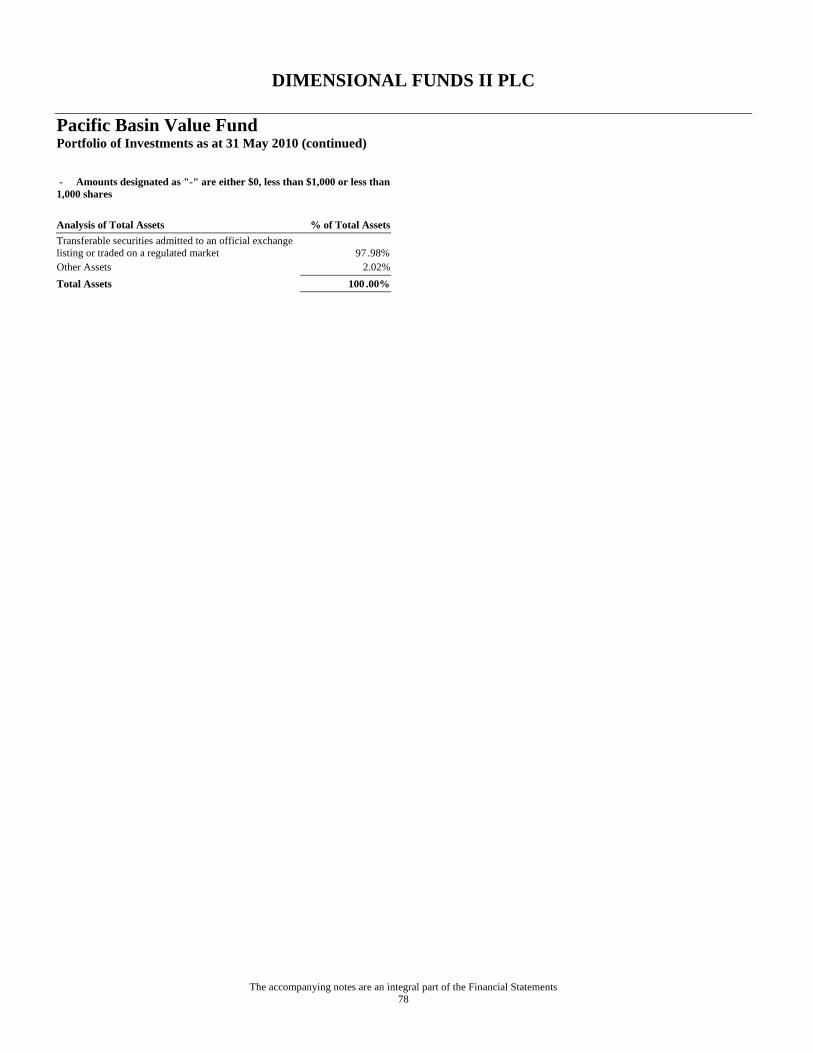
DIMENSIONAL FUNDS II PLC
Pacific Basin Value Fund Portfolio of Investments as at 31 May 2010 (continued)
The accompanying notes are an integral part of the Financial Statements 78
- Amounts designated as "-" are either $0, less than $1,000 or less than 1,000 shares
Analysis of Total Assets % of Total Assets Transferable securities admitted to an official exchange listing or traded on a regulated market 97 .98% Other Assets 2.02% Total Assets 100 .00%

DIMENSIONAL FUNDS II PLC
Notes to the Financial Statements
79
1. Organisation
Dimensional Funds II plc (the “Company”) was incorporated on 5 December 2006 as an investment company with segregated liability between sub-funds and variable capital under the laws of Ireland as a public limited company pursuant to the Companies Acts, 1963 to 2009 and the European Communities (Undertakings for Collective Investment in Transferable Securities) Regulations, 2003, as amended (the “UCITS Regulations”). All shares of the Company are listed on the Irish Stock Exchange.
2. Significant Accounting Policies
a) Basis of presentation
The financial statements have been prepared in accordance with accounting standards generally accepted in Ireland and with Irish statute comprising the Companies Act, 1963 to 2009, and the UCITS Regulations. Accounting standards generally accepted in Ireland in preparing financial statements giving a true and fair view are those published by the Institute of Chartered Accountants in Ireland and issued by the Accounting Standards Board.
The format and certain wording of the financial statements have been adapted from that contained in the Companies (Amendment) Act, 1986 and Financial Reporting Standard No. 3 “Reporting Financial Performance” to one which, in the opinion of the Directors, more appropriately reflects the Company’s business as an investment fund.
The financial statements have been prepared under the historical cost convention as modified by the revaluation of financial assets and financial liabilities held at fair value through profit or loss.
The Company has availed of the exemption available to an open ended investment company under Financial Reporting Standards No.1 “Cash flow statements” (“FRS 1”) not to prepare a cash flow statement.
The information required by Financial Reporting Standard No. 3 “Reporting Financial Performance” (“FRS 3”) to be included in a Statement of Total Recognised Gains and Losses and Reconciliation of Movements in Shareholders’ Funds is contained in the Profit and Loss Account and the Statement of Changes in Net Assets Attributable to Holders of Redeemable Shares.
b) Investments at Fair Value
In accordance with Financial Reporting Standard No. 26 “Financial Instruments: Disclosure and Measurement” (“FRS 26”) the Company has classified its investments at fair value through profit or loss.
Purchases and sales of investments are recognised on trade date – the date on which the Company commits to purchase or sell the asset. Investments are initially recognised at fair value and transaction costs for all financial assets carried at fair value through profit or loss are expensed as incurred. Investments are derecognised when the rights to receive cash flows from the investments have expired or the Company has transferred substantially all risks and rewards of ownership.
Gains and losses arising from changes in the fair value of the financial assets at ‘fair value through profit or loss’ category are included in the Profit and Loss Account in the period in which they arise.
The fair value of financial instruments traded in active markets (such as publicly traded derivatives and trading securities) is based on quoted market prices at the balance sheet date. The quoted market price used for financial assets held by the Company is the current bid price. When the Company holds derivatives with offsetting market risks it uses mid-market prices as a basis for establishing fair values for the offsetting risk positions and applies the bid or asking price to the net open position, as appropriate.
Investment transactions are accounted for on a trade date basis. Profits and losses on the disposal of investments are computed on a first-in, first-out basis and are included in the Profit and Loss Account. Unrealised gains and losses on investments are recognised in the Profit and Loss Account.
DIMENSIONAL FUNDS II PLC
Notes to the Financial Statements (continued)
80
2. Significant Accounting Policies (continued)
b) Investments at Fair Value (continued)
The prospectus requires investments to be valued as follows: Investments which are quoted, listed or traded on or under the rules of any Recognised Market are valued by reference to the latest available dealing price on the relevant Recognised Market at the relevant Valuation Point. If the investment is normally quoted, listed or traded on or under the rules of more than one Recognised Market, the relevant Recognised Market is that which the Directors or the Investment Manager, as their delegate, determine provides the fairest criterion of value for the investment. Unlisted investments, if any, are valued at their probable realisation value determined with care and in good faith by the Administrator in consultation with the Investment Manager, who is approved for that purpose by the Custodian. The Funds do not invest in any unlisted securities other than certain unlisted warrants and rights that have been received as a result of corporate actions.
The fair value of derivatives that are not exchange-traded are estimated at the amount that the Fund would receive or pay to terminate the contract at the balance sheet date taking into account current market conditions (volatility, appropriate yield curve) and the current creditworthiness of the counterparties.
The fair value of financial instruments traded in active markets (such as publicly traded derivatives and trading securities) is based on quoted market prices at the balance sheet date. The quoted market price used for financial assets held by the Company is the current bid price.
When a “readily available market quotation” for a security is not available, the Company employs “fair value” methodologies to price securities. As a general principle, fair value is the price that the Fund might reasonably expect to receive upon a current sale. The fair valuation process requires the Investment Managers Investment Committee (the “Investment Committee”) to make a determination in good faith as to the value of a particular security or group of securities depending on the particular facts and circumstances involved. Circumstances in which a market quotation is not readily available may include, trading suspensions prior to the close of the relevant market; events that unexpectedly close entire markets such as natural disasters, power blackouts, or similar major events; market holidays; or volume of trading in a security.
Units or shares in funds which are not valued in accordance with the above provisions shall be valued on the basis of the latest available redemption price or such units or shares after the deduction of any redemption charges as provided by the fund’s Administrator. As at 31 May 2010 all investments in funds, were administered by the Company’s Administrator.
The Investment Committee reviews the appropriateness and accuracy of the methods used in fair valuing securities on a monthly basis including a comparison of fair values against the last market price and the next available market price, such as the next-day opening price.
The Emerging Markets Targeted Value Fund, European Value Fund, Global Core Equity Fund, Global Targeted Value Fund and Pacific Basin Value Fund (the “International Equity Portfolios”) apply a fair value price in the circumstances described below. Generally, trading in foreign securities markets is completed each day at various times prior to the close of the New York Stock Exchange (“NYSE”). For example, trading in the Japanese securities markets is completed each day at the close of the Tokyo Stock Exchange (normally, 11:00 p.m. Pacific Standard Time (“PST”), which is fourteen hours prior to the close of the NYSE (normally, 1:00 p.m. PST) and the time that the net asset values of the International Equity Portfolios are computed. Due to the time differences between the closings of the relevant foreign securities exchanges and the time the International Equity Portfolios price their shares at the close of the NYSE, the International Equity Portfolios will fair value their foreign investments when it is determined that the market quotations for the foreign investments are either unreliable or not readily available. The fair value prices will attempt to reflect the impact of the U.S. financial markets' perceptions and trading activities on the International Equity Portfolios' foreign investments since the last closing prices of the foreign investments were calculated on their primary foreign securities markets or exchanges. For these purposes, the Board of Directors of the Company have determined that movements in relevant indices or other appropriate market indicators, after the close of the Tokyo Stock Exchange or the London Stock Exchange, demonstrate that market quotations may be unreliable, and may trigger fair value pricing. Consequently, fair valuation of portfolio securities may occur on a daily basis.
DIMENSIONAL FUNDS II PLC
Notes to the Financial Statements (continued)
81
2. Significant Accounting Policies (continued)
b) Investments at Fair Value (continued)
The fair value pricing by the International Equity Portfolios utilises data furnished by an independent pricing service (and that data draws upon, among other information, the market values of foreign investments). The fair value prices of portfolio securities generally will be used when it is determined that the use of such prices will have a material impact on the net asset value of an International Equity Portfolio. When an International Equity Portfolio uses fair value pricing, the values assigned to the International Equity Portfolio's foreign investments may not be the quoted or published prices of the investments on their primary markets or exchanges. The Investment Manager monitors the variance to the following days opening price. As at 31 May 2010 and 31 May 2009 fair value pricing was adopted by the International Equity Portfolios.
c) Income
Interest income and expense are recognised in the Profit and Loss Account for all debt instruments using the effective interest method. The effective interest rate is the rate that exactly discounts estimated future cash payments or receipts throughout the expected life of the financial instrument, or a shorter period where appropriate, to the net carrying amount of the financial asset or financial liability. Dividend income and expense are recorded on the ex-dividend date gross of withholding taxes and are disclosed separately in the Profit and Loss Account, net of any tax credits.
d) Expense Recognition
All expenses are taken to the Profit and Loss Account on an accruals basis. Dimensional Fund Advisors Limited (the “Investment Manager”) has paid the Company’s initial formation expenses and the establishment expenses of the Funds. Costs and expenses incurred in the operation of a Fund are borne out of the assets of the relevant Fund.
e) Foreign Currency Translation
i) Functional and presentation currency: Items included in the Company’s financial statements are measured using the currency of the primary economic environment in which it operates (the “functional currency”). This is the Euro for European Value Fund and the U.S. Dollar for Emerging Markets Targeted Value Fund, Global Core Equity Fund, Global Targeted Value Fund and Pacific Basin Value Fund. The Company has adopted the functional currency of each Fund as the presentation currency for the financial statements. The combined Balance Sheet, Profit and Loss Account and Statement of Changes in Net Asset Attributable to Holders of Redeemable Participating Shares are presented in Euro.
ii) Purchases and sales of securities, and income and expenses are translated at the rate of exchange quoted on the respective date that such transactions are recorded. All assets and liabilities denominated in foreign currencies are translated at the rate of exchange at the latest available rate at the Valuation Point. Foreign exchange gains and losses resulting from the settlement of such transactions and from the translation at period-end exchange rates of monetary assets and liabilities denominated in foreign currencies are recognised in the Profit and Loss Account.
f) Redeemable Shares
Redeemable shares are redeemable at the Shareholder’s option and are classified as financial liabilities. Any distribution on these redeemable shares is recognised in the Profit and Loss Account as finance costs. The redeemable shares can be put back to the Company at any time for cash equal to a proportionate share of the Company’s net asset value. The redeemable shares are carried at the redemption amount that is payable at the balance sheet date if the shareholders exercised their right to put the shares back to the Company.
g) Income Equalisation
The Company may operate an equalisation account in respect of certain classes of shares in each of the Funds. This arrangement is intended to ensure that the income per redeemable share which is distributed in respect of the distribution period is not affected by changes in the number of redeemable shares in issue during that period. The calculation of equalisation is based on net income and represents the income portion of the price of subscriptions/redemptions of redeemable shares. Refer to note 12 for disclosure of income equalisation on subscriptions and redemptions during the period.
DIMENSIONAL FUNDS II PLC
Notes to the Financial Statements (continued)
82
2. Significant Accounting Policies (continued)
h) Anti-dilution levies
The Company operated an anti-dilution levy in respect of Share Classes in each Fund up to 1 September 2009. In calculating the subscription/redemption price for the Shares of each class in the Fund, the Directors would have on any Dealing Day, when there were subscriptions/redemptions, adjust the subscription/redemption price by adding/deducting an anti-dilution levy to cover dealing costs and to preserve the value of the underlying assets of the Fund. Anti-dilution levies were accounted for as a reduction of capital subscribed or a reduction in the proceeds paid to the redeeming shareholder.
i) Lending of Securities
The Funds have appointed PFPC Trust Company (“PFPC”), a sub-custodian to the Company, as Stock Lending Agent. Certain Funds may lend securities, through the PFPC as Stock Lending Agent, to brokers, dealers and other financial organisations via PFPC to earn additional income. Each security loan is collateralised with collateral assets in an amount greater than the current market value of the loaned securities. There is a risk of delay in receiving collateral or in recovering the securities loaned or even loss of rights in collateral should the borrower fail financially.
However, in the event of default or bankruptcy by the other party to the agreement, realisation and/or retention of the collateral may be subject to legal proceedings. In the event that the borrower fails to return loaned securities, and cash collateral being maintained by the borrower is insufficient to cover the value of loaned securities and provided such collateral insufficiency is not the result of investment losses, the lending agent has agreed to pay the amount of the shortfall to the respective Fund or, at the option of the lending agent, to replace the securities.
Subject to each Fund’s investment policy, any cash collateral received by the Fund from securities on loan is invested in securities of the U.S. government or its agencies, repurchase agreements collateralised by securities of the U.S. government or its agencies, and registered and unregistered money market funds. Agencies include both agency debentures and agency mortgage backed securities. In addition, each Portfolio will be able to terminate the loan at any time and will receive reasonable interest on the loan, as well as amounts equal to any dividends, interest or other distributions on the loaned securities.
As at 31 May 2010 each of the following Funds had outstanding loans of securities to certain brokers, dealers or other financial institutions for which each Fund has a security interest and lien upon segregated cash and/or securities equivalent to or greater than (i) 102% of the current market value of the loaned securities with respect to U.S. securities, and (ii) 105% of the current market value of the loaned securities with respect to non-U.S. securities of the market value of securities loaned through PFPC:
Market Value of Loaned Securities As at 31 May 2010 As at 31 May 2009GBP GBP
Emerging Markets Targeted Value Fund 5,968,172 9,541,374European Value Fund 8,100,318 1,854,464Global Core Equity Fund 2,331,004 14,854Global Targeted Value Fund 6,575,458 2,407,364Pacific Basin Value Fund 298,032 38,411Total 23,272,984 13,856,467
Fair value of securities received as collateral 27,948,904 15,582,747 The securities received as collateral for security lending purposes were government bonds.
DIMENSIONAL FUNDS II PLC
Notes to the Financial Statements (continued)
83
3. Net Gain/(Loss) on Financial Assets at fair value through profit or loss
For the period ended 31 May 2010:
Emerging Markets
Targeted Value Fund
European Value Fund
Global Core Equity Fund
Global Targeted Value Fund
Pacific Basin Value Fund
USD EUR USD USD USD Net realised gain/(loss) on financial assets at fair value through profit or loss 2,637,179 (1,185,313 ) 617,686 1,845,564 (126,387 ) Net change in unrealised (loss)/gain on financial assets at fair value through profit or loss (5,212,609 ) 679,759 (5,752,291 ) (274,351 ) (32,907 ) (2,575,430 ) (505,554 ) (5,134,605 ) 1,571,213 (159,294 ) For the period ended 31 May 2009:
Emerging Markets Targeted
Value Fund European Value
Fund Global Core Equity Fund
Global Targeted Value Fund
Pacific Basin Value Fund
USD EUR USD USD USD Net realised (loss)/gain on financial assets at fair value through profit or loss (6,683,135 ) (12,579,396 ) 1,252 (3,965,715 ) (20,640,193 ) Net change in unrealised gain on financial assets at fair value through profit or loss 134,399,922 12,266,173 6,570,503 21,865,754 21,712,332 127,716,787 (313,223 ) 6,571,755 17,900,039 1,072,139 4. Fees and Expenses
Management fee
The Investment Manager is entitled to receive management fees in respect of each Fund payable out of the assets of the Fund accruing daily and payable monthly in arrears. The table below shows the rates at which the Investment Manager’s fees are charged.
Fund % of daily Net Asset Value Emerging Markets Targeted Value Fund 0.75% European Value Fund 0.40% Global Core Equity Fund 0.30% Global Targeted Value Fund 0.50% Pacific Basin Value Fund 0.40%
For the period ended 31 May 2010 and 31 May 2009 the Investment Manager has placed an expense cap on the annual expenses of European Value Fund, Global Core Equity Fund and Pacific Basin Value Fund of 0.65%, 0.55% and 0.65% respectively of Net Asset Value. Any expenses incurred above the agreed expense cap will be reimbursed to the respective Fund by the Investment Manager.
For the period ended 31 May 2010, the Investment Manager has waived the management fees of EUR53 for European Value Fund (31 May 2009: EUR5,591), USD27,575 for Global Core Equity Fund (31 May 2009: USD15,131) and USD36,580 for Pacific Basin Value Fund (31 May 2009: USD21,902).
For the period ended 31 May 2010, the Investment Manager reimbursed expenses of USD730 (31 May 2009: USD11,078) to Pacific Basin Value Fund.
DIMENSIONAL FUNDS II PLC
Notes to the Financial Statements (continued)
84
4. Fees and Expenses (continued)
Administration and Custodian fees
BNY Mellon Investment Servicing (International) Limited (the “Administrator”) acts as transfer agent and administrator of the Company providing shareholder services and maintenance of the accounting books and records.
BNY Mellon International Bank Limited (the “Custodian”), has been appointed as custodian by the Company.
The Administrator and the Custodian receive from each Fund a combined fee calculated at an annual rate not to exceed 0.10% of the average Net Asset Value of each Fund, payable monthly in arrears. This fee encompasses the Administrator’s and the Custodian’s combined services as transfer agent, administrator and custodian, excluding out of pocket expenses. The combined fee is subject to a minimum annual fee for each Fund, exclusive of out-of-pocket expenses, of USD50,000 for the first two years of operation and USD65,000 for the third year and thereafter. The Administrator is also entitled to receive a fee of USD2,000 per Fund per annum for the preparation of financial statements.
Each Fund will also reimburse the Administrator all reasonable expenses incurred for the benefit of the respective Fund when contracting with entities providing paying or transfer agency services. The Administrator shall also be entitled to reimbursement of all reasonable out-of-pocket expenses incurred for the benefit of the Funds out of the assets of the Funds in respect of which such charge and expenses were incurred.
The Funds also bear the cost of all sub-custodian charges and transaction charges incurred by Custodian, or any sub-custodian, which shall not exceed normal commercial rates. The Custodian shall also be entitled to reimbursement of properly vouched out of pocket expenses incurred by the Custodian, or any sub-custodian, for the benefit of the Funds out of the assets of the Fund in respect of which such charges and expenses were incurred.
Directors’ fees
The Directors are entitled to a fee in remuneration for their services. The amount of a Directors’ remuneration in any one year in respect of the Company shall not exceed EUR10,000. These fees will not be increased without the Shareholders being notified.
Directors’ fees of EUR11,377 (31 May 2009: EUR6,190) were accrued during the period ended 31 May 2010. Directors’ fees of EUR10,450 (31 May 2009: EUR6,561) were accrued at period end. The Directors who are employees of the Investment Manager and Investment Sub-Advisors waive their entitlement to any such remuneration for the life of the Company.
5. Cash and Cash Equivalents
The cash balances were held at PFPC Trust Company at 31 May 2010 and 31 May 2009. Cash and cash equivalents comprise cash balances valued at their face value with interest accrued, where applicable.
As at 31 May 2010 the Company uses a cash sweep facility into a money market deposit account established at, and held in the name of, PNC Bank, N.A., as sub-custodian for PFPC Trust Company.
6. Taxation
The Company will not be liable to tax in respect of its income and gains, other than on the occurrence of a chargeable event. Generally a chargeable event arises on any distribution, redemption, repurchase, cancellation, transfer of shares or on the ending of a ‘Relevant Period’, a ‘Relevant Period’ being an eight year period beginning with the acquisition of the shares by the Shareholders and each subsequent period of eight years beginning immediately after the preceding Relevant Period.
A chargeable event does not include:
(i) Any transactions in relation to shares held in a recognised clearing system as designated by order of the Revenue Commissioners of Ireland: or
(ii) An exchange of shares representing a Fund for another Fund: or (iii) An exchange of shares arising on a qualifying amalgamation or reconstruction of the Fund with another Fund: or (iv) Certain exchanges of shares between spouses and former spouse.
A chargeable event will not occur in respect of Shareholders who are neither resident nor ordinarily resident in Ireland and who have provided the Fund with a relevant declaration to that effect.
DIMENSIONAL FUNDS II PLC
Notes to the Financial Statements (continued)
85
6. Taxation (continued)
In the absence of an appropriate declaration, the Fund will be liable to Irish Tax on the occurrence of a chargeable event. There were no chargeable events during the period under review.
Capital gains, dividends and interest received may be subject to withholding taxes imposed by the country of origin and such taxes may not be recoverable by the Fund or its Shareholders.
The Company may incur capital gains taxes for income earned from transactions in foreign jurisdictions. For the period ended 31 May 2010 Emerging Markets Targeted Value Fund incurred capital gains taxes in respect of Indian and Thai securities of USD97,156 (31 May 2009: USD Nil).
7. Share Capital
The authorised share capital of the Company is 500,000,300,002 Shares of no par value divided into 2 Subscriber Shares of no par value, 300,000 Capitalisation Shares of no par value and 5,000,000,000,000 Shares of no par value. The Subscriber Shares and the Capitalisation Shares together are defined as “Non-Participating Shares”.
As at 31 May 2010, the two subscriber shares were held by Matsack Trust Limited and Matsack Nominees Limited. The Non-Participating Shares entitle the holders to attend and vote at general meetings of the Company but do not entitle the holders to participate in the profits or assets of the Company except for a return of capital on a winding-up. Following the expiration of the initial offer of Shares in the Funds, the Non-Participating Shares may at the option of the Directors either be redesignated as Shares at the Offer Price or repurchased. The Non-Participating Shares shall have one vote for each Non-Participating Share held. Non-Participating Shares entitle the holders to attend and vote at general meetings of the Company but do not entitle the holders to participate in the profits or assets of the Company except for a return of capital on a winding-up. The Non-Participating Shares are not included in the calculation of the NAV per redeemable share.
Shares entitle the holders to attend and vote at general meetings of the Company and to participate equally (subject to any differences between fees, charges and expenses applicable to different Classes) in the profits and assets of the Company on the terms and conditions set out in the Prospectus.
The Funds have the ability to issue multiple classes of redeemable shares. Each redeemable share within a class represents an identical legal interest in the Funds and has identical rights.

DIMENSIONAL FUNDS II PLC
Notes to the Financial Statements (continued)
86
7. Share Capital (continued)
The following redeemable share transactions occurred during the period ended 31 May 2010: U.S. Dollar Class A Euro Class B Sterling Class C Sterling Class D
Emerging Markets Targeted Value Fund Balance at the start of the period 318,571 206,252 84,446 16,565,502 Issue of redeemable shares during the period 867,897 322,196 2,543,527 278,020 Redemption of redeemable shares during the period (357,000) (19,442) (18,539) (1,132,433) Balance at the end of the period 829,468 509,006 2,609,434 15,711,089 European Value Fund Balance at the start of the period 1,435 8,008,482 4,663 156,151 Issue of redeemable shares during the period – 327,538 4,844 80,267 Redemption of redeemable shares during the period – (47,779) – (891) Balance at the end of the period 1,435 8,288,241 9,507 235,527 Global Core Equity Fund Balance at the start of the period 343,365 1,146,567 967,612 3,401,887 Issue of redeemable shares during the period 67,512 454,724 1,167,623 1,112,460 Redemption of redeemable shares during the period – (56,549) (140,940) (215,224) Balance at the end of the period 410,877 1,544,742 1,994,295 4,299,123 Global Targeted Value Fund Balance at the start of the period 11,597,179 869,383 506,408 5,285,365 Issue of redeemable shares during the period 3,437,448 500,912 3,845,667 1,078,583 Redemption of redeemable shares during the period (3,955,093) (16,809) (221,732) (1,660,986) Balance at the end of the period 11,079,534 1,353,486 4,130,343 4,702,962 Pacific Basin Value Fund Balance at the start of the period 2,280,311 14,336 2,645 81,413 Issue of redeemable shares during the period 16,633 1,033 4,283 15,490 Redemption of redeemable shares during the period (30,075) (2,262) – (1,804) Balance at the end of the period 2,266,869 13,107 6,928 95,099
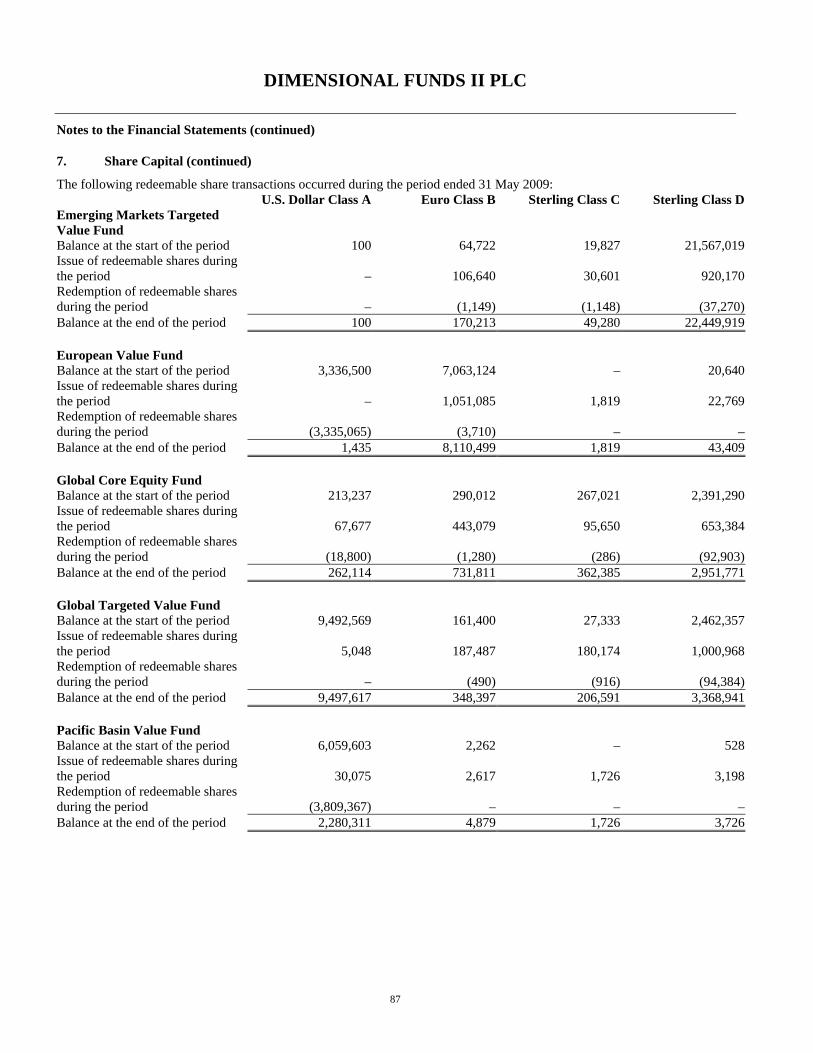
DIMENSIONAL FUNDS II PLC
Notes to the Financial Statements (continued)
87
7. Share Capital (continued)
The following redeemable share transactions occurred during the period ended 31 May 2009: U.S. Dollar Class A Euro Class B Sterling Class C Sterling Class D
Emerging Markets Targeted Value Fund Balance at the start of the period 100 64,722 19,827 21,567,019 Issue of redeemable shares during the period – 106,640 30,601 920,170 Redemption of redeemable shares during the period – (1,149) (1,148) (37,270) Balance at the end of the period 100 170,213 49,280 22,449,919 European Value Fund Balance at the start of the period 3,336,500 7,063,124 – 20,640 Issue of redeemable shares during the period – 1,051,085 1,819 22,769 Redemption of redeemable shares during the period (3,335,065) (3,710) – – Balance at the end of the period 1,435 8,110,499 1,819 43,409 Global Core Equity Fund Balance at the start of the period 213,237 290,012 267,021 2,391,290 Issue of redeemable shares during the period 67,677 443,079 95,650 653,384 Redemption of redeemable shares during the period (18,800) (1,280) (286) (92,903) Balance at the end of the period 262,114 731,811 362,385 2,951,771 Global Targeted Value Fund Balance at the start of the period 9,492,569 161,400 27,333 2,462,357 Issue of redeemable shares during the period 5,048 187,487 180,174 1,000,968 Redemption of redeemable shares during the period – (490) (916) (94,384) Balance at the end of the period 9,497,617 348,397 206,591 3,368,941 Pacific Basin Value Fund Balance at the start of the period 6,059,603 2,262 – 528 Issue of redeemable shares during the period 30,075 2,617 1,726 3,198 Redemption of redeemable shares during the period (3,809,367) – – – Balance at the end of the period 2,280,311 4,879 1,726 3,726
DIMENSIONAL FUNDS II PLC
Notes to the Financial Statements (continued)
88
8. Related Party Transactions
As at 31 May 2010 and 31 May 2009 the Investment Manager, Dimensional Fund Advisors Limited held shares in each of the following Funds: Emerging Markets Targeted Value Fund 100 Class A Shares, Global Core Equity Fund 100 Class A Shares, Global Core Equity Fund 100 Class B Shares and Global Core Equity Fund 100 Class C Shares, respectively.
As at 31 May 2010 Global Core Equity Fund invested in the following sub-funds of Dimensional Funds plc and Dimensional Funds II plc: European Small Companies Fund 182,203 Class D Shares, Global Targeted Value Fund 600,774 Class D Shares, Pacific Basin Small Companies Fund 122,734 Class D Shares and U.S. Small Companies Fund 251,600 Class D Shares, respectively. Dimensional Funds plc is also administered by the Administrator of the Company.
As at 31 May 2009 Global Core Equity Fund invested in the following sub-funds of Dimensional Funds plc and Dimensional Fund II plc: European Small Companies Fund 27,036 Class D Shares, Global Targeted Value Fund 387,107 Class D Shares, Pacific Basin Small Companies Fund 39,396 Class D Shares and U.S. Small Companies Fund 165,736 Class D Shares, respectively.
The Directors received fees during the period as outlined in note 4. Management fees waived during the period are disclosed in note 4.
In the opinion of the Directors, the Investment Manager and the Investment Sub-Advisors are related parties under FRS 8 “Related Party Transactions”. Fees payable to these parties and the amounts due at 31 May 2010 are shown in note 4 and disclosed in the Profit and Loss Account.
There have been no other related party transactions in the period under review.
9. Risk Management
The Company had adopted FRS 29 “Financial Instruments: Disclosure” (“FRS 29”) for the current and prior period. The objective of FRS 29 is to provide information about the Company’s exposure to material risk and to disclose the Company’s policies to manage these risks.
The management of financial instruments is fundamental to the Company’s business. The Directors have appointed Dimensional Fund Advisors Limited as Investment Manager to each Fund. The Company has been established for the purpose of investing in transferable securities in accordance with the UCITS Regulations. The Investment Manager has responsibility for investing and managing the assets of the Funds according to their investment objectives, investments guidelines approved by the Board and policies set forth in the Prospectus and in accordance with the UCITS Regulations.
The investment objective for each Fund is outlined below:
Emerging Markets Targeted Value Fund- to achieve long-term total return. European Value Fund- to achieve long-term total return. Global Core Equity Fund- to maximise long-long term total return. Global Targeted Value Fund- to maximise long-long term total return. Pacific Basin Value Fund- to achieve long-term total return.
The Investment Manager has appointed Dimensional Fund Advisors L.P. as an Investment Sub-Advisor to provide investment advisory and investment management services to the Investment Manager in respect of Emerging Markets Targeted Value Fund, Global Core Equity Fund and Global Targeted Value Fund. The Investment Manager has also appointed DFA Australia Limited as Investment Sub-Advisor to Emerging Markets Targeted Value Fund, Global Core Equity Fund, Global Targeted Value Fund and Pacific Basin Value Fund.
a) Market risk
The investments of a Fund are subject to normal capital market fluctuations and to the risks inherent in investment in international securities markets, there can be no assurances that appreciation or preservation will occur.
The Company is exposed to market risk, credit risk and liquidity risk. Market risk includes market price risk, currency risk, interest risk and other price risk.
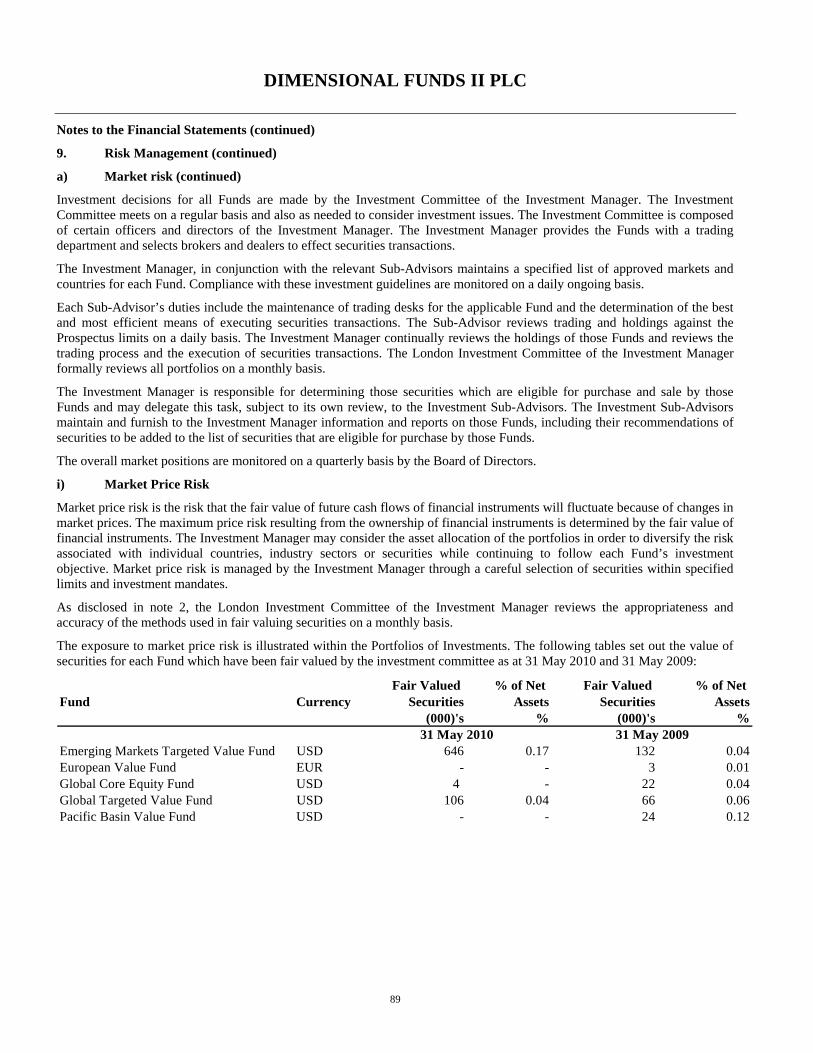
DIMENSIONAL FUNDS II PLC
Notes to the Financial Statements (continued)
89
9. Risk Management (continued)
a) Market risk (continued)
Investment decisions for all Funds are made by the Investment Committee of the Investment Manager. The Investment Committee meets on a regular basis and also as needed to consider investment issues. The Investment Committee is composed of certain officers and directors of the Investment Manager. The Investment Manager provides the Funds with a trading department and selects brokers and dealers to effect securities transactions.
The Investment Manager, in conjunction with the relevant Sub-Advisors maintains a specified list of approved markets and countries for each Fund. Compliance with these investment guidelines are monitored on a daily ongoing basis.
Each Sub-Advisor’s duties include the maintenance of trading desks for the applicable Fund and the determination of the best and most efficient means of executing securities transactions. The Sub-Advisor reviews trading and holdings against the Prospectus limits on a daily basis. The Investment Manager continually reviews the holdings of those Funds and reviews the trading process and the execution of securities transactions. The London Investment Committee of the Investment Manager formally reviews all portfolios on a monthly basis.
The Investment Manager is responsible for determining those securities which are eligible for purchase and sale by those Funds and may delegate this task, subject to its own review, to the Investment Sub-Advisors. The Investment Sub-Advisors maintain and furnish to the Investment Manager information and reports on those Funds, including their recommendations of securities to be added to the list of securities that are eligible for purchase by those Funds.
The overall market positions are monitored on a quarterly basis by the Board of Directors.
i) Market Price Risk
Market price risk is the risk that the fair value of future cash flows of financial instruments will fluctuate because of changes in market prices. The maximum price risk resulting from the ownership of financial instruments is determined by the fair value of financial instruments. The Investment Manager may consider the asset allocation of the portfolios in order to diversify the risk associated with individual countries, industry sectors or securities while continuing to follow each Fund’s investment objective. Market price risk is managed by the Investment Manager through a careful selection of securities within specified limits and investment mandates.
As disclosed in note 2, the London Investment Committee of the Investment Manager reviews the appropriateness and accuracy of the methods used in fair valuing securities on a monthly basis.
The exposure to market price risk is illustrated within the Portfolios of Investments. The following tables set out the value of securities for each Fund which have been fair valued by the investment committee as at 31 May 2010 and 31 May 2009:
Fair Valued % of Net Fair Valued % of Net Fund Currency Securities Assets Securities Assets
(000)'s % (000)'s %
Emerging Markets Targeted Value Fund USD 646 0.17 132 0.04European Value Fund EUR - - 3 0.01Global Core Equity Fund USD 4 - 22 0.04Global Targeted Value Fund USD 106 0.04 66 0.06Pacific Basin Value Fund USD - - 24 0.12
31 May 2010 31 May 2009
DIMENSIONAL FUNDS II PLC
Notes to the Financial Statements (continued)
90
9. Risk Management (continued)
a) Market risk (continued)
i) Market Price Risk (continued)
Each Fund’s market price risk is monitored, but not managed, relative to an index. The following table sets out a comparative index for each Fund and quantifies the estimated impact to the value of the Net Asset Value for each Fund based on positive and negative movements in the comparable index using Beta. Beta is a measure of a Fund’s securities volatility in relation to the market or index.
As at 31 May 2010
Fund Index Currency Positive 5% Negative 5%Emerging Markets Targeted Value Fund MSCI Emerging SMID Value Index USD 5.14% (5.14)%European Value Fund MSCI Europe Large Value Index EUR 5.44% (5.44)%Global Core Equity Fund MSCI The World Net TR Index USD 5.35% (5.35)%Global Targeted Value Fund MSCI World SMID Value Index USD 5.23% (5.23)%Pacific Basin Value Fund MSCI Pacific Large Value Index USD 5.78% (5.78)%
As at 31 May 2009
Fund Index Currency Positive 5% Negative 5%Emerging Markets Targeted Value Fund MSCI Emerging SMID Value Index USD 5.17% (5.17%)European Value Fund MSCI Europe Large Value Index EUR 5.46% (5.46%)Global Core Equity Fund* MSCI The World Net TR Index USD n/a n/aGlobal Targeted Value Fund* MSCI World SMID Value Index USD 5.22% (5.22%)Pacific Basin Value Fund MSCI Pacific Large Value Index USD 5.90% (5.90%)
movement in Index
Impact on Net Asset Value due tomovement in Index
Impact on Net Asset Value due to
*Global Core Equity Fund and Global Targeted Value Fund launched during the period ended 31 May 2010, therefore for the purposes FRS 29 the Investment Manger has assumed beta for these Funds.
The sensitivity analysis set out above, should not be used as an indication of future performance.
The sensitivity analysis is subject to limitations for example:
• the sensitivities are based on historical data and cannot take account of the fact that future market price movements, correlations between markets and levels of market liquidity in conditions of market stress may bear no relation to historical patterns;
• the market price risk information is a relative estimate of risk rather than a precise and accurate number; • the market price information represents a hypothetical outcome and is not intended to be predictive; and • future market conditions could vary significantly from those experienced.
ii) Foreign currency risk
Since securities may be denominated in a foreign currency and may require settlement in foreign currencies and pay interest and/or a dividend in foreign currencies, changes in the relationship of these foreign currencies to the functional currency in respect of the Funds can significantly affect the value of the investments and earnings of the Funds. Monetary assets and liabilities denominated in foreign currencies are translated to the functional currency of each Fund at the foreign currency closing exchange rate ruling at the balance sheet date. Foreign currency exchange differences arising on translation and realised gains and losses on disposals or settlements of monetary assets and liabilities are recognised in the Profit and Loss Account. Non-monetary assets and liabilities denominated in foreign currencies that are measured at fair value are translated to the functional currency of each Fund at the foreign currency exchange rates ruling at the dates that the values were determined. Foreign investments may also subject the Funds to foreign government exchange restrictions, expropriation, taxation, or other political, social or economic developments, all of which could affect the market and/or credit risk of the investments.
DIMENSIONAL FUNDS II PLC
Notes to the Financial Statements (continued)
91
9. Risk Management (continued)
a) Market risk (continued)
ii) Foreign currency risk (continued)
A Fund may ‘cross-hedge’ on foreign currency exposure by selling a related foreign currency into the functional currency of the Fund. As at 31 May 2010 and 31 May 2009, the Funds did not hold any forward foreign exchange contracts to cross-hedge currency exposure. The Investment Manager does not actively manage that currency exposure of the Funds.
All assets and liabilities held by the Funds are monetary assets and liabilities except for investments in equity type instruments which are defined as non-monetary assets, under FRS 29.
The Fund’s currency exposure, for monetary and non-monetary assets and liabilities, as at 31 May 2010 was as follows:
Currency
Emerging Markets
Targeted Value Fund
European Value Fund
Global Core Equity Fund
Global Targeted Value Fund
Pacific Basin Value Fund
USD EUR USD USD USD Australian Dollar – – 3,926,225 10,229,213 5,801,817 Brazilian Real 35,460,669 – – – – British Pound (995,169 ) 13,810,318 30,899,740 20,751,481 (8,123 ) Canadian Dollar – – 5,275,612 18,124,171 – Chilean Peso 10,101,379 – – – – Danish Krone – 1,259,159 448,124 1,550,195 – Euro (58,691 ) 31,364,512 13,071,808 32,160,908 (33,235 ) Hong Kong Dollar 44,446,578 – 1,135,725 4,204,303 1,780,232 Hungarian Forint 602,876 – – – – Indian Rupee 46,080,277 – – – – Indonesian Rupiah 15,372,291 – – – – Israeli Shekel 4,886,682 – – 424,625 – Japanese Yen – – 9,625,218 31,556,117 14,851,932 Malaysian Ringgit 20,930,649 – – – – Mexican Peso 17,856,527 – – – – New Zealand Dollar – – 23,648 804,825 27,364 Norwegian Krone – 1,044,871 427,177 1,863,904 – Philippine Peso 4,507,182 – – – – Polish Zloty 11,651,442 – – – – Singapore Dollar – – 722,985 2,484,678 1,099,413 South African Rand 37,609,140 – – – – South Korean Won 44,660,779 – – – – Swedish Krona – 3,029,079 1,245,199 3,793,511 – Swiss Franc – 7,058,911 3,030,885 6,632,545 – Taiwan Dollar 45,063,975 – – – – Thai Baht 11,903,903 – – – – Turkish Lira 12,807,695 – – – – United States Dollar 8,454,891 (9,501 ) 50,098,023 125,267,152 (237,531 ) 371,343,075 57,557,349 119,930,369 259,847,628 23,281,869 Adjustment from bid market value to fair value (330,027 ) (420,154 ) (231,834 ) (267,087 ) (138,030 ) Total 371,013,048 57,137,195 119,698,535 259,580,541 23,143,839
DIMENSIONAL FUNDS II PLC
Notes to the Financial Statements (continued)
92
9. Risk Management (continued)
a) Market risk (continued)
ii) Foreign currency risk (continued)
The Fund’s currency exposure, for monetary and non-monetary assets and liabilities, as at 31 May 2009 was as follows:
Currency
Emerging Markets
Targeted Value Fund
European Value Fund
Global Core Equity Fund
Global Targeted Value Fund
Pacific Basin Value Fund
USD EUR USD USD USD Australian Dollar – – 1,513,755 3,325,050 3,312,404 Brazilian Real 39,685,020 – – – – British Pound (1,453,937 ) 11,562,981 5,593,159 12,540,211 22,038 Canadian Dollar – – 2,260,518 6,817,570 – Chilean Peso 6,101,018 – – – – Danish Krone – 657,418 187,150 1,029,804 – Euro (33,097 ) 24,802,372 6,692,468 20,342,107 (23,526 ) Hong Kong Dollar 48,440,019 – 544,492 1,371,794 2,287,303 Hungarian Forint 1,741,002 – – – – Indian Rupee 37,490,516 – – – – Indonesian Rupiah 6,554,114 – – – – Israeli Shekel 7,881,329 – – – – Japanese Yen – – 5,701,500 19,285,543 11,810,037 Malaysian Ringgit 21,362,926 – – – – Mexican Peso 19,836,084 – – – – New Zealand Dollar – – 17,533 365,441 112,747 Norwegian Krone – 624,974 209,827 1,191,043 – Philippine Peso 3,092,842 – – – – Polish Zloty 6,577,922 – – – – Singapore Dollar – – 243,470 871,354 1,359,223 South African Rand 35,929,692 – – – – South Korean Won 36,291,196 – – – – Swedish Krona – 2,278,766 438,233 1,429,705 – Swiss Franc – 5,463,784 1,778,578 4,616,241 – Taiwan Dollar 44,085,424 – – – – Thai Baht 6,805,512 – – – – Turkish Lira 9,081,482 – – – – United States Dollar 1,067,860 (8,742 ) 29,683,304 45,642,947 38,408 330,536,924 45,381,553 54,863,987 118,828,810 18,918,634 Adjustment from bid market value to fair value 2,876,018 407,704 191,983 754,998 178,379 Total 333,412,942 45,789,257 55,055,970 119,583,808 19,097,013
DIMENSIONAL FUNDS II PLC
Notes to the Financial Statements (continued)
93
9. Risk Management (continued)
a) Market risk (continued)
ii) Foreign currency risk (continued)
The following table sets out a sensitivity analysis in relation to foreign currency risk and its effect on the Net Asset Value of each Fund where foreign currency risk is deemed significant (greater than 10% of Net Asset Value). Sensitivity analysis is calculated based on +/-10% for the Funds exposed to emerging and developing countries and based on at +/-5% on all other investments and cash. Other net assets and liabilities are not significant and are assumed unchanged. All other market parameters have also been assumed unchanged.
Fund Currency Positive 10% Negative 10% Positive 10% Negative 10%
Emerging Targeted Value Fund Brazilian Real 0.00% (0.00)% 1.20% (1.20%)Hong Kong Dollar 1.19% (1.19)% 1.45% (1.45%)Indian Rupee 1.23% (1.23)% 1.13% (1.13%)South African Rand 0.00% (0.00)% 1.09% (1.09%)South Korean Won 1.23% (1.23)% 1.10% (1.10%)Taiwan Dollar 1.22% (1.22)% 1.33% (1.33%)
Positive 5% Negative 5% Positive 5% Negative 5%European Value Fund British Pound 1.19% (1.19)% 1.27% (1.27%)
Euro 2.73% (2.73)% 2.73% (2.73%)Swiss Franc 0.61% (0.61)% 0.60% (0.60%)
Global Core Equity Fund British Pound 0.50% (0.50)% 0.51% (0.51%)Euro 0.67% (0.67)% 0.72% (0.72%)Japanese Yen 0.52% (0.52)% 0.63% (0.63%)United States Dollar 2.48% (2.48)% 2.35% (2.35%)
Global Targeted Value Fund British Pound 0.00% (0.00)% 0.53% (0.53%)Euro 0.63% (0.63)% 0.86% (0.86%)Japanese Yen 0.63% (0.63)% 0.80% (0.80%)United States Dollar 2.36% (2.36)% 1.93% (1.93%)
Pacific Basin Value Fund Australian Dollar 1.18% (1.18)% 0.88% (0.88%)Hong Kong Dollar 0.00% (0.00)% 0.61% (0.61%)Japanese Yen 3.19% (3.19)% 3.13% (3.13%)
31 May 2010 31 May 2009Impact on Net Asset Value due to movement in foreign
exchange rates
The sensitivity analysis set out above, should not be used as an indication of future performance.
The sensitivity analysis is subject to limitations for example:
• the sensitivities are based on historical data and cannot take account of the fact that future market price movements, correlations between markets and levels of market liquidity in conditions of market stress may bear no relation to historical patterns;
• the market price risk information is a relative estimate of risk rather than a precise and accurate number; • the market price information represents a hypothetical outcome and is not intended to be predictive; and • future market conditions could vary significantly from those experienced.
DIMENSIONAL FUNDS II PLC
Notes to the Financial Statements (continued)
94
9. Risk Management (continued)
a) Market risk (continued)
iii) Interest Rate Risk
The majority of the Company’s financial assets and financial liabilities are non-interest bearing, as a result the Company is not subject to a significant amount of risk due to the fluctuations in the prevailing levels of market interest rates. Any excess cash and cash equivalents are invested in short-term market interest rates earning a rate under Libor or invested in money market funds.
The fixed-income investments in which a Fund may invest are interest rate sensitive and may be subject to price volatility due to such factors including, but not limited to, changes in interest rates, market perception of the creditworthiness of the issuer and general market liquidity. The magnitude of these fluctuations will be greater when the maturity of the outstanding investments is longer. An increase in interest rates will generally reduce the value of fixed-income securities, while a decline in interest rates will generally increase the value of fixed-income securities. As at 31 May 2010 and 31 May 2009 the Funds did not hold any investments in interest bearing securities.
b) Credit risk
Credit risk is the risk that a counterparty to or issue of a financial instrument will fail to discharge an obligation or commitment that it has entered into with the Funds. The Funds are exposed to credit risk on parties with whom it trades and will also bear the risk of settlement default.
All transactions in exchange traded securities are settled/paid for upon delivery using approved brokers. The risk of default is considered minimal, as delivery of securities sold is only made once the broker has received payment.
Payment is made on a purchase once the securities have been received by the broker in all developed countries. The trade will fail if either party fails to meet their obligation. In certain Emerging Market countries, the Fund settles with the settlement house one day prior to the counterparty settlement. However the transaction will still fail if the counterparty does not settle the transaction. At times some of the markets in which the Funds will invest can be less liquid and more volatile. This may result in fluctuations in the price of the Shares.
Transactions involving derivative financial instruments are with counterparties with whom the Company has master netting agreements which provide for the net settlement for contracts with the same counterparty in the event of default. The credit risk associated with derivative financial assets subject to a master netting arrangement is eliminated only to the extent that financial liabilities due to the same counterparty will be settled after the assets are realised. As at 31 May 2010 and 31 May 2009 the Funds did not hold derivative positions.
All of the Company’s assets are held by the Custodian and Sub-Custodian. The Company’s non-cash assets are maintained by the Custodian in segregated accounts so that in the event of the Custodian’s insolvency or bankruptcy the Company’s non-cash assets are segregated and protected and this further reduces counterparty risk. While cash held by the Custodian or any depository will be identifiable as belonging to the Company, the Company will be exposed to the credit risk of the Custodian or any depository where cash is deposited. In the event of the insolvency of the Custodian or any depository, the Company will be treated as a general creditor of the Custodian or other depository in relation to cash holdings of the Company.
Bankruptcy or insolvency of the Custodian may cause the Funds’ rights with respect to the cash held by the Custodian to be delayed or limited. The Custodian is rated as A-1+ by Standard & Poors rating agency. If the credit quality or financial position of the Custodian deteriorated significantly the Investment Manager would move the custodian relationship to another bank.
As at 31 May 2010 and 31 May 2009 the total amount of financial assets exposed to credit risk approximates to their carrying value in the Balance Sheet.

DIMENSIONAL FUNDS II PLC
Notes to the Financial Statements (continued)
95
9. Risk Management (continued)
b) Credit risk (continued)
For efficient portfolio management purposes, each Fund may enter into stock lending agreements subject to the conditions and limits set out in the Financial Regulator Notices. Until the expiry of the stock lending transactions, collateral obtained such contracts or transactions:
(i) must be marked to market daily;
(ii) must equal or exceed, in value at all times, the value of the amount invested or securities loaned;
(iii) must be transferred to the trustee or its agent; and
(iv) immediately be available to the relevant Fund without recourse to the counterparty in the event of default of that counterparty.
The Funds participate in security lending which is executed through PFPC as the stock lending agent. As such the Funds are exposed to an underlying exposure to the credit risk and risk that the borrower may default. A list of eligible borrowers is maintained by PFPC. Minimum credit rating of an eligible borrower is A2 by Moodys or its equivalent. If the credit rating falls below the minimum credit rating PFPC can terminate the stock lending arrangement. Collateral is held and monitored by PFPC with the Custodian undertaking an overview of this on a periodic basis.
The Funds’ exposure to stock lending is disclosed in note 2.
c) Liquidity risk
Numerous Emerging Market countries have recently experienced serious and potentially continuing, economic and political problems. Stock markets in many emerging countries are relatively small and risky. Investors are often limited in their investment and divestment activities. Additional restrictions may be imposed under emergency conditions. Emerging Market securities may decline or fluctuate because of economic and political actions of Emerging Market governments and less regulated or liquid securities markets. Investors holding the securities are also exposed to the possibility that an Emerging Market currency will fluctuate against the base currency of the relevant Fund.
The legislative framework in Emerging Market countries for the purchase and sale of investments and in relation to the beneficial interests in those investments may be relatively new and untested. There can be no assurance regarding how the courts or agencies of Emerging Market countries will react to questions arising from the Funds’ investments in such countries and arrangements contemplated in relation thereto.
The Investment Manager performs liquidity analysis on all Funds on a monthly basis. The number of potentially illiquid assets held in all Funds is minor in all cases.
The Company is exposed to daily cash redemptions of redeemable shares. It therefore invests the majority of its assets in investments that are traded in an active market and can be readily disposed of; it invests only a limited proportion of its assets in investments not actively traded on a stock exchange. The Company’s listed securities are considered readily realisable as they are listed on recognised and established stock exchanges. The Administrator monitors subscription and redemption volumes and notifies the Investment Manager of significant movements and unusual trends as appropriate.
If outstanding redemption requests from Shareholders of any Fund for any Dealing Day exceed in the aggregate more than 10% of all the outstanding Shares of that Fund, the Directors shall be entitled at their discretion to refuse to redeem such excess Shares. If the Directors refuse to redeem Shares for these reasons, the requests for redemption on such date shall be reduced rateably and the Company shall not be obliged to redeem the remainder of the Shares to which each request relates until the Dealing Day next following the date of such refusal to redeem. At the expiry of any such period, the Company shall complete the redemption of the remaining Shares in respect of which redemption requests were received prior to the relevant Dealing Day and in priority to any subsequent requests.
The Company does not engage in leverage activities.
As at 31 May 2010, the Company has a multi-currency discretionary line of credit in place of USD15million. This credit line can be used to fund shareholder redemptions requests and for other short-term temporary purposes. Amounts may be drawn down for a period of up to two months. The line of credit renewal date is 22 June 2010.

DIMENSIONAL FUNDS II PLC
Notes to the Financial Statements (continued)
96
9. Risk Management (continued)
d) Liquidity risk (continued)
Details of contractual maturities as at 31 May 2010 and 31 May 2009 are outlined below:
31 May 2010:
Emerging Markets
Targeted Value Fund
European Value Fund
Global Core Equity Fund
Global Targeted Value Fund
Pacific Basin Value Fund
Liabilities USD EUR USD USD USD Less than 1 month Management fee 222,611 17,777 22,913 101,921 1,577 Payable for shares repurchased 59,483 62 131,878 2,235,985 277,595 Payable for securities purchased 1,321,644 75,639 132,094 1,729,167 96,671 Distributions payable 973,586 22,042 395,896 382,373 10,525 Accrued expenses 209,175 19,059 48,422 81,781 24,305 Redeemable Shares 371,013,048 57,137,195 119,698,535 259,580,541 23,143,839 3 months - 1year Capital gains tax 345,427 – – – – Accrued expenses 51,815 18,555 29,234 41,219 28,975 Total Financial Liabilities 374,196,789 57,290,329 120,458,972 264,152,987 23,583,487 31 May 2009:
Emerging Markets
Targeted Value Fund
European Value Fund
Global Core Equity Fund
Global Targeted Value Fund
Pacific Basin Value Fund
Liabilities USD EUR USD USD USD Less than 1 month Management fee 181,393 13,866 10,097 45,139 – Payable for shares repurchased 11,638 – 838 2,452 – Payable for securities purchased 17,303 – 7,370 28,766 315,663 Distributions payable 1,469,584 3,794 221,298 190,472 507 Accrued expenses 112,343 9,667 14,862 23,095 14,636 Redeemable Shares 333,412,942 45,789,257 55,055,970 119,583,808 19,097,013 3 months - 1year Capital gains tax – – – – – Accrued expenses 34,305 16,895 20,020 24,269 28,605 Total Financial Liabilities 335,239,508 45,833,479 55,506,083 119,898,001 19,456,424

DIMENSIONAL FUNDS II PLC
Notes to the Financial Statements (continued)
97
10. Foreign Exchange Rates
The following exchange rates were used to convert the investments and other assets and liabilities denominated in currencies other than the respective Fund’s base currency at 31 May 2010 and 31 May 2009: 31 May 2010 31 May 2009 Exchange Rates against Euro British Pound 0.8486 0.8747 Danish Krone 7.4401 7.4468 Norwegian Krone 7.9599 8.9113 Swedish Krona 9.6350 10.6975 Swiss Franc 1.4225 1.5096 United States Dollar 1.2271 1.4137 Exchange Rates against US Dollar Australian Dollar 1.1802 1.2486 Brazilian Real 1.8143 1.9676 British Pound 0.6915 0.6187 Canadian Dollar 1.0524 1.0918 Chilean Peso 529.7500 561.8500 Danish Krone 6.0630 5.2676 Euro 0.8149 0.7074 Hong Kong Dollar 7.7875 7.7523 Hungarian Forint 224.1576 200.8206 Indian Rupee 46.3450 47.1150 Indonesian Rupiah 9,260.5000 10,290.0000 Israeli Shekel 3.8425 3.9088 Japanese Yen 90.9100 95.2800 Malaysian Ringgit 3.2960 3.4945 Mexican Peso 12.9230 13.1720 New Zealand Dollar 0.6787 0.6406 Norwegian Krone 6.4866 6.3035 Philippine Peso 46.2050 47.3350 Polish Zloty 3.3266 3.1858 Singapore Dollar 1.4068 1.4444 South African Rand 7.6010 7.9560 South Korean Won 1,194.6500 1,255.1000 Swedish Krona 7.8516 7.5670 Swiss Franc 1.1592 1.0678 Taiwan Dollar 31.9635 32.5405 Thai Baht 32.5550 34.3100 Turkish Lira 1.5685 1.5340 At 31 May 2010 an exchange rate of 0.7325 (May 2009: 0.7544) was used to translate the Profit and Loss Account of Emerging Markets Targeted Value Fund, Pacific Basin value Fund, Global Targeted Fund and Global Core Equity Fund from USD to EUR.
DIMENSIONAL FUNDS II PLC
Notes to the Financial Statements (continued)
98
11. Derivative Financial Instruments
A Fund may employ investment techniques and instruments for efficient portfolio management of its assets including for hedging against market movements, currency exchange or interest rate risks, under the conditions and within the limits stipulated by the Financial Regulator under the UCITS Regulations. A Fund may use such investment techniques and instruments only where their use is, in the opinion of the Investment Manager, consistent with the investment policies of that Fund. In particular, a Fund may lend its securities, enter repurchase and reverse repurchase agreements, call options, spot and forward contracts and financial futures. The total exposure of a Fund including but not limited to its exposure from the use of any derivative instruments, may not exceed the total net assets of the Fund. The Funds did not enter into any trading in derivative financial instruments for the period ended 31 May 2010 and 31 May 2009.
12. Distributions
The Directors may declare dividends in respect of any redeemable shares out of net income (including dividend and interest income) and the excess of realised and unrealised capital gains over realised and unrealised losses in respect of investments of the Company.
The Directors anticipate that there will be no dividend distributions in respect of the Class A Shares and Class B Shares of the Funds. Accordingly, income and capital gains arising in respect of the Class A Shares or Class B Shares of the Funds will be re-invested in the relevant Fund and reflected in the Net Asset Value per redeemable share of the relevant Fund.
The Directors anticipate making dividend distributions in respect of the Class C Shares, Class D Shares, Class E Shares and Class N of the Funds. Accordingly, any income arising in respect of the Class C Shares, Class D Shares, Class E Shares or Class N of the Funds will be distributed to redeemable shareholders in the relevant Fund in accordance with their respective shareholdings. Dividends of the Class C Shares and Class D Shares are declared by the Directors for the periods ending 31 May and 30 November. Dividends of the Class E Shares and Class N Shares are declared by the Directors for the period ending 30 November. For the period ended 31 May 2010 there were no Class E Shares or Class N Shares in issue.
Distributions for the period ended 31 May 2010:
Emerging Markets
Targeted Value Fund
European Value Fund
Global Core Equity Fund
Global Targeted Value Fund
Pacific Basin Value Fund
USD EUR USD USD USD 31 May Interim Distribution 973,586 22,042 395,896 382,373 10,525 973,586 22,042 395,896 382,373 10,525 Add: Income deducted on cancellation of shares 1,811 22 8,657 12,403 77 Deduct: Income received on issue of shares (71,296) (1,156) (45,038) (103,285) (751) Net distribution for the period 904,101 20,908 359,515 291,491 9,851 Details of the distribution per share are disclosed below.
DIMENSIONAL FUNDS II PLC
Notes to the Financial Statements (continued)
99
12. Distributions (continued)
Distributions for the period ended 31 May 2009:
Emerging Markets
Targeted Value Fund
European Value Fund
Global Core Equity Fund
Global Targeted Value Fund
Pacific Basin Value Fund
USD EUR USD USD USD 31 May Interim Distribution 1,469,584 3,794 221,298 190,471 507 1,469,584 3,794 221,298 190,471 507 Add: Income deducted on cancellation of shares 1,439 – 4,119 3,540 – Deduct: Income received on issue of shares (5,861) (689) (16,503) (19,807) (204) Net distribution for the period 1,465,162 3,105 208,914 174,204 303 Details of the distribution per share are disclosed below. Distributions per Share Class for the period ended 31 May 2010 were as follows:
Fund Fund Class Ex Date Pay Date
Dividend per Redeemable
Share Amount
Emerging Markets Targeted Value Fund Class C 28 May 2010 14 June 2010 £0.04 £104,012Emerging Markets Targeted Value Fund Class D 28 May 2010 28 May 2010 £0.04 £569,213
European Value Fund Class C 28 May 2010 14 June 2010 £0.14 £1,296European Value Fund Class D 28 May 2010 28 May 2010 £0.07 £17,408
Global Core Equity Fund Class C 28 May 2010 14 June 2010 £0.04 £86,273Global Core Equity Fund Class D 28 May 2010 28 May 2010 £0.04 £187,485
Global Targeted Value Fund Class C 28 May 2010 14 June 2010 £0.03 £121,060Global Targeted Value Fund Class D 28 May 2010 28 May 2010 £0.03 £143,346
Pacific Basin Value Fund Class C 28 May 2010 14 June 2010 £0.07 £504Pacific Basin Value Fund Class D 28 May 2010 28 May 2010 £0.07 £6,774
DIMENSIONAL FUNDS II PLC
Notes to the Financial Statements (continued)
100
12. Distributions (continued)
Distributions per Share Class for the year ended 31 May 2009 were as follows:
Fund Fund Class Ex Date Pay Date
Dividend per Redeemable
Share AmountEmerging Markets Targeted Value Fund Class C 29 May 2009 3 June 2009 £0.04 £2,190Emerging Markets Targeted Value Fund Class D 29 May 2009 3 June 2009 £0.04 £907,041
European Value Fund Class C 29 May 2009 3 June 2009 £0.12 £221European Value Fund Class D 29 May 2009 3 June 2009 £0.07 £3,097
Global Core Equity Fund Class C 29 May 2009 3 June 2009 £0.04 £14,865Global Core Equity Fund Class D 29 May 2009 3 June 2009 £0.04 £122,052
Global Targeted Value Fund Class C 29 May 2009 3 June 2009 £0.03 £6,557Global Targeted Value Fund Class D 29 May 2009 3 June 2009 £0.03 £111,288
Pacific Basin Value Fund Class C 29 May 2009 3 June 2009 £0.06 £96Pacific Basin Value Fund Class D 29 May 2009 3 June 2009 £0.06 £217
13. Financial Assets at fair value through profit or loss
Currency 31 May 2010 31 May 2009
Fund Fair Value
Fair value gains/(losses)
charged to profit or loss Fair Value
Fair value gains/(losses)
charged to profit or loss
Emerging Markets Targeted Value Fund USD Equities* 371,318,823 (2,575,430) 329,645,069 127,716,787 Total 371,318,823 (2,575,430) 329,645,069 127,716,787 European Value Fund EUR Equities* 57,054,898 (505,554) 45,007,637 (313,223) Total 57,054,898 (505,554) 45,007,637 (313,223) Global Core Equity Fund USD Equities* 98,138,441 (9,226,094) 45,499,145 5,172,382 Collective Investment Schemes 21,331,233 4,091,489 9,082,591 1,399,373 Total 119,469,674 (5,134,605) 54,581,736 6,571,755 Global Targeted Value Fund USD Equities* 257,689,152 1,571,213 118,481,884 17,900,039 Total 257,689,152 1,571,213 118,481,884 17,900,039 Pacific Basin Value Fund USD Equities* 23,241,475 (159,294) 18,714,506 1,072,139 Total 23,241,475 (159,294) 18,714,506 1,072,139
* Equities include common stock, preferred stock, REITS rights and warrants.
** Collective Investments Schemes include UCIT Funds.
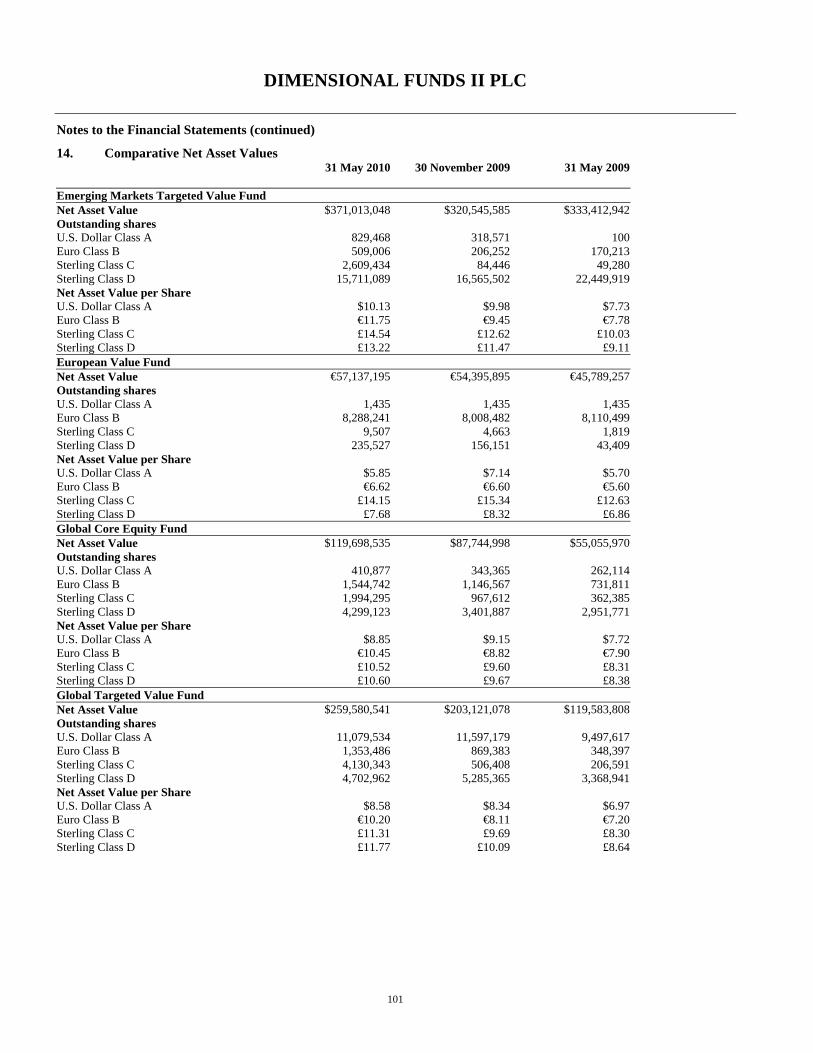
DIMENSIONAL FUNDS II PLC
Notes to the Financial Statements (continued)
101
14. Comparative Net Asset Values 31 May 2010 30 November 2009 31 May 2009 Emerging Markets Targeted Value Fund Net Asset Value $371,013,048 $320,545,585 $333,412,942 Outstanding shares U.S. Dollar Class A 829,468 318,571 100 Euro Class B 509,006 206,252 170,213 Sterling Class C 2,609,434 84,446 49,280 Sterling Class D 15,711,089 16,565,502 22,449,919 Net Asset Value per Share U.S. Dollar Class A $10.13 $9.98 $7.73 Euro Class B €11.75 €9.45 €7.78 Sterling Class C £14.54 £12.62 £10.03 Sterling Class D £13.22 £11.47 £9.11 European Value Fund Net Asset Value €57,137,195 €54,395,895 €45,789,257 Outstanding shares U.S. Dollar Class A 1,435 1,435 1,435 Euro Class B 8,288,241 8,008,482 8,110,499 Sterling Class C 9,507 4,663 1,819 Sterling Class D 235,527 156,151 43,409 Net Asset Value per Share U.S. Dollar Class A $5.85 $7.14 $5.70 Euro Class B €6.62 €6.60 €5.60 Sterling Class C £14.15 £15.34 £12.63 Sterling Class D £7.68 £8.32 £6.86 Global Core Equity Fund Net Asset Value $119,698,535 $87,744,998 $55,055,970 Outstanding shares U.S. Dollar Class A 410,877 343,365 262,114 Euro Class B 1,544,742 1,146,567 731,811 Sterling Class C 1,994,295 967,612 362,385 Sterling Class D 4,299,123 3,401,887 2,951,771 Net Asset Value per Share U.S. Dollar Class A $8.85 $9.15 $7.72 Euro Class B €10.45 €8.82 €7.90 Sterling Class C £10.52 £9.60 £8.31 Sterling Class D £10.60 £9.67 £8.38 Global Targeted Value Fund Net Asset Value $259,580,541 $203,121,078 $119,583,808 Outstanding shares U.S. Dollar Class A 11,079,534 11,597,179 9,497,617 Euro Class B 1,353,486 869,383 348,397 Sterling Class C 4,130,343 506,408 206,591 Sterling Class D 4,702,962 5,285,365 3,368,941 Net Asset Value per Share U.S. Dollar Class A $8.58 $8.34 $6.97 Euro Class B €10.20 €8.11 €7.20 Sterling Class C £11.31 £9.69 £8.30 Sterling Class D £11.77 £10.09 £8.64
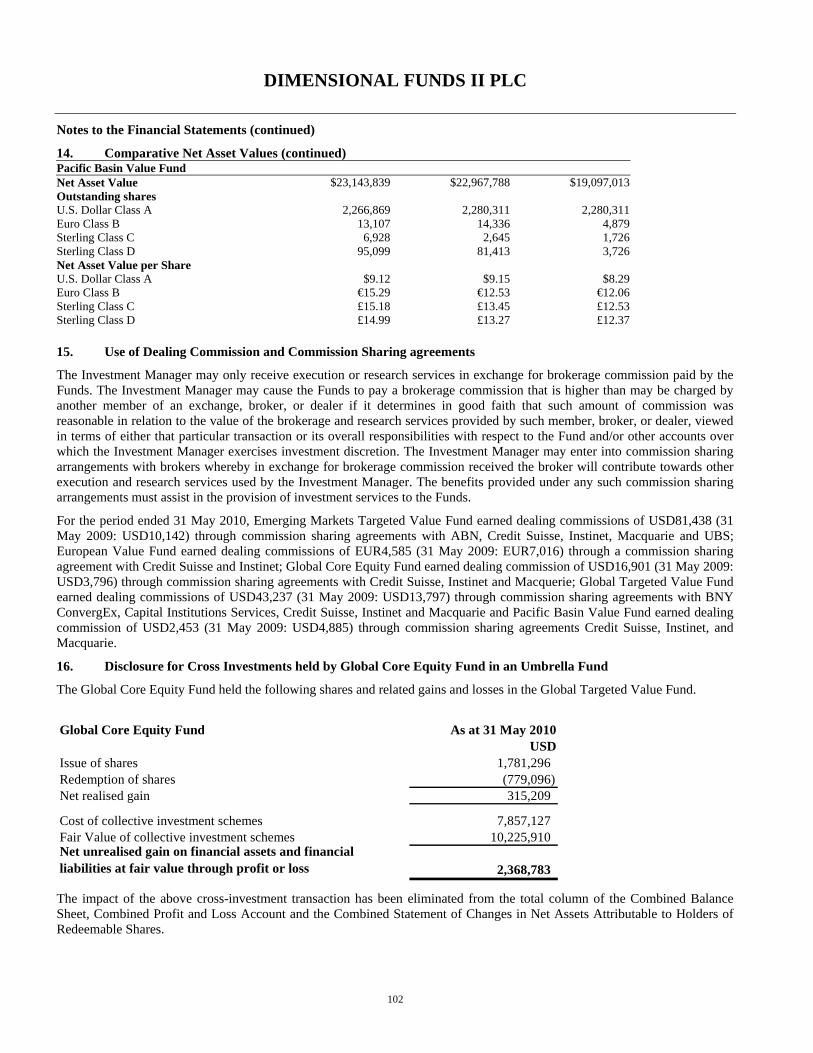
DIMENSIONAL FUNDS II PLC
Notes to the Financial Statements (continued)
102
14. Comparative Net Asset Values (continued) Pacific Basin Value Fund Net Asset Value $23,143,839 $22,967,788 $19,097,013 Outstanding shares U.S. Dollar Class A 2,266,869 2,280,311 2,280,311 Euro Class B 13,107 14,336 4,879 Sterling Class C 6,928 2,645 1,726 Sterling Class D 95,099 81,413 3,726 Net Asset Value per Share U.S. Dollar Class A $9.12 $9.15 $8.29 Euro Class B €15.29 €12.53 €12.06 Sterling Class C £15.18 £13.45 £12.53 Sterling Class D £14.99 £13.27 £12.37 15. Use of Dealing Commission and Commission Sharing agreements
The Investment Manager may only receive execution or research services in exchange for brokerage commission paid by the Funds. The Investment Manager may cause the Funds to pay a brokerage commission that is higher than may be charged by another member of an exchange, broker, or dealer if it determines in good faith that such amount of commission was reasonable in relation to the value of the brokerage and research services provided by such member, broker, or dealer, viewed in terms of either that particular transaction or its overall responsibilities with respect to the Fund and/or other accounts over which the Investment Manager exercises investment discretion. The Investment Manager may enter into commission sharing arrangements with brokers whereby in exchange for brokerage commission received the broker will contribute towards other execution and research services used by the Investment Manager. The benefits provided under any such commission sharing arrangements must assist in the provision of investment services to the Funds.
For the period ended 31 May 2010, Emerging Markets Targeted Value Fund earned dealing commissions of USD81,438 (31 May 2009: USD10,142) through commission sharing agreements with ABN, Credit Suisse, Instinet, Macquarie and UBS; European Value Fund earned dealing commissions of EUR4,585 (31 May 2009: EUR7,016) through a commission sharing agreement with Credit Suisse and Instinet; Global Core Equity Fund earned dealing commission of USD16,901 (31 May 2009: USD3,796) through commission sharing agreements with Credit Suisse, Instinet and Macquerie; Global Targeted Value Fund earned dealing commissions of USD43,237 (31 May 2009: USD13,797) through commission sharing agreements with BNY ConvergEx, Capital Institutions Services, Credit Suisse, Instinet and Macquarie and Pacific Basin Value Fund earned dealing commission of USD2,453 (31 May 2009: USD4,885) through commission sharing agreements Credit Suisse, Instinet, and Macquarie.
16. Disclosure for Cross Investments held by Global Core Equity Fund in an Umbrella Fund
The Global Core Equity Fund held the following shares and related gains and losses in the Global Targeted Value Fund.
Global Core Equity Fund As at 31 May 2010USD
Issue of shares 1,781,296 Redemption of shares (779,096) Net realised gain 315,209
Cost of collective investment schemes 7,857,127 Fair Value of collective investment schemes 10,225,910 Net unrealised gain on financial assets and financial liabilities at fair value through profit or loss 2,368,783 The impact of the above cross-investment transaction has been eliminated from the total column of the Combined Balance Sheet, Combined Profit and Loss Account and the Combined Statement of Changes in Net Assets Attributable to Holders of Redeemable Shares.
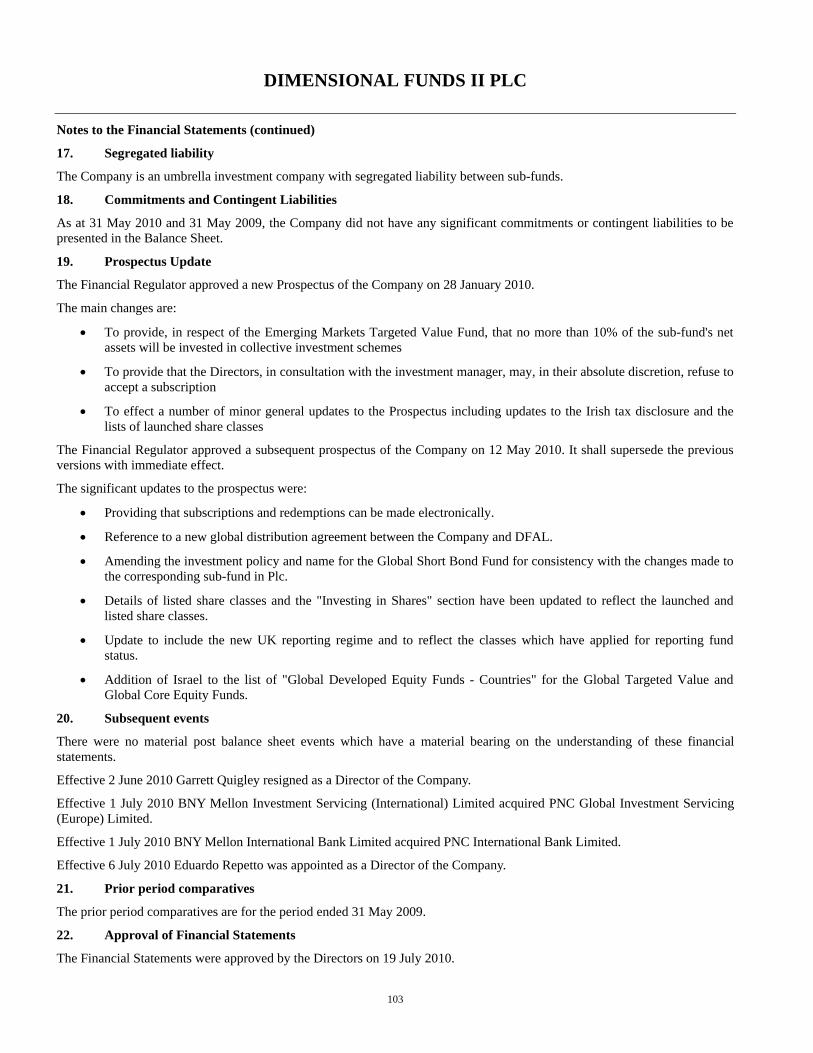
DIMENSIONAL FUNDS II PLC
Notes to the Financial Statements (continued)
103
17. Segregated liability
The Company is an umbrella investment company with segregated liability between sub-funds.
18. Commitments and Contingent Liabilities
As at 31 May 2010 and 31 May 2009, the Company did not have any significant commitments or contingent liabilities to be presented in the Balance Sheet.
19. Prospectus Update
The Financial Regulator approved a new Prospectus of the Company on 28 January 2010.
The main changes are:
• To provide, in respect of the Emerging Markets Targeted Value Fund, that no more than 10% of the sub-fund's net assets will be invested in collective investment schemes
• To provide that the Directors, in consultation with the investment manager, may, in their absolute discretion, refuse to accept a subscription
• To effect a number of minor general updates to the Prospectus including updates to the Irish tax disclosure and the lists of launched share classes
The Financial Regulator approved a subsequent prospectus of the Company on 12 May 2010. It shall supersede the previous versions with immediate effect.
The significant updates to the prospectus were:
• Providing that subscriptions and redemptions can be made electronically.
• Reference to a new global distribution agreement between the Company and DFAL.
• Amending the investment policy and name for the Global Short Bond Fund for consistency with the changes made to the corresponding sub-fund in Plc.
• Details of listed share classes and the "Investing in Shares" section have been updated to reflect the launched and listed share classes.
• Update to include the new UK reporting regime and to reflect the classes which have applied for reporting fund status.
• Addition of Israel to the list of "Global Developed Equity Funds - Countries" for the Global Targeted Value and Global Core Equity Funds.
20. Subsequent events
There were no material post balance sheet events which have a material bearing on the understanding of these financial statements.
Effective 2 June 2010 Garrett Quigley resigned as a Director of the Company.
Effective 1 July 2010 BNY Mellon Investment Servicing (International) Limited acquired PNC Global Investment Servicing (Europe) Limited.
Effective 1 July 2010 BNY Mellon International Bank Limited acquired PNC International Bank Limited.
Effective 6 July 2010 Eduardo Repetto was appointed as a Director of the Company.
21. Prior period comparatives
The prior period comparatives are for the period ended 31 May 2009.
22. Approval of Financial Statements
The Financial Statements were approved by the Directors on 19 July 2010.
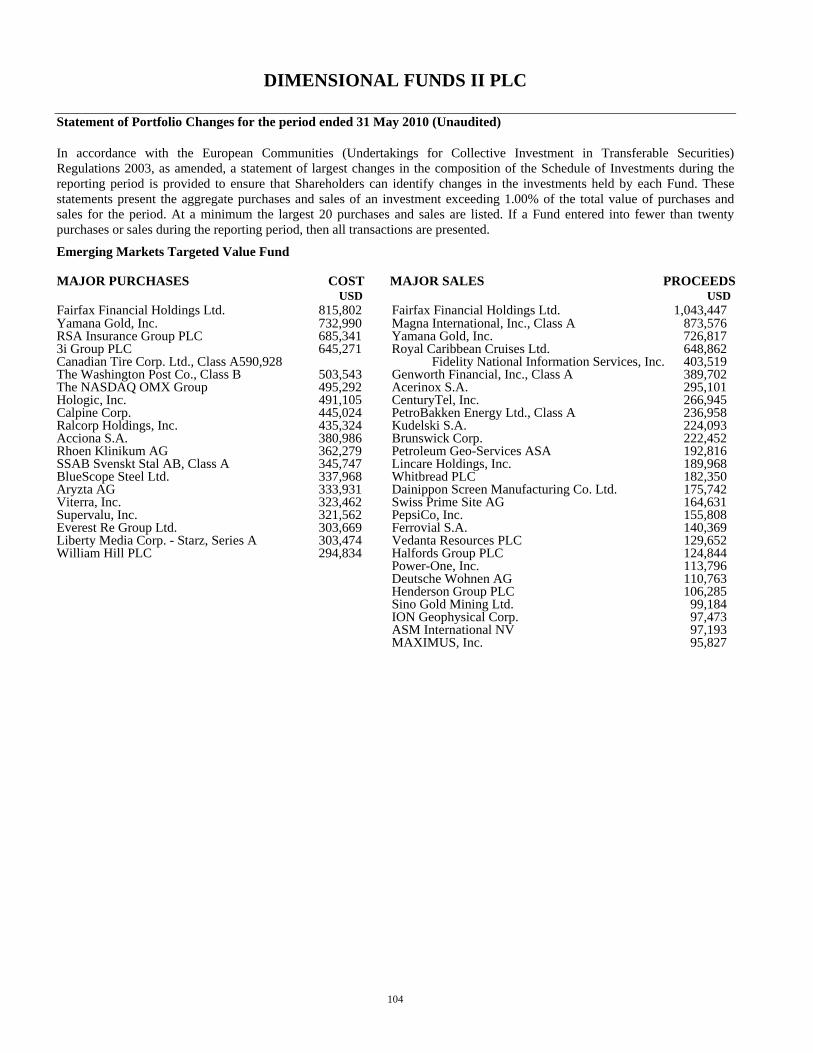
DIMENSIONAL FUNDS II PLC
104
Statement of Portfolio Changes for the period ended 31 May 2010 (Unaudited)
In accordance with the European Communities (Undertakings for Collective Investment in Transferable Securities) Regulations 2003, as amended, a statement of largest changes in the composition of the Schedule of Investments during the reporting period is provided to ensure that Shareholders can identify changes in the investments held by each Fund. These statements present the aggregate purchases and sales of an investment exceeding 1.00% of the total value of purchases and sales for the period. At a minimum the largest 20 purchases and sales are listed. If a Fund entered into fewer than twenty purchases or sales during the reporting period, then all transactions are presented. Emerging Markets Targeted Value Fund MAJOR PURCHASES COST MAJOR SALES PROCEEDS USD USD Fairfax Financial Holdings Ltd. 815,802 Fairfax Financial Holdings Ltd. 1,043,447 Yamana Gold, Inc. 732,990 Magna International, Inc., Class A 873,576 RSA Insurance Group PLC 685,341 Yamana Gold, Inc. 726,817 3i Group PLC 645,271 Royal Caribbean Cruises Ltd. 648,862 Canadian Tire Corp. Ltd., Class A590,928 Fidelity National Information Services, Inc. 403,519 The Washington Post Co., Class B 503,543 Genworth Financial, Inc., Class A 389,702 The NASDAQ OMX Group 495,292 Acerinox S.A. 295,101 Hologic, Inc. 491,105 CenturyTel, Inc. 266,945 Calpine Corp. 445,024 PetroBakken Energy Ltd., Class A 236,958 Ralcorp Holdings, Inc. 435,324 Kudelski S.A. 224,093 Acciona S.A. 380,986 Brunswick Corp. 222,452 Rhoen Klinikum AG 362,279 Petroleum Geo-Services ASA 192,816 SSAB Svenskt Stal AB, Class A 345,747 Lincare Holdings, Inc. 189,968 BlueScope Steel Ltd. 337,968 Whitbread PLC 182,350 Aryzta AG 333,931 Dainippon Screen Manufacturing Co. Ltd. 175,742 Viterra, Inc. 323,462 Swiss Prime Site AG 164,631 Supervalu, Inc. 321,562 PepsiCo, Inc. 155,808 Everest Re Group Ltd. 303,669 Ferrovial S.A. 140,369 Liberty Media Corp. - Starz, Series A 303,474 Vedanta Resources PLC 129,652 William Hill PLC 294,834 Halfords Group PLC 124,844 Power-One, Inc. 113,796 Deutsche Wohnen AG 110,763 Henderson Group PLC 106,285 Sino Gold Mining Ltd. 99,184 ION Geophysical Corp. 97,473 ASM International NV 97,193 MAXIMUS, Inc. 95,827
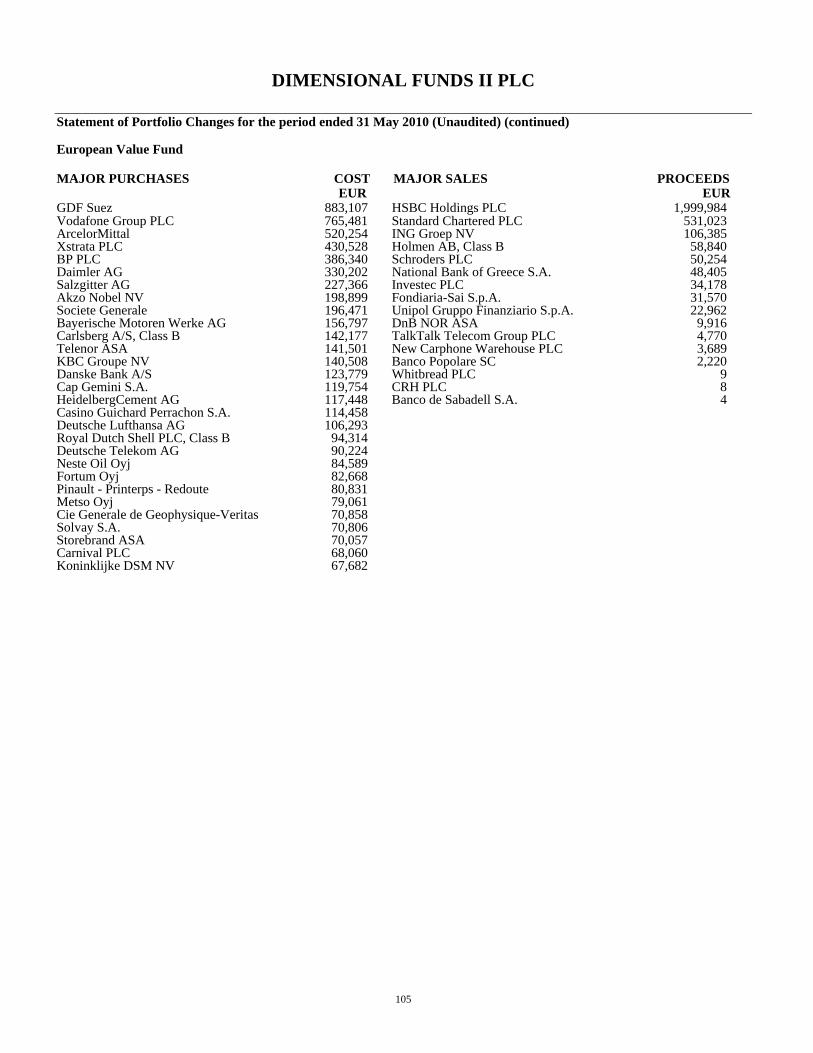
DIMENSIONAL FUNDS II PLC
105
Statement of Portfolio Changes for the period ended 31 May 2010 (Unaudited) (continued)
European Value Fund MAJOR PURCHASES COST MAJOR SALES PROCEEDS EUR EUR GDF Suez 883,107 HSBC Holdings PLC 1,999,984 Vodafone Group PLC 765,481 Standard Chartered PLC 531,023 ArcelorMittal 520,254 ING Groep NV 106,385 Xstrata PLC 430,528 Holmen AB, Class B 58,840 BP PLC 386,340 Schroders PLC 50,254 Daimler AG 330,202 National Bank of Greece S.A. 48,405 Salzgitter AG 227,366 Investec PLC 34,178 Akzo Nobel NV 198,899 Fondiaria-Sai S.p.A. 31,570 Societe Generale 196,471 Unipol Gruppo Finanziario S.p.A. 22,962 Bayerische Motoren Werke AG 156,797 DnB NOR ASA 9,916 Carlsberg A/S, Class B 142,177 TalkTalk Telecom Group PLC 4,770 Telenor ASA 141,501 New Carphone Warehouse PLC 3,689 KBC Groupe NV 140,508 Banco Popolare SC 2,220 Danske Bank A/S 123,779 Whitbread PLC 9 Cap Gemini S.A. 119,754 CRH PLC 8 HeidelbergCement AG 117,448 Banco de Sabadell S.A. 4 Casino Guichard Perrachon S.A. 114,458 Deutsche Lufthansa AG 106,293 Royal Dutch Shell PLC, Class B 94,314 Deutsche Telekom AG 90,224 Neste Oil Oyj 84,589 Fortum Oyj 82,668 Pinault - Printerps - Redoute 80,831 Metso Oyj 79,061 Cie Generale de Geophysique-Veritas 70,858 Solvay S.A. 70,806 Storebrand ASA 70,057 Carnival PLC 68,060 Koninklijke DSM NV 67,682
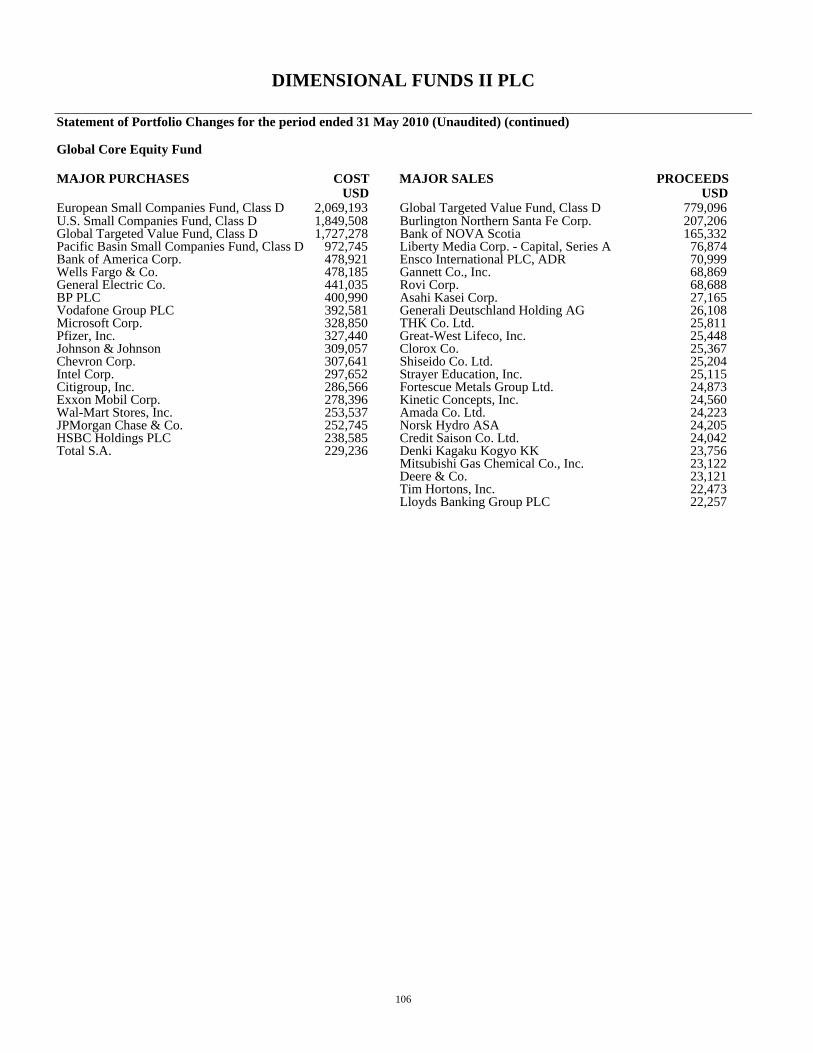
DIMENSIONAL FUNDS II PLC
106
Statement of Portfolio Changes for the period ended 31 May 2010 (Unaudited) (continued)
Global Core Equity Fund MAJOR PURCHASES COST MAJOR SALES PROCEEDS USD USD European Small Companies Fund, Class D 2,069,193 Global Targeted Value Fund, Class D 779,096 U.S. Small Companies Fund, Class D 1,849,508 Burlington Northern Santa Fe Corp. 207,206 Global Targeted Value Fund, Class D 1,727,278 Bank of NOVA Scotia 165,332 Pacific Basin Small Companies Fund, Class D 972,745 Liberty Media Corp. - Capital, Series A 76,874 Bank of America Corp. 478,921 Ensco International PLC, ADR 70,999 Wells Fargo & Co. 478,185 Gannett Co., Inc. 68,869 General Electric Co. 441,035 Rovi Corp. 68,688 BP PLC 400,990 Asahi Kasei Corp. 27,165 Vodafone Group PLC 392,581 Generali Deutschland Holding AG 26,108 Microsoft Corp. 328,850 THK Co. Ltd. 25,811 Pfizer, Inc. 327,440 Great-West Lifeco, Inc. 25,448 Johnson & Johnson 309,057 Clorox Co. 25,367 Chevron Corp. 307,641 Shiseido Co. Ltd. 25,204 Intel Corp. 297,652 Strayer Education, Inc. 25,115 Citigroup, Inc. 286,566 Fortescue Metals Group Ltd. 24,873 Exxon Mobil Corp. 278,396 Kinetic Concepts, Inc. 24,560 Wal-Mart Stores, Inc. 253,537 Amada Co. Ltd. 24,223 JPMorgan Chase & Co. 252,745 Norsk Hydro ASA 24,205 HSBC Holdings PLC 238,585 Credit Saison Co. Ltd. 24,042 Total S.A. 229,236 Denki Kagaku Kogyo KK 23,756 Mitsubishi Gas Chemical Co., Inc. 23,122 Deere & Co. 23,121 Tim Hortons, Inc. 22,473 Lloyds Banking Group PLC 22,257
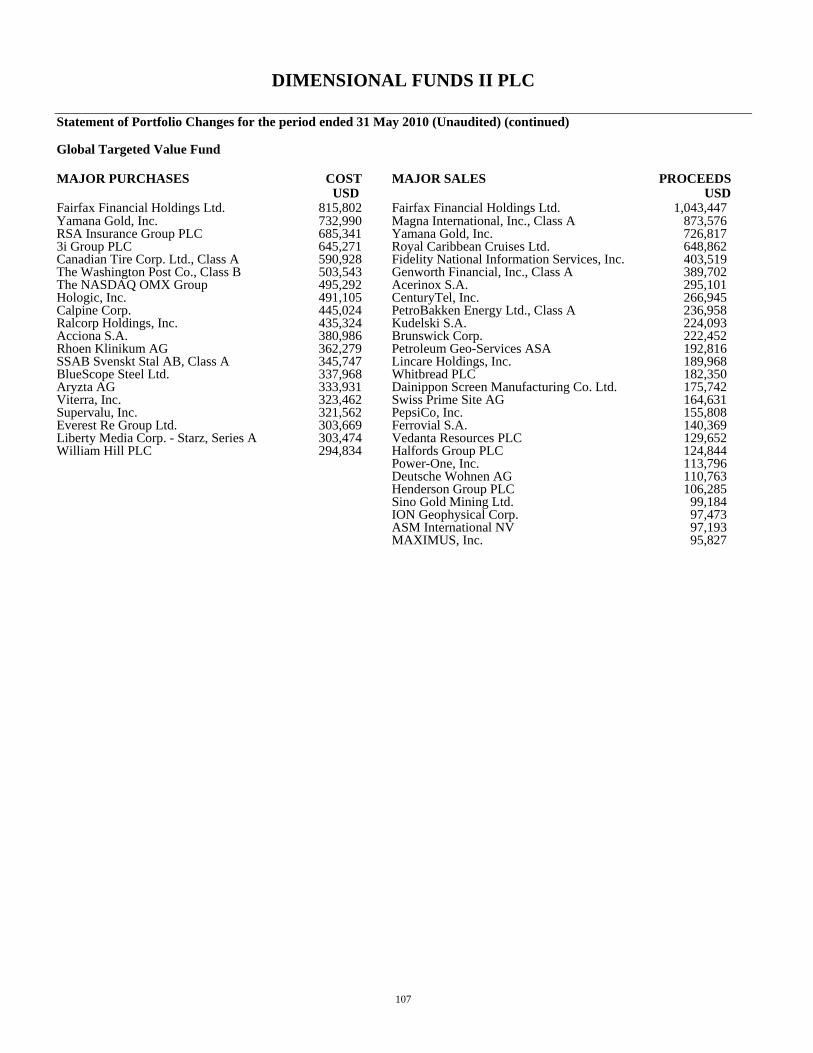
DIMENSIONAL FUNDS II PLC
107
Statement of Portfolio Changes for the period ended 31 May 2010 (Unaudited) (continued)
Global Targeted Value Fund MAJOR PURCHASES COST MAJOR SALES PROCEEDS USD USD Fairfax Financial Holdings Ltd. 815,802 Fairfax Financial Holdings Ltd. 1,043,447 Yamana Gold, Inc. 732,990 Magna International, Inc., Class A 873,576 RSA Insurance Group PLC 685,341 Yamana Gold, Inc. 726,817 3i Group PLC 645,271 Royal Caribbean Cruises Ltd. 648,862 Canadian Tire Corp. Ltd., Class A 590,928 Fidelity National Information Services, Inc. 403,519 The Washington Post Co., Class B 503,543 Genworth Financial, Inc., Class A 389,702 The NASDAQ OMX Group 495,292 Acerinox S.A. 295,101 Hologic, Inc. 491,105 CenturyTel, Inc. 266,945 Calpine Corp. 445,024 PetroBakken Energy Ltd., Class A 236,958 Ralcorp Holdings, Inc. 435,324 Kudelski S.A. 224,093 Acciona S.A. 380,986 Brunswick Corp. 222,452 Rhoen Klinikum AG 362,279 Petroleum Geo-Services ASA 192,816 SSAB Svenskt Stal AB, Class A 345,747 Lincare Holdings, Inc. 189,968 BlueScope Steel Ltd. 337,968 Whitbread PLC 182,350 Aryzta AG 333,931 Dainippon Screen Manufacturing Co. Ltd. 175,742 Viterra, Inc. 323,462 Swiss Prime Site AG 164,631 Supervalu, Inc. 321,562 PepsiCo, Inc. 155,808 Everest Re Group Ltd. 303,669 Ferrovial S.A. 140,369 Liberty Media Corp. - Starz, Series A 303,474 Vedanta Resources PLC 129,652 William Hill PLC 294,834 Halfords Group PLC 124,844 Power-One, Inc. 113,796 Deutsche Wohnen AG 110,763 Henderson Group PLC 106,285 Sino Gold Mining Ltd. 99,184 ION Geophysical Corp. 97,473 ASM International NV 97,193 MAXIMUS, Inc. 95,827
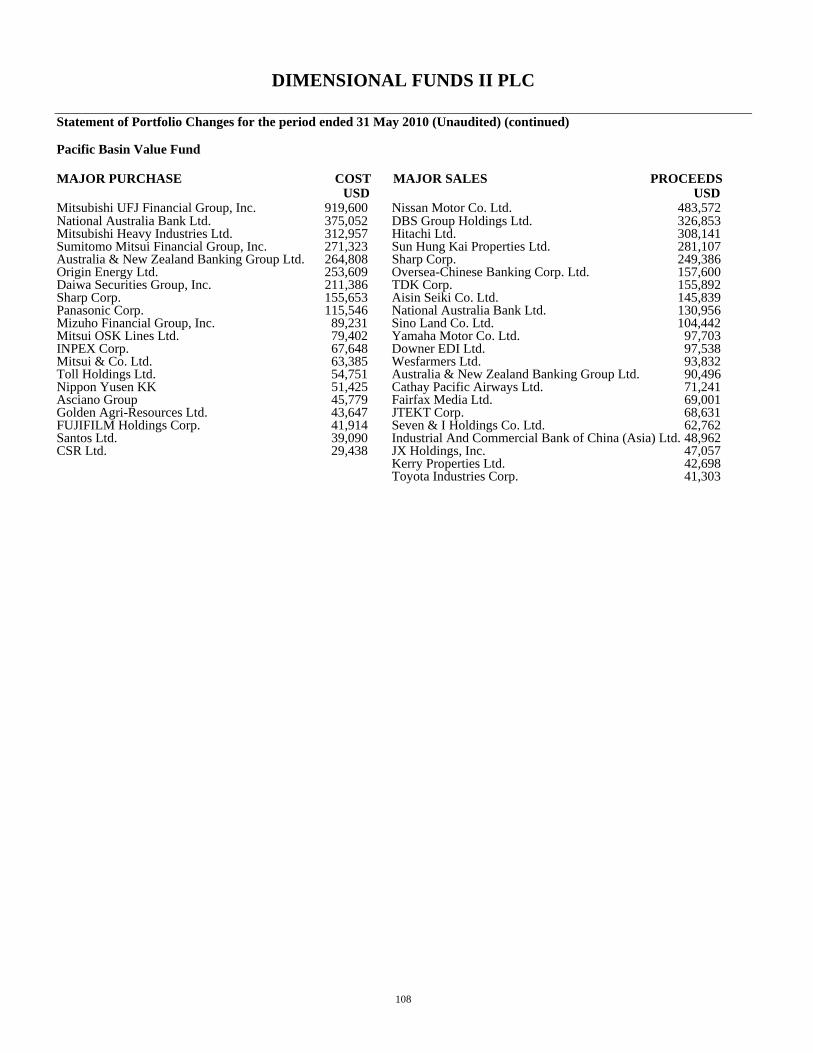
DIMENSIONAL FUNDS II PLC
108
Statement of Portfolio Changes for the period ended 31 May 2010 (Unaudited) (continued)
Pacific Basin Value Fund MAJOR PURCHASE COST MAJOR SALES PROCEEDS USD USD Mitsubishi UFJ Financial Group, Inc. 919,600 Nissan Motor Co. Ltd. 483,572 National Australia Bank Ltd. 375,052 DBS Group Holdings Ltd. 326,853 Mitsubishi Heavy Industries Ltd. 312,957 Hitachi Ltd. 308,141 Sumitomo Mitsui Financial Group, Inc. 271,323 Sun Hung Kai Properties Ltd. 281,107 Australia & New Zealand Banking Group Ltd. 264,808 Sharp Corp. 249,386 Origin Energy Ltd. 253,609 Oversea-Chinese Banking Corp. Ltd. 157,600 Daiwa Securities Group, Inc. 211,386 TDK Corp. 155,892 Sharp Corp. 155,653 Aisin Seiki Co. Ltd. 145,839 Panasonic Corp. 115,546 National Australia Bank Ltd. 130,956 Mizuho Financial Group, Inc. 89,231 Sino Land Co. Ltd. 104,442 Mitsui OSK Lines Ltd. 79,402 Yamaha Motor Co. Ltd. 97,703 INPEX Corp. 67,648 Downer EDI Ltd. 97,538 Mitsui & Co. Ltd. 63,385 Wesfarmers Ltd. 93,832 Toll Holdings Ltd. 54,751 Australia & New Zealand Banking Group Ltd. 90,496 Nippon Yusen KK 51,425 Cathay Pacific Airways Ltd. 71,241 Asciano Group 45,779 Fairfax Media Ltd. 69,001 Golden Agri-Resources Ltd. 43,647 JTEKT Corp. 68,631 FUJIFILM Holdings Corp. 41,914 Seven & I Holdings Co. Ltd. 62,762 Santos Ltd. 39,090 Industrial And Commercial Bank of China (Asia) Ltd. 48,962 CSR Ltd. 29,438 JX Holdings, Inc. 47,057 Kerry Properties Ltd. 42,698 Toyota Industries Corp. 41,303


Authorised and Regulated by the Financial Services Authority
Firm Reference Number: 150100
Dimensional Fund Advisors Limited 7 Down Street
London W1J 7AJ
www.dfauk.com