Barclays Multi- Manager Funds PLC
494
Wealth Management Barclays Multi-Manager Fund PLC Annual report and audited financial statements for the financial year ended 31 May 2021
-
Upload
khangminh22 -
Category
Documents
-
view
0 -
download
0
Transcript of Barclays Multi- Manager Funds PLC

Wealth Management
Barclays Multi-Manager Fund PLCAnnual report and audited financial statements for the financial year ended 31 May 2021

Barclays Multi-Manager Fund PLC Annual Report and Audited Financial Statements 2021
Organisation 1
Background to the Company 6
Investment manager’s report 15
Depositary’s report to the Shareholders 29
Directors’ report 30
Independent auditors’ report to the members of Barclays Multi-Manager Fund PLC 38
Statement of comprehensive income 43
Statement of financial position 49
Statement of changes in net assets attributable to holders of redeemable participating shares 55
Statement of cash flows 61
Notes to the financial statements 67
Contents Page

Barclays Multi-Manager Fund PLC Annual Report and Audited Financial Statements 2021
Contents (continued)
Page
Schedule of investments as at 31 May 2021 GlobalAccess UK Opportunities Fund 171 GlobalAccess Global Government Bond Fund 177 GlobalAccess Asia Pacific (ex -Japan) Fund 195 GlobalAccess Emerging Market Equity Fund 207 GlobalAccess Global High Yield Bond Fund 232 GlobalAccess Global Corporate Bond Fund 277 GlobalAccess Emerging Market Debt Fund 315 GlobalAccess Global Short Duration Bond Fund 356 GlobalAccess US Small & Mid Cap Equity Fund 377 GlobalAccess US Equity Fund 394 GlobalAccess Global Equity Income Fund 402 GlobalAccess Emerging Market Local Currency Debt Fund 423 GlobalAccess Europe (ex-UK) Alpha Fund 437 GlobalAccess Japan Fund 448 Schedule of portfolio changes for the financial year ended 31 May 2021 (unaudited): GlobalAccess UK Opportunities Fund 455 GlobalAccess Global Government Bond Fund 457 GlobalAccess Asia Pacific (ex -Japan) Fund 459 GlobalAccess Emerging Market Equity Fund 461 GlobalAccess Global High Yield Bond Fund 463 GlobalAccess Global Corporate Bond Fund 465 GlobalAccess Emerging Market Debt Fund 467 GlobalAccess Global Property Securities Fund 469 GlobalAccess Global Short Duration Bond Fund 471 GlobalAccess US Small & Mid Cap Equity Fund 473 GlobalAccess US Equity Fund 475 GlobalAccess Global Equity Income Fund 477 GlobalAccess Emerging Market Local Currency Debt Fund 479 GlobalAccess Europe (ex-UK) Alpha Fund 481 GlobalAccess Japan Fund 483 Appendix 1 UCITS V remuneration disclosure (unaudited) 485 Appendix 2: Securities financing transaction regulations (unaudited) 487 Appendix 3: Other information (unaudited) 488

Barclays Multi-Manager Fund PLC Annual Report and Audited Financial Statements 2021
1
Organisation
Directors of the Company Investment manager & promoter Registered office Séan Blake (Irish)1 Barclays Investment Solutions Limited 6th Floor David Kingston (Irish)1 Acting through its Wealth 2 Grand Canal Square Hugh Paul Shovlin (Irish)1 Management Division Dublin 2 Kishor Mandalia (UK) 1 Churchill Place Ireland
Canary Wharf London E14 5HP United Kingdom Depositary Administrator, registrar and Independent auditors Northern Trust Fiduciary Services transfer agent PricewaterhouseCoopers (Ireland) Limited Northern Trust International Fund One Spencer Dock Georges Court Administration Services (Ireland) North Wall Quay 54 – 62 Townsend Street Limited Dublin 1 Dublin 2 Georges Court Ireland Ireland 54 – 62 Townsend Street Dublin 2 Ireland Secretary Irish legal advisor Wilton Secretarial Limited William Fry Solicitors 6th Floor 6th Floor 2 Grand Canal Square 2 Grand Canal Square Dublin 2 Dublin 2 Ireland Ireland
1Independent non-executive Directors
Registered No: 390324

Barclays Multi-Manager Fund PLC Annual Report and Audited Financial Statements 2021
2
Organisation (continued) Distributors Axeltis S.A. Allfunds Bank S.A.U. SMBC Nikko Securities Inc 8-12 rue des Pirogues de Bercy Calle Estafeta 6 3-1 Marunouchi 3-chome CS 91235 75580 La Moraleja Chiyoda-ku Paris Cedex 12 Madrid Tokyo 100 -8325 France Spain Japan Barclays Bank PLC Barclays Bank PLC Barclays Bank PLC 1 Churchill Place Guernsey Branch Jersey Branch Canary Wharf Le Marchant House 13 Library Place London, E14 5HP St Peter Port St Helier United Kingdom Guernsey, GY1 3BE Jersey, JE4 8NE Channel Islands Channel Islands Barclays Bank PLC Barclays Bank Suisse SA Barclays Bank UK PLC Isle of Man Branch Chemin de Grange-Canal 18-20 1 Churchill Place Barclays House P.O. Box 3941 Canary Wharf Victoria Street 1211 Geneva 3 London, E14 5HP Douglas Switzerland United Kingdom Isle of Man, IM99 1AJ Barclays Investment Solutions Limited 1 Churchill Place Canary Wharf London, E14 5HP United Kingdom Sub-Investment Managers AllianceBernstein Allianz Global Investors Arrowstreet Capital, L.P. Devonshire House 199 Bishopsgate 200 Clarendon Street One Mayfair Place Shoreditch The John Hancock Centre London W1J 8AJ London EC2M 3TY 30th Floor United Kingdom United Kingdom Boston 02116-5021 United States Artemis Fund Managers Limited Baillie Gifford & Co BlackRock Inc. 42 Melville Street Calton Square 55 East 52nd Street Edinburgh EH3 7HA 1 Greenside Row New York United Kingdom Edinburgh EH1 3AN NY 10055 United Kingdom USA BNY Mellon ARX Investimentos Ceredex Value Advisors LLC Colchester Global Investors Avenge Borges de Medeiros 333 Piedmont Road NE 20 Saville Row 633 4o andar Suite 1500 London W1S 3PR Offices Shopping Leblon Atlanta GA 30305 United Kingdom Rio de Janeiro CEP 22430-041 United States Brazil
Barclays Multi-Manager Fund PLC Annual Report and Audited Financial Statements 2021
3
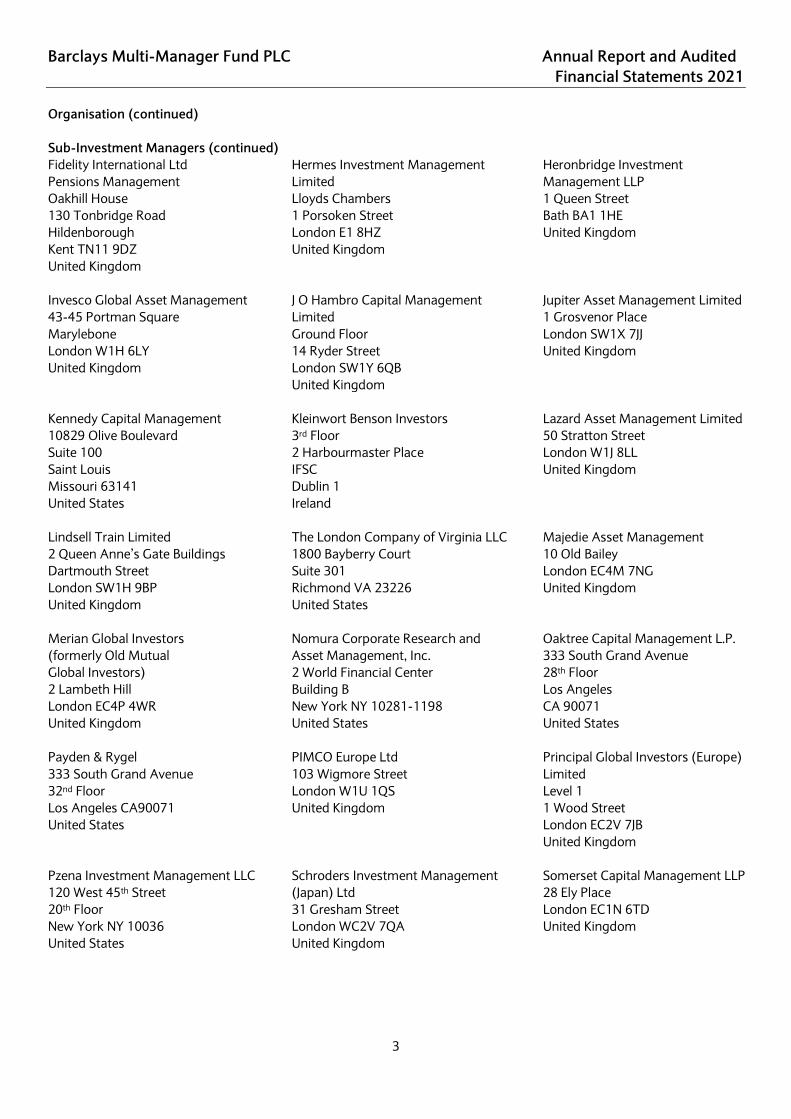
Organisation (continued) Sub-Investment Managers (continued) Fidelity International Ltd Hermes Investment Management Heronbridge Investment Pensions Management Limited Management LLP Oakhill House Lloyds Chambers 1 Queen Street 130 Tonbridge Road 1 Porsoken Street Bath BA1 1HE Hildenborough London E1 8HZ United Kingdom Kent TN11 9DZ United Kingdom United Kingdom Invesco Global Asset Management J O Hambro Capital Management Jupiter Asset Management Limited 43-45 Portman Square Limited 1 Grosvenor Place Marylebone Ground Floor London SW1X 7JJ London W1H 6LY 14 Ryder Street United Kingdom United Kingdom London SW1Y 6QB United Kingdom Kennedy Capital Management Kleinwort Benson Investors Lazard Asset Management Limited 10829 Olive Boulevard 3rd Floor 50 Stratton Street Suite 100 2 Harbourmaster Place London W1J 8LL Saint Louis IFSC United Kingdom Missouri 63141 Dublin 1 United States Ireland Lindsell Train Limited The London Company of Virginia LLC Majedie Asset Management 2 Queen Anne’s Gate Buildings 1800 Bayberry Court 10 Old Bailey Dartmouth Street Suite 301 London EC4M 7NG London SW1H 9BP Richmond VA 23226 United Kingdom United Kingdom United States Merian Global Investors Nomura Corporate Research and Oaktree Capital Management L.P. (formerly Old Mutual Asset Management, Inc. 333 South Grand Avenue Global Investors) 2 World Financial Center 28th Floor 2 Lambeth Hill Building B Los Angeles London EC4P 4WR New York NY 10281-1198 CA 90071 United Kingdom United States United States Payden & Rygel PIMCO Europe Ltd Principal Global Investors (Europe) 333 South Grand Avenue 103 Wigmore Street Limited 32nd Floor London W1U 1QS Level 1 Los Angeles CA90071 United Kingdom 1 Wood Street United States London EC2V 7JB United Kingdom Pzena Investment Management LLC Schroders Investment Management Somerset Capital Management LLP 120 West 45th Street (Japan) Ltd 28 Ely Place 20th Floor 31 Gresham Street London EC1N 6TD New York NY 10036 London WC2V 7QA United Kingdom United States United Kingdom

Barclays Multi-Manager Fund PLC Annual Report and Audited Financial Statements 2021
4
Organisation (continued) Sub-investment managers (continued) T. Rowe Price Wellington Management Company LLP 100 East Pratt Street 75 State Street Baltimore Boston MA 02109 Maryland 21202 United States United States Counterparty At the financial period end, one or more of the 14 Funds entered into futures contracts and forward currency contracts with the following counterparties: Bank of America Merrill Lynch Barclays Bank PLC BNP Paribas PLC 5 Canada House 1 Churchill Place 60 London Wall London E14 5AQ Canary Wharf London EC2M 5TQ United Kingdom London E14 5HP United Kingdom United Kingdom Canadian Imperial Bank of Commerce Citibank International plc Deutsche Bank AG 199 Bay Street Citigroup Centre 1 Great Winchester Street Commerce Court 33 Canada Square London EC2N 2DB Toronto ON M5L 1A2 Canary Wharf United Kingdom Canada London E14 5LB United Kingdom Goldman Sachs International HSBC Bank plc2 JP Morgan Chase Bank3 Peterborough Court 8 Canada Square 25 Bank Street 133 Fleet Street Canary Wharf Canary Wharf London EC4A 2BB London E14 5HQ London E14 5JP United Kingdom United Kingdom United Kingdom Morgan Stanley & Co. International plc The Northern Trust Company The Northern Trust Company 25 Cabot Street Chicago Branch 50 Bank Street Canary Wharf 50 South Lasalle Street Canary Wharf London E14 4QA Chicago, Illinois 60675 London E14 5NT United Kingdom United States United Kingdom The Northern Trust Company The Toronto-Dominion Bank Royal Bank of Canada Singapore Branch 55 King St W Riverbank House 1 George Street Toronto 2 Swan Lane Singapore 049145 ON M5K 1A2 London EC4R 3BF Singapore Canada United Kingdom Royal Bank of Scotland Societe Generale Standard Chartered Bank 36 St Andrew Square S G House 1 Basinhall Avenue Edinburgh 41 Tower Hill London EC2V 5DD EH2 2YB London EC3N 4SG United Kingdom United Kingdom United Kingdom 2 Marine Midland Bank is owned by HSBC Bank plc 3 Chase Manhattan Bank is owned by JP Morgan Chase Bank

Barclays Multi-Manager Fund PLC Annual Report and Audited Financial Statements 2021
5
Organisation (continued) Counterparty (continued) State Street Bank UBS Westpac Banking Corp 20 Churchill Place 1 Finsbury Avenue 275 Kent Street Level 18 Canary Wharf London EC2M 2PP Sydney NSE 2000 London E14 5HJ United Kingdom Australia United Kingdom

Barclays Multi-Manager Fund PLC Annual Report and Audited Financial Statements 2021
6
Background to the Company The below details are in summary form only and must be read in conjunction with the detailed information contained in the Prospectus of the Company. Barclays Multi-Manager Fund PLC (the “Company") is an open-ended investment company, with variable capital and limited liability organised under the laws of Ireland (the "Central Bank"). The Company was incorporated in Ireland on 27 September 2004. The Company is authorised by the Central Bank of Ireland as a Undertakings for Collective Investment in Transferable Securities ("UCITS") within the meaning of the European Communities (Undertakings for Collective Investment in Transferable Securities) Regulations 2011 (as amended) (the “UCITS Regulations”) and the Central Bank (Supervision and Enforcement) Act 2013 (Section 48(1)) (Undertakings for Collective Investment in Transferable Securities) Regulations 2019 (as amended) (the "Central Bank UCITS Regulations"). The Company is structured as an umbrella Fund in that different sub-funds (each a “Fund”, collectively the “Funds”) thereof may be established with the prior approval of the Central Bank. In addition, each Fund may have more than one share class. The shares of each class in a Fund will rank pari passu with each other in all respects except as to all or any of the following:
− currency denomination of the class; − dividend policy; − the level of fees and expenses to be charged; − the minimum subscription, minimum holdings and minimum redemption applicable; and − the hedging strategy of the class.
The net assets of each Fund will be separate from one another and will be invested in accordance with the investment objectives and policies applicable to each such Fund. Shares are currently available as Class A shares, Class B shares, Class I shares, Class M shares and Class Z shares. The Class A, Class B, Class I, Class M and Class Z shares are available as accumulation and distribution shares for all Funds in US dollars, British pound and euro, and for the GlobalAccess Japan Fund, also in Japanese yen. The Distributors (stated on page 2 "Organisation") also act as paying agents. The Prospectus, the annual and semi-annual reports, and a list of all fund transactions of the portfolios can be obtained free-of-charge from your local distributor. When a reference is made to the Company in the financial statements, it refers to any of the 14 live Funds within the umbrella. All Funds with exception of the GlobalAccess Global Government Bond Fund are listed on the Global Exchange Market (GEM) of Euronext Dublin (formerly the Irish Stock Exchange). Investment objectives The Company appoints Sub-Investment Managers to provide investment management and advisory services in respect of part or all of the assets of the Funds. The Investment Manager will select high quality Sub-Investment Managers and monitors their performance and can make replacements if they feel it necessary. Details of the Sub-Investment Managers operating during the financial year from 1 June 2020 to 31 May 2021 are outlined in the "Organisation" section on pages 2 to 4. Any alteration to the investment objectives or any material change to the investment policies of any Fund at any time will be subject to the prior approval in writing of a majority of Shareholders of such Fund. The individual Funds’ investment objectives and strategies are briefly outlined in the investment manager report and detailed in the prospectus and supplements to the Funds.

Barclays Multi-Manager Fund PLC Annual Report and Audited Financial Statements 2021
7
Background to the Company (continued) Calculation of net asset value per share in accordance with the Prospectus The net asset value of each Fund is expressed in its base currency. The net asset value attributable to any class of shares within a Fund will be determined by deducting the share of liabilities of that class from its share of the assets of the Fund. The net asset value of each share of each class will be determined by dividing the net asset value attributable to the class by the number of shares of that class in issue. In determining the net asset value in accordance with the Prospectus, the value of an investment which is quoted, listed or normally dealt in on a Regulated Market, including units or shares in an open-ended investment fund, shall be the closing mid-market price on such Regulated Market as at the Valuation Point or the last traded price when no closing mid-market price is available. The value of any investment which is not quoted, listed or normally dealt in on a Regulated Market shall be the probable realisable value estimated with care and in good faith by a competent person, firm or association making a market in such investment (approved for the purpose by the Depositary) and/or other competent person, in accordance with the opinion of the Directors (and approved for the purpose by the Depositary). The value of any futures contracts and options which are dealt in on a Regulated Market shall be the settlement price as determined by the market in question, provided that if such settlement price is not available for any reason or is unrepresentative, same shall be valued at the probable realisation value estimated with care and good faith by a competent person (approved for the purpose by the Depositary). The value of any over the counter (“OTC”) derivatives contracts such as forward contracts shall be valued at least daily at a price obtained from the counterparty or by an alternative valuation provided by a competent person (which may be the administrator or the investment manager) appointed by the Directors and approved by the Depositary for such purpose. Distribution policy It is intended that each distributing share class of each Fund will declare and pay its investment income return to Shareholders as dividends on a quarterly basis, usually within 10 business days following the end of the relevant quarter (i.e. within 10 business days of the end of February, May, August and November of each year). In determining the net asset value in accordance with the Prospectus, the fees and expenses of all the "Bond Funds", as defined below and in the Prospectus and Supplements, will be charged to the income of the Funds. The "Equity Funds", as defined below and in the Prospectus and Supplements (with the exception of the GlobalAccess Global Equity Income Fund and GlobalAccess Global Property Securities Fund), will charge all of their fees and expenses to available income in the first instance and where there is insufficient income, then to capital of the Funds. Fees and expenses of the GlobalAccess Global Equity Income Fund and the GlobalAccess Global Property Securities Fund will be charged to the capital of the Fund. Single swinging prices Shares will be issued and redeemed at a single price. The net asset value per share may be adjusted on any Dealing Day depending on whether or not a Fund is in a net subscription position or in a net redemption position on such Dealing Day to arrive at the price. The adjustment relates to costs which impact on the value of the Fund. For valuation purposes the securities are valued as outlined above. When these values are compared with the actual cost of buying or selling assets for a Fund differences arise due to dealing charges and spreads from buying or selling of the underlying investments. These costs have an adverse effect on the value of a Fund and are known as "dilution". To mitigate the effects of dilution, the Directors have determined to make a dilution adjustment to the net asset value per share. The Directors have determined to make a dilution adjustment as, in their opinion, the existing Shareholders, in case of subscriptions, or remaining Shareholders, in case of redemptions, are adversely affected. The dilution adjustment involves adding to, when the Fund is in a net subscription position, and deducting from, when the Fund is in a net redemption position, the net asset value per share such a figure as the Directors consider represents an appropriate figure to meet duties, charges and spreads. When the dilution adjustment is made, it increases the price where the Fund is in a net subscription position and decreases the price where the Fund is in a net redemption position.

Barclays Multi-Manager Fund PLC Annual Report and Audited Financial Statements 2021
8
Background to the Company (continued) Single Swinging Prices (continued) The threshold for applying the dilution adjustment on daily dealing is 1% of a Fund’s net asset value. This is a daily process. The Directors review on a periodic basis the size of the dilution adjustment. Funds at a glance Fund Size
31 May 2021 Launch Date Active
or Indexed
Fund Currency
Investment Management Fee4
Ongoing Charges
GlobalAccess UK Opportunities Fund
426,328,746
17 Aug 2004 Active GBP
Class A accumulating shares 1.50% 1.60% Class A accumulating EUR shares 1.50% 1.63% Class B accumulating shares 1.25% 1.35% Class I accumulating shares 0.90% 1.00% Class I distributing shares 0.90% 1.00% Class I accumulating EUR shares 0.90% 1.02% Class I accumulating USD shares 0.90% 1.04% Class M accumulating shares 0.70% 0.80% Class M distributing shares 0.70% 0.80% Class M accumulating EUR shares 0.70% 0.84% Class M accumulating USD shares 0.70% 0.84% Class Z accumulating shares 2.00% 2.10% Class Z accumulating EUR shares 2.00% 2.13% GlobalAccess Global Government Bond Fund
123,784,737
18 Aug 2004 Active USD
Class A accumulating EUR shares 1.15% - Class B distributing shares 0.95% 1.23% Class B accumulating EUR shares^^ - - Class I accumulating shares 0.60% 0.88% Class I accumulating GBP shares 0.60% 0.92% Class I distributing GBP shares 0.60% 0.92% Class M accumulating shares 0.45% 0.73% Class M distributing shares 0.45% 0.73% Class M accumulating EUR shares 0.45% 0.77% Class M accumulating GBP shares 0.45% 0.76% Class M distributing EUR Shares^^ - - Class M distributing GBP Shares 0.45% 0.77% Class Z accumulating shares 1.15% 1.43% Class Z accumulating EUR shares 1.15% 1.47% GlobalAccess Asia Pacific (ex-Japan) Fund
106,127,939
12 Aug 2004 Active USD
Class A accumulating shares 1.50% 1.86% Class B accumulating shares 1.25% 1.61% Class I accumulating shares (Unhedged)~
0.90% 1.26%
Class I accumulating GBP shares 0.90% 1.30% Class I distributing GBP shares 0.90% 1.30% Class M accumulating shares 0.75% 1.11% Class M distributing shares 0.75% 1.11% Class M accumulating EUR shares 0.75% 1.16% Class M accumulating GBP shares 0.75% 1.15%

Barclays Multi-Manager Fund PLC Annual Report and Audited Financial Statements 2021
9
Background to the Company (continued) Funds at a glance (continued) Fund Size
31 May 2021 Launch Date Active
or Indexed
Fund Currency
Investment Management Fee4
Ongoing Charges
GlobalAccess Asia Pacific (ex-Japan) Fund (continued)
106,127,939
12 Aug 2004 Active USD
Class M distributing GBP shares 0.75% 1.16% Class M distributing GBP shares (Unhedged)
0.75% 1.11%
Class Z accumulating shares 2.00% 2.36% Class Z accumulating EUR shares 2.00% 2.40% GlobalAccess Emerging Market Equity Fund
725,096,800
29 Aug 2007 Active USD
Class A accumulating shares 1.50% 1.63% Class A accumulating EUR shares 1.50% 1.67% Class A distributing EUR shares 1.50% 1.67% Class A distributing GBP shares 1.50% 1.67% Class B accumulating shares 1.25% 1.38% Class B accumulating EUR shares 1.25% 1.42% Class B accumulating GBP shares 1.25% 1.42% Class B distributing GBP shares^^ - - Class I accumulating shares 1.10% 1.23% Class I accumulating EUR shares 1.10% 1.27% Class I accumulating GBP shares 1.10% 1.27% Class I accumulating GBP shares (Unhedged)~
1.10% 1.24%
Class I distributing GBP shares 1.10% 1.27% Class M accumulating shares 0.95% 1.08% Class M distributing shares 0.95% 1.08% Class M accumulating EUR shares 0.95% 1.12% Class M accumulating GBP shares 0.95% 1.12% Class M distributing EUR shares^^ - - Class M distributing GBP shares 0.95% 1.12% Class M distributing GBP shares (Unhedged)
0.95% 1.08%
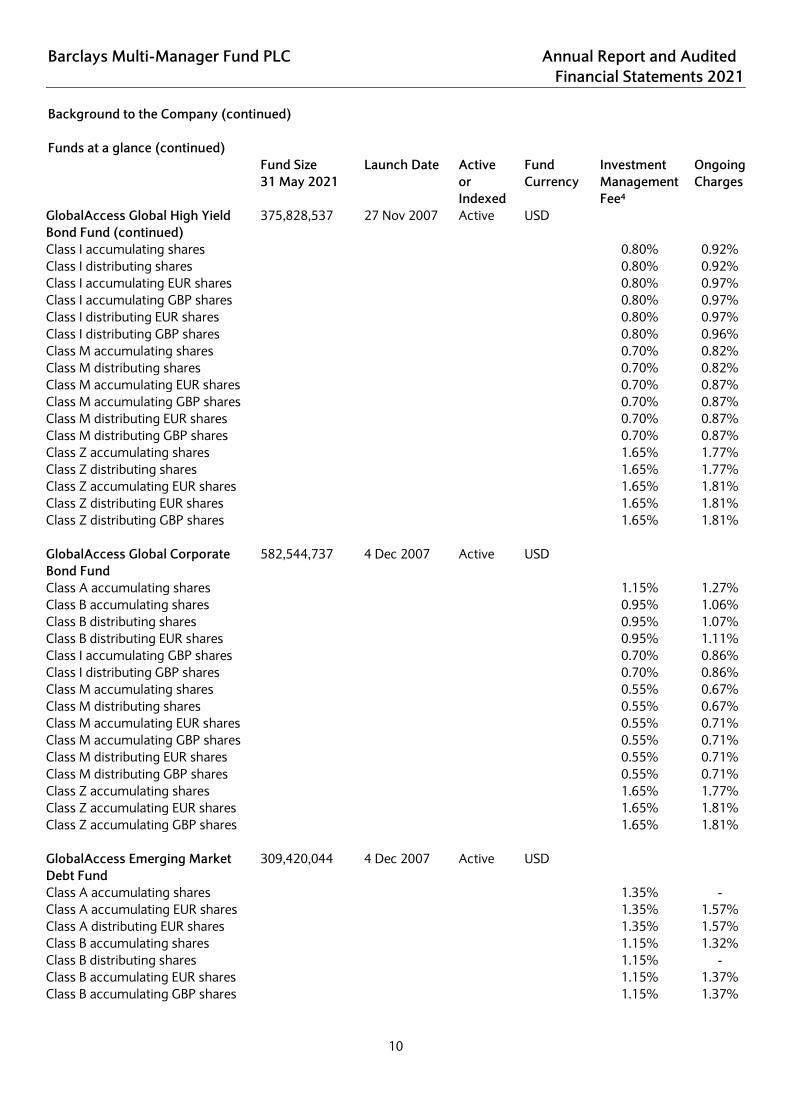
Class Z accumulating shares 2.00% 2.13% Class Z accumulating EUR shares 2.00% 2.17% GlobalAccess Global High Yield Bond Fund
375,828,537
27 Nov 2007 Active USD
Class A accumulating shares 1.25% 1.37% Class A distributing shares 1.25% 1.37% Class A accumulating EUR shares 1.25% 1.41% Class A accumulating GBP shares 1.25% 1.41% Class A distributing EUR shares 1.25% 1.41% Class A distributing GBP shares 1.25% 1.41% Class B accumulating shares 1.05% 1.17% Class B distributing shares 1.05% 1.17% Class B accumulating EUR shares 1.05% 1.21% Class B accumulating GBP shares 1.05% 1.21% Class B distributing EUR shares 1.05% 1.21% Class B distributing GBP shares 1.05% 1.21%
Barclays Multi-Manager Fund PLC Annual Report and Audited Financial Statements 2021
10
Background to the Company (continued) Funds at a glance (continued) Fund Size
31 May 2021 Launch Date Active
or Indexed
Fund Currency
Investment Management Fee4
Ongoing Charges
GlobalAccess Global High Yield Bond Fund (continued)
375,828,537 27 Nov 2007 Active USD
Class I accumulating shares 0.80% 0.92% Class I distributing shares 0.80% 0.92% Class I accumulating EUR shares 0.80% 0.97% Class I accumulating GBP shares 0.80% 0.97% Class I distributing EUR shares 0.80% 0.97% Class I distributing GBP shares 0.80% 0.96% Class M accumulating shares 0.70% 0.82% Class M distributing shares 0.70% 0.82% Class M accumulating EUR shares 0.70% 0.87% Class M accumulating GBP shares 0.70% 0.87% Class M distributing EUR shares 0.70% 0.87% Class M distributing GBP shares 0.70% 0.87% Class Z accumulating shares 1.65% 1.77% Class Z distributing shares 1.65% 1.77% Class Z accumulating EUR shares 1.65% 1.81% Class Z distributing EUR shares 1.65% 1.81% Class Z distributing GBP shares 1.65% 1.81% GlobalAccess Global Corporate Bond Fund
582,544,737
4 Dec 2007 Active USD
Class A accumulating shares 1.15% 1.27% Class B accumulating shares 0.95% 1.06% Class B distributing shares 0.95% 1.07% Class B distributing EUR shares 0.95% 1.11% Class I accumulating GBP shares 0.70% 0.86% Class I distributing GBP shares 0.70% 0.86% Class M accumulating shares 0.55% 0.67% Class M distributing shares 0.55% 0.67% Class M accumulating EUR shares 0.55% 0.71% Class M accumulating GBP shares 0.55% 0.71% Class M distributing EUR shares 0.55% 0.71% Class M distributing GBP shares 0.55% 0.71% Class Z accumulating shares 1.65% 1.77% Class Z accumulating EUR shares 1.65% 1.81% Class Z accumulating GBP shares 1.65% 1.81% GlobalAccess Emerging Market Debt Fund
309,420,044 4 Dec 2007 Active USD
Class A accumulating shares 1.35% - Class A accumulating EUR shares 1.35% 1.57% Class A distributing EUR shares 1.35% 1.57% Class B accumulating shares 1.15% 1.32% Class B distributing shares 1.15% - Class B accumulating EUR shares 1.15% 1.37% Class B accumulating GBP shares 1.15% 1.37%

Barclays Multi-Manager Fund PLC Annual Report and Audited Financial Statements 2021
11
Background to the Company (continued) Funds at a glance (continued)
Fund Size 31 May 2021
Launch Date Active or Indexed
Fund Currency
Investment Management Fee4
Ongoing Charges
GlobalAccess Emerging Market Debt Fund (continued)
309,420,044 4 Dec 2007 Active USD
Class I accumulating shares 0.80% 0.98% Class I accumulating EUR shares 0.80% 1.02% Class I accumulating GBP shares 0.80% 1.02% Class I distributing GBP shares 0.80% 1.02% Class M accumulating shares 0.70% 0.88% Class M distributing shares 0.70% 0.88% Class M accumulating EUR shares 0.70% 0.92% Class M accumulating GBP shares 0.70% 0.92% Class M distributing EUR shares 0.70% 0.92% Class M distributing GBP shares 0.70% 0.92% Class Z accumulating shares 1.65% 1.83% Class Z accumulating EUR shares 1.65% 1.87% Class Z distributing EUR shares 1.65% 1.87% Class Z distributing GBP shares 1.65% 1.73% GlobalAccess Global Short Duration Bond Fund
120,732,252
30 Nov 2010 Active USD
Class A accumulating shares 0.80% 1.03% Class B accumulating shares 0.65% 0.88% Class B accumulating GBP shares 0.65% 0.92% Class I accumulating GBP shares 0.65% 0.91% Class I distributing GBP shares 0.65% 0.92% Class M accumulating shares 0.55% 0.78% Class M distributing shares 0.55% 0.78% Class M accumulating EUR shares 0.55% 0.82% Class M accumulating GBP shares 0.55% 0.82% Class M distributing EUR shares 0.55% 0.82% Class M distributing GBP shares 0.55% 0.82% Class Z accumulating shares 0.80% 1.02% Class Z accumulating EUR shares 0.80% 1.07% GlobalAccess US Small & Mid Cap Equity Fund
126,058,549
1 Jun 2011 Active USD
Class A accumulating shares 1.50% 1.84% Class A accumulating GBP shares 1.50% 1.88% Class B accumulating shares 1.25% 1.58% Class B distributing shares 1.25% 1.59% Class B accumulating EUR shares 1.25% 1.63% Class B accumulating GBP shares^^ - - Class I accumulating GBP shares 1.05% 1.43% Class I distributing GBP shares 1.05% 1.43% Class M accumulating shares 0.90% 1.24% Class M distributing shares 0.90% 1.24% Class M accumulating EUR shares 0.90% 1.28%

Barclays Multi-Manager Fund PLC Annual Report and Audited Financial Statements 2021
12
Background to the Company (continued) Funds at a glance (continued) Fund Size
31 May 2021 Launch Date Active
or Indexed
Fund Currency
Investment Management Fee4
Ongoing Charges
GlobalAccess US Small & Mid Cap Equity Fund (continued)
126,058,549 1 Jun 2011 Active USD
Class M accumulating GBP shares 0.90% 1.28% Class M distributing EUR shares^^ - - Class M distributing GBP shares 0.90% 1.28% Class Z accumulating shares 2.00% 2.34% Class Z accumulating EUR shares 2.00% 2.38% GlobalAccess US Equity Fund 349,018,165 3 Nov 2011 Active USD Class A accumulating share 1.50% 1.65% Class A accumulating EUR shares 1.50% 1.69% Class A accumulating GBP shares 1.50% 1.69% Class B accumulating shares 1.25% 1.40% Class B accumulating GBP shares 1.25% 1.44% Class I accumulating GBP shares 0.70% 0.89% Class I accumulating GBP shares (Unhedged)~
0.70% 0.83%
Class I distributing GBP shares 0.70% 0.89% Class M accumulating shares 0.50% 0.65% Class M distributing shares 0.50% 0.65% Class M accumulating EUR shares 0.50% 0.69% Class M accumulating GBP shares 0.50% 0.69% Class M distributing GBP shares 0.50% 0.69% Class M distributing GBP shares (Unhedged)
0.50% 0.65%
Class Z accumulating shares 2.00% 2.14% Class Z accumulating EUR shares 2.00% 2.19% GlobalAccess Global Equity Income Fund
100,122,393
13 Dec 2011 Active USD
Class A accumulating shares 1.50% 1.94% Class A distributing shares 1.50% 1.94% Class A accumulating EUR shares 1.50% 1.98% Class A accumulating GBP shares 1.50% 1.98% Class A distributing EUR shares 1.50% 1.98% Class A distributing GBP shares 1.50% 1.98% Class B accumulating shares 1.25% 1.69% Class B distributing shares 1.25% 1.69% Class B accumulating EUR shares 1.25% 1.73% Class B accumulating GBP shares 1.25% 1.73% Class B distributing EUR shares 1.25% 1.73% Class B distributing GBP shares 1.25% 1.73% Class I accumulating shares 0.90% 1.34% Class I accumulating EUR shares^^ - - Class I accumulating GBP shares 0.90% 1.38% Class I distributing GBP shares 0.90% 1.38% Class I distributing GBP shares (Unhedged)~
0.90% 1.32%
Class M accumulating shares 0.75% 1.19%

Barclays Multi-Manager Fund PLC Annual Report and Audited Financial Statements 2021
13
Background to the Company (continued) Funds at a glance (continued) Fund Size
31 May 2021 Launch Date Active
or Indexed
Fund Currency
Investment Management Fee4
Ongoing Charges
GlobalAccess Global Equity Income Fund (continued)
100,122,393
13 Dec 2011 Active USD
Class M distributing shares 0.75% 1.19% Class M accumulating EUR shares 0.75% 1.24% Class M accumulating GBP shares 0.75% 1.24% Class M distributing EUR shares 0.75% 1.24% Class M distributing GBP shares 0.75% 1.24% Class Z accumulating shares 2.00% 2.44% Class Z distributing shares 2.00% 2.44% Class Z accumulating EUR shares 2.00% 2.48% Class Z accumulating GBP shares 2.00% 2.48% Class Z distributing EUR shares 2.00% 2.48% GlobalAccess Emerging Market Local Currency Debt Fund
404,552,276
13 Nov 2012 Active USD
Class B accumulating share 1.15% 1.34% Class I distributing GBP shares 0.80% 1.03% Class I distributing USD shares~ 0.80% 1.00% Class M accumulating shares 0.75% 0.94% Class M distributing shares 0.75% 0.94% Class M accumulating EUR shares 0.75% 0.98% Class M distributing EUR shares^^ - - Class M distributing GBP shares 0.75% 0.94% GlobalAccess Europe (ex-UK) Alpha Fund
118,106,815
12 Aug 2004 Active EUR
Class A accumulating share 1.50% 1.81% Class A distributing shares^^ - - Class A accumulating GBP shares 1.50% 1.85% Class A accumulating USD shares 1.50% 1.85% Class B accumulating shares 1.25% 1.56% Class B accumulating GBP shares 1.25% 1.60% Class B accumulating USD shares 1.25% 1.60% Class I accumulating shares 0.90% 1.21% Class I accumulating GBP shares 0.90% 1.25% Class I accumulating GBP shares (Unhedged)~
0.90% 1.21%
Class I accumulating USD shares 0.90% 1.25% Class I distributing GBP shares 0.90% 1.25% Class M accumulating shares 0.75% 1.06% Class M distributing shares 0.75% 1.06% Class M accumulating GBP shares 0.75% 1.10% Class M accumulating USD shares 0.75% 1.10% Class M distributing GBP shares 0.75% 1.10% Class M distributing GBP shares (Unhedged)
0.75% 1.06%
Class Z accumulating shares 2.00% 2.31%

Barclays Multi-Manager Fund PLC Annual Report and Audited Financial Statements 2021
14
Background to the Company (continued) Funds at a glance (continued) Fund Size
31 May 2021 Launch Date Active
or Indexed
Fund Currency
Investment Management Fee4
Ongoing Charges
GlobalAccess Japan Fund 28,729,167,212 17 Aug 2004 Active JPY Class A accumulating EUR shares 1.50% 1.73% Class A accumulating USD shares 1.50% 1.72% Class B accumulating USD shares 1.25% 1.48% Class I accumulating GBP shares 0.90% 1.13% Class I accumulating GBP shares (Unhedged)~
0.90% 1.06%
Class I distributing GBP shares 0.90% 1.13% Class M accumulating shares 0.80% 0.97% Class M distributing shares 0.80% 0.97% Class M accumulating EUR shares 0.80% 1.03% Class M accumulating GBP shares 0.80% 1.02% Class M accumulating USD shares 0.80% 1.03% Class M distributing GBP shares 0.80% 1.03% Class Z accumulating shares 2.00% 2.17% Class Z accumulating EUR shares 2.00% 2.23% ~Class launched during the financial year ^^Class terminated during the financial year 4 The investment management fee rates shown above are the rates as at 31 May 2021. The investment manager can charge rates in excess of the figures above. A full list of the investment management fee rates that can be charged against share classes within the Funds are listed in the Prospectus of the Company. Ongoing charges may be distorted where share classes have been in existence for less than 1 year or where the assets under management have a very low value. Such ongoing charges have been annualised.

Barclays Multi-Manager Fund PLC Annual Report and Audited Financial Statements 2021
15
Investment manager’s report for the financial year ended 31 May 2021 Product overview The sub-funds are managed using a multi-manager approach leveraging off Barclays expertise in manager selection. We look to select a blend of active third party managers to generate out performance against their market mandates. Different Fund Managers have different skills and specialise in different areas. No single manager will be a leader in all areas and through all stages of the market cycle. Within Multi Manager, different investment managers are appointed to manage funds within the same asset class. So, as well as giving you access to the best-of-breed institutional investment managers, Multi Manager also diversifies the risk from any one fund manager underperforming. When selecting managers, the Manager/Funds Research Team first develops a list of investment managers arranged in peer groups. On the quantitative side, we look at managers regionally, split into peer groups according to investment style. Then, using a proprietary multi-factor screening method, we can evaluate past risk-adjusted performance on a relative and absolute basis. That allows us to assess each manager’s ability to match our investment targets. When awarding mandates, we aim to blend those managers ideally suited to each level of risk and performance. The next step is to define qualitative requirements for managers, so that the team has a clear view of the sort of manager combinations it would ideally like to appoint. The team employs a rigorous selection process, judging the managers against its multiple criteria, including but not limited to: investment style, resources, processes for stock selection and research, portfolio construction, risk controls, strategy assessment and investment processes. This may entail several interviews with each manager. A number of changes were brought to the GlobalAccess Funds during the financial year under review: In November 2020 we removed Somerset Capital Management LLP from the GlobalAccess Emerging Markets Equity Fund. In January 2021 we removed Payden & Rygel from the GlobalAccess Global Short Duration Bond Fund. In January 2021 we removed Payden & Rygel from the GlobalAccess Global Government Bond Fund. In February 2021 we closed the GlobalAccess Global Property Securities Fund. Market overview Global equity and bond markets finished the financial year with broadly strong positive returns, continuing a rapid recovery from market lows in the first quarter of 2020. The financial year began with markets still dealing with the effects of the COVID-19 pandemic as central banks globally continued to provide unprecedented levels of support to the markets by lowering interest rates and engaging in very large quantitative easing programs. These programs provided much needed support to the markets by buying both government and corporate debt, while economies in many countries have been supported through furlough programs as well as other programs. Economic growth was impacted severely by the virus and the necessary lock down measures that followed but the level of monetary and fiscal support has helped reduce the impact and spurred a rapid recovery as the financial year progressed. Returns from global equities were notably positive over the financial year. Asia, Emerging Markets and US equity markets were among the top performers, while UK equities have lagged. In terms of sector performance, using the MSCI AC World Index, those sectors typically seen as more defensive, such as consumer staples and healthcare, have delivered positive returns over the financial year but still lagged the broader market. Consumer discretionary, materials and information technology outperformed. We continued to see marked divergence in sector performance with financials as the top performing sector returning 62.5% over the financial year, while utilities were the main laggard delivering a return of 16.1%.

Barclays Multi-Manager Fund PLC Annual Report and Audited Financial Statements 2021
16
Investment manager’s report for the financial year ended 31 May 2021 (continued) Market overview (continued) Bond returns were also mainly positive over the financial year despite many fixed income yields across the developed world continuing to remain in negative territory. Over the financial year total returns from corporate bonds were positive with global high yield bonds delivering the highest positive returns. The ICE BofA Merrill Lynch US High Yield Constrained index returned 15.2% on a total return basis while returns from government bonds were less impressive with the Bloomberg Barclays Global Aggregate Treasuries Index delivering a negative total return, falling by 1.8% over the financial year. Emerging market bonds were also among the best performers and notably outperformed developed market government bonds. (Source: Barclays, Bloomberg) Performance overview The GlobalAccess UK Alpha Fund ceased trading on 31 March 2020. The GlobalAccess UK Opportunities Fund outperformed the FTSE All-Share benchmark over the financial year. 2020 will go down in history as the year that the Covid-19 pandemic led to seismic changes globally. Little can be said now that has not already been written on the topic. The terrible impact, financial, social and otherwise of the virus and the actions taken to combat it will be felt for decades to come. These political actions had huge financial consequences. The global travel industry ground to a halt, as workers stopped flying for business and individuals and families were stopped travelling abroad for leisure. Deserted airports became home for hundreds of aeroplanes that were not needed, pilots and cabin crews found work elsewhere. In some cases, these cabin crew were found helping out with medical services. In the UK, many could be found in vaccination centres, ensuring those coming for their jab were seen quickly and efficiently. It was these jabs that were a literal shot in the arm for both those receiving them, and the global economy. The announcement of successful vaccine trials in November 2020 led to financial markets enjoying a marked change of direction. From the start of the reporting period until then UK markets drifted lower. But news that the Pfizer and then AstraZeneca vaccines were approved saw one of the sharpest moves in share prices seen since the financial crisis of 2008. Until this point, many listed UK companies had struggled to deal with the consequences of the pandemic. Those who had suffered were related to travel and leisure and consumer spending. Many had taken advantage of government support packages, just to tide them over until things got better. ‘Covid Winners’ included online retailers, as well as other internet related names such as gambling businesses. There was a reversal of market fortunes that started in mid-November, and carried on through the reporting period. Value as a style outperformed strongly from then. Investors were prepared to buy troubled companies for the first time in many years, as they were felt to be very attractively valued. This view was supported by the amount of private equity activity in the UK market. There were bids in a range of sectors, including gambling (Entain), insurance (RSA Insurance), security (G4S), St Modwen and Urban and Civic (housebuilding), mostly from US private equity companies. These companies were able to take longer term views on how to run a business than the listed market affords management. The three managers in the fund each performed in line with the market from the start of the reporting period until the end of October 2020. However, the vaccine news in November 2020 saw a marked change in fortunes. Lindsell Trains’ investment style – long term owners of quality growth shares suddenly became out of favour. In contrast, the value inclinations of both Heronbridge and JO Hambro were more in vogue. From that point until the end of the financial year, the fund performed well, driven by these latter two managers. Heronbridge’s returns were led by stocks being acquired (Aggreko), as well as strong recoveries in industrial or cyclical companies such as IMI, Mitie and recruitment firms Page Group and Hays. The fund remains positioned similarly today, with a bias towards undervalued shares, which the managers particularly find in the mid and smaller sized names listed on the UK market.

Barclays Multi-Manager Fund PLC Annual Report and Audited Financial Statements 2021
17
Investment manager’s report for the financial year ended 31 May 2021 (continued) Performance overview (continued) It’s probably important to note that the good performance by JO Hambro in the latter part of the reporting period is caused by the same stocks and sector positioning that drove the poor performance in the first half. Anglo American, Aviva and 3i Group are the three biggest contributors to positive performance over the financial year. Recoveries in the share price of Barclays, a bid for property firm St Modwen, and improvement in the operating conditions for the likes of ITV are also important. And after many years of strong outperformance, it is unsurprising that Lindsell Train found the conditions harder to navigate. The manager will not change his view based on a few months of poor performance. A change in perception in financial markets will not influence how much the global population will need to use soap, drink whisky or wear designer clothing brands such as companies like PZ Cussons, Diageo or Burberry sell. Not owning some of the sectors that recovered so strongly from their lows – such as banks, mining and oil companies – is behind both the fund’s long term track record as well as its short term weakness. The GlobalAccess Europe (ex-UK) Alpha Fund outperformed the MSCI Europe ex-UK benchmark over the financial year. European equity market returns over the financial year were strongly positive and rose in a broadly steady manner with the one exception of October 2020. The reporting period can be split into two distinct sub-periods. The reporting year was characterised by markets rising strongly upwards as a result initially of the raft of monetary and fiscal support measures put in place in response to the Coronavirus pandemic around the world. This was followed by optimism towards the end of 2020 when the Pfizer/BioNTech vaccine discovery was announced and Joe Biden became the US president. Both were interpreted as positive signs of an impending economic recovery (led by the USA). The early part of 2021 continued to see strong returns as the vaccine programme was rolled out successfully in many developed parts of the world and lockdowns were increasingly eased. The 12 month period really was remarkably bifurcated with growth names continuing to outperform until November 2020, whereupon the long-awaited revival in value names occurred. So great was the resurgence of value companies from that point that the value style handily outperformed the growth style over the financial year as a whole. Every sector in the MSCI Europe ex UK index, except for two, registered at least 20% gains. Those two were the defensive areas of Healthcare and Consumer Staples. Banks led the pack, returning over 50%. This fund is designed to be balanced in terms of style and provide an all-weather return. The efficacy and value of this approach was really evident over this period given the swing in the performance of styles. The combination of managers within the fund remained unchanged with Invesco Perpetual providing a defined value style, Allianz providing a defined quality growth style and Blackrock having a focus on income and returns from dividend yield. These styles are complementary and we expect all three to outperform over the long-term with manager specific stock outperformance, driven by stock selection, layered on top. Pleasingly none of the three managers under-performed over the financial year. Invesco outperformed by the most – over 11% - in keeping with its style, yet Allianz also comfortably outperformed (by over 7%). Blackrock was broadly in line with index. Invesco’s largest overweight position was in Banks and its returning over 50% was a key driver. Allianz added considerable value from stock selection despite the growth positioning, most particularly within IT and Healthcare. The GlobalAccess Japan Fund outperformed the TOPIX benchmark during the financial year. Japanese equities rallied throughout the financial year, despite the continued presence of Covid-19 and a change in Japan’s prime minister. Shinzo Abe announced his resignation as prime minister of Japan in September 2020 due to the resurgence of a long-standing health problem and Yoshihide Suga, the Chief Cabinet Secretary, quickly emerged as his replacement. The change in leader ultimately had little impact on the overall market and Japanese equities rallied strongly into the end of the year in 2020, bolstered by positive sentiment around an accelerating global vaccine rollout.

Barclays Multi-Manager Fund PLC Annual Report and Audited Financial Statements 2021
18
Investment manager’s report for the financial year ended 31 May 2021 (continued) Performance overview (continued) The market has continued to rally so far in 2021, supported by continued substantial fiscal and monetary policy tailwinds, upbeat forecasts for economic growth and earnings and a weaker Japanese Yen. The GlobalAccess Japan Fund outperformed during the financial year, driven primarily by strong stock selection. At the sector level, an overweight position in IT, underweight positions in health care and consumer staples, and zero weight in utilities were the main positives as the traditional defensive sectors lagged in the market rally. Good stock selection in consumer discretionary and industrials was the main driver of the outperformance, with strong stock selection in health care, consumer staples and materials also contributing positively. Among the underlying managers, Both Schroders and Baillie Gifford outperformed the TOPIX benchmark index over the financial year. Schroders outperformed, with positive contribution coming from both sector allocation and stock selection. At the sector level, an underweight to consumer staples was among the main positive contributors, while an underweight to utilities and health care was also positive. Strong stock selection in consumer staples and technology was also among the key positive contributors, although this was somewhat offset by selection in industrials and communication services. In terms of individual stocks, an overweight position in Ibiden, a specialist ceramics maker, was among the single largest positive contributors, as was an overweight position in electrical and industrial machinery conglomerate Hitachi. Overweight positions in Bandai Namco, which produces toys and gaming software, and Hoya, a specialist in precision optical products, were also among the main positives, while zero weights in Softbank Group and Sony were among the largest detractors over the financial year. Baillie Gifford was the best performing manager and also outperformed the index over the financial year. The outperformance was primarily driven by strong stock selection, while sector allocation also contributed positively. Stock selection was particularly good in industrials, communication services and consumer discretionary, while at the sector level, an underweight position in health care and overweight position in communication services were also positive. At the stock level, several internet platforms made a large positive contribution. Chief among these were Softbank Group, and Mercari Inc which operates a trading app similar to ebay. A position in leading online advertising and gaming platform Cyber Agent was also among the main positives, as was a position in Nidec, a world leading manufacturer of precision motors. An overweight position in Inpex Corp and zero weight in Tokyo Electron were among the main detractors. The GlobalAccess Asia Pacific (ex-Japan) Fund outperformed the MSCI AC Asia Pacific ex-Japan benchmark. Asian equities rallied significantly during the financial year, helped by ongoing central bank support and a gradual easing of social and economic lockdowns. Despite the strong headline returns for the index, there was considerable divergence in returns between countries and sectors. Taiwan, India, South Korea and Australia were among the best performers, while markets in Thailand, Malaysia and the Philippines were the main laggards. The largest country weight in the benchmark index, China, underperformed as expectations for policy normalisation, regulatory uncertainty for certain industries, and ongoing geopolitical concerns dampened sentiment in the second half of the financial year. The Fund outperformed the benchmark index, primarily driven by strong stock selection, while country and sector allocation also contributed positively to the outperformance. An overweight position in Taiwan and underweight position in Malaysia were both positive, while overweight positions in IT and consumer discretionary, and an underweight to consumer staples were all positive contributors. Good stock picking in industrials and materials were among the main positives, while strong stock selection in Taiwan, Hong Kong, South Korea and India was the main driver of outperformance during the financial year. Among the underlying managers, Schroders outperformed during the financial year as stock selection in China, Hong Kong and Taiwan was particularly strong. Stock selection within consumer discretionary was among the key detractors but this was more than offset by good stock selection in industrials, financials and health care.

Barclays Multi-Manager Fund PLC Annual Report and Audited Financial Statements 2021
19
Investment manager’s report for the financial year ended 31 May 2021 (continued) Performance overview (continued) At the stock level, overweight positions in Taiwan Semiconductor Manufacturing Company (TSMC), a key global manufacturer of semiconductors, and Indian private hospital operator Apollo Hospitals enterprise were among the key positive contributors. An overweight position in power tool manufacturer Techtronic Industries was also among the main positives, while an overweight to New Oriental Education was among the main detractors. Hermes also outperformed during the financial year, driven by stock selection, particularly within IT and Consumer Discretionary. Stock selection in South Korea was positive but more than offset by negative stock selection in China and Taiwan. Sector allocation was positive, with an underweight position in financials and overweight position in IT the main contributors. At the stock level, an underweight to index heavyweight Alibaba Group and an overweight position in Kumho Petrochemical, which manufactures latex and rubber products, were among the largest positive contributors. An overweight position in Lotte Fine Chemical, a South Korean chemical manufacturer, and overweight position in ASE Technology, a Taiwanese semiconductor assembler, were also among the largest positives Fidelity slightly underperformed the benchmark MSCI AC Asia Pacific ex-Japan index, despite Australian equities being among the better performers during the financial year. At the sector level, an overweight position in IT and an underweight position in industrials were the main positives, while an underweight position in financials was among the main detractors. Stock selection was particularly strong in financials and materials, although this was offset by selection in IT and consumer staples. At the stock level, overweight positions in Mineral Resources and Lynas Rare Earths were among the largest positive contributors. Among the largest detractors were underweight positions in Westpac Banking and National Australia Bank, as well as several stocks not held in the portfolio, with zero positions in Wesfarmers and Fortescue Metals also among the largest detractors. The GlobalAccess Emerging Markets Equity Fund outperformed versus the MSCI Emerging Markets USD benchmark over the financial year. Emerging markets equities continued to recover strongly from the lows seen in the first quarter of 2020 and rallied significantly during the financial year, helped by ongoing central bank support and a gradual easing of social and economic lockdowns. Despite the strong headline returns for the index, there was considerable divergence in returns between countries and sectors. India, South Korea, South Africa and Mexico were among the best performers, while markets in Turkey, Thailand and Malaysia underperformed. The Fund outperformed primarily driven by strong selection in Taiwan, Hong Kong and India. Stock selection was particularly good within industrials and consumer discretionary while selection in materials and financials also contributed positively over the financial year. An overweight position to Hong Kong and underweight position in Taiwan were modest negative contributors. An overweight to technology and good stock selection within real estate were also among the main positives. Among the underlying managers, Somerset was the worst performer, with an underweight position in China and overweight position in Hungary among the main negatives during the first half of the financial year. The lead manager of the Somerset mandate announced his resignation from Somerset during the financial year and we took the decision to exit our position in the mandate in the fourth quarter of 2020. At the end of the financial year, this was largely complete, with the assets reallocated to the remaining managers in the blend. Pzena outperformed noticeably in the last 7 months of the financial year to finish significantly ahead of the benchmark index for the whole period, while ArrowStreet and Schroders also outperformed the benchmark index by a wide margin. Arx lagged the benchmark index as Brazilian equities underperformed over the financial year. At the stock level, an underweight position in Alibaba finished the financial year as a positive, as the share price weakened significantly during the latter half of the financial year on both the shock suspension of the listing of Ant Financial and news of potential regulation from China’s antitrust watchdog. Overweight positions in Taiwan Semiconductor Manufacturing Company (TSMC), a key global manufacturer of semiconductors, and Indian private hospital operator Apollo Hospitals enterprise were also among the key positive contributors.

Barclays Multi-Manager Fund PLC Annual Report and Audited Financial Statements 2021
20
Investment manager’s report for the financial year ended 31 May 2021 (continued) Performance overview (continued) An overweight position in power tool manufacturer Techtronic Industries was also among the main positives while an underweight to Nio and a zero weight in Meituan were among the main detractors. The GlobalAccess US Small & Mid Cap Equity Fund underperformed the Russell 2500 benchmark over the financial year. Early in the financial year, the US economy was positively aided by promising trials for potential COVID-19 vaccines, the US Federal Reserve’s pledge for unlimited financial purchases to sustain liquidity, and better-than-expected US corporate earnings. A resurgence in coronavirus infections in many areas of the country forced some states to pause or roll back their reopening efforts, increasing the uncertainty about the path of the US economic recovery. During the summer of 2020, US equities extended their extraordinary rally, with markets bolstered by substantial monetary support from the US Federal Reserve (Fed), a broadening US economic recovery, better-than-expected corporate earnings, and promising trials for COVID-19 vaccines. The US economy gradually recovered, however, the path to a sustainable economic recovery was clouded by concerns about a resurgence in coronavirus infections in many areas of the country, an undetermined timeline for vaccines, high unemployment, elevated debt burdens, and uncertainty about additional fiscal stimulus. Shares of large-cap technology companies, which had been key drivers of the market’s powerful rally from its March lows, fell sharply in early September amid concerns about crowded positioning and stretched valuations. Corporate earnings were better than expected, with 84% of companies in the S&P 500 exceeding consensus forecasts. Towards the end of 2020, US equities fell amid worsening coronavirus trends and heightened volatility ahead of the US presidential election on November 3. At the end of October, the S&P 500 Index suffered its largest weekly decline since March, erasing the strong gains from earlier in the month. A third wave of COVID-19 infections engulfed the country, with the US reporting a record number of COVID-19 cases on October 30. November saw a different story with US equities registering their largest gain since April. Results from Phase 3 trials indicated that a vaccine developed by biotech company Moderna has 94% efficacy, while Pfizer and BioNTech’s vaccine demonstrated 95% efficacy. These encouraging results triggered a rotation from growth and momentum stocks to value and cyclicals. Congress faced mounting pressure to provide additional fiscal stimulus, as the economy continued to suffer under the weight of the pandemic and as coronavirus-related unemployment benefits for nearly 14 million Americans are set to expire at the end of the year. Joe Biden was elected president after a closely contested election, removing a key element of uncertainty for the market. The start of 2021 saw US equities rally again bolstered by an accelerating vaccine rollout, substantial fiscal and monetary policy tailwinds and upbeat forecasts for economic growth and earnings. Expectations for a strong rebound in the US economy sparked inflationary fears, contributing to a pro-cyclical rotation, although the US Federal Reserve (Fed) Chair Jerome Powell indicated that he did not believe inflation would increase substantially or at a sustained rate. The Democrats also secured slim majorities in both houses of Congress after winning control of the Senate. Corporate earnings remained a bright spot in the US economy, with companies providing upward revisions to their forward earnings estimates along with optimistic commentary and sentiment. US equities ended the financial year on a high note, advancing against a backdrop of improving COVID-19 trends, vaccine progress, business reopening, ample liquidity, and exceptionally strong corporate earnings; although markets grappled with concerns about inflation, taxes, Fed policy, and elevated indicators of valuation and sentiment. London Company underperformed as their portfolio is biased towards quality and defensive stocks. These stocks tend to outperform during a market sell-off and lag in strong rallies. Kennedy performed strongly due to its value bias and was impacted by the noticeable outperformance of value stocks during the last 6 months. Stock selection in financials, real estate and utilities sectors drove the positive returns while selection in the materials and consumer discretionary detracted.

Barclays Multi-Manager Fund PLC Annual Report and Audited Financial Statements 2021
21
Investment manager’s report for the financial year ended 31 May 2021 (continued) Performance overview (continued) The GlobalAccess US Equity Fund outperformed its S&P 500 benchmark over the financial year. Early in the financial year, the US economy was positively aided by promising trials for potential COVID-19 vaccines, the US Federal Reserve’s pledge for unlimited financial purchases to sustain liquidity, and better-than-expected US corporate earnings. A resurgence in coronavirus infections in many areas of the country forced some states to pause or roll back their reopening efforts, increasing the uncertainty about the path of the US economic recovery. During the summer of 2020, US equities extended their extraordinary rally, with markets bolstered by substantial monetary support from the US Federal Reserve (Fed), a broadening US economic recovery, better-than-expected corporate earnings, and promising trials for COVID-19 vaccines. The US economy gradually recovered however, the path to a sustainable economic recovery was clouded by concerns about a resurgence in coronavirus infections in many areas of the country, an undetermined timeline for vaccines, high unemployment, elevated debt burdens, and uncertainty about additional fiscal stimulus. Shares of large-cap technology companies, which had been key drivers of the market’s powerful rally from its March lows, fell sharply in early September amid concerns about crowded positioning and stretched valuations. Corporate earnings were better than expected, with 84% of companies in the S&P 500 exceeding consensus forecasts. Towards the end of 2020, US equities fell amid worsening coronavirus trends and heightened volatility ahead of the US presidential election on November 3. At the end of October, the S&P 500 Index suffered its largest weekly decline since March, erasing the strong gains from earlier in the month. A third wave of COVID-19 infections engulfed the country, with the US reporting a record number of COVID-19 cases on October 30. November saw a different story with US equities registering their largest gain since April. Results from Phase 3 trials indicated that a vaccine developed by biotech company Moderna has 94% efficacy, while Pfizer and BioNTech’s vaccine demonstrated 95% efficacy. These encouraging results triggered a rotation from growth and momentum stocks to value and cyclicals. Congress faced mounting pressure to provide additional fiscal stimulus, as the economy continued to suffer under the weight of the pandemic and as coronavirus-related unemployment benefits for nearly 14 million Americans are set to expire at the end of the year. Joe Biden was elected president after a closely contested election, removing a key element of uncertainty for the market. The start of 2021 saw US equities rally again bolstered by an accelerating vaccine rollout, substantial fiscal and monetary policy tailwinds and upbeat forecasts for economic growth and earnings. Expectations for a strong rebound in the US economy sparked inflationary fears, contributing to a pro-cyclical rotation, although the US Federal Reserve (Fed) Chair Jerome Powell indicated that he did not believe inflation would increase substantially or at a sustained rate. The Democrats also secured slim majorities in both houses of Congress after winning control of the Senate. Corporate earnings remained a bright spot in the US economy, with companies providing upward revisions to their forward earnings estimates along with optimistic commentary and sentiment. US equities ended the financial year on a high note, advancing against a backdrop of improving COVID-19 trends, vaccine progress, business reopening, ample liquidity, and exceptionally strong corporate earnings; although markets grappled with concerns about inflation, taxes, Fed policy, and elevated indicators of valuation and sentiment. Ceredex performed strongly due to stock selection as well as having a value bias which was helped by the noticeable outperformance of value versus growth stocks during the financial year. Alliance Bernstein underperformed as their portfolio is biased towards high conviction large cap growth stocks. Overall, relative outperformance was driven by stock selection. The IT, financials and consumer staples sector contributed the most from relative performance whilst selection in consumer discretionary and industrials detracted.

Barclays Multi-Manager Fund PLC Annual Report and Audited Financial Statements 2021
22
Investment manager’s report for the financial year ended 31 May 2021 (continued) Performance overview (continued) The GlobalAccess Global Equity Income Fund outperformed its MSCI World benchmark over the financial year. Early in the financial year, equity markets continued to be an extraordinary balance between weak fundamentals and extreme policy measures at both a monetary and fiscal level. They continued their recovery during June, driven by Central Banks’ policies to re-fire growth, as well as signs that the global economy was emerging from lockdown. Global equity markets rallied over the summer on a combination of improving economic data, continued monetary support and optimism over prospects for a COVID-19 vaccine. September saw a rebound from 2020 peaks. After their rebound in the second quarter of 2020, global equities made further gains over the next few months helped by optimism regarding the economic outlook given the unprecedented levels of monetary and financial support from central banks and governments. The US market recorded new highs with technology stocks driving returns. At the sector level, cyclically exposed sectors such as consumer discretionary, materials and industrials performed well while information technology continued to outperform. Conversely, more defensive sectors such as utilities and health care underperformed while financials continued to lag the broader index. The energy sector also performed poorly due to concerns about the level of oil demand. Equity markets retracted in October as the list of near-term macro headwinds increased, particularly the uptick in COVID 19 cases in Europe, the noisy final stages of Brexit deal negotiations and the forthcoming US elections. Markets enjoyed a strong rally during November with the US election coming to a close, but mainly due to encouraging news on Covid-19 vaccine approvals. Global equities continued their strong performance from 2020 into the start of 2021. Progress on COVID-19 vaccines rollout globally, fresh fiscal stimulus package in the US and positive corporate earnings and economic data supported markets, although rising bond yields and inflationary pressures dampened investor sentiment. From a sector perspective, cyclicals outperformed their more defensive counterparts. Markets rotated towards value and small caps on expectations of recovery and rising bond yields. Overall, this period benefitted from positive stock selection in IT, consumer discretionary and the US. This was offset by stock selection in communication services and Japan. Sector allocation was positive due to an overweight to financials and industrials. An overweight position to Taiwan was also a notable contributor to performance. Detractors were underweight positions to consumer discretionary alongside an overweight to consumer staples and Germany. The GlobalAccess Global Property Securities Fund ceased trading on 23 February 2021. The GlobalAccess Global Government Bond Fund outperformed the Bloomberg Barclays Global Treasury USD Hedged Benchmark. The global government bond market delivered a negative return in USD hedged terms during the reporting period. the financial year began with the market still dealing with the effects of the COVID-19 pandemic. Central banks globally continued to provide unprecedented levels of support to the markets by lowering interest rates and engaging in very large quantitative easing programs. These programs provided much needed support to the markets by buying both sovereign and corporate debt. In addition, the economies were supported through significant fiscal support through furlough programs as well as other support programs. Economic growth was impacted severely by the virus and the necessary lock down measures that followed but the level of monetary and fiscal support helped reduce the impact and spurred a rapid recovery as the financial year progressed.

Barclays Multi-Manager Fund PLC Annual Report and Audited Financial Statements 2021
23
Investment manager’s report for the financial year ended 31 May 2021 (continued) Performance overview (continued) The financial year began with sovereign bond yields mostly at or close to historic low levels. Low policy rates across major economies helped keep low maturity government bonds anchored whilst the bond buying programs from major central banks kept prices high and yields low in longer dated bonds. Following the US presidential election, sentiment improved quickly and so 2021 began as a challenging period for the government bond market. During the first quarter of 2021, a $1.9 trillion fiscal package was approved in the US with further fiscal stimulus through infrastructure spending expected later in the year. The Federal Reserve re-iterated its intention to keep monetary policy very accommodative viewing the inflation overshoot as transitory. The policy mix in the US led the market to become increasingly focused on the risk of higher inflation. The fund outperformed the benchmark during the reporting period. For much of the financial year, the fund had a structural underweight to Japan. The decision to underweight Japan added value on the back of a small negative return from Japan combined with a positive return from the Payden & Rygel mandate. The mandate benefitted from exposure to European peripheral debt combined with the exposure to high quality credit which performed very strongly over the financial year. Towards the end of the financial year the structural underweight to Japan was closed and the mandate managed by Payden & Rygel was closed. Pimco were the primary driver of the strong performance of the fund. During the first half of the reporting period, the mandate benefitted from country selection, most notably within Europe where overweight positions in Italy and Slovakia added value whilst underweight positioning in Germany towards the end of the financial year also added value. In addition, the mandate benefitted from country positioning within high quality emerging market sovereign debt through issuers such as Saudi Arabia, Israel, China and Peru. In addition to sovereign debt the strategy benefitted from exposure to high quality non-sovereign issuers mainly through agency mortgage backed securities and high quality financial credit. Currency positioning also added value to the fund at the margin primarily through an underweight to the US Dollar against a basket of other currencies. During the second half of the reporting period, the fund benefitted from underweight positions in the US, UK and Germany although this was partially offset by overweight positions in France, Australia and Canada. The fund also benefitted from positions in inflation linked government bonds which performed relatively well during the financial year. In addition, the allocations to government related securities and peripheral European bonds all contributed positively to the relative performance of the Fund. The GlobalAccess Global Corporate Bond Fund outperformed the Bloomberg Barclays Global Corporate USD Hedged Benchmark. The credit market performed well during the reporting period. The financial year began with the market still dealing with the effects of the COVID-19 pandemic. From a valuation perspective the market was attractive relative to government bonds. Central banks globally continued to provide unprecedented levels of support to the markets by keeping interest rates low and engaging in very large quantitative easing programs. These programs provided much needed support to the markets by buying both sovereign and corporate debt. In addition, the economies were supported through significant fiscal support through furlough programs as well as other support programs. Economic growth was impacted severely by the virus and the necessary lock down measures that followed but the level of monetary and fiscal support helped reduce the impact to some extent. Following the US presidential election, sentiment improved quickly and so 2021 began as a challenging period for the government bond market which had a knock on impact to all fixed income assets. During the first quarter of 2021, a $1.9 trillion fiscal package was approved in the US with further fiscal stimulus through infrastructure spending expected later in the year. The Federal Reserve re-iterated its intention to keep monetary policy very accommodative viewing the inflation overshoot as transitory. The policy mix in the US led the market to become increasingly focused on the risk of higher inflation. Despite the weakness in government bonds, on a relative basis, corporate credit contributed to add value.
Barclays Multi-Manager Fund PLC Annual Report and Audited Financial Statements 2021
24
Investment manager’s report for the financial year ended 31 May 2021 (continued) Performance overview (continued) The Fund delivered a strong positive return during the financial year and outperformed the market as both sub-investment managers contributed positively to the performance for the fund. Corporate allocation and selection decisions drove the majority of the returns for both managers whilst interest rate strategies and currency positioning were more muted. Wellington performed well during the selloff in 2020 and continued to perform well during the start of the reporting period. The team increased exposure to credit risk and benefitted from the exposure to sub-investment grade credit which contributed well to performance during the financial year. From a selection perspective, positioning in names such as Hess and EQT Midstream contributed to returns as did positions in Charter Communications in the telecommunication sector. During 2021, the relative performance from Wellington was more muted. Sector allocation decisions combined with exposure to sub-investment grade credit continued to add value although security selection decisions detracted as the focus on less cyclical issuers dragged on performance. During the first half of the financial year, Pimco benefitted from an overweight to financials as well as through exposure to emerging markets through the gaming sector in Macau. Within financials, exposure to banking issuers as well as GE Capital added value. The mandate also benefitted from our overweight to real estate as the market performed well. However, the strong contribution from these positions was slightly offset by the underweight to the industrial sector which also performed well. As the financial year progressed, Pimco continued to perform well as the mandate was driven by allocation and selection decisions within corporate credit. The most notable contributions came from issuer selection decisions within banking, consumer services and transportation. In addition, the exposure to emerging markets continued to contribute positively to the performance of the Fund. The GlobalAccess Global Inflation Linked Bond Fund ceased trading on 27 November 2019. The GlobalAccess Global High Yield Bond Fund outperformed the ICE BofA Merrill Lynch US High Yield Constrained index. Risk assets rallied strongly over the 12 month period ended May 2021, buoyed by optimism over the rollout of the COVID vaccines, the re-opening of the global economy and large US fiscal stimulus packages all providing a strong tailwind. High yield also proved to be more resilient in early 2021, as traditional fixed income assets came under pressure amid rising rates, over concerns that inflationary pressures were building up. The asset class benefitted from its shorter duration and meaningfully outperformed investment grade bonds. Nomura performed particularly well over the financial year, significantly outperforming the index. The overweight to select lower rated credits and underweights in BBs, which moved lower in sympathy with the sell-off in US Treasuries earlier this year. Sector allocations were also a source of alpha as the portfolio’s exposure to the more cyclically driven sectors benefitted from the economic reopening. The portfolio profited from both the overweight and credit selection in several of the top-performing industries over the financial year, including energy, particularly exploration and production and oil field equipment and services, and also recreation and travel. Credit selection within gaming and support services sectors, specifically the overweight positions in regional gaming issuers and car rental companies also added value. Detractors over the financial year included satellite telecom and the underweight position to automakers and department Stores. Banking credits have also been a slight drag year to date in 2021. Oaktree performed in line with the index over the financial year. The portfolio benefitted from positive sector selection within energy, particularly in exploration and production names and the overweight to select credits in the oil field equipment and services sector. Detractors over the financial year included positions in aerospace/defence bonds.

Barclays Multi-Manager Fund PLC Annual Report and Audited Financial Statements 2021
25
Investment manager’s report for the financial year ended 31 May 2021 (continued) Performance overview (continued) Portfolio activity over the financial year included Nomura reducing exposure to select longer dated credits in late 2020, which had performed well over the year. However, the team did maintain some exposure to this segment of the market and also added to select longer duration bonds, which they believe may be upgraded to investment grade either later this year or in early 2022. Profits were also taken in some cyclical sectors such as gyms, which performed well as lockdowns were lifted, as well in certain CCC rated names on the view that their outperformance may be coming to an end. More recently, exposure to energy was reduced over concerns that rising COVID cases in India, which is one of the largest importers of oil, could potentially result in falling demand. In addition, lower rated gaming names were also trimmed as valuations tightened. Earlier in the financial year Oaktree took profits in auto and airline bonds that performed well but were deemed to offer little upside and added to select energy names, with a focus on those issuers that are exposed to the Permean Basin. They also added to cruiselines, largely through the new issue market. More recently, they too have taken profits in select energy names, in particular exploration and production credits on the view that supply may exceed demand. The team added to select names within the health facilities sector, which includes hospitals, dialysis and psychiatric exposure. Other areas that were added to were railroad credits and new issues in the resort/theme park space, which are expected to benefit as re-openings continue and that consumers are more likely to holiday in the US than travel abroad. The GlobalAccess Emerging Markets Debt Fund outperformed its JPMorgan Emerging Market Bond Global Diversified benchmark. The external Emerging Market debt asset class performed strongly over the 12 months to end May 2021. Returns were primarily supported by carry and credit spread compression. Gains were partly offset by the impact of higher US Treasury yields earlier in 2021. High yield countries outperformed investment grade countries due to both their shorter duration profile and the spread rally. Lazard significantly outperformed the benchmark over the financial year. The overweight position to high yield countries contributed to relative outperformance. The main contributors included the overweight to Ecuador, which performed well on the back of the government’s fast action and bondholder-friendly restructuring as well as the overweight position in the Mexican state oil producer PEMEX, which has benefitted from the rebound in crude oil prices. The off-index allocation to corporate credit was also beneficial as EM corporate bonds outperformed sovereigns during the financial year. Gains were partly offset by the overweight position in Sri Lanka, where bond prices fell on the expectation that the country may require some form of debt restructuring. Wellington outperformed the benchmark over the financial year. Country allocation drove relative outperformance, with currency positioning also contributing. In contrast, the underweight to credit spread duration and security selection detracted. The exposure to off index local bonds had a muted impact. The main contributors over the financial year included the underweight to both Peru and Chile, with elections resulting in volatility in Peru and market unrest in Chile. In addition, positive security selection in Brazil, specifically an allocation to external corporate debt across industries, contributed to results. Other contributors included an underweight to the Philippines. Detractors included the underweight to South Africa, negative security selection in Croatia, specifically an allocation to EUR-denominated sovereign debt. Negative security selection in Mexico, particularly the allocation to Mexican Peso denominated supranational debt, was also a detractor. In addition, the overweight to Panama and Oman for most of the financial year also proved unfavourable. Portfolio activity over the financial year saw Wellington slightly decrease the off index exposure to local markets, reducing both EM currencies and local debt exposure. Within external debt, the overweight to Romania was increased on the view that the country is benefitting from the EU Recovery Fund. Exposure to Qatar was reduced, moving to an underweight position, as valuations have become less attractive. The off benchmark position in EM corporate debt was increased over the financial year adding to select names in China, Israel, and Russia. The team also added to Peru and new issues from Pakistan and Gabon, which were funded by reducing exposure to Nigeria.

Barclays Multi-Manager Fund PLC Annual Report and Audited Financial Statements 2021
26
Investment manager’s report for the financial year ended 31 May 2021 (continued) Performance overview (continued) Lazard increased the overweight to high yield countries over the financial year, diversifying exposure across a broad range of markets. Profits were also taken in select High Yield countries such as Angola and Argentina. In other markets such as Ukraine, Ghana and in Mexico largely in Pemex, the team moved from longer duration bonds to shorter duration securities. The exposure in Turkey was reduced from a slight overweight to a neutral position, with mostly front end exposure. The portfolio’s exposure was pared back in Chile, Ghana, Qatar and Russia, while new issues in external sovereign debt in Pakistan, Kuwait and Ghana were added. The team also increased the portfolio’s off-index exposure to corporates driven by the view that EM companies are poised to continue to outperform due to their strong balance sheet fundamentals, attractive spread pickup, and shorter duration profile. This included energy and bank credits in Brazil and select names in communications, energy, metals and mining and utilities in India. The GlobalAccess Global Short Duration Bond Fund outperformed the Bloomberg Barclays Global Treasuries 1-3 Years Index USD Hedged benchmark over the financial year. The market for short duration government bonds was relatively muted during the financial year. the financial year began with sovereign bond yields mostly at or close to historic low levels. Low policy rates across major economies helped keep low maturity government bonds anchored whilst the bond buying programs from major central banks kept prices high and yields low in longer dated bonds. Central banks globally continued to provide unprecedented levels of support to the markets by lowering interest rates and engaging in very large quantitative easing programs. These programs provided much needed support to the markets by buying both sovereign and corporate debt. In addition, the economies were supported through significant fiscal support through furlough programs as well as other support programs. Economic growth was clearly impacted severely by the virus and the necessary lock down measures that followed but the level of monetary and fiscal support helped reduce the impact to some extent. Following the US presidential election, sentiment improved quickly and so 2021 began as a challenging period for the government bond market which had a knock on impact to all fixed income assets. During the first quarter of 2021, a $1.9 trillion fiscal package was approved in the US with further fiscal stimulus through infrastructure spending expected later in the year. The Federal Reserve re-iterated its intention to keep monetary policy very accommodative viewing the inflation overshoot as transitory. The policy mix in the US led the market to become increasingly focused on the risk of higher inflation. Despite the weakness in government bonds, on a relative basis, corporate credit contributed to add value. The corporate credit market continued to recover throughout the financial year both in investment grade and high yield. The recovery was relatively uniform across regions however, initially business whose revenues were insulated from the effects of the COVID-19 pandemic performed well but as time passed investors became comfortable in taking some selective risk in more cyclical businesses which performed well towards the end of the financial year particularly following the presidential election in the US. The fund delivered a strong return and outperformed the index comfortably during the reporting period and so recovered fully from the drawdown experienced earlier in 2020. Both T Rowe Price and Payden and Rygel contributed to the strong returns of the fund. During the financial year the decision was made to revert to a single manager portfolio and so the mandate managed by Payden & Rygel was closed. The fund has a large degree of flexibility to invest in low maturity assets across the full spectrum of fixed income asset classes. These asset allocation decisions were the most prominent driver of returns for the fund during the financial year however, the fund also benefitted from selection decisions within sovereign debt. T Rowe Price added value within sovereign debt through positions in Italy, Chile and Cyprus and through some positions in inflation linked sovereign bonds through the US and Canada. In addition, the fund benefitted from some positions in emerging market issuers.

Barclays Multi-Manager Fund PLC Annual Report and Audited Financial Statements 2021
27
Investment manager’s report for the financial year ended 31 May 2021 (continued) Performance overview (continued) The GlobalAccess Emerging Market Local Currency Debt Fund outperformed the JP Morgan GBI-EM Global Diversified benchmark. Local emerging market debt performed well over the financial year, as risk sentiment remained strong. The performance was positive as global markets rallied following the US elections in November 2020. The USD dollar weakened over the financial year, giving a boost to EM currencies. EM FX strongly outperformed local bonds, which lagged as global rates rose earlier this year. Turkish assets were volatile, having initially outperformed with the appointment of a new central bank governor in late 2020 that the market approved of. However, this was short lived, as he was unexpectedly removed earlier this year and replaced with an individual whose views are more aligned with President Erdogan’s. This led to a sharp sell-off in both bonds and the Turkish Lira. Elsewhere, currency movements in the Latin America region were mixed, with the Mexican Peso and Chilean Peso each performing well while the Peruvian Sol lagged after leftist presidential candidate Pedro Castillo extended his poll lead ahead of June’s election. After generating strong returns in 2020, Colombian bonds lost some ground year to date as the market began to price the potential risk of a country downgrade. BlackRock was the slightly better performer over the financial year. Relative returns were driven by the bond segment of the portfolio, with the largest contributors to outperformance being Romania, Mexico and Uruguay. The largest contributors to outperformance within the FX component were the underweight positions in the Turkish Lira and the Peruvian Sol. The FX segment was defensively positioned in June 2020 and hurt relative returns as the FX market rallied in the first half of the month. From mid-June onwards, the team added risk through both the rates and FX segments. These changes led to the outperformance generated in the third quarter, which offset some of the underperformance experienced earlier in 2020. Throughout October and the start of November, the portfolio held a defensive stance due to risk events such as the US elections. Following the outcome of the US election, the risk in the portfolio was increased, mainly driven by the FX segment. The portfolio delivered positive active returns over the first quarter of 2021, with the bond component delivering positive returns. More recently positive performance in the FX segment added value, with overweight positions in currencies such as the Czech Koruna, Russian Rouble and Hungarian Forint contributing. An underweight position in the Peruvian Sol was also a contributor. Colchester benefitted from positive bond selection while currency selection detracted slightly over the financial year. The main bond contributors included the overweight positions in South African bonds, which have rallied strongly and in Indonesian bonds. Within FX, the main detractors were underweight positions in the Czech Koruna and the Chinese Yuan. Contributors included the overweight to both the Mexican Peso and the South African Rand. Both managers were active over the financial year. Colchester, increased exposure to both Chinese and Malaysian government bonds, and reduced exposure in Mexico, Colombia and Russia. With regards to currency positioning, the team added to the Chinese Yuan and Malaysian Ringgit. Profits were taken in many of the LATAM currencies such as the Brazilian Real, Mexican Peso, Chilean Peso and Colombian Peso. The team also reduced exposure to the Russian Rouble over the financial year and established an off index position in the Korean Won. BlackRock added to risk early on in the financial year, largely through high beta EMFX. However, the team reduced this exposure in the first quarter of this year and increased the USD position on concerns that the recovery in global growth would occur later this year and not earlier as previously expected. More recently, the team significantly added to the FX segment of the portfolio, following signals to move from a more defensive to aggressive stance. The long USD position was moved to a short and exposure was also increased to currencies such as the Mexican peso, Brazilian Real and the South African Rand. In addition, the underweight to the Peruvian Sol was reduced. They also increased the underweight to the Romanian Leu and the Polish Zloty. Within the bond segment, the exposure to Russia was increased while the team added to the underweight in Hungary.

Barclays Multi-Manager Fund PLC Annual Report and Audited Financial Statements 2021
28
Investment manager’s report for the financial year ended 31 May 2021 (continued) The following managers are responsible for managing assets as of 31 May 2021.
GlobalAccess UK Opportunities Fund Lindsell Train Limited Heronbridge Investment Management LLP J O Hambro Capital Management Limited
GlobalAccess Global Government Bond Fund Payden & Rygel (terminated 19 January 2021) PIMCO Europe Ltd
GlobalAccess Asia Pacific (ex-Japan) Fund Hermes Investment Management Limited Fidelity International Ltd Schroders Investment Management (Japan) Ltd
GlobalAccess Emerging Markets Equity Fund Pzena Investment Management LLC Schroders investment Management (Japan) Ltd Arrowstreet Capital, L.P. Somerset Capital Management LLP (terminated 25 November 2020) BNY Mellon ARX Investimentos
GlobalAccess Global High Yield Bond Fund Oaktree Capital Management LP Nomura Corporate Research and Asset Management, Inc.
GlobalAccess Global Corporate Bond Fund PIMCO Europe Ltd Wellington Management Company LLP
GlobalAccess Emerging Market Debt Fund Wellington Management Company LLP Lazard Asset Management Limited
GlobalAccess Global Property Securities Fund Principal Global Investors (Europe) Limited (terminated 23 February 2021)
GlobalAccess Global Short Duration Bond Fund T Rowe Price Payden & Rygel (terminated 28 January 2021)
GlobalAccess US Small & Mid Cap Equity Fund Kennedy Capital Management Wellington Management Company LLP The London Company of Virginia LLC
GlobalAccess US Equity Fund Ceredex Value Advisors LLC T Rowe Price AllianceBernstein
GlobalAccess Global Equity Income Fund Artemis Fund Managers Limited Baillie Gifford & Co Kleinwort Benson Investors
GlobalAccess Emerging Market Local Currency Debt Fund Colchester Global Investors BlackRock Inc.
GlobalAccess Europe (ex-UK) Alpha Fund Allianz Global Investors BlackRock Inc. Invesco Global Asset Management
GlobalAccess Japan Fund Baillie Gifford & Co Schroders Investment Management (Japan) Ltd
Barclays Investment Solutions Limited, acting through its Wealth & Investment Management Division 20 September 2021

Barclays Multi-Manager Fund PLC Annual Report and Audited Financial Statements 2021
29
Depositary’s report to the Shareholders for the financial year ended 31 May 2021 We, Northern Trust Fiduciary Services (Ireland) Limited, appointed Depositary to Barclays Multi-Manager Fund PLC (the “Company"), provide this report solely in favour of the Shareholders of the Fund for the financial year ended 31 May 2021 (the “Annual Accounting Period”). This report is provided in accordance with the UCITS Regulations – European Communities (Undertakings for Collective Investment in Transferable Securities) Regulations 2011(SI No 352 of 2011) (as amended) which implemented Directive 2009/65/EU into Irish Law (“the Regulations”). We do not, in the provision of this report, accept nor assume responsibility for any other purpose or person to whom this report is shown. In accordance with our Depositary obligation as provided for under the Regulations, we have enquired into the conduct of the Company for this period and we hereby report thereon to the Shareholders of the Company as follows; We are of the opinion that the Company has been managed during the Annual Accounting Period, in all material respects:
(i.) in accordance with the limitations imposed on the investment and borrowing powers of the Company by the constitutional documents and by the Regulations; and
(ii.) otherwise in accordance with the provisions of the constitutional document and the Regulations.
____________________________________________ For and on behalf of Northern Trust Fiduciary Services (Ireland) Limited 20 September 2021

Barclays Multi-Manager Fund PLC Annual Report and Audited Financial Statements 2021
30
Directors’ report The board of Directors (the “Board”) present herewith the annual report and audited financial statements for the financial year ended 31 May 2021. Statement of Directors' responsibilities The Directors are responsible for preparing the annual report and the financial statements in accordance with International Financial Reporting Standards as adopted by the European Union ("IFRS") and those parts of the Companies Act 2014 (as amended) applicable to companies reporting under IFRS and the European Communities (Undertakings for Collective Investment in Transferable Securities) Regulations 2011 (as amended) (the “UCITS Regulations”) and the Central Bank (Supervision and Enforcement) Act 2013 (Section 48(1)) (Undertakings for Collective Investment in Transferable Securities) Regulations 2019 (as amended) (the "Central Bank UCITS Regulations"). The Companies Act 2014 (as amended) requires the Directors to prepare financial statements for each financial year which give a true and fair view of the assets, liabilities, financial position and profit or loss of the Company for that financial year. In preparing each of the financial statements, the Directors are required to: • select suitable accounting policies and then apply them consistently; • make judgements and estimates that are reasonable and prudent; • state whether the financial statements have been prepared in accordance with applicable accounting standards and
identify the standards in question, subject to any material departures from those standards being disclosed and explained in the notes to the financial statements; and
• prepare the financial statements on the going concern basis unless it is inappropriate to presume that the Company will continue in business.
The Directors confirm that they have complied with the above requirements in preparing the financial statements. The Directors are responsible for keeping adequate accounting records that are sufficient to: • correctly record and explain the transactions of the Company; • enable, at any time, the assets, liabilities, financial position and profit or loss of the Company to be determined with
reasonable accuracy; and • enable the Directors to ensure that the financial statements comply with the Companies Act 2014 (as amended) and
enable those financial statements to be audited. The Directors are also responsible for safeguarding the assets of the Company and thereby for taking reasonable steps for the prevention and detection of fraud and other irregularities. The measures taken by the Directors to ensure compliance with the Company’s obligation to keep accounting records are the appointment of an experienced administrator Northern Trust International Fund Administration Services (Ireland) Limited (the “Administrator”) and through such appointment, the use of appropriate systems and procedures to maintain proper accounting records. The accounting records are held at the office of the Administrator. The address at which this business is conducted is as follows: Georges Court 54-62 Townsend Street Dublin 2 Ireland

Barclays Multi-Manager Fund PLC Annual Report and Audited Financial Statements 2021
31
Directors’ report (continued) Statement of Directors' responsibilities (continued) Audited annual reports and unaudited interim reports are available on www.barclaysinvestments.com. The Directors are responsible for the maintenance and integrity of the financial statements published on this website. Information published on the internet is accessible in many countries with different legal requirements. Legislation in Ireland governing the preparation and dissemination of financial statements may differ from legislation in other jurisdictions. The work carried out by the auditors does not involve consideration of these matters and, accordingly, the auditors accept no responsibility for any changes that may have occurred to the financial statements since they were initially presented on the website. Statement of relevant audit information Each of the persons who are Directors at the time when this Directors’ report is approved has confirmed that in the context of Section 330 of the Companies Act 2014 (as amended):
(i.) so far as each Director is aware, there is no relevant audit information of which the Company’s auditors are unaware; and
(ii.) that the Directors have taken all reasonable steps that ought to have been taken as Directors in order to be aware of any relevant audit information and to establish that the Company’s Auditors are aware of that information.
Directors’ compliance statement The Directors acknowledge that they are responsible for securing the Company’s compliance with the relevant obligations as set out in section 225 of the Companies Act 2014 (as amended). The Directors confirm that:
(i.) a compliance policy document has been drawn up that sets out policies, that in our opinion are appropriate to the Company, respecting compliance by the Company with its relevant obligations;
(ii.) appropriate arrangements or structures are in place that are, in our opinion, designed to secure material compliance with the Company's relevant obligations; and
(iii.) during the financial year, the arrangements or structures referred to in (ii) have been reviewed. Audit committee The Directors acknowledge that they are required, under Section 167 of the Companies Act 2014 (as amended), to consider the establishment of an audit committee. The Directors have decided not to establish an audit committee because in the Directors' opinion, at this time, the responsibilities of an audit committee, under Section 167 (i.e. the monitoring of internal control, internal audit, risk management, the financial reporting process, statutory audit and statutory financial statements, the review and monitoring of the independence of the auditors and the provision by the auditors of additional services to the Company) are already being fulfilled by the Board by virtue of the Board’s corporate governance regime and the existing arrangements and structures in place designed to secure compliance with the extensive legal and regulatory obligations imposed on UCITS investment companies in connection with the Company’s management. Remuneration policy The UCITS V Directive requires the financial statements of the Company to include certain remuneration information, for details refer to Appendix 1. Corporate governance report Although there is no specific statutory corporate governance code applicable to Irish collective investment undertakings, the Company is subject to corporate governance practices imposed by:
(i.) The Companies Act 2014 (as amended) which is available for inspection at the registered office of the Company (6th Floor, 2 Grand Canal Place, Dublin 2, Ireland) and may also be obtained at: www.irishstatutebook.ie;

Barclays Multi-Manager Fund PLC Annual Report and Audited Financial Statements 2021
32
Directors’ report (continued) Corporate governance report (continued) (ii.) The Articles of Association of the Company which are available for inspection at the registered office of the
Company and at the Companies Registration Office in Ireland; (iii.) The Central Bank of Ireland in its Central Bank UCITS Regulations, which can be obtained from the website at:
www.centralbank.ie and are available for inspection at the registered office of the Company; (iv.) The Euronext Dublin continuing obligations requirements for open ended funds which can be obtained from the
Euronext Dublin website at: www.ise.ie. A voluntary corporate governance code for Irish-domiciled collective investment undertakings, was published by Irish Funds (“IF”) the industry association for investment funds in Ireland in December 2011 (the "Code"). The Code is available from the IF website (www.irishfunds.ie). The Directors adopted the Code in November 2012. The Company does not apply additional corporate governance requirements beyond those required by the above. The Company currently has no direct employees. Consistent with the regulatory framework applicable to investment fund companies such as the Company (and in contrast to normal operating companies with a full time executive management and employees), the Company operates under a model whereby it has delegated investment management, administration and distribution functions to third parties without abrogating the Directors’ overall responsibility. The Directors have in place mechanisms for monitoring the exercise of such delegated functions, which are always subject to the supervision and direction of the Directors. These delegations of functions and the appointment of regulated third party entities are detailed in the Company’s Prospectus. The Company has also appointed Northern Trust Fiduciary Services (Ireland) Limited (the “Depositary”) as depositary of its assets. This entity has responsibility for the safekeeping of such assets in accordance with the UCITS Regulations and for exercising independent oversight over how the Company is managed. The depositary is regulated by and under the supervision of the Central Bank. The Directors receive reports on a regular (and at least quarterly) basis from each of its delegate service providers and the depositary which enable them to assess the performance of the delegate service providers and the depositary (as the case may be). Diversity report In accordance with Regulation 6 of the European Union (Disclosure of Non-Financial and Diversity Information by certain large undertakings and groups) Regulations 2017, the Board has adopted a diversity policy which sets out the approach to diversity on the Board ("Diversity Policy"). The Diversity Policy acknowledges that the Board recognises and embraces the benefits of having a diverse Board and that a truly diverse Board will include and make good use of differences in skills, industry experience, background, race, age, gender, education, professional backgrounds and other distinctions between directors. The objective of the Diversity Policy is to ensure that diversity is considered in determining the optimum composition of the Board and when possible should be balanced appropriately. The Board has considered the diversity of the Board and, whilst acknowledging the importance of diversity and its many aspects has not set specific targets in respect of diversity. The Diversity Policy states that all Board appointments will be made on merit, in the context of the skills, experience, independence and knowledge which the Board as a whole requires to be effective. In identifying suitable candidates, the Board will consider the benefits of all aspects of diversity including but not limited to, those described above, in order to enable it to discharge its duties and responsibilities effectively. Internal control and risk management systems The Board is responsible for overseeing the establishment and maintenance of adequate internal control and risk management systems of the Company in relation to the financial reporting process. The Board is comprised of three independent Directors and one appointed by the promoter, Barclays Investment Solutions Limited. The Board meets on a quarterly basis, or more frequently as required. The Company has no employees and all Directors with the exception of Kishor Mandalia serve in a non-executive capacity. As a result all functions relating to the Company’s financial reporting process, including the preparation of the Company’s financial statements, have been outsourced.

Barclays Multi-Manager Fund PLC Annual Report and Audited Financial Statements 2021
33
Directors’ report (continued) Internal control and risk management systems (continued) The Company has appointed the administrator (consistent with the regulatory framework applicable to investment fund companies such as the Company) to maintain the accounting records of the Company independently of the investment manager and the depositary. Through this appointment the Directors have procedures in place to ensure that all relevant accounting records are properly maintained and are readily available, including production of annual and half yearly financial statements. The Administrator has functional responsibility for the preparation of the Company’s annual and semi-annual financial statements and the maintenance of its books and records. On appointing the Administrator, the Board noted that it is regulated by the Central Bank of Ireland and, in the Board’s opinion, has significant experience as an administrator. The Board has delegated the day to day responsibility for monitoring the controls applied by the administrator to Barclays Investment Solutions Limited, acting through its Wealth Management Division (the "Investment Manager"), which performs day to day monitoring activities and formally reports to the Board on a quarterly basis (or more frequently as required). The Board also noted the independence of the administrator from the Company’s investment manager. The Board has satisfied itself that the administrator has sufficient knowledge, skills and resources to produce the financial statements in accordance with the relevant rules and regulations. The appointment of the administrator is intended to manage rather than eliminate the risk of failure to achieve the Company’s financial reporting objectives and can only provide reasonable and not absolute assurance against material misstatement or loss. The annual and semi-annual financial statements of the Company are required to be approved by the Board and filed with the Central Bank of Ireland and the Euronext Dublin within the relevant respective time periods. The statutory financial statements are required to be audited by independent auditors who report annually to the Board on their findings. The Board evaluates and discusses significant accounting and reporting issues as the need arises, these are documented in minutes of meetings of the Board. The Board reviews the financial statements prior to their approval, though it should be noted that such review does not include verification of information in the financial statements to underlying documents. The annual financial statements are subject to independent audit by PricewaterhouseCoopers (the “auditors”) who report annually to the Board on their findings and on the audit process. This report includes observations as to the extent to which the annual financial statements provide a true and fair view. The auditors present this report at the Board meeting at which the financial statements are presented to the Board for approval. The Board also invites the auditors to attend the Board meeting prior to the commencement of the audit, at which the auditors present the audit plan to the Board. The Directors evaluate and discuss significant accounting and reporting issues as the need arises. The Directors have no power to amend the financial statements, with the exception of the provisions set out in Sections 366 to 379 of the Companies Act 2014 (as amended). Shareholders’ meetings The convening and conduct of Shareholders’ meetings are governed by the Memorandum and Articles of Association of the Company and the Companies Act 2014 (as amended). Although the Directors may convene an extraordinary general meeting of the Company at any time, the Directors are required to convene an annual general meeting of the Company within eighteen months of incorporation and at least within fifteen months of the date of the previous annual general meeting thereafter. Annual general meetings are held once in each year, generally within six months of the end of the financial year. Shareholders representing not less than one-tenth of the paid up share capital of the Company may also request the Directors to convene a Shareholders’ meeting. Not less than twenty one clear days’ notice of every annual general meeting and any meeting convened for the passing of a special resolution must be given to Shareholders and fourteen clear days’ notice must be given in the case of any other general meeting unless the auditors of the Company and all the Shareholders of the Company entitled to attend and vote agree to shorter notice.

Barclays Multi-Manager Fund PLC Annual Report and Audited Financial Statements 2021
34
Directors’ report (continued) Shareholders’ meetings (continued) Two Shareholders present either in person or by proxy constitutes a quorum at a general meeting. Every holder of shares present in person or by proxy who votes on a show of hands is entitled to one vote and the holders of participating shares shall have one vote in respect of all of the subscriber shares in issue. On a poll, every holder of shares present in person or by proxy is entitled to one vote in respect of each share held by them. The Chairman of a general meeting of the Company or at least three Shareholders present in person or by proxy, or any Shareholders present representing at least one tenth of the total voting rights of all the Shareholder concerned having the right to vote at the meeting or Shareholder(s) holding shares conferring the right to vote at the meeting, being shares on which an aggregate sum has been paid up equal to not less than ten per cent of the total sum paid up on all the shares conferring the right to vote at such meeting may demand a poll. Shareholders may resolve to pass an ordinary resolution or special resolution at a Shareholders’ meeting. An ordinary resolution of the Company or of the Shareholders of a particular fund or class requires a simple majority of the votes cast by the Shareholders voting in person or by proxy at the meeting at which the resolution is proposed. A special resolution of the Company or of the Shareholders of a particular fund or class requires a majority of not less than 75% of the Shareholders present in person or by proxy and voting in general meeting in order to pass a special resolution including a resolution to amend the Memorandum and Articles of Association. Connected persons' transactions In accordance with the Central Bank’s UCITS Regulation 41(1), any transaction carried out with a UCITS by a management company or depositary to the UCITS, the delegates or sub-delegates of the management company or depositary, and any associated or group of such a management company, depositary, delegate or sub-delegate (“connected persons”) must be carried out as if conducted at arm’s length. Such transactions must be in the best interests of the shareholders. In addition to those transactions, there are also transactions carried out by connected persons on behalf of the Company to which the Directors have no direct access and in respect of which the Directors must rely upon assurances from the Company’s delegates that the connected person carrying out those transactions do carry them out on a similar basis. Shareholders should have regard to the governance structure of the Company as more particularly described in the corporate governance statement report (above) and the roles and responsibilities of the Company’s respective delegates subject to the overall supervision of the Board. Further, Shareholders should refer to the Prospectus which identifies many of the connected persons' transactions and the general nature of the contractual arrangements with the principal connected persons but it is not exhaustive of all connected persons' transactions. Shareholders should also refer to the provisions of the Prospectus dealing with conflicts of interest. Therefore, having regard to confirmations from the Company’s management and its relevant delegates, the Board is satisfied that:
(i.) there are arrangements (as evidenced by written procedures documented by the investment manager) in place to ensure that the obligations described above are applied to all transactions with connected persons; and
(ii.) transactions with connected persons entered into during the financial year complied with these obligations, as attested through regular updates to the Directors.
Risk management objectives and policies Risk management is carried out under policies approved by the Board. The Board provides written principles for overall risk management as well as written policies covering specific areas, such as foreign exchange risk, interest rate risk, credit risk, use of derivative financial instruments and non-derivative financial instruments, and investing excess liquidity. A detailed review of the risk exposure is detailed in note 2, on pages 77 to 86 of the financial statements.

Barclays Multi-Manager Fund PLC Annual Report and Audited Financial Statements 2021
35
Directors’ report (continued) Principal activities The Company has been authorised by the Central Bank of Ireland as a UCITS (Undertakings for Collective Investment in Transferable Securities) within the meaning of the UCITS Regulations and the Central Bank UCITS Regulations. It is structured as an umbrella fund consisting of different Funds each comprising one or more Share Classes. The assets of each Fund are invested separately on behalf of each Fund in accordance with the investment objective and policies of each Fund. At 31 May 2021, the Company had 14 Funds in operation. Review of business and future developments The movement of net asset values per share during the financial year is detailed in note 11 on pages 126 to 142 of the financial statements. The assets under management in the Company decreased to GBP 3,050,533,612 from GBP 3,443,397,284 during the financial year. The investment manager's report contains a review of the factors that contributed to the performance for the financial year. The Directors do not anticipate any change in the structure or investment objectives of the Company. Results The results for the financial year and the appropriation thereof are set out in the Statement of comprehensive income on pages 43-48. Dividends The Directors recommend the payment of quarterly dividends out of each Fund's investment income attributable to the distributing share class Shareholders. These distributions are usually declared and paid within 10 business days following the end of the relevant quarter, i.e. within 10 business days of the end of February, May, August and November each year. Dividends paid during the financial year are detailed in note 12, on pages 143 to 145. Directors The Directors of the Company, who all served for the full financial year, are shown below Seán Blake (Irish) (Independent non-executive Director) David Kingston (Irish) (Independent non-executive Director) Hugh Paul Shovlin (Irish) (Independent non-executive Director) Kishor Mandalia (British) Directors’ and secretary's interests None of the Directors, secretary or their connected persons had any interest in the share capital of the Company during the financial years ended 31 May 2021 or 31 May 2020. Transactions involving Directors and company secretary There are no contracts or arrangements of any significance in relation to the business of the Company in which the Directors, Secretary or their connected persons had any interest as defined in the Companies Act 2014 (as amended), at any time during financial years ended 31 May 2021 and 31 May 2020. Details of transactions with related entities are disclosed in note 17 "Related Party Transactions" on pages 167 to 168 of the financial statements. Significant events during the financial year A number of share class launches and terminations occurred within the Funds during the financial year. Please refer to 'Funds at a glance section within 'Background to the Company' on pages 8 to 14 for details. Dividends declared during the financial year are disclosed in Note 20.
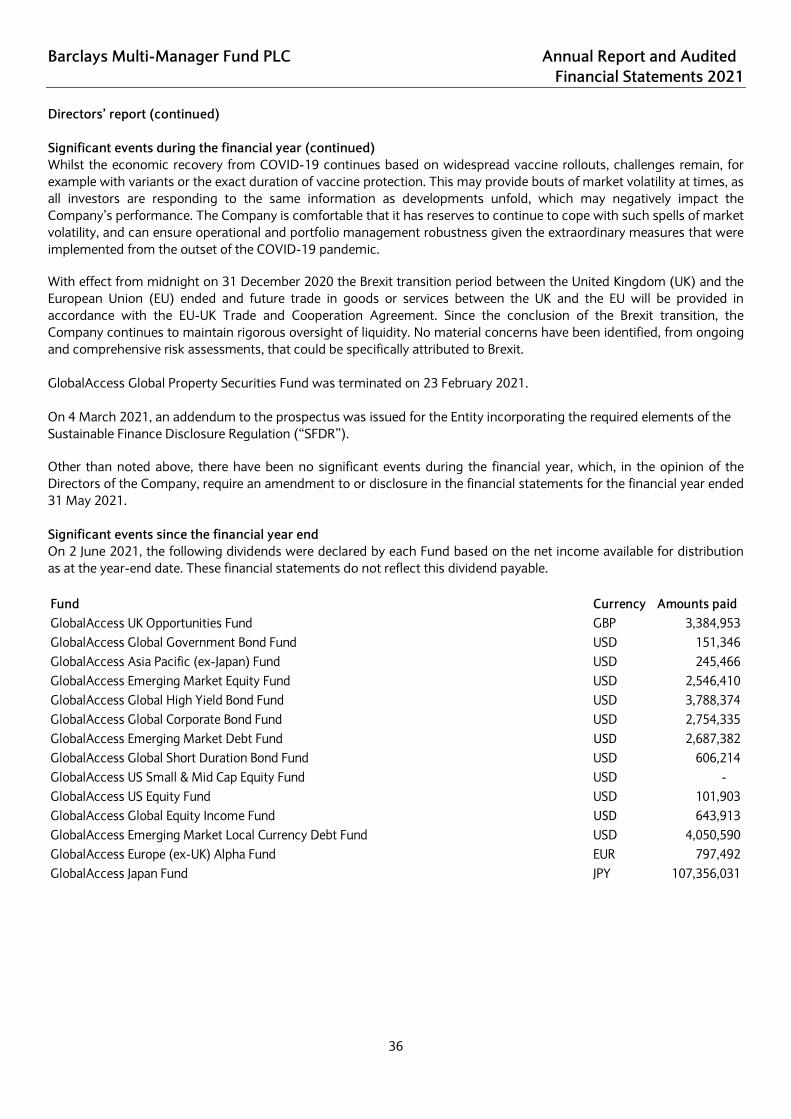
Barclays Multi-Manager Fund PLC Annual Report and Audited Financial Statements 2021
36
Directors’ report (continued) Significant events during the financial year (continued) Whilst the economic recovery from COVID-19 continues based on widespread vaccine rollouts, challenges remain, for example with variants or the exact duration of vaccine protection. This may provide bouts of market volatility at times, as all investors are responding to the same information as developments unfold, which may negatively impact the Company’s performance. The Company is comfortable that it has reserves to continue to cope with such spells of market volatility, and can ensure operational and portfolio management robustness given the extraordinary measures that were implemented from the outset of the COVID-19 pandemic. With effect from midnight on 31 December 2020 the Brexit transition period between the United Kingdom (UK) and the European Union (EU) ended and future trade in goods or services between the UK and the EU will be provided in accordance with the EU-UK Trade and Cooperation Agreement. Since the conclusion of the Brexit transition, the Company continues to maintain rigorous oversight of liquidity. No material concerns have been identified, from ongoing and comprehensive risk assessments, that could be specifically attributed to Brexit. GlobalAccess Global Property Securities Fund was terminated on 23 February 2021. On 4 March 2021, an addendum to the prospectus was issued for the Entity incorporating the required elements of the Sustainable Finance Disclosure Regulation (“SFDR”). Other than noted above, there have been no significant events during the financial year, which, in the opinion of the Directors of the Company, require an amendment to or disclosure in the financial statements for the financial year ended 31 May 2021. Significant events since the financial year end On 2 June 2021, the following dividends were declared by each Fund based on the net income available for distribution as at the year-end date. These financial statements do not reflect this dividend payable. Fund Currency Amounts paidGlobalAccess UK Opportunities Fund GBP 3,384,953 GlobalAccess Global Government Bond Fund USD 151,346 GlobalAccess Asia Pacific (ex-Japan) Fund USD 245,466 GlobalAccess Emerging Market Equity Fund USD 2,546,410 GlobalAccess Global High Yield Bond Fund USD 3,788,374 GlobalAccess Global Corporate Bond Fund USD 2,754,335 GlobalAccess Emerging Market Debt Fund USD 2,687,382 GlobalAccess Global Short Duration Bond Fund USD 606,214 GlobalAccess US Small & Mid Cap Equity Fund USD - GlobalAccess US Equity Fund USD 101,903 GlobalAccess Global Equity Income Fund USD 643,913 GlobalAccess Emerging Market Local Currency Debt Fund USD 4,050,590 GlobalAccess Europe (ex-UK) Alpha Fund EUR 797,492 GlobalAccess Japan Fund JPY 107,356,031

Barclays Multi-Manager Fund PLC Annual Report and Audited Financial Statements 2021
37
Directors’ report (continued) Significant events since the financial year end (continued) There have been no other significant events since the financial year end through to 20 September 2021, which, in the opinion of the Directors of the Company, require an amendment to or disclosure in the financial statements for the financial year ended 31 May 2021. Independent auditors The Auditors, PricewaterhouseCoopers, have indicated their willingness to continue in office and will be re-appointed in accordance with Section 383, of the Companies Act 2014 (as amended). On behalf of the board of Directors ______________________________ Séan Blake Director _______________________________ David Kingston Director
20 September 2021

38
Independent auditors’ report to the members of Barclays Multi-Manager Fund PLC
Report on the audit of the financial statements
Opinion
In our opinion, Barclays Multi-Manager Fund PLC’s financial statements:
give a true and fair view of the Company’s and Funds’ assets, liabilities and financial position as at 31 May 2021 and of their results and cash flows for the year then ended;
have been properly prepared in accordance with International Financial Reporting Standards (“IFRSs”) as adopted by the European Union; and
have been properly prepared in accordance with the requirements of the Companies Act 2014 and the European Communities (Undertakings for Collective Investment in Transferable Securities) Regulations 2011 (as amended).
We have audited the financial statements, included within the Annual report and audited financial statements, which comprise:
the Statement of financial position as at 31 May 2021;
the Statement of comprehensive income for the year then ended;
the Statement of cash flows for the year then ended;
the Statement of changes in net assets attributable to holders of redeemable participating shares for the year then ended;
the Schedule of investments for each of the Funds as at 31 May 2021; and
the notes to the financial statements for the Company and for each of its Funds, which include a description of the significant accounting policies.
Basis for opinion
We conducted our audit in accordance with International Standards on Auditing (Ireland) (“ISAs (Ireland)”) and applicable law.
Our responsibilities under ISAs (Ireland) are further described in the Auditors’ responsibilities for the audit of the financial statements section of our report. We believe that the audit evidence we have obtained is sufficient and appropriate to provide a basis for our opinion.
Independence
We remained independent of the Company in accordance with the ethical requirements that are relevant to our audit of the financial statements in Ireland, which includes IAASA’s Ethical Standard as applicable to listed entities, and we have fulfilled our other ethical responsibilities in accordance with these requirements.
Our audit approach
Overview
Materiality
Overall materiality: 100 basis points (fixed income funds) and 50 basis points (equity funds) of Net Asset Value ("NAV") for Funds in operation and Average Net Assets ("ANA") for the terminated Fund at 31 May 2021 for each of the Company’s Funds.
Audit scope
The Company is an open-ended investment Company with variable capital and engages Barclays Investment Solutions Limited acting through its Wealth Management Division (the “Investment Manager”) and other sub-investment managers (the "Sub-Investment Managers") to provide investment management and advisory services with regards to part or all of the assets of the Funds. The Investment Manager monitors the performance of the Sub-Investment Managers. We tailored the scope of our audit taking into account the types of investments within the Funds, the involvement of the third parties referred to overleaf, the accounting processes and controls, and the industry in which the Company operates. We look at each of the Funds at an individual level.
Key audit matters
Existence of financial assets and financial liabilities at fair value through profit or loss. Valuation of financial assets and financial liabilities at fair value through profit or loss.

39
Independent auditors’ report to the members of Barclays Multi-Manager Fund PLC (continued)
The scope of our audit
As part of designing our audit, we determined materiality and assessed the risks of material misstatement in the financial statements. In particular, we looked at where the directors made subjective judgements, for example the selection of pricing sources to value the investment portfolio. As in all of our audits, we also addressed the risk of management override of internal controls, including evaluating whether there was evidence of bias by the directors that represented a risk of material misstatement due to fraud.
Key audit matters
Key audit matters are those matters that, in the auditors’ professional judgement, were of most significance in the audit of the financial statements of the current period and include the most significant assessed risks of material misstatement (whether or not due to fraud) identified by the auditors, including those which had the greatest effect on: the overall audit strategy; the allocation of resources in the audit; and directing the efforts of the engagement team. These matters, and any comments we make on the results of our procedures thereon, were addressed in the context of our audit of the financial statements as a whole, and in forming our opinion thereon, and we do not provide a separate opinion on these matters. This is not a complete list of all risks identified by our audit.
Key audit matter How our audit addressed the key audit matter
Existence of financial assets and financial liabilities at fair value through profit or loss Refer to the Schedule of investments for each of the Funds, the significant accounting policies set out in note 1 and note 14 for further details. The financial assets and financial liabilities at fair value through profit or loss included in the Statement of financial position of each Fund are held in the Fund's name at 31 May 2021. This is considered a key audit matter as it represents a principal element of the financial statements.
We obtained independent confirmation from the Depositary and relevant counterparties. For financial assets and financial liabilities at fair value through profit or loss held with counterparties, we obtained an independent confirmation from each broker or performed alternative procedures to evidence the existence of the positions. No material misstatements were identified as a result of the procedures we performed.
Valuation of financial assets and financial liabilities at fair value through profit or loss Refer to the Schedule of investments for each of the Funds, the significant accounting policies set out in note 1 and note 14 for further details. The financial assets and financial liabilities at fair value through profit or loss included in the Statement of financial position of each Fund at 31 May 2021 are valued at fair value in line with IFRS. These financial assets and financial liabilities are comprised primarily of level 1 and level 2 investments at 31 May 2021. We focused on the valuation of these level 1 and level 2 financial assets and financial liabilities at fair value through profit or loss as it represents a principal element of the net asset value (NAV) of the funds within the audited financial statements.
We tested the valuation of the level 1 and level 2 financial assets and financial liabilities at fair value through profit or loss by independently obtaining price quotations from third party vendor sources for the investments included within the financial statements. No material misstatements were identified as a result of the procedures we performed.
How we tailored the audit scope
We tailored the scope of our audit to ensure that we performed enough work to be able to give an opinion on the financial statements as a whole, taking into account the structure of the Company, the accounting processes and controls, and the industry in which it operates.
As at 31 May 2021 there are 14 Funds operating and 1 Fund terminated. The Company's Statement of financial position, Statement of comprehensive income, Statement of cash flows and Statement of changes in net assets attributable to holders of redeemable participating shares are an aggregation of the positions and results of the Funds.
The directors control the affairs of the Company and are responsible for the overall investment policy which is determined by them. The directors have delegated certain responsibilities to the Investment Manager and to Northern Trust International Fund Administration Services (Ireland) Limited (the "Administrator"). The financial statements, which remain the responsibility of the directors, are prepared on their behalf by the Administrator. The Company has appointed Northern Trust Fiduciary Services (Ireland) Limited(the “Depositary”) to act as Depositary of the Company’s assets. In establishing the overall approach to our audit we assessed the risk of material misstatement at a Fund level, taking into account the nature, likelihood and potential magnitude of any misstatement. As part of our risk assessment, we considered the Company’s interaction with the Administrator, and we assessed the control environment in place at the Administrator

40
Independent auditors’ report to the members of Barclays Multi-Manager Fund PLC (continued)
Materiality
The scope of our audit was influenced by our application of materiality. We set certain quantitative thresholds for materiality. These, together with qualitative considerations, helped us to determine the scope of our audit and the nature, timing and extent of our audit procedures on the individual financial statement line items and disclosures and in evaluating the effect of misstatements, both individually and in aggregate on the financial statements as a whole.
Based on our professional judgement, we determined materiality for the financial statements of each of the Company’s Funds as follows:
Overall materiality and how we determined it
100 basis points (fixed income funds) and 50 basis points (equity funds) (2020: 100 basis points (fixed income funds) and 50 basis points (equity funds)) of Net Asset Value ("NAV") for Funds in operation and Average Net Assets ("ANA") for the terminated Fund at 31 May 2021 for each of the Company’s Funds.
Rationale for benchmark applied
We have applied this benchmark because the main objective of the Company is to provide investors with a total return at a fund level.
We agreed with the Board of directors that we would report to them misstatements identified during our audit above 10 basis points (fixed income funds) and 5 basis points (equity funds), for NAV per share impacting differences (2020: 10 basis points (fixed income funds) and 5 basis points (equity funds), for NAV per share impacting differences) as well as misstatements below that amount that, in our view, warranted reporting for qualitative reasons.
Conclusions relating to going concern
Our evaluation of the directors’ assessment of the Company’s and Funds’ ability to continue to adopt the going concern basis of accounting included:
Obtaining an understanding of the key indicators that are monitored with respect to the going concern assumption and management’s future plans for the Company and Funds over the going concern period (being 12 months from the date of approval of the financial statements);
The financial statements describe the directors’ reasons why the financial statements of GlobalAccess Global Property Securities Fund have been prepared on a basis other than going concern;
We reviewed available board minutes during the period under audit and those available up to the date of this report;
Considering post year end capital activity as recorded in the underlying accounting records;
Making enquiries of management with respect to any planned significant redemptions of which they have been informed of;
Considering the liquidity risk management techniques which are available to the Company and Funds.
Based on the work we have performed, we have not identified any material uncertainties relating to events or conditions that, individually or collectively, may cast significant doubt on the Company’s and Funds’ ability to continue as a going concern for a period of at least twelve months from the date on which the financial statements are authorised for issue.
In auditing the financial statements, we have concluded that the directors’ use of the going concern basis of accounting in the preparation of the financial statements is appropriate.
However, because not all future events or conditions can be predicted, this conclusion is not a guarantee as to the Company’s and Funds’ ability to continue as a going concern.
Our responsibilities and the responsibilities of the directors with respect to going concern are described in the relevant sections of this report.
Reporting on other information
The other information comprises all of the information in the Annual report and audited financial statements other than the financial statements and our auditors’ report thereon. The directors are responsible for the other information. Our opinion on the financial statements does not cover the other information and, accordingly, we do not express an audit opinion or, except to the extent otherwise explicitly stated in this report, any form of assurance thereon. In connection with our audit of the financial statements, our responsibility is to read the other information and, in doing so, consider whether the other information is materially inconsistent with the financial statements or our knowledge obtained in the audit, or otherwise appears to be materially misstated. If we identify an apparent material inconsistency or material misstatement, we are required to perform procedures to conclude whether there is a material misstatement of the financial statements or a material misstatement of the other information. If, based on the work we have performed, we conclude that there is a material misstatement of this other information, we are required to report that fact. We have nothing to report based on these responsibilities.

41
Independent auditors’ report to the members of Barclays Multi-Manager Fund PLC (continued)
Reporting on Other Information (continued)
With respect to the Directors’ report, we also considered whether the disclosures required by the Companies Act 2014 have been included.
Based on the responsibilities described above and our work undertaken in the course of the audit, ISAs (Ireland) and the Companies Act 2014 require us to also report certain opinions and matters as described below:
• In our opinion, based on the work undertaken in the course of the audit, the information given in the Directors’ report for the year ended 31 May 2021 is consistent with the financial statements and has been prepared in accordance with applicable legal requirements.
• Based on our knowledge and understanding of the Company and its environment obtained in the course of the audit, we have not identified any material misstatements in the Directors’ report.
Responsibilities for the financial statements and the audit
Responsibilities of the directors for the financial statements
As explained more fully in the Statement of Directors' responsibilities set out on page 30, the directors are responsible for the preparation of the financial statements in accordance with the applicable framework and for being satisfied that they give a true and fair view.
The directors are also responsible for such internal control as they determine is necessary to enable the preparation of financial statements that are free from material misstatement, whether due to fraud or error.
In preparing the financial statements, the directors are responsible for assessing the Company’s and Funds’ ability to continue as going concerns, disclosing as applicable, matters related to going concern and using the going concern basis of accounting unless the directors either intend to liquidate the Company or to cease operations, or have no realistic alternative but to do so.
Auditors’ responsibilities for the audit of the financial statements
Our objectives are to obtain reasonable assurance about whether the financial statements as a whole are free from material misstatement, whether due to fraud or error, and to issue an auditors’ report that includes our opinion. Reasonable assurance is a high level of assurance, but is not a guarantee that an audit conducted in accordance with ISAs (Ireland) will always detect a material misstatement when it exists. Misstatements can arise from fraud or error and are considered material if, individually or in the aggregate, they could reasonably be expected to influence the economic decisions of users taken on the basis of these financial statements.
Our audit testing might include testing complete populations of certain transactions and balances, possibly using data auditing techniques. However, it typically involves selecting a limited number of items for testing, rather than testing complete populations. We will often seek to target particular items for testing based on their size or risk characteristics. In other cases, we will use audit sampling to enable us to draw a conclusion about the population from which the sample is selected.
A further description of our responsibilities for the audit of the financial statements is located on the IAASA website at:
https://www.iaasa.ie/getmedia/b2389013-1cf6-458b-9b8f-a98202dc9c3a/Description_of_auditors_responsibilities_for_audit.pdf.
This description forms part of our auditors’ report.
Use of this report
This report, including the opinions, has been prepared for and only for the Company’s members as a body in accordance with section 391 of the Companies Act 2014 and for no other purpose. We do not, in giving these opinions, accept or assume responsibility for any other purpose or to any other person to whom this report is shown or into whose hands it may come save where expressly agreed by our prior consent in writing.

42
Independent auditors’ report to the members of Barclays Multi-Manager Fund PLC (continued) Other required reporting
Companies Act 2014 opinions on other matters
We have obtained all the information and explanations which we consider necessary for the purposes of our audit. In our opinion the accounting records of the Company were sufficient to permit the financial statements to be readily and
properly audited. The financial statements are in agreement with the accounting records.
Companies Act 2014 exception reporting
Directors’ remuneration and transactions
Under the Companies Act 2014 we are required to report to you if, in our opinion, the disclosures of directors’ remuneration and transactions specified by sections 305 to 312 of that Act have not been made. We have no exceptions to report arising from this responsibility.
Mary Ruane for and on behalf of PricewaterhouseCoopers Chartered Accountants and Statutory Audit Firm Dublin September 2021

Barclays Multi-Manager Fund PLC Annual Report and Audited Financial Statements 2021
43
Statement of comprehensive income
Financial year ended
Financial year ended
Financial year ended
Financial year ended
Financial year ended
31 May 2020 31 May 2021 31 May 2020 31 May 2021 31 May 2020GBP GBP GBP USD USD
IncomeOperating income 1(c), 3 565,595 11,981,668 12,206,786 44,558 57,020Net (losses)/gains on financial assets and financial liabilities at fair value through profit or loss 4 (2,077,856) 95,664,809 (59,262,816) 3,948,856 12,053,891Total net (losses)/gains (1,512,261) 107,646,477 (47,056,030) 3,993,414 12,110,911
Operating expenses 5 (358,594) (3,193,105) (3,404,766) (1,094,576) (1,422,741)Net operating (loss)/profit (1,870,855) 104,453,372 (50,460,796) 2,898,838 10,688,170
Finance costsDistributions to holders of redeemable participating shares 1(e), 12 (547,654) (6,777,140) (10,678,110) (287,960) (1,022,980)Interest expense (331) (3,328) (345) (30,052) (48,000)(Loss)/profit for the financial year before tax (2,418,840) 97,672,904 (61,139,251) 2,580,826 9,617,190
Non-reclaimable withholding tax 1(q) (4,299) (49,405) (64,604) - 924(Loss)/profit for the financial year after tax (2,423,139) 97,623,499 (61,203,855) 2,580,826 9,618,114
(Decrease)/increase in net assets attributable to holders of redeemable participating shares (2,423,139) 97,623,499 (61,203,855) 2,580,826 9,618,114
GlobalAccess UK Alpha Fund*GlobalAccess UK Opportunities
FundGlobalAccess Global Government
Bond Fund
* *GlobalAccess UK Alpha Fund ceased trading on 31 March 2020.
There are no recognised gains or losses arising in the financial year other than the (decrease)/increase in net assets attributable to holders of redeemable participating shares of the Company. In arriving at the results for the financial year, all amounts above relate to continuing operations, with the exclusion of terminated funds during the year. The accompanying notes form an integral part of the financial statements.

Barclays Multi-Manager Fund PLC Annual Report and Audited Financial Statements 2021
44
Statement of comprehensive income (continued)
Financial year ended
Financial year ended
Financial year ended
Financial year ended
Financial year ended
Financial year ended
31 May 2021 31 May 2020 31 May 2021 31 May 2020 31 May 2021 31 May 2020USD USD USD USD USD USD
IncomeOperating income 1(c), 3 2,559,046 2,842,900 15,146,791 18,023,956 986,918 1,626,823Net gains/(losses) on financial assets and financial liabilities at fair value through profit or loss 4 39,290,258 (5,148,963) 266,273,170 (53,121,809) 153,059,786 (19,370,099)Total net income/(expense) 41,849,304 (2,306,063) 281,419,961 (35,097,853) 154,046,704 (17,743,276)
Operating expenses 5 (1,048,637) (1,044,229) (6,997,303) (6,514,501) (4,989,226) (6,243,330)Net operating profit/(loss) 40,800,667 (3,350,292) 274,422,658 (41,612,354) 149,057,478 (23,986,606)
Finance costsDistributions to holders of redeemable participating shares 1(e), 12 (718,348) (1,347,244) (5,535,256) (9,038,971) (27,575,279) (36,037,987)Interest expense (6,996) (3,393) (18,014) (35,326) (12,297) (40,591)Profit/(loss) for the financial year before tax 40,075,323 (4,700,929) 268,869,388 (50,686,651) 121,469,902 (60,065,184)
Non-reclaimable withholding tax 1(q) (316,440) (387,036) (1,768,109) (2,052,363) (34,623) 28,075Profit/(loss) for the financial year after tax 39,758,883 (5,087,965) 267,101,279 (52,739,014) 121,435,279 (60,037,109)
Increase/(decrease) in net assets attributable to holders of redeemable participating shares 39,758,883 (5,087,965) 267,101,279 (52,739,014) 121,435,279 (60,037,109)
GlobalAccess Asia Pacific (ex-Japan) Fund
GlobalAccess Emerging Market Equity Fund
GlobalAccess Global High Yield Bond Fund
There are no recognised gains or losses arising in the financial year other than the increase/(decrease) in net assets attributable to holders of redeemable participating shares of the Company. In arriving at the results for the financial year, all amounts above relate to continuing operations, with the exclusion of terminated funds during the year. The accompanying notes form an integral part of the financial statements.
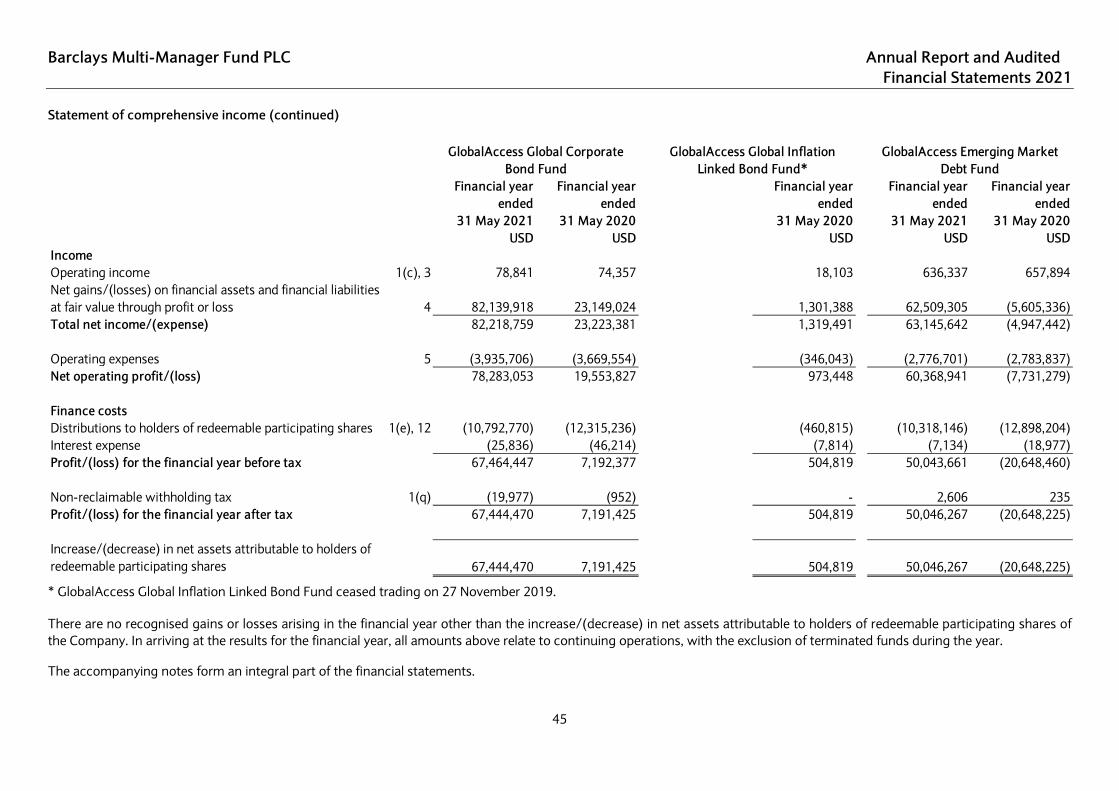
Barclays Multi-Manager Fund PLC Annual Report and Audited Financial Statements 2021
45
Statement of comprehensive income (continued)
Financial year ended
Financial year ended
Financial year ended
Financial year ended
Financial year ended
31 May 2021 31 May 2020 31 May 2020 31 May 2021 31 May 2020USD USD USD USD USD
IncomeOperating income 1(c), 3 78,841 74,357 18,103 636,337 657,894Net gains/(losses) on financial assets and financial liabilities at fair value through profit or loss 4 82,139,918 23,149,024 1,301,388 62,509,305 (5,605,336)Total net income/(expense) 82,218,759 23,223,381 1,319,491 63,145,642 (4,947,442)
Operating expenses 5 (3,935,706) (3,669,554) (346,043) (2,776,701) (2,783,837)Net operating profit/(loss) 78,283,053 19,553,827 973,448 60,368,941 (7,731,279)
Finance costsDistributions to holders of redeemable participating shares 1(e), 12 (10,792,770) (12,315,236) (460,815) (10,318,146) (12,898,204)Interest expense (25,836) (46,214) (7,814) (7,134) (18,977)Profit/(loss) for the financial year before tax 67,464,447 7,192,377 504,819 50,043,661 (20,648,460)
Non-reclaimable withholding tax 1(q) (19,977) (952) - 2,606 235Profit/(loss) for the financial year after tax 67,444,470 7,191,425 504,819 50,046,267 (20,648,225)
Increase/(decrease) in net assets attributable to holders of redeemable participating shares 67,444,470 7,191,425 504,819 50,046,267 (20,648,225)
GlobalAccess Global Corporate Bond Fund
GlobalAccess Global Inflation Linked Bond Fund*
GlobalAccess Emerging Market Debt Fund
* GlobalAccess Global Inflation Linked Bond Fund ceased trading on 27 November 2019. There are no recognised gains or losses arising in the financial year other than the increase/(decrease) in net assets attributable to holders of redeemable participating shares of the Company. In arriving at the results for the financial year, all amounts above relate to continuing operations, with the exclusion of terminated funds during the year. The accompanying notes form an integral part of the financial statements.

Barclays Multi-Manager Fund PLC Annual Report and Audited Financial Statements 2021
46
Statement of comprehensive income (continued)
Financial year ended
Financial year ended
Financial year ended
Financial year ended
Financial year ended
Financial year ended
31 May 2021 31 May 2020 31 May 2021 31 May 2020 31 May 2021 31 May 2020USD USD USD USD USD USD
IncomeOperating income 1(c), 3 4,125,212 3,479,675 64,956 274,938 1,274,438 1,821,829Net gains/(losses) on financial assets and financial liabilities at fair value through profit or loss 4 28,990,762 (47,610,299) 18,905,864 (1,807,393) 51,625,721 1,187,093Total net income/(expense) 33,115,974 (44,130,624) 18,970,820 (1,532,455) 52,900,159 3,008,922
Operating expenses 5 (1,279,404) (1,173,820) (1,328,891) (1,968,160) (1,442,442) (1,552,783)Net operating profit/(loss) 31,836,570 (45,304,444) 17,641,929 (3,500,615) 51,457,717 1,456,139
Finance costsDistributions to holders of redeemable participating shares 1(e), 12 (4,525,950) (2,124,634) (3,120,680) (6,864,479) - (192)Interest expense (2,680) (3,183) (21,287) (58,365) (1,445) (3,577)Profit/(loss) for the financial year before tax 27,307,940 (47,432,261) 14,499,962 (10,423,459) 51,456,272 1,452,370
Non-reclaimable withholding tax 1(q) (636,426) (666,982) (15,204) (8,409) (322,188) (491,820)Profit/(loss) for the financial year after tax 26,671,514 (48,099,243) 14,484,758 (10,431,868) 51,134,084 960,550
Increase/(decrease) in net assets attributable to holders of redeemable participating shares 26,671,514 (48,099,243) 14,484,758 (10,431,868) 51,134,084 960,550
GlobalAccess Global Property Securities Fund*
GlobalAccess Global Short Duration Bond Fund
GlobalAccess US Small & Mid Cap Equity Fund
* GlobalAccess Global Property Securities Fund ceased trading on 23 February 2021. There are no recognised gains or losses arising in the financial year other than the increase/(decrease) in net assets attributable to holders of redeemable participating shares of the Company. In arriving at the results for the financial year, all amounts above relate to continuing operations, , with the exclusion of terminated funds during the year. The accompanying notes form an integral part of the financial statements.

Barclays Multi-Manager Fund PLC Annual Report and Audited Financial Statements 2021
47
Statement of comprehensive income (continued)
Financial year ended
Financial year ended
Financial year ended
Financial year ended
Financial year ended
Financial year ended
31 May 2021 31 May 2020 31 May 2021 31 May 2020 31 May 2021 31 May 2020USD USD USD USD USD USD
IncomeOperating income 1(c), 3 3,835,304 4,692,098 3,699,477 5,105,178 579,026 1,023,421Net gains/(losses) on financial assets and financial liabilities at fair value through profit or loss 4 100,086,576 34,537,712 46,803,798 (445,385) 45,562,566 (30,133,732)Total net income/(expense) 103,921,880 39,229,810 50,503,275 4,659,793 46,141,592 (29,110,311)
Operating expenses 5 (2,199,420) (2,182,183) (1,546,320) (1,907,303) (3,642,244) (5,562,156)Net operating profit/(loss) 101,722,460 37,047,627 48,956,955 2,752,490 42,499,348 (34,672,467)
Finance costsDistributions to holders of redeemable participating shares 1(e), 12 (922,164) (1,435,557) (2,628,934) (4,684,723) (18,067,651) (26,139,109)Interest expense (2,640) (11,113) (4,625) (8,101) (10,859) (32,026)Profit/(loss) for the financial year before tax 100,797,656 35,600,957 46,323,396 (1,940,334) 24,420,838 (60,843,602)
Non-reclaimable withholding tax 1(q) (1,044,980) (1,243,980) (691,899) (853,022) (1,443,270) (1,852,199)Profit/(loss) for the financial year after tax 99,752,676 34,356,977 45,631,497 (2,793,356) 22,977,568 (62,695,801)
Increase/(decrease) in net assets attributable to holders of redeemable participating shares 99,752,676 34,356,977 45,631,497 (2,793,356) 22,977,568 (62,695,801)
GlobalAccess US Equity Fund
GlobalAccess Global Equity Income Fund
GlobalAccess Emerging Market Local Currency Debt Fund
There are no recognised gains or losses arising in the financial year other than the increase/(decrease) in net assets attributable to holders of redeemable participating shares of the Company. In arriving at the results for the financial year, all amounts above relate to continuing operations, with the exclusion of terminated funds during the year. The accompanying notes form an integral part of the financial statements.

Barclays Multi-Manager Fund PLC Annual Report and Audited Financial Statements 2021
48
Statement of comprehensive income (continued)
Financial year ended
Financial year ended
Financial year ended
Financial year ended
Financial year ended
Financial year ended
31 May 2021 31 May 2020 31 May 2021 31 May 2020 31 May 2021 31 May 2020EUR EUR JPY JPY GBP GBP
IncomeOperating income 1(c), 3 3,332,906 3,232,836 521,179,407 614,441,833 43,374,567 51,557,060Net gains/(losses) on financial assets and financial liabilities at fair value through profit or loss 4 34,790,846 4,564,997 6,743,796,040 927,247,282 848,059,436 (122,661,458)Total net income/(expense) 38,123,752 7,797,833 7,264,975,447 1,541,689,115 891,434,003 (71,104,398)
Operating expenses 5 (1,585,038) (1,884,731) (266,621,611) (249,182,336) (30,675,475) (36,055,815)Net operating profit/(loss) 36,538,714 5,913,102 6,998,353,836 1,292,506,779 860,758,528 (107,160,213)
Finance costsDistributions to holders of redeemable participating shares 1(e), 12 (990,476) (2,658,941) (197,873,070) (275,797,874) (72,378,080) (106,190,451)Interest expense (11,036) (14,640) (7,489,574) (3,623,314) (173,756) (290,941)Profit/(loss) for the financial year before tax 35,537,202 3,239,521 6,792,991,192 1,013,085,591 788,206,692 (213,641,605)
Non-reclaimable withholding tax 1(q) (155,318) (51,613) (78,041,834) (92,116,679) (5,452,185) (6,752,716)Profit/(loss) for the financial year after tax 35,381,884 3,187,908 6,714,949,358 920,968,912 782,754,507 (220,394,321)
Increase/(decrease) in net assets attributable to holders of redeemable participating shares 35,381,884 3,187,908 6,714,949,358 920,968,912 782,754,507 (220,394,321)
GlobalAccess Europe (ex-UK) Alpha Fund GlobalAccess Japan Fund Aggregated total
There are no recognised gains or losses arising in the financial year other than the increase/(decrease) in net assets attributable to holders of redeemable participating shares of the Company. In arriving at the results for the financial year, all amounts above relate to continuing operations, with the exclusion of terminated funds during the year. The accompanying notes form an integral part of the financial statements.

Barclays Multi-Manager Fund PLC Annual Report and Audited Financial Statements 2021
49
Statement of financial position
Financial year ended
Financial year ended
Financial year ended
Financial year ended
Financial year ended
31 May 2020 31 May 2021 31 May 2020 31 May 2021 31 May 2020GBP GBP GBP USD USD
Current assetsFinancial assets at fair value through profit or loss 1(b), 2 - 419,077,627 339,302,052 135,730,264 156,467,709Cash and cash equivalents 1(f), 2, 6 93,339 7,190,609 13,422,003 2,104,263 3,671,445Margin cash due from broker 1(g), 2, 6 - 994,071 1,001,411 36,409 235,971Cash held as collateral 1(h), 6 - - - 486,000 400,000Other receivables 1(i), 2, 7 4,556 2,739,876 2,338,119 38,508,032 36,150,653Total current assets 97,895 430,002,183 356,063,585 176,864,968 196,925,778
Current liabilitiesFinancial liabilities at fair value through profit or loss 1(b), 2 - (9,479) (8,688) (1,445,151) (1,931,355)Bank overdraft 1(f), 8 (8,052) - - - -Margin cash due to broker 1(g), 2, 8 - - - (222,656) (132,593)Cash pledged as collateral 1(h), 8 - - - - (554,000)Other payables 1(k), 2, 9 (89,843) (3,663,958) (1,899,654) (51,412,424) (52,811,845)
Total current liabilities (excluding net assets attributable to holders of redeemable participating shares) (97,895) (3,673,437) (1,908,342) (53,080,231) (55,429,793)
Net assets attributable to holders of redeemable participating shares 11 - 426,328,746 354,155,243 123,784,737 141,495,985
GlobalAccess UK Alpha Fund*GlobalAccess UK Opportunities
FundGlobalAccess Global Government
Bond Fund
* GlobalAccess UK Alpha Fund ceased trading on 31 March 2020. The accompanying notes form an integral part of the financial statements.

Barclays Multi-Manager Fund PLC Annual Report and Audited Financial Statements 2021
50
Statement of financial position (continued)
Financial year ended
Financial year ended
Financial year ended
Financial year ended
Financial year ended
Financial year ended
31 May 2021 31 May 2020 31 May 2021 31 May 2020 31 May 2021 31 May 2020USD USD USD USD USD USD
Current assetsFinancial assets at fair value through profit or loss 1(b), 2 103,347,930 70,356,681 686,583,443 474,419,600 376,486,419 580,231,479Cash and cash equivalents 1(f), 2, 6 2,460,513 3,034,204 36,088,679 15,787,655 7,368,327 6,487,964Margin cash due from broker 1(g), 2, 6 81,248 239,800 1,769,794 614,852 - -Other receivables 1(i), 2, 7 591,907 1,124,076 4,716,637 2,710,079 1,689,693 4,987,501Total current assets 106,481,598 74,754,761 729,158,553 493,532,186 385,544,439 591,706,944
Current liabilitiesFinancial liabilities at fair value through profit or loss 1(b), 2 (384) (6,210) (20,996) (14,137) (153,618) (574,102)Bank overdraft 1(f), 8 - - (1,776) - (1,332,197) -Other payables 1(k), 2, 9 (353,275) (859,230) (4,038,981) (3,580,120) (8,230,087) (6,833,017)
Total current liabilities (excluding net assets attributable to holders of redeemable participating shares) (353,659) (865,440) (4,061,753) (3,594,257) (9,715,902) (7,407,119)
Net assets attributable to holders of redeemable participating shares 11 106,127,939 73,889,321 725,096,800 489,937,929 375,828,537 584,299,825
GlobalAccess Asia Pacific (ex-Japan) Fund
GlobalAccess Emerging Market Equity Fund
GlobalAccess Global High Yield Bond Fund
The accompanying notes form an integral part of the financial statements.

Barclays Multi-Manager Fund PLC Annual Report and Audited Financial Statements 2021
51
Statement of financial position (continued)
Financial year ended
Financial year ended
Financial year ended
Financial year ended
Financial year ended
31 May 2021 31 May 2020 31 May 2020 31 May 2021 31 May 2020USD USD USD USD USD
Current assetsFinancial assets at fair value through profit or loss 1(b), 2 579,244,198 482,749,083 - 297,358,748 255,582,702Cash and cash equivalents 1(f), 2, 6 5,681,396 3,322,616 36,391 12,651,196 10,653,798Margin cash due from broker 1(g), 2, 6 1,237,432 1,746,735 - 1,135,041 734,906Cash held as collateral 1(h), 6 1,650,000 390,000 - 50,000 110,000Other receivables 1(i), 2, 7 9,974,785 9,356,967 - 2,053,569 3,075,335Total current assets 597,787,811 497,565,401 36,391 313,248,554 270,156,741
Current liabilitiesFinancial liabilities at fair value through profit or loss 1(b), 2 (3,512,711) (2,954,764) - (1,201,866) (587,123)Bank overdraft 1(f), 8 - - - - -Margin cash due to broker 1(g), 2, 8 (358,143) (40,846) - (366,341) (127,149)Cash pledged as collateral 1(h), 8 - (280,000) - - (50,000)Other payables 1(k), 2, 9 (11,372,220) (14,981,393) (36,391) (2,260,303) (2,933,359)
Total current liabilities (excluding net assets attributable to holders of redeemable participating shares) (15,243,074) (18,257,003) (36,391) (3,828,510) (3,697,631)
Net assets attributable to holders of redeemable participating shares 11 582,544,737 479,308,398 - 309,420,044 266,459,110
GlobalAccess Global Corporate Bond Fund
GlobalAccess Global Inflation Linked Bond Fund*
GlobalAccess Emerging Market Debt Fund
* GlobalAccess Global Inflation Linked Bond Fund ceased trading on 27 November 2019. The accompanying notes form an integral part of the financial statements.

Barclays Multi-Manager Fund PLC Annual Report and Audited Financial Statements 2021
52
Statement of financial position (continued)
Financial year ended
Financial year ended
Financial year ended
Financial year ended
Financial year ended
Financial year ended
31 May 2021 31 May 2020 31 May 2021 31 May 2020 31 May 2021 31 May 2020USD USD USD USD USD USD
Current assetsFinancial assets at fair value through profit or loss 1(b), 2 - 177,600,844 117,707,141 179,561,529 122,882,767 90,965,571Cash and cash equivalents 1(f), 2, 6 115,708 6,109,531 9,234,854 9,113,400 3,629,737 3,244,997Margin cash due from broker 1(g), 2, 6 - - 2,319,577 1,969,041 154,303 316,944Cash held as collateral 1(h), 6 - - 20,000 230,000 - -Other receivables 1(i), 2, 7 5,991 1,014,388 1,377,869 1,951,502 580,736 207,985Total current assets 121,699 184,724,763 130,659,441 192,825,472 127,247,543 94,735,497
Current liabilitiesFinancial liabilities at fair value through profit or loss 1(b), 2 - (1,158) (612,730) (983,341) (13,997) (10,297)Bank overdraft 1(f), 8 (30,557) - (4) (37,308) (107) -Margin cash due to broker 1(g), 2, 8 - - (2,259,026) (2,072,986) - -Cash pledged as collateral 1(h), 8 - - - (260,000) - -Other payables 1(k), 2, 9 (91,142) (2,250,678) (7,055,429) (3,999,494) (1,174,890) (604,127)
Total current liabilities (excluding net assets attributable to holders of redeemable participating shares) (121,699) (2,251,836) (9,927,189) (7,353,129) (1,188,994) (614,424)
Net assets attributable to holders of redeemable participating shares 11 - 182,472,927 120,732,252 185,472,343 126,058,549 94,121,073
GlobalAccess Global Property Securities Fund*
GlobalAccess Global Short Duration Bond Fund
GlobalAccess US Small & Mid Cap Equity Fund
* GlobalAccess Global Property Securities Fund ceased trading on 23 February 2021. The accompanying notes form an integral part of the financial statements.
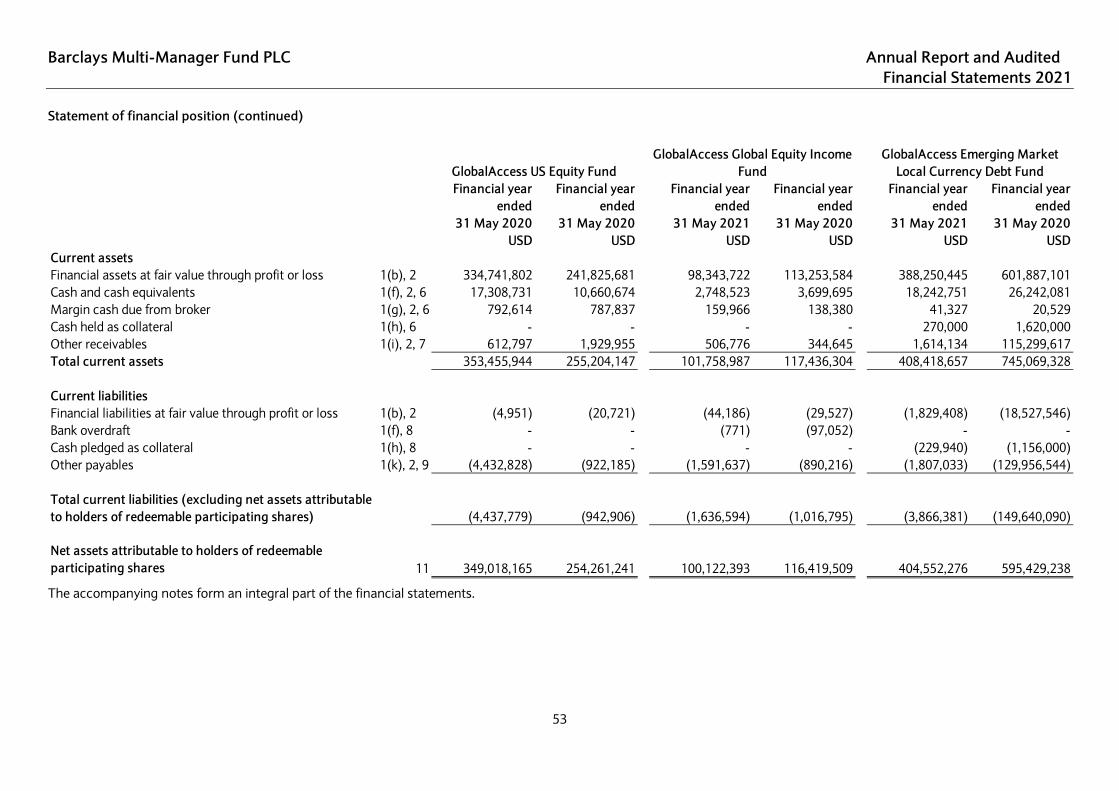
Barclays Multi-Manager Fund PLC Annual Report and Audited Financial Statements 2021
53
Statement of financial position (continued)
Financial year ended
Financial year ended
Financial year ended
Financial year ended
Financial year ended
Financial year ended
31 May 2020 31 May 2020 31 May 2021 31 May 2020 31 May 2021 31 May 2020USD USD USD USD USD USD
Current assetsFinancial assets at fair value through profit or loss 1(b), 2 334,741,802 241,825,681 98,343,722 113,253,584 388,250,445 601,887,101Cash and cash equivalents 1(f), 2, 6 17,308,731 10,660,674 2,748,523 3,699,695 18,242,751 26,242,081Margin cash due from broker 1(g), 2, 6 792,614 787,837 159,966 138,380 41,327 20,529Cash held as collateral 1(h), 6 - - - - 270,000 1,620,000Other receivables 1(i), 2, 7 612,797 1,929,955 506,776 344,645 1,614,134 115,299,617Total current assets 353,455,944 255,204,147 101,758,987 117,436,304 408,418,657 745,069,328
Current liabilitiesFinancial liabilities at fair value through profit or loss 1(b), 2 (4,951) (20,721) (44,186) (29,527) (1,829,408) (18,527,546)Bank overdraft 1(f), 8 - - (771) (97,052) - -Cash pledged as collateral 1(h), 8 - - - - (229,940) (1,156,000)Other payables 1(k), 2, 9 (4,432,828) (922,185) (1,591,637) (890,216) (1,807,033) (129,956,544)
Total current liabilities (excluding net assets attributable to holders of redeemable participating shares) (4,437,779) (942,906) (1,636,594) (1,016,795) (3,866,381) (149,640,090)
Net assets attributable to holders of redeemable participating shares 11 349,018,165 254,261,241 100,122,393 116,419,509 404,552,276 595,429,238
GlobalAccess US Equity FundGlobalAccess Global Equity Income
FundGlobalAccess Emerging Market
Local Currency Debt Fund
The accompanying notes form an integral part of the financial statements.

Barclays Multi-Manager Fund PLC Annual Report and Audited Financial Statements 2021
54
Statement of financial position (continued)
Financial year ended
Financial year ended
Financial year ended
Financial year ended
Financial year ended
Financial year ended
31 May 2020 31 May 2020 31 May 2021 31 May 2020 31 May 2021 31 May 2020EUR EUR JPY JPY GBP GBP
Current assetsFinancial assets at fair value through profit or loss 1(b), 2 116,758,722 118,717,575 27,457,715,586 22,808,368,203 2,975,832,377 3,387,643,439Cash and cash equivalents 1(f), 2, 6 2,358,091 1,580,851 1,003,562,211 779,048,706 98,426,279 103,343,091Margin cash due from broker 1(g), 2, 6 929 929 102,460,090 101,070,083 7,090,062 7,265,395Cash held as collateral 1(h), 6 - - - - 1,741,821 2,224,379Other receivables 1(i), 2, 7 124,488 381,984 338,365,427 430,457,578 48,802,606 150,019,687Total current assets 119,242,230 120,681,339 28,902,103,314 24,118,944,570 3,131,893,145 3,650,495,991
Current liabilitiesFinancial liabilities at fair value through profit or loss 1(b), 2 (31,429) (156,586) (3,737,907) (2,886,391) (6,279,328) (20,910,772)Bank overdraft 1(f), 8 - - - - (960,543) (116,732)Margin cash due to broker 1(g), 2, 8 - - - - (2,255,480) (1,919,901)Cash pledged as collateral 1(h), 8 - - - - (161,759) (1,860,390)Other payables 1(k), 2, 9 (1,103,986) (993,840) (169,198,195) (123,096,527) (71,702,423) (182,290,912)
Total current liabilities (excluding net assets attributable to holders of redeemable participating shares) (1,135,415) (1,150,426) (172,936,102) (125,982,918) (81,359,533) (207,098,707)
Net assets attributable to holders of redeemable participating shares 11 118,106,815 119,530,913 28,729,167,212 23,992,961,652 3,050,533,612 3,443,397,284
GlobalAccess Europe (ex-UK) Alpha Fund GlobalAccess Japan Fund Aggregated total
The accompanying notes form an integral part of the financial statements.
_________________________________ _____________________________ Séan Blake David Kingston Dated: 20 September 2021

Barclays Multi-Manager Fund PLC Annual Report and Audited Financial Statements 2021
55
Statement of changes in net assets attributable to holders of redeemable participating shares
Financial year ended
Financial year ended
Financial year ended
Financial year ended
Financial year ended
31 May 2020 31 May 2021 31 May 2020 31 May 2021 31 May 2020GBP GBP GBP USD USD
Net assets attributable to holders of redeemable participating shares at the beginning of the financial year 27,980,124 354,155,243 415,990,378 141,495,985 222,843,584
(Decrease)/increase in net assets attributable to holders of redeemable participating shares (2,423,139) 97,623,499 (61,203,855) 2,580,826 9,618,114
Share transactionsProceeds from issue of redeemable participating shares 5,874 100,653,416 70,592,903 23,280,773 8,786,556Payments on redemptions of redeemable participating shares (25,562,859) (126,103,412) (71,224,183) (43,572,847) (99,752,269)Net changes in net assets resulting from share transactions (25,556,985) (25,449,996) (631,280) (20,292,074) (90,965,713)
Net (decrease)/increase in shareholders' funds (27,980,124) 72,173,503 (61,835,135) (17,711,248) (81,347,599)
Net assets attributable to holders of redeemable participating shares at the end of the financial year 11 - 426,328,746 354,155,243 123,784,737 141,495,985
GlobalAccess UK Alpha Fund*GlobalAccess UK Opportunities
FundGlobalAccess Global Government
Bond Fund
* GlobalAccess UK Alpha Fund ceased trading on 31 March 2020. The accompanying notes form an integral part of the financial statements.

Barclays Multi-Manager Fund PLC Annual Report and Audited Financial Statements 2021
56
Statement of changes in net assets attributable to holders of redeemable participating shares (continued)
Financial year ended
Financial year ended
Financial year ended
Financial year ended
Financial year ended
Financial year ended
31 May 2021 31 May 2020 31 May 2021 31 May 2020 31 May 2021 31 May 2020USD USD USD USD USD USD
Net assets attributable to holders of redeemable participating shares at the beginning of the financial year 73,889,321 101,160,427 489,937,929 605,549,648 584,299,825 879,648,299
Increase/(decrease) in net assets attributable to holders of redeemable participating shares 39,758,883 (5,087,965) 267,101,279 (52,739,014) 121,435,279 (60,037,109)
Share transactionsProceeds from issue of redeemable participating shares 15,118,299 3,090,241 91,709,126 59,127,854 94,767,563 86,071,117Payments on redemptions of redeemable participating shares (22,638,564) (25,273,382) (123,651,534) (122,000,559) (424,674,130) (321,382,482)Net changes in net assets resulting from share transactions (7,520,265) (22,183,141) (31,942,408) (62,872,705) (329,906,567) (235,311,365)
Net increase/(decrease) in shareholders' funds 32,238,618 (27,271,106) 235,158,871 (115,611,719) (208,471,288) (295,348,474)
Net assets attributable to holders of redeemable participating shares at the end of the financial year 11 106,127,939 73,889,321 725,096,800 489,937,929 375,828,537 584,299,825
GlobalAccess Asia Pacific (ex-Japan) Fund
GlobalAccess Emerging Market Equity Fund
GlobalAccess Global High Yield Bond Fund
The accompanying notes form an integral part of the financial statements.

Barclays Multi-Manager Fund PLC Annual Report and Audited Financial Statements 2021
57
Statement of changes in net assets attributable to holders of redeemable participating shares (continued)
Financial year ended
Financial year ended
Financial year ended
Financial year ended
Financial year ended
Financial year ended
31 May 2021 31 May 2020 31 May 2021 31 May 2020 31 May 2021 31 May 2020USD USD USD USD USD USD
Net assets attributable to holders of redeemable participating shares at the beginning of the financial year 479,308,398 525,293,255 48,539,831 266,459,110 323,769,981
Increase/(decrease) in net assets attributable to holders of redeemable participating shares 67,444,470 7,191,425 504,819 50,046,267 (20,648,225)
Share transactionsProceeds from issue of redeemable participating shares 179,146,402 51,659,908 507,899 48,339,090 35,279,399Payments on redemptions of redeemable participating shares (143,354,533) (104,836,190) (49,552,549) (55,424,423) (71,942,045)Net changes in net assets resulting from share transactions 35,791,869 (53,176,282) (49,044,650) (7,085,333) (36,662,646)
Net increase/(decrease) in shareholders' funds 103,236,339 (45,984,857) (48,539,831) 42,960,934 (57,310,871)
Net assets attributable to holders of redeemable participating shares at the end of the financial year 11 582,544,737 479,308,398 - 309,420,044 266,459,110
GlobalAccess Global Corporate Bond Fund
GlobalAccess Global Inflation Linked Bond Fund*
GlobalAccess Emerging Market Debt Fund
* GlobalAccess Global Inflation Linked Bond Fund ceased trading on 27 November 2019. The accompanying notes form an integral part of the financial statements.

Barclays Multi-Manager Fund PLC Annual Report and Audited Financial Statements 2021
58
Statement of changes in net assets attributable to holders of redeemable participating shares (continued)
Financial year ended
Financial year ended
Financial year ended
Financial year ended
Financial year ended
Financial year ended
31 May 2021 31 May 2020 31 May 2021 31 May 2020 31 May 2021 31 May 2020USD USD USD USD USD USD
Net assets attributable to holders of redeemable participating shares at the beginning of the financial year 182,472,927 79,869,367 185,472,343 281,149,525 94,121,073 135,704,800
Increase/(decrease) in net assets attributable to holders of redeemable participating shares 26,671,514 (48,099,243) 14,484,758 (10,431,868) 51,134,084 960,550
Share transactionsProceeds from issue of redeemable participating shares 14,449,074 179,421,359 33,018,034 65,769,089 17,365,794 5,049,184Payments on redemptions of redeemable participating shares (223,593,515) (28,718,556) (112,242,883) (151,014,403) (36,562,402) (47,593,461)Net changes in net assets resulting from share transactions (209,144,441) 150,702,803 (79,224,849) (85,245,314) (19,196,608) (42,544,277)
Net (decrease)/increase in shareholders' funds (182,472,927) 102,603,560 (64,740,091) (95,677,182) 31,937,476 (41,583,727)
Net assets attributable to holders of redeemable participating shares at the end of the financial year 11 - 182,472,927 120,732,252 185,472,343 126,058,549 94,121,073
GlobalAccess Global Property Securities Fund*
GlobalAccess Global Short Duration Bond Fund
GlobalAccess US Small & Mid Cap Equity Fund
* GlobalAccess Property Securities Fund ceased trading on 23 February 2021. The accompanying notes form an integral part of the financial statements.

Barclays Multi-Manager Fund PLC Annual Report and Audited Financial Statements 2021
59
Statement of changes in net assets attributable to holders of redeemable participating shares (continued)
Financial year ended
Financial year ended
Financial year ended
Financial year ended
Financial year ended
Financial year ended
31 May 2021 31 May 2020 31 May 2021 31 May 2020 31 May 2021 31 May 2020USD USD USD USD USD USD
Net assets attributable to holders of redeemable participating shares at the beginning of the financial year 254,261,241 298,326,778 116,419,509 190,231,390 595,429,238 425,670,001
Increase/(decrease) in net assets attributable to holders of redeemable participating shares 99,752,676 34,356,977 45,631,497 (2,793,356) 22,977,568 (62,695,801)
Share transactionsProceeds from issue of redeemable participating shares 60,537,217 6,463,276 9,751,549 2,751,003 78,860,453 408,399,227Payments on redemptions of redeemable participating shares (65,532,969) (84,885,790) (71,680,162) (73,769,528) (292,714,983) (175,944,189)Net changes in net assets resulting from share transactions (4,995,752) (78,422,514) (61,928,613) (71,018,525) (213,854,530) 232,455,038
Net increase/(decrease) in shareholders' funds 94,756,924 (44,065,537) (16,297,116) (73,811,881) (190,876,962) 169,759,237
Net assets attributable to holders of redeemable participating shares at the end of the financial year 11 349,018,165 254,261,241 100,122,393 116,419,509 404,552,276 595,429,238
GlobalAccess US Equity FundGlobalAccess Global Equity Income
FundGlobalAccess Emerging Market
Local Currency Debt Fund
The accompanying notes form an integral part of the financial statements.
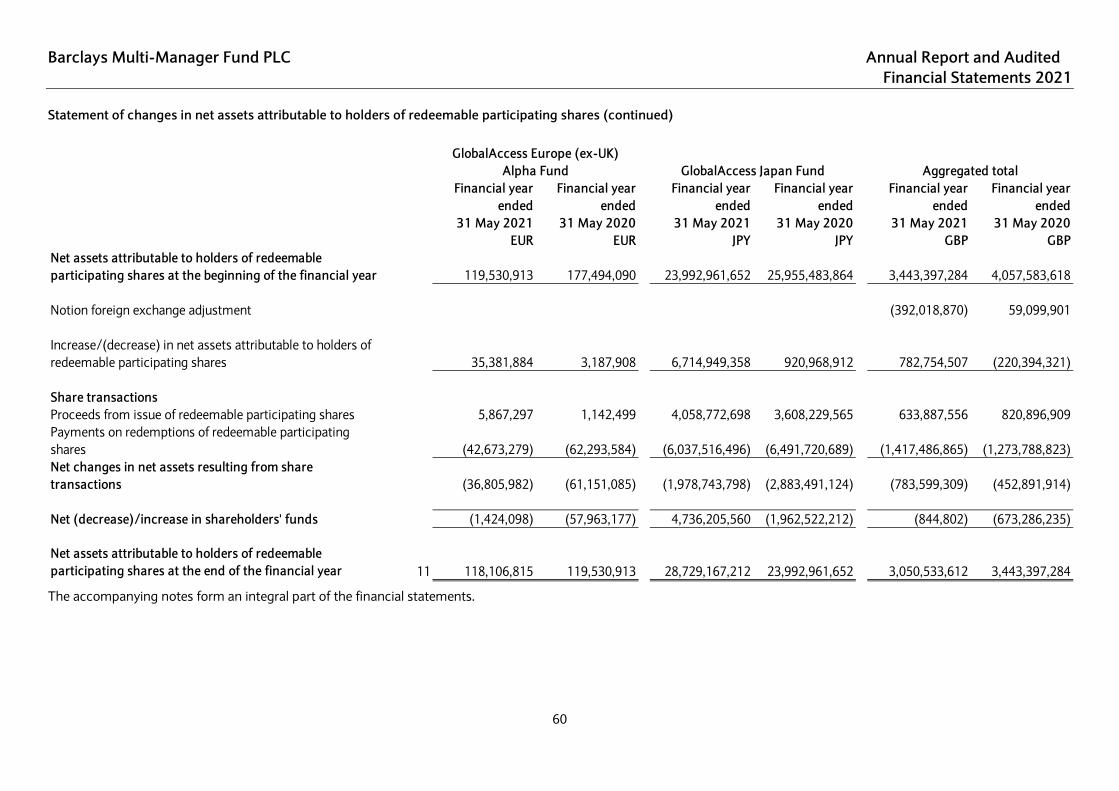
Barclays Multi-Manager Fund PLC Annual Report and Audited Financial Statements 2021
60
Statement of changes in net assets attributable to holders of redeemable participating shares (continued)
Financial year ended
Financial year ended
Financial year ended
Financial year ended
Financial year ended
Financial year ended
31 May 2021 31 May 2020 31 May 2021 31 May 2020 31 May 2021 31 May 2020EUR EUR JPY JPY GBP GBP
Net assets attributable to holders of redeemable participating shares at the beginning of the financial year 119,530,913 177,494,090 23,992,961,652 25,955,483,864 3,443,397,284 4,057,583,618
Notion foreign exchange adjustment (392,018,870) 59,099,901
Increase/(decrease) in net assets attributable to holders of redeemable participating shares 35,381,884 3,187,908 6,714,949,358 920,968,912 782,754,507 (220,394,321)
Share transactionsProceeds from issue of redeemable participating shares 5,867,297 1,142,499 4,058,772,698 3,608,229,565 633,887,556 820,896,909Payments on redemptions of redeemable participating shares (42,673,279) (62,293,584) (6,037,516,496) (6,491,720,689) (1,417,486,865) (1,273,788,823)Net changes in net assets resulting from share transactions (36,805,982) (61,151,085) (1,978,743,798) (2,883,491,124) (783,599,309) (452,891,914)
Net (decrease)/increase in shareholders' funds (1,424,098) (57,963,177) 4,736,205,560 (1,962,522,212) (844,802) (673,286,235)
Net assets attributable to holders of redeemable participating shares at the end of the financial year 11 118,106,815 119,530,913 28,729,167,212 23,992,961,652 3,050,533,612 3,443,397,284
GlobalAccess Europe (ex-UK) Alpha Fund GlobalAccess Japan Fund Aggregated total
The accompanying notes form an integral part of the financial statements.

Barclays Multi-Manager Fund PLC Annual Report and Audited Financial Statements 2021
61
Statement of cash flows
Financial year ended
Financial year ended
Financial year ended
Financial year ended
Financial year ended
31 May 2020 31 May 2021 31 May 2020 31 May 2021 31 May 2020GBP GBP GBP USD USD
Cash flows from operating profitsProceeds from sale of financial assets 32,376,146 127,483,868 72,937,935 687,557,811 962,026,318Purchases of financial assets (7,805,786) (110,935,117) (76,232,135) (669,673,971) (876,095,585)Interest received 176 1,328 2,269 2,035,757 2,948,714Net dividends received 755,996 11,204,540 13,368,728 - -Other income/(expense) 5,036 4,376 13,444 (31,921) 416,997Margin cash due from/(to) broker 96,569 7,340 952,085 289,625 (543,962)Cash (pledged)/held as collateral - - - (640,000) 154,000Operating expenses paid (419,887) (3,026,286) (3,619,642) (1,136,334) (1,521,383)Net cash provided by operating activities 25,008,250 24,740,049 7,422,684 18,400,967 87,385,099
Cash flows from financing activitiesDistributions paid to holders of redeemable participating shares (547,654) (6,777,140) (10,678,110) (287,960) (1,022,980)Interest paid (297) (3,297) (348) (30,340) (47,626)Share transactionsAmounts received from issue of redeemable participating shares 5,923 100,961,417 70,724,410 23,769,552 8,359,890Amounts paid on redemption of redeemable participating shares (25,562,859) (125,020,121) (72,171,141) (43,594,746) (99,903,612)Net cash (used in) financing activities (26,104,887) (30,839,141) (12,125,189) (20,143,494) (92,614,328)
Net (decrease) in cash and cash equivalents (1,096,637) (6,099,092) (4,702,505) (1,742,527) (5,229,229)
Cash and cash equivalents at the beginning of the financial year 1,166,662 13,422,003 17,796,987 3,671,445 9,075,129Exchange on cash and cash equivalents 15,262 (132,302) 327,521 175,345 (174,455)Cash and cash equivalents at the end of the financial year 85,287 7,190,609 13,422,003 2,104,263 3,671,445
GlobalAccess UK Alpha Fund*GlobalAccess UK Opportunities
FundGlobalAccess Global Government
Bond Fund
* GlobalAccess UK Alpha Fund ceased trading on 31 March 2020. The accompanying notes form an integral part of the financial statements.

Barclays Multi-Manager Fund PLC Annual Report and Audited Financial Statements 2021
62
Statement of cash flows (continued)
Financial year ended
Financial year ended
Financial year ended
Financial year ended
Financial year ended
Financial year ended
31 May 2021 31 May 2020 31 May 2021 31 May 2020 31 May 2021 31 May 2020USD USD USD USD USD USD
Cash flows from operating profitsProceeds from sale of financial assets 36,997,099 49,548,842 382,698,030 211,485,588 953,541,621 999,571,230Purchases of financial assets (31,454,867) (26,788,011) (334,238,869) (170,524,025) (595,930,029) (760,861,334)Interest received 11,364 8,395 8,917 301,974 46,158 82,549Net dividends received 1,888,398 2,603,614 13,053,194 16,430,863 901,338 1,689,314Other income 6,164 6,605 2,246 8,008 3,655,750 5,245,318Margin cash due from/(to) broker 158,552 (113,204) (1,154,942) 3,922,408 - -Cash held/(pledged) as collateral - - - - - -Operating expenses paid (955,784) (1,160,315) (6,401,160) (7,078,654) (5,309,053) (7,101,238)Net cash provided by operating activities 6,650,926 24,105,926 53,967,416 54,546,162 356,905,785 238,625,839
Cash flows from financing activitiesDistributions paid to holders of redeemable participating shares (718,348) (1,347,244) (5,535,256) (9,038,971) (27,575,279) (36,037,987)Interest paid (6,998) (3,448) (17,979) (35,978) (12,043) (40,782)Share transactionsAmounts received from issue of redeemable participating shares 15,343,724 3,078,517 89,925,094 59,362,817 95,183,833 86,113,995Amounts paid on redemption of redeemable participating shares (22,811,459) (25,133,599) (123,708,934) (122,189,497) (424,661,070) (325,534,115)Net cash (used in) financing activities (8,193,081) (23,405,774) (39,337,075) (71,901,629) (357,064,559) (275,498,889)
Net (decrease)/increase in cash and cash equivalents (1,542,155) 700,152 14,630,341 (17,355,467) (158,774) (36,873,050)
Cash and cash equivalents at the beginning of the financial year 3,034,204 2,939,524 15,787,655 38,781,562 6,487,964 39,027,023Exchange on cash and cash equivalents 968,464 (605,472) 5,668,907 (5,638,440) (293,060) 4,333,991Cash and cash equivalents at the end of the financial year 2,460,513 3,034,204 36,086,903 15,787,655 6,036,130 6,487,964
GlobalAccess Asia Pacific (ex-Japan) Fund
GlobalAccess Emerging Market Equity Fund
GlobalAccess Global High Yield Bond Fund
The accompanying notes form an integral part of the financial statements.

Barclays Multi-Manager Fund PLC Annual Report and Audited Financial Statements 2021
63
Statement of cash flows (continued)
Financial year ended
Financial year ended
Financial year ended
Financial year ended
Financial year ended
31 May 2021 31 May 2020 31 May 2020 31 May 2021 31 May 2020USD USD USD USD USD
Cash flows from operating profitsProceeds from sale of financial assets 927,018,227 2,186,402,174 1,129,217,713 323,682,035 408,661,930Purchases of financial assets (941,993,348) (2,136,159,723) (1,081,933,232) (299,038,283) (362,757,224)Interest received 58,061 72,689 10,725 20,135 58,510Net dividends received 12,873 2,289 - 611,403 722,299Other (expense)/income (657,980) 891,689 92,130 (469,726) 1,158,099Margin cash due from/(to) broker 826,600 (1,235,378) 161,353 (160,943) 1,344,924Cash (pledged)/held as collateral (1,540,000) (110,000) - 10,000 (60,000)Operating expenses paid (3,829,818) (3,914,112) (641,436) (2,635,569) (2,942,878)Net cash (unsed in)/provided by operating activities (20,105,385) 45,949,628 46,907,253 22,019,052 46,185,660
Cash flows from financing activitiesDistributions paid to holders of redeemable participating shares (10,792,770) (12,315,236) (460,815) (10,318,146) (12,898,204)Interest paid (25,975) (46,136) (7,852) (6,825) (18,973)Share transactionsAmounts received from issue of redeemable participating shares 179,650,930 50,166,333 507,899 47,468,685 35,491,559Amounts paid on redemption of redeemable participating shares (142,650,429) (107,270,297) (49,890,155) (55,118,579) (72,854,739)Net cash provided by/(used in) financing activities 26,181,756 (69,465,336) (49,850,923) (17,974,865) (50,280,357)
Net increase/(decrease) in cash and cash equivalents 6,076,371 (23,515,708) (2,943,670) 4,044,187 (4,094,697)
Cash and cash equivalents at the beginning of the financial year 3,322,616 23,304,827 2,957,335 10,653,798 12,856,539Exchange on cash and cash equivalents (3,717,591) 3,533,497 22,726 (2,046,789) 1,891,956Cash and cash equivalents at the end of the financial year 5,681,396 3,322,616 36,391 12,651,196 10,653,798
GlobalAccess Global Corporate Bond Fund
GlobalAccess Global Inflation Linked Bond Fund*
GlobalAccess Emerging Market Debt Fund
* GlobalAccess Global Inflation Linked Bond Fund ceased trading on 27 November 2019. The accompanying notes form an integral part of the financial statements.

Barclays Multi-Manager Fund PLC Annual Report and Audited Financial Statements 2021
64
Statement of cash flows (continued)
Financial year ended
Financial year ended
Financial year ended
Financial year ended
Financial year ended
Financial year ended
31 May 2021 31 May 2020 31 May 2021 31 May 2020 31 May 2021 31 May 2020USD USD USD USD USD USD
Cash flows from operating profitsProceeds from sale of financial assets 255,475,100 70,598,074 394,564,660 830,321,257 73,340,313 111,390,129Purchases of financial assets (50,135,295) (216,727,715) (316,145,271) (751,378,354) (55,715,265) (68,624,689)Interest received 1,934 6,313 4,906,918 9,053,929 8,005 18,134Net dividends received 3,707,744 2,717,333 41,207 191,962 961,275 1,351,706Other income 6,322 6,447 208,453 1,117,068 5,266 7,503Margin cash due (to)/from broker - - (164,496) 378,751 162,641 (246,667)Cash (pledged)/held as collateral - - (50,000) 30,000 - -Operating expenses paid (1,669,098) (1,051,203) (1,432,008) (2,144,127) (1,322,109) (1,762,896)Net cash provided by/(used in) operating activities 207,386,707 (144,450,751) 81,929,463 87,570,486 17,440,126 42,133,220
Cash flows from financing activitiesDistributions paid to holders of redeemable participating shares (4,525,950) (2,124,634) (3,120,680) (6,864,479) - (192)Interest paid 4,101 (3,153) (21,345) (58,300) (1,449) (3,568)Share transactionsAmounts received from issue of redeemable participating shares 14,647,122 179,223,311 33,925,258 65,115,727 17,039,389 5,087,208Amounts paid on redemption of redeemable participating shares (223,740,205) (29,543,687) (112,343,971) (151,262,229) (36,063,364) (47,804,815)Net cash (used in)/provided by financing activities (213,614,932) 147,551,837 (81,560,738) (93,069,281) (19,025,424) (42,721,367)
Net (decrease)/increase in cash and cash equivalents (6,228,225) 3,101,086 368,725 (5,498,795) (1,585,298) (588,147)
Cash and cash equivalents at the beginning of the financial year 6,109,531 3,249,037 9,076,092 11,178,664 3,244,997 5,057,976Exchange on cash and cash equivalents 203,845 (240,592) (209,967) 3,396,223 1,969,931 (1,224,832)Cash and cash equivalents at the end of the financial year 85,151 6,109,531 9,234,850 9,076,092 3,629,630 3,244,997
GlobalAccess Global Property Securities Fund*
GlobalAccess Global Short Duration Bond Fund
GlobalAccess US Small & Mid Cap Equity Fund
* GlobalAccess Global Property Securities Fund ceased trading on 23 February 2021. The accompanying notes form an integral part of the financial statements.
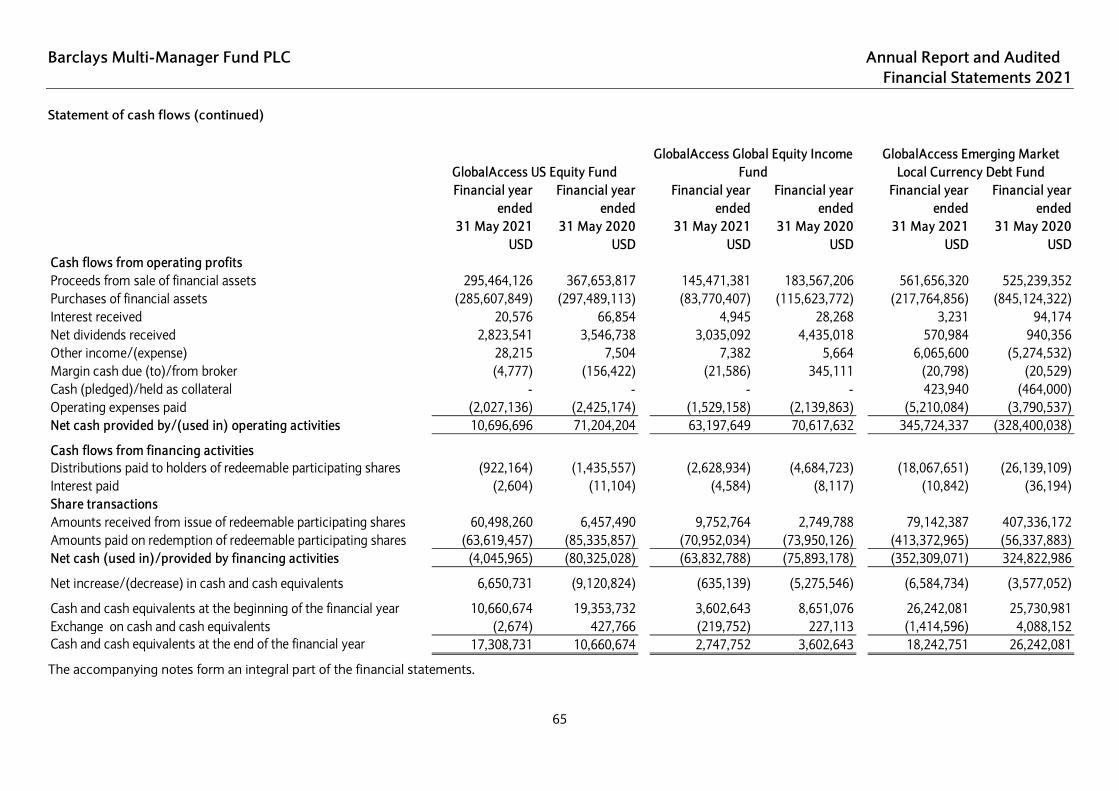
Barclays Multi-Manager Fund PLC Annual Report and Audited Financial Statements 2021
65
Statement of cash flows (continued)
Financial year ended
Financial year ended
Financial year ended
Financial year ended
Financial year ended
Financial year ended
31 May 2021 31 May 2020 31 May 2021 31 May 2020 31 May 2021 31 May 2020USD USD USD USD USD USD
Cash flows from operating profitsProceeds from sale of financial assets 295,464,126 367,653,817 145,471,381 183,567,206 561,656,320 525,239,352Purchases of financial assets (285,607,849) (297,489,113) (83,770,407) (115,623,772) (217,764,856) (845,124,322)Interest received 20,576 66,854 4,945 28,268 3,231 94,174Net dividends received 2,823,541 3,546,738 3,035,092 4,435,018 570,984 940,356Other income/(expense) 28,215 7,504 7,382 5,664 6,065,600 (5,274,532)Margin cash due (to)/from broker (4,777) (156,422) (21,586) 345,111 (20,798) (20,529)Cash (pledged)/held as collateral - - - - 423,940 (464,000)Operating expenses paid (2,027,136) (2,425,174) (1,529,158) (2,139,863) (5,210,084) (3,790,537)Net cash provided by/(used in) operating activities 10,696,696 71,204,204 63,197,649 70,617,632 345,724,337 (328,400,038)
Cash flows from financing activitiesDistributions paid to holders of redeemable participating shares (922,164) (1,435,557) (2,628,934) (4,684,723) (18,067,651) (26,139,109)Interest paid (2,604) (11,104) (4,584) (8,117) (10,842) (36,194)Share transactionsAmounts received from issue of redeemable participating shares 60,498,260 6,457,490 9,752,764 2,749,788 79,142,387 407,336,172Amounts paid on redemption of redeemable participating shares (63,619,457) (85,335,857) (70,952,034) (73,950,126) (413,372,965) (56,337,883)Net cash (used in)/provided by financing activities (4,045,965) (80,325,028) (63,832,788) (75,893,178) (352,309,071) 324,822,986
Net increase/(decrease) in cash and cash equivalents 6,650,731 (9,120,824) (635,139) (5,275,546) (6,584,734) (3,577,052)
Cash and cash equivalents at the beginning of the financial year 10,660,674 19,353,732 3,602,643 8,651,076 26,242,081 25,730,981Exchange on cash and cash equivalents (2,674) 427,766 (219,752) 227,113 (1,414,596) 4,088,152Cash and cash equivalents at the end of the financial year 17,308,731 10,660,674 2,747,752 3,602,643 18,242,751 26,242,081
GlobalAccess US Equity FundGlobalAccess Global Equity Income
FundGlobalAccess Emerging Market
Local Currency Debt Fund
The accompanying notes form an integral part of the financial statements.

Barclays Multi-Manager Fund PLC Annual Report and Audited Financial Statements 2021
66
Statement of cash flows (continued)
Financial year ended
Financial year ended
Financial year ended
Financial year ended
Financial year ended
Financial year ended
31 May 2021 31 May 2020 31 May 2021 31 May 2020 31 May 2021 31 May 2020EUR EUR JPY JPY GBP GBP
Cash flows from operating profitsProceeds from sale of financial assets 97,637,278 169,863,837 7,316,751,943 9,856,496,054 4,041,326,315 6,692,990,684Purchases of financial assets (60,860,692) (107,538,888) (5,230,674,829) (6,922,823,885) (3,110,982,148) (6,337,655,195)Interest received 626 1,481 391,363 273,968 5,345,405 10,108,547Net dividends received 3,179,939 3,229,591 454,579,871 567,769,293 37,926,940 48,550,450Other income 4,472 6,743 1,207,980 255,207 6,631,564 2,948,655Margin cash due from/(to) broker - 10,892 (1,390,007) (31,408,347) (70,004) 3,867,776Cash pledged as collateral - - - - (1,346,103) (356,535)Operating expenses paid (1,547,433) (2,125,277) (250,785,098) (272,636,963) (31,245,306) (37,746,998)Net cash provided by operating activities 38,414,190 63,448,379 2,290,081,223 3,197,925,327 947,586,663 382,707,384
Cash flows from financing activitiesDistributions paid to holders of redeemable participating shares (990,476) (2,658,941) (197,873,070) (275,797,874) (72,378,080) (106,190,451)Interest paid (10,643) (15,325) (7,344,908) (3,599,950) (167,123) (294,944)Share transactionsAmounts received from issue of redeemable participating shares 5,847,777 1,142,268 4,145,182,681 3,506,402,999 634,790,006 817,647,912Amounts paid on redemption of redeemable participating shares (42,392,446) (62,333,733) (6,037,365,067) (6,534,735,632) (1,503,837,121) (1,188,206,443)Net cash (used in) financing activities (37,545,788) (63,865,731) (2,097,400,364) (3,307,730,457) (941,592,318) (477,043,926)
Net (decrease) in cash and cash equivalents 868,402 (417,352) 192,680,859 (109,805,130) 5,994,345 (94,336,542)
Cash and cash equivalents at the beginning of the financial year 1,580,851 1,572,550 779,048,706 918,696,984 103,226,359 187,463,280Exchange on cash and cash equivalents (91,162) 425,653 31,832,646 (29,843,148) (11,754,968) 10,099,621Cash and cash equivalents at the end of the financial year 2,358,091 1,580,851 1,003,562,211 779,048,706 97,465,736 103,226,359
GlobalAccess Europe (ex-UK) Alpha Fund GlobalAccess Japan Fund Aggregated total
The accompanying notes form an integral part of the financial statements.
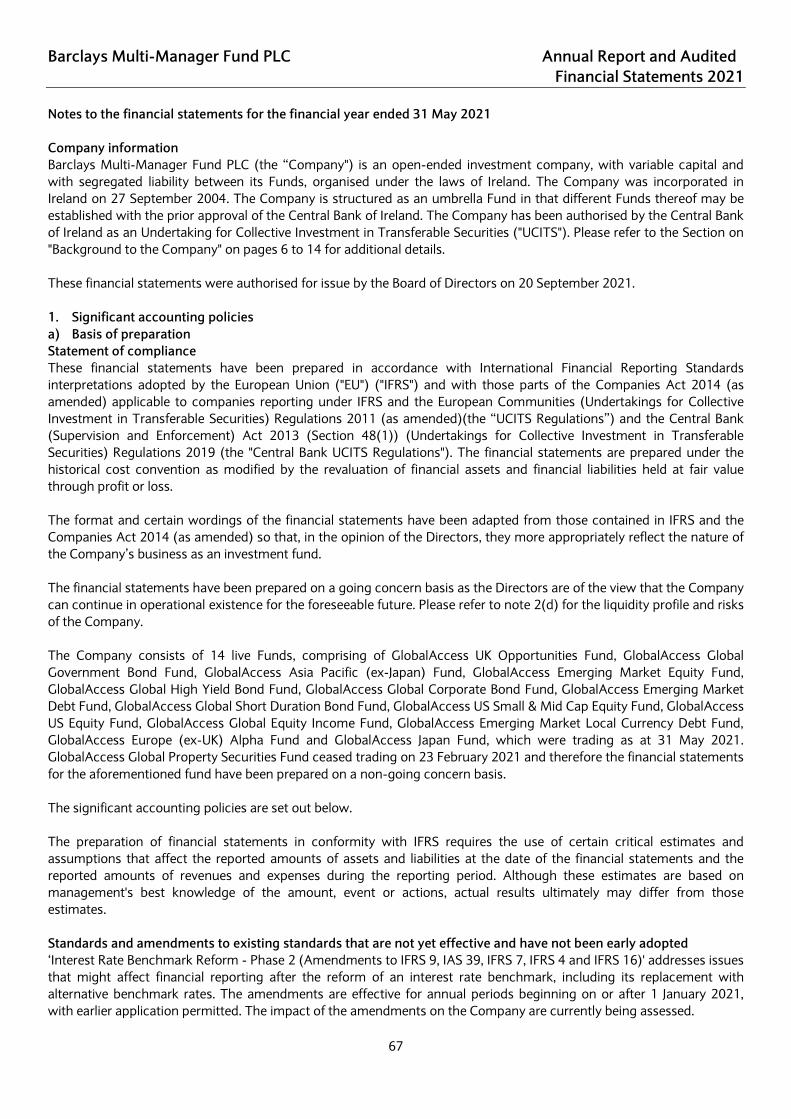
Barclays Multi-Manager Fund PLC Annual Report and Audited Financial Statements 2021
67
Notes to the financial statements for the financial year ended 31 May 2021 Company information Barclays Multi-Manager Fund PLC (the “Company") is an open-ended investment company, with variable capital and with segregated liability between its Funds, organised under the laws of Ireland. The Company was incorporated in Ireland on 27 September 2004. The Company is structured as an umbrella Fund in that different Funds thereof may be established with the prior approval of the Central Bank of Ireland. The Company has been authorised by the Central Bank of Ireland as an Undertaking for Collective Investment in Transferable Securities ("UCITS"). Please refer to the Section on "Background to the Company" on pages 6 to 14 for additional details. These financial statements were authorised for issue by the Board of Directors on 20 September 2021. 1. Significant accounting policies a) Basis of preparation Statement of compliance These financial statements have been prepared in accordance with International Financial Reporting Standards interpretations adopted by the European Union ("EU") ("IFRS") and with those parts of the Companies Act 2014 (as amended) applicable to companies reporting under IFRS and the European Communities (Undertakings for Collective Investment in Transferable Securities) Regulations 2011 (as amended)(the “UCITS Regulations”) and the Central Bank (Supervision and Enforcement) Act 2013 (Section 48(1)) (Undertakings for Collective Investment in Transferable Securities) Regulations 2019 (the "Central Bank UCITS Regulations"). The financial statements are prepared under the historical cost convention as modified by the revaluation of financial assets and financial liabilities held at fair value through profit or loss. The format and certain wordings of the financial statements have been adapted from those contained in IFRS and the Companies Act 2014 (as amended) so that, in the opinion of the Directors, they more appropriately reflect the nature of the Company’s business as an investment fund. The financial statements have been prepared on a going concern basis as the Directors are of the view that the Company can continue in operational existence for the foreseeable future. Please refer to note 2(d) for the liquidity profile and risks of the Company. The Company consists of 14 live Funds, comprising of GlobalAccess UK Opportunities Fund, GlobalAccess Global Government Bond Fund, GlobalAccess Asia Pacific (ex-Japan) Fund, GlobalAccess Emerging Market Equity Fund, GlobalAccess Global High Yield Bond Fund, GlobalAccess Global Corporate Bond Fund, GlobalAccess Emerging Market Debt Fund, GlobalAccess Global Short Duration Bond Fund, GlobalAccess US Small & Mid Cap Equity Fund, GlobalAccess US Equity Fund, GlobalAccess Global Equity Income Fund, GlobalAccess Emerging Market Local Currency Debt Fund, GlobalAccess Europe (ex-UK) Alpha Fund and GlobalAccess Japan Fund, which were trading as at 31 May 2021. GlobalAccess Global Property Securities Fund ceased trading on 23 February 2021 and therefore the financial statements for the aforementioned fund have been prepared on a non-going concern basis. The significant accounting policies are set out below. The preparation of financial statements in conformity with IFRS requires the use of certain critical estimates and assumptions that affect the reported amounts of assets and liabilities at the date of the financial statements and the reported amounts of revenues and expenses during the reporting period. Although these estimates are based on management's best knowledge of the amount, event or actions, actual results ultimately may differ from those estimates. Standards and amendments to existing standards that are not yet effective and have not been early adopted ‘Interest Rate Benchmark Reform - Phase 2 (Amendments to IFRS 9, IAS 39, IFRS 7, IFRS 4 and IFRS 16)' addresses issues that might affect financial reporting after the reform of an interest rate benchmark, including its replacement with alternative benchmark rates. The amendments are effective for annual periods beginning on or after 1 January 2021, with earlier application permitted. The impact of the amendments on the Company are currently being assessed.

Barclays Multi-Manager Fund PLC Annual Report and Audited Financial Statements 2021
68
Notes to the financial statements (continued) for the financial year ended 31 May 2021 1. Significant accounting policies (continued) b) Financial assets and financial liabilities at fair value through profit or loss (i) Classification Assets The Fund classifies its investments based on both the Fund’s business model for managing those financial assets and the contractual cash flow characteristics of the financial assets. The portfolio of financial assets is managed and performance is evaluated on a fair value basis. The Fund is primarily focused on fair value information and uses that information to assess the assets’ performance and to make decisions. The Fund has not taken the option to irrevocably designate any equity securities as fair value through other comprehensive income. The contractual cash flows of the Fund’s debt securities are solely principal and interest, however, these securities are neither held for the purpose of collecting contractual cash flows nor held both for collecting contractual cash flows and for sale. The collection of contractual cash flows is only incidental to achieving the Fund’s business model’s objective. Consequently, all investments are measured at fair value through profit or loss. Liabilities In accordance with the Central Bank requirements, the Fund may, though the use of futures or forwards, achieve synthetic net short positions. Short positions are held for trading and are consequently classified as financial liabilities at fair value through profit or loss. Derivative contracts that have a negative fair value are presented as liabilities at fair value through profit or loss. As such, the Fund classifies all of its investment portfolio as financial assets or liabilities as fair value through profit or loss. The Fund’s policy requires the Investment Manager and the Board of Directors to evaluate the information about these financial assets and liabilities on a fair value basis together with other related financial information. Derivatives Derivatives are categorised as Fair Value Through Profit or Loss (“FVTPL”), as the Funds do not designate any derivatives as hedges for hedge accounting purposes as described under IFRS 9. (ii) Recognition, derecognition and measurement Regular purchases and sales of investments are recognised on the trade date – the date on which the Fund commits to purchase or sell the investment. Financial assets and financial liabilities at fair value through profit or loss are initially recognised at fair value. Transaction costs are expensed as incurred in the statement of comprehensive income. Financial assets are derecognised when the rights to receive cash flows from the investments have expired or the Fund has transferred substantially all risks and rewards of ownership. When the Fund purchases an option, an amount equal to fair value which is based on the premium paid is recorded as an asset. When the Fund writes an option, an amount equal to fair value which is based on the premium received by the Fund is recorded as a liability. When options are closed, the difference between the premium and the amount paid or received, net of brokerage commissions, or the full amount of the premium if the option expires worthless, is recognized as a gain or loss and is presented in the statement of comprehensive income within net (losses)/gains on financial assets and financial labilities at fair value through profit or loss. Subsequent to initial recognition, all financial assets and financial liabilities at fair value through profit or loss are measured at fair value. Gains and losses arising from changes in the fair value of the ‘financial assets or financial liabilities at fair value through profit or loss’ category are presented in the statement of comprehensive income within net (losses)/gains on financial assets and financial labilities at fair value through profit or loss in the financial year in which they arise. Dividend income from financial assets at fair value through profit or loss is recognised in the statement of comprehensive income within dividend income when the Fund’s right to receive payments is established. Interest on debt securities at fair value through profit or loss is recognised in the statement of comprehensive income within interest income based on the effective interest rate. Dividend expense is included within net (losses)/gains on financial assets and financial labilities at fair value through profit or loss.

Barclays Multi-Manager Fund PLC Annual Report and Audited Financial Statements 2021
69
Notes to the financial statements (continued) for the financial year ended 31 May 2021 1. Significant accounting policies (continued) b) Financial assets and financial liabilities at fair value through profit or loss (continued) (iii) Fair value estimation Fair value is the price that would be received to sell an asset or paid to transfer a liability in an orderly transaction between market participants at the measurement date. The fair value of financial assets and liabilities traded in active markets (such as publicly traded derivatives and trading securities) are based on quoted market prices at the close of trading on the reporting date. The Fund utilises the last traded market price for both financial assets and financial liabilities where the last traded price falls within the bid-ask spread. In circumstances where the last traded price is not within the bid-ask spread, the Directors will determine the point within the bid-ask spread that is most representative of fair value. If a significant movement in fair value occurs subsequent to the close of trading up to midnight in Dublin on the year-end date, valuation techniques will be applied to determine the fair value. A significant event is any event that occurs after the last market price for a security, close of market or close of the foreign exchange, but before the Fund’s valuation time that materially affects the integrity of the closing prices for any security, instrument, currency or securities affected by that event so that they cannot be considered ‘readily available’ market quotations. The fair value of financial assets and liabilities that are not traded in an active market (for example, over-the-counter derivatives) is determined using valuation techniques. The Fund uses a variety of methods and makes assumptions that are based on market conditions existing at each reporting date. Valuation techniques engaged by the Fund include the use of comparable recent ordinary transactions between market participants, reference to other instruments that are substantially the same, discounted cash flow analysis, option pricing models and other valuation techniques commonly used by market participants making the maximum use of market inputs and relying as little as possible on entity-specific inputs. (iv) Fair value measurement principles The Funds may from time to time invest in financial instruments that are not traded in an active market (for example in over-the-counter derivatives such as forward contracts). The fair value is determined by using valuation techniques. For open futures contracts, changes in the value of the contract are recognised as unrealised fair value gains or losses in the statement of comprehensive income by "marking to market" the contract at the year-end date using quoted daily settlement prices established by the exchange on which they trade. The unrealised gain on open futures contracts is shown in the financial assets at fair value through profit or loss in the statement of financial position. The unrealised loss on open futures contracts is shown in the financial liabilities at fair value through profit or loss in the statement of financial position. When the contract is closed, the difference between the proceeds from (or cost of) the closing transactions and the original transaction is recorded as a realised gain or loss. Realised gains or losses are included in the statement of comprehensive income. For open forward contracts, the unrealised gain or loss is calculated by reference to the difference between the contract rate and the rate to close out the contract as at the year-end date. Realised gains or losses, which are recognised on the maturity of a contract, include net gains on contracts which have been settled or offset by other contracts. Realised gains or losses and changes in unrealised gains or losses are recognised in the statement of comprehensive income. Unrealised gains and losses are included in the statement of financial position. Foreign currency contracts that are held for up to five business days are treated as spot forward currency contracts and are presented gross within other receivables and other payables in the statement of financial position. Forward foreign currency contracts are positions held for greater than five business days, these are disclosed on the statement of financial position under financial assets at fair value through profit or loss or financial liabilities at fair value through profit or loss. The fair value of any Investment which is a unit of or participation in an open-ended investment fund/mutual fund shall be the latest available net asset value of such unit/participation or where such Investment is quoted, listed or dealt in on a Regulated Market, it shall be the closing mid-market price on such Regulated Market as at the valuation point.
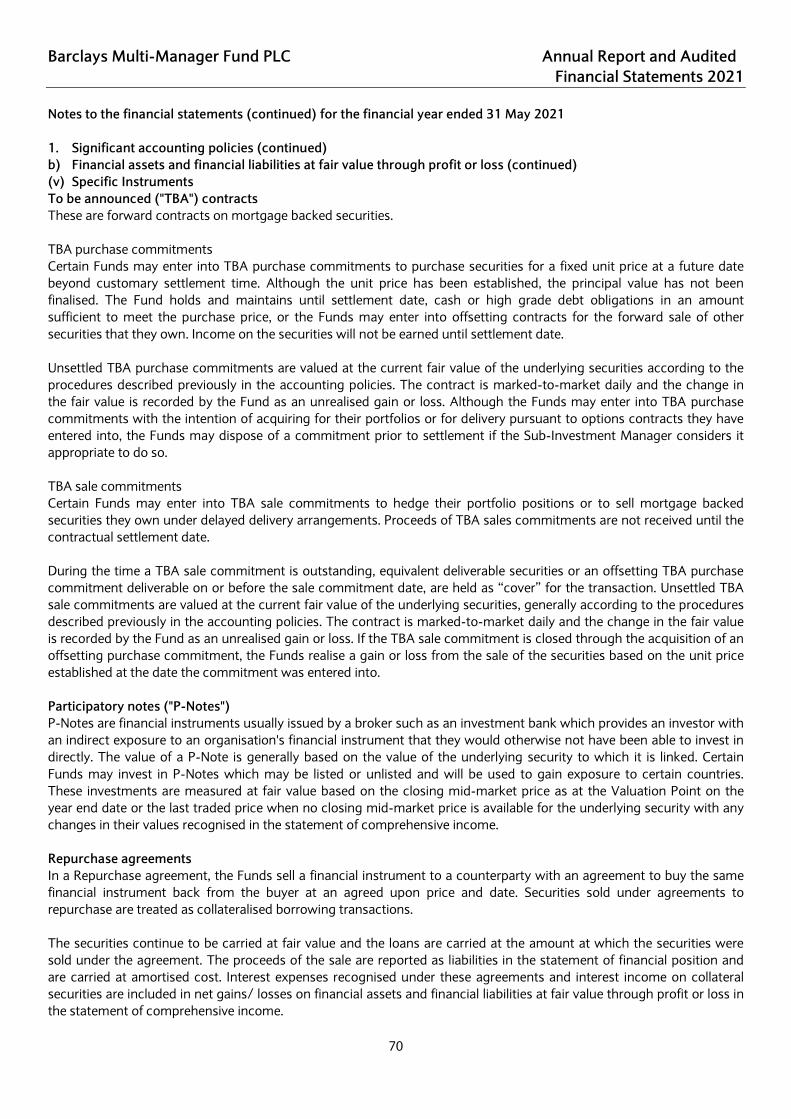
Barclays Multi-Manager Fund PLC Annual Report and Audited Financial Statements 2021
70
Notes to the financial statements (continued) for the financial year ended 31 May 2021 1. Significant accounting policies (continued) b) Financial assets and financial liabilities at fair value through profit or loss (continued) (v) Specific Instruments To be announced ("TBA") contracts These are forward contracts on mortgage backed securities. TBA purchase commitments Certain Funds may enter into TBA purchase commitments to purchase securities for a fixed unit price at a future date beyond customary settlement time. Although the unit price has been established, the principal value has not been finalised. The Fund holds and maintains until settlement date, cash or high grade debt obligations in an amount sufficient to meet the purchase price, or the Funds may enter into offsetting contracts for the forward sale of other securities that they own. Income on the securities will not be earned until settlement date. Unsettled TBA purchase commitments are valued at the current fair value of the underlying securities according to the procedures described previously in the accounting policies. The contract is marked-to-market daily and the change in the fair value is recorded by the Fund as an unrealised gain or loss. Although the Funds may enter into TBA purchase commitments with the intention of acquiring for their portfolios or for delivery pursuant to options contracts they have entered into, the Funds may dispose of a commitment prior to settlement if the Sub-Investment Manager considers it appropriate to do so. TBA sale commitments Certain Funds may enter into TBA sale commitments to hedge their portfolio positions or to sell mortgage backed securities they own under delayed delivery arrangements. Proceeds of TBA sales commitments are not received until the contractual settlement date. During the time a TBA sale commitment is outstanding, equivalent deliverable securities or an offsetting TBA purchase commitment deliverable on or before the sale commitment date, are held as “cover” for the transaction. Unsettled TBA sale commitments are valued at the current fair value of the underlying securities, generally according to the procedures described previously in the accounting policies. The contract is marked-to-market daily and the change in the fair value is recorded by the Fund as an unrealised gain or loss. If the TBA sale commitment is closed through the acquisition of an offsetting purchase commitment, the Funds realise a gain or loss from the sale of the securities based on the unit price established at the date the commitment was entered into. Participatory notes ("P-Notes") P-Notes are financial instruments usually issued by a broker such as an investment bank which provides an investor with an indirect exposure to an organisation's financial instrument that they would otherwise not have been able to invest in directly. The value of a P-Note is generally based on the value of the underlying security to which it is linked. Certain Funds may invest in P-Notes which may be listed or unlisted and will be used to gain exposure to certain countries. These investments are measured at fair value based on the closing mid-market price as at the Valuation Point on the year end date or the last traded price when no closing mid-market price is available for the underlying security with any changes in their values recognised in the statement of comprehensive income.
Repurchase agreements In a Repurchase agreement, the Funds sell a financial instrument to a counterparty with an agreement to buy the same financial instrument back from the buyer at an agreed upon price and date. Securities sold under agreements to repurchase are treated as collateralised borrowing transactions.
The securities continue to be carried at fair value and the loans are carried at the amount at which the securities were sold under the agreement. The proceeds of the sale are reported as liabilities in the statement of financial position and are carried at amortised cost. Interest expenses recognised under these agreements and interest income on collateral securities are included in net gains/ losses on financial assets and financial liabilities at fair value through profit or loss in the statement of comprehensive income.

Barclays Multi-Manager Fund PLC Annual Report and Audited Financial Statements 2021
71
Notes to the financial statements (continued) for the financial year ended 31 May 2021 1. Significant accounting policies (continued) b) Financial assets and financial liabilities at fair value through profit or loss (continued) (v) Specific instruments (continued) Repurchase agreements (continued) Collateral on repurchase agreements is marked to market daily and additional collateral is acquired by the Funds as needed to ensure that the value includes accrued interest equal to or exceeding the repurchase price. In the event of default, the Funds have a contractual right to liquidate the collateral and apply the proceeds in satisfying the obligation. If the counterparty defaults or enters into insolvency proceedings, realisation of the collateral by the Funds may be delayed or limited. Reverse repurchase agreements Securities purchased under agreements to resell (reverse repurchase agreements) are reported not as purchases of the securities, but as receivables and are carried in the statement of financial position designated at fair value. Interest earned on reverse repurchase agreements is recognized as interest income, over the life of each agreement and is included in net gains/losses on financial assets and financial liabilities at fair value through profit or loss in the statement of comprehensive income. The Funds are also permitted to sell a financial instrument that has been received as collateral for a reverse repurchase agreement, whether through the physical sale of the asset or as part of an onward repurchase agreement. Warrants The Funds may invest in warrants. Warrants which are fully paid up and have a zero strike price exhibit the identical risk and return characteristics as in the case where the Fund had acquired the underlying equity directly. Such warrants are valued at the Official Close/Last Trade price for the underlying equity quoted on the stock exchange or principal market on which it is listed or, if the Official Close/Last Trade price is unavailable or unrepresentative, the last available mid-price on such stock exchange or market. Warrants detailed in the schedule of investments at 31 May 2021 are fully paid and have a zero strike price. (vi) Transfers between levels of the fair value hierarchy Transfers between levels of the fair value hierarchy are deemed to have occurred at the beginning of the reporting period. (vii) Critical accounting estimates and assumptions Financial instruments at fair value are either priced with reference to a quoted market price for that instrument or by using a valuation model or recognised broker. Where the fair value is calculated using a valuation model, the methodology is to calculate the expected cash flows under the terms of each specific contract and then discount these values back to a present value. The expected cash flows for each contract are determined either directly by reference to actual cash flows implicit in observable market prices or through modelling cash flows using appropriate financial markets pricing models. Wherever possible these models use as their basis observable market prices and rates including, for example, interest rate yield curves, equities and commodities prices, option volatilities and currency rates. The process of calculating fair value on liquid instruments or from a valuation model may require estimation of certain pricing parameters, assumptions or model characteristics. These estimates are calibrated against industry standards, economic models and observed transaction prices. Changes to assumptions or estimated levels can potentially impact the fair value of an instrument as reported. Securities valued using stale prices are noted as such in the Funds' schedule of investments on pages 171 to 454.

Barclays Multi-Manager Fund PLC Annual Report and Audited Financial Statements 2021
72
Notes to the financial statements (continued) for the financial year ended 31 May 2021 1. Significant accounting policies (continued) b) Financial assets and financial liabilities at fair value through profit or loss (continued) (vii) Critical accounting estimates and assumptions Single broker price: Management make estimates and assumptions concerning the future. The resulting accounting estimates will, by definition, seldom equal the actual results. The estimates and assumptions that have a significant risk of causing a material adjustment to the carrying amounts of assets and liabilities within the next financial year are outlined below. Barclays Investments Solutions Limited, acting through its Wealth Management division (the “investment manager”) and Northern Trust International Fund Administration Services (Ireland) Limited (the “Administrator”) have an agreed documented pricing policy in place which sets out the policies, sources and approach to the pricing methodologies. For certain assets, the lead broker, normally the counterparty the relevant Fund has transacted with, has supplied indicative quotes as at the year-end date. Based on in-depth knowledge of the markets, the investment manager believes that, for certain assets, using prices from a single broker source provides a more accurate price than that available from third-party pricing providers. Where unquoted or thinly traded securities are included in the portfolio of investments, the price will not be available from a vendor. In these circumstances, the investment manager management nominates a reputable pricing source to provide the primary price, possibly a market maker, broker or other competent party, who is independent of the investment manager. Prices calculated by the investment manager on behalf of the Directors: The prices used at the year-end which have been valued by the Directors are the best estimate of fair value as at the year-end date. However, there is a degree of uncertainty in respect of these prices. It may not always be possible to close out the positions at the stated mark of the given counterparty. The Directors believe that the values arrived at are reasonable and prudent, however actual results may differ from these estimates and the differences could be material. c) Income i) Dividend income Dividend income arising on the underlying investments of the Funds is recognised as income when the entity's right to receive payment is established. Dividend income is reported gross of non-reclaimable withholding tax in the statement of comprehensive income. Further analysis of the dividend income is contained in note 3 of these financial statements. ii) Deposit interest Deposit interest is recognised as income of the Company on an effective interest basis in the statement of comprehensive income.
iii) Bond income Bond income arising on fixed interest securities and liquidity instruments is recognised as a component of the operating income in the statement of comprehensive income under the heading "operating income". Further analysis of the operating income is contained in note 3 of these financial statements.
d) Equalisation The Company operates an equalisation account in respect of each of the Funds in order that dividends may be paid to all Shareholders in a Fund at the same rate. If redeemable participating shares are acquired when the equalisation account is in operation, otherwise than at the beginning of a distribution period, the first distribution after acquisition will include a refund of capital, referred to as an equalisation payment. When a Shareholder subscribes during a distribution year the return of capital is reflected as equalisation income in the financial statements. Where a Shareholder redeems shares during a distribution year the return of capital is reflected as equalisation expense in the financial statements.
Net equalisation is included in distributions under finance costs in the statement of comprehensive income. A further breakdown of the equalisation figures is included in note 12 of these financial statements.

Barclays Multi-Manager Fund PLC Annual Report and Audited Financial Statements 2021
73
Notes to the financial statements (continued) for the financial year ended 31 May 2021 1. Significant accounting policies (continued) e) Distributions As outlined in the background to the Company each distributing share classes within the Funds will distribute quarterly at the end of February, May, August and November each year. Proposed distributions to holders of redeemable participating shares are recognised in the statement of comprehensive income when they are appropriately authorised and no longer at the discretion of the Fund. Distributions are classified as finance costs in the statement of comprehensive income. See note 21 of these financial statements for distributions declared during the financial year and note 12 for proposed distributions recognisable subsequent to financial year end.
f) Cash and cash equivalents Cash and cash equivalents includes cash in hand, deposits held at call with banks, other short-term highly liquid investments with original maturities of three months or less, and bank overdrafts. Cash and bank overdrafts are valued at amortised cost, which approximates fair value and are reported in the statement of financial position. All Company cash and cash equivalents are held with The Northern Trust Company (acting as global-custodian to Northern Trust Fiduciary Services (Ireland) Limited) (31 May 2020: same), other than bank balances held as security by counterparties to derivatives contracts (see notes 6 and 8). While cash and cash equivalents are also subject to the impairment requirements of IFRS 9, the identified impairment loss was immaterial.
g) Margin cash due from/(to) broker Margin cash due from/(to) broker consists of cash collateral held as security by/for counterparties to futures. Cash collateral is valued at amortised cost which approximates fair value and are reported in the statement of financial position. Counterparty balances are held with Barclays Bank PLC, Goldman Sachs International, HSBC Bank plc, JP Morgan Chase Bank and Morgan Stanley & Co. International Plc (31 May 2020: Barclays Bank PLC, Goldman Sachs International, HSBC Bank plc, JP Morgan Chase Bank and Morgan Stanley & Co. International Plc) (see notes 6 and 8). While margin cash due from/(to) broker is also subject to the impairment requirements of IFRS 9, the identified impairment loss was immaterial. h) Cash/securities held/pledged as collateral Cash received as collateral is recorded as an asset on the statement of financial position and is valued at its fair value. A related liability to repay the collateral is recorded as a liability on the statement of financial position and is also valued at its fair value in line with the requirement of IAS 39. Cash pledged as collateral is recorded as an asset on the statement of financial position and is valued at its fair value. Securities pledged as collateral to counterparties are disclosed in the statement of financial position as financial assets at fair value through profit or loss pledged as collateral. Securities received as collateral from counterparties are disclosed by way of note in the financial statements. There were no securities received as collateral from counterparties at the financial year end. As part of their investing in futures, the Funds may receive or pledge collateral either in the form of cash and cash equivalents or securities. At 31 May 2021, cash and cash equivalents received and pledged as collateral by the Funds to counterparties are disclosed within notes 6 and 8. At 31 May 2021, no security was received as collateral on any of the Funds (31 May 2020: None). i) Other receivables Other receivables are non-derivative financial assets with fixed or determinable payments that are not quoted in an active market. Receivables are recognised initially at fair value plus transaction costs that are directly attributable to their acquisition origination. They are subsequently measured at amortised cost using the effective interest method, less provision for impairment.

Barclays Multi-Manager Fund PLC Annual Report and Audited Financial Statements 2021
74
Notes to the financial statements (continued) for the financial year ended 31 May 2021 1. Significant accounting policies (continued) j) Impairment The Funds recognise loss allowances for expected credit losses (“ECLs”) on financial assets measured at amortised cost.
The Funds measure loss allowances at an amount equal to lifetime ECLs, except for the following, which are measured at 12-month ECLs: - financial assets that are determined to have low credit risk at the reporting date; and - other financial assets for which credit risk (i.e. the risk of default occurring over the expected life of the asset) has not increased significantly since initial recognition.
When determining whether the credit risk of a financial asset has increased significantly since initial recognition and when estimating ECLs, the Funds consider reasonable and supportable information that is relevant and available without undue cost or effort. This includes both quantitative and qualitative information and analysis, based on the Funds’ historical experience and informed credit assessment and including forward-looking information. The Funds assume that the credit risk on a financial asset has increased significantly if it is more than 30 days past due.
The Funds consider a financial asset to be in default when: - the borrower is unlikely to pay its credit obligations to the Sub-Funds in full, without recourse by the Sub-Funds to actions such as realising security (if any is held); or - the financial asset is more than 90 days past due.
The Funds consider a financial asset to have low credit risk when the credit rating of the counterparty is equivalent to the globally understood definition of ‘investment grade’. The Funds consider this to be Baa3 or higher per Moodys or BBB or higher per Standard and Poor’s. Lifetime ECLs are the ECLs that result from all possible default events over the expected life of a financial instrument.
12-month ECLs are the portion of ECLs that result from default events that are possible within the 12 months after the reporting date (or a shorter period if the expected life of the instrument is less than 12 months). The maximum period considered when estimating ECLs is the maximum contractual period over which the Funds are exposed to credit risk. Measurement of ECLs ECLs are a probability-weighted estimate of credit losses. Credit losses are measured as the present value of all cash shortfalls (i.e. the difference between the cash flows due to the entity in accordance with the contract and the cash flows that the Funds expect to receive). ECLs are discounted at the effective interest rate of the financial asset.
Credit-impaired financial assets At each reporting date, the Funds assess whether financial assets carried at amortised cost are credit-impaired. A financial asset is ‘credit-impaired’ when one or more events that have a detrimental impact on the estimated future cash flows of the financial asset have occurred.
Evidence that a financial asset is credit-impaired includes the following observable data: - significant financial difficulty of the borrower or issuer; - a breach of contract such as a default or being more than 90 days past due; or - it is probable that the borrower will enter bankruptcy or other financial reorganisation.
Presentation of allowance for ECLs in the statement of financial position Loss allowances for financial assets measured at amortised cost are deducted from the gross carrying amount of the assets. Write-off The gross carrying amount of a financial asset is written off when a Fund has no reasonable expectations of recovering a financial asset in its entirety or a portion thereof.

Barclays Multi-Manager Fund PLC Annual Report and Audited Financial Statements 2021
75
Notes to the financial statements (continued) for the financial year ended 31 May 2021 1. Significant accounting policies (continued) k) Other payables Other payables are recognised initially at fair value and subsequently stated at amortised cost. The difference between the proceeds and the amount payable is recognised over the year of the payable using the effective interest method.
l) Redeemable participating shares Redeemable participating shares in the Company are redeemable at the option of the Shareholders, and are classified as a financial liability in the statement of financial position. The shares are valued at the redemption amount that would be payable if the Shareholder exercised the right to redeem shares in the Company and are classified as financial liabilities. Shares are issued and redeemed at a single price (the "Price"), which is based on the net asset value per share plus or minus dilution adjustments. Dilution adjustments are levied, as in the opinion of the Directors, the existing shareholders, in the case of subscriptions, or the remaining shareholders, in the case of redemptions, might otherwise be adversely affected. The dilution adjustment involves adding to, when the Company is in a net subscription position, and deducting from when the Company is in a net redemption position, the net asset value per share, such figure as the Directors consider appropriate to meet duties and charges and spreads between buying and selling prices of the underlying investments. The dilution levy is included in Proceeds from issue of redeemable participating shares in the Statement of changes in net assets attributable to holders of redeemable participating shares when the Company is in a net subscription position, and is included in Payments on redemption of redeemable participating shares in the Statement of changes in net assets attributable to holders of redeemable participating shares when the Company is in a net redemption position. m) Offsetting financial instruments Financial assets and financial liabilities are offset and the net amount reported in the statement of financial position when there is a legally enforceable right to offset the recognised amounts and there is an intention to settle on a net basis, or realise the asset and settle the liability simultaneously. The legally enforceable right must not be contingent on future events and must be enforceable in the normal course of business and in the event of default, insolvency or bankruptcy of the Company or the counterparty. At 31 May 2021 (31 May 2020: same), no financial assets or financial liabilities were offset in the statement of financial position. Spot currency contracts which are open for five business days or less are presented gross within other receivables or other payables in the statement of financial position.
n) Sale and purchase of securities awaiting settlement Sale and Purchase of securities awaiting settlement represent receivables for securities sold and payables for securities purchased that have been contracted for but not yet settled or delivered respectively as at the reporting date. These are recorded initially at amortized cost and subsequently measured at fair value.
o) Subscriptions and redemptions of shares awaiting settlement Subscriptions and redemptions of shares awaiting settlement relate to receivables on share subscriptions and payables on share redemptions that have been contracted for but not yet settled or delivered on the reporting date, respectively. These are recorded initially at amortized cost and subsequently measured at fair value. p) Fair value of net assets attributable to holders of redeemable participating shares In accordance with the provisions of the Prospectus and Supplements, listed investments are stated at the closing mid-market price at the valuation point or the last traded price when no closing mid-market price is available on the valuation day for the purpose of determining the net asset value per share for subscriptions and redemptions and for various fee calculations.
Net assets attributable to redeemable participating shareholders represent a liability on the statement of financial position, carried at the redemption amount that would be payable at the statement of financial position date if the Shareholder exercised the right to redeem shares in the Company.

Barclays Multi-Manager Fund PLC Annual Report and Audited Financial Statements 2021
76
Notes to the financial statements (continued) for the financial year ended 31 May 2021 1. Significant accounting policies (continued) q) Taxation Under current law and practice, the Company qualifies as an investment undertaking as defined in Section 739B of the Taxes Consolidation Act, 1997, as amended. On that basis, it is not chargeable to Irish tax on its income or gains. The Company will not be liable for tax in respect of its income and gains, other than on the occurrence of a chargeable event. A chargeable event includes any distribution or any redemption or transfer of shares.
However, some dividend and interest income received by the Company may be subject to withholding tax imposed in the country of origin. Investment income is recorded gross of such taxes in the statement of comprehensive income.
r) Foreign exchange The Company has adopted British pound as its functional and presentation currency, as the majority of the Company's investors are based in the UK. A foreign currency transaction is recorded in the functional currency, by applying to the foreign currency amount the actual exchange rate between the functional currency and the foreign currency at the date of the transaction.
The functional and presentation currency of each Fund is: Fund Currency GlobalAccess UK Opportunities Fund British pound GlobalAccess Europe (ex-UK) Alpha Fund Euro GlobalAccess Global Government Bond Fund US dollar GlobalAccess Asia Pacific (ex-Japan) Fund US dollar GlobalAccess Emerging Market Equity Fund US dollar GlobalAccess Global High Yield Bond Fund US dollar GlobalAccess Global Corporate Bond Fund US dollar GlobalAccess Emerging Market Debt Fund US dollar GlobalAccess Global Property Securities Fund US dollar GlobalAccess Global Short Duration Bond Fund US dollar GlobalAccess US Small & Mid Cap Equity Fund US dollar GlobalAccess US Equity Fund US dollar GlobalAccess Global Equity Income Fund US dollar GlobalAccess Emerging Market Local Currency Debt Fund US dollar GlobalAccess Japan Fund Japanese yen s) Translation to presentation currency For the purpose of combining the financial statements of the Funds to arrive at Company figures (required under Irish Company Law), the amounts in the financial statements have been translated into the presentation currency which is British pound, at the exchange rate ruling at 31 May 2021. The translation has no effect on the net asset value per share attributable to the individual Funds. The average exchange rates were used to convert balances in the statement of comprehensive income. The resulting transaction loss GBP 392,018,870 (31 May 2020: Gain GBP 59,099,901) is due to the movement in exchange rates between 1 June 2020 and 31 May 2021. This is a notional loss which has no impact on the net asset value per share attributable to the individual share class of the individual Funds. Proceeds from subscriptions and amounts paid on redemption of redeemable participating shares are translated at average rates, which approximate the rates prevailing at the dates of the transactions. Translation differences on non-monetary items, such as equities, held at fair value through profit or loss are reported as part of the fair value gain or loss in the statement of comprehensive income and as exchange gain on cash and cash equivalents in the statement of cash flows.

Barclays Multi-Manager Fund PLC Annual Report and Audited Financial Statements 2021
77
Notes to the financial statements (continued) for the financial year ended 31 May 2021 1. Significant accounting policies (continued) t) Transaction costs Transaction costs are costs incurred to acquire or dispose of financial assets or financial liabilities at fair value through profit or loss. They include fees and commissions paid to agents, advisers, brokers and dealers. Transaction costs are expensed when incurred and are included as part of the cost of such purchases or sales.
u) Valuation point The valuation point used to value the securities for the purpose of the financial statements is that of 10 p.m. on 31 May 2021 (31 May 2020: 10 p.m. on 29 May 2020) per the Prospectus.
2. Financial risk management a) Strategy in using financial instruments The Company is an umbrella Fund and consists of a series of 14 Funds at financial year end. Each Fund has its own investment objectives and the Company appoints Sub-Investment Managers to provide investment management and advisory services in respect of the assets of the Funds. The investment manager monitors the performance of the Sub-Investment Managers. Each Fund's investment objectives are set out in the Prospectus to the Fund. The Company trades in financial instruments, taking positions in traded and over-the-counter instruments, including derivatives, to take advantage of short and long term market movements in the equity and bond markets. Investments held at year end are representative of the type of investments held during the financial year. In pursuing its investment objectives, each Fund is exposed to a variety of financial risks: market risk (including market price risk, interest rate risk and currency risk), credit risk and liquidity risk that could result in a reduction in a Fund's net assets or a reduction of the profits available for distribution. The Funds devote considerable resources to maintaining effective controls to manage, measure and mitigate each of these risks, and regularly reviews its risk management procedures and systems to ensure that they continue to meet the needs of the business. The Fund's overall risk management programme focuses on the unpredictability of financial markets and seeks to minimise potential adverse effects on the Funds' financial performance. As part of the overall risk management process, the Company has appointed Arkus Financial Services ("Arkus") to provide risk calculations for the Company. The output is provided to the investment manager's risk management function for review. Arkus provides independent, third-party monitoring of the relevant regulatory limits and provides certain information that assists the Directors in understanding the risk positions of the securities held individually and how they behave at the Fund Level. Arkus undertakes daily reporting directly to the risk management function of the investment manager. The data used for reporting purposes is taken directly from the Administrator, to ensure that reporting is at arm’s length from the investment manager. Immediate escalation of items identified in daily reports will be provided to the Board, Depositary and Regulator by the risk manager within the risk management function of the investment manager. Where a Fund has more than one Sub-Investment Manager, the investment manager will prepare 'Objectives, Guidelines and Reporting Requirements' which set maximum exposure limits per Sub-Investment Manager which seek to ensure that the Fund as a whole does not breach any quantitative limits set out in the Prospectus. The Sub-Investment Managers provide the investment manager with regular updates on their risk monitoring activities and makes available all necessary information for the investment manager to assess the functioning of the control processes in place. At a minimum, the investment manager reports quarterly to the Board. The Sub-Investment Managers are chosen by the investment manager/Funds research team from a global market of around 10,000 different fund-management companies. When selecting managers, the investment manager/Funds research team first develops a list of investment managers arranged in peer groups according to regions and investment style.
Barclays Multi-Manager Fund PLC Annual Report and Audited Financial Statements 2021
78
Notes to the financial statements (continued) for the financial year ended 31 May 2021 2. Financial risk management (continued) a) Strategy in using financial instruments (continued) Then, to assess each manager’s ability to match the investment targets, the investment manager/Funds research team uses a proprietary multi-factor screening method to evaluate past risk-adjusted performance on a relative and absolute basis. The performance and risk of the selected Sub-Investment Managers are monitored closely and regularly by the investment manager/Funds research team.
The investment manager ensures that each Sub-Investment Manager is aware of, and agrees to, applicable concentration limits and risk diversification rules for the Fund or portion of a Fund it manages. It ensures that controls are established to monitor the inherent risks, examine the level and effectiveness of these controls, procure statements and reports on the risk control activities, evaluate the findings and actively manage risk diversification breaches and corrective actions.
The Funds make use of the following financial derivatives instruments:
(i) Futures (Involving debt and equity indices, currencies, interest rates and other asset categories and combinations of these);
(ii) Foreign exchange forward contracts; or, (iii) Combinations of (i) and (ii) above.
The commercial purpose behind the use of all these financial derivatives instruments is:
(i) for the purposes of efficient portfolio management; (ii) to increase investment returns; (iii) to hedge away unwanted investment risk; or, (iv) exposure to new asset types.
The Funds are subject to a number of investment restrictions imposed by external regulators or self-imposed by the Prospectus and Memorandum and Articles of Association. These restrictions are intended to reduce the risks associated with the Funds' financial instruments. Compliance by the Funds with the investment restrictions imposed by the UCITS Regulations is monitored weekly and reported to the Board monthly by the Depositary. The investment manager also reports quarterly to the Board on whether the Funds have been operated in accordance with the investment guidelines as defined in the Prospectus as well as any self-imposed limitations. These policies for managing risk have been applied throughout the financial year.
b) Market risk Market risk is the risk that the value of an investment will decrease due to movements in market factors. Market risk comprises three types of risk: market price risk, foreign currency risk and interest rate risk.
The Sub-Investment Managers mitigate market risk through asset allocation, security selection and hedging within specified limits. Risk exposures are monitored on a daily basis by the Company’s investment manager and are reviewed on a quarterly basis by the Board. At 31 May 2021, each Fund's market risk is affected by three main components:
(i) changes in actual market prices, (ii) foreign currency movements, and, (iii) interest rate movements.
(i) Market price risk Market price is defined as the prevailing price at which the financial instruments held by the Funds may be sold within a public arena. It is the estimated amount for which an investment should exchange between a willing buyer and a willing seller in an arms-length transaction wherein the parties had each acted knowledgeably, prudently, and without compulsion. Market price risk is the risk of financial loss resulting from movements in market prices.

Barclays Multi-Manager Fund PLC Annual Report and Audited Financial Statements 2021
79
Notes to the financial statements (continued) for the financial year ended 31 May 2021
2. Financial risk management (continued) b) Market risk (continued) (i) Market price risk (continued) The Board manage the market price risks inherent in the investment portfolios by ensuring full and timely access to relevant information from the investment manager. The Board meets regularly and at each meeting reviews investment performance and overall market positions. They monitor the investment manager’s compliance with the Funds’ objectives. There were no material changes to the Company’s policies and processes for managing market price risk and the methods and assumptions used to measure risk during the financial year. Value at risk A key metric used to measure market risk is Value-at-Risk (“VaR”) which encompasses currency, interest rate and price risk. VaR is a statistical risk measure that estimates the potential portfolio loss from adverse market movements in an ordinary market environment. VaR analysis reflects the interdependencies between risk variables, unlike a traditional sensitivity analysis. The VaR calculations are based on an adjusted historical simulation model with a confidence level of 99%, a holding period equivalent to one month and a historical observation period of not less than one year (250 days). A VaR number is defined at a specified probability and a specified time horizon. A 2% one month VaR means that the expectation is that 99% of the time over a one-month period the Fund will lose no more than this number in percentage terms. Therefore, higher VaR numbers indicate higher risk.
Value-at-Risk as at31 May 2021
Value-at-Risk as at31 May 2020
Portfolio Name Portfolio VaR (%) Portfolio VaR (%)GlobalAccess UK Opportunities Fund 7.94 9.48GlobalAccess Global Government Bond Fund 2.33 3.18GlobalAccess Asia Pacific (ex-Japan) Fund 9.26 10.67GlobalAccess Emerging Market Equity Fund 9.45 10.56GlobalAccess Global High Yield Bond Fund 5.41 3.35GlobalAccess Global Corporate Bond Fund 4.26 2.66GlobalAccess Emerging Market Debt Fund 5.75 4.64GlobalAccess Global Property Securities Fund* - 9.19GlobalAccess Global Short Duration Bond Fund 1.01 0.90GlobalAccess US Equity Fund 9.92 10.28GlobalAccess Global Equity Income Fund 9.56 9.21GlobalAccess Emerging Market Local Currency Debt Fund 5.89 7.04GlobalAccess Europe (ex-UK) Alpha Fund 9.44 11.06GlobalAccess Japan Fund 11.09 12.15GlobalAccess US Small and Mid Cap Equity Fund 12.93 13.91 Some limitations of VaR analysis:
- the methodology is based on historical data and cannot take account of the fact that future market price movements, correlations between markets and levels of market liquidity in conditions of market stress may bear no relation to historical patterns; and
- the VaR is a point-in-time calculation, and does not necessarily reflect the risk position of the Funds at any time other than the date and time at which it is calculated.
VaR is presented for the purposes of financial reporting. The investment manager also calculates each Fund’s global exposure using the commitment approach as prescribed in the UCITS notices, as detailed in ESMA paper 10-788. * GlobalAccess Property Securities Fund ceased trading on 23 February 2021.

Barclays Multi-Manager Fund PLC Annual Report and Audited Financial Statements 2021
80
Notes to the financial statements (continued) for the financial year ended 31 May 2021
2. Financial risk management (continued) b) Market risk (continued) (ii) Foreign currency risk Foreign currency risk is the risk that the fair value or future cash flows of a financial instrument will fluctuate because of changes in foreign exchange rates. Certain of the Funds' assets, liabilities and income are denominated in currencies other than their functional currency. They are, therefore, exposed to currency risk as the value of the securities denominated in other currencies will fluctuate due to changes in exchange rates. Income denominated in foreign currencies is converted to the appropriate functional currency on receipt. Where appropriate, as defined in the Funds' investment policies and Prospectus, the Company can employ techniques and instruments intended to hedge currency risk in the context of the management of its assets and liabilities. In this regard, the Company utilises hedged exposure to one currency by entering into forward foreign currency transactions. The details of forward foreign currency contracts which are open for greater than five business days are disclosed in the Funds' schedule of investments, where applicable. Spot currency contracts which are open for five business days or less are presented gross within other receivables or other payables in the statement of financial position. All foreign currency contracts can either be settled net or gross at the discretion of the investment manager and where the terms of the agreement permits positions to be settled net. During the financial year all foreign currency contracts settled gross. The currency hedging is executed at the Sub-Investment Manager level using currency Forwards, in line with the guidelines of the portfolio of investments. It is the responsibility of the Sub-Investment Manager to execute these trades and monitor the resulting currency exposure of their portfolio of investments. In accordance with Company policy, the investment manager monitors the Funds' currency position on a daily basis and the Board reviews it on a regular basis. There were no material changes to the Company’s policies and processes for currency risk and the methods used to measure risk during the financial year. The Funds' foreign currency exposure is shown in the schedule of investment by disclosing the currency of the underlying positions. The current year exposure currencies are representative of the prior year. The Funds’ sensitivity to changes in foreign exchange rates is included in the calculation of VaR disclosed earlier. (iii) Interest rate risk Interest rate risk is the risk that an investment's value will change due to a change in the absolute level of interest rates, in the spread between two rates, in the shape of the yield curve or in any other interest rate relationship. The Funds' interest bearing financial assets and financial liabilities expose them to risks associated with the effects of fluctuations in the prevailing levels of market interest rates on their financial position and cash flows. The Funds are also exposed to interest rate risk through their bank balances where interest is earned and interest expense of overdrafts. Interest rate risk affects the value of bonds more directly than equities and as such, will affect different Funds based on their constituent securities. For GlobalAccess UK Opportunities Fund, GlobalAccess Asia Pacific (ex-Japan) Fund, GlobalAccess Emerging Market Equity Fund, GlobalAccess US Small & Mid Cap Equity Fund, GlobalAccess US Equity Fund, GlobalAccess Global Equity Income Fund, GlobalAccess Europe (ex-UK) Alpha Fund and GlobalAccess Japan Fund, the majority of the financial assets are equity shares and other investments which neither pay interest nor have a maturity date and therefore, there is no significant interest rate exposure. The interest rate exposure for the fixed income Funds is disclosed for each holding in the Funds’ schedules of investments. The Funds’ sensitivity to changes in interest rates is incorporated into the calculation of VaR disclosed earlier.

Barclays Multi-Manager Fund PLC Annual Report and Audited Financial Statements 2021
81
Notes to the financial statements (continued) for the financial year ended 31 May 2021 2. Financial risk management (continued) c) Credit risk The Company takes on exposure to credit risk, which is the risk that a counterparty or an issuer will be unable to pay amounts in full when due. Financial assets which potentially expose the Company to credit risk consist principally of bonds, cash balances and deposits with and receivables from the Depositary and the counterparties to derivative contracts as well as equities. The carrying amounts of financial assets best represent the maximum credit risk exposure at the statement of financial position date. All transactions in listed securities are settled/paid for upon delivery using approved brokers. The risk of default is considered minimal, as delivery of securities sold is only made once the broker has received payment. Payment is made on a purchase once the securities have been received by the broker. The trade will fail if either party fails to meet its obligation. All details of counterparties, and amounts/collateral held as security, are disclosed in the schedule of investments. Nil securities held as collateral on the 31 May 2021 (2020: Nil). The Sub-Investment Managers assess all counterparties and brokers separately as part of their risk management process, for credit risk before contracting with them. Counterparties for foreign exchange forwards and spot forward currency contracts entered into by Barclays are approved internally as part of the trading and best execution policy for the Funds. At present, counterparties are all major international banking institutions and it is not envisaged that this policy will change in the near future. Approval is reviewed if a counterparty's credit rating deteriorates. Counterparty exposure is monitored through the daily generation of a compliance report to test that the exposure to counterparties does not exceed limits required by legal and Prospectus rules. Credit risk arising on transactions with brokers relates to transactions awaiting settlement. Risk relating to unsettled transactions is considered small due to the short settlement period involved and the high credit quality of the brokers used. The Sub-Investment Managers monitor the credit rating and financial positions of the brokers used to further mitigate this risk. Where the investment manager has entered into transactions with brokers directly on behalf of the Funds, the credit rating and financial positions of the brokers used will be monitored by them. Certain Funds invest into forward contracts which expose the Funds to counterparty risk, should they default. The maximum credit exposure to these counterparties equals the unrealised gain on the contracts as at 31 May 2021 and 31 May 2020 as disclosed in each Fund's schedule of investments where this is settled net or the notional amount where this is settled gross. Although the Sub-Investment Managers employ appropriate procedures to ensure that the counterparties are reputable institutions and that the credit risk to the Fund is acceptable, the Funds may incur a loss if a counterparty were to default on its obligations. The Fund mitigates this risk through ensuring that the exposure to over-the-counter derivative counterparties does not exceed 5% of the net asset value ("NAV") of the Fund. This limit is raised to 10% in the case of credit institutions. Certain Funds invest in participatory notes ("P-Notes") which also exposes them to counterparty risk whereby the primary exposure is to the issuer(s) of those notes. Although the Sub-Investment Managers employ appropriate procedures to ensure that the counterparties are reputable institutions and that the credit risk to the Fund is acceptable, the Funds may incur a loss if a counterparty were to default on its obligations. The Fund mitigates this risk through ensuring that the exposure to such counterparties does not exceed 10% of the NAV of each Fund. A combination of two or more of investments in transferable securities or money market instruments, deposits, and/or counterparty risk exposures arising from OTC derivatives transactions issued by, or made or undertaken with, the same body may not exceed 20% of the NAV of a Fund. Northern Trust Fiduciary Services (Ireland) Limited (“NTFSIL”) is the appointed Depositary of the Fund, responsible for the safe-keeping of assets. NTFSIL has appointed The Northern Trust Company (“TNTC”) as its global sub-custodian.

Barclays Multi-Manager Fund PLC Annual Report and Audited Financial Statements 2021
82
Notes to the financial statements (continued) for the financial year ended 31 May 2021
2. Financial risk management (continued) c) Credit risk (continued) Both NTFSIL and TNTC are wholly owned subsidiaries of Northern Trust Corporation (“NTC”). As at 31 May 2021, NTC had a long term credit rating from Standard & Poor’s of (A+). TNTC (as global sub-custodian of NTFSIL) does not appoint external sub-custodians within the U.S., the U.K., Ireland, Canada, Belgium, France, Germany, Netherlands and Saudi Arabia. However, in all other markets, TNTC appoints local external sub-custodians. NTFSIL, in the discharge of its depositary duties, verifies the Fund’s ownership of other assets, (as defined under other assets, Art 22(5) of UCITS V Directive 2014/91/EU ), by assessing whether the Fund holds the ownership based on information or documents provided by the Fund or where available, on external evidence. TNTC, in the discharge of its delegated depositary duties, holds in custody (i) all financial instruments that may be registered in a financial instruments account opened on the books of TNTC and (ii) all financial instruments that can be physically delivered to TNTC. TNTC ensures all financial instruments (held in a financial instruments account on the books of TNTC) are held in segregated accounts in the name of the Fund, clearly identifiable as belonging to the Fund, and distinct and separately from the proprietary assets of TNTC, NTFSIL and NTC. In addition TNTC, as banker, holds cash of the Fund on deposit. Such cash is held on the statement of financial position of TNTC. In the event of insolvency of TNTC, in accordance with standard banking practice, the Fund will rank as an unsecured creditor of TNTC in respect of any cash deposits. Insolvency of NTFSIL and or one of its agents or affiliates may cause the Fund’s rights with respect to its assets to be delayed. The Responsible Party manages risk by monitoring the credit quality and financial position of the Depositary and such risk is further managed by the Depositary monitoring the credit quality and financial positions of sub-custodian appointments. The counterparties and their credit ratings at 31 May 2021 are as follows: Bank of America Merrill Lynch (A-), Barclays Capital (A), Barclays Bank PLC (A), Citibank N.A. (A+), BNP Paribas Plc (A+), Canadian Imperial Bank of Commerce (A+), Deutsche Bank AG (BBB+), Goldman Sachs International (A+), HSBC Bank plc (A+), J.P. Morgan Chase Bank (A+), Morgan Stanley & Co. International Plc (A+), Societe Generale (A), Royal Bank of Canada (AA-), Royal Bank of Scotland (A), Standard Chartered Bank (A), State Street Bank (A), Toronto-Dominion Bank (AA-), UBS (A+) and Westpac Banking (AA-). All credit ratings are from Standard & Poor's. The counterparties and their credit ratings at 31 May 2020 are as follows: Bank of America Merrill Lynch (A+), Barclays Capital (A), Barclays Bank PLC (A), Citibank N.A. (A+), BNP Paribas Plc (A+), CITIC Securities Co (BBB+), Credit Suisse (A+), Deutsche Bank AG (BBB+), Goldman Sachs International (A+), HSBC Bank plc (A+), J.P. Morgan Chase Bank (A+), Morgan Stanley & Co. International Plc (A+), Societe Generale (A), Royal Bank of Canada (AA-), Standard Chartered Bank (A), State Street Bank (A) and UBS (A+). All credit ratings are from Standard & Poor's. Both Northern Trust Fiduciary Services (Ireland) Limited and The Northern Trust Company are wholly owned subsidiaries of Northern Trust Corporation. As at 31 May 2021, Northern Trust Corporation had a long term rating from Standard & Poor's of A+ (31 May 2020: A+).

Barclays Multi-Manager Fund PLC Annual Report and Audited Financial Statements 2021
83
Notes to the financial statements (continued) for the financial year ended 31 May 2021
2. Financial risk management (continued) c) Credit risk (continued) Northern Trust acts as its own sub-custodian in the UK and Ireland. In all other markets Northern Trust appoints a local sub-custodian. Northern Trust continually reviews its sub-custodian network to ensure clients have access to the most efficient, creditworthy and cost-effective provider in each market. The Prospectus limits the level of investment in bonds that are below investment grade for certain Funds. The investment manager monitors the proportion of bonds to the assets under management on a daily basis through the generation of a daily compliance report and ensures, through respective divestment, those restrictions are adhered to. Portfolio by rating category The investment manager utilises well-known rating agencies for determining credit quality of the financial assets. For unrated securities, the relevant Sub-Investment Manager assigns an internal rating using an approach that is consistent with the ratings agencies. The rating limits defined in the Prospectus are monitored on a daily basis by the investment manager and Sub-Investment Managers (e.g. no more than 10% in sub-investment grade bonds for some portfolios). For GlobalAccess UK Opportunities Fund, GlobalAccess Pacific Asia Pacific (ex-Japan) Fund, GlobalAccess Emerging Market Equity Fund, GlobalAccess Global Property Securities Fund*, GlobalAccess US Small & Mid Cap Equity Fund, GlobalAccess US Equity Fund, GlobalAccess Global Equity Income Fund, GlobalAccess Europe (ex-UK) Alpha Fund, and GlobalAccess Japan Fund the majority of the financial assets are non-interest bearing equity securities. As a result, they are not subject to significant amounts of credit risk. * GlobalAccess Global Property Securities Fund ceased trading on 23 February 2021.

Barclays Multi-Manager Fund PLC Annual Report and Audited Financial Statements 2021
84
Notes to the financial statements (continued) for the financial year ended 31 May 2021
2. Financial risk management (continued) c) Credit risk (continued) As at 31 May 2021 and 31 May 2020, the remaining Funds were invested in debt securities with the following credit quality:
Rating as at 31 May 2021 31 May 2020 31 May 2021 31 May 2020 31 May 2021 31 May 2020Investment Grade 75% 62% 2% 5% 84% 89%Non-Investment Grade 0% 0% 94% 93% 13% 6%Not rated 25% 38% 4% 2% 3% 5%
100% 100% 100% 100% 100% 100%
Rating as at 31 May 2021 31 May 2020 31 May 2021 31 May 2020 31 May 2021 31 May 2020Investment Grade 31% 44% 58% 57% 54% 66%Non-Investment Grade 66% 54% 31% 24% 26% 23%Not rated 3% 2% 11% 19% 20% 11%
100% 100% 100% 100% 100% 100%
GlobalAccess Global Short Duration Bond Fund
GlobalAccess Emerging Market Local Currency Debt Fund
GlobalAccess Global Government Bond Fund
GlobalAccess Global High Yield Bond Fund
GlobalAccess Global Corporate Bond Fund
GlobalAccess Emerging Market Debt Fund

Barclays Multi-Manager Fund PLC Annual Report and Audited Financial Statements 2021
85
Notes to the financial statements (continued) for the financial year ended 31 May 2021
2. Financial risk management (continued) c) Credit risk (continued) In accordance with Company policy, the investment manager monitors the Funds' credit position on a daily basis. The Directors rely on the investment manager to keep them informed of any material event. There were no material changes to the Company’s policies and processes for managing credit risk and the methods used to measure risk during the financial year. Unrated positions which have been acquired by the Fund(s) are assessed by the relevant investment manager as to the creditworthiness of the position, as per the Fund Prospectus. The manager is not currently aware as of the date in the accounts of any securities being in default. d) Liquidity risk Liquidity risk is the risk that an entity will encounter difficulty in meeting obligations associated with its financial liabilities. Liquidity risk is controlled in the following ways: - The investment manager and the relevant trading desk considers and monitors the liquidity of all instruments utilised. - Procedures are in place to review liquidity requirements and to ensure that they will be met both on an ongoing basis and in the event of extreme market movements. The Company is exposed to daily cash redemptions of redeemable participating shares. The Funds generally retain a certain portion of their assets in cash, which is available to satisfy redemptions. In order to prevent a detrimental liquidity gap, redemption proceeds in respect of shares are paid five business days after the relevant dealing day or such other period as the Directors may determine (not exceeding ten business days) provided that all the relevant documentation has been furnished to and received by the Administrator. The investment manager and the Administrator consider and monitor liquidity on a daily basis to ensure that the appropriate liquidity is maintained in line with the daily redemption policy adopted by the Company. An overall liquidity risk assessment of each Fund is performed on a daily basis by Arkus and provided to the risk control and governance team of the investment manager. Reports are provided to the investment manager’s Risk Forum at each meeting. The liquidity level of each Fund is assessed to confirm its ability to meet redemptions. Liquidity reports enable the investment manager’s risk control and governance team to determine the liquidity of the Fund. The liquidity assessment of the assets within the portfolio is facilitated by Arkus. These liquidity assessment reports are submitted to the Risk Manager and the investment manager’s risk forum. Any issues identified are escalated to the Board. The Directors rely on the investment manager to keep them informed of any material event. There were no material changes to the Company's policies and processes for liquidity risk and the methods used to measure risk during the financial year. The Company maintains a mixture of long term and short term committed facilities that are designed to ensure the Company has sufficient available funds for operations and planned expansion. The investment manager ensures at all times that the vast majority of assets in the Company are highly liquid and offer daily liquidity. The monitoring and reporting of liquidity risk take the form of cash flow measurements and projections for the next day, week and month as these are key periods for liquidity management. Sources of liquidity are regularly reviewed and daily liquidity reporting is also carried out by the investment manager. Duties, charges and spreads may have an adverse/dilution effect on the value of the Funds. The Directors may at their discretion make a dilution adjustment if, in their opinion, the remaining shareholders, in case of redemptions, might otherwise be adversely affected especially in circumstances where a Fund is in continual decline (i.e. is experiencing a net outflow of redemptions) or a Fund is experiencing a net redemption position on any dealing day. Where a dilution adjustment is made, it will decrease the price where the Fund is in a net redemption position.
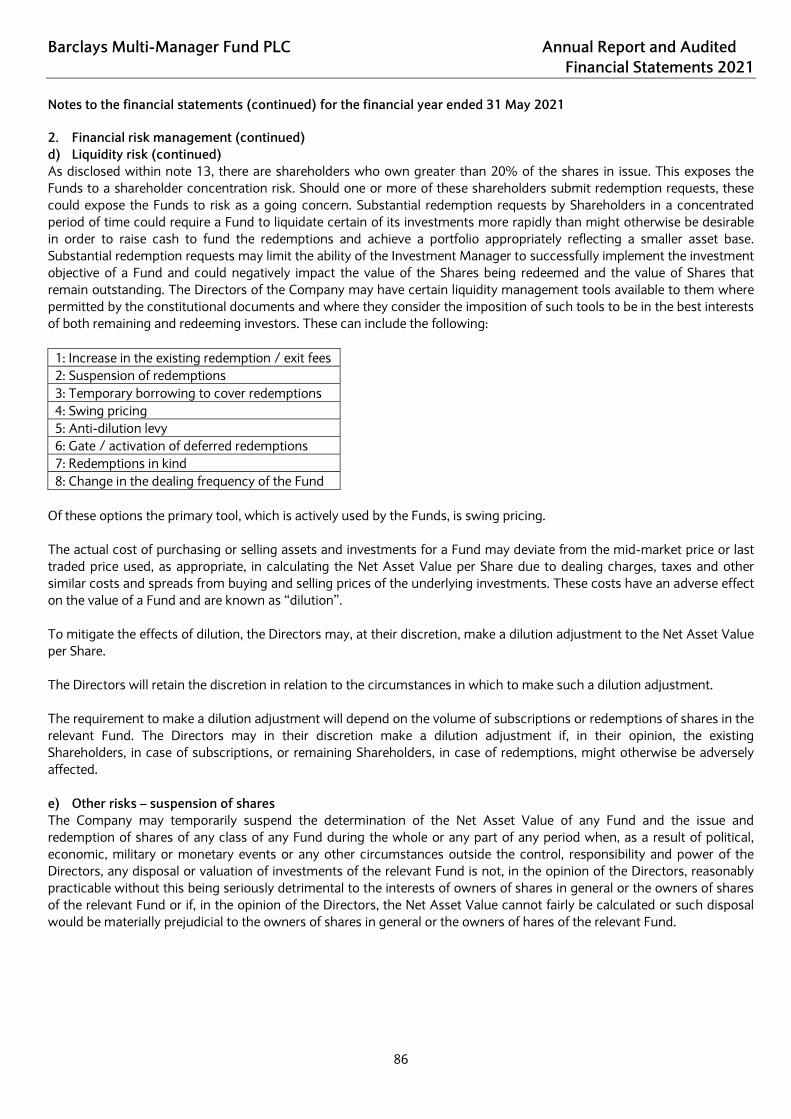
Barclays Multi-Manager Fund PLC Annual Report and Audited Financial Statements 2021
86
Notes to the financial statements (continued) for the financial year ended 31 May 2021
2. Financial risk management (continued) d) Liquidity risk (continued) As disclosed within note 13, there are shareholders who own greater than 20% of the shares in issue. This exposes the Funds to a shareholder concentration risk. Should one or more of these shareholders submit redemption requests, these could expose the Funds to risk as a going concern. Substantial redemption requests by Shareholders in a concentrated period of time could require a Fund to liquidate certain of its investments more rapidly than might otherwise be desirable in order to raise cash to fund the redemptions and achieve a portfolio appropriately reflecting a smaller asset base. Substantial redemption requests may limit the ability of the Investment Manager to successfully implement the investment objective of a Fund and could negatively impact the value of the Shares being redeemed and the value of Shares that remain outstanding. The Directors of the Company may have certain liquidity management tools available to them where permitted by the constitutional documents and where they consider the imposition of such tools to be in the best interests of both remaining and redeeming investors. These can include the following:
1: Increase in the existing redemption / exit fees 2: Suspension of redemptions 3: Temporary borrowing to cover redemptions 4: Swing pricing 5: Anti-dilution levy 6: Gate / activation of deferred redemptions 7: Redemptions in kind 8: Change in the dealing frequency of the Fund
Of these options the primary tool, which is actively used by the Funds, is swing pricing. The actual cost of purchasing or selling assets and investments for a Fund may deviate from the mid-market price or last traded price used, as appropriate, in calculating the Net Asset Value per Share due to dealing charges, taxes and other similar costs and spreads from buying and selling prices of the underlying investments. These costs have an adverse effect on the value of a Fund and are known as “dilution”. To mitigate the effects of dilution, the Directors may, at their discretion, make a dilution adjustment to the Net Asset Value per Share. The Directors will retain the discretion in relation to the circumstances in which to make such a dilution adjustment. The requirement to make a dilution adjustment will depend on the volume of subscriptions or redemptions of shares in the relevant Fund. The Directors may in their discretion make a dilution adjustment if, in their opinion, the existing Shareholders, in case of subscriptions, or remaining Shareholders, in case of redemptions, might otherwise be adversely affected. e) Other risks – suspension of shares The Company may temporarily suspend the determination of the Net Asset Value of any Fund and the issue and redemption of shares of any class of any Fund during the whole or any part of any period when, as a result of political, economic, military or monetary events or any other circumstances outside the control, responsibility and power of the Directors, any disposal or valuation of investments of the relevant Fund is not, in the opinion of the Directors, reasonably practicable without this being seriously detrimental to the interests of owners of shares in general or the owners of shares of the relevant Fund or if, in the opinion of the Directors, the Net Asset Value cannot fairly be calculated or such disposal would be materially prejudicial to the owners of shares in general or the owners of hares of the relevant Fund.

Barclays Multi-Manager Fund PLC Annual Report and Audited Financial Statements 2021
87
Notes to the financial statements (continued) for the financial year ended 31 May 2021
3. Operating income
Financial year ended
Financial year ended
Financial year ended
Financial year ended
Financial year ended
31 May 2020 31 May 2021 31 May 2020 31 May 2021 31 May 2020GBP GBP GBP USD USD
Interest income 158 1,328 2,264 39,759 49,050Dividend income 559,185 11,976,753 12,198,270 - -Sundry income 6,252 3,587 6,252 4,799 7,970
565,595 11,981,668 12,206,786 44,558 57,020TRUE TRUE
Financial year ended
Financial year ended
Financial year ended
Financial year ended
Financial year ended
Financial year ended
31 May 2021 31 May 2020 31 May 2021 31 May 2020 31 May 2021 31 May 2020USD USD USD USD USD USD
Interest income 11,364 7,816 8,895 284,291 46,158 67,929Dividend income 2,542,883 2,827,114 15,133,097 17,731,696 935,961 1,550,924Sundry income 4,799 7,970 4,799 7,969 4,799 7,970
2,559,046 2,842,900 15,146,791 18,023,956 986,918 1,626,823
GlobalAccess UK Alpha Fund* GlobalAccess UK Opportunities FundGlobalAccess Global Government
Bond Fund
GlobalAccess Asia Pacific(ex-Japan) Fund
GlobalAccess Emerging Market Equity Fund
GlobalAccess Global High Yield Bond Fund
* GlobalAccess UK Alpha Fund ceased trading on 31 March 2020.

Barclays Multi-Manager Fund PLC Annual Report and Audited Financial Statements 2021
88
Notes to the financial statements (continued) for the financial year ended 31 May 2021 3. Operating income (continued)
Financial year ended
Financial year ended
Financial year ended
Financial year ended
Financial year ended
31 May 2021 31 May 2020 31 May 2020 31 May 2021 31 May 2020USD USD USD USD USD
Interest income 58,058 64,506 - 20,135 56,338Dividend income 15,984 1,881 10,134 611,403 593,586Sundry income 4,799 7,970 7,969 4,799 7,970
78,841 74,357 18,103 636,337 657,894
Financial year ended
Financial year ended
Financial year ended
Financial year ended
Financial year ended
Financial year ended
31 May 2021 31 May 2020 31 May 2021 31 May 2020 31 May 2021 31 May 2020USD USD USD USD USD USD
Interest income 7,925 5,434 18,950 75,006 8,005 15,337Dividend income 4,112,488 3,466,271 41,207 191,962 1,261,634 1,798,522Sundry income 4,799 7,970 4,799 7,970 4,799 7,970
4,125,212 3,479,675 64,956 274,938 1,274,438 1,821,829
GlobalAccess Global Corporate Bond Fund
GlobalAccess Global Inflation Linked Bond Fund*
GlobalAccess Emerging Market Debt Fund
GlobalAccess Global Property Securities Fund**
GlobalAccess Global Short Duration Bond Fund
GlobalAccess US Small & Mid Cap Equity Fund
* GlobalAccess Global Inflation Linked Bond Fund ceased trading on 27 November 2019. ** GlobalAccess Global Property Securities Fund ceased trading on 23 February 2021.

Barclays Multi-Manager Fund PLC Annual Report and Audited Financial Statements 2021
89
Notes to the financial statements (continued) for the financial year ended 31 May 2021 3. Operating income (continued)
Financial year ended
Financial year ended
Financial year ended
Financial year ended
Financial year ended
Financial year ended
31 May 2021 31 May 2020 31 May 2021 31 May 2020 31 May 2021 31 May 2020USD USD USD USD USD USD
Interest income 20,576 56,268 4,945 23,335 3,243 83,065Dividend income 3,809,929 4,627,860 3,689,456 5,073,873 570,984 940,356Sundry income 4,799 7,970 5,076 7,970 4,799 -
3,835,304 4,692,098 3,699,477 5,105,178 579,026 1,023,421
Financial year ended
Financial year ended
Financial year ended
Financial year ended
Financial year ended
Financial year ended
31 May 2021 31 May 2020 31 May 2021 31 May 2020 31 May 2021 31 May 2020EUR EUR JPY JPY GBP GBP
Interest income 626 1,469 391,355 273,770 190,523 630,343Dividend income 3,328,267 3,224,165 520,278,879 613,301,970 43,129,931 50,825,786Sundry income 4,013 7,202 509,173 866,093 54,113 100,931
3,332,906 3,232,836 521,179,407 614,441,833 43,374,567 51,557,060
GlobalAccess US Equity FundGlobalAccess Global Equity Income
FundGlobalAccess Emerging Market Local
Currency Debt Fund
GlobalAccess Europe (ex-UK) Alpha Fund GlobalAccess Japan Fund Aggregated total in GBP

Barclays Multi-Manager Fund PLC Annual Report and Audited Financial Statements 2021
90
Notes to the financial statements (continued) for the financial year ended 31 May 2021 4. Net gains/(losses) on financial assets and financial liabilities at fair value through profit or loss
Financial year ended
Financial year ended
Financial year ended
Financial year ended
Financial year ended
Financial year ended
31 May 2021 31 May 2020 31 May 2021 31 May 2020 31 May 2021 31 May 2020GBP GBP GBP GBP USD USD
Net fair value (losses)/gains on investments and derivative contracts through profit or loss (2,065,452) 97,081,733 (60,486,550) 2,708,096 9,940,600Net change in fair value on forward currency contracts (25,483) (75,519) (333,604) (253,846) 979,899Net fair value gains/(losses) on sale of futures contracts 13,079 (1,341,405) 1,557,338 131,801 (632,856)Other fair value gains - - - 1,362,805 1,766,248
(2,077,856) 95,664,809 (59,262,816) 3,948,856 12,053,891
Financial year ended
Financial year ended
Financial year ended
Financial year ended
Financial year ended
Financial year ended
31 May 2021 31 May 2020 31 May 2021 31 May 2020 31 May 2021 31 May 2020USD USD USD USD USD USD
Net fair value gains/(losses) on investments and derivative contracts through profit or loss 39,256,836 (5,479,487) 265,734,099 (55,852,826) 121,097,888 (84,125,631)Net change in fair value on forward currency contracts 73,857 285,585 191,746 2,331,690 328,558 23,355,845Net fair value (losses)/gains on sale of futures contracts (40,435) 44,939 347,325 399,327 - -Other fair value gains - - - - 31,633,340 41,399,687
39,290,258 (5,148,963) 266,273,170 (53,121,809) 153,059,786 (19,370,099)
GlobalAccess UK Alpha Fund* GlobalAccess UK Opportunities FundGlobalAccess Global Government
Bond Fund
GlobalAccess Asia Pacific(ex-Japan) Fund
GlobalAccess Emerging Market Equity Fund
GlobalAccess Global High Yield Bond Fund
* GlobalAccess UK Alpha Fund ceased trading on 31 March 2020.

Barclays Multi-Manager Fund PLC Annual Report and Audited Financial Statements 2021
91
Notes to the financial statements (continued) for the financial year ended 31 May 2021
4. Net gains/(losses) on financial assets and financial liabilities at fair value through profit or loss (continued)
Financial year ended
Financial year ended
Financial year ended
Financial year ended
Financial year ended
Financial year ended
31 May 2021 31 May 2020 31 May 2020 31 May 2021 31 May 2020USD USD USD USD USD
Net fair value gains/(losses) on investments and derivative contracts through profit or loss 64,796,418 (1,701,104) 586,802 48,664,228 (28,889,433)Net change in fair value on forward currency contracts 2,723,052 10,441,726 245,401 809,572 8,411,430Net fair value gains/(losses) on sale of futures contracts 366,403 (794,293) 196,711 107,596 381,831Other fair value gains 14,254,045 15,202,695 272,474 12,927,909 14,490,836
82,139,918 23,149,024 1,301,388 62,509,305 (5,605,336)
Financial year ended
Financial year ended
Financial year ended
Financial year ended
Financial year ended
Financial year ended
31 May 2021 31 May 2020 31 May 2021 31 May 2020 31 May 2021 31 May 2020USD USD USD USD USD USD
Net fair value gains/(losses) on investments and derivative contracts through profit or loss 29,008,361 (47,744,017) 16,454,453 (14,423,710) 51,580,182 432,557Net change in fair value on forward currency contracts (17,599) 133,718 (1,875,514) 3,884,842 136,091 664,544Net fair value (losses)/gains on sale of futures contracts - - (111,312) 563,075 (90,552) 89,992Other fair value gains - - 4,438,237 8,168,400 - -
28,990,762 (47,610,299) 18,905,864 (1,807,393) 51,625,721 1,187,093
GlobalAccess Global Corporate Bond Fund
GlobalAccess Global Inflation Linked Bond Fund*
GlobalAccess Emerging Market Debt Fund
GlobalAccess Global Property Securities Fund**
GlobalAccess Global Short Duration Bond Fund
GlobalAccess US Small & Mid Cap Equity Fund
* GlobalAccess Global Inflation Linked Bond Fund ceased trading on 27 November 2019. ** GlobalAccess Global Property Securities Fund ceased trading on 23 February 2021.

Barclays Multi-Manager Fund PLC Annual Report and Audited Financial Statements 2021
92
Notes to the financial statements (continued) for the financial year ended 31 May 2021 4. Net gains/(losses) on financial assets and financial liabilities at fair value through profit or loss (continued)
Financial year ended
Financial year ended
Financial year ended
Financial year ended
Financial year ended
Financial year ended
31 May 2021 31 May 2020 31 May 2021 31 May 2020 31 May 2021 31 May 2020USD USD USD USD USD USD
Net fair value gains/(losses) on investments and derivative contracts through profit or loss 100,235,015 33,618,080 47,323,552 (2,977,836) 24,677,061 (65,863,011)Net change in fair value on forward currency contracts (85,517) 658,550 (143,627) 2,083,421 (589,633) 742,621Net fair value (losses)/gains on sale of futures contracts (62,922) 261,082 (376,127) 449,030 21,699 (239,133)Other fair value gains - - - - 21,453,439 35,225,791
100,086,576 34,537,712 46,803,798 (445,385) 45,562,566 (30,133,732)
Financial year ended
Financial year ended
Financial year ended
Financial year ended
Financial year ended
Financial year ended
31 May 2021 31 May 2020 31 May 2021 31 May 2020 31 May 2021 31 May 2020EUR EUR JPY JPY GBP GBP
Net fair value gains/(losses) on investments and derivative contracts through profit or loss 34,660,361 4,639,357 6,777,951,263 851,812,290 783,901,804 (260,211,823)Net change in fair value on forward currency contracts 130,485 (74,360) (5,170,225) 23,714,994 976,228 42,707,346Net fair value (losses)/gains on sale of futures contracts - - (28,984,998) 51,719,998 (1,325,762) 2,519,362Other fair value gains - - - - 64,507,166 92,323,657
34,790,846 4,564,997 6,743,796,040 927,247,282 848,059,436 (122,661,458)
GlobalAccess US Equity Fund GlobalAccess Global Equity Income Fund
GlobalAccess Emerging Market Local Currency Debt Fund
GlobalAccess Europe (ex-UK) Alpha Fund GlobalAccess Japan Fund Aggregated total in GBP

Barclays Multi-Manager Fund PLC Annual Report and Audited Financial Statements 2021
93
Notes to the financial statements (continued) for the financial year ended 31 May 2021 5. Operating expenses
Financial year ended
Financial year ended
Financial year ended
Financial year ended
Financial year ended
31 May 2020 31 May 2021 31 May 2020 31 May 2021 31 May 2020GBP GBP GBP USD USD
Investment management fees (137,051) (2,783,052) (2,995,650) (649,887) (940,566)Administration & Depositary fees (111,065) (297,553) (300,961) (255,608) (320,105)Auditors' remuneration (7,842) (12,709) (12,440) (21,141) (17,913)Directors' fees (3,541) (5,663) (4,301) (7,505) (5,458)Sundry expenses (99,096) (94,128) (91,414) (160,435) (138,699)
(358,595) (3,193,105) (3,404,766) (1,094,576) (1,422,741)
TRUE TRUE
Financial year ended
Financial year ended
Financial year ended
Financial year ended
Financial year ended
Financial year ended
31 May 2021 31 May 2020 31 May 2021 31 May 2020 31 May 2021 31 May 2020USD USD USD USD USD USD
Investment management fees (699,936) (721,032) (6,097,847) (5,659,902) (4,114,275) (5,333,723)Administration & Depositary fees (217,200) (204,302) (713,283) (671,615) (547,679) (568,481)Auditors' remuneration (14,147) (11,530) (18,076) (15,116) (27,115) (23,364)Directors' fees (7,505) (5,458) (7,505) (5,458) (7,505) (5,458)Sundry expenses (109,849) (101,907) (160,592) (162,410) (292,652) (312,304)
(1,048,637) (1,044,229) (6,997,303) (6,514,501) (4,989,226) (6,243,330)TRUE TRUE TRUE
GlobalAccess UK Alpha Fund* GlobalAccess UK Opportunities FundGlobalAccess Global Government
Bond Fund
GlobalAccess Asia Pacific(ex-Japan) Fund
GlobalAccess Emerging Market Equity Fund
GlobalAccess Global High Yield Bond Fund
* GlobalAccess UK Alpha Fund ceased trading on 31 March 2020.

Barclays Multi-Manager Fund PLC Annual Report and Audited Financial Statements 2021
94
Notes to the financial statements (continued) for the financial year ended 31 May 2021 5. Operating expenses (continued)
Financial year ended
Financial year ended
Financial year ended
Financial year ended
Financial year ended
31 May 2021 31 May 2020 31 May 2020 31 May 2021 31 May 2020USD USD USD USD USD
Investment management fees (3,033,804) (2,849,954) (111,233) (2,123,655) (2,155,541)Administration & Depositary fees (516,857) (493,131) (110,892) (407,148) (404,658)Auditors' remuneration (27,115) (23,364) (11,056) (21,141) (17,913)Directors' fees (7,505) (5,458) (3,192) (7,505) (5,458)Sundry expenses (350,425) (297,648) (109,670) (217,252) (200,267)
(3,935,706) (3,669,555) (346,043) (2,776,701) (2,783,837)
TRUE TRUE TRUE
Financial year ended
Financial year ended
Financial year ended
Financial year ended
Financial year ended
Financial year ended
31 May 2021 31 May 2020 31 May 2021 31 May 2020 31 May 2021 31 May 2020USD USD USD USD USD USD
Investment management fees (950,122) (880,162) (912,045) (1,495,191) (1,054,008) (1,193,472)Administration & Depositary fees (183,389) (180,474) (252,063) (294,127) (243,679) (236,797)Auditors' remuneration (11,033) (11,558) (21,141) (17,913) (18,076) (15,116)Directors' fees (7,082) (5,458) (7,505) (5,458) (7,505) (5,458)Sundry expenses (127,778) (96,168) (136,137) (155,471) (119,174) (101,940)
(1,279,404) (1,173,820) (1,328,891) (1,968,160) (1,442,442) (1,552,783)TRUE TRUE TRUE
GlobalAccess Global Property Securities Fund**
GlobalAccess Global Short Duration Bond Fund
GlobalAccess US Small & Mid Cap Equity Fund
GlobalAccess Global Corporate Bond Fund
GlobalAccess Global Inflation Linked Bond Fund*
GlobalAccess Emerging Market Debt Fund
* GlobalAccess Global Inflation Linked Bond Fund ceased trading on 27 November 2019. ** GlobalAccess Global Property Securities Fund ceased trading on 23 February 2021.

Barclays Multi-Manager Fund PLC Annual Report and Audited Financial Statements 2021
95
Notes to the financial statements (continued) for the financial year ended 31 May 2021 5. Operating expenses (continued)
Financial year ended
Financial year ended
Financial year ended
Financial year ended
Financial year ended
Financial year ended
31 May 2021 31 May 2020 31 May 2021 31 May 2020 31 May 2021 31 May 2020USD USD USD USD USD USD
Investment management fees (1,728,362) (1,772,082) (1,014,833) (1,356,574) (2,896,018) (4,523,363)Administration & Depositary fees (311,311) (278,108) (361,093) (376,014) (611,200) (851,195)Auditors' remuneration (14,147) (11,530) (18,164) (15,152) (21,141) (17,913)Directors' fees (7,505) (5,458) (7,505) (5,458) (7,504) (5,458)Sundry expenses (138,095) (115,005) (144,725) (154,105) (106,381) (164,227)
(2,199,420) (2,182,183) (1,546,320) (1,907,303) (3,642,244) (5,562,156)
TRUE TRUE TRUE
Financial year ended
Financial year ended
Financial year ended
Financial year ended
Financial year ended
Financial year ended
31 May 2021 31 May 2020 31 May 2021 31 May 2020 31 May 2021 31 May 2020EUR EUR JPY JPY GBP GBP
Investment management fees (1,198,940) (1,487,857) (218,556,069) (206,111,300) (24,332,447) (28,916,571)Administration & Depositary fees (277,489) (289,454) (33,398,102) (31,023,709) (4,242,649) (4,846,307)Auditors' remuneration (10,984) (10,719) (1,562,975) (1,546,170) (207,698) (206,933)Directors' fees (6,339) (4,919) (803,246) (574,658) (84,141) (70,781)Sundry expenses (91,286) (91,783) (12,301,219) (9,926,499) (1,808,540) (2,015,226)
(1,585,038) (1,884,732) (266,621,611) (249,182,336) (30,675,475) (36,055,818)
GlobalAccess Europe (ex-UK) Alpha Fund GlobalAccess Japan Fund Aggregated total in GBP
GlobalAccess US Equity FundGlobalAccess Global Equity Income
FundGlobalAccess Emerging Market Local
Currency Debt Fund

Barclays Multi-Manager Fund PLC Annual Report and Audited Financial Statements 2021
96
Notes to the financial statements (continued) for the financial year ended 31 May 2021 6. Cash and cash equivalents, cash collateral & margin cash due from broker
Financial year ended
Financial year ended
Financial year ended
Financial year ended
Financial year ended
31 May 2020 31 May 2021 31 May 2020 31 May 2021 31 May 2020GBP GBP GBP USD USD
Cash and cash equivalents The Northern Trust Company 93,339 7,190,609 13,422,003 2,104,263 3,671,445 Cash held as collateral - - - 486,000 400,000 Margin cash due from broker: Barclays Bank UK PLC - - - 36,409 234,703 Goldman Sachs International - 994,071 1,001,411 - 1,268
93,339 8,184,680 14,423,414 2,626,672 4,307,416 TRUE TRUE TRUE
Financial year ended
Financial year ended
Financial year ended
Financial year ended
Financial year ended
Financial year ended
31 May 2021 31 May 2020 31 May 2021 31 May 2020 31 May 2021 31 May 2020USD USD USD USD USD USD
Cash and cash equivalents The Northern Trust Company 2,460,513 3,034,204 36,088,679 15,787,655 7,368,327 6,487,964 Margin cash due from broker: Goldman Sachs International 81,248 239,800 1,769,794 614,852 - -
2,541,761 3,274,004 37,858,473 16,402,507 7,368,327 6,487,964 TRUE TRUE TRUE
GlobalAccess Asia Pacific(ex-Japan) Fund
GlobalAccess Emerging Market Equity Fund
GlobalAccess Global High Yield Bond Fund
GlobalAccess UK Alpha Fund* GlobalAccess UK Opportunities FundGlobalAccess Global Government
Bond Fund
* GlobalAccess UK Alpha Fund ceased trading on 31 March 2020.

Barclays Multi-Manager Fund PLC Annual Report and Audited Financial Statements 2021
97
Notes to the financial statements (continued) for the financial year ended 31 May 2021
6. Cash and cash equivalents, cash collateral & margin cash due from broker (continued)
Financial year ended
Financial year ended
Financial year ended
Financial year ended
Financial year ended
31 May 2021 31 May 2020 31 May 2020 31 May 2021 31 May 2020USD USD USD USD USD
Cash and cash equivalents The Northern Trust Company 5,681,396 3,322,616 36,391 12,651,196 10,653,798 Cash held as collateral 1,650,000 390,000 - 50,000 110,000 Margin cash due from broker: Barclays Bank UK PLC 7,447 435,130 - - - JP Morgan Chase Bank - - - 1,135,041 734,906 Morgan Stanley 1,229,985 1,311,605 - - -
8,568,828 5,459,351 36,391 13,836,237 11,498,704 TRUE TRUE TRUE
Financial year ended
Financial year ended
Financial year ended
Financial year ended
Financial year ended
Financial year ended
31 May 2021 31 May 2020 31 May 2021 31 May 2020 31 May 2021 31 May 2020USD USD USD USD USD USD
Cash and cash equivalents The Northern Trust Company 115,708 6,109,531 9,234,854 9,113,400 3,629,737 3,244,997 Cash held as collateral - - 20,000 230,000 - - Margin cash due from broker: Goldman Sachs International - - - - 154,303 316,944 JP Morgan Chase Bank - - 2,319,577 1,969,041 - -
115,708 6,109,531 11,574,431 11,312,441 3,784,040 3,561,941 TRUE TRUE TRUE
GlobalAccess Global Property Securities Fund**
GlobalAccess Global Short Duration Bond Fund
GlobalAccess US Small & Mid Cap Equity Fund
GlobalAccess Global Corporate Bond Fund
GlobalAccess Global Inflation Linked Bond Fund*
GlobalAccess Emerging Market Debt Fund
* GlobalAccess Global Inflation Linked Bond Fund ceased trading on 27 November 2019. ** GlobalAccess Global Property Securities Fund ceased trading on 23 February 2021.

Barclays Multi-Manager Fund PLC Annual Report and Audited Financial Statements 2021
98
Notes to the financial statements (continued) for the financial year ended 31 May 2021 6. Cash and cash equivalents, cash collateral & margin cash due from broker (continued)
Financial year ended
Financial year ended
Financial year ended
Financial year ended
Financial year ended
Financial year ended
31 May 2021 31 May 2020 31 May 2021 31 May 2020 31 May 2021 31 May 2020USD USD USD USD USD USD
Cash and cash equivalents The Northern Trust Company 17,308,731 10,660,674 2,748,523 3,699,695 18,242,751 26,242,081 Cash held as collateral - - - - 270,000 1,620,000 Margin cash due from broker: Goldman Sachs International 792,614 787,837 159,966 138,380 - - HSBC - - - - 41,327 20,529
18,101,345 11,448,511 2,908,489 3,838,075 18,554,078 27,882,610 TRUE TRUE TRUE
Financial year ended
Financial year ended
Financial year ended
Financial year ended
Financial year ended
Financial year ended
31 May 2021 31 May 2020 31 May 2021 31 May 2020 31 May 2021 31 May 2020EUR EUR JPY JPY GBP GBP
Cash and cash equivalents The Northern Trust Company 2,358,091 1,580,851 1,003,562,211 779,048,706 98,426,279 103,343,091 Cash held as collateral - - - - 1,741,821 2,224,379 Margin cash due from broker: Barclays Bank UK PLC - - - - 30,852 541,804 Goldman Sachs International 929 929 102,460,090 101,070,083 3,734,603 3,458,947 HSBC - - - - 29,073 16,605 JP Morgan Chase Bank - - - - 2,430,262 2,187,128 Morgan Stanley & Co. International plc - - 865,272 1,060,911
2,359,020 1,581,780 1,106,022,301 880,118,789 107,258,162 112,832,865
GlobalAccess Europe (ex-UK) Alpha Fund GlobalAccess Japan Fund Aggregated total in GBP
GlobalAccess US Equity FundGlobalAccess Global Equity Income
FundGlobalAccess Emerging Market Local
Currency Debt Fund

Barclays Multi-Manager Fund PLC Annual Report and Audited Financial Statements 2021
99
Notes to the financial statements (continued) for the financial year ended 31 May 2021 7. Other receivables
Financial year ended
Financial year ended
Financial year ended
Financial year ended
Financial year ended
31 May 2020 31 May 2021 31 May 2020 31 May 2021 31 May 2020GBP GBP GBP USD USD
Interest income receivable - - - 8 2 Dividend income 3,339 1,644,050 921,242 - - Sale of securities awaiting settlement - 166,726 178,867 38,429,261 35,599,283 Subscriptions of shares awaiting settlement - 923,392 1,231,393 32,843 521,622
Sundry income 1,217 5,708 6,617 45,920 29,746 4,556 2,739,876 2,338,119 38,508,032 36,150,653
TRUE TRUE TRUE
Financial year ended
Financial year ended
Financial year ended
Financial year ended
Financial year ended
Financial year ended
31 May 2021 31 May 2020 31 May 2021 31 May 2020 31 May 2021 31 May 2020USD USD USD USD USD USD
Interest income receivable - - - 22 - - Dividend income 510,313 172,268 1,669,145 1,357,351 - - Sale of securities awaiting settlement 45,252 688,587 817,790 909,374 701,654 3,576,981 Subscriptions of shares awaiting settlement 36,325 261,750 2,221,428 437,396 987,233 1,403,503 Sundry income 17 1,471 8,274 5,936 806 7,017
591,907 1,124,076 4,716,637 2,710,079 1,689,693 4,987,501 TRUE TRUE TRUE
GlobalAccess Asia Pacific(ex-Japan) Fund
GlobalAccess Emerging Market Equity Fund
GlobalAccess Global High Yield Bond Fund
GlobalAccess UK Alpha Fund* GlobalAccess UK Opportunities FundGlobalAccess Global Government
Bond Fund
* GlobalAccess UK Alpha Fund ceased trading on 31 March 2020.

Barclays Multi-Manager Fund PLC Annual Report and Audited Financial Statements 2021
100
Notes to the financial statements (continued) for the financial year ended 31 May 2021 7. Other receivables (continued)
Financial year ended
Financial year ended
Financial year ended
Financial year ended
Financial year ended
Financial year ended
31 May 2021 31 May 2020 31 May 2021 31 May 2020 31 May 2021 31 May 2020USD USD USD USD USD USD
Interest income receivable - 3 - - - - Dividend income - - - - - - Sale of securities awaiting settlement 8,013,889 6,952,349 - - 917,625 2,805,699 Subscriptions of shares awaiting settlement 1,814,102 2,318,630 - - 1,135,788 265,383 Sundry income 146,794 85,985 - - 156 4,253
9,974,785 9,356,967 - - 2,053,569 3,075,335
TRUE TRUE TRUE
Financial year ended
Financial year ended
Financial year ended
Financial year ended
Financial year ended
Financial year ended
31 May 2021 31 May 2020 31 May 2021 31 May 2020 31 May 2021 31 May 2020USD USD USD USD USD USD
Interest income receivable 5,991 - - - - - Dividend income - 231,682 - - 67,879 89,708 Sale of securities awaiting settlement - 582,550 1,364,552 1,019,191 186,420 117,623 Subscriptions of shares awaiting settlement - 198,048 3,813 911,037 326,405 - Sundry income - 2,108 9,504 21,274 32 654
5,991 1,014,388 1,377,869 1,951,502 580,736 207,985 TRUE TRUE TRUE
GlobalAccess Global Property Securities Fund*
GlobalAccess Global Short Duration Bond Fund
GlobalAccess US Small & Mid Cap Equity Fund
GlobalAccess Global Corporate Bond Fund
GlobalAccess Global Inflation Linked Bond Fund*
GlobalAccess Emerging Market Debt Fund
* GlobalAccess Global Inflation Linked Bond Fund ceased trading on 27 November 2019. ** GlobalAccess Global Property Securities Fund ceased trading on 23 February 2021.

Barclays Multi-Manager Fund PLC Annual Report and Audited Financial Statements 2021
101
Notes to the financial statements (continued) for the financial year ended 31 May 2021 7. Other receivables (continued)
Financial year ended
Financial year ended
Financial year ended
Financial year ended
Financial year ended
Financial year ended
31 May 2021 31 May 2020 31 May 2021 31 May 2020 31 May 2021 31 May 2020USD USD USD USD USD USD
Interest income receivable - - - - 12 - Dividend income 294,530 353,122 270,425 307,960 - - Sale of securities awaiting settlement 273,495 1,547,210 233,129 31,672 152,672 111,818,055 Subscriptions of shares awaiting settlement 44,743 5,786 - 1,215 1,445,197 1,727,131 Sundry income 29 23,837 3,222 3,798 16,253 1,754,431
612,797 1,929,955 506,776 344,645 1,614,134 115,299,617
TRUE TRUE TRUE
Financial year ended
Financial year ended
Financial year ended
Financial year ended
Financial year ended
Financial year ended
31 May 2021 31 May 2020 31 May 2021 31 May 2020 31 May 2021 31 May 2020EUR EUR JPY JPY GBP GBP
Interest income receivable - - - 8 4,229 22 Dividend income 90,057 97,047 221,549,206 233,892,032 5,124,613 4,799,882 Sale of securities awaiting settlement 14,680 284,233 32,779,631 25,414,128 36,363,219 134,612,745 Subscriptions of shares awaiting settlement 19,751 231 83,836,044 170,246,027 7,141,038 9,022,370 Sundry income - 473 200,546 905,383 169,507 1,584,668
124,488 381,984 338,365,427 430,457,578 48,802,606 150,019,687
GlobalAccess Europe (ex-UK) Alpha Fund GlobalAccess Japan Fund Aggregated total in GBP
GlobalAccess US Equity FundGlobalAccess Global Equity Income
FundGlobalAccess Emerging Market Local
Currency Debt Fund

Barclays Multi-Manager Fund PLC Annual Report and Audited Financial Statements 2021
102
Notes to the financial statements (continued) for the financial year ended 31 May 2021
8. Bank overdraft, cash collateral & margin cash due to broker
Financial year ended
Financial year ended
Financial year ended
Financial year ended
Financial year ended
31 May 2020 31 May 2021 31 May 2020 31 May 2021 31 May 2020GBP GBP GBP USD USD
Bank overdraft The Northern Trust Company (8,052) - - - Cash pledged as collateral - - - - (554,000)Margin cash due to broker: Barclays Bank UK PLC - - - (222,656) (131,436) Goldman Sachs International - - - - (1,157)
(8,052) - - (222,656) (686,593)
TRUE TRUE
Financial year ended
Financial year ended
Financial year ended
Financial year ended
Financial year ended
Financial year ended
31 May 2021 31 May 2020 31 May 2021 31 May 2020 31 May 2021 31 May 2020USD USD USD USD USD USD
Bank overdraft The Northern Trust Company - - (1,776) - (1,332,197) -
- - (1,776) - (1,332,197) - TRUE TRUE TRUE TRUE TRUE TRUE
GlobalAccess Asia Pacific(ex-Japan) Fund
GlobalAccess Emerging Market Equity Fund
GlobalAccess Global High Yield Bond Fund
GlobalAccess UK Alpha Fund* GlobalAccess UK Opportunities FundGlobalAccess Global Government
Bond Fund
* GlobalAccess UK Alpha Fund ceased trading on 31 March 2020.

Barclays Multi-Manager Fund PLC Annual Report and Audited Financial Statements 2021
103
Notes to the financial statements (continued) for the financial year ended 31 May 2021 8. Bank overdraft, cash collateral & margin cash due to broker (continued)
Financial year ended
Financial year ended
Financial year ended
Financial year ended
Financial year ended
Financial year ended
31 May 2021 31 May 2020 31 May 2021 31 May 2020 31 May 2021 31 May 2020USD USD USD USD USD USD
Bank overdraft The Northern Trust Company - - - - (30,557) - Cash pledged as collateral - (280,000) - (50,000) - Margin cash due to broker: - Barclays Bank UK PLC (175,228) (40,846) - - - JP Morgan Chase Bank - - (366,341) (127,149) - - Morgan Stanley & Co. International plc (182,915) - - - - -
(358,143) (320,846) (366,341) (177,149) (30,557) -
TRUE TRUE TRUE
Financial year ended
Financial year ended
Financial year ended
Financial year ended
Financial year ended
Financial year ended
31 May 2021 31 May 2020 31 May 2021 31 May 2020 31 May 2021 31 May 2020USD USD USD USD USD USD
Bank overdraft The Northern Trust Company (4) (37,308) (107) - - - Cash pledged as collateral - (260,000) - - - Margin cash due to broker: JP Morgan Chase Bank (2,259,026) (2,072,986) - - - -
(2,259,030) (2,370,294) (107) - - - TRUE TRUE FALSE TRUE
GlobalAccess Global Short Duration Bond Fund
GlobalAccess US Small & Mid Cap Equity Fund GlobalAccess US Equity Fund
GlobalAccess Global Corporate Bond Fund
GlobalAccess Emerging Market Debt Fund
GlobalAccess Global Property Securities Fund*
* GlobalAccess Global Property Securities Fund ceased trading on 23 February 2021.

Barclays Multi-Manager Fund PLC Annual Report and Audited Financial Statements 2021
104
Notes to the financial statements (continued) for the financial year ended 31 May 2021 8. Bank overdraft, cash collateral & margin cash due to broker (continued)
Financial year ended
Financial year ended
Financial year ended
Financial year ended
Financial year ended
Financial year ended
31 May 2021 31 May 2020 31 May 2021 31 May 2020 31 May 2021 31 May 2020USD USD USD USD EUR EUR
Bank overdraft The Northern Trust Company (771) (97,052) - - - Cash pledged as collateral - - (229,940) (1,156,000) - -
(771) (97,052) (229,940) (1,156,000) - -
TRUE TRUE TRUE
Financial year ended
Financial year ended
Financial year ended
Financial year ended
31 May 2021 31 May 2020 31 May 2021 31 May 2020JPY JPY GBP GBP
Bank overdraft The Northern Trust Company - - (960,542) (116,732)Cash pledged as collateral - - (161,759) (1,860,390)Margin cash due to broker: Barclays Bank UK PLC - - (279,905) (139,353) Goldman Sachs International - - - (936) JP Morgan Chase Bank - - (1,846,898) (1,779,612) Morgan Stanley & Co. International plc - - (128,678) -
- - (3,377,782) (3,897,023)
GlobalAccess Japan Fund Aggregated total in GBP
GlobalAccess Global Equity Income Fund
GlobalAccess Emerging Market Local Currency Debt Fund
GlobalAccess Europe (ex-UK) Alpha Fund

Barclays Multi-Manager Fund PLC Annual Report and Audited Financial Statements 2021
105
Notes to the financial statements (continued) for the financial year ended 31 May 2021 9. Other payables
Financial year ended
Financial year ended
Financial year ended
Financial year ended
Financial year ended
31 May 2020 31 May 2021 31 May 2020 31 May 2021 31 May 2020GBP GBP GBP USD USD
Interest payable (41) (38) (7) (153) (441)Investment management fees payable (7,172) (720,291) (590,924) (147,082) (190,060)Other expenses payable (82,630) (156,421) (119,089) (165,395) (147,290)Purchase of securities awaiting settlement - (1,144,142) (629,859) (51,099,149) (52,451,510)Redemptions of shares awaiting settlement - (1,643,066) (559,775) (645) (22,544)
(89,843) (3,663,958) (1,899,654) (51,412,424) (52,811,845)
TRUE TRUE TRUE
Financial year ended
Financial year ended
Financial year ended
Financial year ended
Financial year ended
Financial year ended
31 May 2021 31 May 2020 31 May 2021 31 May 2020 31 May 2021 31 May 2020USD USD USD USD USD USD
Interest payable (15) (17) (67) (32) (375) (121)Investment management fees payable (197,476) (139,928) (1,699,940) (1,183,311) (729,407) (1,061,337)Other expenses payable (138,097) (108,480) (310,486) (229,556) (272,613) (260,040)Dividend WHT payable (17,443) (11,844) (91,725) (93,356) - - Purchase of securities awaiting settlement - (425,822) (1,196,651) (1,276,353) (6,565,422) (4,862,309)Redemptions of shares awaiting settlement (244) (173,139) (740,112) (797,512) (662,270) (649,210)
(353,275) (859,230) (4,038,981) (3,580,120) (8,230,087) (6,833,017)TRUE TRUE TRUE
GlobalAccess Asia Pacific(ex-Japan) Fund
GlobalAccess Emerging Market Equity Fund
GlobalAccess Global High Yield Bond Fund
GlobalAccess UK Alpha Fund* GlobalAccess UK Opportunities FundGlobalAccess Global Government
Bond Fund
* GlobalAccess UK Alpha Fund ceased trading on 31 March 2020.

Barclays Multi-Manager Fund PLC Annual Report and Audited Financial Statements 2021
106
Notes to the financial statements (continued) for the financial year ended 31 May 2021 9. Other payables (continued)
Financial year ended
Financial year ended
Financial year ended
Financial year ended
Financial year ended
31 May 2021 31 May 2020 31 May 2020 31 May 2021 31 May 2020USD USD USD USD USD
Interest payable (387) (526) (9) (323) (14)Investment management fees payable (810,907) (653,895) - (544,073) (455,919)Other expenses payable (282,397) (268,863) (36,382) (227,402) (177,130)Purchase of securities awaiting settlement (9,269,137) (13,752,821) - (1,048,006) (2,165,642)Redemptions of shares awaiting settlement (1,009,392) (305,288) - (440,499) (134,655)
(11,372,220) (14,981,393) (36,391) (2,260,303) (2,933,360)
TRUE TRUE
Financial year ended
Financial year ended
Financial year ended
Financial year ended
Financial year ended
Financial year ended
31 May 2021 31 May 2020 31 May 2021 31 May 2020 31 May 2021 31 May 2020USD USD USD USD USD USD
Interest payable (6,821) (40) (86) (144) (13) (17)Investment management fees payable (1) (328,779) (171,087) (281,817) (295,313) (207,384)Other expenses payable (84,320) (108,679) (158,851) (156,349) (153,651) (114,793)Dividend WHT payable - (37,142) - - (19,228) (25,837)Purchase of securities awaiting settlement - (1,629,348) (6,704,573) (3,439,264) (174,716) (223,165)Redemptions of shares awaiting settlement - (146,690) (20,832) (121,920) (531,969) (32,931)
(91,142) (2,250,678) (7,055,429) (3,999,494) (1,174,890) (604,127)TRUE TRUE TRUE
GlobalAccess Global Property Securities Fund
GlobalAccess Global Short Duration Bond Fund
GlobalAccess US Small & Mid Cap Equity Fund
GlobalAccess Global Corporate Bond Fund
GlobalAccess Global Inflation Linked Bond Fund*
GlobalAccess Emerging Market Debt Fund
* GlobalAccess Global Inflation Linked Bond Fund ceased trading on 27 November 2019. ** GlobalAccess Global Property Securities Fund ceased trading on 23 February 2021.

Barclays Multi-Manager Fund PLC Annual Report and Audited Financial Statements 2021
107
Notes to the financial statements (continued) for the financial year ended 31 May 2021 9. Other payables (continued)
Financial year ended
Financial year ended
Financial year ended
Financial year ended
Financial year ended
Financial year ended
31 May 2021 31 May 2020 31 May 2021 31 May 2020 31 May 2021 31 May 2020USD USD USD USD USD USD
Interest payable (57) (21) (97) (56) (131) (114)Investment management fees payable (495,400) (358,614) (222,726) (241,698) (732,242) (1,203,333)Other expenses payable (176,815) (122,416) (247,261) (209,397) (296,868) (1,721,752)US Dividend WHT payable (86,644) (105,937) - - - - Purchase of securities awaiting settlement (1,584,139) (158,936) (244,677) (290,317) (133,240) (5,728,811)Redemptions of shares awaiting settlement (2,089,773) (176,261) (876,876) (148,748) (644,552) (121,302,534)
(4,432,828) (922,185) (1,591,637) (890,216) (1,807,033) (129,956,544)
TRUE TRUE TRUE
Financial year ended
Financial year ended
Financial year ended
Financial year ended
Financial year ended
Financial year ended
31 May 2021 31 May 2020 31 May 2021 31 May 2020 31 May 2021 31 May 2020EUR EUR JPY JPY GBP GBP
Interest payable (974) (581) (440,043) (295,377) (9,703) (4,044)Investment management fees payable (291,770) (278,266) (57,768,173) (43,204,414) (5,595,742) (6,273,602)Other expenses payable (148,040) (120,352) (17,394,520) (14,276,371) (2,164,274) (3,378,548)Dividend WHT payable (7,521) (11,122) (33,232,382) (35,083,807) (371,452) (495,136)Purchase of securities awaiting settlement (174,777) (383,448) (44,207,787) (14,232,697) (56,464,217) (70,971,133)Redemptions of shares awaiting settlement (480,904) (200,071) (16,155,290) (16,003,861) (7,097,035) (101,168,450)
(1,103,986) (993,840) (169,198,195) (123,096,527) (71,702,423) (182,290,913)
GlobalAccess Europe (ex-UK) Alpha Fund GlobalAccess Japan Fund Aggregated total in GBP
GlobalAccess US Equity FundGlobalAccess Global Equity Income
FundGlobalAccess Emerging Market Local
Currency Debt Fund

Barclays Multi-Manager Fund PLC Annual Report and Audited Financial Statements 2021
108
Notes to the financial statements (continued) for the financial year ended 31 May 2021 10. Share capital
Authorised capital and subscribers shares On incorporation, the authorised share capital of the Company was €300,000 divided into 300,000 subscriber shares of a par value of €1 each and 500,000,000,000 redeemable participating shares of no par value. There are 300,000 subscriber shares currently in issue which are held by the investment manager and nominees of the investment manager. The subscribers shares are disclosed by way of this note only and do not form part of the net assets attributable to holders of redeemable participating shares at the end of the financial year. Redeemable participating shares The issued redeemable participating share capital is at all times equal to the net asset value of the Company. Redeemable participating shares are redeemable at the shareholders' option and in accordance with the offering documents are classified as financial liabilities. The movement in the number of participating shares is shown in the following tables:

Barclays Multi-Manager Fund PLC Annual Report and Audited Financial Statements 2021
109
Notes to the financial statements (continued) for the financial year ended 31 May 2021 10. Share capital (continued) GlobalAccess UK Alpha Fund*
Balance at 1 June 2020
Issued during the year
Redeemed during the year
Balance at 31 May 2021
Balance at 1 June 2019
Issued during the year
Redeemed during the year
Balance at 31 May 2020
Class A accumulating shares - - - - 44,081 - (44,081) -Class A distributing shares - - - - 147,582 2,090 (149,672) -Class B accumulating shares - - - - 90,000 - (90,000) -Class B distributing EUR shares - - - - 62,889 - (62,889) -Class I accumulating shares - - - - 18,144 633 (18,777) -Class I distributing shares - - - - 48,878 - (48,878) -Class M accumulating shares - - - - 245,794 - (245,794) -Class M distributing shares - - - - 12,618,864 - (12,618,864) -Class M accumulating EUR shares - - - - 38,167 - (38,167) -Class M accumulating USD shares - - - - 44,304 - (44,304) -Class M distributing USD shares - - - - 96,921 - (96,921) -Class Z accumulating shares - - - - 13,546 - (13,546) -Class Z accumulating EUR shares - - - - 110,889 - (110,889) - * GlobalAccess UK Alpha Fund ceased trading on 31 March 2020.

Barclays Multi-Manager Fund PLC Annual Report and Audited Financial Statements 2021
110
Notes to the financial statements (continued) for the financial year ended 31 May 2021 10. Share capital (continued) GlobalAccess UK Opportunities Fund
Balance at 1 June 2020
Issued during the year
Redeemed during the year
Balance at 31 May 2021
Balance at 1 June 2019
Issued during the year
Redeemed during the year
Balance at 31 May 2020
Class A accumulating shares 55,115 45,000 (20,000) 80,115 55,115 3,124 (3,124) 55,115Class A accumulating EUR shares 21,189 31,746 (5,518) 47,417 31,087 2,895 (12,793) 21,189Class B accumulating shares 195,000 4,580 (100,000) 99,580 160,000 35,000 - 195,000Class B accumulating USD shares - - - - 21,781 - (21,781) -Class I accumulating shares 62,707 7,362 (8,218) 61,851 10,087 54,513 (1,893) 62,707Class I distributing shares 33,734 22,722 (14,010) 42,446 32,718 13,256 (12,240) 33,734Class I accumulating EUR shares 1,476 - (1,284) 192 3,575 - (2,099) 1,476Class I accumulating USD shares 34,197 - (18,350) 15,847 146,930 - (112,733) 34,197Class M accumulating shares 4,416,614 1,568,070 (1,108,481) 4,876,203 4,165,060 1,814,261 (1,562,707) 4,416,614Class M distributing shares 134,680,743 36,073,804 (42,920,619) 127,833,928 131,747,413 23,157,408 (20,224,078) 134,680,743Class M accumulating EUR shares 839,138 18,805 (590,326) 267,617 2,822,937 12,066 (1,995,865) 839,138Class M accumulating USD shares 223,478 - (125,914) 97,564 571,973 44,577 (393,072) 223,478Class M distributing EUR shares - - - - 48,343 - (48,343) -Class Z accumulating shares 32,350 - (11,192) 21,158 38,248 - (5,898) 32,350Class Z accumulating EUR shares 501,581 10,710 (174,181) 338,110 894,700 19,413 (412,532) 501,581

Barclays Multi-Manager Fund PLC Annual Report and Audited Financial Statements 2021
111
Notes to the financial statements (continued) for the financial year ended 31 May 20211 10. Share capital (continued) GlobalAccess Global Government Bond Fund
Balance at 1 June 2020
Issued during the year
Redeemed during the year
Balance at 31 May 2021
Balance at 1 June 2019
Issued during the year
Redeemed during the year
Balance at 31 May 2020
Class A accumulating EUR shares 9,513 - (9,513) - 9,513 - - 9,513Class B distributing shares 463,888 - - 463,888 498,536 - (34,648) 463,888Class B accumulating EUR shares 36,250 - (36,250) - 276,250 - (240,000) 36,250Class I accumulating shares 60,094 - - 60,094 75,926 - (15,832) 60,094Class I accumulating GBP shares 165,994 9,349 (99,832) 75,511 18,747 150,332 (3,085) 165,994Class I distributing GBP shares 65,606 4,893 (2,167) 68,332 46,782 26,713 (7,889) 65,606Class M accumulating shares 3,637,356 628,053 (1,351,582) 2,913,827 10,708,820 1,052,208 (8,123,672) 3,637,356Class M distributing shares 91,251,710 15,248,730 (26,325,349) 80,175,091 137,378,707 2,603,305 (48,730,302) 91,251,710Class M accumulating EUR shares 1,425,298 100,000 (570,557) 954,741 14,832,066 1,798,555 (15,205,323) 1,425,298Class M accumulating GBP shares 2,671,237 - (2,530,864) 140,373 4,628,127 190,141 (2,147,031) 2,671,237Class M distributing EUR shares 1,009,142 - (1,009,142) - 4,027,318 - (3,018,176) 1,009,142Class M distributing GBP shares 4,406,523 1,409,561 (426,963) 5,389,121 5,533,055 1,255,503 (2,382,035) 4,406,523Class Z accumulating shares 656,950 - (68,978) 587,972 850,463 - (193,513) 656,950Class Z accumulating EUR shares 4,183,421 - (757,683) 3,425,738 4,975,331 340,152 (1,132,062) 4,183,421

Barclays Multi-Manager Fund PLC Annual Report and Audited Financial Statements 2021
112
Notes to the financial statements (continued) for the financial year ended 31 May 2021 10. Share capital (continued) GlobalAccess Asia Pacific (ex-Japan) Fund
Balance at 1 June 2020
Issued during the year
Redeemed during the year
Balance at 31 May 2021
Balance at 1 June 2019
Issued during the year
Redeemed during the year
Balance at 31 May 2020
Class A accumulating shares 30,148 - - 30,148 79,531 - (49,383) 30,148Class B accumulating shares 70,000 - - 70,000 70,000 - - 70,000Class B accumulating GBP shares - - - - 70,423 - (70,423) -Class I accumulating GBP shares (Unhedged) - 9,282 (42) 9,240 - - - -Class I accumulating GBP shares 47,303 34,827 (11,349) 70,781 63,132 13,811 (29,640) 47,303Class I distributing GBP shares 4,270 3,498 (3,462) 4,306 7,010 634 (3,374) 4,270Class M accumulating shares 3,553,604 157,516 (1,772,100) 1,939,020 5,413,181 980,384 (2,839,961) 3,553,604Class M distributing shares 20,338,707 2,847,955 (4,344,016) 18,842,646 25,127,268 287,000 (5,075,561) 20,338,707Class M accumulating EUR shares 133,986 8,097 - 142,083 399,263 - (265,277) 133,986Class M accumulating GBP shares 1,177,168 300,413 (16,215) 1,461,366 1,247,903 85,423 (156,158) 1,177,168Class M distributing GBP shares 585,936 - (137,149) 448,787 726,886 131,600 (272,550) 585,936Class M Distributing GBP shares (Unhedged) 1,176 177,175 (15,054) 163,297 - 1,179 (3) 1,176Class Z accumulating shares 7,224 500 (5,256) 2,468 9,400 - (2,176) 7,224Class Z accumulating EUR shares 277,588 5,048 (143,334) 139,302 850,644 6,817 (579,873) 277,588

Barclays Multi-Manager Fund PLC Annual Report and Audited Financial Statements 2021
113
Notes to the financial statements (continued) for the financial year ended 31 May 2021 10. Share capital (continued) GlobalAccess Emerging Market Equity Fund
Balance at 1 June 2020
Issued during the year
Redeemed during the year
Balance at 31 May 2021
Balance at 1 June 2019
Issued during the year
Redeemed during the year
Balance at 31 May 2020
Class A accumulating shares 1,861,252 - (1,043,293) 817,959 2,173,228 - (311,976) 1,861,252Class A accumulating EUR shares 817,853 29,492 (308,592) 538,753 1,369,080 - (551,227) 817,853Class A distributing EUR shares 71,204 - - 71,204 71,204 - - 71,204Class A distributing GBP shares 237,429 953 (162,739) 75,643 235,588 1,841 - 237,429Class B accumulating shares 1,530,787 - (640,000) 890,787 1,813,443 - (282,656) 1,530,787Class B distributing shares - - - - 102,004 - (102,004) -Class B accumulating EUR shares 139,135 - - 139,135 139,263 - (128) 139,135Class B accumulating GBP shares 168,066 - (82,782) 85,284 209,388 - (41,322) 168,066Class B distributing GBP shares 222,883 - (222,883) - 866,314 - (643,431) 222,883Class I accumulating shares 57,798 30,000 - 87,798 13,998 43,800 - 57,798Class I accumulating EUR shares 22,910 - (6,637) 16,273 28,653 - (5,743) 22,910Class I accumulating GBP shares 278,308 24,638 (104,658) 198,288 308,970 32,422 (63,084) 278,308Class I accumulating GBP shares (Unhedged) - 12,057 (111) 11,946 - - - -Class I distributing GBP shares 48,078 237,960 (3,510) 282,528 9,089 53,925 (14,936) 48,078Class M accumulating shares 6,024,366 257,416 (1,395,101) 4,886,681 14,908,214 10 (8,883,858) 6,024,366Class M distributing shares 469,387,869 67,230,670 (82,605,237) 454,013,302 498,081,239 56,502,391 (85,195,761) 469,387,869Class M accumulating EUR shares 2,038,078 125,246 (328,288) 1,835,036 2,472,130 153,642 (587,694) 2,038,078Class M accumulating GBP shares 24,746,936 959,924 (5,215,395) 20,491,465 35,163,125 502,924 (10,919,113) 24,746,936Class M distributing EUR shares 530,146 - (530,146) - 530,146 - - 530,146Class M distributing GBP shares 8,689,598 771,349 (2,547,753) 6,913,194 9,619,748 879,558 (1,809,708) 8,689,598Class M Distributing GBP shares (Unhedged) 11,210 1,620,222 (165,276) 1,466,156 - 11,244 (34) 11,210Class Z accumulating shares 73,049 - (20,721) 52,328 96,266 - (23,217) 73,049Class Z accumulating EUR shares 15,166,495 563,956 (5,227,219) 10,503,232 28,771,559 545,297 (14,150,361) 15,166,495

Barclays Multi-Manager Fund PLC Annual Report and Audited Financial Statements 2021
114
Notes to the financial statements (continued) for the financial year ended 31 May 2021 10. Share capital (continued) GlobalAccess Global High Yield Bond Fund
Balance at 1 June 2020
Issued during the year
Redeemed during the year
Balance at 31 May 2021
Balance at 1 June 2019
Issued during the year
Redeemed during the year
Balance at 31 May 2020
Class A accumulating shares 2,027,632 - (1,115,164) 912,468 2,611,152 - (583,520) 2,027,632Class A distributing shares 2,399,324 - (784,502) 1,614,822 3,306,362 - (907,038) 2,399,324Class A accumulating EUR shares 2,359,644 - (846,307) 1,513,337 3,030,443 - (670,799) 2,359,644Class A accumulating GBP shares 517,698 - (215,140) 302,558 652,833 - (135,135) 517,698Class A distributing EUR shares 4,814,956 127,877 (1,431,954) 3,510,879 5,152,825 - (337,869) 4,814,956Class A distributing GBP shares 466,946 5,797 - 472,743 1,180,923 11,518 (725,495) 466,946Class B accumulating shares 3,556,471 - (2,146,515) 1,409,956 3,948,850 30,000 (422,379) 3,556,471Class B distributing shares 4,028,736 1 (757,843) 3,270,894 7,110,666 - (3,081,930) 4,028,736Class B accumulating EUR shares 1,008,571 - (178,916) 829,655 1,552,934 - (544,363) 1,008,571Class B accumulating GBP shares 2,123,444 - (603,102) 1,520,342 2,254,307 - (130,863) 2,123,444Class B distributing EUR shares 2,783,111 - - 2,783,111 3,051,169 632,912 (900,970) 2,783,111Class B distributing GBP shares 4,114,813 - (2,342,524) 1,772,289 5,540,909 - (1,426,096) 4,114,813Class I accumulating shares 153,858 - - 153,858 153,858 - - 153,858Class I distributing shares 880,455 - - 880,455 880,455 - - 880,455Class I accumulating EUR shares 1,601,602 - (134,193) 1,467,409 3,724,989 211,527 (2,334,914) 1,601,602Class I accumulating GBP shares 396,005 17,306 (134,508) 278,803 394,978 37,428 (36,401) 396,005Class I distributing EUR shares 823,400 - - 823,400 823,400 - - 823,400Class I distributing GBP shares 1,074,870 26,941 (265,242) 836,569 1,108,571 3,105 (36,806) 1,074,870Class M accumulating shares 6,028,739 263,091 (1,965,068) 4,326,762 8,542,226 357,294 (2,870,781) 6,028,739Class M distributing shares 108,214,804 19,633,252 (62,717,822) 65,130,234 152,094,981 3,624,783 (47,504,960) 108,214,804Class M accumulating EUR shares 8,136,482 61,359 (2,449,958) 5,747,883 20,377,430 422,289 (12,663,237) 8,136,482Class M accumulating GBP shares 9,742,314 318,426 (2,958,839) 7,101,901 12,662,115 694,445 (3,614,246) 9,742,314Class M distributing EUR shares 3,760,250 63,428 (2,821,289) 1,002,389 10,711,678 502,498 (7,453,926) 3,760,250Class M distributing GBP shares 481,151,823 78,819,927 (342,619,669) 217,352,081 640,879,826 95,005,842 (254,733,845) 481,151,823Class Z accumulating shares 931,822 - (265,993) 665,829 1,208,931 27,251 (304,360) 931,822Class Z distributing shares 496,885 33,529 (32,499) 497,915 534,803 - (37,918) 496,885Class Z accumulating EUR shares 7,650,331 56,897 (2,496,856) 5,210,372 12,675,927 298,502 (5,324,098) 7,650,331Class Z distributing EUR shares 3,108,659 - (198,091) 2,910,568 3,530,629 7,595 (429,565) 3,108,659Class Z distributing GBP shares 125,695 - - 125,695 125,695 - - 125,695

Barclays Multi-Manager Fund PLC Annual Report and Audited Financial Statements 2021
115
Notes to the financial statements (continued) for the financial year ended 31 May 2021 10. Share capital (continued) GlobalAccess Global Corporate Bond Fund
Balance at 1 June 2020
Issued during the year
Redeemed during the year
Balance at 31 May 2021
Balance at 1 June 2019
Issued during the year
Redeemed during the year
Balance at 31 May 2020
Class A accumulating shares 34,965 - - 34,965 100,832 - (65,867) 34,965Class A distributing GBP shares - - - - 214,636 2,151 (216,787) -Class B accumulating shares 2,030,000 200,000 (2,000,000) 230,000 2,483,898 - (453,898) 2,030,000Class B distributing shares 355,131 - (180,000) 175,131 355,131 - - 355,131Class B distributing EUR shares 113,122 - - 113,122 830,865 - (717,743) 113,122Class I accumulating GBP shares 178,717 65,104 (114,690) 129,131 238,282 23,861 (83,426) 178,717Class I distributing GBP shares 47,722 21,335 (1,722) 67,335 50,794 8,498 (11,570) 47,722Class M accumulating shares 3,263,864 241,000 (1,360,890) 2,143,974 5,899,024 797,000 (3,432,160) 3,263,864Class M distributing shares 95,465,849 23,187,747 (17,841,273) 100,812,323 133,386,711 1,692,768 (39,613,630) 95,465,849Class M accumulating EUR shares 1,689,131 295,462 (448,314) 1,536,279 2,868,855 458,783 (1,638,507) 1,689,131Class M accumulating GBP shares 240,697 - - 240,697 303,276 - (62,579) 240,697Class M distributing EUR shares 398,551 - - 398,551 398,551 - - 398,551Class M distributing GBP shares 365,456,136 138,011,956 (105,373,700) 398,094,392 363,452,403 49,416,229 (47,412,496) 365,456,136Class Z accumulating shares 485,879 - (10,964) 474,915 614,214 - (128,335) 485,879Class Z accumulating EUR shares 2,976,800 37,687 (933,733) 2,080,754 5,478,596 33,458 (2,535,254) 2,976,800Class Z accumulating GBP shares 54,548 9,441 (12,511) 51,478 334,525 - (279,977) 54,548

Barclays Multi-Manager Fund PLC Annual Report and Audited Financial Statements 2021
116
Notes to the financial statements (continued) for the financial year ended 31 May 2021 10. Share capital (continued) GlobalAccess Global Inflation Linked Bond Fund*
Balance at 1 June 2020
Issued during the year
Redeemed during the year
Balance at 31 May 2021
Balance at 1 June 2019
Issued during the year
Redeemed during the year
Balance at 31 May 2020
Class A accumulating shares - - - - 260,252 - (260,252) -Class A accumulating EUR shares - - - - 75,649 - (75,649) -Class A distributing EUR shares - - - - 131,008 - (131,008) -Class A distributing GBP shares - - - - 804,338 4,038 (808,376) -Class B accumulating shares - - - - 1,185,216 - (1,185,216) -Class B accumulating EUR shares - - - - 608,403 - (608,403) -Class B accumulating GBP shares - - - - 782,295 - (782,295) -Class B distributing GBP shares - - - - 15,844 - (15,844) -Class I accumulating GBP shares - - - - 30,413 - (30,413) -Class I distributing GBP shares - - - - 6,389 - (6,389) -Class M accumulating shares - - - - 5,334,401 53,908 (5,388,309) -Class M distributing shares - - - - 7,497,944 - (7,497,944) -Class M accumulating EUR shares - - - - 503,694 77,766 (581,460) -Class M accumulating GBP shares - - - - 4,501,378 29,970 (4,531,348) -Class M distributing EUR shares - - - - 1,724,466 - (1,724,466) -Class M distributing GBP shares - - - - 10,269,516 214,268 (10,483,784) -Class Z accumulating shares - - - - 177,609 - (177,609) -Class Z accumulating EUR shares - - - - 1,191,199 - (1,191,199) - * GlobalAccess Global Inflation Linked Bond Fund ceased trading on 27 November 2019.

Barclays Multi-Manager Fund PLC Annual Report and Audited Financial Statements 2021
117
Notes to the financial statements (continued) for the financial year ended 31 May 2021 10. Share capital (continued) GlobalAccess Emerging Market Debt Fund
Balance at 1 June 2020
Issued during the year
Redeemed during the year
Balance at 31 May 2021
Balance at 1 June 2019
Issued during the year
Redeemed during the year
Balance at 31 May 2020
Class A accumulating shares 118,318 - (118,318) - 118,318 - - 118,318Class A accumulating EUR shares 91,237 - (32,064) 59,173 99,283 6,068 (14,114) 91,237Class A distributing EUR shares 298,237 - - 298,237 298,237 - - 298,237Class A distributing GBP shares - - - - 187,209 3,344 (190,553) -Class B accumulating shares 563,567 - (533,519) 30,048 563,567 - - 563,567Class B distributing shares 165,153 - (165,153) - 165,153 - - 165,153Class B accumulating EUR shares 70,675 - (48,841) 21,834 128,525 - (57,850) 70,675Class B accumulating GBP shares 1,159,622 - - 1,159,622 1,159,622 - - 1,159,622Class I accumulating shares 9,058 - - 9,058 16,400 - (7,342) 9,058Class I accumulating EUR shares 140,160 - (31,438) 108,722 191,131 1 (50,972) 140,160Class I accumulating GBP shares 49,163 20,640 (18,233) 51,570 52,579 3,732 (7,148) 49,163Class I distributing GBP shares 51,557 31,141 (5,754) 76,944 139,954 13,506 (101,903) 51,557Class M accumulating shares 881,842 80,000 (540,834) 421,008 5,911,214 373,931 (5,403,303) 881,842Class M distributing shares 51,663,472 4,784,522 (7,383,878) 49,064,116 67,977,891 1,903,075 (18,217,494) 51,663,472Class M accumulating EUR shares 1,096,113 - (50,674) 1,045,439 2,084,303 100,283 (1,088,473) 1,096,113Class M accumulating GBP shares 169,324 - - 169,324 1,171,357 109,240 (1,111,273) 169,324Class M distributing EUR shares 517,918 103,381 (63,887) 557,412 1,163,578 163,730 (809,390) 517,918Class M distributing GBP shares 225,358,350 41,570,595 (42,425,261) 224,503,684 224,965,874 33,760,302 (33,367,826) 225,358,350Class Z accumulating shares 82,289 2,941 (14,881) 70,349 284,783 2,481 (204,975) 82,289Class Z distributing shares - - - - 44,309 - (44,309) -Class Z accumulating EUR shares 1,122,978 22,228 (356,435) 788,771 1,825,989 52,708 (755,719) 1,122,978Class Z distributing EUR shares 53,571 33,241 (35,633) 51,179 41,697 19,915 (8,041) 53,571Class Z distributing GBP shares 865 - - 865 865 - - 865

Barclays Multi-Manager Fund PLC Annual Report and Audited Financial Statements 2021
118
Notes to the financial statements (continued) for the financial year ended 31 May 2021 10. Share capital (continued) GlobalAccess Global Property Securities Fund
Balance at 1 June 2020
Issued during the year
Redeemed during the year
Balance at 31 May 2021
Balance at 1 June 2019
Issued during the year
Redeemed during the year
Balance at 31 May 2020
Class A accumulating shares - - - - 54,885 - (54,885) -Class A distributing GBP shares 282,486 - (282,486) - 282,486 - - 282,486Class B accumulating shares 80,000 - (80,000) - 80,000 - - 80,000Class B accumulating GBP shares 149,649 - (149,649) - 149,649 - - 149,649Class B distributing GBP shares - - - - 117,000 - (117,000) -Class I accumulating GBP shares 21,419 386 (21,805) - 14,384 7,371 (336) 21,419Class I distributing GBP shares 17,649 216 (17,865) - 11,152 6,497 - 17,649Class M accumulating shares 5,879 - (5,879) - 49,293 - (43,414) 5,879Class M distributing shares 131,909,963 9,819,918 (141,729,881) - 45,969,383 102,309,506 (16,368,926) 131,909,963Class M accumulating EUR shares 291,457 - (291,457) - 948,927 - (657,470) 291,457Class M accumulating GBP shares 492,379 - (492,379) - 989,047 - (496,668) 492,379Class M distributing GBP shares 515,988 - (515,988) - 792,545 27,124 (303,681) 515,988Class Z accumulating EUR shares 10,158 - (10,158) - 44,807 - (34,649) 10,158 * GlobalAccess Global Property Securities Fund ceased trading on 23 February 2021.

Barclays Multi-Manager Fund PLC Annual Report and Audited Financial Statements 2021
119
Notes to the financial statements (continued) for the financial year ended 31 May 2021 10. Share capital (continued) GlobalAccess Global Short Duration Bond Fund
Balance at 1 June 2020
Issued during the year
Redeemed during the year
Balance at 31 May 2021
Balance at 1 June 2019
Issued during the year
Redeemed during the year
Balance at 31 May 2020
Class A accumulating shares 8,342 - - 8,342 52,351 - (44,009) 8,342Class B accumulating shares 5,750,000 - (4,090,000) 1,660,000 2,790,000 3,380,000 (420,000) 5,750,000Class B accumulating GBP shares 114,044 - (45,413) 68,631 80,843 33,201 - 114,044Class B distributing GBP shares - - - - 740,741 - (740,741) -Class I accumulating GBP shares 47 4,763 (153) 4,657 398 15,356 (15,707) 47Class I distributing GBP shares 95,179 297 (297) 95,179 395,228 - (300,049) 95,179Class M accumulating shares 2,074,771 165,000 (998,349) 1,241,422 3,492,293 952,511 (2,370,033) 2,074,771Class M distributing shares 59,522,245 16,760,510 (19,041,464) 57,241,291 98,602,019 3,831,022 (42,910,796) 59,522,245Class M accumulating EUR shares 395,056 - (170,462) 224,594 315,860 79,302 (106) 395,056Class M accumulating GBP shares 791,889 17,012 - 808,901 931,544 - (139,655) 791,889Class M distributing EUR shares 8,505,608 329,845 (3,714,271) 5,121,182 4,818,920 6,556,401 (2,869,713) 8,505,608Class M distributing GBP shares 46,047,449 2,637,950 (45,895,793) 2,789,606 66,136,297 33,509,825 (53,598,673) 46,047,449Class Z accumulating shares 211,942 - (109,478) 102,464 214,516 - (2,574) 211,942Class Z accumulating EUR shares 1,675,196 5,538 (527,596) 1,153,138 3,752,092 8,908 (2,085,804) 1,675,196

Barclays Multi-Manager Fund PLC Annual Report and Audited Financial Statements 2021
120
Notes to the financial statements (continued) for the financial year ended 31 May 2021 10. Share capital (continued) GlobalAccess US Small & Mid Cap Equity Fund
Balance at 1 June 2020
Issued during the year
Redeemed during the year
Balance at 31 May 2021
Balance at 1 June 2019
Issued during the year
Redeemed during the year
Balance at 31 May 2020
Class A accumulating shares 399,514 - (81,086) 318,428 419,395 - (19,881) 399,514Class A accumulating GBP shares 261,676 2,624 (31,837) 232,463 261,676 - - 261,676Class B accumulating shares 1,360,000 35,500 (640,000) 755,500 1,470,000 - (110,000) 1,360,000Class B distributing shares 154,500 - - 154,500 154,500 - - 154,500Class B accumulating EUR shares 65,274 - - 65,274 65,274 - - 65,274Class B accumulating GBP shares 58,140 - (58,140) - 58,140 - - 58,140Class I accumulating GBP shares 131,848 4,595 (12,920) 123,523 136,008 30,010 (34,170) 131,848Class I distributing GBP shares 36,408 19,071 (8,048) 47,431 48,756 604 (12,952) 36,408Class M accumulating shares 9,282,045 572,274 (4,065,199) 5,789,120 13,561,289 470,755 (4,749,999) 9,282,045Class M distributing shares 30,046,778 4,543,458 (7,849,274) 26,740,962 42,478,068 1,600,273 (14,031,563) 30,046,778Class M accumulating EUR shares 523,016 54,018 (297,872) 279,162 530,544 10,301 (17,829) 523,016Class M accumulating GBP shares 3,105,644 605,273 (294,626) 3,416,291 3,841,372 118,527 (854,255) 3,105,644Class M distributing EUR shares 112,474 - (112,474) - 179,930 29,285 (96,741) 112,474Class M distributing GBP shares 3,103,848 874,711 (593,023) 3,385,536 4,470,907 257,809 (1,624,868) 3,103,848Class Z accumulating shares 854,475 58,915 (312,023) 601,367 934,500 39,615 (119,640) 854,475Class Z accumulating EUR shares 1,864,342 14,459 (500,138) 1,378,663 3,371,217 37,585 (1,544,460) 1,864,342

Barclays Multi-Manager Fund PLC Annual Report and Audited Financial Statements 2021
121
Notes to the financial statements (continued) for the financial year ended 31 May 2021 10. Share capital (continued) GlobalAccess US Equity Fund
Balance at 1 June 2020
Issued during the year
Redeemed during the year
Balance at 31 May 2021
Balance at 1 June 2019
Issued during the year
Redeemed during the year
Balance at 31 May 2020
Class A accumulating shares 50,502 - (13,410) 37,092 54,152 - (3,650) 50,502Class A accumulating EUR shares 22,907 - (3,331) 19,576 25,707 - (2,800) 22,907Class A accumulating GBP shares 1,281 - - 1,281 4,006 - (2,725) 1,281Class B accumulating shares 60,000 - (8,000) 52,000 59,000 5,000 (4,000) 60,000Class B accumulating GBP shares 17,596 - - 17,596 17,596 - - 17,596Class I accumulating GBP shares 6,459 619 (73) 7,005 5,765 705 (11) 6,459Class I accumulating GBP shares (Unhedged) - 76 - 76 - - - -Class I distributing GBP shares 868 122 (180) 810 1,150 54 (336) 868Class M accumulating shares 449,336 7,200 (178,064) 278,472 779,345 16,020 (346,029) 449,336Class M distributing shares 6,128,696 1,279,375 (1,214,036) 6,194,035 7,725,695 157,700 (1,754,699) 6,128,696Class M accumulating EUR shares 22,259 812 (958) 22,113 26,794 2 (4,537) 22,259Class M accumulating GBP shares 52,604 21,607 (3,948) 70,263 57,924 - (5,320) 52,604Class M distributing GBP shares 2,799 12,393 - 15,192 2,799 - - 2,799Class M distributing GBP shares (Unhedged) 383 61,006 (5,245) 56,144 - 385 (2) 383Class Z accumulating shares 61,736 1,911 (19,879) 43,768 84,899 1,453 (24,616) 61,736Class Z accumulating EUR shares 533,490 7,823 (152,575) 388,738 933,400 11,641 (411,551) 533,490

Barclays Multi-Manager Fund PLC Annual Report and Audited Financial Statements 2021
122
Notes to the financial statements (continued) for the financial year ended 31 May 2021 10. Share capital (continued) GlobalAccess Global Equity Income Fund
Balance at 1 June 2020
Issued during the year
Redeemed during the year
Balance at 31 May 2021
Balance at 1 June 2019
Issued during the year
Redeemed during the year
Balance at 31 May 2020
Class A accumulating shares 73,006 - - 73,006 73,006 - - 73,006Class A distributing shares 1,159,857 - (112,598) 1,047,259 1,264,798 - (104,941) 1,159,857Class A accumulating EUR shares 582,038 - (25,545) 556,493 634,811 - (52,773) 582,038Class A accumulating GBP shares 93,384 - - 93,384 93,384 - - 93,384Class A distributing EUR shares 2,788,303 67,751 (557,700) 2,298,354 3,352,234 - (563,931) 2,788,303Class A distributing GBP shares 131,931 - - 131,931 131,931 - - 131,931Class B accumulating shares 986,025 - (393,913) 592,112 1,263,607 - (277,582) 986,025Class B distributing shares 1,242,652 - (248,138) 994,514 1,613,160 - (370,508) 1,242,652Class B accumulating EUR shares 437,168 - (289,837) 147,331 528,594 - (91,426) 437,168Class B accumulating GBP shares 292,031 - (100,789) 191,242 292,031 - - 292,031Class B distributing EUR shares 765,339 - (224,155) 541,184 1,608,982 - (843,643) 765,339Class B distributing GBP shares 170,099 - (80,814) 89,285 748,852 315 (579,068) 170,099Class I accumulating shares 72,073 - (48,049) 24,024 80,081 - (8,008) 72,073Class I accumulating EUR shares 129,316 - (129,316) - 129,316 - - 129,316Class I accumulating GBP shares 53,385 2,938 (34,439) 21,884 76,753 3,351 (26,719) 53,385Class I accumulating GBP shares (Unhedged) - 2,129 - 2,129 - - - -Class I distributing GBP shares 243,331 7,430 (20,128) 230,633 333,003 6,194 (95,866) 243,331Class M accumulating shares 177,403 - (118,269) 59,134 197,114 - (19,711) 177,403Class M distributing shares 38,451,049 3,849,004 (24,657,403) 17,642,650 63,087,369 1,387,000 (26,023,320) 38,451,049Class M accumulating EUR shares 783,919 - - 783,919 843,679 - (59,760) 783,919Class M accumulating GBP shares 4,976,426 56,747 (960,641) 4,072,532 7,471,942 732 (2,496,248) 4,976,426Class M distributing EUR shares 184,146 - (8,536) 175,610 216,488 - (32,342) 184,146Class M distributing GBP shares 9,964,966 60,507 (2,721,072) 7,304,401 13,217,997 14,545 (3,267,576) 9,964,966Class Z accumulating shares 56,344 - - 56,344 71,555 - (15,211) 56,344Class Z distributing shares 94,714 - (762) 93,952 98,382 - (3,668) 94,714Class Z accumulating EUR shares 2,212,399 35,449 (684,714) 1,563,134 4,214,749 152,191 (2,154,541) 2,212,399Class Z accumulating GBP shares 65,020 - - 65,020 64,208 812 - 65,020Class Z distributing EUR shares 364,975 770 (27,863) 337,882 446,013 32,910 (113,948) 364,975

Barclays Multi-Manager Fund PLC Annual Report and Audited Financial Statements 2021
123
Notes to the financial statements (continued) for the financial year ended 31 May 2021 10. Share capital (continued) GlobalAccess Emerging Market Local Currency Debt Fund
Balance at 1 June 2020
Issued during the year
Redeemed during the year
Balance at 31 May 2021
Balance at 1 June 2019
Issued during the year
Redeemed during the year
Balance at 31 May 2020
Class B accumulating shares 1,578,878 - (528,878) 1,050,000 1,078,878 500,000 - 1,578,878Class I distributing GBP shares 69,031 36,178 (38,985) 66,224 45,544 25,785 (2,298) 69,031Class I distributing USD shares - 7,658 - 7,658 - - - -Class M accumulating shares 2,911,934 440,000 (1,535,900) 1,816,034 5,855,406 650,000 (3,593,472) 2,911,934Class M distributing shares 605,764,022 126,347,415 (91,308,116) 640,803,321 671,373,466 82,450,426 (148,059,870) 605,764,022Class M accumulating EUR shares 85,617 - - 85,617 85,617 - - 85,617Class M accumulating GBP shares - - - - 201,328 - (201,328) -Class M distributing EUR shares 1,119,378 - (1,119,378) - - 1,462,464 (343,086) 1,119,378Class M distributing GBP shares 490,656,350 76,521 (488,833,919) 1,898,952 - 671,011,485 (180,355,135) 490,656,350

Barclays Multi-Manager Fund PLC Annual Report and Audited Financial Statements 2021
124
Notes to the financial statements (continued) for the financial year ended 31 May 2021 10. Share capital (continued) GlobalAccess Europe (ex-UK) Alpha Fund
Balance at 1 June 2020
Issued during the year
Redeemed during the year
Balance at 31 May 2021
Balance at 1 June 2019
Issued during the year
Redeemed during the year
Balance at 31 May 2020
Class A accumulating shares 1,739,544 - (238,633) 1,500,911 2,208,820 507 (469,783) 1,739,544Class A distributing shares 29,732 86 (29,818) - 50,807 859 (21,934) 29,732Class A accumulating GBP shares 527,892 - (323,484) 204,408 527,892 7,335 (7,335) 527,892Class A accumulating USD shares 357,875 - (162,609) 195,266 420,172 - (62,297) 357,875Class B accumulating shares 96,846 - (30,000) 66,846 96,846 - - 96,846Class B accumulating GBP shares 521,837 - (70,906) 450,931 860,633 - (338,796) 521,837Class B accumulating USD shares 360,544 - - 360,544 460,909 - (100,365) 360,544Class I accumulating shares 49,618 54 (4,032) 45,640 88,358 - (38,740) 49,618Class I accumulating GBP shares 38,797 1,185 (1,765) 38,217 44,990 1,133 (7,326) 38,797Class I accumulating GBP shares (Unhedged) - 2,411 - 2,411 - - - -Class I accumulating USD shares 49,901 - (29,589) 20,312 224,392 - (174,491) 49,901Class I distributing GBP shares 36,187 9,485 (4,722) 40,950 61,213 4,060 (29,086) 36,187Class M accumulating shares 8,547,809 79,000 (3,945,987) 4,680,822 14,515,327 379,987 (6,347,505) 8,547,809Class M distributing shares 37,585,967 1,812,149 (10,925,981) 28,472,135 55,749,530 110,314 (18,273,877) 37,585,967Class M accumulating GBP shares 943,792 25,310 (182,408) 786,694 1,231,633 - (287,841) 943,792Class M accumulating USD shares 410,020 60,289 (283,007) 187,302 607,345 - (197,325) 410,020Class M distributing GBP shares 181,932 - - 181,932 181,932 - - 181,932Class M distributing GBP shares (Unhedged) 2,315 354,419 (31,524) 325,210 - 2,337 (22) 2,315Class Z accumulating shares 9,097,079 99,433 (2,304,749) 6,891,763 12,951,938 112,548 (3,967,407) 9,097,079

Barclays Multi-Manager Fund PLC Annual Report and Audited Financial Statements 2021
125
Notes to the financial statements (continued) for the financial year ended 31 May 2021 10. Share capital (continued) GlobalAccess Japan Fund
Balance at 1 June 2020
Issued during the year
Redeemed during the year
Balance at 31 May 2021
Balance at 1 June 2019
Issued during the year
Redeemed during the year
Balance at 31 May 2020
Class A accumulating EUR shares 66,635 - (11,093) 55,542 92,673 - (26,038) 66,635Class A accumulating USD shares 5,981 - - 5,981 9,499 - (3,518) 5,981Class B accumulating USD shares 190,000 100,000 (130,000) 160,000 230,000 - (40,000) 190,000Class I accumulating GBP shares 46,708 23,912 (29,553) 41,067 26,220 22,868 (2,380) 46,708Class I accumulating GBP shares (Unhedged) - 4,121 - 4,121 - - - -Class I distributing GBP shares 9,215 1,913 - 11,128 7,803 4,177 (2,765) 9,215Class M accumulating shares 3,814,100 240,000 (1,976,110) 2,077,990 6,856,739 782,499 (3,825,138) 3,814,100Class M distributing shares 142,340,576 21,449,086 (28,178,629) 135,611,033 153,559,884 21,690,225 (32,909,533) 142,340,576Class M accumulating EUR shares 134,040 43,988 (4,290) 173,738 228,559 - (94,519) 134,040Class M accumulating GBP shares 113,359 90,221 (7,503) 196,077 180,647 11,305 (78,593) 113,359Class M accumulating USD shares 753,899 - (543,018) 210,881 1,296,917 - (543,018) 753,899Class M distributing EUR shares - - - - 152,285 - (152,285) -Class M distributing GBP shares 271,234 - (240,771) 30,463 616,962 2,300 (348,028) 271,234Class Z accumulating shares 6,296 - (1,296) 5,000 55,989 - (49,693) 6,296Class Z accumulating EUR shares 1,338,865 94,538 (455,461) 977,942 2,198,655 17,281 (877,071) 1,338,865

Barclays Multi-Manager Fund PLC Annual Report and Audited Financial Statements 2021
126
Notes to the financial statements (continued) for the financial year ended 31 May 2021 11. Net asset value GlobalAccess UK Alpha Fund*
Net asset valueNet asset value per share Net asset value
Net asset value per share Net asset value
Net asset value per share
Class A accumulating shares - - - - £96,463 £2.1883Class A distributing shares - - - - £302,135 £2.0472Class B accumulating shares - - - - £206,820 £2.2980Class B distributing EUR shares - - - - €143,736 €2.2856Class I accumulating shares - - - - £42,429 £2.3385Class I distributing shares - - - - £99,513 £2.0359Class M accumulating shares - - - - £566,677 £2.3055Class M distributing shares - - - - £25,710,892 £2.0375Class M accumulating EUR shares - - - - €142,451 €3.7323Class M accumulating USD shares - - - - $177,080 $3.9969Class M distributing USD shares - - - - $351,200 $3.6236Class Z accumulating shares - - - - £30,251 £2.2332Class Z accumulating EUR shares - - - - €285,913 €2.5784
As at 31 May 2021 As at 31 May 2020 As at 31 May 2019
* GlobalAccess UK Alpha Fund ceased trading on 31 March 2020.

Barclays Multi-Manager Fund PLC Annual Report and Audited Financial Statements 2021
127
Notes to the financial statements (continued) for the financial year ended 31 May 2021 11. Net asset value (continued) GlobalAccess UK Opportunities Fund
Net asset valueNet asset value per share Net asset value
Net asset value per share Net asset value
Net asset value per share
Class A accumulating shares £284,631 £3.5528 £152,610 £2.7690 £175,787 £3.1895Class A accumulating EUR shares €187,804 €3.9607 €65,783 €3.1046 €111,345 €3.5817Class B accumulating shares £415,934 £4.1769 £633,230 £3.2473 £596,999 £3.7312Class B accumulating USD shares - - - - $119,747 $5.4978Class I accumulating shares £227,503 £3.6782 £178,693 £2.8497 £32,915 £3.2630Class I distributing shares £134,023 £3.1575 £83,879 £2.4865 £95,609 £2.9222Class I accumulating EUR shares €826 €4.3005 €4,946 €3.3517 €13,743 €3.8438Class I accumulating USD shares $104,491 $6.5938 $173,407 $5.0708 $830,017 $5.6491Class M accumulating shares £18,961,713 £3.8886 £13,279,857 £3.0068 £14,315,973 £3.4372Class M distributing shares £403,322,767 £3.1551 £334,609,568 £2.4845 £384,633,756 £2.9195Class M accumulating EUR shares €1,134,586 €4.2396 €2,767,078 €3.2975 €10,655,704 €3.7747Class M accumulating USD shares $644,532 $6.6062 $1,133,737 $5.0731 $3,225,987 $5.6401Class M distributing EUR shares - - - - €163,948 €3.3914Class Z accumulating shares £144,883 £6.8477 £173,522 £5.3639 £237,500 £6.2094Class Z accumulating EUR shares €1,362,908 €4.0310 €1,593,002 €3.1760 €3,293,991 €3.6817
As at 31 May 2021 As at 31 May 2020 As at 31 May 2019

Barclays Multi-Manager Fund PLC Annual Report and Audited Financial Statements 2021
128
Notes to the financial statements (continued) for the financial year ended 31 May 2021 11. Net asset value (continued) GlobalAccess Global Government Bond Fund
Net asset valueNet asset value per share Net asset value
Net asset value per share Net asset value
Net asset value per share
Class A accumulating EUR shares - - €9,932 €1.0440 €9,657 €1.0151Class B distributing shares $610,702 $1.3165 $608,414 $1.3116 $618,016 $1.2397Class B accumulating EUR shares - - €34,904 €0.9629 €258,018 €0.9340Class I accumulating shares $81,244 $1.3519 $80,657 $1.3422 $95,935 $1.2635Class I accumulating GBP shares £61,096 £0.8091 £133,754 £0.8058 £14,472 £0.7720Class I distributing GBP shares £53,485 £0.7827 £51,180 £0.7801 £35,094 £0.7502Class M accumulating shares $4,513,406 $1.5490 $5,585,146 $1.5355 $15,457,791 $1.4435Class M distributing shares $106,517,149 $1.3286 $120,457,653 $1.3201 $171,442,007 $1.2480Class M accumulating EUR shares €915,224 €0.9586 €1,367,427 €0.9594 €13,744,362 €0.9267Class M accumulating GBP shares £115,476 £0.8226 £2,185,336 £0.8181 £3,621,429 £0.7825Class M distributing EUR shares - - €898,203 €0.8901 €3,475,508 €0.8630Class M distributing GBP shares £4,482,006 £0.8317 £3,651,537 £0.8287 £4,408,722 £0.7968Class Z accumulating shares $761,201 $1.2946 $849,036 $1.2924 $1,040,330 $1.2233Class Z accumulating EUR shares €2,849,416 €0.8318 €3,506,335 €0.8382 €4,054,905 €0.8150
As at 31 May 2021 As at 31 May 2020 As at 31 May 2019

Barclays Multi-Manager Fund PLC Annual Report and Audited Financial Statements 2021
129
Notes to the financial statements (continued) for the financial year ended 31 May 2021 11. Net asset value (continued) GlobalAccess Asia Pacific (ex-Japan) Fund
Net asset valueNet asset value per share Net asset value
Net asset value per share Net asset value
Net asset value per share
Class A accumulating shares $153,612 $5.0952 $98,355 $3.2624 $275,141 $3.4595Class B accumulating shares $403,380 $5.7626 $257,622 $3.6803 $272,517 $3.8931Class B accumulating GBP shares - - - - £149,577 £2.1240Class I accumulating GBP shares (Unhedged) £27,896 £3.0189 - - - -Class I accumulating GBP shares £210,357 £2.9719 £90,327 £1.9095 £130,818 £2.0721Class I distributing GBP shares £11,748 £2.7285 £7,542 £1.7664 £13,626 £1.9438Class M accumulating shares $4,861,481 $2.5072 $5,662,149 $1.5934 $9,078,775 $1.6772Class M distributing shares $90,141,993 $4.7839 $62,440,691 $3.0700 $82,504,086 $3.2834Class M accumulating EUR shares €513,023 €3.6107 €311,655 €2.3260 €1,008,324 €2.5255Class M accumulating GBP shares £4,694,674 £3.2125 £2,426,110 £2.0610 £2,786,362 £2.2328Class M distributing GBP shares £1,229,105 £2.7387 £1,039,009 £1.7732 £1,418,309 £1.9512Class M Distributing GBP shares (Unhedged) £421,779 £2.5829 £2,244 £1.9078 - -Class Z accumulating shares $11,941 $4.8386 $22,490 $3.1133 $31,190 $3.3181Class Z accumulating EUR shares €452,061 €3.2452 €587,640 €2.1170 €1,978,691 €2.3261
As at 31 May 2021 As at 31 May 2020 As at 31 May 2019

Barclays Multi-Manager Fund PLC Annual Report and Audited Financial Statements 2021
130
Notes to the financial statements (continued) for the financial year ended 31 May 2021 11. Net asset value (continued) GlobalAccess Emerging Market Equity Fund
Net asset valueNet asset value per share Net asset value
Net asset value per share Net asset value
Net asset value per share
Class A accumulating shares $1,299,671 $1.5889 $1,903,195 $1.0225 $2,431,782 $1.1190Class A distributing shares - - - - - -Class A accumulating EUR shares €537,307 €0.9973 €531,996 €0.6505 €1,005,644 €0.7345Class A accumulating GBP shares - - - - - -Class A distributing EUR shares €70,243 €0.9865 €46,094 €0.6474 €52,539 €0.7379Class A distributing GBP shares £62,820 £0.8305 £128,793 £0.5424 £145,796 £0.6189Class B accumulating shares $1,293,796 $1.4524 $1,427,386 $0.9325 $1,845,842 $1.0179Class B distributing shares - - - - $106,707 $1.0461Class B accumulating EUR shares €144,877 €1.0413 €94,261 €0.6775 €106,288 €0.7632Class B accumulating GBP shares £75,018 £0.8796 £95,776 £0.5699 £134,199 £0.6409Class B distributing GBP shares - - £126,760 £0.5687 £561,704 £0.6484Class I accumulating shares $140,420 $1.5994 $59,255 $1.0252 $15,640 $1.1173Class I accumulating EUR shares €17,022 €1.0460 €15,568 €0.6795 €21,903 €0.7644Class I accumulating GBP shares £178,389 £0.8996 £161,951 £0.5819 £201,933 £0.6536Class I accumulating GBP shares (Unhedged) £10,850 £0.9083 - - - -Class I distributing GBP shares £233,390 £0.8261 £25,875 £0.5382 £5,582 £0.6141Class M accumulating shares $7,671,305 $1.5698 $6,053,335 $1.0048 $16,303,282 $1.0936Class M distributing shares $661,213,042 $1.4564 $442,291,463 $0.9423 $519,646,197 $1.0433Class M accumulating EUR shares €1,973,164 €1.0753 €1,421,578 €0.6975 €1,936,723 €0.7834Class M accumulating GBP shares £19,579,071 £0.9555 £15,272,910 £0.6172 £24,332,815 £0.6920Class M distributing EUR shares - - €332,784 €0.6277 €380,658 €0.7180Class M distributing GBP shares £5,682,203 £0.8219 £4,660,040 £0.5363 £5,884,042 £0.6117Class M Distributing GBP shares (Unhedged) £1,135,760 £0.7747 €6,471 €0.5773 - -Class Z accumulating shares $79,310 $1.5157 $71,619 $0.9804 $103,796 $1.0782Class Z accumulating EUR shares €9,590,522 €0.9131 €9,077,483 €0.5985 €19,548,714 €0.6794
As at 31 May 2021 As at 31 May 2020 As at 31 May 2019
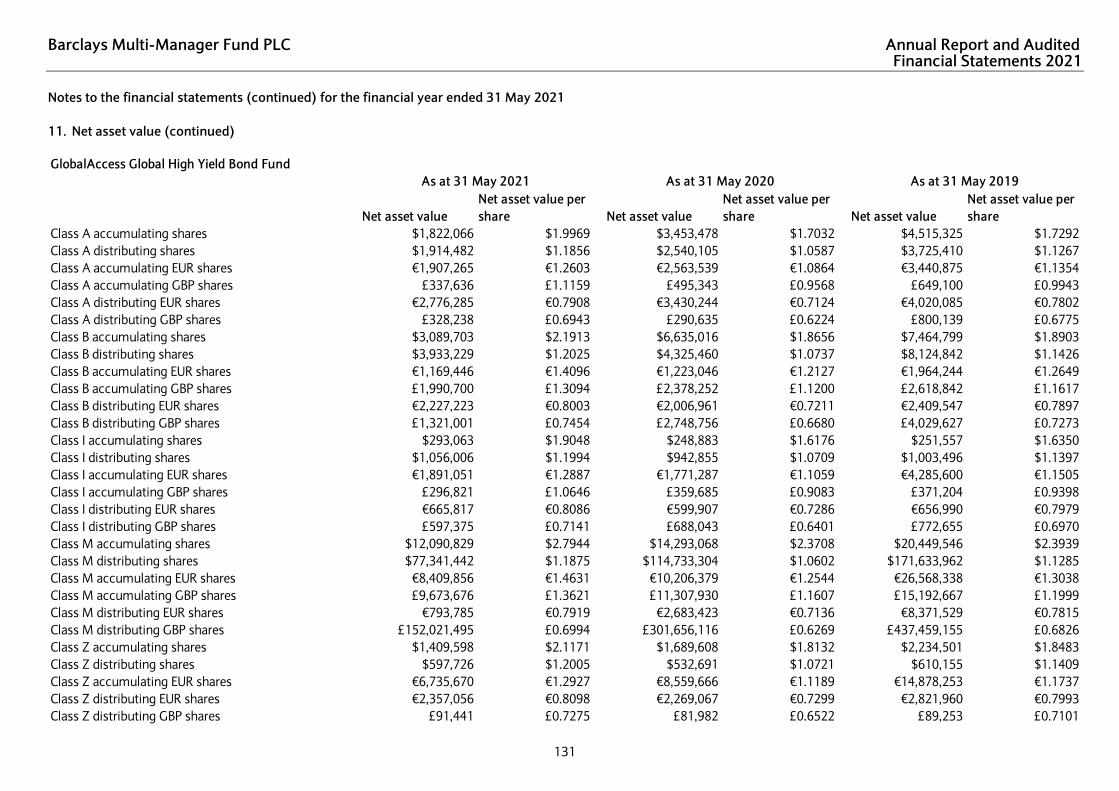
Barclays Multi-Manager Fund PLC Annual Report and Audited Financial Statements 2021
131
Notes to the financial statements (continued) for the financial year ended 31 May 2021 11. Net asset value (continued) GlobalAccess Global High Yield Bond Fund
Net asset valueNet asset value per share Net asset value
Net asset value per share Net asset value
Net asset value per share
Class A accumulating shares $1,822,066 $1.9969 $3,453,478 $1.7032 $4,515,325 $1.7292Class A distributing shares $1,914,482 $1.1856 $2,540,105 $1.0587 $3,725,410 $1.1267Class A accumulating EUR shares €1,907,265 €1.2603 €2,563,539 €1.0864 €3,440,875 €1.1354Class A accumulating GBP shares £337,636 £1.1159 £495,343 £0.9568 £649,100 £0.9943Class A distributing EUR shares €2,776,285 €0.7908 €3,430,244 €0.7124 €4,020,085 €0.7802Class A distributing GBP shares £328,238 £0.6943 £290,635 £0.6224 £800,139 £0.6775Class B accumulating shares $3,089,703 $2.1913 $6,635,016 $1.8656 $7,464,799 $1.8903Class B distributing shares $3,933,229 $1.2025 $4,325,460 $1.0737 $8,124,842 $1.1426Class B accumulating EUR shares €1,169,446 €1.4096 €1,223,046 €1.2127 €1,964,244 €1.2649Class B accumulating GBP shares £1,990,700 £1.3094 £2,378,252 £1.1200 £2,618,842 £1.1617Class B distributing EUR shares €2,227,223 €0.8003 €2,006,961 €0.7211 €2,409,547 €0.7897Class B distributing GBP shares £1,321,001 £0.7454 £2,748,756 £0.6680 £4,029,627 £0.7273Class I accumulating shares $293,063 $1.9048 $248,883 $1.6176 $251,557 $1.6350Class I distributing shares $1,056,006 $1.1994 $942,855 $1.0709 $1,003,496 $1.1397Class I accumulating EUR shares €1,891,051 €1.2887 €1,771,287 €1.1059 €4,285,600 €1.1505Class I accumulating GBP shares £296,821 £1.0646 £359,685 £0.9083 £371,204 £0.9398Class I distributing EUR shares €665,817 €0.8086 €599,907 €0.7286 €656,990 €0.7979Class I distributing GBP shares £597,375 £0.7141 £688,043 £0.6401 £772,655 £0.6970Class M accumulating shares $12,090,829 $2.7944 $14,293,068 $2.3708 $20,449,546 $2.3939Class M distributing shares $77,341,442 $1.1875 $114,733,304 $1.0602 $171,633,962 $1.1285Class M accumulating EUR shares €8,409,856 €1.4631 €10,206,379 €1.2544 €26,568,338 €1.3038Class M accumulating GBP shares £9,673,676 £1.3621 £11,307,930 £1.1607 £15,192,667 £1.1999Class M distributing EUR shares €793,785 €0.7919 €2,683,423 €0.7136 €8,371,529 €0.7815Class M distributing GBP shares £152,021,495 £0.6994 £301,656,116 £0.6269 £437,459,155 £0.6826Class Z accumulating shares $1,409,598 $2.1171 $1,689,608 $1.8132 $2,234,501 $1.8483Class Z distributing shares $597,726 $1.2005 $532,691 $1.0721 $610,155 $1.1409Class Z accumulating EUR shares €6,735,670 €1.2927 €8,559,666 €1.1189 €14,878,253 €1.1737Class Z distributing EUR shares €2,357,056 €0.8098 €2,269,067 €0.7299 €2,821,960 €0.7993Class Z distributing GBP shares £91,441 £0.7275 £81,982 £0.6522 £89,253 £0.7101
As at 31 May 2021 As at 31 May 2020 As at 31 May 2019

Barclays Multi-Manager Fund PLC Annual Report and Audited Financial Statements 2021
132
Notes to the financial statements (continued) for the financial year ended 31 May 2021 11. Net asset value (continued) GlobalAccess Global Corporate Bond Fund
Net asset valueNet asset value per share Net asset value
Net asset value per share Net asset value
Net asset value per share
Class A accumulating shares $53,514 $1.5305 $51,252 $1.4658 $138,903 $1.3776Class A distributing GBP shares - - - - £155,491 £0.7244Class B accumulating shares $328,264 $1.4272 $2,769,275 $1.3642 $3,178,149 $1.2795Class B distributing shares $220,668 $1.2600 $435,322 $1.2258 $416,837 $1.1738Class B distributing EUR shares €98,883 €0.8741 €97,085 €0.8582 €702,987 €0.8461Class I accumulating GBP shares £115,017 £0.8907 £152,445 £0.8530 £194,217 £0.8151Class I distributing GBP shares £48,865 £0.7257 £33,863 £0.7096 £35,228 £0.6935Class M accumulating shares $4,150,619 $1.9359 $6,015,632 $1.8431 $10,156,945 $1.7218Class M distributing shares $125,585,440 $1.2457 $115,692,757 $1.2119 $154,778,243 $1.1604Class M accumulating EUR shares €1,752,063 €1.1405 €1,852,413 €1.0967 €3,025,829 €1.0547Class M accumulating GBP shares £220,223 £0.9149 £210,580 £0.8749 £253,077 £0.8345Class M distributing EUR shares €388,912 €0.9758 €381,807 €0.9580 €376,252 €0.9441Class M distributing GBP shares £313,406,654 £0.7873 £280,808,596 £0.7684 £272,996,162 £0.7511Class Z accumulating shares $713,587 $1.5026 $702,688 $1.4462 $838,943 $1.3659Class Z accumulating EUR shares €2,157,550 €1.0369 €3,000,760 €1.0080 €5,370,461 €0.9803Class Z accumulating GBP shares £44,210 £0.8588 £45,282 £0.8301 £267,808 £0.8006
As at 31 May 2021 As at 31 May 2020 As at 31 May 2019

Barclays Multi-Manager Fund PLC Annual Report and Audited Financial Statements 2021
133
Notes to the financial statements (continued) for the financial year ended 31 May 2021 11. Net asset value (continued) GlobalAccess Global Inflation Linked Bond Fund*
Net asset valueNet asset value per share Net asset value
Net asset value per share Net asset value
Net asset value per share
Class A accumulating shares - - - - $404,422 $1.5540Class A accumulating EUR shares - - - - €80,941 €1.0700Class A distributing EUR shares - - - - €137,886 €1.0525Class A distributing GBP shares - - - - £731,178 £0.9090Class B accumulating shares - - - - $1,900,708 $1.6037Class B accumulating EUR shares - - - - €665,473 €1.0938Class B accumulating GBP shares - - - - £801,791 £1.0249Class B distributing GBP shares - - - - £15,544 £0.9811Class I accumulating GBP shares - - - - £29,320 £0.9641Class I distributing GBP shares - - - - £5,772 £0.9034Class M accumulating shares - - - - $9,192,189 $1.7232Class M distributing shares - - - - $11,289,034 $1.5056Class M accumulating EUR shares - - - - €580,826 €1.1531Class M accumulating GBP shares - - - - £4,471,810 £0.9934Class M distributing EUR shares - - - - €1,800,772 €1.0442Class M distributing GBP shares - - - - £10,237,352 £0.9969Class Z accumulating shares - - - - $293,206 $1.6509Class Z accumulating EUR shares - - - - €1,153,608 €0.9684
As at 31 May 2021 As at 31 May 2020 As at 31 May 2019
* GlobalAccess Global Inflation Linked Bond Fund ceased trading on 27 November 2019.

Barclays Multi-Manager Fund PLC Annual Report and Audited Financial Statements 2021
134
Notes to the financial statements (continued) for the financial year ended 31 May 2021 11. Net asset value (continued) GlobalAccess Emerging Market Debt Fund
Net asset valueNet asset value per share Net asset value
Net asset value per share Net asset value
Net asset value per share
Class A accumulating shares - - $185,760 $1.5700 $187,345 $1.5834Class A accumulating EUR shares €70,033 €1.1835 €98,834 €1.0833 €111,758 €1.1257Class A distributing EUR shares €289,476 €0.9706 €272,797 €0.9147 €294,031 €0.9859Class A distributing GBP shares - - - - £145,587 £0.7777Class B accumulating shares $67,222 $2.2372 $1,138,657 $2.0204 $1,146,078 $2.0336Class B distributing shares - - $198,947 $1.2046 $208,171 $1.2605Class B accumulating EUR shares €28,266 €1.2946 €83,580 €1.1826 €157,684 €1.2269Class B accumulating GBP shares £1,369,881 £1.1813 £1,243,397 £1.0722 £1,281,768 £1.1053Class I accumulating shares $15,701 $1.7333 $14,132 $1.5601 $25,667 $1.5651Class I accumulating EUR shares €121,552 €1.1180 €142,628 €1.0176 €200,982 €1.0515Class I accumulating GBP shares £54,109 £1.0492 £46,663 £0.9491 £51,283 £0.9754Class I distributing GBP shares £57,017 £0.7410 £35,789 £0.6942 £104,147 £0.7442Class M accumulating shares $1,010,056 $2.3991 $1,902,375 $2.1573 $12,776,288 $2.1614Class M distributing shares $62,806,441 $1.2801 $61,678,022 $1.1938 $84,918,771 $1.2492Class M accumulating EUR shares €1,495,939 €1.4309 €1,426,262 €1.3012 €2,801,249 €1.3440Class M accumulating GBP shares £210,130 £1.2410 £189,885 £1.1214 £1,348,267 £1.1510Class M distributing EUR shares €496,999 €0.8916 €435,119 €0.8401 €1,054,056 €0.9059Class M distributing GBP shares £168,038,040 £0.7480 £157,841,702 £0.7005 £168,770,602 £0.7502Class Z accumulating shares $143,107 $2.0342 $151,956 $1.8466 $532,063 $1.8683Class Z distributing shares - - - - $55,760 $1.2584Class Z accumulating EUR shares €939,328 €1.1909 €1,227,675 €1.0932 €2,080,447 €1.1394Class Z distributing EUR shares €44,251 €0.8646 €43,685 €0.8155 €36,650 €0.8790Class Z distributing GBP shares £694 £0.8021 £649 £0.7510 £695 £0.8039
As at 31 May 2021 As at 31 May 2020 As at 31 May 2019

Barclays Multi-Manager Fund PLC Annual Report and Audited Financial Statements 2021
135
Notes to the financial statements (continued) for the financial year ended 31 May 2021 11. Net asset value (continued) GlobalAccess Global Property Securities Fund*
Net asset valueNet asset value per share Net asset value
Net asset value per share Net asset value
Net asset value per share
Class A accumulating shares - - - - €99,934 €1.8208Class A distributing GBP shares - - £223,941 £0.7928 £281,212 £0.9955Class B accumulating shares - - $122,450 $1.5306 $143,223 $1.7903Class B accumulating GBP shares - - €124,158 €0.8297 €151,546 €1.0127Class B distributing GBP shares - - - - £116,554 £0.9962Class I accumulating GBP shares - - £19,766 £0.9228 £16,137 £1.1218Class I distributing GBP shares - - £13,773 £0.7804 £10,859 £0.9737Class M accumulating shares - - $9,398 $1.5985 $91,795 $1.8622Class M distributing shares - - $180,510,411 $1.3684 $75,198,500 $1.6358Class M accumulating EUR shares - - €279,717 €0.9597 €1,101,180 €1.1604Class M accumulating GBP shares - - £446,541 £0.9069 £1,090,667 £1.1027Class M distributing GBP shares - - £391,679 £0.7591 £750,612 £0.9471Class Z accumulating EUR shares - - €10,262 €1.0103 €55,358 €1.2355
As at 31 May 2021 As at 31 May 2020 As at 31 May 2019
* GlobalAccess Global Property Securities Fund ceased trading on 23 February 2021.

Barclays Multi-Manager Fund PLC Annual Report and Audited Financial Statements 2021
136
Notes to the financial statements (continued) for the financial year ended 31 May 2021 11. Net asset value (continued) GlobalAccess Global Short Duration Bond Fund
Net asset valueNet asset value per share Net asset value
Net asset value per share Net asset value
Net asset value per share
Class A accumulating shares $16,324 $1.9568 $15,359 $1.8411 $96,258 $1.8387Class B accumulating shares $3,295,494 $1.9852 $10,723,933 $1.8650 $5,188,436 $1.8597Class B accumulating GBP shares £82,403 £1.2007 £129,139 £1.1324 £92,918 £1.1494Class B distributing GBP shares - - - - £777,230 £1.0493Class I accumulating GBP shares £5,585 £1.1993 £53 £1.1191 £451 £1.1332Class I distributing GBP shares £96,980 £1.0189 £93,014 £0.9773 £401,443 £1.0157Class M accumulating shares $2,572,964 $2.0726 $4,035,647 $1.9451 $6,766,787 $1.9376Class M distributing shares $99,534,139 $1.7389 $98,964,791 $1.6627 $167,494,389 $1.6987Class M accumulating EUR shares €289,841 €1.2905 €482,894 €1.2223 €394,526 €1.2491Class M accumulating GBP shares £973,595 £1.2036 £898,001 £1.1340 £1,071,177 £1.1499Class M distributing EUR shares €5,819,347 €1.1363 €9,322,183 €1.0960 €5,533,064 €1.1482Class M distributing GBP shares £2,895,764 £1.0381 £45,856,457 £0.9959 £68,410,573 £1.0344Class Z accumulating shares $198,989 $1.9420 $387,219 $1.8270 $391,391 $1.8245Class Z accumulating EUR shares €1,539,047 €1.3347 €2,122,949 €1.2673 €4,871,434 €1.2983
As at 31 May 2021 As at 31 May 2020 As at 31 May 2019

Barclays Multi-Manager Fund PLC Annual Report and Audited Financial Statements 2021
137
Notes to the financial statements (continued) for the financial year ended 31 May 2021 11. Net asset value (continued) GlobalAccess US Small & Mid Cap Equity Fund
Net asset valueNet asset value per share Net asset value
Net asset value per share Net asset value
Net asset value per share
Class A accumulating shares $922,761 $2.8979 $740,545 $1.8536 $797,882 $1.9025Class A accumulating GBP shares £388,604 £1.6717 £283,232 £1.0824 £302,168 £1.1547Class B accumulating shares $2,245,984 $2.9728 $2,579,677 $1.8968 $2,854,442 $1.9418Class B distributing shares $458,757 $2.9693 $292,709 $1.8946 $299,617 $1.9393Class B accumulating EUR shares €82,569 €1.2650 €53,461 €0.8190 €56,674 €0.8683Class B accumulating GBP shares - - £63,742 £1.0964 £67,825 £1.1666Class I accumulating GBP shares £208,850 £1.6908 £143,703 £1.0899 £157,407 £1.1573Class I distributing GBP shares £80,192 £1.6907 £39,684 £1.0900 £56,439 £1.1576Class M accumulating shares $17,724,038 $3.0616 $18,069,213 $1.9467 $26,926,801 $1.9856Class M distributing shares $81,847,938 $3.0608 $58,475,395 $1.9461 $84,317,339 $1.9850Class M accumulating EUR shares €510,445 €1.8285 €617,037 €1.1798 €661,207 €1.2463Class M accumulating GBP shares £5,731,644 £1.6777 £3,353,817 £1.0799 £4,397,792 £1.1448Class M distributing EUR shares - - €131,467 €1.1689 €222,151 €1.2347Class M distributing GBP shares £5,757,265 £1.7006 £3,396,922 £1.0944 £5,190,398 £1.1609Class Z accumulating shares $1,678,251 $2.7907 $1,532,889 $1.7940 $1,729,338 $1.8506Class Z accumulating EUR shares €2,585,377 €1.8753 €2,280,715 €1.2233 €4,407,080 €1.3073
As at 31 May 2021 As at 31 May 2020 As at 31 May 2019

Barclays Multi-Manager Fund PLC Annual Report and Audited Financial Statements 2021
138
Notes to the financial statements (continued) for the financial year ended 31 May 2021 11. Net asset value (continued) GlobalAccess US Equity Fund
Net asset valueNet asset value per share Net asset value
Net asset value per share Net asset value
Net asset value per share
Class A accumulating shares $1,668,182 $44.9746 $1,631,733 $32.3100 $1,570,045 $28.9932Class A accumulating EUR shares €620,035 €31.6733 €528,179 €23.0575 €547,467 €21.2964Class A accumulating GBP shares £34,019 £26.5645 £24,670 £19.2646 £71,159 £17.7634Class B accumulating shares $2,607,381 $50.1419 $2,155,939 $35.9323 $1,897,584 $32.1624Class B accumulating GBP shares £477,434 £27.1326 £345,382 £19.6281 £317,730 £18.0566Class I accumulating GBP shares £198,197 £28.2922 £131,468 £20.3555 £107,350 £18.6220Class I accumulating GBP shares (Unhedged) £1,946 £25.6742 - - - -Class I distributing GBP shares £21,793 £26.8956 £16,826 £19.3800 £20,461 £17.7894Class M accumulating shares $13,651,275 $49.0221 $15,667,735 $34.8686 $24,142,022 $30.9773Class M distributing shares $307,170,680 $49.5914 $217,000,210 $35.4072 $244,402,831 $31.6351Class M accumulating EUR shares €730,288 €33.0247 €529,844 €23.8032 €583,171 €21.7653Class M accumulating GBP shares £2,033,063 £28.9352 £1,092,928 £20.7763 £1,098,842 £18.9704Class M distributing GBP shares £410,260 £27.0043 £54,459 £19.4534 £49,989 £17.8568Class M Distributing GBP shares (Unhedged) £1,428,154 £25.4374 €8,007 €20.8958 - -Class Z accumulating shares $1,868,355 $42.6873 $1,902,711 $30.8199 $2,359,981 $27.7974Class Z accumulating EUR shares €11,332,355 €29.1517 €11,378,409 €21.3283 €18,481,761 €19.8005
As at 31 May 2021 As at 31 May 2020 As at 31 May 2019

Barclays Multi-Manager Fund PLC Annual Report and Audited Financial Statements 2021
139
Notes to the financial statements (continued) for the financial year ended 31 May 2021 11. Net asset value (continued) GlobalAccess Global Equity Income Fund
Net asset valueNet asset value per share Net asset value
Net asset value per share Net asset value
Net asset value per share
Class A accumulating shares $241,315 $3.3054 $166,517 $2.2809 $170,232 $2.3318Class A distributing shares $2,614,097 $2.4961 $2,049,522 $1.7670 $2,357,860 $1.8642Class A accumulating EUR shares €1,195,428 €2.1481 €875,290 €1.5038 €1,005,526 €1.5840Class A accumulating GBP shares £180,518 £1.9331 £125,912 £1.3483 £132,546 £1.4194Class A distributing EUR shares €3,709,756 €1.6141 €3,230,493 €1.1586 €4,221,931 €1.2594Class A distributing GBP shares £191,205 £1.4493 £136,761 £1.0366 £148,614 £1.1265Class B accumulating shares $2,008,373 $3.3919 $2,302,173 $2.3348 $3,008,548 $2.3809Class B distributing shares $2,540,164 $2.5542 $2,241,125 $1.8035 $3,061,670 $1.8979Class B accumulating EUR shares €335,600 €2.2779 €695,450 €1.5908 €883,472 €1.6714Class B accumulating GBP shares £378,119 £1.9772 £401,709 £1.3756 £421,823 £1.4444Class B distributing EUR shares €942,484 €1.7415 €954,348 €1.2470 €2,175,277 €1.3520Class B distributing GBP shares €133,379 €1.4938 €181,326 €1.0660 €865,446 €1.1557Class I accumulating shares $81,330 $3.3853 $167,357 $2.3220 $188,971 $2.3597Class I accumulating EUR shares - - €202,513 €1.5660 €212,031 €1.6396Class I accumulating GBP shares £41,626 £1.9022 £70,407 £1.3188 £105,864 £1.3793Class I distributing GBP shares £350,017 £1.5176 £262,569 £1.0791 £388,154 £1.1656Class I distributing GBP shares (Unhedged) £3,182 £1.4945 - - - -Class M accumulating shares $204,469 $3.4577 $420,119 $2.3682 $473,657 $2.4030Class M distributing shares $47,360,088 $2.6844 $72,523,877 $1.8861 $124,601,420 $1.9751Class M accumulating EUR shares €1,308,929 €1.6697 €909,509 €1.1602 €1,023,341 €1.2130Class M accumulating GBP shares £8,483,628 £2.0831 £7,176,960 £1.4422 £11,258,297 £1.5067Class M distributing EUR shares €319,300 €1.8182 €238,542 €1.2954 €302,599 €1.3978Class M distributing GBP shares £11,461,966 £1.5692 £11,101,724 £1.1141 £15,880,623 £1.2014Class Z accumulating shares $173,758 $3.0839 $120,496 $2.1386 $157,222 $2.1972Class Z distributing shares $228,211 $2.4290 $163,676 $1.7281 $180,263 $1.8323Class Z accumulating EUR shares €3,367,790 €2.1545 €3,353,737 €1.5159 €6,763,806 €1.6048Class Z accumulating GBP shares £113,161 £1.7404 £79,322 £1.2200 £82,871 £1.2907Class Z distributing EUR shares €549,597 €1.6266 €428,270 €1.1734 €571,523 €1.2814
As at 31 May 2021 As at 31 May 2020 As at 31 May 2019

Barclays Multi-Manager Fund PLC Annual Report and Audited Financial Statements 2021
140
Notes to the financial statements (continued) for the financial year ended 31 May 2021 11. Net asset value (continued) GlobalAccess Emerging Market Local Currency Debt Fund
Net asset valueNet asset value per share Net asset value
Net asset value per share Net asset value
Net asset value per share
Class B accumulating shares $946,740 $0.9017 $1,307,045 $0.8278 $896,824 $0.8313Class I distributing GBP shares £24,187 £0.3652 £24,178 £0.3503 £17,153 £0.3766Class I distributing USD shares $4,829 $0.6305 - - - -Class M accumulating shares $1,406,831 $0.7747 $2,062,532 $0.7083 $4,147,036 $0.7082Class M distributing shares $401,034,583 $0.6258 $361,577,216 $0.5969 $420,437,547 $0.6262Class M accumulating EUR shares €48,094 €0.5617 €44,539 €0.5202 €45,869 €0.5358Class M accumulating GBP shares - - - - £92,392 £0.4589Class M distributing EUR shares - - €503,336 €0.4497 - -Class M distributing GBP shares £749,989 £0.3949 £185,912,083 £0.3789 - -
As at 31 May 2021 As at 31 May 2020 As at 31 May 2019

Barclays Multi-Manager Fund PLC Annual Report and Audited Financial Statements 2021
141
Notes to the financial statements (continued) for the financial year ended 31 May 2021 11. Net asset value (continued) GlobalAccess Europe (ex-UK) Alpha Fund
Net asset valueNet asset value per share Net asset value
Net asset value per share Net asset value
Net asset value per share
Class A accumulating shares €4,438,755 €2.9574 €3,829,048 €2.2012 €4,821,232 €2.1827Class A distributing shares - - €58,949 €1.9827 €101,703 €2.0018Class A accumulating GBP shares £521,709 £2.5523 £998,728 £1.8919 £991,158 £1.8776Class A accumulating USD shares $924,439 $4.7343 $1,246,020 $3.4817 $1,411,895 $3.3603Class B accumulating shares €212,310 €3.1761 €228,358 €2.3579 €225,870 €2.3323Class B accumulating GBP shares £870,866 £1.9313 £745,162 £1.4280 £1,216,716 £1.4137Class B accumulating USD shares $1,077,337 $2.9881 $790,280 $2.1919 $972,612 $2.1102Class I accumulating shares €140,070 €3.0690 €112,667 €2.2707 €197,772 €2.2383Class I accumulating GBP shares £96,570 £2.5269 £72,235 £1.8619 £82,577 £1.8355Class I accumulating GBP shares (Unhedged) £5,753 £2.3866 - - - -Class I accumulating USD shares $91,340 $4.4969 $164,061 $3.2877 $707,978 $3.1551Class I distributing GBP shares £90,732 £2.2157 £59,710 £1.6500 £101,889 £1.6645Class M accumulating shares €10,142,244 €2.1668 €13,682,412 €1.6007 €22,868,057 €1.5754Class M distributing shares €76,135,629 €2.6740 €75,164,534 €1.9998 €112,386,930 €2.0159Class M accumulating EUR shares - - €4,242 €1.8327 - -Class M accumulating GBP shares £1,968,560 £2.5023 £1,737,665 £1.8412 £2,233,741 £1.8136Class M accumulating USD shares $856,334 $4.5719 $1,367,084 $3.3342 $1,939,684 $3.1937Class M distributing GBP shares £421,045 £2.3143 £313,526 £1.7233 £316,355 £1.7389Class M distributing GBP shares (Unhedged) £760,674 £2.3390 £4,715 £1.8327 - -Class Z accumulating shares €19,119,314 €2.7742 €18,878,490 €2.0752 €26,786,531 €2.0681
As at 31 May 2021 As at 31 May 2020 As at 31 May 2019

Barclays Multi-Manager Fund PLC Annual Report and Audited Financial Statements 2021
142
Notes to the financial statements (continued) for the financial year ended 31 May 2021 11. Net asset value (continued) GlobalAccess Japan Fund
Net asset valueNet asset value per share Net asset value
Net asset value per share Net asset value
Net asset value per share
Class A accumulating EUR shares €89,237 €1.6067 €84,169 €1.2631 €114,465 €1.2351Class A accumulating USD shares $13,412 $2.2425 $10,425 $1.7431 $15,770 $1.6602Class B accumulating USD shares $294,386 $1.8399 $271,074 $1.4267 $311,755 $1.3555Class I accumulating GBP shares £64,921 £1.5809 £57,369 £1.2283 £31,222 £1.1908Class I accumulating GBP shares (Unhedged) £4,619 £1.1210 - - - -Class I distributing GBP shares £16,611 £1.4927 £10,752 £1.1668 £8,908 £1.1416Class M accumulating shares ¥451,290,810 ¥217.1766 ¥642,969,102 ¥168.5769 ¥1,114,309,239 ¥162.5130Class M distributing shares ¥27,888,148,159 ¥205.6455 ¥22,905,689,448 ¥160.9217 ¥24,086,702,454 ¥156.8562Class M accumulating EUR shares €295,209 €1.6992 €177,828 €1.3267 €294,535 €1.2887Class M accumulating GBP shares £246,475 £1.2570 £110,610 £0.9757 £170,652 £0.9448Class M accumulating USD shares $409,156 $1.9402 $1,129,568 $1.4983 $1,837,868 $1.4171Class M distributing EUR shares - - - - €165,792 €1.0887Class M distributing GBP shares £45,478 £1.4929 £316,592 £1.1672 £704,655 £1.1421Class Z accumulating shares ¥980,200 ¥196.0400 ¥969,620 ¥153.9937 ¥8,411,359 ¥150.2323Class Z accumulating EUR shares €1,496,052 €1.5298 €1,618,348 €1.2087 €2,611,955 €1.1880
As at 31 May 2021 As at 31 May 2020 As at 31 May 2019
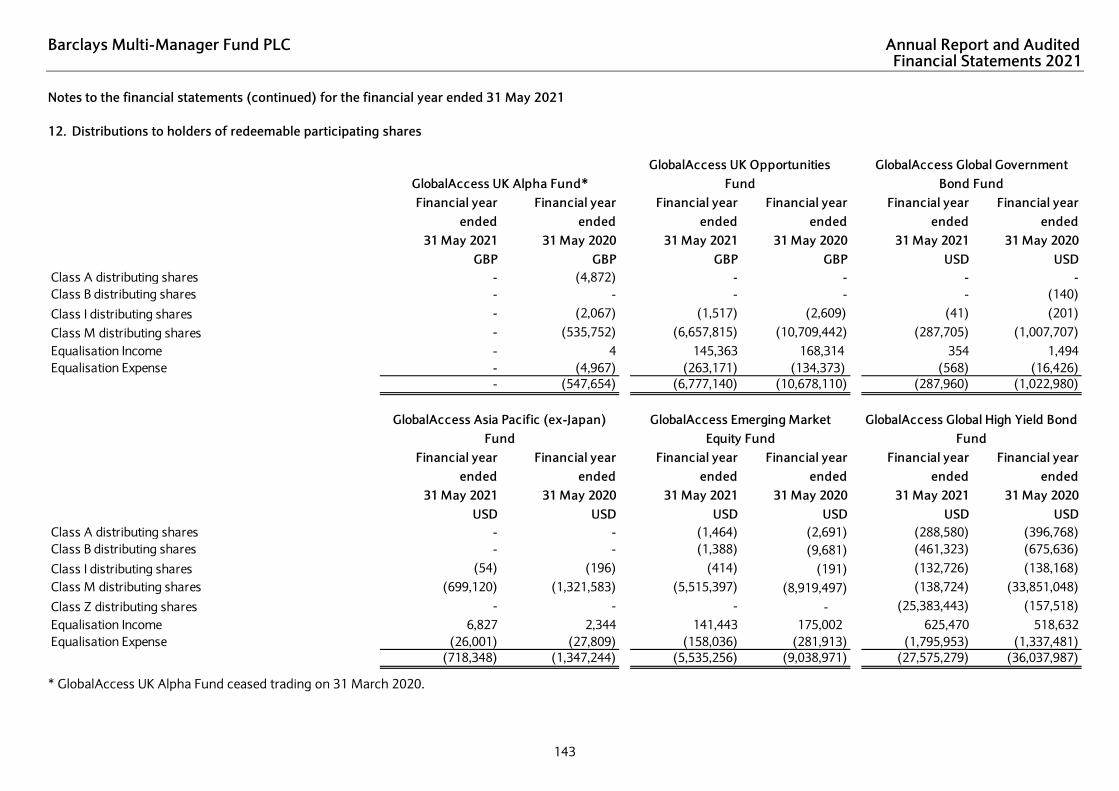
Barclays Multi-Manager Fund PLC Annual Report and Audited Financial Statements 2021
143
Notes to the financial statements (continued) for the financial year ended 31 May 2021 12. Distributions to holders of redeemable participating shares
Financial year ended
Financial year ended
Financial year ended
Financial year ended
Financial year ended
Financial year ended
31 May 2021 31 May 2020 31 May 2021 31 May 2020 31 May 2021 31 May 2020GBP GBP GBP GBP USD USD
Class A distributing shares - (4,872) - - - - Class B distributing shares - - - - - (140)
Class I distributing shares - (2,067) (1,517) (2,609) (41) (201)
Class M distributing shares - (535,752) (6,657,815) (10,709,442) (287,705) (1,007,707)Equalisation Income - 4 145,363 168,314 354 1,494 Equalisation Expense - (4,967) (263,171) (134,373) (568) (16,426)
- (547,654) (6,777,140) (10,678,110) (287,960) (1,022,980)
Financial year ended
Financial year ended
Financial year ended
Financial year ended
Financial year ended
Financial year ended
31 May 2021 31 May 2020 31 May 2021 31 May 2020 31 May 2021 31 May 2020USD USD USD USD USD USD
Class A distributing shares - - (1,464) (2,691) (288,580) (396,768)Class B distributing shares - - (1,388) (9,681) (461,323) (675,636)
Class I distributing shares (54) (196) (414) (191) (132,726) (138,168)Class M distributing shares (699,120) (1,321,583) (5,515,397) (8,919,497) (138,724) (33,851,048)
Class Z distributing shares - - - - (25,383,443) (157,518)Equalisation Income 6,827 2,344 141,443 175,002 625,470 518,632 Equalisation Expense (26,001) (27,809) (158,036) (281,913) (1,795,953) (1,337,481)
(718,348) (1,347,244) (5,535,256) (9,038,971) (27,575,279) (36,037,987)
GlobalAccess UK Alpha Fund*GlobalAccess UK Opportunities
FundGlobalAccess Global Government
Bond Fund
GlobalAccess Asia Pacific (ex-Japan) Fund
GlobalAccess Emerging Market Equity Fund
GlobalAccess Global High Yield Bond Fund
* GlobalAccess UK Alpha Fund ceased trading on 31 March 2020.

Barclays Multi-Manager Fund PLC Annual Report and Audited Financial Statements 2021
144
Notes to the financial statements (continued) for the financial year ended 31 May 2021 12. Distributions to holders of redeemable participating shares (continued)
Financial year ended
Financial year ended
Financial year ended
Financial year ended
Financial year ended
Financial year ended
31 May 2021 31 May 2020 31 May 2021 31 May 2020 31 May 2021 31 May 2020USD USD USD USD USD USD
Class A distributing shares - (1,963) - (11,740) (9,854) (15,361)Class B distributing shares (7,018) (19,561) - (259) (6,751) (8,240)
Class I distributing shares (990) (888) - (120) (1,855) (3,028)Class M distributing shares (10,894,702) (12,240,694) - (447,906) (10,264,663) (12,801,302)
Class Z distributing shares - - - - (1,338) (2,889)Equalisation Income 495,071 151,981 - 20 231,704 176,775 Equalisation Expense (385,131) (204,111) - (810) (265,389) (244,159)
(10,792,770) (12,315,236) - (460,815) (10,318,146) (12,898,204)
Financial year ended
Financial year ended
Financial year ended
Financial year ended
Financial year ended
Financial year ended
31 May 2021 31 May 2020 31 May 2021 31 May 2020 31 May 2021 31 May 2020USD USD USD USD USD USD
Class A distributing shares (6,244) (9,384) - - - - Class B distributing shares - (1,108) - (7,449) - - Class I distributing shares (318) (450) (2,118) (10,039) - - Class M distributing shares (3,938,339) (2,723,643) (2,972,509) (6,691,017) - - Equalisation Income 46,783 674,522 66,205 84,139 - - Equalisation Expense (627,832) (64,571) (212,258) (240,113) - (192)
(4,525,950) (2,124,634) (3,120,680) (6,864,479) - (192)
GlobalAccess Global Corporate Bond Fund
GlobalAccess Global Inflation Linked Bond Fund*
GlobalAccess Emerging Market Debt Fund
GlobalAccess Global Property Securities Fund
GlobalAccess Global Short Duration Bond Fund
GlobalAccess US Small & Mid Cap Equity Fund
* GlobalAccess Global Inflation Linked Bond Fund ceased trading on 27 November 2019. ** GlobalAccess Global Property Securities Fund ceased trading on 23 February 2021.

Barclays Multi-Manager Fund PLC Annual Report and Audited Financial Statements 2021
145
Notes to the financial statements (continued) for the financial year ended 31 May 2021 12. Distributions to holders of redeemable participating shares (continued)
Financial year ended
Financial year ended
Financial year ended
Financial year ended
Financial year ended
Financial year ended
31 May 2021 31 May 2020 31 May 2021 31 May 2020 31 May 2021 31 May 2020USD USD USD USD USD USD
Class A distributing shares - - (162,610) (225,215) - - Class B distributing shares - - (91,028) (172,696) - - Class I distributing shares (39) (92) (9,474) (15,036) (1,203) (1,024)Class M distributing shares (939,880) (1,398,485) (2,207,731) (4,100,772) (18,017,775) (25,957,846)Class Z distributing shares - - (18,164) (25,816) - - Equalisation Income 42,872 2,121 23,115 4,436 504,113 921,756Equalisation Expense (25,117) (39,101) (163,042) (149,624) (552,786) (1,101,995)
(922,164) (1,435,557) (2,628,934) (4,684,723) (18,067,651) (26,139,109)
Financial year ended
Financial year ended
Financial year ended
Financial year ended
31 May 2020 31 May 2020 31 May 2020 31 May 2020EUR EUR JPY JPY
Class A distributing shares (171) (1,746) - - Class I distributing shares (737) (2,540) (9,952) (15,474)Class M distributing shares (963,754) (2,590,784) (198,242,463) (278,883,370)Equalisation Income 5,971 294 4,778,797 8,292,242Equalisation Expense (31,785) (64,165) (4,399,452) (5,191,272)
(990,476) (2,658,941) (197,873,070) (275,797,874)
GlobalAccess Europe (ex-UK) Alpha Fund GlobalAccess Japan Fund
GlobalAccess US Equity FundGlobalAccess Global Equity Income
FundGlobalAccess Emerging Market Local
Currency Debt Fund
Distributions per share class have not been disclosed as due to the number of classes and currencies involved it would not be practicable to present this information within these financial statements. It is not considered that this information is material to readers of the financial statements.

Barclays Multi-Manager Fund PLC Annual Report and Audited Financial Statements 2021
146
Notes to the financial statements (continued) for the financial year ended 31 May 2021 13. Significant shareholders As at 31 May 2021
Fund
GlobalAccess UK Opportunities Fund Nil 2 88.77%GlobalAccess Global Government Bond Fund Nil 1 84.14%GlobalAccess Asia Pacific (ex-Japan) Fund Nil 1 73.37%GlobalAccess Emerging Market Equity Fund Nil 2 93.24%GlobalAccess Emerging Market Debt Fund Nil 1 77.00%GlobalAccess US Small & Mid Cap Equity Fund Nil 2 79.37%GlobalAccess Emerging Market Local Currency Debt Fund Nil 1 79.24%GlobalAccess Japan Fund Nil 1 79.31%GlobalAccess Global Short Duration Bond Fund Nil 1 79.26%GlobalAccess US Equity Fund Nil 1 85.29%GlobalAccess Global Equity Income Fund Nil 2 66.55%GlobalAccess Europe (ex-UK) Alpha Fund Nil 1 61.48%GlobalAccess Global High Yield Bond Fund Nil 1 63.64%GlobalAccess Global Corporate Bond Fund Nil 1 78.14%
Total % of shares held by funds managed by Barclays Investment
Solutions Limited or held by affiliates of Barclays Investment Solutions Limited
Number of investors holding 20% or more of the voting shares who are not
affiliates of Barclays Investment Solutions Limited
Total % of shares held by shareholders holding 20% or more of the voting shares in issue who are not affiliates of Barclays
Investment Solutions Limited

Barclays Multi-Manager Fund PLC Annual Report and Audited Financial Statements 2021
147
Notes to the financial statements (continued) for the financial year ended 31 May 2021 13. Significant shareholders (continued) As at 31 May 2020
Fund
GlobalAccess UK Opportunities Fund Nil 1 72.46%GlobalAccess Global Government Bond Fund Nil 1 82.38%GlobalAccess Asia Pacific (ex-Japan) Fund Nil 1 71.95%GlobalAccess Emerging Market Equity Fund Nil 2 89.58%GlobalAccess Emerging Market Debt Fund Nil 1 69.10%GlobalAccess Global Property Securities Fund Nil 2 95.39%GlobalAccess US Small & Mid Cap Equity Fund Nil 1 55.61%GlobalAccess Emerging Market Local Currency Debt Fund Nil 1 84.38%GlobalAccess Japan Fund Nil 2 93.65%GlobalAccess Global Short Duration Bond Fund Nil 2 77.08%GlobalAccess US Equity Fund Nil 1 82.22%GlobalAccess Global Equity Income Fund Nil 2 74.12%GlobalAccess Europe (ex-UK) Alpha Fund Nil 1 59.89%GlobalAccess Global High Yield Bond Fund Nil 1 65.94%GlobalAccess Global Corporate Bond Fund Nil 1 68.22%
Total % of shares held by funds managed by Barclays Investment
Solutions Limited or held by affiliates of Barclays Investment Solutions Limited
Number of investors holding 20% or more of the voting shares who are not
affiliates of Barclays Investment Solutions Limited
Total % of shares held by shareholders holding 20% or more of the voting shares in issue who are not affiliates of Barclays
Investment Solutions Limited
Barclays Multi-Manager Fund PLC Annual Report and Audited Financial Statements 2021
148
Notes to the financial statements (continued) for the financial year ended 31 May 2021 14. Financial risk management Fair value hierarchy disclosure IFRS 13 'Fair Value Measurement' requires the Funds to classify fair value measurements using a fair value hierarchy that reflects the significance of the inputs used in making the measurements for assets and liabilities in the statement of financial position. The disclosures are based on a three-level fair value hierarchy for the inputs used in valuation techniques to measure fair value. The fair value of financial assets and financial liabilities traded in an active market (such as trading securities) are based on quoted market prices at the close of trading on the year end date. The quoted market price used for financial assets held by the Funds is the closing mid-market price as at the Valuation Point on the year end date or the last traded price when no closing mid-market price is available. The fair value of the currency contracts held by the Funds is arrived at using a pricing model. A financial instrument is regarded as quoted in an active market if the quoted prices are readily and regularly available from an exchange, dealer, broker, industry group, pricing service, or regulatory agency, and those prices represent actual and regularly occurring market transactions on an arm's length basis. The fair value of financial assets and financial liabilities that are not traded in an active market is determined by using valuation techniques. The Funds use a variety of methods and makes assumptions that are based on market conditions existing at the end date. The Funds classify fair value measurements using a fair value hierarchy that reflects the significance of the inputs used in making the measurements. The fair value hierarchy has the following levels:
(i) Quoted prices (unadjusted) in active markets for identical assets or liabilities (level 1).
(ii) Inputs other than quoted prices included within level 1 that are observable for the asset or liability, either directly (that is, as prices) or indirectly (that is, derived from prices) (level 2).
(iii) Inputs for the asset or liability that are not based on observable market data (that is, unobservable inputs) (level 3).
Investments classified within level 3 have significant unobservable inputs, as they trade infrequently. Level 3 investments include bonds and equities for the financial year ended 31 May 2021 and 31 May 2020. As observable prices are not available for these securities, the Fund has used valuation techniques to derive the fair value. The level 3 bonds and equities amounts consist of securities with stale and/or suspended prices. The total market value of level 3 securities are deemed immaterial for the purposes of presenting a level 3 roll forward table and is also deemed immaterial for a sensitivity analysis to be included. The tables on the following pages show a summary of the fair valuations according to the inputs as at 31 May 2021 and 31 May 2020 in valuing the portfolios assets and liabilities.

Barclays Multi-Manager Fund PLC Annual Report and Audited Financial Statements 2021
149
Notes to the financial statements (continued) for the financial year ended 31 May 2021 14. Financial risk management (continued) Fair value hierarchy disclosure (continued) GlobalAccess UK Alpha Fund*
Level 1 Level 2 Level 3 Level 1 Level 2 Level 3GBP GBP GBP GBP GBP GBP
AssetsCash and cash equivalents - - - 93,339 - - Other receivables - - - - 4,556 - Total assets - - - 93,339 4,556 -
LiabilitiesBank overdraft - - - (8,052) - - Other payables - - - - (89,843) - Total liabilities - - - (8,052) (89,843) -
As at 31 May 2021 As at 31 May 2020
* GlobalAccess UK Alpha Fund ceased trading on 31 March 2020.

Barclays Multi-Manager Fund PLC Annual Report and Audited Financial Statements 2021
150
Notes to the financial statements (continued) for the financial year ended 31 May 2021 14. Financial risk management (continued) Fair value hierarchy disclosure (continued) GlobalAccess UK Opportunities Fund
Level 1 Level 2 Level 3 Level 1 Level 2 Level 3GBP GBP GBP GBP GBP GBP
AssetsEquity securities 418,972,071 - - 337,780,363 - - Derivatives 105,525 31 - 1,447,260 74,429 - Cash and cash equivalents 7,190,609 - - 13,422,003 - - Margin cash due from broker 994,071 - - 1,001,411 - - Other receivables - 2,739,876 - - 2,338,119 - Total assets 427,262,276 2,739,907 - 353,651,037 2,412,548 -
LiabilitiesDerivatives - (9,479) - (330) (8,358) - Other payables - (3,663,958) - - (1,899,654) - Net assets attributable to holders of redeemable participating shares - (426,328,746) - - (354,155,243) - Total liabilities - (430,002,183) - (330) (356,063,255) -
As at 31 May 2021 As at 31 May 2020

Barclays Multi-Manager Fund PLC Annual Report and Audited Financial Statements 2021
151
Notes to the financial statements (continued) for the financial year ended 31 May 2021 14. Financial risk management (continued) Fair value hierarchy disclosure (continued) GlobalAccess Global Government Bond Fund
Level 1 Level 2 Level 3 Level 1 Level 2 Level 3USD USD USD USD USD USD
AssetsDebt securities - 134,363,338 - - 155,042,434 - Investment funds 549,900 - - - - - Derivatives 253,879 563,147 - 336,161 1,089,114 - Cash and cash equivalents 2,104,263 - - 3,671,445 - - Cash held as collateral 486,000 - - 400,000 - - Margin cash due from broker 36,409 - - 235,971 - - Other receivables - 38,508,032 - - 36,150,653 - Total assets 3,430,451 173,434,517 - 4,643,577 192,282,201 -
LiabilitiesDerivatives (51,181) (1,393,970) - (265,264) (1,666,091) - Cash pledged as collateral - - - (554,000) - - Margin cash due to broker (222,656) - - (132,593) - - Other payables - (51,412,424) - - (52,811,845) - Net assets attributable to holders of redeemable participating shares - (123,784,737) - - (141,495,985) - Total liabilities (273,837) (176,591,131) - (951,857) (195,973,921) -
As at 31 May 2021 As at 31 May 2020

Barclays Multi-Manager Fund PLC Annual Report and Audited Financial Statements 2021
152
Notes to the financial statements (continued) for the financial year ended 31 May 2021 14. Financial risk management (continued) Fair value hierarchy disclosure (continued) GlobalAccess Asia Pacific (ex-Japan) Fund
Level 1 Level 2 Level 3 Level 1 Level 2 Level 3USD USD USD USD USD USD
AssetsEquity securities 100,838,429 - 7,526 67,222,862 - 69,061Investment funds - 1,874,964 - - 1,192,494 - P-Notes - 499,148 - - 1,771,997 - Derivatives - 127,863 - 42,135 58,132 - Cash and cash equivalents 2,460,513 - - 3,034,204 - - Margin cash due from broker 81,248 - - 239,800 - - Other receivables - 591,907 - - 1,124,076 - Total assets 103,380,190 3,093,882 7,526 70,539,001 4,146,699 69,061
LiabilitiesDerivatives - (384) - (1,700) (4,510) - Other payables - (353,275) - - (859,230) - Net assets attributable to holders of redeemable participating shares - (106,127,939) - - (73,889,321) - Total liabilities - (106,481,598) - (1,700) (74,753,061) -
As at 31 May 2021 As at 31 May 2020
There were no transfers greater than 1% of the NAV between levels for the financial assets and financial liabilities which are recorded at fair value as at 31 May 2021 or as at 31 May 2020.

Barclays Multi-Manager Fund PLC Annual Report and Audited Financial Statements 2021
153
Notes to the financial statements (continued) for the financial year ended 31 May 2021 14. Financial risk management (continued) Fair value hierarchy disclosure (continued) GlobalAccess Emerging Market Equity Fund
Level 1 Level 2 Level 3 Level 1 Level 2 Level 3USD USD USD USD USD USD
AssetsEquity securities 672,101,440 - 1,613 459,536,536 - - Investment funds - 13,377,449 - - 7,098,033 - P-Notes - - - - 7,188,489 - Warrants - 22,310 - - 61,841 - Derivatives 395,010 685,621 - 47,685 487,016 - Cash and cash equivalents 36,088,679 - - 15,787,655 - - Margin cash due from broker 1,769,794 - - 614,852 - - Other receivables - 4,716,637 - - 2,710,079 - Total assets 710,354,923 18,802,017 1,613 475,986,728 17,545,458 -
LiabilitiesDerivatives - (20,996) - - (14,137) - Bank overdraft (1,776) - - - - - Other payables - (4,038,981) - - (3,580,120) - Net assets attributable to holders of redeemable participating shares - (725,096,800) - - (489,937,929) - Total liabilities (1,776) (729,156,777) - - (493,532,186) -
As at 31 May 2021 As at 31 May 2020
There were no transfers greater than 1% of the NAV between levels for the financial assets and financial liabilities which are recorded at fair value as at 31 May 2021 or as at 31 May 2020.

Barclays Multi-Manager Fund PLC Annual Report and Audited Financial Statements 2021
154
Notes to the financial statements (continued) for the financial year ended 31 May 2021 14. Financial risk management (continued) Fair value hierarchy disclosure (continued) GlobalAccess Global High Yield Bond Fund
Level 1 Level 2 Level 3 Level 1 Level 2 Level 3USD USD USD USD USD USD
AssetsEquity securities 1,840,850 - 1,396,222 1,292,067 - 706,802Debt securities - 359,476,712 1,115,657 - 552,595,887 30,135Investment funds 8,537,517 - - 21,752,162 - - Warrants - 50,791 481,115 - 26,907 148,038Derivatives - 3,587,555 - - 3,679,481 - Cash and cash equivalents 7,368,327 - - 6,487,964 - - Other receivables - 1,689,693 - - 4,987,501 - Total assets 17,746,694 364,804,751 2,992,994 29,532,193 561,289,776 884,975
LiabilitiesDerivatives - (153,618) - - (574,102) - Bank overdraft (1,332,197) - - - - - Other payables - (8,230,087) - - (6,833,017) - Net assets attributable to holders of redeemable participating shares - (375,828,537) - - (584,299,825) - Total liabilities (1,332,197) (384,212,242) - - (591,706,944) -
As at 31 May 2021 As at 31 May 2020
There were no transfers greater than 1% of the NAV between levels for the financial assets and financial liabilities which are recorded at fair value as at 31 May 2021 or as at 31 May 2020.

Barclays Multi-Manager Fund PLC Annual Report and Audited Financial Statements 2021
155
Notes to the financial statements (continued) for the financial year ended 31 May 2021 14. Financial risk management (continued) Fair value hierarchy disclosure (continued) GlobalAccess Global Corporate Bond Fund
Level 1 Level 2 Level 3 Level 1 Level 2 Level 3USD USD USD USD USD USD
AssetsEquity securities - - - 211,025 - - Debt securities - 554,808,945 - - 463,891,727 - Investment funds 17,368,160 - - 15,226,640 - - Derivatives 388,659 6,678,434 - 296,430 3,123,261 - Cash and cash equivalents 5,681,396 - - 3,322,616 - - Cash held as collateral 1,650,000 - - 390,000 - - Margin cash due from broker 1,237,432 - - 1,746,735 - - Other receivables - 9,974,785 - - 9,356,967 - Total assets 26,325,647 571,462,164 - 21,193,446 476,371,955 -
LiabilitiesDerivatives (95,145) (3,417,566) - (369,319) (2,585,445) - Cash pledged as collateral - - - (280,000) - - Margin cash due to broker (358,143) - - (40,846) - - Other payables - (11,372,220) - - (14,981,393) - Net assets attributable to holders of redeemable participating shares - (582,544,737) - - (479,308,398) - Total liabilities (453,288) (597,334,523) - (690,165) (496,875,236) -
As at 31 May 2021 As at 31 May 2020

Barclays Multi-Manager Fund PLC Annual Report and Audited Financial Statements 2021
156
Notes to the financial statements (continued) for the financial year ended 31 May 2021 14. Financial risk management (continued) Fair value hierarchy disclosure (continued) GlobalAccess Global Inflation Linked Bond Fund*
Level 1 Level 2 Level 3 Level 1 Level 2 Level 3USD USD USD USD USD USD
AssetsCash and cash equivalents - - - 36,391 - - Total assets - - - 36,391 - -
LiabilitiesOther payables - - - - (36,391) - Total liabilities - - - - (36,391) -
As at 31 May 2021 As at 31 May 2020
* GlobalAccess Global Inflation Linked Bond Fund ceased trading on 27 November 2019.

Barclays Multi-Manager Fund PLC Annual Report and Audited Financial Statements 2021
157
Notes to the financial statements (continued) for the financial year ended 31 May 2021 14. Financial risk management (continued) Fair value hierarchy disclosure (continued) GlobalAccess Emerging Market Debt Fund
Level 1 Level 2 Level 3 Level 1 Level 2 Level 3USD USD USD USD USD USD
AssetsDebt securities - 278,083,740 - - 242,274,355 - Investment funds 15,353,190 - - 10,918,440 - - Derivatives 316,673 3,605,145 - 250,307 2,139,600 - Cash and cash equivalents 12,651,196 - - 10,653,798 - - Cash held as collateral 50,000 - - 110,000 - - Margin cash due from broker 1,135,041 - - 734,906 - - Other receivables - 2,053,569 - - 3,075,335 - Total assets 29,506,100 283,742,454 - 22,667,451 247,489,290 -
LiabilitiesDerivatives (17,665) (1,184,201) - (58,895) (528,228) - Cash pledged as collateral - - - (50,000) - - Margin cash due to broker (366,341) - - (127,149) - - Other payables - (2,260,303) - - (2,933,360) - Net assets attributable to holders of redeemable participating shares - (309,420,044) - - (266,459,110) - Total liabilities (384,006) (312,864,548) - (236,044) (269,920,698) -
As at 31 May 2021 As at 31 May 2020

Barclays Multi-Manager Fund PLC Annual Report and Audited Financial Statements 2021
158
Notes to the financial statements (continued) for the financial year ended 31 May 2021 14. Financial risk management (continued) Fair value hierarchy disclosure (continued) GlobalAccess Global Property Securities Fund
Level 1 Level 2 Level 3 Level 1 Level 2 Level 3USD USD USD USD USD USD
AssetsEquity securities - - - 172,105,765 - - Investment funds - - - 5,476,322 - - Derivatives - - - - 18,757 - Cash and cash equivalents 115,708 - - 6,109,531 - - Other receivables - 5,991 - - 1,014,388 - Total assets 115,708 5,991 - 183,691,618 1,033,145 -
LiabilitiesDerivatives - - - - (1,158) - Bank overdraft (30,557) - - - - - Other payables - (91,142) - - (2,250,678) - Net assets attributable to holders of redeemable participating shares - - - - (182,472,927) - Total liabilities (30,557) (91,142) - - (184,724,763) -
As at 31 May 2021 As at 31 May 2020
* GlobalAccess Global Property Securities Fund ceased trading on 23 February 2021.

Barclays Multi-Manager Fund PLC Annual Report and Audited Financial Statements 2021
159
Notes to the financial statements (continued) for the financial year ended 31 May 2021 14. Financial risk management (continued) Fair value hierarchy disclosure (continued) GlobalAccess Global Short Duration Bond Fund
Level 1 Level 2 Level 3 Level 1 Level 2 Level 3USD USD USD USD USD USD
AssetsDebt securities - 114,458,485 - - 173,236,898 - Investment funds 2,766,195 - - 3,484,733 - - Derivatives 6,362 476,099 - 163,691 2,676,207 - Cash and cash equivalents 9,234,854 - - 9,113,400 - - Cash held as collateral 20,000 - - 230,000 - - Margin cash due from broker 2,319,577 - - 1,969,041 - - Other receivables - 1,377,869 - - 1,951,502 - Total assets 14,346,988 116,312,453 - 14,960,865 177,864,607 -
LiabilitiesDerivatives (40,892) (571,838) - (86,909) (896,432) - Bank overdraft (4) - - (37,308) - - Cash pledged as collateral - - - (260,000) - - Margin cash due to broker (2,259,026) - - (2,072,986) - - Other payables - (7,055,429) - - (3,999,494) - Net assets attributable to holders of redeemable participating shares - (120,732,252) - - (185,472,343) - Total liabilities (2,299,922) (128,359,519) - (2,457,203) (190,368,269) -
As at 31 May 2021 As at 31 May 2020

Barclays Multi-Manager Fund PLC Annual Report and Audited Financial Statements 2021
160
Notes to the financial statements (continued) for the financial year ended 31 May 2021 14. Financial risk management (continued) Fair value hierarchy disclosure (continued) GlobalAccess US Small & Mid Cap Equity Fund
Level 1 Level 2 Level 3 Level 1 Level 2 Level 3USD USD USD USD USD USD
AssetsEquity securities 121,220,957 - - 89,293,690 - - Investment funds 1,370,496 - - 1,429,806 - - Derivatives 4,395 286,919 - 89,992 152,083 - Cash and cash equivalents 3,629,737 - - 3,244,997 - - Margin cash due from broker 154,303 - - 316,944 - - Other receivables - 580,736 - - 207,985 - Total assets 126,379,888 867,655 - 94,375,429 360,068 -
LiabilitiesDerivatives (4,955) (9,042) - - (10,297) - Bank overdraft (107) - - - - - Other payables - (1,174,890) - - (604,127) - Net assets attributable to holders of redeemable participating shares - (126,058,549) - - (94,121,073) - Total liabilities (5,062) (127,242,481) - - (94,735,497) -
As at 31 May 2021 As at 31 May 2020
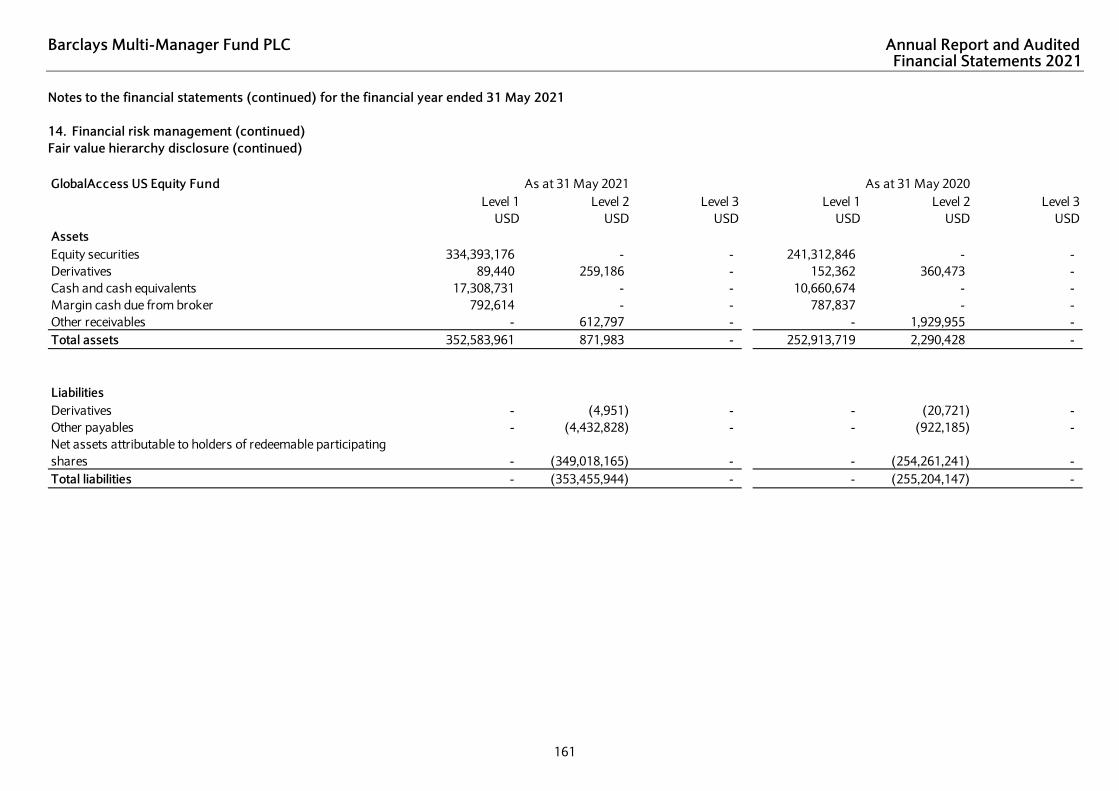
Barclays Multi-Manager Fund PLC Annual Report and Audited Financial Statements 2021
161
Notes to the financial statements (continued) for the financial year ended 31 May 2021 14. Financial risk management (continued) Fair value hierarchy disclosure (continued) GlobalAccess US Equity Fund
Level 1 Level 2 Level 3 Level 1 Level 2 Level 3USD USD USD USD USD USD
AssetsEquity securities 334,393,176 - - 241,312,846 - - Derivatives 89,440 259,186 - 152,362 360,473 - Cash and cash equivalents 17,308,731 - - 10,660,674 - - Margin cash due from broker 792,614 - - 787,837 - - Other receivables - 612,797 - - 1,929,955 - Total assets 352,583,961 871,983 - 252,913,719 2,290,428 -
LiabilitiesDerivatives - (4,951) - - (20,721) - Other payables - (4,432,828) - - (922,185) - Net assets attributable to holders of redeemable participating shares - (349,018,165) - - (254,261,241) - Total liabilities - (353,455,944) - - (255,204,147) -
As at 31 May 2021 As at 31 May 2020

Barclays Multi-Manager Fund PLC Annual Report and Audited Financial Statements 2021
162
Notes to the financial statements (continued) for the financial year ended 31 May 2021 14. Financial risk management (continued) Fair value hierarchy disclosure (continued) GlobalAccess Global Equity Income Fund
Level 1 Level 2 Level 3 Level 1 Level 2 Level 3USD USD USD USD USD USD
AssetsEquity securities 97,736,801 - - 112,141,568 - - Derivatives 4,773 602,148 - 380,900 731,116 - Cash and cash equivalents 2,748,523 - - 3,699,695 - - Margin cash due from broker 159,966 - - 138,380 - - Other receivables - 506,776 - - 344,645 - Total assets 100,650,063 1,108,924 - 116,360,543 1,075,761 -
LiabilitiesDerivatives - (44,186) - - (29,527) - Bank overdraft (771) - - (97,052) - - Other payables - (1,591,637) - - (890,216) - Net assets attributable to holders of redeemable participating shares - (100,122,393) - - (116,419,509) - Total liabilities (771) (101,758,216) - (97,052) (117,339,252) -
As at 31 May 2021 As at 31 May 2020

Barclays Multi-Manager Fund PLC Annual Report and Audited Financial Statements 2021
163
Notes to the financial statements (continued) for the financial year ended 31 May 2021 14. Financial risk management (continued) Fair value hierarchy disclosure (continued) GlobalAccess Emerging Market Local Currency Debt Fund
Level 1 Level 2 Level 3 Level 1 Level 2 Level 3USD USD USD USD USD USD
AssetsDebt securities - 364,109,320 - - 530,859,642 - Investment funds 21,537,090 - - 51,157,352 - - Derivatives 26,483 2,577,552 - 4,784 19,865,323 - Cash and cash equivalents 18,242,751 - - 81,242,081 - - Cash held as collateral 270,000 - - 1,620,000 - - Margin cash due from broker 41,327 - - 20,529 - - Other receivables - 1,614,134 - - 60,299,617 - Total assets 40,117,651 368,301,006 - 134,044,746 611,024,582 -
LiabilitiesDerivatives - (1,829,408) - - (18,527,546) - Cash pledged as collateral (229,940) - - (1,156,000) - - Other payables - (1,807,033) - - (129,956,544) - Net assets attributable to holders of redeemable participating shares - (404,552,276) - - (595,429,238) - Total liabilities (229,940) (408,188,717) - (1,156,000) (743,913,328) -
As at 31 May 2021 As at 31 May 2020

Barclays Multi-Manager Fund PLC Annual Report and Audited Financial Statements 2021
164
Notes to the financial statements (continued) for the financial year ended 31 May 2021 14. Financial risk management (continued) Fair value hierarchy disclosure (continued) GlobalAccess Europe (ex-UK) Alpha Fund
Level 1 Level 2 Level 3 Level 1 Level 2 Level 3EUR EUR EUR EUR EUR EUR
AssetsEquity securities 115,814,485 - - 117,949,786 - - Investment funds 938,832 - - 767,712 - - Derivatives - 5,405 - - 77 - Cash and cash equivalents 2,358,091 - - 1,580,851 - - Margin cash due from broker 929 - - 929 - - Other receivables - 124,488 - - 381,984 - Total assets 119,112,337 129,893 - 120,299,278 382,061 -
LiabilitiesDerivatives - (31,429) - - (156,586) - Other payables - (1,103,986) - - (993,840) - Net assets attributable to holders of redeemable participating shares - (118,106,815) - - (119,530,913) - Total liabilities - (119,242,230) - - (120,681,339) -
As at 31 May 2021 As at 31 May 2020

Barclays Multi-Manager Fund PLC Annual Report and Audited Financial Statements 2021
165
Notes to the financial statements (continued) for the financial year ended 31 May 2021 14. Financial risk management (continued) Fair value hierarchy disclosure (continued) GlobalAccess Japan Fund
Level 1 Level 2 Level 3 Level 1 Level 2 Level 3JPY JPY JPY JPY JPY JPY
AssetsEquity securities 27,450,132,330 - - 22,767,481,240 - - Derivatives 4,200,000 3,383,256 - 32,114,998 8,771,965 - Cash and cash equivalents 1,003,562,211 - - 779,048,706 - - Margin cash due from broker 102,460,090 - - 101,070,083 - - Other receivables - 338,365,427 - - 430,457,578 - Total assets 28,560,354,631 341,748,683 - 23,679,715,027 439,229,543 -
LiabilitiesDerivatives (3,465,000) (272,907) - (2,395,000) (491,391) - Other payables - (169,198,195) - - (123,096,527) - Net assets attributable to holders of redeemable participating shares - (28,729,167,212) - - (23,992,961,652) - Total liabilities (3,465,000) (28,898,638,314) - (2,395,000) (24,116,549,570) -
As at 31 May 2021 As at 31 May 2020
The primary objective of the Funds is to invest in transferable securities. The Funds also invest in financial derivative instruments, such as futures and forwards, for the purposes of efficient portfolio management. As at 31 May 2021 and 31 May 2020, some of these derivative transactions were subject to master netting arrangements. All financial derivative transactions are disclosed in the Schedule of Investments. Margin balances are maintained by the Funds for the purposes of providing collateral on futures. The fair value of the majority of the financial derivative instruments is less than 1% of the net asset value of the Funds and is therefore considered insignificant. On the grounds of materiality, the Company has chosen not to present any details of the derivative offsetting arrangements within the financial statements. Where the fair value of the financial derivative instruments exceeds 1% of the net asset value of the Funds at either an individual or at a counterparty aggregate level, the offsetting agreement in place for these positions is disclosed by way a footnote in each respective schedule of investments.
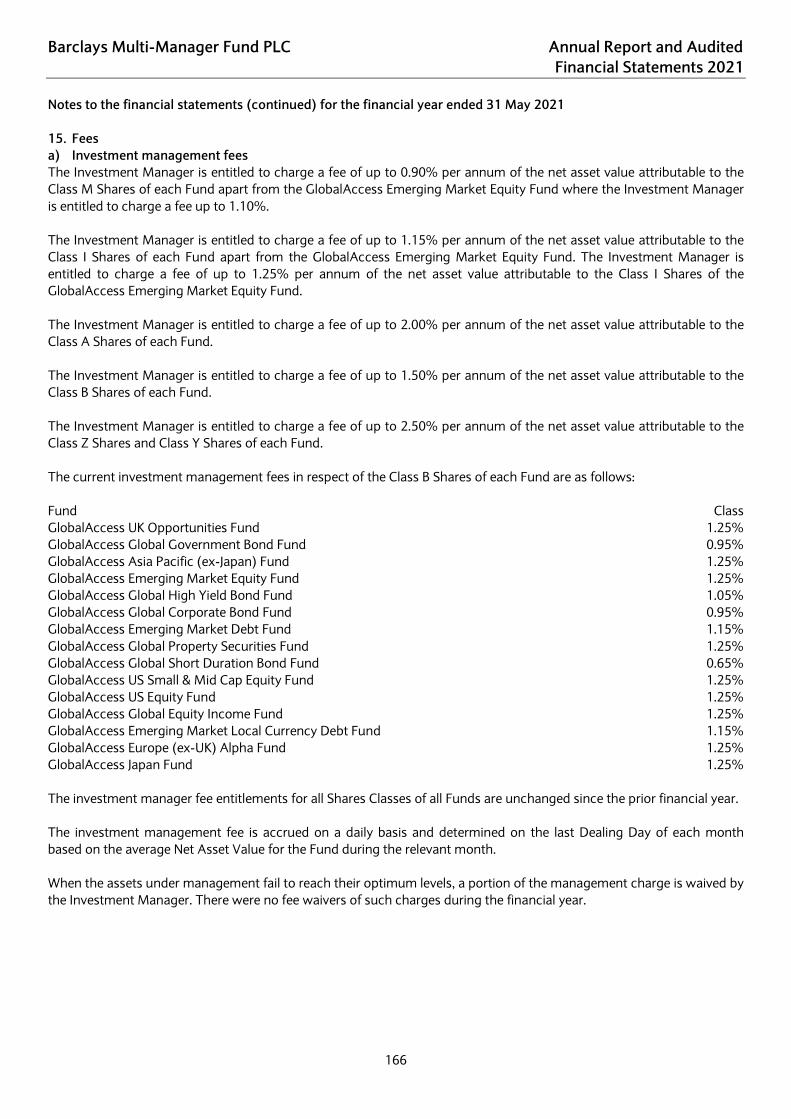
Barclays Multi-Manager Fund PLC Annual Report and Audited Financial Statements 2021
166
Notes to the financial statements (continued) for the financial year ended 31 May 2021 15. Fees a) Investment management fees The Investment Manager is entitled to charge a fee of up to 0.90% per annum of the net asset value attributable to the Class M Shares of each Fund apart from the GlobalAccess Emerging Market Equity Fund where the Investment Manager is entitled to charge a fee up to 1.10%. The Investment Manager is entitled to charge a fee of up to 1.15% per annum of the net asset value attributable to the Class I Shares of each Fund apart from the GlobalAccess Emerging Market Equity Fund. The Investment Manager is entitled to charge a fee of up to 1.25% per annum of the net asset value attributable to the Class I Shares of the GlobalAccess Emerging Market Equity Fund. The Investment Manager is entitled to charge a fee of up to 2.00% per annum of the net asset value attributable to the Class A Shares of each Fund. The Investment Manager is entitled to charge a fee of up to 1.50% per annum of the net asset value attributable to the Class B Shares of each Fund. The Investment Manager is entitled to charge a fee of up to 2.50% per annum of the net asset value attributable to the Class Z Shares and Class Y Shares of each Fund. The current investment management fees in respect of the Class B Shares of each Fund are as follows: Fund Class GlobalAccess UK Opportunities Fund 1.25% GlobalAccess Global Government Bond Fund 0.95% GlobalAccess Asia Pacific (ex-Japan) Fund 1.25% GlobalAccess Emerging Market Equity Fund 1.25% GlobalAccess Global High Yield Bond Fund 1.05% GlobalAccess Global Corporate Bond Fund 0.95% GlobalAccess Emerging Market Debt Fund 1.15% GlobalAccess Global Property Securities Fund 1.25% GlobalAccess Global Short Duration Bond Fund 0.65% GlobalAccess US Small & Mid Cap Equity Fund 1.25% GlobalAccess US Equity Fund 1.25% GlobalAccess Global Equity Income Fund 1.25% GlobalAccess Emerging Market Local Currency Debt Fund 1.15% GlobalAccess Europe (ex-UK) Alpha Fund 1.25% GlobalAccess Japan Fund 1.25% The investment manager fee entitlements for all Shares Classes of all Funds are unchanged since the prior financial year. The investment management fee is accrued on a daily basis and determined on the last Dealing Day of each month based on the average Net Asset Value for the Fund during the relevant month. When the assets under management fail to reach their optimum levels, a portion of the management charge is waived by the Investment Manager. There were no fee waivers of such charges during the financial year.

Barclays Multi-Manager Fund PLC Annual Report and Audited Financial Statements 2021
167
Notes to the financial statements (continued) for the financial year ended 31 May 2021 15. Fees (continued) b) Administration and Depositary fees The Administrator and the Depositary shall be entitled to an aggregate annual fee not to exceed 0.20% of the net asset value of each Fund, billed and payable monthly. The fees of the Administrator are charged based on an accumulation of assets held in Barclays Investment Solutions Limited, acting through its Wealth Management Division. There is a rate agreement between Barclays and Northern Trust International Fund Administration Services (Ireland) Limited where the fees charged are determined by the rate card. The fees are calculated by accumulating all Barclays assets under Administration with Northern Trust International Fund Administration Services (Ireland) Limited and applying the rate card. The Administrator will be entitled to certain out of pocket expenses, transfer agency fees, financial statements preparation charges and registrar fees at normal commercial rates. The Depositary shall also be entitled to recover from the Company transaction charges and out-of-pocket expenses at normal commercial rates. The fees of the Administrator and Depositary shall be accrued daily based on the daily Net Asset Value of each Fund and will be paid monthly in arrears out of the assets of each Fund. c) Directors’ fees The Directors shall be entitled to a fee and remuneration for their services at a rate to be determined from time to time by the Directors provided that no Director may be paid in excess of EUR 40,000 in any one financial year without the approval of the Board. The total of the Directors' fees for the financial year are GBP 84,141 (31 May 2020: GBP 70,781). Please refer to note 17 in relation to Directors who did not earn fees during the financial year. 16. Auditors’ remuneration The remuneration for all work carried out by the statutory audit firm in respect of the financial year is as follows (all amounts are exclusive of VAT):
Financial year Financial yearended ended
31 May 2021 31 May 2020EUR EUR
Statutory audit of financial statements 179,283 190,000Other assurance services - - Tax advisory services 133,900 142,500Other non-audit services - -
313,183 332,500
17. Related party transactions The following parties are considered to be related parties to the Company as at 31 May 2021:
Directors of the company Séan Blake (independent Director) David Kingston (independent Director) Hugh Paul Shovlin (independent Director) Kishor Mandalia Investment Manager Barclays Investment Solutions Limited, acting through its
Wealth Management Division Distributor Barclays Investment Solutions Limited Counterparty to future contracts Barclays Bank plc The margin cash for futures contracts on each Fund held with Barclays Bank PLC is shown in notes 6 and 8. In its capacity as counterparty to future contracts, the margin cash due from/(to) broker are disclosed within notes 6 and 8. Fees paid during the financial year to the Investment Manager totalled GBP 24,332,447 (31 May 2020: GBP 28,916,571) and are shown in note 5. Balances outstanding to the Investment Manager at 31 May 2021 totalled GBP 5,595,742 (31 May 2020: GBP 6,273,602) and are disclosed in note 9. Amounts receivable from the Investment Manager at 31 May 2021 totalled GBP Nil (31 May 2020: GBP Nil).
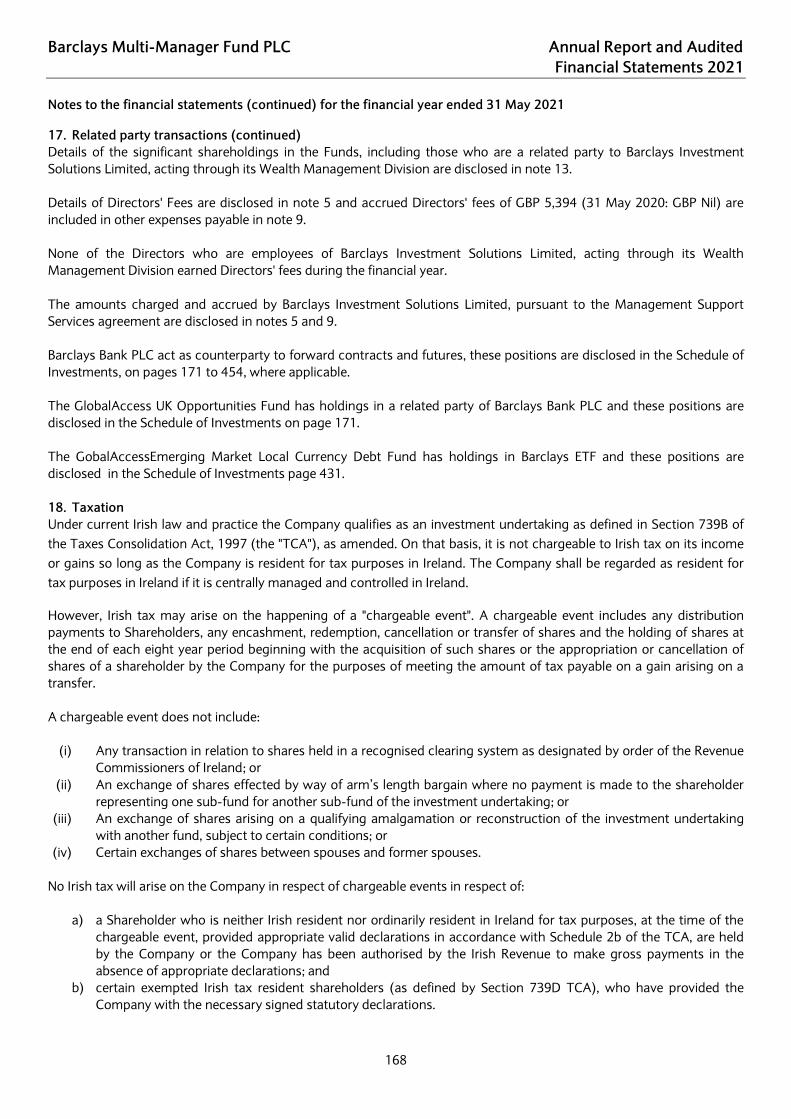
Barclays Multi-Manager Fund PLC Annual Report and Audited Financial Statements 2021
168
Notes to the financial statements (continued) for the financial year ended 31 May 2021 17. Related party transactions (continued) Details of the significant shareholdings in the Funds, including those who are a related party to Barclays Investment Solutions Limited, acting through its Wealth Management Division are disclosed in note 13. Details of Directors' Fees are disclosed in note 5 and accrued Directors' fees of GBP 5,394 (31 May 2020: GBP Nil) are included in other expenses payable in note 9. None of the Directors who are employees of Barclays Investment Solutions Limited, acting through its Wealth Management Division earned Directors' fees during the financial year. The amounts charged and accrued by Barclays Investment Solutions Limited, pursuant to the Management Support Services agreement are disclosed in notes 5 and 9. Barclays Bank PLC act as counterparty to forward contracts and futures, these positions are disclosed in the Schedule of Investments, on pages 171 to 454, where applicable. The GlobalAccess UK Opportunities Fund has holdings in a related party of Barclays Bank PLC and these positions are disclosed in the Schedule of Investments on page 171. The GobalAccessEmerging Market Local Currency Debt Fund has holdings in Barclays ETF and these positions are disclosed in the Schedule of Investments page 431. 18. Taxation Under current Irish law and practice the Company qualifies as an investment undertaking as defined in Section 739B of the Taxes Consolidation Act, 1997 (the "TCA"), as amended. On that basis, it is not chargeable to Irish tax on its income or gains so long as the Company is resident for tax purposes in Ireland. The Company shall be regarded as resident for tax purposes in Ireland if it is centrally managed and controlled in Ireland.
However, Irish tax may arise on the happening of a "chargeable event". A chargeable event includes any distribution payments to Shareholders, any encashment, redemption, cancellation or transfer of shares and the holding of shares at the end of each eight year period beginning with the acquisition of such shares or the appropriation or cancellation of shares of a shareholder by the Company for the purposes of meeting the amount of tax payable on a gain arising on a transfer. A chargeable event does not include:
(i) Any transaction in relation to shares held in a recognised clearing system as designated by order of the Revenue Commissioners of Ireland; or
(ii) An exchange of shares effected by way of arm’s length bargain where no payment is made to the shareholder representing one sub-fund for another sub-fund of the investment undertaking; or
(iii) An exchange of shares arising on a qualifying amalgamation or reconstruction of the investment undertaking with another fund, subject to certain conditions; or
(iv) Certain exchanges of shares between spouses and former spouses. No Irish tax will arise on the Company in respect of chargeable events in respect of:
a) a Shareholder who is neither Irish resident nor ordinarily resident in Ireland for tax purposes, at the time of the chargeable event, provided appropriate valid declarations in accordance with Schedule 2b of the TCA, are held by the Company or the Company has been authorised by the Irish Revenue to make gross payments in the absence of appropriate declarations; and
b) certain exempted Irish tax resident shareholders (as defined by Section 739D TCA), who have provided the Company with the necessary signed statutory declarations.

Barclays Multi-Manager Fund PLC Annual Report and Audited Financial Statements 2021
169
Notes to the financial statements (continued) for the financial year ended 31 May 2021
18. Taxation (continued) Any dividends, interest and capital gains received by the Company from securities issued in countries other than Ireland may be subject to taxes, including withholding tax, imposed by the country from which the investment income/gain arises. The Company may not be able to benefit from the reduced rates of withholding tax by virtue of the double taxation treaties in operation between Ireland and other countries and such taxes may be not recoverable by the Company or its shareholders. 19. Segregated liability The Company is structured as an umbrella fund with segregated liability between its Funds. As a matter of Irish law, the assets of one Fund will not be available to meet the liabilities of another. However, the Company is a single legal entity that may operate or have assets held on its behalf or be subject to claims in other jurisdictions that may not necessarily recognise such segregation. 20. Significant events during the financial year A number of share class launch and terminations occurred within the Funds during the financial year. Please refer to 'Funds at a glance section within 'Background to the Company' on pages 8 to 14 for details. On 2 June 2020, 1 September 2020 and 2 December 2020, the following dividends were declared by each Fund on the new income available for distribution: Fund Currency Amounts paid Amounts paid Amounts paid
2 June 2020 1 September 2020 2 December 2020GlobalAccess UK Opportunities Fund GBP 1,831,942 1,823,789 1,527,010
GlobalAccess Global Government Bond Fund USD 138,794 34,623 70,799
GlobalAccess Asia Pacific (ex-Japan) Fund USD 224,979 417,390 6,018
GlobalAccess Emerging Market Equity Fund USD 2,158,212 2,576,003 293,931
GlobalAccess Global High Yield Bond Fund USD 7,161,444 6,484,285 7,277,668
GlobalAccess Global Corporate Bond Fund USD 2,883,911 2,582,796 2,632,075
GlobalAccess Emerging Market Debt Fund USD 2,530,799 2,567,022 2,563,397
GlobalAccess Global Property Securities Fund USD 1,183,442 1,440,257 1,321,201
GlobalAccess Global Short Duration Bond Fund USD 981,895 822,681 849,133
GlobalAccess US Small & Mid Cap Equity Fund USD - - -
GlobalAccess US Equity Fund USD 265,124 151,781 232,212
GlobalAccess Global Equity Income Fund USD 868,027 720,711 607,801
GlobalAccess Emerging Market Local Currency Debt Fund USD 5,200,034 4,251,920 4,170,692
GlobalAccess Europe (ex-UK) Alpha Fund EUR 564,839 257,075 102,278
GlobalAccess Japan Fund JPY 138,889,338 - 59,363,077 Whilst the economic recovery from COVID-19 continues based on widespread vaccine rollouts, challenges remain, for example with variants or the exact duration of vaccine protection. This may provide bouts of market volatility at times, as all investors are responding to the same information as developments unfold, which may negatively impact the Company’s performance. The Company is comfortable that it has reserves to continue to cope with such spells of market volatility, and can ensure operational and portfolio management robustness given the extraordinary measures that were implemented from the outset of the COVID-19 pandemic.

Barclays Multi-Manager Fund PLC Annual Report and Audited Financial Statements 2021
170
Notes to the financial statements (continued) for the financial year ended 31 May 2021
20. Significant events during the financial year (continued) With effect from midnight on 31 December 2020 the Brexit transition period between the United Kingdom (UK) and the European Union (EU) ended and future trade in goods or services between the UK and the EU will be provided in accordance with the EU-UK Trade and Cooperation Agreement. Since the conclusion of the Brexit transition, the Company continues to maintain rigorous oversight of liquidity. No material concerns have been identified, from ongoing and comprehensive risk assessments, that could be specifically attributed to Brexit. GlobalAccess Global Property Securities Fund was terminated on 23 February 2021. On 4 March 2021, an addendum to the prospectus was issued for the Entity incorporating the required elements of the Sustainable Finance Disclosure Regulation (“SFDR”). Other than noted above, there have been no significant events during the financial year, which, in the opinion of the Directors of the Company, require an amendment to or disclosure in the financial statements for the financial year ended 31 May 2021. 21. Significant events since the financial year end On 2 June 2021, the following dividends were declared by each Fund based on the net income available for distribution as at the year-end date. These financial statements do not reflect this dividend payable. Fund Currency Amounts paidGlobalAccess UK Opportunities Fund GBP 3,384,953 GlobalAccess Global Government Bond Fund USD 151,346 GlobalAccess Asia Pacific (ex-Japan) Fund USD 245,466 GlobalAccess Emerging Market Equity Fund USD 2,546,410 GlobalAccess Global High Yield Bond Fund USD 3,788,374 GlobalAccess Global Corporate Bond Fund USD 2,754,335 GlobalAccess Emerging Market Debt Fund USD 2,687,382 GlobalAccess Global Short Duration Bond Fund USD 606,214 GlobalAccess US Small & Mid Cap Equity Fund USD - GlobalAccess US Equity Fund USD 101,903 GlobalAccess Global Equity Income Fund USD 643,913 GlobalAccess Emerging Market Local Currency Debt Fund USD 4,050,590 GlobalAccess Europe (ex-UK) Alpha Fund EUR 797,492 GlobalAccess Japan Fund JPY 107,356,031 There have been no other significant events since the financial year end through to 20 September 2021, which, in the opinion of the Directors of the Company, require an amendment to or disclosure in the financial statements for the financial year ended 31 May 2021. 22. Approval of the financial statements The Board of Directors of the Company approved the financial statements on 20 September 2021.

Barclays Multi-Manager Fund PLC Annual Report and Audited Financial Statements 2021
GlobalAccess UK Opportunities Fund
Schedule of investments as at 31 May 2021
Transferable securities admitted to an official stock exchange listing or traded on a regulated market. The percentages in brackets show the equivalent sector holdings at 31 May 2020.
Holdings Financial assets at fair value through profit or loss CurrencyFair value
GBP% of net
assets
Equities: 98.27% (31 May 2020: 95.37%)
Cayman Islands: 0.37% (31 May 2020: 0.54%)
Entertainment: 0.37% (31 May 2020: 0.54%)142,990 Manchester United Plc Class A Com USD0.0005 USD 1,571,733 0.37
Total Cayman Islands 1,571,733 0.37
Jersey: 3.71% (31 May 2020: 2.05%)
Advertising: 3.08% (31 May 2020: 2.05%)1,346,789 WPP PLC Com GBP0.10 GBP 13,120,418 3.08
Commercial services: 0.63% (31 May 2020: 0.00%)99,850 Experian PLC Com USD0.10 GBP 2,699,445 0.63
Total Jersey 15,819,863 3.71
Netherlands: 1.11% (31 May 2020: 1.26%)
Beverages: 1.11% (31 May 2020: 1.26%)66,974 Heineken Holding NV Com EUR1.60 EUR 4,750,987 1.11
Total Netherlands 4,750,987 1.11
United Kingdom: 91.45% (31 May 2020: 89.67%)
Aerospace/defense: 2.90% (31 May 2020: 2.43%)1,182,450 BAE Systems PLC Com GBP0.03 GBP 6,227,964 1.46
298,292 Ultra Electronics GBP5.00 GBP 6,147,798 1.44
Agriculture: 3.67% (31 May 2020: 3.20%)272,969 British American Tobacco PLC Com GBP0.25 GBP 7,404,967 1.74513,961 Imperial Brands PLC Com GBP0.10 GBP 8,222,091 1.93
Apparel: 2.46% (31 May 2020: 2.45%)491,500 Burberry Group PLC Com GBP0.0005 GBP 10,500,898 2.46
Auto manufacturers: 0.01% (31 May 2020: 0.00%)2,647 Aston Martin Lagonda Global Holdings PLC GBP0.10 GBP 55,786 0.01
Banks: 2.36% (31 May 2020: 1.94%)3,927,790 Barclays PLC Com GBP0.25^ GBP 7,192,177 1.69
627,677 HSBC Holdings PLC Com USD0.50 GBP 2,858,127 0.67
Beverages: 4.77% (31 May 2020: 5.84%)210,449 A.G. Barr PLC Com GBP0.04 GBP 1,098,544 0.26347,500 Diageo Com GBP28.93518 GBP 11,829,769 2.78130,980 Fevertree Drinks PLC Com GBP0.0025 GBP 3,347,194 0.79
1,292,602 Stock Spirits Group PLC Com GBP0.10 GBP 3,467,405 0.8122,167 Young & Co's Brewery PLC Class A Com GBP0.13 GBP 356,334 0.08
171

Barclays Multi-Manager Fund PLC Annual Report and Audited Financial Statements 2021
GlobalAccess UK Opportunities Fund
Holdings Financial assets at fair value through profit or loss Currency Fair value
GBP % of net
assets
Equities: 98.27% (31 May 2020: 95.37%) (continued)
United Kingdom: 91.45% (31 May 2020: 89.67%) (continued)
Beverages: 4.77% (31 May 2020: 5.84%) (continued)
27,460 Young & Co's Brewery PLC Com GBP0.13 GBP 232,586 0.05
Chemicals: 1.42% (31 May 2020: 1.59%)1,269,923 Elementis PLC GBP5.00 GBP 2,009,653 0.471,294,045 Essentra PLC Com GBP0.25 GBP 4,034,185 0.95
Commercial services: 9.69% (31 May 2020: 10.05%)4,794,747 Hays PLC Com GBP0.01 GBP 8,304,502 1.95
942,793 Hyve Group PLC Com GBP0.1 GBP 1,241,187 0.29546,377 Mears Group PLC Com GBP0.01 GBP 1,013,529 0.24
1,483,969 Pagegroup PLC Com GBP0.01 GBP 8,903,814 2.091,273,038 QinetiQ Group PLC Com GBP0.01 GBP 4,523,104 1.06
540,658 RELX PLC Com GBP0.14 GBP 9,941,349 2.33621,233 Savills PLC Com GBP0.03 GBP 7,380,248 1.73
Cosmetics/personal care: 5.28% (31 May 2020: 4.95%)3,516,219 PZ Cussons PLC Com GBP1.00 GBP 8,983,939 2.11
319,953 Unilever PLC Com GBP0.0311 GBP 13,521,214 3.17
Distribution/wholesale: 3.18% (31 May 2020: 2.25%)136,630 Bunzl PLC Com GBP0.32 GBP 3,123,362 0.73683,331 Headlam Group GBP5.00 GBP 3,238,989 0.76438,060 Travis Perkins PLC GBP0.11 GBP 7,195,135 1.69
Diversified financial services: 12.69% (31 May 2020: 16.24%)
283,744 Close Brothers Group PLC GBP0.25 GBP 4,661,914 1.09516,928 Hargreaves Lansdown PLC Com GBP0.004 GBP 8,564,205 2.01553,195 Jupiter Fund Management PLC Com GBP0.02 GBP 1,538,435 0.36110,074 London Stock Exchange Group PLC Com GBP0.07 GBP 8,335,904 1.95
1,448,654 Man Group PLC Com USD0.03 GBP 2,581,863 0.61457,150 Numis Corp PLC Com GBP0.05 GBP 1,693,741 0.40603,559 Rathbone Brothers GBP5.00 GBP 10,851,991 2.55227,500 Schroders PLC Com GBP1.00 GBP 8,093,312 1.90297,838 Schroders PLC Com-Non Voting GBP1.00 GBP 7,781,018 1.82
Electronics: 2.30% (31 May 2020: 2.52%)419,785 Electrocomponents PLC Com GBP0.10 GBP 4,154,822 0.97115,794 Spectris PLC Com GBP0.05 GBP 3,718,146 0.87757,052 TT Electronics GBP25.00 GBP 1,947,516 0.46
Engineering & construction: 0.38% (31 May 2020: 0.10%)
352,710 Ricardo PLC GBP0.25 GBP 1,622,466 0.38
Schedule of investments as at 31 May 2021 (continued)
Transferable securities admitted to an official stock exchange listing or traded on a regulated market. The percentages in brackets show the equivalent sector holdings at 31 May 2020.
172

Barclays Multi-Manager Fund PLC Annual Report and Audited Financial Statements 2021
GlobalAccess UK Opportunities Fund
Holdings Financial assets at fair value through profit or loss Currency Fair value
GBP % of net
assets
Equities: 98.27% (31 May 2020: 95.37%) (continued)
United Kingdom: 91.45% (31 May 2020: 89.67%) (continued)
Food: 4.38% (31 May 2020: 3.54%)
3,760,707 Tesco PLC GBP0.06 GBP 8,397,659 1.975,818,565 Wm Morrison Supermarkets PLC Com GBP0.10 GBP 10,288,677 2.41
Gas: 0.60% (31 May 2020: 0.17%)4,648,159 Centrica PLC Com GBP0.06 GBP 2,541,149 0.60
Healthcare-products: 1.61% (31 May 2020: 0.76%)2,898,008 ConvaTec Group PLC Com GBP0.10 GBP 6,884,218 1.61
Holding companies-diversified: 1.48% (31 May 2020: 0.46%)
9,267,639 Mitie Group PLC Com GBP0.03 GBP 6,301,995 1.48
Home builders: 0.74% (31 May 2020: 0.70%)685,341 Crest Nicholson Holdings plc Com GBP0.03428571 GBP 3,138,176 0.74
Household products/wares: 1.17% (31 May 2020: 0.91%)
78,420 Reckitt Benckiser Group PLC Com GBP0.10 GBP 4,993,394 1.17
Insurance: 2.37% (31 May 2020: 1.37%)1,862,787 Aviva PLC Com GBP0.25 GBP 7,660,711 1.80
820,922 Direct Line Insurance Group PLC Com GBP0.11 GBP 2,441,012 0.57
Internet: 0.96% (31 May 2020: 0.59%)1,522,400 Moneysupermarket.com Group PLC Com GBP0.0002 GBP 4,110,480 0.96
Investment companies: 0.89% (31 May 2020: 0.59%)2,189,380 Melrose Industries PLC Com GBP0.07 GBP 3,781,607 0.89
Media: 8.19% (31 May 2020: 6.87%)1,644,258 Daily Mail & General Trust PLC Com GBP0.13 GBP 14,757,215 3.46
931,376 Euromoney Institutional Investor PLC Com GBP0.0025 GBP 9,900,527 2.323,261,628 ITV PLC Com GBP0.10 GBP 4,188,746 0.98
741,132 Pearson PLC Com GBP0.25 GBP 6,065,424 1.43
Mining: 2.61% (31 May 2020: 3.71%)251,840 Anglo American PLC Com USD0.54945 GBP 7,896,443 1.85
53,600 Rio Tinto PLC Com GBP0.10 GBP 3,251,108 0.76
Miscellaneous manufacturing: 4.20% (31 May 2020: 3.01%)
539,195 IMI PLC Com GBP0.29 GBP 8,947,941 2.102,578,221 Senior PLC GBP10.00 GBP 4,101,949 0.96
216,953 Smiths Group PLC Com GBP0.38 GBP 3,362,229 0.79110,835 Vitec Group GBP20.00 GBP 1,493,502 0.35
Schedule of investments as at 31 May 2021 (continued)
Transferable securities admitted to an official stock exchange listing or traded on a regulated market. The percentages in brackets show the equivalent sector holdings at 31 May 2020.
173

Barclays Multi-Manager Fund PLC Annual Report and Audited Financial Statements 2021
GlobalAccess UK Opportunities Fund
Holdings Financial assets at fair value through profit or loss Currency Fair value
GBP % of net
assets
Equities: 98.27% (31 May 2020: 95.37%) (continued)
United Kingdom: 91.45% (31 May 2020: 89.67%) (continued)
Oil & gas: 2.15% (31 May 2020: 2.23%)
2,004,652 BP PLC Com USD0.25 GBP 6,137,743 1.44234,386 Royal Dutch Shell PLC Class B Com EUR0.07 GBP 3,008,345 0.71
Oil & gas services: 0.00% (31 May 2020: 0.46%)
Pharmaceuticals: 1.13% (31 May 2020: 1.80%)357,946 GlaxoSmithKline PLC Com GBP0.25 GBP 4,811,868 1.13
Private equity: 1.69% (31 May 2020: 1.38%)581,078 3i Group PLC Com GBP0.74 GBP 7,221,347 1.69
Real estate: 1.59% (31 May 2020: 1.00%)1,232,238 St Modwen Properties PLC GBP10.00 GBP 6,771,148 1.59
Real estate investment trusts: 0.00% (31 May 2020: 0.17%)
Retail: 0.18% (31 May 2020: 0.49%)297,846 Wickes Group PLC GBP0.10 GBP 763,230 0.18
Software: 2.66% (31 May 2020: 3.82%)289,866 EMIS Group PLC Com GBP0.01 GBP 3,440,709 0.81
1,205,000 Sage Group PLC Com GBP0.01 GBP 7,910,825 1.85
Telecommunications: 1.36% (31 May 2020: 1.39%)4,532,772 Vodafone Group PLC Com USD0.21 GBP 5,816,000 1.36
Transportation: 0.38% (31 May 2020: 0.69%)52,075 Clarkson GBP25.00 GBP 1,602,608 0.38
Total United Kingdom 389,889,168 91.45
United States: 1.63% (31 May 2020: 1.85%)
Food: 1.63% (31 May 2020: 1.85%)155,267 Mondelez International Inc Class A Com NPV USD 6,940,320 1.63
Total United States 6,940,320 1.63
Total equities 418,972,071 98.27
Schedule of investments as at 31 May 2021 (continued)
Transferable securities admitted to an official stock exchange listing or traded on a regulated market. The percentages in brackets show the equivalent sector holdings at 31 May 2020.
174

Barclays Multi-Manager Fund PLC Annual Report and Audited Financial Statements 2021
GlobalAccess UK Opportunities Fund
No. of contracts Futures contracts: 0.03% (31 May 2020: 0.41%) CounterpartyUnrealised
gain% of net
assetsGBP
35 FTSE 100 Index Future June 2021 Goldman Sachs 105,525 0.03
Total futures contracts 105,525 0.03
Forward currency contracts: 0.00% (31 May 2020: 0.02%)
Counterparty Cncy Buys Cncy SellsMaturity
dateUnrealised
gain% of net
assetsGBP
UBS GBP 2,759 EUR 3,188 17/06/2021 16 – CCT_1769400_177102
UBS GBP 962 EUR 1,110 17/06/2021 7 – CCT_1769400_177037
UBS GBP 879 EUR 1,018 17/06/2021 4 – CCT_1769400_176789
UBS GBP 5,309 EUR 6,166 17/06/2021 4 – CCT_1769400_176907
UBS GBP 354 EUR 411 17/06/2021 – – CCT_1769400_176387
Total fair value gains on forward currency contracts 31 –
Counterparty Cncy Buys Cncy SellsMaturity
dateUnrealised
loss% of net
assetsGBP
UBS EUR 811 GBP 698 17/06/2021 (1) – CCT_1769400_176556
UBS EUR 32,483 GBP 28,039 17/06/2021 (94) – CCT_1769400_176846
UBS EUR 152,286 GBP 131,159 17/06/2021 (145) – CCT_1769400_176554
UBS USD 102,511 GBP 73,074 17/06/2021 (960) – CCT_1769400_176552
UBS EUR 1,120,276 GBP 964,859 17/06/2021 (1,071) – CCT_1769400_176557
UBS EUR 1,346,033 GBP 1,159,297 17/06/2021 (1,286) – CCT_1769400_176555
UBS USD 632,177 GBP 450,639 17/06/2021 (5,922) – CCT_1769400_176559
Total fair value losses on forward currency contracts (9,479) –
Total forward currency contracts (9,448) –
Fair value GBP
% of net assets
Total value of investments 419,068,148 98.30
Cash and cash equivalents* 7,190,609 1.69
Other net assets** 69,989 0.01
Net assets attributable to holders of redeemable participating shares 426,328,746 100.00
Schedule of investments as at 31 May 2021 (continued)
Transferable securities admitted to an official stock exchange listing or traded on a regulated market. The percentages in brackets show the equivalent sector holdings at 31 May 2020.
175

Barclays Multi-Manager Fund PLC Annual Report and Audited Financial Statements 2021
GlobalAccess UK Opportunities Fund
Analysis of total assets (unaudited)% of total
assets
Transferable securities and money market instruments admitted to official stock exchangelisting or traded on a regulated market. 97.43Financial derivative instruments dealt in on a regulated market. 0.02Other assets. 2.55
100.00
*All cash holdings are held with The Northern Trust Company.**Including GBP 994,071 held with Goldman Sachs as security by the counterparty to derivatives contracts.^ Related party.
The Industry Classification Benchmark (“ICB”) is jointly owned by FTSE and Dow Jones and has been licensed for use. FTSE and Dow Jones do not accept liability to any person for any loss or damage arising out of any error or omission in ICB.
Schedule of investments as at 31 May 2021 (continued)
Transferable securities admitted to an official stock exchange listing or traded on a regulated market. The percentages in brackets show the equivalent sector holdings at 31 May 2020.
176

Barclays Multi-Manager Fund PLC Annual Report and Audited Financial Statements 2021
GlobalAccess Global Government Bond Fund
Schedule of investments as at 31 May 2021
Transferable securities admitted to an official stock exchange listing or traded on a regulated market. The percentages in brackets show the equivalent sector holdings at 31 May 2020.
Holdings Financial assets at fair value through profit or loss CurrencyFair value
USD% of net
assets
Bonds: 108.00% (31 May 2020: 109.12%)
Australia: 2.74% (31 May 2020: 1.46%)
Corporate bonds: 0.00% (31 May 2020: 0.07%)
Government bonds: 2.74% (31 May 2020: 1.39%)2,000,000 Australia Government Bond Series 164 0.5% 21/09/2026 AUD 1,522,603 1.23
200,000 Australia Government Bond Series 160 1% 21/12/2030 AUD 146,552 0.12500,000 Australia Government Bond Series 162 1.75% 21/06/2051 AUD 315,828 0.25100,000 Australia Government Bond Series 150 3% 21/03/2047 AUD 83,646 0.07
1,300,000 Australia Government Bond Series 128 5.75% 15/07/2022 AUD 1,071,240 0.86200,000 Northern Territory Treasury Corp 2.5% 21/05/2032 AUD 157,884 0.13100,000 Treasury Corp of Victoria 4.25% 20/12/2032 AUD 95,479 0.08
Total Australia 3,393,232 2.74
Belgium: 0.83% (31 May 2020: 1.42%)
Government bonds: 0.83% (31 May 2020: 1.03%)300,000 Belgium Government Bond Series 78 1.6% 22/06/2047 EUR 429,198 0.35300,000 Communaute Francaise de Belgique Series EMTN 0%
22/06/2029EUR 362,187 0.29
200,000 Ministeries Van de Vlaamse Gemeenschap Series EMTN 0.875% 21/03/2046
EUR 238,559 0.19
Government sponsored agencies: 0.00% (31 May 2020: 0.39%)
Total Belgium 1,029,944 0.83
Canada: 5.33% (31 May 2020: 2.09%)
Corporate bonds: 0.35% (31 May 2020: 0.38%)300,000 Royal Bank of Canada Series GMTn FRN 30/01/2025 GBP 430,178 0.35
Government bonds: 3.64% (31 May 2020: 1.24%)1,100,000 Canadian Government Bond 1.25% 01/06/2030 CAD 896,658 0.72
400,000 Province of Alberta Canada Series EMTN 0.625% 16/01/2026
EUR 506,782 0.41
700,000 Province of Alberta Canada 2.55% 01/06/2027 CAD 614,631 0.50600,000 Province of Alberta Canada Series MTN 3.6% 11/04/2028 AUD 518,408 0.42400,000 Province of Ontario Canada Series EMTN 0.01%
25/11/2030EUR 477,998 0.39
400,000 Province of Ontario Canada 2.4% 02/06/2026 CAD 349,610 0.28400,000 Province of Ontario Canada 2.7% 02/06/2029 CAD 351,910 0.28400,000 Province of Ontario Canada 2.9% 02/06/2028 CAD 357,974 0.29
177

Barclays Multi-Manager Fund PLC Annual Report and Audited Financial Statements 2021
GlobalAccess Global Government Bond Fund
Holdings Financial assets at fair value through profit or loss Currency Fair value
USD % of net
assets
Bonds: 108.00% (31 May 2020: 109.12%) (continued) Canada: 5.33% (31 May 2020: 2.09%) (continued)
Government bonds: 3.64% (31 May 2020: 1.24%) 500,000 Province of Quebec Canada 2.5% 01/09/2026 CAD 440,218 0.35
Government sponsored agencies: 1.34% (31 May 2020: 0.47%)
400,000 Ontario Teachers' Finance Trust Series GMTN 0.05% 25/11/2030
EUR 477,929 0.39
400,000 Ontario Teachers' Finance Trust Series EMTN 0.1% 19/05/2028
EUR 489,769 0.39
100,000 Ontario Teachers' Finance Trust Series EMTN 0.9% 20/05/2041
EUR 122,188 0.10
600,000 Ontario Teachers' Finance Trust Series REGS 1.25% 27/09/2030
USD 565,159 0.46
Total Canada 6,599,412 5.33
Cayman Islands: 0.25% (31 May 2020: 0.34%)
Corporate bonds: 0.25% (31 May 2020: 0.34%)300,000 Tencent Holdings Ltd Series REGS 1.81% 26/01/2026 USD 305,870 0.25
Total Cayman Islands 305,870 0.25
Czech Republic: 0.00% (31 May 2020: 0.51%)
Government bonds: 0.00% (31 May 2020: 0.51%)
Denmark: 1.37% (31 May 2020: 2.09%)
Corporate bonds: 1.37% (31 May 2020: 2.09%)6,774,151 Jyske Realkredit A/S Series CCE. 1% 01/10/2050 DKK 1,107,818 0.89
1 Jyske Realkredit A/S Series 111E 1.5% 01/10/2050 DKK – –1 Jyske Realkredit A/S Series 111E 2% 01/10/2047 DKK – –
3,750,087 Nordea Kredit Realkreditaktieselskab Series CC2 1% 01/10/2050
DKK 591,062 0.48
1 Nordea Kredit Realkreditaktieselskab Series cc2 2% 01/10/2047
DKK – –
1 Nordea Kredit Realkreditaktieselskab Series cc2 2% 01/10/2050
DKK – –
1 Nordea Kredit Realkreditaktieselskab Series cC2 2.5% 01/10/2047
DKK – –
2 Nykredit Realkredit A/S Series 01/E 1.5% 01/10/2050 DKK 1 –1 Nykredit Realkredit A/S Series 01E 2% 01/10/2047 DKK – –1 Nykredit Realkredit A/S Series 01E 2.5% 01/10/2047 DKK – –
Schedule of investments as at 31 May 2021 (continued)
Transferable securities admitted to an official stock exchange listing or traded on a regulated market. The percentages in brackets show the equivalent sector holdings at 31 May 2020.
178

Barclays Multi-Manager Fund PLC Annual Report and Audited Financial Statements 2021
GlobalAccess Global Government Bond Fund
Holdings Financial assets at fair value through profit or loss Currency Fair value
USD % of net
assets
Bonds: 108.00% (31 May 2020: 109.12%) (continued) Denmark: 1.37% (31 May 2020: 2.09%) (continued)
Corporate bonds: 1.37% (31 May 2020: 2.09%) 1 Realkredit Danmark A/S Series 27S 2% 01/10/2050 DKK – –
Government sponsored agencies: 0.00% (31 May 2020: 0.00%)
1 Nordea Kredit Realkreditaktieselskab Series cC2 3% 01/10/2047
DKK – –
1 Realkredit Danmark A/S Series 23S 2% 01/10/2047 DKK – –1 Realkredit Danmark A/S Series 23S 2.5% 01/10/2047 DKK – –
Total Denmark 1,698,881 1.37
Finland: 0.00% (31 May 2020: 1.08%)
Government bonds: 0.00% (31 May 2020: 1.08%)
France: 6.38% (31 May 2020: 7.32%)
Corporate bonds: 0.20% (31 May 2020: 0.33%)200,000 Credit Agricole SA Perpetual FRN Perpetual EUR 245,731 0.20
Government bonds: 4.88% (31 May 2020: 6.33%)300,000 Agence France Locale Series EMTN 0% 20/03/2031 EUR 356,158 0.29
1,000,000 France Treasury Bill BTF 0% 07/07/2021 EUR 1,223,411 0.99500,000 French Republic Government Bond OAT 0% 25/11/2030 EUR 606,784 0.49700,000 French Republic Government Bond OAT 0.75%
25/05/2052EUR 807,881 0.65
950,000 French Republic Government Bond OAT 1.5% 25/05/2050 EUR 1,336,909 1.081,100,000 French Republic Government Bond OAT 2% 25/05/2048 EUR 1,715,672 1.38
Government sponsored agencies: 1.30% (31 May 2020: 0.66%)
100,000 Agence Francaise de Developpement Series EMTN 0.375% 25/05/2036
EUR 118,000 0.10
100,000 Dexia Credit Local SA Series EMTN 0% 21/01/2028 EUR 122,587 0.10200,000 IDF Mobilites Series EMTN 0.4% 28/05/2031 EUR 245,502 0.20300,000 SFIL SA Series EMTN 0.05% 04/06/2029 EUR 365,196 0.29400,000 SFIL SA Series EMTN 0.625% 09/02/2026 USD 394,732 0.32300,000 SNCF Mobilities 1% 25/05/2040 EUR 360,963 0.29
Total France 7,899,526 6.38
Germany: 4.07% (31 May 2020: 5.02%)
Corporate bonds: 2.35% (31 May 2020: 0.93%)400,000 Aareal Bank AG Series EMTN 0.625% 14/02/2025 USD 398,014 0.32200,000 Aareal Bank AG FRN 29/04/2025 GBP 291,926 0.24
Schedule of investments as at 31 May 2021 (continued)
Transferable securities admitted to an official stock exchange listing or traded on a regulated market. The percentages in brackets show the equivalent sector holdings at 31 May 2020.
179

Barclays Multi-Manager Fund PLC Annual Report and Audited Financial Statements 2021
GlobalAccess Global Government Bond Fund
Holdings Financial assets at fair value through profit or loss Currency Fair value
USD % of net
assets
Bonds: 108.00% (31 May 2020: 109.12%) (continued) Germany: 4.07% (31 May 2020: 5.02%) (continued)
Corporate bonds: 2.35% (31 May 2020: 0.93%) 100,000 Deutsche Bank AG Series EMTN FRN 03/09/2026 EUR 126,272 0.10200,000 Deutsche Bank AG FRN 17/02/2032 EUR 244,114 0.20900,000 Deutsche Bank AG Series EMTN 1.625% 20/01/2027 EUR 1,149,574 0.93100,000 Deutsche Bank AG Series EMTN FRN 19/11/2030 EUR 127,330 0.10150,000 Deutsche Bank AG/New York NY FRN 28/05/2032 USD 149,580 0.12200,000 Deutsche Bank AG/New York NY 3.7% 30/05/2024 USD 215,376 0.17200,000 Deutsche Bank AG/New York NY FRN 3.95% 27/02/2023 USD 210,919 0.17
Government bonds: 1.52% (31 May 2020: 4.09%)900,000 Bundesobligation Series 183 0% 10/04/2026 EUR 1,131,080 0.92600,000 Bundesrepublik Deutschland Bundesanleihe 0%
15/02/2031EUR 746,686 0.60
Government sponsored agencies: 0.20% (31 May 2020: 0.00%)
200,000 Kreditanstalt fuer Wiederaufbau Series EMTN 0% 31/03/2027
EUR 248,643 0.20
Total Germany 5,039,514 4.07
Hong Kong: 0.15% (31 May 2020: 0.16%)
Corporate bonds: 0.00% (31 May 2020: 0.16%)
Government bonds: 0.15% (31 May 2020: 0.00%)200,000 Hong Kong Government International Bond Series REGS
2.375% 02/02/2051USD 187,366 0.15
Total Hong Kong 187,366 0.15
Hungary: 0.25% (31 May 2020: 0.20%)
Government bonds: 0.25% (31 May 2020: 0.20%)85,000,000 Hungary Government International Bond Series 24/C
2.5% 24/10/2024HUF 306,910 0.25
Total Hungary 306,910 0.25
Ireland: 0.00% (31 May 2020: 2.94%)
Government bonds: 0.00% (31 May 2020: 2.94%)
Israel: 3.22% (31 May 2020: 1.67%)
Government bonds: 3.22% (31 May 2020: 1.67%)2,000,000 Bank of Israel Bill - Makam Series 312 0% 02/03/2022 ILS 618,624 0.50
Schedule of investments as at 31 May 2021 (continued)
Transferable securities admitted to an official stock exchange listing or traded on a regulated market. The percentages in brackets show the equivalent sector holdings at 31 May 2020.
180

Barclays Multi-Manager Fund PLC Annual Report and Audited Financial Statements 2021
GlobalAccess Global Government Bond Fund
Holdings Financial assets at fair value through profit or loss Currency Fair value
USD % of net
assets
Bonds: 108.00% (31 May 2020: 109.12%) (continued) Israel: 3.22% (31 May 2020: 1.67%) (continued)
Government bonds: 3.22% (31 May 2020: 1.67%) 1,100,000 Bank of Israel Bill - Makam Series 412 0% 06/04/2022 ILS 340,277 0.281,400,000 Israel Government Bond - Fixed Series 327 2% 31/03/2027 ILS 463,830 0.374,400,000 Israel Government Bond - Fixed Series 122 5.5%
31/01/2022ILS 1,428,832 1.15
1,000,000 Israel Government Bond - Fixed Series 1121 FRN 30/11/2021
ILS 307,850 0.25
300,000 Israel Government International Bond Series EMTN 0% 22/07/2022
EUR 367,775 0.30
200,000 Israel Government International Bond 3.8% 13/05/2060 USD 220,214 0.18200,000 Israel Government International Bond 4.125% 17/01/2048 USD 236,254 0.19
Total Israel 3,983,656 3.22
Italy: 2.13% (31 May 2020: 6.06%)
Corporate bonds: 0.31% (31 May 2020: 0.42%)300,000 Banca Monte dei Paschi di Siena SpA 0.875% 17/05/2026 EUR 382,172 0.31
Government bonds: 1.62% (31 May 2020: 5.64%)1,200,000 Italy Buoni Poliennali Del Tesoro 0% 01/04/2026 EUR 1,456,400 1.18
300,000 Republic of Italy Government International Bond Series EMTN 6% 04/08/2028
GBP 550,264 0.44
Government sponsored agencies: 0.20% (31 May 2020: 0.00%)
200,000 AMCO - Asset Management Co SpA Series EMTN 0.75% 20/04/2028
EUR 242,462 0.20
Total Italy 2,631,298 2.13
Japan: 24.55% (31 May 2020: 14.46%)
Corporate bonds: 2.10% (31 May 2020: 1.63%)1,300,000 Central Nippon Expressway Co Ltd 2.849% 03/03/2022 USD 1,322,776 1.07
200,000 Nissan Motor Co Ltd Series 144A 3.043% 15/09/2023 USD 209,345 0.17300,000 Nissan Motor Co Ltd Series 144A 4.81% 17/09/2030 USD 332,142 0.27300,000 Sumitomo Mitsui Banking Corp Series EMTN 0.01%
10/09/2025EUR 369,204 0.30
300,000 Sumitomo Mitsui Trust Bank Ltd Series EMTN 0.01% 15/10/2027
EUR 364,871 0.29
Government bonds: 21.23% (31 May 2020: 12.40%)110,000,000 Japan Government Ten Year Bond Series 354 0.1%
20/03/2029JPY 1,015,035 0.82
500,000,000 Japan Government Thirty Year Bond Series 62 0.5% 20/03/2049
JPY 4,414,916 3.57
Schedule of investments as at 31 May 2021 (continued)
Transferable securities admitted to an official stock exchange listing or traded on a regulated market. The percentages in brackets show the equivalent sector holdings at 31 May 2020.
181

Barclays Multi-Manager Fund PLC Annual Report and Audited Financial Statements 2021
GlobalAccess Global Government Bond Fund
Holdings Financial assets at fair value through profit or loss Currency Fair value
USD % of net
assets
Bonds: 108.00% (31 May 2020: 109.12%) (continued) Japan: 24.55% (31 May 2020: 14.46%) (continued)
Government bonds: 21.23% (31 May 2020: 12.40%) 400,000,000 Japan Government Twenty Year Bond Series 153 1.3%
20/06/2035JPY 4,190,550 3.38
100,000,000 Japan Treasury Discount Bill Series 976 0% 07/06/2021 JPY 914,133 0.74250,000,000 Japan Treasury Discount Bill Series 977 0% 14/06/2021 JPY 2,285,379 1.85670,000,000 Japan Treasury Discount Bill Series 984 0% 12/07/2021 JPY 6,125,324 4.95120,000,000 Japan Treasury Discount Bill Series 987 0% 26/07/2021 JPY 1,097,119 0.89520,000,000 Japan Treasury Discount Bill Series 990 0% 02/08/2021 JPY 4,754,281 3.84
30,000,000 Japan Treasury Discount Bill Series 992 0% 10/08/2021 JPY 274,292 0.2240,000,000 Japan Treasury Discount Bill Series 993 0% 16/08/2021 JPY 365,730 0.29
800,000 Tokyo Metropolitan Government Series 144A 2.625% 29/05/2024
USD 847,331 0.68
Government sponsored agencies: 1.22% (31 May 2020: 0.43%)
300,000 Central Nippon Expressway Co Ltd 1.352% 28/04/2026 USD 301,854 0.24400,000 Development Bank of Japan Inc Series GMTN 0.01%
15/10/2024EUR 493,657 0.40
200,000 Development Bank of Japan Inc 1.875% 02/10/2024 USD 208,451 0.17500,000 Japan Bank for International Cooperation 1.875%
15/04/2031USD 502,023 0.41
Total Japan 30,388,413 24.55
Jersey: 0.23% (31 May 2020: 0.24%)
Corporate bonds: 0.23% (31 May 2020: 0.24%)200,000 AA Bond Co Ltd Series EMTN 2.75% 31/07/2023 GBP 288,828 0.23
Total Jersey 288,828 0.23
Latvia: 0.89% (31 May 2020: 0.17%)
Government bonds: 0.89% (31 May 2020: 0.17%)1,100,000 Latvia Government International Bond Series REGS 5.25%
16/06/2021USD 1,103,875 0.89
Total Latvia 1,103,875 0.89
Lithuania: 2.54% (31 May 2020: 3.04%)
Government bonds: 2.54% (31 May 2020: 3.04%)200,000 Lithuania Government Bond Series 4Y 0% 02/06/2024 EUR 247,418 0.20800,000 Lithuania Government Bond Series 5Y 0.4% 16/08/2023 EUR 995,460 0.80900,000 Lithuania Government Bond Series 5Y 0.4% 17/04/2024 EUR 1,123,860 0.91
Schedule of investments as at 31 May 2021 (continued)
Transferable securities admitted to an official stock exchange listing or traded on a regulated market. The percentages in brackets show the equivalent sector holdings at 31 May 2020.
182

Barclays Multi-Manager Fund PLC Annual Report and Audited Financial Statements 2021
GlobalAccess Global Government Bond Fund
Holdings Financial assets at fair value through profit or loss Currency Fair value
USD % of net
assets
Bonds: 108.00% (31 May 2020: 109.12%) (continued) Lithuania: 2.54% (31 May 2020: 3.04%) (continued)
Government bonds: 2.54% (31 May 2020: 3.04%) 600,000 Lithuania Government International Bond Series EMTN
0.75% 06/05/2030EUR 776,006 0.63
Total Lithuania 3,142,744 2.54
Luxembourg: 0.00% (31 May 2020: 0.19%)
Corporate bonds: 0.00% (31 May 2020: 0.19%)
Malaysia: 0.44% (31 May 2020: 0.67%)
Government bonds: 0.28% (31 May 2020: 0.67%)1,400,000 Malaysia Government Bond Series 307 3.502%
31/05/2027MYR 350,416 0.28
Government sponsored agencies: 0.16% (31 May 2020: 0.00%)
200,000 Petronas Capital Ltd Series REGS 3.404% 28/04/2061 USD 197,986 0.16
Total Malaysia 548,402 0.44
Mexico: 0.66% (31 May 2020: 0.62%)
Government bonds: 0.66% (31 May 2020: 0.62%)14,350,000 Mexican Bonos Series M 20 10% 05/12/2024 MXN 816,688 0.66
Total Mexico 816,688 0.66
Multinational: 1.41% (31 May 2020: 0.00%)
Government sponsored agencies: 1.41% (31 May 2020: 0.00%)
6,500,000 Asian Development Bank Series GMTN 4.7% 12/03/2024 MXN 327,061 0.26800,000 EUROFIMA Series MTN 3.35% 21/05/2029 AUD 686,294 0.56300,000 European Union Series EMTN 0% 04/07/2029 EUR 370,161 0.30300,000 International Development Association 0.35%
22/04/2036EUR 363,224 0.29
Total Multinational 1,746,740 1.41
Netherlands: 0.61% (31 May 2020: 0.25%)
Corporate bonds: 0.61% (31 May 2020: 0.25%)200,000 ABN AMRO Bank NV FRN Perpetual EUR 262,714 0.21200,000 Cooperatieve Rabobank UA FRN Perpetual EUR 245,887 0.20
Schedule of investments as at 31 May 2021 (continued)
Transferable securities admitted to an official stock exchange listing or traded on a regulated market. The percentages in brackets show the equivalent sector holdings at 31 May 2020.
183

Barclays Multi-Manager Fund PLC Annual Report and Audited Financial Statements 2021
GlobalAccess Global Government Bond Fund
Holdings Financial assets at fair value through profit or loss Currency Fair value
USD % of net
assets
Bonds: 108.00% (31 May 2020: 109.12%) (continued) Netherlands: 0.61% (31 May 2020: 0.25%) (continued)
Corporate bonds: 0.61% (31 May 2020: 0.25%) 200,000 Cooperatieve Rabobank UA Series REGS FRN Perpetual EUR 246,205 0.20
Total Netherlands 754,806 0.61
New Zealand: 0.12% (31 May 2020: 0.00%)
Government bonds: 0.12% (31 May 2020: 0.00%)200,000 New Zealand Government Bond 1.5% 15/05/2031 NZD 141,660 0.12
Total New Zealand 141,660 0.12
Norway: 0.23% (31 May 2020: 0.22%)
Corporate bonds: 0.17% (31 May 2020: 0.00%)200,000 DNB Bank ASA FRN Perpetual USD 208,394 0.17
Government bonds: 0.06% (31 May 2020: 0.22%)600,000 Norway Government Bond Series 483 1.25% 17/09/2031 NOK 70,316 0.06
Total Norway 278,710 0.23
People's Republic of China: 9.73% (31 May 2020: 4.46%)
Corporate bonds: 0.16% (31 May 2020: 0.00%)200,000 CNPC Global Capital Ltd 1.35% 23/06/2025 USD 199,262 0.16
Government bonds: 9.57% (31 May 2020: 4.46%)6,000,000 China Government Bond Series 1623 2.7% 03/11/2026 CNH 930,237 0.754,500,000 China Government Bond Series 1617 2.74% 04/08/2026 CNH 699,443 0.576,100,000 China Government Bond Series INBK 2.85% 04/06/2027 CNH 948,964 0.76
50,200,000 China Government Bond Series INBK 3.02% 22/10/2025 CNH 7,913,121 6.393,100,000 China Government Bond Series INBK 3.28% 03/12/2027 CNH 493,983 0.405,200,000 China Government Bond Series 1725 3.82% 02/11/2027 CNH 859,576 0.70
Total People's Republic of China 12,044,586 9.73
Peru: 1.58% (31 May 2020: 0.00%)
Government bonds: 1.58% (31 May 2020: 0.00%)800,000 Peruvian Government International Bond Series REGs
5.94% 12/02/2029PEN 235,000 0.19
5,200,000 Peruvian Government International Bond Series REGs 8.2% 12/08/2026
PEN 1,718,172 1.39
Total Peru 1,953,172 1.58
Schedule of investments as at 31 May 2021 (continued)
Transferable securities admitted to an official stock exchange listing or traded on a regulated market. The percentages in brackets show the equivalent sector holdings at 31 May 2020.
184

Barclays Multi-Manager Fund PLC Annual Report and Audited Financial Statements 2021
GlobalAccess Global Government Bond Fund
Holdings Financial assets at fair value through profit or loss Currency Fair value
USD % of net
assets
Bonds: 108.00% (31 May 2020: 109.12%) (continued)
Poland: 0.31% (31 May 2020: 0.64%)
Corporate bonds: 0.31% (31 May 2020: 0.24%)300,000 PKO Bank Hipoteczny SA 0.75% 24/01/2024 EUR 376,852 0.31
Government bonds: 0.00% (31 May 2020: 0.40%)
Total Poland 376,852 0.31
Republic of South Korea: 2.22% (31 May 2020: 1.69%)
Corporate bonds: 0.20% (31 May 2020: 0.00%)200,000 Hana Bank 0.01% 26/01/2026 EUR 246,245 0.20
Government bonds: 1.78% (31 May 2020: 1.69%)2,100,000,000 Korea Treasury Bond Series 3112 4% 10/12/2031 KRW 2,205,851 1.78
Government sponsored agencies: 0.24% (31 May 2020: 0.00%)
300,000 Korea Expressway Corp Series REGS 1.125% 17/05/2026 USD 299,307 0.24
Total Republic of South Korea 2,751,403 2.22
Romania: 0.20% (31 May 2020: 0.00%)
Government bonds: 0.20% (31 May 2020: 0.00%)100,000 Romanian Government International Bond Series REGS
1.375% 02/12/2029EUR 121,443 0.10
100,000 Romanian Government International Bond Series REGS 2% 14/04/2033
EUR 121,015 0.10
Total Romania 242,458 0.20
Russian Federation: 0.08% (31 May 2020: 0.51%)
Government bonds: 0.08% (31 May 2020: 0.51%)7,300,000 Russian Federal Bond - OFZ Series 6225 7.25%
10/05/2034RUB 100,677 0.08
Total Russian Federation 100,677 0.08
Saudi Arabia: 2.54% (31 May 2020: 2.13%)
Government bonds: 2.54% (31 May 2020: 2.13%)800,000 KSA Sukuk Ltd Series REGS 4.303% 19/01/2029 USD 920,010 0.74
1,000,000 Saudi Government International Bond Series REGS 2.375% 26/10/2021
USD 1,008,808 0.82
Schedule of investments as at 31 May 2021 (continued)
Transferable securities admitted to an official stock exchange listing or traded on a regulated market. The percentages in brackets show the equivalent sector holdings at 31 May 2020.
185

Barclays Multi-Manager Fund PLC Annual Report and Audited Financial Statements 2021
GlobalAccess Global Government Bond Fund
Holdings Financial assets at fair value through profit or loss Currency Fair value
USD % of net
assets
Bonds: 108.00% (31 May 2020: 109.12%) (continued) Saudi Arabia: 2.54% (31 May 2020: 2.13%) (continued)
Government bonds: 2.54% (31 May 2020: 2.13%) 1,100,000 Saudi Government International Bond Series REGS 3.625%
04/03/2028 - IrelandUSD 1,215,514 0.98
Total Saudi Arabia 3,144,332 2.54
Singapore: 0.17% (31 May 2020: 0.00%)
Corporate bonds: 0.17% (31 May 2020: 0.00%)200,000 BOC Aviation Ltd Series REGS 3.5% 18/09/2027 USD 213,649 0.17
Total Singapore 213,649 0.17
Slovakia: 0.00% (31 May 2020: 1.28%)
Government bonds: 0.00% (31 May 2020: 1.28%)
Slovenia: 0.27% (31 May 2020: 0.00%)
Government bonds: 0.27% (31 May 2020: 0.00%)300,000 Slovenia Government International Bond Series 144A
5.25% 18/02/2024USD 338,790 0.27
Total Slovenia 338,790 0.27
Spain: 7.20% (31 May 2020: 8.31%)
Corporate bonds: 0.00% (31 May 2020: 0.08%)
Government bonds: 7.20% (31 May 2020: 8.23%)1,500,000 Spain Government Bond Series 5YR 0.25% 30/07/2024 EUR 1,872,830 1.511,000,000 Spain Government Bond 0.8% 30/07/2027 EUR 1,284,958 1.04
700,000 Spain Government Bond 1.25% 31/10/2030 EUR 923,351 0.75400,000 Spain Government Bond 1.4% 30/07/2028 EUR 534,580 0.43153,000 Spain Government Bond 1.45% 30/04/2029 EUR 205,400 0.17800,000 Spain Government Bond 2.15% 31/10/2025 EUR 1,084,102 0.87
2,200,000 Spain Government Bond 4.4% 31/10/2023 EUR 3,009,589 2.43
Total Spain 8,914,810 7.20
Sweden: 0.15% (31 May 2020: 0.23%)
Government bonds: 0.15% (31 May 2020: 0.23%)1,500,000 Sweden Government Bond Series 1061 0.75% 12/11/2029 SEK 187,268 0.15
Total Sweden 187,268 0.15
Schedule of investments as at 31 May 2021 (continued)
Transferable securities admitted to an official stock exchange listing or traded on a regulated market. The percentages in brackets show the equivalent sector holdings at 31 May 2020.
186

Barclays Multi-Manager Fund PLC Annual Report and Audited Financial Statements 2021
GlobalAccess Global Government Bond Fund
Holdings Financial assets at fair value through profit or loss Currency Fair value
USD % of net
assets
Bonds: 108.00% (31 May 2020: 109.12%) (continued)
Switzerland: 0.73% (31 May 2020: 0.00%)
Corporate bonds: 0.73% (31 May 2020: 0.00%)400,000 Credit Suisse Group AG Series 144A FRN 14/05/2032 USD 406,793 0.33250,000 Credit Suisse Group AG Series 144A FRN 01/04/2031 USD 278,293 0.22200,000 UBS AG 5.125% 15/05/2024 USD 220,944 0.18
Total Switzerland 906,030 0.73
United Kingdom: 8.12% (31 May 2020: 11.60%)
Corporate bonds: 2.19% (31 May 2020: 3.19%)100,000 HSBC Holdings PLC FRN 24/07/2027 GBP 143,364 0.12300,000 HSBC Holdings PLC FRN 22/05/2030 USD 331,378 0.27200,000 HSBC Holdings PLC FRN Perpetual USD 202,496 0.16300,000 HSBC Holdings PLC FRN 13/03/2028 USD 333,694 0.27300,000 HSBC Holdings PLC 4.3% 08/03/2026 USD 340,413 0.27200,000 HSBC Holdings PLC Series EMTN FRN 16/02/2024 AUD 161,137 0.13200,000 Nationwide Building Society Series 144A FRN 26/04/2023 USD 205,838 0.17200,000 Nationwide Building Society Series GMTN FRN
24/02/2031GBP 284,437 0.23
300,000 Natwest Group PLC FRN 22/03/2025 USD 327,458 0.26300,000 Santander UK PLC Series EMTN 1.125% 10/03/2025 EUR 382,710 0.31
Government bonds: 5.93% (31 May 2020: 8.41%)2,900,000 United Kingdom Gilt 0.625% 31/07/2035 GBP 3,844,504 3.112,400,000 United Kingdom Gilt 1% 22/04/2024 GBP 3,497,061 2.82
Total United Kingdom 10,054,490 8.12
United States: 16.30% (31 May 2020: 26.05%)
Corporate bonds: 0.73% (31 May 2020: 3.15%)100,000 Broadcom Inc Series 144A 2.45% 15/02/2031 USD 96,112 0.08200,000 Goldman Sachs Group Inc Series EMTN FRN 30/04/2024 EUR 244,705 0.20
96,728 JetBlue Airways Corp Series 1A 4% 15/11/2032 USD 105,758 0.09100,000 Pacific Gas & Electric Co 3.5% 15/06/2025 USD 105,479 0.08100,000 Southern California Edison Co FRN 03/04/2023 USD 100,268 0.08200,000 Wells Fargo & Co Series EMTN FRN 04/05/2025 EUR 253,763 0.20
Government bonds: 4.22% (31 May 2020: 11.88%)200,000 American Municipal Power Inc 7.334% 15/02/2028 USD 255,319 0.21700,000 United States Treasury Note/Bond 0.375% 31/01/2026 USD 688,420 0.56300,000 United States Treasury Note/Bond 1.375% 15/11/2040 USD 260,391 0.21
1,200,000 United States Treasury Note/Bond 1.625% 15/05/2031 USD 1,202,625 0.97850,000 United States Treasury Note/Bond 1.625% 15/11/2050 USD 726,484 0.59
Schedule of investments as at 31 May 2021 (continued)
Transferable securities admitted to an official stock exchange listing or traded on a regulated market. The percentages in brackets show the equivalent sector holdings at 31 May 2020.
187
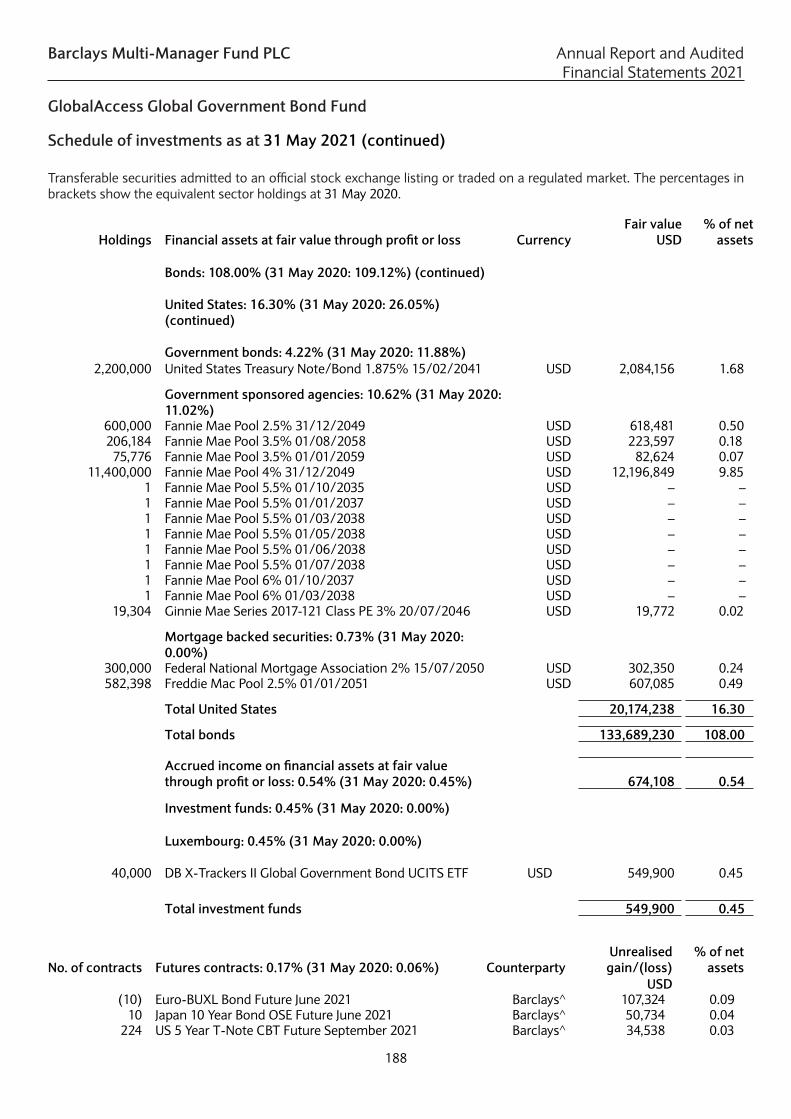
Barclays Multi-Manager Fund PLC Annual Report and Audited Financial Statements 2021
GlobalAccess Global Government Bond Fund
Holdings Financial assets at fair value through profit or loss Currency Fair value
USD % of net
assets
Bonds: 108.00% (31 May 2020: 109.12%) (continued)
United States: 16.30% (31 May 2020: 26.05%) (continued)
Government bonds: 4.22% (31 May 2020: 11.88%)
2,200,000 United States Treasury Note/Bond 1.875% 15/02/2041 USD 2,084,156 1.68
Government sponsored agencies: 10.62% (31 May 2020: 11.02%)
600,000 Fannie Mae Pool 2.5% 31/12/2049 USD 618,481 0.50206,184 Fannie Mae Pool 3.5% 01/08/2058 USD 223,597 0.18
75,776 Fannie Mae Pool 3.5% 01/01/2059 USD 82,624 0.0711,400,000 Fannie Mae Pool 4% 31/12/2049 USD 12,196,849 9.85
1 Fannie Mae Pool 5.5% 01/10/2035 USD – –1 Fannie Mae Pool 5.5% 01/01/2037 USD – –1 Fannie Mae Pool 5.5% 01/03/2038 USD – –1 Fannie Mae Pool 5.5% 01/05/2038 USD – –1 Fannie Mae Pool 5.5% 01/06/2038 USD – –1 Fannie Mae Pool 5.5% 01/07/2038 USD – –1 Fannie Mae Pool 6% 01/10/2037 USD – –1 Fannie Mae Pool 6% 01/03/2038 USD – –
19,304 Ginnie Mae Series 2017-121 Class PE 3% 20/07/2046 USD 19,772 0.02
Mortgage backed securities: 0.73% (31 May 2020: 0.00%)
300,000 Federal National Mortgage Association 2% 15/07/2050 USD 302,350 0.24582,398 Freddie Mac Pool 2.5% 01/01/2051 USD 607,085 0.49
Total United States 20,174,238 16.30
Total bonds 133,689,230 108.00
Accrued income on financial assets at fair value through profit or loss: 0.54% (31 May 2020: 0.45%) 674,108 0.54
Investment funds: 0.45% (31 May 2020: 0.00%)
Luxembourg: 0.45% (31 May 2020: 0.00%)
40,000 DB X-Trackers II Global Government Bond UCITS ETF USD 549,900 0.45
Total investment funds 549,900 0.45
No. of contracts Futures contracts: 0.17% (31 May 2020: 0.06%) CounterpartyUnrealised gain/(loss)
% of net assets
USD(10) Euro-BUXL Bond Future June 2021 Barclays^ 107,324 0.09
10 Japan 10 Year Bond OSE Future June 2021 Barclays^ 50,734 0.04224 US 5 Year T-Note CBT Future September 2021 Barclays^ 34,538 0.03
Schedule of investments as at 31 May 2021 (continued)
Transferable securities admitted to an official stock exchange listing or traded on a regulated market. The percentages in brackets show the equivalent sector holdings at 31 May 2020.
188

Barclays Multi-Manager Fund PLC Annual Report and Audited Financial Statements 2021
GlobalAccess Global Government Bond Fund
No. of contracts Futures contracts: 0.17% (31 May 2020: 0.06%) Counterparty Unrealised gain/(loss)
% of net assets
USD 13 US Ultra CBT Future September 2021 Barclays^ 25,402 0.02
(17) Euro-OAT EUX Future June 2021 Barclays^ 24,025 0.0251 Euro-BTP EUX Future September 2021 Barclays^ 5,930 0.01
(85) Euro-SCHATZ EUX Future June 2021 Barclays^ 4,536 –20 US 2 Year T-Note Future September 2021 Barclays^ 1,390 –
Total fair value gains on open futures contracts 253,879 0.21
(1) Euro-Bund EUX Future June 2021 (306) – 9K6TPWU(7) Euro-BOBL EUX Future June 2021 Barclays^ (1,198) – 9K6TPUU(6) SFE 3 Year T-Bond Future June 2021 Barclays^ (1,511) – 9K9TP3U(7) US 10 Year T-Note Future September 2021 Barclays^ (2,680) – 9K8UM9U(7) Long Gilt LIF Future September 2021 Barclays^ (3,980) – 9K9TF0U(8) US Long Bond CBT Future September 2021 Barclays^ (6,874) (0.01) 9K9TD3U
(15) Australia 10 Year SFE Future June 2021 Barclays^ (15,382) (0.01) 9K9TP2U(32) US 10 Year Ultra CBT Future September 2021 Barclays^ (19,250) (0.02) 9K9TB4U
Total fair value losses on open futures contracts (51,181) (0.04)
Total futures contracts 202,698 0.17
Forward currency contracts: -0.68% (31 May 2020: -0.41%)
Counterparty Cncy Buys Cncy SellsMaturity
dateUnrealised
gain% of net
assetsUSD
Bank of America USD 4,822,392 JPY 520,000,000 2/08/2021 66,859 0.05 CCT_1769408_123997
Bank of America MYR 848,000 USD 204,470 23/06/2021 1,044 – CCT_1769408_123367
Bank of America USD 2,172,287 AUD 2,805,157 2/06/2021 956 – CCT_1769408_124256
Bank of America RUB 46,035,000 USD 625,081 22/06/2021 889 – CCT_1769408_126071
Barclays^ KRW 619,706,945 USD 552,496 16/06/2021 5,706 0.01 CCT_1769408_120642
Barclays^ USD 275,094 JPY 30,000,000 10/08/2021 720 – CCT_1769408_124713
BNP Paribas USD 2,667,707 AUD 3,432,748 2/07/2021 10,236 0.01 CCT_1769408_125836
BNP Paribas MYR 1,531,113 USD 369,328 23/06/2021 1,739 – CCT_1769408_125935
BNP Paribas EUR 61,000 USD 73,279 2/06/2021 1,303 – CCT_1769408_124617
BNP Paribas CAD 140,000 USD 115,665 2/06/2021 220 – CCT_1769408_125414
BNP Paribas USD 9,767,670 JPY 1,068,300,000 2/07/2021 24 – CCT_1769408_126082
BNP Paribas TWD 27,804 USD 1,000 16/06/2021 9 – CCT_1769408_121432
Citibank USD 386,313 ILS 1,221,330 31/01/2022 9,104 0.01 CCT_1769408_117444
Citibank USD 385,364 ILS 1,221,220 31/01/2022 8,189 0.01 CCT_1769408_117237
Citibank USD 83,428 PEN 302,820 8/07/2021 3,850 – CCT_1769408_116961
Citibank USD 242,036 ILS 777,420 31/01/2022 1,929 – CCT_1769408_117592
Citibank TWD 2,025,655 USD 73,000 16/06/2021 546 – CCT_1769408_121433
Citibank USD 284,778 MXN 5,762,000 8/11/2021 492 – CCT_1769408_125234
Deutsche USD 1,026,400 MYR 4,176,113 23/06/2021 14,313 0.01 CCT_1769408_120840
Goldman Sachs USD 1,895,615 PEN 6,972,357 7/09/2021 64,221 0.05 CCT_1769408_120644
Schedule of investments as at 31 May 2021 (continued)
Transferable securities admitted to an official stock exchange listing or traded on a regulated market. The percentages in brackets show the equivalent sector holdings at 31 May 2020.
Holdings Financial assets at fair value through profit or loss Currency Fair value
USD % of net
assets
Bonds: 108.00% (31 May 2020: 109.12%) (continued)
United States: 16.30% (31 May 2020: 26.05%) (continued)
Government bonds: 4.22% (31 May 2020: 11.88%)
2,200,000 United States Treasury Note/Bond 1.875% 15/02/2041 USD 2,084,156 1.68
Government sponsored agencies: 10.62% (31 May 2020: 11.02%)
600,000 Fannie Mae Pool 2.5% 31/12/2049 USD 618,481 0.50206,184 Fannie Mae Pool 3.5% 01/08/2058 USD 223,597 0.18
75,776 Fannie Mae Pool 3.5% 01/01/2059 USD 82,624 0.0711,400,000 Fannie Mae Pool 4% 31/12/2049 USD 12,196,849 9.85
1 Fannie Mae Pool 5.5% 01/10/2035 USD – –1 Fannie Mae Pool 5.5% 01/01/2037 USD – –1 Fannie Mae Pool 5.5% 01/03/2038 USD – –1 Fannie Mae Pool 5.5% 01/05/2038 USD – –1 Fannie Mae Pool 5.5% 01/06/2038 USD – –1 Fannie Mae Pool 5.5% 01/07/2038 USD – –1 Fannie Mae Pool 6% 01/10/2037 USD – –1 Fannie Mae Pool 6% 01/03/2038 USD – –
19,304 Ginnie Mae Series 2017-121 Class PE 3% 20/07/2046 USD 19,772 0.02
Mortgage backed securities: 0.73% (31 May 2020: 0.00%)
300,000 Federal National Mortgage Association 2% 15/07/2050 USD 302,350 0.24582,398 Freddie Mac Pool 2.5% 01/01/2051 USD 607,085 0.49
Total United States 20,174,238 16.30
Total bonds 133,689,230 108.00
Accrued income on financial assets at fair value through profit or loss: 0.54% (31 May 2020: 0.45%) 674,108 0.54
Investment funds: 0.45% (31 May 2020: 0.00%)
Luxembourg: 0.45% (31 May 2020: 0.00%)
40,000 DB X-Trackers II Global Government Bond UCITS ETF USD 549,900 0.45
Total investment funds 549,900 0.45
No. of contracts Futures contracts: 0.17% (31 May 2020: 0.06%) CounterpartyUnrealised gain/(loss)
% of net assets
USD(10) Euro-BUXL Bond Future June 2021 Barclays^ 107,324 0.09
10 Japan 10 Year Bond OSE Future June 2021 Barclays^ 50,734 0.04224 US 5 Year T-Note CBT Future September 2021 Barclays^ 34,538 0.03
189

Barclays Multi-Manager Fund PLC Annual Report and Audited Financial Statements 2021
GlobalAccess Global Government Bond Fund
Forward currency contracts: -0.68% (31 May 2020: -0.41%) (continued)
Counterparty Cncy Buys Cncy SellsMaturity
date
Unrealised gain
% of net assets
USD Goldman Sachs CNH 16,791,000 USD 2,581,770 16/06/2021 51,140 0.04 CCT_1769408_124160
Goldman Sachs PLN 1,697,000 USD 445,903 16/09/2021 17,501 0.01 CCT_1769408_124616
Goldman Sachs USD 109,763 PEN 411,064 14/06/2021 1,967 – CCT_1769408_124833
Goldman Sachs CNH 181,000 USD 27,926 16/06/2021 456 – CCT_1769408_124401
Goldman Sachs MXN 3,314,632 USD 165,980 10/06/2021 399 – CCT_1769408_125299
Goldman Sachs USD 64,952 CNH 414,000 16/06/2021 35 – CCT_1769408_126070
JP Morgan CNY 3,617,002 USD 555,181 16/06/2021 12,526 0.01 CCT_1769408_120638
JP Morgan TWD 2,975,028 USD 107,000 16/06/2021 1,016 – CCT_1769408_121436
JP Morgan USD 630,561 AUD 814,034 2/06/2021 458 – CCT_1769408_124260
JP Morgan TWD 27,800 USD 1,000 16/06/2021 9 – CCT_1769408_121435
Marine Midland Bank USD 2,318,299 JPY 250,000,000 14/06/2021 32,825 0.03 CCT_1769408_120842
Marine Midland Bank EUR 1,119,000 USD 1,350,158 2/06/2021 17,988 0.02 CCT_1769408_125028
Marine Midland Bank CNH 3,354,000 USD 508,415 16/06/2021 17,509 0.02 CCT_1769408_123112
Marine Midland Bank EUR 321,000 USD 392,121 2/06/2021 350 – CCT_1769408_125286
Marine Midland Bank TWD 27,808 USD 1,000 16/06/2021 10 – CCT_1769408_121437
Morgan Stanley DKK 324,000 USD 53,201 1/07/2021 84 – CCT_1769408_125417
Northern Trust USD 234,550 PEN 873,674 25/03/2022 5,702 0.01 CCT_1769408_122078
Northern Trust TWD 5,516,280 USD 198,000 16/06/2021 2,282 – CCT_1769408_121345
Northern Trust MXN 1,022,606 USD 48,627 3/09/2021 2,221 – CCT_1769408_120459
Northern Trust TWD 2,643,850 USD 95,000 16/06/2021 991 – CCT_1769408_121346
Standard Chartered USD 10,489,025 JPY 1,146,300,000 2/06/2021 10,483 0.01 CCT_1769408_124409
Standard Chartered IDR 4,721,061,700 USD 324,338 16/06/2021 6,174 0.01 CCT_1769408_120524
Standard Chartered MYR 1,797,000 USD 433,765 23/06/2021 1,741 – CCT_1769408_123249
Standard Chartered USD 33,133,191 EUR 27,083,921 2/07/2021 1,084 – CCT_1769408_126083
Standard Chartered USD 471,128 TWD 12,951,783 16/06/2021 883 – CCT_1769408_120529
Standard Chartered TWD 110,920 USD 4,000 16/06/2021 27 – CCT_1769408_121431
UBS GBP 4,035,937 USD 5,661,834 17/06/2021 75,355 0.06 CCT_1769409_168639
UBS EUR 2,870,773 USD 3,465,586 17/06/2021 45,248 0.04 CCT_1769409_168636
UBS USD 942,281 JPY 100,000,000 7/06/2021 28,141 0.02 CCT_1769408_120217
UBS EUR 915,638 USD 1,105,355 17/06/2021 14,432 0.01 CCT_1769409_168645
UBS USD 1,105,685 JPY 120,000,000 26/07/2021 8,311 0.01 CCT_1769408_123684
UBS GBP 223,799 USD 313,957 17/06/2021 4,179 – CCT_1769409_168631
UBS EUR 800,689 USD 975,887 2/06/2021 3,075 – CCT_1769408_125422
UBS GBP 308,810 USD 436,039 17/06/2021 2,942 – CCT_1769409_168790
UBS GBP 68,944 USD 96,718 17/06/2021 1,287 – CCT_1769409_168641
UBS GBP 53,261 USD 74,717 17/06/2021 994 – CCT_1769409_168634
Schedule of investments as at 31 May 2021 (continued)
Transferable securities admitted to an official stock exchange listing or traded on a regulated market. The percentages in brackets show the equivalent sector holdings at 31 May 2020.
190

Barclays Multi-Manager Fund PLC Annual Report and Audited Financial Statements 2021
GlobalAccess Global Government Bond Fund
Forward currency contracts: -0.68% (31 May 2020: -0.41%) (continued)
Counterparty Cncy Buys Cncy SellsMaturity
date
Unrealised gain
% of net assets
USD UBS GBP 59,029 USD 83,499 17/06/2021 413 – CCT_1769409_168520
UBS GBP 25,456 USD 36,009 17/06/2021 177 – CCT_1769409_168931
UBS GBP 13,708 USD 19,360 17/06/2021 126 – CCT_1769409_169285
UBS GBP 8,384 USD 11,849 17/06/2021 69 – CCT_1769409_169228
UBS GBP 4,103 USD 5,781 17/06/2021 52 – CCT_1769409_168730
UBS GBP 7,712 USD 10,919 17/06/2021 44 – CCT_1769409_169136
UBS GBP 1,553 USD 2,182 17/06/2021 26 – CCT_1769409_168637
UBS GBP 2,157 USD 3,041 17/06/2021 25 – CCT_1769409_168586
UBS GBP 3,962 USD 5,609 17/06/2021 23 – CCT_1769409_168986
UBS GBP 2,006 USD 2,837 17/06/2021 14 – CCT_1769409_168519
UBS GBP 6,683 USD 9,498 17/06/2021 3 – CCT_1769409_168860
UBS GBP 556 USD 789 17/06/2021 1 – CCT_1769409_169363
UBS EUR 8 USD 10 17/06/2021 – – CCT_1769409_168643
Total fair value gains on forward currency contracts 563,147 0.45
Counterparty Cncy Buys Cncy SellsMaturity
dateUnrealised
loss% of net
assetsUSD
Bank of America USD 3,592 RUB 270,059 20/08/2021 (50) – CCT_1769408_124875
Bank of America USD 116,249 PLN 441,271 16/09/2021 (4,250) – CCT_1769408_123665
Bank of America USD 629,737 DKK 3,957,275 1/07/2021 (21,081) (0.02) CCT_1769408_122215
Barclays^ USD 76,188 PLN 289,888 16/09/2021 (2,972) – CCT_1769408_123491
Barclays^ USD 253,990 MXN 5,264,000 5/08/2021 (8,588) (0.01) CCT_1769408_121828
Barclays^ USD 156,937 MXN 3,314,632 10/06/2021 (9,443) (0.01) CCT_1769408_114004
BNP Paribas USD 2,403,726 CAD 2,904,104 2/07/2021 (23) – CCT_1769408_126079
BNP Paribas USD 15,259 TWD 432,000 16/06/2021 (425) – CCT_1769408_123003
BNP Paribas USD 208,154 ILS 681,940 12/11/2021 (2,193) – CCT_1769408_124873
BNP Paribas USD 368,058 MYR 1,531,113 22/09/2021 (2,265) – CCT_1769408_125940
BNP Paribas USD 184,848 SEK 1,560,000 2/06/2021 (3,281) – CCT_1769408_124430
BNP Paribas JPY 78,000,000 USD 717,312 2/06/2021 (4,299) (0.01) CCT_1769408_124817
BNP Paribas USD 529,522 CNH 3,443,000 16/06/2021 (10,357) (0.01) CCT_1769408_124245
BNP Paribas USD 510,430 CNH 3,334,886 16/06/2021 (12,497) (0.01) CCT_1769408_121391
BNP Paribas USD 1,587,997 KRW 1,785,321,136 16/06/2021 (20,133) (0.02) CCT_1769408_120526
BNP Paribas USD 1,995,240 CAD 2,454,457 2/06/2021 (36,427) (0.03) CCT_1769408_124405
Citibank USD 3,046 RUB 227,738 22/06/2021 (51) – CCT_1769408_121170
Citibank USD 2,668 RUB 206,096 22/07/2021 (122) – CCT_1769408_123673
Citibank USD 61,612 ILS 199,980 6/04/2022 (219) – CCT_1769408_124632
Citibank PEN 86,227 USD 23,000 14/06/2021 (388) – CCT_1769408_123990
Citibank USD 775,849 AUD 1,003,000 2/06/2021 (523) – CCT_1769408_124431
Citibank MXN 5,762,000 USD 290,131 2/06/2021 (703) – CCT_1769408_125233
Citibank USD 122,193 ILS 400,000 6/04/2022 (1,481) – CCT_1769408_122788
Citibank USD 152,740 ILS 500,100 2/03/2022 (1,793) – CCT_1769408_120609
Citibank USD 51,523 CNH 341,000 16/06/2021 (1,947) – CCT_1769408_122593
Schedule of investments as at 31 May 2021 (continued)
Transferable securities admitted to an official stock exchange listing or traded on a regulated market. The percentages in brackets show the equivalent sector holdings at 31 May 2020.
Forward currency contracts: -0.68% (31 May 2020: -0.41%) (continued)
Counterparty Cncy Buys Cncy SellsMaturity
date
Unrealised gain
% of net assets
USD Goldman Sachs CNH 16,791,000 USD 2,581,770 16/06/2021 51,140 0.04 CCT_1769408_124160
Goldman Sachs PLN 1,697,000 USD 445,903 16/09/2021 17,501 0.01 CCT_1769408_124616
Goldman Sachs USD 109,763 PEN 411,064 14/06/2021 1,967 – CCT_1769408_124833
Goldman Sachs CNH 181,000 USD 27,926 16/06/2021 456 – CCT_1769408_124401
Goldman Sachs MXN 3,314,632 USD 165,980 10/06/2021 399 – CCT_1769408_125299
Goldman Sachs USD 64,952 CNH 414,000 16/06/2021 35 – CCT_1769408_126070
JP Morgan CNY 3,617,002 USD 555,181 16/06/2021 12,526 0.01 CCT_1769408_120638
JP Morgan TWD 2,975,028 USD 107,000 16/06/2021 1,016 – CCT_1769408_121436
JP Morgan USD 630,561 AUD 814,034 2/06/2021 458 – CCT_1769408_124260
JP Morgan TWD 27,800 USD 1,000 16/06/2021 9 – CCT_1769408_121435
Marine Midland Bank USD 2,318,299 JPY 250,000,000 14/06/2021 32,825 0.03 CCT_1769408_120842
Marine Midland Bank EUR 1,119,000 USD 1,350,158 2/06/2021 17,988 0.02 CCT_1769408_125028
Marine Midland Bank CNH 3,354,000 USD 508,415 16/06/2021 17,509 0.02 CCT_1769408_123112
Marine Midland Bank EUR 321,000 USD 392,121 2/06/2021 350 – CCT_1769408_125286
Marine Midland Bank TWD 27,808 USD 1,000 16/06/2021 10 – CCT_1769408_121437
Morgan Stanley DKK 324,000 USD 53,201 1/07/2021 84 – CCT_1769408_125417
Northern Trust USD 234,550 PEN 873,674 25/03/2022 5,702 0.01 CCT_1769408_122078
Northern Trust TWD 5,516,280 USD 198,000 16/06/2021 2,282 – CCT_1769408_121345
Northern Trust MXN 1,022,606 USD 48,627 3/09/2021 2,221 – CCT_1769408_120459
Northern Trust TWD 2,643,850 USD 95,000 16/06/2021 991 – CCT_1769408_121346
Standard Chartered USD 10,489,025 JPY 1,146,300,000 2/06/2021 10,483 0.01 CCT_1769408_124409
Standard Chartered IDR 4,721,061,700 USD 324,338 16/06/2021 6,174 0.01 CCT_1769408_120524
Standard Chartered MYR 1,797,000 USD 433,765 23/06/2021 1,741 – CCT_1769408_123249
Standard Chartered USD 33,133,191 EUR 27,083,921 2/07/2021 1,084 – CCT_1769408_126083
Standard Chartered USD 471,128 TWD 12,951,783 16/06/2021 883 – CCT_1769408_120529
Standard Chartered TWD 110,920 USD 4,000 16/06/2021 27 – CCT_1769408_121431
UBS GBP 4,035,937 USD 5,661,834 17/06/2021 75,355 0.06 CCT_1769409_168639
UBS EUR 2,870,773 USD 3,465,586 17/06/2021 45,248 0.04 CCT_1769409_168636
UBS USD 942,281 JPY 100,000,000 7/06/2021 28,141 0.02 CCT_1769408_120217
UBS EUR 915,638 USD 1,105,355 17/06/2021 14,432 0.01 CCT_1769409_168645
UBS USD 1,105,685 JPY 120,000,000 26/07/2021 8,311 0.01 CCT_1769408_123684
UBS GBP 223,799 USD 313,957 17/06/2021 4,179 – CCT_1769409_168631
UBS EUR 800,689 USD 975,887 2/06/2021 3,075 – CCT_1769408_125422
UBS GBP 308,810 USD 436,039 17/06/2021 2,942 – CCT_1769409_168790
UBS GBP 68,944 USD 96,718 17/06/2021 1,287 – CCT_1769409_168641
UBS GBP 53,261 USD 74,717 17/06/2021 994 – CCT_1769409_168634
191

Barclays Multi-Manager Fund PLC Annual Report and Audited Financial Statements 2021
GlobalAccess Global Government Bond Fund
Forward currency contracts: -0.68% (31 May 2020: -0.41%) (continued)
Counterparty Cncy Buys Cncy SellsMaturity
date
Unrealised loss
% of net assets
USD Citibank USD 83,292 GBP 60,000 2/06/2021 (1,998) – CCT_1769408_124538
Citibank USD 152,581 ILS 500,000 6/04/2022 (2,011) – CCT_1769408_122941
Citibank USD 213,641 ILS 699,930 2/03/2022 (2,640) – CCT_1769408_120608
Citibank USD 243,614 ILS 800,320 2/03/2022 (3,688) – CCT_1769408_120763
Citibank USD 776,250 EUR 638,000 2/06/2021 (3,801) – CCT_1769408_124818
Citibank USD 159,965 MXN 3,276,000 22/06/2021 (4,248) – CCT_1769408_118595
Citibank USD 302,132 ILS 1,000,300 30/11/2021 (6,498) (0.01) CCT_1769408_121059
Citibank USD 237,256 HUF 71,345,015 16/08/2021 (13,575) (0.01) CCT_1769408_123675
Citibank USD 486,616 DKK 3,068,379 1/07/2021 (18,013) (0.02) CCT_1769408_122263
Citibank USD 1,192,108 EUR 992,000 2/06/2021 (20,761) (0.02) CCT_1769408_124540
Goldman Sachs USD 11,570 RUB 866,911 20/08/2021 (120) – CCT_1769408_125169
Goldman Sachs USD 680,784 EUR 557,000 2/06/2021 (232) – CCT_1769408_125220
Goldman Sachs USD 163,307 MXN 3,314,632 27/10/2021 (464) – CCT_1769408_125300
Goldman Sachs USD 11,168 RUB 861,907 22/07/2021 (503) – CCT_1769408_123797
Goldman Sachs USD 38,840 PLN 147,764 16/09/2021 (1,510) – CCT_1769408_123496
Goldman Sachs PEN 411,064 USD 109,667 12/11/2021 (1,777) – CCT_1769408_124832
Goldman Sachs USD 83,292 PLN 316,263 16/09/2021 (3,071) – CCT_1769408_123251
Goldman Sachs USD 2,637,122 GBP 1,866,000 2/06/2021 (15,397) (0.01) CCT_1769408_125403
Goldman Sachs USD 8,044,357 GBP 5,690,178 2/07/2021 (44,550) (0.04) CCT_1769408_125941
Goldman Sachs USD 3,292,906 CNH 21,697,290 16/06/2021 (109,334) (0.09) CCT_1769408_120974
JP Morgan USD 25,799 ILS 84,000 31/01/2022 (144) – CCT_1769408_118042
JP Morgan USD 461,496 ILS 1,500,000 31/01/2022 (1,781) – CCT_1769408_117954
JP Morgan USD 122,022 CNH 799,000 16/06/2021 (3,265) – CCT_1769408_121712
JP Morgan USD 542,587 DKK 3,420,814 1/07/2021 (20,003) (0.02) CCT_1769408_122313
Marine Midland Bank USD 3,232 RUB 240,462 22/06/2021 (38) – CCT_1769408_121318
Marine Midland Bank USD 3,711 RUB 278,789 20/08/2021 (49) – CCT_1769408_124949
Marine Midland Bank PEN 22,551 USD 6,000 14/06/2021 (86) – CCT_1769408_123991
Marine Midland Bank USD 215,548 ILS 699,209 12/11/2021 (125) – CCT_1769408_124824
Marine Midland Bank USD 292,803 EUR 240,000 2/06/2021 (633) – CCT_1769408_125536
Marine Midland Bank USD 365,163 JPY 40,000,000 16/08/2021 (685) – CCT_1769408_125082
Marine Midland Bank USD 49,000 KRW 55,379,800 16/06/2021 (883) – CCT_1769408_122041
Marine Midland Bank USD 138,142 PLN 529,069 16/09/2021 (6,332) (0.01) CCT_1769408_123372
Marine Midland Bank USD 475,453 CAD 589,647 2/06/2021 (12,625) (0.01) CCT_1769408_124254
Marine Midland Bank USD 1,522,376 CNH 10,028,000 16/06/2021 (50,062) (0.04) CCT_1769408_122996
Marine Midland Bank USD 5,247,338 GBP 3,764,178 2/06/2021 (103,442) (0.09) CCT_1769408_124334
Morgan Stanley USD 2,648 RUB 202,896 22/07/2021 (99) – CCT_1769408_123505
Schedule of investments as at 31 May 2021 (continued)
Transferable securities admitted to an official stock exchange listing or traded on a regulated market. The percentages in brackets show the equivalent sector holdings at 31 May 2020.
192

Barclays Multi-Manager Fund PLC Annual Report and Audited Financial Statements 2021
GlobalAccess Global Government Bond Fund
Forward currency contracts: -0.68% (31 May 2020: -0.41%) (continued)
Counterparty Cncy Buys Cncy SellsMaturity
date
Unrealised loss
% of net assets
USD Morgan Stanley USD 72,000 KRW 81,338,400 16/06/2021 (1,266) – CCT_1769408_122042
Morgan Stanley USD 142,763 NZD 198,000 2/06/2021 (1,381) – CCT_1769408_124663
Morgan Stanley NOK 4,840,000 USD 583,348 2/06/2021 (1,565) – CCT_1769408_124427
Morgan Stanley USD 478,077 CNH 3,154,000 16/06/2021 (16,485) (0.01) CCT_1769408_122461
Morgan Stanley USD 4,269,012 CNH 28,039,726 16/06/2021 (127,752) (0.10) CCT_1769408_121045
Northern Trust USD 10,353 RUB 765,744 22/06/2021 (60) – CCT_1769408_121581
Northern Trust PEN 302,286 USD 81,852 14/06/2021 (2,581) – CCT_1769408_121344
Royal Bank of Scotland USD 284,737 MXN 5,762,000 2/06/2021 (4,691) (0.01) CCT_1769408_123128
Societe Generale USD 4,094 RUB 308,748 20/08/2021 (70) – CCT_1769408_124948
Societe Generale USD 3,031 RUB 235,411 22/07/2021 (157) – CCT_1769408_123670
Societe Generale USD 6,057,401 JPY 670,000,000 12/07/2021 (68,976) (0.06) CCT_1769408_122558
Societe Generale USD 4,222,419 CNH 27,454,000 16/06/2021 (82,501) (0.07) CCT_1769408_124087
Standard Chartered USD 56,000 KRW 63,100,800 16/06/2021 (838) – CCT_1769408_121931
Standard Chartered USD 119,000 KRW 134,041,600 16/06/2021 (1,738) – CCT_1769408_121930
Standard Chartered USD 31,865,113 EUR 26,455,610 2/06/2021 (480,841) (0.39) CCT_1769408_124411
UBS USD 482 GBP 340 17/06/2021 (2) – CCT_1769409_169046
UBS USD 3,286 RUB 245,522 22/06/2021 (52) – CCT_1769408_121048
UBS USD 3,281 RUB 245,534 22/06/2021 (58) – CCT_1769408_121052
UBS USD 20,294 EUR 16,679 17/06/2021 (103) – CCT_1769409_168456
UBS USD 2,853 RUB 218,690 22/07/2021 (109) – CCT_1769408_123504
UBS USD 13,980 GBP 10,000 17/06/2021 (236) – CCT_1769409_168404
UBS USD 151,585 GBP 108,432 17/06/2021 (2,554) – CCT_1769409_168402
Total fair value losses on forward currency contracts (1,393,970) (1.13)
Total forward currency contracts (830,823) (0.68)
Fair value USD
% of net assets
Total value of investments 134,285,113 108.48
Cash and cash equivalents* 2,590,263 2.09
Other net liabilities** (13,090,639) (10.57)
Net assets attributable to holders of redeemable participating shares 123,784,737 100.00
Schedule of investments as at 31 May 2021 (continued)
Transferable securities admitted to an official stock exchange listing or traded on a regulated market. The percentages in brackets show the equivalent sector holdings at 31 May 2020.
Forward currency contracts: -0.68% (31 May 2020: -0.41%) (continued)
Counterparty Cncy Buys Cncy SellsMaturity
date
Unrealised loss
% of net assets
USD Citibank USD 83,292 GBP 60,000 2/06/2021 (1,998) – CCT_1769408_124538
Citibank USD 152,581 ILS 500,000 6/04/2022 (2,011) – CCT_1769408_122941
Citibank USD 213,641 ILS 699,930 2/03/2022 (2,640) – CCT_1769408_120608
Citibank USD 243,614 ILS 800,320 2/03/2022 (3,688) – CCT_1769408_120763
Citibank USD 776,250 EUR 638,000 2/06/2021 (3,801) – CCT_1769408_124818
Citibank USD 159,965 MXN 3,276,000 22/06/2021 (4,248) – CCT_1769408_118595
Citibank USD 302,132 ILS 1,000,300 30/11/2021 (6,498) (0.01) CCT_1769408_121059
Citibank USD 237,256 HUF 71,345,015 16/08/2021 (13,575) (0.01) CCT_1769408_123675
Citibank USD 486,616 DKK 3,068,379 1/07/2021 (18,013) (0.02) CCT_1769408_122263
Citibank USD 1,192,108 EUR 992,000 2/06/2021 (20,761) (0.02) CCT_1769408_124540
Goldman Sachs USD 11,570 RUB 866,911 20/08/2021 (120) – CCT_1769408_125169
Goldman Sachs USD 680,784 EUR 557,000 2/06/2021 (232) – CCT_1769408_125220
Goldman Sachs USD 163,307 MXN 3,314,632 27/10/2021 (464) – CCT_1769408_125300
Goldman Sachs USD 11,168 RUB 861,907 22/07/2021 (503) – CCT_1769408_123797
Goldman Sachs USD 38,840 PLN 147,764 16/09/2021 (1,510) – CCT_1769408_123496
Goldman Sachs PEN 411,064 USD 109,667 12/11/2021 (1,777) – CCT_1769408_124832
Goldman Sachs USD 83,292 PLN 316,263 16/09/2021 (3,071) – CCT_1769408_123251
Goldman Sachs USD 2,637,122 GBP 1,866,000 2/06/2021 (15,397) (0.01) CCT_1769408_125403
Goldman Sachs USD 8,044,357 GBP 5,690,178 2/07/2021 (44,550) (0.04) CCT_1769408_125941
Goldman Sachs USD 3,292,906 CNH 21,697,290 16/06/2021 (109,334) (0.09) CCT_1769408_120974
JP Morgan USD 25,799 ILS 84,000 31/01/2022 (144) – CCT_1769408_118042
JP Morgan USD 461,496 ILS 1,500,000 31/01/2022 (1,781) – CCT_1769408_117954
JP Morgan USD 122,022 CNH 799,000 16/06/2021 (3,265) – CCT_1769408_121712
JP Morgan USD 542,587 DKK 3,420,814 1/07/2021 (20,003) (0.02) CCT_1769408_122313
Marine Midland Bank USD 3,232 RUB 240,462 22/06/2021 (38) – CCT_1769408_121318
Marine Midland Bank USD 3,711 RUB 278,789 20/08/2021 (49) – CCT_1769408_124949
Marine Midland Bank PEN 22,551 USD 6,000 14/06/2021 (86) – CCT_1769408_123991
Marine Midland Bank USD 215,548 ILS 699,209 12/11/2021 (125) – CCT_1769408_124824
Marine Midland Bank USD 292,803 EUR 240,000 2/06/2021 (633) – CCT_1769408_125536
Marine Midland Bank USD 365,163 JPY 40,000,000 16/08/2021 (685) – CCT_1769408_125082
Marine Midland Bank USD 49,000 KRW 55,379,800 16/06/2021 (883) – CCT_1769408_122041
Marine Midland Bank USD 138,142 PLN 529,069 16/09/2021 (6,332) (0.01) CCT_1769408_123372
Marine Midland Bank USD 475,453 CAD 589,647 2/06/2021 (12,625) (0.01) CCT_1769408_124254
Marine Midland Bank USD 1,522,376 CNH 10,028,000 16/06/2021 (50,062) (0.04) CCT_1769408_122996
Marine Midland Bank USD 5,247,338 GBP 3,764,178 2/06/2021 (103,442) (0.09) CCT_1769408_124334
Morgan Stanley USD 2,648 RUB 202,896 22/07/2021 (99) – CCT_1769408_123505
193

Barclays Multi-Manager Fund PLC Annual Report and Audited Financial Statements 2021
GlobalAccess Global Government Bond Fund
Analysis of total assets (unaudited)% of total
assets
Transferable securities and money market instruments admitted to official stock exchangelisting or traded on a regulated market. 75.97Investment funds and AIFs. 0.31Financial derivative instruments dealt in on a regulated market. 0.14OTC financial derivative instruments. 0.32Other assets. 23.26
100.00
*All cash holdings are held with The Northern Trust Company.**Including USD (186,247) held with Barclays Capital as security by the counterparty to derivatives contracts.^ Related party.
The Industry Classification Benchmark (“ICB”) is jointly owned by FTSE and Dow Jones and has been licensed for use. FTSE and Dow Jones do not accept liability to any person for any loss or damage arising out of any error or omission in ICB.
Schedule of investments as at 31 May 2021 (continued)
Transferable securities admitted to an official stock exchange listing or traded on a regulated market. The percentages in brackets show the equivalent sector holdings at 31 May 2020.
194

Barclays Multi-Manager Fund PLC Annual Report and Audited Financial Statements 2021
GlobalAccess Asia Pacific (ex -Japan) Fund
Schedule of investments as at 31 May 2021
Transferable securities admitted to an official stock exchange listing or traded on a regulated market. The percentages in brackets show the equivalent sector holdings at 31 May 2020.
Holdings Financial assets at fair value through profit or loss CurrencyFair value
USD% of net
assets
Equities: 95.02% (31 May 2020: 91.07%)
Australia: 13.57% (31 May 2020: 13.94%)
Advertising: 0.23% (31 May 2020: 0.04%)33,603 IVE Group Ltd Com NPV AUD 38,040 0.04
157,543 oOh!media Ltd Com NPV AUD 205,480 0.19
Auto parts & equipment: 0.13% (31 May 2020: 0.08%)28,260 PWR Holdings Ltd Com NPV AUD 139,560 0.13
Banks: 2.55% (31 May 2020: 1.86%)32,709 Australia & New Zealand Banking Group Ltd Com NPV AUD 727,018 0.6823,028 Commonwealth Bank of Australia Com NPV AUD 1,777,759 1.68
4,072 National Australia Bank Ltd NPV AUD 84,913 0.085,537 Westpac Banking Corp Com NPV AUD 113,148 0.11
Beverages: 0.34% (31 May 2020: 0.27%)40,221 Treasury Wine Estates Ltd Com NPV AUD 362,545 0.34
Biotechnology: 1.42% (31 May 2020: 1.50%)5,861 CSL Ltd Com NPV AUD 1,317,187 1.24
140,495 Starpharma Holdings Ltd Com NPV AUD 192,488 0.18
Building materials: 0.00% (31 May 2020: 0.10%)
Commercial services: 0.04% (31 May 2020: 0.00%)18,694 Nitro Software Ltd NPV AUD 41,819 0.04
Diversified financial services: 0.96% (31 May 2020: 1.08%)
7,165 Macquarie Group Ltd Com NPV AUD 842,780 0.7924,730 Pacific Current Group Ltd Com NPV AUD 104,517 0.108,775 Pinnacle Investment Management Group Ltd Com NPV AUD 70,266 0.07
Electric: 0.09% (31 May 2020: 0.31%)29,348 Origin Energy Ltd Com NPV AUD 90,299 0.09
Engineering & construction: 0.39% (31 May 2020: 0.76%)
43,206 LendLease Group Ltd Com NPV AUD 410,855 0.39
Entertainment: 0.00% (31 May 2020: 0.22%)
Environmental control: 0.28% (31 May 2020: 0.00%)140,122 Cleanaway Waste Management Ltd Com NPV AUD 298,811 0.28
Food: 0.70% (31 May 2020: 0.88%)26,688 Bega Cheese Ltd NPV AUD 123,431 0.1224,973 Coles Group Ltd Com NPV AUD 320,497 0.30
9,315 Woolworths Group Ltd Com NPV AUD 300,128 0.28
195

Barclays Multi-Manager Fund PLC Annual Report and Audited Financial Statements 2021
GlobalAccess Asia Pacific (ex -Japan) Fund
Holdings Financial assets at fair value through profit or loss Currency Fair value
USD % of net
assets
Equities: 95.02% (31 May 2020: 91.07%) (continued) Australia: 13.57% (31 May 2020: 13.94%) (continued)
Healthcare-products: 0.21% (31 May 2020: 0.27%)724 Cochlear Ltd Com NPV AUD 127,228 0.12
27,377 Medical Developments International Ltd Com NPV AUD 100,764 0.09
Healthcare-services: 0.00% (31 May 2020: 0.22%)
Insurance: 0.34% (31 May 2020: 0.48%)116,266 Steadfast Group Ltd Com NPV AUD 360,883 0.34
Internet: 0.07% (31 May 2020: 0.09%)97,232 iSignthis Ltd Com NPV** AUD 7,526 0.0123,757 Lynch Group Holdings Ltd NPV AUD 64,638 0.06
Iron/steel: 0.56% (31 May 2020: 0.74%)19,061 BlueScope Steel Ltd Com NPV AUD 313,305 0.298,086 Mineral Resources Ltd Com NPV AUD 283,781 0.27
Leisure time: 0.00% (31 May 2020: 0.09%)
Media: 0.04% (31 May 2020: 0.04%)33,083 HT&E Ltd Com NPV AUD 44,238 0.04
Mining: 2.47% (31 May 2020: 2.34%)21,730 Australian Strategic Materials Ltd NPV AUD 79,980 0.0736,591 BHP Billiton Ltd Com NPV AUD 1,355,976 1.2816,021 Calix Ltd NPV AUD 34,661 0.03
118,574 Evolution Mining Ltd Com NPV AUD 497,001 0.4719,746 Lynas Corp Ltd Com NPV AUD 84,294 0.08
183,255 Nickel Mines Ltd Com NPV AUD 145,749 0.14476,920 Red 5 Ltd Com NPV AUD 61,834 0.0636,730 Salt Lake Potash Ltd AUD1.00 AUD 9,951 0.01
350,875 Salt Lake Potash Ltd Com NPV AUD 98,453 0.09145,124 Westgold Resources Ltd Com NPV AUD 255,558 0.24
Oil & gas: 0.38% (31 May 2020: 0.00%)76,238 Santos Ltd Com NPV AUD 399,216 0.38
Packaging & containers: 0.05% (31 May 2020: 0.00%)4,461 Amcor Pty Ltd Com NPV AUD 53,090 0.05
Pharmaceuticals: 0.24% (31 May 2020: 0.16%)1,571 Blackmores Ltd Com NPV AUD 86,113 0.08
80,352 PolyNovo Ltd Com NPV AUD 168,242 0.16
Pipelines: 0.14% (31 May 2020: 0.13%)20,777 APA Group Com NPV AUD 148,682 0.14
Schedule of investments as at 31 May 2021 (continued)
Transferable securities admitted to an official stock exchange listing or traded on a regulated market. The percentages in brackets show the equivalent sector holdings at 31 May 2020.
196

Barclays Multi-Manager Fund PLC Annual Report and Audited Financial Statements 2021
GlobalAccess Asia Pacific (ex -Japan) Fund
Holdings Financial assets at fair value through profit or loss Currency Fair value
USD % of net
assets
Equities: 95.02% (31 May 2020: 91.07%) (continued) Australia: 13.57% (31 May 2020: 13.94%) (continued)
Real estate investment trusts: 0.62% (31 May 2020: 0.78%)
43,935 Goodman Group Reits AUD 660,603 0.62
Retail: 0.21% (31 May 2020: 0.31%)18,475 Bapcor Ltd Com NPV AUD 116,907 0.119,470 Lovisa Holdings Ltd Com NPV AUD 104,016 0.10
Software: 0.55% (31 May 2020: 0.57%)33,151 Megaport Ltd Com NPV AUD 384,395 0.368,788 Nuix Ltd AUD1.00 AUD 18,876 0.028,347 WiseTech Global Ltd Com NPV AUD 182,362 0.17
Telecommunications: 0.56% (31 May 2020: 0.62%)51,363 Service Stream Ltd Com NPV AUD 38,863 0.04
204,202 Telstra Corp Ltd Com NPV AUD 555,590 0.52
Total Australia 14,404,316 13.57
Bermuda: 3.20% (31 May 2020: 2.84%)
Commercial services: 0.60% (31 May 2020: 0.49%)783,485 COSCO SHIPPING Ports Ltd Com HKD0.10 HKD 635,465 0.60
Electrical components & equipment: 0.56% (31 May 2020: 0.49%)
227,214 Johnson Electric Holdings Ltd Com HKD0.05 HKD 592,092 0.56
Holding companies-diversified: 0.73% (31 May 2020: 0.78%)
12,000 Jardine Matheson Holdings Ltd Com USD0.25 USD 778,020 0.73
Oil & gas: 0.65% (31 May 2020: 0.67%)916,000 Kunlun Energy Co Ltd Com HKD0.01 HKD 691,016 0.65
Retail: 0.66% (31 May 2020: 0.41%)398,000 Chow Sang Sang Holdings International Ltd Com HKD0.25 HKD 699,460 0.66
Total Bermuda 3,396,053 3.20
Cayman Islands: 19.50% (31 May 2020: 22.16%)
Apparel: 0.57% (31 May 2020: 0.64%)23,600 Shenzhou International Group Holdings Ltd Com HKD0.10 HKD 609,058 0.57
Beverages: 0.51% (31 May 2020: 0.40%)159,400 Budweiser Brewing Co APAC Ltd USD0.00001 HKD 541,684 0.51
Schedule of investments as at 31 May 2021 (continued)
Transferable securities admitted to an official stock exchange listing or traded on a regulated market. The percentages in brackets show the equivalent sector holdings at 31 May 2020.
197

Barclays Multi-Manager Fund PLC Annual Report and Audited Financial Statements 2021
GlobalAccess Asia Pacific (ex -Japan) Fund
Holdings Financial assets at fair value through profit or loss Currency Fair value
USD % of net
assets
Equities: 95.02% (31 May 2020: 91.07%) (continued)
Cayman Islands: 19.50% (31 May 2020: 22.16%) (continued)
Commercial services: 0.76% (31 May 2020: 1.47%)
78,790 New Oriental Education & Technology Group Inc ADR USD0.01
USD 806,416 0.76
Electronics: 0.26% (31 May 2020: 0.32%)45,500 AAC Technologies Holdings Inc Com USD0.01 HKD 276,413 0.26
Food: 1.07% (31 May 2020: 1.19%)15,000 China Mengniu Dairy Co Ltd Com HKD0.10 HKD 90,884 0.09
550,096 Tingyi Cayman Islands Holding Corp Class C Com USD0.005
HKD 1,045,432 0.98
Holding companies-diversified: 1.29% (31 May 2020: 1.72%)
175,000 CK Hutchison Holdings Ltd Com HKD1.00 HKD 1,370,341 1.29
Internet: 11.72% (31 May 2020: 12.71%)8,818 Alibaba Group Holding Ltd ADR NPV USD 1,886,655 1.78
51,861 Alibaba Group Holding Ltd Com NPV HKD 1,409,234 1.337,325 Baidu - ADR USD 1,437,641 1.35
43,500 Baozun Inc Com HKD0.0001 HKD 503,025 0.4744,950 JD.com Inc Com HKD0.00002 HKD 1,687,080 1.5947,100 Tencent Holdings Ltd Com HKD0.00002 HKD 3,754,928 3.5410,565 Trip.com Group Ltd Com NPV USD 442,039 0.4226,406 Vipshop Holdings Ltd ADR USD0.0001 USD 610,639 0.5813,802 Weibo Corp ADR NPV USD 701,763 0.66
Lodging: 0.59% (31 May 2020: 1.56%)10,911 Huazhu Group Ltd ADR USD1.00 USD 623,945 0.59
Machinery-diversified: 0.72% (31 May 2020: 0.59%)220,000 Haitian International Holdings Ltd Com HKD0.10 HKD 767,462 0.72
Real estate: 0.52% (31 May 2020: 0.00%)118,000 China Resources Land Ltd Com HKD0.10 HKD 552,272 0.52
Retail: 0.65% (31 May 2020: 0.57%)358,800 Chow Tai Fook Jewellery Group Ltd Com HKD1.00 HKD 688,355 0.65
Semiconductors: 0.57% (31 May 2020: 0.60%)45,500 ASM Pacific Technology Ltd Com HKD0.10 HKD 602,364 0.57
Software: 0.27% (31 May 2020: 0.39%)2,431 NetEase Inc ADR USD0.0001 USD 286,749 0.27
Total Cayman Islands 20,694,379 19.50
Schedule of investments as at 31 May 2021 (continued)
Transferable securities admitted to an official stock exchange listing or traded on a regulated market. The percentages in brackets show the equivalent sector holdings at 31 May 2020.
198
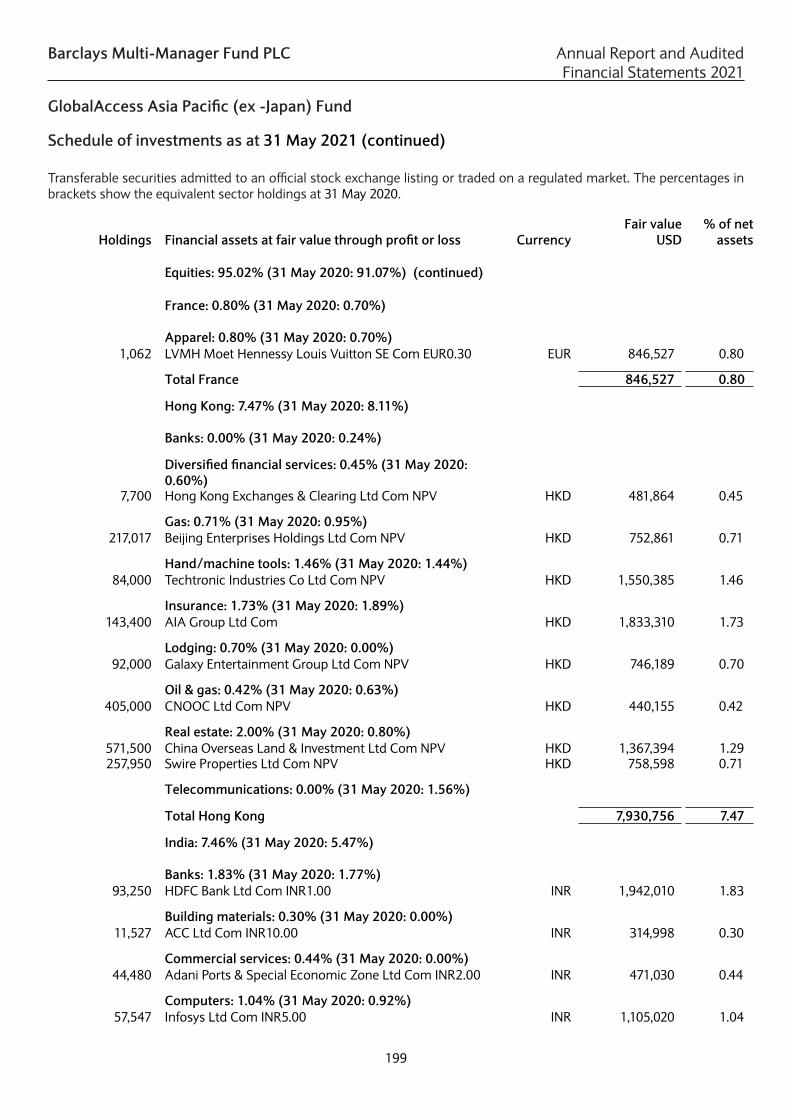
Barclays Multi-Manager Fund PLC Annual Report and Audited Financial Statements 2021
GlobalAccess Asia Pacific (ex -Japan) Fund
Holdings Financial assets at fair value through profit or loss Currency Fair value
USD % of net
assets
Equities: 95.02% (31 May 2020: 91.07%) (continued)
France: 0.80% (31 May 2020: 0.70%)
Apparel: 0.80% (31 May 2020: 0.70%)1,062 LVMH Moet Hennessy Louis Vuitton SE Com EUR0.30 EUR 846,527 0.80
Total France 846,527 0.80
Hong Kong: 7.47% (31 May 2020: 8.11%)
Banks: 0.00% (31 May 2020: 0.24%)
Diversified financial services: 0.45% (31 May 2020: 0.60%)
7,700 Hong Kong Exchanges & Clearing Ltd Com NPV HKD 481,864 0.45
Gas: 0.71% (31 May 2020: 0.95%)217,017 Beijing Enterprises Holdings Ltd Com NPV HKD 752,861 0.71
Hand/machine tools: 1.46% (31 May 2020: 1.44%)84,000 Techtronic Industries Co Ltd Com NPV HKD 1,550,385 1.46
Insurance: 1.73% (31 May 2020: 1.89%)143,400 AIA Group Ltd Com HKD 1,833,310 1.73
Lodging: 0.70% (31 May 2020: 0.00%)92,000 Galaxy Entertainment Group Ltd Com NPV HKD 746,189 0.70
Oil & gas: 0.42% (31 May 2020: 0.63%)405,000 CNOOC Ltd Com NPV HKD 440,155 0.42
Real estate: 2.00% (31 May 2020: 0.80%)571,500 China Overseas Land & Investment Ltd Com NPV HKD 1,367,394 1.29257,950 Swire Properties Ltd Com NPV HKD 758,598 0.71
Telecommunications: 0.00% (31 May 2020: 1.56%)
Total Hong Kong 7,930,756 7.47
India: 7.46% (31 May 2020: 5.47%)
Banks: 1.83% (31 May 2020: 1.77%)93,250 HDFC Bank Ltd Com INR1.00 INR 1,942,010 1.83
Building materials: 0.30% (31 May 2020: 0.00%)11,527 ACC Ltd Com INR10.00 INR 314,998 0.30
Commercial services: 0.44% (31 May 2020: 0.00%)44,480 Adani Ports & Special Economic Zone Ltd Com INR2.00 INR 471,030 0.44
Computers: 1.04% (31 May 2020: 0.92%)57,547 Infosys Ltd Com INR5.00 INR 1,105,020 1.04
Schedule of investments as at 31 May 2021 (continued)
Transferable securities admitted to an official stock exchange listing or traded on a regulated market. The percentages in brackets show the equivalent sector holdings at 31 May 2020.
199

Barclays Multi-Manager Fund PLC Annual Report and Audited Financial Statements 2021
GlobalAccess Asia Pacific (ex -Japan) Fund
Holdings Financial assets at fair value through profit or loss Currency Fair value
USD % of net
assets
Equities: 95.02% (31 May 2020: 91.07%) (continued) India: 7.46% (31 May 2020: 5.47%) (continued)
Electric: 0.35% (31 May 2020: 0.34%)120,424 Power Grid Corp of India Ltd Com INR10.00 INR 374,301 0.35
Gas: 0.55% (31 May 2020: 0.00%)262,546 GAIL India Ltd Com INR10.00 INR 579,429 0.55
Healthcare-services: 1.28% (31 May 2020: 0.85%)31,030 Apollo Hospitals Enterprise Ltd Com INR5.00 INR 1,360,111 1.28
Household products/wares: 0.56% (31 May 2020: 0.57%)
91,039 Marico Ltd Com INR1.00 INR 596,490 0.56
Media: 0.29% (31 May 2020: 0.36%)103,242 Zee Entertainment Enterprises Ltd Com INR1.00 INR 297,831 0.28355,263 Zee Entertainment Enterprises Pref INR2.00 INR 9,661 0.01
Real estate: 0.82% (31 May 2020: 0.66%)79,812 Phoenix Mills Ltd Com INR2.00 INR 867,055 0.82
Total India 7,917,936 7.46
Japan: 0.99% (31 May 2020: 1.47%)
Auto manufacturers: 0.99% (31 May 2020: 0.37%)1,173 Honda Motor Co Com Ltd ADR NPV USD 36,662 0.03
33,200 Honda Motor Co Ltd Com NPV JPY 1,018,200 0.96
Semiconductors: 0.00% (31 May 2020: 0.46%)
Software: 0.00% (31 May 2020: 0.64%)
Total Japan 1,054,862 0.99
Luxembourg: 0.62% (31 May 2020: 0.30%)
Apparel: 0.62% (31 May 2020: 0.30%)345,300 Samsonite International SA Com HKD0.01 HKD 653,558 0.62
Total Luxembourg 653,558 0.62
New Zealand: 0.44% (31 May 2020: 0.24%)
Food: 0.07% (31 May 2020: 0.19%)35,571 Synlait Milk Ltd Com NPV AUD 77,645 0.07
Lodging: 0.31% (31 May 2020: 0.00%)125,276 SKYCITY Entertainment Group Ltd Com NPV AUD 328,243 0.31
Schedule of investments as at 31 May 2021 (continued)
Transferable securities admitted to an official stock exchange listing or traded on a regulated market. The percentages in brackets show the equivalent sector holdings at 31 May 2020.
200

Barclays Multi-Manager Fund PLC Annual Report and Audited Financial Statements 2021
GlobalAccess Asia Pacific (ex -Japan) Fund
Holdings Financial assets at fair value through profit or loss Currency Fair value
USD % of net
assets
Equities: 95.02% (31 May 2020: 91.07%) (continued) New Zealand: 0.44% (31 May 2020: 0.24%) (continued)
Software: 0.06% (31 May 2020: 0.05%)36,761 Vista Group International Ltd Com AUD1.00 AUD 56,625 0.06
Total New Zealand 462,513 0.44
Papua New Guinea: 0.00% (31 May 2020: 0.34%)
Oil & gas: 0.00% (31 May 2020: 0.34%)
People's Republic of China: 8.97% (31 May 2020: 6.74%)
Building materials: 0.86% (31 May 2020: 0.00%)39,435 Oppein Home Group Inc CNY1.00 CNH 916,629 0.86
Chemicals: 0.63% (31 May 2020: 0.36%)2,117,597 China BlueChemical Ltd Com HKD1.00 HKD 663,003 0.63
Engineering & construction: 0.33% (31 May 2020: 0.49%)
525,935 Beijing Capital International Airport Co Ltd Com CNY1.00 HKD 354,743 0.33
Home furnishings: 1.23% (31 May 2020: 0.37%)50,546 Haier Smart Home Co Ltd CNY1.00 CNH 239,341 0.2331,600 Haier Smart Home Co Ltd HKD1.00 HKD 133,036 0.1273,100 Midea Group Co Ltd CNY1.00 CNH 929,092 0.88
Insurance: 2.54% (31 May 2020: 2.53%)267,600 China Pacific Insurance Group Co Ltd Com CNY1.00 HKD 1,005,918 0.95678,000 PICC Property & Casualty Co Ltd Com CNY1.00 HKD 646,875 0.61
96,000 Ping An Insurance Group Co of China Ltd Com CNY1.00 HKD 1,044,258 0.98
Media: 0.38% (31 May 2020: 0.37%)261,846 China South Publishing & Media Group Co Ltd CNY1.00 CNH 398,361 0.38
Oil & gas: 0.61% (31 May 2020: 0.52%)1,220,000 China Petroleum & Chemical Corp Com CNY1.00 HKD 649,981 0.61
Oil & gas services: 0.25% (31 May 2020: 0.39%)286,000 China Oilfield Services Ltd Com CNY1.00 HKD 268,633 0.25
Pharmaceuticals: 1.80% (31 May 2020: 1.71%)329,200 Sinopharm Group Co Ltd Com CNY1.00 HKD 1,120,832 1.06
40,105 Yunnan Baiyao Group Co Ltd CNY1.00 CNH 790,413 0.74
Transportation: 0.34% (31 May 2020: 0.00%)289,830 Shenzhen Airport Co Ltd CNY1.00 CNH 358,160 0.34
Total People's Republic of China 9,519,275 8.97
Schedule of investments as at 31 May 2021 (continued)
Transferable securities admitted to an official stock exchange listing or traded on a regulated market. The percentages in brackets show the equivalent sector holdings at 31 May 2020.
201

Barclays Multi-Manager Fund PLC Annual Report and Audited Financial Statements 2021
GlobalAccess Asia Pacific (ex -Japan) Fund
Holdings Financial assets at fair value through profit or loss Currency Fair value
USD % of net
assets
Equities: 95.02% (31 May 2020: 91.07%) (continued)
Philippines: 0.00% (31 May 2020: 0.53%)
Real estate: 0.00% (31 May 2020: 0.53%)
Republic of South Korea: 13.57% (31 May 2020: 9.26%)
Apparel: 0.98% (31 May 2020: 0.79%)24,450 Youngone Corp Com KRW500.00 KRW 1,040,344 0.98
Auto manufacturers: 0.41% (31 May 2020: 0.00%)4,342 Hyundai Motor Co Pref (Cumulative) KRW5000.00 KRW 436,721 0.41
32 Hyundai Motor Co Pref (Non-cumulative) KRW5000.00 KRW 3,204 –
Chemicals: 2.39% (31 May 2020: 0.58%)3,796 Kumho Petrochemical Co Ltd Com KRW5000.00 KRW 791,794 0.75
935 LG Chem Ltd Com KRW5000.00 KRW 689,647 0.6517,604 LOTTE Fine Chemical Co Ltd Com KRW5000.00 KRW 1,051,281 0.99
Diversified financial services: 1.25% (31 May 2020: 0.72%)
25,126 KB Financial Group Inc KRW 1,328,610 1.25
Insurance: 0.55% (31 May 2020: 0.42%)3,050 Samsung Fire & Marine Insurance Co Ltd Com KRW500.00 KRW 581,286 0.55
Internet: 0.86% (31 May 2020: 0.00%)2,807 NAVER Corp Com KRW500.00 KRW 915,203 0.86
Iron/steel: 0.51% (31 May 2020: 0.25%)11,292 Hyundai Steel Co Class C Com KRW5000.00 KRW 542,215 0.51
Semiconductors: 6.62% (31 May 2020: 6.50%)89,940 Samsung Electronics Co Ltd Com KRW100.00 KRW 6,512,464 6.14
4,498 SK Hynix Inc KRW 513,137 0.48
Total Republic of South Korea 14,405,906 13.57
Singapore: 1.56% (31 May 2020: 1.89%)
Banks: 1.07% (31 May 2020: 1.01%)121,574 Oversea-Chinese Banking Corp Ltd Com NPV SGD 1,138,016 1.07
Electronics: 0.49% (31 May 2020: 0.88%)36,000 Venture Corp Ltd Com NPV SGD 518,218 0.49
Total Singapore 1,656,234 1.56
Schedule of investments as at 31 May 2021 (continued)
Transferable securities admitted to an official stock exchange listing or traded on a regulated market. The percentages in brackets show the equivalent sector holdings at 31 May 2020.
202

Barclays Multi-Manager Fund PLC Annual Report and Audited Financial Statements 2021
GlobalAccess Asia Pacific (ex -Japan) Fund
Holdings Financial assets at fair value through profit or loss Currency Fair value
USD % of net
assets
Equities: 95.02% (31 May 2020: 91.07%) (continued)
South Africa: 0.91% (31 May 2020: 0.00%)
Internet: 0.91% (31 May 2020: 0.00%)4,362 Naspers Ltd ZAR 969,663 0.91
Total South Africa 969,663 0.91
Taiwan: 12.12% (31 May 2020: 13.97%)
Chemicals: 0.00% (31 May 2020: 0.45%)
Computers: 1.03% (31 May 2020: 1.30%)48,000 Asustek Computer Inc TWD 687,267 0.65
169,000 Lite-On Technology Corp TWD 405,587 0.38
Electronics: 0.66% (31 May 2020: 2.41%)52,905 Simplo Technology Co Ltd Com TWD10.00 TWD 700,002 0.66
Semiconductors: 10.43% (31 May 2020: 9.81%)505,000 ASE Technology Holding Co Ltd Com TWD 2,044,331 1.93
52,000 MediaTek Inc TWD 1,873,356 1.76254,748 Powertech Technology Inc Com TWD10.00 TWD 985,124 0.93285,183 Taiwan Semiconductor Manufacturing Co Ltd TWD 6,162,350 5.81
Total Taiwan 12,858,017 12.12
Thailand: 1.38% (31 May 2020: 1.56%)
Banks: 0.84% (31 May 2020: 1.07%)113,400 Bangkok Bank PCL ADR THB10.00 THB 416,605 0.39123,800 Kasikornbank PCL ADR THB10.00 THB 472,647 0.45
Home builders: 0.54% (31 May 2020: 0.49%)2,090,460 AP Thailand PCL Com THB1.00 THB 573,898 0.54
Total Thailand 1,463,150 1.38
United Kingdom: 1.72% (31 May 2020: 1.01%)
Banks: 0.66% (31 May 2020: 0.00%)95,700 Standard Chartered PLC Com HKD0.50 HKD 693,277 0.66
Mining: 1.06% (31 May 2020: 1.01%)13,086 Rio Tinto PLC Com GBP0.10 GBP 1,128,289 1.06
Total United Kingdom 1,821,566 1.72
United States: 0.74% (31 May 2020: 0.54%)
Retail: 0.74% (31 May 2020: 0.54%)4,000 Yum China Holdings Inc Com HKD0.01 HKD 266,579 0.25
Schedule of investments as at 31 May 2021 (continued)
Transferable securities admitted to an official stock exchange listing or traded on a regulated market. The percentages in brackets show the equivalent sector holdings at 31 May 2020.
203

Barclays Multi-Manager Fund PLC Annual Report and Audited Financial Statements 2021
GlobalAccess Asia Pacific (ex -Japan) Fund
Holdings Financial assets at fair value through profit or loss Currency Fair value
USD % of net
assets
Equities: 95.02% (31 May 2020: 91.07%) (continued) United States: 0.74% (31 May 2020: 0.54%) (continued)
Retail: 0.74% (31 May 2020: 0.54%) (continued) 7,755 Yum China Holdings Inc Com USD0.01 USD 524,665 0.49
Total United States 791,244 0.74
Total equities 100,845,955 95.02
Investment funds: 1.77% (31 May 2020: 1.61%)
Luxembourg: 1.77% (31 May 2020: 1.61%)
4,461 Schroder International Selection Fund - Asian Smaller Companies Class I Acc
USD 1,874,964 1.77
Total investment funds 1,874,964 1.77
P-notes: 0.47% (31 May 2020: 2.40%)
Singapore: 0.47% (31 May 2020: 0.66%)
328,094 China South Publishing & Media Group Co Ltd 30/06/2025
USD 499,148 0.47
Total Singapore 499,148 0.47
Switzerland: 0.00% (31 May 2020: 1.74%)
Total p-notes 499,148 0.47
Total warrants – –
Futures contracts: 0.00% (31 May 2020: 0.06%)
Forward currency contracts: 0.12% (31 May 2020: 0.07%)
Counterparty Cncy Buys Cncy SellsMaturity
dateUnrealised
gain% of net
assetsUSD
Barclays^ GBP 22,301 USD 31,571 17/06/2021 130 – CCT_1769380_128657
Barclays^ GBP 18,340 USD 25,964 17/06/2021 107 – CCT_1769380_128655
Barclays^ GBP 3,772 USD 5,341 17/06/2021 22 – CCT_1769380_128654
Barclays^ GBP 255 USD 361 17/06/2021 1 – CCT_1769380_128656
UBS GBP 4,609,770 USD 6,466,840 17/06/2021 86,069 0.08 CCT_1769380_127989
Schedule of investments as at 31 May 2021 (continued)
Transferable securities admitted to an official stock exchange listing or traded on a regulated market. The percentages in brackets show the equivalent sector holdings at 31 May 2020.
204

Barclays Multi-Manager Fund PLC Annual Report and Audited Financial Statements 2021
GlobalAccess Asia Pacific (ex -Japan) Fund
Forward currency contracts: 0.12% (31 May 2020: 0.07%) (continued)
Counterparty Cncy Buys Cncy SellsMaturity
date
Unrealised gain
% of net assets
USD UBS GBP 1,210,780 USD 1,698,548 17/06/2021 22,607 0.02 CCT_1769380_127994
UBS EUR 505,540 USD 610,286 17/06/2021 7,968 0.01 CCT_1769380_127996
UBS EUR 445,734 USD 538,088 17/06/2021 7,026 0.01 CCT_1769380_127997
UBS GBP 190,880 USD 267,777 17/06/2021 3,564 – CCT_1769380_127988
UBS GBP 10,517 USD 14,754 17/06/2021 196 – CCT_1769380_127992
UBS GBP 9,997 USD 14,141 17/06/2021 70 – CCT_1769380_127816
UBS GBP 4,997 USD 7,045 17/06/2021 59 – CCT_1769380_127910
UBS GBP 14,800 USD 21,003 17/06/2021 35 – CCT_1769380_128730
UBS GBP 997 USD 1,411 17/06/2021 6 – CCT_1769380_128343
UBS GBP 499 USD 706 17/06/2021 3 – CCT_1769380_128348
UBS GBP 796 USD 1,131 17/06/2021 – – CCT_1769380_128208
Total fair value gains on forward currency contracts 127,863 0.12
Counterparty Cncy Buys Cncy SellsMaturity
dateUnrealised
loss% of net
assetsUSD
Barclays^ USD 211 GBP 150 17/06/2021 (2) – CCT_1769380_128100
Barclays^ EUR 7,920 USD 9,697 17/06/2021 (11) – CCT_1769380_128652
Barclays^ EUR 9,152 USD 11,205 17/06/2021 (12) – CCT_1769380_128653
Barclays^ USD 4,088 GBP 2,900 17/06/2021 (35) – CCT_1769380_128094
Barclays^ USD 7,896 EUR 6,500 17/06/2021 (54) – CCT_1769380_128099
Barclays^ USD 8,867 EUR 7,300 17/06/2021 (60) – CCT_1769380_128096
Barclays^ USD 24,666 GBP 17,500 17/06/2021 (210) – CCT_1769380_128095
Total fair value losses on forward currency contracts (384) –
Total forward currency contracts 127,479 0.12
Fair value USD
% of net assets
Total value of investments 103,347,546 97.38
Cash and cash equivalents* 2,460,513 2.32
Other net assets*** 319,880 0.30
Net assets attributable to holders of redeemable participating shares 106,127,939 100.00
Schedule of investments as at 31 May 2021 (continued)
Transferable securities admitted to an official stock exchange listing or traded on a regulated market. The percentages in brackets show the equivalent sector holdings at 31 May 2020.
Holdings Financial assets at fair value through profit or loss Currency Fair value
USD % of net
assets
Equities: 95.02% (31 May 2020: 91.07%) (continued) United States: 0.74% (31 May 2020: 0.54%) (continued)
Retail: 0.74% (31 May 2020: 0.54%) (continued) 7,755 Yum China Holdings Inc Com USD0.01 USD 524,665 0.49
Total United States 791,244 0.74
Total equities 100,845,955 95.02
Investment funds: 1.77% (31 May 2020: 1.61%)
Luxembourg: 1.77% (31 May 2020: 1.61%)
4,461 Schroder International Selection Fund - Asian Smaller Companies Class I Acc
USD 1,874,964 1.77
Total investment funds 1,874,964 1.77
P-notes: 0.47% (31 May 2020: 2.40%)
Singapore: 0.47% (31 May 2020: 0.66%)
328,094 China South Publishing & Media Group Co Ltd 30/06/2025
USD 499,148 0.47
Total Singapore 499,148 0.47
Switzerland: 0.00% (31 May 2020: 1.74%)
Total p-notes 499,148 0.47
Total warrants – –
Futures contracts: 0.00% (31 May 2020: 0.06%)
Forward currency contracts: 0.12% (31 May 2020: 0.07%)
Counterparty Cncy Buys Cncy SellsMaturity
dateUnrealised
gain% of net
assetsUSD
Barclays^ GBP 22,301 USD 31,571 17/06/2021 130 – CCT_1769380_128657
Barclays^ GBP 18,340 USD 25,964 17/06/2021 107 – CCT_1769380_128655
Barclays^ GBP 3,772 USD 5,341 17/06/2021 22 – CCT_1769380_128654
Barclays^ GBP 255 USD 361 17/06/2021 1 – CCT_1769380_128656
UBS GBP 4,609,770 USD 6,466,840 17/06/2021 86,069 0.08 CCT_1769380_127989
205

Barclays Multi-Manager Fund PLC Annual Report and Audited Financial Statements 2021
GlobalAccess Asia Pacific (ex -Japan) Fund
Analysis of total assets (unaudited)% of total
assets
Transferable securities and money market instruments admitted to official stock exchangelisting or traded on a regulated market. 95.18Investment funds and AIFs. 1.76OTC financial derivative instruments. 0.12Other assets. 2.94
100.00
*All cash holdings are held with The Northern Trust Company.**Valued at a stale price.*** Including USD 81,248 held with Goldman Sachs as security by the counterparty to derivatives contracts.^ Related party.
The Industry Classification Benchmark (“ICB”) is jointly owned by FTSE and Dow Jones and has been licensed for use. FTSE and Dow Jones do not accept liability to any person for any loss or damage arising out of any error or omission in ICB.
Schedule of investments as at 31 May 2021 (continued)
Transferable securities admitted to an official stock exchange listing or traded on a regulated market. The percentages in brackets show the equivalent sector holdings at 31 May 2020.
206

Barclays Multi-Manager Fund PLC Annual Report and Audited Financial Statements 2021
GlobalAccess Emerging Market Equity Fund
Schedule of investments as at 31 May 2021
Transferable securities admitted to an official stock exchange listing or traded on a regulated market. The percentages in brackets show the equivalent sector holdings at 31 May 2020.
Holdings Financial assets at fair value through profit or loss CurrencyFair value
USD% of net
assets
Equities: 92.69% (31 May 2020: 93.79%)
Argentina: 0.02% (31 May 2020: 0.02%)
Oil & gas: 0.02% (31 May 2020: 0.00%)28,100 YPF SA ADR NPV USD 132,211 0.02
Telecommunications: 0.00% (31 May 2020: 0.02%)
Total Argentina 132,211 0.02
Bermuda: 3.21% (31 May 2020: 1.98%)
Apparel: 0.42% (31 May 2020: 0.00%)1,199,000 Yue Yuen Industrial Holdings Ltd Com HKD0.25 HKD 3,057,247 0.42
Electrical components & equipment: 0.54% (31 May 2020: 0.37%)
1,504,827 Johnson Electric Holdings Ltd Com HKD0.05 HKD 3,921,395 0.54
Forest products & paper: 0.01% (31 May 2020: 0.00%)32,000 Nine Dragons Paper Holdings Ltd Com HKD0.10 HKD 48,363 0.01
Holding companies-diversified: 0.93% (31 May 2020: 0.79%)
104,300 Jardine Matheson Holdings Ltd Com USD0.25 USD 6,762,291 0.93
Home furnishings: 0.24% (31 May 2020: 0.00%)169,900 VTech Holdings Ltd USD0.05 HKD 1,753,989 0.24
Oil & gas: 0.00% (31 May 2020: 0.08%)
Pharmaceuticals: 0.00% (31 May 2020: 0.02%)
Retail: 0.43% (31 May 2020: 0.44%)1,776,000 Chow Sang Sang Holdings International Ltd Com HKD0.25 HKD 3,121,209 0.43
Transportation: 0.64% (31 May 2020: 0.28%)12,234,000 Pacific Basin Shipping Ltd Com USD0.01 HKD 4,642,152 0.64
Total Bermuda 23,306,646 3.21
Brazil: 5.39% (31 May 2020: 6.19%)
Aerospace/defense: 0.07% (31 May 2020: 0.04%)152,111 Embraer SA Com NPV BRL 501,138 0.07
Banks: 0.69% (31 May 2020: 0.40%)174,188 Banco Bradesco SA Pref NPV BRL 878,733 0.1217,400 Banco do Brasil SA ADR NPV USD 110,664 0.02
105,292 Banco do Brasil SA Com NPV BRL 671,812 0.09595,412 Itau Unibanco Holding SA Pref NPV BRL 3,350,862 0.46
207

Barclays Multi-Manager Fund PLC Annual Report and Audited Financial Statements 2021
GlobalAccess Emerging Market Equity Fund
Holdings Financial assets at fair value through profit or loss Currency Fair value
USD % of net
assets
Equities: 92.69% (31 May 2020: 93.79%) (continued) Brazil: 5.39% (31 May 2020: 6.19%) (continued)
Beverages: 0.78% (31 May 2020: 0.72%)1,658,100 Ambev SA Com NPV BRL 5,669,650 0.78
Chemicals: 0.00% (31 May 2020: 0.01%)
Commercial services: 0.12% (31 May 2020: 0.09%)374,468 Santos Brasil Participacoes SA Com NPV BRL 640,400 0.0940,979 YDUQS Participacoes Com NPV BRL 256,975 0.03
Distribution/wholesale: 0.11% (31 May 2020: 0.00%)48,396 Sendas Distribuidora SA Com NPV BRL 824,651 0.11
Diversified financial services: 0.14% (31 May 2020: 0.25%)
292,159 B3 SA - Brasil Bolsa Balcao Com NPV BRL 976,174 0.14
Electric: 1.10% (31 May 2020: 1.01%)45,189 AES Brasil Energia SA Com NPV BRL 120,377 0.0247,941 Cia Energetica de Minas Gerais Com BRL5.00 BRL 149,267 0.02
1,745,113 Cia Energetica de Minas Gerais Pref BRL5.00 BRL 4,517,365 0.6280,872 Cia Energetica de Sao Paulo Class B Pref NPV BRL 372,766 0.05
111,797 Cia Paranaense de Energia Com NPV BRL 660,486 0.0920,910 CPFL Energia SA Com NPV BRL 114,490 0.0295,944 EDP - Energias do Brasil SA Com NPV BRL 340,865 0.05
9,752 Engie Brasil Energia SA Com NPV BRL 73,948 0.01514,443 Light SA Com NPV BRL 1,605,168 0.22
Food: 0.25% (31 May 2020: 0.37%)31,426 BRF SA ADR NPV USD 154,773 0.0290,439 Cia Brasileira de Distribuicao Com NPV BRL 679,406 0.0948,700 Grupo Mateus SA Com NPV BRL 75,444 0.0118,382 JBS SA Com NPV BRL 105,727 0.02
230,843 Marfrig Global Foods SA Com NPV BRL 806,491 0.11
Forest products & paper: 0.09% (31 May 2020: 0.02%)131,200 Klabin SA Com NPV BRL 657,869 0.09
Healthcare-services: 0.03% (31 May 2020: 0.00%)18,191 Rede D'Or Sao Luiz SA Com NPV BRL 243,486 0.03
Holding companies-diversified: 0.12% (31 May 2020: 0.14%)
407,162 Itausa - Investimentos Itau SA Pref NPV BRL 842,169 0.12
Insurance: 0.15% (31 May 2020: 1.18%)211,743 Hapvida Participacoes e Investimentos SA Com NPV BRL 644,342 0.0963,219 Sul America SA Com NPV BRL 417,638 0.06
Schedule of investments as at 31 May 2021 (continued)
Transferable securities admitted to an official stock exchange listing or traded on a regulated market. The percentages in brackets show the equivalent sector holdings at 31 May 2020.
208

Barclays Multi-Manager Fund PLC Annual Report and Audited Financial Statements 2021
GlobalAccess Emerging Market Equity Fund
Holdings Financial assets at fair value through profit or loss Currency Fair value
USD % of net
assets
Equities: 92.69% (31 May 2020: 93.79%) (continued) Brazil: 5.39% (31 May 2020: 6.19%) (continued)
Internet: 0.13% (31 May 2020: 0.24%)80,254 B2W Cia Digital Com NPV BRL 913,400 0.13
Investment companies: 0.06% (31 May 2020: 0.03%)32,670 Bradespar SA Pref NPV BRL 443,325 0.06
Iron/steel: 0.65% (31 May 2020: 0.60%)93,500 Cia Siderurgica Nacional SA ADR NPV USD 798,022 0.1164,300 Gerdau Com NPV BRL 338,895 0.05
393,359 Metalurgica Gerdau SA Pref NPV BRL 1,109,310 0.1533,658 Vale SA ADR NPV USD 724,152 0.1078,671 Vale SA Com NPV BRL 1,719,263 0.24
Machinery-diversified: 0.04% (31 May 2020: 0.04%)46,400 WEG SA Com NPV BRL 301,889 0.04
Oil & gas: 0.45% (31 May 2020: 0.53%)292,862 Petrobras Distribuidora SA Com NPV BRL 1,436,673 0.20132,245 Petroleo Brasileiro SA Com NPV BRL 670,542 0.09206,525 Petroleo Brasileiro SA Pref NPV BRL 1,057,211 0.15
7,800 Ultrapar Participacoes SA ADR NPV USD 28,665 –21,700 Ultrapar Participacoes SA Com NPV BRL 79,782 0.01
Pharmaceuticals: 0.00% (31 May 2020: 0.07%)
Real estate: 0.07% (31 May 2020: 0.06%)241,861 BR Malls Participacoes SA Com NPV BRL 514,549 0.07
Retail: 0.14% (31 May 2020: 0.22%)113,464 Atacadao SA Com NPV BRL 483,753 0.0646,400 C&A Modas Ltda Com NPV BRL 124,310 0.02
120,428 Lojas Americanas SA Com NPV BRL 429,571 0.06
Software: 0.00% (31 May 2020: 0.05%)
Telecommunications: 0.20% (31 May 2020: 0.12%)41,193 Telefonica Brasil ADR NPV USD 348,699 0.0555,181 Telefonica Brasil Com NPV BRL 465,007 0.06
285,343 TIM SA/Brazil Com NPV BRL 661,698 0.09
Total Brazil 39,111,852 5.39
Cayman Islands: 16.13% (31 May 2020: 17.19%)
Apparel: 0.63% (31 May 2020: 0.52%)176,300 Shenzhou International Group Holdings Ltd Com HKD0.10 HKD 4,549,868 0.63
Auto parts & equipment: 0.00% (31 May 2020: 0.02%)
Schedule of investments as at 31 May 2021 (continued)
Transferable securities admitted to an official stock exchange listing or traded on a regulated market. The percentages in brackets show the equivalent sector holdings at 31 May 2020.
209

Barclays Multi-Manager Fund PLC Annual Report and Audited Financial Statements 2021
GlobalAccess Emerging Market Equity Fund
Holdings Financial assets at fair value through profit or loss Currency Fair value
USD % of net
assets
Equities: 92.69% (31 May 2020: 93.79%) (continued)
Cayman Islands: 16.13% (31 May 2020: 17.19%) (continued)
Beverages: 0.61% (31 May 2020: 0.38%)
1,303,400 Budweiser Brewing Co APAC Ltd USD0.00001 HKD 4,429,306 0.61
Building materials: 0.02% (31 May 2020: 0.00%)52,000 China Lesso Group Holdings Ltd HKD0.05 HKD 137,348 0.02
Chemicals: 0.04% (31 May 2020: 0.09%)48,500 Kingboard Holdings Ltd Com HKD0.10 HKD 257,613 0.04
Commercial services: 0.80% (31 May 2020: 1.37%)569,970 New Oriental Education & Technology Group Inc ADR
USD0.01USD 5,833,643 0.80
Diversified financial services: 0.00% (31 May 2020: 0.06%)
Electronics: 0.00% (31 May 2020: 0.03%)
Energy-alternate sources: 0.00% (31 May 2020: 0.02%)
Food: 0.09% (31 May 2020: 0.04%)111,000 China Mengniu Dairy Co Ltd Com HKD0.10 HKD 672,539 0.09
Healthcare-products: 0.00% (31 May 2020: 0.09%)
Internet: 10.94% (31 May 2020: 11.22%)71,431 Alibaba Group Holding Ltd Com NPV USD 15,283,020 2.11
264,656 Alibaba Group Holding Ltd Com NPV HKD 7,191,572 0.9915,686 Baidu Inc ADR USD0.0001 USD 3,078,613 0.42
342,900 Baozun Inc Com HKD0.0001 HKD 3,965,222 0.55179,950 JD.com Inc Com HKD0.00002 HKD 6,753,950 0.93
35,079 Tencent Holdings Ltd ADR NPV USD 2,749,317 0.38373,500 Tencent Holdings Ltd Com HKD0.00002 HKD 29,776,342 4.11120,661 Trip.com Group Ltd Com NPV USD 5,048,456 0.69237,696 Vipshop Holdings Ltd ADR USD0.0001 USD 5,496,720 0.76
Lodging: 0.56% (31 May 2020: 1.33%)70,455 Huazhu Group Ltd ADR USD1.00 USD 4,028,969 0.56
Machinery-diversified: 0.72% (31 May 2020: 0.44%)1,498,000 Haitian International Holdings Ltd Com HKD0.10 HKD 5,225,716 0.72
Mining: 0.11% (31 May 2020: 0.00%)479,000 China Hongqiao Group Ltd Com USD0.01 HKD 772,073 0.11
Miscellaneous manufacturing: 0.21% (31 May 2020: 0.08%)
42,000 Airtac International Group Com TWD10.00 TWD 1,519,181 0.21
Schedule of investments as at 31 May 2021 (continued)
Transferable securities admitted to an official stock exchange listing or traded on a regulated market. The percentages in brackets show the equivalent sector holdings at 31 May 2020.
210

Barclays Multi-Manager Fund PLC Annual Report and Audited Financial Statements 2021
GlobalAccess Emerging Market Equity Fund
Holdings Financial assets at fair value through profit or loss Currency Fair value
USD % of net
assets
Equities: 92.69% (31 May 2020: 93.79%) (continued)
Cayman Islands: 16.13% (31 May 2020: 17.19%) (continued)
Pharmaceuticals: 0.00% (31 May 2020: 0.01%)
Real estate: 0.48% (31 May 2020: 0.00%)752,000 China Resources Land Ltd Com HKD0.10 HKD 3,519,565 0.48
Retail: 0.04% (31 May 2020: 0.17%)3,652,000 Grand Baoxin Auto Group Ltd Com HKD0.01 HKD 303,498 0.04
Semiconductors: 0.49% (31 May 2020: 0.50%)268,400 ASM Pacific Technology Ltd Com HKD0.10 HKD 3,553,284 0.49
Software: 0.39% (31 May 2020: 0.82%)23,780 NetEase Inc ADR USD0.0001 USD 2,804,970 0.39
Total Cayman Islands 116,950,785 16.13
Chile: 0.11% (31 May 2020: 0.79%)
Beverages: 0.06% (31 May 2020: 0.60%)50,390 Cia Cervecerias Unidas SA Com NPV CLP 449,833 0.06
Electric: 0.00% (31 May 2020: 0.06%)
Investment companies: 0.00% (31 May 2020: 0.13%)
Retail: 0.05% (31 May 2020: 0.00%)77,802 Falabella SA Com NPV CLP 349,205 0.05
Total Chile 799,038 0.11
China: 0.03% (31 May 2020: 0.00%)
Banks: 0.03% (31 May 2020: 0.00%)362,000 China CITIC Bank Corp Ltd Com HKD1.00 HKD 197,527 0.03
Total China 197,527 0.03
Colombia: 0.00% (31 May 2020: 0.00%)
Investment companies: 0.00% (31 May 2020: 0.00%)3,913 Grupo de Inversiones Suramericana SA Pref COP187.50 COP 18,605 –
Total Colombia 18,605 –
Cyprus: 0.19% (31 May 2020: 0.00%)
Banks: 0.19% (31 May 2020: 0.00%)15,108 TCS Group Holding PLC Class A GDR NPV USD 1,133,251 0.16
Schedule of investments as at 31 May 2021 (continued)
Transferable securities admitted to an official stock exchange listing or traded on a regulated market. The percentages in brackets show the equivalent sector holdings at 31 May 2020.
211

Barclays Multi-Manager Fund PLC Annual Report and Audited Financial Statements 2021
GlobalAccess Emerging Market Equity Fund
Holdings Financial assets at fair value through profit or loss Currency Fair value
USD % of net
assets
Equities: 92.69% (31 May 2020: 93.79%) (continued) Cyprus: 0.19% (31 May 2020: 0.00%) (continued)
Banks: 0.19% (31 May 2020: 0.00%) (continued) 2,785 TCS Group Holding PLC GDR NPV RUB 209,438 0.03
Total Cyprus 1,342,689 0.19
Czech Republic: 0.47% (31 May 2020: 0.27%)
Banks: 0.02% (31 May 2020: 0.00%)43,489 Moneta Money Bank AS Com CZK1.00 CZK 163,948 0.02
Electric: 0.45% (31 May 2020: 0.27%)108,693 CEZ AS Class A Com CZK100.00 CZK 3,267,097 0.45
Total Czech Republic 3,431,045 0.47
France: 0.86% (31 May 2020: 0.66%)
Apparel: 0.86% (31 May 2020: 0.66%)7,781 LVMH Moet Hennessy Louis Vuitton SE Com EUR0.30 EUR 6,202,287 0.86
Total France 6,202,287 0.86
Germany: 0.00% (31 May 2020: 0.44%)
Transportation: 0.00% (31 May 2020: 0.44%)
Greece: 0.19% (31 May 2020: 0.61%)
Banks: 0.00% (31 May 2020: 0.36%)
Entertainment: 0.07% (31 May 2020: 0.00%)32,246 OPAP SA Com EUR0.30 EUR 508,393 0.07
Retail: 0.03% (31 May 2020: 0.00%)12,233 JUMBO SA Com EUR0.88 EUR 238,783 0.03
Telecommunications: 0.09% (31 May 2020: 0.25%)34,255 Hellenic Telecommunications Organization SA Com
EUR2.83EUR 619,957 0.09
Total Greece 1,367,133 0.19
Hong Kong: 7.48% (31 May 2020: 8.16%)
Auto manufacturers: 0.00% (31 May 2020: 0.00%)1,252,000 Brilliance China Automotive Holdings Com NPV HKD 1,613 –
Banks: 0.00% (31 May 2020: 0.47%)
Schedule of investments as at 31 May 2021 (continued)
Transferable securities admitted to an official stock exchange listing or traded on a regulated market. The percentages in brackets show the equivalent sector holdings at 31 May 2020.
212

Barclays Multi-Manager Fund PLC Annual Report and Audited Financial Statements 2021
GlobalAccess Emerging Market Equity Fund
Holdings Financial assets at fair value through profit or loss Currency Fair value
USD % of net
assets
Equities: 92.69% (31 May 2020: 93.79%) (continued) Hong Kong: 7.48% (31 May 2020: 8.16%) (continued)
Computers: 0.35% (31 May 2020: 0.40%)2,134,000 Lenovo Ltd Com NPV HKD 2,555,697 0.35
Diversified financial services: 0.75% (31 May 2020: 0.60%)
233,000 Far East Horizon Ltd NPV HKD 254,576 0.0482,800 Hong Kong Exchanges & Clearing Ltd Com NPV HKD 5,181,601 0.71
Electric: 0.26% (31 May 2020: 0.39%)1,476,000 China Resources Power Holdings Co Ltd Com NPV HKD 1,900,792 0.26
Electronics: 0.00% (31 May 2020: 0.04%)
Hand/machine tools: 1.60% (31 May 2020: 1.34%)627,000 Techtronic Industries Co Ltd Com NPV HKD 11,572,514 1.60
Insurance: 1.99% (31 May 2020: 1.69%)1,128,000 AIA Group Ltd Com NPV HKD 14,421,012 1.99
Lodging: 1.14% (31 May 2020: 0.14%)1,019,000 Galaxy Entertainment Group Ltd Com NPV HKD 8,264,859 1.14
Oil & gas: 0.69% (31 May 2020: 1.05%)4,599,800 CNOOC Ltd Com NPV HKD 4,999,074 0.69
Pharmaceuticals: 0.00% (31 May 2020: 0.02%)
Real estate: 0.70% (31 May 2020: 0.98%)1,737,800 Swire Properties Ltd Com NPV HKD 5,110,649 0.70
Telecommunications: 0.00% (31 May 2020: 1.04%)
Total Hong Kong 54,262,387 7.48
Hungary: 0.51% (31 May 2020: 1.65%)
Banks: 0.49% (31 May 2020: 0.98%)65,316 OTP Bank PLC Com HUF100.00 HUF 3,593,770 0.49
Oil & gas: 0.00% (31 May 2020: 0.66%)
Pharmaceuticals: 0.02% (31 May 2020: 0.01%)4,727 Richter Gedeon Nyrt HUF100.00 HUF 135,264 0.02
Total Hungary 3,729,034 0.51
India: 7.67% (31 May 2020: 8.27%)
Auto manufacturers: 0.00% (31 May 2020: 0.84%)
Schedule of investments as at 31 May 2021 (continued)
Transferable securities admitted to an official stock exchange listing or traded on a regulated market. The percentages in brackets show the equivalent sector holdings at 31 May 2020.
213

Barclays Multi-Manager Fund PLC Annual Report and Audited Financial Statements 2021
GlobalAccess Emerging Market Equity Fund
Holdings Financial assets at fair value through profit or loss Currency Fair value
USD % of net
assets
Equities: 92.69% (31 May 2020: 93.79%) (continued) India: 7.67% (31 May 2020: 8.27%) (continued)
Banks: 2.46% (31 May 2020: 1.81%)693,181 HDFC Bank Ltd Com INR1.00 INR 14,436,081 1.9986,339 ICICI Bank Ltd Com INR2.00 INR 787,540 0.11
445,170 State Bank of India Com INR1.00 INR 2,601,384 0.36
Coal: 0.00% (31 May 2020: 0.04%)
Computers: 1.24% (31 May 2020: 0.78%)467,363 Infosys Ltd Com INR5.00 INR 8,974,322 1.24
Diversified financial services: 0.69% (31 May 2020: 0.87%)
43,528 Muthoot Finance Ltd Com INR10.00 INR 790,334 0.11558,956 REC Ltd Com INR10.00 INR 1,124,685 0.15158,389 Shriram Transport Finance Co Ltd INR10.00 INR 3,108,620 0.43
Electric: 0.07% (31 May 2020: 0.81%)163,000 Power Grid Corp of India Ltd Com INR10.00 INR 506,636 0.07
Healthcare-services: 1.08% (31 May 2020: 0.50%)178,978 Apollo Hospitals Enterprise Ltd Com INR5.00 INR 7,844,990 1.08
Household products/wares: 0.56% (31 May 2020: 0.46%)
620,693 Marico Ltd Com INR1.00 INR 4,066,801 0.56
Investment companies: 0.02% (31 May 2020: 0.00%)2,667 Bajaj Holdings & Investment Ltd Com INR10.00 INR 130,172 0.02
Media: 0.21% (31 May 2020: 0.26%)521,365 Zee Entertainment Enterprises Ltd Com INR1.00 INR 1,504,024 0.21
Mining: 0.10% (31 May 2020: 0.04%)189,276 Vedanta Ltd Com INR1.00 INR 714,061 0.10
Oil & gas: 0.08% (31 May 2020: 0.13%)146,636 Hindustan Petroleum Corp Ltd Com INR10.00 INR 563,293 0.08
Pharmaceuticals: 0.40% (31 May 2020: 0.46%)211,534 Aurobindo Pharma Com INR1.00 INR 2,917,158 0.40
Real estate: 0.76% (31 May 2020: 0.58%)510,888 Phoenix Mills Ltd Com INR2.00 INR 5,550,141 0.76
Software: 0.00% (31 May 2020: 0.69%)
Total India 55,620,242 7.67
Schedule of investments as at 31 May 2021 (continued)
Transferable securities admitted to an official stock exchange listing or traded on a regulated market. The percentages in brackets show the equivalent sector holdings at 31 May 2020.
214

Barclays Multi-Manager Fund PLC Annual Report and Audited Financial Statements 2021
GlobalAccess Emerging Market Equity Fund
Holdings Financial assets at fair value through profit or loss Currency Fair value
USD % of net
assets
Equities: 92.69% (31 May 2020: 93.79%) (continued)
Indonesia: 0.33% (31 May 2020: 0.34%)
Banks: 0.18% (31 May 2020: 0.16%)3,067,400 Bank Mandiri Persero Tbk PT Com IDR250.00 IDR 1,291,509 0.18
Building materials: 0.04% (31 May 2020: 0.00%)410,700 Semen Indonesia Persero Tbk PT IDR100.00 IDR 279,336 0.04
Distribution/wholesale: 0.00% (31 May 2020: 0.12%)
Engineering & construction: 0.00% (31 May 2020: 0.01%)
Food: 0.02% (31 May 2020: 0.03%)271,300 Indofood Sukses Makmur Tbk PT Com IDR100.00 IDR 120,404 0.02
Forest products & paper: 0.01% (31 May 2020: 0.00%)199,000 Indah Kiat Pulp & Paper Corp Tbk PT Com IDR1000.00 IDR 118,278 0.01
Mining: 0.06% (31 May 2020: 0.00%)2,597,500 Aneka Tambang Tbk IDR100.00 IDR 444,740 0.06
Telecommunications: 0.02% (31 May 2020: 0.02%)6,500 Telekomunikasi Indonesia Persero Tbk ADR NPV USD 150,897 0.02
Total Indonesia 2,405,164 0.33
Luxembourg: 0.72% (31 May 2020: 0.32%)
Apparel: 0.59% (31 May 2020: 0.24%)2,282,700 Samsonite International SA Com HKD0.01 HKD 4,320,521 0.59
Iron/steel: 0.13% (31 May 2020: 0.08%)25,159 Ternium SA ADR EUR1.00 USD 921,197 0.13
Total Luxembourg 5,241,718 0.72
Malaysia: 0.22% (31 May 2020: 0.21%)
Chemicals: 0.00% (31 May 2020: 0.03%)
Entertainment: 0.00% (31 May 2020: 0.02%)
Healthcare-products: 0.05% (31 May 2020: 0.00%)283,600 Top Glove Corp Bhd Com MYR0.50 MYR 355,832 0.05
Holding companies-diversified: 0.01% (31 May 2020: 0.00%)
222,900 IJM Corp Bhd Com MYR1.00 MYR 95,926 0.01
Schedule of investments as at 31 May 2021 (continued)
Transferable securities admitted to an official stock exchange listing or traded on a regulated market. The percentages in brackets show the equivalent sector holdings at 31 May 2020.
215

Barclays Multi-Manager Fund PLC Annual Report and Audited Financial Statements 2021
GlobalAccess Emerging Market Equity Fund
Holdings Financial assets at fair value through profit or loss Currency Fair value
USD % of net
assets
Equities: 92.69% (31 May 2020: 93.79%) (continued) Malaysia: 0.22% (31 May 2020: 0.21%) (continued)
Lodging: 0.08% (31 May 2020: 0.16%)855,200 Genting Malaysia Bhd Com MYR0.10 MYR 577,460 0.08
Miscellaneous manufacturing: 0.08% (31 May 2020: 0.00%)
106,500 Hartalega Holdings Bhd Com MYR0.50 MYR 232,521 0.03307,333 Supermax Corp Bhd NPV MYR 308,115 0.05
Total Malaysia 1,569,854 0.22
Marshall Island: 0.00% (31 May 2020: 0.02%)
Transportation: 0.00% (31 May 2020: 0.02%)
Mexico: 0.35% (31 May 2020: 0.16%)
Banks: 0.07% (31 May 2020: 0.06%)10,904 Banco Santander Mexico SA Institucion de Banca Multiple
Grupo Financiero Santand ADR NPVUSD 64,116 0.01
84,656 Banco Santander Mexico SA Institucion de Banca Multiple Grupo Financiero Santand Com MXN3.78
MXN 100,354 0.01
28,400 Grupo Financiero Banorte CV Com MXN3.50 MXN 196,257 0.03153,360 Grupo Financiero Inbursa SAB de CV Com MXN0.4137108 MXN 156,224 0.02
Building materials: 0.19% (31 May 2020: 0.00%)131,500 Cemex SAB de CV ADR NPV USD 1,088,162 0.15329,100 Cemex SAB de CV Com NPV MXN 278,297 0.04
Chemicals: 0.01% (31 May 2020: 0.00%)21,200 Orbia Advance Corp SAB de CV Com NPV MXN 60,326 0.01
Engineering & construction: 0.00% (31 May 2020: 0.03%)
Mining: 0.08% (31 May 2020: 0.05%)113,600 Grupo Mexico SAB de CV Com NPV MXN 554,526 0.08
Retail: 0.00% (31 May 2020: 0.02%)1,206 Alsea SAB de CV Com NPV MXN 2,026 –
Total Mexico 2,500,288 0.35
Netherlands: 0.05% (31 May 2020: 0.83%)
Food: 0.05% (31 May 2020: 0.83%)11,813 X5 Retail Group GDR EUR1.00 RUB 357,531 0.05
Total Netherlands 357,531 0.05
Schedule of investments as at 31 May 2021 (continued)
Transferable securities admitted to an official stock exchange listing or traded on a regulated market. The percentages in brackets show the equivalent sector holdings at 31 May 2020.
216

Barclays Multi-Manager Fund PLC Annual Report and Audited Financial Statements 2021
GlobalAccess Emerging Market Equity Fund
Holdings Financial assets at fair value through profit or loss Currency Fair value
USD % of net
assets
Equities: 92.69% (31 May 2020: 93.79%) (continued)
Nigeria: 0.00% (31 May 2020: 0.18%)
Banks: 0.00% (31 May 2020: 0.18%)
People's Republic of China: 9.99% (31 May 2020: 7.66%)
Airlines: 0.15% (31 May 2020: 0.00%)488,000 Air China Ltd Com CNY1.00 HKD 392,032 0.06992,000 China Southern Airlines Co Ltd CNY1.00 HKD 672,939 0.09
Apparel: 0.00% (31 May 2020: 0.03%)
Auto manufacturers: 0.22% (31 May 2020: 0.28%)608,600 Chongqing Changan Automobile Co Ltd Com CNY1.00 HKD 591,639 0.08
1,094,000 Dongfeng Motor Group Co Ltd Com CNY1.00 HKD 1,022,634 0.14
Auto parts & equipment: 0.05% (31 May 2020: 0.00%)40,759 Huayu Automotive Systems Co Ltd CNY1.00 CNH 156,925 0.0289,600 Weifu High-Technology Group Co Ltd Com CNY1.00 HKD 194,467 0.03
Banks: 0.97% (31 May 2020: 0.72%)1,171,100 Bank of Beijing Co Ltd CNY1.00 CNH 901,398 0.12
4,902,000 Bank of China Ltd Com CNY1.00 HKD 1,841,100 0.2539,700 Bank of Hangzhou Co Ltd CNY1.00 CNH 102,885 0.01
450,800 Bank of Suzhou Co Ltd CNY1.00 CNH 541,517 0.082,787,000 China Construction Bank Corp Com CNY1.00 HKD 2,289,195 0.32
989,000 China Everbright Bank Co Ltd Com CNY1.00 HKD 418,598 0.061,621,000 Chongqing Rural Commercial Bank Co Ltd Com HKD1.00 HKD 732,043 0.10
15,108 Industrial & Commercial Bank of China Ltd ADR NPV USD 198,670 0.03
Beverages: 0.99% (31 May 2020: 1.46%)105,800 Anhui Kouzi Distillery Co Ltd CNY1.00 CNH 1,114,930 0.15
17,899 Chongqing Brewery Co Ltd CNY1.00 CNH 485,477 0.0772,500 Jiangsu King's Luck Brewery JSC Ltd CNY1.00 CNH 677,547 0.0923,100 JiuGui Liquor Co Ltd CNY1.00 CNH 893,935 0.1220,900 Luzhou Laojiao Co Ltd CNY1.00 CNH 901,728 0.1350,642 Shanghai Bairun Investment Holding Group Co Ltd
CNY1.00CNH 980,520 0.14
11,942 Shanxi Xinghuacun Fen Wine Factory Co Ltd Com CNY1.00
CNH 867,335 0.12
58,327 Sichuan Swellfun Co Ltd CNY1.00 CNH 1,167,391 0.1645,778 Yantai Changyu Pioneer Wine Co Ltd Com CNY1.00 HKD 92,337 0.01
Building materials: 1.00% (31 May 2020: 0.24%)84,000 China National Building Material Co Ltd HKD1.00 HKD 112,450 0.02
306,816 Oppein Home Group Inc CNY1.00 CNH 7,131,645 0.98
Chemicals: 0.19% (31 May 2020: 0.00%)273,000 Ningxia Baofeng Energy Group Co Ltd CNY1.00 CNH 608,966 0.08
7,600 Sinopec Shanghai Petrochemical Co Ltd ADR NPV USD 193,040 0.03
Schedule of investments as at 31 May 2021 (continued)
Transferable securities admitted to an official stock exchange listing or traded on a regulated market. The percentages in brackets show the equivalent sector holdings at 31 May 2020.
217

Barclays Multi-Manager Fund PLC Annual Report and Audited Financial Statements 2021
GlobalAccess Emerging Market Equity Fund
Holdings Financial assets at fair value through profit or loss Currency Fair value
USD % of net
assets
Equities: 92.69% (31 May 2020: 93.79%) (continued)
People’s Republic of China: 9.99% (31 May 2020: 7.66%) (continued)
Chemicals: 0.19% (31 May 2020: 0.00%) (continued)
325,264 Tangshan Sanyou Chemical Industries Co Ltd CNY1.00 CNH 519,853 0.0740,510 Xinjiang Zhongtai Chemical Co Ltd CNY1.00 CNH 63,537 0.01
Coal: 0.22% (31 May 2020: 0.02%)25,327 China Shenhua Energy Co Ltd ADR NPV USD 223,004 0.0326,200 China Shenhua Energy Co Ltd Class A Com CNY1.00 CNH 82,124 0.01
234,000 China Shenhua Energy Co Ltd Com CNY1.00 HKD 529,729 0.08405,000 Huaibei Mining Holdings Co Ltd Com CNY1.00 CNH 728,639 0.10
Commercial services: 0.00% (31 May 2020: 0.11%)
Computers: 0.00% (31 May 2020: 0.02%)8,600 BOE Technology Group Co Ltd Com CNY1.00 HKD 4,249 –
Cosmetics/personal care: 0.00% (31 May 2020: 0.05%)
Distribution/wholesale: 0.16% (31 May 2020: 0.00%)70,200 Shanghai Jahwa United Co Ltd CNY1.00 CNH 647,075 0.09
476,900 Wuchan Zhongda Group Co Ltd CNY1.00 CNH 539,193 0.07
Diversified financial services: 0.26% (31 May 2020: 0.08%)
1,949,000 China Cinda Asset Management Co Ltd Com CNY1.00 HKD 415,600 0.0697,500 China Galaxy Securities Co Ltd Com CNY1.00 HKD 61,241 0.0119,200 China International Capital Corp Ltd Com CNY1.00 HKD 56,588 0.01
138,500 CITIC Securities Co Ltd Com CNY1.00 HKD 383,220 0.05268,000 Everbright Securities Co Ltd Com CNY1.00 HKD 234,979 0.03112,600 Guotai Junan Securities Co Ltd Com CNY1.00 HKD 169,307 0.0230,200 Huatai Securities Co Ltd Com CNY1.00 HKD 46,732 0.01
218,800 Orient Securities Co Ltd/China Com CNY1.00 HKD 155,756 0.0263,866 Shanghai DZH Ltd CNY1.00 CNH 88,344 0.01
1,004,000 Shenwan Hongyuan Group Co Ltd Com HKD1.00 HKD 300,762 0.04
Electric: 0.03% (31 May 2020: 0.06%)588,000 Huadian Power International Corp Ltd Com CNY1.00 HKD 182,204 0.03
Electrical components & equipment: 0.05% (31 May 2020: 0.00%)
391,000 Dongfang Electric Corp Ltd Com HKD1.00 HKD 340,305 0.05
Electronics: 0.00% (31 May 2020: 0.34%)
Engineering & construction: 0.00% (31 May 2020: 0.14%)
Food: 0.00% (31 May 2020: 0.05%)
Schedule of investments as at 31 May 2021 (continued)
Transferable securities admitted to an official stock exchange listing or traded on a regulated market. The percentages in brackets show the equivalent sector holdings at 31 May 2020.
218

Barclays Multi-Manager Fund PLC Annual Report and Audited Financial Statements 2021
GlobalAccess Emerging Market Equity Fund
Holdings Financial assets at fair value through profit or loss Currency Fair value
USD % of net
assets
Equities: 92.69% (31 May 2020: 93.79%) (continued)
People’s Republic of China: 9.99% (31 May 2020: 7.66%) (continued)
Forest products & paper: 0.03% (31 May 2020: 0.00%)
269,800 Shandong Chenming Paper Holdings Ltd Com CNY1.00 HKD 193,799 0.03
Healthcare-products: 0.00% (31 May 2020: 0.21%)
Home furnishings: 1.23% (31 May 2020: 0.04%)26,800 Ecovacs Robotics Co Ltd CNY1.00 CNH 767,147 0.1078,951 Jason Furniture Hangzhou Co Ltd CNY1.00 CNH 995,095 0.14
564,700 Midea Group Co Ltd CNY1.00 CNH 7,177,271 0.99
Insurance: 2.16% (31 May 2020: 1.81%)27,975 China Life Insurance Co Ltd ADR USD 299,192 0.04
235,000 China Life Insurance Co Ltd Com CNY1.00 HKD 495,658 0.071,972,800 China Pacific Insurance Group Co Ltd Com CNY1.00 HKD 7,415,825 1.02
195,500 New China Life Insurance Co Ltd Com CNY1.00 HKD 731,113 0.10308,000 People's Insurance Co Group of China Ltd Com CNY1.00 HKD 113,695 0.02
7,400 Ping An Insurance Group Co of China Ltd ADR NPV USD 162,245 0.02593,500 Ping An Insurance Group Co of China Ltd Com CNY1.00 HKD 6,455,908 0.89
Internet: 0.03% (31 May 2020: 0.00%)11,793 Hithink RoyalFlush Information Network Co Ltd CNY1.00 CNH 220,968 0.03
Leisure time: 0.06% (31 May 2020: 0.00%)11,600 Zhejiang Cfmoto Power Co Ltd Class A CNY1.00 CNH 245,066 0.048,000 Zhejiang Cfmoto Power Co Ltd CNY1.00 CNY 169,330 0.02
Machinery-construction & mining: 0.06% (31 May 2020: 0.00%)
378,000 Zoomlion Heavy Industry Science and Technology Co Ltd Com CNY1.00
HKD 456,105 0.06
Machinery-diversified: 0.01% (31 May 2020: 0.04%)7,900 Jiangsu Hengli Hydraulic Co Ltd CNY1.00 CNH 98,772 0.01
Media: 0.05% (31 May 2020: 0.00%)246,300 China South Publishing & Media Group Co Ltd CNY1.00 CNH 374,710 0.05
Mining: 0.48% (31 May 2020: 0.02%)29,100 Aluminum Corp of China Ltd ADR NPV USD 427,043 0.06
501,000 Jiangxi Copper Com CNY1.00 HKD 1,188,385 0.161,166,500 Shandong Nanshan Aluminum Co Ltd CNY1.00 CNH 736,773 0.10
359,397 Xiamen Tungsten Co Ltd CNY1.00 CNH 1,139,506 0.16
Miscellaneous manufacturing: 0.11% (31 May 2020: 0.09%)
45,500 China International Marine Containers Group Co Ltd CNY1.00
HKD 86,764 0.01
Schedule of investments as at 31 May 2021 (continued)
Transferable securities admitted to an official stock exchange listing or traded on a regulated market. The percentages in brackets show the equivalent sector holdings at 31 May 2020.
219

Barclays Multi-Manager Fund PLC Annual Report and Audited Financial Statements 2021
GlobalAccess Emerging Market Equity Fund
Holdings Financial assets at fair value through profit or loss Currency Fair value
USD % of net
assets
Equities: 92.69% (31 May 2020: 93.79%) (continued)
People’s Republic of China: 9.99% (31 May 2020: 7.66%) (continued)
Miscellaneous manufacturing: 0.11% (31 May 2020:
0.09%) (continued)
198,819 Zhejiang Weixing New Building Materials Co Ltd CNY1.00 CNH 730,837 0.10
Oil & gas: 0.90% (31 May 2020: 0.73%)10,085 China Petroleum & Chemical ADR Com CNY1.00 USD 545,094 0.08
206,000 China Petroleum & Chemical Corp CNY1.00 CNH 142,719 0.029,074,000 China Petroleum & Chemical Corp Com CNY1.00 HKD 4,834,369 0.67
5,665 Petrochina Co ADR HKD0.10 USD 233,568 0.03817,926 PetroChina Co Ltd Class A Com CNY1.00 CNH 593,621 0.08
402,000 PetroChina Co Ltd Class H Com CNY1.00 HKD 163,933 0.02
Pharmaceuticals: 0.00% (31 May 2020: 0.75%)
Real estate: 0.01% (31 May 2020: 0.00%)63,800 Shenzhen Overseas Chinese Town Co Ltd CNY1.00 CNH 83,547 0.01
Retail: 0.33% (31 May 2020: 0.05%)1,252,638 Zhejiang Semir Garment Co Ltd CNY1.00 CNH 2,351,915 0.33
Semiconductors: 0.07% (31 May 2020: 0.00%)51,537 Hoshine Silicon Industry Co Ltd Com CNH1.00 CNH 517,707 0.07
Software: 0.07% (31 May 2020: 0.11%)3,551 G-bits Network Technology Xiamen Co Ltd CNY1.00 CNH 279,999 0.04
59,800 Shanghai Baosight Software Co Ltd Com CNY1.00 USD 235,463 0.03
Telecommunications: 0.00% (31 May 2020: 0.20%)
Transportation: 0.10% (31 May 2020: 0.01%)490,000 COSCO SHIPPING Energy Transportation Co Ltd CNY1.00 HKD 227,597 0.03248,500 COSCO SHIPPING Holdings Co Ltd HKD1.00 HKD 522,851 0.07
Total People's Republic of China 72,469,374 9.99
Peru: 0.02% (31 May 2020: 0.02%)
Mining: 0.02% (31 May 2020: 0.02%)14,651 Cia de Minas Buenaventura SA ADR NPV USD 168,853 0.02
Total Peru 168,853 0.02
Philippines: 0.30% (31 May 2020: 0.36%)
Real estate: 0.30% (31 May 2020: 0.36%)2,987,300 Ayala Land Inc Com PHP1.00 PHP 2,148,326 0.30
Total Philippines 2,148,326 0.30
Schedule of investments as at 31 May 2021 (continued)
Transferable securities admitted to an official stock exchange listing or traded on a regulated market. The percentages in brackets show the equivalent sector holdings at 31 May 2020.
220
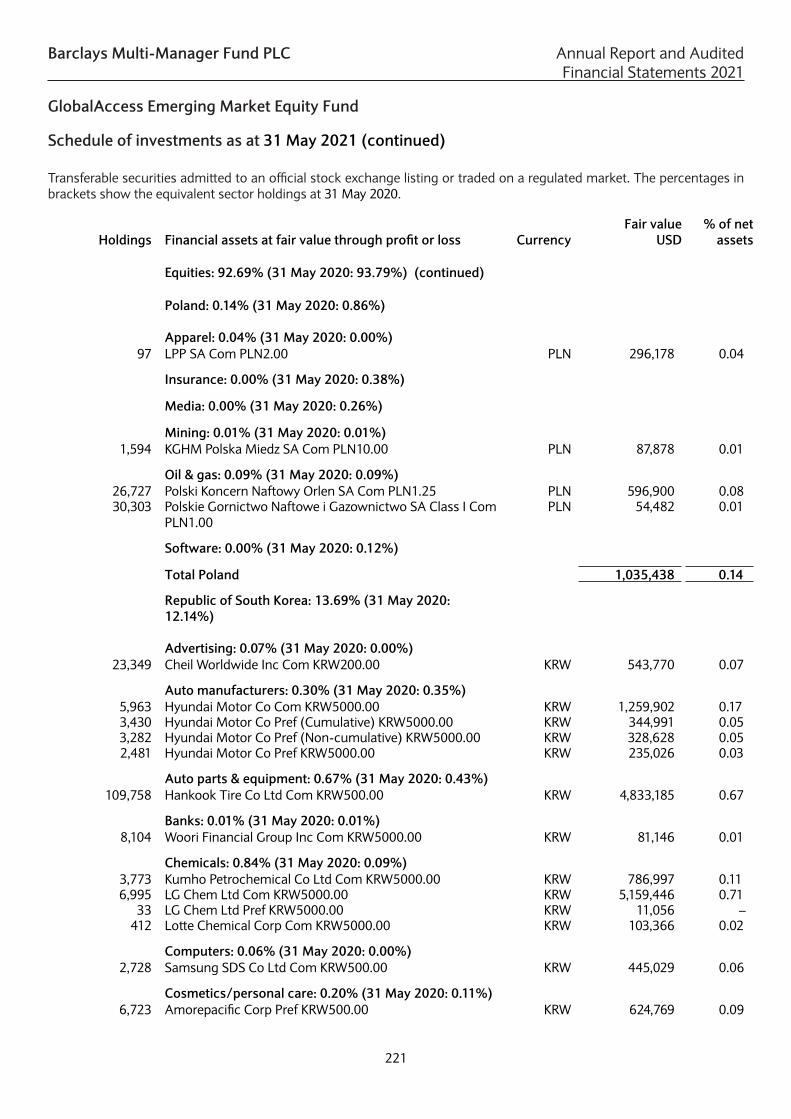
Barclays Multi-Manager Fund PLC Annual Report and Audited Financial Statements 2021
GlobalAccess Emerging Market Equity Fund
Holdings Financial assets at fair value through profit or loss Currency Fair value
USD % of net
assets
Equities: 92.69% (31 May 2020: 93.79%) (continued)
Poland: 0.14% (31 May 2020: 0.86%)
Apparel: 0.04% (31 May 2020: 0.00%)97 LPP SA Com PLN2.00 PLN 296,178 0.04
Insurance: 0.00% (31 May 2020: 0.38%)
Media: 0.00% (31 May 2020: 0.26%)
Mining: 0.01% (31 May 2020: 0.01%)1,594 KGHM Polska Miedz SA Com PLN10.00 PLN 87,878 0.01
Oil & gas: 0.09% (31 May 2020: 0.09%)26,727 Polski Koncern Naftowy Orlen SA Com PLN1.25 PLN 596,900 0.0830,303 Polskie Gornictwo Naftowe i Gazownictwo SA Class I Com
PLN1.00PLN 54,482 0.01
Software: 0.00% (31 May 2020: 0.12%)
Total Poland 1,035,438 0.14
Republic of South Korea: 13.69% (31 May 2020: 12.14%)
Advertising: 0.07% (31 May 2020: 0.00%)23,349 Cheil Worldwide Inc Com KRW200.00 KRW 543,770 0.07
Auto manufacturers: 0.30% (31 May 2020: 0.35%)5,963 Hyundai Motor Co Com KRW5000.00 KRW 1,259,902 0.173,430 Hyundai Motor Co Pref (Cumulative) KRW5000.00 KRW 344,991 0.053,282 Hyundai Motor Co Pref (Non-cumulative) KRW5000.00 KRW 328,628 0.052,481 Hyundai Motor Co Pref KRW5000.00 KRW 235,026 0.03
Auto parts & equipment: 0.67% (31 May 2020: 0.43%)109,758 Hankook Tire Co Ltd Com KRW500.00 KRW 4,833,185 0.67
Banks: 0.01% (31 May 2020: 0.01%)8,104 Woori Financial Group Inc Com KRW5000.00 KRW 81,146 0.01
Chemicals: 0.84% (31 May 2020: 0.09%)3,773 Kumho Petrochemical Co Ltd Com KRW5000.00 KRW 786,997 0.116,995 LG Chem Ltd Com KRW5000.00 KRW 5,159,446 0.71
33 LG Chem Ltd Pref KRW5000.00 KRW 11,056 –412 Lotte Chemical Corp Com KRW5000.00 KRW 103,366 0.02
Computers: 0.06% (31 May 2020: 0.00%)2,728 Samsung SDS Co Ltd Com KRW500.00 KRW 445,029 0.06
Cosmetics/personal care: 0.20% (31 May 2020: 0.11%)6,723 Amorepacific Corp Pref KRW500.00 KRW 624,769 0.09
Schedule of investments as at 31 May 2021 (continued)
Transferable securities admitted to an official stock exchange listing or traded on a regulated market. The percentages in brackets show the equivalent sector holdings at 31 May 2020.
221

Barclays Multi-Manager Fund PLC Annual Report and Audited Financial Statements 2021
GlobalAccess Emerging Market Equity Fund
Holdings Financial assets at fair value through profit or loss Currency Fair value
USD % of net
assets
Equities: 92.69% (31 May 2020: 93.79%) (continued)
Republic of South Korea: 13.69% (31 May 2020: 12.14%) (continued)
Cosmetics/personal care: 0.20% (31 May 2020: 0.11%)
(continued)
11,346 AMOREPACIFIC Group Com KRW500.00 KRW 793,980 0.11
Diversified financial services: 0.68% (31 May 2020: 1.09%)
33,183 DGB Financial Group Inc Com KRW5000.00 KRW 282,685 0.046,726 Hana Financial Group Inc Com KRW5000.00 KRW 281,650 0.04
27,740 KB Financial Group Inc Com KRW5000.00 KRW 1,466,833 0.20498 Korea Investment Holdings Co Ltd Com KRW5000.00 KRW 46,503 0.01
22,622 NH Investment & Securities Co Ltd Com KRW5000.00 KRW 229,570 0.031,727 Samsung Card Co Ltd Class C Com KRW5000.00 KRW 52,888 0.01
67,030 Shinhan Financial Group Co Ltd Com KRW5000.00 KRW 2,562,530 0.35
Electrical components & equipment: 0.25% (31 May 2020: 0.17%)
10,316 LG Electronics Inc Com KRW5000.00 KRW 1,413,628 0.205,939 LG Electronics Inc Pref KRW5000.00 KRW 383,532 0.05
Electronics: 0.11% (31 May 2020: 0.03%)10,289 LG Display Co Ltd Com KRW5000.00 KRW 222,023 0.03
5,906 Samsung Electro-Mechanics Co Ltd Pref KRW5000.00 KRW 567,450 0.08
Engineering & construction: 0.00% (31 May 2020: 0.04%)
Food: 0.02% (31 May 2020: 0.07%)718 CJ CheilJedang Corp Pref KRW5000.00 KRW 144,595 0.02
Holding companies-diversified: 0.00% (31 May 2020: 0.03%)
Insurance: 0.64% (31 May 2020: 0.99%)95,620 DB Insurance Co Ltd Com KRW500.00 KRW 4,359,077 0.6010,087 Hyundai Marine & Fire Insurance Co Ltd Com KRW500.00 KRW 221,296 0.03
398 Samsung Fire & Marine Insurance Co Ltd Pref KRW 500.00 KRW 58,659 0.01
Internet: 1.20% (31 May 2020: 0.15%)26,776 NAVER Corp Com KRW500.00 KRW 8,730,126 1.20
Iron/steel: 1.03% (31 May 2020: 0.58%)1,427 Hyundai Steel Co Class C Com KRW5000.00 KRW 68,521 0.014,300 POSCO ADR KRW5000.00 USD 344,752 0.05
22,018 POSCO Com KRW5000.00 KRW 7,030,184 0.97
Machinery-diversified: 0.01% (31 May 2020: 0.01%)1,165 Hyundai Robotics Co Ltd Com KRW5000.00 KRW 73,871 0.01
Schedule of investments as at 31 May 2021 (continued)
Transferable securities admitted to an official stock exchange listing or traded on a regulated market. The percentages in brackets show the equivalent sector holdings at 31 May 2020.
222

Barclays Multi-Manager Fund PLC Annual Report and Audited Financial Statements 2021
GlobalAccess Emerging Market Equity Fund
Holdings Financial assets at fair value through profit or loss Currency Fair value
USD % of net
assets
Equities: 92.69% (31 May 2020: 93.79%) (continued)
Republic of South Korea: 13.69% (31 May 2020: 12.14%) (continued)
Retail: 0.10% (31 May 2020: 0.00%)
6,508 Lotte Shopping Co Com KRW5000.00 KRW 710,225 0.10
Semiconductors: 7.03% (31 May 2020: 7.36%)536,162 Samsung Electronics Co Ltd Com KRW100.00 KRW 38,822,945 5.35
274 Samsung Electronics Co Ltd GDR NPV USD 495,461 0.0760,371 Samsung Electronics Co Ltd Pref KRW100.00 KRW 3,963,876 0.5567,774 SK Hynix Inc Com KRW5000.00 KRW 7,731,744 1.06
Shipbuilding: 0.43% (31 May 2020: 0.25%)24,554 Hyundai Heavy Industries Co Ltd Com KRW5000.00 KRW 3,154,749 0.43
Telecommunications: 0.04% (31 May 2020: 0.38%)4,921 SK Telecom Co Ltd ADR NPV USD 157,718 0.02
350 SK Telecom Co Ltd Com KRW500.00 KRW 99,939 0.02
Total Republic of South Korea 99,228,321 13.69
Romania: 0.20% (31 May 2020: 0.14%)
Banks: 0.20% (31 May 2020: 0.14%)2,193,778 Banca Transilvania SA Com RON1.00 RON 1,482,356 0.20
Total Romania 1,482,356 0.20
Russian Federation: 2.44% (31 May 2020: 3.61%)
Banks: 0.50% (31 May 2020: 1.20%)742,590 Sberbank of Russia PJSC Com RUB3.00 RUB 3,136,449 0.43
688,040,000 VTB Bank PJSC Com RUB0.01 RUB 456,227 0.07
Diversified financial services: 0.04% (31 May 2020: 0.08%)
125,450 Moscow Exchange MICEX-RTS PJSC Com RUB0.01 RUB 287,562 0.04
Electric: 0.18% (31 May 2020: 0.06%)18,373,600 Inter RAO UES PJSC Com PUB2.81 RUB 1,266,661 0.18
Food: 0.15% (31 May 2020: 0.07%)14,752 Magnit PJSC Com RUB0.01 RUB 1,097,027 0.15
Iron/steel: 0.13% (31 May 2020: 0.00%)454,620 Magnitogorsk Iron & Steel Works PJSC Com RUB1.00 RUB 389,529 0.05146,990 Novolipetskiy Metallurgicheskiy Kombinat PAO Com
RUB1.00RUB 523,615 0.07
2,381 Severstal PAO RUB0.01 RUB 54,596 0.01
Schedule of investments as at 31 May 2021 (continued)
Transferable securities admitted to an official stock exchange listing or traded on a regulated market. The percentages in brackets show the equivalent sector holdings at 31 May 2020.
223

Barclays Multi-Manager Fund PLC Annual Report and Audited Financial Statements 2021
GlobalAccess Emerging Market Equity Fund
Holdings Financial assets at fair value through profit or loss Currency Fair value
USD % of net
assets
Equities: 92.69% (31 May 2020: 93.79%) (continued)
Russian Federation: 2.44% (31 May 2020: 3.61%) (continued)
Mining: 0.41% (31 May 2020: 0.53%)
436,580 Alrosa PJSC Com RUB0.50 RUB 697,260 0.1036,788 MMC Norilsk Nickel PJSC ADR NPV - England USD 1,317,378 0.1813,479 MMC Norilsk Nickel PJSC ADR NPV - United States USD 481,268 0.07
1,128 MMC Norilsk Nickel PJSC Com RUB1.00 RUB 405,128 0.05445 Polyus PJSC Com RUB1.00 RUB 96,171 0.01
Oil & gas: 0.99% (31 May 2020: 1.65%)294,060 Gazprom PJSC Com RUB5.00 RUB 1,044,007 0.14
72,604 LUKOIL PJSC ADR NPV - England USD 5,915,048 0.82502,800 Surgutneftegas PJSC Com RUB1.00 RUB 248,939 0.03
Telecommunications: 0.04% (31 May 2020: 0.02%)56,480 Mobile TeleSystems PJSC Com RUB0.01 RUB 260,253 0.04
Total Russian Federation 17,677,118 2.44
Singapore: 2.45% (31 May 2020: 2.57%)
Banks: 1.14% (31 May 2020: 0.89%)888,140 Oversea-Chinese Banking Corp Ltd Com NPV SGD 8,313,601 1.14
Distribution/wholesale: 0.00% (31 May 2020: 0.28%)
Electronics: 0.97% (31 May 2020: 1.09%)160,388 Flex Ltd Com NPV USD 2,929,487 0.40284,500 Venture Corp Ltd Com NPV SGD 4,095,361 0.57
Food: 0.34% (31 May 2020: 0.31%)679,200 Wilmar International Ltd Com NPV SGD 2,455,188 0.34
Total Singapore 17,793,637 2.45
South Africa: 0.91% (31 May 2020: 1.22%)
Insurance: 0.00% (31 May 2020: 0.59%)
Investment companies: 0.00% (31 May 2020: 0.04%)
Iron/steel: 0.02% (31 May 2020: 0.00%)3,815 Kumba Iron Ore Ltd Com ZAR0.0001 ZAR 177,801 0.02
Mining: 0.05% (31 May 2020: 0.13%)12,094 African Rainbow Minerals Ltd ZAR0.05 ZAR 234,374 0.03
5,938 Northam Platinum Ltd Com ZAR0.0001 ZAR 100,816 0.02
Schedule of investments as at 31 May 2021 (continued)
Transferable securities admitted to an official stock exchange listing or traded on a regulated market. The percentages in brackets show the equivalent sector holdings at 31 May 2020.
224

Barclays Multi-Manager Fund PLC Annual Report and Audited Financial Statements 2021
GlobalAccess Emerging Market Equity Fund
Holdings Financial assets at fair value through profit or loss Currency Fair value
USD % of net
assets
Equities: 92.69% (31 May 2020: 93.79%) (continued) South Africa: 0.91% (31 May 2020: 1.22%) (continued)
Office/business equipment: 0.16% (31 May 2020: 0.15%)
301,352 Reunert Ltd Com ZAR0.10 ZAR 1,160,271 0.16
Oil & gas: 0.57% (31 May 2020: 0.18%)3,700 Sasol Ltd ADR NPV USD 60,514 0.01
247,161 Sasol Ltd Com NPV ZAR 4,033,750 0.56
Pharmaceuticals: 0.00% (31 May 2020: 0.06%)
Retail: 0.11% (31 May 2020: 0.07%)47,301 Mr Price Co Com ZAR0.00025 ZAR 804,462 0.11
Total South Africa 6,571,988 0.91
Spain: 0.00% (31 May 2020: 0.01%)
Retail: 0.00% (31 May 2020: 0.01%)
Switzerland: 0.00% (31 May 2020: 0.64%)
Beverages: 0.00% (31 May 2020: 0.64%)
Taiwan: 12.00% (31 May 2020: 10.29%)
Apparel: 0.05% (31 May 2020: 0.04%)50,000 Far Eastern New Century Corp Com TWD10.00 TWD 57,281 0.01
204,000 Pou Chen Corp Com TWD10.00 TWD 277,863 0.04
Computers: 1.65% (31 May 2020: 0.93%)254,000 Acer Inc TWD10.00 TWD 293,289 0.04
14,000 Asustek Computer Inc Com TWD10.00 TWD 200,453 0.03245,000 Catcher Technology Co Ltd Com TWD10.00 TWD 1,635,256 0.23347,000 Chicony Electronics Co Ltd Com TWD10.00 TWD 978,589 0.14
2,710,000 Compal Electronics Inc Com TWD10.00 TWD 2,304,556 0.323,149,000 Innolux Corp Com TWD10.00 TWD 2,774,839 0.381,309,000 Lite-On Technology Corp Com TWD10.00 TWD 3,141,505 0.43
538,000 Wistron Corp Com TWD10.00 TWD 599,781 0.08
Diversified financial services: 0.00% (31 May 2020: 0.15%)
Electrical components & equipment: 0.03% (31 May 2020: 0.00%)
22,000 Delta Electronics Inc TWD10.00 TWD 235,700 0.03
Electronics: 0.81% (31 May 2020: 0.35%)271,000 AU Optronics Corporation Com TWD10.00 TWD 253,771 0.04
Schedule of investments as at 31 May 2021 (continued)
Transferable securities admitted to an official stock exchange listing or traded on a regulated market. The percentages in brackets show the equivalent sector holdings at 31 May 2020.
225

Barclays Multi-Manager Fund PLC Annual Report and Audited Financial Statements 2021
GlobalAccess Emerging Market Equity Fund
Holdings Financial assets at fair value through profit or loss Currency Fair value
USD % of net
assets
Equities: 92.69% (31 May 2020: 93.79%) (continued) Taiwan: 12.00% (31 May 2020: 10.29%) (continued)
Electronics: 0.81% (31 May 2020: 0.35%) (continued) 1,363,275 Hon Hai Precision Industry Co Ltd Com TWD10.00 TWD 5,592,860 0.77
Engineering & construction: 0.10% (31 May 2020: 0.00%)
90,000 United Integrated Services Co Ltd TWD10.00 TWD 752,310 0.10
Food: 0.00% (31 May 2020: 0.02%)
Home furnishings: 0.05% (31 May 2020: 0.00%)26,000 Nien Made Enterprise Co Ltd Com TWD10.00 TWD 383,336 0.05
Insurance: 0.00% (31 May 2020: 0.08%)
Leisure time: 0.04% (31 May 2020: 0.00%)23,000 Giant Manufacturing Co Ltd Com TWD10.00 TWD 275,575 0.04
Miscellaneous manufacturing: 0.00% (31 May 2020: 0.16%)
Retail: 0.00% (31 May 2020: 0.69%)
Semiconductors: 8.99% (31 May 2020: 7.87%)286,000 ASE Industrial Holding Co Ltd Com TWD10.00 TWD 1,157,779 0.16264,000 MediaTek Inc Com TWD10.00 TWD 9,510,886 1.31
3,000 Nanya Technology Corp TWD 8,895 –53,000 Novatek Microelectronics Corp Com TWD10.00 TWD 1,024,289 0.1481,000 Realtek Semiconductor Corp Com TWD10.00 TWD 1,464,925 0.2031,177 Taiwan Semiconductor Manufacturing Co Ltd ADR NPV USD 3,658,621 0.50
2,177,000 Taiwan Semiconductor Manufacturing Co Ltd Com TWD10.00
TWD 47,041,496 6.49
509,000 United Microelectronics Corp Com TWD10.00 TWD 976,329 0.14267,000 Winbond Electronics Corp TWD10.00 TWD 330,062 0.05
Transportation: 0.28% (31 May 2020: 0.00%)577,000 Evergreen Marine Corp Taiwan Ltd TWD10.00 TWD 2,059,893 0.28
Total Taiwan 86,990,139 12.00
Thailand: 1.42% (31 May 2020: 1.24%)
Banks: 1.28% (31 May 2020: 1.09%)129,500 Bangkok Bank PCL ADR THB10.00 THB 475,752 0.06388,000 Bangkok Bank PCL Com THB10.00 THB 1,425,420 0.20
5,353 Kasikornbank PCL ADR NPV USD 81,606 0.01950,300 Kasikornbank PCL ADR THB10.00 THB 3,628,086 0.50
58,300 Kasikornbank PCL ADR THB10.00 THB 222,580 0.03345,300 Krung Thai Bank PCL Com THB5.15 THB 119,946 0.02
1,007,500 Siam Commercial Bank PCL ADR THB10.00 THB 3,298,123 0.45
Schedule of investments as at 31 May 2021 (continued)
Transferable securities admitted to an official stock exchange listing or traded on a regulated market. The percentages in brackets show the equivalent sector holdings at 31 May 2020.
226

Barclays Multi-Manager Fund PLC Annual Report and Audited Financial Statements 2021
GlobalAccess Emerging Market Equity Fund
Holdings Financial assets at fair value through profit or loss Currency Fair value
USD % of net
assets
Equities: 92.69% (31 May 2020: 93.79%) (continued) Thailand: 1.42% (31 May 2020: 1.24%) (continued)
Banks: 1.28% (31 May 2020: 1.09%) (continued) 13,900 Siam Commercial Bank PCL Com THB10.00 THB 45,503 0.01
Chemicals: 0.07% (31 May 2020: 0.06%)251,300 PTT Global Chemical PCL Com THB10.00 THB 507,870 0.07
Diversified financial services: 0.07% (31 May 2020: 0.00%)
243,700 Muangthai Capital PCL Com THB1.00 THB 482,758 0.07
Energy-alternate sources: 0.00% (31 May 2020: 0.05%)
Lodging: 0.00% (31 May 2020: 0.04%)
Total Thailand 10,287,644 1.42
Turkey: 0.64% (31 May 2020: 1.28%)
Auto manufacturers: 0.30% (31 May 2020: 0.26%)105,242 Ford Otomotiv Sanayi AS Class A Com TRY1.00 TRY 2,158,412 0.30
Banks: 0.15% (31 May 2020: 0.24%)1,734,179 Akbank Turk AS Com TRY1.00 TRY 1,064,842 0.15
Chemicals: 0.00% (31 May 2020: 0.34%)
Food: 0.01% (31 May 2020: 0.00%)10,472 BIM Birlesik Magazalar AS Com TRY1.00 TRY 78,972 0.01
Holding companies-diversified: 0.05% (31 May 2020: 0.12%)
387,350 Haci Omer Sabanci Holding AS Com TRY1.00 TRY 405,091 0.05
Home furnishings: 0.02% (31 May 2020: 0.03%)36,340 Arcelik Com TRY1.00 TRY 135,513 0.02
Insurance: 0.00% (31 May 2020: 0.26%)
Iron/steel: 0.10% (31 May 2020: 0.03%)334,226 Eregli Demir ve Celik Fabrikalari TAS Com TRY1.00 TRY 758,408 0.10
Telecommunications: 0.01% (31 May 2020: 0.00%)15,600 Turkcell Iletisim Hizmetleri AS ADR NPV USD 72,462 0.01
Total Turkey 4,673,700 0.64
Schedule of investments as at 31 May 2021 (continued)
Transferable securities admitted to an official stock exchange listing or traded on a regulated market. The percentages in brackets show the equivalent sector holdings at 31 May 2020.
227

Barclays Multi-Manager Fund PLC Annual Report and Audited Financial Statements 2021
GlobalAccess Emerging Market Equity Fund
Holdings Financial assets at fair value through profit or loss Currency Fair value
USD % of net
assets
Equities: 92.69% (31 May 2020: 93.79%) (continued)
United Arab Emirates: 0.43% (31 May 2020: 0.93%)
Banks: 0.43% (31 May 2020: 0.93%)1,674,530 Abu Dhabi Commercial Bank PJSC Com AED1.00 AED 3,088,824 0.43
Total United Arab Emirates 3,088,824 0.43
United Kingdom: 2.49% (31 May 2020: 1.46%)
Banks: 1.23% (31 May 2020: 0.31%)730,900 Standard Chartered PLC Com HKD0.50 HKD 5,294,842 0.73509,014 Standard Chartered PLC Com USD0.50 GBP 3,675,702 0.50
Mining: 1.26% (31 May 2020: 1.15%)53,152 Antofagasta PLC Com GBP5.00 GBP 1,166,767 0.1692,193 Rio Tinto PLC Com GBP0.10 GBP 7,948,980 1.10
Total United Kingdom 18,086,291 2.49
United States: 1.64% (31 May 2020: 1.07%)
Computers: 0.56% (31 May 2020: 0.38%)57,007 Cognizant Technology Solutions Corp Class A Com
USD0.01USD 4,079,991 0.56
Mining: 0.19% (31 May 2020: 0.00%)19,068 Southern Copper Corp USD0.01 USD 1,329,707 0.19
Retail: 0.89% (31 May 2020: 0.69%)34,200 Yum China Holdings Inc Com HKD0.01 HKD 2,279,251 0.3161,578 Yum China Holdings Inc Com USD0.01 USD 4,166,059 0.58
Total United States 11,855,008 1.64
Total equities 672,103,053 92.69
Investment funds: 1.85% (31 May 2020: 1.45%)
Luxembourg: 1.85% (31 May 2020: 1.45%)
31,825 Schroder International Selection Fund - Asian Smaller Companies Class I Acc
USD 13,377,449 1.85
Total investment funds 13,377,449 1.85
Schedule of investments as at 31 May 2021 (continued)
Transferable securities admitted to an official stock exchange listing or traded on a regulated market. The percentages in brackets show the equivalent sector holdings at 31 May 2020.
228

Barclays Multi-Manager Fund PLC Annual Report and Audited Financial Statements 2021
GlobalAccess Emerging Market Equity Fund
Holdings Financial assets at fair value through profit or loss Currency Fair value
USD % of net
assets
P-notes: 0.00% (31 May 2020: 1.47%)
Switzerland: 0.00% (31 May 2020: 1.47%)
Warrants: 0.00% (31 May 2020: 0.01%)
Indonesia: 0.00% (31 May 2020: 0.01%)
995,595 Barito Pacific Tbk PT 06/03/2021 IDR 22,310 –Total Indonesia 22,310 –
Total warrants 22,310 –
No. of contracts Futures contracts: 0.05% (31 May 2020: 0.01%) CounterpartyUnrealised
gain% of net
assetsUSD
265 MSCI NYF Emerging Markets Index Future June 2021 Goldman Sachs 395,010 0.05
Total futures contracts 395,010 0.05
Forward currency contracts: 0.10% (31 May 2020: 0.10%)
Counterparty Cncy Buys Cncy SellsMaturity
dateUnrealised
gain% of net
assetsUSD
Barclays^ GBP 2,000 USD 2,831 17/06/2021 12 – CCT_1776767_323774
Northern Trust GBP 157,959 USD 222,578 17/06/2021 1,966 – CCT_1776767_323036
UBS GBP 19,850,000 USD 27,846,671 17/06/2021 370,621 0.05 CCT_1776767_322766
UBS EUR 9,704,403 USD 11,715,117 17/06/2021 152,959 0.02 CCT_1776767_322778
UBS GBP 5,776,064 USD 8,102,980 17/06/2021 107,845 0.02 CCT_1776767_322767
UBS EUR 1,973,975 USD 2,382,974 17/06/2021 31,113 0.01 CCT_1776767_322777
UBS EUR 537,789 USD 649,217 17/06/2021 8,477 – CCT_1776767_322780
UBS GBP 178,208 USD 250,001 17/06/2021 3,327 – CCT_1776767_322772
UBS EUR 144,974 USD 175,012 17/06/2021 2,285 – CCT_1776767_322782
UBS GBP 115,645 USD 162,233 17/06/2021 2,159 – CCT_1776767_322770
UBS GBP 75,035 USD 105,263 17/06/2021 1,401 – CCT_1776767_322764
UBS GBP 62,851 USD 88,171 17/06/2021 1,174 – CCT_1776767_322748
UBS EUR 70,306 USD 84,873 17/06/2021 1,108 – CCT_1776767_322774
UBS GBP 24,257 USD 33,912 17/06/2021 571 – CCT_1776767_322432
UBS GBP 25,000 USD 35,221 17/06/2021 317 – CCT_1776767_322928
UBS EUR 17,031 USD 20,560 17/06/2021 268 – CCT_1776767_322779
UBS USD 12,169 EUR 9,935 17/06/2021 18 – CCT_1776767_323683
Total fair value gains on forward currency contracts 685,621 0.10
Schedule of investments as at 31 May 2021 (continued)
Transferable securities admitted to an official stock exchange listing or traded on a regulated market. The percentages in brackets show the equivalent sector holdings at 31 May 2020.
229

Barclays Multi-Manager Fund PLC Annual Report and Audited Financial Statements 2021
GlobalAccess Emerging Market Equity Fund
Forward currency contracts: 0.10% (31 May 2020: 0.10%) (continued)
Counterparty Cncy Buys Cncy SellsMaturity
dateUnrealised
loss% of net
assetsUSD
Barclays^ USD 591 EUR 490 17/06/2021 (7) – CCT_1776767_322763
Barclays^ USD 2,518 GBP 1,793 17/06/2021 (31) – CCT_1776767_322760
Barclays^ USD 2,456 EUR 2,033 17/06/2021 (31) – CCT_1776767_322759
Barclays^ USD 2,995 GBP 2,133 17/06/2021 (37) – CCT_1776767_322761
Barclays^ USD 4,536 GBP 3,231 17/06/2021 (56) – CCT_1776767_322755
Barclays^ USD 5,046 EUR 4,177 17/06/2021 (63) – CCT_1776767_322752
Barclays^ USD 6,900 GBP 4,913 17/06/2021 (85) – CCT_1776767_322758
Barclays^ USD 18,786 EUR 15,553 17/06/2021 (234) – CCT_1776767_322750
Barclays^ USD 68,395 EUR 56,623 17/06/2021 (853) – CCT_1776767_322756
Barclays^ USD 229,656 GBP 163,547 17/06/2021 (2,830) – CCT_1776767_322751
Barclays^ USD 341,098 EUR 282,392 17/06/2021 (4,255) – CCT_1776767_322754
Barclays^ USD 804,615 GBP 572,996 17/06/2021 (9,914) – CCT_1776767_322753
Northern Trust USD 64,830 GBP 45,621 17/06/2021 (21) – CCT_1776767_323134
UBS USD 2,576 EUR 2,108 17/06/2021 (2) – CCT_1776767_323331
UBS USD 3,576 EUR 2,927 17/06/2021 (3) – CCT_1776767_323776
UBS USD 7,275 EUR 5,953 17/06/2021 (5) – CCT_1776767_323236
UBS USD 6,253 EUR 5,123 17/06/2021 (13) – CCT_1776767_323902
UBS USD 2,979 EUR 2,452 17/06/2021 (19) – CCT_1776767_323038
UBS USD 12,688 EUR 10,427 17/06/2021 (64) – CCT_1776767_322510
UBS USD 27,421 GBP 19,384 17/06/2021 (135) – CCT_1776767_323238
UBS USD 30,536 EUR 25,154 17/06/2021 (226) – CCT_1776767_322926
UBS USD 139,451 GBP 98,264 17/06/2021 (233) – CCT_1776767_323901
UBS USD 24,114 EUR 19,961 17/06/2021 (298) – CCT_1776767_322762
UBS USD 395,322 GBP 279,209 17/06/2021 (1,581) – CCT_1776767_323550
Total fair value losses on forward currency contracts (20,996) –
Total forward currency contracts 664,625 0.10
Fair value USD
% of net assets
Total value of investments 686,562,447 94.69
Cash and cash equivalents* 36,086,903 4.98
Other net assets** 2,447,450 0.33
Net assets attributable to holders of redeemable participating shares 725,096,800 100.00
Schedule of investments as at 31 May 2021 (continued)
Transferable securities admitted to an official stock exchange listing or traded on a regulated market. The percentages in brackets show the equivalent sector holdings at 31 May 2020.
230

Barclays Multi-Manager Fund PLC Annual Report and Audited Financial Statements 2021
GlobalAccess Emerging Market Equity Fund
Analysis of total assets (unaudited)% of total
assets
Transferable securities and money market instruments admitted to official stock exchangelisting or traded on a regulated market. 92.18Investment funds and AIFs. 1.83Financial derivative instruments dealt in on a regulated market. 0.05OTC financial derivative instruments. 0.09Other assets. 5.85
100.00
*All cash holdings are held with The Northern Trust Company.**Including USD 1,769,794 held with Goldman Sachs as security by the counterparty to derivatives contracts.^ Related party.
The accompanying notes form an integral part of the Financial Statements.
The Industry Classification Benchmark (“ICB”) is jointly owned by FTSE and Dow Jones and has been licensed for use. FTSE and Dow Jones do not accept liability to any person for any loss or damage arising out of any error or omission in ICB.
Schedule of investments as at 31 May 2021 (continued)
Transferable securities admitted to an official stock exchange listing or traded on a regulated market. The percentages in brackets show the equivalent sector holdings at 31 May 2020.
Forward currency contracts: 0.10% (31 May 2020: 0.10%) (continued)
Counterparty Cncy Buys Cncy SellsMaturity
dateUnrealised
loss% of net
assetsUSD
Barclays^ USD 591 EUR 490 17/06/2021 (7) – CCT_1776767_322763
Barclays^ USD 2,518 GBP 1,793 17/06/2021 (31) – CCT_1776767_322760
Barclays^ USD 2,456 EUR 2,033 17/06/2021 (31) – CCT_1776767_322759
Barclays^ USD 2,995 GBP 2,133 17/06/2021 (37) – CCT_1776767_322761
Barclays^ USD 4,536 GBP 3,231 17/06/2021 (56) – CCT_1776767_322755
Barclays^ USD 5,046 EUR 4,177 17/06/2021 (63) – CCT_1776767_322752
Barclays^ USD 6,900 GBP 4,913 17/06/2021 (85) – CCT_1776767_322758
Barclays^ USD 18,786 EUR 15,553 17/06/2021 (234) – CCT_1776767_322750
Barclays^ USD 68,395 EUR 56,623 17/06/2021 (853) – CCT_1776767_322756
Barclays^ USD 229,656 GBP 163,547 17/06/2021 (2,830) – CCT_1776767_322751
Barclays^ USD 341,098 EUR 282,392 17/06/2021 (4,255) – CCT_1776767_322754
Barclays^ USD 804,615 GBP 572,996 17/06/2021 (9,914) – CCT_1776767_322753
Northern Trust USD 64,830 GBP 45,621 17/06/2021 (21) – CCT_1776767_323134
UBS USD 2,576 EUR 2,108 17/06/2021 (2) – CCT_1776767_323331
UBS USD 3,576 EUR 2,927 17/06/2021 (3) – CCT_1776767_323776
UBS USD 7,275 EUR 5,953 17/06/2021 (5) – CCT_1776767_323236
UBS USD 6,253 EUR 5,123 17/06/2021 (13) – CCT_1776767_323902
UBS USD 2,979 EUR 2,452 17/06/2021 (19) – CCT_1776767_323038
UBS USD 12,688 EUR 10,427 17/06/2021 (64) – CCT_1776767_322510
UBS USD 27,421 GBP 19,384 17/06/2021 (135) – CCT_1776767_323238
UBS USD 30,536 EUR 25,154 17/06/2021 (226) – CCT_1776767_322926
UBS USD 139,451 GBP 98,264 17/06/2021 (233) – CCT_1776767_323901
UBS USD 24,114 EUR 19,961 17/06/2021 (298) – CCT_1776767_322762
UBS USD 395,322 GBP 279,209 17/06/2021 (1,581) – CCT_1776767_323550
Total fair value losses on forward currency contracts (20,996) –
Total forward currency contracts 664,625 0.10
Fair value USD
% of net assets
Total value of investments 686,562,447 94.69
Cash and cash equivalents* 36,086,903 4.98
Other net assets** 2,447,450 0.33
Net assets attributable to holders of redeemable participating shares 725,096,800 100.00
231

Barclays Multi-Manager Fund PLC Annual Report and Audited Financial Statements 2021
GlobalAccess Global High Yield Bond Fund
Schedule of investments as at 31 May 2021
Transferable securities admitted to an official stock exchange listing or traded on a regulated market. The percentages in brackets show the equivalent sector holdings at 31 May 2020.
Holdings Financial assets at fair value through profit or loss CurrencyFair value
USD% of net
assets
Bonds: 94.59% (31 May 2020: 93.09%)
Corporate bonds: 0.00% (31 May 2020: 0.00%)Australia: 0.51% (31 May 2020: 0.60%)
Corporate bonds: 0.51% (31 May 2020: 0.60%)375,000 FMG Resources August 2006 Pty Ltd Series 144A 4.375%
01/04/2031USD 392,269 0.11
93,229 Midwest Vanadium Pty Ltd Series 144A 13.25% 15/02/2028**
USD 326 –
615,000 Mineral Resources Ltd Series 144A 8.125% 01/05/2027 USD 675,750 0.18800,000 Nufarm Australia Ltd / Nufarm Americas Inc Series 144A
5.75% 30/04/2026USD 820,852 0.22
100,000 Virgin Australia Holdings Ltd Series 144A 8.125% 15/11/2024**
USD 9,375 –
Total Australia 1,898,572 0.51
Austria: 0.17% (31 May 2020: 0.04%)
Corporate bonds: 0.17% (31 May 2020: 0.04%)400,000 ams AG Series 144a 7% 31/07/2025 USD 430,614 0.11200,000 JBS USA Food Co Series 144A 7% 15/01/2026 USD 213,550 0.06
Total Austria 644,164 0.17
Bermuda: 1.00% (31 May 2020: 0.61%)
Corporate bonds: 1.00% (31 May 2020: 0.61%)352,140 Digicel Group 0.5 Ltd 10% 01/04/2024 USD 346,418 0.09208,000 Digicel Group Holdings Ltd Series 144A 8% 01/04/2025 USD 175,968 0.05400,000 Digicel Ltd Series 144A 6.75% 01/03/2023 USD 381,000 0.10200,000 Fly Leasing Ltd 5.25% 15/10/2024 USD 205,001 0.05150,000 Nabors Industries Ltd Series 144A 7.25% 15/01/2026 USD 130,705 0.04175,000 Nabors Industries Ltd Series 144A 7.5% 15/01/2028 USD 148,973 0.04150,000 NCL Corp Ltd Series 144A 3.625% 15/12/2024 USD 143,545 0.04600,000 NCL Corp Ltd Series 144A 5.875% 15/03/2026 USD 626,253 0.17150,000 NCL Corp Ltd Series 144A 10.25% 01/02/2026 USD 175,324 0.05150,000 NCL Corp Ltd Series 144A 12.25% 15/05/2024 USD 181,867 0.05225,000 NCL Finance Ltd Series 144A 6.125% 15/03/2028 USD 234,859 0.06350,000 Viking Cruises Ltd Series 144A 5.875% 15/09/2027 USD 338,188 0.09125,000 Viking Cruises Ltd Series 144A 6.25% 15/05/2025 USD 124,206 0.03200,000 Viking Cruises Ltd Series 144A 13% 15/05/2025 USD 233,988 0.06150,000 Viking Ocean Cruises Ship VII Ltd Series 144A 5.625%
15/02/2029USD 152,005 0.04
150,000 VOC Escrow Ltd Series 144A 5% 15/02/2028 USD 151,141 0.04
Total Bermuda 3,749,441 1.00
232

Barclays Multi-Manager Fund PLC Annual Report and Audited Financial Statements 2021
GlobalAccess Global High Yield Bond Fund
Holdings Financial assets at fair value through profit or loss Currency Fair value
USD % of net
assets
Bonds: 94.59% (31 May 2020: 93.09%) (continued)
British Virgin Islands: 0.11% (31 May 2020: 0.00%)
Corporate bonds: 0.11% (31 May 2020: 0.00%)200,000 Studio City Finance Ltd Series 144A 5% 15/01/2029 USD 204,412 0.05200,000 Studio City Finance Ltd Series 144A 6% 15/07/2025 USD 211,200 0.06
Total British Virgin Islands 415,612 0.11
Canada: 4.85% (31 May 2020: 6.10%)
Corporate bonds: 4.83% (31 May 2020: 6.10%)625,000 1011778 BC ULC / New Red Finance Inc Series 144A 4%
15/10/2030USD 606,309 0.16
50,000 1011778 BC ULC / New Red Finance Inc Series 144A 4.375% 15/01/2028
USD 50,742 0.01
175,000 Baffinland Iron Mines Corp / Baffinland Iron Mines LP Series 144A 8.75% 15/07/2026
USD 184,879 0.05
320,000 Bausch Health Cos Inc Series 144A 4.875% 01/06/2028 USD 322,994 0.09295,000 Bausch Health Cos Inc Series 144A 5% 30/01/2028 USD 276,973 0.07
50,000 Bausch Health Cos Inc Series 144A 5% 15/02/2029 USD 45,943 0.01100,000 Bausch Health Cos Inc Series 144A 5.25% 15/02/2031 USD 91,649 0.03125,000 Bausch Health Cos Inc Series 144A 5.5% 01/11/2025 USD 128,475 0.03
1,313,000 Bausch Health Cos Inc Series 144A 6.125% 15/04/2025 USD 1,344,499 0.36125,000 Bausch Health Cos Inc Series 144A 6.25% 15/02/2029 USD 122,344 0.03225,000 Bausch Health Cos Inc Series 144A 7% 15/01/2028 USD 230,796 0.06125,000 Bausch Health Cos Inc Series 144A 7.25% 30/05/2029 USD 129,219 0.03854,000 Bausch Health Cos Inc Series 144A 9% 15/12/2025 USD 915,616 0.24650,000 Baytex Energy Corp Series 144A 8.75% 01/04/2027 USD 631,537 0.17300,000 Bombardier Inc Series 144A 6% 15/10/2022 USD 300,750 0.08249,000 Bombardier Inc Series 144A 6.125% 15/01/2023 USD 261,537 0.07275,000 Bombardier Inc Series 144A 7.5% 01/12/2024 USD 282,591 0.08585,000 Bombardier Inc Series 144A 7.5% 15/03/2025 USD 590,133 0.16350,000 Bombardier Inc Series 144A 7.875% 15/04/2027 USD 355,710 0.10150,000 Brookfield Residential Properties Inc Series 144A 4.875%
15/02/2030USD 147,743 0.04
175,000 Brookfield Residential Properties Inc / Brookfield Residential US LLC Series 144a 5% 15/06/2029
USD 175,656 0.05
75,000 Cenovus Energy Inc 5.25% 15/06/2037 USD 86,006 0.0275,000 Cenovus Energy Inc 5.375% 15/07/2025 USD 85,639 0.0275,000 Cenovus Energy Inc 5.4% 15/06/2047 USD 88,228 0.02
100,000 Cenovus Energy Inc 6.75% 15/11/2039 USD 131,965 0.0425,000 Clarios Global LP Series 144A 6.75% 15/05/2025 USD 26,848 0.01
300,000 Cooke Omega Investments Inc / Alpha VesselCo Holdings Inc Series 144A 8.5% 15/12/2022
USD 309,000 0.08
415,000 Empire Communities Corp Series 144A 7% 15/12/2025 USD 439,647 0.12275,000 Ensign Drilling Inc Series 144A 9.25% 15/04/2024 USD 216,734 0.06275,000 Fairstone Financial Inc Series 144A 7.875% 15/07/2024 USD 286,957 0.08
1,325,000 First Quantum Minerals Ltd Series 144A 6.5% 01/03/2024 USD 1,352,742 0.36
Schedule of investments as at 31 May 2021 (continued)
Transferable securities admitted to an official stock exchange listing or traded on a regulated market. The percentages in brackets show the equivalent sector holdings at 31 May 2020.
233

Barclays Multi-Manager Fund PLC Annual Report and Audited Financial Statements 2021
GlobalAccess Global High Yield Bond Fund
Holdings Financial assets at fair value through profit or loss Currency Fair value
USD % of net
assets
Bonds: 94.59% (31 May 2020: 93.09%) (continued) Canada: 4.85% (31 May 2020: 6.10%) (continued)
Corporate bonds: 4.83% (31 May 2020: 6.10%) 200,000 First Quantum Minerals Ltd Series 144A 7.5% 01/04/2025 USD 207,912 0.06425,000 Garda World Security Corp Series 144A 6% 01/06/2029 USD 421,787 0.11350,000 Gateway Casinos & Entertainment Ltd Series 144A 8.25%
01/03/2024USD 347,335 0.09
540,000 GFL Environmental Inc Series 144A 4% 01/08/2028 USD 521,759 0.14760,000 goeasy Ltd Series 144A 4.375% 01/05/2026 USD 770,450 0.21
75,000 Hudbay Minerals Inc Series 144A 4.5% 01/04/2026 USD 74,526 0.02225,000 Hudbay Minerals Inc Series 144A 6.125% 01/04/2029 USD 235,968 0.06175,000 Husky III Holding Ltd Series 144A 13% 15/02/2025 USD 190,515 0.05200,000 IAMGOLD Corp Series 144A 5.75% 15/10/2028 USD 210,256 0.06150,000 Intelligent Packaging Holdco Issuer LP Series 144A 9%
15/01/2026USD 154,091 0.04
615,000 Intelligent Packaging Ltd Finco Inc / Intelligent Packaging Ltd Co-Issuer LLC Series 144A 6% 15/09/2028
USD 636,703 0.17
235,000 Intertape Polymer Group Inc Series 144A 4.375% 15/06/2029
USD 237,644 0.06
50,000 Masonite International Corp Series 144A 5.375% 01/02/2028
USD 52,941 0.01
75,000 Masonite International Corp Series 144A 5.75% 15/09/2026
USD 78,288 0.02
200,000 Mattamy Group Corp Series 144A 4.625% 01/03/2030 USD 199,772 0.0550,000 MEG Energy Corp Series 144A 5.875% 01/02/2029 USD 52,135 0.01
610,000 MEG Energy Corp Series 144A 7.125% 01/02/2027 USD 654,994 0.17150,000 Methanex Corp 5.125% 15/10/2027 USD 157,110 0.04125,000 Mountain Province Diamonds Inc Series 144A 8%
15/12/2022USD 114,024 0.03
150,000 Northwest Acquisitions ULC / Dominion Finco Inc Series 144A 7.125% 01/11/2022**
USD 555 –
150,000 Open Text Corp Series 144A 3.875% 15/02/2028 USD 150,147 0.04450,000 Parkland Corp/Canada Series 144A 4.5% 01/10/2029 USD 457,702 0.12200,000 Parkland Fuel Corp Series 144A 5.875% 15/07/2027 USD 213,460 0.06175,000 Precision Drilling Corp 5.25% 15/11/2024 USD 171,170 0.05355,000 Precision Drilling Corp Series 144A 7.125% 15/01/2026 USD 359,862 0.10255,000 Precision Drilling Corp 7.75% 15/12/2023 USD 257,996 0.07518,750 Sanjel Corp 0.0% 31/12/2049 0% 31/12/2049** USD – –250,000 Superior Plus LP / Superior General Partner Inc Series
144A 4.5% 15/03/2029USD 254,606 0.07
75,000 Taseko Mines Ltd Series 144A 7% 15/02/2026 USD 78,490 0.02125,000 Teine Energy Ltd Series 144A 6.875% 15/04/2029 USD 126,936 0.03150,000 Telesat Canada / Telesat LLC Series 144A 4.875%
01/06/2027USD 143,154 0.04
200,000 Telesat Canada / Telesat LLC Series 144A 5.625% 06/12/2026
USD 199,741 0.05
Schedule of investments as at 31 May 2021 (continued)
Transferable securities admitted to an official stock exchange listing or traded on a regulated market. The percentages in brackets show the equivalent sector holdings at 31 May 2020.
234

Barclays Multi-Manager Fund PLC Annual Report and Audited Financial Statements 2021
GlobalAccess Global High Yield Bond Fund
Holdings Financial assets at fair value through profit or loss Currency Fair value
USD % of net
assets
Bonds: 94.59% (31 May 2020: 93.09%) (continued) Canada: 4.85% (31 May 2020: 6.10%) (continued)
Corporate bonds: 4.83% (31 May 2020: 6.10%) 200,000 Telesat Canada / Telesat LLC Series 144A 6.5%
15/10/2027USD 190,500 0.05
Government sponsored agencies: 0.02% (31 May 2020: 0.00%)
100,000 NOVA Chemicals Corp Series 144A 4.25% 15/05/2029 USD 100,397 0.02
Total Canada 18,242,787 4.85
Cayman Islands: 0.96% (31 May 2020: 0.90%)
Corporate bonds: 0.96% (31 May 2020: 0.90%)335,000 American Airlines Inc/AAdvantage Loyalty IP Ltd Series
144A 5.75% 20/04/2029USD 359,792 0.10
236,000 Global Aircraft Leasing Co Ltd Series 144A 6.5% 15/09/2024
USD 236,474 0.06
470,000 Hawaiian Brand Intellectual Property Ltd / HawaiianMiles Loyalty Ltd Series 144A 5.75% 20/01/2026
USD 499,963 0.13
400,000 Melco Resorts Finance Ltd Series 144A 5.25% 26/04/2026 USD 417,450 0.11200,000 MGM China Holdings Ltd Series 144A 5.375% 15/05/2024 USD 205,271 0.05
4,481 Noble Finance Co Series 144A 11% 15/02/2028 USD 4,817 –125,000 Seagate HDD Cayman Series 144A 3.125% 15/07/2029 USD 119,235 0.03100,000 Seagate HDD Cayman Series 144A 3.375% 15/07/2031 USD 94,992 0.03400,000 Shelf Drilling Holdings Ltd Series 144A 8.25% 15/02/2025 USD 312,600 0.08
25,000 Shelf Drilling Holdings Ltd Series 144A 8.875% 15/11/2024
USD 25,827 0.01
74,799 Spirit Loyalty Cayman Ltd / Spirit IP Cayman Ltd Series 144A 8% 20/09/2025
USD 84,897 0.02
308,125 Transocean Guardian Ltd Series 144A 5.875% 15/01/2024 USD 286,941 0.08100,000 Transocean Inc 9.35% 15/12/2041 USD 60,275 0.02235,000 Transocean Inc Series 144A 11.5% 30/01/2027 USD 234,509 0.06125,000 Transocean Poseidon Ltd Series 144A 6.875% 01/02/2027 USD 121,719 0.03137,846 Transocean Sentry Ltd Series 144A 5.375% 15/05/2023 USD 131,880 0.03200,000 Wynn Macau Ltd Series 144A 5.5% 15/01/2026 USD 210,202 0.06200,000 Wynn Macau Ltd Series 144A 5.625% 26/08/2028 USD 211,007 0.06
Total Cayman Islands 3,617,851 0.96
France: 1.30% (31 May 2020: 0.88%)
Corporate bonds: 1.30% (31 May 2020: 0.88%)175,000 Altice France SA/France Series REGS 3.375% 15/01/2028 EUR 210,780 0.06200,000 Altice France SA/France Series 144A 5.125% 15/01/2029 USD 198,258 0.05
1,670,000 Altice France SA/France Series 144A 5.125% 15/07/2029 USD 1,657,901 0.44110,000 Altice France SA/France Series 144a 5.5% 15/01/2028 USD 112,777 0.03400,000 Altice France SA/France Series 144A 8.125% 01/02/2027 USD 436,500 0.12
Schedule of investments as at 31 May 2021 (continued)
Transferable securities admitted to an official stock exchange listing or traded on a regulated market. The percentages in brackets show the equivalent sector holdings at 31 May 2020.
235

Barclays Multi-Manager Fund PLC Annual Report and Audited Financial Statements 2021
GlobalAccess Global High Yield Bond Fund
Holdings Financial assets at fair value through profit or loss Currency Fair value
USD % of net
assets
Bonds: 94.59% (31 May 2020: 93.09%) (continued) France: 1.30% (31 May 2020: 0.88%) (continued)
Corporate bonds: 1.30% (31 May 2020: 0.88%) 100,000 Banijay Entertainment Series REGS 3.5% 01/03/2025 EUR 123,460 0.03100,000 CAB SELAS Series REGS 3.375% 01/02/2028 EUR 121,959 0.03105,000 Chrome Bidco SASU Series REGS 3.5% 31/05/2028 EUR 129,315 0.03250,000 Constellium SE Series 144A 3.75% 15/04/2029 USD 243,126 0.07250,000 Constellium SE Series 144A 5.625% 15/06/2028 USD 265,744 0.07100,000 Electricite de France SA Series EMTn FRN Perpetual EUR 136,823 0.04140,000 Laboratoire Eimer Selas Series REGS 5% 01/02/2029 EUR 174,070 0.05160,000 Loxam SAS Series REGS 2.875% 15/04/2026 EUR 195,502 0.05597,552 Novasep Holding SAS 8% 31/05/2022** EUR 683,108 0.18150,000 Parts Europe SA Series REGS 6.5% 16/07/2025 EUR 194,022 0.05
Total France 4,883,345 1.30
Germany: 0.39% (31 May 2020: 0.48%)
Corporate bonds: 0.39% (31 May 2020: 0.48%)355,000 Cheplapharm Arzneimittel GmbH Series 144a 5.5%
15/01/2028USD 365,338 0.10
105,000 Gruenenthal GmbH Series REGS 4.125% 15/05/2028 EUR 131,456 0.03100,000 Nidda Healthcare Holding GmbH Series REGS 3.5%
30/09/2024EUR 122,493 0.03
200,000 Novelis Sheet Ingot GmbH Series REGS 3.375% 15/04/2029
EUR 253,219 0.07
135,000 Tele Columbus AG Series REGS 3.875% 02/05/2025 EUR 169,417 0.05200,000 Vertical Holdco GmbH Series 144A 7.625% 15/07/2028 USD 215,556 0.06155,000 WEPA Hygieneprodukte GmbH Series REGS 2.875%
15/12/2027EUR 188,016 0.05
Total Germany 1,445,495 0.39
Ireland: 0.58% (31 May 2020: 0.54%)
Corporate bonds: 0.58% (31 May 2020: 0.54%)495,000 Endo Dac / Endo Finance LLC / Endo Finco Inc Series
144A 6% 30/06/2028USD 342,221 0.09
358,000 Endo Dac / Endo Finance LLC / Endo Finco Inc Series 144A 9.5% 31/07/2027
USD 364,713 0.10
770,000 Jazz Securities DAC Series 144A 4.375% 15/01/2029 USD 792,900 0.21200,000 LCPR Senior Secured Financing DAC Series 144A 6.75%
15/10/2027USD 215,224 0.06
200,000 Motion Bondco DAC Series 144A 6.625% 15/11/2027 USD 203,382 0.05180,000 Virgin Media Vendor Financing Notes III DAC Series REGS
4.875% 15/07/2028GBP 261,383 0.07
Total Ireland 2,179,823 0.58
Schedule of investments as at 31 May 2021 (continued)
Transferable securities admitted to an official stock exchange listing or traded on a regulated market. The percentages in brackets show the equivalent sector holdings at 31 May 2020.
236

Barclays Multi-Manager Fund PLC Annual Report and Audited Financial Statements 2021
GlobalAccess Global High Yield Bond Fund
Holdings Financial assets at fair value through profit or loss Currency Fair value
USD % of net
assets
Bonds: 94.59% (31 May 2020: 93.09%) (continued)
Isle Of Man: 0.00% (31 May 2020: 0.14%)
Corporate bonds: 0.00% (31 May 2020: 0.14%)
Israel: 0.09% (31 May 2020: 0.00%)
Corporate bonds: 0.09% (31 May 2020: 0.00%)100,000 Energean Israel Finance Ltd 5.375% 30/03/2028 USD 103,951 0.03100,000 Energean Israel Finance Ltd 5.875% 30/03/2031 USD 103,977 0.03
75,000 Leviathan Bond Ltd 6.125% 30/06/2025 USD 82,636 0.0250,000 Leviathan Bond Ltd 6.5% 30/06/2027 USD 55,743 0.01
Total Israel 346,307 0.09
Italy: 0.43% (31 May 2020: 0.12%)
Corporate bonds: 0.43% (31 May 2020: 0.12%)185,000 Brunello Bidco SpA Series REGS 3.5% 15/02/2028 EUR 226,699 0.06200,000 Cedacri Mergeco SPA Series REGS FRN 15/05/2028 EUR 249,176 0.07160,000 Centurion Bidco SpA Series REGS 5.875% 30/09/2026 EUR 204,706 0.06100,000 Gamma Bidco SpA Series REGS FRN 15/07/2025 EUR 123,029 0.03170,000 Guala Closures SpA/Italy Series REGS FRN 15/04/2024 EUR 208,287 0.06105,000 Limacorporate SpA Series REGS FRN 15/08/2023 EUR 128,378 0.03193,000 Sisal Pay SpA Series REGS FRN 17/12/2026 EUR 237,415 0.06125,000 Sofima Holding SPA Series REGS 3.75% 15/01/2028 EUR 153,252 0.04
75,000 Telecom Italia SpA/Milano 5.303% 30/05/2024 USD 81,656 0.02
Total Italy 1,612,598 0.43
Jersey: 0.11% (31 May 2020: 0.08%)
Corporate bonds: 0.11% (31 May 2020: 0.08%)120,000 AA Bond Co Ltd Series REGS 6.5% 31/01/2026 GBP 176,879 0.05145,000 CPUK Finance Ltd 6.5% 28/08/2026 GBP 218,685 0.06
Total Jersey 395,564 0.11
Liberia: 0.55% (31 May 2020: 0.16%)
Corporate bonds: 0.55% (31 May 2020: 0.16%)300,000 Royal Caribbean Cruises 3.7% 15/03/2028 USD 288,817 0.08225,000 Royal Caribbean Cruises 5.25% 15/11/2022 USD 232,664 0.06175,000 Royal Caribbean Cruises Series 144A 11.5% 01/06/2025 USD 202,795 0.06970,000 Royal Caribbean Cruises Ltd Series 144A 5.5% 01/04/2028 USD 1,022,137 0.27100,000 Royal Caribbean Cruises Ltd 7.5% 15/10/2027 USD 117,626 0.03
Schedule of investments as at 31 May 2021 (continued)
Transferable securities admitted to an official stock exchange listing or traded on a regulated market. The percentages in brackets show the equivalent sector holdings at 31 May 2020.
237

Barclays Multi-Manager Fund PLC Annual Report and Audited Financial Statements 2021
GlobalAccess Global High Yield Bond Fund
Holdings Financial assets at fair value through profit or loss Currency Fair value
USD % of net
assets
Bonds: 94.59% (31 May 2020: 93.09%) (continued) Liberia: 0.55% (31 May 2020: 0.16%) (continued)
Corporate bonds: 0.55% (31 May 2020: 0.16%) 175,000 Royal Caribbean Cruises Ltd Series 144A 9.125%
15/06/2023USD 193,804 0.05
Total Liberia 2,057,843 0.55
Luxembourg: 2.81% (31 May 2020: 2.97%)
Corporate bonds: 2.81% (31 May 2020: 2.97%)200,000 4finance SA Series 144A 10.75% 01/05/2022 USD 179,233 0.05610,000 Altice Financing SA Series 144A 5% 15/01/2028 USD 606,148 0.16845,000 Altice France Holding SA Series 144a 6% 15/02/2028 USD 829,237 0.22400,000 Altice France Holding SA Series 144A 10.5% 15/05/2027 USD 447,700 0.12125,000 ArcelorMittal 7.25% 15/10/2039 USD 172,034 0.05600,000 ARD Finance SA Series 144A 6.5% 30/06/2027 USD 627,030 0.17250,000 Camelot Finance SA Series 144A 4.5% 01/11/2026 USD 259,415 0.07300,000 Consolidated Energy Finance SA Series 144A 6.5%
15/05/2026USD 302,467 0.08
415,000 Dana Financing Luxembourg Sarl Series REGS 3% 15/07/2029
EUR 517,120 0.14
740,000 Dana Financing Luxembourg Sarl Series 144A 5.75% 15/04/2025
USD 763,991 0.20
125,000 eDreams ODIGEO SA Series REGS 5.5% 01/09/2023 EUR 152,267 0.04175,000 Endo Luxembourg Finance Co I Sarl / Endo US Inc Series
144A 6.125% 01/04/2029USD 172,812 0.05
200,000 Herens Holdco Sarl Series 144A 4.75% 15/05/2028 USD 200,794 0.051,855,000 Intelsat Jackson Holdings SA Series 144A 8% 15/02/2024 USD 1,678,438 0.45
225,000 Intelsat Luxembourg SA 7.75% 01/06/2021 USD 7,727 –50,000 JBS USA LUX SA / JBS USA Food Co / JBS USA Finance Inc
Series 144A 3.75% 01/12/2031USD 50,707 0.01
100,000 LHMC Finco 2 Sarl Series REGS 7.25% 02/10/2025 EUR 117,986 0.031,200,000 Mallinckrodt International Finance SA / Mallinckrodt CB
LLC Series 144a 5.75% 01/08/2022USD 851,307 0.23
175,000 Matterhorn Telecom SA Series REGS 3.125% 15/09/2026 EUR 215,665 0.06150,000 Motion Finco Sarl Series REGS 7% 15/05/2025 EUR 193,712 0.05115,000 Summer BC Holdco B SARL Series REGS 5.75%
31/10/2026EUR 146,932 0.04
560,000 Telecom Italia Capital SA 6% 30/09/2034 USD 619,587 0.16255,000 Telecom Italia Capital SA 6.375% 15/11/2033 USD 295,383 0.08
75,000 Telecom Italia Capital SA 7.2% 18/07/2036 USD 93,150 0.02400,000 Telenet Finance Luxembourg Notes Sarl Series 144A 5.5%
01/03/2028USD 422,500 0.11
250,000 Trinseo Materials Operating SCA / Trinseo Materials Finance Inc Series 144A 5.125% 01/04/2029
USD 256,972 0.07
Schedule of investments as at 31 May 2021 (continued)
Transferable securities admitted to an official stock exchange listing or traded on a regulated market. The percentages in brackets show the equivalent sector holdings at 31 May 2020.
238

Barclays Multi-Manager Fund PLC Annual Report and Audited Financial Statements 2021
GlobalAccess Global High Yield Bond Fund
Holdings Financial assets at fair value through profit or loss Currency Fair value
USD % of net
assets
Bonds: 94.59% (31 May 2020: 93.09%) (continued) Luxembourg: 2.81% (31 May 2020: 2.97%) (continued)
Corporate bonds: 2.81% (31 May 2020: 2.97%) 375,000 Trinseo Materials Operating SCA / Trinseo Materials
Finance Inc Series 144A 5.375% 01/09/2025USD 382,984 0.10
Total Luxembourg 10,563,298 2.81
Malta: 0.06% (31 May 2020: 0.05%)
Corporate bonds: 0.06% (31 May 2020: 0.05%)200,000 VistaJet Malta Finance PLC / XO Management Holding Inc
Series 144A 10.5% 01/06/2024USD 214,750 0.06
Total Malta 214,750 0.06
Marshall Islands: 0.04% (31 May 2020: 0.02%)
Corporate bonds: 0.04% (31 May 2020: 0.02%)200,000 Navios Maritime Acquisition Corp / Navios Acquisition
Finance US Inc Series 144A 8.125% 15/11/2021USD 162,504 0.04
Total Marshall Islands 162,504 0.04
Mexico: 0.23% (31 May 2020: 0.17%)
Corporate bonds: 0.23% (31 May 2020: 0.17%)200,000 Cemex SAB de CV Series 144A 3.875% 11/07/2031 USD 200,529 0.05400,000 Cemex SAB de CV Series 144A 5.45% 19/11/2029 USD 439,700 0.12200,000 Cemex SAB de CV Series 144A 7.375% 05/06/2027 USD 225,518 0.06
Total Mexico 865,747 0.23
Multinational: 0.73% (31 May 2020: 1.12%)
Corporate bonds: 0.73% (31 May 2020: 1.12%)300,000 Ardagh Packaging Finance PLC Series 144a 5.25%
15/08/2027USD 303,000 0.08
110,000 Cascades Inc/Cascades USA Inc Series 144A 5.125% 15/01/2026
USD 116,950 0.03
740,000 Cascades Inc/Cascades USA Inc Series 144A 5.375% 15/01/2028
USD 768,675 0.20
425,000 Connect Finco SARL / Connect US Finco LLC Series 144A 6.75% 01/10/2026
USD 439,888 0.12
25,000 Delta Air Lines Inc Series 144A 4.75% 20/10/2028 USD 27,309 0.01100,000 Delta Air Lines Inc / SkyMiles IP Ltd Series 144A 4.5%
20/10/2025USD 108,024 0.03
250,000 Herbalife Nutrition Ltd / HLF Financing Inc Series 144A 7.875% 01/09/2025
USD 272,183 0.07
Schedule of investments as at 31 May 2021 (continued)
Transferable securities admitted to an official stock exchange listing or traded on a regulated market. The percentages in brackets show the equivalent sector holdings at 31 May 2020.
239

Barclays Multi-Manager Fund PLC Annual Report and Audited Financial Statements 2021
GlobalAccess Global High Yield Bond Fund
Holdings Financial assets at fair value through profit or loss Currency Fair value
USD % of net
assets
Bonds: 94.59% (31 May 2020: 93.09%) (continued) Multinational: 0.73% (31 May 2020: 1.12%) (continued)
Corporate bonds: 0.73% (31 May 2020: 1.12%) 300,000 JBS USA LUX SA / JBS USA Food Co / JBS USA Finance Inc
Series 144A 5.5% 15/01/2030USD 330,378 0.09
100,000 Panther BF Aggregator 2 LP Series REGs 4.375% 15/05/2026
EUR 126,929 0.03
250,000 Titan Acquisition Ltd / Titan Co-Borrower LLC Series 144A 7.75% 15/04/2026
USD 259,836 0.07
Total Multinational 2,753,172 0.73
Netherlands: 1.26% (31 May 2020: 1.59%)
Corporate bonds: 1.26% (31 May 2020: 1.59%)200,000 Alcoa Nederland Holding BV Series 144A 4.125%
31/03/2029USD 204,883 0.05
350,000 Alcoa Nederland Holding BV Series 144A 6.125% 15/05/2028
USD 381,518 0.10
225,000 Clear Channel International BV Series 144A 6.625% 01/08/2025
USD 235,509 0.06
175,000 Eagle Intermediate Global Holding BV/Ruyi US Finance LLC Series 144A 7.5% 01/05/2025
USD 159,469 0.04
671,000 OCI NV Series 144A 4.625% 15/10/2025 USD 699,507 0.19200,000 OCI NV Series 144A 5.25% 01/11/2024 USD 206,437 0.05
91,000 OI European Group BV Series 144A 4% 15/03/2023 USD 93,901 0.02180,000 Saipem Finance International BV Series EMTN 3.125%
31/03/2028EUR 220,174 0.06
150,000 Sensata Technologies BV Series 144A 4% 15/04/2029 USD 150,457 0.04130,000 Sigma Holdco BV Series REGS 5.75% 15/05/2026 EUR 153,179 0.04275,000 Teva Pharmaceutical Finance Netherlands III BV 4.1%
01/10/2046USD 236,204 0.06
450,000 Trivium Packaging Finance BV Series 144A 5.5% 15/08/2026
USD 469,967 0.13
400,000 UPC Broadband Finco BV Series 144A 4.875% 15/07/2031 USD 400,042 0.11200,000 UPC Holding BV Series 144A 5.5% 15/01/2028 USD 209,495 0.06225,000 Ziggo Bond Co BV Series REGS 3.375% 28/02/2030 EUR 271,389 0.07175,000 Ziggo Bond Co BV Series 144a 5.125% 28/02/2030 USD 177,873 0.05450,000 Ziggo Bond Co BV Series 144A 6% 15/01/2027 USD 471,141 0.13
Total Netherlands 4,741,145 1.26
Panama: 1.02% (31 May 2020: 0.12%)
Corporate bonds: 1.02% (31 May 2020: 0.12%)2,010,000 Carnival Corp Series 144A 5.75% 01/03/2027 USD 2,138,137 0.57
250,000 Carnival Corp 6.65% 15/01/2028 USD 271,719 0.07425,000 Carnival Corp Series 144A 7.625% 01/03/2026 USD 465,906 0.12
Schedule of investments as at 31 May 2021 (continued)
Transferable securities admitted to an official stock exchange listing or traded on a regulated market. The percentages in brackets show the equivalent sector holdings at 31 May 2020.
240

Barclays Multi-Manager Fund PLC Annual Report and Audited Financial Statements 2021
GlobalAccess Global High Yield Bond Fund
Holdings Financial assets at fair value through profit or loss Currency Fair value
USD % of net
assets
Bonds: 94.59% (31 May 2020: 93.09%) (continued) Panama: 1.02% (31 May 2020: 0.12%) (continued)
Corporate bonds: 1.02% (31 May 2020: 0.12%) 300,000 Carnival Corp Series 144A 9.875% 01/08/2027 USD 352,208 0.09525,000 Carnival Corp Series 144A 10.5% 01/02/2026 USD 620,282 0.17
Total Panama 3,848,252 1.02
Spain: 0.06% (31 May 2020: 0.00%)
Corporate bonds: 0.06% (31 May 2020: 0.00%)185,000 Lorca Telecom Bondco SA Series REGS 4% 18/09/2027 EUR 230,220 0.06
Total Spain 230,220 0.06
Switzerland: 0.00% (31 May 2020: 0.10%)
Corporate bonds: 0.00% (31 May 2020: 0.10%)
United Kingdom: 1.66% (31 May 2020: 1.97%)
Corporate bonds: 1.66% (31 May 2020: 1.97%)200,000 Algeco Global Finance Plc Series 144A 8% 15/02/2023 USD 204,575 0.05200,000 Barclays PLC^ FRN Perpetual USD 221,000 0.06200,000 Barclays PLC^ FRN Perpetual USD 227,375 0.06165,000 Bellis Finco PLC Series REGS 4% 16/02/2027 GBP 234,688 0.06200,000 Drax Finco PLC Series 144A 6.625% 01/11/2025 USD 206,751 0.06185,000 eG Global Finance PLC Series REGS 6.25% 30/10/2025 EUR 230,439 0.06200,000 eG Global Finance PLC Series 144a 6.75% 07/02/2025 USD 204,900 0.05100,000 Hurricane Finance PLC Series REGS 8% 15/10/2025 GBP 154,908 0.04570,000 International Game Technology PLC Series 144A 4.125%
15/04/2026USD 589,275 0.16
200,000 Jaguar Land Rover Automotive PLC Series 144A 5.875% 15/01/2028
USD 204,463 0.05
200,000 Jaguar Land Rover Automotive PLC Series 144A 7.75% 15/10/2025
USD 217,219 0.06
200,000 Merlin Entertainments PLC Series 144A 5.75% 15/06/2026
USD 211,052 0.06
200,000 Natwest Group PLC FRN Perpetual USD 202,502 0.05300,000 Natwest Group PLC Series U FRN Perpetual USD 299,475 0.08201,000 Petra Diamonds US Treasury PLC Series 144A 10.5%
08/03/2026USD 195,473 0.05
150,000 Pinnacle Bidco PLC Series REGS 5.5% 15/02/2025 EUR 186,263 0.05265,000 Rolls-Royce PLC Series 144a 5.75% 15/10/2027 USD 285,537 0.08470,000 TechnipFMC PLC Series 144A 6.5% 01/02/2026 USD 506,083 0.13155,000 Thames Water Kemble Finance PLC Series REGS 4.625%
19/05/2026GBP 224,504 0.06
470,000 Virgin Media Finance PLC Series 144A 5% 15/07/2030 USD 468,678 0.13
Schedule of investments as at 31 May 2021 (continued)
Transferable securities admitted to an official stock exchange listing or traded on a regulated market. The percentages in brackets show the equivalent sector holdings at 31 May 2020.
241

Barclays Multi-Manager Fund PLC Annual Report and Audited Financial Statements 2021
GlobalAccess Global High Yield Bond Fund
Holdings Financial assets at fair value through profit or loss Currency Fair value
USD % of net
assets
Bonds: 94.59% (31 May 2020: 93.09%) (continued)
United Kingdom: 1.66% (31 May 2020: 1.97%) (continued)
Corporate bonds: 1.66% (31 May 2020: 1.97%)
400,000 Vmed O2 UK Financing I PLC Series 144A 4.25% 31/01/2031
USD 388,170 0.10
200,000 Vodafone Group PLC Series NC10 FRN 27/08/2080 EUR 249,284 0.07275,000 Vodafone Group PLC FRN 04/04/2079 USD 331,302 0.09
Total United Kingdom 6,243,916 1.66
United States: 75.67% (31 May 2020: 74.33%)
Corporate bonds: 75.67% (31 May 2020: 74.33%)130,000 Abercrombie & Fitch Management Co Series 144A 8.75%
15/07/2025USD 143,897 0.04
410,000 Academy Ltd Series 144A 6% 15/11/2027 USD 436,342 0.12410,000 Acadia Healthcare Co Inc Series 144A 5% 15/04/2029 USD 426,455 0.11325,000 Acadia Healthcare Co Inc Series 144A 5.5% 01/07/2028 USD 344,908 0.09370,000 ACCO Brands Corp Series 144A 4.25% 15/03/2029 USD 364,949 0.10175,000 Acrisure LLC / Acrisure Finance Inc Series 144A 4.25%
15/02/2029USD 171,367 0.05
325,000 Acrisure LLC / Acrisure Finance Inc Series 144A 7% 15/11/2025
USD 332,342 0.09
75,000 Acrisure LLC / Acrisure Finance Inc Series 144A 10.125% 01/08/2026
USD 84,551 0.02
540,000 Acuris Finance Us Inc / Acuris Finance SARL Series 144A 5% 01/05/2028
USD 540,675 0.14
200,000 Adams Homes Inc Series 144A 7.5% 15/02/2025 USD 210,625 0.06225,000 Adient US LLC Series 144A 9% 15/04/2025 USD 249,028 0.07400,000 Adtalem Global Education Inc Series 144A 5.5%
01/03/2028USD 400,538 0.11
175,000 Advanced Drainage Systems Inc Series 144A 5% 30/09/2027
USD 183,008 0.05
250,000 Aethon United BR LP / Aethon United Finance Corp Series 144A 8.25% 15/02/2026
USD 268,125 0.07
200,000 Affinity Gaming Series 144A 6.875% 15/12/2027 USD 212,719 0.06300,000 AG Issuer LLC Series 144A 6.25% 01/03/2028 USD 312,032 0.08445,000 Ahead DB Holdings LLC Series 144A 6.625% 01/05/2028 USD 451,157 0.12600,000 Ahern Rentals Inc Series 144A 7.375% 15/05/2023 USD 545,058 0.15
75,000 Albertsons Cos Inc / Safeway Inc / New Albertsons LP / Albertsons LLC Series 144A 3.5% 15/03/2029
USD 72,033 0.02
250,000 Albertsons Cos Inc / Safeway Inc / New Albertsons LP / Albertsons LLC Series 144A 4.625% 15/01/2027
USD 259,068 0.07
665,000 Albertsons Cos Inc / Safeway Inc / New Albertsons LP / Albertsons LLC Series 144A 5.875% 15/02/2028
USD 708,065 0.19
150,000 Allegheny Technologies Inc 5.875% 01/12/2027 USD 159,215 0.04
Schedule of investments as at 31 May 2021 (continued)
Transferable securities admitted to an official stock exchange listing or traded on a regulated market. The percentages in brackets show the equivalent sector holdings at 31 May 2020.
242

Barclays Multi-Manager Fund PLC Annual Report and Audited Financial Statements 2021
GlobalAccess Global High Yield Bond Fund
Holdings Financial assets at fair value through profit or loss Currency Fair value
USD % of net
assets
Bonds: 94.59% (31 May 2020: 93.09%) (continued)
United States: 75.67% (31 May 2020: 74.33%) (continued)
Corporate bonds: 75.67% (31 May 2020: 74.33%)
250,000 Allen Media LLC / Allen Media Co-Issuer Inc Series 144A 10.5% 15/02/2028
USD 265,586 0.07
200,000 Allied Universal Holdco LLC / Allied Universal Finance Corp Series 144A 6% 01/06/2029
USD 203,074 0.05
1,006,000 Allied Universal Holdco LLC / Allied Universal Finance Corp Series 144A 6.625% 15/07/2026
USD 1,068,276 0.28
400,000 Allied Universal Holdco LLC / Allied Universal Finance Corp Series 144A 9.75% 15/07/2027
USD 441,754 0.12
655,000 Allied Universal Holdco LLC/Allied Universal Finance Corp/Atlas Luxco 4 Sarl Series 144A 4.625% 01/06/2028
USD 656,487 0.17
100,000 Ally Financial Inc Series B FRN Perpetual USD 103,000 0.03125,000 Ally Financial Inc 8% 01/11/2031 USD 176,830 0.05
75,000 Alta Equipment Group Inc Series 144A 5.625% 15/04/2026
USD 77,157 0.02
52,000 AMC Entertainment Holdings Inc Series 144A 10.5% 24/04/2026
USD 56,160 0.01
563,095 AMC Entertainment Holdings Inc Series 144A 12% 15/06/2026
USD 555,352 0.15
250,000 AMC Networks Inc 4.25% 15/02/2029 USD 248,437 0.0775,000 American Airlines Group Inc Series 144A 5% 01/06/2022 USD 74,910 0.02
700,000 American Airlines Inc Series 144A 11.75% 15/07/2025 USD 880,446 0.23425,000 American Airlines Inc/AAdvantage Loyalty IP Ltd Series
144A 5.5% 20/04/2026USD 447,856 0.12
150,000 AmeriGas Partners LP / AmeriGas Finance Corp 5.75% 20/05/2027
USD 166,892 0.04
175,000 Amkor Technology Inc Series 144A 6.625% 15/09/2027 USD 189,085 0.05225,000 AMN Healthcare Inc Series 144A 4% 15/04/2029 USD 225,741 0.06175,000 Amsted Industries Inc Series 144A 5.625% 01/07/2027 USD 184,504 0.05125,000 Antero Midstream Partners LP / Antero Midstream
Finance Corp Series 144A 5.375% 15/06/2029USD 126,713 0.03
225,000 Antero Midstream Partners LP / Antero Midstream Finance Corp Series 144A 5.75% 01/03/2027
USD 232,305 0.06
300,000 Antero Midstream Partners LP / Antero Midstream Finance Corp Series 144A 7.875% 15/05/2026
USD 333,000 0.09
150,000 Antero Resources Corp Series 144A 5.375% 01/03/2030 USD 150,760 0.0450,000 Antero Resources Corp 5.625% 01/06/2023 USD 50,000 0.01
150,000 Antero Resources Corp Series 144A 7.625% 01/02/2029 USD 165,216 0.04200,000 Apache Corp 4.25% 15/01/2030 USD 201,757 0.05
15,000 Apache Corp 4.75% 15/04/2043 USD 14,854 –790,000 Apache Corp 5.1% 01/09/2040 USD 816,311 0.22275,000 Apache Corp 5.35% 01/07/2049 USD 282,373 0.08
1,025,000 Appvion Escrow Line 01/06/2020** USD – –345,000 APX Group Inc Series 144A 6.75% 15/02/2027 USD 366,193 0.10
Schedule of investments as at 31 May 2021 (continued)
Transferable securities admitted to an official stock exchange listing or traded on a regulated market. The percentages in brackets show the equivalent sector holdings at 31 May 2020.
243

Barclays Multi-Manager Fund PLC Annual Report and Audited Financial Statements 2021
GlobalAccess Global High Yield Bond Fund
Holdings Financial assets at fair value through profit or loss Currency Fair value
USD % of net
assets
Bonds: 94.59% (31 May 2020: 93.09%) (continued)
United States: 75.67% (31 May 2020: 74.33%) (continued)
Corporate bonds: 75.67% (31 May 2020: 74.33%)
65,000 Aramark Services Inc Series 144A 5% 01/02/2028 USD 67,173 0.02515,000 Aramark Services Inc Series 144A 6.375% 01/05/2025 USD 547,834 0.15680,000 Archrock Partners LP / Archrock Partners Finance Corp
Series 144A 6.25% 01/04/2028USD 706,642 0.19
410,000 Archrock Partners LP / Archrock Partners Finance Corp Series 144A 6.875% 01/04/2027
USD 435,711 0.12
100,000 Arconic Corp Series 144A 6% 15/05/2025 USD 106,906 0.03705,000 Arconic Corp Series 144A 6.125% 15/02/2028 USD 751,354 0.20150,000 Arrow Bidco LLC Series 144A 9.5% 15/03/2024 USD 147,660 0.04105,000 Asbury Automotive Group Inc 4.5% 01/03/2028 USD 108,338 0.03180,000 Asbury Automotive Group Inc 4.75% 01/03/2030 USD 188,415 0.05150,000 Ascend Learning LLC Series 144a 6.875% 01/08/2025** USD 153,585 0.04289,000 Ascent Resources Utica Holdings LLC / ARU Finance Corp
Series 144A 7% 01/11/2026**USD 297,773 0.08
175,000 Ascent Resources Utica Holdings LLC / ARU Finance Corp Series 144A 8.25% 31/12/2028
USD 190,531 0.05
237,000 Ascent Resources Utica Holdings LLC / ARU Finance Corp Series 144A 9% 01/11/2027
USD 326,467 0.09
325,000 ASGN Inc Series 144A 4.625% 15/05/2028 USD 338,951 0.09150,000 Ashton Woods USA LLC / Ashton Woods Finance Co
Series 144A 6.625% 15/01/2028USD 161,043 0.04
100,000 Ashton Woods USA LLC / Ashton Woods Finance Co Series 144A 6.75% 01/08/2025
USD 103,758 0.03
350,000 ASP AMC Merger Sub Inc Series 144A 8% 15/05/2025 USD 328,125 0.09315,000 AssuredPartners Inc Series 144A 5.625% 15/01/2029 USD 313,041 0.08175,000 AssuredPartners Inc Series 144A 7% 15/08/2025 USD 179,127 0.05125,000 Atkore Inc Series 144A 4.25% 01/06/2031 USD 124,119 0.03
75,000 Austin BidCo Inc Series 144A 7.125% 15/12/2028 USD 75,095 0.02524,000 Aventine Renew Energy 10% 01/04/2017** USD – –150,000 Avient Corp Series 144A 5.75% 15/05/2025 USD 158,999 0.04125,000 Avis Budget Car Rental LLC / Avis Budget Finance Inc
Series 144A 4.75% 01/04/2028USD 128,908 0.03
32,000 Avis Budget Car Rental LLC / Avis Budget Finance Inc Series 144A 5.25% 15/03/2025
USD 32,660 0.01
125,000 Avis Budget Car Rental LLC / Avis Budget Finance Inc Series 144A 5.375% 01/03/2029
USD 130,157 0.03
425,000 Banff Merger Sub Inc Series 144a 9.75% 01/09/2026 USD 450,500 0.1275,000 Bank of America Corp Series FF FRN Perpetual USD 84,281 0.02
250,000 Bank of America Corp Series 'DD' Series DD FRN Perpetual USD 290,231 0.08200,000 Bank of America Corp Series 'JJ' Series JJ FRN Perpetual USD 213,125 0.06150,000 Basic Energy Services Inc Series 144A 10.75% 15/10/2023 USD 29,250 0.01325,000 Bausch Health Cos Inc Series 144A 8.5% 31/01/2027 USD 348,563 0.09
Schedule of investments as at 31 May 2021 (continued)
Transferable securities admitted to an official stock exchange listing or traded on a regulated market. The percentages in brackets show the equivalent sector holdings at 31 May 2020.
244

Barclays Multi-Manager Fund PLC Annual Report and Audited Financial Statements 2021
GlobalAccess Global High Yield Bond Fund
Holdings Financial assets at fair value through profit or loss Currency Fair value
USD % of net
assets
Bonds: 94.59% (31 May 2020: 93.09%) (continued)
United States: 75.67% (31 May 2020: 74.33%) (continued)
Corporate bonds: 75.67% (31 May 2020: 74.33%)
275,000 BCPE Empire Holdings Inc Series 144A 7.625% 01/05/2027
USD 279,601 0.07
125,000 BCPE Ulysses Intermediate Inc Series 144A 7.75% 01/04/2027
USD 129,846 0.03
175,000 Beacon Roofing Supply Inc Series 144A 4.125% 15/05/2029
USD 172,812 0.05
175,000 Beacon Roofing Supply Inc Series 144A 4.5% 15/11/2026 USD 182,894 0.05175,000 Beazer Homes USA Inc 6.75% 15/03/2025 USD 181,704 0.05200,000 Beazer Homes USA Inc 7.25% 15/10/2029 USD 224,637 0.06200,000 Bidfair Holdings Inc Series 144A 5.875% 01/06/2029 USD 201,310 0.05565,000 Big River Steel LLC / BRS Finance Corp Series 144A
6.625% 31/01/2029USD 613,576 0.16
50,000 Bloomin' Brands Inc / OSI Restaurant Partners LLC Series 144A 5.125% 15/04/2029
USD 51,315 0.01
115,000 Blue Racer Midstream LLC / Blue Racer Finance Corp Series 144A 6.625% 15/07/2026
USD 120,385 0.03
200,000 Blue Racer Midstream LLC / Blue Racer Finance Corp Series 144A 7.625% 15/12/2025
USD 216,524 0.06
150,000 Boxer Parent Co Inc Series 144A 7.125% 02/10/2025 USD 161,153 0.0475,000 Boxer Parent Co Inc Series 144A 9.125% 01/03/2026 USD 79,089 0.02
510,000 Boyd Gaming Corp 4.75% 01/12/2027 USD 522,084 0.14525,000 Boyd Gaming Corp Series 144A 4.75% 15/06/2031 USD 531,720 0.14275,000 Boyd Gaming Corp 6% 15/08/2026 USD 286,179 0.08250,000 Boyd Gaming Corp 6.375% 01/04/2026 USD 258,613 0.07125,000 Boyd Gaming Corp Series 144A 8.625% 01/06/2025 USD 137,656 0.04730,000 Boyne USA Inc Series 144A 4.75% 15/05/2029 USD 755,623 0.20350,000 Brand Industrial Services Inc Series 144A 8.5%
15/07/2025USD 358,964 0.10
200,000 BrighTrust PLCar Escrow Corp Series 144A 9.75% 15/10/2025
USD 217,831 0.06
320,000 Brink's Co Series 144A 5.5% 15/07/2025 USD 341,098 0.09400,000 Bristow Group Inc Series 144A 6.875% 01/03/2028 USD 410,560 0.11100,000 BroadStreet Partners Inc Series 144A 5.875% 15/04/2029 USD 99,784 0.03237,922 Buffalo Thunder Development Authority 0%
15/12/2099**USD – –
708,924 Buffalo Thunder Development Authority Series 144A 11% 09/12/2022**
USD 361,551 0.10
125,000 Builders FirstSource Inc Series 144A 5% 01/03/2030 USD 130,331 0.03303,000 Builders FirstSource Inc Series 144A 6.75% 01/06/2027 USD 324,589 0.09200,000 Burford Capital Global Finance LLC Series 144A 6.25%
15/04/2028USD 209,286 0.06
100,000 BWX Technologies Inc Series 144A 4.125% 15/04/2029 USD 100,748 0.03175,000 C&S Group Enterprises LLC Series 144A 5% 15/12/2028 USD 167,317 0.04
Schedule of investments as at 31 May 2021 (continued)
Transferable securities admitted to an official stock exchange listing or traded on a regulated market. The percentages in brackets show the equivalent sector holdings at 31 May 2020.
245

Barclays Multi-Manager Fund PLC Annual Report and Audited Financial Statements 2021
GlobalAccess Global High Yield Bond Fund
Holdings Financial assets at fair value through profit or loss Currency Fair value
USD % of net
assets
Bonds: 94.59% (31 May 2020: 93.09%) (continued)
United States: 75.67% (31 May 2020: 74.33%) (continued)
Corporate bonds: 75.67% (31 May 2020: 74.33%)
550,000 Cablevision Lightpath LLC Series 144A 5.625% 15/09/2028
USD 554,414 0.15
700,000 Caesars Entertainment Inc Series 144A 6.25% 01/07/2025 USD 738,619 0.20700,000 Caesars Entertainment Inc Series 144A 8.125%
01/07/2027USD 777,830 0.21
475,000 Caesars Resort Collection LLC Series 144A 5.25% 15/10/2025
USD 479,541 0.13
150,000 Caesars Resort Collection LLC / CRC Finco Inc Series 144A 5.75% 01/07/2025
USD 157,503 0.04
350,000 Callon Petroleum Co 6.125% 01/10/2024 USD 323,341 0.0994,000 Callon Petroleum Co 6.375% 01/07/2026 USD 84,395 0.02
325,000 Calpine Corp Series 144A 4.5% 15/02/2028 USD 329,063 0.09225,000 Calpine Corp Series 144A 4.625% 01/02/2029 USD 220,002 0.06175,000 Calpine Corp Series 144A 5% 01/02/2031 USD 169,960 0.05840,000 Calpine Corp Series 144A 5.125% 15/03/2028 USD 847,379 0.23135,000 Calpine Corp Series 144A 5.25% 01/06/2026 USD 139,122 0.04152,533 Carlson Travel Inc Series 144A 11.5% 15/12/2026** USD 76,468 0.02390,000 Carpenter Technology Corp 6.375% 15/07/2028 USD 426,706 0.11125,000 Carriage Services Inc Series 144A 4.25% 15/05/2029 USD 125,000 0.03220,000 Carriage Services Inc Series 144A 6.625% 01/06/2026 USD 230,932 0.06275,000 Carrizo Oil & Gas Inc 6.25% 15/04/2023 USD 260,480 0.07425,000 Castle US Holding Corp Series 144A 9.5% 15/02/2028 USD 440,704 0.12275,000 CCO Holdings LLC Series 144A 4.25% 01/02/2031 USD 274,794 0.07
1,025,000 CCO Holdings LLC / CCO Holdings Capital Corp 4.5% 01/05/2032
USD 1,037,664 0.28
475,000 CCO Holdings LLC / CCO Holdings Capital Corp Series 144A 4.5% 01/06/2033
USD 474,549 0.13
1,140,000 CCO Holdings LLC / CCO Holdings Capital Corp Series 144A 4.75% 01/03/2030
USD 1,183,819 0.32
120,000 CCO Holdings LLC / CCO Holdings Capital Corp Series 144A 5% 01/02/2028
USD 125,702 0.03
60,000 CCO Holdings LLC / CCO Holdings Capital Corp Series 144A 5.375% 01/06/2029
USD 65,281 0.02
85,000 CCO Holdings LLC / CCO Holdings Capital Corp Series 144A 5.5% 01/05/2026
USD 87,971 0.02
120,000 CD&R Smokey Buyer Inc Series 144A 6.75% 15/07/2025 USD 127,950 0.0375,000 CEC Entertainment LLC Series 144A 6.75% 01/05/2026 USD 75,843 0.02
100,000 Cedar Fair LP 5.25% 15/07/2029 USD 101,988 0.03745,000 Cedar Fair LP / Canada's Wonderland Co / Magnum
Management Corp 5.375% 01/06/2024USD 755,773 0.20
100,000 Cedar Fair LP / Canada's Wonderland Co / Magnum Management Corp / Millennium Op Series 144A 5.5% 01/05/2025
USD 104,625 0.03
Schedule of investments as at 31 May 2021 (continued)
Transferable securities admitted to an official stock exchange listing or traded on a regulated market. The percentages in brackets show the equivalent sector holdings at 31 May 2020.
246

Barclays Multi-Manager Fund PLC Annual Report and Audited Financial Statements 2021
GlobalAccess Global High Yield Bond Fund
Holdings Financial assets at fair value through profit or loss Currency Fair value
USD % of net
assets
Bonds: 94.59% (31 May 2020: 93.09%) (continued)
United States: 75.67% (31 May 2020: 74.33%) (continued)
Corporate bonds: 75.67% (31 May 2020: 74.33%)
250,000 Cedar Fair LP / Canada's Wonderland Co / Magnum Management Corp / Millennium Op Series 144A 6.5% 01/10/2028
USD 265,937 0.07
300,000 Centene Corp 3% 15/10/2030 USD 300,502 0.08225,000 Centene Corp 4.25% 15/12/2027 USD 236,546 0.06200,000 Centene Corp Series 144A 5.375% 01/06/2026 USD 208,590 0.06250,000 Centennial Resource Production LLC Series 144A 5.375%
15/01/2026USD 242,969 0.06
125,000 Central Garden & Pet Co Series 144A 4.125% 30/04/2031 USD 125,629 0.03355,000 Central Garden & Pet Co 5.125% 01/02/2028 USD 373,696 0.10175,000 Century Communities Inc 5.875% 15/07/2025 USD 181,354 0.0575,000 Century Communities Inc 6.75% 01/06/2027 USD 81,000 0.02
350,000 CenturyLink Inc Series 144A 4.5% 15/01/2029 USD 339,318 0.091,120,000 CenturyLink Inc Series 144A 5.125% 15/12/2026 USD 1,161,650 0.31
160,000 ChampionX Corp 6.375% 01/05/2026 USD 168,314 0.04645,000 Change Healthcare Holdings LLC / Change Healthcare
Finance Inc Series 144A 5.75% 01/03/2025USD 657,152 0.17
76,480 CHAPARRAL ENERGY 9.0% PIK 14/2/2025 9% 14/02/2025
USD 76,480 0.02
100,000 Charles River Laboratories International Inc Series 144A 3.75% 15/03/2029
USD 99,853 0.03
100,000 Charles River Laboratories International Inc Series 144A 4% 15/03/2031
USD 101,593 0.03
265,000 Cheniere Energy Inc Series 144A 4.625% 15/10/2028 USD 278,601 0.07300,000 Cheniere Energy Partners LP Series 144A 4% 01/03/2031 USD 310,054 0.08215,000 Chesapeake Energy Corp Series 144A 5.5% 01/02/2026 USD 227,107 0.06105,000 Chesapeake Energy Corp Series 144A 5.875% 01/02/2029 USD 113,437 0.03155,000 Chobani LLC / Chobani Finance Corp Inc Series 144A 7.5%
15/04/2025USD 161,478 0.04
1,370,000 CHS/Community Health Systems Inc Series 144A 4.75% 15/02/2031
USD 1,345,285 0.36
415,000 CHS/Community Health Systems Inc Series 144A 5.625% 15/03/2027
USD 435,684 0.12
335,000 CHS/Community Health Systems Inc Series 144A 6% 15/01/2029
USD 351,331 0.09
200,000 CHS/Community Health Systems Inc Series 144A 6.125% 01/04/2030
USD 199,431 0.05
300,000 CHS/Community Health Systems Inc Series 144A 6.625% 15/02/2025
USD 316,125 0.08
168,000 CHS/Community Health Systems Inc Series 144A 6.875% 01/04/2028
USD 161,447 0.04
250,000 CHS/Community Health Systems Inc Series 144A 6.875% 15/04/2029
USD 255,502 0.07
Schedule of investments as at 31 May 2021 (continued)
Transferable securities admitted to an official stock exchange listing or traded on a regulated market. The percentages in brackets show the equivalent sector holdings at 31 May 2020.
247

Barclays Multi-Manager Fund PLC Annual Report and Audited Financial Statements 2021
GlobalAccess Global High Yield Bond Fund
Holdings Financial assets at fair value through profit or loss Currency Fair value
USD % of net
assets
Bonds: 94.59% (31 May 2020: 93.09%) (continued)
United States: 75.67% (31 May 2020: 74.33%) (continued)
Corporate bonds: 75.67% (31 May 2020: 74.33%)
640,000 CHS/Community Health Systems Inc Series 144A 8% 15/03/2026
USD 685,837 0.18
275,000 CHS/Community Health Systems Inc Series 144A 8% 15/12/2027
USD 301,813 0.08
900,000 Churchill Downs Inc Series 144A 5.5% 01/04/2027 USD 938,641 0.25400,000 Cinemark USA Inc 4.875% 01/06/2023 USD 400,914 0.11175,000 Cinemark USA Inc Series 144A 5.875% 15/03/2026 USD 181,566 0.05600,000 Citgo Holding Inc Series 144A 9.25% 01/08/2024 USD 615,750 0.16
1,310,000 CITGO Petroleum Corp Series 144A 6.375% 15/06/2026 USD 1,344,466 0.36280,000 CITGO Petroleum Corp Series 144A 7% 15/06/2025 USD 291,556 0.08100,000 Citigroup Inc Series W FRN Perpetual USD 102,250 0.03375,000 Citigroup Inc Series V FRN Perpetual USD 386,016 0.10225,000 Citigroup Inc Series 'T' Series T FRN Perpetual USD 261,844 0.07350,000 Clarios Global LP / Clarios US Finance Co Series 144A
8.5% 15/05/2027USD 381,063 0.10
230,000 Clean Harbors Inc Series 144A 5.125% 15/07/2029 USD 250,055 0.07150,000 Clear Channel Outdoor Holdings Inc Series 144A 7.5%
01/06/2029USD 149,797 0.04
770,000 Clear Channel Outdoor Holdings Inc Series 144A 7.75% 15/04/2028
USD 789,789 0.21
375,000 Clear Channel Worldwide Holdings Inc Series 144A 5.125% 15/08/2027
USD 379,106 0.10
277,000 Clear Channel Worldwide Holdings Inc 9.25% 15/02/2024 USD 291,058 0.0825,000 Clearway Energy Operating LLC Series 144A 3.75%
15/02/2031USD 24,219 0.01
300,000 Clearway Energy Operating LLC Series 144A 4.75% 15/03/2028
USD 310,778 0.08
225,000 Clearway Energy Operating LLC 5% 15/09/2026 USD 232,583 0.06630,000 Cleveland-Cliffs Inc Series 144A 4.625% 01/03/2029 USD 649,300 0.17390,000 Cleveland-Cliffs Inc Series 144A 4.875% 01/03/2031 USD 399,259 0.11275,000 Cleveland-Cliffs Inc 5.875% 01/06/2027 USD 288,406 0.08250,000 Cleveland-Cliffs Inc Series 144A 6.75% 15/03/2026 USD 270,309 0.07
15,000 Cleveland-Cliffs Inc Series 144A 9.875% 17/10/2025 USD 17,570 –1,250,000 Cloud Peak Energy Resources LLC 6.375% 01/10/2020** USD 12,500 –
350,000 CNX Midstream Partners LP / CNX Midstream Finance Corp Series 144A 6.5% 15/03/2026
USD 366,476 0.10
250,000 CNX Resources Corp Series 144A 6% 15/01/2029 USD 267,229 0.07350,000 CNX Resources Corp Series 144A 7.25% 14/03/2027 USD 376,828 0.10150,000 Coeur Mining Inc Series 144A 5.125% 15/02/2029 USD 147,564 0.04460,000 Colgate Energy Partners III LLC Series 144A 7.75%
15/02/2026USD 471,051 0.13
280,000 CommScope Finance LLC Series 144A 5.5% 01/03/2024 USD 288,386 0.08175,000 CommScope Finance LLC Series 144A 6% 01/03/2026 USD 184,056 0.05
Schedule of investments as at 31 May 2021 (continued)
Transferable securities admitted to an official stock exchange listing or traded on a regulated market. The percentages in brackets show the equivalent sector holdings at 31 May 2020.
248

Barclays Multi-Manager Fund PLC Annual Report and Audited Financial Statements 2021
GlobalAccess Global High Yield Bond Fund
Holdings Financial assets at fair value through profit or loss Currency Fair value
USD % of net
assets
Bonds: 94.59% (31 May 2020: 93.09%) (continued)
United States: 75.67% (31 May 2020: 74.33%) (continued)
Corporate bonds: 75.67% (31 May 2020: 74.33%)
200,000 CommScope Finance LLC Series 144A 8.25% 01/03/2027 USD 213,750 0.06125,000 CommScope Inc Series 144A 7.125% 01/07/2028 USD 133,899 0.04845,000 CommScope Technologies LLC Series 144A 5%
15/03/2027USD 852,791 0.23
554,000 CommScope Technologies LLC Series 144A 6% 15/06/2025
USD 566,288 0.15
740,000 Compass Group Diversified Holdings LLC Series 144A 5.25% 15/04/2029
USD 764,779 0.20
100,000 Compass Minerals International Inc Series 144A 6.75% 01/12/2027
USD 107,378 0.03
199,000 Comstock Escrow Corp 9.75% 15/08/2026 USD 216,305 0.06995,000 Comstock Resources Inc Series 144A 6.75% 01/03/2029 USD 1,041,218 0.28420,000 Consolidated Communications Inc Series 144A 5%
01/10/2028USD 427,881 0.11
200,000 Consolidated Communications Inc Series 144A 6.5% 01/10/2028
USD 216,724 0.06
36,000 Continental Resources Inc 4.5% 15/04/2023 USD 37,630 0.01150,000 Cooper-Standard Automotive Inc Series 144A 5.625%
15/11/2026USD 129,464 0.03
125,000 Cornerstone Building Brands Inc Series 144A 6.125% 15/01/2029
USD 133,728 0.04
150,000 Cornerstone Chemical Co Series 144A 6.75% 15/08/2024 USD 139,421 0.04630,000 Coty Inc Series 144A 5% 15/04/2026 USD 640,036 0.17225,000 Covanta Holding Corp 5% 01/09/2030 USD 232,069 0.06
1,115,000 Covanta Holding Corp 6% 01/01/2027 USD 1,167,751 0.31200,000 CP Atlas Buyer Inc Series 144A 7% 01/12/2028 USD 207,108 0.06
25,000 CPI CG Inc Series 144A 8.625% 15/03/2026 USD 26,203 0.01750,000 CQP Holdco LP / BIP-V Chinook Holdco LLC 5.5%
15/06/2031USD 759,375 0.20
325,000 Crestwood Midstream Partners LP / Crestwood Midstream Finance Corp Series 144A 6% 01/02/2029
USD 336,812 0.09
355,000 CrownRock LP / CrownRock Finance Inc Series 144A 5% 01/05/2029
USD 365,618 0.10
575,000 CrownRock LP / CrownRock Finance Inc Series 144A 5.625% 15/10/2025
USD 594,487 0.16
200,000 CSC Holdings LLC Series 144A 4.125% 01/12/2030 USD 195,710 0.05400,000 CSC Holdings LLC Series 144a 4.5% 15/11/2031 USD 398,822 0.11400,000 CSC Holdings LLC Series 144a 4.625% 01/12/2030 USD 388,104 0.10200,000 CSC Holdings LLC Series 144A 5% 15/11/2031 USD 198,986 0.05
1,485,000 CSC Holdings LLC Series 144A 5.5% 15/04/2027 USD 1,561,106 0.42600,000 CSC Holdings LLC Series 144A 5.75% 15/01/2030 USD 627,051 0.17425,000 CSC Holdings LLC Series 144A 6.5% 01/02/2029 USD 465,496 0.12
Schedule of investments as at 31 May 2021 (continued)
Transferable securities admitted to an official stock exchange listing or traded on a regulated market. The percentages in brackets show the equivalent sector holdings at 31 May 2020.
249

Barclays Multi-Manager Fund PLC Annual Report and Audited Financial Statements 2021
GlobalAccess Global High Yield Bond Fund
Holdings Financial assets at fair value through profit or loss Currency Fair value
USD % of net
assets
Bonds: 94.59% (31 May 2020: 93.09%) (continued)
United States: 75.67% (31 May 2020: 74.33%) (continued)
Corporate bonds: 75.67% (31 May 2020: 74.33%)
430,000 Cushman & Wakefield US Borrower LLC Series 144A 6.75% 15/05/2028
USD 463,862 0.12
150,000 DAE Funding LLC Series 144A 5% 01/08/2024 USD 154,279 0.0475,000 Dana Inc 4.25% 01/09/2030 USD 77,464 0.02
125,000 Darling Ingredients Inc Series 144A 5.25% 15/04/2027 USD 130,928 0.03175,000 DaVita Inc Series 144A 3.75% 15/02/2031 USD 168,013 0.04885,000 DaVita Inc Series 144A 4.625% 01/06/2030 USD 903,758 0.24405,000 DCP Midstream Operating LP 5.125% 15/05/2029 USD 437,106 0.12100,000 DCP Midstream Operating LP 5.375% 15/07/2025 USD 109,666 0.03190,000 DCP Midstream Operating LP 5.6% 01/04/2044 USD 199,200 0.05200,000 DCP Midstream Operating LP 5.625% 15/07/2027 USD 220,459 0.06
60,000 DCP Midstream Operating LP Series 144A 6.45% 03/11/2036
USD 68,722 0.02
175,000 Dealer Tire LLC Series 144A 8% 01/02/2028 USD 185,431 0.05200,000 Delek Logistics Partners LP / Delek Logistics Finance Corp
6.75% 15/05/2025USD 205,479 0.05
175,000 Delek Logistics Partners LP / Delek Logistics Finance Corp Series 144A 7.125% 01/06/2028
USD 180,906 0.05
350,000 Dell International LLC / EMC Corp Series 144A 7.125% 15/06/2024
USD 357,438 0.10
125,000 Delta Air Lines Inc 3.625% 15/03/2022 USD 127,083 0.03455,000 Delta Air Lines Inc Series 144A 7% 01/05/2025 USD 529,403 0.14150,000 Delta Air Lines Inc 7.375% 15/01/2026 USD 176,739 0.05
75,000 Deluxe Corp Series 144A 8% 01/06/2029 USD 78,131 0.02700,000 Diamond Sports Group LLC / Diamond Sports Finance Co
Series 144A 5.375% 15/08/2026USD 518,868 0.14
275,000 Diamond Sports Group LLC / Diamond Sports Finance Co Series 144A 6.625% 15/08/2027
USD 157,721 0.04
250,000 Diebold Nixdorf Inc 8.5% 15/04/2024 USD 256,226 0.07100,000 Diebold Nixdorf Inc Series 144A 9.375% 15/07/2025 USD 111,143 0.03250,000 DISH DBS Corp Series 144A 5.125% 01/06/2029 USD 248,337 0.07150,000 DISH DBS Corp 5.875% 15/11/2024 USD 159,854 0.04385,000 DISH DBS Corp 7.375% 01/07/2028 USD 412,912 0.11555,000 DISH DBS Corp 7.75% 01/07/2026 USD 631,146 0.17275,000 Diversified Healthcare Trust 4.375% 01/03/2031 USD 259,080 0.07175,000 Diversified Healthcare Trust 9.75% 15/06/2025 USD 194,878 0.05200,000 Downstream Development Authority of the Quapaw Tribe
of Oklahoma Series 144A 10.5% 15/02/2023USD 209,229 0.06
225,000 Dycom Industries Inc Series 144A 4.5% 15/04/2029 USD 224,156 0.06225,000 Edgewell Personal Care Co Series 144A 4.125%
01/04/2029USD 225,803 0.06
405,000 Edgewell Personal Care Co Series 144A 5.5% 01/06/2028 USD 431,588 0.11500,000 Embarq Corp 7.995% 01/06/2036 USD 565,708 0.15
Schedule of investments as at 31 May 2021 (continued)
Transferable securities admitted to an official stock exchange listing or traded on a regulated market. The percentages in brackets show the equivalent sector holdings at 31 May 2020.
250

Barclays Multi-Manager Fund PLC Annual Report and Audited Financial Statements 2021
GlobalAccess Global High Yield Bond Fund
Holdings Financial assets at fair value through profit or loss Currency Fair value
USD % of net
assets
Bonds: 94.59% (31 May 2020: 93.09%) (continued)
United States: 75.67% (31 May 2020: 74.33%) (continued)
Corporate bonds: 75.67% (31 May 2020: 74.33%)
350,000 Encompass Health Corp 4.5% 01/02/2028 USD 361,812 0.10150,000 Encompass Health Corp 4.75% 01/02/2030 USD 157,510 0.04250,000 Endeavor Energy Resources LP / EER Finance Inc Series
144A 5.75% 30/01/2028USD 264,983 0.07
75,000 Endo Finance LLC Series 144A 5.75% 15/01/2022 USD 69,094 0.02300,000 Endure Digital Inc Series 144A 6% 15/02/2029 USD 288,738 0.08195,000 Energizer Holdings Inc Series 144A 4.375% 31/03/2029 USD 192,806 0.05170,000 Energizer Holdings Inc Series 144A 4.75% 15/06/2028 USD 172,773 0.05175,000 Energy Transfer LP Series A FRN Perpetual USD 154,024 0.0450,000 Energy Transfer LP Series B FRN Perpetual USD 48,562 0.01
535,000 EnerSys Series 144A 4.375% 15/12/2027 USD 554,889 0.15250,000 EnLink Midstream LLC 5.375% 01/06/2029 USD 252,194 0.07310,000 EnLink Midstream LLC Series 144A 5.625% 15/01/2028 USD 323,446 0.09125,000 EnLink Midstream Partners 5.05% 01/04/2045 USD 105,782 0.03325,000 EnLink Midstream Partners LP 4.85% 15/07/2026 USD 328,660 0.09175,000 EnLink Midstream Partners LP 5.45% 01/06/2047 USD 154,057 0.04189,000 EnLink Midstream Partners LP 5.6% 01/04/2044 USD 169,831 0.05125,000 Entercom Media Corp Series 144A 6.75% 31/03/2029 USD 127,424 0.03250,000 Envision Healthcare Corp Series 144A 8.75% 15/10/2026 USD 173,103 0.05305,000 EQM Midstream Partners LP Series 144A 4.5%
15/01/2029USD 305,703 0.08
152,000 EQM Midstream Partners LP 4.75% 15/07/2023 USD 159,299 0.04430,000 EQM Midstream Partners LP Series 144A 4.75%
15/01/2031USD 433,285 0.12
175,000 EQM Midstream Partners LP 5.5% 15/07/2028 USD 187,255 0.05175,000 EQM Midstream Partners LP Series 144A 6% 01/07/2025 USD 189,873 0.0550,000 EQM Midstream Partners LP Series 144A 6.5%
01/07/2027USD 55,076 0.01
100,000 EQM Midstream Partners LP 6.5% 15/07/2048 USD 106,317 0.03125,000 EQT Corp Series 144A 3.125% 15/05/2026 USD 127,622 0.0350,000 EQT Corp Series 144A 3.625% 15/05/2031 USD 51,559 0.01
250,000 EQT Corp 3.9% 01/10/2027 USD 267,288 0.07100,000 EQT Corp 5% 15/01/2029 USD 111,124 0.03125,000 EQT Corp 6.625% 01/02/2025 USD 146,149 0.04150,000 EQT Corp 7.5% 01/02/2030 USD 195,218 0.05100,000 EQT Midstream Partners LP 4% 01/08/2024 USD 102,448 0.03500,000 Esc Cb Gulfport Energy D01/15/18 6.38% USD 20,000 0.01210,000 Esc Gcb Gulfport Energy D04/15/17 6.00% USD 8,400 –531,000 Esc Gcb Sanchez Energy D02/23/15 6.13% ** USD 2,655 –30,980 Escrow Hercules 01/10/2020** USD – –
535,000 ESH Hospitality Inc Series 144A 4.625% 01/10/2027 USD 566,926 0.15270,000 ESH Hospitality Inc Series 144A 5.25% 01/05/2025 USD 275,400 0.07207,000 Everi Payments Inc Series 144A 7.5% 15/12/2025 USD 215,123 0.06
Schedule of investments as at 31 May 2021 (continued)
Transferable securities admitted to an official stock exchange listing or traded on a regulated market. The percentages in brackets show the equivalent sector holdings at 31 May 2020.
251

Barclays Multi-Manager Fund PLC Annual Report and Audited Financial Statements 2021
GlobalAccess Global High Yield Bond Fund
Holdings Financial assets at fair value through profit or loss Currency Fair value
USD % of net
assets
Bonds: 94.59% (31 May 2020: 93.09%) (continued)
United States: 75.67% (31 May 2020: 74.33%) (continued)
Corporate bonds: 75.67% (31 May 2020: 74.33%)
700,000 Exela Intermediate LLC / Exela Finance Inc Series 144A 10% 15/07/2023
USD 240,625 0.06
375,000 Exterran Energy Solutions LP / EES Finance Corp 8.125% 01/05/2025
USD 340,202 0.09
230,000 FelCor Lodging LP 6% 01/06/2025 USD 235,766 0.06250,000 Ferrellgas LP / Ferrellgas Finance Corp Series 144A 5.375%
01/04/2026USD 244,064 0.06
450,000 Ferrellgas LP / Ferrellgas Finance Corp Series 144A 5.875% 01/04/2029
USD 438,169 0.12
300,000 FirstCash Inc Series 144A 4.625% 01/09/2028 USD 311,260 0.08630,000 FirstEnergy Corp Series C 5.35% 15/07/2047 USD 730,530 0.19120,000 FirstEnergy Transmission LLC Series 144A 4.55%
01/04/2049USD 134,144 0.04
100,000 Five Point Operating Co LP / Five Point Capital Corp Series 144A 7.875% 15/11/2025
USD 105,704 0.03
125,000 Flex Acquisition Co Inc Series 144A 6.875% 15/01/2025 USD 126,247 0.03150,000 Flex Acquisition Co Inc Series 144A 7.875% 15/07/2026 USD 156,407 0.04
25,000 Ford Motor Co 5.291% 08/12/2046 USD 26,608 0.01675,000 Ford Motor Co 8.5% 21/04/2023 USD 754,363 0.20600,000 Ford Motor Co 9% 22/04/2025 USD 733,830 0.20200,000 Ford Motor Credit Co LLC 3.815% 02/11/2027 USD 204,500 0.05400,000 Ford Motor Credit Co LLC 4% 13/11/2030 USD 408,488 0.11200,000 Ford Motor Credit Co LLC 4.063% 01/11/2024 USD 211,695 0.06200,000 Ford Motor Credit Co LLC 4.134% 04/08/2025 USD 212,400 0.06200,000 Ford Motor Credit Co LLC 4.14% 15/02/2023 USD 208,192 0.06200,000 Ford Motor Credit Co LLC 4.542% 01/08/2026 USD 215,642 0.06200,000 Ford Motor Credit Co LLC 4.687% 09/06/2025 USD 215,460 0.06900,000 Ford Motor Credit Co LLC 5.113% 03/05/2029 USD 987,948 0.26420,000 Ford Motor Credit Co LLC 5.125% 16/06/2025 USD 460,163 0.12110,000 Ford Motor Credit Co LLC 5.596% 07/01/2022 USD 112,887 0.03150,000 Forestar Group Inc Series 144A 3.85% 15/05/2026 USD 151,291 0.04200,000 Forestar Group Inc Series 144A 5% 01/03/2028 USD 207,969 0.06200,000 Fortress Transportation & Infrastructure Investors LLC
Series 144A 6.5% 01/10/2025USD 207,750 0.06
75,000 Fortress Transportation and Infrastructure Investors LLC Series 144A 5.5% 01/05/2028
USD 78,000 0.02
175,000 Fortress Transportation and Infrastructure Investors LLC Series 144A 9.75% 01/08/2027
USD 202,125 0.05
225,000 Foundation Building Materials Inc Series 144A 6% 01/03/2029
USD 220,878 0.06
337,000 Foxtrot Escrow Issuer LLC / Foxtrot Escrow Corp Series 144A 12.25% 15/11/2026
USD 390,556 0.10
250,000 Freedom Mortgage Corp Series 144A 7.625% 01/05/2026 USD 261,220 0.07
Schedule of investments as at 31 May 2021 (continued)
Transferable securities admitted to an official stock exchange listing or traded on a regulated market. The percentages in brackets show the equivalent sector holdings at 31 May 2020.
252

Barclays Multi-Manager Fund PLC Annual Report and Audited Financial Statements 2021
GlobalAccess Global High Yield Bond Fund
Holdings Financial assets at fair value through profit or loss Currency Fair value
USD % of net
assets
Bonds: 94.59% (31 May 2020: 93.09%) (continued)
United States: 75.67% (31 May 2020: 74.33%) (continued)
Corporate bonds: 75.67% (31 May 2020: 74.33%)
250,000 Freeport-McMoRan Inc 4.125% 01/03/2028 USD 261,250 0.07250,000 Freeport-McMoRan Inc 4.25% 01/03/2030 USD 269,404 0.07175,000 Freeport-McMoRan Inc 4.375% 01/08/2028 USD 185,089 0.05175,000 Freeport-McMoRan Inc 4.625% 01/08/2030 USD 192,367 0.05150,000 Freeport-McMoRan Inc 5% 01/09/2027 USD 158,443 0.04250,000 Freeport-McMoRan Inc 5.45% 15/03/2043 USD 302,188 0.08
1,085,000 Frontier Communications Corp Series 144A 5% 01/05/2028
USD 1,113,481 0.30
190,000 Frontier Communications Holdings LLC Series 144A 5.875% 15/10/2027
USD 202,260 0.05
60,077 Frontier Communications Holdings LLC 5.875% 01/11/2029
USD 60,548 0.02
285,000 Frontier Communications Holdings LLC Series 144A 6.75% 01/05/2029
USD 298,347 0.08
175,000 Full House Resorts Inc Series 144A 8.25% 15/02/2028 USD 190,394 0.05425,000 FXI Holdings Inc Series 144A 7.875% 01/11/2024 USD 438,997 0.12175,000 Gap Inc Series 144A 8.625% 15/05/2025 USD 193,677 0.05
7,193 Gbl. Aviation Hldgs. 2nd Lein Term 13.07.2017 0% 13/07/2017**
USD – –
150,000 GCI LLC Series 144A 4.75% 15/10/2028 USD 153,188 0.04100,000 Genesis Energy LP 6.5% 01/10/2025 USD 100,772 0.03225,000 Genesis Energy LP 7.75% 01/02/2028 USD 226,618 0.06125,000 Genesis Energy LP / Genesis Energy Finance Corp 8%
15/01/2027USD 128,594 0.03
100,000 Genworth Holdings Inc Series . 4.8% 15/02/2024 USD 97,125 0.03375,000 Genworth Holdings Inc Series . 4.9% 15/08/2023 USD 371,065 0.10175,000 Genworth Mortgage Holdings Inc Series 144A 6.5%
15/08/2025USD 190,237 0.05
125,000 GEO Group Inc 6% 15/04/2026 USD 75,313 0.0250,000 Global Infrastructure Solutions Inc Series 144A 5.625%
01/06/2029USD 51,352 0.01
175,000 Global Marine Inc 7% 01/06/2028 USD 104,125 0.03125,000 Go Daddy Operating Co LLC / GD Finance Co Inc Series
144A 3.5% 01/03/2029USD 120,781 0.03
300,000 Go Daddy Operating Co LLC / GD Finance Co Inc Series 144A 5.25% 01/12/2027
USD 313,890 0.08
525,000 Golden Entertainment Inc Series 144A 7.625% 15/04/2026
USD 562,057 0.15
1,385,000 Golden Nugget Inc Series 144A 6.75% 15/10/2024 USD 1,399,584 0.37275,000 Golden Nugget Inc Series 144A 8.75% 01/10/2025 USD 290,931 0.08175,000 Goldman Sachs Group Inc Series R FRN Perpetual USD 186,375 0.05125,000 Goodyear Tire & Rubber Co 5% 31/05/2026 USD 128,518 0.03175,000 Goodyear Tire & Rubber Co Series 144A 5% 15/07/2029 USD 178,684 0.05
Schedule of investments as at 31 May 2021 (continued)
Transferable securities admitted to an official stock exchange listing or traded on a regulated market. The percentages in brackets show the equivalent sector holdings at 31 May 2020.
253

Barclays Multi-Manager Fund PLC Annual Report and Audited Financial Statements 2021
GlobalAccess Global High Yield Bond Fund
Holdings Financial assets at fair value through profit or loss Currency Fair value
USD % of net
assets
Bonds: 94.59% (31 May 2020: 93.09%) (continued)
United States: 75.67% (31 May 2020: 74.33%) (continued)
Corporate bonds: 75.67% (31 May 2020: 74.33%)
320,000 Goodyear Tire & Rubber Co 5.25% 30/04/2031 USD 326,800 0.09225,000 Goodyear Tire & Rubber Co Series 144A 5.25%
15/07/2031USD 230,096 0.06
805,000 Goodyear Tire & Rubber Co 9.5% 31/05/2025 USD 904,180 0.24150,000 Graham Holdings Co Series 144A 5.75% 01/06/2026 USD 156,625 0.04125,000 Granite Holdings US Acquisition Co Series 144A 11%
01/10/2027USD 140,568 0.04
450,000 Gray Television Inc Series 144A 4.75% 15/10/2030 USD 442,647 0.12415,000 Great Lakes Dredge & Dock Corp Series 144A 5.25%
01/06/2029USD 423,300 0.11
225,000 Greif Inc Series 144A 6.5% 01/03/2027 USD 236,531 0.06480,000 Greystar Real Estate Partners LLC Series 144A 5.75%
01/12/2025USD 494,400 0.13
325,000 Griffon Corp 5.75% 01/03/2028 USD 343,281 0.09565,000 Grinding Media Inc / Moly-Cop AltaSteel Ltd Series 144A
7.375% 15/12/2023USD 578,650 0.15
50,000 Gulfport Energy Corp 6.375% 15/05/2025 USD 53,084 0.01207,801 Gulfport Energy Corp 8% 17/05/2026 USD 225,464 0.0650,000 GYP Holdings III Corp Series 144A 4.625% 01/05/2029 USD 50,375 0.01
125,000 H&E Equipment Services Inc Series 144A 3.875% 15/12/2028
USD 121,074 0.03
250,000 Harland Clarke Holdings Corp Series 144A 8.375% 15/08/2022
USD 255,286 0.07
400,000 Harvest Midstream I LP Series 144A 7.5% 01/09/2028 USD 431,128 0.11100,000 HAT Holdings I LLC / HAT Holdings II LLC Series 144A
3.75% 15/09/2030USD 96,553 0.03
125,000 HAT Holdings I LLC / HAT Holdings II LLC Series 144A 5.25% 15/07/2024
USD 128,919 0.03
50,000 HAT Holdings I LLC / HAT Holdings II LLC Series 144A 6% 15/04/2025
USD 52,813 0.01
100,000 HCA Inc 3.5% 01/09/2030 USD 102,833 0.03150,000 HCA Inc 7.69% 15/06/2025 USD 183,502 0.05350,000 Helios Software Holdings Inc / ION Corporate Solutions
Finance Sarl Series 144A 4.625% 01/05/2028USD 341,635 0.09
505,000 Herc Holdings Inc Series 144A 5.5% 15/07/2027 USD 532,775 0.14425,000 Hertz Corp Series 144A 5.5% 15/10/2024 USD 449,790 0.12575,000 Hess Midstream Operations LP Series 144A 5.625%
15/02/2026USD 597,399 0.16
425,000 Hess Midstream Partners LP Series 144A 5.125% 15/06/2028
USD 446,505 0.12
150,000 Hilcorp Energy I LP / Hilcorp Finance Co Series 144A 5.75% 01/02/2029
USD 154,185 0.04
Schedule of investments as at 31 May 2021 (continued)
Transferable securities admitted to an official stock exchange listing or traded on a regulated market. The percentages in brackets show the equivalent sector holdings at 31 May 2020.
254

Barclays Multi-Manager Fund PLC Annual Report and Audited Financial Statements 2021
GlobalAccess Global High Yield Bond Fund
Holdings Financial assets at fair value through profit or loss Currency Fair value
USD % of net
assets
Bonds: 94.59% (31 May 2020: 93.09%) (continued)
United States: 75.67% (31 May 2020: 74.33%) (continued)
Corporate bonds: 75.67% (31 May 2020: 74.33%)
150,000 Hilcorp Energy I LP / Hilcorp Finance Co Series 144A 6% 01/02/2031
USD 155,419 0.04
225,000 Hilcorp Energy I LP / Hilcorp Finance Co Series 144A 6.25% 01/11/2028
USD 236,531 0.06
175,000 Hillenbrand Inc 3.75% 01/03/2031 USD 173,475 0.0550,000 Hilton Domestic Operating Co Inc Series 144A 3.625%
15/02/2032USD 49,000 0.01
50,000 Hilton Domestic Operating Co Inc Series 144A 3.75% 01/05/2029
USD 50,252 0.01
225,000 Hilton Domestic Operating Co Inc Series 144A 5.375% 01/05/2025
USD 237,173 0.06
225,000 Hilton Domestic Operating Co Inc Series 144A 5.75% 01/05/2028
USD 242,718 0.06
1,070,000 Hilton Grand Vacations Borrower Escrow LLC / Hilton Grand Vacations Borrower Esc Series 144A 5% 01/06/2029
USD 1,082,037 0.29
235,000 HLF Financing Sarl LLC / Herbalife International Inc Series 144A 4.875% 01/06/2029
USD 235,505 0.06
148 Holdco Member Int Sorenson Plan Of Reorg 0% 31/12/2049**
USD 1,136 –
275,000 Holly Energy Partners LP Series 144A 5% 01/02/2028 USD 282,255 0.08345,000 Home Point Capital Inc Series 144A 5% 01/02/2026 USD 333,053 0.09325,000 Howard Hughes Corp Series 144A 4.125% 01/02/2029 USD 323,355 0.09
25,000 Howard Hughes Corp Series 144A 4.375% 01/02/2031 USD 24,817 0.01125,000 Howard Hughes Corp Series 144A 5.375% 01/08/2028 USD 131,797 0.04250,000 Howmet Aerospace Inc 5.125% 01/10/2024 USD 273,763 0.07400,000 Howmet Aerospace Inc 5.95% 01/02/2037 USD 464,632 0.12735,000 HUB International Ltd Series 144A 7% 01/05/2026 USD 764,312 0.2050,000 Hughes Satellite Systems Corp 6.625% 01/08/2026 USD 55,598 0.01
295,000 Hunt Cos Inc Series 144A 5.25% 15/04/2029 USD 284,225 0.08780,000 IAA Spinco Inc Series 144A 5.5% 15/06/2027** USD 820,739 0.22250,000 Icahn Enterprises LP / Icahn Enterprises Finance Corp
Series 144A 4.375% 01/02/2029USD 245,667 0.07
525,000 Icahn Enterprises LP / Icahn Enterprises Finance Corp 4.75% 15/09/2024
USD 547,785 0.15
550,000 Icahn Enterprises LP / Icahn Enterprises Finance Corp 5.25% 15/05/2027
USD 564,373 0.15
525,000 Icahn Enterprises LP / Icahn Enterprises Finance Corp 6.25% 15/05/2026
USD 555,881 0.15
175,000 iHeartCommunications Inc Series 144A 4.75% 15/01/2028
USD 179,015 0.05
125,000 iHeartCommunications Inc Series 144A 5.25% 15/08/2027
USD 129,679 0.03
Schedule of investments as at 31 May 2021 (continued)
Transferable securities admitted to an official stock exchange listing or traded on a regulated market. The percentages in brackets show the equivalent sector holdings at 31 May 2020.
255

Barclays Multi-Manager Fund PLC Annual Report and Audited Financial Statements 2021
GlobalAccess Global High Yield Bond Fund
Holdings Financial assets at fair value through profit or loss Currency Fair value
USD % of net
assets
Bonds: 94.59% (31 May 2020: 93.09%) (continued)
United States: 75.67% (31 May 2020: 74.33%) (continued)
Corporate bonds: 75.67% (31 May 2020: 74.33%)
382,848 iHeartCommunications Inc 6.375% 01/05/2026 USD 409,437 0.11315,000 iHeartCommunications Inc 8.375% 01/05/2027 USD 337,576 0.09650,000 Illuminate Buyer LLC / Illuminate Holdings IV Inc Series
144A 9% 01/07/2028USD 720,759 0.19
1,540,000 Imola Merger Corp Series 144A 4.75% 15/05/2029 USD 1,557,340 0.41320,000 Indigo Natural Resources LLC Series 144A 5.375%
01/02/2029USD 321,315 0.09
458,245 INN OF THE MTN GODS RESORT 9.25% 30/11/2023 9.25% 30/11/2023
USD 455,954 0.12
200,000 Innophos Holdings Inc Series 144A 9.375% 15/02/2028 USD 217,375 0.06175,000 Installed Building Products Inc Series 144A 5.75%
01/02/2028USD 184,811 0.05
475,000 Interface Inc Series 144A 5.5% 01/12/2028 USD 496,981 0.13125,000 IRB Holding Corp Series 144A 6.75% 15/02/2026 USD 129,376 0.03
75,000 IRB Holding Corp Series 144A 7% 15/06/2025 USD 81,124 0.02150,000 Iris Holdings Inc Series 144A 8.75% 15/02/2026 USD 153,262 0.04225,000 Iron Mountain Inc Series 144A 4.5% 15/02/2031 USD 223,942 0.06
1,000,000 Iron Mountain Inc Series 144A 4.875% 15/09/2027 USD 1,038,755 0.2850,000 Iron Mountain Inc Series 144A 4.875% 15/09/2029 USD 51,313 0.01
185,000 Iron Mountain Inc Series 144A 5% 15/07/2028 USD 191,428 0.05440,000 Iron Mountain Inc Series 144A 5.25% 15/07/2030 USD 459,983 0.12775,000 J2 Global Inc Series 144A 4.625% 15/10/2030 USD 793,491 0.21275,000 Jacobs Entertainment Inc Series 144A 7.875% 01/02/2024 USD 288,043 0.0870,000 JB Poindexter & Co Inc Series 144A 7.125% 15/04/2026 USD 74,032 0.02
225,000 JELD-WEN Inc Series 144A 6.25% 15/05/2025 USD 241,988 0.06225,000 JPMorgan Chase & Co Series HH FRN Perpetual USD 229,781 0.06425,000 JPMorgan Chase & Co Series 'R' Series R FRN Perpetual USD 450,007 0.12
75,000 JPW Industries Holding Corp Series 144A 9% 01/10/2024 USD 79,085 0.0261,000 K Hovnanian Enterprises Inc Series 144A 5%
01/02/2040**USD 44,225 0.01
62,000 K Hovnanian Enterprises Inc Series 144A 13.5% 01/02/2026**
USD 63,550 0.02
100,000 Kaiser Aluminum Corp Series 144A 4.625% 01/03/2028 USD 102,285 0.031,015,000 KAR Auction Services Inc Series 144A 5.125% 01/06/2025 USD 1,036,569 0.28
175,000 KB Home 4% 15/06/2031 USD 175,437 0.05175,000 KB Home 6.875% 15/06/2027 USD 207,474 0.0650,000 KB Home 7.625% 15/05/2023 USD 54,399 0.01
150,000 Ken Garff Automotive LLC Series 144A 4.875% 15/09/2028
USD 149,719 0.04
285,000 Kraft Heinz Foods Co 4.875% 01/10/2049 USD 327,532 0.09150,000 Kraft Heinz Foods Co 5% 04/06/2042 USD 174,589 0.05450,000 Kraft Heinz Foods Co 5.2% 15/07/2045 USD 532,361 0.14645,000 Kraft Heinz Foods Co 6.5% 09/02/2040 USD 861,935 0.23
Schedule of investments as at 31 May 2021 (continued)
Transferable securities admitted to an official stock exchange listing or traded on a regulated market. The percentages in brackets show the equivalent sector holdings at 31 May 2020.
256

Barclays Multi-Manager Fund PLC Annual Report and Audited Financial Statements 2021
GlobalAccess Global High Yield Bond Fund
Holdings Financial assets at fair value through profit or loss Currency Fair value
USD % of net
assets
Bonds: 94.59% (31 May 2020: 93.09%) (continued)
United States: 75.67% (31 May 2020: 74.33%) (continued)
Corporate bonds: 75.67% (31 May 2020: 74.33%)
600,000 Kraft Heinz Foods Co 6.875% 26/01/2039 USD 825,686 0.22150,000 Kronos Acquisition Holdings Inc / KIK Custom Products
Inc Series 144A 7% 31/12/2027USD 152,826 0.04
620,000 L Brands Inc Series 144A 6.625% 01/10/2030 USD 709,512 0.19600,000 L Brands Inc 6.75% 01/07/2036 USD 715,086 0.19100,000 L Brands Inc 6.875% 01/11/2035 USD 120,634 0.03135,000 L Brands Inc 6.95% 01/03/2033 USD 157,797 0.04430,000 L Brands Inc 7.5% 15/06/2029 USD 495,680 0.13100,000 L Brands Inc Series 144a 9.375% 01/07/2025 USD 127,556 0.03225,000 Ladder Capital Finance Holdings LLLP / Ladder Capital
Finance Corp Series 144A 4.25% 01/02/2027USD 220,704 0.06
75,000 Ladder Capital Finance Holdings LLLP / Ladder Capital Finance Corp Series 144A 5.25% 15/03/2022
USD 75,750 0.02
75,000 Lamar Media Corp 3.75% 15/02/2028 USD 75,769 0.02225,000 Lamar Media Corp 4% 15/02/2030 USD 226,516 0.06660,000 Laredo Petroleum Inc 9.5% 15/01/2025 USD 693,122 0.18100,000 LBM Acquisition LLC Series 144A 6.25% 15/01/2029 USD 102,543 0.03250,000 LCM Investments Holdings II LLC Series 144A 4.875%
01/05/2029USD 257,064 0.07
230,000 LD Holdings Group LLC Series 144A 6.125% 01/04/2028 USD 227,442 0.06540,000 LD Holdings Group LLC Series 144A 6.5% 01/11/2025 USD 559,337 0.15465,000 Legends Hospitality Holding Co LLC / Legends Hospitality
Co-Issuer Inc Series 144A 5% 01/02/2026USD 481,856 0.13
175,000 Level 3 Financing Inc Series 144A 3.75% 15/07/2029 USD 168,954 0.05100,000 Level 3 Financing Inc Series 144A 4.25% 01/07/2028 USD 100,340 0.03570,000 Level 3 Financing Inc Series 144A 4.625% 15/09/2027 USD 586,809 0.16375,000 Life Time Inc Series 144A 5.75% 15/01/2026 USD 387,070 0.10
1,100,000 Life Time Inc Series 144A 8% 15/04/2026 USD 1,161,919 0.31125,000 LifePoint Health Inc Series 144A 5.375% 15/01/2029 USD 121,896 0.03150,000 LifePoint Health Inc Series 144A 6.75% 15/04/2025 USD 158,958 0.04175,000 Lithia Motors Inc Series 144A 3.875% 01/06/2029 USD 180,007 0.05100,000 Lithia Motors Inc Series 144A 4.375% 15/01/2031 USD 105,530 0.03100,000 Lithia Motors Inc Series 144A 4.625% 15/12/2027 USD 105,473 0.03300,000 Live Nation Entertainment Inc Series 144A 5.625%
15/03/2026USD 312,825 0.08
175,000 Live Nation Entertainment Inc Series 144A 6.5% 15/05/2027
USD 193,388 0.05
805,000 LogMeIn Inc Series 144A 5.5% 01/09/2027 USD 830,989 0.22275,000 LSF9 Atlantis Holdings LLC / Victra Finance Corp Series
144A 7.75% 15/02/2026USD 280,574 0.07
125,000 Macy's Retail Holdings LLC 5.125% 15/01/2042 USD 115,470 0.03275,000 Macy's Retail Holdings LLC Series 144A 5.875%
01/04/2029USD 293,562 0.08
Schedule of investments as at 31 May 2021 (continued)
Transferable securities admitted to an official stock exchange listing or traded on a regulated market. The percentages in brackets show the equivalent sector holdings at 31 May 2020.
257

Barclays Multi-Manager Fund PLC Annual Report and Audited Financial Statements 2021
GlobalAccess Global High Yield Bond Fund
Holdings Financial assets at fair value through profit or loss Currency Fair value
USD % of net
assets
Bonds: 94.59% (31 May 2020: 93.09%) (continued)
United States: 75.67% (31 May 2020: 74.33%) (continued)
Corporate bonds: 75.67% (31 May 2020: 74.33%)
150,000 Magic Mergeco Inc Series 144A 5.25% 01/05/2028 USD 152,063 0.04275,000 Magic Mergeco Inc Series 144A 7.875% 01/05/2029 USD 281,322 0.07250,000 Magnolia Oil & Gas Operating LLC / Magnolia Oil & Gas
Finance Corp Series 144A 6% 01/08/2026USD 258,401 0.07
175,000 MajorDrive Holdings IV LLC Series 144A 6.375% 01/06/2029
USD 173,714 0.05
75,000 Manitowoc Co Inc Series 144A 9% 01/04/2026 USD 81,930 0.02570,000 Marriott Ownership Resorts Inc Series 144A 6.125%
15/09/2025USD 607,914 0.16
75,000 Marriott Ownership Resorts Inc / ILG LLC 6.5% 15/09/2026
USD 78,346 0.02
425,000 Matador Resources Co 5.875% 15/09/2026 USD 427,125 0.11125,000 Match Group Inc Series 144A 5% 15/12/2027 USD 131,226 0.03
25,000 Mattel Inc Series 144A 3.375% 01/04/2026 USD 25,945 0.0150,000 Mattel Inc 5.45% 01/11/2041 USD 56,719 0.0225,000 Mattel Inc 6.2% 01/10/2040 USD 30,535 0.0123,000 Mattel Inc Series 144A 6.75% 31/12/2025 USD 24,263 0.01
175,000 Matthews International Corp Series 144A 5.25% 01/12/2025
USD 181,366 0.05
1,270,000 Mauser Packaging Solutions Holding Co Series 144A 5.5% 15/04/2024
USD 1,283,252 0.34
700,000 Mauser Packaging Solutions Holding Co Series 144a 7.25% 15/04/2025
USD 690,081 0.18
126,000 MBIA Inc 7.15% 15/07/2027 USD 129,042 0.03425,000 MEDNAX Inc Series 144A 6.25% 15/01/2027 USD 450,842 0.12200,000 Mercer International Inc Series 144A 5.125% 01/02/2029 USD 206,276 0.05830,000 Mercer International Inc 5.5% 15/01/2026 USD 853,867 0.23496,000 Meredith Corp 6.875% 01/02/2026 USD 518,677 0.14275,000 Meritage Homes Corp 6% 01/06/2025 USD 313,627 0.08225,000 Metis Merger Sub LLC Series 144A 6.5% 15/05/2029 USD 221,887 0.06535,000 MGIC Investment Corp 5.25% 15/08/2028 USD 566,709 0.15
25,000 MGM Resorts International 5.5% 15/04/2027 USD 27,186 0.01300,000 MGM Resorts International 7.75% 15/03/2022 USD 314,406 0.08500,000 Midas Intermediate Holdco II LLC / Midas Intermediate
Holdco II Finance Inc Series 144A 7.875% 01/10/2022USD 490,025 0.13
200,000 Midcap Financial Issuer Trust 6.5% 01/05/2028 USD 209,474 0.06200,000 Midcontinent Communications / Midcontinent Finance
Corp Series 144A 5.375% 15/08/2027USD 208,806 0.06
400,000 Midwest Gaming Borrower LLC / Midwest Gaming Finance Corp Series 144A 4.875% 01/05/2029
USD 401,160 0.11
75,000 Mileage Plus Holdings LLC / Mileage Plus Intellectual Property Assets Ltd Series 144A 6.5% 20/06/2027
USD 82,429 0.02
200,000 Minerals Technologies Inc Series 144A 5% 01/07/2028 USD 208,604 0.06
Schedule of investments as at 31 May 2021 (continued)
Transferable securities admitted to an official stock exchange listing or traded on a regulated market. The percentages in brackets show the equivalent sector holdings at 31 May 2020.
258
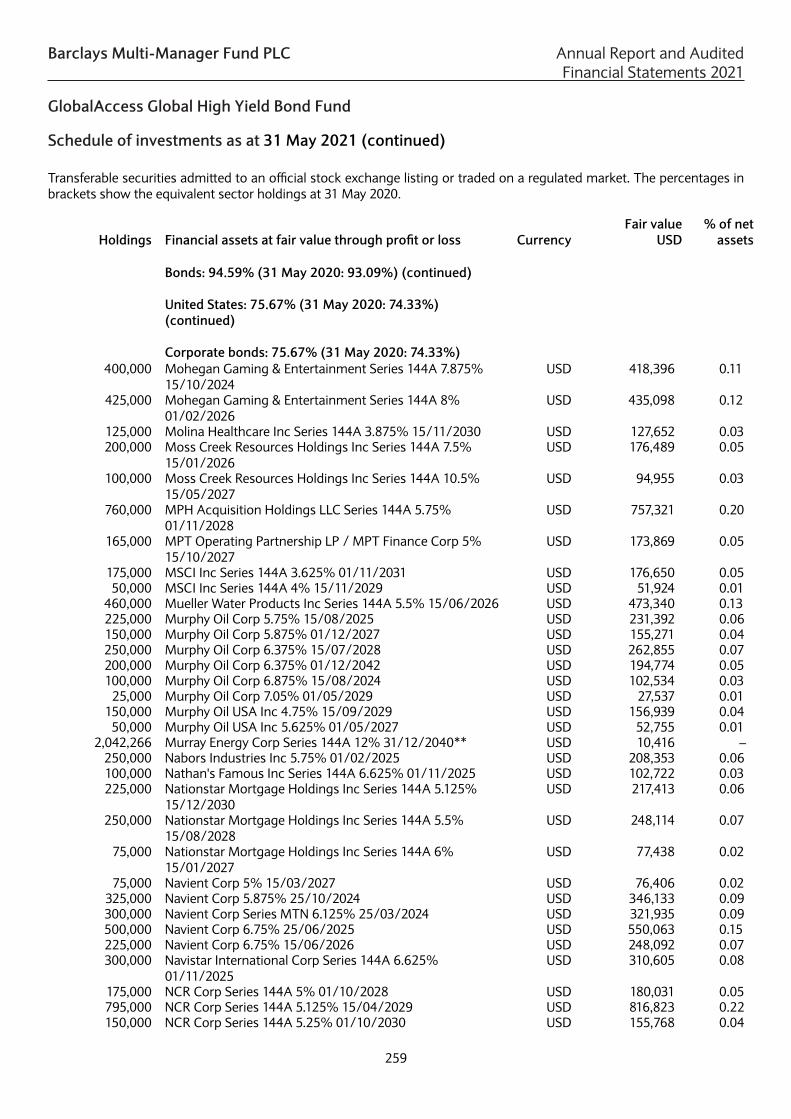
Barclays Multi-Manager Fund PLC Annual Report and Audited Financial Statements 2021
GlobalAccess Global High Yield Bond Fund
Holdings Financial assets at fair value through profit or loss Currency Fair value
USD % of net
assets
Bonds: 94.59% (31 May 2020: 93.09%) (continued)
United States: 75.67% (31 May 2020: 74.33%) (continued)
Corporate bonds: 75.67% (31 May 2020: 74.33%)
400,000 Mohegan Gaming & Entertainment Series 144A 7.875% 15/10/2024
USD 418,396 0.11
425,000 Mohegan Gaming & Entertainment Series 144A 8% 01/02/2026
USD 435,098 0.12
125,000 Molina Healthcare Inc Series 144A 3.875% 15/11/2030 USD 127,652 0.03200,000 Moss Creek Resources Holdings Inc Series 144A 7.5%
15/01/2026USD 176,489 0.05
100,000 Moss Creek Resources Holdings Inc Series 144A 10.5% 15/05/2027
USD 94,955 0.03
760,000 MPH Acquisition Holdings LLC Series 144A 5.75% 01/11/2028
USD 757,321 0.20
165,000 MPT Operating Partnership LP / MPT Finance Corp 5% 15/10/2027
USD 173,869 0.05
175,000 MSCI Inc Series 144A 3.625% 01/11/2031 USD 176,650 0.0550,000 MSCI Inc Series 144A 4% 15/11/2029 USD 51,924 0.01
460,000 Mueller Water Products Inc Series 144A 5.5% 15/06/2026 USD 473,340 0.13225,000 Murphy Oil Corp 5.75% 15/08/2025 USD 231,392 0.06150,000 Murphy Oil Corp 5.875% 01/12/2027 USD 155,271 0.04250,000 Murphy Oil Corp 6.375% 15/07/2028 USD 262,855 0.07200,000 Murphy Oil Corp 6.375% 01/12/2042 USD 194,774 0.05100,000 Murphy Oil Corp 6.875% 15/08/2024 USD 102,534 0.03
25,000 Murphy Oil Corp 7.05% 01/05/2029 USD 27,537 0.01150,000 Murphy Oil USA Inc 4.75% 15/09/2029 USD 156,939 0.04
50,000 Murphy Oil USA Inc 5.625% 01/05/2027 USD 52,755 0.012,042,266 Murray Energy Corp Series 144A 12% 31/12/2040** USD 10,416 –
250,000 Nabors Industries Inc 5.75% 01/02/2025 USD 208,353 0.06100,000 Nathan's Famous Inc Series 144A 6.625% 01/11/2025 USD 102,722 0.03225,000 Nationstar Mortgage Holdings Inc Series 144A 5.125%
15/12/2030USD 217,413 0.06
250,000 Nationstar Mortgage Holdings Inc Series 144A 5.5% 15/08/2028
USD 248,114 0.07
75,000 Nationstar Mortgage Holdings Inc Series 144A 6% 15/01/2027
USD 77,438 0.02
75,000 Navient Corp 5% 15/03/2027 USD 76,406 0.02325,000 Navient Corp 5.875% 25/10/2024 USD 346,133 0.09300,000 Navient Corp Series MTN 6.125% 25/03/2024 USD 321,935 0.09500,000 Navient Corp 6.75% 25/06/2025 USD 550,063 0.15225,000 Navient Corp 6.75% 15/06/2026 USD 248,092 0.07300,000 Navistar International Corp Series 144A 6.625%
01/11/2025USD 310,605 0.08
175,000 NCR Corp Series 144A 5% 01/10/2028 USD 180,031 0.05795,000 NCR Corp Series 144A 5.125% 15/04/2029 USD 816,823 0.22150,000 NCR Corp Series 144A 5.25% 01/10/2030 USD 155,768 0.04
Schedule of investments as at 31 May 2021 (continued)
Transferable securities admitted to an official stock exchange listing or traded on a regulated market. The percentages in brackets show the equivalent sector holdings at 31 May 2020.
259

Barclays Multi-Manager Fund PLC Annual Report and Audited Financial Statements 2021
GlobalAccess Global High Yield Bond Fund
Holdings Financial assets at fair value through profit or loss Currency Fair value
USD % of net
assets
Bonds: 94.59% (31 May 2020: 93.09%) (continued)
United States: 75.67% (31 May 2020: 74.33%) (continued)
Corporate bonds: 75.67% (31 May 2020: 74.33%)
645,000 NCR Corp Series 144A 5.75% 01/09/2027 USD 680,072 0.18695,000 NCR Corp Series 144A 6.125% 01/09/2029 USD 755,976 0.20250,000 NCR Corp Series 144A 8.125% 15/04/2025 USD 272,812 0.07175,000 NESCO Holdings II Inc Series 144A 5.5% 15/04/2029 USD 180,689 0.05400,000 Netflix Inc 6.375% 15/05/2029 USD 500,446 0.13635,000 New Enterprise Stone & Lime Co Inc Series 144A 6.25%
15/03/2026USD 655,241 0.17
275,000 New Enterprise Stone & Lime Co Inc Series 144A 9.75% 15/07/2028
USD 306,625 0.08
125,000 New Fortress Energy Inc Series 144A 6.5% 30/09/2026 USD 125,937 0.03245,000 New Residential Investment Corp Series 144A 6.25%
15/10/2025USD 245,314 0.07
142,000 Newell Brands Inc 4.7% 01/04/2026 USD 159,754 0.04350,000 Newell Brands Inc 5.875% 01/04/2036 USD 436,049 0.12175,000 Newell Brands Inc 6% 01/04/2046 USD 222,071 0.06425,000 News Corp Series 144A 3.875% 15/05/2029 USD 429,250 0.11400,000 Nexstar Broadcasting Inc Series 144A 4.75% 01/11/2028 USD 408,042 0.11870,000 Nexstar Broadcasting Inc Series 144A 5.625% 15/07/2027 USD 921,112 0.25325,000 NextEra Energy Operating Partners LP Series 144A 3.875%
15/10/2026USD 341,517 0.09
230,000 NFP Corp 4.875% 15/08/2028 USD 230,862 0.06665,000 NFP Corp Series 144A 6.875% 15/08/2028 USD 688,214 0.18100,000 NFP Corp Series 144A 7% 15/05/2025 USD 109,650 0.03400,000 NGL Energy Operating LLC / NGL Energy Finance Corp
Series 144A 7.5% 01/02/2026USD 416,972 0.11
50,000 Nielsen Finance LLC / Nielsen Finance Co Series 144A 5.625% 01/10/2028
USD 52,937 0.01
125,000 Nielsen Finance LLC / Nielsen Finance Co Series 144A 5.875% 01/10/2030
USD 135,170 0.04
225,000 Nine Energy Service Inc Series 144A 8.75% 01/11/2023 USD 94,078 0.03250,000 NMI Holdings Inc Series 144A 7.375% 01/06/2025 USD 286,975 0.08
32,363 NOBLE FIN CO SR SEC PIK TOGGLE 11.0% 15/02/2028 11% 15/02/2028
USD 33,981 0.01
350,000 Nokia of America Corp 6.45% 15/03/2029 USD 392,875 0.10300,000 Northern Oil and Gas Inc Series 144A 8.125% 01/03/2028 USD 314,662 0.08540,000 Novelis Corp Series 144A 5.875% 30/09/2026 USD 563,984 0.15125,000 NRG Energy Inc Series 144A 3.375% 15/02/2029 USD 120,864 0.03100,000 NRG Energy Inc Series 144A 3.625% 15/02/2031 USD 96,000 0.03300,000 NRG Energy Inc 6.625% 15/01/2027 USD 311,714 0.08
25,000 NuStar Logistics LP 5.75% 01/10/2025 USD 26,641 0.0179,000 NuStar Logistics LP 6% 01/06/2026 USD 84,794 0.02
306,000 NuStar Logistics LP 6.375% 01/10/2030 USD 335,534 0.09100,000 Oasis Petroleum Inc Series 144A 6.375% 01/06/2026 USD 101,750 0.03
Schedule of investments as at 31 May 2021 (continued)
Transferable securities admitted to an official stock exchange listing or traded on a regulated market. The percentages in brackets show the equivalent sector holdings at 31 May 2020.
260

Barclays Multi-Manager Fund PLC Annual Report and Audited Financial Statements 2021
GlobalAccess Global High Yield Bond Fund
Holdings Financial assets at fair value through profit or loss Currency Fair value
USD % of net
assets
Bonds: 94.59% (31 May 2020: 93.09%) (continued)
United States: 75.67% (31 May 2020: 74.33%) (continued)
Corporate bonds: 75.67% (31 May 2020: 74.33%)
80,000 Occidental Petroleum Corp 2.9% 15/08/2024 USD 79,900 0.02805,000 Occidental Petroleum Corp 3.2% 15/08/2026 USD 776,825 0.21780,000 Occidental Petroleum Corp 3.4% 15/04/2026 USD 761,518 0.20125,000 Occidental Petroleum Corp 3.5% 15/06/2025 USD 125,432 0.03240,000 Occidental Petroleum Corp 4.4% 15/04/2046 USD 206,500 0.05
70,000 Occidental Petroleum Corp 4.4% 15/08/2049 USD 58,903 0.02175,000 Occidental Petroleum Corp 5.5% 01/12/2025 USD 188,348 0.05325,000 Occidental Petroleum Corp 5.55% 15/03/2026 USD 347,344 0.09150,000 Occidental Petroleum Corp 5.875% 01/09/2025 USD 162,720 0.04125,000 Occidental Petroleum Corp 6.125% 01/01/2031 USD 138,810 0.04325,000 Occidental Petroleum Corp 6.2% 15/03/2040 USD 343,330 0.09275,000 Occidental Petroleum Corp 6.45% 15/09/2036 USD 310,162 0.08300,000 Occidental Petroleum Corp 6.6% 15/03/2046 USD 328,559 0.09200,000 Occidental Petroleum Corp 6.95% 01/07/2024 USD 222,650 0.06125,000 Occidental Petroleum Corp 7.125% 15/10/2027 USD 139,655 0.04425,000 Occidental Petroleum Corp 7.5% 01/05/2031 USD 506,640 0.13175,000 Occidental Petroleum Corp 7.875% 15/09/2031 USD 213,272 0.06125,000 Occidental Petroleum Corp 7.95% 15/06/2039 USD 151,250 0.04150,000 Occidental Petroleum Corp 8% 15/07/2025 USD 176,609 0.05275,000 Occidental Petroleum Corp 8.5% 15/07/2027 USD 334,687 0.09350,000 Occidental Petroleum Corp 8.875% 15/07/2030 USD 449,607 0.12360,000 Occidental Petroleum Corp FRN 15/08/2022 USD 357,413 0.10335,000 Oceaneering International Inc 6% 01/02/2028 USD 334,075 0.09375,000 Olin Corp 5% 01/02/2030 USD 398,512 0.11420,000 Olin Corp 5.125% 15/09/2027 USD 439,055 0.12485,000 Olin Corp 5.625% 01/08/2029 USD 528,160 0.14225,000 Olin Corp Series 144A 9.5% 01/06/2025 USD 279,810 0.07
50,000 ON Semiconductor Corp Series 144A 3.875% 01/09/2028 USD 50,859 0.01605,000 OneMain Finance Corp 6.625% 15/01/2028 USD 687,359 0.18275,000 Open Text Holdings Inc Series 144A 4.125% 15/02/2030 USD 276,713 0.07625,000 Organon Finance 1 LLC Series 144A 5.125% 30/04/2031 USD 642,144 0.17855,000 Ortho-Clinical Diagnostics Inc / Ortho-Clinical Diagnostics
SA Series 144A 7.25% 01/02/2028USD 930,967 0.25
75,000 Ortho-Clinical Diagnostics Inc / Ortho-Clinical Diagnostics SA Series 144A 7.375% 01/06/2025
USD 80,489 0.02
100,000 Outfront Media Capital LLC / Outfront Media Capital Corp Series 144A 4.25% 15/01/2029
USD 99,219 0.03
50,000 Outfront Media Capital LLC / Outfront Media Capital Corp Series 144A 4.625% 15/03/2030
USD 49,818 0.01
250,000 Outfront Media Capital LLC / Outfront Media Capital Corp Series 144A 5% 15/08/2027
USD 259,498 0.07
125,000 Ovintiv Inc 8.125% 15/09/2030 USD 170,324 0.05500,000 Owens & Minor Inc Series 144A 4.5% 31/03/2029 USD 504,342 0.13
Schedule of investments as at 31 May 2021 (continued)
Transferable securities admitted to an official stock exchange listing or traded on a regulated market. The percentages in brackets show the equivalent sector holdings at 31 May 2020.
261

Barclays Multi-Manager Fund PLC Annual Report and Audited Financial Statements 2021
GlobalAccess Global High Yield Bond Fund
Holdings Financial assets at fair value through profit or loss Currency Fair value
USD % of net
assets
Bonds: 94.59% (31 May 2020: 93.09%) (continued)
United States: 75.67% (31 May 2020: 74.33%) (continued)
Corporate bonds: 75.67% (31 May 2020: 74.33%)
75,000 Owens-Brockway Glass Container Inc Series 144A 6.375% 15/08/2025
USD 83,391 0.02
100,000 Owens-Brockway Glass Container Inc Series 144A 6.625% 13/05/2027
USD 108,750 0.03
275,000 Oxford Finance LLC / Oxford Finance Co-Issuer II Inc 6.375% 15/12/2022**
USD 278,029 0.07
225,000 P&L Development LLC / PLD Finance Corp Series 144A 7.75% 15/11/2025
USD 239,233 0.06
1,591,000 Par Pharmaceutical Inc Series 144A 7.5% 01/04/2027 USD 1,624,809 0.43685,000 Park Intermediate Holdings LLC / PK Domestic Property
LLC / PK Finance Co-Issuer Series 144A 4.875% 15/05/2029
USD 710,105 0.19
275,000 Park Intermediate Holdings LLC / PK Domestic Property LLC / PK Finance Co-Issuer Series 144A 7.5% 01/06/2025
USD 297,798 0.08
200,000 Park River Holdings Inc Series 144A 5.625% 01/02/2029 USD 191,768 0.0535,753 Parker Drilling Tl 13.00% 26/3/2024 0% 26/03/2024** USD 33,250 0.01
200,000 Park-Ohio Industries Inc 6.625% 15/04/2027 USD 205,132 0.05125,000 Party City Holdings Inc Series 144A 8.75% 15/02/2026 USD 132,500 0.04175,000 Patrick Industries Inc Series 144A 4.75% 01/05/2029 USD 174,799 0.05125,000 Patrick Industries Inc Series 144A 7.5% 15/10/2027 USD 135,904 0.04125,000 PBF Holding Co LLC Series 144A 9.25% 15/05/2025 USD 128,890 0.03175,000 PBF Holding Co LLC / PBF Finance Corp 6% 15/02/2028 USD 129,284 0.0325,000 PBF Holding Co LLC / PBF Finance Corp 7.25%
15/06/2025USD 20,357 0.01
400,000 PBF Logistics LP / PBF Logistics Finance Corp 6.875% 15/05/2023
USD 399,752 0.11
485,000 PDC Energy Inc 5.75% 15/05/2026 USD 506,830 0.1375,000 Peninsula Pacific Entertainment LLC / Peninsula Pacific
Entertainment Finance In Series 144A 8.5% 15/11/2027USD 80,308 0.02
570,000 PennyMac Financial Services Inc Series 144A 4.25% 15/02/2029
USD 553,678 0.15
10,000 PennyMac Financial Services Inc Series 144A 5.375% 15/10/2025
USD 10,513 –
245,000 Performance Food Group Inc Series 144A 5.5% 01/06/2024
USD 246,129 0.07
440,000 Performance Food Group Inc Series 144A 5.5% 15/10/2027
USD 459,950 0.12
975,000 PetSmart Inc / PetSmart Finance Corp Series 144A 4.75% 15/02/2028
USD 1,011,026 0.27
250,000 PetSmart Inc / PetSmart Finance Corp Series 144A 7.75% 15/02/2029
USD 275,547 0.07
195,000 PG&E Corp 5% 01/07/2028 USD 194,269 0.05485,000 PG&E Corp 5.25% 01/07/2030 USD 491,062 0.13
Schedule of investments as at 31 May 2021 (continued)
Transferable securities admitted to an official stock exchange listing or traded on a regulated market. The percentages in brackets show the equivalent sector holdings at 31 May 2020.
262
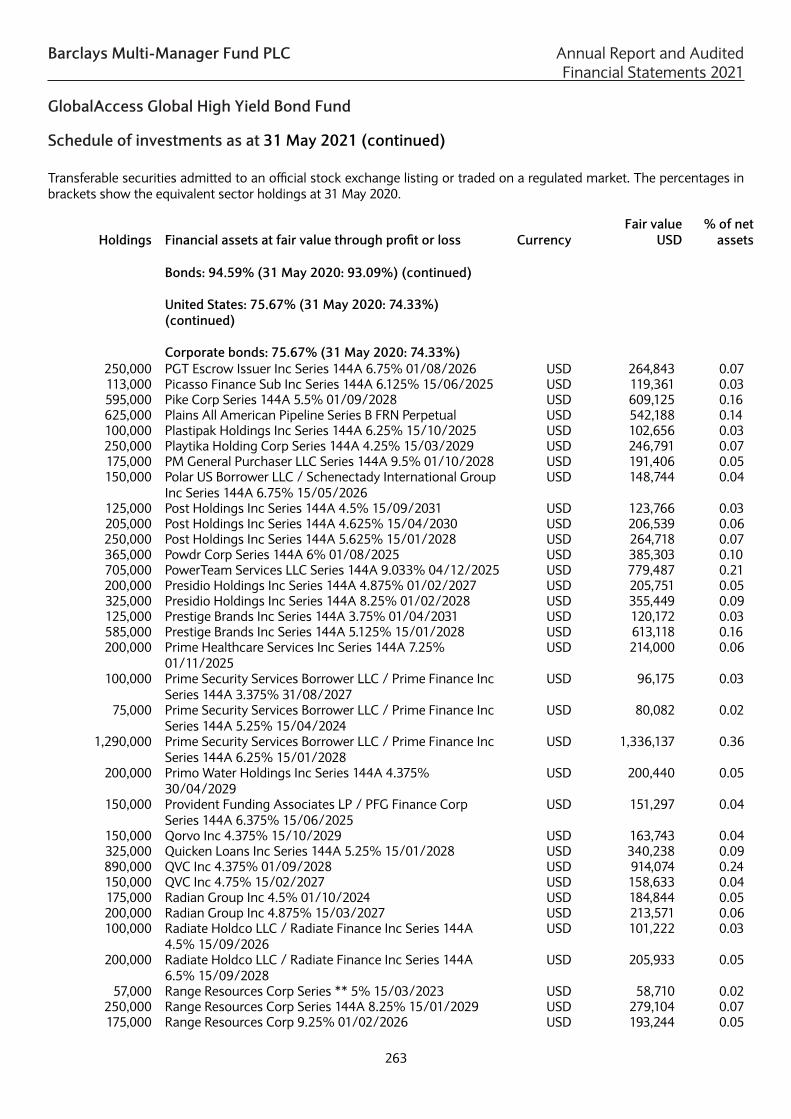
Barclays Multi-Manager Fund PLC Annual Report and Audited Financial Statements 2021
GlobalAccess Global High Yield Bond Fund
Holdings Financial assets at fair value through profit or loss Currency Fair value
USD % of net
assets
Bonds: 94.59% (31 May 2020: 93.09%) (continued)
United States: 75.67% (31 May 2020: 74.33%) (continued)
Corporate bonds: 75.67% (31 May 2020: 74.33%)
250,000 PGT Escrow Issuer Inc Series 144A 6.75% 01/08/2026 USD 264,843 0.07113,000 Picasso Finance Sub Inc Series 144A 6.125% 15/06/2025 USD 119,361 0.03595,000 Pike Corp Series 144A 5.5% 01/09/2028 USD 609,125 0.16625,000 Plains All American Pipeline Series B FRN Perpetual USD 542,188 0.14100,000 Plastipak Holdings Inc Series 144A 6.25% 15/10/2025 USD 102,656 0.03250,000 Playtika Holding Corp Series 144A 4.25% 15/03/2029 USD 246,791 0.07175,000 PM General Purchaser LLC Series 144A 9.5% 01/10/2028 USD 191,406 0.05150,000 Polar US Borrower LLC / Schenectady International Group
Inc Series 144A 6.75% 15/05/2026USD 148,744 0.04
125,000 Post Holdings Inc Series 144A 4.5% 15/09/2031 USD 123,766 0.03205,000 Post Holdings Inc Series 144A 4.625% 15/04/2030 USD 206,539 0.06250,000 Post Holdings Inc Series 144A 5.625% 15/01/2028 USD 264,718 0.07365,000 Powdr Corp Series 144A 6% 01/08/2025 USD 385,303 0.10705,000 PowerTeam Services LLC Series 144A 9.033% 04/12/2025 USD 779,487 0.21200,000 Presidio Holdings Inc Series 144A 4.875% 01/02/2027 USD 205,751 0.05325,000 Presidio Holdings Inc Series 144A 8.25% 01/02/2028 USD 355,449 0.09125,000 Prestige Brands Inc Series 144A 3.75% 01/04/2031 USD 120,172 0.03585,000 Prestige Brands Inc Series 144A 5.125% 15/01/2028 USD 613,118 0.16200,000 Prime Healthcare Services Inc Series 144A 7.25%
01/11/2025USD 214,000 0.06
100,000 Prime Security Services Borrower LLC / Prime Finance Inc Series 144A 3.375% 31/08/2027
USD 96,175 0.03
75,000 Prime Security Services Borrower LLC / Prime Finance Inc Series 144A 5.25% 15/04/2024
USD 80,082 0.02
1,290,000 Prime Security Services Borrower LLC / Prime Finance Inc Series 144A 6.25% 15/01/2028
USD 1,336,137 0.36
200,000 Primo Water Holdings Inc Series 144A 4.375% 30/04/2029
USD 200,440 0.05
150,000 Provident Funding Associates LP / PFG Finance Corp Series 144A 6.375% 15/06/2025
USD 151,297 0.04
150,000 Qorvo Inc 4.375% 15/10/2029 USD 163,743 0.04325,000 Quicken Loans Inc Series 144A 5.25% 15/01/2028 USD 340,238 0.09890,000 QVC Inc 4.375% 01/09/2028 USD 914,074 0.24150,000 QVC Inc 4.75% 15/02/2027 USD 158,633 0.04175,000 Radian Group Inc 4.5% 01/10/2024 USD 184,844 0.05200,000 Radian Group Inc 4.875% 15/03/2027 USD 213,571 0.06100,000 Radiate Holdco LLC / Radiate Finance Inc Series 144A
4.5% 15/09/2026USD 101,222 0.03
200,000 Radiate Holdco LLC / Radiate Finance Inc Series 144A 6.5% 15/09/2028
USD 205,933 0.05
57,000 Range Resources Corp Series ** 5% 15/03/2023 USD 58,710 0.02250,000 Range Resources Corp Series 144A 8.25% 15/01/2029 USD 279,104 0.07175,000 Range Resources Corp 9.25% 01/02/2026 USD 193,244 0.05
Schedule of investments as at 31 May 2021 (continued)
Transferable securities admitted to an official stock exchange listing or traded on a regulated market. The percentages in brackets show the equivalent sector holdings at 31 May 2020.
263

Barclays Multi-Manager Fund PLC Annual Report and Audited Financial Statements 2021
GlobalAccess Global High Yield Bond Fund
Holdings Financial assets at fair value through profit or loss Currency Fair value
USD % of net
assets
Bonds: 94.59% (31 May 2020: 93.09%) (continued)
United States: 75.67% (31 May 2020: 74.33%) (continued)
Corporate bonds: 75.67% (31 May 2020: 74.33%)
800,000 Realogy Group LLC / Realogy Co-Issuer Corp Series 144A 5.75% 15/01/2029
USD 836,884 0.22
565,000 Realogy Group LLC / Realogy Co-Issuer Corp Series 144A 7.625% 15/06/2025
USD 613,759 0.16
125,000 Realogy Group LLC / Realogy Co-Issuer Corp Series 144A 9.375% 01/04/2027
USD 139,179 0.04
380,000 Renewable Energy Group Inc Series 144a 5.875% 01/06/2028
USD 395,962 0.11
200,000 Rent-A-Center Inc/TX Series 144A 6.375% 15/02/2029 USD 214,587 0.06565,000 Reynolds Group Issuer Inc / Reynolds Group Issuer LLC /
Reynolds Group Issuer Lu Series 144A 4% 15/10/2027USD 556,096 0.15
200,000 RHP Hotel Properties LP / RHP Finance Corp Series 144A 4.5% 15/02/2029
USD 199,481 0.05
565,000 RHP Hotel Properties LP / RHP Finance Corp 4.75% 15/10/2027
USD 574,859 0.15
148,000 Rite Aid Corp Series 144A 7.5% 01/07/2025 USD 153,742 0.04691,000 Rite Aid Corp Series 144A 8% 15/11/2026 USD 718,947 0.19615,000 Rocket Software Inc Series 144A 6.5% 15/02/2029 USD 598,865 0.1675,000 Rockies Express Pipeline LLC Series 144A 3.6%
15/05/2025USD 75,578 0.02
50,000 Rockies Express Pipeline LLC Series 144A 4.8% 15/05/2030
USD 50,038 0.01
75,000 Rockies Express Pipeline LLC Series 144A 4.95% 15/07/2029
USD 77,048 0.02
125,000 Rockies Express Pipeline LLC Series 144A 6.875% 15/04/2040
USD 134,713 0.04
50,000 Rockies Express Pipeline LLC Series 144A 7.5% 15/07/2038
USD 55,750 0.01
200,000 RP Crown Parent LLC Series 144A 7.375% 15/10/2024 USD 204,467 0.05200,000 RP Escrow Issuer LLC Series 144A 5.25% 15/12/2025 USD 206,995 0.06370,000 Sabre GLBL Inc Series 144A 7.375% 01/09/2025 USD 399,137 0.11285,000 Sabre GLBL Inc Series 144A 9.25% 15/04/2025 USD 333,806 0.09100,000 Salem Media Group Inc Series 144A 6.75% 01/06/2024 USD 98,500 0.03131,250 Sanjel Corp 0% Perp 0% 31/12/2049** USD – –
1,525,000 SC CB SANCHEZ ENE? RGY D06/15/14 7.75% ESCRO ** USD 7,625 –275,000 Science Applications International Corp Series 144A
4.875% 01/04/2028USD 286,590 0.08
225,000 Scientific Games International Inc Series REGS 3.375% 15/02/2026
EUR 275,842 0.07
575,000 Scientific Games International Inc Series 144A 7% 15/05/2028
USD 623,001 0.17
150,000 Scientific Games International Inc Series 144A 7.25% 15/11/2029
USD 166,320 0.04
Schedule of investments as at 31 May 2021 (continued)
Transferable securities admitted to an official stock exchange listing or traded on a regulated market. The percentages in brackets show the equivalent sector holdings at 31 May 2020.
264

Barclays Multi-Manager Fund PLC Annual Report and Audited Financial Statements 2021
GlobalAccess Global High Yield Bond Fund
Holdings Financial assets at fair value through profit or loss Currency Fair value
USD % of net
assets
Bonds: 94.59% (31 May 2020: 93.09%) (continued)
United States: 75.67% (31 May 2020: 74.33%) (continued)
Corporate bonds: 75.67% (31 May 2020: 74.33%)
200,000 Scientific Games International Inc Series 144A 8.25% 15/03/2026
USD 215,400 0.06
225,000 SCIH Salt Holdings Inc Series 144A 4.875% 01/05/2028 USD 223,594 0.06175,000 SCIH Salt Holdings Inc Series 144A 6.625% 01/05/2029 USD 173,906 0.05225,000 Scotts Miracle-Gro Co Series 144A 4% 01/04/2031 USD 222,451 0.06
50,000 Scripps Escrow II Inc Series 144A 3.875% 15/01/2029 USD 48,759 0.01465,000 Scripps Escrow II Inc Series 144A 5.375% 15/01/2031 USD 466,816 0.12200,000 Scripps Escrow Inc Series 144A 5.875% 15/07/2027 USD 206,757 0.06150,000 Sealed Air Corp Series 144A 4% 01/12/2027 USD 157,958 0.04
1,145,000 SeaWorld Parks & Entertainment Inc Series 144A 9.5% 01/08/2025
USD 1,237,568 0.33
900,000 SEG Holding LLC / SEG Finance Corp Series 144A 5.625% 15/10/2028
USD 943,425 0.25
200,000 Select Medical Corp Series 144A 6.25% 15/08/2026 USD 211,313 0.06150,000 Sensata Technologies Inc Series 144A 3.75% 15/02/2031 USD 146,761 0.04175,000 Service Corp International/US 4% 15/05/2031 USD 178,404 0.0525,000 Service Properties Trust 3.95% 15/01/2028 USD 22,410 0.01
300,000 Service Properties Trust 4.35% 01/10/2024 USD 295,050 0.0850,000 Service Properties Trust 4.375% 15/02/2030 USD 45,073 0.01
250,000 Service Properties Trust 4.95% 15/02/2027 USD 240,161 0.0675,000 Service Properties Trust 4.95% 01/10/2029 USD 70,035 0.02
100,000 Service Properties Trust 5% 15/08/2022 USD 101,147 0.03250,000 Service Properties Trust 5.25% 15/02/2026 USD 245,326 0.07200,000 Service Properties Trust 5.5% 15/12/2027 USD 206,145 0.05
75,000 Service Properties Trust 7.5% 15/09/2025 USD 83,883 0.02600,000 SESI LLC 7.75% 15/09/2024 USD 231,038 0.06335,000 Shea Homes LP Series 144A 4.75% 15/02/2028 USD 336,802 0.09240,000 Shea Homes LP / Shea Homes Funding Corp Series 144A
4.75% 01/04/2029USD 239,537 0.06
255,000 Signal Parent Inc Series 144A 6.125% 01/04/2029 USD 249,706 0.07370,000 Simmons Foods Inc/Simmons Prepared Foods Inc/
Simmons Pet Food Inc/Simmons Feed Series 144A 4.625% 01/03/2029
USD 375,359 0.10
200,000 Sinclair Television Group Inc Series 144A 4.125% 01/12/2030
USD 194,790 0.05
150,000 Sinclair Television Group Inc Series 144A 5.125% 15/02/2027
USD 150,375 0.04
175,000 Sinclair Television Group Inc Series 144A 5.5% 01/03/2030
USD 175,288 0.05
150,000 Sinclair Television Group Inc Series 144A 5.875% 15/03/2026
USD 154,041 0.04
175,000 Sirius XM Radio Inc Series 144A 4.625% 15/07/2024 USD 179,594 0.051,715,000 Sirius XM Radio Inc Series 144A 5.5% 01/07/2029 USD 1,858,631 0.49
Schedule of investments as at 31 May 2021 (continued)
Transferable securities admitted to an official stock exchange listing or traded on a regulated market. The percentages in brackets show the equivalent sector holdings at 31 May 2020.
265

Barclays Multi-Manager Fund PLC Annual Report and Audited Financial Statements 2021
GlobalAccess Global High Yield Bond Fund
Holdings Financial assets at fair value through profit or loss Currency Fair value
USD % of net
assets
Bonds: 94.59% (31 May 2020: 93.09%) (continued)
United States: 75.67% (31 May 2020: 74.33%) (continued)
Corporate bonds: 75.67% (31 May 2020: 74.33%)
70,000 Six Flags Entertainment Corp Series 144A 4.875% 31/07/2024
USD 70,741 0.02
425,000 Six Flags Entertainment Corp Series 144A 5.5% 15/04/2027
USD 442,563 0.12
30,000 Six Flags Theme Parks Inc Series 144A 7% 01/07/2025 USD 32,329 0.01350,000 Sizzling Platter LLC / Sizzling Platter Finance Corp Series
144A 8.5% 28/11/2025USD 353,251 0.09
75,000 SM Energy Co 5% 15/01/2024 USD 73,095 0.02200,000 SM Energy Co 5.625% 01/06/2025 USD 191,810 0.05150,000 SM Energy Co 6.125% 15/11/2022 USD 149,719 0.04175,000 SM Energy Co 6.625% 15/01/2027 USD 175,616 0.05360,000 SM Energy Co 6.75% 15/09/2026 USD 359,730 0.10
25,000 Smyrna Ready Mix Concrete LLC Series 144a 6% 01/11/2028
USD 26,085 0.01
125,000 Solaris Midstream Holdings LLC Series 144A 7.625% 01/04/2026
USD 130,940 0.03
300,000 Sonic Automotive Inc 6.125% 15/03/2027 USD 314,547 0.08200,000 Sotheby's Inc Series 144A 7.375% 15/10/2027 USD 214,254 0.06490,000 Southwestern Energy Co 6.45% 23/01/2025 USD 537,270 0.14100,000 Southwestern Energy Co 8.375% 15/09/2028 USD 110,934 0.03
50,000 Spanish Broadcasting System Inc Series 144A 9.75% 01/03/2026
USD 49,291 0.01
300,000 Specialty Building Products Holdings LLC / SBP Finance Corp Series 144A 6.375% 30/09/2026
USD 312,670 0.08
8,000 Spectrum Brands 5.75% 15/07/2025 USD 8,210 –175,000 Spectrum Brands Inc Series 144A 3.875% 15/03/2031 USD 170,405 0.05345,000 Spectrum Brands Inc Series 144A 5.5% 15/07/2030** USD 371,066 0.10175,000 Spirit AeroSystems Inc 4.6% 15/06/2028 USD 169,583 0.0575,000 Spirit AeroSystems Inc Series 144A 5.5% 15/01/2025 USD 79,219 0.02
150,000 Spirit AeroSystems Inc Series 144A 7.5% 15/04/2025 USD 160,688 0.04325,000 Springleaf Finance Corp 7.125% 15/03/2026 USD 378,625 0.10375,000 Sprint Capital Corp 8.75% 15/03/2032 USD 556,489 0.15200,000 Sprint Corp 7.125% 15/06/2024 USD 230,832 0.06125,000 Sprint Corp 7.25% 15/09/2021 USD 127,085 0.03100,000 Square Inc Series 144A 3.5% 01/06/2031 USD 100,119 0.03325,000 SRM Escrow Issuer LLC Series 144A 6% 01/11/2028 USD 339,100 0.09125,000 SRS Distribution Inc Series 144A 4.625% 01/07/2028 USD 126,306 0.03125,000 SRS Distribution Inc Series 144A 6.125% 01/07/2029 USD 127,656 0.03250,000 SS&C Technologies Inc Series 144A 5.5% 30/09/2027 USD 265,088 0.07450,000 Staples Inc Series 144A 7.5% 15/04/2026 USD 467,303 0.12350,000 Staples Inc Series 144A 10.75% 15/04/2027 USD 359,044 0.10
90,000 Star Merger Sub Inc Series 144A 6.875% 15/08/2026 USD 96,222 0.03278,000 Star Merger Sub Inc Series 144A 10.25% 15/02/2027 USD 307,699 0.08
Schedule of investments as at 31 May 2021 (continued)
Transferable securities admitted to an official stock exchange listing or traded on a regulated market. The percentages in brackets show the equivalent sector holdings at 31 May 2020.
266

Barclays Multi-Manager Fund PLC Annual Report and Audited Financial Statements 2021
GlobalAccess Global High Yield Bond Fund
Holdings Financial assets at fair value through profit or loss Currency Fair value
USD % of net
assets
Bonds: 94.59% (31 May 2020: 93.09%) (continued)
United States: 75.67% (31 May 2020: 74.33%) (continued)
Corporate bonds: 75.67% (31 May 2020: 74.33%)
920,000 Station Casinos LLC Series 144A 4.5% 15/02/2028 USD 931,380 0.25495,000 Stevens Holding Co Inc Series 144A 6.125% 01/10/2026 USD 531,276 0.14225,000 STL Holding Co LLC Series 144A 7.5% 15/02/2026 USD 235,055 0.06850,000 Suburban Propane Partners LP/Suburban Energy Finance
Corp Series 144A 5% 01/06/2031USD 859,953 0.23
590,000 Suburban Propane Partners LP/Suburban Energy Finance Corp 5.5% 01/06/2024
USD 596,859 0.16
520,000 Summit Materials LLC / Summit Materials Finance Corp Series 144A 5.125% 01/06/2025
USD 528,395 0.14
175,000 Summit Materials LLC / Summit Materials Finance Corp Series 144A 5.25% 15/01/2029
USD 184,996 0.05
100,000 Summit Materials LLC / Summit Materials Finance Corp Series 144A 6.5% 15/03/2027
USD 105,831 0.03
250,000 Summit Midstream Holdings LLC / Summit Midstream Finance Corp 5.5% 15/08/2022
USD 247,403 0.07
105,000 Summit Midstream Holdings LLC / Summit Midstream Finance Corp 5.75% 15/04/2025
USD 92,220 0.02
425,000 Summit Midstream Partners F2F Series A 9.5% Perpetual**
USD 281,031 0.07
615,000 SunCoke Energy Partners LP / SunCoke Energy Partners Finance Corp Series 144A 7.5% 15/06/2025
USD 637,294 0.17
75,000 Sunoco LP / Sunoco Finance Corp Series 144A 4.5% 15/05/2029
USD 74,617 0.02
100,000 Sunoco LP / Sunoco Finance Corp 5.5% 15/02/2026 USD 103,375 0.03175,000 Synaptics Inc Series 144A 4% 15/06/2029 USD 173,881 0.05100,000 Talen Energy Supply LLC Series 144A 6.625% 15/01/2028 USD 99,794 0.03
50,000 Talen Energy Supply LLC Series 144A 7.25% 15/05/2027 USD 51,326 0.01250,000 Talen Energy Supply LLC Series 144A 10.5% 15/01/2026 USD 227,813 0.06245,000 Tallgrass Energy Partners LP Series 144A 6% 01/03/2027 USD 251,125 0.07200,000 Tallgrass Energy Partners LP / Tallgrass Energy Finance
Corp Series 144A 6% 31/12/2030USD 204,488 0.05
125,000 Tallgrass Energy Partners LP / Tallgrass Energy Finance Corp Series 144A 7.5% 01/10/2025
USD 136,801 0.04
225,000 Talos Production Inc Series 144A 12% 15/01/2026 USD 229,812 0.061,365,000 Targa Resources Partners LP 5.875% 15/04/2026 USD 1,431,544 0.38
325,000 Targa Resources Partners LP / Targa Resources Partners Finance Corp Series 144A 4% 15/01/2032
USD 322,691 0.09
250,000 Targa Resources Partners LP / Targa Resources Partners Finance Corp Series 144A 4.875% 01/02/2031
USD 262,041 0.07
250,000 Targa Resources Partners LP / Targa Resources Partners Finance Corp 5% 15/01/2028
USD 261,848 0.07
75,000 Targa Resources Partners LP / Targa Resources Partners Finance Corp 5.5% 01/03/2030
USD 81,129 0.02
Schedule of investments as at 31 May 2021 (continued)
Transferable securities admitted to an official stock exchange listing or traded on a regulated market. The percentages in brackets show the equivalent sector holdings at 31 May 2020.
267

Barclays Multi-Manager Fund PLC Annual Report and Audited Financial Statements 2021
GlobalAccess Global High Yield Bond Fund
Holdings Financial assets at fair value through profit or loss Currency Fair value
USD % of net
assets
Bonds: 94.59% (31 May 2020: 93.09%) (continued)
United States: 75.67% (31 May 2020: 74.33%) (continued)
Corporate bonds: 75.67% (31 May 2020: 74.33%)
150,000 Targa Resources Partners LP / Targa Resources Partners Finance Corp 6.875% 15/01/2029
USD 166,875 0.04
225,000 Taylor Morrison Communities Inc Series 144A 5.75% 15/01/2028
USD 249,536 0.07
450,000 TEGNA Inc 4.625% 15/03/2028 USD 460,125 0.12620,000 TEGNA Inc Series 144A 4.75% 15/03/2026 USD 659,354 0.18175,000 TEGNA Inc 5% 15/09/2029 USD 179,392 0.05400,000 Tempo Acquisition LLC / Tempo Acquisition Finance Corp
Series 144A 6.75% 01/06/2025USD 407,740 0.11
175,000 Tempur Sealy International Inc Series 144A 4% 15/04/2029
USD 175,570 0.05
375,000 Tenet Healthcare Corp Series 144A 4.25% 01/06/2029 USD 375,330 0.10150,000 Tenet Healthcare Corp Series 144A 4.625% 01/09/2024 USD 153,572 0.04150,000 Tenet Healthcare Corp Series 144A 4.875% 01/01/2026 USD 155,136 0.04
2,135,000 Tenet Healthcare Corp 5.125% 01/05/2025 USD 2,167,057 0.58175,000 Tenet Healthcare Corp Series 144A 5.125% 01/11/2027 USD 182,879 0.05914,000 Tenet Healthcare Corp Series 144A 6.125% 01/10/2028 USD 957,831 0.25150,000 Tenet Healthcare Corp Series 144A 6.25% 01/02/2027 USD 156,563 0.04175,000 Tenet Healthcare Corp 6.875% 15/11/2031 USD 196,432 0.05350,000 Tenneco Inc 5% 15/07/2026 USD 348,264 0.09250,000 Tenneco Inc Series 144A 5.125% 15/04/2029 USD 250,312 0.07400,000 Tenneco Inc Series 144A 7.875% 15/01/2029 USD 447,982 0.12325,000 Terex Corp Series 144A 5% 15/05/2029 USD 338,432 0.09150,000 TerraForm Power Operating LLC Series 144A 4.75%
15/01/2030USD 153,530 0.04
125,000 TerraForm Power Operating LLC Series 144A 5% 31/01/2028
USD 131,681 0.04
9,847 Texas Competitive Series 144A 11.5% 01/10/2020 USD 11 –150,000 Titan International Inc Series 144A 7% 30/04/2028 USD 156,517 0.04150,000 TKC Holdings Inc Series 144A 10.5% 15/05/2029 USD 157,958 0.04525,000 T-Mobile USA Inc 2.625% 15/02/2029 USD 504,942 0.13535,000 TMS International Corp Series 144A 6.25% 15/04/2029 USD 557,069 0.15175,000 Townsquare Media Inc Series 144A 6.875% 01/02/2026 USD 185,062 0.05300,000 TPC Group Inc Series 144A 10.5% 01/08/2024 USD 281,646 0.07445,000 TransDigm Inc Series 144A 4.625% 15/01/2029 USD 440,376 0.12250,000 TransDigm Inc Series 144A 4.875% 01/05/2029 USD 247,436 0.07875,000 TransDigm Inc 5.5% 15/11/2027 USD 913,386 0.24740,000 TransDigm Inc Series 144A 6.25% 15/03/2026 USD 780,963 0.21
75,000 TransDigm Inc 6.375% 15/06/2026 USD 77,723 0.02400,000 TransDigm Inc 7.5% 15/03/2027 USD 427,140 0.11235,000 TransDigm Inc Series 144A 8% 15/12/2025 USD 254,472 0.07125,000 TransMontaigne Partners LP / TLP Finance Corp 6.125%
15/02/2026USD 126,788 0.03
Schedule of investments as at 31 May 2021 (continued)
Transferable securities admitted to an official stock exchange listing or traded on a regulated market. The percentages in brackets show the equivalent sector holdings at 31 May 2020.
268

Barclays Multi-Manager Fund PLC Annual Report and Audited Financial Statements 2021
GlobalAccess Global High Yield Bond Fund
Holdings Financial assets at fair value through profit or loss Currency Fair value
USD % of net
assets
Bonds: 94.59% (31 May 2020: 93.09%) (continued)
United States: 75.67% (31 May 2020: 74.33%) (continued)
Corporate bonds: 75.67% (31 May 2020: 74.33%)
75,000 TRI Pointe Group Inc 5.25% 01/06/2027 USD 80,292 0.02100,000 TRI Pointe Group Inc 5.7% 15/06/2028 USD 109,787 0.03225,000 TRI Pointe Group Inc / TRI Pointe Homes Inc 5.875%
15/06/2024USD 250,452 0.07
150,000 Trident TPI Holdings Inc Series 144A 9.25% 01/08/2024 USD 158,050 0.04200,000 TriMas Corp Series 144A 4.125% 15/04/2029 USD 200,770 0.05150,000 Triton Water Holdings Inc Series 144A 6.25% 01/04/2029 USD 150,592 0.04125,000 Triumph Group Inc Series 144A 6.25% 15/09/2024 USD 127,571 0.03105,000 Triumph Group Inc Series 144A 8.875% 01/06/2024 USD 116,484 0.03375,000 Tronox Inc Series 144A 4.625% 15/03/2029 USD 384,581 0.1060,000 Tronox Inc Series 144A 6.5% 01/05/2025 USD 64,027 0.02
225,000 TTM Technologies Inc Series 144A 4% 01/03/2029 USD 222,970 0.06150,000 Turning Point Brands Inc Series 144A 5.625% 15/02/2026 USD 155,135 0.04100,000 Twilio Inc 3.875% 15/03/2031 USD 101,431 0.03340,000 Uber Technologies Inc Series 144A 6.25% 15/01/2028 USD 367,200 0.10590,000 Uber Technologies Inc Series 144A 7.5% 15/05/2025 USD 637,642 0.17150,000 Uber Technologies Inc Series 144A 7.5% 15/09/2027 USD 164,549 0.04175,000 Uber Technologies Inc Series 144A 8% 01/11/2026 USD 189,281 0.05
71,374 United Airlines 2020-1 Class A Pass Through Trust Series 20-1 5.875% 15/04/2029
USD 79,307 0.02
25,000 United Airlines Holdings Inc 5% 01/02/2024 USD 25,990 0.01125,000 United Airlines Inc Series 144a 4.375% 15/04/2026 USD 129,689 0.03200,000 United Airlines Inc Series 144A 4.625% 15/04/2029 USD 206,880 0.06125,000 United Continental Holdings Inc 4.25% 01/10/2022 USD 127,969 0.03100,000 United Natural Foods Inc Series 144A 6.75% 15/10/2028 USD 107,246 0.03500,000 United States Steel Corp 6.875% 01/03/2029 USD 524,482 0.14275,000 United Wholesale Mortgage LLC Series 144A 5.5%
15/04/2029USD 271,941 0.07
125,000 Uniti Group LP / Uniti Fiber Holdings Inc / CSL Capital LLC Series 144A 7.125% 15/12/2024
USD 128,906 0.03
250,000 Uniti Group LP / Uniti Fiber Holdings Inc / CSL Capital LLC Series 144A 7.875% 15/02/2025
USD 268,125 0.07
175,000 Uniti Group LP / Uniti Group Finance Inc / CSL Capital LLC Series 144A 4.75% 15/04/2028
USD 173,666 0.05
275,000 Uniti Group LP / Uniti Group Finance Inc / CSL Capital LLC Series 144A 6.5% 15/02/2029
USD 272,594 0.07
485,000 Univar Solutions USA Inc Series 144A 5.125% 01/12/2027 USD 509,255 0.14175,000 Univision Communications Inc Series 144A 4.5%
01/05/2029USD 177,322 0.05
125,000 Univision Communications Inc Series 144A 5.125% 15/02/2025
USD 127,050 0.03
445,000 Univision Communications Inc Series 144A 6.625% 01/06/2027
USD 481,712 0.13
Schedule of investments as at 31 May 2021 (continued)
Transferable securities admitted to an official stock exchange listing or traded on a regulated market. The percentages in brackets show the equivalent sector holdings at 31 May 2020.
269

Barclays Multi-Manager Fund PLC Annual Report and Audited Financial Statements 2021
GlobalAccess Global High Yield Bond Fund
Holdings Financial assets at fair value through profit or loss Currency Fair value
USD % of net
assets
Bonds: 94.59% (31 May 2020: 93.09%) (continued)
United States: 75.67% (31 May 2020: 74.33%) (continued)
Corporate bonds: 75.67% (31 May 2020: 74.33%)
325,000 Univision Communications Inc Series 144A 9.5% 01/05/2025
USD 358,769 0.10
50,000 US Acute Care Solutions LLC Series 144A 6.375% 01/03/2026
USD 51,565 0.01
93,879 US Airways 2012-2 Class B Pass Through Trust 6.75% 03/12/2022
USD 93,903 0.03
125,000 US Concrete Inc Series 144A 5.125% 01/03/2029 USD 128,152 0.0391,000 US Concrete Inc 6.375% 01/06/2024 USD 93,002 0.02
515,000 US Foods Inc Series 144A 4.75% 15/02/2029 USD 514,356 0.14550,000 US Foods Inc Series 144A 6.25% 15/04/2025 USD 583,434 0.16125,000 USA Compression Partners LP / USA Compression Finance
Corp 6.875% 01/04/2026USD 131,562 0.04
335,000 USA Compression Partners LP / USA Compression Finance Corp 6.875% 01/09/2027
USD 352,430 0.09
150,000 Vector Group Ltd Series 144A 5.75% 01/02/2029 USD 151,691 0.04450,000 Veritas US Inc / Veritas Bermuda Ltd Series 144A 7.5%
01/09/2025USD 466,312 0.12
150,000 Verscend Escrow Corp Series 144A 9.75% 15/08/2026 USD 159,188 0.04460,000 ViaSat Inc Series 144A 5.625% 15/09/2025 USD 470,695 0.13150,000 VICI Properties LP / VICI Note Co Inc Series 144A 3.75%
15/02/2027USD 151,886 0.04
145,000 VICI Properties LP / VICI Note Co Inc Series 144A 4.125% 15/08/2030
USD 147,414 0.04
235,000 VICI Properties LP / VICI Note Co Inc Series 144A 4.25% 01/12/2026
USD 242,164 0.06
110,000 VICI Properties LP / VICI Note Co Inc Series 144A 4.625% 01/12/2029
USD 114,763 0.03
150,000 Victors Merger Corp Series 144A 6.375% 15/05/2029 USD 149,224 0.04100,000 Viking Cruises Ltd Series 144a 7% 15/02/2029 USD 102,683 0.03315,000 Vine Energy Holdings LLC Series 144A 6.75% 15/04/2029 USD 319,331 0.09350,000 Vistra Operations Co LLC Series 144A 4.375% 01/05/2029 USD 352,480 0.09
1,155,000 Vistra Operations Co LLC Series 144A 5% 31/07/2027 USD 1,180,987 0.3150,000 Vistra Operations Co LLC Series 144A 5.5% 01/09/2026 USD 51,685 0.01
600,000 VM Consolidated Inc Series 144A 5.5% 15/04/2029 USD 609,441 0.16125,000 Wabash National Corp Series 144A 5.5% 01/10/2025 USD 128,908 0.03480,000 WASH Multifamily Acquisition Inc Series 144A 5.75%
15/04/2026USD 500,616 0.13
500,000 Washington Mutual Escrow Line 15/11/2021** USD 5,813 –1,115,000 Watco Cos LLC / Watco Finance Corp Series 144A 6.5%
15/06/2027USD 1,182,212 0.31
250,000 Weekley Homes LLC / Weekley Finance Corp Series 144A 4.875% 15/09/2028
USD 260,124 0.07
Schedule of investments as at 31 May 2021 (continued)
Transferable securities admitted to an official stock exchange listing or traded on a regulated market. The percentages in brackets show the equivalent sector holdings at 31 May 2020.
270

Barclays Multi-Manager Fund PLC Annual Report and Audited Financial Statements 2021
GlobalAccess Global High Yield Bond Fund
Holdings Financial assets at fair value through profit or loss Currency Fair value
USD % of net
assets
Bonds: 94.59% (31 May 2020: 93.09%) (continued)
United States: 75.67% (31 May 2020: 74.33%) (continued)
Corporate bonds: 75.67% (31 May 2020: 74.33%)
350,000 Werner FinCo LP / Werner FinCo Inc Series 144A 8.75% 15/07/2025
USD 367,903 0.10
275,000 WESCO Distribution Inc Series 144A 7.125% 15/06/2025 USD 297,344 0.0875,000 WESCO Distribution Inc Series 144A 7.25% 15/06/2028 USD 83,258 0.02
150,000 Western Gas Partners LP 4.5% 01/03/2028 USD 159,375 0.0475,000 Western Gas Partners LP 4.75% 15/08/2028 USD 80,562 0.02
690,000 Western Gas Partners LP 5.3% 01/03/2048 USD 707,250 0.19520,000 Western Gas Partners LP 5.5% 15/08/2048 USD 540,095 0.14175,000 Western Global Airlines LLC Series 144A 10.375%
15/08/2025USD 198,288 0.05
50,000 Western Midstream Operating LP 4.65% 01/07/2026 USD 53,433 0.01200,000 Western Midstream Operating LP 5.3 % 01/02/2030 USD 220,750 0.06150,000 Western Midstream Operating LP 5.45% 01/04/2044 USD 155,609 0.04150,000 Wheel Pros Inc Series 144A 6.5% 15/05/2029 USD 151,007 0.04250,000 White Cap Buyer LLC Series 144A 6.875% 15/10/2028 USD 263,466 0.07150,000 White Cap Parent LLC Series 144A 8.25% 15/03/2026 USD 155,406 0.04150,000 Williams Scotsman International Inc Series 144A 4.625%
15/08/2028USD 154,195 0.04
125,000 Windstream Escrow LLC / Windstream Escrow Finance Corp Series 144A 7.75% 15/08/2028
USD 127,893 0.03
200,000 Winnebago Industries Inc Series 144A 6.25% 15/07/2028 USD 217,281 0.06165,000 Wolverine World Wide Inc Series 144A 6.375%
15/05/2025USD 176,020 0.05
83,000 WPX Energy Inc 5.875% 15/06/2028 USD 91,490 0.02175,000 WR Grace & Co-Conn Series 144A 4.875% 15/06/2027 USD 184,409 0.05125,000 WW International Inc Series 144A 4.5% 15/04/2029 USD 125,141 0.03100,000 Wyndham Destinations Inc Series 144A 4.625%
01/03/2030USD 103,222 0.03
225,000 Wyndham Destinations Inc Series 144A 6.625% 31/07/2026
USD 257,938 0.07
550,000 Wynn Las Vegas LLC / Wynn Las Vegas Capital Corp Series 144A 5.25% 15/05/2027
USD 582,313 0.15
350,000 Wynn Las Vegas LLC / Wynn Las Vegas Capital Corp Series 144A 5.5% 01/03/2025
USD 373,625 0.10
250,000 Wynn Resorts Finance LLC / Wynn Resorts Capital Corp Series 144A 7.75% 15/04/2025
USD 269,375 0.07
1,205,000 Xerox Holdings Corp Series 144A 5% 15/08/2025 USD 1,268,311 0.34150,000 Xerox Holdings Corp Series 144A 5.5% 15/08/2028 USD 155,218 0.04100,000 XHR LP Series 144A 4.875% 01/06/2029 USD 101,755 0.03175,000 XHR LP Series 144A 6.375% 15/08/2025 USD 185,562 0.05215,000 XPO Logistics Inc Series 144A 6.25% 01/05/2025 USD 230,173 0.06
Schedule of investments as at 31 May 2021 (continued)
Transferable securities admitted to an official stock exchange listing or traded on a regulated market. The percentages in brackets show the equivalent sector holdings at 31 May 2020.
271

Barclays Multi-Manager Fund PLC Annual Report and Audited Financial Statements 2021
GlobalAccess Global High Yield Bond Fund
Holdings Financial assets at fair value through profit or loss Currency Fair value
USD % of net
assets
Bonds: 94.59% (31 May 2020: 93.09%) (continued)
United States: 75.67% (31 May 2020: 74.33%) (continued)
Corporate bonds: 75.67% (31 May 2020: 74.33%)
250,000 Zayo Group Holdings Inc Series 144A 4% 01/03/2027 USD 244,688 0.07
Total United States 284,381,386 75.67
Total bonds 355,493,792 94.59
Accrued income on financial assets at fair value through profit or loss: 1.36% (31 May 2020: 1.50%) 5,098,577 1.37
Equities: 0.86% (31 May 2020: 0.34%)
Bermuda: 0.03% (31 May 2020: 0.00%)
Mining: 0.03% (31 May 2020: 0.00%)5,409,965 Petra Diamonds Ltd Com GBP0.00001 GBP 110,202 0.03
Total Bermuda 110,202 0.03
Cayman Islands: 0.00% (31 May 2020: 0.00%)
Common stock: 0.00% (31 May 2020: 0.00%)336 Noble Corp SHS 144A Com USD1.00 USD 4,368 –
Total Cayman Islands 4,368 –
Luxembourg: 0.02% (31 May 2020: 0.01%)
Chemicals: 0.02% (31 May 2020: 0.01%)13,356 Novasep Holding Alphabet Share Class A** USD 6,411 –13,356 Novasep Holding Alphabet Share Class B** USD 6,411 –13,356 Novasep Holding Alphabet Share Class C** USD 6,410 –13,356 Novasep Holding Alphabet Share Class D** USD 6,411 –13,356 Novasep Holding Alphabet Share Class E** USD 6,411 0.0113,356 Novasep Holding Alphabet Share Class F** USD 6,411 –13,356 Novasep Holding Alphabet Share Class G** USD 6,411 –13,356 Novasep Holding Alphabet Share Class H** USD 6,411 –13,356 Novasep Holding Alphabet Share Class I** USD 6,411 –13,356 Novasep Holding Alphabet Share Class J** USD 6,411 0.01
Total Luxembourg 64,109 0.02
United States: 0.81% (31 May 2020: 0.33%)
Banks: 0.00% (31 May 2020: 0.08%)
Schedule of investments as at 31 May 2021 (continued)
Transferable securities admitted to an official stock exchange listing or traded on a regulated market. The percentages in brackets show the equivalent sector holdings at 31 May 2020.
272

Barclays Multi-Manager Fund PLC Annual Report and Audited Financial Statements 2021
GlobalAccess Global High Yield Bond Fund
Holdings Financial assets at fair value through profit or loss Currency Fair value
USD % of net
assets
Equities: 0.86% (31 May 2020: 0.34%) (continued) United States: 0.81% (31 May 2020: 0.33%) (continued)
Chemicals: 0.08% (31 May 2020: 0.06%)17,176 Hexion Holdings Corp Com Class B USD1.00 USD 295,857 0.08
Common stock: 0.31% (31 May 2020: 0.07%)36 David's Bridal Com USD1.00** USD 14 –
15,688 Diamond Offshore Drilling Inc Com USD1.00 USD 90,206 0.032,472 Ferrellgas Partners LP New Unit LTD Com USD1.00 USD 494,400 0.135,956 Nine Point Common** USD 1 –
33,708 Phi Group Inc Com USD1.00 USD 575,059 0.15427 Superior Energy Inc Class A Com USD1.00 USD 559 –
Electric: 0.00% (31 May 2020: 0.00%)
Electrical components & equipment: 0.00% (31 May 2020: 0.00%)
Energy alternate sources: 0.00% (31 May 2020: 0.00%)
Foreign currencies: 0.07% (31 May 2020: 0.04%)31,200 UC Holdings Inc USD1.00** USD 241,800 0.07
Gas: 0.04% (31 May 2020: 0.00%)6,288 Global Partners LP Pref USD25.00 USD 164,997 0.04
Internet: 0.00% (31 May 2020: 0.00%)23,922 Bluestem Group Inc USD0.01** USD 15,549 –
Iron/steel: 0.00% (31 May 2020: 0.00%)
Oil & gas: 0.13% (31 May 2020: 0.00%)7,802 Gulfport Energy Corp Com USD0.01 USD 489,965 0.131,294 Parker Drilling Co Com USD0.01 USD 7,473 –9,218 Warren Resources Inc USD1.00** USD 922 –
Oil & gas services: 0.05% (31 May 2020: 0.00%)7,410 FTS International Inc Com USD1000.00 USD 193,438 0.05
Pharmaceuticals: 0.00% (31 May 2020: 0.00%)
Software: 0.00% (31 May 2020: 0.03%)
Telecommunications: 0.13% (31 May 2020: 0.00%)19,577 Frontier Communications Parent Inc USD 488,153 0.13
Trucking & leasing: 0.00% (31 May 2020: 0.05%)
Total United States 3,058,393 0.81
Total equities 3,237,072 0.86
Schedule of investments as at 31 May 2021 (continued)
Transferable securities admitted to an official stock exchange listing or traded on a regulated market. The percentages in brackets show the equivalent sector holdings at 31 May 2020.
273

Barclays Multi-Manager Fund PLC Annual Report and Audited Financial Statements 2021
GlobalAccess Global High Yield Bond Fund
Holdings Financial assets at fair value through profit or loss Currency Fair value
USD % of net
assets
Investment funds: 2.27% (31 May 2020: 3.72%)
Ireland: 2.27% (31 May 2020: 3.72%)
83,347 iShares USD High Yield Corp Bond UCITS ETF 4.7116% USD 8,537,517 2.27
Total investment funds 8,537,517 2.27
Warrants: 0.14% (31 May 2020: 0.03%)
France: 0.00% (31 May 2020: 0.00%)
189,900 Wts. Novasep Hldg. Sas 5/31/2019 31/05/2022** EUR – –Total France – –United States: 0.14% (31 May 2020: 0.03%)
6,043,358 Education Mgmt 05/01/2022 05/01/2022** USD – –12,758 Vistra Energy Corp NPV 02/02/2024 USD 3,954 –
16 Wts. Chaparral Energy 01/10/2024** USD – –16 Wts. Chaparral Energy 01/10/2025** USD – –
136 Wts. David's Bridal 31/12/2040** USD – –2,021 Wts. Iheartmedia Inc 01/05/2039 USD 46,837 0.01
28,203 Wts. Phi Group 30/08/2044** USD 481,115 0.13Total United States 531,906 0.14
Total warrants 531,906 0.14
Forward currency contracts: 0.92% (31 May 2020: 0.53%)
Counterparty Cncy Buys Cncy SellsMaturity
dateUnrealised
gain% of net
assetsUSD
UBS GBP 151,714,172 USD 212,832,985 17/06/2021 2,832,668 0.75 CCT_1769411_403110
UBS GBP 9,847,040 USD 13,813,970 17/06/2021 183,855 0.05 CCT_1769411_403103
UBS EUR 8,386,443 USD 10,124,081 17/06/2021 132,185 0.04 CCT_1769411_403117
UBS EUR 6,832,792 USD 8,248,519 17/06/2021 107,697 0.03 CCT_1769411_403129
UBS GBP 2,650,168 USD 3,717,802 17/06/2021 49,481 0.01 CCT_1769411_403088
UBS EUR 2,769,926 USD 3,343,843 17/06/2021 43,659 0.01 CCT_1769411_403113
UBS EUR 2,365,590 USD 2,855,730 17/06/2021 37,286 0.01 CCT_1769411_403120
UBS EUR 2,221,754 USD 2,682,093 17/06/2021 35,019 0.01 CCT_1769411_403118
UBS EUR 1,902,757 USD 2,297,001 17/06/2021 29,991 0.01 CCT_1769411_403125
UBS EUR 1,885,910 USD 2,276,663 17/06/2021 29,725 0.01 CCT_1769411_403130
UBS GBP 1,317,180 USD 1,847,812 17/06/2021 24,593 0.01 CCT_1769411_403109
UBS EUR 1,166,504 USD 1,408,199 17/06/2021 18,386 0.01 CCT_1769411_403116
UBS GBP 755,696 USD 1,060,132 17/06/2021 14,110 0.01 CCT_1769411_403087
UBS EUR 791,682 USD 955,715 17/06/2021 12,478 – CCT_1769411_403126
UBS EUR 664,052 USD 801,641 17/06/2021 10,467 – CCT_1769411_403119
UBS GBP 416,964 USD 584,940 17/06/2021 7,785 – CCT_1769411_403104
Schedule of investments as at 31 May 2021 (continued)
Transferable securities admitted to an official stock exchange listing or traded on a regulated market. The percentages in brackets show the equivalent sector holdings at 31 May 2020.
274

Barclays Multi-Manager Fund PLC Annual Report and Audited Financial Statements 2021
GlobalAccess Global High Yield Bond Fund
Holdings Financial assets at fair value through profit or loss Currency Fair value
USD % of net
assets
Investment funds: 2.27% (31 May 2020: 3.72%)
Ireland: 2.27% (31 May 2020: 3.72%)
83,347 iShares USD High Yield Corp Bond UCITS ETF 4.7116% USD 8,537,517 2.27
Total investment funds 8,537,517 2.27
Warrants: 0.14% (31 May 2020: 0.03%)
France: 0.00% (31 May 2020: 0.00%)
189,900 Wts. Novasep Hldg. Sas 5/31/2019 31/05/2022** EUR – –Total France – –United States: 0.14% (31 May 2020: 0.03%)
6,043,358 Education Mgmt 05/01/2022 05/01/2022** USD – –12,758 Vistra Energy Corp NPV 02/02/2024 USD 3,954 –
16 Wts. Chaparral Energy 01/10/2024** USD – –16 Wts. Chaparral Energy 01/10/2025** USD – –
136 Wts. David's Bridal 31/12/2040** USD – –2,021 Wts. Iheartmedia Inc 01/05/2039 USD 46,837 0.01
28,203 Wts. Phi Group 30/08/2044** USD 481,115 0.13Total United States 531,906 0.14
Total warrants 531,906 0.14
Forward currency contracts: 0.92% (31 May 2020: 0.53%)
Counterparty Cncy Buys Cncy SellsMaturity
dateUnrealised
gain% of net
assetsUSD
UBS GBP 151,714,172 USD 212,832,985 17/06/2021 2,832,668 0.75 CCT_1769411_403110
UBS GBP 9,847,040 USD 13,813,970 17/06/2021 183,855 0.05 CCT_1769411_403103
UBS EUR 8,386,443 USD 10,124,081 17/06/2021 132,185 0.04 CCT_1769411_403117
UBS EUR 6,832,792 USD 8,248,519 17/06/2021 107,697 0.03 CCT_1769411_403129
UBS GBP 2,650,168 USD 3,717,802 17/06/2021 49,481 0.01 CCT_1769411_403088
UBS EUR 2,769,926 USD 3,343,843 17/06/2021 43,659 0.01 CCT_1769411_403113
UBS EUR 2,365,590 USD 2,855,730 17/06/2021 37,286 0.01 CCT_1769411_403120
UBS EUR 2,221,754 USD 2,682,093 17/06/2021 35,019 0.01 CCT_1769411_403118
UBS EUR 1,902,757 USD 2,297,001 17/06/2021 29,991 0.01 CCT_1769411_403125
UBS EUR 1,885,910 USD 2,276,663 17/06/2021 29,725 0.01 CCT_1769411_403130
UBS GBP 1,317,180 USD 1,847,812 17/06/2021 24,593 0.01 CCT_1769411_403109
UBS EUR 1,166,504 USD 1,408,199 17/06/2021 18,386 0.01 CCT_1769411_403116
UBS GBP 755,696 USD 1,060,132 17/06/2021 14,110 0.01 CCT_1769411_403087
UBS EUR 791,682 USD 955,715 17/06/2021 12,478 – CCT_1769411_403126
UBS EUR 664,052 USD 801,641 17/06/2021 10,467 – CCT_1769411_403119
UBS GBP 416,964 USD 584,940 17/06/2021 7,785 – CCT_1769411_403104
Forward currency contracts: 0.92% (31 May 2020: 0.53%) (continued)
Counterparty Cncy Buys Cncy SellsMaturity
date
Unrealised gain
% of net assets
USD UBS GBP 346,074 USD 485,491 17/06/2021 6,461 – CCT_1769411_403105
UBS GBP 327,336 USD 459,204 17/06/2021 6,112 – CCT_1769411_403085
UBS GBP 91,218 USD 127,966 17/06/2021 1,703 – CCT_1769411_403090
UBS GBP 53,341 USD 74,571 17/06/2021 1,255 – CCT_1769411_402657
UBS GBP 54,411 USD 76,425 17/06/2021 921 – CCT_1769411_403096
UBS GBP 87,689 USD 124,005 17/06/2021 647 – CCT_1769411_402752
UBS GBP 37,614 USD 53,125 17/06/2021 345 – CCT_1769411_404366
UBS GBP 24,963 USD 35,248 17/06/2021 238 – CCT_1769411_403472
UBS GBP 80,016 USD 113,556 17/06/2021 189 – CCT_1769411_404519
UBS GBP 71,605 USD 101,618 17/06/2021 170 – CCT_1769411_404522
UBS USD 39,486 EUR 32,238 17/06/2021 59 – CCT_1769411_404257
UBS GBP 6,743 USD 9,547 17/06/2021 39 – CCT_1769411_403825
UBS GBP 1,898 USD 2,675 17/06/2021 24 – CCT_1769411_403348
UBS GBP 1,282 USD 1,816 17/06/2021 7 – CCT_1769411_403937
Total fair value gains on forward currency contracts 3,587,555 0.96
Counterparty Cncy Buys Cncy SellsMaturity
dateUnrealised
loss% of net
assetsUSD
Northern Trust USD 1,264,891 GBP 909,111 4/06/2021 (27,410) (0.01) CCT_1769414_26775
Northern Trust USD 6,507,717 EUR 5,413,926 4/06/2021 (111,619) (0.03) CCT_1769414_26777
UBS USD 1,739 EUR 1,422 17/06/2021 (1) – CCT_1769411_403581
UBS USD 3,454 EUR 2,826 17/06/2021 (2) – CCT_1769411_403718
UBS USD 676 EUR 555 17/06/2021 (3) – CCT_1769411_402890
UBS USD 4,255 EUR 3,486 17/06/2021 (9) – CCT_1769411_404518
UBS USD 2,614 EUR 2,151 17/06/2021 (17) – CCT_1769411_403471
UBS USD 19,211 EUR 15,789 17/06/2021 (98) – CCT_1769411_402753
UBS USD 336,955 GBP 237,110 17/06/2021 (103) – CCT_1769411_403582
UBS USD 15,934 EUR 13,190 17/06/2021 (197) – CCT_1769411_403102
UBS USD 27,306 GBP 19,370 17/06/2021 (228) – CCT_1769411_402995
UBS USD 55,540 GBP 39,264 17/06/2021 (275) – CCT_1769411_402892
UBS USD 46,688 EUR 38,458 17/06/2021 (345) – CCT_1769411_403349
UBS USD 227,111 GBP 160,033 17/06/2021 (379) – CCT_1769411_404523
UBS USD 72,537 GBP 51,324 17/06/2021 (422) – CCT_1769411_404256
UBS USD 117,325 GBP 82,967 17/06/2021 (614) – CCT_1769411_402749
UBS USD 70,230 GBP 50,000 17/06/2021 (847) – CCT_1769411_403100
UBS USD 226,806 GBP 160,200 17/06/2021 (923) – CCT_1769411_403824
UBS USD 219,912 GBP 155,461 17/06/2021 (1,080) – CCT_1769411_403720
UBS USD 299,902 GBP 211,816 17/06/2021 (1,200) – CCT_1769411_404101
UBS USD 115,325 GBP 82,105 17/06/2021 (1,390) – CCT_1769411_403101
UBS USD 169,061 GBP 120,000 17/06/2021 (1,522) – CCT_1769411_403350
UBS USD 942,736 GBP 666,657 17/06/2021 (4,934) – CCT_1769411_402747
Total fair value losses on forward currency contracts (153,618) (0.04)
Total forward currency contracts 3,433,937 0.92
Schedule of investments as at 31 May 2021 (continued)
Transferable securities admitted to an official stock exchange listing or traded on a regulated market. The percentages in brackets show the equivalent sector holdings at 31 May 2020.
275

Barclays Multi-Manager Fund PLC Annual Report and Audited Financial Statements 2021
GlobalAccess Global High Yield Bond Fund
Fair value USD
% of net assets
Total value of investments 376,332,801 100.15
Cash and cash equivalents* 6,036,130 1.61
Other net liabilities (6,540,394) (1.76)
Net assets attributable to holders of redeemable participating shares 375,828,537 100.00
Analysis of total assets (unaudited)% of total
assets
Transferable securities and money market instruments admitted to official stock exchangelisting or traded on a regulated market. 94.51Investment funds and AIFs. 2.21OTC financial derivative instruments. 0.93Other assets. 2.35
100.00
*All cash holdings are held with The Northern Trust Company.**Valued at a stale price.^ Related party.
The accompanying notes form an integral part of the Financial Statements.
The Industry Classification Benchmark (“ICB”) is jointly owned by FTSE and Dow Jones and has been licensed for use. FTSE and Dow Jones do not accept liability to any person for any loss or damage arising out of any error or omission in ICB.
Schedule of investments as at 31 May 2021 (continued)
Transferable securities admitted to an official stock exchange listing or traded on a regulated market. The percentages in brackets show the equivalent sector holdings at 31 May 2020.
276

Barclays Multi-Manager Fund PLC Annual Report and Audited Financial Statements 2021
GlobalAccess Corporate Bond Fund
Schedule of investments as at 31 May 2021
Transferable securities admitted to an official stock exchange listing or traded on a regulated market. The percentages in brackets show the equivalent sector holdings at 31 May 2020.
Holdings Financial assets at fair value through profit or loss CurrencyFair value
USD% of net
assets
Bonds: 94.53% (31 May 2020: 96.06%)
Argentina: 0.04% (31 May 2020: 0.10%)
Corporate bonds: 0.00% (31 May 2020: 0.02%)
Government bonds: 0.04% (31 May 2020: 0.08%)637,100 Argentine Republic Government International Bond
0.125% 09/07/2041USD 237,696 0.04
9,739 Argentine Republic Government International Bond 1% 09/07/2029
USD 3,798 –
Total Argentina 241,494 0.04
Australia: 0.45% (31 May 2020: 0.36%)
Corporate bonds: 0.45% (31 May 2020: 0.36%)100,000 Lendlease Finance Ltd Series MTN 3.4% 27/10/2027 AUD 81,675 0.01550,000 Macquarie Bank Ltd Series EMTN 1.125% 15/12/2025 GBP 782,704 0.14700,000 NBN Co Ltd Series 144A 2.625% 05/05/2031 USD 704,517 0.12300,000 Transurban Finance Co Pty Ltd Series 144A 2.45%
16/03/2031USD 296,078 0.05
700,000 Woodside Finance Ltd Series 144A 3.7% 15/03/2028 USD 743,659 0.13
Total Australia 2,608,633 0.45
Austria: 0.09% (31 May 2020: 0.05%)
Corporate bonds: 0.09% (31 May 2020: 0.05%)200,000 Erste Group Bank AG Series PERP FRN Perpetual EUR 260,516 0.05200,000 Erste Group Bank AG Series EMTN FRN Perpetual EUR 252,777 0.04
Total Austria 513,293 0.09
Belgium: 0.10% (31 May 2020: 0.40%)
Corporate bonds: 0.10% (31 May 2020: 0.40%)405,000 Anheuser-Busch InBev SA/NV Series EMTN 2.875%
02/04/2032EUR 596,505 0.10
Total Belgium 596,505 0.10
Bermuda: 1.03% (31 May 2020: 0.91%)
Corporate bonds: 1.03% (31 May 2020: 0.91%)1,300,000 Aircastle Ltd Series 144A 2.85% 26/01/2028 USD 1,279,170 0.22
200,000 Aircastle Ltd 4.25% 15/06/2026 USD 216,407 0.04180,000 Athene Holding Ltd 3.95% 25/05/2051 USD 184,105 0.03100,000 Bacardi Ltd 2.75% 03/07/2023 EUR 128,546 0.02
1,300,000 Bacardi Ltd Series 144A 4.45% 15/05/2025 USD 1,451,269 0.25800,000 Bacardi Ltd Series 144A 5.15% 15/05/2038 USD 967,055 0.17200,000 IHS Markit Ltd 3.625% 01/05/2024 USD 215,453 0.04
277

Barclays Multi-Manager Fund PLC Annual Report and Audited Financial Statements 2021
GlobalAccess Corporate Bond Fund
Holdings Financial assets at fair value through profit or loss Currency Fair value
USD % of net
assets
Bonds: 94.53% (31 May 2020: 96.06%) (continued) Bermuda: 1.03% (31 May 2020: 0.91%) (continued)
Corporate bonds: 1.03% (31 May 2020: 0.91%) 1,355,000 IHS Markit Ltd 4.25% 01/05/2029 USD 1,546,378 0.26
Total Bermuda 5,988,383 1.03
Brazil: 0.31% (31 May 2020: 0.25%)
Corporate bonds: 0.23% (31 May 2020: 0.25%)500,000 Banco Bradesco SA/Cayman Islands Series 144A 2.85%
27/01/2023USD 513,033 0.09
200,000 Banco BTG Pactual SA/Cayman Islands Series REGS 2.75% 11/01/2026
USD 193,302 0.03
200,000 Banco BTG Pactual SA/Cayman Islands Series REGS 5.5% 31/01/2023
USD 211,702 0.04
400,000 Itau Unibanco Holding SA/Cayman Island Series 144A 2.9% 24/01/2023
USD 410,154 0.07
Government bonds: 0.08% (31 May 2020: 0.00%)465,000 Brazilian Government International Bond 3.875%
12/06/2030USD 470,510 0.08
Total Brazil 1,798,701 0.31
British Virgin Islands: 0.24% (31 May 2020: 0.00%)
Corporate bonds: 0.24% (31 May 2020: 0.00%)200,000 CLP Power Hong Kong Financing Ltd Series EMTN 2.125%
30/06/2030USD 196,296 0.03
200,000 Contemporary Ruiding Development Ltd 2.625% 17/09/2030
USD 197,128 0.03
600,000 New Metro Global Ltd 4.5% 02/05/2026 USD 596,980 0.10200,000 SF Holding Investment Ltd 2.875% 20/02/2030 USD 201,815 0.04200,000 Shanghai Port Group BVI Development 2 Co Ltd 2.375%
13/07/2030USD 197,508 0.04
Total British Virgin Islands 1,389,727 0.24
Canada: 1.48% (31 May 2020: 1.41%)
Corporate bonds: 0.53% (31 May 2020: 0.68%)96,344 Air Canada 2013-1 Class A Pass Through Trust Series 144A
4.125% 15/11/2026USD 98,690 0.02
626,403 Air Canada 2015-2 Class AA Pass Through Trust Series 144A 3.75% 15/06/2029
USD 646,267 0.11
300,000 Brookfield Finance Inc 4.35% 15/04/2030 USD 342,128 0.06500,000 Brookfield Finance Inc 4.7% 20/09/2047 USD 585,959 0.10500,000 Fairfax Financial Holdings Ltd 3.95% 03/03/2031 CAD 419,392 0.07
Schedule of investments as at 31 May 2021 (continued)
Transferable securities admitted to an official stock exchange listing or traded on a regulated market. The percentages in brackets show the equivalent sector holdings at 31 May 2020.
278

Barclays Multi-Manager Fund PLC Annual Report and Audited Financial Statements 2021
GlobalAccess Corporate Bond Fund
Holdings Financial assets at fair value through profit or loss Currency Fair value
USD % of net
assets
Bonds: 94.53% (31 May 2020: 96.06%) (continued) Canada: 1.48% (31 May 2020: 1.41%) (continued)
Corporate bonds: 0.53% (31 May 2020: 0.68%) 200,000 Fairfax Financial Holdings Ltd 4.85% 17/04/2028 USD 226,309 0.04400,000 Great-West Lifeco Inc 1.75% 07/12/2026 EUR 530,224 0.09100,000 Manulife Financial Corp 4.15% 04/03/2026 USD 113,205 0.02100,000 West Fraser Timber Co Ltd Series 144A 4.35% 15/10/2024 USD 107,682 0.02
Government bonds: 0.95% (31 May 2020: 0.73%)475,000 Province of Ontario Canada Series EMTN 0.25%
15/12/2026GBP 655,429 0.11
1,800,000 Province of Ontario Canada 2.6% 02/06/2025 CAD 1,582,669 0.27800,000 Province of Ontario Canada 3.5% 02/06/2024 CAD 716,643 0.12
1,300,000 Province of Quebec Canada 1.5% 01/09/2031 CAD 1,015,519 0.181,800,000 Province of Quebec Canada 2.75% 01/09/2025 CAD 1,597,301 0.27
Total Canada 8,637,417 1.48
Cayman Islands: 2.71% (31 May 2020: 2.55%)
Corporate bonds: 2.71% (31 May 2020: 2.55%)500,000 Alibaba Group Holding Ltd 2.7% 09/02/2041 USD 465,706 0.08800,000 Amber Circle Funding Ltd 3.25% 04/12/2022 USD 827,883 0.14100,000 Avolon Holdings Funding Ltd Series 144A 5.5%
15/01/2026USD 112,474 0.02
200,000 China Mengniu Dairy Co Ltd 1.875% 17/06/2025 USD 201,175 0.03800,000 CK Hutchison Finance 16 Ltd Series B 2% 06/04/2028 EUR 1,086,075 0.19200,000 Country Garden Holdings Co Ltd 2.7% 12/07/2026 USD 196,992 0.03300,000 Country Garden Holdings Co Ltd 5.125% 14/01/2027 USD 321,378 0.05300,000 Kaisa Group Holdings Ltd 9.75% 28/09/2023 USD 307,880 0.05200,000 Kaisa Group Holdings Ltd Series REGS 11.95%
22/10/2022USD 210,925 0.04
200,000 KWG Group Holdings Ltd 7.875% 01/09/2023 USD 206,270 0.04570,000 Meituan Series REGS 2.125% 28/10/2025 USD 565,330 0.10225,000 Meituan Series REGS 3.05% 28/10/2030 USD 218,503 0.04900,000 Melco Resorts Finance Ltd 4.875% 06/06/2025 USD 924,192 0.16200,000 Melco Resorts Finance Ltd Series 144A 5.625%
17/07/2027USD 211,250 0.04
200,000 Melco Resorts Finance Ltd Series 144A 5.75% 21/07/2028 USD 213,600 0.04300,000 MGM China Holdings Ltd Series 144A 5.375% 15/05/2024 USD 307,907 0.05
62,451 Odebrecht Offshore Drilling Finance Ltd Series REGS 6.72% 01/12/2022
USD 61,984 0.01
553,805 Odebrecht Offshore Drilling Finance Ltd Series 144A 7.72% 01/12/2026
USD 121,821 0.02
71,662 Odebrecht Oil & Gas Finance Ltd Series 144A 0% Perpetual
USD 967 –
350,000 Park Aerospace Holdings Ltd Series 144A 4.5% 15/03/2023
USD 367,325 0.06
Schedule of investments as at 31 May 2021 (continued)
Transferable securities admitted to an official stock exchange listing or traded on a regulated market. The percentages in brackets show the equivalent sector holdings at 31 May 2020.
279

Barclays Multi-Manager Fund PLC Annual Report and Audited Financial Statements 2021
GlobalAccess Corporate Bond Fund
Holdings Financial assets at fair value through profit or loss Currency Fair value
USD % of net
assets
Bonds: 94.53% (31 May 2020: 96.06%) (continued)
Cayman Islands: 2.71% (31 May 2020: 2.55%) (continued)
Corporate bonds: 2.71% (31 May 2020: 2.55%)
300,000 Park Aerospace Holdings Ltd Series 144A 5.25% 15/08/2022
USD 315,476 0.05
400,000 QNB Finance Ltd Series EMTN 1.375% 26/01/2026 USD 395,020 0.07700,000 QNB Finance Ltd FRN Series EMTN FRN 12/02/2022 USD 701,348 0.12600,000 Sands China Ltd 4.6% 08/08/2023 USD 642,261 0.11
1,100,000 Sands China Ltd 5.4% 08/08/2028 USD 1,262,800 0.21100,000 Seagate HDD Cayman Series 144A 4.125% 15/01/2031 USD 99,348 0.02500,000 Seazen Group Ltd 6% 12/08/2024 USD 523,750 0.09200,000 Seazen Group Ltd 6.45% 11/06/2022 USD 204,900 0.03600,000 Sunac China Holdings Ltd 6.65% 03/08/2024 USD 624,007 0.11200,000 Sunny Optical Technology Group Co Ltd 3.75%
23/01/2023USD 207,307 0.04
1,240,000 Tencent Holdings Ltd Series REGS 2.88% 22/04/2031 USD 1,262,344 0.22400,000 Tencent Holdings Ltd Series 144A 3.24% 03/06/2050 USD 367,171 0.06200,000 Tencent Holdings Ltd Series REGS 3.84% 22/04/2051 USD 202,655 0.03500,000 Tencent Holdings Ltd Series REGS 3.94% 22/04/2061 USD 511,737 0.09288,000 Vale Overseas Ltd 6.875% 21/11/2036 USD 393,234 0.07200,000 Wynn Macau Ltd Series 144A 5.5% 15/01/2026 USD 210,202 0.04900,000 Wynn Macau Ltd Series 144A 5.5% 01/10/2027 USD 944,266 0.16
Total Cayman Islands 15,797,463 2.71
Chile: 0.26% (31 May 2020: 0.00%)
Government bonds: 0.26% (31 May 2020: 0.00%)450,000 Chile Government International Bond 3.1% 07/05/2041 USD 438,597 0.08505,000 Chile Government International Bond 3.1% 22/01/2061 USD 462,403 0.08595,000 Chile Government International Bond 3.5% 15/04/2053 USD 601,173 0.10
Total Chile 1,502,173 0.26
Colombia: 0.04% (31 May 2020: 0.04%)
Corporate bonds: 0.04% (31 May 2020: 0.04%)200,000 Bancolombia SA 3% 29/01/2025 USD 204,952 0.04
Total Colombia 204,952 0.04
Croatia: 0.35% (31 May 2020: 0.00%)
Government bonds: 0.35% (31 May 2020: 0.00%)1,370,000 Croatia Government International Bond 1.5% 17/06/2031 EUR 1,739,104 0.30
Schedule of investments as at 31 May 2021 (continued)
Transferable securities admitted to an official stock exchange listing or traded on a regulated market. The percentages in brackets show the equivalent sector holdings at 31 May 2020.
280

Barclays Multi-Manager Fund PLC Annual Report and Audited Financial Statements 2021
GlobalAccess Corporate Bond Fund
Holdings Financial assets at fair value through profit or loss Currency Fair value
USD % of net
assets
Bonds: 94.53% (31 May 2020: 96.06%) (continued) Croatia: 0.35% (31 May 2020: 0.00%) (continued)
Government bonds: 0.35% (31 May 2020: 0.00%) 265,000 Croatia Government International Bond 1.75%
04/03/2041EUR 326,463 0.05
Total Croatia 2,065,567 0.35
Curaçao: 0.14% (31 May 2020: 0.12%)
Corporate bonds: 0.14% (31 May 2020: 0.12%)220,000 Teva Pharmaceutical Finance Co BV 2.95% 18/12/2022 USD 221,353 0.04600,000 Teva Pharmaceutical Finance Co BV Series 2 3.65%
10/11/2021USD 604,221 0.10
Total Curaçao 825,574 0.14
Denmark: 0.52% (31 May 2020: 0.43%)
Corporate bonds: 0.52% (31 May 2020: 0.43%)200,000 AP Moller - Maersk A/S Series 144A 3.875% 28/09/2025 USD 220,198 0.04540,000 Danske Bank A/S FRN 27/08/2025 EUR 666,668 0.12900,000 Danske Bank A/S Series EMTN FRN 02/09/2030 EUR 1,125,062 0.19695,000 Danske Bank A/S Series EMTN FRN 14/01/2028 GBP 1,013,512 0.17
Total Denmark 3,025,440 0.52
Finland: 0.15% (31 May 2020: 0.34%)
Corporate bonds: 0.15% (31 May 2020: 0.34%)200,000 Balder Finland Oyj Series EMTN 1% 20/01/2029 EUR 240,677 0.04500,000 Sampo OYJ Series EMTN FRN 03/09/2052 EUR 643,095 0.11
Total Finland 883,772 0.15
France: 3.15% (31 May 2020: 4.59%)
Corporate bonds: 3.15% (31 May 2020: 4.59%)600,000 Altarea SCA 1.75% 16/01/2030 EUR 728,762 0.13700,000 BNP Paribas SA FRN 01/09/2028 EUR 849,976 0.15600,000 BNP Paribas SA Series EMTN 1.25% 13/07/2031 GBP 794,523 0.14885,000 BNP Paribas SA Series 144A FRN 13/01/2027 USD 876,554 0.15600,000 BNP Paribas SA Series 144A FRN 30/09/2028 USD 597,005 0.10
1,100,000 BNP Paribas SA Series 144A FRN 09/06/2026 USD 1,138,384 0.20325,000 BNP Paribas SA Series 144A FRN 12/08/2035 USD 312,575 0.05300,000 BNP Paribas SA Series 144A FRN 19/11/2025 USD 317,187 0.05595,000 BNP Paribas SA Series 144A FRN 13/01/2031 USD 617,926 0.11200,000 BNP Paribas SA Series 144A FRN Perpetual USD 204,500 0.04500,000 BPCE SA Series EMTN 0.625% 26/09/2024 EUR 623,223 0.11
Schedule of investments as at 31 May 2021 (continued)
Transferable securities admitted to an official stock exchange listing or traded on a regulated market. The percentages in brackets show the equivalent sector holdings at 31 May 2020.
281

Barclays Multi-Manager Fund PLC Annual Report and Audited Financial Statements 2021
GlobalAccess Corporate Bond Fund
Holdings Financial assets at fair value through profit or loss Currency Fair value
USD % of net
assets
Bonds: 94.53% (31 May 2020: 96.06%) (continued) France: 3.15% (31 May 2020: 4.59%) (continued)
Corporate bonds: 3.15% (31 May 2020: 4.59%) 600,000 BPCE SA Series 144A 1% 20/01/2026 USD 594,181 0.10400,000 BPCE SA Series EMTN 1.375% 23/12/2026 GBP 575,845 0.10250,000 BPCE SA Series 144A 3.25% 11/01/2028 USD 267,920 0.05300,000 Bureau Veritas SA 1.25% 07/09/2023 EUR 376,281 0.06600,000 Cie de Saint-Gobain Series EMTN 1.75% 03/04/2023 EUR 758,666 0.13
1,100,000 Cie de Saint-Gobain 2.375% 04/10/2027 EUR 1,523,673 0.26530,000 Constellium SE Series 144A 3.75% 15/04/2029 USD 515,428 0.09200,000 Credit Agricole Assurances SA FRN 29/01/2048 EUR 261,142 0.05
1,040,000 Credit Agricole SA Series 144A 3.25% 04/10/2024 USD 1,121,410 0.19200,000 Credit Agricole SA FRN Perpetual 'REGS' GBP 336,718 0.06100,000 Holding d'Infrastructures de Transport SASU Series EMTN
1.625% 18/09/2029EUR 127,986 0.02
600,000 Indigo Group SAS 1.625% 19/04/2028 EUR 769,683 0.13200,000 Ingenico Group SA 1.625% 13/09/2024 EUR 255,054 0.04200,000 Orange SA Series EMTN 1.25% 07/07/2027 EUR 260,875 0.04100,000 Orange SA Series EMTN 1.625% 07/04/2032 EUR 135,268 0.02
1,305,000 RCI Banque SA Series EMTN 0.75% 10/04/2023 EUR 1,616,812 0.28200,000 SEB SA 1.5% 31/05/2024 EUR 252,945 0.04
1,400,000 Societe Generale SA Series REGS FRN 14/12/2026 USD 1,393,126 0.24100,000 TDF Infrastructure SAS 2.5% 07/04/2026 EUR 132,839 0.02
Total France 18,336,467 3.15
Germany: 3.05% (31 May 2020: 2.26%)
Corporate bonds: 3.05% (31 May 2020: 2.26%)200,000 Bayer AG 0.375% 06/07/2024 EUR 247,111 0.04100,000 Bayer AG 0.625% 12/07/2031 EUR 116,570 0.02600,000 Bayer Capital Corp BV 1.5% 26/06/2026 EUR 774,009 0.13500,000 Deutsche Bank AG Series EMTN FRN 17/02/2027 EUR 611,493 0.11100,000 Deutsche Bank AG FRN 17/02/2032 EUR 122,057 0.02700,000 Deutsche Bank AG Series EMTN 1.625% 20/01/2027 EUR 894,113 0.15600,000 Deutsche Bank AG Series EMTN FRN 19/11/2030 EUR 763,981 0.13200,000 Deutsche Bank AG 3.3% 16/11/2022 USD 207,781 0.04400,000 Deutsche Bank AG Series D 5% 14/02/2022 USD 412,672 0.07100,000 Deutsche Bank AG Series EMTN FRN 19/05/2031 EUR 144,542 0.03800,000 Deutsche Bank AG/New York NY FRN 26/11/2025 USD 869,074 0.15300,000 Deutsche Telekom AG Series EMTN 0.5% 05/07/2027 EUR 374,457 0.06890,000 E.ON SE Series EMTN 1% 07/10/2025 EUR 1,132,763 0.19500,000 Fraport AG Frankfurt Airport Services Worldwide 1.625%
09/07/2024EUR 633,057 0.11
200,000 Fraport AG Frankfurt Airport Services Worldwide 1.875% 31/03/2028
EUR 253,150 0.04
600,000 IHO Verwaltungs GmbH Series REGS 3.625% 15/05/2025 EUR 747,470 0.13300,000 IKB Deutsche Industriebank AG FRN 31/01/2028 EUR 374,604 0.06
Schedule of investments as at 31 May 2021 (continued)
Transferable securities admitted to an official stock exchange listing or traded on a regulated market. The percentages in brackets show the equivalent sector holdings at 31 May 2020.
282

Barclays Multi-Manager Fund PLC Annual Report and Audited Financial Statements 2021
GlobalAccess Corporate Bond Fund
Holdings Financial assets at fair value through profit or loss Currency Fair value
USD % of net
assets
Bonds: 94.53% (31 May 2020: 96.06%) (continued) Germany: 3.05% (31 May 2020: 2.26%) (continued)
Corporate bonds: 3.05% (31 May 2020: 2.26%) 900,000 Vantage Towers AG Series EMTN 0.375% 31/03/2027 EUR 1,093,343 0.19400,000 Vantage Towers AG Series EMTN 0.75% 31/03/2030 EUR 483,387 0.08
1,500,000 Volkswagen Bank GmbH Series EMTN 0.625% 08/09/2021
EUR 1,838,841 0.32
500,000 Volkswagen Bank GmbH Series EMTN 1.875% 31/01/2024 EUR 641,954 0.11980,000 Volkswagen Leasing GmbH Series EMTN 0.25%
12/01/2026EUR 1,199,272 0.21
825,000 Volkswagen Leasing GmbH Series EMTN 0.625% 19/07/2029
EUR 1,000,320 0.17
1,000,000 Volkswagen Leasing GmbH Series EMTN 1.125% 04/04/2024
EUR 1,261,769 0.22
1,000,000 Volkswagen Leasing GmbH Series emtn 1.375% 20/01/2025
EUR 1,278,699 0.22
300,000 Vonovia Finance BV Series 144A 5% 02/10/2023 USD 318,414 0.05
Total Germany 17,794,903 3.05
Guernsey: 0.09% (31 May 2020: 0.07%)
Corporate bonds: 0.09% (31 May 2020: 0.07%)200,000 Globalworth Real Estate Investments Ltd 2.875%
20/06/2022EUR 251,937 0.05
100,000 Globalworth Real Estate Investments Ltd Series EMTN 2.95% 29/07/2026
EUR 133,018 0.02
100,000 Globalworth Real Estate Investments Ltd Series EMTN 3% 29/03/2025
EUR 132,055 0.02
Total Guernsey 517,010 0.09
Hong Kong: 0.36% (31 May 2020: 0.41%)
Corporate bonds: 0.36% (31 May 2020: 0.41%)700,000 AIA Group Ltd Series 144A 3.6% 09/04/2029 USD 767,013 0.13600,000 Lenovo Group Ltd Series EMTN 5.875% 24/04/2025 USD 682,419 0.12600,000 Vanke Real Estate Hong Kong Co Ltd Series EMTN 4.15%
18/04/2023USD 629,234 0.11
Total Hong Kong 2,078,666 0.36
Schedule of investments as at 31 May 2021 (continued)
Transferable securities admitted to an official stock exchange listing or traded on a regulated market. The percentages in brackets show the equivalent sector holdings at 31 May 2020.
283

Barclays Multi-Manager Fund PLC Annual Report and Audited Financial Statements 2021
GlobalAccess Corporate Bond Fund
Holdings Financial assets at fair value through profit or loss Currency Fair value
USD % of net
assets
Bonds: 94.53% (31 May 2020: 96.06%) (continued)
India: 0.10% (31 May 2020: 0.22%)
Corporate bonds: 0.05% (31 May 2020: 0.16%)300,000 Shriram Transport Finance Co Ltd Series REGS 5.95%
24/10/2022USD 307,504 0.05
Government sponsored agencies: 0.05% (31 May 2020: 0.06%)
300,000 Export-Import Bank of India Series 144A 3.25% 15/01/2030
USD 303,191 0.05
Total India 610,695 0.10
Indonesia: 0.03% (31 May 2020: 0.00%)
Corporate bonds: 0.03% (31 May 2020: 0.00%)200,000 Perusahaan Perseroan Persero PT Perusahaan Listrik
Negara Series 144A 3% 30/06/2030USD 199,250 0.03
Total Indonesia 199,250 0.03
Ireland: 1.05% (31 May 2020: 1.13%)
Corporate bonds: 1.05% (31 May 2020: 1.13%)655,000 CRH SMW Finance DAC Series EMTN 1.25% 05/11/2026 EUR 847,973 0.15
1,957,000 GE Capital International Funding Co Unlimited Co 4.418% 15/11/2035
USD 2,278,436 0.39
100,000 Johnson Controls International plc 4.95% 02/07/2064 USD 126,579 0.02385,000 Johnson Controls International plc / Tyco Fire & Security
Finance SCA 1.75% 15/09/2030USD 365,397 0.06
900,000 Ryanair DAC Series EMTN 0.875% 25/05/2026 EUR 1,103,657 0.19950,000 SMBC Aviation Capital Finance DAC Series 144A 3%
15/07/2022USD 971,866 0.17
291,000 Virgin Media Vendor Financing Notes III DAC Series REGS 4.875% 15/07/2028
GBP 422,570 0.07
Total Ireland 6,116,478 1.05
Israel: 0.04% (31 May 2020: 0.40%)
Government bonds: 0.04% (31 May 2020: 0.40%)200,000 Israel Government International Bond 3.8% 13/05/2060 USD 220,214 0.04
Total Israel 220,214 0.04
Italy: 1.44% (31 May 2020: 1.00%)
Corporate bonds: 1.19% (31 May 2020: 0.76%)300,000 Atlantia SpA Series EMTN 1.625% 03/02/2025 EUR 376,515 0.06400,000 Atlantia SpA Series EMTN 1.875% 13/07/2027 EUR 504,388 0.09
Schedule of investments as at 31 May 2021 (continued)
Transferable securities admitted to an official stock exchange listing or traded on a regulated market. The percentages in brackets show the equivalent sector holdings at 31 May 2020.
284
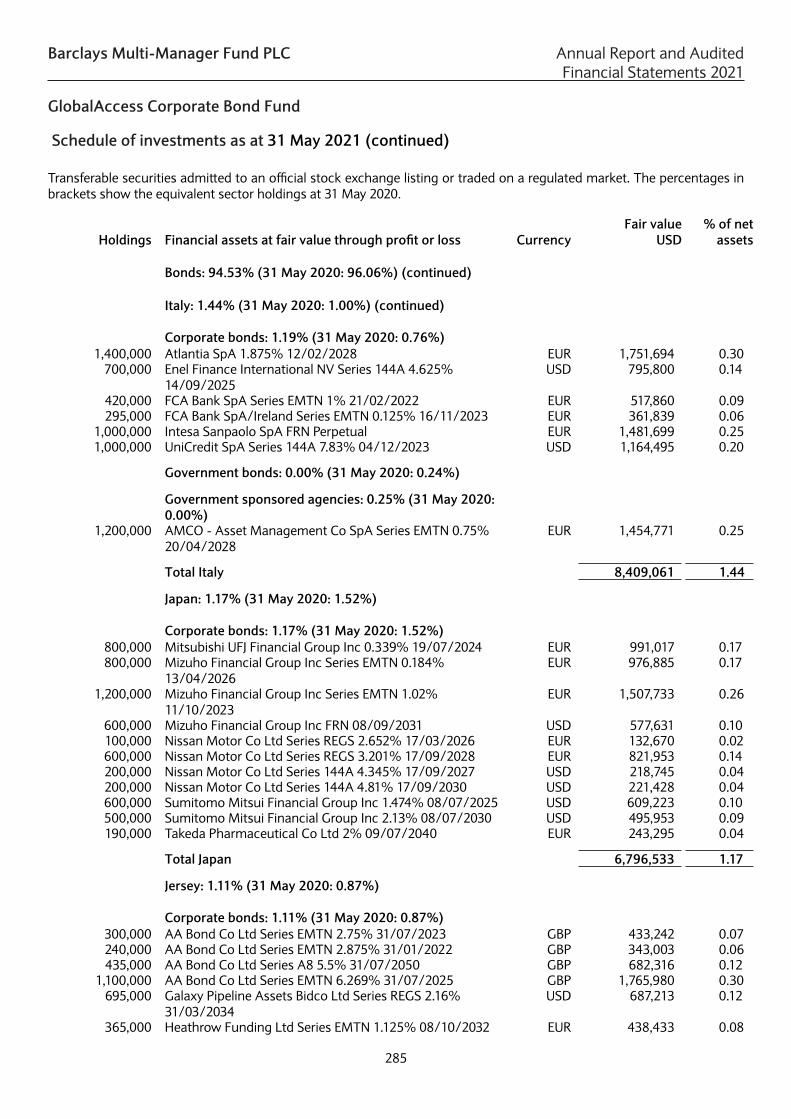
Barclays Multi-Manager Fund PLC Annual Report and Audited Financial Statements 2021
GlobalAccess Corporate Bond Fund
Holdings Financial assets at fair value through profit or loss Currency Fair value
USD % of net
assets
Bonds: 94.53% (31 May 2020: 96.06%) (continued) Italy: 1.44% (31 May 2020: 1.00%) (continued)
Corporate bonds: 1.19% (31 May 2020: 0.76%) 1,400,000 Atlantia SpA 1.875% 12/02/2028 EUR 1,751,694 0.30
700,000 Enel Finance International NV Series 144A 4.625% 14/09/2025
USD 795,800 0.14
420,000 FCA Bank SpA Series EMTN 1% 21/02/2022 EUR 517,860 0.09295,000 FCA Bank SpA/Ireland Series EMTN 0.125% 16/11/2023 EUR 361,839 0.06
1,000,000 Intesa Sanpaolo SpA FRN Perpetual EUR 1,481,699 0.251,000,000 UniCredit SpA Series 144A 7.83% 04/12/2023 USD 1,164,495 0.20
Government bonds: 0.00% (31 May 2020: 0.24%)
Government sponsored agencies: 0.25% (31 May 2020: 0.00%)
1,200,000 AMCO - Asset Management Co SpA Series EMTN 0.75% 20/04/2028
EUR 1,454,771 0.25
Total Italy 8,409,061 1.44
Japan: 1.17% (31 May 2020: 1.52%)
Corporate bonds: 1.17% (31 May 2020: 1.52%)800,000 Mitsubishi UFJ Financial Group Inc 0.339% 19/07/2024 EUR 991,017 0.17800,000 Mizuho Financial Group Inc Series EMTN 0.184%
13/04/2026EUR 976,885 0.17
1,200,000 Mizuho Financial Group Inc Series EMTN 1.02% 11/10/2023
EUR 1,507,733 0.26
600,000 Mizuho Financial Group Inc FRN 08/09/2031 USD 577,631 0.10100,000 Nissan Motor Co Ltd Series REGS 2.652% 17/03/2026 EUR 132,670 0.02600,000 Nissan Motor Co Ltd Series REGS 3.201% 17/09/2028 EUR 821,953 0.14200,000 Nissan Motor Co Ltd Series 144A 4.345% 17/09/2027 USD 218,745 0.04200,000 Nissan Motor Co Ltd Series 144A 4.81% 17/09/2030 USD 221,428 0.04600,000 Sumitomo Mitsui Financial Group Inc 1.474% 08/07/2025 USD 609,223 0.10500,000 Sumitomo Mitsui Financial Group Inc 2.13% 08/07/2030 USD 495,953 0.09190,000 Takeda Pharmaceutical Co Ltd 2% 09/07/2040 EUR 243,295 0.04
Total Japan 6,796,533 1.17
Jersey: 1.11% (31 May 2020: 0.87%)
Corporate bonds: 1.11% (31 May 2020: 0.87%)300,000 AA Bond Co Ltd Series EMTN 2.75% 31/07/2023 GBP 433,242 0.07240,000 AA Bond Co Ltd Series EMTN 2.875% 31/01/2022 GBP 343,003 0.06435,000 AA Bond Co Ltd Series A8 5.5% 31/07/2050 GBP 682,316 0.12
1,100,000 AA Bond Co Ltd Series EMTN 6.269% 31/07/2025 GBP 1,765,980 0.30695,000 Galaxy Pipeline Assets Bidco Ltd Series REGS 2.16%
31/03/2034USD 687,213 0.12
365,000 Heathrow Funding Ltd Series EMTN 1.125% 08/10/2032 EUR 438,433 0.08
Schedule of investments as at 31 May 2021 (continued)
Transferable securities admitted to an official stock exchange listing or traded on a regulated market. The percentages in brackets show the equivalent sector holdings at 31 May 2020.
285

Barclays Multi-Manager Fund PLC Annual Report and Audited Financial Statements 2021
GlobalAccess Corporate Bond Fund
Holdings Financial assets at fair value through profit or loss Currency Fair value
USD % of net
assets
Bonds: 94.53% (31 May 2020: 96.06%) (continued) Jersey: 1.11% (31 May 2020: 0.87%) (continued)
Corporate bonds: 1.11% (31 May 2020: 0.87%) 200,000 Heathrow Funding Ltd Series EMTN 1.875% 12/07/2032 EUR 257,661 0.04390,000 Heathrow Funding Ltd 2.625% 16/03/2028 GBP 555,453 0.10370,000 Heathrow Funding Ltd Series EMTN 2.75% 13/10/2031 GBP 545,061 0.09200,000 Heathrow Funding Ltd Series EMTN 2.75% 09/08/2049 GBP 278,984 0.05300,000 HSBC Capital Funding Dollar 1 F2F Series REGS FRN
PerpetualUSD 494,079 0.08
Total Jersey 6,481,425 1.11
Luxembourg: 2.16% (31 May 2020: 1.26%)
Corporate bonds: 2.16% (31 May 2020: 1.26%)200,000 ALROSA Finance SA Series REGS 4.65% 09/04/2024 USD 216,223 0.04600,000 Aroundtown SA Series EMTN 1.625% 31/01/2028 EUR 774,802 0.13400,000 Aroundtown SA Series EMTN 3% 16/10/2029 GBP 600,724 0.10100,000 Bank of China Luxembourg SA 0.125% 16/01/2023 EUR 122,480 0.02350,000 Becton Dickinson Euro Finance SARL 1.213% 12/02/2036 EUR 417,013 0.07700,000 Bevco Lux Sarl 1.5% 16/09/2027 EUR 895,575 0.15500,000 Blackstone Property Partners Europe Holdings Sarl Series
EMTN 2.2% 24/07/2025EUR 653,827 0.11
1,200,000 CPI Property Group SA Series EMTN 1.5% 27/01/2031 EUR 1,423,341 0.24300,000 Cromwell Ereit Lux Finco Sarl Series EMTN 2.125%
19/11/2025EUR 379,393 0.06
310,000 DH Europe Finance II Sarl 0.45% 18/03/2028 EUR 379,705 0.071,100,000 Gazprom Neft OAO Via GPN Capital SA Series REGS
4.375% 19/09/2022USD 1,144,187 0.20
200,000 Gazprom OAO Via Gaz Capital Series REGS 6.51% 07/03/2022
USD 208,984 0.04
200,000 Logicor Financing Sarl Series EMTN 0.75% 15/07/2024 EUR 248,784 0.041,465,000 Medtronic Global Holdings SCA 0% 15/03/2023 EUR 1,802,114 0.31
700,000 Medtronic Global Holdings SCA 1.375% 15/10/2040 EUR 845,649 0.15700,000 Sberbank of Russia Via SB Capital SA Series REGS 5.125%
29/10/2022USD 733,201 0.13
500,000 Sberbank of Russia Via SB Capital SA Series 7 5.717% 16/06/2021
USD 500,438 0.09
600,000 Traton Finance Luxembourg SA Series EMTN 0.75% 24/03/2029
EUR 735,955 0.13
400,000 Traton Finance Luxembourg SA Series EMTN 1.25% 24/03/2033
EUR 488,220 0.08
Total Luxembourg 12,570,615 2.16
Schedule of investments as at 31 May 2021 (continued)
Transferable securities admitted to an official stock exchange listing or traded on a regulated market. The percentages in brackets show the equivalent sector holdings at 31 May 2020.
286

Barclays Multi-Manager Fund PLC Annual Report and Audited Financial Statements 2021
GlobalAccess Corporate Bond Fund
Holdings Financial assets at fair value through profit or loss Currency Fair value
USD % of net
assets
Bonds: 94.53% (31 May 2020: 96.06%) (continued)
Malaysia: 0.04% (31 May 2020: 0.05%)
Government sponsored agencies: 0.04% (31 May 2020: 0.05%)
220,000 Petronas Capital Ltd Series REGS 3.5% 21/04/2030 USD 239,748 0.04
Total Malaysia 239,748 0.04
Mexico: 0.43% (31 May 2020: 0.50%)
Corporate bonds: 0.09% (31 May 2020: 0.37%)200,000 BBVA Bancomer SA/Texas Series 144A 6.75% 30/09/2022 USD 213,250 0.03100,000 Petroleos Mexicanos 5.95% 28/01/2031 USD 97,375 0.02200,000 Trust F/1401 Series REGS 6.95% 30/01/2044 USD 243,877 0.04
Government bonds: 0.34% (31 May 2020: 0.11%)495,000 Mexico Government International Bond 2.659%
24/05/2031USD 481,798 0.09
275,000 Mexico Government International Bond 3.771% 24/05/2061
USD 252,487 0.04
715,000 Mexico Government International Bond 4.75% 27/04/2032
USD 816,530 0.14
405,000 United Mexican States Treasury Bond 4.28% 14/08/2041 USD 420,783 0.07
Government sponsored agencies: 0.00% (31 May 2020: 0.02%)
Total Mexico 2,526,100 0.43
Multinational: 0.02% (31 May 2020: 0.02%)
Corporate bonds: 0.02% (31 May 2020: 0.02%)100,000 NXP BV / NXP Funding LLC / NXP USA Inc Series 144A
3.15% 01/05/2027USD 107,500 0.02
Total Multinational 107,500 0.02
Netherlands: 3.98% (31 May 2020: 5.36%)
Corporate bonds: 3.98% (31 May 2020: 5.36%)545,000 Airbus SE Series EMTN 1.625% 09/06/2030 EUR 720,012 0.12205,000 Airbus SE Series EMTN 2.375% 09/06/2040 EUR 282,740 0.05600,000 ASR Nederland NV FRN 02/05/2049 EUR 818,811 0.14600,000 Atrium Finance Issuer BV Series EMTN 2.625%
05/09/2027EUR 786,108 0.14
1,300,000 Cooperatieve Rabobank UA Series EMTN 4.625% 23/05/2029
GBP 2,187,382 0.38
655,000 CRH Funding BV 1.625% 05/05/2030 EUR 874,757 0.15490,000 Danfoss Finance I BV Series EMTN 0.375% 28/10/2028 EUR 592,309 0.10
Schedule of investments as at 31 May 2021 (continued)
Transferable securities admitted to an official stock exchange listing or traded on a regulated market. The percentages in brackets show the equivalent sector holdings at 31 May 2020.
287

Barclays Multi-Manager Fund PLC Annual Report and Audited Financial Statements 2021
GlobalAccess Corporate Bond Fund
Holdings Financial assets at fair value through profit or loss Currency Fair value
USD % of net
assets
Bonds: 94.53% (31 May 2020: 96.06%) (continued) Netherlands: 3.98% (31 May 2020: 5.36%) (continued)
Corporate bonds: 3.98% (31 May 2020: 5.36%) 370,000 Danfoss Finance II BV Series EMTN 0.75% 28/04/2031 EUR 448,652 0.08310,000 Deutsche Telekom International Finance BV Series EMTn
1.5% 03/04/2028EUR 410,741 0.07
110,000 Deutsche Telekom International Finance BV Series EMTN 2% 01/12/2029
EUR 152,527 0.03
400,000 Digital Dutch Finco BV 1% 15/01/2032 EUR 478,422 0.08425,000 E.ON International Finance BV Series EMTN 6.375%
07/06/2032GBP 850,018 0.15
600,000 Enel Finance International NV Series 144A 3.625% 25/05/2027
USD 660,413 0.11
845,000 Euronext NV 0.75% 17/05/2031 EUR 1,031,363 0.18420,000 Heineken NV Series EMTN 1% 04/05/2026 EUR 537,464 0.09110,000 Heineken NV Series EMTN 1.625% 30/03/2025 EUR 143,067 0.02400,000 ING Groep NV FRN 01/02/2030 EUR 472,772 0.08700,000 ING Groep NV Series EMTN FRN 26/05/2031 EUR 907,346 0.16800,000 ING Groep NV FRN Perpetual USD 881,164 0.15465,000 LyondellBasell Industries NV 4.625% 26/02/2055 USD 536,949 0.09100,000 NE Property BV Series EMTN 2.625% 22/05/2023 EUR 126,943 0.02300,000 Sagax Euro Mtn NL BV Series EMTN 1% 17/05/2029 EUR 364,979 0.06945,000 Siemens Financieringsmaatschappij NV Series 144A 0.4%
11/03/2023USD 947,739 0.16
300,000 Syngenta Finance NV Series EMTN 3.375% 16/04/2026 EUR 398,874 0.07700,000 Volkswagen Financial Services NV Series EMTN 1.125%
18/09/2023GBP 1,001,823 0.17
500,000 Volkswagen Financial Services NV Series EMTN 1.625% 10/02/2024
GBP 724,408 0.12
900,000 Volkswagen International Finance NV Series EMTN 0.875% 22/09/2028
EUR 1,134,497 0.19
300,000 Volkswagen International Finance NV Series EMTN 1.5% 21/01/2041
EUR 353,510 0.06
195,000 Volkswagen International Finance NV FRN Perpetual EUR 270,504 0.05500,000 Vonovia Finance BV Series EMTN 1% 28/01/2041 EUR 557,351 0.10
1,320,000 VZ Vendor Financing II BV Series REGS 2.875% 15/01/2029
EUR 1,577,852 0.27
300,000 Wintershall Dea Finance 2 BV Series NC5 FRN Perpetual EUR 362,524 0.06400,000 Wintershall Dea Finance 2 BV Series NC8 FRN Perpetual EUR 478,575 0.08100,000 Wintershall Dea Finance BV 1.332% 25/09/2028 EUR 124,584 0.02500,000 Wintershall Dea Finance BV 1.823% 25/09/2031 EUR 626,387 0.11200,000 WPC Eurobond BV 2.125% 15/04/2027 EUR 264,402 0.05100,000 ZF Europe Finance BV 2.5% 23/10/2027 EUR 124,622 0.02
Total Netherlands 23,212,591 3.98
Schedule of investments as at 31 May 2021 (continued)
Transferable securities admitted to an official stock exchange listing or traded on a regulated market. The percentages in brackets show the equivalent sector holdings at 31 May 2020.
288

Barclays Multi-Manager Fund PLC Annual Report and Audited Financial Statements 2021
GlobalAccess Corporate Bond Fund
Holdings Financial assets at fair value through profit or loss Currency Fair value
USD % of net
assets
Bonds: 94.53% (31 May 2020: 96.06%) (continued)
New Zealand: 0.02% (31 May 2020: 0.02%)
Government sponsored agencies: 0.02% (31 May 2020: 0.02%)
100,000 China Construction Bank New Zealand Ltd Series EMTN FRN 20/12/2021
USD 100,118 0.02
Total New Zealand 100,118 0.02
Norway: 0.53% (31 May 2020: 0.09%)
Corporate bonds: 0.53% (31 May 2020: 0.09%)1,420,000 Aker BP ASA Series EMTN 1.125% 12/05/2029 EUR 1,725,976 0.30
150,000 Aker BP ASA Series 144A 2.875% 15/01/2026 USD 156,859 0.03700,000 DNB Bank ASA FRN Perpetual USD 729,379 0.12400,000 Yara International ASA Series 144A 4.75% 01/06/2028 USD 468,935 0.08
Total Norway 3,081,149 0.53
Panama: 0.23% (31 May 2020: 0.00%)
Government bonds: 0.23% (31 May 2020: 0.00%)1,205,000 Panama Government International Bond 2.252%
29/09/2032USD 1,158,318 0.20
200,000 Panama Government International Bond 3.87% 23/07/2060
USD 201,098 0.03
Total Panama 1,359,416 0.23
People's Republic of China: 0.16% (31 May 2020: 0.23%)
Corporate bonds: 0.16% (31 May 2020: 0.23%)300,000 Export-Import Bank of China Series 144A 3.625%
31/07/2024USD 328,078 0.06
600,000 Vanke Real Estate Hong Kong Co Ltd Series EMTN FRN 25/05/2023
USD 601,916 0.10
Total People's Republic of China 929,994 0.16
Peru: 0.49% (31 May 2020: 0.69%)
Government bonds: 0.49% (31 May 2020: 0.69%)3,000,000 Peru Government Bond 5.94% 12/02/2029 PEN 881,222 0.151,000,000 Peru Government Bond 6.15% 12/08/2032 PEN 287,280 0.05
200,000 Peruvian Government International Bond Series REGS 5.35% 12/08/2040
PEN 48,704 0.01
700,000 Peruvian Government International Bond Series 144A 5.94% 12/02/2029
PEN 205,625 0.03
Schedule of investments as at 31 May 2021 (continued)
Transferable securities admitted to an official stock exchange listing or traded on a regulated market. The percentages in brackets show the equivalent sector holdings at 31 May 2020.
289

Barclays Multi-Manager Fund PLC Annual Report and Audited Financial Statements 2021
GlobalAccess Corporate Bond Fund
Holdings Financial assets at fair value through profit or loss Currency Fair value
USD % of net
assets
Bonds: 94.53% (31 May 2020: 96.06%) (continued) Peru: 0.49% (31 May 2020: 0.69%) (continued)
Government bonds: 0.49% (31 May 2020: 0.69%) 3,100,000 Peruvian Government International Bond Series 144A
6.95% 12/08/2031PEN 950,028 0.16
1,500,000 Peruvian Government International Bond Series 144A 8.2% 12/08/2026
PEN 495,627 0.09
Total Peru 2,868,486 0.49
Qatar: 0.20% (31 May 2020: 0.56%)
Government bonds: 0.20% (31 May 2020: 0.56%)530,000 Qatar Government International Bond Series REGS 3.4%
16/04/2025USD 578,681 0.10
450,000 Qatar Government International Bond Series REGS 5.103% 23/04/2048
USD 585,261 0.10
Total Qatar 1,163,942 0.20
Republic of South Korea: 0.03% (31 May 2020: 0.00%)
Corporate bonds: 0.03% (31 May 2020: 0.00%)200,000 Shinhan Bank Co Ltd 1.183% 29/09/2025 AUD 153,925 0.03
Total Republic of South Korea 153,925 0.03
Romania: 0.36% (31 May 2020: 0.00%)
Government bonds: 0.36% (31 May 2020: 0.00%)1,073,000 Romanian Government International Bond Series REGS
1.375% 02/12/2029EUR 1,303,081 0.22
343,000 Romanian Government International Bond Series REGS 2% 14/04/2033
EUR 415,081 0.07
92,000 Romanian Government International Bond Series REGS 2.124% 16/07/2031
EUR 115,091 0.02
196,000 Romanian Government International Bond Series REGS 3.624% 26/05/2030
EUR 275,923 0.05
Total Romania 2,109,176 0.36
Russian Federation: 0.10% (31 May 2020: 0.44%)
Government bonds: 0.10% (31 May 2020: 0.44%)29,000,000 Russian Federal Bond - OFZ Series 6228 7.65%
10/04/2030RUB 412,936 0.07
9,400,000 Russian Federal Bond - OFZ Series 6218 8.5% 17/09/2031 RUB 141,278 0.03
Total Russian Federation 554,214 0.10
Schedule of investments as at 31 May 2021 (continued)
Transferable securities admitted to an official stock exchange listing or traded on a regulated market. The percentages in brackets show the equivalent sector holdings at 31 May 2020.
290

Barclays Multi-Manager Fund PLC Annual Report and Audited Financial Statements 2021
GlobalAccess Corporate Bond Fund
Holdings Financial assets at fair value through profit or loss Currency Fair value
USD % of net
assets
Bonds: 94.53% (31 May 2020: 96.06%) (continued)
Saudi Arabia: 0.23% (31 May 2020: 0.11%)
Corporate bonds: 0.09% (31 May 2020: 0.00%)200,000 Saudi Arabian Oil Co Series REGS 1.25% 24/11/2023 USD 202,629 0.04280,000 Saudi Arabian Oil Co Series REGS 1.625% 24/11/2025 USD 284,927 0.05
Government bonds: 0.14% (31 May 2020: 0.11%)447,000 Saudi Government International Bond Series REGS 2.25%
02/02/2033USD 428,608 0.07
413,000 Saudi Government International Bond Series REGS 3.45% 02/02/2061
USD 398,421 0.07
Total Saudi Arabia 1,314,585 0.23
Serbia: 0.10% (31 May 2020: 0.00%)
Government bonds: 0.10% (31 May 2020: 0.00%)505,000 Serbia International Bond Series REGS 1.65% 03/03/2033 EUR 597,317 0.10
Total Serbia 597,317 0.10
Singapore: 0.37% (31 May 2020: 0.44%)
Corporate bonds: 0.37% (31 May 2020: 0.44%)200,000 BOC Aviation Ltd Series 144A 2.75% 18/09/2022 USD 204,111 0.04600,000 BOC Aviation Ltd Series 144A 3.5% 10/10/2024 USD 639,855 0.11500,000 BOC Aviation Ltd Series GMTN 4% 25/01/2024 USD 533,499 0.09700,000 SP Group Treasury Pte Ltd Series REGS 3.375%
27/02/2029USD 763,670 0.13
Total Singapore 2,141,135 0.37
South Africa: 0.20% (31 May 2020: 0.00%)
Government bonds: 0.20% (31 May 2020: 0.00%)14,200,000 Republic of South Africa Government Bond Series R186
10.5% 21/12/2026ZAR 1,183,402 0.20
Total South Africa 1,183,402 0.20
Spain: 0.67% (31 May 2020: 0.45%)
Corporate bonds: 0.67% (31 May 2020: 0.45%)200,000 ACS Actividades de Construccion y Servicios SA Series
EMTN 1.375% 17/06/2025EUR 248,044 0.04
100,000 Banco de Sabadell SA FRN 11/03/2027 EUR 126,021 0.021,300,000 Banco Santander SA Series EMTN 1.5% 14/04/2026 GBP 1,844,341 0.32
200,000 Banco Santander SA 2.746% 28/05/2025 USD 212,083 0.04500,000 Banco Santander SA FRN Perpetual EUR 620,607 0.11
Schedule of investments as at 31 May 2021 (continued)
Transferable securities admitted to an official stock exchange listing or traded on a regulated market. The percentages in brackets show the equivalent sector holdings at 31 May 2020.
291

Barclays Multi-Manager Fund PLC Annual Report and Audited Financial Statements 2021
GlobalAccess Corporate Bond Fund
Holdings Financial assets at fair value through profit or loss Currency Fair value
USD % of net
assets
Bonds: 94.53% (31 May 2020: 96.06%) (continued) Spain: 0.67% (31 May 2020: 0.45%) (continued)
Corporate bonds: 0.67% (31 May 2020: 0.45%) 600,000 CaixaBank SA FRN Perpetual EUR 840,150 0.14
Total Spain 3,891,246 0.67
Sweden: 0.60% (31 May 2020: 0.34%)
Corporate bonds: 0.60% (31 May 2020: 0.34%)100,000 Molnlycke Holding AB 1.75% 28/02/2024 EUR 128,122 0.02400,000 Sagax AB 1.125% 30/01/2027 EUR 498,464 0.09
1,435,000 Securitas Direct Series REGS 3.875% 15/07/2026 EUR 1,803,366 0.31665,000 Telefonaktiebolaget LM Ericsson 4.125% 15/05/2022 USD 684,232 0.12310,000 Volvo Treasury AB Series EMTN 0% 18/05/2026 EUR 377,261 0.06
Total Sweden 3,491,445 0.60
Switzerland: 2.14% (31 May 2020: 2.05%)
Corporate bonds: 2.14% (31 May 2020: 2.05%)900,000 Credit Suisse AG Series MTN 3.625% 09/09/2024 USD 984,189 0.17
1,800,000 Credit Suisse AG Series 144A 6.5% 08/08/2023 144A' USD 1,993,468 0.34500,000 Credit Suisse Group AG Series EMTN FRN 24/06/2027 EUR 622,597 0.11320,000 Credit Suisse Group AG FRN 12/09/2025 GBP 467,655 0.08835,000 Credit Suisse Group AG Series EMTN FRN 09/06/2028 GBP 1,216,264 0.21750,000 Credit Suisse Group AG Series 144A 3.574% 09/01/2023 USD 763,556 0.13550,000 Credit Suisse Group AG 4.207% 12/06/2024 Series 144A
FRN 12/06/2024USD 588,046 0.10
1,200,000 UBS AG 5.125% 15/05/2024 USD 1,325,664 0.23600,000 UBS AG/Stamford CT 7.625% 17/08/2022 USD 650,796 0.11500,000 UBS Group FRN Perpetual EUR 634,136 0.11825,000 UBS Group AG 0.25% 24/02/2028 EUR 994,972 0.17390,000 UBS Group AG Series 144A FRN 11/02/2032 USD 375,051 0.06410,000 UBS Group AG Series 144A FRN 13/08/2030 USD 433,593 0.08500,000 UBS Group AG Series 144A FRN Perpetual USD 499,375 0.09800,000 UBS Group Funding Switzerland AG Series 144A 4.125%
24/09/2025USD 897,963 0.15
Total Switzerland 12,447,325 2.14
United Arab Emirates: 0.37% (31 May 2020: 0.55%)
Government bonds: 0.24% (31 May 2020: 0.42%)785,000 Abu Dhabi Government International Bond Series REGS
0.75% 02/09/2023USD 792,528 0.14
395,000 Abu Dhabi Government International Bond Series REGS 2.5% 16/04/2025
USD 419,111 0.07
Schedule of investments as at 31 May 2021 (continued)
Transferable securities admitted to an official stock exchange listing or traded on a regulated market. The percentages in brackets show the equivalent sector holdings at 31 May 2020.
292

Barclays Multi-Manager Fund PLC Annual Report and Audited Financial Statements 2021
GlobalAccess Corporate Bond Fund
Holdings Financial assets at fair value through profit or loss Currency Fair value
USD % of net
assets
Bonds: 94.53% (31 May 2020: 96.06%) (continued)
United Arab Emirates: 0.37% (31 May 2020: 0.55%) (continued)
Government bonds: 0.24% (31 May 2020: 0.42%)
200,000 Abu Dhabi Government International Bond Series REGS 3.125% 30/09/2049
USD 198,567 0.03
Government sponsored agencies: 0.13% (31 May 2020: 0.13%)
500,000 First Abu Dhabi Bank PJSC Series EMTN 1.375% 19/02/2023
GBP 716,984 0.13
Total United Arab Emirates 2,127,190 0.37
United Kingdom: 7.28% (31 May 2020: 5.98%)
Corporate bonds: 7.28% (31 May 2020: 5.98%)300,000 AA Bond Co Ltd Series EMTN 4.875% 31/07/2024 GBP 454,446 0.08200,000 Anglo American Capital PLC Series 144A 2.625%
10/09/2030USD 198,398 0.03
455,000 Anglo American Capital PLC Series 144A 2.875% 17/03/2031
USD 459,785 0.08
465,000 Anglo American Capital PLC Series 144A 4% 11/09/2027 USD 517,435 0.09200,000 Anglo American Capital PLC Series 144A 4.5%
15/03/2028USD 227,743 0.04
965,000 Anglo American Capital PLC Series 144A 5.375% 01/04/2025
USD 1,107,483 0.19
755,000 Aviva PLC Series EMTN FRN 03/07/2044 EUR 1,020,406 0.18293,000 Barclays Bank PLC^ 7.625% 21/11/2022 USD 320,676 0.06700,000 BAT International Finance PLC 1.668% 25/03/2026 USD 698,902 0.12730,000 Bellis Acquisition Co PLC Series REGS 3.25% 16/02/2026 GBP 1,039,208 0.18365,000 BP Capital Markets BV Series EMTN 0.933% 04/12/2040 EUR 410,481 0.07400,000 Bunzl Finance PLC Series EMTN 1.5% 30/10/2030 GBP 552,107 0.09100,000 Bunzl Finance PLC 2.25% 11/06/2025 GBP 149,180 0.03300,000 Cadent Finance PLC Series EMTN 2.125% 22/09/2028 GBP 442,405 0.08270,000 CPUK Finance Ltd 3.69% 28/02/2047 GBP 422,072 0.07850,000 FCE Bank PLC Series EMTN 1.134% 10/02/2022 EUR 1,044,534 0.18300,000 G4S International Finance PLC Series EMTN 1.5%
09/01/2023EUR 374,080 0.06
300,000 G4S International Finance PLC Series EMTN 3.125% 24/05/2025
EUR 382,450 0.07
400,000 Gazprom PJSC via Gaz Finance PLC Series 144A 1.5% 17/02/2027
EUR 484,331 0.08
100,000 Grainger PLC 3.375% 24/04/2028 GBP 153,728 0.03252,592 Greene King Finance PLC Series A2 5.318% 15/09/2031 GBP 414,156 0.07500,000 HSBC Holdings PLC Series EMTN FRN 04/12/2024 EUR 635,286 0.11690,000 HSBC Holdings PLC FRN 24/07/2027 GBP 989,214 0.17300,000 HSBC Holdings PLC Series DIP FRN 13/11/2026 GBP 443,349 0.08
Schedule of investments as at 31 May 2021 (continued)
Transferable securities admitted to an official stock exchange listing or traded on a regulated market. The percentages in brackets show the equivalent sector holdings at 31 May 2020.
293

Barclays Multi-Manager Fund PLC Annual Report and Audited Financial Statements 2021
GlobalAccess Corporate Bond Fund
Holdings Financial assets at fair value through profit or loss Currency Fair value
USD % of net
assets
Bonds: 94.53% (31 May 2020: 96.06%) (continued)
United Kingdom: 7.28% (31 May 2020: 5.98%) (continued)
Corporate bonds: 7.28% (31 May 2020: 5.98%)
925,000 HSBC Holdings PLC FRN 24/05/2032 USD 934,787 0.161,700,000 HSBC Holdings PLC Series EMTN FRN Perpetual EUR 2,343,203 0.40
100,000 Imperial Brands Finance PLC Series EMTN 2.125% 12/02/2027
EUR 130,549 0.02
700,000 Imperial Brands Finance PLC Series 144A 3.75% 21/07/2022
USD 720,330 0.12
100,000 Informa PLC Series EMTN 1.25% 22/04/2028 EUR 124,003 0.02300,000 Informa PLC Series EMTN 1.5% 05/07/2023 EUR 378,074 0.06100,000 Informa PLC Series EMTN 2.125% 06/10/2025 EUR 129,857 0.02600,000 Informa PLC Series emtn 3.125% 05/07/2026 GBP 907,418 0.16300,000 InterContinental Hotels Group PLC Series EMTN 2.125%
24/08/2026GBP 433,228 0.07
400,000 Lloyds Bank PLC Series EMTN 7.5% 02/04/2032 USD 309,905 0.05100,000 Lloyds Banking Group PLC Series EMTN 2.25%
16/10/2024GBP 147,936 0.03
332,000 Lloyds Banking Group PLC FRN 03/12/2035 GBP 475,881 0.08900,000 Lloyds Banking Group PLC 4.45% 08/05/2025 USD 1,013,635 0.17600,000 Lloyds Banking Group PLC FRN Perpetual GBP 1,081,605 0.19800,000 Marks & Spencer PLC 4.5% 10/07/2027 GBP 1,216,491 0.21390,000 National Express Group PLC FRN Perpetual GBP 576,727 0.10295,000 National Grid Gas PLC Series EMTN 1.625% 14/01/2043 GBP 364,477 0.06500,000 Nationwide Building Society FRN Perpetual GBP 795,833 0.14900,000 Natwest Group PLC Series EMTN FRN 02/03/2026 EUR 1,159,746 0.20870,000 Natwest Group PLC Series EMTN FRN 28/11/2031 GBP 1,236,814 0.21
1,500,000 Natwest Group PLC FRN 18/05/2029 USD 1,738,306 0.30200,000 Natwest Group PLC FRN Perpetual USD 202,502 0.03400,000 Places For People Treasury PLC Series EMTN 2.875%
17/08/2026GBP 617,945 0.11
700,000 Rolls-Royce PLC Series EMTN 1.625% 09/05/2028 EUR 793,738 0.14100,000 Rolls-Royce PLC Series EMTN 3.375% 18/06/2026 GBP 141,759 0.02100,000 Rolls-Royce PLC Series REGS 5.75% 15/10/2027 GBP 154,787 0.03230,000 Royalty Pharma PLC Series 144A 1.75% 02/09/2027 USD 227,985 0.04375,000 Royalty Pharma PLC Series 144A 3.3% 02/09/2040 USD 364,811 0.06750,000 Santander UK Group Holdings PLC FRN Perpetual 'REGS' GBP 1,184,731 0.20250,000 Santander UK PLC 2.875% 18/06/2024 USD 266,388 0.05100,000 Santander UK PLC Series 144A FRN 12/02/2027 GBP 144,198 0.02100,000 Society of Lloyd's 4.75% 30/10/2024 GBP 157,350 0.03700,000 Standard Chartered PLC Series 144A FRN 14/01/2027 USD 692,661 0.12300,000 Standard Chartered PLC Series 144A FRN 30/01/2026 USD 315,943 0.05
50,000 Tesco PLC Series EMTN 6.125% 24/02/2022 GBP 74,063 0.0194,921 Tesco Property Finance 3 PLC 5.744% 13/04/2040 GBP 179,061 0.03
187,044 Tesco Property Finance 6 PLC 5.4111% 13/07/2044 GBP 345,439 0.06200,000 TP ICAP PLC Series EMTN 5.25% 26/01/2024 GBP 311,751 0.05
Schedule of investments as at 31 May 2021 (continued)
Transferable securities admitted to an official stock exchange listing or traded on a regulated market. The percentages in brackets show the equivalent sector holdings at 31 May 2020.
294
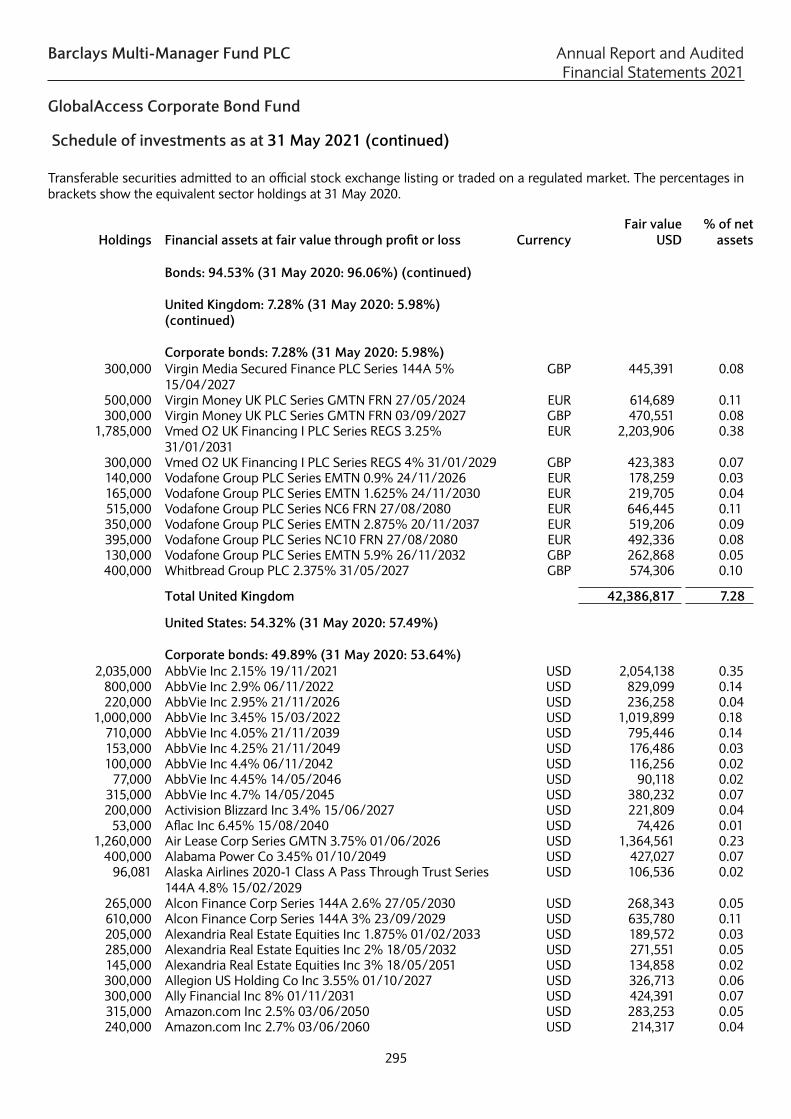
Barclays Multi-Manager Fund PLC Annual Report and Audited Financial Statements 2021
GlobalAccess Corporate Bond Fund
Holdings Financial assets at fair value through profit or loss Currency Fair value
USD % of net
assets
Bonds: 94.53% (31 May 2020: 96.06%) (continued)
United Kingdom: 7.28% (31 May 2020: 5.98%) (continued)
Corporate bonds: 7.28% (31 May 2020: 5.98%)
300,000 Virgin Media Secured Finance PLC Series 144A 5% 15/04/2027
GBP 445,391 0.08
500,000 Virgin Money UK PLC Series GMTN FRN 27/05/2024 EUR 614,689 0.11300,000 Virgin Money UK PLC Series GMTN FRN 03/09/2027 GBP 470,551 0.08
1,785,000 Vmed O2 UK Financing I PLC Series REGS 3.25% 31/01/2031
EUR 2,203,906 0.38
300,000 Vmed O2 UK Financing I PLC Series REGS 4% 31/01/2029 GBP 423,383 0.07140,000 Vodafone Group PLC Series EMTN 0.9% 24/11/2026 EUR 178,259 0.03165,000 Vodafone Group PLC Series EMTN 1.625% 24/11/2030 EUR 219,705 0.04515,000 Vodafone Group PLC Series NC6 FRN 27/08/2080 EUR 646,445 0.11350,000 Vodafone Group PLC Series EMTN 2.875% 20/11/2037 EUR 519,206 0.09395,000 Vodafone Group PLC Series NC10 FRN 27/08/2080 EUR 492,336 0.08130,000 Vodafone Group PLC Series EMTN 5.9% 26/11/2032 GBP 262,868 0.05400,000 Whitbread Group PLC 2.375% 31/05/2027 GBP 574,306 0.10
Total United Kingdom 42,386,817 7.28
United States: 54.32% (31 May 2020: 57.49%)
Corporate bonds: 49.89% (31 May 2020: 53.64%)2,035,000 AbbVie Inc 2.15% 19/11/2021 USD 2,054,138 0.35
800,000 AbbVie Inc 2.9% 06/11/2022 USD 829,099 0.14220,000 AbbVie Inc 2.95% 21/11/2026 USD 236,258 0.04
1,000,000 AbbVie Inc 3.45% 15/03/2022 USD 1,019,899 0.18710,000 AbbVie Inc 4.05% 21/11/2039 USD 795,446 0.14153,000 AbbVie Inc 4.25% 21/11/2049 USD 176,486 0.03100,000 AbbVie Inc 4.4% 06/11/2042 USD 116,256 0.02
77,000 AbbVie Inc 4.45% 14/05/2046 USD 90,118 0.02315,000 AbbVie Inc 4.7% 14/05/2045 USD 380,232 0.07200,000 Activision Blizzard Inc 3.4% 15/06/2027 USD 221,809 0.04
53,000 Aflac Inc 6.45% 15/08/2040 USD 74,426 0.011,260,000 Air Lease Corp Series GMTN 3.75% 01/06/2026 USD 1,364,561 0.23
400,000 Alabama Power Co 3.45% 01/10/2049 USD 427,027 0.0796,081 Alaska Airlines 2020-1 Class A Pass Through Trust Series
144A 4.8% 15/02/2029USD 106,536 0.02
265,000 Alcon Finance Corp Series 144A 2.6% 27/05/2030 USD 268,343 0.05610,000 Alcon Finance Corp Series 144A 3% 23/09/2029 USD 635,780 0.11205,000 Alexandria Real Estate Equities Inc 1.875% 01/02/2033 USD 189,572 0.03285,000 Alexandria Real Estate Equities Inc 2% 18/05/2032 USD 271,551 0.05145,000 Alexandria Real Estate Equities Inc 3% 18/05/2051 USD 134,858 0.02300,000 Allegion US Holding Co Inc 3.55% 01/10/2027 USD 326,713 0.06300,000 Ally Financial Inc 8% 01/11/2031 USD 424,391 0.07315,000 Amazon.com Inc 2.5% 03/06/2050 USD 283,253 0.05240,000 Amazon.com Inc 2.7% 03/06/2060 USD 214,317 0.04
Schedule of investments as at 31 May 2021 (continued)
Transferable securities admitted to an official stock exchange listing or traded on a regulated market. The percentages in brackets show the equivalent sector holdings at 31 May 2020.
295

Barclays Multi-Manager Fund PLC Annual Report and Audited Financial Statements 2021
GlobalAccess Corporate Bond Fund
Holdings Financial assets at fair value through profit or loss Currency Fair value
USD % of net
assets
Bonds: 94.53% (31 May 2020: 96.06%) (continued)
United States: 54.32% (31 May 2020: 57.49%) (continued)
Corporate bonds: 49.89% (31 May 2020: 53.64%)
165,000 Amazon.com Inc 2.875% 12/05/2041 USD 164,165 0.0350,000 Amazon.com Inc 3.1% 12/05/2051 USD 49,962 0.0170,000 Amazon.com Inc 3.25% 12/05/2061 USD 70,312 0.0170,164 American Airlines 2015-1 Class A Pass Through Trust
3.375% 01/05/2027USD 70,355 0.01
80,950 American Airlines 2016-2 Class AA Pass Through Trust Series AA 3.2% 15/12/2029
USD 82,119 0.01
670,106 American Airlines 2017-2 Class A Pass Through Trust Series A 3.6% 15/10/2029
USD 646,695 0.11
83,763 American Airlines 2017-2 Class AA Pass Through Trust Series AA 3.35% 15/04/2031
USD 84,625 0.01
200,000 American Homes 4 Rent LP 4.9% 15/02/2029 USD 230,917 0.04125,000 American International Group Inc 3.4% 30/06/2030 USD 135,110 0.02105,000 American International Group Inc 4.75% 01/04/2048 USD 127,468 0.02265,000 American International Group Inc 4.8% 10/07/2045 USD 319,884 0.05
1,515,000 American Tower Corp 0.45% 15/01/2027 EUR 1,852,018 0.32500,000 American Tower Corp 0.5% 15/01/2028 EUR 603,455 0.10700,000 American Tower Corp 0.875% 21/05/2029 EUR 858,358 0.15400,000 American Tower Corp 1.375% 04/04/2025 EUR 510,478 0.09300,000 American Tower Corp 1.95% 22/05/2026 EUR 395,588 0.07560,000 American Tower Corp 2.1% 15/06/2030 USD 542,254 0.09415,000 American Tower Corp 2.75% 15/01/2027 USD 437,146 0.07600,000 American Tower Corp 3.55% 15/07/2027 USD 657,785 0.11555,000 American Tower Corp 3.8% 15/08/2029 USD 611,564 0.10300,000 American Transmission Systems Inc Series 144A 5.25%
15/01/2022USD 308,298 0.05
425,000 American Water Capital Corp 2.3% 01/06/2031 USD 423,805 0.07580,000 American Water Capital Corp 2.8% 01/05/2030 USD 608,225 0.10200,000 American Water Capital Corp 3.25% 01/06/2051 USD 199,662 0.03
85,000 American Water Capital Corp 3.45% 01/05/2050 USD 87,645 0.0135,000 American Water Capital Corp 3.75% 01/09/2047 USD 38,051 0.0115,000 American Water Capital Corp 4.15% 01/06/2049 USD 17,183 –
135,000 Amgen Inc 2.45% 21/02/2030 USD 137,314 0.02210,000 Amgen Inc 3.15% 21/02/2040 USD 213,018 0.04
1,780,000 Anheuser-Busch Cos LLC / Anheuser-Busch InBev Worldwide Inc 4.9% 01/02/2046
USD 2,137,635 0.37
270,000 Anheuser-Busch InBev Finance Inc 4% 17/01/2043 USD 289,520 0.05310,000 Anheuser-Busch InBev Worldwide Inc 4.375% 15/04/2038 USD 355,222 0.06105,000 Anheuser-Busch InBev Worldwide Inc 5.45% 23/01/2039 USD 133,143 0.02410,000 Anthem Inc 2.55% 15/03/2031 USD 417,544 0.07265,000 Anthem Inc 3.6% 15/03/2051 USD 278,504 0.05297,000 Anthem Inc 3.65% 01/12/2027 USD 331,308 0.06325,000 Apple Inc 2.1% 12/09/2022 USD 332,525 0.06
Schedule of investments as at 31 May 2021 (continued)
Transferable securities admitted to an official stock exchange listing or traded on a regulated market. The percentages in brackets show the equivalent sector holdings at 31 May 2020.
296

Barclays Multi-Manager Fund PLC Annual Report and Audited Financial Statements 2021
GlobalAccess Corporate Bond Fund
Holdings Financial assets at fair value through profit or loss Currency Fair value
USD % of net
assets
Bonds: 94.53% (31 May 2020: 96.06%) (continued)
United States: 54.32% (31 May 2020: 57.49%) (continued)
Corporate bonds: 49.89% (31 May 2020: 53.64%)
205,000 Apple Inc 2.65% 08/02/2051 USD 191,888 0.03475,000 Apple Inc 2.8% 08/02/2061 USD 436,815 0.07
1,757,000 Apple Inc 2.95% 11/09/2049 USD 1,742,280 0.3070,000 Apple Inc 3.45% 09/02/2045 USD 75,148 0.0158,000 Apple Inc 4.375% 13/05/2045 USD 70,989 0.01
400,000 Arthur J Gallagher & Co 2.5% 20/05/2031 USD 399,343 0.07920,000 AT&T Inc 1.6% 19/05/2028 EUR 1,204,621 0.21550,000 AT&T Inc 2.05% 19/05/2032 EUR 739,381 0.13
1,500,000 AT&T Inc 2.25% 01/02/2032 USD 1,444,465 0.25340,000 AT&T Inc 2.35% 05/09/2029 EUR 469,580 0.08359,000 AT&T Inc Series REGS 2.55% 01/12/2033 USD 347,113 0.06410,000 AT&T Inc 2.6% 19/05/2038 EUR 562,862 0.10
2,265,000 AT&T Inc Series 144A 3.5% 15/09/2053 USD 2,152,294 0.37475,000 AT&T Inc Series 144A 3.55% 15/09/2055 USD 449,784 0.08201,000 AT&T Inc Series 144A 3.65% 15/09/2059 USD 192,473 0.03165,000 AT&T Inc 3.85% 01/06/2060 USD 165,396 0.03100,000 AT&T Inc 4.25% 01/06/2043 GBP 177,441 0.03380,000 AT&T Inc 4.375% 14/09/2029 GBP 642,956 0.11100,000 AT&T Inc 4.875% 01/06/2044 GBP 193,750 0.03150,000 AT&T Inc 5.2% 18/11/2033 GBP 279,541 0.05800,000 AT&T Inc 5.5% 15/03/2027 GBP 1,394,718 0.24100,000 AT&T Inc Series EMTN 7% 30/04/2040 GBP 232,526 0.04600,000 Aviation Capital Group LLC Series 144A 5.5% 15/12/2024 USD 676,736 0.12180,000 Baltimore Gas & Electric Co 3.2% 15/09/2049 USD 183,563 0.03205,000 Baltimore Gas and Electric Co 2.9% 15/06/2050 USD 195,797 0.03175,791 Banc of America Alternative Loan Trust Series 2005-10
Class 4A1 5.75% 25/11/2035USD 175,242 0.03
500,000 Bank of America Corp Series EMTN FRN 24/08/2028 EUR 613,791 0.11340,000 Bank of America Corp Series EMTN FRN 02/06/2029 GBP 484,365 0.08700,000 Bank of America Corp Series MTN FRN 23/07/2031 USD 669,482 0.11
2,590,000 Bank of America Corp Series MTN FRN 13/02/2031 USD 2,608,945 0.45690,000 Bank of America Corp Series N FRN 11/03/2032 USD 696,897 0.12375,000 Bank of America Corp Series MTN FRN 19/06/2041 USD 354,870 0.06
1,600,000 Bank of America Corp FRN 22/04/2032 USD 1,623,354 0.28980,000 Bank of America Corp Series MTN FRN 22/10/2030 USD 1,019,912 0.18700,000 Bank of America Corp FRN 20/12/2023 USD 728,509 0.12690,000 Bank of America Corp Series MTN FRN 23/07/2030 USD 734,343 0.13
1,560,000 Bank of America Corp Series GMTN 3.3% 11/01/2023 USD 1,636,392 0.28219,000 Bank of America Corp FRN 20/12/2028 USD 239,424 0.04590,000 Bank of America Corp Series MTN FRN 23/04/2027 USD 649,034 0.11200,000 Bank of America Corp Series GMTN FRN 21/07/2028 USD 220,520 0.04425,000 Bank of America Corp FRN 24/04/2028 USD 471,236 0.08450,000 Bank of America Corp Series MTN FRN 05/03/2029 USD 503,792 0.09160,000 Bank of America Corp Series MTN FRN 15/03/2050 USD 188,765 0.03
Schedule of investments as at 31 May 2021 (continued)
Transferable securities admitted to an official stock exchange listing or traded on a regulated market. The percentages in brackets show the equivalent sector holdings at 31 May 2020.
297

Barclays Multi-Manager Fund PLC Annual Report and Audited Financial Statements 2021
GlobalAccess Corporate Bond Fund
Holdings Financial assets at fair value through profit or loss Currency Fair value
USD % of net
assets
Bonds: 94.53% (31 May 2020: 96.06%) (continued)
United States: 54.32% (31 May 2020: 57.49%) (continued)
Corporate bonds: 49.89% (31 May 2020: 53.64%)
210,000 Bay Area Toll Authority 6.263% 01/04/2049 USD 333,691 0.06400,000 Bayer US Finance II LLC Series 144A 4.25% 15/12/2025 USD 448,751 0.08500,000 Bayer US Finance II LLC Series 144A 4.875% 25/06/2048 USD 599,049 0.10695,000 Becton Dickinson and Co 2.823% 20/05/2030 USD 720,031 0.12165,000 Becton Dickinson and Co 3.794% 20/05/2050 USD 177,065 0.03837,000 Berkshire Hathaway Energy Co 2.85% 15/05/2051 USD 770,895 0.1353,000 Berkshire Hathaway Energy Co 5.15% 15/11/2043 USD 67,803 0.01
340,000 Berkshire Hathaway Finance Corp 4.2% 15/08/2048 USD 404,529 0.07215,000 Bimbo Bakeries USA Inc Series REGS 4% 17/05/2051 USD 225,408 0.04300,000 Black Knight InfoServ LLC Series 144A 3.625%
01/09/2028USD 295,527 0.05
400,000 Blackstone Holdings Finance Co LLC Series REGS 1.5% 10/04/2029
EUR 524,408 0.09
300,000 Blackstone Secured Lending Fund Series 144A 2.75% 16/09/2026
USD 303,389 0.05
90,000 Bloomin' Brands Inc / OSI Restaurant Partners LLC Series 144A 5.125% 15/04/2029
USD 92,368 0.02
200,000 BlueScope Finance Americas LLC Series EMTN 4.625% 25/05/2023
USD 212,484 0.04
475,000 Booking Holdings Inc 0.1% 08/03/2025 EUR 582,067 0.10520,000 Booking Holdings Inc 0.5% 08/03/2028 EUR 637,322 0.11535,000 BorgWarner Inc 1% 19/05/2031 EUR 651,775 0.11
1,460,000 Boston Scientific Corp 0.625% 01/12/2027 EUR 1,803,357 0.31700,000 Boston Scientific Corp 4% 01/03/2029 USD 787,230 0.14345,000 BP Capital Markets America Inc 2.772% 10/11/2050 USD 309,360 0.05245,000 BP Capital Markets America Inc 2.939% 04/06/2051 USD 227,013 0.04570,000 BP Capital Markets America Inc 3.379% 08/02/2061 USD 553,112 0.09655,000 BP Capital Markets America Inc 3.79% 06/02/2024 USD 711,612 0.12525,000 Brighthouse Financial Inc 4.7% 22/06/2047 USD 567,429 0.10135,000 Bristol-Myers Squibb Co 2.35% 13/11/2040 USD 126,057 0.02340,000 Bristol-Myers Squibb Co 2.55% 13/11/2050 USD 309,942 0.05195,312 British Airways 2019-1 Class AA Pass Through Trust Series
144A 3.3% 15/06/2034USD 199,059 0.03
80,000 Brixmor Operating Partnership LP 2.25% 01/04/2028 USD 79,559 0.01700,000 Brixmor Operating Partnership LP 3.85% 01/02/2025 USD 762,298 0.13290,000 Brixmor Operating Partnership LP 4.05% 01/07/2030 USD 319,788 0.05
2,100,000 Broadcom Inc Series 144A 2.6% 15/02/2033 USD 2,001,816 0.3497,000 Broadcom Inc 3.15% 15/11/2025 USD 104,300 0.02
318,000 Broadcom Inc Series REGS 3.419% 15/04/2033 USD 324,655 0.061,035,000 Broadcom Inc Series 144A 3.5% 15/02/2041 USD 1,002,198 0.17
740,000 Broadcom Inc 4.15% 15/11/2030 USD 810,968 0.14870,000 Broadcom Inc 4.75% 15/04/2029 USD 996,006 0.17200,000 Caesars Entertainment Inc Series 144A 6.25% 01/07/2025 USD 211,034 0.04
Schedule of investments as at 31 May 2021 (continued)
Transferable securities admitted to an official stock exchange listing or traded on a regulated market. The percentages in brackets show the equivalent sector holdings at 31 May 2020.
298

Barclays Multi-Manager Fund PLC Annual Report and Audited Financial Statements 2021
GlobalAccess Corporate Bond Fund
Holdings Financial assets at fair value through profit or loss Currency Fair value
USD % of net
assets
Bonds: 94.53% (31 May 2020: 96.06%) (continued)
United States: 54.32% (31 May 2020: 57.49%) (continued)
Corporate bonds: 49.89% (31 May 2020: 53.64%)
200,000 Caesars Resort Collection LLC / CRC Finco Inc Series 144A 5.75% 01/07/2025
USD 210,004 0.04
700,000 Cantor Fitzgerald LP Series 144A 4.875% 01/05/2024 USD 772,081 0.1380,000 Carrier Global Corp 2.722% 15/02/2030 USD 82,218 0.01
140,000 Carrier Global Corp 3.377% 05/04/2040 USD 142,813 0.02805,000 Carrier Global Corp 3.577% 05/04/2050 USD 819,904 0.14200,000 Cboe Global Markets Inc 3.65% 12/01/2027 USD 224,280 0.04500,000 CCO Holdings LLC / CCO Holdings Capital Corp Series
144A 4.75% 01/03/2030USD 519,219 0.09
920,000 Charles Schwab Corp Series H FRN Perpetual USD 925,750 0.16900,000 Charter Communications Operating LLC 4.2% 15/03/2028 USD 1,007,469 0.17705,000 Charter Communications Operating LLC / Charter
Communications Operating Capital 3.5% 01/06/2041USD 673,689 0.12
200,000 Charter Communications Operating LLC / Charter Communications Operating Capital 3.75% 15/02/2028
USD 217,746 0.04
130,000 Charter Communications Operating LLC / Charter Communications Operating Capital 3.85% 01/04/2061
USD 119,592 0.02
1,310,000 Charter Communications Operating LLC / Charter Communications Operating Capital 3.9% 01/06/2052
USD 1,259,422 0.22
210,000 Charter Communications Operating LLC / Charter Communications Operating Capital 4.4% 01/12/2061
USD 212,772 0.04
300,000 Charter Communications Operating LLC / Charter Communications Operating Capital Series USD 4.5% 01/02/2024
USD 327,861 0.06
300,000 Charter Communications Operating LLC / Charter Communications Operating Capital 5.375% 01/05/2047
USD 350,727 0.06
145,000 Children's Hospital Corp Series 2020 2.585% 01/02/2050 USD 132,823 0.0264,349 CHL Mortgage Pass-Through Trust Series 2007-9 Class
A13 5.75% 25/07/2037USD 48,823 0.01
420,000 Cigna Corp 2.375% 15/03/2031 USD 419,063 0.07135,000 Cigna Corp 3.4% 15/03/2051 USD 135,248 0.02
1 Citigroup Commercial Mortgage Trust Series 2014-GC23 Class XA FRN 10/07/2047
USD – –
800,000 Citigroup Inc FRN 03/06/2031 USD 810,051 0.14325,000 Citigroup Inc FRN 29/01/2031 USD 331,336 0.06250,000 Citigroup Inc 3.2% 21/10/2026 USD 271,837 0.05600,000 Citigroup Inc 3.4% 01/05/2026 USD 659,738 0.11550,000 Citigroup Inc 3.7% 12/01/2026 USD 610,719 0.10350,000 Citigroup Inc 4.4% 10/06/2025 USD 392,840 0.07700,000 Cleco Power LLC 6% 01/12/2040 USD 912,034 0.16600,000 Cleveland Electric Illuminating Co Series 144A 3.5%
01/04/2028USD 630,548 0.11
310,000 CME Group Inc 4.15% 15/06/2048 USD 383,646 0.07
Schedule of investments as at 31 May 2021 (continued)
Transferable securities admitted to an official stock exchange listing or traded on a regulated market. The percentages in brackets show the equivalent sector holdings at 31 May 2020.
299

Barclays Multi-Manager Fund PLC Annual Report and Audited Financial Statements 2021
GlobalAccess Corporate Bond Fund
Holdings Financial assets at fair value through profit or loss Currency Fair value
USD % of net
assets
Bonds: 94.53% (31 May 2020: 96.06%) (continued)
United States: 54.32% (31 May 2020: 57.49%) (continued)
Corporate bonds: 49.89% (31 May 2020: 53.64%)
600,000 CNA Financial Corp 2.05% 15/08/2030 USD 581,765 0.10380,000 Comcast Corp 1.5% 20/02/2029 GBP 539,652 0.09
1,032,000 Comcast Corp 1.95% 15/01/2031 USD 1,001,473 0.17163,000 Comcast Corp 2.65% 01/02/2030 USD 168,960 0.03125,000 Comcast Corp 3.25% 01/11/2039 USD 129,089 0.02140,000 Comcast Corp 3.3% 01/04/2027 USD 154,377 0.03265,000 Comcast Corp 3.75% 01/04/2040 USD 291,272 0.05330,000 Comcast Corp 4% 01/03/2048 USD 372,034 0.06
40,000 Comcast Corp 4.049% 01/11/2052 USD 45,680 0.01419,000 Comcast Corp 4.5% 15/01/2043 USD 503,523 0.09
65,000 Comcast Corp 4.75% 01/03/2044 USD 80,864 0.01510,000 CommonSpirit Health 2.782% 01/10/2030 USD 521,727 0.09835,000 CommonSpirit Health 3.91% 01/10/2050 USD 879,370 0.15300,000 Commonwealth Edison Co 3% 01/03/2050 USD 297,285 0.05195,000 Conagra Brands Inc 1.375% 01/11/2027 USD 189,885 0.03485,000 Consumers Energy Co 2.5% 01/05/2060 USD 416,799 0.07
1 Continental Airlines 2007-1 Class A Pass Through Trust Series 071A 5.983% 19/04/2022
USD – –
200,000 CoStar Group Inc Series 144A 2.8% 15/07/2030 USD 199,546 0.0341,358 Countrywide Asset-Backed Certificates Series 2005-AB4
Class 2A4 FRN 25/03/2036USD 39,317 0.01
225,000 Cox Communications Inc Series 144A 1.8% 01/10/2030 USD 211,617 0.04285,000 Cox Communications Inc Series 144A 2.6% 15/06/2031 USD 284,220 0.05325,000 Cox Communications Inc Series 144A 2.95% 01/10/2050 USD 291,881 0.05705,000 Cox Communications Inc Series 144A 3.5% 15/08/2027 USD 771,647 0.13250,000 Cox Communications Inc Series 144A 4.6% 15/08/2047 USD 292,218 0.05225,000 Cox Communications Inc Series 144A 4.7% 15/12/2042 USD 266,519 0.05246,000 Cox Communications Inc Series 144A 4.8% 01/02/2035 USD 291,781 0.05
2,010,000 Crown Castle International Corp 2.25% 15/01/2031 USD 1,944,888 0.33690,000 Crown Castle International Corp 2.9% 01/04/2041 USD 639,082 0.11200,000 Crown Castle International Corp 3.1% 15/11/2029 USD 209,327 0.04
1,150,000 CVS Health Corp 1.875% 28/02/2031 USD 1,096,535 0.191,100,000 CVS Health Corp 2.7% 21/08/2040 USD 1,028,101 0.18
105,000 CVS Health Corp 3% 15/08/2026 USD 114,056 0.02697,000 CVS Health Corp 4.3% 25/03/2028 USD 799,255 0.14775,000 CVS Health Corp 4.78% 25/03/2038 USD 924,181 0.16265,000 CVS Health Corp 5.05% 25/03/2048 USD 327,681 0.06289,647 CVS Pass-Through Trust Series 144A 5.926% 10/01/2034 USD 345,668 0.06500,000 CyrusOne LP / CyrusOne Finance Corp 1.45% 22/01/2027 EUR 622,738 0.11400,000 DAE Funding LLC Series 144A 1.625% 15/02/2024 USD 397,500 0.07700,000 DAE Funding LLC Series 144A 2.625% 20/03/2025 USD 709,030 0.12495,000 Danaher Corp 1.7% 30/03/2024 EUR 635,522 0.11280,000 Danaher Corp 2.1% 30/09/2026 EUR 376,631 0.06100,000 DaVita Inc Series 144A 4.625% 01/06/2030 USD 102,119 0.02
Schedule of investments as at 31 May 2021 (continued)
Transferable securities admitted to an official stock exchange listing or traded on a regulated market. The percentages in brackets show the equivalent sector holdings at 31 May 2020.
300

Barclays Multi-Manager Fund PLC Annual Report and Audited Financial Statements 2021
GlobalAccess Corporate Bond Fund
Holdings Financial assets at fair value through profit or loss Currency Fair value
USD % of net
assets
Bonds: 94.53% (31 May 2020: 96.06%) (continued)
United States: 54.32% (31 May 2020: 57.49%) (continued)
Corporate bonds: 49.89% (31 May 2020: 53.64%)
1,300,000 Dell International LLC / EMC Corp Series 144A 5.85% 15/07/2025
USD 1,524,073 0.26
200,000 Dell International LLC / EMC Corp Series 144A 6.02% 15/06/2026
USD 238,540 0.04
700,000 Delta Air Lines Inc 2.9% 28/10/2024 USD 710,085 0.12400,000 Delta Air Lines Inc 3.625% 15/03/2022 USD 406,665 0.07200,000 Delta Air Lines Inc 3.8% 19/04/2023 USD 207,043 0.04600,000 Delta Air Lines Inc Series 144A 7% 01/05/2025 USD 698,114 0.12
85,000 Devon Energy Corp 5% 15/06/2045 USD 96,652 0.0290,000 Devon Energy Corp 5.6% 15/07/2041 USD 108,670 0.02
185,000 Discovery Communications LLC 3.625% 15/05/2030 USD 197,893 0.03235,000 Discovery Communications LLC 5% 20/09/2037 USD 277,332 0.05205,000 Discovery Communications LLC 5.2% 20/09/2047 USD 241,318 0.04
1,450,000 Dominion Energy Inc Series B 2.75% 15/01/2022 USD 1,469,808 0.25705,000 Dominion Energy Inc Series C 3.375% 01/04/2030 USD 759,951 0.13500,000 DTE Electric Co 3.95% 01/03/2049 USD 581,214 0.10500,000 Duke Energy Carolinas LLC 3.2% 15/08/2049 USD 505,718 0.09300,000 Duke Energy Corp 3.95% 15/08/2047 USD 320,299 0.05
1,500,000 E*TRADE Financial Corp 3.8% 24/08/2027 USD 1,670,637 0.29175,000 East Ohio Gas Co Series 144A 2% 15/06/2030 USD 170,436 0.03360,000 East Ohio Gas Co Series 144A 3% 15/06/2050 USD 341,311 0.06330,000 Electronic Arts Inc 2.95% 15/02/2051 USD 307,751 0.05200,000 Enable Midstream Partners LP 4.4% 15/03/2027 USD 220,989 0.04500,000 Energy Transfer Operating LP 5.15% 15/03/2045 USD 549,720 0.09200,000 Energy Transfer Operating LP 6.5% 01/02/2042 USD 250,597 0.04100,000 Entergy Corp 2.8% 15/06/2030 USD 102,399 0.02100,000 Entergy Gulf States Louisiana LLC 5.59% 01/10/2024 USD 116,113 0.02300,000 Entergy Louisiana LLC 2.35% 15/06/2032 USD 299,497 0.05100,000 Entergy Texas Inc 1.75% 15/03/2031 USD 94,029 0.02575,000 Enterprise Products Operating LLC 2.8% 31/01/2030 USD 598,766 0.10600,000 Enterprise Products Operating LLC 4.2% 31/01/2050 USD 654,349 0.11455,000 Enterprise Products Operating LLC 4.45% 15/02/2043 USD 516,521 0.09400,000 Enterprise Products Operating LLC 4.95% 15/10/2054 USD 476,779 0.08200,000 EPR Properties 4.5% 01/04/2025 USD 211,065 0.04485,000 Equifax Inc 3.1% 15/05/2030 USD 512,675 0.09690,000 Equinix Inc 1.55% 15/03/2028 USD 672,501 0.12185,000 Equinix Inc 1.8% 15/07/2027 USD 186,339 0.03400,000 Equinix Inc 2.15% 15/07/2030 USD 388,512 0.07605,000 Equinix Inc 2.5% 15/05/2031 USD 603,112 0.10200,000 Equinix Inc 3% 15/07/2050 USD 183,409 0.03520,000 Equinix Inc 3.2% 18/11/2029 USD 550,090 0.09190,000 Equinix Inc 3.4% 15/02/2052 USD 186,322 0.03400,000 Essential Utilities Inc 2.4% 01/05/2031 USD 398,318 0.07900,000 Essex Portfolio LP 3.5% 01/04/2025 USD 978,605 0.17
Schedule of investments as at 31 May 2021 (continued)
Transferable securities admitted to an official stock exchange listing or traded on a regulated market. The percentages in brackets show the equivalent sector holdings at 31 May 2020.
301

Barclays Multi-Manager Fund PLC Annual Report and Audited Financial Statements 2021
GlobalAccess Corporate Bond Fund
Holdings Financial assets at fair value through profit or loss Currency Fair value
USD % of net
assets
Bonds: 94.53% (31 May 2020: 96.06%) (continued)
United States: 54.32% (31 May 2020: 57.49%) (continued)
Corporate bonds: 49.89% (31 May 2020: 53.64%)
430,000 Exelon Corp 4.45% 15/04/2046 USD 503,757 0.09240,000 Exelon Corp 5.1% 15/06/2045 USD 303,209 0.05350,000 Expedia Group Inc Series 144A 2.95% 15/03/2031 USD 349,569 0.06527,000 Expedia Group Inc Series 144a 6.25% 01/05/2025 USD 614,616 0.11210,000 FedEx Corp 4.05% 15/02/2048 USD 231,677 0.04
45,000 FedEx Corp 4.55% 01/04/2046 USD 52,701 0.01245,000 FedEx Corp 4.75% 15/11/2045 USD 295,922 0.05110,000 FedEx Corp 4.95% 17/10/2048 USD 137,497 0.02145,000 FedEx Corp 5.1% 15/01/2044 USD 181,117 0.03250,000 FedEx Corp 5.25% 15/05/2050 USD 329,281 0.06360,000 Fidelity National Information Services Inc 2.95%
21/05/2039EUR 529,216 0.09
25,000 Fidelity National Information Services Inc 4.5% 15/08/2046
USD 29,687 0.01
160,000 Fidelity National Information Services Inc Series 30Y 4.75% 15/05/2048
USD 196,106 0.03
425,000 First American Financial Corp 4.3% 01/02/2023 USD 447,882 0.08610,000 Fiserv Inc 3.2% 01/07/2026 USD 663,704 0.11445,000 Fiserv Inc 4.4% 01/07/2049 USD 514,980 0.09100,000 Ford Motor Credit Co LLC Series EMTN 1.744%
19/07/2024EUR 123,093 0.02
300,000 Ford Motor Credit Co LLC Series EMTN 3.021% 06/03/2024
EUR 382,315 0.07
300,000 Ford Motor Credit Co LLC 3.087% 09/01/2023 USD 306,001 0.051,365,000 Ford Motor Credit Co LLC 3.375% 13/11/2025 USD 1,399,200 0.24
460,000 Ford Motor Credit Co LLC 3.813% 12/10/2021 USD 465,523 0.08400,000 Ford Motor Credit Co LLC 5.875% 02/08/2021 USD 402,500 0.07200,000 Ford Motor Credit Co LLC Series EMTN FRN 01/12/2021 EUR 244,373 0.04900,000 Ford Motor Credit Co LLC FRN 03/08/2022 USD 896,504 0.15875,000 Ford Motor Credit Co LLC FRN 15/02/2023 USD 869,890 0.15
1,100,000 Fortune Brands Home & Security Inc 4% 15/06/2025 USD 1,216,803 0.21700,000 Fresenius Medical Care US Finance III Inc Series 144A
1.875% 01/12/2026USD 704,014 0.12
540,000 Frontier Communications Corp Series 144A 5% 01/05/2028
USD 554,175 0.10
200,000 GA Global Funding Trust Series 144A 1.625% 15/01/2026 USD 202,642 0.03865,000 GE Capital Funding LLC 4.4% 15/05/2030 USD 995,231 0.17215,000 General Electric Co 4.25% 01/05/2040 USD 243,415 0.04665,000 General Electric Co 4.35% 01/05/2050 USD 758,933 0.13360,000 General Motors Co 5.2% 01/04/2045 USD 429,452 0.07165,000 General Motors Co 5.4% 01/04/2048 USD 202,236 0.03675,000 General Motors Co 6.125% 01/10/2025 USD 802,904 0.14600,000 General Motors Financial Co Inc 0.6% 20/05/2027 EUR 728,789 0.13
Schedule of investments as at 31 May 2021 (continued)
Transferable securities admitted to an official stock exchange listing or traded on a regulated market. The percentages in brackets show the equivalent sector holdings at 31 May 2020.
302

Barclays Multi-Manager Fund PLC Annual Report and Audited Financial Statements 2021
GlobalAccess Corporate Bond Fund
Holdings Financial assets at fair value through profit or loss Currency Fair value
USD % of net
assets
Bonds: 94.53% (31 May 2020: 96.06%) (continued)
United States: 54.32% (31 May 2020: 57.49%) (continued)
Corporate bonds: 49.89% (31 May 2020: 53.64%)
945,000 General Motors Financial Co Inc 2.35% 08/01/2031 USD 916,249 0.16120,000 Georgia Power Co Series 10-C 4.75% 01/09/2040 USD 143,799 0.02380,000 Gilead Sciences Inc 0.75% 29/09/2023 USD 380,464 0.07385,000 Gilead Sciences Inc 1.65% 01/10/2030 USD 365,066 0.06475,000 Gilead Sciences Inc 2.6% 01/10/2040 USD 444,840 0.08180,000 Gilead Sciences Inc 2.8% 01/10/2050 USD 163,193 0.03330,000 Global Payments Inc 3.2% 15/08/2029 USD 348,014 0.06168,000 GLP Capital LP 5.3% 15/01/2029 USD 194,313 0.03161,000 GLP Capital LP / GLP Financing II Inc 4% 15/01/2030 USD 171,096 0.03280,000 GLP Capital LP / GLP Financing II Inc 4% 15/01/2031 USD 297,347 0.05200,000 GLP Capital LP / GLP Financing II Inc 5.75% 01/06/2028 USD 235,429 0.04
2,000,000 Goldman Sachs Group Inc Series EMTN 1% 18/03/2033 EUR 2,424,006 0.421,520,000 Goldman Sachs Group Inc Series EMTN 1.25%
01/05/2025EUR 1,921,366 0.33
1,070,000 Goldman Sachs Group Inc Series EMTN 1.5% 07/12/2027 GBP 1,521,057 0.26650,000 Goldman Sachs Group Inc FRN 27/01/2032 USD 621,063 0.11
2,000,000 Goldman Sachs Group Inc FRN 31/10/2022 USD 2,021,046 0.351,210,000 Goldman Sachs Group Inc FRN 22/04/2042 USD 1,224,742 0.21
800,000 Goldman Sachs Group Inc 3.75% 22/05/2025 USD 880,906 0.151,365,000 Goldman Sachs Group Inc 3.8% 15/03/2030 USD 1,521,971 0.26
90,000 Goldman Sachs Group Inc FRN 23/04/2029 USD 99,846 0.02300,000 Goldman Sachs Group Inc FRN 01/05/2029 USD 340,714 0.06105,000 Goldman Sachs Group Inc 5.15% 22/05/2045 USD 137,366 0.02300,000 Great-West Lifeco Finance 2018 LP Series 144A 4.047%
17/05/2028USD 339,128 0.06
100,000 Healthpeak Properties Inc Reits 2.875% 15/01/2031 USD 103,196 0.02650,000 Hess Corp 7.3% 15/08/2031 USD 865,600 0.15425,000 Home Depot Inc 2.375% 15/03/2051 USD 374,586 0.06315,000 Home Depot Inc 3.125% 15/12/2049 USD 318,731 0.05190,000 Home Depot Inc 3.3% 15/04/2040 USD 200,314 0.03
60,000 Home Depot Inc 4.5% 06/12/2048 USD 74,885 0.01100,000 Host Hotels & Resorts LP 3.875% 01/04/2024 USD 106,914 0.02550,000 Host Hotels & Resorts LP Series E 4% 15/06/2025 USD 595,157 0.10345,000 Huntsman International LLC 2.95% 15/06/2031 USD 347,261 0.06100,000 Huntsman International LLC 4.5% 01/05/2029 USD 113,023 0.02340,000 Hyatt Hotels Corp 5.75% 23/04/2030 USD 404,811 0.07300,000 Hyatt Hotels Corp FRN 01/09/2022 USD 301,706 0.05490,000 Intel Corp 4.6% 25/03/2040 USD 596,489 0.10185,000 Intercontinental Exchange Inc 1.85% 15/09/2032 USD 173,676 0.03100,000 Intercontinental Exchange Inc 2.1% 15/06/2030 USD 98,553 0.02
1,610,000 Intercontinental Exchange Inc 2.35% 15/09/2022 USD 1,653,409 0.28110,000 Intercontinental Exchange Inc 2.65% 15/09/2040 USD 102,792 0.02340,000 Intercontinental Exchange Inc 3% 15/06/2050 USD 322,171 0.06250,000 Intercontinental Exchange Inc 3% 15/09/2060 USD 230,074 0.04
Schedule of investments as at 31 May 2021 (continued)
Transferable securities admitted to an official stock exchange listing or traded on a regulated market. The percentages in brackets show the equivalent sector holdings at 31 May 2020.
303

Barclays Multi-Manager Fund PLC Annual Report and Audited Financial Statements 2021
GlobalAccess Corporate Bond Fund
Holdings Financial assets at fair value through profit or loss Currency Fair value
USD % of net
assets
Bonds: 94.53% (31 May 2020: 96.06%) (continued)
United States: 54.32% (31 May 2020: 57.49%) (continued)
Corporate bonds: 49.89% (31 May 2020: 53.64%)
225,000 International Business Machines Corp 2.85% 15/05/2040 USD 218,318 0.04300,000 International Business Machines Corp 2.95% 15/05/2050 USD 284,528 0.05300,000 International Flavors & Fragrances Inc Series 144A 1.23%
01/10/2025USD 299,304 0.05
300,000 IPALCO Enterprises Inc 3.7% 01/09/2024 USD 324,466 0.06600,000 Jersey Central Power & Light Co Series 144A 4.3%
15/01/2026USD 666,384 0.11
773,825 JetBlue Airways Corp Series 1A 4% 15/11/2032 USD 846,063 0.151 JPMBB Commercial Mortgage Securities Trust Series 2014-
C23 Class XA FRN 15/09/2047USD – –
740,000 JPMorgan Chase & Co FRN 28/04/2026 GBP 1,054,001 0.18100,000 JPMorgan Chase & Co Series EMTN FRN 25/07/2031 EUR 125,140 0.02395,000 JPMorgan Chase & Co Series EMTN FRN 18/05/2028 EUR 517,738 0.09395,000 JPMorgan Chase & Co FRN 22/04/2032 USD 398,264 0.07850,000 JPMorgan Chase & Co FRN 15/10/2030 USD 880,843 0.15550,000 JPMorgan Chase & Co FRN 13/05/2031 USD 571,312 0.10
1,100,000 JPMorgan Chase & Co FRN 22/04/2042 USD 1,107,419 0.19250,000 JPMorgan Chase & Co FRN 22/04/2052 USD 253,405 0.04
1,010,000 JPMorgan Chase & Co FRN 06/05/2030 USD 1,119,944 0.191,385,000 JPMorgan Chase & Co FRN 23/04/2029 USD 1,559,754 0.27
700,000 JPMorgan Chase & Co FRN 23/07/2024 USD 709,017 0.12400,000 KB Home 4% 15/06/2031 USD 401,000 0.07300,000 Kilroy Realty LP 2.5% 15/11/2032 USD 288,915 0.05285,000 Kinder Morgan Energy Partners LP 4.3% 01/05/2024 USD 312,404 0.05
1,100,000 Kinder Morgan Inc 5.55% 01/06/2045 USD 1,359,808 0.231,200,000 KKR Group Finance Co VII LLC Series REGS 3.625%
25/02/2050USD 1,230,828 0.21
375,000 Kohl's Corp 3.375% 01/05/2031 USD 385,633 0.07185,000 Kohl's Corp 5.55% 17/07/2045 USD 217,540 0.04250,000 Kraft Heinz Foods Co 4.125% 01/07/2027 GBP 396,980 0.07675,000 Leidos Inc Series 144A 2.3% 15/02/2031 USD 646,866 0.11365,000 Leidos Inc Series 144A 4.375% 15/05/2030 USD 410,457 0.07500,000 Lennar Corp 4.5% 30/04/2024 USD 548,380 0.09720,000 Lennar Corp 5.875% 15/11/2024 USD 824,098 0.14200,000 Level 3 Financing Inc Series 144A 3.625% 15/01/2029 USD 192,758 0.03300,000 Level 3 Financing Inc Series 144A 3.875% 15/11/2029 USD 319,099 0.05300,000 Liberty Mutual Group Inc Series 144a FRN 23/05/2059 EUR 378,481 0.06540,000 Lincoln National Corp 3.4% 15/01/2031 USD 583,146 0.10285,000 Magic Mergeco Inc Series 144A 5.25% 01/05/2028 USD 288,920 0.05900,000 Marriott International Inc/MD Series GG 3.5% 15/10/2032 USD 940,135 0.16325,000 Marsh & McLennan Cos Inc 4.375% 15/03/2029 USD 378,965 0.06410,000 Marsh & McLennan Cos Inc 4.9% 15/03/2049 USD 536,905 0.09
1,200,000 Marvell Technology Inc Series 144A 1.65% 15/04/2026 USD 1,200,291 0.21
Schedule of investments as at 31 May 2021 (continued)
Transferable securities admitted to an official stock exchange listing or traded on a regulated market. The percentages in brackets show the equivalent sector holdings at 31 May 2020.
304

Barclays Multi-Manager Fund PLC Annual Report and Audited Financial Statements 2021
GlobalAccess Corporate Bond Fund
Holdings Financial assets at fair value through profit or loss Currency Fair value
USD % of net
assets
Bonds: 94.53% (31 May 2020: 96.06%) (continued)
United States: 54.32% (31 May 2020: 57.49%) (continued)
Corporate bonds: 49.89% (31 May 2020: 53.64%)
300,000 Marvell Technology Inc Series 144A 2.45% 15/04/2028 USD 302,157 0.05580,000 Microchip Technology Inc Series 144A 0.972%
15/02/2024USD 581,327 0.10
925,000 Microchip Technology Inc Series 144A 2.67% 01/09/2023 USD 964,622 0.17695,000 Micron Technology Inc 4.185% 15/02/2027 USD 785,562 0.13400,000 Micron Technology Inc 4.64% 06/02/2024 USD 440,744 0.08150,000 Microsoft Corp 2.125% 15/11/2022 USD 154,212 0.03415,000 Microsoft Corp 2.525% 01/06/2050 USD 387,277 0.07
1,006,000 Microsoft Corp 2.675% 01/06/2060 USD 938,298 0.16392,000 Microsoft Corp 3.041% 17/03/2062 USD 395,360 0.07300,000 Midwest Connector Capital Co LLC Series 144A 3.625%
01/04/2022USD 304,934 0.05
300,000 Midwest Connector Capital Co LLC Series 144A 3.9% 01/04/2024
USD 313,116 0.05
100,000 Mileage Plus Holdings LLC / Mileage Plus Intellectual Property Assets Ltd Series 144A 6.5% 20/06/2027
USD 109,905 0.02
1,365,000 Mondelez International Inc 0.25% 17/03/2028 EUR 1,650,493 0.281,350,000 Mondelez International Inc 0.625% 01/07/2022 USD 1,355,594 0.23
455,000 Mondelez International Inc 1.375% 17/03/2041 EUR 532,998 0.091,200,000 Morgan Stanley Series EMTN FRN 26/07/2024 EUR 1,490,392 0.261,020,000 Morgan Stanley Series MTN FRN 13/02/2032 USD 962,296 0.172,370,000 Morgan Stanley Series GMTN FRN 22/01/2031 USD 2,447,717 0.42
360,000 Morgan Stanley Series MTN FRN 25/01/2052 USD 337,487 0.061,645,000 Morgan Stanley Series GMTN 3.125% 23/01/2023 USD 1,721,418 0.30
15,000 Morgan Stanley FRN 22/04/2042 USD 15,284 –2,225,000 Morgan Stanley Series GMTN FRN 23/01/2030 USD 2,585,644 0.44
595,000 Motorola Solutions Inc 2.75% 24/05/2031 USD 594,292 0.10370,000 MPLX LP 1.75% 01/03/2026 USD 375,118 0.06225,000 MPLX LP 2.65% 15/08/2030 USD 223,845 0.04
30,000 MPLX LP 4% 15/03/2028 USD 33,292 0.01240,000 MPLX LP 4.25% 01/12/2027 USD 271,938 0.05100,000 MPLX LP 4.5% 15/04/2038 USD 111,044 0.02625,000 MPLX LP FRN 09/09/2022 USD 625,389 0.11200,000 MPT Operating Partnership LP / MPT Finance Corp
4.625% 01/08/2029USD 212,451 0.04
240,000 MUFG Americas Holdings Corp 3% 10/02/2025 USD 257,274 0.04425,000 Nasdaq Inc 3.25% 28/04/2050 USD 406,778 0.07200,000 National Fuel Gas Co 2.95% 01/03/2031 USD 198,963 0.03100,000 National Health Investors Inc 3% 01/02/2031 USD 95,240 0.02260,000 National Retail Properties Inc 3.5% 15/04/2051 USD 257,892 0.04295,000 Nationstar Mortgage Holdings Inc Series 144A 5.125%
15/12/2030USD 285,053 0.05
200,000 Netflix Inc Series REGs 3.625% 15/06/2030 EUR 289,792 0.05
Schedule of investments as at 31 May 2021 (continued)
Transferable securities admitted to an official stock exchange listing or traded on a regulated market. The percentages in brackets show the equivalent sector holdings at 31 May 2020.
305

Barclays Multi-Manager Fund PLC Annual Report and Audited Financial Statements 2021
GlobalAccess Corporate Bond Fund
Holdings Financial assets at fair value through profit or loss Currency Fair value
USD % of net
assets
Bonds: 94.53% (31 May 2020: 96.06%) (continued)
United States: 54.32% (31 May 2020: 57.49%) (continued)
Corporate bonds: 49.89% (31 May 2020: 53.64%)
200,000 Netflix Inc Series REGs 3.875% 15/11/2029 EUR 293,133 0.05100,000 Netflix Inc 4.625% 15/05/2029 EUR 152,621 0.03
1,300,000 Nevada Power Co Series DD 2.4% 01/05/2030 USD 1,318,226 0.23535,000 New England Power Co Series 144A 2.807% 06/10/2050 USD 480,344 0.08600,000 New York Life Insurance Co Series 144A 4.45%
15/05/2069USD 726,945 0.12
200,000 Newmark Group Inc 6.125% 15/11/2023 USD 220,885 0.041,500,000 NextEra Energy Capital Holdings Inc 1.95% 01/09/2022 USD 1,531,345 0.26
100,000 NextEra Energy Capital Holdings Inc 2.25% 01/06/2030 USD 99,684 0.02245,000 NextEra Energy Capital Holdings Inc 2.75% 01/11/2029 USD 255,184 0.04500,000 NextEra Energy Capital Holdings Inc FRN 01/05/2079 USD 577,628 0.10700,000 NiSource Inc 1.7% 15/02/2031 USD 653,876 0.11300,000 Nissan Motor Acceptance Corp Series 144A 1.9%
14/09/2021USD 301,131 0.05
900,000 Nissan Motor Acceptance Corp Series 144A FRN 08/03/2024
USD 899,726 0.15
350,000 Northern States Power Co/MN 2.9% 01/03/2050 USD 341,702 0.06516,000 Northwestern Mutual Life Insurance Co Series 144A 3.45%
30/03/2051USD 529,297 0.09
95,000 NVIDIA Corp 3.5% 01/04/2050 USD 102,008 0.02100,000 NVR Inc 3% 15/05/2030 USD 104,504 0.02
42,000 Omega Healthcare Investors Inc 4.375% 01/08/2023 USD 44,955 0.01600,000 ONEOK Inc 4.35% 15/03/2029 USD 670,332 0.12100,000 ONEOK Inc 4.55% 15/07/2028 USD 113,001 0.02480,000 Oracle Corp 2.875% 25/03/2031 USD 492,118 0.08260,000 Oracle Corp 2.95% 01/04/2030 USD 270,916 0.05950,000 Oracle Corp 3.6% 01/04/2040 USD 969,013 0.17150,000 Oracle Corp 3.65% 25/03/2041 USD 153,152 0.03105,000 Oracle Corp 3.95% 25/03/2051 USD 109,172 0.02
55,000 Oracle Corp 4.1% 25/03/2061 USD 57,723 0.01850,000 Organon Finance 1 LLC Series 144a 4.125% 30/04/2028 USD 859,562 0.15158,801 Ownit Mortgage Loan Trust Series '5 M1' Series 2005-5
Class M1 FRN 25/10/2036USD 160,763 0.03
100,000 Pacific Gas and Electric Co 1.75% 16/06/2022 USD 100,007 0.02300,000 Pacific Gas and Electric Co 2.1% 01/08/2027 USD 289,510 0.05200,000 Pacific Gas and Electric Co 2.95% 01/03/2026 USD 205,115 0.04600,000 Pacific Gas and Electric Co 3.15% 01/01/2026 USD 621,848 0.11100,000 Pacific Gas and Electric Co 3.45% 01/07/2025 USD 104,915 0.02400,000 Pacific Gas and Electric Co 3.75% 15/02/2024 USD 421,166 0.07200,000 Pacific Gas and Electric Co 3.95% 01/12/2047 USD 178,845 0.03200,000 Pacific Gas and Electric Co 4.6% 15/06/2043 USD 196,199 0.03450,000 Pacific LifeCorp Series 144A 3.35% 15/09/2050 USD 451,592 0.08255,000 PECO Energy Co 2.8% 15/06/2050 USD 244,292 0.04
Schedule of investments as at 31 May 2021 (continued)
Transferable securities admitted to an official stock exchange listing or traded on a regulated market. The percentages in brackets show the equivalent sector holdings at 31 May 2020.
306

Barclays Multi-Manager Fund PLC Annual Report and Audited Financial Statements 2021
GlobalAccess Corporate Bond Fund
Holdings Financial assets at fair value through profit or loss Currency Fair value
USD % of net
assets
Bonds: 94.53% (31 May 2020: 96.06%) (continued)
United States: 54.32% (31 May 2020: 57.49%) (continued)
Corporate bonds: 49.89% (31 May 2020: 53.64%)
100,000 Pennsylvania Electric Co Series 144A 4.15% 15/04/2025 USD 107,004 0.02900,000 Penske Truck Leasing Co LP Series 144A 3.95%
10/03/2025USD 987,767 0.17
155,000 Pfizer Inc 2.55% 28/05/2040 USD 150,494 0.03715,000 Pfizer Inc 2.7% 28/05/2050 USD 677,062 0.12325,000 Pfizer Inc 4% 15/03/2049 USD 379,741 0.07200,000 Physicians Realty LP 3.95% 15/01/2028 USD 216,245 0.04565,000 PNC Bank NA Series BKNT 2.7% 22/10/2029 USD 585,954 0.10425,000 Post Holdings Inc Series 144A 4.5% 15/09/2031 USD 420,805 0.07
1,160,000 Principal Financial Group Inc 2.125% 15/06/2030 USD 1,142,030 0.20300,000 Prologis LP 2.25% 15/04/2030 USD 301,355 0.05700,000 Protective Life Global Funding Series 144A 1.737%
21/09/2030USD 663,688 0.11
25,000 Public Service Co of Colorado 3.8% 15/06/2047 USD 27,945 –59,000 Public Service Co of Colorado 4.05% 15/09/2049 USD 68,913 0.01
345,000 Public Service Electric and Gas Co Series MTN 3.2% 01/08/2049
USD 356,970 0.06
435,000 Quest Diagnostics Inc 2.8% 30/06/2031 USD 448,550 0.08300,000 Realty Income Corp Series EMTN 1.625% 15/12/2030 GBP 419,600 0.07305,000 Realty Income Corp 1.8% 15/03/2033 USD 282,851 0.05100,000 Regency Centers LP 3.6% 01/02/2027 USD 110,522 0.02292,905 Rio Oil Finance Trust Series REGS 9.75% 06/01/2027 USD 345,262 0.06218,717 Rio Oil Finance Trust Series Series 144A 9.25%
06/07/2024USD 243,325 0.04
300,000 Rockies Express Pipeline LLC Series 144A 3.6% 15/05/2025
USD 302,313 0.05
2,000,000 Sabine Pass Liquefaction LLC 5.75% 15/05/2024 USD 2,259,327 0.39400,000 Sabine Pass Liquefaction LLC 5.875% 30/06/2026 USD 474,808 0.08200,000 Sabine Pass Liquefaction LLC 6.25% 15/03/2022 USD 206,103 0.04300,000 San Diego Gas & Electric Co Series VVV 1.7% 01/10/2030 USD 286,702 0.05100,000 SBA Communications Corp 3.875% 15/02/2027 USD 102,380 0.02200,000 Sempra Energy 3.4% 01/02/2028 USD 217,611 0.04
1,080,000 ServiceNow Inc 1.4% 01/09/2030 USD 991,948 0.17185,000 Skyworks Solutions Inc 0.9% 01/06/2023 USD 185,687 0.03205,000 Skyworks Solutions Inc 1.8% 01/06/2026 USD 206,614 0.0450,000 SLM Corp 5.125% 05/04/2022 USD 51,161 0.01
605,000 Sodexo Inc Series 144A 1.634% 16/04/2026 USD 608,528 0.10300,000 Southern California Edison Co 2.85% 01/08/2029 USD 309,298 0.05400,000 Southern California Edison Co Series 20A 2.95%
01/02/2051USD 354,279 0.06
300,000 Southern California Edison Co Series C 3.6% 01/02/2045 USD 294,995 0.05100,000 Southern California Edison Co 3.65% 01/02/2050 USD 98,312 0.02300,000 Southern California Edison Co Series E 3.7% 01/08/2025 USD 329,031 0.06
Schedule of investments as at 31 May 2021 (continued)
Transferable securities admitted to an official stock exchange listing or traded on a regulated market. The percentages in brackets show the equivalent sector holdings at 31 May 2020.
307

Barclays Multi-Manager Fund PLC Annual Report and Audited Financial Statements 2021
GlobalAccess Corporate Bond Fund
Holdings Financial assets at fair value through profit or loss Currency Fair value
USD % of net
assets
Bonds: 94.53% (31 May 2020: 96.06%) (continued)
United States: 54.32% (31 May 2020: 57.49%) (continued)
Corporate bonds: 49.89% (31 May 2020: 53.64%)
200,000 Southern California Gas Co Series XX 2.55% 01/02/2030 USD 204,845 0.04325,000 Southern Co Gas Capital Corp 3.95% 01/10/2046 USD 348,698 0.06
1,600,000 Spirit AeroSystems Inc 4.6% 15/06/2028 USD 1,550,472 0.2768,395 Spirit Airlines Pass Through Trust 2015-1A Series A 4.1%
01/10/2029USD 71,049 0.01
503,450 Spirit Airlines Pass Through Trust 2017-1A Series A 3.65% 15/02/2030
USD 503,083 0.09
200,000 Spirit Realty LP 4% 15/07/2029 USD 219,281 0.04100,000 Spirit Realty LP 4.45% 15/09/2026 USD 111,763 0.02945,000 Sprint Communications Inc 6% 15/11/2022 USD 1,004,908 0.17265,000 Sprint Corp 7.25% 15/09/2021 USD 269,420 0.05
1,400,000 Sprint Spectrum Co LLC Series 144A 4.738% 20/03/2025 USD 1,503,208 0.26765,000 Sprint Spectrum Co LLC Series 144A 5.152% 20/03/2028 USD 877,520 0.15520,000 SRS Distribution Inc Series 144A 4.625% 01/07/2028 USD 525,434 0.09100,000 Standard Industries Inc Series REGS 2.25% 21/11/2026 EUR 120,769 0.02500,000 Standard Industries Inc/NJ Series 144A 2.25% 21/11/2026 EUR 603,847 0.10300,000 Stryker Corp 0.75% 01/03/2029 EUR 372,566 0.06
1,200,000 Stryker Corp 2.125% 30/11/2027 EUR 1,626,979 0.28300,000 Sunoco Logistics Partners Operations LP 4% 01/10/2027 USD 328,023 0.06300,000 Synchrony Financial 3.95% 01/12/2027 USD 331,714 0.06260,000 Sysco Corp 3.55% 15/03/2025 USD 284,184 0.05123,000 Sysco Corp 4.45% 15/03/2048 USD 142,509 0.02160,000 Sysco Corp 5.65% 01/04/2025 USD 186,844 0.03355,000 Sysco Corp 5.95% 01/04/2030 USD 452,649 0.08
75,000 Sysco Corp 6.6% 01/04/2040 USD 108,265 0.02170,000 Sysco Corp 6.6% 01/04/2050 USD 255,962 0.04200,000 TEGNA Inc 4.625% 15/03/2028 USD 204,500 0.04560,000 Thermo Fisher Scientific Inc 0.125% 01/03/2025 EUR 687,120 0.12
2,040,000 Time Warner Cable LLC 4% 01/09/2021 USD 2,045,381 0.35200,000 Time Warner Cable LLC 6.75% 15/06/2039 USD 274,017 0.05725,000 Time Warner Entertainment Co LP 8.375% 15/03/2023 USD 824,461 0.14500,000 T-Mobile USA Inc 1.5% 15/02/2026 USD 502,153 0.09600,000 T-Mobile USA Inc 2.05% 15/02/2028 USD 598,350 0.10245,000 T-Mobile USA Inc 2.25% 15/11/2031 USD 235,631 0.04100,000 T-Mobile USA Inc 2.875% 15/02/2031 USD 96,587 0.02760,000 T-Mobile USA Inc 3% 15/02/2041 USD 714,613 0.12550,000 T-Mobile USA Inc 3.3% 15/02/2051 USD 518,246 0.09455,000 T-Mobile USA Inc 3.5% 15/04/2025 USD 494,383 0.08
1,375,000 T-Mobile USA Inc 3.875% 15/04/2030 USD 1,509,716 0.26600,000 Toyota Motor Credit Corp 0.75% 19/11/2026 GBP 840,917 0.14155,000 Trane Technologies Global Holding Co Ltd 5.75%
15/06/2043USD 215,744 0.04
200,000 Transocean Inc Series 144A 7.25% 01/11/2025 USD 159,000 0.0372,500 Transocean Pontus Ltd Series 144A 6.125% 01/08/2025 USD 72,092 0.01
Schedule of investments as at 31 May 2021 (continued)
Transferable securities admitted to an official stock exchange listing or traded on a regulated market. The percentages in brackets show the equivalent sector holdings at 31 May 2020.
308

Barclays Multi-Manager Fund PLC Annual Report and Audited Financial Statements 2021
GlobalAccess Corporate Bond Fund
Holdings Financial assets at fair value through profit or loss Currency Fair value
USD % of net
assets
Bonds: 94.53% (31 May 2020: 96.06%) (continued)
United States: 54.32% (31 May 2020: 57.49%) (continued)
Corporate bonds: 49.89% (31 May 2020: 53.64%) 1 UBS Commercial Mortgage Trust Series 2017-C2 Class XA
FRN 15/08/2050USD – –
200,000 UDR Inc Series MTN 2.95% 01/09/2026 USD 214,714 0.04445,000 Union Pacific Corp Series REGS 2.973% 16/09/2062 USD 401,266 0.07
40,000 Union Pacific Corp Series MTN 3.55% 15/08/2039 USD 43,112 0.01552,360 United Airlines 2014-2 Class A Pass Through Trust Series A
3.75% 03/09/2026USD 584,255 0.10
407,492 United Airlines 2016-2 Class A Pass Through Trust Series A 3.1% 07/04/2030
USD 413,101 0.07
216,249 United Airlines 2019-2 Class AA Pass Through Trust Series AA 2.7% 01/11/2033
USD 215,513 0.04
215,000 United Technologies Corp 4.5% 01/06/2042 USD 257,755 0.04200,000 UnitedHealth Group Inc 3.05% 15/05/2041 USD 203,452 0.03195,000 UnitedHealth Group Inc 3.25% 15/05/2051 USD 199,502 0.03295,000 UnitedHealth Group Inc 3.5% 15/08/2039 USD 319,834 0.05200,000 UnitedHealth Group Inc 4.25% 15/03/2043 USD 236,866 0.04100,000 Univision Communications Inc Series 144A 5.125%
15/02/2025USD 101,640 0.02
445,000 Unum Group 4.5% 15/03/2025 USD 499,684 0.09195,000 Unum Group 4.5% 15/12/2049 USD 203,684 0.03180,000 Unum Group 5.75% 15/08/2042 USD 217,774 0.04200,000 US Bancorp Series EMTN 0.85% 07/06/2024 EUR 251,388 0.04220,000 Valero Energy Corp 4.9% 15/03/2045 USD 260,444 0.04190,000 VEREIT Operating Partnership LP 2.2% 15/06/2028 USD 191,198 0.03179,000 VEREIT Operating Partnership LP 2.85% 15/12/2032 USD 182,614 0.03415,000 Verizon Communications Inc 0.875% 19/03/2032 EUR 506,203 0.09430,000 Verizon Communications Inc 1.5% 18/09/2030 USD 404,579 0.07680,000 Verizon Communications Inc Series 12y 1.875%
26/10/2029EUR 919,762 0.16
235,000 Verizon Communications Inc 1.875% 19/09/2030 GBP 334,594 0.06100,000 Verizon Communications Inc 2.1% 22/03/2028 USD 101,387 0.02500,000 Verizon Communications Inc 2.5% 08/04/2031 GBP 745,432 0.13480,000 Verizon Communications Inc 2.55% 21/03/2031 USD 483,047 0.08655,000 Verizon Communications Inc 2.65% 20/11/2040 USD 604,619 0.10
80,000 Verizon Communications Inc 3% 20/11/2060 USD 71,177 0.01125,000 Verizon Communications Inc 3.375% 27/10/2036 GBP 203,962 0.03155,000 Verizon Communications Inc 3.55% 22/03/2051 USD 157,400 0.03245,000 Verizon Communications Inc 3.7% 22/03/2061 USD 247,618 0.04260,000 Verizon Communications Inc 4.272% 15/01/2036 USD 300,544 0.05
75,000 Verizon Communications Inc 4.522% 15/09/2048 USD 88,842 0.0210,000 Verizon Communications Inc 5.25% 16/03/2037 USD 12,798 –
825,000 ViacomCBS Inc 4.75% 15/05/2025 USD 936,715 0.1635,000 Virginia Electric and Power Co 2.45% 15/12/2050 USD 30,846 0.01
Schedule of investments as at 31 May 2021 (continued)
Transferable securities admitted to an official stock exchange listing or traded on a regulated market. The percentages in brackets show the equivalent sector holdings at 31 May 2020.
309

Barclays Multi-Manager Fund PLC Annual Report and Audited Financial Statements 2021
GlobalAccess Corporate Bond Fund
Holdings Financial assets at fair value through profit or loss Currency Fair value
USD % of net
assets
Bonds: 94.53% (31 May 2020: 96.06%) (continued)
United States: 54.32% (31 May 2020: 57.49%) (continued)
Corporate bonds: 49.89% (31 May 2020: 53.64%)
50,000 Virginia Electric and Power Co 4.45% 15/02/2044 USD 59,938 0.0150,000 Virginia Electric and Power Co Series D 4.65% 15/08/2043 USD 61,414 0.01
205,000 Visa Inc 3.65% 15/09/2047 USD 231,616 0.04600,000 VMware Inc 4.7% 15/05/2030 USD 697,730 0.12475,000 Voya Financial Inc 3.65% 15/06/2026 USD 528,952 0.09
85,000 Voya Financial Inc FRN 23/01/2048 USD 89,052 0.021,000,000 Wabtec Corp 4.95% 15/09/2028 USD 1,153,621 0.20
140,000 Walmart Inc 2.95% 24/09/2049 USD 141,743 0.02105,000 Walmart Inc 4.05% 29/06/2048 USD 127,340 0.02250,000 Waste Management Inc 0.75% 15/11/2025 USD 248,197 0.04585,000 Waste Management Inc 1.15% 15/03/2028 USD 564,105 0.10185,000 Waste Management Inc 2% 01/06/2029 USD 185,596 0.03600,000 WEA Finance LLC / Westfield UK & Europe Finance PLC
Series 144A 3.75% 17/09/2024USD 640,989 0.11
425,000 Wells Fargo & Co Series EMTN 1.375% 30/06/2022 GBP 609,242 0.10400,000 Wells Fargo & Co Series EMTN 1.375% 26/10/2026 EUR 515,817 0.09475,000 Wells Fargo & Co Series EMTN 1.5% 12/09/2022 EUR 594,408 0.10200,000 Wells Fargo & Co Series EMTN 1.625% 02/06/2025 EUR 258,760 0.04
1,340,000 Wells Fargo & Co Series EMTN FRN 04/05/2030 EUR 1,755,690 0.30600,000 Wells Fargo & Co Series MTN FRN 11/02/2026 USD 625,830 0.11380,000 Wells Fargo & Co Series MTN FRN 11/02/2031 USD 388,855 0.07160,000 Wells Fargo & Co Series MTN FRN 30/10/2030 USD 167,748 0.03120,000 Wells Fargo & Co 3% 23/10/2026 USD 130,142 0.02500,000 Wells Fargo & Co Series MTN 3.55% 29/09/2025 USD 552,054 0.09800,000 Wells Fargo & Co Series MTN FRN 22/05/2028 USD 884,496 0.15800,000 Weyerhaeuser Co 4% 15/11/2029 USD 910,147 0.16300,000 Weyerhaeuser Co 7.375% 15/03/2032 USD 430,518 0.07500,000 Weyerhaeuser Co 8.5% 15/01/2025 USD 627,614 0.11765,000 Williams Cos Inc 3.5% 15/11/2030 USD 821,003 0.14220,000 Williams Cos Inc 6.3% 15/04/2040 USD 290,797 0.05200,000 WP Carey Inc 4.6% 01/04/2024 USD 219,680 0.04100,000 WPX Energy Inc 5.75% 01/06/2026 USD 104,454 0.02345,000 Xcel Energy Inc 3.5% 01/12/2049 USD 358,151 0.06
Government bonds: 4.25% (31 May 2020: 2.50%)600,000 Bay Area Toll Authority 2.574% 01/04/2031 USD 635,879 0.11305,000 California State University 2.897% 01/11/2051 USD 295,062 0.05425,000 Commonwealth of Massachusetts 2.514% 01/07/2041 USD 417,606 0.07250,000 Metropolitan Transportation Authority 6.668%
15/11/2039USD 354,132 0.06
40,000 Metropolitan Transportation Authority 6.814% 15/11/2040
USD 56,985 0.01
365,000 Michigan State Hospital Finance Authority 3.384% 01/12/2040
USD 389,589 0.07
Schedule of investments as at 31 May 2021 (continued)
Transferable securities admitted to an official stock exchange listing or traded on a regulated market. The percentages in brackets show the equivalent sector holdings at 31 May 2020.
310

Barclays Multi-Manager Fund PLC Annual Report and Audited Financial Statements 2021
GlobalAccess Corporate Bond Fund
Holdings Financial assets at fair value through profit or loss Currency Fair value
USD % of net
assets
Bonds: 94.53% (31 May 2020: 96.06%) (continued)
United States: 54.32% (31 May 2020: 57.49%) (continued)
Government bonds: 4.25% (31 May 2020: 2.50%)
400,000 United States Cash Management Bill 0% 28/09/2021 USD 399,987 0.075,800,000 United States Treasury Bill 0% 15/07/2021 USD 5,799,965 0.993,900,000 United States Treasury Bill 0% 20/07/2021 USD 3,900,000 0.673,600,000 United States Treasury Bill 0% 27/07/2021 USD 3,599,958 0.626,925,000 United States Treasury Inflation Indexed Bonds
0.1293500% 15/07/2030USD 7,906,012 1.36
400,000 University of California 4.765% 15/05/2044 USD 430,320 0.07385,000 University of California 6.583% 15/05/2049 USD 580,096 0.10
Government sponsored agencies: 0.18% (31 May 2020: 1.35%)
205,000 City of San Antonio TX Electric & Gas Systems Revenue 2.905% 01/02/2048
USD 205,249 0.03
115,000 Dallas Fort Worth International Airport 2.919% 01/11/2050
USD 113,449 0.02
180,000 Dallas Fort Worth International Airport 3.089% 01/11/2040
USD 184,050 0.03
262,000 New Jersey Turnpike Authority 7.414% 01/01/2040 USD 422,868 0.07155,000 Texas Transportation Commission 2.562% 01/04/2042 USD 154,187 0.03
Total United States 316,457,824 54.32
Total bonds 550,655,056 94.53
Accrued income on financial assets at fair value through profit or loss: 0.71% (31 May 2020: 0.73%) 4,153,889 0.71
Equities: 0.00% (31 May 2020: 0.04%)
United States: 0.00% (31 May 2020: 0.04%)
Pharmaceuticals: 0.00% (31 May 2020: 0.04%)
Investment funds: 2.98% (31 May 2020: 3.18%)
Ireland: 2.98% (31 May 2020: 3.18%)
2,920,000 iShares Global Corp Bond UCITS ETF USD 17,368,160 2.98
Total investment funds 17,368,160 2.98
Schedule of investments as at 31 May 2021 (continued)
Transferable securities admitted to an official stock exchange listing or traded on a regulated market. The percentages in brackets show the equivalent sector holdings at 31 May 2020.
311

Barclays Multi-Manager Fund PLC Annual Report and Audited Financial Statements 2021
GlobalAccess Corporate Bond Fund
Holdings Financial assets at fair value through profit or loss Currency Fair value
USD % of net
assets
Warrants: 0.00% (31 May 2020: 0.00%)
United States: 0.00% (31 May 2020: 0.00%)
14,204 Stearns Holdings LLC USD1.00 31/12/2049 USD – –Total United States – –
Total warrants – –
No. of contracts Futures contracts: 0.06% (31 May 2020: -0.02%) CounterpartyUnrealised gain/(loss)
% of net assets
USD7 US 10 Year T-Note Future September 2021 Barclays^ 106,112 0.02
(56) Euro-Bund EUX Future June 2021 Morgan Stanley 84,953 0.02(10) Euro-BUXL Bond Future June 2021 Barclays^ 68,297 0.01
57 US 10 Year Ultra CBT Future September 2021 Barclays^ 31,885 0.0199 Canada 10 Year MSE Future September 2021 Morgan Stanley 28,052 0.01
152 US 5 Year T-Note CBT Future September 2021 Barclays^ 17,811 –9 US Ultra CBT Future September 2021 Morgan Stanley 17,586 –
31 Euro-Bund EUX Future September 2021 Morgan Stanley 15,540 –5 Australia 10 Year SFE Future June 2021 Barclays^ 5,725 –1 Japan 10 Year Bond OSE Future June 2021 Barclays^ 4,388 –
56 US 2 Year T-Note Future September 2021 Morgan Stanley 3,875 –13 US Long Bond CBT Future September 2021 Barclays^ 2,516 –
(30) Long Gilt LIF Future September 2021 Morgan Stanley 1,919 –
Total fair value gains on open futures contracts 388,659 0.07
(2) US 10 Year Ultra CBT Future September 2021 Morgan Stanley (219) – DUMMY_9K9TB4U5 US Long Bond CBT Future September 2021 Morgan Stanley (1,586) –
(5) Long Gilt LIF Future September 2021 Barclays^ (2,843) – 9K9TF0U66 Euro-SCHATZ EUX Future June 2021 Barclays^ (3,638) – 9K6TQAU(8) Euro-Bund EUX Future June 2021 Morgan Stanley (6,712) – 9K6TPWU26 Euro-BOBL EUX Future June 2021 Barclays^ (8,155) – 9K6TPUU
(181) US 2 Year T-Note Future September 2021 Barclays^ (18,383) – 9K9TD5U(63) US Ultra CBT Future September 2021 Barclays^ (53,609) (0.01) 9K9TB5U
Total fair value losses on open futures contracts (95,145) (0.01)
Total futures contracts 293,514 0.06
Forward currency contracts: 0.55% (31 May 2020: 0.11%)
Counterparty Cncy Buys Cncy SellsMaturity
dateUnrealised
gain% of net
assetsUSD
Bank of America PLN 910,992 USD 239,993 16/09/2021 8,774 – CCT_1769410_75224
Bank of America BRL 3,396,520 USD 639,784 2/07/2021 5,776 – CCT_1769410_76301
Schedule of investments as at 31 May 2021 (continued)
Transferable securities admitted to an official stock exchange listing or traded on a regulated market. The percentages in brackets show the equivalent sector holdings at 31 May 2020.
312

Barclays Multi-Manager Fund PLC Annual Report and Audited Financial Statements 2021
GlobalAccess Corporate Bond Fund
Forward currency contracts: 0.55% (31 May 2020: 0.11%) (continued)
Counterparty Cncy Buys Cncy SellsMaturity
date
Unrealised gain
% of net assets
USD Barclays^ GBP 14,142,000 USD 19,989,576 4/06/2021 113,278 0.02 CCT_1737886_158521
Barclays^ EUR 55,888,000 USD 68,223,040 4/06/2021 108,427 0.02 CCT_1737886_158522
Barclays^ EUR 216,000 USD 263,776 4/06/2021 316 – CCT_1737886_157696
BNP Paribas EUR 3,217,000 USD 3,864,559 2/06/2021 68,706 0.01 CCT_1769410_75843
BNP Paribas MXN 12,709,000 USD 626,130 2/06/2021 12,249 – CCT_1769410_72215
BNP Paribas USD 641,373 MXN 12,709,000 2/06/2021 2,995 – CCT_1769410_76227
BNP Paribas GBP 187,000 USD 263,094 4/06/2021 2,727 – CCT_1737886_157149
BNP Paribas EUR 217,000 USD 263,399 2/06/2021 1,916 – CCT_1769410_76072
Citibank BRL 3,396,520 USD 617,982 2/06/2021 29,215 0.01 CCT_1769410_75481
Citibank GBP 757,000 USD 1,052,948 4/06/2021 23,128 0.01 CCT_1737886_156514
Citibank USD 326,994 PEN 1,199,218 7/09/2021 12,002 – CCT_1769410_74118
Citibank USD 180,217 PEN 660,441 18/08/2021 6,749 – CCT_1769410_74119
Citibank EUR 301,000 USD 361,385 4/06/2021 6,633 – CCT_1737886_156511
Citibank EUR 350,000 USD 425,842 2/06/2021 2,085 – CCT_1769410_75972
Citibank GBP 220,000 USD 311,408 4/06/2021 1,322 – CCT_1737886_157080
Deutsche EUR 968,000 USD 1,163,656 4/06/2021 19,869 – CCT_1737886_156403
Goldman Sachs PLN 437,499 USD 115,221 16/09/2021 4,248 – CCT_1769410_75128
Goldman Sachs PLN 305,077 USD 80,190 16/09/2021 3,118 – CCT_1769410_75203
Goldman Sachs EUR 142,000 USD 170,705 4/06/2021 2,912 – CCT_1737886_156412
Marine Midland Bank GBP 592,000 USD 829,420 2/06/2021 12,108 – CCT_1769410_76119
Marine Midland Bank EUR 951,000 USD 1,150,924 2/06/2021 11,816 – CCT_1769410_75708
Marine Midland Bank PLN 731,877 USD 191,096 16/09/2021 8,760 – CCT_1769410_75171
Morgan Stanley EUR 386,000 USD 464,603 4/06/2021 7,339 – CCT_1737886_156179
Morgan Stanley EUR 353,000 USD 424,884 4/06/2021 6,712 – CCT_1737886_156181
Morgan Stanley GBP 224,000 USD 315,074 4/06/2021 3,342 – CCT_1737886_157157
Morgan Stanley USD 1,386,759 CAD 1,673,000 2/07/2021 2,004 – CCT_1737886_158527
Morgan Stanley USD 1,848,768 EUR 1,512,000 4/06/2021 121 – CCT_1737886_157559
Northern Trust USD 1,761,318 PEN 6,475,486 15/10/2021 61,181 0.01 CCT_1769410_75328
Northern Trust USD 850,535 PEN 3,132,691 25/03/2022 29,967 0.01 CCT_1769410_75329
Royal Bank of Canada EUR 840,000 USD 1,021,474 4/06/2021 5,552 – CCT_1737886_157434
Royal Bank of Canada EUR 199,000 USD 241,790 4/06/2021 1,517 – CCT_1737886_156795
Standard Chartered INR 38,136,013 USD 511,327 16/06/2021 13,015 – CCT_1769410_74090
Standard Chartered EUR 635,000 USD 767,783 4/06/2021 8,600 – CCT_1737886_157275
Standard Chartered INR 38,136,013 USD 507,837 15/12/2021 2,907 – CCT_1769410_76467
Standard Chartered USD 61,683,895 EUR 50,422,000 2/07/2021 2,018 – CCT_1769410_76653
State Street GBP 228,000 USD 318,914 4/06/2021 5,188 – CCT_1737886_156787
State Street GBP 340,000 USD 480,209 2/06/2021 3,101 – CCT_1737886_157963
Schedule of investments as at 31 May 2021 (continued)
Transferable securities admitted to an official stock exchange listing or traded on a regulated market. The percentages in brackets show the equivalent sector holdings at 31 May 2020.
Holdings Financial assets at fair value through profit or loss Currency Fair value
USD % of net
assets
Warrants: 0.00% (31 May 2020: 0.00%)
United States: 0.00% (31 May 2020: 0.00%)
14,204 Stearns Holdings LLC USD1.00 31/12/2049 USD – –Total United States – –
Total warrants – –
No. of contracts Futures contracts: 0.06% (31 May 2020: -0.02%) CounterpartyUnrealised gain/(loss)
% of net assets
USD7 US 10 Year T-Note Future September 2021 Barclays^ 106,112 0.02
(56) Euro-Bund EUX Future June 2021 Morgan Stanley 84,953 0.02(10) Euro-BUXL Bond Future June 2021 Barclays^ 68,297 0.01
57 US 10 Year Ultra CBT Future September 2021 Barclays^ 31,885 0.0199 Canada 10 Year MSE Future September 2021 Morgan Stanley 28,052 0.01
152 US 5 Year T-Note CBT Future September 2021 Barclays^ 17,811 –9 US Ultra CBT Future September 2021 Morgan Stanley 17,586 –
31 Euro-Bund EUX Future September 2021 Morgan Stanley 15,540 –5 Australia 10 Year SFE Future June 2021 Barclays^ 5,725 –1 Japan 10 Year Bond OSE Future June 2021 Barclays^ 4,388 –
56 US 2 Year T-Note Future September 2021 Morgan Stanley 3,875 –13 US Long Bond CBT Future September 2021 Barclays^ 2,516 –
(30) Long Gilt LIF Future September 2021 Morgan Stanley 1,919 –
Total fair value gains on open futures contracts 388,659 0.07
(2) US 10 Year Ultra CBT Future September 2021 Morgan Stanley (219) – DUMMY_9K9TB4U5 US Long Bond CBT Future September 2021 Morgan Stanley (1,586) –
(5) Long Gilt LIF Future September 2021 Barclays^ (2,843) – 9K9TF0U66 Euro-SCHATZ EUX Future June 2021 Barclays^ (3,638) – 9K6TQAU(8) Euro-Bund EUX Future June 2021 Morgan Stanley (6,712) – 9K6TPWU26 Euro-BOBL EUX Future June 2021 Barclays^ (8,155) – 9K6TPUU
(181) US 2 Year T-Note Future September 2021 Barclays^ (18,383) – 9K9TD5U(63) US Ultra CBT Future September 2021 Barclays^ (53,609) (0.01) 9K9TB5U
Total fair value losses on open futures contracts (95,145) (0.01)
Total futures contracts 293,514 0.06
Forward currency contracts: 0.55% (31 May 2020: 0.11%)
Counterparty Cncy Buys Cncy SellsMaturity
dateUnrealised
gain% of net
assetsUSD
Bank of America PLN 910,992 USD 239,993 16/09/2021 8,774 – CCT_1769410_75224
Bank of America BRL 3,396,520 USD 639,784 2/07/2021 5,776 – CCT_1769410_76301
313

Barclays Multi-Manager Fund PLC Annual Report and Audited Financial Statements 2021
GlobalAccess Corporate Bond Fund
Forward currency contracts: 0.55% (31 May 2020: 0.11%) (continued)
Counterparty Cncy Buys Cncy SellsMaturity
date
Unrealised gain
% of net assets
USD Toronto Dominion GBP 2,700,000 USD 3,744,947 4/06/2021 93,103 0.02 CCT_1737886_156400
UBS GBP 310,527,493 USD 435,625,046 17/06/2021 5,797,884 1.00 CCT_1769407_182818
UBS EUR 2,176,049 USD 2,626,918 17/06/2021 34,298 0.01 CCT_1769407_182822
UBS EUR 1,746,418 USD 2,108,269 17/06/2021 27,527 0.01 CCT_1769407_182814
UBS RUB 32,634,000 USD 437,502 22/06/2021 6,245 – CCT_1769410_75976
UBS EUR 387,754 USD 468,095 17/06/2021 6,112 – CCT_1769407_182826
UBS GBP 329,236 USD 462,445 17/06/2021 5,572 – CCT_1769407_182816
UBS GBP 178,260 USD 249,207 17/06/2021 4,195 – CCT_1769407_182496
UBS GBP 219,209 USD 307,519 17/06/2021 4,093 – CCT_1769407_182810
UBS RUB 20,132,090 USD 268,949 22/07/2021 3,657 – CCT_1769410_75977
UBS GBP 364,586 USD 514,795 17/06/2021 3,473 – CCT_1769407_183020
UBS EUR 211,000 USD 255,007 4/06/2021 2,973 – CCT_1737886_155878
UBS GBP 114,145 USD 160,128 17/06/2021 2,131 – CCT_1769407_182820
UBS RUB 11,495,000 USD 154,401 22/06/2021 1,904 – CCT_1769410_76123
UBS EUR 98,680 USD 119,126 17/06/2021 1,555 – CCT_1769407_182825
UBS GBP 167,517 USD 236,893 17/06/2021 1,236 – CCT_1769407_182564
UBS GBP 124,693 USD 176,111 17/06/2021 1,143 – CCT_1769407_183578
UBS GBP 48,508 USD 68,050 17/06/2021 906 – CCT_1769407_182812
UBS GBP 44,165 USD 61,957 17/06/2021 825 – CCT_1769407_182809
UBS GBP 265,388 USD 376,628 17/06/2021 629 – CCT_1769407_183674
UBS GBP 48,091 USD 67,797 17/06/2021 566 – CCT_1769407_182742
UBS GBP 91,352 USD 129,333 17/06/2021 526 – CCT_1769407_183246
UBS GBP 84,530 USD 119,704 17/06/2021 457 – CCT_1769407_183309
UBS GBP 59,024 USD 83,878 17/06/2021 25 – CCT_1769407_183092
Westpac Banking EUR 1,814,000 USD 2,188,918 4/06/2021 28,970 0.01 CCT_1737886_156682
Westpac Banking GBP 595,000 USD 826,268 4/06/2021 19,524 – CCT_1737886_156664
Westpac Banking EUR 248,000 USD 299,487 4/06/2021 3,730 – CCT_1737886_157153
Westpac Banking GBP 260,000 USD 367,117 2/07/2021 2,488 – CCT_1737886_158313
Westpac Banking EUR 92,000 USD 111,490 4/06/2021 994 – CCT_1737886_156113
Total fair value gains on forward currency contracts 6,678,434 1.14
Counterparty Cncy Buys Cncy SellsMaturity
dateUnrealised
loss% of net
assetsUSD
Bank of America USD 47,967 RUB 3,621,855 22/06/2021 (1,282) – CCT_1769410_74254
Bank of America USD 43,686 ZAR 664,783 15/06/2021 (4,697) – CCT_1769410_72648
Bank of America USD 47,395 ZAR 716,000 15/06/2021 (4,715) – CCT_1769410_72669
Schedule of investments as at 31 May 2021 (continued)
Transferable securities admitted to an official stock exchange listing or traded on a regulated market. The percentages in brackets show the equivalent sector holdings at 31 May 2020.
314

Barclays Multi-Manager Fund PLC Annual Report and Audited Financial Statements 2021
GlobalAccess Corporate Bond Fund
Forward currency contracts: 0.55% (31 May 2020: 0.11%) (continued)
Counterparty Cncy Buys Cncy SellsMaturity
date
Unrealised loss
% of net assets
USD Bank of America USD 641,458 BRL 3,396,520 2/06/2021 (5,739) – CCT_1769410_76300
Barclays^ USD 373,982 EUR 308,000 4/06/2021 (2,594) – CCT_1737886_156987
Barclays^ USD 68,260,239 EUR 55,888,000 2/07/2021 (108,265) (0.02) CCT_1737886_158523
Barclays^ USD 19,990,506 GBP 14,142,000 2/07/2021 (113,140) (0.02) CCT_1737886_158520
Barclays^ USD 69,616,143 EUR 57,508,000 4/06/2021 (696,018) (0.12) CCT_1737886_156169
BNP Paribas JPY 135,400,000 USD 1,238,020 2/07/2021 (35) – CCT_1769410_76652
BNP Paribas USD 5,665,894 CAD 6,845,351 2/07/2021 (55) – CCT_1769410_76649
BNP Paribas MXN 12,709,000 USD 629,570 8/11/2021 (2,532) – CCT_1769410_76228
BNP Paribas USD 4,413,107 CAD 5,428,811 2/06/2021 (80,570) (0.01) CCT_1769410_75711
Canadian Imperial Bank of Commerce EUR 191,000 USD 233,665 2/07/2021 (12) – CCT_1737886_158678
Citibank USD 196,476 AUD 254,000 2/06/2021 (132) – CCT_1769410_75729
Citibank USD 50,055 RUB 3,731,508 22/06/2021 (685) – CCT_1769410_74347
Citibank USD 51,243 RUB 3,831,177 22/06/2021 (852) – CCT_1769410_74321
Citibank USD 122,680 RUB 9,143,324 22/06/2021 (1,648) – CCT_1769410_74385
Citibank USD 50,494 RUB 3,900,254 22/07/2021 (2,319) – CCT_1769410_75250
Deutsche USD 26,527,225 GBP 19,053,000 4/06/2021 (556,616) (0.10) CCT_1737886_156170
Goldman Sachs USD 101,321 RUB 7,819,397 22/07/2021 (4,560) – CCT_1769410_75309
Goldman Sachs USD 25,852,822 GBP 18,287,000 2/07/2021 (143,174) (0.03) CCT_1769410_76565
JP Morgan USD 1,381,185 CAD 1,673,000 4/06/2021 (3,634) – CCT_1737886_157694
JP Morgan USD 1,028,171 EUR 845,000 4/06/2021 (4,969) – CCT_1737886_156862
JP Morgan USD 227,896 ZAR 3,482,883 15/06/2021 (25,586) (0.01) CCT_1769410_72590
Marine Midland Bank USD 54,371 RUB 4,045,232 22/06/2021 (635) – CCT_1769410_74345
Marine Midland Bank USD 559,986 EUR 459,000 2/06/2021 (1,210) – CCT_1769410_76368
Marine Midland Bank USD 843,368 EUR 692,000 2/06/2021 (2,706) – CCT_1769410_76291
Marine Midland Bank USD 1,051,615 CAD 1,304,192 2/06/2021 (27,925) (0.01) CCT_1769410_75640
Marine Midland Bank USD 521,347 ZAR 8,045,081 15/06/2021 (64,169) (0.01) CCT_1769410_72525
Marine Midland Bank USD 26,317,694 GBP 18,879,000 2/06/2021 (518,806) (0.09) CCT_1769410_75670
Morgan Stanley EUR 142,000 USD 173,628 4/06/2021 (11) – CCT_1737886_157561
Morgan Stanley USD 50,104 RUB 3,838,433 22/07/2021 (1,872) – CCT_1769410_75205
Morgan Stanley CAD 1,673,000 USD 1,386,770 4/06/2021 (1,951) – CCT_1737886_158526
Royal Bank of Canada USD 1,097,327 EUR 914,000 4/06/2021 (20,175) – CCT_1737886_156513
Societe Generale USD 57,353 RUB 4,455,025 22/07/2021 (2,972) – CCT_1769410_75227
Standard Chartered JPY 135,400,000 USD 1,238,987 2/06/2021 (1,271) – CCT_1769410_75714
Standard Chartered USD 522,018 INR 38,136,013 16/06/2021 (2,324) – CCT_1769410_76466
Schedule of investments as at 31 May 2021 (continued)
Transferable securities admitted to an official stock exchange listing or traded on a regulated market. The percentages in brackets show the equivalent sector holdings at 31 May 2020.
Forward currency contracts: 0.55% (31 May 2020: 0.11%) (continued)
Counterparty Cncy Buys Cncy SellsMaturity
date
Unrealised gain
% of net assets
USD Toronto Dominion GBP 2,700,000 USD 3,744,947 4/06/2021 93,103 0.02 CCT_1737886_156400
UBS GBP 310,527,493 USD 435,625,046 17/06/2021 5,797,884 1.00 CCT_1769407_182818
UBS EUR 2,176,049 USD 2,626,918 17/06/2021 34,298 0.01 CCT_1769407_182822
UBS EUR 1,746,418 USD 2,108,269 17/06/2021 27,527 0.01 CCT_1769407_182814
UBS RUB 32,634,000 USD 437,502 22/06/2021 6,245 – CCT_1769410_75976
UBS EUR 387,754 USD 468,095 17/06/2021 6,112 – CCT_1769407_182826
UBS GBP 329,236 USD 462,445 17/06/2021 5,572 – CCT_1769407_182816
UBS GBP 178,260 USD 249,207 17/06/2021 4,195 – CCT_1769407_182496
UBS GBP 219,209 USD 307,519 17/06/2021 4,093 – CCT_1769407_182810
UBS RUB 20,132,090 USD 268,949 22/07/2021 3,657 – CCT_1769410_75977
UBS GBP 364,586 USD 514,795 17/06/2021 3,473 – CCT_1769407_183020
UBS EUR 211,000 USD 255,007 4/06/2021 2,973 – CCT_1737886_155878
UBS GBP 114,145 USD 160,128 17/06/2021 2,131 – CCT_1769407_182820
UBS RUB 11,495,000 USD 154,401 22/06/2021 1,904 – CCT_1769410_76123
UBS EUR 98,680 USD 119,126 17/06/2021 1,555 – CCT_1769407_182825
UBS GBP 167,517 USD 236,893 17/06/2021 1,236 – CCT_1769407_182564
UBS GBP 124,693 USD 176,111 17/06/2021 1,143 – CCT_1769407_183578
UBS GBP 48,508 USD 68,050 17/06/2021 906 – CCT_1769407_182812
UBS GBP 44,165 USD 61,957 17/06/2021 825 – CCT_1769407_182809
UBS GBP 265,388 USD 376,628 17/06/2021 629 – CCT_1769407_183674
UBS GBP 48,091 USD 67,797 17/06/2021 566 – CCT_1769407_182742
UBS GBP 91,352 USD 129,333 17/06/2021 526 – CCT_1769407_183246
UBS GBP 84,530 USD 119,704 17/06/2021 457 – CCT_1769407_183309
UBS GBP 59,024 USD 83,878 17/06/2021 25 – CCT_1769407_183092
Westpac Banking EUR 1,814,000 USD 2,188,918 4/06/2021 28,970 0.01 CCT_1737886_156682
Westpac Banking GBP 595,000 USD 826,268 4/06/2021 19,524 – CCT_1737886_156664
Westpac Banking EUR 248,000 USD 299,487 4/06/2021 3,730 – CCT_1737886_157153
Westpac Banking GBP 260,000 USD 367,117 2/07/2021 2,488 – CCT_1737886_158313
Westpac Banking EUR 92,000 USD 111,490 4/06/2021 994 – CCT_1737886_156113
Total fair value gains on forward currency contracts 6,678,434 1.14
Counterparty Cncy Buys Cncy SellsMaturity
dateUnrealised
loss% of net
assetsUSD
Bank of America USD 47,967 RUB 3,621,855 22/06/2021 (1,282) – CCT_1769410_74254
Bank of America USD 43,686 ZAR 664,783 15/06/2021 (4,697) – CCT_1769410_72648
Bank of America USD 47,395 ZAR 716,000 15/06/2021 (4,715) – CCT_1769410_72669
315

Barclays Multi-Manager Fund PLC Annual Report and Audited Financial Statements 2021
GlobalAccess Corporate Bond Fund
Forward currency contracts: 0.55% (31 May 2020: 0.11%) (continued)
Counterparty Cncy Buys Cncy SellsMaturity
date
Unrealised loss
% of net assets
USD Standard Chartered USD 64,600,797 EUR 53,634,000 2/06/2021 (974,818) (0.17) CCT_1769410_75719
State Street USD 480,239 GBP 340,000 2/07/2021 (3,090) – CCT_1737886_157964
State Street USD 734,510 GBP 520,000 2/07/2021 (4,700) – CCT_1737886_157961
State Street USD 994,987 EUR 819,000 4/06/2021 (6,363) – CCT_1737886_157130
State Street USD 639,016 EUR 529,000 4/06/2021 (7,766) – CCT_1737886_157161
UBS USD 22,179 EUR 18,227 17/06/2021 (113) – CCT_1769407_182565
UBS USD 40,681 GBP 28,732 17/06/2021 (163) – CCT_1769407_183408
UBS USD 34,569 GBP 24,537 17/06/2021 (311) – CCT_1769407_182934
UBS USD 94,447 GBP 66,770 17/06/2021 (468) – CCT_1769407_182664
UBS USD 142,440 GBP 100,785 17/06/2021 (828) – CCT_1769407_183507
UBS USD 55,286 RUB 4,130,349 22/06/2021 (877) – CCT_1769410_74280
UBS USD 190,221 GBP 134,472 17/06/2021 (934) – CCT_1769407_183179
UBS USD 55,193 RUB 4,130,555 22/06/2021 (973) – CCT_1769410_74282
UBS USD 53,966 RUB 4,137,237 22/07/2021 (2,056) – CCT_1769410_75206
UBS USD 110,627 RUB 8,483,654 22/07/2021 (4,250) – CCT_1769410_75276
Total fair value losses on forward currency contracts (3,417,566) (0.59)
Total forward currency contracts 3,260,868 0.55
Fair value USD
% of net assets
Total value of investments 575,731,487 98.83
Cash and cash equivalents* 5,681,396 0.98
Other net assets** 1,131,854 0.19
Net assets attributable to holders of redeemable participating shares 582,544,737 100.00
Analysis of total assets (unaudited)% of total
assets
Transferable securities and money market instruments admitted to official stock exchangelisting or traded on a regulated market. 92.81Investment funds and AIFs. 2.91Financial derivative instruments dealt in on a regulated market. 0.07OTC financial derivative instruments. 1.12Other assets. 3.09
100.00
*All cash holdings are held with The Northern Trust Company.**Including (USD 167,781) held with Barclays Bank UK PLC and USD 1,047,070 held with Morgan Stanley as security by the counterparty to derivatives contracts.^ Related party.
Schedule of investments as at 31 May 2021 (continued)
Transferable securities admitted to an official stock exchange listing or traded on a regulated market. The percentages in brackets show the equivalent sector holdings at 31 May 2020.
316

Barclays Multi-Manager Fund PLC Annual Report and Audited Financial Statements 2021
GlobalAccess Corporate Bond Fund
The accompanying notes form an integral part of the Financial Statements.
The Industry Classification Benchmark (“ICB”) is jointly owned by FTSE and Dow Jones and has been licensed for use. FTSE and Dow Jones do not accept liability to any person for any loss or damage arising out of any error or omission in ICB.
Schedule of investments as at 31 May 2021 (continued)
Transferable securities admitted to an official stock exchange listing or traded on a regulated market. The percentages in brackets show the equivalent sector holdings at 31 May 2020.
Forward currency contracts: 0.55% (31 May 2020: 0.11%) (continued)
Counterparty Cncy Buys Cncy SellsMaturity
date
Unrealised loss
% of net assets
USD Standard Chartered USD 64,600,797 EUR 53,634,000 2/06/2021 (974,818) (0.17) CCT_1769410_75719
State Street USD 480,239 GBP 340,000 2/07/2021 (3,090) – CCT_1737886_157964
State Street USD 734,510 GBP 520,000 2/07/2021 (4,700) – CCT_1737886_157961
State Street USD 994,987 EUR 819,000 4/06/2021 (6,363) – CCT_1737886_157130
State Street USD 639,016 EUR 529,000 4/06/2021 (7,766) – CCT_1737886_157161
UBS USD 22,179 EUR 18,227 17/06/2021 (113) – CCT_1769407_182565
UBS USD 40,681 GBP 28,732 17/06/2021 (163) – CCT_1769407_183408
UBS USD 34,569 GBP 24,537 17/06/2021 (311) – CCT_1769407_182934
UBS USD 94,447 GBP 66,770 17/06/2021 (468) – CCT_1769407_182664
UBS USD 142,440 GBP 100,785 17/06/2021 (828) – CCT_1769407_183507
UBS USD 55,286 RUB 4,130,349 22/06/2021 (877) – CCT_1769410_74280
UBS USD 190,221 GBP 134,472 17/06/2021 (934) – CCT_1769407_183179
UBS USD 55,193 RUB 4,130,555 22/06/2021 (973) – CCT_1769410_74282
UBS USD 53,966 RUB 4,137,237 22/07/2021 (2,056) – CCT_1769410_75206
UBS USD 110,627 RUB 8,483,654 22/07/2021 (4,250) – CCT_1769410_75276
Total fair value losses on forward currency contracts (3,417,566) (0.59)
Total forward currency contracts 3,260,868 0.55
Fair value USD
% of net assets
Total value of investments 575,731,487 98.83
Cash and cash equivalents* 5,681,396 0.98
Other net assets** 1,131,854 0.19
Net assets attributable to holders of redeemable participating shares 582,544,737 100.00
Analysis of total assets (unaudited)% of total
assets
Transferable securities and money market instruments admitted to official stock exchangelisting or traded on a regulated market. 92.81Investment funds and AIFs. 2.91Financial derivative instruments dealt in on a regulated market. 0.07OTC financial derivative instruments. 1.12Other assets. 3.09
100.00
*All cash holdings are held with The Northern Trust Company.**Including (USD 167,781) held with Barclays Bank UK PLC and USD 1,047,070 held with Morgan Stanley as security by the counterparty to derivatives contracts.^ Related party.
317

Barclays Multi-Manager Fund PLC Annual Report and Audited Financial Statements 2021
GlobalAccess Emerging Market Debt Fund
Schedule of investments as at 31 May 2021
Transferable securities admitted to an official stock exchange listing or traded on a regulated market. The percentages in brackets show the equivalent sector holdings at 31 May 2020.
Holdings Financial assets at fair value through profit or loss CurrencyFair value
USD% of net
assets
Bonds: 88.72% (31 May 2020: 89.77%)
Angola: 1.83% (31 May 2020: 0.81%)
Government bonds: 1.83% (31 May 2020: 0.81%)1,250,000 Angolan Government International Bond Series REGS 8%
26/11/2029USD 1,277,250 0.42
1,625,000 Angolan Government International Bond Series REGS 8.25% 09/05/2028
USD 1,692,746 0.55
470,000 Angolan Government International Bond Series REGS 9.125% 26/11/2049
USD 479,799 0.15
950,000 Angolan Government International Bond Series REGS 9.375% 08/05/2048
USD 988,739 0.32
200,000 Angolan Government International Bond Series REGS 9.375% 08/05/2048
USD 208,156 0.07
910,000 Angolan Government International Bond Series REGS 9.5% 12/11/2025
USD 1,003,671 0.32
Total Angola 5,650,361 1.83
Argentina: 1.70% (31 May 2020: 1.81%)
Corporate bonds: 0.21% (31 May 2020: 0.23%)395,000 YPF SA Series REGS 6.95% 21/07/2027 USD 259,321 0.08202,000 YPF SA Series REGS 7% 15/12/2047 USD 120,899 0.04311,000 YPF SA Series REGS 8.5% 23/03/2025 USD 265,439 0.0915,000 YPF SA Series REGS 8.5% 28/07/2025 USD 11,175 –
Government bonds: 1.34% (31 May 2020: 1.34%)1 Argentine Republic Government International Bond Series
$DSC 7.82% 31/12/2033USD – –
3,147,030 Argentine Republic Government International Bond 0.5% 09/07/2030
USD 1,166,887 0.38
5,456,998 Argentine Republic Government International Bond 1.125% 09/07/2035
USD 1,811,778 0.58
696,003 Argentine Republic Government International Bond 2% 09/01/2038
USD 275,729 0.09
1,756,000 Argentine Republic Government International Bond 2.5% 09/07/2041
USD 655,146 0.21
431,100 Argentine Republic Government International Bond 1.125% 09/07/2046
USD 144,656 0.05
222,317 Argentine Republic Government International Bond 1% 09/07/2029
USD 86,697 0.03
Government sponsored agencies: 0.15% (31 May 2020: 0.24%)
421,000 Autonomous City of Buenos Aires Argentina Series REGS 7.5% 01/06/2027
USD 335,752 0.11
318

Barclays Multi-Manager Fund PLC Annual Report and Audited Financial Statements 2021
GlobalAccess Emerging Market Debt Fund
Holdings Financial assets at fair value through profit or loss Currency Fair value
USD % of net
assets
Bonds: 88.72% (31 May 2020: 89.77%) (continued) Argentina: 1.70% (31 May 2020: 1.81%) (continued)
Government sponsored agencies: 0.15% (31 May 2020: 0.24%)
198,488 Provincia de Cordoba Series REGS 5% 10/12/2025 USD 141,323 0.04
Total Argentina 5,274,802 1.70
Armenia: 0.44% (31 May 2020: 0.59%)
Government bonds: 0.44% (31 May 2020: 0.59%)690,000 Republic of Armenia International Bond Series REGS 3.6%
02/02/2031USD 640,244 0.21
200,000 Republic of Armenia International Bond Series REGS 3.95% 26/09/2029
USD 194,280 0.06
480,000 Republic of Armenia International Bond Series REGS 7.15% 26/03/2025
USD 541,913 0.17
Total Armenia 1,376,437 0.44
Austria: 0.00% (31 May 2020: 0.16%)
Corporate bonds: 0.00% (31 May 2020: 0.16%)
Azerbaijan: 1.99% (31 May 2020: 2.31%)
Corporate bonds: 1.23% (31 May 2020: 1.07%)300,000 International Bank of Azerbaijan OJSC Series REGS 3.5%
01/09/2024USD 298,500 0.10
2,365,000 Southern Gas Corridor CJSC Series REGS 6.875% 24/03/2026
USD 2,845,450 0.92
525,000 State Oil Co of the Azerbaijan Republic 6.95% 18/03/2030 USD 657,714 0.21
Government bonds: 0.76% (31 May 2020: 1.24%)979,000 Republic of Azerbaijan International Bond Series REGS
3.5% 01/09/2032USD 1,000,018 0.32
970,000 Republic of Azerbaijan International Bond Series REGS 4.75% 18/03/2024
USD 1,055,554 0.34
280,000 Republic of Azerbaijan International Bond Series REGS 5.125% 01/09/2029
USD 312,543 0.10
Total Azerbaijan 6,169,779 1.99
Schedule of investments as at 31 May 2021 (continued)
Transferable securities admitted to an official stock exchange listing or traded on a regulated market. The percentages in brackets show the equivalent sector holdings at 31 May 2020.
319

Barclays Multi-Manager Fund PLC Annual Report and Audited Financial Statements 2021
GlobalAccess Emerging Market Debt Fund
Holdings Financial assets at fair value through profit or loss Currency Fair value
USD % of net
assets
Bonds: 88.72% (31 May 2020: 89.77%) (continued)
Bahamas: 0.07% (31 May 2020: 0.00%)
Government bonds: 0.07% (31 May 2020: 0.00%)200,000 Bahamas Government International Bond Series REGS
8.95% 15/10/2032USD 230,000 0.07
Total Bahamas 230,000 0.07
Bahrain: 1.24% (31 May 2020: 1.74%)
Corporate bonds: 0.40% (31 May 2020: 0.25%)1,120,000 CBB International Sukuk Programme Co Series REGS
6.25% 14/11/2024USD 1,233,289 0.40
Government bonds: 0.84% (31 May 2020: 1.49%)810,000 Bahrain Government International Bond Series REGS
5.625% 30/09/2031USD 814,729 0.26
365,000 Bahrain Government International Bond Series REGS 6.25% 25/01/2051
USD 341,934 0.11
215,000 Bahrain Government International Bond Series REGS 6.75% 20/09/2029
USD 235,606 0.08
450,000 Bahrain Government International Bond Series REGS 7% 26/01/2026
USD 516,586 0.17
290,000 Bahrain Government International Bond Series REGS 7.375% 14/05/2030
USD 326,333 0.10
345,000 Bahrain Government International Bond Series REGS 7.5% 20/09/2047
USD 365,696 0.12
Total Bahrain 3,834,173 1.24
Barbados: 0.08% (31 May 2020: 0.00%)
Government bonds: 0.08% (31 May 2020: 0.00%)230,000 Barbados Government International Bond Series REGS
6.5% 01/10/2029USD 233,450 0.08
Total Barbados 233,450 0.08
Belarus: 0.32% (31 May 2020: 0.22%)
Government bonds: 0.32% (31 May 2020: 0.22%)455,000 Republic of Belarus International Bond Series REGS 6.2%
28/02/2030USD 412,516 0.13
205,000 Republic of Belarus International Bond Series REGS 6.378% 24/02/2031
USD 186,187 0.06
185,000 Republic of Belarus International Bond Series REGS 6.875% 28/02/2023
USD 185,831 0.06
Schedule of investments as at 31 May 2021 (continued)
Transferable securities admitted to an official stock exchange listing or traded on a regulated market. The percentages in brackets show the equivalent sector holdings at 31 May 2020.
320
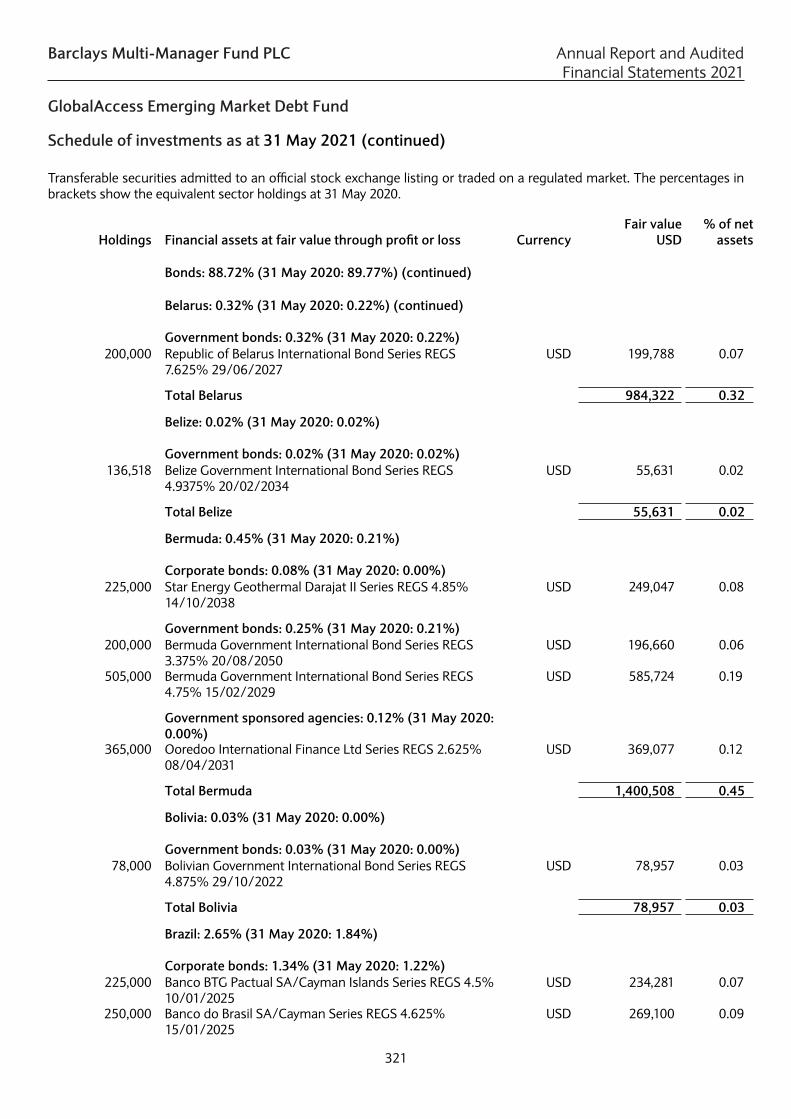
Barclays Multi-Manager Fund PLC Annual Report and Audited Financial Statements 2021
GlobalAccess Emerging Market Debt Fund
Holdings Financial assets at fair value through profit or loss Currency Fair value
USD % of net
assets
Bonds: 88.72% (31 May 2020: 89.77%) (continued) Belarus: 0.32% (31 May 2020: 0.22%) (continued)
Government bonds: 0.32% (31 May 2020: 0.22%) 200,000 Republic of Belarus International Bond Series REGS
7.625% 29/06/2027USD 199,788 0.07
Total Belarus 984,322 0.32
Belize: 0.02% (31 May 2020: 0.02%)
Government bonds: 0.02% (31 May 2020: 0.02%)136,518 Belize Government International Bond Series REGS
4.9375% 20/02/2034USD 55,631 0.02
Total Belize 55,631 0.02
Bermuda: 0.45% (31 May 2020: 0.21%)
Corporate bonds: 0.08% (31 May 2020: 0.00%)225,000 Star Energy Geothermal Darajat II Series REGS 4.85%
14/10/2038USD 249,047 0.08
Government bonds: 0.25% (31 May 2020: 0.21%)200,000 Bermuda Government International Bond Series REGS
3.375% 20/08/2050USD 196,660 0.06
505,000 Bermuda Government International Bond Series REGS 4.75% 15/02/2029
USD 585,724 0.19
Government sponsored agencies: 0.12% (31 May 2020: 0.00%)
365,000 Ooredoo International Finance Ltd Series REGS 2.625% 08/04/2031
USD 369,077 0.12
Total Bermuda 1,400,508 0.45
Bolivia: 0.03% (31 May 2020: 0.00%)
Government bonds: 0.03% (31 May 2020: 0.00%)78,000 Bolivian Government International Bond Series REGS
4.875% 29/10/2022USD 78,957 0.03
Total Bolivia 78,957 0.03
Brazil: 2.65% (31 May 2020: 1.84%)
Corporate bonds: 1.34% (31 May 2020: 1.22%)225,000 Banco BTG Pactual SA/Cayman Islands Series REGS 4.5%
10/01/2025USD 234,281 0.07
250,000 Banco do Brasil SA/Cayman Series REGS 4.625% 15/01/2025
USD 269,100 0.09
Schedule of investments as at 31 May 2021 (continued)
Transferable securities admitted to an official stock exchange listing or traded on a regulated market. The percentages in brackets show the equivalent sector holdings at 31 May 2020.
321

Barclays Multi-Manager Fund PLC Annual Report and Audited Financial Statements 2021
GlobalAccess Emerging Market Debt Fund
Holdings Financial assets at fair value through profit or loss Currency Fair value
USD % of net
assets
Bonds: 88.72% (31 May 2020: 89.77%) (continued) Brazil: 2.65% (31 May 2020: 1.84%) (continued)
Corporate bonds: 1.34% (31 May 2020: 1.22%) 640,000 Banco do Brasil SA/Cayman Series REGS 4.75%
20/03/2024USD 691,686 0.22
570,000 BRF SA Series REGS 4.875% 24/01/2030 USD 593,233 0.19200,000 Centrais Eletricas Brasileiras SA Series REGS 3.625%
04/02/2025USD 206,875 0.07
240,000 Centrais Eletricas Brasileiras SA Series REGS 4.625% 04/02/2030
USD 247,800 0.08
455,000 Centrais Eletricas Brasileiras SA Series REGS 5.75% 27/10/2021
USD 462,758 0.15
955,000 Itau Unibanco Holding SA Series REGS 2.9% 24/01/2023 USD 979,243 0.32235,000 Itau Unibanco Holding SA/Cayman Island Series REGS
2.9% 24/01/2023USD 240,966 0.08
200,000 Rumo Luxembourg Series REGS 5.875% 18/01/2025 USD 210,700 0.07
Government bonds: 1.31% (31 May 2020: 0.62%)960,000 Brazilian Government International Bond 3.875%
12/06/2030USD 971,376 0.31
85,000 Brazilian Government International Bond 4.5% 30/05/2029
USD 91,332 0.03
270,000 Brazilian Government International Bond 4.625% 13/01/2028 - Euromtf
USD 294,480 0.09
735,000 Brazilian Government International Bond 4.75% 14/01/2050
USD 709,282 0.23
400,000 Brazilian Government International Bond 5% 27/01/2045 USD 402,870 0.13915,000 Brazilian Government International Bond 5.625%
21/02/2047USD 985,922 0.32
440,000 Brazilian Government International Bond 8.25% 20/01/2034
USD 610,610 0.20
Total Brazil 8,202,514 2.65
British Virgin Islands: 0.42% (31 May 2020: 0.35%)
Corporate bonds: 0.12% (31 May 2020: 0.00%)200,000 Huarong Finance 2017 Co Ltd 4.75% 27/04/2027 USD 133,500 0.04360,000 Huarong Finance 2019 Co Ltd Series EMTN 3.75%
29/05/2024USD 252,900 0.08
Government sponsored agencies: 0.30% (31 May 2020: 0.35%)
905,000 Sinopec Group Overseas Development 2018 Ltd Series REGS 2.7% 13/05/2030
USD 916,487 0.30
Total British Virgin Islands 1,302,887 0.42
Schedule of investments as at 31 May 2021 (continued)
Transferable securities admitted to an official stock exchange listing or traded on a regulated market. The percentages in brackets show the equivalent sector holdings at 31 May 2020.
322

Barclays Multi-Manager Fund PLC Annual Report and Audited Financial Statements 2021
GlobalAccess Emerging Market Debt Fund
Holdings Financial assets at fair value through profit or loss Currency Fair value
USD % of net
assets
Bonds: 88.72% (31 May 2020: 89.77%) (continued)
Bulgaria: 0.16% (31 May 2020: 0.00%)
Government bonds: 0.16% (31 May 2020: 0.00%)440,000 Bulgaria Government International Bond 1.375%
23/09/2050EUR 497,116 0.16
Total Bulgaria 497,116 0.16
Cameroon: 0.15% (31 May 2020: 0.15%)
Government bonds: 0.15% (31 May 2020: 0.15%)400,000 Republic of Cameroon International Bond Series REGS
9.5% 19/11/2025USD 459,160 0.15
Total Cameroon 459,160 0.15
Canada: 0.09% (31 May 2020: 0.10%)
Corporate bonds: 0.09% (31 May 2020: 0.10%)275,000 First Quantum Minerals Ltd Series 144A 7.25%
01/04/2023USD 280,732 0.09
Total Canada 280,732 0.09
Cayman Islands: 2.34% (31 May 2020: 1.28%)
Corporate bonds: 2.25% (31 May 2020: 1.28%)782,340 Bioceanico Sovereign Certificate Ltd Series REGS 0%
05/06/2034USD 588,257 0.19
400,000 CIFI Holdings Group Co Ltd 4.375% 12/04/2027 USD 395,485 0.13480,000 Country Garden Holdings Co Ltd 2.7% 12/07/2026 USD 472,782 0.15250,000 Country Garden Holdings Co Ltd 4.8% 06/08/2030 USD 261,872 0.08200,000 Country Garden Holdings Co Ltd 7.25% 08/04/2026 USD 222,000 0.07200,000 Meituan Series REGS 2.125% 28/10/2025 USD 198,362 0.06600,000 Meituan Series REGS 3.05% 28/10/2030 USD 582,676 0.19495,000 QNB Finance Ltd Series EMTN 1.375% 26/01/2026 USD 488,837 0.16340,000 QNB Finance Ltd Series EMTN 2.625% 12/05/2025 USD 355,136 0.11200,000 QNB Finance Ltd Series EMTN 3.5% 28/03/2024 USD 213,831 0.07365,000 Sharjah Sukuk Program Ltd Series EMTN 3.854%
03/04/2026USD 395,508 0.13
225,000 Shimao Property Holdings Ltd 5.2% 30/01/2025 USD 234,564 0.08430,000 Tencent Holdings Ltd Series REGS 2.39% 03/06/2030 USD 423,939 0.14215,000 Tencent Holdings Ltd Series REGS 3.24% 03/06/2050 USD 197,354 0.06200,000 Tencent Holdings Ltd Series REGS 3.84% 22/04/2051 USD 202,655 0.07200,000 Tencent Holdings Ltd Series REGS 3.925% 19/01/2038 USD 211,875 0.07240,500 Termocandelaria Power Ltd Series REGS 7.875%
30/01/2029USD 256,249 0.08
500,000 Times China Holdings Ltd 5.75% 14/01/2027 USD 485,603 0.16270,000 Vale Overseas Ltd 3.75% 08/07/2030 USD 287,069 0.09
Schedule of investments as at 31 May 2021 (continued)
Transferable securities admitted to an official stock exchange listing or traded on a regulated market. The percentages in brackets show the equivalent sector holdings at 31 May 2020.
323
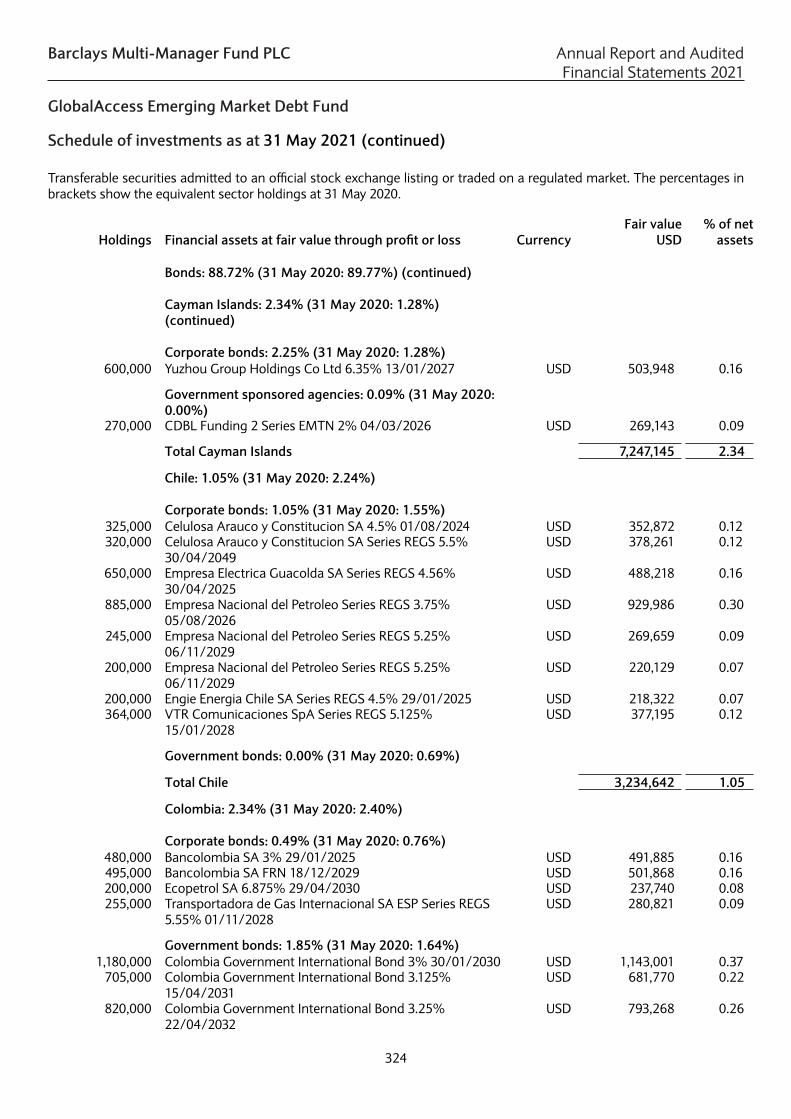
Barclays Multi-Manager Fund PLC Annual Report and Audited Financial Statements 2021
GlobalAccess Emerging Market Debt Fund
Holdings Financial assets at fair value through profit or loss Currency Fair value
USD % of net
assets
Bonds: 88.72% (31 May 2020: 89.77%) (continued)
Cayman Islands: 2.34% (31 May 2020: 1.28%) (continued)
Corporate bonds: 2.25% (31 May 2020: 1.28%)
600,000 Yuzhou Group Holdings Co Ltd 6.35% 13/01/2027 USD 503,948 0.16
Government sponsored agencies: 0.09% (31 May 2020: 0.00%)
270,000 CDBL Funding 2 Series EMTN 2% 04/03/2026 USD 269,143 0.09
Total Cayman Islands 7,247,145 2.34
Chile: 1.05% (31 May 2020: 2.24%)
Corporate bonds: 1.05% (31 May 2020: 1.55%)325,000 Celulosa Arauco y Constitucion SA 4.5% 01/08/2024 USD 352,872 0.12320,000 Celulosa Arauco y Constitucion SA Series REGS 5.5%
30/04/2049USD 378,261 0.12
650,000 Empresa Electrica Guacolda SA Series REGS 4.56% 30/04/2025
USD 488,218 0.16
885,000 Empresa Nacional del Petroleo Series REGS 3.75% 05/08/2026
USD 929,986 0.30
245,000 Empresa Nacional del Petroleo Series REGS 5.25% 06/11/2029
USD 269,659 0.09
200,000 Empresa Nacional del Petroleo Series REGS 5.25% 06/11/2029
USD 220,129 0.07
200,000 Engie Energia Chile SA Series REGS 4.5% 29/01/2025 USD 218,322 0.07364,000 VTR Comunicaciones SpA Series REGS 5.125%
15/01/2028USD 377,195 0.12
Government bonds: 0.00% (31 May 2020: 0.69%)
Total Chile 3,234,642 1.05
Colombia: 2.34% (31 May 2020: 2.40%)
Corporate bonds: 0.49% (31 May 2020: 0.76%)480,000 Bancolombia SA 3% 29/01/2025 USD 491,885 0.16495,000 Bancolombia SA FRN 18/12/2029 USD 501,868 0.16200,000 Ecopetrol SA 6.875% 29/04/2030 USD 237,740 0.08255,000 Transportadora de Gas Internacional SA ESP Series REGS
5.55% 01/11/2028USD 280,821 0.09
Government bonds: 1.85% (31 May 2020: 1.64%)1,180,000 Colombia Government International Bond 3% 30/01/2030 USD 1,143,001 0.37
705,000 Colombia Government International Bond 3.125% 15/04/2031
USD 681,770 0.22
820,000 Colombia Government International Bond 3.25% 22/04/2032
USD 793,268 0.26
Schedule of investments as at 31 May 2021 (continued)
Transferable securities admitted to an official stock exchange listing or traded on a regulated market. The percentages in brackets show the equivalent sector holdings at 31 May 2020.
324

Barclays Multi-Manager Fund PLC Annual Report and Audited Financial Statements 2021
GlobalAccess Emerging Market Debt Fund
Holdings Financial assets at fair value through profit or loss Currency Fair value
USD % of net
assets
Bonds: 88.72% (31 May 2020: 89.77%) (continued) Colombia: 2.34% (31 May 2020: 2.40%) (continued)
Government bonds: 1.85% (31 May 2020: 1.64%) 115,000 Colombia Government International Bond 3.875%
25/04/2027USD 122,122 0.04
710,000 Colombia Government International Bond 4.125% 15/05/2051
USD 650,261 0.21
110,000 Colombia Government International Bond 4.5% 28/01/2026
USD 120,320 0.04
515,000 Colombia Government International Bond 4.5% 15/03/2029
USD 557,395 0.18
585,000 Colombia Government International Bond 5% 15/06/2045 USD 606,669 0.19140,000 Colombia Government International Bond 5.2%
15/05/2049USD 149,208 0.05
125,000 Colombia Government International Bond 5.625% 26/02/2044
USD 138,437 0.04
463,000 Colombia Government International Bond 6.125% 18/01/2041
USD 539,163 0.17
185,000 Colombia Government International Bond 7.375% 18/09/2037
USD 240,777 0.08
Total Colombia 7,254,705 2.34
Costa Rica: 1.08% (31 May 2020: 1.11%)
Government bonds: 1.08% (31 May 2020: 1.11%)160,000 Costa Rica Government International Bond Series REGS
4.25% 26/01/2023USD 163,304 0.05
185,000 Costa Rica Government International Bond Series REGS 4.375% 30/04/2025
USD 193,464 0.06
1,940,000 Costa Rica Government International Bond Series REGS 6.125% 19/02/2031
USD 2,077,274 0.67
300,000 Costa Rica Government International Bond Series REGS 7% 04/04/2044
USD 315,300 0.10
265,000 Costa Rica Government International Bond Series REGS 7.158% 12/03/2045
USD 280,237 0.09
315,000 Instituto Costarricense de Electricidad - Luxembourg Series REGS 6.95% 10/11/2021
USD 318,938 0.11
Total Costa Rica 3,348,517 1.08
Croatia: 2.09% (31 May 2020: 1.37%)
Government bonds: 2.09% (31 May 2020: 1.37%)2,070,000 Croatia Government International Bond 1.125%
19/06/2029EUR 2,595,537 0.84
515,000 Croatia Government International Bond 1.125% 04/03/2033
EUR 621,519 0.20
Schedule of investments as at 31 May 2021 (continued)
Transferable securities admitted to an official stock exchange listing or traded on a regulated market. The percentages in brackets show the equivalent sector holdings at 31 May 2020.
325

Barclays Multi-Manager Fund PLC Annual Report and Audited Financial Statements 2021
GlobalAccess Emerging Market Debt Fund
Holdings Financial assets at fair value through profit or loss Currency Fair value
USD % of net
assets
Bonds: 88.72% (31 May 2020: 89.77%) (continued) Croatia: 2.09% (31 May 2020: 1.37%) (continued)
Government bonds: 2.09% (31 May 2020: 1.37%) 1,615,000 Croatia Government International Bond 1.5% 17/06/2031 EUR 2,050,112 0.66
985,000 Croatia Government International Bond 1.75% 04/03/2041
EUR 1,213,457 0.39
Total Croatia 6,480,625 2.09
Dominican Republic: 3.15% (31 May 2020: 2.72%)
Government bonds: 3.15% (31 May 2020: 2.72%)1,130,000 Dominican Republic International Bond Series REGS 4.5%
30/01/2030USD 1,161,640 0.38
695,000 Dominican Republic International Bond Series REGS 4.875% 23/09/2032
USD 720,715 0.23
480,000 Dominican Republic International Bond Series REGS 5.3% 21/01/2041
USD 482,640 0.16
210,000 Dominican Republic International Bond Series REGS 5.875% 30/01/2060
USD 207,637 0.07
1,190,000 Dominican Republic International Bond Series REGS 5.95% 25/01/2027
USD 1,350,055 0.44
715,000 Dominican Republic International Bond Series REGS 6% 19/07/2028
USD 818,854 0.26
1,295,000 Dominican Republic International Bond Series REGS 6.4% 05/06/2049
USD 1,396,981 0.45
220,000 Dominican Republic International Bond Series REGS 6.5% 15/02/2048
USD 240,570 0.07
1,375,000 Dominican Republic International Bond Series REGS 6.85% 27/01/2045
USD 1,560,281 0.50
675,000 Dominican Republic International Bond Series REGS 6.875% 29/01/2026
USD 788,738 0.26
855,000 Dominican Republic International Bond Series REGS 7.45% 30/04/2044
USD 1,032,627 0.33
Total Dominican Republic 9,760,738 3.15
Ecuador: 1.66% (31 May 2020: 0.97%)
Government bonds: 1.66% (31 May 2020: 0.97%)368,684 Ecuador Government International Bond Series REGS 0%
31/07/2030USD 209,689 0.07
867,640 Ecuador Government International Bond Series REGS 5% 31/07/2030
USD 758,100 0.24
4,512,713 Ecuador Government International Bond Series REGS 1% 31/07/2035
USD 3,181,463 1.03
Schedule of investments as at 31 May 2021 (continued)
Transferable securities admitted to an official stock exchange listing or traded on a regulated market. The percentages in brackets show the equivalent sector holdings at 31 May 2020.
326

Barclays Multi-Manager Fund PLC Annual Report and Audited Financial Statements 2021
GlobalAccess Emerging Market Debt Fund
Holdings Financial assets at fair value through profit or loss Currency Fair value
USD % of net
assets
Bonds: 88.72% (31 May 2020: 89.77%) (continued) Ecuador: 1.66% (31 May 2020: 0.97%) (continued)
Government bonds: 1.66% (31 May 2020: 0.97%) 1,530,800 Ecuador Government International Bond Series REGS 0.5%
31/07/2040USD 981,626 0.32
Total Ecuador 5,130,878 1.66
Egypt: 2.88% (31 May 2020: 2.67%)
Government bonds: 2.88% (31 May 2020: 2.67%)345,000 Egypt Government International Bond Series REGS 3.875%
16/02/2026USD 343,517 0.11
505,000 Egypt Government International Bond Series REGS 5.25% 06/10/2025
USD 536,780 0.17
400,000 Egypt Government International Bond Series REGS 5.875% 11/06/2025 - Luxembourg
USD 430,556 0.14
230,000 Egypt Government International Bond Series REGS 5.875% 16/02/2031
USD 226,931 0.07
200,000 Egypt Government International Bond Series REGS 6.2004% 01/03/2024
USD 214,946 0.07
415,000 Egypt Government International Bond Series REGS 6.375% 11/04/2031
EUR 539,944 0.17
285,000 Egypt Government International Bond Series REGS 7.5% 31/01/2027
USD 325,396 0.10
345,000 Egypt Government International Bond Series REGS 7.5% 16/02/2061
USD 332,031 0.11
1,345,000 Egypt Government International Bond Series REGS 7.6003% 01/03/2029
USD 1,501,383 0.49
200,000 Egypt Government International Bond Series REGS 7.625% 29/05/2032
USD 216,930 0.07
1,453,000 Egypt Government International Bond Series REGS 7.903% 21/02/2048
USD 1,472,194 0.48
1,770,000 Egypt Government International Bond Series REGS 8.5% 31/01/2047
USD 1,884,590 0.61
440,000 Egypt Government International Bond Series REGS 8.7002% 01/03/2049
USD 473,871 0.15
385,000 Egypt Government International Bond Series REGS 8.875% 29/05/2050
USD 423,423 0.14
Total Egypt 8,922,492 2.88
El Salvador: 1.18% (31 May 2020: 0.61%)
Government bonds: 1.18% (31 May 2020: 0.61%)310,000 El Salvador Government International Bond Series REGS
5.875% 30/01/2025USD 310,000 0.10
Schedule of investments as at 31 May 2021 (continued)
Transferable securities admitted to an official stock exchange listing or traded on a regulated market. The percentages in brackets show the equivalent sector holdings at 31 May 2020.
327
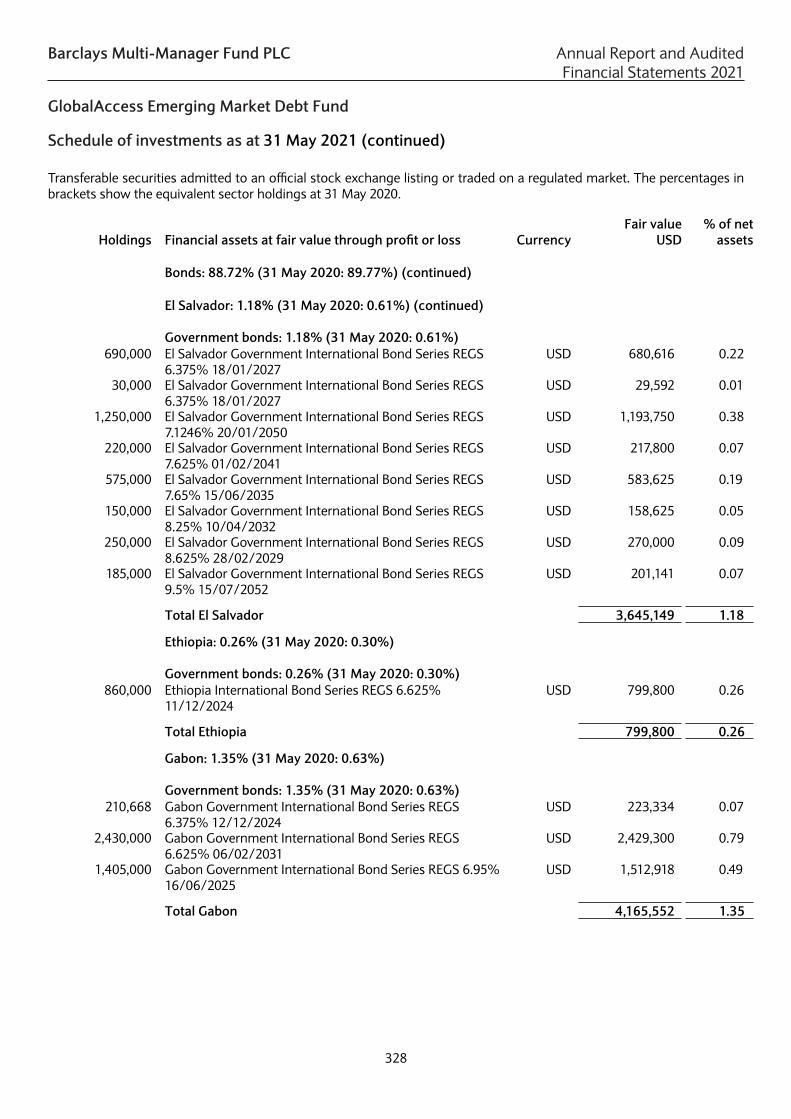
Barclays Multi-Manager Fund PLC Annual Report and Audited Financial Statements 2021
GlobalAccess Emerging Market Debt Fund
Holdings Financial assets at fair value through profit or loss Currency Fair value
USD % of net
assets
Bonds: 88.72% (31 May 2020: 89.77%) (continued) El Salvador: 1.18% (31 May 2020: 0.61%) (continued)
Government bonds: 1.18% (31 May 2020: 0.61%) 690,000 El Salvador Government International Bond Series REGS
6.375% 18/01/2027USD 680,616 0.22
30,000 El Salvador Government International Bond Series REGS 6.375% 18/01/2027
USD 29,592 0.01
1,250,000 El Salvador Government International Bond Series REGS 7.1246% 20/01/2050
USD 1,193,750 0.38
220,000 El Salvador Government International Bond Series REGS 7.625% 01/02/2041
USD 217,800 0.07
575,000 El Salvador Government International Bond Series REGS 7.65% 15/06/2035
USD 583,625 0.19
150,000 El Salvador Government International Bond Series REGS 8.25% 10/04/2032
USD 158,625 0.05
250,000 El Salvador Government International Bond Series REGS 8.625% 28/02/2029
USD 270,000 0.09
185,000 El Salvador Government International Bond Series REGS 9.5% 15/07/2052
USD 201,141 0.07
Total El Salvador 3,645,149 1.18
Ethiopia: 0.26% (31 May 2020: 0.30%)
Government bonds: 0.26% (31 May 2020: 0.30%)860,000 Ethiopia International Bond Series REGS 6.625%
11/12/2024USD 799,800 0.26
Total Ethiopia 799,800 0.26
Gabon: 1.35% (31 May 2020: 0.63%)
Government bonds: 1.35% (31 May 2020: 0.63%)210,668 Gabon Government International Bond Series REGS
6.375% 12/12/2024USD 223,334 0.07
2,430,000 Gabon Government International Bond Series REGS 6.625% 06/02/2031
USD 2,429,300 0.79
1,405,000 Gabon Government International Bond Series REGS 6.95% 16/06/2025
USD 1,512,918 0.49
Total Gabon 4,165,552 1.35
Schedule of investments as at 31 May 2021 (continued)
Transferable securities admitted to an official stock exchange listing or traded on a regulated market. The percentages in brackets show the equivalent sector holdings at 31 May 2020.
328

Barclays Multi-Manager Fund PLC Annual Report and Audited Financial Statements 2021
GlobalAccess Emerging Market Debt Fund
Holdings Financial assets at fair value through profit or loss Currency Fair value
USD % of net
assets
Bonds: 88.72% (31 May 2020: 89.77%) (continued)
Georgia: 0.14% (31 May 2020: 0.35%)
Corporate bonds: 0.07% (31 May 2020: 0.00%)200,000 Georgian Railway JSC Series REGS 7.75% 11/07/2022 USD 215,040 0.07
Government bonds: 0.07% (31 May 2020: 0.35%)220,000 Georgia Government International Bond Series REGS
2.75% 22/04/2026USD 222,730 0.07
Total Georgia 437,770 0.14
Ghana: 1.66% (31 May 2020: 1.61%)
Government bonds: 1.66% (31 May 2020: 1.61%)430,000 Ghana Government International Bond Series REGS
6.375% 11/02/2027USD 434,500 0.14
665,000 Ghana Government International Bond Series REGS 7.625% 16/05/2029
USD 681,635 0.22
670,000 Ghana Government International Bond Series REGS 7.75% 07/04/2029
USD 692,160 0.22
205,000 Ghana Government International Bond Series REGS 7.875% 26/03/2027
USD 217,123 0.07
350,000 Ghana Government International Bond Series REGS 7.875% 11/02/2035
USD 349,314 0.11
200,000 Ghana Government International Bond Series REGS 8.125% 18/01/2026 - Ireland
USD 216,157 0.07
895,000 Ghana Government International Bond Series REGS 8.125% 26/03/2032
USD 919,568 0.30
1,675,000 Ghana Government International Bond Series REGS 8.627% 16/06/2049
USD 1,641,115 0.53
Total Ghana 5,151,572 1.66
Guatemala: 0.49% (31 May 2020: 0.54%)
Government bonds: 0.49% (31 May 2020: 0.54%)340,000 Guatemala Government Bond Series REGS 4.375%
05/06/2027USD 371,960 0.12
645,000 Guatemala Government Bond Series REGS 4.5% 03/05/2026
USD 708,694 0.23
190,000 Guatemala Government Bond Series REGS 4.9% 01/06/2030
USD 213,288 0.07
185,000 Guatemala Government Bond Series REGS 5.375% 24/04/2032
USD 213,444 0.07
Total Guatemala 1,507,386 0.49
Schedule of investments as at 31 May 2021 (continued)
Transferable securities admitted to an official stock exchange listing or traded on a regulated market. The percentages in brackets show the equivalent sector holdings at 31 May 2020.
329

Barclays Multi-Manager Fund PLC Annual Report and Audited Financial Statements 2021
GlobalAccess Emerging Market Debt Fund
Holdings Financial assets at fair value through profit or loss Currency Fair value
USD % of net
assets
Bonds: 88.72% (31 May 2020: 89.77%) (continued)
Honduras: 0.34% (31 May 2020: 0.18%)
Government bonds: 0.34% (31 May 2020: 0.18%)210,000 Honduras Government International Bond Series REGS
5.625% 24/06/2030USD 221,550 0.07
775,000 Honduras Government International Bond Series REGS 7.5% 15/03/2024
USD 837,155 0.27
Total Honduras 1,058,705 0.34
Hong Kong: 0.15% (31 May 2020: 0.00%)
Corporate bonds: 0.15% (31 May 2020: 0.00%)475,000 AIA Group Ltd Series REGS 3.2% 16/09/2040 USD 474,857 0.15
Total Hong Kong 474,857 0.15
Hungary: 0.80% (31 May 2020: 0.90%)
Government bonds: 0.80% (31 May 2020: 0.90%)40,000 Hungary Government International Bond 1.5%
17/11/2050EUR 44,955 0.01
240,000 Hungary Government International Bond 1.625% 28/04/2032
EUR 312,301 0.10
1,645,000 Hungary Government International Bond 1.75% 05/06/2035
EUR 2,121,573 0.69
Total Hungary 2,478,829 0.80
India: 0.14% (31 May 2020: 0.15%)
Corporate bonds: 0.14% (31 May 2020: 0.15%)200,000 Bharti Airtel Ltd Series REGS 4.375% 10/06/2025 USD 218,780 0.07200,000 Power Finance Corp Ltd Series REGS 3.95% 23/04/2030 USD 205,017 0.07
Total India 423,797 0.14
Indonesia: 1.55% (31 May 2020: 3.23%)
Corporate bonds: 0.56% (31 May 2020: 1.20%)255,000 Pertamina Persero PT Series REGS 5.625% 20/05/2043 USD 294,911 0.10260,000 Perusahaan Listrik Negara PT Series REGS 4.875%
17/07/2049USD 277,798 0.09
240,000 Perusahaan Listrik Negara PT Series REGS 5.25% 15/05/2047
USD 266,525 0.09
360,000 Perusahaan Listrik Negara PT Series REGS 6.15% 21/05/2048
USD 443,880 0.14
Schedule of investments as at 31 May 2021 (continued)
Transferable securities admitted to an official stock exchange listing or traded on a regulated market. The percentages in brackets show the equivalent sector holdings at 31 May 2020.
330

Barclays Multi-Manager Fund PLC Annual Report and Audited Financial Statements 2021
GlobalAccess Emerging Market Debt Fund
Holdings Financial assets at fair value through profit or loss Currency Fair value
USD % of net
assets
Bonds: 88.72% (31 May 2020: 89.77%) (continued) Indonesia: 1.55% (31 May 2020: 3.23%) (continued)
Corporate bonds: 0.56% (31 May 2020: 1.20%) 415,000 Perusahaan Perseroan Persero PT Perusahaan Listrik
Negara Series REGS 3.875% 17/07/2029USD 437,580 0.14
Government bonds: 0.99% (31 May 2020: 2.03%)140,000 Indonesia Government International Bond 1.1%
12/03/2033EUR 167,403 0.05
385,000 Indonesia Government International Bond 2.85% 14/02/2030
USD 400,204 0.13
260,000 Indonesia Government International Bond 3.5% 14/02/2050
USD 263,879 0.09
420,000 Indonesia Government International Bond 3.7% 30/10/2049
USD 431,095 0.14
140,000 Indonesia Government International Bond 3.85% 15/10/2030
USD 155,779 0.05
95,000 Indonesia Government International Bond 4.2% 15/10/2050
USD 105,703 0.03
680,000 Indonesia Government International Bond Series REGS 4.625% 15/04/2043
USD 773,523 0.25
220,000 Indonesia Government International Bond Series REGS 5.125% 15/01/2045
USD 265,445 0.09
440,000 Perusahaan Penerbit SBSN Indonesia III Series REGS 4.45% 20/02/2029
USD 503,879 0.16
Total Indonesia 4,787,604 1.55
Iraq: 0.25% (31 May 2020: 0.30%)
Government bonds: 0.25% (31 May 2020: 0.30%)255,500 Iraq International Bond Series REGS 5.8% 15/01/2028 USD 246,813 0.08520,000 Iraq International Bond Series REGS 6.752% 09/03/2023 USD 534,004 0.17
Total Iraq 780,817 0.25
Ireland: 0.37% (31 May 2020: 0.08%)
Corporate bonds: 0.07% (31 May 2020: 0.08%)200,000 Russian Railways via RZD Capital PLC 5.7% 05/04/2022 USD 208,128 0.07
Government sponsored agencies: 0.30% (31 May 2020: 0.00%)
200,000 GTLK Europe Capital DAC 4.65% 10/03/2027 USD 209,667 0.07680,000 GTLK Europe Capital DAC 4.8% 26/02/2028 USD 716,254 0.23
Total Ireland 1,134,049 0.37
Schedule of investments as at 31 May 2021 (continued)
Transferable securities admitted to an official stock exchange listing or traded on a regulated market. The percentages in brackets show the equivalent sector holdings at 31 May 2020.
331

Barclays Multi-Manager Fund PLC Annual Report and Audited Financial Statements 2021
GlobalAccess Emerging Market Debt Fund
Holdings Financial assets at fair value through profit or loss Currency Fair value
USD % of net
assets
Bonds: 88.72% (31 May 2020: 89.77%) (continued)
Isle Of Man: 0.11% (31 May 2020: 0.00%)
Corporate bonds: 0.11% (31 May 2020: 0.00%)320,000 AngloGold Ashanti Holdings PLC 3.75% 01/10/2030 USD 332,275 0.11
Total Isle Of Man 332,275 0.11
Israel: 1.91% (31 May 2020: 1.99%)
Corporate bonds: 1.91% (31 May 2020: 1.53%)415,000 Bank Leumi Le-Israel BM FRN 29/01/2031 USD 426,931 0.14165,000 Delek & Avner Tamar Bond Ltd 5.082% 30/12/2023 USD 167,426 0.05115,000 Delek & Avner Tamar Bond Ltd 5.412% 30/12/2025 USD 117,694 0.04475,000 Energean Israel Finance Ltd 4.5% 30/03/2024 USD 490,018 0.16240,000 Energean Israel Finance Ltd 4.875% 30/03/2026 USD 249,020 0.08
1,810,000 Israel Electric Corp Ltd Series GMTN 4.25% 14/08/2028 USD 2,008,852 0.65925,000 Israel Electric Corp Ltd Series 6 5% 12/11/2024 USD 1,037,993 0.33200,000 Leviathan Bond Ltd 5.75% 30/06/2023 USD 211,042 0.07235,000 Leviathan Bond Ltd 6.125% 30/06/2025 USD 258,926 0.08335,000 Leviathan Bond Ltd 6.5% 30/06/2027 USD 373,476 0.12205,000 Leviathan Bond Ltd 6.75% 30/06/2030 USD 231,120 0.08340,000 Mizrahi-Tefahot Bank Ltd FRN 07/04/2031 USD 344,898 0.11
Government bonds: 0.00% (31 May 2020: 0.46%)
Total Israel 5,917,396 1.91
Ivory Coast: 0.97% (31 May 2020: 0.88%)
Government bonds: 0.97% (31 May 2020: 0.88%)475,000 Ivory Coast Government International Bond Series REGS
5.25% 22/03/2030EUR 613,879 0.20
320,000 Ivory Coast Government International Bond Series REGS 5.875% 17/10/2031
EUR 426,456 0.14
195,000 Ivory Coast Government International Bond Series REGS 6.125% 15/06/2033
USD 208,149 0.06
745,000 Ivory Coast Government International Bond Series REGS 6.375% 03/03/2028
USD 830,504 0.27
310,000 Ivory Coast Government International Bond Series REGS 6.625% 22/03/2048
EUR 399,903 0.13
400,000 Ivory Coast Government International Bond Series REGS 6.875% 17/10/2040
EUR 534,988 0.17
Total Ivory Coast 3,013,879 0.97
Schedule of investments as at 31 May 2021 (continued)
Transferable securities admitted to an official stock exchange listing or traded on a regulated market. The percentages in brackets show the equivalent sector holdings at 31 May 2020.
332

Barclays Multi-Manager Fund PLC Annual Report and Audited Financial Statements 2021
GlobalAccess Emerging Market Debt Fund
Holdings Financial assets at fair value through profit or loss Currency Fair value
USD % of net
assets
Bonds: 88.72% (31 May 2020: 89.77%) (continued)
Jamaica: 0.29% (31 May 2020: 0.75%)
Government bonds: 0.29% (31 May 2020: 0.75%)225,000 Jamaica Government International Bond 6.75%
28/04/2028USD 267,750 0.09
440,000 Jamaica Government International Bond 8% 15/03/2039 USD 625,020 0.20
Total Jamaica 892,770 0.29
Jersey: 0.51% (31 May 2020: 0.00%)
Corporate bonds: 0.37% (31 May 2020: 0.00%)290,000 Galaxy Pipeline Assets Bidco Ltd Series REGS 2.16%
31/03/2034USD 286,750 0.09
330,000 Galaxy Pipeline Assets Bidco Ltd Series REGS 2.625% 31/03/2036
USD 324,298 0.11
290,000 Galaxy Pipeline Assets Bidco Ltd Series REGS 2.94% 30/09/2040
USD 287,767 0.09
240,000 Galaxy Pipeline Assets Bidco Ltd Series REGS 3.25% 30/09/2040
USD 236,869 0.08
Government sponsored agencies: 0.14% (31 May 2020: 0.00%)
240,000 Galaxy Pipeline Assets Bidco Ltd Series REGS 1.75% 30/09/2027
USD 242,526 0.08
200,000 Galaxy Pipeline Assets Bidco Ltd Series REGS 2.625% 31/03/2036
USD 196,544 0.06
Total Jersey 1,574,754 0.51
Jordan: 1.29% (31 May 2020: 0.90%)
Government bonds: 1.29% (31 May 2020: 0.90%)770,000 Jordan Government International Bond Series REGS 4.95%
07/07/2025USD 802,294 0.26
755,000 Jordan Government International Bond Series REGS 5.75% 31/01/2027
USD 807,658 0.26
850,000 Jordan Government International Bond Series REGS 5.85% 07/07/2030
USD 886,355 0.29
465,000 Jordan Government International Bond Series REGS 6.125% 29/01/2026
USD 504,355 0.16
920,000 Jordan Government International Bond Series REGS 7.375% 10/10/2047
USD 977,794 0.32
Total Jordan 3,978,456 1.29
Schedule of investments as at 31 May 2021 (continued)
Transferable securities admitted to an official stock exchange listing or traded on a regulated market. The percentages in brackets show the equivalent sector holdings at 31 May 2020.
333

Barclays Multi-Manager Fund PLC Annual Report and Audited Financial Statements 2021
GlobalAccess Emerging Market Debt Fund
Holdings Financial assets at fair value through profit or loss Currency Fair value
USD % of net
assets
Bonds: 88.72% (31 May 2020: 89.77%) (continued)
Kazakhstan: 0.15% (31 May 2020: 0.92%)
Corporate bonds: 0.15% (31 May 2020: 0.80%)200,000 KazMunayGas National Co JSC Series REGS 5.375%
24/04/2030USD 239,317 0.08
200,000 KazTransGas JSC Series REGS 4.375% 26/09/2027 USD 223,442 0.07
Government bonds: 0.00% (31 May 2020: 0.12%)
Total Kazakhstan 462,759 0.15
Kenya: 0.41% (31 May 2020: 2.02%)
Government bonds: 0.41% (31 May 2020: 2.02%)245,000 Kenya Government International Bond Series REGS
6.875% 24/06/2024USD 272,570 0.09
660,000 Kenya Government International Bond Series REGS 7% 22/05/2027
USD 729,333 0.23
240,000 Kenya Government International Bond Series REGS 7.25% 28/02/2028
USD 266,582 0.09
Total Kenya 1,268,485 0.41
Kuwait: 0.00% (31 May 2020: 0.10%)
Government bonds: 0.00% (31 May 2020: 0.10%)
Lebanon: 0.08% (31 May 2020: 0.33%)
Government bonds: 0.08% (31 May 2020: 0.33%)96,000 Lebanon Government International Bond Series GMTN
6.2% 26/02/2025USD 13,084 0.01
70,000 Lebanon Government International Bond Series GMTN 6.6% 27/11/2026
USD 9,611 –
60,000 Lebanon Government International Bond Series GMTN 6.65% 03/11/2028
USD 8,217 –
1,269,000 Lebanon Government International Bond 6% 27/01/2023 USD 174,311 0.06229,000 Lebanon Government International Bond Series GMTN
6.375% 09/03/2020USD 30,915 0.01
Total Lebanon 236,138 0.08
Luxembourg: 0.82% (31 May 2020: 0.89%)
Corporate bonds: 0.82% (31 May 2020: 0.89%)500,000 CSN Resources SA Series REGS 7.625% 17/04/2026 USD 538,880 0.17200,000 Guara Norte Sarl Series REGS 5.198% 15/06/2034 USD 202,695 0.07202,500 Millicom International Cellular SA Series REGS 5.125%
15/01/2028USD 212,368 0.07
Schedule of investments as at 31 May 2021 (continued)
Transferable securities admitted to an official stock exchange listing or traded on a regulated market. The percentages in brackets show the equivalent sector holdings at 31 May 2020.
334

Barclays Multi-Manager Fund PLC Annual Report and Audited Financial Statements 2021
GlobalAccess Emerging Market Debt Fund
Holdings Financial assets at fair value through profit or loss Currency Fair value
USD % of net
assets
Bonds: 88.72% (31 May 2020: 89.77%) (continued) Luxembourg: 0.82% (31 May 2020: 0.89%) (continued)
Corporate bonds: 0.82% (31 May 2020: 0.89%) 400,500 Millicom International Cellular SA Series REGS 6.25%
25/03/2029USD 441,905 0.14
180,000 Millicom International Cellular SA Series REGS 6.625% 15/10/2026
USD 192,396 0.06
385,000 Minerva Luxembourg SA Series REGS 5.875% 19/01/2028 USD 409,447 0.13335,000 Rede D'or Finance Sarl Series REGS 4.5% 22/01/2030 USD 338,940 0.11200,000 Rumo Luxembourg Sarl Series REGS 5.25% 10/01/2028 USD 213,750 0.07
Total Luxembourg 2,550,381 0.82
Macedonia: 1.10% (31 May 2020: 0.56%)
Government bonds: 1.10% (31 May 2020: 0.56%)310,000 North Macedonia Government International Bond Series
REGS 1.625% 10/03/2028EUR 368,292 0.12
220,000 North Macedonia Government International Bond Series REGS 2.75% 18/01/2025
EUR 280,307 0.09
870,000 North Macedonia Government International Bond Series REGS 3.675% 03/06/2026
EUR 1,161,370 0.37
1,305,000 North Macedonia Government International Bond Series REGS 3.975% 24/07/2021
EUR 1,606,129 0.52
Total Macedonia 3,416,098 1.10
Malaysia: 0.33% (31 May 2020: 0.94%)
Corporate bonds: 0.00% (31 May 2020: 0.25%)
Government sponsored agencies: 0.33% (31 May 2020: 0.69%)
745,000 Petronas Capital Ltd Series REGS 3.404% 28/04/2061 USD 737,499 0.24265,000 Petronas Capital Ltd Series REGS 3.5% 21/04/2030 USD 288,787 0.09
Total Malaysia 1,026,286 0.33
Mauritius: 0.27% (31 May 2020: 0.08%)
Corporate bonds: 0.27% (31 May 2020: 0.08%)200,000 Azure Power Energy Ltd Series REGS 5.5% 03/11/2022 USD 204,000 0.07400,000 Clean Renewable Power Mauritius Pte Ltd Series REGS
4.25% 25/03/2027USD 403,600 0.13
200,000 Network i2i Ltd Series REGS FRN Perpetual USD 212,750 0.07
Total Mauritius 820,350 0.27
Schedule of investments as at 31 May 2021 (continued)
Transferable securities admitted to an official stock exchange listing or traded on a regulated market. The percentages in brackets show the equivalent sector holdings at 31 May 2020.
335

Barclays Multi-Manager Fund PLC Annual Report and Audited Financial Statements 2021
GlobalAccess Emerging Market Debt Fund
Holdings Financial assets at fair value through profit or loss Currency Fair value
USD % of net
assets
Bonds: 88.72% (31 May 2020: 89.77%) (continued)
Mexico: 5.40% (31 May 2020: 5.31%)
Corporate bonds: 2.87% (31 May 2020: 2.26%)400,000 Cemex SAB de CV Series REGS 7.375% 05/06/2027 USD 451,036 0.15550,000 Mexico City Airport Trust Series REGS 4.25% 31/10/2026 USD 585,379 0.19725,000 Petroleos Mexicanos 5.95% 28/01/2031 USD 705,969 0.23905,000 Petroleos Mexicanos 6.49% 23/01/2027 USD 968,142 0.31625,000 Petroleos Mexicanos 6.5% 13/03/2027 USD 668,100 0.22190,000 Petroleos Mexicanos 6.5% 23/01/2029 USD 196,317 0.06480,000 Petroleos Mexicanos 6.625% 15/06/2035 USD 463,800 0.15
2,312,000 Petroleos Mexicanos 6.75% 21/09/2047 USD 2,037,034 0.662,180,000 Petroleos Mexicanos 6.84% 23/01/2030 USD 2,261,750 0.73
480,000 Petroleos Mexicanos 6.875% 04/08/2026 USD 532,718 0.17
Government bonds: 1.73% (31 May 2020: 2.28%)140,000 Mexico Government International Bond 1.45%
25/10/2033EUR 161,543 0.05
360,000 Mexico Government International Bond 2.125% 25/10/2051
EUR 368,061 0.12
1,000 Mexico Government International Bond 3.25% 16/04/2030
USD 1,035 –
30,000 Mexico Government International Bond 4.35% 15/01/2047
USD 30,971 0.01
105,000 Mexico Government International Bond 4.5% 22/04/2029 USD 118,844 0.04205,000 Mexico Government International Bond 4.5% 31/01/2050 USD 214,764 0.07660,000 Mexico Government International Bond 4.6% 23/01/2046 USD 700,432 0.22
2,575,000 Mexico Government International Bond 4.75% 27/04/2032
USD 2,940,650 0.95
86,000 Mexico Government International Bond Series MTN 4.75% 08/03/2044
USD 93,895 0.03
360,000 Mexico Government International Bond 5% 27/04/2051 USD 401,763 0.13288,000 Mexico Government International Bond Series GMTN
5.75% 12/10/2110USD 337,467 0.11
Government sponsored agencies: 0.80% (31 May 2020: 0.77%)
660,000 Comision Federal de Electricidad Series REGS 3.348% 09/02/2031
USD 651,958 0.21
200,000 Comision Federal de Electricidad Series REGS 4.677% 09/02/2051
USD 188,665 0.06
195,000 Petroleos Mexicanos 6.375% 23/01/2045 USD 167,671 0.0575,000 Petroleos Mexicanos 6.5% 23/01/2029 USD 77,494 0.03
305,000 Petroleos Mexicanos 6.95% 28/01/2060 USD 270,549 0.091,155,000 Petroleos Mexicanos 7.69% 23/01/2050 USD 1,110,532 0.36
Total Mexico 16,706,539 5.40
Schedule of investments as at 31 May 2021 (continued)
Transferable securities admitted to an official stock exchange listing or traded on a regulated market. The percentages in brackets show the equivalent sector holdings at 31 May 2020.
336

Barclays Multi-Manager Fund PLC Annual Report and Audited Financial Statements 2021
GlobalAccess Emerging Market Debt Fund
Holdings Financial assets at fair value through profit or loss Currency Fair value
USD % of net
assets
Bonds: 88.72% (31 May 2020: 89.77%) (continued)
Mongolia: 0.53% (31 May 2020: 0.49%)
Government bonds: 0.53% (31 May 2020: 0.49%)70,000 Mongolia Government International Bond Series REGS
5.125% 05/12/2022USD 72,975 0.02
279,000 Mongolia Government International Bond Series REGS 5.125% 05/12/2022
USD 290,857 0.09
866,000 Mongolia Government International Bond Series REGS 5.125% 07/04/2026
USD 928,785 0.30
85,000 Mongolia Government International Bond Series REGS 5.625% 01/05/2023
USD 89,563 0.03
235,000 Mongolia Government International Bond Series REGS 8.75% 09/03/2024
USD 269,075 0.09
Total Mongolia 1,651,255 0.53
Morocco: 1.45% (31 May 2020: 1.68%)
Corporate bonds: 0.66% (31 May 2020: 0.98%)639,000 OCP SA Series REGS 4.5% 22/10/2025 USD 684,962 0.22
1,020,000 OCP SA Series REGS 5.625% 25/04/2024 USD 1,113,614 0.36200,000 OCP SA Series REGS 6.875% 25/04/2044 USD 245,358 0.08
Government bonds: 0.79% (31 May 2020: 0.70%)950,000 Morocco Government International Bond Series REGS
1.5% 27/11/2031EUR 1,096,821 0.35
405,000 Morocco Government International Bond Series REGS 2% 30/09/2030
EUR 492,197 0.16
650,000 Morocco Government International Bond Series REGS 2.375% 15/12/2027
USD 636,525 0.21
180,000 Morocco Government International Bond Series REGS 5.5% 11/12/2042
USD 202,922 0.07
Total Morocco 4,472,399 1.45
Mozambique: 0.11% (31 May 2020: 0.06%)
Government bonds: 0.11% (31 May 2020: 0.06%)400,000 Mozambique International Bond Series REGS 5%
15/09/2031USD 326,812 0.11
Total Mozambique 326,812 0.11
Namibia: 0.13% (31 May 2020: 0.00%)
Government bonds: 0.13% (31 May 2020: 0.00%)200,000 Namibia International Bonds Series REGS 5.25%
29/10/2025USD 214,242 0.07
Schedule of investments as at 31 May 2021 (continued)
Transferable securities admitted to an official stock exchange listing or traded on a regulated market. The percentages in brackets show the equivalent sector holdings at 31 May 2020.
337

Barclays Multi-Manager Fund PLC Annual Report and Audited Financial Statements 2021
GlobalAccess Emerging Market Debt Fund
Holdings Financial assets at fair value through profit or loss Currency Fair value
USD % of net
assets
Bonds: 88.72% (31 May 2020: 89.77%) (continued) Namibia: 0.13% (31 May 2020: 0.00%) (continued)
Government bonds: 0.13% (31 May 2020: 0.00%) 200,000 Namibia International Bonds Series REGS 5.5%
03/11/2021USD 203,240 0.06
Total Namibia 417,482 0.13
Netherlands: 1.74% (31 May 2020: 1.35%)
Corporate bonds: 1.54% (31 May 2020: 1.31%)280,000 Bharti Airtel International Netherlands BV Series REGS
5.35% 20/05/2024USD 309,263 0.10
365,000 Braskem Netherlands Finance BV Series REGS 4.5% 31/01/2030
USD 380,239 0.12
250,000 Minejesa Capital BV Series REGS 4.625% 10/08/2030 USD 260,750 0.08400,000 Minejesa Capital BV Series REGS 5.625% 10/08/2037 USD 415,600 0.14500,000 Mong Duong Finance Holdings BV Series REGS 5.125%
07/05/2029USD 498,207 0.16
591,450 MV24 Capital BV Series REGS 6.748% 01/06/2034 USD 636,814 0.21585,000 Petrobras Global Finance BV 6.75% 03/06/2050 USD 658,710 0.21175,000 Petrobras Global Finance BV 6.9% 19/03/2049 USD 204,313 0.07385,000 Prosus NV Series REGS 3.832% 08/02/2051 USD 356,891 0.12815,000 VEON Holdings BV Series REGS 3.375% 25/11/2027 USD 821,764 0.26200,000 VEON Holdings BV Series REGS 4% 09/04/2025 USD 212,015 0.07
Government sponsored agencies: 0.20% (31 May 2020: 0.04%)
540,000 Greenko Dutch BV Series REGS 3.85% 29/03/2026 USD 552,766 0.1860,000 Petrobras Global Finance BV 5.6% 03/01/2031 USD 65,625 0.02
Total Netherlands 5,372,957 1.74
Nigeria: 0.92% (31 May 2020: 1.17%)
Government bonds: 0.92% (31 May 2020: 1.17%)225,000 Nigeria Government International Bond Series REGS 6.5%
28/11/2027USD 240,361 0.08
645,000 Nigeria Government International Bond Series REGS 7.143% 23/02/2030
USD 687,842 0.22
440,000 Nigeria Government International Bond Series REGS 7.625% 21/11/2025
USD 500,942 0.16
660,000 Nigeria Government International Bond Series REGS 7.625% 28/11/2047
USD 667,656 0.22
255,000 Nigeria Government International Bond Series REGS 7.696% 23/02/2038
USD 263,667 0.08
Schedule of investments as at 31 May 2021 (continued)
Transferable securities admitted to an official stock exchange listing or traded on a regulated market. The percentages in brackets show the equivalent sector holdings at 31 May 2020.
338

Barclays Multi-Manager Fund PLC Annual Report and Audited Financial Statements 2021
GlobalAccess Emerging Market Debt Fund
Holdings Financial assets at fair value through profit or loss Currency Fair value
USD % of net
assets
Bonds: 88.72% (31 May 2020: 89.77%) (continued) Nigeria: 0.92% (31 May 2020: 1.17%) (continued)
Government bonds: 0.92% (31 May 2020: 1.17%) 430,000 Nigeria Government International Bond Series REGS
8.747% 21/01/2031USD 493,090 0.16
Total Nigeria 2,853,558 0.92
Oman: 2.32% (31 May 2020: 1.76%)
Government bonds: 2.32% (31 May 2020: 1.76%)995,000 Oman Government International Bond Series REGS
3.625% 15/06/2021USD 996,341 0.32
420,000 Oman Government International Bond Series REGS 4.75% 15/06/2026
USD 434,650 0.14
545,000 Oman Government International Bond Series REGS 4.875% 01/02/2025
USD 571,079 0.18
345,000 Oman Government International Bond Series REGS 5.375% 08/03/2027
USD 359,766 0.12
865,000 Oman Government International Bond Series REGS 5.625% 17/01/2028
USD 907,311 0.29
400,000 Oman Government International Bond Series REGS 6.25% 25/01/2031
USD 425,528 0.14
645,000 Oman Government International Bond Series REGS 6.5% 08/03/2047
USD 622,257 0.20
1,780,000 Oman Government International Bond Series REGS 6.75% 17/01/2048
USD 1,746,322 0.56
495,000 Oman Government International Bond Series REGS 7% 25/01/2051
USD 495,515 0.16
560,000 Oman Government International Bond Series REGS 7.375% 28/10/2032
USD 634,392 0.21
Total Oman 7,193,161 2.32
Pakistan: 1.59% (31 May 2020: 0.65%)
Corporate bonds: 0.47% (31 May 2020: 0.48%)1,055,000 Third Pakistan International Sukuk Co Ltd Series REGS
5.5% 13/10/2021USD 1,066,315 0.34
375,000 Third Pakistan International Sukuk Co Ltd Series REGS 5.625% 05/12/2022
USD 386,310 0.13
Government bonds: 1.12% (31 May 2020: 0.17%)420,000 Pakistan Government International Bond Series REGS 6%
08/04/2026USD 431,130 0.14
2,470,000 Pakistan Government International Bond Series REGS 6.875% 05/12/2027
USD 2,587,325 0.84
Schedule of investments as at 31 May 2021 (continued)
Transferable securities admitted to an official stock exchange listing or traded on a regulated market. The percentages in brackets show the equivalent sector holdings at 31 May 2020.
339

Barclays Multi-Manager Fund PLC Annual Report and Audited Financial Statements 2021
GlobalAccess Emerging Market Debt Fund
Holdings Financial assets at fair value through profit or loss Currency Fair value
USD % of net
assets
Bonds: 88.72% (31 May 2020: 89.77%) (continued) Pakistan: 1.59% (31 May 2020: 0.65%) (continued)
Government bonds: 1.12% (31 May 2020: 0.17%) 425,000 Pakistan Government International Bond Series REGS
7.375% 08/04/2031USD 445,289 0.14
Total Pakistan 4,916,369 1.59
Panama: 2.09% (31 May 2020: 3.52%)
Corporate bonds: 0.08% (31 May 2020: 0.09%)236,698 Aeropuerto Internacional de Tocumen SA Series REGS 6%
18/11/2048USD 255,119 0.08
Government bonds: 2.01% (31 May 2020: 3.43%)200,000 Aeropuerto Internacional de Tocumen SA Series REGS
5.625% 18/05/2036USD 216,000 0.07
955,000 Panama Government International Bond 3.16% 23/01/2030
USD 1,001,566 0.33
780,000 Panama Government International Bond 3.75% 17/04/2026
USD 843,180 0.27
615,000 Panama Government International Bond 3.87% 23/07/2060
USD 618,377 0.20
1,280,000 Panama Government International Bond 3.875% 17/03/2028
USD 1,414,214 0.46
140,000 Panama Government International Bond 4.3% 29/04/2053
USD 151,201 0.05
85,000 Panama Government International Bond 4.5% 16/04/2050
USD 94,372 0.03
1,675,000 Panama Government International Bond 4.5% 01/04/2056
USD 1,857,525 0.60
Total Panama 6,451,554 2.09
Papua New Guinea: 0.02% (31 May 2020: 0.00%)
Government bonds: 0.02% (31 May 2020: 0.00%)55,000 Papua New Guinea Government International Bond Series
REGS 8.375% 04/10/2028USD 54,175 0.02
Total Papua New Guinea 54,175 0.02
Schedule of investments as at 31 May 2021 (continued)
Transferable securities admitted to an official stock exchange listing or traded on a regulated market. The percentages in brackets show the equivalent sector holdings at 31 May 2020.
340

Barclays Multi-Manager Fund PLC Annual Report and Audited Financial Statements 2021
GlobalAccess Emerging Market Debt Fund
Holdings Financial assets at fair value through profit or loss Currency Fair value
USD % of net
assets
Bonds: 88.72% (31 May 2020: 89.77%) (continued)
Paraguay: 1.38% (31 May 2020: 2.15%)
Corporate bonds: 0.21% (31 May 2020: 0.08%)600,000 Telefonica Celular del Paraguay SA Series REGS 5.875%
15/04/2027USD 633,750 0.21
Government bonds: 1.17% (31 May 2020: 2.07%)960,000 Paraguay Government International Bond Series REGS
4.625% 25/01/2023USD 1,017,610 0.33
1,055,000 Paraguay Government International Bond Series REGS 4.7% 27/03/2027
USD 1,188,468 0.38
190,000 Paraguay Government International Bond Series REGS 4.95% 28/04/2031
USD 215,984 0.07
780,000 Paraguay Government International Bond Series REGS 5% 15/04/2026
USD 885,300 0.29
170,000 Paraguay Government International Bond Series REGS 5.4% 30/03/2050
USD 194,482 0.06
105,000 Paraguay Government International Bond Series REGS 6.1% 11/08/2044 - Germany
USD 127,995 0.04
Total Paraguay 4,263,589 1.38
People's Republic of China: 0.18% (31 May 2020: 0.21%)
Corporate bonds: 0.18% (31 May 2020: 0.21%)495,000 Industrial & Commercial Bank of China Ltd Series REGS
4.875% 21/09/2025USD 555,543 0.18
Total People's Republic of China 555,543 0.18
Peru: 1.43% (31 May 2020: 1.03%)
Corporate bonds: 0.39% (31 May 2020: 0.31%)395,000 Banco de Credito del Peru Series REGS FRN 01/07/2030 USD 390,560 0.12210,000 Banco de Credito del Peru Series REGS FRN 30/09/2031 USD 206,430 0.07200,000 Banco Internacional del Peru SAA Interbank Series REGS
3.25% 04/10/2026USD 203,552 0.06
400,000 Kallpa Generacion SA Series REGS 4.875% 24/05/2026 USD 422,940 0.14
Government bonds: 1.04% (31 May 2020: 0.72%)350,000 Peru LNG Srl Series REGS 5.375% 22/03/2030 USD 277,900 0.09689,000 Peruvian Government International Bond 1.862%
01/12/2032USD 627,600 0.20
780,000 Peruvian Government International Bond 2.78% 01/12/2060
USD 649,748 0.21
630,000 Peruvian Government International Bond 2.783% 23/01/2031
USD 633,156 0.21
145,000 Peruvian Government International Bond 3.23% 28/07/2121
USD 120,407 0.04
Schedule of investments as at 31 May 2021 (continued)
Transferable securities admitted to an official stock exchange listing or traded on a regulated market. The percentages in brackets show the equivalent sector holdings at 31 May 2020.
341

Barclays Multi-Manager Fund PLC Annual Report and Audited Financial Statements 2021
GlobalAccess Emerging Market Debt Fund
Holdings Financial assets at fair value through profit or loss Currency Fair value
USD % of net
assets
Bonds: 88.72% (31 May 2020: 89.77%) (continued) Peru: 1.43% (31 May 2020: 1.03%) (continued)
Government bonds: 1.04% (31 May 2020: 0.72%) 640,000 Peruvian Government International Bond 3.55%
10/03/2051USD 627,686 0.20
50,000 Peruvian Government International Bond 6.55% 14/03/2037
USD 67,528 0.02
130,000 Peruvian Government International Bond 8.75% 21/11/2033
USD 202,215 0.07
Total Peru 4,429,722 1.43
Philippines: 0.22% (31 May 2020: 0.89%)
Government bonds: 0.22% (31 May 2020: 0.89%)305,000 Philippine Government International Bond 3.95%
20/01/2040USD 334,316 0.11
140,000 Philippine Government International Bond 6.375% 15/01/2032
USD 192,292 0.06
120,000 Philippine Government International Bond 6.375% 23/10/2034
USD 169,250 0.05
Total Philippines 695,858 0.22
Qatar: 0.97% (31 May 2020: 3.89%)
Government bonds: 0.97% (31 May 2020: 3.89%)225,000 Qatar Government International Bond Series REGS 3.75%
16/04/2030USD 255,325 0.08
695,000 Qatar Government International Bond Series REGS 4.4% 16/04/2050
USD 828,732 0.27
595,000 Qatar Government International Bond Series REGS 4.817% 14/03/2049
USD 751,702 0.25
886,000 Qatar Government International Bond Series REGS 5.103% 23/04/2048
USD 1,152,314 0.37
Total Qatar 2,988,073 0.97
Romania: 2.74% (31 May 2020: 1.39%)
Government bonds: 2.74% (31 May 2020: 1.39%)341,000 Romanian Government International Bond Series REGS
1.375% 02/12/2029EUR 414,120 0.13
1,410,000 Romanian Government International Bond Series REGS 2% 28/01/2032
EUR 1,729,195 0.56
1,405,000 Romanian Government International Bond Series REGS 2.124% 16/07/2031
EUR 1,757,644 0.57
365,000 Romanian Government International Bond Series REGS 2.625% 02/12/2040
EUR 442,490 0.14
Schedule of investments as at 31 May 2021 (continued)
Transferable securities admitted to an official stock exchange listing or traded on a regulated market. The percentages in brackets show the equivalent sector holdings at 31 May 2020.
342

Barclays Multi-Manager Fund PLC Annual Report and Audited Financial Statements 2021
GlobalAccess Emerging Market Debt Fund
Holdings Financial assets at fair value through profit or loss Currency Fair value
USD % of net
assets
Bonds: 88.72% (31 May 2020: 89.77%) (continued) Romania: 2.74% (31 May 2020: 1.39%) (continued)
Government bonds: 2.74% (31 May 2020: 1.39%) 260,000 Romanian Government International Bond Series REGS
2.75% 14/04/2041EUR 315,136 0.10
270,000 Romanian Government International Bond Series EMTN 2.875% 11/03/2029
EUR 363,945 0.12
580,000 Romanian Government International Bond Series REGS 3% 14/02/2031
USD 596,936 0.19
545,000 Romanian Government International Bond Series REGS 3.375% 08/02/2038
EUR 720,206 0.23
385,000 Romanian Government International Bond Series REGS 3.375% 28/01/2050
EUR 496,874 0.16
32,000 Romanian Government International Bond Series REGS 3.624% 26/05/2030
EUR 45,049 0.02
653,000 Romanian Government International Bond Series REGS 3.875% 29/10/2035
EUR 928,663 0.30
160,000 Romanian Government International Bond Series REGS 4% 14/02/2051
USD 164,448 0.05
185,000 Romanian Government International Bond Series EMTN 4.125% 11/03/2039
EUR 264,691 0.09
180,000 Romanian Government International Bond Series REGS 6.125% 22/01/2044
USD 241,304 0.08
Total Romania 8,480,701 2.74
Russian Federation: 3.30% (31 May 2020: 3.90%)
Government bonds: 3.30% (31 May 2020: 3.90%)400,000 Russian Foreign Bond - Eurobond 1.85% 20/11/2032 EUR 475,929 0.15
1,800,000 Russian Foreign Bond - Eurobond Series REGS 4.25% 23/06/2027
USD 2,006,780 0.65
2,800,000 Russian Foreign Bond - Eurobond Series REGS 4.375% 21/03/2029
USD 3,149,306 1.02
1,000,000 Russian Foreign Bond - Eurobond Series REGS 4.75% 27/05/2026
USD 1,134,435 0.37
1,400,000 Russian Foreign Bond - Eurobond Series REGS 5.1% 28/03/2035
USD 1,655,763 0.53
200,000 Russian Foreign Bond - Eurobond Series REGS 5.25% 23/06/2047
USD 249,212 0.08
800,000 Russian Foreign Bond - Eurobond Series REGS 5.625% 04/04/2042
USD 1,014,716 0.33
461,250 Russian Foreign Bond - Eurobond Series REGS 7.5% 31/03/2030
USD 532,212 0.17
Schedule of investments as at 31 May 2021 (continued)
Transferable securities admitted to an official stock exchange listing or traded on a regulated market. The percentages in brackets show the equivalent sector holdings at 31 May 2020.
343

Barclays Multi-Manager Fund PLC Annual Report and Audited Financial Statements 2021
GlobalAccess Emerging Market Debt Fund
Holdings Financial assets at fair value through profit or loss Currency Fair value
USD % of net
assets
Bonds: 88.72% (31 May 2020: 89.77%) (continued)
Russian Federation: 3.30% (31 May 2020: 3.90%) (continued)
Government bonds: 3.30% (31 May 2020: 3.90%) 1 Russian Foreign Bond - Eurobond Series REGS 7.5%
31/03/2030USD – –
Total Russian Federation 10,218,353 3.30
Saudi Arabia: 1.80% (31 May 2020: 2.28%)
Corporate bonds: 0.48% (31 May 2020: 0.96%)405,000 Saudi Arabian Oil Co Series REGS 2.875% 16/04/2024 USD 429,549 0.14985,000 Saudi Arabian Oil Co Series REGS 3.5% 16/04/2029 USD 1,066,690 0.34
Government bonds: 1.32% (31 May 2020: 1.32%)610,000 Saudi Government International Bond Series REGS 2.25%
02/02/2033USD 584,902 0.19
285,000 Saudi Government International Bond Series REGS 2.75% 03/02/2032
USD 289,476 0.09
1,311,000 Saudi Government International Bond Series REGS 3.45% 02/02/2061
USD 1,264,722 0.41
235,000 Saudi Government International Bond Series REGS 3.625% 04/03/2028 - Ireland
USD 259,678 0.08
415,000 Saudi Government International Bond Series REGS 3.75% 21/01/2055
USD 424,551 0.14
500,000 Saudi Government International Bond Series REGS 4.375% 16/04/2029
USD 578,550 0.19
235,000 Saudi Government International Bond Series REGS 4.5% 26/10/2046
USD 269,423 0.09
325,000 Saudi Government International Bond Series REGS 5% 17/04/2049
USD 401,053 0.13
Total Saudi Arabia 5,568,594 1.80
Senegal: 1.04% (31 May 2020: 1.15%)
Government bonds: 1.04% (31 May 2020: 1.15%)400,000 Senegal Government International Bond Series REGS
6.25% 30/07/2024USD 446,468 0.14
1,020,000 Senegal Government International Bond Series REGS 6.25% 23/05/2033
USD 1,081,490 0.35
1,673,000 Senegal Government International Bond Series REGS 6.75% 13/03/2048
USD 1,705,590 0.55
Total Senegal 3,233,548 1.04
Schedule of investments as at 31 May 2021 (continued)
Transferable securities admitted to an official stock exchange listing or traded on a regulated market. The percentages in brackets show the equivalent sector holdings at 31 May 2020.
344

Barclays Multi-Manager Fund PLC Annual Report and Audited Financial Statements 2021
GlobalAccess Emerging Market Debt Fund
Holdings Financial assets at fair value through profit or loss Currency Fair value
USD % of net
assets
Bonds: 88.72% (31 May 2020: 89.77%) (continued)
Serbia: 1.27% (31 May 2020: 0.68%)
Government bonds: 1.27% (31 May 2020: 0.68%)1,395,000 Serbia International Bond Series REGS 1.5% 26/06/2029 EUR 1,703,562 0.55
120,000 Serbia International Bond Series REGS 1.65% 03/03/2033 EUR 141,937 0.041,545,000 Serbia International Bond Series REGS 3.125% 15/05/2027 EUR 2,096,884 0.68
Total Serbia 3,942,383 1.27
Singapore: 0.29% (31 May 2020: 0.08%)
Corporate bonds: 0.29% (31 May 2020: 0.08%)450,000 ABJA Investment Co Pte Ltd 5.45% 24/01/2028 USD 478,688 0.15200,000 Continuum Energy Levanter Pte Ltd Series REGS 4.5%
09/02/2027USD 203,975 0.07
182,400 LLPL Capital Pte Ltd Series REGS 6.875% 04/02/2039 USD 213,507 0.07
Total Singapore 896,170 0.29
South Africa: 1.03% (31 May 2020: 1.01%)
Corporate bonds: 0.24% (31 May 2020: 0.44%)200,000 Eskom Holdings SOC Ltd Series REGS 6.35% 10/08/2028 USD 225,181 0.07260,000 Eskom Holdings SOC Ltd Series REGS 6.75% 06/08/2023 USD 274,734 0.09210,000 Eskom Holdings SOC Ltd Series REGS 8.45% 10/08/2028 USD 237,828 0.08
Government bonds: 0.69% (31 May 2020: 0.47%)205,000 Republic of South Africa Government International Bond
4.85% 27/09/2027USD 221,158 0.07
235,000 Republic of South Africa Government International Bond 4.875% 14/04/2026
USD 255,323 0.08
205,000 Republic of South Africa Government International Bond 5.65% 27/09/2047
USD 206,891 0.07
860,000 Republic of South Africa Government International Bond 5.75% 30/09/2049
USD 868,796 0.28
290,000 Republic of South Africa Government International Bond 5.875% 22/06/2030
USD 329,519 0.11
235,000 Republic of South Africa Government International Bond 6.25% 08/03/2041
USD 256,013 0.08
Government sponsored agencies: 0.10% (31 May 2020: 0.10%)
285,000 Eskom Holdings SOC Ltd Series REGS 7.125% 11/02/2025 USD 302,411 0.10
Total South Africa 3,177,854 1.03
Schedule of investments as at 31 May 2021 (continued)
Transferable securities admitted to an official stock exchange listing or traded on a regulated market. The percentages in brackets show the equivalent sector holdings at 31 May 2020.
345

Barclays Multi-Manager Fund PLC Annual Report and Audited Financial Statements 2021
GlobalAccess Emerging Market Debt Fund
Holdings Financial assets at fair value through profit or loss Currency Fair value
USD % of net
assets
Bonds: 88.72% (31 May 2020: 89.77%) (continued)
Spain: 0.00% (31 May 2020: 0.09%)
Corporate bonds: 0.00% (31 May 2020: 0.09%)
Sri Lanka: 1.05% (31 May 2020: 1.37%)
Government bonds: 1.05% (31 May 2020: 1.37%)205,000 Sri Lanka Government International Bond Series REGS
5.75% 18/04/2023USD 164,642 0.05
345,000 Sri Lanka Government International Bond Series REGS 5.875% 25/07/2022
USD 307,050 0.09
120,000 Sri Lanka Government International Bond Series REGS 6.125% 03/06/2025
USD 87,540 0.03
700,000 Sri Lanka Government International Bond Series REGS 6.2% 11/05/2027
USD 473,522 0.15
815,000 Sri Lanka Government International Bond Series REGS 6.75% 18/04/2028
USD 551,812 0.18
915,000 Sri Lanka Government International Bond Series REGS 6.85% 14/03/2024
USD 683,075 0.22
1,160,000 Sri Lanka Government International Bond Series REGS 6.85% 03/11/2025 - Singapore
USD 838,494 0.28
85,000 Sri Lanka Government International Bond Series REGS 7.55% 28/03/2030
USD 57,551 0.02
130,000 Sri Lanka Government International Bond Series REGS 7.85% 14/03/2029
USD 88,163 0.03
Total Sri Lanka 3,251,849 1.05
Supranational: 0.30% (31 May 2020: 0.64%)
Government sponsored agencies: 0.00% (31 May 2020: 0.29%)
Supranational: 0.30% (31 May 2020: 0.35%)64,400,000 International Finance Corp Series GMTN 0% 22/02/2038 MXN 918,371 0.30
Total Supranational 918,371 0.30
Suriname: 0.02% (31 May 2020: 0.00%)
Government bonds: 0.02% (31 May 2020: 0.00%)70,000 Suriname Government International Bond Series REGS
9.25% 26/10/2026USD 50,085 0.02
Total Suriname 50,085 0.02
Schedule of investments as at 31 May 2021 (continued)
Transferable securities admitted to an official stock exchange listing or traded on a regulated market. The percentages in brackets show the equivalent sector holdings at 31 May 2020.
346

Barclays Multi-Manager Fund PLC Annual Report and Audited Financial Statements 2021
GlobalAccess Emerging Market Debt Fund
Holdings Financial assets at fair value through profit or loss Currency Fair value
USD % of net
assets
Bonds: 88.72% (31 May 2020: 89.77%) (continued)
Trinidad: 0.09% (31 May 2020: 0.00%)
Government bonds: 0.09% (31 May 2020: 0.00%)95,000 Trinidad & Tobago Government International Bond Series
REGS 4.5% 04/08/2026USD 101,935 0.03
175,000 Trinidad & Tobago Government International Bond Series REGS 4.5% 26/06/2030
USD 183,986 0.06
Total Trinidad 285,921 0.09
Tunisia: 0.39% (31 May 2020: 0.41%)
Government bonds: 0.28% (31 May 2020: 0.30%)895,000 Banque Centrale de Tunisie International Bond Series
REGS 5.75% 30/01/2025USD 849,154 0.28
Government sponsored agencies: 0.11% (31 May 2020: 0.11%)
300,000 Banque Centrale de Tunisie International Bond Series REGS 6.375% 15/07/2026
EUR 348,923 0.11
Total Tunisia 1,198,077 0.39
Turkey: 2.77% (31 May 2020: 2.26%)
Corporate bonds: 0.08% (31 May 2020: 0.00%)225,000 Turkiye Vakiflar Bankasi TAO Series REGS 5.75%
30/01/2023USD 230,721 0.08
Government bonds: 2.62% (31 May 2020: 2.26%)290,000 Export Credit Bank of Turkey Series REGS 4.25%
18/09/2022USD 293,814 0.09
950,000 Turkey Government International Bond 3.25% 23/03/2023
USD 944,813 0.31
225,000 Turkey Government International Bond 4.875% 09/10/2026
USD 218,739 0.07
480,000 Turkey Government International Bond 5.25% 13/03/2030 USD 448,338 0.14480,000 Turkey Government International Bond 5.6% 14/11/2024 USD 491,176 0.16375,000 Turkey Government International Bond 5.75% 22/03/2024 USD 387,674 0.13
2,350,000 Turkey Government International Bond 5.75% 11/05/2047 USD 1,964,668 0.63220,000 Turkey Government International Bond 5.75% 11/05/2047 USD 183,926 0.06645,000 Turkey Government International Bond 5.875%
26/06/2031USD 617,178 0.20
330,000 Turkey Government International Bond 5.95% 15/01/2031 USD 318,803 0.10260,000 Turkey Government International Bond 6% 25/03/2027 USD 263,400 0.09290,000 Turkey Government International Bond 6.35% 10/08/2024 USD 303,306 0.10325,000 Turkey Government International Bond 6.375%
14/10/2025USD 338,475 0.11
Schedule of investments as at 31 May 2021 (continued)
Transferable securities admitted to an official stock exchange listing or traded on a regulated market. The percentages in brackets show the equivalent sector holdings at 31 May 2020.
347

Barclays Multi-Manager Fund PLC Annual Report and Audited Financial Statements 2021
GlobalAccess Emerging Market Debt Fund
Holdings Financial assets at fair value through profit or loss Currency Fair value
USD % of net
assets
Bonds: 88.72% (31 May 2020: 89.77%) (continued) Turkey: 2.77% (31 May 2020: 2.26%) (continued)
Government bonds: 2.62% (31 May 2020: 2.26%) 225,000 Turkey Government International Bond 6.75%
30/05/2040USD 217,391 0.07
225,000 Turkey Government International Bond 7.25% 23/12/2023 USD 242,310 0.08325,000 Turkey Government International Bond 7.375%
05/02/2025USD 349,783 0.11
495,000 Turkey Government International Bond 7.625% 26/04/2029
USD 534,316 0.17
Government sponsored agencies: 0.07% (31 May 2020: 0.00%)
205,000 Turkiye Ihracat Kredi Bankasi AS Series REGS 8.25% 24/01/2024
USD 221,707 0.07
Total Turkey 8,570,538 2.77
Ukraine: 2.94% (31 May 2020: 2.22%)
Government bonds: 2.94% (31 May 2020: 2.22%)770,000 Ukraine Government International Bond Series REGS
6.876% 21/05/2029USD 803,789 0.26
2,885,000 Ukraine Government International Bond Series REGS 7.253% 15/03/2033
USD 3,036,621 0.98
2,458,000 Ukraine Government International Bond Series REGS 7.375% 25/09/2032
USD 2,610,666 0.84
345,000 Ukraine Government International Bond Series REGS 7.75% 01/09/2022
USD 364,228 0.12
305,000 Ukraine Government International Bond Series REGS 7.75% 01/09/2025
USD 338,857 0.11
800,000 Ukraine Government International Bond Series REGS 7.75% 01/09/2026
USD 893,240 0.29
730,000 Ukraine Government International Bond Series REGS 7.75% 01/09/2027
USD 812,726 0.26
200,000 Ukraine Government International Bond Series REGS 9.75% 01/11/2028
USD 239,893 0.08
Total Ukraine 9,100,020 2.94
United Arab Emirates: 1.86% (31 May 2020: 2.03%)
Corporate bonds: 0.82% (31 May 2020: 0.00%)1,535,000 Emirate of Dubai Government International Bonds Series
EMTN 3.9% 09/09/2050USD 1,421,333 0.46
235,000 National Central Cooling Co PJSC 2.5% 21/10/2027 USD 233,953 0.08400,000 NBK Tier 1 Financing Ltd Series REGS FRN Perpetual USD 401,388 0.13
Schedule of investments as at 31 May 2021 (continued)
Transferable securities admitted to an official stock exchange listing or traded on a regulated market. The percentages in brackets show the equivalent sector holdings at 31 May 2020.
348

Barclays Multi-Manager Fund PLC Annual Report and Audited Financial Statements 2021
GlobalAccess Emerging Market Debt Fund
Holdings Financial assets at fair value through profit or loss Currency Fair value
USD % of net
assets
Bonds: 88.72% (31 May 2020: 89.77%) (continued)
United Arab Emirates: 1.86% (31 May 2020: 2.03%) (continued)
Corporate bonds: 0.82% (31 May 2020: 0.00%)
450,000 NBK Tier 1 Financing Ltd Series REGS FRN Perpetual USD 472,097 0.15
Government bonds: 1.04% (31 May 2020: 2.03%)1,585,000 Abu Dhabi Government International Bond Series REGS
3.125% 30/09/2049USD 1,573,644 0.51
309,000 Emirate of Dubai Government International Bonds Series EMTN 5.25% 30/01/2043
USD 343,135 0.11
405,000 Finance Department Government of Sharjah Series REGS 3.625% 10/03/2033
USD 408,485 0.13
200,000 Finance Department Government of Sharjah Series REGS 4% 28/07/2050
USD 183,816 0.06
730,000 Finance Department Government of Sharjah Series REGS 4.375% 10/03/2051
USD 707,096 0.23
Total United Arab Emirates 5,744,947 1.86
United Kingdom: 0.82% (31 May 2020: 0.85%)
Corporate bonds: 0.78% (31 May 2020: 0.62%)405,000 MARB BondCo PLC Series REGS 3.95% 29/01/2031 USD 389,883 0.13435,000 NAK Naftogaz Ukraine via Kondor Finance PLC 7.125%
19/07/2024EUR 545,067 0.18
670,000 NAK Naftogaz Ukraine via Kondor Finance PLC 7.375% 19/07/2022
USD 686,750 0.22
430,000 NAK Naftogaz Ukraine via Kondor Finance PLC Series REGS 7.625% 08/11/2026
USD 437,552 0.14
340,000 Ukraine Railways Via Rail Capital Markets PLC 8.25% 09/07/2024
USD 354,280 0.11
Government bonds: 0.04% (31 May 2020: 0.23%)120,000 Ukreximbank Via Biz Finance PLC Series REGS 9.75%
22/01/2025USD 129,598 0.04
Total United Kingdom 2,543,130 0.82
United States: 0.47% (31 May 2020: 0.07%)
Corporate bonds: 0.41% (31 May 2020: 0.07%)295,000 BOC Aviation USA Corp Series REGS 1.625% 29/04/2024 USD 297,448 0.10
Schedule of investments as at 31 May 2021 (continued)
Transferable securities admitted to an official stock exchange listing or traded on a regulated market. The percentages in brackets show the equivalent sector holdings at 31 May 2020.
349

Barclays Multi-Manager Fund PLC Annual Report and Audited Financial Statements 2021
GlobalAccess Emerging Market Debt Fund
Holdings Financial assets at fair value through profit or loss Currency Fair value
USD % of net
assets
Bonds: 88.72% (31 May 2020: 89.77%) (continued) United States: 0.47% (31 May 2020: 0.07%) (continued)
Corporate bonds: 0.41% (31 May 2020: 0.07%) 8,060,000 JPMorgan Chase Bank NA Series EMTN 2.68%
23/05/2030CNY 964,510 0.31
Government sponsored agencies: 0.06% (31 May 2020: 0.00%)
200,000 BOC Aviation USA Corp Series MAY 1.625% 29/04/2024 USD 201,659 0.06
Total United States 1,463,617 0.47
Uruguay: 0.12% (31 May 2020: 0.52%)
Government bonds: 0.12% (31 May 2020: 0.52%)299,000 Uruguay Government International Bond 5.1%
18/06/2050USD 378,401 0.12
Total Uruguay 378,401 0.12
Uzbekistan: 0.32% (31 May 2020: 0.08%)
Government bonds: 0.32% (31 May 2020: 0.08%)330,000 Republic of Uzbekistan Bond Series REGS 3.7%
25/11/2030USD 328,004 0.11
400,000 Republic of Uzbekistan Bond Series REGS 4.75% 20/02/2024
USD 427,072 0.14
200,000 Republic of Uzbekistan Bond Series REGS 5.375% 20/02/2029
USD 223,846 0.07
Total Uzbekistan 978,922 0.32
Venezuela: 0.22% (31 May 2020: 0.16%)
Government bonds: 0.22% (31 May 2020: 0.16%)156,500 Petroleos de Venezuela SA 8.50% 27/10/2020 USD 42,255 0.01
3,730,000 Petroleos de Venezuela SA 6.00% 15/11/2026 USD 167,850 0.05595,000 Venezuela Government International Bond 8.25%
13/10/2024USD 62,475 0.02
460,000 Venezuela Government International Bond 7.65% 21/04/2025
USD 48,300 0.02
35,000 Venezuela Government International Bond 9.375% 07/05/2028 - Germany
USD 3,675 –
3,339,400 Venezuela Government International Bond 9.375% 13/01/2034
USD 350,637 0.12
Total Venezuela 675,192 0.22
Schedule of investments as at 31 May 2021 (continued)
Transferable securities admitted to an official stock exchange listing or traded on a regulated market. The percentages in brackets show the equivalent sector holdings at 31 May 2020.
350

Barclays Multi-Manager Fund PLC Annual Report and Audited Financial Statements 2021
GlobalAccess Emerging Market Debt Fund
Holdings Financial assets at fair value through profit or loss Currency Fair value
USD % of net
assets
Bonds: 88.72% (31 May 2020: 89.77%) (continued)
Virgin Islands: 0.07% (31 May 2020: 0.07%)
Government bonds: 0.07% (31 May 2020: 0.07%)177,340 Star Energy Geothermal Wayang Windu Ltd Series REGS
6.75% 24/04/2033USD 202,067 0.07
Total Virgin Islands 202,067 0.07
Zambia: 0.18% (31 May 2020: 0.04%)
Government bonds: 0.18% (31 May 2020: 0.04%)255,000 Zambia Government International Bond Series REGS 8.5%
14/04/2024USD 170,156 0.06
580,000 Zambia Government International Bond Series REGS 8.97% 30/07/2027 - London
USD 380,859 0.12
Total Zambia 551,015 0.18
Total bonds 274,525,286 88.72
Accrued income on financial assets at fair value through profit or loss: 1.15% (31 May 2020: 1.16%) 3,558,454 1.15
Investment funds: 4.96% (31 May 2020: 4.10%)
Ireland: 4.96% (31 May 2020: 4.10%)
138,000 iShares JP Morgan Emerging Markets Bond UCITS ETF 4.128%
USD 15,353,190 4.96
Total investment funds 15,353,190 4.96
No. of contracts Futures contracts: 0.09% (31 May 2020: 0.07%) CounterpartyUnrealised gain/(loss)
% of net assets
USD(98) Euro-Bund EUX Future June 2021 JP Morgan 128,503 0.04(15) Euro-BUXL Bond Future June 2021 JP Morgan 103,441 0.03
47 US Ultra CBT Future September 2021 JP Morgan 40,687 0.01202 US 5 Year T-Note CBT Future September 2021 JP Morgan 23,670 0.01
58 US Long Bond CBT Future September 2021 JP Morgan 11,828 0.0174 US 2 Year T-Note Future September 2021 JP Morgan 5,118 –
(5) Euro-BOBL EUX Future June 2021 JP Morgan 1,186 –(19) US 10 Year Ultra CBT Future September 2021 JP Morgan 1,133 –
(138) US 10 Year T-Note Future September 2021 JP Morgan 1,107 –
Total fair value gains on open futures contracts 316,673 0.10
(6) Euro-SCHATZ EUX Future June 2021 JP Morgan (293) – 9K6TQAU
Schedule of investments as at 31 May 2021 (continued)
Transferable securities admitted to an official stock exchange listing or traded on a regulated market. The percentages in brackets show the equivalent sector holdings at 31 May 2020.
351

Barclays Multi-Manager Fund PLC Annual Report and Audited Financial Statements 2021
GlobalAccess Emerging Market Debt Fund
No. of contracts Futures contracts: 0.09% (31 May 2020: 0.07%) Counterparty Unrealised gain/(loss)
% of net assets
USD 6 US Long Bond CBT Future September 2021 JP Morgan (609) – DUMMY_08
(2) Euro-Bund EUX Future June 2021 JP Morgan (2,042) – DUMMY_07(4) Euro-BUXL Bond Future June 2021 JP Morgan (14,721) (0.01) DUMMY_09
Total fair value losses on open futures contracts (17,665) (0.01)
Total futures contracts 299,008 0.09
Forward currency contracts: 0.79% (31 May 2020: 0.60%)
Counterparty Cncy Buys Cncy SellsMaturity
dateUnrealised
gain% of net
assetsUSD
Bank of America INR 26,810,000 USD 360,446 16/06/2021 8,171 – CCT_1776772_67378
Bank of America EUR 128,000 USD 151,667 16/06/2021 4,868 – CCT_1776772_66268
Bank of America PLN 1,345,000 USD 363,949 16/06/2021 3,247 – CCT_1776772_67794
Bank of America EUR 1,000 USD 1,215 16/06/2021 8 – CCT_1776772_67482
Barclays^ CZK 8,010,000 USD 366,800 16/06/2021 18,113 0.01 CCT_1776772_66621
Barclays^ EUR 105,000 USD 125,952 16/06/2021 2,456 – CCT_1776772_66746
Barclays^ EUR 4,000 USD 4,816 16/06/2021 76 – CCT_1776772_67155
BNP Paribas HUF 129,000,000 USD 418,139 16/06/2021 35,961 0.01 CCT_1776772_65454
BNP Paribas CZK 9,360,000 USD 424,260 16/06/2021 25,526 0.01 CCT_1776772_65449
BNP Paribas KRW 484,200,000 USD 426,244 16/06/2021 9,900 – CCT_1776772_65444
BNP Paribas SGD 575,000 USD 427,286 16/06/2021 7,991 – CCT_1776772_65446
BNP Paribas KRW 412,410,000 USD 368,125 16/06/2021 3,354 – CCT_1776772_66619
BNP Paribas COP 230,016,000 USD 61,506 16/06/2021 479 – CCT_1776772_66427
BNP Paribas EUR 1,000 USD 1,198 16/06/2021 25 – CCT_1776772_65637
Citibank INR 31,660,000 USD 427,468 16/06/2021 7,833 – CCT_1776772_65439
Goldman Sachs USD 335,697 TRY 2,675,000 16/06/2021 22,175 0.01 CCT_1776772_65440
Goldman Sachs PHP 21,250,000 USD 433,585 16/06/2021 11,656 0.01 CCT_1776772_65450
Goldman Sachs EGP 4,510,000 USD 284,992 16/06/2021 1,888 – CCT_1776772_67147
Goldman Sachs EUR 262,000 USD 319,883 16/06/2021 526 – CCT_1776772_67795
JP Morgan BRL 2,060,000 USD 364,022 2/06/2021 28,505 0.01 CCT_1776772_66628
JP Morgan RUB 28,300,000 USD 363,053 16/06/2021 22,083 0.01 CCT_1776772_66617
JP Morgan USD 183,203 COP 652,662,000 16/06/2021 7,324 – CCT_1776772_65530
JP Morgan SGD 495,000 USD 369,133 16/06/2021 5,584 – CCT_1776772_66620
Marine Midland Bank BRL 3,850,000 USD 707,734 2/06/2021 25,872 0.01 CCT_1776772_64751
Marine Midland Bank RUB 32,378,000 USD 433,116 16/06/2021 7,518 – CCT_1776772_65436
Morgan Stanley HUF 111,200,000 USD 369,859 16/06/2021 21,582 0.01 CCT_1776772_66618
Morgan Stanley EUR 584,000 USD 702,208 16/06/2021 11,985 0.01 CCT_1776772_67259
Morgan Stanley BRL 2,060,000 USD 386,833 2/09/2021 2,186 – CCT_1776772_68210
Morgan Stanley EUR 558,000 USD 681,328 16/06/2021 1,069 – CCT_1776772_67793
Morgan Stanley USD 381,576 EUR 312,000 16/06/2021 21 – CCT_1776772_67747
Northern Trust USD 742,200 TRY 5,840,000 16/06/2021 57,726 0.02 CCT_1776772_65785
Schedule of investments as at 31 May 2021 (continued)
Transferable securities admitted to an official stock exchange listing or traded on a regulated market. The percentages in brackets show the equivalent sector holdings at 31 May 2020.
352
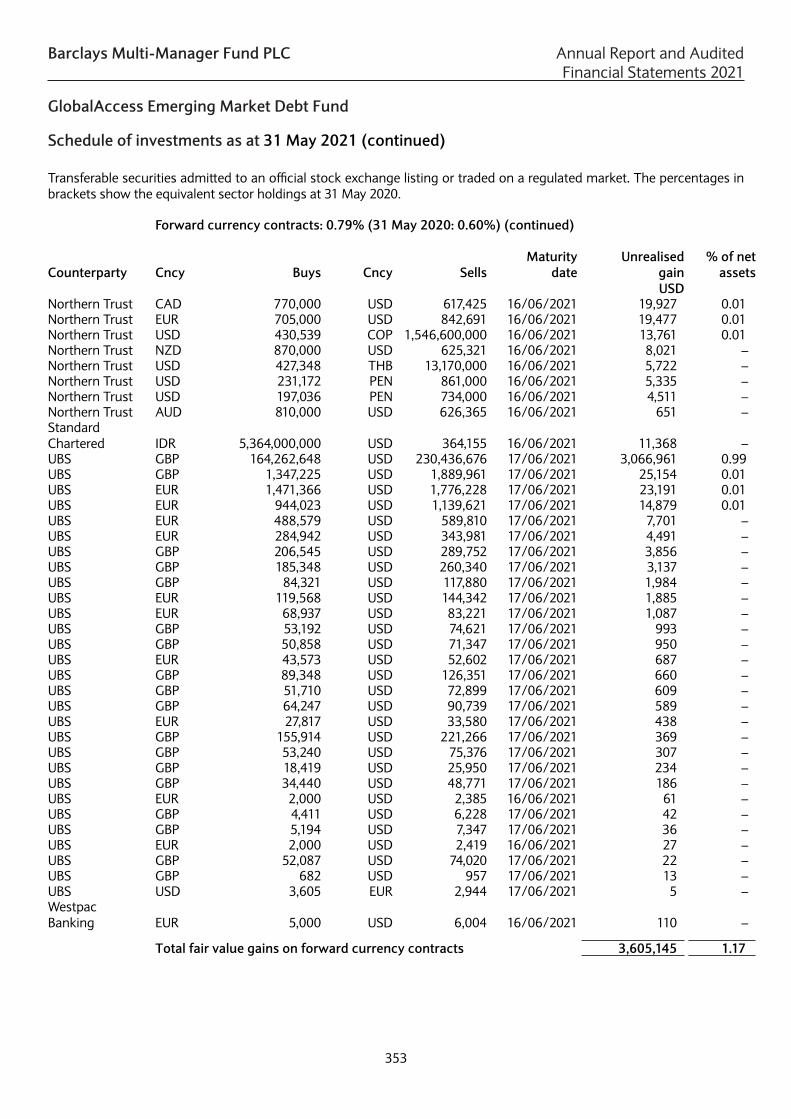
Barclays Multi-Manager Fund PLC Annual Report and Audited Financial Statements 2021
GlobalAccess Emerging Market Debt Fund
No. of contracts Futures contracts: 0.09% (31 May 2020: 0.07%) Counterparty Unrealised gain/(loss)
% of net assets
USD 6 US Long Bond CBT Future September 2021 JP Morgan (609) – DUMMY_08
(2) Euro-Bund EUX Future June 2021 JP Morgan (2,042) – DUMMY_07(4) Euro-BUXL Bond Future June 2021 JP Morgan (14,721) (0.01) DUMMY_09
Total fair value losses on open futures contracts (17,665) (0.01)
Total futures contracts 299,008 0.09
Forward currency contracts: 0.79% (31 May 2020: 0.60%)
Counterparty Cncy Buys Cncy SellsMaturity
dateUnrealised
gain% of net
assetsUSD
Bank of America INR 26,810,000 USD 360,446 16/06/2021 8,171 – CCT_1776772_67378
Bank of America EUR 128,000 USD 151,667 16/06/2021 4,868 – CCT_1776772_66268
Bank of America PLN 1,345,000 USD 363,949 16/06/2021 3,247 – CCT_1776772_67794
Bank of America EUR 1,000 USD 1,215 16/06/2021 8 – CCT_1776772_67482
Barclays^ CZK 8,010,000 USD 366,800 16/06/2021 18,113 0.01 CCT_1776772_66621
Barclays^ EUR 105,000 USD 125,952 16/06/2021 2,456 – CCT_1776772_66746
Barclays^ EUR 4,000 USD 4,816 16/06/2021 76 – CCT_1776772_67155
BNP Paribas HUF 129,000,000 USD 418,139 16/06/2021 35,961 0.01 CCT_1776772_65454
BNP Paribas CZK 9,360,000 USD 424,260 16/06/2021 25,526 0.01 CCT_1776772_65449
BNP Paribas KRW 484,200,000 USD 426,244 16/06/2021 9,900 – CCT_1776772_65444
BNP Paribas SGD 575,000 USD 427,286 16/06/2021 7,991 – CCT_1776772_65446
BNP Paribas KRW 412,410,000 USD 368,125 16/06/2021 3,354 – CCT_1776772_66619
BNP Paribas COP 230,016,000 USD 61,506 16/06/2021 479 – CCT_1776772_66427
BNP Paribas EUR 1,000 USD 1,198 16/06/2021 25 – CCT_1776772_65637
Citibank INR 31,660,000 USD 427,468 16/06/2021 7,833 – CCT_1776772_65439
Goldman Sachs USD 335,697 TRY 2,675,000 16/06/2021 22,175 0.01 CCT_1776772_65440
Goldman Sachs PHP 21,250,000 USD 433,585 16/06/2021 11,656 0.01 CCT_1776772_65450
Goldman Sachs EGP 4,510,000 USD 284,992 16/06/2021 1,888 – CCT_1776772_67147
Goldman Sachs EUR 262,000 USD 319,883 16/06/2021 526 – CCT_1776772_67795
JP Morgan BRL 2,060,000 USD 364,022 2/06/2021 28,505 0.01 CCT_1776772_66628
JP Morgan RUB 28,300,000 USD 363,053 16/06/2021 22,083 0.01 CCT_1776772_66617
JP Morgan USD 183,203 COP 652,662,000 16/06/2021 7,324 – CCT_1776772_65530
JP Morgan SGD 495,000 USD 369,133 16/06/2021 5,584 – CCT_1776772_66620
Marine Midland Bank BRL 3,850,000 USD 707,734 2/06/2021 25,872 0.01 CCT_1776772_64751
Marine Midland Bank RUB 32,378,000 USD 433,116 16/06/2021 7,518 – CCT_1776772_65436
Morgan Stanley HUF 111,200,000 USD 369,859 16/06/2021 21,582 0.01 CCT_1776772_66618
Morgan Stanley EUR 584,000 USD 702,208 16/06/2021 11,985 0.01 CCT_1776772_67259
Morgan Stanley BRL 2,060,000 USD 386,833 2/09/2021 2,186 – CCT_1776772_68210
Morgan Stanley EUR 558,000 USD 681,328 16/06/2021 1,069 – CCT_1776772_67793
Morgan Stanley USD 381,576 EUR 312,000 16/06/2021 21 – CCT_1776772_67747
Northern Trust USD 742,200 TRY 5,840,000 16/06/2021 57,726 0.02 CCT_1776772_65785
Forward currency contracts: 0.79% (31 May 2020: 0.60%) (continued)
Counterparty Cncy Buys Cncy SellsMaturity
date
Unrealised gain
% of net assets
USD Northern Trust CAD 770,000 USD 617,425 16/06/2021 19,927 0.01 CCT_1776772_65764
Northern Trust EUR 705,000 USD 842,691 16/06/2021 19,477 0.01 CCT_1776772_65765
Northern Trust USD 430,539 COP 1,546,600,000 16/06/2021 13,761 0.01 CCT_1776772_65782
Northern Trust NZD 870,000 USD 625,321 16/06/2021 8,021 – CCT_1776772_65773
Northern Trust USD 427,348 THB 13,170,000 16/06/2021 5,722 – CCT_1776772_65781
Northern Trust USD 231,172 PEN 861,000 16/06/2021 5,335 – CCT_1776772_65790
Northern Trust USD 197,036 PEN 734,000 16/06/2021 4,511 – CCT_1776772_65791
Northern Trust AUD 810,000 USD 626,365 16/06/2021 651 – CCT_1776772_65763
Standard Chartered IDR 5,364,000,000 USD 364,155 16/06/2021 11,368 – CCT_1776772_66624
UBS GBP 164,262,648 USD 230,436,676 17/06/2021 3,066,961 0.99 CCT_1776771_283913
UBS GBP 1,347,225 USD 1,889,961 17/06/2021 25,154 0.01 CCT_1776771_283910
UBS EUR 1,471,366 USD 1,776,228 17/06/2021 23,191 0.01 CCT_1776771_283919
UBS EUR 944,023 USD 1,139,621 17/06/2021 14,879 0.01 CCT_1776771_283921
UBS EUR 488,579 USD 589,810 17/06/2021 7,701 – CCT_1776771_283925
UBS EUR 284,942 USD 343,981 17/06/2021 4,491 – CCT_1776771_283928
UBS GBP 206,545 USD 289,752 17/06/2021 3,856 – CCT_1776771_283906
UBS GBP 185,348 USD 260,340 17/06/2021 3,137 – CCT_1776771_283908
UBS GBP 84,321 USD 117,880 17/06/2021 1,984 – CCT_1776771_283563
UBS EUR 119,568 USD 144,342 17/06/2021 1,885 – CCT_1776771_283920
UBS EUR 68,937 USD 83,221 17/06/2021 1,087 – CCT_1776771_283914
UBS GBP 53,192 USD 74,621 17/06/2021 993 – CCT_1776771_283905
UBS GBP 50,858 USD 71,347 17/06/2021 950 – CCT_1776771_283907
UBS EUR 43,573 USD 52,602 17/06/2021 687 – CCT_1776771_283916
UBS GBP 89,348 USD 126,351 17/06/2021 660 – CCT_1776771_283662
UBS GBP 51,710 USD 72,899 17/06/2021 609 – CCT_1776771_283831
UBS GBP 64,247 USD 90,739 17/06/2021 589 – CCT_1776771_284840
UBS EUR 27,817 USD 33,580 17/06/2021 438 – CCT_1776771_283918
UBS GBP 155,914 USD 221,266 17/06/2021 369 – CCT_1776771_284955
UBS GBP 53,240 USD 75,376 17/06/2021 307 – CCT_1776771_284429
UBS GBP 18,419 USD 25,950 17/06/2021 234 – CCT_1776771_284067
UBS GBP 34,440 USD 48,771 17/06/2021 186 – CCT_1776771_284501
UBS EUR 2,000 USD 2,385 16/06/2021 61 – CCT_1776772_66670
UBS GBP 4,411 USD 6,228 17/06/2021 42 – CCT_1776771_284151
UBS GBP 5,194 USD 7,347 17/06/2021 36 – CCT_1776771_284325
UBS EUR 2,000 USD 2,419 16/06/2021 27 – CCT_1776772_66991
UBS GBP 52,087 USD 74,020 17/06/2021 22 – CCT_1776771_284229
UBS GBP 682 USD 957 17/06/2021 13 – CCT_1776771_283902
UBS USD 3,605 EUR 2,944 17/06/2021 5 – CCT_1776771_284746
Westpac Banking EUR 5,000 USD 6,004 16/06/2021 110 – CCT_1776772_67383
Total fair value gains on forward currency contracts 3,605,145 1.17
Schedule of investments as at 31 May 2021 (continued)
Transferable securities admitted to an official stock exchange listing or traded on a regulated market. The percentages in brackets show the equivalent sector holdings at 31 May 2020.
353
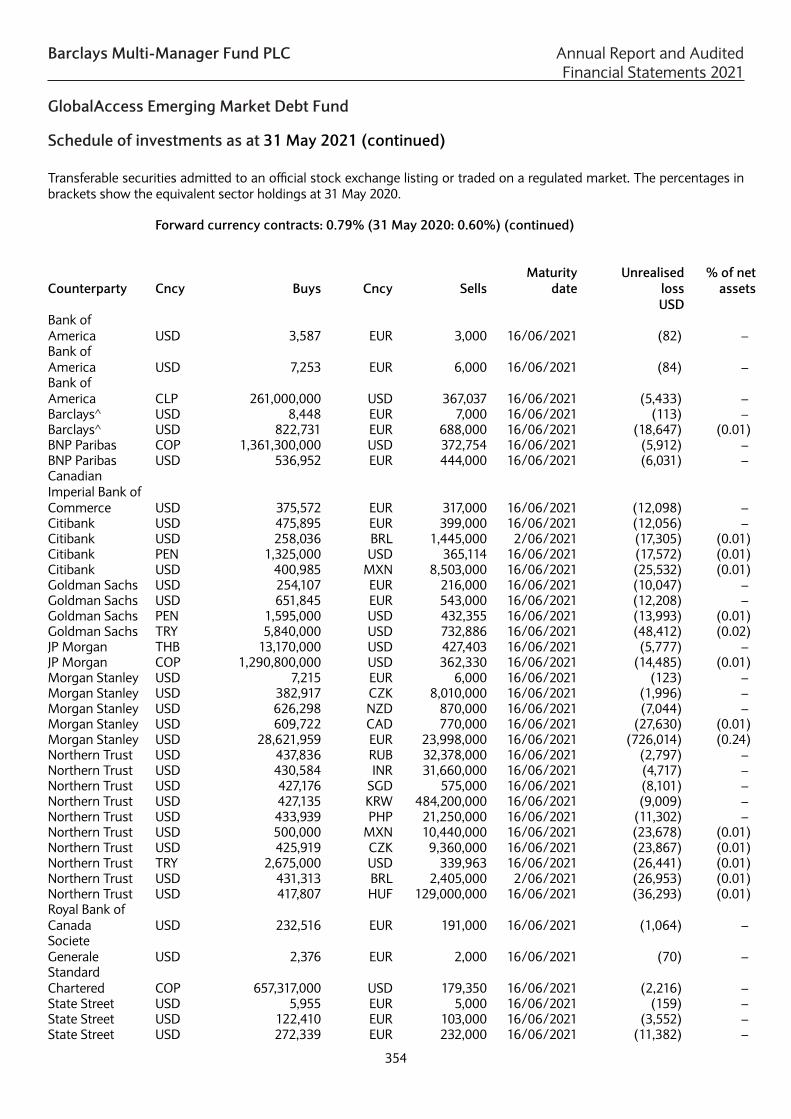
Barclays Multi-Manager Fund PLC Annual Report and Audited Financial Statements 2021
GlobalAccess Emerging Market Debt Fund
Forward currency contracts: 0.79% (31 May 2020: 0.60%) (continued)
Counterparty Cncy Buys Cncy SellsMaturity
dateUnrealised
loss% of net
assetsUSD
Bank of America USD 3,587 EUR 3,000 16/06/2021 (82) – CCT_1776772_66713
Bank of America USD 7,253 EUR 6,000 16/06/2021 (84) – CCT_1776772_67031
Bank of America CLP 261,000,000 USD 367,037 16/06/2021 (5,433) – CCT_1776772_66626
Barclays^ USD 8,448 EUR 7,000 16/06/2021 (113) – CCT_1776772_67435
Barclays^ USD 822,731 EUR 688,000 16/06/2021 (18,647) (0.01) CCT_1776772_66167
BNP Paribas COP 1,361,300,000 USD 372,754 16/06/2021 (5,912) – CCT_1776772_66625
BNP Paribas USD 536,952 EUR 444,000 16/06/2021 (6,031) – CCT_1776772_67626
Canadian Imperial Bank of Commerce USD 375,572 EUR 317,000 16/06/2021 (12,098) – CCT_1776772_66266
Citibank USD 475,895 EUR 399,000 16/06/2021 (12,056) – CCT_1776772_65836
Citibank USD 258,036 BRL 1,445,000 2/06/2021 (17,305) (0.01) CCT_1776772_64924
Citibank PEN 1,325,000 USD 365,114 16/06/2021 (17,572) (0.01) CCT_1776772_66616
Citibank USD 400,985 MXN 8,503,000 16/06/2021 (25,532) (0.01) CCT_1776772_65523
Goldman Sachs USD 254,107 EUR 216,000 16/06/2021 (10,047) – CCT_1776772_66466
Goldman Sachs USD 651,845 EUR 543,000 16/06/2021 (12,208) – CCT_1776772_67376
Goldman Sachs PEN 1,595,000 USD 432,355 16/06/2021 (13,993) (0.01) CCT_1776772_65534
Goldman Sachs TRY 5,840,000 USD 732,886 16/06/2021 (48,412) (0.02) CCT_1776772_65442
JP Morgan THB 13,170,000 USD 427,403 16/06/2021 (5,777) – CCT_1776772_65464
JP Morgan COP 1,290,800,000 USD 362,330 16/06/2021 (14,485) (0.01) CCT_1776772_65532
Morgan Stanley USD 7,215 EUR 6,000 16/06/2021 (123) – CCT_1776772_67260
Morgan Stanley USD 382,917 CZK 8,010,000 16/06/2021 (1,996) – CCT_1776772_67792
Morgan Stanley USD 626,298 NZD 870,000 16/06/2021 (7,044) – CCT_1776772_65535
Morgan Stanley USD 609,722 CAD 770,000 16/06/2021 (27,630) (0.01) CCT_1776772_65537
Morgan Stanley USD 28,621,959 EUR 23,998,000 16/06/2021 (726,014) (0.24) CCT_1776772_65456
Northern Trust USD 437,836 RUB 32,378,000 16/06/2021 (2,797) – CCT_1776772_65783
Northern Trust USD 430,584 INR 31,660,000 16/06/2021 (4,717) – CCT_1776772_65780
Northern Trust USD 427,176 SGD 575,000 16/06/2021 (8,101) – CCT_1776772_65779
Northern Trust USD 427,135 KRW 484,200,000 16/06/2021 (9,009) – CCT_1776772_65789
Northern Trust USD 433,939 PHP 21,250,000 16/06/2021 (11,302) – CCT_1776772_65792
Northern Trust USD 500,000 MXN 10,440,000 16/06/2021 (23,678) (0.01) CCT_1776772_65784
Northern Trust USD 425,919 CZK 9,360,000 16/06/2021 (23,867) (0.01) CCT_1776772_65787
Northern Trust TRY 2,675,000 USD 339,963 16/06/2021 (26,441) (0.01) CCT_1776772_65774
Northern Trust USD 431,313 BRL 2,405,000 2/06/2021 (26,953) (0.01) CCT_1776772_65786
Northern Trust USD 417,807 HUF 129,000,000 16/06/2021 (36,293) (0.01) CCT_1776772_65788
Royal Bank of Canada USD 232,516 EUR 191,000 16/06/2021 (1,064) – CCT_1776772_67835
Societe Generale USD 2,376 EUR 2,000 16/06/2021 (70) – CCT_1776772_65386
Standard Chartered COP 657,317,000 USD 179,350 16/06/2021 (2,216) – CCT_1776772_66325
State Street USD 5,955 EUR 5,000 16/06/2021 (159) – CCT_1776772_65465
State Street USD 122,410 EUR 103,000 16/06/2021 (3,552) – CCT_1776772_66224
State Street USD 272,339 EUR 232,000 16/06/2021 (11,382) – CCT_1776772_66429
Schedule of investments as at 31 May 2021 (continued)
Transferable securities admitted to an official stock exchange listing or traded on a regulated market. The percentages in brackets show the equivalent sector holdings at 31 May 2020.
354

Barclays Multi-Manager Fund PLC Annual Report and Audited Financial Statements 2021
GlobalAccess Emerging Market Debt Fund
Forward currency contracts: 0.79% (31 May 2020: 0.60%) (continued)
Counterparty Cncy Buys Cncy SellsMaturity
dateUnrealised
loss% of net
assetsUSD
Bank of America USD 3,587 EUR 3,000 16/06/2021 (82) – CCT_1776772_66713
Bank of America USD 7,253 EUR 6,000 16/06/2021 (84) – CCT_1776772_67031
Bank of America CLP 261,000,000 USD 367,037 16/06/2021 (5,433) – CCT_1776772_66626
Barclays^ USD 8,448 EUR 7,000 16/06/2021 (113) – CCT_1776772_67435
Barclays^ USD 822,731 EUR 688,000 16/06/2021 (18,647) (0.01) CCT_1776772_66167
BNP Paribas COP 1,361,300,000 USD 372,754 16/06/2021 (5,912) – CCT_1776772_66625
BNP Paribas USD 536,952 EUR 444,000 16/06/2021 (6,031) – CCT_1776772_67626
Canadian Imperial Bank of Commerce USD 375,572 EUR 317,000 16/06/2021 (12,098) – CCT_1776772_66266
Citibank USD 475,895 EUR 399,000 16/06/2021 (12,056) – CCT_1776772_65836
Citibank USD 258,036 BRL 1,445,000 2/06/2021 (17,305) (0.01) CCT_1776772_64924
Citibank PEN 1,325,000 USD 365,114 16/06/2021 (17,572) (0.01) CCT_1776772_66616
Citibank USD 400,985 MXN 8,503,000 16/06/2021 (25,532) (0.01) CCT_1776772_65523
Goldman Sachs USD 254,107 EUR 216,000 16/06/2021 (10,047) – CCT_1776772_66466
Goldman Sachs USD 651,845 EUR 543,000 16/06/2021 (12,208) – CCT_1776772_67376
Goldman Sachs PEN 1,595,000 USD 432,355 16/06/2021 (13,993) (0.01) CCT_1776772_65534
Goldman Sachs TRY 5,840,000 USD 732,886 16/06/2021 (48,412) (0.02) CCT_1776772_65442
JP Morgan THB 13,170,000 USD 427,403 16/06/2021 (5,777) – CCT_1776772_65464
JP Morgan COP 1,290,800,000 USD 362,330 16/06/2021 (14,485) (0.01) CCT_1776772_65532
Morgan Stanley USD 7,215 EUR 6,000 16/06/2021 (123) – CCT_1776772_67260
Morgan Stanley USD 382,917 CZK 8,010,000 16/06/2021 (1,996) – CCT_1776772_67792
Morgan Stanley USD 626,298 NZD 870,000 16/06/2021 (7,044) – CCT_1776772_65535
Morgan Stanley USD 609,722 CAD 770,000 16/06/2021 (27,630) (0.01) CCT_1776772_65537
Morgan Stanley USD 28,621,959 EUR 23,998,000 16/06/2021 (726,014) (0.24) CCT_1776772_65456
Northern Trust USD 437,836 RUB 32,378,000 16/06/2021 (2,797) – CCT_1776772_65783
Northern Trust USD 430,584 INR 31,660,000 16/06/2021 (4,717) – CCT_1776772_65780
Northern Trust USD 427,176 SGD 575,000 16/06/2021 (8,101) – CCT_1776772_65779
Northern Trust USD 427,135 KRW 484,200,000 16/06/2021 (9,009) – CCT_1776772_65789
Northern Trust USD 433,939 PHP 21,250,000 16/06/2021 (11,302) – CCT_1776772_65792
Northern Trust USD 500,000 MXN 10,440,000 16/06/2021 (23,678) (0.01) CCT_1776772_65784
Northern Trust USD 425,919 CZK 9,360,000 16/06/2021 (23,867) (0.01) CCT_1776772_65787
Northern Trust TRY 2,675,000 USD 339,963 16/06/2021 (26,441) (0.01) CCT_1776772_65774
Northern Trust USD 431,313 BRL 2,405,000 2/06/2021 (26,953) (0.01) CCT_1776772_65786
Northern Trust USD 417,807 HUF 129,000,000 16/06/2021 (36,293) (0.01) CCT_1776772_65788
Royal Bank of Canada USD 232,516 EUR 191,000 16/06/2021 (1,064) – CCT_1776772_67835
Societe Generale USD 2,376 EUR 2,000 16/06/2021 (70) – CCT_1776772_65386
Standard Chartered COP 657,317,000 USD 179,350 16/06/2021 (2,216) – CCT_1776772_66325
State Street USD 5,955 EUR 5,000 16/06/2021 (159) – CCT_1776772_65465
State Street USD 122,410 EUR 103,000 16/06/2021 (3,552) – CCT_1776772_66224
State Street USD 272,339 EUR 232,000 16/06/2021 (11,382) – CCT_1776772_66429
Forward currency contracts: 0.79% (31 May 2020: 0.60%) (continued)
Counterparty Cncy Buys Cncy SellsMaturity
date
Unrealised loss
% of net assets
USD Toronto Dominion USD 623,979 AUD 810,000 16/06/2021 (3,037) – CCT_1776772_65462
UBS USD 1,293 EUR 1,058 17/06/2021 (1) – CCT_1776771_284326
UBS USD 5,436 EUR 4,458 17/06/2021 (16) – CCT_1776771_284500
UBS USD 20,109 GBP 14,216 17/06/2021 (100) – CCT_1776771_283753
UBS USD 26,882 GBP 19,021 17/06/2021 (156) – CCT_1776771_284747
UBS USD 42,771 GBP 30,208 17/06/2021 (171) – CCT_1776771_284629
UBS USD 106,887 GBP 75,561 17/06/2021 (525) – CCT_1776771_284328
Total fair value losses on forward currency contracts (1,184,201) (0.38)
Total forward currency contracts 2,420,944 0.79
Fair value USD
% of net assets
Total value of investments 296,156,882 95.71
Cash and cash equivalents* 12,651,196 4.09
Other net assets** 611,966 0.20
Net assets attributable to holders of redeemable participating shares 309,420,044 100.00
Analysis of total assets (unaudited)% of total
assets
Transferable securities and money market instruments admitted to official stock exchangelisting or traded on a regulated market. 88.77Investment funds and AIFs. 4.90Financial derivative instruments dealt in on a regulated market. 0.10OTC financial derivative instruments. 1.15Other assets. 5.08
100.00
*All cash holdings are held with The Northern Trust Company.**Including USD 768,700 held with JP Morgan as security by the counterparty to derivatives contracts.^ Related party.
The accompanying notes form an integral part of the Financial Statements.
The Industry Classification Benchmark (“ICB”) is jointly owned by FTSE and Dow Jones and has been licensed for use. FTSE and Dow Jones do not accept liability to any person for any loss or damage arising out of any error or omission in ICB.
Schedule of investments as at 31 May 2021 (continued)
Transferable securities admitted to an official stock exchange listing or traded on a regulated market. The percentages in brackets show the equivalent sector holdings at 31 May 2020.
355
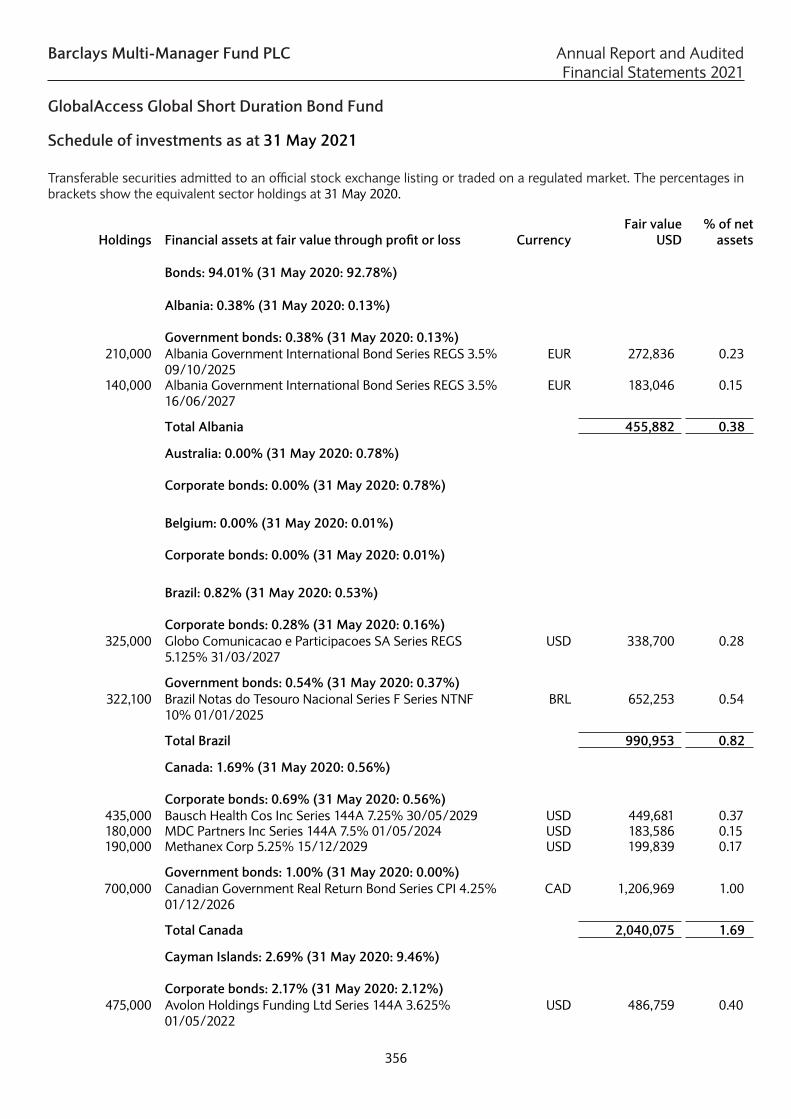
Barclays Multi-Manager Fund PLC Annual Report and Audited Financial Statements 2021
GlobalAccess Global Short Duration Bond Fund
Schedule of investments as at 31 May 2021
Transferable securities admitted to an official stock exchange listing or traded on a regulated market. The percentages in brackets show the equivalent sector holdings at 31 May 2020.
Holdings Financial assets at fair value through profit or loss CurrencyFair value
USD% of net
assets
Bonds: 94.01% (31 May 2020: 92.78%)
Albania: 0.38% (31 May 2020: 0.13%)
Government bonds: 0.38% (31 May 2020: 0.13%)210,000 Albania Government International Bond Series REGS 3.5%
09/10/2025EUR 272,836 0.23
140,000 Albania Government International Bond Series REGS 3.5% 16/06/2027
EUR 183,046 0.15
Total Albania 455,882 0.38
Australia: 0.00% (31 May 2020: 0.78%)
Corporate bonds: 0.00% (31 May 2020: 0.78%)
Belgium: 0.00% (31 May 2020: 0.01%)
Corporate bonds: 0.00% (31 May 2020: 0.01%)
Brazil: 0.82% (31 May 2020: 0.53%)
Corporate bonds: 0.28% (31 May 2020: 0.16%)325,000 Globo Comunicacao e Participacoes SA Series REGS
5.125% 31/03/2027USD 338,700 0.28
Government bonds: 0.54% (31 May 2020: 0.37%)322,100 Brazil Notas do Tesouro Nacional Series F Series NTNF
10% 01/01/2025BRL 652,253 0.54
Total Brazil 990,953 0.82
Canada: 1.69% (31 May 2020: 0.56%)
Corporate bonds: 0.69% (31 May 2020: 0.56%)435,000 Bausch Health Cos Inc Series 144A 7.25% 30/05/2029 USD 449,681 0.37180,000 MDC Partners Inc Series 144A 7.5% 01/05/2024 USD 183,586 0.15190,000 Methanex Corp 5.25% 15/12/2029 USD 199,839 0.17
Government bonds: 1.00% (31 May 2020: 0.00%)700,000 Canadian Government Real Return Bond Series CPI 4.25%
01/12/2026CAD 1,206,969 1.00
Total Canada 2,040,075 1.69
Cayman Islands: 2.69% (31 May 2020: 9.46%)
Corporate bonds: 2.17% (31 May 2020: 2.12%)475,000 Avolon Holdings Funding Ltd Series 144A 3.625%
01/05/2022USD 486,759 0.40
356

Barclays Multi-Manager Fund PLC Annual Report and Audited Financial Statements 2021
GlobalAccess Global Short Duration Bond Fund
Holdings Financial assets at fair value through profit or loss Currency Fair value
USD % of net
assets
Bonds: 94.01% (31 May 2020: 92.78%) (continued)
Cayman Islands: 2.69% (31 May 2020: 9.46%) (continued)
Corporate bonds: 2.17% (31 May 2020: 2.12%)
450,305 Barings CLO Ltd Series 2016-2A Class AR FRN 20/07/2028 USD 450,502 0.37350,000 Dar Al-Arkan Sukuk Co Ltd 6.875% 21/03/2023 USD 367,756 0.31200,000 Health & Happiness International Holdings Ltd 5.625%
24/10/2024USD 208,084 0.17
300,000 OmGrid Funding Ltd Series REGS 5.196% 16/05/2027 USD 312,405 0.26400,000 Shimao Group Holdings Ltd 5.6% 15/07/2026 USD 431,520 0.36350,000 Times China Holdings Ltd 6.75% 16/07/2023 USD 362,226 0.30
Government sponsored agencies: 0.52% (31 May 2020: 7.34%)
625,000 OZLM VIII Ltd Series 2014-8A Class A2RR FRN 17/10/2029
USD 623,183 0.52
Total Cayman Islands 3,242,435 2.69
Chile: 2.80% (31 May 2020: 1.97%)
Corporate bonds: 0.56% (31 May 2020: 0.42%)350,000 AES Gener SA Series 144A FRN 26/03/2079 USD 373,712 0.31300,000 VTR Comunicaciones SpA Series REGS 4.375%
15/04/2029USD 298,650 0.25
Government bonds: 2.24% (31 May 2020: 1.55%)1,815,000,000 Bonos de la Tesoreria de la Republica en pesos 4.7%
01/09/2030CLP 2,704,523 2.24
Total Chile 3,376,885 2.80
Colombia: 0.45% (31 May 2020: 0.00%)
Corporate bonds: 0.45% (31 May 2020: 0.00%)200,000 Banco de Bogota SA Series REGS 6.25% 12/05/2026 USD 219,752 0.18325,000 Bancolombia SA FRN 18/12/2029 USD 329,509 0.27
Total Colombia 549,261 0.45
Cyprus: 0.19% (31 May 2020: 1.94%)
Government bonds: 0.19% (31 May 2020: 1.94%)179,000 Cyprus Government International Bond Series EMTN
0.625% 03/12/2024EUR 225,123 0.19
Total Cyprus 225,123 0.19
Schedule of investments as at 31 May 2021 (continued)
Transferable securities admitted to an official stock exchange listing or traded on a regulated market. The percentages in brackets show the equivalent sector holdings at 31 May 2020.
357

Barclays Multi-Manager Fund PLC Annual Report and Audited Financial Statements 2021
GlobalAccess Global Short Duration Bond Fund
Holdings Financial assets at fair value through profit or loss Currency Fair value
USD % of net
assets
Bonds: 94.01% (31 May 2020: 92.78%) (continued)
Denmark: 0.48% (31 May 2020: 0.31%)
Corporate bonds: 0.48% (31 May 2020: 0.31%)520,000 Danske Bank A/S Series 144A 5.375% 12/01/2024 USD 579,862 0.48
Total Denmark 579,862 0.48
Dominican Republic: 0.00% (31 May 2020: 0.08%)
Government bonds: 0.00% (31 May 2020: 0.08%)
Egypt: 1.01% (31 May 2020: 0.58%)
Government bonds: 1.01% (31 May 2020: 0.58%)455,000 Egypt Government International Bond Series REGS 4.75%
11/04/2025EUR 584,733 0.49
9,900,000 Egypt Treasury Bills Series 364D 0% 15/06/2021 EGP 630,186 0.52
Total Egypt 1,214,919 1.01
France: 1.28% (31 May 2020: 1.54%)
Corporate bonds: 1.28% (31 May 2020: 0.86%)270,000 Altice France SA/France Series 144A 3.375% 15/01/2028 EUR 325,203 0.27500,000 Altice France SA/France Series REGs 5.875% 01/02/2027 EUR 651,459 0.54260,000 Constellium SE Series 144A 5.625% 15/06/2028 USD 276,374 0.23235,000 Louvre Bidco SAS Series REGS 4.25% 30/09/2024 EUR 289,259 0.24
Government bonds: 0.00% (31 May 2020: 0.68%)
Total France 1,542,295 1.28
Germany: 2.76% (31 May 2020: 0.49%)
Corporate bonds: 0.15% (31 May 2020: 0.49%)140,000 Vertical Midco GmbH Series 144A 4.375% 15/07/2027 EUR 179,616 0.15
Government bonds: 2.61% (31 May 2020: 0.00%)820,000 Deutsche Bundesrepublik Inflation Linked Bond Series I/L
0.10671% 15/04/2026EUR 1,176,847 0.98
1,247,000 Deutsche Bundesrepublik Inflation Linked Bond Series I/L 0.5% 15/04/2030
EUR 1,973,611 1.63
Total Germany 3,330,074 2.76
Schedule of investments as at 31 May 2021 (continued)
Transferable securities admitted to an official stock exchange listing or traded on a regulated market. The percentages in brackets show the equivalent sector holdings at 31 May 2020.
358

Barclays Multi-Manager Fund PLC Annual Report and Audited Financial Statements 2021
GlobalAccess Global Short Duration Bond Fund
Holdings Financial assets at fair value through profit or loss Currency Fair value
USD % of net
assets
Bonds: 94.01% (31 May 2020: 92.78%) (continued)
Greece: 1.12% (31 May 2020: 0.66%)
Government bonds: 1.12% (31 May 2020: 0.66%)1,035,000 Hellenic Republic Government Bond 3.5% 30/01/2023 EUR 1,346,415 1.12
Total Greece 1,346,415 1.12
Guernsey: 0.00% (31 May 2020: 0.14%)
Corporate bonds: 0.00% (31 May 2020: 0.14%)
Honduras: 0.00% (31 May 2020: 0.11%)
Government bonds: 0.00% (31 May 2020: 0.11%)
Hong Kong: 0.22% (31 May 2020: 0.44%)
Corporate bonds: 0.22% (31 May 2020: 0.44%)250,000 Yanlord Land HK Co Ltd 6.8% 27/02/2024 USD 263,768 0.22
Total Hong Kong 263,768 0.22
Iceland: 1.01% (31 May 2020: 1.10%)
Corporate bonds: 0.90% (31 May 2020: 1.04%)208,000 Islandsbanki HF Series EMTN 0.5% 20/11/2023 EUR 256,414 0.21475,000 Islandsbanki HF Series GMTN 1.125% 12/04/2022 EUR 586,954 0.49200,000 Landsbankinn HF Series EMTN 1.375% 14/03/2022 EUR 247,259 0.20
Government bonds: 0.11% (31 May 2020: 0.06%)100,000 Iceland Government International Bond 0.625%
03/06/2026EUR 125,512 0.11
Total Iceland 1,216,139 1.01
India: 1.73% (31 May 2020: 1.14%)
Corporate bonds: 1.73% (31 May 2020: 0.98%)200,000 Adani Ports & Special Economic Zone Ltd Series REGS
4.2% 04/08/2027USD 212,877 0.18
200,000 ICICI Bank Ltd/Dubai Series REGS 3.8% 14/12/2027 USD 215,337 0.1880,000,000 NTPC Ltd Series EMTN 7.25% 03/05/2022 INR 1,108,472 0.9240,000,000 NTPC Ltd Series EMTN 7.375% 10/08/2021 INR 546,167 0.45
Government bonds: 0.00% (31 May 2020: 0.16%)
Total India 2,082,853 1.73
Schedule of investments as at 31 May 2021 (continued)
Transferable securities admitted to an official stock exchange listing or traded on a regulated market. The percentages in brackets show the equivalent sector holdings at 31 May 2020.
359

Barclays Multi-Manager Fund PLC Annual Report and Audited Financial Statements 2021
GlobalAccess Global Short Duration Bond Fund
Holdings Financial assets at fair value through profit or loss Currency Fair value
USD % of net
assets
Bonds: 94.01% (31 May 2020: 92.78%) (continued)
Indonesia: 0.00% (31 May 2020: 0.45%)
Corporate bonds: 0.00% (31 May 2020: 0.22%)
Government bonds: 0.00% (31 May 2020: 0.12%)
Government sponsored agencies: 0.00% (31 May 2020: 0.11%)
Ireland: 1.66% (31 May 2020: 1.90%)
Corporate bonds: 1.66% (31 May 2020: 1.31%)740,000 AerCap Ireland Capital DAC 4.45% 16/12/2021 USD 753,409 0.62400,000 Bank of Ireland Group PLC FRN Perpetual EUR 577,886 0.48375,000 C&W Senior Financing DAC Series 144A 7.5% 15/10/2026 USD 395,062 0.33265,000 LCPR Senior Secured Financing DAC Series REGS 5.125%
15/07/2029USD 272,265 0.23
Government sponsored agencies: 0.00% (31 May 2020: 0.59%)
Total Ireland 1,998,622 1.66
Israel: 0.18% (31 May 2020: 0.00%)
Corporate bonds: 0.18% (31 May 2020: 0.00%)200,000 Leviathan Bond Ltd 6.125% 30/06/2025 USD 220,363 0.18
Total Israel 220,363 0.18
Italy: 2.45% (31 May 2020: 3.10%)
Corporate bonds: 0.76% (31 May 2020: 0.79%)750,000 FCA Bank SpA/Ireland Series EMTN 0.25% 28/02/2023 EUR 921,925 0.76
Government bonds: 1.69% (31 May 2020: 2.31%)873,000 Italy Buoni Poliennali Del Tesoro 0.95% 01/03/2023 EUR 1,091,336 0.90707,000 Italy Buoni Poliennali Del Tesoro Series CPI 0.656494%
15/05/2026EUR 947,179 0.79
Total Italy 2,960,440 2.45
Japan: 0.44% (31 May 2020: 0.57%)
Corporate bonds: 0.44% (31 May 2020: 0.57%)233,000 Asahi Group Holdings Ltd 0.01% 19/04/2024 EUR 285,386 0.23250,000 NTT Finance Corp Series 144A 0.583% 01/03/2024 USD 250,490 0.21
Total Japan 535,876 0.44
Schedule of investments as at 31 May 2021 (continued)
Transferable securities admitted to an official stock exchange listing or traded on a regulated market. The percentages in brackets show the equivalent sector holdings at 31 May 2020.
360

Barclays Multi-Manager Fund PLC Annual Report and Audited Financial Statements 2021
GlobalAccess Global Short Duration Bond Fund
Holdings Financial assets at fair value through profit or loss Currency Fair value
USD % of net
assets
Bonds: 94.01% (31 May 2020: 92.78%) (continued)
Kazakhstan: 0.00% (31 May 2020: 0.21%)
Government bonds: 0.00% (31 May 2020: 0.21%)
Liberia: 0.33% (31 May 2020: 0.00%)
Corporate bonds: 0.33% (31 May 2020: 0.00%)60,000 Royal Caribbean Cruises 5.25% 15/11/2022 USD 62,043 0.05
295,000 Royal Caribbean Cruises Series 144A 11.5% 01/06/2025 USD 341,855 0.28
Total Liberia 403,898 0.33
Luxembourg: 1.17% (31 May 2020: 0.77%)
Corporate bonds: 1.17% (31 May 2020: 0.77%)400,000 CSN Resources SA Series REGS 7.625% 17/04/2026 USD 431,104 0.36450,000 Medtronic Global Holdings SCA 0% 15/03/2023 EUR 553,550 0.46275,000 Nexa Resources SA Series REGS 6.5% 18/01/2028 USD 299,684 0.25100,000 PLT VII Finance Sarl Series REGS 4.625% 05/01/2026 EUR 127,309 0.10
Total Luxembourg 1,411,647 1.17
Mauritius: 0.24% (31 May 2020: 0.00%)
Corporate bonds: 0.24% (31 May 2020: 0.00%)275,000 HTA Group Ltd/Mauritius Series REGS 7% 18/12/2025 USD 293,972 0.24
Total Mauritius 293,972 0.24
Mexico: 3.53% (31 May 2020: 1.95%)
Corporate bonds: 2.31% (31 May 2020: 1.63%)400,000 BBVA Bancomer SA/Texas Series REGS FRN 13/09/2034 USD 437,250 0.36200,000 Cemex SAB de CV Series REGS 5.45% 19/11/2029 USD 219,850 0.18550,000 Mexico City Airport Trust Series REGS 4.25% 31/10/2026 USD 585,379 0.48
1,085,000 Petroleos Mexicanos Series EMTN 5.125% 15/03/2023 EUR 1,394,668 1.16145,000 Petroleos Mexicanos 6.49% 23/01/2027 USD 155,117 0.13
Government bonds: 1.22% (31 May 2020: 0.20%)20,325,000 Mexican Bonos Series M 20 7.5% 03/06/2027 MXN 1,080,671 0.90
6,841,000 Mexican Bonos Series M 20 10% 05/12/2024 MXN 389,336 0.32
Government sponsored agencies: 0.00% (31 May 2020: 0.12%)
Total Mexico 4,262,271 3.53
Schedule of investments as at 31 May 2021 (continued)
Transferable securities admitted to an official stock exchange listing or traded on a regulated market. The percentages in brackets show the equivalent sector holdings at 31 May 2020.
361

Barclays Multi-Manager Fund PLC Annual Report and Audited Financial Statements 2021
GlobalAccess Global Short Duration Bond Fund
Holdings Financial assets at fair value through profit or loss Currency Fair value
USD % of net
assets
Bonds: 94.01% (31 May 2020: 92.78%) (continued)
Mongolia: 0.00% (31 May 2020: 0.27%)
Government bonds: 0.00% (31 May 2020: 0.27%)
Multinational: 0.47% (31 May 2020: 0.26%)
Corporate bonds: 0.47% (31 May 2020: 0.26%)445,000 Panther BF Aggregator 2 LP Series REGs 4.375%
15/05/2026EUR 564,833 0.47
Total Multinational 564,833 0.47
Netherlands: 3.28% (31 May 2020: 2.84%)
Corporate bonds: 3.28% (31 May 2020: 2.84%)260,000 Alcoa Nederland Holding BV Series 144A 5.5%
15/12/2027USD 282,091 0.23
255,000 Ashland Services BV Series 144A 2% 30/01/2028 EUR 310,713 0.26200,000 Digital Dutch Finco BV 0.125% 15/10/2022 EUR 245,525 0.20200,000 Equate Petrochemical BV Series REGS 2.625%
28/04/2028USD 201,653 0.17
730,000 LeasePlan Corp NV Series EMTN 1% 25/02/2022 EUR 901,213 0.75220,000 LeasePlan Corp NV FRN Perpetual EUR 299,228 0.25360,000 Siemens Financieringsmaatschappij NV Series 144A
0.65% 11/03/2024USD 361,415 0.30
200,000 Teva Pharmaceutical Finance Netherlands III BV 6% 15/04/2024
USD 211,634 0.18
275,000 Teva Pharmaceutical Finance Netherlands III BV 7.125% 31/01/2025
USD 300,732 0.25
100,000 Trivium Packaging Finance BV Series 144A 3.75% 15/08/2026
EUR 124,918 0.10
275,000 Vivo Energy Investments BV Series REGS 5.125% 24/09/2027
USD 293,906 0.24
345,000 Ziggo BV Series REGS 2.875% 15/01/2030 EUR 424,219 0.35
Total Netherlands 3,957,247 3.28
New Zealand: 0.00% (31 May 2020: 0.33%)
Corporate bonds: 0.00% (31 May 2020: 0.33%)
Nigeria: 0.00% (31 May 2020: 0.24%)
Government bonds: 0.00% (31 May 2020: 0.24%)
Schedule of investments as at 31 May 2021 (continued)
Transferable securities admitted to an official stock exchange listing or traded on a regulated market. The percentages in brackets show the equivalent sector holdings at 31 May 2020.
362

Barclays Multi-Manager Fund PLC Annual Report and Audited Financial Statements 2021
GlobalAccess Global Short Duration Bond Fund
Holdings Financial assets at fair value through profit or loss Currency Fair value
USD % of net
assets
Bonds: 94.01% (31 May 2020: 92.78%) (continued)
Panama: 0.35% (31 May 2020: 0.00%)
Corporate bonds: 0.35% (31 May 2020: 0.00%)360,000 Carnival Corp Series 144A 10.5% 01/02/2026 USD 425,336 0.35
Total Panama 425,336 0.35
People's Republic of China: 0.00% (31 May 2020: 0.21%)
Corporate bonds: 0.00% (31 May 2020: 0.21%)
Peru: 0.00% (31 May 2020: 0.48%)
Corporate bonds: 0.00% (31 May 2020: 0.20%)
Government bonds: 0.00% (31 May 2020: 0.11%)
Government sponsored agencies: 0.00% (31 May 2020: 0.17%)
Philippines: 0.83% (31 May 2020: 0.36%)
Corporate bonds: 0.70% (31 May 2020: 0.36%)400,000 Manila Water Co Inc 4.375% 30/07/2030 USD 430,501 0.35390,000 SM Investments Corp 4.875% 10/06/2024 USD 422,896 0.35
Government bonds: 0.13% (31 May 2020: 0.00%)125,000 Philippine Government International Bond 0.25%
28/04/2025EUR 153,440 0.13
Total Philippines 1,006,837 0.83
Portugal: 0.18% (31 May 2020: 0.25%)
Government bonds: 0.18% (31 May 2020: 0.25%)153,000 Portugal Obrigacoes do Tesouro OT 2.125% 17/10/2028 EUR 215,463 0.18
Total Portugal 215,463 0.18
Romania: 1.87% (31 May 2020: 0.98%)
Government bonds: 1.87% (31 May 2020: 0.98%)60,000 Romania Government Bond Series EMTN 2.875%
28/10/2024EUR 80,308 0.07
403,000 Romanian Government International Bond Series REGS 2% 08/12/2026
EUR 528,646 0.44
663,000 Romanian Government International Bond Series REGS 2.75% 29/10/2025
EUR 898,494 0.74
Schedule of investments as at 31 May 2021 (continued)
Transferable securities admitted to an official stock exchange listing or traded on a regulated market. The percentages in brackets show the equivalent sector holdings at 31 May 2020.
363

Barclays Multi-Manager Fund PLC Annual Report and Audited Financial Statements 2021
GlobalAccess Global Short Duration Bond Fund
Holdings Financial assets at fair value through profit or loss Currency Fair value
USD % of net
assets
Bonds: 94.01% (31 May 2020: 92.78%) (continued) Romania: 1.87% (31 May 2020: 0.98%) (continued)
Government bonds: 1.87% (31 May 2020: 0.98%) 560,000 Romanian Government International Bond Series REGS
2.75% 26/02/2026EUR 755,154 0.62
Total Romania 2,262,602 1.87
Senegal: 0.00% (31 May 2020: 0.16%)
Government bonds: 0.00% (31 May 2020: 0.16%)
Serbia: 1.42% (31 May 2020: 0.73%)
Government bonds: 1.42% (31 May 2020: 0.73%)380,000 Serbia International Bond Series REGS 3.125% 15/05/2027 EUR 515,739 0.42
106,800,000 Serbia Treasury Bonds Series 7Y 4.5% 11/01/2026 RSD 1,204,866 1.00
Total Serbia 1,720,605 1.42
Singapore: 0.52% (31 May 2020: 0.34%)
Corporate bonds: 0.52% (31 May 2020: 0.34%)575,000 ABJA Investment Co Pte Ltd 5.95% 31/07/2024 USD 626,362 0.52
Total Singapore 626,362 0.52
South Africa: 1.58% (31 May 2020: 0.89%)
Corporate bonds: 0.00% (31 May 2020: 0.22%)
Government bonds: 1.58% (31 May 2020: 0.67%)750,000 Republic of South Africa Government Bond 5.875%
30/05/2022USD 789,673 0.65
13,450,000 Republic of South Africa Government Bond Series R186 10.5% 21/12/2026
ZAR 1,120,899 0.93
Total South Africa 1,910,572 1.58
Spain: 0.20% (31 May 2020: 0.88%)
Corporate bonds: 0.00% (31 May 2020: 0.88%)
Government bonds: 0.20% (31 May 2020: 0.00%)199,000 Spain Government Bond 0% 31/01/2025 EUR 246,413 0.20
Total Spain 246,413 0.20
Schedule of investments as at 31 May 2021 (continued)
Transferable securities admitted to an official stock exchange listing or traded on a regulated market. The percentages in brackets show the equivalent sector holdings at 31 May 2020.
364

Barclays Multi-Manager Fund PLC Annual Report and Audited Financial Statements 2021
GlobalAccess Global Short Duration Bond Fund
Holdings Financial assets at fair value through profit or loss Currency Fair value
USD % of net
assets
Bonds: 94.01% (31 May 2020: 92.78%) (continued)
Sri Lanka: 0.00% (31 May 2020: 0.22%)
Government bonds: 0.00% (31 May 2020: 0.22%)
Supranational: 1.64% (31 May 2020: 1.03%)
Government sponsored agencies: 1.64% (31 May 2020: 1.03%)
27,800,000,000 European Investment Bank Series 144A 7.4% 24/01/2022 IDR 1,978,521 1.64
Total Supranational 1,978,521 1.64
Sweden: 0.00% (31 May 2020: 0.54%)
Corporate bonds: 0.00% (31 May 2020: 0.54%)
Switzerland: 0.00% (31 May 2020: 0.24%)
Corporate bonds: 0.00% (31 May 2020: 0.24%)
Thailand: 0.44% (31 May 2020: 0.33%)
Corporate bonds: 0.27% (31 May 2020: 0.33%)325,000 Bangkok Bank PCL/Hong Kong Series REGS FRN
25/09/2034USD 332,784 0.27
Government sponsored agencies: 0.17% (31 May 2020: 0.00%)
204,000 Export Import Bank of Thailand Series EMTN 1.457% 15/10/2025
USD 204,635 0.17
Total Thailand 537,419 0.44
Turkey: 0.19% (31 May 2020: 0.00%)
Corporate bonds: 0.19% (31 May 2020: 0.00%)225,000 Akbank T.A.S. Series REGS 5.125% 31/03/2025 USD 226,330 0.19
Total Turkey 226,330 0.19
United Arab Emirates: 0.61% (31 May 2020: 0.20%)
Corporate bonds: 0.08% (31 May 2020: 0.00%)100,000 Kuwait Projects Co SPC Ltd 4.229% 29/10/2026 USD 99,375 0.08
Government bonds: 0.53% (31 May 2020: 0.20%)350,000 Acwa Power Management And Investments One Ltd
Series REGS 5.95% 15/12/2039USD 415,590 0.34
Schedule of investments as at 31 May 2021 (continued)
Transferable securities admitted to an official stock exchange listing or traded on a regulated market. The percentages in brackets show the equivalent sector holdings at 31 May 2020.
365

Barclays Multi-Manager Fund PLC Annual Report and Audited Financial Statements 2021
GlobalAccess Global Short Duration Bond Fund
Holdings Financial assets at fair value through profit or loss Currency Fair value
USD % of net
assets
Bonds: 94.01% (31 May 2020: 92.78%) (continued)
United Arab Emirates: 0.61% (31 May 2020: 0.20%) (continued)
Government bonds: 0.53% (31 May 2020: 0.20%)
200,000 Oztel Holdings SPC Ltd Series REGS 6.625% 24/04/2028 USD 224,397 0.19
Total United Arab Emirates 739,362 0.61
United Kingdom: 3.13% (31 May 2020: 3.38%)
Corporate bonds: 3.13% (31 May 2020: 3.38%)650,000 Anglo American Capital PLC Series EMTN 3.25%
03/04/2023EUR 843,169 0.70
295,000 Arqiva Broadcast Finance PLC 6.75% 30/09/2023 GBP 433,100 0.36195,000 Jerrold Finco PLC Series REGS 5.25% 15/01/2027 GBP 287,159 0.24200,000 Lloyds Banking Group PLC FRN 15/06/2023 USD 201,899 0.17200,000 LSEGA Financing PLC Series 144A 0.65% 06/04/2024 USD 199,967 0.16560,000 Nationwide Building Society Series 144A FRN 08/03/2024 USD 590,836 0.49590,000 NatWest Markets PLC Series 144A 2.375% 21/05/2023 USD 612,724 0.51600,000 Standard Chartered PLC Series 144A FRN 14/10/2023 USD 605,664 0.50
Total United Kingdom 3,774,518 3.13
United States: 47.83% (31 May 2020: 46.20%)
Corporate bonds: 20.66% (31 May 2020: 22.94%)200,000 7-Eleven Inc Series 144A 0.8% 10/02/2024 USD 199,893 0.17270,000 Albertsons Cos LLC Series 144A 7.5% 15/03/2026 USD 298,316 0.25
1 American Airlines 2016-1 Class B Pass Through Trust Series B 5.25% 15/07/2025
USD – –
240,000 American Airlines Inc/AAdvantage Loyalty IP Ltd Series 144A 5.5% 20/04/2026
USD 252,907 0.21
345,000 Angel Oak Mortgage Trust 2021-2 Series 2021-2 Class M1 FRN 25/04/2066
USD 345,300 0.29
935,000 Angel Oak Mortgage Trust I LLC Series 2019-2 Class M1 FRN 25/03/2049
USD 952,776 0.79
507,450 Applebee's Funding LLC Series 2019-1A Class A2I 4.194% 07/06/2049
USD 524,380 0.43
385,000 Arconic Corp Series 144A 6.125% 15/02/2028 USD 410,314 0.34715,000 AT&T Inc 0.9% 25/03/2024 USD 717,028 0.59
1 Bayview Opportunity Master Fund IVa Trust Series 2017-RT1 Class A1 FRN 28/03/2057
USD – –
1 Bayview Opportunity Master Fund IVa Trust Class A Series 2017-SPL5 Class A FRN 28/06/2057
USD – –
560,000 Bon Secours Mercy Health Inc 1.35% 01/06/2025 USD 564,375 0.47180,000 CarMax Auto Owner Trust Series 2017-4 Class D 3.3%
15/05/2024USD 182,357 0.15
Schedule of investments as at 31 May 2021 (continued)
Transferable securities admitted to an official stock exchange listing or traded on a regulated market. The percentages in brackets show the equivalent sector holdings at 31 May 2020.
366

Barclays Multi-Manager Fund PLC Annual Report and Audited Financial Statements 2021
GlobalAccess Global Short Duration Bond Fund
Holdings Financial assets at fair value through profit or loss Currency Fair value
USD % of net
assets
Bonds: 94.01% (31 May 2020: 92.78%) (continued)
United States: 47.83% (31 May 2020: 46.20%) (continued)
Corporate bonds: 20.66% (31 May 2020: 22.94%)
45,000 CCO Holdings LLC / CCO Holdings Capital Corp Series 144A 5.375% 01/06/2029
USD 48,961 0.04
120,000 Centene Corp 4.25% 15/12/2027 USD 126,158 0.10125,000 Centene Corp 4.625% 15/12/2029 USD 135,108 0.11595,000 Charles Schwab Corp 0.75% 18/03/2024 USD 599,707 0.50350,000 Cheniere Energy Inc Series 144A 4.625% 15/10/2028 USD 367,964 0.31175,000 Chobani LLC / Chobani Finance Corp Inc Series 144A
4.625% 15/11/2028USD 180,631 0.15
310,000 Citigroup Commercial Mortgage Trust 2013-375P Series 2013-375P Class C FRN 10/05/2035
USD 317,437 0.26
420,000 Clear Channel Worldwide Holdings Inc Series 144A 5.125% 15/08/2027
USD 424,599 0.35
720,000 Commercial Mortgage Pass Through Certificates Series 2014-CR14 Class B FRN 10/02/2047
USD 778,429 0.65
270,000 Compass Minerals International Inc Series 144A 6.75% 01/12/2027
USD 289,919 0.24
100,000 Continental Resources Inc 4.375% 15/01/2028 USD 108,625 0.0955,000 Continental Resources Inc/OK Series 144A 5.75%
15/01/2031USD 64,619 0.05
550,000 CSAIL Commercial Mortgage Trust Series 2016-C6 Class C FRN 15/01/2049
USD 591,513 0.49
370,000 CSC Holdings LLC Series 144A 6.5% 01/02/2029 USD 405,255 0.34130,000 Edison International 3.125% 15/11/2022 USD 134,180 0.11
1 Fannie Mae Connecticut Avenue Securities Series 2018-C02 Class 2M2 FRN 25/08/2030
USD – –
350,000 Ford Motor Co 9% 22/04/2025 USD 428,068 0.35263,778 Freddie Mac Structured Agency Credit Risk Debt Notes
Series 2016-DNA2 Class M3 FRN 25/10/2028USD 275,983 0.23
308,670 Freddie Mac Structured Agency Credit Risk Debt Notes Series 2016-HQA2 Class M3 FRN 25/11/2028
USD 323,820 0.27
155,372 Galton Funding Mortgage Trust Series 2018-1 Class A33 FRN 25/11/2057
USD 157,907 0.13
1 Galton Funding Mortgage Trust Series 2018-2 Class A22 FRN 25/10/2058
USD – –
185,000 General Electric Co Series D FRN Perpetual USD 178,164 0.15800,000 General Motors Financial Co Inc 4.375% 25/09/2021 USD 810,217 0.67110,000 Genworth Mortgage Holdings Inc Series 144A 6.5%
15/08/2025USD 119,578 0.10
175,000 Hasbro Inc 2.6% 19/11/2022 USD 180,354 0.15140,000 Hillenbrand Inc 3.75% 01/03/2031 USD 138,780 0.12
65,318 Hilton Grand Vacations Trust Series 2017-AA Class B 2.96% 26/12/2028
USD 66,805 0.06
305,000 Howard Hughes Corp Series 144A 4.125% 01/02/2029 USD 303,457 0.25
Schedule of investments as at 31 May 2021 (continued)
Transferable securities admitted to an official stock exchange listing or traded on a regulated market. The percentages in brackets show the equivalent sector holdings at 31 May 2020.
367

Barclays Multi-Manager Fund PLC Annual Report and Audited Financial Statements 2021
GlobalAccess Global Short Duration Bond Fund
Holdings Financial assets at fair value through profit or loss Currency Fair value
USD % of net
assets
Bonds: 94.01% (31 May 2020: 92.78%) (continued)
United States: 47.83% (31 May 2020: 46.20%) (continued)
Corporate bonds: 20.66% (31 May 2020: 22.94%)
500,000 Hyundai Capital America Series 144A 0.8% 08/01/2024 USD 499,257 0.41410,000 iHeartCommunications Inc Series 144A 5.25%
15/08/2027USD 425,346 0.35
395,000 InTown Hotel Portfolio Trust Series 2018-STAY Class C FRN 15/01/2033
USD 396,180 0.33
570,000 JPMorgan Chase & Co FRN 01/06/2025 USD 571,015 0.47250,000 L Brands Inc 7.5% 15/06/2029 USD 288,186 0.24
45,000 MGIC Investment Corp 5.25% 15/08/2028 USD 47,667 0.04540,000 Micron Technology Inc 4.64% 06/02/2024 USD 595,004 0.49425,000 Morgan Stanley FRN 05/04/2024 USD 426,684 0.35700,000 Morgan Stanley Series MTN 2.625% 17/11/2021 USD 707,841 0.59
48,802 MVW Owner Trust Series 2017-1A Class B 2.75% 20/12/2034
USD 49,870 0.04
58,812 MVW Owner Trust Series 2017-1A Class C 2.99% 20/12/2034
USD 59,818 0.05
400,000 Navient Corp Series MTN 6.125% 25/03/2024 USD 429,246 0.36370,000 Navient Corp 6.75% 15/06/2026 USD 407,973 0.34315,000 Netflix Inc 4.625% 15/05/2029 EUR 480,756 0.40188,000 NGL Energy Operating LLC / NGL Energy Finance Corp
Series 144A 7.5% 01/02/2026USD 195,977 0.16
265,000 Occidental Petroleum Corp 6.625% 01/09/2030 USD 304,037 0.2595,000 Occidental Petroleum Corp 8.875% 15/07/2030 USD 122,036 0.10
510,000 Pacific Gas and Electric Co 1.75% 16/06/2022 USD 510,037 0.42360,000 PetSmart Inc / PetSmart Finance Corp Series 144A 4.75%
15/02/2028USD 373,302 0.31
390,000 Photo Holdings Merger Sub Inc Series 144A 8.5% 01/10/2026
USD 427,206 0.35
115,000 Pioneer Natural Resources Co 0.75% 15/01/2024 USD 115,146 0.10465,000 Principal Life Global Funding II Series 144A 0.5%
08/01/2024USD 465,694 0.39
110,000 Range Resources Corp 9.25% 01/02/2026 USD 121,468 0.10730,000 Santander Retail Auto Lease Trust 2019-A Series 2019-A
Class C 3.3% 22/05/2023USD 744,017 0.62
275,000 Seasoned Credit Risk Transfer Trust Series Series 2017-2 Class M1 FRN 25/08/2056
USD 280,676 0.23
73,436 Sequoia Mortgage Trust Series 2018-CH2 Class A21 FRN 25/06/2048
USD 74,567 0.06
70,000 Skyworks Solutions Inc 0.9% 01/06/2023 USD 70,260 0.0644,722 SMB Private Education Loan Trust Series 2016-A Class
A2A 2.7% 15/05/2031USD 45,999 0.04
321,750 Sonic Capital LLC Series 2018-1A Class A2 4.026% 20/02/2048
USD 332,247 0.28
300,000 Southern Co Series 21-A 0.6% 26/02/2024 USD 300,901 0.25
Schedule of investments as at 31 May 2021 (continued)
Transferable securities admitted to an official stock exchange listing or traded on a regulated market. The percentages in brackets show the equivalent sector holdings at 31 May 2020.
368

Barclays Multi-Manager Fund PLC Annual Report and Audited Financial Statements 2021
GlobalAccess Global Short Duration Bond Fund
Holdings Financial assets at fair value through profit or loss Currency Fair value
USD % of net
assets
Bonds: 94.01% (31 May 2020: 92.78%) (continued)
United States: 47.83% (31 May 2020: 46.20%) (continued)
Corporate bonds: 20.66% (31 May 2020: 22.94%)
185,000 Sprint Capital Corp 6.875% 15/11/2028 USD 231,695 0.19130,000 State Street Corp FRN 30/03/2023 USD 132,811 0.11405,000 Tenet Healthcare Corp Series 144A 5.125% 01/11/2027 USD 423,233 0.35380,000 Tenneco Inc Series 144A 7.875% 15/01/2029 USD 425,583 0.35240,000 T-Mobile USA Inc 3.5% 15/04/2031 USD 244,390 0.20175,000 Townsquare Media Inc Series 144A 6.875% 01/02/2026 USD 185,063 0.1560,000 United Airlines Inc Series 144a 4.375% 15/04/2026 USD 62,251 0.0540,000 United Airlines Inc Series 144A 4.625% 15/04/2029 USD 41,376 0.03
395,000 Univision Communications Inc Series 144A 6.625% 01/06/2027
USD 427,588 0.35
100,000 Verus Securitization Trust 2020-INV1 Series 2020-INV1 Class M1 FRN 25/03/2060
USD 107,092 0.09
195,000 Vistra Operations Co LLC Series 144A 4.375% 01/05/2029 USD 196,382 0.16550,000 Wells Fargo & Co 4.125% 15/08/2023 USD 594,319 0.49
Government bonds: 14.82% (31 May 2020: 10.49%)1,145,000 Capital Projects Finance Authority/FL 4% 01/10/2024 USD 1,143,307 0.95
800,000 City of Detroit MI 2.711% 01/04/2026 USD 803,268 0.6715,000 City of Houston TX Airport System Revenue 0.883%
01/07/2022USD 15,095 0.01
60,000 Colorado Health Facilities Authority 2.8% 01/12/2026 USD 61,340 0.05215,000 Florida Development Finance Corp 2.6% 01/04/2026 USD 219,234 0.18760,000 Franklin County Convention Facilities Authority 1.155%
01/12/2024USD 774,962 0.64
215,000 Great Lakes Water Authority Sewage Disposal System Revenue 1.654% 01/07/2025
USD 222,807 0.18
300,000 Maryland Economic Development Corp 3.85% 01/06/2022
USD 303,484 0.25
640,000 Maryland Stadium Authority 1.424% 01/05/2025 USD 644,583 0.53180,000 Metropolitan Pier & Exposition Authority 3.955%
15/12/2026USD 189,819 0.16
500,000 Metropolitan Transportation Authority 5% 15/05/2022 USD 522,599 0.431,050,000 Montgomery County Industrial Development Authority/
PA 2.65% 15/11/2025USD 1,052,692 0.87
525,000 Montgomery County Industrial Development Authority/PA 2.94% 15/11/2027
USD 520,309 0.43
615,000 State of Illinois 3.14% 01/10/2024 USD 633,499 0.531,030,000 Tobacco Settlement Finance Authority 3% 01/06/2035 USD 1,046,951 0.871,543,000 United States Treasury Bill 0% 17/06/2021 USD 1,543,002 1.283,500,000 United States Treasury Bill 0% 30/12/2021 USD 3,499,536 2.902,000,000 United States Treasury Inflation Indexed Bonds 0.625%
15/01/2026USD 2,505,631 2.08
Schedule of investments as at 31 May 2021 (continued)
Transferable securities admitted to an official stock exchange listing or traded on a regulated market. The percentages in brackets show the equivalent sector holdings at 31 May 2020.
369

Barclays Multi-Manager Fund PLC Annual Report and Audited Financial Statements 2021
GlobalAccess Global Short Duration Bond Fund
Holdings Financial assets at fair value through profit or loss Currency Fair value
USD % of net
assets
Bonds: 94.01% (31 May 2020: 92.78%) (continued)
United States: 47.83% (31 May 2020: 46.20%) (continued)
Government bonds: 14.82% (31 May 2020: 10.49%)
1,770,000 United States Treasury Inflation Indexed Bonds 0.625% 15/01/2024
USD 2,183,867 1.81
Government sponsored agencies: 12.35% (31 May 2020: 12.77%)
655,000 Avis Budget Rental Car Funding AESOP LLC Series 2018-1A Class C 4.73% 20/09/2024
USD 699,210 0.58
520,000 Avis Budget Rental Car Funding AESOP LLC Series 2016-2A Class C 4.83% 20/11/2022
USD 524,765 0.43
260,000 BX Trust 2018-GW Series 2018-GW Class D FRN 15/05/2035
USD 260,330 0.22
785,000 COMM Mortgage Trust Series 2014-CR19 Class E FRN 10/08/2047
USD 734,202 0.61
190,000 Drive Auto Receivables Trust Series 2020-1 Class C 2.36% 16/03/2026
USD 193,846 0.16
72,594 Fannie Mae Pool 2.5% 01/11/2050 USD 75,337 0.0629,507 Fannie Mae Pool 2.5% 01/12/2050 USD 30,593 0.02
610,401 Fannie Mae Pool 2.5% 01/01/2051 USD 632,884 0.52242,835 Fannie Mae Pool 2.5% 01/02/2051 USD 252,031 0.21
1,265,000 Fannie Mae Pool 2.5% 15/06/2051 USD 1,309,695 1.091 Fannie Mae Pool 3% 01/12/2034 USD – –
1,215,000 Fannie Mae Pool 3% 31/12/2049 USD 1,269,028 1.0552,460 Fannie Mae Pool 3.5% 01/05/2042 USD 56,705 0.0573,077 Fannie Mae Pool 3.5% 01/11/2045 USD 78,162 0.07
224,986 Fannie Mae Pool 3.5% 01/12/2045 - FNAS6328F USD 241,448 0.20140,301 Fannie Mae Pool 3.5% 01/01/2046 USD 150,496 0.12
24,087 Fannie Mae Pool 3.5% 01/02/2046 USD 25,834 0.0224,526 Fannie Mae Pool 3.5% 01/11/2047 USD 26,023 0.0234,380 Fannie Mae Pool 3.5% 01/01/2048 USD 36,460 0.03
907,330 Fannie Mae Pool 3.5% 01/02/2048 USD 975,177 0.801 Fannie Mae Pool 3.5% 01/11/2048 USD – –
48,727 Fannie Mae Pool 3.5% 01/10/2049 USD 51,470 0.0417,289 Fannie Mae Pool 3.5% 01/07/2050 USD 18,365 0.02
191,201 Fannie Mae Pool 4% 01/10/2044 USD 208,913 0.17109,533 Fannie Mae Pool 4% 01/06/2045 USD 119,698 0.10
4,458 Fannie Mae Pool 4% 01/09/2045 USD 4,854 –6,795 Fannie Mae Pool 4% 01/11/2045 USD 7,391 0.01
1 Fannie Mae Pool 4% 01/03/2046 USD – –4,878 Fannie Mae Pool 4% 01/12/2049 USD 5,214 –
675,000 Fannie Mae Pool 4% 31/12/2049 USD 721,074 0.60341,666 Fannie Mae Pool 4.5% 01/05/2047 USD 373,932 0.31
58,252 Fannie Mae Pool 4.5% 01/11/2047 USD 64,429 0.05100,326 Fannie Mae Pool 4.5% 01/05/2048 - FNBM4343F USD 110,950 0.09
1 Fannie Mae Pool 4.5% 01/09/2048 USD – –
Schedule of investments as at 31 May 2021 (continued)
Transferable securities admitted to an official stock exchange listing or traded on a regulated market. The percentages in brackets show the equivalent sector holdings at 31 May 2020.
370

Barclays Multi-Manager Fund PLC Annual Report and Audited Financial Statements 2021
GlobalAccess Global Short Duration Bond Fund
Holdings Financial assets at fair value through profit or loss Currency Fair value
USD % of net
assets
Bonds: 94.01% (31 May 2020: 92.78%) (continued)
United States: 47.83% (31 May 2020: 46.20%) (continued)
Government sponsored agencies: 12.35% (31 May
2020: 12.77%)
140,000 Fannie Mae Pool 4.5% 01/03/2049 USD 151,289 0.1354,855 Fannie Mae Pool 4.5% 01/05/2049 USD 59,788 0.05
400,000 Fannie Mae Pool 4.5% 31/12/2049 USD 431,648 0.3616,562 Fannie Mae Pool 4.5% 01/01/2050 USD 17,959 0.02
293,837 Fannie Mae Pool 5% 01/12/2036 USD 337,725 0.2821,217 Fannie Mae Pool 5% 01/06/2040 USD 24,186 0.02
146,010 Fannie Mae Pool 5.5% 01/08/2037 USD 169,388 0.147,100 Federal Home Loan Mortgage Corp 3.5% 01/12/2047 USD 7,532 0.01
99,226 Freddie Mac Pool 4.5% 01/03/2049 USD 107,210 0.0934,059 Freddie Mac Pool 4.5% 01/05/2050 USD 36,977 0.03
267,827 Freddie Mac Pool 5% 01/12/2038 USD 307,486 0.2626,295 Freddie Mac Pool 5% 01/12/2041 USD 29,283 0.02
330,000 Ginnie Mae 3% 31/12/2049 USD 344,173 0.2995,000 Ginnie Mae 4% 31/12/2049 USD 100,777 0.08
935,000 Ginnie Mae 2.5% 31/12/2049 USD 968,307 0.8032,721 Ginnie Mae II Pool 3% 20/07/2046 USD 34,521 0.0342,015 Ginnie Mae II Pool 3% 20/09/2049 USD 43,199 0.0438,781 Ginnie Mae II Pool 3% 20/03/2050 USD 39,806 0.03
166,473 Ginnie Mae II Pool 3.5% 20/06/2043 USD 178,912 0.157,810 Ginnie Mae II Pool 3.5% 20/12/2045 USD 8,366 0.01
213,174 Ginnie Mae II Pool 3.5% 20/03/2046 USD 227,354 0.1915,294 Ginnie Mae II Pool 3.5% 20/04/2046 USD 16,304 0.0113,318 Ginnie Mae II Pool 3.5% 20/05/2046 USD 14,209 0.0114,088 Ginnie Mae II Pool 3.5% 20/06/2046 USD 15,005 0.01
7,131 Ginnie Mae II Pool 3.5% 20/07/2046 USD 7,596 0.01451,630 Ginnie Mae II Pool 3.5% 20/10/2046 USD 482,125 0.40164,397 Ginnie Mae II Pool 4% 20/06/2047 USD 176,807 0.15
53,751 Ginnie Mae II Pool 4% 20/09/2047 USD 57,576 0.0526,079 Ginnie Mae II Pool 4.5% 20/03/2047 USD 28,399 0.0216,943 Ginnie Mae II Pool 4.5% 20/08/2047 USD 18,391 0.0271,608 Ginnie Mae II Pool 4.5% 20/09/2047 USD 77,516 0.0616,669 Ginnie Mae II Pool 5% 20/08/2047 USD 18,448 0.0276,824 Ginnie Mae II Pool 5% 20/09/2047 USD 84,360 0.07
220,000 Independence Plaza Trust Series 2018-INDP Class C 4.158% 10/07/2035
USD 231,673 0.19
110,000 Santander Drive Auto Receivables Trust 2020-4 Series 2020-4 Class D 1.48% 15/01/2027
USD 111,381 0.09
51,555 Sequoia Mortgage Trust Series 2018-CH3 Class A19 FRN 25/08/2048
USD 53,035 0.04
100,000 Verus Securitization Trust 2021-R1 Series 2021-R1 Class M1 2.338% 25/10/2063
USD 101,003 0.08
Schedule of investments as at 31 May 2021 (continued)
Transferable securities admitted to an official stock exchange listing or traded on a regulated market. The percentages in brackets show the equivalent sector holdings at 31 May 2020.
371

Barclays Multi-Manager Fund PLC Annual Report and Audited Financial Statements 2021
GlobalAccess Global Short Duration Bond Fund
Holdings Financial assets at fair value through profit or loss Currency Fair value
USD % of net
assets
Bonds: 94.01% (31 May 2020: 92.78%) (continued)
United States: 47.83% (31 May 2020: 46.20%) (continued)
Government sponsored agencies: 12.35% (31 May
2020: 12.77%)
532,997 Verus Securitization Trust 2021-R2 Series 2021-R2 Class A3 FRN 25/02/2064
USD 536,369 0.44
Total United States 57,744,664 47.83
Virgin Islands: 0.84% (31 May 2020: 0.50%)
Government sponsored agencies: 0.84% (31 May 2020: 0.50%)
1,000,000 1MDB Global Investments Ltd Series REGS 4.4% 09/03/2023
USD 1,012,176 0.84
Total Virgin Islands 1,012,176 0.84
Total bonds 113,493,288 94.01
Accrued income on financial assets at fair value through profit or loss: 0.80% (31 May 2020: 0.63%) 965,197 0.80
Investment funds: 2.29% (31 May 2020: 1.88%)
Ireland: 2.29% (31 May 2020: 1.88%)
270,000 iShares USD Treasury Bond 1-3yr UCITS ETF USD 1,463,400 1.2113,000 iShares USD Ultrashort Bond UCITS ETF USD Dist 1.5527% USD 1,302,795 1.08
Total investment funds 2,766,195 2.29
No. of contracts Futures contracts: -0.03% (31 May 2020: 0.04%) CounterpartyUnrealised gain/(loss)
% of net assets
USD(13) US 10 Year Ultra CBT Future September 2021 JP Morgan 3,342 0.01(11) Euro-BOBL EUX Future June 2021 JP Morgan 3,020 –
Total fair value gains on open futures contracts 6,362 0.01
(5) Canada 10 Year MSE Future September 2021 JP Morgan (1,407) – 9K6TLYU(15) US 10 Year T-Note Future September 2021 JP Morgan (3,047) – 9K8UM9U137 Korea 3 Yr Bond KFX Future June 2021 JP Morgan (6,166) (0.01) 9KX9GSU
(125) US 5 Year T-Note CBT Future September 2021 JP Morgan (30,272) (0.03) 9K9TD4U
Total fair value losses on open futures contracts (40,892) (0.04)
Total futures contracts (34,530) (0.03)
Schedule of investments as at 31 May 2021 (continued)
Transferable securities admitted to an official stock exchange listing or traded on a regulated market. The percentages in brackets show the equivalent sector holdings at 31 May 2020.
372
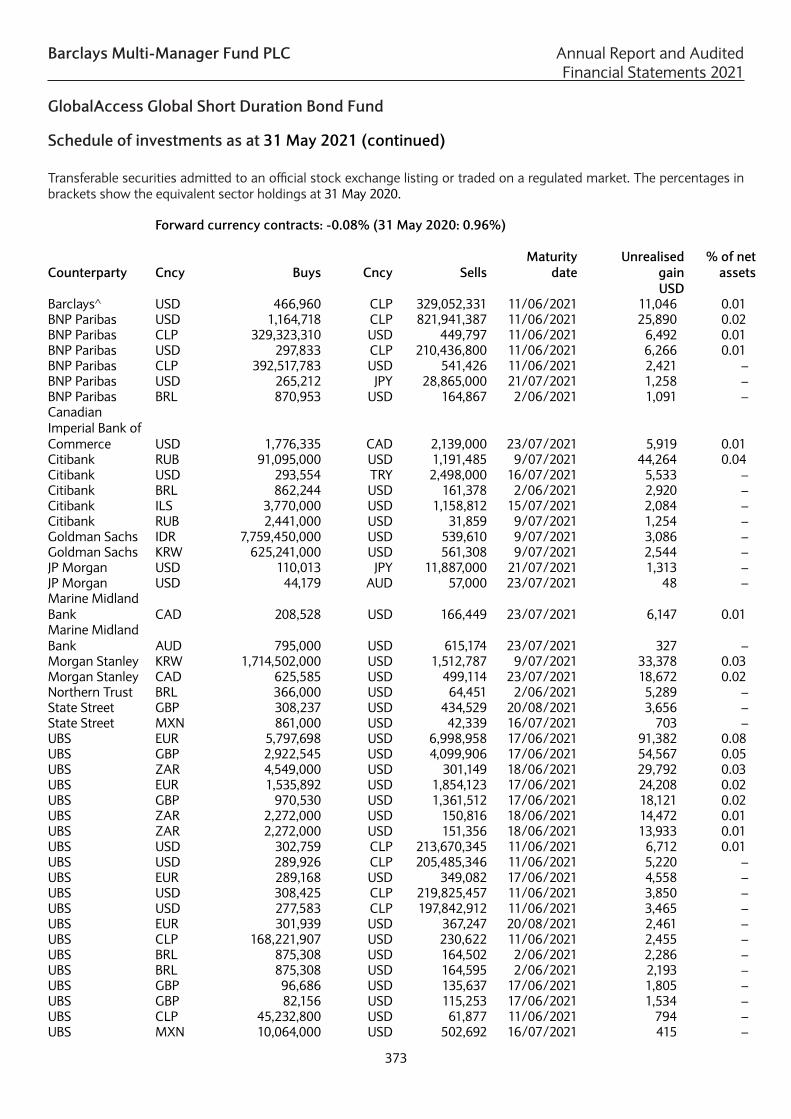
Barclays Multi-Manager Fund PLC Annual Report and Audited Financial Statements 2021
GlobalAccess Global Short Duration Bond Fund
Holdings Financial assets at fair value through profit or loss Currency Fair value
USD % of net
assets
Bonds: 94.01% (31 May 2020: 92.78%) (continued)
United States: 47.83% (31 May 2020: 46.20%) (continued)
Government sponsored agencies: 12.35% (31 May
2020: 12.77%)
532,997 Verus Securitization Trust 2021-R2 Series 2021-R2 Class A3 FRN 25/02/2064
USD 536,369 0.44
Total United States 57,744,664 47.83
Virgin Islands: 0.84% (31 May 2020: 0.50%)
Government sponsored agencies: 0.84% (31 May 2020: 0.50%)
1,000,000 1MDB Global Investments Ltd Series REGS 4.4% 09/03/2023
USD 1,012,176 0.84
Total Virgin Islands 1,012,176 0.84
Total bonds 113,493,288 94.01
Accrued income on financial assets at fair value through profit or loss: 0.80% (31 May 2020: 0.63%) 965,197 0.80
Investment funds: 2.29% (31 May 2020: 1.88%)
Ireland: 2.29% (31 May 2020: 1.88%)
270,000 iShares USD Treasury Bond 1-3yr UCITS ETF USD 1,463,400 1.2113,000 iShares USD Ultrashort Bond UCITS ETF USD Dist 1.5527% USD 1,302,795 1.08
Total investment funds 2,766,195 2.29
No. of contracts Futures contracts: -0.03% (31 May 2020: 0.04%) CounterpartyUnrealised gain/(loss)
% of net assets
USD(13) US 10 Year Ultra CBT Future September 2021 JP Morgan 3,342 0.01(11) Euro-BOBL EUX Future June 2021 JP Morgan 3,020 –
Total fair value gains on open futures contracts 6,362 0.01
(5) Canada 10 Year MSE Future September 2021 JP Morgan (1,407) – 9K6TLYU(15) US 10 Year T-Note Future September 2021 JP Morgan (3,047) – 9K8UM9U137 Korea 3 Yr Bond KFX Future June 2021 JP Morgan (6,166) (0.01) 9KX9GSU
(125) US 5 Year T-Note CBT Future September 2021 JP Morgan (30,272) (0.03) 9K9TD4U
Total fair value losses on open futures contracts (40,892) (0.04)
Total futures contracts (34,530) (0.03)
Forward currency contracts: -0.08% (31 May 2020: 0.96%)
Counterparty Cncy Buys Cncy SellsMaturity
dateUnrealised
gain% of net
assetsUSD
Barclays^ USD 466,960 CLP 329,052,331 11/06/2021 11,046 0.01 CCT_1717145_56920
BNP Paribas USD 1,164,718 CLP 821,941,387 11/06/2021 25,890 0.02 CCT_1717145_57011
BNP Paribas CLP 329,323,310 USD 449,797 11/06/2021 6,492 0.01 CCT_1717145_59688
BNP Paribas USD 297,833 CLP 210,436,800 11/06/2021 6,266 0.01 CCT_1717145_56924
BNP Paribas CLP 392,517,783 USD 541,426 11/06/2021 2,421 – CCT_1717145_59707
BNP Paribas USD 265,212 JPY 28,865,000 21/07/2021 1,258 – CCT_1717145_59391
BNP Paribas BRL 870,953 USD 164,867 2/06/2021 1,091 – CCT_1717145_59520
Canadian Imperial Bank of Commerce USD 1,776,335 CAD 2,139,000 23/07/2021 5,919 0.01 CCT_1717145_59393
Citibank RUB 91,095,000 USD 1,191,485 9/07/2021 44,264 0.04 CCT_1717145_58505
Citibank USD 293,554 TRY 2,498,000 16/07/2021 5,533 – CCT_1717145_58544
Citibank BRL 862,244 USD 161,378 2/06/2021 2,920 – CCT_1717145_59526
Citibank ILS 3,770,000 USD 1,158,812 15/07/2021 2,084 – CCT_1717145_59394
Citibank RUB 2,441,000 USD 31,859 9/07/2021 1,254 – CCT_1717145_58136
Goldman Sachs IDR 7,759,450,000 USD 539,610 9/07/2021 3,086 – CCT_1717145_59418
Goldman Sachs KRW 625,241,000 USD 561,308 9/07/2021 2,544 – CCT_1717145_58615
JP Morgan USD 110,013 JPY 11,887,000 21/07/2021 1,313 – CCT_1717145_58665
JP Morgan USD 44,179 AUD 57,000 23/07/2021 48 – CCT_1717145_58669
Marine Midland Bank CAD 208,528 USD 166,449 23/07/2021 6,147 0.01 CCT_1717145_58611
Marine Midland Bank AUD 795,000 USD 615,174 23/07/2021 327 – CCT_1717145_58603
Morgan Stanley KRW 1,714,502,000 USD 1,512,787 9/07/2021 33,378 0.03 CCT_1717145_58082
Morgan Stanley CAD 625,585 USD 499,114 23/07/2021 18,672 0.02 CCT_1717145_58613
Northern Trust BRL 366,000 USD 64,451 2/06/2021 5,289 – CCT_1717145_58803
State Street GBP 308,237 USD 434,529 20/08/2021 3,656 – CCT_1717145_59344
State Street MXN 861,000 USD 42,339 16/07/2021 703 – CCT_1717145_58919
UBS EUR 5,797,698 USD 6,998,958 17/06/2021 91,382 0.08 CCT_1776780_168916
UBS GBP 2,922,545 USD 4,099,906 17/06/2021 54,567 0.05 CCT_1776780_168907
UBS ZAR 4,549,000 USD 301,149 18/06/2021 29,792 0.03 CCT_1717145_57698
UBS EUR 1,535,892 USD 1,854,123 17/06/2021 24,208 0.02 CCT_1776780_168911
UBS GBP 970,530 USD 1,361,512 17/06/2021 18,121 0.02 CCT_1776780_168903
UBS ZAR 2,272,000 USD 150,816 18/06/2021 14,472 0.01 CCT_1717145_57701
UBS ZAR 2,272,000 USD 151,356 18/06/2021 13,933 0.01 CCT_1717145_57765
UBS USD 302,759 CLP 213,670,345 11/06/2021 6,712 0.01 CCT_1717145_56922
UBS USD 289,926 CLP 205,485,346 11/06/2021 5,220 – CCT_1717145_56963
UBS EUR 289,168 USD 349,082 17/06/2021 4,558 – CCT_1776780_168912
UBS USD 308,425 CLP 219,825,457 11/06/2021 3,850 – CCT_1717145_56874
UBS USD 277,583 CLP 197,842,912 11/06/2021 3,465 – CCT_1717145_56873
UBS EUR 301,939 USD 367,247 20/08/2021 2,461 – CCT_1717145_59347
UBS CLP 168,221,907 USD 230,622 11/06/2021 2,455 – CCT_1717145_59689
UBS BRL 875,308 USD 164,502 2/06/2021 2,286 – CCT_1717145_59548
UBS BRL 875,308 USD 164,595 2/06/2021 2,193 – CCT_1717145_59546
UBS GBP 96,686 USD 135,637 17/06/2021 1,805 – CCT_1776780_168900
UBS GBP 82,156 USD 115,253 17/06/2021 1,534 – CCT_1776780_168909
UBS CLP 45,232,800 USD 61,877 11/06/2021 794 – CCT_1717145_58018
UBS MXN 10,064,000 USD 502,692 16/07/2021 415 – CCT_1717145_58607
Schedule of investments as at 31 May 2021 (continued)
Transferable securities admitted to an official stock exchange listing or traded on a regulated market. The percentages in brackets show the equivalent sector holdings at 31 May 2020.
373

Barclays Multi-Manager Fund PLC Annual Report and Audited Financial Statements 2021
GlobalAccess Global Short Duration Bond Fund
Forward currency contracts: -0.08% (31 May 2020: 0.96%) (continued)
Counterparty Cncy Buys Cncy SellsMaturity
date
Unrealised gain
% of net assets
USD UBS GBP 5,556 USD 7,794 17/06/2021 104 – CCT_1776780_168904
UBS GBP 8,608 USD 12,177 17/06/2021 60 – CCT_1776780_169235
UBS CLP 84,510,000 USD 117,058 11/06/2021 34 – CCT_1717145_57147
UBS GBP 2,869 USD 4,051 17/06/2021 27 – CCT_1776780_169089
UBS GBP 1,787 USD 2,524 17/06/2021 16 – CCT_1776780_169555
UBS GBP 986 USD 1,390 17/06/2021 13 – CCT_1776780_169021
UBS GBP 1,497 USD 2,120 17/06/2021 8 – CCT_1776780_169412
UBS GBP 742 USD 1,048 17/06/2021 6 – CCT_1776780_169496
UBS GBP 935 USD 1,324 17/06/2021 5 – CCT_1776780_169289
UBS GBP 163 USD 229 17/06/2021 2 – CCT_1776780_168850
Total fair value gains on forward currency contracts 476,099 0.39
Counterparty Cncy Buys Cncy SellsMaturity
dateUnrealised
loss% of net
assetsUSD
Bank of America INR 5,310,000 USD 72,859 9/07/2021 (71) – CCT_1717145_59706
Barclays^ USD 1,074,283 INR 79,034,989 9/07/2021 (9,112) (0.01) CCT_1717145_58062
Barclays^ USD 466,858 IDR 6,854,872,320 9/07/2021 (12,572) (0.01) CCT_1717145_58263
BNP Paribas USD 163,361 BRL 870,953 2/09/2021 (1,113) – CCT_1717145_59521
BNP Paribas USD 541,105 CLP 392,517,783 10/09/2021 (2,276) – CCT_1717145_59708
BNP Paribas USD 449,508 CLP 329,323,310 10/09/2021 (6,390) (0.01) CCT_1717145_59687
Citibank GBP 204,000 USD 290,090 20/08/2021 (87) – CCT_1717145_59392
Citibank TRY 2,498,000 USD 288,669 16/07/2021 (649) – CCT_1717145_58340
Citibank USD 63,692 CNH 414,445 18/06/2021 (1,287) – CCT_1717145_57074
Citibank USD 63,374 CNH 413,547 18/06/2021 (1,464) – CCT_1717145_57144
Citibank USD 159,906 BRL 862,244 2/09/2021 (2,924) – CCT_1717145_59525
Citibank JPY 69,612,421 USD 641,899 21/07/2021 (5,331) (0.01) CCT_1717145_58605
Citibank USD 294,106 RSD 29,540,026 16/07/2021 (12,948) (0.01) CCT_1717145_58130
Citibank USD 1,242,879 RUB 93,536,000 9/07/2021 (25,983) (0.02) CCT_1717145_57884
Citibank USD 882,319 RSD 88,620,077 16/07/2021 (38,845) (0.03) CCT_1717145_58129
Citibank USD 7,086,761 EUR 5,826,851 20/08/2021 (47,907) (0.04) CCT_1717145_59322
Goldman Sachs USD 41,402 CNH 270,298 18/06/2021 (977) – CCT_1717145_57407
Goldman Sachs USD 699,715 IDR 10,282,308,480 9/07/2021 (19,430) (0.02) CCT_1717145_58241
JP Morgan CNH 259,000 USD 40,623 18/06/2021 (15) – CCT_1717145_59709
JP Morgan USD 19,523 EUR 16,000 20/08/2021 (69) – CCT_1717145_59710
JP Morgan USD 69,438 MXN 1,392,000 16/07/2021 (149) – CCT_1717145_58668
JP Morgan USD 100,368 KRW 111,775,000 9/07/2021 (432) – CCT_1717145_58628
JP Morgan USD 105,113 CAD 132,000 23/07/2021 (4,141) (0.01) CCT_1717145_58667
Marine Midland Bank USD 127,529 CNH 830,534 18/06/2021 (2,686) – CCT_1717145_57176
Marine Midland Bank USD 192,173 MXN 3,905,723 16/07/2021 (3,077) – CCT_1717145_58443
Marine Midland Bank USD 142,509 CNH 928,869 18/06/2021 (3,124) – CCT_1717145_57286
Schedule of investments as at 31 May 2021 (continued)
Transferable securities admitted to an official stock exchange listing or traded on a regulated market. The percentages in brackets show the equivalent sector holdings at 31 May 2020.
374
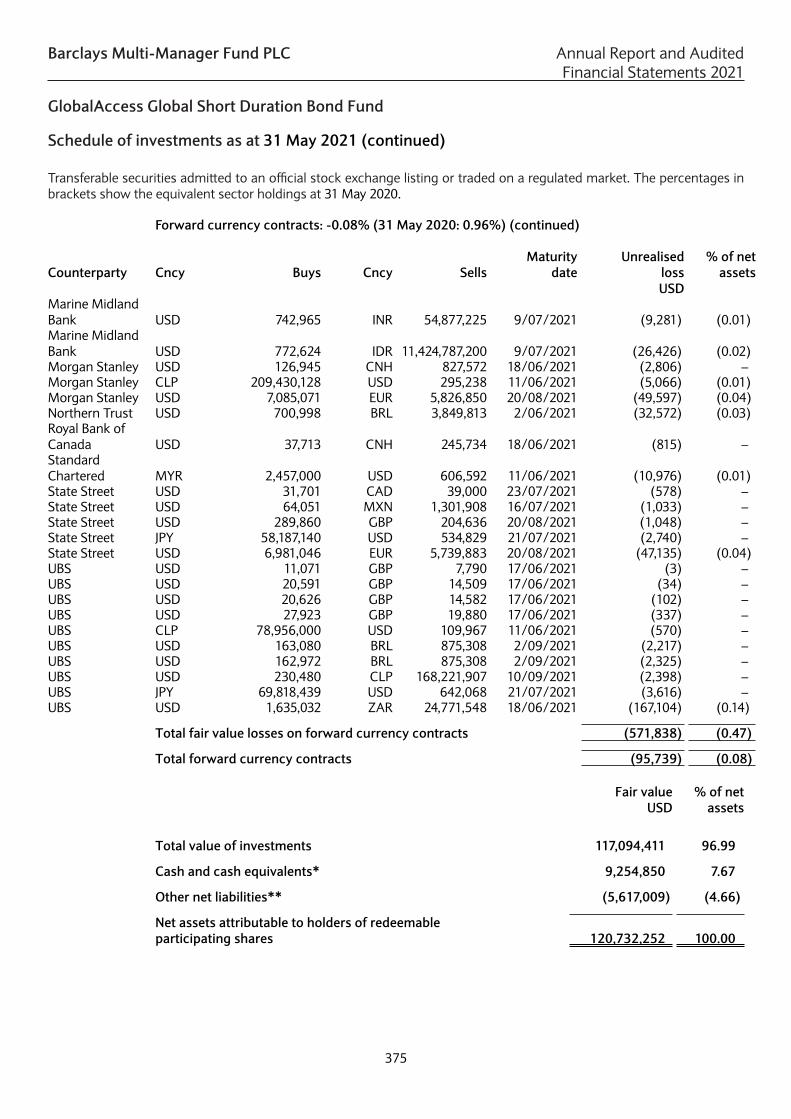
Barclays Multi-Manager Fund PLC Annual Report and Audited Financial Statements 2021
GlobalAccess Global Short Duration Bond Fund
Forward currency contracts: -0.08% (31 May 2020: 0.96%) (continued)
Counterparty Cncy Buys Cncy SellsMaturity
date
Unrealised gain
% of net assets
USD UBS GBP 5,556 USD 7,794 17/06/2021 104 – CCT_1776780_168904
UBS GBP 8,608 USD 12,177 17/06/2021 60 – CCT_1776780_169235
UBS CLP 84,510,000 USD 117,058 11/06/2021 34 – CCT_1717145_57147
UBS GBP 2,869 USD 4,051 17/06/2021 27 – CCT_1776780_169089
UBS GBP 1,787 USD 2,524 17/06/2021 16 – CCT_1776780_169555
UBS GBP 986 USD 1,390 17/06/2021 13 – CCT_1776780_169021
UBS GBP 1,497 USD 2,120 17/06/2021 8 – CCT_1776780_169412
UBS GBP 742 USD 1,048 17/06/2021 6 – CCT_1776780_169496
UBS GBP 935 USD 1,324 17/06/2021 5 – CCT_1776780_169289
UBS GBP 163 USD 229 17/06/2021 2 – CCT_1776780_168850
Total fair value gains on forward currency contracts 476,099 0.39
Counterparty Cncy Buys Cncy SellsMaturity
dateUnrealised
loss% of net
assetsUSD
Bank of America INR 5,310,000 USD 72,859 9/07/2021 (71) – CCT_1717145_59706
Barclays^ USD 1,074,283 INR 79,034,989 9/07/2021 (9,112) (0.01) CCT_1717145_58062
Barclays^ USD 466,858 IDR 6,854,872,320 9/07/2021 (12,572) (0.01) CCT_1717145_58263
BNP Paribas USD 163,361 BRL 870,953 2/09/2021 (1,113) – CCT_1717145_59521
BNP Paribas USD 541,105 CLP 392,517,783 10/09/2021 (2,276) – CCT_1717145_59708
BNP Paribas USD 449,508 CLP 329,323,310 10/09/2021 (6,390) (0.01) CCT_1717145_59687
Citibank GBP 204,000 USD 290,090 20/08/2021 (87) – CCT_1717145_59392
Citibank TRY 2,498,000 USD 288,669 16/07/2021 (649) – CCT_1717145_58340
Citibank USD 63,692 CNH 414,445 18/06/2021 (1,287) – CCT_1717145_57074
Citibank USD 63,374 CNH 413,547 18/06/2021 (1,464) – CCT_1717145_57144
Citibank USD 159,906 BRL 862,244 2/09/2021 (2,924) – CCT_1717145_59525
Citibank JPY 69,612,421 USD 641,899 21/07/2021 (5,331) (0.01) CCT_1717145_58605
Citibank USD 294,106 RSD 29,540,026 16/07/2021 (12,948) (0.01) CCT_1717145_58130
Citibank USD 1,242,879 RUB 93,536,000 9/07/2021 (25,983) (0.02) CCT_1717145_57884
Citibank USD 882,319 RSD 88,620,077 16/07/2021 (38,845) (0.03) CCT_1717145_58129
Citibank USD 7,086,761 EUR 5,826,851 20/08/2021 (47,907) (0.04) CCT_1717145_59322
Goldman Sachs USD 41,402 CNH 270,298 18/06/2021 (977) – CCT_1717145_57407
Goldman Sachs USD 699,715 IDR 10,282,308,480 9/07/2021 (19,430) (0.02) CCT_1717145_58241
JP Morgan CNH 259,000 USD 40,623 18/06/2021 (15) – CCT_1717145_59709
JP Morgan USD 19,523 EUR 16,000 20/08/2021 (69) – CCT_1717145_59710
JP Morgan USD 69,438 MXN 1,392,000 16/07/2021 (149) – CCT_1717145_58668
JP Morgan USD 100,368 KRW 111,775,000 9/07/2021 (432) – CCT_1717145_58628
JP Morgan USD 105,113 CAD 132,000 23/07/2021 (4,141) (0.01) CCT_1717145_58667
Marine Midland Bank USD 127,529 CNH 830,534 18/06/2021 (2,686) – CCT_1717145_57176
Marine Midland Bank USD 192,173 MXN 3,905,723 16/07/2021 (3,077) – CCT_1717145_58443
Marine Midland Bank USD 142,509 CNH 928,869 18/06/2021 (3,124) – CCT_1717145_57286
Forward currency contracts: -0.08% (31 May 2020: 0.96%) (continued)
Counterparty Cncy Buys Cncy SellsMaturity
date
Unrealised loss
% of net assets
USD Marine Midland Bank USD 742,965 INR 54,877,225 9/07/2021 (9,281) (0.01) CCT_1717145_58001
Marine Midland Bank USD 772,624 IDR 11,424,787,200 9/07/2021 (26,426) (0.02) CCT_1717145_58166
Morgan Stanley USD 126,945 CNH 827,572 18/06/2021 (2,806) – CCT_1717145_57145
Morgan Stanley CLP 209,430,128 USD 295,238 11/06/2021 (5,066) (0.01) CCT_1717145_58849
Morgan Stanley USD 7,085,071 EUR 5,826,850 20/08/2021 (49,597) (0.04) CCT_1717145_59320
Northern Trust USD 700,998 BRL 3,849,813 2/06/2021 (32,572) (0.03) CCT_1717145_57250
Royal Bank of Canada USD 37,713 CNH 245,734 18/06/2021 (815) – CCT_1717145_57329
Standard Chartered MYR 2,457,000 USD 606,592 11/06/2021 (10,976) (0.01) CCT_1717145_57021
State Street USD 31,701 CAD 39,000 23/07/2021 (578) – CCT_1717145_58918
State Street USD 64,051 MXN 1,301,908 16/07/2021 (1,033) – CCT_1717145_58441
State Street USD 289,860 GBP 204,636 20/08/2021 (1,048) – CCT_1717145_59425
State Street JPY 58,187,140 USD 534,829 21/07/2021 (2,740) – CCT_1717145_58579
State Street USD 6,981,046 EUR 5,739,883 20/08/2021 (47,135) (0.04) CCT_1717145_59317
UBS USD 11,071 GBP 7,790 17/06/2021 (3) – CCT_1776780_169148
UBS USD 20,591 GBP 14,509 17/06/2021 (34) – CCT_1776780_169630
UBS USD 20,626 GBP 14,582 17/06/2021 (102) – CCT_1776780_168793
UBS USD 27,923 GBP 19,880 17/06/2021 (337) – CCT_1776780_168906
UBS CLP 78,956,000 USD 109,967 11/06/2021 (570) – CCT_1717145_58140
UBS USD 163,080 BRL 875,308 2/09/2021 (2,217) – CCT_1717145_59547
UBS USD 162,972 BRL 875,308 2/09/2021 (2,325) – CCT_1717145_59549
UBS USD 230,480 CLP 168,221,907 10/09/2021 (2,398) – CCT_1717145_59690
UBS JPY 69,818,439 USD 642,068 21/07/2021 (3,616) – CCT_1717145_58565
UBS USD 1,635,032 ZAR 24,771,548 18/06/2021 (167,104) (0.14) CCT_1717145_57177
Total fair value losses on forward currency contracts (571,838) (0.47)
Total forward currency contracts (95,739) (0.08)
Fair value USD
% of net assets
Total value of investments 117,094,411 96.99
Cash and cash equivalents* 9,254,850 7.67
Other net liabilities** (5,617,009) (4.66)
Net assets attributable to holders of redeemable participating shares 120,732,252 100.00
Schedule of investments as at 31 May 2021 (continued)
Transferable securities admitted to an official stock exchange listing or traded on a regulated market. The percentages in brackets show the equivalent sector holdings at 31 May 2020.
375

Barclays Multi-Manager Fund PLC Annual Report and Audited Financial Statements 2021
GlobalAccess Global Short Duration Bond Fund
Analysis of total assets (unaudited)% of total
assets
Transferable securities and money market instruments admitted to official stock exchangelisting or traded on a regulated market. 87.60Investment funds and AIFs. 2.12OTC financial derivative instruments. 0.36Other assets. 9.92
100.00
*All cash holdings are held with The Northern Trust Company.**Including USD 60,551 held with JP Morgan as security by the counterparty to derivatives contracts.^Related party.
The Industry Classification Benchmark (“ICB”) is jointly owned by FTSE and Dow Jones and has been licensed for use. FTSE and Dow Jones do not accept liability to any person for any loss or damage arising out of any error or omission in ICB.
Schedule of investments as at 31 May 2021 (continued)
Transferable securities admitted to an official stock exchange listing or traded on a regulated market. The percentages in brackets show the equivalent sector holdings at 31 May 2020.
376

Barclays Multi-Manager Fund PLC Annual Report and Audited Financial Statements 2021
GlobalAccess US Small & Mid Cap Equity Fund
Schedule of investments as at 31 May 2021
Transferable securities admitted to an official stock exchange listing or traded on a regulated market. The percentages in brackets show the equivalent sector holdings at 31 May 2020.
Holdings Financial assets at fair value through profit or loss CurrencyFair value
USD% of net
assets
Equities: 96.16% (31 May 2020: 94.87%)
Bahamas: 0.02% (31 May 2020: 0.00%)
Leisure time: 0.02% (31 May 2020: 0.00%)2,605 OneSpaWorld Holdings Ltd Com USD0.0001 USD 29,215 0.02
Total Bahamas 29,215 0.02
Bermuda: 2.54% (31 May 2020: 3.31%)
Chemicals: 0.74% (31 May 2020: 0.77%)28,869 Axalta Coating Systems Ltd Com USD1.00 USD 936,366 0.74
Computers: 0.21% (31 May 2020: 0.20%)5,877 Genpact Ltd Com USD0.01 USD 268,843 0.21
Distribution/wholesale: 0.16% (31 May 2020: 0.31%)3,775 Triton International Ltd/Bermuda Com USD0.01 USD 204,888 0.16
Insurance: 1.26% (31 May 2020: 1.51%)4,914 Assured Guaranty Ltd Com USD0.01 USD 234,029 0.194,533 Athene Holding Ltd Class A Com USD0.001 USD 283,584 0.22
285 Enstar Group Ltd Com USD0.01 USD 72,252 0.062,478 James River Group Holdings Com USD0.0002 USD 86,619 0.07
764 White Mountains Insurance Group Ltd Com USD1.00 USD 911,471 0.72
Leisure time: 0.14% (31 May 2020: 0.00%)5,417 Norwegian Cruise Line Holdings Ltd Com USD0.001 USD 172,830 0.14
Pharmaceuticals: 0.03% (31 May 2020: 0.00%)1,347 Myovant Sciences Ltd Com USD0.000018 USD 31,506 0.03
Semiconductors: 0.00% (31 May 2020: 0.52%)
Total Bermuda 3,202,388 2.54
Canada: 0.09% (31 May 2020: 0.17%)
Mining: 0.07% (31 May 2020: 0.14%)9,056 Novagold Resources Inc Com NPV USD 92,960 0.07
Oil & gas: 0.02% (31 May 2020: 0.03%)2,681 Enerplus Corp Com NPV USD 17,547 0.02
Total Canada 110,507 0.09
Cayman Islands: 0.66% (31 May 2020: 0.44%)
Commercial services: 0.11% (31 May 2020: 0.00%)2,106 StoneCo Ltd Com USD0.000079 USD 138,912 0.11
377

Barclays Multi-Manager Fund PLC Annual Report and Audited Financial Statements 2021
GlobalAccess US Small & Mid Cap Equity Fund
Holdings Financial assets at fair value through profit or loss Currency Fair value
USD % of net
assets
Equities: 96.16% (31 May 2020: 94.87%) (continued)
Cayman Islands: 0.66% (31 May 2020: 0.44%) (continued)
Holding companies-diversified: 0.06% (31 May 2020: 0.00%)
7,291 Ares Acquisition Corp NPV USD 72,946 0.06
Machinery-diversified: 0.45% (31 May 2020: 0.35%)10,226 Ichor Holdings Ltd Com USD0.0001 USD 575,724 0.45
Miscellaneous manufacturing: 0.04% (31 May 2020: 0.09%)
542 Fabrinet Com USD0.01 USD 48,604 0.04
Total Cayman Islands 836,186 0.66
Curaçao: 0.00% (31 May 2020: 0.09%)
Healthcare-products: 0.00% (31 May 2020: 0.09%)
Ireland: 0.55% (31 May 2020: 0.79%)
Healthcare-products: 0.00% (31 May 2020: 0.21%)
Healthcare-services: 0.13% (31 May 2020: 0.06%)760 ICON PLC Com EUR0.06 USD 170,118 0.13
Pharmaceuticals: 0.42% (31 May 2020: 0.52%)11,413 Perrigo Co PLC Com EUR0.001 USD 526,653 0.42
Total Ireland 696,771 0.55
Israel: 0.01% (31 May 2020: 0.05%)
Pharmaceuticals: 0.01% (31 May 2020: 0.05%)778 UroGen Pharma Ltd Com ILS0.01 USD 13,739 0.01
Total Israel 13,739 0.01
Jersey: 0.00% (31 May 2020: 0.22%)
Internet: 0.00% (31 May 2020: 0.11%)
Software: 0.00% (31 May 2020: 0.11%)
Luxembourg: 0.07% (31 May 2020: 0.06%)
Packaging & containers: 0.07% (31 May 2020: 0.06%)3,438 Ardagh Group SA Com EUR0.01 USD 84,867 0.07
Total Luxembourg 84,867 0.07
Schedule of investments as at 31 May 2021 (continued)
Transferable securities admitted to an official stock exchange listing or traded on a regulated market. The percentages in brackets show the equivalent sector holdings at 31 May 2020.
378

Barclays Multi-Manager Fund PLC Annual Report and Audited Financial Statements 2021
GlobalAccess US Small & Mid Cap Equity Fund
Holdings Financial assets at fair value through profit or loss Currency Fair value
USD % of net
assets
Equities: 96.16% (31 May 2020: 94.87%) (continued)
Marshall Island: 0.00% (31 May 2020: 0.02%)
Transportation: 0.00% (31 May 2020: 0.02%)
Netherlands: 0.25% (31 May 2020: 0.05%)
Lodging: 0.21% (31 May 2020: 0.00%)36,380 Playa Hotels & Resorts NV Com USD0.01 USD 266,120 0.21
Pharmaceuticals: 0.04% (31 May 2020: 0.05%)7,724 ProQR Therapeutics NV Com USD0.01 USD 48,391 0.04
Total Netherlands 314,511 0.25
Puerto Rico: 0.38% (31 May 2020: 0.00%)
Banks: 0.38% (31 May 2020: 0.00%)5,930 Popular Inc Com USD0.01 USD 483,799 0.38
Total Puerto Rico 483,799 0.38
Singapore: 0.10% (31 May 2020: 0.14%)
Biotechnology: 0.00% (31 May 2020: 0.02%)
Electronics: 0.10% (31 May 2020: 0.12%)6,718 Flex Ltd Com NPV USD 122,704 0.10
Total Singapore 122,704 0.10
Switzerland: 0.00% (31 May 2020: 0.03%)
Biotechnology: 0.00% (31 May 2020: 0.03%)
United Kingdom: 0.72% (31 May 2020: 0.81%)
Biotechnology: 0.19% (31 May 2020: 0.02%)10,067 Abcam PLC Com GBP0.00002 USD 202,347 0.16
870 Immunocore Holdings PLC ADR USD 35,522 0.03
Commercial services: 0.00% (31 May 2020: 0.12%)
Electronics: 0.53% (31 May 2020: 0.46%)11,151 Sensata Technologies Holding PLC Com EUR0.01 USD 662,760 0.53
Healthcare-products: 0.00% (31 May 2020: 0.21%)
Total United Kingdom 900,629 0.72
Schedule of investments as at 31 May 2021 (continued)
Transferable securities admitted to an official stock exchange listing or traded on a regulated market. The percentages in brackets show the equivalent sector holdings at 31 May 2020.
379

Barclays Multi-Manager Fund PLC Annual Report and Audited Financial Statements 2021
GlobalAccess US Small & Mid Cap Equity Fund
Holdings Financial assets at fair value through profit or loss Currency Fair value
USD % of net
assets
Equities: 96.16% (31 May 2020: 94.87%) (continued)
United States: 90.77% (31 May 2020: 88.69%)
Advertising: 0.31% (31 May 2020: 0.23%)11,478 Interpublic Group of Cos Inc Com USD0.10 USD 386,751 0.31
Aerospace/defense: 0.57% (31 May 2020: 0.67%)1,296 Curtiss-Wright Corp Com USD1.00 USD 162,389 0.131,738 Moog Inc Com USD1.00 USD 156,576 0.121,443 Spirit AeroSystems Holdings Inc Class A Com USD0.01 USD 70,996 0.06
775 Teledyne Technologies Inc Com USD0.01 USD 325,253 0.26
Airlines: 0.46% (31 May 2020: 0.15%)883 Allegiant Travel Co Com USD0.001 USD 195,642 0.15
19,255 JetBlue Airways Corp Com USD0.01 USD 387,122 0.31
Apparel: 1.87% (31 May 2020: 1.64%)4,153 Deckers Outdoor Corp Com USD0.01 USD 1,393,872 1.11
11,346 Delta Apparel Inc Com USD0.01 USD 354,392 0.285,269 PVH Corp Com USD1.00 USD 605,171 0.48
Auto manufacturers: 0.24% (31 May 2020: 0.25%)18,871 Wabash National Corp Com USD0.01 USD 301,087 0.24
Auto parts & equipment: 1.45% (31 May 2020: 0.75%)5,515 Cooper Tire & Rubber Co Com USD1.00 USD 327,977 0.26
22,002 Dana Inc Com USD0.01 USD 597,135 0.472,397 Lear Corp Com USD0.01 USD 464,119 0.37
16,774 Meritor Inc Com USD1.00 USD 436,040 0.35
Banks: 7.77% (31 May 2020: 6.25%)6,565 1st Source Corp Com NPV USD 324,475 0.264,248 Atlantic Union Bankshares Corp Com USD0.01 USD 174,274 0.14
800 BancorpSouth Inc Com USD2.50 USD 24,468 0.029,742 Bank OZK Com USD0.01 USD 416,032 0.33
24,337 Cadence BanCorp Com USD0.01 USD 544,540 0.4311,530 Equity Bancshares Inc Com USD0.01 USD 379,568 0.30
456 First Citizens BancShares Inc/NC USD1.00 USD 391,964 0.3135,698 First Horizon National Corp Com USD0.625 USD 680,939 0.5412,655 First Northwest Bancorp Com USD0.01 USD 225,765 0.1820,730 FNB Corp/PA Com USD0.01 USD 277,886 0.2212,356 Home BancShares Inc/AR Com USD0.01 USD 338,122 0.27
8,941 HomeStreet Inc Com NPV USD 402,613 0.325,855 National Bank Holdings Corp Com USD0.01 USD 231,829 0.18
15,573 PacWest Bancorp Com NPV USD 703,822 0.564,071 Peapack Gladstone Financial Com NPV USD 134,974 0.112,701 Pinnacle Financial Partners Inc Com USD1.00 USD 245,670 0.196,987 Prosperity Bancshares Inc Com USD1.00 USD 525,492 0.421,169 Signature Bank/New York NY Com USD0.01 USD 292,051 0.234,918 South State Corp Com USD2.50 USD 436,940 0.34
Schedule of investments as at 31 May 2021 (continued)
Transferable securities admitted to an official stock exchange listing or traded on a regulated market. The percentages in brackets show the equivalent sector holdings at 31 May 2020.
380

Barclays Multi-Manager Fund PLC Annual Report and Audited Financial Statements 2021
GlobalAccess US Small & Mid Cap Equity Fund
Holdings Financial assets at fair value through profit or loss Currency Fair value
USD % of net
assets
Equities: 96.16% (31 May 2020: 94.87%) (continued)
United States: 90.77% (31 May 2020: 88.69%) (continued)
Banks: 7.77% (31 May 2020: 6.25%) (continued)
17,765 Synovus Financial Corp Com USD1.00 USD 872,794 0.692,961 Triumph Bancorp Inc Com USD0.01 USD 248,265 0.207,093 Western Alliance Bancorp Com USD0.0001 USD 709,123 0.56
10,784 Wintrust Financial Corp Com NPV USD 866,602 0.696,071 Zions Bancorporation Com USD0.001 USD 351,420 0.28
Beverages: 0.34% (31 May 2020: 0.20%)411 Boston Beer Co Inc Class A Com USD0.01 USD 434,902 0.34
Biotechnology: 1.92% (31 May 2020: 2.06%)754 Acceleron Pharma Inc Com USD0.001 USD 98,616 0.08
1,171 Akero Therapeutics Inc Com USD0.0001 USD 30,709 0.02885 Aligos Therapeutics Inc Com USD0.0001 USD 24,625 0.02495 Allakos Inc Com USD0.001 USD 50,250 0.04
1,307 ALX Oncology Holdings Inc Com USD0.001 USD 74,002 0.066,195 Amicus Therapeutics Inc Com USD0.01 USD 57,335 0.042,885 Apellis Pharmaceuticals Inc Com USD0.0001 USD 162,426 0.131,413 Arena Pharmaceuticals Inc Com USD0.0001 USD 86,370 0.07
586 Atea Pharmaceuticals Inc Com USD0.001 USD 11,981 0.011,371 Atreca Inc Com USD0.0001 USD 12,387 0.01
829 Avidity Biosciences Inc Com USD0.001 USD 19,697 0.02773 BioAtla Inc Com USD0.0001 USD 33,359 0.03627 Black Diamond Therapeutics Inc Com USD0.0001 USD 8,223 0.01563 Blueprint Medicines Corp Com USD0.001 USD 51,486 0.04
1,127 Celldex Therapeutics Inc Com USD0.001 USD 31,528 0.021,956 ChemoCentryx Inc Com USD0.001 USD 19,873 0.021,467 Constellation Pharmaceuticals Inc Com USD0.0001 USD 29,098 0.021,844 Crinetics Pharmaceuticals Inc Com USD0.001 USD 32,418 0.031,831 Cytokinetics Inc Com USD0.001 USD 39,980 0.03
874 Deciphera Pharmaceuticals Inc Com USD0.01 USD 29,493 0.022,087 Dicerna Pharmaceuticals Inc Com USD0.0001 USD 68,068 0.05
205 Fate Therapeutics Inc Com USD0.001 USD 15,706 0.017,415 ImmunoGen Inc Com USD0.01 USD 45,936 0.041,872 Inozyme Pharma Inc Com USD0.001 USD 30,794 0.021,312 Instil Bio Inc Com USD0.000001 USD 23,426 0.021,641 Iovance Biotherapeutics Inc Com USD0.00004 USD 30,498 0.02
479 Karuna Therapeutics Inc Com USD0.0001 USD 53,631 0.04354 Kymera Therapeutics Inc Com USD0.0001 USD 17,038 0.01706 Mirati Therapeutics Inc Com NPV USD 111,629 0.09
3,764 NeoGenomics Inc Com USD0.001 USD 154,305 0.121,123 Novavax Inc Com USD0.01 USD 165,749 0.131,187 Nurix Therapeutics Inc Com USD0.001 USD 33,194 0.03
847 Olema Pharmaceuticals Inc Com USD0.0001 USD 23,712 0.023,751 Otonomy Inc Com USD0.001 USD 8,777 0.01
Schedule of investments as at 31 May 2021 (continued)
Transferable securities admitted to an official stock exchange listing or traded on a regulated market. The percentages in brackets show the equivalent sector holdings at 31 May 2020.
381

Barclays Multi-Manager Fund PLC Annual Report and Audited Financial Statements 2021
GlobalAccess US Small & Mid Cap Equity Fund
Holdings Financial assets at fair value through profit or loss Currency Fair value
USD % of net
assets
Equities: 96.16% (31 May 2020: 94.87%) (continued)
United States: 90.77% (31 May 2020: 88.69%) (continued)
Biotechnology: 1.92% (31 May 2020: 2.06%)
(continued)
1,598 PTC Therapeutics Inc Com USD0.001 USD 62,785 0.051,031 Radius Health Inc Com USD0.0001 USD 19,898 0.021,566 RAPT Therapeutics Inc Com USD0.001 USD 30,263 0.02
642 Relay Therapeutics Inc Com USD0.001 USD 20,637 0.022,228 Revolution Medicines Inc Com USD0.0001 USD 66,684 0.051,535 Rocket Pharmaceuticals Inc Com USD0.01 USD 65,253 0.05
873 Sage Therapeutics Inc Com USD0.0001 USD 60,722 0.05797 Scholar Rock Holding Corp Com USD0.001 USD 21,431 0.02904 Sigilon Therapeutics Inc Com USD0.001 USD 10,622 0.01942 Syndax Pharmaceuticals Inc Com USD0.0001 USD 17,309 0.01
2,492 TCR2 Therapeutics Inc Com USD0.0001 USD 47,772 0.04971 Turning Point Therapeutics Inc Com USD0.0001 USD 64,304 0.05526 Ultragenyx Pharmaceutical Inc Com USD0.001 USD 53,547 0.04
2,640 Veracyte Inc Com USD0.001 USD 103,158 0.08709 Vincerx Pharma Inc Com USD0.0001 USD 9,933 0.01
1,649 Y-mAbs Therapeutics Inc Com USD0.0001 USD 59,158 0.05351 Zentalis Pharmaceuticals Inc Com USD0.001 USD 19,644 0.02
Building materials: 5.34% (31 May 2020: 3.99%)9,288 Armstrong World Industries Inc Com USD0.01 USD 988,290 0.783,231 Boise Cascade Co Class C Com USD0.01 USD 213,165 0.17
13,333 Builders FirstSource Inc Com USD0.01 USD 593,785 0.474,609 Eagle Materials Inc Com USD0.01 USD 676,186 0.549,928 Fortune Brands Home & Security Inc Com USD0.01 USD 1,024,421 0.814,301 Gibraltar Industries Inc Com USD0.01 USD 341,134 0.27
22,902 JELD-WEN Holding Inc Com USD0.01 USD 642,057 0.513,123 Martin Marietta Materials Inc Com USD0.01 USD 1,136,007 0.903,325 Patrick Industries Inc Com NPV USD 285,285 0.23
12,578 PGT Innovations Inc Com USD0.01 USD 303,822 0.246,676 UFP Industries Inc Com USD1.00 USD 530,575 0.42
Chemicals: 2.10% (31 May 2020: 1.72%)8,307 American Vanguard Corp Com STK USD0.10 USD 152,807 0.124,335 Cabot Corp Com USD1.00 USD 275,641 0.22
27,647 GCP Applied Technologies Inc Com USD0.01 USD 674,310 0.542,033 HB Fuller Co Com USD1.00 USD 140,511 0.115,832 Huntsman Corp Com USD0.01 USD 165,541 0.132,211 Ingevity Corp com USD0.01 USD 182,131 0.141,869 NewMarket Corp Com NPV USD 641,282 0.514,083 Westlake Chemical Corp Com USD0.01 USD 411,873 0.33
Coal: 0.11% (31 May 2020: 0.10%)1,316 Alpha Metallurgical Resources Inc Com USD0.01 USD 26,097 0.02
Schedule of investments as at 31 May 2021 (continued)
Transferable securities admitted to an official stock exchange listing or traded on a regulated market. The percentages in brackets show the equivalent sector holdings at 31 May 2020.
382

Barclays Multi-Manager Fund PLC Annual Report and Audited Financial Statements 2021
GlobalAccess US Small & Mid Cap Equity Fund
Holdings Financial assets at fair value through profit or loss Currency Fair value
USD % of net
assets
Equities: 96.16% (31 May 2020: 94.87%) (continued)
United States: 90.77% (31 May 2020: 88.69%) (continued)
Coal: 0.11% (31 May 2020: 0.10%) (continued)
6,211 Warrior Met Coal Inc Com USD0.01 USD 113,630 0.09
Commercial services: 1.73% (31 May 2020: 2.25%)2,479 AMN Healthcare Services Inc Com USD0.01 USD 219,949 0.181,521 Avalara Inc Com USD0.0001 USD 201,038 0.161,924 Chegg Inc Com USD0.001 USD 147,956 0.121,896 Huron Consulting Group Inc Com USD0.01 USD 103,579 0.081,292 Paylocity Holding Corp Com USD0.001 USD 219,278 0.176,828 Repay Holdings Corp Com USD0.0001 USD 154,859 0.125,716 TriNet Group Inc Com USD0.000025 USD 430,901 0.341,259 United Rentals Com USD0.01 USD 420,594 0.331,458 WEX Inc Com USD0.01 USD 285,695 0.23
Computers: 0.82% (31 May 2020: 1.36%)641 CACI International Inc Class A Com USD0.10 USD 163,471 0.13
2,249 ExlService Holdings Inc Com USD0.001 USD 229,387 0.181,049 Lumentum Holdings Inc Com USD0.001 USD 85,378 0.073,971 Pure Storage Inc Class A Com USD0.0001 USD 75,667 0.061,857 Rapid7 Inc Com USD0.01 USD 155,394 0.131,844 Science Applications International Corp Com USD0.0001 USD 165,766 0.133,166 Varonis Systems Inc Com USD0.001 USD 153,013 0.12
Distribution/wholesale: 0.59% (31 May 2020: 0.99%)4,116 IAA Inc Com USD0.01 USD 234,509 0.19
10,013 LKQ Corp Com USD0.01 USD 510,313 0.40
Diversified financial services: 2.85% (31 May 2020: 2.51%)
2,193 Air Lease Corp Com USD0.01 USD 103,192 0.0816,469 Ares Management Corp Class A Com USD0.01 USD 909,006 0.72
1,414 Evercore Inc Com USD0.01 USD 206,302 0.162,409 Hamilton Lane Inc Class A Com USD0.001 USD 217,581 0.173,501 Hannon Armstrong Sustainable Infrastructure Capital Inc
Reits USD0.01USD 172,232 0.14
1,960 LPL Financial Holdings Inc Com USD0.01 USD 289,707 0.235,206 OneMain Holdings Inc Com USD0.01 USD 301,089 0.245,351 Piper Jaffray Cos Com USD0.01 USD 682,440 0.542,118 PRA Group Inc Com USD0.01 USD 82,380 0.079,098 Stifel Financial Corp Com USD0.15 USD 630,355 0.50
Electric: 0.99% (31 May 2020: 2.14%)5,373 ALLETE Inc Com NPV USD 370,200 0.304,083 Black Hills Corp Com USD1.00 USD 268,682 0.212,351 IDACORP Inc Com NPV USD 230,221 0.184,747 NRG Energy Inc Com USD0.01 USD 152,640 0.12
Schedule of investments as at 31 May 2021 (continued)
Transferable securities admitted to an official stock exchange listing or traded on a regulated market. The percentages in brackets show the equivalent sector holdings at 31 May 2020.
383

Barclays Multi-Manager Fund PLC Annual Report and Audited Financial Statements 2021
GlobalAccess US Small & Mid Cap Equity Fund
Holdings Financial assets at fair value through profit or loss Currency Fair value
USD % of net
assets
Equities: 96.16% (31 May 2020: 94.87%) (continued)
United States: 90.77% (31 May 2020: 88.69%) (continued)
Electric: 0.99% (31 May 2020: 2.14%) (continued)
4,671 Portland General Electric Co Com NPV USD 223,974 0.18
Electrical components & equipment: 0.53% (31 May 2020: 1.48%)
2,043 Acuity Brands Com USD0.01 USD 379,508 0.30894 Generac Com USD0.01 USD 294,014 0.23
Electronics: 1.65% (31 May 2020: 2.03%)9,266 II-VI Inc Com NPV USD 624,297 0.50
672 Itron Inc Com NPV USD 64,078 0.058,880 Methode Electronics Inc Com USD0.50 USD 429,659 0.343,943 Plexus Corp Com USD0.01 USD 389,963 0.313,053 Rogers Corp Com USD1.00 USD 572,636 0.45
Energy-alternate sources: 0.41% (31 May 2020: 0.34%)505 Enphase Energy Inc Com USD0.00001 USD 72,228 0.06
4,208 First Solar Inc Com USD0.001 USD 320,376 0.264,075 FuelCell Energy Inc Com USD0.001 USD 40,078 0.032,716 Sunnova Energy International Inc Com USD0.0001 USD 79,293 0.06
Engineering & construction: 0.83% (31 May 2020: 1.56%)
8,426 Dycom Industries Inc Com USD0.33 USD 631,403 0.502,065 TopBuild Corp Com USD0.01 USD 409,035 0.33
Entertainment: 1.87% (31 May 2020: 1.60%)2,225 Caesars Entertainment Inc Com USD0.00001 USD 239,032 0.196,025 Churchill Downs Inc Com NPV USD 1,202,048 0.966,223 Cinemark Holdings Inc Com USD0.001 USD 140,982 0.117,952 Gaming and Leisure Properties Inc Reits USD0.01 USD 368,535 0.29
361 Penn National Gaming Inc Com USD0.01 USD 29,597 0.032,623 SeaWorld Entertainment Inc Com USD0.01 USD 142,783 0.115,047 Six Flags Entertainment Corp USD1.00 USD 229,260 0.18
Environmental control: 0.59% (31 May 2020: 0.54%)7,982 Clean Harbors Inc Com USD0.01 USD 743,004 0.59
Food: 3.05% (31 May 2020: 2.80%)410 Beyond Meat Inc Com USD0.0001 USD 59,641 0.05
1,264 Calavo Growers Inc Com USD0.001 USD 89,927 0.072,479 Chefs' Warehouse Inc USD0.01 USD 76,217 0.069,260 Hostess Brands Inc Com USD0.0001 USD 145,243 0.11
10,263 Lamb Weston Holdings Inc Com 0 USD1.00 USD 846,851 0.6710,073 Performance Food Group Co Class C Com USD0.01 USD 505,211 0.4013,443 Pilgrim's Pride Corp Com USD0.01 USD 323,103 0.269,044 Post Holdings Inc Com USD0.01 USD 1,044,808 0.83
Schedule of investments as at 31 May 2021 (continued)
Transferable securities admitted to an official stock exchange listing or traded on a regulated market. The percentages in brackets show the equivalent sector holdings at 31 May 2020.
384

Barclays Multi-Manager Fund PLC Annual Report and Audited Financial Statements 2021
GlobalAccess US Small & Mid Cap Equity Fund
Holdings Financial assets at fair value through profit or loss Currency Fair value
USD % of net
assets
Equities: 96.16% (31 May 2020: 94.87%) (continued)
United States: 90.77% (31 May 2020: 88.69%) (continued)
Food: 3.05% (31 May 2020: 2.80%) (continued)
5,809 Simply Good Foods Co Com USD0.01 USD 200,469 0.1614,271 US Foods Holding Corp Com USD0.01 USD 555,499 0.44
Forest products & paper: 0.00% (31 May 2020: 0.32%)
Gas: 0.49% (31 May 2020: 0.24%)14,193 CenterPoint Energy Inc Com USD0.01 USD 359,154 0.296,022 New Jersey Resources Corp Com USD2.50 USD 257,380 0.20
Hand/machine tools: 0.96% (31 May 2020: 0.99%)3,138 Kennametal Inc USD1.125 USD 117,691 0.093,431 Lincoln Electric Holdings Inc Com NPV USD 440,969 0.354,554 Regal Beloit Corp Com USD0.01 USD 647,693 0.52
Healthcare-products: 2.00% (31 May 2020: 2.50%)937 Bio-Techne Corp Com USD0.01 USD 387,642 0.31
2,970 Globus Medical Inc Class A Com USD0.001 USD 214,003 0.173,550 Hill-Rom Holdings Inc Com NPV USD 395,168 0.311,687 ICU Medical Inc Com USD0.10 USD 351,183 0.281,668 Inari Medical Inc Com USD0.001 USD 144,932 0.115,608 Integra LifeSciences Holdings Corp Com USD0.01 USD 387,485 0.312,579 NanoString Technologies Inc Com USD0.0001 USD 143,031 0.11
678 Penumbra Inc Com USD0.001 USD 168,802 0.13912 Quidel Corp Com USD0.001 USD 107,680 0.09
2,585 Tandem Diabetes Care Inc Com USD0.001 USD 220,888 0.18
Healthcare-services: 1.46% (31 May 2020: 2.05%)1,929 Acadia Healthcare Co Inc Com USD0.01 USD 124,102 0.103,305 Accolade Inc Com 0.001 USD 166,985 0.132,408 Addus HomeCare Corp Com USD0.001 USD 231,818 0.196,400 agilon health Inc Com USD0.01 USD 229,824 0.181,443 Encompass Health Com USD0.01 USD 123,788 0.10
729 LHC Group Inc Com USD0.01 USD 143,409 0.11961 Molina Healthcare Inc Com USD0.001 USD 241,586 0.19
6,565 Syneos Health Inc Com USD0.01 USD 577,326 0.46
Holding companies-diversified: 0.09% (31 May 2020: 0.00%)
9,824 Hamilton Lane Alliance Holdings I Inc NPV USD 97,798 0.081,063 Rice Acquisition Corp Com USD0.0001 USD 16,747 0.01
Home builders: 2.09% (31 May 2020: 2.49%)3,612 Cavco Industries Inc Com USD0.01 USD 799,878 0.636,845 Century Communities Inc Com USD0.01 USD 556,807 0.442,510 Installed Building Products Inc Com USD0.01 USD 298,025 0.24
10,902 Skyline Champion Corp Com USD0.028 USD 552,077 0.44
Schedule of investments as at 31 May 2021 (continued)
Transferable securities admitted to an official stock exchange listing or traded on a regulated market. The percentages in brackets show the equivalent sector holdings at 31 May 2020.
385

Barclays Multi-Manager Fund PLC Annual Report and Audited Financial Statements 2021
GlobalAccess US Small & Mid Cap Equity Fund
Holdings Financial assets at fair value through profit or loss Currency Fair value
USD % of net
assets
Equities: 96.16% (31 May 2020: 94.87%) (continued)
United States: 90.77% (31 May 2020: 88.69%) (continued)
Home builders: 2.09% (31 May 2020: 2.49%)
(continued)
3,232 Thor Industries Inc Com USD0.10 USD 397,471 0.32438 Toll Brothers Inc Com USD0.01 USD 28,577 0.02
Home furnishings: 0.01% (31 May 2020: 0.32%)141 American Woodmark Corp Com NPV USD 12,247 0.01
Household products/wares: 0.67% (31 May 2020: 0.28%)
1,099 Avery Dennison Corp Com USD1.00 USD 242,407 0.1919,883 Reynolds Consumer Products Inc Com USD0.001 USD 599,174 0.48
Housewares: 0.41% (31 May 2020: 0.33%)4,670 Toro Co Com USD1.00 USD 518,837 0.41
Insurance: 4.37% (31 May 2020: 3.37%)1,317 Alleghany Corp Com USD1.00 USD 942,445 0.75
13,738 American Equity Investment Life Holding Com USD1.00 USD 419,627 0.33883 American Financial Group Inc Com NPV USD 117,488 0.09
3,362 Assurant Inc Com USD0.028 USD 541,803 0.436,648 Hanover Insurance Com USD0.01 USD 927,828 0.745,798 Lincoln National Corp Com NPV USD 404,729 0.32
36,846 MBIA Inc Com USD1.00 USD 368,276 0.2912,664 MetroMile Inc Com USD0.001 USD 107,327 0.0933,464 MGIC Investment Corp Com USD1.00 USD 492,423 0.39
3,422 Reinsurance Group of America Inc Com USD0.01 USD 431,121 0.344,069 Trupanion Inc Cm USD0.00001 USD 367,024 0.296,033 Voya Financial Inc Com USD0.01 USD 395,373 0.31
Internet: 1.09% (31 May 2020: 1.59%)2,588 8x8 Inc Com USD0.001 USD 60,973 0.052,113 Bumble Inc Com USD0.01 USD 100,980 0.081,771 Cardlytics Inc Com USD0.0001 USD 188,505 0.156,157 Cargurus Inc Com USD0.001 USD 173,781 0.141,434 Etsy Inc Com USD0.001 USD 236,323 0.18
494 F5 Networks Inc Com USD1.00 USD 91,640 0.071,303 Q2 Holdings Inc Com USD0.0001 USD 123,779 0.102,142 Shutterstock Inc Com USD0.01 USD 194,408 0.151,156 Squarespace Inc Com USD0.0001 Class A USD 60,794 0.05
770 Zscaler Inc Com USD0.001 USD 149,434 0.12
Investment companies: 0.06% (31 May 2020: 0.00%)2,528 StepStone Group Inc Com USD0.001 USD 80,062 0.06
Iron/steel: 1.13% (31 May 2020: 0.99%)3,110 Allegheny Technologies Inc Com USD0.10 USD 76,195 0.06
Schedule of investments as at 31 May 2021 (continued)
Transferable securities admitted to an official stock exchange listing or traded on a regulated market. The percentages in brackets show the equivalent sector holdings at 31 May 2020.
386
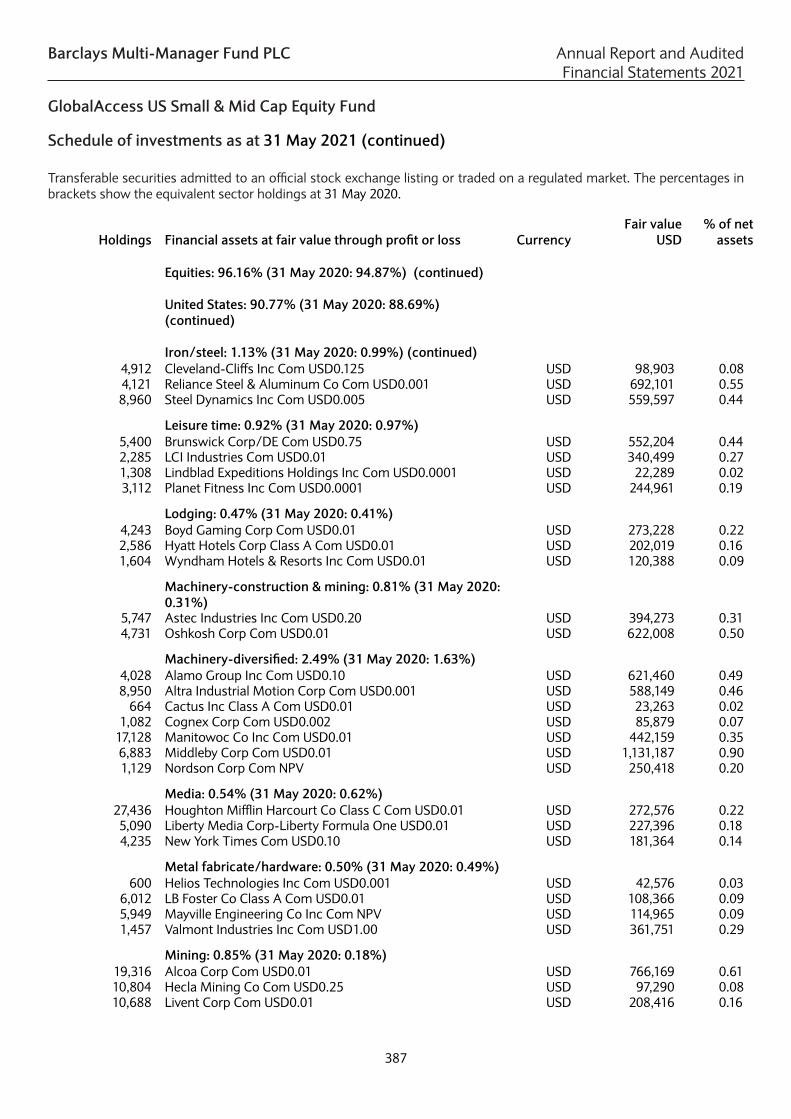
Barclays Multi-Manager Fund PLC Annual Report and Audited Financial Statements 2021
GlobalAccess US Small & Mid Cap Equity Fund
Holdings Financial assets at fair value through profit or loss Currency Fair value
USD % of net
assets
Equities: 96.16% (31 May 2020: 94.87%) (continued)
United States: 90.77% (31 May 2020: 88.69%) (continued)
Iron/steel: 1.13% (31 May 2020: 0.99%) (continued)
4,912 Cleveland-Cliffs Inc Com USD0.125 USD 98,903 0.084,121 Reliance Steel & Aluminum Co Com USD0.001 USD 692,101 0.558,960 Steel Dynamics Inc Com USD0.005 USD 559,597 0.44
Leisure time: 0.92% (31 May 2020: 0.97%)5,400 Brunswick Corp/DE Com USD0.75 USD 552,204 0.442,285 LCI Industries Com USD0.01 USD 340,499 0.271,308 Lindblad Expeditions Holdings Inc Com USD0.0001 USD 22,289 0.023,112 Planet Fitness Inc Com USD0.0001 USD 244,961 0.19
Lodging: 0.47% (31 May 2020: 0.41%)4,243 Boyd Gaming Corp Com USD0.01 USD 273,228 0.222,586 Hyatt Hotels Corp Class A Com USD0.01 USD 202,019 0.161,604 Wyndham Hotels & Resorts Inc Com USD0.01 USD 120,388 0.09
Machinery-construction & mining: 0.81% (31 May 2020: 0.31%)
5,747 Astec Industries Inc Com USD0.20 USD 394,273 0.314,731 Oshkosh Corp Com USD0.01 USD 622,008 0.50
Machinery-diversified: 2.49% (31 May 2020: 1.63%)4,028 Alamo Group Inc Com USD0.10 USD 621,460 0.498,950 Altra Industrial Motion Corp Com USD0.001 USD 588,149 0.46
664 Cactus Inc Class A Com USD0.01 USD 23,263 0.021,082 Cognex Corp Com USD0.002 USD 85,879 0.07
17,128 Manitowoc Co Inc Com USD0.01 USD 442,159 0.356,883 Middleby Corp Com USD0.01 USD 1,131,187 0.901,129 Nordson Corp Com NPV USD 250,418 0.20
Media: 0.54% (31 May 2020: 0.62%)27,436 Houghton Mifflin Harcourt Co Class C Com USD0.01 USD 272,576 0.225,090 Liberty Media Corp-Liberty Formula One USD0.01 USD 227,396 0.184,235 New York Times Com USD0.10 USD 181,364 0.14
Metal fabricate/hardware: 0.50% (31 May 2020: 0.49%)600 Helios Technologies Inc Com USD0.001 USD 42,576 0.03
6,012 LB Foster Co Class A Com USD0.01 USD 108,366 0.095,949 Mayville Engineering Co Inc Com NPV USD 114,965 0.091,457 Valmont Industries Inc Com USD1.00 USD 361,751 0.29
Mining: 0.85% (31 May 2020: 0.18%)19,316 Alcoa Corp Com USD0.01 USD 766,169 0.6110,804 Hecla Mining Co Com USD0.25 USD 97,290 0.0810,688 Livent Corp Com USD0.01 USD 208,416 0.16
Schedule of investments as at 31 May 2021 (continued)
Transferable securities admitted to an official stock exchange listing or traded on a regulated market. The percentages in brackets show the equivalent sector holdings at 31 May 2020.
387

Barclays Multi-Manager Fund PLC Annual Report and Audited Financial Statements 2021
GlobalAccess US Small & Mid Cap Equity Fund
Holdings Financial assets at fair value through profit or loss Currency Fair value
USD % of net
assets
Equities: 96.16% (31 May 2020: 94.87%) (continued)
United States: 90.77% (31 May 2020: 88.69%) (continued)
Miscellaneous manufacturing: 0.67% (31 May 2020: 0.39%)
2,601 Carlisle Cos Inc Com USD1.00 USD 500,173 0.404,949 Textron Inc Com USD0.125 USD 338,833 0.27
Oil & gas: 2.05% (31 May 2020: 1.16%)1,552 APA Corp Com USD0.625 USD 32,274 0.033,302 Brigham Minerals Inc Com USD0.01 USD 59,915 0.05
21,426 Cabot Oil & Gas Corp Com USD0.10 USD 351,493 0.281,071 Chesapeake Energy Corp USD0.01 USD 56,511 0.048,832 Cimarex Energy Co Com USD0.01 USD 597,971 0.47
10,669 Denbury Inc Com USD0.001 USD 714,183 0.571,179 Diamondback Energy Inc Com USD0.01 USD 94,420 0.07
15,725 Helmerich & Payne Com USD0.10 USD 443,995 0.355,511 Magnolia Oil & Gas Corp Com USD0.0001 USD 71,230 0.06
478 Ovintiv Inc Com USD0.01 USD 12,731 0.011,475 PDC Energy Inc Com USD0.01 USD 62,245 0.051,720 Vine Energy Inc Com USD0.01 USD 24,949 0.021,490 Whiting Petroleum Corp Com USD0.001 USD 68,205 0.05
Oil & gas services: 0.04% (31 May 2020: 0.00%)1,702 ChampionX Corp Com USD0.01 USD 45,094 0.04
Packaging & containers: 1.30% (31 May 2020: 0.65%)6,091 Crown Holdings Inc Com USD5.00 USD 628,805 0.50
19,858 Graphic Packaging Holding Co Class C Com USD0.01 USD 350,990 0.286,381 Sonoco Products Co Com NPV USD 430,941 0.344,073 UFP Technologies Inc Com USD0.01 USD 222,976 0.18
Pharmaceuticals: 1.06% (31 May 2020: 1.30%)1,274 89bio Inc Com USD0.001 USD 24,149 0.026,724 AdaptHealth Corp Com USD0.001 USD 176,169 0.141,252 Agios Pharmaceuticals Inc Com USD0.01 USD 69,893 0.05
300 Arvinas Inc Com USD0.001 USD 21,842 0.02583 Ascendis Pharma A/S ADR DKK1.00 USD 78,448 0.06
4,198 Covetrus Inc Com USD0.01 USD 116,474 0.09954 Global Blood Therapeutics Inc Class I Com USD0.001 USD 36,667 0.03378 Intellia Therapeutics Inc Com USD0.0001 USD 28,329 0.02
2,462 KalVista Pharmaceuticals Inc Com USD0.001 USD 66,462 0.05836 Kodiak Sciences Inc Com USD0.01 USD 69,969 0.05907 Kura Oncology Inc Com USD0.0001 USD 20,203 0.02253 Madrigal Pharmaceuticals Inc USD0.0001 USD 28,447 0.02
2,589 Mersana Therapeutics Inc Com USD0.0001 USD 37,100 0.03411 Neurocrine Biosciences Inc Com USD0.001 USD 39,528 0.03
6,095 Owens & Minor Inc Com USD2.00 USD 272,355 0.22988 Reata Pharmaceuticals Inc Com USD0.001 USD 135,005 0.11
Schedule of investments as at 31 May 2021 (continued)
Transferable securities admitted to an official stock exchange listing or traded on a regulated market. The percentages in brackets show the equivalent sector holdings at 31 May 2020.
388

Barclays Multi-Manager Fund PLC Annual Report and Audited Financial Statements 2021
GlobalAccess US Small & Mid Cap Equity Fund
Holdings Financial assets at fair value through profit or loss Currency Fair value
USD % of net
assets
Equities: 96.16% (31 May 2020: 94.87%) (continued)
United States: 90.77% (31 May 2020: 88.69%) (continued)
Pharmaceuticals: 1.06% (31 May 2020: 1.30%)
(continued)
794 Sarepta Therapeutics Inc Com USD0.0001 USD 60,153 0.051,751 TG Therapeutics Inc Com USD0.001 USD 61,075 0.05
Pipelines: 0.00% (31 May 2020: 0.02%)
Real estate: 0.83% (31 May 2020: 0.13%)2,004 Howard Hughes Corp Com USD0.01 USD 212,003 0.171,929 Jones Lang LaSalle Inc Com USD0.01 USD 390,092 0.313,282 McGrath RentCorp Com NPV USD 281,169 0.222,801 Redfin Corp Com USD0.001 USD 165,301 0.13
Real estate investment trusts: 8.08% (31 May 2020: 9.72%)
2,434 Alexandria Real Estate Equities Inc Reits USD0.01 USD 434,128 0.3411,318 American Assets Trust Inc Reits USD0.01 USD 413,616 0.339,723 American Homes 4 Rent Class A Reits USD0.01 USD 370,203 0.293,649 Americold Realty Trust Reits USD0.01 Com USD0.01 USD 138,717 0.11
17,677 Brixmor Property Group Inc Reits USD0.01 USD 401,356 0.324,933 Camden Property Trust Reits USD0.01 USD 618,697 0.495,249 CyrusOne Inc Reits USD0.01 USD 386,983 0.31
12,116 Douglas Emmett Inc Reits USD0.01 USD 420,728 0.339,861 Duke Realty Corp Reits USD0.01 USD 458,241 0.36
12,484 First Industrial Realty Trust Inc Reits USD0.01 USD 632,127 0.504,042 Lamar Advertising Co Com USD0.001 USD 423,885 0.343,955 Life Storage Inc Reits USD0.01 USD 393,602 0.31
12,251 Medical Properties Trust Inc Com USD0.001 USD 259,292 0.213,545 National Health Investors Inc Com USD0.01 USD 233,757 0.19
18,313 New Residential Investment Corp Retis NPV USD 193,660 0.1510,419 NexPoint Residential Trust Inc Com USD0.001 USD 540,434 0.43
7,373 Outfront Media Inc Reits USD0.01 USD 176,325 0.147,600 Potlatch Corp Reits USD1.00 USD 457,596 0.36
13,915 Retail Opportunity Investments Corp Reits USD0.0001 USD 248,452 0.2010,966 Rexford Industrial Realty Inc Class I Reits USD0.01 USD 605,542 0.48
3,851 Ryman Hospitality Properties Inc Reits USD0.01 USD 288,517 0.2337,698 STORE Capital Corp Reits USD0.01 USD 1,297,000 1.032,434 Sun Communities Inc Reits USD0.01 USD 407,805 0.32
12,430 VICI Properties Inc Reits USD0.01 USD 386,759 0.31
Retail: 4.46% (31 May 2020: 4.29%)29,155 American Eagle Outfitters Inc USD0.01 USD 1,033,107 0.82
4,550 America's Car-Mart Inc/TX Com USD0.01 USD 747,656 0.599,498 Bloomin' Brands Inc Com USD0.01 USD 280,808 0.22
15,543 Cannae Holdings Inc Com USD0.0001 USD 557,450 0.447,298 CarMax Inc Com USD0.50 USD 840,875 0.67
Schedule of investments as at 31 May 2021 (continued)
Transferable securities admitted to an official stock exchange listing or traded on a regulated market. The percentages in brackets show the equivalent sector holdings at 31 May 2020.
389

Barclays Multi-Manager Fund PLC Annual Report and Audited Financial Statements 2021
GlobalAccess US Small & Mid Cap Equity Fund
Holdings Financial assets at fair value through profit or loss Currency Fair value
USD % of net
assets
Equities: 96.16% (31 May 2020: 94.87%) (continued)
United States: 90.77% (31 May 2020: 88.69%) (continued)
Retail: 4.46% (31 May 2020: 4.29%) (continued)
1,437 Casey's General Stores Inc Com NPV USD 317,491 0.254,993 Copart Inc Com USD0.0001 USD 644,222 0.514,222 Dick's Sporting Goods Inc Com USD0.01 USD 411,624 0.331,378 Five Below Inc Com USD0.01 USD 253,621 0.208,012 Tapestry Com USD0.01 USD 359,739 0.294,395 Urban Outfitters Inc Com USD0.0001 USD 172,130 0.14
Savings & loans: 0.08% (31 May 2020: 0.25%)3,900 Sterling Bancorp/DE Com USD0.01 USD 103,877 0.08
Semiconductors: 3.98% (31 May 2020: 3.95%)1,170 Axcelis Technologies Inc Com USD0.001 USD 48,532 0.04
19,010 Entegris Inc Com USD0.01 USD 2,176,740 1.737,475 FormFactor Inc Com USD0.001 USD 263,456 0.215,946 Lattice Semiconductor Corp Com USD0.01 USD 315,406 0.25
757 Marvell Technology Inc Com USD0.002 USD 36,567 0.031,848 MKS Instruments Inc Com NPV USD 347,969 0.27
10,333 ON Semiconductor Corp Com USD0.01 USD 413,682 0.3310,948 Rambus Inc Com USD0.001 USD 214,252 0.17
490 Silicon Laboratories Inc Com USD0.0001 USD 66,880 0.053,025 Skyworks Solutions Com USD0.25 USD 514,280 0.41
461 Synaptics Inc Com USD0.001 USD 58,254 0.044,264 Teradyne Inc Com USD0.125 USD 564,383 0.45
Shipbuilding: 0.09% (31 May 2020: 0.12%)500 Huntington Ingalls Industries Inc Com USD0.01 USD 108,090 0.09
Software: 4.85% (31 May 2020: 4.22%)5,370 2U Inc Com USD0.001 USD 195,414 0.153,085 Asana Inc Com USD0.00001 USD 113,420 0.091,083 Aspen Technology Inc Com USD0.10 USD 147,835 0.12
820 Bandwidth Inc Com Class A USD0.001 USD 96,936 0.081,485 Bentley Systems Inc Com USD0.01 USD 85,157 0.079,710 Black Knight Inc Com USD0.0001 USD 712,326 0.565,264 Broadridge Financial Solutions Inc Com USD0.01 USD 839,555 0.663,076 Ceridian HCM Holding Inc Com USD0.01 USD 275,164 0.226,161 Citrix Systems Inc Com USD0.001 USD 708,114 0.563,093 Dynatrace Inc Com USD0.001 USD 160,078 0.13
379 Fair Isaac Corp Com USD0.01 USD 191,907 0.151,899 Guidewire Software Inc Com USD0.0001 USD 185,694 0.152,288 Health Catalyst Inc Com USD0.001 USD 122,740 0.10
543 HubSpot Inc Com USD0.001 USD 273,813 0.22593 j2 Global Inc Com USD0.001 USD 73,873 0.06
4,389 Jack Henry & Associates Com USD0.01 USD 676,762 0.544,012 Medallia Inc Com USD0.001 USD 103,008 0.08
Schedule of investments as at 31 May 2021 (continued)
Transferable securities admitted to an official stock exchange listing or traded on a regulated market. The percentages in brackets show the equivalent sector holdings at 31 May 2020.
390

Barclays Multi-Manager Fund PLC Annual Report and Audited Financial Statements 2021
GlobalAccess US Small & Mid Cap Equity Fund
Holdings Financial assets at fair value through profit or loss Currency Fair value
USD % of net
assets
Equities: 96.16% (31 May 2020: 94.87%) (continued)
United States: 90.77% (31 May 2020: 88.69%) (continued)
Software: 4.85% (31 May 2020: 4.22%) (continued)
540 MongoDB Inc Cpm USD0.001 USD 157,575 0.122,439 nCino Inc Com USD0.0005 USD 149,267 0.123,041 Omnicell Inc Com USD0.001 USD 422,395 0.334,026 Oscar Health Inc Com USD0.00001 USD 101,475 0.081,205 Pegasystems Inc Com USD0.01 USD 142,286 0.11
17,093 Zynga Inc Com NPV USD 185,203 0.15
Telecommunications: 0.44% (31 May 2020: 0.50%)7,181 Ciena Corp Com USD0.01 USD 379,552 0.30
10,097 Viavi Solutions Inc Com USD0.001 USD 177,051 0.14
Textiles: 1.19% (31 May 2020: 1.44%)2,717 Mohawk Industries Inc Com USD0.01 USD 572,254 0.464,157 UniFirst Corp/MA Com USD0.10 USD 922,002 0.73
Toys/games/hobbies: 0.46% (31 May 2020: 0.50%)6,026 Hasbro Inc Com USD0.50 USD 578,375 0.46
Transportation: 0.81% (31 May 2020: 1.68%)9,638 Knight-Swift Transportation Holdings Inc Com Class A
USD0.01USD 460,070 0.36
2,120 Old Dominion Freight Line Inc Com USD0.10 USD 562,489 0.45
Trucking & leasing: 0.58% (31 May 2020: 0.30%)16,503 Greenbrier Cos Inc Com USD0.001 USD 733,228 0.58
Water: 0.00% (31 May 2020: 0.38%)
Total United States 114,425,641 90.77
Total equities 121,220,957 96.16
Investment funds: 1.09% (31 May 2020: 1.52%)
Ireland: 1.09% (31 May 2020: 1.52%)
38,500 DB X-Trackers Russell Midcap UCITS ETF USD 1,370,496 1.09
Total investment funds 1,370,496 1.09
Schedule of investments as at 31 May 2021 (continued)
Transferable securities admitted to an official stock exchange listing or traded on a regulated market. The percentages in brackets show the equivalent sector holdings at 31 May 2020.
391

Barclays Multi-Manager Fund PLC Annual Report and Audited Financial Statements 2021
GlobalAccess US Small & Mid Cap Equity Fund
No. of contracts Futures contracts: 0.00% (31 May 2020: 0.10%) CounterpartyUnrealised gain/(loss)
% of net assets
USD3 E-mini Russell 2000 CME Future June 2021 Goldman Sachs 4,395 –
Total fair value gains on open futures contracts 4,395 –
3 E-mini Russell 2000 CME Future June 2021 Goldman Sachs (4,955) – 9K5EXXU
Total fair value losses on open futures contracts (4,955) –
Total futures contracts (560) –
Forward currency contracts: 0.22% (31 May 2020: 0.15%)
Counterparty Cncy Buys Cncy SellsMaturity
dateUnrealised
gain% of net
assetsUSD
UBS GBP 6,005,909 USD 8,425,420 17/06/2021 112,137 0.09 CCT_1776776_196588
UBS GBP 5,888,336 USD 8,260,481 17/06/2021 109,942 0.09 CCT_1776776_196601
UBS EUR 2,625,994 USD 3,170,090 17/06/2021 41,390 0.03 CCT_1776776_196594
UBS EUR 515,407 USD 622,197 17/06/2021 8,124 0.01 CCT_1776776_196592
UBS GBP 392,376 USD 550,446 17/06/2021 7,326 0.01 CCT_1776776_196591
UBS GBP 210,787 USD 295,704 17/06/2021 3,936 – CCT_1776776_196602
UBS GBP 80,784 USD 113,329 17/06/2021 1,508 – CCT_1776776_196587
UBS EUR 83,399 USD 100,678 17/06/2021 1,314 – CCT_1776776_196597
UBS GBP 55,000 USD 77,487 17/06/2021 697 – CCT_1776776_196697
UBS GBP 230,000 USD 326,406 17/06/2021 545 – CCT_1776776_197236
Total fair value gains on forward currency contracts 286,919 0.23
Counterparty Cncy Buys Cncy SellsMaturity
dateUnrealised
loss% of net
assetsUSD
Barclays^ USD 2,959 EUR 2,450 17/06/2021 (37) – CCT_1776776_196600
Barclays^ USD 3,230 GBP 2,300 17/06/2021 (40) – CCT_1776776_196604
Barclays^ USD 8,706 GBP 6,200 17/06/2021 (107) – CCT_1776776_196605
Barclays^ USD 16,289 GBP 11,600 17/06/2021 (201) – CCT_1776776_196599
Barclays^ USD 18,481 EUR 15,300 17/06/2021 (231) – CCT_1776776_196598
Barclays^ USD 94,940 EUR 78,600 17/06/2021 (1,184) – CCT_1776776_196607
Barclays^ USD 242,931 GBP 173,000 17/06/2021 (2,993) – CCT_1776776_196606
Barclays^ USD 248,548 GBP 177,000 17/06/2021 (3,062) (0.01) CCT_1776776_196603
UBS USD 15,407 EUR 12,624 17/06/2021 (32) – CCT_1776776_197235
UBS USD 302,077 GBP 213,315 17/06/2021 (1,155) – CCT_1776776_196946
Total fair value losses on forward currency contracts (9,042) (0.01)
Total forward currency contracts 277,877 0.22
Schedule of investments as at 31 May 2021 (continued)
Transferable securities admitted to an official stock exchange listing or traded on a regulated market. The percentages in brackets show the equivalent sector holdings at 31 May 2020.
392

Barclays Multi-Manager Fund PLC Annual Report and Audited Financial Statements 2021
GlobalAccess US Small & Mid Cap Equity Fund
Fair value USD
% of net assets
Total value of investments 122,868,770 97.47
Cash and cash equivalents* 3,629,630 2.88
Other net liabilities** (439,851) (0.35)
Net assets attributable to holders of redeemable participating shares 126,058,549 100.00
Analysis of total assets (unaudited)% of total
assets
Transferable securities and money market instruments admitted to official stock exchangelisting or traded on a regulated market. 95.26Investment funds and AIFs. 1.08OTC financial derivative instruments. 0.23Other assets. 3.43
100.00
*All cash holdings are held with The Northern Trust Company.**Including USD 154,303 held with Goldman Sachs as security by the counterparty to derivatives contracts.^Related party.
The accompanying notes form an integral part of the Financial Statements.
The Industry Classification Benchmark (“ICB”) is jointly owned by FTSE and Dow Jones and has been licensed for use. FTSE and Dow Jones do not accept liability to any person for any loss or damage arising out of any error or omission in ICB.
Schedule of investments as at 31 May 2021 (continued)
Transferable securities admitted to an official stock exchange listing or traded on a regulated market. The percentages in brackets show the equivalent sector holdings at 31 May 2020.
No. of contracts Futures contracts: 0.00% (31 May 2020: 0.10%) CounterpartyUnrealised gain/(loss)
% of net assets
USD3 E-mini Russell 2000 CME Future June 2021 Goldman Sachs 4,395 –
Total fair value gains on open futures contracts 4,395 –
3 E-mini Russell 2000 CME Future June 2021 Goldman Sachs (4,955) – 9K5EXXU
Total fair value losses on open futures contracts (4,955) –
Total futures contracts (560) –
Forward currency contracts: 0.22% (31 May 2020: 0.15%)
Counterparty Cncy Buys Cncy SellsMaturity
dateUnrealised
gain% of net
assetsUSD
UBS GBP 6,005,909 USD 8,425,420 17/06/2021 112,137 0.09 CCT_1776776_196588
UBS GBP 5,888,336 USD 8,260,481 17/06/2021 109,942 0.09 CCT_1776776_196601
UBS EUR 2,625,994 USD 3,170,090 17/06/2021 41,390 0.03 CCT_1776776_196594
UBS EUR 515,407 USD 622,197 17/06/2021 8,124 0.01 CCT_1776776_196592
UBS GBP 392,376 USD 550,446 17/06/2021 7,326 0.01 CCT_1776776_196591
UBS GBP 210,787 USD 295,704 17/06/2021 3,936 – CCT_1776776_196602
UBS GBP 80,784 USD 113,329 17/06/2021 1,508 – CCT_1776776_196587
UBS EUR 83,399 USD 100,678 17/06/2021 1,314 – CCT_1776776_196597
UBS GBP 55,000 USD 77,487 17/06/2021 697 – CCT_1776776_196697
UBS GBP 230,000 USD 326,406 17/06/2021 545 – CCT_1776776_197236
Total fair value gains on forward currency contracts 286,919 0.23
Counterparty Cncy Buys Cncy SellsMaturity
dateUnrealised
loss% of net
assetsUSD
Barclays^ USD 2,959 EUR 2,450 17/06/2021 (37) – CCT_1776776_196600
Barclays^ USD 3,230 GBP 2,300 17/06/2021 (40) – CCT_1776776_196604
Barclays^ USD 8,706 GBP 6,200 17/06/2021 (107) – CCT_1776776_196605
Barclays^ USD 16,289 GBP 11,600 17/06/2021 (201) – CCT_1776776_196599
Barclays^ USD 18,481 EUR 15,300 17/06/2021 (231) – CCT_1776776_196598
Barclays^ USD 94,940 EUR 78,600 17/06/2021 (1,184) – CCT_1776776_196607
Barclays^ USD 242,931 GBP 173,000 17/06/2021 (2,993) – CCT_1776776_196606
Barclays^ USD 248,548 GBP 177,000 17/06/2021 (3,062) (0.01) CCT_1776776_196603
UBS USD 15,407 EUR 12,624 17/06/2021 (32) – CCT_1776776_197235
UBS USD 302,077 GBP 213,315 17/06/2021 (1,155) – CCT_1776776_196946
Total fair value losses on forward currency contracts (9,042) (0.01)
Total forward currency contracts 277,877 0.22
393

Barclays Multi-Manager Fund PLC Annual Report and Audited Financial Statements 2021
GlobalAccess US Equity Fund
Schedule of investments as at 31 May 2021
Transferable securities admitted to an official stock exchange listing or traded on a regulated market. The percentages in brackets show the equivalent sector holdings at 31 May 2020.
Holdings Financial assets at fair value through profit or loss CurrencyFair value
USD% of net
assets
Equities: 95.81% (31 May 2020: 94.91%)
Bermuda: 0.27% (31 May 2020: 0.00%)
Insurance: 0.27% (31 May 2020: 0.00%)6,100 RenaissanceRe Holdings Ltd Com USD1.00 USD 939,766 0.27
Total Bermuda 939,766 0.27
Canada: 0.42% (31 May 2020: 0.40%)
Environmental control: 0.42% (31 May 2020: 0.40%)12,031 Waste Connections Inc Com NPV USD 1,460,623 0.42
Total Canada 1,460,623 0.42
Ireland: 2.27% (31 May 2020: 3.22%)
Chemicals: 0.56% (31 May 2020: 0.62%)6,445 Linde PLC Com EUR0.001 USD 1,938,044 0.56
Computers: 0.34% (31 May 2020: 0.30%)4,181 Accenture PLC Com USD0.0000225 USD 1,180,275 0.34
Electronics: 0.22% (31 May 2020: 0.39%)5,570 Allegion PLC Com USD0.01 USD 782,279 0.22
Healthcare-products: 0.50% (31 May 2020: 0.42%)13,822 Medtronic PLC Com USD0.10 USD 1,749,796 0.50
Insurance: 0.65% (31 May 2020: 1.49%)8,690 Willis Towers Watson PLC Com USD0.000304635 USD 2,272,652 0.65
Total Ireland 7,923,046 2.27
Netherlands: 2.02% (31 May 2020: 0.29%)
Semiconductors: 2.02% (31 May 2020: 0.29%)2,460 ASML Holding NV ADR EUR0.09 USD 1,661,090 0.48
25,408 NXP Semiconductors NV Com EUR0.20 USD 5,373,157 1.54
Total Netherlands 7,034,247 2.02
Switzerland: 0.47% (31 May 2020: 0.00%)
Electronics: 0.21% (31 May 2020: 0.00%)5,435 TE Connectivity Ltd Com CHF0.58 USD 737,529 0.21
Insurance: 0.26% (31 May 2020: 0.00%)5,284 Chubb Ltd Com CHF24.15 USD 898,439 0.26
Total Switzerland 1,635,968 0.47
394

Barclays Multi-Manager Fund PLC Annual Report and Audited Financial Statements 2021
GlobalAccess US Equity Fund
Holdings Financial assets at fair value through profit or loss Currency Fair value
USD % of net
assets
Equities: 95.81% (31 May 2020: 94.91%) (continued)
United Kingdom: 0.63% (31 May 2020: 0.00%)
Beverages: 0.63% (31 May 2020: 0.00%)36,468 Coca-Cola European Partners Com EUR0.01 USD 2,207,773 0.63
Total United Kingdom 2,207,773 0.63
United States: 89.73% (31 May 2020: 91.00%)
Advertising: 0.00% (31 May 2020: 0.46%)
Aerospace/defense: 0.47% (31 May 2020: 1.35%)46,630 Howmet Aerospace Inc Com USD1.00 USD 1,654,199 0.47
Agriculture: 0.00% (31 May 2020: 0.31%)
Airlines: 0.22% (31 May 2020: 0.00%)15,915 Delta Air Lines USDD0.0001 USD 758,907 0.22
Apparel: 1.18% (31 May 2020: 0.78%)20,313 NIKE Inc Class B Com NPV USD 2,772,217 0.7911,004 Ralph Lauren Corp USD0.01 USD 1,365,431 0.39
Auto manufacturers: 0.30% (31 May 2020: 0.36%)11,322 PACCAR Inc Com USD1.00 USD 1,036,812 0.30
Auto parts & equipment: 0.62% (31 May 2020: 0.77%)42,264 BorgWarner Inc USD0.01 USD 2,167,932 0.62
Banks: 3.70% (31 May 2020: 4.12%)196,927 Bank of America Corp Com USD0.01 USD 8,348,720 2.39
5,064 Goldman Sachs Group USD0.01 USD 1,884,213 0.548,597 Morgan Stanley Com USD0.01 USD 781,854 0.23
40,479 Wells Fargo & Co Class C Com USD1.666 USD 1,891,382 0.54
Beverages: 2.20% (31 May 2020: 1.99%)34,398 Coca-Cola Co Com USD0.25 USD 1,902,038 0.5434,312 Monster Beverage Corp Com USD0.005 USD 3,234,935 0.9317,194 PepsiCo Inc Com USD0.017 USD 2,544,024 0.73
Biotechnology: 1.10% (31 May 2020: 2.52%)1,530 Illumina Inc Com USD0.01 USD 620,736 0.182,625 Regeneron Pharmaceuticals Inc Com USD0.001 USD 1,319,062 0.389,124 Vertex Pharmaceuticals Inc Com USD0.01 USD 1,904,088 0.54
Building materials: 0.11% (31 May 2020: 0.00%)3,903 Trex Co Inc USD0.01 USD 380,328 0.11
Chemicals: 4.49% (31 May 2020: 2.36%)16,388 Air Products & Chemicals Inc Com USD1.00 USD 4,914,188 1.4121,471 Celanese Corp Class A Com USD0.0001 USD 3,551,947 1.02
Schedule of investments as at 31 May 2021 (continued)
Transferable securities admitted to an official stock exchange listing or traded on a regulated market. The percentages in brackets show the equivalent sector holdings at 31 May 2020.
395

Barclays Multi-Manager Fund PLC Annual Report and Audited Financial Statements 2021
GlobalAccess US Equity Fund
Holdings Financial assets at fair value through profit or loss Currency Fair value
USD % of net
assets
Equities: 95.81% (31 May 2020: 94.91%) (continued)
United States: 89.73% (31 May 2020: 91.00%) (continued)
Chemicals: 4.49% (31 May 2020: 2.36%) (continued)
30,088 FMC Corp Com USD0.10 USD 3,512,172 1.0014,768 International Flavors & Fragrances Inc Com USD0.125 USD 2,092,552 0.605,635 Sherwin-Williams Co Com USD1.00 USD 1,597,889 0.46
Commercial services: 2.34% (31 May 2020: 1.87%)7,182 Chegg Inc Com USD0.001 USD 552,296 0.16
24,755 Global Payments Inc Com NPV USD 4,796,652 1.38524 MarketAxess Holdings Inc Com USD0.003 USD 244,498 0.07
9,840 PayPal Holdings Inc Com USD0.0001 USD 2,559,286 0.73
Computers: 0.73% (31 May 2020: 1.62%)1,793 EPAM Systems Inc Com USD0.001 USD 856,436 0.247,769 Fortinet Inc Com USD0.001 USD 1,698,148 0.49
Cosmetics/personal care: 0.00% (31 May 2020: 0.46%)
Distribution/wholesale: 0.56% (31 May 2020: 0.25%)15,155 Copart Inc Com USD0.0001 USD 1,955,374 0.56
Diversified financial services: 6.65% (31 May 2020: 2.96%)
40,189 American Express Co Class C Com USD0.20 USD 6,436,269 1.8442,236 Capital One Financial Corp Com USD0.01 USD 6,793,027 1.9519,912 Charles Schwab Corp Com USD0.01 USD 1,470,700 0.428,036 Intercontinental Exchange Inc Com USD0.01 USD 907,546 0.26
33,445 Visa Inc com USD0.0001 USD 7,606,898 2.18
Electric: 2.60% (31 May 2020: 3.82%)86,098 NextEra Energy Inc Com USD0.01 USD 6,306,248 1.81
9,765 Sempra Energy Corp Com NPV USD 1,323,792 0.3820,174 Xcel Energy Inc USD2.5 USD 1,430,135 0.41
Electrical components & equipment: 0.75% (31 May 2020: 0.94%)
3,775 AMETEK Inc Com USD0.01 USD 510,456 0.1521,911 Emerson Electric Co Class C Com USD0.50 USD 2,097,211 0.60
Electronics: 2.65% (31 May 2020: 3.01%)32,252 Amphenol Corp Com USD0.001 USD 2,169,431 0.6228,336 Honeywell International Inc Com USD1.00 USD 6,544,199 1.88
400 Mettler-Toledo International Inc Com USD0.01 USD 520,434 0.15
Food: 0.49% (31 May 2020: 1.30%)26,997 Mondelez International Inc Class A Com NPV USD 1,715,389 0.49
Forest products & paper: 0.00% (31 May 2020: 0.03%)
Schedule of investments as at 31 May 2021 (continued)
Transferable securities admitted to an official stock exchange listing or traded on a regulated market. The percentages in brackets show the equivalent sector holdings at 31 May 2020.
396

Barclays Multi-Manager Fund PLC Annual Report and Audited Financial Statements 2021
GlobalAccess US Equity Fund
Holdings Financial assets at fair value through profit or loss Currency Fair value
USD % of net
assets
Equities: 95.81% (31 May 2020: 94.91%) (continued)
United States: 89.73% (31 May 2020: 91.00%) (continued)
Hand/machine tools: 0.00% (31 May 2020: 0.86%)
Healthcare-products: 5.79% (31 May 2020: 9.19%)1,361 ABIOMED Inc Com USD0.01 USD 387,143 0.113,030 Align Technology Inc Com USD0.0001 USD 1,789,382 0.51
28,858 Boston Scientific Corp Com USD0.01 USD 1,228,196 0.356,293 Danaher Corp Com USD0.01 USD 1,611,921 0.46
20,125 Edwards Lifesciences Corp Com USD1.00 USD 1,930,390 0.562,411 IDEXX Laboratories Inc Com USD0.10 USD 1,346,194 0.393,399 Intuitive Surgical Inc Com USD0.001 USD 2,863,895 0.82
28,686 PerkinElmer Inc USD1.00 USD 4,161,765 1.1928,945 Zimmer Biomet Holdings Inc Com USD0.01 USD 4,873,759 1.40
Healthcare-services: 3.34% (31 May 2020: 2.70%)10,808 Humana Inc Com USD0.166 USD 4,731,418 1.3516,833 UnitedHealth Group Inc Com USD0.01 USD 6,936,711 1.99
Household products/wares: 0.42% (31 May 2020: 0.90%)
6,706 Avery Dennison Corp Com USD1.00 USD 1,479,142 0.42
Insurance: 2.36% (31 May 2020: 1.13%)79,967 American International Group Inc Com USD2.50 USD 4,225,856 1.2129,552 Hartford Financial Services USD0.01 USD 1,932,110 0.5515,148 Marsh & McLennan Cos Inc Com USD1.00 USD 2,096,180 0.60
Internet: 10.35% (31 May 2020: 9.11%)5,520 Alphabet Inc Com USD0.001 USD 13,315,289 3.813,394 Amazon.com Inc Com USD0.01 USD 10,944,818 3.14
400 Booking USD 945,110 0.274,820 Etsy Inc Com USD0.001 USD 794,336 0.23
25,438 Facebook Inc com USD0.000006 USD 8,367,449 2.407,100 Pinterest Inc Com Class A USD0.00001 USD 463,594 0.135,816 VeriSign Inc Com USD0.001 USD 1,279,375 0.37
Lodging: 0.00% (31 May 2020: 0.31%)
Machinery-construction & mining: 0.38% (31 May 2020: 0.33%)
5,567 Caterpillar Inc Com USD1.00 USD 1,342,120 0.38
Machinery-diversified: 1.30% (31 May 2020: 1.16%)6,091 Cognex Corp Com USD0.002 USD 483,443 0.142,405 IDEX Corp Com USD0.01 USD 535,630 0.15
13,355 Rockwell Automation Inc Com USD1.00 USD 3,522,915 1.01
Schedule of investments as at 31 May 2021 (continued)
Transferable securities admitted to an official stock exchange listing or traded on a regulated market. The percentages in brackets show the equivalent sector holdings at 31 May 2020.
397

Barclays Multi-Manager Fund PLC Annual Report and Audited Financial Statements 2021
GlobalAccess US Equity Fund
Holdings Financial assets at fair value through profit or loss Currency Fair value
USD % of net
assets
Equities: 95.81% (31 May 2020: 94.91%) (continued)
United States: 89.73% (31 May 2020: 91.00%) (continued)
Media: 0.41% (31 May 2020: 0.00%)
2,076 Charter Communications USD0.001 USD 1,442,457 0.41
Miscellaneous manufacturing: 3.28% (31 May 2020: 1.07%)
9,249 AptarGroup Inc Com USD0.01 USD 1,362,424 0.39424,253 General Electric Co Class C Com USD0.06 USD 5,967,119 1.71
13,370 Parker-Hannifin Corp Com USD0.50 USD 4,121,369 1.18
Oil & gas: 0.77% (31 May 2020: 1.79%)33,535 EOG Resources Inc Com USD0.01 USD 2,695,040 0.77
Oil & gas services: 0.76% (31 May 2020: 0.00%)109,336 Baker Hughes Co USD0.001 USD 2,668,345 0.76
Packaging & containers: 0.16% (31 May 2020: 0.00%)9,492 WestRock USD0.01 USD 553,668 0.16
Pharmaceuticals: 3.53% (31 May 2020: 4.91%)11,424 AbbVie Inc Com USD0.01 USD 1,293,311 0.374,668 Cigna Corp Com USD0.01 USD 1,208,639 0.349,748 Eli Lilly & Co Com NPV USD 1,947,650 0.56
16,224 Johnson & Johnson Com USD1.00 USD 2,746,642 0.7928,963 Zoetis Inc Com USD0.01 USD 5,118,631 1.47
Real estate investment trusts: 1.73% (31 May 2020: 3.71%)
5,222 American Tower Corp Reits USD0.01 USD 1,335,265 0.3817,983 Crown Castle International Corp Reits USD0.01 USD 3,408,768 0.9816,718 Equity Residential Reits USD0.01 USD 1,295,060 0.37
Retail: 4.33% (31 May 2020: 4.42%)18,227 Advance Auto Parts Inc Com USD0.0001 USD 3,458,938 0.99
1,168 Burlington Stores Inc Com USD0.0001 USD 377,731 0.116,440 Costco Wholesale Corp Com USD0.005 USD 2,436,445 0.70
10,184 Dollar Tree Inc Com USD0.01 USD 992,787 0.292,140 Domino's Pizza Inc Com USD0.01 USD 913,780 0.269,662 Home Depot Inc Com USD0.05 USD 3,083,579 0.884,998 McDonald's Corp Com USD0.01 USD 1,169,307 0.348,400 Starbucks Corp Com USD0.001 USD 956,760 0.279,978 TJX Cos Inc Com USD1.00 USD 674,164 0.198,741 Yum! Brands Inc Com NPV USD 1,048,745 0.30
Semiconductors: 6.58% (31 May 2020: 5.56%)18,300 Advanced Micro Devices Inc Com USD0.01 USD 1,465,647 0.4238,130 Intel Corp Com USD0.001 USD 2,177,986 0.62
4,643 IPG Photonics Corp USD0.0001 USD 971,130 0.28
Schedule of investments as at 31 May 2021 (continued)
Transferable securities admitted to an official stock exchange listing or traded on a regulated market. The percentages in brackets show the equivalent sector holdings at 31 May 2020.
398

Barclays Multi-Manager Fund PLC Annual Report and Audited Financial Statements 2021
GlobalAccess US Equity Fund
Holdings Financial assets at fair value through profit or loss Currency Fair value
USD % of net
assets
Equities: 95.81% (31 May 2020: 94.91%) (continued)
United States: 89.73% (31 May 2020: 91.00%) (continued)
Semiconductors: 6.58% (31 May 2020: 5.56%)
(continued)
16,432 KLA-Tencor Corp Com USD0.001 USD 5,209,601 1.493,049 NVIDIA Corp Com USD0.001 USD 1,981,530 0.57
66,112 Qualcomm Inc Com USD0.0001 USD 8,895,370 2.553,260 Texas Instruments Inc Com USD1.00 USD 618,992 0.18
12,914 Xilinx Inc Com USD0.01 USD 1,640,530 0.47
Software: 9.09% (31 May 2020: 8.73%)5,508 Adobe Inc Com USD0.0001 USD 2,778,703 0.807,827 Broadridge Financial Solutions Inc Com USD0.01 USD 1,248,328 0.368,558 Electronic Arts Inc Com USD0.01 USD 1,223,409 0.359,251 Fidelity National Information Services Com USD0.01 USD 1,377,844 0.39
14,407 Fiserv Inc Com USD0.01 USD 1,660,263 0.483,236 Intuit Inc Com USD0.01 USD 1,421,413 0.41
65,544 Microsoft Corp Com USD0.00000625 USD 16,377,152 4.693,347 Roper Technologies Inc Com USD0.01 USD 1,506,886 0.436,882 salesforce.com Inc Com USD0.001 USD 1,638,845 0.47
640 ServiceNow USD0.001 USD 303,360 0.094,747 Take-Two Interactive Software Inc Com USD0.01 USD 881,043 0.251,448 Tyler Technologies Inc Com USD0.01 USD 584,080 0.172,447 Veeva Systems Inc Com USD0.00001 USD 713,056 0.20
Telecommunications: 2.66% (31 May 2020: 3.30%)2,397 Arista Networks Inc Com USD0.0001 USD 813,506 0.23
70,840 AT&T Inc Com USD1.00 USD 2,088,717 0.6012,248 Motorola Solutions Inc Com USD0.01 USD 2,515,372 0.72
3,800 T-Mobile US Inc USD0.00001 USD 537,548 0.1558,916 Verizon Communications Inc Com USD0.10 USD 3,330,522 0.96
Transportation: 1.33% (31 May 2020: 0.40%)21,461 CSX Corp Com USD1.00 USD 2,148,783 0.626,666 Union Pacific Corp Com USD2.50 USD 1,498,283 0.434,608 United Parcel Service Inc Com USD0.01 USD 989,038 0.28
Water: 0.00% (31 May 2020: 0.14%)
Total United States 313,191,753 89.73
Total equities 334,393,176 95.81
Schedule of investments as at 31 May 2021 (continued)
Transferable securities admitted to an official stock exchange listing or traded on a regulated market. The percentages in brackets show the equivalent sector holdings at 31 May 2020.
399

Barclays Multi-Manager Fund PLC Annual Report and Audited Financial Statements 2021
GlobalAccess US Equity Fund
No. of contracts Futures contracts: 0.03% (31 May 2020: 0.06%) CounterpartyUnrealised
gain% of net
assetsUSD
32 S&P500 E-mini CME Future June 2021 Goldman Sachs 89,440 0.03
Total futures contracts 89,440 0.03
Forward currency contracts: 0.07% (31 May 2020: 0.13%)
Counterparty Cncy Buys Cncy SellsMaturity
dateUnrealised
gain% of net
assetsUSD
UBS EUR 11,407,848 USD 13,771,509 17/06/2021 179,808 0.05 CCT_1776783_184160
UBS GBP 1,925,477 USD 2,701,165 17/06/2021 35,951 0.01 CCT_1776783_184157
UBS EUR 729,090 USD 880,154 17/06/2021 11,492 0.01 CCT_1776783_184159
UBS EUR 619,510 USD 747,870 17/06/2021 9,764 – CCT_1776783_184162
UBS GBP 476,615 USD 668,622 17/06/2021 8,899 – CCT_1776783_184138
UBS GBP 353,740 USD 496,246 17/06/2021 6,605 – CCT_1776783_184153
UBS GBP 197,769 USD 277,441 17/06/2021 3,692 – CCT_1776783_184137
UBS GBP 55,000 USD 77,487 17/06/2021 697 – CCT_1776783_184274
UBS GBP 50,000 USD 70,442 17/06/2021 634 – CCT_1776783_184276
UBS GBP 33,967 USD 47,651 17/06/2021 634 – CCT_1776783_184143
UBS GBP 49,505 USD 69,790 17/06/2021 583 – CCT_1776783_184064
UBS GBP 21,746 USD 30,507 17/06/2021 406 – CCT_1776783_184141
UBS USD 13,942 EUR 11,383 17/06/2021 21 – CCT_1776783_184862
Total fair value gains on forward currency contracts 259,186 0.07
Counterparty Cncy Buys Cncy SellsMaturity
dateUnrealised
loss% of net
assetsUSD
Barclays^ USD 562 GBP 400 17/06/2021 (7) – CCT_1776783_184149
Barclays^ USD 913 GBP 650 17/06/2021 (11) – CCT_1776783_184151
Barclays^ USD 5,055 GBP 3,600 17/06/2021 (62) – CCT_1776783_184152
Barclays^ USD 9,127 GBP 6,500 17/06/2021 (112) – CCT_1776783_184150
Barclays^ USD 12,638 GBP 9,000 17/06/2021 (156) – CCT_1776783_184146
Barclays^ USD 14,012 EUR 11,600 17/06/2021 (175) – CCT_1776783_184148
Barclays^ USD 16,307 EUR 13,500 17/06/2021 (203) – CCT_1776783_184145
Barclays^ USD 47,744 GBP 34,000 17/06/2021 (588) – CCT_1776783_184147
Barclays^ USD 259,696 EUR 215,000 17/06/2021 (3,240) – CCT_1776783_184144
UBS USD 3,829 EUR 3,133 17/06/2021 (3) – CCT_1776783_184527
UBS USD 5,994 EUR 4,905 17/06/2021 (4) – CCT_1776783_184939
UBS USD 11,853 EUR 9,712 17/06/2021 (24) – CCT_1776783_185052
UBS USD 3,117 EUR 2,580 17/06/2021 (38) – CCT_1776783_184062
UBS USD 14,893 EUR 12,240 17/06/2021 (76) – CCT_1776783_183925
UBS USD 34,023 EUR 28,026 17/06/2021 (252) – CCT_1776783_184273
Total fair value losses on forward currency contracts (4,951) –
Total forward currency contracts 254,235 0.07
Schedule of investments as at 31 May 2021 (continued)
Transferable securities admitted to an official stock exchange listing or traded on a regulated market. The percentages in brackets show the equivalent sector holdings at 31 May 2020.
400

Barclays Multi-Manager Fund PLC Annual Report and Audited Financial Statements 2021
GlobalAccess US Equity Fund
No. of contracts Futures contracts: 0.03% (31 May 2020: 0.06%) CounterpartyUnrealised
gain% of net
assetsUSD
32 S&P500 E-mini CME Future June 2021 Goldman Sachs 89,440 0.03
Total futures contracts 89,440 0.03
Forward currency contracts: 0.07% (31 May 2020: 0.13%)
Counterparty Cncy Buys Cncy SellsMaturity
dateUnrealised
gain% of net
assetsUSD
UBS EUR 11,407,848 USD 13,771,509 17/06/2021 179,808 0.05 CCT_1776783_184160
UBS GBP 1,925,477 USD 2,701,165 17/06/2021 35,951 0.01 CCT_1776783_184157
UBS EUR 729,090 USD 880,154 17/06/2021 11,492 0.01 CCT_1776783_184159
UBS EUR 619,510 USD 747,870 17/06/2021 9,764 – CCT_1776783_184162
UBS GBP 476,615 USD 668,622 17/06/2021 8,899 – CCT_1776783_184138
UBS GBP 353,740 USD 496,246 17/06/2021 6,605 – CCT_1776783_184153
UBS GBP 197,769 USD 277,441 17/06/2021 3,692 – CCT_1776783_184137
UBS GBP 55,000 USD 77,487 17/06/2021 697 – CCT_1776783_184274
UBS GBP 50,000 USD 70,442 17/06/2021 634 – CCT_1776783_184276
UBS GBP 33,967 USD 47,651 17/06/2021 634 – CCT_1776783_184143
UBS GBP 49,505 USD 69,790 17/06/2021 583 – CCT_1776783_184064
UBS GBP 21,746 USD 30,507 17/06/2021 406 – CCT_1776783_184141
UBS USD 13,942 EUR 11,383 17/06/2021 21 – CCT_1776783_184862
Total fair value gains on forward currency contracts 259,186 0.07
Counterparty Cncy Buys Cncy SellsMaturity
dateUnrealised
loss% of net
assetsUSD
Barclays^ USD 562 GBP 400 17/06/2021 (7) – CCT_1776783_184149
Barclays^ USD 913 GBP 650 17/06/2021 (11) – CCT_1776783_184151
Barclays^ USD 5,055 GBP 3,600 17/06/2021 (62) – CCT_1776783_184152
Barclays^ USD 9,127 GBP 6,500 17/06/2021 (112) – CCT_1776783_184150
Barclays^ USD 12,638 GBP 9,000 17/06/2021 (156) – CCT_1776783_184146
Barclays^ USD 14,012 EUR 11,600 17/06/2021 (175) – CCT_1776783_184148
Barclays^ USD 16,307 EUR 13,500 17/06/2021 (203) – CCT_1776783_184145
Barclays^ USD 47,744 GBP 34,000 17/06/2021 (588) – CCT_1776783_184147
Barclays^ USD 259,696 EUR 215,000 17/06/2021 (3,240) – CCT_1776783_184144
UBS USD 3,829 EUR 3,133 17/06/2021 (3) – CCT_1776783_184527
UBS USD 5,994 EUR 4,905 17/06/2021 (4) – CCT_1776783_184939
UBS USD 11,853 EUR 9,712 17/06/2021 (24) – CCT_1776783_185052
UBS USD 3,117 EUR 2,580 17/06/2021 (38) – CCT_1776783_184062
UBS USD 14,893 EUR 12,240 17/06/2021 (76) – CCT_1776783_183925
UBS USD 34,023 EUR 28,026 17/06/2021 (252) – CCT_1776783_184273
Total fair value losses on forward currency contracts (4,951) –
Total forward currency contracts 254,235 0.07
Fair value USD
% of net assets
Total value of investments 334,736,851 95.91
Cash and cash equivalents* 17,308,731 4.96
Other net liabilities** (3,027,417) (0.87)
Net assets attributable to holders of redeemable participating shares 349,018,165 100.00
Analysis of total assets (unaudited)% of total
assets
Transferable securities and money market instruments admitted to official stock exchangelisting or traded on a regulated market. 94.61Financial derivative instruments dealt in on a regulated market. 0.03OTC financial derivative instruments. 0.07Other assets. 5.29
100.00
*All cash holdings are held with The Northern Trust Company.**Including USD 792,614 held with Goldman Sachs as security by the counterparty to derivatives contracts.^ Related party.
The accompanying notes form an integral part of the Financial Statements.
The Industry Classification Benchmark (“ICB”) is jointly owned by FTSE and Dow Jones and has been licensed for use. FTSE and Dow Jones do not accept liability to any person for any loss or damage arising out of any error or omission in ICB.
Schedule of investments as at 31 May 2021 (continued)
Transferable securities admitted to an official stock exchange listing or traded on a regulated market. The percentages in brackets show the equivalent sector holdings at 31 May 2020.
401

Barclays Multi-Manager Fund PLC Annual Report and Audited Financial Statements 2021
GlobalAccess Global Equity Income Fund
Schedule of investments as at 31 May 2021
Transferable securities admitted to an official stock exchange listing or traded on a regulated market. The percentages in brackets show the equivalent sector holdings at 31 May 2020.
Holdings Financial assets at fair value through profit or loss CurrencyFair value
USD% of net
assets
Equities: 97.62% (31 May 2020: 96.32%)
Australia: 2.30% (31 May 2020: 2.28%)
Banks: 0.30% (31 May 2020: 0.21%)2,480 Australia & New Zealand Banking Group Ltd Com NPV AUD 55,122 0.062,260 Commonwealth Bank of Australia Com NPV AUD 174,472 0.173,258 Westpac Banking Corp Com NPV AUD 66,577 0.07
Biotechnology: 0.09% (31 May 2020: 0.08%)392 CSL Ltd Com NPV AUD 88,097 0.09
Computers: 0.08% (31 May 2020: 0.06%)6,136 Computershare Ltd Com NPV AUD 74,640 0.08
Diversified financial services: 0.08% (31 May 2020: 0.07%)
680 Macquarie Group Ltd Com NPV AUD 79,985 0.08
Electric: 0.00% (31 May 2020: 0.04%)
Engineering & construction: 0.00% (31 May 2020: 0.05%)
Entertainment: 0.04% (31 May 2020: 0.00%)1,356 Aristocrat Leisure Ltd Com NPV AUD 43,092 0.04
Healthcare-products: 0.00% (31 May 2020: 0.06%)
Healthcare-services: 0.75% (31 May 2020: 0.71%)28,036 Sonic Healthcare Ltd Com NPV AUD 755,096 0.75
Insurance: 0.12% (31 May 2020: 0.11%)11,489 Insurance Australia Group Ltd Com NPV AUD 44,688 0.048,770 Suncorp Group Ltd NPV AUD 75,453 0.08
Internet: 0.48% (31 May 2020: 0.41%)32,228 carsales.com Ltd Com NPV AUD 481,085 0.48
Iron/steel: 0.19% (31 May 2020: 0.11%)10,683 Fortescue Metals Group Ltd Com NPV AUD 185,560 0.19
Mining: 0.13% (31 May 2020: 0.05%)3,592 BHP Billiton Ltd Com NPV AUD 133,111 0.13
Oil & gas: 0.00% (31 May 2020: 0.08%)
Real estate investment trusts: 0.04% (31 May 2020: 0.06%)
5,133 Dexus Property Group Reits AUD 41,460 0.04
Transportation: 0.00% (31 May 2020: 0.18%)
Total Australia 2,298,438 2.30
402

Barclays Multi-Manager Fund PLC Annual Report and Audited Financial Statements 2021
GlobalAccess Global Equity Income Fund
Holdings Financial assets at fair value through profit or loss Currency Fair value
USD % of net
assets
Equities: 97.62% (31 May 2020: 96.32%) (continued)
Austria: 0.11% (31 May 2020: 0.06%)
Machinery-diversified: 0.00% (31 May 2020: 0.06%)
Oil & gas: 0.11% (31 May 2020: 0.00%)1,829 OMV AG Com NPV EUR 105,170 0.11
Total Austria 105,170 0.11
Belgium: 0.16% (31 May 2020: 0.17%)
Banks: 0.16% (31 May 2020: 0.17%)1,990 KBC Groep NV Com NPV EUR 162,870 0.16
Total Belgium 162,870 0.16
Bermuda: 0.75% (31 May 2020: 0.61%)
Insurance: 0.19% (31 May 2020: 0.26%)17,045 Hiscox Ltd Com GBP0.065 GBP 190,056 0.19
Retail: 0.56% (31 May 2020: 0.35%)234,400 Man Wah Holdings Ltd Com HKD0.4 HKD 557,211 0.56
Total Bermuda 747,267 0.75
Brazil: 0.48% (31 May 2020: 0.60%)
Diversified financial services: 0.48% (31 May 2020: 0.60%)
144,900 B3 SA - Brasil Bolsa Balcao Com NPV BRL 484,146 0.48
Total Brazil 484,146 0.48
Canada: 2.99% (31 May 2020: 2.47%)
Auto parts & equipment: 0.26% (31 May 2020: 0.00%)2,667 Magna International Inc Com NPV CAD 263,157 0.26
Banks: 1.72% (31 May 2020: 1.51%)2,020 Bank of Montreal Com NPV CAD 211,363 0.218,839 Bank of Nova Scotia Com NPV CAD 594,059 0.597,893 Canadian Imperial Bank of Commerce Com NPV CAD 920,491 0.92
Diversified financial services: 0.00% (31 May 2020: 0.10%)
Food: 0.00% (31 May 2020: 0.08%)
Insurance: 0.46% (31 May 2020: 0.00%)5,953 Great-West Lifeco Inc Com NPV CAD 184,488 0.18
Schedule of investments as at 31 May 2021 (continued)
Transferable securities admitted to an official stock exchange listing or traded on a regulated market. The percentages in brackets show the equivalent sector holdings at 31 May 2020.
403

Barclays Multi-Manager Fund PLC Annual Report and Audited Financial Statements 2021
GlobalAccess Global Equity Income Fund
Holdings Financial assets at fair value through profit or loss Currency Fair value
USD % of net
assets
Equities: 97.62% (31 May 2020: 96.32%) (continued) Canada: 2.99% (31 May 2020: 2.47%) (continued)
Insurance: 0.46% (31 May 2020: 0.00%) (continued) 13,173 Manulife Financial Corp Com NPV CAD 275,760 0.28
Media: 0.13% (31 May 2020: 0.00%)4,742 Quebecor Inc NPV CAD 128,745 0.13
Mining: 0.29% (31 May 2020: 0.41%)4,065 Agnico Eagle Mines Ltd Com NPV CAD 288,127 0.29
Oil & gas: 0.13% (31 May 2020: 0.24%)3,751 Canadian Natural Resources Ltd NPV CAD 131,740 0.13
Retail: 0.00% (31 May 2020: 0.13%)
Total Canada 2,997,930 2.99
Cayman Islands: 2.28% (31 May 2020: 2.24%)
Auto parts & equipment: 0.06% (31 May 2020: 0.00%)14,000 Xinyi Glass Holdings Ltd HKD0.10 HKD 55,828 0.06
Building materials: 0.29% (31 May 2020: 0.67%)278,000 China Resources Cement Holdings Ltd Com HKD0.10 HKD 294,430 0.29
Commercial services: 0.00% (31 May 2020: 0.60%)
Food: 0.24% (31 May 2020: 0.32%)284,000 Want Want China Holdings Ltd Com USD0.02 HKD 210,952 0.21
38,500 WH Group Ltd Com USD0.0001 HKD 32,938 0.03
Holding companies-diversified: 0.00% (31 May 2020: 0.04%)
Real estate: 0.05% (31 May 2020: 0.07%)9,000 Wharf Real Estate Investment Co Ltd Com HKD0.10 HKD 52,733 0.05
Retail: 0.90% (31 May 2020: 0.54%)44,000 ANTA Sports Products HKD 897,710 0.90
Semiconductors: 0.42% (31 May 2020: 0.00%)2,900 ASM Pacific Technology Ltd Com HKD0.10 HKD 38,392 0.045,822 Silicon Motion Technology Corp ADR USD0.01 USD 384,223 0.38
Software: 0.32% (31 May 2020: 0.00%)13,200 NetEase Inc HKD1.00 HKD 319,485 0.32
Total Cayman Islands 2,286,691 2.28
Schedule of investments as at 31 May 2021 (continued)
Transferable securities admitted to an official stock exchange listing or traded on a regulated market. The percentages in brackets show the equivalent sector holdings at 31 May 2020.
404

Barclays Multi-Manager Fund PLC Annual Report and Audited Financial Statements 2021
GlobalAccess Global Equity Income Fund
Holdings Financial assets at fair value through profit or loss Currency Fair value
USD % of net
assets
Equities: 97.62% (31 May 2020: 96.32%) (continued)
Denmark: 1.65% (31 May 2020: 1.31%)
Healthcare-products: 0.06% (31 May 2020: 0.16%)359 Coloplast A/S Class B Com DKK1.00 DKK 56,698 0.06
Pharmaceuticals: 1.13% (31 May 2020: 1.15%)14,318 Novo Nordisk A/S Com DKK0.20 DKK 1,134,999 1.13
Transportation: 0.46% (31 May 2020: 0.00%)167 AP Moller - Maersk A/S Class B Com DKK1000.00 DKK 462,047 0.46
Total Denmark 1,653,744 1.65
Finland: 0.28% (31 May 2020: 0.27%)
Banks: 0.20% (31 May 2020: 0.00%)18,522 Nordea Bank Abp Com SEK1.00 SEK 199,220 0.20
Forest products & paper: 0.08% (31 May 2020: 0.23%)2,099 UPM-Kymmene OYJ Com NPV EUR 79,993 0.08
Machinery-diversified: 0.00% (31 May 2020: 0.04%)
Total Finland 279,213 0.28
France: 3.04% (31 May 2020: 4.38%)
Advertising: 0.18% (31 May 2020: 0.08%)2,705 Publicis Groupe SA Com EUR0.40 EUR 183,520 0.18
Apparel: 0.45% (31 May 2020: 0.41%)497 Kering SA Com EUR4.00 EUR 454,619 0.45
Auto parts & equipment: 0.00% (31 May 2020: 0.07%)
Banks: 0.29% (31 May 2020: 0.07%)4,255 BNP Paribas SA Com EUR2.00 EUR 290,579 0.29
Beverages: 0.26% (31 May 2020: 0.29%)1,163 Pernod Ricard SA Com EUR1.55 EUR 256,127 0.26
Commercial services: 0.48% (31 May 2020: 0.54%)8,883 Edenred Com EUR2.00 EUR 483,197 0.48
Computers: 0.19% (31 May 2020: 0.21%)991 Capgemini Com EUR8.00 EUR 184,958 0.19
Electrical components & equipment: 0.63% (31 May 2020: 0.54%)
620 Legrand SA Com EUR4.00 EUR 64,934 0.073,542 Schneider Electric Com EUR4.00 EUR 560,340 0.56
Schedule of investments as at 31 May 2021 (continued)
Transferable securities admitted to an official stock exchange listing or traded on a regulated market. The percentages in brackets show the equivalent sector holdings at 31 May 2020.
405

Barclays Multi-Manager Fund PLC Annual Report and Audited Financial Statements 2021
GlobalAccess Global Equity Income Fund
Holdings Financial assets at fair value through profit or loss Currency Fair value
USD % of net
assets
Equities: 97.62% (31 May 2020: 96.32%) (continued) France: 3.04% (31 May 2020: 4.38%) (continued)
Engineering & construction: 0.00% (31 May 2020: 0.20%)
Insurance: 0.06% (31 May 2020: 0.52%)3,170 CNP Assurances EUR1.00 EUR 57,468 0.06
Oil & gas: 0.16% (31 May 2020: 0.63%)3,348 TOTAL SE Com EUR2.50 EUR 155,151 0.16
Pharmaceuticals: 0.17% (31 May 2020: 0.70%)1,628 Sanofi Com EUR2.00 EUR 173,132 0.17
Real estate investment trusts: 0.17% (31 May 2020: 0.12%)
1,095 Gecina SA Reits EUR7.50 EUR 174,680 0.17
Total France 3,038,705 3.04
Germany: 3.61% (31 May 2020: 3.43%)
Auto manufacturers: 0.26% (31 May 2020: 0.04%)2,300 Porsche Automobil Holding SE NPV EUR 260,344 0.26
Auto parts & equipment: 0.00% (31 May 2020: 0.71%)
Building materials: 0.00% (31 May 2020: 0.06%)
Chemicals: 0.60% (31 May 2020: 0.00%)2,919 BASF SE NPV EUR 237,904 0.245,137 Covestro AG Com NPV EUR 360,138 0.36
Diversified financial services: 0.63% (31 May 2020: 0.92%)
3,875 Deutsche Boerse AG Com NPV EUR 633,440 0.63
Engineering & construction: 0.00% (31 May 2020: 0.06%)
Miscellaneous manufacturing: 0.22% (31 May 2020: 0.23%)
1,382 Siemens Com NPV EUR 224,122 0.22
Pharmaceuticals: 0.36% (31 May 2020: 0.57%)5,655 Bayer Com NPV EUR 356,179 0.36
Semiconductors: 0.25% (31 May 2020: 0.51%)6,127 Infineon Technologies AG Com NPV EUR 249,232 0.25
Schedule of investments as at 31 May 2021 (continued)
Transferable securities admitted to an official stock exchange listing or traded on a regulated market. The percentages in brackets show the equivalent sector holdings at 31 May 2020.
406

Barclays Multi-Manager Fund PLC Annual Report and Audited Financial Statements 2021
GlobalAccess Global Equity Income Fund
Holdings Financial assets at fair value through profit or loss Currency Fair value
USD % of net
assets
Equities: 97.62% (31 May 2020: 96.32%) (continued) Germany: 3.61% (31 May 2020: 3.43%) (continued)
Software: 0.16% (31 May 2020: 0.29%)1,176 SAP SE Com NPV EUR 163,266 0.16
Telecommunications: 0.00% (31 May 2020: 0.04%)
Transportation: 1.13% (31 May 2020: 0.00%)16,531 Deutsche Post AG Com NPV EUR 1,127,809 1.13
Total Germany 3,612,434 3.61
Hong Kong: 0.81% (31 May 2020: 0.87%)
Banks: 0.12% (31 May 2020: 0.08%)32,500 BOC Hong Kong Holdings Ltd Com NPV HKD 117,563 0.12
Diversified financial services: 0.43% (31 May 2020: 0.38%)
6,900 Hong Kong Exchanges & Clearing Ltd Com NPV HKD 431,800 0.43
Real estate: 0.07% (31 May 2020: 0.08%)4,500 Sun Hung Kai Properties Ltd Com NPV HKD 69,141 0.07
Telecommunications: 0.19% (31 May 2020: 0.33%)31,000 China Mobile Ltd Com NPV HKD 193,218 0.19
Total Hong Kong 811,722 0.81
Ireland: 2.07% (31 May 2020: 1.25%)
Building materials: 0.57% (31 May 2020: 0.81%)5,761 CRH PLC Com EUR0.32 EUR 299,920 0.304,044 Johnson Controls International PLC Com USD0.01 USD 269,108 0.27
Computers: 0.68% (31 May 2020: 0.44%)2,019 Accenture PLC Com USD0.0000225 USD 569,954 0.571,165 Seagate Technology Holdings PLC NPV USD 111,537 0.11
Healthcare-products: 0.43% (31 May 2020: 0.00%)3,415 Medtronic PLC Com USD0.10 USD 432,322 0.43
Miscellaneous manufacturing: 0.39% (31 May 2020: 0.00%)
2,105 Trane Technologies PLC Com USD1.00 USD 392,488 0.39
Total Ireland 2,075,329 2.07
Schedule of investments as at 31 May 2021 (continued)
Transferable securities admitted to an official stock exchange listing or traded on a regulated market. The percentages in brackets show the equivalent sector holdings at 31 May 2020.
407

Barclays Multi-Manager Fund PLC Annual Report and Audited Financial Statements 2021
GlobalAccess Global Equity Income Fund
Holdings Financial assets at fair value through profit or loss Currency Fair value
USD % of net
assets
Equities: 97.62% (31 May 2020: 96.32%) (continued)
Israel: 0.37% (31 May 2020: 0.00%)
Banks: 0.37% (31 May 2020: 0.00%)26,126 Bank Hapoalim BM Com ILS1.00 ILS 222,174 0.2218,374 Bank Leumi Le-Israel BM Com ILS0.10 ILS 143,581 0.15
Total Israel 365,755 0.37
Italy: 1.09% (31 May 2020: 2.02%)
Banks: 0.00% (31 May 2020: 0.05%)
Electrical components & equipment: 0.47% (31 May 2020: 0.00%)
13,515 Prysmian SpA Com EUR0.10 EUR 466,476 0.47
Entertainment: 0.00% (31 May 2020: 1.10%)
Insurance: 0.16% (31 May 2020: 0.28%)8,006 Assicurazioni Generali SpA Com EUR1.00 EUR 164,570 0.16
Telecommunications: 0.46% (31 May 2020: 0.59%)29,886 Infrastrutture Wireless Italiane SpA Com NPV EUR 334,598 0.34
214,709 Telecom Italia SpA Com NPV EUR 123,027 0.12
Total Italy 1,088,671 1.09
Japan: 3.61% (31 May 2020: 4.36%)
Auto manufacturers: 0.07% (31 May 2020: 0.14%)2,300 Honda Motor Co Ltd Com NPV JPY 70,538 0.07
Auto parts & equipment: 0.20% (31 May 2020: 0.13%)3,100 Bridgestone Corp Com NPV JPY 136,191 0.14
900 Denso Corp Com NPV JPY 61,756 0.06
Banks: 0.41% (31 May 2020: 0.54%)7,800 Mitsubishi UFJ Financial Group Inc Com NPV JPY 44,221 0.043,500 Sumitomo Mitsui Financial Group Inc Com NPV JPY 126,457 0.137,000 Sumitomo Mitsui Trust Holdings Inc Com NPV JPY 241,268 0.24
Beverages: 0.07% (31 May 2020: 0.09%)3,200 Kirin Holdings Co Ltd Com NPV JPY 64,676 0.07
Chemicals: 0.13% (31 May 2020: 0.16%)11,400 Asahi Kasei Corp Com NPV JPY 125,520 0.13
Commercial services: 0.05% (31 May 2020: 0.11%)600 Secom Co Ltd Com NPV JPY 46,977 0.05
Schedule of investments as at 31 May 2021 (continued)
Transferable securities admitted to an official stock exchange listing or traded on a regulated market. The percentages in brackets show the equivalent sector holdings at 31 May 2020.
408

Barclays Multi-Manager Fund PLC Annual Report and Audited Financial Statements 2021
GlobalAccess Global Equity Income Fund
Holdings Financial assets at fair value through profit or loss Currency Fair value
USD % of net
assets
Equities: 97.62% (31 May 2020: 96.32%) (continued) Japan: 3.61% (31 May 2020: 4.36%) (continued)
Computers: 0.13% (31 May 2020: 0.05%)1,600 Otsuka Corp Com NPV JPY 85,708 0.08
800 SCSK Corp NPV JPY 46,400 0.05
Cosmetics/personal care: 0.07% (31 May 2020: 0.13%)1,200 Kao Corp Com NPV JPY 73,451 0.07
Distribution/wholesale: 0.26% (31 May 2020: 0.29%)4,400 ITOCHU Corp Com NPV JPY 130,719 0.134,600 Mitsubishi Corp Com NPV JPY 125,465 0.13
Diversified financial services: 0.09% (31 May 2020: 0.10%)
8,500 Nomura Holdings Inc NPV JPY 46,690 0.042,700 ORIX Corp Com NPV JPY 47,703 0.05
Electric: 0.04% (31 May 2020: 0.05%)4,700 Kansai Electric Power Co Inc Com NPV JPY 44,585 0.04
Electrical components & equipment: 0.11% (31 May 2020: 0.14%)
5,400 Brother Industries Ltd Com NPV JPY 112,892 0.11
Electronics: 0.12% (31 May 2020: 0.08%)400 Hoya Corp Com NPV JPY 52,470 0.05
4,200 Yokogawa Electric Corp NPV JPY 66,535 0.07
Engineering & construction: 0.12% (31 May 2020: 0.10%)
4,400 Kajima Corp Com NPV JPY 60,915 0.067,200 Obayashi Corp Com NPV JPY 60,683 0.06
Home builders: 0.16% (31 May 2020: 0.20%)7,500 Sekisui House Ltd Com NPV JPY 156,194 0.16
Insurance: 0.08% (31 May 2020: 0.13%)2,500 MS&AD Insurance Group Holdings Inc Com NPV JPY 76,352 0.08
Internet: 0.06% (31 May 2020: 0.04%)2,000 Kakaku.com Inc Com NPV JPY 60,972 0.06
Leisure time: 0.00% (31 May 2020: 0.04%)
Machinery-construction & mining: 0.13% (31 May 2020: 0.16%)
2,400 Hitachi Ltd Com NPV JPY 125,874 0.13
Office/business equipment: 0.00% (31 May 2020: 0.03%)
Schedule of investments as at 31 May 2021 (continued)
Transferable securities admitted to an official stock exchange listing or traded on a regulated market. The percentages in brackets show the equivalent sector holdings at 31 May 2020.
409

Barclays Multi-Manager Fund PLC Annual Report and Audited Financial Statements 2021
GlobalAccess Global Equity Income Fund
Holdings Financial assets at fair value through profit or loss Currency Fair value
USD % of net
assets
Equities: 97.62% (31 May 2020: 96.32%) (continued) Japan: 3.61% (31 May 2020: 4.36%) (continued)
Oil & gas: 0.00% (31 May 2020: 0.07%)
Pharmaceuticals: 0.26% (31 May 2020: 0.22%)9,300 Astellas Pharma Inc Com NPV JPY 152,768 0.152,300 Medipal Holdings Corp NPV JPY 43,984 0.041,300 Shionogi & Co Ltd NPV JPY 66,061 0.07
Real estate: 0.13% (31 May 2020: 0.10%)1,200 Daito Trust Construction Co Ltd Com NPV JPY 126,368 0.13
Retail: 0.30% (31 May 2020: 0.38%)800 ABC-Mart Inc Com NPV JPY 45,706 0.04
1,200 Sundrug Co Ltd Com NPV JPY 40,340 0.0412,500 USS Co Ltd Com NPV JPY 218,874 0.22
Semiconductors: 0.13% (31 May 2020: 0.09%)300 Tokyo Electron Ltd Com NPV JPY 133,361 0.13
Telecommunications: 0.29% (31 May 2020: 0.58%)300 Hikari Tsushin Inc Com NPV JPY 59,742 0.06
5,100 KDDI Corp Com NPV JPY 173,263 0.174,200 SoftBank Corp NPV JPY 54,029 0.06
Toys/games/hobbies: 0.12% (31 May 2020: 0.07%)200 Nintendo Co Ltd Com NPV JPY 123,744 0.12
Transportation: 0.08% (31 May 2020: 0.14%)3,000 Yamato Holdings Com NPV JPY 82,545 0.08
Total Japan 3,611,997 3.61
Jersey: 1.49% (31 May 2020: 0.78%)
Commercial services: 0.38% (31 May 2020: 0.49%)9,867 Experian PLC Com USD0.10 GBP 379,191 0.38
Distribution/wholesale: 0.66% (31 May 2020: 0.09%)4,873 Ferguson PLC GBP0.10 GBP 664,643 0.66
Mining: 0.45% (31 May 2020: 0.20%)98,389 Glencore PLC Com USD0.01 GBP 449,615 0.45
Total Jersey 1,493,449 1.49
Luxembourg: 0.45% (31 May 2020: 0.21%)
Iron/steel: 0.45% (31 May 2020: 0.00%)8,146 APERAM SA Com NPV EUR 454,362 0.45
Schedule of investments as at 31 May 2021 (continued)
Transferable securities admitted to an official stock exchange listing or traded on a regulated market. The percentages in brackets show the equivalent sector holdings at 31 May 2020.
410

Barclays Multi-Manager Fund PLC Annual Report and Audited Financial Statements 2021
GlobalAccess Global Equity Income Fund
Holdings Financial assets at fair value through profit or loss Currency Fair value
USD % of net
assets
Equities: 97.62% (31 May 2020: 96.32%) (continued) Luxembourg: 0.45% (31 May 2020: 0.21%) (continued)
Metal fabricate/hardware: 0.00% (31 May 2020: 0.21%)
Total Luxembourg 454,362 0.45
Mexico: 0.26% (31 May 2020: 0.36%)
Household products/wares: 0.26% (31 May 2020: 0.36%)
145,120 Kimberly-Clark de Mexico SAB de CV Com NPV MXN 263,513 0.26
Total Mexico 263,513 0.26
Netherlands: 1.79% (31 May 2020: 1.24%)
Chemicals: 0.00% (31 May 2020: 0.58%)
Commercial services: 0.26% (31 May 2020: 0.00%)3,326 Randstad NV EUR0.10 EUR 259,038 0.26
Food: 0.18% (31 May 2020: 0.09%)3,652 Koninklijke Ahold Delhaize NV Com EUR0.01 EUR 105,567 0.111,333 Koninklijke Philips NV Com EUR0.20 EUR 75,084 0.07
Insurance: 0.52% (31 May 2020: 0.00%)10,223 NN Group Com EUR0.12 EUR 519,152 0.52
Machinery-diversified: 0.31% (31 May 2020: 0.00%)17,940 CNH Industrial NV Com EUR0.01 EUR 309,658 0.31
Media: 0.43% (31 May 2020: 0.48%)4,478 Wolters Kluwer NV Com EUR0.12 EUR 429,516 0.43
Semiconductors: 0.09% (31 May 2020: 0.09%)307 ASM International NV EUR0.40 EUR 96,560 0.09
Total Netherlands 1,794,575 1.79
Norway: 0.16% (31 May 2020: 0.00%)
Banks: 0.10% (31 May 2020: 0.00%)4,594 DNB ASA Com NOK10.00 NOK 101,884 0.10
Chemicals: 0.06% (31 May 2020: 0.00%)1,112 Yara International ASA Com NOK 1.70 NOK 59,461 0.06
Total Norway 161,345 0.16
Schedule of investments as at 31 May 2021 (continued)
Transferable securities admitted to an official stock exchange listing or traded on a regulated market. The percentages in brackets show the equivalent sector holdings at 31 May 2020.
411

Barclays Multi-Manager Fund PLC Annual Report and Audited Financial Statements 2021
GlobalAccess Global Equity Income Fund
Holdings Financial assets at fair value through profit or loss Currency Fair value
USD % of net
assets
Equities: 97.62% (31 May 2020: 96.32%) (continued)
People's Republic of China: 0.00% (31 May 2020: 0.48%)
Building materials: 0.00% (31 May 2020: 0.32%)
Insurance: 0.00% (31 May 2020: 0.16%)
Portugal: 0.07% (31 May 2020: 0.00%)
Oil & gas: 0.07% (31 May 2020: 0.00%)5,249 Galp Energia SGPS SA Com EUR1.00 EUR 65,348 0.07
Total Portugal 65,348 0.07
Republic of South Korea: 1.00% (31 May 2020: 0.15%)
Auto manufacturers: 0.38% (31 May 2020: 0.00%)1,806 Hyundai Motor Co Com KRW5000.00 KRW 381,584 0.38
Semiconductors: 0.62% (31 May 2020: 0.15%)8,578 Samsung Electronics Co Ltd Com KRW100.00 KRW 621,124 0.62
Total Republic of South Korea 1,002,708 1.00
Russian Federation: 0.39% (31 May 2020: 0.00%)
Banks: 0.21% (31 May 2020: 0.00%)12,239 Sberbank of Russia PJSC ADR NPV USD 206,564 0.21
Iron/steel: 0.18% (31 May 2020: 0.00%)4,969 Novolipetsk Steel GDR NPV USD 178,287 0.18
Total Russian Federation 384,851 0.39
Singapore: 0.54% (31 May 2020: 0.55%)
Banks: 0.33% (31 May 2020: 0.30%)16,800 United Overseas Bank Ltd Com NPV SGD 331,816 0.33
Diversified financial services: 0.09% (31 May 2020: 0.06%)
11,400 Singapore Exchange Ltd Com NPV SGD 89,106 0.09
Electronics: 0.03% (31 May 2020: 0.00%)2,500 Venture Corp Ltd Com NPV SGD 35,987 0.03
Food: 0.04% (31 May 2020: 0.05%)10,400 Wilmar International Ltd Com NPV SGD 37,594 0.04
Schedule of investments as at 31 May 2021 (continued)
Transferable securities admitted to an official stock exchange listing or traded on a regulated market. The percentages in brackets show the equivalent sector holdings at 31 May 2020.
412

Barclays Multi-Manager Fund PLC Annual Report and Audited Financial Statements 2021
GlobalAccess Global Equity Income Fund
Holdings Financial assets at fair value through profit or loss Currency Fair value
USD % of net
assets
Equities: 97.62% (31 May 2020: 96.32%) (continued) Singapore: 0.54% (31 May 2020: 0.55%) (continued)
Real estate investment trusts: 0.05% (31 May 2020: 0.05%)
30,900 CapitaLand Mall Trust Reits NPV SGD 49,007 0.05
Shipbuilding: 0.00% (31 May 2020: 0.05%)
Transportation: 0.00% (31 May 2020: 0.04%)
Total Singapore 543,510 0.54
South Africa: 0.25% (31 May 2020: 0.30%)
Holding companies-diversified: 0.25% (31 May 2020: 0.30%)
47,073 AVI Ltd Com ZAR0.05 ZAR 251,542 0.25
Total South Africa 251,542 0.25
Spain: 0.83% (31 May 2020: 1.33%)
Electric: 0.44% (31 May 2020: 0.47%)21,660 Iberdrola SA Com EUR0.75 EUR 291,242 0.29
7,667 Red Electrica Corp SA Com EUR0.50 EUR 153,946 0.15
Engineering & construction: 0.00% (31 May 2020: 0.26%)
Oil & gas: 0.11% (31 May 2020: 0.19%)8,410 Repsol SA Com EUR1.00 EUR 112,346 0.11
Retail: 0.10% (31 May 2020: 0.00%)2,497 Inditex SA Com EUR0.03 EUR 96,764 0.10
Software: 0.18% (31 May 2020: 0.22%)2,379 Amadeus IT Holding SA Com EUR0.01 EUR 179,611 0.18
Telecommunications: 0.00% (31 May 2020: 0.19%)
Total Spain 833,909 0.83
Sweden: 1.42% (31 May 2020: 2.09%)
Agriculture: 0.00% (31 May 2020: 0.27%)
Banks: 0.19% (31 May 2020: 0.33%)15,080 Skandinaviska Enskilda Banken AB Com SEK10.00 SEK 193,406 0.19
Schedule of investments as at 31 May 2021 (continued)
Transferable securities admitted to an official stock exchange listing or traded on a regulated market. The percentages in brackets show the equivalent sector holdings at 31 May 2020.
413
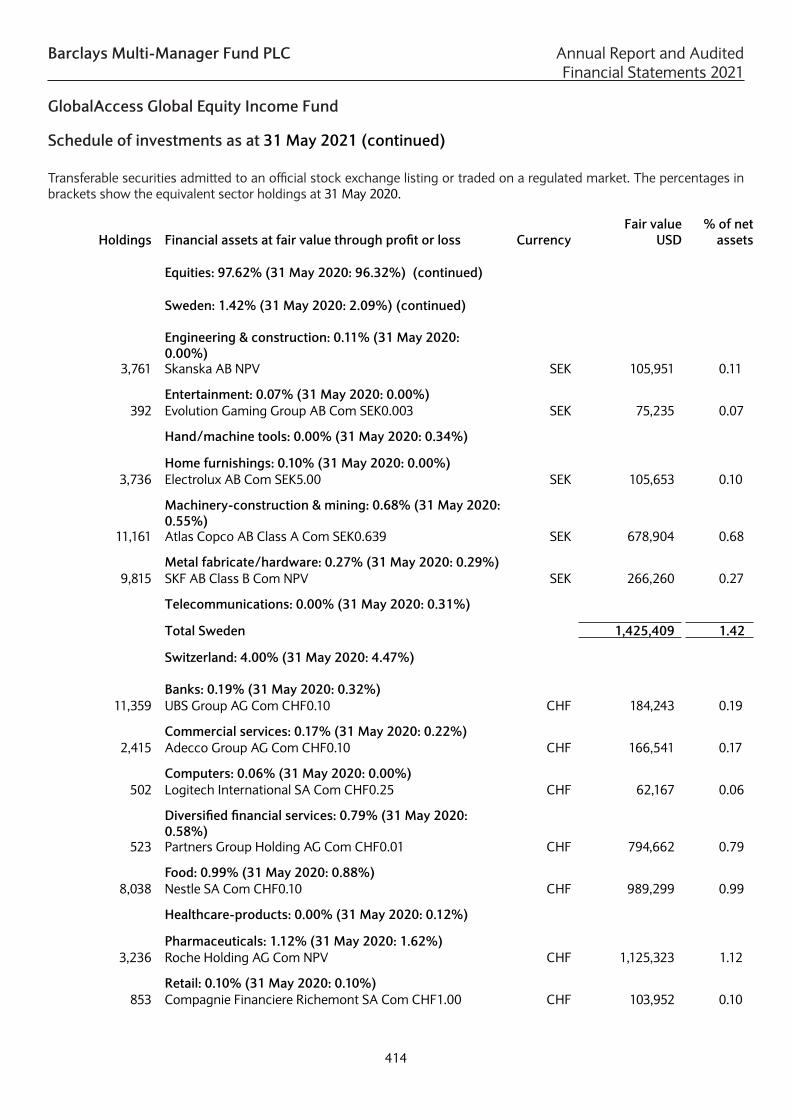
Barclays Multi-Manager Fund PLC Annual Report and Audited Financial Statements 2021
GlobalAccess Global Equity Income Fund
Holdings Financial assets at fair value through profit or loss Currency Fair value
USD % of net
assets
Equities: 97.62% (31 May 2020: 96.32%) (continued) Sweden: 1.42% (31 May 2020: 2.09%) (continued)
Engineering & construction: 0.11% (31 May 2020: 0.00%)
3,761 Skanska AB NPV SEK 105,951 0.11
Entertainment: 0.07% (31 May 2020: 0.00%)392 Evolution Gaming Group AB Com SEK0.003 SEK 75,235 0.07
Hand/machine tools: 0.00% (31 May 2020: 0.34%)
Home furnishings: 0.10% (31 May 2020: 0.00%)3,736 Electrolux AB Com SEK5.00 SEK 105,653 0.10
Machinery-construction & mining: 0.68% (31 May 2020: 0.55%)
11,161 Atlas Copco AB Class A Com SEK0.639 SEK 678,904 0.68
Metal fabricate/hardware: 0.27% (31 May 2020: 0.29%)9,815 SKF AB Class B Com NPV SEK 266,260 0.27
Telecommunications: 0.00% (31 May 2020: 0.31%)
Total Sweden 1,425,409 1.42
Switzerland: 4.00% (31 May 2020: 4.47%)
Banks: 0.19% (31 May 2020: 0.32%)11,359 UBS Group AG Com CHF0.10 CHF 184,243 0.19
Commercial services: 0.17% (31 May 2020: 0.22%)2,415 Adecco Group AG Com CHF0.10 CHF 166,541 0.17
Computers: 0.06% (31 May 2020: 0.00%)502 Logitech International SA Com CHF0.25 CHF 62,167 0.06
Diversified financial services: 0.79% (31 May 2020: 0.58%)
523 Partners Group Holding AG Com CHF0.01 CHF 794,662 0.79
Food: 0.99% (31 May 2020: 0.88%)8,038 Nestle SA Com CHF0.10 CHF 989,299 0.99
Healthcare-products: 0.00% (31 May 2020: 0.12%)
Pharmaceuticals: 1.12% (31 May 2020: 1.62%)3,236 Roche Holding AG Com NPV CHF 1,125,323 1.12
Retail: 0.10% (31 May 2020: 0.10%)853 Compagnie Financiere Richemont SA Com CHF1.00 CHF 103,952 0.10
Schedule of investments as at 31 May 2021 (continued)
Transferable securities admitted to an official stock exchange listing or traded on a regulated market. The percentages in brackets show the equivalent sector holdings at 31 May 2020.
414

Barclays Multi-Manager Fund PLC Annual Report and Audited Financial Statements 2021
GlobalAccess Global Equity Income Fund
Holdings Financial assets at fair value through profit or loss Currency Fair value
USD % of net
assets
Equities: 97.62% (31 May 2020: 96.32%) (continued) Switzerland: 4.00% (31 May 2020: 4.47%) (continued)
Telecommunications: 0.14% (31 May 2020: 0.26%)240 Swisscom AG Com CHF1.00 CHF 135,084 0.14
Transportation: 0.44% (31 May 2020: 0.37%)1,302 Kuehne + Nagel International AG Com CHF1.00 CHF 439,598 0.44
Total Switzerland 4,000,869 4.00
Taiwan: 0.94% (31 May 2020: 0.99%)
Semiconductors: 0.94% (31 May 2020: 0.99%)8,037 Taiwan Semiconductor Manufacturing Co Ltd ADR NPV USD 943,142 0.94
Total Taiwan 943,142 0.94
United Arab Emirates: 0.00% (31 May 2020: 0.07%)
Retail: 0.00% (31 May 2020: 0.07%)
United Kingdom: 6.04% (31 May 2020: 5.64%)
Aerospace/defense: 0.21% (31 May 2020: 0.05%)27,540 BAE Systems PLC Com GBP0.03 GBP 206,193 0.21
Agriculture: 0.26% (31 May 2020: 0.92%)2,586 British American Tobacco PLC ADR NPV USD 100,014 0.104,264 British American Tobacco PLC Com GBP0.25 GBP 164,427 0.16
Beverages: 0.61% (31 May 2020: 0.06%)4,098 Coca-Cola European Partners PLC Com EUR0.01 EUR 248,717 0.251,549 Diageo Com GBP28.93518 GBP 74,959 0.077,883 Fevertree Drinks PLC Com GBP0.0025 GBP 286,361 0.29
Closed-end funds: 0.29% (31 May 2020: 0.41%)152,804 Greencoat UK Wind PLC Com GBP0.01 GBP 286,936 0.29
Cosmetics/personal care: 0.22% (31 May 2020: 0.16%)3,598 Unilever PLC Com GBP0.0311 GBP 216,141 0.22
Diversified financial services: 0.34% (31 May 2020: 0.38%)
14,444 Hargreaves Lansdown PLC Com GBP0.004 GBP 340,166 0.34
Food: 0.06% (31 May 2020: 0.00%)18,166 Tesco PLC GBP0.06 GBP 57,663 0.06
Healthcare-products: 0.09% (31 May 2020: 0.00%)3,924 Smith & Nephew PLC Com USD0.20 GBP 85,942 0.09
Schedule of investments as at 31 May 2021 (continued)
Transferable securities admitted to an official stock exchange listing or traded on a regulated market. The percentages in brackets show the equivalent sector holdings at 31 May 2020.
415
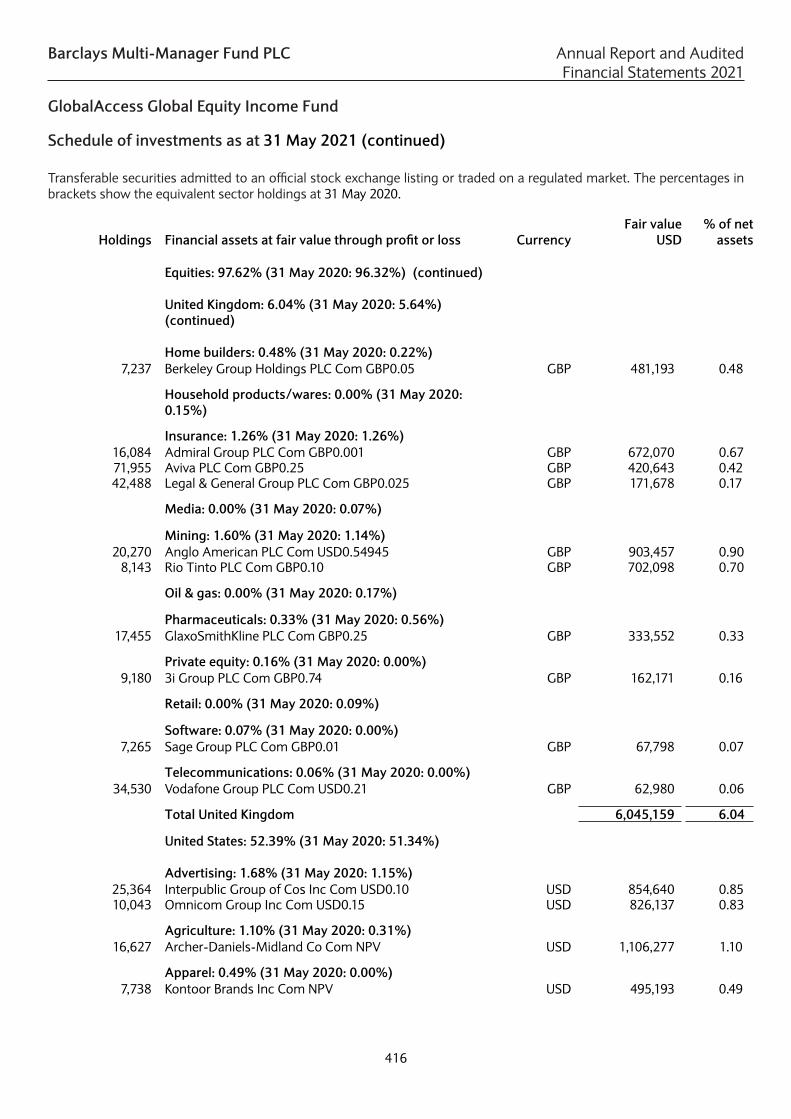
Barclays Multi-Manager Fund PLC Annual Report and Audited Financial Statements 2021
GlobalAccess Global Equity Income Fund
Holdings Financial assets at fair value through profit or loss Currency Fair value
USD % of net
assets
Equities: 97.62% (31 May 2020: 96.32%) (continued)
United Kingdom: 6.04% (31 May 2020: 5.64%) (continued)
Home builders: 0.48% (31 May 2020: 0.22%)
7,237 Berkeley Group Holdings PLC Com GBP0.05 GBP 481,193 0.48
Household products/wares: 0.00% (31 May 2020: 0.15%)
Insurance: 1.26% (31 May 2020: 1.26%)16,084 Admiral Group PLC Com GBP0.001 GBP 672,070 0.6771,955 Aviva PLC Com GBP0.25 GBP 420,643 0.4242,488 Legal & General Group PLC Com GBP0.025 GBP 171,678 0.17
Media: 0.00% (31 May 2020: 0.07%)
Mining: 1.60% (31 May 2020: 1.14%)20,270 Anglo American PLC Com USD0.54945 GBP 903,457 0.90
8,143 Rio Tinto PLC Com GBP0.10 GBP 702,098 0.70
Oil & gas: 0.00% (31 May 2020: 0.17%)
Pharmaceuticals: 0.33% (31 May 2020: 0.56%)17,455 GlaxoSmithKline PLC Com GBP0.25 GBP 333,552 0.33
Private equity: 0.16% (31 May 2020: 0.00%)9,180 3i Group PLC Com GBP0.74 GBP 162,171 0.16
Retail: 0.00% (31 May 2020: 0.09%)
Software: 0.07% (31 May 2020: 0.00%)7,265 Sage Group PLC Com GBP0.01 GBP 67,798 0.07
Telecommunications: 0.06% (31 May 2020: 0.00%)34,530 Vodafone Group PLC Com USD0.21 GBP 62,980 0.06
Total United Kingdom 6,045,159 6.04
United States: 52.39% (31 May 2020: 51.34%)
Advertising: 1.68% (31 May 2020: 1.15%)25,364 Interpublic Group of Cos Inc Com USD0.10 USD 854,640 0.8510,043 Omnicom Group Inc Com USD0.15 USD 826,137 0.83
Agriculture: 1.10% (31 May 2020: 0.31%)16,627 Archer-Daniels-Midland Co Com NPV USD 1,106,277 1.10
Apparel: 0.49% (31 May 2020: 0.00%)7,738 Kontoor Brands Inc Com NPV USD 495,193 0.49
Schedule of investments as at 31 May 2021 (continued)
Transferable securities admitted to an official stock exchange listing or traded on a regulated market. The percentages in brackets show the equivalent sector holdings at 31 May 2020.
416

Barclays Multi-Manager Fund PLC Annual Report and Audited Financial Statements 2021
GlobalAccess Global Equity Income Fund
Holdings Financial assets at fair value through profit or loss Currency Fair value
USD % of net
assets
Equities: 97.62% (31 May 2020: 96.32%) (continued)
United States: 52.39% (31 May 2020: 51.34%) (continued)
Auto manufacturers: 0.26% (31 May 2020: 0.65%)
4,364 General Motors Co Class C Com USD0.01 USD 258,938 0.26
Banks: 1.98% (31 May 2020: 1.91%)4,913 Citigroup Inc Com USD0.01 USD 386,653 0.392,654 Cullen/Frost Bankers Inc Com USD0.01 USD 320,444 0.32
14,349 Huntington Bancshares Inc/OH Com USD0.01 USD 227,504 0.236,205 Morgan Stanley Com USD0.01 USD 564,314 0.563,979 Northern Trust Corp Com USD1.667 USD 482,155 0.48
Beverages: 1.98% (31 May 2020: 3.05%)20,875 Coca-Cola Co Com USD0.25 USD 1,154,283 1.15
1,531 Molson Coors Beverage Co Com USD0.01 USD 89,296 0.094,967 PepsiCo Inc Com USD0.017 USD 734,917 0.74
Biotechnology: 0.75% (31 May 2020: 0.93%)11,286 Gilead Sciences Inc Com USD0.001 USD 746,343 0.75
Building materials: 0.24% (31 May 2020: 0.00%)5,235 Carrier Global Corp Com USD0.01 USD 240,522 0.24
Chemicals: 0.56% (31 May 2020: 0.99%)3,362 Albemarle Corp Com USD0.01 USD 561,740 0.56
Coal: 0.00% (31 May 2020: 0.05%)
Commercial services: 1.83% (31 May 2020: 1.08%)4,583 Automatic Data Processing Inc Com USD0.10 USD 898,658 0.906,936 Robert Half International Inc Com USD0.001 USD 615,778 0.61
12,974 Western Union Co Com USD0.01 USD 317,279 0.32
Computers: 2.53% (31 May 2020: 3.36%)4,782 Apple Inc Com USD0.00001 USD 595,933 0.59
12,089 Hewlett Packard Enterprise Co Com USD0.01 USD 192,880 0.1928,320 HP Inc Com USD0.01 USD 828,218 0.83
2,507 International Business Machines Corp Com USD0.20 USD 360,519 0.367,210 NetApp Inc Com USD0.001 USD 557,766 0.56
Cosmetics/personal care: 0.88% (31 May 2020: 1.49%)6,526 Procter & Gamble Co Com NPV USD 880,357 0.88
Distribution/wholesale: 1.92% (31 May 2020: 1.97%)22,998 Fastenal Co Com USD0.01 USD 1,220,044 1.22
2,415 Watsco Inc Com USD0.50 USD 704,081 0.70
Diversified financial services: 2.55% (31 May 2020: 1.05%)
14,562 Ally Financial Inc Com USD0.10 USD 796,250 0.79
Schedule of investments as at 31 May 2021 (continued)
Transferable securities admitted to an official stock exchange listing or traded on a regulated market. The percentages in brackets show the equivalent sector holdings at 31 May 2020.
417

Barclays Multi-Manager Fund PLC Annual Report and Audited Financial Statements 2021
GlobalAccess Global Equity Income Fund
Holdings Financial assets at fair value through profit or loss Currency Fair value
USD % of net
assets
Equities: 97.62% (31 May 2020: 96.32%) (continued)
United States: 52.39% (31 May 2020: 51.34%) (continued)
Diversified financial services: 2.55% (31 May 2020:
1.05%) (continued)
394 BlackRock Inc Com USD0.01 USD 345,832 0.3519,505 Franklin Resources Inc Com USD 0.10 USD 666,974 0.67
3,891 T Rowe Price Group Inc Com USD0.20 USD 744,776 0.74
Electric: 0.50% (31 May 2020: 0.62%)2,984 Exelon Corp Com NPV USD 134,653 0.135,892 Public Service Enterprise Inc Com NPV USD 366,041 0.37
Electronics: 0.47% (31 May 2020: 0.70%)11,555 National Instruments Corp Com USD0.01 USD 471,502 0.47
Energy-alternate sources: 0.53% (31 May 2020: 0.59%)7,786 NextEra Energy Partners LP Com NPV USD 532,095 0.53
Food: 1.15% (31 May 2020: 0.71%)8,432 Conagra Brands Inc Com USD5.00 USD 321,217 0.323,720 General Mills Inc Com USD0.10 USD 233,895 0.24
13,572 Kraft Heinz Co Com USD0.01 USD 591,739 0.59
Forest products & paper: 0.10% (31 May 2020: 0.00%)1,616 International Paper Co Com USD1.00 USD 101,953 0.10
Hand/machine tools: 0.40% (31 May 2020: 0.00%)1,854 Stanley Black & Decker Inc Com USD2.50 USD 401,938 0.40
Healthcare-services: 1.41% (31 May 2020: 0.95%)284 Anthem Inc Com USD0.01 USD 113,096 0.11395 Humana Inc Com USD0.166 USD 172,919 0.17
5,722 Quest Diagnostics Inc Com USD0.01 USD 753,445 0.75915 UnitedHealth Group Inc Com USD0.01 USD 377,062 0.38
Holding companies-diversified: 0.45% (31 May 2020: 0.00%)
5,069 Spectrum Brands Holdings Inc Com USD0.01 USD 450,609 0.45
Home furnishings: 0.42% (31 May 2020: 0.36%)3,350 Dolby Laboratories Inc Com USD0.001 USD 326,726 0.33
384 Whirlpool Corp Com USD1.00 USD 91,046 0.09
Household products/wares: 0.17% (31 May 2020: 0.53%)
1,312 Kimberly-Clark Corp Com USD1.25 USD 171,413 0.17
Insurance: 1.94% (31 May 2020: 2.62%)2,307 Arthur J Gallagher & Co Com USD1.00 USD 338,287 0.349,254 Equitable Holdings Inc Com USD0.01 USD 294,046 0.29
Schedule of investments as at 31 May 2021 (continued)
Transferable securities admitted to an official stock exchange listing or traded on a regulated market. The percentages in brackets show the equivalent sector holdings at 31 May 2020.
418

Barclays Multi-Manager Fund PLC Annual Report and Audited Financial Statements 2021
GlobalAccess Global Equity Income Fund
Holdings Financial assets at fair value through profit or loss Currency Fair value
USD % of net
assets
Equities: 97.62% (31 May 2020: 96.32%) (continued)
United States: 52.39% (31 May 2020: 51.34%) (continued)
Insurance: 1.94% (31 May 2020: 2.62%) (continued)
1,681 Marsh & McLennan Cos Inc Com USD1.00 USD 232,617 0.237,466 MetLife Inc Com USD0.01 USD 488,015 0.495,507 Prudential Financial Inc Com USD0.01 USD 589,139 0.59
Internet: 0.61% (31 May 2020: 0.00%)9,990 eBay Inc Com USD0.001 USD 608,141 0.61
Machinery-diversified: 0.74% (31 May 2020: 0.83%)2,864 Cummins Inc Com USD2.50 USD 736,692 0.74
Media: 0.77% (31 May 2020: 1.04%)2,218 Comcast Corp Com USD0.01 USD 127,202 0.13
12,016 ViacomCBS Inc Com USD0.001 USD 509,659 0.51745 Walt Disney Co Com USD0.01 USD 133,124 0.13
Mining: 0.96% (31 May 2020: 0.00%)13,070 Newmont Goldcorp Corp Com USD1.60 USD 960,449 0.96
Miscellaneous manufacturing: 0.00% (31 May 2020: 0.42%)
Oil & gas: 1.82% (31 May 2020: 1.29%)15,686 Exxon Mobil Corp Com NPV USD 915,670 0.91
4,987 Hess Corp Com USD1.00 USD 418,035 0.426,129 Valero Energy Corp Com USD0.01 USD 492,864 0.49
Packaging & containers: 0.33% (31 May 2020: 0.00%)3,196 Crown Holdings Inc Com USD5.00 USD 329,939 0.33
Pharmaceuticals: 1.40% (31 May 2020: 4.59%)9,166 AbbVie Inc Com USD0.01 USD 1,037,683 1.041,586 Bristol-Myers Squibb Co Com USD0.10 USD 104,256 0.103,401 Merck & Co Inc Com USD0.50 USD 258,170 0.26
Pipelines: 0.24% (31 May 2020: 0.00%)12,953 Kinder Morgan Inc Com USD0.01 USD 237,493 0.24
Private equity: 0.66% (31 May 2020: 0.00%)7,100 Blackstone Group Inc Com USD0.00001 USD 657,886 0.66
Real estate investment trusts: 2.77% (31 May 2020: 1.68%)
63,027 AGNC Investment Corp Reits USD0.01 USD 1,168,205 1.1711,407 Iron Mountain Inc Reits NPV USD 496,604 0.4914,243 Omega Healthcare Investors Inc Reits USD0.10 USD 521,650 0.524,604 Simon Property Group Inc Reits USD0.0001 USD 591,591 0.59
Schedule of investments as at 31 May 2021 (continued)
Transferable securities admitted to an official stock exchange listing or traded on a regulated market. The percentages in brackets show the equivalent sector holdings at 31 May 2020.
419

Barclays Multi-Manager Fund PLC Annual Report and Audited Financial Statements 2021
GlobalAccess Global Equity Income Fund
Holdings Financial assets at fair value through profit or loss Currency Fair value
USD % of net
assets
Equities: 97.62% (31 May 2020: 96.32%) (continued)
United States: 52.39% (31 May 2020: 51.34%) (continued)
Retail: 3.35% (31 May 2020: 4.54%)
7,049 Best Buy Co Inc Com USD0.10 USD 819,799 0.825,492 CVS Health Corp Com USD0.01 USD 474,866 0.48
688 Domino's Pizza Inc Com USD0.01 USD 293,776 0.29852 Home Depot Inc Com USD0.05 USD 271,911 0.27
2,141 McDonald's Corp Com USD0.01 USD 500,898 0.503,013 Tractor Supply Co Com USD0.008 USD 547,613 0.558,396 Walgreens Boots Alliance Inc Com USD0.01 USD 442,091 0.44
Semiconductors: 3.85% (31 May 2020: 3.38%)3,863 Analog Devices Inc Com USD0.167 USD 636,004 0.631,062 Broadcom Inc Com NPV USD 501,854 0.505,395 Intel Corp Com USD0.001 USD 308,162 0.312,088 KLA-Tencor Corp Com USD0.001 USD 661,980 0.66
803 Lam Research Corp Com USD0.001 USD 521,962 0.521,829 Qualcomm Inc Com USD0.0001 USD 246,092 0.255,160 Texas Instruments Inc Com USD1.00 USD 979,755 0.98
Shipbuilding: 0.00% (31 May 2020: 0.24%)
Software: 3.27% (31 May 2020: 4.75%)3,563 Activision Blizzard Inc Com USD0.000001 USD 346,555 0.35
11,710 Microsoft Corp Com USD0.00000625 USD 2,925,919 2.92
Telecommunications: 2.40% (31 May 2020: 1.33%)18,519 AT&T Inc Com USD1.00 USD 546,033 0.5522,185 Cisco Systems Com USD0.001 USD 1,173,697 1.1711,800 Corning Inc Com USD0.50 USD 514,893 0.51
3,027 Verizon Communications Inc Com USD0.10 USD 171,116 0.17
Transportation: 2.93% (31 May 2020: 2.18%)6,819 CH Robinson Worldwide Inc Com USD0.10 USD 661,682 0.664,904 Expeditors International of Washington Inc Com USD0.01 USD 616,408 0.624,308 Ryder System Inc Com USD0.50 USD 352,373 0.356,076 United Parcel Service Inc Com USD0.01 USD 1,304,122 1.30
Total United States 52,453,028 52.39
Total equities 97,736,801 97.62
Schedule of investments as at 31 May 2021 (continued)
Transferable securities admitted to an official stock exchange listing or traded on a regulated market. The percentages in brackets show the equivalent sector holdings at 31 May 2020.
420

Barclays Multi-Manager Fund PLC Annual Report and Audited Financial Statements 2021
GlobalAccess Global Equity Income Fund
No. of contracts Futures contracts: 0.00% (31 May 2020: 0.33%) CounterpartyUnrealised
gain% of net
assetsUSD
3 S&P500 E-mini CME Future June 2021 Goldman Sachs 4,773 –
Total futures contracts 4,773 –
Forward currency contracts: 0.56% (31 May 2020: 0.61%)
Counterparty Cncy Buys Cncy SellsMaturity
dateUnrealised
gain% of net
assetsUSD
Barclays^ GBP 253,937 USD 355,422 17/06/2021 5,556 0.01 CCT_1776787_263848
Barclays^ GBP 192,936 USD 270,040 17/06/2021 4,223 – CCT_1776787_263857
Barclays^ EUR 81,493 USD 99,144 17/06/2021 518 – CCT_1776787_263853
Barclays^ EUR 72,027 USD 87,628 17/06/2021 459 – CCT_1776787_263860
Barclays^ EUR 28,407 USD 34,560 17/06/2021 181 – CCT_1776787_263854
Barclays^ GBP 8,211 USD 11,492 17/06/2021 180 – CCT_1776787_263851
Barclays^ GBP 7,761 USD 10,862 17/06/2021 170 – CCT_1776787_263841
Barclays^ EUR 25,457 USD 30,971 17/06/2021 162 – CCT_1776787_263846
Barclays^ EUR 20,199 USD 24,574 17/06/2021 128 – CCT_1776787_263847
Barclays^ GBP 4,128 USD 5,777 17/06/2021 90 – CCT_1776787_263858
Barclays^ GBP 3,897 USD 5,454 17/06/2021 85 – CCT_1776787_263856
Barclays^ EUR 11,555 USD 14,057 17/06/2021 73 – CCT_1776787_263845
Barclays^ GBP 2,898 USD 4,056 17/06/2021 63 – CCT_1776787_263844
Barclays^ GBP 2,412 USD 3,376 17/06/2021 53 – CCT_1776787_263855
Barclays^ EUR 7,192 USD 8,750 17/06/2021 46 – CCT_1776787_263840
Barclays^ EUR 7,266 USD 8,840 17/06/2021 46 – CCT_1776787_263859
Barclays^ GBP 961 USD 1,346 17/06/2021 21 – CCT_1776787_263849
UBS GBP 11,173,644 USD 15,675,003 17/06/2021 208,624 0.21 CCT_1776787_264205
UBS GBP 8,535,443 USD 11,973,989 17/06/2021 159,366 0.16 CCT_1776787_264209
UBS EUR 3,708,544 USD 4,476,940 17/06/2021 58,453 0.06 CCT_1776787_264215
UBS EUR 3,304,399 USD 3,989,058 17/06/2021 52,083 0.05 CCT_1776787_264227
UBS EUR 1,267,377 USD 1,529,972 17/06/2021 19,976 0.02 CCT_1776787_264225
UBS EUR 1,158,493 USD 1,398,529 17/06/2021 18,260 0.02 CCT_1776787_264213
UBS EUR 1,240,000 USD 1,501,096 11/06/2021 15,196 0.02 CCT_1717560_96022
UBS EUR 913,100 USD 1,102,291 17/06/2021 14,392 0.01 CCT_1776787_264217
UBS EUR 532,928 USD 643,349 17/06/2021 8,400 0.01 CCT_1776787_264203
UBS GBP 366,139 USD 513,640 17/06/2021 6,836 0.01 CCT_1776787_264204
UBS GBP 338,693 USD 475,138 17/06/2021 6,324 0.01 CCT_1776787_264214
UBS EUR 325,144 USD 392,512 17/06/2021 5,125 0.01 CCT_1776787_264226
UBS EUR 324,195 USD 391,367 17/06/2021 5,110 – CCT_1776787_264223
UBS GBP 185,198 USD 259,806 17/06/2021 3,458 – CCT_1776787_264202
UBS GBP 174,847 USD 245,284 17/06/2021 3,265 – CCT_1776787_264201
UBS GBP 129,154 USD 181,184 17/06/2021 2,411 – CCT_1776787_264195
UBS GBP 109,670 USD 153,851 17/06/2021 2,048 – CCT_1776787_264197
UBS GBP 40,242 USD 56,453 17/06/2021 751 – CCT_1776787_264210
UBS USD 10,633 EUR 8,681 17/06/2021 16 – CCT_1776787_265029
Total fair value gains on forward currency contracts 602,148 0.60
Schedule of investments as at 31 May 2021 (continued)
Transferable securities admitted to an official stock exchange listing or traded on a regulated market. The percentages in brackets show the equivalent sector holdings at 31 May 2020.
421

Barclays Multi-Manager Fund PLC Annual Report and Audited Financial Statements 2021
GlobalAccess Global Equity Income Fund
Forward currency contracts: 0.56% (31 May 2020: 0.61%) (continued)
Counterparty Cncy Buys Cncy SellsMaturity
dateUnrealised
loss% of net
assetsUSD
UBS USD 2,613 EUR 2,139 17/06/2021 (2) – CCT_1776787_264624
UBS USD 327 EUR 269 17/06/2021 (2) – CCT_1776787_264364
UBS USD 4,729 EUR 3,870 17/06/2021 (3) – CCT_1776787_265109
UBS USD 4,622 EUR 3,787 17/06/2021 (10) – CCT_1776787_265258
UBS USD 4,599 EUR 3,780 17/06/2021 (23) – CCT_1776787_263953
UBS USD 141,801 EUR 116,003 17/06/2021 (66) – CCT_1776787_264519
UBS USD 18,721 EUR 15,385 17/06/2021 (94) – CCT_1776787_264049
UBS USD 18,669 EUR 15,365 17/06/2021 (122) – CCT_1776787_263850
UBS USD 118,755 GBP 83,680 17/06/2021 (198) – CCT_1776787_265257
UBS USD 51,216 GBP 36,217 17/06/2021 (268) – CCT_1776787_263951
UBS USD 419,968 GBP 297,353 17/06/2021 (2,727) – CCT_1776787_265111
UBS USD 295,542 EUR 250,000 11/06/2021 (10,163) (0.01) CCT_1717560_95352
UBS USD 1,180,080 EUR 990,000 11/06/2021 (30,508) (0.03) CCT_1717560_95205
Total fair value losses on forward currency contracts (44,186) (0.04)
Total forward currency contracts 557,962 0.56
Fair value USD
% of net assets
Total value of investments 98,299,536 98.18
Cash and cash equivalents* 2,747,752 2.74
Other net liabilities** (924,895) (0.92)
Net assets attributable to holders of redeemable participating shares 100,122,393 100.00
Analysis of total assets (unaudited)% of total
assets
Transferable securities and money market instruments admitted to official stock exchangelisting or traded on a regulated market. 96.05OTC financial derivative instruments. 0.59Other assets. 3.36
100.00
*All cash holdings are held with The Northern Trust Company. **Including USD 159,966 held with Goldman Sachs as security by the counterparty to derivatives contracts.^ Related party.
The Industry Classification Benchmark (“ICB”) is jointly owned by FTSE and Dow Jones and has been licensed for use. FTSE and Dow Jones do not accept liability to any person for any loss or damage arising out of any error or omission in ICB.
Schedule of investments as at 31 May 2021 (continued)
Transferable securities admitted to an official stock exchange listing or traded on a regulated market. The percentages in brackets show the equivalent sector holdings at 31 May 2020.
422

Barclays Multi-Manager Fund PLC Annual Report and Audited Financial Statements 2021
GlobalAccess Emerging Market Local Currency Debt Fund
Schedule of investments as at 31 May 2021
Transferable securities admitted to an official stock exchange listing or traded on a regulated market. The percentages in brackets show the equivalent sector holdings at 31 May 2020.
Holdings Financial assets at fair value through profit or loss CurrencyFair value
USD% of net
assets
Bonds: 88.19% (31 May 2020: 87.14%)
Brazil: 11.97% (31 May 2020: 9.64%)
Government bonds: 11.97% (31 May 2020: 9.64%)2,486,700 Brazil Letras do Tesouro Nacional Series LTN 0%
01/07/2022BRL 4,442,568 1.10
1,815,800 Brazil Letras do Tesouro Nacional Series LTN 0% 01/07/2023
BRL 2,983,796 0.74
4,519,600 Brazil Letras do Tesouro Nacional Series LTN 0% 01/01/2024
BRL 7,114,329 1.76
132,500 Brazil Notas do Tesouro Nacional Series B Series NTNB 6% 15/08/2022
BRL 943,486 0.23
102,100 Brazil Notas do Tesouro Nacional Series B Series NTNB 6% 15/05/2045
BRL 858,623 0.21
166,300 Brazil Notas do Tesouro Nacional Series B Series NTNB 6% 15/08/2050
BRL 1,414,271 0.35
5,709,200 Brazil Notas do Tesouro Nacional Series F Series NTNF 10% 01/01/2023
BRL 11,378,789 2.81
1,995,700 Brazil Notas do Tesouro Nacional Series F Series NTNF 10% 01/01/2025
BRL 4,041,295 1.00
3,418,500 Brazil Notas do Tesouro Nacional Series F Series NTNF 10% 01/01/2027
BRL 6,938,253 1.72
3,096,800 Brazil Notas do Tesouro Nacional Series F Series NTNF 10% 01/01/2029
BRL 6,259,075 1.55
977,800 Brazil Notas do Tesouro Nacional Series F Series NTNF 10% 01/01/2031
BRL 2,043,145 0.50
Total Brazil 48,417,630 11.97
Chile: 1.42% (31 May 2020: 2.15%)
Government bonds: 1.42% (31 May 2020: 2.15%)500,000,000 Bonos de la Tesoreria de la Republica en pesos 2.3%
01/10/2028CLP 638,320 0.16
500,000,000 Bonos de la Tesoreria de la Republica en pesos 2.8% 01/10/2033
CLP 583,052 0.15
1,425,000,000 Bonos de la Tesoreria de la Republica en pesos 4.5% 01/03/2026
CLP 2,159,580 0.53
1,110,000,000 Bonos de la Tesoreria de la Republica en pesos 5% 01/03/2035
CLP 1,631,597 0.40
435,000,000 Bonos de la Tesoreria de la Republica en pesos Series 30YR 6% 01/01/2043
CLP 722,560 0.18
Total Chile 5,735,109 1.42
Colombia: 6.82% (31 May 2020: 7.86%)
Government bonds: 6.82% (31 May 2020: 7.86%)16,751,800,000 Colombian TES Series B 6% 28/04/2028 COP 4,373,950 1.08
423

Barclays Multi-Manager Fund PLC Annual Report and Audited Financial Statements 2021
GlobalAccess Emerging Market Local Currency Debt Fund
Holdings Financial assets at fair value through profit or loss Currency Fair value
USD % of net
assets
Bonds: 88.19% (31 May 2020: 87.14%) (continued) Colombia: 6.82% (31 May 2020: 7.86%) (continued)
Government bonds: 6.82% (31 May 2020: 7.86%) 997,500,000 Colombian TES Series B 6.25% 26/11/2025 COP 277,860 0.07
11,102,100,000 Colombian TES Series B 7% 04/05/2022 COP 3,107,914 0.7710,997,600,000 Colombian TES Series B 7% 30/06/2032 COP 2,858,425 0.717,348,500,000 Colombian TES Series B 7.25% 18/10/2034 COP 1,910,762 0.47
23,964,700,000 Colombian TES Series B 7.5% 26/08/2026 COP 6,950,818 1.724,379,800,000 Colombian TES Series B 7.75% 18/09/2030 COP 1,223,281 0.30
22,102,900,000 Colombian TES Series B 10% 24/07/2024 COP 6,892,322 1.70
Total Colombia 27,595,332 6.82
Czech Republic: 1.54% (31 May 2020: 2.23%)
Government bonds: 1.54% (31 May 2020: 2.23%)35,460,000 Czech Republic Government Bond Series 94 0.95%
15/05/2030CZK 1,597,437 0.40
26,610,000 Czech Republic Government Bond Series 95 1% 26/06/2026
CZK 1,245,242 0.31
34,160,000 Czech Republic Government Bond Series 103 2% 13/10/2033
CZK 1,673,138 0.41
32,850,000 Czech Republic Government Bond Series 105 2.75% 23/07/2029
CZK 1,708,899 0.42
Total Czech Republic 6,224,716 1.54
Dominican Republic: 0.27% (31 May 2020: 0.21%)
Government bonds: 0.27% (31 May 2020: 0.21%)27,850,000 Dominican Republic International Bond Series REGS 8.9%
15/02/2023DOP 516,611 0.13
28,800,000 Dominican Republic International Bond Series REGS 9.75% 05/06/2026
DOP 567,623 0.14
Total Dominican Republic 1,084,234 0.27
Egypt: 0.76% (31 May 2020: 0.72%)
Government bonds: 0.76% (31 May 2020: 0.72%)24,630,000 Egypt Government Bond Series 10YR 14.664%
06/10/2030EGP 1,571,411 0.39
10,735,000 Egypt Government Bond Series 10YR 16.1% 07/05/2029 EGP 735,723 0.18718,000 Egypt Government International Bond Series REGS 5.75%
29/05/2024USD 768,597 0.19
Total Egypt 3,075,731 0.76
Schedule of investments as at 31 May 2021 (continued)
Transferable securities admitted to an official stock exchange listing or traded on a regulated market. The percentages in brackets show the equivalent sector holdings at 31 May 2020.
424

Barclays Multi-Manager Fund PLC Annual Report and Audited Financial Statements 2021
GlobalAccess Emerging Market Local Currency Debt Fund
Holdings Financial assets at fair value through profit or loss Currency Fair value
USD % of net
assets
Bonds: 88.19% (31 May 2020: 87.14%) (continued)
Hungary: 1.89% (31 May 2020: 2.41%)
Government bonds: 1.89% (31 May 2020: 2.41%)82,250,000 Hungary Government Bond Series 30/A 3% 21/08/2030 HUF 301,940 0.08
530,960,000 Hungary Government Bond Series 28/A 6.75% 22/10/2028
HUF 2,427,420 0.60
651,980,000 Hungary Government Bond Series 22/A 7% 24/06/2022 HUF 2,445,730 0.601,660,000 Hungary Government International Bond Series 21/B 2.5%
27/10/2021HUF 5,887 –
188,440,000 Hungary Government International Bond Series 24/C 2.5% 24/10/2024
HUF 680,400 0.17
283,320,000 Hungary Government International Bond Series 27/A 3% 27/10/2027
HUF 1,045,207 0.26
184,980,000 Hungary Government International Bond Series 25/B 5.5% 24/06/2025
HUF 743,651 0.18
Total Hungary 7,650,235 1.89
Indonesia: 11.59% (31 May 2020: 11.35%)
Government bonds: 11.59% (31 May 2020: 11.35%)26,371,000,000 Indonesia Treasury Bond Series FR64 6.125% 15/05/2028 IDR 1,847,851 0.46
6,353,000,000 Indonesia Treasury Bond Series FR81 6.5% 15/06/2025 IDR 463,456 0.1115,319,000,000 Indonesia Treasury Bond Series FR65 6.625% 15/05/2033 IDR 1,075,441 0.2727,417,000,000 Indonesia Treasury Bond Series FR59 7% 15/05/2027 IDR 2,032,721 0.50
10,989,000,000 Indonesia Treasury Bond Series FR82 7% 15/09/2030 IDR 798,753 0.2043,077,000,000 Indonesia Treasury Bond Series FR74 7.5% 15/08/2032 IDR 3,176,208 0.784,380,000,000 Indonesia Treasury Bond Series FR75 7.5% 15/05/2038 IDR 319,972 0.08
65,988,000,000 Indonesia Treasury Bond Series FR77 8.125% 15/05/2024 IDR 5,035,051 1.24112,619,000,000 Indonesia Treasury Bond Series FR78 8.25% 15/05/2029 IDR 8,806,049 2.1812,407,000,000 Indonesia Treasury Bond Series FR58 8.25% 15/06/2032 IDR 962,989 0.2413,799,000,000 Indonesia Treasury Bond Series FR72 8.25% 15/05/2036 IDR 1,065,364 0.2632,591,000,000 Indonesia Treasury Bond Series FR70 8.375% 15/03/2024 IDR 2,490,450 0.6232,555,000,000 Indonesia Treasury Bond Series FR56 8.375% 15/09/2026 IDR 2,571,116 0.6479,882,000,000 Indonesia Treasury Bond Series FR68 8.375% 15/03/2034 IDR 6,220,727 1.5468,258,000,000 Indonesia Treasury Bond Series FR79 8.375% 15/04/2039 IDR 5,337,496 1.3217,339,000,000 Indonesia Treasury Bond Series FR73 8.75% 15/05/2031 IDR 1,404,667 0.3512,165,000,000 Indonesia Treasury Bond Series FR71 9% 15/03/2029 IDR 989,301 0.2410,547,000,000 Indonesia Treasury Bond Series FR54 9.5% 15/07/2031 IDR 886,554 0.223,755,000,000 Indonesia Treasury Bond Series FR52 10.5% 15/08/2030 IDR 334,773 0.08
12,490,000,000 Indonesia Treasury Bond Series FR40 11% 15/09/2025 IDR 1,051,948 0.2681,000,000 Indonesia Treasury Bond Series FR34 12.8% 15/06/2021 IDR 5,690 –
Total Indonesia 46,876,577 11.59
Schedule of investments as at 31 May 2021 (continued)
Transferable securities admitted to an official stock exchange listing or traded on a regulated market. The percentages in brackets show the equivalent sector holdings at 31 May 2020.
425

Barclays Multi-Manager Fund PLC Annual Report and Audited Financial Statements 2021
GlobalAccess Emerging Market Local Currency Debt Fund
Holdings Financial assets at fair value through profit or loss Currency Fair value
USD % of net
assets
Bonds: 88.19% (31 May 2020: 87.14%) (continued)
Kazakhstan: 0.25% (31 May 2020: 0.22%)
Corporate bonds: 0.25% (31 May 2020: 0.22%)426,250,000 Development Bank of Kazakhstan JSC Series REGS 8.95%
04/05/2023 - LondonKZT 998,277 0.25
Total Kazakhstan 998,277 0.25
Malaysia: 9.76% (31 May 2020: 8.39%)
Government bonds: 9.76% (31 May 2020: 8.39%)7,719,000 Malaysia Government Bond Series 220 2.632%
15/04/2031MYR 1,776,754 0.44
6,175,000 Malaysia Government Bond Series 313 3.48% 15/03/2023 MYR 1,536,057 0.387,279,000 Malaysia Government Bond Series 307 3.502%
31/05/2027MYR 1,821,910 0.45
15,174,000 Malaysia Government Bond Series 513 3.733% 15/06/2028
MYR 3,847,734 0.95
8,566,000 Malaysia Government Bond Series 218 3.757% 20/04/2023
MYR 2,144,301 0.53
2,211,000 Malaysia Government Bond Series 519 3.757% 22/05/2040
MYR 507,567 0.13
5,590,000 Malaysia Government Bond Series 215 3.795% 30/09/2022
MYR 1,388,821 0.34
5,565,000 Malaysia Government Bond Series 116 3.8% 17/08/2023 MYR 1,399,406 0.352,013,000 Malaysia Government Bond Series 419 3.828%
05/07/2034MYR 487,448 0.12
4,319,000 Malaysia Government Bond Series 413 3.844% 15/04/2033
MYR 1,059,822 0.26
9,308,000 Malaysia Government Bond Series 118 3.882% 14/03/2025
MYR 2,372,444 0.59
11,103,000 Malaysia Government Bond Series 219 3.885% 15/08/2029
MYR 2,833,938 0.70
946,000 Malaysia Government Bond Series 212 3.892% 15/03/2027
MYR 241,658 0.06
8,793,000 Malaysia Government Bond Series 417 3.899% 16/11/2027
MYR 2,248,658 0.56
10,258,000 Malaysia Government Bond Series 316 3.9% 30/11/2026 MYR 2,620,841 0.656,039,000 Malaysia Government Bond Series 119 3.906%
15/07/2026MYR 1,542,300 0.38
6,364,000 Malaysia Government Bond Series 115 3.955% 15/09/2025
MYR 1,628,527 0.40
19,117,000 Malaysia Government Bond Series 217 4.059% 30/09/2024
MYR 4,887,853 1.21
2,652,000 Malaysia Government Bond Series 114 4.181% 15/07/2024
MYR 679,329 0.17
Schedule of investments as at 31 May 2021 (continued)
Transferable securities admitted to an official stock exchange listing or traded on a regulated market. The percentages in brackets show the equivalent sector holdings at 31 May 2020.
426

Barclays Multi-Manager Fund PLC Annual Report and Audited Financial Statements 2021
GlobalAccess Emerging Market Local Currency Debt Fund
Holdings Financial assets at fair value through profit or loss Currency Fair value
USD % of net
assets
Bonds: 88.19% (31 May 2020: 87.14%) (continued) Malaysia: 9.76% (31 May 2020: 8.39%) (continued)
Government bonds: 9.76% (31 May 2020: 8.39%) 5,465,000 Malaysia Government Bond Series 411 4.232%
30/06/2031MYR 1,418,376 0.35
2,650,000 Malaysia Government Bond Series 311 4.392% 15/04/2026
MYR 691,189 0.17
2,794,000 Malaysia Government Bond Series 310 4.498% 15/04/2030
MYR 740,441 0.18
1,810,000 Malaysia Government Bond Series 216 4.736% 15/03/2046
MYR 462,295 0.11
2,652,000 Malaysia Government Bond Series 317 4.762% 07/04/2037
MYR 693,285 0.17
1,718,000 Malaysia Government Bond Series 418 4.893% 08/06/2038
MYR 452,439 0.11
Total Malaysia 39,483,393 9.76
Mexico: 11.88% (31 May 2020: 12.33%)
Corporate bonds: 0.27% (31 May 2020: 0.15%)22,875,800 Petroleos Mexicanos Series REGS 7.19% 12/09/2024 MXN 1,084,808 0.27
Government bonds: 11.61% (31 May 2020: 12.18%)54,719,500 Mexican Bonos Series M 5.75% 05/03/2026 MXN 2,705,376 0.6721,993,800 Mexican Bonos Series M 6.5% 09/06/2022 MXN 1,123,619 0.2811,953,400 Mexican Bonos Series M 6.75% 09/03/2023 MXN 618,283 0.1565,446,900 Mexican Bonos Series M 7.25% 09/12/2021 MXN 3,332,797 0.8239,188,000 Mexican Bonos Series M 20 7.5% 03/06/2027 MXN 2,083,609 0.5234,919,400 Mexican Bonos Series M 7.75% 29/05/2031 MXN 1,891,823 0.479,295,900 Mexican Bonos Series M 7.75% 23/11/2034 MXN 499,726 0.12
27,614,900 Mexican Bonos Series M 7.75% 13/11/2042 MXN 1,419,916 0.35112,658,300 Mexican Bonos Series M 8% 07/12/2023 MXN 6,014,705 1.49
62,924,700 Mexican Bonos Series M 8% 07/11/2047 MXN 3,298,733 0.82173,793,900 Mexican Bonos Series M 20 8.5% 31/05/2029 MXN 9,805,238 2.4254,783,700 Mexican Bonos Series M 30 8.5% 18/11/2038 MXN 3,052,991 0.75
161,178,700 Mexican Bonos Series M 20 10% 05/12/2024 MXN 9,173,016 2.274,830,000 Mexican Udibonos Series S 4.5% 22/11/2035 MXN 1,947,651 0.48
Total Mexico 48,052,291 11.88
People's Republic of China: 5.91% (31 May 2020: 0.00%)
Government bonds: 5.91% (31 May 2020: 0.00%)22,780,000 China Government Bond Series INBK 1.99% 09/04/2025 CNH 3,455,740 0.8518,990,000 China Government Bond Series INBK 2.68% 21/05/2030 CNY 2,881,165 0.71
9,950,000 China Government Bond Series INBK 3.02% 22/10/2025 CNH 1,568,437 0.3923,070,000 China Government Bond Series 1915 3.13% 21/11/2029 CNH 3,628,151 0.90
Schedule of investments as at 31 May 2021 (continued)
Transferable securities admitted to an official stock exchange listing or traded on a regulated market. The percentages in brackets show the equivalent sector holdings at 31 May 2020.
427
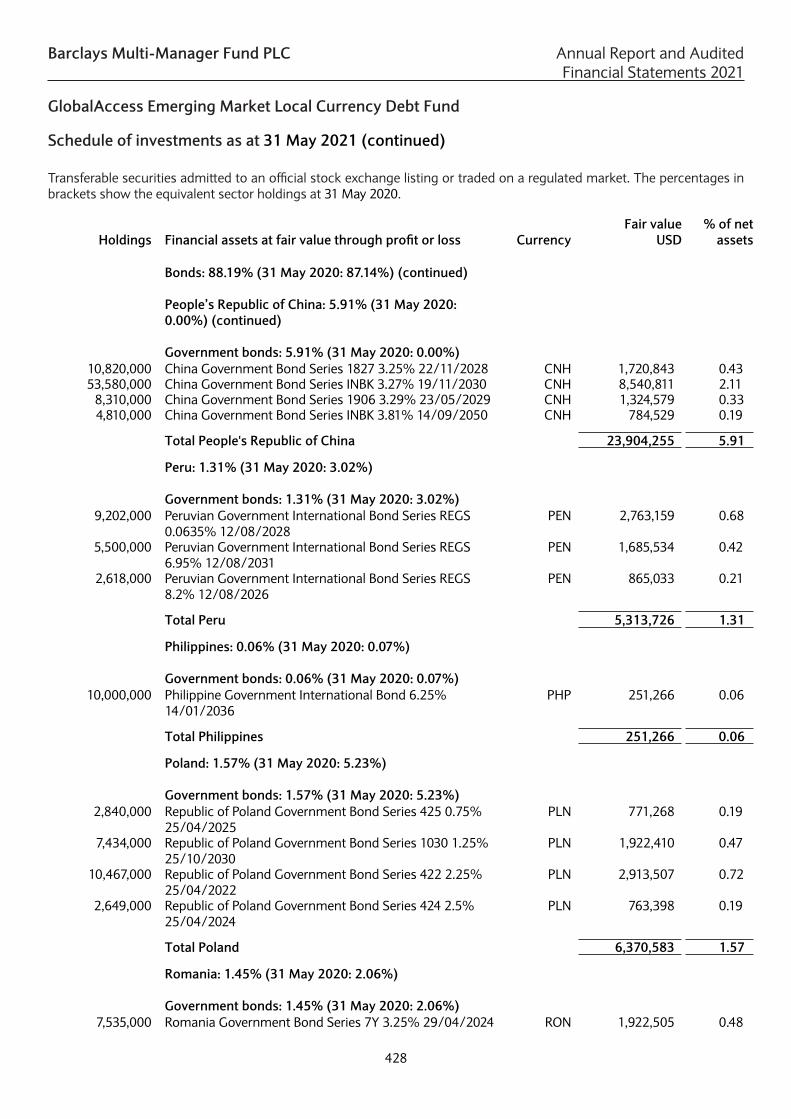
Barclays Multi-Manager Fund PLC Annual Report and Audited Financial Statements 2021
GlobalAccess Emerging Market Local Currency Debt Fund
Holdings Financial assets at fair value through profit or loss Currency Fair value
USD % of net
assets
Bonds: 88.19% (31 May 2020: 87.14%) (continued)
People’s Republic of China: 5.91% (31 May 2020: 0.00%) (continued)
Government bonds: 5.91% (31 May 2020: 0.00%)
10,820,000 China Government Bond Series 1827 3.25% 22/11/2028 CNH 1,720,843 0.4353,580,000 China Government Bond Series INBK 3.27% 19/11/2030 CNH 8,540,811 2.11
8,310,000 China Government Bond Series 1906 3.29% 23/05/2029 CNH 1,324,579 0.334,810,000 China Government Bond Series INBK 3.81% 14/09/2050 CNH 784,529 0.19
Total People's Republic of China 23,904,255 5.91
Peru: 1.31% (31 May 2020: 3.02%)
Government bonds: 1.31% (31 May 2020: 3.02%)9,202,000 Peruvian Government International Bond Series REGS
0.0635% 12/08/2028PEN 2,763,159 0.68
5,500,000 Peruvian Government International Bond Series REGS 6.95% 12/08/2031
PEN 1,685,534 0.42
2,618,000 Peruvian Government International Bond Series REGS 8.2% 12/08/2026
PEN 865,033 0.21
Total Peru 5,313,726 1.31
Philippines: 0.06% (31 May 2020: 0.07%)
Government bonds: 0.06% (31 May 2020: 0.07%)10,000,000 Philippine Government International Bond 6.25%
14/01/2036PHP 251,266 0.06
Total Philippines 251,266 0.06
Poland: 1.57% (31 May 2020: 5.23%)
Government bonds: 1.57% (31 May 2020: 5.23%)2,840,000 Republic of Poland Government Bond Series 425 0.75%
25/04/2025PLN 771,268 0.19
7,434,000 Republic of Poland Government Bond Series 1030 1.25% 25/10/2030
PLN 1,922,410 0.47
10,467,000 Republic of Poland Government Bond Series 422 2.25% 25/04/2022
PLN 2,913,507 0.72
2,649,000 Republic of Poland Government Bond Series 424 2.5% 25/04/2024
PLN 763,398 0.19
Total Poland 6,370,583 1.57
Romania: 1.45% (31 May 2020: 2.06%)
Government bonds: 1.45% (31 May 2020: 2.06%)7,535,000 Romania Government Bond Series 7Y 3.25% 29/04/2024 RON 1,922,505 0.48
Schedule of investments as at 31 May 2021 (continued)
Transferable securities admitted to an official stock exchange listing or traded on a regulated market. The percentages in brackets show the equivalent sector holdings at 31 May 2020.
428

Barclays Multi-Manager Fund PLC Annual Report and Audited Financial Statements 2021
GlobalAccess Emerging Market Local Currency Debt Fund
Holdings Financial assets at fair value through profit or loss Currency Fair value
USD % of net
assets
Bonds: 88.19% (31 May 2020: 87.14%) (continued) Romania: 1.45% (31 May 2020: 2.06%) (continued)
Government bonds: 1.45% (31 May 2020: 2.06%) 1,940,000 Romania Government Bond Series 5Y 3.65% 28/07/2025 RON 503,695 0.121,815,000 Romania Government Bond Series 3Y 4% 25/10/2023 RON 470,188 0.123,365,000 Romania Government Bond Series 5Y 4.25% 28/06/2023 RON 871,393 0.22
246,000 Romanian Government International Bond Series REGS 2% 28/01/2032
EUR 301,689 0.07
703,000 Romanian Government International Bond Series REGS 2.75% 26/02/2026
EUR 947,989 0.23
599,000 Romanian Government International Bond Series REGS 3.624% 26/05/2030
EUR 843,255 0.21
Total Romania 5,860,714 1.45
Russian Federation: 8.20% (31 May 2020: 9.70%)
Government bonds: 8.20% (31 May 2020: 9.70%)549,325,000 Russian Federal Bond - OFZ Series 6224 6.9% 23/05/2029 RUB 7,508,554 1.86
1,607,000 Russian Federal Bond - OFZ Series 6211 7% 25/01/2023 RUB 22,246 0.0185,657,000 Russian Federal Bond - OFZ Series 6215 7% 16/08/2023 RUB 1,190,547 0.29
187,771,000 Russian Federal Bond - OFZ Series 6212 7.05% 19/01/2028
RUB 2,598,426 0.64
130,725,000 Russian Federal Bond - OFZ Series 6222 7.1% 16/10/2024 RUB 1,821,952 0.45290,891,000 Russian Federal Bond - OFZ Series 6225 7.25%
10/05/2034RUB 4,011,788 0.99
71,621,000 Russian Federal Bond - OFZ Series 6228 7.65% 10/04/2030
RUB 1,019,824 0.25
257,405,000 Russian Federal Bond - OFZ Series 6221 7.7% 23/03/2033 RUB 3,672,044 0.9150,499,000 Russian Federal Bond - OFZ Series 6230 7.7% 16/03/2039 RUB 726,616 0.18
192,971,000 Russian Federal Bond - OFZ Series 6219 7.75% 16/09/2026
RUB 2,766,005 0.68
122,873,000 Russian Federal Bond - OFZ Series 6226 7.95% 07/10/2026
RUB 1,773,883 0.44
361,543,000 Russian Federal Bond - OFZ Series 6207 8.15% 03/02/2027
RUB 5,281,989 1.31
52,103,000 Russian Federal Bond - OFZ Series 6218 8.5% 17/09/2031 RUB 783,085 0.19
Total Russian Federation 33,176,959 8.20
South Africa: 10.42% (31 May 2020: 8.92%)
Government bonds: 10.42% (31 May 2020: 8.92%)66,427,000 Republic of South Africa Government Bond Series R209
6.25% 31/03/2036ZAR 3,417,456 0.84
14,150,413 Republic of South Africa Government Bond Series R214 6.5% 28/02/2041
ZAR 688,183 0.17
Schedule of investments as at 31 May 2021 (continued)
Transferable securities admitted to an official stock exchange listing or traded on a regulated market. The percentages in brackets show the equivalent sector holdings at 31 May 2020.
429

Barclays Multi-Manager Fund PLC Annual Report and Audited Financial Statements 2021
GlobalAccess Emerging Market Local Currency Debt Fund
Holdings Financial assets at fair value through profit or loss Currency Fair value
USD % of net
assets
Bonds: 88.19% (31 May 2020: 87.14%) (continued) South Africa: 10.42% (31 May 2020: 8.92%) (continued)
Government bonds: 10.42% (31 May 2020: 8.92%) 86,585,170 Republic of South Africa Government Bond Series R213
7% 28/02/2031ZAR 5,404,000 1.34
15,444,074 Republic of South Africa Government Bond Series 2023 7.75% 28/02/2023
ZAR 1,177,892 0.29
53,902,501 Republic of South Africa Government Bond Series 2030 8% 31/01/2030
ZAR 3,723,280 0.92
18,774,502 Republic of South Africa Government Bond Series 2032 8.25% 31/03/2032
ZAR 1,243,742 0.31
38,927,659 Republic of South Africa Government Bond Series 2037 8.5% 31/01/2037
ZAR 2,418,367 0.60
96,367,259 Republic of South Africa Government Bond Series 2044 8.75% 31/01/2044
ZAR 5,890,431 1.46
141,015,793 Republic of South Africa Government Bond Series 2048 8.75% 28/02/2048
ZAR 8,622,828 2.13
45,446,882 Republic of South Africa Government Bond Series 2035 8.875% 28/02/2035
ZAR 2,984,356 0.74
14,271,557 Republic of South Africa Government Bond Series 2040 9% 31/01/2040
ZAR 903,779 0.22
68,133,409 Republic of South Africa Government Bond Series R186 10.5% 21/12/2026
ZAR 5,678,115 1.40
Total South Africa 42,152,429 10.42
Turkey: 0.91% (31 May 2020: 0.08%)
Government bonds: 0.91% (31 May 2020: 0.08%)32,460,806 Turkey Government Bond 11.7% 13/11/2030 TRY 2,783,969 0.69
2,841,000 Turkey Government International Bond 9% 04/05/2022 TRY 312,194 0.085,974,000 Turkey Government International Bond 12.6% 01/10/2025 TRY 591,110 0.14
Total Turkey 3,687,273 0.91
Uruguay: 0.21% (31 May 2020: 0.55%)
Government bonds: 0.21% (31 May 2020: 0.55%)37,431,000 Uruguay Government International Bond Series REGS
8.5% 15/03/2028UYU 871,758 0.21
Total Uruguay 871,758 0.21
Total bonds 356,782,488 88.19
Accrued income on financial assets at fair value through profit or loss: 1.81% (31 May 2020: 2.01%) 7,326,832 1.81
Schedule of investments as at 31 May 2021 (continued)
Transferable securities admitted to an official stock exchange listing or traded on a regulated market. The percentages in brackets show the equivalent sector holdings at 31 May 2020.
430

Barclays Multi-Manager Fund PLC Annual Report and Audited Financial Statements 2021
GlobalAccess Emerging Market Local Currency Debt Fund
Holdings Financial assets at fair value through profit or loss Currency Fair value
USD % of net
assets
Investment funds: 5.32% (31 May 2020: 8.59%)
Ireland: 5.32% (31 May 2020: 8.59%)
907,425 iShares China CNY Bond UCITS ETF USD 5,066,880 1.25235,500 SPDR Barclays Capital Emerging Markets Local Bond
UCITS ETF^ USD 16,470,210 4.07
Total investment funds 21,537,090 5.32
No. of contracts Futures contracts: 0.01% (31 May 2020: 0.00%) CounterpartyUnrealised
gain% of net
assetsUSD
(12) Euro-Bund EUX Future June 2021 19,073 0.01(95) US 10 Year T-Note Future September 2021 JP Morgan 7,410 –
Total futures contracts 26,483 0.01
Forward currency contracts: 0.19% (31 May 2020: 0.23%)
Counterparty Cncy Buys Cncy SellsMaturity
dateUnrealised
gain% of net
assetsUSD
Bank of America JPY 250,700,000 USD 2,282,285 17/06/2021 9,641 – CCT_1737102_59656
Bank of America IDR 10,893,708,443 USD 754,253 17/06/2021 8,383 – CCT_1737102_58882
Bank of America IDR 9,776,605,680 USD 679,072 17/06/2021 5,358 – CCT_1737102_58559
Bank of America CLP 299,203,210 USD 409,587 17/06/2021 4,941 – CCT_1737102_59530
Bank of America EUR 1,000,000 USD 1,219,167 17/06/2021 3,791 – CCT_1737102_59613
Bank of America IDR 12,394,374,600 USD 865,348 17/06/2021 2,345 – CCT_1737102_58598
Bank of America PHP 3,706,900 USD 77,223 17/06/2021 442 – CCT_1737102_58382
Barclays^ CZK 173,122,831 USD 8,237,790 17/06/2021 81,463 0.02 CCT_1737102_58389
Barclays^ RUB 37,860,000 USD 512,859 17/06/2021 2,308 – CCT_1737102_59423
Barclays^ PHP 9,507,104 USD 197,353 17/06/2021 1,833 – CCT_1737102_59562
Barclays^ USD 357,576 COP 1,323,694,739 17/06/2021 890 – CCT_1737102_58420
Barclays^ IDR 518,400,000 USD 36,180 17/06/2021 111 – CCT_1737102_58837
BNP Paribas UAH 34,383,410 USD 1,207,283 2/06/2021 43,822 0.01 CCT_1737102_54308
BNP Paribas INR 210,647,410 USD 2,855,454 17/06/2021 40,428 0.01 CCT_1737102_58371
BNP Paribas USD 805,970 PEN 2,944,610 17/06/2021 33,526 0.01 CCT_1737102_58444
BNP Paribas UAH 13,432,340 USD 472,304 2/06/2021 16,456 – CCT_1737102_54695
BNP Paribas UAH 14,831,650 USD 516,782 20/07/2021 16,254 – CCT_1737102_56915
BNP Paribas UAH 47,815,750 USD 1,689,006 2/09/2021 10,516 – CCT_1737102_59602
Schedule of investments as at 31 May 2021 (continued)
Transferable securities admitted to an official stock exchange listing or traded on a regulated market. The percentages in brackets show the equivalent sector holdings at 31 May 2020.
431

Barclays Multi-Manager Fund PLC Annual Report and Audited Financial Statements 2021
GlobalAccess Emerging Market Local Currency Debt Fund
Forward currency contracts: 0.19% (31 May 2020: 0.23%) (continued)
Counterparty Cncy Buys Cncy SellsMaturity
date
Unrealised gain
% of net assets
USD BNP Paribas UAH 16,554,540 USD 582,906 11/08/2021 8,751 – CCT_1737102_58254
BNP Paribas ZAR 2,100,000 USD 150,981 17/06/2021 1,815 – CCT_1737102_59568
BNP Paribas IDR 4,384,410,000 USD 305,939 17/06/2021 1,001 – CCT_1737102_58715
BNP Paribas CNH 620,000 USD 96,330 17/06/2021 883 – CCT_1737102_59524
Deutsche PLN 58,805,916 USD 15,740,910 17/06/2021 313,698 0.08 CCT_1737102_58418
Deutsche ZAR 8,190,280 USD 577,419 17/06/2021 18,506 0.01 CCT_1737102_58606
Deutsche CHF 1,028,780 USD 1,141,386 17/06/2021 2,910 – CCT_1737102_58374
Goldman Sachs RUB 508,617,638 USD 6,845,367 17/06/2021 75,467 0.02 CCT_1737102_58410
Goldman Sachs UAH 51,700,000 USD 1,824,277 11/08/2021 23,476 0.01 CCT_1737102_58247
Goldman Sachs RON 5,980,000 USD 1,464,948 17/06/2021 21,289 0.01 CCT_1737102_58556
Goldman Sachs MXN 26,700,000 USD 1,319,538 17/06/2021 19,599 0.01 CCT_1737102_58557
Goldman Sachs RON 3,020,000 USD 742,075 17/06/2021 8,500 – CCT_1737102_58601
Goldman Sachs RUB 42,371,620 USD 570,270 17/06/2021 6,287 – CCT_1737102_58412
Goldman Sachs RON 2,230,000 USD 548,007 17/06/2021 6,225 – CCT_1737102_58495
Goldman Sachs KZT 90,300,000 USD 205,742 21/07/2021 3,440 – CCT_1737102_57112
Goldman Sachs ZAR 1,270,000 USD 89,892 17/06/2021 2,513 – CCT_1737102_59413
Goldman Sachs KZT 519,002,340 USD 1,191,055 2/09/2021 1,940 – CCT_1737102_59607
Goldman Sachs THB 12,100,000 USD 385,436 17/06/2021 1,934 – CCT_1737102_58547
Goldman Sachs THB 8,650,000 USD 275,075 17/06/2021 1,847 – CCT_1737102_59416
Goldman Sachs RON 3,620,000 USD 897,972 17/06/2021 1,724 – CCT_1737102_59459
Goldman Sachs USD 2,585,623 MXN 51,521,229 17/06/2021 1,580 – CCT_1737102_58383
Goldman Sachs KZT 231,800,000 USD 532,874 19/08/2021 1,395 – CCT_1737102_58890
HSBC THB 47,321,430 USD 1,502,745 17/06/2021 12,205 – CCT_1737102_58708
HSBC IDR 4,903,079,970 USD 341,845 17/06/2021 1,405 – CCT_1737102_58506
HSBC USD 392,315 INR 28,479,700 17/06/2021 789 – CCT_1737102_59679
HSBC IDR 3,883,584,790 USD 271,352 17/06/2021 526 – CCT_1737102_58710
JP Morgan BRL 6,470,000 USD 1,208,442 17/06/2021 22,950 0.01 CCT_1737102_59494
JP Morgan EUR 1,400,000 USD 1,692,285 17/06/2021 19,856 0.01 CCT_1737102_58563
JP Morgan USD 2,316,195 JPY 252,700,000 17/06/2021 5,985 – CCT_1737102_59648
JP Morgan THB 17,508,450 USD 556,202 17/06/2021 4,314 – CCT_1737102_58832
JP Morgan EUR 432,210 USD 524,969 17/06/2021 3,606 – CCT_1737102_58634
JP Morgan USD 527,283 MXN 10,469,590 17/06/2021 2,181 – CCT_1737102_58603
JP Morgan USD 254,170 COP 938,400,000 17/06/2021 1,306 – CCT_1737102_58607
JP Morgan USD 219,608 JPY 23,900,000 17/06/2021 1,112 – CCT_1737102_59597
Morgan Stanley CNH 55,879,150 USD 8,684,506 17/06/2021 77,070 0.02 CCT_1737102_58400
Morgan Stanley ZAR 11,640,000 USD 819,471 17/06/2021 27,455 0.01 CCT_1737102_58553
Morgan Stanley ZAR 18,140,667 USD 1,293,569 17/06/2021 26,345 0.01 CCT_1737102_58402
Morgan Stanley COP 6,845,523,300 USD 1,823,042 17/06/2021 21,573 0.01 CCT_1737102_59528
Morgan Stanley ZAR 8,903,710 USD 627,785 17/06/2021 20,048 0.01 CCT_1737102_58636
Morgan Stanley KZT 406,390,860 USD 925,825 21/07/2021 15,588 – CCT_1737102_57118
Morgan Stanley CNH 4,055,950 USD 626,758 17/06/2021 9,195 – CCT_1737102_58509
Morgan Stanley THB 35,800,190 USD 1,140,133 17/06/2021 5,975 – CCT_1737102_58595
Morgan Stanley USD 9,810,680 BRL 51,516,860 17/06/2021 5,817 – CCT_1737102_58415
Morgan Stanley IDR 5,962,430,000 USD 412,766 17/06/2021 4,645 – CCT_1737102_59427
Morgan Stanley IDR 10,234,145,200 USD 712,684 17/06/2021 3,778 – CCT_1737102_59529
Morgan Stanley EUR 255,410 USD 308,615 17/06/2021 3,741 – CCT_1737102_58507
Morgan Stanley CZK 10,730,000 USD 513,578 17/06/2021 2,042 – CCT_1737102_59425
Morgan Stanley USD 553,032 MXN 10,992,200 17/06/2021 1,719 – CCT_1737102_59561
Schedule of investments as at 31 May 2021 (continued)
Transferable securities admitted to an official stock exchange listing or traded on a regulated market. The percentages in brackets show the equivalent sector holdings at 31 May 2020.
432

Barclays Multi-Manager Fund PLC Annual Report and Audited Financial Statements 2021
GlobalAccess Emerging Market Local Currency Debt Fund
Forward currency contracts: 0.19% (31 May 2020: 0.23%) (continued)
Counterparty Cncy Buys Cncy SellsMaturity
date
Unrealised gain
% of net assets
USD Morgan Stanley IDR 612,847,647 USD 42,457 17/06/2021 447 – CCT_1737102_58884
Morgan Stanley MXN 20,799,707 USD 1,042,790 17/06/2021 417 – CCT_1737102_58640
Morgan Stanley USD 403,040 MXN 8,030,320 17/06/2021 280 – CCT_1737102_59526
Northern Trust HUF 884,663,500 USD 2,853,609 14/06/2021 260,639 0.07 CCT_1745083_38140
Northern Trust PLN 26,541,400 USD 7,024,842 9/08/2021 222,805 0.06 CCT_1745083_38762
Northern Trust KRW 9,910,922,800 USD 8,750,594 23/08/2021 188,156 0.05 CCT_1745083_38950
Northern Trust ZAR 47,144,600 USD 3,220,970 16/08/2021 182,268 0.05 CCT_1745083_38807
Northern Trust CNH 56,629,700 USD 8,719,774 11/06/2021 162,797 0.04 CCT_1745083_38769
Northern Trust CNH 25,058,000 USD 3,857,357 11/06/2021 73,079 0.02 CCT_1745083_38796
Northern Trust RON 18,510,200 USD 4,523,951 9/08/2021 68,110 0.02 CCT_1745083_38760
Northern Trust CZK 2,466,300 USD 111,796 14/06/2021 6,720 – CCT_1745083_38121
Northern Trust THB 45,819,600 USD 1,460,991 21/06/2021 5,860 – CCT_1745083_38936
Northern Trust PHP 22,835,000 USD 474,740 14/06/2021 3,764 – CCT_1745083_38798
Northern Trust TRY 6,089,100 USD 710,804 21/06/2021 924 – CCT_1745083_38938
Northern Trust GBP 4,997 USD 7,069 17/06/2021 35 – CCT_1745081_77766
Royal Bank of Canada USD 159,287 MXN 3,168,890 17/06/2021 352 – CCT_1737102_59650
Royal Bank of Scotland USD 11,310,378 JPY 1,228,777,530 17/06/2021 76,763 0.02 CCT_1737102_58398
Royal Bank of Scotland KZT 36,670,000 USD 84,183 19/08/2021 337 – CCT_1737102_59417
Standard Chartered PHP 50,803,456 USD 1,054,561 17/06/2021 9,840 – CCT_1737102_59563
Standard Chartered CZK 12,069,160 USD 570,696 17/06/2021 9,276 – CCT_1737102_58505
Standard Chartered BRL 9,737,270 USD 1,848,493 17/06/2021 4,737 – CCT_1737102_58504
Standard Chartered PLN 2,200,000 USD 597,326 17/06/2021 3,296 – CCT_1737102_59605
Standard Chartered CZK 11,400,000 USD 546,146 17/06/2021 1,670 – CCT_1737102_59612
Standard Chartered USD 519,353 PLN 1,901,170 17/06/2021 314 – CCT_1737102_59560
State Street HUF 597,936,614 USD 2,028,525 17/06/2021 76,273 0.02 CCT_1737102_58393
State Street HUF 315,700,000 USD 1,070,481 17/06/2021 40,815 0.01 CCT_1737102_58375
State Street HUF 169,600,000 USD 574,738 17/06/2021 22,271 0.01 CCT_1737102_58494
State Street CNH 4,140,000 USD 642,060 17/06/2021 7,072 – CCT_1737102_59415
State Street HUF 165,500,000 USD 576,552 17/06/2021 6,024 – CCT_1737102_59611
State Street CNH 730,000 USD 113,187 17/06/2021 1,273 – CCT_1737102_59420
State Street AUD 1,600,000 USD 1,237,608 17/06/2021 948 – CCT_1737102_58566
UBS GBP 823,923 USD 1,155,844 17/06/2021 15,384 – CCT_1745081_77530
UBS EUR 47,098 USD 56,857 17/06/2021 742 – CCT_1745081_77535
UBS GBP 18,644 USD 26,155 17/06/2021 348 – CCT_1745081_77533
Westpac Banking Corp EUR 1,650,020 USD 2,009,010 17/06/2021 8,895 – CCT_1737102_58385
Westpac Banking Corp GBP 810,400 USD 1,146,162 17/06/2021 5,842 – CCT_1737102_58367
Schedule of investments as at 31 May 2021 (continued)
Transferable securities admitted to an official stock exchange listing or traded on a regulated market. The percentages in brackets show the equivalent sector holdings at 31 May 2020.
Forward currency contracts: 0.19% (31 May 2020: 0.23%) (continued)
Counterparty Cncy Buys Cncy SellsMaturity
date
Unrealised gain
% of net assets
USD BNP Paribas UAH 16,554,540 USD 582,906 11/08/2021 8,751 – CCT_1737102_58254
BNP Paribas ZAR 2,100,000 USD 150,981 17/06/2021 1,815 – CCT_1737102_59568
BNP Paribas IDR 4,384,410,000 USD 305,939 17/06/2021 1,001 – CCT_1737102_58715
BNP Paribas CNH 620,000 USD 96,330 17/06/2021 883 – CCT_1737102_59524
Deutsche PLN 58,805,916 USD 15,740,910 17/06/2021 313,698 0.08 CCT_1737102_58418
Deutsche ZAR 8,190,280 USD 577,419 17/06/2021 18,506 0.01 CCT_1737102_58606
Deutsche CHF 1,028,780 USD 1,141,386 17/06/2021 2,910 – CCT_1737102_58374
Goldman Sachs RUB 508,617,638 USD 6,845,367 17/06/2021 75,467 0.02 CCT_1737102_58410
Goldman Sachs UAH 51,700,000 USD 1,824,277 11/08/2021 23,476 0.01 CCT_1737102_58247
Goldman Sachs RON 5,980,000 USD 1,464,948 17/06/2021 21,289 0.01 CCT_1737102_58556
Goldman Sachs MXN 26,700,000 USD 1,319,538 17/06/2021 19,599 0.01 CCT_1737102_58557
Goldman Sachs RON 3,020,000 USD 742,075 17/06/2021 8,500 – CCT_1737102_58601
Goldman Sachs RUB 42,371,620 USD 570,270 17/06/2021 6,287 – CCT_1737102_58412
Goldman Sachs RON 2,230,000 USD 548,007 17/06/2021 6,225 – CCT_1737102_58495
Goldman Sachs KZT 90,300,000 USD 205,742 21/07/2021 3,440 – CCT_1737102_57112
Goldman Sachs ZAR 1,270,000 USD 89,892 17/06/2021 2,513 – CCT_1737102_59413
Goldman Sachs KZT 519,002,340 USD 1,191,055 2/09/2021 1,940 – CCT_1737102_59607
Goldman Sachs THB 12,100,000 USD 385,436 17/06/2021 1,934 – CCT_1737102_58547
Goldman Sachs THB 8,650,000 USD 275,075 17/06/2021 1,847 – CCT_1737102_59416
Goldman Sachs RON 3,620,000 USD 897,972 17/06/2021 1,724 – CCT_1737102_59459
Goldman Sachs USD 2,585,623 MXN 51,521,229 17/06/2021 1,580 – CCT_1737102_58383
Goldman Sachs KZT 231,800,000 USD 532,874 19/08/2021 1,395 – CCT_1737102_58890
HSBC THB 47,321,430 USD 1,502,745 17/06/2021 12,205 – CCT_1737102_58708
HSBC IDR 4,903,079,970 USD 341,845 17/06/2021 1,405 – CCT_1737102_58506
HSBC USD 392,315 INR 28,479,700 17/06/2021 789 – CCT_1737102_59679
HSBC IDR 3,883,584,790 USD 271,352 17/06/2021 526 – CCT_1737102_58710
JP Morgan BRL 6,470,000 USD 1,208,442 17/06/2021 22,950 0.01 CCT_1737102_59494
JP Morgan EUR 1,400,000 USD 1,692,285 17/06/2021 19,856 0.01 CCT_1737102_58563
JP Morgan USD 2,316,195 JPY 252,700,000 17/06/2021 5,985 – CCT_1737102_59648
JP Morgan THB 17,508,450 USD 556,202 17/06/2021 4,314 – CCT_1737102_58832
JP Morgan EUR 432,210 USD 524,969 17/06/2021 3,606 – CCT_1737102_58634
JP Morgan USD 527,283 MXN 10,469,590 17/06/2021 2,181 – CCT_1737102_58603
JP Morgan USD 254,170 COP 938,400,000 17/06/2021 1,306 – CCT_1737102_58607
JP Morgan USD 219,608 JPY 23,900,000 17/06/2021 1,112 – CCT_1737102_59597
Morgan Stanley CNH 55,879,150 USD 8,684,506 17/06/2021 77,070 0.02 CCT_1737102_58400
Morgan Stanley ZAR 11,640,000 USD 819,471 17/06/2021 27,455 0.01 CCT_1737102_58553
Morgan Stanley ZAR 18,140,667 USD 1,293,569 17/06/2021 26,345 0.01 CCT_1737102_58402
Morgan Stanley COP 6,845,523,300 USD 1,823,042 17/06/2021 21,573 0.01 CCT_1737102_59528
Morgan Stanley ZAR 8,903,710 USD 627,785 17/06/2021 20,048 0.01 CCT_1737102_58636
Morgan Stanley KZT 406,390,860 USD 925,825 21/07/2021 15,588 – CCT_1737102_57118
Morgan Stanley CNH 4,055,950 USD 626,758 17/06/2021 9,195 – CCT_1737102_58509
Morgan Stanley THB 35,800,190 USD 1,140,133 17/06/2021 5,975 – CCT_1737102_58595
Morgan Stanley USD 9,810,680 BRL 51,516,860 17/06/2021 5,817 – CCT_1737102_58415
Morgan Stanley IDR 5,962,430,000 USD 412,766 17/06/2021 4,645 – CCT_1737102_59427
Morgan Stanley IDR 10,234,145,200 USD 712,684 17/06/2021 3,778 – CCT_1737102_59529
Morgan Stanley EUR 255,410 USD 308,615 17/06/2021 3,741 – CCT_1737102_58507
Morgan Stanley CZK 10,730,000 USD 513,578 17/06/2021 2,042 – CCT_1737102_59425
Morgan Stanley USD 553,032 MXN 10,992,200 17/06/2021 1,719 – CCT_1737102_59561
433

Barclays Multi-Manager Fund PLC Annual Report and Audited Financial Statements 2021
GlobalAccess Emerging Market Local Currency Debt Fund
Forward currency contracts: 0.19% (31 May 2020: 0.23%) (continued)
Counterparty Cncy Buys Cncy SellsMaturity
date
Unrealised gain
% of net assets
USD Westpac Banking Corp USD 1,149,845 EUR 940,000 17/06/2021 265 – CCT_1737102_58719
Total fair value gains on forward currency contracts 2,577,552 0.64
Counterparty Cncy Buys Cncy SellsMaturity
dateUnrealised
loss% of net
assetsUSD
Bank of America MXN 1,696,043 USD 85,089 17/06/2021 (24) – CCT_1737102_58637
Bank of America USD 1,132,769 RON 4,573,160 17/06/2021 (3,819) – CCT_1737102_58836
Bank of America USD 1,148,817 PLN 4,230,000 17/06/2021 (6,016) – CCT_1737102_59471
Bank of America USD 1,072,327 PLN 3,950,000 17/06/2021 (6,063) – CCT_1737102_59472
Bank of America CLP 420,492,580 USD 593,706 17/06/2021 (11,140) – CCT_1737102_58508
Bank of America CLP 434,185,490 USD 619,645 17/06/2021 (18,108) (0.01) CCT_1737102_58445
Barclays^ USD 574,818 RUB 42,340,000 17/06/2021 (1,309) – CCT_1737102_59463
Barclays^ USD 229,926 RUB 17,063,220 17/06/2021 (2,256) – CCT_1737102_58560
Barclays^ MYR 7,955,300 USD 1,931,742 17/06/2021 (3,508) – CCT_1737102_58391
Barclays^ PEN 3,744,900 USD 1,006,477 17/06/2021 (24,098) (0.01) CCT_1737102_58440
Barclays^ USD 3,405,439 TWD 94,517,960 17/06/2021 (26,909) (0.01) CCT_1737102_58388
Barclays^ USD 4,932,061 RON 20,000,840 17/06/2021 (38,841) (0.01) CCT_1737102_58395
BNP Paribas IDR 30,893,981,990 USD 2,163,208 17/06/2021 (413) – CCT_1737102_58369
BNP Paribas USD 171,506 RUB 12,639,390 17/06/2021 (480) – CCT_1737102_59531
BNP Paribas USD 234,562 CNH 1,500,000 17/06/2021 (631) – CCT_1737102_59594
BNP Paribas USD 1,136,251 RON 4,590,000 17/06/2021 (4,523) – CCT_1737102_58769
BNP Paribas USD 1,318,627 BRL 7,026,030 17/06/2021 (18,591) (0.01) CCT_1737102_59527
BNY Mellon USD 1,216,158 ZAR 16,850,000 17/06/2021 (9,848) – CCT_1737102_59599
Citibank USD 941,740 THB 29,500,000 17/06/2021 (2,674) – CCT_1737102_59652
Citibank USD 1,147,267 THB 36,050,000 17/06/2021 (6,839) – CCT_1737102_59466
Deutsche CLP 206,645,000 USD 288,485 17/06/2021 (2,192) – CCT_1737102_58639
Deutsche USD 666,585 CNH 4,268,720 17/06/2021 (2,729) – CCT_1737102_59559
Deutsche AUD 1,462,880 USD 1,147,572 17/06/2021 (15,160) – CCT_1737102_58378
Goldman Sachs USD 300,322 RUB 22,100,000 17/06/2021 (396) – CCT_1737102_59653
Goldman Sachs USD 1,211,207 KZT 519,002,340 4/06/2021 (424) – CCT_1737102_59606
Goldman Sachs KZT 274,221,700 USD 633,819 11/08/2021 (796) – CCT_1737102_58249
Goldman Sachs USD 228,260 RUB 17,063,220 17/06/2021 (3,921) – CCT_1737102_58551
Goldman Sachs KZT 264,984,700 USD 627,183 4/06/2021 (8,565) – CCT_1737102_54306
Goldman Sachs USD 1,060,799 ZAR 14,820,000 17/06/2021 (17,503) (0.01) CCT_1737102_59457
Goldman Sachs PEN 2,925,060 USD 786,571 17/06/2021 (19,256) (0.01) CCT_1737102_58510
HSBC USD 568,566 RUB 41,825,490 17/06/2021 (559) – CCT_1737102_59564
HSBC USD 161,484 ZAR 2,230,000 17/06/2021 (771) – CCT_1737102_59681
HSBC USD 1,148,089 THB 36,050,000 17/06/2021 (6,017) – CCT_1737102_59465
Schedule of investments as at 31 May 2021 (continued)
Transferable securities admitted to an official stock exchange listing or traded on a regulated market. The percentages in brackets show the equivalent sector holdings at 31 May 2020.
434

Barclays Multi-Manager Fund PLC Annual Report and Audited Financial Statements 2021
GlobalAccess Emerging Market Local Currency Debt Fund
Forward currency contracts: 0.19% (31 May 2020: 0.23%) (continued)
Counterparty Cncy Buys Cncy SellsMaturity
date
Unrealised loss
% of net assets
USD HSBC THB 595,800,210 USD 19,171,433 17/06/2021 (97,464) (0.02) CCT_1737102_58377
JP Morgan USD 559,530 CZK 11,645,590 17/06/2021 (88) – CCT_1737102_59535
JP Morgan USD 688,259 MXN 13,730,000 17/06/2021 (368) – CCT_1737102_59464
JP Morgan NZD 1,554,540 USD 1,132,479 17/06/2021 (807) – CCT_1737102_58366
JP Morgan USD 399,025 RUB 29,470,000 17/06/2021 (1,977) – CCT_1737102_59456
JP Morgan USD 220,885 PLN 820,260 17/06/2021 (3,054) – CCT_1737102_58711
JP Morgan USD 2,169,045 EUR 1,777,710 17/06/2021 (5,019) – CCT_1737102_58712
Morgan Stanley USD 578,684 IDR 8,269,400,000 17/06/2021 (231) – CCT_1737102_59596
Morgan Stanley USD 204,862 MYR 846,490 17/06/2021 (313) – CCT_1737102_58833
Morgan Stanley USD 699,697 ZAR 9,636,150 17/06/2021 (1,429) – CCT_1737102_59651
Morgan Stanley KZT 254,017,640 USD 594,889 4/06/2021 (1,875) – CCT_1737102_54715
Morgan Stanley USD 283,761 IDR 4,086,010,000 17/06/2021 (2,289) – CCT_1737102_58562
Morgan Stanley USD 575,720 INR 42,080,000 17/06/2021 (2,776) – CCT_1737102_59470
Morgan Stanley USD 303,125 TWD 8,450,000 17/06/2021 (3,730) – CCT_1737102_58561
Morgan Stanley USD 611,962 HUF 175,380,000 17/06/2021 (5,394) – CCT_1737102_59455
Morgan Stanley CLP 1,623,541,659 USD 2,323,960 17/06/2021 (74,644) (0.02) CCT_1737102_58419
Northern Trust USD 2,871 GBP 2,029 17/06/2021 (14) – CCT_1745081_77769
Northern Trust USD 111,831 ZAR 1,586,100 16/08/2021 (2,665) – CCT_1745083_38902
Northern Trust USD 42,104 HUF 12,871,000 14/06/2021 (3,205) – CCT_1745083_38194
Northern Trust USD 483,958 MXN 9,800,448 9/08/2021 (4,693) – CCT_1745083_38764
Northern Trust TRY 4,667,200 USD 552,587 21/06/2021 (7,059) – CCT_1745083_38882
Northern Trust USD 1,074,054 BRL 5,782,600 9/06/2021 (27,305) (0.01) CCT_1745083_38748
Northern Trust USD 8,066,840 IDR 23/06/2021 (30,307) (0.01) CCT_1745083_38948
Northern Trust CLP 856,686,700 USD 1,216,971 23/08/2021 (30,784) (0.01) CCT_1745083_38940
Northern Trust USD 1,561,225 RUB 117,583,860 15/06/2021 (39,201) (0.01) CCT_1745083_38778
Northern Trust USD 4,134,632 CNH 26,835,000 10/06/2021 (74,796) (0.02) CCT_1745083_38767
Northern Trust USD 2,897,365 COP 11,117,190,934 15/06/2021 (98,684) (0.03) CCT_1745083_38780
Northern Trust USD 8,657,230 IDR125,270,112,253 28/06/2021 (110,300) (0.03) CCT_1745083_38994
Northern Trust USD 2,955,353 ZAR 43,389,900 10/08/2021 (179,286) (0.04) CCT_1745083_38776
Northern Trust USD 12,750,886 ZAR 186,277,700 10/08/2021 (706,468) (0.18) CCT_1745083_38758
Royal Bank of Canada USD 538,786 MXN 10,913,390 17/06/2021 (8,574) – CCT_1737102_58546
Standard Chartered USD 309,859 ZAR 4,300,000 17/06/2021 (3,009) – CCT_1737102_59595
Standard Chartered USD 687,284 PHP 32,980,000 17/06/2021 (3,692) – CCT_1737102_59418
Standard Chartered USD 693,146 ZAR 9,742,670 17/06/2021 (15,731) – CCT_1737102_58714
Standard Chartered USD 619,030 HUF 180,569,460 17/06/2021 (16,593) – CCT_1737102_58635
UBS USD 4,519 GBP 3,191 17/06/2021 (18) – CCT_1745081_77887
UBS USD 6,733 GBP 4,776 17/06/2021 (56) – CCT_1745081_77484
UBS USD 30,196 GBP 21,380 17/06/2021 (196) – CCT_1745081_77984
UBS USD 77,543 GBP 55,207 17/06/2021 (935) – CCT_1745081_77528
Total fair value losses on forward currency contracts (1,829,408) (0.45)
Total forward currency contracts 748,144 0.19
Schedule of investments as at 31 May 2021 (continued)
Transferable securities admitted to an official stock exchange listing or traded on a regulated market. The percentages in brackets show the equivalent sector holdings at 31 May 2020.
Forward currency contracts: 0.19% (31 May 2020: 0.23%) (continued)
Counterparty Cncy Buys Cncy SellsMaturity
date
Unrealised gain
% of net assets
USD Westpac Banking Corp USD 1,149,845 EUR 940,000 17/06/2021 265 – CCT_1737102_58719
Total fair value gains on forward currency contracts 2,577,552 0.64
Counterparty Cncy Buys Cncy SellsMaturity
dateUnrealised
loss% of net
assetsUSD
Bank of America MXN 1,696,043 USD 85,089 17/06/2021 (24) – CCT_1737102_58637
Bank of America USD 1,132,769 RON 4,573,160 17/06/2021 (3,819) – CCT_1737102_58836
Bank of America USD 1,148,817 PLN 4,230,000 17/06/2021 (6,016) – CCT_1737102_59471
Bank of America USD 1,072,327 PLN 3,950,000 17/06/2021 (6,063) – CCT_1737102_59472
Bank of America CLP 420,492,580 USD 593,706 17/06/2021 (11,140) – CCT_1737102_58508
Bank of America CLP 434,185,490 USD 619,645 17/06/2021 (18,108) (0.01) CCT_1737102_58445
Barclays^ USD 574,818 RUB 42,340,000 17/06/2021 (1,309) – CCT_1737102_59463
Barclays^ USD 229,926 RUB 17,063,220 17/06/2021 (2,256) – CCT_1737102_58560
Barclays^ MYR 7,955,300 USD 1,931,742 17/06/2021 (3,508) – CCT_1737102_58391
Barclays^ PEN 3,744,900 USD 1,006,477 17/06/2021 (24,098) (0.01) CCT_1737102_58440
Barclays^ USD 3,405,439 TWD 94,517,960 17/06/2021 (26,909) (0.01) CCT_1737102_58388
Barclays^ USD 4,932,061 RON 20,000,840 17/06/2021 (38,841) (0.01) CCT_1737102_58395
BNP Paribas IDR 30,893,981,990 USD 2,163,208 17/06/2021 (413) – CCT_1737102_58369
BNP Paribas USD 171,506 RUB 12,639,390 17/06/2021 (480) – CCT_1737102_59531
BNP Paribas USD 234,562 CNH 1,500,000 17/06/2021 (631) – CCT_1737102_59594
BNP Paribas USD 1,136,251 RON 4,590,000 17/06/2021 (4,523) – CCT_1737102_58769
BNP Paribas USD 1,318,627 BRL 7,026,030 17/06/2021 (18,591) (0.01) CCT_1737102_59527
BNY Mellon USD 1,216,158 ZAR 16,850,000 17/06/2021 (9,848) – CCT_1737102_59599
Citibank USD 941,740 THB 29,500,000 17/06/2021 (2,674) – CCT_1737102_59652
Citibank USD 1,147,267 THB 36,050,000 17/06/2021 (6,839) – CCT_1737102_59466
Deutsche CLP 206,645,000 USD 288,485 17/06/2021 (2,192) – CCT_1737102_58639
Deutsche USD 666,585 CNH 4,268,720 17/06/2021 (2,729) – CCT_1737102_59559
Deutsche AUD 1,462,880 USD 1,147,572 17/06/2021 (15,160) – CCT_1737102_58378
Goldman Sachs USD 300,322 RUB 22,100,000 17/06/2021 (396) – CCT_1737102_59653
Goldman Sachs USD 1,211,207 KZT 519,002,340 4/06/2021 (424) – CCT_1737102_59606
Goldman Sachs KZT 274,221,700 USD 633,819 11/08/2021 (796) – CCT_1737102_58249
Goldman Sachs USD 228,260 RUB 17,063,220 17/06/2021 (3,921) – CCT_1737102_58551
Goldman Sachs KZT 264,984,700 USD 627,183 4/06/2021 (8,565) – CCT_1737102_54306
Goldman Sachs USD 1,060,799 ZAR 14,820,000 17/06/2021 (17,503) (0.01) CCT_1737102_59457
Goldman Sachs PEN 2,925,060 USD 786,571 17/06/2021 (19,256) (0.01) CCT_1737102_58510
HSBC USD 568,566 RUB 41,825,490 17/06/2021 (559) – CCT_1737102_59564
HSBC USD 161,484 ZAR 2,230,000 17/06/2021 (771) – CCT_1737102_59681
HSBC USD 1,148,089 THB 36,050,000 17/06/2021 (6,017) – CCT_1737102_59465
435

Barclays Multi-Manager Fund PLC Annual Report and Audited Financial Statements 2021
GlobalAccess Emerging Market Local Currency Debt Fund
Fair value USD
% of net assets
Total value of investments 386,421,037 95.52
Cash and cash equivalents* 18,242,751 4.51
Other net liabilities** (111,512) (0.03)
Net assets attributable to holders of redeemable participating shares 404,552,276 100.00
Analysis of total assets (unaudited)% of total
assets
Transferable securities and money market instruments admitted to official stock exchangelisting or traded on a regulated market. 89.15Investment funds and AIFs. 5.27Financial derivative instruments dealt in on a regulated market. 0.01OTC financial derivative instruments. 0.63Other assets. 4.94
100.00
*All cash holdings are held with The Northern Trust Company.**Including GBP 41,327 held with HSBC as security by the counterparty to derivatives contracts.^ Related party.Securities Representing x.xx% of the net assets of the Fund are single broker priced.
The accompanying notes form an integral part of the Financial Statements.
The Industry Classification Benchmark (“ICB”) is jointly owned by FTSE and Dow Jones and has been licensed for use. FTSE and Dow Jones do not accept liability to any person for any loss or damage arising out of any error or omission in ICB.
Schedule of investments as at 31 May 2021 (continued)
Transferable securities admitted to an official stock exchange listing or traded on a regulated market. The percentages in brackets show the equivalent sector holdings at 31 May 2020.
436

Barclays Multi-Manager Fund PLC Annual Report and Audited Financial Statements 2021
GlobalAccess Europe (ex-UK) Alpha Fund
Schedule of investments as at 31 May 2021
Transferable securities admitted to an official stock exchange listing or traded on a regulated market. The percentages in brackets show the equivalent sector holdings at 31 May 2020.
Holdings Financial assets at fair value through profit or loss CurrencyFair value
EUR% of net
assets
Equities: 98.06% (31 May 2020: 98.68%)
Austria: 0.37% (31 May 2020: 1.29%)
Banks: 0.00% (31 May 2020: 0.96%)
Oil & gas: 0.37% (31 May 2020: 0.33%)9,214 OMV AG Com NPV EUR 433,334 0.37
Total Austria 433,334 0.37
Belgium: 0.09% (31 May 2020: 0.23%)
Insurance: 0.09% (31 May 2020: 0.23%)1,951 Ageas Com NPV EUR 104,359 0.09
Total Belgium 104,359 0.09
Denmark: 12.07% (31 May 2020: 11.85%)
Beverages: 1.10% (31 May 2020: 0.76%)3,206 Carlsberg Class B Com DKK20.00 DKK 480,642 0.417,736 Royal Unibrew A/S Com DKK2.00 DKK 817,670 0.69
Computers: 0.77% (31 May 2020: 0.61%)9,617 Netcompany Group A/S DKK1.00 DKK 913,880 0.77
Energy-alternate sources: 1.03% (31 May 2020: 1.04%)38,077 Vestas Wind Systems A/S DKK0.20 DKK 1,213,886 1.03
Food: 0.42% (31 May 2020: 0.48%)6,800 Chr. Hansen Holding A/S Com DKK10.00 DKK 500,949 0.42
Healthcare-products: 2.58% (31 May 2020: 2.90%)32,642 Ambu A/S Com DKK0.50 DKK 995,194 0.84
7,109 Coloplast A/S Class B Com DKK1.00 DKK 918,290 0.7816,263 GN Store Nord A/S Com DKK4.00 DKK 1,129,636 0.96
Insurance: 0.82% (31 May 2020: 0.53%)50,226 Tryg A/S Com DKK5.00 DKK 963,350 0.82
Pharmaceuticals: 2.29% (31 May 2020: 2.74%)41,694 Novo Nordisk A/S Com DKK0.20 DKK 2,703,238 2.29
Software: 0.54% (31 May 2020: 0.75%)5,771 SimCorp A/S Com DKK1.00 DKK 641,246 0.54
Transportation: 2.52% (31 May 2020: 2.04%)14,923 DSV A/S Com DKK1.00 DKK 2,972,634 2.52
Total Denmark 14,250,615 12.07
437
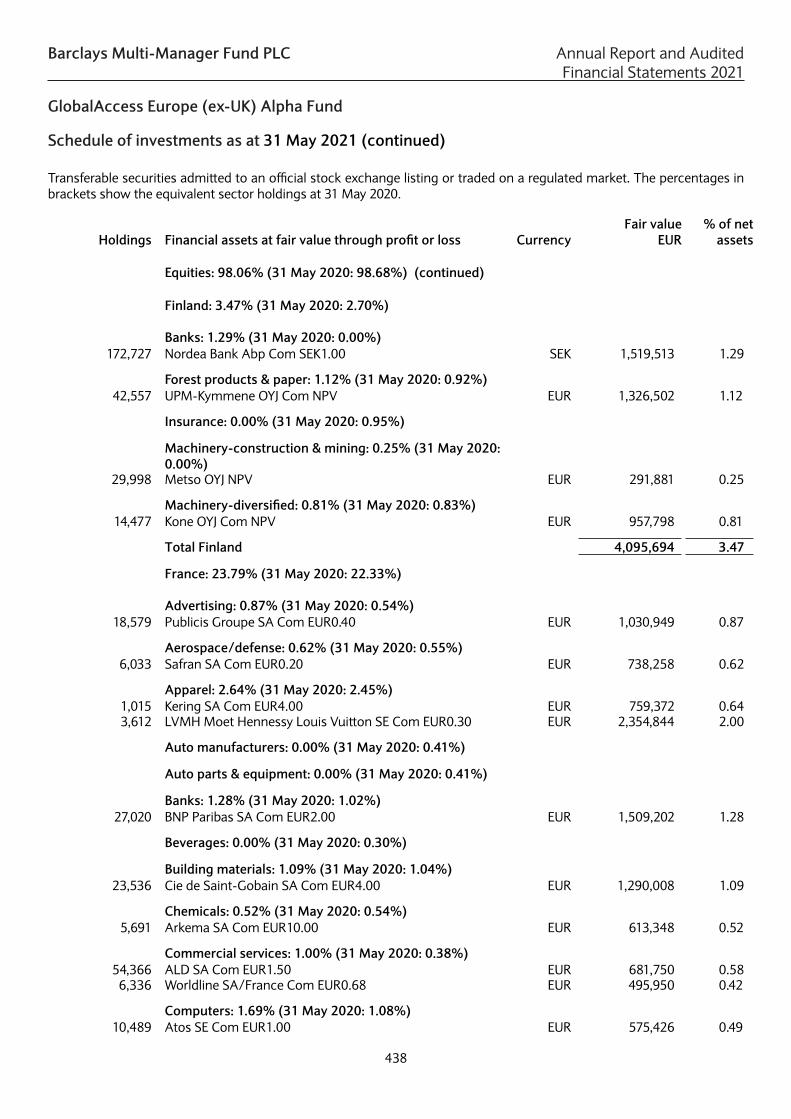
Barclays Multi-Manager Fund PLC Annual Report and Audited Financial Statements 2021
GlobalAccess Europe (ex-UK) Alpha Fund
Holdings Financial assets at fair value through profit or loss Currency Fair value
EUR % of net
assets
Equities: 98.06% (31 May 2020: 98.68%) (continued)
Finland: 3.47% (31 May 2020: 2.70%)
Banks: 1.29% (31 May 2020: 0.00%)172,727 Nordea Bank Abp Com SEK1.00 SEK 1,519,513 1.29
Forest products & paper: 1.12% (31 May 2020: 0.92%)42,557 UPM-Kymmene OYJ Com NPV EUR 1,326,502 1.12
Insurance: 0.00% (31 May 2020: 0.95%)
Machinery-construction & mining: 0.25% (31 May 2020: 0.00%)
29,998 Metso OYJ NPV EUR 291,881 0.25
Machinery-diversified: 0.81% (31 May 2020: 0.83%)14,477 Kone OYJ Com NPV EUR 957,798 0.81
Total Finland 4,095,694 3.47
France: 23.79% (31 May 2020: 22.33%)
Advertising: 0.87% (31 May 2020: 0.54%)18,579 Publicis Groupe SA Com EUR0.40 EUR 1,030,949 0.87
Aerospace/defense: 0.62% (31 May 2020: 0.55%)6,033 Safran SA Com EUR0.20 EUR 738,258 0.62
Apparel: 2.64% (31 May 2020: 2.45%)1,015 Kering SA Com EUR4.00 EUR 759,372 0.643,612 LVMH Moet Hennessy Louis Vuitton SE Com EUR0.30 EUR 2,354,844 2.00
Auto manufacturers: 0.00% (31 May 2020: 0.41%)
Auto parts & equipment: 0.00% (31 May 2020: 0.41%)
Banks: 1.28% (31 May 2020: 1.02%)27,020 BNP Paribas SA Com EUR2.00 EUR 1,509,202 1.28
Beverages: 0.00% (31 May 2020: 0.30%)
Building materials: 1.09% (31 May 2020: 1.04%)23,536 Cie de Saint-Gobain SA Com EUR4.00 EUR 1,290,008 1.09
Chemicals: 0.52% (31 May 2020: 0.54%)5,691 Arkema SA Com EUR10.00 EUR 613,348 0.52
Commercial services: 1.00% (31 May 2020: 0.38%)54,366 ALD SA Com EUR1.50 EUR 681,750 0.58
6,336 Worldline SA/France Com EUR0.68 EUR 495,950 0.42
Computers: 1.69% (31 May 2020: 1.08%)10,489 Atos SE Com EUR1.00 EUR 575,426 0.49
Schedule of investments as at 31 May 2021 (continued)
Transferable securities admitted to an official stock exchange listing or traded on a regulated market. The percentages in brackets show the equivalent sector holdings at 31 May 2020.
438

Barclays Multi-Manager Fund PLC Annual Report and Audited Financial Statements 2021
GlobalAccess Europe (ex-UK) Alpha Fund
Holdings Financial assets at fair value through profit or loss Currency Fair value
EUR % of net
assets
Equities: 98.06% (31 May 2020: 98.68%) (continued) France: 23.79% (31 May 2020: 22.33%) (continued)
Computers: 1.69% (31 May 2020: 1.08%) (continued) 4,567 Capgemini Com EUR8.00 EUR 697,153 0.592,305 Teleperformance SE EUR2.50 EUR 725,499 0.61
Cosmetics/personal care: 1.80% (31 May 2020: 0.82%)5,765 L'Oreal SA Com EUR0.20 EUR 2,122,961 1.80
Electric: 0.63% (31 May 2020: 0.00%)61,349 Engie SA Com EUR1.00 EUR 745,206 0.63
Electrical components & equipment: 0.86% (31 May 2020: 0.93%)
3,954 Legrand SA Com EUR4.00 EUR 338,700 0.295,227 Schneider Electric Com EUR4.00 EUR 676,321 0.57
Engineering & construction: 1.24% (31 May 2020: 2.06%)
15,772 Vinci SA Com EUR2.50 EUR 1,465,850 1.24
Food: 1.08% (31 May 2020: 0.97%)76,304 Carrefour SA Com EUR2.50 EUR 1,275,994 1.08
Healthcare-products: 0.42% (31 May 2020: 0.51%)1,395 Sartorius Stedim Biotech SA Com EUR0.20 EUR 494,597 0.42
Home furnishings: 0.48% (31 May 2020: 0.58%)3,727 SEB SA Com EUR1.00 EUR 567,808 0.48
Insurance: 1.43% (31 May 2020: 1.93%)47,365 AXA SA Com EUR2.29 EUR 1,069,265 0.9123,084 SCOR SE Com EUR7.88 EUR 613,919 0.52
Oil & gas: 1.46% (31 May 2020: 0.96%)45,450 TOTAL SE Com EUR2.50 EUR 1,722,669 1.46
Pharmaceuticals: 2.71% (31 May 2020: 2.86%)36,835 Sanofi Com EUR2.00 EUR 3,203,908 2.71
Software: 0.75% (31 May 2020: 0.81%)4,687 Dassault Systemes Com EUR0.50 EUR 882,328 0.75
Telecommunications: 0.63% (31 May 2020: 1.18%)71,952 Orange SA Com EUR4.00 EUR 748,948 0.63
Water: 0.59% (31 May 2020: 0.00%)27,065 Veolia Environnement SA EUR5.00 EUR 695,300 0.59
Total France 28,095,533 23.79
Schedule of investments as at 31 May 2021 (continued)
Transferable securities admitted to an official stock exchange listing or traded on a regulated market. The percentages in brackets show the equivalent sector holdings at 31 May 2020.
439

Barclays Multi-Manager Fund PLC Annual Report and Audited Financial Statements 2021
GlobalAccess Europe (ex-UK) Alpha Fund
Holdings Financial assets at fair value through profit or loss Currency Fair value
EUR % of net
assets
Equities: 98.06% (31 May 2020: 98.68%) (continued)
Germany: 13.98% (31 May 2020: 15.48%)
Advertising: 0.13% (31 May 2020: 0.12%)2,240 Stroeer SE & Co KGaA Com NPV EUR 150,192 0.13
Aerospace/defense: 0.55% (31 May 2020: 0.48%)3,092 MTU Aero Engines AG Com NPV EUR 652,721 0.55
Apparel: 0.86% (31 May 2020: 0.50%)3,405 adidas AG Com NPV EUR 1,015,882 0.86
Auto manufacturers: 0.58% (31 May 2020: 0.00%)8,979 Daimler AG NPV EUR 683,930 0.58
Chemicals: 0.34% (31 May 2020: 0.68%)3,727 Symrise AG Com NPV EUR 404,566 0.34
Computers: 0.49% (31 May 2020: 0.31%)2,504 Bechtle AG Com NPV EUR 395,069 0.333,758 CANCOM SE NPV EUR 182,507 0.16
Diversified financial services: 0.31% (31 May 2020: 0.45%)
2,727 Deutsche Boerse AG Com NPV EUR 364,600 0.31
Electric: 0.00% (31 May 2020: 0.58%)
Healthcare-products: 0.22% (31 May 2020: 0.00%)1,697 Carl Zeiss Meditec AG NPV EUR 257,392 0.22
Healthcare-services: 0.30% (31 May 2020: 0.66%)7,951 Fresenius SE & Co KGaA Com NPV EUR 350,858 0.30
Home furnishings: 0.17% (31 May 2020: 0.29%)282 Rational AG Com NPV EUR 206,932 0.17
Insurance: 2.12% (31 May 2020: 2.56%)5,446 Allianz SE Com NPV EUR 1,173,341 0.995,642 Muenchener Rueckversicherungs-Gesellschaft AG Com
NPVEUR 1,332,781 1.13
Miscellaneous manufacturing: 0.64% (31 May 2020: 1.14%)
4,238 Knorr-Bremse AG NPV EUR 431,428 0.372,423 Siemens Com NPV EUR 321,387 0.27
Pharmaceuticals: 0.47% (31 May 2020: 0.00%)3,762 Merck Com NPV EUR 555,083 0.47
Real estate: 0.62% (31 May 2020: 0.73%)6,138 LEG Immobilien AG Class A Com NPV EUR 736,713 0.62
Schedule of investments as at 31 May 2021 (continued)
Transferable securities admitted to an official stock exchange listing or traded on a regulated market. The percentages in brackets show the equivalent sector holdings at 31 May 2020.
440

Barclays Multi-Manager Fund PLC Annual Report and Audited Financial Statements 2021
GlobalAccess Europe (ex-UK) Alpha Fund
Holdings Financial assets at fair value through profit or loss Currency Fair value
EUR % of net
assets
Equities: 98.06% (31 May 2020: 98.68%) (continued) Germany: 13.98% (31 May 2020: 15.48%) (continued)
Retail: 0.74% (31 May 2020: 0.80%)10,038 Zalando SE Com NPV EUR 875,615 0.74
Semiconductors: 1.74% (31 May 2020: 1.76%)61,685 Infineon Technologies AG Com NPV EUR 2,052,260 1.74
Software: 1.31% (31 May 2020: 2.37%)7,011 Nemetschek SE Com NPV EUR 424,656 0.369,869 SAP SE Com NPV EUR 1,120,625 0.95
Telecommunications: 1.10% (31 May 2020: 1.08%)76,298 Deutsche Telekom AG Com NPV EUR 1,296,761 1.10
Transportation: 1.29% (31 May 2020: 0.97%)27,415 Deutsche Post AG Com NPV EUR 1,529,757 1.29
Total Germany 16,515,056 13.98
Ireland: 3.47% (31 May 2020: 4.58%)
Airlines: 0.57% (31 May 2020: 1.24%)40,101 Ryanair Holdings PLC Com EUR0.006 EUR 677,606 0.57
Building materials: 1.64% (31 May 2020: 1.59%)14,779 CRH PLC Com EUR0.32 EUR 629,290 0.5316,794 Kingspan Group PLC Com EUR0.13 EUR 1,312,115 1.11
Food: 0.64% (31 May 2020: 0.73%)6,760 Kerry Group PLC Class A Com EUR0.125 EUR 752,219 0.64
Oil & gas: 0.62% (31 May 2020: 1.02%)10,426 DCC PLC Com EUR0.25 GBP 726,573 0.62
Total Ireland 4,097,803 3.47
Italy: 4.59% (31 May 2020: 5.53%)
Aerospace/defense: 0.00% (31 May 2020: 0.26%)
Banks: 1.15% (31 May 2020: 2.07%)45,924 Banca Mediolanum SpA Com EUR0.10 EUR 371,984 0.3293,554 UniCredit SpA Com NPV EUR 982,411 0.83
Electric: 1.67% (31 May 2020: 1.81%)244,740 Enel SpA Com EUR1.00 EUR 1,971,993 1.67
Engineering & construction: 0.30% (31 May 2020: 0.33%)
90,421 Enav SpA Com NPV EUR 357,886 0.30
Schedule of investments as at 31 May 2021 (continued)
Transferable securities admitted to an official stock exchange listing or traded on a regulated market. The percentages in brackets show the equivalent sector holdings at 31 May 2020.
441

Barclays Multi-Manager Fund PLC Annual Report and Audited Financial Statements 2021
GlobalAccess Europe (ex-UK) Alpha Fund
Holdings Financial assets at fair value through profit or loss Currency Fair value
EUR % of net
assets
Equities: 98.06% (31 May 2020: 98.68%) (continued) Italy: 4.59% (31 May 2020: 5.53%) (continued)
Home furnishings: 0.26% (31 May 2020: 0.24%)8,387 De'Longhi SpA Com EUR1.50 EUR 306,377 0.26
Pharmaceuticals: 0.65% (31 May 2020: 0.53%)19,837 Amplifon SpA Com EUR0.02 EUR 772,254 0.65
Telecommunications: 0.56% (31 May 2020: 0.29%)1,407,586 Telecom Italia SpA Com NPV EUR 659,665 0.56
Total Italy 5,422,570 4.59
Luxembourg: 0.64% (31 May 2020: 0.22%)
Iron/steel: 0.64% (31 May 2020: 0.22%)28,333 ArcelorMittal Com NPV EUR 762,441 0.64
Total Luxembourg 762,441 0.64
Netherlands: 6.78% (31 May 2020: 4.50%)
Auto manufacturers: 0.63% (31 May 2020: 0.00%)45,549 Stellantis NV Com EUR0.01 EUR 740,308 0.63
Banks: 1.03% (31 May 2020: 0.94%)107,728 ING Groep NV Com EUR0.01 EUR 1,221,851 1.03
Chemicals: 0.63% (31 May 2020: 0.00%)4,906 Koninklijke DSM NV EUR1.50 EUR 739,457 0.63
Commercial services: 0.34% (31 May 2020: 0.00%)214 Adyen NV EUR0.01 EUR 404,588 0.34
Computers: 0.00% (31 May 2020: 0.15%)
Cosmetics/personal care: 0.00% (31 May 2020: 0.65%)
Food: 0.38% (31 May 2020: 0.00%)18,980 Koninklijke Ahold Delhaize NV Com EUR0.01 EUR 448,735 0.38
Semiconductors: 3.77% (31 May 2020: 2.76%)6,918 ASML Holding NV Com EUR0.09 EUR 3,785,184 3.20
10,014 BE Semiconductor Industries NV Com EUR0.01 EUR 668,234 0.57
Total Netherlands 8,008,357 6.78
Norway: 1.28% (31 May 2020: 1.46%)
Chemicals: 0.48% (31 May 2020: 0.26%)12,934 Yara International ASA Com NOK 1.70 NOK 565,666 0.48
Schedule of investments as at 31 May 2021 (continued)
Transferable securities admitted to an official stock exchange listing or traded on a regulated market. The percentages in brackets show the equivalent sector holdings at 31 May 2020.
442

Barclays Multi-Manager Fund PLC Annual Report and Audited Financial Statements 2021
GlobalAccess Europe (ex-UK) Alpha Fund
Holdings Financial assets at fair value through profit or loss Currency Fair value
EUR % of net
assets
Equities: 98.06% (31 May 2020: 98.68%) (continued) Norway: 1.28% (31 May 2020: 1.46%) (continued)
Insurance: 0.80% (31 May 2020: 0.58%)51,634 Gjensidige Forsikring ASA Com NOK2.00 NOK 948,004 0.80
Oil & gas: 0.00% (31 May 2020: 0.62%)
Total Norway 1,513,670 1.28
Portugal: 2.05% (31 May 2020: 2.56%)
Electric: 2.03% (31 May 2020: 2.38%)509,243 EDP - Energias de Portugal SA Com EUR1.00 EUR 2,395,225 2.03
Food: 0.02% (31 May 2020: 0.18%)27,644 Sonae SGPS SA Com EUR1.00 EUR 21,652 0.02
Total Portugal 2,416,877 2.05
Spain: 5.10% (31 May 2020: 5.32%)
Banks: 0.99% (31 May 2020: 0.86%)414,643 CaixaBank SA Com EUR1.00 EUR 1,164,525 0.99
Electric: 1.96% (31 May 2020: 1.20%)43,187 Endesa SA EUR1.20 EUR 963,286 0.82
122,861 Iberdrola SA Com EUR0.75 EUR 1,351,164 1.14
Engineering & construction: 0.43% (31 May 2020: 0.30%)
3,642 Acciona SA Com EUR1.00 EUR 503,142 0.43
Oil & gas: 0.83% (31 May 2020: 0.98%)89,944 Repsol SA Com EUR1.00 EUR 982,728 0.83
Retail: 0.34% (31 May 2020: 0.56%)12,742 Inditex SA Com EUR0.03 EUR 403,858 0.34
Software: 0.32% (31 May 2020: 0.50%)6,218 Amadeus IT Holding SA Com EUR0.01 EUR 383,961 0.32
Telecommunications: 0.23% (31 May 2020: 0.92%)68,867 Telefonica SA Com EUR1.00 EUR 276,863 0.23
Total Spain 6,029,527 5.10
Sweden: 7.02% (31 May 2020: 7.31%)
Auto manufacturers: 0.00% (31 May 2020: 0.90%)
Schedule of investments as at 31 May 2021 (continued)
Transferable securities admitted to an official stock exchange listing or traded on a regulated market. The percentages in brackets show the equivalent sector holdings at 31 May 2020.
443

Barclays Multi-Manager Fund PLC Annual Report and Audited Financial Statements 2021
GlobalAccess Europe (ex-UK) Alpha Fund
Holdings Financial assets at fair value through profit or loss Currency Fair value
EUR % of net
assets
Equities: 98.06% (31 May 2020: 98.68%) (continued) Sweden: 7.02% (31 May 2020: 7.31%) (continued)
Distribution/wholesale: 0.33% (31 May 2020: 0.30%)27,891 AddTech AB Com SEK0.75 SEK 383,766 0.33
Electronics: 1.38% (31 May 2020: 0.83%)64,623 Assa Abloy AB Com SEK1.00 SEK 1,632,393 1.38
Hand/machine tools: 0.52% (31 May 2020: 0.46%)28,433 Sandvik AB Com SEK1.20 SEK 615,160 0.52
Healthcare-products: 0.16% (31 May 2020: 0.19%)15,453 Elekta AB Com SEK0.50 SEK 186,561 0.16
Leisure time: 0.47% (31 May 2020: 0.31%)14,301 Thule Group AB Com SEK0.01 SEK 548,994 0.47
Machinery-construction & mining: 1.54% (31 May 2020: 1.96%)
19,268 Atlas Copco AB Class A Com SEK0.639 SEK 958,605 0.8146,597 Epiroc AB Class A NPV SEK 863,026 0.73
Machinery-diversified: 0.76% (31 May 2020: 0.81%)77,096 Hexagon AB NPV SEK 903,202 0.76
Miscellaneous manufacturing: 0.69% (31 May 2020: 0.37%)
12,581 Alfa Laval AB NPV SEK 388,283 0.3342,054 Hexpol AB Com SEK0.20 SEK 431,700 0.36
Telecommunications: 1.17% (31 May 2020: 1.18%)124,514 Tele2 AB Com SEK1.25 SEK 1,376,433 1.17
Total Sweden 8,288,123 7.02
Switzerland: 13.36% (31 May 2020: 13.32%)
Building materials: 1.90% (31 May 2020: 1.78%)8,536 Sika AG Com CHF0.01 CHF 2,245,416 1.90
Chemicals: 1.95% (31 May 2020: 0.85%)115 Givaudan SA CHF10.00 CHF 419,854 0.35
3,584 Lonza Group AG Com CHF1.00 CHF 1,886,864 1.60
Commercial services: 0.44% (31 May 2020: 0.55%)9,170 Adecco Group AG Com CHF0.10 CHF 517,214 0.44
Diversified financial services: 1.48% (31 May 2020: 1.48%)
4,788 Cembra Money Bank AG Com CHF1.00 CHF 444,797 0.381,046 Partners Group Holding AG Com CHF0.01 CHF 1,299,901 1.10
Schedule of investments as at 31 May 2021 (continued)
Transferable securities admitted to an official stock exchange listing or traded on a regulated market. The percentages in brackets show the equivalent sector holdings at 31 May 2020.
444

Barclays Multi-Manager Fund PLC Annual Report and Audited Financial Statements 2021
GlobalAccess Europe (ex-UK) Alpha Fund
Holdings Financial assets at fair value through profit or loss Currency Fair value
EUR % of net
assets
Equities: 98.06% (31 May 2020: 98.68%) (continued)
Switzerland: 13.36% (31 May 2020: 13.32%) (continued)
Food: 1.65% (31 May 2020: 1.62%)
60 Chocoladefabriken Lindt & Spruengli AG Com CHF10.00 CHF 468,038 0.4014,667 Nestle SA Com CHF0.10 CHF 1,476,450 1.25
Insurance: 1.09% (31 May 2020: 0.93%)3,787 Zurich Insurance Group AG Com CHF0.10 CHF 1,293,398 1.09
Machinery-diversified: 0.35% (31 May 2020: 0.46%)2,271 Kardex AG Com CHF4.05 CHF 416,677 0.35
Metal fabricate/hardware: 0.81% (31 May 2020: 0.90%)3,799 VAT Group AG Com CHF0.10 CHF 954,250 0.81
Pharmaceuticals: 2.52% (31 May 2020: 3.97%)18,214 Novartis AG Com CHF0.50 CHF 1,307,341 1.115,849 Roche Holding AG Com NPV CHF 1,663,597 1.41
Retail: 0.46% (31 May 2020: 0.00%)1,832 Swatch Group AG CHF2.25 CHF 542,724 0.46
Software: 0.71% (31 May 2020: 0.78%)6,702 Temenos AG Com CHF5.00 CHF 844,005 0.71
Total Switzerland 15,780,526 13.36
Total equities 115,814,485 98.06
Investment funds: 0.79% (31 May 2020: 0.64%)
Ireland: 0.79% (31 May 2020: 0.64%)
9,498 BlackRock Institutional Euro Assets Liquidity Fund Agency Inc
EUR 938,832 0.79
Total investment funds 938,832 0.79
Forward currency contracts: -0.02% (31 May 2020: -0.13%)
Counterparty Cncy Buys Cncy SellsMaturity
dateUnrealised
gain% of net
assetsEUR
UBS GBP 2,161,323 EUR 2,509,483 17/06/2021 2,767 0.01 CCT_1769385_182281
UBS GBP 860,512 EUR 999,130 17/06/2021 1,102 – CCT_1769385_182288
UBS GBP 586,207 EUR 680,637 17/06/2021 751 – CCT_1769385_182294
UBS GBP 415,802 EUR 482,782 17/06/2021 532 – CCT_1769385_182296
Schedule of investments as at 31 May 2021 (continued)
Transferable securities admitted to an official stock exchange listing or traded on a regulated market. The percentages in brackets show the equivalent sector holdings at 31 May 2020.
445

Barclays Multi-Manager Fund PLC Annual Report and Audited Financial Statements 2021
GlobalAccess Europe (ex-UK) Alpha Fund
Forward currency contracts: -0.02% (31 May 2020: -0.13%) (continued)
Counterparty Cncy Buys Cncy SellsMaturity
date
Unrealised gain
% of net assets
EUR UBS GBP 98,955 EUR 114,895 17/06/2021 127 – CCT_1769385_182280
UBS GBP 95,503 EUR 110,887 17/06/2021 122 – CCT_1769385_182285
UBS EUR 82,441 GBP 70,922 17/06/2021 4 – CCT_1769385_182133
Total fair value gains on forward currency contracts 5,405 0.01
Counterparty Cncy Buys Cncy SellsMaturity
dateUnrealised
loss% of net
assetsEUR
UBS GBP 997 EUR 1,159 17/06/2021 – – CCT_1769385_182543
UBS EUR 11,969 GBP 10,403 17/06/2021 (123) – CCT_1769385_182020
UBS EUR 248,598 GBP 214,052 17/06/2021 (208) – CCT_1769385_182767
UBS USD 90,149 EUR 74,677 17/06/2021 (963) – CCT_1769385_182278
UBS USD 845,021 EUR 699,989 17/06/2021 (9,024) (0.01) CCT_1769385_182291
UBS USD 913,227 EUR 756,488 17/06/2021 (9,752) (0.01) CCT_1769385_182292
UBS USD 1,063,720 EUR 881,152 17/06/2021 (11,359) (0.01) CCT_1769385_182297
Total fair value losses on forward currency contracts (31,429) (0.03)
Total forward currency contracts (26,024) (0.02)
Fair value EUR
% of net assets
Total value of investments 116,727,293 98.83
Cash and cash equivalents* 2,358,091 2.00
Other net liabilities** (978,569) (0.83)
Net assets attributable to holders of redeemable participating shares 118,106,815 100.00
Analysis of total assets (unaudited)% of total
assets
Transferable securities and money market instruments admitted to official stock exchangelisting or traded on a regulated market. 97.13Investment funds and AIFs. 0.79Other assets. 2.08
100.00
*All cash holdings are held with The Northern Trust Company.**Including EUR 929 held with Goldman Sachs as security by the counterparty to derivatives contracts. The accompanying notes form an integral part of the Financial Statements.
Schedule of investments as at 31 May 2021 (continued)
Transferable securities admitted to an official stock exchange listing or traded on a regulated market. The percentages in brackets show the equivalent sector holdings at 31 May 2020.
446

Barclays Multi-Manager Fund PLC Annual Report and Audited Financial Statements 2021
GlobalAccess Europe (ex-UK) Alpha Fund
The Industry Classification Benchmark (“ICB”) is jointly owned by FTSE and Dow Jones and has been licensed for use. FTSE and Dow Jones do not accept liability to any person for any loss or damage arising out of any error or omission in ICB.
Schedule of investments as at 31 May 2021 (continued)
Transferable securities admitted to an official stock exchange listing or traded on a regulated market. The percentages in brackets show the equivalent sector holdings at 31 May 2020.
Forward currency contracts: -0.02% (31 May 2020: -0.13%) (continued)
Counterparty Cncy Buys Cncy SellsMaturity
date
Unrealised gain
% of net assets
EUR UBS GBP 98,955 EUR 114,895 17/06/2021 127 – CCT_1769385_182280
UBS GBP 95,503 EUR 110,887 17/06/2021 122 – CCT_1769385_182285
UBS EUR 82,441 GBP 70,922 17/06/2021 4 – CCT_1769385_182133
Total fair value gains on forward currency contracts 5,405 0.01
Counterparty Cncy Buys Cncy SellsMaturity
dateUnrealised
loss% of net
assetsEUR
UBS GBP 997 EUR 1,159 17/06/2021 – – CCT_1769385_182543
UBS EUR 11,969 GBP 10,403 17/06/2021 (123) – CCT_1769385_182020
UBS EUR 248,598 GBP 214,052 17/06/2021 (208) – CCT_1769385_182767
UBS USD 90,149 EUR 74,677 17/06/2021 (963) – CCT_1769385_182278
UBS USD 845,021 EUR 699,989 17/06/2021 (9,024) (0.01) CCT_1769385_182291
UBS USD 913,227 EUR 756,488 17/06/2021 (9,752) (0.01) CCT_1769385_182292
UBS USD 1,063,720 EUR 881,152 17/06/2021 (11,359) (0.01) CCT_1769385_182297
Total fair value losses on forward currency contracts (31,429) (0.03)
Total forward currency contracts (26,024) (0.02)
Fair value EUR
% of net assets
Total value of investments 116,727,293 98.83
Cash and cash equivalents* 2,358,091 2.00
Other net liabilities** (978,569) (0.83)
Net assets attributable to holders of redeemable participating shares 118,106,815 100.00
Analysis of total assets (unaudited)% of total
assets
Transferable securities and money market instruments admitted to official stock exchangelisting or traded on a regulated market. 97.13Investment funds and AIFs. 0.79Other assets. 2.08
100.00
*All cash holdings are held with The Northern Trust Company.**Including EUR 929 held with Goldman Sachs as security by the counterparty to derivatives contracts. The accompanying notes form an integral part of the Financial Statements.
447

Barclays Multi-Manager Fund PLC Annual Report and Audited Financial Statements 2021
GlobalAccess Japan Fund
Schedule of investments as at 31 May 2021
Transferable securities admitted to an official stock exchange listing or traded on a regulated market. The percentages in brackets show the equivalent sector holdings at 31 May 2020.
Holdings Financial assets at fair value through profit or loss CurrencyFair value
JPY% of net
assets
Equities: 95.55% (31 May 2020: 94.89%)
Japan: 95.55% (31 May 2020: 94.89%)
Advertising: 0.58% (31 May 2020: 0.44%)37,200 Digital Garage Inc Com NPV JPY 166,842,000 0.58
Aerospace/defense: 0.00% (31 May 2020: 0.14%)
Auto manufacturers: 4.23% (31 May 2020: 3.96%)154,300 Isuzu Motors Ltd Com NPV JPY 222,654,900 0.77110,000 Mazda Motor Corp Com NPV JPY 102,795,000 0.3656,500 Subaru Corp Com NPV JPY 120,316,750 0.4284,500 Toyota Motor Corp Com NPV JPY 769,837,250 2.68
Auto parts & equipment: 4.29% (31 May 2020: 2.90%)104,500 Bridgestone Corp Com NPV JPY 502,227,000 1.75
35,200 Denso Corp Com NPV JPY 264,228,800 0.9226,600 Koito Manufacturing Co Ltd Com NPV JPY 189,126,000 0.6679,200 NGK Spark Plug Co Ltd Com NPV JPY 136,382,400 0.4714,900 Toyota Industries Corp Com NPV JPY 139,315,000 0.49
Banks: 3.23% (31 May 2020: 2.76%)127,400 AEON Financial Service Co Ltd Com NPV JPY 162,243,900 0.57129,200 Sumitomo Mitsui Financial Group Inc Com NPV JPY 510,663,000 1.78
67,400 Sumitomo Mitsui Trust Holdings Inc Com NPV JPY 254,131,700 0.88
Beverages: 1.18% (31 May 2020: 1.07%)65,000 Asahi Group Holdings Ltd Com NPV JPY 339,105,000 1.18
Building materials: 2.37% (31 May 2020: 1.17%)49,700 AGC Inc Com NPV JPY 237,814,500 0.8388,500 Nichias Corp Com NPV JPY 241,118,250 0.8434,000 TOTO Ltd Com NPV JPY 200,600,000 0.70
Chemicals: 2.22% (31 May 2020: 2.28%)39,200 Aica Kogyo Co Ltd Com NPV JPY 152,684,000 0.5325,600 JSR Corp Com NPV JPY 82,560,000 0.2960,700 Nippon Soda Co Ltd Com NPV JPY 203,193,250 0.7125,600 NOF Corp Com NPV JPY 145,024,000 0.50
1,400 SK Kaken Co Ltd Com NPV JPY 55,685,000 0.19
Commercial services: 3.80% (31 May 2020: 2.68%)77,700 Park24 Co Ltd Com NPV JPY 177,505,650 0.62
164,700 Recruit Holdings Co Ltd Com NPV JPY 914,661,450 3.18
Computers: 3.65% (31 May 2020: 4.49%)81,800 Nomura Research Institute Ltd Com NPV JPY 285,482,000 0.9971,300 Otsuka Corp Com NPV JPY 417,818,000 1.4518,500 TDK Corp Com NPV JPY 257,797,500 0.9037,100 WingArc1st Inc JPY1.00 JPY 88,780,300 0.31
448

Barclays Multi-Manager Fund PLC Annual Report and Audited Financial Statements 2021
GlobalAccess Japan Fund
Holdings Financial assets at fair value through profit or loss Currency Fair value
JPY % of net
assets
Equities: 95.55% (31 May 2020: 94.89%) (continued) Japan: 95.55% (31 May 2020: 94.89%) (continued)
Cosmetics/personal care: 3.10% (31 May 2020: 2.12%)28,800 Kao Corp Com NPV JPY 192,844,800 0.6711,100 Kose Corp Com NPV JPY 190,698,000 0.6627,300 Mandom Corp NPV JPY 52,416,000 0.1827,900 Shiseido Co Ltd Com NPV JPY 221,135,400 0.7754,200 Unicharm Corp Com NPV JPY 234,225,300 0.82
Distribution/wholesale: 4.95% (31 May 2020: 5.34%)89,800 ITOCHU Corp Com NPV JPY 291,850,000 1.0258,800 Mitsubishi Corp Com NPV JPY 175,444,500 0.61
130,600 Mitsui & Co Ltd Com NPV JPY 315,431,650 1.1036,500 Paltac Corporation Com NPV JPY 211,335,000 0.7349,000 Toyota Tsusho Corp Com NPV JPY 240,345,000 0.8467,700 Trusco Nakayama Corp Com NPV JPY 186,310,400 0.65
Diversified financial services: 1.89% (31 May 2020: 2.77%)
100,000 Japan Exchange Group Inc Com NPV JPY 253,050,000 0.88149,600 ORIX Corp Com NPV JPY 289,139,400 1.01
Electrical components & equipment: 1.07% (31 May 2020: 1.05%)
24,600 Nidec Corp Com NPV JPY 308,238,000 1.07
Electronics: 7.02% (31 May 2020: 6.89%)27,700 Hoya Corp Com NPV JPY 397,495,000 1.3856,100 Ibiden Co Ltd Com NPV JPY 284,988,000 0.998,800 Keyence Corp Com NPV JPY 473,924,000 1.65
80,400 Murata Manufacturing Co Ltd Com NPV JPY 665,872,800 2.3236,500 Yaskawa Electric Corp Com NPV JPY 193,632,500 0.68
Engineering & construction: 0.79% (31 May 2020: 1.97%)
60,900 Nippon Densetsu Kogyo Co Ltd Com NPV JPY 108,858,750 0.3886,300 Sanki Engineering Co Ltd Com NPV JPY 119,439,200 0.41
Entertainment: 0.61% (31 May 2020: 0.00%)38,400 Toho Co Ltd/Tokyo Com NPV JPY 174,144,000 0.61
Environmental control: 0.81% (31 May 2020: 0.84%)66,000 Asahi Holdings Inc Com NPV JPY 157,641,000 0.5536,900 METAWATER Co Ltd Com NPV JPY 74,427,300 0.26
Food: 1.17% (31 May 2020: 1.41%)70,940 Seven & i Holdings Co Ltd Com NPV JPY 335,900,900 1.17
Hand/machine tools: 5.69% (31 May 2020: 5.59%)201,600 Amada Co Ltd NPV JPY 234,763,200 0.82
Schedule of investments as at 31 May 2021 (continued)
Transferable securities admitted to an official stock exchange listing or traded on a regulated market. The percentages in brackets show the equivalent sector holdings at 31 May 2020.
449
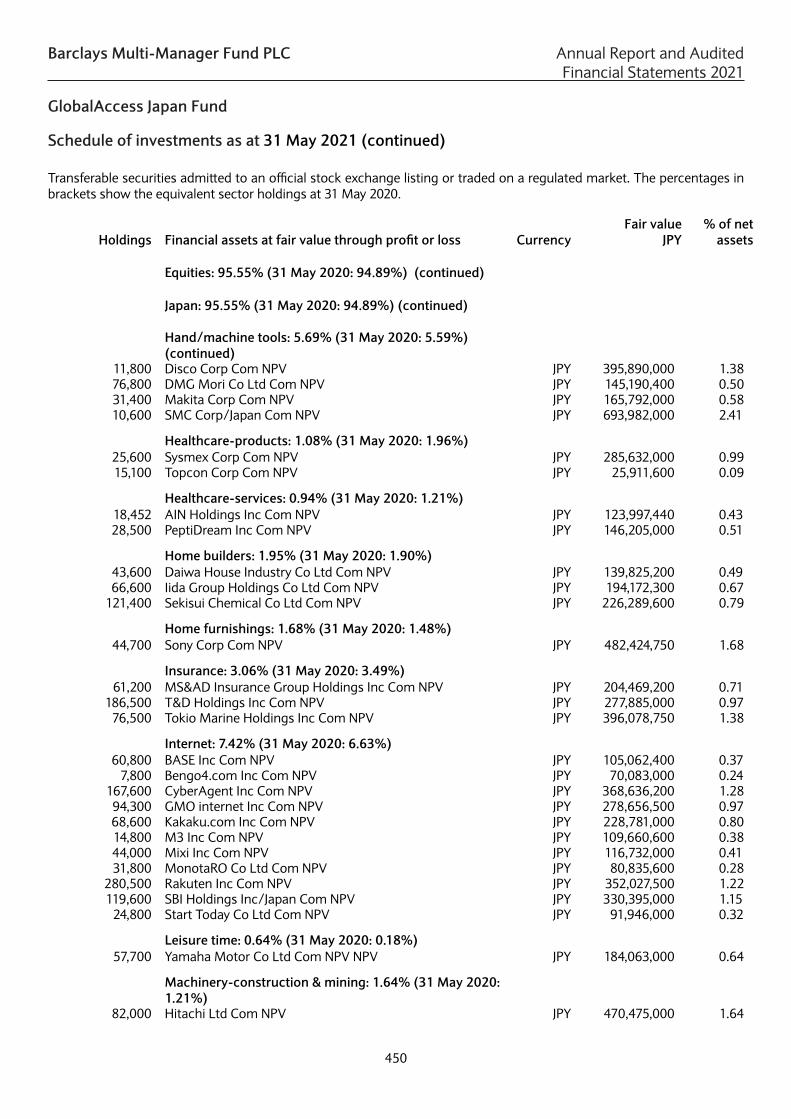
Barclays Multi-Manager Fund PLC Annual Report and Audited Financial Statements 2021
GlobalAccess Japan Fund
Holdings Financial assets at fair value through profit or loss Currency Fair value
JPY % of net
assets
Equities: 95.55% (31 May 2020: 94.89%) (continued) Japan: 95.55% (31 May 2020: 94.89%) (continued)
Hand/machine tools: 5.69% (31 May 2020: 5.59%) (continued)
11,800 Disco Corp Com NPV JPY 395,890,000 1.3876,800 DMG Mori Co Ltd Com NPV JPY 145,190,400 0.5031,400 Makita Corp Com NPV JPY 165,792,000 0.5810,600 SMC Corp/Japan Com NPV JPY 693,982,000 2.41
Healthcare-products: 1.08% (31 May 2020: 1.96%)25,600 Sysmex Corp Com NPV JPY 285,632,000 0.9915,100 Topcon Corp Com NPV JPY 25,911,600 0.09
Healthcare-services: 0.94% (31 May 2020: 1.21%)18,452 AIN Holdings Inc Com NPV JPY 123,997,440 0.4328,500 PeptiDream Inc Com NPV JPY 146,205,000 0.51
Home builders: 1.95% (31 May 2020: 1.90%)43,600 Daiwa House Industry Co Ltd Com NPV JPY 139,825,200 0.4966,600 Iida Group Holdings Co Ltd Com NPV JPY 194,172,300 0.67
121,400 Sekisui Chemical Co Ltd Com NPV JPY 226,289,600 0.79
Home furnishings: 1.68% (31 May 2020: 1.48%)44,700 Sony Corp Com NPV JPY 482,424,750 1.68
Insurance: 3.06% (31 May 2020: 3.49%)61,200 MS&AD Insurance Group Holdings Inc Com NPV JPY 204,469,200 0.71
186,500 T&D Holdings Inc Com NPV JPY 277,885,000 0.9776,500 Tokio Marine Holdings Inc Com NPV JPY 396,078,750 1.38
Internet: 7.42% (31 May 2020: 6.63%)60,800 BASE Inc Com NPV JPY 105,062,400 0.37
7,800 Bengo4.com Inc Com NPV JPY 70,083,000 0.24167,600 CyberAgent Inc Com NPV JPY 368,636,200 1.2894,300 GMO internet Inc Com NPV JPY 278,656,500 0.9768,600 Kakaku.com Inc Com NPV JPY 228,781,000 0.8014,800 M3 Inc Com NPV JPY 109,660,600 0.3844,000 Mixi Inc Com NPV JPY 116,732,000 0.4131,800 MonotaRO Co Ltd Com NPV JPY 80,835,600 0.28
280,500 Rakuten Inc Com NPV JPY 352,027,500 1.22119,600 SBI Holdings Inc/Japan Com NPV JPY 330,395,000 1.15
24,800 Start Today Co Ltd Com NPV JPY 91,946,000 0.32
Leisure time: 0.64% (31 May 2020: 0.18%)57,700 Yamaha Motor Co Ltd Com NPV NPV JPY 184,063,000 0.64
Machinery-construction & mining: 1.64% (31 May 2020: 1.21%)
82,000 Hitachi Ltd Com NPV JPY 470,475,000 1.64
Schedule of investments as at 31 May 2021 (continued)
Transferable securities admitted to an official stock exchange listing or traded on a regulated market. The percentages in brackets show the equivalent sector holdings at 31 May 2020.
450

Barclays Multi-Manager Fund PLC Annual Report and Audited Financial Statements 2021
GlobalAccess Japan Fund
Holdings Financial assets at fair value through profit or loss Currency Fair value
JPY % of net
assets
Equities: 95.55% (31 May 2020: 94.89%) (continued) Japan: 95.55% (31 May 2020: 94.89%) (continued)
Machinery-diversified: 3.67% (31 May 2020: 2.98%)10,300 FANUC Corp Com NPV JPY 270,709,750 0.9428,800 Hosokawa Micron Corp Com NPV JPY 173,664,000 0.60
145,400 Kubota Corp Com NPV JPY 361,609,800 1.2634,300 Nabtesco Corp Com NPV JPY 172,014,500 0.6061,200 Rheon Automatic Machinery Co Ltd Com NPV JPY 77,815,800 0.27
Metal fabricate/hardware: 0.82% (31 May 2020: 0.87%)66,800 MISUMI Group Inc Com NPV JPY 234,969,000 0.82
Mining: 0.53% (31 May 2020: 0.42%)30,900 Sumitomo Metal Mining Co Ltd Com NPV JPY 151,549,050 0.53
Miscellaneous manufacturing: 1.26% (31 May 2020: 1.24%)
37,600 Fukushima Galilei Co Ltd Com NPV JPY 158,484,000 0.5527,200 Glory Ltd Com NPV JPY 61,200,000 0.2122,500 Kureha Corp Com NPV JPY 143,100,000 0.50
Oil & gas: 1.24% (31 May 2020: 1.52%)218,900 Inpex Corp Com NPV JPY 164,831,700 0.57421,800 JXTG Holdings Inc Com NPV JPY 190,885,590 0.67
Pharmaceuticals: 3.41% (31 May 2020: 3.63%)212,300 Astellas Pharma Inc Com NPV JPY 381,503,100 1.33
18,400 Sawai Group Holdings Co Ltd NPV JPY 87,860,000 0.3172,100 Ship Healthcare Holdings Inc Com NPV JPY 186,486,650 0.6586,800 Takeda Pharmaceutical Co Ltd Com NPV JPY 322,765,800 1.12
Real estate: 1.99% (31 May 2020: 1.73%)9,200 Daito Trust Construction Co Ltd Com NPV JPY 105,984,000 0.37
76,300 Mitsubishi Estate Co Ltd Com NPV JPY 135,318,050 0.47130,200 Mitsui Fudosan Co Ltd Com NPV JPY 331,684,500 1.15
Retail: 1.54% (31 May 2020: 2.80%)47,600 AT-Group Co Ltd Com NPV JPY 73,327,800 0.255,900 Nitori Holdings Co Ltd Com NPV JPY 111,967,250 0.39
119,300 Pan Pacific International Holdings Corp Com NPV JPY 257,210,800 0.90
Semiconductors: 0.62% (31 May 2020: 0.95%)17,100 Rohm Co Ltd Com NPV JPY 177,241,500 0.62
Software: 1.27% (31 May 2020: 0.49%)15,200 Freee KK Com NPV JPY 125,552,000 0.4440,600 Mercari Inc Com NPV JPY 210,511,000 0.7317,500 Miroku Jyoho Service Co Ltd NPV JPY 27,965,000 0.10
Schedule of investments as at 31 May 2021 (continued)
Transferable securities admitted to an official stock exchange listing or traded on a regulated market. The percentages in brackets show the equivalent sector holdings at 31 May 2020.
451

Barclays Multi-Manager Fund PLC Annual Report and Audited Financial Statements 2021
GlobalAccess Japan Fund
Holdings Financial assets at fair value through profit or loss Currency Fair value
JPY % of net
assets
Equities: 95.55% (31 May 2020: 94.89%) (continued) Japan: 95.55% (31 May 2020: 94.89%) (continued)
Telecommunications: 5.06% (31 May 2020: 5.68%)92,800 KDDI Corp Com NPV JPY 344,891,200 1.20
171,400 Nippon Telegraph & Telephone Corp Com NPV JPY 502,287,700 1.7573,600 SoftBank Group Corp Com NPV JPY 607,825,600 2.11
Toys/games/hobbies: 1.48% (31 May 2020: 1.33%)25,700 Bandai Namco Holdings Inc Com NPV JPY 201,616,500 0.70
3,300 Nintendo Co Ltd Com NPV JPY 223,360,500 0.78
Transportation: 1.60% (31 May 2020: 3.32%)21,700 East Japan Railway Co Com NPV JPY 166,026,700 0.5839,200 Hitachi Transport System Ltd Com NPV JPY 136,808,000 0.4832,900 Sankyu Inc Com NPV JPY 155,863,750 0.54
Total Japan 27,450,132,330 95.55
Total equities 27,450,132,330 95.55
No. of contracts Futures contracts: 0.00% (31 May 2020: 0.12%) CounterpartyUnrealised gain/(loss)
% of net assets
JPY15 OSE TOPIX Index Future June 2021 Goldman Sachs 4,200,000 0.01
Total fair value gains on open futures contracts 4,200,000 0.01
10 OSE TOPIX Index Future June 2021 Goldman Sachs (3,465,000) (0.01) DUMMY_01
Total fair value losses on open futures contracts (3,465,000) (0.01)
Total futures contracts 735,000 –
Forward currency contracts: 0.01% (31 May 2020: 0.04%)
Counterparty Cncy Buys Cncy SellsMaturity
dateUnrealised
gain% of net
assetsJPY
Barclays^ EUR 32,360 JPY 4,279,249 17/06/2021 49,634 – CCT_1769391_181916
Barclays^ EUR 32,124 JPY 4,283,472 17/06/2021 13,820 – CCT_1769391_182740
Barclays^ EUR 6,420 JPY 848,918 17/06/2021 9,847 – CCT_1769391_181915
Barclays^ GBP 5,421 JPY 833,418 17/06/2021 9,474 – CCT_1769391_181922
Barclays^ GBP 5,369 JPY 826,067 17/06/2021 8,823 – CCT_1769391_182749
Barclays^ USD 9,156 JPY 995,280 17/06/2021 6,263 – CCT_1769391_181918
Barclays^ USD 6,528 JPY 709,581 17/06/2021 4,466 – CCT_1769391_181912
Barclays^ USD 9,029 JPY 983,724 17/06/2021 3,916 – CCT_1769391_182739
Barclays^ EUR 1,920 JPY 253,873 17/06/2021 2,945 – CCT_1769391_181910
Barclays^ USD 6,452 JPY 702,962 17/06/2021 2,799 – CCT_1769391_182744
Schedule of investments as at 31 May 2021 (continued)
Transferable securities admitted to an official stock exchange listing or traded on a regulated market. The percentages in brackets show the equivalent sector holdings at 31 May 2020.
452
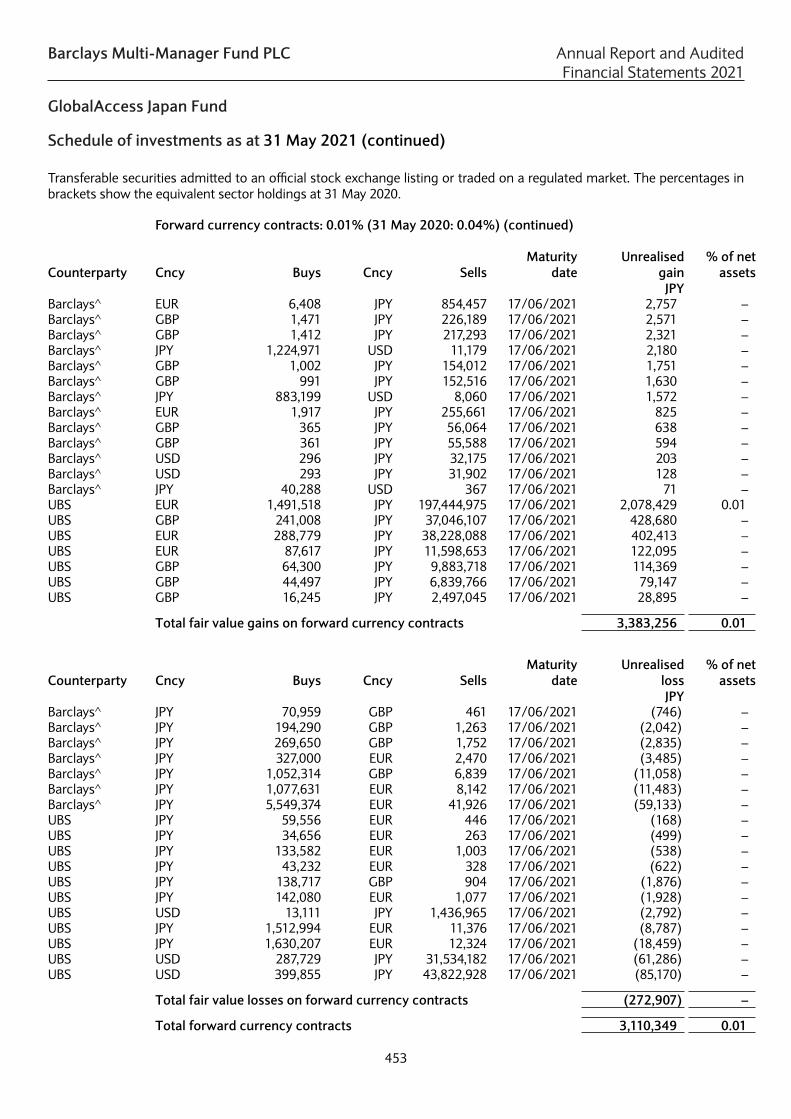
Barclays Multi-Manager Fund PLC Annual Report and Audited Financial Statements 2021
GlobalAccess Japan Fund
Holdings Financial assets at fair value through profit or loss Currency Fair value
JPY % of net
assets
Equities: 95.55% (31 May 2020: 94.89%) (continued) Japan: 95.55% (31 May 2020: 94.89%) (continued)
Telecommunications: 5.06% (31 May 2020: 5.68%)92,800 KDDI Corp Com NPV JPY 344,891,200 1.20
171,400 Nippon Telegraph & Telephone Corp Com NPV JPY 502,287,700 1.7573,600 SoftBank Group Corp Com NPV JPY 607,825,600 2.11
Toys/games/hobbies: 1.48% (31 May 2020: 1.33%)25,700 Bandai Namco Holdings Inc Com NPV JPY 201,616,500 0.70
3,300 Nintendo Co Ltd Com NPV JPY 223,360,500 0.78
Transportation: 1.60% (31 May 2020: 3.32%)21,700 East Japan Railway Co Com NPV JPY 166,026,700 0.5839,200 Hitachi Transport System Ltd Com NPV JPY 136,808,000 0.4832,900 Sankyu Inc Com NPV JPY 155,863,750 0.54
Total Japan 27,450,132,330 95.55
Total equities 27,450,132,330 95.55
No. of contracts Futures contracts: 0.00% (31 May 2020: 0.12%) CounterpartyUnrealised gain/(loss)
% of net assets
JPY15 OSE TOPIX Index Future June 2021 Goldman Sachs 4,200,000 0.01
Total fair value gains on open futures contracts 4,200,000 0.01
10 OSE TOPIX Index Future June 2021 Goldman Sachs (3,465,000) (0.01) DUMMY_01
Total fair value losses on open futures contracts (3,465,000) (0.01)
Total futures contracts 735,000 –
Forward currency contracts: 0.01% (31 May 2020: 0.04%)
Counterparty Cncy Buys Cncy SellsMaturity
dateUnrealised
gain% of net
assetsJPY
Barclays^ EUR 32,360 JPY 4,279,249 17/06/2021 49,634 – CCT_1769391_181916
Barclays^ EUR 32,124 JPY 4,283,472 17/06/2021 13,820 – CCT_1769391_182740
Barclays^ EUR 6,420 JPY 848,918 17/06/2021 9,847 – CCT_1769391_181915
Barclays^ GBP 5,421 JPY 833,418 17/06/2021 9,474 – CCT_1769391_181922
Barclays^ GBP 5,369 JPY 826,067 17/06/2021 8,823 – CCT_1769391_182749
Barclays^ USD 9,156 JPY 995,280 17/06/2021 6,263 – CCT_1769391_181918
Barclays^ USD 6,528 JPY 709,581 17/06/2021 4,466 – CCT_1769391_181912
Barclays^ USD 9,029 JPY 983,724 17/06/2021 3,916 – CCT_1769391_182739
Barclays^ EUR 1,920 JPY 253,873 17/06/2021 2,945 – CCT_1769391_181910
Barclays^ USD 6,452 JPY 702,962 17/06/2021 2,799 – CCT_1769391_182744
Forward currency contracts: 0.01% (31 May 2020: 0.04%) (continued)
Counterparty Cncy Buys Cncy SellsMaturity
date
Unrealised gain
% of net assets
JPY Barclays^ EUR 6,408 JPY 854,457 17/06/2021 2,757 – CCT_1769391_182746
Barclays^ GBP 1,471 JPY 226,189 17/06/2021 2,571 – CCT_1769391_181920
Barclays^ GBP 1,412 JPY 217,293 17/06/2021 2,321 – CCT_1769391_182742
Barclays^ JPY 1,224,971 USD 11,179 17/06/2021 2,180 – CCT_1769391_182169
Barclays^ GBP 1,002 JPY 154,012 17/06/2021 1,751 – CCT_1769391_181911
Barclays^ GBP 991 JPY 152,516 17/06/2021 1,630 – CCT_1769391_182743
Barclays^ JPY 883,199 USD 8,060 17/06/2021 1,572 – CCT_1769391_182166
Barclays^ EUR 1,917 JPY 255,661 17/06/2021 825 – CCT_1769391_182738
Barclays^ GBP 365 JPY 56,064 17/06/2021 638 – CCT_1769391_181917
Barclays^ GBP 361 JPY 55,588 17/06/2021 594 – CCT_1769391_182741
Barclays^ USD 296 JPY 32,175 17/06/2021 203 – CCT_1769391_181923
Barclays^ USD 293 JPY 31,902 17/06/2021 128 – CCT_1769391_182748
Barclays^ JPY 40,288 USD 367 17/06/2021 71 – CCT_1769391_182177
UBS EUR 1,491,518 JPY 197,444,975 17/06/2021 2,078,429 0.01 CCT_1769391_182184
UBS GBP 241,008 JPY 37,046,107 17/06/2021 428,680 – CCT_1769391_182172
UBS EUR 288,779 JPY 38,228,088 17/06/2021 402,413 – CCT_1769391_182183
UBS EUR 87,617 JPY 11,598,653 17/06/2021 122,095 – CCT_1769391_182189
UBS GBP 64,300 JPY 9,883,718 17/06/2021 114,369 – CCT_1769391_182187
UBS GBP 44,497 JPY 6,839,766 17/06/2021 79,147 – CCT_1769391_182185
UBS GBP 16,245 JPY 2,497,045 17/06/2021 28,895 – CCT_1769391_182190
Total fair value gains on forward currency contracts 3,383,256 0.01
Counterparty Cncy Buys Cncy SellsMaturity
dateUnrealised
loss% of net
assetsJPY
Barclays^ JPY 70,959 GBP 461 17/06/2021 (746) – CCT_1769391_182168
Barclays^ JPY 194,290 GBP 1,263 17/06/2021 (2,042) – CCT_1769391_182167
Barclays^ JPY 269,650 GBP 1,752 17/06/2021 (2,835) – CCT_1769391_182171
Barclays^ JPY 327,000 EUR 2,470 17/06/2021 (3,485) – CCT_1769391_182165
Barclays^ JPY 1,052,314 GBP 6,839 17/06/2021 (11,058) – CCT_1769391_182173
Barclays^ JPY 1,077,631 EUR 8,142 17/06/2021 (11,483) – CCT_1769391_182164
Barclays^ JPY 5,549,374 EUR 41,926 17/06/2021 (59,133) – CCT_1769391_182170
UBS JPY 59,556 EUR 446 17/06/2021 (168) – CCT_1769391_182745
UBS JPY 34,656 EUR 263 17/06/2021 (499) – CCT_1769391_181834
UBS JPY 133,582 EUR 1,003 17/06/2021 (538) – CCT_1769391_182823
UBS JPY 43,232 EUR 328 17/06/2021 (622) – CCT_1769391_181832
UBS JPY 138,717 GBP 904 17/06/2021 (1,876) – CCT_1769391_181979
UBS JPY 142,080 EUR 1,077 17/06/2021 (1,928) – CCT_1769391_181982
UBS USD 13,111 JPY 1,436,965 17/06/2021 (2,792) – CCT_1769391_182176
UBS JPY 1,512,994 EUR 11,376 17/06/2021 (8,787) – CCT_1769391_182512
UBS JPY 1,630,207 EUR 12,324 17/06/2021 (18,459) – CCT_1769391_181921
UBS USD 287,729 JPY 31,534,182 17/06/2021 (61,286) – CCT_1769391_182192
UBS USD 399,855 JPY 43,822,928 17/06/2021 (85,170) – CCT_1769391_182188
Total fair value losses on forward currency contracts (272,907) –
Total forward currency contracts 3,110,349 0.01
Schedule of investments as at 31 May 2021 (continued)
Transferable securities admitted to an official stock exchange listing or traded on a regulated market. The percentages in brackets show the equivalent sector holdings at 31 May 2020.
453
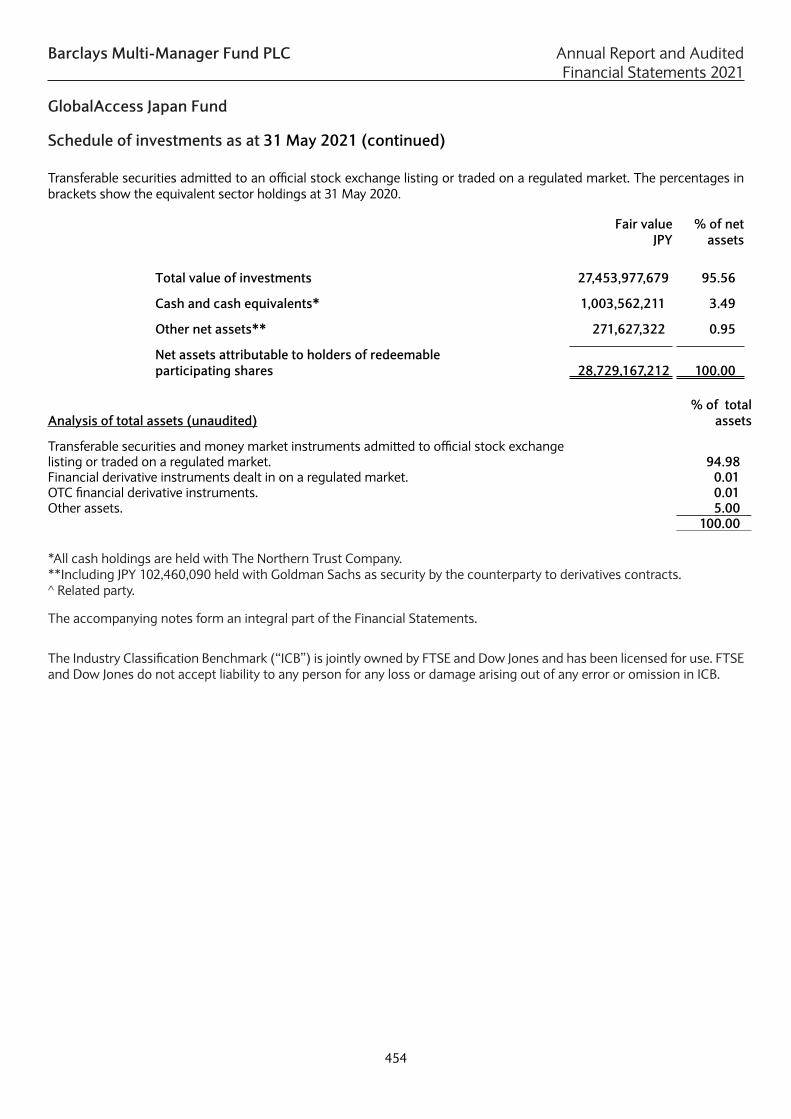
Barclays Multi-Manager Fund PLC Annual Report and Audited Financial Statements 2021
GlobalAccess Japan Fund
Fair value JPY
% of net assets
Total value of investments 27,453,977,679 95.56
Cash and cash equivalents* 1,003,562,211 3.49
Other net assets** 271,627,322 0.95
Net assets attributable to holders of redeemable participating shares 28,729,167,212 100.00
Analysis of total assets (unaudited)% of total
assets
Transferable securities and money market instruments admitted to official stock exchangelisting or traded on a regulated market. 94.98Financial derivative instruments dealt in on a regulated market. 0.01OTC financial derivative instruments. 0.01Other assets. 5.00
100.00
*All cash holdings are held with The Northern Trust Company.**Including JPY 102,460,090 held with Goldman Sachs as security by the counterparty to derivatives contracts.^ Related party.
The accompanying notes form an integral part of the Financial Statements.
The Industry Classification Benchmark (“ICB”) is jointly owned by FTSE and Dow Jones and has been licensed for use. FTSE and Dow Jones do not accept liability to any person for any loss or damage arising out of any error or omission in ICB.
Schedule of investments as at 31 May 2021 (continued)
Transferable securities admitted to an official stock exchange listing or traded on a regulated market. The percentages in brackets show the equivalent sector holdings at 31 May 2020.
454

Barclays Multi-Manager Fund PLC Annual Report and Audited Financial Statements 2021
455
Schedule of portfolio changes (unaudited) for the financial year ended 31 May 2021GlobalAccess UK Opportunities FundLargest Purchases Cost
GBP3,017,247 Wm Morrison Supermarkets PLC Com GBP0.10 5,391,5532,073,280 Tesco PLC GBP0.06 4,681,1562,185,935 ConvaTec Group PLC Com GBP0.10 4,286,868
96,853 Unilever PLC Com GBP0.0311 4,153,709507,146 Daily Mail & General Trust PLC Com GBP0.13 3,616,093
1,279,624 BP PLC Com USD0.25 3,589,2051,183,403 Moneysupermarket.com Group PLC Com GBP0.0002 3,241,910
196,806 GlaxoSmithKline PLC Com GBP0.25 2,982,104917,819 Aviva PLC Com GBP0.25 2,859,341
6,103,198 Centrica PLC Com GBP0.06 2,826,47899,850 Experian PLC Com USD0.10 2,800,12343,600 Reckitt Benckiser Group PLC Com GBP0.10 2,743,229
127,479 Ultra Electronics GBP5.00 2,607,636378,825 Pearson PLC Com GBP0.25 2,526,514
93,900 British American Tobacco PLC Com GBP0.25 2,526,086249,486 3i Group PLC Com GBP0.74 2,369,308
1,816,391 Vodafone Group PLC Com USD0.21 2,322,995100,836 Bunzl PLC Com GBP0.32 2,321,123141,962 Rathbone Brothers GBP5.00 2,241,694577,680 St Modwen Properties PLC GBP10.00 2,202,652718,116 QinetiQ Group PLC Com GBP0.01 2,108,746
6,948,342 Mitie Group PLC Com GBP0.03 2,050,923305,538 WPP PLC Com GBP0.10 2,000,069669,510 Direct Line Insurance Group PLC Com GBP0.11 1,996,934138,850 Imperial Brands PLC Com GBP0.10 1,879,006197,303 Euromoney Institutional Investor PLC Com GBP0.0025 1,803,083
1,388,798 Barclays PLC Com GBP0.25^ 1,717,219341,650 BAE Systems PLC Com GBP0.03 1,620,072
1,144,446 Melrose Industries PLC Com GBP0.07 1,614,266734,686 PZ Cussons PLC Com GBP1.00 1,542,712
78,249 Anglo American PLC Com USD0.54945 1,532,609343,689 Aggreko PLC Com GBP0.05 1,512,497132,371 IMI PLC Com GBP0.29 1,388,664
98,188 Royal Dutch Shell PLC Class B Com EUR0.07 1,209,642549,861 Tesco PLC Com GBP0.05 1,200,704
95,193 Travis Perkins Com GBP0.10 1,176,194298,880 Ricardo PLC GBP0.25 1,133,718433,201 Crest Nicholson Holdings plc Com GBP0.03428571 1,120,497

Barclays Multi-Manager Fund PLC Annual Report and Audited Financial Statements 2021
456
Schedule of portfolio changes (unaudited) (continued) for the financial year ended 31 May 2021GlobalAccess UK Opportunities FundLargest Sales Proceeds
GBP1,148,832 Aggreko PLC Com GBP0.05 9,723,416
150,761 Rio Tinto PLC Com GBP0.10 8,011,10258,240 London Stock Exchange Group PLC Com GBP0.07 5,216,309
131,660 Schroders PLC Com GBP1.00 4,589,2301,054,094 Urban & Civic PLC Com GBP0.20 3,619,248
446,022 Daily Mail & General Trust PLC Com GBP0.13 3,600,551178,750 RELX PLC Com GBP0.14 3,326,771
3,681,752 Restaurant Group PLC Com GBP0.28 3,285,4161,310,296 Tesco PLC Com GBP0.05 3,010,219
219,799 GlaxoSmithKline PLC Com GBP0.25 3,009,617119,577 Anglo American PLC Com USD0.54945 2,903,540334,132 Electrocomponents PLC Com GBP0.10 2,728,880
61,400 Unilever PLC Com GBP0.0311 2,710,265259,826 3i Group PLC Com GBP0.74 2,710,163
90,500 Diageo Com GBP28.93518 2,630,921386,369 Pearson PLC Com GBP0.25 2,609,209170,100 IMI PLC Com GBP0.29 2,515,665
2,154,178 McCarthy & Stone PLC Com GBP8.00 2,491,167241,158 Euromoney Institutional Investor PLC Com GBP0.0025 2,348,205749,692 Stock Spirits Group PLC Com GBP0.10 2,073,812731,371 BP PLC Com USD0.25 2,033,399325,498 Sage Group PLC Com GBP0.01 1,950,206684,042 John Wood Group PLC Com GBP0.04 1,854,603
64,383 Clarkson GBP25.00 1,820,780930,320 Wm Morrison Supermarkets PLC Com GBP0.10 1,734,767105,500 Hargreaves Lansdown PLC Com GBP0.004 1,719,818143,521 Royal Dutch Shell PLC Class B Com EUR0.07 1,701,741
54,400 Spectris PLC Com GBP0.05 1,639,014762,903 Provident Financial PLC Com GBP0.21 1,607,749
3,076,734 Centrica PLC Com GBP0.06 1,564,8231,353,099 Elementis PLC GBP5.00 1,533,092
87,500 Burberry Group PLC Com GBP0.0005 1,510,8151,093,660 Barclays PLC Com GBP0.25^ 1,503,676
423,276 Aviva PLC Com GBP0.25 1,419,066491,717 Essentra PLC Com GBP0.25 1,311,680617,906 ConvaTec Group PLC Com GBP0.10 1,256,035994,163 Vodafone Group PLC Com USD0.21 1,248,965
Purchases and sales disclosed are the aggregate purchases of a security exceeding 1 per cent of the total value of purchases forthe financial year and aggregate disposals greater than 1 per cent of the total value of sales for the financial year respectively.Where there are fewer than 20 purchases or sales falling within this category, those purchases or sales and the next largestpurchases or sales so that at least 20 purchases or sales are disclosed.

Barclays Multi-Manager Fund PLC Annual Report and Audited Financial Statements 2021
457
Schedule of portfolio changes (unaudited) for the financial year ended 31 May 2021GlobalAccess Global Government Bond FundLargest Purchases Cost
USD25,600,000 Fannie Mae 2.5% 15/01/2051 26,790,50025,600,000 Fannie Mae 2.5% 15/11/2046 26,749,00025,300,000 Fannie Mae 2.5% 15/05/2050 26,401,85219,600,000 Fannie Mae 4% 15/04/2049 21,036,50818,700,000 Fannie Mae 2% 15/04/2050 18,965,77715,200,000 Fannie Mae 2.5% 15/04/2050 15,832,68014,600,000 Fannie Mae 4% 15/04/2049 15,675,50014,600,000 Fannie Mae 4% 15/05/2049 15,672,90614,600,000 Fannie Mae Pool 4% 31/12/2049 15,593,34414,600,000 Fannie Mae 4% 30/07/2048 15,573,03114,000,000 Fannie Mae 2.5% 15/02/2049 14,557,10913,400,000 Fannie Mae 2.5% 15/03/2049 14,009,07812,800,000 Fannie Mae 2.5% 15/12/2048 13,368,50012,800,000 Fannie Mae 2.5% 15/09/2048 13,329,87512,800,000 Fannie Mae 2.5% 30/10/2046 13,318,444
1,010,000,000 Japan Treasury Discount Bill 0% 25/01/2021 9,623,67550,200,000 China Government Bond Series INBK 3.02% 22/10/2025 7,736,430
6,400,000 France Treasury Bill BTF 0% 27/01/2021 7,707,5067,200,000 Fannie Mae 2% 15/06/2049 7,262,795
760,000,000 Japan Treasury Discount Bill 0% 26/10/2020 7,232,0817,100,000 Fannie Mae 2% 15/05/2050 7,202,4656,000,000 France Treasury Bill BTF 0% 14/10/2020 7,092,6977,000,000 United States Treasury Bill 0% 25/02/2021 6,999,4936,400,000 Fannie Mae 4% 15/03/2044 6,865,5006,400,000 Fannie Mae 4% 15/02/2044 6,854,2506,400,000 Fannie Mae 4% 30/11/2049 6,833,7506,400,000 Fannie Mae 4% 30/10/2048 6,828,000

Barclays Multi-Manager Fund PLC Annual Report and Audited Financial Statements 2021
458
Schedule of portfolio changes (unaudited) (continued) for the financial year ended 31 May 2021GlobalAccess Global Government Bond FundLargest Sales Proceeds
USD25,600,000 Fannie Mae 2.5% 15/01/2051 26,800,00025,600,000 Fannie Mae 2.5% 15/11/2046 26,748,00025,300,000 Fannie Mae 2.5% 15/05/2050 26,227,73819,600,000 Fannie Mae 4% 15/04/2049 21,011,67218,700,000 Fannie Mae 2% 15/04/2050 19,037,39917,800,000 Fannie Mae 4% 30/07/2048 18,963,20315,200,000 Fannie Mae 2.5% 15/04/2050 15,915,50814,600,000 Fannie Mae 4% 15/05/2049 15,679,49214,600,000 Fannie Mae 4% 15/04/2049 15,593,39514,000,000 Fannie Mae 2.5% 15/02/2049 14,669,00013,400,000 Fannie Mae 2.5% 15/03/2049 14,026,28112,800,000 Fannie Mae 2.5% 30/10/2046 13,405,19512,800,000 Fannie Mae Pool 2.5% 31/12/2049 13,354,48412,800,000 Fannie Mae 2.5% 15/09/2048 13,353,00012,800,000 Fannie Mae 2.5% 15/12/2048 13,314,500
1,010,000,000 Japan Treasury Discount Bill 0% 25/01/2021 9,723,6636,400,000 France Treasury Bill BTF 0% 27/01/2021 7,766,9677,200,000 Fannie Mae 2% 15/06/2049 7,265,850
770,000,000 Japan Treasury Discount Bill 0% 03/08/2020 7,257,646760,000,000 Japan Treasury Discount Bill 0% 26/10/2020 7,247,413
7,100,000 Fannie Mae 2% 15/05/2050 7,131,8206,000,000 France Treasury Bill BTF 0% 14/10/2020 7,055,7017,000,000 United States Treasury Bill 0% 25/02/2021 6,999,882
Purchases and sales disclosed are the aggregate purchases of a security exceeding 1 percent of the total value of purchases forthe year and aggregate disposals greater than 1 percent of the total value of sales for the year respectively. Where there arefewer than 20 purchases or sales falling within this category, those purchases or sales and the next largest purhases or salesso that at least 20 purchases or sales are disclosed.

Barclays Multi-Manager Fund PLC Annual Report and Audited Financial Statements 2021
459
Schedule of portfolio changes (unaudited) for the financial year ended 31 May 2021GlobalAccess Asia Pacific (ex-Japan) FundLargest Purchases Cost
USD623,000 China Overseas Land & Investment Ltd Com NPV 1,630,561
44,950 JD.com Inc Com HKD0.00002 1,593,32432,645 Alibaba Group Holding Ltd Com NPV 1,055,058
5,464 Baidu Inc ADR NPV 1,012,67573,100 Midea Group Co Ltd CNY1.00 912,746
4,362 Naspers Ltd Com ZAR0.02 837,98539,435 Oppein Home Group Inc CNY1.00 803,26712,000 Jardine Matheson Holdings Ltd Com USD0.25 780,414
2,807 NAVER Corp Com KRW500.00 775,396935 LG Chem Ltd Com KRW5000.00 741,539
26,900 Honda Motor Co Ltd Com NPV 736,58392,000 Galaxy Entertainment Group Ltd Com NPV 689,22295,700 Standard Chartered PLC Com HKD0.50 592,263
118,966 Adani Ports & Special Economic Zone Ltd Com INR2.00 590,438126,000 China Resources Land Ltd Com HKD0.10 557,358
3,286 Samsung Fire & Marine Insurance Co Ltd Com KRW500.00 547,4918,221 Samsung Electronics Co Ltd Com KRW100.00 542,2336,527 Kumho Petrochemical Co Ltd Com KRW5000.00 535,905
586,000 China Oilfield Services Ltd Com CNY1.00 515,987265,384 GAIL India Ltd Com INR10.00 494,802
43,500 Baozun Inc Com HKD0.0001 488,06467,000 China Mobile Ltd Com NPV 461,95152,000 Asustek Computer Inc Com TWD10.00 428,17933,500 Ping An Insurance Group Co of China Ltd Com CNY1.00 424,009
6,287 JD.com Inc ADR USD0.00002 400,176289,830 Shenzhen Airport Co Ltd CNY1.00 376,726448,000 Kunlun Energy Co Ltd Com HKD0.01 372,008
10,565 Trip.com Group Ltd Com NPV 368,65789,001 Santos Ltd Com NPV 359,25416,000 MediaTek Inc Com TWD10.00 352,052
4,690 SK Hynix Inc Com KRW1.00 344,48714,224 ACC Ltd Com INR10.00 323,163

Barclays Multi-Manager Fund PLC Annual Report and Audited Financial Statements 2021
460
Schedule of portfolio changes (unaudited) (continued) for the financial year ended 31 May 2021GlobalAccess Asia Pacific (ex-Japan) FundLargest Sales Proceeds
USD11,220 Alibaba Group Holding Ltd ADR NPV 3,059,08635,688 Samsung Electronics Co Ltd Com KRW100.00 1,978,421
111,000 Taiwan Semiconductor Manufacturing Co Ltd TWD10.00 1,767,366363,000 Hon Hai Precision Industry Co Ltd Com TWD10.00 1,224,136175,000 China Mobile Ltd Com NPV 1,200,205
94,303 Midea Group Co Ltd 27/05/2021 1,157,34245,000 MediaTek Inc Com TWD10.00 1,088,92932,897 Jardine Strategic Holdings Ltd USD0.05 1,064,54212,700 Tencent Holdings Ltd Com HKD0.00002 906,80341,679 Oppein Home Group Inc 05/02/2021 829,98924,100 Nexon Co Ltd NPV 753,02974,486 Adani Ports & Special Economic Zone Ltd Com INR2.00 729,35456,000 Asustek Computer Inc Com TWD10.00 697,789
182,000 Sands China Ltd Com USD0.01 696,5022,731 Kumho Petrochemical Co Ltd Com KRW5000.00 605,806
18,400 Alibaba Group Holding Ltd Com NPV 596,216632,000 China Oilfield Services Ltd Com CNY1.00 567,418
43,000 Techtronic Industries Co Ltd Com NPV 536,8476,287 JD.com Inc ADR USD0.00002 500,980
615,200 Ayala Land Inc PHP1.00 449,981168,000 ASE Technology Holding Co Ltd Com TWD1.00 424,669
19,396 Yunnan Baiyao Group Co Ltd CNY1.00 424,405118,844 Haier Smart Home Co Ltd CNY1.00 405,318
11,300 China Mobile Ltd ADR HKD1.00 394,811204,000 Taiwan Fertilizer Co Ltd Com TWD10.00 372,588202,000 Lite-On Technology Corp Com TWD10.00 363,717
2,317 Samsung Fire & Marine Insurance Co Ltd Com KRW500.00 359,797344,000 Kunlun Energy Co Ltd Com HKD0.01 357,869
Purchases and sales disclosed are the aggregate purchases of a security exceeding 1 per cent of the total value of purchasesfor the year and aggregate disposals greater than 1 per cent of the total value of sales for the year respectively. Where there arefewer than 20 purchases or sales falling within this category, those purchases or sales and the next largest purchases or salesso that at least 20 purchases or sales are disclosed.

Barclays Multi-Manager Fund PLC Annual Report and Audited Financial Statements 2021
461
Schedule of portfolio changes (unaudited) for the financial year ended 31 May 2021GlobalAccess Emerging Markets Equity FundLargest Purchases Cost
USD96,500 Tencent Holdings Ltd Com HKD0.00002 7,084,165
564,700 Midea Group Co Ltd CNY1.00 6,948,499917,000 Galaxy Entertainment Group Ltd Com NPV 6,678,851306,816 Oppein Home Group Inc CNY1.00 6,226,317
22,677 NAVER Corp Com KRW500.00 6,222,506179,950 JD.com Inc Com HKD0.00002 6,033,883
6,995 LG Chem Ltd Com KRW5000.00 5,548,334151,700 Alibaba Group Holding Ltd Com NPV 5,477,122
18,808 Alibaba Group Holding Ltd Com NPV 4,583,361730,900 Standard Chartered PLC Com HKD0.50 4,521,667
83,174 NIO Inc ADR NPV 4,354,545145,561 Trip.com Group Ltd Com NPV 4,348,733258,000 Taiwan Semiconductor Manufacturing Co Ltd Com TWD10.00 4,331,895
1,658,100 Ambev SA Com NPV 4,273,922342,900 Baozun Inc Com HKD0.0001 3,923,106
71,854 Samsung Electronics Co Ltd Com KRW100.00 3,849,949174,000 MediaTek Inc Com TWD10.00 3,825,269752,000 China Resources Land Ltd Com HKD0.10 3,349,401158,389 Shriram Transport Finance Co Ltd INR10.00 2,921,153
37,669 SK Hynix Inc Com KRW5000.00 2,645,641
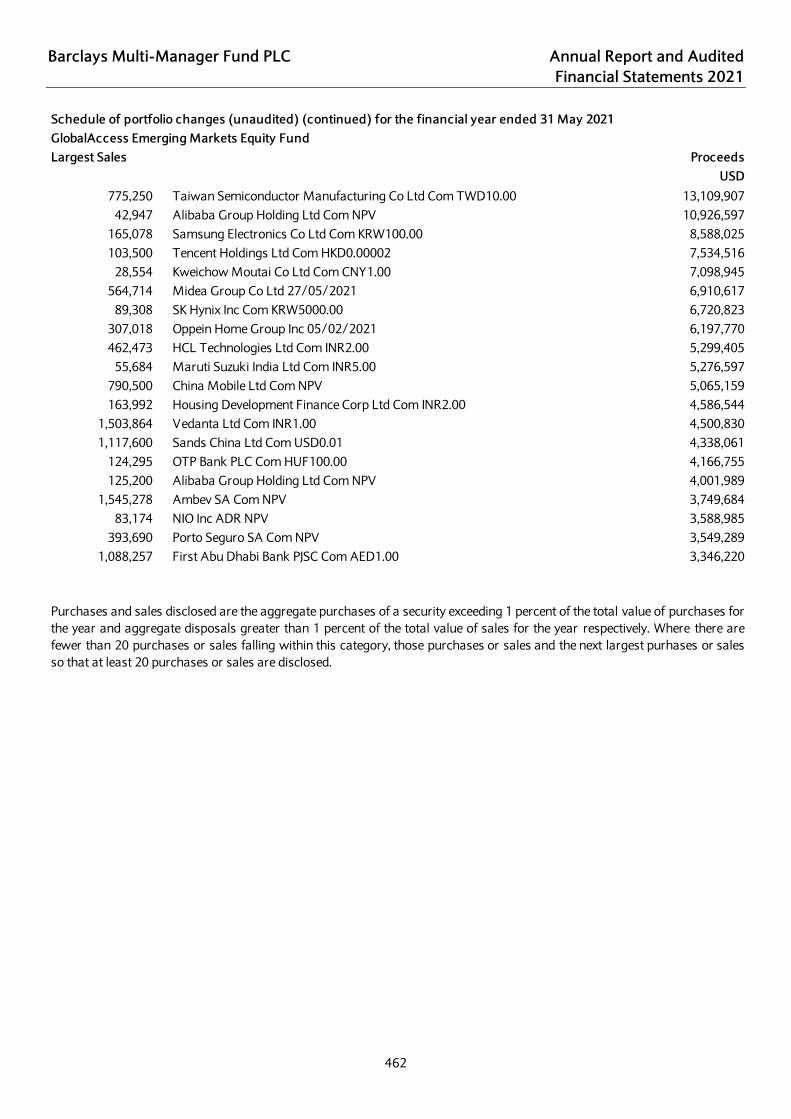
Barclays Multi-Manager Fund PLC Annual Report and Audited Financial Statements 2021
462
Schedule of portfolio changes (unaudited) (continued) for the financial year ended 31 May 2021GlobalAccess Emerging Markets Equity FundLargest Sales Proceeds
USD775,250 Taiwan Semiconductor Manufacturing Co Ltd Com TWD10.00 13,109,907
42,947 Alibaba Group Holding Ltd Com NPV 10,926,597165,078 Samsung Electronics Co Ltd Com KRW100.00 8,588,025103,500 Tencent Holdings Ltd Com HKD0.00002 7,534,516
28,554 Kweichow Moutai Co Ltd Com CNY1.00 7,098,945564,714 Midea Group Co Ltd 27/05/2021 6,910,617
89,308 SK Hynix Inc Com KRW5000.00 6,720,823307,018 Oppein Home Group Inc 05/02/2021 6,197,770462,473 HCL Technologies Ltd Com INR2.00 5,299,405
55,684 Maruti Suzuki India Ltd Com INR5.00 5,276,597790,500 China Mobile Ltd Com NPV 5,065,159163,992 Housing Development Finance Corp Ltd Com INR2.00 4,586,544
1,503,864 Vedanta Ltd Com INR1.00 4,500,8301,117,600 Sands China Ltd Com USD0.01 4,338,061
124,295 OTP Bank PLC Com HUF100.00 4,166,755125,200 Alibaba Group Holding Ltd Com NPV 4,001,989
1,545,278 Ambev SA Com NPV 3,749,68483,174 NIO Inc ADR NPV 3,588,985
393,690 Porto Seguro SA Com NPV 3,549,2891,088,257 First Abu Dhabi Bank PJSC Com AED1.00 3,346,220
Purchases and sales disclosed are the aggregate purchases of a security exceeding 1 percent of the total value of purchases forthe year and aggregate disposals greater than 1 percent of the total value of sales for the year respectively. Where there arefewer than 20 purchases or sales falling within this category, those purchases or sales and the next largest purhases or salesso that at least 20 purchases or sales are disclosed.
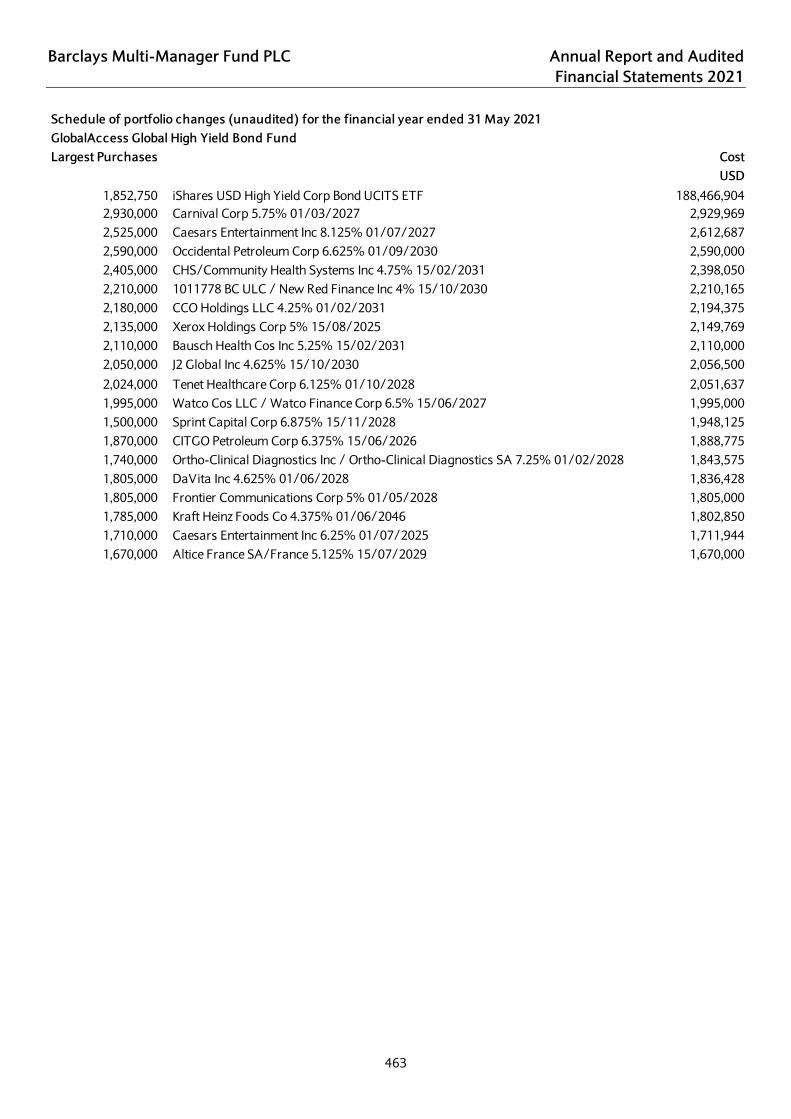
Barclays Multi-Manager Fund PLC Annual Report and Audited Financial Statements 2021
463
Schedule of portfolio changes (unaudited) for the financial year ended 31 May 2021GlobalAccess Global High Yield Bond FundLargest Purchases Cost
USD1,852,750 iShares USD High Yield Corp Bond UCITS ETF 188,466,9042,930,000 Carnival Corp 5.75% 01/03/2027 2,929,9692,525,000 Caesars Entertainment Inc 8.125% 01/07/2027 2,612,6872,590,000 Occidental Petroleum Corp 6.625% 01/09/2030 2,590,0002,405,000 CHS/Community Health Systems Inc 4.75% 15/02/2031 2,398,0502,210,000 1011778 BC ULC / New Red Finance Inc 4% 15/10/2030 2,210,1652,180,000 CCO Holdings LLC 4.25% 01/02/2031 2,194,3752,135,000 Xerox Holdings Corp 5% 15/08/2025 2,149,7692,110,000 Bausch Health Cos Inc 5.25% 15/02/2031 2,110,0002,050,000 J2 Global Inc 4.625% 15/10/2030 2,056,500
2,024,000 Tenet Healthcare Corp 6.125% 01/10/2028 2,051,6371,995,000 Watco Cos LLC / Watco Finance Corp 6.5% 15/06/2027 1,995,0001,500,000 Sprint Capital Corp 6.875% 15/11/2028 1,948,1251,870,000 CITGO Petroleum Corp 6.375% 15/06/2026 1,888,7751,740,000 Ortho-Clinical Diagnostics Inc / Ortho-Clinical Diagnostics SA 7.25% 01/02/2028 1,843,5751,805,000 DaVita Inc 4.625% 01/06/2028 1,836,4281,805,000 Frontier Communications Corp 5% 01/05/2028 1,805,0001,785,000 Kraft Heinz Foods Co 4.375% 01/06/2046 1,802,8501,710,000 Caesars Entertainment Inc 6.25% 01/07/2025 1,711,9441,670,000 Altice France SA/France 5.125% 15/07/2029 1,670,000

Barclays Multi-Manager Fund PLC Annual Report and Audited Financial Statements 2021
464
Schedule of portfolio changes (unaudited) (continued) for the financial year ended 31 May 2021GlobalAccess Global High Yield Bond FundLargest Sales Proceeds
USD1,996,903 iShares USD High Yield Corp Bond UCITS ETF 202,708,1573,725,000 Tronox Finance PLC 5.75% 01/10/2025 3,667,6313,295,000 1011778 BC Unlimited Liabilited Co 5% 15/10/2025 3,372,5193,160,000 Kraft Heinz Foods Co 4.375% 01/06/2046 3,358,2052,810,000 Eldorado Resorts Inc 6% 01/04/2025 2,936,4501,900,000 Sprint Capital Corp 8.75% 15/03/2032 2,834,0312,590,000 Occidental Petroleum Corp 6.625% 01/09/2030 2,548,3502,440,000 Bausch Health Cos Inc 6.125% 15/04/2025 2,497,8412,380,000 Hunt Cos Inc 6.25% 15/02/2026 2,448,3752,670,000 Golden Nugget Inc 6.75% 15/10/2024 2,375,1541,875,000 Freeport-McMoRan Inc 5.45% 15/03/2043 2,264,2052,105,000 TransDigm Inc 6.5% 15/05/2025 2,135,5751,940,000 United Rentals North America Inc 5.875% 15/09/2026 2,056,4001,905,000 Prime Security Services Borrower LLC 5.75% 15/04/2026 2,045,7501,955,000 Post Holdings Inc 5% 15/08/2026 2,028,6222,010,000 Bausch Health Cos Inc 5.25% 15/02/2031 2,021,6621,905,000 H&E Equipment Services LLC 5.625% 01/09/2025 1,985,8691,825,000 Caesars Entertainment Inc 8.125% 01/07/2027 1,977,6291,525,000 Sprint Capital Corp 6.875% 15/11/2028 1,959,6251,905,000 CCO Holdings LLC 4.25% 01/02/2031 1,945,394
Purchases and sales disclosed are the aggregate purchases of a security exceeding 1 percent of the total value of purchases forthe year and aggregate disposals greater than 1 percent of the total value of sales for the year respectively. Where there arefewer than 20 purchases or sales falling within this category, those purchases or sales and the next largest purhases or salesso that at least 20 purchases or sales are disclosed.

Barclays Multi-Manager Fund PLC Annual Report and Audited Financial Statements 2021
465
Schedule of portfolio changes (unaudited) for the financial year ended 31 May 2021GlobalAccess Global Corporate Bond FundLargest Purchases Cost
USD26,130,000 iShares Global Corp Bond UCITS ETF 155,595,23215,600,000 United States Cash Management Bill 0% 09/02/2021 15,599,67813,800,000 Federal Home Loan Bank Consolidated Discount Notes 0% 19/08/2020 13,799,86613,200,000 United States Treasury Bill 0% 11/02/2021 13,199,48313,150,000 United States Treasury Bill 0% 31/12/2020 13,147,36411,385,000 United States Treasury Inflation Indexed Bonds 15/07/2030 12,836,00012,000,000 United States Treasury Bill 0% 01/06/2021 11,999,76711,555,000 United States Treasury Bill 0% 14/01/2021 11,554,10410,500,000 United States Treasury Bill 0% 20/08/2020 10,499,983
1,085,100,000 Japan Treasury Discount Bill 0% 08/02/2021 10,469,566
9,800,000 Federal Home Loan Bank Discount Notes 0% 21/08/2020 9,799,9959,800,000 United States Treasury Bill 0% 21/01/2021 9,799,5309,300,000 United States Treasury Bill 0% 25/03/2021 9,299,5888,700,000 Federal Home Loan Bank Consolidated Discount Notes 0% 18/09/2020 8,699,5268,300,000 Federal Home Loan Bank Consolidated Discount Notes 0% 20/07/2020 8,299,9528,290,000 United States Treasury Bill 0% 22/10/2020 8,287,7927,800,000 Federal Home Loan Bank Consolidated Discount Notes 0% 22/07/2020 7,799,9857,700,000 United States Treasury Bill 0% 12/01/2020 7,699,9787,500,000 United States Cash Management Bill 0% 12/01/2021 7,499,9377,300,000 Federal Home Loan Bank Discount Notes 0% 23/07/2020 7,299,988

Barclays Multi-Manager Fund PLC Annual Report and Audited Financial Statements 2021
466
Schedule of portfolio changes (unaudited) (continued) for the financial year ended 31 May 2021GlobalAccess Global Corporate Bond FundLargest Sales Proceeds
USD25,872,000 iShares Global Corp Bond UCITS ETF 153,708,69316,200,000 Federal Home Loan Bank Consolidated Discount Notes 0% 19/08/2020 16,199,24315,600,000 United States Cash Management Bill 0% 09/02/2021 15,599,94513,200,000 United States Treasury Bill 0% 11/02/2021 13,199,82113,150,000 United States Treasury Bill 0% 31/12/2020 13,149,09512,000,000 United States Treasury Bill 0% 01/06/2021 11,999,94211,555,000 United States Treasury Bill 0% 14/01/2021 11,554,68710,500,000 United States Treasury Bill 0% 20/08/2020 10,500,000
1,085,100,000 Japan Treasury Discount Bill 0% 08/02/2021 10,315,1299,800,000 Federal Home Loan Bank Discount Notes 0% 21/08/2020 9,800,0009,800,000 United States Treasury Bill 0% 21/01/2021 9,799,8299,300,000 United States Treasury Bill 0% 25/03/2021 9,299,8298,700,000 Federal Home Loan Bank Consolidated Discount Notes 0% 18/09/2020 8,699,9328,300,000 Federal Home Loan Bank Consolidated Discount Notes 0% 20/07/2020 8,300,0008,290,000 United States Treasury Bill 0% 22/10/2020 8,289,0857,800,000 Federal Home Loan Bank Consolidated Discount Notes 0% 22/07/2020 7,800,0007,700,000 United States Treasury Bill 0% 21/07/2020 7,700,0007,500,000 United States Cash Management Bill 0% 12/01/2021 7,500,0007,300,000 Federal Home Loan Bank Discount Notes 0% 23/07/2020 7,300,0007,100,000 United States Treasury Bill 0% 20/05/2021 7,099,650
Purchases and sales disclosed are the aggregate purchases of a security exceeding 1 percent of the total value of purchases forthe year and aggregate disposals greater than 1 percent of the total value of sales for the year respectively. Where there arefewer than 20 purchases or sales falling within this category, those purchases or sales and the next largest purhases or salesso that at least 20 purchases or sales are disclosed.

Barclays Multi-Manager Fund PLC Annual Report and Audited Financial Statements 2021
467
Schedule of portfolio changes (unaudited) for the financial year ended 31 May 2021GlobalAccess Emerging Market Debt FundLargest Purchases Cost
USD729,450 iShares JP Morgan Emerging Markets Bond UCITS ETF 81,395,074
6,638,713 Ecuador Government International Bond Series REGS 0.5% 31/07/2035 5,064,4025,767,998 Argentine Republic Government International Bond 0.125% 09/07/2035 3,672,0682,885,000 Ukraine Government International Bond Series REGS 7.253% 15/03/2033 2,921,0332,000,000 Russian Foreign Bond - Eurobond Series REGS 5.1% 28/03/2035 2,445,7003,842,030 Argentine Republic Government International Bond 0.125% 09/07/2030 2,376,6492,211,640 Ecuador Government International Bond Series REGS 0.5% 31/07/2030 2,123,3311,990,000 Pakistan Government International Bond Series REGS 6.875% 05/12/2027 2,105,5811,615,000 Croatia Government International Bond 1.5% 17/06/2031 1,961,4442,355,000 Turkey Government International Bond 5.75% 05/11/2047 1,961,0341,645,000 Hungary Government International Bond 1.75% 05/06/2035 1,959,1721,935,000 Emirate of Dubai Government International Bonds Series EMTN 3.9% 09/09/2050 1,884,2501,635,000 Gabon Government International Bond Series REGS 6.625% 06/02/2031 1,656,6451,410,000 Philippine Government International Bond 3.95% 20/01/2040 1,643,0561,460,000 Saudi Government International Bond Series REGS 3.625% 04/03/2028 1,618,7371,195,000 Serbia International Bond Series REGS 3.125% 15/05/2027 1,561,6342,069,800 Ecuador Government International Bond Series REGS 0.5% 31/07/2040 1,555,1601,290,000 Romanian Government International Bond Series REGS 2% 28/01/2032 1,529,3431,450,000 Jordan Government International Bond Series REGS 5.85% 07/07/2030 1,475,9441,375,000 Dominican Republic International Bond Series REGS 4.875% 23/09/2032 1,446,683

Barclays Multi-Manager Fund PLC Annual Report and Audited Financial Statements 2021
468
Schedule of portfolio changes (unaudited) (continued) for the financial year ended 31 May 2021GlobalAccess Emerging Market Debt FundLargest Sales Proceeds
USD695,450 iShares JP Morgan Emerging Markets Bond UCITS ETF 77,098,915
2,595,000 Qatar Government International Bond Series REGS 5.103% 23/04/2048 3,586,4382,580,000 Ecuador Government International Bond 7.875% 23/01/2028 2,272,9741,880,000 Qatar Government International Bond Series REGS 4.5% 23/04/2028 2,253,6002,160,000 Kenya Government International Bond Series REGS 7% 22/05/2027 2,192,6872,125,000 Turkey Government International Bond 4.875% 09/10/2026 2,027,4931,800,000 Republic of Azerbaijan International Bond Series REGS 3.5% 09/01/2032 1,806,3191,575,000 Saudi Government International Bond Series REGS 3.625% 04/03/2028 1,750,5631,430,000 Republic of Armenia International Bond Series REGS 7.15% 26/03/2025 1,623,3001,404,000 Mexico Government International Bond 4.5% 22/04/2029 1,616,7601,405,000 Bahrain Government International Bond Series REGS 7.375% 14/05/2030 1,573,5901,200,000 Russian Foreign Bond - Eurobond Series REGS 5.1% 28/03/2035 1,510,6001,290,000 Nigeria Government International Bond Series REGS 7.875% 16/02/2032 1,424,0781,288,000 Hungary Government International Bond 5.375% 21/02/2023 1,416,0701,245,000 Abu Dhabi Government International Bond Series REGS 3.125% 16/04/2030 1,346,4351,200,000 Russian Foreign Bond - Eurobond Series REGS 4.25% 23/06/2027 1,344,8401,000,000 KazMunayGas National Co JSC Series REGS 5.75% 19/04/2047 1,259,4001,105,000 Philippine Government International Bond 3.95% 20/01/2040 1,226,3191,195,000 Qatar Government International Bond 2.375% 02/06/2021 1,210,1292,126,000 Ecuador Government International Bond Series REGS 0.5% 31/07/2035 1,197,823
Purchases and sales disclosed are the aggregate purchases of a security exceeding 1 per cent of the total value of purchasesfor the year and aggregate disposals greater than 1 per cent of the total value of sales for the year respectively. Where there arefewer than 20 purchases or sales falling within this category, those purchases or sales and the next largest purchases or salesso that at least 20 purchases or sales are disclosed.

Barclays Multi-Manager Fund PLC Annual Report and Audited Financial Statements 2021
469
Schedule of portfolio changes (unaudited) for the financial year ended 31 May 2021GlobalAccess Global Property Securities Fund*Largest Purchases Cost
USD177,000 iShares FTSE Epra/Nareit Developed Markets Property Fund 4,070,709
38,253 Welltower Inc Reits USD1.00 2,168,97418,296 Camden Property Trust Reits USD0.01 1,714,031
962 Japan Retail Fund Investment Corp Reits NPV 1,581,66041,296 Ventas Reits USD0.25 1,467,20546,320 Healthcare Realty Trust Inc Reits USD0.01 1,388,941
1,218 United Urban Investment Corp Reits NPV 1,300,6085,795 Essex Property Trust Inc Reits USD0.0001 1,257,505
40,850 Allied Properties Real Estate Investment Trust Reits NPV 1,233,16363,270 Broadstone Net Lease Inc Com USD0.00025 1,066,098
814,100 CapitaLand Commercial Trust Reits NPV 1,046,89844,186 21Vianet Group Inc NPV 1,019,96314,974 Agree Realty Corp Reits USD0.0001 973,252
409,300 Mapletree Industrial Trust SGD1.00 952,1943,891 American Tower Corp Reits USD0.01 937,351
17,253 Terreno Realty Corp Com Reits USD0.01 897,3328,120 Choice Hotels International Inc Com USD0.01 741,914
41,400 Mitsubishi Estate Co Ltd Com NPV 726,96625,244 MGM Growth Properties LLC NPV 718,182
388,000 Sunac Services Holdings Ltd HKD0.01 621,5589,825 Cellnex Telecom SA Com EUR0.25 609,771
18,428 American Campus Communities Inc Com USD0.01 602,2883,719 Alexandria Real Estate Equities Inc Reits USD0.01 599,072
352,780 Scentre Reits NPV 597,738241,000 Hang Lung Properties Ltd Com HKD1.00 597,699376,500 CapitaLand Mall Trust Reits NPV 577,878
69,300 Link Reits NPV 534,937186,600 ESR Cayman Ltd HKD0.001 491,172
13,854 Persimmon PLC Com GBP0.10 489,208467,865 Vicinity Centres Com AUD1.00 477,195
15,900 Allied Properties Real Estate Investment Trust Reits NPV 472,31617,065 Healthcare Trust of America Inc Reits USD0.01 440,97762,808 Charter Hall Group Reits NPV 439,79148,230 Summit Industrial Income Reits NPV 438,18913,594 Apartment Investment & Management Co Class A Reits USD0.01 421,139
6,036 Vonovia SE Com NPV 419,877

Barclays Multi-Manager Fund PLC Annual Report and Audited Financial Statements 2021
470
Schedule of portfolio changes (unaudited) (continued) for the financial year ended 31 May 2021GlobalAccess Global Property Securities Fund*Largest Sales Proceeds
USD115,742 Prologis Inc Reits USD0.01 11,408,524435,500 iShares FTSE Epra/Nareit Developed Markets Property Fund 10,153,356146,143 Vonovia SE Com NPV 9,884,736
45,492 AvalonBay Communities Inc Reits USD0.01 7,363,500545,621 Segro PLC Reits GBP10.00 7,115,116109,893 Welltower Inc Reits USD1.00 6,721,772217,733 Invitation Homes Inc Reits USD0.01 6,408,004
24,247 Essex Property Trust Inc Reits USD0.0001 5,799,93731,775 Alexandria Real Estate Equities Inc Reits USD0.01 5,295,096
390,139 Goodman Group Reits NPV 5,214,429153,479 American Homes 4 Rent Class A Reits USD0.01 4,678,147
95,653 Rexford Industrial Realty Inc Class I Reits USD0.01 4,535,689282,300 Mitsubishi Estate Co Ltd Com NPV 4,495,176
28,707 Sun Communities Inc Reits USD0.01 4,063,679278,000 Sun Hung Kai Properties Ltd Com NPV 3,992,396
5,139 Equinix Inc Reits USD0.001 3,776,661130,004 Healthcare Trust of America Inc Reits USD0.01 3,662,999115,944 STORE Capital Corp Reits USD0.01 3,563,043
15,825 American Tower Corp Reits USD0.01 3,443,825369,100 Link Reits NPV 3,303,851683,000 New World Development Co Ltd NPV 3,263,981
2,258 Nomura Real Estate Master Fund Inc Reits NPV 3,263,11328,490 Extra Space Storage Inc Reits USD0.01 3,154,640
161,700 Mitsui Fudosan Co Ltd Com NPV 3,138,89298,586 Allied Properties Real Estate Investment Trust Reits NPV 2,989,754
2,351 United Urban Investment Corp Reits NPV 2,923,72581,147 CubeSmart Reits USD0.01 2,767,940
201,400 UNITE Group PLC GBP25.00 2,701,7491,441 Industrial & Infrastructure Investment Corp Reits 2,643,2121,615 Japan Retail Fund Investment Corp Reits NPV 2,575,470
113,183 Entra ASA Com NOK1.00 2,528,789
Purchases and sales disclosed are the aggregate purchases of a security exceeding 1 per cent of the total value of purchasesfor the financial year and aggregate disposals greater than 1 per cent of the total value of sales for the financial yearrespectively. Where there are fewer than 20 purchases or sales falling within this category, those purchases or sales and thenext largest purchases or sales so that at least 20 purchases or sales are disclosed.
* GlobalAccess Global Property Securities Fund ceased trading on 23 February 2021.
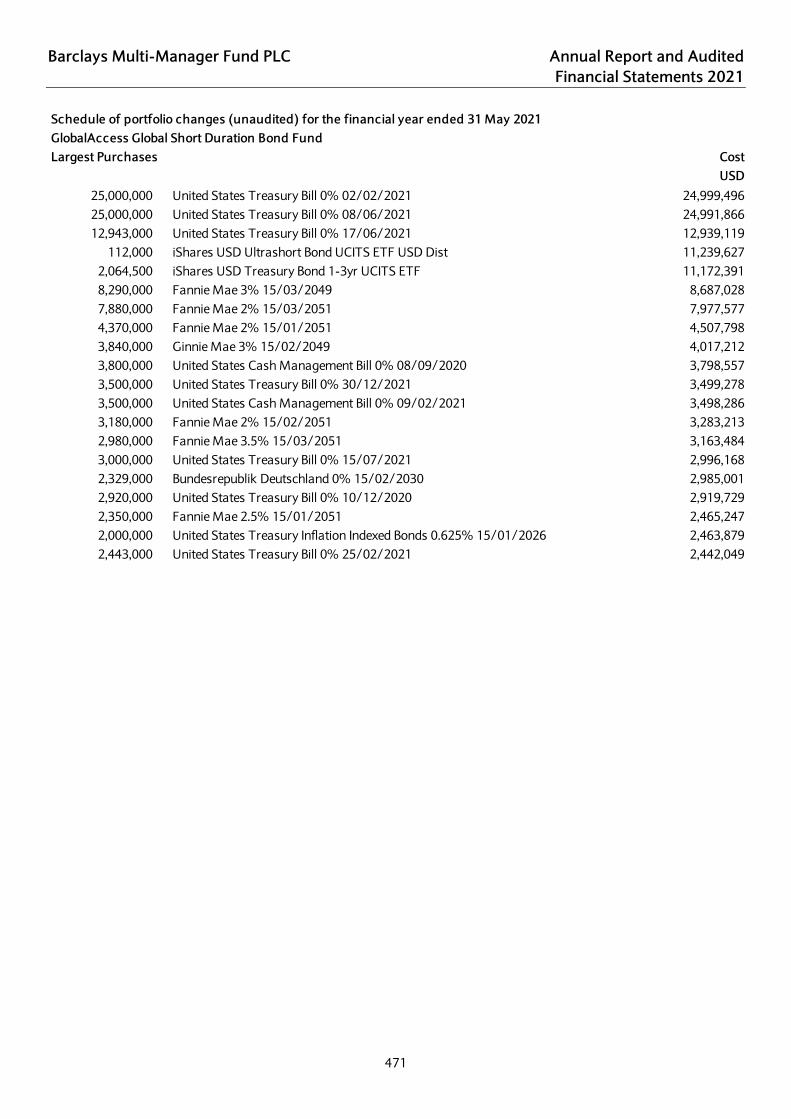
Barclays Multi-Manager Fund PLC Annual Report and Audited Financial Statements 2021
471
Schedule of portfolio changes (unaudited) for the financial year ended 31 May 2021GlobalAccess Global Short Duration Bond FundLargest Purchases Cost
USD25,000,000 United States Treasury Bill 0% 02/02/2021 24,999,49625,000,000 United States Treasury Bill 0% 08/06/2021 24,991,86612,943,000 United States Treasury Bill 0% 17/06/2021 12,939,119
112,000 iShares USD Ultrashort Bond UCITS ETF USD Dist 11,239,6272,064,500 iShares USD Treasury Bond 1-3yr UCITS ETF 11,172,3918,290,000 Fannie Mae 3% 15/03/2049 8,687,0287,880,000 Fannie Mae 2% 15/03/2051 7,977,5774,370,000 Fannie Mae 2% 15/01/2051 4,507,7983,840,000 Ginnie Mae 3% 15/02/2049 4,017,2123,800,000 United States Cash Management Bill 0% 08/09/2020 3,798,5573,500,000 United States Treasury Bill 0% 30/12/2021 3,499,2783,500,000 United States Cash Management Bill 0% 09/02/2021 3,498,2863,180,000 Fannie Mae 2% 15/02/2051 3,283,2132,980,000 Fannie Mae 3.5% 15/03/2051 3,163,4843,000,000 United States Treasury Bill 0% 15/07/2021 2,996,1682,329,000 Bundesrepublik Deutschland 0% 15/02/2030 2,985,0012,920,000 United States Treasury Bill 0% 10/12/2020 2,919,7292,350,000 Fannie Mae 2.5% 15/01/2051 2,465,2472,000,000 United States Treasury Inflation Indexed Bonds 0.625% 15/01/2026 2,463,8792,443,000 United States Treasury Bill 0% 25/02/2021 2,442,049
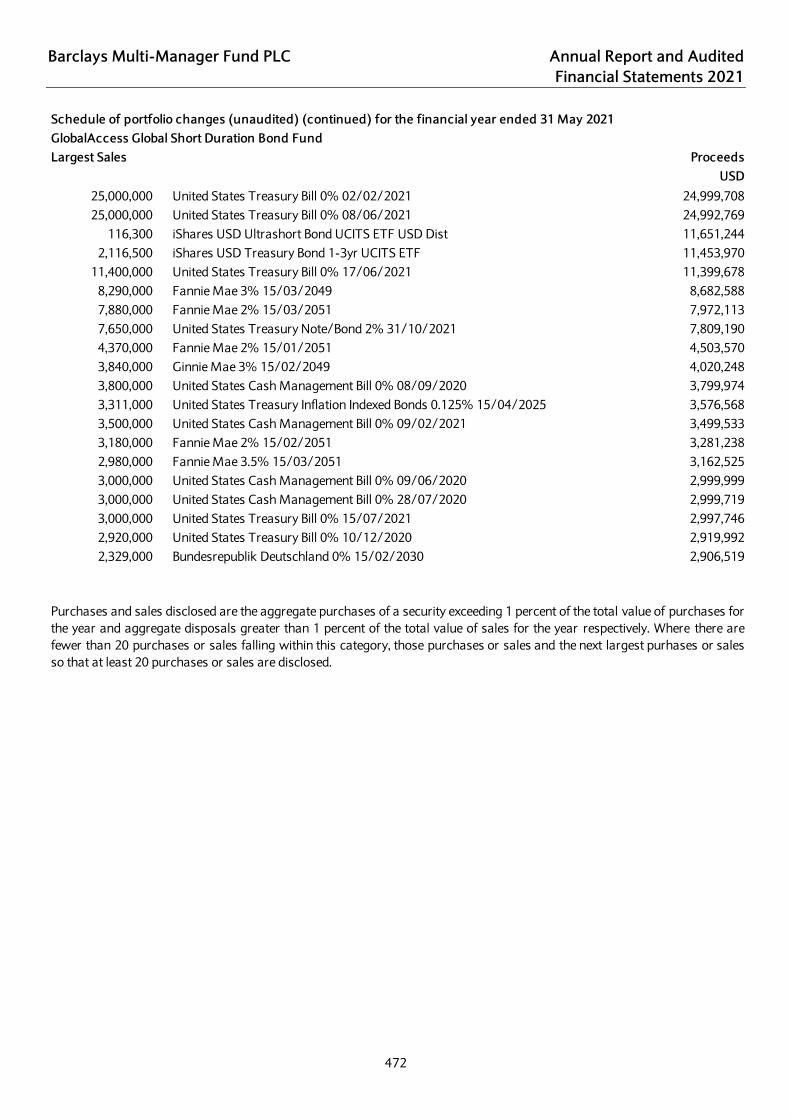
Barclays Multi-Manager Fund PLC Annual Report and Audited Financial Statements 2021
472
Schedule of portfolio changes (unaudited) (continued) for the financial year ended 31 May 2021GlobalAccess Global Short Duration Bond FundLargest Sales Proceeds
USD25,000,000 United States Treasury Bill 0% 02/02/2021 24,999,70825,000,000 United States Treasury Bill 0% 08/06/2021 24,992,769
116,300 iShares USD Ultrashort Bond UCITS ETF USD Dist 11,651,2442,116,500 iShares USD Treasury Bond 1-3yr UCITS ETF 11,453,970
11,400,000 United States Treasury Bill 0% 17/06/2021 11,399,6788,290,000 Fannie Mae 3% 15/03/2049 8,682,5887,880,000 Fannie Mae 2% 15/03/2051 7,972,1137,650,000 United States Treasury Note/Bond 2% 31/10/2021 7,809,1904,370,000 Fannie Mae 2% 15/01/2051 4,503,5703,840,000 Ginnie Mae 3% 15/02/2049 4,020,2483,800,000 United States Cash Management Bill 0% 08/09/2020 3,799,9743,311,000 United States Treasury Inflation Indexed Bonds 0.125% 15/04/2025 3,576,5683,500,000 United States Cash Management Bill 0% 09/02/2021 3,499,5333,180,000 Fannie Mae 2% 15/02/2051 3,281,2382,980,000 Fannie Mae 3.5% 15/03/2051 3,162,5253,000,000 United States Cash Management Bill 0% 09/06/2020 2,999,9993,000,000 United States Cash Management Bill 0% 28/07/2020 2,999,7193,000,000 United States Treasury Bill 0% 15/07/2021 2,997,7462,920,000 United States Treasury Bill 0% 10/12/2020 2,919,9922,329,000 Bundesrepublik Deutschland 0% 15/02/2030 2,906,519
Purchases and sales disclosed are the aggregate purchases of a security exceeding 1 percent of the total value of purchases forthe year and aggregate disposals greater than 1 percent of the total value of sales for the year respectively. Where there arefewer than 20 purchases or sales falling within this category, those purchases or sales and the next largest purhases or salesso that at least 20 purchases or sales are disclosed.

Barclays Multi-Manager Fund PLC Annual Report and Audited Financial Statements 2021
473
Schedule of portfolio changes (unaudited) for the financial year ended 31 May 2021GlobalAccess US Small & Mid Cap Equity FundLargest Purchases Cost
USD268,000 DB X-Trackers Russell Midcap UCITS ETF 7,780,378
9,357 Middleby Corp Com USD0.01 1,105,5649,710 Black Knight Inc Com USD0.0001 695,5465,809 Hanover Insurance Com USD0.01 674,9574,389 Jack Henry & Associates Com USD0.01 671,790
15,878 Cannae Holdings Inc Com USD0.0001 628,13420,308 Reynolds Consumer Products Inc Com USD0.001 621,14029,731 GCP Applied Technologies Inc Com USD0.01 610,879
4,714 Signature Bank/New York NY Com USD0.01 574,54016,754 US Foods Holding Corp Com USD0.01 507,997
20,510 Meritor Inc Com USD1.00 495,03422,200 Alcoa Corp Com USD0.01 485,490
5,848 Fortune Brands Home & Security Inc Com USD0.01 470,54511,629 Builders FirstSource Inc Com USD0.01 467,33011,111 Denbury Inc Com USD0.001 455,783
9,638 Knight-Swift Transportation Holdings Inc Com Class A USD0.01 453,21614,935 American Equity Investment Life Holding Com USD1.00 450,469
5,972 PVH Corp Com USD1.00 442,5182,242 Quidel Corp Com USD0.001 431,7245,956 Astec Industries Inc Com USD0.20 431,102

Barclays Multi-Manager Fund PLC Annual Report and Audited Financial Statements 2021
474
Schedule of portfolio changes (unaudited) (continued) for the financial year ended 31 May 2021GlobalAccess US Small & Mid Cap Equity FundLargest Sales Proceeds
USD289,500 DB X-Trackers Russell Midcap UCITS ETF 8,191,032
5,364 TopBuild Corp Com USD0.01 891,25114,855 HD Supply Holdings Inc Com USD0.01 816,427
4,553 Varian Medical Systems Inc Com USD1.00 766,3603,937 Old Dominion Freight Line Inc Com USD0.10 765,770
10,039 Western Alliance Bancorp Com USD0.0001 729,8584,598 LGI Homes Inc Com USD0.01 658,935
15,132 Marvell Technology Group Ltd Com USD0.002 655,23912,293 Triton International Ltd/Bermuda Com USD0.01 654,683
2,840 Generac Com USD0.01 645,9823,545 Signature Bank/New York NY Com USD0.01 570,3909,614 Wintrust Financial Corp Com NPV 566,8155,637 Copart Inc Com USD0.0001 537,4743,844 Middleby Corp Com USD0.01 525,2226,249 Lumentum Holdings Inc Com USD0.001 518,0297,822 Advanced Drainage Systems Inc Com USD0.01 501,0314,575 Dollar Tree Inc Com USD0.01 478,9851,319 Teledyne Technologies Inc Com USD0.01 458,9456,824 Trimble Inc Com NPV 453,9618,388 Cooper Tire & Rubber Co Com USD1.00 442,267
Purchases and sales disclosed are the aggregate purchases of a security exceeding 1 percent of the total value of purchases forthe year and aggregate disposals greater than 1 percent of the total value of sales for the year respectively. Where there arefewer than 20 purchases or sales falling within this category, those purchases or sales and the next largest purhases or salesso that at least 20 purchases or sales are disclosed.

Barclays Multi-Manager Fund PLC Annual Report and Audited Financial Statements 2021
475
Schedule of portfolio changes (unaudited) for the financial year ended 31 May 2021GlobalAccess US Equity FundLargest Purchases Cost
USD26,239 Air Products & Chemicals Inc Com USD1.00 7,551,66416,513 Humana Inc Com USD0.166 6,602,02323,692 KLA-Tencor Corp Com USD0.001 6,274,40369,964 Progressive Corp Com USD1.00 6,230,61144,005 Qualcomm Inc Com USD0.0001 5,954,000
100,745 Verizon Communications Inc Com USD0.10 5,760,07230,761 Global Payments Inc Com NPV 5,633,75524,693 Microsoft Corp Com USD0.00000625 5,384,20973,228 Capital One Financial Corp Com USD0.01 5,314,97323,212 Rockwell Automation Inc Com USD1.00 5,243,47441,326 American Express Co Class C Com USD0.20 5,219,58868,929 Emerson Electric Co Class C Com USD0.50 5,199,97326,032 NXP Semiconductors NV Com EUR0.20 5,146,63729,370 Advance Auto Parts Inc Com USD0.0001 4,963,01127,522 Stanley Black & Decker Inc Com USD2.50 4,705,149
360,068 General Electric Co Class C Com USD0.06 4,624,71714,941 Parker-Hannifin Corp Com USD0.50 4,369,88849,864 CSX Corp Com USD1.00 4,122,70329,412 PerkinElmer Inc USD1.00 4,109,35557,897 EOG Resources Inc Com USD0.01 4,072,32379,967 American International Group Inc Com USD2.50 4,062,680
1,266 Amazon.com Inc Com USD0.01 4,037,67162,951 Raytheon Technologies USD1.00 3,952,72422,078 Celanese Corp Class A Com USD0.0001 3,545,932
103,322 Freeport-McMoRan Inc USD0.10 3,497,12130,939 FMC Corp Com USD0.10 3,460,22825,094 Zimmer Biomet Holdings Inc Com USD0.01 3,448,10718,553 Honeywell International Inc Com USD1.00 3,427,80528,379 International Flavors & Fragrances Inc Com USD0.125 3,411,17038,632 NextEra Energy Inc Com USD0.01 3,366,69786,668 Marathon Petroleum Corp Com USD0.01 3,203,93412,666 Becton Dickinson and Co Com USD1.00 3,127,524
110,969 Bank of America Corp Com USD0.01 2,944,15471,736 Coca-Cola European Partners Com EUR0.01 2,920,658
1,636 Alphabet Inc Com USD0.001 2,906,358

Barclays Multi-Manager Fund PLC Annual Report and Audited Financial Statements 2021
476
Schedule of portfolio changes (unaudited) (continued) for the financial year ended 31 May 2021GlobalAccess US Equity FundLargest Sales Proceeds
USD34,392 Becton Dickinson and Co Com USD1.00 8,497,39344,931 Stanley Black & Decker Inc Com USD2.50 8,447,90325,655 Air Products & Chemicals Inc Com USD1.00 7,345,083
117,279 Verizon Communications Inc Com USD0.10 6,853,70469,964 Progressive Corp Com USD1.00 6,534,40153,607 Xilinx Inc Com USD0.01 6,423,25239,829 Apple Inc Com USD0.00001 6,371,918
118,216 Marathon Petroleum Corp Com USD0.01 5,733,33025,551 Microsoft Corp Com USD0.00000625 5,491,22639,382 Qualcomm Inc Com USD0.0001 5,272,71650,544 Abbott Laboratories Com NPV 4,875,43362,951 Raytheon Technologies USD1.00 4,695,94258,648 Merck & Co Inc Com USD0.50 4,580,26923,222 L3Harris Technologies Inc Com USD1.00 4,531,02720,624 Willis Towers Watson PLC Com USD0.000304635 4,477,112
103,322 Freeport-McMoRan Inc USD0.10 4,436,68131,207 Avery Dennison Corp Com USD1.00 4,323,00610,339 Humana Inc Com USD0.166 4,281,35047,018 Emerson Electric Co Class C Com USD0.50 4,261,68434,914 AMETEK Inc Com USD0.01 4,232,53846,264 American Electric Power Co Inc USD6.50 3,784,92523,248 Advance Auto Parts Inc Com USD0.0001 3,783,60320,531 Honeywell International Inc Com USD1.00 3,707,192
2,150 Alphabet Inc Com USD0.001 3,631,69428,550 Zimmer Biomet Holdings Inc Com USD0.01 3,604,78520,952 Crown Castle International Corp Reits USD0.01 3,500,920
1,114 Amazon.com Inc Com USD0.01 3,438,73430,992 Capital One Financial Corp Com USD0.01 3,414,178
114,588 American Homes 4 Rent Class A Reits USD0.01 3,383,37777,954 BorgWarner Inc USD0.01 3,380,52416,465 Ecolab Inc Com USD1.00 3,332,41817,755 Motorola Solutions Inc Com USD0.01 3,262,12144,916 Sysco Corp Com USD1.00 3,242,44592,052 Bank of America Corp Com USD0.01 3,218,247
106,071 Wells Fargo & Co Class C Com USD1.666 3,182,48320,620 NextEra Energy Inc Com USD0.01 3,040,83620,453 JB Hunt Transport Services Inc Com USD0.01 2,979,33146,023 Otis Worldwide Corp Com USD0.01 2,946,820
Purchases and sales disclosed are the aggregate purchases of a security exceeding 1 per cent of the total value of purchasesfor the year and aggregate disposals greater than 1 per cent of the total value of sales for the year respectively. Where there arefewer than 20 purchases or sales falling within this category, those purchases or sales and the next largest purchases or salesso that at least 20 purchases or sales are disclosed.

Barclays Multi-Manager Fund PLC Annual Report and Audited Financial Statements 2021
477
Schedule of portfolio changes (unaudited) for the financial year ended 31 May 2021GlobalAccess Global Equity Income FundLargest Purchases Cost
USD39,439 Deutsche Post AG Com NPV 1,708,255
7,404 Microsoft Corp Com USD0.00000625 1,627,98482,712 HP Inc Com USD0.01 1,588,61429,123 Citigroup Inc Com USD0.01 1,514,72333,175 Cisco Systems Com USD0.001 1,502,63394,162 AGNC Investment Corp Reits USD0.01 1,398,60219,201 Samsung Electronics Co Ltd Com KRW100.00 1,101,36317,537 Newmont Goldcorp Corp Com USD1.60 1,068,92011,798 Simon Property Group Inc Reits USD0.0001 999,89319,986 Archer-Daniels-Midland Co Com NPV 948,83116,961 Exxon Mobil Corp Com NPV 912,087
6,549 Siemens Com NPV 880,3813,655 Accenture PLC Com USD0.0000225 847,1634,921 Automatic Data Processing Inc Com USD0.10 790,360
36,896 Franklin Resources Inc Com USD 0.10 789,80612,085 Robert Half International Inc Com USD0.001 763,65218,567 NN Group Com EUR0.12 745,65119,830 Omega Healthcare Investors Inc Reits USD0.10 721,427
4,575 Johnson & Johnson Com USD1.00 716,831371 AP Moller - Maersk A/S Class B Com DKK1000.00 715,964

Barclays Multi-Manager Fund PLC Annual Report and Audited Financial Statements 2021
478
Schedule of portfolio changes (unaudited) (continued) for the financial year ended 31 May 2021GlobalAccess Global Equity Income FundLargest Sales Proceeds
USD18,827 Microsoft Corp Com USD0.00000625 4,075,82317,467 Apple Inc Com USD0.00001 2,801,858
7,568 Home Depot Inc Com USD0.05 2,093,45937,347 Citigroup Inc Com USD0.01 2,035,55530,036 Bristol-Myers Squibb Co Com USD0.10 1,836,76433,788 Coca-Cola Co Com USD0.25 1,683,94738,360 General Motors Co Class C Com USD0.01 1,659,75511,059 Johnson & Johnson Com USD1.00 1,647,72162,867 HP Inc Com USD0.01 1,558,566
3,825 Broadcom Inc Com NPV 1,548,65112,867 Best Buy Co Inc Com USD0.10 1,399,04387,883 AGNC Investment Corp Reits USD0.01 1,388,42123,620 Verizon Communications Inc Com USD0.10 1,377,12914,699 Simon Property Group Inc Reits USD0.0001 1,350,221
211,458 RAI Way SpA Com NPV 1,296,43011,919 AbbVie Inc Com USD0.01 1,265,97117,686 Morgan Stanley Com USD0.01 1,230,47328,536 MetLife Inc Com USD0.01 1,214,36311,131 Sanofi Com EUR2.00 1,127,28522,908 Deutsche Post AG Com NPV 1,092,028
Purchases and sales disclosed are the aggregate purchases of a security exceeding 1 percent of the total value of purchases forthe year and aggregate disposals greater than 1 percent of the total value of sales for the year respectively. Where there arefewer than 20 purchases or sales falling within this category, those purchases or sales and the next largest purhases or salesso that at least 20 purchases or sales are disclosed.

Barclays Multi-Manager Fund PLC Annual Report and Audited Financial Statements 2021
479
Schedule of portfolio changes (unaudited) for the financial year ended 31 May 2021GlobalAccess Emerging Market Local Currency Debt FundLargest Purchases Cost
USD585,000 SPDR Barclays Capital Emerging Markets Local Bond UCITS ETF 40,866,189
53,580,000 China Government Bond Series INBK 3.27% 19/11/2030 8,280,5964,519,600 Brazil Letras do Tesouro Nacional Series LTN 0% 01/01/2024 6,657,2002,766,100 Brazil Notas do Tesouro Nacional Series F Series NTNF 10% 01/01/2027 5,759,4153,391,700 Brazil Letras do Tesouro Nacional Series LTN 0% 01/07/2022 5,652,509
43,224,672 Turkey Government Bond 11.7% 13/11/2030 5,473,91218,642,000 Republic of Poland Government Bond Series 422 2.25% 25/04/2022 5,171,419
2,404,600 Brazil Notas do Tesouro Nacional Series F Series NTNF 10% 01/01/2029 4,976,33276,628,556 Republic of South Africa Government Bond Series 2030 8% 31/01/2030 4,574,02814,773,000 Republic of Poland Government Bond Series 1030 1.25% 25/10/2030 3,915,61471,185,100 Mexican Bonos Series M 8% 07/12/2023 3,886,80711,415,000 Republic of Poland Government Bond Series 1029 2.75% 25/10/2029 3,449,06265,446,900 Mexican Bonos Series M 7.25% 09/12/2021 3,369,89323,070,000 China Government Bond Series 1915 3.13% 21/11/2029 3,353,20422,780,000 China Government Bond Series INBK 1.99% 09/04/2025 3,331,423
855,320,000 Hungary Government Bond Series 30/A 3% 21/08/2030 2,996,00839,165,375 Republic of South Africa Government Bond Series R186 10.5% 21/12/2026 2,700,29652,472,000 Republic of South Africa Government Bond Series 2048 8.75% 28/02/2048 2,698,53139,956,000 Egypt Government Bond Series 10YR 14.664% 06/10/2030 2,610,146
651,980,000 Hungary Government Bond Series 22/A 7% 24/06/2022 2,406,4657,941,000 Republic of Poland Government Bond Series 1026 2.5% 25/07/2026 2,341,736
47,229,800 Mexican Bonos Series M 6.5% 09/06/2022 2,298,9237,589,000 Republic of Poland Government Bond Series 1022 5.75% 23/09/2022 2,265,524
45,813,049 Republic of South Africa Government Bond Series 2044 8.75% 31/01/2044 2,243,7337,543,600,000 Colombian TES Series B 7.25% 18/10/2034 2,165,055

Barclays Multi-Manager Fund PLC Annual Report and Audited Financial Statements 2021
480
Schedule of portfolio changes (unaudited) (continued) for the financial year ended 31 May 2021GlobalAccess Emerging Market Local Currency Debt FundLargest Sales Proceeds
USD964,500 SPDR Barclays Capital Emerging Markets Local Bond UCITS ETF 66,728,468
243,730,350 Republic of South Africa Government Bond Series R186 10.5% 21/12/2026 17,702,59437,859,000 Republic of Poland Government Bond Series 1026 2.5% 25/07/2026 10,660,74536,710,000 Republic of Poland Government Bond Series 1029 2.75% 25/10/2029 10,651,746
3,827,400 Brazil Notas do Tesouro Nacional Series F Series NTNF 10% 01/01/2023 8,324,0812,256,340,000 Hungary Government Bond Series 30/A 3% 21/08/2030 8,062,372
25,905,300,000 Colombian TES Series B 7% 04/05/2022 7,567,329153,438,700 Mexican Bonos Series M 6.5% 10/06/2021 7,359,925129,021,400 Mexican Bonos Series M 20 10% 05/12/2024 7,025,300
3,131,700 Brazil Notas do Tesouro Nacional Series F Series NTNF 10% 01/01/2025 6,814,684113,263,225 Republic of South Africa Government Bond Series 2030 8% 31/01/2030 6,723,854
19,243,600,000 Colombian TES Series B 7.5% 26/08/2026 6,034,0172,729,100 Brazil Notas do Tesouro Nacional Series F Series NTNF 10% 01/01/2029 5,937,455
363,784,000 Russian Federal Bond - OFZ Series 6212 7.05% 19/01/2028 5,772,97719,417,000 Republic of Poland Government Bond Series 1028 2.75% 25/04/2028 5,561,89114,672,000 Peruvian Government International Bond Series REGS 6.95% 12/08/2031 5,228,921
1,001,370 iShares China CNY Bond UCITS ETF 5,057,4082,261,700 Brazil Notas do Tesouro Nacional Series F Series NTNF 10% 01/01/2027 5,047,570
97,579,000 Mexican Bonos Series M 20 7.5% 03/06/2027 5,005,06395,065,400 Mexican Bonos Series M 7.75% 13/11/2042 4,988,354
60,942,000,000 Indonesia Treasury Bond Series FR71 9% 15/03/2029 4,678,86516,177,000 Republic of Poland Government Bond Series 1023 2.5% 25/01/2023 4,363,55814,597,000 Republic of Poland Government Bond Series 1025 3.25% 25/07/2025 4,169,946
Purchases and sales disclosed are the aggregate purchases of a security exceeding 1 percent of the total value of purchases forthe year and aggregate disposals greater than 1 percent of the total value of sales for the year respectively. Where there arefewer than 20 purchases or sales falling within this category, those purchases or sales and the next largest purhases or salesso that at least 20 purchases or sales are disclosed.

Barclays Multi-Manager Fund PLC Annual Report and Audited Financial Statements 2021
481
Schedule of portfolio changes (unaudited) for the financial year ended 31 May 2021GlobalAccess Europe (ex-UK) Alpha FundLargest Purchases Cost
EUR507,750 iShares MSCI Europe ex-UK UCITS ETF 17,160,207
75,774 BlackRock Institutional Euro Assets Liquidity Fund Agency Inc 7,507,936246,968 Nordea Bank Abp Com SEK1.00 1,814,710
4,193 L'Oreal SA Com EUR0.20 1,191,9853,998 Roche Holding AG Com NPV 1,184,7222,302 Lonza Group AG Com CHF1.00 1,051,973
43,187 Endesa SA EUR1.20 971,09111,503 Sanofi Com EUR2.00 954,74377,995 Engie SA Com EUR1.00 909,19121,784 TOTAL SE Com EUR2.50 761,279
2,305 Teleperformance SE EUR2.50 735,21316,933 BNP Paribas SA Com EUR2.00 731,051
29,970 Assa Abloy AB Com SEK1.00 725,24414,538 Neste OYJ NPV 720,793
4,991 Koninklijke DSM NV EUR1.50 717,5027,910 Vinci SA Com EUR2.50 714,9675,589 Orsted A/S DKK1.00 711,9513,607 Allianz SE Com NPV 698,9058,979 Daimler AG NPV 679,387
28,479 Veolia Environnement SA EUR5.00 654,38132,888 ArcelorMittal Com NPV 646,456
2,488 adidas AG Com NPV 624,789

Barclays Multi-Manager Fund PLC Annual Report and Audited Financial Statements 2021
482
Schedule of portfolio changes (unaudited) (continued) for the financial year ended 31 May 2021GlobalAccess Europe (ex-UK) Alpha FundLargest Sales Proceeds
EUR531,750 iShares MSCI Europe ex-UK UCITS ETF 18,021,066
66,723 BlackRock Institutional Euro Assets Liquidity Fund Agency Inc 6,611,462111,495 Volvo AB Com NPV 2,191,563
4,821 ASML Holding NV Com EUR0.09 1,975,26022,334 Novartis AG Com CHF0.50 1,741,97036,053 Atlas Copco AB Class A Com SEK0.639 1,596,53611,363 DSV A/S Com DKK1.00 1,569,56150,469 Infineon Technologies AG Com NPV 1,542,41645,840 Bouygues SA Com EUR1.00 1,537,484
312,129 EDP - Energias de Portugal SA Com EUR1.00 1,509,60311,333 Siemens Com NPV 1,420,888
6,685 Allianz SE Com NPV 1,291,69427,754 BNP Paribas SA Com EUR2.00 1,254,84747,924 Erste Group Bank AG Com NPV 1,226,861
8,715 Vestas Wind Systems A/S Com DKK1.00 1,220,81291,577 Ryanair Holdings PLC Com EUR0.006 1,201,024
5,649 Sika AG Com CHF0.01 1,194,76213,714 Sanofi Com EUR2.00 1,156,98119,050 Novo Nordisk A/S Com DKK0.20 1,123,73934,970 Sampo OYJ Class A Com NPV 1,091,047
2,176 LVMH Moet Hennessy Louis Vuitton SE Com EUR0.30 1,056,1551,393 Rational AG Com NPV 1,026,3573,524 Roche Holding AG Com NPV 1,010,054
35,983 SCOR SE Com EUR7.88 975,523
Purchases and sales disclosed are the aggregate purchases of a security exceeding 1 percent of the total value of purchases forthe year and aggregate disposals greater than 1 percent of the total value of sales for the year respectively. Where there arefewer than 20 purchases or sales falling within this category, those purchases or sales and the next largest purhases or salesso that at least 20 purchases or sales are disclosed.

Barclays Multi-Manager Fund PLC Annual Report and Audited Financial Statements 2021
483
Schedule of portfolio changes (unaudited) for the financial year ended 31 May 2021GlobalAccess Japan FundLargest Purchases Cost
JPY212,300 Astellas Pharma Inc Com NPV 369,060,040
71,000 Bridgestone Corp Com 261,584,193201,600 Amada Co Ltd NPV 245,064,237
27,900 Shiseido Co Ltd Com NPV 193,645,57453,900 AGC Inc Com NPV 173,528,28240,000 Toho Co Ltd/Tokyo Com NPV 168,496,48143,900 Nihon Kohden Corp Com NPV 157,101,851
133,500 AEON Financial Service Co Ltd Com NPV 154,390,20257,700 Yamaha Motor Co Ltd Com NPV 154,002,67441,200 Aica Kogyo Co Ltd Com NPV 147,588,854
81,600 Park24 Co Ltd Com NPV 141,195,58924,400 BASE Inc Com NPV 138,754,971
9,200 Daito Trust Construction Co Ltd Com NPV 115,545,14157,700 NGK Spark Plug Co Ltd Com 109,617,31410,000 Hoya Corp Com NPV 107,240,70316,100 Freee KK Com NPV 103,330,44523,800 Seven & i Holdings Co Ltd Com 101,738,15441,600 Nichias Corp Com 101,475,693
8,500 Bengo4.com Inc Com NPV 89,670,01022,300 Takeda Pharmaceutical Co Ltd Com 83,456,53156,900 Sanki Engineering Co Ltd Com 80,104,10715,900 Nabtesco Corp Com 78,220,75537,100 WingArc1st Inc JPY1.00 77,087,40014,100 Tokio Marine Holdings Inc Com 72,132,92853,500 T&D Holdings Inc Com 71,153,00216,300 Recruit Holdings Co Ltd Com 66,326,54229,100 Mitsui & Co Ltd Com 64,636,037
136,900 JXTG Holdings Inc Com 63,696,40710,100 Hosokawa Micron Corp Com NPV 61,790,38216,200 Fukushima Galilei Co Ltd Com NPV 57,547,494
7,700 Kao Corp Com 57,199,35518,500 Nomura Research Institute Ltd Com 56,771,09127,300 Mandom Corp NPV 56,640,07015,100 Digital Garage Inc Com NPV 55,875,14211,600 METAWATER Co Ltd Com NPV 54,837,62211,000 Ibiden Co Ltd Com NPV 54,538,83128,900 Sekisui Chemical Co Ltd Com 52,915,454

Barclays Multi-Manager Fund PLC Annual Report and Audited Financial Statements 2021
484
Schedule of portfolio changes (unaudited) (continued) for the financial year ended 31 May 2021GlobalAccess Japan FundLargest Sales Proceeds
JPY41,800 SoftBank Group Corp Com 305,468,26775,800 Shimadzu Corp Com NPV 285,196,232
140,500 Santen Pharmaceutical Co Ltd Com NPV 215,650,7876,500 Disco Corp Com 211,339,296
117,500 Mitsui & Co Ltd Com 210,732,83648,200 Taisei Corp Com NPV 196,428,60876,000 Pan Pacific International Holdings Corp Com 182,183,95432,800 Otsuka Corp Com 175,221,85358,900 JSR Corp Com 173,825,62640,200 Ibiden Co Ltd Com NPV 172,511,57512,700 TDK Corp Com 169,180,87169,100 Hitachi Capital Corp Com NPV 166,438,37939,700 Enplas Corp Com NPV 156,794,65024,400 Koito Manufacturing Co Ltd Com 154,351,49433,600 Sankyu Inc Com 141,529,13043,900 Nihon Kohden Corp Com NPV 133,542,997
2,100 SMC Corp/Japan Com 131,891,15641,700 Fuji Oil Holdings Inc Com NPV 125,436,267
9,000 Hoya Corp Com NPV 118,068,09488,900 JGC Corp Com NPV 114,220,77824,500 Recruit Holdings Co Ltd Com 110,563,13511,800 Bandai Namco Holdings Inc Com 104,154,98310,400 Murata Manufacturing Co Ltd Com 102,393,84139,200 Sony Financial Holdings Inc Com NPV 101,627,82830,500 Daiwa House Industry Co Ltd Com 98,224,01766,500 Topcon Corp Com 97,276,58025,800 Hitachi Transport System Ltd Com 86,923,31431,800 Nippon Telegraph & Telephone Corp Com 86,314,83524,700 Nomura Research Institute Ltd Com 80,747,238
107,100 Japan Post Holdings Co Ltd Com NPV 79,849,79524,400 KDDI Corp Com 79,202,86925,000 Asahi Holdings Inc Com NPV 78,997,36525,300 ITOCHU Corp Com 76,462,33615,500 NOF Corp Com NPV 74,726,19710,200 Toyota Motor Corp Com 72,990,23115,800 Yaskawa Electric Corp Com 72,429,44334,900 Nafco Co Ltd Com NPV 71,482,488
Purchases and sales disclosed are the aggregate purchases of a security exceeding 1 percent of the total value of purchases forthe year and aggregate disposals greater than 1 percent of the total value of sales for the year respectively. Where there arefewer than 20 purchases or sales falling within this category, those purchases or sales and the next largest purhases or salesso that at least 20 purchases or sales are disclosed.

Barclays Multi-Manager Fund PLC Annual Report and Audited Financial Statements 2021
485
Appendix 1: UCITS V remuneration disclosure (unaudited) The UCITS V Directive requires the financial statements of the Company to include some remuneration-related information applicable to delegates of a self-managed UCITS including the requirement to establish a remuneration policy which aligns with the interests of the UCITS. The UCITS V Directive requires that delegates of a UCITS self-managed company have a remuneration policy which is consistent with, and promotes, sound and effective risk management and which discourages excessive risk taking. The policy must address the manner in which variable remuneration is paid to “identified staff” (which includes senior management, risk takers and control functions). The investment manager has in place a remuneration policy to ensure that the interests of the investment manager and the shareholders are aligned. Such remuneration policy imposes remuneration rules on staff and senior management within the investment manager whose activities have an impact on the risk profile of the Company. The investment manager will ensure that such remuneration policies and practices will be consistent with sound and effective risk management and will not encourage risk-taking which is inconsistent with the risk profile and Articles of the Company and will be consistent with UCITS V and ESMA's remuneration guidelines. The investment manager will ensure the remuneration policy will at all times be consistent with the business strategy, objectives, values and interests of each Fund and the shareholders and includes measures to ensure that all relevant conflicts of interest can be managed appropriately at all times to avoid conflicts of interests. Remuneration policy Our remuneration philosophy applies to all employees across the whole of Barclays. It ensures that all employees are aligned with and support the achievement of Barclays’ Group priorities. This is achieved by linking remuneration to a broad assessment of performance, based on expected standards of delivery and behaviour, which are discussed with employees at the start of and throughout the performance year. Under the Barclays’ performance management approach, employees are encouraged to align each of their objectives to business and team goals and behavioural expectations are set in relation to our values. This ensures that clear expectations are set for not only ‘what’ employees are expected to deliver, but also ‘how’ they are expected to go about it. Individual performance is then evaluated against both the ‘what’ (performance against objectives) and the ‘how’ (demonstration of our values). This evaluation takes into account various factors including:
i. Performance against agreed objectives (both financial and non-financial) and core job responsibilities. ii. Adherence to relevant risk policies and procedures and control frameworks. iii. Behaviour in line with Barclays’ values. iv. Colleague and stakeholder feedback. v. Input from the risk and compliance functions where there are concerns about the behaviour of any individuals or
the risk of the business undertaken. There is no specific weighting between the financial and non-financial considerations for employees because all of them are important to the determination of the overall performance assessment. Linking individual performance assessment and remuneration decisions to both the Barclays’ business strategy and our values in this way promotes the delivery of sustainable individual and business performance, and establishes clear alignment between remuneration policy and Barclays’ strategy.

Barclays Multi-Manager Fund PLC Annual Report and Audited Financial Statements 2021
486
Appendix 1: UCITS V remuneration disclosure (unaudited) (continued) The table below outlines the quantitative remuneration information of the investment manager relevant to the Company as required under the UCITS V Directive:
Head count
Total remuneration (£)
UCITS staff of which:
Fixed remuneration 5 86,586 Variable remuneration 1 1,626
UCITS Remuneration Code Staff of which: Senior management * 4 84,141 Other code staff 1 4,071
*Non executive director fees are also included. Methodology Fixed and variable pay determined by reference to the amount of time that an individual is dedicated to the fund above. Fixed and variable pay determined by reference to the amount of time that an individual is dedicated to the Investment Manager vis a vis work carried out on the Company.

Barclays Multi-Manager Fund PLC Annual Report and Audited Financial Statements 2021
487
Appendix 2: Securities financing transaction regulation (unaudited) At 31 May 2021, none of the Funds held any investments in scope for Regulation (EU) 2015/2365 on transparency of securities financing and of reuse (“SFTR”).

Barclays Multi-Manager Fund PLC Annual Report and Audited Financial Statements 2021
488
Appendix 3: Other information (unaudited) FX Rates The following exchange rates were used to convert investments, assets and liabilities to the presentation and functional currencies of the various Funds: US dollarAustralian dollar 1.2919 New Zealand dollar 1.3736Argentinian peso 94.6848 Nigerian naira 410.5000Brazilian real 5.2481 Norwegian krone 8.3193British pound 0.7035 Philippines peso 47.6950Canadian dollar 1.2081 Polish zloty 3.6632Chilean peso 721.6850 Russian Federation rouble 73.3582Chinese yuan 6.3606 Romanian leu 4.0217Colombian peso 3,708.0000 Qatari rial 3.6417Czech koruna 20.8098 Peruvian Neuvo sol 3.8175Danish krone 6.0830 Saudi A. rijals 3.7503Egyptian pound 15.6700 Serbian dinar 96.1750Euro 0.8179 Singapore dollar 1.3210Hong Kong dollar 7.7613 South African rand 13.7200Hungarian forint 284.0265 South Korean won 1,111.0500Indian rupee 72.6225 Swiss franc 0.8994Indonesian rupiah 14,280.0000 Swedish krona 8.2922Israel shekel 3.2485 Taiwanese dollar 27.6050Japanese yen 109.3950 Thai baht 31.2350Malaysian dollar 4.1245 Turkish lira 8.4768Mexican peso 19.9083 UAE dirham 3.6729Moroccan dirham 8.8293 Uruguayan peso 43.8000
EuroBritish pound 0.8601 Swedish krona 10.1385Danish krone 7.4373 Swiss franc 1.0996Norwegian krone 10.1715 United States dollar 1.2227
British poundCanadian dollar 1.7173 Japanese yen 155.5050Danish krone 8.6469 Norwegian krone 11.8258Euro 1.1626 Swiss franc 1.2784Hong Kong dollar 11.0327 United States dollar 1.4215
Japanese yenBritish pound 0.0064 Swiss franc 0.0082Euro 0.0075 United States dollar 0.0091
British poundEuro 1.1247 United States dollar 1.3343Japanese yen 141.8678
The following average exchange rates were used to convert transaction balances in the Company Statement ofComprehensive Income and the Statement of Changes in Net Assets Attributable to Redeemable Participating Shareholdersto the presentation currency:

Barclays Multi-Manager Fund PLC Annual Report and Audited Financial Statements 2021
489
Appendix 3: Other information (unaudited) (continued) Transaction costs Transaction costs included in the cost of purchases and sales amounted to GBP 1,212,586 for the financial year. A split per Fund can be found below. These are already recognised in the statement of comprehensive income as part of 'Net gains/(losses) on financial assets and financial liabilities at fair value through profit or loss'. Only transaction costs which are separately identifiable are disclosed. Depositary related transaction costs are included as part of the administration and depositary fees which are disclosed in Note 5.
Year ended Year endedCurrency 31 May 2021 31 May 2020
GlobalAccess UK Alpha Fund GBP - 31,589
GlobalAccess UK Opportunities Fund GBP 34,515 42,448
USD 103,699 142,692
GlobalAccess Asia Pacific (ex-Japan) Fund USD 56,415 64,224
USD 255,591 268,242
GlobalAccess Global High Yield Bond Fund USD 83,388 92,610
GlobalAccess Global Corporate Bond Fund USD 160,624 204,581
USD - 44,400
GlobalAccess Emerging Market Debt Fund USD 86,773 91,731
USD 37,976 54,209
USD 73,063 98,161
USD 50,859 54,510
GlobalAccess US Equity Fund USD 61,856 63,883
GlobalAccess Global Equity Income Fund USD 90,969 123,676
USD 365,127 530,016
GlobalAccess Europe (ex-UK) Alpha Fund EUR 95,638 111,350
GlobalAccess Japan Fund JPY 4,263,170 5,035,200
GlobalAccess US Small & Mid Cap Equity Fund
GlobalAccess Emerging Market Local Currency Debt Fund
GlobalAccess Global Government Bond Fund
GlobalAccess Emerging Market Equity Fund
GlobalAccess Global Inflation Linked Bond Fund
GlobalAccess Global Property Securities Fund
GlobalAccess Global Short Duration Bond Fund
Efficient portfolio management The Funds may, for the purposes of efficient portfolio management and hedging of currency risks, enter into futures contracts or write call options and purchase put options on currencies provided that these transactions may only concern contracts, which are traded on a regulated market operating regularly, being organised and open to the public. The Funds may also enter into forward purchases or sales of currencies or exchange currencies on the basis of "over the counter" arrangement with highly rated financial institutions specialising in this type of transaction. During the year, the Funds entered into futures contracts and forward currency transactions for the purpose of hedging currency risk on investment and cash holdings, to hedge benchmark risk and also to attempt to hedge the value of certain classes of EUR, USD, JPY and GBP denominated shares. Contracts outstanding at 31 May 2021 are disclosed in the relevant Fund's schedule of investments. Realised and unrealised fair value gains and losses on financial instruments used for efficient portfolio management purposes are included in the statement of comprehensive income. Please refer to note 2 for details on the Funds uses of financial derivatives. Soft commission The investment manager and the sub-investment managers can enter into soft commission arrangements with brokers, under which certain goods and services used to support investment decision-making, can be received by the investment manager and the sub-investment managers. The investment manager and the sub-investment managers would not make direct payment for these services, but would transact an agreed amount of business with the brokers on behalf of the Funds. Commission would be paid by the Funds on these transactions.

Barclays Multi-Manager Fund PLC Annual Report and Audited Financial Statements 2021
490
Appendix 3: Other information (unaudited) (continued) Soft commission (continued) The goods and services used for the Funds may include the following:
i. Research and analytical services, including economic factors, trends and computer services used to support investment making decisions.
ii. Safe custody services in relation to investments managed for clients. iii. Performance and valuation services.
There were no soft commission arrangements entered into by Barclays Investment Services Limited during the financial year. French equity savings plan (French Plan d'Epargne en Actions) As at the date of this Annual Report (31 May 2021), the Funds listed below (the "Eligible Funds”) were eligible to be held within the framework of a French Plan d'Epargne en Actions ("PEA"): Name of Fund Percentage invested in PEA eligible assets
GlobalAccess UK Opportunities Fund 95%
GlobalAccess Europe (ex-UK) Alpha Fund 84%
The PEA eligibility of the Eligible Funds results from, to the best knowledge of the Company, tax law1 and practices in force in France as at the date of this Annual Report. Such tax law and practices may change from time to time and, therefore, Eligible Funds which may currently be held within the framework of a PEA could lose their PEA eligibility. Further, Eligible Funds could lose their PEA eligibility due to changes impacting their investment universe or benchmark index. However, notwithstanding the above, prospective and existing French investors should note that the GlobalAccess UK Opportunities Fund will not continue to be PEA eligible investment from 30 September 2021, which is the end of the transition period allowed for PEA eligible funds to dispose of United Kingdom issued securities. This is as a result of the United Kingdom’s departure from the European Union and European Economic Area (“Brexit”) which has made United Kingdom issued securities ineligible for inclusion in the 75% EEA securities quota required for PEA eligible collective investments. The below link provides further information from the AMF (the French Regulator) on the impact of Brexit on PEA. https://www.amf-france.org/en/news-publications/news/your-equity-savings-plan-and-brexit-extension-transition-period-your-investments-uk-securities The GlobalAccess Europe (ex-UK) Alpha Fund will continue to be PEA eligible, subject to any future changes to any tax law and practices in force in France or any future changes impacting its investment universe or benchmark index. Prospective and existing French investors should consult their own professional advisers as to the implications of their subscribing for, purchasing, holding, switching or disposing of Shares in the Funds.
1 Article 91 quater L of Annex 2 to the General Tax Code which requires PEA eligible funds to permanently invest at least 75% of their assets in securities or rights listed in (a) or (b) of I, 1° of Article L.221-31 of the French Monetary and Financial Code.

This item can be provided in Braille, large print or audio by contacting us. Barclays Multi-Manager Fund PLC (the “Company”) is an Open-Ended Investment Company. The Company is authorised in Ireland by the Central Bank of Ireland as an Undertaking for Collective Investments in Transferable Securities. The Company is a recognised scheme in the UK for the purpose of section 264 of the UK Financial Services and Markets Act. The Company’s registered address is 6th Floor, 2 Grand Canal Square, Dublin 2, Ireland. Barclays Bank UK PLC is authorised by the Prudential Regulation Authority and regulated by the Financial Conduct Authority and the Prudential Regulation Authority (Financial Services Register No. 759676). Registered in England. Registered No. 9740322. Registered Office: 1 Churchill Place, London E14 5HP.