Annual Commentary Harding Loevner Funds plc
108
Annual Commentary 30 June 2021 Harding Loevner Funds plc Global Equity Fund International Equity Fund Emerging Markets Equity Fund Global Small Companies Equity Fund
-
Upload
khangminh22 -
Category
Documents
-
view
0 -
download
0
Transcript of Annual Commentary Harding Loevner Funds plc

Annual Commentary30 June 2021
Harding Loevner Funds plc
Global Equity Fund
International Equity Fund
Emerging Markets Equity Fund
Global Small Companies Equity Fund

2
3
13
8
18
Global Equity Fund
International Equity Fund
Emerging Markets Equity Fund
Global Small Companies Equity Fund
Table of Contents
Contact
Harding Loevner - Transfer Agencyc/o Northern Trust International Fund Administration Services (Ireland) Ltd.George’s Court, 54-62 Townsend StreetDublin 2, Ireland
Phone: +353 1 434 5085Fax: +353 1 434 5289www.hardingloevnerfundsplc.com

3
Portfolio Management Team
Performance SummaryThe Global Equity Fund USD Class A shares rose 38.90% (at dealing prices) for the 12 months ended 30 June 2021, net of fees, in US dollar terms, underperforming its benchmark, the MSCI All Country World Index, which rose 39.27%. Please refer to the chart immediately following this commentary for returns related to the fund’s other share classes.
Market ReviewThe global economic rebound gathered steam throughout the period as numerous COVID vaccine candidates were approved, economic policymakers provided unparalleled levels of fiscal stimulus, and central banks slashed borrowing costs and rolled out a dizzying array of measures designed to support asset prices and keep liquidity flowing to businesses. In the US, retail sales climbed to the strongest level on record and restaurant and airline bookings, while still below pre-COVID levels, continued to improve. Additionally, the Biden administration passed a colossal US$1.9 trillion relief package, the third such stimulus measure since the pandemic began, sending direct payments to millions of Americans and extending unemployment insurance. In China, electricity generation and rail cargo volume rose substantially year over year, but consumer spending remained subdued despite much of daily life having returned to normal. Many emerging economies outside of China, however, continued to struggle with inadequate vaccine supplies and health care logistics to get enough shots in arms even as the new, more virulent Delta strain of the virus led to resurgent waves of infections. The recovery in Europe has also remained precarious with Delta’s spread and vaccine rollout delays extending
or renewing lockdowns. Cognizant of these difficulties, the EU approved an €800 billion recovery fund late in the period aimed at infrastructure investment and support for businesses.
Lockdown measures helped to spur a sharp rise in retail trading activity, with a record number of people opening online accounts, and option volumes rising dramatically. This speculative frenzy extended to initial public offerings (IPOs) in many markets, with shares of newly listed companies (many of them still loss-making) being met by strong institutional and retail demand.
Cryptocurrencies continued their run of popularity. As homebuyers and corporate treasurers alike raced to lock in low interest rates, bond yields rose, with the yield on the US 10-year reaching nearly 1.75% in the first quarter of 2021. Commodity prices, particularly those linked with industrial activity such as iron ore and copper, jumped higher, while Brent crude rose to over US$60 per barrel.
This speculation was tempered somewhat towards the end of the period due to a slew of regulatory actions. In the IPO market, the US Security and Exchange Commission suggested that heightened regulation of special purpose acquisition companies (SPACs) is an agency priority, grinding IPO activity in the space to a halt. Cryptocurrency prices also fell sharply from their first quarter highs as Chinese regulators introduced new proposals to curtail the country’s large cryptocurrency mining sector. On the other hand, the re-opening of more normal consumer and business activity caused shortages and sharp price rises for many goods due to inventory liquidations last year that need to be rebuilt, stoking fears that inflation may again return to the fore.
By sector, Materials and Financials performed well in the year, the latter aided by a steepening yield curve and surprisingly low credit defaults. Stocks in the Information Technology and Consumer Discretionary sectors were also strong performers. Less-cyclical sectors—Consumer Staples, Health Care, and Utilities—all underperformed for the period.
In terms of geography, Canada was a big outperformer, helped by its large weighting in banks and Energy. The US also outperformed, bolstered by its large tech industry. Stocks in Japan and Europe both inside and outside the eurozone lagged as both regions experienced a steep rise in COVID-19 infections towards the end of the period.
Style effects favored the least expensive and fastest-growing companies. However, shares of the lowest-quality companies—those with more leverage and less consistent returns—outperformed those of the highest-quality companies.
Global Equity Fund
Peter Baughan, CFACo-Lead Portfolio Manager
Jingyi LiCo-Lead Portfolio Manager
Scott CrawshawPortfolio Manager
Christopher Mack, CFAPortfolio Manager
Richard Schmidt, CFAPortfolio Manager

4
Performance AttributionStrong stocks in Health Care contributed the most to relative performance in the period, particularly US-based manufacturer of 3D digital scanners and clear dental aligners Align Technologies. The company reported strong earnings during the fourth quarter of 2020, continuing to benefit from pent-up demand once dentist’s offices began to reopen during the previous quarter. Additionally, Align has been expanding its product line by combining orthodontics with restorative dental treatment, aiming to increase its business to General Practitioners as well as orthodontists. Strong stocks in Financials were also helpful; SVB Financial Group, a US-based bank focus on the tech and biotech startup communities, benefited from rising expectations for increased economic growth and higher interest rates. The company also reported exceptional earnings growth during the period. Weak stocks in Materials detracted, particularly German supplier of flavors and fragrance ingredients Symrise. Shares lagged as the company experienced slower organic sales growth in its beverage
and sweets segments. The Fund’s overweight in Health Care and small cash weight also detracted during the period.
Viewed by geography, strong stocks in the US contributed, especially SVB Financial and agricultural equipment manufacturer John Deere. Deere delivered stronger-than-expected fourth-quarter earnings and raised its guidance for 2021. Poor stocks in Emerging Markets and Europe (both inside and outside the eurozone) detracted. Polish video game producer CD Projekt declined as a ransomware attack delayed the company’s efforts to patch its game Cyberpunk 2077, whose highly anticipated launch late last year was marred by bugs. Chinese internet giant Alibaba was forced to withdraw its planned IPO for its Ant Financial affiliate and was hit with fines by Chinese regulators over alleged antitrust abuse.
Perspective and Outlook
Regulation of the antitrust variety became an increasingly relevant issue worldwide following muscular interventions by regulators in Europe, Asia, and the US in the second quarter of 2021. The shift in regulatory headwinds is a development we take seriously, as any changes can swiftly reshape entire industries and companies. How-ever, it’s also a phenomenon with which we’re intimately familiar; we deal with regulatory threats routinely as an explicit factor in our industry analyses, our business assessments, and our projections of companies’ growth and profitability.
In the US, there is growing concern that too much market power is concentrated in a handful of companies that dominate their respective industries. Under the new presidential administration, antitrust regulators appear to be gearing up to take legal action against big technology firms in particular. The rising threat is epitomized by the bipartisan appointment of Lina Khan, a controversial legal scholar, to the FTC. Khan has argued for a new antitrust framework that counters market power in companies even if their product is free to consumers or has led to lower prices. In Europe, antitrust agencies are already further along in clamping down on the tech behemoths, pursuing active investigations into potential market abuses by Apple, Facebook, Alphabet, and Amazon.com. In April, Chinese regulators sent a strong message to all companies tempted to abuse the market power derived from potent platform and network effects—imposing a US$2.8 billion fine on Alibaba and summoning 34 leading Chinese technology and e-commerce companies to inform them that they had one month to self-inspect and “completely rectify” any conflicts with recently updated regulations on online competition.
Antitrust is far from the only category of shifting regulatory risk facing many companies globally; environmental regulations also continue to ratchet up as the political and social consensus surrounding climate change solidifies. This is a particular headwind for the oil industry, which suffered a notable setback in May when a Dutch court ordered Royal Dutch Shell, generally considered one of the more progressive oil and gas producers in terms of transitioning toward greener energy sources, to ensure
Sector Fund Benchmark1
Comm Services 11.2 9.4
Cons Discretionary 10.5 12.7
Cons Staples 2.2 6.9
Energy 2.2 3.4
Financials 14.4 14.1
Health Care 21.7 11.6
Industrials 11.2 9.9
Info Technology 24.1 21.9
Materials 0.0 4.9
Real Estate 0.0 2.6
Utilities 0.5 2.6
Cash 2.0 –
Portfolio Positioning (% Weight) at 30 June 2021
Geography Fund Benchmark1
Canada 0.0 2.9
Emerging Markets 14.8 12.9
Europe EMU 6.3 8.5
Europe ex-EMU 7.0 7.9
Frontier Markets2 0.0 –
Japan 3.4 5.9
Middle East 0.0 0.2
Pacific ex-Japan 2.6 3.0
United States 63.9 58.7
Cash 2.0 –
Ten Largest Holdings at 30 June 2021
Company Sector Market %
Alphabet Comm Services US 3.5
First Republic Bank Financials US 3.5
SVB Financial Group Financials US 3.2
Illumina Health Care US 3.0
Amazon.com Cons Discretionary US 3.0
PayPal Info Technology US 2.8
Facebook Comm Services US 2.6
John Deere Industrials US 2.5
Microsoft Info Technology US 2.1
Wuxi Biologics Health Care China 2.1
Ten Largest Holdings 28.3%
1MSCI All Country World Index; 2Includes countries with less-developed markets outside the index.
Sector Fund Benchmark1
Comm Services 11.2 9.4
Cons Discretionary 10.5 12.7
Cons Staples 2.2 6.9
Energy 2.2 3.4
Financials 14.4 14.1
Health Care 21.7 11.6
Industrials 11.2 9.9
Info Technology 24.1 21.9
Materials 0.0 4.9
Real Estate 0.0 2.6
Utilities 0.5 2.6
Cash 2.0 –
Portfolio Positioning (% Weight) at 30 June 2021
Geography Fund Benchmark1
Canada 0.0 2.9
Emerging Markets 14.8 12.9
Europe EMU 6.3 8.5
Europe ex-EMU 7.0 7.9
Frontier Markets2 0.0 –
Japan 3.4 5.9
Middle East 0.0 0.2
Pacific ex-Japan 2.6 3.0
United States 63.9 58.7
Cash 2.0 –
Ten Largest Holdings at 30 June 2021
Company Sector Market %
Alphabet Comm Services US 3.5
First Republic Bank Financials US 3.5
SVB Financial Group Financials US 3.2
Illumina Health Care US 3.0
Amazon.com Cons Discretionary US 3.0
PayPal Info Technology US 2.8
Facebook Comm Services US 2.6
John Deere Industrials US 2.5
Microsoft Info Technology US 2.1
Wuxi Biologics Health Care China 2.1
Ten Largest Holdings 28.3%

5
the net CO2 emissions of all its products and operations are 45% lower by 2030. Though the company has the right to appeal, and it is not entirely clear how the Dutch court will enforce its decision (perhaps explaining the negligible impact on Royal Dutch’s share price so far), if this judgment is a sign of things to come, it throws doubt on the viability of many global energy companies.
Our analysts incorporate the range of potential effects of existing and potential future regulations into their analysis of the competitive structure of each industry. We model regulations in terms of their impact on each of Michael Porter’s “Five Forces,” our workhorse template for understanding business strategy.1 We know, for instance, that the threat of new entrants can increase if the state nurtures them, and that the threat of substitution can be tilted by subsidies or prohibitions of alternative products.
Regulatory influences may affect our view of Porter’s competitive forces so negatively that it pushes us to avoid some industries entirely. Electric utilities, for example, are generally treated as regulated monopolies, due to the critical necessity of their product, the asset intensity of their physical infrastructure, and the typical absence of competitive alternatives. Their rates are controlled, and their investments are mandated by regulators with a view to providing reliable power to the residents and industries within reach of their grid. There is broad political support for this approach, and the consequence is to weaken severely the utilities’ bargaining power over their customers. Environmental regulations targeted at reducing CO
2 emissions also have broad political
support and, by requiring the use of specific energy sources, weaken the utilities’ bargaining power over their suppliers and hamstringing their cash flow return on invested capital (CFROI).
We cover no electric utilities and only a few companies in the broader Utilities sector; the exceptions are cases where we think regulators have good reason to allow adequate returns on invested capital. ENN Energy, a private-sector gas utility in China, is one. ENN earned a five-year average annual CFROI of about 11% while growing at a double-digit pace thanks to regulations pressing businesses and consumers to switch away from coal to natural gas as part of a key step in the transition toward the country’s long-term goal of net carbon neutrality.
Though ENN’s gas sales are subject to controls on pricing and profits, it can collect a connection fee from residential users, a
lucrative incentive intended to help fund expansion of the gas distribution network. Also, many local governments are promoting the development of communities and industrial parks with smaller carbon footprints. This is proving to be a boon for ENN’s integrated energy business, which combines natural gas and renewable energy sources to meet customers’ steam, cooling, heating, and electricity needs, and which saw its sales volumes grow 79% YoY this quarter.
In the US and Europe, open political debate tends to presage where new regulatory scrutiny is likely to fall, as well as the magnitude and scope of potential mandates, restrictions, or penalties. There are established legal processes by which companies can argue their side and courts to which they can appeal. In contrast, in less developed markets, regulatory action can come suddenly without warning, and allow companies no opportunity to argue their case or avenue for appeal. We have experienced this kind of seemingly arbitrary regulatory action in China in recent years: from the 2018 freezing of new video game approvals that harmed Tencent and NetEase; to the 11th-hour suspension of Ant Group’s initial public offering due to financial regulatory reforms, and the forced seclusion of Jack Ma, founder of its parent company, Alibaba; to recent proposals to restrict the provision of supplementary tutoring. In each instance, investors have suffered from the unpredictable regulatory change, a pattern of caprice we have come to accept as part of the price of admission to investing in some of the world’s most attractive high-quality growing companies.
We should note that in addition to incorporating country-level regulatory considerations into our Porter forces assessments and growth forecasts, we also use country-level risk differentials to adjust the discount rates we use in our valuation models—and on this score China only falls to the middle of the pack. We require higher risk premia to be reflected in discount rates for companies operating in countries with higher legal, governance, and regulatory risks or weak governmental finances (which often lead to a grasping regulatory hand). To assess comparative country risk, we use third-party measures of political stability, rule of law, corruption, and openness of markets from the World Bank’s Worldwide Governance Indicators and the Heritage Foundation’s Index of Economic Freedom, and sovereign credit ratings from ratings agencies.
Our monitoring of regulatory risks faced by industries and companies along with our country-level real discount rate premiums tend to tilt us toward markets with lower risk exposure, and away from more vulnerable ones. But predicting
1Of Porter’s 15 books, his 2008 Competitive Strategy: Techniques for Analyzing Industries and Competitors is perhaps the best single source for explaining the principles we find so helpful in our own analysis.
Regulatory influences may affect our view of Porter’s competitive forces so negatively that it pushes us to avoid some industries entirely. Electric utilities are an example, except where we think regulators have good reason to allow adequate returns on invested capital.
In each instance, investors have suffered from the unpredictable regulatory change in China, a pattern of caprice we have come to accept as part of the price of admission to investing in some of the world’s most attractive high-quality growing companies.

6
which industries, countries, or companies may face unfavorable regulatory change is a hugely imprecise task. These differences in discount rates may not account sufficiently for the capriciousness of regulators. Therefore, our portfolio investment guidelines constrain industry, country, and individual security weights to ensure a high level of diversification and thereby limit the potential impact of regulatory (as well as other) shocks that we fail to foresee. The recent unforeseen shifts in China’s regulation of fintech and e-commerce illustrate how limiting our holding in a single country or company—such as Alibaba—can mitigate our exposure.
Lest we leave the impression that regulation and regulatory changes provide only risk and not their own form of opportunity, consider the global automotive industry, where environmental regulations such as emissions and fuel-efficiency standards have increased manufacturing costs, but have also sparked innovation, providing potential growth opportunities for innovative suppliers able to walk the tight rope between regulatory mandates and market preferences. Likewise, while the entire Health Care sector faces perennial regulatory pressure as governments implement various methods of constraining the prices of medical treatment, it also enjoys key regulatory benefits. These structures—patent protection for new drugs (which keeps rivalry at bay), safety regulations (which raise the bar for less-experienced new entrants), and government funding of drugs for large portions of the population—have kept returns to investing in research, development, and drug manufacturing high for many decades. This regulatory framework, though altered from time to time, has been effective at sustaining innovation in drug development, to the benefit of many patients not only within the US, but throughout the world. It also underpins the long-term growth of many of our Health Care holdings.
Sector Fund Benchmark1
Comm Services 11.2 9.4
Cons Discretionary 10.5 12.7
Cons Staples 2.2 6.9
Energy 2.2 3.4
Financials 14.4 14.1
Health Care 21.7 11.6
Industrials 11.2 9.9
Info Technology 24.1 21.9
Materials 0.0 4.9
Real Estate 0.0 2.6
Utilities 0.5 2.6
Cash 2.0 –
Portfolio Positioning (% Weight) at 30 June 2021
Geography Fund Benchmark1
Canada 0.0 2.9
Emerging Markets 14.8 12.9
Europe EMU 6.3 8.5
Europe ex-EMU 7.0 7.9
Frontier Markets2 0.0 –
Japan 3.4 5.9
Middle East 0.0 0.2
Pacific ex-Japan 2.6 3.0
United States 63.9 58.7
Cash 2.0 –
Ten Largest Holdings at 30 June 2021
Company Sector Market %
Alphabet Comm Services US 3.5
First Republic Bank Financials US 3.5
SVB Financial Group Financials US 3.2
Illumina Health Care US 3.0
Amazon.com Cons Discretionary US 3.0
PayPal Info Technology US 2.8
Facebook Comm Services US 2.6
John Deere Industrials US 2.5
Microsoft Info Technology US 2.1
Wuxi Biologics Health Care China 2.1
Ten Largest Holdings 28.3%

7
Class D 6 Months 1 Year 3 Years 5 Years 10 Years Since Inception
US Dollar 4 January 2018
Global Equity Fund USD D1 11.39 37.77 16.66 – – 14.32
MSCI All Country World Index2 12.30 39.27 14.57 – – 11.64
Performance (% Total Return)as of 30 June 2021
Class A 6 Months 1 Year 3 Years 5 Years 10 Years Since Inception
US Dollar 21 June 2007
Global Equity Fund USD A1 11.80 38.90 17.55 18.32 12.23 9.17
MSCI All Country World Index2 12.30 39.27 14.57 14.61 9.90 6.39
Euro 21 June 2007
Global Equity Fund EUR A1 15.19 31.60 16.94 16.76 14.50 10.18
MSCI All Country World Index2 15.87 31.90 13.97 13.13 12.13 7.33
GBP Sterling 5 March 2008
Global Equity Fund GBP A1 10.54 24.38 15.70 17.42 13.91 13.06
MSCI All Country World Index2 11.12 24.56 12.85 13.86 11.56 10.37
Class B 6 Months 1 Year 3 Years 5 Years 10 Years Since Inception
US Dollar 5 June 2018
Global Equity Fund USD B1 11.66 38.47 17.24 – – 16.08
MSCI All Country World Index2 12.30 39.27 14.57 – – 13.51
GBP Sterling 15 August 2018
Global Equity Fund GBP B1 10.37 23.96 – – – 14.94
MSCI All Country World Index2 11.12 24.56 – – – 11.51
Class S 6 Months 1 Year 3 Years 5 Years 10 Years Since Inception
Canadian Dollar 23 August 2019
Global Equity Fund CAD S1 9.27 27.69 – – – 27.44
MSCI All Country World Index2 9.16 26.62 – – – 19.02
Euro 3 June 2019
Global Equity Fund EUR S1 15.60 32.49 – – – 22.97
MSCI All Country World Index2 15.87 31.90 – – – 16.58
GBP Sterling 26 October 2018
Global Equity Fund GBP S1 10.92 25.28 – – – 21.32
MSCI All Country World Index2 11.12 24.56 – – – 15.65
1Net of fees; 2Net of withholding taxes. Returns are annualized for periods greater than one year.
Please read the separate disclosures page for important information.
Class M 6 Months 1 Year 3 Years 5 Years 10 Years Since Inception
Euro 31 January 2018
Global Equity Fund EUR M1 15.19 31.61 17.00 – – 15.88
MSCI All Country World Index2 15.87 31.90 13.97 – – 12.37
Singapore Dollar 21 September 2015
Global Equity Fund SGD M1 13.80 34.06 17.09 18.33 – 15.81
MSCI All Country World Index2 14.22 34.19 14.02 14.58 – 12.24
Class S1 6 Months 1 Year 3 Years 5 Years Since Inception
US Dollar 29 August 2018
Global Equity Fund USD S11 11.87 39.05 – – – 17.35
MSCI All Country World Index2 12.30 39.27 – – – 13.65

8
Portfolio Management Team
Performance Summary
The International Equity Fund USD Class A shares rose 34.12% (at dealing prices) for the 12 months ended 30 June 2021, net of fees, in US dollar terms, underperforming its benchmark, the MSCI All Country World ex-US Index, which rose 35.72%. Please refer to the chart immediately following this commentary for returns related to the fund’s other share classes.
Market Review
The global economic rebound gathered steam throughout the period as numerous COVID vaccine candidates were approved, economic policymakers provided unparalleled levels of fiscal stimulus, and central banks slashed borrowing costs and rolled out a dizzying array of measures designed to support asset prices and keep liquidity flowing to businesses. In the US, retail sales climbed to the strongest level on record and restaurant and airline bookings, while still below pre-COVID levels, continued to improve. Additionally, the Biden administration passed a colossal US$1.9 trillion relief package, the third such stimulus measure since the pandemic began, sending direct payments to millions of Americans and extending unemployment insurance. In China, electricity generation and rail cargo volume rose substantially year over year, but consumer spending remained subdued despite much of daily life having returned to normal. Many emerging economies outside of China, however, continued to struggle with inadequate vaccine supplies and health care logistics to get enough shots in arms even as the
new, more virulent Delta strain of the virus led to resurgent waves of infections. The recovery in Europe has also remained precarious with Delta’s spread and vaccine rollout delays extending or renewing lockdowns. Cognizant of these difficulties, the EU approved an €800 billion recovery fund late in the period aimed at infrastructure investment and support for businesses.
Lockdown measures helped to spur a sharp rise in retail trading activity, with a record number of people opening online accounts, and option volumes rising dramatically. This speculative frenzy extended to initial public offerings (IPOs) in many markets, with shares of newly listed companies (many of them still loss-making) being met by strong institutional and retail demand. Cryptocurrencies continued their run of popularity. As homebuyers and corporate treasurers alike raced to lock in low interest rates, bond yields rose, with the yield on the US 10-year reaching nearly 1.75% in the first quarter of 2021. Commodity prices, particularly those linked with industrial activity such as iron ore and copper, jumped higher, while Brent crude rose to over US$60 per barrel.
This speculation was tempered somewhat towards the end of the period due to a slew of regulatory actions. In the IPO market, the US Security and Exchange Commission suggested that heightened regulation of special purpose acquisition companies (SPACs) is an agency priority, grinding IPO activity in the space to a halt. Cryptocurrency prices also fell sharply from their first quarter highs as Chinese regulators introduced new proposals to curtail the country’s large cryptocurrency mining sector. On the other hand, the re-opening of more normal consumer and business activity caused shortages and sharp price rises for many goods due to inventory liquidations last year that need to be rebuilt, stoking fears that inflation may again return to the fore.
By sector, Information Technology (IT) and Materials performed well in the year. Stocks in the Consumer Discretionary, Financials, and Industrials sectors were also strong performers. Less-cyclical sectors—Consumer Staples, Health Care, and Utilities—all underperformed for the period.
In terms of geography, Canada was a big outperformer, helped by its large weighting in banks and Energy and from the strong pull from the US for its exports of commodities and manufactured goods. Emerging Markets, particularly Taiwan and South Korea, also outperformed as their domestic semiconductor manufacturers benefitted from the global chip shortage. In contrast, China lagged the rest of EM and the broader index, with domestic regulatory shifts reversing the positive sentiment towards that market enjoyed in the spring of 2020 when the country quickly managed to control the coronavirus outbreak. Stocks in Japan and Europe outside the eurozone also lagged as both regions experienced a steep rise in COVID-19 infections towards the end of the period. Style effects
International Equity Fund
Ferrill Roll, CFACo-Lead Portfolio Manager
Andrew West, CFACo-Lead Portfolio Manager
Bryan Lloyd, CFAPortfolio Manager
Babatunde Ojo, CFAPortfolio Manager
Patrick Todd, CFAPortfolio Manager

9
significantly favored the least expensive and fastest-growing companies. However, shares of the lowest-quality companies—those with more leverage and less consistent returns—outperformed those of the highest-quality companies.
Performance Attribution
Stock selection in Consumer Discretionary and Materials detracted the most from relative performance during the period. In Consumer Discretionary, shares of Japan’s largest home furnishing retailer NITORI detracted as the yen weakened against the US dollar, hurting Japanese importers. Within the strong-performing Materials sector, shares of German supplier of flavors and fragrance ingredients Symrise lagged as the company experienced slower organic sales growth in its beverage and sweets segments. The Fund’s overweights in Health Care and Consumer Staples, and underweight in Consumer Discretionary also detracted.
Strong stocks in Consumer Staples and Health Care mostly offset the drag from large sector weights. In Consumer Staples, French cosmetic maker L’Oréal reported first-quarter 2021 sales declined about 5% overall but also provided upbeat guidance for the rest of the year. Sales in China grew 6% year-over-year, and cosmetics demand globally appears resilient. Sonova Holding, a Swiss hearing aid manufacturer, was a top contributor in Health Care. The company’s business rebounded strongly from lockdowns as management raised earnings guidance for the full year. Sonova also announced the acquisition of the consumer audio division of Sennheiser, which will allow it to face off against Bose or other consumer audio brands entering the hearing aid market. The Fund’s large weight in IT was also helpful during the period, with our holdings almost matching the torrid 57% return for the sector.
Viewed by region, our stocks in Japan were the largest source of underperformance. Pharmaceutical manufacturer Chugai Pharmaceutical was hurt by falling off-label usage of its rheumatoid arthritis drug Actemra as a treatment for COVID-19 after its initial promise faltered in subsequent clinical trials. Additionally, sales of other Chugai-discovered products for export by its majority owner, Roche, were weak in the first quarter of 2021. Shares of manufacturer of hygiene and household cleaning products Unicharm declined in response to rising input costs (like for petroleum) and a year-over-year decline in sales in Japan. The Fund’s modest holding of cash also detracted during this period of strong equity returns. Strongly performing stocks in Emerging Markets helped boost relative returns, especially Taiwanese semiconductor manufacturer TSMC. The company posted strong earnings throughout the period, seeing an increased demand for its high-performance chips, including from Apple (which unveiled new iPad models which utilize TSMC-manufactured A14 processors) and AMD, a US-based design studio which has been gaining share from Intel’s integrated design-and-manufacturing model by leveraging TSMC’s advanced manufacturing lead. Another semiconductor stock helped lift our returns in the eurozone. Shares of Infineon Technologies, a German manufacturer of semiconductors used for electric power management in automobiles and industrial machinery, rose on expectations for a stronger recovery in the auto industry and the rising share of electric vehicles in China, Europe, and the US; all despite near-term shortages plaguing the broader auto-related semiconductor segment.
Perspective and Outlook
Regulation of the antitrust variety became an increasingly relevant issue worldwide following muscular interventions by regulators in Europe, Asia, and the US in the second quarter of 2021. The shift in regulatory headwinds is a development we take seriously, as any changes can swiftly reshape entire industries and companies. However, it’s also a phenomenon with which we’re intimately familiar; we deal with regulatory threats routinely as an explicit factor in our industry analyses, our business assessments, and our projections of companies’ growth and profitability.
1MSCI All Country World ex-US Index; 2Includes countries with less-developed markets outside the index; 3Includes companies classified in countries outside the index.
Portfolio Positioning (% Weight) at 30 June 2021
Geography Fund Benchmark1
Canada 1.9 7.0
Emerging Markets 24.8 31.3
Europe EMU 22.2 20.5
Europe ex-EMU 25.7 19.2
Frontier Markets2 0.0 –
Japan 12.5 14.3
Middle East 1.1 0.4
Pacific ex-Japan 8.2 7.3
Other3 1.0 –
Cash 2.6 –
Sector Fund Benchmark1
Comm Services 4.2 6.7
Cons Discretionary 2.4 13.8
Cons Staples 12.8 8.5
Energy 3.0 4.5
Financials 16.2 18.6
Health Care 13.3 9.3
Industrials 14.3 11.8
Info Technology 20.3 12.9
Materials 9.9 8.3
Real Estate 0.0 2.6
Utilities 1.0 3.0
Cash 2.6 –

10
In the US, there is growing concern that too much market power is concentrated in a handful of companies that dominate their respective industries. Under the new presidential administration, antitrust regulators appear to be gearing up to take legal action against big technology firms in particular. The rising threat is epitomized by the bipartisan appointment of Lina Khan, a controversial legal scholar, to the FTC. Khan has argued for a new antitrust framework that counters market power in companies even if their product is free to consumers or has led to lower prices. In Europe, antitrust agencies are already further along in clamping down on the tech behemoths, pursuing active investigations into potential market abuses by Apple, Facebook, Alphabet, and Amazon.com. In April, Chinese regulators sent a strong message to all companies tempted to abuse the market power derived from potent platform and network effects—imposing a US$2.8 billion fine on Alibaba and summoning 34 leading Chinese technology and e-commerce companies to inform them that they had one month to self-inspect and “completely rectify” any conflicts with recently updated regulations on online competition.
Antitrust is far from the only category of shifting regulatory risk facing many companies globally; environmental regulations also continue to ratchet up as the political and social consensus surrounding climate change solidifies. This is a particular headwind for the oil industry, which suffered a notable setback in May when a Dutch court ordered Royal Dutch Shell, generally considered one of the more progressive oil and gas producers in terms of transitioning toward greener energy sources, to ensure the net CO2 emissions of all its products and operations are 45% lower by 2030. Though the company has the right to appeal, and it is not entirely clear how the Dutch court will enforce its decision (perhaps explaining the negligible impact on Royal Dutch’s share price so far), if this judgment is a sign of things to come, it throws doubt on the viability of many global energy companies.
Our analysts incorporate the range of potential effects of existing and potential future regulations into their analysis of the competitive structure of each industry. We model regulations in terms of their impact on each of Michael Porter’s “Five Forces,” our workhorse template for understanding business strategy.1 We know, for instance, that the threat of new entrants can increase if the state nurtures them, and that the threat of substitution can be tilted by subsidies or prohibitions of alternative products.
Regulatory influences may affect our view of Porter’s competitive forces so negatively that it pushes us to avoid some industries entirely. Electric utilities, for example, are generally treated as regulated monopolies, due to the critical necessity of their product, the asset intensity of their physical infrastructure, and the typical absence of competitive alternatives. Their rates are controlled, and their investments are mandated by regulators with a view to providing reliable power to the residents and industries
within reach of their grid. There is broad political support for this approach, and the consequence is to weaken severely the utilities’ bargaining power over their customers. Environmental regulations targeted at reducing CO2 emissions also have broad political support and, by requiring the use of specific energy sources, weaken the utilities’ bargaining power over their suppliers and hamstringing their cash flow return on invested capital (CFROI).
We cover no electric utilities and only a few companies in the broader Utilities sector; the exceptions are cases where we think regulators have good reason to allow adequate returns on invested capital. ENN Energy, a private-sector gas utility in China, is one. ENN earned a five-year average annual CFROI of about 11% while growing at a double-digit pace thanks to regulations pressing businesses and consumers to switch away from coal to natural gas as part of a key step in the transition toward the country’s long-term goal of net carbon neutrality.
Though ENN’s gas sales are subject to controls on pricing and profits, it can collect a connection fee from residential users, a lucrative incentive intended to help fund expansion of the gas distribution network. Also, many local governments are promoting the development of communities and industrial parks with smaller carbon footprints. This is proving to be a boon for ENN’s integrated energy business, which combines natural gas and renewable energy sources to meet customers’ steam, cooling, heating, and electricity needs, and which saw its sales volumes grow 79% YoY this quarter.
In the US and Europe, open political debate tends to presage where new regulatory scrutiny is likely to fall, as well as the magnitude and scope of potential mandates, restrictions, or penalties. There are established legal processes by which companies can argue their side and courts to which they can appeal. In contrast, in less developed markets, regulatory action can come suddenly without warning, and allow companies no opportunity to argue their case or avenue for appeal. We have experienced this kind of seemingly arbitrary regulatory action in China in recent years: from the 2018 freezing of new video game approvals that harmed Tencent and NetEase; to the 11th-hour suspension of Ant Group’s initial public offering due to financial regulatory reforms, and the forced seclusion of Jack Ma, founder of its parent company, Alibaba; to recent proposals to restrict the provision of supplementary tutoring. In each instance, investors have suffered from the unpredictable regulatory change, a pattern of caprice we have come to accept as part of the price of admission to investing in some of the world’s most attractive high-quality growing companies.
We should note that in addition to incorporating country-level regulatory considerations into our Porter forces assessments and growth forecasts, we also use country-level risk differentials to adjust the discount rates we use in our valuation models—and on this score China only falls to the middle of the pack. We require higher risk premia to be reflected in discount rates for companies operating in countries with higher legal, governance, and regulatory risks or weak governmental finances (which often
1Of Porter’s 15 books, his 2008 Competitive Strategy: Techniques for Analyzing Industries and Competitors is perhaps the best single source for explaining the principles we find so helpful in our own analysis.

11
lead to a grasping regulatory hand). To assess comparative country risk, we use third-party measures of political stability, rule of law, corruption, and openness of markets from the World Bank’s Worldwide Governance Indicators and the Heritage Foundation’s Index of Economic Freedom, and sovereign credit ratings from ratings agencies.
Our monitoring of regulatory risks faced by industries and companies along with our country-level real discount rate premiums tend to tilt us toward markets with lower risk exposure, and away from more vulnerable ones. But predicting which industries, countries, or companies may face unfavorable regulatory change is a hugely imprecise task. These differences in discount rates may not account sufficiently for the capriciousness of regulators. Therefore, our portfolio investment guidelines constrain industry, country, and individual security weights to ensure a high level of diversification and thereby limit the potential impact of regulatory (as well as other) shocks that we fail to foresee. The recent unforeseen shifts in China’s regulation of fintech and e-commerce illustrate how limiting our holding in a single country or company—such as Alibaba—can mitigate our exposure.
Lest we leave the impression that regulation and regulatory changes provide only risk and not their own form of opportunity, consider the global automotive industry, where environmental regulations such as emissions and fuel-efficiency standards have increased manufacturing costs, but have also sparked innovation, providing potential growth opportunities for innovative suppliers able to walk the tight rope between regulatory mandates and market preferences. Likewise, while the entire Health Care sector faces perennial regulatory pressure as governments implement various methods of constraining the prices of medical treatment, it also enjoys key regulatory benefits. These structures—patent protection for new drugs (which keeps rivalry at bay), safety regulations (which raise the bar for less-experienced new entrants), and government funding of drugs for large portions of the population—have kept returns to investing in research, development, and drug manufacturing high for many decades. This regulatory framework, though altered from time to time, has been effective at sustaining innovation in drug development, to the benefit of many patients not only within the US, but throughout the world. It also underpins the long-term growth of many of our Health Care holdings.
Company Sector Market %
Infineon Technologies Info Technology Germany 3.9
Samsung Electronics Info Technology South Korea 3.8
TSMC Info Technology Taiwan 3.7
Atlas Copco Industrials Sweden 3.4
L'Oréal Cons Staples France 3.4
AIA Group Financials Hong Kong 3.0
Adyen Info Technology Netherlands 3.0
BHP Materials Australia 2.9
Roche Health Care Switzerland 2.8
Schneider Electric Industrials France 2.5
Ten Largest Holdings 32.4%
Ten Largest Holdings at 30 June 2021
12
Class A 6 Months 1 Year 3 Years 5 Years Since Inception
US Dollar1 7 June 2013
International Equity Fund USD A2 6.26 34.12 11.36 12.76 9.07
MSCI All Country World ex-US Index3 9.16 35.72 9.38 11.08 6.80
GBP Sterling 7 June 2013
International Equity Fund GBP A2 5.03 20.13 9.62 11.91 10.67
MSCI All Country World ex-US Index3 8.02 21.39 7.74 10.35 8.37
Performance (% Total Return)as of 30 June 2021
Class B 6 Months 1 Year 3 Years 5 Years Since Inception
US Dollar 25 October 2013
International Equity Fund USD B2 6.13 33.79 11.08 12.51 8.28
MSCI All Country World ex-US Index3 9.16 35.72 9.38 11.08 6.03
Class S 6 Months 1 Year 3 Years 5 Years Since Inception
US Dollar 26 October 2018
International Equity Fund USD S2 6.70 35.13 – –– – 18.55
MSCI All Country World ex-US Index3 9.16 35.72 – –– – 14.66
1USD Class A shares launched on 2 December 2013; returns prior to this are derived from the GBP Class A return; 2Net of fees; 3Net of withholding taxes. Returns are annualized for periods greater than one year.
Please read the separate disclosures page for important information.

13
Portfolio Management Team
Performance Summary
The Emerging Markets Equity Fund USD Class A shares rose 43.21% (at dealing prices) for the fiscal year ended 30 June 2021, net of fees, in US dollar terms, outperforming its benchmark the MSCI Emerging Markets Index, which rose 40.90%. Please refer to the chart immediately following this commentary for returns related to the fund’s other share classes.
Market Review
Stocks in Emerging Markets (EMs) surged upward during the fiscal year, sustaining their remarkable recovery from the sharp market decline in early 2020 caused by the initial shock of the global COVID-19 outbreak. The discovery and broadening global distribution of effective vaccines starting in late 2020 especially helped ignite an acceleration in economic activity, which boosted commodity prices and stoked enthusiasm for EM assets. Brent crude prices rose nearly 75% during the year to touch US$75 per barrel, with support from continued supply discipline by OPEC+ and expectations of increasing oil demand. Prices of industrial metals, agricultural products, and other commodities also made significant gains.
Investor enthusiasm appeared to wane at the end of the fiscal year, however, reflecting the new threat posed by COVID-19 variants and the potential for higher interest rates as the Chinese central bank tightened credit to contain rising debt levels and the US Federal Reserve signaled that interest rate increases might come sooner than previously expected due to rising inflationary pressures.
All sectors in the MSCI EM Index were positive, with Information Technology (IT) posting the best performance led by semiconductor and other hardware manufacturers. A strong appetite for stocks in more speculative areas like electronic vehicles (EVs) further helped
IT shares. The Materials sector was also particularly strong, as mining stocks rallied with the rise in metals prices. Communication Services and Consumer Staples lagged the index, but the worst sector was Real Estate, which is dominated by Chinese developers whose stocks were weighed down by the prospect of tightening liquidity conditions. Revelations of financial stress at Evergrande, one of China’s largest property companies, also hurt sentiment.
By geography, Latin America produced the strongest returns, led by Mexico and Brazil, supported by stronger commodity prices. Brazil was also lifted in part by the government’s progress in tax and administrative reform as well as supportive comments from officials about potential privatization plans, which boosted state-owned assets including oil giant Petrobras. Smaller markets in Latin America underperformed, however, amid a cloud of political uncertainty and the threat of populist movements. In Peru, for instance, the new president Pedro Castillo was narrowly elected on a socialist platform that supported nationalizing various industries, including mining.
Asia performed roughly in line with the index, but China significantly lagged the broad market, despite its early control of the pandemic and its economy’s robust recovery. The equity market was hampered by a rising intensity in government regulation, including new rules at the very end of the period constraining the practices of after-school tutoring firms. The country’s giant internet platforms, including social media and game giant Tencent, also continued to be jostled by a flurry of new regulatory directives. Elsewhere in Asia, South Korea, Taiwan, and India all participated in the market rally. But here, too, smaller markets were weak, with Malaysia, Thailand, and Indonesia struggling with new COVID-19 waves and necessary shutdowns.
Performance Attribution
The Fund’s outperformance in the year was primarily due to strong stocks in Consumer Staples and Industrials as well as the Fund’s overweight in IT. In Consumer Staples, shares of Jiangsu Yanghe Brewery, a Chinese white liquor maker, rose to reflect the company’s success in reviving its previously lagging sales growth with a new marketing campaign and improved management of its distributors. Hong Kong-based cordless power tool manufacturer Techtronic Industries and Taiwanese pneumatic equipment producer AirTAC led within Industrials. Techtronic benefited from the surge in do-it-yourself activities as the pandemic kept people at home; its research and development efforts also paid off in good reception for new products such as ride-on lawn mowers and heavy-duty utility cable crimpers. AirTAC enjoyed strong year-over-year sales growth in the first quarter of 2021 partly owing to what appears to be a surge in automation investment by Chinese factories.
Emerging Markets Equity Fund
Scott CrawshawCo-Lead Portfolio Manager
Craig Shaw, CFACo-Lead Portfolio Manager
Pradipta ChakraborttyPortfolio Manager
Richard Schmidt, CFAPortfolio Manager

14
The Fund lagged within the Consumer Discretionary sector, despite strong returns from a number of holdings, including Chinese auto glass producer Fuyao Glass, which benefited from a recovery in China’s auto industry. The biggest detractor in the sector was New Oriental, which was caught up in the regulatory dragnet deployed against after-school tutoring companies. Sands China, the Macao-based casino group, also lagged as travel restrictions have continued to severely limit its foot traffic. The Fund’s lack of holdings in the very strong Materials sector also hurt relative returns.
By geography, the Fund benefited from strong stocks in Asia, particularly China, where key contributors included Fuyao Glass and Sunny Optical, a manufacturer of smartphone cameras, and Taiwan. Relative returns in Taiwan were helped by AirTAC and Eclat Textile, a leading manufacturer of performance-based fabrics that has benefited from strong consumer demand for athleisure apparel (i.e., yoga pants). Our South Korean holdings contributed negatively to relative returns despite posting overall strong returns over the 12-month period as stocks not held, including leading social and ecommerce platform Kakao and many auto and EV-related stocks, performed even more strongly.
The Fund underperformed in Latin America, especially Brazil where energy and chemicals business Ultrapar reported lower revenues in 2020 primarily due to declines in its fuel distribution business. Shares of Peruvian commercial bank Credicorp were weak amid rising political and regulatory risk associated with the country’s sharp turn to the left in the wake of Pedro Castillo’s victory.
Investment Perspectives
Sudden and jarring regulatory change has always been a fact of life for investors in EMs, one of the trade-offs of investing in companies with large growth opportunities found in emerging economies whose regulatory structures are less developed. Of course, smart business managers in all economies, developing and developed, will look to capitalize on market opportunities previously overlooked by regulators…until they no longer are! With the rise of a plethora of new, highly innovative internet-based business models, it seems as if regulators are in catch-up mode, trying to understand the new business models and their broader economic, social, and political impact while trying to control them at the same time.
The Chinese government’s recently revived aggression against the after-school tutoring industry was a reminder that regulatory risk in China is acute. Under the Chinese political system, officials have the power to act quickly and suddenly, without the forewarning that comes with the relatively more transparent regulatory sausage-making in the US and other democratic countries. In many cases, regulatory change in China has been targeted toward goals for the benefit of the overall economy and society. Yet under the leadership of President Xi Jinping, the tempo of state interference in various industries in recent years has increased—and has not been limited to addressing social, economic, and development
goals, but also aimed to achieve the political goals of the Chinese Communist Party, currently celebrating its 100th anniversary. The government’s execution of these multiple agendas adds uncertainty and presents analytical challenges for investors seeking to understand the long-term prospects of industries and the companies within them.
Our approach to grappling with this risk is essentially the same no matter the country. Rather than analyzing regulation as an independent factor, we integrate this analysis into our qualitative assessment of individual industries and businesses. Our analysts consider the impact of existing and potential future regulations on the competitive structure of each industry, on a business’s growth potential, and on the ESG risks or opportunities it faces. We focus on regulations’ and potential regulations’ impact on
Geography Fund Benchmark1
Brazil 6.9 5.2
China + Hong Kong2 34.0 37.5
India 7.8 9.9
Mexico 5.2 1.8
Russia 8.5 3.3
South Africa 1.5 3.5
South Korea 9.6 13.2
Taiwan 11.5 14.0
Small Emerging Markets3 5.3 11.6
Frontier Markets4 1.6 –
Developed Market Listed5 7.2 –
Cash 0.9 –
Sector Fund Benchmark1
Comm Services 9.2 11.3
Cons Discretionary 15.4 17.6
Cons Staples 9.1 5.6
Energy 5.6 5.0
Financials 21.5 17.8
Health Care 3.6 5.0
Industrials 9.8 4.9
Info Technology 23.2 20.4
Materials 0.0 8.4
Real Estate 0.0 2.0
Utilities 1.7 2.0
Cash 0.9 –
Portfolio Positioning (% Weight) at 30 June 2021
1MSCI Emerging Markets Index; 2The Emerging Markets Equity Fund’s end weight in China is 27.2% and Hong Kong is 6.6%. The Benchmark does not include Hong Kong; 3Includes the remaining emerging markets which, individually, comprise less than 5% of the index; 4Includes countries with less-developed markets outside the index; 5Includes emerging markets or frontier markets companies listed in developed markets.

15
each of Harvard Business School professor Michael Porter’s “Five Forces,” our workhorse template for understanding competitive strategy. We know, for instance, that the threat of new entrants can increase if the state nurtures or subsidizes them, or it can recede if regulation demands quality standards that only incumbents with large financial resources can sustain; bargaining power of buyers can be enhanced via price controls or regulations that strengthen consumer rights; and threat of substitution can be tilted either by subsidization of or restrictions upon alternative products.
Our consistent use of this framework facilitates collaborative debate among our colleagues that supports analysts in honing their independent insights about key foreseeable regulatory risks prior to investing in a company, and helps us react prudently, and adapt our expectations, after policy “shocks” occur. We recently found ourselves in that position with regards to our holding in New Oriental. For several years the government maintained a firm but generally supportive regulatory framework for the after-school tutoring industry that favored larger, higher-quality companies such as New Oriental. Beginning in March the government pivoted to criticizing the industry as a whole (President Xi called it a “social problem”), with reports spreading of harsher regulations to come. It is unclear what has so irked the authorities. Student burnout continues to be a concern; the government may additionally be seeking ways to control child-rearing expenses now that parents are being encouraged to go from aiming for one child to three in an attempt to reverse the country’s declining birth rate. Regulators may also be reacting to the fact that some giants of the internet, which are facing their own bouts of regulatory torment of late, are behind the launch of larger new entrants into after-school tutoring. From the regulators’ perspective, dominating Chinese social media and commerce may be (barely) tolerable, but purloining control of the education system—that may be a step too far. Before the other shoe dropped, with the government’s announcement in July that it would effectively force every company in the sector to operate as a non-profit, we initiated a sale of our position, which was completed shortly after the conclusion of the fiscal year.
Regulation, especially in China, is a double-edged sword, as capable of turning the Porter forces for a company or industry benign as malignant. Moreover, this process is frequently an opaque one that may fully reveal itself only over time. The development of pharmaceutical industry regulations is a case in point. Over the past five years, China has been pursuing a two-pronged reform agenda as part of its efforts to improve the performance of its health care system, upgrading the quality and availability of effective drugs and therapies available to its citizens, and controlling drug prices, which historically have been on the
high end globally. In 2017, the government began focusing on the first prong, implementing reforms to accelerate the drug approval process, raise drug quality standards, and tighten restrictions on producers of ineffective products. We gradually increased our investments in China’s pharmaceutical industry, purchasing CSPC Pharmaceutical Group, a high-quality drug manufacturer, and Jiangsu Hengrui Medicine, a specialist in surgical anesthetics and oncology drugs among other products, based partly on our view that these reforms would advantage the country’s best-managed, world-class companies over less-capable peers.
In the second half of 2018, the government began pushing its second reform goal. Officials introduced “centralized procurement” or “group purchasing” for commonly administered drugs eligible under China’s government-administered health plans. But while the impact of the group-purchasing policies on China’s leading pharmaceutical companies was initially significant, it has not been as bad as the market feared. We have come to appreciate that, in addition to forcing companies to sacrifice some pricing, group pricing also expands their addressable market and thus can actually help them to generate higher sales and, for those with scale and efficiency, higher profits despite the lower pricing. We believe our portfolio holdings, with their strong production and distribution capabilities, will be able to navigate the group-purchasing process effectively. What has also become clear is that regulators have a third prong in their agenda: encouraging the development of more innovative drugs. We see this, too, as benefitting companies like Hengrui and CSPC, which possess strong R&D and robust pipelines of innovative treatments.
And then there is the happy confluence of regulatory impacts on ENN Energy, our private-sector gas utility holding. In the context of utilities, positive regulation is almost always an oxymoron. Utilities are generally treated as regulated monopolies due to the critical necessity of their product, the asset intensity of their physical infrastructure, and the typical lack of competitive alternatives. There is widespread political support for this approach, and the consequence is to severely weaken utilities’ bargaining power over their customers.
Across the global stock universe, we only cover a few companies in the Utilities sector; the exceptions are where we think regulators have good reason to allow adequate returns on invested capital. Starting last October, the Chinese government began laying out an ambitious plan to decarbonize its economy with a goal of carbon net neutrality by 2060. A key feature of that plan is using natural gas to quickly wean off coal the large segments of the economy still reliant on this filthiest of energy sources, and to ease the eventual transition to even cleaner sources such as solar power and wind. ENN sits at the juncture of all these forces. Though ENN’s gas sales are subject to controls on pricing and profits, it is able to collect a connection fee from residential users, a lucrative incentive intended to help fund expansion of the gas distribution network. Furthermore, many local governments are promoting the development of communities and industrial parks with smaller carbon footprints. This is proving to be a boon for ENN’s integrated energy business, which combines natural gas and renewable
Regulation, especially in China, is a double-edged sword, as capable of turning the competitive forces for a company or industry benign as malignant. Moreover, this process is frequently an opaque one that may fully reveal itself only over time.

16
energy sources to meet customers’ steam, cooling, heating, and electricity needs, and which saw its sales volumes grow 79% year-over-year in the second quarter of 2021.
Policy changes in China often reflect an intense interplay between the government’s top-down agenda and the bottom-up forces driven by private firms moving quickly to explore new ideas. At one extreme, the government has shown a willingness to be remarkably hands-off, providing sufficient leeway for private firms to operate and innovate, and often proactively clearing red tape for innovators. At the other, it has demonstrated a suddenness, and at times a level of caprice, that can be painful for investors who didn’t see that one coming. We continue to view regulatory shifts with a long-term perspective and, in China especially, against the broader backdrop of growth and innovation taking place.
Company Sector Market %
Samsung Electronics Info Technology South Korea 5.1
TSMC Info Technology Taiwan 5.1
Alibaba Cons Discretionary China 4.4
Tencent Comm Services China 4.3
EPAM Info Technology United States 3.8
LG Household & Health Care Cons Staples South Korea 2.6
AIA Group Financials Hong Kong 2.5
Novatek Energy Russia 2.3
Tata Consultancy Services Info Technology India 2.3
Sberbank Financials Russia 2.2
Ten Largest Holdings 34.6%
Ten Largest Holdings at 30 June 2021

17
Class A 6 Months 1 Year 3 Years 5 Years Since Inception
US Dollar 25 September 2012
Emerging Markets Equity Fund USD A1 6.89 43.21 8.89 11.56 6.82
MSCI Emerging Markets Index2 7.45 40.90 11.27 13.03 6.11
Performance (% Total Return)as of 30 June 2021
Class B 6 Months 1 Year 3 Years 5 Years Since Inception
US Dollar 25 October 2013
Emerging Markets Equity Fund USD B1 6.68 42.62 8.56 11.22 6.68
MSCI Emerging Markets Index2 7.45 40.90 11.27 13.03 7.45
Canadian Dollar 28 February 2020
Emerging Markets Equity Fund CAD B1 3.88 30.23 – – 16.89
MSCI Emerging Markets Index2 4.44 28.11 – – 21.57
Class I 6 Months 1 Year 3 Years 5 Years Since Inception
US Dollar 9 January 2017
Emerging Markets Equity Fund USD I1 7.01 43.57 9.20 – 12.06
MSCI Emerging Markets Index2 7.45 40.90 11.27 – 13.08
Class S 6 Months 1 Year 3 Years 5 Years Since Inception
Canadian Dollar 7 October 2020
Emerging Markets Equity Fund CAD S1 – – – – 4.69
MSCI Emerging Markets Index2 – – – – 4.44
1Net of fees; 2Net of withholding taxes. Returns are annualized for periods greater than one year.
Please read the separate disclosures page for important information.
18
Portfolio Management Team
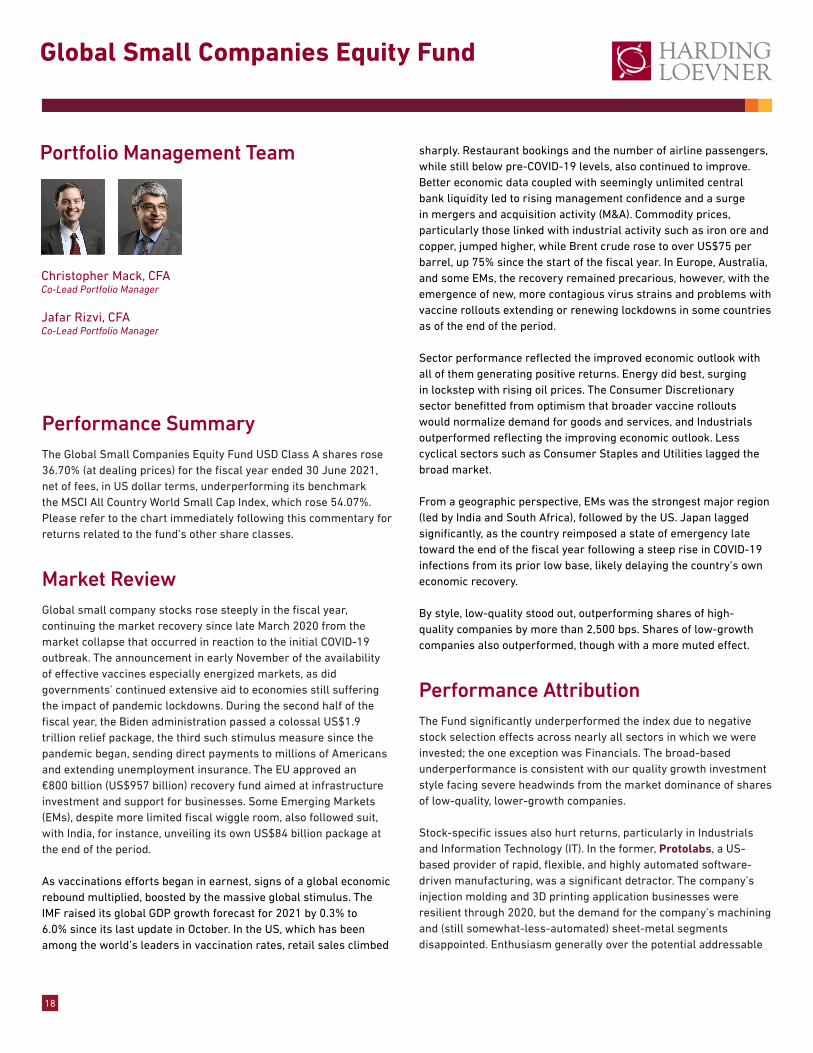
Performance SummaryThe Global Small Companies Equity Fund USD Class A shares rose 36.70% (at dealing prices) for the fiscal year ended 30 June 2021, net of fees, in US dollar terms, underperforming its benchmark the MSCI All Country World Small Cap Index, which rose 54.07%. Please refer to the chart immediately following this commentary for returns related to the fund’s other share classes.
Market ReviewGlobal small company stocks rose steeply in the fiscal year, continuing the market recovery since late March 2020 from the market collapse that occurred in reaction to the initial COVID-19 outbreak. The announcement in early November of the availability of effective vaccines especially energized markets, as did governments’ continued extensive aid to economies still suffering the impact of pandemic lockdowns. During the second half of the fiscal year, the Biden administration passed a colossal US$1.9 trillion relief package, the third such stimulus measure since the pandemic began, sending direct payments to millions of Americans and extending unemployment insurance. The EU approved an €800 billion (US$957 billion) recovery fund aimed at infrastructure investment and support for businesses. Some Emerging Markets (EMs), despite more limited fiscal wiggle room, also followed suit, with India, for instance, unveiling its own US$84 billion package at the end of the period. As vaccinations efforts began in earnest, signs of a global economic rebound multiplied, boosted by the massive global stimulus. The IMF raised its global GDP growth forecast for 2021 by 0.3% to 6.0% since its last update in October. In the US, which has been among the world’s leaders in vaccination rates, retail sales climbed
sharply. Restaurant bookings and the number of airline passengers, while still below pre-COVID-19 levels, also continued to improve. Better economic data coupled with seemingly unlimited central bank liquidity led to rising management confidence and a surge in mergers and acquisition activity (M&A). Commodity prices, particularly those linked with industrial activity such as iron ore and copper, jumped higher, while Brent crude rose to over US$75 per barrel, up 75% since the start of the fiscal year. In Europe, Australia, and some EMs, the recovery remained precarious, however, with the emergence of new, more contagious virus strains and problems with vaccine rollouts extending or renewing lockdowns in some countries as of the end of the period.
Sector performance reflected the improved economic outlook with all of them generating positive returns. Energy did best, surging in lockstep with rising oil prices. The Consumer Discretionary sector benefitted from optimism that broader vaccine rollouts would normalize demand for goods and services, and Industrials outperformed reflecting the improving economic outlook. Less cyclical sectors such as Consumer Staples and Utilities lagged the broad market.
From a geographic perspective, EMs was the strongest major region (led by India and South Africa), followed by the US. Japan lagged significantly, as the country reimposed a state of emergency late toward the end of the fiscal year following a steep rise in COVID-19 infections from its prior low base, likely delaying the country’s own economic recovery. By style, low-quality stood out, outperforming shares of high-quality companies by more than 2,500 bps. Shares of low-growth companies also outperformed, though with a more muted effect.
Performance AttributionThe Fund significantly underperformed the index due to negative stock selection effects across nearly all sectors in which we were invested; the one exception was Financials. The broad-based underperformance is consistent with our quality growth investment style facing severe headwinds from the market dominance of shares of low-quality, lower-growth companies.
Stock-specific issues also hurt returns, particularly in Industrials and Information Technology (IT). In the former, Protolabs, a US-based provider of rapid, flexible, and highly automated software-driven manufacturing, was a significant detractor. The company’s injection molding and 3D printing application businesses were resilient through 2020, but the demand for the company’s machining and (still somewhat-less-automated) sheet-metal segments disappointed. Enthusiasm generally over the potential addressable
Global Small Companies Equity Fund
Christopher Mack, CFACo-Lead Portfolio Manager
Jafar Rizvi, CFACo-Lead Portfolio Manager

19
market for the company’s technology appeared to peak at the end of January. Kinaxis, a Canada-based supply chain software company, hurt returns in IT. The company was a major beneficiary of the pandemic-related disruptions as businesses across various industries flocked to its platform to navigate logistics challenges. But the company’s growth pipeline then slowed a bit, disappointing investors.
Good stocks in Financials included Signature Bank, a full-service commercial bank in New York, whose shares soared on signs it had done a better job than expected containing losses from the impact of the pandemic on its loan book, and that the city’s economic recovery was underway. Also, cryptocurrency emerged as a surprising new source of deposit inflows and growth for the company. Signature is becoming the bank of choice for businesses in the digital asset ecosystem, now holding the deposits and managing the liquidity for the top five crypto exchanges and many of the largest crypto trading firms. The Fund’s lack of holdings in the lagging Real Estate sector was also helpful during the year.
Viewed by geography, poor stocks in the US, including Protolabs and Guidewire Software, a Silicon Valley-based niche provider of
software to property and casualty insurers, were among the Fund’s largest relative detractors. The Fund’s underweight to the US and overweight to Japan also hurt performance versus the index. In Europe outside the monetary union, British aerospace technology supplier Senior was a major contributor following a private equity firm’s cash offer to purchase the company, which Senior’s board rejected as too low. Senior’s strength in fluid conveyance and thermal management technology should drive its revenue growth in a rebounding aerospace market. Within Frontier Emerging Markets, shares of Vietnamese steelmaker Hoa Phat Group surged as demand for steel in Vietnam remained high, while the company’s new production complex has helped it grow its export sales to China.
Perspective and OutlookThinking about how customer habits form and evolve is central to our task of finding industries with favorable competitive structures and companies with durable growth prospects. Following the outbreak of COVID-19, the daily habits of consumers and enterprises throughout the world were transformed. As vaccination efforts have progressed, variants emerged, and what our post-pandemic reality will look like comes fitfully more into focus, we’ve had to discern where habits have shifted, which new habits have become ingrained, and which may revert. Perhaps the most obvious set of behavioral changes resulting from lockdowns and social distancing is people’s increased dependence on digital technologies.
A greater proportion of the populace has become much more reliant on technology for a wide range of interactions including work, school, health care, social interaction, and many aspects of daily life such as buying food and other goods. Among small cap technology companies, many of whom are niche service providers to large enterprises, the same sort of digitization of standard routines and daily tasks has occurred, no less powerfully for being “behind the scenes.” While the shares of companies that benefitted commercially from the shift to online living fared very well in 2020, for much of the second half of the fiscal year starting in 2021 they have been among the worst performers. The market assumes “back to the old normal” and turned its favor away from 2020’s darlings toward more economically sensitive businesses that stand to benefit more from an immediate pickup in business activity.
Geography Fund Benchmark1
Canada 1.1 3.1
Emerging Markets 8.0 11.9
Europe EMU 16.4 6.8
Europe ex-EMU 19.9 11.1
Frontier Markets2 2.8 –
Japan 14.4 9.1
Middle East 1.2 0.9
Pacific ex-Japan 2.1 4.6
United States 32.9 52.5
Cash 1.2 –
Sector Fund Benchmark1
Comm Services 6.6 3.5
Cons Discretionary 10.3 13.6
Cons Staples 6.0 4.4
Energy 0.5 3.4
Financials 12.2 12.5
Health Care 13.8 11.7
Industrials 22.5 17.8
Info Technology 22.7 13.5
Materials 3.4 7.7
Real Estate 0.0 9.3
Utilities 0.8 2.6
Cash 1.2 –
1MSCI All Country World Small Cap Index; 2Includes countries with less-developed markets outside the index.
Among small cap technology companies, many of whom are niche service providers to large enterprises, the same sort of digitization of standard routines and daily tasks has occurred as experienced elsewhere, and no less powerfully for being “behind the scenes.”
Portfolio Positioning (% Weight) at 30 June 2021

20
The market’s expectations for rising inflation and interest rates have also hurt high-growth small cap stocks, including technology stocks. The market valuations of such companies are based on earnings growth projected well into the future. As the rates at which those future earnings are discounted back to the present go up, intrinsic valuations of companies come down, and eventually so must the prices paid for their shares. The net result was a significant rotation from companies trading at lofty valuations whose growth is “on the come” to more cyclically exposed firms benefiting “in the here and now” from a post-pandemic recovery. In some cases, the share prices of our holdings looked expensive even before 2021’s pickup in rates and we trimmed our exposures to them. With benefit of hindsight, we might have trimmed more. By and large, though, we have maintained our positions in these stocks because we continue to believe that the new habits formed during the pandemic are likely to become more ingrained over time, raising the rate and duration of their prospective growth from already high levels. A recovery in their share prices toward the end of the fiscal have only added to our resolve.
If there is one pandemic habit that almost everyone agrees should persist, it is the shift in grocery shopping from supermarket aisle to online. What some may not realize is that a similar shift has occurred in how restaurants and caterers obtain their provisions, as their proprietors graduate from recurrent faxes and stamped contracts to online ordering, where transactions occur at the click of a mouse. Portfolio company Infomart, Japan’s largest B2B platform catering to the food service industry, has been one beneficiary of the online-ordering trend.
To be sure, Infomart isn’t the only Japanese company facilitating food sales online. But whereas its competitors might sell software to food wholesalers to help with e-invoicing, for example, or build an e-commerce wholesale platform just for one food category like fish, Infomart gets all types of wholesalers and their restaurant clients to participate in a single cloud-based system. The model exploits the strong network effect that takes hold once a critical mass of participants is achieved. Both wholesalers and restaurants pay a flat monthly subscription fee (which Infomart waived for the restaurants through much of the pandemic), and the wholesalers also pay a 1.2% commission on all their sales occurring on the platform. So far, Infomart has been able to leverage its enterprise wholesaler clients to encourage their customers to participate. Those smaller businesses, in turn, have gravitated toward Infomart wholesalers for an increasing portion of their orders as it saves them the hassle of toggling among paper-based or independent online systems of companies not yet on Infomart’s centralized platform. Further, information sharing across the network enables valuable new services to participants such as access to a database for tracing foods back to their source and checking on potential allergens.
Prior to the pandemic, marketing expenditures for Infomart were largely devoted to promoting the value of an online system; since the start of the pandemic, the “selling” hurdle has been reduced to a more pro-forma manager sign-off. The company continued
to grow the number of participating distributors throughout 2020, and, while the recent return of lockdowns has thrown a crimp into its plans, the surge in eateries signing up earlier in the year gave an indication of what the future should like once diners physically return with fewer interruptions to restaurants. Throughout the pandemic, businesses have sometimes had to go to great lengths to guarantee a steady flow of goods amid the disruptions of quarantines, shifting demand, and backlogs in supply chains. As consumer memory of household cleaner, toilet paper, and flour shortages recede, here again we think investors are underestimating the stickiness of new behaviors that have arisen behind-the-scenes during the past year—in this case involving the way businesses manage their supply chains. Kinaxis, a Canada-based supply chain software company, was a major beneficiary of the pandemic-related disruptions as businesses across various industries flocked to its platform to navigate logistics challenges. The company’s software utilizes standard inventory information from internal enterprise resource planning (ERP) systems together with alternative data such as container backlogs, weather forecasts, and competitors’ price promotions to adjust orders to changing conditions automatically—while also giving customers an ability to probe for even deeper efficiencies and levels of resilience. Once a company’s data is loaded onto the platform, the software becomes tough to replace because of the costs involved in swapping out a system so deeply embedded in customers’ core processes, and because the company can no longer necessarily envision how to operate without it.
Over the early months of 2021, Kinaxis’s growth pipeline slowed a bit. But we view the blip as transitory. Part of the issue involves the company’s ongoing shift to a software-as-a-service (SaaS) model. The transition to this model away from fixed software packages is expected to be a long-term positive for the growth and profitability of software companies generally, as the benefits of deploying technology through the cloud boosts the addressable market and provides software architects with valuable information from users to better tailor future upgrades and versions. In the short-term, however, the SaaS transition to a subscription model has created
Company Sector Market %
Stock Yards Bancorp Financials US 2.4
EnerSys Industrials US 2.4
Signature Bank Financials US 2.3
Altair Engineering Info Technology US 2.2
Healthcare Services Industrials US 2.2
Ollie's Bargain Outlet Cons Discretionary US 2.0
BorgWarner Cons Discretionary US 2.0
Dechra Health Care UK 1.8
Reply Info Technology Italy 1.8
Alten Info Technology France 1.8
Ten Largest Holdings 20.9%
Ten Largest Holdings at 30 June 2021

21
tough earnings comparisons for some of these companies, as one-time revenues from perpetual license fees recognized immediately are replaced by term license fees that have to be amortized over the term of the license. Kinaxis is one of those companies. From our perspective, deferral of revenues from this transition has no bearing on its growth potential going forward.
Israeli cybersecurity firm CyberArk is another example of a company whose products have become further entrenched, but where near-term earnings saw a hit due to revenue model transitions. CyberArk had a robust year in 2020 as its customers prioritized digital transformation initiatives in the remote working environment. Towards the end of 2020, shares of CyberArk rallied even further following the December SolarWinds cyberattacks. This large-scale break was engineered by Russian hackers to take advantage of a common weakness of cloud-based software applications—the tendency of users to bypass security measures when updating programs from vendors they know and trust. The SolarWinds event will, in our view, result in even greater security spending by businesses, many of which had already identified cybersecurity as an imperative. And CyberArk—which leads in preventing or cutting off hackers’ access to the most-high-access accounts once a network has been breached—seems poised to benefit from its role as a key last line of defense. Somewhat paradoxically, CyberArk’s stock price retreated during the first three months of 2021 when earnings saw less of an immediate bounce from SolarWinds than some investors expected. Given the increased focus on security to counter the various ways the frictionless convenience of SaaS makes us all more vulnerable, we remain encouraged that CyberArk’s long-term growth outlook is bright—and potentially getting brighter.
Performance (% Total Return)as of 30 June 2021
1Net of fees; 2Net of withholding taxes.Please read the separate disclosures page for important information.
Class A 6 Months 1 Year 3 Years Since Inception
US Dollar 13 December 2018
Global Small Companies Equity Fund USD A1 6.25 36.70 – 22.18
MSCI All Country World Small Cap Index2 15.43 54.07 – 20.41

22
Disclosures
Companies held in the Funds during the period appear in bold type; only the first reference to a
particular holding appears in bold. The Funds are actively managed; therefore holdings shown may
not be current. Fund holdings and sector and geographic allocations should not be considered
recommendations to buy or sell any security. Current and future Fund holdings are subject to risk.
Sector and geographical weightings and Top 10 data is sourced from: FactSet, Harding Loevner
Funds, and MSCI Inc. Differences may exist between this source data and similar information
reported in the financial statements due to timing differences and/or adjustments required
pursuant to International Financial Reporting Standards (IFRS).
MSCI Inc. and S&P do not make any express or implied warranties or representations and shall
have no liability whatsoever with respect to any GICS data contained herein; All data is based on
the US dollar class.
FactSet Fundamentals, Copyright 2021 FactSet Research Systems, Inc. All rights reserved.
Sources
Global Equity Fund: FactSet; Harding Loevner Funds plc Global Equity Fund, based on the
underlying holdings; MSCI Inc. and S&P.
International Equity Fund: FactSet; Harding Loevner Funds plc International Equity Fund, based on
the underlying holdings; MSCI Inc. and S&P.
Emerging Market Equity Fund: FactSet; Harding Loevner Funds plc Emerging Markets Equity Fund,
based on the underlying holdings; MSCI Inc. and S&P.
Global Small Companies Equity Fund: FactSet; Harding Loevner Funds plc Global Small Companies
Equity Fund, based on the underlying holdings; MSCI Inc. and S&P.
Index Definitions
The MSCI All Country World Index is a free float-adjusted market capitalization index that is designed to measure equity market performance in the global developed and emerging markets. The Index consists of 49 developed and emerging market countries. Net dividends reinvested.
The MSCI All Country World ex-US Index is a free float-adjusted market capitalization index that is designed to measure equity market performance in the global developed and emerging markets, excluding the US. The Index consists of 48 developed and emerging market countries.
Net dividends reinvested.
The MSCI Emerging Markets Index is a free float-adjusted market capitalization index that is designed to measure equity market performance in the global emerging markets. The Index
consists of 26 emerging market countries. Net dividends reinvested.
The MSCI All Country World Small Cap Index is a free float-adjusted market capitalization index
that is designed to measure small cap developed and emerging market equity performance. The
Index consists of 50 developed and emerging market countries, and is comprised of companies
that fall within a market capitalization range of USD 3-28,441 million (as of June 30, 2021).
You cannot invest directly in these Indexes.
Annual Disclosure of Voting Activity 30 June 2021
Harding Loevner Funds plc

1
The EU Shareholder Rights Directive (“SRD II”), as transposed into Irish law, requires asset managers to publicly disclose an engagement policy that describes how they integrate shareholder engagement into their investment strategy.
The following disclosure summarizes how Harding Loevner Funds plc, through its Investment Manager Harding Loevner LP (“Harding Loevner,” “we”), has implemented its engagement policy, including a general description of its voting behavior, its use of third-party corporate governance research providers, and an explanation of the most significant votes it cast in 2020.
Description of Voting Behavior
Harding Loevner votes all proxies on behalf of clients who have delegated such authority to us, including Harding Loevner Funds plc. We have a fiduciary duty to act solely in the best interest of our clients, including exercising voting rights to maximize shareholder value. Therefore, we demand that firms provide clear information in their financial reporting and offer shareholders regular access to management. We seek to use our voting power to promote high standards of corporate governance, including adequate disclosure of company policies, activities, and returns. We support company boards in aligning management compensation with long-term shareholder returns through remuneration policies. In addition, we support board independence, both in the composition of individual committees and of the board overall. If company management or shareholders propose a policy that we believe will damage long-term shareholder value, we vote against it.
Overview of Proxy Voting Guidelines
Harding Loevner assigns responsibility for determining how to vote on proposals of a company whose shares we hold in our clients’ portfolio to the individual research analyst who is primarily responsible for research coverage of that company. Applying Harding Loevner’s proxy voting guidelines, analysts consider each proposal separately according to its individual circumstances. In considering a complex or controversial proposal, the covering analyst may submit their proposed voting decision to investment colleagues for additional input if desired. However, the covering analyst retains the ultimate discretion on how to vote. Harding Loevner requires analysts to engage with a company formally whenever they vote against a company’s management’s recommendation; this engagement is normally initiated in the form of a letter to management explaining our rationale for the vote and inviting discussion.
We record all votes along with the reason for deviations from management recommendations and any related company engagement, where applicable, in our centralized research management system, where the information is accessible to our entire firm, including all investment professionals.
We disclose to clients our votes on their behalf upon request or as required by law or regulation. Our website, www.hardingloevner.com, contains a complete record of all proxies cast by Harding Loevner Funds plc in addition to our Shareholder Engagement Policy and our Form ADV Part 2, which includes our proxy voting guidelines.
To assure the effectiveness of our engagement policy, we periodically review our proxy voting guidelines to ensure that they provide appropriate guidance on emerging issues.
Use of Third-Party Corporate Governance Research Providers
Harding Loevner obtains proxy voting research including voting recommendations from corporate governance research firm Glass Lewis. Our research analysts refer to Glass Lewis research when determining how Harding Loevner should vote, but they do not rely upon Glass Lewis recommendations and retain sole responsibility for each voting decision.
Annual Disclosure of Voting Activity

2
Explanation of the Most Significant Votes Cast in 2020
In 2020, Harding Loevner analysts cast approximately 5,000 proxy votes for more than 400 different companies held across our investment strategies. The charts on the right summarize our voting activity.
Harding Loevner’s careful research and extensive analysis of a company’s governance, management foresight, and business strategy mean that we generally expect to be supportive of boards and often tend to vote with company management; indeed, the vast majority of our votes were cast alongside management’s recommendation. This makes votes against management noteworthy. In 2020, we voted against management’s recommendation on 271 proposals across all of Harding Loevner’s investment strategies; roughly half of our votes against management were in connection with director appointments. Our concerns in this area included insufficient board or committee independence, inadequate qualifications, lack of cognitive and skill diversity, a director serving on an excessive number of boards (“over-boarding”), and committee chairs whose committee failed to carry out its duties.
We chose to abstain from voting in 62 proxies. Most often, we abstained because we had insufficient information to cast a vote responsibly. In other instances, we disagreed with management recommendation but wanted to engage with management instead of voting against them. We also abstained for procedural reasons, including cumulative voting structures in which shareholders can choose to either allocate their votes across all candidates for the board of directors when the board has multiple openings, or apply their votes to just one candidate and abstain from voting on the appointment of the remaining candidates.
Some of our votes against management are more significant than others. For the purposes of this annual disclosure to clients, our definition of “significant” votes against management considers whether the company was held by Harding Loevner Funds plc and the size of our investment in the company, as well as other factors, including whether the proposal:
� Was controversial in nature, defined as those proposals for which more than 25% of shareholders voted against management;1
� Involved a high-profile issue, such as those that are typically subject to supermajority approval, or involved a specific issue of material importance to the industry in which the company operates; or
� Involved HL analyst engagement with company management, either before or after the vote, beyond sending them a letter explaining our vote.
Of the 271 votes against management across all of our investment strategies in 2020, 28 votes met at least one of the criteria to be considered significant. On the following pages, we summarize 10 of the votes that were indicative of the types of proposals where we disagreed with management that we believe were most significant.
1Harding Loevner selected a 25% threshold to define “controversial” in order to focus on those votes with particularly high instances of votes against management proposals (or for shareholder proposals). We acknowledge that other thresholds could be used and will continue to review market practice and regulatory guidance in establishing a definition of “significant.”
For Management Recommendation
4,667
Against Management Recommendation
271
Abstain from Management
Recommendation62
2020 Proxy Vote Activity
Director Appointment
125
Remuneration 39
Amendment to Articles/Procedure
33
Share Issuance 25
Authorization of Transactions
18Other
31
Votes Cast Against Management

3
The company: Makita is one of the world’s leading manufacturers of electric power tools.
The proposal, our vote & rationale: Management proposed the reelection of Mr. Mitsuhiko Wakayama, an internal statutory auditor for Makita, to its board of directors and board of statutory auditors. We voted against the appointment due to his lack of independence, which we believe hampers his objectivity and the board of director’s ability to perform proper oversight.
The outcome: The resolution passed, leaving the board of directors with less than a third of its members as independent. Many Japanese companies have limited board independence; Harding Loevner analysts have engaged with Makita and other Japanese holdings often to promote the importance of board independence. After Mr. Wakayama was re-appointed, our covering analyst again engaged with company management to reiterate our belief in the importance of board independence as well as board diversity, and to urge it to improve the company’s governance in this regard. We were pleased to see a slight improvement in board independence in 2021, with five independent directors out of a total of 15 directors.
Director Appointment
MakitaCountry: Japan
Sector: Industrials
Sub-Fund: Global Equity
LindeCounty: United States
Sector: Materials
Sub-Fund: Global & International Equity
The company: Linde is one of the world’s leading industrial gas companies, with sizeable operations throughout North and South America and a growing presence in Asia.
The proposal, our vote & rationale: In 2019 and 2020, we voted against the re-appointment of Prof. Dr. Martin H. Richenhagen as a director on the Linde board. At the time of each vote, Dr. Richenhagen served as the chairman, president, and CEO of AGCO Corporation as well as a board member for Linde and an additional company. We were concerned that Dr. Richenhagen was “overboarded,” and that he would not be able to effectively fulfill his obligations as a director on three different boards while also serving as a CEO.
The outcome: The resolution passed, and Dr. Richenhagen was appointed to the board. We wrote to the chairman of Linde to express our concerns about the appointment, as we had done after we voted against his appointment in 2019. At the end of 2020, Dr. Richenhagen retired from his roles at AGCO, but remained a director for Linde. His retirement assuaged our concerns that he was overboarded and in 2021 we voted in favor of his reappointment to the Linde board.
Walgreens Boots AllianceCountry: United States
Materials: Consumer Staples
Sub-Fund: Global Equity
The company: Walgreens Boots Alliance (WBA) is a global, pharmacy-led health and wellbeing enterprise. The company’s portfolio of retail and business brands includes Walgreens, Duane Reade, Boots and Alliance Healthcare.
The proposal, our vote & rationale: We voted in favor of a shareholder proposal for the appointment of an independent board chairman. We believe it to be best practice to require an independent chairman to protect shareholder interests and ensure independent oversight of the company. This is especially important for boards that have demonstrated sub-optimal decision making or insufficient ability to challenge and oversee management, two specific concerns that we had with WBA.
The outcome: The proposal did not pass. We engaged with WBA to reiterate our belief in the importance of an independent chairman.

4
CSPC Pharmaceutical GroupCountry: China
Sector: Health Care
Sub-Fund: Emerging Markets Equity
The company: CSPC is a leader in China’s pharmaceutical industry. CSPC derives the bulk of its revenues from finished drugs––specialties include treatments for cancer and stroke. The company also manufactures materials for drug production, such as vitamin C and caffeine.
The proposal, our vote & rationale: We voted against a proposal to re-elect Mr. Lee Ka Sze as a non-executive director on the audit committee. Mr. Lee serves as a partner at a law firm that provides legal services to CSPC, which we view as a conflict of interest. We further believe that the audit committee should be composed exclusively of independent directors.
The outcome: The proposal passed, and Mr. Lee was re-appointed as a director on the audit committee. We wrote to the CSPC chairman to express our concerns about Mr. Lee’s position on the board, and the potential for him to prioritize his own interests over those of shareholders. We continue to monitor board independence at CSPC and intend to continue voting against proposals that are inconsistent with adequate board independence.
LG Household & Health CareCountry: South Korea
Sector: Consumer Staples
Sub-Fund: Emerging Markets Equity
The company: LG Household & Health Care is the leading provider of household and personal care products in South Korea, with dominant market shares in home care products, cosmetics, and beverages. The company is rapidly expanding in China and throughout Southeast Asia.
The proposal, our vote & rationale: We voted against a management proposal to appoint Mr. Ki-Young Kim to the board of directors on concerns about board independence. LG Household & Health Care considers Mr. Kim to be an independent director; however, Mr. Kim serves as a partner at Yulchon LLC, a law firm that has provided advisory services to over a dozen members of the Koo family, which founded and still owns a large stake in LG Household & Health Care.
The outcome: The proposal passed, and Mr. Kim was appointed to the board. We wrote to LG Household & Health Care to emphasize the importance of an independent board in ensuring fair and objective oversight and adding value to the company’s corporate governance. We continue to monitor board independence at LG Household & Health Care and intend to continue voting against proposals that are inconsistent with adequate board independence.
Amendment to Procedure
AlphabetCountry: United States
Sector: Communication Services
Sub-Fund: Global Equity
The company: Alphabet is the parent company of Google, the world’s leading search engine, as well as several other subsidiaries.
The proposal, our vote & rationale: We voted against management’s recommendation and in favor of a shareholder proposal that called for equal shareholder voting. We have supported multiple proposals over time to improve Alphabet’s voting structure and agreed that a policy of one vote per share generally safeguards minority shareholders and allows those with a significant minority of shares to weigh in on issues set forth by the board.
The outcome: The proposal did not pass. We followed up by sending a letter to the chairman of the Alphabet board outlining our decision to vote against management recommendation. We will continue to monitor the company and its treatment of minority shareholders.

5
The company: Globant is an Argentine information technology services provider that specializes in developing creative, customer-facing technology, including websites and mobile apps. Its clients include Disney, American Express, Ubisoft, and Google.
The proposal, our vote & rationale: We voted against a management proposal to increase the percentage of share capital required to add an agenda item to a shareholder meeting from 5% to 10%. We seek to vote in accordance with proposals that are in the best interests of minority shareholders, and this proposal would have made it more difficult for minority shareholders to voice concerns.
The outcome: The proposal did not pass. As a follow-up to our vote against management, we wrote to Globant to explain our belief in protecting minority shareholder rights and our decision to vote against management. We were pleased that nearly two-thirds of shareholders voted against the proposal.
Abbott LabsCountry: United States
Sector: Health Care
Sub-Fund: Global Equity
The company: Abbott Labs develops, manufactures, and sells a broad range of health care products, including nutritional products, branded generic pharmaceuticals, diagnostic systems and tests, and medical devices.
The proposal, our vote & rationale: We voted in favor of a shareholder proposal to institute a simple majority vote, against management recommendation. We agreed that Abbott’s supermajority approval structure for votes could act as an impediment to takeover proposals and limit minority shareholders’ ability to approve ballot items.
The outcome: The proposal passed, leading Abbott to transition from a supermajority to a simple majority for future proxy votes. While we were pleased that the proposal had passed and that Abbott improved its voting structure, we still sent a letter to the chairman of Abbott as a follow-up to reiterate our belief in the importance of a simple majority vote.
GlobantCountry: Argentina
Sector: Information Technology
Sub-Fund: Global Small Companies Equity
Remuneration
NikeCountry: United States
Sector: Consumer Discretionary
Sub-Fund: Global Equity
The company: Nike is the world’s largest seller of athletic footwear and apparel.
The proposal, our vote & rationale: We voted against a management proposal on the remuneration for the newly appointed CEO, as we believed that the signing bonus of $45 million, not including an additional $10 million to be paid after the first year, was excessive. The proposal also included an additional $10 million for the previous CEO, who resigned in the wake of an athlete doping scandal.
The outcome: The proposal passed. While we understand that the board needed to act quickly to find a replacement after the resignation of both the former CEO and his presumed successor, we engaged with Nike to express our belief that the new CEO’s remuneration was excessive. We also shared our disappointment over the generous compensation for the ex-CEO; we felt Nike should not reward executives who were stepping down due to alleged misconduct. Our analyst will continue to monitor executive compensation at Nike and advocate for compensation that is aligned with shareholder interests.

400 Crossing Blvd, 4th Floor, Bridgewater, NJ 08807 T: (908)218-7900 F: (908)218-1915 HardingLoevner.com ©2021 Harding Loevner 6
Holdings identified may not be held in the identified sub-fund as of 30 June 2021. A complete list of holdings is available upon request.
Lobbying & Political Spending
Vertex PharmaceuticalsCountry: United States
Sector: Health Care
Sub-Fund: Global Equity
The company: Vertex Pharmaceuticals develops, manufactures, and commercializes treatments for patients with serious diseases, with a focus on cystic fibrosis and related diseases.
The proposal, our vote & rationale: Shareholders introduced a proposal to increase company disclosures related to political lobbying. We voted in favor of the proposal, believing that Vertex could meet the disclosure standards set by its peers without compromising its relationships with patients or its ability to receive fair treatment from lawmakers. Vertex recommended voting against the proposal.
The outcome: The proposal did not pass. Following our vote against management, we sent Vertex a letter explaining our rationale. Additionally, Harding Loevner’s covering analyst, ESG Analyst, and Deputy Director of Research discussed the importance of adequate disclosures with the company’s investor relations team, Head of Corporate Responsibility, and Corporate Counsel. While the proposal failed, Vertex has since enhanced its disclosures around lobbying and political spending, publishing a Political Engagement Principles document that outlines the extent of its lobbying and political activities and discloses all contributions to industry and trade organizations as well as other corporate contributions.

Audited Financial Statements30 June 2021
Harding Loevner Funds plc
Global Equity Fund
International Equity Fund
Emerging Markets Equity Fund
Global Small Companies Equity Fund

Harding Loevner Funds plcTable of Contents
Directors and Other Information 1
Directors’ Responsibilities Statement 2
Background to the Company and Directors’ Report 3
Depositary’s Report 10
Independent Auditors’ Report to the Shareholders of Harding Loevner Funds Plc 11
Schedule of InvestmentsThe Harding Loevner Global Equity Fund (“Global Equity Fund”) 14The Harding Loevner International Equity Fund (“International Equity Fund”) 16The Harding Loevner Emerging Markets Equity Fund (“Emerging Markets Equity Fund”) 18The Harding Loevner Global Small Companies Equity Fund (“Global Small Companies Equity Fund”) 20
Significant Purchases and Sales (Unaudited) 22
Statement of Financial Position 26
Statement of Comprehensive Income 32
Statement of Changes in Net Assets Attributable to Holders of Redeemable Participating Shares 34
Statement of Cash Flows 36
Notes to Financial Statements 38
Appendix 1 - Remuneration Disclosure (Unaudited) 70
Appendix 2 - Financial Information (Unaudited) 71

Harding Loevner Funds plcDirectors and Other Information
For the Financial Year Ended 30 June 2021
1
DIRECTORS David LoevnerMike KirbyJim Cleary Ryan Bowles
(US resident) (Non-executive)(Irish resident) (Non-executive)(Irish resident) (Independent, Non-executive) (US resident) (Non-executive)
REGISTERED OFFICE 2nd Floor5 Earlsfort TerraceDublin 2IrelandRegistered Number: 437095
INVESTMENT MANAGER Harding Loevner LP400 Crossing Boulevard4th FloorBridgewaterNew Jersey 08807USA
DEPOSITARY Northern Trust Fiduciary Services (Ireland) LimitedGeorge’s Court54-62 Townsend StreetDublin 2, D02 R156Ireland
ADMINISTRATOR Northern Trust International Fund Administration Services (Ireland) LimitedGeorge’s Court54-62 Townsend StreetDublin 2, D02 R156Ireland
COMPANY SECRETARY Dechert Secretarial Limited2nd Floor5 Earlsfort TerraceDublin 2, D02 CK83Ireland
INDEPENDENT AUDITORS Deloitte Ireland LLPChartered Accountants and Statutory Audit FirmDeloitte & Touche HouseEarlsfort TerraceDublin 2, D02 AY28Ireland
IRISH LEGAL ADVISERS Dechert 2nd Floor5 Earlsfort TerraceDublin 2, D02 CK83Ireland

Harding Loevner Funds plcDirectors’ Responsibilities Statement
For the Financial Year Ended 30 June 2021
2
Directors’ Responsibilities Statement
The Directors are responsible for preparing the Directors’ Report and the financial statements in accordance with the Companies Act 2014 and the applicable regulations.
Irish company law requires the Directors to prepare financial statements for each financial year. Under the law, the Directors have elected to prepare the financial statements in accordance with International Financial Reporting Standards as adopted by the European Union. Under company law, the Directors must not approve the financial statements unless they are satisfied that they give a true and fair view of the assets, liabilities and financial position of the Harding Loevner Funds plc (the “Company”) as at the financial year end date and of the profit or loss of the Company for the financial year and otherwise comply with the Companies Act 2014.
In preparing those financial statements, the Directors are required to:
• select suitable accounting policies for the Company financial statements and then apply them consistently;
• make judgements and estimates that are reasonable and prudent;
• state whether the financial statements have been prepared in accordance with the applicable accounting standards, identify those standards, and note the effect and the reasons for any material departure from those standards; and
• prepare the financial statements on the going concern basis unless it is inappropriate to presume that the Company will continue in business.
The Directors are responsible for keeping adequate accounting records which disclose with reasonable accuracy at any time the financial position of the Company and to enable them to ensure that the financial statements are prepared in accordance with International Financial Reporting Standards as adopted by the European Union and comply with the Companies Act 2014 and the European Communities (Undertakings for Collective Investment in Transferable Securities) Regulations 2011, (as amended) (the "UCITS Regulations”) and the Central Bank (Supervision and Enforcement) Act 2013 (Section 48(1)) (Undertakings for Collective Investment in Transferable Securities) Regulations 2019, as amended (the "Central Bank UCITS Regulations"). They are also responsible for safeguarding the assets of the Company and hence for taking reasonable steps for the prevention and detection of fraud and other irregularities.
Under the UCITS Regulations, the Directors are required to entrust the assets of the Company to the Depositary for safe-keeping. In carrying out this duty, the Directors have delegated custody of the Company’s assets to Northern Trust Fiduciary Services (Ireland) Limited.
FOR AND ON BEHALF OF THE BOARD OF DIRECTORS Director Director J. Cleary M. Kirby 24 September 2021

Harding Loevner Funds plcBackground to the Company and Directors’ Report
For the Financial Year Ended 30 June 2021
3
The following information is derived from and should be read in conjunction with the full text and definition section of the Prospectus. Capitalised terms shall bear the meaning as defined in the Prospectus, unless otherwise stated.
Date of Incorporation
The Company was incorporated on 29 March 2007 and commenced operations on 1 June 2007.
Background to the Company
The Company is an umbrella type open-ended investment company with variable capital and segregated liability between sub-funds governed by the laws of Ireland and authorised by the Central Bank of Ireland (the “Central Bank”) under the European Communities (Undertakings for Collective Investment in Transferable Securities) Regulations 2011, as amended (“the UCITS Regulations”) and the Central Bank (Supervision and Enforcement) Act 2013 (Section 48(1)) (Undertakings for Collective Investment in Transferable Securities) Regulations 2019 as amended, (the "Central Bank UCITS Regulations"). Shares representing interests in different sub-funds may be issued from time to time by the Directors. Shares of more than one class may be issued in relation to a sub-fund. A separate portfolio of assets will be maintained for each sub-fund (and accordingly not for each class of shares) and will be invested in accordance with the investment objective and policies applicable to such sub-fund.
There are five sub-funds (the “sub-funds”) of the Company currently in existence, namely:
The Harding Loevner Global Equity Fund
The Company created the Harding Loevner Global Equity Fund (the “Global Equity Fund”) on 31 May 2007 and commenced its operations on 1 June 2007.
The investment objective of the Global Equity Fund is to achieve long-term capital appreciation by investing primarily in global equities.
As at 30 June 2021 the following classes of shares were authorised to be issued in the Global Equity Fund:
US Dollar Euro Sterling Australian Dollar Singapore DollarClass A Class B Class D Class I Class M Class S Class S1
Class A Class D Class M Class S
Class A Class B Class D Class I Class M Class S
Class A Class F Class M
Class A Class D Class M Class S
Swiss Franc Canadian DollarClass A Class D
Class A Class S
As at 30 June 2021 the following share classes were in issue in the Global Equity Fund:
US Dollar Euro Sterling Singapore Dollar Canadian DollarClass A Class B Class D Class S1
Class A Class M Class S
Class A Class B Class S
Class M Class S
The Harding Loevner International Equity Fund
The Company created the Harding Loevner International Equity Fund (the “International Equity Fund”) on 31 May 2007 and commenced its operations on 3 April 2013.
The investment objective of the International Equity Fund is to achieve long-term capital appreciation by investing primarily in equities of companies based in global markets other than the United States of America.

Harding Loevner Funds plcBackground to the Company and Directors’ Report (Continued)
For the Financial Year Ended 30 June 2021
4
As at 30 June 2021 the following classes of shares were authorised to be issued in the International Equity Fund:
US Dollar Euro SterlingClass A Class B Class I Class M Class S
Class A Class S
Class A Class S
As at 30 June 2021 the following share classes were in issue in the International Equity Fund:
US Dollar SterlingClass A Class B Class S
Class A
The Harding Loevner Emerging Markets Equity Fund
The Company created the Harding Loevner Emerging Markets Equity Fund (the “Emerging Markets Equity Fund”) on 31 May 2007 and commenced its operations on 25 September 2012.
The investment objective of the Emerging Markets Equity Fund is to achieve long-term capital appreciation by investing primarily in emerging markets equities.
As at 30 June 2021 the following classes of shares were authorised to be issued in the Emerging Markets Equity Fund:
US Dollar Euro Sterling Australian Dollar Canadian DollarClass A Class B Class I Class M Class S
Class A Class B Class I Class M Class S
Class A Class B Class I Class M Class S
Class A Class B Class I Class F
Class A Class B Class I Class M Class S
As at 30 June 2021 the following share classes were in issue in the Emerging Markets Equity Fund:
US Dollar Canadian DollarClass A Class B Class I
Class B Class S
The Harding Loevner Frontier Emerging Markets Equity Fund
The Company created the Harding Loevner Frontier Emerging Markets Equity Fund (the “Frontier Emerging Markets Equity Fund”) on 31 May 2007 and commenced its operations on 25 September 2012. On 15 August 2017 shares for the Frontier Emerging Markets Equity Fund were fully redeemed. The Fund will remain in a dormant status and open to investors should Subscriptions arise in the future.
The investment objective of the Frontier Emerging Markets Equity Fund is to achieve long-term capital appreciation by investing primarily in frontier emerging markets equities.
As at 30 June 2021 the following classes of shares were authorised to be issued in the Frontier Emerging Markets Equity Fund:
US Dollar Euro Sterling Australian DollarClass A Class A Class A Class A
As at 30 June 2021 there were no share classes in issue in the Frontier Emerging Markets Equity Fund.
The Harding Loevner International Equity Fund (Continued)

Harding Loevner Funds plcBackground to the Company and Directors’ Report (Continued)
For the Financial Year Ended 30 June 2021
5
The Harding Loevner Global Small Companies Equity Fund
The Company created the Harding Loevner Global Small Companies Equity Fund ("Global Small Companies Equity Fund") on 4 December 2018 and commenced its operations on 13 December 2018.
The investment objective of the Global Small Companies Equity Fund is to achieve long-term capital appreciation through investments in equity securities of small companies based both inside and outside the United States.
As at 30 June 2021 the following class of shares were authorised to be issued in the Global Small Companies Equity Fund:
Euro Sterling US DollarClass A Class A Class A
Class B Class S
As at 30 June 2021, only the US Dollar Class A shares were in issue in the Global Small Companies Equity Fund.
Connected Persons
The Central Bank UCITS Regulations requires that any transaction carried out with a UCITS by a management company or depositary to the UCITS, the delegates or sub-delegates of the management company or depositary, and any associated or group of such a management company, depositary, delegate or sub-delegate (“connected persons”) must be carried out as if conducted at arm’s length and must be in the best interests of the shareholders.
The Directors are satisfied that there are arrangements (evidenced by written procedures) in place, to ensure that the obligations set out in Regulation 43(1) of the Central Bank UCITS Regulations are applied to all transactions with connected persons, and are satisfied that transactions with connected persons entered into during the period complied with the obligations set out in Regulation 43(1) of the Central Bank UCITS Regulations.
Significant Events During the Financial Year
Effective 1 July 2020 on the Global Equity Fund the expense caps were reduced to 0.75% for the Class M shares, 0.80% for the Class A shares, 1.10% for the Class B shares, 10 bps of operating expenses excluding Investment Management Fees (“Management fee”) for the USD Class S1 and 0.10% and for Class S shares.
Effective close of business 30 September 2020, the Prospectus and Supplements in respect of the Company were updated. The update reduced the Emerging Markets Equity Fund’s Class A Management fees from 1.10% to 1.00% and permitted purchases and repurchases of shares to take place via certain electronic means, going forward.
On 7 October 2020, the Canadian Dollar Class S shares for Emerging Market Equity Fund were first issued.
On 7 October 2020, the Canadian Dollar Class I shares for Emerging Markets Equity Fund liquidated.
On 9 November 2020, the Canadian Dollar Class M shares for Emerging Markets Equity Fund liquidated.
On 8 January 2021, the US Dollar Class S shares for Global Equity Fund liquidated.
An updated Prospectus and Supplements were filed with the Central Bank of Ireland on 9 March 2021. These were updated to reflect the requirements of Regulation (EU) 2019/2088 of the European Parliament and of the Council of 27 November 2019 on sustainability-related disclosures in the financial services sector (“SFDR”).
During the financial year ended 30 June 2021, the Global Equity Fund distributed the following net income:
A distribution of 0.002428750 per share on the Sterling Class S shares, with a total value of GBP 395,651, for the financial year ended 30 June 2021. This distribution was declared on 19 January 2021 with a record date of 15 January 2021, an ex-date of 19 January 2021 and a pay date of 22 January 2021.
A distribution of 0.005009537 per share on the Sterling Class S shares, with a total value of GBP 814,103, for the financial year ended 30 June 2021. This distribution was declared on 21 July 2020 with a record date of 20 July 2020, an ex-date of 21 July 2020 and a pay date of 24 July 2020.
During the financial year ended 30 June 2021, the International Equity Fund distributed the following net income:
A distribution of 0.001825456 per share on the Sterling Class A shares, with a total value of GBP 3,266, for the financial period ended 31 December 2020. This distribution was declared on 19 January 2021 with a record date of 15 January 2021, an ex-date of 19 January 2021 and a pay date of 22 January 2021.

Harding Loevner Funds plcBackground to the Company and Directors’ Report (Continued)
For the Financial Year Ended 30 June 2021
6
A distribution of 0.012711116 per share on the Sterling Class A shares, with a total value of GBP 13,170. This distribution was declared on 21 July 2020 with a record date of 20 July 2020, an ex-date of 21 July 2020 and a pay date of 24 July 2020.
The continued outbreak of Covid-19, including the Delta variant, has resulted in ongoing restrictions on the ability of people to travel, socialise and leave their homes. Global financial markets continue to react to this news to varying degrees, with concerns regarding the economic impact this may have on a global scale. The eventual impact on the global economy and the operations and financial performance of certain sub-fund’s investments will largely depend upon future developments, including (i) the duration and spread of the outbreak, including the Delta variant, (ii) the effects on the financial markets, and (iii) the effects on the economy overall, all of which are highly uncertain and cannot be predicted. If the financial performance of a sub-fund is impacted because of these factors for an extended period, the relevant sub-fund’s investment results may be adversely affected. The Board of Directors (“the Board”) has considered the general impact resulting from the spread of Covid-19 on the Company and has ongoing engagement with its delegates. The delegates have invoked their Business Continuity Plans (BCPs) which are operating effectively allowing the Company to continue to service its client base. The Board continues to closely monitor market conditions taking into account any changes in liquidity or other market volatility and/or restrictions.
Review of the Business and Future Developments
The movement in Dealing Net Asset Value (“NAV”) per share for the Global Equity Fund, International Equity Fund, Emerging Markets Equity Fund and Global Small Companies Equity Fund during the financial year was as follows:
The Harding Loevner Global Equity Fund
Class 30 June 2021 30 June 2020Euro Class A EUR 2.882 EUR 2.190Sterling Class A GBP 2.464 GBP 1.981US Dollar Class A USD 3.421 USD 2.463Sterling Class B GBP 1.490 GBP 1.202US Dollar Class B USD 1.580 USD 1.141US Dollar Class D USD 1.594 USD 1.157Euro Class M EUR 1.653 EUR 1.256Singapore Dollar Class M SGD 2.334 SGD 1.741Canadian Dollar Class S CAD 1.568 CAD 1.228Euro Class S EUR 1.615 EUR 1.219Sterling Class S GBP 1.650 GBP 1.324US Dollar Class S – USD 1.260US Dollar Class S1 USD 1.574 USD 1.132
The Harding Loevner International Equity Fund
Class 30 June 2021 30 June 2020Sterling Class A GBP 2.104 GBP 1.765US Dollar Class A USD 1.867 USD 1.392US Dollar Class B USD 1.853 USD 1.385US Dollar Class S USD 1.577 USD 1.167
The Harding Loevner Emerging Markets Equity Fund
Class 30 June 2021 30 June 2020US Dollar Class A USD 1.783 USD 1.245Canadian Dollar Class B CAD 1.232 CAD 0.946US Dollar Class B USD 1.566 USD 1.098Canadian Dollar Class I – CAD 1.524US Dollar Class I USD 1.664 USD 1.159Canadian Dollar Class M – CAD 1.353Canadian Dollar Class S CAD 1.206 –
Frontier Emerging Markets Equity Fund
As at 30 June 2021 there were no share classes in issue in the Frontier Emerging Markets Equity Fund.
The Harding Loevner Global Small Companies Equity Fund
Class 30 June 2021 30 June 2020US Dollar Class A USD 1.652 USD 1.218
Significant Events During the Financial Year (Continued)
Harding Loevner Funds plcBackground to the Company and Directors’ Report (Continued)
For the Financial Year Ended 30 June 2021
7
Review of the Business and Future Developments (Continued)
The Investment Manager’s report on pages 3 to 21 of the Annual Commentary section contains a review of the factors which contributed to the performance for the financial year. The Investment Manager’s report covers the financial year to 30 June 2021. The NAV per share differs from the dealing NAV due to the treatment of preliminary expenses. The Directors do not anticipate any change in the structure or investment objective of the Company.
Risk Management Objectives and Policies
The main risks arising from the Company’s financial instruments are set out in the Company’s Prospectus and in note 13 ‘Financial Instruments and Associated Risks’.
The Investment Manager may use financial derivative instruments for investment purposes, for efficient portfolio management purposes, to gain exposure to markets in a cost efficient manner consistent with the maintenance of an appropriate level of risk within the sub-funds, or for hedging purposes in accordance with the requirements of the Central Bank.
Results and Dividends
The results and dividends for the financial year are set out in the Statement of Comprehensive Income on pages 32 to 33. The Directors intend to declare a dividend in respect of the Sterling currency classes of the Global Equity and International Equity Funds such that substantially all of the net income relating to such classes shall be distributed on a semi-annual basis (on or about 15 January and 15 July in each calendar year).
UK Reporting Fund Status
The United Kingdom HM Revenue and Customs (“HMRC”) has confirmed that the Global Equity Fund Sterling Class A Shares is in the UK Reporting Fund Regime from 1 July 2010 onwards (and was previously certified as a distributing fund) and the Global Equity Fund Sterling Class B is in the UK Reporting Fund Regime from 15 August 2018. All required submissions for Reporting Status for the financial year ended 30 June 2021 will be made within the required timeframe with the initial deadline being currently six months after the year end date.
Events After the Reporting Date
The Global Equity Fund distributed net income of 0.004754419 per share on the Sterling Class S shares, with a total value of GBP 775,307. This distribution was declared on 20 July 2021 with a record date of 19 July 2021, an ex-date of 20 July 2021 and a pay date of 23 July 2021.
The International Equity Fund distributed net income of 0.013512861 per share on the Sterling Class A shares, with a total value of GBP 24,194. This distribution was declared on 20 July 2021 with a record date of 19 July 2021, an ex-date of 20 July 2021 and a pay date of 23 July 2021.
There have been no other material events to report subsequent to the financial year ended 30 June 2021.
Directors
The names of the persons who were Directors of the Company at any time during the financial year ended 30 June 2021 are set out below.
David Loevner (US resident)Mike Kirby (Irish resident)Jim Cleary (Irish resident)Ryan Bowles (US resident)
Company Secretary
Dechert Secretarial Limited, 2nd Floor 5 Earlsfort Terrace, Dublin 2, D02 CK83, Ireland.
Directors’ and Secretary’s Interests in Shares and Contracts
Entities related to David Loevner and Ryan Bowles are limited partners of the Investment Manager. Mike Kirby is the Managing Principal of KB Associates, who provide consulting services to the Company. No other Directors had, at any time during the year or at the end of the financial year, a material interest in any contract of significance, in relation to the business of the Company. No Director held any shares in the Company at 30 June 2021.
Accounting Records
The measures taken by the Directors to secure compliance with the Company’s obligation to keep adequate accounting records are the use of appropriate systems and procedures and employment of competent persons. The accounting records of the Company are kept at Northern Trust International Fund Administration Services (Ireland) Limited, Georges Court, 54-62 Townsend Street, Dublin 2, D02 R156, Ireland.

Harding Loevner Funds plcBackground to the Company and Directors’ Report (Continued)
For the Financial Year Ended 30 June 2021
8
Independent Auditors
The independent auditors, Deloitte Ireland LLP, Chartered Accountants and Statutory Audit Firm, have declared their willingness to continue in office in accordance with the Companies Act 2014.
Statement of Corporate Governance
The European Communities (Directive 2006/461EC) Regulations (S.I. 450 of 2009 and S.I. 83 of 2010) (the “Regulations”) require the inclusion of a corporate governance statement in the Directors’ Report. Although there is no specific statutory corporate governance code applicable to Irish collective investment schemes, the Company is subject to corporate governance practices imposed by:
(i) The Irish Companies Act 2014, which are available for inspection at the registered office of the Company; and may also be obtained at http://www.irishstatutebook.ie
(ii) The Articles of Association of the Company, which are available for inspection at the registered office of the Company at 2nd Floor 5 Earlsfort Terrace, Dublin 2, Ireland and at the Companies Registration Office in Ireland; and
(iii) The Central Bank of Ireland (“Central Bank”) in their UCITS regulations, which can be obtained from the Central Bank’s website at: http://www.centralbank.ie/regulation/industry-sectors/funds/ucits/Pages/default.aspx and are available for inspection at the registered office of the Company.
The Board of Directors voluntarily complies with the Corporate Governance Code for Collective Investment Schemes and Management Companies as published by Irish Funds (the “IF Code”) as the Company’s corporate governance code. The Board of Directors has assessed the measures included in the IF Code as being consistent with its corporate governance practices and procedures for the financial year.
Audit Committee
The Directors believe that there is no requirement to form an audit committee as the Board has four non-executive, including one independent, Directors and the Company complies with the provisions of the IF Code. The Directors have delegated the day-to-day investment management and administration of the Company to the Investment Manager and to the Administrator respectively. The Directors have also appointed Northern Trust Fiduciary Services (Ireland) Limited as depositary of the assets of the Company.
Directors’ Compliance Statement
The Directors acknowledge that they are responsible for securing the Company’s compliance with the relevant obligations as set out in section 225 of the Companies Act 2014.
The Directors confirm that:
1) A compliance policy document has been drawn up that sets out policies that in our opinion are appropriate to the Company, respecting compliance by the company with its relevant obligations.
2) Appropriate arrangements or structures are in place that are, in our opinion, designed to secure material compliance with the Company's relevant obligations, and
3) During the financial year, the arrangements or structures referred to in (2) have been reviewed.
Statement on Relevant Audit Information
The Directors confirm that during the financial year end 30 June 2021:
1) so far as the Director is aware, there is no relevant audit information of which the Company’s statutory auditors are unaware, and
2) the Director has taken all the steps that he or she ought to have taken as a Director in order to make himself or herself aware of any relevant audit information and to establish that the company’s statutory auditors are aware of that information.
Harding Loevner Funds plcBackground to the Company and Directors’ Report (Continued)
For the Financial Year Ended 30 June 2021
9
FOR AND ON BEHALF OF THE BOARD OF DIRECTORS Director Director J. Cleary M. Kirby 24 September 2021

Harding Loevner Funds plcDepositary’s Report
For the Financial Year Ended 30 June 2021
10
Report of the Depositary to the Shareholders
We, Northern Trust Fiduciary Services (Ireland) Limited, appointed Depositary to Harding Loevner Funds plc (“the Fund”), provide this report solely in favour of the shareholders of the Fund for the financial year ended 30 June 2021. This report is provided in accordance with the UCITS Regulations – European Communities (Undertakings for Collective Investment in Transferable Securities) Regulations 2011 (SI No 352 of 2011), as amended, which implemented Directive 2009/65/EU into Irish Law (“the Regulations”).
We do not, in the provision of this report, accept nor assume responsibility for any other purpose or person to whom this report is shown.
In accordance with our Depositary obligation as provided for under the Regulations, we have enquired into the conduct of the Fund for the financial year ended 30 June 2021 and we hereby report thereon to the shareholders of the Fund as follows;
We are of the opinion that the Fund has been managed during the financial year, in all material respects:
(i) in accordance with the limitations imposed on the investment and borrowing powers of the Fund by the constitutional documents and by the Regulations; and
(ii) otherwise in accordance with the provisions of the constitutional document and the Regulations.
For and on behalf of
Northern Trust Fiduciary Services (Ireland) LimitedGeorges Court 54-62 Townsend StreetDublin 2, D02 R156Ireland
24 September 2021
LF41
Stamp

Continued on next page/
Deloitte Ireland LLPChartered Accountants &Statutory Audit Firm
INDEPENDENT AUDITOR’S REPORT TO THE SHAREHOLDERS OFHARDING LOEVNER FUNDS PLC
Report on the audit of the financial statements
Opinion on the financial statements of Harding Loevner Funds Plc (“the company”)In our opinion the financial statements:
give a true and fair view of the assets, liabilities and financial position of the company as at 30 June 2021 and of the profit for the financial year then ended; and
have been properly prepared in accordance with the relevant financial reporting framework, the applicable Regulations and, in particular, with the requirements of the Companies Act 2014.
The financial statements we have audited comprise:
the Statement of Comprehensive Income; the Statement of Financial Position; the Statement of Changes in Net Assets attributable to holders of Redeemable Shares; the Statement of Cash Flows; and the related notes 1 to 21, including a summary of significant accounting policies as set out in note 2.
The relevant financial reporting framework that has been applied in their preparation is the Companies Act 2014 and International Financial Reporting Standards as adopted by the European Union (“IFRS”) (“the relevant financial reporting framework”).
The applicable regulations that have been applied in their preparation is the European Communities (Undertakings for Collective Investment in Transferable Securities) Regulations, 2011 and Central Bank (Supervision and Enforcement) Act 2013 (Section 48(1)) (Undertakings for Collective Investment in Transferable Securities) Regulations, 2019 (“the applicable Regulations”).
Basis for opinionWe conducted our audit in accordance with International Standards on Auditing (Ireland) (ISAs (Ireland)) and applicable law. Our responsibilities under those standards are described below in the “Auditor's responsibilities for the audit of the financial statements” section of our report.
We are independent of the company in accordance with the ethical requirements that are relevant to our audit of the financial statements in Ireland, including the Ethical Standard issued by the Irish Auditing and Accounting Supervisory Authority, and we have fulfilled our other ethical responsibilities in accordance with these requirements. We believe that the audit evidence we have obtained is sufficient and appropriate to provide a basis for our opinion.
Conclusions relating to going concernIn auditing the financial statements, we have concluded that the directors' use of the going concern basis of accounting in the preparation of the financial statements is appropriate.
Based on the work we have performed, we have not identified any material uncertainties relating to events or conditions that, individually or collectively, may cast significant doubt on the company’s ability to continue as a going concern for a period of at least twelve months from when the financial statements are authorised for issue.
Our responsibilities and the responsibilities of the directors with respect to going concern are described in the relevant sections of this report.

/Continued from previous page
INDEPENDENT AUDITOR’S REPORT TO THE SHAREHOLDERS OF HARDING LOEVNER FUNDS PLC
Continued on next page/
Other informationThe other information comprises the information included in the Annual Report and Audited Financial Statements, other than the financial statements and our auditor’s report thereon. The directors are responsible for the other information contained within the Annual Report and Audited Financial Statements. Our opinion on the financial statements does not cover the other information and, except to the extent otherwise explicitly stated in our report, we do not express any form of assurance conclusion thereon.
Our responsibility is to read the other information and, in doing so, consider whether the other information is materially inconsistent with the financial statements or our knowledge obtained in the audit or otherwise appears to be materially misstated. If we identify such material inconsistencies or apparent material misstatements, we are required to determine whether there is a material misstatement in the financial statements or a material misstatement of the other information. If, based on the work we have performed, we conclude that there is a material misstatement of this other information, we are required to report that fact.
We have nothing to report in this regard.
Responsibilities of directorsAs explained more fully in the Directors' Responsibilities Statement, the directors are responsible for the preparation of the financial statements and for being satisfied that they give a true and fair view and otherwise comply with the Companies Act 2014, and for such internal control as the directors determine is necessary to enable the preparation of financial statements that are free from material misstatement, whether due to fraud or error.
In preparing the financial statements, the directors are responsible for assessing the company’s ability to continue as a going concern, disclosing, as applicable, matters related to going concern and using the going concern basis of accounting unless the directors either intend to liquidate the company or to cease operations, or have no realistic alternative but to do so.
Auditor’s responsibilities for the audit of the financial statementsOur objectives are to obtain reasonable assurance about whether the financial statements as a whole are free from material misstatement, whether due to fraud or error, and to issue an auditor's report that includes our opinion. Reasonable assurance is a high level of assurance, but is not a guarantee that an audit conducted in accordance with ISAs (Ireland) will always detect a material misstatement when it exists. Misstatements can arise from fraud or error and are considered material if, individually or in the aggregate, they could reasonably be expected to influence the economic decisions of users taken on the basis of these financial statements.
As part of an audit in accordance with ISAs (Ireland), we exercise professional judgment and maintain professional scepticism throughout the audit. We also:
Identify and assess the risks of material misstatement of the financial statements, whether due to fraud or error, design and perform audit procedures responsive to those risks, and obtain audit evidence that is sufficient and appropriate to provide a basis for our opinion. The risk of not detecting a material misstatement resulting from fraud is higher than for one resulting from error, as fraud may involve collusion, forgery, intentional omissions, misrepresentations, or the override of internal control.
Obtain an understanding of internal control relevant to the audit in order to design audit procedures that are appropriate in the circumstances, but not for the purpose of expressing an opinion on the effectiveness of the company’s internal control.
Evaluate the appropriateness of accounting policies used and the reasonableness of accounting estimates and related disclosures made by the directors.
Conclude on the appropriateness of the directors’ use of the going concern basis of accounting and, based on the audit evidence obtained, whether a material uncertainty exists related to events or conditions that may cast significant doubt on the company’s ability to continue as a going concern. If we conclude that a material uncertainty exists, we are required to draw attention in our auditor’s report to the related disclosures in the financial statements or, if such disclosures are inadequate, to modify our

/Continued from previous page
INDEPENDENT AUDITOR’S REPORT TO THE SHAREHOLDERS OF HARDING LOEVNER FUNDS PLC
opinion. Our conclusions are based on the audit evidence obtained up to the date of the auditor’s report. However, future events or conditions may cause the entity (or where relevant, the group) to cease to continue as a going concern.
Evaluate the overall presentation, structure and content of the financial statements, including the disclosures, and whether the financial statements represent the underlying transactions and events in a manner that achieves fair presentation.
We communicate with those charged with governance regarding, among other matters, the planned scope and timing of the audit and significant audit findings, including any significant deficiencies in internal control that the auditor identifies during the audit.
Report on other legal and regulatory requirements
Opinion on other matters prescribed by the Companies Act 2014Based solely on the work undertaken in the course of the audit, we report that:
We have obtained all the information and explanations which we consider necessary for the purposes of our audit. In our opinion the accounting records of the company were sufficient to permit the financial statements to be readily and
properly audited. The financial statements are in agreement with the accounting records. In our opinion the information given in the directors’ report is consistent with the financial statements and the directors’
report has been prepared in accordance with the Companies Act 2014.
Matters on which we are required to report by exceptionBased on the knowledge and understanding of the company and its environment obtained in the course of the audit, we have not identified material misstatements in the directors' report.
We have nothing to report in respect of the provisions in the Companies Act 2014 which require us to report to you if, in our opinion, the disclosures of directors’ remuneration and transactions specified by law are not made.
Use of our reportThis report is made solely to the company’s shareholders, as a body, in accordance with Section 391 of the Companies Act 2014. Our audit work has been undertaken so that we might state to the company’s shareholders those matters we are required to state to them in an auditor’s report and for no other purpose. To the fullest extent permitted by law, we do not accept or assume responsibility to anyone other than the company and the company’s shareholders as a body, for our audit work, for this report, or for the opinions we have formed.
Michael HartwellFor and on behalf of Deloitte Ireland LLPChartered Accountants and Statutory Audit Firm Deloitte & Touche House, 29 Earlsfort Terrace, Dublin 2
28 September 2021

Harding Loevner Funds plcGlobal Equity FundSchedule of Investments30 June 2021
14
Transferable Securities Security Description - Equities Shares
Market Value USD
% Net Assets
Australia: 0.48% (30 June 2020: 0.00%)
Xero (Information Technology) 62,921 6,469,421 0.48%
Brazil: 0.99% (30 June 2020: 2.22%)
B3 (Financials) 3,944,100 13,337,843 0.99%
China: 8.68% (30 June 2020: 6.64%)
Alibaba (Consumer Discretionary) 469,204 13,294,808 0.98%Country Garden Services (Industrials) 2,181,000 23,567,598 1.75%ENN Energy (Utilities) 386,000 7,347,835 0.54%NetEase (Communication Services) 654,800 14,834,476 1.10%Tencent Holdings (Communication Services) 238,100 17,908,942 1.33%Trip.com (Consumer Discretionary) 348,418 12,385,324 0.92%Wuxi Biologics (Health Care) 1,520,500 27,866,923 2.06%CHINA TOTAL 117,205,906 8.68%
Denmark: 0.83% (30 June 2020: 0.78%)
Genmab (Health Care) 27,431 11,223,910 0.83%
Finland: 0.88% (30 June 2020: 1.00%)
Neste (Energy) 194,446 11,906,344 0.88%
France: 2.12% (30 June 2020: 3.11%)
L'Oreal (Consumer Staples) 31,435 14,007,590 1.04%Schneider Electric SE (Industrials) 93,113 14,649,033 1.08%FRANCE TOTAL 28,656,623 2.12%
Germany: 0.96% (30 June 2020: 2.35%)
TeamViewer (Information Technology) 344,863 12,970,985 0.96%
Hong Kong: 1.11% (30 June 2020: 2.29%)
AIA Group (Financials) 1,208,400 15,018,817 1.11%
India: 1.24% (30 June 2020: 2.74%)
HDFC Bank ADR (Financials) 228,880 16,735,706 1.24%
Indonesia: 0.94% (30 June 2020: 1.31%)
Bank Central Asia (Financials) 6,114,976 12,704,390 0.94%
Japan: 3.34% (30 June 2020: 7.52%)
Chugai Pharmaceutical (Health Care) 254,100 10,068,394 0.75%Keyence (Information Technology) 22,400 11,305,351 0.83%Misumi Group (Industrials) 167,200 5,658,869 0.42%Sysmex (Health Care) 152,556 18,126,281 1.34%JAPAN TOTAL 45,158,895 3.34%
Netherlands: 2.35% (30 June 2020: 0.00%)
Adyen (Information Technology) 5,553 13,567,301 1.01%ASML (Information Technology) 26,231 18,121,424 1.34%NETHERLANDS TOTAL 31,688,725 2.35%
Poland: 0.87% (30 June 2020: 0.00%)
CD Projekt (Communication Services) 241,120 11,699,980 0.87%
Republic of South Korea: 1.04% (30 June 2020: 0.00%)
Samsung Electronics (Voting) GDR Reg S (Information Technology) 7,907 14,102,134 1.04%
Transferable Securities Security Description - Equities (Cont’d) Shares
Market Value USD
% Net Assets
Russian Federation: 0.00% (30 June 2020: 1.63%)
Singapore: 0.95% (30 June 2020: 0.00%)
DBS Group (Financials) 577,586 12,804,223 0.95%
Spain: 0.00% (30 June 2020: 0.43%)
Sweden: 1.73% (30 June 2020: 0.00%)
Atlas Copco AB (Industrials) 218,287 13,365,395 0.99%Epiroc (Industrials) 436,548 9,946,935 0.74%SWEDEN TOTAL 23,312,330 1.73%
Switzerland: 2.94% (30 June 2020: 6.51%)
Alcon (Health Care) 195,014 13,701,683 1.01%Roche Holding (Health Care) 44,825 16,885,981 1.25%VAT Group (Industrials) 27,586 9,170,985 0.68%SWITZERLAND TOTAL 39,758,649 2.94%
Taiwan: 1.07% (30 June 2020: 0.00%)
Taiwan Semiconductor ADR (Information Technology) 45,589 5,477,974 0.41%Taiwan Semiconductor (Information Technology) 418,000 8,926,335 0.66%TAIWAN TOTAL 14,404,309 1.07%
United Kingdom: 1.52% (30 June 2020: 2.88%)
Abcam (Health Care) 724,542 13,841,198 1.02%Spirax-Sarco Engineering (Industrials) 35,593 6,703,454 0.50%UNITED KINGDOM TOTAL 20,544,652 1.52%
United States: 63.93% (30 June 2020: 57.02%)
Accenture (Information Technology) 56,159 16,555,111 1.23%Adobe Systems (Information Technology) 46,934 27,486,428 2.04%Align Technology (Health Care) 37,868 23,137,348 1.71%Alphabet (Communication Services) 19,336 47,214,451 3.49%Amazon.com (Consumer Discretionary) 11,871 40,838,139 3.03%AMETEK (Industrials) 96,807 12,923,734 0.96%Apple Inc (Information Technology) 99,518 13,629,985 1.01%CME Group (Financials) 88,582 18,839,620 1.40%Danaher (Health Care) 65,789 17,655,136 1.31%Deere (Industrials) 94,786 33,431,970 2.47%Disney (Communication Services) 72,685 12,775,843 0.95%eBay (Consumer Discretionary) 312,273 21,924,687 1.62%Edwards Lifesciences (Health Care) 135,244 14,007,221 1.04%EPAM Systems (Information Technology) 42,381 21,654,996 1.60%Estee Lauder (Consumer Staples) 48,234 15,342,271 1.13%Etsy (Consumer Discretionary) 68,965 14,195,756 1.05%Facebook (Communication Services) 101,654 35,346,112 2.62%First Republic Bank (Financials) 248,597 46,529,900 3.45%Illumina (Health Care) 86,699 41,026,834 3.04%Intuitive Surgical Inc (Health Care) 14,697 13,515,949 1.00%IQVIA (Health Care) 50,575 12,255,334 0.91%MasterCard (Information Technology) 31,099 11,353,934 0.84%Microsoft (Information Technology) 105,411 28,555,840 2.11%Nike (Consumer Discretionary) 180,014 27,810,363 2.06%NVIDIA (Information Technology) 26,413 21,133,041 1.56%PayPal (Information Technology) 128,298 37,396,301 2.77%Pinterest (Communication Services) 145,372 11,477,119 0.85%Roper (Industrials) 24,538 11,537,768 0.85%salesforce.com (Information Technology) 54,578 13,331,768 0.99%Schlumberger (Energy) 565,005 18,085,810 1.34%SVB Financial Group (Financials) 77,271 42,995,903 3.18%Synopsys (Information Technology) 61,710 17,019,001 1.26%Thermo Fisher Scientific (Health Care) 41,653 21,012,689 1.55%

Harding Loevner Funds plcGlobal Equity FundSchedule of Investments (Continued)30 June 2021
15
Transferable Securities Security Description - Equities (Cont’d) Shares
Market Value USD
% Net Assets
United States (Continued)
Trade Desk (Information Technology) 177,970 13,767,759 1.02%Tradeweb Markets (Financials) 180,963 15,302,231 1.13%UnitedHealth Group (Health Care) 37,110 14,860,328 1.10%Verisk Analytics (Industrials) 55,508 9,698,358 0.72%Vertex Pharmaceuticals (Health Care) 122,001 24,599,062 1.82%VF (Consumer Discretionary) 135,038 11,078,518 0.82%Workday (Information Technology) 50,755 12,117,249 0.90%UNITED STATES TOTAL 863,419,867 63.93%
Total transferable securities (30 June 2020: 98.43%) 1,323,123,709 97.97%(Cost: USD 914,731,178) (30 June 2020: Cost: USD 706,633,237)
Cash and cash equivalents (30 June 2020: 1.81%)
23,800,170 1.76%
Other assets and liabilities (30 June 2020: (0.24)%) 3,612,949 0.27%
Net assets attributable to holders of redeemable participating shares 1,350,536,828 100.00%
Analysis of total gross assets% of total
gross assetsTransferable securities admitted to an official stock exchange listing 97.90%Cash and cash equivalents 1.76%Other assets 0.34%
100.00%

Harding Loevner Funds plcInternational Equity FundSchedule of Investments30 June 2021
16
Transferable Securities Security Description - Equities Shares
Market Value USD
% Net Assets
Australia: 2.88% (30 June 2020: 0.00%)
BHP Group Limited ADR (Materials) 84,953 6,187,127 2.88%
Brazil: 2.74% (30 June 2020: 2.84%)
Ambev ADR (Consumer Staples) 775,606 2,668,085 1.24%Itau Unibanco (Pref) ADR (Financials) 536,802 3,226,180 1.50%BRAZIL TOTAL 5,894,265 2.74%
Canada: 1.87% (30 June 2020: 2.15%)
Alimentation Couche-Tard (Consumer Staples) 56,900 2,090,832 0.97%Canadian National Railway (Industrials) 18,291 1,930,066 0.90%CANADA TOTAL 4,020,898 1.87%
China: 7.21% (30 June 2020: 7.09%)
Alibaba Group Holding ADR (Consumer Discretionary) 14,328 3,249,304 1.51%CSPC Pharmaceutical Group (Health Care) 1,632,000 2,362,567 1.10%ENN Energy (Utilities) 117,000 2,227,194 1.03%Ping An Insurance (Financials) 256,000 2,507,476 1.17%Tencent Holdings (Communication Services) 68,500 5,152,300 2.40%CHINA TOTAL 15,498,841 7.21%
Denmark: 0.99% (30 June 2020: 1.09%)
Novozymes (Materials) 28,395 2,140,294 0.99%
France: 8.13% (30 June 2020: 8.37%)
Air Liquide (Materials) 11,560 2,024,016 0.94%Dassault Systemes (Information Technology) 11,695 2,835,873 1.32%L'Oreal (Consumer Staples) 16,515 7,359,165 3.42%Schneider Electric SE (Industrials) 33,488 5,268,510 2.45%FRANCE TOTAL 17,487,564 8.13%
Germany: 9.67% (30 June 2020: 12.60%)
Allianz (Financials) 20,392 5,085,016 2.36%Fuchs Petrolub (Pref) (Materials) 19,097 928,868 0.43%Infineon Technologies (Information Technology) 211,525 8,482,590 3.95%SAP ADR (Information Technology) 21,935 3,080,990 1.43%Symrise (Materials) 23,050 3,211,456 1.50%GERMANY TOTAL 20,788,920 9.67%
Hong Kong: 3.02% (30 June 2020: 3.21%)
AIA Group (Financials) 522,500 6,493,985 3.02%
India: 2.69% (30 June 2020: 2.12%)
HDFC Bank ADR (Financials) 36,285 2,653,159 1.23%ICICI Bank ADR (Financials) 183,123 3,131,403 1.46%INDIA TOTAL 5,784,562 2.69%
Indonesia: 0.97% (30 June 2020: 0.00%)
Telkom Indonesia Persero ADR (Communication Services) 96,161 2,083,809 0.97%
Israel: 1.16% (30 June 2020: 1.45%)
Check Point (Information Technology) 21,420 2,487,504 1.16%
Japan: 12.50% (30 June 2020: 15.78%)
Chugai Pharmaceutical (Health Care) 82,600 3,272,922 1.52%Fanuc (Industrials) 8,200 1,977,758 0.92%
Transferable Securities Security Description - Equities (Cont’d) Shares
Market Value USD
% Net Assets
Japan (Continued)
Keyence (Information Technology) 8,600 4,340,447 2.02%Komatsu (Industrials) 99,900 2,482,326 1.16%Kubota (Industrials) 157,500 3,185,584 1.48%Nitori Holdings (Consumer Discretionary) 10,200 1,805,050 0.84%Shionogi (Health Care) 47,300 2,465,586 1.14%Sysmex (Health Care) 28,898 3,433,580 1.60%UNICHARM (Consumer Staples) 97,200 3,910,923 1.82%JAPAN TOTAL 26,874,176 12.50%
Mexico: 1.09% (30 June 2020: 1.09%)
FEMSA ADR (Consumer Staples) 27,833 2,352,167 1.09%
Netherlands: 3.01% (30 June 2020: 2.40%)
Adyen (Information Technology) 2,647 6,467,251 3.01%
Republic of South Korea: 3.77% (30 June 2020: 3.06%)
Samsung Electronics (Pref) GDR Reg S (Information Technology) 2,650 4,314,200 2.01%Samsung Electronics (Voting) GDR Reg S (Information Technology) 2,126 3,791,721 1.76%REPUBLIC OF SOUTH KOREA TOTAL 8,105,921 3.77%
Russian Federation: 2.69% (30 June 2020: 2.85%)
Lukoil ADR (Energy) 43,000 3,956,000 1.84%Yandex (Communication Services) 25,835 1,827,826 0.85%RUSSIAN FEDERATION TOTAL 5,783,826 2.69%
Singapore: 2.30% (30 June 2020: 2.17%)
DBS Group (Financials) 223,294 4,950,096 2.30%
Spain: 1.37% (30 June 2020: 1.37%)
BBVA (Financials) 477,144 2,957,864 1.37%
Sweden: 7.72% (30 June 2020: 5.60%)
Alfa Laval (Industrials) 91,287 3,224,555 1.50%Atlas Copco AB (Industrials) 120,806 7,396,775 3.44%Epiroc (Industrials) 154,617 3,523,015 1.63%Skandinaviska Enskilda Banken (Financials) 190,993 2,467,169 1.15%SWEDEN TOTAL 16,611,514 7.72%
Switzerland: 10.76% (30 June 2020: 12.04%)
Alcon (Health Care) 39,860 2,800,564 1.30%Lonza Group (Health Care) 6,478 4,591,486 2.14%Nestle ADR (Consumer Staples) 33,384 4,164,320 1.94%Roche Holding (Health Care) 15,941 6,005,118 2.79%SGS (Industrials) 603 1,859,997 0.86%Sonova Holding (Health Care) 9,893 3,720,901 1.73%SWITZERLAND TOTAL 23,142,386 10.76%
Taiwan: 3.69% (30 June 2020: 4.15%)
Taiwan Semiconductor ADR (Information Technology) 66,088 7,941,134 3.69%
United Kingdom: 6.25% (30 June 2020: 6.95%)
Diageo (Consumer Staples) 49,734 2,381,066 1.11%Rio Tinto (Materials) 56,493 4,648,952 2.16%Royal Dutch Shell (Energy) 128,764 2,491,889 1.16%Standard Chartered PLC (Financials) 216,780 1,382,409 0.64%

Harding Loevner Funds plcInternational Equity FundSchedule of Investments (Continued)30 June 2021
17
Transferable Securities Security Description - Equities (Cont’d) Shares
Market Value USD
% Net Assets
United Kingdom (Continued)
Unilever (Consumer Staples) 43,510 2,546,227 1.18%UNITED KINGDOM TOTAL 13,450,543 6.25%
United States: 1.01% (30 June 2020: 1.53%)
Linde (Materials) 7,497 2,163,276 1.01%
Total transferable securities (30 June 2020: 99.91%) 209,667,923 97.49%(Cost: USD 147,517,843) (30 June 2020: Cost: USD 164,034,819)
Cash and cash equivalents (30 June 2020: 1.54%)
5,188,033 2.41%
Other assets and liabilities (30 June 2020: (1.45)%) 210,762 0.10%
Net assets attributable to holders of redeemable participating shares 215,066,718 100.00%
Analysis of total gross assets% of total
gross assetsTransferable securities admitted to an official stock exchange listing 97.38%Cash and cash equivalents 2.41%Other assets 0.21%
100.00%

Harding Loevner Funds plcEmerging Markets Equity FundSchedule of Investments30 June 2021
18
Transferable Securities Security Description - Equities Shares
Market Value USD
% Net Assets
Brazil: 6.95% (30 June 2020: 6.97%)
Ambev ADR (Consumer Staples) 1,246,402 4,287,623 1.08%B3 (Financials) 886,800 2,998,910 0.76%Banco Bradesco ADR (Financials) 1,011,913 5,191,114 1.31%Cia Brasileira de Distribuicao ADR (Consumer Staples) 74,382 579,436 0.15%Itau Unibanco (Pref) ADR (Financials) 746,239 4,484,896 1.13%Localiza Rent a Car (Industrials) 321,755 4,140,158 1.05%Lojas Renner (Consumer Discretionary) 216,900 1,928,804 0.49%Ultrapar Participacoes (Energy) 468,400 3,767 0.00%Ultrapar Participacoes (Energy) 379,725 1,403,985 0.35%WEG (Industrials) 370,180 2,507,412 0.63%BRAZIL TOTAL 27,526,105 6.95%
Chile: 0.24% (30 June 2020: 0.28%)
Banco Santander Chile ADR (Financials) 46,992 933,731 0.24%
China: 27.45% (30 June 2020: 26.77%)
51job ADR (Industrials) 34,331 2,669,922 0.67%Alibaba (Consumer Discretionary) 402,788 11,412,923 2.88%Alibaba Group Holding ADR (Consumer Discretionary) 26,197 5,940,956 1.50%Baidu (Communication Services) 137,560 3,532,767 0.89%China Tourism Group Duty Free (Consumer Discretionary) 85,153 3,950,868 1.00%Country Garden Services (Industrials) 307,000 3,317,401 0.84%CSPC Pharmaceutical Group (Health Care) 3,983,760 5,767,096 1.45%ENN Energy (Utilities) 346,265 6,591,446 1.66%Fuyao Glass Industry Group (Consumer Discretionary) 665,200 4,686,377 1.18%Hefei Meiya Optoelectronic Technology (Industrials) 297,489 2,564,604 0.65%Jiangsu Hengrui Medicine (Health Care) 142,920 1,501,886 0.38%Midea Group (China A) (Consumer Discretionary) 540,887 5,968,276 1.51%New Oriental Education & Technology (Consumer Discretionary) 146,210 1,205,188 0.31%Ping An Insurance (Financials) 569,000 5,573,259 1.41%Sangfor Technologies (Information Technology) 82,200 3,297,633 0.83%SF Holding (Industrials) 177,400 1,856,816 0.47%Shenzhou (Consumer Discretionary) 221,550 5,595,605 1.41%Sino Biopharmaceutical (Health Care) 1,381,160 1,355,491 0.34%Sunny Optical (Information Technology) 190,300 6,014,660 1.52%Tencent Holdings (Communication Services) 226,750 17,055,240 4.30%Wuxi Biologics (Health Care) 317,000 5,809,809 1.47%Zhejiang Sanhua Intelligent Controls (Industrials) 636,345 2,359,220 0.59%ZTO Express Cayman ADR (Industrials) 24,208 734,713 0.19%CHINA TOTAL 108,762,156 27.45%
Colombia: 0.53% (30 June 2020: 0.69%)
Bancolombia (Pref) ADR (Financials) 73,218 2,108,678 0.53%
Czech Republic: 0.65% (30 June 2020: 0.62%)
Komercni Banka (Financials) 73,775 2,596,763 0.65%
Egypt: 0.44% (30 June 2020: 0.73%)
Commercial International Bank GDR (Financials) 525,861 1,727,453 0.44%
Hong Kong: 6.68% (30 June 2020: 6.79%)
AIA Group (Financials) 814,800 10,126,888 2.56%ASM Pacific Technology (Information Technology) 231,729 3,139,741 0.79%
Transferable Securities Security Description - Equities (Cont’d) Shares
Market Value USD
% Net Assets
Hong Kong (Continued)
Sands China (Consumer Discretionary) 1,213,300 5,109,915 1.29%Techtronic (Industrials) 463,000 8,086,086 2.04%HONG KONG TOTAL 26,462,630 6.68%
India: 7.88% (30 June 2020: 7.09%)
HDFC Bank ADR (Financials) 59,719 4,366,653 1.10%Housing Development Finance (Financials) 254,594 8,478,189 2.14%Kotak Mahindra Bank (Financials) 208,057 4,774,843 1.20%Maruti Suzuki India (Consumer Discretionary) 43,399 4,388,303 1.11%Tata Consultancy Services (Information Technology) 204,940 9,224,781 2.33%INDIA TOTAL 31,232,769 7.88%
Indonesia: 2.21% (30 June 2020: 2.78%)
Astra International (Consumer Discretionary) 4,655,400 1,586,046 0.40%Bank Central Asia (Financials) 1,490,274 3,096,173 0.78%Bank Rakyat (Financials) 14,965,925 4,066,603 1.03%INDONESIA TOTAL 8,748,822 2.21%
Italy: 0.76% (30 June 2020: 0.64%)
Tenaris ADR (Energy) 136,711 2,993,971 0.76%
Kenya: 1.24% (30 June 2020: 1.29%)
East African Breweries (Consumer Staples) 356,559 597,294 0.15%Safaricom (Communication Services) 11,276,290 4,331,810 1.09%KENYA TOTAL 4,929,104 1.24%
Mexico: 5.20% (30 June 2020: 3.99%)
FEMSA ADR (Consumer Staples) 59,039 4,989,386 1.26%GF Banorte (Financials) 973,370 6,287,304 1.59%Grupo Aeroportuario del Sureste ADR (Industrials) 19,718 3,645,858 0.92%Wal-Mart de Mexico (Consumer Staples) 1,739,300 5,677,549 1.43%MEXICO TOTAL 20,600,097 5.20%
Panama: 0.40% (30 June 2020: 0.81%)
Copa Holdings (Industrials) 21,323 1,606,262 0.40%
Peru: 0.00% (30 June 2020: 0.96%)
Poland: 0.41% (30 June 2020: 0.00%)
CD Projekt (Communication Services) 33,457 1,623,450 0.41%
Republic of South Korea: 9.67% (30 June 2020: 9.73%)
Amorepacific (Consumer Staples) 7,893 1,766,226 0.45%Coway (Consumer Discretionary) 39,104 2,732,749 0.69%LG Household & Health Care (Consumer Staples) 6,674 10,442,293 2.63%NCSoft (Communication Services) 4,171 3,037,091 0.77%Samsung Electronics (Pref) GDR Reg S (Information Technology) 846 1,377,288 0.35%Samsung Electronics (Voting) GDR Reg S (Information Technology) 10,625 18,949,687 4.78%REPUBLIC OF SOUTH KOREA TOTAL 38,305,334 9.67%
Russian Federation: 8.56% (30 June 2020: 8.67%)
Lukoil ADR (Energy) 93,985 8,646,620 2.18%NovaTek GDR Reg S (Energy) 42,423 9,303,364 2.35%Sberbank ADR (Financials) 537,098 8,918,512 2.25%

Harding Loevner Funds plcEmerging Markets Equity FundSchedule of Investments (Continued)30 June 2021
19
Transferable Securities Security Description - Equities (Cont’d) Shares
Market Value USD
% Net Assets
Russian Federation (Continued)
Yandex (Communication Services) 99,922 7,069,482 1.78%RUSSIAN FEDERATION TOTAL 33,937,978 8.56%
South Africa: 1.50% (30 June 2020: 1.34%)
Discovery Holdings (Financials) 358,369 3,168,855 0.80%Standard Bank (Financials) 309,460 2,765,420 0.70%SOUTH AFRICA TOTAL 5,934,275 1.50%
Taiwan: 11.50% (30 June 2020: 9.28%)
Airtac (Industrials) 145,000 5,594,437 1.41%Eclat (Consumer Discretionary) 283,273 6,669,433 1.69%Hon Hai Precision (Information Technology) 1,528,568 6,144,446 1.55%Largan Precision (Information Technology) 32,000 3,560,341 0.90%Silergy (Information Technology) 25,000 3,400,628 0.86%Taiwan Semiconductor (Information Technology) 945,465 20,190,280 5.09%TAIWAN TOTAL 45,559,565 11.50%
Thailand: 0.83% (30 June 2020: 0.91%)
Siam Commercial Bank (Financials) 1,076,800 3,292,555 0.83%
United Kingdom: 2.70% (30 June 2020: 2.19%)
Bank of Georgia (Financials) 40,788 758,312 0.19%Coca-Cola HBC (Consumer Staples) 220,833 7,985,203 2.02%Network International (Information Technology) 386,909 1,957,268 0.49%UNITED KINGDOM TOTAL 10,700,783 2.70%
United States: 3.77% (30 June 2020: 2.99%)
EPAM Systems (Information Technology) 29,232 14,936,383 3.77%
Total transferable securities (30 June 2020: 95.52%) 394,518,864 99.57%(Cost: USD 264,222,268) (30 June 2020: Cost: USD 320,890,600)
Cash and cash equivalents (30 June 2020: 3.67%)
2,741,811 0.69%
Other assets and liabilities (30 June 2020: 0.81%) (1,026,392) (0.26%)
Net assets attributable to holders of redeemable participating shares 396,234,283 100.00%
Analysis of total gross assets% of total
gross assetsTransferable securities admitted to an official stock exchange listing 99.09%Cash and cash equivalents 0.69%Other assets 0.22%
100.00%

Harding Loevner Funds plcGlobal Small Companies Equity FundSchedule of Investments30 June 2021
20
Transferable Securities Security Description - Equities Shares
Market Value USD
% Net Assets
Argentina: 0.61% (30 June 2020: 0.58%)
Globant (Information Technology) 46 10,082 0.61%
Australia: 1.10% (30 June 2020: 0.00%)
Domain Holdings (Communication Services) 4,689 18,145 1.10%
Bangladesh: 0.63% (30 June 2020: 0.26%)
Square Pharmaceuticals (Health Care) 4,087 10,392 0.63%
Canada: 1.07% (30 June 2020: 2.03%)
Kinaxis (Information Technology) 135 17,759 1.07%
China: 0.51% (30 June 2020: 1.09%)
Haitian (Industrials) 2,500 8,388 0.51%
Denmark: 1.81% (30 June 2020: 2.11%)
Ambu (Health Care) 226 8,688 0.53%SimCorp (Information Technology) 169 21,214 1.28%DENMARK TOTAL 29,902 1.81%
Finland: 1.09% (30 June 2020: 1.37%)
Vaisala (Information Technology) 439 18,037 1.09%
France: 3.43% (30 June 2020: 3.86%)
Alten (Information Technology) 226 29,960 1.81%LISI (Industrials) 434 14,178 0.86%Rubis (Utilities) 281 12,491 0.76%FRANCE TOTAL 56,629 3.43%
Germany: 6.95% (30 June 2020: 7.59%)
Bechtle (Information Technology) 115 21,361 1.29%Carl Zeiss Meditec (Health Care) 66 12,753 0.77%Fuchs Petrolub (Materials) 408 15,844 0.96%Nemetschek (Information Technology) 161 12,317 0.75%Rational (Industrials) 18 16,306 0.99%STRATEC Biomedical (Health Care) 134 18,717 1.13%Symrise (Materials) 85 11,843 0.72%TeamViewer (Information Technology) 151 5,679 0.34%GERMANY TOTAL 114,820 6.95%
Hong Kong: 1.01% (30 June 2020: 1.44%)
Vitasoy International (Consumer Staples) 4,500 16,721 1.01%
Indonesia: 0.96% (30 June 2020: 0.65%)
Bank BTPN Syariah (Financials) 32,200 6,396 0.39%Sarana Menara Nusantara (Communication Services) 109,900 9,398 0.57%INDONESIA TOTAL 15,794 0.96%
Israel: 1.27% (30 June 2020: 1.33%)
CyberArk (Information Technology) 161 20,973 1.27%
Italy: 3.79% (30 June 2020: 3.13%)
DiaSorin (Health Care) 86 16,265 0.99%Fineco (Financials) 912 15,896 0.96%Reply (Information Technology) 185 30,404 1.84%ITALY TOTAL 62,565 3.79%
Transferable Securities Security Description - Equities (Cont’d) Shares
Market Value USD
% Net Assets
Japan: 14.46% (30 June 2020: 18.26%)
ABC-Mart (Consumer Discretionary) 300 17,202 1.04%Ariake Japan (Consumer Staples) 300 18,606 1.13%Bengo4.com (Communication Services) 70 6,124 0.37%Cosmos Pharmaceutical (Consumer Staples) 150 22,008 1.33%Infomart (Information Technology) 1,000 8,200 0.49%JCU (Materials) 500 16,112 0.98%Kakaku.com (Communication Services) 200 6,040 0.37%Misumi Group (Industrials) 510 17,261 1.04%MonotaRO (Industrials) 360 8,522 0.51%Nihon M&A Center Inc (Industrials) 380 9,855 0.60%Nomura Research Institute (Information Technology) 400 13,232 0.80%Pigeon (Consumer Staples) 250 7,044 0.43%Rakus (Information Technology) 500 13,660 0.83%Rinnai (Consumer Discretionary) 100 9,514 0.58%Santen Pharmaceutical (Health Care) 1,200 16,526 1.00%SMS (Industrials) 320 9,577 0.58%Stanley Electric (Consumer Discretionary) 200 5,788 0.35%Sugi (Consumer Staples) 200 14,582 0.88%UT Group (Industrials) 650 18,957 1.15%JAPAN TOTAL 238,810 14.46%
Lithuania: 0.98% (30 June 2020: 0.78%)
Siauliu Bankas (Financials) 20,515 16,177 0.98%
Malaysia: 0.64% (30 June 2020: 0.66%)
TIME dotCom (Communication Services) 3,100 10,499 0.64%
Mexico: 0.45% (30 June 2020: 1.29%)
Megacable Holdings (Communication Services) 2,100 7,431 0.45%
Netherlands: 0.00% (30 June 2020: 0.79%)
Norway: 1.36% (30 June 2020: 1.25%)
Tomra Systems (Industrials) 408 22,508 1.36%
Peru: 0.00% (30 June 2020: 0.36%)
Philippines: 0.49% (30 June 2020: 0.00%)
Robinsons Retail (Consumer Staples) 7,400 8,141 0.49%
Republic of South Korea: 0.35% (30 June 2020: 0.29%)
Cheil Worldwide (Communication Services) 257 5,740 0.35%
South Africa: 1.27% (30 June 2020: 1.19%)
Discovery Holdings (Financials) 2,378 21,027 1.27%
Spain: 1.29% (30 June 2020: 0.00%)
Bankinter (Financials) 2,995 15,054 0.91%Linea Directa (Financials) 2,995 6,275 0.38%SPAIN TOTAL 21,329 1.29%
Sweden: 2.33% (30 June 2020: 3.03%)
Alfa Laval (Industrials) 175 6,182 0.37%Paradox Interactive (Communication Services) 315 6,625 0.40%Thule Group AB (Consumer Discretionary) 580 25,713 1.56%SWEDEN TOTAL 38,520 2.33%

Harding Loevner Funds plcGlobal Small Companies Equity FundSchedule of Investments (Continued)30 June 2021
21
Transferable Securities Security Description - Equities (Cont’d) Shares
Market Value USD
% Net Assets
Switzerland: 2.63% (30 June 2020: 2.35%)
Bossard (Industrials) 48 14,655 0.89%LEM Holding (Information Technology) 10 20,967 1.27%Temenos Group AG (Information Technology) 49 7,870 0.47%SWITZERLAND TOTAL 43,492 2.63%
Taiwan: 2.40% (30 June 2020: 2.67%)
Advantech (Information Technology) 1,099 13,608 0.82%Eclat (Consumer Discretionary) 415 9,771 0.59%Silergy (Information Technology) 120 16,323 0.99%TAIWAN TOTAL 39,702 2.40%
Turkey: 0.16% (30 June 2020: 0.32%)
Ulker Biskuvi Sanayi (Consumer Staples) 1,076 2,563 0.16%
Ukraine: 0.43% (30 June 2020: 0.43%)
Kernel (Consumer Staples) 491 7,044 0.43%
United Arab Emirates: 0.21% (30 June 2020: 0.14%)
Agthia Group (Consumer Staples) 2,160 3,470 0.21%
United Kingdom: 11.88% (30 June 2020: 9.48%)
Abcam (Health Care) 1,361 26,000 1.58%Bank of Georgia (Financials) 600 11,155 0.68%Clarkson (Industrials) 98 4,324 0.26%Dechra Pharmaceuticals (Health Care) 509 30,769 1.86%Diploma (Industrials) 624 25,067 1.52%EMIS Group (Health Care) 1,082 17,212 1.04%Rathbone Bros (Financials) 351 8,798 0.53%Rightmove (Communication Services) 1,209 10,861 0.65%Senior (Industrials) 14,183 29,723 1.80%Spirax-Sarco Engineering (Industrials) 50 9,417 0.57%YouGov (Communication Services) 1,405 22,934 1.39%UNITED KINGDOM TOTAL 196,260 11.88%
United States: 33.06% (30 June 2020: 30.34%)
ABIOMED (Health Care) 63 19,663 1.19%Allegion (Industrials) 64 8,915 0.54%Altair Engineering (Information Technology) 539 37,175 2.25%BorgWarner (Consumer Discretionary) 694 33,687 2.04%Cable One (Communication Services) 3 5,738 0.35%Cognex (Information Technology) 219 18,407 1.11%Elanco Animal Health (Health Care) 169 5,863 0.35%EnerSys (Industrials) 406 39,679 2.40%Exponent (Industrials) 230 20,518 1.24%Five Below Inc (Consumer Discretionary) 69 13,336 0.81%Guidewire Software (Information Technology) 156 17,584 1.06%Healthcare Services Group (Industrials) 1,137 35,895 2.17%HEICO (Industrials) 129 17,985 1.09%Helmerich & Payne (Energy) 227 7,407 0.45%IPG Photonics (Information Technology) 107 22,553 1.37%Lazard (Financials) 211 9,548 0.58%LeMaitre Vascular (Health Care) 317 19,343 1.17%Neurocrine Biosciences (Health Care) 117 11,386 0.69%Ollie's Bargain Outlet Holding (Consumer Discretionary) 402 33,820 2.05%Planet Fitness (Consumer Discretionary) 306 23,026 1.39%Proto Labs (Industrials) 321 29,468 1.79%Reinsurance Group of America (Financials) 116 13,224 0.80%Repligen (Health Care) 80 15,970 0.97%Sensata (Industrials) 122 7,072 0.43%Signature Bank (Financials) 158 38,813 2.35%
Transferable Securities Security Description - Equities (Cont’d) Shares
Market Value USD
% Net Assets
United States (Continued)
Stock Yards Bancorp (Financials) 787 40,050 2.42%UNITED STATES TOTAL 546,125 33.06%
Vietnam: 0.80% (30 June 2020: 0.35%)
Hoa Phat Group (Materials) 5,896 13,193 0.80%
Total transferable securities 1,642,238 99.42%(Cost: USD 1,168,989) (30 June 2020: Cost: USD 1,039,413) (30 June 2020: 99.42%)
Cash and cash equivalents (30 June 2020: 2.89%)
10,720 0.65%
Other assets and liabilities (30 June 2020: (2.31)%) (1,099) (0.07%)
Net assets attributable to holders of redeemable participating shares 1,651,859 100.00%
Analysis of total gross assets% total
gross assetsTransferable securities admitted to an official stock exchange listing 97.58%Cash and cash equivalents 0.64%Other assets 1.78%
100.00%

Harding Loevner Funds plcGlobal Equity FundSignificant Purchases & Sales30 June 2021 (unaudited)
22
Significant Purchases Security Description Nominal
Base Cost USD
CME Group 157,933 28,088,494CD Projekt 249,111 23,694,758Adobe Systems 48,648 22,958,980Country Garden Services 2,207,000 21,611,624Amazon.com 6,434 21,102,327SVB Financial Group 46,574 20,926,126Wuxi Biologics Cayman 1,538,500 20,201,267TeamViewer 360,973 19,149,492Alibaba 524,000 18,132,484Roche Holding 51,238 17,688,428Samsung Electronics (Voting) GDR Reg S 8,237 16,382,912Danaher 67,117 16,362,141B3 1,440,700 15,541,562Accenture 58,129 15,408,358Etsy 116,660 15,147,651Schlumberger 591,382 15,121,672ASML 27,256 15,115,739Chugai Pharmaceutical 261,200 13,272,765Atlas Copco AB 228,422 13,083,022Trade Desk 18,545 13,072,099UnitedHealth Group 38,755 13,039,174Adyen NV 5,709 12,959,570DBS Group 711,886 12,894,739Edwards Lifesciences 151,282 12,775,230Neste 199,678 12,411,894Intuitive Surgical Inc 16,674 12,326,567AMETEK 101,407 11,795,737Genmab 31,057 11,298,426Tradeweb Markets 204,883 11,139,374Deere 36,040 10,545,936VF 152,916 10,439,947Taiwan Semiconductor ADR 81,110 10,341,135Pinterest 145,372 10,020,471IQVIA 51,993 9,445,330Taiwan Semiconductor 429,000 9,209,253Epiroc 388,261 8,798,720Illumina 24,941 7,994,202VAT Group 28,359 7,803,642Microsoft 34,384 7,622,404First Republic Bank 48,663 7,529,157eBay 128,276 6,904,586
Significant Sales Security Description Nominal
Base Proceeds USD
PayPal 144,359 36,639,455Lonza Group 59,450 36,090,654Apple Inc 202,721 27,136,393Symrise 205,720 25,705,263Itau Unibanco (Pref) ADR 4,815,619 24,321,466Alibaba 659,500 22,267,897Yandex 330,410 21,768,768Linde 76,419 19,768,208Roper 49,275 19,127,932Proto Labs 97,871 18,694,584ICICI Bank ADR 1,245,680 18,634,336Trade Desk 39,042 17,961,694ExxonMobil 356,303 15,835,127Abbott Labs 140,943 15,204,698Tencent Holdings 198,600 14,957,580CME Group 69,351 14,809,155Verisk Analytics 78,336 14,630,228Standard Chartered PLC 2,196,762 14,486,134MasterCard 44,091 14,372,269AIA Group 1,319,600 13,928,803Kubota 602,400 13,586,603Nestle ADR 119,858 13,561,387Keyence 26,500 13,454,363Kone 152,334 12,415,044Shiseido 184,000 12,172,941Sonova Holding 46,680 12,053,665Air Liquide 73,121 11,837,366Makita 244,247 11,474,832UnitedHealth Group 31,134 10,071,313Etsy 47,695 10,014,004HDFC Bank ADR 137,010 9,803,101Cognizant Technology 116,954 9,412,827Colgate-Palmolive 120,143 9,104,270Nidec 130,600 8,836,864Fanuc 33,700 8,650,169CHR. Hansen 75,508 8,499,004
The above represents aggregate purchases of a security exceeding 1 per cent of the total value of purchases for the year or aggregate disposals greater than 1 per cent of the total value of sales. If there were fewer than 20 purchases/sales that exceed 1 per cent during the year the largest 20 purchases/sales are disclosed.

Harding Loevner Funds plcInternational Equity FundSignificant Purchases & Sales30 June 2021 (unaudited)
23
Significant Purchases Security Description Nominal
Base Cost USD
BHP Group Limited 97,862 6,655,765Telkom Indonesia 110,240 2,553,247SEB Group (Skandinaviska Enskilda Banken)
190,993 2,377,570
CSPC Pharmaceutical Group 1,856,000 2,110,106ENN Energy 133,000 2,021,130Alibaba Group Holding 6,201 1,610,661Lukoil 20,188 1,553,677Shionogi 24,200 1,316,368Infineon Technologies 24,088 960,485Atlas Copco AB 13,736 787,976AIA Group 63,200 783,708L'Oreal 1,978 779,502Adyen 334 743,758Taiwan Semiconductor 6,272 707,927Tencent Holdings 8,600 698,145Roche Holding 2,012 696,598Allianz 2,707 661,555Lonza Group 949 615,648DBS Group 29,744 599,977Schneider Electric SE 3,905 591,157UNICHARM 12,600 549,227Keyence 1,100 544,455Rio Tinto 6,572 537,816Nestle 4,531 528,495Samsung Electronics (Pref) 286 461,265Chugai Pharmaceutical 9,600 446,522Symrise 3,398 440,999Samsung Electronics (Voting) 223 403,421
Significant Sales Security Description Nominal
Base Proceeds USD
Taiwan Semiconductor 78,303 7,603,959ADIDAS 10,983 3,824,512SAP 24,510 3,221,868Lonza Group 4,147 2,502,735AIA Group 191,400 2,225,016Infineon Technologies 62,026 2,154,563Atlas Copco AB 37,018 2,038,134Yandex 31,941 2,004,474Tencent Holdings 25,200 1,944,518China Mobile ADR 64,489 1,908,299L'Oreal 4,953 1,902,246Linde 6,945 1,774,730BBVA 328,746 1,710,904Diageo 41,359 1,701,051Roche Holding 4,850 1,667,211Adyen 805 1,627,907Dassault Systemes 7,645 1,595,563Keyence 3,300 1,547,069DBS Group 81,200 1,515,546Allianz 6,328 1,509,227UNICHARM 35,500 1,505,392Schneider Electric SE 10,358 1,484,971Chugai Pharmaceutical 31,700 1,454,373Rio Tinto 16,627 1,256,033Nestle 10,458 1,230,178Samsung Electronics (Pref) 759 1,094,726Kubota 54,500 1,074,219Ping An Insurance 92,000 991,966BHP Group Limited 12,909 964,465Samsung Electronics (Voting) 604 961,707Sysmex 10,100 935,484Symrise 7,382 935,119Alibaba Group Holding 3,900 926,948Komatsu 35,200 896,664Lukoil 11,839 895,300Alcon 12,449 835,997Alfa Laval 27,907 822,412Sonova Holding 2,949 818,143ICICI Bank 54,450 808,280Itau Unibanco (Pref) 150,188 783,369Check Point 6,546 777,480
The above represents aggregate purchases of a security exceeding 1 per cent of the total value of purchases for the year or aggregate disposals greater than 1 per cent of the total value of sales. If there were fewer than 20 purchases/sales that exceed 1 per cent during the year the largest 20 purchases/sales are disclosed.

Harding Loevner Funds plcEmerging Markets Equity FundSignificant Purchases & Sales30 June 2021 (unaudited)
24
Significant Purchases Security Description Nominal
Base Cost USD
New Oriental Education 46,430 7,265,009Alibaba 197,100 6,263,865Wuxi Biologics Cayman 317,000 4,171,046CD Projekt 43,750 4,028,307Fuyao Glass Industry Group 874,400 3,802,060China International Travel (China A) 111,353 3,634,061Hon Hai Precision 1,295,000 3,466,363Sangfor Technologies 82,200 3,355,835NCSOFT 4,171 3,143,773Country Garden Services 307,000 2,716,581Hefei Meiya Optoelectronic Technolgy 297,489 2,271,772Ping An Insurance 198,500 2,259,797Zhejiang Sanhua Intelligent Controls 636,345 2,196,185CSPC Pharmaceutical Group 1,450,000 2,146,180Ultrapar Participacoes SA 501,800 2,084,862Jiangsu Hengrui Medicine 158,100 2,083,147Silergy 32,000 2,074,434Network International 507,773 1,986,246Tata Consultancy Services 59,916 1,837,556Airtac 77,000 1,757,701Wal-Mart de Mexico 600,400 1,421,395GF Banorte 324,900 1,189,880B3 113,900 1,161,353Samsung Electronics (Voting) GDR Reg S 516 947,359Yandex 13,284 879,494
Significant Sales Security Description Nominal
Base Proceeds USD
Taiwan Semiconductor 934,000 17,627,557Tencent Holdings 123,700 10,191,573Samsung Electronics (Voting) GDR Reg S 4,339 7,995,152Hangzhou Hikvision Digital Tec (China A) 874,593 6,322,668EPAM Systems 14,521 5,903,939Samsung Electronics (Pref) GDR Reg S 3,267 5,207,796Fuyao Glass Industry Group 799,693 4,476,743Alibaba 135,600 4,102,509Alibaba Group Holding 14,660 3,920,070Yandex 60,232 3,900,203Credicorp 26,596 3,470,757AIA Group 268,200 3,324,277Copa Holdings 37,867 3,058,017Amorepacific 13,263 2,981,173LG Household & Health Care 2,198 2,952,848Housing Development Finance 83,842 2,884,291Jiangsu Yanghe Brewery 98,000 2,799,999Tata Consultancy Services 67,467 2,722,110Trip.com ADR 84,498 2,692,408Sberbank GDR 176,875 2,628,687Midea Group (China A) 178,200 2,490,646Techtronic 152,000 2,417,494NovaTek GDR Reg S 13,354 2,379,587Baidu ADR 8,193 2,378,407Lukoil ADR 30,951 2,344,604Coca-Cola HBC 72,725 2,287,48451job ADR 31,011 2,102,898SF Holding 171,500 2,069,519New Oriental Education 10,999 2,061,527Ping An Insurance 163,000 1,977,967WEG 150,300 1,928,123Hon Hai Precision 481,000 1,919,633
The above represents aggregate purchases of a security exceeding 1 per cent of the total value of purchases for the year or aggregate disposals greater than 1 per cent of the total value of sales. If there were fewer than 20 purchases/sales that exceed 1 per cent during the year the largest 20 purchases/sales are disclosed.

Harding Loevner Funds plcGlobal Small Companies Equity FundSignificant Purchases & Sales30 June 2021 (unaudited)
25
Significant Purchases Security Description Nominal
Base Cost USD
Stock Yards Bancorp 787 38,206Ollie's Bargain Outlet Holdings 402 34,794Diploma 624 19,999UT Group 650 19,799Santen Pharmaceutical 1,200 19,675Domain Holdings Australia 4,689 15,829Bankinter 2,995 13,934Healthcare Services Group 455 13,929Exponent 132 12,420Five Below 69 12,171Proto Labs 129 11,441Reinsurance Group of America 81 9,957Rakus 500 8,344Vaisala 210 8,019Bank BTPN Syariah 32,200 7,977Robinsons Retail Holdings 7,400 7,949Reply 76 7,914Bengo4.com 70 7,415TeamViewer 151 7,006Square Pharmaceuticals 2,346 5,665EMIS Group 337 4,499Signature Aviation 1,077 3,215Bank of Georgia 244 3,075Planet Fitness 40 3,012
Significant Sales Security Description Nominal
Base Proceeds USD
SVB Financial Group 45 22,722Trade Desk 45 19,698Thule Group AB 437 17,961ASM International 61 15,874EPAM Systems 30 14,567Grupo Herdez 6,300 14,512Nihon M&A Center Inc 260 14,110Eclat 585 13,571Nakanishi 800 12,871Nokian Renkaat 360 12,864Signature Aviation 2,182 12,398Penumbra 58 12,072Carl Zeiss Meditec 65 12,047Rollins 324 10,655Signature Bank 40 8,531MonotaRO 170 8,470Cosmos Pharmaceutical 50 8,34351job ADR 112 8,203Kansas City Southern 39 8,110Exponent 77 7,440Misumi Group 240 7,117Alten 57 6,597Kinaxis 35 5,326Rightmove 615 4,899Pigeon 100 3,781Spirax-Sarco Engineering 19 3,596Infomart 400 3,468IPSOS 99 3,326Alicorp 1,914 3,281
The above represents aggregate purchases of a security exceeding 1 per cent of the total value of purchases for the year or aggregate disposals greater than 1 per cent of the total value of sales. If there were fewer than 20 purchases/sales that exceed 1 per cent during the year the largest 20 purchases/sales are disclosed.

Harding Loevner Funds plcStatement of Financial Position
As at 30 June 2021
26
The notes on pages 38 to 69 are an integral part of these financial statements.
1.1 Global Equity Fund
As at 30 June
2021 USD
1.2 International Equity Fund
As at 30 June
2021 USD
1.3 Emerging Markets
Equity Fund As at
30 June 2021 USD
1.5 Global Small Companies
Equity Fund As at
30 June 2021 USD
9.9 Total As at
30 June 2021 USD
NotesCurrent assetsFinancial assets at fair value though profit or loss 2,4,13 1,323,123,709 209,667,923 394,518,864 1,642,238 1,928,952,734Cash and cash equivalents 2,5 23,800,170 5,188,033 2,741,811 10,720 31,740,734Receivables 6 4,643,614 448,765 877,369 30,072 5,999,820Total current assets 1,351,567,493 215,304,721 398,138,044 1,683,030 1,966,693,288
Financial liabilities not at fair value through profit or lossCreditors (amounts falling due within one year) 3,8 1,030,665 238,003 1,903,761 31,171 3,203,600Total liabilities excluding net assets attributable to holders of redeemable participating shares 1,030,665 238,003 1,903,761 31,171 3,203,600Net assets attributable to holders of redeemable participating shares 15 1,350,536,828 215,066,718 396,234,283 1,651,859 1,963,489,688

Harding Loevner Funds plcStatement of Financial Position (Continued)
As at 30 June 2021
27
The notes on pages 38 to 69 are an integral part of these financial statements.
1.1 Global Equity Fund
As at 30 June
2021 USD
1.2 International Equity Fund
As at 30 June
2021 USD
1.3 Emerging Markets
Equity Fund As at
30 June 2021 USD
1.5 Global Small Companies
Equity Fund As at
30 June 2021 USD
NotesRedeemable participating shares in issue at financial year end Euro Class A 10 69,717,084.302 – – –Sterling Class A 10 30,085,853.745 1,790,469.575 – –US Dollar Class A 10 50,975,107.177 43,710,789.940 6,436,502.294 1,000,000.000Canadian Dollar Class B 10 – – 500,000.000 –Sterling Class B 10 99,000.000 – – –US Dollar Class B 10 4,381,744.754 5,865,599.797 2,084,144.724 –US Dollar Class D 10 375,318.483 – – –US Dollar Class I 10 – – 36,894,259.876 –Euro Class M 10 30,938,896.021 – – –Singapore Dollar Class M 10 74,230,336.126 – – –Canadian Dollar Class S 10 35,500,000.000 – 328,617,200.376 –Euro Class S 10 19,393,309.642 – – –Sterling Class S 10 163,070,766.560 – – –US Dollar Class S 10 – 74,439,994.939 – –US Dollar Class S1 10 116,723,426.995 – – –
Net Asset Value per redeemable participating share Euro Class A 14 EUR 2.882 – – –Euro Class A USD equivalent 14 USD 3.417 – – –Sterling Class A 14 GBP 2.464 GBP 2.104 – –Sterling Class A USD equivalent 14 USD 3.408 USD 2.911 – –US Dollar Class A 14 USD 3.421 USD 1.867 USD 1.783 USD 1.652Canadian Dollar Class B 14 – – CAD 1.232 –Canadian Dollar Class B USD equivalent 14 – – USD 0.994 –Sterling Class B 14 GBP 1.490 – – –Sterling Class B USD equivalent 14 USD 2.062 – – –US Dollar Class B 14 USD 1.580 USD 1.853 USD 1.566 –US Dollar Class D 14 USD 1.594 – – –US Dollar Class I 14 – – USD 1.664 –

Harding Loevner Funds plcStatement of Financial Position (Continued)
As at 30 June 2021
28
The notes on pages 38 to 69 are an integral part of these financial statements.
1.1 Global Equity Fund
As at 30 June
2021 USD
1.2 International Equity Fund
As at 30 June
2021 USD
1.3 Emerging Markets
Equity Fund As at
30 June 2021 USD
1.5 Global Small Companies
Equity Fund As at
30 June 2021 USD
Notes
Net Asset Value per redeemable participating share
Euro Class M 14 EUR 1.653 – – –Euro Class M USD equivalent 14 USD 1.960 – – –Singapore Dollar Class M 14 SGD 2.334 – – –Singapore Dollar Class M USD equivalent 14 USD 1.735 – – –Canadian Dollar Class S 14 CAD 1.568 – CAD 1.206 –Canadian Dollar Class S USD equivalent 14 USD 1.265 – USD 0.973 –Euro Class S 14 EUR 1.615 – – –Euro Class S USD equivalent 14 USD 1.915 – – –Sterling Class S 14 GBP 1.650 – – –Sterling Class S USD equivalent 14 USD 2.283 – – –US Dollar Class S 14 – USD 1.577 – –US Dollar Class S1 14 USD 1.574 – – –
FOR AND ON BEHALF OF THE BOARD OF DIRECTORS Director Director J. Cleary M. Kirby 24 September 2021

Harding Loevner Funds plcStatement of Financial Position (Continued)
As at 30 June 2020
29
The notes on pages 38 to 69 are an integral part of these financial statements.
1.1 Global Equity Fund
As at 30 June
2020 USD
1.2 International Equity Fund
As at 30 June
2020 USD
1.3 Emerging Markets
Equity Fund As at
30 June 2020 USD
1.5 Global Small Companies
Equity Fund As at
30 June 2020 USD
9.9 Total As at
30 June 2020 USD
NotesCurrent assetsFinancial assets at fair value though profit or loss 2,4,13 983,002,615 188,755,627 352,317,263 1,192,833 1,525,268,338Cash and cash equivalents 2,5 18,027,090 2,903,899 13,553,803 34,684 34,519,476Receivables 6 3,328,581 12,429,119 4,206,014 6,334 19,970,048Total current assets 1,004,358,286 204,088,645 370,077,080 1,233,851 1,579,757,862
Financial liabilities not at fair value through profit or lossCreditors (amounts falling due within one year) 3,8 5,660,327 15,156,530 1,246,949 34,035 22,097,841Total liabilities excluding net assets attributable to holders of redeemable participating shares 5,660,327 15,156,530 1,246,949 34,035 22,097,841Net assets attributable to holders of redeemable participating shares 15 998,697,959 188,932,115 368,830,131 1,199,816 1,557,660,021

Harding Loevner Funds plcStatement of Financial Position (Continued)
As at 30 June 2020
30
The notes on pages 38 to 69 are an integral part of these financial statements.
1.1 Global Equity Fund
As at 30 June
2020 USD
1.2 International Equity Fund
As at 30 June
2020 USD
1.3 Emerging Markets
Equity Fund As at
30 June 2020 USD
1.5 Global Small Companies
Equity Fund As at
30 June 2020 USD
NotesRedeemable participating shares in issue at financial year end Euro Class A 10 58,379,745.983 – – –Sterling Class A 10 21,384,373.318 1,036,062.413 – –US Dollar Class A 10 35,066,441.702 44,421,112.392 10,601,892.194 1,000,000.000Canadian Dollar Class B 10 – – 500,000.000 –Sterling Class B 10 99,000.000 – – –US Dollar Class B 10 2,357,989.165 6,647,384.162 4,669,639.937 –US Dollar Class D 10 375,318.483 – – –Canadian Dollar Class I 10 – – 145,824,614.180 –US Dollar Class I 10 – – 98,817,574.656 –Canadian Dollar Class M 10 – – 72,215,000.000 –Euro Class M 10 37,605,562.688 – – –Singapore Dollar Class M 10 69,491,829.620 – – –Canadian Dollar Class S 10 35,500,000.000 – – –Euro Class S 10 41,476,628.681 – – –Sterling Class S 10 162,510,630.091 – – –US Dollar Class S 10 44,034,323.011 99,094,946.145 – –US Dollar Class S1 10 143,126,067.259 – – –
Net Asset Value per redeemable participating share Euro Class A 14 EUR 2.190 – – –Euro Class A USD equivalent 14 USD 2.462 – – –Sterling Class A 14 GBP 1.981 GBP 1.765 – –Sterling Class A USD equivalent 14 USD 2.455 USD 2.188 – –US Dollar Class A 14 USD 2.463 USD 1.392 USD 1.245 USD 1.218Canadian Dollar Class B 14 – – CAD 0.946 –Canadian Dollar Class B USD equivalent 14 – – USD 0.697 –Sterling Class B 14 GBP 1.202 – – –Sterling Class B USD equivalent 14 USD 1.489 – – –US Dollar Class B 14 USD 1.141 USD 1.385 USD 1.098 –

Harding Loevner Funds plcStatement of Financial Position (Continued)
As at 30 June 2020
31
The notes on pages 38 to 69 are an integral part of these financial statements.
1.1 Global Equity Fund
As at 30 June
2020 USD
1.2 International Equity Fund
As at 30 June
2020 USD
1.3 Emerging Markets
Equity Fund As at
30 June 2020 USD
1.5 Global Small Companies
Equity Fund As at
30 June 2020 USD
Notes
Net Asset Value per redeemable participating share
US Dollar Class D 14 USD 1.157 – – –Canadian Dollar Class I 14 – – CAD 1.524 –Canadian Dollar Class I USD equivalent 14 – – USD 1.122 –US Dollar Class I 14 – – USD 1.159 –Canadian Dollar Class M 14 – – CAD 1.353 –Canadian Dollar Class M USD equivalent 14 – – USD 0.996 –Euro Class M 14 EUR 1.256 – – –Euro Class M USD equivalent 14 USD 1.411 – – –Singapore Dollar Class M 14 SGD 1.741 – – –Singapore Dollar Class M USD equivalent 14 USD 1.249 – – –Canadian Dollar Class S 14 CAD 1.228 – – –Canadian Dollar Class S USD equivalent 14 USD 0.904 – – –Euro Class S 14 EUR 1.219 – – –Euro Class S USD equivalent 14 USD 1.369 – – –Sterling Class S 14 GBP 1.324 – – –Sterling Class S USD equivalent 14 USD 1.641 – – –US Dollar Class S 14 USD 1.260 USD 1.167 – –US Dollar Class S1 14 USD 1.132 – – –

Harding Loevner Funds plcStatement of Comprehensive Income
For the Financial Year Ended 30 June 2021
32
1.1Global Equity Fund
Financial year ended 30 June
2021 USD
1.2International Equity Fund
Financial year ended 30 June
2021 USD
1.3Emerging Markets
Equity Fund Financial year ended
30 June 2021 USD
1.5Global Small Companies
Equity Fund Financial year ended
30 June 2021 USD
9.9Total Financial year ended
30 June 2021 USD
NotesIncomeDividend income 2 8,448,939 4,133,912 7,815,018 17,003 20,414,872Interest income 2 6,744 4,636 11,097 14 22,491Other income 23,765 4,595 10,609 136,075 175,044Operating expense reimbursements 232,500 48,598 139,479 – 420,577Net realised gain on financial assets at fair value through profit or loss 2 260,573,137 20,860,664 54,930,333 128,220 336,492,354Net realised loss on foreign currency 2 (212,789) (16,350) (69,936) (3) (299,078)Net movement in unrealised gain on financial assets at fair value through profit or loss 2 132,023,152 37,429,273 98,869,933 319,829 268,642,187Net movement in unrealised gain/(loss) on foreign currency 2 646 (542) (778) (5) (679)Total investment gain 401,096,094 62,464,786 161,705,755 601,133 625,867,768
ExpensesOperating expenses 3 (6,306,642) (914,503) (3,524,587) (146,444) (10,892,176)Total investment gain before finance costs 394,789,452 61,550,283 158,181,168 454,689 614,975,592
Finance costsDistributions paid during the financial year 9 (1,575,948) (21,220) – – (1,597,168)Bank interest expense (8,765) (1) (57) (1) (8,824)Withholding tax (1,404,800) (454,205) (1,010,807) (2,645) (2,872,457)Increase in net assets attributable to holders of redeemable participating shares from operations 391,799,939 61,074,857 157,170,304 452,043 610,497,143
The notes on pages 38 to 69 are an integral part of these financial statements.

Harding Loevner Funds plcStatement of Comprehensive Income (Continued)
For the Financial Year Ended 30 June 2020
33
1.1Global Equity Fund
Financial year ended 30 June
2020 USD
1.2International Equity Fund
Financial year ended 30 June
2020 USD
1.3Emerging Markets
Equity Fund Financial year ended
30 June 2020 USD
1.5Global Small Companies
Equity Fund Financial year ended
30 June 2020 USD
9.9Total Financial year ended
30 June 2020 USD
NotesIncomeDividend income 2 9,043,130 5,336,310 10,683,714 14,739 25,077,893Interest income 2 570,408 118,571 256,201 488 945,668Other income 22,651 6,539 12,602 878 42,670Operating expense reimbursements – 38,286 135,999 132,944 307,229Net realised gain/(loss) on financial assets at fair value through profit or loss 2 71,599,416 (319,669) 15,812,548 40,906 87,133,201Net realised loss on foreign currency 2 (403,454) (50,344) (401,727) (92) (855,617)Net movement in unrealised gain/(loss) on financial assets at fair value through profit or loss 2 66,863,347 (3,581,698) (62,922,096) 34,000 393,553Net movement in unrealised (loss)/gain on foreign currency 2 (917) 750 (2,690) (7) (2,864)Total investment gain/(loss) 147,694,581 1,548,745 (36,425,449) 223,856 113,041,733
ExpensesOperating expenses 3 (4,832,818) (852,187) (5,678,710) (140,472) (11,504,187)Total investment gain/(loss) before finance costs 142,861,763 696,558 (42,104,159) 83,384 101,537,546
Finance costsDistributions paid during the financial year 9 (3,065,536) (41,723) – – (3,107,259)Bank interest expense (13) (8) (159) (1) (181)Withholding tax (1,401,329) (569,431) (987,241) (2,439) (2,960,440)Increase/(decrease) in net assets attributable to holders of redeemable participating shares from operations 138,394,885 85,396 (43,091,559) 80,944 95,469,666
The notes on pages 38 to 69 are an integral part of these financial statements.

Harding Loevner Funds plcStatement of Changes in Net Assets Attributable to Holders of Redeemable Participating Shares
For the Financial Year Ended 30 June 2021
34
1.1Global Equity Fund
Financial year ended 30 June
2021 USD
1.2International Equity Fund
Financial year ended 30 June
2021 USD
1.3Emerging Markets
Equity Fund Financial year ended
30 June 2021 USD
1.5Global Small Companies
Equity Fund Financial year ended
30 June 2021 USD
9.9Total Financial year ended
30 June 2021 USD
NotesNet assets attributable to holders of redeemable participating shares at the beginning of the financial year 998,697,959 188,932,115 368,830,131 1,199,816 1,557,660,021
Increase in net assets attributable to holders of redeemable participating shares from operations 391,799,939 61,074,857 157,170,304 452,043 610,497,143
Issue of redeemable participating shares during the financial year 162,274,015 32,162,637 681,708 – 195,118,360Payments for shares redeemed during the financial year (202,235,085) (67,102,891) (130,577,860) – (399,915,836)Anti-dilution levy 2 – – 130,000 – 130,000Net decrease from redeemable participating shares issued/redeemed during the financial year (39,961,070) (34,940,254) (129,766,152) – (204,667,476)Net assets attributable to holders of redeemable participating shares at the end of the financial year 15 1,350,536,828 215,066,718 396,234,283 1,651,859 1,963,489,688
The subscriptions and redemptions do not include share class switches.
The notes on pages 38 to 69 are an integral part of these financial statements.

Harding Loevner Funds plcStatement of Changes in Net Assets Attributable to Holders of Redeemable Participating Shares (Continued)
For the Financial Year Ended 30 June 2020
35
1.1Global Equity Fund
Financial year ended 30 June
2020 USD
1.2International Equity Fund
Financial year ended 30 June
2020 USD
1.3Emerging Markets
Equity Fund Financial year ended
30 June 2020 USD
1.5Global Small Companies
Equity Fund Financial year ended
30 June 2020 USD
9.9Total Financial year ended
30 June 2020 USD
NotesNet assets attributable to holders of redeemable participating shares at the beginning of the financial year 996,748,798 239,275,905 609,649,565 1,118,872 1,846,793,140
Increase/(decrease) in net assets attributable to holders of redeemable participating shares from operations 138,394,885 85,396 (43,091,559) 80,944 95,469,666
Issue of redeemable participating shares during the financial year 100,242,829 68,538,350 19,691,018 – 187,436,897Payments for shares redeemed during the financial year (236,688,553) (118,967,536) (217,418,893) – (572,039,682)Net decrease from redeemable participating shares issued/redeemed during the financial year (136,445,724) (50,429,186) (197,727,875) – (384,602,785)Net assets attributable to holders of redeemable participating shares at the end of the financial year 15 998,697,959 188,932,115 368,830,131 1,199,816 1,557,660,021
The subscriptions and redemptions do not include share class switches.
The notes on pages 38 to 69 are an integral part of these financial statements.

Harding Loevner Funds plcStatement of Cash Flows
For the Financial Year Ended 30 June 2021
36
1.1Global Equity Fund
Financial year ended 30 June
2021 USD
1.2International Equity Fund
Financial year ended 30 June
2021 USD
1.3Emerging Markets
Equity Fund Financial year ended
30 June 2021 USD
1.5Global Small Companies
Equity Fund Financial year ended
30 June 2021 USD
9.9Total Financial year ended
30 June 2021 USD
Cash flows from operating activities
Increase in net assets attributable to holders of redeemable participating shares from operations 391,799,939 61,074,857 157,170,304 452,043 610,497,143Adjustment for:Net realised gain on financial assets at fair value through profit or loss (260,573,137) (20,860,664) (54,930,333) (128,220) (336,492,354)Net movement in unrealised gain on financial assets at fair value through profit or loss (132,023,152) (37,429,273) (98,869,933) (319,829) (268,642,187)Purchase of financial assets (660,233,254) (40,320,816) (71,682,262) (300,385) (772,536,717)Sale of financial assets 712,708,449 77,698,457 183,280,927 299,029 973,986,862Dividends paid 1,575,948 21,220 – – 1,597,168Decrease/(increase) in receivables and other assets 770,176 12,115,354 3,328,645 (23,738) 16,190,437(Decrease)/increase in creditors (4,634,452) (14,993,854) 656,467 (2,864) (18,974,703)Net cash flows provided by/(used in) operating activities 49,390,517 37,305,281 118,953,815 (23,964) 205,625,649Cash flows from financing activitiesProceeds from redeemable participating shares issued during the financial year 160,188,806 32,027,637 681,708 – 192,898,151Payments for redeemable participating shares redeemed during the financial year (202,230,295) (67,027,564) (130,447,515) – (399,705,374)Dividends paid (1,575,948) (21,220) – – (1,597,168)Net cash flows used in financing activities (43,617,437) (35,021,147) (129,765,807) – (208,404,391)Net increase/(decrease) in cash and cash equivalents 5,773,080 2,284,134 (10,811,992) (23,964) (2,778,742)Reconciliation of cash movement during the financial yearNet cash and cash equivalents at the beginning of the financial year 18,027,090 2,903,899 13,553,803 34,684 34,519,476Net cash and cash equivalents at the end of the financial year 23,800,170 5,188,033 2,741,811 10,720 31,740,734
Supplementary informationDividends received 7,835,153 4,111,042 7,979,870 16,909 19,942,974Interest received 16,168 5,637 15,829 23 37,657Interest paid (8,339) (7) (56) (1) (8,403)
The notes on pages 38 to 69 are an integral part of these financial statements.

Harding Loevner Funds plcStatement of Cash Flows (Continued)
For the Financial Year Ended 30 June 2020
37
1.1Global Equity Fund
Financial year ended 30 June
2020 USD
1.2International Equity Fund
Financial year ended 30 June
2020 USD
1.3Emerging Markets
Equity Fund Financial year ended
30 June 2020 USD
1.5Global Small Companies
Equity Fund Financial year ended
30 June 2020 USD
9.9Total Financial year ended
30 June 2020 USD
Cash flows from operating activities
Increase/(decrease) in net assets attributable to holders of redeemable participating shares from operations 138,394,885 85,396 (43,091,559) 80,944 95,469,666Adjustment for:Net realised (gain)/loss on financial assets at fair value through profit or loss (71,599,416) 319,669 (15,812,548) (40,906) (87,133,201)Net movement in unrealised (gain)/loss on financial assets at fair value through profit or loss (66,863,347) 3,581,698 62,922,096 (34,000) (393,553)Purchase of financial assets (355,214,188) (105,030,754) (82,506,237) (315,692) (543,066,871)Sale of financial assets 466,044,773 143,617,567 274,360,536 311,167 884,334,043Dividends paid 3,065,536 41,723 – – 3,107,259Increase in receivables and other assets (655,305) (11,302,009) (819,848) (768) (12,777,930)Increase/(decrease) in creditors 3,397,690 (646,745) (511,847) 15,594 2,254,692Net cash flows provided by operating activities 116,570,628 30,666,545 194,540,593 16,339 341,794,105Cash flows from financing activitiesProceeds from redeemable participating shares issued during the financial year 99,118,164 68,538,350 19,691,018 – 189,284,562Payments for redeemable participating shares redeemed during the financial year (235,229,809) (103,967,536) (217,418,893) – (558,553,268)Dividends paid (3,065,536) (41,723) – – (3,107,259)Net cash flows used in financing activities (139,177,181) (35,470,909) (197,727,875) – (372,375,965)Net (decrease)/increase in cash and cash equivalents (22,606,553) (4,804,364) (3,187,282) 16,339 (30,581,860)Reconciliation of cash movement during the financial yearNet cash and cash equivalents at the beginning of the financial year 40,633,643 7,708,263 16,741,085 18,345 65,101,336Net cash and cash equivalents at the end of the financial year 18,027,090 2,903,899 13,553,803 34,684 34,519,476
Supplementary informationDividends received 9,242,080 5,587,812 12,834,460 14,762 27,679,114Interest received 612,752 133,573 278,356 519 1,025,200Interest paid (139) - (159) - (298)
The notes on pages 38 to 69 are an integral part of these financial statements.

Harding Loevner Funds plcNotes to Financial Statements
For the Financial Year Ended 30 June 2021
38
1. General Information
Harding Loevner Funds plc (the “Company”) is an umbrella type open-ended investment company with variable capital and segregated liability between sub-funds each a “Fund”, governed by the laws of Ireland and authorised by the Central Bank of Ireland (the “Central Bank”) under the European Communities (Undertakings for Collective Investment in Transferable Securities) Regulations 2011, as amended (“the UCITS Regulations”) and the Central Bank (Supervision and Enforcement) Act 2013 (Section 48(1)) (Undertakings for Collective Investment in Transferable Securities) Regulations 2019, as amended (the "Central Bank UCITS Regulations").
The Company was incorporated and registered in Ireland under the Companies Act 2014 on 29 March 2007, with registered number 437095.
The state of the origin of the Company is Ireland. In Switzerland, this document may only be provided to qualified investors within the meaning of art. 10 para. 3 and 3ter CISA. In Switzerland, the representative is ACOLIN Fund Services AG, Leutschenbachstrasse 50, CH-8050 Zurich, whilst the paying agent is Banque Cantonale de Genève, 17, Quai de l’Ile, CH-1204 Geneva. The basic documents of the Company as well as the annual and, if applicable, semi-annual report may be obtained free of charge from the representative. Past performance is no indication of current or future performance. The performance data do not take account of the commissions and costs incurred on the issue and redemption of units.
2. Significant Accounting Policies
The significant accounting policies applied in the preparation of these financial statements are set out below. These policies have been consistently applied to all years presented, unless otherwise stated.
Statement of Compliance and Basis of Preparation
The financial statements have been prepared in accordance with International Financial Reporting Standards (“IFRS”) as adopted by the European Union and in accordance with Irish statute comprising the Companies Act 2014, the UCITS Regulations and the Central Bank UCITS Regulations.
The preparation of financial statements in conformity with IFRS requires the use of certain critical accounting estimates. It also requires the Directors to exercise its judgement in the process of applying the Company’s accounting policies.
Accounting standards in issue
Accounting standards in issue and effective for the first time in these financial statements
There were a number of standards and amendments which became effective during the financial year, however these did not have an impact on the sub-funds in the current year and are not expected to have an impact in future.
Accounting standards in issue that are not yet effective and have not been early adopted
A number of new standards, amendments to standards and interpretations are effective for annual periods beginning after 1 July 2021. None of these have a material effect on the financial statements of the Company.
Foreign Currency Translation
(i) Functional and Presentation Currency
Items included in the Company’s financial statements are measured using the currency of the primary economic environment in which it operates (the “functional currency”). The functional currency and presentation currency of the Company and sub-funds is the US Dollar (“USD”).
(ii) Transactions and Balances
Transactions in foreign currencies are translated at the foreign currency exchange rate ruling at the date of the transaction. Monetary assets and liabilities denominated in foreign currencies are translated to US Dollar at the foreign currency closing exchange rate ruling at the reporting date. Foreign currency exchange differences arising on translation and realised gains and losses on disposals or settlements of monetary assets and liabilities are recognised in the Statement of Comprehensive Income. Non-monetary assets and liabilities denominated in foreign currencies that are measured at fair value are translated to US Dollar at the foreign currency exchange rates ruling at the dates that the values were determined. Any unrealised and realised foreign exchange gains or losses arising on investments are included in “net movement in unrealised gain/(loss) on financial assets at fair value through profit or loss” and “net realised gain/(loss) on financial assets at fair value through profit or loss” respectively. All other foreign currency exchange differences relating to monetary items, including cash and cash equivalents, are included in the “net realised gain/(loss) on foreign currency” and “net movement in unrealised gain/(loss) on foreign currency” in the Statement of Comprehensive Income.

Harding Loevner Funds plcNotes to Financial Statements (Continued)
For the Financial Year Ended 30 June 2021
39
Financial Assets and Liabilities at Fair Value Through Profit or Loss
(i) Classification
In accordance with IFRS 9 - Financial Instruments: Recognition and Measurement (“IFRS 9”), all of the Company’s investments are classified as financial assets and financial liabilities at fair value through profit or loss. This category has two sub-categories: financial assets or financial liabilities held for trading; and those designated at fair value through profit or loss at inception.
Financial Assets and Liabilities Held for Trading
Financial assets or financial liabilities held for trading are those acquired or incurred principally for the purposes of selling or repurchasing in the short term or, if on initial recognition, are part of a portfolio of identifiable financial investments that are managed together and for which there is evidence of a recent actual pattern of short-term profit taking. Derivatives are categorised as held for trading.
Financial Assets and Liabilities Designated at Fair Value Through Profit or Loss at Inception
Financial assets and financial liabilities designated at fair value through profit or loss at inception are those that are managed and their performance evaluated on a fair value basis in accordance with the Company’s documented investment strategy. The Company’s policy is for the Investment Manager and the Directors to evaluate the information about these financial assets on a fair value basis together with other related financial information. Equities are categorised as financial assets and liabilities designated at fair value through profit or loss at inception.
(ii) Recognition
Financial assets and liabilities are recognised on the Company’s Statement of Financial Position when the Company becomes a party to the contractual provisions of the instrument. Regular way purchases and sales of investments are recognised on the trade date, which is the date on which the Company commits to purchase or sell the investment. Investments other than those subject to regular way sale are derecognised when the rights to receive cash flows from the investments have expired or the Company has transferred substantially all risks and rewards of ownership.
(iii) Measurement
Financial assets and financial liabilities at fair value through profit or loss are initially recognised at fair value. Transaction costs are expensed in the Statement of Comprehensive Income. Subsequent to initial recognition, all financial assets and financial liabilities at fair value through profit or loss are measured at fair value. Gains and losses arising from changes in the fair value of the ‘financial assets or financial liabilities at fair value through profit or loss’ category are presented in the Statement of Comprehensive Income in the period in which they arise. Unrealised gains and losses on investments arising during the financial year are taken to the Statement of Comprehensive Income.
Interest income from financial assets at fair value through profit or loss is recognised in the Statement of Comprehensive Income within interest income using the effective interest method. Dividend income from equity investments at fair value through profit or loss is recognised in the Statement of Comprehensive Income within dividend income when the Company’s right to receive payments is established.
(iv) Fair Value Estimation
IFRS 13 – Fair Value Measurement (“IFRS 13”) defines fair value as the price that would be received to sell an asset or paid to transfer a liability in an orderly transaction between market participants at the measurement date. The fair value of financial instruments traded in active markets (such as publicly traded derivatives and trading securities, exchange traded funds, warrants, floating rate notes and bonds) is based on quoted market prices at the Statement of Financial Position date. The quoted market price used for financial assets and liabilities held by the Company is the current last traded price.
(v) Derecognition of Financial Assets and Liabilities
The Company derecognises a financial asset when the contractual rights to the cash flows from the financial asset expire or it transfers the financial asset and the transfer qualifies for derecognition in accordance with IFRS 9. The Company uses the average cost method to determine realised gains and losses on derecognition. A financial liability is derecognised when the obligation specified in the contract is discharged, cancelled or expired.
Forward Currency Contracts
A forward currency contract involves an obligation to purchase or sell a specific currency at a future date, at a price set at the time the contract is made. Forward currency contracts are valued by reference to the forward price at which a new forward contract at the same size and maturity could be undertaken at the valuation date. The unrealised gain or loss on open forward currency contracts (if any) is calculated as the difference between the contract rate and the forward price, and is recognised in the Statement of Comprehensive Income.
2. Significant Accounting Policies (Continued)

Harding Loevner Funds plcNotes to Financial Statements (Continued)
For the Financial Year Ended 30 June 2021
40
Redeemable Participating Shares
The Company issues redeemable participating shares, which are redeemable at the holder’s option and are classified as financial liabilities. Redeemable participating shares can be put back to the Company at any time for cash equal to a proportionate share of the Company’s Net Asset Value. The redeemable participating shares are carried at the redemption amount that is payable at the reporting date if the holder exercises the right to put the shares back to the Company.
Anti-Dilution Levy
The Directors may, where there are large net subscriptions and/or redemptions, charge an anti-dilution levy which will be calculated to cover the costs of acquiring and/or redeeming investments as a result of net subscriptions and/or redemptions on any Dealing Day, which will include any dealing spreads, commissions and will be charged in circumstances where the Directors believe it is necessary to prevent an adverse effect on the value of the assets of the sub-funds. The level of the anti-dilution levy may vary but at no time shall exceed a maximum 5% of the Net Asset Value of the sub-fund. The amount of anti-dilution levy charged during the financial year, if any, is disclosed in the Statement of Changes in Net Assets Attributable to Holders of Redeemable Participating Shares.
Cash and Cash Equivalents
Cash and cash equivalents comprises current deposits with banks. Cash equivalents are short-term highly liquid investments that are readily convertible to known amounts of cash, are subject to an insignificant risk of changes in value of base currency, and may be held for the purpose of meeting short-term cash commitments rather than for investment or other purposes.
Dividend and Interest Income
Dividend income, gross of withholding tax, relating to exchange-traded equity investments is recognised in the Statement of Comprehensive Income on the ex-dividend date. In some cases, the Company may receive or choose dividends in the form of additional shares rather than cash. In such cases, the Company recognises the dividend income for the amount of the cash dividend alternative with the corresponding debit treated as an additional investment. Interest income is accounted for on an accrual basis.
Interest income on cash and cash equivalents is recognised in the Statement of Comprehensive Income using effective interest rates. The effective interest rate is the rate that exactly discounts estimated future cash payments or receipts throughout the expected life of the financial instrument, or a shorter period where appropriate, to the net carrying amount of the financial asset or financial liability.
Expenses
All expenses, including management fees, administration fees, depositary fees and custodian fees, are recognised in the Statement of Comprehensive Income on an accrual basis.
Offsetting Financial Instruments
Financial assets and liabilities are offset and the net amount reported in the Statement of Financial Position when there is a legally enforceable right to offset the recognised amounts and there is an intention to settle on a net basis, or realise the asset and settle the liability simultaneously.
Taxation
Under current law and practice, the Company qualifies as an investment undertaking as defined in Section 739B of the Taxes Consolidation Act, 1997, as amended. On that basis it is not chargeable to Irish tax on its income or gains. However, Irish tax may arise on the happening of a “chargeable event”. A chargeable event includes any distribution payments to shareholders or any encashment, redemption, cancellation or transfer of shares.
No Irish tax will arise on the Company in respect of chargeable events in respect of:
a) a shareholder who is neither Irish resident nor ordinarily resident in Ireland for tax purposes, at the time of the chargeable event, provided appropriate valid declarations in accordance with the provisions of the Taxes Consolidation Act, 1997, as amended are held by the Company; and
b) certain exempted Irish tax resident shareholders who have provided the Company with the necessary signed statutory declarations.
Dividends, interest and capital gains (if any) received on investments made by the Company may be subject to withholding taxes imposed by the country from which the investment income/gains are received and such taxes may not be recoverable by the Company or its shareholders.
2. Significant Accounting Policies (Continued)

Harding Loevner Funds plcNotes to Financial Statements (Continued)
For the Financial Year Ended 30 June 2021
41
Transaction Costs
Transaction costs are incremental costs that are directly attributable to the acquisition, issue or disposal of a financial asset or financial liability. An incremental cost is one that would not have been incurred if the entity had not acquired, issued or disposed of the financial instrument. Transaction costs, when incurred, are immediately recognized in Statement of Comprehensive Income as a change in fair value of financial assets and at fair value through profit or loss.
For the financial year ended 30 June 2021 the Company incurred transaction costs totaling USD 1,234,972 (financial year ended 30 June 2020: USD 1,197,657). The transaction costs include USD 450,294 (financial year ended 30 June 2020: USD 675,169) of commissions and USD 784,678 (financial year ended 30 June 2020: USD 522,488) of brokerage charges.
3. Operating Expenses
1.1 Global Equity Fund
30 June 2021 USD
1.2 International Equity Fund
30 June 2021 USD
1.3 Emerging Markets
Equity Fund 30 June 2021
USD
1.5 Global Small Companies
Equity Fund 30 June 2021
USD
9.9 Total 30 June 2021
USD
Administration fee 374,753 102,000 148,144 84,000 708,897Directors' fees 42,633 9,313 18,545 53 70,544Audit fee 12,691 12,691 12,691 5,689 43,762Transfer agent fee 53,514 27,316 22,080 15,182 118,092Sub-custodian fee 145,293 40,982 119,542 1,476 307,293Depositary fee 208,882 57,119 108,164 9,000 383,165Management fee 5,181,213 619,392 1,756,918 13,402 7,570,925Capital gains tax payment 12,054 – 1,191,790 20 1,203,864Legal fees 111,169 19,709 42,175 138 173,191Professional fee 74,331 6,191 13,841 2,792 97,155Registration and filing fee 37,791 5,180 60,558 11,243 114,772Other fees 52,318 14,610 30,139 3,449 100,516Total 6,306,642 914,503 3,524,587 146,444 10,892,176
1.1 Global Equity Fund
30 June 2020 USD
1.2 International Equity Fund
30 June 2020 USD
1.3 Emerging Markets
Equity Fund 30 June 2020
USD
1.5 Global Small Companies
Equity Fund 30 June 2020
USD
9.9 Total 30 June 2020
USD
Administration fee 318,165 102,558 175,143 84,003 679,869Directors' fees 35,907 9,359 20,344 41 65,651Audit fee 11,627 11,627 11,627 5,915 40,796Transfer agent fee 36,805 21,341 22,065 15,213 95,424Sub-custodian fee 90,982 41,035 162,874 4,347 299,238Depositary fee 182,905 66,773 121,700 9,002 380,380Management fee 3,913,157 543,194 4,309,672 10,269 8,776,292Capital gains tax payment – – 715,297 – 715,297Legal fees 89,178 23,535 45,981 187 158,881Professional fee 81,062 17,295 29,502 77 127,936Registration and filing fee 38,660 4,861 32,014 18,505 94,040Other fees 34,370 10,609 32,491 (7,087) 70,383Total 4,832,818 852,187 5,678,710 140,472 11,504,187
Directors’ Fees
The total Directors’ fees are disclosed in the operating expense tables. All of these fees were emoluments in respect of services for the Company. The listing of the members of the Board of Directors is shown on page 1 of the financial statements. Currently only Mike Kirby and Jim Cleary receive a Director’s fee. David Loevner’s and Ryan Bowles’ Directors’ fees have been waived. The fees for the financial year ended 30 June 2021 were USD 70,544 (financial year ended 30 June 2020: USD 65,651). There were no Directors fees payable as at 30 June 2021.
Auditors’ Remunerations
Fees and expenses payable to the statutory auditors, Deloitte Ireland LLP, amounting to USD 35,579 (excluding VAT) (30 June 2020: USD 33,168), were earned in respect of the financial year, of which USD 35,579 (excluding VAT) (30 June 2020: USD 33,168) was payable at the financial year end, which entirely relates to the audit of the financial statements of the Company. There were no fees and expenses paid in respect of other assurance, tax advisory or non-audit services provided by the auditors for the financial year ended 30 June 2021 (30 June 2020: USD Nil).
2. Significant Accounting Policies (Continued)

Harding Loevner Funds plcNotes to Financial Statements (Continued)
For the Financial Year Ended 30 June 2021
42
Administration Fee
The Company has an administration agreement with Northern Trust International Fund Administration Services (Ireland) Limited (the “Administrator”) to provide fund accounting & financial reporting services and transfer agency services for the sub-funds. As per the terms of the agreement, the sub-funds pay an administration fee determined as a percentage of the Net Asset Value of the sub-funds calculated in accordance with a sliding scale subject to a minimum monthly fee of USD 7,000 per sub-fund (up to 2 classes of shares) plus a minimum monthly fee of USD 750 per additional share class.
The Administrator shall be entitled to receive out of the net assets of each sub-fund an annual fee, accrued and calculated at each Valuation Point and payable monthly in arrears at an annual rate which will not exceed 0.05% of the Net Asset Value of the sub-fund, plus value added tax, if any, subject to a monthly minimum fee per sub-fund of USD 7,000. For its Transfer Agency services, the Administrator shall be entitled to receive out of the net assets of each sub-fund an annual base fee of USD 15,000 per sub-fund. For the provision of services in respect of German tax filings, the Administrator shall be entitled to receive out of the net assets of each sub-fund requiring such services an annual fee of EUR 15,000. The Administrator is entitled to be repaid all of its properly vouched out-of-pocket expenses out of the assets of the sub-funds plus value added tax, if any.
The Administration fee for the Company for the financial year ended 30 June 2021 was USD 708,897 (financial year ended 30 June 2020: USD 679,869). The amount payable at 30 June 2021 was USD 65,879 (30 June 2020: USD 104,037).
The Northern Trust Company, London Branch (“TNTC”) provides KIID services to the Company. Fees of USD 17,635 (30 June 2020: 15,635) were paid to TNTC during the financial year and USD 7,790 (30 June 2020: USD 6,729) was payable at 30 June 2021.
Depositary Fee
The Company has a depositary agreement with Northern Trust Fiduciary Services (Ireland) Limited (the “Depositary”) to provide oversight and verification services for the sub-funds. Per the terms of the agreement, the sub-funds pay a fee up to 0.027% of the Net Asset Value of the sub-funds calculated in accordance with a sliding scale subject to a minimum monthly fee of USD 750 per sub-fund.
Subject to a minimum annual custody fee of USD 9,000 per sub-fund, the Depositary will be entitled to receive out of the net assets of each sub-fund the following additional transaction fees: Clean Payments USD 10, ETD Transactions USD 25, Hedge Fund Holdings USD 1,500, Hedge Funds Transactions USD 25, Margin Movements USD 20, OTC Holdings Moderate – IM Valuations USD 900, OTC Holdings Moderate – Independent Valuations USD 900, OTC Holdings Simple – IM Valuations USD 600, OTC Holdings Simple – Independent Valuations USD 600, OTC Transactions – Moderate USD 150, OTC Transactions – Simple USD 100, Principal Paydowns USD 5, Private Market Holdings USD 1,500, Private Market Transactions USD 25, Real Estate Fund Holdings USD 1,500, Real Estate Holding Transactions USD 25, Single Line Item USD 1,500, Single Line Transactions USD 25, STIF Holdings, USD 1,500, STIF Transactions USD 10, Swap Resets USD 20, Third Party Fixed Deposits USD 50, and Third Party FX USD 50. The Depositary fee is accrued and calculated at each valuation point and payable monthly in arrears.
The Depositary fee for the financial year ended 30 June 2021 was USD 690,458 (financial year ended 30 June 2020: USD 679,618). The amount payable at 30 June 2021 was USD 68,248 (30 June 2020: USD 106,500).
Investment Manager Fees and Expenses
The Investment Manager is entitled to receive from the sub-funds out of the assets of the sub-funds an annual fee of:
- 0.70% for the Global Equity Fund Class M shares, 0.75% for the Class A shares, 1.00% for the Class B shares, 1.50% for the Class D shares and the following for USD Class S1 shares:
0.65% on the first USD 50 million of assets attributable to the US Dollar Class S1 shares; plus0.55% on the next USD 50 million of assets attributable to the US Dollar Class S1 shares; plus0.45% on the next USD 150 million of assets attributable to the US Dollar Class S1 shares; plus0.40% on the next USD 250 million of assets attributable to the US Dollar Class S1 shares; plus0.35% on the next USD 250 million of assets attributable to the US Dollar Class S1 shares; plus0.30% on assets attributable to the US Dollar Class S1 shares in excess of USD 750 million.
- 0.75% for the International Equity Fund Class A shares, and 1.00% for the Class B shares. - 0.80% for the Emerging Markets Equity Fund Class I shares, 1.00% for the Class A shares, 1.35% for the Class B shares and 0.95%
for the Class M shares; and- 0.90% for the Global Small Companies Equity Fund Class A shares.
The Investment Manager shall not receive a fee for the Class S shares of the Global Equity Fund, Emerging Market Equity Fund, the International Equity Fund and Global Small Companies Equity Fund. Fees for these share classes are charged outside of the net asset value.
This fee accrues and is calculated on each dealing day and is payable monthly in arrears.
3. Operating Expenses (Continued)
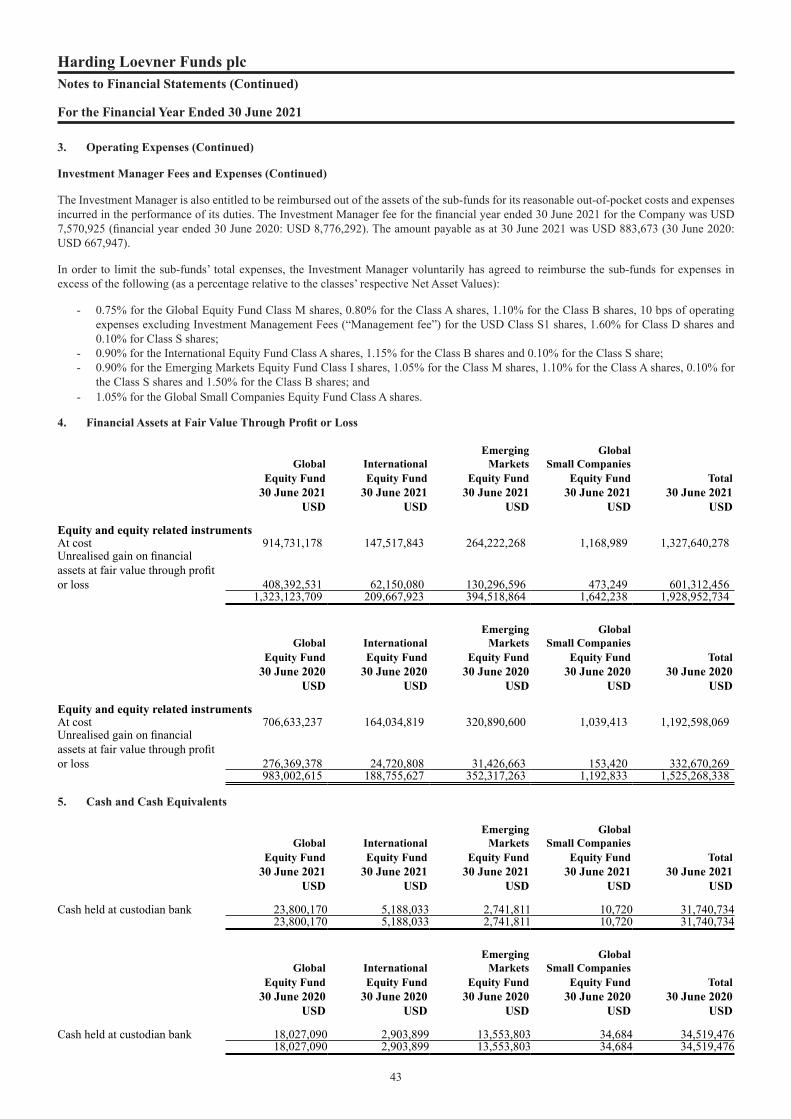
Harding Loevner Funds plcNotes to Financial Statements (Continued)
For the Financial Year Ended 30 June 2021
43
The Investment Manager is also entitled to be reimbursed out of the assets of the sub-funds for its reasonable out-of-pocket costs and expenses incurred in the performance of its duties. The Investment Manager fee for the financial year ended 30 June 2021 for the Company was USD 7,570,925 (financial year ended 30 June 2020: USD 8,776,292). The amount payable as at 30 June 2021 was USD 883,673 (30 June 2020: USD 667,947).
In order to limit the sub-funds’ total expenses, the Investment Manager voluntarily has agreed to reimburse the sub-funds for expenses in excess of the following (as a percentage relative to the classes’ respective Net Asset Values):
- 0.75% for the Global Equity Fund Class M shares, 0.80% for the Class A shares, 1.10% for the Class B shares, 10 bps of operating expenses excluding Investment Management Fees (“Management fee”) for the USD Class S1 shares, 1.60% for Class D shares and 0.10% for Class S shares;
- 0.90% for the International Equity Fund Class A shares, 1.15% for the Class B shares and 0.10% for the Class S share;- 0.90% for the Emerging Markets Equity Fund Class I shares, 1.05% for the Class M shares, 1.10% for the Class A shares, 0.10% for
the Class S shares and 1.50% for the Class B shares; and - 1.05% for the Global Small Companies Equity Fund Class A shares.
4. Financial Assets at Fair Value Through Profit or Loss
1.1 Global Equity Fund
30 June 2021 USD
1.2 International Equity Fund
30 June 2021 USD
1.3 Emerging Markets
Equity Fund 30 June 2021
USD
1.5 Global Small Companies
Equity Fund 30 June 2021
USD
9.9 Total 30 June 2021
USD
Equity and equity related instrumentsAt cost 914,731,178 147,517,843 264,222,268 1,168,989 1,327,640,278Unrealised gain on financial assets at fair value through profit or loss 408,392,531 62,150,080 130,296,596 473,249 601,312,456
1,323,123,709 209,667,923 394,518,864 1,642,238 1,928,952,734
1.1 Global Equity Fund
30 June 2020 USD
1.2 International Equity Fund
30 June 2020 USD
1.3 Emerging Markets
Equity Fund 30 June 2020
USD
1.5 Global Small Companies
Equity Fund 30 June 2020
USD
9.9 Total 30 June 2020
USD
Equity and equity related instrumentsAt cost 706,633,237 164,034,819 320,890,600 1,039,413 1,192,598,069Unrealised gain on financial assets at fair value through profit or loss 276,369,378 24,720,808 31,426,663 153,420 332,670,269
983,002,615 188,755,627 352,317,263 1,192,833 1,525,268,338
5. Cash and Cash Equivalents
1.1 Global Equity Fund
30 June 2021 USD
1.2 International Equity Fund
30 June 2021 USD
1.3 Emerging Markets
Equity Fund 30 June 2021
USD
1.5 Global Small Companies
Equity Fund 30 June 2021
USD
9.9 Total 30 June 2021
USD
Cash held at custodian bank 23,800,170 5,188,033 2,741,811 10,720 31,740,73423,800,170 5,188,033 2,741,811 10,720 31,740,734
1.1 Global Equity Fund
30 June 2020 USD
1.2 International Equity Fund
30 June 2020 USD
1.3 Emerging Markets
Equity Fund 30 June 2020
USD
1.5 Global Small Companies
Equity Fund 30 June 2020
USD
9.9 Total 30 June 2020
USD
Cash held at custodian bank 18,027,090 2,903,899 13,553,803 34,684 34,519,47618,027,090 2,903,899 13,553,803 34,684 34,519,476
3. Operating Expenses (Continued)
Investment Manager Fees and Expenses (Continued)
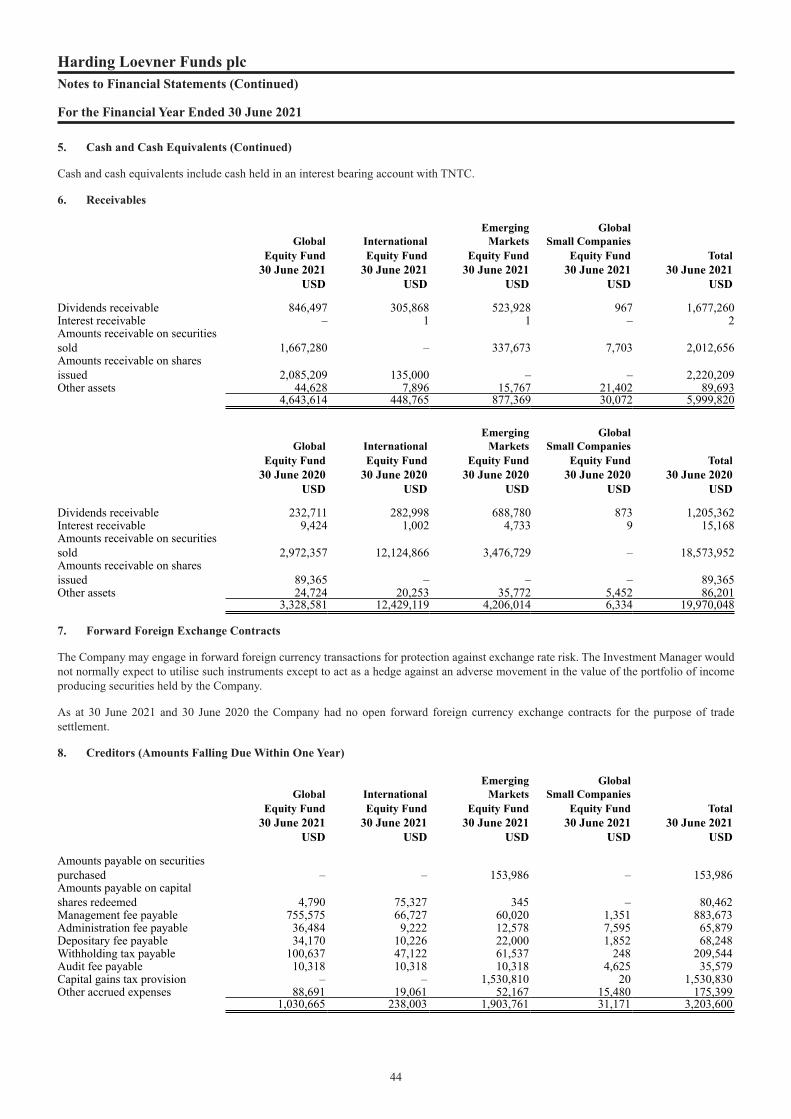
Harding Loevner Funds plcNotes to Financial Statements (Continued)
For the Financial Year Ended 30 June 2021
44
Cash and cash equivalents include cash held in an interest bearing account with TNTC.
6. Receivables
1.1 Global Equity Fund
30 June 2021 USD
1.2 International Equity Fund
30 June 2021 USD
1.3 Emerging Markets
Equity Fund 30 June 2021
USD
1.5 Global Small Companies
Equity Fund 30 June 2021
USD
9.9 Total 30 June 2021
USD
Dividends receivable 846,497 305,868 523,928 967 1,677,260Interest receivable – 1 1 – 2Amounts receivable on securities sold 1,667,280 – 337,673 7,703 2,012,656Amounts receivable on shares issued 2,085,209 135,000 – – 2,220,209Other assets 44,628 7,896 15,767 21,402 89,693
4,643,614 448,765 877,369 30,072 5,999,820
1.1 Global Equity Fund
30 June 2020 USD
1.2 International Equity Fund
30 June 2020 USD
1.3 Emerging Markets
Equity Fund 30 June 2020
USD
1.5 Global Small Companies
Equity Fund 30 June 2020
USD
9.9 Total 30 June 2020
USD
Dividends receivable 232,711 282,998 688,780 873 1,205,362Interest receivable 9,424 1,002 4,733 9 15,168Amounts receivable on securities sold 2,972,357 12,124,866 3,476,729 – 18,573,952Amounts receivable on shares issued 89,365 – – – 89,365Other assets 24,724 20,253 35,772 5,452 86,201
3,328,581 12,429,119 4,206,014 6,334 19,970,048
7. Forward Foreign Exchange Contracts
The Company may engage in forward foreign currency transactions for protection against exchange rate risk. The Investment Manager would not normally expect to utilise such instruments except to act as a hedge against an adverse movement in the value of the portfolio of income producing securities held by the Company.
As at 30 June 2021 and 30 June 2020 the Company had no open forward foreign currency exchange contracts for the purpose of trade settlement.
8. Creditors (Amounts Falling Due Within One Year)
1.1 Global Equity Fund
30 June 2021 USD
1.2 International Equity Fund
30 June 2021 USD
1.3 Emerging Markets
Equity Fund 30 June 2021
USD
1.5 Global Small Companies
Equity Fund 30 June 2021
USD
9.9 Total 30 June 2021
USD
Amounts payable on securities purchased – – 153,986 – 153,986Amounts payable on capital shares redeemed 4,790 75,327 345 – 80,462Management fee payable 755,575 66,727 60,020 1,351 883,673Administration fee payable 36,484 9,222 12,578 7,595 65,879Depositary fee payable 34,170 10,226 22,000 1,852 68,248Withholding tax payable 100,637 47,122 61,537 248 209,544Audit fee payable 10,318 10,318 10,318 4,625 35,579Capital gains tax provision – – 1,530,810 20 1,530,830Other accrued expenses 88,691 19,061 52,167 15,480 175,399
1,030,665 238,003 1,903,761 31,171 3,203,600
5. Cash and Cash Equivalents (Continued)

Harding Loevner Funds plcNotes to Financial Statements (Continued)
For the Financial Year Ended 30 June 2021
45
1.1 Global Equity Fund
30 June 2020 USD
1.2 International Equity Fund
30 June 2020 USD
1.3 Emerging Markets
Equity Fund 30 June 2020
USD
1.5 Global Small Companies
Equity Fund 30 June 2020
USD
9.9 Total 30 June 2020
USD
Amounts payable on securities purchased 4,655,882 – – – 4,655,882Amounts payable on capital shares redeemed 423,444 15,000,000 – – 15,423,444Management fee payable 344,289 50,198 272,502 958 667,947Administration fee payable 51,451 17,000 21,586 14,000 104,037Depositary fee payable 44,013 16,904 42,590 2,993 106,500Capital gains tax provision – – 775,234 – 775,234Other accrued expenses 141,248 72,428 135,037 16,084 364,797
5,660,327 15,156,530 1,246,949 34,035 22,097,841
9. Distributions to Redeemable Participating Shareholders
The Directors intend to declare a dividend in respect of the Sterling Class shares of Global Equity Fund such that substantially all of the net income relating to such classes shall be distributed on a semi-annual basis. There are no dividend entitlements for all other share classes of the Global Equity Fund. The Directors also intend to declare a dividend in respect of Sterling Class shares of the International Equity Fund on a semi-annual basis. There are no dividend entitlements for all other share classes of the International Equity Fund. There are no dividend entitlements for share classes of the Emerging Markets Equity Fund or the Global Small Companies Equity Fund.
During the financial year ended 30 June 2021 the Directors declared dividends totaling USD 1,597,168 (30 June 2020: USD 3,107,259).
10. Redeemable Participating Shares
The authorised share capital of the Company is 1,000,000,000,000 shares of no par value initially designated as unclassified shares. The minimum issued share capital of the Company is €2 represented by 2 shares (the “Subscriber Shares”) issued for the purposes of the incorporation of the Company and to obtain a certificate to commence trade at an issue price of €1 per share which are fully paid up and which are beneficially owned by David Loevner (1 share) and Ryan Bowles (1 share). The maximum issued share capital of the Company is 1,000,000,000,000 unclassified shares of no par value. The Subscriber Shares do not form part of the Net Asset Value of the Company and are thus disclosed in the financial statements by way of this note only.
The unclassified shares are available for issue as shares. The issue price is payable in full on acceptance. There are no rights of pre-emption attaching to the shares in the Company.
Global Equity Fund
The Global Equity Fund issued the following redeemable participating shares during the financial year:
Share class Initial offer price Minimum initial investment Minimum additional investmentUS Dollar Class A USD 1.000 USD 1,000,000 USD 100Euro Class A EUR 1.000 USD 1,000,000 or currency equivalent EUR 100Sterling Class A GBP 1.000 USD 1,000,000 or currency equivalent GBP 100US Dollar Class B USD 1.000 USD 100 USD 100Sterling Class B GBP 1.000 USD 100 or currency equivalent GBP 100US Dollar Class D USD 1.000 USD 100 USD 100Euro Class M EUR 1.000 USD 50,000,000 or currency equivalent EUR 100Sterling Class M GBP 1.000 USD 50,000,000 or currency equivalent GBP 100Euro Class S EUR 1.000 USD 20,000,000 or currency equivalent EUR 100Sterling Class S GBP 1.000 USD 20,000,000 or currency equivalent GBP 100Canadian Dollar Class S CAD 1.000 USD 20,000,000 or currency equivalent EUR 100US Dollar Class S1 USD 1.000 USD 20,000,000 USD 100
8. Creditors (Amounts Falling Due Within One Year) (Continued)
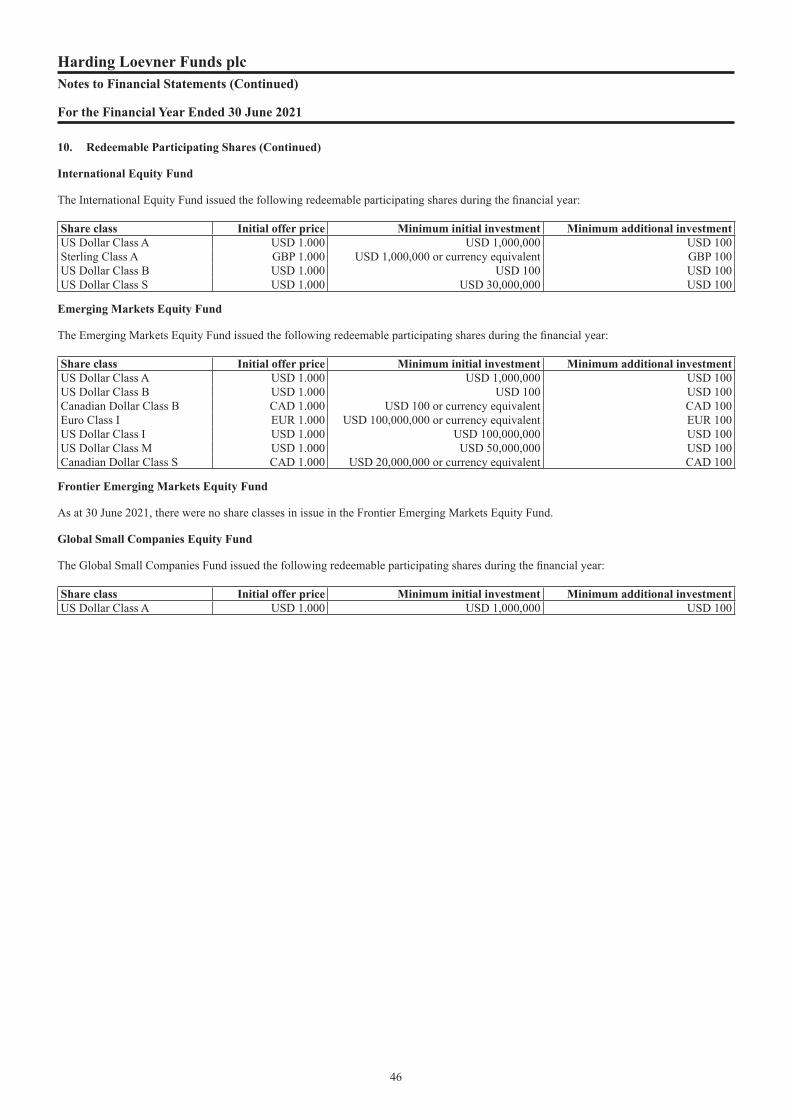
Harding Loevner Funds plcNotes to Financial Statements (Continued)
For the Financial Year Ended 30 June 2021
46
International Equity Fund
The International Equity Fund issued the following redeemable participating shares during the financial year:
Share class Initial offer price Minimum initial investment Minimum additional investmentUS Dollar Class A USD 1.000 USD 1,000,000 USD 100Sterling Class A GBP 1.000 USD 1,000,000 or currency equivalent GBP 100US Dollar Class B USD 1.000 USD 100 USD 100US Dollar Class S USD 1.000 USD 30,000,000 USD 100
Emerging Markets Equity Fund
The Emerging Markets Equity Fund issued the following redeemable participating shares during the financial year:
Share class Initial offer price Minimum initial investment Minimum additional investmentUS Dollar Class A USD 1.000 USD 1,000,000 USD 100US Dollar Class B USD 1.000 USD 100 USD 100Canadian Dollar Class B CAD 1.000 USD 100 or currency equivalent CAD 100Euro Class I EUR 1.000 USD 100,000,000 or currency equivalent EUR 100US Dollar Class I USD 1.000 USD 100,000,000 USD 100US Dollar Class M USD 1.000 USD 50,000,000 USD 100Canadian Dollar Class S CAD 1.000 USD 20,000,000 or currency equivalent CAD 100
Frontier Emerging Markets Equity Fund
As at 30 June 2021, there were no share classes in issue in the Frontier Emerging Markets Equity Fund.
Global Small Companies Equity Fund
The Global Small Companies Fund issued the following redeemable participating shares during the financial year:
Share class Initial offer price Minimum initial investment Minimum additional investmentUS Dollar Class A USD 1.000 USD 1,000,000 USD 100
10. Redeemable Participating Shares (Continued)

Harding Loevner Funds plcNotes to Financial Statements (Continued)
For the Financial Year Ended 30 June 2021
47
The following table details the movement in the redeemable participating shares during the financial year ended 30 June 2021 and 30 June 2020:
Global Equity Fund
Opening shares
Shares issued during the
financial year
Shares redeemed during the
financial year Closing shares
30 June 2021Euro Class A 58,379,746 19,967,840 (8,630,502) 69,717,084Sterling Class A 21,384,373 9,869,054 (1,167,573) 30,085,854US Dollar Class A 35,066,442 20,024,904 (4,116,239) 50,975,107Sterling Class B 99,000 – – 99,000US Dollar Class B 2,357,989 2,758,906 (735,150) 4,381,745US Dollar Class D 375,318 54,475 (54,475) 375,318Euro Class M 37,605,563 – (6,666,667) 30,938,896Singapore Dollar Class M 69,491,830 4,738,506 – 74,230,336Canadian Dollar Class S 35,500,000 – – 35,500,000Euro Class S 41,476,629 – (22,083,319) 19,393,310Sterling Class S 162,510,630 560,137 – 163,070,767US Dollar Class S 44,034,323 – (44,034,323) –US Dollar Class S1 143,126,067 – (26,402,640) 116,723,427
30 June 2020Euro Class A 47,720,264 16,747,645 (6,088,163) 58,379,746Sterling Class A 50,439,870 7,703,894 (36,759,391) 21,384,373US Dollar Class A 31,288,577 4,675,774 (897,910) 35,066,442Sterling Class B 99,000 – – 99,000US Dollar Class B 1,265,065 3,520,971 (2,428,047) 2,357,989US Dollar Class D 470,501 172,938 (268,120) 375,318Euro Class M 61,072,804 – (23,467,241) 37,605,563Singapore Dollar Class M 69,491,830 – – 69,491,830Canadian Dollar Class S – 35,500,000 – 35,500,000Euro Class S 52,523,827 3,846,154 (14,893,352) 41,476,629Sterling Class S 202,788,814 1,079,703 (41,357,886) 162,510,630US Dollar Class S 49,952,866 1,342,682 (7,261,226) 44,034,323US Dollar Class S1 156,725,342 – (13,599,275) 143,126,067
International Equity Fund
Opening shares
Shares issued during the
financial year
Shares redeemed during the
financial year Closing shares
30 June 2021Sterling Class A 1,036,062 867,020 (112,612) 1,790,470US Dollar Class A 44,421,112 12,938,528 (13,648,850) 43,710,790US Dollar Class B 6,647,384 1,602,937 (2,384,721) 5,865,600US Dollar Class S 99,094,946 2,628,121 (27,283,072) 74,439,995
30 June 2020Sterling Class A 1,611,804 20,206 (595,948) 1,036,062US Dollar Class A 51,051,341 8,609,723 (15,239,951) 44,421,112US Dollar Class B 8,082,301 863,727 (2,298,644) 6,647,384US Dollar Class S 137,582,471 49,403,240 (87,890,765) 99,094,946
10. Redeemable Participating Shares (Continued)
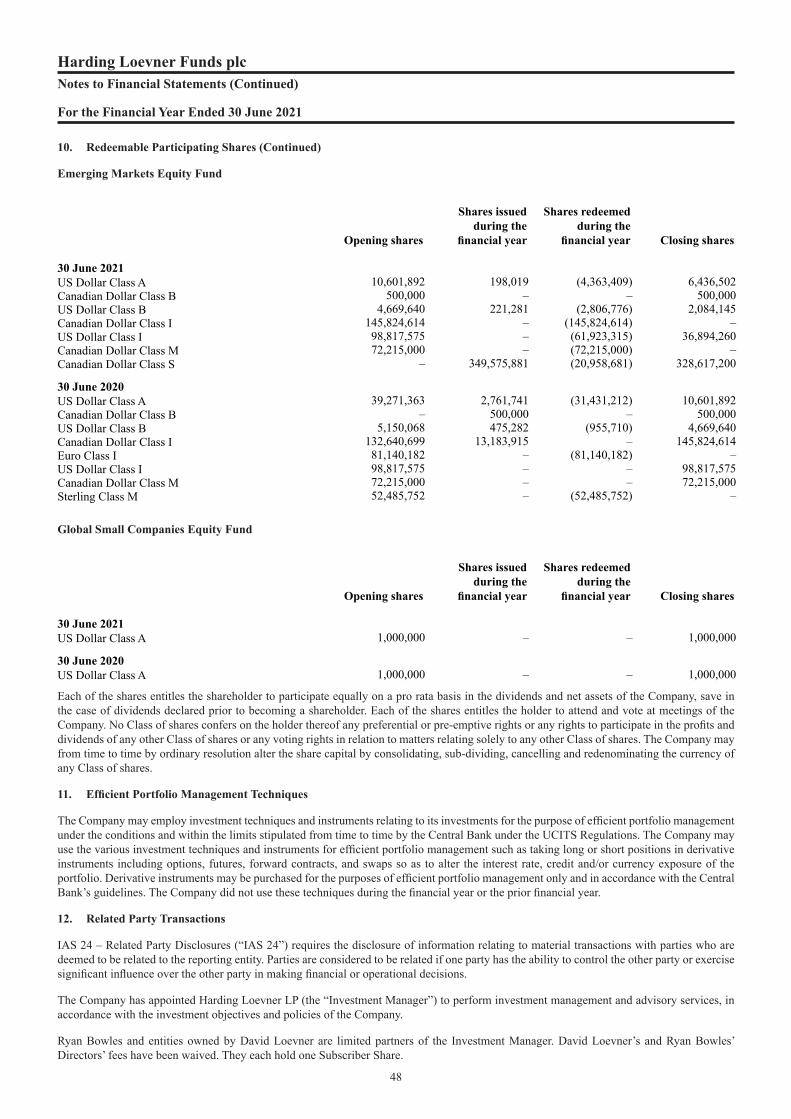
Harding Loevner Funds plcNotes to Financial Statements (Continued)
For the Financial Year Ended 30 June 2021
48
Emerging Markets Equity Fund
Opening shares
Shares issued during the
financial year
Shares redeemed during the
financial year Closing shares
30 June 2021US Dollar Class A 10,601,892 198,019 (4,363,409) 6,436,502Canadian Dollar Class B 500,000 – – 500,000US Dollar Class B 4,669,640 221,281 (2,806,776) 2,084,145Canadian Dollar Class I 145,824,614 – (145,824,614) –US Dollar Class I 98,817,575 – (61,923,315) 36,894,260Canadian Dollar Class M 72,215,000 – (72,215,000) –Canadian Dollar Class S – 349,575,881 (20,958,681) 328,617,200
30 June 2020US Dollar Class A 39,271,363 2,761,741 (31,431,212) 10,601,892Canadian Dollar Class B – 500,000 – 500,000US Dollar Class B 5,150,068 475,282 (955,710) 4,669,640Canadian Dollar Class I 132,640,699 13,183,915 – 145,824,614Euro Class I 81,140,182 – (81,140,182) –US Dollar Class I 98,817,575 – – 98,817,575Canadian Dollar Class M 72,215,000 – – 72,215,000Sterling Class M 52,485,752 – (52,485,752) –
Global Small Companies Equity Fund
Opening shares
Shares issued during the
financial year
Shares redeemed during the
financial year Closing shares
30 June 2021US Dollar Class A 1,000,000 – – 1,000,000
30 June 2020US Dollar Class A 1,000,000 – – 1,000,000
Each of the shares entitles the shareholder to participate equally on a pro rata basis in the dividends and net assets of the Company, save in the case of dividends declared prior to becoming a shareholder. Each of the shares entitles the holder to attend and vote at meetings of the Company. No Class of shares confers on the holder thereof any preferential or pre-emptive rights or any rights to participate in the profits and dividends of any other Class of shares or any voting rights in relation to matters relating solely to any other Class of shares. The Company may from time to time by ordinary resolution alter the share capital by consolidating, sub-dividing, cancelling and redenominating the currency of any Class of shares.
11. Efficient Portfolio Management Techniques
The Company may employ investment techniques and instruments relating to its investments for the purpose of efficient portfolio management under the conditions and within the limits stipulated from time to time by the Central Bank under the UCITS Regulations. The Company may use the various investment techniques and instruments for efficient portfolio management such as taking long or short positions in derivative instruments including options, futures, forward contracts, and swaps so as to alter the interest rate, credit and/or currency exposure of the portfolio. Derivative instruments may be purchased for the purposes of efficient portfolio management only and in accordance with the Central Bank’s guidelines. The Company did not use these techniques during the financial year or the prior financial year.
12. Related Party Transactions
IAS 24 – Related Party Disclosures (“IAS 24”) requires the disclosure of information relating to material transactions with parties who are deemed to be related to the reporting entity. Parties are considered to be related if one party has the ability to control the other party or exercise significant influence over the other party in making financial or operational decisions.
The Company has appointed Harding Loevner LP (the “Investment Manager”) to perform investment management and advisory services, in accordance with the investment objectives and policies of the Company.
Ryan Bowles and entities owned by David Loevner are limited partners of the Investment Manager. David Loevner’s and Ryan Bowles’ Directors’ fees have been waived. They each hold one Subscriber Share.
10. Redeemable Participating Shares (Continued)

Harding Loevner Funds plcNotes to Financial Statements (Continued)
For the Financial Year Ended 30 June 2021
49
Mike Kirby is the Managing Principal of KB Associates, who provide consulting services to the Company. Fees of USD 58,651 (30 June 2020: USD 71,241) were paid to KB Associates during the financial year and USD 17,322 (30 June 2020: USD 15,196) was payable at 30 June 2021.
TNTC earned fees for provision of KIID services to the Company. Please refer to Note 3 for details of these fees.
The amounts earned by the Directors and the Investment Manager are disclosed in Note 3 on pages 42 to 43. The amount owing to the Directors and the Investment Manager are disclosed in Note 3 on pages 42 to 43.
Although not deemed to be related parties under IFRS as they do not exercise “significant influence” over the activities of the sub-funds, UCITS Regulations also deems a "Depositary" and its "associated or group companies" to be related parties to the Company. As such, Northern Trust Fiduciary Services (Ireland) Limited, the Depositary, and Northern Trust International Fund Administration Services (Ireland) Limited, the Administrator, are related parties to the Company under the Central Bank’s UCITS Regulations. During the year, Northern Trust Fiduciary Services (Ireland) Limited and Northern Trust International Fund Administration Services (Ireland) Limited earned fees for provision of custody and administration services to the Company as disclosed in Note 3 to the financial statements. During the year companies related to the Depositary were also selected by the Investment Manager on behalf of the Company to execute foreign currency spot and forward foreign currency transactions and to accept deposits. All of the above transactions were carried out as if conducted at arms length.
13. Financial Instruments and Associated Risks
The Company maintains positions in a variety of freely transferable equity and equity related securities as dictated by its investment management strategy.
The Company seeks to achieve its objective by investing in companies that the Investment Manager regards as well managed, financially sound, fast growing, and competitively well positioned. Each sub-fund’s investment portfolio comprises of quoted equity investments that it intends to hold for an indefinite period of time. Portfolio allocation is determined by the Investment Manager who manages the distribution of the assets to achieve the investment objectives. The composition of the portfolio and divergence from the target portfolio allocation is monitored by the Investment Manager. In instances where the portfolio has diverged from the target portfolio allocations, the Investment Manager will rebalance the portfolio to align it with the target portfolio allocations. The Company may invest in derivative financial instruments.
The nature and extent of the financial instruments outstanding at the reporting date and the risk management policies employed by the Company are discussed below. Further information on the risks arising from the Company’s financial instruments are set out in the Prospectus and Supplements.
Market Risk
The market value of the Company’s investments fluctuates with, amongst other things, general economic conditions, the condition of certain financial markets, international political events, developments or trends in any particular industry and the financial condition of the issuers of the securities in which the Company invests.
The Company’s market risk is comprised mainly of price risk and foreign currency risk. Market price of the securities owned by the Company will fluctuate as a result of factors specific to an individual security as well as global factors affecting all instruments traded in the market. Interest rate risk, another component of market risk, is minimal since the Company tends to be fully invested in non-interest bearing assets minimizing each sub-fund’s cash weighting.
Market risk is managed by the Investment Manager by ensuring that each sub-fund’s portfolio remains diversified across economic sectors, industries, geography and currencies. Also, limits are imposed on the number of holdings, maximum position in a single security, single sector/industry, single country etc.
At the level of individual holdings, the Investment Manager monitors the performance of the companies in which it has invested to support continued investment in the stock of the companies. The Investment Manager continually reviews future growth prospects, financial strength, management quality and competitive position of each of the companies in the portfolio. At the portfolio level, the Investment Manager uses a global factor risk model to estimate prospective tracking error versus each sub-fund’s benchmark (refer to the Investment Manager’s report pages 3 to 21 of the Annual Commentary). Such analysis and review helps identify unacceptable risks and allows the Investment Manager to take corrective action where needed.
Equity Risk
The price of equity securities fluctuates based on changes in a company’s financial condition and overall market and economic conditions. Prices of equities fluctuate daily dependent on market conditions. Markets can be influenced by factors such as political and economic news, corporate earnings reports, demographic trends, catastrophic events, pandemics and wider market expectations. The value of equities can fall as well as rise. A sub-fund investing in equities could incur significant losses.
12. Related Party Transactions (Continued)

Harding Loevner Funds plcNotes to Financial Statements (Continued)
For the Financial Year Ended 30 June 2021
50
Hong Kong – Shanghai and Shenzhen Stock Connect Risk
A sub-fund may invest in certain eligible securities listed and traded on the Shanghai Stock Exchange through China Connect. China Connect is a securities trading and clearing programme developed by The Stock Exchange of Hong Kong Limited (“SEHK”), the Shanghai Stock Exchange (“SSE”), Hong Kong Securities Clearing Company Limited (“HKSCC”), Shenzhen Stock Exchange (“SZSE”) and China Securities Depository and Clearing Corporation Limited for the establishment of mutual market access between SEHK and SSE. A sub-fund may trade and settle select securities listed on the SSE through the SEHK, HKSCC and SZSE trading link. Trading through China Connect is subject to a number of restrictions which may impact a Fund’s investments. In particular, it should be noted that China Connect is in its initial stages. Further developments are likely and there is no assurance as to whether or how such developments may restrict or affect a Fund’s investments. Further details on the risks associated with investing though China Connect are set out in the Company’s Prospectus.
Price Risk
Price risk encompasses the risk that the value of an investment will fluctuate as a result of changes in market prices whether caused by factors specific to an individual investment or all factors affecting all securities traded in the market. All of the Company’s financial instruments are carried at fair value, with fair value changes recognised in the Statement of Comprehensive Income and the Statement of Financial Position, all changes in market conditions will directly affect Net Investment Income and Net Asset Value, respectively.
Adherence to the investment guidelines and to investment and borrowing powers set out in the instrument of incorporation, the Prospectus and the UCITS Regulations issued by the Central Bank mitigates the risk of excessive exposure to any particular sector, geographic region, type of security or issuer.
All of the Company’s equity investments are listed on stock exchanges and regulated markets as outlined in Appendix 1 at page 72 of the Prospectus. Details of the investment objective and policies for each sub-fund of the Company appear in the supplement for the relevant sub-fund.
Price Risk Sensitivity Analysis
Sensitivity analysis has been determined based on the exposure to risks as at 30 June 2021.
The Company’s price risk is one of the three main components of market risk. If the price of equities at 30 June 2021 had increased by 10% for the Global Equity Fund with all other variables held constant, this would have increased net assets attributable to holders of redeemable participating shares by approximately USD 132,312,371 (30 June 2020: USD 98,300,262). Conversely, if the price of equities had decreased by 10%, this would have decreased net assets attributable to holders of redeemable participating shares by approximately USD 132,312,371 (30 June 2020: USD 98,300,262).
If the price of equities at 30 June 2021 had increased by 10% for the International Equity Fund with all other variables held constant, this would have increased net assets attributable to holders of redeeming participating shares by approximately USD 20,966,792 (30 June 2020: USD 18,875,563). Conversely, if the price of equities had decreased by 10%, this would have decreased net assets attributable to holders of redeemable participating shares by approximately USD 20,966,792 (30 June 2020: USD 18,875,563).
If the price of equities at 30 June 2021 had increased by 10% for the Emerging Markets Equity Fund with all other variables held constant, this would have increased net assets attributable to holders of redeemable participating shares by approximately USD 39,451,886 (30 June 2020: USD 35,231,726). Conversely, if the price of equities had decreased by 10%, this would have decreased net assets attributable to holders of redeemable participating shares by approximately USD 39,451,886 (30 June 2020: USD 35,231,726).
The Frontier Emerging Markets Equity Fund is a dormant sub-fund and did not hold any investments in the current financial year or prior financial year and therefore has no exposure to price risk.
If the price of equities at 30 June 2021 had increased by 10% for the Global Small Companies Equity Fund with all other variables held constant, this would have increased net assets attributable to holders of redeemable participating shares by approximately USD 164,224 (30 June 2020: USD 119,283). Conversely, if the price of equities had decreased by 10%, this would have decreased net assets attributable to holder of redeemable participating shares by approximately USD 164,224 (30 June 2020: USD 119,283).
Foreign Currency Risk
Foreign currency risk is the risk that the fair value of a financial instrument will fluctuate because of changes in foreign exchange rates. The functional currency of the Company is US Dollars but the investments in equity securities are made in a number of countries worldwide in local currencies. The financial assets and liabilities of the sub-funds are denominated in currencies other than the base currency with the effect that the statement of financial position can be significantly affected by currency movements. Share classes not denominated in USD will have exposure to USD movements.
13. Financial Instruments and Associated Risks (Continued)

Harding Loevner Funds plcNotes to Financial Statements (Continued)
For the Financial Year Ended 30 June 2021
51
The Company’s currency risk exposure is managed by the Investment Manager as follows:
• The Company’s foreign currency exposure is embedded in the foreign equity securities it owns. The risk is managed through diversification and use of a global factor risk model as referenced above.
• The Company tends to be fully invested in equity securities and holds limited cash.
The following table sets out the Company’s total exposure to foreign currency risk and the net exposure to foreign currencies of the monetary assets and liabilities.
Global Equity Fund
30 June 2021
Monetary assets USD
Other assets/ (liabilities)
USD
Net exposure
USD
Net exposure
%
Australian Dollar 6,469,421 – 6,469,421 0.48Brazilian Real 13,337,843 164,728 13,502,571 1.00British Sterling Pound 20,569,777 (27) 20,569,750 1.52Danish Krone 11,223,910 – 11,223,910 0.83Euro 67,189,236 (37) 67,189,199 4.97Hong Kong Dollar 132,224,723 194,391 132,419,114 9.80Indonesian Rupiah 12,704,390 – 12,704,390 0.94Japanese Yen 45,158,895 58,323 45,217,218 3.35Polish Zloty 11,699,979 (4) 11,699,975 0.87Singapore Dollar 12,804,223 – 12,804,223 0.95Swedish Krona 23,312,330 – 23,312,330 1.73Swiss Franc 26,056,966 – 26,056,966 1.93Taiwan Dollar 8,926,335 29,629 8,955,964 0.66Foreign currency exposure 391,678,028 447,003 392,125,031 29.03
US Dollar 956,269,477 2,142,320 958,411,797 70.97
1,347,947,505 2,589,323 1,350,536,828 100.00
30 June 2020
Monetary assets USD
Other assets/ (liabilities)
USD
Net exposure
USD
Net exposure
%
British Sterling Pound 29,149,340 (412,287) 28,737,053 2.88Danish Krone 7,787,029 – 7,787,029 0.78Euro 87,288,354 (2,652,437) 84,635,917 8.48Hong Kong Dollar 47,679,923 – 47,679,923 4.77Indonesian Rupiah 13,066,758 – 13,066,758 1.31Japanese Yen 75,119,278 105,172 75,224,450 7.53Swiss Franc 39,983,930 – 39,983,930 4.00Foreign currency exposure 300,074,612 (2,959,552) 297,115,060 29.75
US Dollar 700,955,042 544,931 701,499,973 70.25
1,001,029,654 (2,414,621) 998,615,033 100.00
13. Financial Instruments and Associated Risks (Continued)
Foreign Currency Risk (Continued)
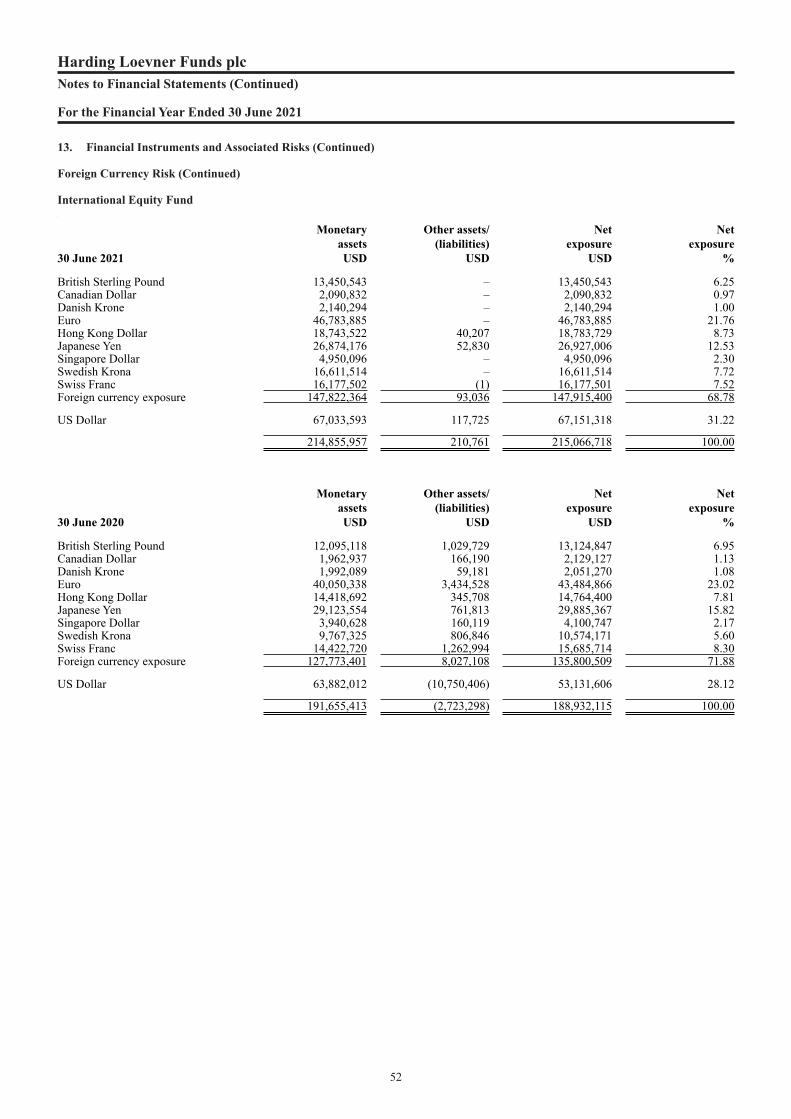
Harding Loevner Funds plcNotes to Financial Statements (Continued)
For the Financial Year Ended 30 June 2021
52
International Equity Fund(
30 June 2021
Monetary assets USD
Other assets/ (liabilities)
USD
Net exposure
USD
Net exposure
%
British Sterling Pound 13,450,543 – 13,450,543 6.25Canadian Dollar 2,090,832 – 2,090,832 0.97Danish Krone 2,140,294 – 2,140,294 1.00Euro 46,783,885 – 46,783,885 21.76Hong Kong Dollar 18,743,522 40,207 18,783,729 8.73Japanese Yen 26,874,176 52,830 26,927,006 12.53Singapore Dollar 4,950,096 – 4,950,096 2.30Swedish Krona 16,611,514 – 16,611,514 7.72Swiss Franc 16,177,502 (1) 16,177,501 7.52Foreign currency exposure 147,822,364 93,036 147,915,400 68.78
US Dollar 67,033,593 117,725 67,151,318 31.22
214,855,957 210,761 215,066,718 100.00
30 June 2020
Monetary assets USD
Other assets/ (liabilities)
USD
Net exposure
USD
Net exposure
%
British Sterling Pound 12,095,118 1,029,729 13,124,847 6.95Canadian Dollar 1,962,937 166,190 2,129,127 1.13Danish Krone 1,992,089 59,181 2,051,270 1.08Euro 40,050,338 3,434,528 43,484,866 23.02Hong Kong Dollar 14,418,692 345,708 14,764,400 7.81Japanese Yen 29,123,554 761,813 29,885,367 15.82Singapore Dollar 3,940,628 160,119 4,100,747 2.17Swedish Krona 9,767,325 806,846 10,574,171 5.60Swiss Franc 14,422,720 1,262,994 15,685,714 8.30Foreign currency exposure 127,773,401 8,027,108 135,800,509 71.88
US Dollar 63,882,012 (10,750,406) 53,131,606 28.12
191,655,413 (2,723,298) 188,932,115 100.00
13. Financial Instruments and Associated Risks (Continued)
Foreign Currency Risk (Continued)

Harding Loevner Funds plcNotes to Financial Statements (Continued)
For the Financial Year Ended 30 June 2021
53
Emerging Markets Equity Fund
30 June 2021
Monetary assets USD
Other assets/ (liabilities)
USD
Net exposure
USD
Net exposure
%
Brazilian Real 12,983,036 51,065 13,034,101 3.29British Sterling Pound 10,700,783 – 10,700,783 2.70Chinese Yuan 21,499,303 1 21,499,304 5.43Czech Republic Koruna 2,596,763 – 2,596,763 0.66Hong Kong Dollar 104,217,555 284,396 104,501,951 26.36Indian Rupee 26,866,116 59,935 26,926,051 6.80Indonesian Rupiah 8,748,822 – 8,748,822 2.21Kenyan Shilling 4,929,103 – 4,929,103 1.24Mexican Nuevo Peso 11,964,853 – 11,964,853 3.02Polish Zloty 1,623,450 (1) 1,623,449 0.41South African Rand 5,934,275 – 5,934,275 1.50South Korean Won 17,978,359 – 17,978,359 4.54Taiwan Dollar 45,559,565 114,152 45,673,717 11.52Thai Baht 3,292,555 – 3,292,555 0.83Foreign currency exposure 278,894,538 509,548 279,404,086 70.51
US Dollar 118,366,146 (1,535,949) 116,830,197 29.49
397,260,684 (1,026,401) 396,234,283 100.00
30 June 2020
Monetary assets USD
Other assets/ (liabilities)
USD
Net exposure
USD
Net exposure
%
Brazilian Real 10,731,648 16,601 10,748,249 2.91British Sterling Pound 8,095,686 – 8,095,686 2.19Canadian Dollar 18 – 18 –Chinese Yuan 16,351,573 – 16,351,573 4.43Czech Republic Koruna 2,277,794 – 2,277,794 0.62Euro 10 – 10 –Hong Kong Dollar 73,827,317 157,617 73,984,934 20.06Indian Rupee 22,546,277 – 22,546,277 6.11Indonesian Rupiah 10,248,265 54,413 10,302,678 2.79Kenyan Shilling 4,753,562 – 4,753,562 1.29Mexican Nuevo Peso 7,471,525 1 7,471,526 2.03South African Rand 4,927,803 – 4,927,803 1.34South Korean Won 15,993,989 – 15,993,989 4.34Taiwan Dollar 34,216,310 125,810 34,342,120 9.31Thai Baht 3,357,413 – 3,357,413 0.91Foreign currency exposure 214,799,190 354,442 215,153,632 58.33
US Dollar 151,071,874 2,604,625 153,676,499 41.67
365,871,064 2,959,067 368,830,131 100.00
Frontier Emerging Markets Equity Fund The Frontier Emerging Markets Equity Fund is a dormant sub-fund and so had no exposure to foreign currency risk as at 30 June 2021 and 30 June 2020.
13. Financial Instruments and Associated Risks (Continued)
Foreign Currency Risk (Continued)

Harding Loevner Funds plcNotes to Financial Statements (Continued)
For the Financial Year Ended 30 June 2021
54
Global Small Companies Equity Fund
30 June 2021
Monetary assets USD
Other assets/ (liabilities)
USD
Net exposure
USD
Net exposure
%
Australian Dollar 18,145 – 18,145 1.10Bangladesh Taka 10,392 – 10,392 0.63British Sterling Pound 192,669 3,591 196,260 11.88Canadian Dollar 17,759 – 17,759 1.08Danish Krone 29,902 – 29,902 1.81Euro 285,447 4,552 289,999 17.55Hong Kong Dollar 25,109 – 25,109 1.52Indonesian Rupiah 15,794 – 15,794 0.96Japanese Yen 238,810 122 238,932 14.46Malaysian Ringgit 10,499 – 10,499 0.64Mexican Nuevo Peso 7,431 – 7,431 0.45Norwegian Krone 22,508 – 22,508 1.36Peruvian Nuevo Sol 1 – 1 –Philippine Peso 8,141 – 8,141 0.49Polish Zloty 7,044 – 7,044 0.43South African Rand 21,027 – 21,027 1.27South Korean Won 5,740 – 5,740 0.35Swedish Krona 38,520 – 38,520 2.33Swiss Franc 43,492 – 43,492 2.63Taiwan Dollar 39,702 – 39,702 2.40Turkish Lira 2,563 – 2,563 0.16UAE Dirham 3,470 – 3,470 0.21Vietnamese Dong 13,193 – 13,193 0.80Foreign currency exposure 1,057,358 8,265 1,065,623 64.51
US Dollar 595,621 (9,385) 586,236 35.49
1,652,979 (1,120) 1,651,859 100.00
13. Financial Instruments and Associated Risks (Continued)
Foreign Currency Risk (Continued)

Harding Loevner Funds plcNotes to Financial Statements (Continued)
For the Financial Year Ended 30 June 2021
55
30 June 2020
Monetary assets USD
Other assets/ (liabilities)
USD
Net exposure
USD
Net exposure
%
Bangladesh Taka 3,145 – 3,145 0.29British Sterling Pound 113,747 – 113,747 9.51Canadian Dollar 24,300 – 24,300 2.06Danish Krone 25,320 – 25,320 2.14Euro 210,252 381 210,633 17.59Hong Kong Dollar 22,292 – 22,292 1.89Indonesian Rupiah 7,847 – 7,847 0.68Japanese Yen 219,050 271 219,321 18.31Malaysian Ringgit 7,871 – 7,871 –Mexican Nuevo Peso 15,457 – 15,457 1.32Norwegian Krone 14,967 – 14,967 1.28Peruvian Nuevo Sol 4,340 – 4,340 0.39Polish Zloty 5,175 – 5,175 0.46South African Rand 14,328 – 14,328 1.23South Korean Won 3,504 – 3,504 0.32Swedish Krona 36,304 – 36,304 3.06Swiss Franc 28,245 – 28,245 2.39Taiwan Dollar 32,019 – 32,019 2.70Turkish Lira 3,815 – 3,815 0.35UAE Dirham 1,664 – 1,664 0.17Vietnamese Dong 4,204 – 4,204 0.38Foreign currency exposure 797,846 652 798,498 66.55
US Dollar 429,671 (28,353) 401,318 33.45
1,227,517 (27,701) 1,199,816 100.00
Foreign Currency Risk Sensitivity Analysis
At 30 June 2021 had the exchange rate between the US Dollar and all other currencies increased or decreased by 10% for Global Equity Fund with all other variables held constant, the increase or decrease respectively in net assets attributable to holders of redeemable participating shares would amount to approximately USD 39,212,503 (30 June 2020: USD 29,711,506).
At 30 June 2021 had the exchange rate between the US Dollar and all other currencies increased or decreased by 10% for International Equity Fund with all other variables held constant, the increase or decrease respectively in net assets attributable to holders of redeemable participating shares would amount to approximately USD 14,791,540 (30 June 2020: USD 13,580,051).
At 30 June 2021 had the exchange rate between the US Dollar and all other currencies increased or decreased by 10% for Emerging Markets Equity Fund with all other variables held constant, the increase or decrease respectively in net assets attributable to holders of redeemable participating shares would amount to approximately USD 27,940,409 (30 June 2020: USD 21,515,363).
Frontier Emerging Markets Equity Fund is a dormant sub-fund and had no exposure to foreign currency risk as at 30 June 2021 and 30 June 2020.
At 30 June 2021 had the exchange rate between the US Dollar and all other currencies increased or decreased by 10% for Global Small Companies Equity Fund with all other variables held constant, the increase or decrease respectively in net assets attributable to holders of redeemable participating shares would amount to approximately USD 106,562 (30 June 2020: USD 78,950).
In accordance with the Company’s policy, the Investment Manager monitors each sub-fund’s currency position on a daily basis.
13. Financial Instruments and Associated Risks (Continued)
Foreign Currency Risk (Continued)
Global Small Companies Equity Fund (Continued)

Harding Loevner Funds plcNotes to Financial Statements (Continued)
For the Financial Year Ended 30 June 2021
56
The following table demonstrates the impact of a 10% movement in exchange rates against the US Dollar for each individual currency:
Global Equity Fund
Effect of increase/decrease
30 June 2021 USD
+/-
Effect of increase/decrease
30 June 2020 USD
+/-
Australian Dollar 646,942 –Brazilian Real 1,350,257 –British Sterling Pound 2,056,975 2,873,705Danish Krone 1,122,391 778,703Euro 6,718,920 8,463,592Hong Kong Dollar 13,241,911 4,767,992Indonesian Rupiah 1,270,439 1,306,676Japanese Yen 4,521,722 7,522,445Polish Zloty 1,169,998 –Singapore Dollar 1,280,422 –Swedish Krona 2,331,233 –Swiss Franc 2,605,697 3,998,393Taiwan Dollar 895,596 –
39,212,503 29,711,506
International Equity Fund
Effect of increase/decrease
30 June 2021 USD
+/-
Effect of increase/decrease
30 June 2020 USD
+/-
British Sterling Pound 1,345,054 1,312,485Canadian Dollar 209,083 212,913Danish Krone 214,029 205,127Euro 4,678,389 4,348,486Hong Kong Dollar 1,878,373 1,476,440Japanese Yen 2,692,701 2,988,537Singapore Dollar 495,010 410,075Swedish Krona 1,661,151 1,057,417Swiss Franc 1,617,750 1,568,571
14,791,540 13,580,051
13. Financial Instruments and Associated Risks (Continued)
Foreign Currency Risk Sensitivity Analysis (Continued)

Harding Loevner Funds plcNotes to Financial Statements (Continued)
For the Financial Year Ended 30 June 2021
57
Emerging Markets Equity Fund
Effect of increase/decrease
30 June 2021 USD
+/-
Effect of increase/decrease
30 June 2020 USD
+/-
Brazilian Real 1,303,410 1,074,825British Sterling Pound 1,070,078 809,569Canadian Dollar – 2Chinese yuan 2,149,931 1,635,157Czech Koruna 259,676 227,779Euro – 1Hong Kong Dollar 10,450,195 7,398,493Indian Rupee 2,692,605 2,254,628Indonesian Rupiah 874,882 1,030,268Kenyan Shilling 492,910 475,356Mexican Peso 1,196,485 747,153Polish Zloty 162,345 –South African Rand 593,428 492,780South Korean Won 1,797,836 1,599,399Taiwan Dollar 4,567,372 3,434,212Thai Baht 329,256 335,741
27,940,409 21,515,363
Frontier Emerging Markets Equity Fund
Frontier Emerging Markets Equity Fund is a dormant sub-fund and so had no exposure to foreign currency sensitivity risk analysis as at 30 June 2021 or 30 June 2020.
Global Small Companies Equity Fund
Effect of increase/decrease
30 June 2021 USD
+/-
Effect of increase/decrease
30 June 2020 USD
+/-
Australian Dollar 1,815 –Bangladesh Taka 1,039 315British Sterling Pound 19,626 11,375Canadian Dollar 1,776 2,430Danish Krone 2,990 2,532Euro 29,000 21,063Hong Kong Dollar 2,511 2,229Indonesian Rupiah 1,580 785Japanese Yen 23,893 21,932Malaysian Ringgit 1,050 787Mexican Peso 743 1,546Norwegian Krone 2,251 1,497Peruvian Nuevo Sol – 434Philippine Peso 814 –Polish Zloty 704 518South African Rand 2,103 1,433South Korean Won 574 350Swedish Krona 3,852 3,630Swiss Franc 4,349 2,824Taiwan Dollar 3,970 3,202Turkish Lira 256 382UAE Dirham 347 166Vietnamese Dong 1,319 420
106,562 79,850
13. Financial Instruments and Associated Risks (Continued)
Foreign Currency Risk Sensitivity Analysis (Continued)

Harding Loevner Funds plcNotes to Financial Statements (Continued)
For the Financial Year Ended 30 June 2021
58
Credit Risk
Credit risk is the risk that the counterparty to a financial instrument will fail to discharge an obligation or commitment that it has entered into with the sub-fund. The counterparty risk relates primarily to the brokers used for trading in equities of foreign companies and to cash and cash equivalents held with the Depositary. The Investment Manager uses brokers from its approved brokers list for investment by the sub-fund. The approved broker list is reviewed annually by the Investment Manager to determine if any changes are warranted. The factors used during the review process include, but are not limited to:
• The extent to which the broker, acting as Principal, is willing to commit its own capital to fulfill difficult orders;• The extent of the broker’s distribution network and the broker’s ability to fulfill more difficult orders (e.g. thinly-traded securities);• Demonstrated ability to execute a transaction in a particular market, region or security;• The broker’s execution abilities, including the level of accuracy in executing orders, speed of execution, and the ability to obtain
best net price; and• The broker’s communications and administrative capabilities, including efficiency of reporting, settlement efficiency, and proper
correction of trade errors.
Most trades settle DVP (delivery vs. payment) using the Company’s Custodian bank thus further limiting the credit risk of counterparty. The carrying amounts of financial assets best represent the maximum credit risk exposure at the reporting date.
The following financial assets were exposed to credit risk:
1.1 Global Equity Fund 30 June 2021
USD
1.2 International Equity Fund 30 June 2021
USD
1.3 Emerging Markets
Equity Fund 30 June 2021
USD
1.5 Global Small Companies
Equity Fund 30 June 2021
USD
9.9 Total 30 June 2021
USD
Cash and cash equivalents 23,800,170 5,188,033 2,741,811 10,720 31,740,734Amounts receivable on securities sold 1,667,280 – 337,673 7,703 2,012,656Amounts receivable on shares issued 2,085,209 135,000 – – 2,220,209Dividend receivable 846,497 305,868 523,928 967 1,677,260Interest receivable – 1 1 – 2Other assets 44,628 7,896 15,767 21,402 89,693Total 28,443,784 5,636,798 3,619,180 40,792 37,740,554
1.1 Global Equity Fund 30 June 2020
USD
1.2 International Equity Fund 30 June 2020
USD
1.3 Emerging Markets
Equity Fund 30 June 2020
USD
1.5 Global Small Companies
Equity Fund 30 June 2020
USD
9.9 Total 30 June 2020
USD
Cash and cash equivalents 18,027,090 2,903,899 13,553,803 34,684 34,519,476Amounts receivable on securities sold 2,972,357 12,124,866 3,476,729 – 18,573,952Amounts receivable on shares issued 89,365 – – – 89,365Dividend receivable 232,711 282,998 688,780 873 1,205,362Interest receivable 9,424 1,002 4,733 9 15,168Other assets 24,724 20,253 35,772 5,452 86,201Total 21,355,671 15,333,018 17,759,817 41,018 54,489,524
Northern Trust Fiduciary Services (Ireland) Limited (“NTFSIL”) is the appointed Depositary of the Fund, responsible for the safe-keeping of assets. NTFSIL has appointed The Northern Trust Company (“TNTC”) as its global sub-custodian. Both NTFSIL and TNTC are wholly owned subsidiaries of Northern Trust Corporation (“NTC”). As at the financial year-end date 30 June 2021, NTC had a long term credit rating from Standard & Poor’s of (A+) (30 June 2020: A+).
TNTC (as global sub-custodian of NTFSIL) does not appoint external sub-custodians within the U.S., the U.K., Ireland, Canada Belgium, France, Germany, Netherlands and Saudi Arabia. However, in all other markets, TNTC appoints local external sub-custodians.
NTFSIL, in the discharge of its depositary duties, verifies the Fund’s ownership of Other Assets, (as defined under Other Assets, (Art 22(5) of UCITS V Directive 2014/91/EU)), by assessing whether the Fund holds the ownership based on information or documents provided by the Fund or where available, on external evidence.
13. Financial Instruments and Associated Risks (Continued)

Harding Loevner Funds plcNotes to Financial Statements (Continued)
For the Financial Year Ended 30 June 2021
59
TNTC, in the discharge of its delegated depositary duties, holds in custody (i) all financial instruments that may be registered in a financial instruments account opened on the books of TNTC and (ii) all financial instruments that can be physically delivered to TNTC. TNTC ensures all financial instruments (held in a financial instruments account on the books of TNTC) are held in segregated accounts in the name of the Fund, clearly identifiable as belonging to the Fund, and distinct and separately from the proprietary assets of TNTC, NTFSIL and NTC.
In addition TNTC, as banker, holds cash of the Fund on deposit. Such cash is held on the Statement of Financial Position of TNTC. In the event of insolvency of TNTC, in accordance with standard banking practice, the Fund will rank as an unsecured creditor of TNTC in respect of any cash deposits.
Insolvency of NTFSIL and or one of its agents or affiliates may cause the Fund’s rights with respect to its assets to be delayed.
The Responsible Party manages risk by monitoring the credit quality and financial position of the Depositary and such risk is further managed by the Depositary monitoring the credit quality and financial positions of sub-custodian appointments.
Concentration Risk
The Investment Manager analyses concentration based on the sector allocation of the financial assets that each sub-fund holds. The sub-funds’ concentration risk by sector as at 30 June 2021 and 30 June 2020 were as follows:
Global Equity Fund
Sector2021
% of NAV2020
% of NAVCommunication Services 11.21% 11.84%Consumer Discretionary 10.48% 7.33%Consumer Staples 2.17% 5.41%Energy 2.22% 1.57%Financials 14.39% 13.19%Health Care 21.74% 19.03%Industrials 11.16% 12.95%Information Technology 24.06% 21.53%Materials – 5.77%Utilities 0.54% –Cash & other assets/(liabilities) 2.03% 1.38%
100.00% 100.00%
International Equity Fund
Sector2021
% of NAV2020
% of NAVCommunication Services 4.22% 5.51%Consumer Discretionary 2.35% 4.20%Consumer Staples 12.77% 14.68%Energy 3.00% 2.59%Financials 16.20% 15.48%Health Care 13.32% 14.39%Industrials 14.34% 13.79%Information Technology 20.35% 21.46%Materials 9.91% 7.81%Utilities 1.03% –Cash & other assets/(liabilities) 2.51% 0.09%
100.00% 100.00%
13. Financial Instruments and Associated Risks (Continued)
Credit Risk (Continued)

Harding Loevner Funds plcNotes to Financial Statements (Continued)
For the Financial Year Ended 30 June 2021
60
Emerging Markets Equity Fund
Sector2021
% of NAV2020
% of NAVCommunication Services 9.24% 10.41%Consumer Discretionary 15.46% 14.51%Consumer Staples 9.17% 9.90%Energy 5.64% 5.70%Financials 21.64% 22.98%Health Care 3.64% 1.72%Industrials 9.86% 8.07%Information Technology 23.26% 20.83%Utilities 1.66% 1.40%Cash & other assets/(liabilities) 0.43% 4.48%
100.00% 100.00%
Global Small Companies Equity Fund
Sector2021
% of NAV2020
% of NAVCommunication Services 6.64% 5.88%Consumer Discretionary 10.41% 9.71%Consumer Staples 6.07% 9.86%Energy 0.45% 0.37%Financials 12.25% 7.22%Health Care 13.90% 14.60%Industrials 22.67% 21.89%Information Technology 22.81% 25.19%Materials 3.46% 3.62%Utilities 0.76% 1.08%Cash & other assets/(liabilities) 0.58% 0.58%
100.00% 100.00%Liquidity Risk
Liquidity risk is the risk that an entity will encounter difficulty in meeting obligations associated with financial liabilities.
The Company’s Memorandum and Articles of Association provides for the monthly creation and cancellation of shares. The Company has offered daily liquidity since inception and has been exposed to the liquidity risk of meeting shareholder redemptions at any time. The Directors may decline to affect a repurchase request that would have the effect of reducing the value of any holding of shares below the minimum holding for that Class of shares. Any repurchase request having such an effect may be treated by the Company as a request to repurchase the entire holding of that Class of shares.
The Company’s securities may be listed on non-developed or emerging stock markets, which may result in less liquidity than securities traded on major developed market stock exchanges.
1.1 Global Equity Fund 30 June 2021
USD
1.2 International Equity Fund 30 June 2021
USD
1.3 Emerging Markets
Equity Fund 30 June 2021
USD
1.5 Global Small Companies
Equity Fund 30 June 2021
USD
9.9 Total 30 June 2021
USDFinancial liabilities not at fair value through profit or lossPayable for securities purchased (due within one month) – – (153,986) – (153,986)Audit fee payable (due within one to three months) (12,471) (12,471) (12,472) (6,345) (43,759)Accrued expenses (due within one year) (1,018,194) (225,532) (1,737,303) (24,826) (3,005,855)Net assets attributable to holders of participating shares (1,350,536,828) (215,066,718) (396,234,283) (1,651,859) (1,963,489,688)Total (1,351,567,493) (215,304,721) (398,138,044) (1,683,030) (1,966,693,288)
13. Financial Instruments and Associated Risks (Continued)
Concentration Risk (Continued)

Harding Loevner Funds plcNotes to Financial Statements (Continued)
For the Financial Year Ended 30 June 2021
61
1.1 Global Equity Fund 30 June 2020
USD
1.2 International Equity Fund 30 June 2020
USD
1.3 Emerging Markets
Equity Fund 30 June 2020
USD
1.5 Global Small Companies
Equity Fund 30 June 2020
USD
9.9 Total 30 June 2020
USDFinancial liabilities not at fair value through profit or lossPayable for securities purchased (due within one month) (4,655,882) – – – (4,655,882)Audit fee payable (due within one to three months) (9,453) (9,453) (9,453) (4,809) (33,168)Accrued expenses (due within one year) (994,992) (15,147,077) (1,237,496) (29,226) (17,408,791)Net assets attributable to holders of participating shares (998,697,959) (188,932,115) (368,830,131) (1,199,816) (1,557,660,021)Total (1,004,358,286) (204,088,645) (370,077,080) (1,233,851) (1,579,757,862)
Valuation of Financial Instruments
IFRS 13 requires disclosures surrounding the level in the fair value hierarchy in which fair value measurements are categorised for assets and liabilities measured in the statement of financial position. The determination of fair value for financial assets and financial liabilities for which there is no observable market price requires the use of valuation techniques as described in Note 2, Significant accounting policies. For financial instruments that trade infrequently and have little price transparency, fair value is less objective and requires varying degrees of judgement depending on liquidity, concentration, uncertainty of market factors, pricing assumptions and other risks affecting the specific instrument.
The Company categorises investments using the following hierarchy as defined by IFRS 13:
• Level 1 – Quoted prices (unadjusted) in active markets for identical assets or liabilities;
• Level 2 – Inputs other than quoted prices included within Level 1 that are observable for the asset or liability, either directly (i.e. as prices) or indirectly (i.e. derived from prices). This category includes instruments valued using: quoted market prices in active markets for similar instruments; quoted prices for similar instruments in markets that are considered less than active; or other valuation techniques where all significant inputs are directly or indirectly observable from market data;
• Level 3 – Inputs for the asset or liability that are not based on observable market data (unobservable inputs). This category includes all instruments where the valuation technique includes inputs not based on observable data and the unobservable inputs could have a significant impact on the instrument’s valuation. This category includes instruments that are valued based on quoted prices for similar instruments where significant unobservable adjustments or assumptions are required to reflect differences between the instruments.
The following table analyses within the fair value hierarchy each sub-fund's financial assets measured at fair value as at 30 June 2021 and 30 June 2020.
Global Equity Fund
30 June 2021Level 1
USDLevel 2
USDLevel 3
USDTotal USD
Equities 1,323,123,709 – – 1,323,123,7091,323,123,709 – – 1,323,123,709
30 June 2020Level 1
USDLevel 2
USDLevel 3
USDTotal USD
Equities 983,002,615 – – 983,002,615983,002,615 – – 983,002,615
13. Financial Instruments and Associated Risks (Continued)
Liquidity Risk (Continued)

Harding Loevner Funds plcNotes to Financial Statements (Continued)
For the Financial Year Ended 30 June 2021
62
International Equity Fund
30 June 2021Level 1
USDLevel 2
USDLevel 3
USDTotal USD
Equities 209,667,923 – – 209,667,923209,667,923 – – 209,667,923
30 June 2020Level 1
USDLevel 2
USDLevel 3
USDTotal USD
Equities 188,755,627 – – 188,755,627188,755,627 – – 188,755,627
Emerging Markets Equity Fund
30 June 2021Level 1
USDLevel 2
USDLevel 3
USDTotal USD
Equities 394,518,864 – – 394,518,864394,518,864 – – 394,518,864
30 June 2020Level 1
USDLevel 2
USDLevel 3
USDTotal USD
Equities 352,317,263 – – 352,317,263352,317,263 – – 352,317,263
Global Small Companies Equity Fund
30 June 2021Level 1
USDLevel 2
USDLevel 3
USDTotal USD
Equities 1,642,238 – – 1,642,2381,642,238 – – 1,642,238
30 June 2020Level 1
USDLevel 2
USDLevel 3
USDTotal USD
Equities 1,192,833 – – 1,192,8331,192,833 – – 1,192,833
There were no transfers between levels during the financial year ended 30 June 2021 and 30 June 2020.
For each class of assets and liabilities not measured at fair value in the Statement of Financial Position but for which fair value is disclosed, IFRS 13 requires the Company to disclose the level within the fair value hierarchy which the fair value measurement would be categorised and a description of the valuation technique and inputs used in the technique. Assets and liabilities not carried at fair value are carried at amortised cost; their carrying values are a reasonable approximation of fair value.
Non-Developed Markets Risk
The Global Equity Fund, International Equity Fund, and Global Small Companies Equity Fund may invest a portion of its capital in securities of companies based in non-developed, emerging markets or frontier markets. Investing in the securities of such companies and countries involves certain considerations not usually associated with investing in securities of developed market companies or countries, including without limitations, less liquidity, greater price and foreign currency volatility, and greater legal, tax and regulatory risk.
13. Financial Instruments and Associated Risks (Continued)
Valuation of Financial Instruments (Continued)

Harding Loevner Funds plcNotes to Financial Statements (Continued)
For the Financial Year Ended 30 June 2021
63
Securities listed on non-developed, emerging stock markets and frontier markets due to political or other events in these countries, may not be quickly liquidated at their fair value amounts. This risk is managed by limiting investment in a single non-developed or emerging country as follows:
This risk for the Global Equity Fund and Global Small Companies Equity Fund is managed by limiting investment in non-developed, emerging countries, and frontier countries to 25% in the aggregate. The risk for the International Equity Fund is managed by limiting investment in non-developed, emerging and frontier markets to 30% in the aggregate.
Emerging market securities involve unique risks such as exposure to economies less diverse and mature than that of the US or more established foreign markets. Economic or political instability may cause larger price changes in emerging market securities than in securities of issuers based in more developed countries.
Investments in frontier markets involve risks similar to investments in emerging markets but to a greater extent since frontier markets are even smaller, less developed and less accessible than emerging markets. Frontier markets may also experience greater political and economic instability and may have less transparency, less ethical practices, and weaker corporate governance compared to emerging markets. The countries that comprise frontier markets include the lesser developed countries located in Africa, Asia (including countries in the Commonwealth of Independent States, formerly the Soviet Union), the Middle East, Eastern Europe and Latin America.
The Emerging Markets Equity Fund aims to invest primarily in emerging markets. Therefore, the fund does not have any limitation on aggregate emerging markets ownership.
Global Exposure
Under the Central Bank’s UCITS Regulations, the Investment Manager is required to employ a risk management process which enables it to accurately measure, monitor and manage the global exposure to the Company from financial derivative instruments. The Investment Manager uses a methodology known as the commitment approach to measure the global exposure of the Company and the sub-funds. The commitment approach is a methodology that aggregates the underlying market or notional values of financial derivative instruments to determine the exposure of the Company to financial derivative instruments. In accordance with the UCITS Regulations, global exposures for each sub-fund to financial derivative instruments must not exceed 100% of the sub-fund’s Net Asset Value.
14. Net Asset Value per Redeemable Participating Share
Global Equity Fund Net assets attributable to holders of redeemable participating shares 30 June 2021 30 June 2020 30 June 2019
Euro Class A EUR 200,974,357 EUR 127,860,680 EUR 90,419,093Euro Class A USD equivalent USD 238,305,370 USD 143,651,466 USD 102,815,554
Sterling Class A GBP 74,133,960 GBP 42,353,650 GBP 85,617,562Sterling Class A USD equivalent USD 102,549,491 USD 52,480,331 USD 108,730,033
US Dollar Class A USD 174,374,158 USD 86,381,348 USD 67,487,737
Sterling Class B GBP 147,547 GBP 118,963 GBP 102,025Sterling Class B USD equivalent USD 204,102 USD 147,408 USD 129,567
US Dollar Class B USD 6,921,847 USD 2,690,156 USD 1,266,879
US Dollar Class D USD 598,148 USD 434,121 USD 480,325
Euro Class M EUR 51,150,934 EUR 47,232,360 EUR 66,321,832Euro Class M USD equivalent USD 60,652,226 USD 53,065,560 USD 75,414,557
Singapore Dollar Class M SGD 173,221,076 SGD 120,965,939 SGD 102,782,293Singapore Dollar Class M USD equivalent USD 128,817,637 USD 86,801,047 USD 75,966,218
Canadian Dollar Class S CAD 55,648,711 CAD 43,579,382 –Canadian Dollar Class S USD equivalent USD 44,892,474 USD 32,100,311 –
Euro Class S EUR 31,316,427 EUR 50,552,783 EUR 54,964,458Euro Class S USD equivalent USD 37,133,457 USD 56,796,055 USD 62,500,087
Sterling Class S GBP 269,144,654 GBP 215,232,747 GBP 230,142,137Sterling Class S USD equivalent USD 372,307,844 USD 266,694,918 USD 292,269,036
US Dollar Class S – USD 55,466,777 USD 54,683,090
13. Financial Instruments and Associated Risks (Continued)
Non-Developed Markets Risk (Continued)

Harding Loevner Funds plcNotes to Financial Statements (Continued)
For the Financial Year Ended 30 June 2021
64
Global Equity Fund (Continued) Net assets attributable to holders of redeemable participating shares 30 June 2021 30 June 2020 30 June 2019
US Dollar Class S1 USD 183,780,073 USD 161,988,461 USD 155,005,715
Net Asset Value per redeemable participating share 30 June 2021 30 June 2020 30 June 2019
Euro Class A EUR 2.882 EUR 2.190 EUR 1.895Euro Class A USD equivalent USD 3.417 USD 2.462 USD 2.155
Sterling Class A GBP 2.464 GBP 1.981 GBP 1.697Sterling Class A USD equivalent USD 3.408 USD 2.455 USD 2.156
US Dollar Class A USD 3.421 USD 2.463 USD 2.157
Sterling Class B GBP 1.490 GBP 1.202 GBP 1.031Sterling Class B USD equivalent USD 2.062 USD 1.489 USD 1.309
US Dollar Class B USD 1.580 USD 1.141 USD 1.001
US Dollar Class D USD 1.594 USD 1.157 USD 1.021
Euro Class M EUR 1.653 EUR 1.256 EUR 1.086Euro Class M USD equivalent USD 1.960 USD 1.411 USD 1.235
Singapore Dollar Class M SGD 2.334 SGD 1.741 SGD 1.479Singapore Dollar Class M USD equivalent USD 1.735 USD 1.249 USD 1.093
Canadian Dollar Class S CAD 1.568 CAD 1.228 –Canadian Dollar Class S USD equivalent USD 1.265 USD 0.904 –
Euro Class S EUR 1.615 EUR 1.219 EUR 1.046Euro Class S USD equivalent USD 1.915 USD 1.369 USD 1.190
Sterling Class S GBP 1.650 GBP 1.324 GBP 1.135Sterling Class S USD equivalent USD 2.283 USD 1.641 USD 1.441
US Dollar Class S – USD 1.260 USD 1.095
US Dollar Class S1 USD 1.574 USD 1.132 USD 0.989
International Equity FundNet assets attributable to holders of redeemable participating shares 30 June 2021 30 June 2020 30 June 2019
Sterling Class A GBP 3,767,650 GBP 1,829,019 GBP 2,763,763Sterling Class A USD equivalent USD 5,211,791 USD 2,266,337 USD 3,509,842
US Dollar Class A USD 81,614,738 USD 61,853,345 USD 69,385,905
US Dollar Class B USD 10,867,868 USD 9,207,847 USD 10,955,618
US Dollar Class S USD 117,372,320 USD 115,604,585 USD 155,424,540
Net Asset Value per redeemable participating share 30 June 2021 30 June 2020 30 June 2019
Sterling Class A GBP 2.104 GBP 1.765 GBP 1.715Sterling Class A USD equivalent USD 2.911 USD 2.188 USD 2.178
US Dollar Class A USD 1.867 USD 1.392 USD 1.359
US Dollar Class B USD 1.853 USD 1.385 USD 1.356
US Dollar Class S USD 1.577 USD 1.167 USD 1.130
14. Net Asset Value per Redeemable Participating Share (Continued)

Harding Loevner Funds plcNotes to Financial Statements (Continued)
For the Financial Year Ended 30 June 2021
65
Emerging Markets Equity Fund Net assets attributable to holders of redeemable participating shares 30 June 2021 30 June 2020 30 June 2019
US Dollar Class A USD 11,475,486 USD 13,198,733 USD 11,724,616
Canadian Dollar Class B CAD 616,089 CAD 472,891 –Canadian Dollar Class B USD equivalent USD 497,006 USD 348,328 –
US Dollar Class B USD 3,263,900 USD 5,125,672 USD 6,195,701
Canadian Dollar Class I – CAD 222,193,885 CAD 212,406,426Canadian Dollar Class I USD equivalent – USD 163,666,680 USD 162,198,027
Euro Class I – – EUR 94,112,972Euro Class I USD equivalent – – USD 107,015,864
US Dollar Class I USD 61,375,900 USD 114,545,557 USD 124,804,012
Canadian Dollar Class M – CAD 97,672,750 CAD 102,808,567Canadian Dollar Class M USD equivalent – USD 71,945,161 USD 78,506,790
Sterling Class M – – GBP 61,011,719Sterling Class M USD equivalent – – USD 77,481,840
Canadian Dollar Class S CAD 396,203,420 – –Canadian Dollar Class S USD equivalent USD 319,621,991 – –
Net Asset Value per redeemable participating share 30 June 2021 30 June 2020 30 June 2019
US Dollar Class A USD 1.783 USD 1.245 USD 1.361
Canadian Dollar Class B CAD 1.232 CAD 0.946 –Canadian Dollar Class B USD equivalent USD 0.994 USD 0.697 –
US Dollar Class B USD 1.566 USD 1.098 USD 1.203
Canadian Dollar Class I – CAD 1.524 CAD 1.601Canadian Dollar Class I USD equivalent – USD 1.122 USD 1.223
Euro Class I – – EUR 1.160Euro Class I USD equivalent – – USD 1.319
US Dollar Class I USD 1.664 USD 1.159 USD 1.263
Canadian Dollar Class M – CAD 1.353 CAD 1.424Canadian Dollar Class M USD equivalent – USD 0.996 USD 1.087
Sterling Class M – – GBP 1.162Sterling Class M USD equivalent – – USD 1.476
Canadian Dollar Class S CAD 1.206 – –Canadian Dollar Class S USD equivalent USD 0.973 – –
No shares were held in the Frontier Emerging Markets Equity Fund as at 30 June 2021, 30 June 2020 and 30 June 2019. Global Small Companies Equity FundNet assets attributable to holders of redeemable participating shares 30 June 2021 30 June 2020 30 June 2019
US Dollar Class A USD 1,651,859 USD 1,217,828 USD 1,118,872
Net Asset Value per redeemable participating share 30 June 2021 30 June 2020 30 June 2019
US Dollar Class A USD 1.652 USD 1.218 USD 1.119
14. Net Asset Value per Redeemable Participating Share (Continued)
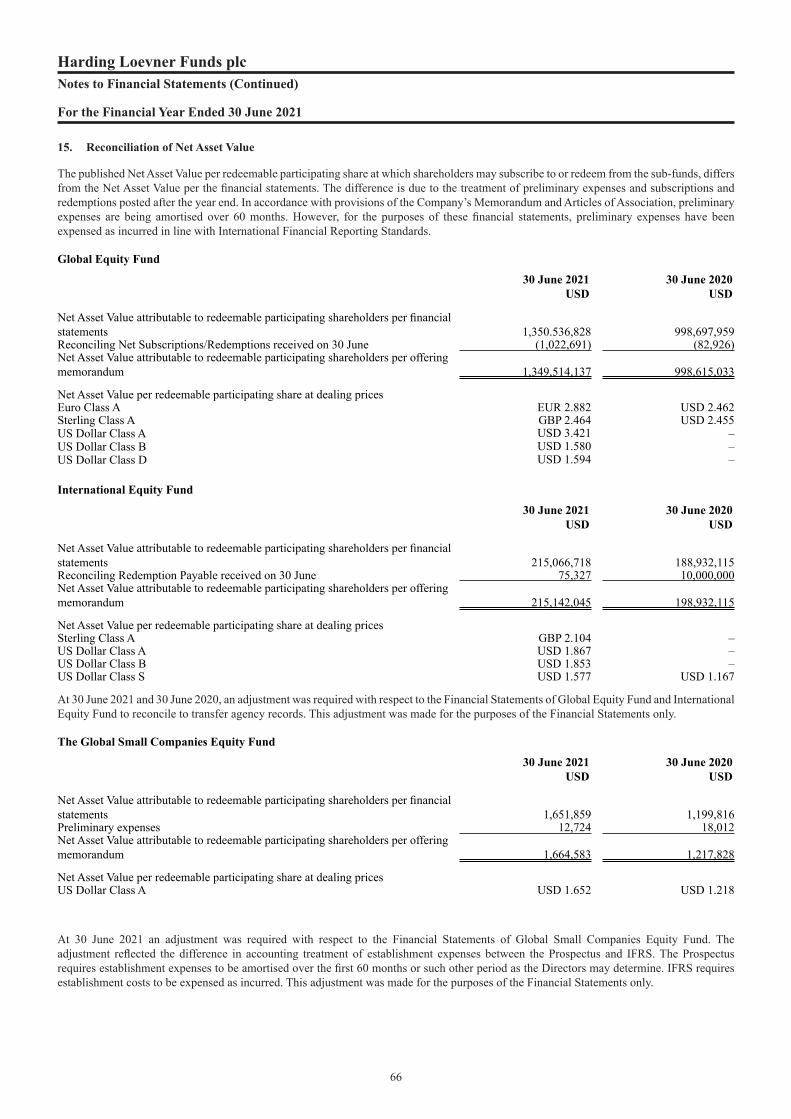
Harding Loevner Funds plcNotes to Financial Statements (Continued)
For the Financial Year Ended 30 June 2021
66
15. Reconciliation of Net Asset Value
The published Net Asset Value per redeemable participating share at which shareholders may subscribe to or redeem from the sub-funds, differs from the Net Asset Value per the financial statements. The difference is due to the treatment of preliminary expenses and subscriptions and redemptions posted after the year end. In accordance with provisions of the Company’s Memorandum and Articles of Association, preliminary expenses are being amortised over 60 months. However, for the purposes of these financial statements, preliminary expenses have been expensed as incurred in line with International Financial Reporting Standards.
Global Equity Fund 30 June 2021
USD
30 June 2020
USD
Net Asset Value attributable to redeemable participating shareholders per financial statements 1,350.536,828 998,697,959Reconciling Net Subscriptions/Redemptions received on 30 June (1,022,691) (82,926)Net Asset Value attributable to redeemable participating shareholders per offering memorandum 1,349,514,137 998,615,033
Net Asset Value per redeemable participating share at dealing pricesEuro Class A EUR 2.882 USD 2.462Sterling Class A GBP 2.464 USD 2.455 US Dollar Class A USD 3.421 –US Dollar Class B USD 1.580 –US Dollar Class D USD 1.594 –
International Equity Fund 30 June 2021
USD
30 June 2020
USD
Net Asset Value attributable to redeemable participating shareholders per financial statements 215,066,718 188,932,115Reconciling Redemption Payable received on 30 June 75,327 10,000,000Net Asset Value attributable to redeemable participating shareholders per offering memorandum 215,142,045 198,932,115
Net Asset Value per redeemable participating share at dealing pricesSterling Class A GBP 2.104 –US Dollar Class A USD 1.867 –US Dollar Class B USD 1.853 –US Dollar Class S USD 1.577 USD 1.167
At 30 June 2021 and 30 June 2020, an adjustment was required with respect to the Financial Statements of Global Equity Fund and International Equity Fund to reconcile to transfer agency records. This adjustment was made for the purposes of the Financial Statements only.
The Global Small Companies Equity Fund 30 June 2021
USD
30 June 2020
USD
Net Asset Value attributable to redeemable participating shareholders per financial statements 1,651,859 1,199,816Preliminary expenses 12,724 18,012Net Asset Value attributable to redeemable participating shareholders per offering memorandum 1,664,583 1,217,828
Net Asset Value per redeemable participating share at dealing pricesUS Dollar Class A USD 1.652 USD 1.218
At 30 June 2021 an adjustment was required with respect to the Financial Statements of Global Small Companies Equity Fund. The adjustment reflected the difference in accounting treatment of establishment expenses between the Prospectus and IFRS. The Prospectus requires establishment expenses to be amortised over the first 60 months or such other period as the Directors may determine. IFRS requires establishment costs to be expensed as incurred. This adjustment was made for the purposes of the Financial Statements only.

Harding Loevner Funds plcNotes to Financial Statements (Continued)
For the Financial Year Ended 30 June 2021
67
16. Exchange Rates
The following exchange rates (against the USD) were used to convert the investments and other assets and liabilities denominated in currencies other than USD as at 30 June 2021 and 30 June 2020:
30 June 2021 30 June 2020AED UAE Dirham 3.6732 3.6732AUD Australian Dollar 1.3320 1.4524BDT Bangladesh Taka 84.7750 84.85BRL Brazilian Real 5.0179 5.4908CAD Canadian Dollar 1.2383 1.362CHF Swiss Franc 0.9244 0.9476CLP Chilean Peso 728.1100 820.6CNH Chinese Renminbi 6.4609 7.0678CNY Chinese Yuan 6.4615 7.0741COP Colombian Peso 3,734.0000 3,739.28CZK Czech Republic Koruna 21.5086 23.7213DKK Danish Krone 6.2706 6.636EEK Estonian Kroon 13.1939 13.931EGP Egyptian Pound 15.6950 16.14EUR Euro 0.8432 0.8904GBP British Sterling Pound 0.7239 0.8093GHS Ghanian Cedi 5.8900 5.785HKD Hong Kong Dollar 7.7659 7.7505HRK Croatian Kuna 6.3188 6.7404HUF Hungarian Forint 296.0031 315.5768IDR Indonesian Rupiah 14,500.0000 14,285.00INR Indian Rupee 74.3300 75.5038JOD Jordanian Dinar 0.7090 0.709JPY Japanese Yen 110.9900 107.885KES Kenyan Shilling 107.9000 106.55KRW South Korean won 1,126.1500 1,202.85KZT Kazakhstan Tenge 427.2450 405.73LKR Sri Lankan Rupee 199.5000 186.23MAD Moroccan Dirham 8.9300 9.7095MUR Mauritian Rupee 43.0000 40.275MXN Mexican Nuevo Peso 19.9105 23.107MYR Malaysian Ringgit 4.1515 4.285NGN Nigerian Naira 410.0000 386.58PEN Peruvian Nuevo Sol 3.8325 3.5355PHP Philippine Peso 48.8150 49.825PKR Pakistani Rupee 157.6000 167.9PLN Polish Zloty 3.8070 3.9557QAR Qatari Rial 3.6410 3.641RON Romanian Leu 4.1526 4.3091RUB Russian Rouble 73.0538 71.2544SAR Saudi Arabia Riyal 3.7504 3.751SEK Swedish Krona 8.5522 9.3167SGD Singapore Dollar 1.3442 1.3951THB Thai Baht 32.0500 30.9075TRY Turkish Lira 8.6875 6.8548TTD Trinidad & Tabago Dollar 6.7473 6.7413TWD Taiwan Dollar 27.8625 29.5045TZS Tanzanian Shilling 2,319.0000 2,318.00VND Vietnamese Dong 23,016.0000 23,206.00XOF West African CFA Franc 553.1302 584.0333ZAR South African Rand 14.2788 17.375
17. Soft Commissions
The Investment Manager may place trades on behalf of the Company with brokers that will, from time to time, provide or procure research products, specialised software or related services that assist the investment manager in the provision of investment services to its clients, including the Company, provided that each broker has agreed to provide best execution with respect to such trades. The Investment Manager’s use of soft commissions falls within the safe harbor created by Section 28(e) of the U.S. Securities Exchange Act of 1934. Where a product or service provides both eligible and non-eligible assistance, the Investment Manager will make a reasonable allocation of the cost that may be paid for with soft commissions.

Harding Loevner Funds plcNotes to Financial Statements (Continued)
For the Financial Year Ended 30 June 2021
68
18. Contingent Liabilities
There were no contingent liabilities as at 30 June 2021 or 30 June 2020.
19. Events During the Year
Effective 1 July 2020 on the Global Equity Fund the expense caps were reduced to 0.75% for the Class M shares, 0.80% for the Class A shares, 1.10% for the Class B shares, 10 bps of operating expenses excluding Investment Management Fees (“Management fee”) for the USD Class S1 and 0.10% and for Class S shares.
Effective close of business 30 September 2020, the Prospectus and Supplements in respect of the Company were updated. The update reduced the Emerging Markets Equity Fund’s Class A Management fees from 1.10% to 1.00% and permitted purchases and repurchases of shares to take place via certain electronic means, going forward.
On 7 October 2020, the Canadian Dollar Class S shares for Emerging Market Equity Fund were first issued.
On 7 October 2020, the Canadian Dollar Class I shares for Emerging Markets Equity Fund liquidated.
On 9 November 2020, the Canadian Dollar Class M shares for Emerging Markets Equity Fund liquidated.
On 8 January 2021, the US Dollar Class S shares for Global Equity Fund liquidated.
An updated Prospectus and Supplements were filed with the Central Bank of Ireland on 9 March 2021. These were updated to reflect the requirements of Regulation (EU) 2019/2088 of the European Parliament and of the Council of 27 November 2019 on sustainability-related disclosures in the financial services sector (“SFDR”).
During the financial year ended 30 June 2021, the Global Equity Fund distributed the following net income:
A distribution of 0.002428750 per share on the Sterling Class S shares, with a total value of GBP 395,651, for the financial year ended 30 June 2021. This distribution was declared on 19 January 2021 with a record date of 15 January 2020, an ex-date of 19 January 2020 and a pay date of 22 January 2020.
A distribution of 0.005009537 per share on the Sterling Class S shares, with a total value of GBP 814,103, for the financial year ended 30 June 2021. This distribution was declared on 21 July 2020 with a record date of 20 July 2020, an ex-date of 21 July 2020 and a pay date of 24 July 2020.
During the financial year ended 30 June 2021, the International Equity Fund distributed the following net income:
A distribution of 0.001825456 per share on the Sterling Class A shares, with a total value of GBP 3,266, for the financial period ended 31 December 2020. This distribution was declared on 19 January 2021 with a record date of 15 January 2021, an ex-date of 19 January 2021 and a pay date of 22 January 2021.
A distribution of 0.012711116 per share on the Sterling Class A shares, with a total value of GBP 13,170. This distribution was declared on 21 July 2020 with a record date of 20 July 2020, an ex-date of 21 July 2020 and a pay date of 24 July 2020.
The continued outbreak of Covid-19, including the Delta variant, has resulted in ongoing restrictions on the ability of people to travel, socialise and leave their homes. Global financial markets continue to react to this news to varying degrees, with concerns regarding the economic impact this may have on a global scale. The eventual impact on the global economy and the operations and financial performance of certain sub-fund’s investments will largely depend upon future developments, including (i) the duration and spread of the outbreak, including the Delta variant, (ii) the effects on the financial markets, and (iii) the effects on the economy overall, all of which are highly uncertain and cannot be predicted. If the financial performance of a sub-fund is impacted because of these factors for an extended period, the relevant sub-fund’s investment results may be adversely affected. The Board of Directors (“the Board”) has considered the general impact resulting from the spread of Covid-19 on the Company and has ongoing engagement with its delegates. The delegates have invoked their Business Continuity Plans (BCPs) which are operating effectively allowing the Company to continue to service its client base. The Board continues to closely monitor market conditions taking into account any changes in liquidity or other market volatility and/or restrictions.
20. Events After the Reporting Date
The Global Equity Fund distributed net income of 0.004754419 per share on the Sterling Class S shares, with a total value of GBP 775,307. This distribution was declared on 20 July 2021 with a record date of 19 July 2021, an ex-date of 20 July 2021 and a pay date of 23 July 2021.
The International Equity Fund distributed net income of 0.013512861 per share on the Sterling Class A shares, with a total value of GBP 24,194. This distribution was declared on 20 July 2021 with a record date of 19 July 2021, an ex-date of 20 July 2021 and a pay date of 23 July 2021.
There have been no other material events to report subsequent to the financial year ended 30 June 2021.

Harding Loevner Funds plcNotes to Financial Statements (Continued)
For the Financial Year Ended 30 June 2021
69
21. Approval of the Financial Statements
The financial statements were approved and authorised for issue on 24 September 2021.

Harding Loevner Funds plcAppendix 1 - Remuneration Disclosure (Unaudited)
For the Financial Year Ended 30 June 2021
70
Remuneration
In line with the requirements of the UCITS Regulations, Harding Loevner Funds Plc (“the Company”) is required to adopt a remuneration policy. The remuneration policy is designed to ensure that any relevant conflicts of interest can be managed appropriately at all times and that the remuneration of senior staff is in line with the risk policies and objectives of the Company. The Company’s remuneration policy applies to those categories of identified staff, including senior management, risk takers, control functions and any employee receiving total remuneration that falls into the remuneration bracket of senior management and risk takers, whose professional activities have a material impact on the risk profiles of the Company. The Company applies its remuneration policy and practices in a way and to the extent that is proportionate to its size, its internal organisation and the nature, scope and complexity of its activities. The directors of the Company, Designated Persons and MLRO (the “Identified Staff of the Company”) receive fixed remuneration in respect of their services which is set at a level determined by the Board as a whole and which is not performance related. This is detailed on page 42. None of the Identified Staff of the Company are currently in receipt of variable remuneration in respect of their services as directors of the Company and none of the identified staff of the Company are currently in receipt of a pension from the Company.
Harding Loevner LP has been appointed as the Investment Manager to the Company (the “Investment Manager”). The Investment Manager’s compensation for all its employees and partners (“Staff Members”), including the Investment Manager’s Staff Members who can exert a material influence on the risk profile of the Company i.e. the co-lead portfolio managers for each sub-fund of the Company, as designated by the Investment Manager from time to time (the “Identified Staff”), includes a fixed base salary, a benefits package, an annual performance based cash bonus, and for Staff Members other than limited partners of the Investment Manager, an equity-linked deferred compensation plan.
Variable Remuneration
Staff Members who are not partners of the Investment Manager, participation in the firm’s equity-linked deferred compensation plan (“ELIP”).
The Investment Manager does not pay any Identified Staff any Variable Remuneration, as the Investment Manager does not determine compensation based directly on the performance of any sub-fund.
Annual cash bonuses are determined for each employee, including Identified Staff, based upon the completion of agreed-upon personal objectives and contributions to the achievement of firm-wide objectives. These objectives are determined collaboratively by the employee and his/her supervisor at the beginning of each year, placed in writing, and subject to final approval by the Investment Manager’s Compensation Committee.
Personal objectives for investment professionals are primarily concerned with their contributions to investment performance. Contributions of portfolio managers, including Identified Staff, to investment performance are measured by the returns of their individual model portfolios relative to applicable benchmarks. No client account, including any sub-fund, is permitted to deviate from the relevant strategy-level model portfolio except to accommodate unique, agreed-upon client guidelines or restrictions. Portfolio managers are not rewarded for the outperformance of any individual client account, including of any sub-fund.
Identified Staff must achieve a specified level of outperformance in the measurement year in order to earn the target bonus amount related to their investment performance objective. This portion of the annual cash bonus is adjusted upward or downward based upon the degree of out- or underperformance of their individual model portfolio relative to its benchmark.
Another portion of the annual cash bonus for Identified Staff is based upon their degree of success in achieving other objectives relating to their portfolio management or other responsibilities that must be subjectively measured, such as collaborating with colleagues, supervising other investment professionals, representing the firm externally, producing written investment narratives, or completing any special projects.
Long-term compensation
To all employees, including Identified Staff, who are not limited partners of the Investment Manager, the Investment Manager provides long-term deferred compensation via its ELIP, believing it is an effective approach to linking employees’ long-term financial rewards to the long-term investment success of its clients. The degree of participation in the ELIP is determined each year according to length of tenure and overall level of present and anticipated future contributions to the firm. Each year’s deferred compensation award under the ELIP is subject to a 5-year vesting schedule.
Other Variable Remuneration principles
No level of Variable Remuneration is guaranteed.
The total number of Identified Staff of the Investment Manager as at 30 June 2021 was 10.
The Investment Manager’s pay to Identified Staff relates to all funds which the Identified Staff currently manage.
The assets under management of the Investment Manager, inclusive of those under management of the Identified Staff, as at 30 June 2021 was US $87.6n of which the Company represents US $1.96bn, or 2.24% of total assets.

Harding Loevner Funds plcAppendix 2 - Financial Information (Unaudited)
For the Financial Year Ended 30 June 2021
71
Global Equity FundFor the Financial Year Ended 30 June 2021
Total Expenses Ratio US Dollar Class A 30 June 2021
USD
US Dollar Class B 30 June 2021
USD
US Dollar Class D 30 June 2021
USD
Euro Class A30 June 2021
USD
Euro Class M 30 June 2021
USD
Sterling Class A 30 June 2021
USD
Euro Class S 30 June 2021
USD
Expenses 994,172 50,113 9,048 1,511,594 470,242 617,130 42,877 Average net assets 124,276,490 4,587,778 568,691 188,937,592 62,704,090 77,131,382 47,986,886 Total Expense Ratio (*,**) 0.80% 1.09% 1.59% 0.80% 0.75% 0.80% 0.09%
Canadian Dollar Class S
30 June 2021 USD
Singapore Dollar Class M
30 June 2021 USD
US Dollar Class S 30 June 2021
USD
Sterling Class S 30 June 2021
USD
US Dollar Class S1 30 June 2021
USD
Sterling Class B 30 June 2021
USD
Expenses 35,448 812,707 28,248 294,071 1,170,731 1,941 Average net assets 38,946,166 108,361,856 62,324,696 323,090,665 188,882,904 177,917 Total Expense Ratio (*,**) 0.09% 0.75% 0.09% 0.09% 0.62% 1.09%
Portfolio Turnover Ratio TotalPurchases and sales of securities (i) 1,372,941,703 Subscription and redemption of shares (ii) *** 364,671,434 Monthly average of total assets (iii) 1,227,977,112 Portfolio Turnover Ratio 82%
* The Total Expense Ratio for Global Equity Fund include operating expense reimbursements of USD 232,500 (30 June 2020: Nil).** The Total Expense Ratio is annualised.*** The subscription and redemption of shares figure in the above table excludes share class switches.Note - the portfolio turnover ratio is calculated as follows ((i-ii)/iii) x 100). The portfolio turnover ratio is not annualised.The US Dollar Class S closed on 8 January 2021.
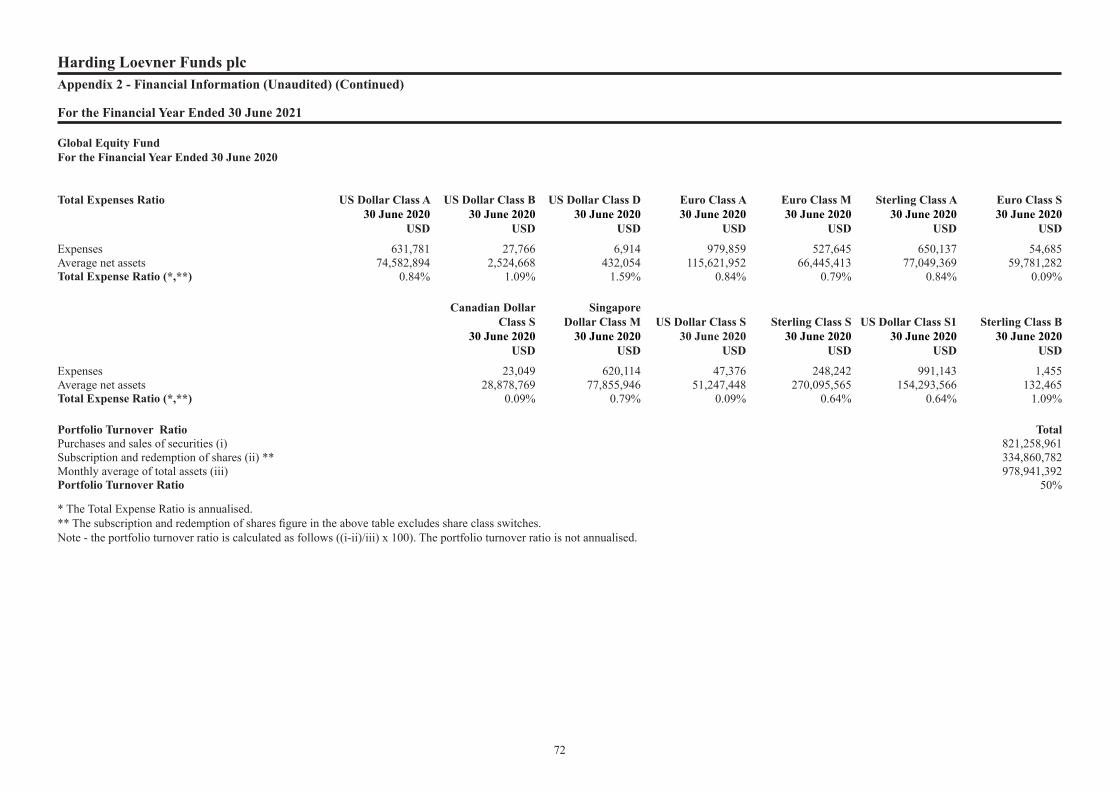
Harding Loevner Funds plcAppendix 2 - Financial Information (Unaudited) (Continued)
For the Financial Year Ended 30 June 2021
72
Global Equity Fund For the Financial Year Ended 30 June 2020
Total Expenses Ratio US Dollar Class A 30 June 2020
USD
US Dollar Class B 30 June 2020
USD
US Dollar Class D 30 June 2020
USD
Euro Class A30 June 2020
USD
Euro Class M 30 June 2020
USD
Sterling Class A 30 June 2020
USD
Euro Class S 30 June 2020
USD
Expenses 631,781 27,766 6,914 979,859 527,645 650,137 54,685Average net assets 74,582,894 2,524,668 432,054 115,621,952 66,445,413 77,049,369 59,781,282Total Expense Ratio (*,**) 0.84% 1.09% 1.59% 0.84% 0.79% 0.84% 0.09%
Canadian Dollar Class S
30 June 2020 USD
Singapore Dollar Class M
30 June 2020 USD
US Dollar Class S 30 June 2020
USD
Sterling Class S 30 June 2020
USD
US Dollar Class S1 30 June 2020
USD
Sterling Class B 30 June 2020
USD
Expenses 23,049 620,114 47,376 248,242 991,143 1,455Average net assets 28,878,769 77,855,946 51,247,448 270,095,565 154,293,566 132,465Total Expense Ratio (*,**) 0.09% 0.79% 0.09% 0.64% 0.64% 1.09%
Portfolio Turnover Ratio TotalPurchases and sales of securities (i) 821,258,961 Subscription and redemption of shares (ii) ** 334,860,782 Monthly average of total assets (iii) 978,941,392 Portfolio Turnover Ratio 50%
* The Total Expense Ratio is annualised.** The subscription and redemption of shares figure in the above table excludes share class switches.Note - the portfolio turnover ratio is calculated as follows ((i-ii)/iii) x 100). The portfolio turnover ratio is not annualised.

Harding Loevner Funds plcAppendix 2 - Financial Information (Unaudited) (Continued)
For the Financial Year Ended 30 June 2021
73
International Equity FundFor the Financial Year Ended 30 June 2021
Total Expenses Ratio US Dollar Class A 30 June 2021
USD
US Dollar Class B 30 June 2021
USD
Sterling Class A 30 June 2021
USD
US Dollar Class S 30 June 2021
USD
Expenses 584,488 110,953 33,694 132,170 Average net assets 65,795,130 9,746,324 3,795,391 132,215,087 Total Expense Ratio (*,**) 0.89% 1.14% 0.89% 0.10%
Portfolio Turnover Ratio TotalPurchases and sales of securities (i) 118,019,273 Subscription and redemption of shares (ii) *** 99,265,528 Monthly average of total assets (iii) 211,551,932 Portfolio Turnover Ratio 9%
For the Financial Year Ended 30 June 2020
Total Expenses Ratio US Dollar Class A 30 June 2020
USD
US Dollar Class B 30 June 2020
USD
Sterling Class A 30 June 2020
USD
US Dollar Class S 30 June 2020
USD
Expenses 501,448 107,052 20,802 178,060Average net assets 57,022,784 9,479,114 2,370,644 177,092,632Total Expense Ratio (*,**) 0.87% 1.12% 0.87% 0.10%
Portfolio Turnover Ratio TotalPurchases and sales of securities (i) 248,648,321 Subscription and redemption of shares (ii) *** 187,505,886 Monthly average of total assets (iii) 245,965,174 Portfolio Turnover Ratio 25%
* The Total Expense Ratios for International Equity Fund include operating expense reimbursements of USD 48,598 (30 June 2020: USD 38,286).** The Total Expense Ratio is annualised.*** The subscription and redemption of shares figure in the above table excludes share class switches.Note - the portfolio turnover ratio is calculated as follows ((i-ii)/iii) x 100). The portfolio turnover ratio is not annualised.

Harding Loevner Funds plcAppendix 2 - Financial Information (Unaudited) (Continued)
For the Financial Year Ended 30 June 2021
74
Emerging Markets Equity FundFor the Financial Year Ended 30 June 2021
Total Expenses RatioUS Dollar Class A
30 June 2021 USD
US Dollar Class B 30 June 2021
USD
US Dollar Class I
30 June 2021 USD
Canadian Dollar Class B
30 June 2021 USD
Canadian Dollar Class I
30 June 2021 USD
Canadian Dollar Class M
30 June 2021 USD
Canadian Dollar Class S
30 June 2021 USD
Expenses 100,836 66,502 1,018,217 6,571 432,843 299,603 216,945 Average net assets 12,256,178 4,486,003 113,133,987 442,244 177,317,276 78,898,581 297,645,760 Total Expense Ratio (*,**) 1.10% 1.48% 0.90% 1.48% 0.90% 1.05% 0.10%
Portfolio Turnover Ratio TotalPurchases and sales of securities (i) 254,963,189 Subscription and redemption of shares (ii) *** 131,259,568Monthly average of total assets (iii) 684,180,029 Portfolio Turnover Ratio 18%
* The Total Expense Ratios for Emerging Markets Equity Fund include operating expense reimbursements of USD 139,485 (30 June 2020: USD 135,999).** The Total Expense Ratio is annualised.*** The subscription and redemption of shares figure in the above table excludes share class switches.Note - the portfolio turnover ratio is calculated as follows ((i-ii)/iii) x 100). The portfolio turnover ratio is not annualised.

Harding Loevner Funds plcAppendix 2 - Financial Information (Unaudited) (Continued)
For the Financial Year Ended 30 June 2021
75
Emerging Markets Equity FundFor the Financial Year Ended 30 June 2020
Total Expenses RatioUS Dollar Class A
30 June 2020 USD
US Dollar Class B 30 June 2020
USD
US Dollar Class I
30 June 2020 USD
Canadian Dollar Class B
30 June 2020 USD
Canadian Dollar Class I
30 June 2020 USD
Canadian Dollar Class M
30 June 2020 USD
US Dollar Class M
30 June 2020 USD
Expenses 518,489 82,544 1,088,767 1,634 1,531,930 798,443 51,702Average net assets 42,972,586 5,547,658 120,316,628 325,367 169,289,344 75,628,950 64,363,757Total Expense Ratio (*,**) 1.20% 1.48% 0.90% 1.49% 0.90% 1.05% 1.05%
Total Expenses Ratio EuroClass I
30 June 2020 USD
Expenses 741,303Average net assets 92,473,339Total Expense Ratio (*,**) 0.90%
Portfolio Turnover Ratio TotalPurchases and sales of securities (i) 356,866,773 Subscription and redemption of shares (ii) *** 237,109,911 Monthly average of total assets (iii) 570,917,628 Portfolio Turnover Ratio 21%
* The Total Expense Ratio is annualised.** The subscription and redemption of shares figure in the above table excludes share class switches.Note - the portfolio turnover ratio is calculated as follows ((i-ii)/iii) x 100). The portfolio turnover ratio is not annualised.

Harding Loevner Funds plcAppendix 2 - Financial Information (Unaudited) (Continued)
For the Financial Year Ended 30 June 2021
76
Global Small Companies Equity FundFor the Financial Year Ended 30 June 2021
Total Expenses Ratio US Dollar Class A 30 June 2021
USD
Expenses 15,636 Average net assets 1,489,104 Total Expense Ratio (*,**,***) 1.05%
Portfolio Turnover Ratio TotalPurchases and sales of securities (i) 599,414 Subscription and redemption of shares (ii) **** -Monthly average of total assets (iii) 1,489,104 Portfolio Turnover Ratio 40%
For the Financial Year Ended 30 June 2020
Total Expenses Ratio US Dollar Class A 30 June 2020
USD
Expenses 11,981Average net assets 1,134,819Total Expense Ratio (*,**,***) 1.05%
Portfolio Turnover Ratio TotalPurchases and sales of securities (i) 626,859 Subscription and redemption of shares (ii) **** -Monthly average of total assets (iii) 1,134,819 Portfolio Turnover Ratio 55%
* The Total Expense Ratios for Global Small Companies Equity Fund include operating expense reimbursements of USD 135,497 (30 June 2020: USD 132,944).** The Total Expense Ratios for Global Small Companies Equity Fund include preliminary expenses of USD 5,289 (30 June 2020: USD 5,332). These are amortised for valuation purposes over five years; however, they were expensed in the financial statements during the period they were incurred.*** The Total Expense Ratio is annualised.**** The subscription and redemption of shares figure in the above table excludes share class switches.Note - the portfolio turnover ratio is calculated as follows ((i-ii)/iii) x 100). The portfolio turnover ratio is not annualised.

+ 353 1 434 5085www.hardingloevnerfundsplc.com