RBC Funds (Lux) - Fundsquare
112
RBC Funds (Lux) Société d’Investissement à Capital Variable (SICAV) under Luxembourg Law (R.C.S Luxembourg B 148411) Annual Report, including Audited Financial Statements for the year ended October 31, 2017 No subscription can be received on the basis of financial reports. Subscriptions are only valid if made on the basis of the current prospectus accompanied by the Key Investor Information Document ("KIID"), the latest annual report and the most recent semi-annual report, if published thereafter.
-
Upload
khangminh22 -
Category
Documents
-
view
6 -
download
0
Transcript of RBC Funds (Lux) - Fundsquare

RBC Funds (Lux)Société d’Investissement à Capital Variable (SICAV)under Luxembourg Law(R.C.S Luxembourg B 148411)
Annual Report, including Audited Financial Statementsfor the year ended October 31, 2017
No subscription can be received on the basis of financial reports. Subscriptions are only valid if made on the basis of thecurrent prospectus accompanied by the Key Investor Information Document ("KIID"), the latest annual report and the mostrecent semi-annual report, if published thereafter.
Table of contents
PageManagement and Administration 3General Information 6Report of the Board of Directors 7Audit report 12Statement of Investments and Geographical/Economic Portfolio Breakdowns
RBC Funds (Lux) - Global Equity Focus Fund 14
RBC Funds (Lux) - European Equity Focus Fund 17
RBC Funds (Lux) - Canadian Equity Value Fund 20
RBC Funds (Lux) - U.S. Mid Cap Value Equity Fund 24
RBC Funds (Lux) - U.S. Small Cap Equity Fund 28
RBC Funds (Lux) - Asia ex-Japan Equity Fund 33
RBC Funds (Lux) - Emerging Markets Value Equity Fund 36
RBC Funds (Lux) - Emerging Markets Equity Fund 41
RBC Funds (Lux) - Emerging Markets Small Cap Equity Fund 45
RBC Funds (Lux) - Global Resources Fund 49
RBC Funds (Lux) - Global Bond Fund 53
RBC Funds (Lux) - U.S. Investment Grade Corporate Bond Fund 58
RBC Funds (Lux) - Conservative Portfolio 65
RBC Funds (Lux) - Balanced Portfolio 67
RBC Funds (Lux) - Growth Portfolio 69
Combined Statement of Net Assets 71Combined Statement of Operations and Changes in Net Assets 77Changes in the Number of Shares 83Statistics 95Notes to the Financial Statements 99Information Concerning the Remuneration Policy (Unaudited) 112
RBC Funds (Lux)
2
Management and Administration
BOARD OF DIRECTORS OF THE FUNDFrank LIPPA, CPA, CA (resigned on July 01, 2017)Chief Operating Officer and Chief Financial Officer of RBC Global Asset Management Inc.155 Wellington Street West, Suite 2300Toronto, OntarioCanada M5V 3K7
Francisco LUCARIndependent Consultant21, Route d'HermanceCH-1222 GenevaSwitzerland
Laurence BENSAFIPortfolio Manager and Deputy Head, Emerging Markets Equities of RBC Global Asset Management (UK) LimitedRiverbank House2 Swan LaneLondon EC4R 3BFUnited Kingdom
Milos VUKOVICVice President and Head, Investment Policy of RBC Global Asset Management Inc.155 Wellington Street West, Suite 2300Toronto, OntarioCanada M5V 3K7
Matthew GRAHAMChief Operating Officer of RBC Global Asset Management Inc.155 Wellington Street West, Suite 2300Toronto, OntarioCanada M5V 3K7
BOARD OF DIRECTORS OF THE MANAGEMENT COMPANY
Chairman:Yie-Hsin HungChairman and Chief Executive OfficerNew York Life Insurance CompanySenior Managing Director and Co-PresidentNew York Life Investment Management
Directors:Jean-Yves MaldagueManaging DirectorCandriam Luxembourg
Naïm Abou-JaoudéChairman of the Executive CommitteeCandriam Investors Group
John M. GradySenior Managing DirectorNew York Life Investment Management
John T. FleurantExecutive Vice President and Chief Financial OfficerNew York Life Insurance Company
Christopher O. BLUNTExecutive Vice President and President of the Investments GroupNew York Life Insurance Company
RBC Funds (Lux)
3
BOARD OF MANAGEMENT
Chairman:Jean-Yves MaldagueManaging DirectorCandriam Luxembourg
Members:Naïm Abou-JaoudéDirector - ManagerCandriam Luxembourg
Michel OryManagerCandriam Luxembourg
Alain PetersManagerCandriam Luxembourg
REGISTERED OFFICE14, porte de FranceL-4360 Esch-sur-AlzetteGrand Duchy of Luxembourg
MANAGEMENT COMPANYCandriam Luxembourg, société en commandite par actions19-21, route d'ArlonL-8009 StrassenGrand Duchy of Luxembourg
PROMOTER, INVESTMENT MANAGER AND DISTRIBUTORRBC Global Asset Management Inc.155 Wellington Street West, Suites 2200 & 2300Toronto, OntarioCanada M5V 3K7
SUB-INVESTMENT MANAGERSRBC Global Asset Management (UK) LimitedRiverbank House2 Swan LaneLondon EC4R 3BFEngland
RBC Global Asset Management (U.S.) Inc.50 South Sixth Street, Suite 2350Minneapolis, Minnesota 55402United States of America
RBC Investment Management (Asia) Limited17th Floor, Cheung Kong Center2 Queen's Road, CentralHong Kong
DEPOSITARY BANK AND PAYING AGENT,ADMINISTRATIVE AND DOMICILIARY AGENT,REGISTRAR AND TRANSFER AGENTRBC Investor Services Bank S.A.14, porte de FranceL-4360 Esch-sur-AlzetteGrand Duchy of Luxembourg
RBC Funds (Lux)
4
Management and Administration (continued)
AUDITORPricewaterhouseCoopers, Société coopérative2, rue Gerhard MercatorB.P. 1443L-1014 LuxembourgGrand Duchy of Luxembourg
LEGAL ADVISORArendt & Medernach S.A.41A, avenue J.F. KennedyL-2082 LuxembourgGrand Duchy of Luxembourg
RBC Funds (Lux)
5
Management and Administration (continued)
General Information
Annual Meetings of shareholders will generally be held at the registered office of the Fund in Luxembourg on the first Thursdayin the month of April at 14:00 or, if any such day is not a Business Day, on the next following Business Day, unless otherwisestated in the notice of convocation.
Notices of all general meetings will be sent to the holders of registered Shares by registered mail at least eight calendar daysprior to the meeting at their addresses shown on the register of shareholders. Such notices will include the agenda and willspecify the time and place of the meeting and the conditions of admission.
They will also refer to the rules of quorum and majorities required by Luxembourg law and laid down in Article 67 and 67-1 ofthe Luxembourg law of August 10, 1915 on commercial companies (as amended) and in the Articles of Incorporation of theFund.
Each whole Share confers the right to one vote. Approval from a simple majority of the shareholders at a meeting ofshareholders of a Sub-Fund or a Class is required in respect of the payment of a dividend (if any) for a particular Sub-Fund orClass.
Any change to the Articles of Incorporation must be approved by shareholders at a general meeting of the shareholders ofthe Fund.
Annual reports, including audited financial statements of the Fund shall be published within four (4) months following the endof the fiscal year of the Fund, and unaudited semi-annual reports shall be published within two (2) months following the periodto which they refer.
The annual reports shall be sent to each registered shareholder by electronic means or in hard copy form at the addressshown on the register of shareholders.
Copies of the latest annual and semi-annual reports may be obtained free of charge during normal office hours at theregistered office of the Fund in Luxembourg and available online at www.rbcgam.lu.
A Key Investor Information Document (“KIID”) for each available Class of Shares of each Sub-Fund shall be made available toinvestors free of charge prior to their subscription for Shares.
A detailed schedule of portfolio movements is available free of charge upon request at the registered office of the Fund.
For the following Sub-Funds, no notification for marketing in the Federal Republic of Germany has been filed with the FederalFinancial Supervisory Authority (BaFin), so that Shares of these Sub-Funds may not be marketed to investors within thejurisdiction of the Investment Code:
RBC Funds (Lux) - Conservative PortfolioRBC Funds (Lux) - Balanced PortfolioRBC Funds (Lux) - Growth Portfolio
RBC Funds (Lux)
6
Report of the Board of Directors
Dear Shareholders:
We are pleased to provide you with this annual report for RBC Funds (Lux) (the “Fund”) for the year ended October 31, 2017.
The Fund
The Fund is an open-ended investment company with variable capital. The Fund has multiple Sub-Funds, each of which has itsown investment policy and restrictions. During the year, the total net assets of the Fund increased to US$1.1 billion at year endfrom US$538 million.
The Fund qualifies as an Undertaking for Collective Investments in Transferable Securities (UCITS) and may therefore be offeredfor sale in European Union Member States, subject to registration in countries other than the Grand Duchy of Luxembourg. Inaddition, applications to register the Fund and its Sub-Funds may be made in other countries.
As of October 31, 2017, the Fund and certain specific Sub-Funds are currently registered for distribution in the Grand Duchy ofLuxembourg, Austria, Belgium, Denmark, Finland, France, Germany, Ireland, Italy (institutional investors only), the Netherlands,Norway, Singapore (restricted availability), Spain, Sweden, Switzerland and the United Kingdom.
Responsibility of the Directors
The preparation of the combined financial statements of the Fund is carried out by RBC Investor Services Bank S.A. asAdministrator under supervision of the Board of Directors. In accordance with Luxembourg laws and regulations, the Directorshave taken reasonable steps to ensure that appropriate internal controls relevant to the preparation and fair presentation ofcombined financial statements are in place by the Fund's service providers, and otherwise to exercise oversight with respectto accounting estimates of judgments made in connection with the preparation of the combined financial statements. TheBoard of Directors is satisfied that it has fully complied with these requirements.
ALFI Code of Conduct
The Board of Directors adheres to the Association of the Luxembourg Fund Industry (“ALFI”) Code of Conduct for Luxembourginvestment Funds. The Code of Conduct sets a framework of high-level principles and best practice recommendations for thegovernance of Luxembourg investment Funds.
Annual General Meeting
The Annual General Meeting of the Fund will be held on April 5, 2018.
For up-to-date information about the Sub-Funds of RBC Funds (Lux), please visit our website at www.rbcgam.lu. On behalf ofthe entire team at RBC Global Asset Management, we would like to thank you for your trust and confidence.
The Board of DirectorsLuxembourg, January 25, 2018
RBC Funds (Lux)
7

Review of the Sub-Funds
RBC Funds (Lux) – Global Equity Focus Fund
The Fund’s Class O shares (USD) returned 29.6%, outperforming the 22.8% rise in the MSCI World Net Index. The Fund’sperformance included fees and expenses while the benchmark return did not include any costs of investing.
The rally in value stocks witnessed at the end of 2016 reversed at the start of 2017. Relative returns were driven by strong stockselection. U.S. pharmaceutical Kite Pharma, which was the subject of an all-cash takeover offer from Gilead Sciences, andU.S. computer games developer Activision Blizzard were the top performers during the period. Nidec, a Japanesemanufacturer of electric motors, also continued to perform well as the company is poised to benefit from the continuedelectrification of cars and developments in robotics.
The biggest detractor over the period was TJX, the U.S. discount retailer, which suffered from a fall in mall traffic and the threatof online alternatives. Swiss pharmaceutical Roche experienced competition on several of its key compounds, andInternational Flavors & Fragrances, a U.S.-based company, recorded disappointing results late in 2016.
RBC Funds (Lux) – European Equity Focus Fund
The Fund’s Class O shares (EUR) returned 18.6% in the year ended October 31, 2017, underperforming the 19.5% gain in theMSCI Europe Net Index. The Fund’s performance included fees and expenses while the benchmark return did not include anycosts of investing.
The beginning of the period was dominated by a market moves into cyclical stocks and away from defensive issues, markinga revival of Europe’s lowest-quality stocks and sectors. Throughout 2017, equity markets rose steadily as earnings growthoutweighed geopolitical tensions and the eventual end of quantitative easing by the European Central Bank.
Asset allocation was positive for performance due to the Fund’s overweight position in Industrials and underweights in thedomestically focused Telecommunication Services and Utilities sectors. Holdings of luxury-goods maker Christian Dior andbudget airline Ryanair contributed the most to relative performance. The stock with the most negative impact onperformance was BT Group, the U.K. telecom company.
The portfolio manager’s approach is anchored in finding companies that require less significant amounts of capital. As such,the portfolio manager is unlikely to rotate the portfolio in reaction to macroeconomic outcomes.
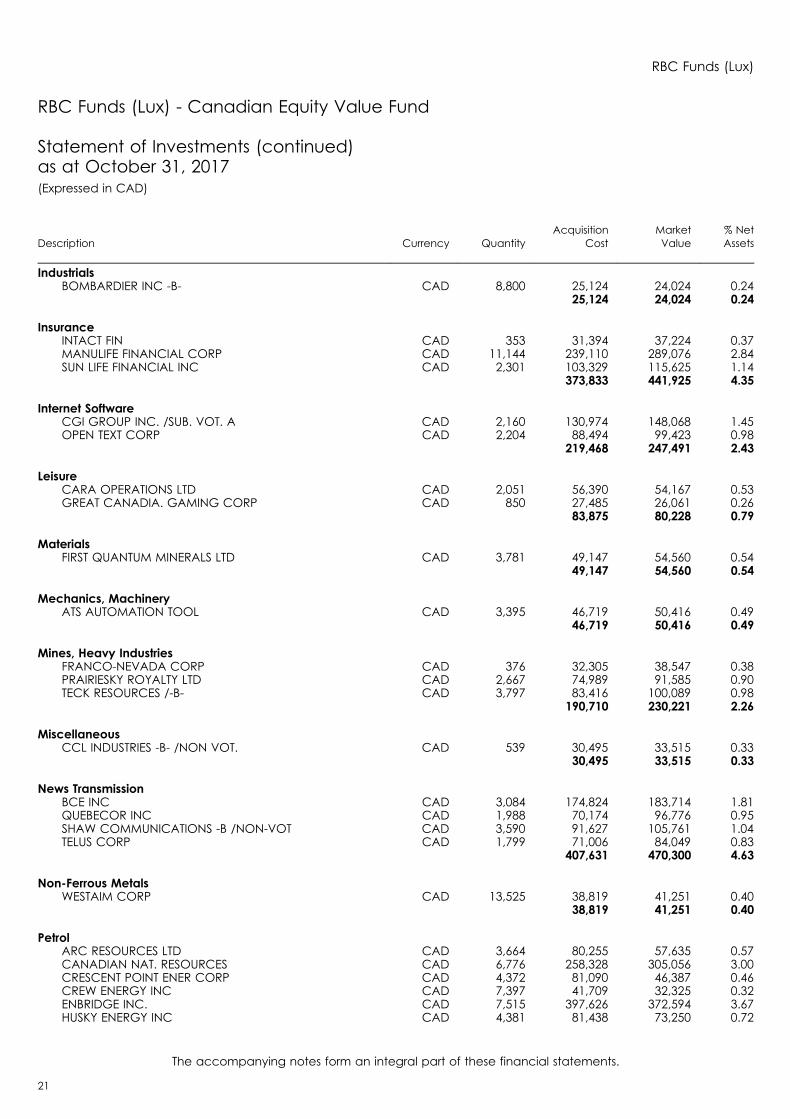
RBC Funds (Lux) – Canadian Equity Value Fund
The Fund’s Class O shares (CAD) returned 11.3% during the period ended October 31, 2017, underperforming the 11.5% gain inthe S&P/TSX Capped Composite Index. The Fund’s performance included fees and expenses while the benchmark return didnot include any costs of investing.
The Fund benefited during the period from asset weighting and security selection. The largest contributor to performance wasthe Materials sector, where returns were boosted by underweight positioning in precious metals, and in particular theavoidance of poorly performing producers such as Wheaton Precious Metals and Tahoe Resources. Conversely, a lack ofrelative exposure to the strong Consumer Discretionary sector hurt returns.
The portfolio manager believes that stocks, while not as attractive as they were when the cycle began, remain somewhatattractive relative to fixed income. Equities have benefited from rising earnings and price-to-earnings ratios through this bullmarket, but earnings rather than valuations may now be the force needed to propel them higher.
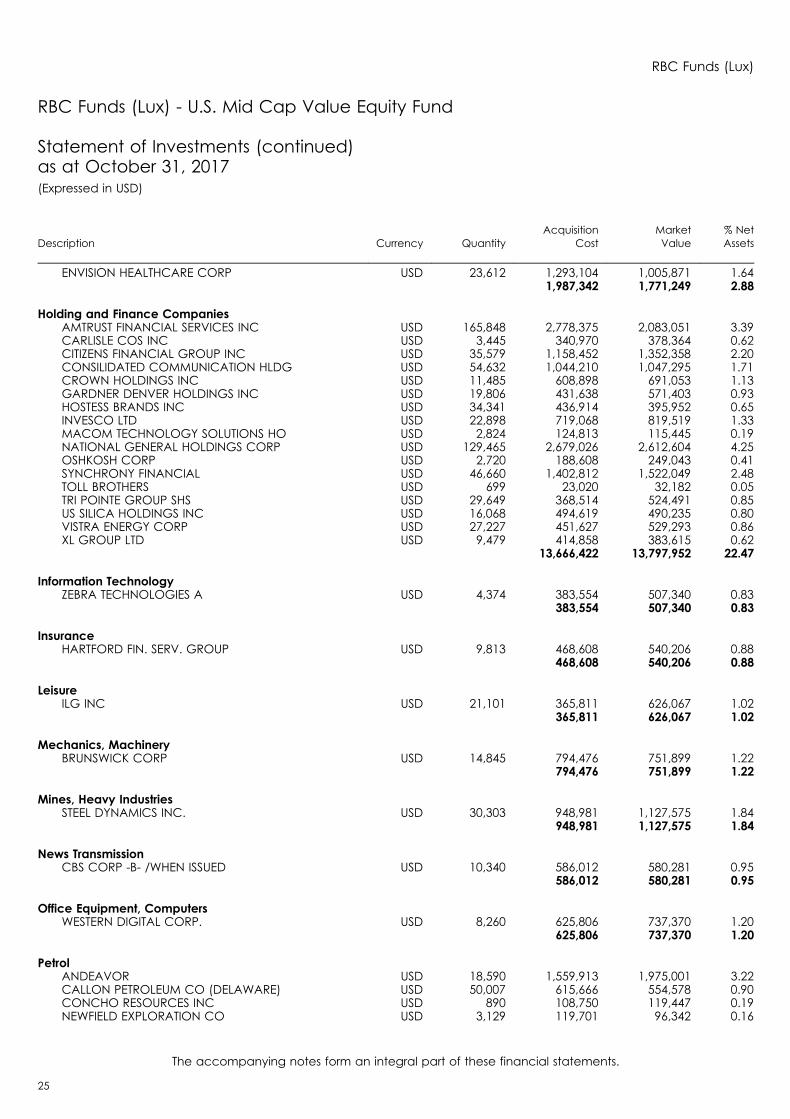
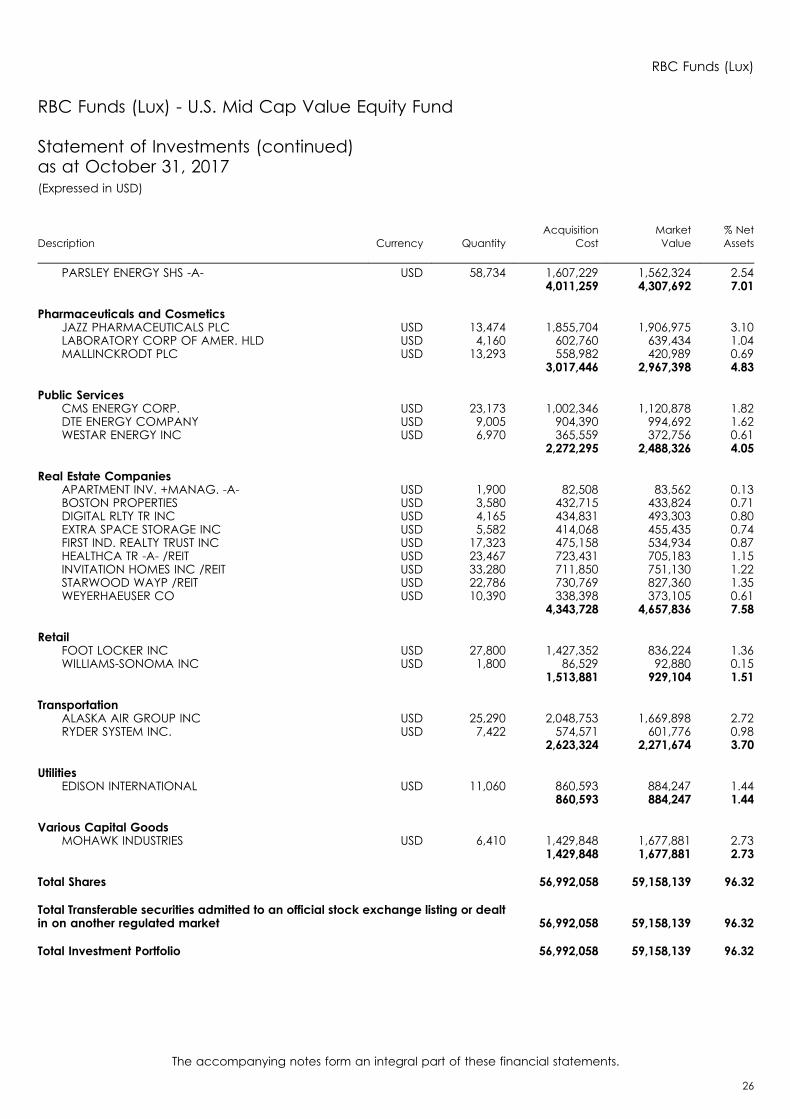
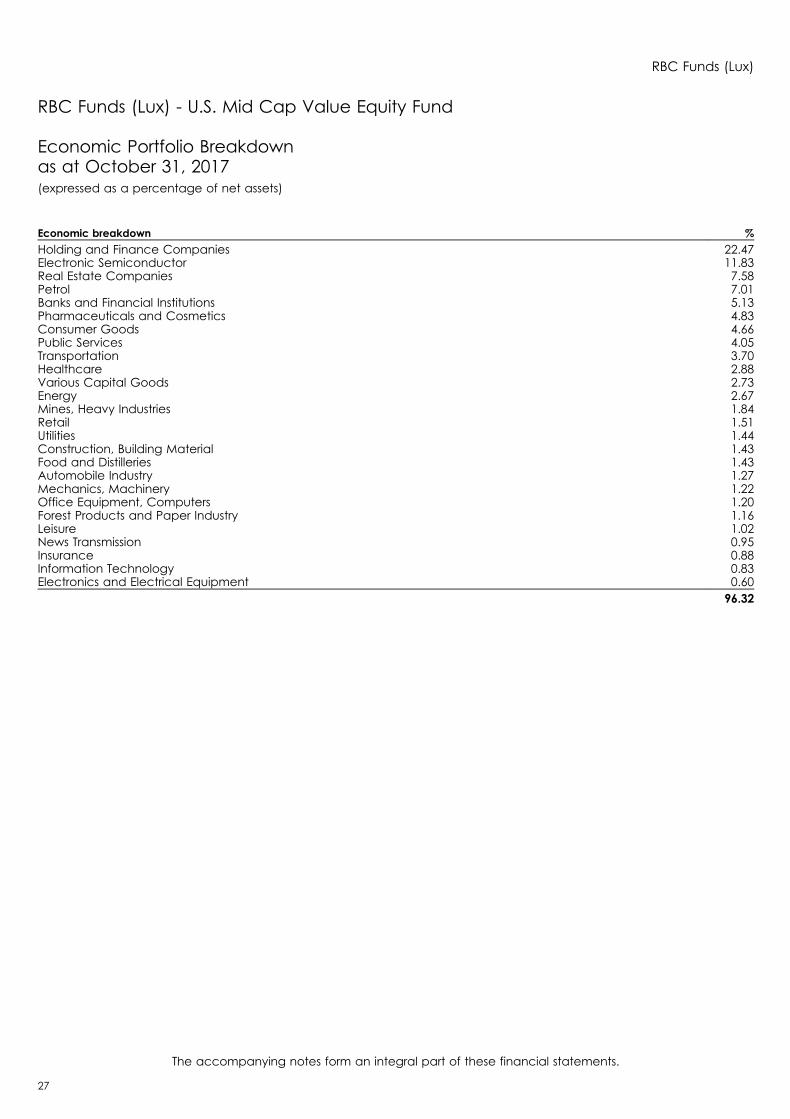
RBC Funds (Lux) – U.S. Mid Cap Value Equity Fund
Over the past fiscal year, the Fund’s Class O shares (USD) returned 12.4%, underperforming the 17.1% gain in the Russell MidcapValue Index. Stock selection had a negative impact on relative returns, leading to the Fund’s underperformance. Sectorallocation decisions contributed modestly to returns. The Fund’s performance included fees and expenses while thebenchmark return did not include any costs of investing.
Stock selection in the Financials sector weighed on performance, primarily due to holdings in the insurance company AmTrustFinancial Services, while Alaska Air Group and Spirit Airlines held back returns in the Industrials sector. Specialtybiopharmaceutical company Mallinckrodt in the Health Care sector also had an adverse impact on relative returns.
These detractors were offset somewhat by favourable stock selection in the Information Technology and Real Estate sectors.Semiconductor manufacturer Lam Research boosted returns in the Information Technology sector, while Starwood WaypointHomes aided performance in the Real Estate sector. The Fund benefited from a moderate overweight position in theInformation Technology sector and a significant underweight in the Real Estate sector.
According to a shareholder notice dated December 21, 2017, the Fund was liquidated on January 10, 2018.
RBC Funds (Lux)
8

RBC Funds (Lux) – U.S. Small Cap Equity Fund
Over the past fiscal year, the Fund’s Class O shares (USD) returned 25.4% over the period, outperforming the 24.8% gain in theRussell 2000 Value Index. Favorable stock selection drove outperformance, while the impact of sector allocation decisionshad a moderately positive impact on returns. The Fund’s performance included fees and expenses while the benchmarkreturn did not include any costs of investing.
Favourable stock selection was most pronounced in the Information Technology sector, with Novanta and Coherent Inc.contributing the most to returns. Within the Real Estate sector, data center REIT DuPont Fabros Technology was another strongcontributor. Returns in these stocks more than offset the negative impact of stock selection in the Consumer Discretionary andFinancials sectors. In terms of sector allocation, the Fund’s moderate overweight to the strong-performing Industrials sectorcontributed the most to returns, followed by a modest underweight to the poorly performing Consumer Staples sector.
RBC Funds (Lux) – Asia ex-Japan Equity Fund
The Fund’s Class O shares (USD) returned 25.1% in the year ended October 31, 2017, underperforming the 30.5% gain in theMSCI AC Asia Ex-Japan Index. The Fund’s underperformance was driven by the negative effect of security selection, whileasset allocation had small positive effect on relative returns. The Fund’s performance included fees and expenses while thebenchmark return did not include any costs of investing.
At the sector level, stocks in the Information Technology, Financials and Consumer Staples sectors had a positive impact onrelative performance. Within Information Technology, both internet and hardware stocks performed strongly. Most of thepositive benefit of stock selection came from securities in mainland China, Hong Kong and Taiwan, as the North Asia regionsignificantly outperformed South Asia. Investors rotated into North Asia, as confidence in the Chinese economy improvedsupported by government policies. Relative returns were hurt by poor stock selection. Bellamy’s, an Australian food andbeverage company in the Consumer Discretionary sector, and Indian pharmaceuticals company Divis Laboratories, hurtperformance.
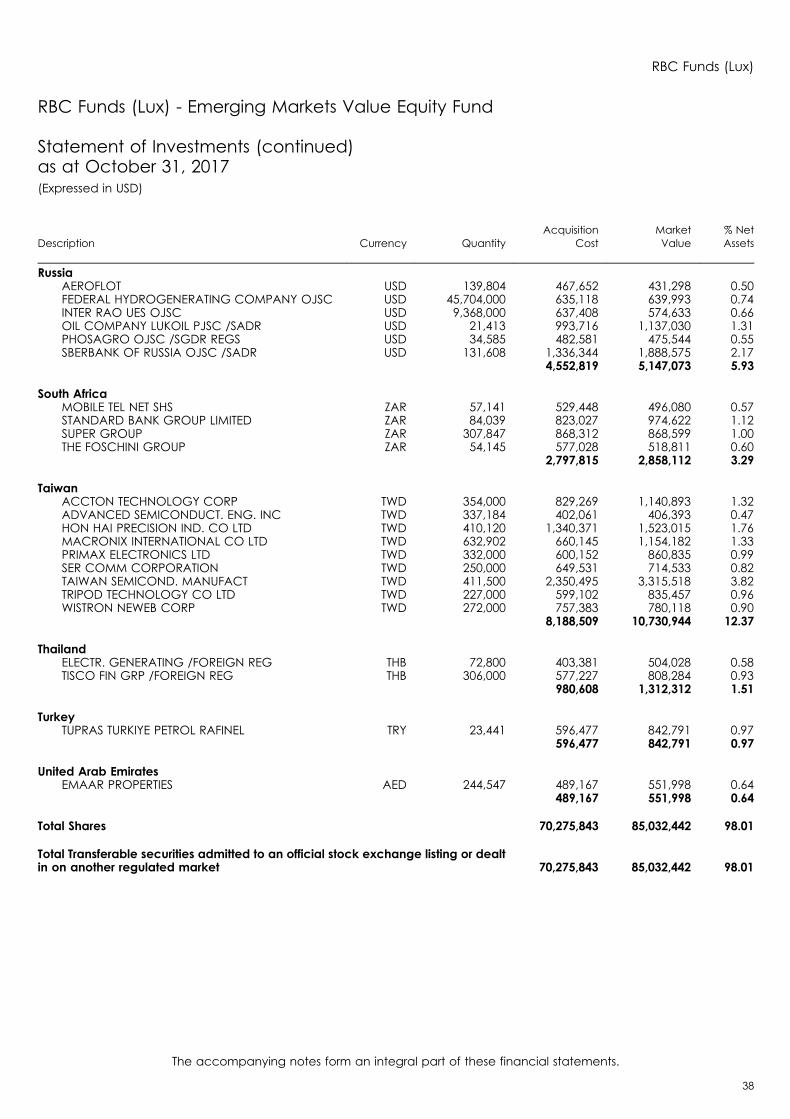
RBC Funds (Lux) – Emerging Markets Value Equity Fund
The Fund’s Class O shares (USD) returned 28.3% in the year ended October 31, 2017, which outperformed the 26.5% gain in theMSCI Emerging Markets Net Index. The Fund’s performance included fees and expenses while the benchmark return did notinclude any costs of investing.
Emerging-market equities performed strongly during the fiscal year, outperforming developed-market equities, buoyed by animproving outlook for emerging economies and continued strength in emerging-market currencies relative to the U.S. dollar.Additionally, emerging-market profitability began to recover due to increased productivity after five consecutive years ofdeclines. Flows into emerging-market equities also resumed after five years of flat to negative flows.
Asset allocation and stock selection contributed positively to overall returns. The Fund’s underweight position in the ConsumerStaples and Telecommunication Services sectors aided performance, while an overweight in Utilities held back returns. At thecountry level, the Fund’s underweight allocations to South Africa and Malaysia had a positive impact on performance. Stockselection was strong in the Financials and Information Technology sectors, and negative in the Real Estate and Industrialssectors. Stock selection in Taiwan and Brazil was strong, while stock selection in China was negative due to not holdingTencent, a Chinese technology company.
RBC Funds (Lux) – Emerging Markets Equity Fund
The Fund’s Class O shares (USD) returned 22.7% in the year ended October 31, 2017, underperforming the 26.5% gain in theMSCI Emerging Markets Net Index. The Fund’s performance included fees and expenses while the benchmark return did notinclude any costs of investing.
Emerging-market equities performed strongly during the fiscal year, outperforming developed-market equities, buoyed by animproving outlook for emerging economies and continued strength in emerging-market currencies relative to the U.S. dollar.Additionally, emerging-market profitability began to recover due to increased productivity after five consecutive years ofdeclines. Flows into emerging-market equities also resumed after five years of flat to negative flows.
Asset allocation had a negative impact on relative performance, while stock selection contributed positively. From an asset-allocation perspective, the Fund’s overweight position in the Consumer Staples and Health Care sectors hurt relativeperformance, while underweight positions in Telecommunication Services aided returns. At the country level, the Fund’sunderweight in Mexico and lack of holdings in Qatar was a positive, while an underweight in China held back relative returns.Stock selection was positive in the Consumer Discretionary sector, notably due to the Fund’s holding in Naspers, a SouthAfrican media company. Meanwhile, stock selection in India, Korea and Russia had a negative effect on returns.
RBC Funds (Lux)
9
Review of the Sub-Funds (continued)
RBC Funds (Lux) – Emerging Markets Small Cap Equity Fund
The Fund’s Class O shares (USD) returned 10.9% in the year ended October 31, 2017, which underperformed the 20.7% gain theMSCI Emerging Markets Small Cap Net Index. The Fund’s performance included fees and expenses while the benchmarkreturn did not include any costs of investing.
Small-cap equities lagged broader emerging-markets indexes due in part to the strong outperformance of large-capitalization stocks in the Information Technology sector. Emerging-market equities outperformed developed-marketequities during the period, buoyed by an improving outlook for emerging economies and continued strength in emerging-market currencies relative to the U.S. dollar.
Asset allocation and stock selection hurt the Fund’s relative returns over the period. Asset allocation was negative due to theFund’s overweight position in the Consumer Staples and Consumer Discretionary sectors. Additionally, the Fund’s overweightin the Philippines held back performance, partially offset by the positive impact the Fund’s overweight position in India. Stockselection in the Information Technology and Consumer Staples sectors had a negative impact on returns, while stock selectionin the Industrials andMaterials sectors was a positive. Stock selection in the Indonesia market contributed to returns, while stockselection in Taiwan and Brazil was negative.
RBC Funds (Lux) – Global Resources Fund
The Fund’s Class O shares (USD) gained 8.3% in the year ended October 31, 2017, underperforming the 14.9% rise in theblended benchmark. The Fund’s performance included fees and expenses while the benchmark return did not include anycosts of investing.
Prices for most commodities rose during the period, as global GDP growth stimulated demand for chemicals and base metals,and coordinated production cuts by OPEC helped to reduce oil inventories and improve the supply/demand outlook.Precious-metals prices were supported by a weakening U.S. dollar, but could not gain traction as unrelenting strength in thebroader market reduced the perceived need for investors to own safe-haven assets. However, the performance of resource-based equities was mixed, with Materials stocks generating double-digit returns, while Energy stocks suffered modest-to-heavylosses as a host of perceived challenges in the future offset the positive impact of rising oil prices.
Within the Fund, an overweight position in Materials stocks benefited portfolio performance, offset by the negative impact ofbeing overweight shares of exploration and production companies. Positions in Kirkland Lake Gold and Interfor were amongthe largest contributors to relative returns, and overweight positions in Rio Tinto and Akzo Nobel also boosted performance.Overweight positions in Seven Generations Energy and U.S. Silica and were among the shares that hurt returns the most.
RBC Funds (Lux) – Global Bond Fund
The Fund’s Class O shares (USD) returned 0.4%, matching the 0.4% gain in the Citigroup World Government Bond Index. TheFund’s performance included fees and expenses while the benchmark return did not include any costs of investing.
Global bond markets sold off after Donald Trump’s surprise election victory in November fuelled by expectations of fiscalstimulus, tax cuts, regulatory rollbacks and infrastructure spending. By March, bond markets rebounded amid rising skepticismabout whether Congress would manage to pass pro-growth policies and escalating tension surrounding the regime in NorthKorea. By the end of reporting period, global bond markets had recouped most of the losses incurred after Trump’s election.
Major central banks continue to pursue divergent monetary policies. The U.S. Federal Reserve and Bank of Canada (BOC)have started raising rates, while the European Central Bank and the Bank of Japan continue with bond-buying programs. TheBOC was the most aggressive in raising policy rates after stellar domestic economic growth in the first half of the year. It was,therefore, no surprise that Canada’s bond market was the worst-performing among its global peers during the period.
The Fund’s relative exposure to European bonds, and small allocations to higher-risk corporate and emerging-market debt,contributed to performance, as did strategies that took advantage of yield curves in different markets.
RBC Funds (Lux) – U.S. Investment Grade Corporate Bond Fund
The Fund’s Class O shares (USD) returned 3.4%, underperforming the 3.5% rise in the Barclays Capital U.S. Corporate BondIndex. The Fund’s performance included fees and expenses while the benchmark return did not include any costs of investing.
Corporate bonds gained due to their excess yield over Treasuries and a smaller decline in their prices relative to governmentsecurities. The narrowing gap between yields on corporate bonds and government securities and higher income generatedby corporate bonds resulted in a 4.37% excess return over Treasuries during the 12 months ended October 31, 2017.
The Fund’s performance reflected a focus on investing in large companies with stable to improving credit outlooks. Securityselection was a primary driver of relative performance, with stocks in the Information Technology and Utilities sectors providingthe strongest benefit relative to the benchmark. Conversely, the Fund’s holdings in commodity-related sectors such as
RBC Funds (Lux)
10
Review of the Sub-Funds (continued)

Materials and Energy lagged the benchmark. These sectors have seen some of the strongest performance in the corporatemarket over 2017, led by companies with credit profiles that we view as unattractive.
RBC Funds (Lux) – Conservative Portfolio
The Fund’s Class O shares (USD) returned 9.0% in the year ended October 31, 2017, underperforming the 9.1% rise in theblended benchmark. The Fund’s performance included fees and expenses while the benchmark return did not include anycosts of investing.
The Fund was overweight equities and underweight bonds, which had a positive impact on the portfolio’s return. All of theFund’s fixed-income holdings contributed positively, led by the RBC (Lux) U.S. Investment Grade Corporate Bond Fund. TheFund’s equity positions had a positive impact on performance, led by the iShares Core S&P 500 Index Fund.
Our models continue to suggest the long-term direction for bond yields is higher, which would weigh on total returns for bondholders. Prospective returns for equities are much better than for fixed income, but we recognize that valuations are abovetheir long-term averages, so earnings growth is now critical for the continuity of the bull market. The Fund has been dialingback the risk exposure in the asset mix as the business cycle matures, trimming the equity-overweight allocation and puttingthe proceeds in fixed income.
RBC Funds (Lux) – Balanced Portfolio
The Fund’s Class O shares (USD) returned 13.5% in the year ended October 31, 2017, underperforming the 13.9% rise in theblended benchmark. The Fund’s performance included fees and expenses while the benchmark return did not include anycosts of investing.
The Fund was overweight equities and underweight fixed income, which had a positive impact on returns. All of the Fund’sfixed-income holdings contributed positively, led by the RBC (Lux) U.S. Investment Grade Corporate Bond Fund. The Fund’sequity positions had a positive impact on performance, led by the Robeco U.S. Large Cap Equity Fund.
Our models continue to suggest the long-term direction for bond yields is higher, which would weigh on total returns for bondholders. Prospective returns for equities are much better than for fixed income, but we recognize that valuations are abovetheir long-term averages, so earnings growth is now critical for the continuity of the bull market. The Fund has been dialingback the risk exposure in the asset mix as the business cycle matures, trimming the equity-overweight allocation and puttingthe proceeds to fixed income.
RBC Funds (Lux) – Growth Portfolio
The Fund’s Class O shares (USD) gained 17.1%, underperforming the 17.4% rise in the blended benchmark. The Fund’sperformance included fees and expenses while the benchmark return did not include any costs of investing.
The Fund was overweight equities and underweight fixed income, which had a positive impact on returns. Among fixed-income holdings in the portfolio, U.S. bond funds contributed positively, led by the RBC (Lux) U.S. Investment Grade CorporateBond Fund. All the Fund’s equity holdings had a positive impact on returns. The largest contributor among equity positions wasthe Threadneedle European Select Fund.
Our models continue to suggest the long-term direction for bond yields is higher, which would weigh on total returns for bondholders. Prospective returns for equities are much better than for fixed income, but we recognize that valuations are abovetheir long-term averages, so earnings growth is now critical for the continuity of the bull market. The Fund has been dialingback the risk exposure in the asset mix as the business cycle matures, trimming the equity-overweight allocation and puttingthe proceeds to fixed income.
RBC Funds (Lux)
11
Review of the Sub-Funds (continued)

AUDIT REPORT
To the Shareholders ofRBC Funds (Lux)
Our opinion
In our opinion, the accompanying financial statements give a true and fair view of the financial position of RBC Funds (Lux)and of each of its sub-funds as at October 31, 2017, and of the results of their operations and changes in their net assets for theyear then ended in accordance with Luxembourg legal and regulatory requirements relating to the preparation andpresentation of the financial statements.
What we have audited
The Fund’s financial statements comprise:
• the Statement of Investments as at October 31, 2017;• the Combined Statement of Net Assets as at October 31,2017;• the Combined Statement of Operations and Changes in Net Assets for the year then ended;• the notes to the financial statements, which include a summary of significant accounting policies.
Basis for opinion
We conducted our audit in accordance with the Law of July 23, 2016 on the audit profession (Law of July 23, 2016) and withInternational Standards on Auditing (ISAs) as adopted for Luxembourg by the “Commission de Surveillance du SecteurFinancier” (CSSF). Our responsibilities under those Law and standards are further described in the “Responsibilities of the“Réviseurd’entreprises agréé” for the audit of the financial statements” section of our report.
We believe that the audit evidence we have obtained is sufficient and appropriate to provide a basis for our opinion.
We are independent of the Fund in accordance with the International Ethics Standards Board for Accountants’ Code of Ethicsfor Professional Accountants (IESBA Code) as adopted for Luxembourg by the CSSF together with the ethical requirementsthat are relevant to our audit of the financial statements. We have fulfilled our other ethical responsibilities under those ethicalrequirements.
Other information
The Board of Directors of the SICAV is responsible for the other information. The other information comprises the informationincluded in the annual report but does not include the financial statements and our audit report thereon.
Our opinion on the financial statements does not cover the other information and we do not express any form of assuranceconclusion thereon.
In connection with our audit of the financial statements, our responsibility is to read the other information identified above and,in doing so, consider whether the other information is materially inconsistent with the financial statements or our knowledgeobtained in the audit, or otherwise appears to be materially misstated. If, based on the work we have performed, weconclude that there is a material misstatement of this other information, we are required to report that fact. We have nothingto report in this regard.
PricewaterhouseCoopers, Société coopérative, 2, rue Gerhard Mercator, B.P. 1443, L-1014 LuxembourgT: +352 494848 1, F:+352 494848 2900, www.pwc.lu
Cabinet de révision agréé. Expert-comptable (autorisation gouvernementale n°10028256)R.C.S. Luxembourg B 65 477 - TVA LU25482518
12

_IpwcResponsibilities of the Board of Directors of the SICAV and those charged with governance for the financial statements
The Board of Directors of the SICAV is responsible for the preparation and fair presentation of the financial statements inaccordance with Luxembourg legal and regulatory requirements relating to the preparation and presentation of the financialstatements, and for such internal control as the Board of Directors of the SICAV determines is necessary to enable thepreparation of financial statements that are free from material misstatement, whether due to fraud or error.
In preparing the financial statements, the Board of Directors of the SICAV is responsible for assessing the Fund's ability tocontinue as a going concern, disclosing, as applicable, matters related to going concern and using the going concern basisof accounting unless the Board of Directors of the SICAV either intends to liquidate the Fund or to cease operations, or has norealistic alternative but to do so.
Those charged with governance are responsible for overseeing the Fund's financial reporting process.
Responsibilities of the “Réviseur d'entreprises agréé" for the audit of the financial statements
The objectives of our audit are to obtain reasonable assurance about whether the financial statements as a whole are freefrom material misstatement, whether due to fraud or error, and to issue an audit report that includes our opinion. Reasonableassurance is a high level of assurance, but is not a guarantee that an audit conducted in accordance with the Lawof July 23, 2016 and with lSAs as adopted for Luxembourg by the CSSF will always detect a material misstatement when itexists. Misstatements can arise from fraud or error and are considered material if, individually or in the aggregate, they couldreasonably be expected to influence the economic decisions of users taken on the basis of these financial statements.
As part of an audit in accordance with the Law of July 23, 2016 and with lSAs as adopted for Luxembourg by the CSSF, weexercise professional judgment and maintain professional scepticism throughout the audit.
We also:
- identify and assess the risks of material misstatement of the financial statements, whether due to fraud or error, design andperform audit procedures responsive to those risks, and obtain audit evidence that is sufficient and appropriate to provide abasis for our opinion. The risk of not detecting a material misstatement resulting from fraud is higher than for one resulting fromerror, as fraud may involve collusion, forgery, intentional omissions, misrepresentations, or the ovenide of internal control;
- obtain an understanding of internal control relevant to the audit in order to design audit procedures that are appropriate inthe circumstances, but not for the purpose of expressing an opinion on the effectiveness of the Fund's internal control:
- evaluate the appropriateness of accounting policies used and the reasonableness of accounting estimates and relateddisclosures made by the Board of Directors of the SICAV:
' conclude on the appropriateness of the Board of Directors of the SlCAV's use of the going concern basis of accounting and.based on the audit evidence obtained, whether a material uncertainty exists related to events or conditions that may castsignificant doubt on the Fund's ability to continue as a going concern. If we conclude that a material uncertainty exists, weare required to draw attention in our audit report to the related disclosures in the financial statements or, if such disclosures areinadequate, to modify our opinion. Our conclusions are based on the audit evidence obtained up to the date of our auditreport. However, future events or conditions may cause the Fund to cease to continue as a going concern;
- evaluate the overall presentation, structure and content of the financial statements, including the disclosures, and whetherthe financial statements represent the underlying transactions and events in a manner that achieves fair presentation.
We communicate with those charged with governance regarding, among other matters, the planned scope and timing ofthe audit and significant audit findings, including any significant deficiencies in internal control that we identify during ouraudit.
Pricewaterhousecoopers, Société coopérative Luxembourg, January 25, 2018Represented by
Serene Shtayyeh
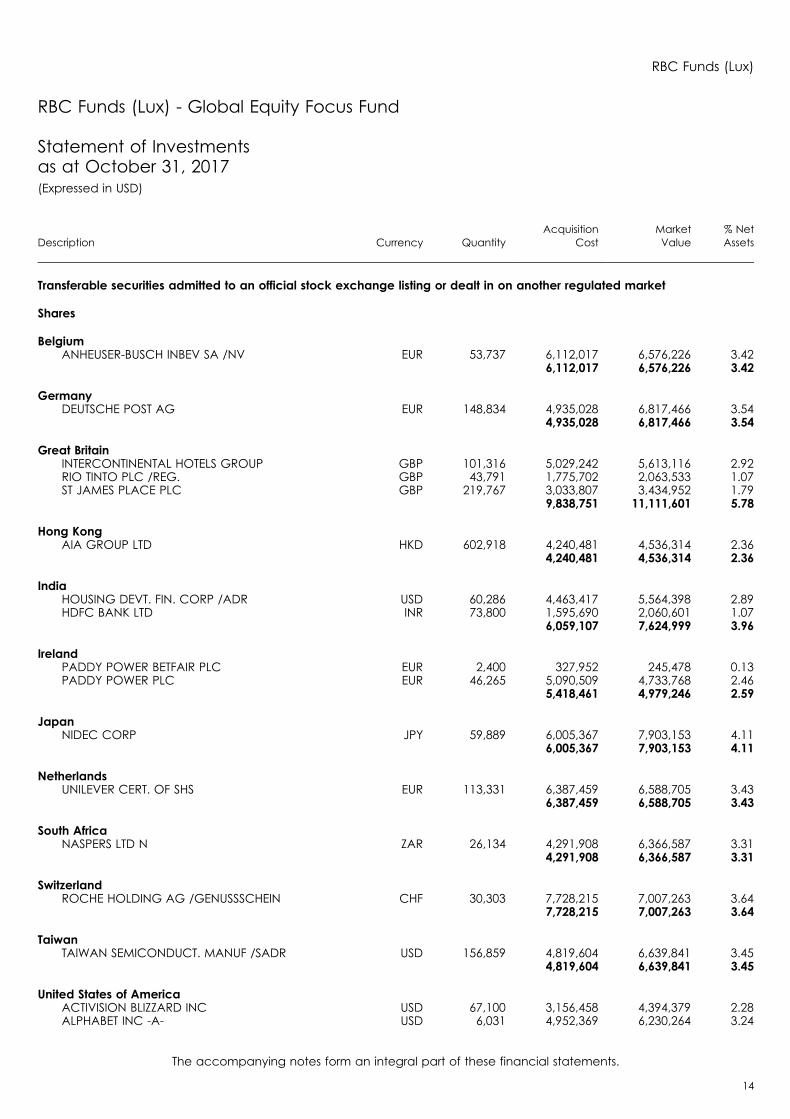
RBC Funds (Lux) - Global Equity Focus Fund
Statement of Investmentsas at October 31, 2017(Expressed in USD)
Description Currency QuantityAcquisition
CostMarketValue
% NetAssets
Transferable securities admitted to an official stock exchange listing or dealt in on another regulated market
Shares
BelgiumANHEUSER-BUSCH INBEV SA /NV EUR 53,737 6,112,017 6,576,226 3.42
6,112,017 6,576,226 3.42
GermanyDEUTSCHE POST AG EUR 148,834 4,935,028 6,817,466 3.54
4,935,028 6,817,466 3.54
Great BritainINTERCONTINENTAL HOTELS GROUP GBP 101,316 5,029,242 5,613,116 2.92RIO TINTO PLC /REG. GBP 43,791 1,775,702 2,063,533 1.07ST JAMES PLACE PLC GBP 219,767 3,033,807 3,434,952 1.79
9,838,751 11,111,601 5.78
Hong KongAIA GROUP LTD HKD 602,918 4,240,481 4,536,314 2.36
4,240,481 4,536,314 2.36
IndiaHOUSING DEVT. FIN. CORP /ADR USD 60,286 4,463,417 5,564,398 2.89HDFC BANK LTD INR 73,800 1,595,690 2,060,601 1.07
6,059,107 7,624,999 3.96
IrelandPADDY POWER BETFAIR PLC EUR 2,400 327,952 245,478 0.13PADDY POWER PLC EUR 46,265 5,090,509 4,733,768 2.46
5,418,461 4,979,246 2.59
JapanNIDEC CORP JPY 59,889 6,005,367 7,903,153 4.11
6,005,367 7,903,153 4.11
NetherlandsUNILEVER CERT. OF SHS EUR 113,331 6,387,459 6,588,705 3.43
6,387,459 6,588,705 3.43
South AfricaNASPERS LTD N ZAR 26,134 4,291,908 6,366,587 3.31
4,291,908 6,366,587 3.31
SwitzerlandROCHE HOLDING AG /GENUSSSCHEIN CHF 30,303 7,728,215 7,007,263 3.64
7,728,215 7,007,263 3.64
TaiwanTAIWAN SEMICONDUCT. MANUF /SADR USD 156,859 4,819,604 6,639,841 3.45
4,819,604 6,639,841 3.45
United States of AmericaACTIVISION BLIZZARD INC USD 67,100 3,156,458 4,394,379 2.28ALPHABET INC -A- USD 6,031 4,952,369 6,230,264 3.24
RBC Funds (Lux)
The accompanying notes form an integral part of these financial statements.
14
Description Currency QuantityAcquisition
CostMarketValue
% NetAssets
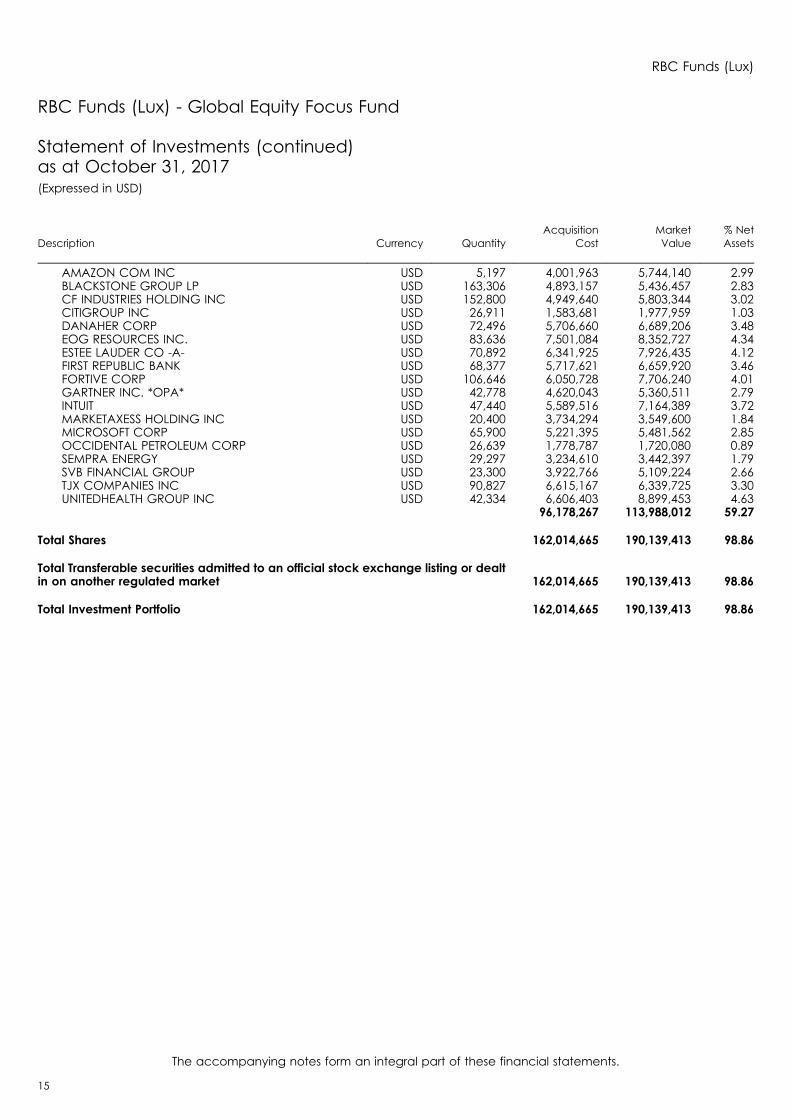
AMAZON COM INC USD 5,197 4,001,963 5,744,140 2.99BLACKSTONE GROUP LP USD 163,306 4,893,157 5,436,457 2.83CF INDUSTRIES HOLDING INC USD 152,800 4,949,640 5,803,344 3.02CITIGROUP INC USD 26,911 1,583,681 1,977,959 1.03DANAHER CORP USD 72,496 5,706,660 6,689,206 3.48EOG RESOURCES INC. USD 83,636 7,501,084 8,352,727 4.34ESTEE LAUDER CO -A- USD 70,892 6,341,925 7,926,435 4.12FIRST REPUBLIC BANK USD 68,377 5,717,621 6,659,920 3.46FORTIVE CORP USD 106,646 6,050,728 7,706,240 4.01GARTNER INC. *OPA* USD 42,778 4,620,043 5,360,511 2.79INTUIT USD 47,440 5,589,516 7,164,389 3.72MARKETAXESS HOLDING INC USD 20,400 3,734,294 3,549,600 1.84MICROSOFT CORP USD 65,900 5,221,395 5,481,562 2.85OCCIDENTAL PETROLEUM CORP USD 26,639 1,778,787 1,720,080 0.89SEMPRA ENERGY USD 29,297 3,234,610 3,442,397 1.79SVB FINANCIAL GROUP USD 23,300 3,922,766 5,109,224 2.66TJX COMPANIES INC USD 90,827 6,615,167 6,339,725 3.30UNITEDHEALTH GROUP INC USD 42,334 6,606,403 8,899,453 4.63
96,178,267 113,988,012 59.27
Total Shares 162,014,665 190,139,413 98.86
Total Transferable securities admitted to an official stock exchange listing or dealtin on another regulated market 162,014,665 190,139,413 98.86
Total Investment Portfolio 162,014,665 190,139,413 98.86
RBC Funds (Lux)
The accompanying notes form an integral part of these financial statements.
15
RBC Funds (Lux) - Global Equity Focus Fund
Statement of Investments (continued)as at October 31, 2017(Expressed in USD)

RBC Funds (Lux) - Global Equity Focus Fund
Geographic Portfolio Breakdownas at October 31, 2017(expressed as a percentage of net assets)
Geographical breakdown %
United States of America 59.27Great Britain 5.78Japan 4.11India 3.96Switzerland 3.64Germany 3.54Taiwan 3.45Netherlands 3.43Belgium 3.42South Africa 3.31Ireland 2.59Hong Kong 2.36
98.86
RBC Funds (Lux)
The accompanying notes form an integral part of these financial statements.
16

RBC Funds (Lux) - European Equity Focus Fund
Statement of Investmentsas at October 31, 2017(Expressed in EUR)
Description Currency QuantityAcquisition
CostMarketValue
% NetAssets
Transferable securities admitted to an official stock exchange listing or dealt in on another regulated market
Shares
DenmarkCHRISTIAN HANSEN HOLDING A/S DKK 1,642 79,499 123,350 2.10NOVO NORDISK A/S /-B- DKK 6,181 287,968 263,978 4.49NOVOZYMES SHS -B- DKK 4,194 172,910 198,843 3.39
540,377 586,171 9.98
FinlandKONE OYJ -B- EUR 2,179 88,211 101,258 1.73SAMPO PLC A EUR 4,716 207,940 212,126 3.61
296,151 313,384 5.34
FranceESSILOR INTERNATIONAL EUR 1,161 128,815 126,201 2.15LVMH ACT. EUR 1,068 239,149 273,515 4.65
367,964 399,716 6.80
GermanyBAYER EUR 1,418 166,920 158,391 2.69CONTINENTAL AG EUR 766 155,571 166,911 2.84HENKEL /VORZUG EUR 1,736 190,845 209,188 3.56SYMRISE AG EUR 1,465 83,108 97,877 1.67
596,444 632,367 10.76
Great BritainANTOFAGASTA PLC GBP 15,215 137,259 165,547 2.82ASHTEAD GROUP PLC GBP 6,400 117,715 141,532 2.41AUTO TRADER GR GBP 21,100 92,157 82,379 1.40BT GROUP PLC GBP 34,540 203,621 102,488 1.74HARGREAVES LANSDOWN PLC GBP 6,539 109,847 117,921 2.01LSE GROUP GBP 4,984 187,430 213,676 3.64MICRO FOCUS INTERNATIONAL PLC GBP 4,441 87,727 133,900 2.28RIGHTMOVE PLC GBP 1,632 72,873 77,279 1.32ROYAL DUTCH SHELL PLC -A- EUR 8,269 195,367 222,974 3.79SCHRODERS PLC GBP 5,668 237,231 225,685 3.84UNILEVER PLC GBP 5,240 217,375 255,025 4.34
1,658,602 1,738,406 29.59
IrelandCRH PLC EUR 4,377 140,512 141,400 2.41DCC GBP 1,304 106,759 106,133 1.81PADDY POWER PLC EUR 2,261 205,554 198,585 3.38RYANAIR HOLDINGS PLC /SADR USD 2,071 142,161 199,305 3.39
594,986 645,423 10.99
ItalyLUXOTTICA GROUP EUR 2,275 121,040 112,021 1.91RECORDATI IND CHIMICA /POST RAG EUR 3,071 65,425 122,564 2.08
186,465 234,585 3.99
NetherlandsASML HOLDING NV EUR 475 71,423 73,530 1.25
RBC Funds (Lux)
The accompanying notes form an integral part of these financial statements.
17
Description Currency QuantityAcquisition
CostMarketValue
% NetAssets
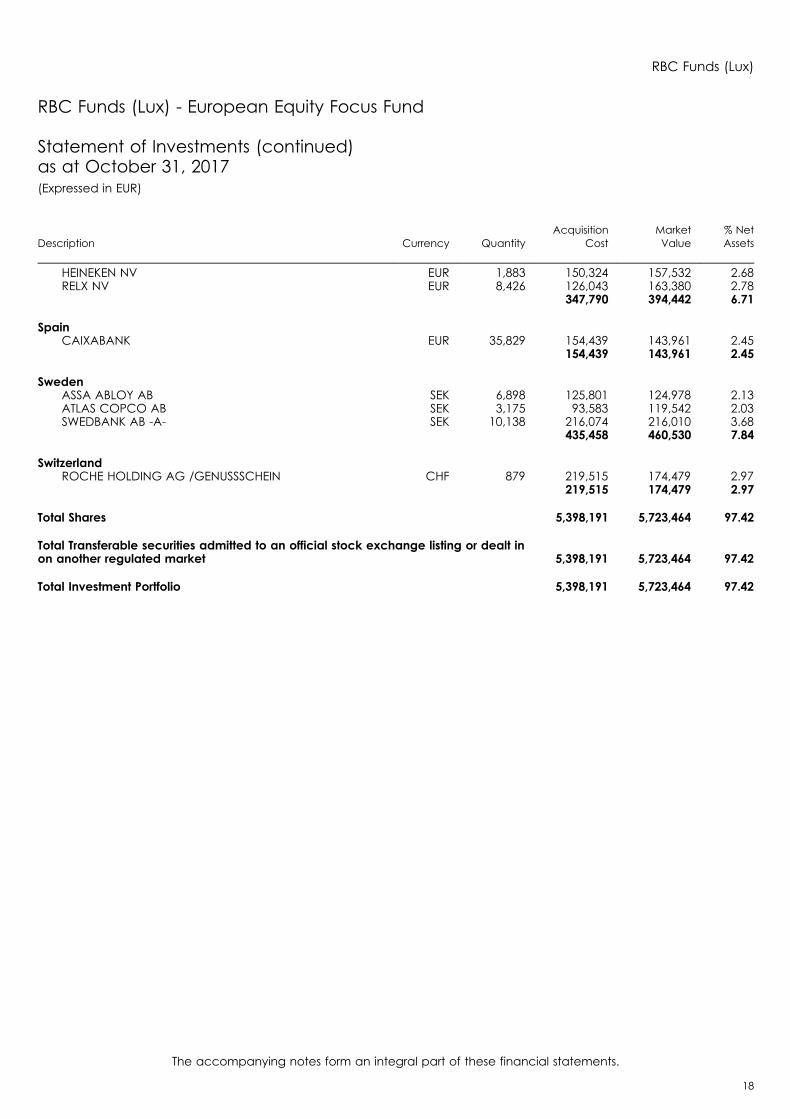
HEINEKEN NV EUR 1,883 150,324 157,532 2.68RELX NV EUR 8,426 126,043 163,380 2.78
347,790 394,442 6.71
SpainCAIXABANK EUR 35,829 154,439 143,961 2.45
154,439 143,961 2.45
SwedenASSA ABLOY AB SEK 6,898 125,801 124,978 2.13ATLAS COPCO AB SEK 3,175 93,583 119,542 2.03SWEDBANK AB -A- SEK 10,138 216,074 216,010 3.68
435,458 460,530 7.84
SwitzerlandROCHE HOLDING AG /GENUSSSCHEIN CHF 879 219,515 174,479 2.97
219,515 174,479 2.97
Total Shares 5,398,191 5,723,464 97.42
Total Transferable securities admitted to an official stock exchange listing or dealt inon another regulated market 5,398,191 5,723,464 97.42
Total Investment Portfolio 5,398,191 5,723,464 97.42
RBC Funds (Lux)
The accompanying notes form an integral part of these financial statements.
18
RBC Funds (Lux) - European Equity Focus Fund
Statement of Investments (continued)as at October 31, 2017(Expressed in EUR)
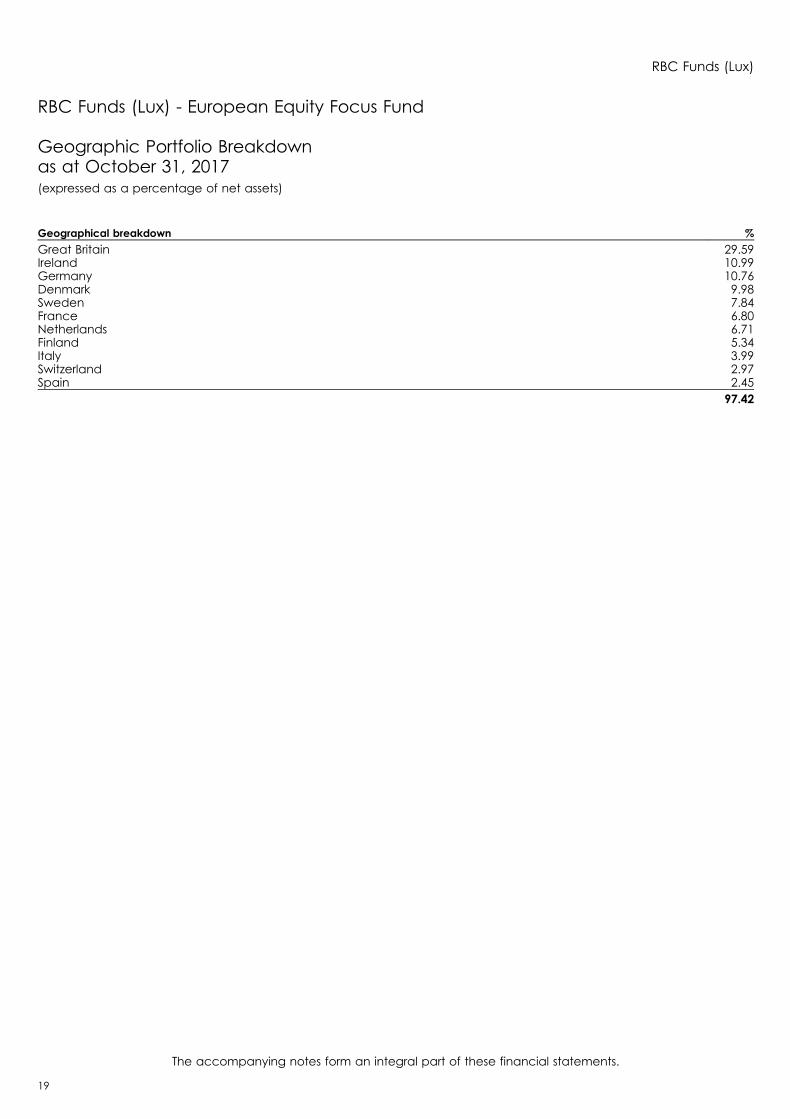
RBC Funds (Lux) - European Equity Focus Fund
Geographic Portfolio Breakdownas at October 31, 2017(expressed as a percentage of net assets)
Geographical breakdown %
Great Britain 29.59Ireland 10.99Germany 10.76Denmark 9.98Sweden 7.84France 6.80Netherlands 6.71Finland 5.34Italy 3.99Switzerland 2.97Spain 2.45
97.42
RBC Funds (Lux)
The accompanying notes form an integral part of these financial statements.
19

RBC Funds (Lux) - Canadian Equity Value Fund
Statement of Investmentsas at October 31, 2017(Expressed in CAD)
Description Currency QuantityAcquisition
CostMarketValue
% NetAssets
Transferable securities admitted to an official stock exchange listing or dealt in on another regulated market
Shares
Banks and Financial InstitutionsBANK OF MONTREAL CAD 3,418 298,374 337,801 3.32BANK OF NOVA SCOTIA CAD 6,052 413,092 504,010 4.96CANAD. IMPER. BK OF COMMERCE CAD 1,991 210,405 226,098 2.22NATIONAL BANK OF CANADA CAD 1,183 60,709 74,068 0.73ROYAL BANK OF CANADA CAD 7,325 600,866 738,873 7.27TORONTO DOMINION BK CAD 9,237 539,552 677,441 6.67
2,122,998 2,558,291 25.17
ChemicalsAGRIUM INC CAD 848 105,378 119,101 1.17METHANEX CORP CAD 448 25,373 28,166 0.28POTASH CORP SASKATCHEWAN CAD 4,898 135,034 122,989 1.21
265,785 270,256 2.66
Electronic SemiconductorONEX CORP /SUB. VOT. CAD 747 58,084 73,243 0.72
58,084 73,243 0.72
Electronics and Electrical EquipmentBLACKBERRY LTD SHS CAD 2,225 28,454 31,417 0.31ROGERS COMMUN. /B. N-V. *OPR* CAD 2,435 145,594 162,999 1.60SNC LAVALIN GROUP INC CAD 1,708 86,299 99,269 0.98
260,347 293,685 2.89
Environmental Services & RecyclingWASTE CONNECTIONS INC CAD 1,787 111,842 162,885 1.60
111,842 162,885 1.60
Food and DistilleriesMAPLE LEAF FOODS INC CAD 2,006 53,523 67,121 0.66SAPUTO GRP I. /WHEN ISSUED CAD 1,412 61,888 65,771 0.65
115,411 132,892 1.31
Forest Products and Paper IndustryINTERFOR CORPORATION COMMON CAD 1,109 15,799 23,289 0.23
15,799 23,289 0.23
Graphic Art, PublishingTHOMSON-REUTERS CORP CAD 1,294 65,128 78,054 0.77
65,128 78,054 0.77
Holding and Finance CompaniesACASTA ENTERPRISES INC -B- CAD 8,378 47,138 46,079 0.45ECN CAPITAL CORP CAD 11,892 44,187 50,303 0.50ELEMENT FLEET MANAGEMENT CORP CAD 2,639 23,074 26,231 0.26FAIRFAX FIN. HLDS /SUB. VOT *OPR* CAD 207 126,868 140,638 1.38POWER CORP. CANADA CAD 3,422 102,604 113,200 1.11RESTAURANT BRANDS INTL INC CAD 811 46,879 67,597 0.67
390,750 444,048 4.37
RBC Funds (Lux)
The accompanying notes form an integral part of these financial statements.
20
Description Currency QuantityAcquisition
CostMarketValue
% NetAssets
IndustrialsBOMBARDIER INC -B- CAD 8,800 25,124 24,024 0.24
25,124 24,024 0.24
InsuranceINTACT FIN CAD 353 31,394 37,224 0.37MANULIFE FINANCIAL CORP CAD 11,144 239,110 289,076 2.84SUN LIFE FINANCIAL INC CAD 2,301 103,329 115,625 1.14
373,833 441,925 4.35
Internet SoftwareCGI GROUP INC. /SUB. VOT. A CAD 2,160 130,974 148,068 1.45OPEN TEXT CORP CAD 2,204 88,494 99,423 0.98
219,468 247,491 2.43
LeisureCARA OPERATIONS LTD CAD 2,051 56,390 54,167 0.53GREAT CANADIA. GAMING CORP CAD 850 27,485 26,061 0.26
83,875 80,228 0.79
MaterialsFIRST QUANTUM MINERALS LTD CAD 3,781 49,147 54,560 0.54
49,147 54,560 0.54
Mechanics, MachineryATS AUTOMATION TOOL CAD 3,395 46,719 50,416 0.49
46,719 50,416 0.49
Mines, Heavy IndustriesFRANCO-NEVADA CORP CAD 376 32,305 38,547 0.38PRAIRIESKY ROYALTY LTD CAD 2,667 74,989 91,585 0.90TECK RESOURCES /-B- CAD 3,797 83,416 100,089 0.98
190,710 230,221 2.26
MiscellaneousCCL INDUSTRIES -B- /NON VOT. CAD 539 30,495 33,515 0.33
30,495 33,515 0.33
News TransmissionBCE INC CAD 3,084 174,824 183,714 1.81QUEBECOR INC CAD 1,988 70,174 96,776 0.95SHAW COMMUNICATIONS -B /NON-VOT CAD 3,590 91,627 105,761 1.04TELUS CORP CAD 1,799 71,006 84,049 0.83
407,631 470,300 4.63
Non-Ferrous MetalsWESTAIM CORP CAD 13,525 38,819 41,251 0.40
38,819 41,251 0.40
PetrolARC RESOURCES LTD CAD 3,664 80,255 57,635 0.57CANADIAN NAT. RESOURCES CAD 6,776 258,328 305,056 3.00CRESCENT POINT ENER CORP CAD 4,372 81,090 46,387 0.46CREW ENERGY INC CAD 7,397 41,709 32,325 0.32ENBRIDGE INC. CAD 7,515 397,626 372,594 3.67HUSKY ENERGY INC CAD 4,381 81,438 73,250 0.72
RBC Funds (Lux)
The accompanying notes form an integral part of these financial statements.
21
RBC Funds (Lux) - Canadian Equity Value Fund
Statement of Investments (continued)as at October 31, 2017(Expressed in CAD)

Description Currency QuantityAcquisition
CostMarketValue
% NetAssets
IMPERIAL OIL LTD CAD 2,017 87,497 84,371 0.83KEYERA CAD 1,447 57,153 54,957 0.54PEMBINA PIPELINE CORP CAD 2,437 85,667 103,938 1.02SHAWCOR LTD SHS CAD 1,747 58,561 48,846 0.48SUNCOR ENERGY CAD 7,544 284,651 330,427 3.25TRANSCANADA CORP CAD 4,401 250,518 269,561 2.65
1,764,493 1,779,347 17.51
Precious MetalsAGNICO EAGLE MINES LIMITED CAD 1,064 61,548 61,286 0.60BARRICK GOLD CORP CAD 5,497 123,396 102,464 1.01DETOUR GOLD CORPORATION CAD 1,802 30,956 24,778 0.24GOLDCORP INC CAD 4,385 82,930 73,887 0.73LUNDIN MINING CORP CAD 3,365 25,458 33,112 0.33
324,288 295,527 2.91
Public ServicesEMERA INC CAD 993 45,989 48,260 0.47FORTIS INC CAD 2,020 84,812 95,970 0.94TRANSALTA CORP. CAD 6,464 43,971 49,320 0.49
174,772 193,550 1.90
Real Estate CompaniesALLIED PROPERTIES REIT NV CAD 1,362 48,493 56,305 0.56BROOKFIELD /LP CAD 1,438 40,685 54,284 0.54BROOKFIELD ASSET MGMT -A- /LTD CAD 5,412 227,393 292,897 2.88BROOKFIELD INFR. /PARTNERSHIP CAD 949 49,230 51,796 0.51BROOKFIELD PROPERTY PARTNER LP CAD 1,635 45,440 49,148 0.48CHARTWELL RET RES TRUST UNITS CAD 3,193 43,478 49,013 0.48COLLIERS INTL GRP - SUBORD VT CAD 419 25,903 31,681 0.31DREAM OFFICE REIT /TRUST UNIT -A- CAD 1,257 26,502 27,491 0.27FIRST CAPITAL REALTY INC CAD 2,387 47,360 48,838 0.48RIOCAN REAL ESTATE INVESTMENT CAD 2,700 67,549 66,069 0.65
622,033 727,522 7.16
RetailALIMENT COUCHE TARD-VTG B CAD 1,959 107,344 118,500 1.16LOBLAW COMPANIES LTD CAD 1,982 133,940 131,962 1.30
241,284 250,462 2.46
TransportationCANADIAN NATIONAL RAILWAY CAD 3,485 275,598 361,778 3.56CANADIAN PACIFIC RAILWAY CO CAD 996 194,908 222,785 2.19
470,506 584,563 5.75
Total Shares 8,469,341 9,541,545 93.87
Total Transferable securities admitted to an official stock exchange listing or dealt inon another regulated market 8,469,341 9,541,545 93.87
Total Investment Portfolio 8,469,341 9,541,545 93.87
RBC Funds (Lux)
The accompanying notes form an integral part of these financial statements.
22
RBC Funds (Lux) - Canadian Equity Value Fund
Statement of Investments (continued)as at October 31, 2017(Expressed in CAD)

RBC Funds (Lux) - Canadian Equity Value Fund
Economic Portfolio Breakdownas at October 31, 2017(expressed as a percentage of net assets)
Economic breakdown %
Banks and Financial Institutions 25.17Petrol 17.51Real Estate Companies 7.16Transportation 5.75News Transmission 4.63Holding and Finance Companies 4.37Insurance 4.35Precious Metals 2.91Electronics and Electrical Equipment 2.89Chemicals 2.66Retail 2.46Internet Software 2.43Mines, Heavy Industries 2.26Public Services 1.90Environmental Services & Recycling 1.60Food and Distilleries 1.31Leisure 0.79Graphic Art, Publishing 0.77Electronic Semiconductor 0.72Materials 0.54Mechanics, Machinery 0.49Non-Ferrous Metals 0.40Miscellaneous 0.33Industrials 0.24Forest Products and Paper Industry 0.23
93.87
RBC Funds (Lux)
The accompanying notes form an integral part of these financial statements.
23

RBC Funds (Lux) - U.S. Mid Cap Value Equity Fund
Statement of Investmentsas at October 31, 2017(Expressed in USD)
Description Currency QuantityAcquisition
CostMarketValue
% NetAssets
Transferable securities admitted to an official stock exchange listing or dealt in on another regulated market
Shares
Automobile IndustryLEAR CORP USD 1,749 250,295 307,107 0.50LITHIA MOTORS INC -A- USD 2,737 239,281 309,774 0.50TENNECO INC USD 2,820 175,298 163,870 0.27
664,874 780,751 1.27
Banks and Financial InstitutionsHUNTINGTON BANCSHARES INC USD 30,060 387,893 414,828 0.67SIGNATURE BANK NY USD 11,580 1,568,610 1,505,516 2.45SVB FINANCIAL GROUP USD 5,623 884,019 1,233,011 2.01
2,840,522 3,153,355 5.13
Construction, Building MaterialKEANE GROUP INC USD 31,866 448,859 492,011 0.80LENNAR CORP. -A- USD 6,880 326,355 383,010 0.63
775,214 875,021 1.43
Consumer GoodsNEWELL BRANDS INC USD 55,038 2,396,432 2,244,450 3.65WHIRLPOOL CORP. USD 3,771 682,543 618,180 1.01
3,078,975 2,862,630 4.66
Electronic SemiconductorARROW ELECTRONICS INC. USD 5,549 366,414 463,841 0.75CAVIUM USD 23,181 1,463,083 1,599,257 2.60CYPRESS SEMICONDUCTORS USD 60,104 821,124 953,250 1.55INTEGRATED DEVICE TECHN. INC USD 18,388 479,685 571,315 0.93LAM RESEARCH CORP USD 7,711 922,441 1,608,283 2.62MICROSEMI USD 23,085 1,108,373 1,232,047 2.01ON SEMICONDUCTOR CORP USD 39,345 593,276 838,835 1.37
5,754,396 7,266,828 11.83
Electronics and Electrical EquipmentCOHERENT INC. USD 1,400 334,099 367,794 0.60
334,099 367,794 0.60
EnergyNOBLE ENERGY USD 19,440 611,852 541,793 0.88RANGE RESOURCES USD 60,681 1,514,525 1,098,933 1.79
2,126,377 1,640,726 2.67
Food and DistilleriesJM SMUCKER CO USD 8,251 924,228 875,018 1.43
924,228 875,018 1.43
Forest Products and Paper IndustryWESTROCK CO USD 11,608 593,987 711,919 1.16
593,987 711,919 1.16
HealthcareCENTENE CORP. DE USD 8,171 694,238 765,378 1.24
RBC Funds (Lux)
The accompanying notes form an integral part of these financial statements.
24
Description Currency QuantityAcquisition
CostMarketValue
% NetAssets
ENVISION HEALTHCARE CORP USD 23,612 1,293,104 1,005,871 1.641,987,342 1,771,249 2.88
Holding and Finance CompaniesAMTRUST FINANCIAL SERVICES INC USD 165,848 2,778,375 2,083,051 3.39CARLISLE COS INC USD 3,445 340,970 378,364 0.62CITIZENS FINANCIAL GROUP INC USD 35,579 1,158,452 1,352,358 2.20CONSILIDATED COMMUNICATION HLDG USD 54,632 1,044,210 1,047,295 1.71CROWN HOLDINGS INC USD 11,485 608,898 691,053 1.13GARDNER DENVER HOLDINGS INC USD 19,806 431,638 571,403 0.93HOSTESS BRANDS INC USD 34,341 436,914 395,952 0.65INVESCO LTD USD 22,898 719,068 819,519 1.33MACOM TECHNOLOGY SOLUTIONS HO USD 2,824 124,813 115,445 0.19NATIONAL GENERAL HOLDINGS CORP USD 129,465 2,679,026 2,612,604 4.25OSHKOSH CORP USD 2,720 188,608 249,043 0.41SYNCHRONY FINANCIAL USD 46,660 1,402,812 1,522,049 2.48TOLL BROTHERS USD 699 23,020 32,182 0.05TRI POINTE GROUP SHS USD 29,649 368,514 524,491 0.85US SILICA HOLDINGS INC USD 16,068 494,619 490,235 0.80VISTRA ENERGY CORP USD 27,227 451,627 529,293 0.86XL GROUP LTD USD 9,479 414,858 383,615 0.62
13,666,422 13,797,952 22.47
Information TechnologyZEBRA TECHNOLOGIES A USD 4,374 383,554 507,340 0.83
383,554 507,340 0.83
InsuranceHARTFORD FIN. SERV. GROUP USD 9,813 468,608 540,206 0.88
468,608 540,206 0.88
LeisureILG INC USD 21,101 365,811 626,067 1.02
365,811 626,067 1.02
Mechanics, MachineryBRUNSWICK CORP USD 14,845 794,476 751,899 1.22
794,476 751,899 1.22
Mines, Heavy IndustriesSTEEL DYNAMICS INC. USD 30,303 948,981 1,127,575 1.84
948,981 1,127,575 1.84
News TransmissionCBS CORP -B- /WHEN ISSUED USD 10,340 586,012 580,281 0.95
586,012 580,281 0.95
Office Equipment, ComputersWESTERN DIGITAL CORP. USD 8,260 625,806 737,370 1.20
625,806 737,370 1.20
PetrolANDEAVOR USD 18,590 1,559,913 1,975,001 3.22CALLON PETROLEUM CO (DELAWARE) USD 50,007 615,666 554,578 0.90CONCHO RESOURCES INC USD 890 108,750 119,447 0.19NEWFIELD EXPLORATION CO USD 3,129 119,701 96,342 0.16
RBC Funds (Lux)
The accompanying notes form an integral part of these financial statements.
25
RBC Funds (Lux) - U.S. Mid Cap Value Equity Fund
Statement of Investments (continued)as at October 31, 2017(Expressed in USD)
Description Currency QuantityAcquisition
CostMarketValue
% NetAssets
PARSLEY ENERGY SHS -A- USD 58,734 1,607,229 1,562,324 2.544,011,259 4,307,692 7.01
Pharmaceuticals and CosmeticsJAZZ PHARMACEUTICALS PLC USD 13,474 1,855,704 1,906,975 3.10LABORATORY CORP OF AMER. HLD USD 4,160 602,760 639,434 1.04MALLINCKRODT PLC USD 13,293 558,982 420,989 0.69
3,017,446 2,967,398 4.83
Public ServicesCMS ENERGY CORP. USD 23,173 1,002,346 1,120,878 1.82DTE ENERGY COMPANY USD 9,005 904,390 994,692 1.62WESTAR ENERGY INC USD 6,970 365,559 372,756 0.61
2,272,295 2,488,326 4.05
Real Estate CompaniesAPARTMENT INV. +MANAG. -A- USD 1,900 82,508 83,562 0.13BOSTON PROPERTIES USD 3,580 432,715 433,824 0.71DIGITAL RLTY TR INC USD 4,165 434,831 493,303 0.80EXTRA SPACE STORAGE INC USD 5,582 414,068 455,435 0.74FIRST IND. REALTY TRUST INC USD 17,323 475,158 534,934 0.87HEALTHCA TR -A- /REIT USD 23,467 723,431 705,183 1.15INVITATION HOMES INC /REIT USD 33,280 711,850 751,130 1.22STARWOOD WAYP /REIT USD 22,786 730,769 827,360 1.35WEYERHAEUSER CO USD 10,390 338,398 373,105 0.61
4,343,728 4,657,836 7.58
RetailFOOT LOCKER INC USD 27,800 1,427,352 836,224 1.36WILLIAMS-SONOMA INC USD 1,800 86,529 92,880 0.15
1,513,881 929,104 1.51
TransportationALASKA AIR GROUP INC USD 25,290 2,048,753 1,669,898 2.72RYDER SYSTEM INC. USD 7,422 574,571 601,776 0.98
2,623,324 2,271,674 3.70
UtilitiesEDISON INTERNATIONAL USD 11,060 860,593 884,247 1.44
860,593 884,247 1.44
Various Capital GoodsMOHAWK INDUSTRIES USD 6,410 1,429,848 1,677,881 2.73
1,429,848 1,677,881 2.73
Total Shares 56,992,058 59,158,139 96.32
Total Transferable securities admitted to an official stock exchange listing or dealtin on another regulated market 56,992,058 59,158,139 96.32
Total Investment Portfolio 56,992,058 59,158,139 96.32
RBC Funds (Lux)
The accompanying notes form an integral part of these financial statements.
26
RBC Funds (Lux) - U.S. Mid Cap Value Equity Fund
Statement of Investments (continued)as at October 31, 2017(Expressed in USD)
RBC Funds (Lux) - U.S. Mid Cap Value Equity Fund
Economic Portfolio Breakdownas at October 31, 2017(expressed as a percentage of net assets)
Economic breakdown %
Holding and Finance Companies 22.47Electronic Semiconductor 11.83Real Estate Companies 7.58Petrol 7.01Banks and Financial Institutions 5.13Pharmaceuticals and Cosmetics 4.83Consumer Goods 4.66Public Services 4.05Transportation 3.70Healthcare 2.88Various Capital Goods 2.73Energy 2.67Mines, Heavy Industries 1.84Retail 1.51Utilities 1.44Construction, Building Material 1.43Food and Distilleries 1.43Automobile Industry 1.27Mechanics, Machinery 1.22Office Equipment, Computers 1.20Forest Products and Paper Industry 1.16Leisure 1.02News Transmission 0.95Insurance 0.88Information Technology 0.83Electronics and Electrical Equipment 0.60
96.32
RBC Funds (Lux)
The accompanying notes form an integral part of these financial statements.
27

RBC Funds (Lux) - U.S. Small Cap Equity Fund
Statement of Investmentsas at October 31, 2017(Expressed in USD)
Description Currency QuantityAcquisition
CostMarketValue
% NetAssets
Transferable securities admitted to an official stock exchange listing or dealt in on another regulated market
Shares
Automobile IndustryMOTORCAR PARTS OF AMERICA INC USD 17,410 501,230 503,323 1.26
501,230 503,323 1.26
Banks and Financial InstitutionsCHEMIACAL FINANCIAL CORP USD 16,810 765,037 885,719 2.22COBIZ FINANCIAL INC USD 22,940 340,666 468,894 1.18COMMUNITY BANK SYSTEM INC. USD 6,510 311,225 359,938 0.90FIC PREMIER BANCORP INC USD 17,620 550,497 711,848 1.79FIRST BUSEY CORP USD 8,980 283,150 279,458 0.70HANMI FINANCIAL CORP USD 15,742 431,336 484,067 1.22HERITAGE FINANCIAL CORPORATION USD 21,890 481,300 667,645 1.68MERCANTILE BANK CORP USD 12,110 333,998 437,171 1.10STERLING BANC — SHS USD 23,540 469,552 589,677 1.48SYNOVUS FINANCIAL CORP USD 16,950 634,594 794,107 1.99TEXAS CAPITAL BANCSHARES INC USD 8,970 567,348 771,868 1.94UNITED COMMUNITY BANKS USD 21,720 509,555 595,562 1.50
5,678,258 7,045,954 17.70
ChemicalsOMNOVA SOLUTIONS /WHEN ISSUED USD 75,110 663,961 829,965 2.09ZAGG USD 12 80 188 -
664,041 830,153 2.09
Construction, Building MaterialBMC STOCK HOLDINGS INC USD 20,230 445,319 433,934 1.09LIBBEY INC. USD 17,560 291,587 120,110 0.30PATRICK INDUSTRIES USD 6,506 407,949 605,058 1.52TAYLOR MORRISON HOME CORP 2013 USD 17,720 333,896 427,938 1.08
1,478,751 1,587,040 3.99
Consumer DiscretionarySTEVEN MADDEN LTD USD 14,510 544,641 565,890 1.42
544,641 565,890 1.42
Consumer GoodsACCO BRANDS /WHEN ISSUED USD 61,694 662,281 805,107 2.02
662,281 805,107 2.02
Electronic SemiconductorCOHU INC USD 6,460 150,361 166,668 0.42ENERSYS INC USD 9,570 673,336 663,871 1.67UNIVERSAL ELECTRONICS INC USD 7,040 456,746 422,400 1.06
1,280,443 1,252,939 3.15
Electronics and Electrical EquipmentCOHERENT INC. USD 2,510 350,361 659,402 1.66VISHAY PREC GRP USD 11,577 212,441 284,215 0.71
562,802 943,617 2.37
RBC Funds (Lux)
The accompanying notes form an integral part of these financial statements.
28

Description Currency QuantityAcquisition
CostMarketValue
% NetAssets
Environmental Services & RecyclingCASELLA WASTE SYSTEMS INC. A USD 25,340 296,527 467,776 1.18
296,527 467,776 1.18
Food and DistilleriesDEAN FOODS USD 15,640 272,192 152,490 0.39JOHN B SAN FILIPPO AND SON USD 7,050 418,232 414,893 1.04
690,424 567,383 1.43
Forest Products and Paper IndustryLYDALL INC USD 9,385 453,763 542,453 1.36
453,763 542,453 1.36
Graphic Art, PublishingENNIS INC USD 10,923 189,893 220,098 0.55GRAY TELEVISION INC USD 37,240 466,817 579,827 1.46NEW MEDIA INVESTMENT GROUP INC USD 7,600 119,857 121,372 0.30
776,567 921,297 2.31
HealthcareCARRIAGE SERVICES INC. USD 12,420 300,857 321,678 0.81
300,857 321,678 0.81
Holding and Finance CompaniesCOMPASS DIVERSIFIED HOLDINGS USD 54,150 919,604 928,672 2.33DANA INC USD 15,830 305,126 482,657 1.21DELEK US HOLDINGS INC (NEW) USD 17,080 368,661 444,934 1.12KOPPERS HOLDINGS INC USD 11,321 368,624 549,635 1.38LEGACYTEXAS FIN GRP USD 9,836 340,714 392,358 0.99NORTHRIM BANCORP INC USD 2,180 59,460 70,850 0.18SPIRE INC USD 11,950 800,393 943,452 2.37
3,162,582 3,812,558 9.58
IndustrialsDUCOMMUN INC USD 13,106 370,333 432,105 1.09
370,333 432,105 1.09
InsuranceAMERICAN FINANCIAL GROUP USD 3,750 302,825 395,587 1.00AMERISAFE INC USD 10,480 588,619 678,056 1.70PROASSURANCE CORP USD 5,130 278,189 287,537 0.72REINSURANCE GRP AMERICA INC USD 3,490 390,877 521,336 1.31
1,560,510 1,882,516 4.73
Internet SoftwareNOVANTA INC USD 16,450 339,084 778,085 1.96TAKE TWO INTERACT. SOFTWARE USD 4,010 200,766 443,706 1.11
539,850 1,221,791 3.07
Investment FundsLASALLE HOTEL PROPERTIES /SBI USD 13,950 403,366 393,530 0.99
403,366 393,530 0.99
LeisureRED ROBIN GOURMET BURGERS INC USD 4,890 287,478 334,476 0.84
287,478 334,476 0.84
RBC Funds (Lux)
The accompanying notes form an integral part of these financial statements.
29
RBC Funds (Lux) - U.S. Small Cap Equity Fund
Statement of Investments (continued)as at October 31, 2017(Expressed in USD)

Description Currency QuantityAcquisition
CostMarketValue
% NetAssets
Mechanics, MachineryAMERICAN OUTDOOR BRANDS CORP USD 19,295 443,611 276,497 0.69COLOMBUS MCKINNON CORP USD 19,180 485,505 758,761 1.91RELIANCE STEEL & ALUMINIUM CO USD 8,300 612,471 637,772 1.60
1,541,587 1,673,030 4.20
Mines, Heavy IndustriesNN INC USD 26,370 561,062 779,234 1.96
561,062 779,234 1.96
Non-Ferrous MetalsKAISER ALUMINUM CORP USD 3,520 307,817 349,114 0.88
307,817 349,114 0.88
Office Equipment, ComputersHERMAN MILLER INC. USD 12,900 425,326 433,440 1.09SAPIENS INTL CORP NV USD 20,997 277,363 293,328 0.74SYNAPTICS INC USD 4,400 244,440 163,328 0.41
947,129 890,096 2.24
PetrolCALLON PETROLEUM CO (DELAWARE) USD 40,070 497,575 444,377 1.11GULFPORT ENERGY CORP USD 13,280 310,436 181,936 0.46RSP PERMIAN INC USD 8,330 301,659 286,635 0.72
1,109,670 912,948 2.29
Pharmaceuticals and CosmeticsGLOBUS MEDICAL INC -A- USD 14,670 406,198 467,533 1.17INVACARE CORP. USD 24,550 368,725 380,525 0.96PHARMERICA CORP USD 3,180 81,173 93,174 0.23TELEFLEX INC USD 1,880 331,000 445,522 1.12WEST PHARMACEUTICAL SERVICES USD 3,480 272,025 352,872 0.89
1,459,121 1,739,626 4.37
Precious MetalsRING ENERGY INC USD 38,322 443,487 490,905 1.23
443,487 490,905 1.23
Public ServicesNORTHWESTERN CORP. USD 6,660 388,479 394,805 0.99PORTLAND GENERAL ELECTRIC CO USD 16,770 738,102 800,600 2.01
1,126,581 1,195,405 3.00
Real Estate CompaniesCOL PROPERTY /REIT USD 19,440 429,829 429,235 1.08COMM HL /REIT USD 15,330 369,693 420,502 1.06CUBESMART USD 9,000 242,286 244,980 0.61DIAMONDROCK HOSPITALITY CO USD 33,270 353,987 361,312 0.91EASTGROUP PROPERTIES INC USD 2,580 202,585 233,722 0.59GRAMERCY PROPERTY TRUST /REIT USD 9,986 287,082 296,584 0.74NAT STOR /REIT USD 13,350 313,958 330,946 0.83PHYSICIANS REALTY TRUST /REIT USD 17,370 350,561 301,891 0.76STAG INDUSTRIAL INC -SHS- USD 9,170 221,257 250,341 0.63TERRENO REALTY CORP USD 8,830 276,307 324,238 0.81
3,047,545 3,193,751 8.02
RBC Funds (Lux)
The accompanying notes form an integral part of these financial statements.
30
RBC Funds (Lux) - U.S. Small Cap Equity Fund
Statement of Investments (continued)as at October 31, 2017(Expressed in USD)
Description Currency QuantityAcquisition
CostMarketValue
% NetAssets
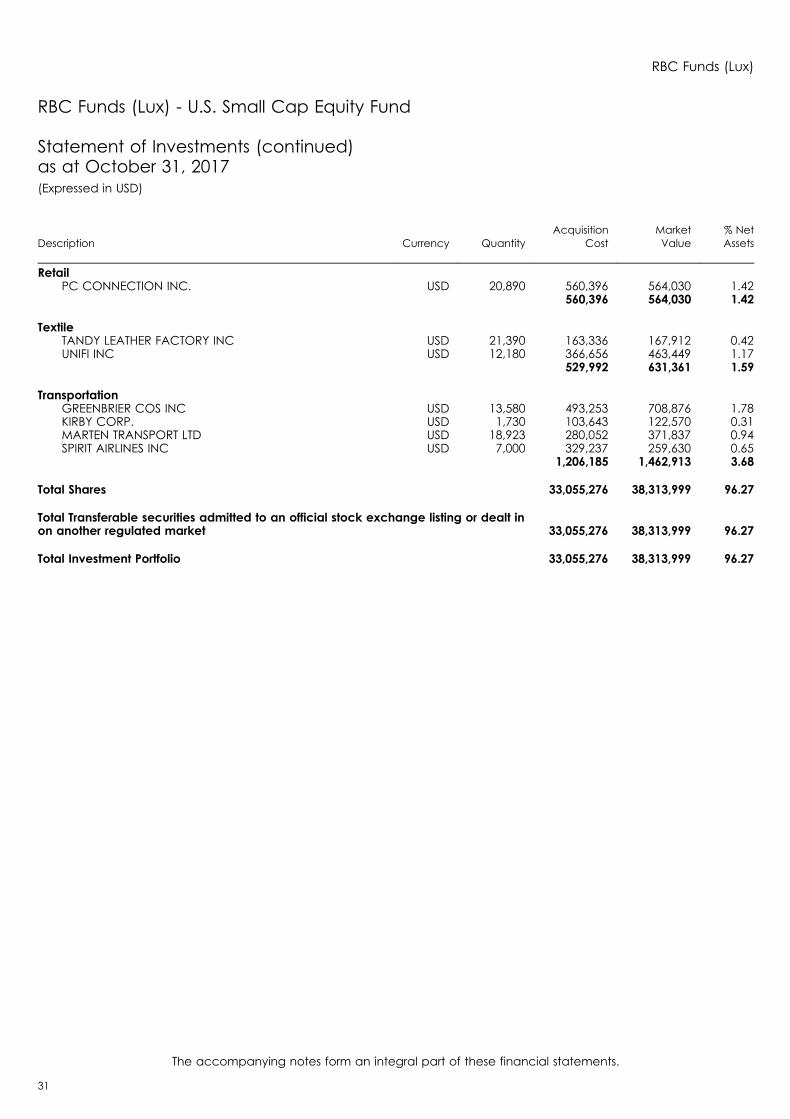
RetailPC CONNECTION INC. USD 20,890 560,396 564,030 1.42
560,396 564,030 1.42
TextileTANDY LEATHER FACTORY INC USD 21,390 163,336 167,912 0.42UNIFI INC USD 12,180 366,656 463,449 1.17
529,992 631,361 1.59
TransportationGREENBRIER COS INC USD 13,580 493,253 708,876 1.78KIRBY CORP. USD 1,730 103,643 122,570 0.31MARTEN TRANSPORT LTD USD 18,923 280,052 371,837 0.94SPIRIT AIRLINES INC USD 7,000 329,237 259,630 0.65
1,206,185 1,462,913 3.68
Total Shares 33,055,276 38,313,999 96.27
Total Transferable securities admitted to an official stock exchange listing or dealt inon another regulated market 33,055,276 38,313,999 96.27
Total Investment Portfolio 33,055,276 38,313,999 96.27
RBC Funds (Lux)
The accompanying notes form an integral part of these financial statements.
31
RBC Funds (Lux) - U.S. Small Cap Equity Fund
Statement of Investments (continued)as at October 31, 2017(Expressed in USD)
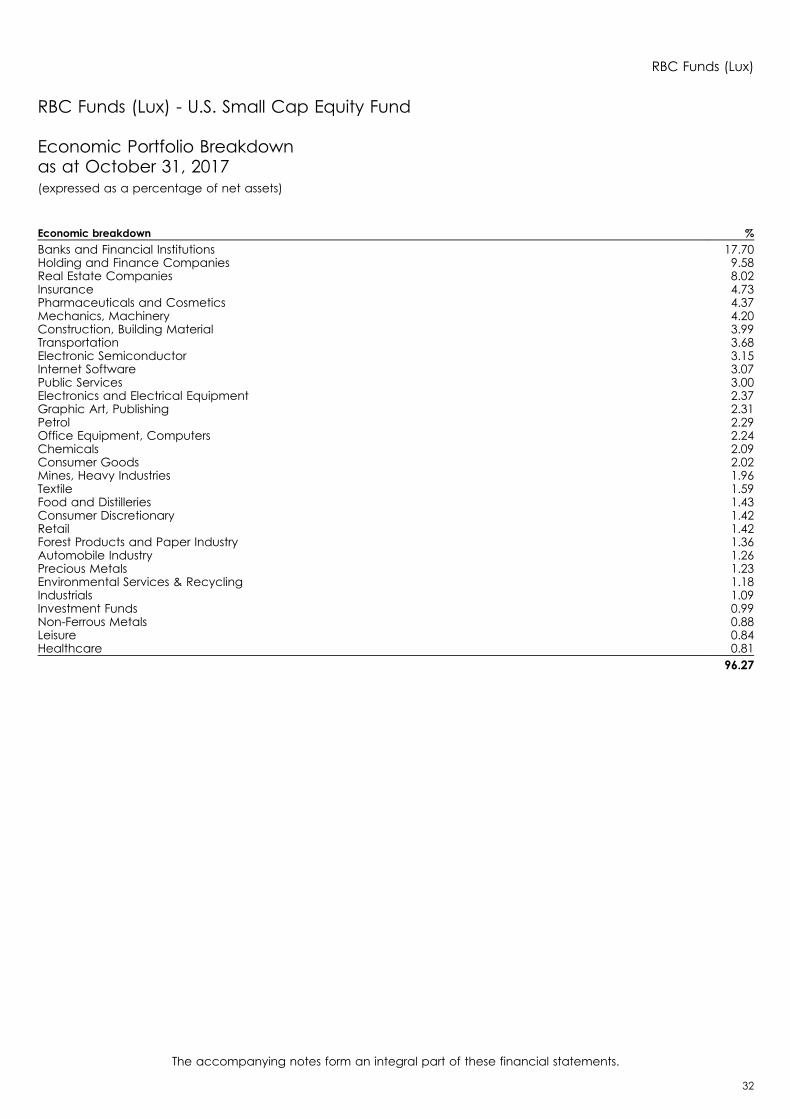
RBC Funds (Lux) - U.S. Small Cap Equity Fund
Economic Portfolio Breakdownas at October 31, 2017(expressed as a percentage of net assets)
Economic breakdown %
Banks and Financial Institutions 17.70Holding and Finance Companies 9.58Real Estate Companies 8.02Insurance 4.73Pharmaceuticals and Cosmetics 4.37Mechanics, Machinery 4.20Construction, Building Material 3.99Transportation 3.68Electronic Semiconductor 3.15Internet Software 3.07Public Services 3.00Electronics and Electrical Equipment 2.37Graphic Art, Publishing 2.31Petrol 2.29Office Equipment, Computers 2.24Chemicals 2.09Consumer Goods 2.02Mines, Heavy Industries 1.96Textile 1.59Food and Distilleries 1.43Consumer Discretionary 1.42Retail 1.42Forest Products and Paper Industry 1.36Automobile Industry 1.26Precious Metals 1.23Environmental Services & Recycling 1.18Industrials 1.09Investment Funds 0.99Non-Ferrous Metals 0.88Leisure 0.84Healthcare 0.81
96.27
RBC Funds (Lux)
The accompanying notes form an integral part of these financial statements.
32

RBC Funds (Lux) - Asia ex-Japan Equity Fund
Statement of Investmentsas at October 31, 2017(Expressed in USD)
Description Currency QuantityAcquisition
CostMarketValue
% NetAssets
Transferable securities admitted to an official stock exchange listing or dealt in on another regulated market
Shares
BermudasCAFE DE CORAL HOLDINGS LTD HKD 42,000 132,076 129,201 1.04
132,076 129,201 1.04
Cayman IslandsALIBABA GROUP HOLDING LTD /ADR USD 3,300 310,392 610,137 4.93FABRINET USD 6,230 240,052 231,632 1.87IMAX CHINA HOLDING INC HKD 64,400 155,497 199,347 1.61NETEASE INC /ADR USD 833 206,925 234,839 1.90NEXTEER AUTOMOTIVE GROUP LTD HKD 92,261 91,958 180,459 1.46SHENZHOU INTL GROUP LTD HKD 30,000 172,937 256,096 2.07TENCENT HOLDINGS LTD HKD 17,400 352,862 780,146 6.31WEIBO CORP /SADR -A- USD 1,500 111,398 138,975 1.13
1,642,021 2,631,631 21.28
ChinaHUATAI SECURITIES CO LTD HKD 89,400 177,642 192,969 1.56PING AN INSUR. (GRP) CO -H- HKD 61,000 484,294 535,583 4.33
661,936 728,552 5.89
Hong KongAIA GROUP LTD HKD 73,200 409,298 550,752 4.45CHINA UNICO (HK) HKD 134,000 192,174 190,305 1.54
601,472 741,057 5.99
IndiaASIAN PAINTS INR 7,453 97,890 135,877 1.10BAJAJ FINANCE LTD INR 10,071 265,558 279,968 2.26HDFC BANK LTD INR 3,739 74,423 104,398 0.85HINDUSTAN UNILEVER LTD INR 12,322 175,676 235,412 1.90HOUSING DEVT. FIN. CORP /ADR USD 6,400 346,463 590,720 4.78MARICO LTD /DEMAT INR 26,471 94,218 128,838 1.04PAGE INDUSTRIES INR 418 82,424 128,788 1.04VOLTAS LTD /DEMATERIALISED INR 28,257 228,844 247,621 2.00
1,365,496 1,851,622 14.97
IndonesiaCATUR SENTOSA ADIPRANA IDR 3,665,240 145,570 127,012 1.03PT ARWANA CITRAMULIA TBK IDR 2,112,800 121,300 59,818 0.48PT BANK CENTRAL ASIA TBK IDR 135,700 156,348 209,108 1.69PT CIPUTRA DEVELOPMENT TBK IDR 967,100 80,777 86,278 0.70PT HANJAYA MANDALA SAMPOERNA IDR 606,400 150,600 177,945 1.44PT PP (PERSERO) TBK IDR 590,108 161,890 124,000 1.00PT SURYA CITRA MEDIA TBK IDR 1,330,500 304,842 210,910 1.71
1,121,327 995,071 8.05
KoreaAMOREPACIFIC CORP KRW 650 207,727 182,261 1.47KOREA ELECTRIC POWER CORP. KRW 9,541 353,656 333,988 2.70LG CHEMICAL LTD KRW 521 121,246 187,730 1.52NAVER CORP - SHS KRW 182 122,449 145,298 1.18
RBC Funds (Lux)
The accompanying notes form an integral part of these financial statements.
33

Description Currency QuantityAcquisition
CostMarketValue
% NetAssets
SAMSUNG ELECTR. /PFD N-VOT. KRW 54 56,046 108,017 0.87SAMSUNG ELECTRONICS CO LTD KRW 289 632,284 710,744 5.75SAMSUNG ENGINEERING CO LTD KRW 16,252 173,114 177,059 1.43SAMSUNG FIRE & MARINE INSUR. KRW 950 217,370 231,600 1.87SHINHAN FINANCIAL GROUP KRW 8,393 321,813 376,247 3.04
2,205,705 2,452,944 19.83
PhilippinesJOLLIBEE FOODS CORP. PHP 24,610 101,488 118,697 0.96
101,488 118,697 0.96
SingaporeASIAN PAY TV SGD 202,400 58,835 86,166 0.70
58,835 86,166 0.70
TaiwanCATCHER TECHNOLOGY CO LTD TWD 32,000 304,831 339,528 2.75LARGAN PRECISION CO LTD TWD 2,000 253,971 378,984 3.06MEDIA TEK INCORPORATION TWD 24,000 178,930 272,550 2.20TAIWAN SEMICOND. MANUFACT TWD 70,000 311,804 564,001 4.56
1,049,536 1,555,063 12.57
ThailandC.P. ALL — SHS FOREIGN REGIST THB 168,500 268,978 355,053 2.87KASIKORNBANK PUBL. COM. LTD /NVDR THB 31,300 191,007 207,283 1.68
459,985 562,336 4.55
Total Shares 9,399,877 11,852,340 95.83
Total Transferable securities admitted to an official stock exchange listing or dealt inon another regulated market 9,399,877 11,852,340 95.83
Other transferable securities
Shares
Cayman IslandsCHINA LITERATURE LIMITED HKD 13 93 92 -
93 92 -
IndiaFUTURE RETAIL INR 17,236 139,172 138,522 1.12
139,172 138,522 1.12
Total Shares 139,265 138,614 1.12
Total Other transferable securities 139,265 138,614 1.12
Total Investment Portfolio 9,539,142 11,990,954 96.95
RBC Funds (Lux)
The accompanying notes form an integral part of these financial statements.
34
RBC Funds (Lux) - Asia ex-Japan Equity Fund
Statement of Investments (continued)as at October 31, 2017(Expressed in USD)

RBC Funds (Lux) - Asia ex-Japan Equity Fund
Geographic Portfolio Breakdownas at October 31, 2017(expressed as a percentage of net assets)
Geographical breakdown %
Cayman Islands 21.28Korea 19.83India 16.09Taiwan 12.57Indonesia 8.05Hong Kong 5.99China 5.89Thailand 4.55Bermudas 1.04Philippines 0.96Singapore 0.70
96.95
RBC Funds (Lux)
The accompanying notes form an integral part of these financial statements.
35
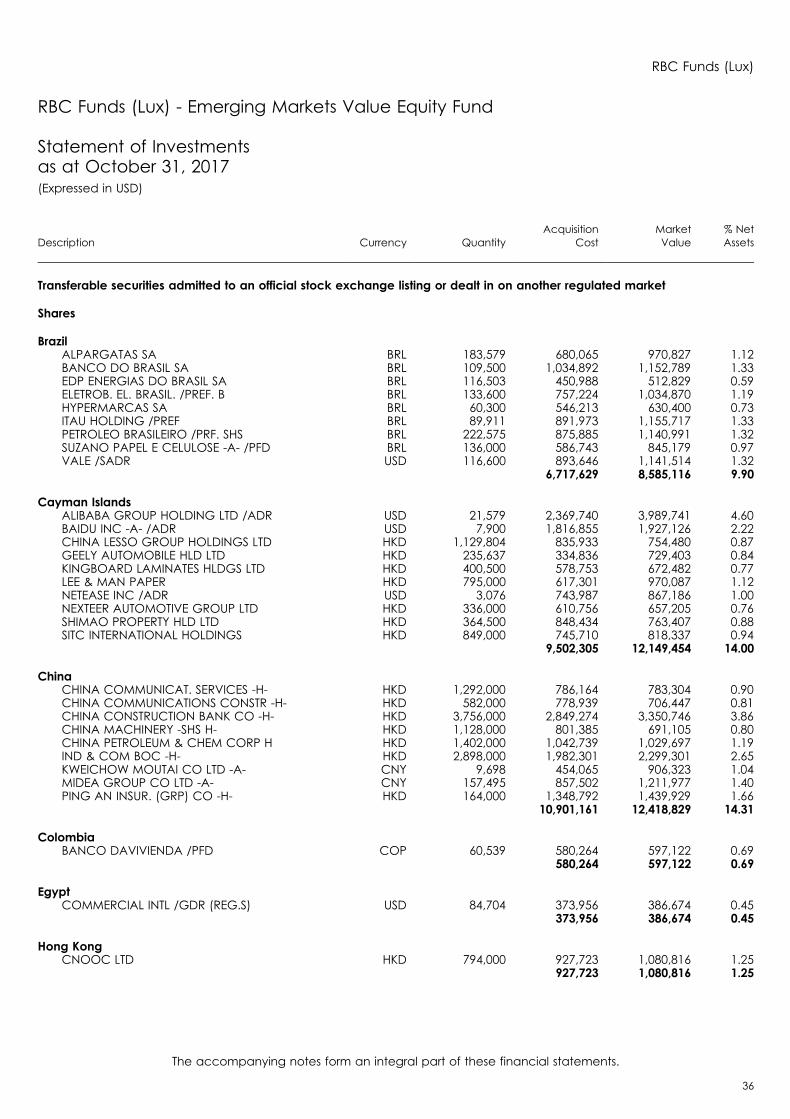
RBC Funds (Lux) - Emerging Markets Value Equity Fund
Statement of Investmentsas at October 31, 2017(Expressed in USD)
Description Currency QuantityAcquisition
CostMarketValue
% NetAssets
Transferable securities admitted to an official stock exchange listing or dealt in on another regulated market
Shares
BrazilALPARGATAS SA BRL 183,579 680,065 970,827 1.12BANCO DO BRASIL SA BRL 109,500 1,034,892 1,152,789 1.33EDP ENERGIAS DO BRASIL SA BRL 116,503 450,988 512,829 0.59ELETROB. EL. BRASIL. /PREF. B BRL 133,600 757,224 1,034,870 1.19HYPERMARCAS SA BRL 60,300 546,213 630,400 0.73ITAU HOLDING /PREF BRL 89,911 891,973 1,155,717 1.33PETROLEO BRASILEIRO /PRF. SHS BRL 222,575 875,885 1,140,991 1.32SUZANO PAPEL E CELULOSE -A- /PFD BRL 136,000 586,743 845,179 0.97VALE /SADR USD 116,600 893,646 1,141,514 1.32
6,717,629 8,585,116 9.90
Cayman IslandsALIBABA GROUP HOLDING LTD /ADR USD 21,579 2,369,740 3,989,741 4.60BAIDU INC -A- /ADR USD 7,900 1,816,855 1,927,126 2.22CHINA LESSO GROUP HOLDINGS LTD HKD 1,129,804 835,933 754,480 0.87GEELY AUTOMOBILE HLD LTD HKD 235,637 334,836 729,403 0.84KINGBOARD LAMINATES HLDGS LTD HKD 400,500 578,753 672,482 0.77LEE & MAN PAPER HKD 795,000 617,301 970,087 1.12NETEASE INC /ADR USD 3,076 743,987 867,186 1.00NEXTEER AUTOMOTIVE GROUP LTD HKD 336,000 610,756 657,205 0.76SHIMAO PROPERTY HLD LTD HKD 364,500 848,434 763,407 0.88SITC INTERNATIONAL HOLDINGS HKD 849,000 745,710 818,337 0.94
9,502,305 12,149,454 14.00
ChinaCHINA COMMUNICAT. SERVICES -H- HKD 1,292,000 786,164 783,304 0.90CHINA COMMUNICATIONS CONSTR -H- HKD 582,000 778,939 706,447 0.81CHINA CONSTRUCTION BANK CO -H- HKD 3,756,000 2,849,274 3,350,746 3.86CHINA MACHINERY -SHS H- HKD 1,128,000 801,385 691,105 0.80CHINA PETROLEUM & CHEM CORP H HKD 1,402,000 1,042,739 1,029,697 1.19IND & COM BOC -H- HKD 2,898,000 1,982,301 2,299,301 2.65KWEICHOW MOUTAI CO LTD -A- CNY 9,698 454,065 906,323 1.04MIDEA GROUP CO LTD -A- CNY 157,495 857,502 1,211,977 1.40PING AN INSUR. (GRP) CO -H- HKD 164,000 1,348,792 1,439,929 1.66
10,901,161 12,418,829 14.31
ColombiaBANCO DAVIVIENDA /PFD COP 60,539 580,264 597,122 0.69
580,264 597,122 0.69
EgyptCOMMERCIAL INTL /GDR (REG.S) USD 84,704 373,956 386,674 0.45
373,956 386,674 0.45
Hong KongCNOOC LTD HKD 794,000 927,723 1,080,816 1.25
927,723 1,080,816 1.25
RBC Funds (Lux)
The accompanying notes form an integral part of these financial statements.
36
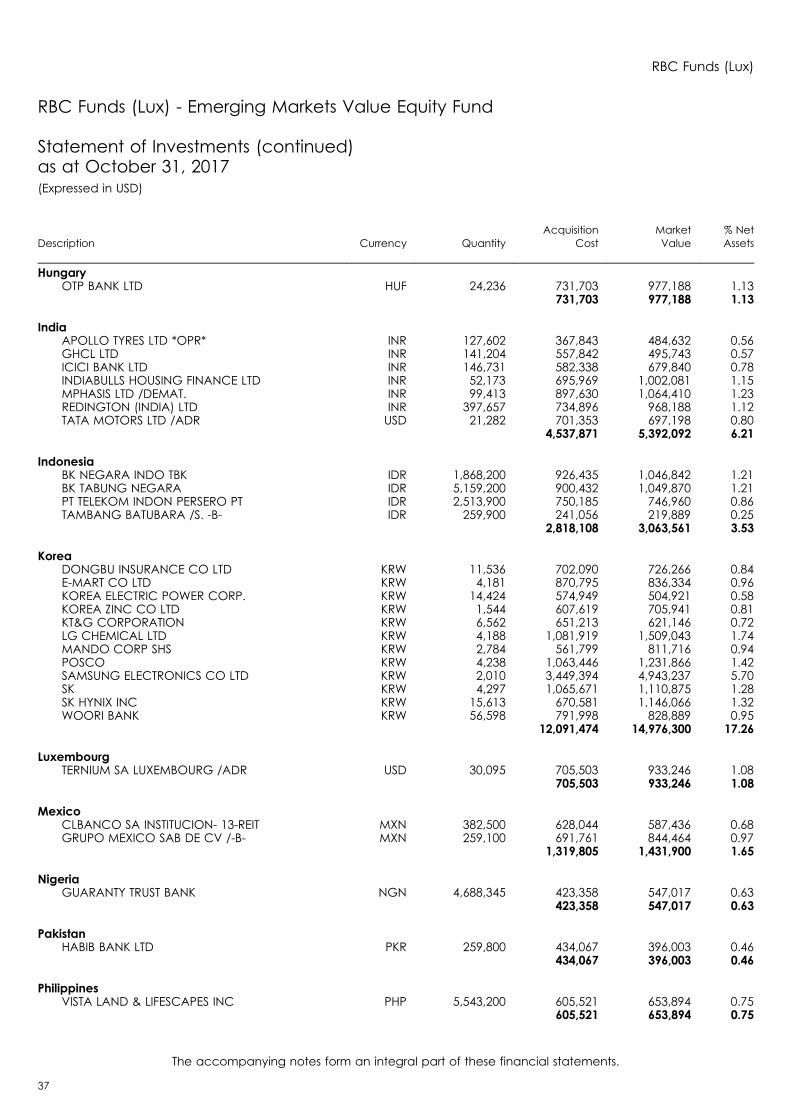
Description Currency QuantityAcquisition
CostMarketValue
% NetAssets
HungaryOTP BANK LTD HUF 24,236 731,703 977,188 1.13
731,703 977,188 1.13
IndiaAPOLLO TYRES LTD *OPR* INR 127,602 367,843 484,632 0.56GHCL LTD INR 141,204 557,842 495,743 0.57ICICI BANK LTD INR 146,731 582,338 679,840 0.78INDIABULLS HOUSING FINANCE LTD INR 52,173 695,969 1,002,081 1.15MPHASIS LTD /DEMAT. INR 99,413 897,630 1,064,410 1.23REDINGTON (INDIA) LTD INR 397,657 734,896 968,188 1.12TATA MOTORS LTD /ADR USD 21,282 701,353 697,198 0.80
4,537,871 5,392,092 6.21
IndonesiaBK NEGARA INDO TBK IDR 1,868,200 926,435 1,046,842 1.21BK TABUNG NEGARA IDR 5,159,200 900,432 1,049,870 1.21PT TELEKOM INDON PERSERO PT IDR 2,513,900 750,185 746,960 0.86TAMBANG BATUBARA /S. -B- IDR 259,900 241,056 219,889 0.25
2,818,108 3,063,561 3.53
KoreaDONGBU INSURANCE CO LTD KRW 11,536 702,090 726,266 0.84E-MART CO LTD KRW 4,181 870,795 836,334 0.96KOREA ELECTRIC POWER CORP. KRW 14,424 574,949 504,921 0.58KOREA ZINC CO LTD KRW 1,544 607,619 705,941 0.81KT&G CORPORATION KRW 6,562 651,213 621,146 0.72LG CHEMICAL LTD KRW 4,188 1,081,919 1,509,043 1.74MANDO CORP SHS KRW 2,784 561,799 811,716 0.94POSCO KRW 4,238 1,063,446 1,231,866 1.42SAMSUNG ELECTRONICS CO LTD KRW 2,010 3,449,394 4,943,237 5.70SK KRW 4,297 1,065,671 1,110,875 1.28SK HYNIX INC KRW 15,613 670,581 1,146,066 1.32WOORI BANK KRW 56,598 791,998 828,889 0.95
12,091,474 14,976,300 17.26
LuxembourgTERNIUM SA LUXEMBOURG /ADR USD 30,095 705,503 933,246 1.08
705,503 933,246 1.08
MexicoCLBANCO SA INSTITUCION- 13-REIT MXN 382,500 628,044 587,436 0.68GRUPO MEXICO SAB DE CV /-B- MXN 259,100 691,761 844,464 0.97
1,319,805 1,431,900 1.65
NigeriaGUARANTY TRUST BANK NGN 4,688,345 423,358 547,017 0.63
423,358 547,017 0.63
PakistanHABIB BANK LTD PKR 259,800 434,067 396,003 0.46
434,067 396,003 0.46
PhilippinesVISTA LAND & LIFESCAPES INC PHP 5,543,200 605,521 653,894 0.75
605,521 653,894 0.75
RBC Funds (Lux)
The accompanying notes form an integral part of these financial statements.
37
RBC Funds (Lux) - Emerging Markets Value Equity Fund
Statement of Investments (continued)as at October 31, 2017(Expressed in USD)
Description Currency QuantityAcquisition
CostMarketValue
% NetAssets
RussiaAEROFLOT USD 139,804 467,652 431,298 0.50FEDERAL HYDROGENERATING COMPANY OJSC USD 45,704,000 635,118 639,993 0.74INTER RAO UES OJSC USD 9,368,000 637,408 574,633 0.66OIL COMPANY LUKOIL PJSC /SADR USD 21,413 993,716 1,137,030 1.31PHOSAGRO OJSC /SGDR REGS USD 34,585 482,581 475,544 0.55SBERBANK OF RUSSIA OJSC /SADR USD 131,608 1,336,344 1,888,575 2.17
4,552,819 5,147,073 5.93
South AfricaMOBILE TEL NET SHS ZAR 57,141 529,448 496,080 0.57STANDARD BANK GROUP LIMITED ZAR 84,039 823,027 974,622 1.12SUPER GROUP ZAR 307,847 868,312 868,599 1.00THE FOSCHINI GROUP ZAR 54,145 577,028 518,811 0.60
2,797,815 2,858,112 3.29
TaiwanACCTON TECHNOLOGY CORP TWD 354,000 829,269 1,140,893 1.32ADVANCED SEMICONDUCT. ENG. INC TWD 337,184 402,061 406,393 0.47HON HAI PRECISION IND. CO LTD TWD 410,120 1,340,371 1,523,015 1.76MACRONIX INTERNATIONAL CO LTD TWD 632,902 660,145 1,154,182 1.33PRIMAX ELECTRONICS LTD TWD 332,000 600,152 860,835 0.99SER COMM CORPORATION TWD 250,000 649,531 714,533 0.82TAIWAN SEMICOND. MANUFACT TWD 411,500 2,350,495 3,315,518 3.82TRIPOD TECHNOLOGY CO LTD TWD 227,000 599,102 835,457 0.96WISTRON NEWEB CORP TWD 272,000 757,383 780,118 0.90
8,188,509 10,730,944 12.37
ThailandELECTR. GENERATING /FOREIGN REG THB 72,800 403,381 504,028 0.58TISCO FIN GRP /FOREIGN REG THB 306,000 577,227 808,284 0.93
980,608 1,312,312 1.51
TurkeyTUPRAS TURKIYE PETROL RAFINEL TRY 23,441 596,477 842,791 0.97
596,477 842,791 0.97
United Arab EmiratesEMAAR PROPERTIES AED 244,547 489,167 551,998 0.64
489,167 551,998 0.64
Total Shares 70,275,843 85,032,442 98.01
Total Transferable securities admitted to an official stock exchange listing or dealtin on another regulated market 70,275,843 85,032,442 98.01
RBC Funds (Lux)
The accompanying notes form an integral part of these financial statements.
38
RBC Funds (Lux) - Emerging Markets Value Equity Fund
Statement of Investments (continued)as at October 31, 2017(Expressed in USD)

Description Currency QuantityAcquisition
CostMarketValue
% NetAssets
Other transferable securities
Shares
ThailandBCP-F SHS THB 583,200 550,101 732,941 0.84
550,101 732,941 0.84
Total Shares 550,101 732,941 0.84
Total Other transferable securities 550,101 732,941 0.84
Total Investment Portfolio 70,825,944 85,765,383 98.85
RBC Funds (Lux)
The accompanying notes form an integral part of these financial statements.
39
RBC Funds (Lux) - Emerging Markets Value Equity Fund
Statement of Investments (continued)as at October 31, 2017(Expressed in USD)
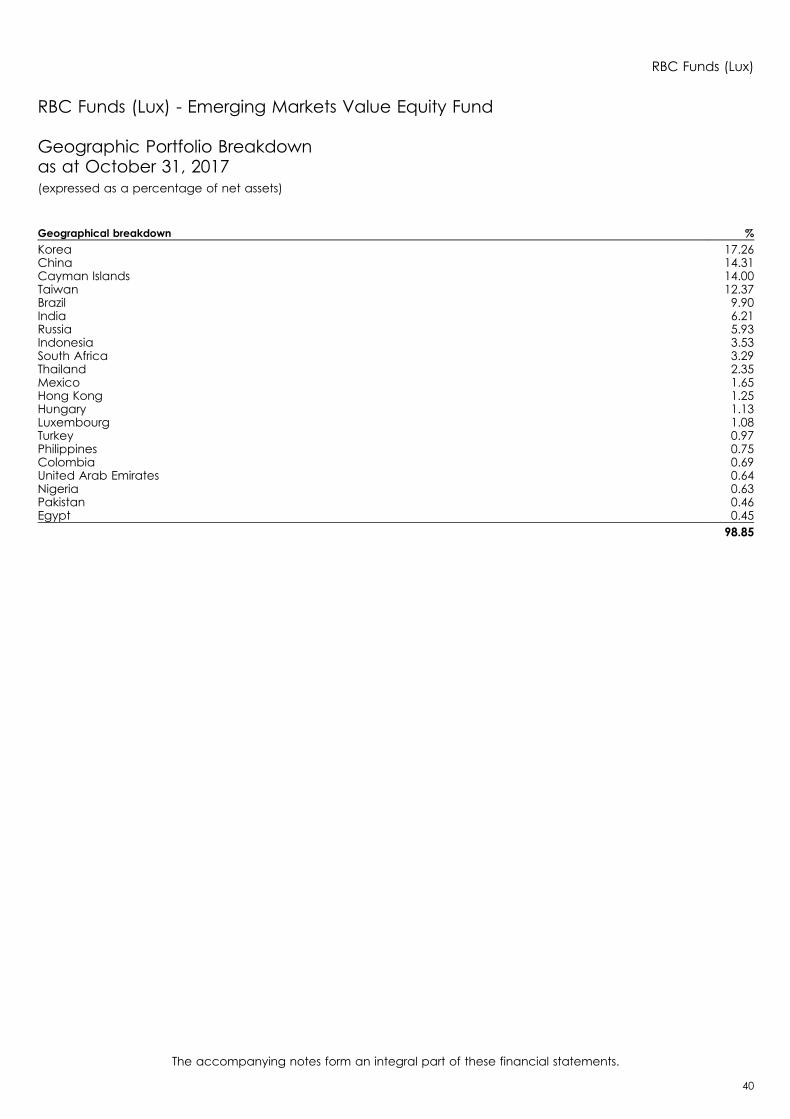
RBC Funds (Lux) - Emerging Markets Value Equity Fund
Geographic Portfolio Breakdownas at October 31, 2017(expressed as a percentage of net assets)
Geographical breakdown %
Korea 17.26China 14.31Cayman Islands 14.00Taiwan 12.37Brazil 9.90India 6.21Russia 5.93Indonesia 3.53South Africa 3.29Thailand 2.35Mexico 1.65Hong Kong 1.25Hungary 1.13Luxembourg 1.08Turkey 0.97Philippines 0.75Colombia 0.69United Arab Emirates 0.64Nigeria 0.63Pakistan 0.46Egypt 0.45
98.85
RBC Funds (Lux)
The accompanying notes form an integral part of these financial statements.
40

RBC Funds (Lux) - Emerging Markets Equity Fund
Statement of Investmentsas at October 31, 2017(Expressed in USD)
Description Currency QuantityAcquisition
CostMarketValue
% NetAssets
Transferable securities admitted to an official stock exchange listing or dealt in on another regulated market
Shares
BangladeshBRAC BANK LIMITED BDT 3,396,407 3,656,682 4,119,609 0.89
3,656,682 4,119,609 0.89
BermudasCREDICORP USD 57,900 9,051,855 12,126,576 2.62
9,051,855 12,126,576 2.62
BrazilBANCO BRADESCO /SADR USD 1,372,550 11,713,448 14,507,854 3.13NATURA COSMETICOS SA BRL 633,400 6,053,763 5,996,419 1.29TOTVS SA BRL 524,600 5,112,050 5,224,588 1.13WEG SA BRL 768,040 4,295,276 4,996,066 1.08
27,174,537 30,724,927 6.63
Cayman IslandsALIBABA GROUP HOLDING LTD /ADR USD 90,900 10,159,199 16,806,501 3.63BAIDU INC -A- /ADR USD 39,108 7,738,937 9,540,005 2.06CHINA RESOURCES LAND HKD 1,247,491 3,434,546 3,717,638 0.80
21,332,682 30,064,144 6.49
ChileCIA CERVECERIAS UNIDAS SA CLP 76,507 1,043,490 1,090,944 0.24COMPANIA CERVECERIAS /SADR USD 165,200 3,882,814 4,704,896 1.01
4,926,304 5,795,840 1.25
ChinaFUYAO GR GL HKD 100,000 385,143 380,683 0.08FUYAO GRP GLASS IND. CO LTD A CNY 2,074,335 5,843,539 8,497,796 1.83HANGZHOU HIKV -A- CNY 1,446,263 4,409,726 8,571,885 1.85MIDEA GROUP CO LTD -A- CNY 745,180 4,595,731 5,734,413 1.24PING AN INSUR. (GRP) CO -H- HKD 582,500 4,787,351 5,114,383 1.10WEIFU HIGH-TECHNO GRP CO /-B- HKD 1,394,765 3,868,894 3,280,528 0.71
23,890,384 31,579,688 6.81
Great BritainANTOFAGASTA PLC GBP 1,127,454 9,955,825 14,290,798 3.09UNILEVER PLC GBP 254,413 12,634,114 14,424,410 3.11
22,589,939 28,715,208 6.20
Hong KongAIA GROUP LTD HKD 2,197,800 14,396,317 16,536,096 3.57CHINA MOBILE LTD HKD 901,705 10,306,731 9,055,453 1.95CN MERCHANT PT HKD 1,799,000 5,472,513 5,626,363 1.22
30,175,561 31,217,912 6.74
IndiaDR REDDY S LABORATORIES /ADR USD 339,700 14,770,876 12,354,889 2.67HCL TECHNOLOGIES /DEMAT. INR 371,690 5,054,179 4,911,027 1.06HERO MOTOCORP LTD INR 83,413 4,070,014 4,957,952 1.07HOUSING DEVT FIN CORP INR 830,630 18,220,223 21,895,863 4.72
RBC Funds (Lux)
The accompanying notes form an integral part of these financial statements.
41
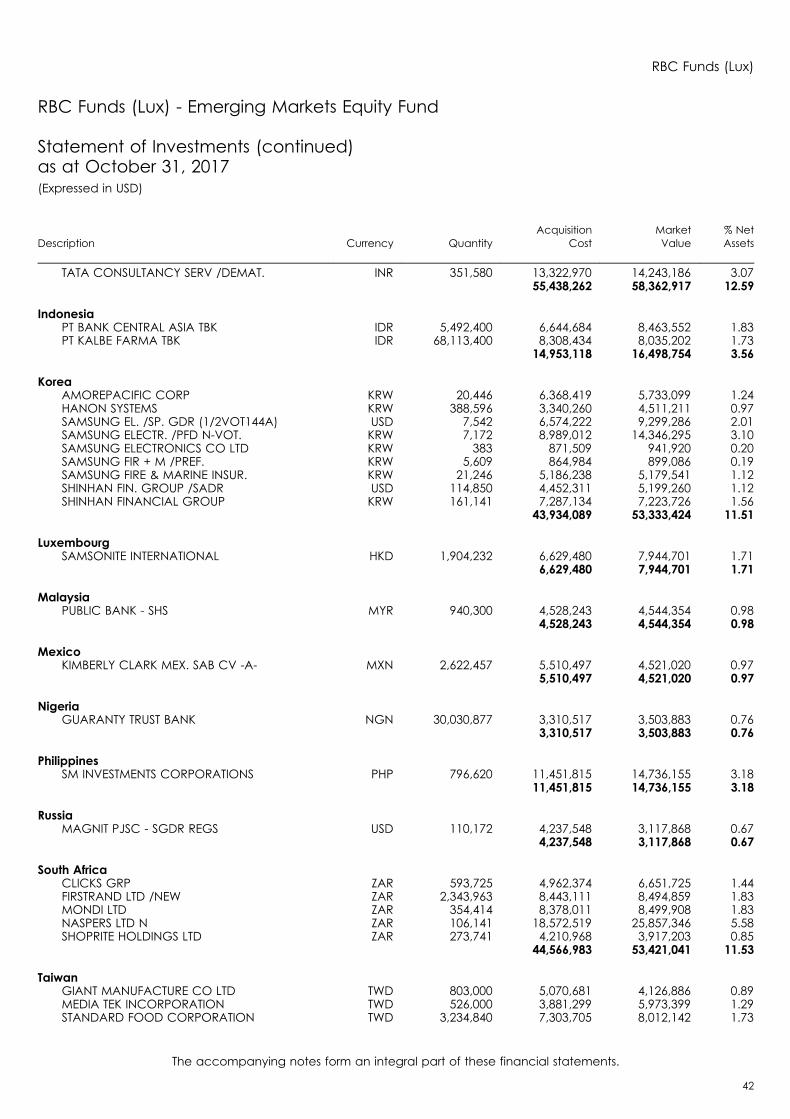
Description Currency QuantityAcquisition
CostMarketValue
% NetAssets
TATA CONSULTANCY SERV /DEMAT. INR 351,580 13,322,970 14,243,186 3.0755,438,262 58,362,917 12.59
IndonesiaPT BANK CENTRAL ASIA TBK IDR 5,492,400 6,644,684 8,463,552 1.83PT KALBE FARMA TBK IDR 68,113,400 8,308,434 8,035,202 1.73
14,953,118 16,498,754 3.56
KoreaAMOREPACIFIC CORP KRW 20,446 6,368,419 5,733,099 1.24HANON SYSTEMS KRW 388,596 3,340,260 4,511,211 0.97SAMSUNG EL. /SP. GDR (1/2VOT144A) USD 7,542 6,574,222 9,299,286 2.01SAMSUNG ELECTR. /PFD N-VOT. KRW 7,172 8,989,012 14,346,295 3.10SAMSUNG ELECTRONICS CO LTD KRW 383 871,509 941,920 0.20SAMSUNG FIR + M /PREF. KRW 5,609 864,984 899,086 0.19SAMSUNG FIRE & MARINE INSUR. KRW 21,246 5,186,238 5,179,541 1.12SHINHAN FIN. GROUP /SADR USD 114,850 4,452,311 5,199,260 1.12SHINHAN FINANCIAL GROUP KRW 161,141 7,287,134 7,223,726 1.56
43,934,089 53,333,424 11.51
LuxembourgSAMSONITE INTERNATIONAL HKD 1,904,232 6,629,480 7,944,701 1.71
6,629,480 7,944,701 1.71
MalaysiaPUBLIC BANK - SHS MYR 940,300 4,528,243 4,544,354 0.98
4,528,243 4,544,354 0.98
MexicoKIMBERLY CLARK MEX. SAB CV -A- MXN 2,622,457 5,510,497 4,521,020 0.97
5,510,497 4,521,020 0.97
NigeriaGUARANTY TRUST BANK NGN 30,030,877 3,310,517 3,503,883 0.76
3,310,517 3,503,883 0.76
PhilippinesSM INVESTMENTS CORPORATIONS PHP 796,620 11,451,815 14,736,155 3.18
11,451,815 14,736,155 3.18
RussiaMAGNIT PJSC - SGDR REGS USD 110,172 4,237,548 3,117,868 0.67
4,237,548 3,117,868 0.67
South AfricaCLICKS GRP ZAR 593,725 4,962,374 6,651,725 1.44FIRSTRAND LTD /NEW ZAR 2,343,963 8,443,111 8,494,859 1.83MONDI LTD ZAR 354,414 8,378,011 8,499,908 1.83NASPERS LTD N ZAR 106,141 18,572,519 25,857,346 5.58SHOPRITE HOLDINGS LTD ZAR 273,741 4,210,968 3,917,203 0.85
44,566,983 53,421,041 11.53
TaiwanGIANT MANUFACTURE CO LTD TWD 803,000 5,070,681 4,126,886 0.89MEDIA TEK INCORPORATION TWD 526,000 3,881,299 5,973,399 1.29STANDARD FOOD CORPORATION TWD 3,234,840 7,303,705 8,012,142 1.73
RBC Funds (Lux)
The accompanying notes form an integral part of these financial statements.
42
RBC Funds (Lux) - Emerging Markets Equity Fund
Statement of Investments (continued)as at October 31, 2017(Expressed in USD)

Description Currency QuantityAcquisition
CostMarketValue
% NetAssets
TAIWAN SEMICOND. MANUFACT TWD 2,625,000 14,920,308 21,150,022 4.56UNI-PRESIDENT ENTERPRISES CORP TWD 3,404,000 6,166,925 7,110,585 1.53
37,342,918 46,373,034 10.00
ThailandCENTRAL PATTANA /FOREIGN REG THB 1,966,400 3,030,058 4,705,810 1.01DELTA ELECTRONICS PUB. /FOR. RG THB 3,380,100 8,417,807 8,750,308 1.89
11,447,865 13,456,118 2.90
TurkeyENKA INSAAT VE SANAYI AS TRY 5,579,543 8,318,874 8,450,401 1.82
8,318,874 8,450,401 1.82
United Arab EmiratesEMAAR MALLS SHS AED 1,010,063 738,916 635,303 0.14
738,916 635,303 0.14
Total Shares 395,207,069 463,242,877 99.95
Total Transferable securities admitted to an official stock exchange listing ordealt in on another regulated market 395,207,069 463,242,877 99.95
Total Investment Portfolio 395,207,069 463,242,877 99.95
RBC Funds (Lux)
The accompanying notes form an integral part of these financial statements.
43
RBC Funds (Lux) - Emerging Markets Equity Fund
Statement of Investments (continued)as at October 31, 2017(Expressed in USD)
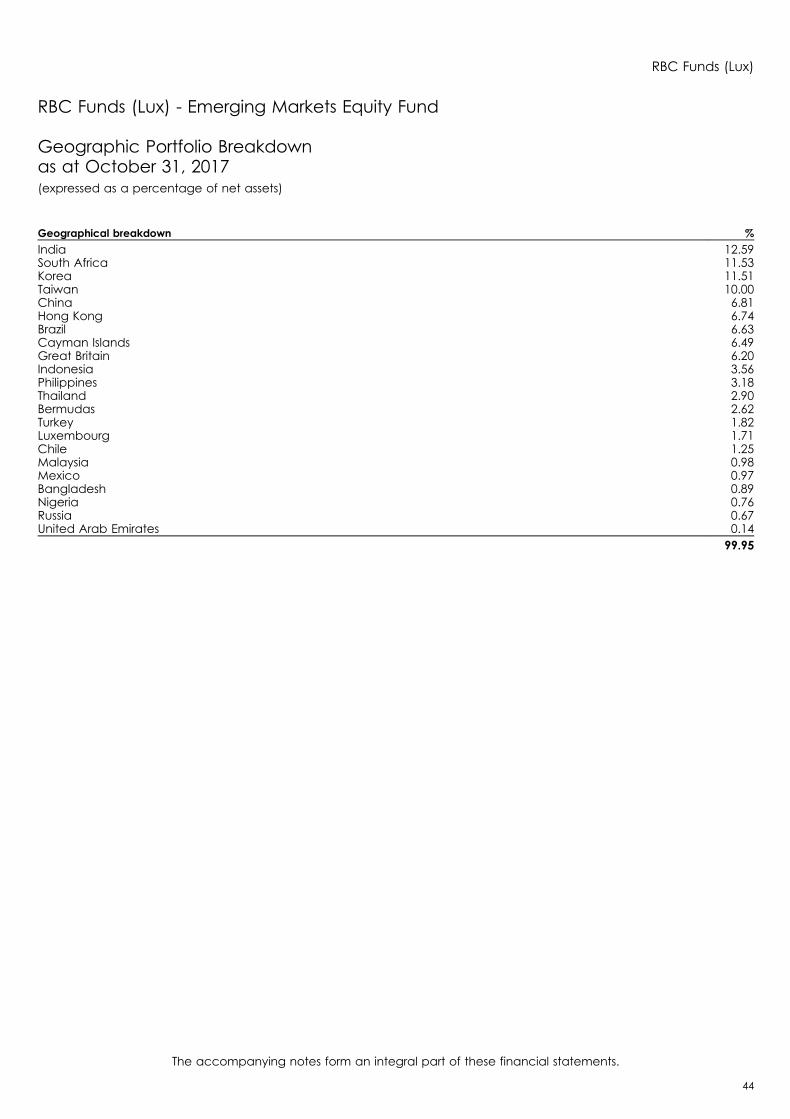
RBC Funds (Lux) - Emerging Markets Equity Fund
Geographic Portfolio Breakdownas at October 31, 2017(expressed as a percentage of net assets)
Geographical breakdown %
India 12.59South Africa 11.53Korea 11.51Taiwan 10.00China 6.81Hong Kong 6.74Brazil 6.63Cayman Islands 6.49Great Britain 6.20Indonesia 3.56Philippines 3.18Thailand 2.90Bermudas 2.62Turkey 1.82Luxembourg 1.71Chile 1.25Malaysia 0.98Mexico 0.97Bangladesh 0.89Nigeria 0.76Russia 0.67United Arab Emirates 0.14
99.95
RBC Funds (Lux)
The accompanying notes form an integral part of these financial statements.
44
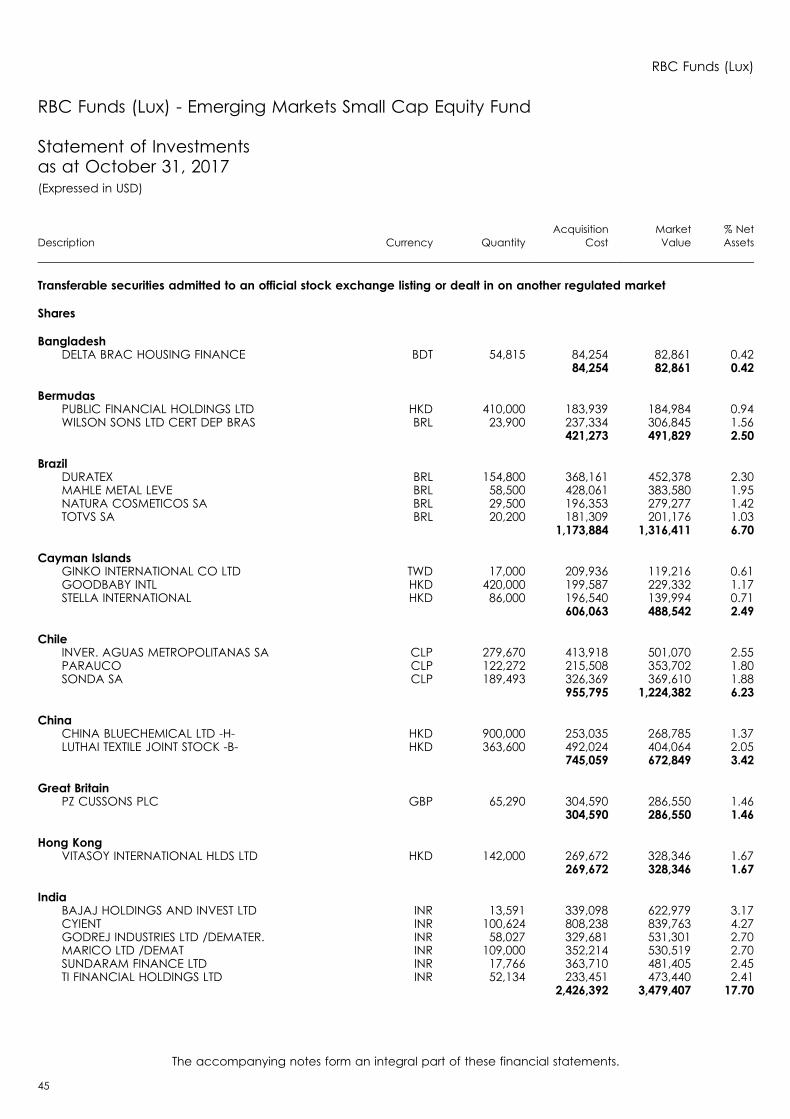
RBC Funds (Lux) - Emerging Markets Small Cap Equity Fund
Statement of Investmentsas at October 31, 2017(Expressed in USD)
Description Currency QuantityAcquisition
CostMarketValue
% NetAssets
Transferable securities admitted to an official stock exchange listing or dealt in on another regulated market
Shares
BangladeshDELTA BRAC HOUSING FINANCE BDT 54,815 84,254 82,861 0.42
84,254 82,861 0.42
BermudasPUBLIC FINANCIAL HOLDINGS LTD HKD 410,000 183,939 184,984 0.94WILSON SONS LTD CERT DEP BRAS BRL 23,900 237,334 306,845 1.56
421,273 491,829 2.50
BrazilDURATEX BRL 154,800 368,161 452,378 2.30MAHLE METAL LEVE BRL 58,500 428,061 383,580 1.95NATURA COSMETICOS SA BRL 29,500 196,353 279,277 1.42TOTVS SA BRL 20,200 181,309 201,176 1.03
1,173,884 1,316,411 6.70
Cayman IslandsGINKO INTERNATIONAL CO LTD TWD 17,000 209,936 119,216 0.61GOODBABY INTL HKD 420,000 199,587 229,332 1.17STELLA INTERNATIONAL HKD 86,000 196,540 139,994 0.71
606,063 488,542 2.49
ChileINVER. AGUAS METROPOLITANAS SA CLP 279,670 413,918 501,070 2.55PARAUCO CLP 122,272 215,508 353,702 1.80SONDA SA CLP 189,493 326,369 369,610 1.88
955,795 1,224,382 6.23
ChinaCHINA BLUECHEMICAL LTD -H- HKD 900,000 253,035 268,785 1.37LUTHAI TEXTILE JOINT STOCK -B- HKD 363,600 492,024 404,064 2.05
745,059 672,849 3.42
Great BritainPZ CUSSONS PLC GBP 65,290 304,590 286,550 1.46
304,590 286,550 1.46
Hong KongVITASOY INTERNATIONAL HLDS LTD HKD 142,000 269,672 328,346 1.67
269,672 328,346 1.67
IndiaBAJAJ HOLDINGS AND INVEST LTD INR 13,591 339,098 622,979 3.17CYIENT INR 100,624 808,238 839,763 4.27GODREJ INDUSTRIES LTD /DEMATER. INR 58,027 329,681 531,301 2.70MARICO LTD /DEMAT INR 109,000 352,214 530,519 2.70SUNDARAM FINANCE LTD INR 17,766 363,710 481,405 2.45TI FINANCIAL HOLDINGS LTD INR 52,134 233,451 473,440 2.41
2,426,392 3,479,407 17.70
RBC Funds (Lux)
The accompanying notes form an integral part of these financial statements.
45

Description Currency QuantityAcquisition
CostMarketValue
% NetAssets
IndonesiaPT ACSET INDONUSA TBK IDR 1,037,900 253,418 225,747 1.15PT SELAMAT SEMPURNA TBK IDR 2,743,700 209,088 260,958 1.33
462,506 486,705 2.48
JerseyINT DIAGNOS USD 48,977 212,277 191,010 0.97
212,277 191,010 0.97
KoreaAMOREPACIFIC /PFD N/V KRW 2,675 475,177 426,396 2.17DGB FINANCIAL GROUP KRW 49,102 454,237 458,213 2.33KOH YOUNG TECHNOLOGY INC KRW 5,019 198,662 344,215 1.75LOEN ENTERTAINMENT INC KRW 3,546 272,287 337,241 1.72MACQUARIE KOREA INFRASTR. FUND KRW 25,436 194,745 193,526 0.98MEDY TOX KRW 406 174,085 153,543 0.78
1,769,193 1,913,134 9.73
LuxembourgSAMSONITE INTERNATIONAL HKD 107,300 332,494 447,669 2.28
332,494 447,669 2.28
MalaysiaBERJAYA AUTO BHD MYR 324,800 162,627 156,512 0.80LPI CAPITAL BHD MYR 45,800 170,278 197,112 1.00
332,905 353,624 1.80
MexicoGRUPO HERDEZ SAB DE CV MXN 142,237 334,586 304,842 1.55VESTA SHS MXN 221,900 328,884 274,905 1.40
663,470 579,747 2.95
NigeriaGUARANTY TRUST BK PLC /SGDR USD 25,616 140,391 153,696 0.78
140,391 153,696 0.78
PhilippinesCENTURY PACIFIC FOOD INC PHP 1,005,800 298,111 296,131 1.51INTEGRATED PHP 722,600 216,085 247,743 1.26SECURITY BANK CORP. PHP 80,840 277,678 385,204 1.96
791,874 929,078 4.73
South AfricaAVI LTD ZAR 38,000 285,204 265,089 1.35CASHBUILD LTD ZAR 6,733 153,153 173,309 0.88CLICKS GRP ZAR 24,216 165,296 271,301 1.38OCEANA GROUP LTD ZAR 43,876 346,720 279,863 1.43
950,373 989,562 5.04
TaiwanCHROMA ATE INC TWD 92,000 199,550 448,415 2.28GIANT MANUFACTURE CO LTD TWD 56,000 367,792 287,803 1.47PACIFIC HOSPITAL SUPPLY CO LTD TWD 60,100 146,597 150,850 0.77POYA CO LTD TWD 14,140 175,676 181,207 0.92STANDARD FOOD CORPORATION TWD 207,149 437,023 513,072 2.61VOLTRON POW TWD 11,000 212,072 207,165 1.05
RBC Funds (Lux)
The accompanying notes form an integral part of these financial statements.
46
RBC Funds (Lux) - Emerging Markets Small Cap Equity Fund
Statement of Investments (continued)as at October 31, 2017(Expressed in USD)
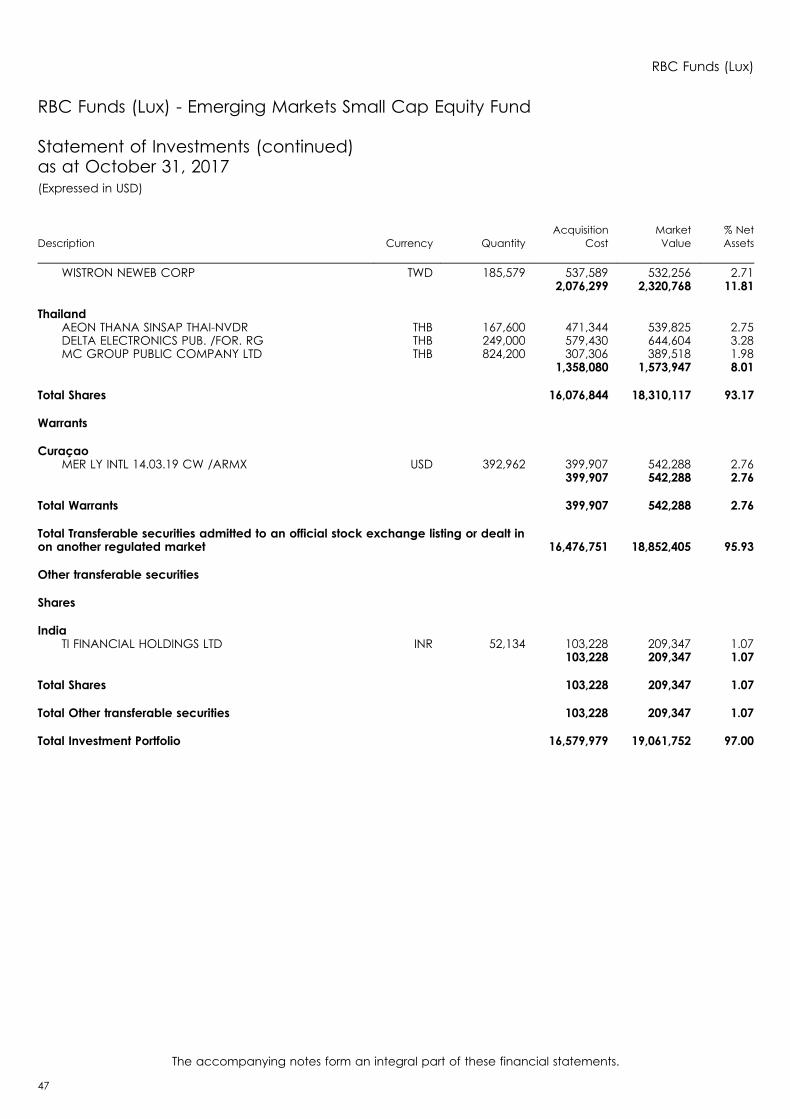
Description Currency QuantityAcquisition
CostMarketValue
% NetAssets
WISTRON NEWEB CORP TWD 185,579 537,589 532,256 2.712,076,299 2,320,768 11.81
ThailandAEON THANA SINSAP THAI-NVDR THB 167,600 471,344 539,825 2.75DELTA ELECTRONICS PUB. /FOR. RG THB 249,000 579,430 644,604 3.28MC GROUP PUBLIC COMPANY LTD THB 824,200 307,306 389,518 1.98
1,358,080 1,573,947 8.01
Total Shares 16,076,844 18,310,117 93.17
Warrants
CuraçaoMER LY INTL 14.03.19 CW /ARMX USD 392,962 399,907 542,288 2.76
399,907 542,288 2.76
Total Warrants 399,907 542,288 2.76
Total Transferable securities admitted to an official stock exchange listing or dealt inon another regulated market 16,476,751 18,852,405 95.93
Other transferable securities
Shares
IndiaTI FINANCIAL HOLDINGS LTD INR 52,134 103,228 209,347 1.07
103,228 209,347 1.07
Total Shares 103,228 209,347 1.07
Total Other transferable securities 103,228 209,347 1.07
Total Investment Portfolio 16,579,979 19,061,752 97.00
RBC Funds (Lux)
The accompanying notes form an integral part of these financial statements.
47
RBC Funds (Lux) - Emerging Markets Small Cap Equity Fund
Statement of Investments (continued)as at October 31, 2017(Expressed in USD)

RBC Funds (Lux) - Emerging Markets Small Cap Equity Fund
Geographic Portfolio Breakdownas at October 31, 2017(expressed as a percentage of net assets)
Geographical breakdown %
India 18.77Taiwan 11.81Korea 9.73Thailand 8.01Brazil 6.70Chile 6.23South Africa 5.04Philippines 4.73China 3.42Mexico 2.95Curaçao 2.76Bermudas 2.50Cayman Islands 2.49Indonesia 2.48Luxembourg 2.28Malaysia 1.80Hong Kong 1.67Great Britain 1.46Jersey 0.97Nigeria 0.78Bangladesh 0.42
97.00
RBC Funds (Lux)
The accompanying notes form an integral part of these financial statements.
48
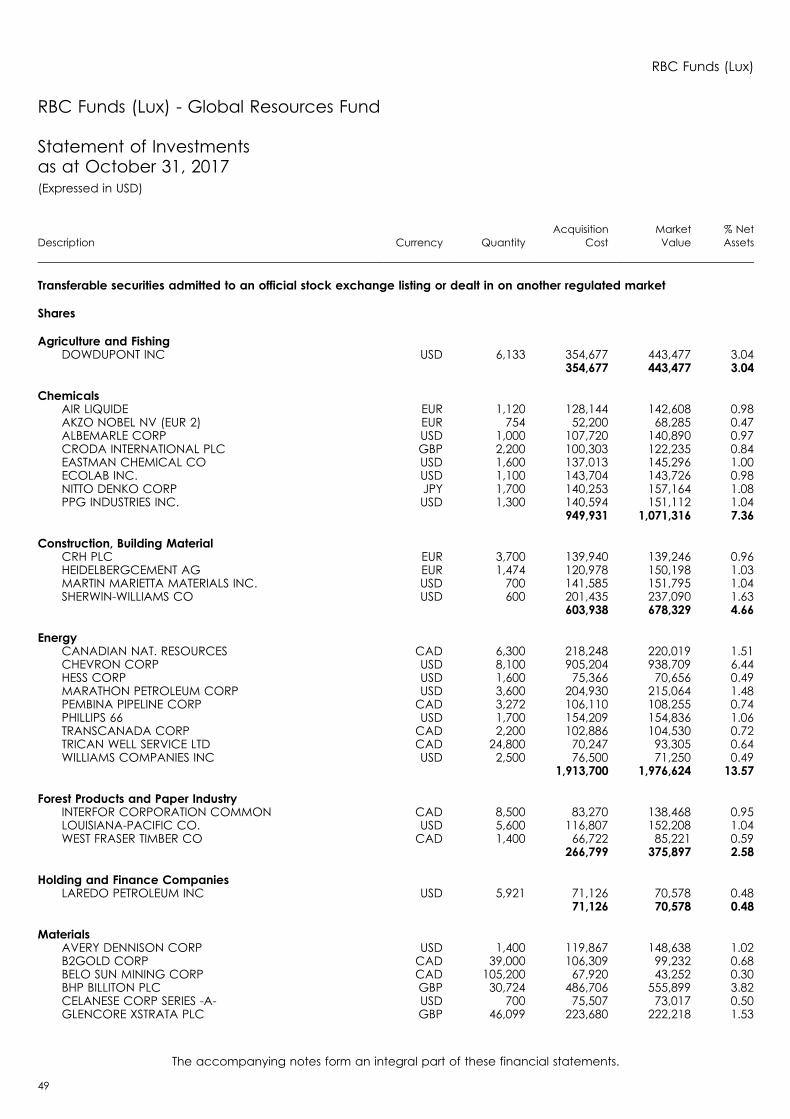
RBC Funds (Lux) - Global Resources Fund
Statement of Investmentsas at October 31, 2017(Expressed in USD)
Description Currency QuantityAcquisition
CostMarketValue
% NetAssets
Transferable securities admitted to an official stock exchange listing or dealt in on another regulated market
Shares
Agriculture and FishingDOWDUPONT INC USD 6,133 354,677 443,477 3.04
354,677 443,477 3.04
ChemicalsAIR LIQUIDE EUR 1,120 128,144 142,608 0.98AKZO NOBEL NV (EUR 2) EUR 754 52,200 68,285 0.47ALBEMARLE CORP USD 1,000 107,720 140,890 0.97CRODA INTERNATIONAL PLC GBP 2,200 100,303 122,235 0.84EASTMAN CHEMICAL CO USD 1,600 137,013 145,296 1.00ECOLAB INC. USD 1,100 143,704 143,726 0.98NITTO DENKO CORP JPY 1,700 140,253 157,164 1.08PPG INDUSTRIES INC. USD 1,300 140,594 151,112 1.04
949,931 1,071,316 7.36
Construction, Building MaterialCRH PLC EUR 3,700 139,940 139,246 0.96HEIDELBERGCEMENT AG EUR 1,474 120,978 150,198 1.03MARTIN MARIETTA MATERIALS INC. USD 700 141,585 151,795 1.04SHERWIN-WILLIAMS CO USD 600 201,435 237,090 1.63
603,938 678,329 4.66
EnergyCANADIAN NAT. RESOURCES CAD 6,300 218,248 220,019 1.51CHEVRON CORP USD 8,100 905,204 938,709 6.44HESS CORP USD 1,600 75,366 70,656 0.49MARATHON PETROLEUM CORP USD 3,600 204,930 215,064 1.48PEMBINA PIPELINE CORP CAD 3,272 106,110 108,255 0.74PHILLIPS 66 USD 1,700 154,209 154,836 1.06TRANSCANADA CORP CAD 2,200 102,886 104,530 0.72TRICAN WELL SERVICE LTD CAD 24,800 70,247 93,305 0.64WILLIAMS COMPANIES INC USD 2,500 76,500 71,250 0.49
1,913,700 1,976,624 13.57
Forest Products and Paper IndustryINTERFOR CORPORATION COMMON CAD 8,500 83,270 138,468 0.95LOUISIANA-PACIFIC CO. USD 5,600 116,807 152,208 1.04WEST FRASER TIMBER CO CAD 1,400 66,722 85,221 0.59
266,799 375,897 2.58
Holding and Finance CompaniesLAREDO PETROLEUM INC USD 5,921 71,126 70,578 0.48
71,126 70,578 0.48
MaterialsAVERY DENNISON CORP USD 1,400 119,867 148,638 1.02B2GOLD CORP CAD 39,000 106,309 99,232 0.68BELO SUN MINING CORP CAD 105,200 67,920 43,252 0.30BHP BILLITON PLC GBP 30,724 486,706 555,899 3.82CELANESE CORP SERIES -A- USD 700 75,507 73,017 0.50GLENCORE XSTRATA PLC GBP 46,099 223,680 222,218 1.53
RBC Funds (Lux)
The accompanying notes form an integral part of these financial statements.
49

Description Currency QuantityAcquisition
CostMarketValue
% NetAssets
POTASH CORP SASKATCHEWAN CAD 11,906 213,496 231,914 1.59PRAXAIR USD 1,700 209,632 248,404 1.70SHIN-ETSU CHEMICAL CO JPY 1,600 141,443 167,702 1.15WESTERN FOREST PROD CAD 17,400 24,222 35,364 0.24
1,668,782 1,825,640 12.53
Mines, Heavy IndustriesALCOA CORP USD 3,100 133,350 148,118 1.02ARIZONA MINING INC CAD 53,423 97,433 134,272 0.92CARDINAL RESOURCES LTD AUD 18,169 10,110 8,150 0.06CARDINAL RESOURCES LTD CAD 71,831 38,964 33,433 0.23FIRST QUANTUM MINERALS LTD CAD 15,200 136,179 170,147 1.17KIRKLAND LAKE GOLD LTD CAD 21,500 191,163 252,343 1.73MASON GRAPHITE SHS CAD 37,634 34,739 86,122 0.59METALS X LTD AUD 120,459 82,116 92,362 0.63MOUNTAIN PROVINCE DIAMONDS INC CAD 40,300 184,548 111,293 0.77NEMASKA LITHIUM CAD 32,700 31,462 46,928 0.32
940,064 1,083,168 7.44
Non-Ferrous MetalsNEO LITHIUM CORP CAD 51,800 51,025 81,572 0.56RIO TINTO PLC /REG. GBP 15,816 593,892 745,286 5.12UMICORE SA EUR 1,800 77,893 80,459 0.55
722,810 907,317 6.23
Packaging and Container IndustryBALL CORP. USD 1,700 62,958 72,981 0.50PACKAGING CORP OF AMERICA USD 900 73,119 104,643 0.72
136,077 177,624 1.22
PetrolCABOT OIL+GAS INC. /CL. USD 2,800 69,549 77,560 0.53CONCHO RESOURCES INC USD 3,255 367,803 436,854 3.00CONOCOPHILLIPS USD 7,100 356,846 363,165 2.49DIAMONDBACK ENERGY INC SHS USD 3,600 338,439 385,776 2.65ENCANA CORP CAD 19,800 236,013 231,776 1.59EOG RESOURCES INC. USD 4,996 443,723 498,950 3.43EXXON MOBIL CORP USD 3,500 289,039 291,725 2.00GALP ENERGIA SGPS SA -B- SHRS EUR 20,433 288,934 379,903 2.61HALLIBURTON CO USD 8,262 375,030 353,118 2.43PAREX RESOURCES CAD 11,400 105,982 151,752 1.04PARSLEY ENERGY SHS -A- USD 4,000 137,730 106,400 0.73ROYAL DUTCH SHELL PLC -A- EUR 29,200 860,366 917,250 6.30SUNCOR ENERGY CAD 8,400 293,847 285,408 1.96TOTAL SA EUR 10,900 588,950 607,851 4.17VALERO ENER. CORP USD 2,200 146,794 173,558 1.19
4,899,045 5,261,046 36.12
Pharmaceuticals and CosmeticsINTL FLAVORS FRAG USD 500 68,732 73,710 0.51
68,732 73,710 0.51
Precious MetalsCRITICAL ELEM CAD 44,900 28,670 60,953 0.42ENDEAVOUR MINING CORPORATION CAD 3,686 45,556 65,565 0.45JOHNSON MATTHEY PLC GBP 1,000 45,757 44,898 0.31
RBC Funds (Lux)
The accompanying notes form an integral part of these financial statements.
50
RBC Funds (Lux) - Global Resources Fund
Statement of Investments (continued)as at October 31, 2017(Expressed in USD)

Description Currency QuantityAcquisition
CostMarketValue
% NetAssets
LUNDIN MINING CORP CAD 9,100 56,241 69,463 0.48MARATHON GOLD CAD 79,300 43,732 63,361 0.43
219,956 304,240 2.09
Total Shares 12,815,637 14,248,966 97.83
Total Transferable securities admitted to an official stock exchange listing or dealt inon another regulated market 12,815,637 14,248,966 97.83
Total Investment Portfolio 12,815,637 14,248,966 97.83
RBC Funds (Lux)
The accompanying notes form an integral part of these financial statements.
51
RBC Funds (Lux) - Global Resources Fund
Statement of Investments (continued)as at October 31, 2017(Expressed in USD)

RBC Funds (Lux) - Global Resources Fund
Economic Portfolio Breakdownas at October 31, 2017(expressed as a percentage of net assets)
Economic breakdown %
Petrol 36.12Energy 13.57Materials 12.53Mines, Heavy Industries 7.44Chemicals 7.36Non-Ferrous Metals 6.23Construction, Building Material 4.66Agriculture and Fishing 3.04Forest Products and Paper Industry 2.58Precious Metals 2.09Packaging and Container Industry 1.22Pharmaceuticals and Cosmetics 0.51Holding and Finance Companies 0.48
97.83
RBC Funds (Lux)
The accompanying notes form an integral part of these financial statements.
52

RBC Funds (Lux) - Global Bond Fund
Statement of Investmentsas at October 31, 2017(Expressed in USD)
Description CurrencyNominal
ValueAcquisition
CostMarketValue
% NetAssets
Transferable securities admitted to an official stock exchange listing or dealt in on another regulated market
Bonds
AustriaAUSTRIA 0.5% 17-20.04.27 EUR 680,000 749,333 789,363 0.84
749,333 789,363 0.84
BelgiumBELGIUM OLO 2.6% 14-22.06.24 EUR 1,000,000 1,281,031 1,360,394 1.44BELGIUM OLO 3.75% 22.06.45 REGS EUR 223,000 342,656 386,037 0.41
1,623,687 1,746,431 1.85
CanadaALTAGAS 3.72% 12-28.09.21 CAD 100,000 82,537 80,737 0.08BELL CA 2% 16-01.10.21 CAD 200,000 156,597 152,935 0.16CANADA 1.5% 12-01.06.23 CAD 1,545,000 1,227,179 1,186,933 1.26CANADA 1.5% 15-01.06.26 CAD 2,538,000 1,932,671 1,906,995 2.02CND GVT 0.75% 17-01.08.19 CAD 700,000 539,213 537,264 0.57ENBRIDGE PIP 6.62% 08-19.11.18 CAD 100,000 87,698 81,414 0.09H R REAL EST 4.45% 02.03.20 SR. F CAD 200,000 165,995 161,662 0.17HSBC BANK C 2.491% 14-13.05.19 CAD 200,000 156,771 156,850 0.17ONTARIO 1.625% 16-18.01.19 USD 2,300,000 2,301,263 2,296,090 2.43ONTARIO 1.875% 15-21.05.20 USD 700,000 699,209 697,855 0.74ONTARIO 2% 14-30.01.19 USD 1,660,000 1,679,037 1,664,600 1.76ONTARIO 2.4% 15-02.06.26 CAD 255,000 203,805 195,888 0.21ONTARIO 2.5% 14-10.09.21 USD 1,700,000 1,735,311 1,718,295 1.82ROGERS COM 2.8% 14-13.03.19 CAD 200,000 157,140 157,040 0.17ROGERS COM 4.7% 10-29.09.20 CAD 200,000 170,727 166,052 0.18
11,295,153 11,160,610 11.83
DenmarkDENMARK 3% 10-15.11.21 DKK 5,950,000 1,132,739 1,059,075 1.12
1,132,739 1,059,075 1.12
FinlandFINLAND 1.375% 17-15.04.47 EUR 90,000 100,573 106,203 0.11
100,573 106,203 0.11
FranceFRANCE 0% 16-25.02.20 /OAT EUR 250,000 285,461 295,321 0.31FRANCE 0.5% 15-25.05.26 /OAT EUR 2,015,000 2,239,422 2,362,632 2.50FRANCE 1.25% 15-25.05.36 /OAT EUR 1,376,000 1,473,217 1,582,467 1.68FRANCE 1.75% 15-25.05.66 /OAT EUR 125,000 120,001 139,610 0.15FRANCE 4% 09-25.04.60 OAT EUR 38,000 76,160 72,497 0.08
4,194,261 4,452,527 4.72
GermanyGERMANY 0.5% 16-15.02.26 EUR 1,287,000 1,511,166 1,546,421 1.64GERMANY 2.5% 14-15.08.46 EUR 504,000 799,477 777,066 0.82GERMANY 4% 05-04.01.37 EUR 500,000 882,204 900,286 0.95
3,192,847 3,223,773 3.41
Great BritainUK 1.25% 17-22.07.27 GBP 2,006,000 2,644,586 2,634,485 2.79
RBC Funds (Lux)
The accompanying notes form an integral part of these financial statements.
53

Description CurrencyNominal
ValueAcquisition
CostMarketValue
% NetAssets
UK 3.25% 12-22.01.44 /RPI GBP 1,062,000 1,728,337 1,788,081 1.90UK TSY 4.5% 09-07.09.34 GBP 270,000 473,732 501,075 0.53
4,846,655 4,923,641 5.22
IrelandIRELAND 1.7% 17-15.05.37 EUR 150,000 153,677 180,448 0.19IRELAND 5% 10-18.10.20 EUR 500,000 697,175 678,886 0.72
850,852 859,334 0.91
ItalyITALY 0.65% 15-01.11.20 /BTP EUR 1,580,000 1,725,194 1,873,517 1.98ITALY 1.45% 15-15.09.22 /BTP EUR 725,000 826,760 878,146 0.93ITALY 1.5% 14-01.08.19 /BTP EUR 1,640,000 1,832,068 1,969,545 2.09ITALY 1.6% 16-01.06.26 /BTP EUR 3,275,000 3,547,612 3,818,637 4.05ITALY 2.25% 16-01.09.36 /BTP EUR 264,000 284,100 294,445 0.31ITALY 3.25% 14-01.09.46 /BTP EUR 91,000 105,806 112,312 0.12ITALY 3.45% 17-01.03.48 BTP EUR 165,000 183,891 206,960 0.22
8,505,431 9,153,562 9.70
JapanDBJ 0.375% 15-21.10.19 EUR 100,000 111,827 117,392 0.13DBJ 1.05% 03-20.06.23 JPY 30,000,000 294,617 278,155 0.30DBJ 1.7% 02-20.09.22 JPY 56,000,000 591,495 532,275 0.56JAPAN 0.1% 14-20.12.19 JPY 112,000,000 1,006,286 991,004 1.05JAPAN 0.1% 16-20.06.26 JPY 161,500,000 1,458,136 1,431,346 1.52JAPAN 0.1% 16-20.09.21 JPY 75,800,000 703,190 672,430 0.71JAPAN 0.2% 16-20.06.36 JPY 459,000,000 4,227,464 3,807,235 4.04JAPAN 0.3% 14-20.12.24 JPY 236,000,000 1,973,258 2,126,683 2.25JAPAN 0.3% 16-20.06.46 JPY 84,850,000 698,346 645,613 0.68JAPAN 0.4% 16-20.03.56 JPY 13,600,000 100,201 96,134 0.10JAPAN 0.5% 16-20.09.36 JPY 238,000,000 2,230,614 2,079,547 2.20JAPAN 0.6% 16-20.12.36 JPY 48,500,000 436,107 430,636 0.46JAPAN 1.5% 14-20.12.44 JPY 34,000,000 321,542 349,817 0.37JFM 0.875% 14-22.09.21 EUR 380,000 421,779 453,697 0.48JFM 1.9% 08-22.06.18 JPY 170,000,000 1,742,588 1,513,680 1.60
16,317,450 15,525,644 16.45
MexicoPEMEX 2.5% 17-21.08.21 EUR 100,000 108,001 122,207 0.13
108,001 122,207 0.13
NetherlandsNETHERLANDS 0.75% 15.07.27 144A EUR 340,000 362,733 406,701 0.43
362,733 406,701 0.43
PolandPOLAND 2.25% 16-25.04.22 PLN 2,290,000 627,567 620,320 0.66
627,567 620,320 0.66
PortugalPORTUGUESE 2.2% 15-17.10.22 EUR 430,000 495,811 536,149 0.57
495,811 536,149 0.57
RomaniaROMANIA 2.875% 14-28.10.24 EUR 60,000 69,489 76,969 0.08
RBC Funds (Lux)
The accompanying notes form an integral part of these financial statements.
54
RBC Funds (Lux) - Global Bond Fund
Statement of Investments (continued)as at October 31, 2017(Expressed in USD)

Description CurrencyNominal
ValueAcquisition
CostMarketValue
% NetAssets
ROMANIA 4.625% 13-18.09.20 REGS EUR 180,000 219,476 237,507 0.25288,965 314,476 0.33
SpainSPAIN 1.15% 15-30.07.20 EUR 2,500,000 2,883,747 3,015,662 3.20SPAIN 1.45% 17-31.10.27 EUR 580,000 658,567 675,430 0.72SPAIN 2.75% 14-30.04.19 EUR 2,550,000 3,024,229 3,109,416 3.29SPAIN 4% 14-31.10.64 EUR 100,000 132,263 145,505 0.15SPAIN 4.1% 08-30.07.18 EUR 370,000 421,498 445,396 0.47SPAIN 5.5% 11-30.04.21 EUR 500,000 703,578 694,799 0.74SPAIN GOVERNMENT EUR 210,000 319,291 340,719 0.36
8,143,173 8,426,927 8.93
SwedenSWEDEN 1.5% 11-13.11.23 SEK 3,930,000 482,246 507,723 0.54
482,246 507,723 0.54
United States of AmericaUSA 1.5% 14-30.11.19 /TBO* USD 2,495,000 2,503,732 2,489,152 2.64USA 1.5% 15-31.01.22 /TBO* USD 6,600,000 6,510,052 6,484,111 6.87USA 1.625% 15-31.07.20 /TBO* USD 2,030,000 2,020,758 2,025,757 2.15USA 1.750% 13-15.05.23 TBO* USD 3,500,000 3,447,457 3,437,794 3.64USA 2.125% 10-15.02.40 /INFL** USD 260,000 362,108 372,149 0.39USA 2.375% 17-15.05.27 /TBO* USD 4,798,000 4,836,211 4,800,999 5.09USA 2.5% 15-15.02.45 /TBO* USD 2,207,000 2,062,318 2,053,545 2.18USA 3.5% 09-15.02.39 TBO* USD 800,000 924,012 901,047 0.95USA 4.375% 09-15.11.39 /TBO* USD 250,000 339,346 317,280 0.34
23,005,994 22,881,834 24.25
Total Bonds 86,323,471 86,816,500 92.00
Total Transferable securities admitted to an official stock exchange listing or dealt in onanother regulated market 86,323,471 86,816,500 92.00
Investment Funds
IrelandISH USD DUR BD ETF USD /DIS USD 14,000 1,405,602 1,418,900 1.51ISHARES JPM USD EM BD UCITS ETF USD 8,000 861,006 915,920 0.97ISHARES USD HGH YD ETF-USD /DIS USD 8,400 911,615 898,212 0.95
3,178,223 3,233,032 3.43
Total Investment Funds 3,178,223 3,233,032 3.43
RBC Funds (Lux)
The accompanying notes form an integral part of these financial statements.
55
RBC Funds (Lux) - Global Bond Fund
Statement of Investments (continued)as at October 31, 2017(Expressed in USD)
* TBO = Treasury Bonds** INFL = Inflation

Description CurrencyNominal
ValueAcquisition
CostMarketValue
% NetAssets
Other transferable securities
Bonds
CanadaBMO 2.84% 13-04.06.20 CAD 200,000 167,519 158,678 0.17CHOICE PRP 3.6% 14-20.09.21 REST CAD 200,000 164,698 160,582 0.17QUEBEC 2.75% 14-01.09.25 CAD 500,000 383,872 396,548 0.42
716,089 715,808 0.76
Total Bonds 716,089 715,808 0.76
Total Other transferable securities 716,089 715,808 0.76
Total Investment Portfolio 90,217,783 90,765,340 96.19
RBC Funds (Lux)
The accompanying notes form an integral part of these financial statements.
56
RBC Funds (Lux) - Global Bond Fund
Statement of Investments (continued)as at October 31, 2017(Expressed in USD)
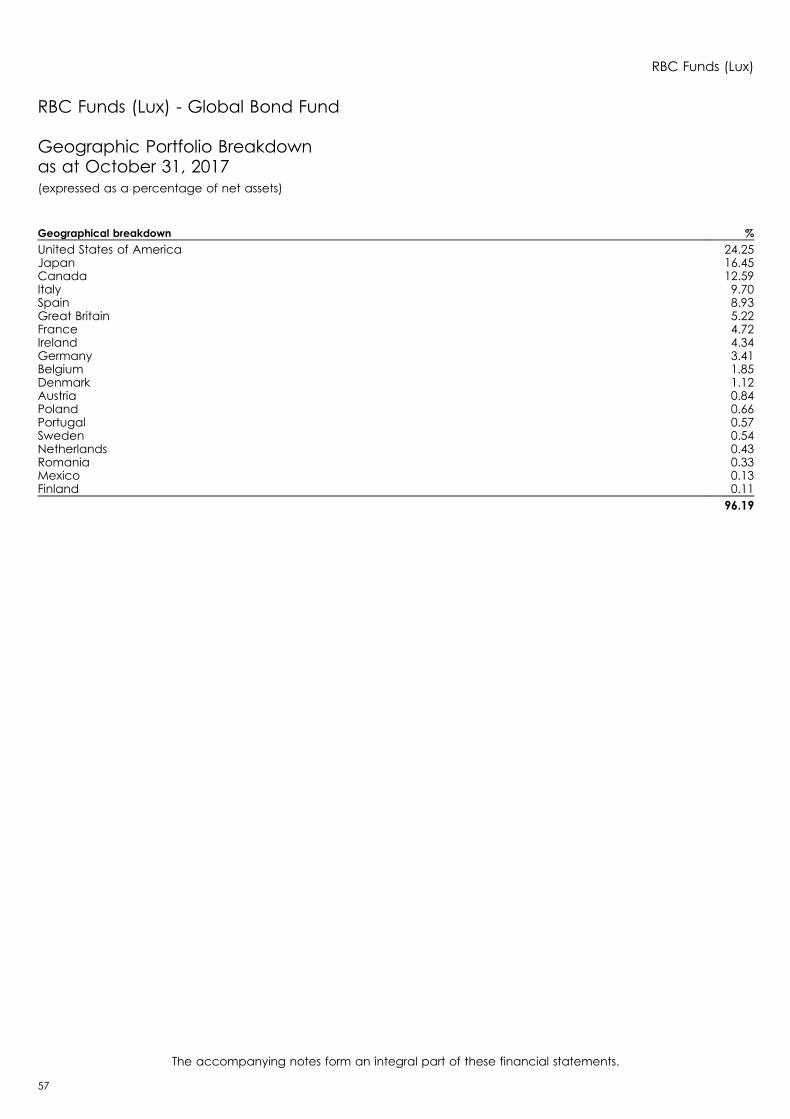
RBC Funds (Lux) - Global Bond Fund
Geographic Portfolio Breakdownas at October 31, 2017(expressed as a percentage of net assets)
Geographical breakdown %
United States of America 24.25Japan 16.45Canada 12.59Italy 9.70Spain 8.93Great Britain 5.22France 4.72Ireland 4.34Germany 3.41Belgium 1.85Denmark 1.12Austria 0.84Poland 0.66Portugal 0.57Sweden 0.54Netherlands 0.43Romania 0.33Mexico 0.13Finland 0.11
96.19
RBC Funds (Lux)
The accompanying notes form an integral part of these financial statements.
57
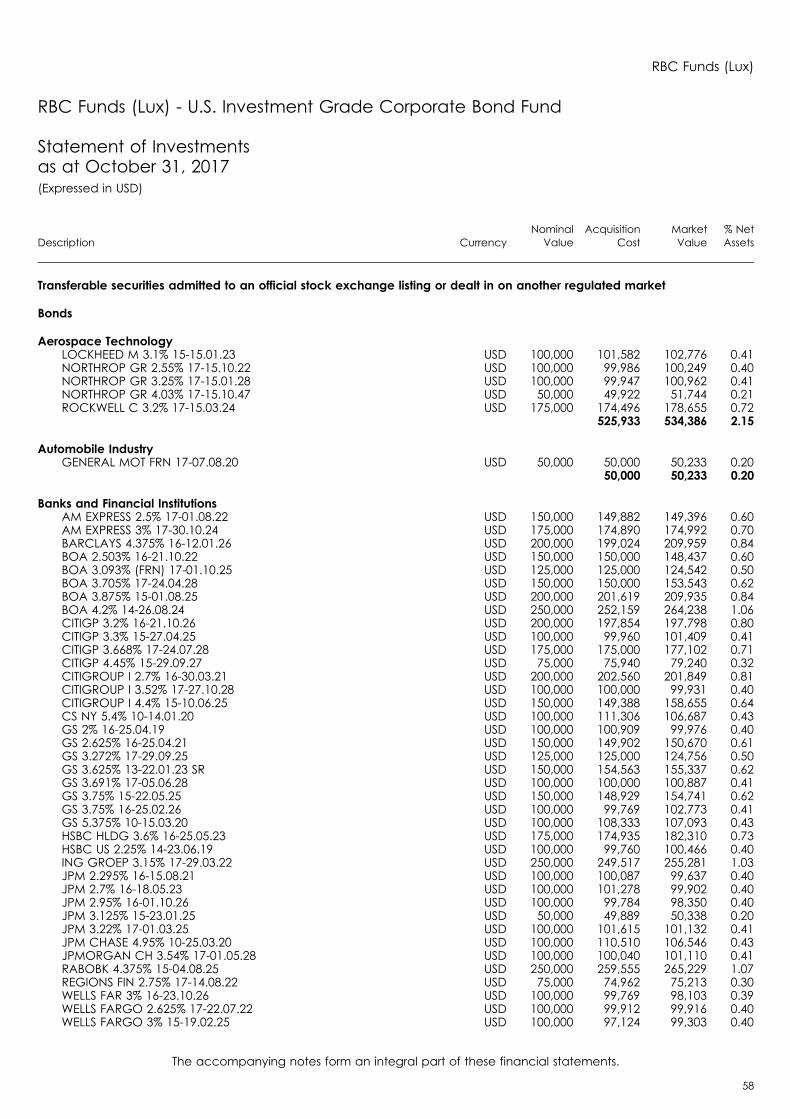
RBC Funds (Lux) - U.S. Investment Grade Corporate Bond Fund
Statement of Investmentsas at October 31, 2017(Expressed in USD)
Description CurrencyNominal
ValueAcquisition
CostMarketValue
% NetAssets
Transferable securities admitted to an official stock exchange listing or dealt in on another regulated market
Bonds
Aerospace TechnologyLOCKHEED M 3.1% 15-15.01.23 USD 100,000 101,582 102,776 0.41NORTHROP GR 2.55% 17-15.10.22 USD 100,000 99,986 100,249 0.40NORTHROP GR 3.25% 17-15.01.28 USD 100,000 99,947 100,962 0.41NORTHROP GR 4.03% 17-15.10.47 USD 50,000 49,922 51,744 0.21ROCKWELL C 3.2% 17-15.03.24 USD 175,000 174,496 178,655 0.72
525,933 534,386 2.15
Automobile IndustryGENERAL MOT FRN 17-07.08.20 USD 50,000 50,000 50,233 0.20
50,000 50,233 0.20
Banks and Financial InstitutionsAM EXPRESS 2.5% 17-01.08.22 USD 150,000 149,882 149,396 0.60AM EXPRESS 3% 17-30.10.24 USD 175,000 174,890 174,992 0.70BARCLAYS 4.375% 16-12.01.26 USD 200,000 199,024 209,959 0.84BOA 2.503% 16-21.10.22 USD 150,000 150,000 148,437 0.60BOA 3.093% (FRN) 17-01.10.25 USD 125,000 125,000 124,542 0.50BOA 3.705% 17-24.04.28 USD 150,000 150,000 153,543 0.62BOA 3.875% 15-01.08.25 USD 200,000 201,619 209,935 0.84BOA 4.2% 14-26.08.24 USD 250,000 252,159 264,238 1.06CITIGP 3.2% 16-21.10.26 USD 200,000 197,854 197,798 0.80CITIGP 3.3% 15-27.04.25 USD 100,000 99,960 101,409 0.41CITIGP 3.668% 17-24.07.28 USD 175,000 175,000 177,102 0.71CITIGP 4.45% 15-29.09.27 USD 75,000 75,940 79,240 0.32CITIGROUP I 2.7% 16-30.03.21 USD 200,000 202,560 201,849 0.81CITIGROUP I 3.52% 17-27.10.28 USD 100,000 100,000 99,931 0.40CITIGROUP I 4.4% 15-10.06.25 USD 150,000 149,388 158,655 0.64CS NY 5.4% 10-14.01.20 USD 100,000 111,306 106,687 0.43GS 2% 16-25.04.19 USD 100,000 100,909 99,976 0.40GS 2.625% 16-25.04.21 USD 150,000 149,902 150,670 0.61GS 3.272% 17-29.09.25 USD 125,000 125,000 124,756 0.50GS 3.625% 13-22.01.23 SR USD 150,000 154,563 155,337 0.62GS 3.691% 17-05.06.28 USD 100,000 100,000 100,887 0.41GS 3.75% 15-22.05.25 USD 150,000 148,929 154,741 0.62GS 3.75% 16-25.02.26 USD 100,000 99,769 102,773 0.41GS 5.375% 10-15.03.20 USD 100,000 108,333 107,093 0.43HSBC HLDG 3.6% 16-25.05.23 USD 175,000 174,935 182,310 0.73HSBC US 2.25% 14-23.06.19 USD 100,000 99,760 100,466 0.40ING GROEP 3.15% 17-29.03.22 USD 250,000 249,517 255,281 1.03JPM 2.295% 16-15.08.21 USD 100,000 100,087 99,637 0.40JPM 2.7% 16-18.05.23 USD 100,000 101,278 99,902 0.40JPM 2.95% 16-01.10.26 USD 100,000 99,784 98,350 0.40JPM 3.125% 15-23.01.25 USD 50,000 49,889 50,338 0.20JPM 3.22% 17-01.03.25 USD 100,000 101,615 101,132 0.41JPM CHASE 4.95% 10-25.03.20 USD 100,000 110,510 106,546 0.43JPMORGAN CH 3.54% 17-01.05.28 USD 100,000 100,040 101,110 0.41RABOBK 4.375% 15-04.08.25 USD 250,000 259,555 265,229 1.07REGIONS FIN 2.75% 17-14.08.22 USD 75,000 74,962 75,213 0.30WELLS FAR 3% 16-23.10.26 USD 100,000 99,769 98,103 0.39WELLS FARGO 2.625% 17-22.07.22 USD 100,000 99,912 99,916 0.40WELLS FARGO 3% 15-19.02.25 USD 100,000 97,124 99,303 0.40
RBC Funds (Lux)
The accompanying notes form an integral part of these financial statements.
58
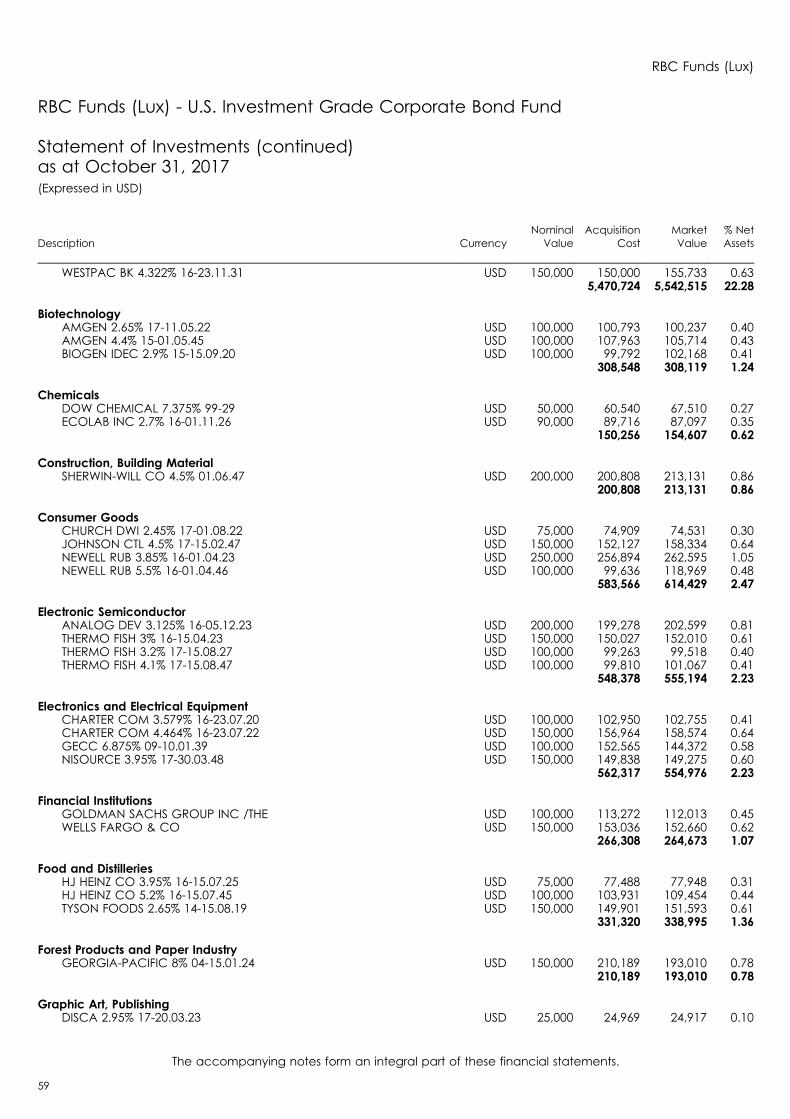
Description CurrencyNominal
ValueAcquisition
CostMarketValue
% NetAssets
WESTPAC BK 4.322% 16-23.11.31 USD 150,000 150,000 155,733 0.635,470,724 5,542,515 22.28
BiotechnologyAMGEN 2.65% 17-11.05.22 USD 100,000 100,793 100,237 0.40AMGEN 4.4% 15-01.05.45 USD 100,000 107,963 105,714 0.43BIOGEN IDEC 2.9% 15-15.09.20 USD 100,000 99,792 102,168 0.41
308,548 308,119 1.24
ChemicalsDOW CHEMICAL 7.375% 99-29 USD 50,000 60,540 67,510 0.27ECOLAB INC 2.7% 16-01.11.26 USD 90,000 89,716 87,097 0.35
150,256 154,607 0.62
Construction, Building MaterialSHERWIN-WILL CO 4.5% 01.06.47 USD 200,000 200,808 213,131 0.86
200,808 213,131 0.86
Consumer GoodsCHURCH DWI 2.45% 17-01.08.22 USD 75,000 74,909 74,531 0.30JOHNSON CTL 4.5% 17-15.02.47 USD 150,000 152,127 158,334 0.64NEWELL RUB 3.85% 16-01.04.23 USD 250,000 256,894 262,595 1.05NEWELL RUB 5.5% 16-01.04.46 USD 100,000 99,636 118,969 0.48
583,566 614,429 2.47
Electronic SemiconductorANALOG DEV 3.125% 16-05.12.23 USD 200,000 199,278 202,599 0.81THERMO FISH 3% 16-15.04.23 USD 150,000 150,027 152,010 0.61THERMO FISH 3.2% 17-15.08.27 USD 100,000 99,263 99,518 0.40THERMO FISH 4.1% 17-15.08.47 USD 100,000 99,810 101,067 0.41
548,378 555,194 2.23
Electronics and Electrical EquipmentCHARTER COM 3.579% 16-23.07.20 USD 100,000 102,950 102,755 0.41CHARTER COM 4.464% 16-23.07.22 USD 150,000 156,964 158,574 0.64GECC 6.875% 09-10.01.39 USD 100,000 152,565 144,372 0.58NISOURCE 3.95% 17-30.03.48 USD 150,000 149,838 149,275 0.60
562,317 554,976 2.23
Financial InstitutionsGOLDMAN SACHS GROUP INC /THE USD 100,000 113,272 112,013 0.45WELLS FARGO & CO USD 150,000 153,036 152,660 0.62
266,308 264,673 1.07
Food and DistilleriesHJ HEINZ CO 3.95% 16-15.07.25 USD 75,000 77,488 77,948 0.31HJ HEINZ CO 5.2% 16-15.07.45 USD 100,000 103,931 109,454 0.44TYSON FOODS 2.65% 14-15.08.19 USD 150,000 149,901 151,593 0.61
331,320 338,995 1.36
Forest Products and Paper IndustryGEORGIA-PACIFIC 8% 04-15.01.24 USD 150,000 210,189 193,010 0.78
210,189 193,010 0.78
Graphic Art, PublishingDISCA 2.95% 17-20.03.23 USD 25,000 24,969 24,917 0.10
RBC Funds (Lux)
The accompanying notes form an integral part of these financial statements.
59
RBC Funds (Lux) - U.S. Investment Grade Corporate Bond Fund
Statement of Investments (continued)as at October 31, 2017(Expressed in USD)

Description CurrencyNominal
ValueAcquisition
CostMarketValue
% NetAssets
DISCA 3.95% 17-20.03.28 USD 150,000 149,337 149,086 0.60DISCA 5% 17-20.09.37 USD 75,000 74,925 77,563 0.31DISCA 5.2% 17-20.09.47 USD 75,000 74,909 76,740 0.31
324,140 328,306 1.32
Holding and Finance CompaniesACCESS MID 3.75% 17-15.06.27 USD 175,000 175,300 175,920 0.71ACTAVIS FD 4.75% 15-15.03.45 USD 34,000 33,796 36,006 0.14AGL CAPITAL 2.45% 16-01.10.23 USD 100,000 99,922 97,441 0.39AMEX CR 2.2% 17-03.03.20 USD 150,000 149,844 150,492 0.61ANH-BSCH 3.65% 16-01.02.26 USD 150,000 149,701 155,050 0.62ANH-BSCH 4.7% 16-01.02.36 USD 75,000 78,135 82,367 0.33ANH-BSCH 4.9% 16-01.02.46 USD 125,000 124,706 141,135 0.57BPCM 2.75% 10.05.23 USD 75,000 71,141 75,570 0.30BPCM 3.119% 16-04.05.26 USD 100,000 100,000 100,935 0.41CS GR FUND 3.125% 16-10.12.20 USD 250,000 255,325 254,951 1.02DUKE ENERGY 3.75% 16-01.09.46 USD 150,000 150,329 146,431 0.59EMD FIN 2.95% 15-19.03.22 144A USD 150,000 149,736 152,440 0.61ENTERP PROD 7.034% 07-15.01.68 USD 197,000 219,655 197,985 0.80ETP 4.2% 17-15.04.27 USD 125,000 124,733 126,703 0.51EXELON GEN 2.95% 15-15.01.20 USD 100,000 100,895 101,594 0.41FORD MC 2.021% 16-03.05.19 USD 275,000 276,611 274,906 1.11FORD MC 3.2% 15-15.01.21 USD 140,000 139,898 143,276 0.58FORD MC 5.75% 11-01.02.21 USD 200,000 229,294 220,292 0.89GEN MOTORS 3.2% 13.07.20 USD 100,000 101,961 102,313 0.41GEN MOTORS 4.375% 14-25.09.21 USD 150,000 156,388 159,422 0.64GENERAL 3.45% 17-14.01.22 USD 150,000 149,802 153,888 0.62GENERAL MOTORS 3.45% 10.04.22 USD 100,000 97,647 102,335 0.41KINDER MORG 3.5% 14-01.03.21 USD 100,000 96,388 102,947 0.41KINDER MORG 4.25% 14-01.09.24 USD 100,000 101,571 104,484 0.42KINDER MORG 6.95% 07-15.01.38 USD 150,000 170,699 184,785 0.74MAGELLAN MIDS 5.15% 15.10.43 USD 50,000 51,543 56,126 0.23MOR ST 2.5% 16-21.04.21 USD 100,000 99,664 100,269 0.40MOR ST 2.75% 17-19.05.22 USD 100,000 100,578 100,313 0.40MOR ST 3.125% 16-27.07.26 USD 100,000 99,320 98,660 0.40MOR ST 3.591% 17-22.07.28 USD 200,000 200,000 201,568 0.81MOR ST 3.625% 17-20.01.27 USD 100,000 98,999 101,945 0.41MOR ST 3.875% 16-27.01.26 USD 150,000 152,423 156,659 0.63MOR ST 4.1%13-22.05.23 USD 100,000 97,550 105,412 0.42SEP 3.375% 16-15.10.26 USD 100,000 99,865 99,718 0.40SHELL INT F 4.375% 15-11.05.45 USD 50,000 49,051 54,327 0.22SHIRE ACQ I 2.4% 16-23.09.21 USD 100,000 99,892 99,421 0.40SHIRE ACQ I 2.875% 16-23.09.23 USD 100,000 99,987 99,126 0.40SHIRE ACQ I 3.2% 16-23.09.26 USD 100,000 99,881 97,676 0.39WALGRN BTS 3.8% 14-18.11.24 USD 75,000 77,802 77,083 0.31WALGRN BTS 4.8% 14-18.11.44 USD 100,000 105,855 104,359 0.42
5,035,887 5,096,330 20.49
IndustrialsACTAVIS FD 2.45% 14-15.06.19 USD 100,000 100,746 100,674 0.40AT&T INC USD 150,000 148,582 148,349 0.60
249,328 249,023 1.00
InsuranceAXA 8.6% 00-15.12.30 USD 150,000 174,963 216,375 0.87HARTF FIN 5.5% 10-30.03.20 USD 100,000 106,181 107,743 0.43
RBC Funds (Lux)
The accompanying notes form an integral part of these financial statements.
60
RBC Funds (Lux) - U.S. Investment Grade Corporate Bond Fund
Statement of Investments (continued)as at October 31, 2017(Expressed in USD)
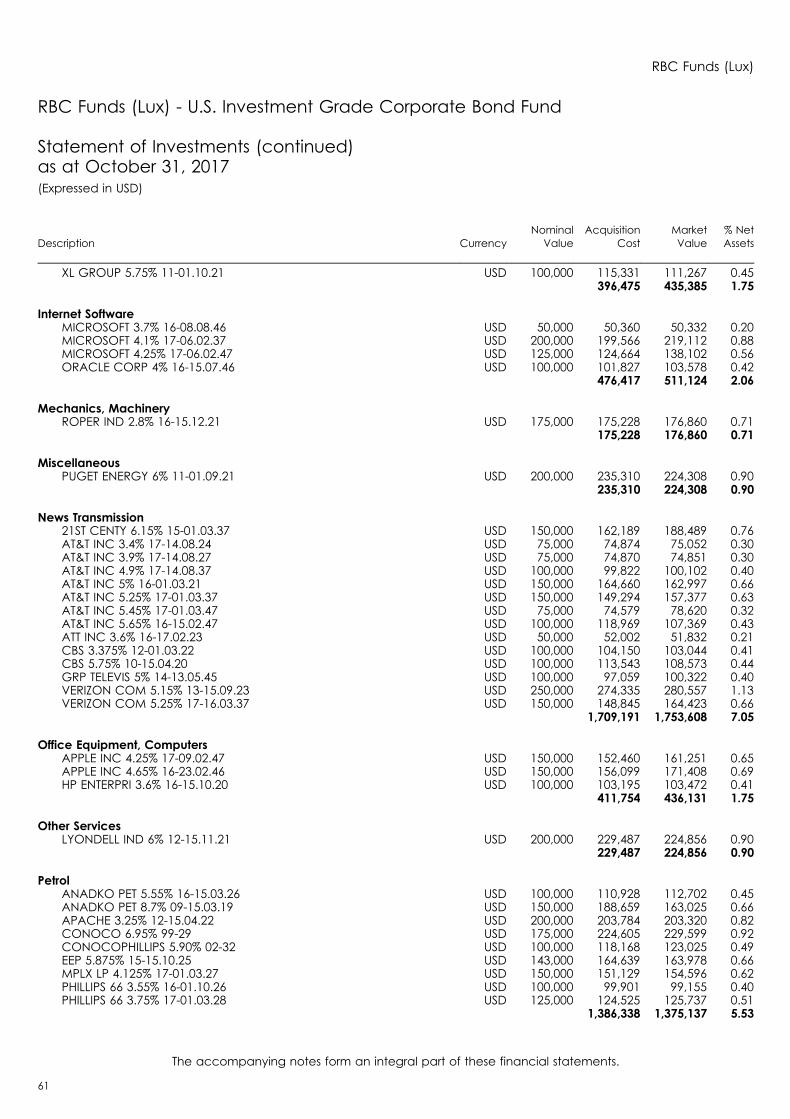
Description CurrencyNominal
ValueAcquisition
CostMarketValue
% NetAssets
XL GROUP 5.75% 11-01.10.21 USD 100,000 115,331 111,267 0.45396,475 435,385 1.75
Internet SoftwareMICROSOFT 3.7% 16-08.08.46 USD 50,000 50,360 50,332 0.20MICROSOFT 4.1% 17-06.02.37 USD 200,000 199,566 219,112 0.88MICROSOFT 4.25% 17-06.02.47 USD 125,000 124,664 138,102 0.56ORACLE CORP 4% 16-15.07.46 USD 100,000 101,827 103,578 0.42
476,417 511,124 2.06
Mechanics, MachineryROPER IND 2.8% 16-15.12.21 USD 175,000 175,228 176,860 0.71
175,228 176,860 0.71
MiscellaneousPUGET ENERGY 6% 11-01.09.21 USD 200,000 235,310 224,308 0.90
235,310 224,308 0.90
News Transmission21ST CENTY 6.15% 15-01.03.37 USD 150,000 162,189 188,489 0.76AT&T INC 3.4% 17-14.08.24 USD 75,000 74,874 75,052 0.30AT&T INC 3.9% 17-14.08.27 USD 75,000 74,870 74,851 0.30AT&T INC 4.9% 17-14.08.37 USD 100,000 99,822 100,102 0.40AT&T INC 5% 16-01.03.21 USD 150,000 164,660 162,997 0.66AT&T INC 5.25% 17-01.03.37 USD 150,000 149,294 157,377 0.63AT&T INC 5.45% 17-01.03.47 USD 75,000 74,579 78,620 0.32AT&T INC 5.65% 16-15.02.47 USD 100,000 118,969 107,369 0.43ATT INC 3.6% 16-17.02.23 USD 50,000 52,002 51,832 0.21CBS 3.375% 12-01.03.22 USD 100,000 104,150 103,044 0.41CBS 5.75% 10-15.04.20 USD 100,000 113,543 108,573 0.44GRP TELEVIS 5% 14-13.05.45 USD 100,000 97,059 100,322 0.40VERIZON COM 5.15% 13-15.09.23 USD 250,000 274,335 280,557 1.13VERIZON COM 5.25% 17-16.03.37 USD 150,000 148,845 164,423 0.66
1,709,191 1,753,608 7.05
Office Equipment, ComputersAPPLE INC 4.25% 17-09.02.47 USD 150,000 152,460 161,251 0.65APPLE INC 4.65% 16-23.02.46 USD 150,000 156,099 171,408 0.69HP ENTERPRI 3.6% 16-15.10.20 USD 100,000 103,195 103,472 0.41
411,754 436,131 1.75
Other ServicesLYONDELL IND 6% 12-15.11.21 USD 200,000 229,487 224,856 0.90
229,487 224,856 0.90
PetrolANADKO PET 5.55% 16-15.03.26 USD 100,000 110,928 112,702 0.45ANADKO PET 8.7% 09-15.03.19 USD 150,000 188,659 163,025 0.66APACHE 3.25% 12-15.04.22 USD 200,000 203,784 203,320 0.82CONOCO 6.95% 99-29 USD 175,000 224,605 229,599 0.92CONOCOPHILLIPS 5.90% 02-32 USD 100,000 118,168 123,025 0.49EEP 5.875% 15-15.10.25 USD 143,000 164,639 163,978 0.66MPLX LP 4.125% 17-01.03.27 USD 150,000 151,129 154,596 0.62PHILLIPS 66 3.55% 16-01.10.26 USD 100,000 99,901 99,155 0.40PHILLIPS 66 3.75% 17-01.03.28 USD 125,000 124,525 125,737 0.51
1,386,338 1,375,137 5.53
RBC Funds (Lux)
The accompanying notes form an integral part of these financial statements.
61
RBC Funds (Lux) - U.S. Investment Grade Corporate Bond Fund
Statement of Investments (continued)as at October 31, 2017(Expressed in USD)
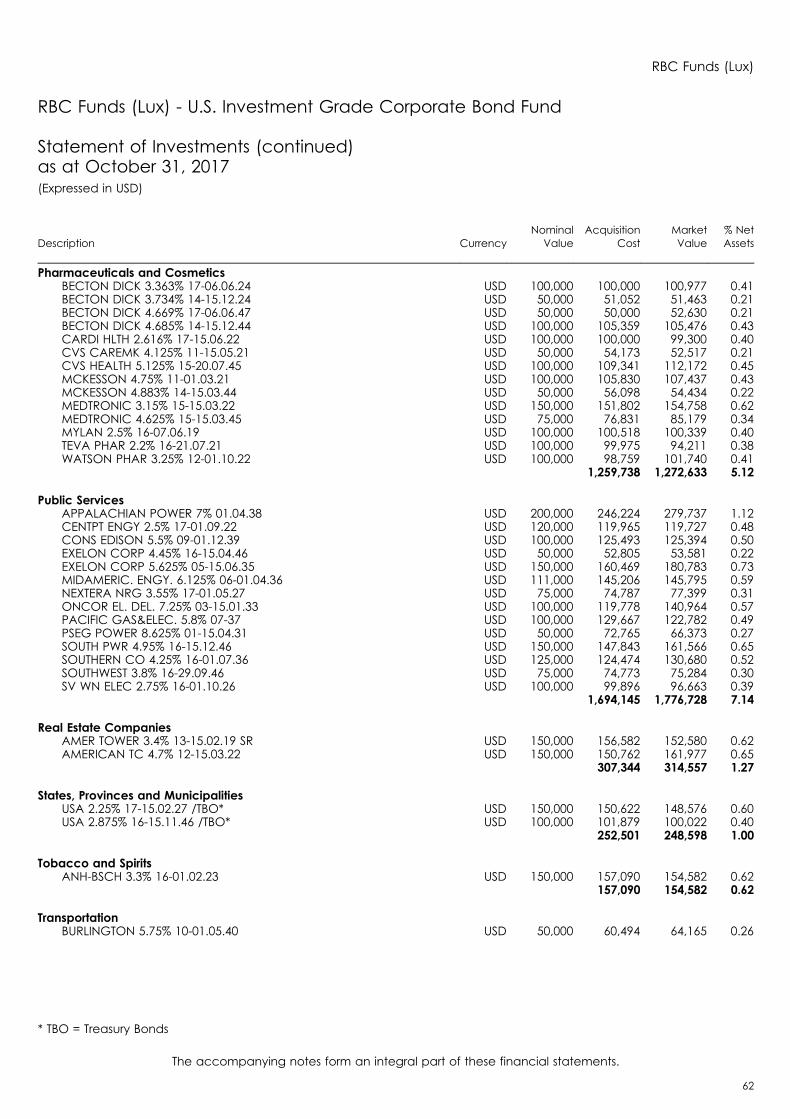
Description CurrencyNominal
ValueAcquisition
CostMarketValue
% NetAssets
Pharmaceuticals and CosmeticsBECTON DICK 3.363% 17-06.06.24 USD 100,000 100,000 100,977 0.41BECTON DICK 3.734% 14-15.12.24 USD 50,000 51,052 51,463 0.21BECTON DICK 4.669% 17-06.06.47 USD 50,000 50,000 52,630 0.21BECTON DICK 4.685% 14-15.12.44 USD 100,000 105,359 105,476 0.43CARDI HLTH 2.616% 17-15.06.22 USD 100,000 100,000 99,300 0.40CVS CAREMK 4.125% 11-15.05.21 USD 50,000 54,173 52,517 0.21CVS HEALTH 5.125% 15-20.07.45 USD 100,000 109,341 112,172 0.45MCKESSON 4.75% 11-01.03.21 USD 100,000 105,830 107,437 0.43MCKESSON 4.883% 14-15.03.44 USD 50,000 56,098 54,434 0.22MEDTRONIC 3.15% 15-15.03.22 USD 150,000 151,802 154,758 0.62MEDTRONIC 4.625% 15-15.03.45 USD 75,000 76,831 85,179 0.34MYLAN 2.5% 16-07.06.19 USD 100,000 100,518 100,339 0.40TEVA PHAR 2.2% 16-21.07.21 USD 100,000 99,975 94,211 0.38WATSON PHAR 3.25% 12-01.10.22 USD 100,000 98,759 101,740 0.41
1,259,738 1,272,633 5.12
Public ServicesAPPALACHIAN POWER 7% 01.04.38 USD 200,000 246,224 279,737 1.12CENTPT ENGY 2.5% 17-01.09.22 USD 120,000 119,965 119,727 0.48CONS EDISON 5.5% 09-01.12.39 USD 100,000 125,493 125,394 0.50EXELON CORP 4.45% 16-15.04.46 USD 50,000 52,805 53,581 0.22EXELON CORP 5.625% 05-15.06.35 USD 150,000 160,469 180,783 0.73MIDAMERIC. ENGY. 6.125% 06-01.04.36 USD 111,000 145,206 145,795 0.59NEXTERA NRG 3.55% 17-01.05.27 USD 75,000 74,787 77,399 0.31ONCOR EL. DEL. 7.25% 03-15.01.33 USD 100,000 119,778 140,964 0.57PACIFIC GAS&ELEC. 5.8% 07-37 USD 100,000 129,667 122,782 0.49PSEG POWER 8.625% 01-15.04.31 USD 50,000 72,765 66,373 0.27SOUTH PWR 4.95% 16-15.12.46 USD 150,000 147,843 161,566 0.65SOUTHERN CO 4.25% 16-01.07.36 USD 125,000 124,474 130,680 0.52SOUTHWEST 3.8% 16-29.09.46 USD 75,000 74,773 75,284 0.30SV WN ELEC 2.75% 16-01.10.26 USD 100,000 99,896 96,663 0.39
1,694,145 1,776,728 7.14
Real Estate CompaniesAMER TOWER 3.4% 13-15.02.19 SR USD 150,000 156,582 152,580 0.62AMERICAN TC 4.7% 12-15.03.22 USD 150,000 150,762 161,977 0.65
307,344 314,557 1.27
States, Provinces and MunicipalitiesUSA 2.25% 17-15.02.27 /TBO* USD 150,000 150,622 148,576 0.60USA 2.875% 16-15.11.46 /TBO* USD 100,000 101,879 100,022 0.40
252,501 248,598 1.00
Tobacco and SpiritsANH-BSCH 3.3% 16-01.02.23 USD 150,000 157,090 154,582 0.62
157,090 154,582 0.62
TransportationBURLINGTON 5.75% 10-01.05.40 USD 50,000 60,494 64,165 0.26
RBC Funds (Lux)
The accompanying notes form an integral part of these financial statements.
62
RBC Funds (Lux) - U.S. Investment Grade Corporate Bond Fund
Statement of Investments (continued)as at October 31, 2017(Expressed in USD)
* TBO = Treasury Bonds
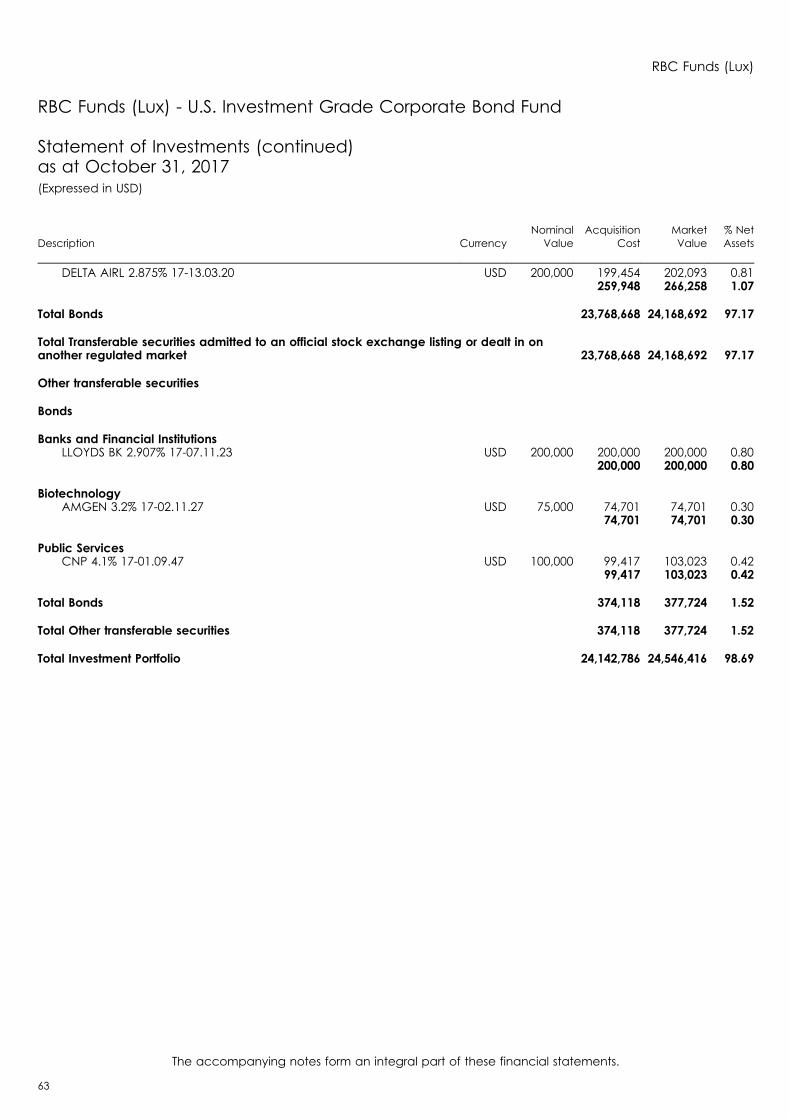
Description CurrencyNominal
ValueAcquisition
CostMarketValue
% NetAssets
DELTA AIRL 2.875% 17-13.03.20 USD 200,000 199,454 202,093 0.81259,948 266,258 1.07
Total Bonds 23,768,668 24,168,692 97.17
Total Transferable securities admitted to an official stock exchange listing or dealt in onanother regulated market 23,768,668 24,168,692 97.17
Other transferable securities
Bonds
Banks and Financial InstitutionsLLOYDS BK 2.907% 17-07.11.23 USD 200,000 200,000 200,000 0.80
200,000 200,000 0.80
BiotechnologyAMGEN 3.2% 17-02.11.27 USD 75,000 74,701 74,701 0.30
74,701 74,701 0.30
Public ServicesCNP 4.1% 17-01.09.47 USD 100,000 99,417 103,023 0.42
99,417 103,023 0.42
Total Bonds 374,118 377,724 1.52
Total Other transferable securities 374,118 377,724 1.52
Total Investment Portfolio 24,142,786 24,546,416 98.69
RBC Funds (Lux)
The accompanying notes form an integral part of these financial statements.
63
RBC Funds (Lux) - U.S. Investment Grade Corporate Bond Fund
Statement of Investments (continued)as at October 31, 2017(Expressed in USD)

RBC Funds (Lux) - U.S. Investment Grade Corporate Bond Fund
Economic Portfolio Breakdownas at October 31, 2017(expressed as a percentage of net assets)
Economic breakdown %
Banks and Financial Institutions 23.08Holding and Finance Companies 20.49Public Services 7.56News Transmission 7.05Petrol 5.53Pharmaceuticals and Cosmetics 5.12Consumer Goods 2.47Electronic Semiconductor 2.23Electronics and Electrical Equipment 2.23Aerospace Technology 2.15Internet Software 2.06Insurance 1.75Office Equipment, Computers 1.75Biotechnology 1.54Food and Distilleries 1.36Graphic Art, Publishing 1.32Real Estate Companies 1.27Financial Institutions 1.07Transportation 1.07Industrials 1.00States, Provinces and Municipalities 1.00Miscellaneous 0.90Other Services 0.90Construction, Building Material 0.86Forest Products and Paper Industry 0.78Mechanics, Machinery 0.71Chemicals 0.62Tobacco and Spirits 0.62Automobile Industry 0.20
98.69
RBC Funds (Lux)
The accompanying notes form an integral part of these financial statements.
64
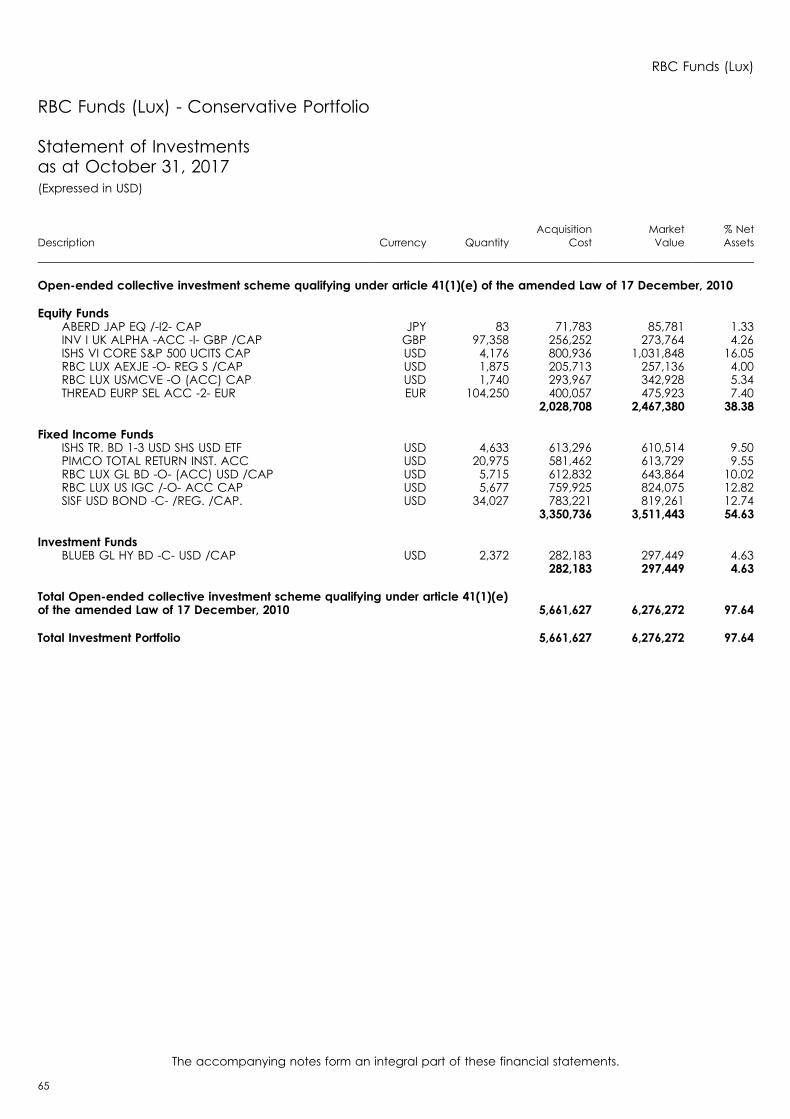
RBC Funds (Lux) - Conservative Portfolio
Statement of Investmentsas at October 31, 2017(Expressed in USD)
Description Currency QuantityAcquisition
CostMarketValue
% NetAssets
Open-ended collective investment scheme qualifying under article 41(1)(e) of the amended Law of 17 December, 2010
Equity FundsABERD JAP EQ /-I2- CAP JPY 83 71,783 85,781 1.33INV I UK ALPHA -ACC -I- GBP /CAP GBP 97,358 256,252 273,764 4.26ISHS VI CORE S&P 500 UCITS CAP USD 4,176 800,936 1,031,848 16.05RBC LUX AEXJE -O- REG S /CAP USD 1,875 205,713 257,136 4.00RBC LUX USMCVE -O (ACC) CAP USD 1,740 293,967 342,928 5.34THREAD EURP SEL ACC -2- EUR EUR 104,250 400,057 475,923 7.40
2,028,708 2,467,380 38.38
Fixed Income FundsISHS TR. BD 1-3 USD SHS USD ETF USD 4,633 613,296 610,514 9.50PIMCO TOTAL RETURN INST. ACC USD 20,975 581,462 613,729 9.55RBC LUX GL BD -O- (ACC) USD /CAP USD 5,715 612,832 643,864 10.02RBC LUX US IGC /-O- ACC CAP USD 5,677 759,925 824,075 12.82SISF USD BOND -C- /REG. /CAP. USD 34,027 783,221 819,261 12.74
3,350,736 3,511,443 54.63
Investment FundsBLUEB GL HY BD -C- USD /CAP USD 2,372 282,183 297,449 4.63
282,183 297,449 4.63
Total Open-ended collective investment scheme qualifying under article 41(1)(e)of the amended Law of 17 December, 2010 5,661,627 6,276,272 97.64
Total Investment Portfolio 5,661,627 6,276,272 97.64
RBC Funds (Lux)
The accompanying notes form an integral part of these financial statements.
65
RBC Funds (Lux) - Conservative Portfolio
Economic Portfolio Breakdownas at October 31, 2017(expressed as a percentage of net assets)
Economic breakdown %
Investment Funds 97.6497.64
RBC Funds (Lux)
The accompanying notes form an integral part of these financial statements.
66
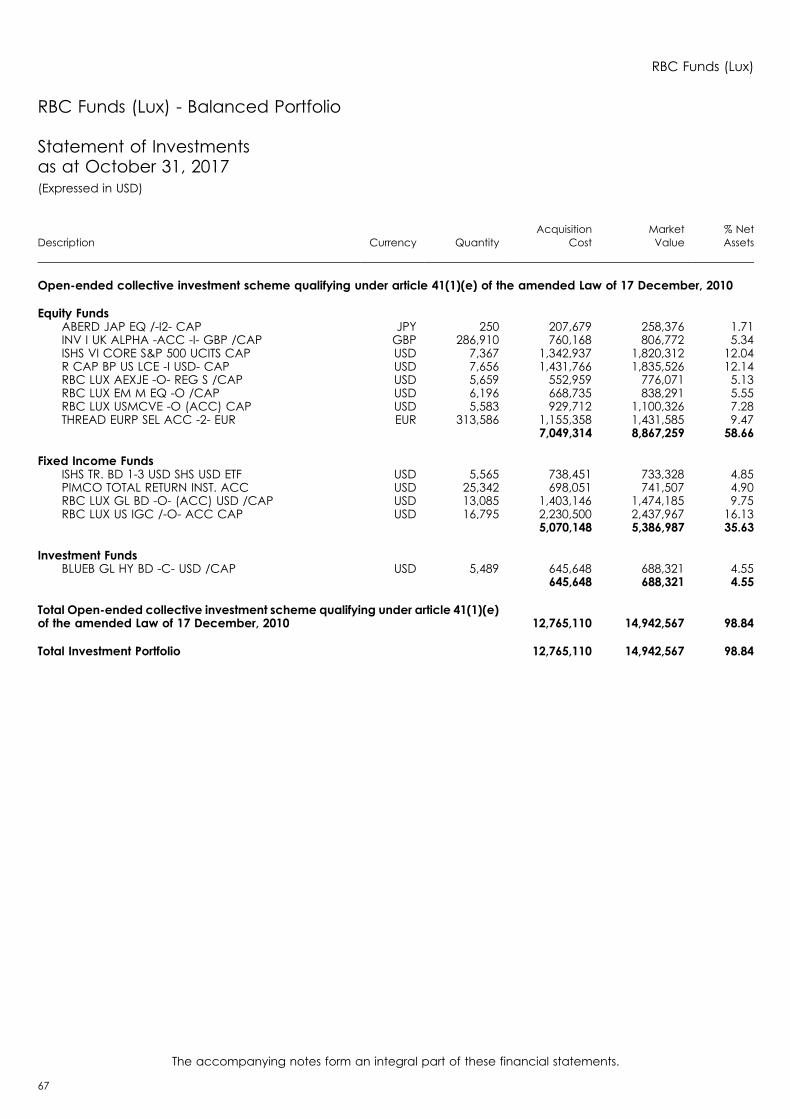
RBC Funds (Lux) - Balanced Portfolio
Statement of Investmentsas at October 31, 2017(Expressed in USD)
Description Currency QuantityAcquisition
CostMarketValue
% NetAssets
Open-ended collective investment scheme qualifying under article 41(1)(e) of the amended Law of 17 December, 2010
Equity FundsABERD JAP EQ /-I2- CAP JPY 250 207,679 258,376 1.71INV I UK ALPHA -ACC -I- GBP /CAP GBP 286,910 760,168 806,772 5.34ISHS VI CORE S&P 500 UCITS CAP USD 7,367 1,342,937 1,820,312 12.04R CAP BP US LCE -I USD- CAP USD 7,656 1,431,766 1,835,526 12.14RBC LUX AEXJE -O- REG S /CAP USD 5,659 552,959 776,071 5.13RBC LUX EM M EQ -O /CAP USD 6,196 668,735 838,291 5.55RBC LUX USMCVE -O (ACC) CAP USD 5,583 929,712 1,100,326 7.28THREAD EURP SEL ACC -2- EUR EUR 313,586 1,155,358 1,431,585 9.47
7,049,314 8,867,259 58.66
Fixed Income FundsISHS TR. BD 1-3 USD SHS USD ETF USD 5,565 738,451 733,328 4.85PIMCO TOTAL RETURN INST. ACC USD 25,342 698,051 741,507 4.90RBC LUX GL BD -O- (ACC) USD /CAP USD 13,085 1,403,146 1,474,185 9.75RBC LUX US IGC /-O- ACC CAP USD 16,795 2,230,500 2,437,967 16.13
5,070,148 5,386,987 35.63
Investment FundsBLUEB GL HY BD -C- USD /CAP USD 5,489 645,648 688,321 4.55
645,648 688,321 4.55
Total Open-ended collective investment scheme qualifying under article 41(1)(e)of the amended Law of 17 December, 2010 12,765,110 14,942,567 98.84
Total Investment Portfolio 12,765,110 14,942,567 98.84
RBC Funds (Lux)
The accompanying notes form an integral part of these financial statements.
67
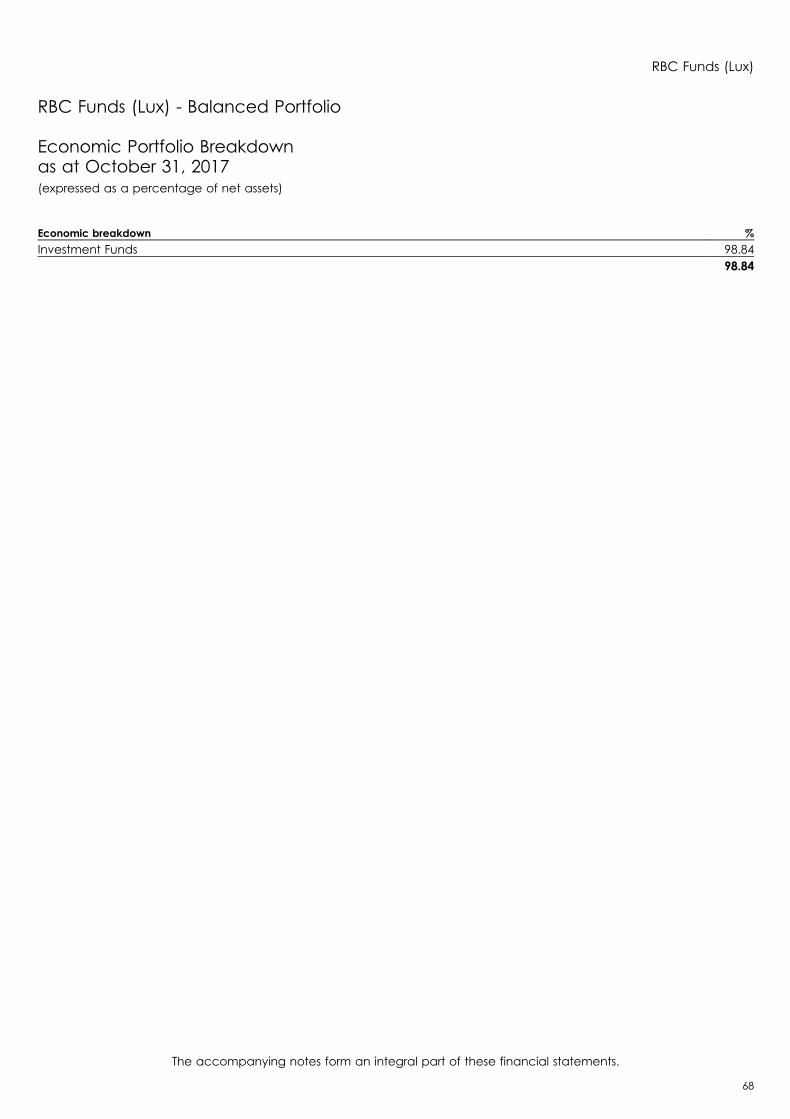
RBC Funds (Lux) - Balanced Portfolio
Economic Portfolio Breakdownas at October 31, 2017(expressed as a percentage of net assets)
Economic breakdown %
Investment Funds 98.8498.84
RBC Funds (Lux)
The accompanying notes form an integral part of these financial statements.
68
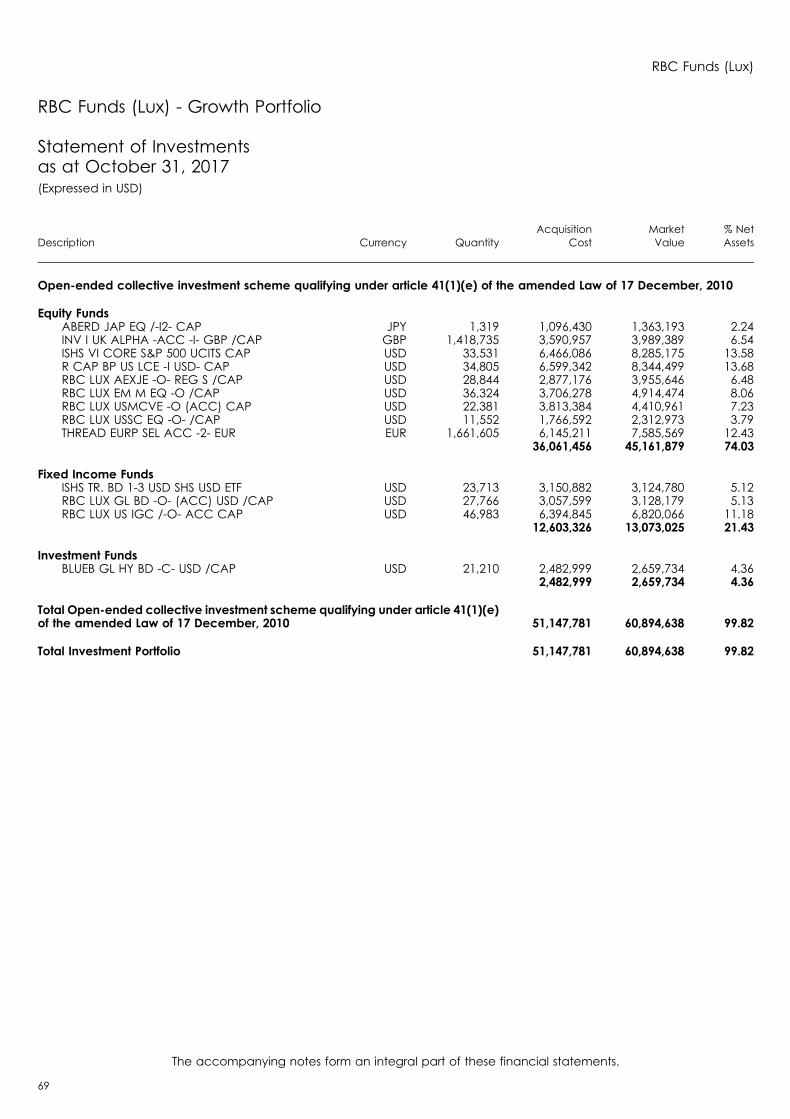
RBC Funds (Lux) - Growth Portfolio
Statement of Investmentsas at October 31, 2017(Expressed in USD)
Description Currency QuantityAcquisition
CostMarketValue
% NetAssets
Open-ended collective investment scheme qualifying under article 41(1)(e) of the amended Law of 17 December, 2010
Equity FundsABERD JAP EQ /-I2- CAP JPY 1,319 1,096,430 1,363,193 2.24INV I UK ALPHA -ACC -I- GBP /CAP GBP 1,418,735 3,590,957 3,989,389 6.54ISHS VI CORE S&P 500 UCITS CAP USD 33,531 6,466,086 8,285,175 13.58R CAP BP US LCE -I USD- CAP USD 34,805 6,599,342 8,344,499 13.68RBC LUX AEXJE -O- REG S /CAP USD 28,844 2,877,176 3,955,646 6.48RBC LUX EM M EQ -O /CAP USD 36,324 3,706,278 4,914,474 8.06RBC LUX USMCVE -O (ACC) CAP USD 22,381 3,813,384 4,410,961 7.23RBC LUX USSC EQ -O- /CAP USD 11,552 1,766,592 2,312,973 3.79THREAD EURP SEL ACC -2- EUR EUR 1,661,605 6,145,211 7,585,569 12.43
36,061,456 45,161,879 74.03
Fixed Income FundsISHS TR. BD 1-3 USD SHS USD ETF USD 23,713 3,150,882 3,124,780 5.12RBC LUX GL BD -O- (ACC) USD /CAP USD 27,766 3,057,599 3,128,179 5.13RBC LUX US IGC /-O- ACC CAP USD 46,983 6,394,845 6,820,066 11.18
12,603,326 13,073,025 21.43
Investment FundsBLUEB GL HY BD -C- USD /CAP USD 21,210 2,482,999 2,659,734 4.36
2,482,999 2,659,734 4.36
Total Open-ended collective investment scheme qualifying under article 41(1)(e)of the amended Law of 17 December, 2010 51,147,781 60,894,638 99.82
Total Investment Portfolio 51,147,781 60,894,638 99.82
RBC Funds (Lux)
The accompanying notes form an integral part of these financial statements.
69

RBC Funds (Lux) - Growth Portfolio
Economic Portfolio Breakdownas at October 31, 2017(expressed as a percentage of net assets)
Economic breakdown %
Investment Funds 99.8299.82
RBC Funds (Lux)
The accompanying notes form an integral part of these financial statements.
70
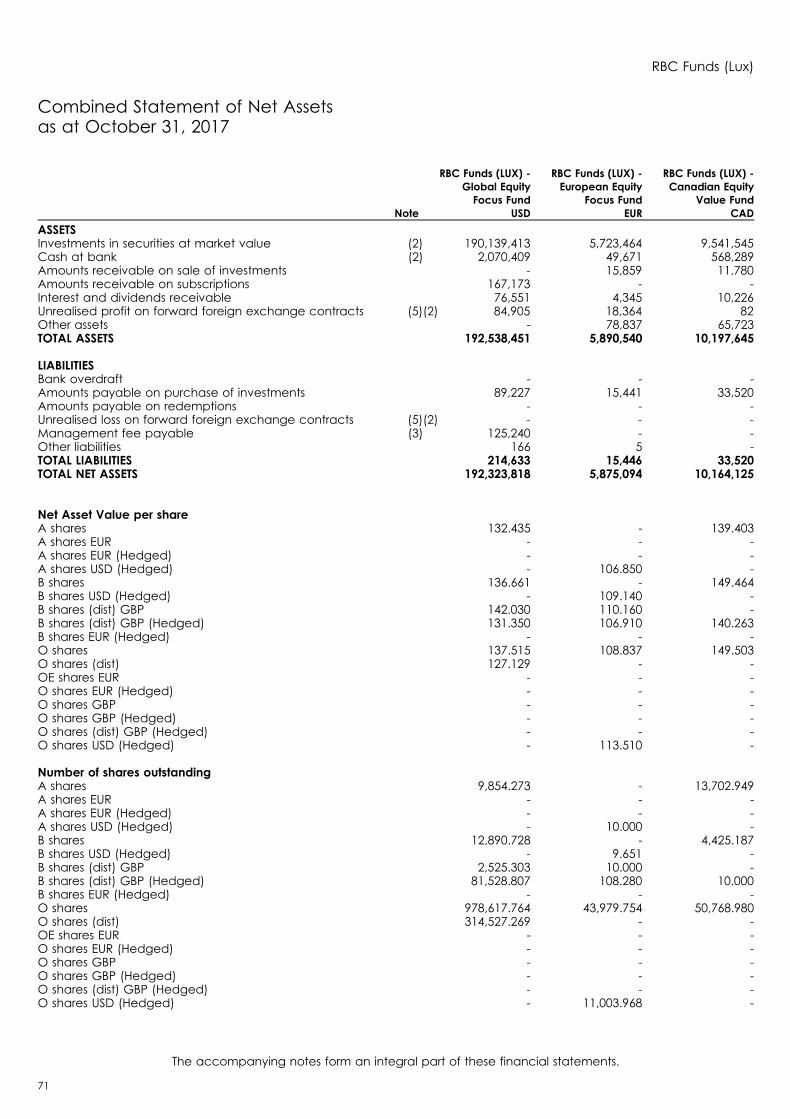
Combined Statement of Net Assetsas at October 31, 2017
RBC Funds (LUX) -Global EquityFocus Fund
RBC Funds (LUX) -European Equity
Focus Fund
RBC Funds (LUX) -Canadian Equity
Value FundNote USD EUR CAD
ASSETSInvestments in securities at market value (2) 190,139,413 5,723,464 9,541,545Cash at bank (2) 2,070,409 49,671 568,289Amounts receivable on sale of investments - 15,859 11,780Amounts receivable on subscriptions 167,173 - -Interest and dividends receivable 76,551 4,345 10,226Unrealised profit on forward foreign exchange contracts (5)(2) 84,905 18,364 82Other assets - 78,837 65,723TOTAL ASSETS 192,538,451 5,890,540 10,197,645
LIABILITIESBank overdraft - - -Amounts payable on purchase of investments 89,227 15,441 33,520Amounts payable on redemptions - - -Unrealised loss on forward foreign exchange contracts (5)(2) - - -Management fee payable (3) 125,240 - -Other liabilities 166 5 -TOTAL LIABILITIES 214,633 15,446 33,520TOTAL NET ASSETS 192,323,818 5,875,094 10,164,125
Net Asset Value per shareA shares 132.435 - 139.403A shares EUR - - -A shares EUR (Hedged) - - -A shares USD (Hedged) - 106.850 -B shares 136.661 - 149.464B shares USD (Hedged) - 109.140 -B shares (dist) GBP 142.030 110.160 -B shares (dist) GBP (Hedged) 131.350 106.910 140.263B shares EUR (Hedged) - - -O shares 137.515 108.837 149.503O shares (dist) 127.129 - -OE shares EUR - - -O shares EUR (Hedged) - - -O shares GBP - - -O shares GBP (Hedged) - - -O shares (dist) GBP (Hedged) - - -O shares USD (Hedged) - 113.510 -
Number of shares outstandingA shares 9,854.273 - 13,702.949A shares EUR - - -A shares EUR (Hedged) - - -A shares USD (Hedged) - 10.000 -B shares 12,890.728 - 4,425.187B shares USD (Hedged) - 9.651 -B shares (dist) GBP 2,525.303 10.000 -B shares (dist) GBP (Hedged) 81,528.807 108.280 10.000B shares EUR (Hedged) - - -O shares 978,617.764 43,979.754 50,768.980O shares (dist) 314,527.269 - -OE shares EUR - - -O shares EUR (Hedged) - - -O shares GBP - - -O shares GBP (Hedged) - - -O shares (dist) GBP (Hedged) - - -O shares USD (Hedged) - 11,003.968 -
RBC Funds (Lux)
The accompanying notes form an integral part of these financial statements.
71
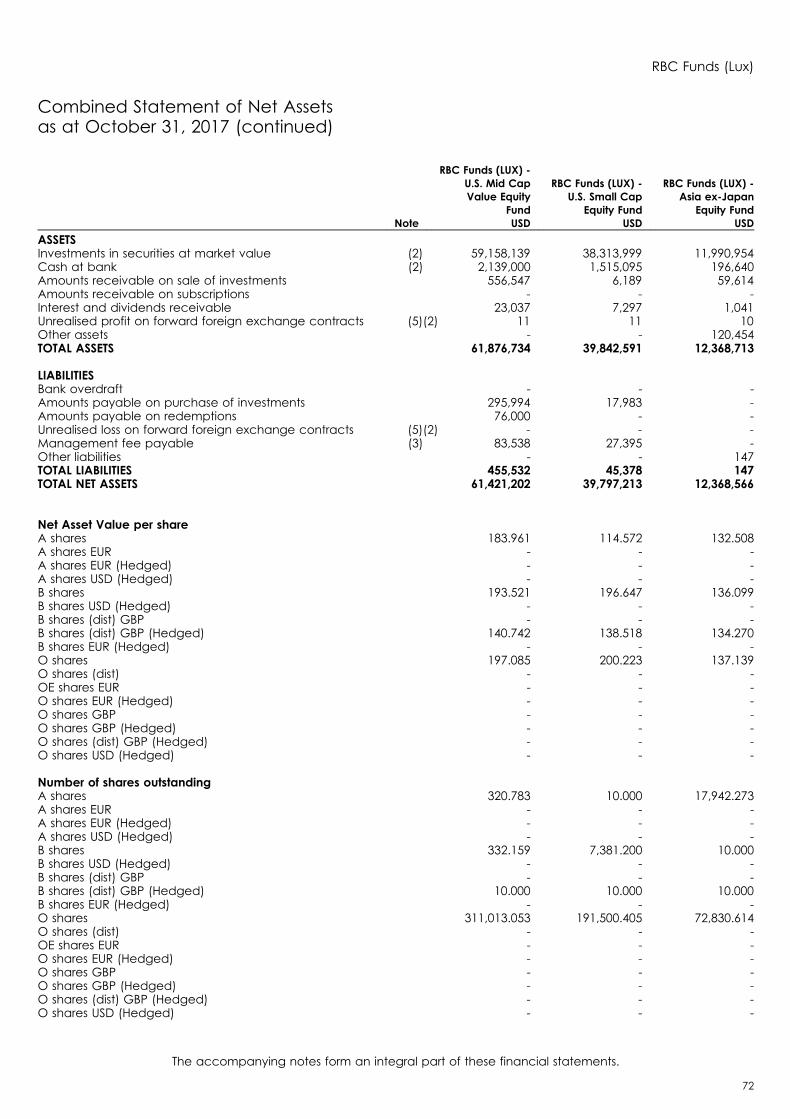
RBC Funds (LUX) -U.S. Mid CapValue Equity
Fund
RBC Funds (LUX) -U.S. Small Cap
Equity Fund
RBC Funds (LUX) -Asia ex-Japan
Equity FundNote USD USD USD
ASSETSInvestments in securities at market value (2) 59,158,139 38,313,999 11,990,954Cash at bank (2) 2,139,000 1,515,095 196,640Amounts receivable on sale of investments 556,547 6,189 59,614Amounts receivable on subscriptions - - -Interest and dividends receivable 23,037 7,297 1,041Unrealised profit on forward foreign exchange contracts (5)(2) 11 11 10Other assets - - 120,454TOTAL ASSETS 61,876,734 39,842,591 12,368,713
LIABILITIESBank overdraft - - -Amounts payable on purchase of investments 295,994 17,983 -Amounts payable on redemptions 76,000 - -Unrealised loss on forward foreign exchange contracts (5)(2) - - -Management fee payable (3) 83,538 27,395 -Other liabilities - - 147TOTAL LIABILITIES 455,532 45,378 147TOTAL NET ASSETS 61,421,202 39,797,213 12,368,566
Net Asset Value per shareA shares 183.961 114.572 132.508A shares EUR - - -A shares EUR (Hedged) - - -A shares USD (Hedged) - - -B shares 193.521 196.647 136.099B shares USD (Hedged) - - -B shares (dist) GBP - - -B shares (dist) GBP (Hedged) 140.742 138.518 134.270B shares EUR (Hedged) - - -O shares 197.085 200.223 137.139O shares (dist) - - -OE shares EUR - - -O shares EUR (Hedged) - - -O shares GBP - - -O shares GBP (Hedged) - - -O shares (dist) GBP (Hedged) - - -O shares USD (Hedged) - - -
Number of shares outstandingA shares 320.783 10.000 17,942.273A shares EUR - - -A shares EUR (Hedged) - - -A shares USD (Hedged) - - -B shares 332.159 7,381.200 10.000B shares USD (Hedged) - - -B shares (dist) GBP - - -B shares (dist) GBP (Hedged) 10.000 10.000 10.000B shares EUR (Hedged) - - -O shares 311,013.053 191,500.405 72,830.614O shares (dist) - - -OE shares EUR - - -O shares EUR (Hedged) - - -O shares GBP - - -O shares GBP (Hedged) - - -O shares (dist) GBP (Hedged) - - -O shares USD (Hedged) - - -
RBC Funds (Lux)
The accompanying notes form an integral part of these financial statements.
72
Combined Statement of Net Assetsas at October 31, 2017 (continued)

RBC Funds (LUX) -Emerging Markets
Value EquityFund
RBC Funds (LUX) -Emerging Markets
Equity Fund
RBC Funds (LUX) -Emerging Markets
Small CapEquity Fund
Note USD USD USD
ASSETSInvestments in securities at market value (2) 85,765,383 463,242,877 19,061,752Cash at bank (2) 1,208,733 1,940,167 505,705Amounts receivable on sale of investments 337,061 571,743 -Amounts receivable on subscriptions - 20,803 -Interest and dividends receivable 54,099 441,419 15,033Unrealised profit on forward foreign exchange contracts (5)(2) 2,579 - 8Other assets - - 69,542TOTAL ASSETS 87,367,855 466,217,009 19,652,040
LIABILITIESBank overdraft - 214,714 -Amounts payable on purchase of investments 593,993 877,783 -Amounts payable on redemptions - 255,647 -Unrealised loss on forward foreign exchange contracts (5)(2) - 814,321 -Management fee payable (3) 10,365 584,427 -Other liabilities 1,567 688 -TOTAL LIABILITIES 605,925 2,747,580 -TOTAL NET ASSETS 86,761,930 463,469,429 19,652,040
Net Asset Value per shareA shares 111.306 141.484 108.726A shares EUR - 111.150 -A shares EUR (Hedged) - 119.730 -A shares USD (Hedged) - - -B shares 113.938 146.998 111.235B shares USD (Hedged) - - -B shares (dist) GBP - 135.513 -B shares (dist) GBP (Hedged) 110.020 142.226 109.060B shares EUR (Hedged) - 118.319 -O shares 114.629 135.296 111.932O shares (dist) - - -OE shares EUR - 104.000 -O shares EUR (Hedged) - - -O shares GBP 169.140 153.556 142.630O shares GBP (Hedged) - - -O shares (dist) GBP (Hedged) - - -O shares USD (Hedged) - - -
Number of shares outstandingA shares 10.000 460.000 10.000A shares EUR - 10.000 -A shares EUR (Hedged) - 10.000 -A shares USD (Hedged) - - -B shares 722.346 13,831.867 35,829.366B shares USD (Hedged) - - -B shares (dist) GBP - 44.092 -B shares (dist) GBP (Hedged) 3,055.576 13,141.198 9.782B shares EUR (Hedged) - 341,513.763 -O shares 428,672.902 2,565,374.769 54,371.240O shares (dist) - - -OE shares EUR - 10.000 -O shares EUR (Hedged) - - -O shares GBP 165,151.897 317,391.986 50,569.341O shares GBP (Hedged) - - -O shares (dist) GBP (Hedged) - - -O shares USD (Hedged) - - -
RBC Funds (Lux)
The accompanying notes form an integral part of these financial statements.
73
Combined Statement of Net Assetsas at October 31, 2017 (continued)

RBC Funds (LUX) -Global Resources
Fund
RBC Funds (LUX) -Global Bond
Fund
RBC Funds (LUX) -U.S. Investment
Grade CorporateBond Fund
Note USD USD USD
ASSETSInvestments in securities at market value (2) 14,248,966 90,765,340 24,546,416Cash at bank (2) 248,075 2,168,687 335,695Amounts receivable on sale of investments 254,195 - -Amounts receivable on subscriptions - - -Interest and dividends receivable 5,530 487,920 206,140Unrealised profit on forward foreign exchange contracts (5)(2) 55,685 1,136,827 9Other assets - - 58,981TOTAL ASSETS 14,812,451 94,558,774 25,147,241
LIABILITIESBank overdraft 1 - -Amounts payable on purchase of investments 217,292 - 274,701Amounts payable on redemptions - - -Unrealised loss on forward foreign exchange contracts (5)(2) - - -Management fee payable (3) 28,340 197,357 -Other liabilities 1,053 27 -TOTAL LIABILITIES 246,686 197,384 274,701TOTAL NET ASSETS 14,565,765 94,361,390 24,872,540
Net Asset Value per shareA shares 70.779 110.931 129.073A shares EUR - - -A shares EUR (Hedged) - - -A shares USD (Hedged) - - -B shares 75.970 113.183 110.644B shares USD (Hedged) - - -B shares (dist) GBP - - -B shares (dist) GBP (Hedged) 91.894 111.506 119.120B shares EUR (Hedged) - - -O shares 117.876 112.662 145.160O shares (dist) - - 109.722OE shares EUR - - -O shares EUR (Hedged) - - -O shares GBP - - -O shares GBP (Hedged) - - -O shares (dist) GBP (Hedged) - 106.333 -O shares USD (Hedged) - - -
Number of shares outstandingA shares 14,345.827 2,661.044 3,270.683A shares EUR - - -A shares EUR (Hedged) - - -A shares USD (Hedged) - - -B shares 3,020.482 1,121.739 10.000B shares USD (Hedged) - - -B shares (dist) GBP - - -B shares (dist) GBP (Hedged) 76,813.711 1,348.859 10.000B shares EUR (Hedged) - - -O shares 33,486.570 377,501.741 167,996.526O shares (dist) - - 558.468OE shares EUR - - -O shares EUR (Hedged) - - -O shares GBP - - -O shares GBP (Hedged) - - -O shares (dist) GBP (Hedged) - 362,658.236 -O shares USD (Hedged) - - -
RBC Funds (Lux)
The accompanying notes form an integral part of these financial statements.
74
Combined Statement of Net Assetsas at October 31, 2017 (continued)
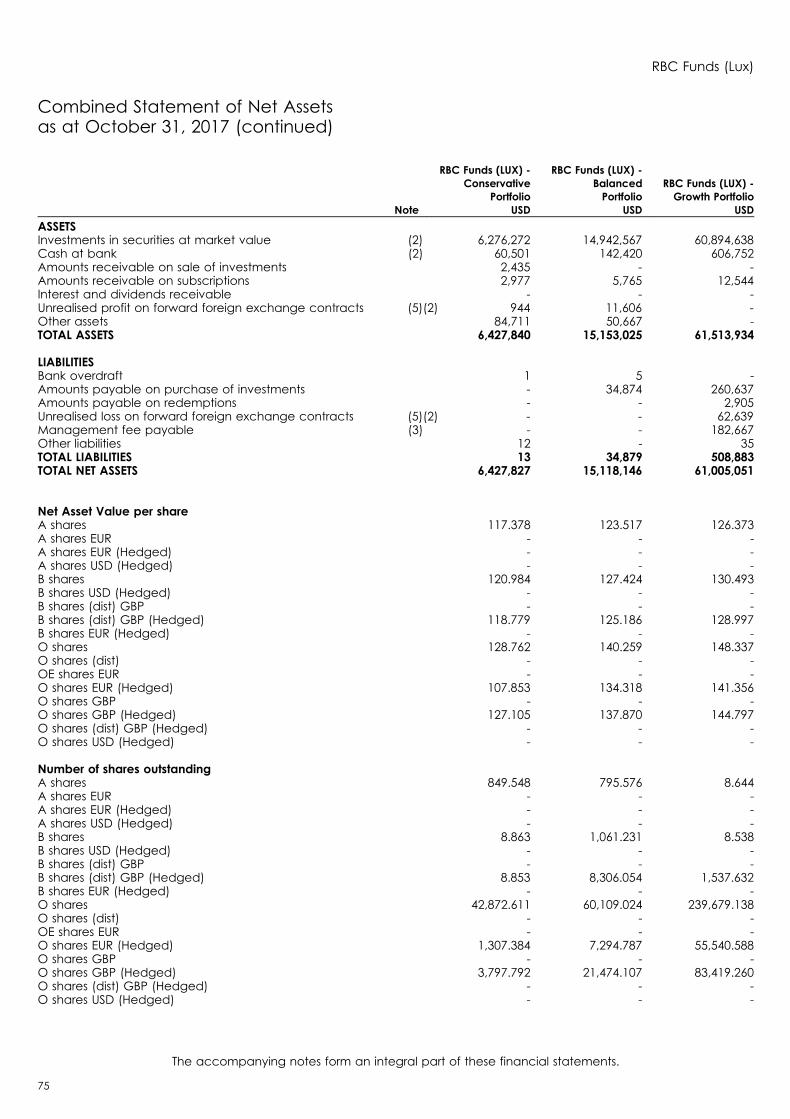
RBC Funds (LUX) -Conservative
Portfolio
RBC Funds (LUX) -BalancedPortfolio
RBC Funds (LUX) -Growth Portfolio
Note USD USD USD
ASSETSInvestments in securities at market value (2) 6,276,272 14,942,567 60,894,638Cash at bank (2) 60,501 142,420 606,752Amounts receivable on sale of investments 2,435 - -Amounts receivable on subscriptions 2,977 5,765 12,544Interest and dividends receivable - - -Unrealised profit on forward foreign exchange contracts (5)(2) 944 11,606 -Other assets 84,711 50,667 -TOTAL ASSETS 6,427,840 15,153,025 61,513,934
LIABILITIESBank overdraft 1 5 -Amounts payable on purchase of investments - 34,874 260,637Amounts payable on redemptions - - 2,905Unrealised loss on forward foreign exchange contracts (5)(2) - - 62,639Management fee payable (3) - - 182,667Other liabilities 12 - 35TOTAL LIABILITIES 13 34,879 508,883TOTAL NET ASSETS 6,427,827 15,118,146 61,005,051
Net Asset Value per shareA shares 117.378 123.517 126.373A shares EUR - - -A shares EUR (Hedged) - - -A shares USD (Hedged) - - -B shares 120.984 127.424 130.493B shares USD (Hedged) - - -B shares (dist) GBP - - -B shares (dist) GBP (Hedged) 118.779 125.186 128.997B shares EUR (Hedged) - - -O shares 128.762 140.259 148.337O shares (dist) - - -OE shares EUR - - -O shares EUR (Hedged) 107.853 134.318 141.356O shares GBP - - -O shares GBP (Hedged) 127.105 137.870 144.797O shares (dist) GBP (Hedged) - - -O shares USD (Hedged) - - -
Number of shares outstandingA shares 849.548 795.576 8.644A shares EUR - - -A shares EUR (Hedged) - - -A shares USD (Hedged) - - -B shares 8.863 1,061.231 8.538B shares USD (Hedged) - - -B shares (dist) GBP - - -B shares (dist) GBP (Hedged) 8.853 8,306.054 1,537.632B shares EUR (Hedged) - - -O shares 42,872.611 60,109.024 239,679.138O shares (dist) - - -OE shares EUR - - -O shares EUR (Hedged) 1,307.384 7,294.787 55,540.588O shares GBP - - -O shares GBP (Hedged) 3,797.792 21,474.107 83,419.260O shares (dist) GBP (Hedged) - - -O shares USD (Hedged) - - -
RBC Funds (Lux)
The accompanying notes form an integral part of these financial statements.
75
Combined Statement of Net Assetsas at October 31, 2017 (continued)

CombinedStatement
Note USD
ASSETSInvestments in securities at market value (2) 1,093,415,975Cash at bank (2) 13,636,586Amounts receivable on sale of investments 1,815,397Amounts receivable on subscriptions 209,262Interest and dividends receivable 1,331,061Unrealised profit on forward foreign exchange contracts (5)(2) 1,314,052Other assets 527,180TOTAL ASSETS 1,112,249,513
LIABILITIESBank overdraft 214,721Amounts payable on purchase of investments 2,706,475Amounts payable on redemptions 334,552Unrealised loss on forward foreign exchange contracts (5)(2) 876,960Management fee payable (3) 1,239,329Other liabilities 3,701TOTAL LIABILITIES 5,375,738TOTAL NET ASSETS 1,106,873,775
RBC Funds (Lux)
The accompanying notes form an integral part of these financial statements.
76
Combined Statement of Net Assetsas at October 31, 2017 (continued)
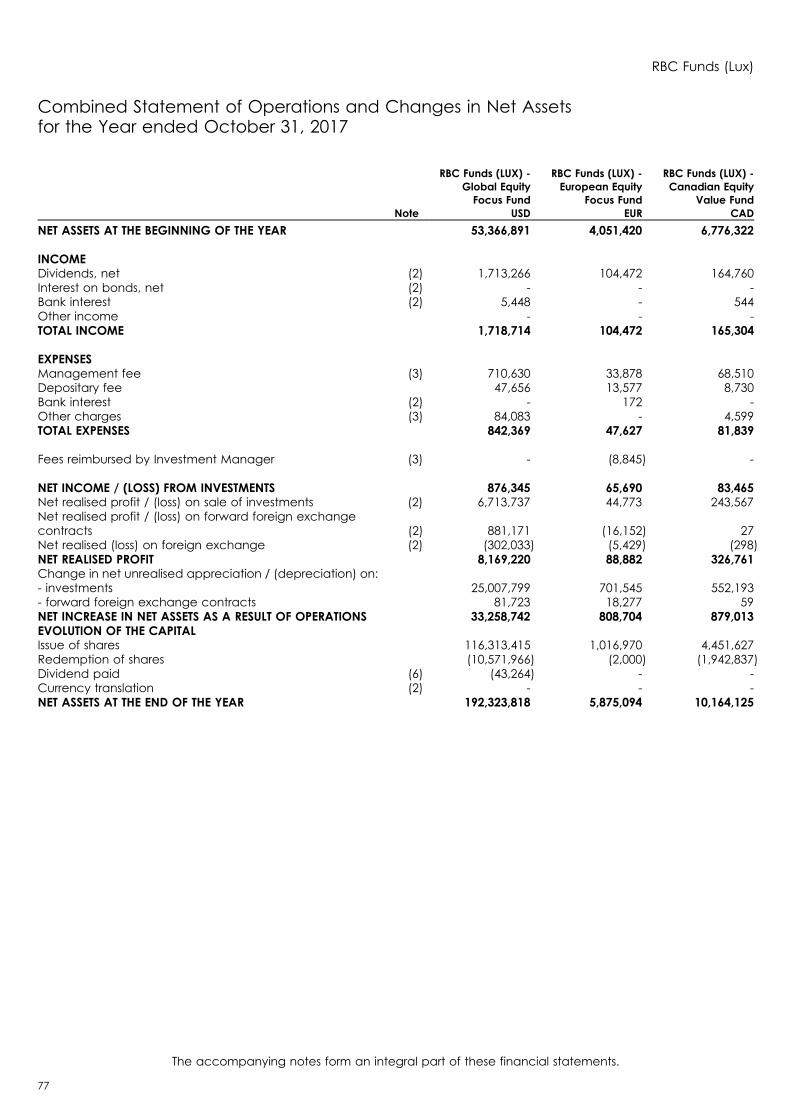
Combined Statement of Operations and Changes in Net Assetsfor the Year ended October 31, 2017
RBC Funds (LUX) -Global EquityFocus Fund
RBC Funds (LUX) -European Equity
Focus Fund
RBC Funds (LUX) -Canadian Equity
Value FundNote USD EUR CAD
NET ASSETS AT THE BEGINNING OF THE YEAR 53,366,891 4,051,420 6,776,322
INCOMEDividends, net (2) 1,713,266 104,472 164,760Interest on bonds, net (2) - - -Bank interest (2) 5,448 - 544Other income - - -TOTAL INCOME 1,718,714 104,472 165,304
EXPENSESManagement fee (3) 710,630 33,878 68,510Depositary fee 47,656 13,577 8,730Bank interest (2) - 172 -Other charges (3) 84,083 - 4,599TOTAL EXPENSES 842,369 47,627 81,839
Fees reimbursed by Investment Manager (3) - (8,845) -
NET INCOME / (LOSS) FROM INVESTMENTS 876,345 65,690 83,465Net realised profit / (loss) on sale of investments (2) 6,713,737 44,773 243,567Net realised profit / (loss) on forward foreign exchangecontracts (2) 881,171 (16,152) 27Net realised (loss) on foreign exchange (2) (302,033) (5,429) (298)NET REALISED PROFIT 8,169,220 88,882 326,761Change in net unrealised appreciation / (depreciation) on:- investments 25,007,799 701,545 552,193- forward foreign exchange contracts 81,723 18,277 59NET INCREASE IN NET ASSETS AS A RESULT OF OPERATIONS 33,258,742 808,704 879,013EVOLUTION OF THE CAPITALIssue of shares 116,313,415 1,016,970 4,451,627Redemption of shares (10,571,966) (2,000) (1,942,837)Dividend paid (6) (43,264) - -Currency translation (2) - - -NET ASSETS AT THE END OF THE YEAR 192,323,818 5,875,094 10,164,125
RBC Funds (Lux)
The accompanying notes form an integral part of these financial statements.
77

RBC Funds (LUX) -U.S. Mid CapValue Equity
Fund
RBC Funds (LUX) -U.S. Small Cap
Equity Fund
RBC Funds (LUX) -Asia ex-Japan
Equity FundNote USD USD USD
NET ASSETS AT THE BEGINNING OF THE YEAR 26,630,907 23,668,345 10,926,158
INCOMEDividends, net (2) 433,042 370,239 140,888Interest on bonds, net (2) - - -Bank interest (2) 4,133 4,480 810Other income 2,908 5,384 -TOTAL INCOME 440,083 380,103 141,698
EXPENSESManagement fee (3) 344,718 232,772 103,223Depositary fee 13,207 9,729 60,245Bank interest (2) - - -Other charges (3) 33,434 23,759 -TOTAL EXPENSES 391,359 266,260 163,468
Fees reimbursed by Investment Manager (3) - - (40,436)
NET INCOME / (LOSS) FROM INVESTMENTS 48,724 113,843 18,666Net realised profit / (loss) on sale of investments (2) 2,350,979 1,639,790 1,081,301Net realised profit / (loss) on forward foreign exchangecontracts (2) 115 104 100Net realised (loss) on foreign exchange (2) (244) (204) (27,019)NET REALISED PROFIT 2,399,574 1,753,533 1,073,048Change in net unrealised appreciation / (depreciation) on:- investments 1,252,205 5,083,499 1,445,214- forward foreign exchange contracts 9 9 8NET INCREASE IN NET ASSETS AS A RESULT OF OPERATIONS 3,651,788 6,837,041 2,518,270EVOLUTION OF THE CAPITALIssue of shares 41,924,485 23,452,191 1,477,333Redemption of shares (10,785,978) (14,160,364) (2,553,195)Dividend paid (6) - - -Currency translation (2) - - -NET ASSETS AT THE END OF THE YEAR 61,421,202 39,797,213 12,368,566
RBC Funds (Lux)
The accompanying notes form an integral part of these financial statements.
78
Combined Statement of Operations and Changes in Net Assetsfor the Year ended October 31, 2017 (continued)

RBC Funds (LUX) -Emerging Markets
Value EquityFund
RBC Funds (LUX) -Emerging Markets
Equity Fund
RBC Funds (LUX) -Emerging Markets
Small CapEquity Fund
Note USD USD USD
NET ASSETS AT THE BEGINNING OF THE YEAR 26,979,777 179,635,016 13,825,194
INCOMEDividends, net (2) 1,405,411 6,295,637 392,503Interest on bonds, net (2) - - -Bank interest (2) - 20,368 2,721Other income - - -TOTAL INCOME 1,405,411 6,316,005 395,224
EXPENSESManagement fee (3) 446,456 2,547,210 173,096Depositary fee 138,357 384,596 75,678Bank interest (2) 1,505 - -Other charges (3) 20,003 250,304 -TOTAL EXPENSES 606,321 3,182,110 248,774
Fees reimbursed by Investment Manager (3) - - (20,299)
NET INCOME / (LOSS) FROM INVESTMENTS 799,090 3,133,895 166,749Net realised profit / (loss) on sale of investments (2) 2,771,264 (921,608) 454,487Net realised profit / (loss) on forward foreign exchangecontracts (2) 25,092 387,249 87Net realised (loss) on foreign exchange (2) (138,730) (576,129) (34,525)NET REALISED PROFIT 3,456,716 2,023,407 586,798Change in net unrealised appreciation / (depreciation) on:- investments 11,252,375 62,999,666 1,441,539- forward foreign exchange contracts 2,116 (785,224) 7NET INCREASE IN NET ASSETS AS A RESULT OF OPERATIONS 14,711,207 64,237,849 2,028,344EVOLUTION OF THE CAPITALIssue of shares 48,647,186 298,129,373 3,841,012Redemption of shares (3,571,657) (78,522,700) (42,510)Dividend paid (6) (4,583) (10,109) -Currency translation (2) - - -NET ASSETS AT THE END OF THE YEAR 86,761,930 463,469,429 19,652,040
RBC Funds (Lux)
The accompanying notes form an integral part of these financial statements.
79
Combined Statement of Operations and Changes in Net Assetsfor the Year ended October 31, 2017 (continued)
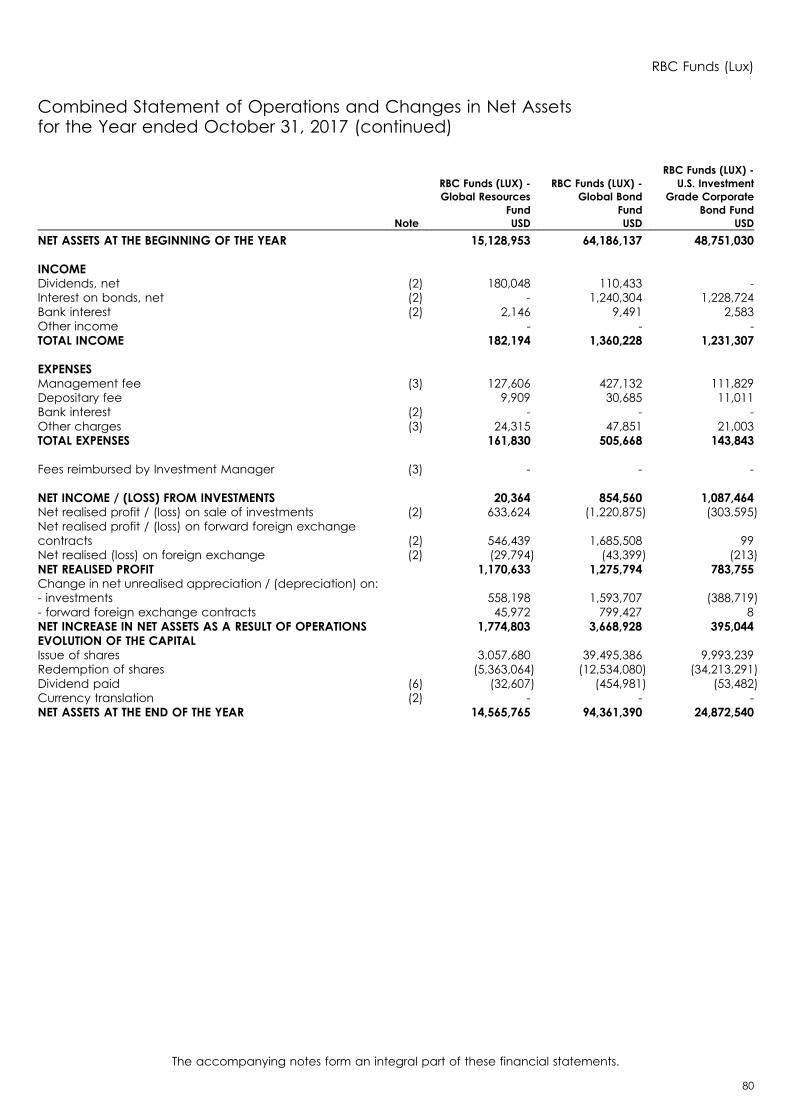
RBC Funds (LUX) -Global Resources
Fund
RBC Funds (LUX) -Global Bond
Fund
RBC Funds (LUX) -U.S. Investment
Grade CorporateBond Fund
Note USD USD USD
NET ASSETS AT THE BEGINNING OF THE YEAR 15,128,953 64,186,137 48,751,030
INCOMEDividends, net (2) 180,048 110,433 -Interest on bonds, net (2) - 1,240,304 1,228,724Bank interest (2) 2,146 9,491 2,583Other income - - -TOTAL INCOME 182,194 1,360,228 1,231,307
EXPENSESManagement fee (3) 127,606 427,132 111,829Depositary fee 9,909 30,685 11,011Bank interest (2) - - -Other charges (3) 24,315 47,851 21,003TOTAL EXPENSES 161,830 505,668 143,843
Fees reimbursed by Investment Manager (3) - - -
NET INCOME / (LOSS) FROM INVESTMENTS 20,364 854,560 1,087,464Net realised profit / (loss) on sale of investments (2) 633,624 (1,220,875) (303,595)Net realised profit / (loss) on forward foreign exchangecontracts (2) 546,439 1,685,508 99Net realised (loss) on foreign exchange (2) (29,794) (43,399) (213)NET REALISED PROFIT 1,170,633 1,275,794 783,755Change in net unrealised appreciation / (depreciation) on:- investments 558,198 1,593,707 (388,719)- forward foreign exchange contracts 45,972 799,427 8NET INCREASE IN NET ASSETS AS A RESULT OF OPERATIONS 1,774,803 3,668,928 395,044EVOLUTION OF THE CAPITALIssue of shares 3,057,680 39,495,386 9,993,239Redemption of shares (5,363,064) (12,534,080) (34,213,291)Dividend paid (6) (32,607) (454,981) (53,482)Currency translation (2) - - -NET ASSETS AT THE END OF THE YEAR 14,565,765 94,361,390 24,872,540
RBC Funds (Lux)
The accompanying notes form an integral part of these financial statements.
80
Combined Statement of Operations and Changes in Net Assetsfor the Year ended October 31, 2017 (continued)

RBC Funds (LUX) -Conservative
Portfolio
RBC Funds (LUX) -BalancedPortfolio
RBC Funds (LUX) -Growth Portfolio
Note USD USD USD
NET ASSETS AT THE BEGINNING OF THE YEAR 3,424,441 11,447,839 50,850,632
INCOMEDividends, net (2) 3,742 6,546 27,993Interest on bonds, net (2) - - -Bank interest (2) 61 510 2,208Other income - - -TOTAL INCOME 3,803 7,056 30,201
EXPENSESManagement fee (3) 20,632 65,878 268,875Depositary fee 15,781 24,762 40,208Bank interest (2) - - -Other charges (3) - - 43,224TOTAL EXPENSES 36,413 90,640 352,307
Fees reimbursed by Investment Manager (3) (9,437) (3,148) -
NET INCOME / (LOSS) FROM INVESTMENTS (23,173) (80,436) (322,106)Net realised profit / (loss) on sale of investments (2) 77,578 440,190 1,272,703Net realised profit / (loss) on forward foreign exchangecontracts (2) 51,852 329,138 1,472,550Net realised (loss) on foreign exchange (2) (1,916) (491) (42,220)NET REALISED PROFIT 104,341 688,401 2,380,927Change in net unrealised appreciation / (depreciation) on:- investments 310,553 1,320,657 7,801,312- forward foreign exchange contracts 222 6,864 (33,862)NET INCREASE IN NET ASSETS AS A RESULT OF OPERATIONS 415,116 2,015,922 10,148,377EVOLUTION OF THE CAPITALIssue of shares 2,926,225 4,382,466 8,955,979Redemption of shares (337,955) (2,728,081) (8,949,937)Dividend paid (6) - - -Currency translation (2) - - -NET ASSETS AT THE END OF THE YEAR 6,427,827 15,118,146 61,005,051
RBC Funds (Lux)
The accompanying notes form an integral part of these financial statements.
81
Combined Statement of Operations and Changes in Net Assetsfor the Year ended October 31, 2017 (continued)

CombinedStatement
Note USD
NET ASSETS AT THE BEGINNING OF THE YEAR 538,318,498
INCOMEDividends, net (2) 11,329,263Interest on bonds, net (2) 2,469,028Bank interest (2) 55,381Other income 8,292TOTAL INCOME 13,861,964
EXPENSESManagement fee (3) 5,672,669Depositary fee 884,413Bank interest (2) 1,705Other charges (3) 551,544TOTAL EXPENSES 7,110,331
Fees reimbursed by Investment Manager (3) (83,624)
NET INCOME / (LOSS) FROM INVESTMENTS 6,835,257Net realised profit / (loss) on sale of investments (2) 15,230,677Net realised profit / (loss) on forward foreign exchange contracts (2) 5,360,709Net realised (loss) on foreign exchange (2) (1,203,473)NET REALISED PROFIT 26,223,170Change in net unrealised appreciation / (depreciation) on:- investments 120,923,625- forward foreign exchange contracts 138,617NET INCREASE IN NET ASSETS AS A RESULT OF OPERATIONS 147,285,412EVOLUTION OF THE CAPITALIssue of shares 607,233,972Redemption of shares (185,844,235)Dividend paid (6) (599,026)Currency translation (2) 479,154NET ASSETS AT THE END OF THE YEAR 1,106,873,775
RBC Funds (Lux)
The accompanying notes form an integral part of these financial statements.
82
Combined Statement of Operations and Changes in Net Assetsfor the Year ended October 31, 2017 (continued)
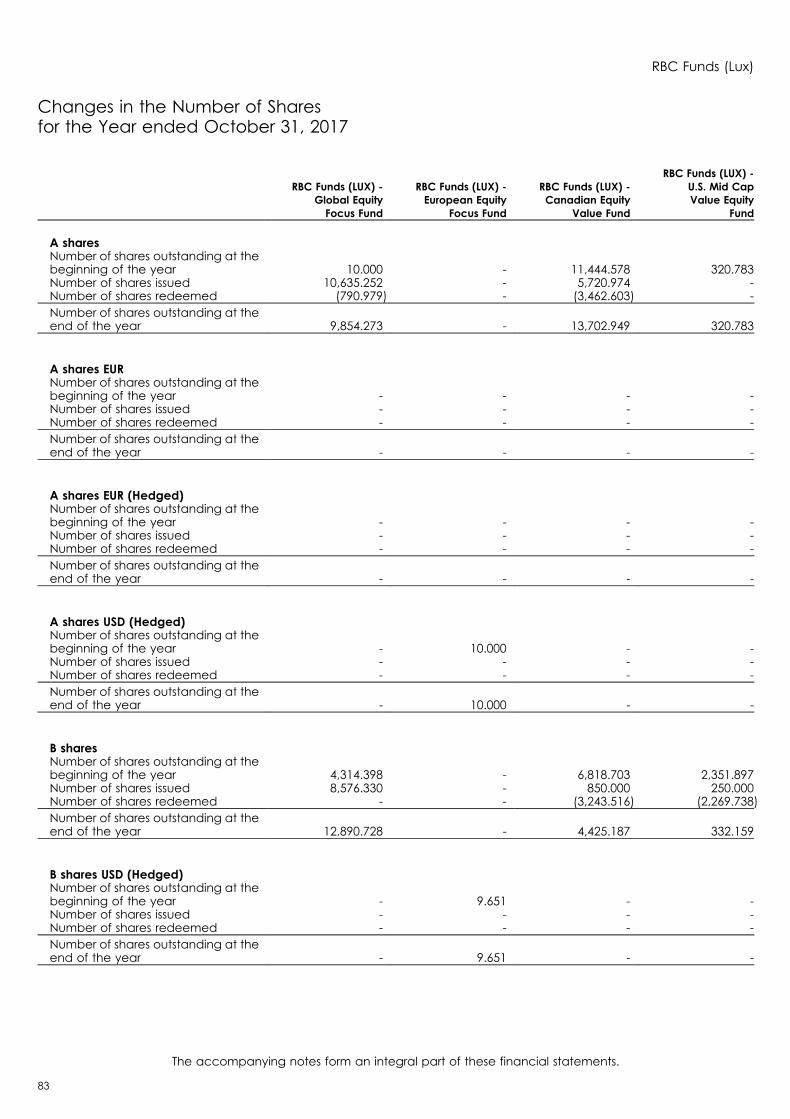
Changes in the Number of Sharesfor the Year ended October 31, 2017
RBC Funds (LUX) -Global EquityFocus Fund
RBC Funds (LUX) -European Equity
Focus Fund
RBC Funds (LUX) -Canadian Equity
Value Fund
RBC Funds (LUX) -U.S. Mid CapValue Equity
Fund
A sharesNumber of shares outstanding at thebeginning of the year 10.000 - 11,444.578 320.783Number of shares issued 10,635.252 - 5,720.974 -Number of shares redeemed (790.979) - (3,462.603) -Number of shares outstanding at theend of the year 9,854.273 - 13,702.949 320.783
A shares EURNumber of shares outstanding at thebeginning of the year - - - -Number of shares issued - - - -Number of shares redeemed - - - -Number of shares outstanding at theend of the year - - - -
A shares EUR (Hedged)Number of shares outstanding at thebeginning of the year - - - -Number of shares issued - - - -Number of shares redeemed - - - -Number of shares outstanding at theend of the year - - - -
A shares USD (Hedged)Number of shares outstanding at thebeginning of the year - 10.000 - -Number of shares issued - - - -Number of shares redeemed - - - -Number of shares outstanding at theend of the year - 10.000 - -
B sharesNumber of shares outstanding at thebeginning of the year 4,314.398 - 6,818.703 2,351.897Number of shares issued 8,576.330 - 850.000 250.000Number of shares redeemed - - (3,243.516) (2,269.738)Number of shares outstanding at theend of the year 12,890.728 - 4,425.187 332.159
B shares USD (Hedged)Number of shares outstanding at thebeginning of the year - 9.651 - -Number of shares issued - - - -Number of shares redeemed - - - -Number of shares outstanding at theend of the year - 9.651 - -
RBC Funds (Lux)
The accompanying notes form an integral part of these financial statements.
83

RBC Funds (LUX) -Global EquityFocus Fund
RBC Funds (LUX) -European Equity
Focus Fund
RBC Funds (LUX) -Canadian Equity
Value Fund
RBC Funds (LUX) -U.S. Mid CapValue Equity
Fund
B shares (dist) GBPNumber of shares outstanding at thebeginning of the year 2,502.777 - - -Number of shares issued 22.526 10.000 - -Number of shares redeemed - - - -Number of shares outstanding at theend of the year 2,525.303 10.000 - -
B shares (dist) GBP (Hedged)Number of shares outstanding at thebeginning of the year 30,777.477 108.280 10.000 10.000Number of shares issued 70,204.055 - - -Number of shares redeemed (19,452.725) - - -Number of shares outstanding at theend of the year 81,528.807 108.280 10.000 10.000
B shares EUR (Hedged)Number of shares outstanding at thebeginning of the year - - - -Number of shares issued - - - -Number of shares redeemed - - - -Number of shares outstanding at theend of the year - - - -
O sharesNumber of shares outstanding at thebeginning of the year 458,349.897 44,000.000 32,815.980 149,214.211Number of shares issued 580,166.328 - 25,165.985 215,289.988Number of shares redeemed (59,898.461) (20.246) (7,212.985) (53,491.146)Number of shares outstanding at theend of the year 978,617.764 43,979.754 50,768.980 311,013.053
O shares (dist)Number of shares outstanding at thebeginning of the year - - - -Number of shares issued 314,527.269 - - -Number of shares redeemed - - - -Number of shares outstanding at theend of the year 314,527.269 - - -
OE shares EURNumber of shares outstanding at thebeginning of the year - - - -Number of shares issued - - - -Number of shares redeemed - - - -Number of shares outstanding at theend of the year - - - -
RBC Funds (Lux)
The accompanying notes form an integral part of these financial statements.
84
Changes in the Number of Sharesfor the Year ended October 31, 2017 (continued)

RBC Funds (LUX) -Global EquityFocus Fund
RBC Funds (LUX) -European Equity
Focus Fund
RBC Funds (LUX) -Canadian Equity
Value Fund
RBC Funds (LUX) -U.S. Mid CapValue Equity
Fund
O shares EUR (Hedged)Number of shares outstanding at thebeginning of the year - - - -Number of shares issued - - - -Number of shares redeemed - - - -Number of shares outstanding at theend of the year - - - -
O shares GBPNumber of shares outstanding at thebeginning of the year - - - -Number of shares issued - - - -Number of shares redeemed - - - -Number of shares outstanding at theend of the year - - - -
O shares GBP (Hedged)Number of shares outstanding at thebeginning of the year - - - -Number of shares issued - - - -Number of shares redeemed - - - -Number of shares outstanding at theend of the year - - - -
O shares (dist) GBP (Hedged)Number of shares outstanding at thebeginning of the year - - - -Number of shares issued - - - -Number of shares redeemed - - - -Number of shares outstanding at theend of the year - - - -
O shares USD (Hedged)Number of shares outstanding at thebeginning of the year - 10.000 - -Number of shares issued - 10,993.968 - -Number of shares redeemed - - - -Number of shares outstanding at theend of the year - 11,003.968 - -
RBC Funds (Lux)
The accompanying notes form an integral part of these financial statements.
85
Changes in the Number of Sharesfor the Year ended October 31, 2017 (continued)

RBC Funds (LUX) -U.S. Small Cap
Equity Fund
RBC Funds (LUX) -Asia ex-Japan
Equity Fund
RBC Funds (LUX) -Emerging Markets
Value EquityFund
RBC Funds (LUX) -Emerging Markets
Equity Fund
A sharesNumber of shares outstanding at thebeginning of the year 10.000 18,955.896 10.000 460.000Number of shares issued - - - -Number of shares redeemed - (1,013.623) - -Number of shares outstanding at theend of the year 10.000 17,942.273 10.000 460.000
A shares EURNumber of shares outstanding at thebeginning of the year - - - -Number of shares issued - - - 10.000Number of shares redeemed - - - -Number of shares outstanding at theend of the year - - - 10.000
A shares EUR (Hedged)Number of shares outstanding at thebeginning of the year - - - -Number of shares issued - - - 10.000Number of shares redeemed - - - -Number of shares outstanding at theend of the year - - - 10.000
A shares USD (Hedged)Number of shares outstanding at thebeginning of the year - - - -Number of shares issued - - - -Number of shares redeemed - - - -Number of shares outstanding at theend of the year - - - -
B sharesNumber of shares outstanding at thebeginning of the year 4,672.223 10.000 722.346 31,931.814Number of shares issued 7,375.244 - - 36,811.000Number of shares redeemed (4,666.267) - - (54,910.947)Number of shares outstanding at theend of the year 7,381.200 10.000 722.346 13,831.867
B shares USD (Hedged)Number of shares outstanding at thebeginning of the year - - - -Number of shares issued - - - -Number of shares redeemed - - - -Number of shares outstanding at theend of the year - - - -
RBC Funds (Lux)
The accompanying notes form an integral part of these financial statements.
86
Changes in the Number of Sharesfor the Year ended October 31, 2017 (continued)
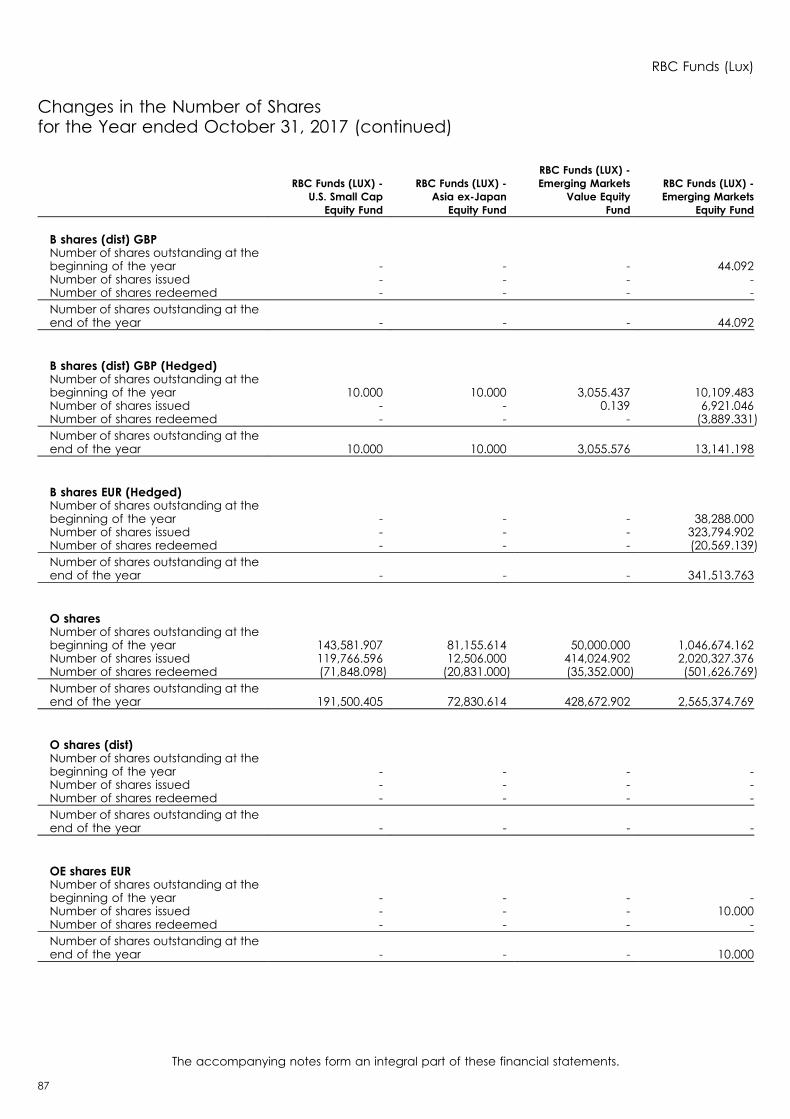
RBC Funds (LUX) -U.S. Small Cap
Equity Fund
RBC Funds (LUX) -Asia ex-Japan
Equity Fund
RBC Funds (LUX) -Emerging Markets
Value EquityFund
RBC Funds (LUX) -Emerging Markets
Equity Fund
B shares (dist) GBPNumber of shares outstanding at thebeginning of the year - - - 44.092Number of shares issued - - - -Number of shares redeemed - - - -Number of shares outstanding at theend of the year - - - 44.092
B shares (dist) GBP (Hedged)Number of shares outstanding at thebeginning of the year 10.000 10.000 3,055.437 10,109.483Number of shares issued - - 0.139 6,921.046Number of shares redeemed - - - (3,889.331)Number of shares outstanding at theend of the year 10.000 10.000 3,055.576 13,141.198
B shares EUR (Hedged)Number of shares outstanding at thebeginning of the year - - - 38,288.000Number of shares issued - - - 323,794.902Number of shares redeemed - - - (20,569.139)Number of shares outstanding at theend of the year - - - 341,513.763
O sharesNumber of shares outstanding at thebeginning of the year 143,581.907 81,155.614 50,000.000 1,046,674.162Number of shares issued 119,766.596 12,506.000 414,024.902 2,020,327.376Number of shares redeemed (71,848.098) (20,831.000) (35,352.000) (501,626.769)Number of shares outstanding at theend of the year 191,500.405 72,830.614 428,672.902 2,565,374.769
O shares (dist)Number of shares outstanding at thebeginning of the year - - - -Number of shares issued - - - -Number of shares redeemed - - - -Number of shares outstanding at theend of the year - - - -
OE shares EURNumber of shares outstanding at thebeginning of the year - - - -Number of shares issued - - - 10.000Number of shares redeemed - - - -Number of shares outstanding at theend of the year - - - 10.000
RBC Funds (Lux)
The accompanying notes form an integral part of these financial statements.
87
Changes in the Number of Sharesfor the Year ended October 31, 2017 (continued)
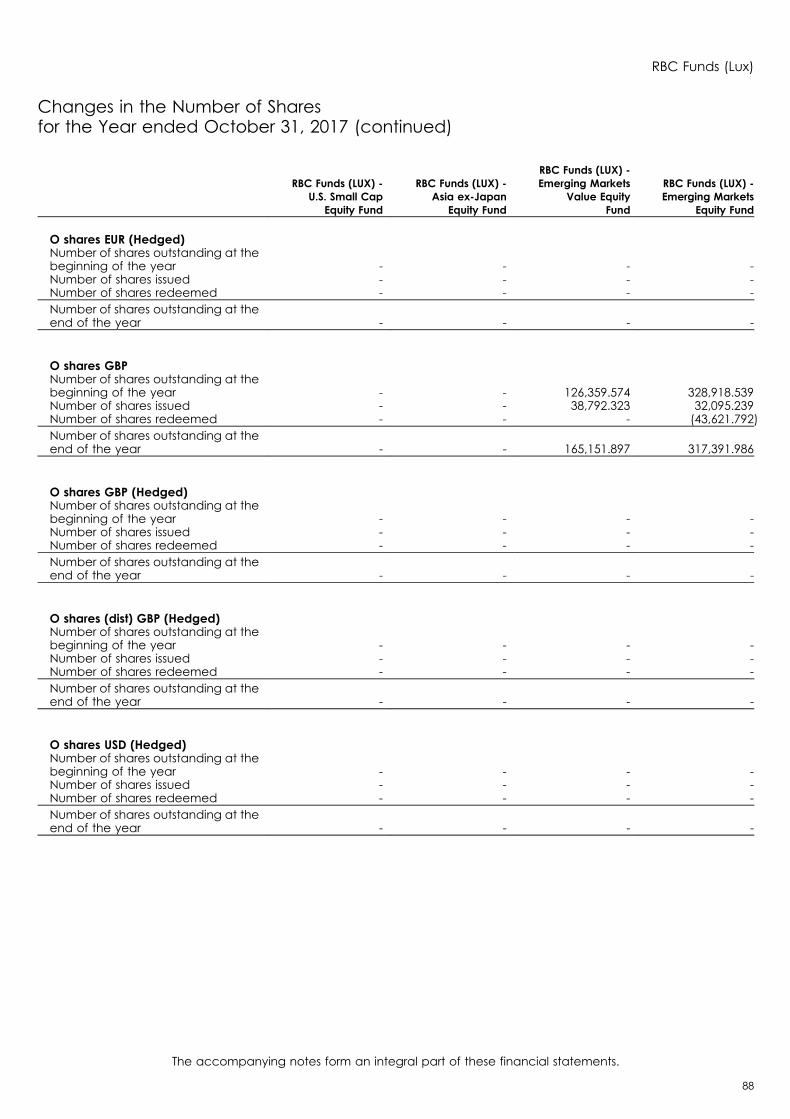
RBC Funds (LUX) -U.S. Small Cap
Equity Fund
RBC Funds (LUX) -Asia ex-Japan
Equity Fund
RBC Funds (LUX) -Emerging Markets
Value EquityFund
RBC Funds (LUX) -Emerging Markets
Equity Fund
O shares EUR (Hedged)Number of shares outstanding at thebeginning of the year - - - -Number of shares issued - - - -Number of shares redeemed - - - -Number of shares outstanding at theend of the year - - - -
O shares GBPNumber of shares outstanding at thebeginning of the year - - 126,359.574 328,918.539Number of shares issued - - 38,792.323 32,095.239Number of shares redeemed - - - (43,621.792)Number of shares outstanding at theend of the year - - 165,151.897 317,391.986
O shares GBP (Hedged)Number of shares outstanding at thebeginning of the year - - - -Number of shares issued - - - -Number of shares redeemed - - - -Number of shares outstanding at theend of the year - - - -
O shares (dist) GBP (Hedged)Number of shares outstanding at thebeginning of the year - - - -Number of shares issued - - - -Number of shares redeemed - - - -Number of shares outstanding at theend of the year - - - -
O shares USD (Hedged)Number of shares outstanding at thebeginning of the year - - - -Number of shares issued - - - -Number of shares redeemed - - - -Number of shares outstanding at theend of the year - - - -
RBC Funds (Lux)
The accompanying notes form an integral part of these financial statements.
88
Changes in the Number of Sharesfor the Year ended October 31, 2017 (continued)

RBC Funds (LUX) -Emerging Markets
Small CapEquity Fund
RBC Funds (LUX) -Global Resources
Fund
RBC Funds (LUX) -Global Bond
Fund
RBC Funds (LUX) -U.S. Investment
Grade CorporateBond Fund
A sharesNumber of shares outstanding at thebeginning of the year 10.000 8,041.514 14,125.607 3,270.683Number of shares issued - 15,865.000 1,321.167 -Number of shares redeemed - (9,560.687) (12,785.730) -Number of shares outstanding at theend of the year 10.000 14,345.827 2,661.044 3,270.683
A shares EURNumber of shares outstanding at thebeginning of the year - - - -Number of shares issued - - - -Number of shares redeemed - - - -Number of shares outstanding at theend of the year - - - -
A shares EUR (Hedged)Number of shares outstanding at thebeginning of the year - - - -Number of shares issued - - - -Number of shares redeemed - - - -Number of shares outstanding at theend of the year - - - -
A shares USD (Hedged)Number of shares outstanding at thebeginning of the year - - - -Number of shares issued - - - -Number of shares redeemed - - - -Number of shares outstanding at theend of the year - - - -
B sharesNumber of shares outstanding at thebeginning of the year 1,716.795 8,088.167 1,121.739 10.000Number of shares issued 34,509.067 1,061.254 - -Number of shares redeemed (396.496) (6,128.939) - -Number of shares outstanding at theend of the year 35,829.366 3,020.482 1,121.739 10.000
B shares USD (Hedged)Number of shares outstanding at thebeginning of the year - - - -Number of shares issued - - - -Number of shares redeemed - - - -Number of shares outstanding at theend of the year - - - -
RBC Funds (Lux)
The accompanying notes form an integral part of these financial statements.
89
Changes in the Number of Sharesfor the Year ended October 31, 2017 (continued)

RBC Funds (LUX) -Emerging Markets
Small CapEquity Fund
RBC Funds (LUX) -Global Resources
Fund
RBC Funds (LUX) -Global Bond
Fund
RBC Funds (LUX) -U.S. Investment
Grade CorporateBond Fund
B shares (dist) GBPNumber of shares outstanding at thebeginning of the year - - - -Number of shares issued - - - -Number of shares redeemed - - - -Number of shares outstanding at theend of the year - - - -
B shares (dist) GBP (Hedged)Number of shares outstanding at thebeginning of the year 9.782 72,461.185 10.000 10.000Number of shares issued - 15,362.867 1,338.859 -Number of shares redeemed - (11,010.341) - -Number of shares outstanding at theend of the year 9.782 76,813.711 1,348.859 10.000
B shares EUR (Hedged)Number of shares outstanding at thebeginning of the year - - - -Number of shares issued - - - -Number of shares redeemed - - - -Number of shares outstanding at theend of the year - - - -
O sharesNumber of shares outstanding at thebeginning of the year 50,000.000 58,483.549 219,540.251 283,556.729Number of shares issued 4,371.240 1,417.500 225,442.151 70,652.859Number of shares redeemed - (26,414.479) (67,480.661) (186,213.062)Number of shares outstanding at theend of the year 54,371.240 33,486.570 377,501.741 167,996.526
O shares (dist)Number of shares outstanding at thebeginning of the year - - - 79,978.278Number of shares issued - - - -Number of shares redeemed - - - (79,419.810)Number of shares outstanding at theend of the year - - - 558.468
OE shares EURNumber of shares outstanding at thebeginning of the year - - - -Number of shares issued - - - -Number of shares redeemed - - - -Number of shares outstanding at theend of the year - - - -
RBC Funds (Lux)
The accompanying notes form an integral part of these financial statements.
90
Changes in the Number of Sharesfor the Year ended October 31, 2017 (continued)

RBC Funds (LUX) -Emerging Markets
Small CapEquity Fund
RBC Funds (LUX) -Global Resources
Fund
RBC Funds (LUX) -Global Bond
Fund
RBC Funds (LUX) -U.S. Investment
Grade CorporateBond Fund
O shares EUR (Hedged)Number of shares outstanding at thebeginning of the year - - - -Number of shares issued - - - -Number of shares redeemed - - - -Number of shares outstanding at theend of the year - - - -
O shares GBPNumber of shares outstanding at thebeginning of the year 50,368.814 - - -Number of shares issued 200.527 - - -Number of shares redeemed - - - -Number of shares outstanding at theend of the year 50,569.341 - - -
O shares GBP (Hedged)Number of shares outstanding at thebeginning of the year - - - -Number of shares issued - - - -Number of shares redeemed - - - -Number of shares outstanding at theend of the year - - - -
O shares (dist) GBP (Hedged)Number of shares outstanding at thebeginning of the year - - 286,002.637 -Number of shares issued - - 103,589.439 -Number of shares redeemed - - (26,933.840) -Number of shares outstanding at theend of the year - - 362,658.236 -
O shares USD (Hedged)Number of shares outstanding at thebeginning of the year - - - -Number of shares issued - - - -Number of shares redeemed - - - -Number of shares outstanding at theend of the year - - - -
RBC Funds (Lux)
The accompanying notes form an integral part of these financial statements.
91
Changes in the Number of Sharesfor the Year ended October 31, 2017 (continued)

RBC Funds (LUX) -Conservative
Portfolio
RBC Funds (LUX) -BalancedPortfolio
RBC Funds (LUX) -Growth Portfolio
A sharesNumber of shares outstanding at thebeginning of the year 1,284.600 1,219.822 8.644Number of shares issued - - -Number of shares redeemed (435.052) (424.246) -Number of shares outstanding at theend of the year 849.548 795.576 8.644
A shares EURNumber of shares outstanding at thebeginning of the year - - -Number of shares issued - - -Number of shares redeemed - - -Number of shares outstanding at theend of the year - - -
A shares EUR (Hedged)Number of shares outstanding at thebeginning of the year - - -Number of shares issued - - -Number of shares redeemed - - -Number of shares outstanding at theend of the year - - -
A shares USD (Hedged)Number of shares outstanding at thebeginning of the year - - -Number of shares issued - - -Number of shares redeemed - - -Number of shares outstanding at theend of the year - - -
B sharesNumber of shares outstanding at thebeginning of the year 905.695 1,936.160 8.538Number of shares issued - - -Number of shares redeemed (896.832) (874.929) -Number of shares outstanding at theend of the year 8.863 1,061.231 8.538
B shares USD (Hedged)Number of shares outstanding at thebeginning of the year - - -Number of shares issued - - -Number of shares redeemed - - -Number of shares outstanding at theend of the year - - -
RBC Funds (Lux)
The accompanying notes form an integral part of these financial statements.
92
Changes in the Number of Sharesfor the Year ended October 31, 2017 (continued)

RBC Funds (LUX) -Conservative
Portfolio
RBC Funds (LUX) -BalancedPortfolio
RBC Funds (LUX) -Growth Portfolio
B shares (dist) GBPNumber of shares outstanding at thebeginning of the year - - -Number of shares issued - - -Number of shares redeemed - - -Number of shares outstanding at theend of the year - - -
B shares (dist) GBP (Hedged)Number of shares outstanding at thebeginning of the year 8.853 9,117.885 2,175.628Number of shares issued - - 31.387Number of shares redeemed - (811.831) (669.383)Number of shares outstanding at theend of the year 8.853 8,306.054 1,537.632
B shares EUR (Hedged)Number of shares outstanding at thebeginning of the year - - -Number of shares issued - - -Number of shares redeemed - - -Number of shares outstanding at theend of the year - - -
O sharesNumber of shares outstanding at thebeginning of the year 22,123.046 54,176.340 229,940.351Number of shares issued 20,979.040 15,068.201 47,700.640Number of shares redeemed (229.475) (9,135.517) (37,961.853)Number of shares outstanding at theend of the year 42,872.611 60,109.024 239,679.138
O shares (dist)Number of shares outstanding at thebeginning of the year - - -Number of shares issued - - -Number of shares redeemed - - -Number of shares outstanding at theend of the year - - -
OE shares EURNumber of shares outstanding at thebeginning of the year - - -Number of shares issued - - -Number of shares redeemed - - -Number of shares outstanding at theend of the year - - -
RBC Funds (Lux)
The accompanying notes form an integral part of these financial statements.
93
Changes in the Number of Sharesfor the Year ended October 31, 2017 (continued)

RBC Funds (LUX) -Conservative
Portfolio
RBC Funds (LUX) -BalancedPortfolio
RBC Funds (LUX) -Growth Portfolio
O shares EUR (Hedged)Number of shares outstanding at thebeginning of the year - 908.241 59,451.779Number of shares issued 1,307.384 6,565.047 3,314.231Number of shares redeemed - (178.501) (7,225.422)Number of shares outstanding at theend of the year 1,307.384 7,294.787 55,540.588
O shares GBPNumber of shares outstanding at thebeginning of the year - - -Number of shares issued - - -Number of shares redeemed - - -Number of shares outstanding at theend of the year - - -
O shares GBP (Hedged)Number of shares outstanding at thebeginning of the year 3,962.521 20,226.270 87,719.829Number of shares issued 876.017 8,357.063 10,977.820Number of shares redeemed (1,040.746) (7,109.226) (15,278.389)Number of shares outstanding at theend of the year 3,797.792 21,474.107 83,419.260
O shares (dist) GBP (Hedged)Number of shares outstanding at thebeginning of the year - - -Number of shares issued - - -Number of shares redeemed - - -Number of shares outstanding at theend of the year - - -
O shares USD (Hedged)Number of shares outstanding at thebeginning of the year - - -Number of shares issued - - -Number of shares redeemed - - -Number of shares outstanding at theend of the year - - -
RBC Funds (Lux)
The accompanying notes form an integral part of these financial statements.
94
Changes in the Number of Sharesfor the Year ended October 31, 2017 (continued)
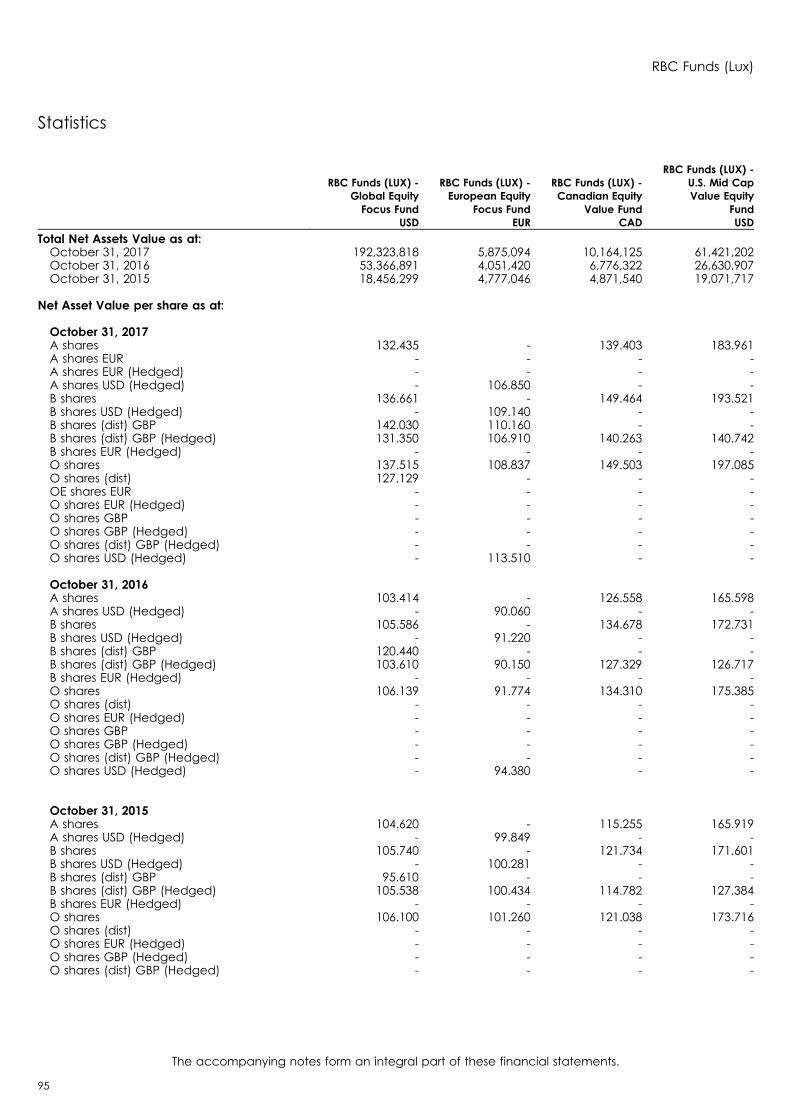
Statistics
RBC Funds (LUX) -Global EquityFocus Fund
RBC Funds (LUX) -European Equity
Focus Fund
RBC Funds (LUX) -Canadian Equity
Value Fund
RBC Funds (LUX) -U.S. Mid CapValue Equity
FundUSD EUR CAD USD
Total Net Assets Value as at:October 31, 2017 192,323,818 5,875,094 10,164,125 61,421,202October 31, 2016 53,366,891 4,051,420 6,776,322 26,630,907October 31, 2015 18,456,299 4,777,046 4,871,540 19,071,717
Net Asset Value per share as at:
October 31, 2017A shares 132.435 - 139.403 183.961A shares EUR - - - -A shares EUR (Hedged) - - - -A shares USD (Hedged) - 106.850 - -B shares 136.661 - 149.464 193.521B shares USD (Hedged) - 109.140 - -B shares (dist) GBP 142.030 110.160 - -B shares (dist) GBP (Hedged) 131.350 106.910 140.263 140.742B shares EUR (Hedged) - - - -O shares 137.515 108.837 149.503 197.085O shares (dist) 127.129 - - -OE shares EUR - - - -O shares EUR (Hedged) - - - -O shares GBP - - - -O shares GBP (Hedged) - - - -O shares (dist) GBP (Hedged) - - - -O shares USD (Hedged) - 113.510 - -
October 31, 2016A shares 103.414 - 126.558 165.598A shares USD (Hedged) - 90.060 - -B shares 105.586 - 134.678 172.731B shares USD (Hedged) - 91.220 - -B shares (dist) GBP 120.440 - - -B shares (dist) GBP (Hedged) 103.610 90.150 127.329 126.717B shares EUR (Hedged) - - - -O shares 106.139 91.774 134.310 175.385O shares (dist) - - - -O shares EUR (Hedged) - - - -O shares GBP - - - -O shares GBP (Hedged) - - - -O shares (dist) GBP (Hedged) - - - -O shares USD (Hedged) - 94.380 - -
October 31, 2015A shares 104.620 - 115.255 165.919A shares USD (Hedged) - 99.849 - -B shares 105.740 - 121.734 171.601B shares USD (Hedged) - 100.281 - -B shares (dist) GBP 95.610 - - -B shares (dist) GBP (Hedged) 105.538 100.434 114.782 127.384B shares EUR (Hedged) - - - -O shares 106.100 101.260 121.038 173.716O shares (dist) - - - -O shares EUR (Hedged) - - - -O shares GBP (Hedged) - - - -O shares (dist) GBP (Hedged) - - - -
RBC Funds (Lux)
The accompanying notes form an integral part of these financial statements.
95

RBC Funds (LUX) -U.S. Small Cap
Equity Fund
RBC Funds (LUX) -Asia ex-Japan
Equity Fund
RBC Funds (LUX) -Emerging Markets
Value EquityFund
RBC Funds (LUX) -Emerging Markets
Equity FundUSD USD USD USD
Total Net Assets Value as at:October 31, 2017 39,797,213 12,368,566 86,761,930 463,469,429October 31, 2016 23,668,345 10,926,158 26,979,777 179,635,016October 31, 2015 7,622,153 8,355,415 4,254,638 98,655,699
Net Asset Value per share as at:
October 31, 2017A shares 114.572 132.508 111.306 141.484A shares EUR - - - 111.150A shares EUR (Hedged) - - - 119.730A shares USD (Hedged) - - - -B shares 196.647 136.099 113.938 146.998B shares USD (Hedged) - - - -B shares (dist) GBP - - - 135.513B shares (dist) GBP (Hedged) 138.518 134.270 110.020 142.226B shares EUR (Hedged) - - - 118.319O shares 200.223 137.139 114.629 135.296O shares (dist) - - - -OE shares EUR - - - 104.000O shares EUR (Hedged) - - - -O shares GBP - - 169.140 153.556O shares GBP (Hedged) - - - -O shares (dist) GBP (Hedged) - - - -O shares USD (Hedged) - - - -
October 31, 2016A shares 92.475 107.063 87.753 116.696A shares USD (Hedged) - - - -B shares 157.326 109.029 89.018 120.099B shares USD (Hedged) - - - -B shares (dist) GBP - - - 120.431B shares (dist) GBP (Hedged) 111.785 108.970 88.370 118.592B shares EUR (Hedged) - - - 98.710O shares 159.707 109.595 89.334 110.303O shares (dist) - - - -O shares EUR (Hedged) - - - -O shares GBP - - 143.370 136.167O shares GBP (Hedged) - - - -O shares (dist) GBP (Hedged) - - - -O shares USD (Hedged) - - - -
October 31, 2015A shares 86.427 99.347 80.933 110.287A shares USD (Hedged) - - - -B shares 145.755 100.289 81.305 112.465B shares USD (Hedged) - - - -B shares (dist) GBP - - - 89.641B shares (dist) GBP (Hedged) 104.179 100.625 81.293 112.451B shares EUR (Hedged) - - - 93.827O shares 147.518 100.584 81.391 103.035O shares (dist) - - - -O shares EUR (Hedged) - - - -O shares GBP (Hedged) - - - -O shares (dist) GBP (Hedged) - - - -
RBC Funds (Lux)
The accompanying notes form an integral part of these financial statements.
96
Statistics (continued)

RBC Funds (LUX) -Emerging Markets
Small CapEquity Fund
RBC Funds (LUX) -Global Resources
Fund
RBC Funds (LUX) -Global Bond
Fund
RBC Funds (LUX) -U.S. Investment
Grade CorporateBond Fund
USD USD USD USD
Total Net Assets Value as at:October 31, 2017 19,652,040 14,565,765 94,361,390 24,872,540October 31, 2016 13,825,194 15,128,953 64,186,137 48,751,030October 31, 2015 4,639,119 14,713,149 68,083,484 51,502,935
Net Asset Value per share as at:
October 31, 2017A shares 108.726 70.779 110.931 129.073A shares EUR - - - -A shares EUR (Hedged) - - - -A shares USD (Hedged) - - - -B shares 111.235 75.970 113.183 110.644B shares USD (Hedged) - - - -B shares (dist) GBP - - - -B shares (dist) GBP (Hedged) 109.060 91.894 111.506 119.120B shares EUR (Hedged) - - - -O shares 111.932 117.876 112.662 145.160O shares (dist) - - - 109.722OE shares EUR - - - -O shares EUR (Hedged) - - - -O shares GBP 142.630 - - -O shares GBP (Hedged) - - - -O shares (dist) GBP (Hedged) - - 106.333 -O shares USD (Hedged) - - - -
October 31, 2016A shares 99.193 66.111 111.428 125.834A shares USD (Hedged) - - - -B shares 100.563 70.359 113.123 107.391B shares USD (Hedged) - - - -B shares (dist) GBP - - - -B shares (dist) GBP (Hedged) 99.910 86.616 113.039 117.073B shares EUR (Hedged) - - - -O shares 100.940 108.843 112.209 140.321O shares (dist) - - - 106.880O shares EUR (Hedged) - - - -O shares GBP 139.900 - - -O shares GBP (Hedged) - - - -O shares (dist) GBP (Hedged) - - 108.395 -O shares USD (Hedged) - - - -
October 31, 2015A shares 89.451 59.729 107.011 118.584A shares USD (Hedged) - - - -B shares 89.862 63.029 108.096 100.722B shares USD (Hedged) - - - -B shares (dist) GBP - - - -B shares (dist) GBP (Hedged) 89.988 79.267 108.176 109.920B shares EUR (Hedged) - - - -O shares 89.967 97.212 106.848 131.116O shares (dist) - - - 103.584O shares EUR (Hedged) - - - -O shares GBP (Hedged) - - - -O shares (dist) GBP (Hedged) - - 104.354 -
RBC Funds (Lux)
The accompanying notes form an integral part of these financial statements.
97
Statistics (continued)
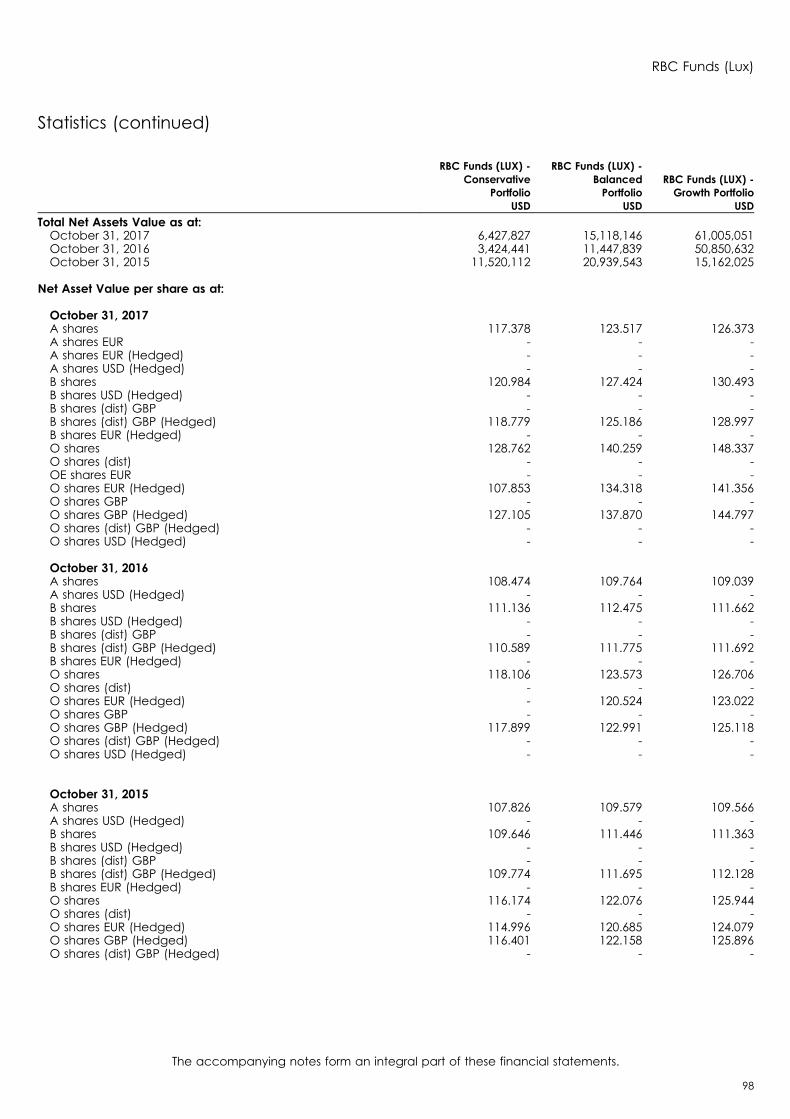
RBC Funds (LUX) -Conservative
Portfolio
RBC Funds (LUX) -BalancedPortfolio
RBC Funds (LUX) -Growth Portfolio
USD USD USD
Total Net Assets Value as at:October 31, 2017 6,427,827 15,118,146 61,005,051October 31, 2016 3,424,441 11,447,839 50,850,632October 31, 2015 11,520,112 20,939,543 15,162,025
Net Asset Value per share as at:
October 31, 2017A shares 117.378 123.517 126.373A shares EUR - - -A shares EUR (Hedged) - - -A shares USD (Hedged) - - -B shares 120.984 127.424 130.493B shares USD (Hedged) - - -B shares (dist) GBP - - -B shares (dist) GBP (Hedged) 118.779 125.186 128.997B shares EUR (Hedged) - - -O shares 128.762 140.259 148.337O shares (dist) - - -OE shares EUR - - -O shares EUR (Hedged) 107.853 134.318 141.356O shares GBP - - -O shares GBP (Hedged) 127.105 137.870 144.797O shares (dist) GBP (Hedged) - - -O shares USD (Hedged) - - -
October 31, 2016A shares 108.474 109.764 109.039A shares USD (Hedged) - - -B shares 111.136 112.475 111.662B shares USD (Hedged) - - -B shares (dist) GBP - - -B shares (dist) GBP (Hedged) 110.589 111.775 111.692B shares EUR (Hedged) - - -O shares 118.106 123.573 126.706O shares (dist) - - -O shares EUR (Hedged) - 120.524 123.022O shares GBP - - -O shares GBP (Hedged) 117.899 122.991 125.118O shares (dist) GBP (Hedged) - - -O shares USD (Hedged) - - -
October 31, 2015A shares 107.826 109.579 109.566A shares USD (Hedged) - - -B shares 109.646 111.446 111.363B shares USD (Hedged) - - -B shares (dist) GBP - - -B shares (dist) GBP (Hedged) 109.774 111.695 112.128B shares EUR (Hedged) - - -O shares 116.174 122.076 125.944O shares (dist) - - -O shares EUR (Hedged) 114.996 120.685 124.079O shares GBP (Hedged) 116.401 122.158 125.896O shares (dist) GBP (Hedged) - - -
RBC Funds (Lux)
The accompanying notes form an integral part of these financial statements.
98
Statistics (continued)
Notes to the Financial StatementsFor the year ended October 31, 2017
1 - Organisation
RBC Funds (Lux) (the “Fund”) is an open-ended investment company with variable capital, incorporated in the Grand Duchyof Luxembourg as a “Société d'Investissement à Capital Variable” in accordance with the provisions of the Part I of theamended law of December 17, 2010 concerning Undertakings for Collective Investment (the "Law").
The Fund was incorporated in Luxembourg on October 2, 2009 for an unlimited period.
The Articles of Incorporation of the Fund were published in the RESA (Recueil électronique des sociétés et associations),Recueil des Sociétés et Associations (“Mémorial”) on October 16, 2009 which has been replaced since June 1, 2016 by RESA,the central electronic platform of the Grand Duchy of Luxembourg. The Fund qualifies as an undertaking for collectiveinvestment under Part I of the Law. The Fund is registered with the Luxembourg Commercial and Companies’ Register undernumber B 148411. The Articles of Incorporation of the Fund were amended on April 5, 2012 and recently on April 20, 2017. Suchamendment was published in the RESA on April 27, 2017.
The Board of Directors may, at any time, decide to create additional Sub-Funds and, in such case, the Prospectus will beupdated by adding corresponding Appendices.
Pursuant to the Articles of Incorporation, the Board of Directors may decide to issue, within each Sub-Fund, separate classes ofShares (the “Class” or “Classes” or “Share Class(es)”) whose assets will be commonly invested, but where a specific sales orredemption charge structure, fee structure, minimum subscription amount or dividend policy or such other distinctive feature,as decided from time to time by the Board of Directors, may be applied.
The Fund is managed by Candriam Luxembourg, société en commandite par actions (the “Management Company”).
Three share classes are available to the investors.
– Class A and Class B Shares are available for investment by all investors.
– Class O Shares are available for investment by Institutional Investors only.
At October 31, 2017 the SICAV comprised fifteen active Sub-Funds:
– RBC Funds (Lux) – Global Equity Focus Fund (expressed in USD) was launched on August 26, 2014. Its objective is to providelong-term capital appreciation by investing primarily in equity securities of a diversified mix of companies operating invarious countries around the world across a range of sectors.
– RBC Funds (Lux) – European Equity Focus Fund (expressed in EUR) was launched on April 28, 2015. Its objective is to providelong-term capital appreciation by investing primarily in equity securities of companies located in or with significantbusiness interests in Europe.
– RBC Funds (Lux) – Canadian Equity Value Fund (expressed in CAD) was launched on April 15, 2011. Its objective is toprovide long-term capital appreciation by investing primarily in equity securities of Canadian companies that providebroad exposure to economic growth opportunities in Canada. This Sub Fund was previously named "Canadian EquityFund".
– RBC Funds (Lux) – U.S. Mid Cap Value Equity Fund (expressed in USD) was launched on November 3, 2011. Its objective is toprovide long-term capital appreciation by investing primarily in U.S. mid-capitalized equity investments and commonstock equivalents.
– RBC Funds (Lux) – U.S. Small Cap Equity Fund (expressed in USD) was launched on November 3, 2011. Its objective is toprovide long-term capital appreciation by investing primarily in U.S. small market capitalization equities and commonstock equivalents.
RBC Funds (Lux)
99
1 - Organisation (continued)
– RBC Funds (Lux) – Asia ex-Japan Equity Fund (expressed in USD) was launched on September 16, 2014. Its objective is toprovide long-term capital appreciation by investing primarily in equity securities of companies domiciled in or conductinga substantial portion of their business in Asia, excluding Japan.
– RBC Funds (Lux) – Emerging Markets Value Equity Fund (expressed in USD) was launched on April 28, 2015. Its objective is toprovide long-term total returns consisting of regular dividend income and capital growth by investing primarily in equitysecurities of companies located in or with significant business interests in emerging markets with above average dividendyields.
– RBC Funds (Lux) – Emerging Markets Equity Fund (expressed in USD) was launched on March 26, 2013. Its objective is toprovide long-term capital appreciation by investing primarily in equity securities of companies located in or with significantbusiness interests in emerging markets.
– RBC Funds (Lux) – Emerging Markets Small Cap Equity Fund (expressed in USD) was launched on April 28, 2015. Its objectiveof the Sub-Fund is to provide long-term capital growth by investing primarily in equity securities of small-cap companieslocated in or with significant business interests in emerging markets.
– RBC Funds (Lux) – Global Resources Fund (expressed in USD) was launched on October 20, 2009. Its objective is to providelong-term capital appreciation by investing primarily in equity securities of companies around the world in the energy andmaterials sectors.
– RBC Funds (Lux) – Global Bond Fund (expressed in USD) was launched on August 27, 2012. Its objective is to maximize totalreturns by investing primarily in a diversified portfolio of high quality debt securities from anywhere around the world.
– RBC Funds (Lux) – U.S. Investment Grade Corporate Bond Fund (expressed in USD) was launched on May 3, 2010. Itsobjective is to maximize total returns by investing primarily in a diversified portfolio of investment grade corporate fixedincome securities.
– RBC Funds (Lux) – Conservative Portfolio (expressed in USD) was launched on September 5, 2012. Its objective is to provideinvestors with the potential for moderate capital growth by investing primarily in a portfolio of Target Funds with anemphasis on fixed-income securities.
– RBC Funds (Lux) – Balanced Portfolio (expressed in USD) was launched on September 5, 2012. Its objective is to provideinvestors with the potential for moderate capital growth by investing primarily in a portfolio of Target Funds with a balanceof fixed-income and equity securities.
– RBC Funds (Lux) – Growth Portfolio (expressed in USD) was launched on September 5, 2012. Its objective is to provideinvestors with the potential for long-term capital growth by investing primarily in a portfolio of Target Funds with anemphasis on equity securities.
Each Sub-Fund may use derivatives such as options, futures, forward contracts, and swaps for hedging purposes, efficientportfolio management and for investment purposes. The Sub-Fund may use derivatives for hedging (protecting against)market risk, interest rate risk and currency risk. In particular, the Sub-Funds may seek to hedge their investments againstcurrency fluctuations which are adverse to the Reference Currency of the Sub-Funds by using currency options, futurescontracts and forward foreign exchange contracts.
2 - Significant Accounting Policies
The financial statements have been prepared in conformity with legal and regulatory requirements in Luxembourg applicableto undertakings for collective investment and generally accepted accounting principles in Luxembourg.
a) Valuation of investments
(i) the value of any cash on hand or on deposit, bills and demand notes and accounts receivable, prepaid expenses, cashdividends and interest declared or accrued as aforesaid and not yet received shall be deemed to be the full amount thereof,unless, however, the same is unlikely to be paid or received in full, in which case the value thereof shall be determined aftermaking such discount as appropriate in such case to reflect the true value thereof;
RBC Funds (Lux)
100
Notes to the Financial Statements (continued)For the year ended October 31, 2017
2 - Significant Accounting Policies (continued)
(ii) the value of Transferable Securities, Money Market Instruments and any other assets which are listed or dealt in on any stockexchange shall be based on the latest available closing price. Transferable Securities, Money Market Instruments and anyother assets traded on any other Regulated Market shall be valued in a manner as similar as possible to that provided for listedsecurities. The value of Money Market Instruments not listed or dealt in on any Regulated Market, stock exchange, or anyOther Regulated Market and with remaining maturity of less than 12 months may be valued by the amortised cost method,which approximates market value;
(iii) for non-listed assets or assets not dealt in on any stock exchange or other Regulated Market, as well as listed or non-listedassets on such other market for which no valuation price is available or assets for which the listed prices are not representativeof the fair market value, the value thereof shall be determined prudently and in good faith by the Board of Directors of theFund on the basis of foreseeable purchase and sale prices;
(iv) shares or units in underlying open-ended UCIs shall be valued at their last determined and available net asset value or, ifsuch price is not representative of the fair market value of such assets, then the price shall be determined on a fair andequitable basis. Units or shares of a closed-ended UCI will be valued at their last available stock market value;
(v) Money Market Instruments with a remaining maturity of more than ninety days at the time of purchase shall be valued attheir market price. Money Market Instruments with a remaining maturity of less than ninety days at the time of purchase orsecurities the applicable interest rate or reference interest rate of which is adjusted at least once every ninety days on thebasis of market conditions shall be valued at cost plus accrued interest from its date of acquisition, adjusted by an amountequal to the sum of (i) any accrued interest paid on its acquisition and (ii) any premium or discount from its face amount paidor credited at the time of its acquisition, multiplied by a fraction the numerator of which is the number of days elapsed from itsdate of acquisition to the relevant Valuation Day and the denominator of which is the number of days between suchacquisition date and the maturity date of such instruments;
(vi) liquid assets not otherwise described above may be valued at nominal value plus any accrued interest or on an amortizedcost basis. All other assets, where practice allows, may be valued in the same manner;
(vii) the net liquidating value of futures, forward and options contracts not traded on exchanges or on other RegulatedMarkets shall be determined pursuant to established policies on a basis consistently applied for each different variety ofcontracts. The liquidating value of futures, forward and options contracts traded on exchanges or on other Regulated Marketsshall be based upon the last available settlement prices of these contracts on exchanges and/or Regulated Markets on whichthe particular futures, forward or options contracts are traded by the Fund; provided that if a futures, forward or optionscontract could not be liquidated on the day with respect to which net assets are being determined, the basis for determiningthe liquidating value of such contract shall be such value as may be deemed fair and reasonable.
b) Net realised profit/(loss) on sales of investments
The net realised profit or loss on sales of investments is determined on the basis of the average cost of investments sold.
c) Foreign currencies
Assets and liabilities expressed in currencies other than the Sub-Fund’s currency are translated into the Sub-Fund’s currency atthe exchange rates prevailing at the closing date.
Income and expenses in currencies other than the Sub-Fund’s currency are translated into the Sub-Fund’s currency at theexchange rates prevailing at the transaction date.
The exchange rates used as at October 31, 2017 are:
1 USD = 3.672649 AED1.304206 AUD
83.022001 BDT3.271352 BRL1.289100 CAD0.996800 CHF
635.727908 CLP6.627388 CNY
3,039.513678 COP
RBC Funds (Lux)
101
Notes to the Financial Statements (continued)For the year ended October 31, 2017
2 - Significant Accounting Policies (continued)
6.387613 DKK0.858406 EUR0.753040 GBP7.801773 HKD
267.363237 HUF13,563.000136 IDR
64.771034 INR113.630037 JPY
1,119.820829 KRW19.130335 MXN4.233503 MYR
359.971202 NGN51.626226 PHP
105.329682 PKR3.638851 PLN3.951008 RON8.371774 SEK1.362400 SGD
33.220384 THB3.796550 TRY
30.159544 TWD14.141271 ZAR
The various items of the combined statement of net assets and the combined statement of operations and changes in netassets of the Fund from November 1, 2016 to October 31, 2017 are equal to the total sum of the corresponding items of thefinancial statements of each Sub-Fund translated into USD, where applicable, at the exchange rates ruling asat October 31, 2017 (please see note 2 (f) for further information).
d) Cost of investment securities
The cost of investment securities expressed in currencies other than the Sub-Fund’s currency is translated into the Sub-Fund’scurrency at the exchange rate applicable at the purchase date.
e) Income
Dividends are recognized on an ex-dividend basis, net of withholding taxes in the country of origin. Interest is recognized on anaccrual basis.
f) Forward foreign exchange contracts
Forward foreign exchange contracts are valued at the forward rate applicable at the Statement of Net Assets date for theperiod until their maturity. The net unrealised appreciation/(depreciation) on open forward foreign exchange contracts atyear-end is disclosed in the Statement of Net Assets under “Unrealised gain/(loss) on forward foreign exchange contracts".
g) Combined statements
Currency Translation
Opening net assets are maintained at the closing exchange rate of the previous year. Exchange differences arising inaggregate are included in the combined statement of operations and changes in net assets for the year under "currencytranslation".
Global financial statements of the SICAV
The various items of the combined statement of net assets as at October 31, 2017 of the SICAV are equal to the total sum ofthe corresponding items of the financial statements of each Sub-Fund translated into USD at the exchange rates ruling at theclosing date.
RBC Funds (Lux)
102
Notes to the Financial Statements (continued)For the year ended October 31, 2017

2 - Significant Accounting Policies (continued)
The investments made by certain Sub-Funds of the SICAV in other Sub-Funds of the SICAV have not been eliminated from thecombined statement of net assets as of October 31, 2017. As of October 31, 2017, the total of intra-SICAV investmentsamounted to USD 34,237,142. Therefore the combined net assets at the closing date would amount to USD 1,072,636,633 if noaccount were taken of these intra-SICAV investments.
Sub-Funds Intra-SICAV investments Amount (USD)RBC Funds (Lux) - Conservative Portfolio RBC Funds (Lux) - Asia ex-Japan Equity Fund 257,136
RBC Funds (Lux) - U.S Mid Cap Value Equity Fund 342,928RBC Funds (Lux) - Global Bond Fund 643,864RBC Funds (Lux) - U.S Investment Grade Corporate Bond Fund 824,075
RBC Funds (Lux) - Balanced Portfolio RBC Funds (Lux) - Asia ex-Japan Equity Fund 776,071RBC Funds (Lux) - Emerging Markets Equity Fund 838,291RBC Funds (Lux) - U.S Mid Cap Value Equity Fund 1,100,326RBC Funds (Lux) - Global Bond Fund 1,474,185RBC Funds (Lux) - U.S Investment Grade Corporate Bond Fund 2,437,967
RBC Funds (Lux) - Growth Portfolio RBC Funds (Lux) - Asia ex-Japan Equity Fund 3,955,646RBC Funds (Lux) - Emerging Markets Equity Fund 4,914,474RBC Funds (Lux) - U.S Mid Cap Value Equity Fund 4,410,961RBC Funds (Lux) - U.S Small Cap Equity Fund 2,312,973RBC Funds (Lux) - Global Bond Fund 3,128,179RBC Funds (Lux) - U.S Investment Grade Corporate Bond Fund 6,820,066TOTAL 34,237,142
3 - Expenses
3.1. Total Expense Ratio
The total expense ratio (“TER”) is the ratio of gross amount of the expenses of a Sub-Fund to its average net assets (excludingTransaction Costs and Extraordinary Expenses if any). The TER includes all the expenses charged on the assets ofeach Sub-Fund as described in part 3.2. and 3.3. to this note. The maximum TER for each Class of each Sub-Fund is specified inthe Appendix of the prospectus for each class of a Sub-Fund.
The actual TER applied are as follows:
Class A Class B Class O
RBC Funds (Lux) - Global Equity Focus Fund 1.80% 0.80% 0.70%RBC Funds (Lux) - European Equity Focus Fund******** 1.90% 1.00% 0.70%RBC Funds (Lux) - Canadian Equity Value Fund 1.80% 1.05% 0.75%RBC Funds (Lux) - U.S. Mid Cap Value Equity Fund 2.00% 1.15% 0.85%RBC Funds (Lux) - U.S. Small Cap Equity Fund 2.00% 1.15% 0.85%RBC Funds (Lux) - Asia ex-Japan Equity Fund 2.00% 1.15% 0.90%RBC Funds (Lux) - Emerging Markets Value Equity Fund 2.35% 1.40% 1.15%RBC Funds (Lux) - Emerging Markets Equity Fund* 2.20% 1.25% 1.05%RBC Funds (Lux) - Emerging Markets Small Cap Equity Fund 2.50% 1.55% 1.30%RBC Funds (Lux) - Global Resources Fund 2.00% 1.15% 0.85%RBC Funds (Lux) - Global Bond Fund 1.50% 1.00% 0.65%RBC Funds (Lux) - U.S. Investment Grade Corporate Bond Fund 1.30% 0.80% 0.45%RBC Funds (Lux) - Conservative Portfolio** 1.25% 0.75% 0.60%RBC Funds (Lux) - Balanced Portfolio*** 1.40% 0.75% 0.60%RBC Funds (Lux) - Growth Portfolio**** 1.50% 0.75% 0.60%
As at October 31, 2017, for the Sub-Funds that invest a substantial proportion of their assets in other UCITS and/or UCIs, themaximum TER charged both to the relevant Sub-Funds and to the UCITS and other UCIs in which such Sub-Funds have investedis as follows:
Class A Class B Class ORBC Funds (Lux) - Conservative Portfolio 1.80% 1.30% 1.15%RBC Funds (Lux) - Balanced Portfolio 2.05% 1.40% 1.25%RBC Funds (Lux) - Growth Portfolio 2.20% 1.45% 1.30%
RBC Funds (Lux)
103
Notes to the Financial Statements (continued)For the year ended October 31, 2017

3 - Expenses (continued)
3.2. Management Fees
The Fund is charged a management fee for the management company services of the Management Company and theportfolio management services of the Investment Manager. Such management fee is calculated as a percentage of theaverage net assets of each Sub-Fund or Class under its management. Management fees are accrued on each Valuation Dayand payable monthly. The maximum rate is specified in the Appendix of the prospectus for each Class of a Sub-Fund.
As of October 31, 2017 the actual management fees rate applied per annum per class are up to the documented rates:
Class A Class B Class ORBC Funds (Lux) - Global Equity Focus Fund 1.60% 0.60% 0.60%RBC Funds (Lux) - European Equity Focus Fund********* 1.60% 0.70% 0.60%RBC Funds (Lux) - Canadian Equity Value Fund 1.50% 0.75% 0.65%RBC Funds (Lux) - U.S. Mid Cap Value Equity Fund 1.70% 0.85% 0.75%RBC Funds (Lux) - U.S. Small Cap Equity Fund 1.70% 0.85% 0.75%RBC Funds (Lux) - Asia ex-Japan Equity Fund 1.70% 0.85% 0.75%RBC Funds (Lux) - Emerging Markets Value Equity Fund 1.90% 0.95% 0.85%RBC Funds (Lux) - Emerging Markets Equity Fund 1.90% 0.95% 0.85%RBC Funds (Lux) - Emerging Markets Small Cap Equity Fund 2.05% 1.10% 1.00%RBC Funds (Lux) - Global Resources Fund 1.70% 0.85% 0.75%RBC Funds (Lux) - Global Bond Fund 1.20% 0.70% 0.55%RBC Funds (Lux) - U.S. Investment Grade Corporate Bond Fund 1.00% 0.50% 0.35%RBC Funds (Lux) - Conservative Portfolio***** 1.00% 0.50% 0.45%RBC Funds (Lux) - Balanced Portfolio****** 1.15% 0.50% 0.45%RBC Funds (Lux) - Growth Portfolio******* 1.25% 0.50% 0.45%
* Effective February 1, 2017, the total expense ratio for the RBC Funds (Lux) – Emerging Markets Equity Fund in respect of ClassA, B and O shares was reduced from 2.30% to 2.20%, 1.35% to 1.25% and 1.10% to 1.05% respectively.
** Effective February 1, 2017, the total expense ratio for the RBC Funds (Lux) –Conservative Portfolio in respect of Class A, B andO shares was reduced from 1.80% to 1.25%, 1.05% to 0.75% and 0.75% to 0.60% respectively.
*** Effective February 1, 2017, the total expense ratio for the RBC Funds (Lux) – Balanced Portfolio in respect of Class A, B and Oshares was reduced from 1.80% to 1.40%, 1.05% to 0.75% and 0.75% to 0.60% respectively.
**** Effective February 1, 2017, the total expense ratio for the RBC Funds (Lux) – Growth Portfolio in respect of Class A, B and Oshares was reduced from 1.80% to 1.50%, 1.05% to 0.75% and 0.75% to 0.60% respectively.
***** Effective February 1, 2017, (T) the management fee for the RBC Funds (Lux) – Conservative Portfolio in respect of Class A,B and O Shares were also reduced from 1.50% to 1.00%, 0.75% to 0.50% and 0.60% to 0.45% respectively.
****** Effective February 1, 2017, (T) the management fee for the RBC Funds (Lux) – Balanced Portfolio in respect of Class A, Band O Shares were also reduced from 1.50% to 1.15%, 0.75% to 0.50% and 0.60% to 0.45% respectively.
******* Effective February 1, 2017, (T) the management fee for the RBC Funds (Lux) – Growth Portfolio in respect of Class A, Band O Shares were also reduced from 1.50% to 1.25%, 0.75% to 0.50% and 0.60% to 0.45% respectively.
******** Effective September 1, 2017, the total expense ratio for the RBC Funds (Lux) - European Equity Focus Fund in respect ofClass A, B and O Shares was also reduced from 2.00% to 1.90%, 1.15% to 1.00% and 0.85% to 0.70%.
*********Effective September 1, 2017, (T) the management fee for the RBC Funds (Lux) - European Equity Focus Fund in respectof Class A, B and O Shares was also reduced from 1.70% to 1.60%, 0.85% to 0.70% and 0.75% to 0.60%.
RBC Funds (Lux)
104
Notes to the Financial Statements (continued)For the year ended October 31, 2017

3 - Expenses (continued)
3.3. Depositary Fees and Other Charges
The Fund will pay to the Depositary and Paying Agent, the Administrative and Domiciliary Agent and the Registrar and TransferAgent annual fees which will vary from 0.005 % of the net asset value to a maximum of 2% of the net asset value per Sub-Fundsubject to a minimum fee per Sub-Fund of EUR 20,000. These fees are payable on a monthly basis and do not include anytransaction related fees and costs of sub-custodians or similar agents. The Depositary and Paying Agent, the Administrativeand Domiciliary Agent as well as the Registrar and Transfer Agent are also entitled to be reimbursed of reasonabledisbursements and out of pocket expenses which are not included in the above mentioned fees. The amount paid by theFund to the Depositary and Paying Agent, the Administrative and Domiciliary Agent and the Registrar and Transfer Agent ismentioned in the "Combined statement of operations and changes in net assets", under the section "other charges".
The Fund bears all of its ordinary operating expenses including but not limited to formation expenses such as organization andregistration costs; the Luxembourg asset-based “taxe d’abonnement” as defined in the note 4; director fees and otherreasonable out-of-pocket expenses incurred by the Fund and its Board of Directors; legal and auditing fees and expenses;ongoing registration and listing fees, including translation expenses; and the costs and expenses of preparing, printing, anddistributing the Fund’s prospectus, KIID, financial reports and other documents made available to its shareholders.
Each share class of each Sub-Fund has a maximum TER as indicated in part 3.1 above. TER consist of management fees andoperationg expenses. When operating expenses exceed the maximum amount provided for under the respective TER foreach share class of each Sub-Fund, the excess expenses are absorbed by management fees accrued. This ensures that eachshare class of each Sub-Fund capped the operating expenses to the maximum TER.
4 - Taxation
Under current law and practice, the Fund is not liable to any Luxembourg income tax, nor are dividends paid by the Fund (ifany) liable to any Luxembourg withholding tax.
However, in relation to Class A and B Shares, the Fund is liable in Luxembourg to a subscription tax (taxe d’abonnement) of0.05% per annum of its net assets, such tax being payable quarterly and calculated on the total net asset value of therespective Class at the end of the relevant quarter.
A reduced tax rate of 0.01% per annum of the net assets will be applicable to Class O Shares which are only sold to and heldby Institutional Investors. Such tax is payable quarterly and calculated on the total net assets of the Class at the end of therelevant quarter.
Sub-Funds that are invested in other Luxembourg investment Funds, which in turn are subject to the subscription tax providedfor by the law of December 17, 2010, as amended, relating to undertakings in collective investment, no subscription tax is duefrom the Sub-Funds on the portion of assets invested therein.
5 - Forward Foreign Exchange Contracts
As at October 31, 2017 the Fund entered into the following outstanding forward foreign exchange contracts:
RBC Funds (Lux) - Global Equity Focus Fund
Share class Purchase Sales Maturity DateNet unrealisedprofit (in USD)
GBP B shares (dist) GBP (Hedged) 10,566,861 USD 13,952,356 15/11/2017 84,905
TOTAL 84,905
RBC Funds (Lux)
105
Notes to the Financial Statements (continued)For the year ended October 31, 2017
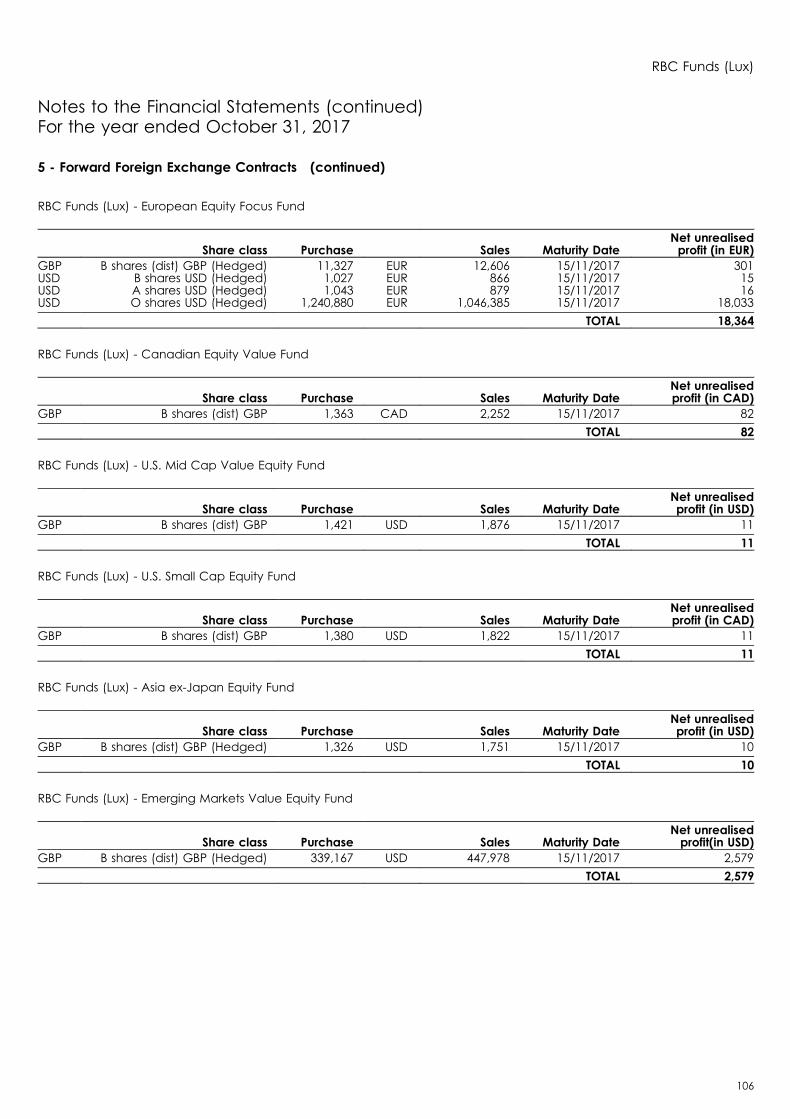
5 - Forward Foreign Exchange Contracts (continued)
RBC Funds (Lux) - European Equity Focus Fund
Share class Purchase Sales Maturity DateNet unrealisedprofit (in EUR)
GBP B shares (dist) GBP (Hedged) 11,327 EUR 12,606 15/11/2017 301USD B shares USD (Hedged) 1,027 EUR 866 15/11/2017 15USD A shares USD (Hedged) 1,043 EUR 879 15/11/2017 16USD O shares USD (Hedged) 1,240,880 EUR 1,046,385 15/11/2017 18,033
TOTAL 18,364
RBC Funds (Lux) - Canadian Equity Value Fund
Share class Purchase Sales Maturity DateNet unrealisedprofit (in CAD)
GBP B shares (dist) GBP 1,363 CAD 2,252 15/11/2017 82
TOTAL 82
RBC Funds (Lux) - U.S. Mid Cap Value Equity Fund
Share class Purchase Sales Maturity DateNet unrealisedprofit (in USD)
GBP B shares (dist) GBP 1,421 USD 1,876 15/11/2017 11
TOTAL 11
RBC Funds (Lux) - U.S. Small Cap Equity Fund
Share class Purchase Sales Maturity DateNet unrealisedprofit (in CAD)
GBP B shares (dist) GBP 1,380 USD 1,822 15/11/2017 11
TOTAL 11
RBC Funds (Lux) - Asia ex-Japan Equity Fund
Share class Purchase Sales Maturity DateNet unrealisedprofit (in USD)
GBP B shares (dist) GBP (Hedged) 1,326 USD 1,751 15/11/2017 10
TOTAL 10
RBC Funds (Lux) - Emerging Markets Value Equity Fund
Share class Purchase Sales Maturity DateNet unrealisedprofit(in USD)
GBP B shares (dist) GBP (Hedged) 339,167 USD 447,978 15/11/2017 2,579
TOTAL 2,579
RBC Funds (Lux)
106
Notes to the Financial Statements (continued)For the year ended October 31, 2017

5 - Forward Foreign Exchange Contracts (continued)
RBC Funds (Lux) - Emerging Markets Equity Fund
Share class Purchase Sales Maturity DateNet unrealised
profit/(loss) (in USD)EUR A shares EUR (Hedged) 1,181 USD 1,401 15/11/2017 (25)EUR B shares EUR (Hedged) 40,261,712 USD 47,765,690 15/11/2017 (829,271)USD B shares EUR (Hedged) 8,209 EUR 6,950 15/11/2017 107USD B shares (dist) GBP (Hedged) 529,355 GBP 401,148 15/11/2017 (3,538)GBP B shares (dist) GBP (Hedged) 2,279,153 USD 3,009,346 15/11/2017 18,334EUR 2,403 USD 2,785 02/11/2017 15EUR 29,471 USD 34,281 03/11/2017 57
TOTAL (814,321)
RBC Funds (Lux) - Emerging Markets Small Cap Equity Fund
Share class Purchase Sales Maturity DateNet unrealisedprofit (in USD)
GBP B shares (dist) GBP (Hedged) 1,060 USD 1,400 15/11/2017 8
TOTAL 8
RBC Funds (Lux) - Global Resources Fund
Share class Purchase Sales Maturity DateNet unrealisedprofit (in USD)
GBP B shares (dist) GBP 6,990,335 USD 9,230,436 15/11/2017 55,685
TOTAL 55,685
RBC Funds (Lux) - Global Bond Fund
Share class Purchase Sales Maturity DateNet unrealised
profit/(loss) (in USD)GBP B shares (dist) GBP (Hedged) 151,120 USD 199,547 15/11/2017 1,204GBP O shares GBP (Hedged) 38,568,291 USD 50,939,696 15/11/2017 295,309EUR 852,879 USD 1,008,530 15/11/2017 (14,258)MXN 16,257,000 USD 897,150 07/11/2017 (48,290)PLN 2,777,040 USD 777,577 15/11/2017 (14,486)RON 1,984,889 USD 512,296 15/11/2017 (10,007)USD 5,673,513 CAD 7,117,817 15/11/2017 151,271USD 1,104,931 DKK 6,932,096 15/11/2017 18,817USD 32,192,397 EUR 27,137,032 15/11/2017 556,109USD 4,903,528 GBP 3,712,950 15/11/2017 (28,830)USD 15,089,053 JPY 1,691,633,953 15/11/2017 193,346USD 848,842 MXN 16,257,000 07/11/2017 (18)USD 1,403,064 PLN 5,057,545 15/11/2017 13,323USD 512,317 RON 1,984,889 15/11/2017 10,031USD 532,650 SEK 4,285,144 15/11/2017 20,379ZAR 6,497,000 USD 464,370 27/11/2017 (7,072)
TOTAL 1,136,827
RBC Funds (Lux) - U.S. Investment Grade Corporate Bond Fund
Share class Purchase Sales Maturity DateNet unrealisedprofit (in USD)
GBP B shares (dist) GBP 1,174 USD 1,550 15/11/2017 9
TOTAL 9
RBC Funds (Lux)
107
Notes to the Financial Statements (continued)For the year ended October 31, 2017
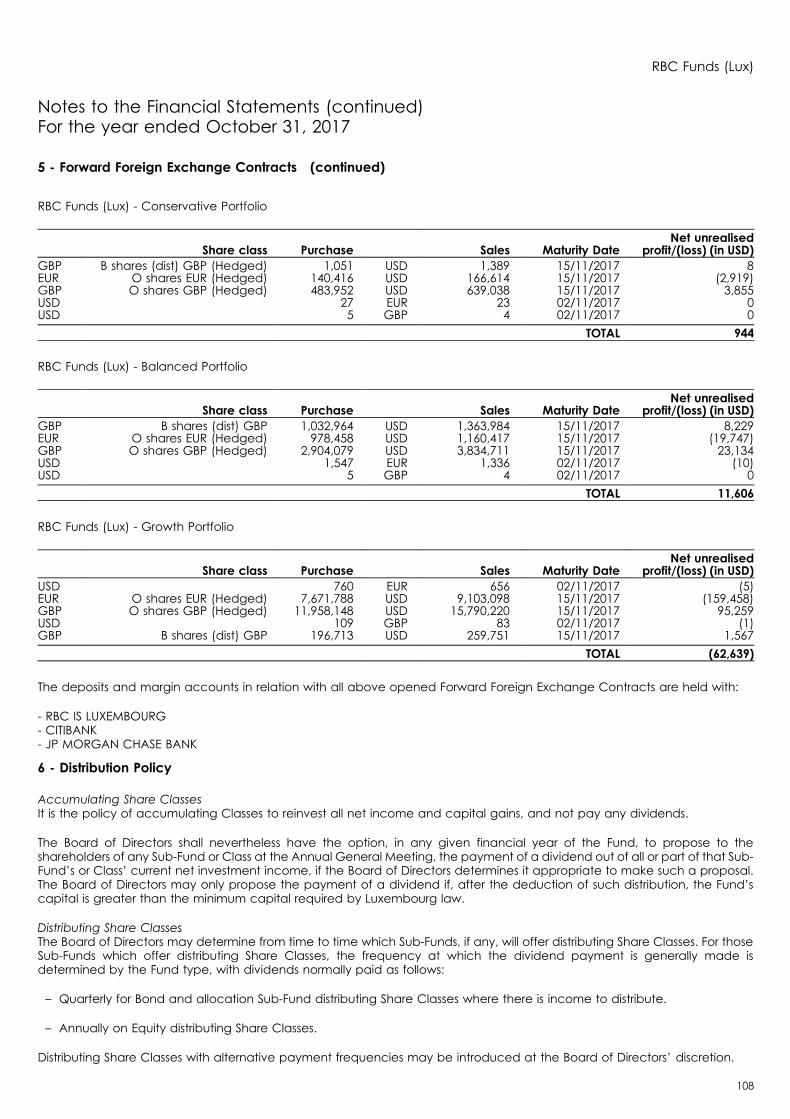
5 - Forward Foreign Exchange Contracts (continued)
RBC Funds (Lux) - Conservative Portfolio
Share class Purchase Sales Maturity DateNet unrealised
profit/(loss) (in USD)GBP B shares (dist) GBP (Hedged) 1,051 USD 1,389 15/11/2017 8EUR O shares EUR (Hedged) 140,416 USD 166,614 15/11/2017 (2,919)GBP O shares GBP (Hedged) 483,952 USD 639,038 15/11/2017 3,855USD 27 EUR 23 02/11/2017 0USD 5 GBP 4 02/11/2017 0
TOTAL 944
RBC Funds (Lux) - Balanced Portfolio
Share class Purchase Sales Maturity DateNet unrealised
profit/(loss) (in USD)GBP B shares (dist) GBP 1,032,964 USD 1,363,984 15/11/2017 8,229EUR O shares EUR (Hedged) 978,458 USD 1,160,417 15/11/2017 (19,747)GBP O shares GBP (Hedged) 2,904,079 USD 3,834,711 15/11/2017 23,134USD 1,547 EUR 1,336 02/11/2017 (10)USD 5 GBP 4 02/11/2017 0
TOTAL 11,606
RBC Funds (Lux) - Growth Portfolio
Share class Purchase Sales Maturity DateNet unrealised
profit/(loss) (in USD)USD 760 EUR 656 02/11/2017 (5)EUR O shares EUR (Hedged) 7,671,788 USD 9,103,098 15/11/2017 (159,458)GBP O shares GBP (Hedged) 11,958,148 USD 15,790,220 15/11/2017 95,259USD 109 GBP 83 02/11/2017 (1)GBP B shares (dist) GBP 196,713 USD 259,751 15/11/2017 1,567
TOTAL (62,639)
The deposits and margin accounts in relation with all above opened Forward Foreign Exchange Contracts are held with:
- RBC IS LUXEMBOURG- CITIBANK- JP MORGAN CHASE BANK
6 - Distribution Policy
Accumulating Share ClassesIt is the policy of accumulating Classes to reinvest all net income and capital gains, and not pay any dividends.
The Board of Directors shall nevertheless have the option, in any given financial year of the Fund, to propose to theshareholders of any Sub-Fund or Class at the Annual General Meeting, the payment of a dividend out of all or part of that Sub-Fund’s or Class’ current net investment income, if the Board of Directors determines it appropriate to make such a proposal.The Board of Directors may only propose the payment of a dividend if, after the deduction of such distribution, the Fund’scapital is greater than the minimum capital required by Luxembourg law.
Distributing Share ClassesThe Board of Directors may determine from time to time which Sub-Funds, if any, will offer distributing Share Classes. For thoseSub-Funds which offer distributing Share Classes, the frequency at which the dividend payment is generally made isdetermined by the Fund type, with dividends normally paid as follows:
– Quarterly for Bond and allocation Sub-Fund distributing Share Classes where there is income to distribute.
– Annually on Equity distributing Share Classes.
Distributing Share Classes with alternative payment frequencies may be introduced at the Board of Directors’ discretion.
RBC Funds (Lux)
108
Notes to the Financial Statements (continued)For the year ended October 31, 2017

6 - Distribution Policy (continued)
Distributing Classes issued as of the dividend record date are eligible to receive dividends, which, unless a shareholder haselected in writing to receive the dividend payment in cash, are reinvested in additional Shares. Where a shareholder haselected to receive dividends, payment will be made in the currency of the relevant Share Class.
The Board of Directors decided to pay dividends as detailed below:
Sub-Fund Share Class Ex-date Pay date Amount per shareRBC Funds (Lux) - Global EquityFocus Fund
B (dist) GBP November 2, 2016 November 8, 2016 USD 1.3000
RBC Funds (Lux) - Global EquityFocus Fund
B (dist) GBP (Hedged) November 2, 2016 November 8, 2016 USD 1.3000
RBC Funds (Lux) - Emerging MarketsValue Equity Fund
B (dist) GBP (Hedged) November 2, 2016 November 8, 2016 USD 1.5000
RBC Funds (Lux) - Emerging MarketsEquity Fund
B (dist) GBP (Hedged) November 2, 2016 November 8, 2016 USD 1.0000
RBC Funds (Lux) - Global ResourcesFund
B (dist) GBP (Hedged) November 2, 2016 November 8, 2016 USD 0.4500
RBC Funds (Lux) - Global Bond Fund O (dist) GBP (Hedged) November 2, 2016 November 8, 2016 USD 0.4000RBC Funds (Lux) - Global Bond Fund O (dist) GBP (Hedged) Feburary 1, 2017 Feburary 7, 2017 USD 0.3300RBC Funds (Lux) - Global Bond Fund O (dist) GBP (Hedged) May 2, 2017 May 8, 2017 USD 0.3300RBC Funds (Lux) - Global Bond Fund B (dist) GBP (Hedged) August 1, 2017 August 7, 2017 USD 0.4200RBC Funds (Lux) - Global Bond Fund O (dist) GBP (Hedged) August 1, 2017 August 7, 2017 USD 0.4200RBC Funds (Lux) - U.S InvestmentGrade Corporate Bond Fund
O (dist) USD Feburary 1, 2017 Feburary 7, 2017 USD 0.8000
7 - Transaction Costs
For the year ended October 31, 2017 the Fund incurred transaction costs relating to purchase or sale of transferable securities,money market instruments, derivatives or other eligible assets as follows:
RBC Funds (Lux) - Global Equity Focus Fund 308,005 USDRBC Funds (Lux) - European Equity Focus Fund 10,270 EURRBC Funds (Lux) - Canadian Equity Value Fund 6,186 CADRBC Funds (Lux) - U.S. Mid Cap Value Equity Fund 122,361 USDRBC Funds (Lux) - U.S. Small Cap Equity Fund 45,329 USDRBC Funds (Lux) - Asia ex-Japan Equity Fund 47,189 USDRBC Funds (Lux) - Emerging Markets Value Equity Fund 183,425 USDRBC Funds (Lux) - Emerging Markets Equity Fund 651,247 USDRBC Funds (Lux) - Emerging Markets Small Cap Equity Fund 31,916 USDRBC Funds (Lux) - Global Resources Fund 58,277 USDRBC Funds (Lux) - Global Bond Fund 812 USDRBC Funds (Lux) - U.S. Investment Grade Corporate Bond Fund 0 USDRBC Funds (Lux) - Conservative Portfolio 601 USDRBC Funds (Lux) - Balanced Portfolio 1,045 USDRBC Funds (Lux) - Growth Portfolio 3,614 USD
These transaction costs are composed of brokerage costs and are included in cost of securities.
Furthermore, in accordance with the practices of the bondmarkets, a bid-offer spread is applied to securities purchase or saletransactions. According to this principle, the selling and buying prices applied by the broker to a given transaction are notidentical and the difference between them constitutes the broker’s remuneration.
RBC Funds (Lux)
109
Notes to the Financial Statements (continued)For the year ended October 31, 2017

8 - Swing pricing
A Sub-Fund may suffer a reduction in value, known as “dilution”, when trading the underlying assets as a result of net inflows ornet outflows of the respective Sub-Fund. This is due to transaction charges and other costs that may be incurred by liquidatingand purchasing the underlying assets and the spreads between the buying and selling prices (“dealing costs”). In order tocounter this effect and to protect shareholders’ interests, on or after September 1, 2017, the Board of Directors adopted aswing pricing mechanism as part of its valuation methods. This means that in certain circumstances adjustments to the netasset value per Share may be made to counter the impact of dealing and other costs when these are deemed to besignificant.
If on any Valuation Day, the aggregate net investor(s)’ transactions in a Sub-Fund exceed a pre-determined threshold, the netasset value per Share may be adjusted upwards or downwards to reflect the costs attributable to the net inflows and netoutflows, respectively. Typically, such adjustments will increase the net asset value per Share when there are net subscriptionsinto the Sub-Fund and decrease the net asset value per Share when there are net redemptions out of the Sub-Fund. The Boardof Directors is responsible for setting the threshold, which will be a percentage of the net assets of the respective Sub-Fund. Thethreshold is based on objective criteria such as the size of a Sub-Fund and the dealing costs for a Sub-Fund, and may berevised from time to time.
With the exception of the Allocation Sub-Funds, the swing pricing mechanism may be applied across all Sub-Funds of theFund. The percentage by which the net asset value is adjusted will be set by the Board of Directors and subsequently reviewedon a periodic basis to reflect an approximation of current dealing and other costs. The extent of the adjustment may vary fromSub-Fund to Sub-Fund due to different transaction charges in certain jurisdictions on the sell and the buy side, but may notexceed 2% of the original net asset value per Share.
The net asset value per Share of each Share Class of a Sub-Fund will be calculated separately, but any adjustment will bemade at the Sub-Fund level and in percentage terms, equally affecting the net asset value per Share of all Share Classes ofthe Sub-Fund. If swing pricing is applied to a Sub-Fund on a particular Valuation Day, the net asset value adjustment will beapplicable to all transactions received on that day. Due to the application of swing pricing, investors are advised that thevolatility of the Sub-Fund’s net asset value might not reflect the true portfolio performance.
The following sub-funds can be subject to swing pricing :
The Bond Sub-Funds
RBC Funds (Lux) - Global Bond FundRBC Funds (Lux) - U.S. Investment Grade Corporate Bond Fund
The Equity Sub-Funds
RBC Funds (Lux) - Global Equity Focus FundRBC Funds (Lux) - European Equity Focus FundRBC Funds (Lux) - Canadian Equity Value FundRBC Funds (Lux) - U.S. Mid Cap Value Equity FundRBC Funds (Lux) - U.S. Small Cap Equity FundRBC Funds (Lux) - Asia ex-Japan Equity FundRBC Funds (Lux) - Emerging Markets Value Equity FundRBC Funds (Lux) - Emerging Markets Equity FundRBC Funds (Lux) - Emerging Markets Small Cap Equity FundRBC Funds (Lux) - Global Resources Fund
As at October 31, 2017, no adjustment as mentioned above was made.
9 - Global Exposure
All the Sub-Funds use the commitment approach to monitor their global exposure.
10 - Information according to the ESMA’s “Guidelines on ETFs and other UCITS issues”
During the fiscal year, each Sub-Fund may have employed efficient portfolio management techniques relating toTransferable Securities and Money Market Instruments.
RBC Funds (Lux)
110
Notes to the Financial Statements (continued)For the year ended October 31, 2017

10 - Information according to the ESMA’s “Guidelines on ETFs and other UCITS issues” (continued)
On October 31, 2017, the Fund was not invested in any derivatives and during the year under review, the Fund did not performany derivative transactions, except the Forward foreign exchange contracts. The outstanding Forward foreign exchangecontracts on October 31, 2017 are disclosed in note 5 to the Annual Report.
No collateral was received that could be attributed to the Fund's counterparty risk.
11 - Subsequent Events
The following dividends will be distributed:
Sub-Fund Share Class Ex-date Pay date Amount per shareRBC Funds (Lux) - Global EquityFocus Fund
B (dist) GBP November 2, 2017 November 8, 2017 USD 1.0000
RBC Funds (Lux) - Global EquityFocus Fund
B (dist) GBP (Hedged) November 2, 2017 November 8, 2017 USD 1.0000
RBC Funds (Lux) - Global EquityFocus Fund
O (dist) USD November 2, 2017 November 8, 2017 USD 0.7500
RBC Funds (Lux) - European EquityFocus Fund
B (dist) GBP (Hedged) November 2, 2017 November 8, 2017 USD 1.2500
RBC Funds (Lux) - Emerging MarketsValue Equity Fund
B (dist) GBP (Hedged) November 2, 2017 November 8, 2017 USD 1.2500
RBC Funds (Lux) - Emerging MarketsEquity Fund
B (dist) GBP November 2, 2017 November 8, 2017 USD 1.2500
RBC Funds (Lux) - Emerging MarketsEquity Fund
B (dist) GBP (Hedged) November 2, 2017 November 8, 2017 USD 1.2500
RBC Funds (Lux) - Global ResourcesFund
B (dist) GBP (Hedged) November 2, 2017 November 8, 2017 USD 0.2000
RBC Funds (Lux) - Global Bond B (Dist) GBP (Hedged) November 2, 2017 November 8, 2013 USD 0.5000RBC Funds (Lux) - Global Bond O (Dist) GBP
(Hedged)November 2, 2017 November 8, 2017 USD 0.5000
According to a shareholder notice dated December 21, 2017, RBC Funds (Lux) - U.S. Mid Cap Value Equity Fund wasliquidated on January 10, 2018.
RBC Funds (Lux)
111
Notes to the Financial Statements (continued)For the year ended October 31, 2017

Information Concerning the Remuneration Policy (unaudited)
European Directive 2014/91/EU amending Directive 2009/65/EC on undertakings for collective investment intransferablesecurities, which is applicable to the Fund, came into force on March 18, 2016. It is implemented in nationallaw under theLuxembourg Act of May 10, 2016 implementing Directive 2014/91/EU. Due to these new regulations, the Fund isrequired topublish information relating to the remuneration of identified employees within the meaning of the Act in theannual report.
Candriam Luxembourg holds a double licence, viz. first, as a management company in accordance with section 15 of theLaw of December 17, 2010 on undertakings for collective investment and, second, as a manager of alternative investmentfunds in accordance with the Law of July 12, 2013 relating to alternative investment fund managers.
The responsibilities incumbent on Candriam Luxembourg under these two laws are relatively similar and CandriamLuxembourg considers that its personnel is remunerated in the same manner for tasks relating to administration of UCITS and ofalternative investment funds.
During its financial year ended on December 31, 2017 Candriam Luxembourg paid the following amounts to its personnel:
• Total gross amount of fixed remunerations paid (excluding payments or benefits that can be considered to be part of ageneral and non-discretionary policy and to have no incentive effect on risk management): EUR 11,642,636.
• Total gross amount of variable remunerations paid: EUR 5,367,906.
• Number of beneficiaries: 117.
Aggregate amount of remunerations, broken down between senior management and the members of the personnel of theinvestment manager whose activities have a significant impact on the fund's risk profile. The systems of Candriam Luxembourgdo not permit such an identification for each fund under management. The numbers below also show the aggregate amountof overall remunerations at Candriam Luxembourg.The systems of Candriam Luxembourg do not allow such amounts to beidentified per AIF managed. The figures below therefore show the aggregate amount of the remunerations at the overall levelof Candriam Luxembourg.
• Aggregate amount of the remunerations of the senior management: EUR 3,451,866.
• Aggregate amount of the remunerations of the members of the personnel of Candriam Luxembourg whose activitieshave a significant impact on the risk profile of the funds of which it is the management company (excluding seniormanagement): EUR 1,557,996.
The remuneration policy was last reviewed by the remuneration committee of Candriam Luxembourg on January 24, 2017and was adopted by the board of directors of Candriam Luxembourg.
RBC Funds (Lux)
112