Allianz Global Investors Fund - Fundsquare
496
Semi-Annual Report as at 31 March 2012 Allianz Global Investors Fund Société d’Investissement à Capital Variable R.C.S. Luxembourg No. 71.182 Allianz Global Investors Luxembourg S.A.
-
Upload
khangminh22 -
Category
Documents
-
view
1 -
download
0
Transcript of Allianz Global Investors Fund - Fundsquare
Semi-Annual Report as at 31 March 2012
Allianz Global Investors Fund
Société d’Investissement à Capital VariableR.C.S. Luxembourg No. 71.182
Allianz Global Investors Luxembourg S.A.
Allianz Global Investors Fund
General Information
Allianz Global Investors Fundc/o Allianz Global Investors Luxembourg S.A.
6A, route de TrèvesL-2633 SenningerbergInternet: www.allianzglobalinvestors.luE-mail: [email protected]
Allianz Global Investors Fund (the “Company”) is incorporated under the laws of the Grand Duchy of Luxembourg as an open-ended investment company with variable share capital. The Company is authorised by the Commission de Surveillance du Secteur Financier as a “Société d’Investissement à Capital Variable” (SICAV) and registered pursuant to Part I of the Luxembourg Law of 17 December 2010 on Undertakings for Collective Investment. The Company was established on 9 August 1999.
The Company has launched different Subfunds (the “Subfunds”) and each Subfund has issued shares in a number of classes and currencies. The following Subfunds were available for subscription and redemption on 31 March 2012:Allianz Asian Multi Income PlusAllianz Convertible Bond1)
Allianz Enhanced Fixed Income Euro1)
Allianz Euro Bond Strategy1)
Allianz Euro High Yield Bond1)
Allianz Euro Investment Grade Bond Strategy1)
Allianz Euroland Equity SRI1)
Allianz Flexible Bond Strategy1)
Allianz Income and Growth1)
Allianz PIMCO Euro Bond1)
Allianz PIMCO Treasury Euro Bond Plus 20131)
Allianz PIMCO Treasury Short Term Plus Euro1)
Allianz RCM Asia PacificAllianz RCM Best Styles EurolandAllianz RCM BrazilAllianz RCM BRIC EquityAllianz RCM ChinaAllianz RCM Commodities1)
Allianz RCM Currencies Strategy1)
Allianz RCM Demographic TrendsAllianz RCM Discovery Europe Strategy1)
Allianz RCM Discovery Germany Strategy1)
Allianz RCM Dynamic Emerging Multi Asset1)
Allianz RCM Dynamic Multi Asset Plus1)
Allianz RCM Emerging AsiaAllianz RCM Enhanced Short Term EuroAllianz RCM Euroland Equity GrowthAllianz RCM Europe Equity GrowthAllianz RCM Europe Small Cap Equity1)
Allianz RCM European EquityAllianz RCM European Equity DividendAllianz RCM Global Agricultural TrendsAllianz RCM Global EcoTrendsAllianz RCM Global EquityAllianz RCM Global Hi-Tech GrowthAllianz RCM Global Metals and MiningAllianz RCM Global SustainabilityAllianz RCM Global UnconstrainedAllianz RCM Greater China DynamicAllianz RCM Growing Markets Protect1)
Allianz RCM Hong KongAllianz RCM IndiaAllianz RCM IndonesiaAllianz RCM JapanAllianz RCM KoreaAllianz RCM Little DragonsAllianz RCM Oriental IncomeAllianz RCM Renminbi Currency1)
Allianz RCM Renminbi Fixed Income1)
Allianz RCM Tech Alpha Plus Strategy1)
Allianz RCM ThailandAllianz RCM TigerAllianz RCM Total Return Asian EquityAllianz RCM US Equity FundAllianz RCM USD LiquidityAllianz Real Estate Securities Europe1)
Allianz Structured Alpha Strategy1)
Allianz US High YieldAllianz US Large Cap Value1)
Protect Global Winner 20141)
A separate pool of assets and separate accounting records are maintained for each Subfund.
1) Not authorized in Hong Kong and not available to Hong Kong Residents.
Allianz Global Investors Fund
The figures presented in this report relate to the period from 1 October 2011 to 31 March 2012. They should not necessarily be taken as an indication of the future development of the Subfunds.
Subscriptions are only valid if made on the basis of the current Prospectus, the Management Regulations, the Key Investor Information Document supplemented by the latest available audited Annual Report.
The Prospectus, the articles of incorporation, the Key Investor Information Document as well as the respective annual and semi-annual reports can be obtained from the Management Company, the Custodian and each Paying and Information Agent without charge.
Allianz Global Investors Fund
Launch of new Subfunds
With the approval of the Luxembourg Supervisory Authority, the Board of Directors of Allianz Gobal Investors Fund (“the Company”) decided to launch the following new Subfunds:
with effect from 11 October 2011– Allianz RCM Tech Alpha Plus Strategy– Allianz RCM Discovery Germany Strategy
with effect from 18 October 2011– Allianz RCM Renminbi Currency
with effect from 31 January 2012– Allianz Convertible Bond
with effect from 6 March 2012– Allianz Enhanced Fixed Income Euro
with effect from 20 March 2012– Allianz Euro Investment Grade Bond Strategy
Merger of the Subfunds
With the approval of the Luxembourg Supervisory Authority, the Board of Directors of Allianz Gobal Investors Fund (“the Company”) decided to merge the following Subfunds:
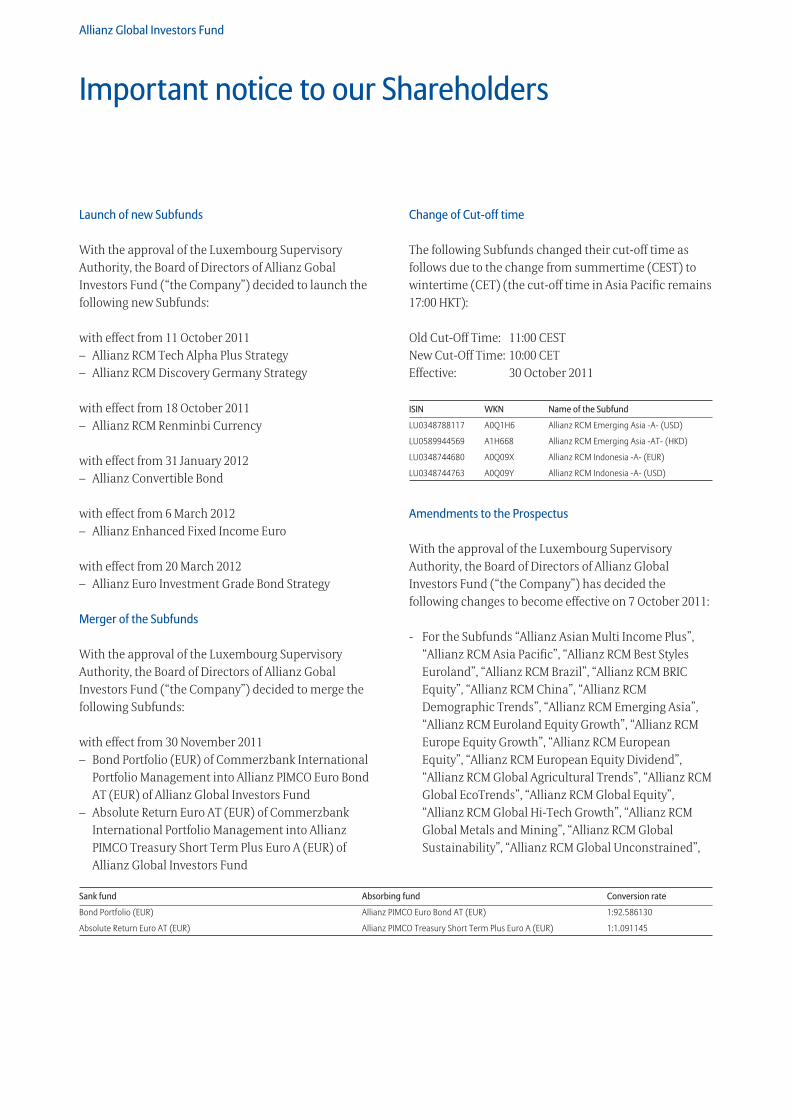
with effect from 30 November 2011– Bond Portfolio (EUR) of Commerzbank International
Portfolio Management into Allianz PIMCO Euro Bond AT (EUR) of Allianz Global Investors Fund
– Absolute Return Euro AT (EUR) of Commerzbank International Portfolio Management into Allianz PIMCO Treasury Short Term Plus Euro A (EUR) of Allianz Global Investors Fund
Change of Cut-off time
The following Subfunds changed their cut-off time as follows due to the change from summertime (CEST) to wintertime (CET) (the cut-off time in Asia Pacific remains 17:00 HKT):
Old Cut-Off Time: 11:00 CESTNew Cut-Off Time: 10:00 CETEffective: 30 October 2011
ISIN WKN Name of the Subfund
LU0348788117 A0Q1H6 Allianz RCM Emerging Asia -A- (USD)
LU0589944569 A1H668 Allianz RCM Emerging Asia -AT- (HKD)
LU0348744680 A0Q09X Allianz RCM Indonesia -A- (EUR)
LU0348744763 A0Q09Y Allianz RCM Indonesia -A- (USD)
Amendments to the Prospectus
With the approval of the Luxembourg Supervisory Authority, the Board of Directors of Allianz Global Investors Fund (“the Company”) has decided the following changes to become effective on 7 October 2011:
- For the Subfunds “Allianz Asian Multi Income Plus”, “Allianz RCM Asia Pacific”, “Allianz RCM Best Styles Euroland”, “Allianz RCM Brazil”, “Allianz RCM BRIC Equity”, “Allianz RCM China”, “Allianz RCM Demographic Trends”, “Allianz RCM Emerging Asia”, “Allianz RCM Euroland Equity Growth”, “Allianz RCM Europe Equity Growth”, “Allianz RCM European Equity”, “Allianz RCM European Equity Dividend”, “Allianz RCM Global Agricultural Trends”, “Allianz RCM Global EcoTrends”, “Allianz RCM Global Equity”, “Allianz RCM Global Hi-Tech Growth”, “Allianz RCM Global Metals and Mining”, “Allianz RCM Global Sustainability”, “Allianz RCM Global Unconstrained”,
Important notice to our Shareholders
Sank fund Absorbing fund Conversion rate
Bond Portfolio (EUR) Allianz PIMCO Euro Bond AT (EUR) 1:92.586130
Absolute Return Euro AT (EUR) Allianz PIMCO Treasury Short Term Plus Euro A (EUR) 1:1.091145
Allianz Global Investors Fund
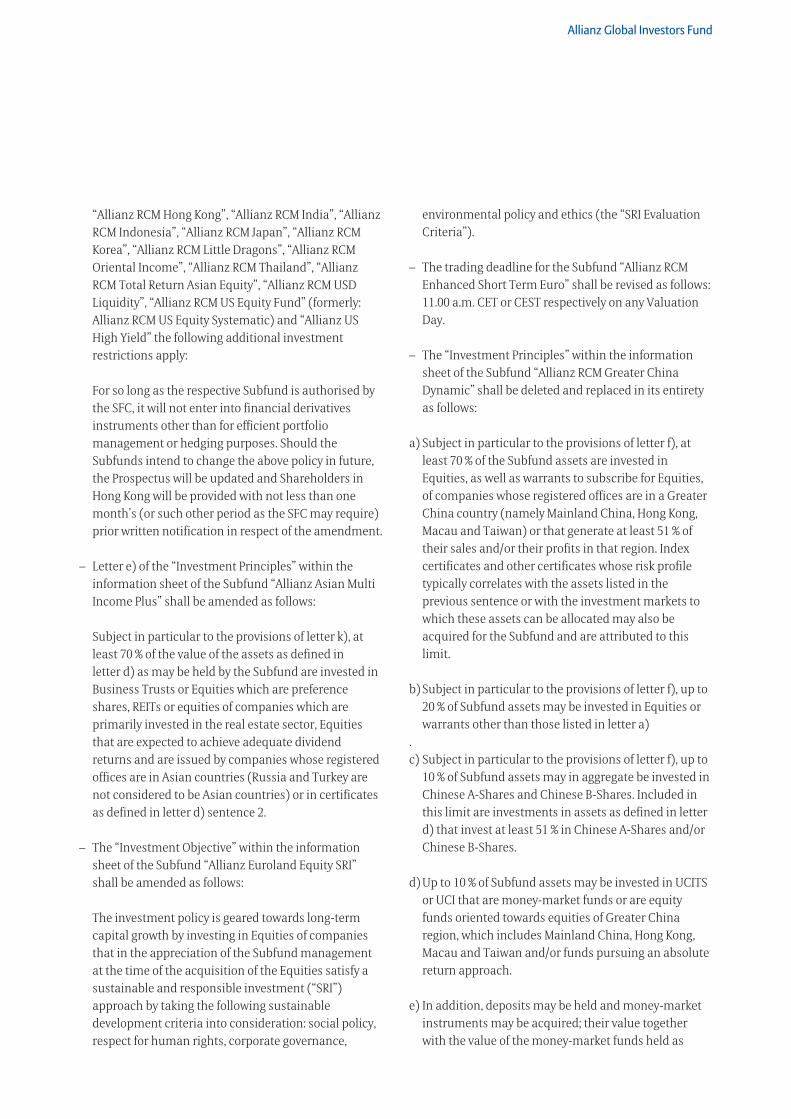
“Allianz RCM Hong Kong”, “Allianz RCM India”, “Allianz RCM Indonesia”, “Allianz RCM Japan”, “Allianz RCM Korea”, “Allianz RCM Little Dragons”, “Allianz RCM Oriental Income”, “Allianz RCM Thailand”, “Allianz RCM Total Return Asian Equity”, “Allianz RCM USD Liquidity”, “Allianz RCM US Equity Fund” (formerly: Allianz RCM US Equity Systematic) and “Allianz US High Yield” the following additional investment restrictions apply:
For so long as the respective Subfund is authorised by the SFC, it will not enter into financial derivatives instruments other than for efficient portfolio management or hedging purposes. Should the Subfunds intend to change the above policy in future, the Prospectus will be updated and Shareholders in Hong Kong will be provided with not less than one month’s (or such other period as the SFC may require) prior written notification in respect of the amendment.
– Letter e) of the “Investment Principles” within the information sheet of the Subfund “Allianz Asian Multi Income Plus” shall be amended as follows:
Subject in particular to the provisions of letter k), at least 70 % of the value of the assets as defined in letter d) as may be held by the Subfund are invested in Business Trusts or Equities which are preference shares, REITs or equities of companies which are primarily invested in the real estate sector, Equities that are expected to achieve adequate dividend returns and are issued by companies whose registered offices are in Asian countries (Russia and Turkey are not considered to be Asian countries) or in certificates as defined in letter d) sentence 2.
– The “Investment Objective” within the information sheet of the Subfund “Allianz Euroland Equity SRI” shall be amended as follows:
The investment policy is geared towards long-term capital growth by investing in Equities of companies that in the appreciation of the Subfund management at the time of the acquisition of the Equities satisfy a sustainable and responsible investment (“SRI”) approach by taking the following sustainable development criteria into consideration: social policy, respect for human rights, corporate governance,
environmental policy and ethics (the “SRI Evaluation Criteria”).
– The trading deadline for the Subfund “Allianz RCM Enhanced Short Term Euro” shall be revised as follows: 11.00 a.m. CET or CEST respectively on any Valuation Day.
– The “Investment Principles” within the information sheet of the Subfund “Allianz RCM Greater China Dynamic” shall be deleted and replaced in its entirety as follows:
a) Subject in particular to the provisions of letter f), at least 70 % of the Subfund assets are invested in Equities, as well as warrants to subscribe for Equities, of companies whose registered offices are in a Greater China country (namely Mainland China, Hong Kong, Macau and Taiwan) or that generate at least 51 % of their sales and/or their profits in that region. Index certificates and other certificates whose risk profile typically correlates with the assets listed in the previous sentence or with the investment markets to which these assets can be allocated may also be acquired for the Subfund and are attributed to this limit.
b) Subject in particular to the provisions of letter f), up to 20 % of Subfund assets may be invested in Equities or warrants other than those listed in letter a)
.c) Subject in particular to the provisions of letter f), up to
10 % of Subfund assets may in aggregate be invested in Chinese A-Shares and Chinese B-Shares. Included in this limit are investments in assets as defined in letter d) that invest at least 51 % in Chinese A-Shares and/or Chinese B-Shares.
d) Up to 10 % of Subfund assets may be invested in UCITS or UCI that are money-market funds or are equity funds oriented towards equities of Greater China region, which includes Mainland China, Hong Kong, Macau and Taiwan and/or funds pursuing an absolute return approach.
e) In addition, deposits may be held and money-market instruments may be acquired; their value together with the value of the money-market funds held as
Allianz Global Investors Fund
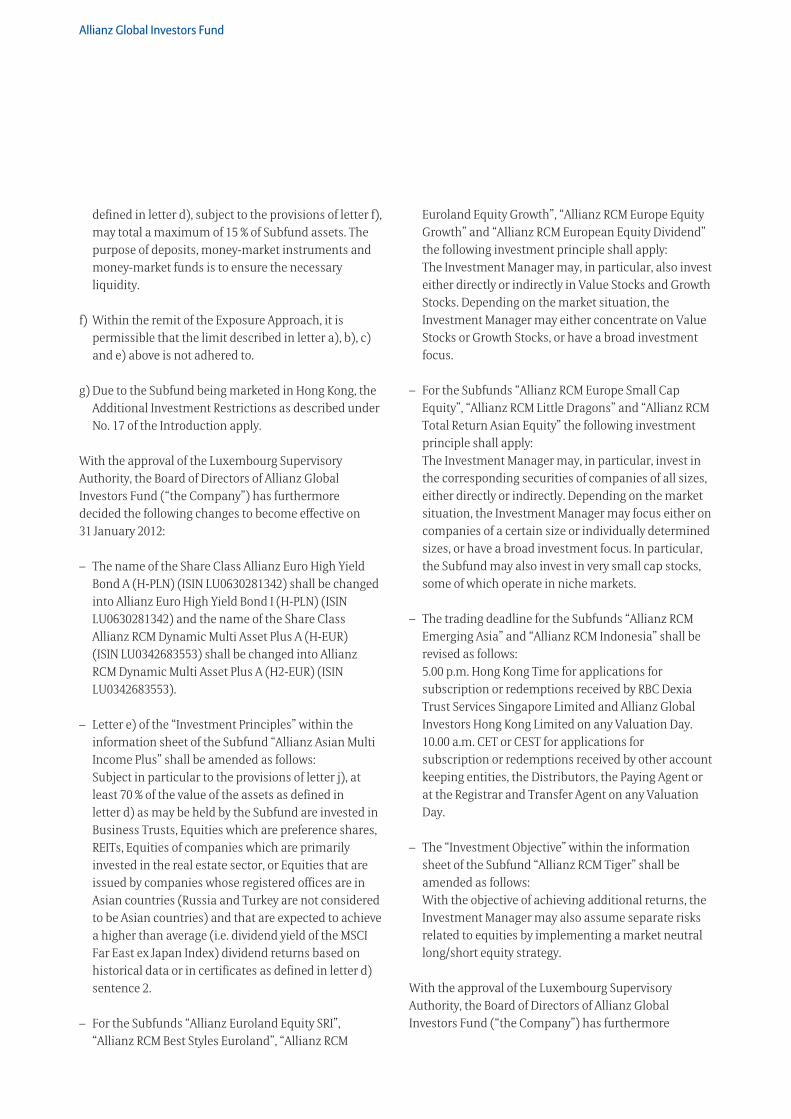
defined in letter d), subject to the provisions of letter f), may total a maximum of 15 % of Subfund assets. The purpose of deposits, money-market instruments and money-market funds is to ensure the necessary liquidity.
f) Within the remit of the Exposure Approach, it is permissible that the limit described in letter a), b), c) and e) above is not adhered to.
g) Due to the Subfund being marketed in Hong Kong, the Additional Investment Restrictions as described under No. 17 of the Introduction apply.
With the approval of the Luxembourg Supervisory Authority, the Board of Directors of Allianz Global Investors Fund (“the Company”) has furthermore decided the following changes to become effective on 31 January 2012:
– The name of the Share Class Allianz Euro High Yield Bond A (H-PLN) (ISIN LU0630281342) shall be changed into Allianz Euro High Yield Bond I (H-PLN) (ISIN LU0630281342) and the name of the Share Class Allianz RCM Dynamic Multi Asset Plus A (H-EUR) (ISIN LU0342683553) shall be changed into Allianz RCM Dynamic Multi Asset Plus A (H2-EUR) (ISIN LU0342683553).
– Letter e) of the “Investment Principles” within the information sheet of the Subfund “Allianz Asian Multi Income Plus” shall be amended as follows: Subject in particular to the provisions of letter j), at least 70 % of the value of the assets as defined in letter d) as may be held by the Subfund are invested in Business Trusts, Equities which are preference shares, REITs, Equities of companies which are primarily invested in the real estate sector, or Equities that are issued by companies whose registered offices are in Asian countries (Russia and Turkey are not considered to be Asian countries) and that are expected to achieve a higher than average (i.e. dividend yield of the MSCI Far East ex Japan Index) dividend returns based on historical data or in certificates as defined in letter d) sentence 2.
– For the Subfunds “Allianz Euroland Equity SRI”, “Allianz RCM Best Styles Euroland”, “Allianz RCM
Euroland Equity Growth”, “Allianz RCM Europe Equity Growth” and “Allianz RCM European Equity Dividend” the following investment principle shall apply: The Investment Manager may, in particular, also invest either directly or indirectly in Value Stocks and Growth Stocks. Depending on the market situation, the Investment Manager may either concentrate on Value Stocks or Growth Stocks, or have a broad investment focus.
– For the Subfunds “Allianz RCM Europe Small Cap Equity”, “Allianz RCM Little Dragons” and “Allianz RCM Total Return Asian Equity” the following investment principle shall apply: The Investment Manager may, in particular, invest in the corresponding securities of companies of all sizes, either directly or indirectly. Depending on the market situation, the Investment Manager may focus either on companies of a certain size or individually determined sizes, or have a broad investment focus. In particular, the Subfund may also invest in very small cap stocks, some of which operate in niche markets.
– The trading deadline for the Subfunds “Allianz RCM Emerging Asia” and “Allianz RCM Indonesia” shall be revised as follows: 5.00 p.m. Hong Kong Time for applications for subscription or redemptions received by RBC Dexia Trust Services Singapore Limited and Allianz Global Investors Hong Kong Limited on any Valuation Day. 10.00 a.m. CET or CEST for applications for subscription or redemptions received by other account keeping entities, the Distributors, the Paying Agent or at the Registrar and Transfer Agent on any Valuation Day.
– The “Investment Objective” within the information sheet of the Subfund “Allianz RCM Tiger” shall be amended as follows: With the objective of achieving additional returns, the Investment Manager may also assume separate risks related to equities by implementing a market neutral long/short equity strategy.
With the approval of the Luxembourg Supervisory Authority, the Board of Directors of Allianz Global Investors Fund (“the Company”) has furthermore
Allianz Global Investors Fund
decided the following changes to become effective on 31 March 2012:
– PIMCO Deutschland GmbH will be appointed as investment manager of following Subfunds in place of Allianz Global Investors Kapitalanlagegesellschaft mbH:
– Allianz PIMCO Euro Bond– Allianz PIMCO Treasury Euro Bond Plus 2013– Allianz PIMCO Treasury Short Term Plus Euro
Beyond that, with effect from 30 April 2012, PIMCO Deutschland GmbH will completely delegate the investment management of the Subfund “Allianz PIMCO Euro Bond” to PIMCO Europe Ltd acting as sub-investment manager.
The Prospectus (dated January 2012) and the Key Investor Information Document (dated March 2012) for additional Information on the Fund are accessible or available free of Allianz Global Investors Fund charge for the Shareholders at the registered office of the Company, the Custodian and the Information Agents.
Subsequent events
Launch of new Subfunds
With the approval of the Luxembourg Supervisory Authority, the Board of Directors of Allianz Gobal Investors Fund (“the Company”) decided to launch the following new Subfund:
with effect from 2 May 2012– Allianz Target Return Bond
Allianz Global Investors Fund
Contents
Performance . . . . . . . . . . . . . . . . . . . . . . . . . . . . . . . . . . . . . . . . . . . . . . . . 8
Investment Policy and Subfund Assets
Allianz Asian Multi Income Plus . . . . . . . . . . . . . . . . . . . . . . . . . . . . . . . 20
Allianz Convertible Bond . . . . . . . . . . . . . . . . . . . . . . . . . . . . . . . . . . . . . 21
Allianz Enhanced Fixed Income Euro . . . . . . . . . . . . . . . . . . . . . . . . . . 22
Allianz Euro Bond Strategy . . . . . . . . . . . . . . . . . . . . . . . . . . . . . . . . . . . 23
Allianz Euro High Yield Bond . . . . . . . . . . . . . . . . . . . . . . . . . . . . . . . . . 24
Allianz Euro Investment Grade Bond Strategy. . . . . . . . . . . . . . . . . . 25
Allianz Euroland Equity SRI . . . . . . . . . . . . . . . . . . . . . . . . . . . . . . . . . . . 26
Allianz Flexible Bond Strategy . . . . . . . . . . . . . . . . . . . . . . . . . . . . . . . . 27
Allianz Income and Growth . . . . . . . . . . . . . . . . . . . . . . . . . . . . . . . . . . 28
Allianz PIMCO Euro Bond . . . . . . . . . . . . . . . . . . . . . . . . . . . . . . . . . . . . . 29
Allianz PIMCO Treasury Euro Bond Plus 2013 . . . . . . . . . . . . . . . . . . 30
Allianz PIMCO Treasury Short Term Plus Euro . . . . . . . . . . . . . . . . . . 31
Allianz RCM Asia Pacific . . . . . . . . . . . . . . . . . . . . . . . . . . . . . . . . . . . . . . 32
Allianz RCM Best Styles Euroland . . . . . . . . . . . . . . . . . . . . . . . . . . . . . 33
Allianz RCM Brazil . . . . . . . . . . . . . . . . . . . . . . . . . . . . . . . . . . . . . . . . . . . 34
Allianz RCM BRIC Equity . . . . . . . . . . . . . . . . . . . . . . . . . . . . . . . . . . . . . . 35
Allianz RCM China . . . . . . . . . . . . . . . . . . . . . . . . . . . . . . . . . . . . . . . . . . . 36
Allianz RCM Commodities . . . . . . . . . . . . . . . . . . . . . . . . . . . . . . . . . . . . 38
Allianz RCM Currencies Strategy . . . . . . . . . . . . . . . . . . . . . . . . . . . . . . 39
Allianz RCM Demographic Trends . . . . . . . . . . . . . . . . . . . . . . . . . . . . 40
Allianz RCM Discovery Europe Strategy . . . . . . . . . . . . . . . . . . . . . . . . 41
Allianz RCM Discovery Germany Strategy . . . . . . . . . . . . . . . . . . . . . 42
Allianz RCM Dynamic Emerging Multi Asset . . . . . . . . . . . . . . . . . . . 43
Allianz RCM Dynamic Multi Asset Plus . . . . . . . . . . . . . . . . . . . . . . . . . 44
Allianz RCM Emerging Asia . . . . . . . . . . . . . . . . . . . . . . . . . . . . . . . . . . . 45
Allianz RCM Enhanced Short Term Euro . . . . . . . . . . . . . . . . . . . . . . . 46
Allianz RCM Euroland Equity Growth . . . . . . . . . . . . . . . . . . . . . . . . . . 47
Allianz RCM Europe Equity Growth . . . . . . . . . . . . . . . . . . . . . . . . . . . . 48
Allianz RCM Europe Small Cap Equity . . . . . . . . . . . . . . . . . . . . . . . . . 50
Allianz RCM European Equity . . . . . . . . . . . . . . . . . . . . . . . . . . . . . . . . . 51
Allianz RCM European Equity Dividend . . . . . . . . . . . . . . . . . . . . . . . . 52
Allianz RCM Global Agricultural Trends . . . . . . . . . . . . . . . . . . . . . . . . 53
Allianz RCM Global EcoTrends . . . . . . . . . . . . . . . . . . . . . . . . . . . . . . . . 55
Allianz RCM Global Equity . . . . . . . . . . . . . . . . . . . . . . . . . . . . . . . . . . . . 56
Allianz RCM Global Hi-Tech Growth . . . . . . . . . . . . . . . . . . . . . . . . . . . 57
Allianz RCM Global Metals and Mining . . . . . . . . . . . . . . . . . . . . . . . . 58
Allianz RCM Global Sustainability . . . . . . . . . . . . . . . . . . . . . . . . . . . . . 59
Allianz RCM Global Unconstrained . . . . . . . . . . . . . . . . . . . . . . . . . . . . 60
Allianz RCM Greater China Dynamic . . . . . . . . . . . . . . . . . . . . . . . . . . 61
Allianz RCM Growing Markets Protect . . . . . . . . . . . . . . . . . . . . . . . . . 62
Allianz RCM Hong Kong . . . . . . . . . . . . . . . . . . . . . . . . . . . . . . . . . . . . . . 63
Allianz RCM India . . . . . . . . . . . . . . . . . . . . . . . . . . . . . . . . . . . . . . . . . . . . 64
Allianz RCM Indonesia . . . . . . . . . . . . . . . . . . . . . . . . . . . . . . . . . . . . . . . 65
Allianz RCM Japan . . . . . . . . . . . . . . . . . . . . . . . . . . . . . . . . . . . . . . . . . . . 66
Allianz RCM Korea . . . . . . . . . . . . . . . . . . . . . . . . . . . . . . . . . . . . . . . . . . . 67
Allianz RCM Little Dragons . . . . . . . . . . . . . . . . . . . . . . . . . . . . . . . . . . . 68
Allianz RCM Oriental Income . . . . . . . . . . . . . . . . . . . . . . . . . . . . . . . . . 69
Allianz RCM Renminbi Currency . . . . . . . . . . . . . . . . . . . . . . . . . . . . . . 70
Allianz RCM Renminbi Fixed Income . . . . . . . . . . . . . . . . . . . . . . . . . . 71
Allianz RCM Tech Alpha Plus Strategy . . . . . . . . . . . . . . . . . . . . . . . . . 72
Allianz RCM Thailand . . . . . . . . . . . . . . . . . . . . . . . . . . . . . . . . . . . . . . . . 73
Allianz RCM Tiger . . . . . . . . . . . . . . . . . . . . . . . . . . . . . . . . . . . . . . . . . . . . 74
Allianz RCM Total Return Asian Equity . . . . . . . . . . . . . . . . . . . . . . . . . 75
Allianz RCM US Equity Fund . . . . . . . . . . . . . . . . . . . . . . . . . . . . . . . . . . 76
Allianz RCM USD Liquidity . . . . . . . . . . . . . . . . . . . . . . . . . . . . . . . . . . . . 78
Allianz Real Estate Securities Europe . . . . . . . . . . . . . . . . . . . . . . . . . . 79
Allianz Structured Alpha Strategy . . . . . . . . . . . . . . . . . . . . . . . . . . . . . 80
Allianz US High Yield . . . . . . . . . . . . . . . . . . . . . . . . . . . . . . . . . . . . . . . . . 81
Allianz US Large Cap Value . . . . . . . . . . . . . . . . . . . . . . . . . . . . . . . . . . . 83
Protect Global Winner 2014 . . . . . . . . . . . . . . . . . . . . . . . . . . . . . . . . . . 84
Combined Financial Statements of the Company
Statement of Net Assets
Statement of Changes in Net Assets
Allianz Global Investors Fund . . . . . . . . . . . . . . . . . . . . . . . . . . . . . . . . . 85
Financial Statements of the Subfunds
Investment Portfolios
Statement of Net Assets
Statement of Changes in Net Assets
Statement of Changes in Shares
Allianz Asian Multi Income Plus . . . . . . . . . . . . . . . . . . . . . . . . . . . . . . . 90
Allianz Convertible Bond . . . . . . . . . . . . . . . . . . . . . . . . . . . . . . . . . . . . . 97
Allianz Enhanced Fixed Income Euro . . . . . . . . . . . . . . . . . . . . . . . . . . 102
Allianz Euro Bond Strategy . . . . . . . . . . . . . . . . . . . . . . . . . . . . . . . . . . . 106
Allianz Euro High Yield Bond . . . . . . . . . . . . . . . . . . . . . . . . . . . . . . . . . 117
Allianz Euro Investment Grade Bond Strategy. . . . . . . . . . . . . . . . . . 125
Allianz Euroland Equity SRI . . . . . . . . . . . . . . . . . . . . . . . . . . . . . . . . . . . 130
Allianz Flexible Bond Strategy . . . . . . . . . . . . . . . . . . . . . . . . . . . . . . . . 135
Allianz Income and Growth . . . . . . . . . . . . . . . . . . . . . . . . . . . . . . . . . . 145
Allianz PIMCO Euro Bond . . . . . . . . . . . . . . . . . . . . . . . . . . . . . . . . . . . . . 156
Allianz PIMCO Treasury Euro Bond Plus 2013 . . . . . . . . . . . . . . . . . . 172
Allianz PIMCO Treasury Short Term Plus Euro . . . . . . . . . . . . . . . . . . 180
Allianz RCM Asia Pacific . . . . . . . . . . . . . . . . . . . . . . . . . . . . . . . . . . . . . . 193
Allianz RCM Best Styles Euroland . . . . . . . . . . . . . . . . . . . . . . . . . . . . . 199
Allianz RCM Brazil . . . . . . . . . . . . . . . . . . . . . . . . . . . . . . . . . . . . . . . . . . . 204
Allianz RCM BRIC Equity . . . . . . . . . . . . . . . . . . . . . . . . . . . . . . . . . . . . . . 210
Allianz RCM China . . . . . . . . . . . . . . . . . . . . . . . . . . . . . . . . . . . . . . . . . . . 216
Allianz RCM Commodities . . . . . . . . . . . . . . . . . . . . . . . . . . . . . . . . . . . . 223
Allianz Global Investors Fund
Allianz RCM Currencies Strategy . . . . . . . . . . . . . . . . . . . . . . . . . . . . . . 227
Allianz RCM Demographic Trends . . . . . . . . . . . . . . . . . . . . . . . . . . . . 234
Allianz RCM Discovery Europe Strategy . . . . . . . . . . . . . . . . . . . . . . . . 239
Allianz RCM Discovery Germany Strategy . . . . . . . . . . . . . . . . . . . . . 244
Allianz RCM Dynamic Emerging Multi Asset . . . . . . . . . . . . . . . . . . . 248
Allianz RCM Dynamic Multi Asset Plus . . . . . . . . . . . . . . . . . . . . . . . . . 254
Allianz RCM Emerging Asia . . . . . . . . . . . . . . . . . . . . . . . . . . . . . . . . . . . 259
Allianz RCM Enhanced Short Term Euro . . . . . . . . . . . . . . . . . . . . . . . 264
Allianz RCM Euroland Equity Growth . . . . . . . . . . . . . . . . . . . . . . . . . . 271
Allianz RCM Europe Equity Growth . . . . . . . . . . . . . . . . . . . . . . . . . . . . 276
Allianz RCM Europe Small Cap Equity . . . . . . . . . . . . . . . . . . . . . . . . . 282
Allianz RCM European Equity . . . . . . . . . . . . . . . . . . . . . . . . . . . . . . . . . 288
Allianz RCM European Equity Dividend . . . . . . . . . . . . . . . . . . . . . . . . 293
Allianz RCM Global Agricultural Trends . . . . . . . . . . . . . . . . . . . . . . . . 298
Allianz RCM Global EcoTrends . . . . . . . . . . . . . . . . . . . . . . . . . . . . . . . . 303
Allianz RCM Global Equity . . . . . . . . . . . . . . . . . . . . . . . . . . . . . . . . . . . . 308
Allianz RCM Global Hi-Tech Growth . . . . . . . . . . . . . . . . . . . . . . . . . . . 315
Allianz RCM Global Metals and Mining . . . . . . . . . . . . . . . . . . . . . . . . 320
Allianz RCM Global Sustainability . . . . . . . . . . . . . . . . . . . . . . . . . . . . . 325
Allianz RCM Global Unconstrained . . . . . . . . . . . . . . . . . . . . . . . . . . . . 330
Allianz RCM Greater China Dynamic . . . . . . . . . . . . . . . . . . . . . . . . . . 334
Allianz RCM Growing Markets Protect . . . . . . . . . . . . . . . . . . . . . . . . . 339
Allianz RCM Hong Kong . . . . . . . . . . . . . . . . . . . . . . . . . . . . . . . . . . . . . . 342
Allianz RCM India . . . . . . . . . . . . . . . . . . . . . . . . . . . . . . . . . . . . . . . . . . . . 348
Allianz RCM Indonesia . . . . . . . . . . . . . . . . . . . . . . . . . . . . . . . . . . . . . . . 352
Allianz RCM Japan . . . . . . . . . . . . . . . . . . . . . . . . . . . . . . . . . . . . . . . . . . . 356
Allianz RCM Korea . . . . . . . . . . . . . . . . . . . . . . . . . . . . . . . . . . . . . . . . . . . 361
Allianz RCM Little Dragons . . . . . . . . . . . . . . . . . . . . . . . . . . . . . . . . . . . 365
Allianz RCM Oriental Income . . . . . . . . . . . . . . . . . . . . . . . . . . . . . . . . . 372
Allianz RCM Renminbi Currency . . . . . . . . . . . . . . . . . . . . . . . . . . . . . . 379
Allianz RCM Renminbi Fixed Income . . . . . . . . . . . . . . . . . . . . . . . . . . 386
Allianz RCM Tech Alpha Plus Strategy . . . . . . . . . . . . . . . . . . . . . . . . . 393
Allianz RCM Thailand . . . . . . . . . . . . . . . . . . . . . . . . . . . . . . . . . . . . . . . . 397
Allianz RCM Tiger . . . . . . . . . . . . . . . . . . . . . . . . . . . . . . . . . . . . . . . . . . . . 401
Allianz RCM Total Return Asian Equity . . . . . . . . . . . . . . . . . . . . . . . . . 406
Allianz RCM US Equity Fund . . . . . . . . . . . . . . . . . . . . . . . . . . . . . . . . . . 411
Allianz RCM USD Liquidity . . . . . . . . . . . . . . . . . . . . . . . . . . . . . . . . . . . . 417
Allianz Real Estate Securities Europe . . . . . . . . . . . . . . . . . . . . . . . . . . 420
Allianz Structured Alpha Strategy . . . . . . . . . . . . . . . . . . . . . . . . . . . . . 424
Allianz US High Yield . . . . . . . . . . . . . . . . . . . . . . . . . . . . . . . . . . . . . . . . . 443
Allianz US Large Cap Value . . . . . . . . . . . . . . . . . . . . . . . . . . . . . . . . . . . 452
Protect Global Winner 2014 . . . . . . . . . . . . . . . . . . . . . . . . . . . . . . . . . . 457
Notes to the Financial Statements . . . . . . . . . . . . . . . . . . . . . . . . . . . 460
Note for Investors
in the Federal Republic of Germany . . . . . . . . . . . . . . . . . . . . . . . . . . 484
Note for Investors in the Republic of Austria . . . . . . . . . . . . . . . . . . 485
Note for Investors in Switzerland . . . . . . . . . . . . . . . . . . . . . . . . . . . . 486
Directory . . . . . . . . . . . . . . . . . . . . . . . . . . . . . . . . . . . . . . . . . . . . . . . . . . . 491
8
Allianz Global Investors Fund
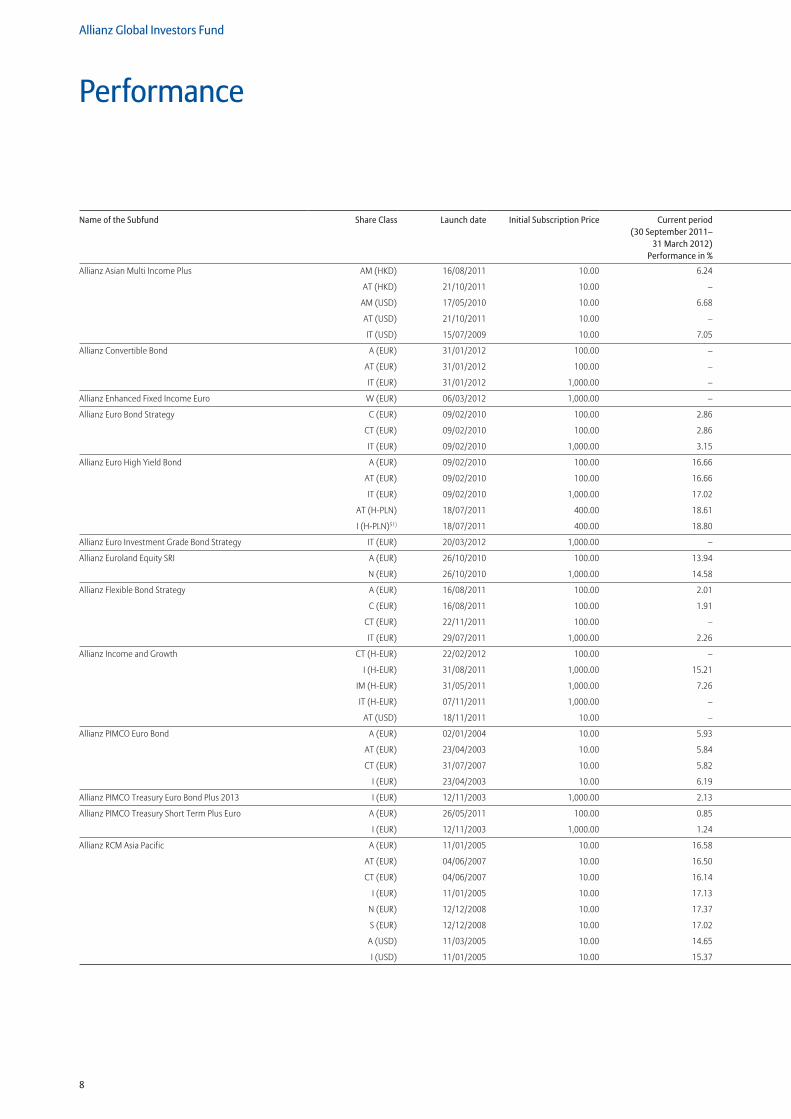
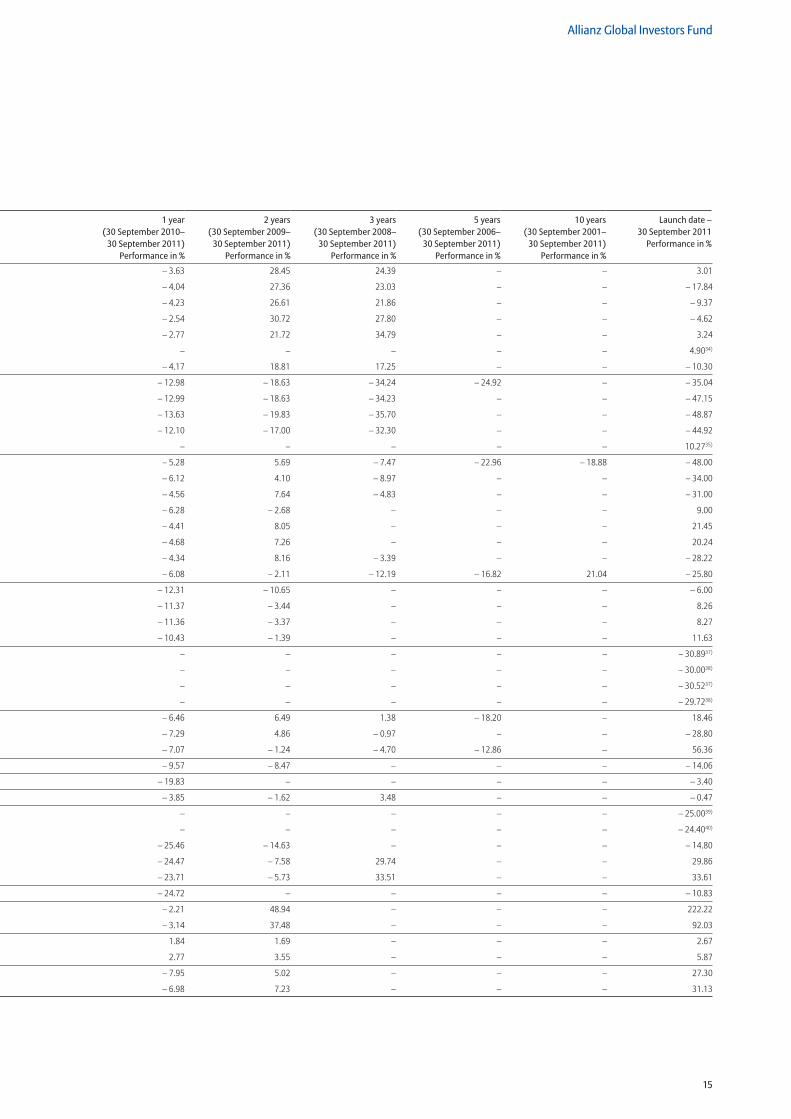
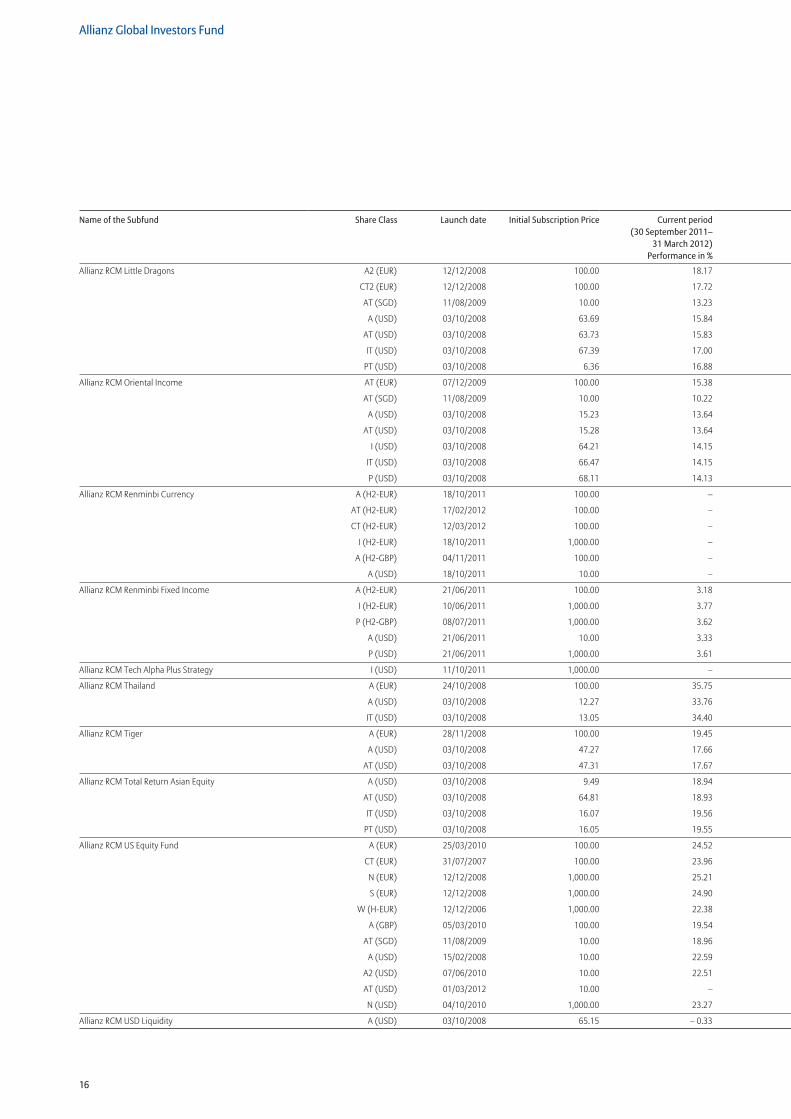
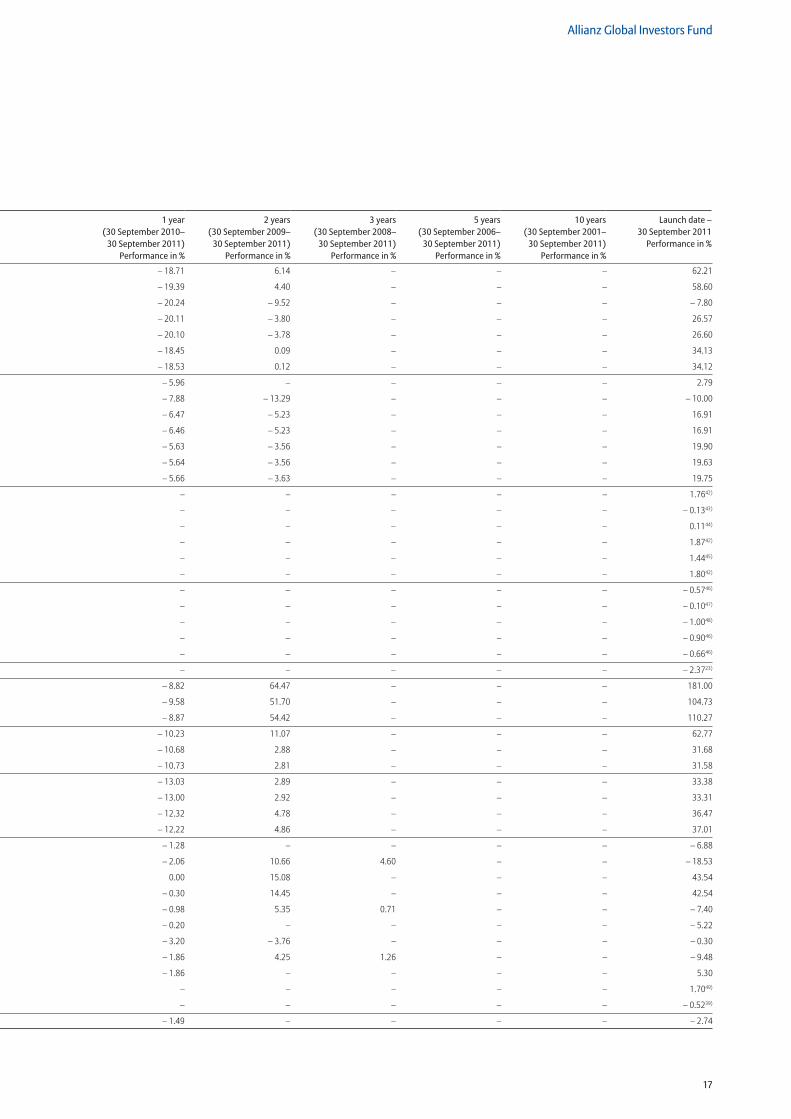
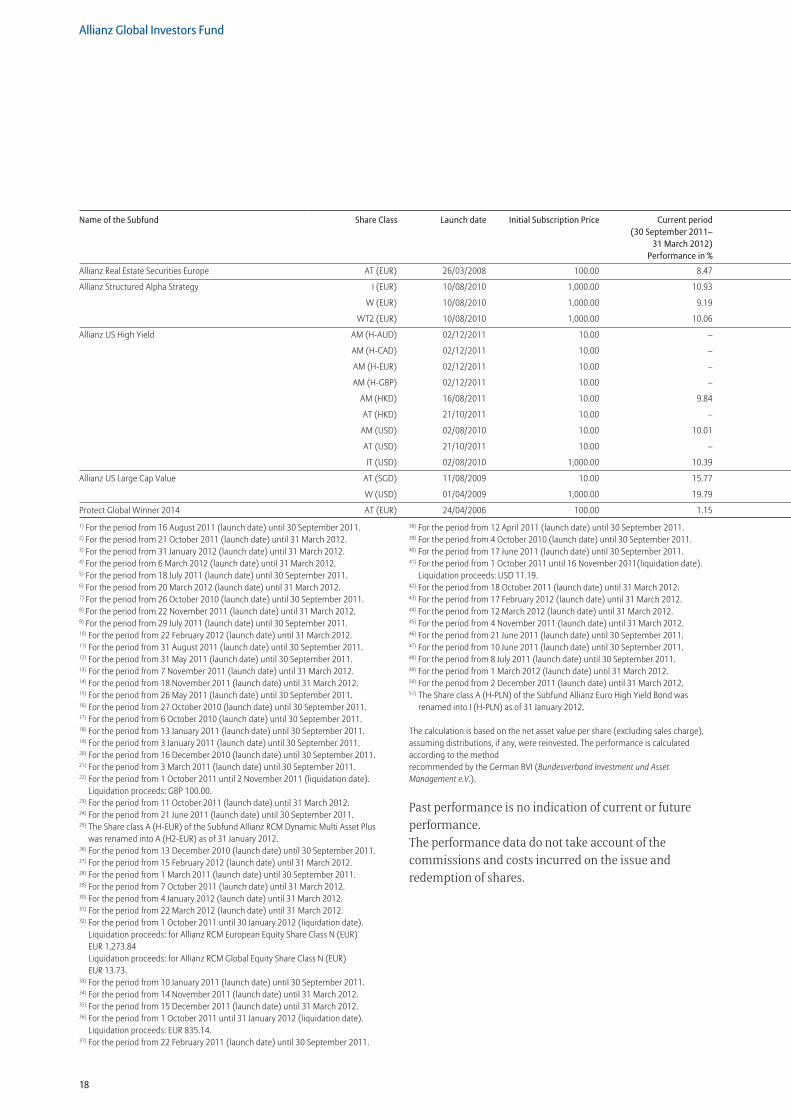
Performance
Allianz Asian Multi Income Plus AM (HKD) 16/08/2011 10.00 6.24 – – – – – – 6.621)
AT (HKD) 21/10/2011 10.00 – – – – – – 6.402)
AM (USD) 17/05/2010 10.00 6.68 – 1.20 – – – – 6.98
AT (USD) 21/10/2011 10.00 – – – – – – 6.502)
IT (USD) 15/07/2009 10.00 7.05 – 0.47 17.93 – – – 27.60
Allianz Convertible Bond A (EUR) 31/01/2012 100.00 – – – – – – 3.123)
AT (EUR) 31/01/2012 100.00 – – – – – – 3.163)
IT (EUR) 31/01/2012 1,000.00 – – – – – – 3.263)
Allianz Enhanced Fixed Income Euro W (EUR) 06/03/2012 1,000.00 – – – – – – – 0.264)
Allianz Euro Bond Strategy C (EUR) 09/02/2010 100.00 2.86 – 1.04 – – – – 3.91
CT (EUR) 09/02/2010 100.00 2.86 – 1.04 – – – – 3.90
IT (EUR) 09/02/2010 1,000.00 3.15 – 0.46 – – – – 4.92
Allianz Euro High Yield Bond A (EUR) 09/02/2010 100.00 16.66 – 10.41 – – – – – 0.39
AT (EUR) 09/02/2010 100.00 16.66 – 10.40 – – – – – 0.33
IT (EUR) 09/02/2010 1,000.00 17.02 – 9.87 – – – – 0.64
AT (H-PLN) 18/07/2011 400.00 18.61 – – – – – – 12.075)
I (H-PLN)51) 18/07/2011 400.00 18.80 – – – – – – 11.955)
Allianz Euro Investment Grade Bond Strategy IT (EUR) 20/03/2012 1,000.00 – – – – – – 0.146)
Allianz Euroland Equity SRI A (EUR) 26/10/2010 100.00 13.94 – – – – – – 21.417)
N (EUR) 26/10/2010 1,000.00 14.58 – – – – – – 20.567)
Allianz Flexible Bond Strategy A (EUR) 16/08/2011 100.00 2.01 – – – – – – 0.021)
C (EUR) 16/08/2011 100.00 1.91 – – – – – – 0.041)
CT (EUR) 22/11/2011 100.00 – – – – – – 2.628)
IT (EUR) 29/07/2011 1,000.00 2.26 – – – – – 0.839)
Allianz Income and Growth CT (H-EUR) 22/02/2012 100.00 – – – – – – 0.6310)
I (H-EUR) 31/08/2011 1,000.00 15.21 – – – – – – 3.8611)
IM (H-EUR) 31/05/2011 1,000.00 7.26 – – – – – – 10.5812)
IT (H-EUR) 07/11/2011 1,000.00 – – – – – – 7.2613)
AT (USD) 18/11/2011 10.00 – – – – – – 9.5014)
Allianz PIMCO Euro Bond A (EUR) 02/01/2004 10.00 5.93 – 3.52 8.15 11.38 6.39 – 18.07
AT (EUR) 23/04/2003 10.00 5.84 – 3.42 8.28 11.46 6.48 – 21.60
CT (EUR) 31/07/2007 10.00 5.82 – 3.56 7.98 11.08 – – 8.30
I (EUR) 23/04/2003 10.00 6.19 – 2.81 9.61 13.61 9.72 – 28.02
Allianz PIMCO Treasury Euro Bond Plus 2013 I (EUR) 12/11/2003 1,000.00 2.13 2.83 8.83 21.83 22.77 – 44.43
Allianz PIMCO Treasury Short Term Plus Euro A (EUR) 26/05/2011 100.00 0.85 – – – – – – 1.5515)
I (EUR) 12/11/2003 1,000.00 1.24 0.58 3.40 6.97 13.00 – 20.74
Allianz RCM Asia Pacific A (EUR) 11/01/2005 10.00 16.58 – 13.78 5.79 26.71 12.45 – 63.41
AT (EUR) 04/06/2007 10.00 16.50 – 13.75 5.82 26.74 – – – 10.90
CT (EUR) 04/06/2007 10.00 16.14 – 14.41 4.14 23.91 – – – 14.50
I (EUR) 11/01/2005 10.00 17.13 – 12.96 7.64 29.83 16.77 – 71.84
N (EUR) 12/12/2008 10.00 17.37 – 12.70 8.24 – – – 56.62
S (EUR) 12/12/2008 10.00 17.02 – 13.08 7.34 – – – 54.89
A (USD) 11/03/2005 10.00 14.65 – 14.31 – 1.92 19.61 16.65 – 49.51
I (USD) 11/01/2005 10.00 15.37 – 13.59 – 0.52 22.22 24.88 – 76.86
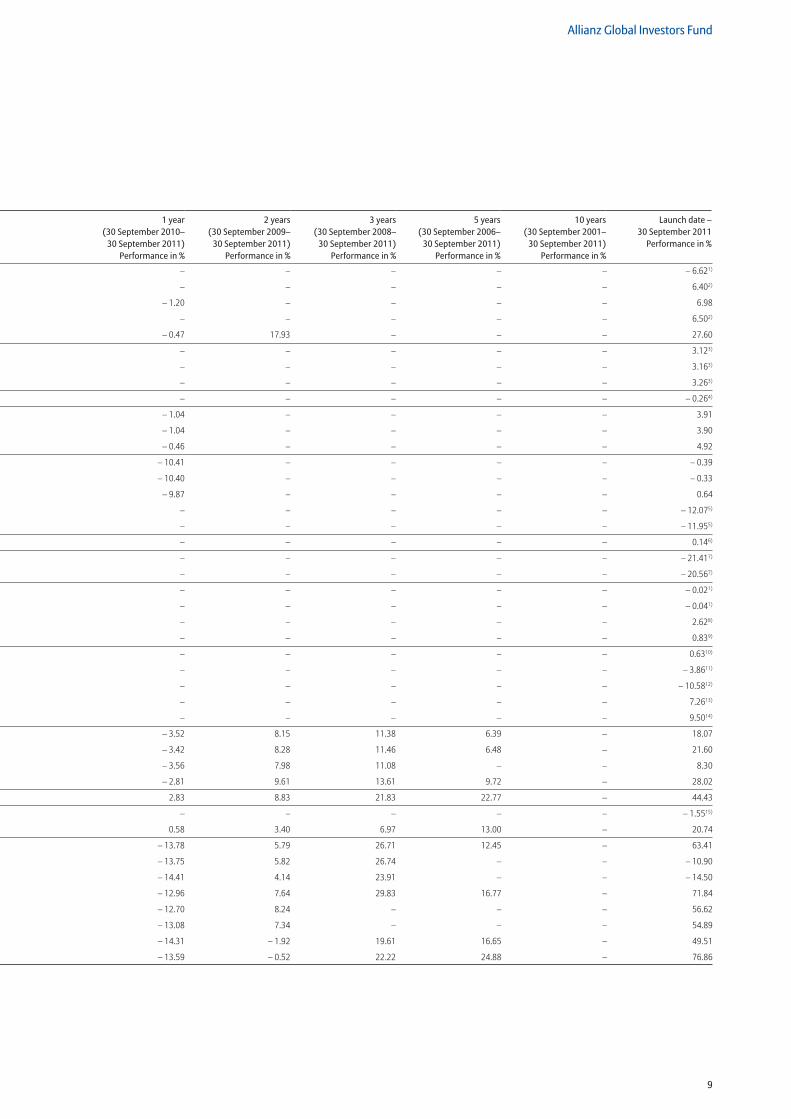
Name of the Subfund Share Class Launch date Initial Subscription Price Current period (30 September 2011–
31 March 2012) Performance in %
1 year (30 September 2010–
30 September 2011) Performance in %
2 years (30 September 2009–
30 September 2011)Performance in %
3 years (30 September 2008–
30 September 2011)Performance in %
5 years (30 September 2006–
30 September 2011)Performance in %
10 years (30 September 2001–
30 September 2011)Performance in %
Launch date – 30 September 2011
Performance in %
9
Allianz Global Investors Fund
Allianz Asian Multi Income Plus AM (HKD) 16/08/2011 10.00 6.24 – – – – – – 6.621)
AT (HKD) 21/10/2011 10.00 – – – – – – 6.402)
AM (USD) 17/05/2010 10.00 6.68 – 1.20 – – – – 6.98
AT (USD) 21/10/2011 10.00 – – – – – – 6.502)
IT (USD) 15/07/2009 10.00 7.05 – 0.47 17.93 – – – 27.60
Allianz Convertible Bond A (EUR) 31/01/2012 100.00 – – – – – – 3.123)
AT (EUR) 31/01/2012 100.00 – – – – – – 3.163)
IT (EUR) 31/01/2012 1,000.00 – – – – – – 3.263)
Allianz Enhanced Fixed Income Euro W (EUR) 06/03/2012 1,000.00 – – – – – – – 0.264)
Allianz Euro Bond Strategy C (EUR) 09/02/2010 100.00 2.86 – 1.04 – – – – 3.91
CT (EUR) 09/02/2010 100.00 2.86 – 1.04 – – – – 3.90
IT (EUR) 09/02/2010 1,000.00 3.15 – 0.46 – – – – 4.92
Allianz Euro High Yield Bond A (EUR) 09/02/2010 100.00 16.66 – 10.41 – – – – – 0.39
AT (EUR) 09/02/2010 100.00 16.66 – 10.40 – – – – – 0.33
IT (EUR) 09/02/2010 1,000.00 17.02 – 9.87 – – – – 0.64
AT (H-PLN) 18/07/2011 400.00 18.61 – – – – – – 12.075)
I (H-PLN)51) 18/07/2011 400.00 18.80 – – – – – – 11.955)
Allianz Euro Investment Grade Bond Strategy IT (EUR) 20/03/2012 1,000.00 – – – – – – 0.146)
Allianz Euroland Equity SRI A (EUR) 26/10/2010 100.00 13.94 – – – – – – 21.417)
N (EUR) 26/10/2010 1,000.00 14.58 – – – – – – 20.567)
Allianz Flexible Bond Strategy A (EUR) 16/08/2011 100.00 2.01 – – – – – – 0.021)
C (EUR) 16/08/2011 100.00 1.91 – – – – – – 0.041)
CT (EUR) 22/11/2011 100.00 – – – – – – 2.628)
IT (EUR) 29/07/2011 1,000.00 2.26 – – – – – 0.839)
Allianz Income and Growth CT (H-EUR) 22/02/2012 100.00 – – – – – – 0.6310)
I (H-EUR) 31/08/2011 1,000.00 15.21 – – – – – – 3.8611)
IM (H-EUR) 31/05/2011 1,000.00 7.26 – – – – – – 10.5812)
IT (H-EUR) 07/11/2011 1,000.00 – – – – – – 7.2613)
AT (USD) 18/11/2011 10.00 – – – – – – 9.5014)
Allianz PIMCO Euro Bond A (EUR) 02/01/2004 10.00 5.93 – 3.52 8.15 11.38 6.39 – 18.07
AT (EUR) 23/04/2003 10.00 5.84 – 3.42 8.28 11.46 6.48 – 21.60
CT (EUR) 31/07/2007 10.00 5.82 – 3.56 7.98 11.08 – – 8.30
I (EUR) 23/04/2003 10.00 6.19 – 2.81 9.61 13.61 9.72 – 28.02
Allianz PIMCO Treasury Euro Bond Plus 2013 I (EUR) 12/11/2003 1,000.00 2.13 2.83 8.83 21.83 22.77 – 44.43
Allianz PIMCO Treasury Short Term Plus Euro A (EUR) 26/05/2011 100.00 0.85 – – – – – – 1.5515)
I (EUR) 12/11/2003 1,000.00 1.24 0.58 3.40 6.97 13.00 – 20.74
Allianz RCM Asia Pacific A (EUR) 11/01/2005 10.00 16.58 – 13.78 5.79 26.71 12.45 – 63.41
AT (EUR) 04/06/2007 10.00 16.50 – 13.75 5.82 26.74 – – – 10.90
CT (EUR) 04/06/2007 10.00 16.14 – 14.41 4.14 23.91 – – – 14.50
I (EUR) 11/01/2005 10.00 17.13 – 12.96 7.64 29.83 16.77 – 71.84
N (EUR) 12/12/2008 10.00 17.37 – 12.70 8.24 – – – 56.62
S (EUR) 12/12/2008 10.00 17.02 – 13.08 7.34 – – – 54.89
A (USD) 11/03/2005 10.00 14.65 – 14.31 – 1.92 19.61 16.65 – 49.51
I (USD) 11/01/2005 10.00 15.37 – 13.59 – 0.52 22.22 24.88 – 76.86
Name of the Subfund Share Class Launch date Initial Subscription Price Current period (30 September 2011–
31 March 2012) Performance in %
1 year (30 September 2010–
30 September 2011) Performance in %
2 years (30 September 2009–
30 September 2011)Performance in %
3 years (30 September 2008–
30 September 2011)Performance in %
5 years (30 September 2006–
30 September 2011)Performance in %
10 years (30 September 2001–
30 September 2011)Performance in %
Launch date – 30 September 2011
Performance in %
10
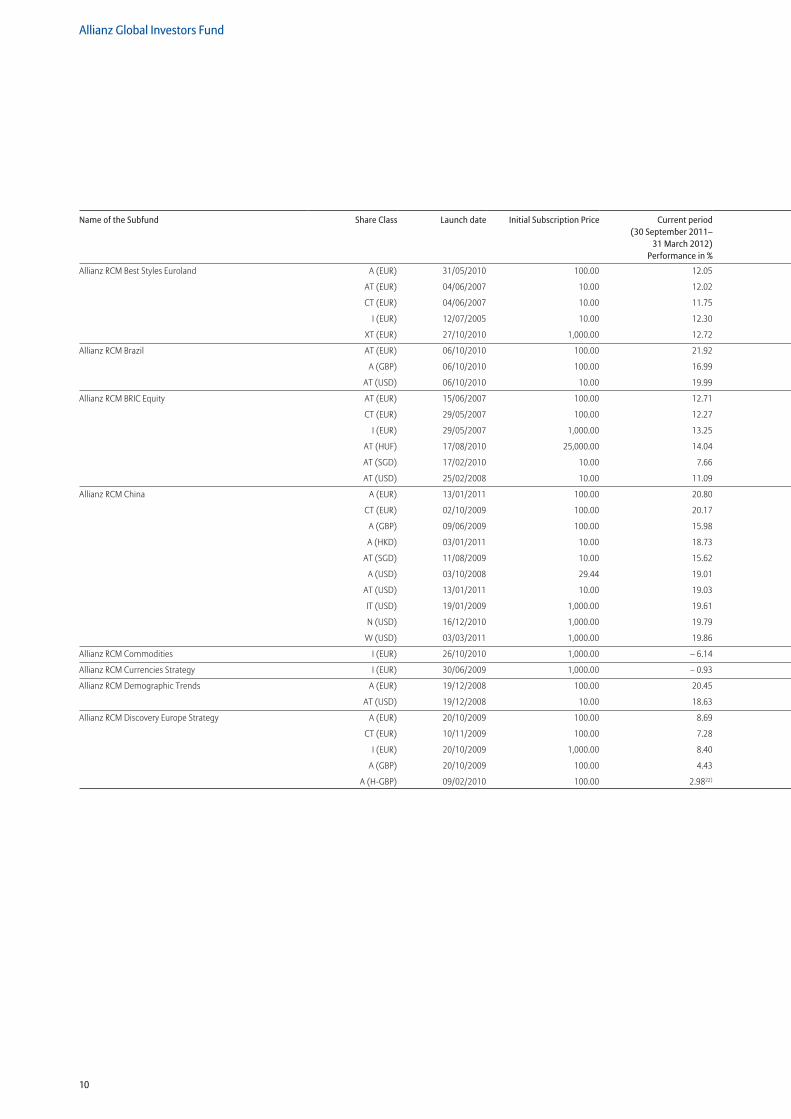
Allianz Global Investors Fund
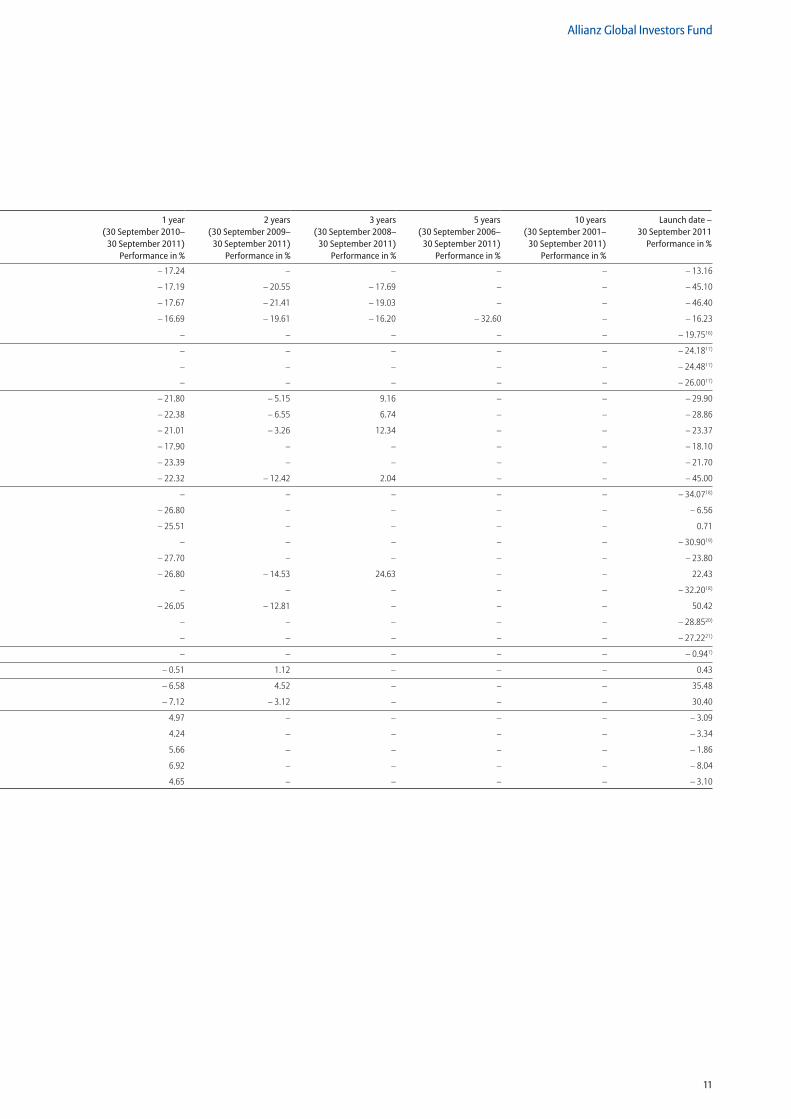
Allianz RCM Best Styles Euroland A (EUR) 31/05/2010 100.00 12.05 – 17.24 – – – – – 13.16
AT (EUR) 04/06/2007 10.00 12.02 – 17.19 – 20.55 – 17.69 – – – 45.10
CT (EUR) 04/06/2007 10.00 11.75 – 17.67 – 21.41 – 19.03 – – – 46.40
I (EUR) 12/07/2005 10.00 12.30 – 16.69 – 19.61 – 16.20 – 32.60 – – 16.23
XT (EUR) 27/10/2010 1,000.00 12.72 – – – – – – 19.7516)
Allianz RCM Brazil AT (EUR) 06/10/2010 100.00 21.92 – – – – – – 24.1817)
A (GBP) 06/10/2010 100.00 16.99 – – – – – – 24.4817)
AT (USD) 06/10/2010 10.00 19.99 – – – – – – 26.0017)
Allianz RCM BRIC Equity AT (EUR) 15/06/2007 100.00 12.71 – 21.80 – 5.15 9.16 – – – 29.90
CT (EUR) 29/05/2007 100.00 12.27 – 22.38 – 6.55 6.74 – – – 28.86
I (EUR) 29/05/2007 1,000.00 13.25 – 21.01 – 3.26 12.34 – – – 23.37
AT (HUF) 17/08/2010 25,000.00 14.04 – 17.90 – – – – – 18.10
AT (SGD) 17/02/2010 10.00 7.66 – 23.39 – – – – – 21.70
AT (USD) 25/02/2008 10.00 11.09 – 22.32 – 12.42 2.04 – – – 45.00
Allianz RCM China A (EUR) 13/01/2011 100.00 20.80 – – – – – – 34.0718)
CT (EUR) 02/10/2009 100.00 20.17 – 26.80 – – – – – 6.56
A (GBP) 09/06/2009 100.00 15.98 – 25.51 – – – – 0.71
A (HKD) 03/01/2011 10.00 18.73 – – – – – – 30.9019)
AT (SGD) 11/08/2009 10.00 15.62 – 27.70 – – – – – 23.80
A (USD) 03/10/2008 29.44 19.01 – 26.80 – 14.53 24.63 – – 22.43
AT (USD) 13/01/2011 10.00 19.03 – – – – – – 32.2018)
IT (USD) 19/01/2009 1,000.00 19.61 – 26.05 – 12.81 – – – 50.42
N (USD) 16/12/2010 1,000.00 19.79 – – – – – – 28.8520)
W (USD) 03/03/2011 1,000.00 19.86 – – – – – – 27.2221)
Allianz RCM Commodities I (EUR) 26/10/2010 1,000.00 – 6.14 – – – – – – 0.947)
Allianz RCM Currencies Strategy I (EUR) 30/06/2009 1,000.00 – 0.93 – 0.51 1.12 – – – 0.43
Allianz RCM Demographic Trends A (EUR) 19/12/2008 100.00 20.45 – 6.58 4.52 – – – 35.48
AT (USD) 19/12/2008 10.00 18.63 – 7.12 – 3.12 – – – 30.40
Allianz RCM Discovery Europe Strategy A (EUR) 20/10/2009 100.00 8.69 4.97 – – – – – 3.09
CT (EUR) 10/11/2009 100.00 7.28 4.24 – – – – – 3.34
I (EUR) 20/10/2009 1,000.00 8.40 5.66 – – – – – 1.86
A (GBP) 20/10/2009 100.00 4.43 6.92 – – – – – 8.04
A (H-GBP) 09/02/2010 100.00 2.9822) 4.65 – – – – – 3.10
Name of the Subfund Share Class Launch date Initial Subscription Price Current period (30 September 2011–
31 March 2012) Performance in %
1 year (30 September 2010–
30 September 2011) Performance in %
2 years (30 September 2009–
30 September 2011)Performance in %
3 years (30 September 2008–
30 September 2011)Performance in %
5 years (30 September 2006–
30 September 2011)Performance in %
10 years (30 September 2001–
30 September 2011)Performance in %
Launch date – 30 September 2011
Performance in %
11
Allianz Global Investors Fund
Allianz RCM Best Styles Euroland A (EUR) 31/05/2010 100.00 12.05 – 17.24 – – – – – 13.16
AT (EUR) 04/06/2007 10.00 12.02 – 17.19 – 20.55 – 17.69 – – – 45.10
CT (EUR) 04/06/2007 10.00 11.75 – 17.67 – 21.41 – 19.03 – – – 46.40
I (EUR) 12/07/2005 10.00 12.30 – 16.69 – 19.61 – 16.20 – 32.60 – – 16.23
XT (EUR) 27/10/2010 1,000.00 12.72 – – – – – – 19.7516)
Allianz RCM Brazil AT (EUR) 06/10/2010 100.00 21.92 – – – – – – 24.1817)
A (GBP) 06/10/2010 100.00 16.99 – – – – – – 24.4817)
AT (USD) 06/10/2010 10.00 19.99 – – – – – – 26.0017)
Allianz RCM BRIC Equity AT (EUR) 15/06/2007 100.00 12.71 – 21.80 – 5.15 9.16 – – – 29.90
CT (EUR) 29/05/2007 100.00 12.27 – 22.38 – 6.55 6.74 – – – 28.86
I (EUR) 29/05/2007 1,000.00 13.25 – 21.01 – 3.26 12.34 – – – 23.37
AT (HUF) 17/08/2010 25,000.00 14.04 – 17.90 – – – – – 18.10
AT (SGD) 17/02/2010 10.00 7.66 – 23.39 – – – – – 21.70
AT (USD) 25/02/2008 10.00 11.09 – 22.32 – 12.42 2.04 – – – 45.00
Allianz RCM China A (EUR) 13/01/2011 100.00 20.80 – – – – – – 34.0718)
CT (EUR) 02/10/2009 100.00 20.17 – 26.80 – – – – – 6.56
A (GBP) 09/06/2009 100.00 15.98 – 25.51 – – – – 0.71
A (HKD) 03/01/2011 10.00 18.73 – – – – – – 30.9019)
AT (SGD) 11/08/2009 10.00 15.62 – 27.70 – – – – – 23.80
A (USD) 03/10/2008 29.44 19.01 – 26.80 – 14.53 24.63 – – 22.43
AT (USD) 13/01/2011 10.00 19.03 – – – – – – 32.2018)
IT (USD) 19/01/2009 1,000.00 19.61 – 26.05 – 12.81 – – – 50.42
N (USD) 16/12/2010 1,000.00 19.79 – – – – – – 28.8520)
W (USD) 03/03/2011 1,000.00 19.86 – – – – – – 27.2221)
Allianz RCM Commodities I (EUR) 26/10/2010 1,000.00 – 6.14 – – – – – – 0.947)
Allianz RCM Currencies Strategy I (EUR) 30/06/2009 1,000.00 – 0.93 – 0.51 1.12 – – – 0.43
Allianz RCM Demographic Trends A (EUR) 19/12/2008 100.00 20.45 – 6.58 4.52 – – – 35.48
AT (USD) 19/12/2008 10.00 18.63 – 7.12 – 3.12 – – – 30.40
Allianz RCM Discovery Europe Strategy A (EUR) 20/10/2009 100.00 8.69 4.97 – – – – – 3.09
CT (EUR) 10/11/2009 100.00 7.28 4.24 – – – – – 3.34
I (EUR) 20/10/2009 1,000.00 8.40 5.66 – – – – – 1.86
A (GBP) 20/10/2009 100.00 4.43 6.92 – – – – – 8.04
A (H-GBP) 09/02/2010 100.00 2.9822) 4.65 – – – – – 3.10
Name of the Subfund Share Class Launch date Initial Subscription Price Current period (30 September 2011–
31 March 2012) Performance in %
1 year (30 September 2010–
30 September 2011) Performance in %
2 years (30 September 2009–
30 September 2011)Performance in %
3 years (30 September 2008–
30 September 2011)Performance in %
5 years (30 September 2006–
30 September 2011)Performance in %
10 years (30 September 2001–
30 September 2011)Performance in %
Launch date – 30 September 2011
Performance in %
12
Allianz Global Investors Fund
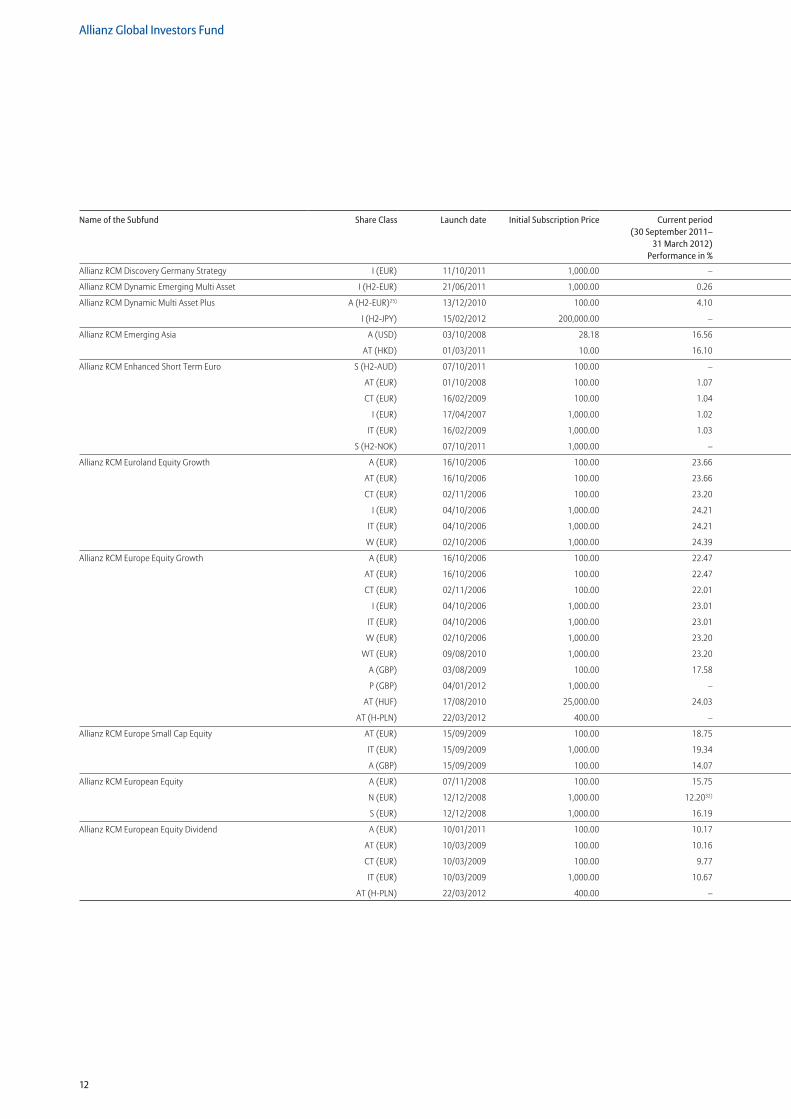
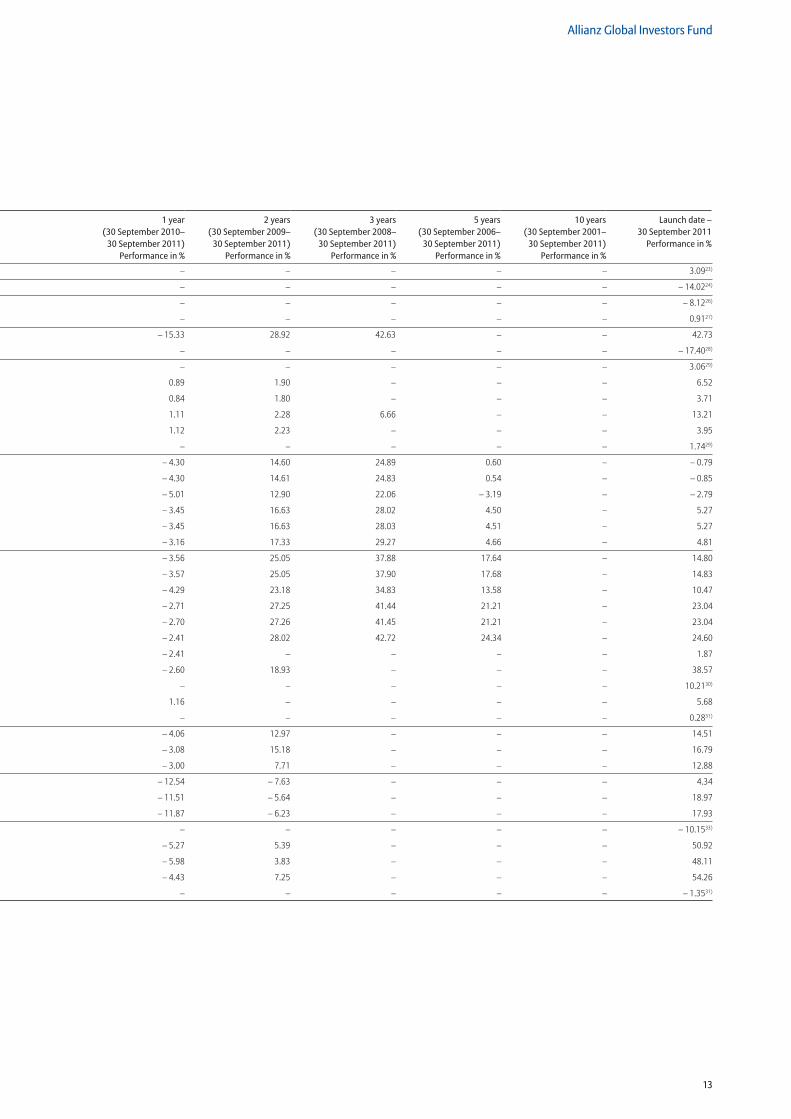
Allianz RCM Discovery Germany Strategy I (EUR) 11/10/2011 1,000.00 – – – – – – 3.0923)
Allianz RCM Dynamic Emerging Multi Asset I (H2-EUR) 21/06/2011 1,000.00 0.26 – – – – – – 14.0224)
Allianz RCM Dynamic Multi Asset Plus A (H2-EUR)25) 13/12/2010 100.00 4.10 – – – – – – 8.1226)
I (H2-JPY) 15/02/2012 200,000.00 – – – – – – 0.9127)
Allianz RCM Emerging Asia A (USD) 03/10/2008 28.18 16.56 – 15.33 28.92 42.63 – – 42.73
AT (HKD) 01/03/2011 10.00 16.10 – – – – – – 17.4028)
Allianz RCM Enhanced Short Term Euro S (H2-AUD) 07/10/2011 100.00 – – – – – – 3.0629)
AT (EUR) 01/10/2008 100.00 1.07 0.89 1.90 – – – 6.52
CT (EUR) 16/02/2009 100.00 1.04 0.84 1.80 – – – 3.71
I (EUR) 17/04/2007 1,000.00 1.02 1.11 2.28 6.66 – – 13.21
IT (EUR) 16/02/2009 1,000.00 1.03 1.12 2.23 – – – 3.95
S (H2-NOK) 07/10/2011 1,000.00 – – – – – – 1.7429)
Allianz RCM Euroland Equity Growth A (EUR) 16/10/2006 100.00 23.66 – 4.30 14.60 24.89 0.60 – – 0.79
AT (EUR) 16/10/2006 100.00 23.66 – 4.30 14.61 24.83 0.54 – – 0.85
CT (EUR) 02/11/2006 100.00 23.20 – 5.01 12.90 22.06 – 3.19 – – 2.79
I (EUR) 04/10/2006 1,000.00 24.21 – 3.45 16.63 28.02 4.50 – 5.27
IT (EUR) 04/10/2006 1,000.00 24.21 – 3.45 16.63 28.03 4.51 – 5.27
W (EUR) 02/10/2006 1,000.00 24.39 – 3.16 17.33 29.27 4.66 – 4.81
Allianz RCM Europe Equity Growth A (EUR) 16/10/2006 100.00 22.47 – 3.56 25.05 37.88 17.64 – 14.80
AT (EUR) 16/10/2006 100.00 22.47 – 3.57 25.05 37.90 17.68 – 14.83
CT (EUR) 02/11/2006 100.00 22.01 – 4.29 23.18 34.83 13.58 – 10.47
I (EUR) 04/10/2006 1,000.00 23.01 – 2.71 27.25 41.44 21.21 – 23.04
IT (EUR) 04/10/2006 1,000.00 23.01 – 2.70 27.26 41.45 21.21 – 23.04
W (EUR) 02/10/2006 1,000.00 23.20 – 2.41 28.02 42.72 24.34 – 24.60
WT (EUR) 09/08/2010 1,000.00 23.20 – 2.41 – – – – 1.87
A (GBP) 03/08/2009 100.00 17.58 – 2.60 18.93 – – – 38.57
P (GBP) 04/01/2012 1,000.00 – – – – – – 10.2130)
AT (HUF) 17/08/2010 25,000.00 24.03 1.16 – – – – 5.68
AT (H-PLN) 22/03/2012 400.00 – – – – – – 0.2831)
Allianz RCM Europe Small Cap Equity AT (EUR) 15/09/2009 100.00 18.75 – 4.06 12.97 – – – 14.51
IT (EUR) 15/09/2009 1,000.00 19.34 – 3.08 15.18 – – – 16.79
A (GBP) 15/09/2009 100.00 14.07 – 3.00 7.71 – – – 12.88
Allianz RCM European Equity A (EUR) 07/11/2008 100.00 15.75 – 12.54 – 7.63 – – – 4.34
N (EUR) 12/12/2008 1,000.00 12.2032) – 11.51 – 5.64 – – – 18.97
S (EUR) 12/12/2008 1,000.00 16.19 – 11.87 – 6.23 – – – 17.93
Allianz RCM European Equity Dividend A (EUR) 10/01/2011 100.00 10.17 – – – – – – 10.1533)
AT (EUR) 10/03/2009 100.00 10.16 – 5.27 5.39 – – – 50.92
CT (EUR) 10/03/2009 100.00 9.77 – 5.98 3.83 – – – 48.11
IT (EUR) 10/03/2009 1,000.00 10.67 – 4.43 7.25 – – – 54.26
AT (H-PLN) 22/03/2012 400.00 – – – – – – – 1.3531)
Name of the Subfund Share Class Launch date Initial Subscription Price Current period (30 September 2011–
31 March 2012) Performance in %
1 year (30 September 2010–
30 September 2011) Performance in %
2 years (30 September 2009–
30 September 2011)Performance in %
3 years (30 September 2008–
30 September 2011)Performance in %
5 years (30 September 2006–
30 September 2011)Performance in %
10 years (30 September 2001–
30 September 2011)Performance in %
Launch date – 30 September 2011
Performance in %
13
Allianz Global Investors Fund
Allianz RCM Discovery Germany Strategy I (EUR) 11/10/2011 1,000.00 – – – – – – 3.0923)
Allianz RCM Dynamic Emerging Multi Asset I (H2-EUR) 21/06/2011 1,000.00 0.26 – – – – – – 14.0224)
Allianz RCM Dynamic Multi Asset Plus A (H2-EUR)25) 13/12/2010 100.00 4.10 – – – – – – 8.1226)
I (H2-JPY) 15/02/2012 200,000.00 – – – – – – 0.9127)
Allianz RCM Emerging Asia A (USD) 03/10/2008 28.18 16.56 – 15.33 28.92 42.63 – – 42.73
AT (HKD) 01/03/2011 10.00 16.10 – – – – – – 17.4028)
Allianz RCM Enhanced Short Term Euro S (H2-AUD) 07/10/2011 100.00 – – – – – – 3.0629)
AT (EUR) 01/10/2008 100.00 1.07 0.89 1.90 – – – 6.52
CT (EUR) 16/02/2009 100.00 1.04 0.84 1.80 – – – 3.71
I (EUR) 17/04/2007 1,000.00 1.02 1.11 2.28 6.66 – – 13.21
IT (EUR) 16/02/2009 1,000.00 1.03 1.12 2.23 – – – 3.95
S (H2-NOK) 07/10/2011 1,000.00 – – – – – – 1.7429)
Allianz RCM Euroland Equity Growth A (EUR) 16/10/2006 100.00 23.66 – 4.30 14.60 24.89 0.60 – – 0.79
AT (EUR) 16/10/2006 100.00 23.66 – 4.30 14.61 24.83 0.54 – – 0.85
CT (EUR) 02/11/2006 100.00 23.20 – 5.01 12.90 22.06 – 3.19 – – 2.79
I (EUR) 04/10/2006 1,000.00 24.21 – 3.45 16.63 28.02 4.50 – 5.27
IT (EUR) 04/10/2006 1,000.00 24.21 – 3.45 16.63 28.03 4.51 – 5.27
W (EUR) 02/10/2006 1,000.00 24.39 – 3.16 17.33 29.27 4.66 – 4.81
Allianz RCM Europe Equity Growth A (EUR) 16/10/2006 100.00 22.47 – 3.56 25.05 37.88 17.64 – 14.80
AT (EUR) 16/10/2006 100.00 22.47 – 3.57 25.05 37.90 17.68 – 14.83
CT (EUR) 02/11/2006 100.00 22.01 – 4.29 23.18 34.83 13.58 – 10.47
I (EUR) 04/10/2006 1,000.00 23.01 – 2.71 27.25 41.44 21.21 – 23.04
IT (EUR) 04/10/2006 1,000.00 23.01 – 2.70 27.26 41.45 21.21 – 23.04
W (EUR) 02/10/2006 1,000.00 23.20 – 2.41 28.02 42.72 24.34 – 24.60
WT (EUR) 09/08/2010 1,000.00 23.20 – 2.41 – – – – 1.87
A (GBP) 03/08/2009 100.00 17.58 – 2.60 18.93 – – – 38.57
P (GBP) 04/01/2012 1,000.00 – – – – – – 10.2130)
AT (HUF) 17/08/2010 25,000.00 24.03 1.16 – – – – 5.68
AT (H-PLN) 22/03/2012 400.00 – – – – – – 0.2831)
Allianz RCM Europe Small Cap Equity AT (EUR) 15/09/2009 100.00 18.75 – 4.06 12.97 – – – 14.51
IT (EUR) 15/09/2009 1,000.00 19.34 – 3.08 15.18 – – – 16.79
A (GBP) 15/09/2009 100.00 14.07 – 3.00 7.71 – – – 12.88
Allianz RCM European Equity A (EUR) 07/11/2008 100.00 15.75 – 12.54 – 7.63 – – – 4.34
N (EUR) 12/12/2008 1,000.00 12.2032) – 11.51 – 5.64 – – – 18.97
S (EUR) 12/12/2008 1,000.00 16.19 – 11.87 – 6.23 – – – 17.93
Allianz RCM European Equity Dividend A (EUR) 10/01/2011 100.00 10.17 – – – – – – 10.1533)
AT (EUR) 10/03/2009 100.00 10.16 – 5.27 5.39 – – – 50.92
CT (EUR) 10/03/2009 100.00 9.77 – 5.98 3.83 – – – 48.11
IT (EUR) 10/03/2009 1,000.00 10.67 – 4.43 7.25 – – – 54.26
AT (H-PLN) 22/03/2012 400.00 – – – – – – – 1.3531)
Name of the Subfund Share Class Launch date Initial Subscription Price Current period (30 September 2011–
31 March 2012) Performance in %
1 year (30 September 2010–
30 September 2011) Performance in %
2 years (30 September 2009–
30 September 2011)Performance in %
3 years (30 September 2008–
30 September 2011)Performance in %
5 years (30 September 2006–
30 September 2011)Performance in %
10 years (30 September 2001–
30 September 2011)Performance in %
Launch date – 30 September 2011
Performance in %
14
Allianz Global Investors Fund
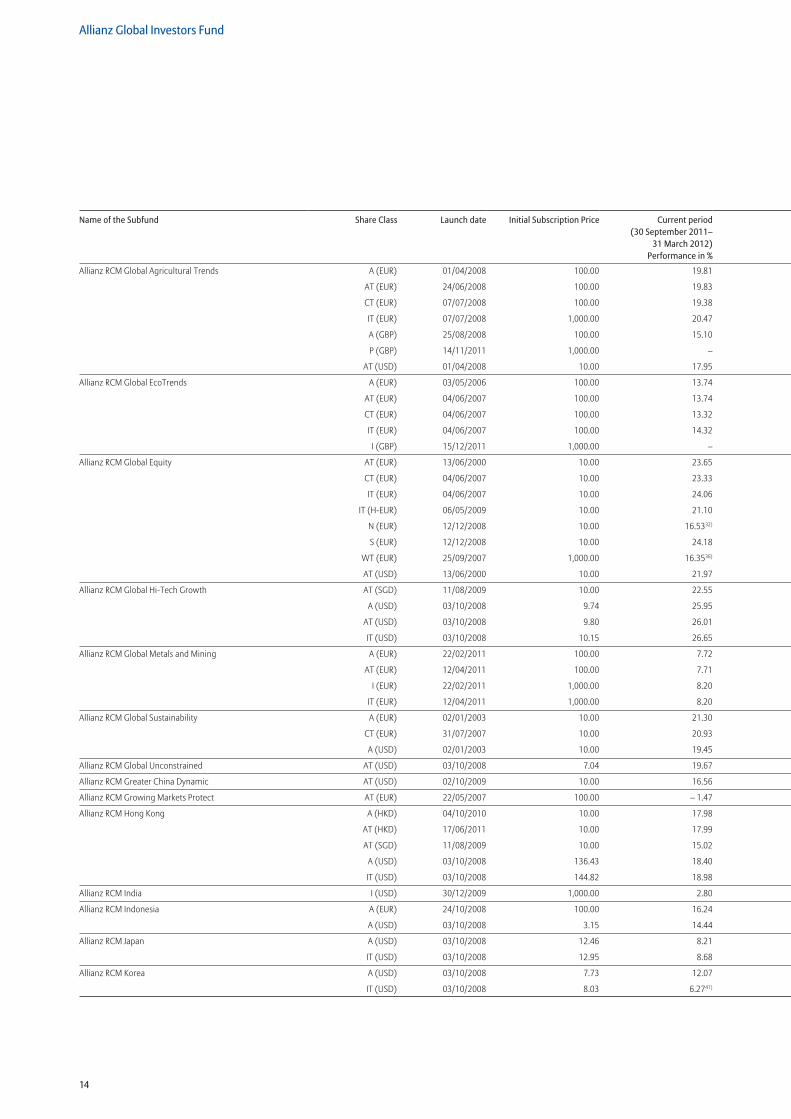
Allianz RCM Global Agricultural Trends A (EUR) 01/04/2008 100.00 19.81 – 3.63 28.45 24.39 – – 3.01
AT (EUR) 24/06/2008 100.00 19.83 – 4.04 27.36 23.03 – – – 17.84
CT (EUR) 07/07/2008 100.00 19.38 – 4.23 26.61 21.86 – – – 9.37
IT (EUR) 07/07/2008 1,000.00 20.47 – 2.54 30.72 27.80 – – – 4.62
A (GBP) 25/08/2008 100.00 15.10 – 2.77 21.72 34.79 – – 3.24
P (GBP) 14/11/2011 1,000.00 – – – – – – 4.9034)
AT (USD) 01/04/2008 10.00 17.95 – 4.17 18.81 17.25 – – – 10.30
Allianz RCM Global EcoTrends A (EUR) 03/05/2006 100.00 13.74 – 12.98 – 18.63 – 34.24 – 24.92 – – 35.04
AT (EUR) 04/06/2007 100.00 13.74 – 12.99 – 18.63 – 34.23 – – – 47.15
CT (EUR) 04/06/2007 100.00 13.32 – 13.63 – 19.83 – 35.70 – – – 48.87
IT (EUR) 04/06/2007 100.00 14.32 – 12.10 – 17.00 – 32.30 – – – 44.92
I (GBP) 15/12/2011 1,000.00 – – – – – – 10.2735)
Allianz RCM Global Equity AT (EUR) 13/06/2000 10.00 23.65 – 5.28 5.69 – 7.47 – 22.96 – 18.88 – 48.00
CT (EUR) 04/06/2007 10.00 23.33 – 6.12 4.10 – 8.97 – – – 34.00
IT (EUR) 04/06/2007 10.00 24.06 – 4.56 7.64 – 4.83 – – – 31.00
IT (H-EUR) 06/05/2009 10.00 21.10 – 6.28 – 2.68 – – – 9.00
N (EUR) 12/12/2008 10.00 16.5332) – 4.41 8.05 – – – 21.45
S (EUR) 12/12/2008 10.00 24.18 – 4.68 7.26 – – – 20.24
WT (EUR) 25/09/2007 1,000.00 16.3536) – 4.34 8.16 – 3.39 – – – 28.22
AT (USD) 13/06/2000 10.00 21.97 – 6.08 – 2.11 – 12.19 – 16.82 21.04 – 25.80
Allianz RCM Global Hi-Tech Growth AT (SGD) 11/08/2009 10.00 22.55 – 12.31 – 10.65 – – – – 6.00
A (USD) 03/10/2008 9.74 25.95 – 11.37 – 3.44 – – – 8.26
AT (USD) 03/10/2008 9.80 26.01 – 11.36 – 3.37 – – – 8.27
IT (USD) 03/10/2008 10.15 26.65 – 10.43 – 1.39 – – – 11.63
Allianz RCM Global Metals and Mining A (EUR) 22/02/2011 100.00 7.72 – – – – – – 30.8937)
AT (EUR) 12/04/2011 100.00 7.71 – – – – – – 30.0038)
I (EUR) 22/02/2011 1,000.00 8.20 – – – – – – 30.5237)
IT (EUR) 12/04/2011 1,000.00 8.20 – – – – – – 29.7238)
Allianz RCM Global Sustainability A (EUR) 02/01/2003 10.00 21.30 – 6.46 6.49 1.38 – 18.20 – 18.46
CT (EUR) 31/07/2007 10.00 20.93 – 7.29 4.86 – 0.97 – – – 28.80
A (USD) 02/01/2003 10.00 19.45 – 7.07 – 1.24 – 4.70 – 12.86 – 56.36
Allianz RCM Global Unconstrained AT (USD) 03/10/2008 7.04 19.67 – 9.57 – 8.47 – – – – 14.06
Allianz RCM Greater China Dynamic AT (USD) 02/10/2009 10.00 16.56 – 19.83 – – – – – 3.40
Allianz RCM Growing Markets Protect AT (EUR) 22/05/2007 100.00 – 1.47 – 3.85 – 1.62 3.48 – – – 0.47
Allianz RCM Hong Kong A (HKD) 04/10/2010 10.00 17.98 – – – – – – 25.0039)
AT (HKD) 17/06/2011 10.00 17.99 – – – – – – 24.4040)
AT (SGD) 11/08/2009 10.00 15.02 – 25.46 – 14.63 – – – – 14.80
A (USD) 03/10/2008 136.43 18.40 – 24.47 – 7.58 29.74 – – 29.86
IT (USD) 03/10/2008 144.82 18.98 – 23.71 – 5.73 33.51 – – 33.61
Allianz RCM India I (USD) 30/12/2009 1,000.00 2.80 – 24.72 – – – – – 10.83
Allianz RCM Indonesia A (EUR) 24/10/2008 100.00 16.24 – 2.21 48.94 – – – 222.22
A (USD) 03/10/2008 3.15 14.44 – 3.14 37.48 – – – 92.03
Allianz RCM Japan A (USD) 03/10/2008 12.46 8.21 1.84 1.69 – – – 2.67
IT (USD) 03/10/2008 12.95 8.68 2.77 3.55 – – – 5.87
Allianz RCM Korea A (USD) 03/10/2008 7.73 12.07 – 7.95 5.02 – – – 27.30
IT (USD) 03/10/2008 8.03 6.2741) – 6.98 7.23 – – – 31.13
Name of the Subfund Share Class Launch date Initial Subscription Price Current period (30 September 2011–
31 March 2012) Performance in %
1 year (30 September 2010–
30 September 2011) Performance in %
2 years (30 September 2009–
30 September 2011)Performance in %
3 years (30 September 2008–
30 September 2011)Performance in %
5 years (30 September 2006–
30 September 2011)Performance in %
10 years (30 September 2001–
30 September 2011)Performance in %
Launch date – 30 September 2011
Performance in %
15
Allianz Global Investors Fund
Allianz RCM Global Agricultural Trends A (EUR) 01/04/2008 100.00 19.81 – 3.63 28.45 24.39 – – 3.01
AT (EUR) 24/06/2008 100.00 19.83 – 4.04 27.36 23.03 – – – 17.84
CT (EUR) 07/07/2008 100.00 19.38 – 4.23 26.61 21.86 – – – 9.37
IT (EUR) 07/07/2008 1,000.00 20.47 – 2.54 30.72 27.80 – – – 4.62
A (GBP) 25/08/2008 100.00 15.10 – 2.77 21.72 34.79 – – 3.24
P (GBP) 14/11/2011 1,000.00 – – – – – – 4.9034)
AT (USD) 01/04/2008 10.00 17.95 – 4.17 18.81 17.25 – – – 10.30
Allianz RCM Global EcoTrends A (EUR) 03/05/2006 100.00 13.74 – 12.98 – 18.63 – 34.24 – 24.92 – – 35.04
AT (EUR) 04/06/2007 100.00 13.74 – 12.99 – 18.63 – 34.23 – – – 47.15
CT (EUR) 04/06/2007 100.00 13.32 – 13.63 – 19.83 – 35.70 – – – 48.87
IT (EUR) 04/06/2007 100.00 14.32 – 12.10 – 17.00 – 32.30 – – – 44.92
I (GBP) 15/12/2011 1,000.00 – – – – – – 10.2735)
Allianz RCM Global Equity AT (EUR) 13/06/2000 10.00 23.65 – 5.28 5.69 – 7.47 – 22.96 – 18.88 – 48.00
CT (EUR) 04/06/2007 10.00 23.33 – 6.12 4.10 – 8.97 – – – 34.00
IT (EUR) 04/06/2007 10.00 24.06 – 4.56 7.64 – 4.83 – – – 31.00
IT (H-EUR) 06/05/2009 10.00 21.10 – 6.28 – 2.68 – – – 9.00
N (EUR) 12/12/2008 10.00 16.5332) – 4.41 8.05 – – – 21.45
S (EUR) 12/12/2008 10.00 24.18 – 4.68 7.26 – – – 20.24
WT (EUR) 25/09/2007 1,000.00 16.3536) – 4.34 8.16 – 3.39 – – – 28.22
AT (USD) 13/06/2000 10.00 21.97 – 6.08 – 2.11 – 12.19 – 16.82 21.04 – 25.80
Allianz RCM Global Hi-Tech Growth AT (SGD) 11/08/2009 10.00 22.55 – 12.31 – 10.65 – – – – 6.00
A (USD) 03/10/2008 9.74 25.95 – 11.37 – 3.44 – – – 8.26
AT (USD) 03/10/2008 9.80 26.01 – 11.36 – 3.37 – – – 8.27
IT (USD) 03/10/2008 10.15 26.65 – 10.43 – 1.39 – – – 11.63
Allianz RCM Global Metals and Mining A (EUR) 22/02/2011 100.00 7.72 – – – – – – 30.8937)
AT (EUR) 12/04/2011 100.00 7.71 – – – – – – 30.0038)
I (EUR) 22/02/2011 1,000.00 8.20 – – – – – – 30.5237)
IT (EUR) 12/04/2011 1,000.00 8.20 – – – – – – 29.7238)
Allianz RCM Global Sustainability A (EUR) 02/01/2003 10.00 21.30 – 6.46 6.49 1.38 – 18.20 – 18.46
CT (EUR) 31/07/2007 10.00 20.93 – 7.29 4.86 – 0.97 – – – 28.80
A (USD) 02/01/2003 10.00 19.45 – 7.07 – 1.24 – 4.70 – 12.86 – 56.36
Allianz RCM Global Unconstrained AT (USD) 03/10/2008 7.04 19.67 – 9.57 – 8.47 – – – – 14.06
Allianz RCM Greater China Dynamic AT (USD) 02/10/2009 10.00 16.56 – 19.83 – – – – – 3.40
Allianz RCM Growing Markets Protect AT (EUR) 22/05/2007 100.00 – 1.47 – 3.85 – 1.62 3.48 – – – 0.47
Allianz RCM Hong Kong A (HKD) 04/10/2010 10.00 17.98 – – – – – – 25.0039)
AT (HKD) 17/06/2011 10.00 17.99 – – – – – – 24.4040)
AT (SGD) 11/08/2009 10.00 15.02 – 25.46 – 14.63 – – – – 14.80
A (USD) 03/10/2008 136.43 18.40 – 24.47 – 7.58 29.74 – – 29.86
IT (USD) 03/10/2008 144.82 18.98 – 23.71 – 5.73 33.51 – – 33.61
Allianz RCM India I (USD) 30/12/2009 1,000.00 2.80 – 24.72 – – – – – 10.83
Allianz RCM Indonesia A (EUR) 24/10/2008 100.00 16.24 – 2.21 48.94 – – – 222.22
A (USD) 03/10/2008 3.15 14.44 – 3.14 37.48 – – – 92.03
Allianz RCM Japan A (USD) 03/10/2008 12.46 8.21 1.84 1.69 – – – 2.67
IT (USD) 03/10/2008 12.95 8.68 2.77 3.55 – – – 5.87
Allianz RCM Korea A (USD) 03/10/2008 7.73 12.07 – 7.95 5.02 – – – 27.30
IT (USD) 03/10/2008 8.03 6.2741) – 6.98 7.23 – – – 31.13
Name of the Subfund Share Class Launch date Initial Subscription Price Current period (30 September 2011–
31 March 2012) Performance in %
1 year (30 September 2010–
30 September 2011) Performance in %
2 years (30 September 2009–
30 September 2011)Performance in %
3 years (30 September 2008–
30 September 2011)Performance in %
5 years (30 September 2006–
30 September 2011)Performance in %
10 years (30 September 2001–
30 September 2011)Performance in %
Launch date – 30 September 2011
Performance in %
16
Allianz Global Investors Fund
Allianz RCM Little Dragons A2 (EUR) 12/12/2008 100.00 18.17 – 18.71 6.14 – – – 62.21
CT2 (EUR) 12/12/2008 100.00 17.72 – 19.39 4.40 – – – 58.60
AT (SGD) 11/08/2009 10.00 13.23 – 20.24 – 9.52 – – – – 7.80
A (USD) 03/10/2008 63.69 15.84 – 20.11 – 3.80 – – – 26.57
AT (USD) 03/10/2008 63.73 15.83 – 20.10 – 3.78 – – – 26.60
IT (USD) 03/10/2008 67.39 17.00 – 18.45 0.09 – – – 34.13
PT (USD) 03/10/2008 6.36 16.88 – 18.53 0.12 – – – 34.12
Allianz RCM Oriental Income AT (EUR) 07/12/2009 100.00 15.38 – 5.96 – – – – 2.79
AT (SGD) 11/08/2009 10.00 10.22 – 7.88 – 13.29 – – – – 10.00
A (USD) 03/10/2008 15.23 13.64 – 6.47 – 5.23 – – – 16.91
AT (USD) 03/10/2008 15.28 13.64 – 6.46 – 5.23 – – – 16.91
I (USD) 03/10/2008 64.21 14.15 – 5.63 – 3.56 – – – 19.90
IT (USD) 03/10/2008 66.47 14.15 – 5.64 – 3.56 – – – 19.63
P (USD) 03/10/2008 68.11 14.13 – 5.66 – 3.63 – – – 19.75
Allianz RCM Renminbi Currency A (H2-EUR) 18/10/2011 100.00 – – – – – – 1.7642)
AT (H2-EUR) 17/02/2012 100.00 – – – – – – – 0.1343)
CT (H2-EUR) 12/03/2012 100.00 – – – – – – 0.1144)
I (H2-EUR) 18/10/2011 1,000.00 – – – – – – 1.8742)
A (H2-GBP) 04/11/2011 100.00 – – – – – – 1.4445)
A (USD) 18/10/2011 10.00 – – – – – – 1.8042)
Allianz RCM Renminbi Fixed Income A (H2-EUR) 21/06/2011 100.00 3.18 – – – – – – 0.5746)
I (H2-EUR) 10/06/2011 1,000.00 3.77 – – – – – – 0.1047)
P (H2-GBP) 08/07/2011 1,000.00 3.62 – – – – – – 1.0048)
A (USD) 21/06/2011 10.00 3.33 – – – – – – 0.9046)
P (USD) 21/06/2011 1,000.00 3.61 – – – – – – 0.6646)
Allianz RCM Tech Alpha Plus Strategy I (USD) 11/10/2011 1,000.00 – – – – – – – 2.3723)
Allianz RCM Thailand A (EUR) 24/10/2008 100.00 35.75 – 8.82 64.47 – – – 181.00
A (USD) 03/10/2008 12.27 33.76 – 9.58 51.70 – – – 104.73
IT (USD) 03/10/2008 13.05 34.40 – 8.87 54.42 – – – 110.27
Allianz RCM Tiger A (EUR) 28/11/2008 100.00 19.45 – 10.23 11.07 – – – 62.77
A (USD) 03/10/2008 47.27 17.66 – 10.68 2.88 – – – 31.68
AT (USD) 03/10/2008 47.31 17.67 – 10.73 2.81 – – – 31.58
Allianz RCM Total Return Asian Equity A (USD) 03/10/2008 9.49 18.94 – 13.03 2.89 – – – 33.38
AT (USD) 03/10/2008 64.81 18.93 – 13.00 2.92 – – – 33.31
IT (USD) 03/10/2008 16.07 19.56 – 12.32 4.78 – – – 36.47
PT (USD) 03/10/2008 16.05 19.55 – 12.22 4.86 – – – 37.01
Allianz RCM US Equity Fund A (EUR) 25/03/2010 100.00 24.52 – 1.28 – – – – – 6.88
CT (EUR) 31/07/2007 100.00 23.96 – 2.06 10.66 4.60 – – – 18.53
N (EUR) 12/12/2008 1,000.00 25.21 0.00 15.08 – – – 43.54
S (EUR) 12/12/2008 1,000.00 24.90 – 0.30 14.45 – – – 42.54
W (H-EUR) 12/12/2006 1,000.00 22.38 – 0.98 5.35 0.71 – – – 7.40
A (GBP) 05/03/2010 100.00 19.54 – 0.20 – – – – – 5.22
AT (SGD) 11/08/2009 10.00 18.96 – 3.20 – 3.76 – – – – 0.30
A (USD) 15/02/2008 10.00 22.59 – 1.86 4.25 1.26 – – – 9.48
A2 (USD) 07/06/2010 10.00 22.51 – 1.86 – – – – 5.30
AT (USD) 01/03/2012 10.00 – – – – – – 1.7049)
N (USD) 04/10/2010 1,000.00 23.27 – – – – – – 0.5239)
Allianz RCM USD Liquidity A (USD) 03/10/2008 65.15 – 0.33 – 1.49 – – – – – 2.74
Name of the Subfund Share Class Launch date Initial Subscription Price Current period (30 September 2011–
31 March 2012) Performance in %
1 year (30 September 2010–
30 September 2011) Performance in %
2 years (30 September 2009–
30 September 2011)Performance in %
3 years (30 September 2008–
30 September 2011)Performance in %
5 years (30 September 2006–
30 September 2011)Performance in %
10 years (30 September 2001–
30 September 2011)Performance in %
Launch date – 30 September 2011
Performance in %
17
Allianz Global Investors Fund
Allianz RCM Little Dragons A2 (EUR) 12/12/2008 100.00 18.17 – 18.71 6.14 – – – 62.21
CT2 (EUR) 12/12/2008 100.00 17.72 – 19.39 4.40 – – – 58.60
AT (SGD) 11/08/2009 10.00 13.23 – 20.24 – 9.52 – – – – 7.80
A (USD) 03/10/2008 63.69 15.84 – 20.11 – 3.80 – – – 26.57
AT (USD) 03/10/2008 63.73 15.83 – 20.10 – 3.78 – – – 26.60
IT (USD) 03/10/2008 67.39 17.00 – 18.45 0.09 – – – 34.13
PT (USD) 03/10/2008 6.36 16.88 – 18.53 0.12 – – – 34.12
Allianz RCM Oriental Income AT (EUR) 07/12/2009 100.00 15.38 – 5.96 – – – – 2.79
AT (SGD) 11/08/2009 10.00 10.22 – 7.88 – 13.29 – – – – 10.00
A (USD) 03/10/2008 15.23 13.64 – 6.47 – 5.23 – – – 16.91
AT (USD) 03/10/2008 15.28 13.64 – 6.46 – 5.23 – – – 16.91
I (USD) 03/10/2008 64.21 14.15 – 5.63 – 3.56 – – – 19.90
IT (USD) 03/10/2008 66.47 14.15 – 5.64 – 3.56 – – – 19.63
P (USD) 03/10/2008 68.11 14.13 – 5.66 – 3.63 – – – 19.75
Allianz RCM Renminbi Currency A (H2-EUR) 18/10/2011 100.00 – – – – – – 1.7642)
AT (H2-EUR) 17/02/2012 100.00 – – – – – – – 0.1343)
CT (H2-EUR) 12/03/2012 100.00 – – – – – – 0.1144)
I (H2-EUR) 18/10/2011 1,000.00 – – – – – – 1.8742)
A (H2-GBP) 04/11/2011 100.00 – – – – – – 1.4445)
A (USD) 18/10/2011 10.00 – – – – – – 1.8042)
Allianz RCM Renminbi Fixed Income A (H2-EUR) 21/06/2011 100.00 3.18 – – – – – – 0.5746)
I (H2-EUR) 10/06/2011 1,000.00 3.77 – – – – – – 0.1047)
P (H2-GBP) 08/07/2011 1,000.00 3.62 – – – – – – 1.0048)
A (USD) 21/06/2011 10.00 3.33 – – – – – – 0.9046)
P (USD) 21/06/2011 1,000.00 3.61 – – – – – – 0.6646)
Allianz RCM Tech Alpha Plus Strategy I (USD) 11/10/2011 1,000.00 – – – – – – – 2.3723)
Allianz RCM Thailand A (EUR) 24/10/2008 100.00 35.75 – 8.82 64.47 – – – 181.00
A (USD) 03/10/2008 12.27 33.76 – 9.58 51.70 – – – 104.73
IT (USD) 03/10/2008 13.05 34.40 – 8.87 54.42 – – – 110.27
Allianz RCM Tiger A (EUR) 28/11/2008 100.00 19.45 – 10.23 11.07 – – – 62.77
A (USD) 03/10/2008 47.27 17.66 – 10.68 2.88 – – – 31.68
AT (USD) 03/10/2008 47.31 17.67 – 10.73 2.81 – – – 31.58
Allianz RCM Total Return Asian Equity A (USD) 03/10/2008 9.49 18.94 – 13.03 2.89 – – – 33.38
AT (USD) 03/10/2008 64.81 18.93 – 13.00 2.92 – – – 33.31
IT (USD) 03/10/2008 16.07 19.56 – 12.32 4.78 – – – 36.47
PT (USD) 03/10/2008 16.05 19.55 – 12.22 4.86 – – – 37.01
Allianz RCM US Equity Fund A (EUR) 25/03/2010 100.00 24.52 – 1.28 – – – – – 6.88
CT (EUR) 31/07/2007 100.00 23.96 – 2.06 10.66 4.60 – – – 18.53
N (EUR) 12/12/2008 1,000.00 25.21 0.00 15.08 – – – 43.54
S (EUR) 12/12/2008 1,000.00 24.90 – 0.30 14.45 – – – 42.54
W (H-EUR) 12/12/2006 1,000.00 22.38 – 0.98 5.35 0.71 – – – 7.40
A (GBP) 05/03/2010 100.00 19.54 – 0.20 – – – – – 5.22
AT (SGD) 11/08/2009 10.00 18.96 – 3.20 – 3.76 – – – – 0.30
A (USD) 15/02/2008 10.00 22.59 – 1.86 4.25 1.26 – – – 9.48
A2 (USD) 07/06/2010 10.00 22.51 – 1.86 – – – – 5.30
AT (USD) 01/03/2012 10.00 – – – – – – 1.7049)
N (USD) 04/10/2010 1,000.00 23.27 – – – – – – 0.5239)
Allianz RCM USD Liquidity A (USD) 03/10/2008 65.15 – 0.33 – 1.49 – – – – – 2.74
Name of the Subfund Share Class Launch date Initial Subscription Price Current period (30 September 2011–
31 March 2012) Performance in %
1 year (30 September 2010–
30 September 2011) Performance in %
2 years (30 September 2009–
30 September 2011)Performance in %
3 years (30 September 2008–
30 September 2011)Performance in %
5 years (30 September 2006–
30 September 2011)Performance in %
10 years (30 September 2001–
30 September 2011)Performance in %
Launch date – 30 September 2011
Performance in %
18
Allianz Global Investors Fund
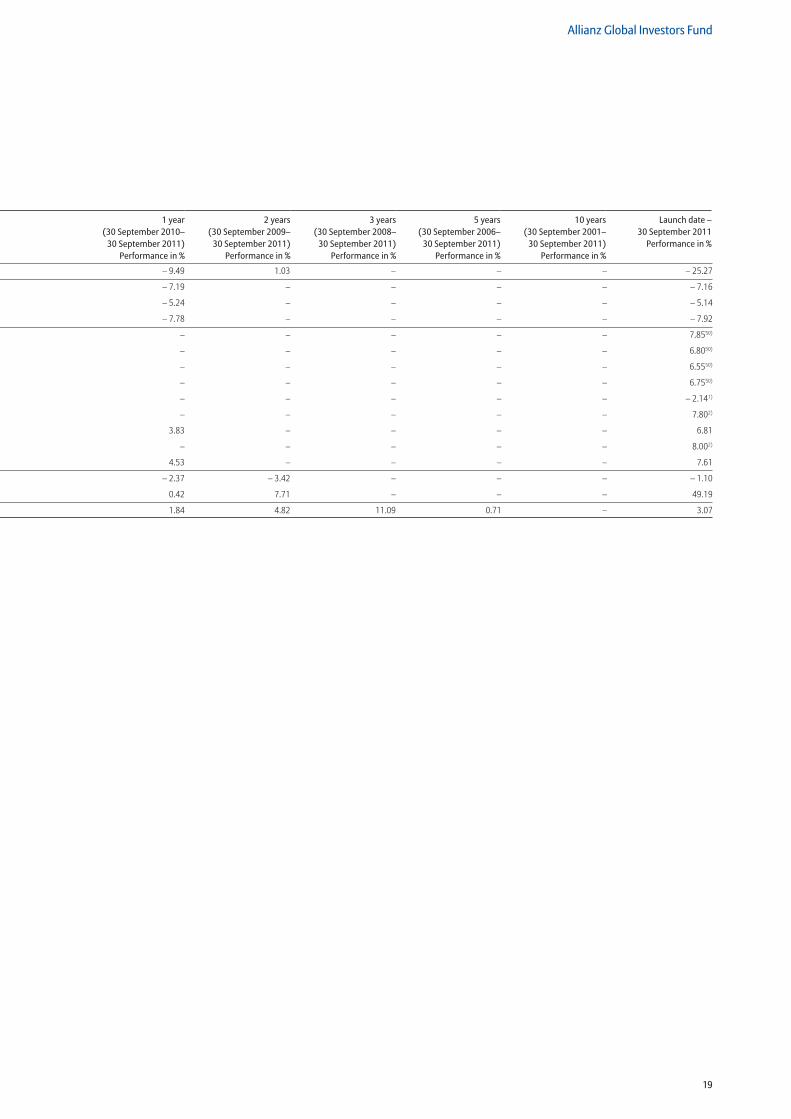
Allianz Real Estate Securities Europe AT (EUR) 26/03/2008 100.00 8.47 – 9.49 1.03 – – – – 25.27
Allianz Structured Alpha Strategy I (EUR) 10/08/2010 1,000.00 10.93 – 7.19 – – – – – 7.16
W (EUR) 10/08/2010 1,000.00 9.19 – 5.24 – – – – – 5.14
WT2 (EUR) 10/08/2010 1,000.00 10.06 – 7.78 – – – – – 7.92
Allianz US High Yield AM (H-AUD) 02/12/2011 10.00 – – – – – – 7.8550)
AM (H-CAD) 02/12/2011 10.00 – – – – – – 6.8050)
AM (H-EUR) 02/12/2011 10.00 – – – – – – 6.5550)
AM (H-GBP) 02/12/2011 10.00 – – – – – – 6.7550)
AM (HKD) 16/08/2011 10.00 9.84 – – – – – – 2.141)
AT (HKD) 21/10/2011 10.00 – – – – – – 7.802)
AM (USD) 02/08/2010 10.00 10.01 3.83 – – – – 6.81
AT (USD) 21/10/2011 10.00 – – – – – – 8.002)
IT (USD) 02/08/2010 1,000.00 10.39 4.53 – – – – 7.61
Allianz US Large Cap Value AT (SGD) 11/08/2009 10.00 15.77 – 2.37 – 3.42 – – – – 1.10
W (USD) 01/04/2009 1,000.00 19.79 0.42 7.71 – – – 49.19
Protect Global Winner 2014 AT (EUR) 24/04/2006 100.00 1.15 1.84 4.82 11.09 0.71 – 3.07
Name of the Subfund Share Class Launch date Initial Subscription Price Current period (30 September 2011–
31 March 2012) Performance in %
1 year (30 September 2010–
30 September 2011) Performance in %
2 years (30 September 2009–
30 September 2011)Performance in %
3 years (30 September 2008–
30 September 2011)Performance in %
5 years (30 September 2006–
30 September 2011)Performance in %
10 years (30 September 2001–
30 September 2011)Performance in %
Launch date – 30 September 2011
Performance in %
1) For the period from 16 August 2011 (launch date) until 30 September 2011.2) For the period from 21 October 2011 (launch date) until 31 March 2012.3) For the period from 31 January 2012 (launch date) until 31 March 2012.4) For the period from 6 March 2012 (launch date) until 31 March 2012.5) For the period from 18 July 2011 (launch date) until 30 September 2011.6) For the period from 20 March 2012 (launch date) until 31 March 2012.7) For the period from 26 October 2010 (launch date) until 30 September 2011.8) For the period from 22 November 2011 (launch date) until 31 March 2012.9) For the period from 29 July 2011 (launch date) until 30 September 2011.10) For the period from 22 February 2012 (launch date) until 31 March 2012.11) For the period from 31 August 2011 (launch date) until 30 September 2011.12) For the period from 31 May 2011 (launch date) until 30 September 2011.13) For the period from 7 November 2011 (launch date) until 31 March 2012.14) For the period from 18 November 2011 (launch date) until 31 March 2012.15) For the period from 26 May 2011 (launch date) until 30 September 2011.16) For the period from 27 October 2010 (launch date) until 30 September 2011.17) For the period from 6 October 2010 (launch date) until 30 September 2011.18) For the period from 13 January 2011 (launch date) until 30 September 2011.19) For the period from 3 January 2011 (launch date) until 30 September 2011.20) For the period from 16 December 2010 (launch date) until 30 September 2011.21) For the period from 3 March 2011 (launch date) until 30 September 2011.22) For the period from 1 October 2011 until 2 November 2011 (liquidation date).
Liquidation proceeds: GBP 100.00.23) For the period from 11 October 2011 (launch date) until 31 March 2012.24) For the period from 21 June 2011 (launch date) until 30 September 2011.25) The Share class A (H-EUR) of the Subfund Allianz RCM Dynamic Multi Asset Plus
was renamed into A (H2-EUR) as of 31 January 2012.26) For the period from 13 December 2010 (launch date) until 30 September 2011.27) For the period from 15 February 2012 (launch date) until 31 March 2012.28) For the period from 1 March 2011 (launch date) until 30 September 2011.29) For the period from 7 October 2011 (launch date) until 31 March 2012.30) For the period from 4 January 2012 (launch date) until 31 March 2012.31) For the period from 22 March 2012 (launch date) until 31 March 2012.32) For the period from 1 October 2011 until 30 January 2012 (liquidation date).
Liquidation proceeds: for Allianz RCM European Equity Share Class N (EUR) EUR 1,273.84 Liquidation proceeds: for Allianz RCM Global Equity Share Class N (EUR) EUR 13.73.
33) For the period from 10 January 2011 (launch date) until 30 September 2011.34) For the period from 14 November 2011 (launch date) until 31 March 2012.35) For the period from 15 December 2011 (launch date) until 31 March 2012.36) For the period from 1 October 2011 until 31 January 2012 (liquidation date).
Liquidation proceeds: EUR 835.14.37) For the period from 22 February 2011 (launch date) until 30 September 2011.
38) For the period from 12 April 2011 (launch date) until 30 September 2011.39) For the period from 4 October 2010 (launch date) until 30 September 2011. 40) For the period from 17 June 2011 (launch date) until 30 September 2011.41) For the period from 1 October 2011 until 16 November 2011(liquidation date).
Liquidation proceeds: USD 11.19.42) For the period from 18 October 2011 (launch date) until 31 March 2012.43) For the period from 17 February 2012 (launch date) until 31 March 2012.44) For the period from 12 March 2012 (launch date) until 31 March 2012.45) For the period from 4 November 2011 (launch date) until 31 March 2012.46) For the period from 21 June 2011 (launch date) until 30 September 2011.47) For the period from 10 June 2011 (launch date) until 30 September 2011.48) For the period from 8 July 2011 (launch date) until 30 September 2011.49) For the period from 1 March 2012 (launch date) until 31 March 2012.50) For the period from 2 December 2011 (launch date) until 31 March 2012.51) The Share class A (H-PLN) of the Subfund Allianz Euro High Yield Bond was
renamed into I (H-PLN) as of 31 January 2012.
The calculation is based on the net asset value per share (excluding sales charge), assuming distributions, if any, were reinvested. The performance is calculated according to the method recommended by the German BVI (Bundesverband Investment und Asset Management e.V.).
Past performance is no indication of current or future performance.The performance data do not take account of the commissions and costs incurred on the issue and redemption of shares.
19
Allianz Global Investors Fund
Allianz Real Estate Securities Europe AT (EUR) 26/03/2008 100.00 8.47 – 9.49 1.03 – – – – 25.27
Allianz Structured Alpha Strategy I (EUR) 10/08/2010 1,000.00 10.93 – 7.19 – – – – – 7.16
W (EUR) 10/08/2010 1,000.00 9.19 – 5.24 – – – – – 5.14
WT2 (EUR) 10/08/2010 1,000.00 10.06 – 7.78 – – – – – 7.92
Allianz US High Yield AM (H-AUD) 02/12/2011 10.00 – – – – – – 7.8550)
AM (H-CAD) 02/12/2011 10.00 – – – – – – 6.8050)
AM (H-EUR) 02/12/2011 10.00 – – – – – – 6.5550)
AM (H-GBP) 02/12/2011 10.00 – – – – – – 6.7550)
AM (HKD) 16/08/2011 10.00 9.84 – – – – – – 2.141)
AT (HKD) 21/10/2011 10.00 – – – – – – 7.802)
AM (USD) 02/08/2010 10.00 10.01 3.83 – – – – 6.81
AT (USD) 21/10/2011 10.00 – – – – – – 8.002)
IT (USD) 02/08/2010 1,000.00 10.39 4.53 – – – – 7.61
Allianz US Large Cap Value AT (SGD) 11/08/2009 10.00 15.77 – 2.37 – 3.42 – – – – 1.10
W (USD) 01/04/2009 1,000.00 19.79 0.42 7.71 – – – 49.19
Protect Global Winner 2014 AT (EUR) 24/04/2006 100.00 1.15 1.84 4.82 11.09 0.71 – 3.07
Name of the Subfund Share Class Launch date Initial Subscription Price Current period (30 September 2011–
31 March 2012) Performance in %
1 year (30 September 2010–
30 September 2011) Performance in %
2 years (30 September 2009–
30 September 2011)Performance in %
3 years (30 September 2008–
30 September 2011)Performance in %
5 years (30 September 2006–
30 September 2011)Performance in %
10 years (30 September 2001–
30 September 2011)Performance in %
Launch date – 30 September 2011
Performance in %
20
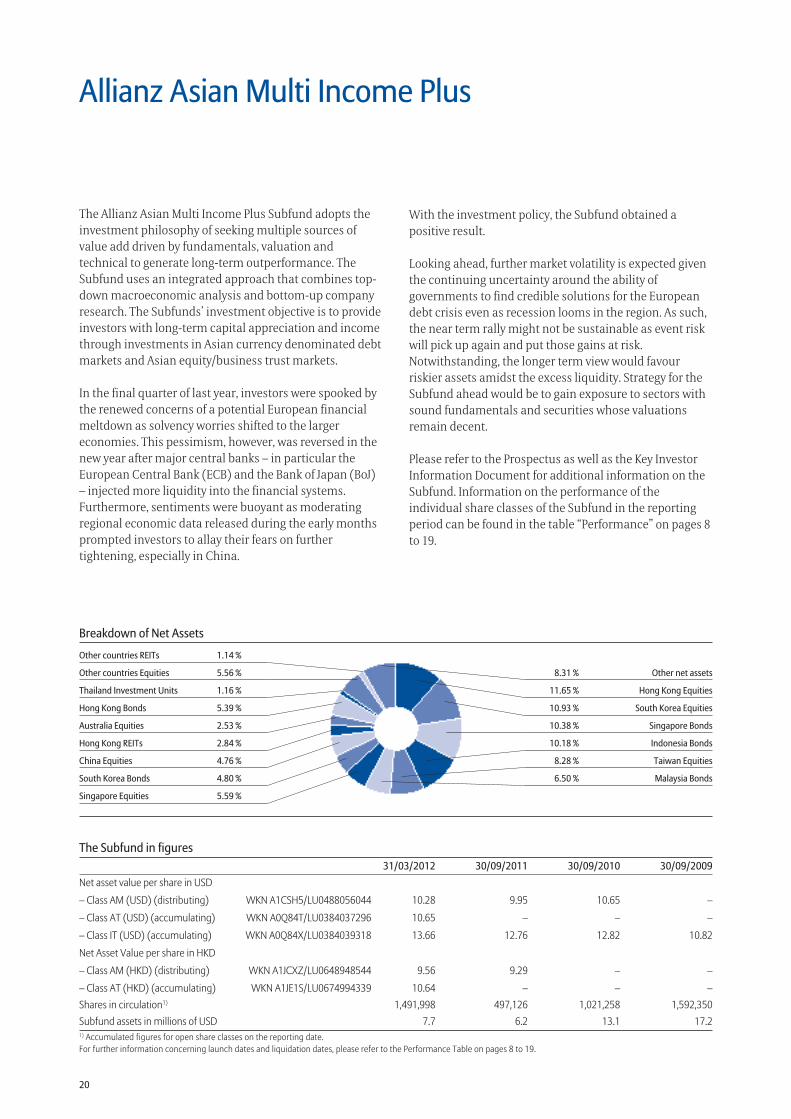
The Subfund in figures 31/03/2012 30/09/2011 30/09/2010 30/09/2009Net asset value per share in USD
– Class AM (USD) (distributing) WKN A1CSH5/LU0488056044 10.28 9.95 10.65 –
– Class AT (USD) (accumulating) WKN A0Q84T/LU0384037296 10.65 – – –
– Class IT (USD) (accumulating) WKN A0Q84X/LU0384039318 13.66 12.76 12.82 10.82
Net Asset Value per share in HKD
– Class AM (HKD) (distributing) WKN A1JCXZ/LU0648948544 9.56 9.29 – –
– Class AT (HKD) (accumulating) WKN A1JE1S/LU0674994339 10.64 – – –Shares in circulation1) 1,491,998 497,126 1,021,258 1,592,350Subfund assets in millions of USD 7.7 6.2 13.1 17.21) Accumulated figures for open share classes on the reporting date.For further information concerning launch dates and liquidation dates, please refer to the Performance Table on pages 8 to 19.
Breakdown of Net Assets
8.31 % Other net assets
11.65 % Hong Kong Equities
10.93 % South Korea Equities
10.38 % Singapore Bonds
10.18 % Indonesia Bonds
8.28 % Taiwan Equities
6.50 % Malaysia Bonds
Other countries REITs 1.14 %
Other countries Equities 5.56 %
Thailand Investment Units 1.16 %
Hong Kong Bonds 5.39 %
Australia Equities 2.53 %
Hong Kong REITs 2.84 %
China Equities 4.76 %
South Korea Bonds 4.80 %
Singapore Equities 5.59 %
Allianz Asian Multi Income Plus
The Allianz Asian Multi Income Plus Subfund adopts the investment philosophy of seeking multiple sources of value add driven by fundamentals, valuation and technical to generate long-term outperformance. The Subfund uses an integrated approach that combines top-down macroeconomic analysis and bottom-up company research. The Subfunds’ investment objective is to provide investors with long-term capital appreciation and income through investments in Asian currency denominated debt markets and Asian equity/business trust markets.
In the final quarter of last year, investors were spooked by the renewed concerns of a potential European financial meltdown as solvency worries shifted to the larger economies. This pessimism, however, was reversed in the new year after major central banks – in particular the European Central Bank (ECB) and the Bank of Japan (BoJ) – injected more liquidity into the financial systems. Furthermore, sentiments were buoyant as moderating regional economic data released during the early months prompted investors to allay their fears on further tightening, especially in China.
With the investment policy, the Subfund obtained a positive result.
Looking ahead, further market volatility is expected given the continuing uncertainty around the ability of governments to find credible solutions for the European debt crisis even as recession looms in the region. As such, the near term rally might not be sustainable as event risk will pick up again and put those gains at risk. Notwithstanding, the longer term view would favour riskier assets amidst the excess liquidity. Strategy for the Subfund ahead would be to gain exposure to sectors with sound fundamentals and securities whose valuations remain decent.
Please refer to the Prospectus as well as the Key Investor Information Document for additional information on the Subfund. Information on the performance of the individual share classes of the Subfund in the reporting period can be found in the table “Performance” on pages 8 to 19.
Investment Policy and Subfund Assets
21
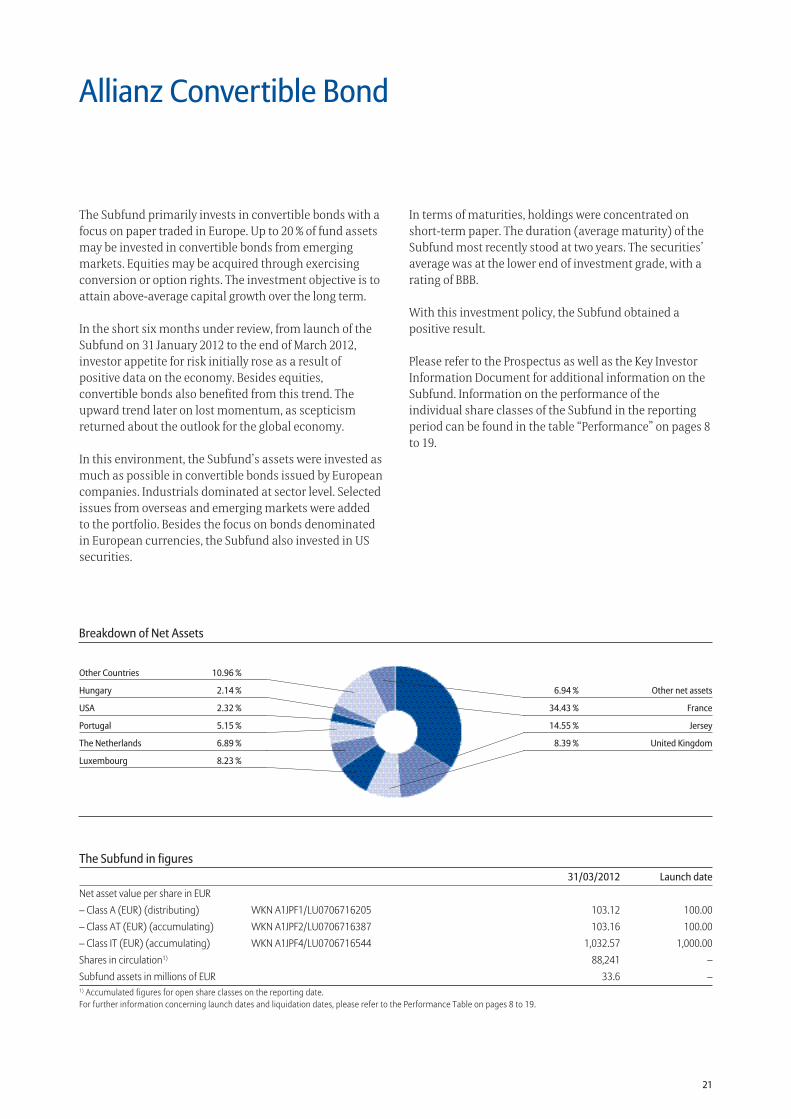
The Subfund in figures 31/03/2012 Launch dateNet asset value per share in EUR– Class A (EUR) (distributing) WKN A1JPF1/LU0706716205 103.12 100.00– Class AT (EUR) (accumulating) WKN A1JPF2/LU0706716387 103.16 100.00– Class IT (EUR) (accumulating) WKN A1JPF4/LU0706716544 1,032.57 1,000.00Shares in circulation1) 88,241 –Subfund assets in millions of EUR 33.6 –1) Accumulated figures for open share classes on the reporting date.For further information concerning launch dates and liquidation dates, please refer to the Performance Table on pages 8 to 19.
Breakdown of Net Assets
6.94 % Other net assets
34.43 % France
14.55 % Jersey
8.39 % United Kingdom
Other Countries 10.96 %
Hungary 2.14 %
USA 2.32 %
Portugal 5.15 %
The Netherlands 6.89 %
Luxembourg 8.23 %
Allianz Convertible Bond
The Subfund primarily invests in convertible bonds with a focus on paper traded in Europe. Up to 20 % of fund assets may be invested in convertible bonds from emerging markets. Equities may be acquired through exercising conversion or option rights. The investment objective is to attain above-average capital growth over the long term.
In the short six months under review, from launch of the Subfund on 31 January 2012 to the end of March 2012, investor appetite for risk initially rose as a result of positive data on the economy. Besides equities, convertible bonds also benefited from this trend. The upward trend later on lost momentum, as scepticism returned about the outlook for the global economy.
In this environment, the Subfund’s assets were invested as much as possible in convertible bonds issued by European companies. Industrials dominated at sector level. Selected issues from overseas and emerging markets were added to the portfolio. Besides the focus on bonds denominated in European currencies, the Subfund also invested in US securities.
In terms of maturities, holdings were concentrated on short-term paper. The duration (average maturity) of the Subfund most recently stood at two years. The securities’ average was at the lower end of investment grade, with a rating of BBB.
With this investment policy, the Subfund obtained a positive result.
Please refer to the Prospectus as well as the Key Investor Information Document for additional information on the Subfund. Information on the performance of the individual share classes of the Subfund in the reporting period can be found in the table “Performance” on pages 8 to 19.
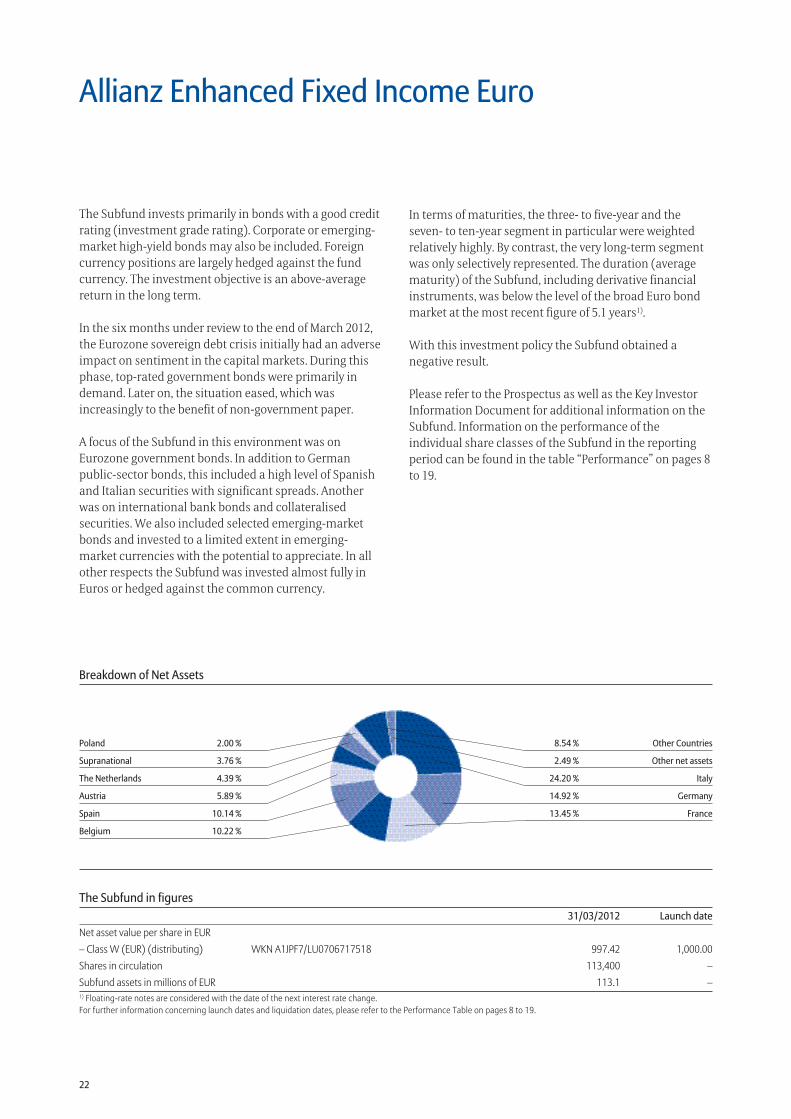
22
The Subfund in figures 31/03/2012 Launch dateNet asset value per share in EUR– Class W (EUR) (distributing) WKN A1JPF7/LU0706717518 997.42 1,000.00Shares in circulation 113,400 –Subfund assets in millions of EUR 113.1 –1) Floating-rate notes are considered with the date of the next interest rate change.For further information concerning launch dates and liquidation dates, please refer to the Performance Table on pages 8 to 19.
Breakdown of Net Assets
8.54 % Other Countries
2.49 % Other net assets
24.20 % Italy
14.92 % Germany
13.45 % France
Poland 2.00 %
Supranational 3.76 %
The Netherlands 4.39 %
Austria 5.89 %
Spain 10.14 %
Belgium 10.22 %
Allianz Enhanced Fixed Income Euro
The Subfund invests primarily in bonds with a good credit rating (investment grade rating). Corporate or emerging-market high-yield bonds may also be included. Foreign currency positions are largely hedged against the fund currency. The investment objective is an above-average return in the long term.
In the six months under review to the end of March 2012, the Eurozone sovereign debt crisis initially had an adverse impact on sentiment in the capital markets. During this phase, top-rated government bonds were primarily in demand. Later on, the situation eased, which was increasingly to the benefit of non-government paper.
A focus of the Subfund in this environment was on Eurozone government bonds. In addition to German public-sector bonds, this included a high level of Spanish and Italian securities with significant spreads. Another was on international bank bonds and collateralised securities. We also included selected emerging-market bonds and invested to a limited extent in emerging-market currencies with the potential to appreciate. In all other respects the Subfund was invested almost fully in Euros or hedged against the common currency.
In terms of maturities, the three- to five-year and the seven- to ten-year segment in particular were weighted relatively highly. By contrast, the very long-term segment was only selectively represented. The duration (average maturity) of the Subfund, including derivative financial instruments, was below the level of the broad Euro bond market at the most recent figure of 5.1 years1).
With this investment policy the Subfund obtained a negative result.
Please refer to the Prospectus as well as the Key Investor Information Document for additional information on the Subfund. Information on the performance of the individual share classes of the Subfund in the reporting period can be found in the table “Performance” on pages 8 to 19.
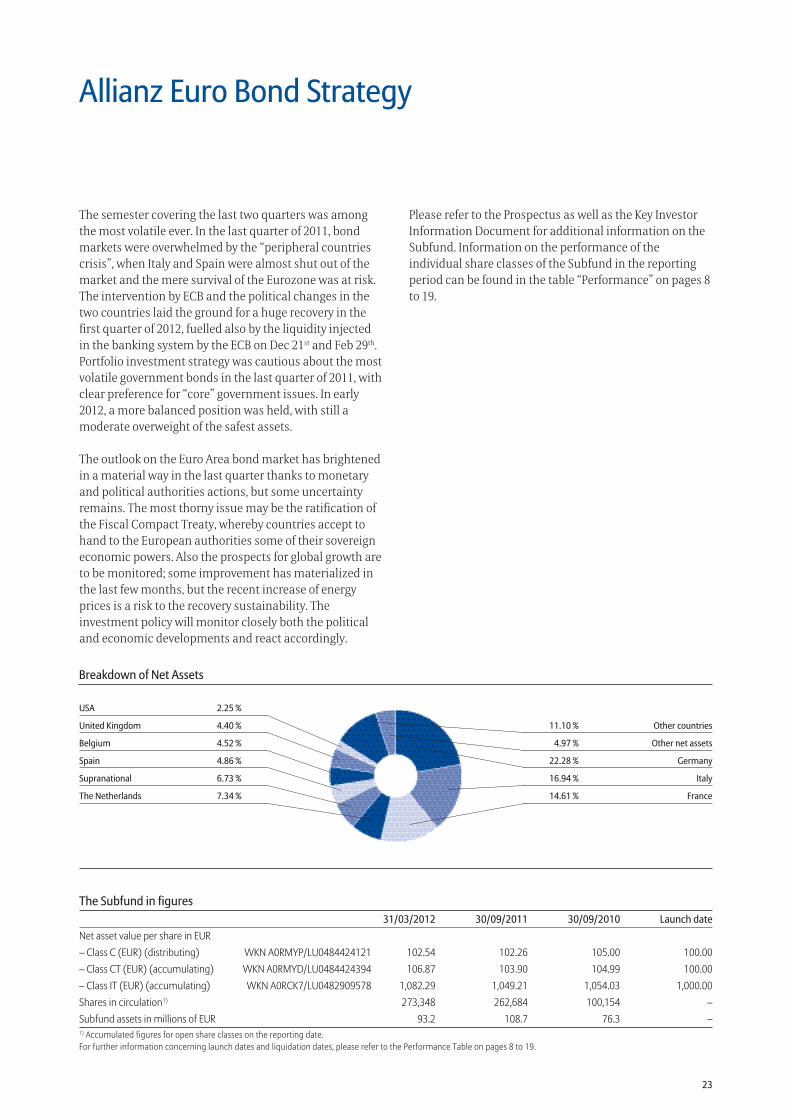
23
The Subfund in figures 31/03/2012 30/09/2011 30/09/2010 Launch dateNet asset value per share in EUR– Class C (EUR) (distributing) WKN A0RMYP/LU0484424121 102.54 102.26 105.00 100.00– Class CT (EUR) (accumulating) WKN A0RMYD/LU0484424394 106.87 103.90 104.99 100.00– Class IT (EUR) (accumulating) WKN A0RCK7/LU0482909578 1,082.29 1,049.21 1,054.03 1,000.00Shares in circulation1) 273,348 262,684 100,154 –Subfund assets in millions of EUR 93.2 108.7 76.3 –1) Accumulated figures for open share classes on the reporting date.For further information concerning launch dates and liquidation dates, please refer to the Performance Table on pages 8 to 19.
Breakdown of Net Assets
11.10 % Other countries
4.97 % Other net assets
22.28 % Germany
16.94 % Italy
14.61 % France
USA 2.25 %
United Kingdom 4.40 %
Belgium 4.52 %
Spain 4.86 %
Supranational 6.73 %
The Netherlands 7.34 %
Allianz Euro Bond Strategy
The semester covering the last two quarters was among the most volatile ever. In the last quarter of 2011, bond markets were overwhelmed by the “peripheral countries crisis”, when Italy and Spain were almost shut out of the market and the mere survival of the Eurozone was at risk. The intervention by ECB and the political changes in the two countries laid the ground for a huge recovery in the first quarter of 2012, fuelled also by the liquidity injected in the banking system by the ECB on Dec 21st and Feb 29th. Portfolio investment strategy was cautious about the most volatile government bonds in the last quarter of 2011, with clear preference for “core” government issues. In early 2012, a more balanced position was held, with still a moderate overweight of the safest assets.
The outlook on the Euro Area bond market has brightened in a material way in the last quarter thanks to monetary and political authorities actions, but some uncertainty remains. The most thorny issue may be the ratification of the Fiscal Compact Treaty, whereby countries accept to hand to the European authorities some of their sovereign economic powers. Also the prospects for global growth are to be monitored; some improvement has materialized in the last few months, but the recent increase of energy prices is a risk to the recovery sustainability. The investment policy will monitor closely both the political and economic developments and react accordingly.
Please refer to the Prospectus as well as the Key Investor Information Document for additional information on the Subfund. Information on the performance of the individual share classes of the Subfund in the reporting period can be found in the table “Performance” on pages 8 to 19.
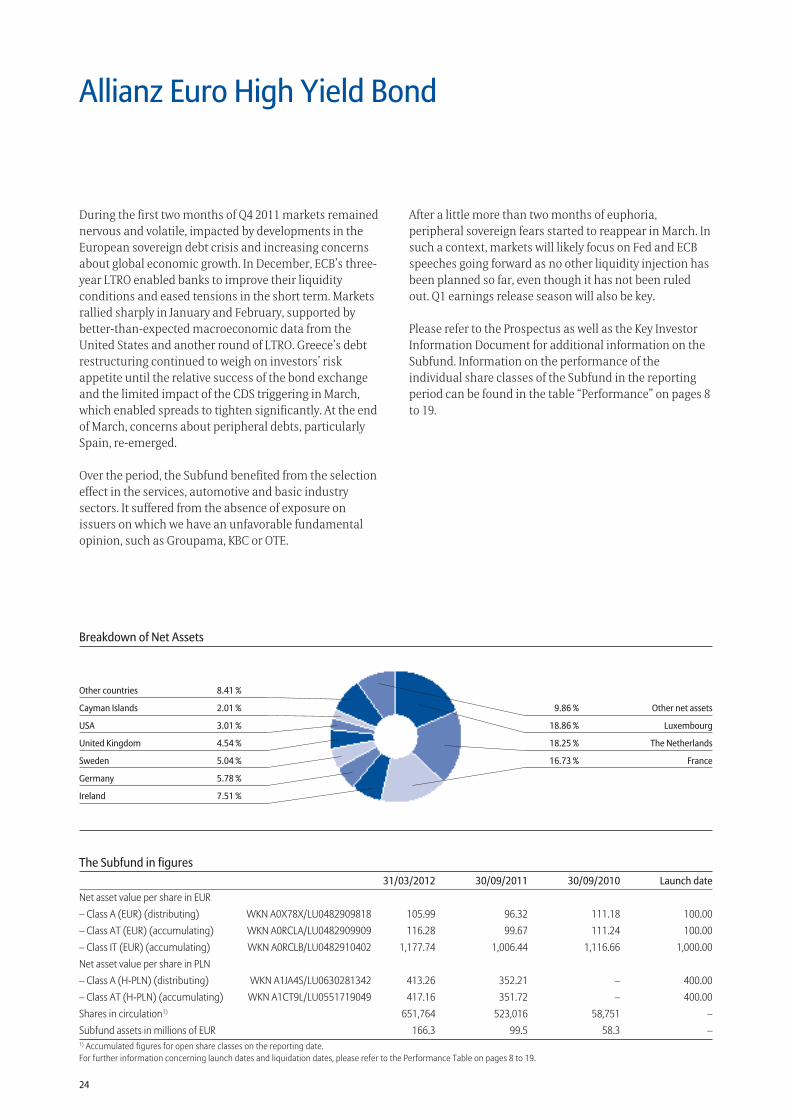
24
The Subfund in figures 31/03/2012 30/09/2011 30/09/2010 Launch dateNet asset value per share in EUR– Class A (EUR) (distributing) WKN A0X78X/LU0482909818 105.99 96.32 111.18 100.00– Class AT (EUR) (accumulating) WKN A0RCLA/LU0482909909 116.28 99.67 111.24 100.00– Class IT (EUR) (accumulating) WKN A0RCLB/LU0482910402 1,177.74 1,006.44 1,116.66 1,000.00Net asset value per share in PLN– Class A (H-PLN) (distributing) WKN A1JA4S/LU0630281342 413.26 352.21 – 400.00– Class AT (H-PLN) (accumulating) WKN A1CT9L/LU0551719049 417.16 351.72 – 400.00Shares in circulation1) 651,764 523,016 58,751 –Subfund assets in millions of EUR 166.3 99.5 58.3 –1) Accumulated figures for open share classes on the reporting date.For further information concerning launch dates and liquidation dates, please refer to the Performance Table on pages 8 to 19.
Breakdown of Net Assets
9.86 % Other net assets
18.86 % Luxembourg
18.25 % The Netherlands
16.73 % France
Other countries 8.41 %
Cayman Islands 2.01 %
USA 3.01 %
United Kingdom 4.54 %
Sweden 5.04 %
Germany 5.78 %
Ireland 7.51 %
Allianz Euro High Yield Bond
During the first two months of Q4 2011 markets remained nervous and volatile, impacted by developments in the European sovereign debt crisis and increasing concerns about global economic growth. In December, ECB’s three-year LTRO enabled banks to improve their liquidity conditions and eased tensions in the short term. Markets rallied sharply in January and February, supported by better-than-expected macroeconomic data from the United States and another round of LTRO. Greece’s debt restructuring continued to weigh on investors’ risk appetite until the relative success of the bond exchange and the limited impact of the CDS triggering in March, which enabled spreads to tighten significantly. At the end of March, concerns about peripheral debts, particularly Spain, re-emerged.
Over the period, the Subfund benefited from the selection effect in the services, automotive and basic industry sectors. It suffered from the absence of exposure on issuers on which we have an unfavorable fundamental opinion, such as Groupama, KBC or OTE.
After a little more than two months of euphoria, peripheral sovereign fears started to reappear in March. In such a context, markets will likely focus on Fed and ECB speeches going forward as no other liquidity injection has been planned so far, even though it has not been ruled out. Q1 earnings release season will also be key.
Please refer to the Prospectus as well as the Key Investor Information Document for additional information on the Subfund. Information on the performance of the individual share classes of the Subfund in the reporting period can be found in the table “Performance” on pages 8 to 19.
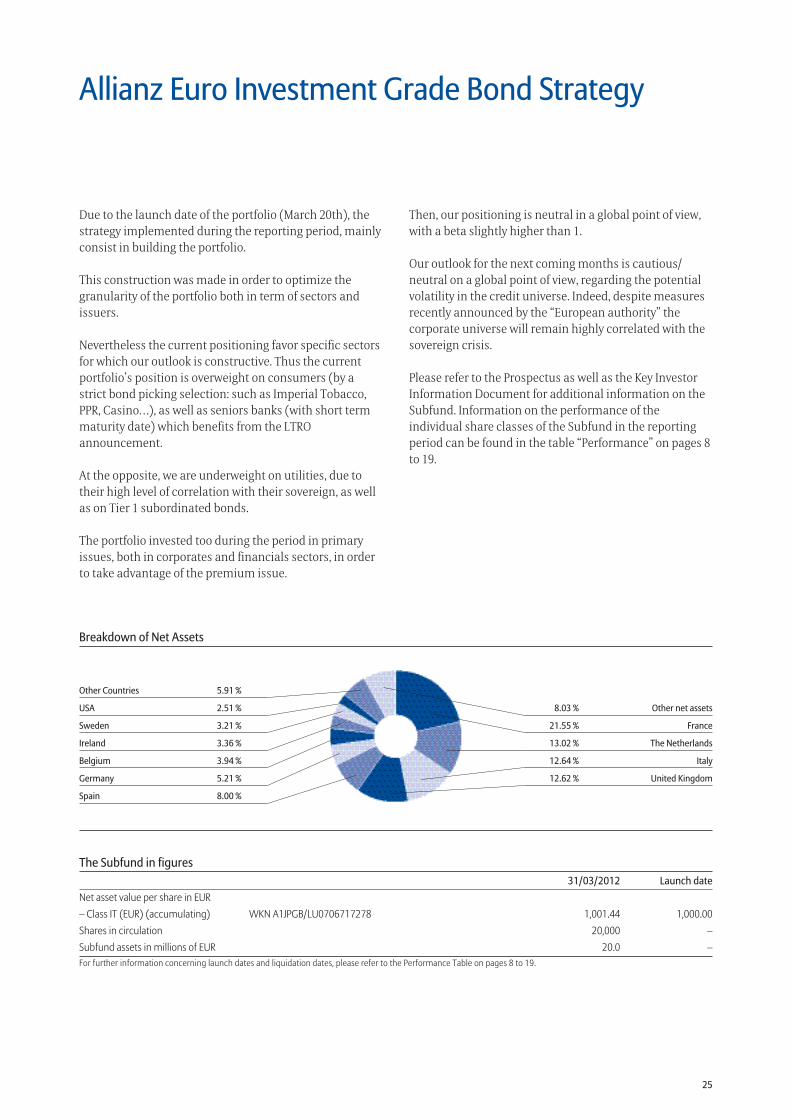
25
Allianz Euro Investment Grade Bond Strategy
Due to the launch date of the portfolio (March 20th), the strategy implemented during the reporting period, mainly consist in building the portfolio.
This construction was made in order to optimize the granularity of the portfolio both in term of sectors and issuers.
Nevertheless the current positioning favor specific sectors for which our outlook is constructive. Thus the current portfolio’s position is overweight on consumers (by a strict bond picking selection: such as Imperial Tobacco, PPR, Casino…), as well as seniors banks (with short term maturity date) which benefits from the LTRO announcement.
At the opposite, we are underweight on utilities, due to their high level of correlation with their sovereign, as well as on Tier 1 subordinated bonds.
The portfolio invested too during the period in primary issues, both in corporates and financials sectors, in order to take advantage of the premium issue.
Then, our positioning is neutral in a global point of view, with a beta slightly higher than 1.
Our outlook for the next coming months is cautious/neutral on a global point of view, regarding the potential volatility in the credit universe. Indeed, despite measures recently announced by the “European authority” the corporate universe will remain highly correlated with the sovereign crisis.
Please refer to the Prospectus as well as the Key Investor Information Document for additional information on the Subfund. Information on the performance of the individual share classes of the Subfund in the reporting period can be found in the table “Performance” on pages 8 to 19.
The Subfund in figures 31/03/2012 Launch dateNet asset value per share in EUR– Class IT (EUR) (accumulating) WKN A1JPGB/LU0706717278 1,001.44 1,000.00Shares in circulation 20,000 –Subfund assets in millions of EUR 20.0 –For further information concerning launch dates and liquidation dates, please refer to the Performance Table on pages 8 to 19.
Breakdown of Net Assets
8.03 % Other net assets
21.55 % France
13.02 % The Netherlands
12.64 % Italy
12.62 % United Kingdom
Other Countries 5.91 %
USA 2.51 %
Sweden 3.21 %
Ireland 3.36 %
Belgium 3.94 %
Germany 5.21 %
Spain 8.00 %
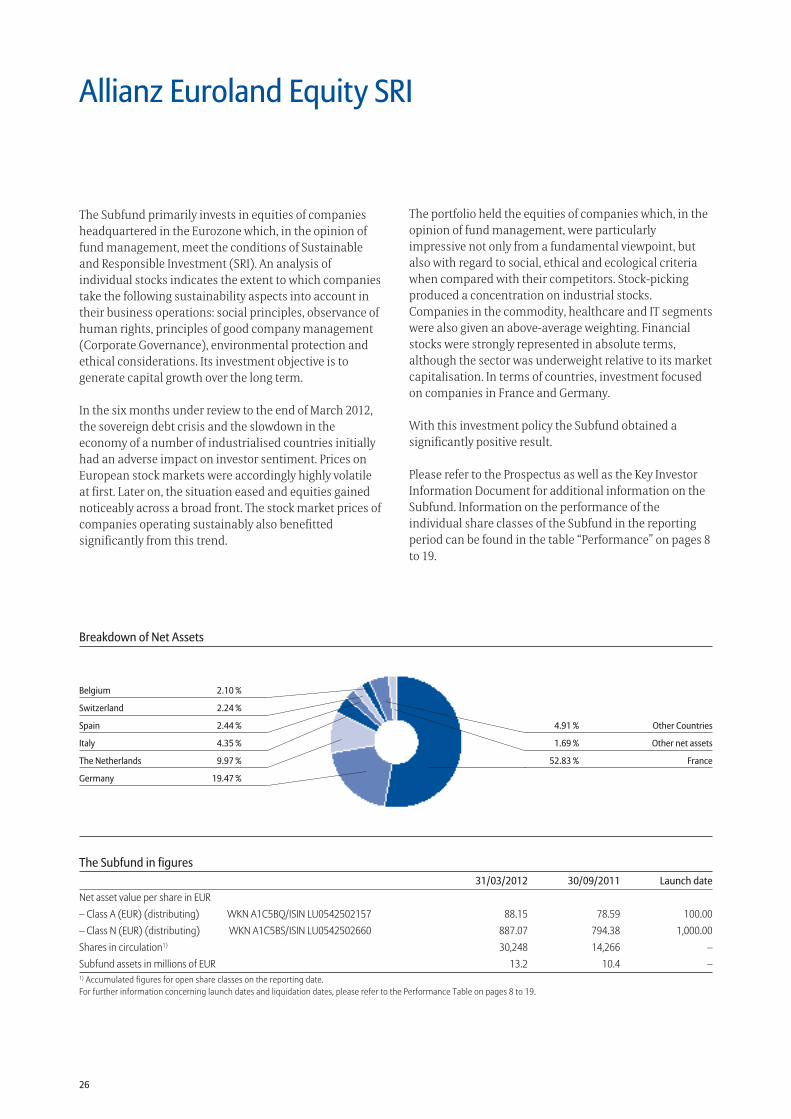
26
The Subfund in figures 31/03/2012 30/09/2011 Launch dateNet asset value per share in EUR– Class A (EUR) (distributing) WKN A1C5BQ/ISIN LU0542502157 88.15 78.59 100.00– Class N (EUR) (distributing) WKN A1C5BS/ISIN LU0542502660 887.07 794.38 1,000.00Shares in circulation1) 30,248 14,266 –Subfund assets in millions of EUR 13.2 10.4 –1) Accumulated figures for open share classes on the reporting date.For further information concerning launch dates and liquidation dates, please refer to the Performance Table on pages 8 to 19.
Breakdown of Net Assets
4.91 % Other Countries
1.69 % Other net assets
52.83 % France
Belgium 2.10 %
Switzerland 2.24 %
Spain 2.44 %
Italy 4.35 %
The Netherlands 9.97 %
Germany 19.47 %
Allianz Euroland Equity SRI
The Subfund primarily invests in equities of companies headquartered in the Eurozone which, in the opinion of fund management, meet the conditions of Sustainable and Responsible Investment (SRI). An analysis of individual stocks indicates the extent to which companies take the following sustainability aspects into account in their business operations: social principles, observance of human rights, principles of good company management (Corporate Governance), environmental protection and ethical considerations. Its investment objective is to generate capital growth over the long term.
In the six months under review to the end of March 2012, the sovereign debt crisis and the slowdown in the economy of a number of industrialised countries initially had an adverse impact on investor sentiment. Prices on European stock markets were accordingly highly volatile at first. Later on, the situation eased and equities gained noticeably across a broad front. The stock market prices of companies operating sustainably also benefitted significantly from this trend.
The portfolio held the equities of companies which, in the opinion of fund management, were particularly impressive not only from a fundamental viewpoint, but also with regard to social, ethical and ecological criteria when compared with their competitors. Stock-picking produced a concentration on industrial stocks. Companies in the commodity, healthcare and IT segments were also given an above-average weighting. Financial stocks were strongly represented in absolute terms, although the sector was underweight relative to its market capitalisation. In terms of countries, investment focused on companies in France and Germany.
With this investment policy the Subfund obtained a significantly positive result.
Please refer to the Prospectus as well as the Key Investor Information Document for additional information on the Subfund. Information on the performance of the individual share classes of the Subfund in the reporting period can be found in the table “Performance” on pages 8 to 19.
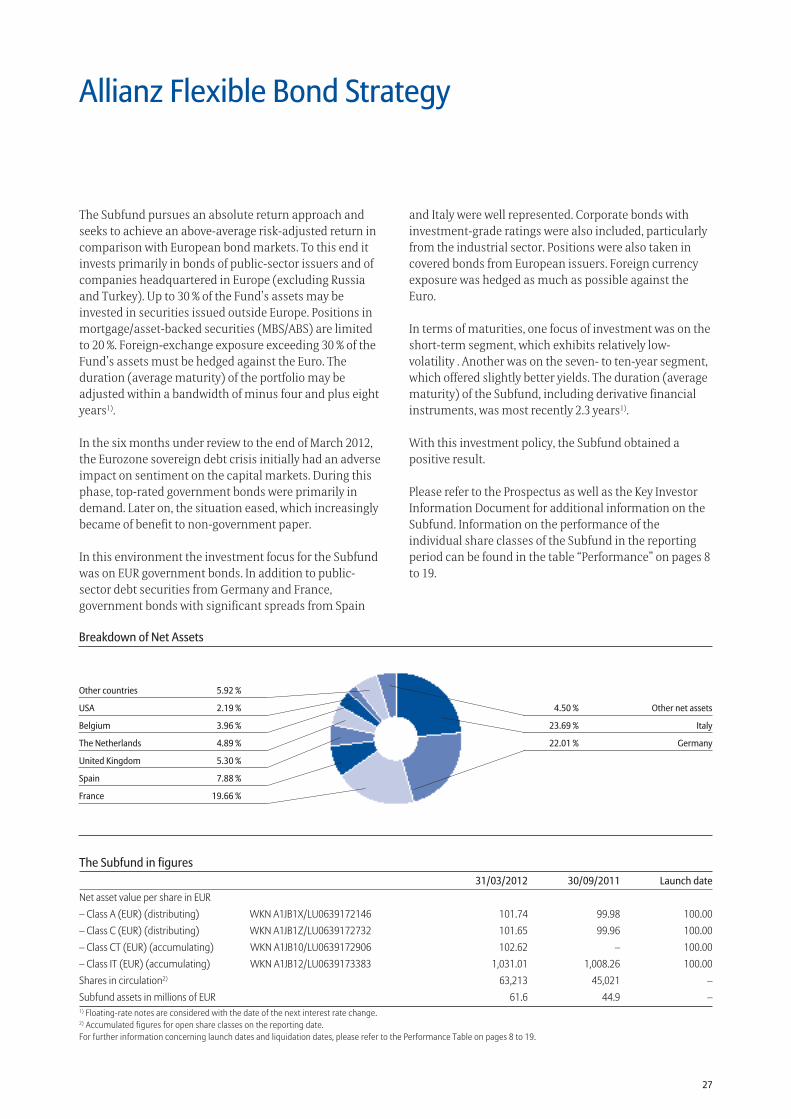
27
The Subfund in figures 31/03/2012 30/09/2011 Launch dateNet asset value per share in EUR– Class A (EUR) (distributing) WKN A1JB1X/LU0639172146 101.74 99.98 100.00– Class C (EUR) (distributing) WKN A1JB1Z/LU0639172732 101.65 99.96 100.00– Class CT (EUR) (accumulating) WKN A1JB10/LU0639172906 102.62 – 100.00– Class IT (EUR) (accumulating) WKN A1JB12/LU0639173383 1,031.01 1,008.26 100.00Shares in circulation2) 63,213 45,021 –Subfund assets in millions of EUR 61.6 44.9 –1) Floating-rate notes are considered with the date of the next interest rate change.2) Accumulated figures for open share classes on the reporting date.For further information concerning launch dates and liquidation dates, please refer to the Performance Table on pages 8 to 19.
Breakdown of Net Assets
4.50 % Other net assets
23.69 % Italy
22.01 % Germany
Other countries 5.92 %
USA 2.19 %
Belgium 3.96 %
The Netherlands 4.89 %
United Kingdom 5.30 %
Spain 7.88 %
France 19.66 %
Allianz Flexible Bond Strategy
The Subfund pursues an absolute return approach and seeks to achieve an above-average risk-adjusted return in comparison with European bond markets. To this end it invests primarily in bonds of public-sector issuers and of companies headquartered in Europe (excluding Russia and Turkey). Up to 30 % of the Fund’s assets may be invested in securities issued outside Europe. Positions in mortgage/asset-backed securities (MBS/ABS) are limited to 20 %. Foreign-exchange exposure exceeding 30 % of the Fund’s assets must be hedged against the Euro. The duration (average maturity) of the portfolio may be adjusted within a bandwidth of minus four and plus eight years1).
In the six months under review to the end of March 2012, the Eurozone sovereign debt crisis initially had an adverse impact on sentiment on the capital markets. During this phase, top-rated government bonds were primarily in demand. Later on, the situation eased, which increasingly became of benefit to non-government paper.
In this environment the investment focus for the Subfund was on EUR government bonds. In addition to public-sector debt securities from Germany and France, government bonds with significant spreads from Spain
and Italy were well represented. Corporate bonds with investment-grade ratings were also included, particularly from the industrial sector. Positions were also taken in covered bonds from European issuers. Foreign currency exposure was hedged as much as possible against the Euro.
In terms of maturities, one focus of investment was on the short-term segment, which exhibits relatively low-volatility . Another was on the seven- to ten-year segment, which offered slightly better yields. The duration (average maturity) of the Subfund, including derivative financial instruments, was most recently 2.3 years1).
With this investment policy, the Subfund obtained a positive result.
Please refer to the Prospectus as well as the Key Investor Information Document for additional information on the Subfund. Information on the performance of the individual share classes of the Subfund in the reporting period can be found in the table “Performance” on pages 8 to 19.
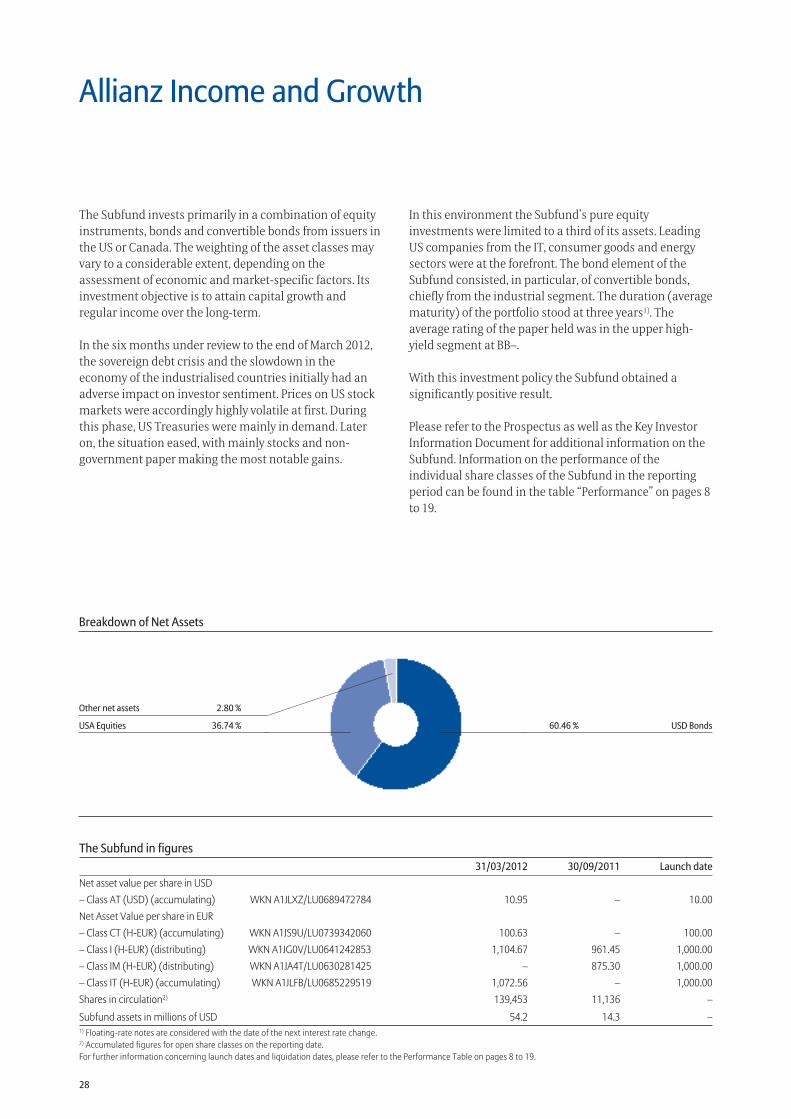
28
The Subfund in figures 31/03/2012 30/09/2011 Launch dateNet asset value per share in USD– Class AT (USD) (accumulating) WKN A1JLXZ/LU0689472784 10.95 – 10.00Net Asset Value per share in EUR– Class CT (H-EUR) (accumulating) WKN A1JS9U/LU0739342060 100.63 – 100.00– Class I (H-EUR) (distributing) WKN A1JG0V/LU0641242853 1,104.67 961.45 1,000.00– Class IM (H-EUR) (distributing) WKN A1JA4T/LU0630281425 – 875.30 1,000.00– Class IT (H-EUR) (accumulating) WKN A1JLFB/LU0685229519 1,072.56 – 1,000.00Shares in circulation2) 139,453 11,136 –
Subfund assets in millions of USD 54.2 14.3 –1) Floating-rate notes are considered with the date of the next interest rate change.2) Accumulated figures for open share classes on the reporting date.For further information concerning launch dates and liquidation dates, please refer to the Performance Table on pages 8 to 19.
Breakdown of Net Assets
60.46 % USD Bonds
Other net assets 2.80 %
USA Equities 36.74 %
Allianz Income and Growth
The Subfund invests primarily in a combination of equity instruments, bonds and convertible bonds from issuers in the US or Canada. The weighting of the asset classes may vary to a considerable extent, depending on the assessment of economic and market-specific factors. Its investment objective is to attain capital growth and regular income over the long-term.
In the six months under review to the end of March 2012, the sovereign debt crisis and the slowdown in the economy of the industrialised countries initially had an adverse impact on investor sentiment. Prices on US stock markets were accordingly highly volatile at first. During this phase, US Treasuries were mainly in demand. Later on, the situation eased, with mainly stocks and non-government paper making the most notable gains.
In this environment the Subfund’s pure equity investments were limited to a third of its assets. Leading US companies from the IT, consumer goods and energy sectors were at the forefront. The bond element of the Subfund consisted, in particular, of convertible bonds, chiefly from the industrial segment. The duration (average maturity) of the portfolio stood at three years1). The average rating of the paper held was in the upper high-yield segment at BB–.
With this investment policy the Subfund obtained a significantly positive result.
Please refer to the Prospectus as well as the Key Investor Information Document for additional information on the Subfund. Information on the performance of the individual share classes of the Subfund in the reporting period can be found in the table “Performance” on pages 8 to 19.
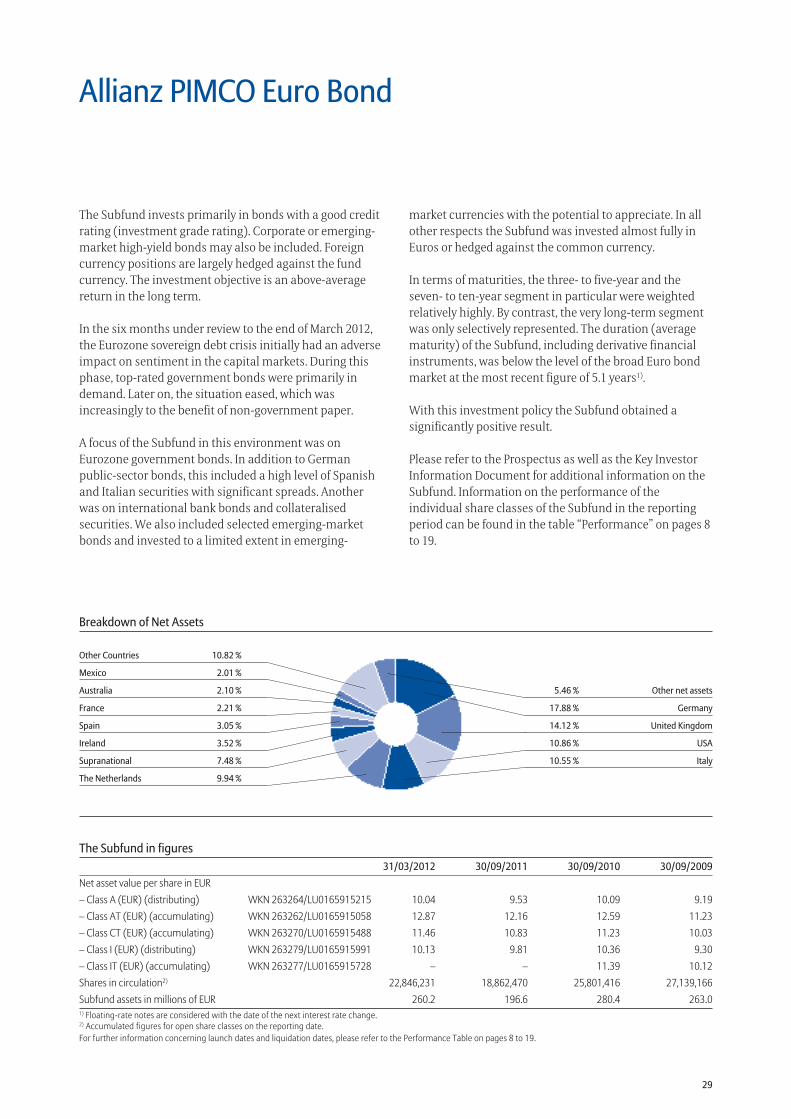
29
The Subfund in figures 31/03/2012 30/09/2011 30/09/2010 30/09/2009Net asset value per share in EUR– Class A (EUR) (distributing) WKN 263264/LU0165915215 10.04 9.53 10.09 9.19– Class AT (EUR) (accumulating) WKN 263262/LU0165915058 12.87 12.16 12.59 11.23– Class CT (EUR) (accumulating) WKN 263270/LU0165915488 11.46 10.83 11.23 10.03– Class I (EUR) (distributing) WKN 263279/LU0165915991 10.13 9.81 10.36 9.30– Class IT (EUR) (accumulating) WKN 263277/LU0165915728 – – 11.39 10.12Shares in circulation2) 22,846,231 18,862,470 25,801,416 27,139,166Subfund assets in millions of EUR 260.2 196.6 280.4 263.01) Floating-rate notes are considered with the date of the next interest rate change.2) Accumulated figures for open share classes on the reporting date.For further information concerning launch dates and liquidation dates, please refer to the Performance Table on pages 8 to 19.
5.46 % Other net assets
17.88 % Germany
14.12 % United Kingdom
10.86 % USA
10.55 % Italy
Other Countries 10.82 %
Mexico 2.01 %
Australia 2.10 %
France 2.21 %
Spain 3.05 %
Ireland 3.52 %
Supranational 7.48 %
The Netherlands 9.94 %
Breakdown of Net Assets
Allianz PIMCO Euro Bond
The Subfund invests primarily in bonds with a good credit rating (investment grade rating). Corporate or emerging-market high-yield bonds may also be included. Foreign currency positions are largely hedged against the fund currency. The investment objective is an above-average return in the long term.
In the six months under review to the end of March 2012, the Eurozone sovereign debt crisis initially had an adverse impact on sentiment in the capital markets. During this phase, top-rated government bonds were primarily in demand. Later on, the situation eased, which was increasingly to the benefit of non-government paper.
A focus of the Subfund in this environment was on Eurozone government bonds. In addition to German public-sector bonds, this included a high level of Spanish and Italian securities with significant spreads. Another was on international bank bonds and collateralised securities. We also included selected emerging-market bonds and invested to a limited extent in emerging-
market currencies with the potential to appreciate. In all other respects the Subfund was invested almost fully in Euros or hedged against the common currency.
In terms of maturities, the three- to five-year and the seven- to ten-year segment in particular were weighted relatively highly. By contrast, the very long-term segment was only selectively represented. The duration (average maturity) of the Subfund, including derivative financial instruments, was below the level of the broad Euro bond market at the most recent figure of 5.1 years1).
With this investment policy the Subfund obtained a significantly positive result.
Please refer to the Prospectus as well as the Key Investor Information Document for additional information on the Subfund. Information on the performance of the individual share classes of the Subfund in the reporting period can be found in the table “Performance” on pages 8 to 19.
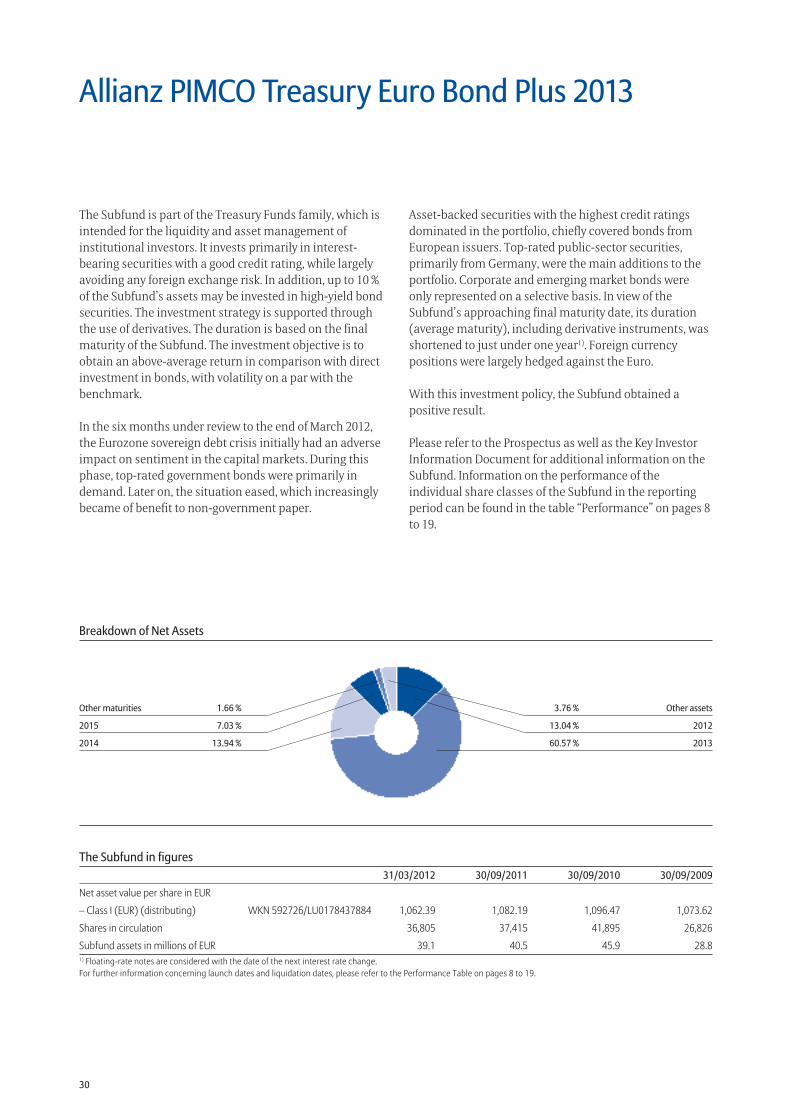
30
The Subfund in figures 31/03/2012 30/09/2011 30/09/2010 30/09/2009
Net asset value per share in EUR
– Class I (EUR) (distributing) WKN 592726/LU0178437884 1,062.39 1,082.19 1,096.47 1,073.62
Shares in circulation 36,805 37,415 41,895 26,826
Subfund assets in millions of EUR 39.1 40.5 45.9 28.81) Floating-rate notes are considered with the date of the next interest rate change.For further information concerning launch dates and liquidation dates, please refer to the Performance Table on pages 8 to 19.
3.76 % Other assets
13.04 % 2012
60.57 % 2013
Other maturities 1.66 %
2015 7.03 %
2014 13.94 %
Breakdown of Net Assets
Allianz PIMCO Treasury Euro Bond Plus 2013
The Subfund is part of the Treasury Funds family, which is intended for the liquidity and asset management of institutional investors. It invests primarily in interest-bearing securities with a good credit rating, while largely avoiding any foreign exchange risk. In addition, up to 10 % of the Subfund’s assets may be invested in high-yield bond securities. The investment strategy is supported through the use of derivatives. The duration is based on the final maturity of the Subfund. The investment objective is to obtain an above-average return in comparison with direct investment in bonds, with volatility on a par with the benchmark.
In the six months under review to the end of March 2012, the Eurozone sovereign debt crisis initially had an adverse impact on sentiment in the capital markets. During this phase, top-rated government bonds were primarily in demand. Later on, the situation eased, which increasingly became of benefit to non-government paper.
Asset-backed securities with the highest credit ratings dominated in the portfolio, chiefly covered bonds from European issuers. Top-rated public-sector securities, primarily from Germany, were the main additions to the portfolio. Corporate and emerging market bonds were only represented on a selective basis. In view of the Subfund’s approaching final maturity date, its duration (average maturity), including derivative instruments, was shortened to just under one year1). Foreign currency positions were largely hedged against the Euro.
With this investment policy, the Subfund obtained a positive result.
Please refer to the Prospectus as well as the Key Investor Information Document for additional information on the Subfund. Information on the performance of the individual share classes of the Subfund in the reporting period can be found in the table “Performance” on pages 8 to 19.
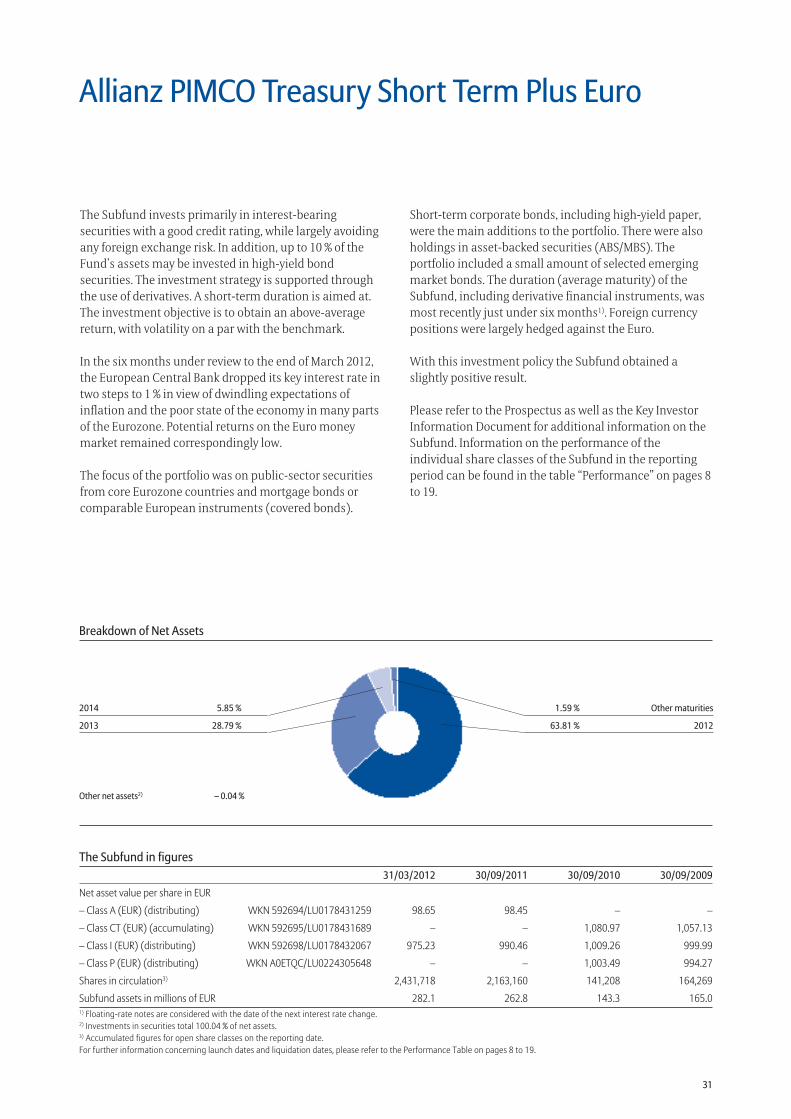
31
The Subfund in figures 31/03/2012 30/09/2011 30/09/2010 30/09/2009
Net asset value per share in EUR
– Class A (EUR) (distributing) WKN 592694/LU0178431259 98.65 98.45 – –
– Class CT (EUR) (accumulating) WKN 592695/LU0178431689 – – 1,080.97 1,057.13
– Class I (EUR) (distributing) WKN 592698/LU0178432067 975.23 990.46 1,009.26 999.99
– Class P (EUR) (distributing) WKN A0ETQC/LU0224305648 – – 1,003.49 994.27
Shares in circulation3) 2,431,718 2,163,160 141,208 164,269
Subfund assets in millions of EUR 282.1 262.8 143.3 165.01) Floating-rate notes are considered with the date of the next interest rate change.2) Investments in securities total 100.04 % of net assets.3) Accumulated figures for open share classes on the reporting date.For further information concerning launch dates and liquidation dates, please refer to the Performance Table on pages 8 to 19.
1.59 % Other maturities
63.81 % 2012
2014 5.85 %
2013 28.79 %
Breakdown of Net Assets
Allianz PIMCO Treasury Short Term Plus Euro
The Subfund invests primarily in interest-bearing securities with a good credit rating, while largely avoiding any foreign exchange risk. In addition, up to 10 % of the Fund’s assets may be invested in high-yield bond securities. The investment strategy is supported through the use of derivatives. A short-term duration is aimed at. The investment objective is to obtain an above-average return, with volatility on a par with the benchmark.
In the six months under review to the end of March 2012, the European Central Bank dropped its key interest rate in two steps to 1 % in view of dwindling expectations of inflation and the poor state of the economy in many parts of the Eurozone. Potential returns on the Euro money market remained correspondingly low.
The focus of the portfolio was on public-sector securities from core Eurozone countries and mortgage bonds or comparable European instruments (covered bonds).
Short-term corporate bonds, including high-yield paper, were the main additions to the portfolio. There were also holdings in asset-backed securities (ABS/MBS). The portfolio included a small amount of selected emerging market bonds. The duration (average maturity) of the Subfund, including derivative financial instruments, was most recently just under six months1). Foreign currency positions were largely hedged against the Euro.
With this investment policy the Subfund obtained a slightly positive result.
Please refer to the Prospectus as well as the Key Investor Information Document for additional information on the Subfund. Information on the performance of the individual share classes of the Subfund in the reporting period can be found in the table “Performance” on pages 8 to 19.
Other net assets2) – 0.04 %
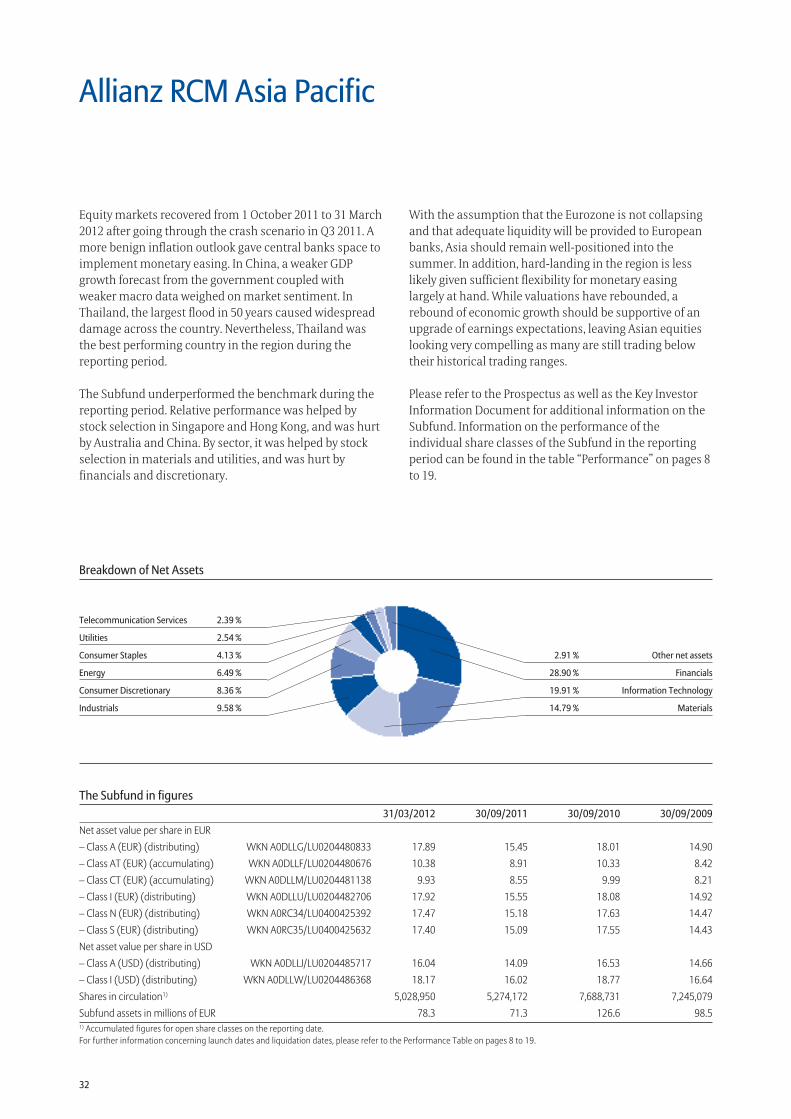
32
The Subfund in figures 31/03/2012 30/09/2011 30/09/2010 30/09/2009Net asset value per share in EUR– Class A (EUR) (distributing) WKN A0DLLG/LU0204480833 17.89 15.45 18.01 14.90– Class AT (EUR) (accumulating) WKN A0DLLF/LU0204480676 10.38 8.91 10.33 8.42– Class CT (EUR) (accumulating) WKN A0DLLM/LU0204481138 9.93 8.55 9.99 8.21– Class I (EUR) (distributing) WKN A0DLLU/LU0204482706 17.92 15.55 18.08 14.92– Class N (EUR) (distributing) WKN A0RC34/LU0400425392 17.47 15.18 17.63 14.47– Class S (EUR) (distributing) WKN A0RC35/LU0400425632 17.40 15.09 17.55 14.43Net asset value per share in USD– Class A (USD) (distributing) WKN A0DLLJ/LU0204485717 16.04 14.09 16.53 14.66– Class I (USD) (distributing) WKN A0DLLW/LU0204486368 18.17 16.02 18.77 16.64Shares in circulation1) 5,028,950 5,274,172 7,688,731 7,245,079Subfund assets in millions of EUR 78.3 71.3 126.6 98.51) Accumulated figures for open share classes on the reporting date.For further information concerning launch dates and liquidation dates, please refer to the Performance Table on pages 8 to 19.
Breakdown of Net Assets
2.91 % Other net assets
28.90 % Financials
19.91 % Information Technology
14.79 % Materials
Telecommunication Services 2.39 %
Utilities 2.54 %
Consumer Staples 4.13 %
Energy 6.49 %
Consumer Discretionary 8.36 %
Industrials 9.58 %
Allianz RCM Asia Pacific
Equity markets recovered from 1 October 2011 to 31 March 2012 after going through the crash scenario in Q3 2011. A more benign inflation outlook gave central banks space to implement monetary easing. In China, a weaker GDP growth forecast from the government coupled with weaker macro data weighed on market sentiment. In Thailand, the largest flood in 50 years caused widespread damage across the country. Nevertheless, Thailand was the best performing country in the region during the reporting period.
The Subfund underperformed the benchmark during the reporting period. Relative performance was helped by stock selection in Singapore and Hong Kong, and was hurt by Australia and China. By sector, it was helped by stock selection in materials and utilities, and was hurt by financials and discretionary.
With the assumption that the Eurozone is not collapsing and that adequate liquidity will be provided to European banks, Asia should remain well-positioned into the summer. In addition, hard-landing in the region is less likely given sufficient flexibility for monetary easing largely at hand. While valuations have rebounded, a rebound of economic growth should be supportive of an upgrade of earnings expectations, leaving Asian equities looking very compelling as many are still trading below their historical trading ranges.
Please refer to the Prospectus as well as the Key Investor Information Document for additional information on the Subfund. Information on the performance of the individual share classes of the Subfund in the reporting period can be found in the table “Performance” on pages 8 to 19.
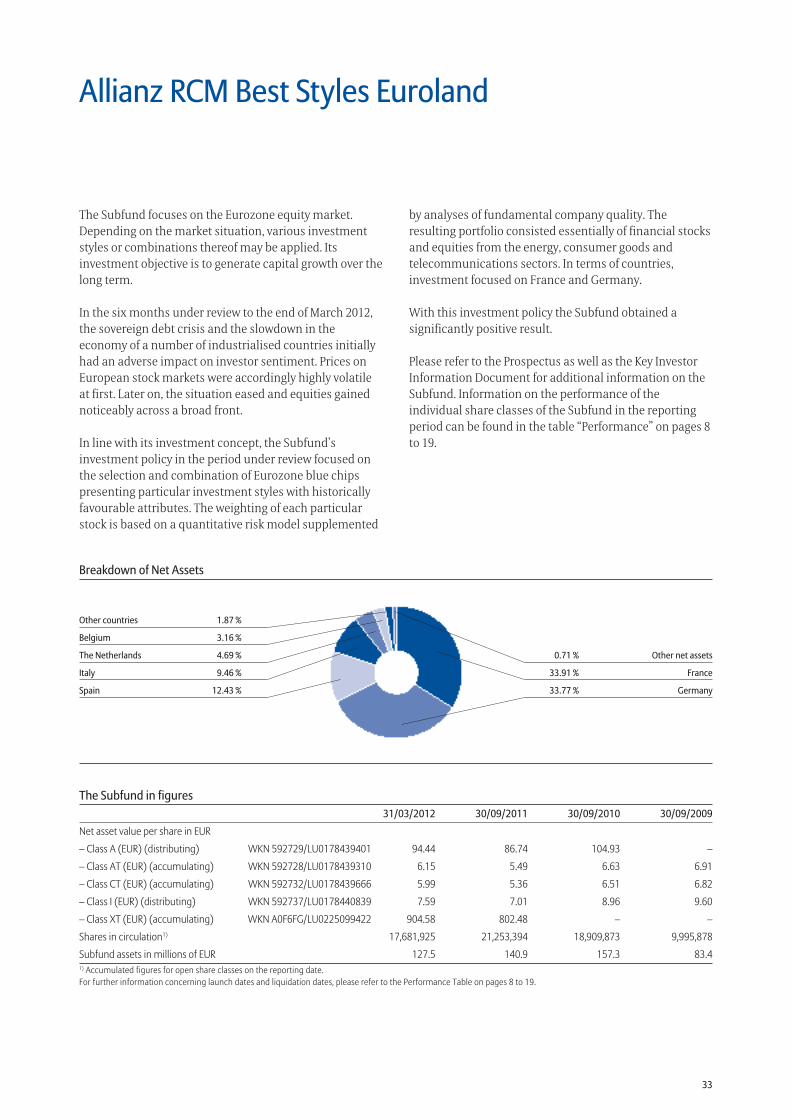
33
The Subfund in figures 31/03/2012 30/09/2011 30/09/2010 30/09/2009
Net asset value per share in EUR
– Class A (EUR) (distributing) WKN 592729/LU0178439401 94.44 86.74 104.93 –
– Class AT (EUR) (accumulating) WKN 592728/LU0178439310 6.15 5.49 6.63 6.91
– Class CT (EUR) (accumulating) WKN 592732/LU0178439666 5.99 5.36 6.51 6.82
– Class I (EUR) (distributing) WKN 592737/LU0178440839 7.59 7.01 8.96 9.60
– Class XT (EUR) (accumulating) WKN A0F6FG/LU0225099422 904.58 802.48 – –
Shares in circulation1) 17,681,925 21,253,394 18,909,873 9,995,878
Subfund assets in millions of EUR 127.5 140.9 157.3 83.41) Accumulated figures for open share classes on the reporting date.For further information concerning launch dates and liquidation dates, please refer to the Performance Table on pages 8 to 19.
0.71 % Other net assets
33.91 % France
33.77 % Germany
Other countries 1.87 %
Belgium 3.16 %
The Netherlands 4.69 %
Italy 9.46 %
Spain 12.43 %
Breakdown of Net Assets
Allianz RCM Best Styles Euroland
The Subfund focuses on the Eurozone equity market. Depending on the market situation, various investment styles or combinations thereof may be applied. Its investment objective is to generate capital growth over the long term.
In the six months under review to the end of March 2012, the sovereign debt crisis and the slowdown in the economy of a number of industrialised countries initially had an adverse impact on investor sentiment. Prices on European stock markets were accordingly highly volatile at first. Later on, the situation eased and equities gained noticeably across a broad front.
In line with its investment concept, the Subfund’s investment policy in the period under review focused on the selection and combination of Eurozone blue chips presenting particular investment styles with historically favourable attributes. The weighting of each particular stock is based on a quantitative risk model supplemented
by analyses of fundamental company quality. The resulting portfolio consisted essentially of financial stocks and equities from the energy, consumer goods and telecommunications sectors. In terms of countries, investment focused on France and Germany.
With this investment policy the Subfund obtained a significantly positive result.
Please refer to the Prospectus as well as the Key Investor Information Document for additional information on the Subfund. Information on the performance of the individual share classes of the Subfund in the reporting period can be found in the table “Performance” on pages 8 to 19.
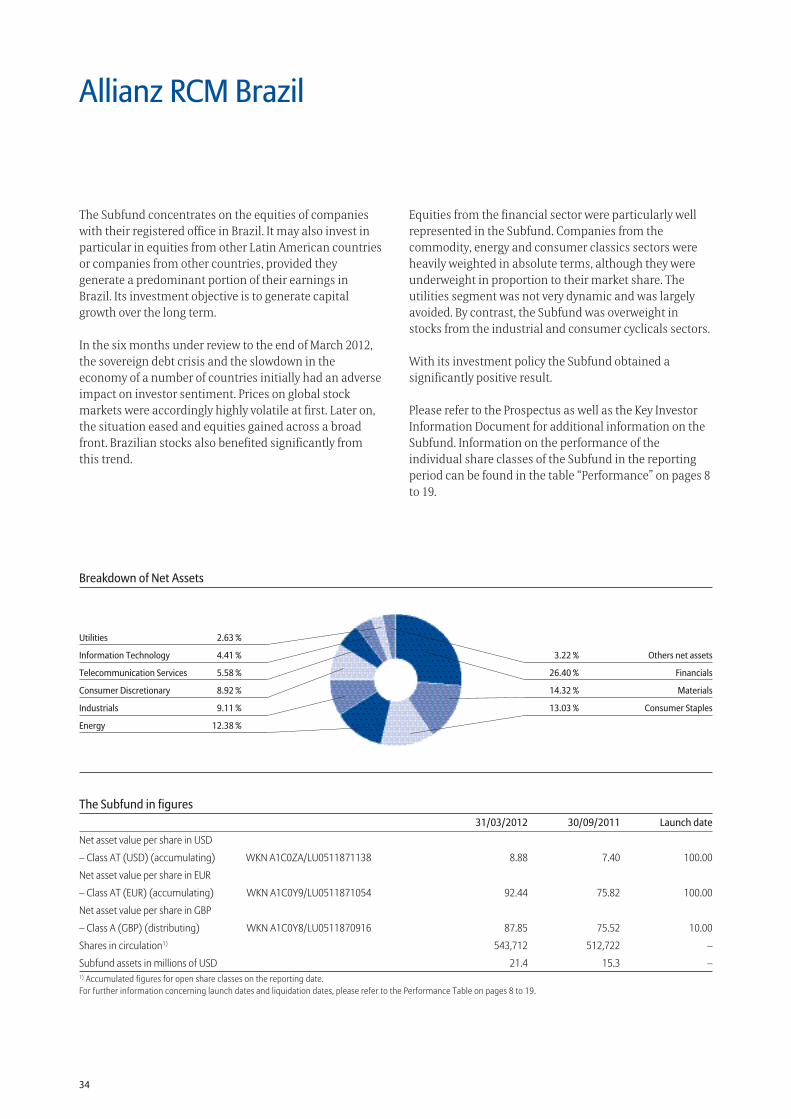
34
The Subfund in figures 31/03/2012 30/09/2011 Launch date
Net asset value per share in USD
– Class AT (USD) (accumulating) WKN A1C0ZA/LU0511871138 8.88 7.40 100.00
Net asset value per share in EUR
– Class AT (EUR) (accumulating) WKN A1C0Y9/LU0511871054 92.44 75.82 100.00
Net asset value per share in GBP
– Class A (GBP) (distributing) WKN A1C0Y8/LU0511870916 87.85 75.52 10.00
Shares in circulation1) 543,712 512,722 –
Subfund assets in millions of USD 21.4 15.3 –1) Accumulated figures for open share classes on the reporting date.For further information concerning launch dates and liquidation dates, please refer to the Performance Table on pages 8 to 19.
3.22 % Others net assets
26.40 % Financials
14.32 % Materials
13.03 % Consumer Staples
Utilities 2.63 %
Information Technology 4.41 %
Telecommunication Services 5.58 %
Consumer Discretionary 8.92 %
Industrials 9.11 %
Energy 12.38 %
Breakdown of Net Assets
Allianz RCM Brazil
The Subfund concentrates on the equities of companies with their registered office in Brazil. It may also invest in particular in equities from other Latin American countries or companies from other countries, provided they generate a predominant portion of their earnings in Brazil. Its investment objective is to generate capital growth over the long term.
In the six months under review to the end of March 2012, the sovereign debt crisis and the slowdown in the economy of a number of countries initially had an adverse impact on investor sentiment. Prices on global stock markets were accordingly highly volatile at first. Later on, the situation eased and equities gained across a broad front. Brazilian stocks also benefited significantly from this trend.
Equities from the financial sector were particularly well represented in the Subfund. Companies from the commodity, energy and consumer classics sectors were heavily weighted in absolute terms, although they were underweight in proportion to their market share. The utilities segment was not very dynamic and was largely avoided. By contrast, the Subfund was overweight in stocks from the industrial and consumer cyclicals sectors.
With its investment policy the Subfund obtained a significantly positive result.
Please refer to the Prospectus as well as the Key Investor Information Document for additional information on the Subfund. Information on the performance of the individual share classes of the Subfund in the reporting period can be found in the table “Performance” on pages 8 to 19.
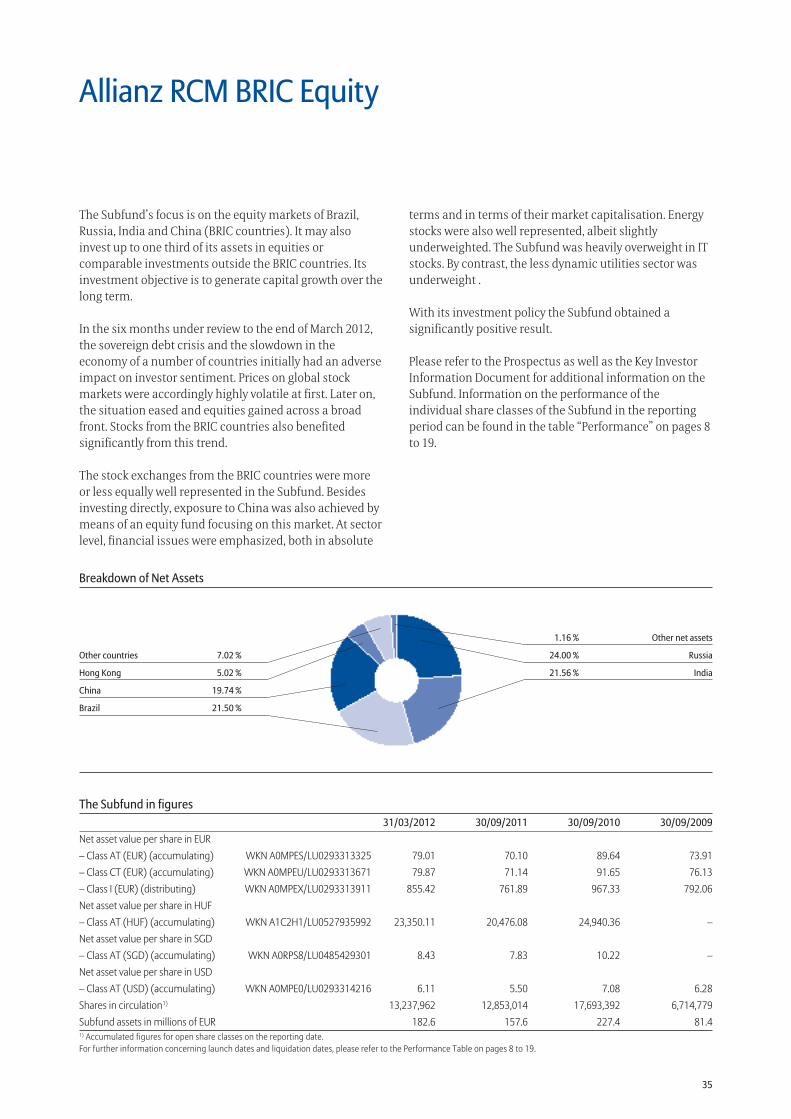
35
The Subfund in figures 31/03/2012 30/09/2011 30/09/2010 30/09/2009Net asset value per share in EUR– Class AT (EUR) (accumulating) WKN A0MPES/LU0293313325 79.01 70.10 89.64 73.91– Class CT (EUR) (accumulating) WKN A0MPEU/LU0293313671 79.87 71.14 91.65 76.13– Class I (EUR) (distributing) WKN A0MPEX/LU0293313911 855.42 761.89 967.33 792.06Net asset value per share in HUF– Class AT (HUF) (accumulating) WKN A1C2H1/LU0527935992 23,350.11 20,476.08 24,940.36 –Net asset value per share in SGD– Class AT (SGD) (accumulating) WKN A0RPS8/LU0485429301 8.43 7.83 10.22 –Net asset value per share in USD– Class AT (USD) (accumulating) WKN A0MPE0/LU0293314216 6.11 5.50 7.08 6.28Shares in circulation1) 13,237,962 12,853,014 17,693,392 6,714,779Subfund assets in millions of EUR 182.6 157.6 227.4 81.41) Accumulated figures for open share classes on the reporting date.For further information concerning launch dates and liquidation dates, please refer to the Performance Table on pages 8 to 19.
Breakdown of Net Assets
1.16 % Other net assets
24.00 % Russia
21.56 % India
Other countries 7.02 %
Hong Kong 5.02 %
China 19.74 %
Brazil 21.50 %
Allianz RCM BRIC Equity
The Subfund’s focus is on the equity markets of Brazil, Russia, India and China (BRIC countries). It may also invest up to one third of its assets in equities or comparable investments outside the BRIC countries. Its investment objective is to generate capital growth over the long term.
In the six months under review to the end of March 2012, the sovereign debt crisis and the slowdown in the economy of a number of countries initially had an adverse impact on investor sentiment. Prices on global stock markets were accordingly highly volatile at first. Later on, the situation eased and equities gained across a broad front. Stocks from the BRIC countries also benefited significantly from this trend.
The stock exchanges from the BRIC countries were more or less equally well represented in the Subfund. Besides investing directly, exposure to China was also achieved by means of an equity fund focusing on this market. At sector level, financial issues were emphasized, both in absolute
terms and in terms of their market capitalisation. Energy stocks were also well represented, albeit slightly underweighted. The Subfund was heavily overweight in IT stocks. By contrast, the less dynamic utilities sector was underweight .
With its investment policy the Subfund obtained a significantly positive result.
Please refer to the Prospectus as well as the Key Investor Information Document for additional information on the Subfund. Information on the performance of the individual share classes of the Subfund in the reporting period can be found in the table “Performance” on pages 8 to 19.
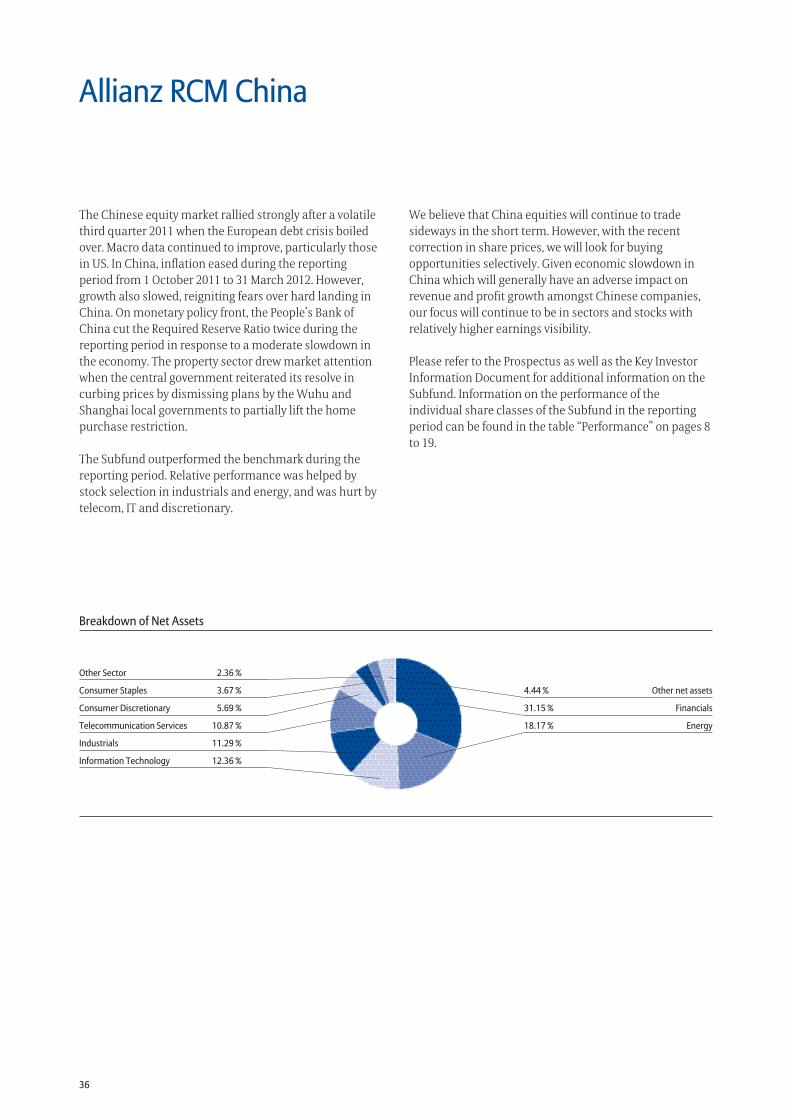
36
4.44 % Other net assets
31.15 % Financials
18.17 % Energy
Other Sector 2.36 %
Consumer Staples 3.67 %
Consumer Discretionary 5.69 %
Telecommunication Services 10.87 %
Industrials 11.29 %
Information Technology 12.36 %
Breakdown of Net Assets
Allianz RCM China
The Chinese equity market rallied strongly after a volatile third quarter 2011 when the European debt crisis boiled over. Macro data continued to improve, particularly those in US. In China, inflation eased during the reporting period from 1 October 2011 to 31 March 2012. However, growth also slowed, reigniting fears over hard landing in China. On monetary policy front, the People’s Bank of China cut the Required Reserve Ratio twice during the reporting period in response to a moderate slowdown in the economy. The property sector drew market attention when the central government reiterated its resolve in curbing prices by dismissing plans by the Wuhu and Shanghai local governments to partially lift the home purchase restriction.
The Subfund outperformed the benchmark during the reporting period. Relative performance was helped by stock selection in industrials and energy, and was hurt by telecom, IT and discretionary.
We believe that China equities will continue to trade sideways in the short term. However, with the recent correction in share prices, we will look for buying opportunities selectively. Given economic slowdown in China which will generally have an adverse impact on revenue and profit growth amongst Chinese companies, our focus will continue to be in sectors and stocks with relatively higher earnings visibility.
Please refer to the Prospectus as well as the Key Investor Information Document for additional information on the Subfund. Information on the performance of the individual share classes of the Subfund in the reporting period can be found in the table “Performance” on pages 8 to 19.
37
Allianz RCM China
The Subfund in figures 31/03/2012 30/09/2011 30/09/2010 30/09/2009
Net asset value per share in USD
– Class A (USD) (distributing) WKN A0Q1P2/LU0348825331 42.71 35.93 49.10 42.17
– Class AT (USD) (accumulating) WKN A0Q1QA/LU0348827113 8.07 6.78 – –
– Class IT (USD) (accumulating) WKN A0Q1QW/LU0348831818 1,799.22 1,504.24 2,034.21 1,725.23
– Class N (USD) (distributing) WKN A1CSGS/LU0567130009 837.62 711.50 – –
– Class W (USD) (distributing) WKN A0X8R6/IE00B4P77354 856.51 727.77 – –
Net asset value per share in EUR
– Class A (EUR) (distributing) WKN A0Q1P1/LU0348825174 78.82 65.93 – –
– Class CT (EUR) (accumulating) WKN A0Q1QD/LU0348827899 112.29 93.44 127.65 –
Net asset value per share in GBP
– Class A (GBP) (distributing) WKN A0Q1P3/LU0348825687 116.44 100.40 134.92 114.69
Net asset value per share in HKD
– Class A (HKD) (distributing) WKN A1CT92/LU0561508036 8.16 6.91 – –
Net asset value per share in SGD
– Class AT (SGD) (accumulating) WKN A0X8FD/LU0417516902 8.81 7.62 10.54 9.63
Shares in circulation1) 14,466,258 15,418,991 6,840,882 5,127,493
Subfund assets in millions of USD 534.5 465.5 426.5 267.41) Accumulated figures for open share classes on the reporting date.For further information concerning launch dates and liquidation dates, please refer to the Performance Table on pages 8 to 19.
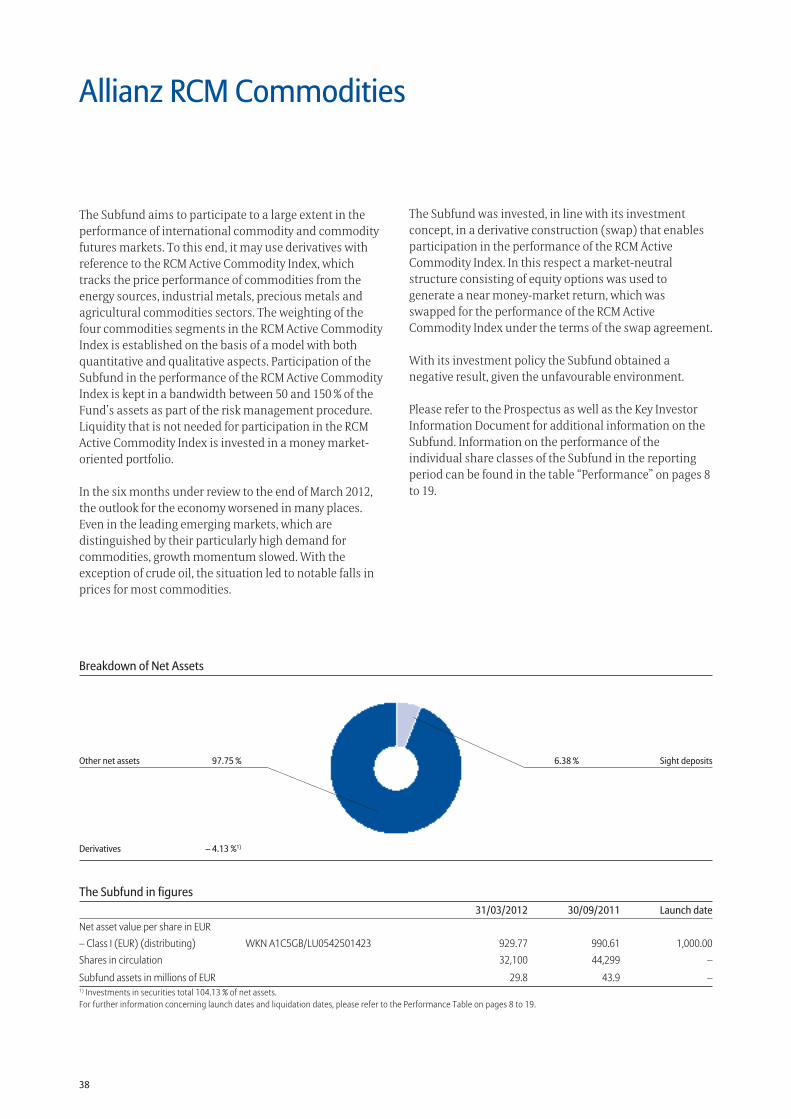
38
The Subfund in figures 31/03/2012 30/09/2011 Launch dateNet asset value per share in EUR– Class I (EUR) (distributing) WKN A1C5GB/LU0542501423 929.77 990.61 1,000.00Shares in circulation 32,100 44,299 –
Subfund assets in millions of EUR 29.8 43.9 –1) Investments in securities total 104.13 % of net assets.For further information concerning launch dates and liquidation dates, please refer to the Performance Table on pages 8 to 19.
6.38 % Sight depositsOther net assets 97.75 %
Breakdown of Net Assets
Derivatives – 4.13 %1)
Allianz RCM Commodities
The Subfund aims to participate to a large extent in the performance of international commodity and commodity futures markets. To this end, it may use derivatives with reference to the RCM Active Commodity Index, which tracks the price performance of commodities from the energy sources, industrial metals, precious metals and agricultural commodities sectors. The weighting of the four commodities segments in the RCM Active Commodity Index is established on the basis of a model with both quantitative and qualitative aspects. Participation of the Subfund in the performance of the RCM Active Commodity Index is kept in a bandwidth between 50 and 150 % of the Fund’s assets as part of the risk management procedure. Liquidity that is not needed for participation in the RCM Active Commodity Index is invested in a money market-oriented portfolio.
In the six months under review to the end of March 2012, the outlook for the economy worsened in many places. Even in the leading emerging markets, which are distinguished by their particularly high demand for commodities, growth momentum slowed. With the exception of crude oil, the situation led to notable falls in prices for most commodities.
The Subfund was invested, in line with its investment concept, in a derivative construction (swap) that enables participation in the performance of the RCM Active Commodity Index. In this respect a market-neutral structure consisting of equity options was used to generate a near money-market return, which was swapped for the performance of the RCM Active Commodity Index under the terms of the swap agreement.
With its investment policy the Subfund obtained a negative result, given the unfavourable environment.
Please refer to the Prospectus as well as the Key Investor Information Document for additional information on the Subfund. Information on the performance of the individual share classes of the Subfund in the reporting period can be found in the table “Performance” on pages 8 to 19.
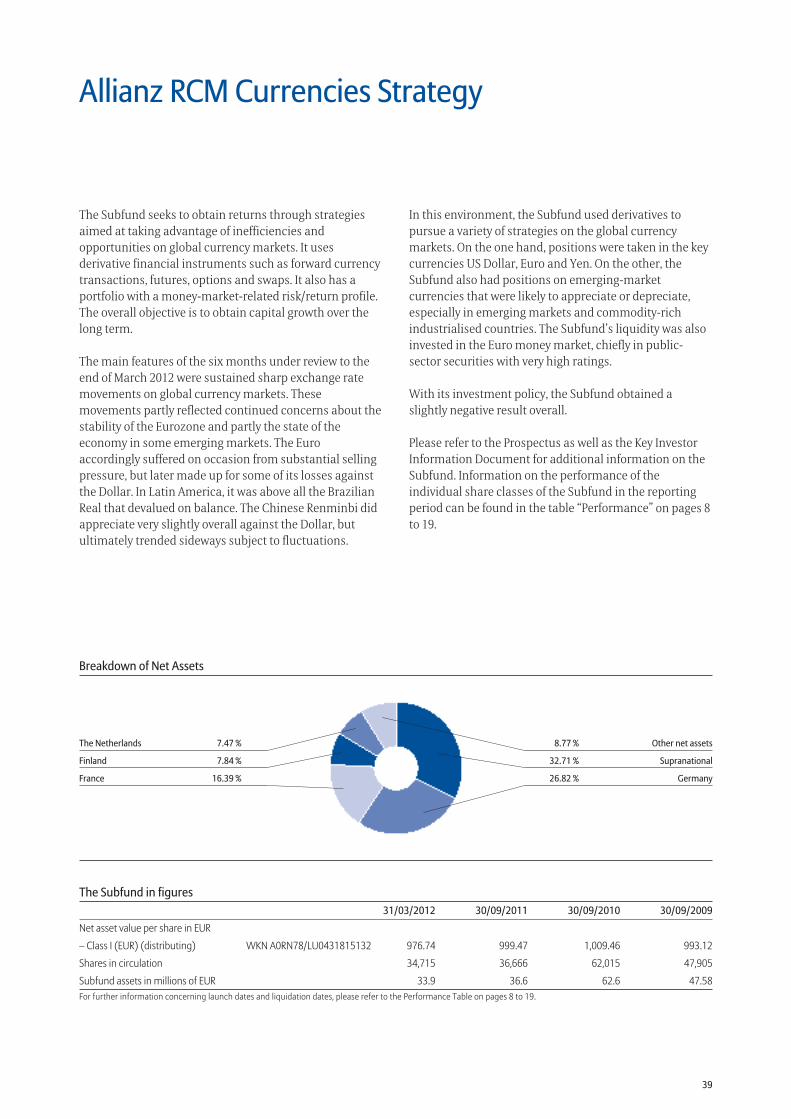
39
The Subfund in figures 31/03/2012 30/09/2011 30/09/2010 30/09/2009
Net asset value per share in EUR
– Class I (EUR) (distributing) WKN A0RN78/LU0431815132 976.74 999.47 1,009.46 993.12
Shares in circulation 34,715 36,666 62,015 47,905
Subfund assets in millions of EUR 33.9 36.6 62.6 47.58For further information concerning launch dates and liquidation dates, please refer to the Performance Table on pages 8 to 19.
8.77 % Other net assets
32.71 % Supranational
26.82 % Germany
The Netherlands 7.47 %
Finland 7.84 %
France 16.39 %
Breakdown of Net Assets
Allianz RCM Currencies Strategy
The Subfund seeks to obtain returns through strategies aimed at taking advantage of inefficiencies and opportunities on global currency markets. It uses derivative financial instruments such as forward currency transactions, futures, options and swaps. It also has a portfolio with a money-market-related risk/return profile. The overall objective is to obtain capital growth over the long term.
The main features of the six months under review to the end of March 2012 were sustained sharp exchange rate movements on global currency markets. These movements partly reflected continued concerns about the stability of the Eurozone and partly the state of the economy in some emerging markets. The Euro accordingly suffered on occasion from substantial selling pressure, but later made up for some of its losses against the Dollar. In Latin America, it was above all the Brazilian Real that devalued on balance. The Chinese Renminbi did appreciate very slightly overall against the Dollar, but ultimately trended sideways subject to fluctuations.
In this environment, the Subfund used derivatives to pursue a variety of strategies on the global currency markets. On the one hand, positions were taken in the key currencies US Dollar, Euro and Yen. On the other, the Subfund also had positions on emerging-market currencies that were likely to appreciate or depreciate, especially in emerging markets and commodity-rich industrialised countries. The Subfund’s liquidity was also invested in the Euro money market, chiefly in public-sector securities with very high ratings.
With its investment policy, the Subfund obtained a slightly negative result overall.
Please refer to the Prospectus as well as the Key Investor Information Document for additional information on the Subfund. Information on the performance of the individual share classes of the Subfund in the reporting period can be found in the table “Performance” on pages 8 to 19.
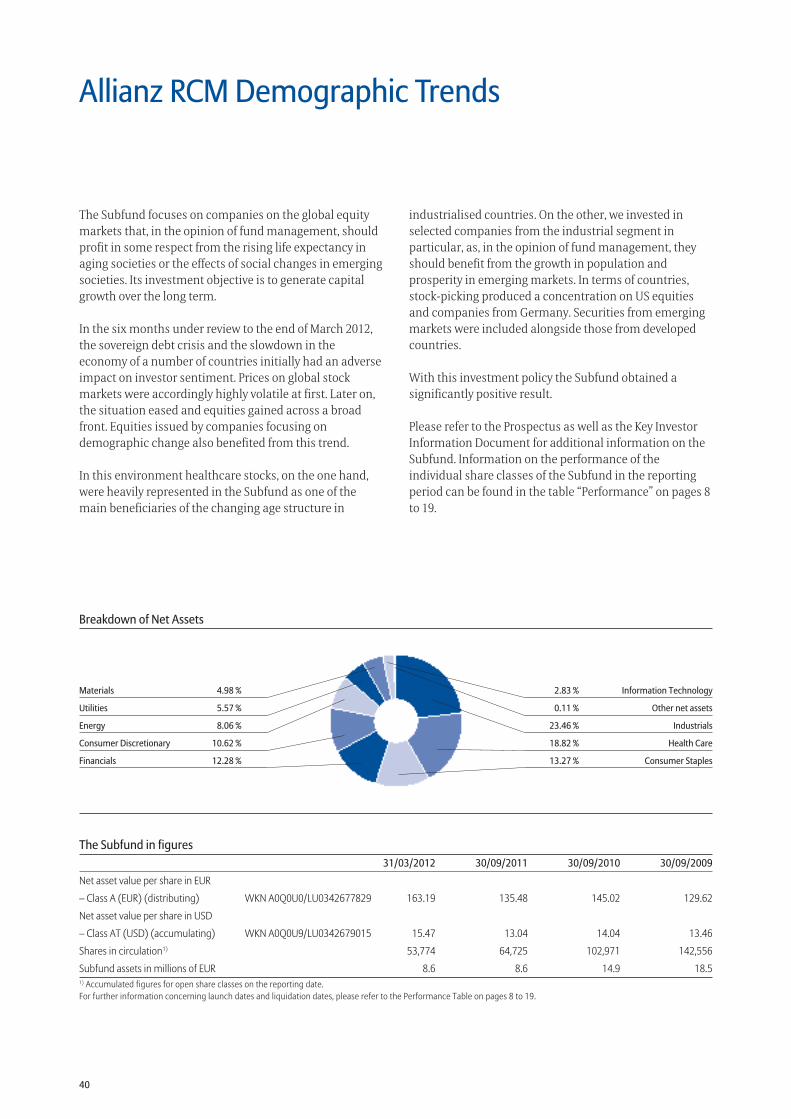
40
The Subfund in figures 31/03/2012 30/09/2011 30/09/2010 30/09/2009
Net asset value per share in EUR
– Class A (EUR) (distributing) WKN A0Q0U0/LU0342677829 163.19 135.48 145.02 129.62
Net asset value per share in USD
– Class AT (USD) (accumulating) WKN A0Q0U9/LU0342679015 15.47 13.04 14.04 13.46
Shares in circulation1) 53,774 64,725 102,971 142,556
Subfund assets in millions of EUR 8.6 8.6 14.9 18.51) Accumulated figures for open share classes on the reporting date.For further information concerning launch dates and liquidation dates, please refer to the Performance Table on pages 8 to 19.
2.83 % Information Technology
0.11 % Other net assets
23.46 % Industrials
18.82 % Health Care
13.27 % Consumer Staples
Materials 4.98 %
Utilities 5.57 %
Energy 8.06 %
Consumer Discretionary 10.62 %
Financials 12.28 %
Breakdown of Net Assets
Allianz RCM Demographic Trends
The Subfund focuses on companies on the global equity markets that, in the opinion of fund management, should profit in some respect from the rising life expectancy in aging societies or the effects of social changes in emerging societies. Its investment objective is to generate capital growth over the long term.
In the six months under review to the end of March 2012, the sovereign debt crisis and the slowdown in the economy of a number of countries initially had an adverse impact on investor sentiment. Prices on global stock markets were accordingly highly volatile at first. Later on, the situation eased and equities gained across a broad front. Equities issued by companies focusing on demographic change also benefited from this trend.
In this environment healthcare stocks, on the one hand, were heavily represented in the Subfund as one of the main beneficiaries of the changing age structure in
industrialised countries. On the other, we invested in selected companies from the industrial segment in particular, as, in the opinion of fund management, they should benefit from the growth in population and prosperity in emerging markets. In terms of countries, stock-picking produced a concentration on US equities and companies from Germany. Securities from emerging markets were included alongside those from developed countries.
With this investment policy the Subfund obtained a significantly positive result.
Please refer to the Prospectus as well as the Key Investor Information Document for additional information on the Subfund. Information on the performance of the individual share classes of the Subfund in the reporting period can be found in the table “Performance” on pages 8 to 19.
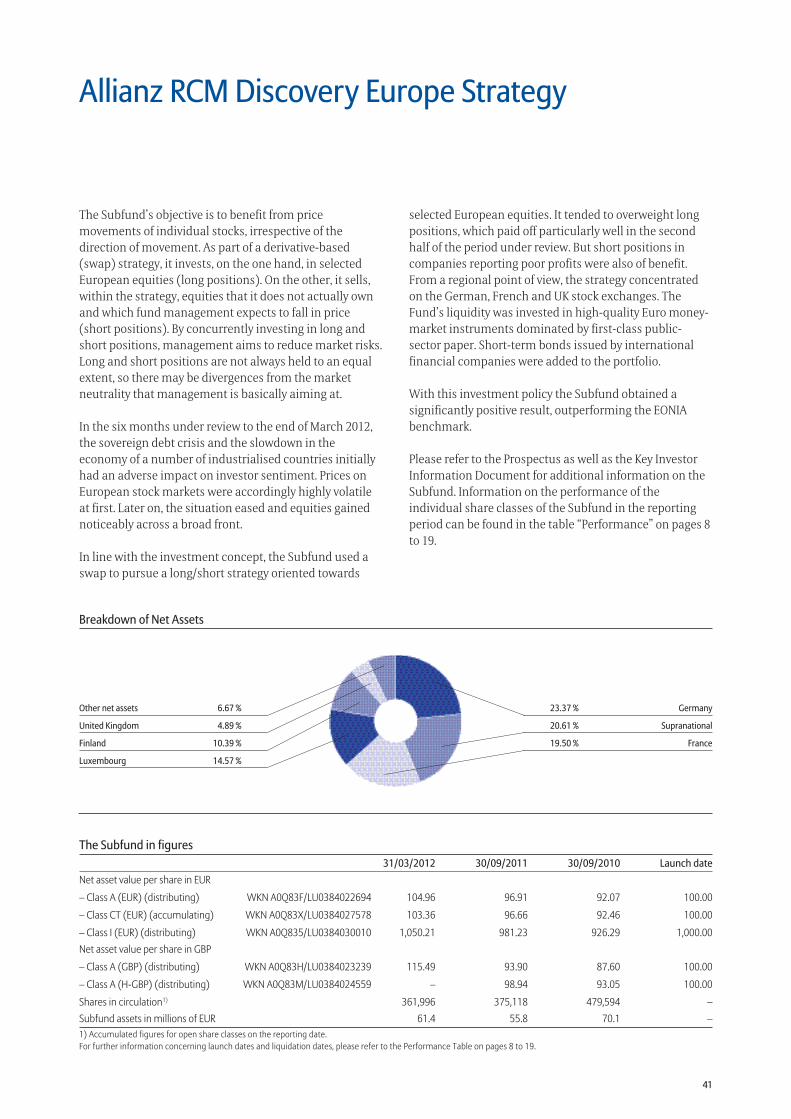
41
The Subfund in figures 31/03/2012 30/09/2011 30/09/2010 Launch dateNet asset value per share in EUR
– Class A (EUR) (distributing) WKN A0Q83F/LU0384022694 104.96 96.91 92.07 100.00
– Class CT (EUR) (accumulating) WKN A0Q83X/LU0384027578 103.36 96.66 92.46 100.00
– Class I (EUR) (distributing) WKN A0Q835/LU0384030010 1,050.21 981.23 926.29 1,000.00Net asset value per share in GBP
– Class A (GBP) (distributing) WKN A0Q83H/LU0384023239 115.49 93.90 87.60 100.00
– Class A (H-GBP) (distributing) WKN A0Q83M/LU0384024559 – 98.94 93.05 100.00
Shares in circulation1) 361,996 375,118 479,594 –Subfund assets in millions of EUR 61.4 55.8 70.1 –1) Accumulated figures for open share classes on the reporting date.For further information concerning launch dates and liquidation dates, please refer to the Performance Table on pages 8 to 19.
Breakdown of Net Assets
23.37 % Germany
20.61 % Supranational
19.50 % France
Other net assets 6.67 %
United Kingdom 4.89 %
Finland 10.39 %
Luxembourg 14.57 %
Allianz RCM Discovery Europe Strategy
The Subfund’s objective is to benefit from price movements of individual stocks, irrespective of the direction of movement. As part of a derivative-based (swap) strategy, it invests, on the one hand, in selected European equities (long positions). On the other, it sells, within the strategy, equities that it does not actually own and which fund management expects to fall in price (short positions). By concurrently investing in long and short positions, management aims to reduce market risks. Long and short positions are not always held to an equal extent, so there may be divergences from the market neutrality that management is basically aiming at.
In the six months under review to the end of March 2012, the sovereign debt crisis and the slowdown in the economy of a number of industrialised countries initially had an adverse impact on investor sentiment. Prices on European stock markets were accordingly highly volatile at first. Later on, the situation eased and equities gained noticeably across a broad front.
In line with the investment concept, the Subfund used a swap to pursue a long/short strategy oriented towards
selected European equities. It tended to overweight long positions, which paid off particularly well in the second half of the period under review. But short positions in companies reporting poor profits were also of benefit. From a regional point of view, the strategy concentrated on the German, French and UK stock exchanges. The Fund’s liquidity was invested in high-quality Euro money-market instruments dominated by first-class public-sector paper. Short-term bonds issued by international financial companies were added to the portfolio.
With this investment policy the Subfund obtained a significantly positive result, outperforming the EONIA benchmark.
Please refer to the Prospectus as well as the Key Investor Information Document for additional information on the Subfund. Information on the performance of the individual share classes of the Subfund in the reporting period can be found in the table “Performance” on pages 8 to 19.
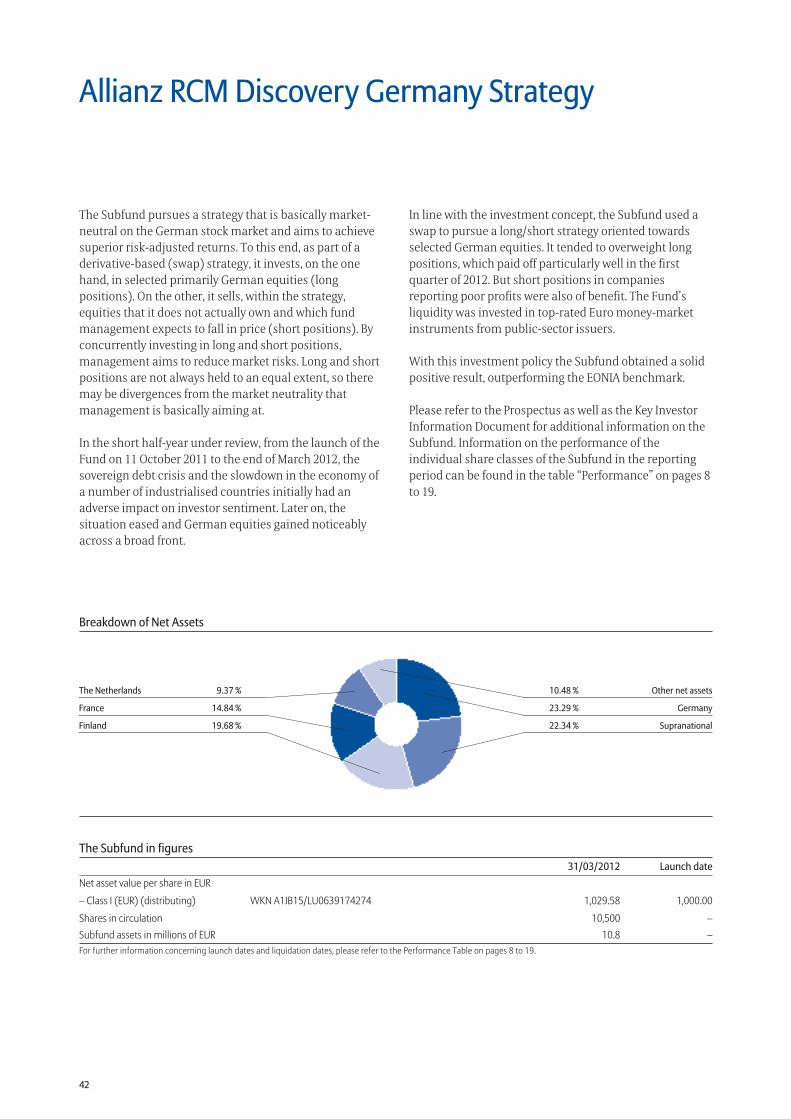
42
The Subfund in figures 31/03/2012 Launch dateNet asset value per share in EUR
– Class I (EUR) (distributing) WKN A1JB15/LU0639174274 1,029.58 1,000.00
Shares in circulation 10,500 –Subfund assets in millions of EUR 10.8 –For further information concerning launch dates and liquidation dates, please refer to the Performance Table on pages 8 to 19.
Breakdown of Net Assets
10.48 % Other net assets
23.29 % Germany
22.34 % Supranational
The Netherlands 9.37 %
France 14.84 %
Finland 19.68 %
Allianz RCM Discovery Germany Strategy
The Subfund pursues a strategy that is basically market-neutral on the German stock market and aims to achieve superior risk-adjusted returns. To this end, as part of a derivative-based (swap) strategy, it invests, on the one hand, in selected primarily German equities (long positions). On the other, it sells, within the strategy, equities that it does not actually own and which fund management expects to fall in price (short positions). By concurrently investing in long and short positions, management aims to reduce market risks. Long and short positions are not always held to an equal extent, so there may be divergences from the market neutrality that management is basically aiming at.
In the short half-year under review, from the launch of the Fund on 11 October 2011 to the end of March 2012, the sovereign debt crisis and the slowdown in the economy of a number of industrialised countries initially had an adverse impact on investor sentiment. Later on, the situation eased and German equities gained noticeably across a broad front.
In line with the investment concept, the Subfund used a swap to pursue a long/short strategy oriented towards selected German equities. It tended to overweight long positions, which paid off particularly well in the first quarter of 2012. But short positions in companies reporting poor profits were also of benefit. The Fund’s liquidity was invested in top-rated Euro money-market instruments from public-sector issuers.
With this investment policy the Subfund obtained a solid positive result, outperforming the EONIA benchmark.
Please refer to the Prospectus as well as the Key Investor Information Document for additional information on the Subfund. Information on the performance of the individual share classes of the Subfund in the reporting period can be found in the table “Performance” on pages 8 to 19.
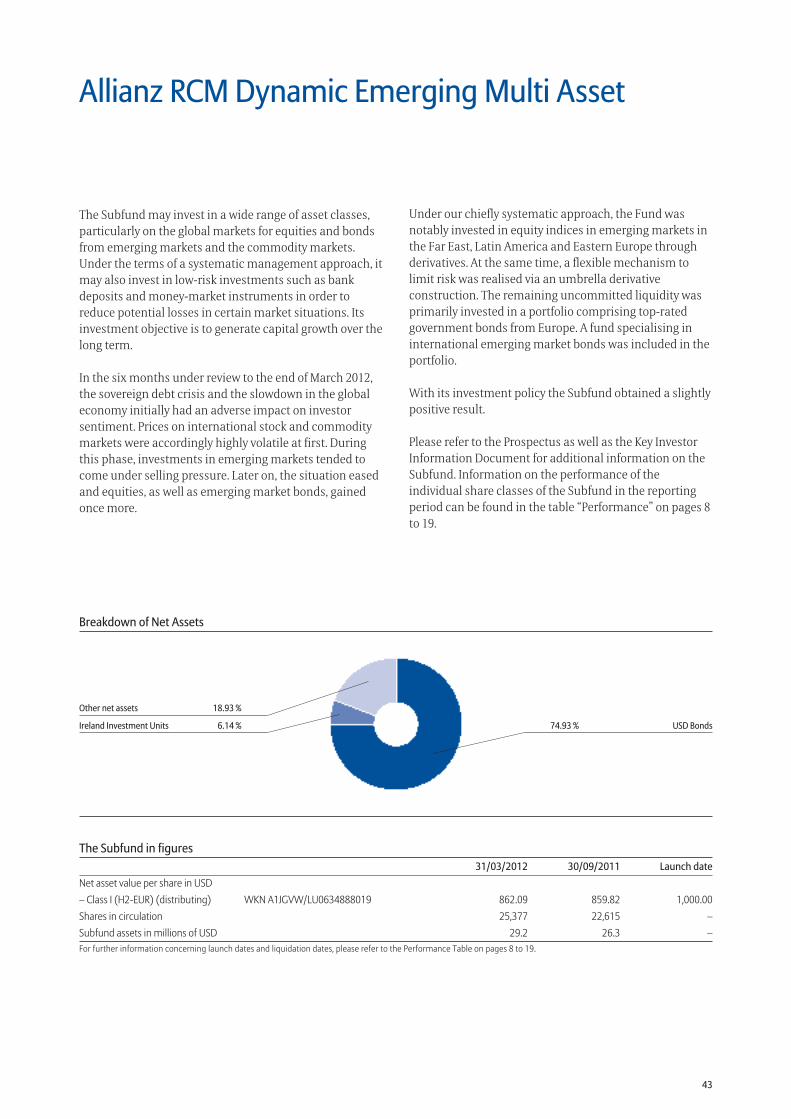
43
The Subfund in figures 31/03/2012 30/09/2011 Launch dateNet asset value per share in USD– Class I (H2-EUR) (distributing) WKN A1JGVW/LU0634888019 862.09 859.82 1,000.00Shares in circulation 25,377 22,615 –Subfund assets in millions of USD 29.2 26.3 –For further information concerning launch dates and liquidation dates, please refer to the Performance Table on pages 8 to 19.
74.93 % USD Bonds
Other net assets 18.93 %
Ireland Investment Units 6.14 %
Breakdown of Net Assets
Allianz RCM Dynamic Emerging Multi Asset
The Subfund may invest in a wide range of asset classes, particularly on the global markets for equities and bonds from emerging markets and the commodity markets. Under the terms of a systematic management approach, it may also invest in low-risk investments such as bank deposits and money-market instruments in order to reduce potential losses in certain market situations. Its investment objective is to generate capital growth over the long term.
In the six months under review to the end of March 2012, the sovereign debt crisis and the slowdown in the global economy initially had an adverse impact on investor sentiment. Prices on international stock and commodity markets were accordingly highly volatile at first. During this phase, investments in emerging markets tended to come under selling pressure. Later on, the situation eased and equities, as well as emerging market bonds, gained once more.
Under our chiefly systematic approach, the Fund was notably invested in equity indices in emerging markets in the Far East, Latin America and Eastern Europe through derivatives. At the same time, a flexible mechanism to limit risk was realised via an umbrella derivative construction. The remaining uncommitted liquidity was primarily invested in a portfolio comprising top-rated government bonds from Europe. A fund specialising in international emerging market bonds was included in the portfolio.
With its investment policy the Subfund obtained a slightly positive result.
Please refer to the Prospectus as well as the Key Investor Information Document for additional information on the Subfund. Information on the performance of the individual share classes of the Subfund in the reporting period can be found in the table “Performance” on pages 8 to 19.
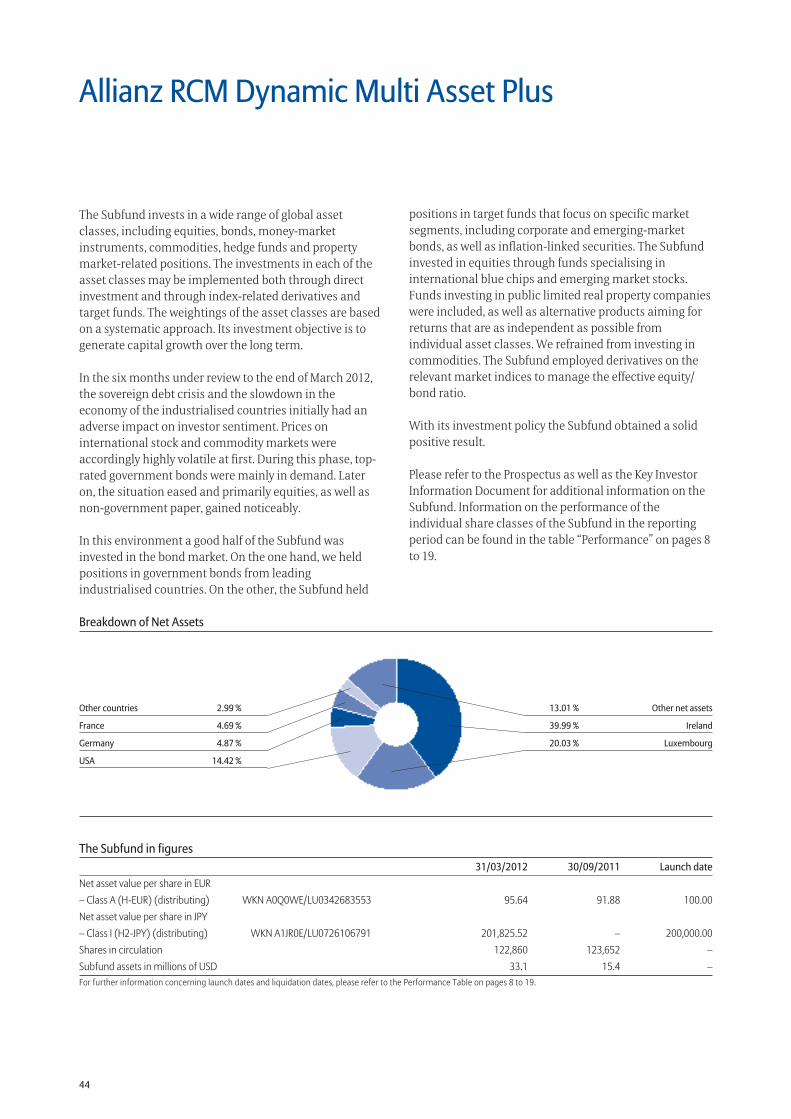
44
The Subfund in figures 31/03/2012 30/09/2011 Launch dateNet asset value per share in EUR– Class A (H-EUR) (distributing) WKN A0Q0WE/LU0342683553 95.64 91.88 100.00Net asset value per share in JPY– Class I (H2-JPY) (distributing) WKN A1JR0E/LU0726106791 201,825.52 – 200,000.00Shares in circulation 122,860 123,652 –Subfund assets in millions of USD 33.1 15.4 –For further information concerning launch dates and liquidation dates, please refer to the Performance Table on pages 8 to 19.
13.01 % Other net assets
39.99 % Ireland
20.03 % Luxembourg
Other countries 2.99 %
France 4.69 %
Germany 4.87 %
USA 14.42 %
Breakdown of Net Assets
Allianz RCM Dynamic Multi Asset Plus
The Subfund invests in a wide range of global asset classes, including equities, bonds, money-market instruments, commodities, hedge funds and property market-related positions. The investments in each of the asset classes may be implemented both through direct investment and through index-related derivatives and target funds. The weightings of the asset classes are based on a systematic approach. Its investment objective is to generate capital growth over the long term.
In the six months under review to the end of March 2012, the sovereign debt crisis and the slowdown in the economy of the industrialised countries initially had an adverse impact on investor sentiment. Prices on international stock and commodity markets were accordingly highly volatile at first. During this phase, top-rated government bonds were mainly in demand. Later on, the situation eased and primarily equities, as well as non-government paper, gained noticeably.
In this environment a good half of the Subfund was invested in the bond market. On the one hand, we held positions in government bonds from leading industrialised countries. On the other, the Subfund held
positions in target funds that focus on specific market segments, including corporate and emerging-market bonds, as well as inflation-linked securities. The Subfund invested in equities through funds specialising in international blue chips and emerging market stocks. Funds investing in public limited real property companies were included, as well as alternative products aiming for returns that are as independent as possible from individual asset classes. We refrained from investing in commodities. The Subfund employed derivatives on the relevant market indices to manage the effective equity/bond ratio.
With its investment policy the Subfund obtained a solid positive result.
Please refer to the Prospectus as well as the Key Investor Information Document for additional information on the Subfund. Information on the performance of the individual share classes of the Subfund in the reporting period can be found in the table “Performance” on pages 8 to 19.
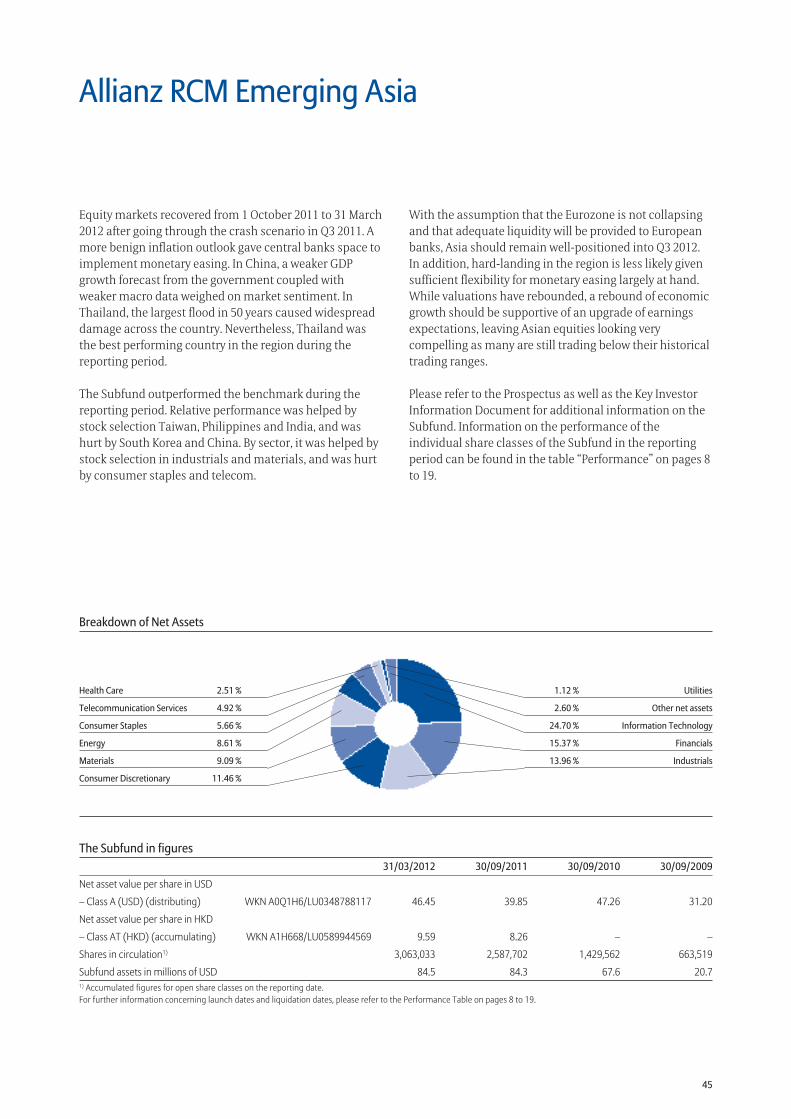
45
The Subfund in figures 31/03/2012 30/09/2011 30/09/2010 30/09/2009
Net asset value per share in USD
– Class A (USD) (distributing) WKN A0Q1H6/LU0348788117 46.45 39.85 47.26 31.20
Net asset value per share in HKD
– Class AT (HKD) (accumulating) WKN A1H668/LU0589944569 9.59 8.26 – –
Shares in circulation1) 3,063,033 2,587,702 1,429,562 663,519
Subfund assets in millions of USD 84.5 84.3 67.6 20.71) Accumulated figures for open share classes on the reporting date.For further information concerning launch dates and liquidation dates, please refer to the Performance Table on pages 8 to 19.
1.12 % Utilities
2.60 % Other net assets
24.70 % Information Technology
15.37 % Financials
13.96 % Industrials
Health Care 2.51 %
Telecommunication Services 4.92 %
Consumer Staples 5.66 %
Energy 8.61 %
Materials 9.09 %
Consumer Discretionary 11.46 %
Breakdown of Net Assets
Allianz RCM Emerging Asia
Equity markets recovered from 1 October 2011 to 31 March 2012 after going through the crash scenario in Q3 2011. A more benign inflation outlook gave central banks space to implement monetary easing. In China, a weaker GDP growth forecast from the government coupled with weaker macro data weighed on market sentiment. In Thailand, the largest flood in 50 years caused widespread damage across the country. Nevertheless, Thailand was the best performing country in the region during the reporting period.
The Subfund outperformed the benchmark during the reporting period. Relative performance was helped by stock selection Taiwan, Philippines and India, and was hurt by South Korea and China. By sector, it was helped by stock selection in industrials and materials, and was hurt by consumer staples and telecom.
With the assumption that the Eurozone is not collapsing and that adequate liquidity will be provided to European banks, Asia should remain well-positioned into Q3 2012. In addition, hard-landing in the region is less likely given sufficient flexibility for monetary easing largely at hand. While valuations have rebounded, a rebound of economic growth should be supportive of an upgrade of earnings expectations, leaving Asian equities looking very compelling as many are still trading below their historical trading ranges.
Please refer to the Prospectus as well as the Key Investor Information Document for additional information on the Subfund. Information on the performance of the individual share classes of the Subfund in the reporting period can be found in the table “Performance” on pages 8 to 19.
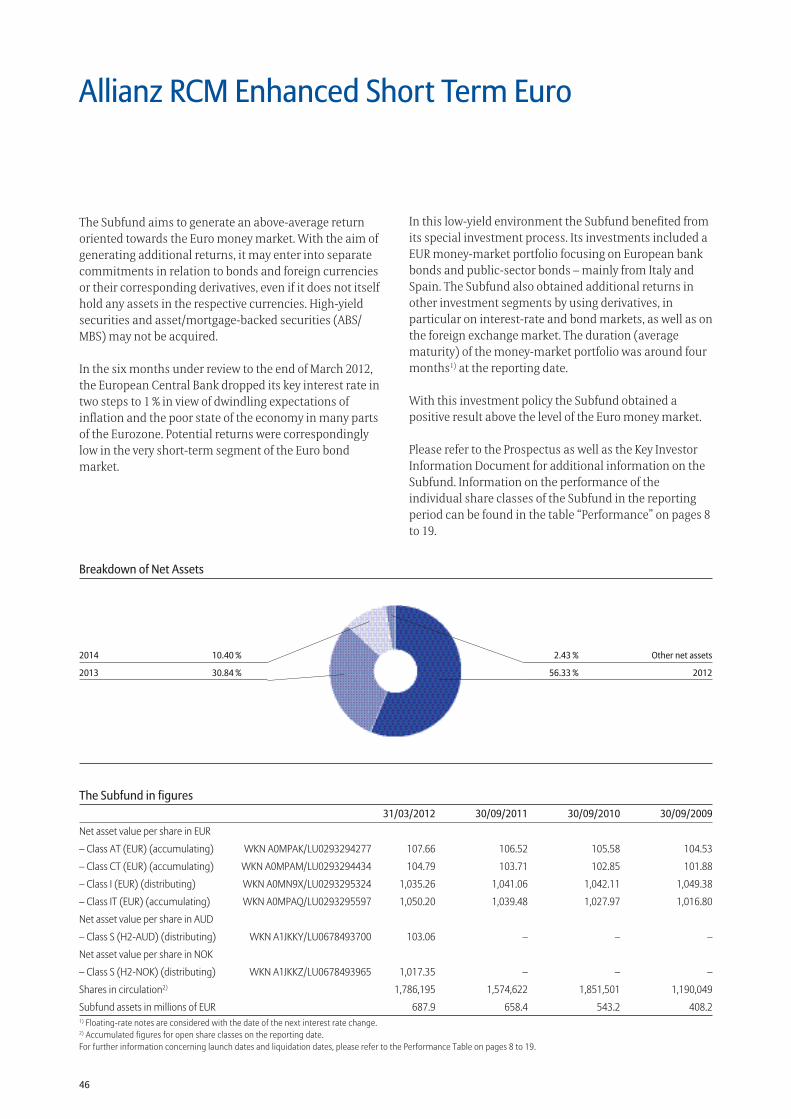
46
The Subfund in figures 31/03/2012 30/09/2011 30/09/2010 30/09/2009
Net asset value per share in EUR
– Class AT (EUR) (accumulating) WKN A0MPAK/LU0293294277 107.66 106.52 105.58 104.53
– Class CT (EUR) (accumulating) WKN A0MPAM/LU0293294434 104.79 103.71 102.85 101.88
– Class I (EUR) (distributing) WKN A0MN9X/LU0293295324 1,035.26 1,041.06 1,042.11 1,049.38
– Class IT (EUR) (accumulating) WKN A0MPAQ/LU0293295597 1,050.20 1,039.48 1,027.97 1,016.80
Net asset value per share in AUD
– Class S (H2-AUD) (distributing) WKN A1JKKY/LU0678493700 103.06 – – –
Net asset value per share in NOK
– Class S (H2-NOK) (distributing) WKN A1JKKZ/LU0678493965 1,017.35 – – –
Shares in circulation2) 1,786,195 1,574,622 1,851,501 1,190,049
Subfund assets in millions of EUR 687.9 658.4 543.2 408.21) Floating-rate notes are considered with the date of the next interest rate change.2) Accumulated figures for open share classes on the reporting date.For further information concerning launch dates and liquidation dates, please refer to the Performance Table on pages 8 to 19.
2.43 % Other net assets
56.33 % 2012
2014 10.40 %
2013 30.84 %
Breakdown of Net Assets
Allianz RCM Enhanced Short Term Euro
The Subfund aims to generate an above-average return oriented towards the Euro money market. With the aim of generating additional returns, it may enter into separate commitments in relation to bonds and foreign currencies or their corresponding derivatives, even if it does not itself hold any assets in the respective currencies. High-yield securities and asset/mortgage-backed securities (ABS/MBS) may not be acquired.
In the six months under review to the end of March 2012, the European Central Bank dropped its key interest rate in two steps to 1 % in view of dwindling expectations of inflation and the poor state of the economy in many parts of the Eurozone. Potential returns were correspondingly low in the very short-term segment of the Euro bond market.
In this low-yield environment the Subfund benefited from its special investment process. Its investments included a EUR money-market portfolio focusing on European bank bonds and public-sector bonds – mainly from Italy and Spain. The Subfund also obtained additional returns in other investment segments by using derivatives, in particular on interest-rate and bond markets, as well as on the foreign exchange market. The duration (average maturity) of the money-market portfolio was around four months1) at the reporting date.
With this investment policy the Subfund obtained a positive result above the level of the Euro money market.
Please refer to the Prospectus as well as the Key Investor Information Document for additional information on the Subfund. Information on the performance of the individual share classes of the Subfund in the reporting period can be found in the table “Performance” on pages 8 to 19.
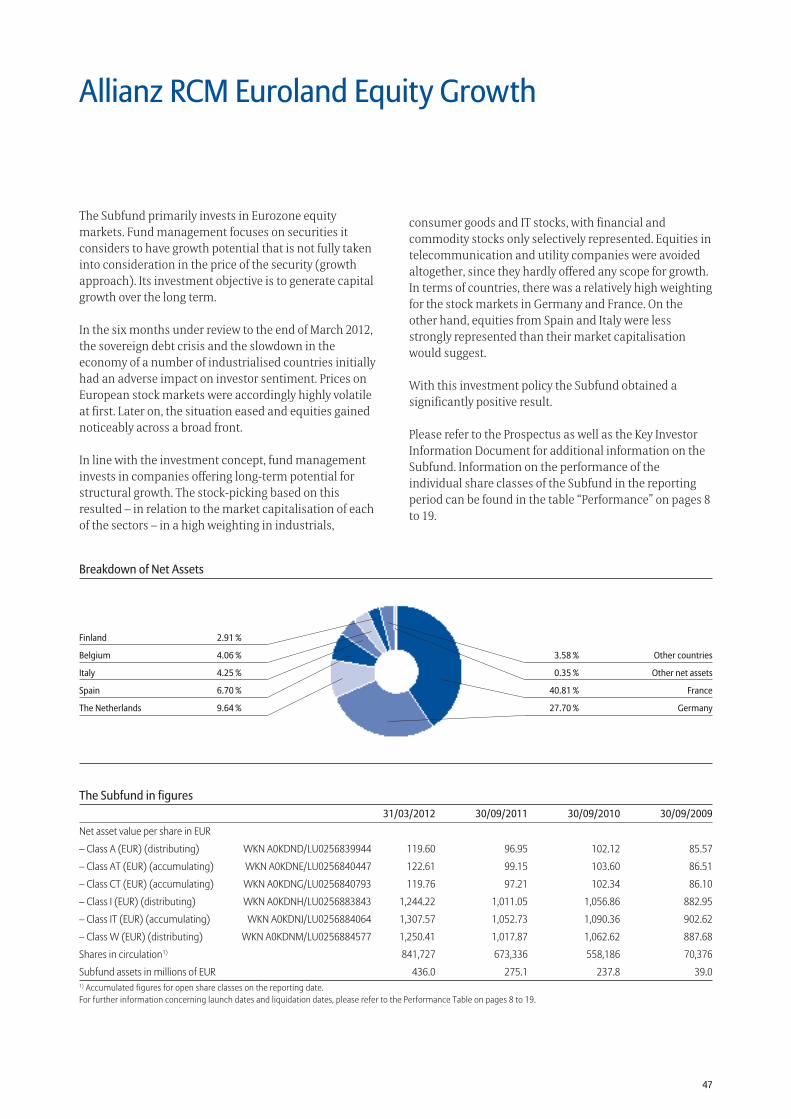
47
The Subfund in figures 31/03/2012 30/09/2011 30/09/2010 30/09/2009
Net asset value per share in EUR
– Class A (EUR) (distributing) WKN A0KDND/LU0256839944 119.60 96.95 102.12 85.57
– Class AT (EUR) (accumulating) WKN A0KDNE/LU0256840447 122.61 99.15 103.60 86.51
– Class CT (EUR) (accumulating) WKN A0KDNG/LU0256840793 119.76 97.21 102.34 86.10
– Class I (EUR) (distributing) WKN A0KDNH/LU0256883843 1,244.22 1,011.05 1,056.86 882.95
– Class IT (EUR) (accumulating) WKN A0KDNJ/LU0256884064 1,307.57 1,052.73 1,090.36 902.62
– Class W (EUR) (distributing) WKN A0KDNM/LU0256884577 1,250.41 1,017.87 1,062.62 887.68
Shares in circulation1) 841,727 673,336 558,186 70,376
Subfund assets in millions of EUR 436.0 275.1 237.8 39.01) Accumulated figures for open share classes on the reporting date.For further information concerning launch dates and liquidation dates, please refer to the Performance Table on pages 8 to 19.
Breakdown of Net Assets
3.58 % Other countries
0.35 % Other net assets
40.81 % France
27.70 % Germany
Finland 2.91 %
Belgium 4.06 %
Italy 4.25 %
Spain 6.70 %
The Netherlands 9.64 %
Allianz RCM Euroland Equity Growth
The Subfund primarily invests in Eurozone equity markets. Fund management focuses on securities it considers to have growth potential that is not fully taken into consideration in the price of the security (growth approach). Its investment objective is to generate capital growth over the long term.
In the six months under review to the end of March 2012, the sovereign debt crisis and the slowdown in the economy of a number of industrialised countries initially had an adverse impact on investor sentiment. Prices on European stock markets were accordingly highly volatile at first. Later on, the situation eased and equities gained noticeably across a broad front.
In line with the investment concept, fund management invests in companies offering long-term potential for structural growth. The stock-picking based on this resulted – in relation to the market capitalisation of each of the sectors – in a high weighting in industrials,
consumer goods and IT stocks, with financial and commodity stocks only selectively represented. Equities in telecommunication and utility companies were avoided altogether, since they hardly offered any scope for growth. In terms of countries, there was a relatively high weighting for the stock markets in Germany and France. On the other hand, equities from Spain and Italy were less strongly represented than their market capitalisation would suggest.
With this investment policy the Subfund obtained a significantly positive result.
Please refer to the Prospectus as well as the Key Investor Information Document for additional information on the Subfund. Information on the performance of the individual share classes of the Subfund in the reporting period can be found in the table “Performance” on pages 8 to 19.

48
Breakdown of Net Assets
6.53 % Other Countries
1.11 % Other net assets
23.06 % United Kingdom
22.51 % France
12.85 % Germany
Spain 2.50 %
Italy 2.62 %
The Netherlands 3.36 %
Switzerland 7.05 %
Denmark 8.40 %
Sweden 10.01 %
Allianz RCM Europe Equity Growth
The Subfund primarily invests in European equity markets. Fund management focuses on securities it considers to have growth potential that is not fully taken into consideration in the price of the security (growth approach). Its investment objective is to generate capital growth over the long term.
In the six months under review to the end of March 2012, the sovereign debt crisis and the slowdown in the economy of a number of industrialised countries initially had an adverse impact on investor sentiment. Prices on European stock markets were accordingly highly volatile at first. Later on, the situation eased and equities gained noticeably across a broad front.
In line with the investment concept, fund management invests in companies offering long-term potential for structural growth. The stock-picking based on this resulted – in relation to the market capitalisation of each of the sectors – in a high weighting in industrials,
consumer goods and healthcare stocks, with financial and commodity stocks only selectively represented. Equities in telecommunication and utility companies were avoided altogether, since they hardly offered any scope for growth. In terms of countries, this produced a relatively high weighting for the stock markets in France, Sweden and Denmark. The German market was more or less neutrally weighted. UK and Swiss equities were much less strongly represented than their market capitalisation would suggest.
With this investment policy the Subfund obtained a significantly positive result.
Please refer to the Prospectus as well as the Key Investor Information Document for additional information on the Subfund. Information on the performance of the individual share classes of the Subfund in the reporting period can be found in the table “Performance” on pages 8 to 19.
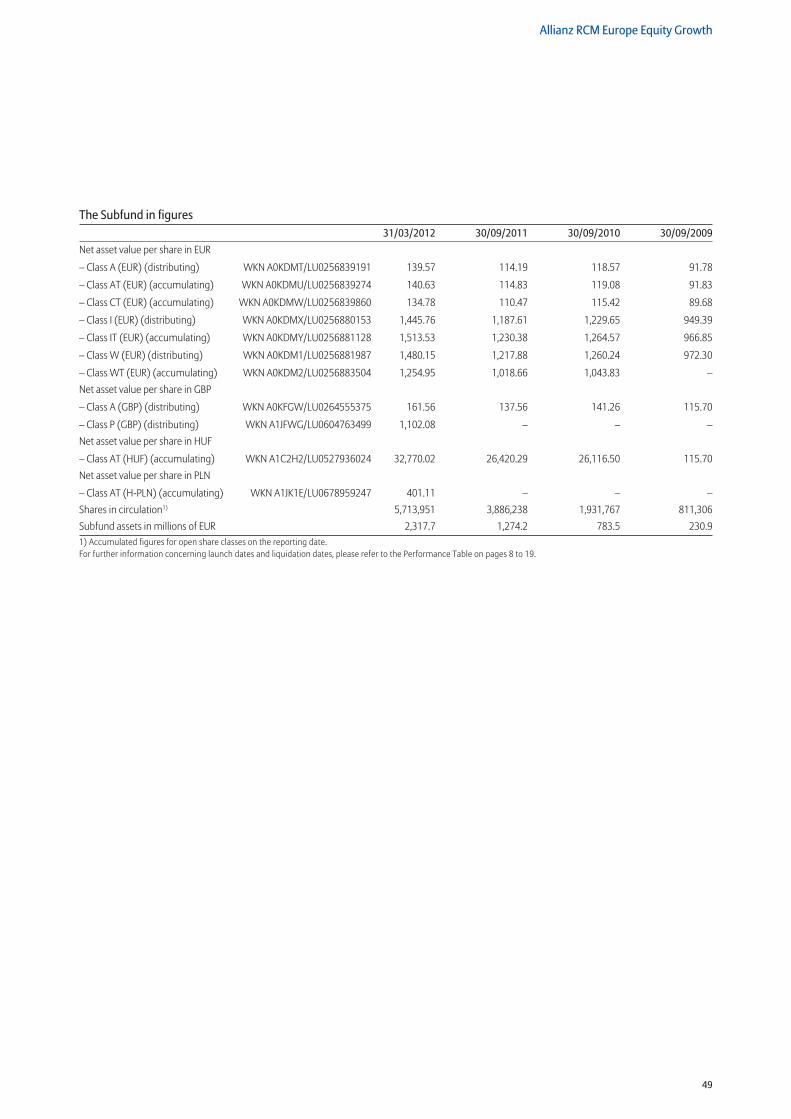
49
Allianz RCM Europe Equity Growth
The Subfund in figures 31/03/2012 30/09/2011 30/09/2010 30/09/2009Net asset value per share in EUR
– Class A (EUR) (distributing) WKN A0KDMT/LU0256839191 139.57 114.19 118.57 91.78
– Class AT (EUR) (accumulating) WKN A0KDMU/LU0256839274 140.63 114.83 119.08 91.83
– Class CT (EUR) (accumulating) WKN A0KDMW/LU0256839860 134.78 110.47 115.42 89.68
– Class I (EUR) (distributing) WKN A0KDMX/LU0256880153 1,445.76 1,187.61 1,229.65 949.39
– Class IT (EUR) (accumulating) WKN A0KDMY/LU0256881128 1,513.53 1,230.38 1,264.57 966.85
– Class W (EUR) (distributing) WKN A0KDM1/LU0256881987 1,480.15 1,217.88 1,260.24 972.30
– Class WT (EUR) (accumulating) WKN A0KDM2/LU0256883504 1,254.95 1,018.66 1,043.83 –Net asset value per share in GBP
– Class A (GBP) (distributing) WKN A0KFGW/LU0264555375 161.56 137.56 141.26 115.70
– Class P (GBP) (distributing) WKN A1JFWG/LU0604763499 1,102.08 – – –Net asset value per share in HUF
– Class AT (HUF) (accumulating) WKN A1C2H2/LU0527936024 32,770.02 26,420.29 26,116.50 115.70Net asset value per share in PLN
– Class AT (H-PLN) (accumulating) WKN A1JK1E/LU0678959247 401.11 – – –Shares in circulation1) 5,713,951 3,886,238 1,931,767 811,306Subfund assets in millions of EUR 2,317.7 1,274.2 783.5 230.91) Accumulated figures for open share classes on the reporting date.For further information concerning launch dates and liquidation dates, please refer to the Performance Table on pages 8 to 19.
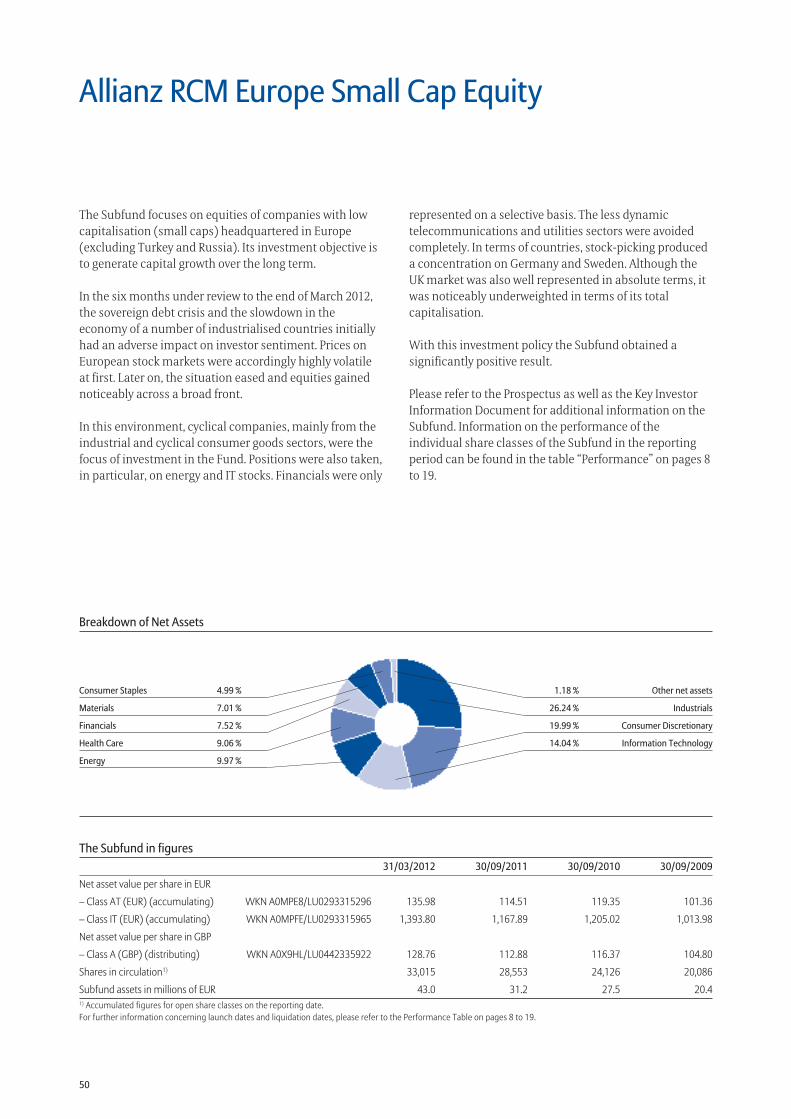
50
The Subfund in figures 31/03/2012 30/09/2011 30/09/2010 30/09/2009
Net asset value per share in EUR
– Class AT (EUR) (accumulating) WKN A0MPE8/LU0293315296 135.98 114.51 119.35 101.36
– Class IT (EUR) (accumulating) WKN A0MPFE/LU0293315965 1,393.80 1,167.89 1,205.02 1,013.98
Net asset value per share in GBP
– Class A (GBP) (distributing) WKN A0X9HL/LU0442335922 128.76 112.88 116.37 104.80
Shares in circulation1) 33,015 28,553 24,126 20,086
Subfund assets in millions of EUR 43.0 31.2 27.5 20.41) Accumulated figures for open share classes on the reporting date.For further information concerning launch dates and liquidation dates, please refer to the Performance Table on pages 8 to 19.
1.18 % Other net assets
26.24 % Industrials
19.99 % Consumer Discretionary
14.04 % Information Technology
Consumer Staples 4.99 %
Materials 7.01 %
Financials 7.52 %
Health Care 9.06 %
Energy 9.97 %
Breakdown of Net Assets
Allianz RCM Europe Small Cap Equity
The Subfund focuses on equities of companies with low capitalisation (small caps) headquartered in Europe (excluding Turkey and Russia). Its investment objective is to generate capital growth over the long term.
In the six months under review to the end of March 2012, the sovereign debt crisis and the slowdown in the economy of a number of industrialised countries initially had an adverse impact on investor sentiment. Prices on European stock markets were accordingly highly volatile at first. Later on, the situation eased and equities gained noticeably across a broad front.
In this environment, cyclical companies, mainly from the industrial and cyclical consumer goods sectors, were the focus of investment in the Fund. Positions were also taken, in particular, on energy and IT stocks. Financials were only
represented on a selective basis. The less dynamic telecommunications and utilities sectors were avoided completely. In terms of countries, stock-picking produced a concentration on Germany and Sweden. Although the UK market was also well represented in absolute terms, it was noticeably underweighted in terms of its total capitalisation.
With this investment policy the Subfund obtained a significantly positive result.
Please refer to the Prospectus as well as the Key Investor Information Document for additional information on the Subfund. Information on the performance of the individual share classes of the Subfund in the reporting period can be found in the table “Performance” on pages 8 to 19.
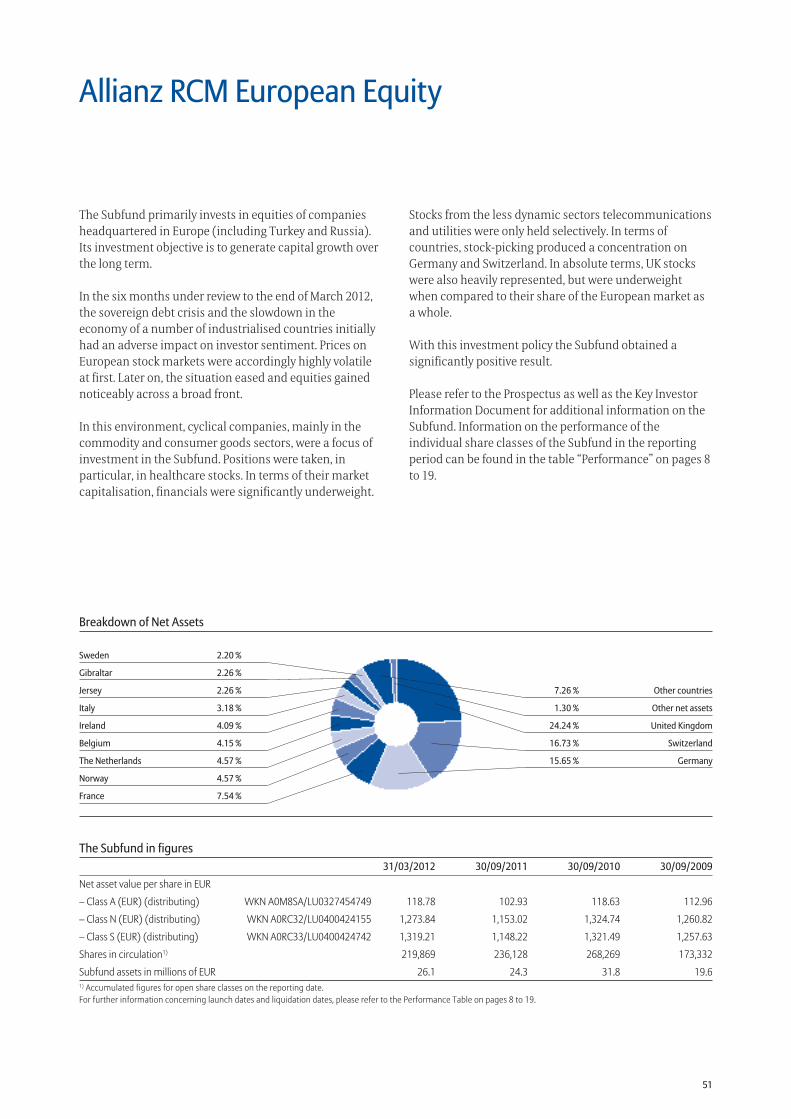
51
The Subfund in figures 31/03/2012 30/09/2011 30/09/2010 30/09/2009
Net asset value per share in EUR
– Class A (EUR) (distributing) WKN A0M8SA/LU0327454749 118.78 102.93 118.63 112.96
– Class N (EUR) (distributing) WKN A0RC32/LU0400424155 1,273.84 1,153.02 1,324.74 1,260.82
– Class S (EUR) (distributing) WKN A0RC33/LU0400424742 1,319.21 1,148.22 1,321.49 1,257.63
Shares in circulation1) 219,869 236,128 268,269 173,332
Subfund assets in millions of EUR 26.1 24.3 31.8 19.61) Accumulated figures for open share classes on the reporting date.For further information concerning launch dates and liquidation dates, please refer to the Performance Table on pages 8 to 19.
7.26 % Other countries
1.30 % Other net assets
24.24 % United Kingdom
16.73 % Switzerland
15.65 % Germany
Sweden 2.20 %
Gibraltar 2.26 %
Jersey 2.26 %
Italy 3.18 %
Ireland 4.09 %
Belgium 4.15 %
The Netherlands 4.57 %
Norway 4.57 %
France 7.54 %
Breakdown of Net Assets
Allianz RCM European Equity
The Subfund primarily invests in equities of companies headquartered in Europe (including Turkey and Russia). Its investment objective is to generate capital growth over the long term.
In the six months under review to the end of March 2012, the sovereign debt crisis and the slowdown in the economy of a number of industrialised countries initially had an adverse impact on investor sentiment. Prices on European stock markets were accordingly highly volatile at first. Later on, the situation eased and equities gained noticeably across a broad front.
In this environment, cyclical companies, mainly in the commodity and consumer goods sectors, were a focus of investment in the Subfund. Positions were taken, in particular, in healthcare stocks. In terms of their market capitalisation, financials were significantly underweight.
Stocks from the less dynamic sectors telecommunications and utilities were only held selectively. In terms of countries, stock-picking produced a concentration on Germany and Switzerland. In absolute terms, UK stocks were also heavily represented, but were underweight when compared to their share of the European market as a whole.
With this investment policy the Subfund obtained a significantly positive result.
Please refer to the Prospectus as well as the Key Investor Information Document for additional information on the Subfund. Information on the performance of the individual share classes of the Subfund in the reporting period can be found in the table “Performance” on pages 8 to 19.
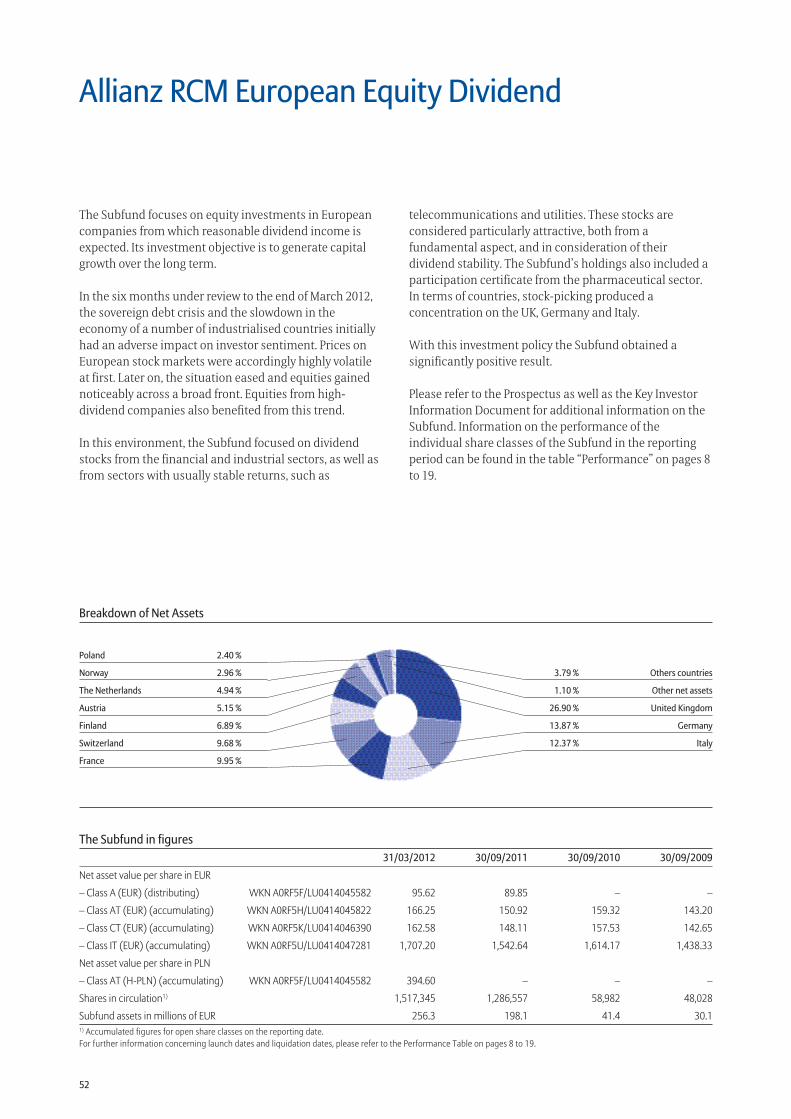
52
The Subfund in figures 31/03/2012 30/09/2011 30/09/2010 30/09/2009
Net asset value per share in EUR
– Class A (EUR) (distributing) WKN A0RF5F/LU0414045582 95.62 89.85 – –
– Class AT (EUR) (accumulating) WKN A0RF5H/LU0414045822 166.25 150.92 159.32 143.20
– Class CT (EUR) (accumulating) WKN A0RF5K/LU0414046390 162.58 148.11 157.53 142.65
– Class IT (EUR) (accumulating) WKN A0RF5U/LU0414047281 1,707.20 1,542.64 1,614.17 1,438.33
Net asset value per share in PLN
– Class AT (H-PLN) (accumulating) WKN A0RF5F/LU0414045582 394.60 – – –
Shares in circulation1) 1,517,345 1,286,557 58,982 48,028
Subfund assets in millions of EUR 256.3 198.1 41.4 30.11) Accumulated figures for open share classes on the reporting date.For further information concerning launch dates and liquidation dates, please refer to the Performance Table on pages 8 to 19.
3.79 % Others countries
1.10 % Other net assets
26.90 % United Kingdom
13.87 % Germany
12.37 % Italy
Poland 2.40 %
Norway 2.96 %
The Netherlands 4.94 %
Austria 5.15 %
Finland 6.89 %
Switzerland 9.68 %
France 9.95 %
Breakdown of Net Assets
Allianz RCM European Equity Dividend
The Subfund focuses on equity investments in European companies from which reasonable dividend income is expected. Its investment objective is to generate capital growth over the long term.
In the six months under review to the end of March 2012, the sovereign debt crisis and the slowdown in the economy of a number of industrialised countries initially had an adverse impact on investor sentiment. Prices on European stock markets were accordingly highly volatile at first. Later on, the situation eased and equities gained noticeably across a broad front. Equities from high-dividend companies also benefited from this trend.
In this environment, the Subfund focused on dividend stocks from the financial and industrial sectors, as well as from sectors with usually stable returns, such as
telecommunications and utilities. These stocks are considered particularly attractive, both from a fundamental aspect, and in consideration of their dividend stability. The Subfund’s holdings also included a participation certificate from the pharmaceutical sector. In terms of countries, stock-picking produced a concentration on the UK, Germany and Italy.
With this investment policy the Subfund obtained a significantly positive result.
Please refer to the Prospectus as well as the Key Investor Information Document for additional information on the Subfund. Information on the performance of the individual share classes of the Subfund in the reporting period can be found in the table “Performance” on pages 8 to 19.
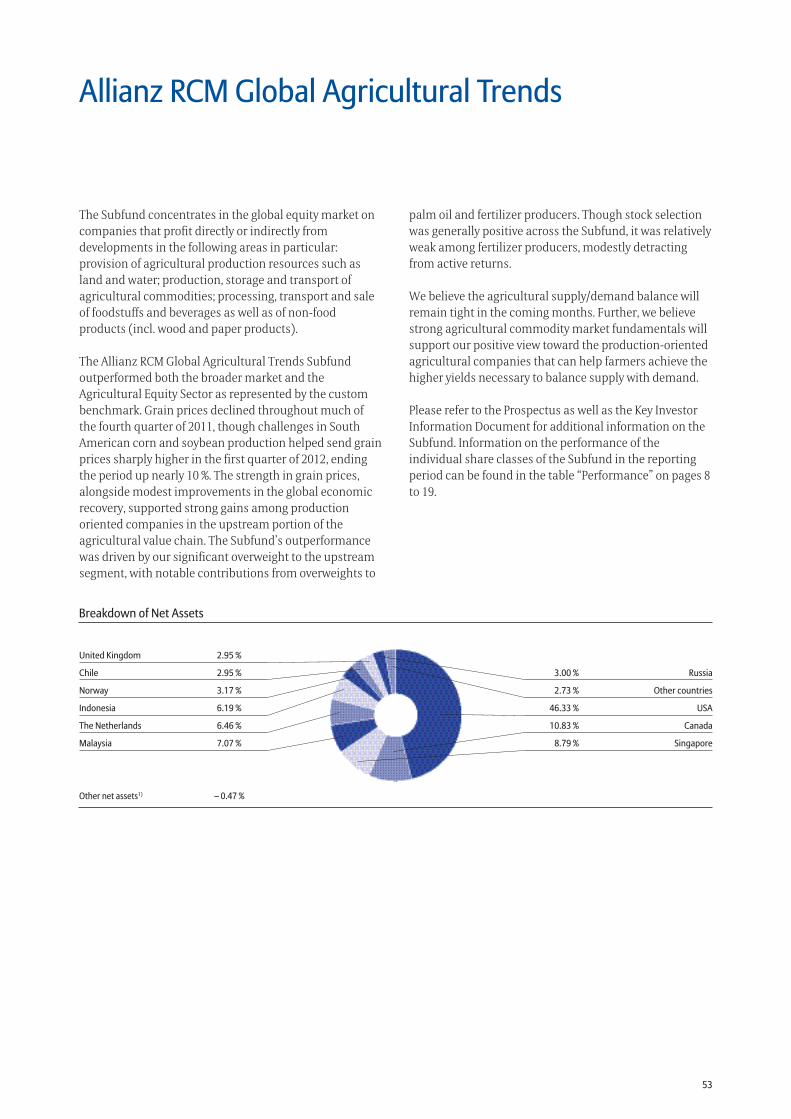
53
Breakdown of Net Assets
3.00 % Russia
2.73 % Other countries
46.33 % USA
10.83 % Canada
8.79 % Singapore
United Kingdom 2.95 %
Chile 2.95 %
Norway 3.17 %
Indonesia 6.19 %
The Netherlands 6.46 %
Malaysia 7.07 %
The Subfund concentrates in the global equity market on companies that profit directly or indirectly from developments in the following areas in particular: provision of agricultural production resources such as land and water; production, storage and transport of agricultural commodities; processing, transport and sale of foodstuffs and beverages as well as of non-food products (incl. wood and paper products).
The Allianz RCM Global Agricultural Trends Subfund outperformed both the broader market and the Agricultural Equity Sector as represented by the custom benchmark. Grain prices declined throughout much of the fourth quarter of 2011, though challenges in South American corn and soybean production helped send grain prices sharply higher in the first quarter of 2012, ending the period up nearly 10 %. The strength in grain prices, alongside modest improvements in the global economic recovery, supported strong gains among production oriented companies in the upstream portion of the agricultural value chain. The Subfund’s outperformance was driven by our significant overweight to the upstream segment, with notable contributions from overweights to
palm oil and fertilizer producers. Though stock selection was generally positive across the Subfund, it was relatively weak among fertilizer producers, modestly detracting from active returns.
We believe the agricultural supply/demand balance will remain tight in the coming months. Further, we believe strong agricultural commodity market fundamentals will support our positive view toward the production-oriented agricultural companies that can help farmers achieve the higher yields necessary to balance supply with demand.
Please refer to the Prospectus as well as the Key Investor Information Document for additional information on the Subfund. Information on the performance of the individual share classes of the Subfund in the reporting period can be found in the table “Performance” on pages 8 to 19.
Allianz RCM Global Agricultural Trends
Other net assets1) – 0.47 %
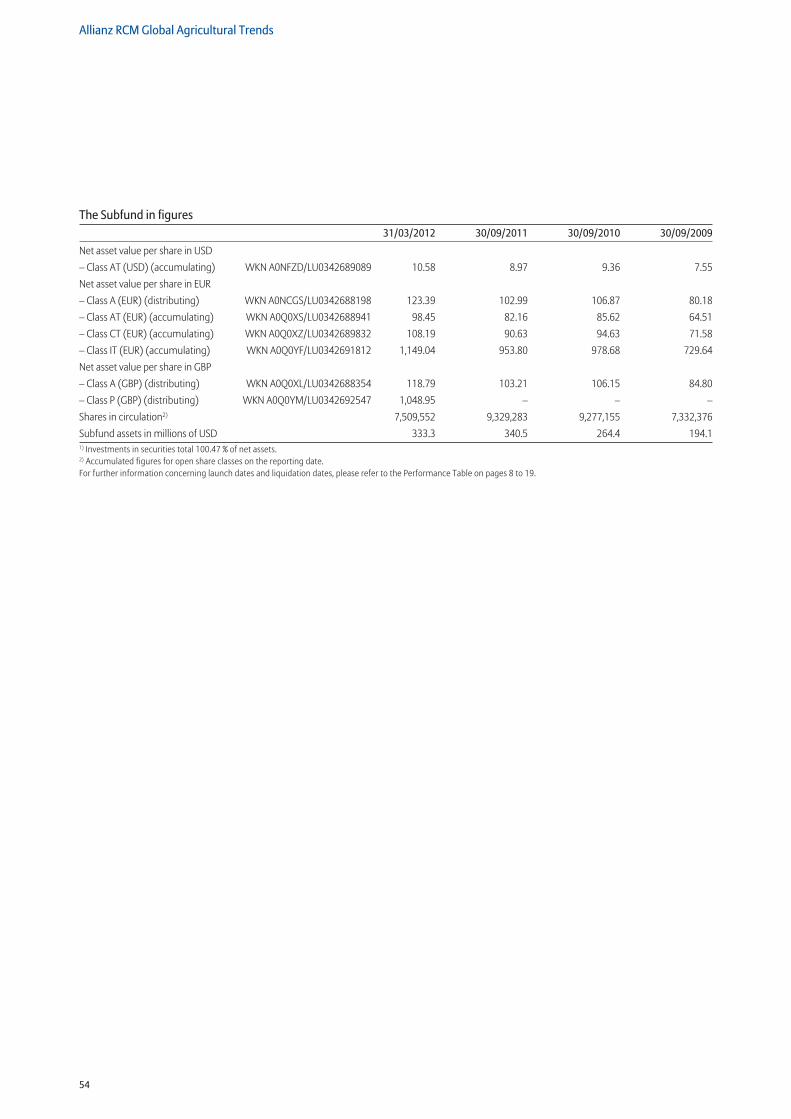
54
Allianz RCM Global Agricultural Trends
The Subfund in figures 31/03/2012 30/09/2011 30/09/2010 30/09/2009
Net asset value per share in USD– Class AT (USD) (accumulating) WKN A0NFZD/LU0342689089 10.58 8.97 9.36 7.55Net asset value per share in EUR– Class A (EUR) (distributing) WKN A0NCGS/LU0342688198 123.39 102.99 106.87 80.18– Class AT (EUR) (accumulating) WKN A0Q0XS/LU0342688941 98.45 82.16 85.62 64.51– Class CT (EUR) (accumulating) WKN A0Q0XZ/LU0342689832 108.19 90.63 94.63 71.58– Class IT (EUR) (accumulating) WKN A0Q0YF/LU0342691812 1,149.04 953.80 978.68 729.64Net asset value per share in GBP– Class A (GBP) (distributing) WKN A0Q0XL/LU0342688354 118.79 103.21 106.15 84.80– Class P (GBP) (distributing) WKN A0Q0YM/LU0342692547 1,048.95 – – –Shares in circulation2) 7,509,552 9,329,283 9,277,155 7,332,376Subfund assets in millions of USD 333.3 340.5 264.4 194.11) Investments in securities total 100.47 % of net assets.2) Accumulated figures for open share classes on the reporting date.For further information concerning launch dates and liquidation dates, please refer to the Performance Table on pages 8 to 19.
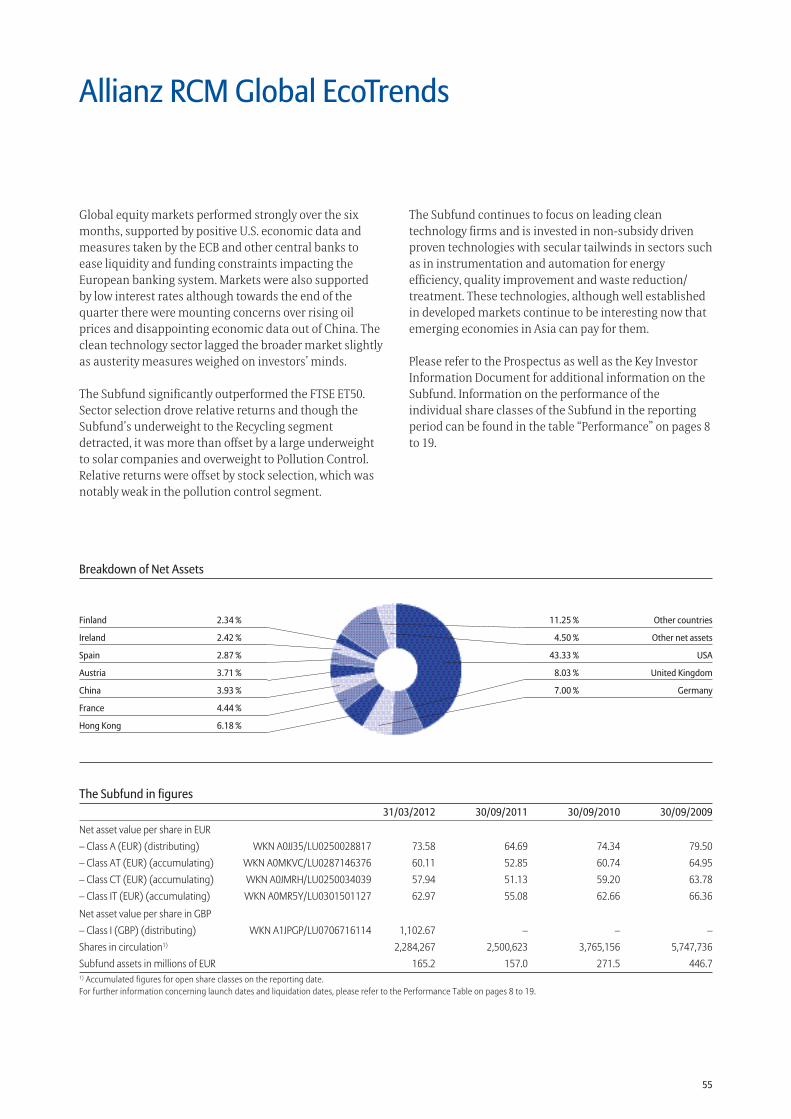
55
The Subfund in figures 31/03/2012 30/09/2011 30/09/2010 30/09/2009
Net asset value per share in EUR– Class A (EUR) (distributing) WKN A0JJ35/LU0250028817 73.58 64.69 74.34 79.50– Class AT (EUR) (accumulating) WKN A0MKVC/LU0287146376 60.11 52.85 60.74 64.95– Class CT (EUR) (accumulating) WKN A0JMRH/LU0250034039 57.94 51.13 59.20 63.78– Class IT (EUR) (accumulating) WKN A0MR5Y/LU0301501127 62.97 55.08 62.66 66.36
Net asset value per share in GBP– Class I (GBP) (distributing) WKN A1JPGP/LU0706716114 1,102.67 – – –Shares in circulation1) 2,284,267 2,500,623 3,765,156 5,747,736Subfund assets in millions of EUR 165.2 157.0 271.5 446.71) Accumulated figures for open share classes on the reporting date.For further information concerning launch dates and liquidation dates, please refer to the Performance Table on pages 8 to 19.
11.25 % Other countries
4.50 % Other net assets
43.33 % USA
8.03 % United Kingdom
7.00 % Germany
Finland 2.34 %
Ireland 2.42 %
Spain 2.87 %
Austria 3.71 %
China 3.93 %
France 4.44 %
Hong Kong 6.18 %
Breakdown of Net Assets
Allianz RCM Global EcoTrends
Global equity markets performed strongly over the six months, supported by positive U.S. economic data and measures taken by the ECB and other central banks to ease liquidity and funding constraints impacting the European banking system. Markets were also supported by low interest rates although towards the end of the quarter there were mounting concerns over rising oil prices and disappointing economic data out of China. The clean technology sector lagged the broader market slightly as austerity measures weighed on investors’ minds.
The Subfund significantly outperformed the FTSE ET50. Sector selection drove relative returns and though the Subfund’s underweight to the Recycling segment detracted, it was more than offset by a large underweight to solar companies and overweight to Pollution Control. Relative returns were offset by stock selection, which was notably weak in the pollution control segment.
The Subfund continues to focus on leading clean technology firms and is invested in non-subsidy driven proven technologies with secular tailwinds in sectors such as in instrumentation and automation for energy efficiency, quality improvement and waste reduction/treatment. These technologies, although well established in developed markets continue to be interesting now that emerging economies in Asia can pay for them.
Please refer to the Prospectus as well as the Key Investor Information Document for additional information on the Subfund. Information on the performance of the individual share classes of the Subfund in the reporting period can be found in the table “Performance” on pages 8 to 19.
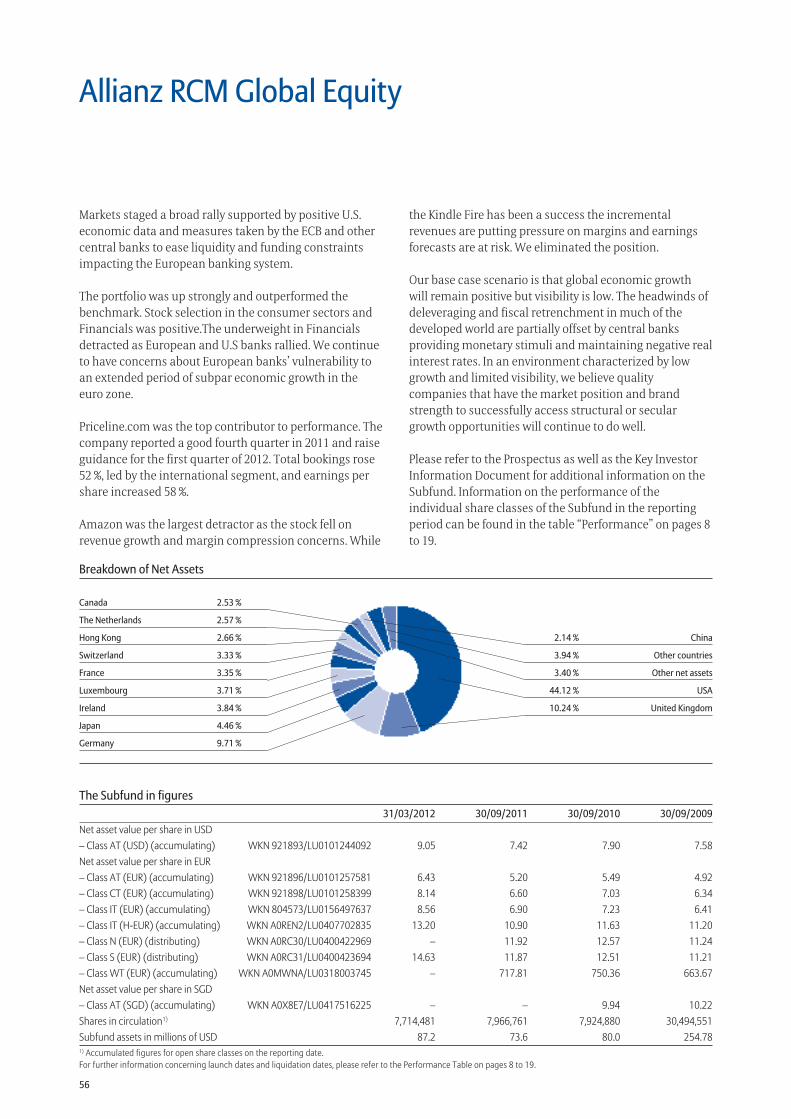
56
The Subfund in figures 31/03/2012 30/09/2011 30/09/2010 30/09/2009Net asset value per share in USD– Class AT (USD) (accumulating) WKN 921893/LU0101244092 9.05 7.42 7.90 7.58Net asset value per share in EUR– Class AT (EUR) (accumulating) WKN 921896/LU0101257581 6.43 5.20 5.49 4.92– Class CT (EUR) (accumulating) WKN 921898/LU0101258399 8.14 6.60 7.03 6.34– Class IT (EUR) (accumulating) WKN 804573/LU0156497637 8.56 6.90 7.23 6.41– Class IT (H-EUR) (accumulating) WKN A0REN2/LU0407702835 13.20 10.90 11.63 11.20– Class N (EUR) (distributing) WKN A0RC30/LU0400422969 – 11.92 12.57 11.24– Class S (EUR) (distributing) WKN A0RC31/LU0400423694 14.63 11.87 12.51 11.21– Class WT (EUR) (accumulating) WKN A0MWNA/LU0318003745 – 717.81 750.36 663.67Net asset value per share in SGD– Class AT (SGD) (accumulating) WKN A0X8E7/LU0417516225 – – 9.94 10.22 Shares in circulation1) 7,714,481 7,966,761 7,924,880 30,494,551Subfund assets in millions of USD 87.2 73.6 80.0 254.781) Accumulated figures for open share classes on the reporting date.For further information concerning launch dates and liquidation dates, please refer to the Performance Table on pages 8 to 19.
Breakdown of Net Assets
2.14 % China
3.94 % Other countries
3.40 % Other net assets
44.12 % USA
10.24 % United Kingdom
Canada 2.53 %
The Netherlands 2.57 %
Hong Kong 2.66 %
Switzerland 3.33 %
France 3.35 %
Luxembourg 3.71 %
Ireland 3.84 %
Japan 4.46 %
Germany 9.71 %
Allianz RCM Global Equity
Markets staged a broad rally supported by positive U.S. economic data and measures taken by the ECB and other central banks to ease liquidity and funding constraints impacting the European banking system.
The portfolio was up strongly and outperformed the benchmark. Stock selection in the consumer sectors and Financials was positive.The underweight in Financials detracted as European and U.S banks rallied. We continue to have concerns about European banks’ vulnerability to an extended period of subpar economic growth in the euro zone.
Priceline.com was the top contributor to performance. The company reported a good fourth quarter in 2011 and raise guidance for the first quarter of 2012. Total bookings rose 52 %, led by the international segment, and earnings per share increased 58 %.
Amazon was the largest detractor as the stock fell on revenue growth and margin compression concerns. While
the Kindle Fire has been a success the incremental revenues are putting pressure on margins and earnings forecasts are at risk. We eliminated the position.
Our base case scenario is that global economic growth will remain positive but visibility is low. The headwinds of deleveraging and fiscal retrenchment in much of the developed world are partially offset by central banks providing monetary stimuli and maintaining negative real interest rates. In an environment characterized by low growth and limited visibility, we believe quality companies that have the market position and brand strength to successfully access structural or secular growth opportunities will continue to do well.
Please refer to the Prospectus as well as the Key Investor Information Document for additional information on the Subfund. Information on the performance of the individual share classes of the Subfund in the reporting period can be found in the table “Performance” on pages 8 to 19.
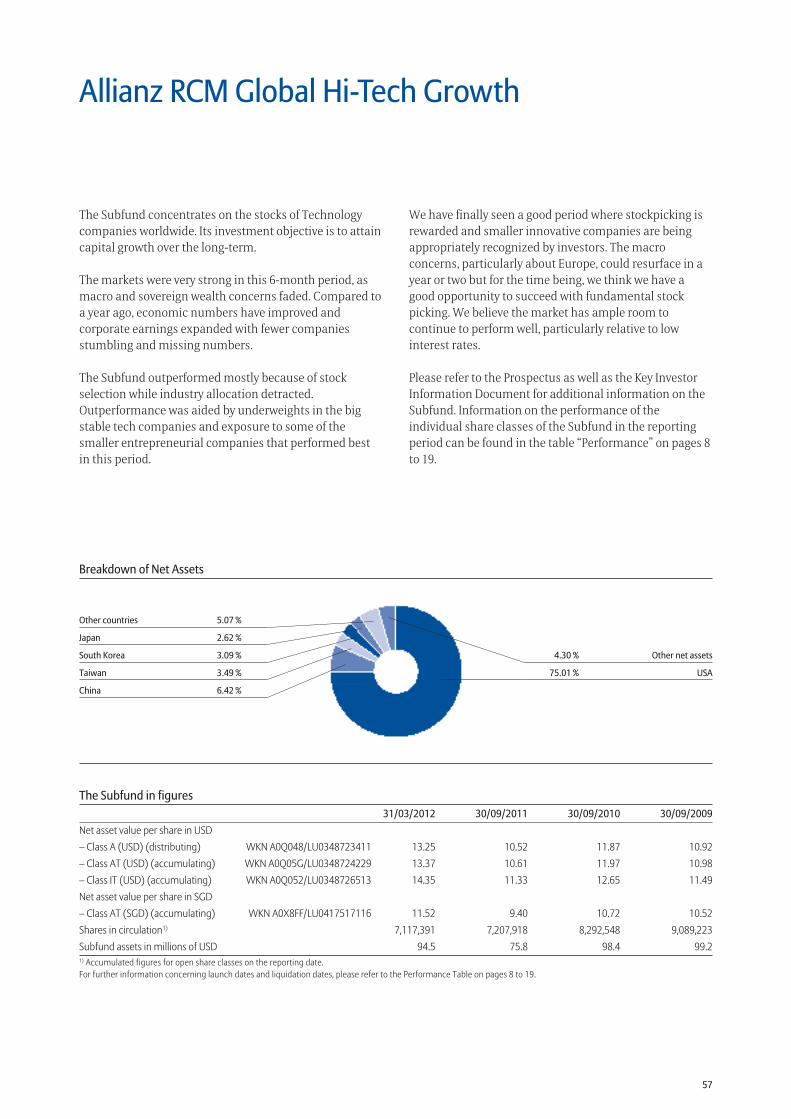
57
The Subfund in figures 31/03/2012 30/09/2011 30/09/2010 30/09/2009Net asset value per share in USD– Class A (USD) (distributing) WKN A0Q048/LU0348723411 13.25 10.52 11.87 10.92– Class AT (USD) (accumulating) WKN A0Q05G/LU0348724229 13.37 10.61 11.97 10.98– Class IT (USD) (accumulating) WKN A0Q052/LU0348726513 14.35 11.33 12.65 11.49Net asset value per share in SGD– Class AT (SGD) (accumulating) WKN A0X8FF/LU0417517116 11.52 9.40 10.72 10.52Shares in circulation1) 7,117,391 7,207,918 8,292,548 9,089,223Subfund assets in millions of USD 94.5 75.8 98.4 99.21) Accumulated figures for open share classes on the reporting date.For further information concerning launch dates and liquidation dates, please refer to the Performance Table on pages 8 to 19.
4.30 % Other net assets
75.01 % USA
Other countries 5.07 %
Japan 2.62 %
South Korea 3.09 %
Taiwan 3.49 %
China 6.42 %
Breakdown of Net Assets
Allianz RCM Global Hi-Tech Growth
The Subfund concentrates on the stocks of Technology companies worldwide. Its investment objective is to attain capital growth over the long-term.
The markets were very strong in this 6-month period, as macro and sovereign wealth concerns faded. Compared to a year ago, economic numbers have improved and corporate earnings expanded with fewer companies stumbling and missing numbers.
The Subfund outperformed mostly because of stock selection while industry allocation detracted. Outperformance was aided by underweights in the big stable tech companies and exposure to some of the smaller entrepreneurial companies that performed best in this period.
We have finally seen a good period where stockpicking is rewarded and smaller innovative companies are being appropriately recognized by investors. The macro concerns, particularly about Europe, could resurface in a year or two but for the time being, we think we have a good opportunity to succeed with fundamental stock picking. We believe the market has ample room to continue to perform well, particularly relative to low interest rates.
Please refer to the Prospectus as well as the Key Investor Information Document for additional information on the Subfund. Information on the performance of the individual share classes of the Subfund in the reporting period can be found in the table “Performance” on pages 8 to 19.
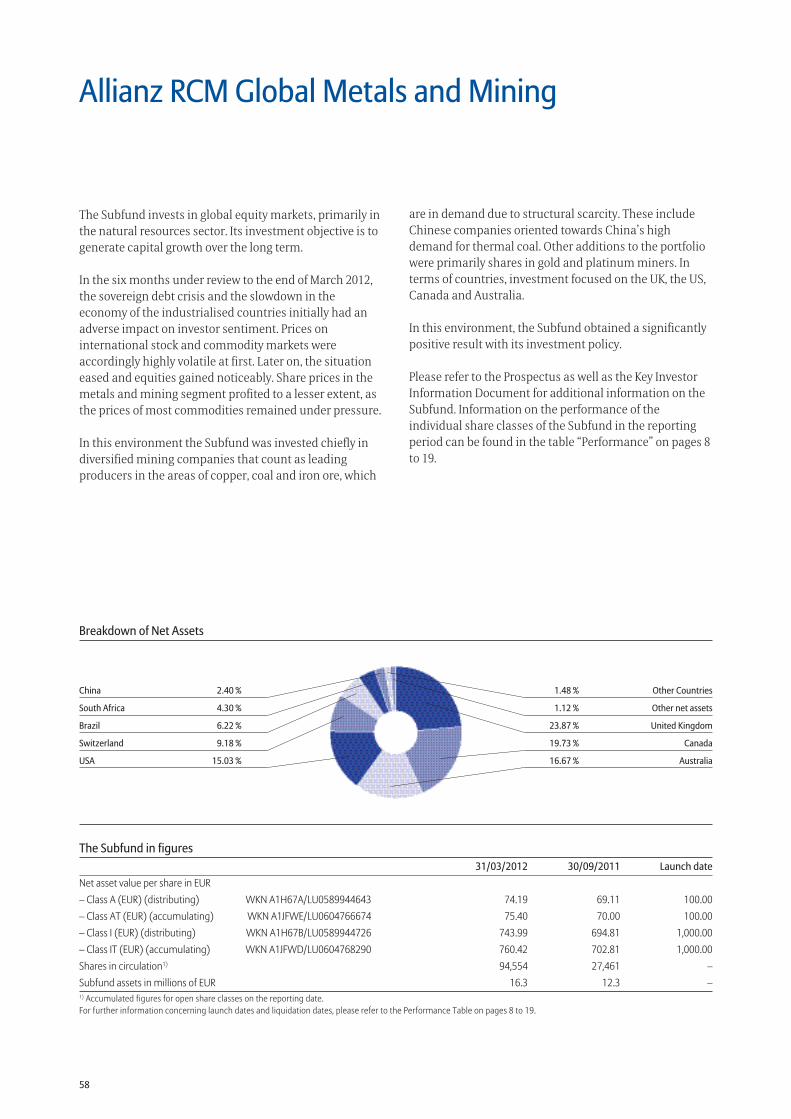
58
The Subfund in figures 31/03/2012 30/09/2011 Launch dateNet asset value per share in EUR– Class A (EUR) (distributing) WKN A1H67A/LU0589944643 74.19 69.11 100.00– Class AT (EUR) (accumulating) WKN A1JFWE/LU0604766674 75.40 70.00 100.00– Class I (EUR) (distributing) WKN A1H67B/LU0589944726 743.99 694.81 1,000.00– Class IT (EUR) (accumulating) WKN A1JFWD/LU0604768290 760.42 702.81 1,000.00Shares in circulation1) 94,554 27,461 –Subfund assets in millions of EUR 16.3 12.3 –1) Accumulated figures for open share classes on the reporting date.For further information concerning launch dates and liquidation dates, please refer to the Performance Table on pages 8 to 19.
1.48 % Other Countries
1.12 % Other net assets
23.87 % United Kingdom
19.73 % Canada
16.67 % Australia
China 2.40 %
South Africa 4.30 %
Brazil 6.22 %
Switzerland 9.18 %
USA 15.03 %
Breakdown of Net Assets
Allianz RCM Global Metals and Mining
The Subfund invests in global equity markets, primarily in the natural resources sector. Its investment objective is to generate capital growth over the long term.
In the six months under review to the end of March 2012, the sovereign debt crisis and the slowdown in the economy of the industrialised countries initially had an adverse impact on investor sentiment. Prices on international stock and commodity markets were accordingly highly volatile at first. Later on, the situation eased and equities gained noticeably. Share prices in the metals and mining segment profited to a lesser extent, as the prices of most commodities remained under pressure.
In this environment the Subfund was invested chiefly in diversified mining companies that count as leading producers in the areas of copper, coal and iron ore, which
are in demand due to structural scarcity. These include Chinese companies oriented towards China’s high demand for thermal coal. Other additions to the portfolio were primarily shares in gold and platinum miners. In terms of countries, investment focused on the UK, the US, Canada and Australia.
In this environment, the Subfund obtained a significantly positive result with its investment policy.
Please refer to the Prospectus as well as the Key Investor Information Document for additional information on the Subfund. Information on the performance of the individual share classes of the Subfund in the reporting period can be found in the table “Performance” on pages 8 to 19.
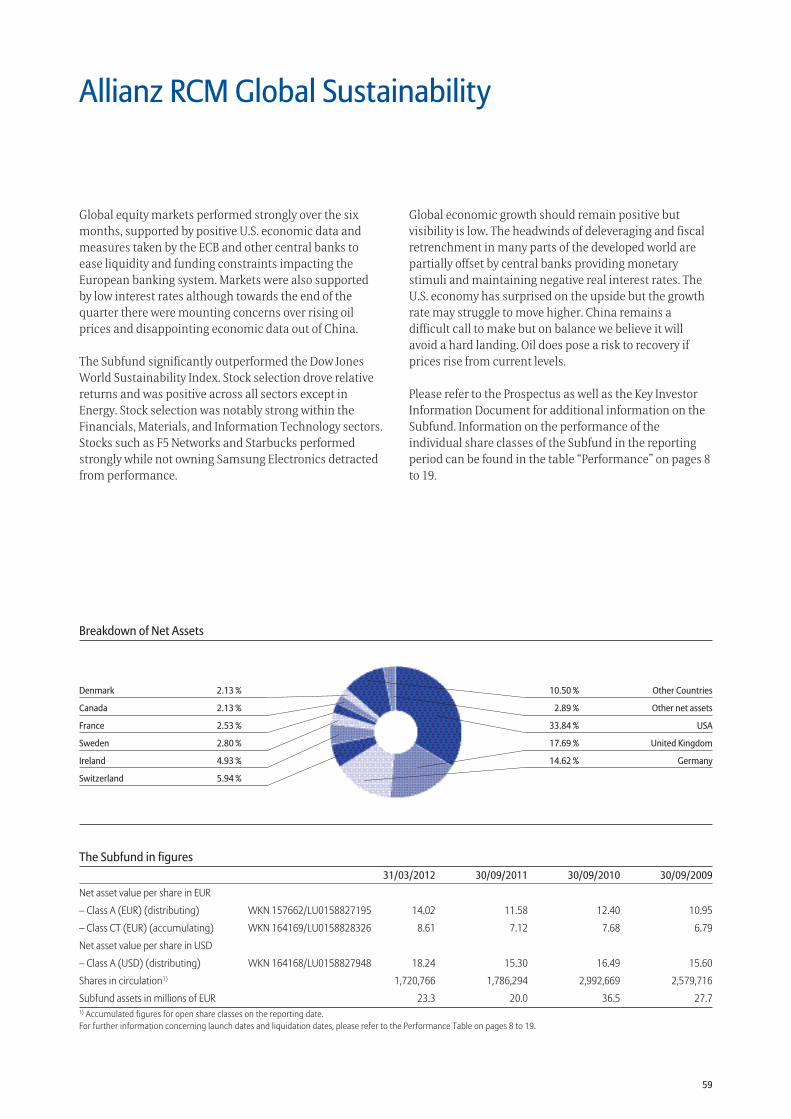
59
The Subfund in figures 31/03/2012 30/09/2011 30/09/2010 30/09/2009
Net asset value per share in EUR
– Class A (EUR) (distributing) WKN 157662/LU0158827195 14.02 11.58 12.40 10.95
– Class CT (EUR) (accumulating) WKN 164169/LU0158828326 8.61 7.12 7.68 6.79
Net asset value per share in USD
– Class A (USD) (distributing) WKN 164168/LU0158827948 18.24 15.30 16.49 15.60
Shares in circulation1) 1,720,766 1,786,294 2,992,669 2,579,716
Subfund assets in millions of EUR 23.3 20.0 36.5 27.71) Accumulated figures for open share classes on the reporting date.For further information concerning launch dates and liquidation dates, please refer to the Performance Table on pages 8 to 19.
10.50 % Other Countries
2.89 % Other net assets
33.84 % USA
17.69 % United Kingdom
14.62 % Germany
Denmark 2.13 %
Canada 2.13 %
France 2.53 %
Sweden 2.80 %
Ireland 4.93 %
Switzerland 5.94 %
Breakdown of Net Assets
Allianz RCM Global Sustainability
Global equity markets performed strongly over the six months, supported by positive U.S. economic data and measures taken by the ECB and other central banks to ease liquidity and funding constraints impacting the European banking system. Markets were also supported by low interest rates although towards the end of the quarter there were mounting concerns over rising oil prices and disappointing economic data out of China.
The Subfund significantly outperformed the Dow Jones World Sustainability Index. Stock selection drove relative returns and was positive across all sectors except in Energy. Stock selection was notably strong within the Financials, Materials, and Information Technology sectors. Stocks such as F5 Networks and Starbucks performed strongly while not owning Samsung Electronics detracted from performance.
Global economic growth should remain positive but visibility is low. The headwinds of deleveraging and fiscal retrenchment in many parts of the developed world are partially offset by central banks providing monetary stimuli and maintaining negative real interest rates. The U.S. economy has surprised on the upside but the growth rate may struggle to move higher. China remains a difficult call to make but on balance we believe it will avoid a hard landing. Oil does pose a risk to recovery if prices rise from current levels.
Please refer to the Prospectus as well as the Key Investor Information Document for additional information on the Subfund. Information on the performance of the individual share classes of the Subfund in the reporting period can be found in the table “Performance” on pages 8 to 19.
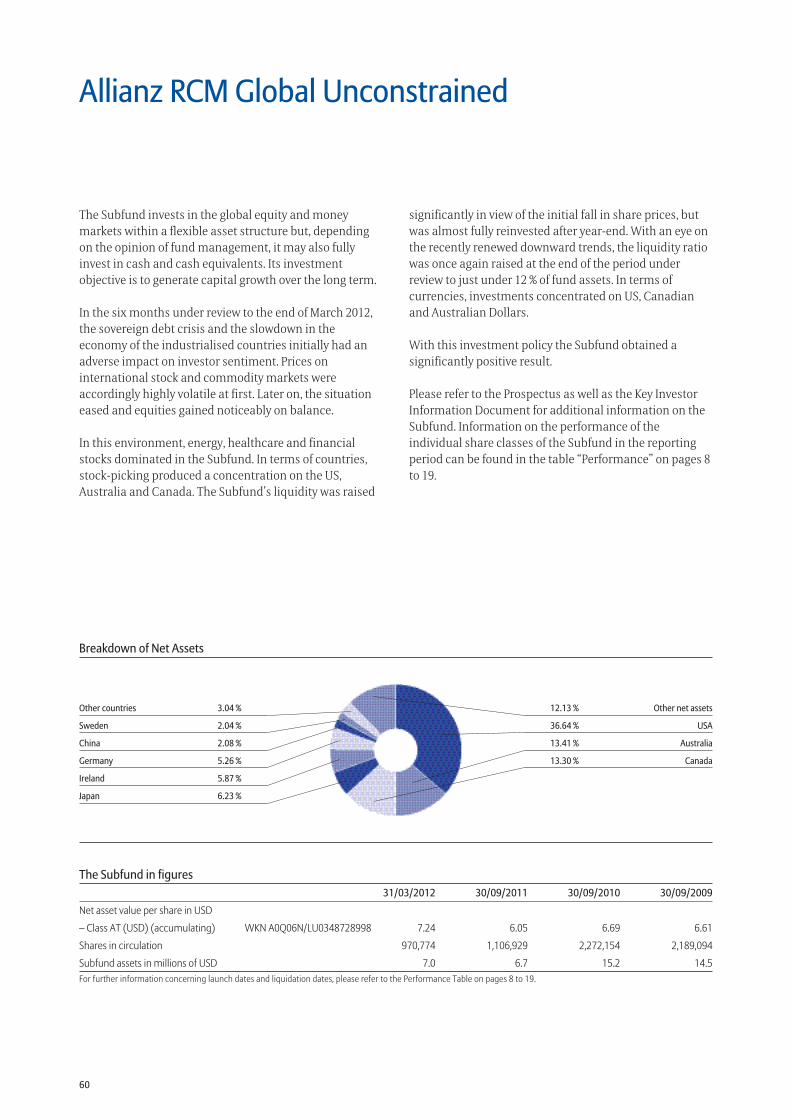
60
The Subfund in figures 31/03/2012 30/09/2011 30/09/2010 30/09/2009
Net asset value per share in USD
– Class AT (USD) (accumulating) WKN A0Q06N/LU0348728998 7.24 6.05 6.69 6.61
Shares in circulation 970,774 1,106,929 2,272,154 2,189,094
Subfund assets in millions of USD 7.0 6.7 15.2 14.5For further information concerning launch dates and liquidation dates, please refer to the Performance Table on pages 8 to 19.
12.13 % Other net assets
36.64 % USA
13.41 % Australia
13.30 % Canada
Other countries 3.04 %
Sweden 2.04 %
China 2.08 %
Germany 5.26 %
Ireland 5.87 %
Japan 6.23 %
Breakdown of Net Assets
Allianz RCM Global Unconstrained
The Subfund invests in the global equity and money markets within a flexible asset structure but, depending on the opinion of fund management, it may also fully invest in cash and cash equivalents. Its investment objective is to generate capital growth over the long term.
In the six months under review to the end of March 2012, the sovereign debt crisis and the slowdown in the economy of the industrialised countries initially had an adverse impact on investor sentiment. Prices on international stock and commodity markets were accordingly highly volatile at first. Later on, the situation eased and equities gained noticeably on balance.
In this environment, energy, healthcare and financial stocks dominated in the Subfund. In terms of countries, stock-picking produced a concentration on the US, Australia and Canada. The Subfund’s liquidity was raised
significantly in view of the initial fall in share prices, but was almost fully reinvested after year-end. With an eye on the recently renewed downward trends, the liquidity ratio was once again raised at the end of the period under review to just under 12 % of fund assets. In terms of currencies, investments concentrated on US, Canadian and Australian Dollars.
With this investment policy the Subfund obtained a significantly positive result.
Please refer to the Prospectus as well as the Key Investor Information Document for additional information on the Subfund. Information on the performance of the individual share classes of the Subfund in the reporting period can be found in the table “Performance” on pages 8 to 19.
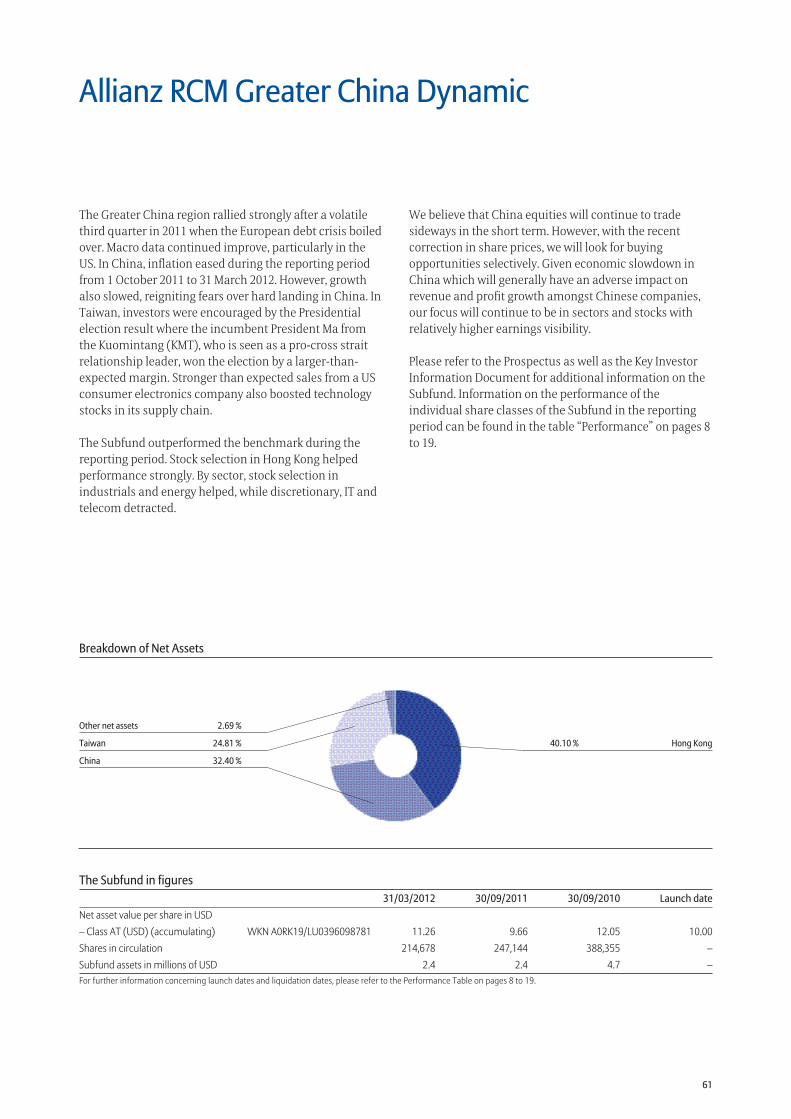
61
The Subfund in figures 31/03/2012 30/09/2011 30/09/2010 Launch dateNet asset value per share in USD– Class AT (USD) (accumulating) WKN A0RK19/LU0396098781 11.26 9.66 12.05 10.00Shares in circulation 214,678 247,144 388,355 –Subfund assets in millions of USD 2.4 2.4 4.7 –For further information concerning launch dates and liquidation dates, please refer to the Performance Table on pages 8 to 19.
Breakdown of Net Assets
40.10 % Hong Kong
Other net assets 2.69 %
Taiwan 24.81 %
China 32.40 %
Allianz RCM Greater China Dynamic
The Greater China region rallied strongly after a volatile third quarter in 2011 when the European debt crisis boiled over. Macro data continued improve, particularly in the US. In China, inflation eased during the reporting period from 1 October 2011 to 31 March 2012. However, growth also slowed, reigniting fears over hard landing in China. In Taiwan, investors were encouraged by the Presidential election result where the incumbent President Ma from the Kuomintang (KMT), who is seen as a pro-cross strait relationship leader, won the election by a larger-than-expected margin. Stronger than expected sales from a US consumer electronics company also boosted technology stocks in its supply chain.
The Subfund outperformed the benchmark during the reporting period. Stock selection in Hong Kong helped performance strongly. By sector, stock selection in industrials and energy helped, while discretionary, IT and telecom detracted.
We believe that China equities will continue to trade sideways in the short term. However, with the recent correction in share prices, we will look for buying opportunities selectively. Given economic slowdown in China which will generally have an adverse impact on revenue and profit growth amongst Chinese companies, our focus will continue to be in sectors and stocks with relatively higher earnings visibility.
Please refer to the Prospectus as well as the Key Investor Information Document for additional information on the Subfund. Information on the performance of the individual share classes of the Subfund in the reporting period can be found in the table “Performance” on pages 8 to 19.
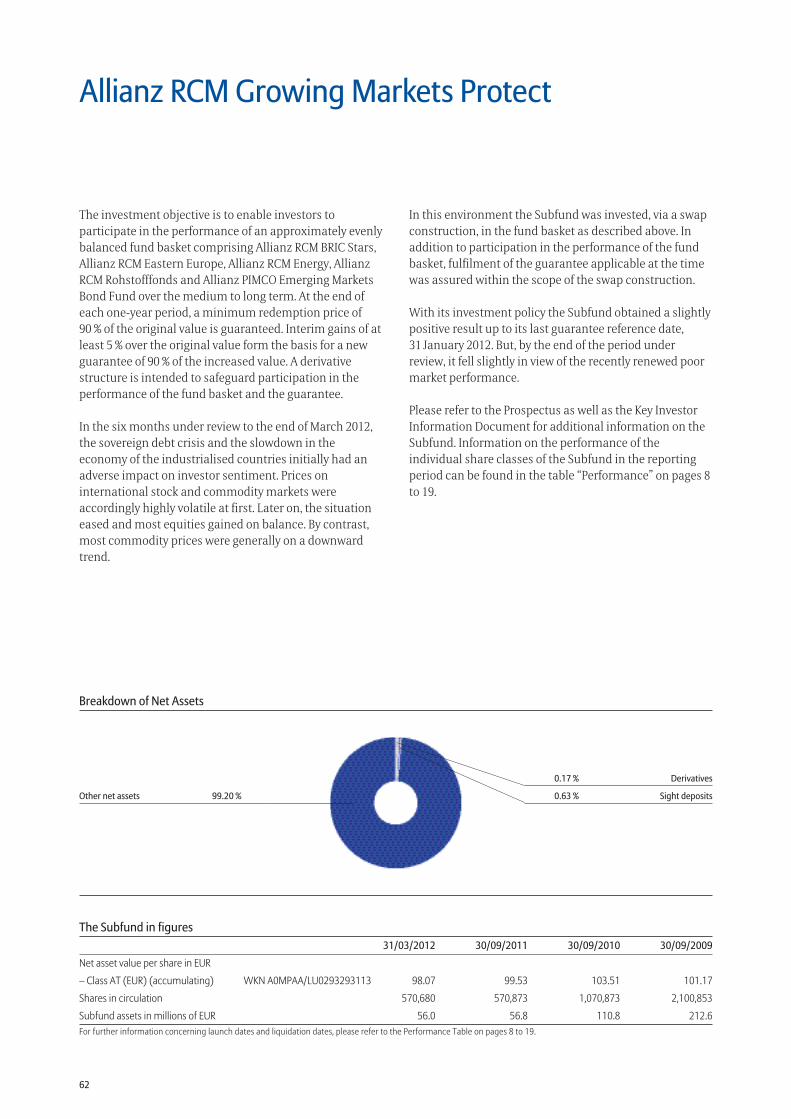
62
The Subfund in figures 31/03/2012 30/09/2011 30/09/2010 30/09/2009
Net asset value per share in EUR
– Class AT (EUR) (accumulating) WKN A0MPAA/LU0293293113 98.07 99.53 103.51 101.17
Shares in circulation 570,680 570,873 1,070,873 2,100,853
Subfund assets in millions of EUR 56.0 56.8 110.8 212.6For further information concerning launch dates and liquidation dates, please refer to the Performance Table on pages 8 to 19.
0.17 % Derivatives
0.63 % Sight depositsOther net assets 99.20 %
Breakdown of Net Assets
Allianz RCM Growing Markets Protect
The investment objective is to enable investors to participate in the performance of an approximately evenly balanced fund basket comprising Allianz RCM BRIC Stars, Allianz RCM Eastern Europe, Allianz RCM Energy, Allianz RCM Rohstofffonds and Allianz PIMCO Emerging Markets Bond Fund over the medium to long term. At the end of each one-year period, a minimum redemption price of 90 % of the original value is guaranteed. Interim gains of at least 5 % over the original value form the basis for a new guarantee of 90 % of the increased value. A derivative structure is intended to safeguard participation in the performance of the fund basket and the guarantee.
In the six months under review to the end of March 2012, the sovereign debt crisis and the slowdown in the economy of the industrialised countries initially had an adverse impact on investor sentiment. Prices on international stock and commodity markets were accordingly highly volatile at first. Later on, the situation eased and most equities gained on balance. By contrast, most commodity prices were generally on a downward trend.
In this environment the Subfund was invested, via a swap construction, in the fund basket as described above. In addition to participation in the performance of the fund basket, fulfilment of the guarantee applicable at the time was assured within the scope of the swap construction.
With its investment policy the Subfund obtained a slightly positive result up to its last guarantee reference date, 31 January 2012. But, by the end of the period under review, it fell slightly in view of the recently renewed poor market performance.
Please refer to the Prospectus as well as the Key Investor Information Document for additional information on the Subfund. Information on the performance of the individual share classes of the Subfund in the reporting period can be found in the table “Performance” on pages 8 to 19.
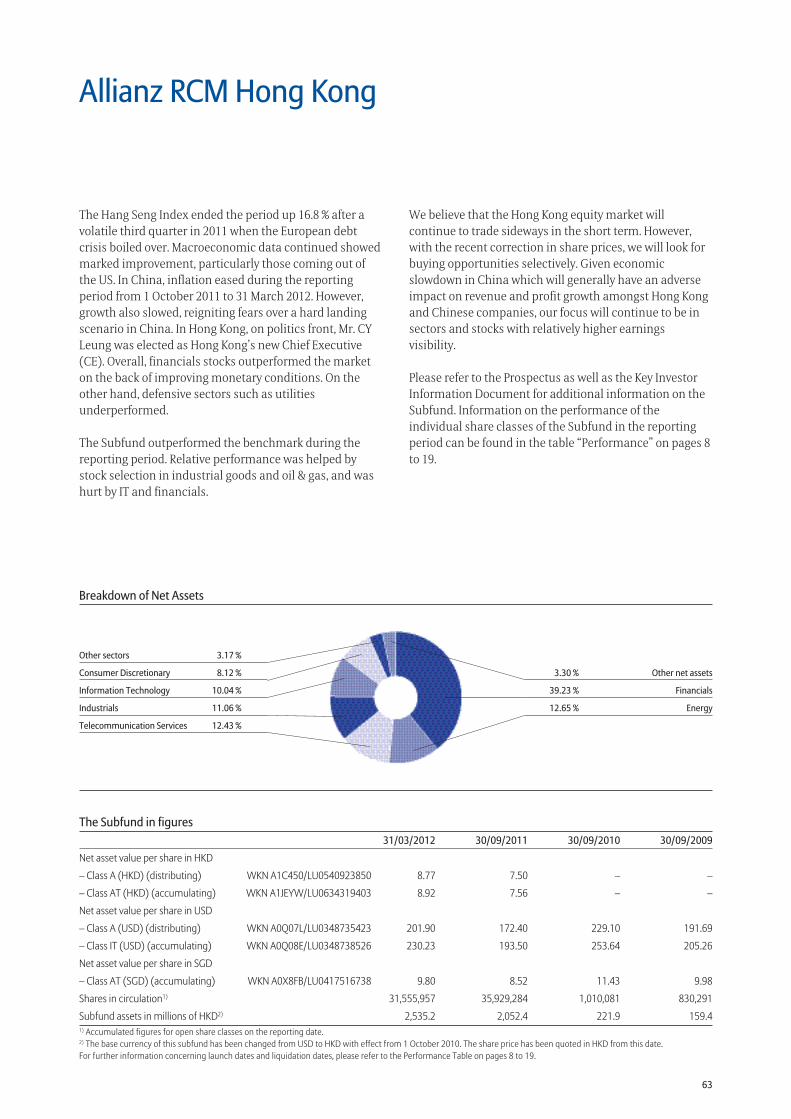
63
The Subfund in figures 31/03/2012 30/09/2011 30/09/2010 30/09/2009
Net asset value per share in HKD
– Class A (HKD) (distributing) WKN A1C450/LU0540923850 8.77 7.50 – –
– Class AT (HKD) (accumulating) WKN A1JEYW/LU0634319403 8.92 7.56 – –
Net asset value per share in USD
– Class A (USD) (distributing) WKN A0Q07L/LU0348735423 201.90 172.40 229.10 191.69
– Class IT (USD) (accumulating) WKN A0Q08E/LU0348738526 230.23 193.50 253.64 205.26
Net asset value per share in SGD
– Class AT (SGD) (accumulating) WKN A0X8FB/LU0417516738 9.80 8.52 11.43 9.98
Shares in circulation1) 31,555,957 35,929,284 1,010,081 830,291
Subfund assets in millions of HKD2) 2,535.2 2,052.4 221.9 159.41) Accumulated figures for open share classes on the reporting date.2) The base currency of this subfund has been changed from USD to HKD with effect from 1 October 2010. The share price has been quoted in HKD from this date.For further information concerning launch dates and liquidation dates, please refer to the Performance Table on pages 8 to 19.
3.30 % Other net assets
39.23 % Financials
12.65 % Energy
Other sectors 3.17 %
Consumer Discretionary 8.12 %
Information Technology 10.04 %
Industrials 11.06 %
Telecommunication Services 12.43 %
Breakdown of Net Assets
Allianz RCM Hong Kong
The Hang Seng Index ended the period up 16.8 % after a volatile third quarter in 2011 when the European debt crisis boiled over. Macroeconomic data continued showed marked improvement, particularly those coming out of the US. In China, inflation eased during the reporting period from 1 October 2011 to 31 March 2012. However, growth also slowed, reigniting fears over a hard landing scenario in China. In Hong Kong, on politics front, Mr. CY Leung was elected as Hong Kong’s new Chief Executive (CE). Overall, financials stocks outperformed the market on the back of improving monetary conditions. On the other hand, defensive sectors such as utilities underperformed.
The Subfund outperformed the benchmark during the reporting period. Relative performance was helped by stock selection in industrial goods and oil & gas, and was hurt by IT and financials.
We believe that the Hong Kong equity market will continue to trade sideways in the short term. However, with the recent correction in share prices, we will look for buying opportunities selectively. Given economic slowdown in China which will generally have an adverse impact on revenue and profit growth amongst Hong Kong and Chinese companies, our focus will continue to be in sectors and stocks with relatively higher earnings visibility.
Please refer to the Prospectus as well as the Key Investor Information Document for additional information on the Subfund. Information on the performance of the individual share classes of the Subfund in the reporting period can be found in the table “Performance” on pages 8 to 19.
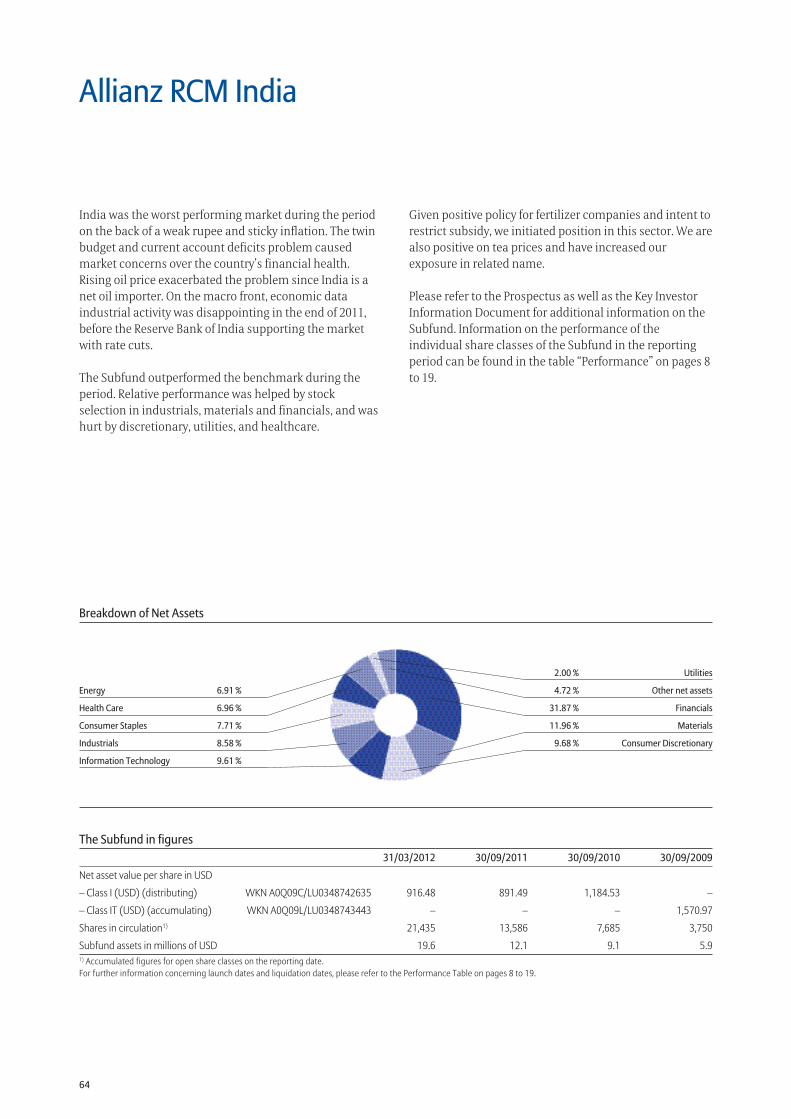
64
The Subfund in figures 31/03/2012 30/09/2011 30/09/2010 30/09/2009
Net asset value per share in USD
– Class I (USD) (distributing) WKN A0Q09C/LU0348742635 916.48 891.49 1,184.53 –
– Class IT (USD) (accumulating) WKN A0Q09L/LU0348743443 – – – 1,570.97
Shares in circulation1) 21,435 13,586 7,685 3,750
Subfund assets in millions of USD 19.6 12.1 9.1 5.91) Accumulated figures for open share classes on the reporting date.For further information concerning launch dates and liquidation dates, please refer to the Performance Table on pages 8 to 19.
2.00 % Utilities
4.72 % Other net assets
31.87 % Financials
11.96 % Materials
9.68 % Consumer Discretionary
Energy 6.91 %
Health Care 6.96 %
Consumer Staples 7.71 %
Industrials 8.58 %
Information Technology 9.61 %
Breakdown of Net Assets
Allianz RCM India
India was the worst performing market during the period on the back of a weak rupee and sticky inflation. The twin budget and current account deficits problem caused market concerns over the country’s financial health. Rising oil price exacerbated the problem since India is a net oil importer. On the macro front, economic data industrial activity was disappointing in the end of 2011, before the Reserve Bank of India supporting the market with rate cuts.
The Subfund outperformed the benchmark during the period. Relative performance was helped by stock selection in industrials, materials and financials, and was hurt by discretionary, utilities, and healthcare.
Given positive policy for fertilizer companies and intent to restrict subsidy, we initiated position in this sector. We are also positive on tea prices and have increased our exposure in related name.
Please refer to the Prospectus as well as the Key Investor Information Document for additional information on the Subfund. Information on the performance of the individual share classes of the Subfund in the reporting period can be found in the table “Performance” on pages 8 to 19.
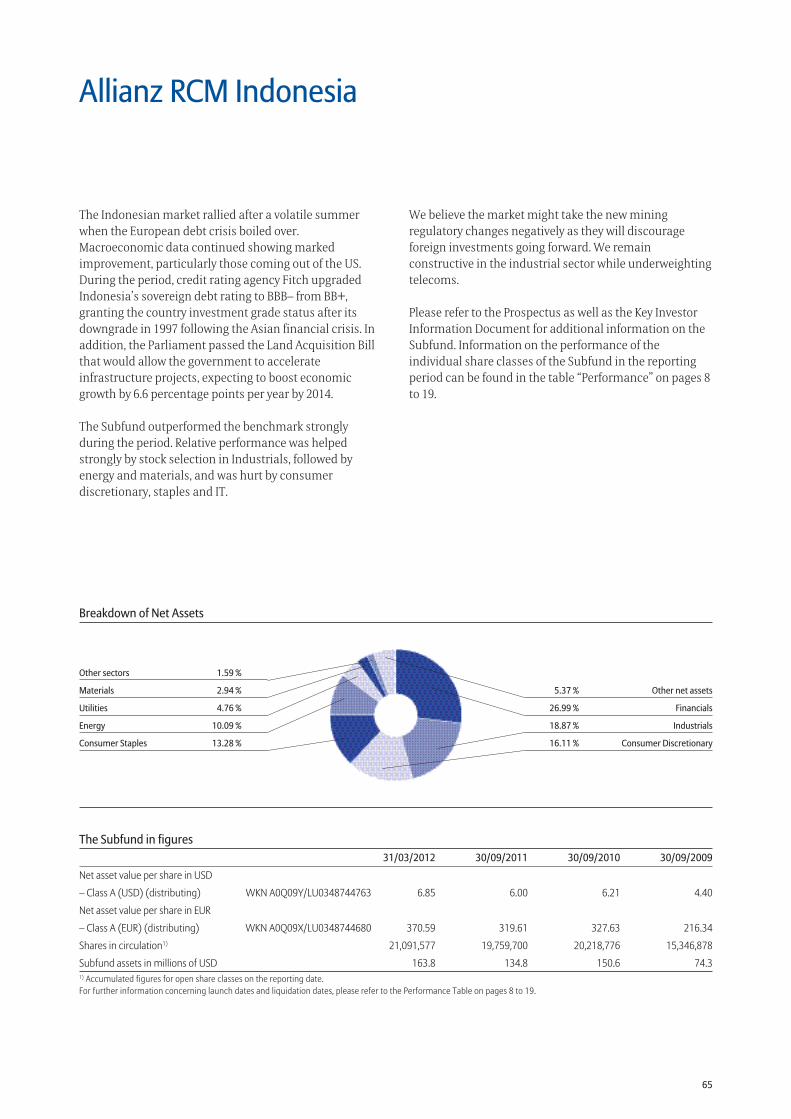
65
The Subfund in figures 31/03/2012 30/09/2011 30/09/2010 30/09/2009
Net asset value per share in USD
– Class A (USD) (distributing) WKN A0Q09Y/LU0348744763 6.85 6.00 6.21 4.40
Net asset value per share in EUR
– Class A (EUR) (distributing) WKN A0Q09X/LU0348744680 370.59 319.61 327.63 216.34
Shares in circulation1) 21,091,577 19,759,700 20,218,776 15,346,878
Subfund assets in millions of USD 163.8 134.8 150.6 74.31) Accumulated figures for open share classes on the reporting date.For further information concerning launch dates and liquidation dates, please refer to the Performance Table on pages 8 to 19.
5.37 % Other net assets
26.99 % Financials
18.87 % Industrials
16.11 % Consumer Discretionary
Other sectors 1.59 %
Materials 2.94 %
Utilities 4.76 %
Energy 10.09 %
Consumer Staples 13.28 %
Breakdown of Net Assets
Allianz RCM Indonesia
The Indonesian market rallied after a volatile summer when the European debt crisis boiled over. Macroeconomic data continued showing marked improvement, particularly those coming out of the US. During the period, credit rating agency Fitch upgraded Indonesia’s sovereign debt rating to BBB– from BB+, granting the country investment grade status after its downgrade in 1997 following the Asian financial crisis. In addition, the Parliament passed the Land Acquisition Bill that would allow the government to accelerate infrastructure projects, expecting to boost economic growth by 6.6 percentage points per year by 2014.
The Subfund outperformed the benchmark strongly during the period. Relative performance was helped strongly by stock selection in Industrials, followed by energy and materials, and was hurt by consumer discretionary, staples and IT.
We believe the market might take the new mining regulatory changes negatively as they will discourage foreign investments going forward. We remain constructive in the industrial sector while underweighting telecoms.
Please refer to the Prospectus as well as the Key Investor Information Document for additional information on the Subfund. Information on the performance of the individual share classes of the Subfund in the reporting period can be found in the table “Performance” on pages 8 to 19.
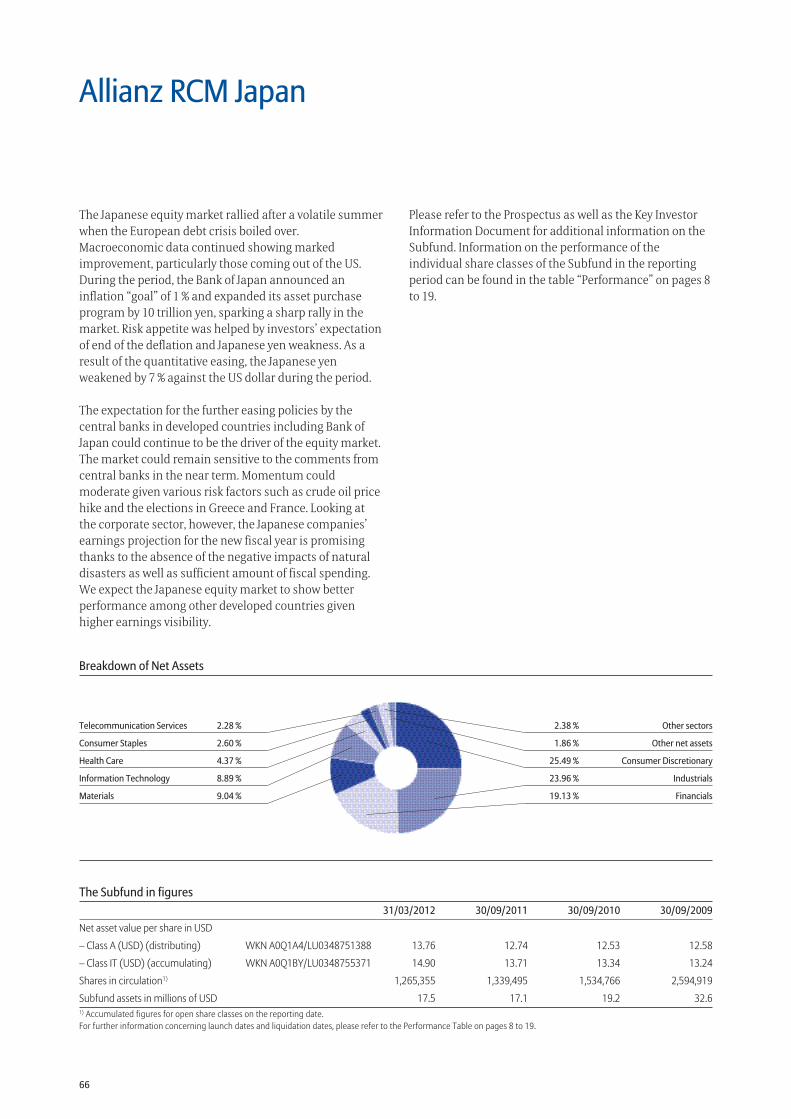
66
The Subfund in figures 31/03/2012 30/09/2011 30/09/2010 30/09/2009
Net asset value per share in USD
– Class A (USD) (distributing) WKN A0Q1A4/LU0348751388 13.76 12.74 12.53 12.58
– Class IT (USD) (accumulating) WKN A0Q1BY/LU0348755371 14.90 13.71 13.34 13.24
Shares in circulation1) 1,265,355 1,339,495 1,534,766 2,594,919
Subfund assets in millions of USD 17.5 17.1 19.2 32.61) Accumulated figures for open share classes on the reporting date.For further information concerning launch dates and liquidation dates, please refer to the Performance Table on pages 8 to 19.
2.38 % Other sectors
1.86 % Other net assets
25.49 % Consumer Discretionary
23.96 % Industrials
19.13 % Financials
Telecommunication Services 2.28 %
Consumer Staples 2.60 %
Health Care 4.37 %
Information Technology 8.89 %
Materials 9.04 %
Breakdown of Net Assets
Allianz RCM Japan
The Japanese equity market rallied after a volatile summer when the European debt crisis boiled over. Macroeconomic data continued showing marked improvement, particularly those coming out of the US. During the period, the Bank of Japan announced an inflation “goal” of 1 % and expanded its asset purchase program by 10 trillion yen, sparking a sharp rally in the market. Risk appetite was helped by investors’ expectation of end of the deflation and Japanese yen weakness. As a result of the quantitative easing, the Japanese yen weakened by 7 % against the US dollar during the period.
The expectation for the further easing policies by the central banks in developed countries including Bank of Japan could continue to be the driver of the equity market. The market could remain sensitive to the comments from central banks in the near term. Momentum could moderate given various risk factors such as crude oil price hike and the elections in Greece and France. Looking at the corporate sector, however, the Japanese companies’ earnings projection for the new fiscal year is promising thanks to the absence of the negative impacts of natural disasters as well as sufficient amount of fiscal spending. We expect the Japanese equity market to show better performance among other developed countries given higher earnings visibility.
Please refer to the Prospectus as well as the Key Investor Information Document for additional information on the Subfund. Information on the performance of the individual share classes of the Subfund in the reporting period can be found in the table “Performance” on pages 8 to 19.
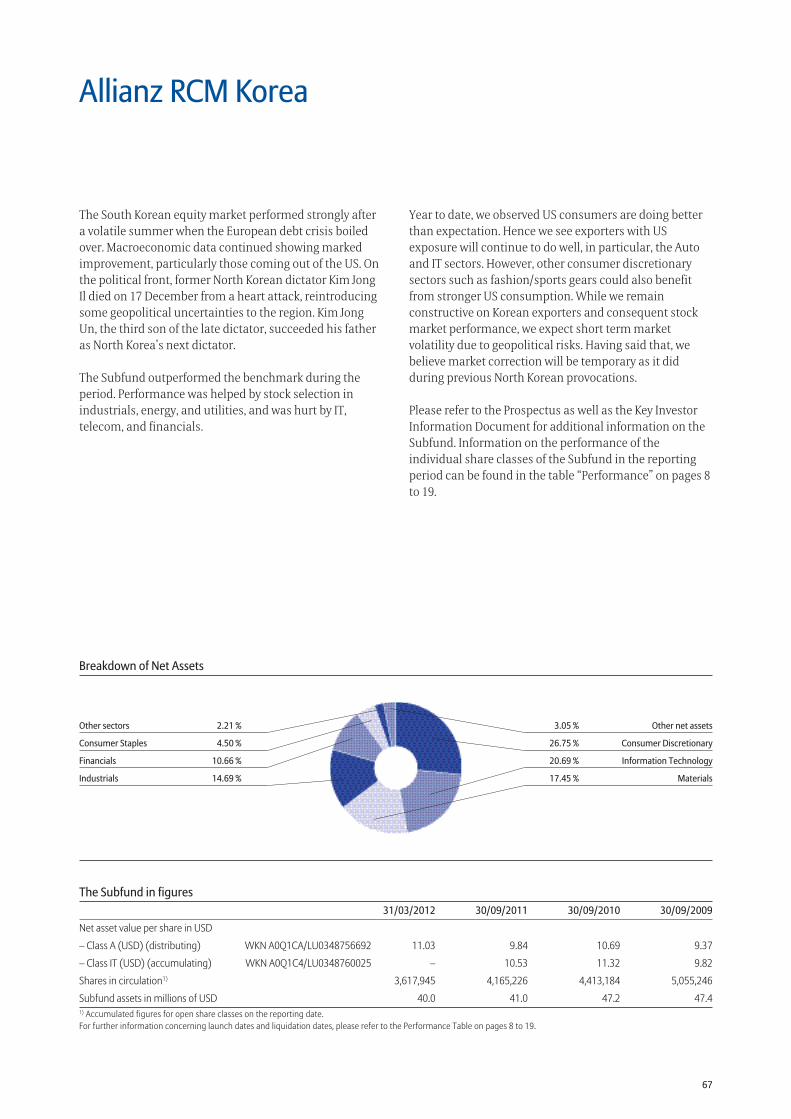
67
The Subfund in figures 31/03/2012 30/09/2011 30/09/2010 30/09/2009
Net asset value per share in USD
– Class A (USD) (distributing) WKN A0Q1CA/LU0348756692 11.03 9.84 10.69 9.37
– Class IT (USD) (accumulating) WKN A0Q1C4/LU0348760025 – 10.53 11.32 9.82
Shares in circulation1) 3,617,945 4,165,226 4,413,184 5,055,246
Subfund assets in millions of USD 40.0 41.0 47.2 47.41) Accumulated figures for open share classes on the reporting date.For further information concerning launch dates and liquidation dates, please refer to the Performance Table on pages 8 to 19.
3.05 % Other net assets
26.75 % Consumer Discretionary
20.69 % Information Technology
17.45 % Materials
Other sectors 2.21 %
Consumer Staples 4.50 %
Financials 10.66 %
Industrials 14.69 %
Breakdown of Net Assets
Allianz RCM Korea
The South Korean equity market performed strongly after a volatile summer when the European debt crisis boiled over. Macroeconomic data continued showing marked improvement, particularly those coming out of the US. On the political front, former North Korean dictator Kim Jong Il died on 17 December from a heart attack, reintroducing some geopolitical uncertainties to the region. Kim Jong Un, the third son of the late dictator, succeeded his father as North Korea’s next dictator.
The Subfund outperformed the benchmark during the period. Performance was helped by stock selection in industrials, energy, and utilities, and was hurt by IT, telecom, and financials.
Year to date, we observed US consumers are doing better than expectation. Hence we see exporters with US exposure will continue to do well, in particular, the Auto and IT sectors. However, other consumer discretionary sectors such as fashion/sports gears could also benefit from stronger US consumption. While we remain constructive on Korean exporters and consequent stock market performance, we expect short term market volatility due to geopolitical risks. Having said that, we believe market correction will be temporary as it did during previous North Korean provocations.
Please refer to the Prospectus as well as the Key Investor Information Document for additional information on the Subfund. Information on the performance of the individual share classes of the Subfund in the reporting period can be found in the table “Performance” on pages 8 to 19.
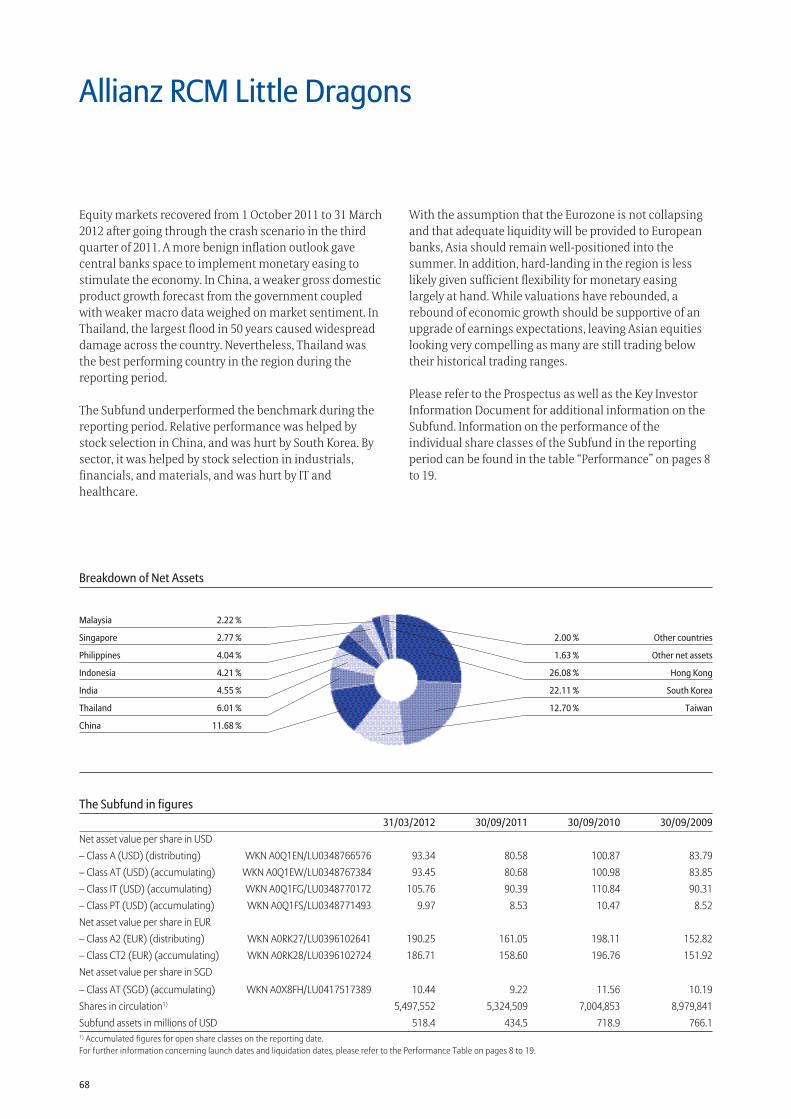
68
The Subfund in figures 31/03/2012 30/09/2011 30/09/2010 30/09/2009Net asset value per share in USD– Class A (USD) (distributing) WKN A0Q1EN/LU0348766576 93.34 80.58 100.87 83.79– Class AT (USD) (accumulating) WKN A0Q1EW/LU0348767384 93.45 80.68 100.98 83.85– Class IT (USD) (accumulating) WKN A0Q1FG/LU0348770172 105.76 90.39 110.84 90.31– Class PT (USD) (accumulating) WKN A0Q1FS/LU0348771493 9.97 8.53 10.47 8.52Net asset value per share in EUR– Class A2 (EUR) (distributing) WKN A0RK27/LU0396102641 190.25 161.05 198.11 152.82– Class CT2 (EUR) (accumulating) WKN A0RK28/LU0396102724 186.71 158.60 196.76 151.92Net asset value per share in SGD
– Class AT (SGD) (accumulating) WKN A0X8FH/LU0417517389 10.44 9.22 11.56 10.19Shares in circulation1) 5,497,552 5,324,509 7,004,853 8,979,841Subfund assets in millions of USD 518.4 434.5 718.9 766.11) Accumulated figures for open share classes on the reporting date.For further information concerning launch dates and liquidation dates, please refer to the Performance Table on pages 8 to 19.
2.00 % Other countries
1.63 % Other net assets
26.08 % Hong Kong
22.11 % South Korea
12.70 % Taiwan
Malaysia 2.22 %
Singapore 2.77 %
Philippines 4.04 %
Indonesia 4.21 %
India 4.55 %
Thailand 6.01 %
China 11.68 %
Breakdown of Net Assets
Allianz RCM Little Dragons
Equity markets recovered from 1 October 2011 to 31 March 2012 after going through the crash scenario in the third quarter of 2011. A more benign inflation outlook gave central banks space to implement monetary easing to stimulate the economy. In China, a weaker gross domestic product growth forecast from the government coupled with weaker macro data weighed on market sentiment. In Thailand, the largest flood in 50 years caused widespread damage across the country. Nevertheless, Thailand was the best performing country in the region during the reporting period.
The Subfund underperformed the benchmark during the reporting period. Relative performance was helped by stock selection in China, and was hurt by South Korea. By sector, it was helped by stock selection in industrials, financials, and materials, and was hurt by IT and healthcare.
With the assumption that the Eurozone is not collapsing and that adequate liquidity will be provided to European banks, Asia should remain well-positioned into the summer. In addition, hard-landing in the region is less likely given sufficient flexibility for monetary easing largely at hand. While valuations have rebounded, a rebound of economic growth should be supportive of an upgrade of earnings expectations, leaving Asian equities looking very compelling as many are still trading below their historical trading ranges.
Please refer to the Prospectus as well as the Key Investor Information Document for additional information on the Subfund. Information on the performance of the individual share classes of the Subfund in the reporting period can be found in the table “Performance” on pages 8 to 19.
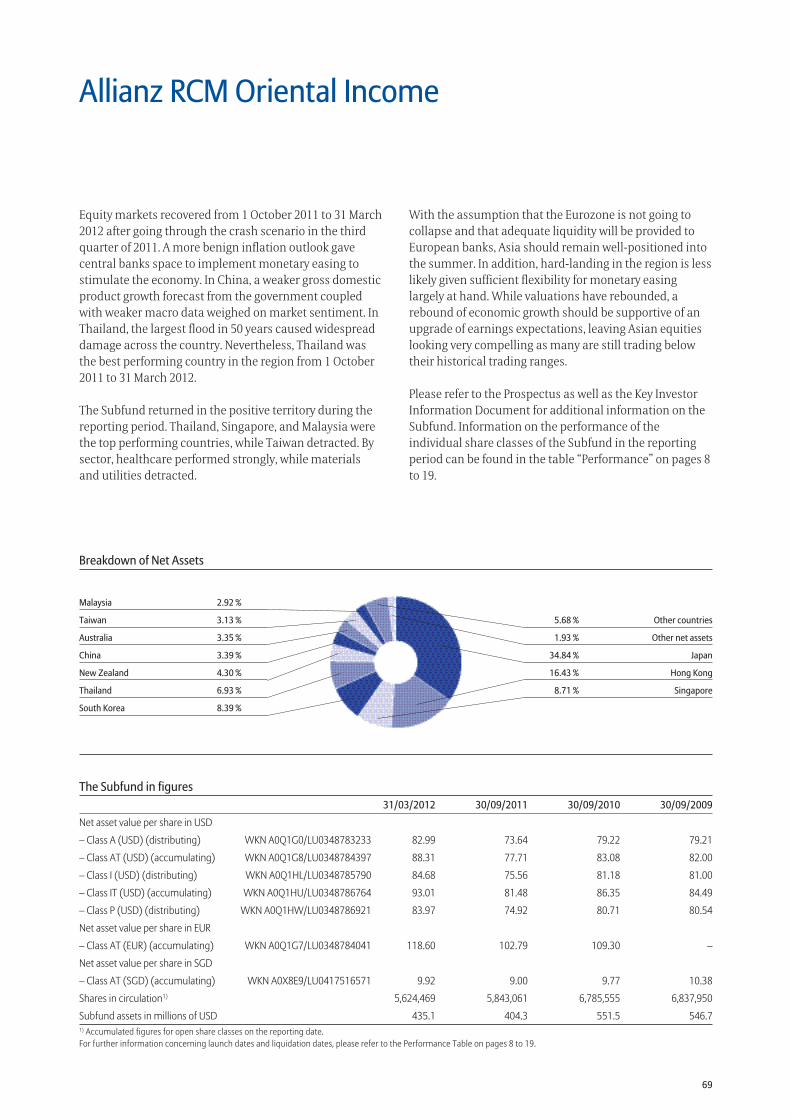
69
The Subfund in figures 31/03/2012 30/09/2011 30/09/2010 30/09/2009
Net asset value per share in USD
– Class A (USD) (distributing) WKN A0Q1G0/LU0348783233 82.99 73.64 79.22 79.21
– Class AT (USD) (accumulating) WKN A0Q1G8/LU0348784397 88.31 77.71 83.08 82.00
– Class I (USD) (distributing) WKN A0Q1HL/LU0348785790 84.68 75.56 81.18 81.00
– Class IT (USD) (accumulating) WKN A0Q1HU/LU0348786764 93.01 81.48 86.35 84.49
– Class P (USD) (distributing) WKN A0Q1HW/LU0348786921 83.97 74.92 80.71 80.54
Net asset value per share in EUR
– Class AT (EUR) (accumulating) WKN A0Q1G7/LU0348784041 118.60 102.79 109.30 –
Net asset value per share in SGD
– Class AT (SGD) (accumulating) WKN A0X8E9/LU0417516571 9.92 9.00 9.77 10.38
Shares in circulation1) 5,624,469 5,843,061 6,785,555 6,837,950
Subfund assets in millions of USD 435.1 404.3 551.5 546.71) Accumulated figures for open share classes on the reporting date.For further information concerning launch dates and liquidation dates, please refer to the Performance Table on pages 8 to 19.
5.68 % Other countries
1.93 % Other net assets
34.84 % Japan
16.43 % Hong Kong
8.71 % Singapore
Malaysia 2.92 %
Taiwan 3.13 %
Australia 3.35 %
China 3.39 %
New Zealand 4.30 %
Thailand 6.93 %
South Korea 8.39 %
Breakdown of Net Assets
Allianz RCM Oriental Income
Equity markets recovered from 1 October 2011 to 31 March 2012 after going through the crash scenario in the third quarter of 2011. A more benign inflation outlook gave central banks space to implement monetary easing to stimulate the economy. In China, a weaker gross domestic product growth forecast from the government coupled with weaker macro data weighed on market sentiment. In Thailand, the largest flood in 50 years caused widespread damage across the country. Nevertheless, Thailand was the best performing country in the region from 1 October 2011 to 31 March 2012.
The Subfund returned in the positive territory during the reporting period. Thailand, Singapore, and Malaysia were the top performing countries, while Taiwan detracted. By sector, healthcare performed strongly, while materials and utilities detracted.
With the assumption that the Eurozone is not going to collapse and that adequate liquidity will be provided to European banks, Asia should remain well-positioned into the summer. In addition, hard-landing in the region is less likely given sufficient flexibility for monetary easing largely at hand. While valuations have rebounded, a rebound of economic growth should be supportive of an upgrade of earnings expectations, leaving Asian equities looking very compelling as many are still trading below their historical trading ranges.
Please refer to the Prospectus as well as the Key Investor Information Document for additional information on the Subfund. Information on the performance of the individual share classes of the Subfund in the reporting period can be found in the table “Performance” on pages 8 to 19.
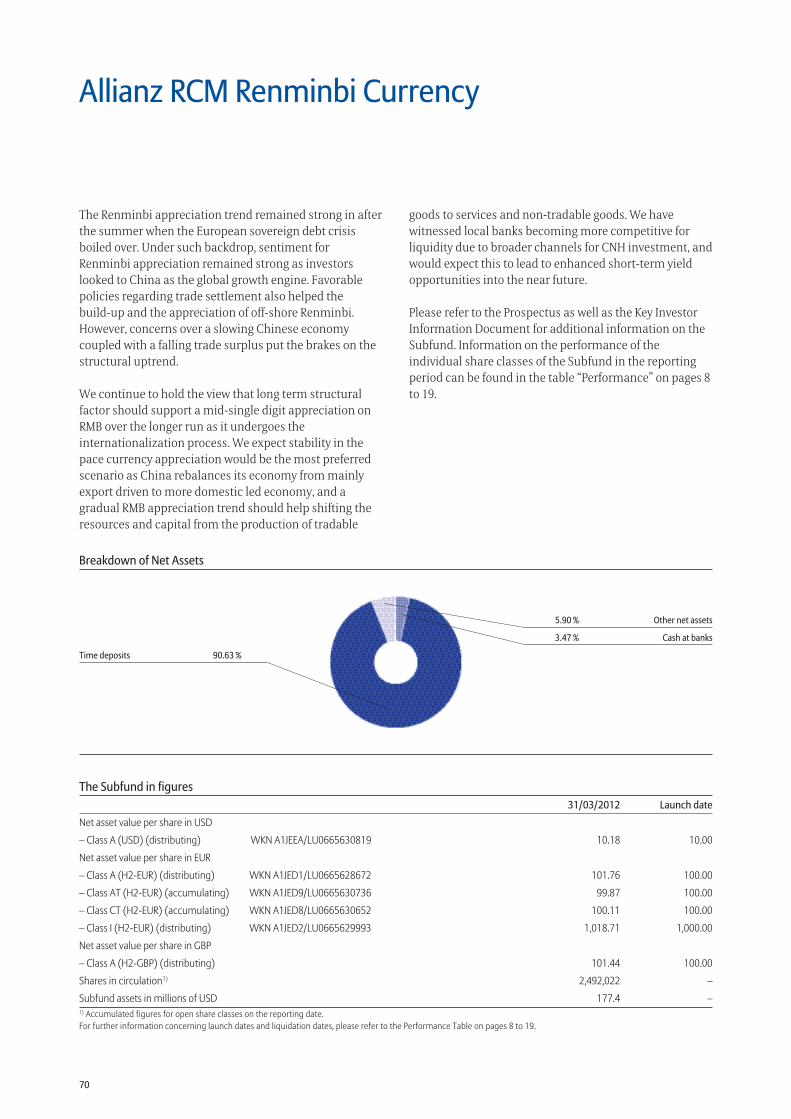
70
The Subfund in figures 31/03/2012 Launch date
Net asset value per share in USD
– Class A (USD) (distributing) WKN A1JEEA/LU0665630819 10.18 10.00
Net asset value per share in EUR
– Class A (H2-EUR) (distributing) WKN A1JED1/LU0665628672 101.76 100.00
– Class AT (H2-EUR) (accumulating) WKN A1JED9/LU0665630736 99.87 100.00
– Class CT (H2-EUR) (accumulating) WKN A1JED8/LU0665630652 100.11 100.00
– Class I (H2-EUR) (distributing) WKN A1JED2/LU0665629993 1,018.71 1,000.00
Net asset value per share in GBP
– Class A (H2-GBP) (distributing) 101.44 100.00
Shares in circulation1) 2,492,022 –
Subfund assets in millions of USD 177.4 –1) Accumulated figures for open share classes on the reporting date.For further information concerning launch dates and liquidation dates, please refer to the Performance Table on pages 8 to 19.
5.90 % Other net assets
3.47 % Cash at banks
Time deposits 90.63 %
Breakdown of Net Assets
Allianz RCM Renminbi Currency
The Renminbi appreciation trend remained strong in after the summer when the European sovereign debt crisis boiled over. Under such backdrop, sentiment for Renminbi appreciation remained strong as investors looked to China as the global growth engine. Favorable policies regarding trade settlement also helped the build-up and the appreciation of off-shore Renminbi. However, concerns over a slowing Chinese economy coupled with a falling trade surplus put the brakes on the structural uptrend.
We continue to hold the view that long term structural factor should support a mid-single digit appreciation on RMB over the longer run as it undergoes the internationalization process. We expect stability in the pace currency appreciation would be the most preferred scenario as China rebalances its economy from mainly export driven to more domestic led economy, and a gradual RMB appreciation trend should help shifting the resources and capital from the production of tradable
goods to services and non-tradable goods. We have witnessed local banks becoming more competitive for liquidity due to broader channels for CNH investment, and would expect this to lead to enhanced short-term yield opportunities into the near future.
Please refer to the Prospectus as well as the Key Investor Information Document for additional information on the Subfund. Information on the performance of the individual share classes of the Subfund in the reporting period can be found in the table “Performance” on pages 8 to 19.
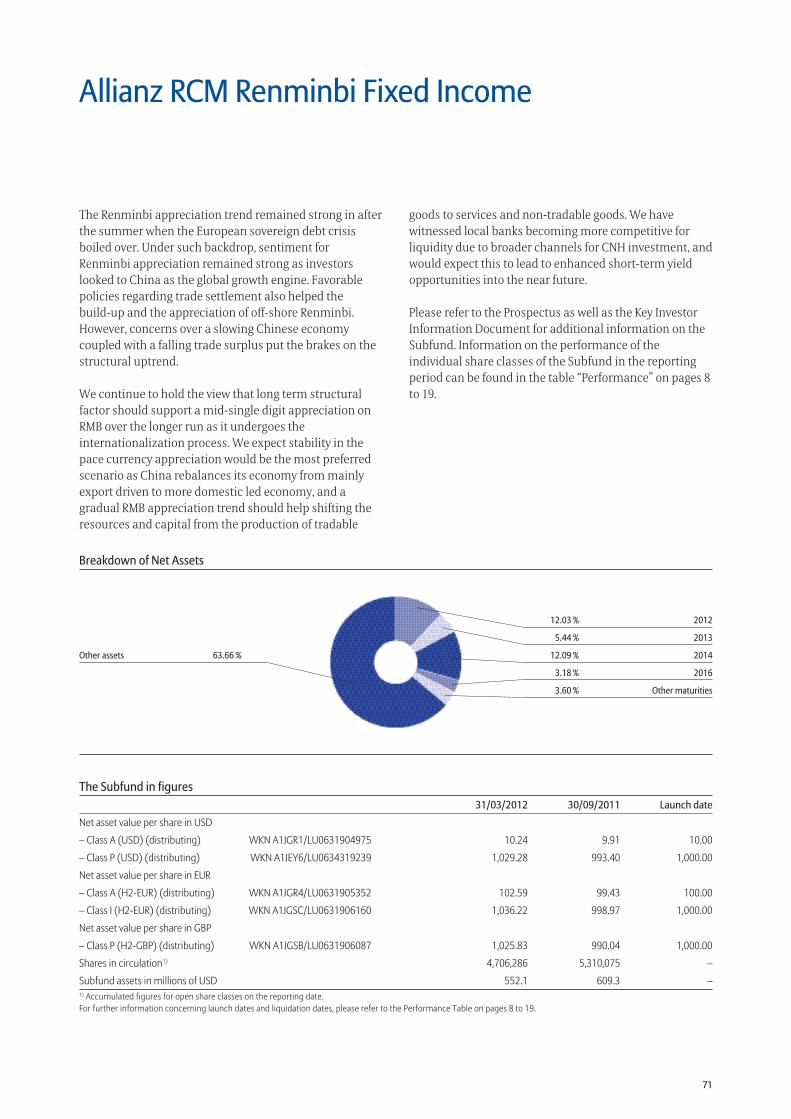
71
The Subfund in figures 31/03/2012 30/09/2011 Launch date
Net asset value per share in USD
– Class A (USD) (distributing) WKN A1JGR1/LU0631904975 10.24 9.91 10.00
– Class P (USD) (distributing) WKN A1JEY6/LU0634319239 1,029.28 993.40 1,000.00
Net asset value per share in EUR
– Class A (H2-EUR) (distributing) WKN A1JGR4/LU0631905352 102.59 99.43 100.00
– Class I (H2-EUR) (distributing) WKN A1JGSC/LU0631906160 1,036.22 998.97 1,000.00
Net asset value per share in GBP
– Class P (H2-GBP) (distributing) WKN A1JGSB/LU0631906087 1,025.83 990.04 1,000.00
Shares in circulation1) 4,706,286 5,310,075 –
Subfund assets in millions of USD 552.1 609.3 –1) Accumulated figures for open share classes on the reporting date.For further information concerning launch dates and liquidation dates, please refer to the Performance Table on pages 8 to 19.
12.03 % 2012
5.44 % 2013
12.09 % 2014
3.18 % 2016
3.60 % Other maturities
Other assets 63.66 %
Breakdown of Net Assets
Allianz RCM Renminbi Fixed Income
The Renminbi appreciation trend remained strong in after the summer when the European sovereign debt crisis boiled over. Under such backdrop, sentiment for Renminbi appreciation remained strong as investors looked to China as the global growth engine. Favorable policies regarding trade settlement also helped the build-up and the appreciation of off-shore Renminbi. However, concerns over a slowing Chinese economy coupled with a falling trade surplus put the brakes on the structural uptrend.
We continue to hold the view that long term structural factor should support a mid-single digit appreciation on RMB over the longer run as it undergoes the internationalization process. We expect stability in the pace currency appreciation would be the most preferred scenario as China rebalances its economy from mainly export driven to more domestic led economy, and a gradual RMB appreciation trend should help shifting the resources and capital from the production of tradable
goods to services and non-tradable goods. We have witnessed local banks becoming more competitive for liquidity due to broader channels for CNH investment, and would expect this to lead to enhanced short-term yield opportunities into the near future.
Please refer to the Prospectus as well as the Key Investor Information Document for additional information on the Subfund. Information on the performance of the individual share classes of the Subfund in the reporting period can be found in the table “Performance” on pages 8 to 19.
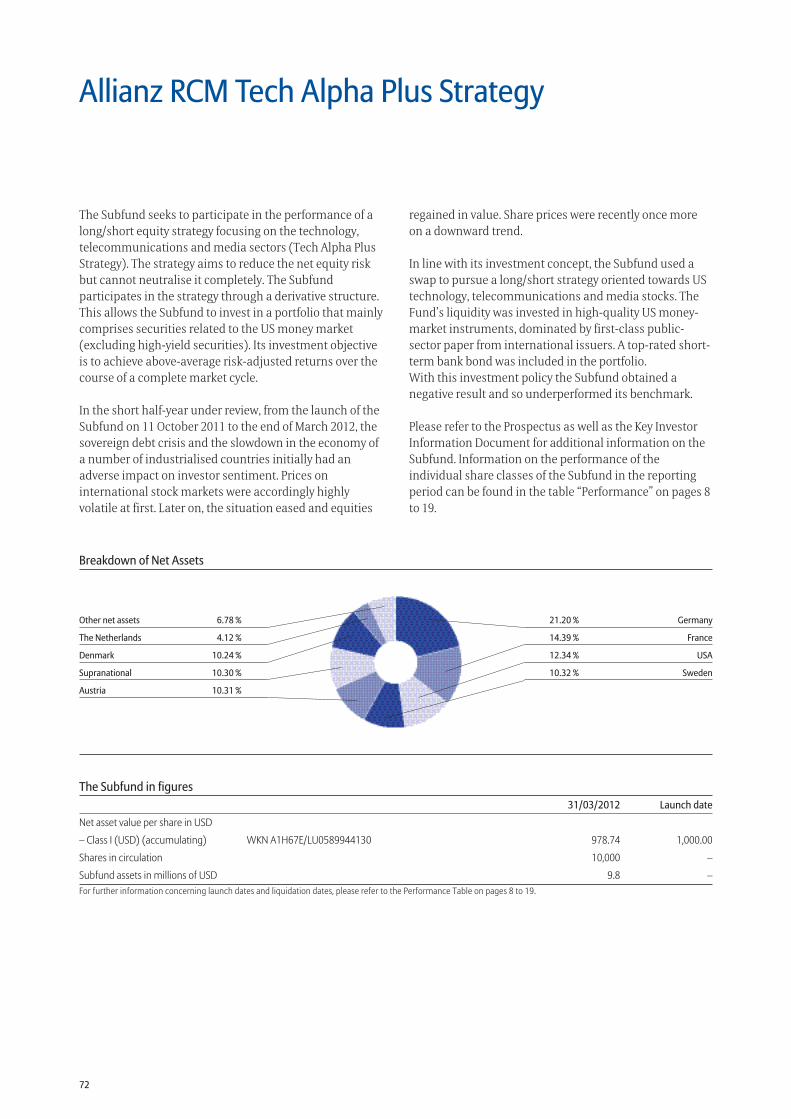
72
The Subfund in figures 31/03/2012 Launch date
Net asset value per share in USD
– Class I (USD) (accumulating) WKN A1H67E/LU0589944130 978.74 1,000.00
Shares in circulation 10,000 –
Subfund assets in millions of USD 9.8 –For further information concerning launch dates and liquidation dates, please refer to the Performance Table on pages 8 to 19.
21.20 % Germany
14.39 % France
12.34 % USA
10.32 % Sweden
Other net assets 6.78 %
The Netherlands 4.12 %
Denmark 10.24 %
Supranational 10.30 %
Austria 10.31 %
Breakdown of Net Assets
Allianz RCM Tech Alpha Plus Strategy
The Subfund seeks to participate in the performance of a long/short equity strategy focusing on the technology, telecommunications and media sectors (Tech Alpha Plus Strategy). The strategy aims to reduce the net equity risk but cannot neutralise it completely. The Subfund participates in the strategy through a derivative structure. This allows the Subfund to invest in a portfolio that mainly comprises securities related to the US money market (excluding high-yield securities). Its investment objective is to achieve above-average risk-adjusted returns over the course of a complete market cycle.
In the short half-year under review, from the launch of the Subfund on 11 October 2011 to the end of March 2012, the sovereign debt crisis and the slowdown in the economy of a number of industrialised countries initially had an adverse impact on investor sentiment. Prices on international stock markets were accordingly highly volatile at first. Later on, the situation eased and equities
regained in value. Share prices were recently once more on a downward trend.
In line with its investment concept, the Subfund used a swap to pursue a long/short strategy oriented towards US technology, telecommunications and media stocks. The Fund’s liquidity was invested in high-quality US money-market instruments, dominated by first-class public-sector paper from international issuers. A top-rated short-term bank bond was included in the portfolio.With this investment policy the Subfund obtained a negative result and so underperformed its benchmark.
Please refer to the Prospectus as well as the Key Investor Information Document for additional information on the Subfund. Information on the performance of the individual share classes of the Subfund in the reporting period can be found in the table “Performance” on pages 8 to 19.
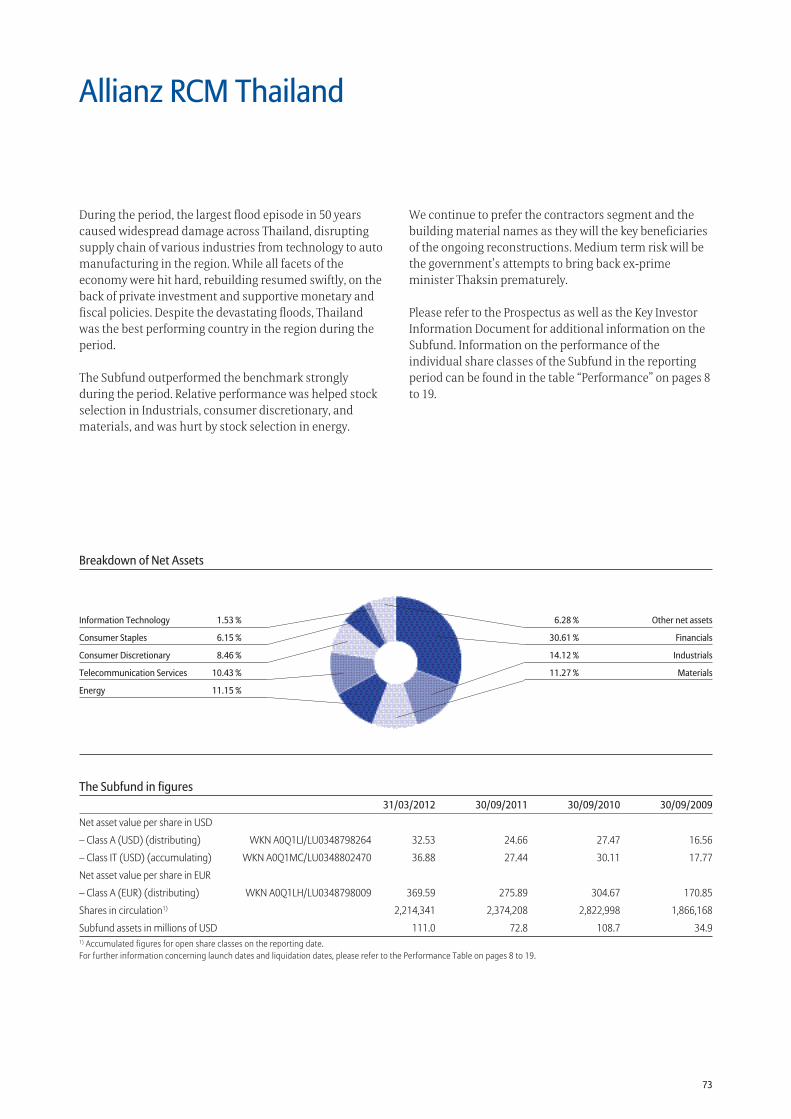
73
The Subfund in figures 31/03/2012 30/09/2011 30/09/2010 30/09/2009
Net asset value per share in USD
– Class A (USD) (distributing) WKN A0Q1LJ/LU0348798264 32.53 24.66 27.47 16.56
– Class IT (USD) (accumulating) WKN A0Q1MC/LU0348802470 36.88 27.44 30.11 17.77
Net asset value per share in EUR
– Class A (EUR) (distributing) WKN A0Q1LH/LU0348798009 369.59 275.89 304.67 170.85
Shares in circulation1) 2,214,341 2,374,208 2,822,998 1,866,168
Subfund assets in millions of USD 111.0 72.8 108.7 34.91) Accumulated figures for open share classes on the reporting date.For further information concerning launch dates and liquidation dates, please refer to the Performance Table on pages 8 to 19.
6.28 % Other net assets
30.61 % Financials
14.12 % Industrials
11.27 % Materials
Information Technology 1.53 %
Consumer Staples 6.15 %
Consumer Discretionary 8.46 %
Telecommunication Services 10.43 %
Energy 11.15 %
Breakdown of Net Assets
Allianz RCM Thailand
During the period, the largest flood episode in 50 years caused widespread damage across Thailand, disrupting supply chain of various industries from technology to auto manufacturing in the region. While all facets of the economy were hit hard, rebuilding resumed swiftly, on the back of private investment and supportive monetary and fiscal policies. Despite the devastating floods, Thailand was the best performing country in the region during the period.
The Subfund outperformed the benchmark strongly during the period. Relative performance was helped stock selection in Industrials, consumer discretionary, and materials, and was hurt by stock selection in energy.
We continue to prefer the contractors segment and the building material names as they will the key beneficiaries of the ongoing reconstructions. Medium term risk will be the government’s attempts to bring back ex-prime minister Thaksin prematurely.
Please refer to the Prospectus as well as the Key Investor Information Document for additional information on the Subfund. Information on the performance of the individual share classes of the Subfund in the reporting period can be found in the table “Performance” on pages 8 to 19.
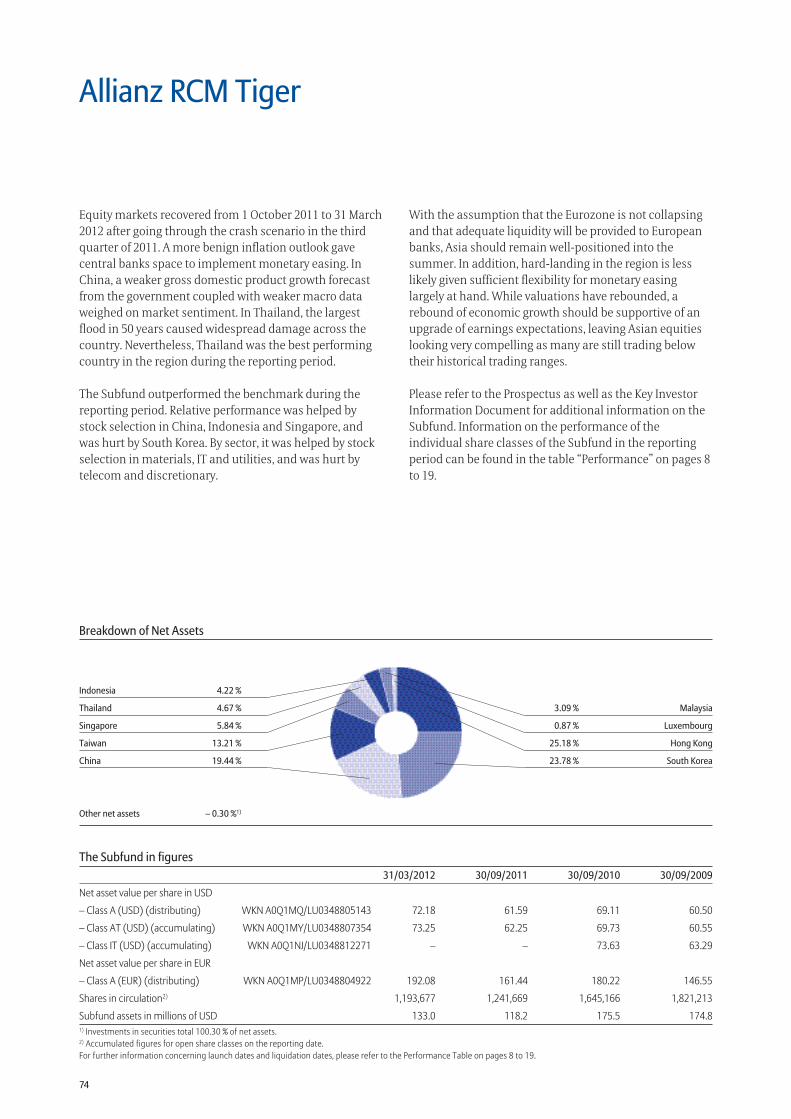
74
The Subfund in figures 31/03/2012 30/09/2011 30/09/2010 30/09/2009
Net asset value per share in USD
– Class A (USD) (distributing) WKN A0Q1MQ/LU0348805143 72.18 61.59 69.11 60.50
– Class AT (USD) (accumulating) WKN A0Q1MY/LU0348807354 73.25 62.25 69.73 60.55
– Class IT (USD) (accumulating) WKN A0Q1NJ/LU0348812271 – – 73.63 63.29
Net asset value per share in EUR
– Class A (EUR) (distributing) WKN A0Q1MP/LU0348804922 192.08 161.44 180.22 146.55
Shares in circulation2) 1,193,677 1,241,669 1,645,166 1,821,213
Subfund assets in millions of USD 133.0 118.2 175.5 174.81) Investments in securities total 100.30 % of net assets.2) Accumulated figures for open share classes on the reporting date.For further information concerning launch dates and liquidation dates, please refer to the Performance Table on pages 8 to 19.
3.09 % Malaysia
0.87 % Luxembourg
25.18 % Hong Kong
23.78 % South Korea
Indonesia 4.22 %
Thailand 4.67 %
Singapore 5.84 %
Taiwan 13.21 %
China 19.44 %
Breakdown of Net Assets
Equity markets recovered from 1 October 2011 to 31 March 2012 after going through the crash scenario in the third quarter of 2011. A more benign inflation outlook gave central banks space to implement monetary easing. In China, a weaker gross domestic product growth forecast from the government coupled with weaker macro data weighed on market sentiment. In Thailand, the largest flood in 50 years caused widespread damage across the country. Nevertheless, Thailand was the best performing country in the region during the reporting period.
The Subfund outperformed the benchmark during the reporting period. Relative performance was helped by stock selection in China, Indonesia and Singapore, and was hurt by South Korea. By sector, it was helped by stock selection in materials, IT and utilities, and was hurt by telecom and discretionary.
With the assumption that the Eurozone is not collapsing and that adequate liquidity will be provided to European banks, Asia should remain well-positioned into the summer. In addition, hard-landing in the region is less likely given sufficient flexibility for monetary easing largely at hand. While valuations have rebounded, a rebound of economic growth should be supportive of an upgrade of earnings expectations, leaving Asian equities looking very compelling as many are still trading below their historical trading ranges.
Please refer to the Prospectus as well as the Key Investor Information Document for additional information on the Subfund. Information on the performance of the individual share classes of the Subfund in the reporting period can be found in the table “Performance” on pages 8 to 19.
Allianz RCM Tiger
Other net assets – 0.30 %1)
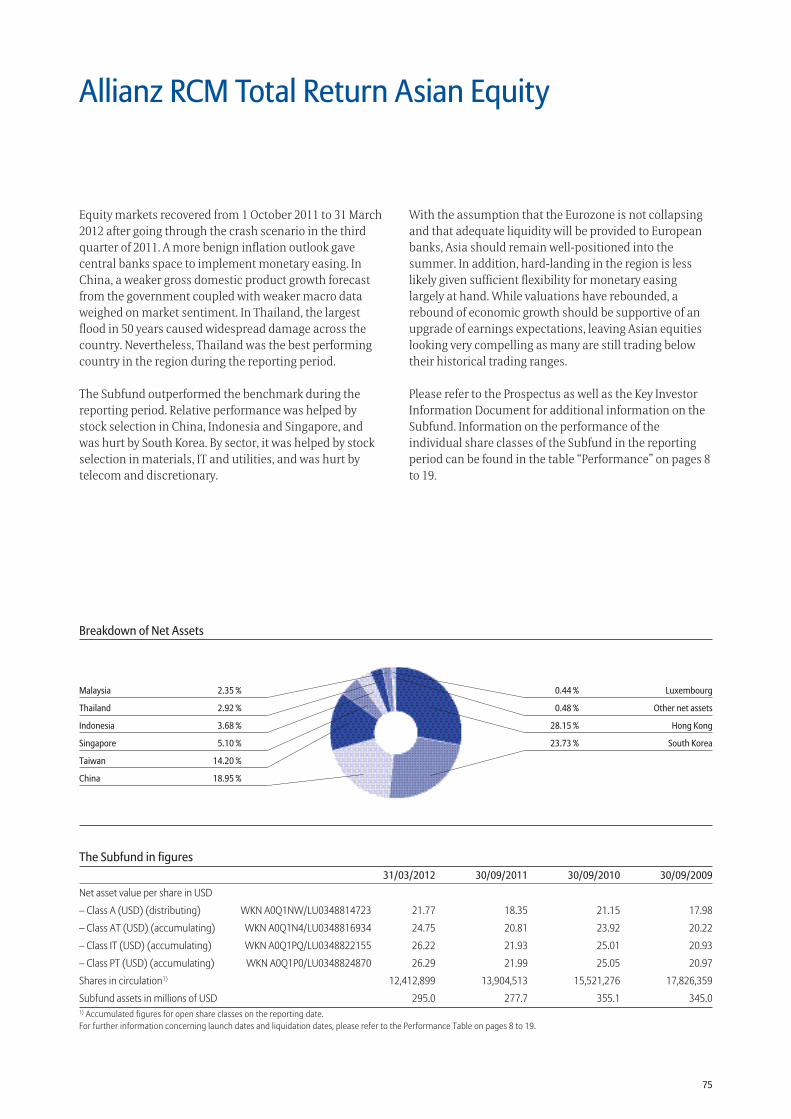
75
The Subfund in figures 31/03/2012 30/09/2011 30/09/2010 30/09/2009
Net asset value per share in USD
– Class A (USD) (distributing) WKN A0Q1NW/LU0348814723 21.77 18.35 21.15 17.98
– Class AT (USD) (accumulating) WKN A0Q1N4/LU0348816934 24.75 20.81 23.92 20.22
– Class IT (USD) (accumulating) WKN A0Q1PQ/LU0348822155 26.22 21.93 25.01 20.93
– Class PT (USD) (accumulating) WKN A0Q1P0/LU0348824870 26.29 21.99 25.05 20.97
Shares in circulation1) 12,412,899 13,904,513 15,521,276 17,826,359
Subfund assets in millions of USD 295.0 277.7 355.1 345.01) Accumulated figures for open share classes on the reporting date.For further information concerning launch dates and liquidation dates, please refer to the Performance Table on pages 8 to 19.
0.44 % Luxembourg
0.48 % Other net assets
28.15 % Hong Kong
23.73 % South Korea
Malaysia 2.35 %
Thailand 2.92 %
Indonesia 3.68 %
Singapore 5.10 %
Taiwan 14.20 %
China 18.95 %
Breakdown of Net Assets
Allianz RCM Total Return Asian Equity
Equity markets recovered from 1 October 2011 to 31 March 2012 after going through the crash scenario in the third quarter of 2011. A more benign inflation outlook gave central banks space to implement monetary easing. In China, a weaker gross domestic product growth forecast from the government coupled with weaker macro data weighed on market sentiment. In Thailand, the largest flood in 50 years caused widespread damage across the country. Nevertheless, Thailand was the best performing country in the region during the reporting period.
The Subfund outperformed the benchmark during the reporting period. Relative performance was helped by stock selection in China, Indonesia and Singapore, and was hurt by South Korea. By sector, it was helped by stock selection in materials, IT and utilities, and was hurt by telecom and discretionary.
With the assumption that the Eurozone is not collapsing and that adequate liquidity will be provided to European banks, Asia should remain well-positioned into the summer. In addition, hard-landing in the region is less likely given sufficient flexibility for monetary easing largely at hand. While valuations have rebounded, a rebound of economic growth should be supportive of an upgrade of earnings expectations, leaving Asian equities looking very compelling as many are still trading below their historical trading ranges.
Please refer to the Prospectus as well as the Key Investor Information Document for additional information on the Subfund. Information on the performance of the individual share classes of the Subfund in the reporting period can be found in the table “Performance” on pages 8 to 19.
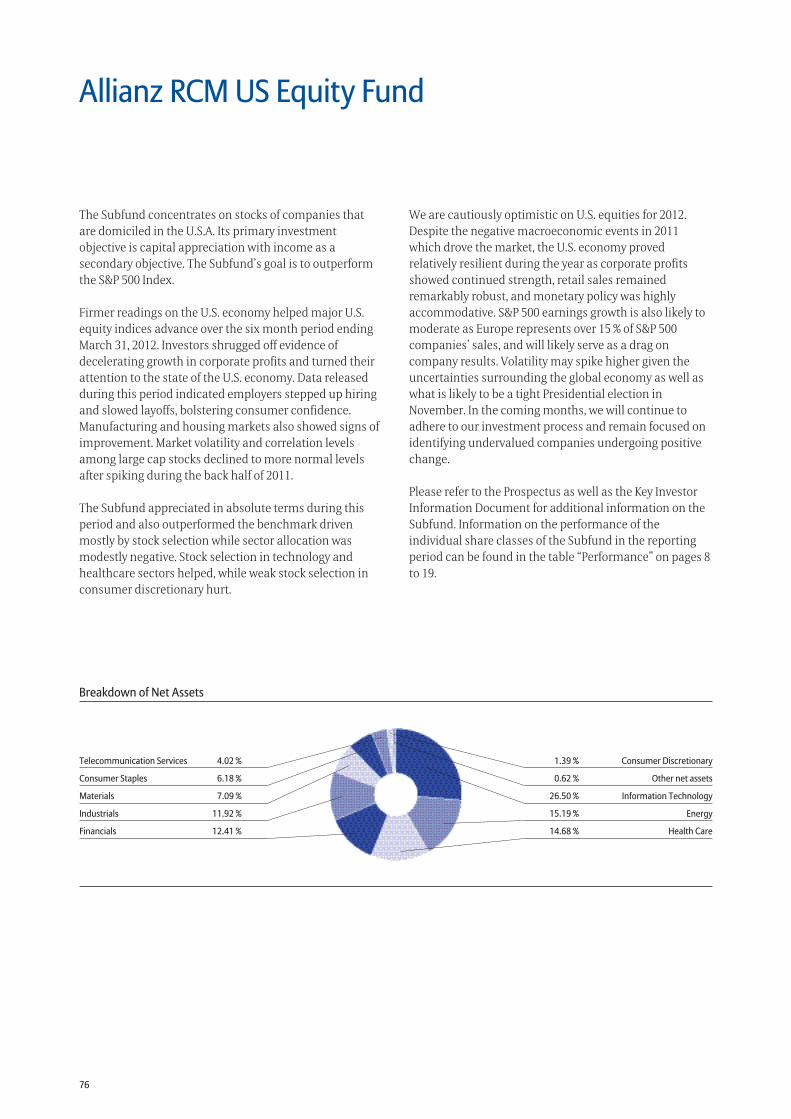
76
1.39 % Consumer Discretionary
0.62 % Other net assets
26.50 % Information Technology
15.19 % Energy
14.68 % Health Care
Telecommunication Services 4.02 %
Consumer Staples 6.18 %
Materials 7.09 %
Industrials 11.92 %
Financials 12.41 %
Breakdown of Net Assets
Allianz RCM US Equity Fund
The Subfund concentrates on stocks of companies that are domiciled in the U.S.A. Its primary investment objective is capital appreciation with income as a secondary objective. The Subfund’s goal is to outperform the S&P 500 Index.
Firmer readings on the U.S. economy helped major U.S. equity indices advance over the six month period ending March 31, 2012. Investors shrugged off evidence of decelerating growth in corporate profits and turned their attention to the state of the U.S. economy. Data released during this period indicated employers stepped up hiring and slowed layoffs, bolstering consumer confidence. Manufacturing and housing markets also showed signs of improvement. Market volatility and correlation levels among large cap stocks declined to more normal levels after spiking during the back half of 2011.
The Subfund appreciated in absolute terms during this period and also outperformed the benchmark driven mostly by stock selection while sector allocation was modestly negative. Stock selection in technology and healthcare sectors helped, while weak stock selection in consumer discretionary hurt.
We are cautiously optimistic on U.S. equities for 2012. Despite the negative macroeconomic events in 2011 which drove the market, the U.S. economy proved relatively resilient during the year as corporate profits showed continued strength, retail sales remained remarkably robust, and monetary policy was highly accommodative. S&P 500 earnings growth is also likely to moderate as Europe represents over 15 % of S&P 500 companies’ sales, and will likely serve as a drag on company results. Volatility may spike higher given the uncertainties surrounding the global economy as well as what is likely to be a tight Presidential election in November. In the coming months, we will continue to adhere to our investment process and remain focused on identifying undervalued companies undergoing positive change.
Please refer to the Prospectus as well as the Key Investor Information Document for additional information on the Subfund. Information on the performance of the individual share classes of the Subfund in the reporting period can be found in the table “Performance” on pages 8 to 19.
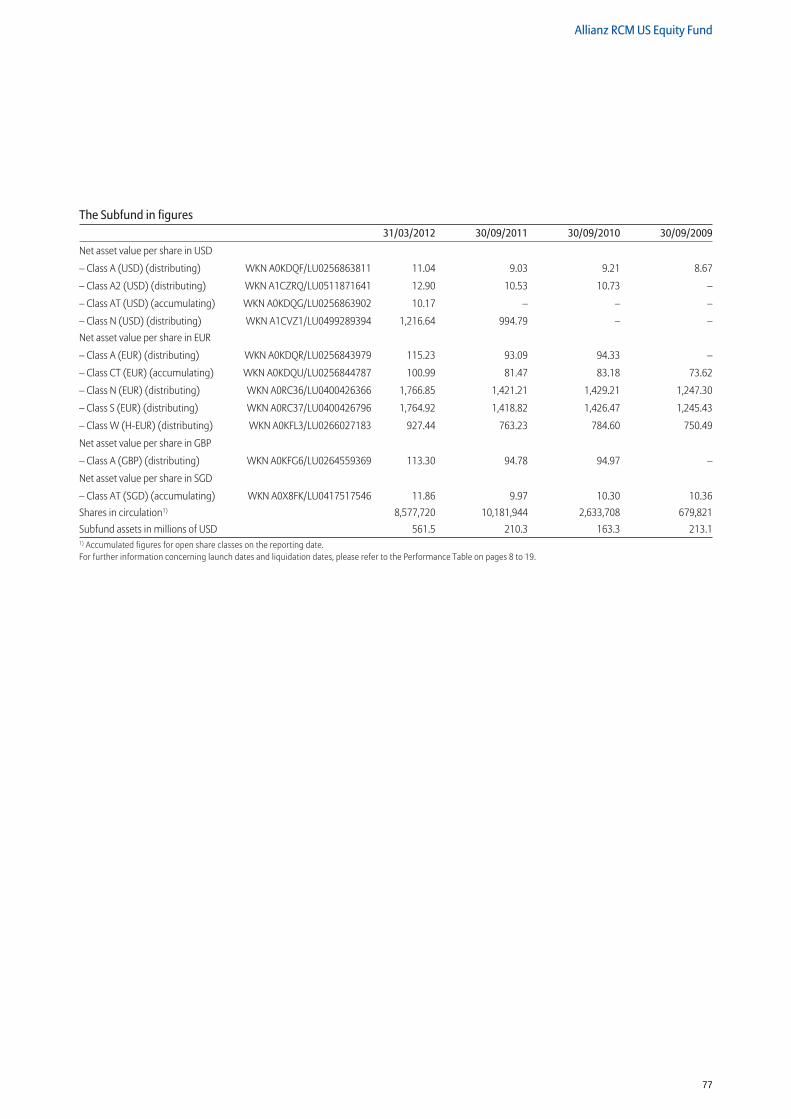
77
Allianz RCM US Equity Fund
The Subfund in figures 31/03/2012 30/09/2011 30/09/2010 30/09/2009
Net asset value per share in USD
– Class A (USD) (distributing) WKN A0KDQF/LU0256863811 11.04 9.03 9.21 8.67
– Class A2 (USD) (distributing) WKN A1CZRQ/LU0511871641 12.90 10.53 10.73 –
– Class AT (USD) (accumulating) WKN A0KDQG/LU0256863902 10.17 – – –
– Class N (USD) (distributing) WKN A1CVZ1/LU0499289394 1,216.64 994.79 – –Net asset value per share in EUR
– Class A (EUR) (distributing) WKN A0KDQR/LU0256843979 115.23 93.09 94.33 –
– Class CT (EUR) (accumulating) WKN A0KDQU/LU0256844787 100.99 81.47 83.18 73.62
– Class N (EUR) (distributing) WKN A0RC36/LU0400426366 1,766.85 1,421.21 1,429.21 1,247.30
– Class S (EUR) (distributing) WKN A0RC37/LU0400426796 1,764.92 1,418.82 1,426.47 1,245.43
– Class W (H-EUR) (distributing) WKN A0KFL3/LU0266027183 927.44 763.23 784.60 750.49
Net asset value per share in GBP
– Class A (GBP) (distributing) WKN A0KFG6/LU0264559369 113.30 94.78 94.97 –
Net asset value per share in SGD
– Class AT (SGD) (accumulating) WKN A0X8FK/LU0417517546 11.86 9.97 10.30 10.36Shares in circulation1) 8,577,720 10,181,944 2,633,708 679,821Subfund assets in millions of USD 561.5 210.3 163.3 213.11) Accumulated figures for open share classes on the reporting date.For further information concerning launch dates and liquidation dates, please refer to the Performance Table on pages 8 to 19.
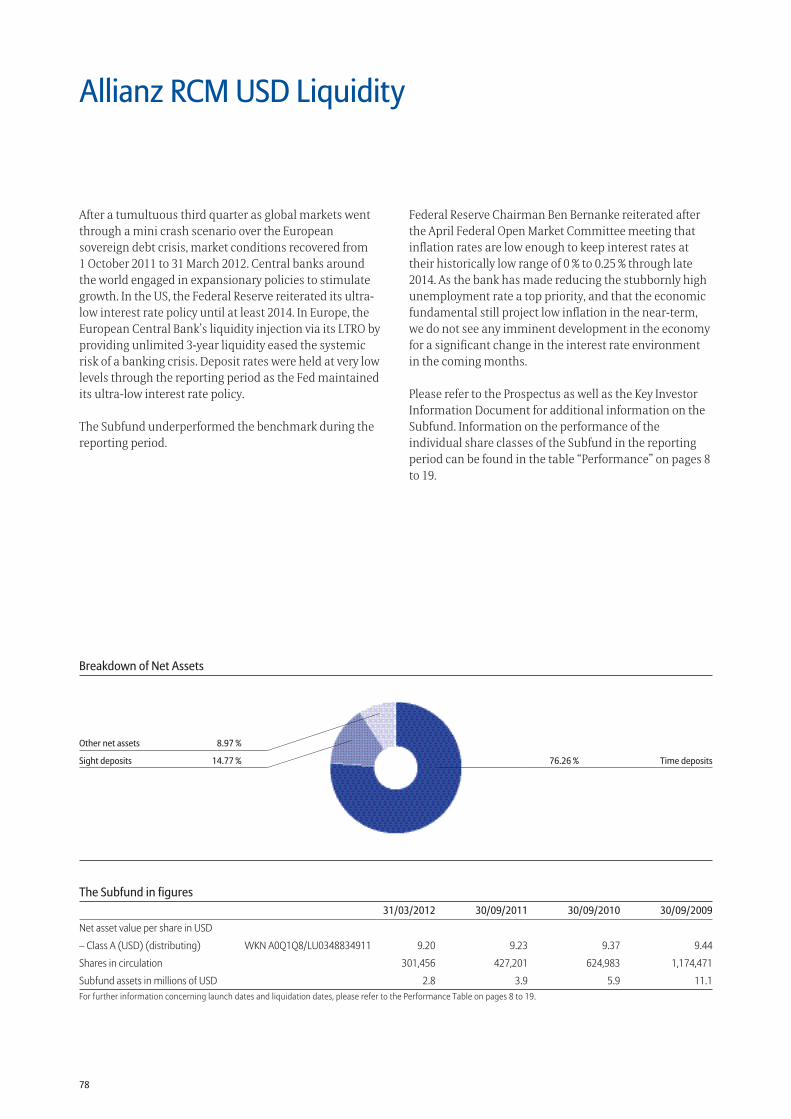
78
The Subfund in figures 31/03/2012 30/09/2011 30/09/2010 30/09/2009
Net asset value per share in USD
– Class A (USD) (distributing) WKN A0Q1Q8/LU0348834911 9.20 9.23 9.37 9.44
Shares in circulation 301,456 427,201 624,983 1,174,471
Subfund assets in millions of USD 2.8 3.9 5.9 11.1For further information concerning launch dates and liquidation dates, please refer to the Performance Table on pages 8 to 19.
76.26 % Time deposits
Other net assets 8.97 %
Sight deposits 14.77 %
Breakdown of Net Assets
Allianz RCM USD Liquidity
After a tumultuous third quarter as global markets went through a mini crash scenario over the European sovereign debt crisis, market conditions recovered from 1 October 2011 to 31 March 2012. Central banks around the world engaged in expansionary policies to stimulate growth. In the US, the Federal Reserve reiterated its ultra-low interest rate policy until at least 2014. In Europe, the European Central Bank’s liquidity injection via its LTRO by providing unlimited 3-year liquidity eased the systemic risk of a banking crisis. Deposit rates were held at very low levels through the reporting period as the Fed maintained its ultra-low interest rate policy.
The Subfund underperformed the benchmark during the reporting period.
Federal Reserve Chairman Ben Bernanke reiterated after the April Federal Open Market Committee meeting that inflation rates are low enough to keep interest rates at their historically low range of 0 % to 0.25 % through late 2014. As the bank has made reducing the stubbornly high unemployment rate a top priority, and that the economic fundamental still project low inflation in the near-term, we do not see any imminent development in the economy for a significant change in the interest rate environment in the coming months.
Please refer to the Prospectus as well as the Key Investor Information Document for additional information on the Subfund. Information on the performance of the individual share classes of the Subfund in the reporting period can be found in the table “Performance” on pages 8 to 19.
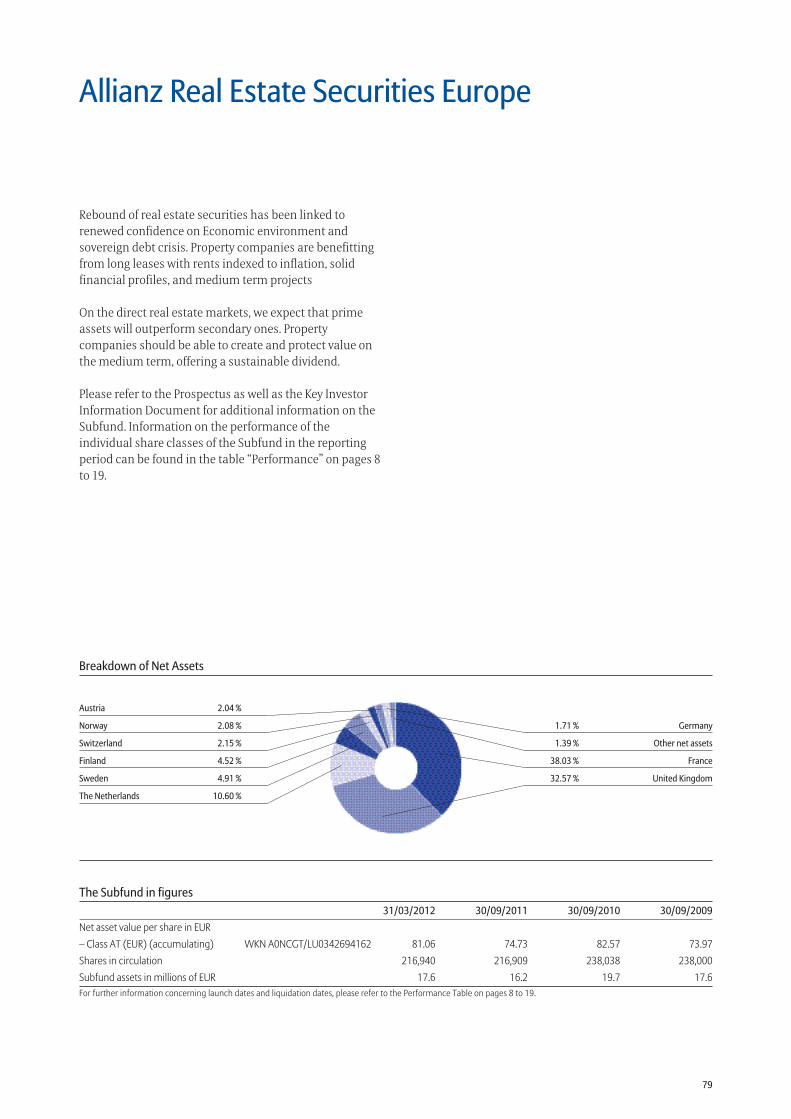
79
The Subfund in figures 31/03/2012 30/09/2011 30/09/2010 30/09/2009Net asset value per share in EUR– Class AT (EUR) (accumulating) WKN A0NCGT/LU0342694162 81.06 74.73 82.57 73.97Shares in circulation 216,940 216,909 238,038 238,000Subfund assets in millions of EUR 17.6 16.2 19.7 17.6For further information concerning launch dates and liquidation dates, please refer to the Performance Table on pages 8 to 19.
Breakdown of Net Assets
1.71 % Germany
1.39 % Other net assets
38.03 % France
32.57 % United Kingdom
Austria 2.04 %
Norway 2.08 %
Switzerland 2.15 %
Finland 4.52 %
Sweden 4.91 %
The Netherlands 10.60 %
Allianz Real Estate Securities Europe
Rebound of real estate securities has been linked to renewed confidence on Economic environment and sovereign debt crisis. Property companies are benefitting from long leases with rents indexed to inflation, solid financial profiles, and medium term projects
On the direct real estate markets, we expect that prime assets will outperform secondary ones. Property companies should be able to create and protect value on the medium term, offering a sustainable dividend.
Please refer to the Prospectus as well as the Key Investor Information Document for additional information on the Subfund. Information on the performance of the individual share classes of the Subfund in the reporting period can be found in the table “Performance” on pages 8 to 19.
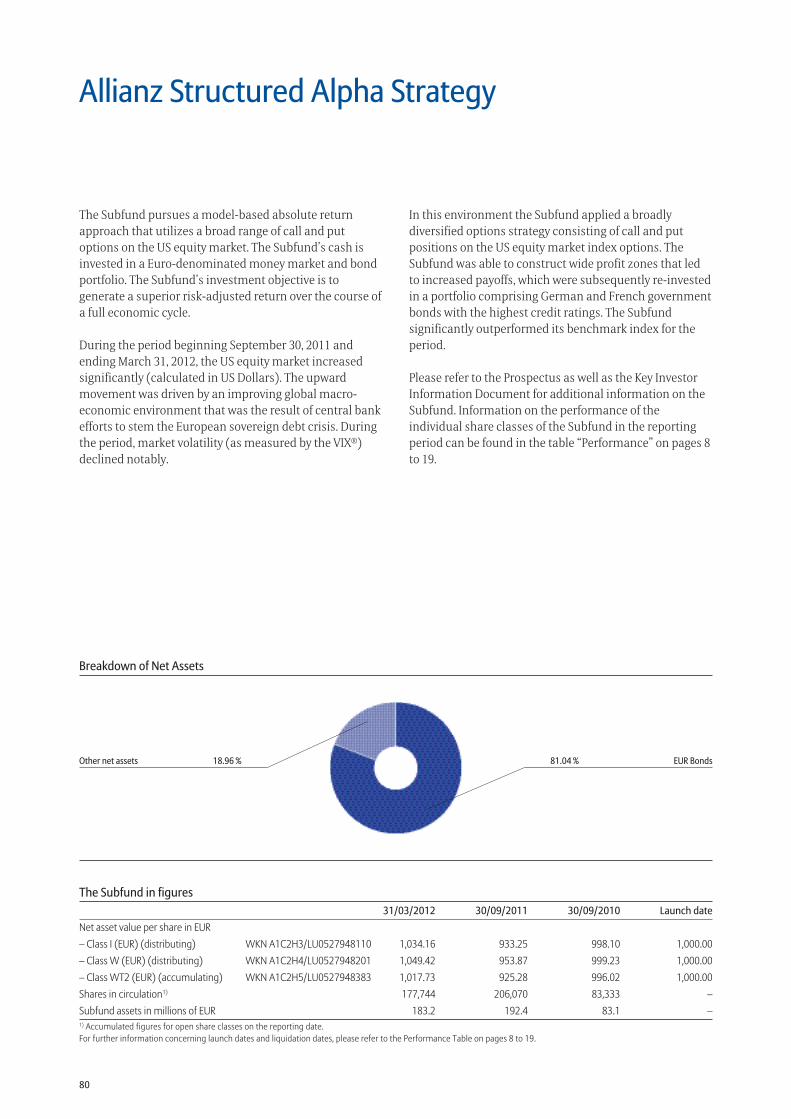
80
The Subfund in figures 31/03/2012 30/09/2011 30/09/2010 Launch dateNet asset value per share in EUR– Class I (EUR) (distributing) WKN A1C2H3/LU0527948110 1,034.16 933.25 998.10 1,000.00– Class W (EUR) (distributing) WKN A1C2H4/LU0527948201 1,049.42 953.87 999.23 1,000.00– Class WT2 (EUR) (accumulating) WKN A1C2H5/LU0527948383 1,017.73 925.28 996.02 1,000.00Shares in circulation1) 177,744 206,070 83,333 –Subfund assets in millions of EUR 183.2 192.4 83.1 –1) Accumulated figures for open share classes on the reporting date.For further information concerning launch dates and liquidation dates, please refer to the Performance Table on pages 8 to 19.
Breakdown of Net Assets
81.04 % EUR BondsOther net assets 18.96 %
Allianz Structured Alpha Strategy
The Subfund pursues a model-based absolute return approach that utilizes a broad range of call and put options on the US equity market. The Subfund’s cash is invested in a Euro-denominated money market and bond portfolio. The Subfund’s investment objective is to generate a superior risk-adjusted return over the course of a full economic cycle.
During the period beginning September 30, 2011 and ending March 31, 2012, the US equity market increased significantly (calculated in US Dollars). The upward movement was driven by an improving global macro-economic environment that was the result of central bank efforts to stem the European sovereign debt crisis. During the period, market volatility (as measured by the VIX®) declined notably.
In this environment the Subfund applied a broadly diversified options strategy consisting of call and put positions on the US equity market index options. The Subfund was able to construct wide profit zones that led to increased payoffs, which were subsequently re-invested in a portfolio comprising German and French government bonds with the highest credit ratings. The Subfund significantly outperformed its benchmark index for the period.
Please refer to the Prospectus as well as the Key Investor Information Document for additional information on the Subfund. Information on the performance of the individual share classes of the Subfund in the reporting period can be found in the table “Performance” on pages 8 to 19.
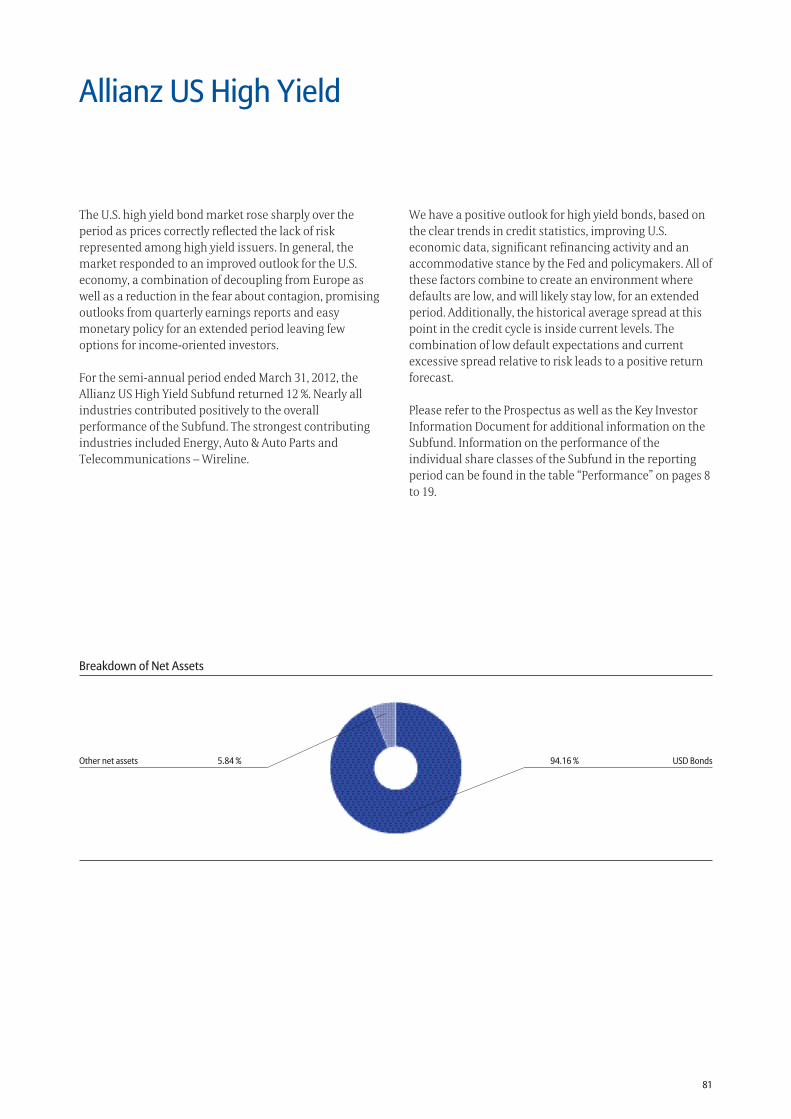
81
Breakdown of Net Assets
94.16 % USD BondsOther net assets 5.84 %
Allianz US High Yield
The U.S. high yield bond market rose sharply over the period as prices correctly reflected the lack of risk represented among high yield issuers. In general, the market responded to an improved outlook for the U.S. economy, a combination of decoupling from Europe as well as a reduction in the fear about contagion, promising outlooks from quarterly earnings reports and easy monetary policy for an extended period leaving few options for income-oriented investors.
For the semi-annual period ended March 31, 2012, the Allianz US High Yield Subfund returned 12 %. Nearly all industries contributed positively to the overall performance of the Subfund. The strongest contributing industries included Energy, Auto & Auto Parts and Telecommunications – Wireline.
We have a positive outlook for high yield bonds, based on the clear trends in credit statistics, improving U.S. economic data, significant refinancing activity and an accommodative stance by the Fed and policymakers. All of these factors combine to create an environment where defaults are low, and will likely stay low, for an extended period. Additionally, the historical average spread at this point in the credit cycle is inside current levels. The combination of low default expectations and current excessive spread relative to risk leads to a positive return forecast.
Please refer to the Prospectus as well as the Key Investor Information Document for additional information on the Subfund. Information on the performance of the individual share classes of the Subfund in the reporting period can be found in the table “Performance” on pages 8 to 19.
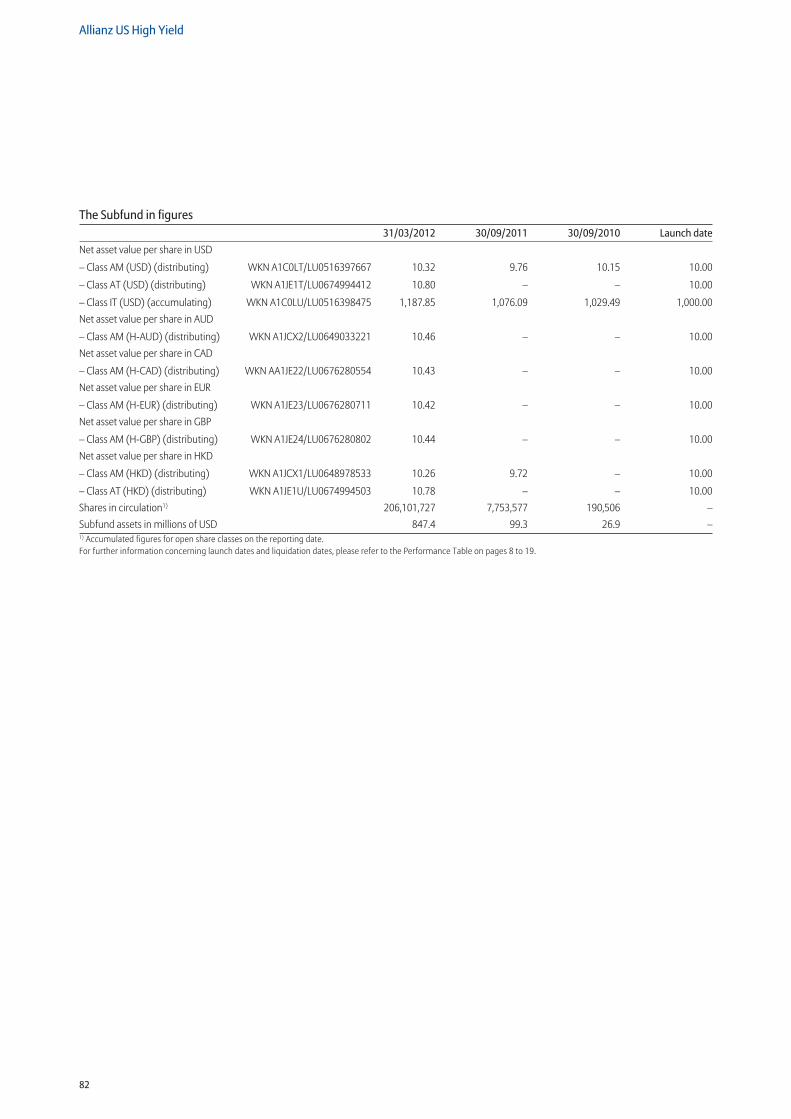
82
Allianz US High Yield
The Subfund in figures 31/03/2012 30/09/2011 30/09/2010 Launch dateNet asset value per share in USD
– Class AM (USD) (distributing) WKN A1C0LT/LU0516397667 10.32 9.76 10.15 10.00
– Class AT (USD) (distributing) WKN A1JE1T/LU0674994412 10.80 – – 10.00
– Class IT (USD) (accumulating) WKN A1C0LU/LU0516398475 1,187.85 1,076.09 1,029.49 1,000.00Net asset value per share in AUD
– Class AM (H-AUD) (distributing) WKN A1JCX2/LU0649033221 10.46 – – 10.00Net asset value per share in CAD
– Class AM (H-CAD) (distributing) WKN AA1JE22/LU0676280554 10.43 – – 10.00Net asset value per share in EUR
– Class AM (H-EUR) (distributing) WKN A1JE23/LU0676280711 10.42 – – 10.00Net asset value per share in GBP
– Class AM (H-GBP) (distributing) WKN A1JE24/LU0676280802 10.44 – – 10.00Net asset value per share in HKD
– Class AM (HKD) (distributing) WKN A1JCX1/LU0648978533 10.26 9.72 – 10.00
– Class AT (HKD) (distributing) WKN A1JE1U/LU0674994503 10.78 – – 10.00Shares in circulation1) 206,101,727 7,753,577 190,506 –Subfund assets in millions of USD 847.4 99.3 26.9 –1) Accumulated figures for open share classes on the reporting date.For further information concerning launch dates and liquidation dates, please refer to the Performance Table on pages 8 to 19.
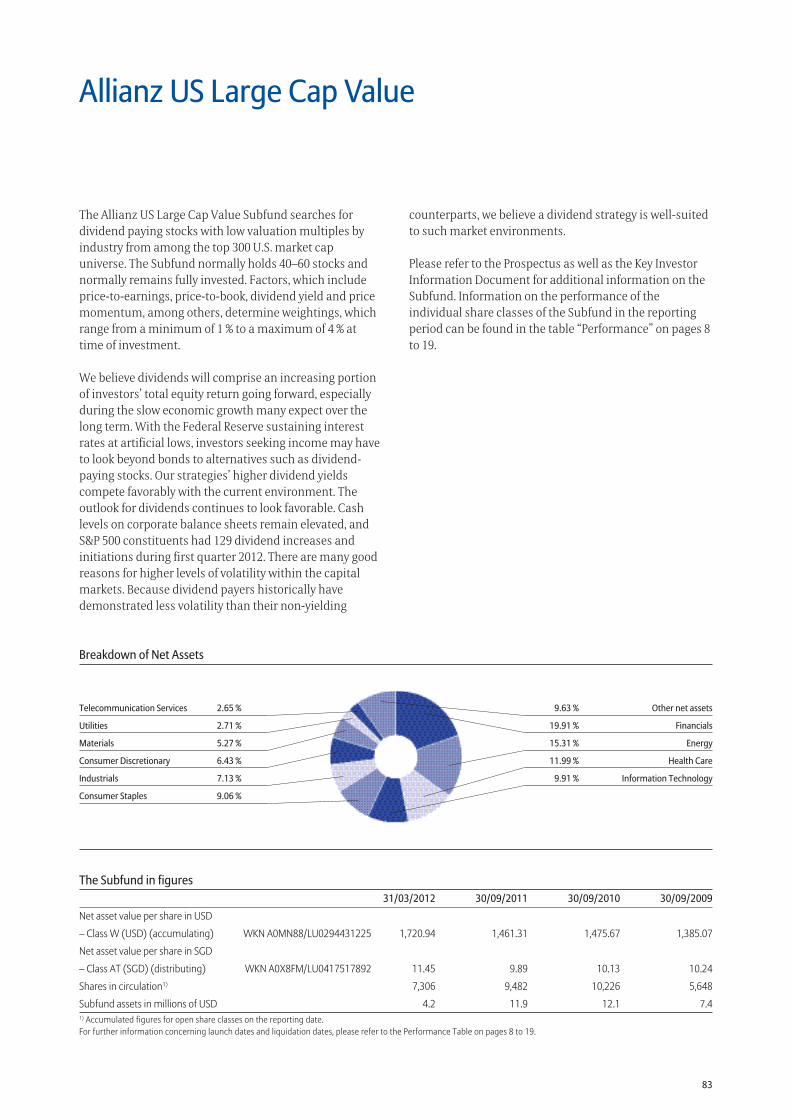
83
The Subfund in figures 31/03/2012 30/09/2011 30/09/2010 30/09/2009
Net asset value per share in USD
– Class W (USD) (accumulating) WKN A0MN88/LU0294431225 1,720.94 1,461.31 1,475.67 1,385.07
Net asset value per share in SGD
– Class AT (SGD) (distributing) WKN A0X8FM/LU0417517892 11.45 9.89 10.13 10.24
Shares in circulation1) 7,306 9,482 10,226 5,648
Subfund assets in millions of USD 4.2 11.9 12.1 7.41) Accumulated figures for open share classes on the reporting date.For further information concerning launch dates and liquidation dates, please refer to the Performance Table on pages 8 to 19.
9.63 % Other net assets
19.91 % Financials
15.31 % Energy
11.99 % Health Care
9.91 % Information Technology
Telecommunication Services 2.65 %
Utilities 2.71 %
Materials 5.27 %
Consumer Discretionary 6.43 %
Industrials 7.13 %
Consumer Staples 9.06 %
Breakdown of Net Assets
Allianz US Large Cap Value
The Allianz US Large Cap Value Subfund searches for dividend paying stocks with low valuation multiples by industry from among the top 300 U.S. market cap universe. The Subfund normally holds 40–60 stocks and normally remains fully invested. Factors, which include price-to-earnings, price-to-book, dividend yield and price momentum, among others, determine weightings, which range from a minimum of 1 % to a maximum of 4 % at time of investment.
We believe dividends will comprise an increasing portion of investors’ total equity return going forward, especially during the slow economic growth many expect over the long term. With the Federal Reserve sustaining interest rates at artificial lows, investors seeking income may have to look beyond bonds to alternatives such as dividend-paying stocks. Our strategies’ higher dividend yields compete favorably with the current environment. The outlook for dividends continues to look favorable. Cash levels on corporate balance sheets remain elevated, and S&P 500 constituents had 129 dividend increases and initiations during first quarter 2012. There are many good reasons for higher levels of volatility within the capital markets. Because dividend payers historically have demonstrated less volatility than their non-yielding
counterparts, we believe a dividend strategy is well-suited to such market environments.
Please refer to the Prospectus as well as the Key Investor Information Document for additional information on the Subfund. Information on the performance of the individual share classes of the Subfund in the reporting period can be found in the table “Performance” on pages 8 to 19.
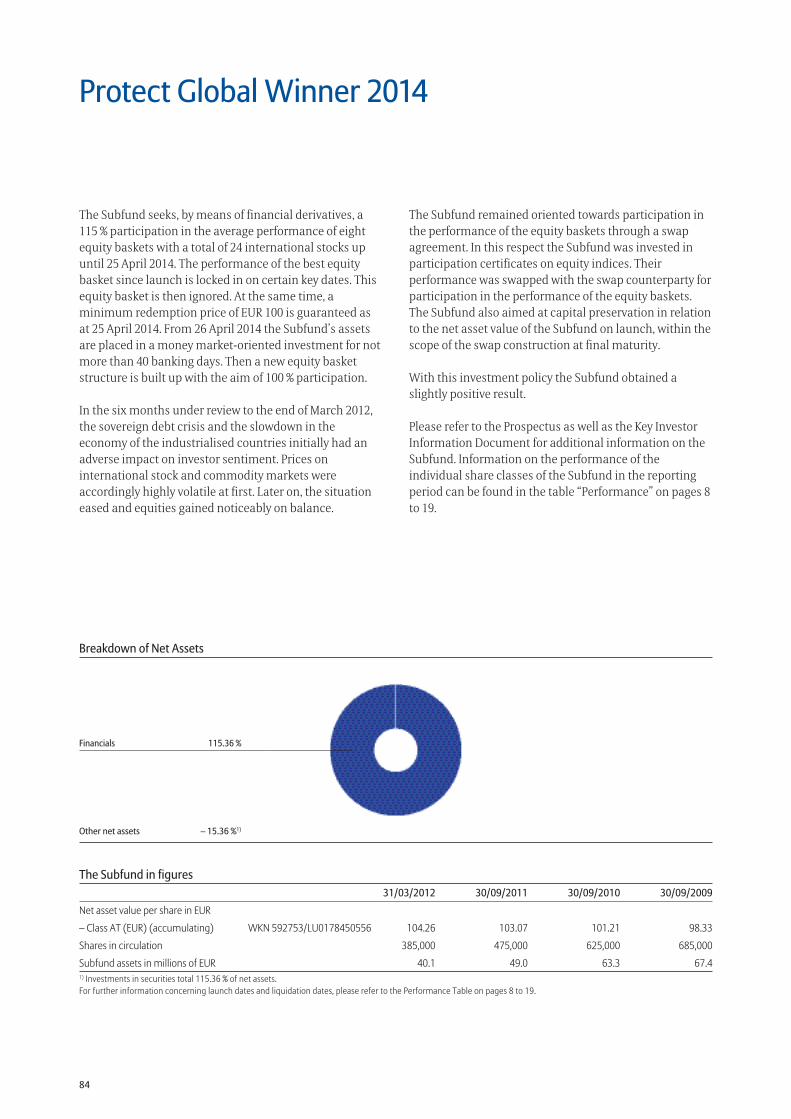
84
The Subfund in figures 31/03/2012 30/09/2011 30/09/2010 30/09/2009
Net asset value per share in EUR
– Class AT (EUR) (accumulating) WKN 592753/LU0178450556 104.26 103.07 101.21 98.33
Shares in circulation 385,000 475,000 625,000 685,000
Subfund assets in millions of EUR 40.1 49.0 63.3 67.41) Investments in securities total 115.36 % of net assets.For further information concerning launch dates and liquidation dates, please refer to the Performance Table on pages 8 to 19.
Financials 115.36 %
Breakdown of Net Assets
Protect Global Winner 2014
The Subfund seeks, by means of financial derivatives, a 115 % participation in the average performance of eight equity baskets with a total of 24 international stocks up until 25 April 2014. The performance of the best equity basket since launch is locked in on certain key dates. This equity basket is then ignored. At the same time, a minimum redemption price of EUR 100 is guaranteed as at 25 April 2014. From 26 April 2014 the Subfund’s assets are placed in a money market-oriented investment for not more than 40 banking days. Then a new equity basket structure is built up with the aim of 100 % participation.
In the six months under review to the end of March 2012, the sovereign debt crisis and the slowdown in the economy of the industrialised countries initially had an adverse impact on investor sentiment. Prices on international stock and commodity markets were accordingly highly volatile at first. Later on, the situation eased and equities gained noticeably on balance.
The Subfund remained oriented towards participation in the performance of the equity baskets through a swap agreement. In this respect the Subfund was invested in participation certificates on equity indices. Their performance was swapped with the swap counterparty for participation in the performance of the equity baskets. The Subfund also aimed at capital preservation in relation to the net asset value of the Subfund on launch, within the scope of the swap construction at final maturity.
With this investment policy the Subfund obtained a slightly positive result.
Please refer to the Prospectus as well as the Key Investor Information Document for additional information on the Subfund. Information on the performance of the individual share classes of the Subfund in the reporting period can be found in the table “Performance” on pages 8 to 19.
Other net assets – 15.36 %1)
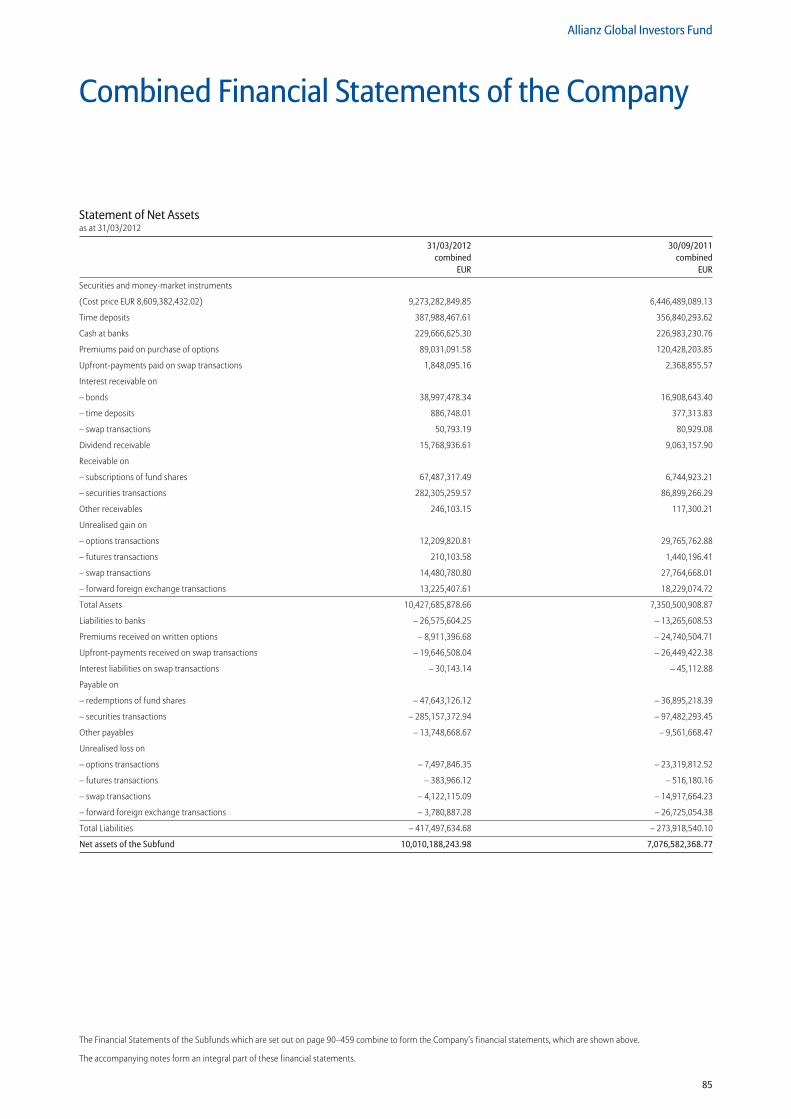
85
Allianz Global Investors Fund
Combined Financial Statements of the Company
The Financial Statements of the Subfunds which are set out on page 90–459 combine to form the Company’s financial statements, which are shown above.
The accompanying notes form an integral part of these financial statements.
Statement of Net AssetsStatement of Changes in Net AssetsAllianz Global Investors Fund
Statement of Net Assetsas at 31/03/2012
31/03/2012 30/09/2011 combined combined EUR EUR
Securities and money-market instruments
(Cost price EUR 8,609,382,432.02) 9,273,282,849.85 6,446,489,089.13
Time deposits 387,988,467.61 356,840,293.62
Cash at banks 229,666,625.30 226,983,230.76
Premiums paid on purchase of options 89,031,091.58 120,428,203.85
Upfront-payments paid on swap transactions 1,848,095.16 2,368,855.57
Interest receivable on
– bonds 38,997,478.34 16,908,643.40
– time deposits 886,748.01 377,313.83
– swap transactions 50,793.19 80,929.08
Dividend receivable 15,768,936.61 9,063,157.90
Receivable on
– subscriptions of fund shares 67,487,317.49 6,744,923.21
– securities transactions 282,305,259.57 86,899,266.29
Other receivables 246,103.15 117,300.21
Unrealised gain on
– options transactions 12,209,820.81 29,765,762.88
– futures transactions 210,103.58 1,440,196.41
– swap transactions 14,480,780.80 27,764,668.01
– forward foreign exchange transactions 13,225,407.61 18,229,074.72
Total Assets 10,427,685,878.66 7,350,500,908.87
Liabilities to banks – 26,575,604.25 – 13,265,608.53
Premiums received on written options – 8,911,396.68 – 24,740,504.71
Upfront-payments received on swap transactions – 19,646,508.04 – 26,449,422.38
Interest liabilities on swap transactions – 30,143.14 – 45,112.88
Payable on
– redemptions of fund shares – 47,643,126.12 – 36,895,218.39
– securities transactions – 285,157,372.94 – 97,482,293.45
Other payables – 13,748,668.67 – 9,561,668.47
Unrealised loss on
– options transactions – 7,497,846.35 – 23,319,812.52
– futures transactions – 383,966.12 – 516,180.16
– swap transactions – 4,122,115.09 – 14,917,664.23
– forward foreign exchange transactions – 3,780,887.28 – 26,725,054.38
Total Liabilities – 417,497,634.68 – 273,918,540.10
Net assets of the Subfund 10,010,188,243.98 7,076,582,368.77
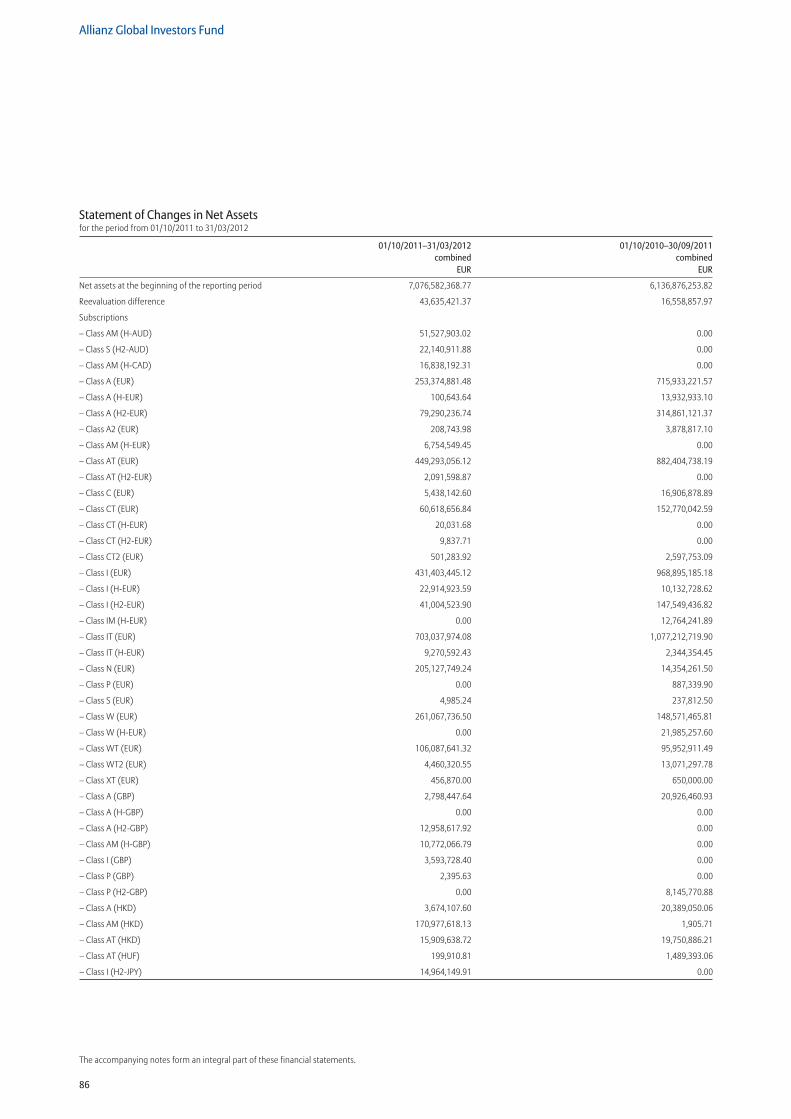
86
Allianz Global Investors Fund
The accompanying notes form an integral part of these financial statements.
Statement of Changes in Net Assetsfor the period from 01/10/2011 to 31/03/2012
01/10/2011–31/03/2012 01/10/2010–30/09/2011 combined combined EUR EUR
Net assets at the beginning of the reporting period 7,076,582,368.77 6,136,876,253.82
Reevaluation difference 43,635,421.37 16,558,857.97
Subscriptions
– Class AM (H-AUD) 51,527,903.02 0.00
– Class S (H2-AUD) 22,140,911.88 0.00
– Class AM (H-CAD) 16,838,192.31 0.00
– Class A (EUR) 253,374,881.48 715,933,221.57
– Class A (H-EUR) 100,643.64 13,932,933.10
– Class A (H2-EUR) 79,290,236.74 314,861,121.37
– Class A2 (EUR) 208,743.98 3,878,817.10
– Class AM (H-EUR) 6,754,549.45 0.00
– Class AT (EUR) 449,293,056.12 882,404,738.19
– Class AT (H2-EUR) 2,091,598.87 0.00
– Class C (EUR) 5,438,142.60 16,906,878.89
– Class CT (EUR) 60,618,656.84 152,770,042.59
– Class CT (H-EUR) 20,031.68 0.00
– Class CT (H2-EUR) 9,837.71 0.00
– Class CT2 (EUR) 501,283.92 2,597,753.09
– Class I (EUR) 431,403,445.12 968,895,185.18
– Class I (H-EUR) 22,914,923.59 10,132,728.62
– Class I (H2-EUR) 41,004,523.90 147,549,436.82
– Class IM (H-EUR) 0.00 12,764,241.89
– Class IT (EUR) 703,037,974.08 1,077,212,719.90
– Class IT (H-EUR) 9,270,592.43 2,344,354.45
– Class N (EUR) 205,127,749.24 14,354,261.50
– Class P (EUR) 0.00 887,339.90
– Class S (EUR) 4,985.24 237,812.50
– Class W (EUR) 261,067,736.50 148,571,465.81
– Class W (H-EUR) 0.00 21,985,257.60
– Class WT (EUR) 106,087,641.32 95,952,911.49
– Class WT2 (EUR) 4,460,320.55 13,071,297.78
– Class XT (EUR) 456,870.00 650,000.00
– Class A (GBP) 2,798,447.64 20,926,460.93
– Class A (H-GBP) 0.00 0.00
– Class A (H2-GBP) 12,958,617.92 0.00
– Class AM (H-GBP) 10,772,066.79 0.00
– Class I (GBP) 3,593,728.40 0.00
– Class P (GBP) 2,395.63 0.00
– Class P (H2-GBP) 0.00 8,145,770.88
– Class A (HKD) 3,674,107.60 20,389,050.06
– Class AM (HKD) 170,977,618.13 1,905.71
– Class AT (HKD) 15,909,638.72 19,750,886.21
– Class AT (HUF) 199,910.81 1,489,393.06
– Class I (H2-JPY) 14,964,149.91 0.00
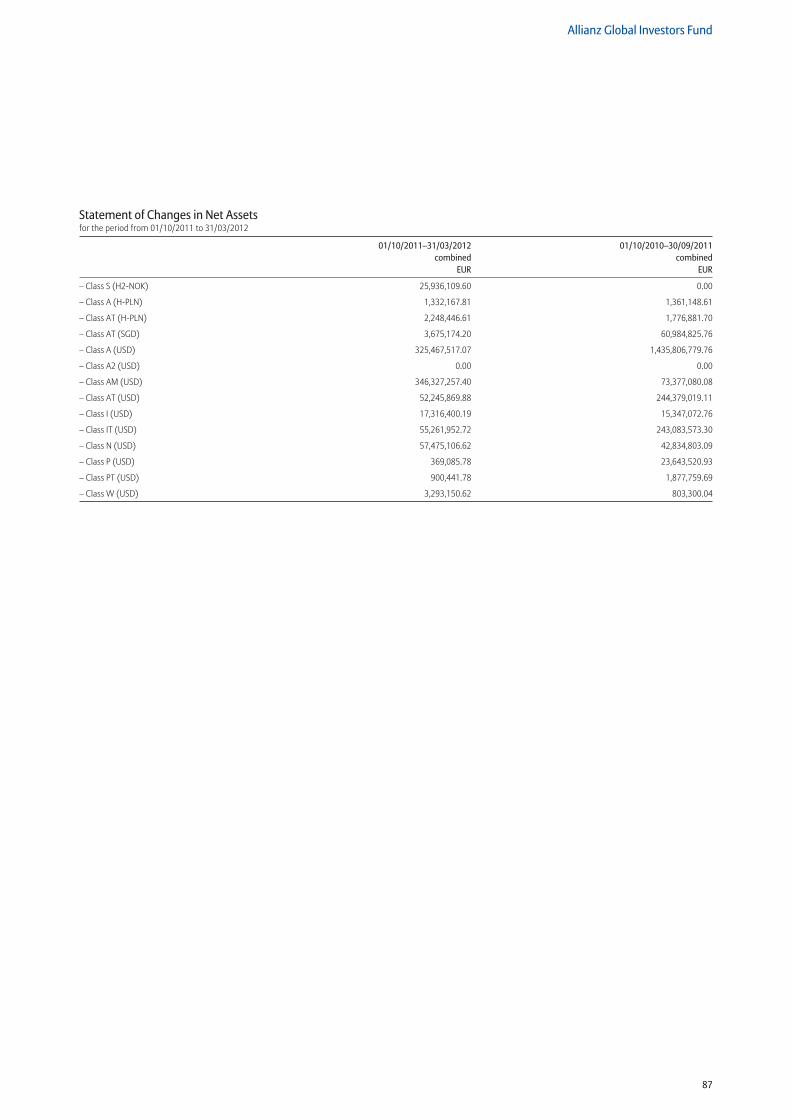
87
Allianz Global Investors Fund
– Class S (H2-NOK) 25,936,109.60 0.00
– Class A (H-PLN) 1,332,167.81 1,361,148.61
– Class AT (H-PLN) 2,248,446.61 1,776,881.70
– Class AT (SGD) 3,675,174.20 60,984,825.76
– Class A (USD) 325,467,517.07 1,435,806,779.76
– Class A2 (USD) 0.00 0.00
– Class AM (USD) 346,327,257.40 73,377,080.08
– Class AT (USD) 52,245,869.88 244,379,019.11
– Class I (USD) 17,316,400.19 15,347,072.76
– Class IT (USD) 55,261,952.72 243,083,573.30
– Class N (USD) 57,475,106.62 42,834,803.09
– Class P (USD) 369,085.78 23,643,520.93
– Class PT (USD) 900,441.78 1,877,759.69
– Class W (USD) 3,293,150.62 803,300.04
Statement of Changes in Net Assetsfor the period from 01/10/2011 to 31/03/2012
01/10/2011–31/03/2012 01/10/2010–30/09/2011 combined combined EUR EUR
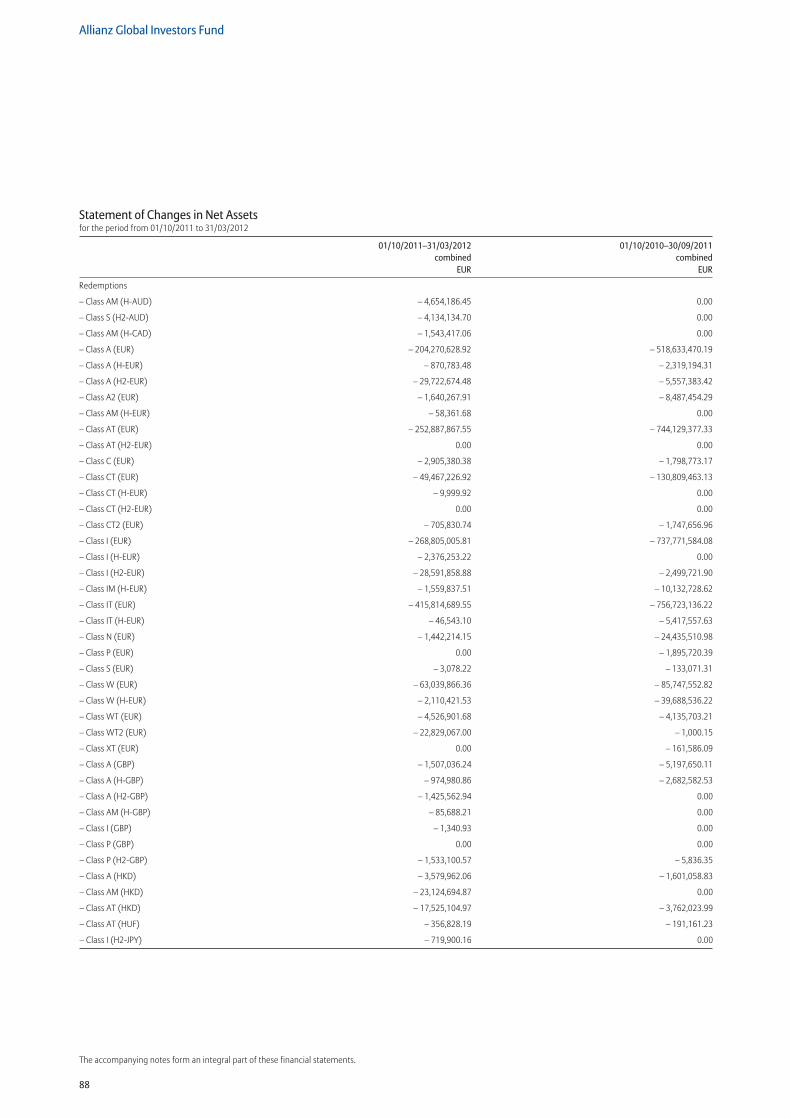
88
Allianz Global Investors Fund
The accompanying notes form an integral part of these financial statements.
Statement of Changes in Net Assetsfor the period from 01/10/2011 to 31/03/2012
01/10/2011–31/03/2012 01/10/2010–30/09/2011 combined combined EUR EUR
Redemptions
– Class AM (H-AUD) – 4,654,186.45 0.00
– Class S (H2-AUD) – 4,134,134.70 0.00
– Class AM (H-CAD) – 1,543,417.06 0.00
– Class A (EUR) – 204,270,628.92 – 518,633,470.19
– Class A (H-EUR) – 870,783.48 – 2,319,194.31
– Class A (H2-EUR) – 29,722,674.48 – 5,557,383.42
– Class A2 (EUR) – 1,640,267.91 – 8,487,454.29
– Class AM (H-EUR) – 58,361.68 0.00
– Class AT (EUR) – 252,887,867.55 – 744,129,377.33
– Class AT (H2-EUR) 0.00 0.00
– Class C (EUR) – 2,905,380.38 – 1,798,773.17
– Class CT (EUR) – 49,467,226.92 – 130,809,463.13
– Class CT (H-EUR) – 9,999.92 0.00
– Class CT (H2-EUR) 0.00 0.00
– Class CT2 (EUR) – 705,830.74 – 1,747,656.96
– Class I (EUR) – 268,805,005.81 – 737,771,584.08
– Class I (H-EUR) – 2,376,253.22 0.00
– Class I (H2-EUR) – 28,591,858.88 – 2,499,721.90
– Class IM (H-EUR) – 1,559,837.51 – 10,132,728.62
– Class IT (EUR) – 415,814,689.55 – 756,723,136.22
– Class IT (H-EUR) – 46,543.10 – 5,417,557.63
– Class N (EUR) – 1,442,214.15 – 24,435,510.98
– Class P (EUR) 0.00 – 1,895,720.39
– Class S (EUR) – 3,078.22 – 133,071.31
– Class W (EUR) – 63,039,866.36 – 85,747,552.82
– Class W (H-EUR) – 2,110,421.53 – 39,688,536.22
– Class WT (EUR) – 4,526,901.68 – 4,135,703.21
– Class WT2 (EUR) – 22,829,067.00 – 1,000.15
– Class XT (EUR) 0.00 – 161,586.09
– Class A (GBP) – 1,507,036.24 – 5,197,650.11
– Class A (H-GBP) – 974,980.86 – 2,682,582.53
– Class A (H2-GBP) – 1,425,562.94 0.00
– Class AM (H-GBP) – 85,688.21 0.00
– Class I (GBP) – 1,340.93 0.00
– Class P (GBP) 0.00 0.00
– Class P (H2-GBP) – 1,533,100.57 – 5,836.35
– Class A (HKD) – 3,579,962.06 – 1,601,058.83
– Class AM (HKD) – 23,124,694.87 0.00
– Class AT (HKD) – 17,525,104.97 – 3,762,023.99
– Class AT (HUF) – 356,828.19 – 191,161.23
– Class I (H2-JPY) – 719,900.16 0.00
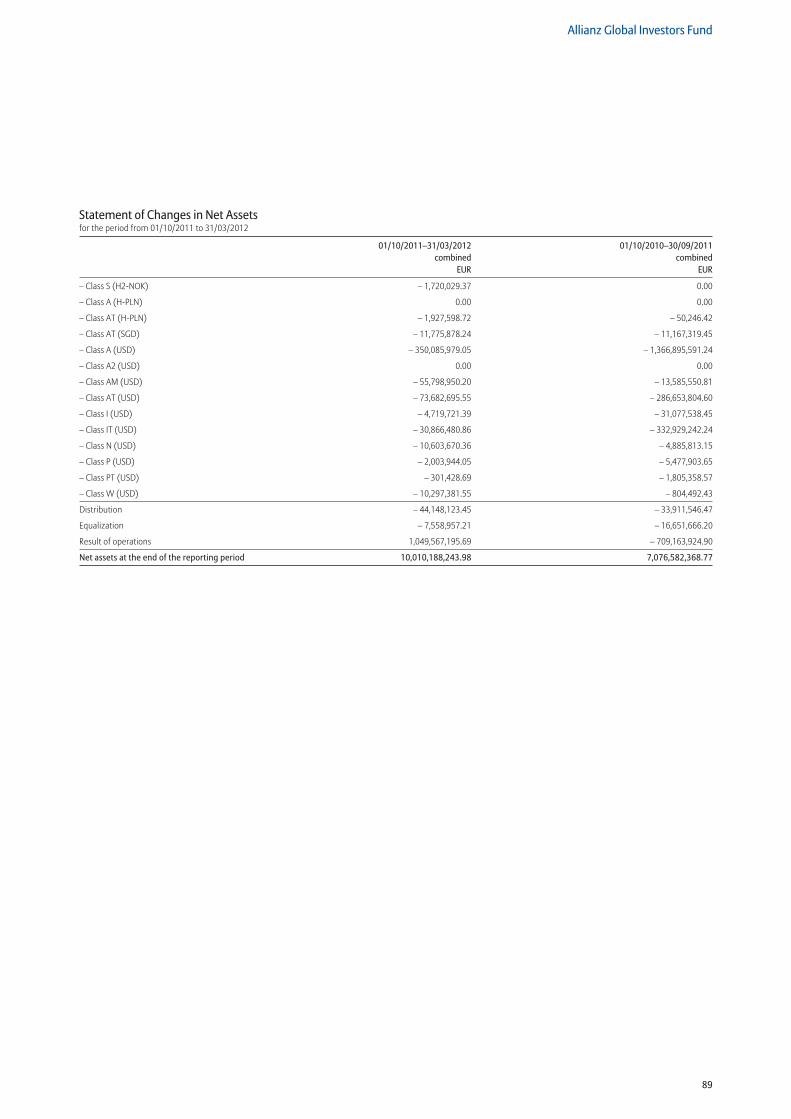
89
Allianz Global Investors Fund
Statement of Changes in Net Assetsfor the period from 01/10/2011 to 31/03/2012
01/10/2011–31/03/2012 01/10/2010–30/09/2011 combined combined EUR EUR
– Class S (H2-NOK) – 1,720,029.37 0.00
– Class A (H-PLN) 0.00 0.00
– Class AT (H-PLN) – 1,927,598.72 – 50,246.42
– Class AT (SGD) – 11,775,878.24 – 11,167,319.45
– Class A (USD) – 350,085,979.05 – 1,366,895,591.24
– Class A2 (USD) 0.00 0.00
– Class AM (USD) – 55,798,950.20 – 13,585,550.81
– Class AT (USD) – 73,682,695.55 – 286,653,804.60
– Class I (USD) – 4,719,721.39 – 31,077,538.45
– Class IT (USD) – 30,866,480.86 – 332,929,242.24
– Class N (USD) – 10,603,670.36 – 4,885,813.15
– Class P (USD) – 2,003,944.05 – 5,477,903.65
– Class PT (USD) – 301,428.69 – 1,805,358.57
– Class W (USD) – 10,297,381.55 – 804,492.43
Distribution – 44,148,123.45 – 33,911,546.47
Equalization – 7,558,957.21 – 16,651,666.20
Result of operations 1,049,567,195.69 – 709,163,924.90
Net assets at the end of the reporting period 10,010,188,243.98 7,076,582,368.77
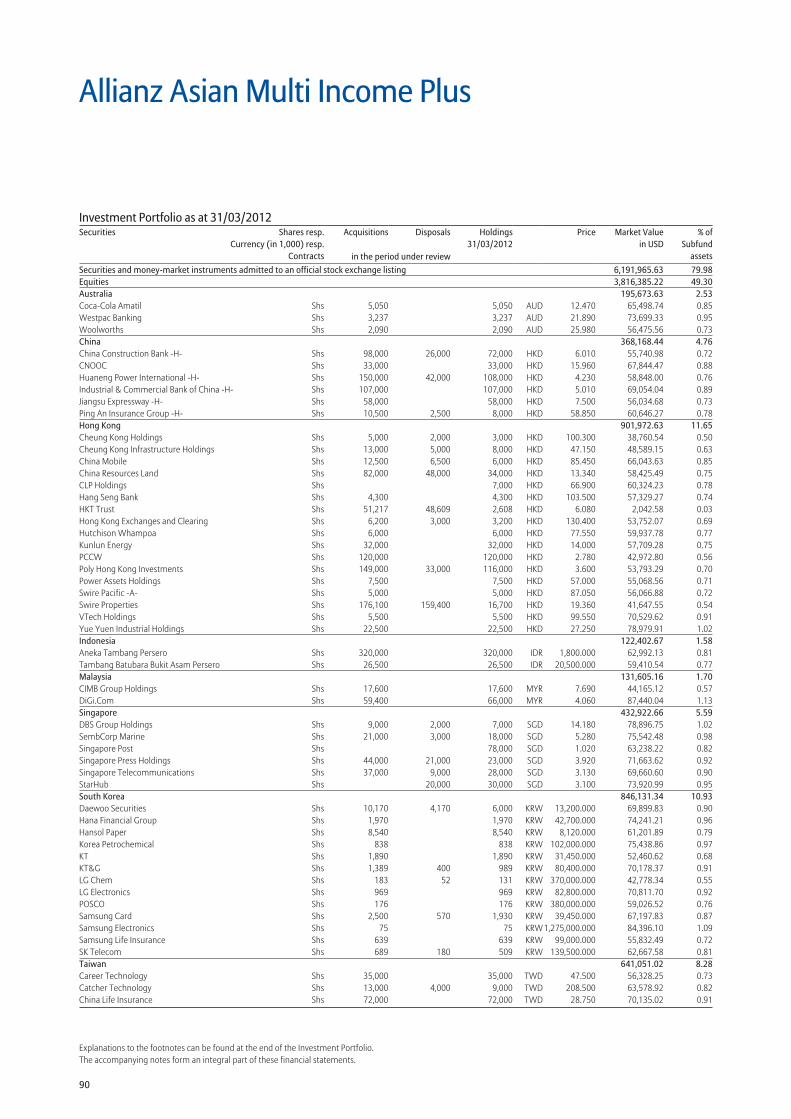
90
Explanations to the footnotes can be found at the end of the Investment Portfolio.The accompanying notes form an integral part of these financial statements.
Securities and money-market instruments admitted to an official stock exchange listing 6,191,965.63 79.98Equities 3,816,385.22 49.30Australia 195,673.63 2.53Coca-Cola Amatil Shs 5,050 5,050 AUD 12.470 65,498.74 0.85Westpac Banking Shs 3,237 3,237 AUD 21.890 73,699.33 0.95Woolworths Shs 2,090 2,090 AUD 25.980 56,475.56 0.73China 368,168.44 4.76China Construction Bank -H- Shs 98,000 26,000 72,000 HKD 6.010 55,740.98 0.72CNOOC Shs 33,000 33,000 HKD 15.960 67,844.47 0.88Huaneng Power International -H- Shs 150,000 42,000 108,000 HKD 4.230 58,848.00 0.76Industrial & Commercial Bank of China -H- Shs 107,000 107,000 HKD 5.010 69,054.04 0.89Jiangsu Expressway -H- Shs 58,000 58,000 HKD 7.500 56,034.68 0.73Ping An Insurance Group -H- Shs 10,500 2,500 8,000 HKD 58.850 60,646.27 0.78Hong Kong 901,972.63 11.65Cheung Kong Holdings Shs 5,000 2,000 3,000 HKD 100.300 38,760.54 0.50Cheung Kong Infrastructure Holdings Shs 13,000 5,000 8,000 HKD 47.150 48,589.15 0.63China Mobile Shs 12,500 6,500 6,000 HKD 85.450 66,043.63 0.85China Resources Land Shs 82,000 48,000 34,000 HKD 13.340 58,425.49 0.75CLP Holdings Shs 7,000 HKD 66.900 60,324.23 0.78Hang Seng Bank Shs 4,300 4,300 HKD 103.500 57,329.27 0.74HKT Trust Shs 51,217 48,609 2,608 HKD 6.080 2,042.58 0.03Hong Kong Exchanges and Clearing Shs 6,200 3,000 3,200 HKD 130.400 53,752.07 0.69Hutchison Whampoa Shs 6,000 6,000 HKD 77.550 59,937.78 0.77Kunlun Energy Shs 32,000 32,000 HKD 14.000 57,709.28 0.75PCCW Shs 120,000 120,000 HKD 2.780 42,972.80 0.56Poly Hong Kong Investments Shs 149,000 33,000 116,000 HKD 3.600 53,793.29 0.70Power Assets Holdings Shs 7,500 7,500 HKD 57.000 55,068.56 0.71Swire Pacific -A- Shs 5,000 5,000 HKD 87.050 56,066.88 0.72Swire Properties Shs 176,100 159,400 16,700 HKD 19.360 41,647.55 0.54VTech Holdings Shs 5,500 5,500 HKD 99.550 70,529.62 0.91Yue Yuen Industrial Holdings Shs 22,500 22,500 HKD 27.250 78,979.91 1.02Indonesia 122,402.67 1.58Aneka Tambang Persero Shs 320,000 320,000 IDR 1,800.000 62,992.13 0.81Tambang Batubara Bukit Asam Persero Shs 26,500 26,500 IDR 20,500.000 59,410.54 0.77Malaysia 131,605.16 1.70CIMB Group Holdings Shs 17,600 17,600 MYR 7.690 44,165.12 0.57DiGi.Com Shs 59,400 66,000 MYR 4.060 87,440.04 1.13Singapore 432,922.66 5.59DBS Group Holdings Shs 9,000 2,000 7,000 SGD 14.180 78,896.75 1.02SembCorp Marine Shs 21,000 3,000 18,000 SGD 5.280 75,542.48 0.98Singapore Post Shs 78,000 SGD 1.020 63,238.22 0.82Singapore Press Holdings Shs 44,000 21,000 23,000 SGD 3.920 71,663.62 0.92Singapore Telecommunications Shs 37,000 9,000 28,000 SGD 3.130 69,660.60 0.90StarHub Shs 20,000 30,000 SGD 3.100 73,920.99 0.95South Korea 846,131.34 10.93Daewoo Securities Shs 10,170 4,170 6,000 KRW 13,200.000 69,899.83 0.90Hana Financial Group Shs 1,970 1,970 KRW 42,700.000 74,241.21 0.96Hansol Paper Shs 8,540 8,540 KRW 8,120.000 61,201.89 0.79Korea Petrochemical Shs 838 838 KRW 102,000.000 75,438.86 0.97KT Shs 1,890 1,890 KRW 31,450.000 52,460.62 0.68KT&G Shs 1,389 400 989 KRW 80,400.000 70,178.37 0.91LG Chem Shs 183 52 131 KRW 370,000.000 42,778.34 0.55LG Electronics Shs 969 969 KRW 82,800.000 70,811.70 0.92POSCO Shs 176 176 KRW 380,000.000 59,026.52 0.76Samsung Card Shs 2,500 570 1,930 KRW 39,450.000 67,197.83 0.87Samsung Electronics Shs 75 75 KRW 1,275,000.000 84,396.10 1.09Samsung Life Insurance Shs 639 639 KRW 99,000.000 55,832.49 0.72SK Telecom Shs 689 180 509 KRW 139,500.000 62,667.58 0.81Taiwan 641,051.02 8.28Career Technology Shs 35,000 35,000 TWD 47.500 56,328.25 0.73Catcher Technology Shs 13,000 4,000 9,000 TWD 208.500 63,578.92 0.82China Life Insurance Shs 72,000 72,000 TWD 28.750 70,135.02 0.91
Allianz Asian Multi Income Plus
Investment Portfolio as at 31/03/2012Securities Shares resp.
Currency (in 1,000) resp.Contracts
Acquisitions Disposals Holdings 31/03/2012
Price Market Valuein USD
% ofSubfund
assetsin the period under review
Financial Statements of the SubfundsInvestment PortfoliosStatement of Net AssetsStatement of Changes in Net AssetsStatement of Changes in Shares
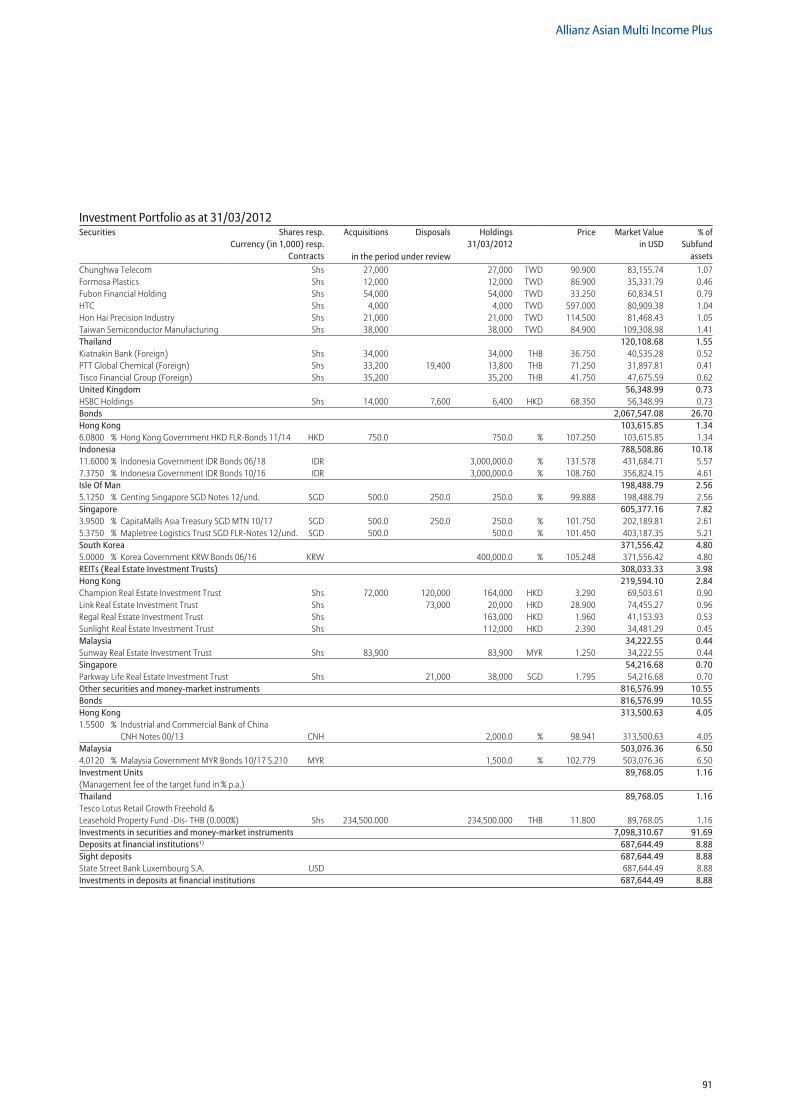
91
Allianz Asian Multi Income Plus
Chunghwa Telecom Shs 27,000 27,000 TWD 90.900 83,155.74 1.07Formosa Plastics Shs 12,000 12,000 TWD 86.900 35,331.79 0.46Fubon Financial Holding Shs 54,000 54,000 TWD 33.250 60,834.51 0.79HTC Shs 4,000 4,000 TWD 597.000 80,909.38 1.04Hon Hai Precision Industry Shs 21,000 21,000 TWD 114.500 81,468.43 1.05Taiwan Semiconductor Manufacturing Shs 38,000 38,000 TWD 84.900 109,308.98 1.41Thailand 120,108.68 1.55Kiatnakin Bank (Foreign) Shs 34,000 34,000 THB 36.750 40,535.28 0.52PTT Global Chemical (Foreign) Shs 33,200 19,400 13,800 THB 71.250 31,897.81 0.41Tisco Financial Group (Foreign) Shs 35,200 35,200 THB 41.750 47,675.59 0.62United Kingdom 56,348.99 0.73HSBC Holdings Shs 14,000 7,600 6,400 HKD 68.350 56,348.99 0.73Bonds 2,067,547.08 26.70Hong Kong 103,615.85 1.346.0800 % Hong Kong Government HKD FLR-Bonds 11/14 HKD 750.0 750.0 % 107.250 103,615.85 1.34Indonesia 788,508.86 10.1811.6000 % Indonesia Government IDR Bonds 06/18 IDR 3,000,000.0 % 131.578 431,684.71 5.577.3750 % Indonesia Government IDR Bonds 10/16 IDR 3,000,000.0 % 108.760 356,824.15 4.61Isle Of Man 198,488.79 2.565.1250 % Genting Singapore SGD Notes 12/und. SGD 500.0 250.0 250.0 % 99.888 198,488.79 2.56Singapore 605,377.16 7.823.9500 % CapitaMalls Asia Treasury SGD MTN 10/17 SGD 500.0 250.0 250.0 % 101.750 202,189.81 2.615.3750 % Mapletree Logistics Trust SGD FLR-Notes 12/und. SGD 500.0 500.0 % 101.450 403,187.35 5.21South Korea 371,556.42 4.805.0000 % Korea Government KRW Bonds 06/16 KRW 400,000.0 % 105.248 371,556.42 4.80REITs (Real Estate Investment Trusts) 308,033.33 3.98Hong Kong 219,594.10 2.84Champion Real Estate Investment Trust Shs 72,000 120,000 164,000 HKD 3.290 69,503.61 0.90Link Real Estate Investment Trust Shs 73,000 20,000 HKD 28.900 74,455.27 0.96Regal Real Estate Investment Trust Shs 163,000 HKD 1.960 41,153.93 0.53Sunlight Real Estate Investment Trust Shs 112,000 HKD 2.390 34,481.29 0.45Malaysia 34,222.55 0.44Sunway Real Estate Investment Trust Shs 83,900 83,900 MYR 1.250 34,222.55 0.44Singapore 54,216.68 0.70Parkway Life Real Estate Investment Trust Shs 21,000 38,000 SGD 1.795 54,216.68 0.70Other securities and money-market instruments 816,576.99 10.55Bonds 816,576.99 10.55Hong Kong 313,500.63 4.051.5500 % Industrial and Commercial Bank of China
CNH Notes 00/13 CNH 2,000.0 % 98.941 313,500.63 4.05Malaysia 503,076.36 6.504.0120 % Malaysia Government MYR Bonds 10/17 S.210 MYR 1,500.0 % 102.779 503,076.36 6.50Investment Units 89,768.05 1.16(Management fee of the target fund in % p.a.)Thailand 89,768.05 1.16Tesco Lotus Retail Growth Freehold & Leasehold Property Fund -Dis- THB (0.000%) Shs 234,500.000 234,500.000 THB 11.800 89,768.05 1.16Investments in securities and money-market instruments 7,098,310.67 91.69Deposits at financial institutions1) 687,644.49 8.88Sight deposits 687,644.49 8.88State Street Bank Luxembourg S.A. USD 687,644.49 8.88Investments in deposits at financial institutions 687,644.49 8.88
Investment Portfolio as at 31/03/2012Securities Shares resp.
Currency (in 1,000) resp.Contracts
Acquisitions Disposals Holdings 31/03/2012
Price Market Valuein USD
% ofSubfund
assetsin the period under review
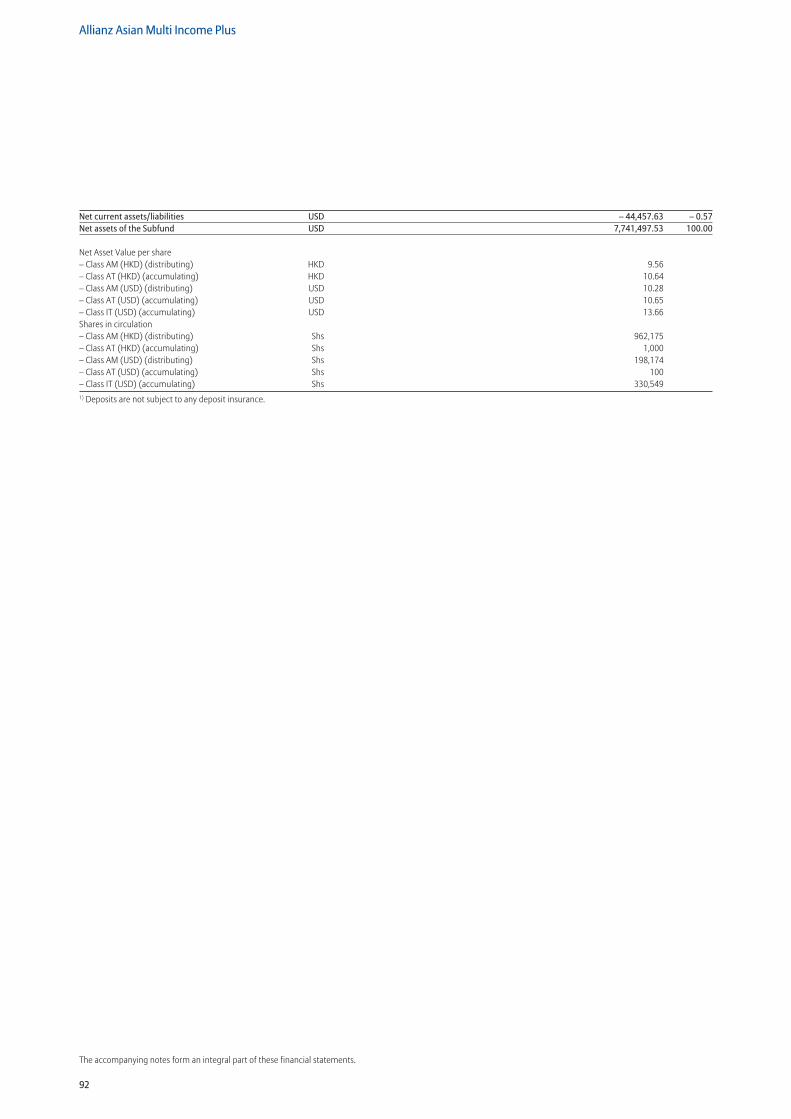
92
Allianz Asian Multi Income Plus
The accompanying notes form an integral part of these financial statements.
Net current assets/liabilities USD – 44,457.63 – 0.57Net assets of the Subfund USD 7,741,497.53 100.00
Net Asset Value per share– Class AM (HKD) (distributing) HKD 9.56– Class AT (HKD) (accumulating) HKD 10.64– Class AM (USD) (distributing) USD 10.28– Class AT (USD) (accumulating) USD 10.65– Class IT (USD) (accumulating) USD 13.66Shares in circulation– Class AM (HKD) (distributing) Shs 962,175 – Class AT (HKD) (accumulating) Shs 1,000 – Class AM (USD) (distributing) Shs 198,174 – Class AT (USD) (accumulating) Shs 100 – Class IT (USD) (accumulating) Shs 330,5491) Deposits are not subject to any deposit insurance.
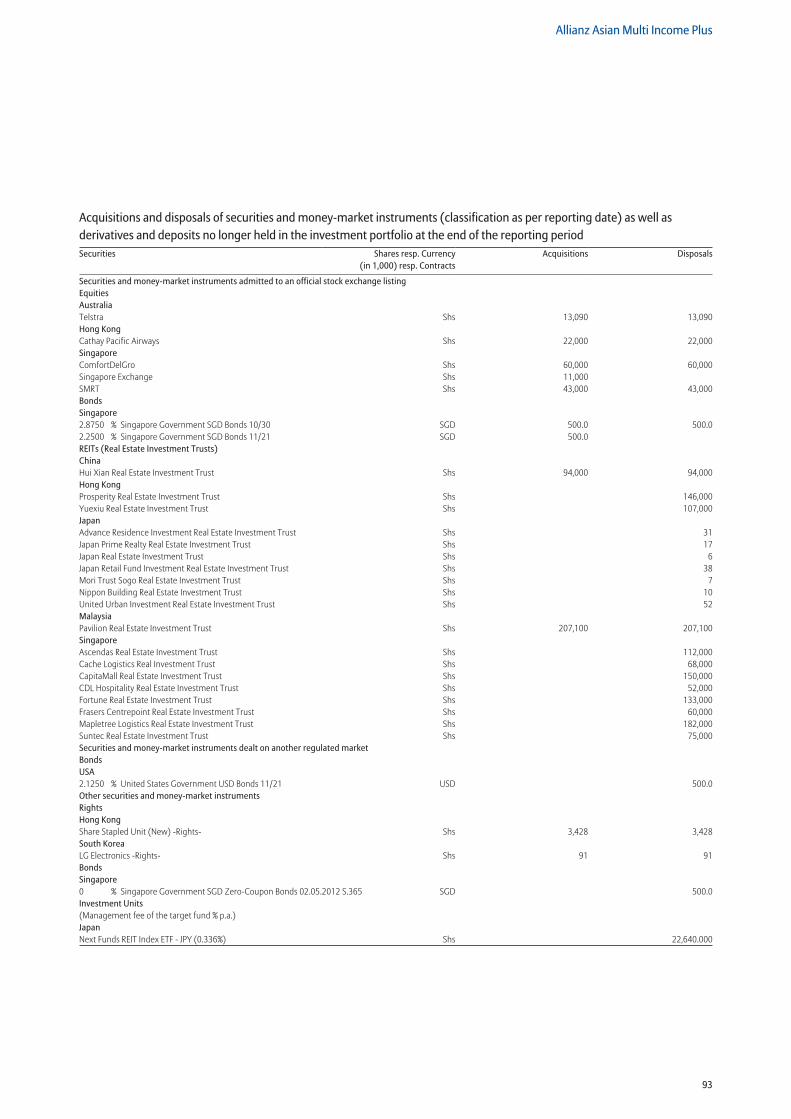
93
Allianz Asian Multi Income Plus
Securities and money-market instruments admitted to an official stock exchange listingEquitiesAustraliaTelstra Shs 13,090 13,090Hong KongCathay Pacific Airways Shs 22,000 22,000SingaporeComfortDelGro Shs 60,000 60,000Singapore Exchange Shs 11,000SMRT Shs 43,000 43,000BondsSingapore2.8750 % Singapore Government SGD Bonds 10/30 SGD 500.0 500.02.2500 % Singapore Government SGD Bonds 11/21 SGD 500.0REITs (Real Estate Investment Trusts)ChinaHui Xian Real Estate Investment Trust Shs 94,000 94,000Hong KongProsperity Real Estate Investment Trust Shs 146,000Yuexiu Real Estate Investment Trust Shs 107,000JapanAdvance Residence Investment Real Estate Investment Trust Shs 31Japan Prime Realty Real Estate Investment Trust Shs 17Japan Real Estate Investment Trust Shs 6Japan Retail Fund Investment Real Estate Investment Trust Shs 38Mori Trust Sogo Real Estate Investment Trust Shs 7Nippon Building Real Estate Investment Trust Shs 10United Urban Investment Real Estate Investment Trust Shs 52MalaysiaPavilion Real Estate Investment Trust Shs 207,100 207,100SingaporeAscendas Real Estate Investment Trust Shs 112,000Cache Logistics Real Investment Trust Shs 68,000CapitaMall Real Estate Investment Trust Shs 150,000CDL Hospitality Real Estate Investment Trust Shs 52,000Fortune Real Estate Investment Trust Shs 133,000Frasers Centrepoint Real Estate Investment Trust Shs 60,000Mapletree Logistics Real Estate Investment Trust Shs 182,000Suntec Real Estate Investment Trust Shs 75,000Securities and money-market instruments dealt on another regulated marketBondsUSA2.1250 % United States Government USD Bonds 11/21 USD 500.0Other securities and money-market instrumentsRightsHong KongShare Stapled Unit (New) -Rights- Shs 3,428 3,428South KoreaLG Electronics -Rights- Shs 91 91BondsSingapore0 % Singapore Government SGD Zero-Coupon Bonds 02.05.2012 S.365 SGD 500.0Investment Units(Management fee of the target fund % p.a.)JapanNext Funds REIT Index ETF - JPY (0.336%) Shs 22,640.000
Acquisitions and disposals of securities and money-market instruments (classification as per reporting date) as well as derivatives and deposits no longer held in the investment portfolio at the end of the reporting periodSecurities Shares resp. Currency
(in 1,000) resp. ContractsAcquisitions Disposals
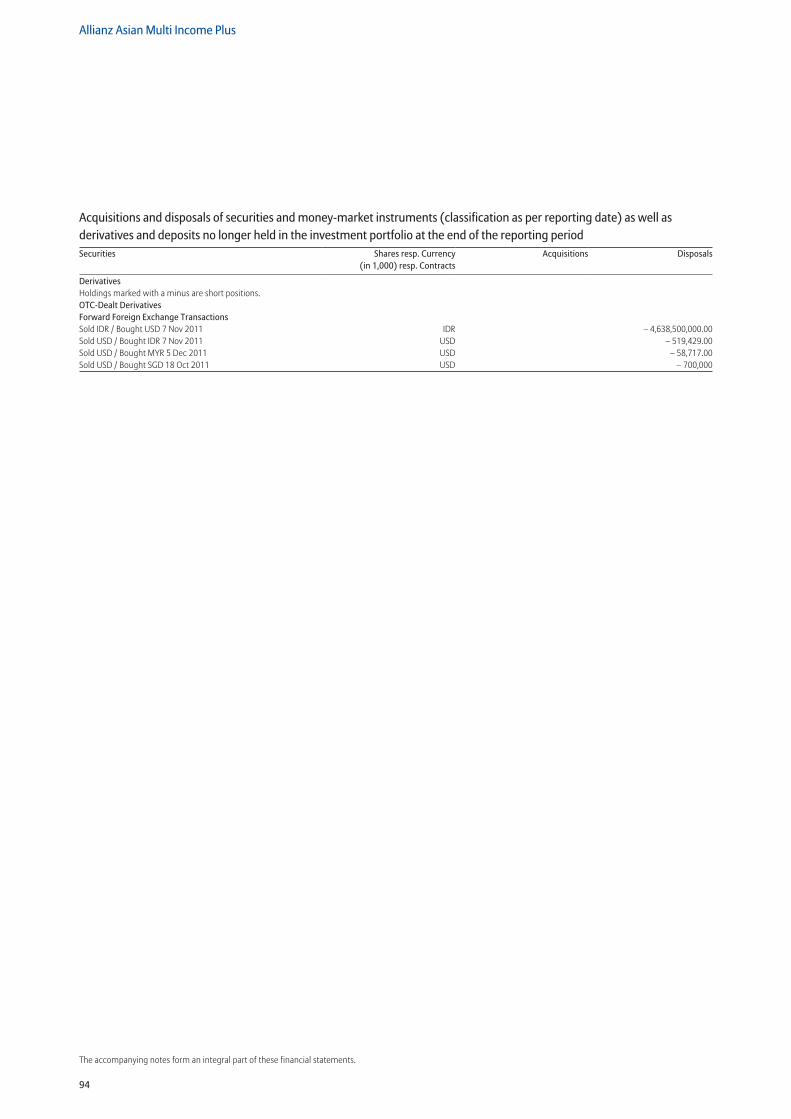
94
Allianz Asian Multi Income Plus
The accompanying notes form an integral part of these financial statements.
DerivativesHoldings marked with a minus are short positions.OTC-Dealt DerivativesForward Foreign Exchange TransactionsSold IDR / Bought USD 7 Nov 2011 IDR – 4,638,500,000.00Sold USD / Bought IDR 7 Nov 2011 USD – 519,429.00Sold USD / Bought MYR 5 Dec 2011 USD – 58,717.00Sold USD / Bought SGD 18 Oct 2011 USD – 700,000
Acquisitions and disposals of securities and money-market instruments (classification as per reporting date) as well as derivatives and deposits no longer held in the investment portfolio at the end of the reporting periodSecurities Shares resp. Currency
(in 1,000) resp. ContractsAcquisitions Disposals
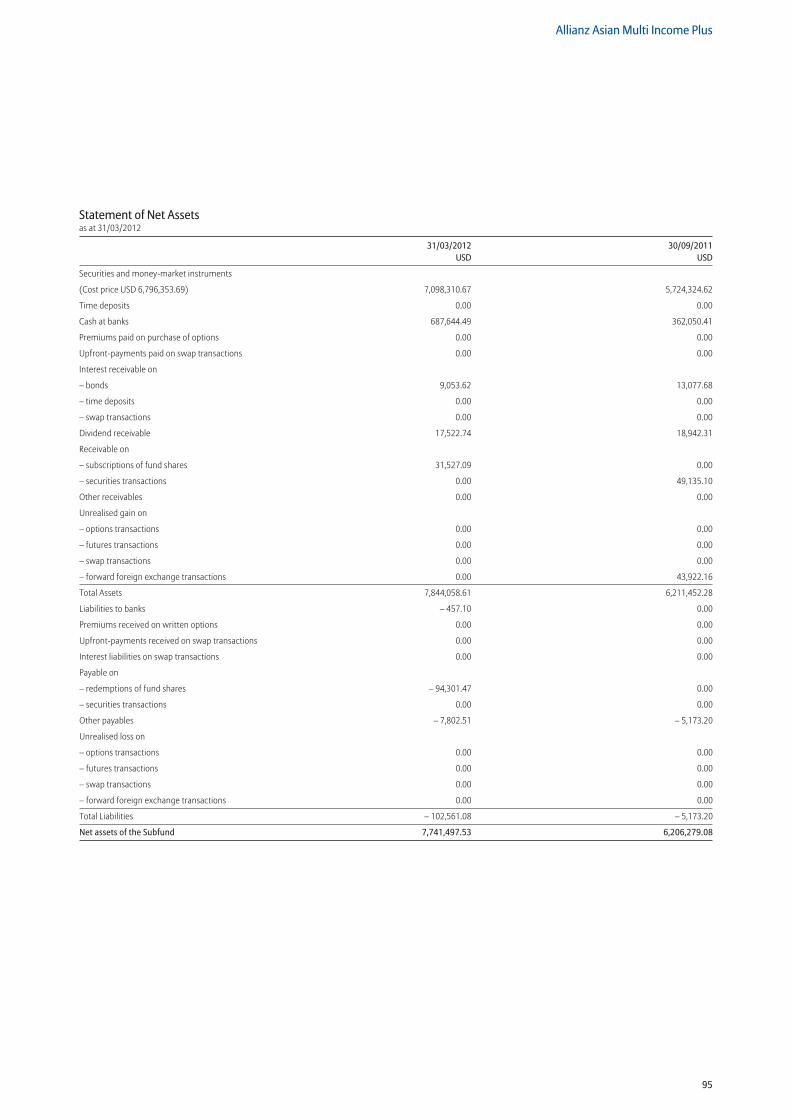
95
Allianz Asian Multi Income Plus
Statement of Net Assetsas at 31/03/2012
31/03/2012 30/09/2011 USD USD
Securities and money-market instruments
(Cost price USD 6,796,353.69) 7,098,310.67 5,724,324.62
Time deposits 0.00 0.00
Cash at banks 687,644.49 362,050.41
Premiums paid on purchase of options 0.00 0.00
Upfront-payments paid on swap transactions 0.00 0.00
Interest receivable on
– bonds 9,053.62 13,077.68
– time deposits 0.00 0.00
– swap transactions 0.00 0.00
Dividend receivable 17,522.74 18,942.31
Receivable on
– subscriptions of fund shares 31,527.09 0.00
– securities transactions 0.00 49,135.10
Other receivables 0.00 0.00
Unrealised gain on
– options transactions 0.00 0.00
– futures transactions 0.00 0.00
– swap transactions 0.00 0.00
– forward foreign exchange transactions 0.00 43,922.16
Total Assets 7,844,058.61 6,211,452.28
Liabilities to banks – 457.10 0.00
Premiums received on written options 0.00 0.00
Upfront-payments received on swap transactions 0.00 0.00
Interest liabilities on swap transactions 0.00 0.00
Payable on
– redemptions of fund shares – 94,301.47 0.00
– securities transactions 0.00 0.00
Other payables – 7,802.51 – 5,173.20
Unrealised loss on
– options transactions 0.00 0.00
– futures transactions 0.00 0.00
– swap transactions 0.00 0.00
– forward foreign exchange transactions 0.00 0.00
Total Liabilities – 102,561.08 – 5,173.20
Net assets of the Subfund 7,741,497.53 6,206,279.08
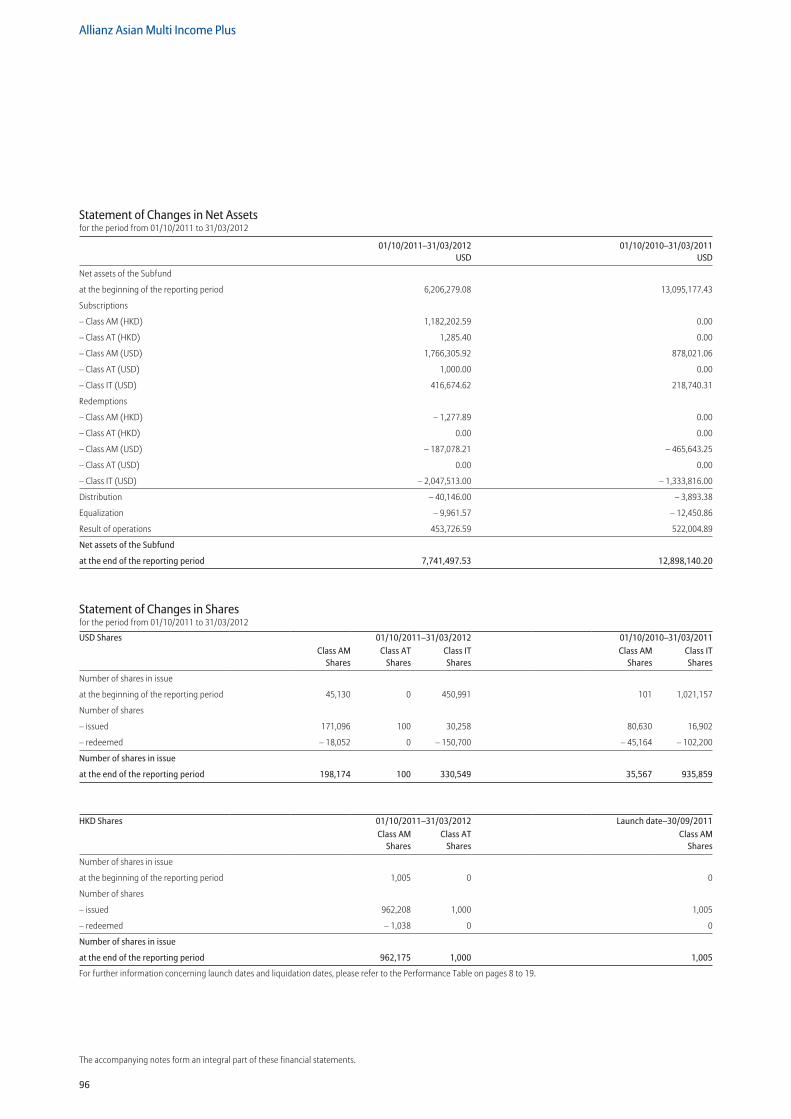
96
Allianz Asian Multi Income Plus
The accompanying notes form an integral part of these financial statements.
Statement of Changes in Net Assetsfor the period from 01/10/2011 to 31/03/2012
01/10/2011–31/03/2012 01/10/2010–31/03/2011 USD USD
Net assets of the Subfund
at the beginning of the reporting period 6,206,279.08 13,095,177.43
Subscriptions
– Class AM (HKD) 1,182,202.59 0.00
– Class AT (HKD) 1,285.40 0.00
– Class AM (USD) 1,766,305.92 878,021.06
– Class AT (USD) 1,000.00 0.00
– Class IT (USD) 416,674.62 218,740.31
Redemptions
– Class AM (HKD) – 1,277.89 0.00
– Class AT (HKD) 0.00 0.00
– Class AM (USD) – 187,078.21 – 465,643.25
– Class AT (USD) 0.00 0.00
– Class IT (USD) – 2,047,513.00 – 1,333,816.00
Distribution – 40,146.00 – 3,893.38
Equalization – 9,961.57 – 12,450.86
Result of operations 453,726.59 522,004.89
Net assets of the Subfund
at the end of the reporting period 7,741,497.53 12,898,140.20
Statement of Changes in Sharesfor the period from 01/10/2011 to 31/03/2012
USD Shares 01/10/2011–31/03/2012 01/10/2010–31/03/2011Class AM
SharesClass AT
SharesClass IT Shares
Class AM Shares
Class IT Shares
Number of shares in issue
at the beginning of the reporting period 45,130 0 450,991 101 1,021,157
Number of shares
– issued 171,096 100 30,258 80,630 16,902
– redeemed – 18,052 0 – 150,700 – 45,164 – 102,200
Number of shares in issue
at the end of the reporting period 198,174 100 330,549 35,567 935,859
HKD Shares 01/10/2011–31/03/2012 Launch date–30/09/2011Class AM
SharesClass AT
SharesClass AM
Shares
Number of shares in issue
at the beginning of the reporting period 1,005 0 0
Number of shares
– issued 962,208 1,000 1,005
– redeemed – 1,038 0 0
Number of shares in issue
at the end of the reporting period 962,175 1,000 1,005
For further information concerning launch dates and liquidation dates, please refer to the Performance Table on pages 8 to 19.
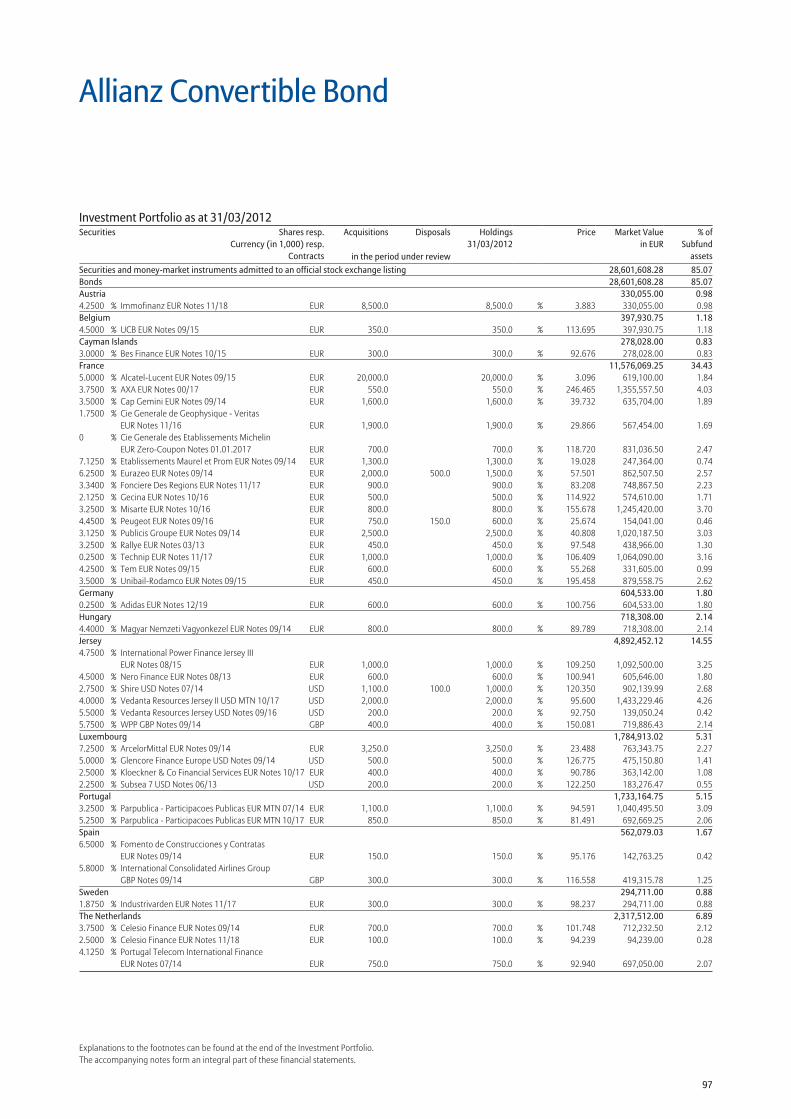
97
Explanations to the footnotes can be found at the end of the Investment Portfolio.The accompanying notes form an integral part of these financial statements.
Allianz Convertible Bond
Securities and money-market instruments admitted to an official stock exchange listing 28,601,608.28 85.07Bonds 28,601,608.28 85.07Austria 330,055.00 0.984.2500 % Immofinanz EUR Notes 11/18 EUR 8,500.0 8,500.0 % 3.883 330,055.00 0.98Belgium 397,930.75 1.184.5000 % UCB EUR Notes 09/15 EUR 350.0 350.0 % 113.695 397,930.75 1.18Cayman Islands 278,028.00 0.833.0000 % Bes Finance EUR Notes 10/15 EUR 300.0 300.0 % 92.676 278,028.00 0.83France 11,576,069.25 34.435.0000 % Alcatel-Lucent EUR Notes 09/15 EUR 20,000.0 20,000.0 % 3.096 619,100.00 1.843.7500 % AXA EUR Notes 00/17 EUR 550.0 550.0 % 246.465 1,355,557.50 4.033.5000 % Cap Gemini EUR Notes 09/14 EUR 1,600.0 1,600.0 % 39.732 635,704.00 1.891.7500 % Cie Generale de Geophysique - Veritas
EUR Notes 11/16 EUR 1,900.0 1,900.0 % 29.866 567,454.00 1.690 % Cie Generale des Etablissements Michelin
EUR Zero-Coupon Notes 01.01.2017 EUR 700.0 700.0 % 118.720 831,036.50 2.477.1250 % Etablissements Maurel et Prom EUR Notes 09/14 EUR 1,300.0 1,300.0 % 19.028 247,364.00 0.746.2500 % Eurazeo EUR Notes 09/14 EUR 2,000.0 500.0 1,500.0 % 57.501 862,507.50 2.573.3400 % Fonciere Des Regions EUR Notes 11/17 EUR 900.0 900.0 % 83.208 748,867.50 2.232.1250 % Gecina EUR Notes 10/16 EUR 500.0 500.0 % 114.922 574,610.00 1.713.2500 % Misarte EUR Notes 10/16 EUR 800.0 800.0 % 155.678 1,245,420.00 3.704.4500 % Peugeot EUR Notes 09/16 EUR 750.0 150.0 600.0 % 25.674 154,041.00 0.463.1250 % Publicis Groupe EUR Notes 09/14 EUR 2,500.0 2,500.0 % 40.808 1,020,187.50 3.033.2500 % Rallye EUR Notes 03/13 EUR 450.0 450.0 % 97.548 438,966.00 1.300.2500 % Technip EUR Notes 11/17 EUR 1,000.0 1,000.0 % 106.409 1,064,090.00 3.164.2500 % Tem EUR Notes 09/15 EUR 600.0 600.0 % 55.268 331,605.00 0.993.5000 % Unibail-Rodamco EUR Notes 09/15 EUR 450.0 450.0 % 195.458 879,558.75 2.62Germany 604,533.00 1.800.2500 % Adidas EUR Notes 12/19 EUR 600.0 600.0 % 100.756 604,533.00 1.80Hungary 718,308.00 2.144.4000 % Magyar Nemzeti Vagyonkezel EUR Notes 09/14 EUR 800.0 800.0 % 89.789 718,308.00 2.14Jersey 4,892,452.12 14.554.7500 % International Power Finance Jersey III
EUR Notes 08/15 EUR 1,000.0 1,000.0 % 109.250 1,092,500.00 3.254.5000 % Nero Finance EUR Notes 08/13 EUR 600.0 600.0 % 100.941 605,646.00 1.802.7500 % Shire USD Notes 07/14 USD 1,100.0 100.0 1,000.0 % 120.350 902,139.99 2.684.0000 % Vedanta Resources Jersey II USD MTN 10/17 USD 2,000.0 2,000.0 % 95.600 1,433,229.46 4.265.5000 % Vedanta Resources Jersey USD Notes 09/16 USD 200.0 200.0 % 92.750 139,050.24 0.425.7500 % WPP GBP Notes 09/14 GBP 400.0 400.0 % 150.081 719,886.43 2.14Luxembourg 1,784,913.02 5.317.2500 % ArcelorMittal EUR Notes 09/14 EUR 3,250.0 3,250.0 % 23.488 763,343.75 2.275.0000 % Glencore Finance Europe USD Notes 09/14 USD 500.0 500.0 % 126.775 475,150.80 1.412.5000 % Kloeckner & Co Financial Services EUR Notes 10/17 EUR 400.0 400.0 % 90.786 363,142.00 1.082.2500 % Subsea 7 USD Notes 06/13 USD 200.0 200.0 % 122.250 183,276.47 0.55Portugal 1,733,164.75 5.153.2500 % Parpublica - Participacoes Publicas EUR MTN 07/14 EUR 1,100.0 1,100.0 % 94.591 1,040,495.50 3.095.2500 % Parpublica - Participacoes Publicas EUR MTN 10/17 EUR 850.0 850.0 % 81.491 692,669.25 2.06Spain 562,079.03 1.676.5000 % Fomento de Construcciones y Contratas
EUR Notes 09/14 EUR 150.0 150.0 % 95.176 142,763.25 0.425.8000 % International Consolidated Airlines Group
GBP Notes 09/14 GBP 300.0 300.0 % 116.558 419,315.78 1.25Sweden 294,711.00 0.881.8750 % Industrivarden EUR Notes 11/17 EUR 300.0 300.0 % 98.237 294,711.00 0.88The Netherlands 2,317,512.00 6.893.7500 % Celesio Finance EUR Notes 09/14 EUR 700.0 700.0 % 101.748 712,232.50 2.122.5000 % Celesio Finance EUR Notes 11/18 EUR 100.0 100.0 % 94.239 94,239.00 0.284.1250 % Portugal Telecom International Finance
EUR Notes 07/14 EUR 750.0 750.0 % 92.940 697,050.00 2.07
Investment Portfolio as at 31/03/2012Securities Shares resp.
Currency (in 1,000) resp.Contracts
Acquisitions Disposals Holdings 31/03/2012
Price Market Valuein EUR
% ofSubfund
assetsin the period under review
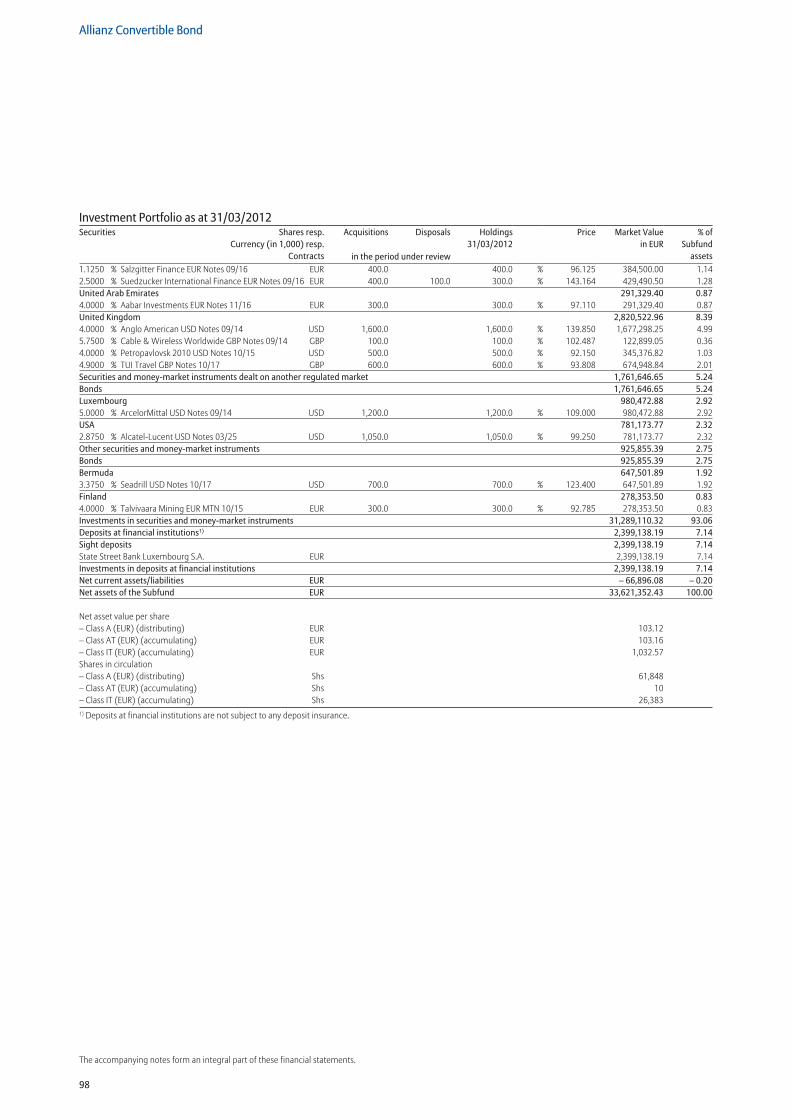
98
Allianz Convertible Bond
The accompanying notes form an integral part of these financial statements.
Investment Portfolio as at 31/03/2012Securities Shares resp.
Currency (in 1,000) resp.Contracts
Acquisitions Disposals Holdings 31/03/2012
Price Market Valuein EUR
% ofSubfund
assetsin the period under review1.1250 % Salzgitter Finance EUR Notes 09/16 EUR 400.0 400.0 % 96.125 384,500.00 1.142.5000 % Suedzucker International Finance EUR Notes 09/16 EUR 400.0 100.0 300.0 % 143.164 429,490.50 1.28United Arab Emirates 291,329.40 0.874.0000 % Aabar Investments EUR Notes 11/16 EUR 300.0 300.0 % 97.110 291,329.40 0.87United Kingdom 2,820,522.96 8.394.0000 % Anglo American USD Notes 09/14 USD 1,600.0 1,600.0 % 139.850 1,677,298.25 4.995.7500 % Cable & Wireless Worldwide GBP Notes 09/14 GBP 100.0 100.0 % 102.487 122,899.05 0.364.0000 % Petropavlovsk 2010 USD Notes 10/15 USD 500.0 500.0 % 92.150 345,376.82 1.034.9000 % TUI Travel GBP Notes 10/17 GBP 600.0 600.0 % 93.808 674,948.84 2.01Securities and money-market instruments dealt on another regulated market 1,761,646.65 5.24Bonds 1,761,646.65 5.24Luxembourg 980,472.88 2.925.0000 % ArcelorMittal USD Notes 09/14 USD 1,200.0 1,200.0 % 109.000 980,472.88 2.92USA 781,173.77 2.322.8750 % Alcatel-Lucent USD Notes 03/25 USD 1,050.0 1,050.0 % 99.250 781,173.77 2.32Other securities and money-market instruments 925,855.39 2.75Bonds 925,855.39 2.75Bermuda 647,501.89 1.923.3750 % Seadrill USD Notes 10/17 USD 700.0 700.0 % 123.400 647,501.89 1.92Finland 278,353.50 0.834.0000 % Talvivaara Mining EUR MTN 10/15 EUR 300.0 300.0 % 92.785 278,353.50 0.83Investments in securities and money-market instruments 31,289,110.32 93.06Deposits at financial institutions1) 2,399,138.19 7.14Sight deposits 2,399,138.19 7.14State Street Bank Luxembourg S.A. EUR 2,399,138.19 7.14Investments in deposits at financial institutions 2,399,138.19 7.14Net current assets/liabilities EUR – 66,896.08 – 0.20Net assets of the Subfund EUR 33,621,352.43 100.00
Net asset value per share – Class A (EUR) (distributing) EUR 103.12 – Class AT (EUR) (accumulating) EUR 103.16 – Class IT (EUR) (accumulating) EUR 1,032.57 Shares in circulation – Class A (EUR) (distributing) Shs 61,848 – Class AT (EUR) (accumulating) Shs 10 – Class IT (EUR) (accumulating) Shs 26,383 1) Deposits at financial institutions are not subject to any deposit insurance.
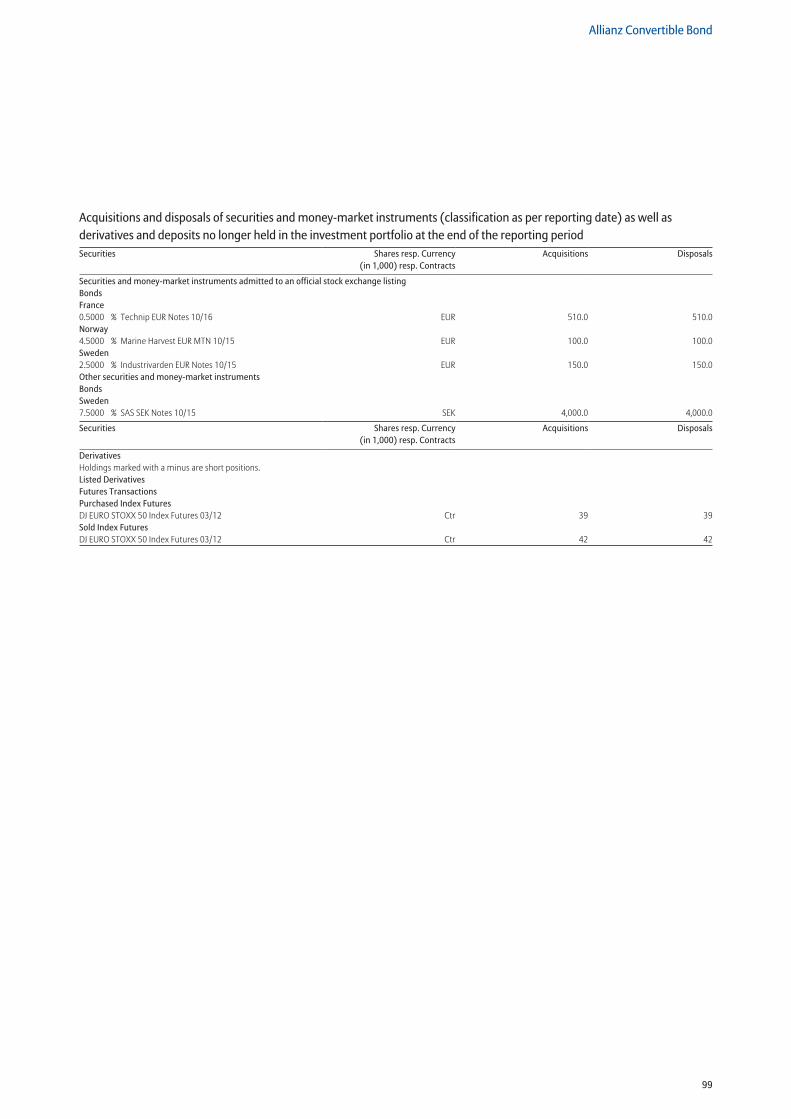
99
Allianz Convertible Bond
Securities and money-market instruments admitted to an official stock exchange listingBondsFrance0.5000 % Technip EUR Notes 10/16 EUR 510.0 510.0Norway4.5000 % Marine Harvest EUR MTN 10/15 EUR 100.0 100.0Sweden2.5000 % Industrivarden EUR Notes 10/15 EUR 150.0 150.0Other securities and money-market instrumentsBondsSweden7.5000 % SAS SEK Notes 10/15 SEK 4,000.0 4,000.0
Securities Shares resp. Currency (in 1,000) resp. Contracts
Acquisitions Disposals
DerivativesHoldings marked with a minus are short positions.Listed DerivativesFutures TransactionsPurchased Index FuturesDJ EURO STOXX 50 Index Futures 03/12 Ctr 39 39Sold Index FuturesDJ EURO STOXX 50 Index Futures 03/12 Ctr 42 42
Acquisitions and disposals of securities and money-market instruments (classification as per reporting date) as well as derivatives and deposits no longer held in the investment portfolio at the end of the reporting periodSecurities Shares resp. Currency
(in 1,000) resp. ContractsAcquisitions Disposals
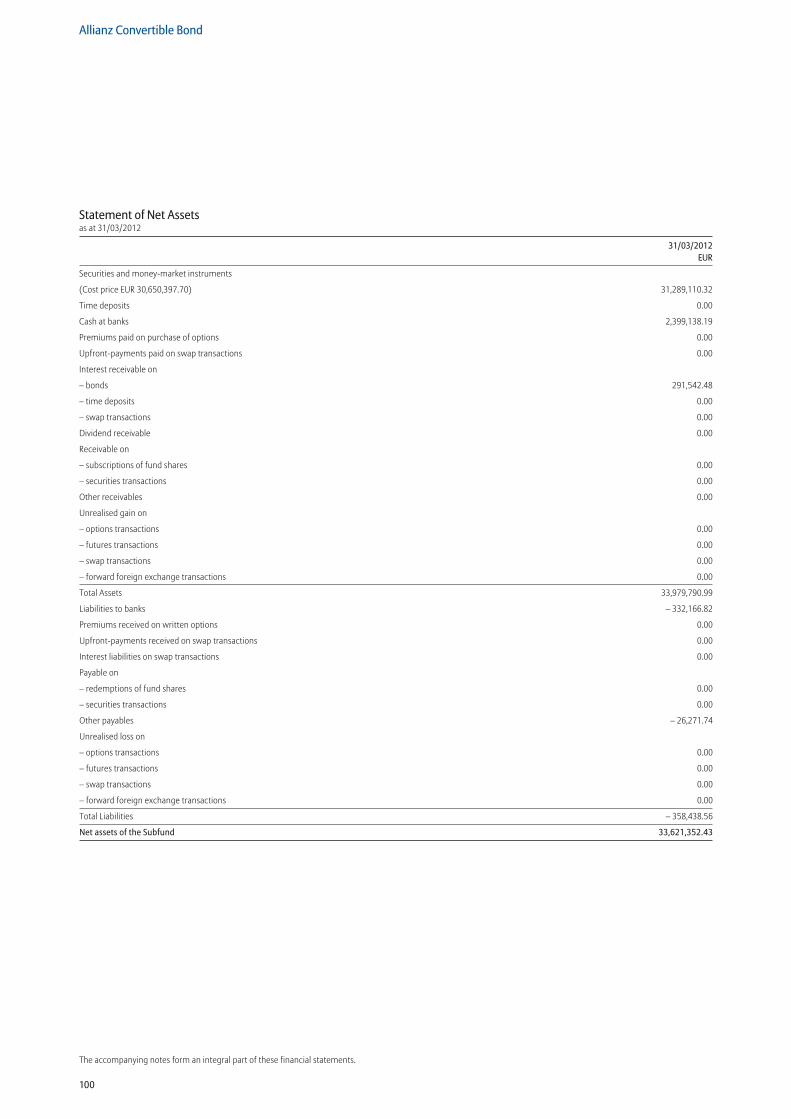
100
Allianz Convertible Bond
The accompanying notes form an integral part of these financial statements.
Statement of Net Assetsas at 31/03/2012
31/03/2012 EUR
Securities and money-market instruments
(Cost price EUR 30,650,397.70) 31,289,110.32
Time deposits 0.00
Cash at banks 2,399,138.19
Premiums paid on purchase of options 0.00
Upfront-payments paid on swap transactions 0.00
Interest receivable on
– bonds 291,542.48
– time deposits 0.00
– swap transactions 0.00
Dividend receivable 0.00
Receivable on
– subscriptions of fund shares 0.00
– securities transactions 0.00
Other receivables 0.00
Unrealised gain on
– options transactions 0.00
– futures transactions 0.00
– swap transactions 0.00
– forward foreign exchange transactions 0.00
Total Assets 33,979,790.99
Liabilities to banks – 332,166.82
Premiums received on written options 0.00
Upfront-payments received on swap transactions 0.00
Interest liabilities on swap transactions 0.00
Payable on
– redemptions of fund shares 0.00
– securities transactions 0.00
Other payables – 26,271.74
Unrealised loss on
– options transactions 0.00
– futures transactions 0.00
– swap transactions 0.00
– forward foreign exchange transactions 0.00
Total Liabilities – 358,438.56
Net assets of the Subfund 33,621,352.43
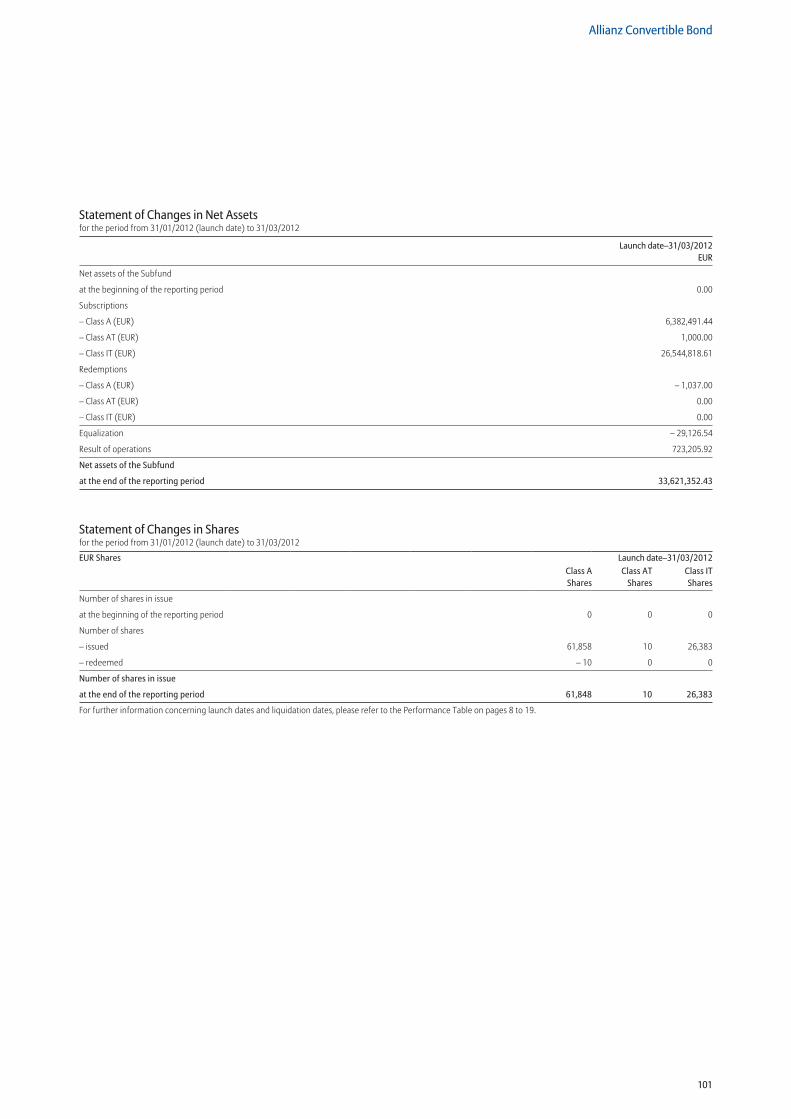
101
Allianz Convertible Bond
Statement of Changes in Net Assetsfor the period from 31/01/2012 (launch date) to 31/03/2012
Launch date–31/03/2012 EUR
Net assets of the Subfund
at the beginning of the reporting period 0.00
Subscriptions
– Class A (EUR) 6,382,491.44
– Class AT (EUR) 1,000.00
– Class IT (EUR) 26,544,818.61
Redemptions
– Class A (EUR) – 1,037.00
– Class AT (EUR) 0.00
– Class IT (EUR) 0.00
Equalization – 29,126.54
Result of operations 723,205.92
Net assets of the Subfund
at the end of the reporting period 33,621,352.43
Statement of Changes in Sharesfor the period from 31/01/2012 (launch date) to 31/03/2012
EUR Shares Launch date–31/03/2012Class A Shares
Class AT Shares
Class IT Shares
Number of shares in issue
at the beginning of the reporting period 0 0 0
Number of shares
– issued 61,858 10 26,383
– redeemed – 10 0 0
Number of shares in issue
at the end of the reporting period 61,848 10 26,383
For further information concerning launch dates and liquidation dates, please refer to the Performance Table on pages 8 to 19.
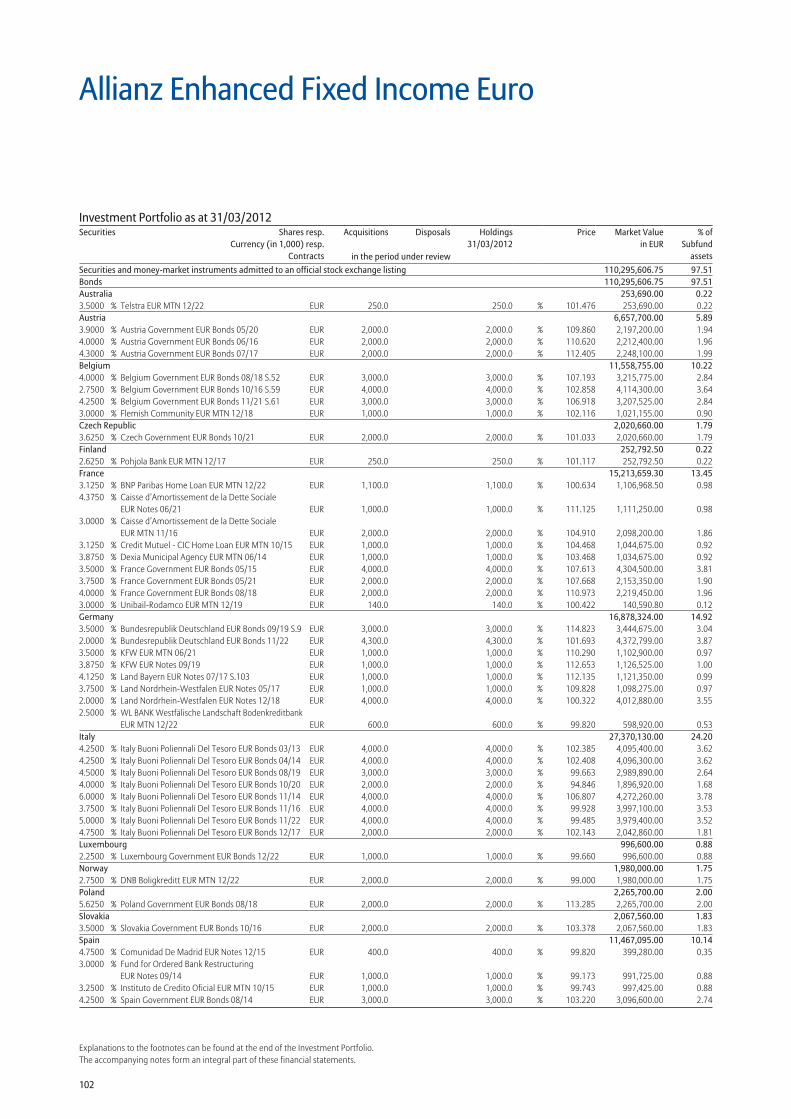
102
Explanations to the footnotes can be found at the end of the Investment Portfolio.The accompanying notes form an integral part of these financial statements.
Allianz Enhanced Fixed Income Euro
Securities and money-market instruments admitted to an official stock exchange listing 110,295,606.75 97.51Bonds 110,295,606.75 97.51Australia 253,690.00 0.223.5000 % Telstra EUR MTN 12/22 EUR 250.0 250.0 % 101.476 253,690.00 0.22Austria 6,657,700.00 5.893.9000 % Austria Government EUR Bonds 05/20 EUR 2,000.0 2,000.0 % 109.860 2,197,200.00 1.944.0000 % Austria Government EUR Bonds 06/16 EUR 2,000.0 2,000.0 % 110.620 2,212,400.00 1.964.3000 % Austria Government EUR Bonds 07/17 EUR 2,000.0 2,000.0 % 112.405 2,248,100.00 1.99Belgium 11,558,755.00 10.224.0000 % Belgium Government EUR Bonds 08/18 S.52 EUR 3,000.0 3,000.0 % 107.193 3,215,775.00 2.842.7500 % Belgium Government EUR Bonds 10/16 S.59 EUR 4,000.0 4,000.0 % 102.858 4,114,300.00 3.644.2500 % Belgium Government EUR Bonds 11/21 S.61 EUR 3,000.0 3,000.0 % 106.918 3,207,525.00 2.843.0000 % Flemish Community EUR MTN 12/18 EUR 1,000.0 1,000.0 % 102.116 1,021,155.00 0.90Czech Republic 2,020,660.00 1.793.6250 % Czech Government EUR Bonds 10/21 EUR 2,000.0 2,000.0 % 101.033 2,020,660.00 1.79Finland 252,792.50 0.222.6250 % Pohjola Bank EUR MTN 12/17 EUR 250.0 250.0 % 101.117 252,792.50 0.22France 15,213,659.30 13.453.1250 % BNP Paribas Home Loan EUR MTN 12/22 EUR 1,100.0 1,100.0 % 100.634 1,106,968.50 0.984.3750 % Caisse d’Amortissement de la Dette Sociale
EUR Notes 06/21 EUR 1,000.0 1,000.0 % 111.125 1,111,250.00 0.983.0000 % Caisse d’Amortissement de la Dette Sociale
EUR MTN 11/16 EUR 2,000.0 2,000.0 % 104.910 2,098,200.00 1.863.1250 % Credit Mutuel - CIC Home Loan EUR MTN 10/15 EUR 1,000.0 1,000.0 % 104.468 1,044,675.00 0.923.8750 % Dexia Municipal Agency EUR MTN 06/14 EUR 1,000.0 1,000.0 % 103.468 1,034,675.00 0.923.5000 % France Government EUR Bonds 05/15 EUR 4,000.0 4,000.0 % 107.613 4,304,500.00 3.813.7500 % France Government EUR Bonds 05/21 EUR 2,000.0 2,000.0 % 107.668 2,153,350.00 1.904.0000 % France Government EUR Bonds 08/18 EUR 2,000.0 2,000.0 % 110.973 2,219,450.00 1.963.0000 % Unibail-Rodamco EUR MTN 12/19 EUR 140.0 140.0 % 100.422 140,590.80 0.12Germany 16,878,324.00 14.923.5000 % Bundesrepublik Deutschland EUR Bonds 09/19 S.9 EUR 3,000.0 3,000.0 % 114.823 3,444,675.00 3.042.0000 % Bundesrepublik Deutschland EUR Bonds 11/22 EUR 4,300.0 4,300.0 % 101.693 4,372,799.00 3.873.5000 % KFW EUR MTN 06/21 EUR 1,000.0 1,000.0 % 110.290 1,102,900.00 0.973.8750 % KFW EUR Notes 09/19 EUR 1,000.0 1,000.0 % 112.653 1,126,525.00 1.004.1250 % Land Bayern EUR Notes 07/17 S.103 EUR 1,000.0 1,000.0 % 112.135 1,121,350.00 0.993.7500 % Land Nordrhein-Westfalen EUR Notes 05/17 EUR 1,000.0 1,000.0 % 109.828 1,098,275.00 0.972.0000 % Land Nordrhein-Westfalen EUR Notes 12/18 EUR 4,000.0 4,000.0 % 100.322 4,012,880.00 3.552.5000 % WL BANK Westfälische Landschaft Bodenkreditbank
EUR MTN 12/22 EUR 600.0 600.0 % 99.820 598,920.00 0.53Italy 27,370,130.00 24.204.2500 % Italy Buoni Poliennali Del Tesoro EUR Bonds 03/13 EUR 4,000.0 4,000.0 % 102.385 4,095,400.00 3.624.2500 % Italy Buoni Poliennali Del Tesoro EUR Bonds 04/14 EUR 4,000.0 4,000.0 % 102.408 4,096,300.00 3.624.5000 % Italy Buoni Poliennali Del Tesoro EUR Bonds 08/19 EUR 3,000.0 3,000.0 % 99.663 2,989,890.00 2.644.0000 % Italy Buoni Poliennali Del Tesoro EUR Bonds 10/20 EUR 2,000.0 2,000.0 % 94.846 1,896,920.00 1.686.0000 % Italy Buoni Poliennali Del Tesoro EUR Bonds 11/14 EUR 4,000.0 4,000.0 % 106.807 4,272,260.00 3.783.7500 % Italy Buoni Poliennali Del Tesoro EUR Bonds 11/16 EUR 4,000.0 4,000.0 % 99.928 3,997,100.00 3.535.0000 % Italy Buoni Poliennali Del Tesoro EUR Bonds 11/22 EUR 4,000.0 4,000.0 % 99.485 3,979,400.00 3.524.7500 % Italy Buoni Poliennali Del Tesoro EUR Bonds 12/17 EUR 2,000.0 2,000.0 % 102.143 2,042,860.00 1.81Luxembourg 996,600.00 0.882.2500 % Luxembourg Government EUR Bonds 12/22 EUR 1,000.0 1,000.0 % 99.660 996,600.00 0.88Norway 1,980,000.00 1.752.7500 % DNB Boligkreditt EUR MTN 12/22 EUR 2,000.0 2,000.0 % 99.000 1,980,000.00 1.75Poland 2,265,700.00 2.005.6250 % Poland Government EUR Bonds 08/18 EUR 2,000.0 2,000.0 % 113.285 2,265,700.00 2.00Slovakia 2,067,560.00 1.833.5000 % Slovakia Government EUR Bonds 10/16 EUR 2,000.0 2,000.0 % 103.378 2,067,560.00 1.83Spain 11,467,095.00 10.144.7500 % Comunidad De Madrid EUR Notes 12/15 EUR 400.0 400.0 % 99.820 399,280.00 0.353.0000 % Fund for Ordered Bank Restructuring
EUR Notes 09/14 EUR 1,000.0 1,000.0 % 99.173 991,725.00 0.883.2500 % Instituto de Credito Oficial EUR MTN 10/15 EUR 1,000.0 1,000.0 % 99.743 997,425.00 0.884.2500 % Spain Government EUR Bonds 08/14 EUR 3,000.0 3,000.0 % 103.220 3,096,600.00 2.74
Investment Portfolio as at 31/03/2012Securities Shares resp.
Currency (in 1,000) resp.Contracts
Acquisitions Disposals Holdings 31/03/2012
Price Market Valuein EUR
% ofSubfund
assetsin the period under review
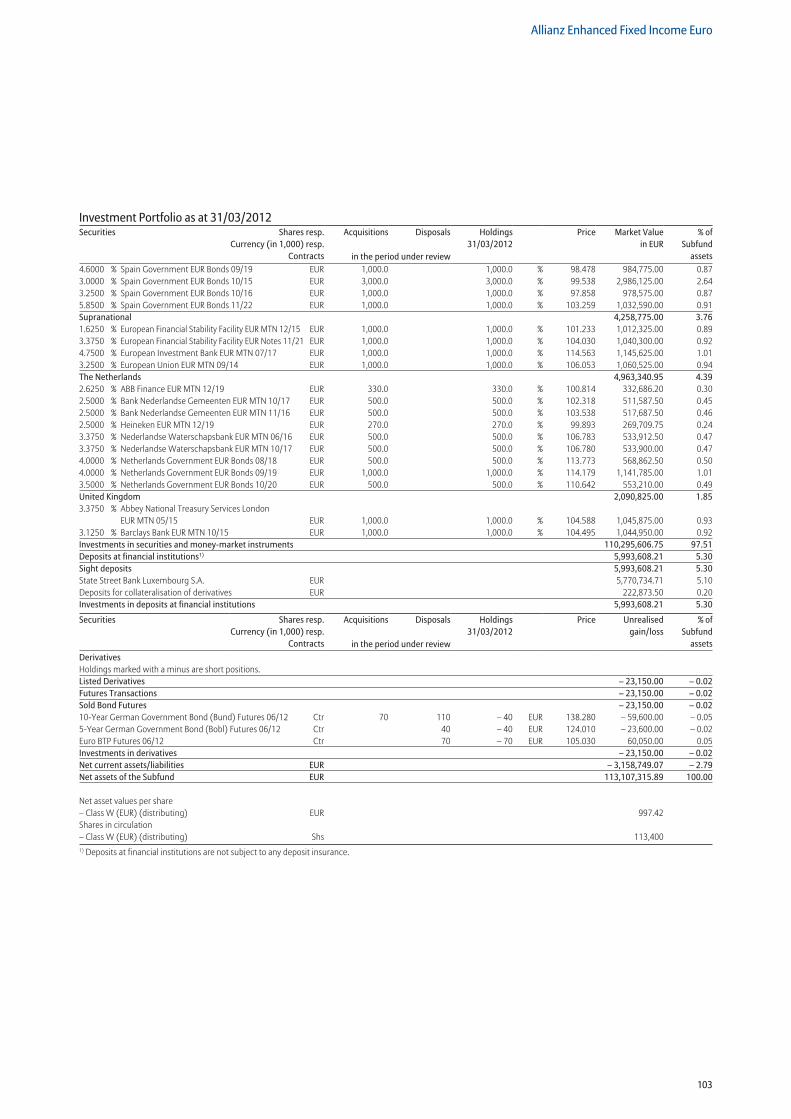
103
Allianz Enhanced Fixed Income Euro
Investment Portfolio as at 31/03/2012Securities Shares resp.
Currency (in 1,000) resp.Contracts
Acquisitions Disposals Holdings 31/03/2012
Price Market Valuein EUR
% ofSubfund
assetsin the period under review4.6000 % Spain Government EUR Bonds 09/19 EUR 1,000.0 1,000.0 % 98.478 984,775.00 0.873.0000 % Spain Government EUR Bonds 10/15 EUR 3,000.0 3,000.0 % 99.538 2,986,125.00 2.643.2500 % Spain Government EUR Bonds 10/16 EUR 1,000.0 1,000.0 % 97.858 978,575.00 0.875.8500 % Spain Government EUR Bonds 11/22 EUR 1,000.0 1,000.0 % 103.259 1,032,590.00 0.91Supranational 4,258,775.00 3.761.6250 % European Financial Stability Facility EUR MTN 12/15 EUR 1,000.0 1,000.0 % 101.233 1,012,325.00 0.893.3750 % European Financial Stability Facility EUR Notes 11/21 EUR 1,000.0 1,000.0 % 104.030 1,040,300.00 0.924.7500 % European Investment Bank EUR MTN 07/17 EUR 1,000.0 1,000.0 % 114.563 1,145,625.00 1.013.2500 % European Union EUR MTN 09/14 EUR 1,000.0 1,000.0 % 106.053 1,060,525.00 0.94The Netherlands 4,963,340.95 4.392.6250 % ABB Finance EUR MTN 12/19 EUR 330.0 330.0 % 100.814 332,686.20 0.302.5000 % Bank Nederlandse Gemeenten EUR MTN 10/17 EUR 500.0 500.0 % 102.318 511,587.50 0.452.5000 % Bank Nederlandse Gemeenten EUR MTN 11/16 EUR 500.0 500.0 % 103.538 517,687.50 0.462.5000 % Heineken EUR MTN 12/19 EUR 270.0 270.0 % 99.893 269,709.75 0.243.3750 % Nederlandse Waterschapsbank EUR MTN 06/16 EUR 500.0 500.0 % 106.783 533,912.50 0.473.3750 % Nederlandse Waterschapsbank EUR MTN 10/17 EUR 500.0 500.0 % 106.780 533,900.00 0.474.0000 % Netherlands Government EUR Bonds 08/18 EUR 500.0 500.0 % 113.773 568,862.50 0.504.0000 % Netherlands Government EUR Bonds 09/19 EUR 1,000.0 1,000.0 % 114.179 1,141,785.00 1.013.5000 % Netherlands Government EUR Bonds 10/20 EUR 500.0 500.0 % 110.642 553,210.00 0.49United Kingdom 2,090,825.00 1.853.3750 % Abbey National Treasury Services London
EUR MTN 05/15 EUR 1,000.0 1,000.0 % 104.588 1,045,875.00 0.933.1250 % Barclays Bank EUR MTN 10/15 EUR 1,000.0 1,000.0 % 104.495 1,044,950.00 0.92Investments in securities and money-market instruments 110,295,606.75 97.51Deposits at financial institutions1) 5,993,608.21 5.30Sight deposits 5,993,608.21 5.30State Street Bank Luxembourg S.A. EUR 5,770,734.71 5.10Deposits for collateralisation of derivatives EUR 222,873.50 0.20Investments in deposits at financial institutions 5,993,608.21 5.30
Securities Shares resp.Currency (in 1,000) resp.
Contracts
Acquisitions Disposals Holdings 31/03/2012
Price Unrealisedgain/loss
% ofSubfund
assetsin the period under reviewDerivatives Holdings marked with a minus are short positions. Listed Derivatives – 23,150.00 – 0.02Futures Transactions – 23,150.00 – 0.02Sold Bond Futures – 23,150.00 – 0.0210-Year German Government Bond (Bund) Futures 06/12 Ctr 70 110 – 40 EUR 138.280 – 59,600.00 – 0.055-Year German Government Bond (Bobl) Futures 06/12 Ctr 40 – 40 EUR 124.010 – 23,600.00 – 0.02Euro BTP Futures 06/12 Ctr 70 – 70 EUR 105.030 60,050.00 0.05Investments in derivatives – 23,150.00 – 0.02Net current assets/liabilities EUR – 3,158,749.07 – 2.79Net assets of the Subfund EUR 113,107,315.89 100.00
Net asset values per share – Class W (EUR) (distributing) EUR 997.42 Shares in circulation – Class W (EUR) (distributing) Shs 113,4001) Deposits at financial institutions are not subject to any deposit insurance.
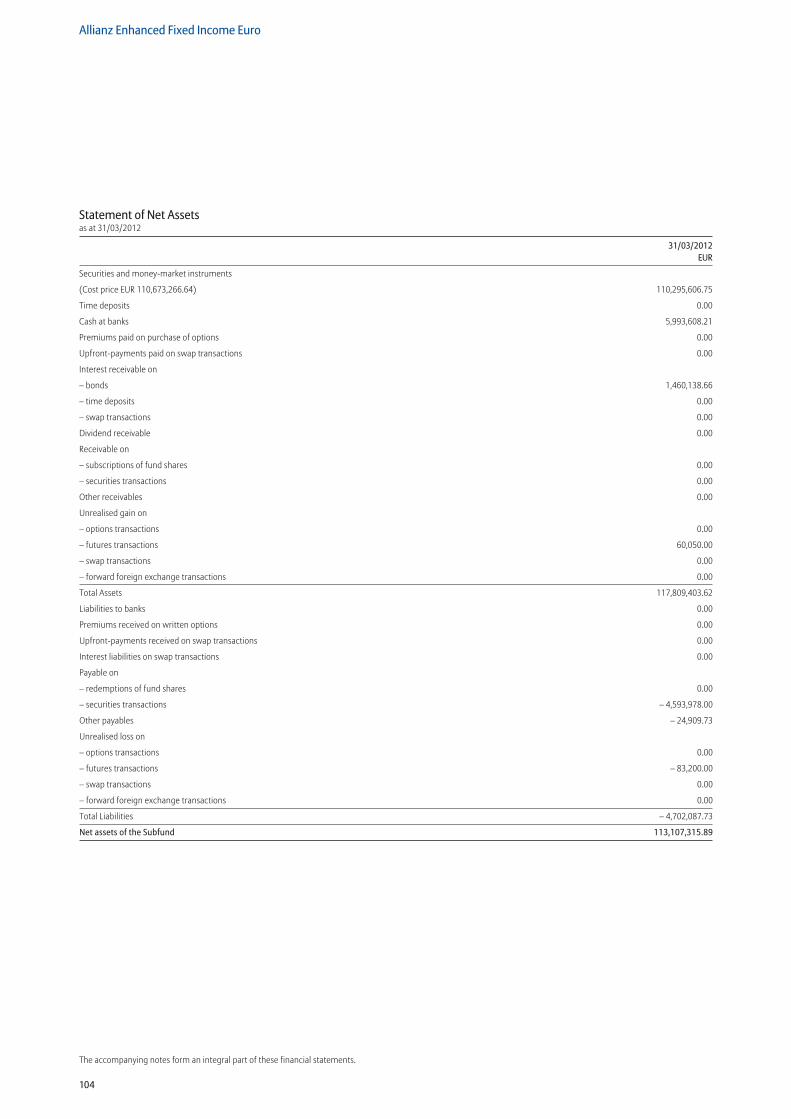
104
Allianz Enhanced Fixed Income Euro
The accompanying notes form an integral part of these financial statements.
Statement of Net Assetsas at 31/03/2012
31/03/2012 EUR
Securities and money-market instruments
(Cost price EUR 110,673,266.64) 110,295,606.75
Time deposits 0.00
Cash at banks 5,993,608.21
Premiums paid on purchase of options 0.00
Upfront-payments paid on swap transactions 0.00
Interest receivable on
– bonds 1,460,138.66
– time deposits 0.00
– swap transactions 0.00
Dividend receivable 0.00
Receivable on
– subscriptions of fund shares 0.00
– securities transactions 0.00
Other receivables 0.00
Unrealised gain on
– options transactions 0.00
– futures transactions 60,050.00
– swap transactions 0.00
– forward foreign exchange transactions 0.00
Total Assets 117,809,403.62
Liabilities to banks 0.00
Premiums received on written options 0.00
Upfront-payments received on swap transactions 0.00
Interest liabilities on swap transactions 0.00
Payable on
– redemptions of fund shares 0.00
– securities transactions – 4,593,978.00
Other payables – 24,909.73
Unrealised loss on
– options transactions 0.00
– futures transactions – 83,200.00
– swap transactions 0.00
– forward foreign exchange transactions 0.00
Total Liabilities – 4,702,087.73
Net assets of the Subfund 113,107,315.89
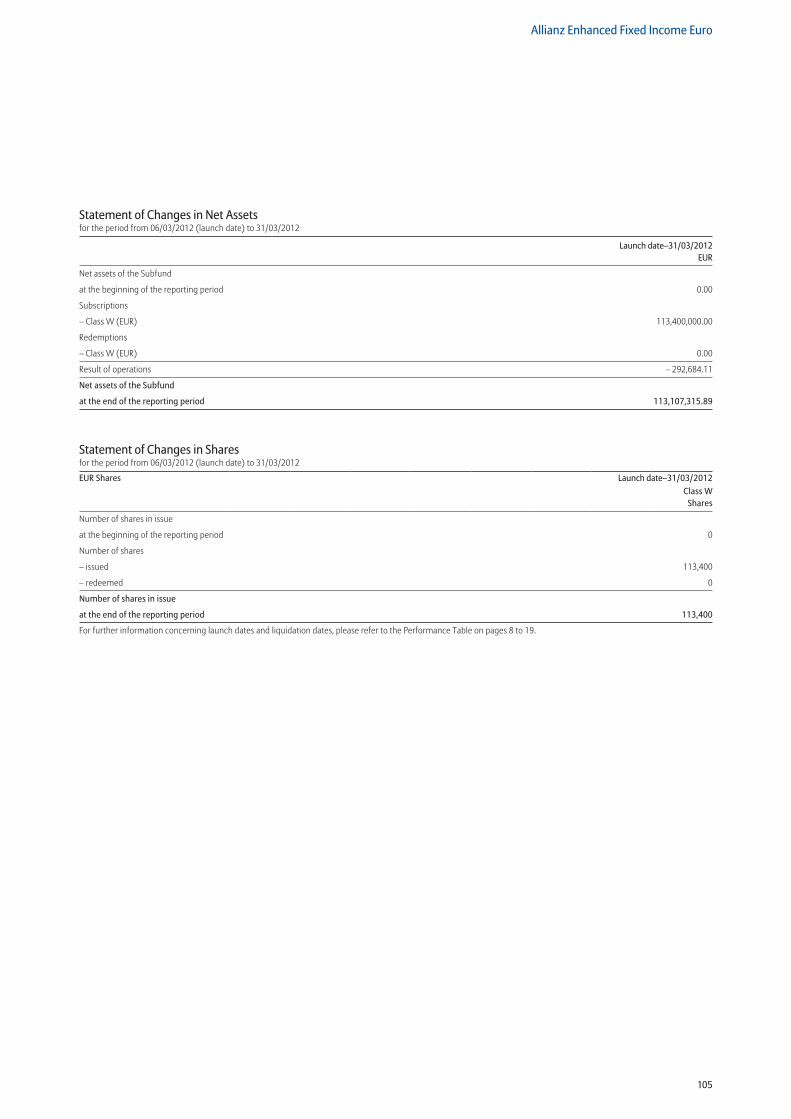
105
Allianz Enhanced Fixed Income Euro
Statement of Changes in Net Assetsfor the period from 06/03/2012 (launch date) to 31/03/2012
Launch date–31/03/2012 EUR
Net assets of the Subfund
at the beginning of the reporting period 0.00
Subscriptions
– Class W (EUR) 113,400,000.00
Redemptions
– Class W (EUR) 0.00
Result of operations – 292,684.11
Net assets of the Subfund
at the end of the reporting period 113,107,315.89
Statement of Changes in Sharesfor the period from 06/03/2012 (launch date) to 31/03/2012
EUR Shares Launch date–31/03/2012Class W
Shares
Number of shares in issue
at the beginning of the reporting period 0
Number of shares
– issued 113,400
– redeemed 0
Number of shares in issue
at the end of the reporting period 113,400
For further information concerning launch dates and liquidation dates, please refer to the Performance Table on pages 8 to 19.
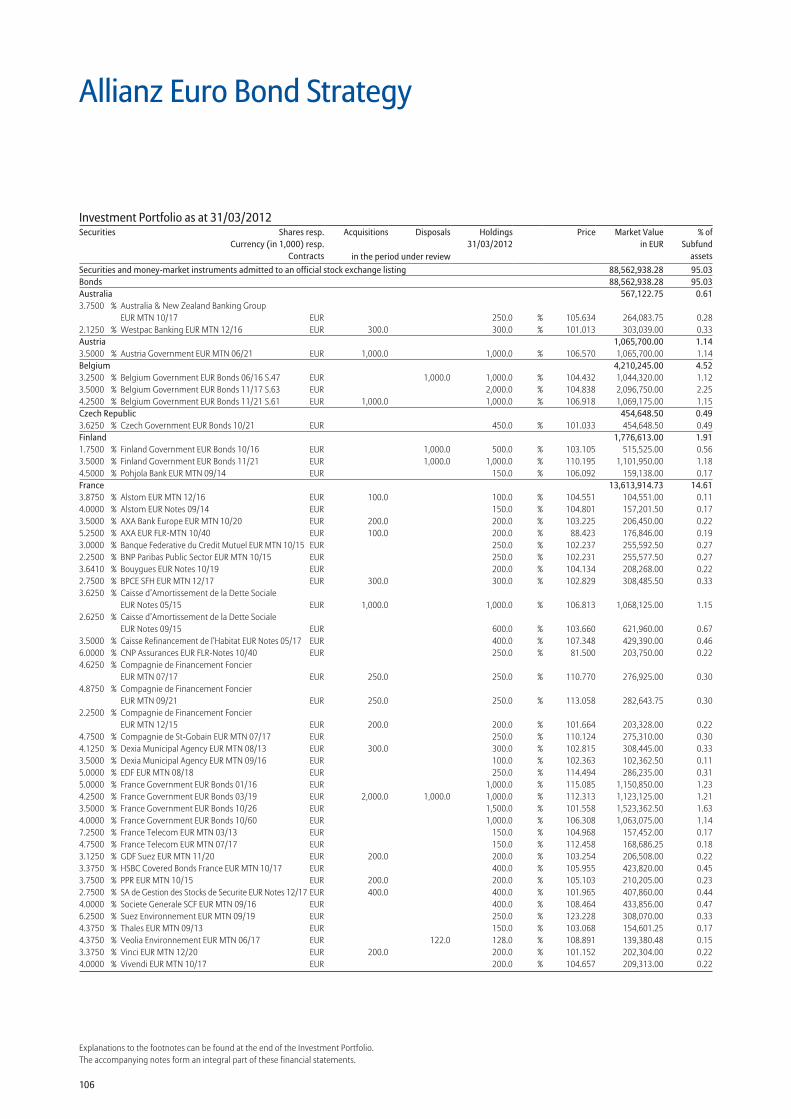
106
Explanations to the footnotes can be found at the end of the Investment Portfolio.The accompanying notes form an integral part of these financial statements.
Allianz Euro Bond Strategy
Securities and money-market instruments admitted to an official stock exchange listing 88,562,938.28 95.03Bonds 88,562,938.28 95.03Australia 567,122.75 0.613.7500 % Australia & New Zealand Banking Group
EUR MTN 10/17 EUR 250.0 % 105.634 264,083.75 0.282.1250 % Westpac Banking EUR MTN 12/16 EUR 300.0 300.0 % 101.013 303,039.00 0.33Austria 1,065,700.00 1.143.5000 % Austria Government EUR MTN 06/21 EUR 1,000.0 1,000.0 % 106.570 1,065,700.00 1.14Belgium 4,210,245.00 4.523.2500 % Belgium Government EUR Bonds 06/16 S.47 EUR 1,000.0 1,000.0 % 104.432 1,044,320.00 1.123.5000 % Belgium Government EUR Bonds 11/17 S.63 EUR 2,000.0 % 104.838 2,096,750.00 2.254.2500 % Belgium Government EUR Bonds 11/21 S.61 EUR 1,000.0 1,000.0 % 106.918 1,069,175.00 1.15Czech Republic 454,648.50 0.493.6250 % Czech Government EUR Bonds 10/21 EUR 450.0 % 101.033 454,648.50 0.49Finland 1,776,613.00 1.911.7500 % Finland Government EUR Bonds 10/16 EUR 1,000.0 500.0 % 103.105 515,525.00 0.563.5000 % Finland Government EUR Bonds 11/21 EUR 1,000.0 1,000.0 % 110.195 1,101,950.00 1.184.5000 % Pohjola Bank EUR MTN 09/14 EUR 150.0 % 106.092 159,138.00 0.17France 13,613,914.73 14.613.8750 % Alstom EUR MTN 12/16 EUR 100.0 100.0 % 104.551 104,551.00 0.114.0000 % Alstom EUR Notes 09/14 EUR 150.0 % 104.801 157,201.50 0.173.5000 % AXA Bank Europe EUR MTN 10/20 EUR 200.0 200.0 % 103.225 206,450.00 0.225.2500 % AXA EUR FLR-MTN 10/40 EUR 100.0 200.0 % 88.423 176,846.00 0.193.0000 % Banque Federative du Credit Mutuel EUR MTN 10/15 EUR 250.0 % 102.237 255,592.50 0.272.2500 % BNP Paribas Public Sector EUR MTN 10/15 EUR 250.0 % 102.231 255,577.50 0.273.6410 % Bouygues EUR Notes 10/19 EUR 200.0 % 104.134 208,268.00 0.222.7500 % BPCE SFH EUR MTN 12/17 EUR 300.0 300.0 % 102.829 308,485.50 0.333.6250 % Caisse d’Amortissement de la Dette Sociale
EUR Notes 05/15 EUR 1,000.0 1,000.0 % 106.813 1,068,125.00 1.152.6250 % Caisse d’Amortissement de la Dette Sociale
EUR Notes 09/15 EUR 600.0 % 103.660 621,960.00 0.673.5000 % Caisse Refinancement de l’Habitat EUR Notes 05/17 EUR 400.0 % 107.348 429,390.00 0.466.0000 % CNP Assurances EUR FLR-Notes 10/40 EUR 250.0 % 81.500 203,750.00 0.224.6250 % Compagnie de Financement Foncier
EUR MTN 07/17 EUR 250.0 250.0 % 110.770 276,925.00 0.304.8750 % Compagnie de Financement Foncier
EUR MTN 09/21 EUR 250.0 250.0 % 113.058 282,643.75 0.302.2500 % Compagnie de Financement Foncier
EUR MTN 12/15 EUR 200.0 200.0 % 101.664 203,328.00 0.224.7500 % Compagnie de St-Gobain EUR MTN 07/17 EUR 250.0 % 110.124 275,310.00 0.304.1250 % Dexia Municipal Agency EUR MTN 08/13 EUR 300.0 300.0 % 102.815 308,445.00 0.333.5000 % Dexia Municipal Agency EUR MTN 09/16 EUR 100.0 % 102.363 102,362.50 0.115.0000 % EDF EUR MTN 08/18 EUR 250.0 % 114.494 286,235.00 0.315.0000 % France Government EUR Bonds 01/16 EUR 1,000.0 % 115.085 1,150,850.00 1.234.2500 % France Government EUR Bonds 03/19 EUR 2,000.0 1,000.0 1,000.0 % 112.313 1,123,125.00 1.213.5000 % France Government EUR Bonds 10/26 EUR 1,500.0 % 101.558 1,523,362.50 1.634.0000 % France Government EUR Bonds 10/60 EUR 1,000.0 % 106.308 1,063,075.00 1.147.2500 % France Telecom EUR MTN 03/13 EUR 150.0 % 104.968 157,452.00 0.174.7500 % France Telecom EUR MTN 07/17 EUR 150.0 % 112.458 168,686.25 0.183.1250 % GDF Suez EUR MTN 11/20 EUR 200.0 200.0 % 103.254 206,508.00 0.223.3750 % HSBC Covered Bonds France EUR MTN 10/17 EUR 400.0 % 105.955 423,820.00 0.453.7500 % PPR EUR MTN 10/15 EUR 200.0 200.0 % 105.103 210,205.00 0.232.7500 % SA de Gestion des Stocks de Securite EUR Notes 12/17 EUR 400.0 400.0 % 101.965 407,860.00 0.444.0000 % Societe Generale SCF EUR MTN 09/16 EUR 400.0 % 108.464 433,856.00 0.476.2500 % Suez Environnement EUR MTN 09/19 EUR 250.0 % 123.228 308,070.00 0.334.3750 % Thales EUR MTN 09/13 EUR 150.0 % 103.068 154,601.25 0.174.3750 % Veolia Environnement EUR MTN 06/17 EUR 122.0 128.0 % 108.891 139,380.48 0.153.3750 % Vinci EUR MTN 12/20 EUR 200.0 200.0 % 101.152 202,304.00 0.224.0000 % Vivendi EUR MTN 10/17 EUR 200.0 % 104.657 209,313.00 0.22
Investment Portfolio as at 31/03/2012Securities Shares resp.
Currency (in 1,000) resp.Contracts
Acquisitions Disposals Holdings 31/03/2012
Price Market Valuein EUR
% ofSubfund
assetsin the period under review
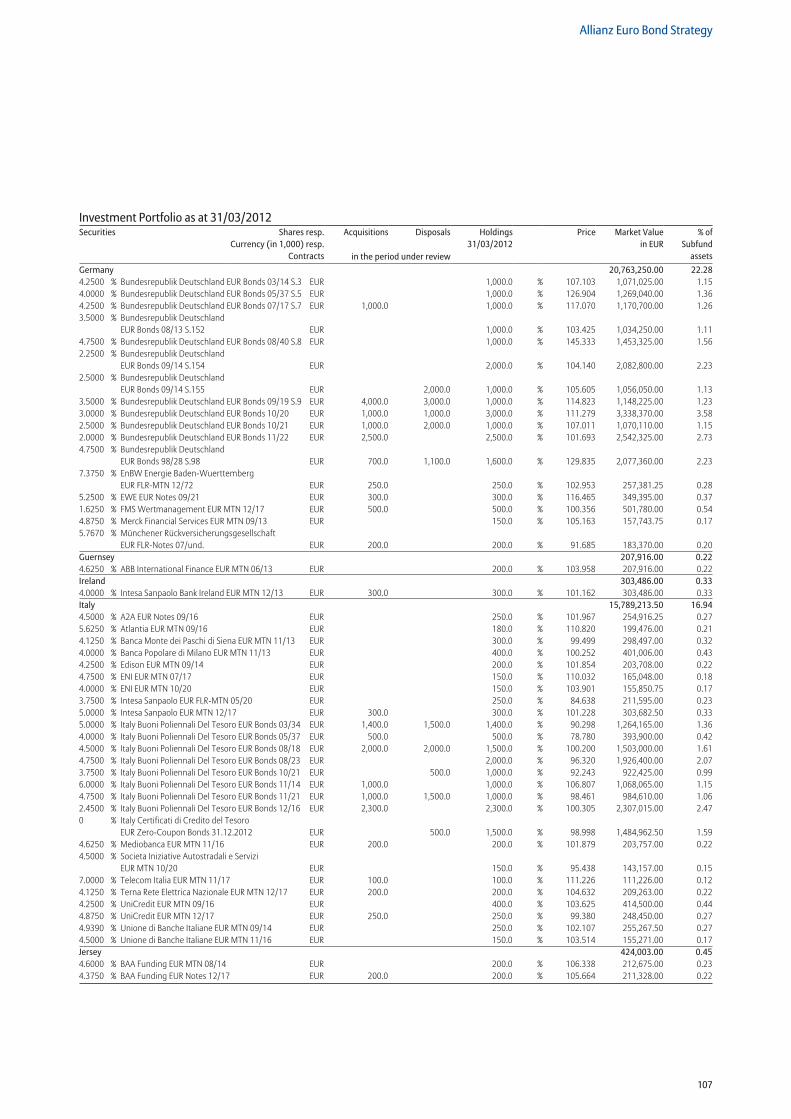
107
Allianz Euro Bond Strategy
Germany 20,763,250.00 22.284.2500 % Bundesrepublik Deutschland EUR Bonds 03/14 S.3 EUR 1,000.0 % 107.103 1,071,025.00 1.154.0000 % Bundesrepublik Deutschland EUR Bonds 05/37 S.5 EUR 1,000.0 % 126.904 1,269,040.00 1.364.2500 % Bundesrepublik Deutschland EUR Bonds 07/17 S.7 EUR 1,000.0 1,000.0 % 117.070 1,170,700.00 1.263.5000 % Bundesrepublik Deutschland
EUR Bonds 08/13 S.152 EUR 1,000.0 % 103.425 1,034,250.00 1.114.7500 % Bundesrepublik Deutschland EUR Bonds 08/40 S.8 EUR 1,000.0 % 145.333 1,453,325.00 1.562.2500 % Bundesrepublik Deutschland
EUR Bonds 09/14 S.154 EUR 2,000.0 % 104.140 2,082,800.00 2.232.5000 % Bundesrepublik Deutschland
EUR Bonds 09/14 S.155 EUR 2,000.0 1,000.0 % 105.605 1,056,050.00 1.133.5000 % Bundesrepublik Deutschland EUR Bonds 09/19 S.9 EUR 4,000.0 3,000.0 1,000.0 % 114.823 1,148,225.00 1.233.0000 % Bundesrepublik Deutschland EUR Bonds 10/20 EUR 1,000.0 1,000.0 3,000.0 % 111.279 3,338,370.00 3.582.5000 % Bundesrepublik Deutschland EUR Bonds 10/21 EUR 1,000.0 2,000.0 1,000.0 % 107.011 1,070,110.00 1.152.0000 % Bundesrepublik Deutschland EUR Bonds 11/22 EUR 2,500.0 2,500.0 % 101.693 2,542,325.00 2.734.7500 % Bundesrepublik Deutschland
EUR Bonds 98/28 S.98 EUR 700.0 1,100.0 1,600.0 % 129.835 2,077,360.00 2.237.3750 % EnBW Energie Baden-Wuerttemberg
EUR FLR-MTN 12/72 EUR 250.0 250.0 % 102.953 257,381.25 0.285.2500 % EWE EUR Notes 09/21 EUR 300.0 300.0 % 116.465 349,395.00 0.371.6250 % FMS Wertmanagement EUR MTN 12/17 EUR 500.0 500.0 % 100.356 501,780.00 0.544.8750 % Merck Financial Services EUR MTN 09/13 EUR 150.0 % 105.163 157,743.75 0.175.7670 % Münchener Rückversicherungsgesellschaft
EUR FLR-Notes 07/und. EUR 200.0 200.0 % 91.685 183,370.00 0.20Guernsey 207,916.00 0.224.6250 % ABB International Finance EUR MTN 06/13 EUR 200.0 % 103.958 207,916.00 0.22Ireland 303,486.00 0.334.0000 % Intesa Sanpaolo Bank Ireland EUR MTN 12/13 EUR 300.0 300.0 % 101.162 303,486.00 0.33Italy 15,789,213.50 16.944.5000 % A2A EUR Notes 09/16 EUR 250.0 % 101.967 254,916.25 0.275.6250 % Atlantia EUR MTN 09/16 EUR 180.0 % 110.820 199,476.00 0.214.1250 % Banca Monte dei Paschi di Siena EUR MTN 11/13 EUR 300.0 % 99.499 298,497.00 0.324.0000 % Banca Popolare di Milano EUR MTN 11/13 EUR 400.0 % 100.252 401,006.00 0.434.2500 % Edison EUR MTN 09/14 EUR 200.0 % 101.854 203,708.00 0.224.7500 % ENI EUR MTN 07/17 EUR 150.0 % 110.032 165,048.00 0.184.0000 % ENI EUR MTN 10/20 EUR 150.0 % 103.901 155,850.75 0.173.7500 % Intesa Sanpaolo EUR FLR-MTN 05/20 EUR 250.0 % 84.638 211,595.00 0.235.0000 % Intesa Sanpaolo EUR MTN 12/17 EUR 300.0 300.0 % 101.228 303,682.50 0.335.0000 % Italy Buoni Poliennali Del Tesoro EUR Bonds 03/34 EUR 1,400.0 1,500.0 1,400.0 % 90.298 1,264,165.00 1.364.0000 % Italy Buoni Poliennali Del Tesoro EUR Bonds 05/37 EUR 500.0 500.0 % 78.780 393,900.00 0.424.5000 % Italy Buoni Poliennali Del Tesoro EUR Bonds 08/18 EUR 2,000.0 2,000.0 1,500.0 % 100.200 1,503,000.00 1.614.7500 % Italy Buoni Poliennali Del Tesoro EUR Bonds 08/23 EUR 2,000.0 % 96.320 1,926,400.00 2.073.7500 % Italy Buoni Poliennali Del Tesoro EUR Bonds 10/21 EUR 500.0 1,000.0 % 92.243 922,425.00 0.996.0000 % Italy Buoni Poliennali Del Tesoro EUR Bonds 11/14 EUR 1,000.0 1,000.0 % 106.807 1,068,065.00 1.154.7500 % Italy Buoni Poliennali Del Tesoro EUR Bonds 11/21 EUR 1,000.0 1,500.0 1,000.0 % 98.461 984,610.00 1.062.4500 % Italy Buoni Poliennali Del Tesoro EUR Bonds 12/16 EUR 2,300.0 2,300.0 % 100.305 2,307,015.00 2.470 % Italy Certificati di Credito del Tesoro
EUR Zero-Coupon Bonds 31.12.2012 EUR 500.0 1,500.0 % 98.998 1,484,962.50 1.594.6250 % Mediobanca EUR MTN 11/16 EUR 200.0 200.0 % 101.879 203,757.00 0.224.5000 % Societa Iniziative Autostradali e Servizi
EUR MTN 10/20 EUR 150.0 % 95.438 143,157.00 0.157.0000 % Telecom Italia EUR MTN 11/17 EUR 100.0 100.0 % 111.226 111,226.00 0.124.1250 % Terna Rete Elettrica Nazionale EUR MTN 12/17 EUR 200.0 200.0 % 104.632 209,263.00 0.224.2500 % UniCredit EUR MTN 09/16 EUR 400.0 % 103.625 414,500.00 0.444.8750 % UniCredit EUR MTN 12/17 EUR 250.0 250.0 % 99.380 248,450.00 0.274.9390 % Unione di Banche Italiane EUR MTN 09/14 EUR 250.0 % 102.107 255,267.50 0.274.5000 % Unione di Banche Italiane EUR MTN 11/16 EUR 150.0 % 103.514 155,271.00 0.17Jersey 424,003.00 0.454.6000 % BAA Funding EUR MTN 08/14 EUR 200.0 % 106.338 212,675.00 0.234.3750 % BAA Funding EUR Notes 12/17 EUR 200.0 200.0 % 105.664 211,328.00 0.22
Investment Portfolio as at 31/03/2012Securities Shares resp.
Currency (in 1,000) resp.Contracts
Acquisitions Disposals Holdings 31/03/2012
Price Market Valuein EUR
% ofSubfund
assetsin the period under review
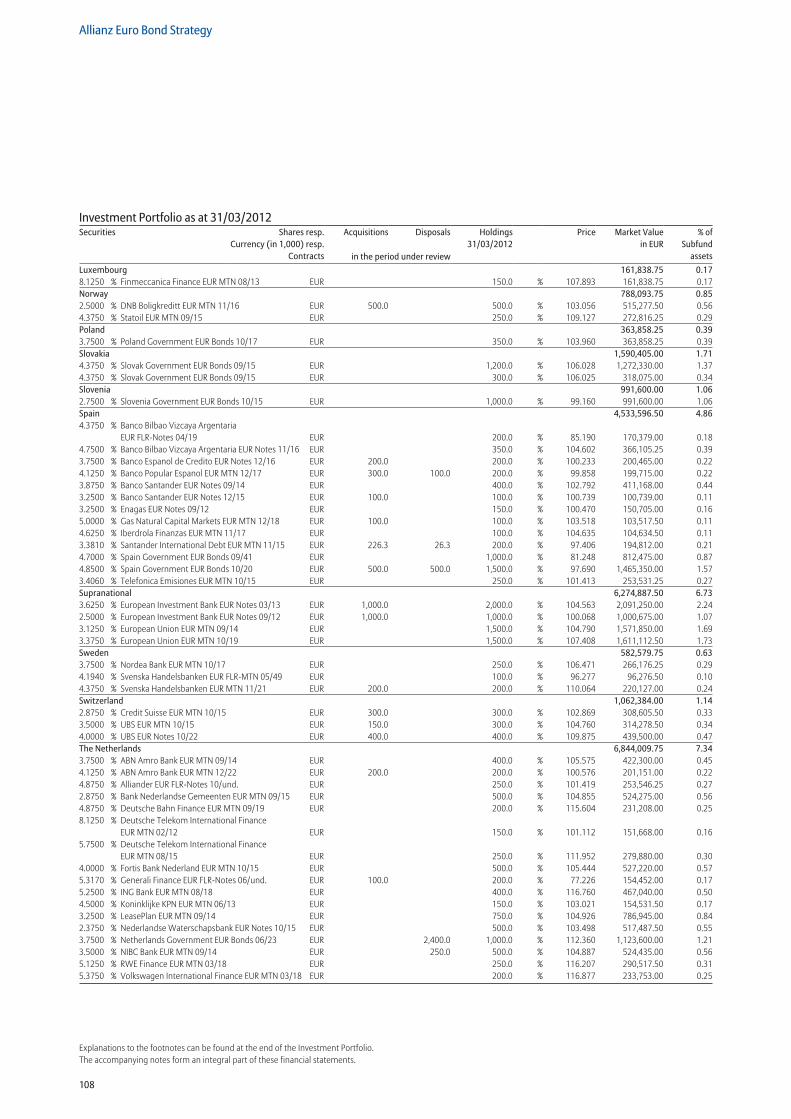
108
Allianz Euro Bond Strategy
Explanations to the footnotes can be found at the end of the Investment Portfolio.The accompanying notes form an integral part of these financial statements.
Luxembourg 161,838.75 0.178.1250 % Finmeccanica Finance EUR MTN 08/13 EUR 150.0 % 107.893 161,838.75 0.17Norway 788,093.75 0.852.5000 % DNB Boligkreditt EUR MTN 11/16 EUR 500.0 500.0 % 103.056 515,277.50 0.564.3750 % Statoil EUR MTN 09/15 EUR 250.0 % 109.127 272,816.25 0.29Poland 363,858.25 0.393.7500 % Poland Government EUR Bonds 10/17 EUR 350.0 % 103.960 363,858.25 0.39Slovakia 1,590,405.00 1.714.3750 % Slovak Government EUR Bonds 09/15 EUR 1,200.0 % 106.028 1,272,330.00 1.374.3750 % Slovak Government EUR Bonds 09/15 EUR 300.0 % 106.025 318,075.00 0.34Slovenia 991,600.00 1.062.7500 % Slovenia Government EUR Bonds 10/15 EUR 1,000.0 % 99.160 991,600.00 1.06Spain 4,533,596.50 4.864.3750 % Banco Bilbao Vizcaya Argentaria
EUR FLR-Notes 04/19 EUR 200.0 % 85.190 170,379.00 0.184.7500 % Banco Bilbao Vizcaya Argentaria EUR Notes 11/16 EUR 350.0 % 104.602 366,105.25 0.393.7500 % Banco Espanol de Credito EUR Notes 12/16 EUR 200.0 200.0 % 100.233 200,465.00 0.224.1250 % Banco Popular Espanol EUR MTN 12/17 EUR 300.0 100.0 200.0 % 99.858 199,715.00 0.223.8750 % Banco Santander EUR Notes 09/14 EUR 400.0 % 102.792 411,168.00 0.443.2500 % Banco Santander EUR Notes 12/15 EUR 100.0 100.0 % 100.739 100,739.00 0.113.2500 % Enagas EUR Notes 09/12 EUR 150.0 % 100.470 150,705.00 0.165.0000 % Gas Natural Capital Markets EUR MTN 12/18 EUR 100.0 100.0 % 103.518 103,517.50 0.114.6250 % Iberdrola Finanzas EUR MTN 11/17 EUR 100.0 % 104.635 104,634.50 0.113.3810 % Santander International Debt EUR MTN 11/15 EUR 226.3 26.3 200.0 % 97.406 194,812.00 0.214.7000 % Spain Government EUR Bonds 09/41 EUR 1,000.0 % 81.248 812,475.00 0.874.8500 % Spain Government EUR Bonds 10/20 EUR 500.0 500.0 1,500.0 % 97.690 1,465,350.00 1.573.4060 % Telefonica Emisiones EUR MTN 10/15 EUR 250.0 % 101.413 253,531.25 0.27Supranational 6,274,887.50 6.733.6250 % European Investment Bank EUR Notes 03/13 EUR 1,000.0 2,000.0 % 104.563 2,091,250.00 2.242.5000 % European Investment Bank EUR Notes 09/12 EUR 1,000.0 1,000.0 % 100.068 1,000,675.00 1.073.1250 % European Union EUR MTN 09/14 EUR 1,500.0 % 104.790 1,571,850.00 1.693.3750 % European Union EUR MTN 10/19 EUR 1,500.0 % 107.408 1,611,112.50 1.73Sweden 582,579.75 0.633.7500 % Nordea Bank EUR MTN 10/17 EUR 250.0 % 106.471 266,176.25 0.294.1940 % Svenska Handelsbanken EUR FLR-MTN 05/49 EUR 100.0 % 96.277 96,276.50 0.104.3750 % Svenska Handelsbanken EUR MTN 11/21 EUR 200.0 200.0 % 110.064 220,127.00 0.24Switzerland 1,062,384.00 1.142.8750 % Credit Suisse EUR MTN 10/15 EUR 300.0 300.0 % 102.869 308,605.50 0.333.5000 % UBS EUR MTN 10/15 EUR 150.0 300.0 % 104.760 314,278.50 0.344.0000 % UBS EUR Notes 10/22 EUR 400.0 400.0 % 109.875 439,500.00 0.47The Netherlands 6,844,009.75 7.343.7500 % ABN Amro Bank EUR MTN 09/14 EUR 400.0 % 105.575 422,300.00 0.454.1250 % ABN Amro Bank EUR MTN 12/22 EUR 200.0 200.0 % 100.576 201,151.00 0.224.8750 % Alliander EUR FLR-Notes 10/und. EUR 250.0 % 101.419 253,546.25 0.272.8750 % Bank Nederlandse Gemeenten EUR MTN 09/15 EUR 500.0 % 104.855 524,275.00 0.564.8750 % Deutsche Bahn Finance EUR MTN 09/19 EUR 200.0 % 115.604 231,208.00 0.258.1250 % Deutsche Telekom International Finance
EUR MTN 02/12 EUR 150.0 % 101.112 151,668.00 0.165.7500 % Deutsche Telekom International Finance
EUR MTN 08/15 EUR 250.0 % 111.952 279,880.00 0.304.0000 % Fortis Bank Nederland EUR MTN 10/15 EUR 500.0 % 105.444 527,220.00 0.575.3170 % Generali Finance EUR FLR-Notes 06/und. EUR 100.0 200.0 % 77.226 154,452.00 0.175.2500 % ING Bank EUR MTN 08/18 EUR 400.0 % 116.760 467,040.00 0.504.5000 % Koninklijke KPN EUR MTN 06/13 EUR 150.0 % 103.021 154,531.50 0.173.2500 % LeasePlan EUR MTN 09/14 EUR 750.0 % 104.926 786,945.00 0.842.3750 % Nederlandse Waterschapsbank EUR Notes 10/15 EUR 500.0 % 103.498 517,487.50 0.553.7500 % Netherlands Government EUR Bonds 06/23 EUR 2,400.0 1,000.0 % 112.360 1,123,600.00 1.213.5000 % NIBC Bank EUR MTN 09/14 EUR 250.0 500.0 % 104.887 524,435.00 0.565.1250 % RWE Finance EUR MTN 03/18 EUR 250.0 % 116.207 290,517.50 0.315.3750 % Volkswagen International Finance EUR MTN 03/18 EUR 200.0 % 116.877 233,753.00 0.25
Investment Portfolio as at 31/03/2012Securities Shares resp.
Currency (in 1,000) resp.Contracts
Acquisitions Disposals Holdings 31/03/2012
Price Market Valuein EUR
% ofSubfund
assetsin the period under review
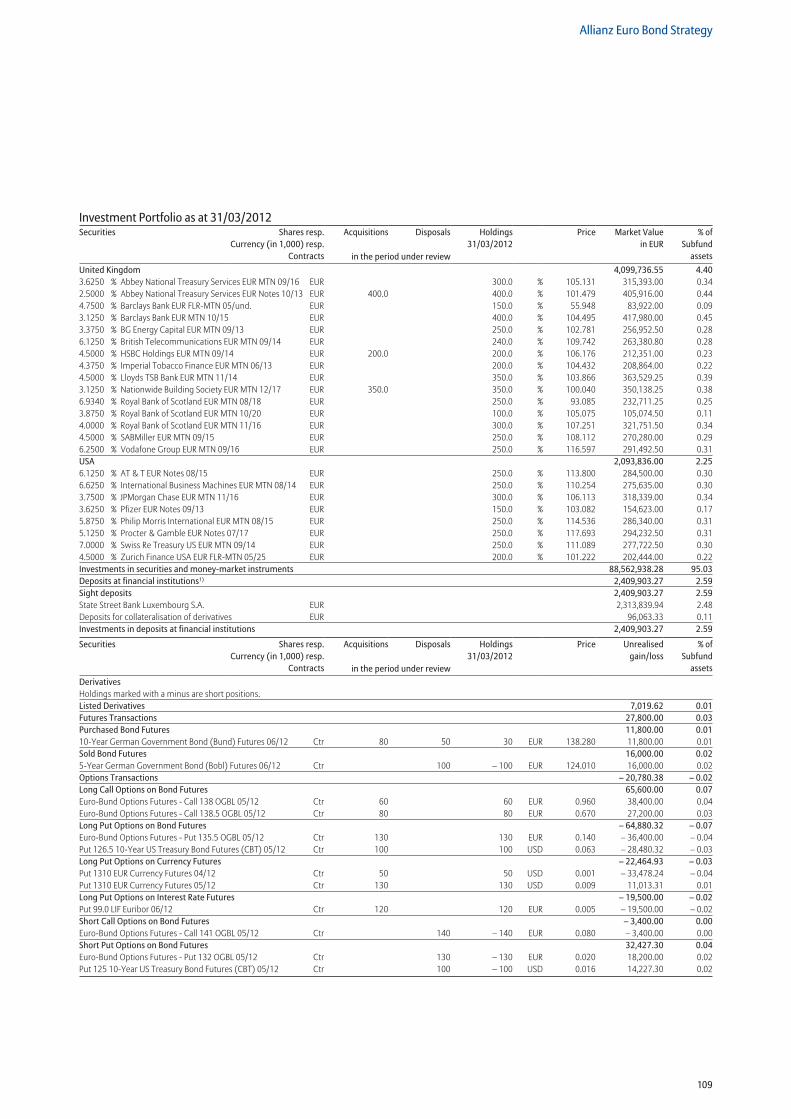
109
Allianz Euro Bond Strategy
United Kingdom 4,099,736.55 4.403.6250 % Abbey National Treasury Services EUR MTN 09/16 EUR 300.0 % 105.131 315,393.00 0.342.5000 % Abbey National Treasury Services EUR Notes 10/13 EUR 400.0 400.0 % 101.479 405,916.00 0.444.7500 % Barclays Bank EUR FLR-MTN 05/und. EUR 150.0 % 55.948 83,922.00 0.093.1250 % Barclays Bank EUR MTN 10/15 EUR 400.0 % 104.495 417,980.00 0.453.3750 % BG Energy Capital EUR MTN 09/13 EUR 250.0 % 102.781 256,952.50 0.286.1250 % British Telecommunications EUR MTN 09/14 EUR 240.0 % 109.742 263,380.80 0.284.5000 % HSBC Holdings EUR MTN 09/14 EUR 200.0 200.0 % 106.176 212,351.00 0.234.3750 % Imperial Tobacco Finance EUR MTN 06/13 EUR 200.0 % 104.432 208,864.00 0.224.5000 % Lloyds TSB Bank EUR MTN 11/14 EUR 350.0 % 103.866 363,529.25 0.393.1250 % Nationwide Building Society EUR MTN 12/17 EUR 350.0 350.0 % 100.040 350,138.25 0.386.9340 % Royal Bank of Scotland EUR MTN 08/18 EUR 250.0 % 93.085 232,711.25 0.253.8750 % Royal Bank of Scotland EUR MTN 10/20 EUR 100.0 % 105.075 105,074.50 0.114.0000 % Royal Bank of Scotland EUR MTN 11/16 EUR 300.0 % 107.251 321,751.50 0.344.5000 % SABMiller EUR MTN 09/15 EUR 250.0 % 108.112 270,280.00 0.296.2500 % Vodafone Group EUR MTN 09/16 EUR 250.0 % 116.597 291,492.50 0.31USA 2,093,836.00 2.256.1250 % AT & T EUR Notes 08/15 EUR 250.0 % 113.800 284,500.00 0.306.6250 % International Business Machines EUR MTN 08/14 EUR 250.0 % 110.254 275,635.00 0.303.7500 % JPMorgan Chase EUR MTN 11/16 EUR 300.0 % 106.113 318,339.00 0.343.6250 % Pfizer EUR Notes 09/13 EUR 150.0 % 103.082 154,623.00 0.175.8750 % Philip Morris International EUR MTN 08/15 EUR 250.0 % 114.536 286,340.00 0.315.1250 % Procter & Gamble EUR Notes 07/17 EUR 250.0 % 117.693 294,232.50 0.317.0000 % Swiss Re Treasury US EUR MTN 09/14 EUR 250.0 % 111.089 277,722.50 0.304.5000 % Zurich Finance USA EUR FLR-MTN 05/25 EUR 200.0 % 101.222 202,444.00 0.22Investments in securities and money-market instruments 88,562,938.28 95.03Deposits at financial institutions1) 2,409,903.27 2.59Sight deposits 2,409,903.27 2.59State Street Bank Luxembourg S.A. EUR 2,313,839.94 2.48Deposits for collateralisation of derivatives EUR 96,063.33 0.11Investments in deposits at financial institutions 2,409,903.27 2.59
Securities Shares resp.Currency (in 1,000) resp.
Contracts
Acquisitions Disposals Holdings 31/03/2012
Price Unrealisedgain/loss
% ofSubfund
assetsin the period under reviewDerivativesHoldings marked with a minus are short positions. Listed Derivatives 7,019.62 0.01Futures Transactions 27,800.00 0.03Purchased Bond Futures 11,800.00 0.0110-Year German Government Bond (Bund) Futures 06/12 Ctr 80 50 30 EUR 138.280 11,800.00 0.01Sold Bond Futures 16,000.00 0.025-Year German Government Bond (Bobl) Futures 06/12 Ctr 100 – 100 EUR 124.010 16,000.00 0.02Options Transactions – 20,780.38 – 0.02Long Call Options on Bond Futures 65,600.00 0.07Euro-Bund Options Futures - Call 138 OGBL 05/12 Ctr 60 60 EUR 0.960 38,400.00 0.04Euro-Bund Options Futures - Call 138.5 OGBL 05/12 Ctr 80 80 EUR 0.670 27,200.00 0.03Long Put Options on Bond Futures – 64,880.32 – 0.07Euro-Bund Options Futures - Put 135.5 OGBL 05/12 Ctr 130 130 EUR 0.140 – 36,400.00 – 0.04Put 126.5 10-Year US Treasury Bond Futures (CBT) 05/12 Ctr 100 100 USD 0.063 – 28,480.32 – 0.03Long Put Options on Currency Futures – 22,464.93 – 0.03Put 1310 EUR Currency Futures 04/12 Ctr 50 50 USD 0.001 – 33,478.24 – 0.04Put 1310 EUR Currency Futures 05/12 Ctr 130 130 USD 0.009 11,013.31 0.01Long Put Options on Interest Rate Futures – 19,500.00 – 0.02Put 99.0 LIF Euribor 06/12 Ctr 120 120 EUR 0.005 – 19,500.00 – 0.02Short Call Options on Bond Futures – 3,400.00 0.00Euro-Bund Options Futures - Call 141 OGBL 05/12 Ctr 140 – 140 EUR 0.080 – 3,400.00 0.00Short Put Options on Bond Futures 32,427.30 0.04Euro-Bund Options Futures - Put 132 OGBL 05/12 Ctr 130 – 130 EUR 0.020 18,200.00 0.02Put 125 10-Year US Treasury Bond Futures (CBT) 05/12 Ctr 100 – 100 USD 0.016 14,227.30 0.02
Investment Portfolio as at 31/03/2012Securities Shares resp.
Currency (in 1,000) resp.Contracts
Acquisitions Disposals Holdings 31/03/2012
Price Market Valuein EUR
% ofSubfund
assetsin the period under review
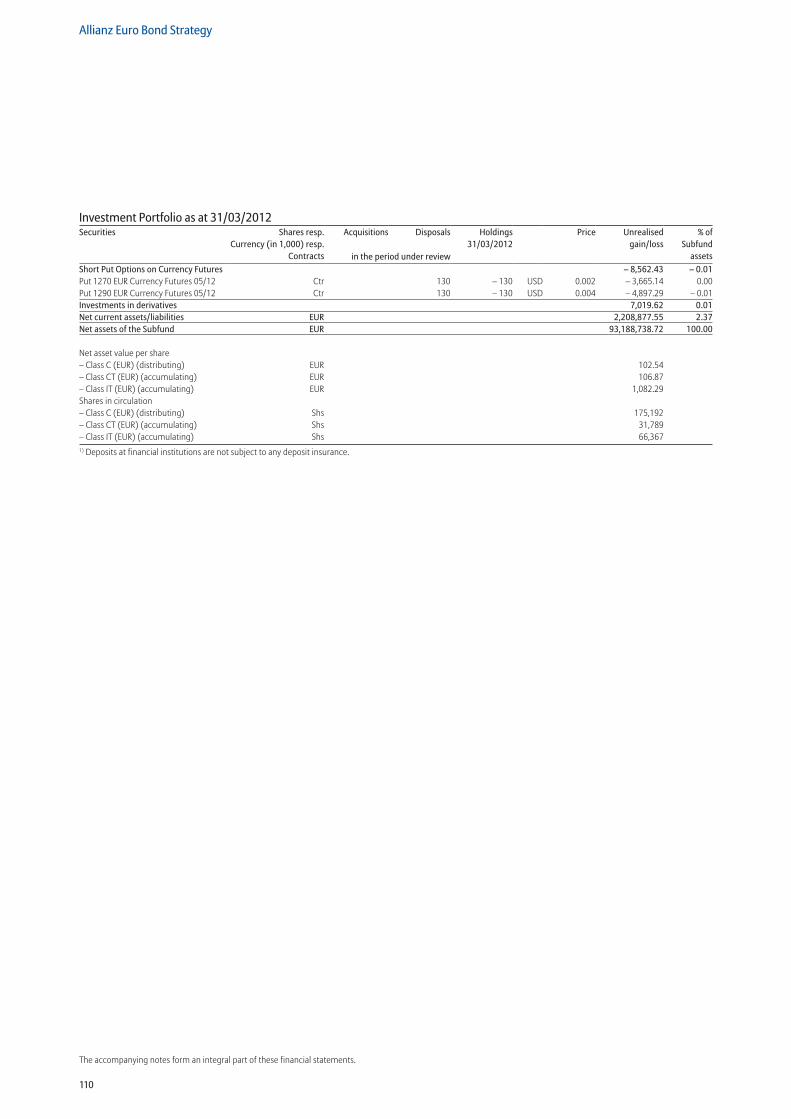
110
Allianz Euro Bond Strategy
The accompanying notes form an integral part of these financial statements.
Short Put Options on Currency Futures – 8,562.43 – 0.01Put 1270 EUR Currency Futures 05/12 Ctr 130 – 130 USD 0.002 – 3,665.14 0.00Put 1290 EUR Currency Futures 05/12 Ctr 130 – 130 USD 0.004 – 4,897.29 – 0.01Investments in derivatives 7,019.62 0.01Net current assets/liabilities EUR 2,208,877.55 2.37Net assets of the Subfund EUR 93,188,738.72 100.00
Net asset value per share – Class C (EUR) (distributing) EUR 102.54 – Class CT (EUR) (accumulating) EUR 106.87 – Class IT (EUR) (accumulating) EUR 1,082.29 Shares in circulation – Class C (EUR) (distributing) Shs 175,192 – Class CT (EUR) (accumulating) Shs 31,789– Class IT (EUR) (accumulating) Shs 66,3671) Deposits at financial institutions are not subject to any deposit insurance.
Investment Portfolio as at 31/03/2012Securities Shares resp.
Currency (in 1,000) resp.Contracts
Acquisitions Disposals Holdings 31/03/2012
Price Unrealisedgain/loss
% ofSubfund
assetsin the period under review
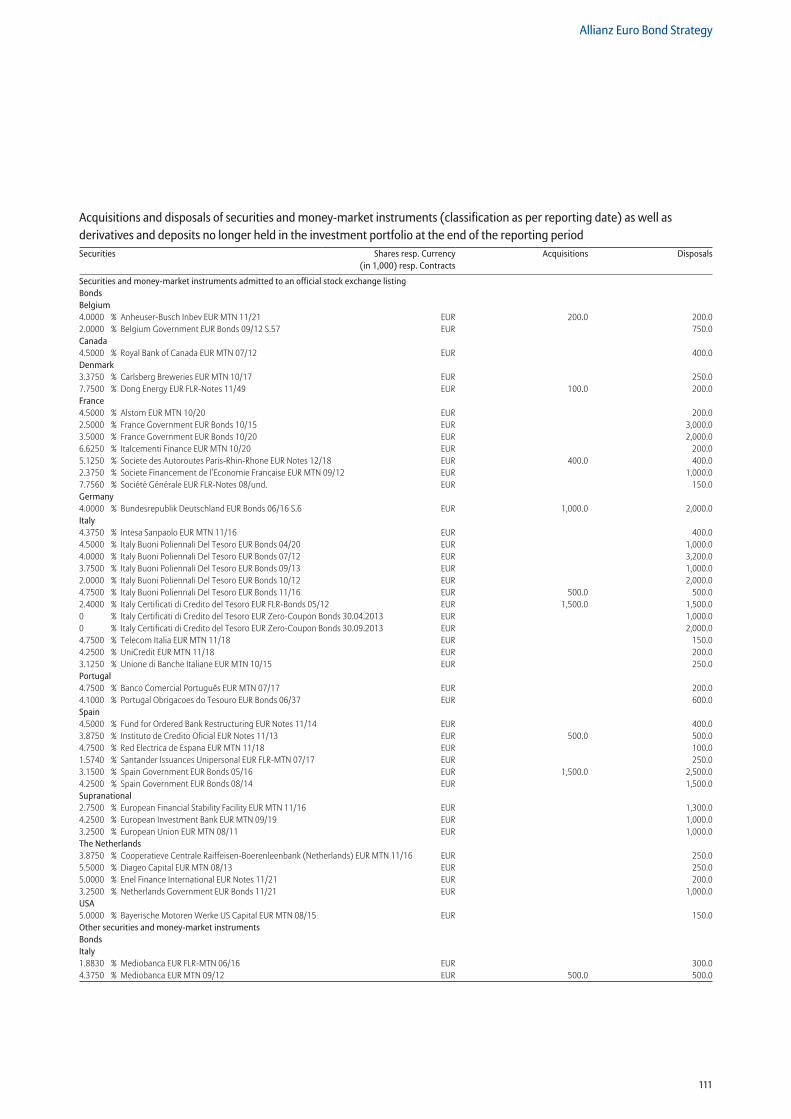
111
Allianz Euro Bond Strategy
Securities and money-market instruments admitted to an official stock exchange listingBondsBelgium4.0000 % Anheuser-Busch Inbev EUR MTN 11/21 EUR 200.0 200.02.0000 % Belgium Government EUR Bonds 09/12 S.57 EUR 750.0Canada4.5000 % Royal Bank of Canada EUR MTN 07/12 EUR 400.0Denmark3.3750 % Carlsberg Breweries EUR MTN 10/17 EUR 250.07.7500 % Dong Energy EUR FLR-Notes 11/49 EUR 100.0 200.0France4.5000 % Alstom EUR MTN 10/20 EUR 200.02.5000 % France Government EUR Bonds 10/15 EUR 3,000.03.5000 % France Government EUR Bonds 10/20 EUR 2,000.06.6250 % Italcementi Finance EUR MTN 10/20 EUR 200.05.1250 % Societe des Autoroutes Paris-Rhin-Rhone EUR Notes 12/18 EUR 400.0 400.02.3750 % Societe Financement de l’Economie Francaise EUR MTN 09/12 EUR 1,000.07.7560 % Société Générale EUR FLR-Notes 08/und. EUR 150.0Germany4.0000 % Bundesrepublik Deutschland EUR Bonds 06/16 S.6 EUR 1,000.0 2,000.0Italy4.3750 % Intesa Sanpaolo EUR MTN 11/16 EUR 400.04.5000 % Italy Buoni Poliennali Del Tesoro EUR Bonds 04/20 EUR 1,000.04.0000 % Italy Buoni Poliennali Del Tesoro EUR Bonds 07/12 EUR 3,200.03.7500 % Italy Buoni Poliennali Del Tesoro EUR Bonds 09/13 EUR 1,000.02.0000 % Italy Buoni Poliennali Del Tesoro EUR Bonds 10/12 EUR 2,000.04.7500 % Italy Buoni Poliennali Del Tesoro EUR Bonds 11/16 EUR 500.0 500.02.4000 % Italy Certificati di Credito del Tesoro EUR FLR-Bonds 05/12 EUR 1,500.0 1,500.00 % Italy Certificati di Credito del Tesoro EUR Zero-Coupon Bonds 30.04.2013 EUR 1,000.00 % Italy Certificati di Credito del Tesoro EUR Zero-Coupon Bonds 30.09.2013 EUR 2,000.04.7500 % Telecom Italia EUR MTN 11/18 EUR 150.04.2500 % UniCredit EUR MTN 11/18 EUR 200.03.1250 % Unione di Banche Italiane EUR MTN 10/15 EUR 250.0Portugal4.7500 % Banco Comercial Português EUR MTN 07/17 EUR 200.04.1000 % Portugal Obrigacoes do Tesouro EUR Bonds 06/37 EUR 600.0Spain4.5000 % Fund for Ordered Bank Restructuring EUR Notes 11/14 EUR 400.03.8750 % Instituto de Credito Oficial EUR Notes 11/13 EUR 500.0 500.04.7500 % Red Electrica de Espana EUR MTN 11/18 EUR 100.01.5740 % Santander Issuances Unipersonal EUR FLR-MTN 07/17 EUR 250.03.1500 % Spain Government EUR Bonds 05/16 EUR 1,500.0 2,500.04.2500 % Spain Government EUR Bonds 08/14 EUR 1,500.0Supranational2.7500 % European Financial Stability Facility EUR MTN 11/16 EUR 1,300.04.2500 % European Investment Bank EUR MTN 09/19 EUR 1,000.03.2500 % European Union EUR MTN 08/11 EUR 1,000.0The Netherlands3.8750 % Cooperatieve Centrale Raiffeisen-Boerenleenbank (Netherlands) EUR MTN 11/16 EUR 250.05.5000 % Diageo Capital EUR MTN 08/13 EUR 250.05.0000 % Enel Finance International EUR Notes 11/21 EUR 200.03.2500 % Netherlands Government EUR Bonds 11/21 EUR 1,000.0USA5.0000 % Bayerische Motoren Werke US Capital EUR MTN 08/15 EUR 150.0Other securities and money-market instrumentsBondsItaly1.8830 % Mediobanca EUR FLR-MTN 06/16 EUR 300.04.3750 % Mediobanca EUR MTN 09/12 EUR 500.0 500.0
Acquisitions and disposals of securities and money-market instruments (classification as per reporting date) as well as derivatives and deposits no longer held in the investment portfolio at the end of the reporting periodSecurities Shares resp. Currency
(in 1,000) resp. ContractsAcquisitions Disposals
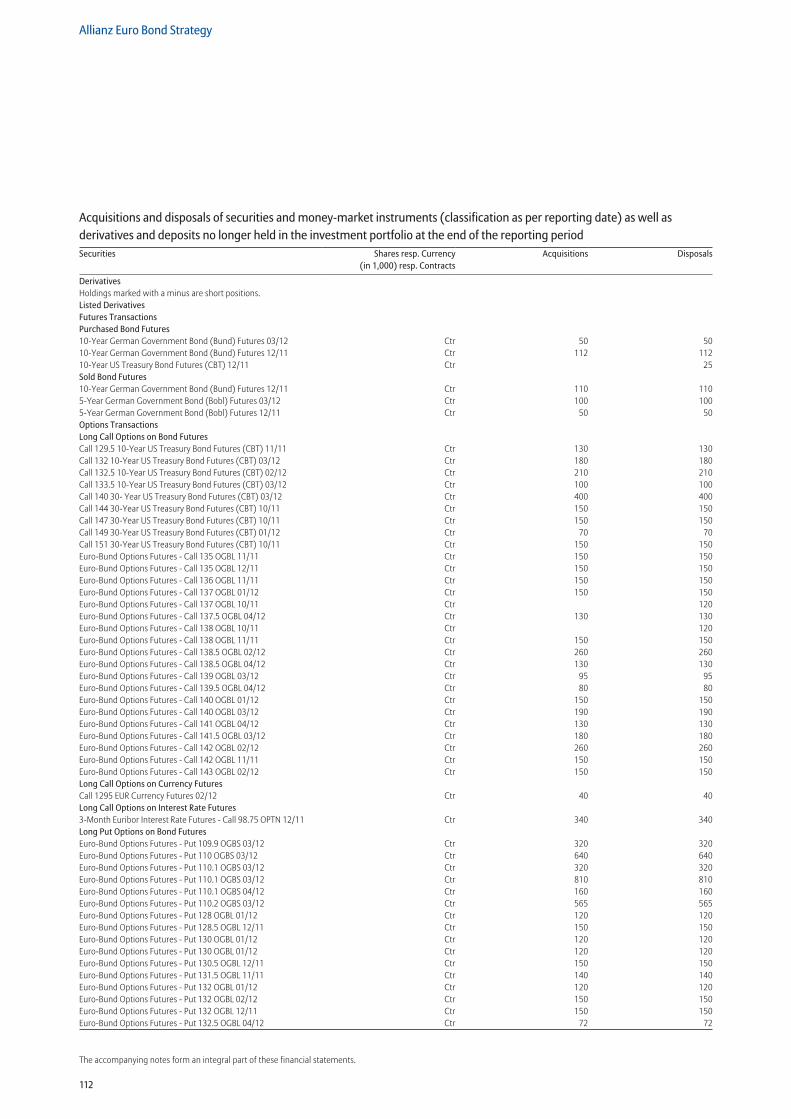
112
Allianz Euro Bond Strategy
The accompanying notes form an integral part of these financial statements.
DerivativesHoldings marked with a minus are short positions.Listed DerivativesFutures TransactionsPurchased Bond Futures10-Year German Government Bond (Bund) Futures 03/12 Ctr 50 5010-Year German Government Bond (Bund) Futures 12/11 Ctr 112 11210-Year US Treasury Bond Futures (CBT) 12/11 Ctr 25Sold Bond Futures10-Year German Government Bond (Bund) Futures 12/11 Ctr 110 1105-Year German Government Bond (Bobl) Futures 03/12 Ctr 100 1005-Year German Government Bond (Bobl) Futures 12/11 Ctr 50 50Options TransactionsLong Call Options on Bond FuturesCall 129.5 10-Year US Treasury Bond Futures (CBT) 11/11 Ctr 130 130Call 132 10-Year US Treasury Bond Futures (CBT) 03/12 Ctr 180 180Call 132.5 10-Year US Treasury Bond Futures (CBT) 02/12 Ctr 210 210Call 133.5 10-Year US Treasury Bond Futures (CBT) 03/12 Ctr 100 100Call 140 30- Year US Treasury Bond Futures (CBT) 03/12 Ctr 400 400Call 144 30-Year US Treasury Bond Futures (CBT) 10/11 Ctr 150 150Call 147 30-Year US Treasury Bond Futures (CBT) 10/11 Ctr 150 150Call 149 30-Year US Treasury Bond Futures (CBT) 01/12 Ctr 70 70Call 151 30-Year US Treasury Bond Futures (CBT) 10/11 Ctr 150 150Euro-Bund Options Futures - Call 135 OGBL 11/11 Ctr 150 150Euro-Bund Options Futures - Call 135 OGBL 12/11 Ctr 150 150Euro-Bund Options Futures - Call 136 OGBL 11/11 Ctr 150 150Euro-Bund Options Futures - Call 137 OGBL 01/12 Ctr 150 150Euro-Bund Options Futures - Call 137 OGBL 10/11 Ctr 120Euro-Bund Options Futures - Call 137.5 OGBL 04/12 Ctr 130 130Euro-Bund Options Futures - Call 138 OGBL 10/11 Ctr 120Euro-Bund Options Futures - Call 138 OGBL 11/11 Ctr 150 150Euro-Bund Options Futures - Call 138.5 OGBL 02/12 Ctr 260 260Euro-Bund Options Futures - Call 138.5 OGBL 04/12 Ctr 130 130Euro-Bund Options Futures - Call 139 OGBL 03/12 Ctr 95 95Euro-Bund Options Futures - Call 139.5 OGBL 04/12 Ctr 80 80Euro-Bund Options Futures - Call 140 OGBL 01/12 Ctr 150 150Euro-Bund Options Futures - Call 140 OGBL 03/12 Ctr 190 190Euro-Bund Options Futures - Call 141 OGBL 04/12 Ctr 130 130Euro-Bund Options Futures - Call 141.5 OGBL 03/12 Ctr 180 180Euro-Bund Options Futures - Call 142 OGBL 02/12 Ctr 260 260Euro-Bund Options Futures - Call 142 OGBL 11/11 Ctr 150 150Euro-Bund Options Futures - Call 143 OGBL 02/12 Ctr 150 150Long Call Options on Currency FuturesCall 1295 EUR Currency Futures 02/12 Ctr 40 40Long Call Options on Interest Rate Futures3-Month Euribor Interest Rate Futures - Call 98.75 OPTN 12/11 Ctr 340 340Long Put Options on Bond FuturesEuro-Bund Options Futures - Put 109.9 OGBS 03/12 Ctr 320 320Euro-Bund Options Futures - Put 110 OGBS 03/12 Ctr 640 640Euro-Bund Options Futures - Put 110.1 OGBS 03/12 Ctr 320 320Euro-Bund Options Futures - Put 110.1 OGBS 03/12 Ctr 810 810Euro-Bund Options Futures - Put 110.1 OGBS 04/12 Ctr 160 160Euro-Bund Options Futures - Put 110.2 OGBS 03/12 Ctr 565 565Euro-Bund Options Futures - Put 128 OGBL 01/12 Ctr 120 120Euro-Bund Options Futures - Put 128.5 OGBL 12/11 Ctr 150 150Euro-Bund Options Futures - Put 130 OGBL 01/12 Ctr 120 120Euro-Bund Options Futures - Put 130 OGBL 01/12 Ctr 120 120Euro-Bund Options Futures - Put 130.5 OGBL 12/11 Ctr 150 150Euro-Bund Options Futures - Put 131.5 OGBL 11/11 Ctr 140 140Euro-Bund Options Futures - Put 132 OGBL 01/12 Ctr 120 120Euro-Bund Options Futures - Put 132 OGBL 02/12 Ctr 150 150Euro-Bund Options Futures - Put 132 OGBL 12/11 Ctr 150 150Euro-Bund Options Futures - Put 132.5 OGBL 04/12 Ctr 72 72
Acquisitions and disposals of securities and money-market instruments (classification as per reporting date) as well as derivatives and deposits no longer held in the investment portfolio at the end of the reporting periodSecurities Shares resp. Currency
(in 1,000) resp. ContractsAcquisitions Disposals
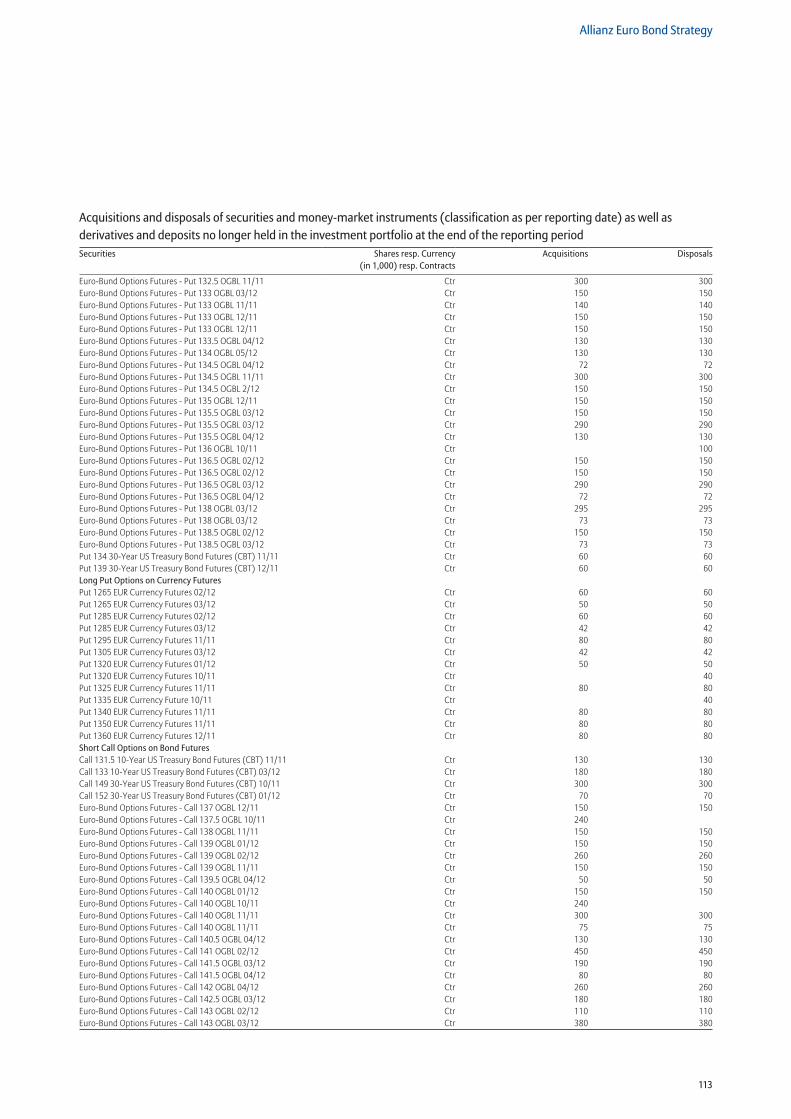
113
Allianz Euro Bond Strategy
Euro-Bund Options Futures - Put 132.5 OGBL 11/11 Ctr 300 300Euro-Bund Options Futures - Put 133 OGBL 03/12 Ctr 150 150Euro-Bund Options Futures - Put 133 OGBL 11/11 Ctr 140 140Euro-Bund Options Futures - Put 133 OGBL 12/11 Ctr 150 150Euro-Bund Options Futures - Put 133 OGBL 12/11 Ctr 150 150Euro-Bund Options Futures - Put 133.5 OGBL 04/12 Ctr 130 130Euro-Bund Options Futures - Put 134 OGBL 05/12 Ctr 130 130Euro-Bund Options Futures - Put 134.5 OGBL 04/12 Ctr 72 72Euro-Bund Options Futures - Put 134.5 OGBL 11/11 Ctr 300 300Euro-Bund Options Futures - Put 134.5 OGBL 2/12 Ctr 150 150Euro-Bund Options Futures - Put 135 OGBL 12/11 Ctr 150 150Euro-Bund Options Futures - Put 135.5 OGBL 03/12 Ctr 150 150Euro-Bund Options Futures - Put 135.5 OGBL 03/12 Ctr 290 290Euro-Bund Options Futures - Put 135.5 OGBL 04/12 Ctr 130 130Euro-Bund Options Futures - Put 136 OGBL 10/11 Ctr 100Euro-Bund Options Futures - Put 136.5 OGBL 02/12 Ctr 150 150Euro-Bund Options Futures - Put 136.5 OGBL 02/12 Ctr 150 150Euro-Bund Options Futures - Put 136.5 OGBL 03/12 Ctr 290 290Euro-Bund Options Futures - Put 136.5 OGBL 04/12 Ctr 72 72Euro-Bund Options Futures - Put 138 OGBL 03/12 Ctr 295 295Euro-Bund Options Futures - Put 138 OGBL 03/12 Ctr 73 73Euro-Bund Options Futures - Put 138.5 OGBL 02/12 Ctr 150 150Euro-Bund Options Futures - Put 138.5 OGBL 03/12 Ctr 73 73Put 134 30-Year US Treasury Bond Futures (CBT) 11/11 Ctr 60 60Put 139 30-Year US Treasury Bond Futures (CBT) 12/11 Ctr 60 60Long Put Options on Currency FuturesPut 1265 EUR Currency Futures 02/12 Ctr 60 60Put 1265 EUR Currency Futures 03/12 Ctr 50 50Put 1285 EUR Currency Futures 02/12 Ctr 60 60Put 1285 EUR Currency Futures 03/12 Ctr 42 42Put 1295 EUR Currency Futures 11/11 Ctr 80 80Put 1305 EUR Currency Futures 03/12 Ctr 42 42Put 1320 EUR Currency Futures 01/12 Ctr 50 50Put 1320 EUR Currency Futures 10/11 Ctr 40Put 1325 EUR Currency Futures 11/11 Ctr 80 80Put 1335 EUR Currency Future 10/11 Ctr 40Put 1340 EUR Currency Futures 11/11 Ctr 80 80Put 1350 EUR Currency Futures 11/11 Ctr 80 80Put 1360 EUR Currency Futures 12/11 Ctr 80 80Short Call Options on Bond FuturesCall 131.5 10-Year US Treasury Bond Futures (CBT) 11/11 Ctr 130 130Call 133 10-Year US Treasury Bond Futures (CBT) 03/12 Ctr 180 180Call 149 30-Year US Treasury Bond Futures (CBT) 10/11 Ctr 300 300Call 152 30-Year US Treasury Bond Futures (CBT) 01/12 Ctr 70 70Euro-Bund Options Futures - Call 137 OGBL 12/11 Ctr 150 150Euro-Bund Options Futures - Call 137.5 OGBL 10/11 Ctr 240 Euro-Bund Options Futures - Call 138 OGBL 11/11 Ctr 150 150Euro-Bund Options Futures - Call 139 OGBL 01/12 Ctr 150 150Euro-Bund Options Futures - Call 139 OGBL 02/12 Ctr 260 260Euro-Bund Options Futures - Call 139 OGBL 11/11 Ctr 150 150Euro-Bund Options Futures - Call 139.5 OGBL 04/12 Ctr 50 50Euro-Bund Options Futures - Call 140 OGBL 01/12 Ctr 150 150Euro-Bund Options Futures - Call 140 OGBL 10/11 Ctr 240 Euro-Bund Options Futures - Call 140 OGBL 11/11 Ctr 300 300Euro-Bund Options Futures - Call 140 OGBL 11/11 Ctr 75 75Euro-Bund Options Futures - Call 140.5 OGBL 04/12 Ctr 130 130Euro-Bund Options Futures - Call 141 OGBL 02/12 Ctr 450 450Euro-Bund Options Futures - Call 141.5 OGBL 03/12 Ctr 190 190Euro-Bund Options Futures - Call 141.5 OGBL 04/12 Ctr 80 80Euro-Bund Options Futures - Call 142 OGBL 04/12 Ctr 260 260Euro-Bund Options Futures - Call 142.5 OGBL 03/12 Ctr 180 180Euro-Bund Options Futures - Call 143 OGBL 02/12 Ctr 110 110Euro-Bund Options Futures - Call 143 OGBL 03/12 Ctr 380 380
Acquisitions and disposals of securities and money-market instruments (classification as per reporting date) as well as derivatives and deposits no longer held in the investment portfolio at the end of the reporting periodSecurities Shares resp. Currency
(in 1,000) resp. ContractsAcquisitions Disposals
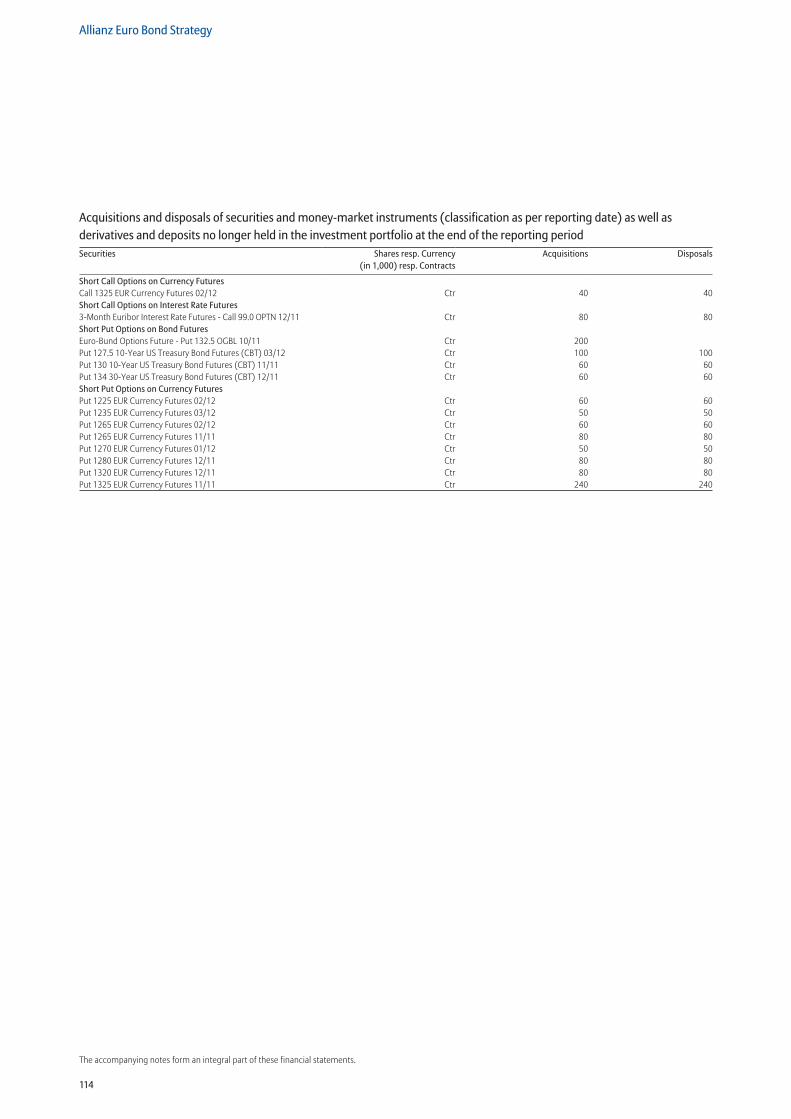
114
Allianz Euro Bond Strategy
The accompanying notes form an integral part of these financial statements.
Short Call Options on Currency FuturesCall 1325 EUR Currency Futures 02/12 Ctr 40 40Short Call Options on Interest Rate Futures3-Month Euribor Interest Rate Futures - Call 99.0 OPTN 12/11 Ctr 80 80Short Put Options on Bond FuturesEuro-Bund Options Future - Put 132.5 OGBL 10/11 Ctr 200 Put 127.5 10-Year US Treasury Bond Futures (CBT) 03/12 Ctr 100 100Put 130 10-Year US Treasury Bond Futures (CBT) 11/11 Ctr 60 60Put 134 30-Year US Treasury Bond Futures (CBT) 12/11 Ctr 60 60Short Put Options on Currency FuturesPut 1225 EUR Currency Futures 02/12 Ctr 60 60Put 1235 EUR Currency Futures 03/12 Ctr 50 50Put 1265 EUR Currency Futures 02/12 Ctr 60 60Put 1265 EUR Currency Futures 11/11 Ctr 80 80Put 1270 EUR Currency Futures 01/12 Ctr 50 50Put 1280 EUR Currency Futures 12/11 Ctr 80 80Put 1320 EUR Currency Futures 12/11 Ctr 80 80Put 1325 EUR Currency Futures 11/11 Ctr 240 240
Acquisitions and disposals of securities and money-market instruments (classification as per reporting date) as well as derivatives and deposits no longer held in the investment portfolio at the end of the reporting periodSecurities Shares resp. Currency
(in 1,000) resp. ContractsAcquisitions Disposals
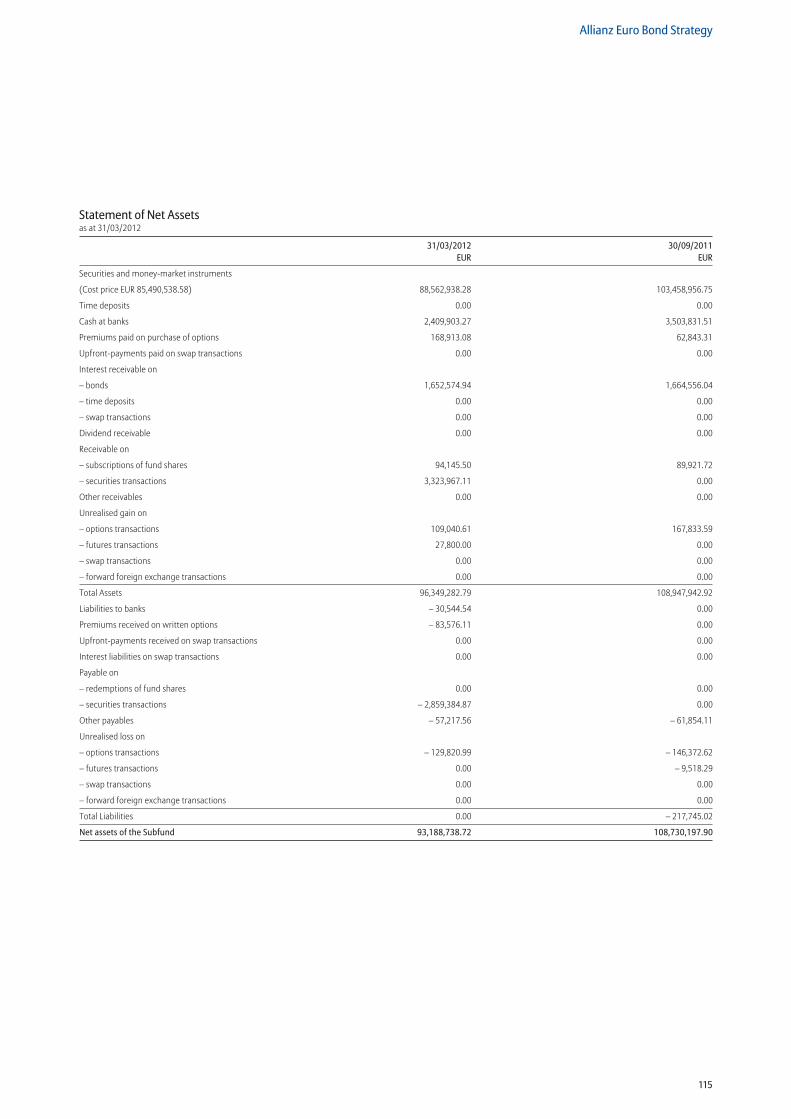
115
Allianz Euro Bond Strategy
Statement of Net Assetsas at 31/03/2012
31/03/2012 30/09/2011 EUR EUR
Securities and money-market instruments
(Cost price EUR 85,490,538.58) 88,562,938.28 103,458,956.75
Time deposits 0.00 0.00
Cash at banks 2,409,903.27 3,503,831.51
Premiums paid on purchase of options 168,913.08 62,843.31
Upfront-payments paid on swap transactions 0.00 0.00
Interest receivable on
– bonds 1,652,574.94 1,664,556.04
– time deposits 0.00 0.00
– swap transactions 0.00 0.00
Dividend receivable 0.00 0.00
Receivable on
– subscriptions of fund shares 94,145.50 89,921.72
– securities transactions 3,323,967.11 0.00
Other receivables 0.00 0.00
Unrealised gain on
– options transactions 109,040.61 167,833.59
– futures transactions 27,800.00 0.00
– swap transactions 0.00 0.00
– forward foreign exchange transactions 0.00 0.00
Total Assets 96,349,282.79 108,947,942.92
Liabilities to banks – 30,544.54 0.00
Premiums received on written options – 83,576.11 0.00
Upfront-payments received on swap transactions 0.00 0.00
Interest liabilities on swap transactions 0.00 0.00
Payable on
– redemptions of fund shares 0.00 0.00
– securities transactions – 2,859,384.87 0.00
Other payables – 57,217.56 – 61,854.11
Unrealised loss on
– options transactions – 129,820.99 – 146,372.62
– futures transactions 0.00 – 9,518.29
– swap transactions 0.00 0.00
– forward foreign exchange transactions 0.00 0.00
Total Liabilities 0.00 – 217,745.02
Net assets of the Subfund 93,188,738.72 108,730,197.90
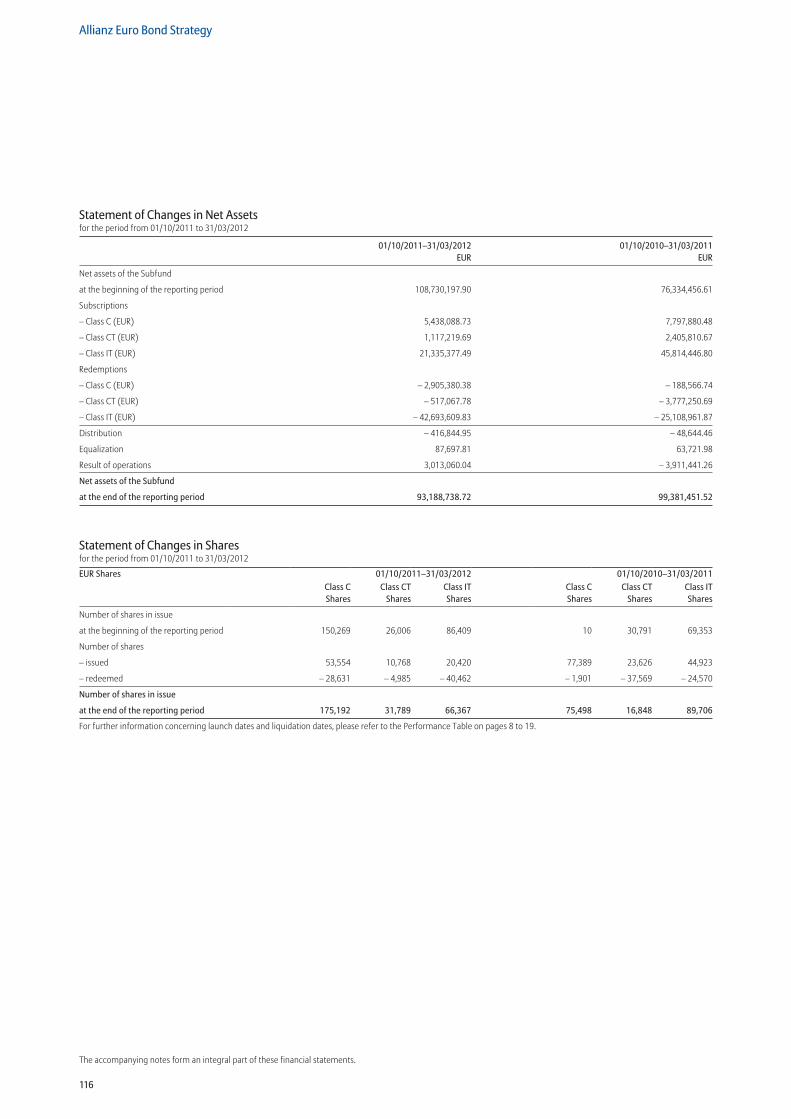
116
Allianz Euro Bond Strategy
The accompanying notes form an integral part of these financial statements.
Statement of Changes in Net Assetsfor the period from 01/10/2011 to 31/03/2012
01/10/2011–31/03/2012 01/10/2010–31/03/2011 EUR EUR
Net assets of the Subfund
at the beginning of the reporting period 108,730,197.90 76,334,456.61
Subscriptions
– Class C (EUR) 5,438,088.73 7,797,880.48
– Class CT (EUR) 1,117,219.69 2,405,810.67
– Class IT (EUR) 21,335,377.49 45,814,446.80
Redemptions
– Class C (EUR) – 2,905,380.38 – 188,566.74
– Class CT (EUR) – 517,067.78 – 3,777,250.69
– Class IT (EUR) – 42,693,609.83 – 25,108,961.87
Distribution – 416,844.95 – 48,644.46
Equalization 87,697.81 63,721.98
Result of operations 3,013,060.04 – 3,911,441.26
Net assets of the Subfund
at the end of the reporting period 93,188,738.72 99,381,451.52
Statement of Changes in Sharesfor the period from 01/10/2011 to 31/03/2012
EUR Shares 01/10/2011–31/03/2012 01/10/2010–31/03/2011Class C Shares
Class CT Shares
Class IT Shares
Class C Shares
Class CT Shares
Class IT Shares
Number of shares in issue
at the beginning of the reporting period 150,269 26,006 86,409 10 30,791 69,353
Number of shares
– issued 53,554 10,768 20,420 77,389 23,626 44,923
– redeemed – 28,631 – 4,985 – 40,462 – 1,901 – 37,569 – 24,570
Number of shares in issue
at the end of the reporting period 175,192 31,789 66,367 75,498 16,848 89,706
For further information concerning launch dates and liquidation dates, please refer to the Performance Table on pages 8 to 19.
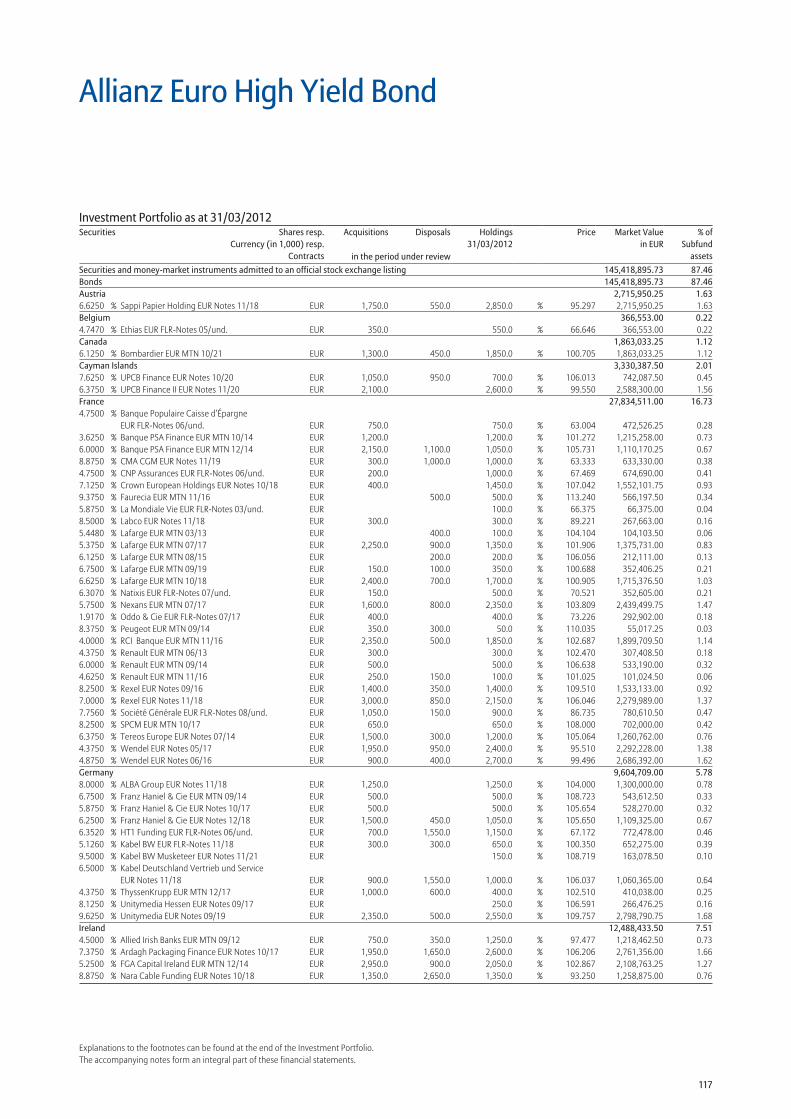
117
Explanations to the footnotes can be found at the end of the Investment Portfolio.The accompanying notes form an integral part of these financial statements.
Allianz Euro High Yield Bond
Securities and money-market instruments admitted to an official stock exchange listing 145,418,895.73 87.46Bonds 145,418,895.73 87.46Austria 2,715,950.25 1.636.6250 % Sappi Papier Holding EUR Notes 11/18 EUR 1,750.0 550.0 2,850.0 % 95.297 2,715,950.25 1.63Belgium 366,553.00 0.224.7470 % Ethias EUR FLR-Notes 05/und. EUR 350.0 550.0 % 66.646 366,553.00 0.22Canada 1,863,033.25 1.126.1250 % Bombardier EUR MTN 10/21 EUR 1,300.0 450.0 1,850.0 % 100.705 1,863,033.25 1.12Cayman Islands 3,330,387.50 2.017.6250 % UPCB Finance EUR Notes 10/20 EUR 1,050.0 950.0 700.0 % 106.013 742,087.50 0.456.3750 % UPCB Finance II EUR Notes 11/20 EUR 2,100.0 2,600.0 % 99.550 2,588,300.00 1.56France 27,834,511.00 16.734.7500 % Banque Populaire Caisse d’Épargne
EUR FLR-Notes 06/und. EUR 750.0 750.0 % 63.004 472,526.25 0.283.6250 % Banque PSA Finance EUR MTN 10/14 EUR 1,200.0 1,200.0 % 101.272 1,215,258.00 0.736.0000 % Banque PSA Finance EUR MTN 12/14 EUR 2,150.0 1,100.0 1,050.0 % 105.731 1,110,170.25 0.678.8750 % CMA CGM EUR Notes 11/19 EUR 300.0 1,000.0 1,000.0 % 63.333 633,330.00 0.384.7500 % CNP Assurances EUR FLR-Notes 06/und. EUR 200.0 1,000.0 % 67.469 674,690.00 0.417.1250 % Crown European Holdings EUR Notes 10/18 EUR 400.0 1,450.0 % 107.042 1,552,101.75 0.939.3750 % Faurecia EUR MTN 11/16 EUR 500.0 500.0 % 113.240 566,197.50 0.345.8750 % La Mondiale Vie EUR FLR-Notes 03/und. EUR 100.0 % 66.375 66,375.00 0.048.5000 % Labco EUR Notes 11/18 EUR 300.0 300.0 % 89.221 267,663.00 0.165.4480 % Lafarge EUR MTN 03/13 EUR 400.0 100.0 % 104.104 104,103.50 0.065.3750 % Lafarge EUR MTN 07/17 EUR 2,250.0 900.0 1,350.0 % 101.906 1,375,731.00 0.836.1250 % Lafarge EUR MTN 08/15 EUR 200.0 200.0 % 106.056 212,111.00 0.136.7500 % Lafarge EUR MTN 09/19 EUR 150.0 100.0 350.0 % 100.688 352,406.25 0.216.6250 % Lafarge EUR MTN 10/18 EUR 2,400.0 700.0 1,700.0 % 100.905 1,715,376.50 1.036.3070 % Natixis EUR FLR-Notes 07/und. EUR 150.0 500.0 % 70.521 352,605.00 0.215.7500 % Nexans EUR MTN 07/17 EUR 1,600.0 800.0 2,350.0 % 103.809 2,439,499.75 1.471.9170 % Oddo & Cie EUR FLR-Notes 07/17 EUR 400.0 400.0 % 73.226 292,902.00 0.188.3750 % Peugeot EUR MTN 09/14 EUR 350.0 300.0 50.0 % 110.035 55,017.25 0.034.0000 % RCI Banque EUR MTN 11/16 EUR 2,350.0 500.0 1,850.0 % 102.687 1,899,709.50 1.144.3750 % Renault EUR MTN 06/13 EUR 300.0 300.0 % 102.470 307,408.50 0.186.0000 % Renault EUR MTN 09/14 EUR 500.0 500.0 % 106.638 533,190.00 0.324.6250 % Renault EUR MTN 11/16 EUR 250.0 150.0 100.0 % 101.025 101,024.50 0.068.2500 % Rexel EUR Notes 09/16 EUR 1,400.0 350.0 1,400.0 % 109.510 1,533,133.00 0.927.0000 % Rexel EUR Notes 11/18 EUR 3,000.0 850.0 2,150.0 % 106.046 2,279,989.00 1.377.7560 % Société Générale EUR FLR-Notes 08/und. EUR 1,050.0 150.0 900.0 % 86.735 780,610.50 0.478.2500 % SPCM EUR MTN 10/17 EUR 650.0 650.0 % 108.000 702,000.00 0.426.3750 % Tereos Europe EUR Notes 07/14 EUR 1,500.0 300.0 1,200.0 % 105.064 1,260,762.00 0.764.3750 % Wendel EUR Notes 05/17 EUR 1,950.0 950.0 2,400.0 % 95.510 2,292,228.00 1.384.8750 % Wendel EUR Notes 06/16 EUR 900.0 400.0 2,700.0 % 99.496 2,686,392.00 1.62Germany 9,604,709.00 5.788.0000 % ALBA Group EUR Notes 11/18 EUR 1,250.0 1,250.0 % 104.000 1,300,000.00 0.786.7500 % Franz Haniel & Cie EUR MTN 09/14 EUR 500.0 500.0 % 108.723 543,612.50 0.335.8750 % Franz Haniel & Cie EUR Notes 10/17 EUR 500.0 500.0 % 105.654 528,270.00 0.326.2500 % Franz Haniel & Cie EUR Notes 12/18 EUR 1,500.0 450.0 1,050.0 % 105.650 1,109,325.00 0.676.3520 % HT1 Funding EUR FLR-Notes 06/und. EUR 700.0 1,550.0 1,150.0 % 67.172 772,478.00 0.465.1260 % Kabel BW EUR FLR-Notes 11/18 EUR 300.0 300.0 650.0 % 100.350 652,275.00 0.399.5000 % Kabel BW Musketeer EUR Notes 11/21 EUR 150.0 % 108.719 163,078.50 0.106.5000 % Kabel Deutschland Vertrieb und Service
EUR Notes 11/18 EUR 900.0 1,550.0 1,000.0 % 106.037 1,060,365.00 0.644.3750 % ThyssenKrupp EUR MTN 12/17 EUR 1,000.0 600.0 400.0 % 102.510 410,038.00 0.258.1250 % Unitymedia Hessen EUR Notes 09/17 EUR 250.0 % 106.591 266,476.25 0.169.6250 % Unitymedia EUR Notes 09/19 EUR 2,350.0 500.0 2,550.0 % 109.757 2,798,790.75 1.68Ireland 12,488,433.50 7.514.5000 % Allied Irish Banks EUR MTN 09/12 EUR 750.0 350.0 1,250.0 % 97.477 1,218,462.50 0.737.3750 % Ardagh Packaging Finance EUR Notes 10/17 EUR 1,950.0 1,650.0 2,600.0 % 106.206 2,761,356.00 1.665.2500 % FGA Capital Ireland EUR MTN 12/14 EUR 2,950.0 900.0 2,050.0 % 102.867 2,108,763.25 1.278.8750 % Nara Cable Funding EUR Notes 10/18 EUR 1,350.0 2,650.0 1,350.0 % 93.250 1,258,875.00 0.76
Investment Portfolio as at 31/03/2012Securities Shares resp.
Currency (in 1,000) resp.Contracts
Acquisitions Disposals Holdings 31/03/2012
Price Market Valuein EUR
% ofSubfund
assetsin the period under review
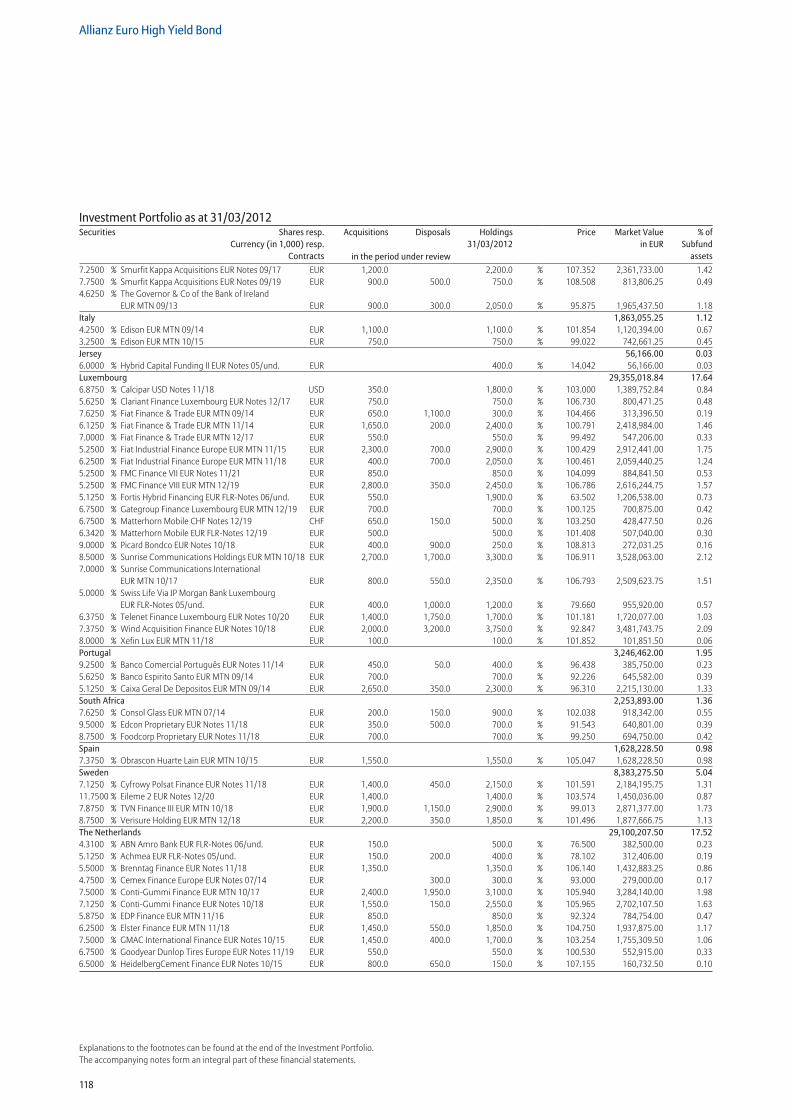
118
Allianz Euro High Yield Bond
Explanations to the footnotes can be found at the end of the Investment Portfolio.The accompanying notes form an integral part of these financial statements.
7.2500 % Smurfit Kappa Acquisitions EUR Notes 09/17 EUR 1,200.0 2,200.0 % 107.352 2,361,733.00 1.427.7500 % Smurfit Kappa Acquisitions EUR Notes 09/19 EUR 900.0 500.0 750.0 % 108.508 813,806.25 0.494.6250 % The Governor & Co of the Bank of Ireland
EUR MTN 09/13 EUR 900.0 300.0 2,050.0 % 95.875 1,965,437.50 1.18Italy 1,863,055.25 1.124.2500 % Edison EUR MTN 09/14 EUR 1,100.0 1,100.0 % 101.854 1,120,394.00 0.673.2500 % Edison EUR MTN 10/15 EUR 750.0 750.0 % 99.022 742,661.25 0.45Jersey 56,166.00 0.036.0000 % Hybrid Capital Funding II EUR Notes 05/und. EUR 400.0 % 14.042 56,166.00 0.03Luxembourg 29,355,018.84 17.646.8750 % Calcipar USD Notes 11/18 USD 350.0 1,800.0 % 103.000 1,389,752.84 0.845.6250 % Clariant Finance Luxembourg EUR Notes 12/17 EUR 750.0 750.0 % 106.730 800,471.25 0.487.6250 % Fiat Finance & Trade EUR MTN 09/14 EUR 650.0 1,100.0 300.0 % 104.466 313,396.50 0.196.1250 % Fiat Finance & Trade EUR MTN 11/14 EUR 1,650.0 200.0 2,400.0 % 100.791 2,418,984.00 1.467.0000 % Fiat Finance & Trade EUR MTN 12/17 EUR 550.0 550.0 % 99.492 547,206.00 0.335.2500 % Fiat Industrial Finance Europe EUR MTN 11/15 EUR 2,300.0 700.0 2,900.0 % 100.429 2,912,441.00 1.756.2500 % Fiat Industrial Finance Europe EUR MTN 11/18 EUR 400.0 700.0 2,050.0 % 100.461 2,059,440.25 1.245.2500 % FMC Finance VII EUR Notes 11/21 EUR 850.0 850.0 % 104.099 884,841.50 0.535.2500 % FMC Finance VIII EUR MTN 12/19 EUR 2,800.0 350.0 2,450.0 % 106.786 2,616,244.75 1.575.1250 % Fortis Hybrid Financing EUR FLR-Notes 06/und. EUR 550.0 1,900.0 % 63.502 1,206,538.00 0.736.7500 % Gategroup Finance Luxembourg EUR MTN 12/19 EUR 700.0 700.0 % 100.125 700,875.00 0.426.7500 % Matterhorn Mobile CHF Notes 12/19 CHF 650.0 150.0 500.0 % 103.250 428,477.50 0.266.3420 % Matterhorn Mobile EUR FLR-Notes 12/19 EUR 500.0 500.0 % 101.408 507,040.00 0.309.0000 % Picard Bondco EUR Notes 10/18 EUR 400.0 900.0 250.0 % 108.813 272,031.25 0.168.5000 % Sunrise Communications Holdings EUR MTN 10/18 EUR 2,700.0 1,700.0 3,300.0 % 106.911 3,528,063.00 2.127.0000 % Sunrise Communications International
EUR MTN 10/17 EUR 800.0 550.0 2,350.0 % 106.793 2,509,623.75 1.515.0000 % Swiss Life Via JP Morgan Bank Luxembourg
EUR FLR-Notes 05/und. EUR 400.0 1,000.0 1,200.0 % 79.660 955,920.00 0.576.3750 % Telenet Finance Luxembourg EUR Notes 10/20 EUR 1,400.0 1,750.0 1,700.0 % 101.181 1,720,077.00 1.037.3750 % Wind Acquisition Finance EUR Notes 10/18 EUR 2,000.0 3,200.0 3,750.0 % 92.847 3,481,743.75 2.098.0000 % Xefin Lux EUR MTN 11/18 EUR 100.0 100.0 % 101.852 101,851.50 0.06Portugal 3,246,462.00 1.959.2500 % Banco Comercial Português EUR Notes 11/14 EUR 450.0 50.0 400.0 % 96.438 385,750.00 0.235.6250 % Banco Espirito Santo EUR MTN 09/14 EUR 700.0 700.0 % 92.226 645,582.00 0.395.1250 % Caixa Geral De Depositos EUR MTN 09/14 EUR 2,650.0 350.0 2,300.0 % 96.310 2,215,130.00 1.33South Africa 2,253,893.00 1.367.6250 % Consol Glass EUR MTN 07/14 EUR 200.0 150.0 900.0 % 102.038 918,342.00 0.559.5000 % Edcon Proprietary EUR Notes 11/18 EUR 350.0 500.0 700.0 % 91.543 640,801.00 0.398.7500 % Foodcorp Proprietary EUR Notes 11/18 EUR 700.0 700.0 % 99.250 694,750.00 0.42Spain 1,628,228.50 0.987.3750 % Obrascon Huarte Lain EUR MTN 10/15 EUR 1,550.0 1,550.0 % 105.047 1,628,228.50 0.98Sweden 8,383,275.50 5.047.1250 % Cyfrowy Polsat Finance EUR Notes 11/18 EUR 1,400.0 450.0 2,150.0 % 101.591 2,184,195.75 1.3111.7500 % Eileme 2 EUR Notes 12/20 EUR 1,400.0 1,400.0 % 103.574 1,450,036.00 0.877.8750 % TVN Finance III EUR MTN 10/18 EUR 1,900.0 1,150.0 2,900.0 % 99.013 2,871,377.00 1.738.7500 % Verisure Holding EUR MTN 12/18 EUR 2,200.0 350.0 1,850.0 % 101.496 1,877,666.75 1.13The Netherlands 29,100,207.50 17.524.3100 % ABN Amro Bank EUR FLR-Notes 06/und. EUR 150.0 500.0 % 76.500 382,500.00 0.235.1250 % Achmea EUR FLR-Notes 05/und. EUR 150.0 200.0 400.0 % 78.102 312,406.00 0.195.5000 % Brenntag Finance EUR Notes 11/18 EUR 1,350.0 1,350.0 % 106.140 1,432,883.25 0.864.7500 % Cemex Finance Europe EUR Notes 07/14 EUR 300.0 300.0 % 93.000 279,000.00 0.177.5000 % Conti-Gummi Finance EUR MTN 10/17 EUR 2,400.0 1,950.0 3,100.0 % 105.940 3,284,140.00 1.987.1250 % Conti-Gummi Finance EUR Notes 10/18 EUR 1,550.0 150.0 2,550.0 % 105.965 2,702,107.50 1.635.8750 % EDP Finance EUR MTN 11/16 EUR 850.0 850.0 % 92.324 784,754.00 0.476.2500 % Elster Finance EUR MTN 11/18 EUR 1,450.0 550.0 1,850.0 % 104.750 1,937,875.00 1.177.5000 % GMAC International Finance EUR Notes 10/15 EUR 1,450.0 400.0 1,700.0 % 103.254 1,755,309.50 1.066.7500 % Goodyear Dunlop Tires Europe EUR Notes 11/19 EUR 550.0 550.0 % 100.530 552,915.00 0.336.5000 % HeidelbergCement Finance EUR Notes 10/15 EUR 800.0 650.0 150.0 % 107.155 160,732.50 0.10
Investment Portfolio as at 31/03/2012Securities Shares resp.
Currency (in 1,000) resp.Contracts
Acquisitions Disposals Holdings 31/03/2012
Price Market Valuein EUR
% ofSubfund
assetsin the period under review
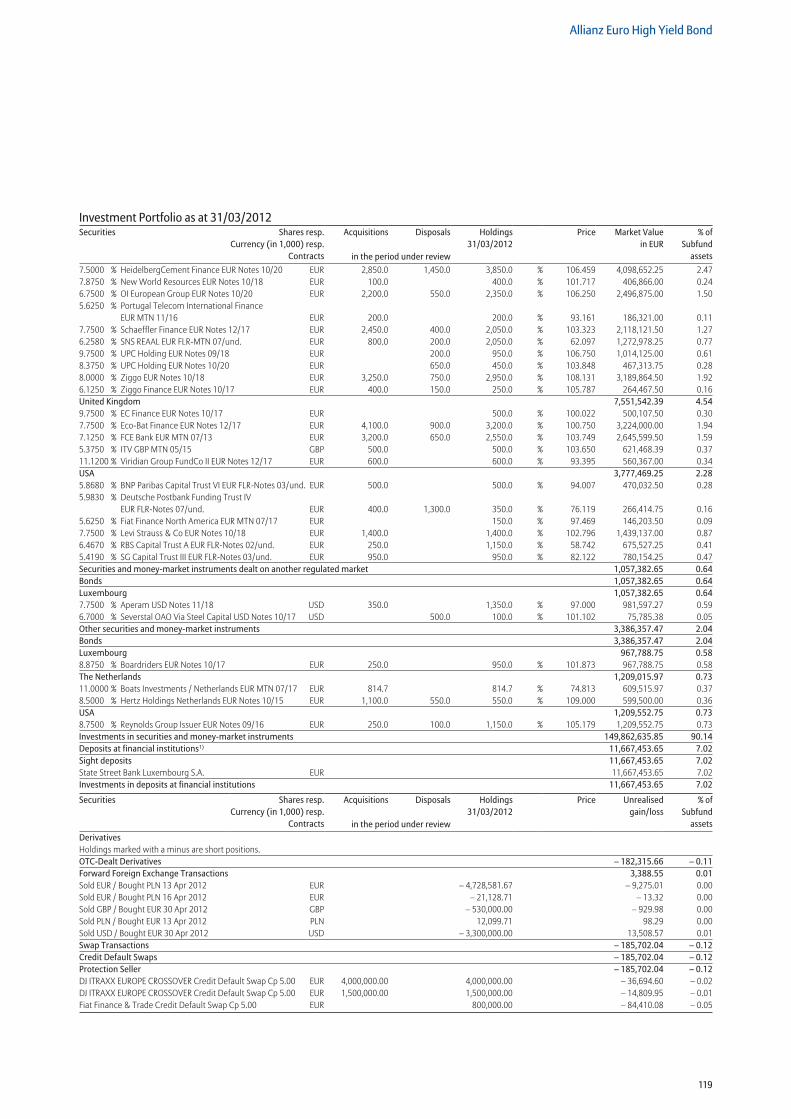
119
Allianz Euro High Yield Bond
7.5000 % HeidelbergCement Finance EUR Notes 10/20 EUR 2,850.0 1,450.0 3,850.0 % 106.459 4,098,652.25 2.477.8750 % New World Resources EUR Notes 10/18 EUR 100.0 400.0 % 101.717 406,866.00 0.246.7500 % OI European Group EUR Notes 10/20 EUR 2,200.0 550.0 2,350.0 % 106.250 2,496,875.00 1.505.6250 % Portugal Telecom International Finance
EUR MTN 11/16 EUR 200.0 200.0 % 93.161 186,321.00 0.117.7500 % Schaeffler Finance EUR Notes 12/17 EUR 2,450.0 400.0 2,050.0 % 103.323 2,118,121.50 1.276.2580 % SNS REAAL EUR FLR-MTN 07/und. EUR 800.0 200.0 2,050.0 % 62.097 1,272,978.25 0.779.7500 % UPC Holding EUR Notes 09/18 EUR 200.0 950.0 % 106.750 1,014,125.00 0.618.3750 % UPC Holding EUR Notes 10/20 EUR 650.0 450.0 % 103.848 467,313.75 0.288.0000 % Ziggo EUR Notes 10/18 EUR 3,250.0 750.0 2,950.0 % 108.131 3,189,864.50 1.926.1250 % Ziggo Finance EUR Notes 10/17 EUR 400.0 150.0 250.0 % 105.787 264,467.50 0.16United Kingdom 7,551,542.39 4.549.7500 % EC Finance EUR Notes 10/17 EUR 500.0 % 100.022 500,107.50 0.307.7500 % Eco-Bat Finance EUR Notes 12/17 EUR 4,100.0 900.0 3,200.0 % 100.750 3,224,000.00 1.947.1250 % FCE Bank EUR MTN 07/13 EUR 3,200.0 650.0 2,550.0 % 103.749 2,645,599.50 1.595.3750 % ITV GBP MTN 05/15 GBP 500.0 500.0 % 103.650 621,468.39 0.3711.1200 % Viridian Group FundCo II EUR Notes 12/17 EUR 600.0 600.0 % 93.395 560,367.00 0.34USA 3,777,469.25 2.285.8680 % BNP Paribas Capital Trust VI EUR FLR-Notes 03/und. EUR 500.0 500.0 % 94.007 470,032.50 0.285.9830 % Deutsche Postbank Funding Trust IV
EUR FLR-Notes 07/und. EUR 400.0 1,300.0 350.0 % 76.119 266,414.75 0.165.6250 % Fiat Finance North America EUR MTN 07/17 EUR 150.0 % 97.469 146,203.50 0.097.7500 % Levi Strauss & Co EUR Notes 10/18 EUR 1,400.0 1,400.0 % 102.796 1,439,137.00 0.876.4670 % RBS Capital Trust A EUR FLR-Notes 02/und. EUR 250.0 1,150.0 % 58.742 675,527.25 0.415.4190 % SG Capital Trust III EUR FLR-Notes 03/und. EUR 950.0 950.0 % 82.122 780,154.25 0.47Securities and money-market instruments dealt on another regulated market 1,057,382.65 0.64Bonds 1,057,382.65 0.64Luxembourg 1,057,382.65 0.647.7500 % Aperam USD Notes 11/18 USD 350.0 1,350.0 % 97.000 981,597.27 0.596.7000 % Severstal OAO Via Steel Capital USD Notes 10/17 USD 500.0 100.0 % 101.102 75,785.38 0.05Other securities and money-market instruments 3,386,357.47 2.04Bonds 3,386,357.47 2.04Luxembourg 967,788.75 0.588.8750 % Boardriders EUR Notes 10/17 EUR 250.0 950.0 % 101.873 967,788.75 0.58The Netherlands 1,209,015.97 0.7311.0000 % Boats Investments / Netherlands EUR MTN 07/17 EUR 814.7 814.7 % 74.813 609,515.97 0.378.5000 % Hertz Holdings Netherlands EUR Notes 10/15 EUR 1,100.0 550.0 550.0 % 109.000 599,500.00 0.36USA 1,209,552.75 0.738.7500 % Reynolds Group Issuer EUR Notes 09/16 EUR 250.0 100.0 1,150.0 % 105.179 1,209,552.75 0.73Investments in securities and money-market instruments 149,862,635.85 90.14Deposits at financial institutions1) 11,667,453.65 7.02Sight deposits 11,667,453.65 7.02State Street Bank Luxembourg S.A. EUR 11,667,453.65 7.02Investments in deposits at financial institutions 11,667,453.65 7.02
Securities Shares resp.Currency (in 1,000) resp.
Contracts
Acquisitions Disposals Holdings 31/03/2012
Price Unrealisedgain/loss
% ofSubfund
assetsin the period under reviewDerivatives Holdings marked with a minus are short positions. OTC-Dealt Derivatives – 182,315.66 – 0.11Forward Foreign Exchange Transactions 3,388.55 0.01Sold EUR / Bought PLN 13 Apr 2012 EUR – 4,728,581.67 – 9,275.01 0.00Sold EUR / Bought PLN 16 Apr 2012 EUR – 21,128.71 – 13.32 0.00Sold GBP / Bought EUR 30 Apr 2012 GBP – 530,000.00 – 929.98 0.00Sold PLN / Bought EUR 13 Apr 2012 PLN 12,099.71 98.29 0.00Sold USD / Bought EUR 30 Apr 2012 USD – 3,300,000.00 13,508.57 0.01Swap Transactions – 185,702.04 – 0.12Credit Default Swaps – 185,702.04 – 0.12Protection Seller – 185,702.04 – 0.12DJ ITRAXX EUROPE CROSSOVER Credit Default Swap Cp 5.00 EUR 4,000,000.00 4,000,000.00 – 36,694.60 – 0.02DJ ITRAXX EUROPE CROSSOVER Credit Default Swap Cp 5.00 EUR 1,500,000.00 1,500,000.00 – 14,809.95 – 0.01Fiat Finance & Trade Credit Default Swap Cp 5.00 EUR 800,000.00 – 84,410.08 – 0.05
Investment Portfolio as at 31/03/2012Securities Shares resp.
Currency (in 1,000) resp.Contracts
Acquisitions Disposals Holdings 31/03/2012
Price Market Valuein EUR
% ofSubfund
assetsin the period under review
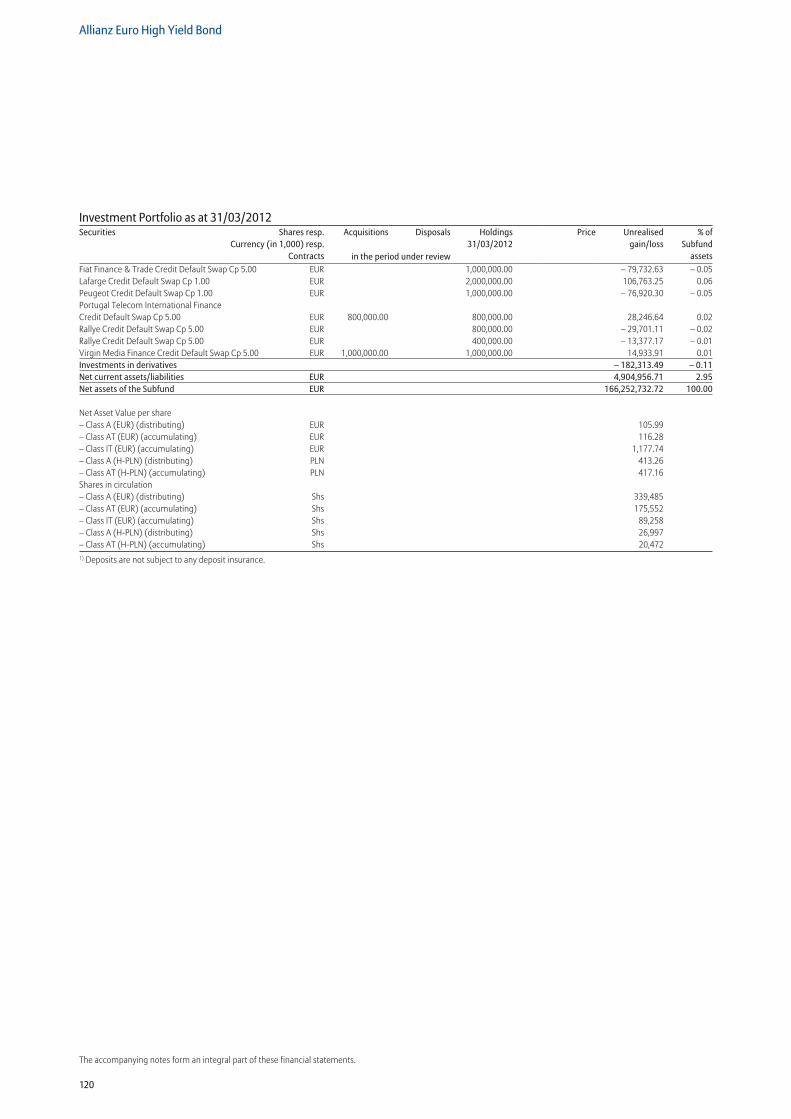
120
Allianz Euro High Yield Bond
The accompanying notes form an integral part of these financial statements.
Investment Portfolio as at 31/03/2012Securities Shares resp.
Currency (in 1,000) resp.Contracts
Acquisitions Disposals Holdings 31/03/2012
Price Unrealisedgain/loss
% ofSubfund
assetsin the period under reviewFiat Finance & Trade Credit Default Swap Cp 5.00 EUR 1,000,000.00 – 79,732.63 – 0.05Lafarge Credit Default Swap Cp 1.00 EUR 2,000,000.00 106,763.25 0.06Peugeot Credit Default Swap Cp 1.00 EUR 1,000,000.00 – 76,920.30 – 0.05Portugal Telecom International Finance Credit Default Swap Cp 5.00 EUR 800,000.00 800,000.00 28,246.64 0.02Rallye Credit Default Swap Cp 5.00 EUR 800,000.00 – 29,701.11 – 0.02Rallye Credit Default Swap Cp 5.00 EUR 400,000.00 – 13,377.17 – 0.01Virgin Media Finance Credit Default Swap Cp 5.00 EUR 1,000,000.00 1,000,000.00 14,933.91 0.01Investments in derivatives – 182,313.49 – 0.11Net current assets/liabilities EUR 4,904,956.71 2.95Net assets of the Subfund EUR 166,252,732.72 100.00
Net Asset Value per share – Class A (EUR) (distributing) EUR 105.99 – Class AT (EUR) (accumulating) EUR 116.28 – Class IT (EUR) (accumulating) EUR 1,177.74 – Class A (H-PLN) (distributing) PLN 413.26 – Class AT (H-PLN) (accumulating) PLN 417.16 Shares in circulation – Class A (EUR) (distributing) Shs 339,485 – Class AT (EUR) (accumulating) Shs 175,552 – Class IT (EUR) (accumulating) Shs 89,258 – Class A (H-PLN) (distributing) Shs 26,997 – Class AT (H-PLN) (accumulating) Shs 20,4721) Deposits are not subject to any deposit insurance.
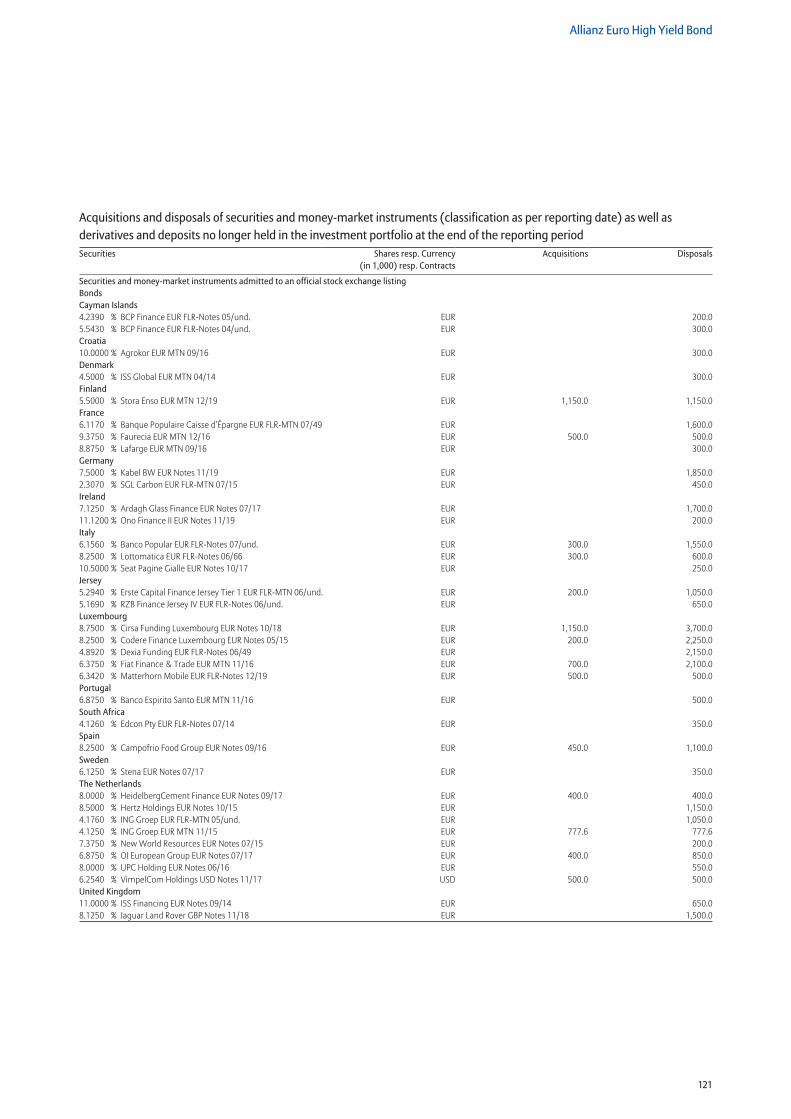
121
Allianz Euro High Yield Bond
Securities and money-market instruments admitted to an official stock exchange listing BondsCayman Islands4.2390 % BCP Finance EUR FLR-Notes 05/und. EUR 200.05.5430 % BCP Finance EUR FLR-Notes 04/und. EUR 300.0Croatia10.0000 % Agrokor EUR MTN 09/16 EUR 300.0Denmark4.5000 % ISS Global EUR MTN 04/14 EUR 300.0Finland5.5000 % Stora Enso EUR MTN 12/19 EUR 1,150.0 1,150.0France6.1170 % Banque Populaire Caisse d’Épargne EUR FLR-MTN 07/49 EUR 1,600.09.3750 % Faurecia EUR MTN 12/16 EUR 500.0 500.08.8750 % Lafarge EUR MTN 09/16 EUR 300.0Germany7.5000 % Kabel BW EUR Notes 11/19 EUR 1,850.02.3070 % SGL Carbon EUR FLR-MTN 07/15 EUR 450.0Ireland7.1250 % Ardagh Glass Finance EUR Notes 07/17 EUR 1,700.011.1200 % Ono Finance II EUR Notes 11/19 EUR 200.0Italy6.1560 % Banco Popular EUR FLR-Notes 07/und. EUR 300.0 1,550.08.2500 % Lottomatica EUR FLR-Notes 06/66 EUR 300.0 600.010.5000 % Seat Pagine Gialle EUR Notes 10/17 EUR 250.0Jersey5.2940 % Erste Capital Finance Jersey Tier 1 EUR FLR-MTN 06/und. EUR 200.0 1,050.05.1690 % RZB Finance Jersey IV EUR FLR-Notes 06/und. EUR 650.0Luxembourg8.7500 % Cirsa Funding Luxembourg EUR Notes 10/18 EUR 1,150.0 3,700.08.2500 % Codere Finance Luxembourg EUR Notes 05/15 EUR 200.0 2,250.04.8920 % Dexia Funding EUR FLR-Notes 06/49 EUR 2,150.06.3750 % Fiat Finance & Trade EUR MTN 11/16 EUR 700.0 2,100.06.3420 % Matterhorn Mobile EUR FLR-Notes 12/19 EUR 500.0 500.0Portugal6.8750 % Banco Espirito Santo EUR MTN 11/16 EUR 500.0South Africa4.1260 % Edcon Pty EUR FLR-Notes 07/14 EUR 350.0Spain8.2500 % Campofrio Food Group EUR Notes 09/16 EUR 450.0 1,100.0Sweden6.1250 % Stena EUR Notes 07/17 EUR 350.0The Netherlands8.0000 % HeidelbergCement Finance EUR Notes 09/17 EUR 400.0 400.08.5000 % Hertz Holdings EUR Notes 10/15 EUR 1,150.04.1760 % ING Groep EUR FLR-MTN 05/und. EUR 1,050.04.1250 % ING Groep EUR MTN 11/15 EUR 777.6 777.67.3750 % New World Resources EUR Notes 07/15 EUR 200.06.8750 % OI European Group EUR Notes 07/17 EUR 400.0 850.08.0000 % UPC Holding EUR Notes 06/16 EUR 550.06.2540 % VimpelCom Holdings USD Notes 11/17 USD 500.0 500.0United Kingdom11.0000 % ISS Financing EUR Notes 09/14 EUR 650.08.1250 % Jaguar Land Rover GBP Notes 11/18 EUR 1,500.0
Acquisitions and disposals of securities and money-market instruments (classification as per reporting date) as well as derivatives and deposits no longer held in the investment portfolio at the end of the reporting periodSecurities Shares resp. Currency
(in 1,000) resp. ContractsAcquisitions Disposals
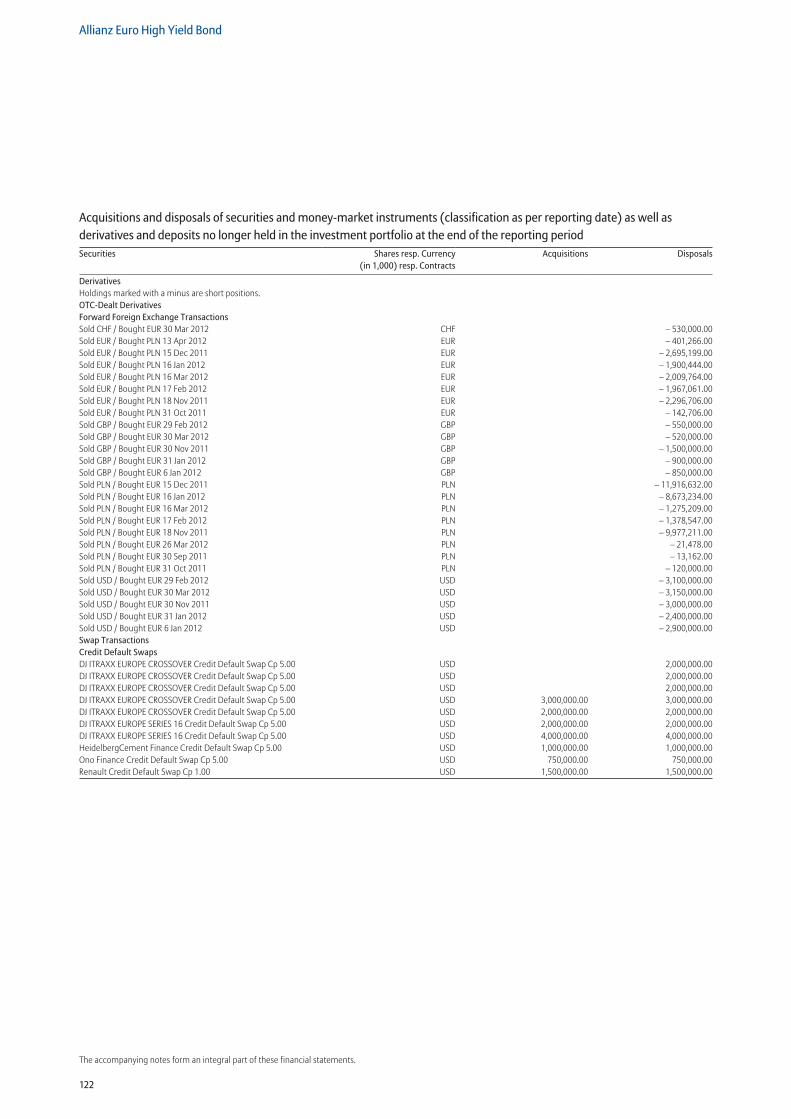
122
Allianz Euro High Yield Bond
The accompanying notes form an integral part of these financial statements.
DerivativesHoldings marked with a minus are short positions. OTC-Dealt DerivativesForward Foreign Exchange TransactionsSold CHF / Bought EUR 30 Mar 2012 CHF – 530,000.00Sold EUR / Bought PLN 13 Apr 2012 EUR – 401,266.00Sold EUR / Bought PLN 15 Dec 2011 EUR – 2,695,199.00Sold EUR / Bought PLN 16 Jan 2012 EUR – 1,900,444.00Sold EUR / Bought PLN 16 Mar 2012 EUR – 2,009,764.00Sold EUR / Bought PLN 17 Feb 2012 EUR – 1,967,061.00Sold EUR / Bought PLN 18 Nov 2011 EUR – 2,296,706.00Sold EUR / Bought PLN 31 Oct 2011 EUR – 142,706.00Sold GBP / Bought EUR 29 Feb 2012 GBP – 550,000.00Sold GBP / Bought EUR 30 Mar 2012 GBP – 520,000.00Sold GBP / Bought EUR 30 Nov 2011 GBP – 1,500,000.00Sold GBP / Bought EUR 31 Jan 2012 GBP – 900,000.00Sold GBP / Bought EUR 6 Jan 2012 GBP – 850,000.00Sold PLN / Bought EUR 15 Dec 2011 PLN – 11,916,632.00Sold PLN / Bought EUR 16 Jan 2012 PLN – 8,673,234.00Sold PLN / Bought EUR 16 Mar 2012 PLN – 1,275,209.00Sold PLN / Bought EUR 17 Feb 2012 PLN – 1,378,547.00Sold PLN / Bought EUR 18 Nov 2011 PLN – 9,977,211.00Sold PLN / Bought EUR 26 Mar 2012 PLN – 21,478.00Sold PLN / Bought EUR 30 Sep 2011 PLN – 13,162.00Sold PLN / Bought EUR 31 Oct 2011 PLN – 120,000.00Sold USD / Bought EUR 29 Feb 2012 USD – 3,100,000.00Sold USD / Bought EUR 30 Mar 2012 USD – 3,150,000.00Sold USD / Bought EUR 30 Nov 2011 USD – 3,000,000.00Sold USD / Bought EUR 31 Jan 2012 USD – 2,400,000.00Sold USD / Bought EUR 6 Jan 2012 USD – 2,900,000.00Swap TransactionsCredit Default SwapsDJ ITRAXX EUROPE CROSSOVER Credit Default Swap Cp 5.00 USD 2,000,000.00DJ ITRAXX EUROPE CROSSOVER Credit Default Swap Cp 5.00 USD 2,000,000.00DJ ITRAXX EUROPE CROSSOVER Credit Default Swap Cp 5.00 USD 2,000,000.00DJ ITRAXX EUROPE CROSSOVER Credit Default Swap Cp 5.00 USD 3,000,000.00 3,000,000.00DJ ITRAXX EUROPE CROSSOVER Credit Default Swap Cp 5.00 USD 2,000,000.00 2,000,000.00DJ ITRAXX EUROPE SERIES 16 Credit Default Swap Cp 5.00 USD 2,000,000.00 2,000,000.00DJ ITRAXX EUROPE SERIES 16 Credit Default Swap Cp 5.00 USD 4,000,000.00 4,000,000.00HeidelbergCement Finance Credit Default Swap Cp 5.00 USD 1,000,000.00 1,000,000.00Ono Finance Credit Default Swap Cp 5.00 USD 750,000.00 750,000.00Renault Credit Default Swap Cp 1.00 USD 1,500,000.00 1,500,000.00
Acquisitions and disposals of securities and money-market instruments (classification as per reporting date) as well as derivatives and deposits no longer held in the investment portfolio at the end of the reporting periodSecurities Shares resp. Currency
(in 1,000) resp. ContractsAcquisitions Disposals
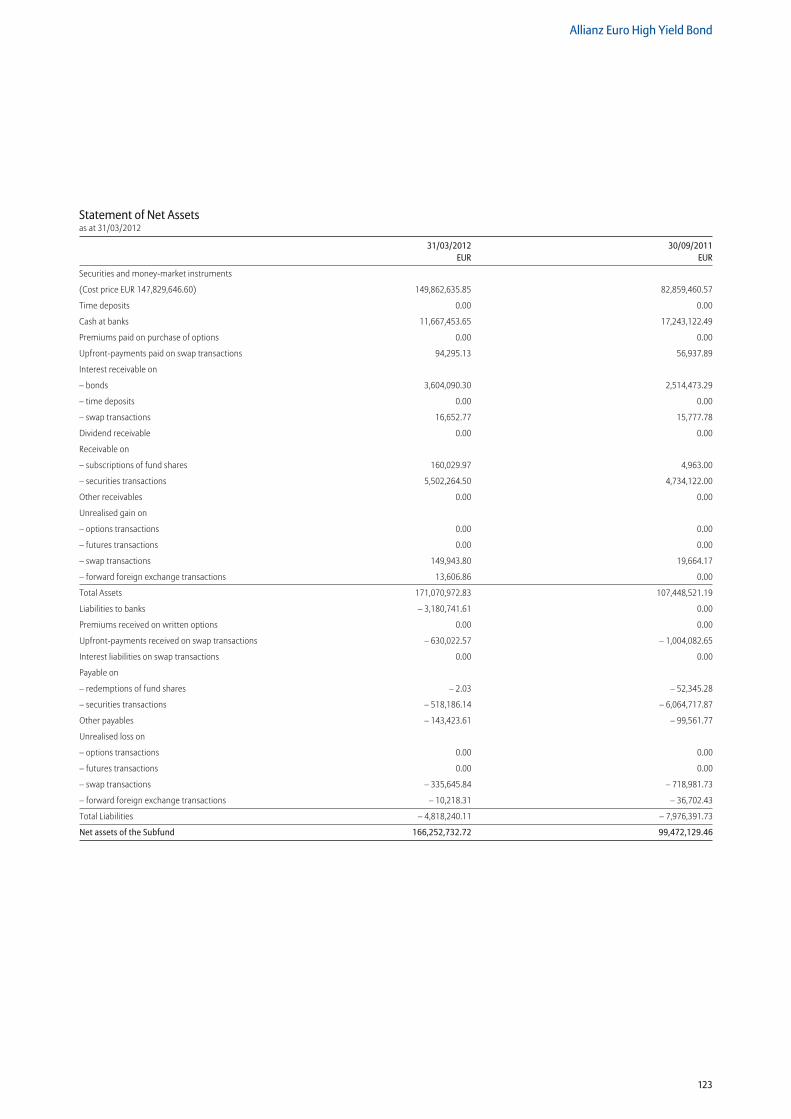
123
Allianz Euro High Yield Bond
Statement of Net Assetsas at 31/03/2012
31/03/2012 30/09/2011 EUR EUR
Securities and money-market instruments
(Cost price EUR 147,829,646.60) 149,862,635.85 82,859,460.57
Time deposits 0.00 0.00
Cash at banks 11,667,453.65 17,243,122.49
Premiums paid on purchase of options 0.00 0.00
Upfront-payments paid on swap transactions 94,295.13 56,937.89
Interest receivable on
– bonds 3,604,090.30 2,514,473.29
– time deposits 0.00 0.00
– swap transactions 16,652.77 15,777.78
Dividend receivable 0.00 0.00
Receivable on
– subscriptions of fund shares 160,029.97 4,963.00
– securities transactions 5,502,264.50 4,734,122.00
Other receivables 0.00 0.00
Unrealised gain on
– options transactions 0.00 0.00
– futures transactions 0.00 0.00
– swap transactions 149,943.80 19,664.17
– forward foreign exchange transactions 13,606.86 0.00
Total Assets 171,070,972.83 107,448,521.19
Liabilities to banks – 3,180,741.61 0.00
Premiums received on written options 0.00 0.00
Upfront-payments received on swap transactions – 630,022.57 – 1,004,082.65
Interest liabilities on swap transactions 0.00 0.00
Payable on
– redemptions of fund shares – 2.03 – 52,345.28
– securities transactions – 518,186.14 – 6,064,717.87
Other payables – 143,423.61 – 99,561.77
Unrealised loss on
– options transactions 0.00 0.00
– futures transactions 0.00 0.00
– swap transactions – 335,645.84 – 718,981.73
– forward foreign exchange transactions – 10,218.31 – 36,702.43
Total Liabilities – 4,818,240.11 – 7,976,391.73
Net assets of the Subfund 166,252,732.72 99,472,129.46
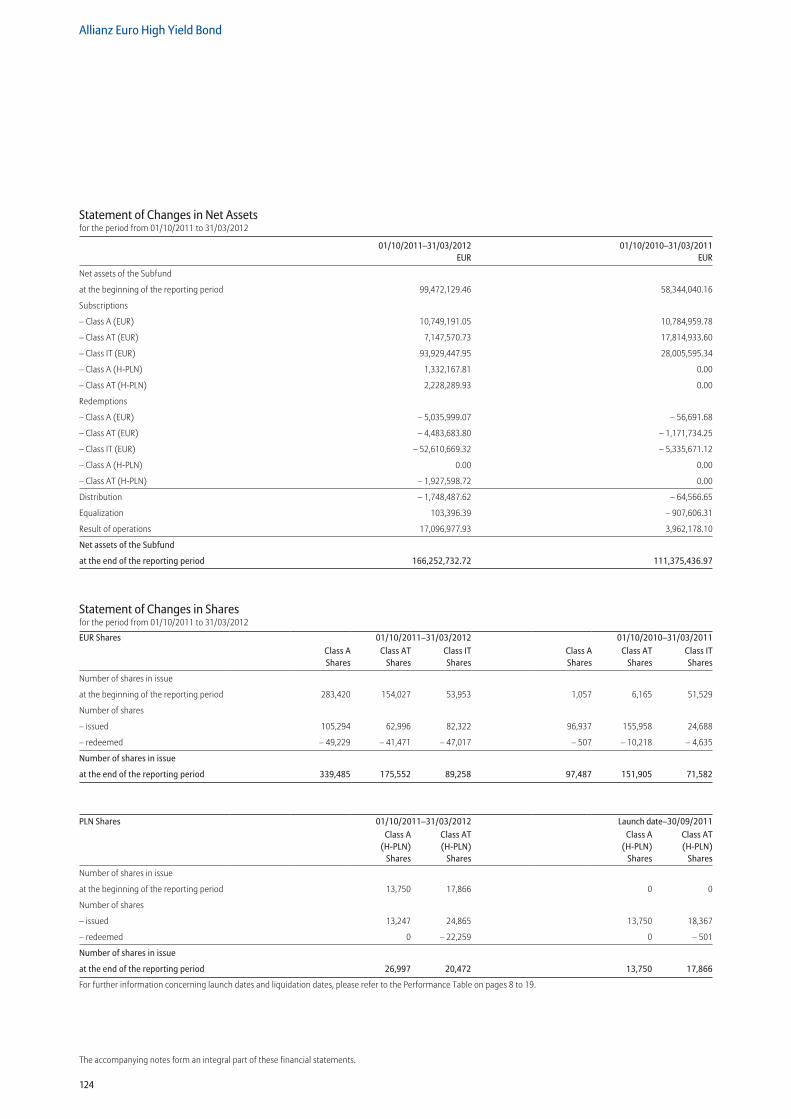
124
Allianz Euro High Yield Bond
The accompanying notes form an integral part of these financial statements.
Statement of Changes in Net Assetsfor the period from 01/10/2011 to 31/03/2012
01/10/2011–31/03/2012 01/10/2010–31/03/2011 EUR EUR
Net assets of the Subfund
at the beginning of the reporting period 99,472,129.46 58,344,040.16
Subscriptions
– Class A (EUR) 10,749,191.05 10,784,959.78
– Class AT (EUR) 7,147,570.73 17,814,933.60
– Class IT (EUR) 93,929,447.95 28,005,595.34
– Class A (H-PLN) 1,332,167.81 0.00
– Class AT (H-PLN) 2,228,289.93 0.00
Redemptions
– Class A (EUR) – 5,035,999.07 – 56,691.68
– Class AT (EUR) – 4,483,683.80 – 1,171,734.25
– Class IT (EUR) – 52,610,669.32 – 5,335,671.12
– Class A (H-PLN) 0.00 0.00
– Class AT (H-PLN) – 1,927,598.72 0.00
Distribution – 1,748,487.62 – 64,566.65
Equalization 103,396.39 – 907,606.31
Result of operations 17,096,977.93 3,962,178.10
Net assets of the Subfund
at the end of the reporting period 166,252,732.72 111,375,436.97
Statement of Changes in Sharesfor the period from 01/10/2011 to 31/03/2012
EUR Shares 01/10/2011–31/03/2012 01/10/2010–31/03/2011Class A Shares
Class AT Shares
Class IT Shares
Class A Shares
Class AT Shares
Class IT Shares
Number of shares in issue
at the beginning of the reporting period 283,420 154,027 53,953 1,057 6,165 51,529
Number of shares
– issued 105,294 62,996 82,322 96,937 155,958 24,688
– redeemed – 49,229 – 41,471 – 47,017 – 507 – 10,218 – 4,635
Number of shares in issue
at the end of the reporting period 339,485 175,552 89,258 97,487 151,905 71,582
PLN Shares 01/10/2011–31/03/2012 Launch date–30/09/2011Class A
(H-PLN) Shares
Class AT (H-PLN)
Shares
Class A (H-PLN)
Shares
Class AT (H-PLN)
Shares
Number of shares in issue
at the beginning of the reporting period 13,750 17,866 0 0
Number of shares
– issued 13,247 24,865 13,750 18,367
– redeemed 0 – 22,259 0 – 501
Number of shares in issue
at the end of the reporting period 26,997 20,472 13,750 17,866
For further information concerning launch dates and liquidation dates, please refer to the Performance Table on pages 8 to 19.
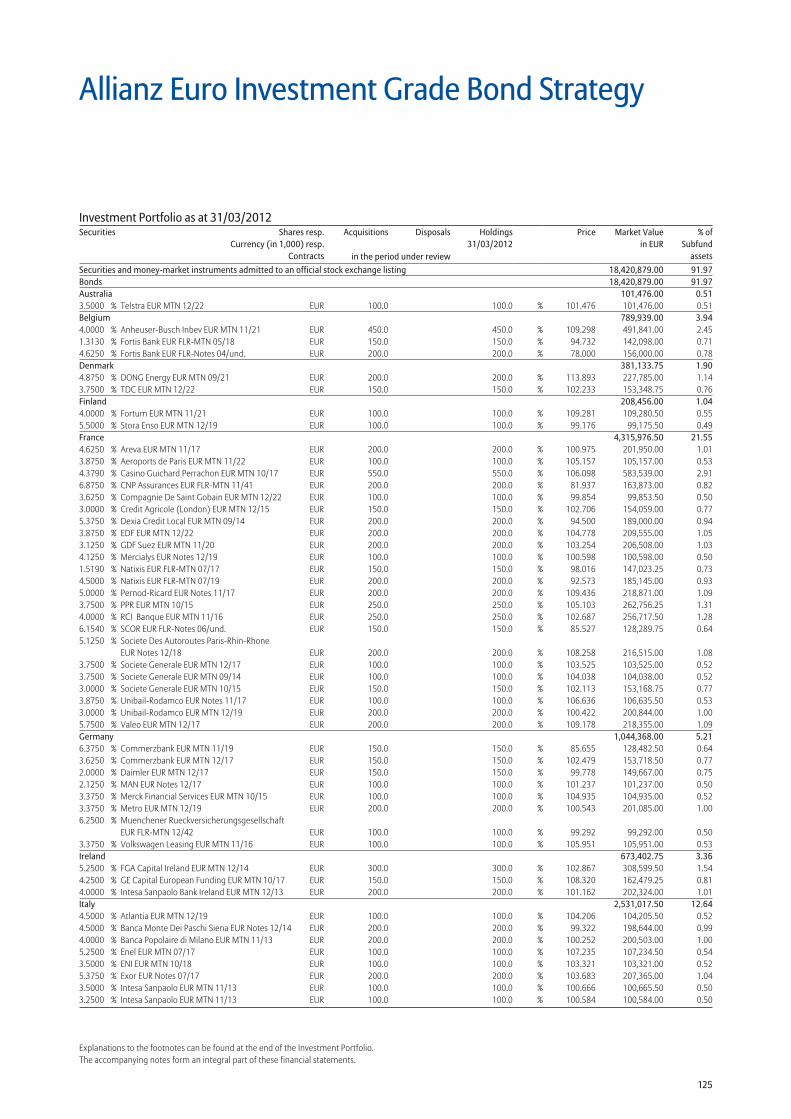
125
Explanations to the footnotes can be found at the end of the Investment Portfolio.The accompanying notes form an integral part of these financial statements.
Allianz Euro Investment Grade Bond Strategy
Securities and money-market instruments admitted to an official stock exchange listing 18,420,879.00 91.97Bonds 18,420,879.00 91.97Australia 101,476.00 0.513.5000 % Telstra EUR MTN 12/22 EUR 100.0 100.0 % 101.476 101,476.00 0.51Belgium 789,939.00 3.944.0000 % Anheuser-Busch Inbev EUR MTN 11/21 EUR 450.0 450.0 % 109.298 491,841.00 2.451.3130 % Fortis Bank EUR FLR-MTN 05/18 EUR 150.0 150.0 % 94.732 142,098.00 0.714.6250 % Fortis Bank EUR FLR-Notes 04/und. EUR 200.0 200.0 % 78.000 156,000.00 0.78Denmark 381,133.75 1.904.8750 % DONG Energy EUR MTN 09/21 EUR 200.0 200.0 % 113.893 227,785.00 1.143.7500 % TDC EUR MTN 12/22 EUR 150.0 150.0 % 102.233 153,348.75 0.76Finland 208,456.00 1.044.0000 % Fortum EUR MTN 11/21 EUR 100.0 100.0 % 109.281 109,280.50 0.555.5000 % Stora Enso EUR MTN 12/19 EUR 100.0 100.0 % 99.176 99,175.50 0.49France 4,315,976.50 21.554.6250 % Areva EUR MTN 11/17 EUR 200.0 200.0 % 100.975 201,950.00 1.013.8750 % Aeroports de Paris EUR MTN 11/22 EUR 100.0 100.0 % 105.157 105,157.00 0.534.3790 % Casino Guichard Perrachon EUR MTN 10/17 EUR 550.0 550.0 % 106.098 583,539.00 2.916.8750 % CNP Assurances EUR FLR-MTN 11/41 EUR 200.0 200.0 % 81.937 163,873.00 0.823.6250 % Compagnie De Saint Gobain EUR MTN 12/22 EUR 100.0 100.0 % 99.854 99,853.50 0.503.0000 % Credit Agricole (London) EUR MTN 12/15 EUR 150.0 150.0 % 102.706 154,059.00 0.775.3750 % Dexia Credit Local EUR MTN 09/14 EUR 200.0 200.0 % 94.500 189,000.00 0.943.8750 % EDF EUR MTN 12/22 EUR 200.0 200.0 % 104.778 209,555.00 1.053.1250 % GDF Suez EUR MTN 11/20 EUR 200.0 200.0 % 103.254 206,508.00 1.034.1250 % Mercialys EUR Notes 12/19 EUR 100.0 100.0 % 100.598 100,598.00 0.501.5190 % Natixis EUR FLR-MTN 07/17 EUR 150.0 150.0 % 98.016 147,023.25 0.734.5000 % Natixis EUR FLR-MTN 07/19 EUR 200.0 200.0 % 92.573 185,145.00 0.935.0000 % Pernod-Ricard EUR Notes 11/17 EUR 200.0 200.0 % 109.436 218,871.00 1.093.7500 % PPR EUR MTN 10/15 EUR 250.0 250.0 % 105.103 262,756.25 1.314.0000 % RCI Banque EUR MTN 11/16 EUR 250.0 250.0 % 102.687 256,717.50 1.286.1540 % SCOR EUR FLR-Notes 06/und. EUR 150.0 150.0 % 85.527 128,289.75 0.645.1250 % Societe Des Autoroutes Paris-Rhin-Rhone
EUR Notes 12/18 EUR 200.0 200.0 % 108.258 216,515.00 1.083.7500 % Societe Generale EUR MTN 12/17 EUR 100.0 100.0 % 103.525 103,525.00 0.523.7500 % Societe Generale EUR MTN 09/14 EUR 100.0 100.0 % 104.038 104,038.00 0.523.0000 % Societe Generale EUR MTN 10/15 EUR 150.0 150.0 % 102.113 153,168.75 0.773.8750 % Unibail-Rodamco EUR Notes 11/17 EUR 100.0 100.0 % 106.636 106,635.50 0.533.0000 % Unibail-Rodamco EUR MTN 12/19 EUR 200.0 200.0 % 100.422 200,844.00 1.005.7500 % Valeo EUR MTN 12/17 EUR 200.0 200.0 % 109.178 218,355.00 1.09Germany 1,044,368.00 5.216.3750 % Commerzbank EUR MTN 11/19 EUR 150.0 150.0 % 85.655 128,482.50 0.643.6250 % Commerzbank EUR MTN 12/17 EUR 150.0 150.0 % 102.479 153,718.50 0.772.0000 % Daimler EUR MTN 12/17 EUR 150.0 150.0 % 99.778 149,667.00 0.752.1250 % MAN EUR Notes 12/17 EUR 100.0 100.0 % 101.237 101,237.00 0.503.3750 % Merck Financial Services EUR MTN 10/15 EUR 100.0 100.0 % 104.935 104,935.00 0.523.3750 % Metro EUR MTN 12/19 EUR 200.0 200.0 % 100.543 201,085.00 1.006.2500 % Muenchener Rueckversicherungsgesellschaft
EUR FLR-MTN 12/42 EUR 100.0 100.0 % 99.292 99,292.00 0.503.3750 % Volkswagen Leasing EUR MTN 11/16 EUR 100.0 100.0 % 105.951 105,951.00 0.53Ireland 673,402.75 3.365.2500 % FGA Capital Ireland EUR MTN 12/14 EUR 300.0 300.0 % 102.867 308,599.50 1.544.2500 % GE Capital European Funding EUR MTN 10/17 EUR 150.0 150.0 % 108.320 162,479.25 0.814.0000 % Intesa Sanpaolo Bank Ireland EUR MTN 12/13 EUR 200.0 200.0 % 101.162 202,324.00 1.01Italy 2,531,017.50 12.644.5000 % Atlantia EUR MTN 12/19 EUR 100.0 100.0 % 104.206 104,205.50 0.524.5000 % Banca Monte Dei Paschi Siena EUR Notes 12/14 EUR 200.0 200.0 % 99.322 198,644.00 0.994.0000 % Banca Popolaire di Milano EUR MTN 11/13 EUR 200.0 200.0 % 100.252 200,503.00 1.005.2500 % Enel EUR MTN 07/17 EUR 100.0 100.0 % 107.235 107,234.50 0.543.5000 % ENI EUR MTN 10/18 EUR 100.0 100.0 % 103.321 103,321.00 0.525.3750 % Exor EUR Notes 07/17 EUR 200.0 200.0 % 103.683 207,365.00 1.043.5000 % Intesa Sanpaolo EUR MTN 11/13 EUR 100.0 100.0 % 100.666 100,665.50 0.503.2500 % Intesa Sanpaolo EUR MTN 11/13 EUR 100.0 100.0 % 100.584 100,584.00 0.50
Investment Portfolio as at 31/03/2012Securities Shares resp.
Currency (in 1,000) resp.Contracts
Acquisitions Disposals Holdings 31/03/2012
Price Market Valuein EUR
% ofSubfund
assetsin the period under review
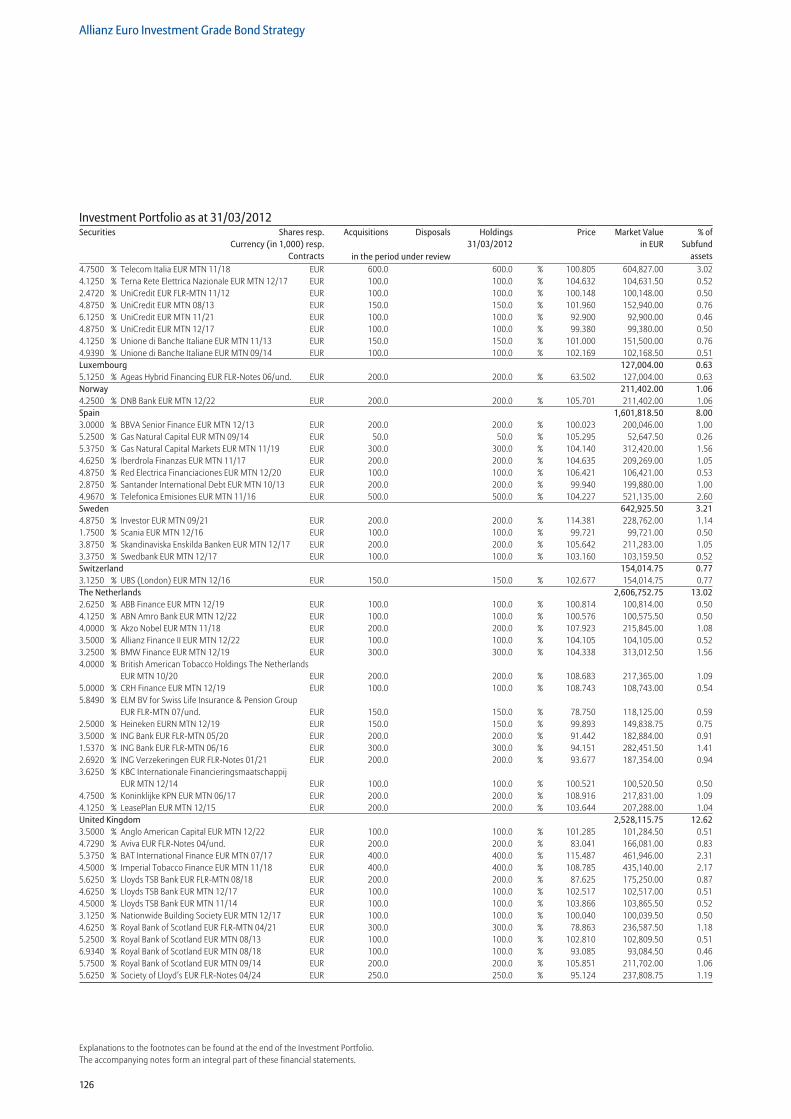
126
Allianz Euro Investment Grade Bond Strategy
Explanations to the footnotes can be found at the end of the Investment Portfolio.The accompanying notes form an integral part of these financial statements.
Investment Portfolio as at 31/03/2012Securities Shares resp.
Currency (in 1,000) resp.Contracts
Acquisitions Disposals Holdings 31/03/2012
Price Market Valuein EUR
% ofSubfund
assetsin the period under review4.7500 % Telecom Italia EUR MTN 11/18 EUR 600.0 600.0 % 100.805 604,827.00 3.024.1250 % Terna Rete Elettrica Nazionale EUR MTN 12/17 EUR 100.0 100.0 % 104.632 104,631.50 0.522.4720 % UniCredit EUR FLR-MTN 11/12 EUR 100.0 100.0 % 100.148 100,148.00 0.504.8750 % UniCredit EUR MTN 08/13 EUR 150.0 150.0 % 101.960 152,940.00 0.766.1250 % UniCredit EUR MTN 11/21 EUR 100.0 100.0 % 92.900 92,900.00 0.464.8750 % UniCredit EUR MTN 12/17 EUR 100.0 100.0 % 99.380 99,380.00 0.504.1250 % Unione di Banche Italiane EUR MTN 11/13 EUR 150.0 150.0 % 101.000 151,500.00 0.764.9390 % Unione di Banche Italiane EUR MTN 09/14 EUR 100.0 100.0 % 102.169 102,168.50 0.51Luxembourg 127,004.00 0.635.1250 % Ageas Hybrid Financing EUR FLR-Notes 06/und. EUR 200.0 200.0 % 63.502 127,004.00 0.63Norway 211,402.00 1.064.2500 % DNB Bank EUR MTN 12/22 EUR 200.0 200.0 % 105.701 211,402.00 1.06Spain 1,601,818.50 8.003.0000 % BBVA Senior Finance EUR MTN 12/13 EUR 200.0 200.0 % 100.023 200,046.00 1.005.2500 % Gas Natural Capital EUR MTN 09/14 EUR 50.0 50.0 % 105.295 52,647.50 0.265.3750 % Gas Natural Capital Markets EUR MTN 11/19 EUR 300.0 300.0 % 104.140 312,420.00 1.564.6250 % Iberdrola Finanzas EUR MTN 11/17 EUR 200.0 200.0 % 104.635 209,269.00 1.054.8750 % Red Electrica Financiaciones EUR MTN 12/20 EUR 100.0 100.0 % 106.421 106,421.00 0.532.8750 % Santander International Debt EUR MTN 10/13 EUR 200.0 200.0 % 99.940 199,880.00 1.004.9670 % Telefonica Emisiones EUR MTN 11/16 EUR 500.0 500.0 % 104.227 521,135.00 2.60Sweden 642,925.50 3.214.8750 % Investor EUR MTN 09/21 EUR 200.0 200.0 % 114.381 228,762.00 1.141.7500 % Scania EUR MTN 12/16 EUR 100.0 100.0 % 99.721 99,721.00 0.503.8750 % Skandinaviska Enskilda Banken EUR MTN 12/17 EUR 200.0 200.0 % 105.642 211,283.00 1.053.3750 % Swedbank EUR MTN 12/17 EUR 100.0 100.0 % 103.160 103,159.50 0.52Switzerland 154,014.75 0.773.1250 % UBS (London) EUR MTN 12/16 EUR 150.0 150.0 % 102.677 154,014.75 0.77The Netherlands 2,606,752.75 13.022.6250 % ABB Finance EUR MTN 12/19 EUR 100.0 100.0 % 100.814 100,814.00 0.504.1250 % ABN Amro Bank EUR MTN 12/22 EUR 100.0 100.0 % 100.576 100,575.50 0.504.0000 % Akzo Nobel EUR MTN 11/18 EUR 200.0 200.0 % 107.923 215,845.00 1.083.5000 % Allianz Finance II EUR MTN 12/22 EUR 100.0 100.0 % 104.105 104,105.00 0.523.2500 % BMW Finance EUR MTN 12/19 EUR 300.0 300.0 % 104.338 313,012.50 1.564.0000 % British American Tobacco Holdings The Netherlands
EUR MTN 10/20 EUR 200.0 200.0 % 108.683 217,365.00 1.095.0000 % CRH Finance EUR MTN 12/19 EUR 100.0 100.0 % 108.743 108,743.00 0.545.8490 % ELM BV for Swiss Life Insurance & Pension Group
EUR FLR-MTN 07/und. EUR 150.0 150.0 % 78.750 118,125.00 0.592.5000 % Heineken EURN MTN 12/19 EUR 150.0 150.0 % 99.893 149,838.75 0.753.5000 % ING Bank EUR FLR-MTN 05/20 EUR 200.0 200.0 % 91.442 182,884.00 0.911.5370 % ING Bank EUR FLR-MTN 06/16 EUR 300.0 300.0 % 94.151 282,451.50 1.412.6920 % ING Verzekeringen EUR FLR-Notes 01/21 EUR 200.0 200.0 % 93.677 187,354.00 0.943.6250 % KBC Internationale Financieringsmaatschappij
EUR MTN 12/14 EUR 100.0 100.0 % 100.521 100,520.50 0.504.7500 % Koninklijke KPN EUR MTN 06/17 EUR 200.0 200.0 % 108.916 217,831.00 1.094.1250 % LeasePlan EUR MTN 12/15 EUR 200.0 200.0 % 103.644 207,288.00 1.04United Kingdom 2,528,115.75 12.623.5000 % Anglo American Capital EUR MTN 12/22 EUR 100.0 100.0 % 101.285 101,284.50 0.514.7290 % Aviva EUR FLR-Notes 04/und. EUR 200.0 200.0 % 83.041 166,081.00 0.835.3750 % BAT International Finance EUR MTN 07/17 EUR 400.0 400.0 % 115.487 461,946.00 2.314.5000 % Imperial Tobacco Finance EUR MTN 11/18 EUR 400.0 400.0 % 108.785 435,140.00 2.175.6250 % Lloyds TSB Bank EUR FLR-MTN 08/18 EUR 200.0 200.0 % 87.625 175,250.00 0.874.6250 % Lloyds TSB Bank EUR MTN 12/17 EUR 100.0 100.0 % 102.517 102,517.00 0.514.5000 % Lloyds TSB Bank EUR MTN 11/14 EUR 100.0 100.0 % 103.866 103,865.50 0.523.1250 % Nationwide Building Society EUR MTN 12/17 EUR 100.0 100.0 % 100.040 100,039.50 0.504.6250 % Royal Bank of Scotland EUR FLR-MTN 04/21 EUR 300.0 300.0 % 78.863 236,587.50 1.185.2500 % Royal Bank of Scotland EUR MTN 08/13 EUR 100.0 100.0 % 102.810 102,809.50 0.516.9340 % Royal Bank of Scotland EUR MTN 08/18 EUR 100.0 100.0 % 93.085 93,084.50 0.465.7500 % Royal Bank of Scotland EUR MTN 09/14 EUR 200.0 200.0 % 105.851 211,702.00 1.065.6250 % Society of Lloyd’s EUR FLR-Notes 04/24 EUR 250.0 250.0 % 95.124 237,808.75 1.19
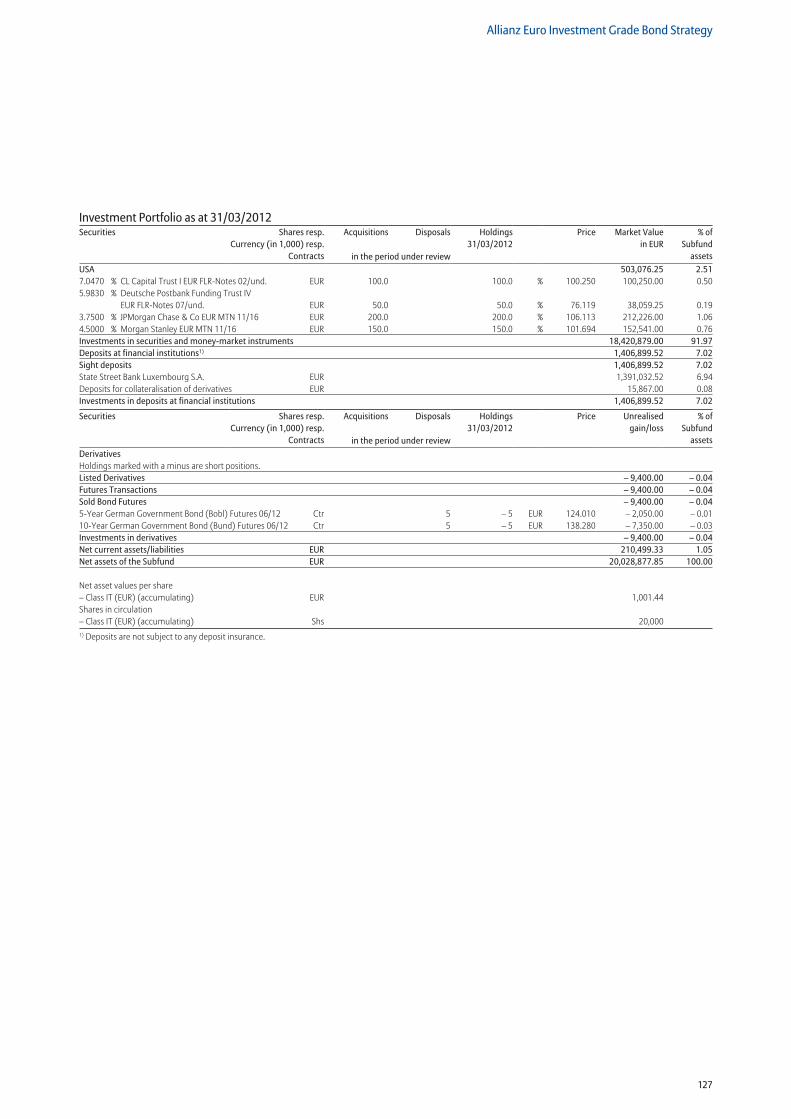
127
Allianz Euro Investment Grade Bond Strategy
USA 503,076.25 2.517.0470 % CL Capital Trust I EUR FLR-Notes 02/und. EUR 100.0 100.0 % 100.250 100,250.00 0.505.9830 % Deutsche Postbank Funding Trust IV
EUR FLR-Notes 07/und. EUR 50.0 50.0 % 76.119 38,059.25 0.193.7500 % JPMorgan Chase & Co EUR MTN 11/16 EUR 200.0 200.0 % 106.113 212,226.00 1.064.5000 % Morgan Stanley EUR MTN 11/16 EUR 150.0 150.0 % 101.694 152,541.00 0.76Investments in securities and money-market instruments 18,420,879.00 91.97Deposits at financial institutions1) 1,406,899.52 7.02Sight deposits 1,406,899.52 7.02State Street Bank Luxembourg S.A. EUR 1,391,032.52 6.94Deposits for collateralisation of derivatives EUR 15,867.00 0.08Investments in deposits at financial institutions 1,406,899.52 7.02
Securities Shares resp.Currency (in 1,000) resp.
Contracts
Acquisitions Disposals Holdings 31/03/2012
Price Unrealisedgain/loss
% ofSubfund
assetsin the period under reviewDerivativesHoldings marked with a minus are short positions. Listed Derivatives – 9,400.00 – 0.04Futures Transactions – 9,400.00 – 0.04Sold Bond Futures – 9,400.00 – 0.045-Year German Government Bond (Bobl) Futures 06/12 Ctr 5 – 5 EUR 124.010 – 2,050.00 – 0.0110-Year German Government Bond (Bund) Futures 06/12 Ctr 5 – 5 EUR 138.280 – 7,350.00 – 0.03Investments in derivatives – 9,400.00 – 0.04Net current assets/liabilities EUR 210,499.33 1.05Net assets of the Subfund EUR 20,028,877.85 100.00
Net asset values per share – Class IT (EUR) (accumulating) EUR 1,001.44 Shares in circulation – Class IT (EUR) (accumulating) Shs 20,0001) Deposits are not subject to any deposit insurance.
Investment Portfolio as at 31/03/2012Securities Shares resp.
Currency (in 1,000) resp.Contracts
Acquisitions Disposals Holdings 31/03/2012
Price Market Valuein EUR
% ofSubfund
assetsin the period under review
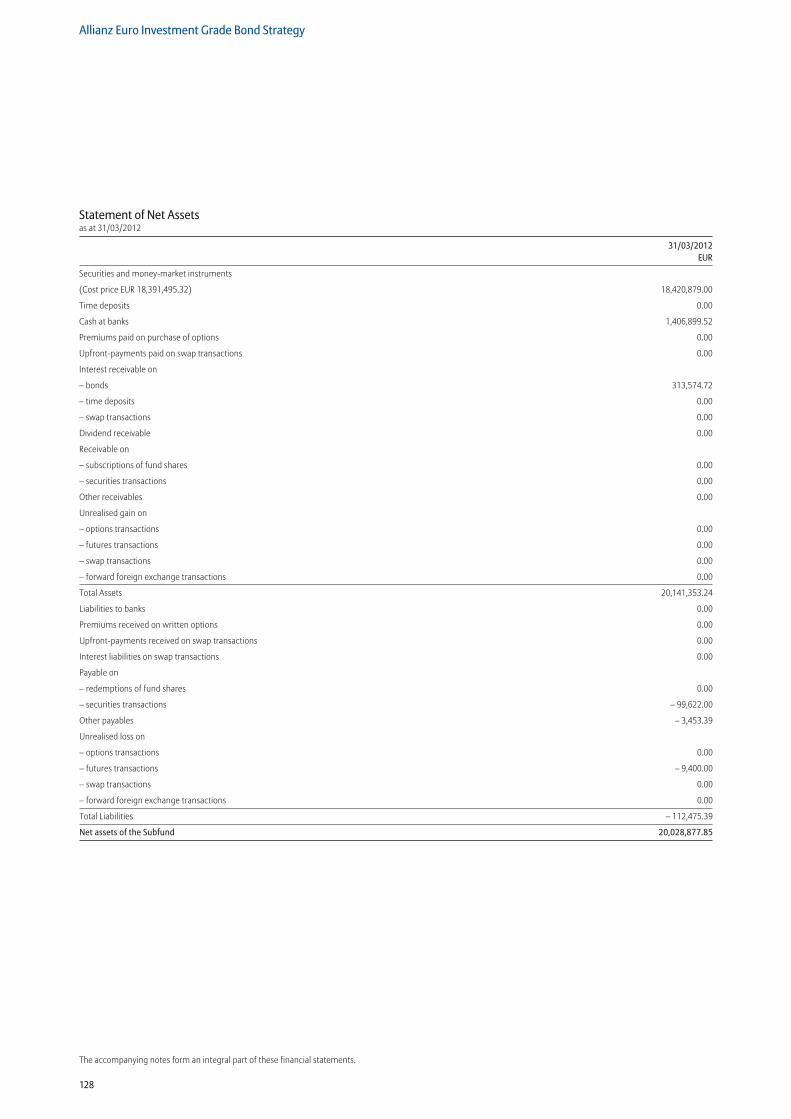
128
Allianz Euro Investment Grade Bond Strategy
The accompanying notes form an integral part of these financial statements.
Statement of Net Assetsas at 31/03/2012
31/03/2012 EUR
Securities and money-market instruments
(Cost price EUR 18,391,495.32) 18,420,879.00
Time deposits 0.00
Cash at banks 1,406,899.52
Premiums paid on purchase of options 0.00
Upfront-payments paid on swap transactions 0.00
Interest receivable on
– bonds 313,574.72
– time deposits 0.00
– swap transactions 0.00
Dividend receivable 0.00
Receivable on
– subscriptions of fund shares 0.00
– securities transactions 0.00
Other receivables 0.00
Unrealised gain on
– options transactions 0.00
– futures transactions 0.00
– swap transactions 0.00
– forward foreign exchange transactions 0.00
Total Assets 20,141,353.24
Liabilities to banks 0.00
Premiums received on written options 0.00
Upfront-payments received on swap transactions 0.00
Interest liabilities on swap transactions 0.00
Payable on
– redemptions of fund shares 0.00
– securities transactions – 99,622.00
Other payables – 3,453.39
Unrealised loss on
– options transactions 0.00
– futures transactions – 9,400.00
– swap transactions 0.00
– forward foreign exchange transactions 0.00
Total Liabilities – 112,475.39
Net assets of the Subfund 20,028,877.85
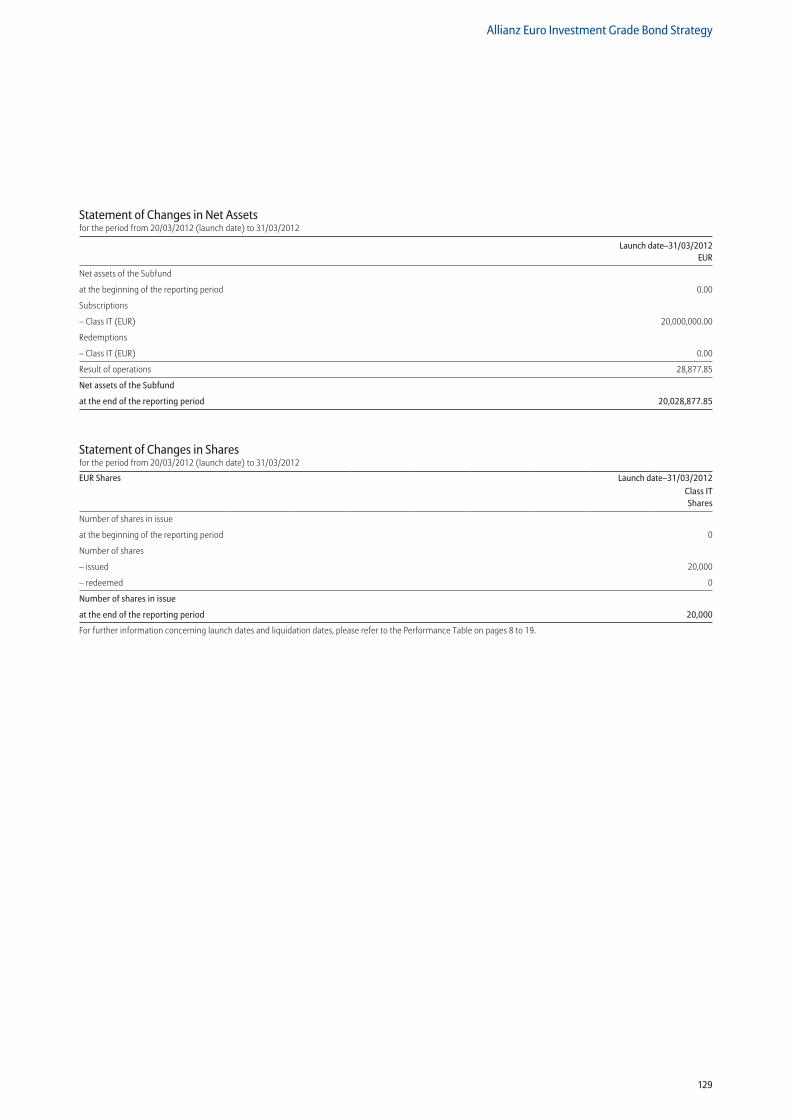
129
Allianz Euro Investment Grade Bond Strategy
Statement of Changes in Net Assetsfor the period from 20/03/2012 (launch date) to 31/03/2012
Launch date–31/03/2012 EUR
Net assets of the Subfund
at the beginning of the reporting period 0.00
Subscriptions
– Class IT (EUR) 20,000,000.00
Redemptions
– Class IT (EUR) 0.00
Result of operations 28,877.85
Net assets of the Subfund
at the end of the reporting period 20,028,877.85
Statement of Changes in Sharesfor the period from 20/03/2012 (launch date) to 31/03/2012
EUR Shares Launch date–31/03/2012Class IT Shares
Number of shares in issue
at the beginning of the reporting period 0
Number of shares
– issued 20,000
– redeemed 0
Number of shares in issue
at the end of the reporting period 20,000
For further information concerning launch dates and liquidation dates, please refer to the Performance Table on pages 8 to 19.
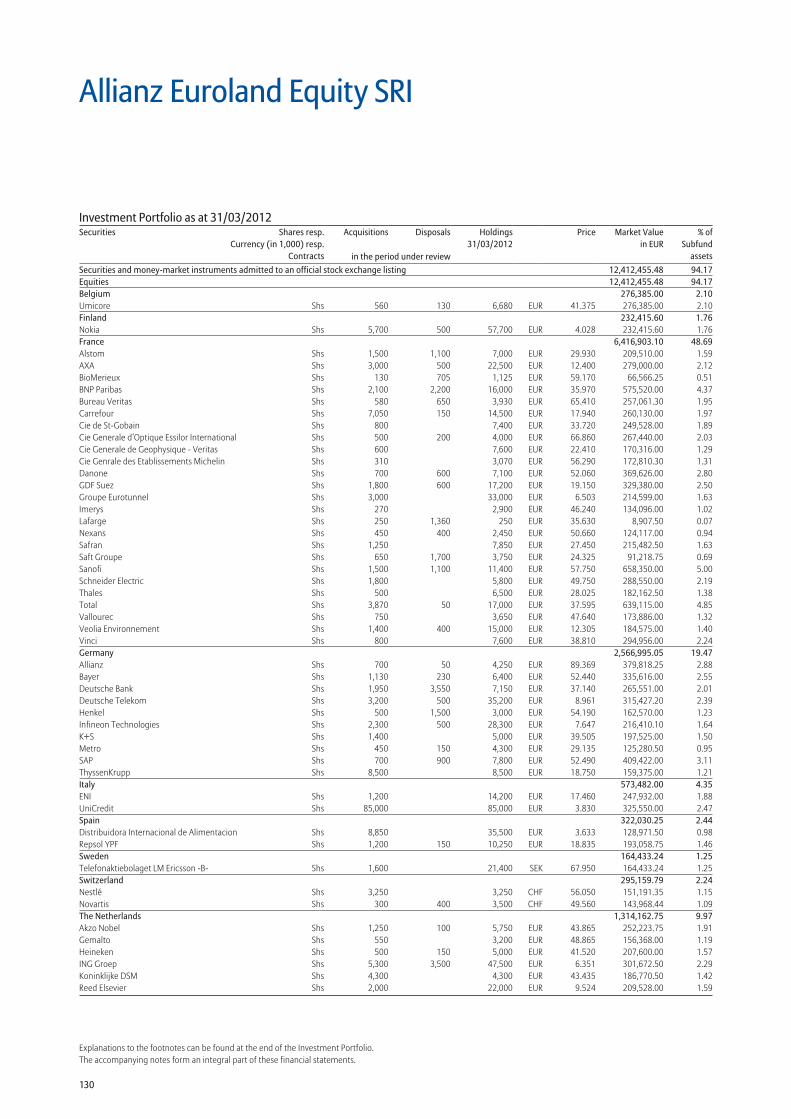
130
Explanations to the footnotes can be found at the end of the Investment Portfolio.The accompanying notes form an integral part of these financial statements.
Allianz Euroland Equity SRI
Securities and money-market instruments admitted to an official stock exchange listing 12,412,455.48 94.17Equities 12,412,455.48 94.17Belgium 276,385.00 2.10Umicore Shs 560 130 6,680 EUR 41.375 276,385.00 2.10Finland 232,415.60 1.76Nokia Shs 5,700 500 57,700 EUR 4.028 232,415.60 1.76France 6,416,903.10 48.69Alstom Shs 1,500 1,100 7,000 EUR 29.930 209,510.00 1.59AXA Shs 3,000 500 22,500 EUR 12.400 279,000.00 2.12BioMerieux Shs 130 705 1,125 EUR 59.170 66,566.25 0.51BNP Paribas Shs 2,100 2,200 16,000 EUR 35.970 575,520.00 4.37Bureau Veritas Shs 580 650 3,930 EUR 65.410 257,061.30 1.95Carrefour Shs 7,050 150 14,500 EUR 17.940 260,130.00 1.97Cie de St-Gobain Shs 800 7,400 EUR 33.720 249,528.00 1.89Cie Generale d’Optique Essilor International Shs 500 200 4,000 EUR 66.860 267,440.00 2.03Cie Generale de Geophysique - Veritas Shs 600 7,600 EUR 22.410 170,316.00 1.29Cie Genrale des Etablissements Michelin Shs 310 3,070 EUR 56.290 172,810.30 1.31Danone Shs 700 600 7,100 EUR 52.060 369,626.00 2.80GDF Suez Shs 1,800 600 17,200 EUR 19.150 329,380.00 2.50Groupe Eurotunnel Shs 3,000 33,000 EUR 6.503 214,599.00 1.63Imerys Shs 270 2,900 EUR 46.240 134,096.00 1.02Lafarge Shs 250 1,360 250 EUR 35.630 8,907.50 0.07Nexans Shs 450 400 2,450 EUR 50.660 124,117.00 0.94Safran Shs 1,250 7,850 EUR 27.450 215,482.50 1.63Saft Groupe Shs 650 1,700 3,750 EUR 24.325 91,218.75 0.69Sanofi Shs 1,500 1,100 11,400 EUR 57.750 658,350.00 5.00Schneider Electric Shs 1,800 5,800 EUR 49.750 288,550.00 2.19Thales Shs 500 6,500 EUR 28.025 182,162.50 1.38Total Shs 3,870 50 17,000 EUR 37.595 639,115.00 4.85Vallourec Shs 750 3,650 EUR 47.640 173,886.00 1.32Veolia Environnement Shs 1,400 400 15,000 EUR 12.305 184,575.00 1.40Vinci Shs 800 7,600 EUR 38.810 294,956.00 2.24Germany 2,566,995.05 19.47Allianz Shs 700 50 4,250 EUR 89.369 379,818.25 2.88Bayer Shs 1,130 230 6,400 EUR 52.440 335,616.00 2.55Deutsche Bank Shs 1,950 3,550 7,150 EUR 37.140 265,551.00 2.01Deutsche Telekom Shs 3,200 500 35,200 EUR 8.961 315,427.20 2.39Henkel Shs 500 1,500 3,000 EUR 54.190 162,570.00 1.23Infineon Technologies Shs 2,300 500 28,300 EUR 7.647 216,410.10 1.64K+S Shs 1,400 5,000 EUR 39.505 197,525.00 1.50Metro Shs 450 150 4,300 EUR 29.135 125,280.50 0.95SAP Shs 700 900 7,800 EUR 52.490 409,422.00 3.11ThyssenKrupp Shs 8,500 8,500 EUR 18.750 159,375.00 1.21Italy 573,482.00 4.35ENI Shs 1,200 14,200 EUR 17.460 247,932.00 1.88UniCredit Shs 85,000 85,000 EUR 3.830 325,550.00 2.47Spain 322,030.25 2.44Distribuidora Internacional de Alimentacion Shs 8,850 35,500 EUR 3.633 128,971.50 0.98Repsol YPF Shs 1,200 150 10,250 EUR 18.835 193,058.75 1.46Sweden 164,433.24 1.25Telefonaktiebolaget LM Ericsson -B- Shs 1,600 21,400 SEK 67.950 164,433.24 1.25Switzerland 295,159.79 2.24Nestlé Shs 3,250 3,250 CHF 56.050 151,191.35 1.15Novartis Shs 300 400 3,500 CHF 49.560 143,968.44 1.09The Netherlands 1,314,162.75 9.97Akzo Nobel Shs 1,250 100 5,750 EUR 43.865 252,223.75 1.91Gemalto Shs 550 3,200 EUR 48.865 156,368.00 1.19Heineken Shs 500 150 5,000 EUR 41.520 207,600.00 1.57ING Groep Shs 5,300 3,500 47,500 EUR 6.351 301,672.50 2.29Koninklijke DSM Shs 4,300 4,300 EUR 43.435 186,770.50 1.42Reed Elsevier Shs 2,000 22,000 EUR 9.524 209,528.00 1.59
Investment Portfolio as at 31/03/2012Securities Shares resp.
Currency (in 1,000) resp.Contracts
Acquisitions Disposals Holdings 31/03/2012
Price Market Valuein EUR
% ofSubfund
assetsin the period under review
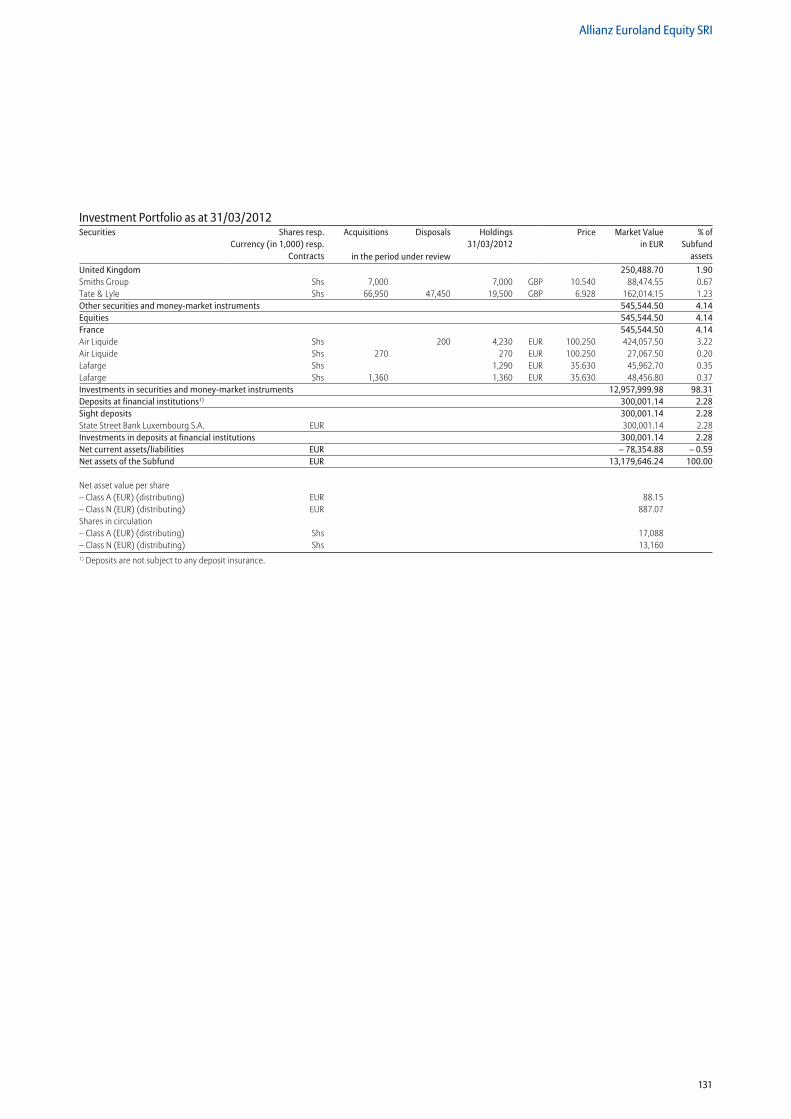
131
Allianz Euroland Equity SRI
United Kingdom 250,488.70 1.90Smiths Group Shs 7,000 7,000 GBP 10.540 88,474.55 0.67Tate & Lyle Shs 66,950 47,450 19,500 GBP 6.928 162,014.15 1.23Other securities and money-market instruments 545,544.50 4.14Equities 545,544.50 4.14France 545,544.50 4.14Air Liquide Shs 200 4,230 EUR 100.250 424,057.50 3.22Air Liquide Shs 270 270 EUR 100.250 27,067.50 0.20Lafarge Shs 1,290 EUR 35.630 45,962.70 0.35Lafarge Shs 1,360 1,360 EUR 35.630 48,456.80 0.37Investments in securities and money-market instruments 12,957,999.98 98.31Deposits at financial institutions1) 300,001.14 2.28Sight deposits 300,001.14 2.28State Street Bank Luxembourg S.A. EUR 300,001.14 2.28Investments in deposits at financial institutions 300,001.14 2.28Net current assets/liabilities EUR – 78,354.88 – 0.59Net assets of the Subfund EUR 13,179,646.24 100.00
Net asset value per share – Class A (EUR) (distributing) EUR 88.15 – Class N (EUR) (distributing) EUR 887.07 Shares in circulation – Class A (EUR) (distributing) Shs 17,088 – Class N (EUR) (distributing) Shs 13,1601) Deposits are not subject to any deposit insurance.
Investment Portfolio as at 31/03/2012Securities Shares resp.
Currency (in 1,000) resp.Contracts
Acquisitions Disposals Holdings 31/03/2012
Price Market Valuein EUR
% ofSubfund
assetsin the period under review
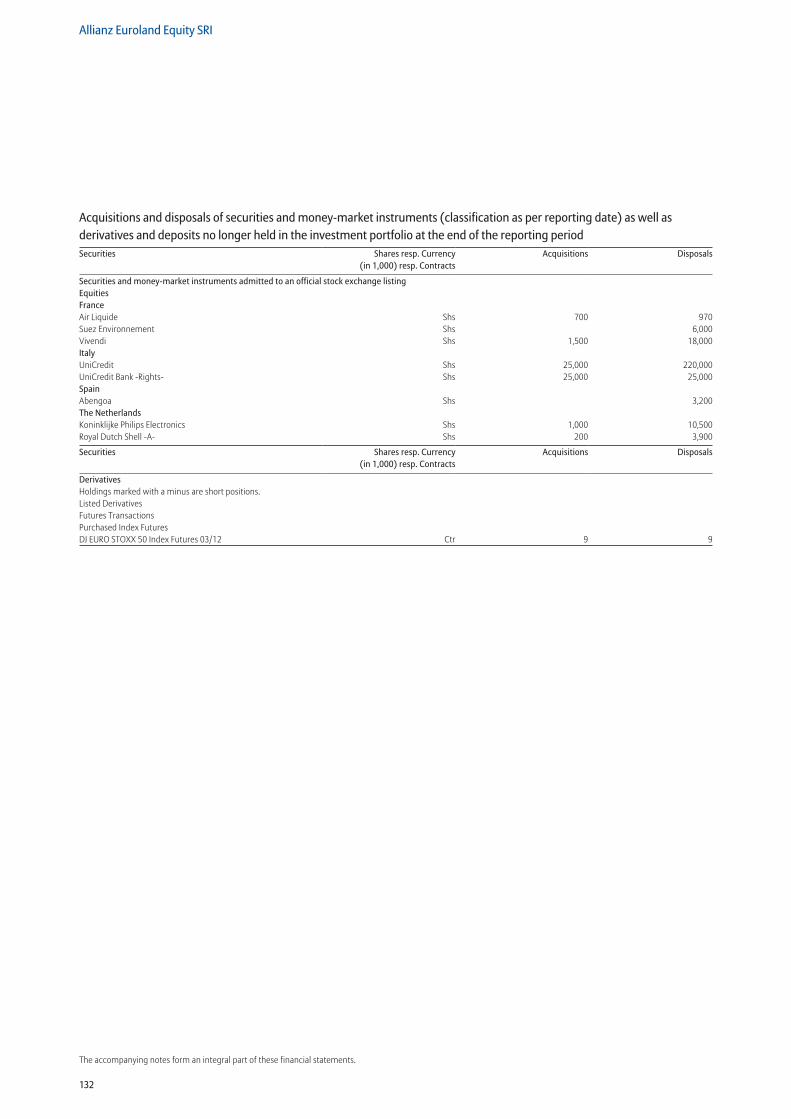
132
Allianz Euroland Equity SRI
The accompanying notes form an integral part of these financial statements.
Securities and money-market instruments admitted to an official stock exchange listingEquitiesFranceAir Liquide Shs 700 970Suez Environnement Shs 6,000Vivendi Shs 1,500 18,000ItalyUniCredit Shs 25,000 220,000UniCredit Bank -Rights- Shs 25,000 25,000SpainAbengoa Shs 3,200The NetherlandsKoninklijke Philips Electronics Shs 1,000 10,500Royal Dutch Shell -A- Shs 200 3,900
Securities Shares resp. Currency (in 1,000) resp. Contracts
Acquisitions Disposals
DerivativesHoldings marked with a minus are short positions. Listed Derivatives Futures Transactions Purchased Index Futures DJ EURO STOXX 50 Index Futures 03/12 Ctr 9 9
Acquisitions and disposals of securities and money-market instruments (classification as per reporting date) as well as derivatives and deposits no longer held in the investment portfolio at the end of the reporting periodSecurities Shares resp. Currency
(in 1,000) resp. ContractsAcquisitions Disposals
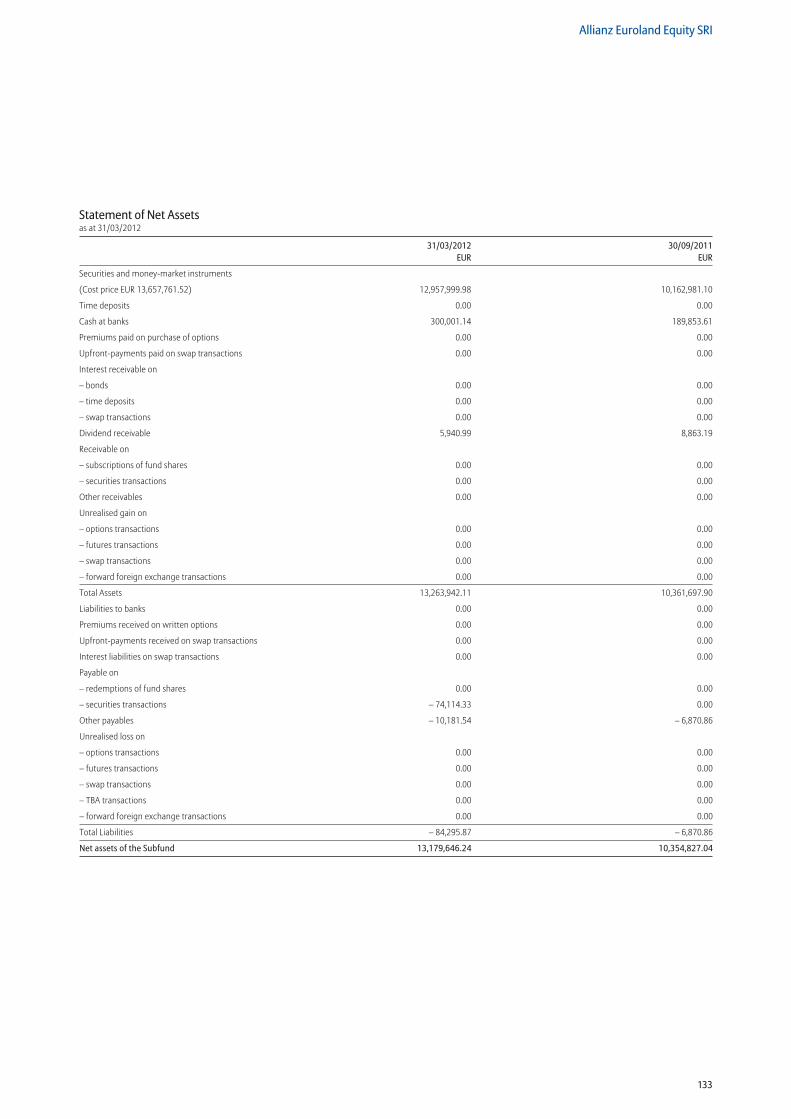
133
Allianz Euroland Equity SRI
Statement of Net Assetsas at 31/03/2012
31/03/2012 30/09/2011 EUR EUR
Securities and money-market instruments
(Cost price EUR 13,657,761.52) 12,957,999.98 10,162,981.10
Time deposits 0.00 0.00
Cash at banks 300,001.14 189,853.61
Premiums paid on purchase of options 0.00 0.00
Upfront-payments paid on swap transactions 0.00 0.00
Interest receivable on
– bonds 0.00 0.00
– time deposits 0.00 0.00
– swap transactions 0.00 0.00
Dividend receivable 5,940.99 8,863.19
Receivable on
– subscriptions of fund shares 0.00 0.00
– securities transactions 0.00 0.00
Other receivables 0.00 0.00
Unrealised gain on
– options transactions 0.00 0.00
– futures transactions 0.00 0.00
– swap transactions 0.00 0.00
– forward foreign exchange transactions 0.00 0.00
Total Assets 13,263,942.11 10,361,697.90
Liabilities to banks 0.00 0.00
Premiums received on written options 0.00 0.00
Upfront-payments received on swap transactions 0.00 0.00
Interest liabilities on swap transactions 0.00 0.00
Payable on
– redemptions of fund shares 0.00 0.00
– securities transactions – 74,114.33 0.00
Other payables – 10,181.54 – 6,870.86
Unrealised loss on
– options transactions 0.00 0.00
– futures transactions 0.00 0.00
– swap transactions 0.00 0.00
– TBA transactions 0.00 0.00
– forward foreign exchange transactions 0.00 0.00
Total Liabilities – 84,295.87 – 6,870.86
Net assets of the Subfund 13,179,646.24 10,354,827.04

134
Allianz Euroland Equity SRI
The accompanying notes form an integral part of these financial statements.
Statement of Changes in Net Assetsfor the period from 01/10/2011 to 31/03/2012
01/10/2011–31/03/2012 Launch date–31/03/2011 EUR
Net assets of the Subfund
at the beginning of the reporting period 10,354,827.04 0.00
Subscriptions
– Class A (EUR) 1,427,605.09 13,967.47
– Class N (EUR) 199,152.50 11,891,591.00
Redemptions
– Class A (EUR) – 63,354.50 0.00
– Class N (EUR) 0.00 0.00
Distribution – 258,544.06 0.00
Equalization 23,690.17 38.01
Result of operations 1,496,270.00 432,778.23
Net assets of the Subfund
at the end of the reporting period 13,179,646.24 12,338,374.71
Statement of Changes in Sharesfor the period from 01/10/2011 to 31/03/2012
EUR Shares 01/10/2011–31/03/2012 Launch date–31/03/2011Class A Shares
Class N Shares
Class A Shares
Class N Shares
Number of shares in issue
at the beginning of the reporting period 1,366 12,900 0 0
Number of shares
– issued 16,441 260 11,900 138
– redeemed – 719 0 0 0
Number of shares in issue
at the end of the reporting period 17,088 13,160 11,900 138
For further information concerning launch dates and liquidation dates, please refer to the Performance Table on pages 8 to 19.
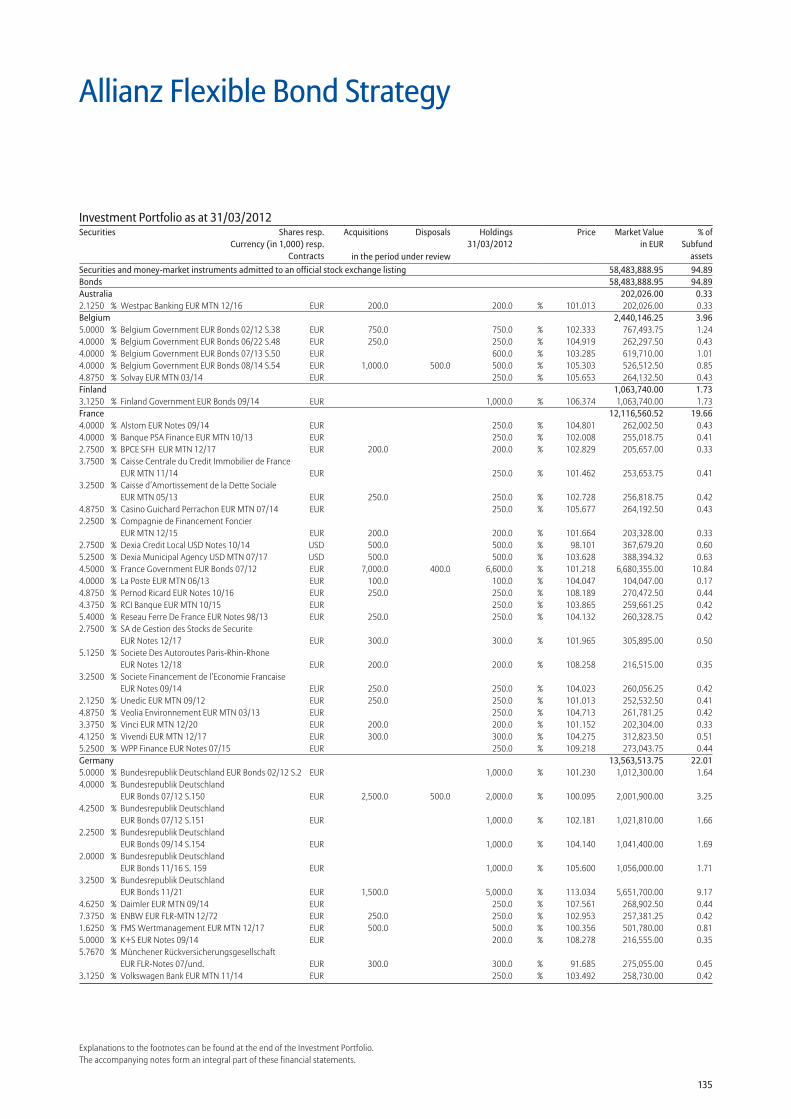
135
Explanations to the footnotes can be found at the end of the Investment Portfolio.The accompanying notes form an integral part of these financial statements.
Allianz Flexible Bond Strategy
Securities and money-market instruments admitted to an official stock exchange listing 58,483,888.95 94.89Bonds 58,483,888.95 94.89Australia 202,026.00 0.332.1250 % Westpac Banking EUR MTN 12/16 EUR 200.0 200.0 % 101.013 202,026.00 0.33Belgium 2,440,146.25 3.965.0000 % Belgium Government EUR Bonds 02/12 S.38 EUR 750.0 750.0 % 102.333 767,493.75 1.244.0000 % Belgium Government EUR Bonds 06/22 S.48 EUR 250.0 250.0 % 104.919 262,297.50 0.434.0000 % Belgium Government EUR Bonds 07/13 S.50 EUR 600.0 % 103.285 619,710.00 1.014.0000 % Belgium Government EUR Bonds 08/14 S.54 EUR 1,000.0 500.0 500.0 % 105.303 526,512.50 0.854.8750 % Solvay EUR MTN 03/14 EUR 250.0 % 105.653 264,132.50 0.43Finland 1,063,740.00 1.733.1250 % Finland Government EUR Bonds 09/14 EUR 1,000.0 % 106.374 1,063,740.00 1.73France 12,116,560.52 19.664.0000 % Alstom EUR Notes 09/14 EUR 250.0 % 104.801 262,002.50 0.434.0000 % Banque PSA Finance EUR MTN 10/13 EUR 250.0 % 102.008 255,018.75 0.412.7500 % BPCE SFH EUR MTN 12/17 EUR 200.0 200.0 % 102.829 205,657.00 0.333.7500 % Caisse Centrale du Credit Immobilier de France
EUR MTN 11/14 EUR 250.0 % 101.462 253,653.75 0.413.2500 % Caisse d’Amortissement de la Dette Sociale
EUR MTN 05/13 EUR 250.0 250.0 % 102.728 256,818.75 0.424.8750 % Casino Guichard Perrachon EUR MTN 07/14 EUR 250.0 % 105.677 264,192.50 0.432.2500 % Compagnie de Financement Foncier
EUR MTN 12/15 EUR 200.0 200.0 % 101.664 203,328.00 0.332.7500 % Dexia Credit Local USD Notes 10/14 USD 500.0 500.0 % 98.101 367,679.20 0.605.2500 % Dexia Municipal Agency USD MTN 07/17 USD 500.0 500.0 % 103.628 388,394.32 0.634.5000 % France Government EUR Bonds 07/12 EUR 7,000.0 400.0 6,600.0 % 101.218 6,680,355.00 10.844.0000 % La Poste EUR MTN 06/13 EUR 100.0 100.0 % 104.047 104,047.00 0.174.8750 % Pernod Ricard EUR Notes 10/16 EUR 250.0 250.0 % 108.189 270,472.50 0.444.3750 % RCI Banque EUR MTN 10/15 EUR 250.0 % 103.865 259,661.25 0.425.4000 % Reseau Ferre De France EUR Notes 98/13 EUR 250.0 250.0 % 104.132 260,328.75 0.422.7500 % SA de Gestion des Stocks de Securite
EUR Notes 12/17 EUR 300.0 300.0 % 101.965 305,895.00 0.505.1250 % Societe Des Autoroutes Paris-Rhin-Rhone
EUR Notes 12/18 EUR 200.0 200.0 % 108.258 216,515.00 0.353.2500 % Societe Financement de l’Economie Francaise
EUR Notes 09/14 EUR 250.0 250.0 % 104.023 260,056.25 0.422.1250 % Unedic EUR MTN 09/12 EUR 250.0 250.0 % 101.013 252,532.50 0.414.8750 % Veolia Environnement EUR MTN 03/13 EUR 250.0 % 104.713 261,781.25 0.423.3750 % Vinci EUR MTN 12/20 EUR 200.0 200.0 % 101.152 202,304.00 0.334.1250 % Vivendi EUR MTN 12/17 EUR 300.0 300.0 % 104.275 312,823.50 0.515.2500 % WPP Finance EUR Notes 07/15 EUR 250.0 % 109.218 273,043.75 0.44Germany 13,563,513.75 22.015.0000 % Bundesrepublik Deutschland EUR Bonds 02/12 S.2 EUR 1,000.0 % 101.230 1,012,300.00 1.644.0000 % Bundesrepublik Deutschland
EUR Bonds 07/12 S.150 EUR 2,500.0 500.0 2,000.0 % 100.095 2,001,900.00 3.254.2500 % Bundesrepublik Deutschland
EUR Bonds 07/12 S.151 EUR 1,000.0 % 102.181 1,021,810.00 1.662.2500 % Bundesrepublik Deutschland
EUR Bonds 09/14 S.154 EUR 1,000.0 % 104.140 1,041,400.00 1.692.0000 % Bundesrepublik Deutschland
EUR Bonds 11/16 S. 159 EUR 1,000.0 % 105.600 1,056,000.00 1.713.2500 % Bundesrepublik Deutschland
EUR Bonds 11/21 EUR 1,500.0 5,000.0 % 113.034 5,651,700.00 9.174.6250 % Daimler EUR MTN 09/14 EUR 250.0 % 107.561 268,902.50 0.447.3750 % ENBW EUR FLR-MTN 12/72 EUR 250.0 250.0 % 102.953 257,381.25 0.421.6250 % FMS Wertmanagement EUR MTN 12/17 EUR 500.0 500.0 % 100.356 501,780.00 0.815.0000 % K+S EUR Notes 09/14 EUR 200.0 % 108.278 216,555.00 0.355.7670 % Münchener Rückversicherungsgesellschaft
EUR FLR-Notes 07/und. EUR 300.0 300.0 % 91.685 275,055.00 0.453.1250 % Volkswagen Bank EUR MTN 11/14 EUR 250.0 % 103.492 258,730.00 0.42
Investment Portfolio as at 31/03/2012Securities Shares resp.
Currency (in 1,000) resp.Contracts
Acquisitions Disposals Holdings 31/03/2012
Price Market Valuein EUR
% ofSubfund
assetsin the period under review
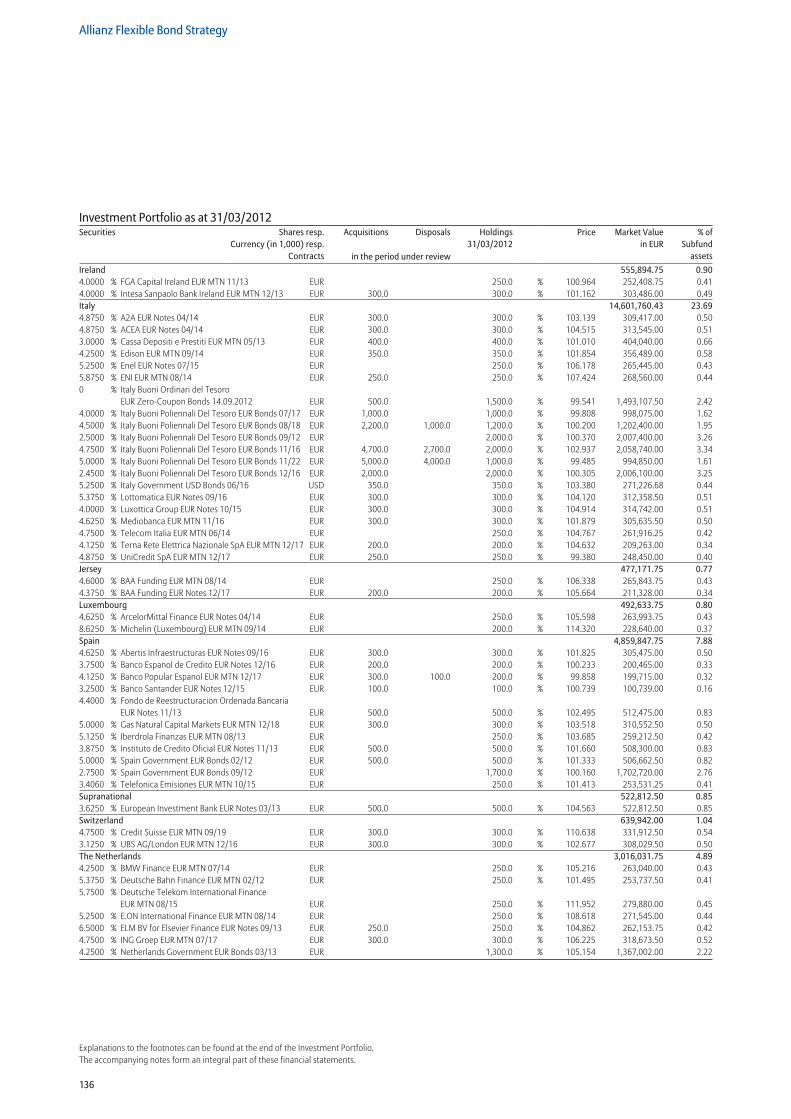
136
Allianz Flexible Bond Strategy
Explanations to the footnotes can be found at the end of the Investment Portfolio.The accompanying notes form an integral part of these financial statements.
Ireland 555,894.75 0.904.0000 % FGA Capital Ireland EUR MTN 11/13 EUR 250.0 % 100.964 252,408.75 0.414.0000 % Intesa Sanpaolo Bank Ireland EUR MTN 12/13 EUR 300.0 300.0 % 101.162 303,486.00 0.49Italy 14,601,760.43 23.694.8750 % A2A EUR Notes 04/14 EUR 300.0 300.0 % 103.139 309,417.00 0.504.8750 % ACEA EUR Notes 04/14 EUR 300.0 300.0 % 104.515 313,545.00 0.513.0000 % Cassa Depositi e Prestiti EUR MTN 05/13 EUR 400.0 400.0 % 101.010 404,040.00 0.664.2500 % Edison EUR MTN 09/14 EUR 350.0 350.0 % 101.854 356,489.00 0.585.2500 % Enel EUR Notes 07/15 EUR 250.0 % 106.178 265,445.00 0.435.8750 % ENI EUR MTN 08/14 EUR 250.0 250.0 % 107.424 268,560.00 0.440 % Italy Buoni Ordinari del Tesoro
EUR Zero-Coupon Bonds 14.09.2012 EUR 500.0 1,500.0 % 99.541 1,493,107.50 2.424.0000 % Italy Buoni Poliennali Del Tesoro EUR Bonds 07/17 EUR 1,000.0 1,000.0 % 99.808 998,075.00 1.624.5000 % Italy Buoni Poliennali Del Tesoro EUR Bonds 08/18 EUR 2,200.0 1,000.0 1,200.0 % 100.200 1,202,400.00 1.952.5000 % Italy Buoni Poliennali Del Tesoro EUR Bonds 09/12 EUR 2,000.0 % 100.370 2,007,400.00 3.264.7500 % Italy Buoni Poliennali Del Tesoro EUR Bonds 11/16 EUR 4,700.0 2,700.0 2,000.0 % 102.937 2,058,740.00 3.345.0000 % Italy Buoni Poliennali Del Tesoro EUR Bonds 11/22 EUR 5,000.0 4,000.0 1,000.0 % 99.485 994,850.00 1.612.4500 % Italy Buoni Poliennali Del Tesoro EUR Bonds 12/16 EUR 2,000.0 2,000.0 % 100.305 2,006,100.00 3.255.2500 % Italy Government USD Bonds 06/16 USD 350.0 350.0 % 103.380 271,226.68 0.445.3750 % Lottomatica EUR Notes 09/16 EUR 300.0 300.0 % 104.120 312,358.50 0.514.0000 % Luxottica Group EUR Notes 10/15 EUR 300.0 300.0 % 104.914 314,742.00 0.514.6250 % Mediobanca EUR MTN 11/16 EUR 300.0 300.0 % 101.879 305,635.50 0.504.7500 % Telecom Italia EUR MTN 06/14 EUR 250.0 % 104.767 261,916.25 0.424.1250 % Terna Rete Elettrica Nazionale SpA EUR MTN 12/17 EUR 200.0 200.0 % 104.632 209,263.00 0.344.8750 % UniCredit SpA EUR MTN 12/17 EUR 250.0 250.0 % 99.380 248,450.00 0.40Jersey 477,171.75 0.774.6000 % BAA Funding EUR MTN 08/14 EUR 250.0 % 106.338 265,843.75 0.434.3750 % BAA Funding EUR Notes 12/17 EUR 200.0 200.0 % 105.664 211,328.00 0.34Luxembourg 492,633.75 0.804.6250 % ArcelorMittal Finance EUR Notes 04/14 EUR 250.0 % 105.598 263,993.75 0.438.6250 % Michelin (Luxembourg) EUR MTN 09/14 EUR 200.0 % 114.320 228,640.00 0.37Spain 4,859,847.75 7.884.6250 % Abertis Infraestructuras EUR Notes 09/16 EUR 300.0 300.0 % 101.825 305,475.00 0.503.7500 % Banco Espanol de Credito EUR Notes 12/16 EUR 200.0 200.0 % 100.233 200,465.00 0.334.1250 % Banco Popular Espanol EUR MTN 12/17 EUR 300.0 100.0 200.0 % 99.858 199,715.00 0.323.2500 % Banco Santander EUR Notes 12/15 EUR 100.0 100.0 % 100.739 100,739.00 0.164.4000 % Fondo de Reestructuracion Ordenada Bancaria
EUR Notes 11/13 EUR 500.0 500.0 % 102.495 512,475.00 0.835.0000 % Gas Natural Capital Markets EUR MTN 12/18 EUR 300.0 300.0 % 103.518 310,552.50 0.505.1250 % Iberdrola Finanzas EUR MTN 08/13 EUR 250.0 % 103.685 259,212.50 0.423.8750 % Instituto de Credito Oficial EUR Notes 11/13 EUR 500.0 500.0 % 101.660 508,300.00 0.835.0000 % Spain Government EUR Bonds 02/12 EUR 500.0 500.0 % 101.333 506,662.50 0.822.7500 % Spain Government EUR Bonds 09/12 EUR 1,700.0 % 100.160 1,702,720.00 2.763.4060 % Telefonica Emisiones EUR MTN 10/15 EUR 250.0 % 101.413 253,531.25 0.41Supranational 522,812.50 0.853.6250 % European Investment Bank EUR Notes 03/13 EUR 500.0 500.0 % 104.563 522,812.50 0.85Switzerland 639,942.00 1.044.7500 % Credit Suisse EUR MTN 09/19 EUR 300.0 300.0 % 110.638 331,912.50 0.543.1250 % UBS AG/London EUR MTN 12/16 EUR 300.0 300.0 % 102.677 308,029.50 0.50The Netherlands 3,016,031.75 4.894.2500 % BMW Finance EUR MTN 07/14 EUR 250.0 % 105.216 263,040.00 0.435.3750 % Deutsche Bahn Finance EUR MTN 02/12 EUR 250.0 % 101.495 253,737.50 0.415.7500 % Deutsche Telekom International Finance
EUR MTN 08/15 EUR 250.0 % 111.952 279,880.00 0.455.2500 % E.ON International Finance EUR MTN 08/14 EUR 250.0 % 108.618 271,545.00 0.446.5000 % ELM BV for Elsevier Finance EUR Notes 09/13 EUR 250.0 250.0 % 104.862 262,153.75 0.424.7500 % ING Groep EUR MTN 07/17 EUR 300.0 300.0 % 106.225 318,673.50 0.524.2500 % Netherlands Government EUR Bonds 03/13 EUR 1,300.0 % 105.154 1,367,002.00 2.22
Investment Portfolio as at 31/03/2012Securities Shares resp.
Currency (in 1,000) resp.Contracts
Acquisitions Disposals Holdings 31/03/2012
Price Market Valuein EUR
% ofSubfund
assetsin the period under review
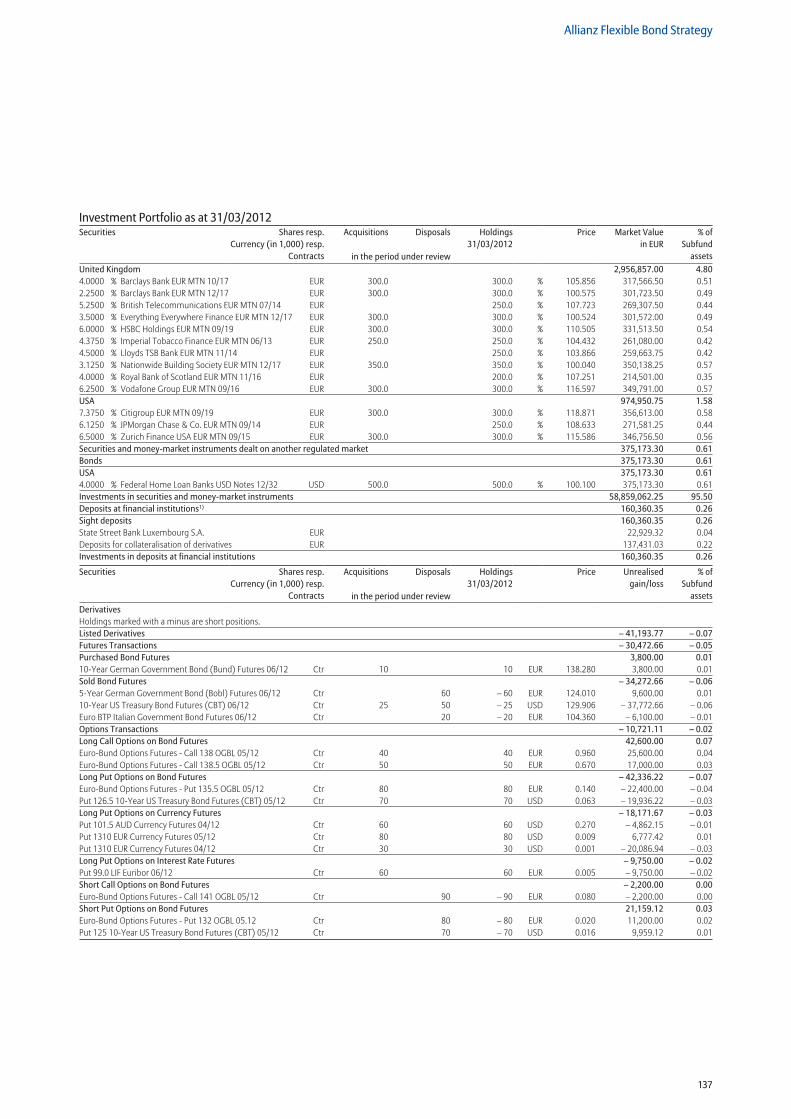
137
Allianz Flexible Bond Strategy
Investment Portfolio as at 31/03/2012Securities Shares resp.
Currency (in 1,000) resp.Contracts
Acquisitions Disposals Holdings 31/03/2012
Price Market Valuein EUR
% ofSubfund
assetsin the period under reviewUnited Kingdom 2,956,857.00 4.804.0000 % Barclays Bank EUR MTN 10/17 EUR 300.0 300.0 % 105.856 317,566.50 0.512.2500 % Barclays Bank EUR MTN 12/17 EUR 300.0 300.0 % 100.575 301,723.50 0.495.2500 % British Telecommunications EUR MTN 07/14 EUR 250.0 % 107.723 269,307.50 0.443.5000 % Everything Everywhere Finance EUR MTN 12/17 EUR 300.0 300.0 % 100.524 301,572.00 0.496.0000 % HSBC Holdings EUR MTN 09/19 EUR 300.0 300.0 % 110.505 331,513.50 0.544.3750 % Imperial Tobacco Finance EUR MTN 06/13 EUR 250.0 250.0 % 104.432 261,080.00 0.424.5000 % Lloyds TSB Bank EUR MTN 11/14 EUR 250.0 % 103.866 259,663.75 0.423.1250 % Nationwide Building Society EUR MTN 12/17 EUR 350.0 350.0 % 100.040 350,138.25 0.574.0000 % Royal Bank of Scotland EUR MTN 11/16 EUR 200.0 % 107.251 214,501.00 0.356.2500 % Vodafone Group EUR MTN 09/16 EUR 300.0 300.0 % 116.597 349,791.00 0.57USA 974,950.75 1.587.3750 % Citigroup EUR MTN 09/19 EUR 300.0 300.0 % 118.871 356,613.00 0.586.1250 % JPMorgan Chase & Co. EUR MTN 09/14 EUR 250.0 % 108.633 271,581.25 0.446.5000 % Zurich Finance USA EUR MTN 09/15 EUR 300.0 300.0 % 115.586 346,756.50 0.56Securities and money-market instruments dealt on another regulated market 375,173.30 0.61Bonds 375,173.30 0.61USA 375,173.30 0.614.0000 % Federal Home Loan Banks USD Notes 12/32 USD 500.0 500.0 % 100.100 375,173.30 0.61Investments in securities and money-market instruments 58,859,062.25 95.50Deposits at financial institutions1) 160,360.35 0.26Sight deposits 160,360.35 0.26State Street Bank Luxembourg S.A. EUR 22,929.32 0.04Deposits for collateralisation of derivatives EUR 137,431.03 0.22Investments in deposits at financial institutions 160,360.35 0.26
Securities Shares resp.Currency (in 1,000) resp.
Contracts
Acquisitions Disposals Holdings 31/03/2012
Price Unrealisedgain/loss
% ofSubfund
assetsin the period under reviewDerivatives Holdings marked with a minus are short positions. Listed Derivatives – 41,193.77 – 0.07Futures Transactions – 30,472.66 – 0.05Purchased Bond Futures 3,800.00 0.0110-Year German Government Bond (Bund) Futures 06/12 Ctr 10 10 EUR 138.280 3,800.00 0.01Sold Bond Futures – 34,272.66 – 0.065-Year German Government Bond (Bobl) Futures 06/12 Ctr 60 – 60 EUR 124.010 9,600.00 0.0110-Year US Treasury Bond Futures (CBT) 06/12 Ctr 25 50 – 25 USD 129.906 – 37,772.66 – 0.06Euro BTP Italian Government Bond Futures 06/12 Ctr 20 – 20 EUR 104.360 – 6,100.00 – 0.01Options Transactions – 10,721.11 – 0.02Long Call Options on Bond Futures 42,600.00 0.07Euro-Bund Options Futures - Call 138 OGBL 05/12 Ctr 40 40 EUR 0.960 25,600.00 0.04Euro-Bund Options Futures - Call 138.5 OGBL 05/12 Ctr 50 50 EUR 0.670 17,000.00 0.03Long Put Options on Bond Futures – 42,336.22 – 0.07Euro-Bund Options Futures - Put 135.5 OGBL 05/12 Ctr 80 80 EUR 0.140 – 22,400.00 – 0.04Put 126.5 10-Year US Treasury Bond Futures (CBT) 05/12 Ctr 70 70 USD 0.063 – 19,936.22 – 0.03Long Put Options on Currency Futures – 18,171.67 – 0.03Put 101.5 AUD Currency Futures 04/12 Ctr 60 60 USD 0.270 – 4,862.15 – 0.01Put 1310 EUR Currency Futures 05/12 Ctr 80 80 USD 0.009 6,777.42 0.01Put 1310 EUR Currency Futures 04/12 Ctr 30 30 USD 0.001 – 20,086.94 – 0.03Long Put Options on Interest Rate Futures – 9,750.00 – 0.02Put 99.0 LIF Euribor 06/12 Ctr 60 60 EUR 0.005 – 9,750.00 – 0.02Short Call Options on Bond Futures – 2,200.00 0.00Euro-Bund Options Futures - Call 141 OGBL 05/12 Ctr 90 – 90 EUR 0.080 – 2,200.00 0.00Short Put Options on Bond Futures 21,159.12 0.03Euro-Bund Options Futures - Put 132 OGBL 05.12 Ctr 80 – 80 EUR 0.020 11,200.00 0.02Put 125 10-Year US Treasury Bond Futures (CBT) 05/12 Ctr 70 – 70 USD 0.016 9,959.12 0.01
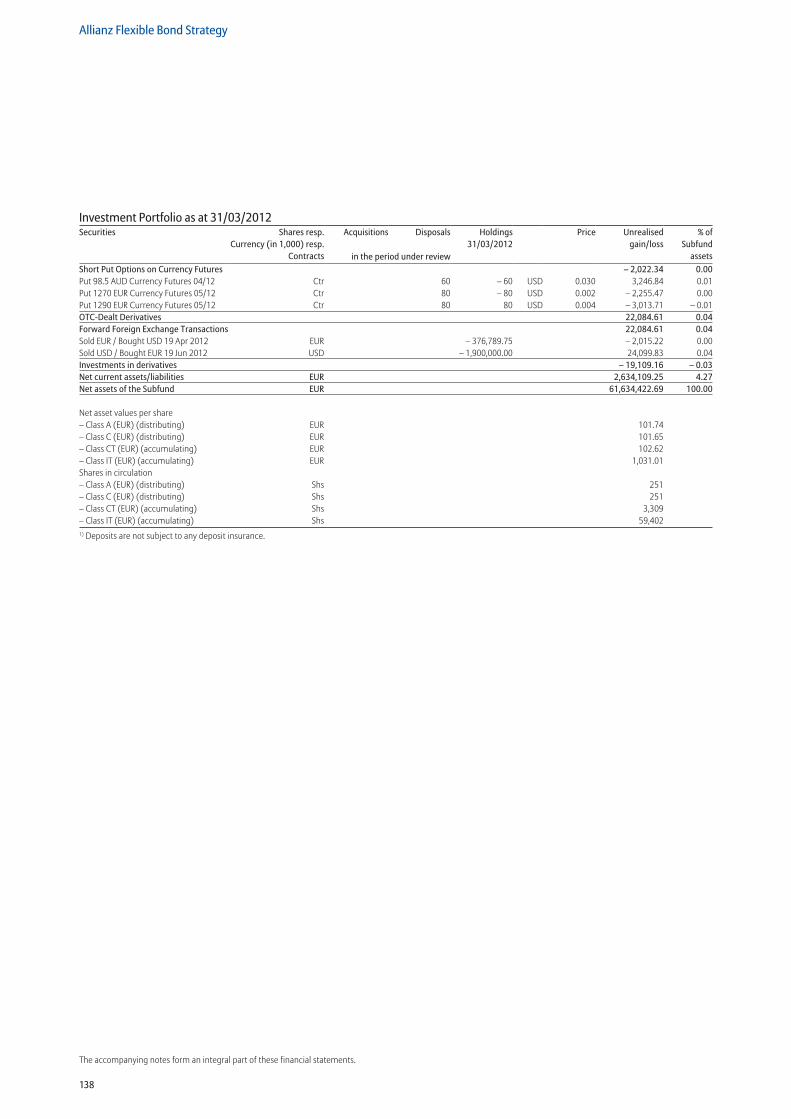
138
Allianz Flexible Bond Strategy
The accompanying notes form an integral part of these financial statements.
Investment Portfolio as at 31/03/2012Securities Shares resp.
Currency (in 1,000) resp.Contracts
Acquisitions Disposals Holdings 31/03/2012
Price Unrealisedgain/loss
% ofSubfund
assetsin the period under reviewShort Put Options on Currency Futures – 2,022.34 0.00Put 98.5 AUD Currency Futures 04/12 Ctr 60 – 60 USD 0.030 3,246.84 0.01Put 1270 EUR Currency Futures 05/12 Ctr 80 – 80 USD 0.002 – 2,255.47 0.00Put 1290 EUR Currency Futures 05/12 Ctr 80 80 USD 0.004 – 3,013.71 – 0.01OTC-Dealt Derivatives 22,084.61 0.04Forward Foreign Exchange Transactions 22,084.61 0.04Sold EUR / Bought USD 19 Apr 2012 EUR – 376,789.75 – 2,015.22 0.00Sold USD / Bought EUR 19 Jun 2012 USD – 1,900,000.00 24,099.83 0.04Investments in derivatives – 19,109.16 – 0.03Net current assets/liabilities EUR 2,634,109.25 4.27Net assets of the Subfund EUR 61,634,422.69 100.00
Net asset values per share – Class A (EUR) (distributing) EUR 101.74 – Class C (EUR) (distributing) EUR 101.65 – Class CT (EUR) (accumulating) EUR 102.62 – Class IT (EUR) (accumulating) EUR 1,031.01 Shares in circulation – Class A (EUR) (distributing) Shs 251 – Class C (EUR) (distributing) Shs 251 – Class CT (EUR) (accumulating) Shs 3,309 – Class IT (EUR) (accumulating) Shs 59,4021) Deposits are not subject to any deposit insurance.
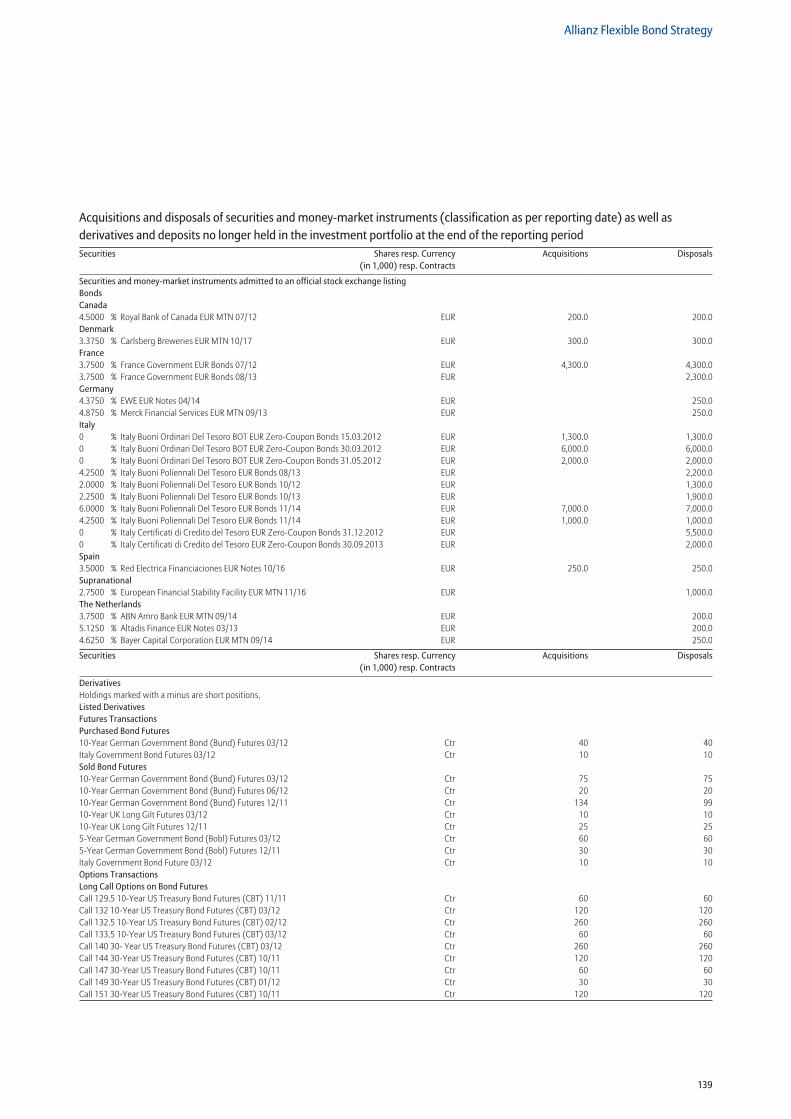
139
Allianz Flexible Bond Strategy
Securities and money-market instruments admitted to an official stock exchange listing BondsCanada4.5000 % Royal Bank of Canada EUR MTN 07/12 EUR 200.0 200.0Denmark3.3750 % Carlsberg Breweries EUR MTN 10/17 EUR 300.0 300.0France3.7500 % France Government EUR Bonds 07/12 EUR 4,300.0 4,300.03.7500 % France Government EUR Bonds 08/13 EUR 2,300.0Germany4.3750 % EWE EUR Notes 04/14 EUR 250.04.8750 % Merck Financial Services EUR MTN 09/13 EUR 250.0Italy0 % Italy Buoni Ordinari Del Tesoro BOT EUR Zero-Coupon Bonds 15.03.2012 EUR 1,300.0 1,300.00 % Italy Buoni Ordinari Del Tesoro BOT EUR Zero-Coupon Bonds 30.03.2012 EUR 6,000.0 6,000.00 % Italy Buoni Ordinari Del Tesoro BOT EUR Zero-Coupon Bonds 31.05.2012 EUR 2,000.0 2,000.04.2500 % Italy Buoni Poliennali Del Tesoro EUR Bonds 08/13 EUR 2,200.02.0000 % Italy Buoni Poliennali Del Tesoro EUR Bonds 10/12 EUR 1,300.02.2500 % Italy Buoni Poliennali Del Tesoro EUR Bonds 10/13 EUR 1,900.06.0000 % Italy Buoni Poliennali Del Tesoro EUR Bonds 11/14 EUR 7,000.0 7,000.04.2500 % Italy Buoni Poliennali Del Tesoro EUR Bonds 11/14 EUR 1,000.0 1,000.00 % Italy Certificati di Credito del Tesoro EUR Zero-Coupon Bonds 31.12.2012 EUR 5,500.00 % Italy Certificati di Credito del Tesoro EUR Zero-Coupon Bonds 30.09.2013 EUR 2,000.0Spain3.5000 % Red Electrica Financiaciones EUR Notes 10/16 EUR 250.0 250.0Supranational2.7500 % European Financial Stability Facility EUR MTN 11/16 EUR 1,000.0The Netherlands3.7500 % ABN Amro Bank EUR MTN 09/14 EUR 200.05.1250 % Altadis Finance EUR Notes 03/13 EUR 200.04.6250 % Bayer Capital Corporation EUR MTN 09/14 EUR 250.0
Securities Shares resp. Currency (in 1,000) resp. Contracts
Acquisitions Disposals
DerivativesHoldings marked with a minus are short positions. Listed Derivatives Futures TransactionsPurchased Bond Futures10-Year German Government Bond (Bund) Futures 03/12 Ctr 40 40Italy Government Bond Futures 03/12 Ctr 10 10Sold Bond Futures10-Year German Government Bond (Bund) Futures 03/12 Ctr 75 7510-Year German Government Bond (Bund) Futures 06/12 Ctr 20 2010-Year German Government Bond (Bund) Futures 12/11 Ctr 134 9910-Year UK Long Gilt Futures 03/12 Ctr 10 1010-Year UK Long Gilt Futures 12/11 Ctr 25 255-Year German Government Bond (Bobl) Futures 03/12 Ctr 60 605-Year German Government Bond (Bobl) Futures 12/11 Ctr 30 30Italy Government Bond Future 03/12 Ctr 10 10Options TransactionsLong Call Options on Bond FuturesCall 129.5 10-Year US Treasury Bond Futures (CBT) 11/11 Ctr 60 60Call 132 10-Year US Treasury Bond Futures (CBT) 03/12 Ctr 120 120Call 132.5 10-Year US Treasury Bond Futures (CBT) 02/12 Ctr 260 260Call 133.5 10-Year US Treasury Bond Futures (CBT) 03/12 Ctr 60 60Call 140 30- Year US Treasury Bond Futures (CBT) 03/12 Ctr 260 260Call 144 30-Year US Treasury Bond Futures (CBT) 10/11 Ctr 120 120Call 147 30-Year US Treasury Bond Futures (CBT) 10/11 Ctr 60 60Call 149 30-Year US Treasury Bond Futures (CBT) 01/12 Ctr 30 30Call 151 30-Year US Treasury Bond Futures (CBT) 10/11 Ctr 120 120
Acquisitions and disposals of securities and money-market instruments (classification as per reporting date) as well as derivatives and deposits no longer held in the investment portfolio at the end of the reporting periodSecurities Shares resp. Currency
(in 1,000) resp. ContractsAcquisitions Disposals
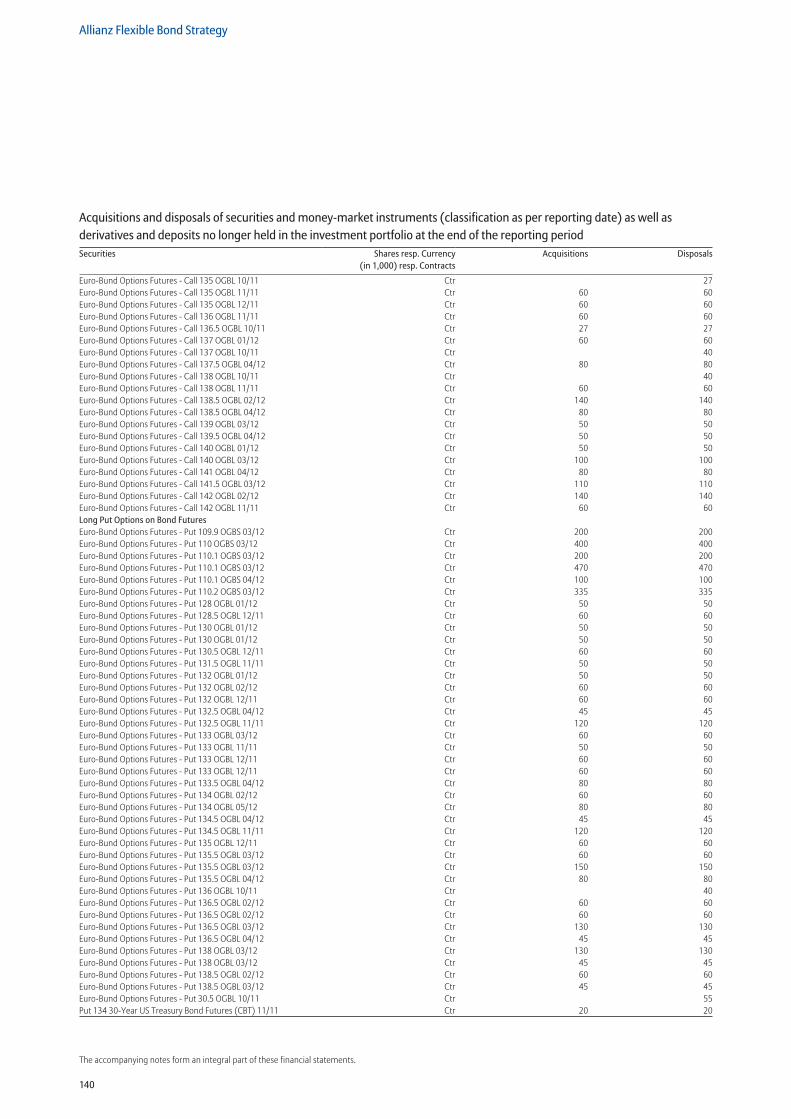
140
Allianz Flexible Bond Strategy
The accompanying notes form an integral part of these financial statements.
Acquisitions and disposals of securities and money-market instruments (classification as per reporting date) as well as derivatives and deposits no longer held in the investment portfolio at the end of the reporting periodSecurities Shares resp. Currency
(in 1,000) resp. ContractsAcquisitions Disposals
Euro-Bund Options Futures - Call 135 OGBL 10/11 Ctr 27Euro-Bund Options Futures - Call 135 OGBL 11/11 Ctr 60 60Euro-Bund Options Futures - Call 135 OGBL 12/11 Ctr 60 60Euro-Bund Options Futures - Call 136 OGBL 11/11 Ctr 60 60Euro-Bund Options Futures - Call 136.5 OGBL 10/11 Ctr 27 27Euro-Bund Options Futures - Call 137 OGBL 01/12 Ctr 60 60Euro-Bund Options Futures - Call 137 OGBL 10/11 Ctr 40Euro-Bund Options Futures - Call 137.5 OGBL 04/12 Ctr 80 80Euro-Bund Options Futures - Call 138 OGBL 10/11 Ctr 40Euro-Bund Options Futures - Call 138 OGBL 11/11 Ctr 60 60Euro-Bund Options Futures - Call 138.5 OGBL 02/12 Ctr 140 140Euro-Bund Options Futures - Call 138.5 OGBL 04/12 Ctr 80 80Euro-Bund Options Futures - Call 139 OGBL 03/12 Ctr 50 50Euro-Bund Options Futures - Call 139.5 OGBL 04/12 Ctr 50 50Euro-Bund Options Futures - Call 140 OGBL 01/12 Ctr 50 50Euro-Bund Options Futures - Call 140 OGBL 03/12 Ctr 100 100Euro-Bund Options Futures - Call 141 OGBL 04/12 Ctr 80 80Euro-Bund Options Futures - Call 141.5 OGBL 03/12 Ctr 110 110Euro-Bund Options Futures - Call 142 OGBL 02/12 Ctr 140 140Euro-Bund Options Futures - Call 142 OGBL 11/11 Ctr 60 60Long Put Options on Bond FuturesEuro-Bund Options Futures - Put 109.9 OGBS 03/12 Ctr 200 200Euro-Bund Options Futures - Put 110 OGBS 03/12 Ctr 400 400Euro-Bund Options Futures - Put 110.1 OGBS 03/12 Ctr 200 200Euro-Bund Options Futures - Put 110.1 OGBS 03/12 Ctr 470 470Euro-Bund Options Futures - Put 110.1 OGBS 04/12 Ctr 100 100Euro-Bund Options Futures - Put 110.2 OGBS 03/12 Ctr 335 335Euro-Bund Options Futures - Put 128 OGBL 01/12 Ctr 50 50Euro-Bund Options Futures - Put 128.5 OGBL 12/11 Ctr 60 60Euro-Bund Options Futures - Put 130 OGBL 01/12 Ctr 50 50Euro-Bund Options Futures - Put 130 OGBL 01/12 Ctr 50 50Euro-Bund Options Futures - Put 130.5 OGBL 12/11 Ctr 60 60Euro-Bund Options Futures - Put 131.5 OGBL 11/11 Ctr 50 50Euro-Bund Options Futures - Put 132 OGBL 01/12 Ctr 50 50Euro-Bund Options Futures - Put 132 OGBL 02/12 Ctr 60 60Euro-Bund Options Futures - Put 132 OGBL 12/11 Ctr 60 60Euro-Bund Options Futures - Put 132.5 OGBL 04/12 Ctr 45 45Euro-Bund Options Futures - Put 132.5 OGBL 11/11 Ctr 120 120Euro-Bund Options Futures - Put 133 OGBL 03/12 Ctr 60 60Euro-Bund Options Futures - Put 133 OGBL 11/11 Ctr 50 50Euro-Bund Options Futures - Put 133 OGBL 12/11 Ctr 60 60Euro-Bund Options Futures - Put 133 OGBL 12/11 Ctr 60 60Euro-Bund Options Futures - Put 133.5 OGBL 04/12 Ctr 80 80Euro-Bund Options Futures - Put 134 OGBL 02/12 Ctr 60 60Euro-Bund Options Futures - Put 134 OGBL 05/12 Ctr 80 80Euro-Bund Options Futures - Put 134.5 OGBL 04/12 Ctr 45 45Euro-Bund Options Futures - Put 134.5 OGBL 11/11 Ctr 120 120Euro-Bund Options Futures - Put 135 OGBL 12/11 Ctr 60 60Euro-Bund Options Futures - Put 135.5 OGBL 03/12 Ctr 60 60Euro-Bund Options Futures - Put 135.5 OGBL 03/12 Ctr 150 150Euro-Bund Options Futures - Put 135.5 OGBL 04/12 Ctr 80 80Euro-Bund Options Futures - Put 136 OGBL 10/11 Ctr 40Euro-Bund Options Futures - Put 136.5 OGBL 02/12 Ctr 60 60Euro-Bund Options Futures - Put 136.5 OGBL 02/12 Ctr 60 60Euro-Bund Options Futures - Put 136.5 OGBL 03/12 Ctr 130 130Euro-Bund Options Futures - Put 136.5 OGBL 04/12 Ctr 45 45Euro-Bund Options Futures - Put 138 OGBL 03/12 Ctr 130 130Euro-Bund Options Futures - Put 138 OGBL 03/12 Ctr 45 45Euro-Bund Options Futures - Put 138.5 OGBL 02/12 Ctr 60 60Euro-Bund Options Futures - Put 138.5 OGBL 03/12 Ctr 45 45Euro-Bund Options Futures - Put 30.5 OGBL 10/11 Ctr 55Put 134 30-Year US Treasury Bond Futures (CBT) 11/11 Ctr 20 20
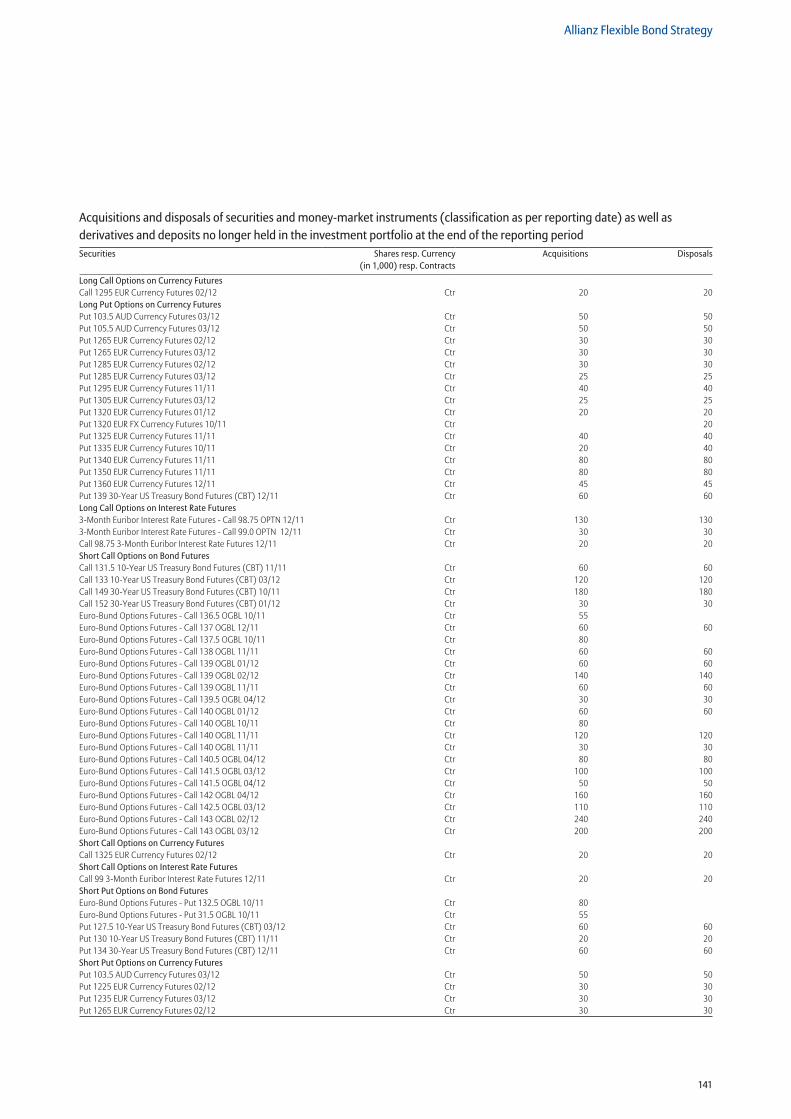
141
Allianz Flexible Bond Strategy
Acquisitions and disposals of securities and money-market instruments (classification as per reporting date) as well as derivatives and deposits no longer held in the investment portfolio at the end of the reporting periodSecurities Shares resp. Currency
(in 1,000) resp. ContractsAcquisitions Disposals
Long Call Options on Currency FuturesCall 1295 EUR Currency Futures 02/12 Ctr 20 20Long Put Options on Currency FuturesPut 103.5 AUD Currency Futures 03/12 Ctr 50 50Put 105.5 AUD Currency Futures 03/12 Ctr 50 50Put 1265 EUR Currency Futures 02/12 Ctr 30 30Put 1265 EUR Currency Futures 03/12 Ctr 30 30Put 1285 EUR Currency Futures 02/12 Ctr 30 30Put 1285 EUR Currency Futures 03/12 Ctr 25 25Put 1295 EUR Currency Futures 11/11 Ctr 40 40Put 1305 EUR Currency Futures 03/12 Ctr 25 25Put 1320 EUR Currency Futures 01/12 Ctr 20 20Put 1320 EUR FX Currency Futures 10/11 Ctr 20Put 1325 EUR Currency Futures 11/11 Ctr 40 40Put 1335 EUR Currency Futures 10/11 Ctr 20 40Put 1340 EUR Currency Futures 11/11 Ctr 80 80Put 1350 EUR Currency Futures 11/11 Ctr 80 80Put 1360 EUR Currency Futures 12/11 Ctr 45 45Put 139 30-Year US Treasury Bond Futures (CBT) 12/11 Ctr 60 60Long Call Options on Interest Rate Futures3-Month Euribor Interest Rate Futures - Call 98.75 OPTN 12/11 Ctr 130 1303-Month Euribor Interest Rate Futures - Call 99.0 OPTN 12/11 Ctr 30 30Call 98.75 3-Month Euribor Interest Rate Futures 12/11 Ctr 20 20Short Call Options on Bond FuturesCall 131.5 10-Year US Treasury Bond Futures (CBT) 11/11 Ctr 60 60Call 133 10-Year US Treasury Bond Futures (CBT) 03/12 Ctr 120 120Call 149 30-Year US Treasury Bond Futures (CBT) 10/11 Ctr 180 180Call 152 30-Year US Treasury Bond Futures (CBT) 01/12 Ctr 30 30Euro-Bund Options Futures - Call 136.5 OGBL 10/11 Ctr 55 Euro-Bund Options Futures - Call 137 OGBL 12/11 Ctr 60 60Euro-Bund Options Futures - Call 137.5 OGBL 10/11 Ctr 80 Euro-Bund Options Futures - Call 138 OGBL 11/11 Ctr 60 60Euro-Bund Options Futures - Call 139 OGBL 01/12 Ctr 60 60Euro-Bund Options Futures - Call 139 OGBL 02/12 Ctr 140 140Euro-Bund Options Futures - Call 139 OGBL 11/11 Ctr 60 60Euro-Bund Options Futures - Call 139.5 OGBL 04/12 Ctr 30 30Euro-Bund Options Futures - Call 140 OGBL 01/12 Ctr 60 60Euro-Bund Options Futures - Call 140 OGBL 10/11 Ctr 80 Euro-Bund Options Futures - Call 140 OGBL 11/11 Ctr 120 120Euro-Bund Options Futures - Call 140 OGBL 11/11 Ctr 30 30Euro-Bund Options Futures - Call 140.5 OGBL 04/12 Ctr 80 80Euro-Bund Options Futures - Call 141.5 OGBL 03/12 Ctr 100 100Euro-Bund Options Futures - Call 141.5 OGBL 04/12 Ctr 50 50Euro-Bund Options Futures - Call 142 OGBL 04/12 Ctr 160 160Euro-Bund Options Futures - Call 142.5 OGBL 03/12 Ctr 110 110Euro-Bund Options Futures - Call 143 OGBL 02/12 Ctr 240 240Euro-Bund Options Futures - Call 143 OGBL 03/12 Ctr 200 200Short Call Options on Currency FuturesCall 1325 EUR Currency Futures 02/12 Ctr 20 20Short Call Options on Interest Rate FuturesCall 99 3-Month Euribor Interest Rate Futures 12/11 Ctr 20 20Short Put Options on Bond FuturesEuro-Bund Options Futures - Put 132.5 OGBL 10/11 Ctr 80 Euro-Bund Options Futures - Put 31.5 OGBL 10/11 Ctr 55 Put 127.5 10-Year US Treasury Bond Futures (CBT) 03/12 Ctr 60 60Put 130 10-Year US Treasury Bond Futures (CBT) 11/11 Ctr 20 20Put 134 30-Year US Treasury Bond Futures (CBT) 12/11 Ctr 60 60Short Put Options on Currency FuturesPut 103.5 AUD Currency Futures 03/12 Ctr 50 50Put 1225 EUR Currency Futures 02/12 Ctr 30 30Put 1235 EUR Currency Futures 03/12 Ctr 30 30Put 1265 EUR Currency Futures 02/12 Ctr 30 30
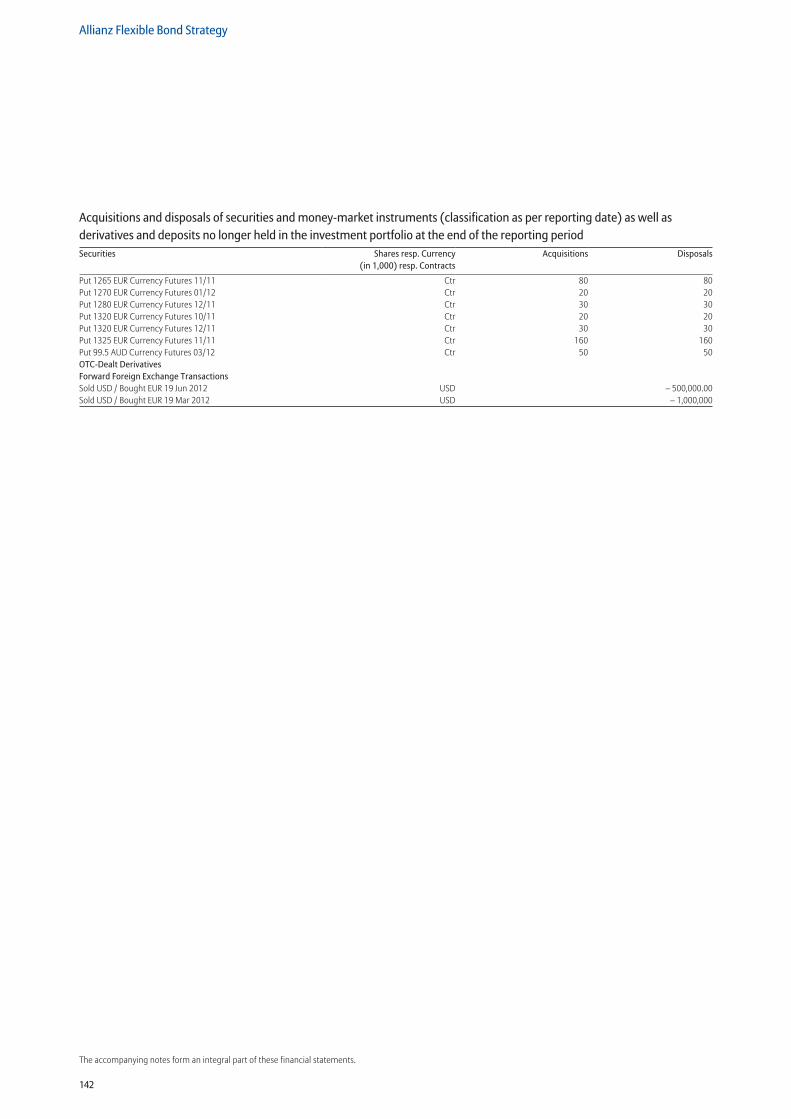
142
Allianz Flexible Bond Strategy
The accompanying notes form an integral part of these financial statements.
Acquisitions and disposals of securities and money-market instruments (classification as per reporting date) as well as derivatives and deposits no longer held in the investment portfolio at the end of the reporting periodSecurities Shares resp. Currency
(in 1,000) resp. ContractsAcquisitions Disposals
Put 1265 EUR Currency Futures 11/11 Ctr 80 80Put 1270 EUR Currency Futures 01/12 Ctr 20 20Put 1280 EUR Currency Futures 12/11 Ctr 30 30Put 1320 EUR Currency Futures 10/11 Ctr 20 20Put 1320 EUR Currency Futures 12/11 Ctr 30 30Put 1325 EUR Currency Futures 11/11 Ctr 160 160Put 99.5 AUD Currency Futures 03/12 Ctr 50 50OTC-Dealt DerivativesForward Foreign Exchange TransactionsSold USD / Bought EUR 19 Jun 2012 USD – 500,000.00Sold USD / Bought EUR 19 Mar 2012 USD – 1,000,000
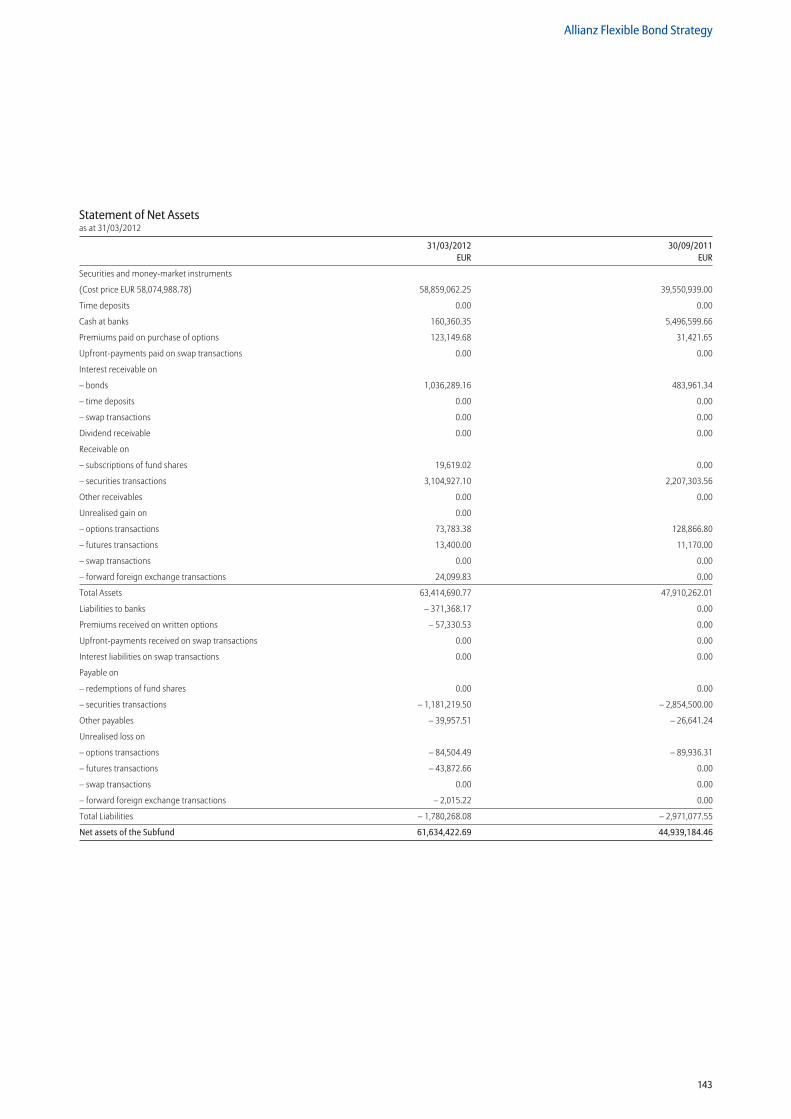
143
Allianz Flexible Bond Strategy
Statement of Net Assetsas at 31/03/2012
31/03/2012 30/09/2011 EUR EUR
Securities and money-market instruments
(Cost price EUR 58,074,988.78) 58,859,062.25 39,550,939.00
Time deposits 0.00 0.00
Cash at banks 160,360.35 5,496,599.66
Premiums paid on purchase of options 123,149.68 31,421.65
Upfront-payments paid on swap transactions 0.00 0.00
Interest receivable on
– bonds 1,036,289.16 483,961.34
– time deposits 0.00 0.00
– swap transactions 0.00 0.00
Dividend receivable 0.00 0.00
Receivable on
– subscriptions of fund shares 19,619.02 0.00
– securities transactions 3,104,927.10 2,207,303.56
Other receivables 0.00 0.00
Unrealised gain on 0.00
– options transactions 73,783.38 128,866.80
– futures transactions 13,400.00 11,170.00
– swap transactions 0.00 0.00
– forward foreign exchange transactions 24,099.83 0.00
Total Assets 63,414,690.77 47,910,262.01
Liabilities to banks – 371,368.17 0.00
Premiums received on written options – 57,330.53 0.00
Upfront-payments received on swap transactions 0.00 0.00
Interest liabilities on swap transactions 0.00 0.00
Payable on
– redemptions of fund shares 0.00 0.00
– securities transactions – 1,181,219.50 – 2,854,500.00
Other payables – 39,957.51 – 26,641.24
Unrealised loss on
– options transactions – 84,504.49 – 89,936.31
– futures transactions – 43,872.66 0.00
– swap transactions 0.00 0.00
– forward foreign exchange transactions – 2,015.22 0.00
Total Liabilities – 1,780,268.08 – 2,971,077.55
Net assets of the Subfund 61,634,422.69 44,939,184.46
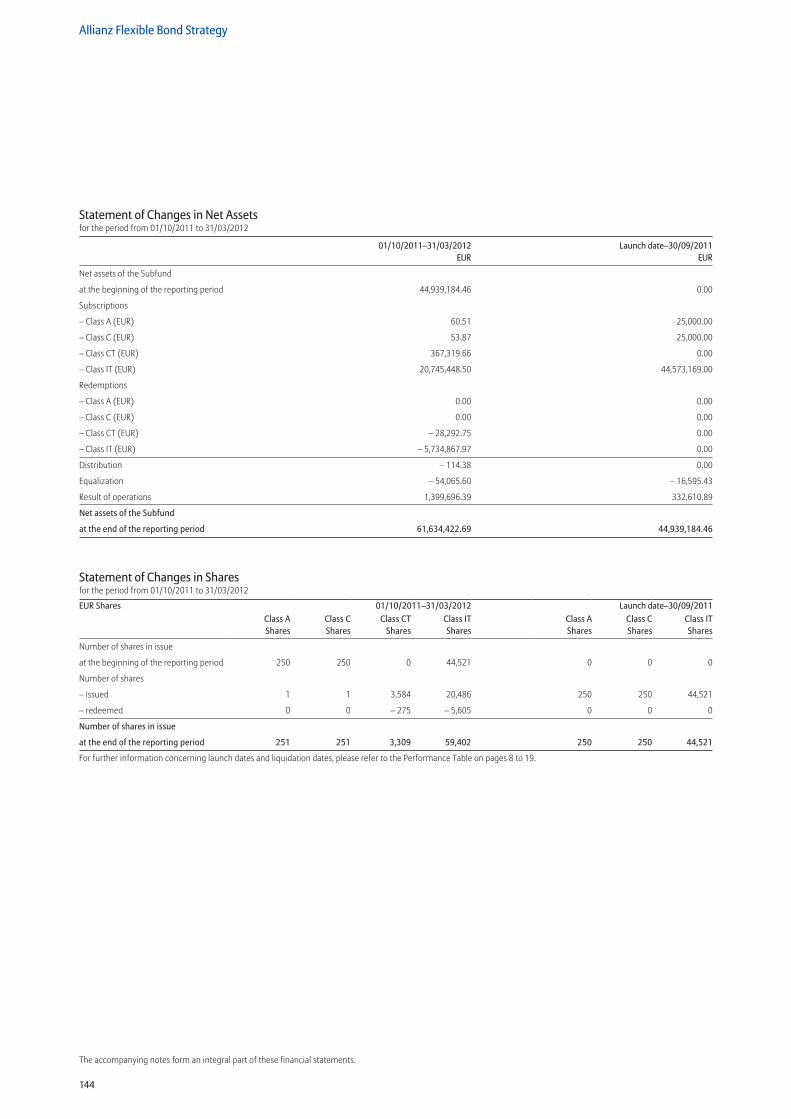
144
Allianz Flexible Bond Strategy
The accompanying notes form an integral part of these financial statements.
Statement of Changes in Net Assetsfor the period from 01/10/2011 to 31/03/2012
01/10/2011–31/03/2012 Launch date–30/09/2011 EUR EUR
Net assets of the Subfund
at the beginning of the reporting period 44,939,184.46 0.00
Subscriptions
– Class A (EUR) 60.51 25,000.00
– Class C (EUR) 53.87 25,000.00
– Class CT (EUR) 367,319.66 0.00
– Class IT (EUR) 20,745,448.50 44,573,169.00
Redemptions
– Class A (EUR) 0.00 0.00
– Class C (EUR) 0.00 0.00
– Class CT (EUR) – 28,292.75 0.00
– Class IT (EUR) – 5,734,867.97 0.00
Distribution – 114.38 0.00
Equalization – 54,065.60 – 16,595.43
Result of operations 1,399,696.39 332,610.89
Net assets of the Subfund
at the end of the reporting period 61,634,422.69 44,939,184.46
Statement of Changes in Sharesfor the period from 01/10/2011 to 31/03/2012
EUR Shares 01/10/2011–31/03/2012 Launch date–30/09/2011Class A Shares
Class C Shares
Class CT Shares
Class IT Shares
Class A Shares
Class C Shares
Class IT Shares
Number of shares in issue
at the beginning of the reporting period 250 250 0 44,521 0 0 0
Number of shares
– issued 1 1 3,584 20,486 250 250 44,521
– redeemed 0 0 – 275 – 5,605 0 0 0
Number of shares in issue
at the end of the reporting period 251 251 3,309 59,402 250 250 44,521
For further information concerning launch dates and liquidation dates, please refer to the Performance Table on pages 8 to 19.
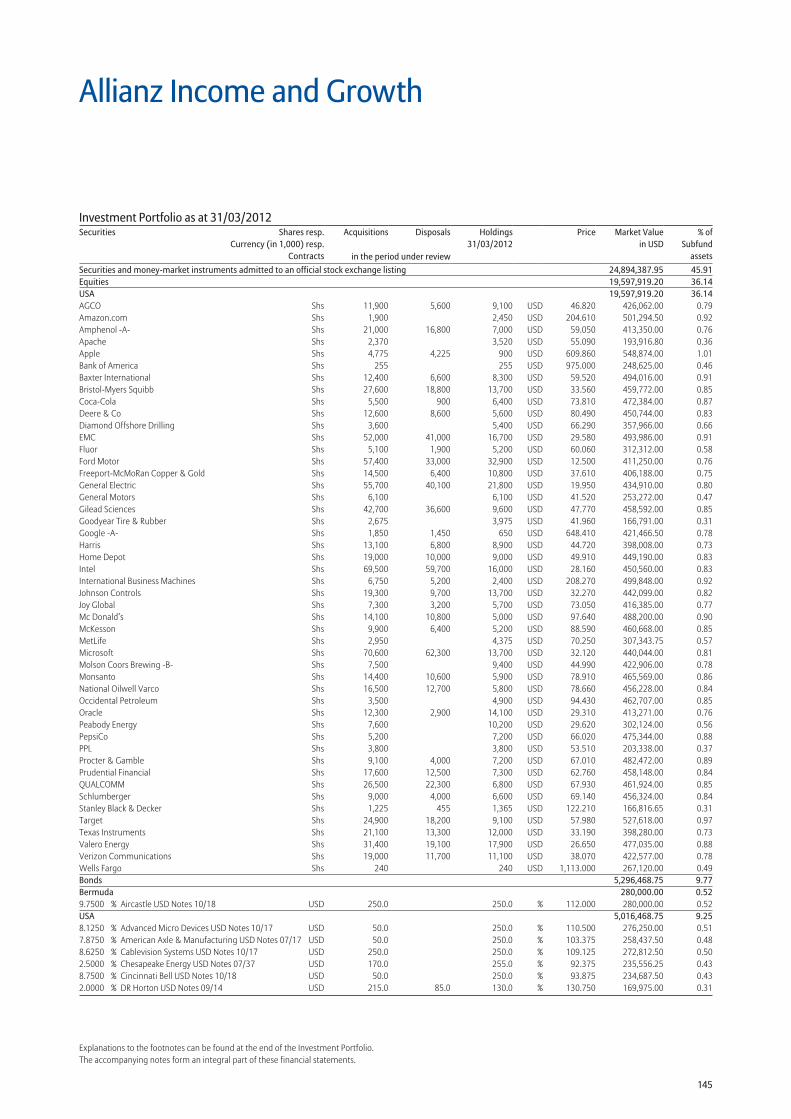
145
Explanations to the footnotes can be found at the end of the Investment Portfolio.The accompanying notes form an integral part of these financial statements.
Allianz Income and Growth
Securities and money-market instruments admitted to an official stock exchange listing 24,894,387.95 45.91Equities 19,597,919.20 36.14USA 19,597,919.20 36.14AGCO Shs 11,900 5,600 9,100 USD 46.820 426,062.00 0.79Amazon.com Shs 1,900 2,450 USD 204.610 501,294.50 0.92Amphenol -A- Shs 21,000 16,800 7,000 USD 59.050 413,350.00 0.76Apache Shs 2,370 3,520 USD 55.090 193,916.80 0.36Apple Shs 4,775 4,225 900 USD 609.860 548,874.00 1.01Bank of America Shs 255 255 USD 975.000 248,625.00 0.46Baxter International Shs 12,400 6,600 8,300 USD 59.520 494,016.00 0.91Bristol-Myers Squibb Shs 27,600 18,800 13,700 USD 33.560 459,772.00 0.85Coca-Cola Shs 5,500 900 6,400 USD 73.810 472,384.00 0.87Deere & Co Shs 12,600 8,600 5,600 USD 80.490 450,744.00 0.83Diamond Offshore Drilling Shs 3,600 5,400 USD 66.290 357,966.00 0.66EMC Shs 52,000 41,000 16,700 USD 29.580 493,986.00 0.91Fluor Shs 5,100 1,900 5,200 USD 60.060 312,312.00 0.58Ford Motor Shs 57,400 33,000 32,900 USD 12.500 411,250.00 0.76Freeport-McMoRan Copper & Gold Shs 14,500 6,400 10,800 USD 37.610 406,188.00 0.75General Electric Shs 55,700 40,100 21,800 USD 19.950 434,910.00 0.80General Motors Shs 6,100 6,100 USD 41.520 253,272.00 0.47Gilead Sciences Shs 42,700 36,600 9,600 USD 47.770 458,592.00 0.85Goodyear Tire & Rubber Shs 2,675 3,975 USD 41.960 166,791.00 0.31Google -A- Shs 1,850 1,450 650 USD 648.410 421,466.50 0.78Harris Shs 13,100 6,800 8,900 USD 44.720 398,008.00 0.73Home Depot Shs 19,000 10,000 9,000 USD 49.910 449,190.00 0.83Intel Shs 69,500 59,700 16,000 USD 28.160 450,560.00 0.83International Business Machines Shs 6,750 5,200 2,400 USD 208.270 499,848.00 0.92Johnson Controls Shs 19,300 9,700 13,700 USD 32.270 442,099.00 0.82Joy Global Shs 7,300 3,200 5,700 USD 73.050 416,385.00 0.77Mc Donald’s Shs 14,100 10,800 5,000 USD 97.640 488,200.00 0.90McKesson Shs 9,900 6,400 5,200 USD 88.590 460,668.00 0.85MetLife Shs 2,950 4,375 USD 70.250 307,343.75 0.57Microsoft Shs 70,600 62,300 13,700 USD 32.120 440,044.00 0.81Molson Coors Brewing -B- Shs 7,500 9,400 USD 44.990 422,906.00 0.78Monsanto Shs 14,400 10,600 5,900 USD 78.910 465,569.00 0.86National Oilwell Varco Shs 16,500 12,700 5,800 USD 78.660 456,228.00 0.84Occidental Petroleum Shs 3,500 4,900 USD 94.430 462,707.00 0.85Oracle Shs 12,300 2,900 14,100 USD 29.310 413,271.00 0.76Peabody Energy Shs 7,600 10,200 USD 29.620 302,124.00 0.56PepsiCo Shs 5,200 7,200 USD 66.020 475,344.00 0.88PPL Shs 3,800 3,800 USD 53.510 203,338.00 0.37Procter & Gamble Shs 9,100 4,000 7,200 USD 67.010 482,472.00 0.89Prudential Financial Shs 17,600 12,500 7,300 USD 62.760 458,148.00 0.84QUALCOMM Shs 26,500 22,300 6,800 USD 67.930 461,924.00 0.85Schlumberger Shs 9,000 4,000 6,600 USD 69.140 456,324.00 0.84Stanley Black & Decker Shs 1,225 455 1,365 USD 122.210 166,816.65 0.31Target Shs 24,900 18,200 9,100 USD 57.980 527,618.00 0.97Texas Instruments Shs 21,100 13,300 12,000 USD 33.190 398,280.00 0.73Valero Energy Shs 31,400 19,100 17,900 USD 26.650 477,035.00 0.88Verizon Communications Shs 19,000 11,700 11,100 USD 38.070 422,577.00 0.78Wells Fargo Shs 240 240 USD 1,113.000 267,120.00 0.49Bonds 5,296,468.75 9.77Bermuda 280,000.00 0.529.7500 % Aircastle USD Notes 10/18 USD 250.0 250.0 % 112.000 280,000.00 0.52USA 5,016,468.75 9.258.1250 % Advanced Micro Devices USD Notes 10/17 USD 50.0 250.0 % 110.500 276,250.00 0.517.8750 % American Axle & Manufacturing USD Notes 07/17 USD 50.0 250.0 % 103.375 258,437.50 0.488.6250 % Cablevision Systems USD Notes 10/17 USD 250.0 250.0 % 109.125 272,812.50 0.502.5000 % Chesapeake Energy USD Notes 07/37 USD 170.0 255.0 % 92.375 235,556.25 0.438.7500 % Cincinnati Bell USD Notes 10/18 USD 50.0 250.0 % 93.875 234,687.50 0.432.0000 % DR Horton USD Notes 09/14 USD 215.0 85.0 130.0 % 130.750 169,975.00 0.31
Investment Portfolio as at 31/03/2012Securities Shares resp.
Currency (in 1,000) resp.Contracts
Acquisitions Disposals Holdings 31/03/2012
Price Market Valuein USD
% ofSubfund
assetsin the period under review
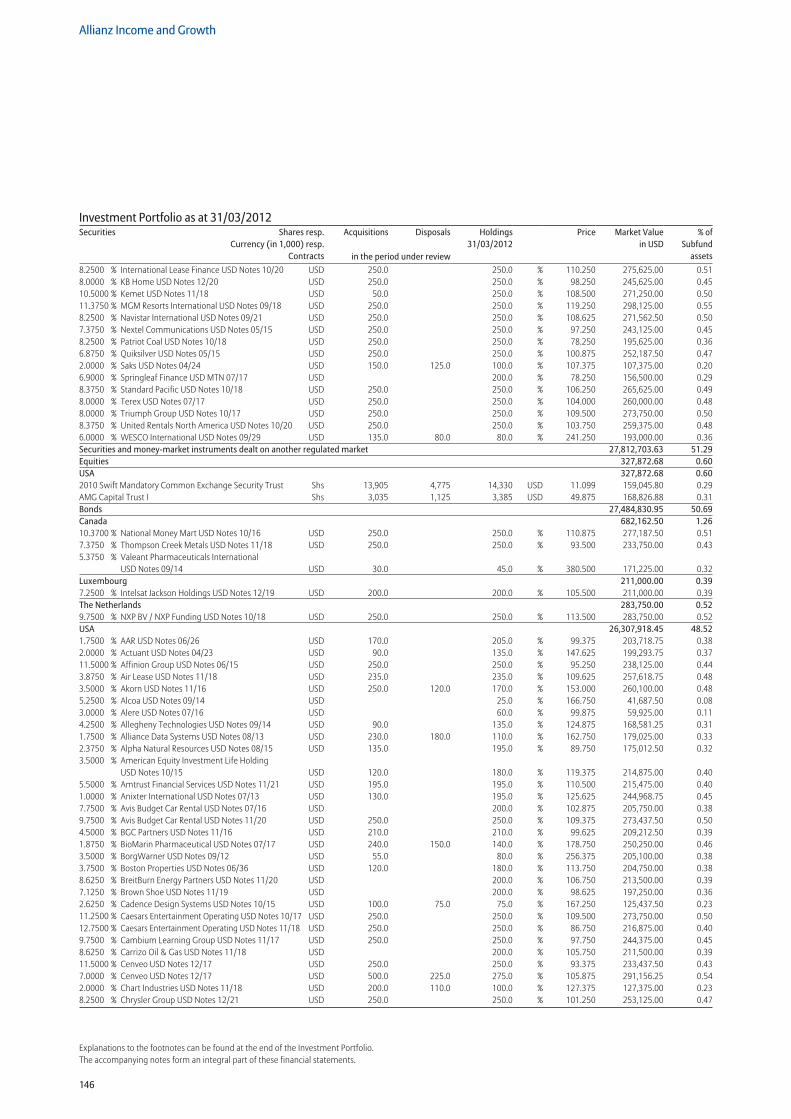
146
Allianz Income and Growth
Explanations to the footnotes can be found at the end of the Investment Portfolio.The accompanying notes form an integral part of these financial statements.
8.2500 % International Lease Finance USD Notes 10/20 USD 250.0 250.0 % 110.250 275,625.00 0.518.0000 % KB Home USD Notes 12/20 USD 250.0 250.0 % 98.250 245,625.00 0.4510.5000 % Kemet USD Notes 11/18 USD 50.0 250.0 % 108.500 271,250.00 0.5011.3750 % MGM Resorts International USD Notes 09/18 USD 250.0 250.0 % 119.250 298,125.00 0.558.2500 % Navistar International USD Notes 09/21 USD 250.0 250.0 % 108.625 271,562.50 0.507.3750 % Nextel Communications USD Notes 05/15 USD 250.0 250.0 % 97.250 243,125.00 0.458.2500 % Patriot Coal USD Notes 10/18 USD 250.0 250.0 % 78.250 195,625.00 0.366.8750 % Quiksilver USD Notes 05/15 USD 250.0 250.0 % 100.875 252,187.50 0.472.0000 % Saks USD Notes 04/24 USD 150.0 125.0 100.0 % 107.375 107,375.00 0.206.9000 % Springleaf Finance USD MTN 07/17 USD 200.0 % 78.250 156,500.00 0.298.3750 % Standard Pacific USD Notes 10/18 USD 250.0 250.0 % 106.250 265,625.00 0.498.0000 % Terex USD Notes 07/17 USD 250.0 250.0 % 104.000 260,000.00 0.488.0000 % Triumph Group USD Notes 10/17 USD 250.0 250.0 % 109.500 273,750.00 0.508.3750 % United Rentals North America USD Notes 10/20 USD 250.0 250.0 % 103.750 259,375.00 0.486.0000 % WESCO International USD Notes 09/29 USD 135.0 80.0 80.0 % 241.250 193,000.00 0.36Securities and money-market instruments dealt on another regulated market 27,812,703.63 51.29Equities 327,872.68 0.60USA 327,872.68 0.602010 Swift Mandatory Common Exchange Security Trust Shs 13,905 4,775 14,330 USD 11.099 159,045.80 0.29AMG Capital Trust I Shs 3,035 1,125 3,385 USD 49.875 168,826.88 0.31Bonds 27,484,830.95 50.69Canada 682,162.50 1.2610.3700 % National Money Mart USD Notes 10/16 USD 250.0 250.0 % 110.875 277,187.50 0.517.3750 % Thompson Creek Metals USD Notes 11/18 USD 250.0 250.0 % 93.500 233,750.00 0.435.3750 % Valeant Pharmaceuticals International
USD Notes 09/14 USD 30.0 45.0 % 380.500 171,225.00 0.32Luxembourg 211,000.00 0.397.2500 % Intelsat Jackson Holdings USD Notes 12/19 USD 200.0 200.0 % 105.500 211,000.00 0.39The Netherlands 283,750.00 0.529.7500 % NXP BV / NXP Funding USD Notes 10/18 USD 250.0 250.0 % 113.500 283,750.00 0.52USA 26,307,918.45 48.521.7500 % AAR USD Notes 06/26 USD 170.0 205.0 % 99.375 203,718.75 0.382.0000 % Actuant USD Notes 04/23 USD 90.0 135.0 % 147.625 199,293.75 0.3711.5000 % Affinion Group USD Notes 06/15 USD 250.0 250.0 % 95.250 238,125.00 0.443.8750 % Air Lease USD Notes 11/18 USD 235.0 235.0 % 109.625 257,618.75 0.483.5000 % Akorn USD Notes 11/16 USD 250.0 120.0 170.0 % 153.000 260,100.00 0.485.2500 % Alcoa USD Notes 09/14 USD 25.0 % 166.750 41,687.50 0.083.0000 % Alere USD Notes 07/16 USD 60.0 % 99.875 59,925.00 0.114.2500 % Allegheny Technologies USD Notes 09/14 USD 90.0 135.0 % 124.875 168,581.25 0.311.7500 % Alliance Data Systems USD Notes 08/13 USD 230.0 180.0 110.0 % 162.750 179,025.00 0.332.3750 % Alpha Natural Resources USD Notes 08/15 USD 135.0 195.0 % 89.750 175,012.50 0.323.5000 % American Equity Investment Life Holding
USD Notes 10/15 USD 120.0 180.0 % 119.375 214,875.00 0.405.5000 % Amtrust Financial Services USD Notes 11/21 USD 195.0 195.0 % 110.500 215,475.00 0.401.0000 % Anixter International USD Notes 07/13 USD 130.0 195.0 % 125.625 244,968.75 0.457.7500 % Avis Budget Car Rental USD Notes 07/16 USD 200.0 % 102.875 205,750.00 0.389.7500 % Avis Budget Car Rental USD Notes 11/20 USD 250.0 250.0 % 109.375 273,437.50 0.504.5000 % BGC Partners USD Notes 11/16 USD 210.0 210.0 % 99.625 209,212.50 0.391.8750 % BioMarin Pharmaceutical USD Notes 07/17 USD 240.0 150.0 140.0 % 178.750 250,250.00 0.463.5000 % BorgWarner USD Notes 09/12 USD 55.0 80.0 % 256.375 205,100.00 0.383.7500 % Boston Properties USD Notes 06/36 USD 120.0 180.0 % 113.750 204,750.00 0.388.6250 % BreitBurn Energy Partners USD Notes 11/20 USD 200.0 % 106.750 213,500.00 0.397.1250 % Brown Shoe USD Notes 11/19 USD 200.0 % 98.625 197,250.00 0.362.6250 % Cadence Design Systems USD Notes 10/15 USD 100.0 75.0 75.0 % 167.250 125,437.50 0.2311.2500 % Caesars Entertainment Operating USD Notes 10/17 USD 250.0 250.0 % 109.500 273,750.00 0.5012.7500 % Caesars Entertainment Operating USD Notes 11/18 USD 250.0 250.0 % 86.750 216,875.00 0.409.7500 % Cambium Learning Group USD Notes 11/17 USD 250.0 250.0 % 97.750 244,375.00 0.458.6250 % Carrizo Oil & Gas USD Notes 11/18 USD 200.0 % 105.750 211,500.00 0.3911.5000 % Cenveo USD Notes 12/17 USD 250.0 250.0 % 93.375 233,437.50 0.437.0000 % Cenveo USD Notes 12/17 USD 500.0 225.0 275.0 % 105.875 291,156.25 0.542.0000 % Chart Industries USD Notes 11/18 USD 200.0 110.0 100.0 % 127.375 127,375.00 0.238.2500 % Chrysler Group USD Notes 12/21 USD 250.0 250.0 % 101.250 253,125.00 0.47
Investment Portfolio as at 31/03/2012Securities Shares resp.
Currency (in 1,000) resp.Contracts
Acquisitions Disposals Holdings 31/03/2012
Price Market Valuein USD
% ofSubfund
assetsin the period under review
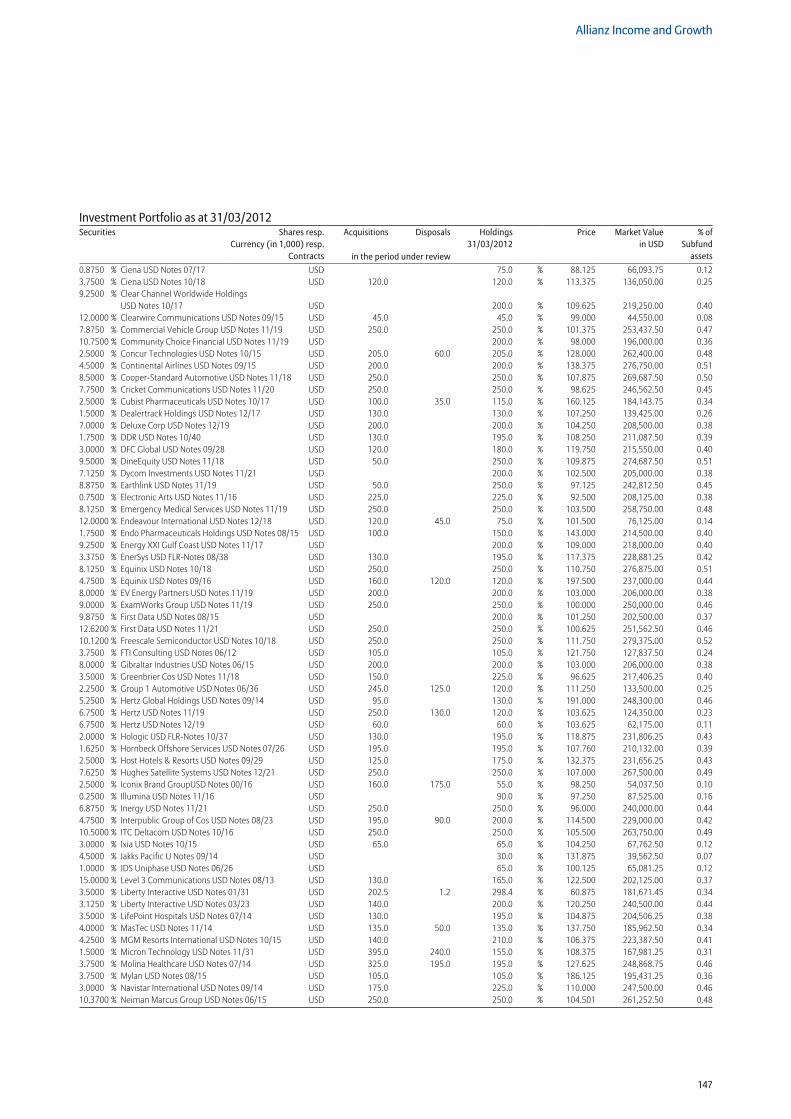
147
Allianz Income and Growth
0.8750 % Ciena USD Notes 07/17 USD 75.0 % 88.125 66,093.75 0.123.7500 % Ciena USD Notes 10/18 USD 120.0 120.0 % 113.375 136,050.00 0.259.2500 % Clear Channel Worldwide Holdings
USD Notes 10/17 USD 200.0 % 109.625 219,250.00 0.4012.0000 % Clearwire Communications USD Notes 09/15 USD 45.0 45.0 % 99.000 44,550.00 0.087.8750 % Commercial Vehicle Group USD Notes 11/19 USD 250.0 250.0 % 101.375 253,437.50 0.4710.7500 % Community Choice Financial USD Notes 11/19 USD 200.0 % 98.000 196,000.00 0.362.5000 % Concur Technologies USD Notes 10/15 USD 205.0 60.0 205.0 % 128.000 262,400.00 0.484.5000 % Continental Airlines USD Notes 09/15 USD 200.0 200.0 % 138.375 276,750.00 0.518.5000 % Cooper-Standard Automotive USD Notes 11/18 USD 250.0 250.0 % 107.875 269,687.50 0.507.7500 % Cricket Communications USD Notes 11/20 USD 250.0 250.0 % 98.625 246,562.50 0.452.5000 % Cubist Pharmaceuticals USD Notes 10/17 USD 100.0 35.0 115.0 % 160.125 184,143.75 0.341.5000 % Dealertrack Holdings USD Notes 12/17 USD 130.0 130.0 % 107.250 139,425.00 0.267.0000 % Deluxe Corp USD Notes 12/19 USD 200.0 200.0 % 104.250 208,500.00 0.381.7500 % DDR USD Notes 10/40 USD 130.0 195.0 % 108.250 211,087.50 0.393.0000 % DFC Global USD Notes 09/28 USD 120.0 180.0 % 119.750 215,550.00 0.409.5000 % DineEquity USD Notes 11/18 USD 50.0 250.0 % 109.875 274,687.50 0.517.1250 % Dycom Investments USD Notes 11/21 USD 200.0 % 102.500 205,000.00 0.388.8750 % Earthlink USD Notes 11/19 USD 50.0 250.0 % 97.125 242,812.50 0.450.7500 % Electronic Arts USD Notes 11/16 USD 225.0 225.0 % 92.500 208,125.00 0.388.1250 % Emergency Medical Services USD Notes 11/19 USD 250.0 250.0 % 103.500 258,750.00 0.4812.0000 % Endeavour International USD Notes 12/18 USD 120.0 45.0 75.0 % 101.500 76,125.00 0.141.7500 % Endo Pharmaceuticals Holdings USD Notes 08/15 USD 100.0 150.0 % 143.000 214,500.00 0.409.2500 % Energy XXI Gulf Coast USD Notes 11/17 USD 200.0 % 109.000 218,000.00 0.403.3750 % EnerSys USD FLR-Notes 08/38 USD 130.0 195.0 % 117.375 228,881.25 0.428.1250 % Equinix USD Notes 10/18 USD 250.0 250.0 % 110.750 276,875.00 0.514.7500 % Equinix USD Notes 09/16 USD 160.0 120.0 120.0 % 197.500 237,000.00 0.448.0000 % EV Energy Partners USD Notes 11/19 USD 200.0 200.0 % 103.000 206,000.00 0.389.0000 % ExamWorks Group USD Notes 11/19 USD 250.0 250.0 % 100.000 250,000.00 0.469.8750 % First Data USD Notes 08/15 USD 200.0 % 101.250 202,500.00 0.3712.6200 % First Data USD Notes 11/21 USD 250.0 250.0 % 100.625 251,562.50 0.4610.1200 % Freescale Semiconductor USD Notes 10/18 USD 250.0 250.0 % 111.750 279,375.00 0.523.7500 % FTI Consulting USD Notes 06/12 USD 105.0 105.0 % 121.750 127,837.50 0.248.0000 % Gibraltar Industries USD Notes 06/15 USD 200.0 200.0 % 103.000 206,000.00 0.383.5000 % Greenbrier Cos USD Notes 11/18 USD 150.0 225.0 % 96.625 217,406.25 0.402.2500 % Group 1 Automotive USD Notes 06/36 USD 245.0 125.0 120.0 % 111.250 133,500.00 0.255.2500 % Hertz Global Holdings USD Notes 09/14 USD 95.0 130.0 % 191.000 248,300.00 0.466.7500 % Hertz USD Notes 11/19 USD 250.0 130.0 120.0 % 103.625 124,350.00 0.236.7500 % Hertz USD Notes 12/19 USD 60.0 60.0 % 103.625 62,175.00 0.112.0000 % Hologic USD FLR-Notes 10/37 USD 130.0 195.0 % 118.875 231,806.25 0.431.6250 % Hornbeck Offshore Services USD Notes 07/26 USD 195.0 195.0 % 107.760 210,132.00 0.392.5000 % Host Hotels & Resorts USD Notes 09/29 USD 125.0 175.0 % 132.375 231,656.25 0.437.6250 % Hughes Satellite Systems USD Notes 12/21 USD 250.0 250.0 % 107.000 267,500.00 0.492.5000 % Iconix Brand GroupUSD Notes 00/16 USD 160.0 175.0 55.0 % 98.250 54,037.50 0.100.2500 % Illumina USD Notes 11/16 USD 90.0 % 97.250 87,525.00 0.166.8750 % Inergy USD Notes 11/21 USD 250.0 250.0 % 96.000 240,000.00 0.444.7500 % Interpublic Group of Cos USD Notes 08/23 USD 195.0 90.0 200.0 % 114.500 229,000.00 0.4210.5000 % ITC Deltacom USD Notes 10/16 USD 250.0 250.0 % 105.500 263,750.00 0.493.0000 % Ixia USD Notes 10/15 USD 65.0 65.0 % 104.250 67,762.50 0.124.5000 % Jakks Pacific U Notes 09/14 USD 30.0 % 131.875 39,562.50 0.071.0000 % JDS Uniphase USD Notes 06/26 USD 65.0 % 100.125 65,081.25 0.1215.0000 % Level 3 Communications USD Notes 08/13 USD 130.0 165.0 % 122.500 202,125.00 0.373.5000 % Liberty Interactive USD Notes 01/31 USD 202.5 1.2 298.4 % 60.875 181,671.45 0.343.1250 % Liberty Interactive USD Notes 03/23 USD 140.0 200.0 % 120.250 240,500.00 0.443.5000 % LifePoint Hospitals USD Notes 07/14 USD 130.0 195.0 % 104.875 204,506.25 0.384.0000 % MasTec USD Notes 11/14 USD 135.0 50.0 135.0 % 137.750 185,962.50 0.344.2500 % MGM Resorts International USD Notes 10/15 USD 140.0 210.0 % 106.375 223,387.50 0.411.5000 % Micron Technology USD Notes 11/31 USD 395.0 240.0 155.0 % 108.375 167,981.25 0.313.7500 % Molina Healthcare USD Notes 07/14 USD 325.0 195.0 195.0 % 127.625 248,868.75 0.463.7500 % Mylan USD Notes 08/15 USD 105.0 105.0 % 186.125 195,431.25 0.363.0000 % Navistar International USD Notes 09/14 USD 175.0 225.0 % 110.000 247,500.00 0.4610.3700 % Neiman Marcus Group USD Notes 06/15 USD 250.0 250.0 % 104.501 261,252.50 0.48
Investment Portfolio as at 31/03/2012Securities Shares resp.
Currency (in 1,000) resp.Contracts
Acquisitions Disposals Holdings 31/03/2012
Price Market Valuein USD
% ofSubfund
assetsin the period under review
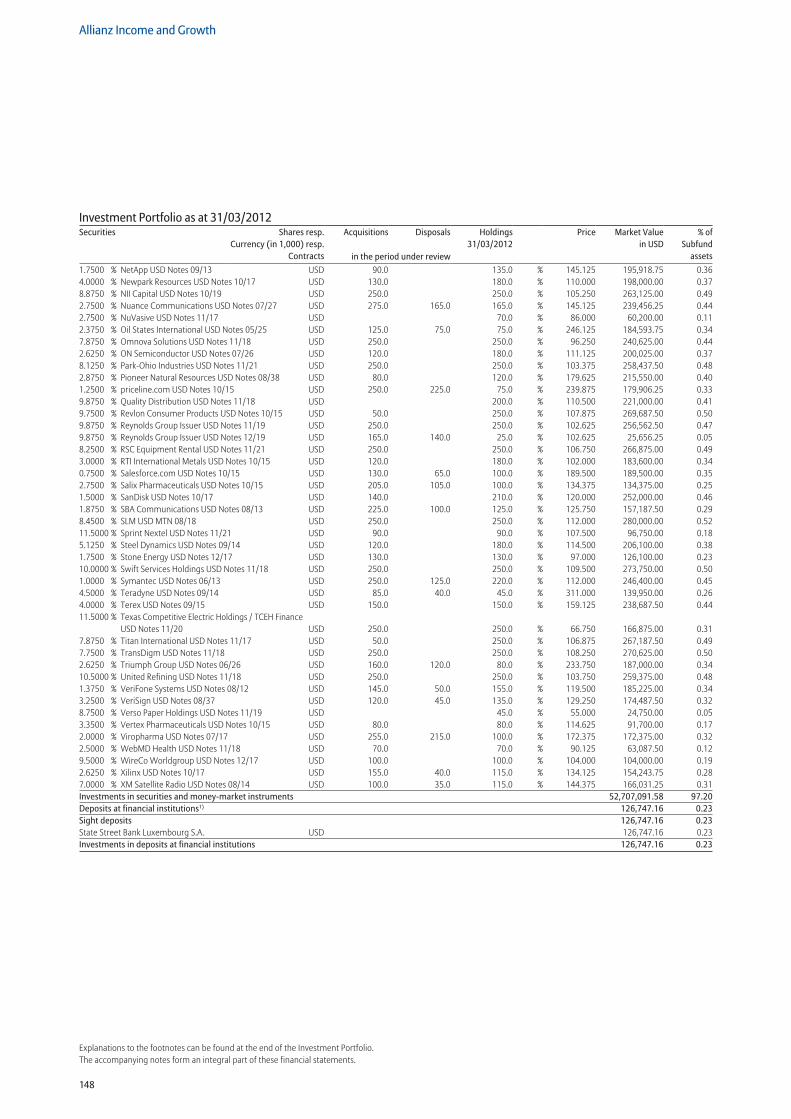
148
Allianz Income and Growth
Explanations to the footnotes can be found at the end of the Investment Portfolio.The accompanying notes form an integral part of these financial statements.
1.7500 % NetApp USD Notes 09/13 USD 90.0 135.0 % 145.125 195,918.75 0.364.0000 % Newpark Resources USD Notes 10/17 USD 130.0 180.0 % 110.000 198,000.00 0.378.8750 % NII Capital USD Notes 10/19 USD 250.0 250.0 % 105.250 263,125.00 0.492.7500 % Nuance Communications USD Notes 07/27 USD 275.0 165.0 165.0 % 145.125 239,456.25 0.442.7500 % NuVasive USD Notes 11/17 USD 70.0 % 86.000 60,200.00 0.112.3750 % Oil States International USD Notes 05/25 USD 125.0 75.0 75.0 % 246.125 184,593.75 0.347.8750 % Omnova Solutions USD Notes 11/18 USD 250.0 250.0 % 96.250 240,625.00 0.442.6250 % ON Semiconductor USD Notes 07/26 USD 120.0 180.0 % 111.125 200,025.00 0.378.1250 % Park-Ohio Industries USD Notes 11/21 USD 250.0 250.0 % 103.375 258,437.50 0.482.8750 % Pioneer Natural Resources USD Notes 08/38 USD 80.0 120.0 % 179.625 215,550.00 0.401.2500 % priceline.com USD Notes 10/15 USD 250.0 225.0 75.0 % 239.875 179,906.25 0.339.8750 % Quality Distribution USD Notes 11/18 USD 200.0 % 110.500 221,000.00 0.419.7500 % Revlon Consumer Products USD Notes 10/15 USD 50.0 250.0 % 107.875 269,687.50 0.509.8750 % Reynolds Group Issuer USD Notes 11/19 USD 250.0 250.0 % 102.625 256,562.50 0.479.8750 % Reynolds Group Issuer USD Notes 12/19 USD 165.0 140.0 25.0 % 102.625 25,656.25 0.058.2500 % RSC Equipment Rental USD Notes 11/21 USD 250.0 250.0 % 106.750 266,875.00 0.493.0000 % RTI International Metals USD Notes 10/15 USD 120.0 180.0 % 102.000 183,600.00 0.340.7500 % Salesforce.com USD Notes 10/15 USD 130.0 65.0 100.0 % 189.500 189,500.00 0.352.7500 % Salix Pharmaceuticals USD Notes 10/15 USD 205.0 105.0 100.0 % 134.375 134,375.00 0.251.5000 % SanDisk USD Notes 10/17 USD 140.0 210.0 % 120.000 252,000.00 0.461.8750 % SBA Communications USD Notes 08/13 USD 225.0 100.0 125.0 % 125.750 157,187.50 0.298.4500 % SLM USD MTN 08/18 USD 250.0 250.0 % 112.000 280,000.00 0.5211.5000 % Sprint Nextel USD Notes 11/21 USD 90.0 90.0 % 107.500 96,750.00 0.185.1250 % Steel Dynamics USD Notes 09/14 USD 120.0 180.0 % 114.500 206,100.00 0.381.7500 % Stone Energy USD Notes 12/17 USD 130.0 130.0 % 97.000 126,100.00 0.2310.0000 % Swift Services Holdings USD Notes 11/18 USD 250.0 250.0 % 109.500 273,750.00 0.501.0000 % Symantec USD Notes 06/13 USD 250.0 125.0 220.0 % 112.000 246,400.00 0.454.5000 % Teradyne USD Notes 09/14 USD 85.0 40.0 45.0 % 311.000 139,950.00 0.264.0000 % Terex USD Notes 09/15 USD 150.0 150.0 % 159.125 238,687.50 0.4411.5000 % Texas Competitive Electric Holdings / TCEH Finance
USD Notes 11/20 USD 250.0 250.0 % 66.750 166,875.00 0.317.8750 % Titan International USD Notes 11/17 USD 50.0 250.0 % 106.875 267,187.50 0.497.7500 % TransDigm USD Notes 11/18 USD 250.0 250.0 % 108.250 270,625.00 0.502.6250 % Triumph Group USD Notes 06/26 USD 160.0 120.0 80.0 % 233.750 187,000.00 0.3410.5000 % United Refining USD Notes 11/18 USD 250.0 250.0 % 103.750 259,375.00 0.481.3750 % VeriFone Systems USD Notes 08/12 USD 145.0 50.0 155.0 % 119.500 185,225.00 0.343.2500 % VeriSign USD Notes 08/37 USD 120.0 45.0 135.0 % 129.250 174,487.50 0.328.7500 % Verso Paper Holdings USD Notes 11/19 USD 45.0 % 55.000 24,750.00 0.053.3500 % Vertex Pharmaceuticals USD Notes 10/15 USD 80.0 80.0 % 114.625 91,700.00 0.172.0000 % Viropharma USD Notes 07/17 USD 255.0 215.0 100.0 % 172.375 172,375.00 0.322.5000 % WebMD Health USD Notes 11/18 USD 70.0 70.0 % 90.125 63,087.50 0.129.5000 % WireCo Worldgroup USD Notes 12/17 USD 100.0 100.0 % 104.000 104,000.00 0.192.6250 % Xilinx USD Notes 10/17 USD 155.0 40.0 115.0 % 134.125 154,243.75 0.287.0000 % XM Satellite Radio USD Notes 08/14 USD 100.0 35.0 115.0 % 144.375 166,031.25 0.31Investments in securities and money-market instruments 52,707,091.58 97.20Deposits at financial institutions1) 126,747.16 0.23Sight deposits 126,747.16 0.23State Street Bank Luxembourg S.A. USD 126,747.16 0.23Investments in deposits at financial institutions 126,747.16 0.23
Investment Portfolio as at 31/03/2012Securities Shares resp.
Currency (in 1,000) resp.Contracts
Acquisitions Disposals Holdings 31/03/2012
Price Market Valuein USD
% ofSubfund
assetsin the period under review
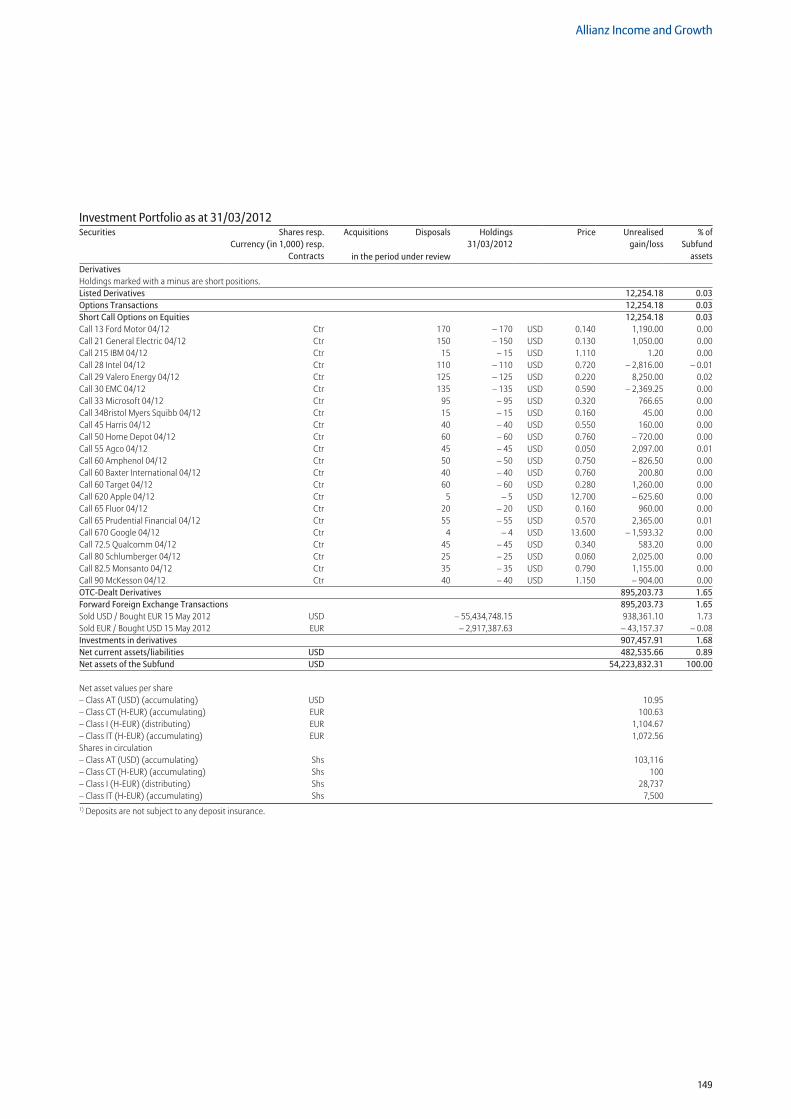
149
Allianz Income and Growth
Investment Portfolio as at 31/03/2012Securities Shares resp.
Currency (in 1,000) resp.Contracts
Acquisitions Disposals Holdings 31/03/2012
Price Unrealisedgain/loss
% ofSubfund
assetsin the period under reviewDerivativesHoldings marked with a minus are short positions. Listed Derivatives 12,254.18 0.03Options Transactions 12,254.18 0.03Short Call Options on Equities 12,254.18 0.03Call 13 Ford Motor 04/12 Ctr 170 – 170 USD 0.140 1,190.00 0.00Call 21 General Electric 04/12 Ctr 150 – 150 USD 0.130 1,050.00 0.00Call 215 IBM 04/12 Ctr 15 – 15 USD 1.110 1.20 0.00Call 28 Intel 04/12 Ctr 110 – 110 USD 0.720 – 2,816.00 – 0.01Call 29 Valero Energy 04/12 Ctr 125 – 125 USD 0.220 8,250.00 0.02Call 30 EMC 04/12 Ctr 135 – 135 USD 0.590 – 2,369.25 0.00Call 33 Microsoft 04/12 Ctr 95 – 95 USD 0.320 766.65 0.00Call 34Bristol Myers Squibb 04/12 Ctr 15 – 15 USD 0.160 45.00 0.00Call 45 Harris 04/12 Ctr 40 – 40 USD 0.550 160.00 0.00Call 50 Home Depot 04/12 Ctr 60 – 60 USD 0.760 – 720.00 0.00Call 55 Agco 04/12 Ctr 45 – 45 USD 0.050 2,097.00 0.01Call 60 Amphenol 04/12 Ctr 50 – 50 USD 0.750 – 826.50 0.00Call 60 Baxter International 04/12 Ctr 40 – 40 USD 0.760 200.80 0.00Call 60 Target 04/12 Ctr 60 – 60 USD 0.280 1,260.00 0.00Call 620 Apple 04/12 Ctr 5 – 5 USD 12.700 – 625.60 0.00Call 65 Fluor 04/12 Ctr 20 – 20 USD 0.160 960.00 0.00Call 65 Prudential Financial 04/12 Ctr 55 – 55 USD 0.570 2,365.00 0.01Call 670 Google 04/12 Ctr 4 – 4 USD 13.600 – 1,593.32 0.00Call 72.5 Qualcomm 04/12 Ctr 45 – 45 USD 0.340 583.20 0.00Call 80 Schlumberger 04/12 Ctr 25 – 25 USD 0.060 2,025.00 0.00Call 82.5 Monsanto 04/12 Ctr 35 – 35 USD 0.790 1,155.00 0.00Call 90 McKesson 04/12 Ctr 40 – 40 USD 1.150 – 904.00 0.00OTC-Dealt Derivatives 895,203.73 1.65Forward Foreign Exchange Transactions 895,203.73 1.65Sold USD / Bought EUR 15 May 2012 USD – 55,434,748.15 938,361.10 1.73Sold EUR / Bought USD 15 May 2012 EUR – 2,917,387.63 – 43,157.37 – 0.08Investments in derivatives 907,457.91 1.68Net current assets/liabilities USD 482,535.66 0.89Net assets of the Subfund USD 54,223,832.31 100.00
Net asset values per share – Class AT (USD) (accumulating) USD 10.95 – Class CT (H-EUR) (accumulating) EUR 100.63 – Class I (H-EUR) (distributing) EUR 1,104.67 – Class IT (H-EUR) (accumulating) EUR 1,072.56 Shares in circulation – Class AT (USD) (accumulating) Shs 103,116 – Class CT (H-EUR) (accumulating) Shs 100 – Class I (H-EUR) (distributing) Shs 28,737 – Class IT (H-EUR) (accumulating) Shs 7,5001) Deposits are not subject to any deposit insurance.
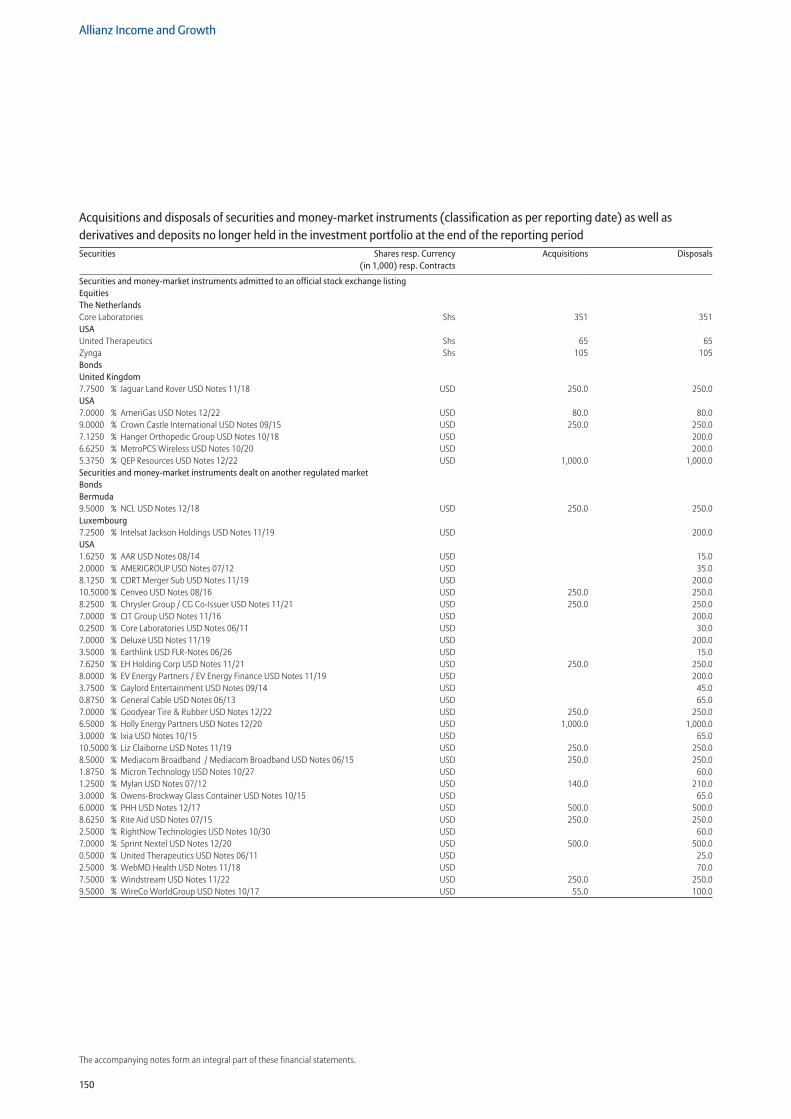
150
Allianz Income and Growth
The accompanying notes form an integral part of these financial statements.
Securities and money-market instruments admitted to an official stock exchange listing EquitiesThe NetherlandsCore Laboratories Shs 351 351USAUnited Therapeutics Shs 65 65Zynga Shs 105 105BondsUnited Kingdom7.7500 % Jaguar Land Rover USD Notes 11/18 USD 250.0 250.0USA7.0000 % AmeriGas USD Notes 12/22 USD 80.0 80.09.0000 % Crown Castle International USD Notes 09/15 USD 250.0 250.07.1250 % Hanger Orthopedic Group USD Notes 10/18 USD 200.06.6250 % MetroPCS Wireless USD Notes 10/20 USD 200.05.3750 % QEP Resources USD Notes 12/22 USD 1,000.0 1,000.0Securities and money-market instruments dealt on another regulated market BondsBermuda9.5000 % NCL USD Notes 12/18 USD 250.0 250.0Luxembourg7.2500 % Intelsat Jackson Holdings USD Notes 11/19 USD 200.0USA1.6250 % AAR USD Notes 08/14 USD 15.02.0000 % AMERIGROUP USD Notes 07/12 USD 35.08.1250 % CDRT Merger Sub USD Notes 11/19 USD 200.010.5000 % Cenveo USD Notes 08/16 USD 250.0 250.08.2500 % Chrysler Group / CG Co-Issuer USD Notes 11/21 USD 250.0 250.07.0000 % CIT Group USD Notes 11/16 USD 200.00.2500 % Core Laboratories USD Notes 06/11 USD 30.07.0000 % Deluxe USD Notes 11/19 USD 200.03.5000 % Earthlink USD FLR-Notes 06/26 USD 15.07.6250 % EH Holding Corp USD Notes 11/21 USD 250.0 250.08.0000 % EV Energy Partners / EV Energy Finance USD Notes 11/19 USD 200.03.7500 % Gaylord Entertainment USD Notes 09/14 USD 45.00.8750 % General Cable USD Notes 06/13 USD 65.07.0000 % Goodyear Tire & Rubber USD Notes 12/22 USD 250.0 250.06.5000 % Holly Energy Partners USD Notes 12/20 USD 1,000.0 1,000.03.0000 % Ixia USD Notes 10/15 USD 65.010.5000 % Liz Claiborne USD Notes 11/19 USD 250.0 250.08.5000 % Mediacom Broadband / Mediacom Broadband USD Notes 06/15 USD 250.0 250.01.8750 % Micron Technology USD Notes 10/27 USD 60.01.2500 % Mylan USD Notes 07/12 USD 140.0 210.03.0000 % Owens-Brockway Glass Container USD Notes 10/15 USD 65.06.0000 % PHH USD Notes 12/17 USD 500.0 500.08.6250 % Rite Aid USD Notes 07/15 USD 250.0 250.02.5000 % RightNow Technologies USD Notes 10/30 USD 60.07.0000 % Sprint Nextel USD Notes 12/20 USD 500.0 500.00.5000 % United Therapeutics USD Notes 06/11 USD 25.02.5000 % WebMD Health USD Notes 11/18 USD 70.07.5000 % Windstream USD Notes 11/22 USD 250.0 250.09.5000 % WireCo WorldGroup USD Notes 10/17 USD 55.0 100.0
Acquisitions and disposals of securities and money-market instruments (classification as per reporting date) as well as derivatives and deposits no longer held in the investment portfolio at the end of the reporting periodSecurities Shares resp. Currency
(in 1,000) resp. ContractsAcquisitions Disposals
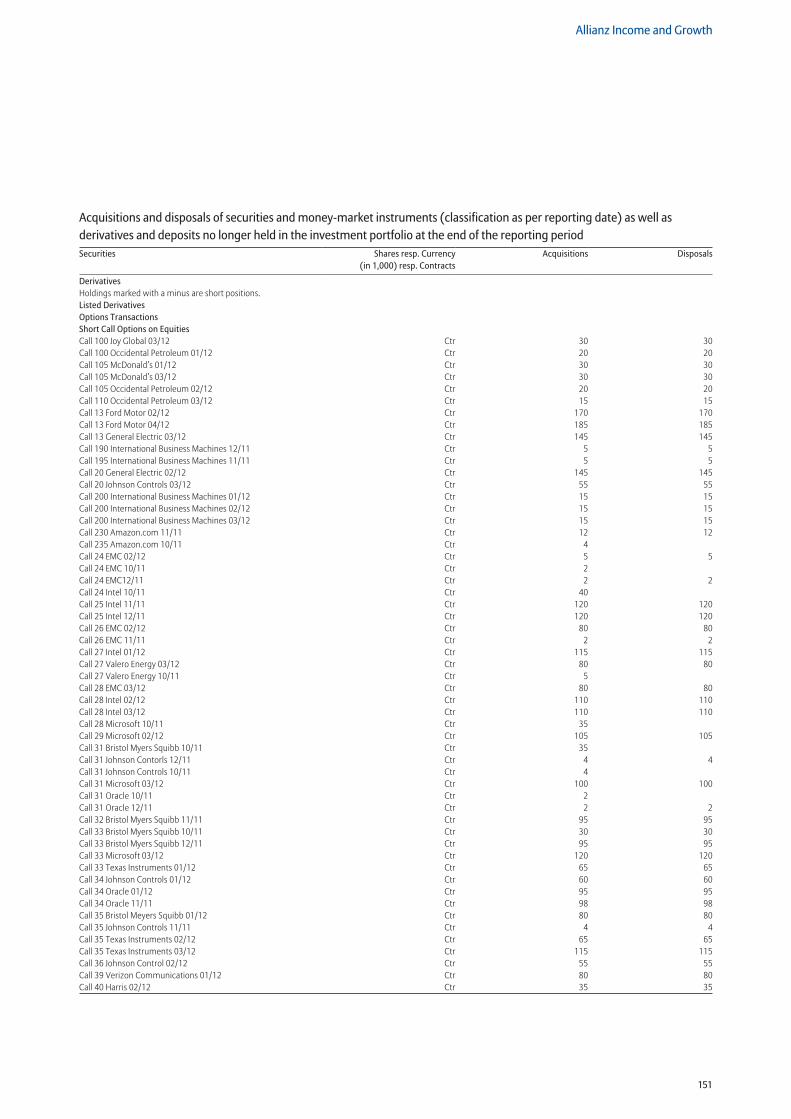
151
Allianz Income and Growth
DerivativesHoldings marked with a minus are short positions. Listed Derivatives Options TransactionsShort Call Options on EquitiesCall 100 Joy Global 03/12 Ctr 30 30Call 100 Occidental Petroleum 01/12 Ctr 20 20Call 105 McDonald’s 01/12 Ctr 30 30Call 105 McDonald’s 03/12 Ctr 30 30Call 105 Occidental Petroleum 02/12 Ctr 20 20Call 110 Occidental Petroleum 03/12 Ctr 15 15Call 13 Ford Motor 02/12 Ctr 170 170Call 13 Ford Motor 04/12 Ctr 185 185Call 13 General Electric 03/12 Ctr 145 145Call 190 International Business Machines 12/11 Ctr 5 5Call 195 International Business Machines 11/11 Ctr 5 5Call 20 General Electric 02/12 Ctr 145 145Call 20 Johnson Controls 03/12 Ctr 55 55Call 200 International Business Machines 01/12 Ctr 15 15Call 200 International Business Machines 02/12 Ctr 15 15Call 200 International Business Machines 03/12 Ctr 15 15Call 230 Amazon.com 11/11 Ctr 12 12Call 235 Amazon.com 10/11 Ctr 4 Call 24 EMC 02/12 Ctr 5 5Call 24 EMC 10/11 Ctr 2 Call 24 EMC12/11 Ctr 2 2Call 24 Intel 10/11 Ctr 40 Call 25 Intel 11/11 Ctr 120 120Call 25 Intel 12/11 Ctr 120 120Call 26 EMC 02/12 Ctr 80 80Call 26 EMC 11/11 Ctr 2 2Call 27 Intel 01/12 Ctr 115 115Call 27 Valero Energy 03/12 Ctr 80 80Call 27 Valero Energy 10/11 Ctr 5 Call 28 EMC 03/12 Ctr 80 80Call 28 Intel 02/12 Ctr 110 110Call 28 Intel 03/12 Ctr 110 110Call 28 Microsoft 10/11 Ctr 35 Call 29 Microsoft 02/12 Ctr 105 105Call 31 Bristol Myers Squibb 10/11 Ctr 35 Call 31 Johnson Contorls 12/11 Ctr 4 4Call 31 Johnson Controls 10/11 Ctr 4 Call 31 Microsoft 03/12 Ctr 100 100Call 31 Oracle 10/11 Ctr 2 Call 31 Oracle 12/11 Ctr 2 2Call 32 Bristol Myers Squibb 11/11 Ctr 95 95Call 33 Bristol Myers Squibb 10/11 Ctr 30 30Call 33 Bristol Myers Squibb 12/11 Ctr 95 95Call 33 Microsoft 03/12 Ctr 120 120Call 33 Texas Instruments 01/12 Ctr 65 65Call 34 Johnson Controls 01/12 Ctr 60 60Call 34 Oracle 01/12 Ctr 95 95Call 34 Oracle 11/11 Ctr 98 98Call 35 Bristol Meyers Squibb 01/12 Ctr 80 80Call 35 Johnson Controls 11/11 Ctr 4 4Call 35 Texas Instruments 02/12 Ctr 65 65Call 35 Texas Instruments 03/12 Ctr 115 115Call 36 Johnson Control 02/12 Ctr 55 55Call 39 Verizon Communications 01/12 Ctr 80 80Call 40 Harris 02/12 Ctr 35 35
Acquisitions and disposals of securities and money-market instruments (classification as per reporting date) as well as derivatives and deposits no longer held in the investment portfolio at the end of the reporting periodSecurities Shares resp. Currency
(in 1,000) resp. ContractsAcquisitions Disposals
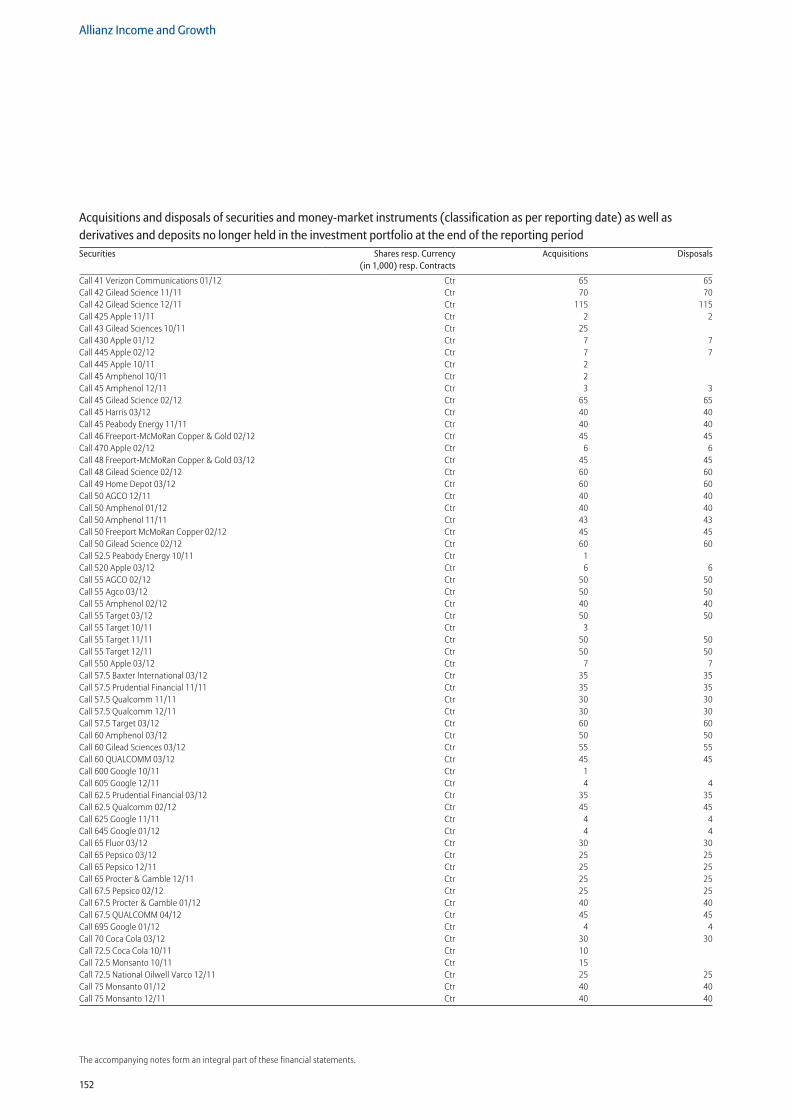
152
Allianz Income and Growth
The accompanying notes form an integral part of these financial statements.
Acquisitions and disposals of securities and money-market instruments (classification as per reporting date) as well as derivatives and deposits no longer held in the investment portfolio at the end of the reporting periodSecurities Shares resp. Currency
(in 1,000) resp. ContractsAcquisitions Disposals
Call 41 Verizon Communications 01/12 Ctr 65 65Call 42 Gilead Science 11/11 Ctr 70 70Call 42 Gilead Science 12/11 Ctr 115 115Call 425 Apple 11/11 Ctr 2 2Call 43 Gilead Sciences 10/11 Ctr 25 Call 430 Apple 01/12 Ctr 7 7Call 445 Apple 02/12 Ctr 7 7Call 445 Apple 10/11 Ctr 2 Call 45 Amphenol 10/11 Ctr 2 Call 45 Amphenol 12/11 Ctr 3 3Call 45 Gilead Science 02/12 Ctr 65 65Call 45 Harris 03/12 Ctr 40 40Call 45 Peabody Energy 11/11 Ctr 40 40Call 46 Freeport-McMoRan Copper & Gold 02/12 Ctr 45 45Call 470 Apple 02/12 Ctr 6 6Call 48 Freeport-McMoRan Copper & Gold 03/12 Ctr 45 45Call 48 Gilead Science 02/12 Ctr 60 60Call 49 Home Depot 03/12 Ctr 60 60Call 50 AGCO 12/11 Ctr 40 40Call 50 Amphenol 01/12 Ctr 40 40Call 50 Amphenol 11/11 Ctr 43 43Call 50 Freeport McMoRan Copper 02/12 Ctr 45 45Call 50 Gilead Science 02/12 Ctr 60 60Call 52.5 Peabody Energy 10/11 Ctr 1 Call 520 Apple 03/12 Ctr 6 6Call 55 AGCO 02/12 Ctr 50 50Call 55 Agco 03/12 Ctr 50 50Call 55 Amphenol 02/12 Ctr 40 40Call 55 Target 03/12 Ctr 50 50Call 55 Target 10/11 Ctr 3 Call 55 Target 11/11 Ctr 50 50Call 55 Target 12/11 Ctr 50 50Call 550 Apple 03/12 Ctr 7 7Call 57.5 Baxter International 03/12 Ctr 35 35Call 57.5 Prudential Financial 11/11 Ctr 35 35Call 57.5 Qualcomm 11/11 Ctr 30 30Call 57.5 Qualcomm 12/11 Ctr 30 30Call 57.5 Target 03/12 Ctr 60 60Call 60 Amphenol 03/12 Ctr 50 50Call 60 Gilead Sciences 03/12 Ctr 55 55Call 60 QUALCOMM 03/12 Ctr 45 45Call 600 Google 10/11 Ctr 1 Call 605 Google 12/11 Ctr 4 4Call 62.5 Prudential Financial 03/12 Ctr 35 35Call 62.5 Qualcomm 02/12 Ctr 45 45Call 625 Google 11/11 Ctr 4 4Call 645 Google 01/12 Ctr 4 4Call 65 Fluor 03/12 Ctr 30 30Call 65 Pepsico 03/12 Ctr 25 25Call 65 Pepsico 12/11 Ctr 25 25Call 65 Procter & Gamble 12/11 Ctr 25 25Call 67.5 Pepsico 02/12 Ctr 25 25Call 67.5 Procter & Gamble 01/12 Ctr 40 40Call 67.5 QUALCOMM 04/12 Ctr 45 45Call 695 Google 01/12 Ctr 4 4Call 70 Coca Cola 03/12 Ctr 30 30Call 72.5 Coca Cola 10/11 Ctr 10 Call 72.5 Monsanto 10/11 Ctr 15 Call 72.5 National Oilwell Varco 12/11 Ctr 25 25Call 75 Monsanto 01/12 Ctr 40 40Call 75 Monsanto 12/11 Ctr 40 40
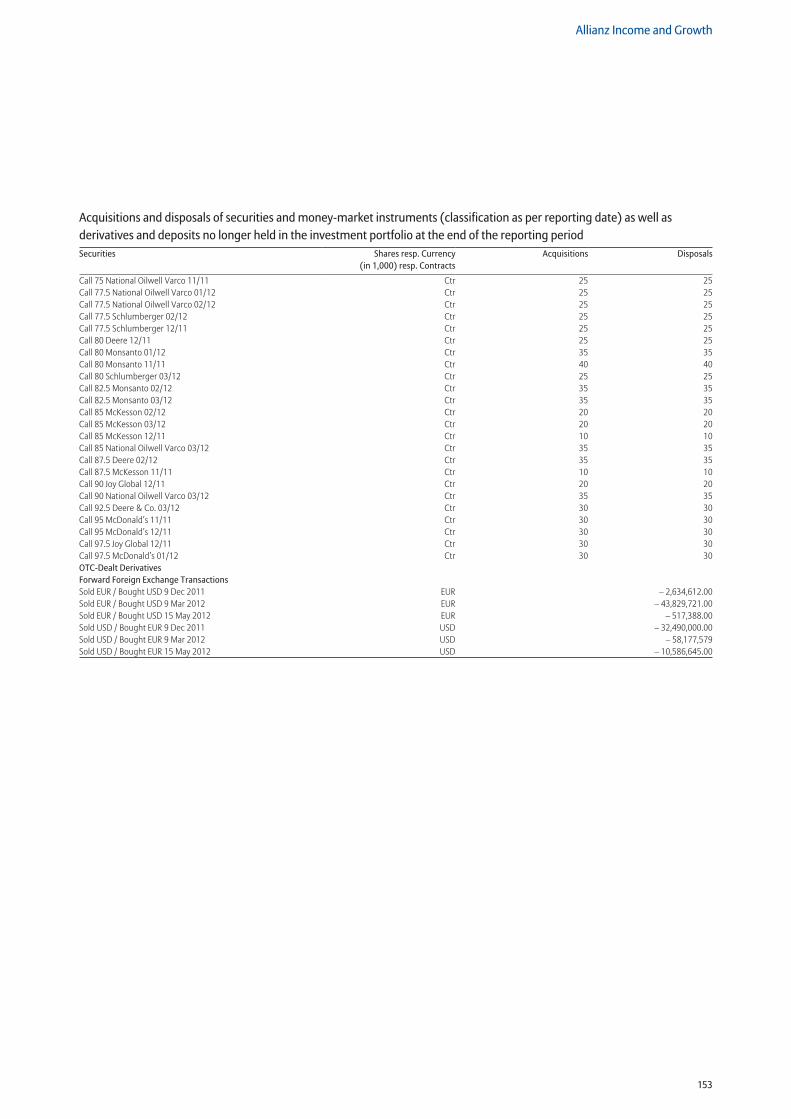
153
Allianz Income and Growth
Acquisitions and disposals of securities and money-market instruments (classification as per reporting date) as well as derivatives and deposits no longer held in the investment portfolio at the end of the reporting periodSecurities Shares resp. Currency
(in 1,000) resp. ContractsAcquisitions Disposals
Call 75 National Oilwell Varco 11/11 Ctr 25 25Call 77.5 National Oilwell Varco 01/12 Ctr 25 25Call 77.5 National Oilwell Varco 02/12 Ctr 25 25Call 77.5 Schlumberger 02/12 Ctr 25 25Call 77.5 Schlumberger 12/11 Ctr 25 25Call 80 Deere 12/11 Ctr 25 25Call 80 Monsanto 01/12 Ctr 35 35Call 80 Monsanto 11/11 Ctr 40 40Call 80 Schlumberger 03/12 Ctr 25 25Call 82.5 Monsanto 02/12 Ctr 35 35Call 82.5 Monsanto 03/12 Ctr 35 35Call 85 McKesson 02/12 Ctr 20 20Call 85 McKesson 03/12 Ctr 20 20Call 85 McKesson 12/11 Ctr 10 10Call 85 National Oilwell Varco 03/12 Ctr 35 35Call 87.5 Deere 02/12 Ctr 35 35Call 87.5 McKesson 11/11 Ctr 10 10Call 90 Joy Global 12/11 Ctr 20 20Call 90 National Oilwell Varco 03/12 Ctr 35 35Call 92.5 Deere & Co. 03/12 Ctr 30 30Call 95 McDonald’s 11/11 Ctr 30 30Call 95 McDonald’s 12/11 Ctr 30 30Call 97.5 Joy Global 12/11 Ctr 30 30Call 97.5 McDonald’s 01/12 Ctr 30 30OTC-Dealt DerivativesForward Foreign Exchange TransactionsSold EUR / Bought USD 9 Dec 2011 EUR – 2,634,612.00Sold EUR / Bought USD 9 Mar 2012 EUR – 43,829,721.00Sold EUR / Bought USD 15 May 2012 EUR – 517,388.00Sold USD / Bought EUR 9 Dec 2011 USD – 32,490,000.00Sold USD / Bought EUR 9 Mar 2012 USD – 58,177,579Sold USD / Bought EUR 15 May 2012 USD – 10,586,645.00
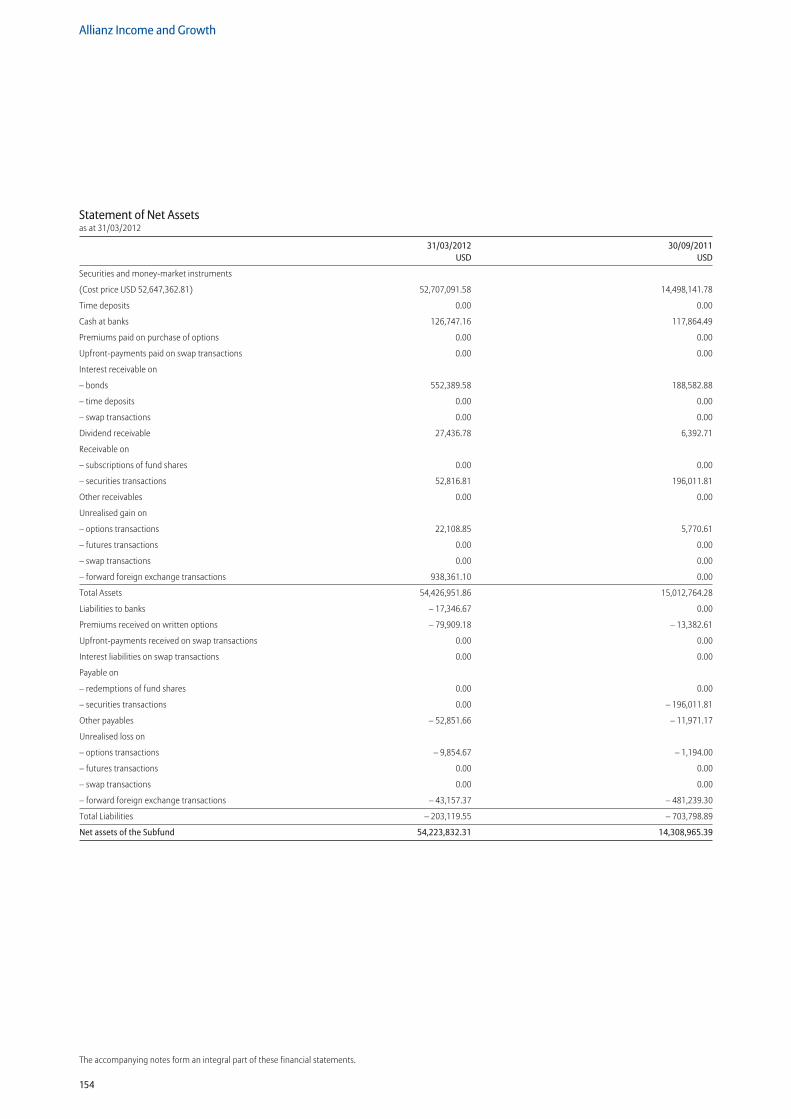
154
Allianz Income and Growth
The accompanying notes form an integral part of these financial statements.
Statement of Net Assetsas at 31/03/2012
31/03/2012 30/09/2011 USD USD
Securities and money-market instruments
(Cost price USD 52,647,362.81) 52,707,091.58 14,498,141.78
Time deposits 0.00 0.00
Cash at banks 126,747.16 117,864.49
Premiums paid on purchase of options 0.00 0.00
Upfront-payments paid on swap transactions 0.00 0.00
Interest receivable on
– bonds 552,389.58 188,582.88
– time deposits 0.00 0.00
– swap transactions 0.00 0.00
Dividend receivable 27,436.78 6,392.71
Receivable on
– subscriptions of fund shares 0.00 0.00
– securities transactions 52,816.81 196,011.81
Other receivables 0.00 0.00
Unrealised gain on
– options transactions 22,108.85 5,770.61
– futures transactions 0.00 0.00
– swap transactions 0.00 0.00
– forward foreign exchange transactions 938,361.10 0.00
Total Assets 54,426,951.86 15,012,764.28
Liabilities to banks – 17,346.67 0.00
Premiums received on written options – 79,909.18 – 13,382.61
Upfront-payments received on swap transactions 0.00 0.00
Interest liabilities on swap transactions 0.00 0.00
Payable on
– redemptions of fund shares 0.00 0.00
– securities transactions 0.00 – 196,011.81
Other payables – 52,851.66 – 11,971.17
Unrealised loss on
– options transactions – 9,854.67 – 1,194.00
– futures transactions 0.00 0.00
– swap transactions 0.00 0.00
– forward foreign exchange transactions – 43,157.37 – 481,239.30
Total Liabilities – 203,119.55 – 703,798.89
Net assets of the Subfund 54,223,832.31 14,308,965.39
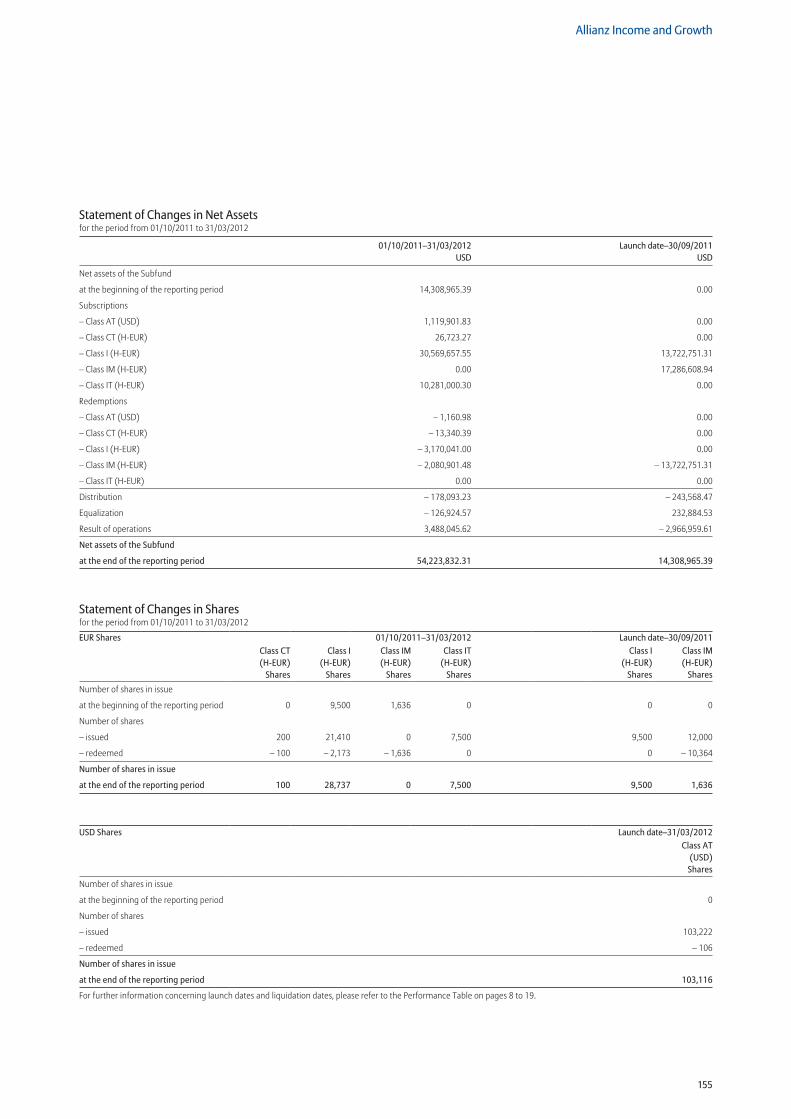
155
Allianz Income and Growth
Statement of Changes in Net Assetsfor the period from 01/10/2011 to 31/03/2012
01/10/2011–31/03/2012 Launch date–30/09/2011 USD USD
Net assets of the Subfund
at the beginning of the reporting period 14,308,965.39 0.00
Subscriptions
– Class AT (USD) 1,119,901.83 0.00
– Class CT (H-EUR) 26,723.27 0.00
– Class I (H-EUR) 30,569,657.55 13,722,751.31
– Class IM (H-EUR) 0.00 17,286,608.94
– Class IT (H-EUR) 10,281,000.30 0.00
Redemptions
– Class AT (USD) – 1,160.98 0.00
– Class CT (H-EUR) – 13,340.39 0.00
– Class I (H-EUR) – 3,170,041.00 0.00
– Class IM (H-EUR) – 2,080,901.48 – 13,722,751.31
– Class IT (H-EUR) 0.00 0.00
Distribution – 178,093.23 – 243,568.47
Equalization – 126,924.57 232,884.53
Result of operations 3,488,045.62 – 2,966,959.61
Net assets of the Subfund
at the end of the reporting period 54,223,832.31 14,308,965.39
Statement of Changes in Sharesfor the period from 01/10/2011 to 31/03/2012
EUR Shares 01/10/2011–31/03/2012 Launch date–30/09/2011Class CT (H-EUR)
Shares
Class I (H-EUR)
Shares
Class IM (H-EUR)
Shares
Class IT (H-EUR)
Shares
Class I (H-EUR)
Shares
Class IM (H-EUR)
Shares
Number of shares in issue
at the beginning of the reporting period 0 9,500 1,636 0 0 0
Number of shares
– issued 200 21,410 0 7,500 9,500 12,000
– redeemed – 100 – 2,173 – 1,636 0 0 – 10,364
Number of shares in issue
at the end of the reporting period 100 28,737 0 7,500 9,500 1,636
USD Shares Launch date–31/03/2012Class AT
(USD) Shares
Number of shares in issue
at the beginning of the reporting period 0
Number of shares
– issued 103,222
– redeemed – 106
Number of shares in issue
at the end of the reporting period 103,116
For further information concerning launch dates and liquidation dates, please refer to the Performance Table on pages 8 to 19.
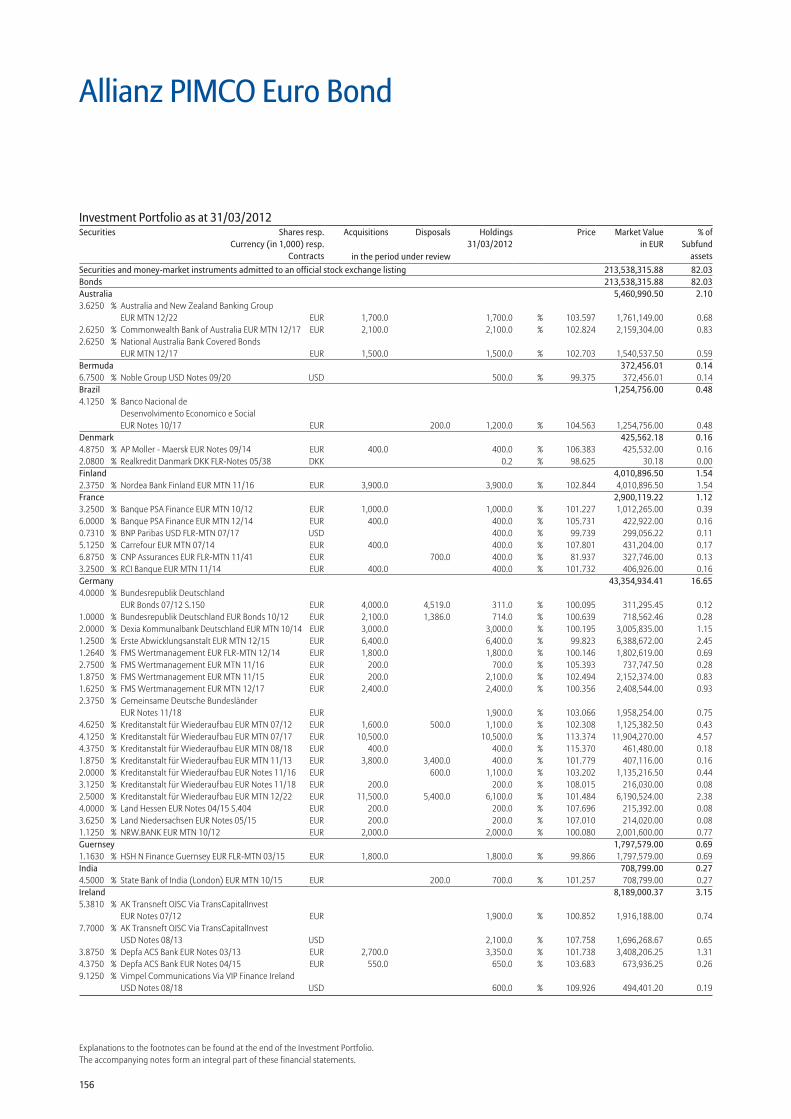
156
Explanations to the footnotes can be found at the end of the Investment Portfolio.The accompanying notes form an integral part of these financial statements.
Securities and money-market instruments admitted to an official stock exchange listing 213,538,315.88 82.03Bonds 213,538,315.88 82.03Australia 5,460,990.50 2.103.6250 % Australia and New Zealand Banking Group
EUR MTN 12/22 EUR 1,700.0 1,700.0 % 103.597 1,761,149.00 0.682.6250 % Commonwealth Bank of Australia EUR MTN 12/17 EUR 2,100.0 2,100.0 % 102.824 2,159,304.00 0.832.6250 % National Australia Bank Covered Bonds
EUR MTN 12/17 EUR 1,500.0 1,500.0 % 102.703 1,540,537.50 0.59Bermuda 372,456.01 0.146.7500 % Noble Group USD Notes 09/20 USD 500.0 % 99.375 372,456.01 0.14Brazil 1,254,756.00 0.484.1250 % Banco Nacional de
Desenvolvimento Economico e Social EUR Notes 10/17 EUR 200.0 1,200.0 % 104.563 1,254,756.00 0.48
Denmark 425,562.18 0.164.8750 % AP Moller - Maersk EUR Notes 09/14 EUR 400.0 400.0 % 106.383 425,532.00 0.162.0800 % Realkredit Danmark DKK FLR-Notes 05/38 DKK 0.2 % 98.625 30.18 0.00Finland 4,010,896.50 1.542.3750 % Nordea Bank Finland EUR MTN 11/16 EUR 3,900.0 3,900.0 % 102.844 4,010,896.50 1.54France 2,900,119.22 1.123.2500 % Banque PSA Finance EUR MTN 10/12 EUR 1,000.0 1,000.0 % 101.227 1,012,265.00 0.396.0000 % Banque PSA Finance EUR MTN 12/14 EUR 400.0 400.0 % 105.731 422,922.00 0.160.7310 % BNP Paribas USD FLR-MTN 07/17 USD 400.0 % 99.739 299,056.22 0.115.1250 % Carrefour EUR MTN 07/14 EUR 400.0 400.0 % 107.801 431,204.00 0.176.8750 % CNP Assurances EUR FLR-MTN 11/41 EUR 700.0 400.0 % 81.937 327,746.00 0.133.2500 % RCI Banque EUR MTN 11/14 EUR 400.0 400.0 % 101.732 406,926.00 0.16Germany 43,354,934.41 16.654.0000 % Bundesrepublik Deutschland
EUR Bonds 07/12 S.150 EUR 4,000.0 4,519.0 311.0 % 100.095 311,295.45 0.121.0000 % Bundesrepublik Deutschland EUR Bonds 10/12 EUR 2,100.0 1,386.0 714.0 % 100.639 718,562.46 0.282.0000 % Dexia Kommunalbank Deutschland EUR MTN 10/14 EUR 3,000.0 3,000.0 % 100.195 3,005,835.00 1.151.2500 % Erste Abwicklungsanstalt EUR MTN 12/15 EUR 6,400.0 6,400.0 % 99.823 6,388,672.00 2.451.2640 % FMS Wertmanagement EUR FLR-MTN 12/14 EUR 1,800.0 1,800.0 % 100.146 1,802,619.00 0.692.7500 % FMS Wertmanagement EUR MTN 11/16 EUR 200.0 700.0 % 105.393 737,747.50 0.281.8750 % FMS Wertmanagement EUR MTN 11/15 EUR 200.0 2,100.0 % 102.494 2,152,374.00 0.831.6250 % FMS Wertmanagement EUR MTN 12/17 EUR 2,400.0 2,400.0 % 100.356 2,408,544.00 0.932.3750 % Gemeinsame Deutsche Bundesländer
EUR Notes 11/18 EUR 1,900.0 % 103.066 1,958,254.00 0.754.6250 % Kreditanstalt für Wiederaufbau EUR MTN 07/12 EUR 1,600.0 500.0 1,100.0 % 102.308 1,125,382.50 0.434.1250 % Kreditanstalt für Wiederaufbau EUR MTN 07/17 EUR 10,500.0 10,500.0 % 113.374 11,904,270.00 4.574.3750 % Kreditanstalt für Wiederaufbau EUR MTN 08/18 EUR 400.0 400.0 % 115.370 461,480.00 0.181.8750 % Kreditanstalt für Wiederaufbau EUR MTN 11/13 EUR 3,800.0 3,400.0 400.0 % 101.779 407,116.00 0.162.0000 % Kreditanstalt für Wiederaufbau EUR Notes 11/16 EUR 600.0 1,100.0 % 103.202 1,135,216.50 0.443.1250 % Kreditanstalt für Wiederaufbau EUR Notes 11/18 EUR 200.0 200.0 % 108.015 216,030.00 0.082.5000 % Kreditanstalt für Wiederaufbau EUR MTN 12/22 EUR 11,500.0 5,400.0 6,100.0 % 101.484 6,190,524.00 2.384.0000 % Land Hessen EUR Notes 04/15 S.404 EUR 200.0 200.0 % 107.696 215,392.00 0.083.6250 % Land Niedersachsen EUR Notes 05/15 EUR 200.0 200.0 % 107.010 214,020.00 0.081.1250 % NRW.BANK EUR MTN 10/12 EUR 2,000.0 2,000.0 % 100.080 2,001,600.00 0.77Guernsey 1,797,579.00 0.691.1630 % HSH N Finance Guernsey EUR FLR-MTN 03/15 EUR 1,800.0 1,800.0 % 99.866 1,797,579.00 0.69India 708,799.00 0.274.5000 % State Bank of India (London) EUR MTN 10/15 EUR 200.0 700.0 % 101.257 708,799.00 0.27Ireland 8,189,000.37 3.155.3810 % AK Transneft OJSC Via TransCapitalInvest
EUR Notes 07/12 EUR 1,900.0 % 100.852 1,916,188.00 0.747.7000 % AK Transneft OJSC Via TransCapitalInvest
USD Notes 08/13 USD 2,100.0 % 107.758 1,696,268.67 0.653.8750 % Depfa ACS Bank EUR Notes 03/13 EUR 2,700.0 3,350.0 % 101.738 3,408,206.25 1.314.3750 % Depfa ACS Bank EUR Notes 04/15 EUR 550.0 650.0 % 103.683 673,936.25 0.269.1250 % Vimpel Communications Via VIP Finance Ireland
USD Notes 08/18 USD 600.0 % 109.926 494,401.20 0.19
Allianz PIMCO Euro Bond
Investment Portfolio as at 31/03/2012Securities Shares resp.
Currency (in 1,000) resp.Contracts
Acquisitions Disposals Holdings 31/03/2012
Price Market Valuein EUR
% ofSubfund
assetsin the period under review
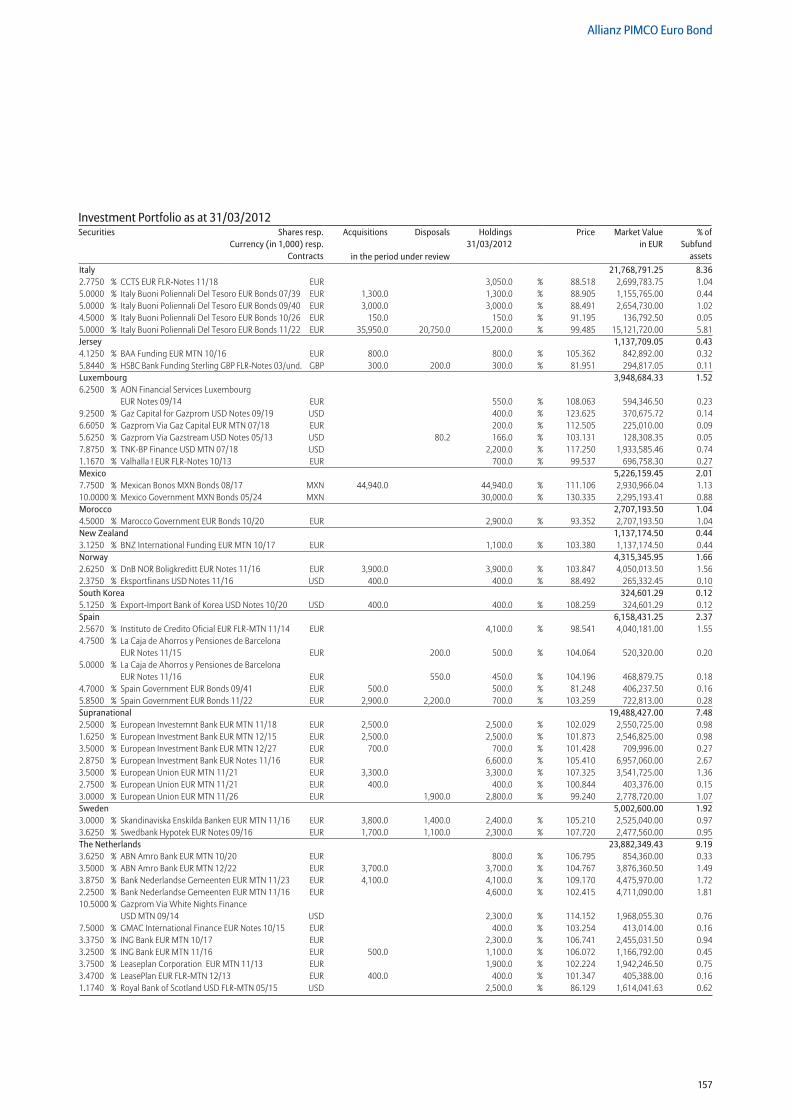
157
Allianz PIMCO Euro Bond
Italy 21,768,791.25 8.362.7750 % CCTS EUR FLR-Notes 11/18 EUR 3,050.0 % 88.518 2,699,783.75 1.045.0000 % Italy Buoni Poliennali Del Tesoro EUR Bonds 07/39 EUR 1,300.0 1,300.0 % 88.905 1,155,765.00 0.445.0000 % Italy Buoni Poliennali Del Tesoro EUR Bonds 09/40 EUR 3,000.0 3,000.0 % 88.491 2,654,730.00 1.024.5000 % Italy Buoni Poliennali Del Tesoro EUR Bonds 10/26 EUR 150.0 150.0 % 91.195 136,792.50 0.055.0000 % Italy Buoni Poliennali Del Tesoro EUR Bonds 11/22 EUR 35,950.0 20,750.0 15,200.0 % 99.485 15,121,720.00 5.81Jersey 1,137,709.05 0.434.1250 % BAA Funding EUR MTN 10/16 EUR 800.0 800.0 % 105.362 842,892.00 0.325.8440 % HSBC Bank Funding Sterling GBP FLR-Notes 03/und. GBP 300.0 200.0 300.0 % 81.951 294,817.05 0.11Luxembourg 3,948,684.33 1.526.2500 % AON Financial Services Luxembourg
EUR Notes 09/14 EUR 550.0 % 108.063 594,346.50 0.239.2500 % Gaz Capital for Gazprom USD Notes 09/19 USD 400.0 % 123.625 370,675.72 0.146.6050 % Gazprom Via Gaz Capital EUR MTN 07/18 EUR 200.0 % 112.505 225,010.00 0.095.6250 % Gazprom Via Gazstream USD Notes 05/13 USD 80.2 166.0 % 103.131 128,308.35 0.057.8750 % TNK-BP Finance USD MTN 07/18 USD 2,200.0 % 117.250 1,933,585.46 0.741.1670 % Valhalla I EUR FLR-Notes 10/13 EUR 700.0 % 99.537 696,758.30 0.27Mexico 5,226,159.45 2.017.7500 % Mexican Bonos MXN Bonds 08/17 MXN 44,940.0 44,940.0 % 111.106 2,930,966.04 1.1310.0000 % Mexico Government MXN Bonds 05/24 MXN 30,000.0 % 130.335 2,295,193.41 0.88Morocco 2,707,193.50 1.044.5000 % Marocco Government EUR Bonds 10/20 EUR 2,900.0 % 93.352 2,707,193.50 1.04New Zealand 1,137,174.50 0.443.1250 % BNZ International Funding EUR MTN 10/17 EUR 1,100.0 % 103.380 1,137,174.50 0.44Norway 4,315,345.95 1.662.6250 % DnB NOR Boligkreditt EUR Notes 11/16 EUR 3,900.0 3,900.0 % 103.847 4,050,013.50 1.562.3750 % Eksportfinans USD Notes 11/16 USD 400.0 400.0 % 88.492 265,332.45 0.10South Korea 324,601.29 0.125.1250 % Export-Import Bank of Korea USD Notes 10/20 USD 400.0 400.0 % 108.259 324,601.29 0.12Spain 6,158,431.25 2.372.5670 % Instituto de Credito Oficial EUR FLR-MTN 11/14 EUR 4,100.0 % 98.541 4,040,181.00 1.554.7500 % La Caja de Ahorros y Pensiones de Barcelona
EUR Notes 11/15 EUR 200.0 500.0 % 104.064 520,320.00 0.205.0000 % La Caja de Ahorros y Pensiones de Barcelona
EUR Notes 11/16 EUR 550.0 450.0 % 104.196 468,879.75 0.184.7000 % Spain Government EUR Bonds 09/41 EUR 500.0 500.0 % 81.248 406,237.50 0.165.8500 % Spain Government EUR Bonds 11/22 EUR 2,900.0 2,200.0 700.0 % 103.259 722,813.00 0.28Supranational 19,488,427.00 7.482.5000 % European Investemnt Bank EUR MTN 11/18 EUR 2,500.0 2,500.0 % 102.029 2,550,725.00 0.981.6250 % European Investment Bank EUR MTN 12/15 EUR 2,500.0 2,500.0 % 101.873 2,546,825.00 0.983.5000 % European Investment Bank EUR MTN 12/27 EUR 700.0 700.0 % 101.428 709,996.00 0.272.8750 % European Investment Bank EUR Notes 11/16 EUR 6,600.0 % 105.410 6,957,060.00 2.673.5000 % European Union EUR MTN 11/21 EUR 3,300.0 3,300.0 % 107.325 3,541,725.00 1.362.7500 % European Union EUR MTN 11/21 EUR 400.0 400.0 % 100.844 403,376.00 0.153.0000 % European Union EUR MTN 11/26 EUR 1,900.0 2,800.0 % 99.240 2,778,720.00 1.07Sweden 5,002,600.00 1.923.0000 % Skandinaviska Enskilda Banken EUR MTN 11/16 EUR 3,800.0 1,400.0 2,400.0 % 105.210 2,525,040.00 0.973.6250 % Swedbank Hypotek EUR Notes 09/16 EUR 1,700.0 1,100.0 2,300.0 % 107.720 2,477,560.00 0.95The Netherlands 23,882,349.43 9.193.6250 % ABN Amro Bank EUR MTN 10/20 EUR 800.0 % 106.795 854,360.00 0.333.5000 % ABN Amro Bank EUR MTN 12/22 EUR 3,700.0 3,700.0 % 104.767 3,876,360.50 1.493.8750 % Bank Nederlandse Gemeenten EUR MTN 11/23 EUR 4,100.0 4,100.0 % 109.170 4,475,970.00 1.722.2500 % Bank Nederlandse Gemeenten EUR MTN 11/16 EUR 4,600.0 % 102.415 4,711,090.00 1.8110.5000 % Gazprom Via White Nights Finance
USD MTN 09/14 USD 2,300.0 % 114.152 1,968,055.30 0.767.5000 % GMAC International Finance EUR Notes 10/15 EUR 400.0 % 103.254 413,014.00 0.163.3750 % ING Bank EUR MTN 10/17 EUR 2,300.0 % 106.741 2,455,031.50 0.943.2500 % ING Bank EUR MTN 11/16 EUR 500.0 1,100.0 % 106.072 1,166,792.00 0.453.7500 % Leaseplan Corporation EUR MTN 11/13 EUR 1,900.0 % 102.224 1,942,246.50 0.753.4700 % LeasePlan EUR FLR-MTN 12/13 EUR 400.0 400.0 % 101.347 405,388.00 0.161.1740 % Royal Bank of Scotland USD FLR-MTN 05/15 USD 2,500.0 % 86.129 1,614,041.63 0.62
Investment Portfolio as at 31/03/2012Securities Shares resp.
Currency (in 1,000) resp.Contracts
Acquisitions Disposals Holdings 31/03/2012
Price Market Valuein EUR
% ofSubfund
assetsin the period under review
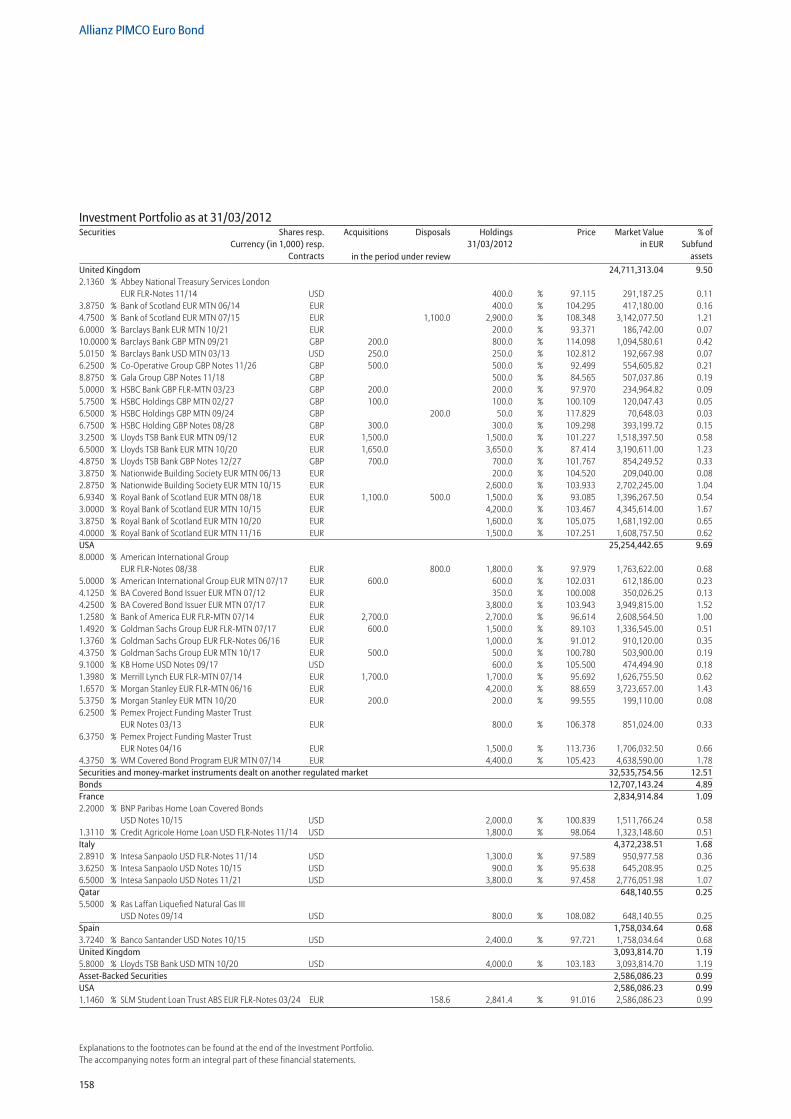
158
Allianz PIMCO Euro Bond
Explanations to the footnotes can be found at the end of the Investment Portfolio.The accompanying notes form an integral part of these financial statements.
United Kingdom 24,711,313.04 9.502.1360 % Abbey National Treasury Services London
EUR FLR-Notes 11/14 USD 400.0 % 97.115 291,187.25 0.113.8750 % Bank of Scotland EUR MTN 06/14 EUR 400.0 % 104.295 417,180.00 0.164.7500 % Bank of Scotland EUR MTN 07/15 EUR 1,100.0 2,900.0 % 108.348 3,142,077.50 1.216.0000 % Barclays Bank EUR MTN 10/21 EUR 200.0 % 93.371 186,742.00 0.0710.0000 % Barclays Bank GBP MTN 09/21 GBP 200.0 800.0 % 114.098 1,094,580.61 0.425.0150 % Barclays Bank USD MTN 03/13 USD 250.0 250.0 % 102.812 192,667.98 0.076.2500 % Co-Operative Group GBP Notes 11/26 GBP 500.0 500.0 % 92.499 554,605.82 0.218.8750 % Gala Group GBP Notes 11/18 GBP 500.0 % 84.565 507,037.86 0.195.0000 % HSBC Bank GBP FLR-MTN 03/23 GBP 200.0 200.0 % 97.970 234,964.82 0.095.7500 % HSBC Holdings GBP MTN 02/27 GBP 100.0 100.0 % 100.109 120,047.43 0.056.5000 % HSBC Holdings GBP MTN 09/24 GBP 200.0 50.0 % 117.829 70,648.03 0.036.7500 % HSBC Holding GBP Notes 08/28 GBP 300.0 300.0 % 109.298 393,199.72 0.153.2500 % Lloyds TSB Bank EUR MTN 09/12 EUR 1,500.0 1,500.0 % 101.227 1,518,397.50 0.586.5000 % Lloyds TSB Bank EUR MTN 10/20 EUR 1,650.0 3,650.0 % 87.414 3,190,611.00 1.234.8750 % Lloyds TSB Bank GBP Notes 12/27 GBP 700.0 700.0 % 101.767 854,249.52 0.333.8750 % Nationwide Building Society EUR MTN 06/13 EUR 200.0 % 104.520 209,040.00 0.082.8750 % Nationwide Building Society EUR MTN 10/15 EUR 2,600.0 % 103.933 2,702,245.00 1.046.9340 % Royal Bank of Scotland EUR MTN 08/18 EUR 1,100.0 500.0 1,500.0 % 93.085 1,396,267.50 0.543.0000 % Royal Bank of Scotland EUR MTN 10/15 EUR 4,200.0 % 103.467 4,345,614.00 1.673.8750 % Royal Bank of Scotland EUR MTN 10/20 EUR 1,600.0 % 105.075 1,681,192.00 0.654.0000 % Royal Bank of Scotland EUR MTN 11/16 EUR 1,500.0 % 107.251 1,608,757.50 0.62USA 25,254,442.65 9.698.0000 % American International Group
EUR FLR-Notes 08/38 EUR 800.0 1,800.0 % 97.979 1,763,622.00 0.685.0000 % American International Group EUR MTN 07/17 EUR 600.0 600.0 % 102.031 612,186.00 0.234.1250 % BA Covered Bond Issuer EUR MTN 07/12 EUR 350.0 % 100.008 350,026.25 0.134.2500 % BA Covered Bond Issuer EUR MTN 07/17 EUR 3,800.0 % 103.943 3,949,815.00 1.521.2580 % Bank of America EUR FLR-MTN 07/14 EUR 2,700.0 2,700.0 % 96.614 2,608,564.50 1.001.4920 % Goldman Sachs Group EUR FLR-MTN 07/17 EUR 600.0 1,500.0 % 89.103 1,336,545.00 0.511.3760 % Goldman Sachs Group EUR FLR-Notes 06/16 EUR 1,000.0 % 91.012 910,120.00 0.354.3750 % Goldman Sachs Group EUR MTN 10/17 EUR 500.0 500.0 % 100.780 503,900.00 0.199.1000 % KB Home USD Notes 09/17 USD 600.0 % 105.500 474,494.90 0.181.3980 % Merrill Lynch EUR FLR-MTN 07/14 EUR 1,700.0 1,700.0 % 95.692 1,626,755.50 0.621.6570 % Morgan Stanley EUR FLR-MTN 06/16 EUR 4,200.0 % 88.659 3,723,657.00 1.435.3750 % Morgan Stanley EUR MTN 10/20 EUR 200.0 200.0 % 99.555 199,110.00 0.086.2500 % Pemex Project Funding Master Trust
EUR Notes 03/13 EUR 800.0 % 106.378 851,024.00 0.336.3750 % Pemex Project Funding Master Trust
EUR Notes 04/16 EUR 1,500.0 % 113.736 1,706,032.50 0.664.3750 % WM Covered Bond Program EUR MTN 07/14 EUR 4,400.0 % 105.423 4,638,590.00 1.78Securities and money-market instruments dealt on another regulated market 32,535,754.56 12.51Bonds 12,707,143.24 4.89France 2,834,914.84 1.092.2000 % BNP Paribas Home Loan Covered Bonds
USD Notes 10/15 USD 2,000.0 % 100.839 1,511,766.24 0.581.3110 % Credit Agricole Home Loan USD FLR-Notes 11/14 USD 1,800.0 % 98.064 1,323,148.60 0.51Italy 4,372,238.51 1.682.8910 % Intesa Sanpaolo USD FLR-Notes 11/14 USD 1,300.0 % 97.589 950,977.58 0.363.6250 % Intesa Sanpaolo USD Notes 10/15 USD 900.0 % 95.638 645,208.95 0.256.5000 % Intesa Sanpaolo USD Notes 11/21 USD 3,800.0 % 97.458 2,776,051.98 1.07Qatar 648,140.55 0.255.5000 % Ras Laffan Liquefied Natural Gas III
USD Notes 09/14 USD 800.0 % 108.082 648,140.55 0.25Spain 1,758,034.64 0.683.7240 % Banco Santander USD Notes 10/15 USD 2,400.0 % 97.721 1,758,034.64 0.68United Kingdom 3,093,814.70 1.195.8000 % Lloyds TSB Bank USD MTN 10/20 USD 4,000.0 % 103.183 3,093,814.70 1.19Asset-Backed Securities 2,586,086.23 0.99USA 2,586,086.23 0.991.1460 % SLM Student Loan Trust ABS EUR FLR-Notes 03/24 EUR 158.6 2,841.4 % 91.016 2,586,086.23 0.99
Investment Portfolio as at 31/03/2012Securities Shares resp.
Currency (in 1,000) resp.Contracts
Acquisitions Disposals Holdings 31/03/2012
Price Market Valuein EUR
% ofSubfund
assetsin the period under review
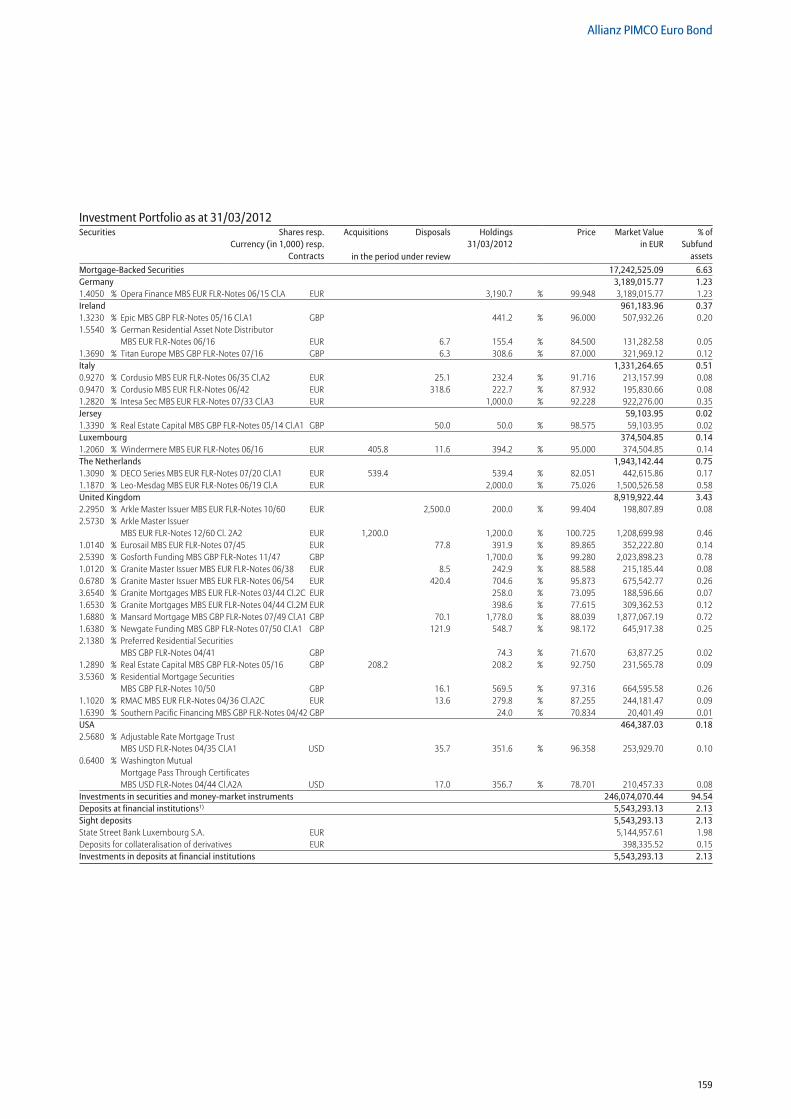
159
Allianz PIMCO Euro Bond
Mortgage-Backed Securities 17,242,525.09 6.63Germany 3,189,015.77 1.231.4050 % Opera Finance MBS EUR FLR-Notes 06/15 Cl.A EUR 3,190.7 % 99.948 3,189,015.77 1.23Ireland 961,183.96 0.371.3230 % Epic MBS GBP FLR-Notes 05/16 Cl.A1 GBP 441.2 % 96.000 507,932.26 0.201.5540 % German Residential Asset Note Distributor
MBS EUR FLR-Notes 06/16 EUR 6.7 155.4 % 84.500 131,282.58 0.051.3690 % Titan Europe MBS GBP FLR-Notes 07/16 GBP 6.3 308.6 % 87.000 321,969.12 0.12Italy 1,331,264.65 0.510.9270 % Cordusio MBS EUR FLR-Notes 06/35 Cl.A2 EUR 25.1 232.4 % 91.716 213,157.99 0.080.9470 % Cordusio MBS EUR FLR-Notes 06/42 EUR 318.6 222.7 % 87.932 195,830.66 0.081.2820 % Intesa Sec MBS EUR FLR-Notes 07/33 Cl.A3 EUR 1,000.0 % 92.228 922,276.00 0.35Jersey 59,103.95 0.021.3390 % Real Estate Capital MBS GBP FLR-Notes 05/14 Cl.A1 GBP 50.0 50.0 % 98.575 59,103.95 0.02Luxembourg 374,504.85 0.141.2060 % Windermere MBS EUR FLR-Notes 06/16 EUR 405.8 11.6 394.2 % 95.000 374,504.85 0.14The Netherlands 1,943,142.44 0.751.3090 % DECO Series MBS EUR FLR-Notes 07/20 Cl.A1 EUR 539.4 539.4 % 82.051 442,615.86 0.171.1870 % Leo-Mesdag MBS EUR FLR-Notes 06/19 Cl.A EUR 2,000.0 % 75.026 1,500,526.58 0.58United Kingdom 8,919,922.44 3.432.2950 % Arkle Master Issuer MBS EUR FLR-Notes 10/60 EUR 2,500.0 200.0 % 99.404 198,807.89 0.082.5730 % Arkle Master Issuer
MBS EUR FLR-Notes 12/60 Cl. 2A2 EUR 1,200.0 1,200.0 % 100.725 1,208,699.98 0.461.0140 % Eurosail MBS EUR FLR-Notes 07/45 EUR 77.8 391.9 % 89.865 352,222.80 0.142.5390 % Gosforth Funding MBS GBP FLR-Notes 11/47 GBP 1,700.0 % 99.280 2,023,898.23 0.781.0120 % Granite Master Issuer MBS EUR FLR-Notes 06/38 EUR 8.5 242.9 % 88.588 215,185.44 0.080.6780 % Granite Master Issuer MBS EUR FLR-Notes 06/54 EUR 420.4 704.6 % 95.873 675,542.77 0.263.6540 % Granite Mortgages MBS EUR FLR-Notes 03/44 Cl.2C EUR 258.0 % 73.095 188,596.66 0.071.6530 % Granite Mortgages MBS EUR FLR-Notes 04/44 Cl.2M EUR 398.6 % 77.615 309,362.53 0.121.6880 % Mansard Mortgage MBS GBP FLR-Notes 07/49 Cl.A1 GBP 70.1 1,778.0 % 88.039 1,877,067.19 0.721.6380 % Newgate Funding MBS GBP FLR-Notes 07/50 Cl.A1 GBP 121.9 548.7 % 98.172 645,917.38 0.252.1380 % Preferred Residential Securities
MBS GBP FLR-Notes 04/41 GBP 74.3 % 71.670 63,877.25 0.021.2890 % Real Estate Capital MBS GBP FLR-Notes 05/16 GBP 208.2 208.2 % 92.750 231,565.78 0.093.5360 % Residential Mortgage Securities
MBS GBP FLR-Notes 10/50 GBP 16.1 569.5 % 97.316 664,595.58 0.261.1020 % RMAC MBS EUR FLR-Notes 04/36 Cl.A2C EUR 13.6 279.8 % 87.255 244,181.47 0.091.6390 % Southern Pacific Financing MBS GBP FLR-Notes 04/42 GBP 24.0 % 70.834 20,401.49 0.01USA 464,387.03 0.182.5680 % Adjustable Rate Mortgage Trust
MBS USD FLR-Notes 04/35 Cl.A1 USD 35.7 351.6 % 96.358 253,929.70 0.100.6400 % Washington Mutual
Mortgage Pass Through Certificates MBS USD FLR-Notes 04/44 Cl.A2A USD 17.0 356.7 % 78.701 210,457.33 0.08
Investments in securities and money-market instruments 246,074,070.44 94.54Deposits at financial institutions1) 5,543,293.13 2.13Sight deposits 5,543,293.13 2.13State Street Bank Luxembourg S.A. EUR 5,144,957.61 1.98Deposits for collateralisation of derivatives EUR 398,335.52 0.15Investments in deposits at financial institutions 5,543,293.13 2.13
Investment Portfolio as at 31/03/2012Securities Shares resp.
Currency (in 1,000) resp.Contracts
Acquisitions Disposals Holdings 31/03/2012
Price Market Valuein EUR
% ofSubfund
assetsin the period under review
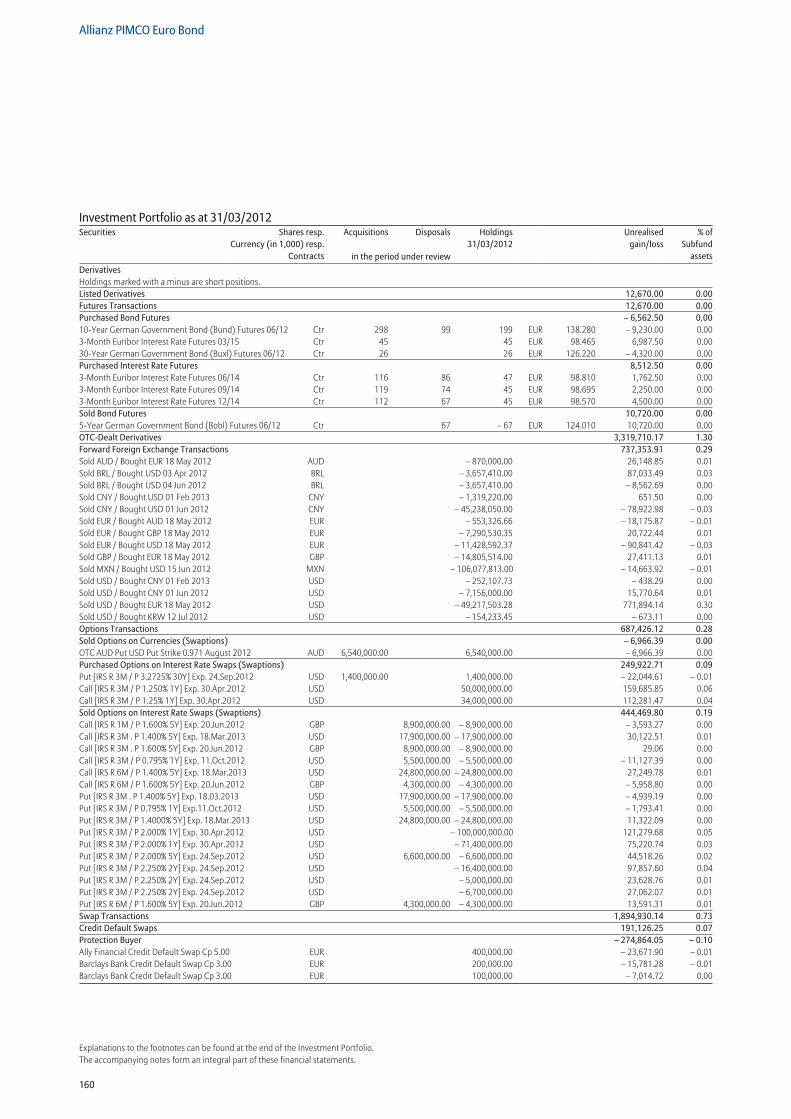
160
Allianz PIMCO Euro Bond
Explanations to the footnotes can be found at the end of the Investment Portfolio.The accompanying notes form an integral part of these financial statements.
Derivatives Holdings marked with a minus are short positions. Listed Derivatives 12,670.00 0.00Futures Transactions 12,670.00 0.00Purchased Bond Futures – 6,562.50 0.0010-Year German Government Bond (Bund) Futures 06/12 Ctr 298 99 199 EUR 138.280 – 9,230.00 0.003-Month Euribor Interest Rate Futures 03/15 Ctr 45 45 EUR 98.465 6,987.50 0.0030-Year German Government Bond (Buxl) Futures 06/12 Ctr 26 26 EUR 126.220 – 4,320.00 0.00Purchased Interest Rate Futures 8,512.50 0.003-Month Euribor Interest Rate Futures 06/14 Ctr 116 86 47 EUR 98.810 1,762.50 0.003-Month Euribor Interest Rate Futures 09/14 Ctr 119 74 45 EUR 98.695 2,250.00 0.003-Month Euribor Interest Rate Futures 12/14 Ctr 112 67 45 EUR 98.570 4,500.00 0.00Sold Bond Futures 10,720.00 0.005-Year German Government Bond (Bobl) Futures 06/12 Ctr 67 – 67 EUR 124.010 10,720.00 0.00OTC-Dealt Derivatives 3,319,710.17 1.30Forward Foreign Exchange Transactions 737,353.91 0.29Sold AUD / Bought EUR 18 May 2012 AUD – 870,000.00 26,148.85 0.01Sold BRL / Bought USD 03 Apr 2012 BRL – 3,657,410.00 87,033.49 0.03Sold BRL / Bought USD 04 Jun 2012 BRL – 3,657,410.00 – 8,562.69 0.00Sold CNY / Bought USD 01 Feb 2013 CNY – 1,319,220.00 651.50 0.00Sold CNY / Bought USD 01 Jun 2012 CNY – 45,238,050.00 – 78,922.98 – 0.03Sold EUR / Bought AUD 18 May 2012 EUR – 553,326.66 – 18,175.87 – 0.01Sold EUR / Bought GBP 18 May 2012 EUR – 7,290,530.35 20,722.44 0.01Sold EUR / Bought USD 18 May 2012 EUR – 11,428,592.37 – 90,841.42 – 0.03Sold GBP / Bought EUR 18 May 2012 GBP – 14,805,514.00 27,411.13 0.01Sold MXN / Bought USD 15 Jun 2012 MXN – 106,077,813.00 – 14,663.92 – 0.01Sold USD / Bought CNY 01 Feb 2013 USD – 252,107.73 – 438.29 0.00Sold USD / Bought CNY 01 Jun 2012 USD – 7,156,000.00 15,770.64 0.01Sold USD / Bought EUR 18 May 2012 USD – 49,217,503.28 771,894.14 0.30Sold USD / Bought KRW 12 Jul 2012 USD – 154,233.45 – 673.11 0.00Options Transactions 687,426.12 0.28Sold Options on Currencies (Swaptions) – 6,966.39 0.00OTC AUD Put USD Put Strike 0.971 August 2012 AUD 6,540,000.00 6,540,000.00 – 6,966.39 0.00Purchased Options on Interest Rate Swaps (Swaptions) 249,922.71 0.09Put [IRS R 3M / P 3.2725% 30Y] Exp. 24.Sep.2012 USD 1,400,000.00 1,400,000.00 – 22,044.61 – 0.01Call [IRS R 3M / P 1.250% 1Y] Exp. 30.Apr.2012 USD 50,000,000.00 159,685.85 0.06Call [IRS R 3M / P 1.25% 1Y] Exp. 30.Apr.2012 USD 34,000,000.00 112,281.47 0.04Sold Options on Interest Rate Swaps (Swaptions) 444,469.80 0.19Call [IRS R 1M / P 1.600% 5Y] Exp. 20.Jun.2012 GBP 8,900,000.00 – 8,900,000.00 – 3,593.27 0.00Call [IRS R 3M . P 1.400% 5Y] Exp. 18.Mar.2013 USD 17,900,000.00 – 17,900,000.00 30,122.51 0.01Call [IRS R 3M . P 1.600% 5Y] Exp. 20.Jun.2012 GBP 8,900,000.00 – 8,900,000.00 29.06 0.00Call [IRS R 3M / P 0.795% 1Y] Exp. 11.Oct.2012 USD 5,500,000.00 – 5,500,000.00 – 11,127.39 0.00Call [IRS R 6M / P 1.400% 5Y] Exp. 18.Mar.2013 USD 24,800,000.00 – 24,800,000.00 27,249.78 0.01Call [IRS R 6M / P 1.600% 5Y] Exp. 20.Jun.2012 GBP 4,300,000.00 – 4,300,000.00 – 5,958.80 0.00Put [IRS R 3M . P 1.400% 5Y] Exp. 18.03.2013 USD 17,900,000.00 – 17,900,000.00 – 4,939.19 0.00Put [IRS R 3M / P 0.795% 1Y] Exp.11.Oct.2012 USD 5,500,000.00 – 5,500,000.00 – 1,793.41 0.00Put [IRS R 3M / P 1.4000% 5Y] Exp. 18.Mar.2013 USD 24,800,000.00 – 24,800,000.00 11,322.09 0.00Put [IRS R 3M / P 2.000% 1Y] Exp. 30.Apr.2012 USD – 100,000,000.00 121,279.68 0.05Put [IRS R 3M / P 2.000% 1Y] Exp. 30.Apr.2012 USD – 71,400,000.00 75,220.74 0.03Put [IRS R 3M / P 2.000% 5Y] Exp. 24.Sep.2012 USD 6,600,000.00 – 6,600,000.00 44,518.26 0.02Put [IRS R 3M / P 2.250% 2Y] Exp. 24.Sep.2012 USD – 16,400,000.00 97,857.60 0.04Put [IRS R 3M / P 2.250% 2Y] Exp. 24.Sep.2012 USD – 5,000,000.00 23,628.76 0.01Put [IRS R 3M / P 2.250% 2Y] Exp. 24.Sep.2012 USD – 6,700,000.00 27,062.07 0.01Put [IRS R 6M / P 1.600% 5Y] Exp. 20.Jun.2012 GBP 4,300,000.00 – 4,300,000.00 13,591.31 0.01Swap Transactions 1,894,930.14 0.73Credit Default Swaps 191,126.25 0.07Protection Buyer – 274,864.05 – 0.10Ally Financial Credit Default Swap Cp 5.00 EUR 400,000.00 – 23,671.90 – 0.01Barclays Bank Credit Default Swap Cp 3.00 EUR 200,000.00 – 15,781.28 – 0.01Barclays Bank Credit Default Swap Cp 3.00 EUR 100,000.00 – 7,014.72 0.00
Investment Portfolio as at 31/03/2012Securities Shares resp.
Currency (in 1,000) resp.Contracts
Acquisitions Disposals Holdings 31/03/2012
Unrealisedgain/loss
% ofSubfund
assetsin the period under review
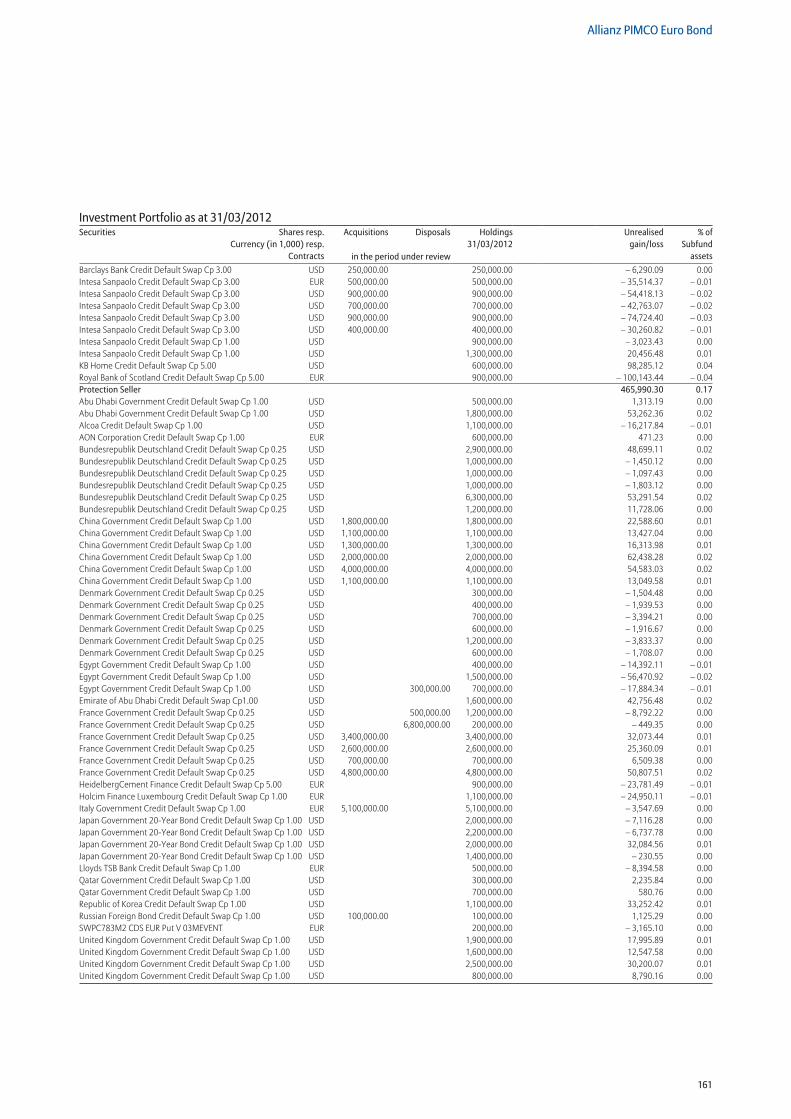
161
Allianz PIMCO Euro Bond
Barclays Bank Credit Default Swap Cp 3.00 USD 250,000.00 250,000.00 – 6,290.09 0.00Intesa Sanpaolo Credit Default Swap Cp 3.00 EUR 500,000.00 500,000.00 – 35,514.37 – 0.01Intesa Sanpaolo Credit Default Swap Cp 3.00 USD 900,000.00 900,000.00 – 54,418.13 – 0.02Intesa Sanpaolo Credit Default Swap Cp 3.00 USD 700,000.00 700,000.00 – 42,763.07 – 0.02Intesa Sanpaolo Credit Default Swap Cp 3.00 USD 900,000.00 900,000.00 – 74,724.40 – 0.03Intesa Sanpaolo Credit Default Swap Cp 3.00 USD 400,000.00 400,000.00 – 30,260.82 – 0.01Intesa Sanpaolo Credit Default Swap Cp 1.00 USD 900,000.00 – 3,023.43 0.00Intesa Sanpaolo Credit Default Swap Cp 1.00 USD 1,300,000.00 20,456.48 0.01KB Home Credit Default Swap Cp 5.00 USD 600,000.00 98,285.12 0.04Royal Bank of Scotland Credit Default Swap Cp 5.00 EUR 900,000.00 – 100,143.44 – 0.04Protection Seller 465,990.30 0.17Abu Dhabi Government Credit Default Swap Cp 1.00 USD 500,000.00 1,313.19 0.00Abu Dhabi Government Credit Default Swap Cp 1.00 USD 1,800,000.00 53,262.36 0.02Alcoa Credit Default Swap Cp 1.00 USD 1,100,000.00 – 16,217.84 – 0.01AON Corporation Credit Default Swap Cp 1.00 EUR 600,000.00 471.23 0.00Bundesrepublik Deutschland Credit Default Swap Cp 0.25 USD 2,900,000.00 48,699.11 0.02Bundesrepublik Deutschland Credit Default Swap Cp 0.25 USD 1,000,000.00 – 1,450.12 0.00Bundesrepublik Deutschland Credit Default Swap Cp 0.25 USD 1,000,000.00 – 1,097.43 0.00Bundesrepublik Deutschland Credit Default Swap Cp 0.25 USD 1,000,000.00 – 1,803.12 0.00Bundesrepublik Deutschland Credit Default Swap Cp 0.25 USD 6,300,000.00 53,291.54 0.02Bundesrepublik Deutschland Credit Default Swap Cp 0.25 USD 1,200,000.00 11,728.06 0.00China Government Credit Default Swap Cp 1.00 USD 1,800,000.00 1,800,000.00 22,588.60 0.01China Government Credit Default Swap Cp 1.00 USD 1,100,000.00 1,100,000.00 13,427.04 0.00China Government Credit Default Swap Cp 1.00 USD 1,300,000.00 1,300,000.00 16,313.98 0.01China Government Credit Default Swap Cp 1.00 USD 2,000,000.00 2,000,000.00 62,438.28 0.02China Government Credit Default Swap Cp 1.00 USD 4,000,000.00 4,000,000.00 54,583.03 0.02China Government Credit Default Swap Cp 1.00 USD 1,100,000.00 1,100,000.00 13,049.58 0.01Denmark Government Credit Default Swap Cp 0.25 USD 300,000.00 – 1,504.48 0.00Denmark Government Credit Default Swap Cp 0.25 USD 400,000.00 – 1,939.53 0.00Denmark Government Credit Default Swap Cp 0.25 USD 700,000.00 – 3,394.21 0.00Denmark Government Credit Default Swap Cp 0.25 USD 600,000.00 – 1,916.67 0.00Denmark Government Credit Default Swap Cp 0.25 USD 1,200,000.00 – 3,833.37 0.00Denmark Government Credit Default Swap Cp 0.25 USD 600,000.00 – 1,708.07 0.00Egypt Government Credit Default Swap Cp 1.00 USD 400,000.00 – 14,392.11 – 0.01Egypt Government Credit Default Swap Cp 1.00 USD 1,500,000.00 – 56,470.92 – 0.02Egypt Government Credit Default Swap Cp 1.00 USD 300,000.00 700,000.00 – 17,884.34 – 0.01Emirate of Abu Dhabi Credit Default Swap Cp1.00 USD 1,600,000.00 42,756.48 0.02France Government Credit Default Swap Cp 0.25 USD 500,000.00 1,200,000.00 – 8,792.22 0.00France Government Credit Default Swap Cp 0.25 USD 6,800,000.00 200,000.00 – 449.35 0.00France Government Credit Default Swap Cp 0.25 USD 3,400,000.00 3,400,000.00 32,073.44 0.01France Government Credit Default Swap Cp 0.25 USD 2,600,000.00 2,600,000.00 25,360.09 0.01France Government Credit Default Swap Cp 0.25 USD 700,000.00 700,000.00 6,509.38 0.00France Government Credit Default Swap Cp 0.25 USD 4,800,000.00 4,800,000.00 50,807.51 0.02HeidelbergCement Finance Credit Default Swap Cp 5.00 EUR 900,000.00 – 23,781.49 – 0.01Holcim Finance Luxembourg Credit Default Swap Cp 1.00 EUR 1,100,000.00 – 24,950.11 – 0.01Italy Government Credit Default Swap Cp 1.00 EUR 5,100,000.00 5,100,000.00 – 3,547.69 0.00Japan Government 20-Year Bond Credit Default Swap Cp 1.00 USD 2,000,000.00 – 7,116.28 0.00Japan Government 20-Year Bond Credit Default Swap Cp 1.00 USD 2,200,000.00 – 6,737.78 0.00Japan Government 20-Year Bond Credit Default Swap Cp 1.00 USD 2,000,000.00 32,084.56 0.01Japan Government 20-Year Bond Credit Default Swap Cp 1.00 USD 1,400,000.00 – 230.55 0.00Lloyds TSB Bank Credit Default Swap Cp 1.00 EUR 500,000.00 – 8,394.58 0.00Qatar Government Credit Default Swap Cp 1.00 USD 300,000.00 2,235.84 0.00Qatar Government Credit Default Swap Cp 1.00 USD 700,000.00 580.76 0.00Republic of Korea Credit Default Swap Cp 1.00 USD 1,100,000.00 33,252.42 0.01Russian Foreign Bond Credit Default Swap Cp 1.00 USD 100,000.00 100,000.00 1,125.29 0.00SWPC783M2 CDS EUR Put V 03MEVENT EUR 200,000.00 – 3,165.10 0.00United Kingdom Government Credit Default Swap Cp 1.00 USD 1,900,000.00 17,995.89 0.01United Kingdom Government Credit Default Swap Cp 1.00 USD 1,600,000.00 12,547.58 0.00United Kingdom Government Credit Default Swap Cp 1.00 USD 2,500,000.00 30,200.07 0.01United Kingdom Government Credit Default Swap Cp 1.00 USD 800,000.00 8,790.16 0.00
Investment Portfolio as at 31/03/2012Securities Shares resp.
Currency (in 1,000) resp.Contracts
Acquisitions Disposals Holdings 31/03/2012
Unrealisedgain/loss
% ofSubfund
assetsin the period under review
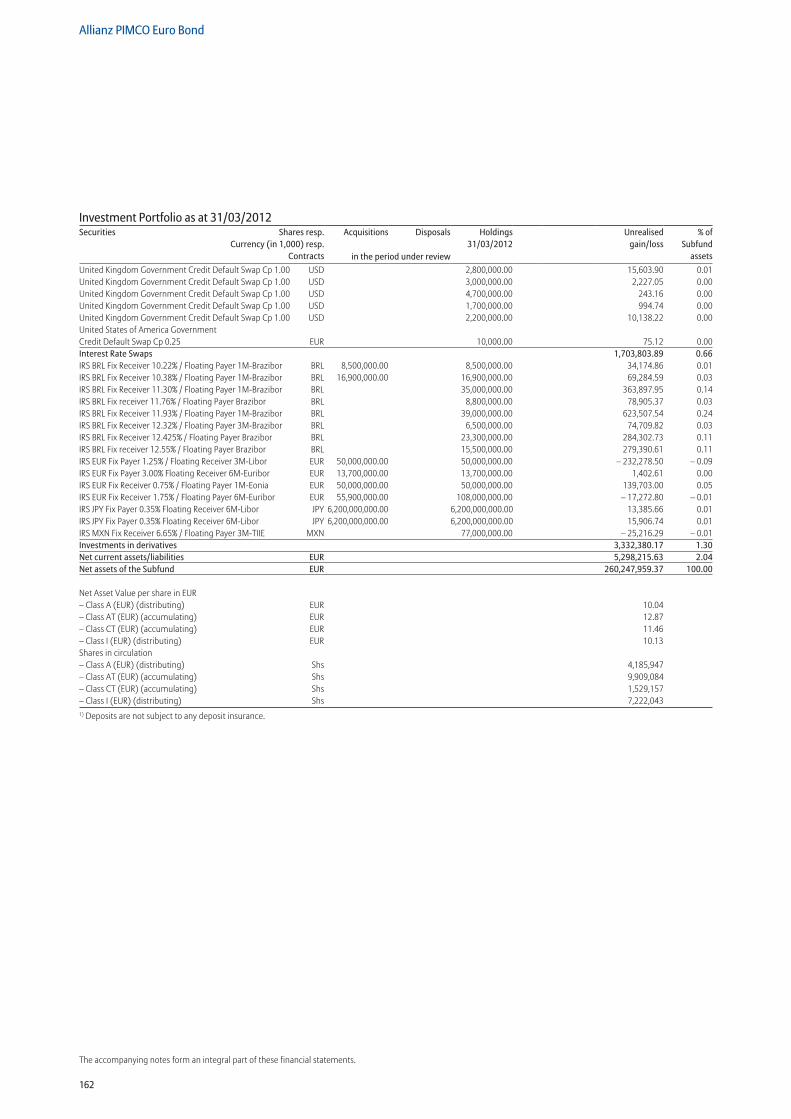
162
Allianz PIMCO Euro Bond
The accompanying notes form an integral part of these financial statements.
United Kingdom Government Credit Default Swap Cp 1.00 USD 2,800,000.00 15,603.90 0.01United Kingdom Government Credit Default Swap Cp 1.00 USD 3,000,000.00 2,227.05 0.00United Kingdom Government Credit Default Swap Cp 1.00 USD 4,700,000.00 243.16 0.00United Kingdom Government Credit Default Swap Cp 1.00 USD 1,700,000.00 994.74 0.00United Kingdom Government Credit Default Swap Cp 1.00 USD 2,200,000.00 10,138.22 0.00United States of America Government Credit Default Swap Cp 0.25 EUR 10,000.00 75.12 0.00Interest Rate Swaps 1,703,803.89 0.66IRS BRL Fix Receiver 10.22% / Floating Payer 1M-Brazibor BRL 8,500,000.00 8,500,000.00 34,174.86 0.01IRS BRL Fix Receiver 10.38% / Floating Payer 1M-Brazibor BRL 16,900,000.00 16,900,000.00 69,284.59 0.03IRS BRL Fix Receiver 11.30% / Floating Payer 1M-Brazibor BRL 35,000,000.00 363,897.95 0.14IRS BRL Fix receiver 11.76% / Floating Payer Brazibor BRL 8,800,000.00 78,905.37 0.03IRS BRL Fix Receiver 11.93% / Floating Payer 1M-Brazibor BRL 39,000,000.00 623,507.54 0.24IRS BRL Fix Receiver 12.32% / Floating Payer 3M-Brazibor BRL 6,500,000.00 74,709.82 0.03IRS BRL Fix Receiver 12.425% / Floating Payer Brazibor BRL 23,300,000.00 284,302.73 0.11IRS BRL Fix receiver 12.55% / Floating Payer Brazibor BRL 15,500,000.00 279,390.61 0.11IRS EUR Fix Payer 1.25% / Floating Receiver 3M-Libor EUR 50,000,000.00 50,000,000.00 – 232,278.50 – 0.09IRS EUR Fix Payer 3.00% Floating Receiver 6M-Euribor EUR 13,700,000.00 13,700,000.00 1,402.61 0.00IRS EUR Fix Receiver 0.75% / Floating Payer 1M-Eonia EUR 50,000,000.00 50,000,000.00 139,703.00 0.05IRS EUR Fix Receiver 1.75% / Floating Payer 6M-Euribor EUR 55,900,000.00 108,000,000.00 – 17,272.80 – 0.01IRS JPY Fix Payer 0.35% Floating Receiver 6M-Libor JPY 6,200,000,000.00 6,200,000,000.00 13,385.66 0.01IRS JPY Fix Payer 0.35% Floating Receiver 6M-Libor JPY 6,200,000,000.00 6,200,000,000.00 15,906.74 0.01IRS MXN Fix Receiver 6.65% / Floating Payer 3M-TIIE MXN 77,000,000.00 – 25,216.29 – 0.01Investments in derivatives 3,332,380.17 1.30Net current assets/liabilities EUR 5,298,215.63 2.04Net assets of the Subfund EUR 260,247,959.37 100.00
Net Asset Value per share in EUR – Class A (EUR) (distributing) EUR 10.04 – Class AT (EUR) (accumulating) EUR 12.87 – Class CT (EUR) (accumulating) EUR 11.46 – Class I (EUR) (distributing) EUR 10.13 Shares in circulation – Class A (EUR) (distributing) Shs 4,185,947 – Class AT (EUR) (accumulating) Shs 9,909,084 – Class CT (EUR) (accumulating) Shs 1,529,157 – Class I (EUR) (distributing) Shs 7,222,0431) Deposits are not subject to any deposit insurance.
Investment Portfolio as at 31/03/2012Securities Shares resp.
Currency (in 1,000) resp.Contracts
Acquisitions Disposals Holdings 31/03/2012
Unrealisedgain/loss
% ofSubfund
assetsin the period under review
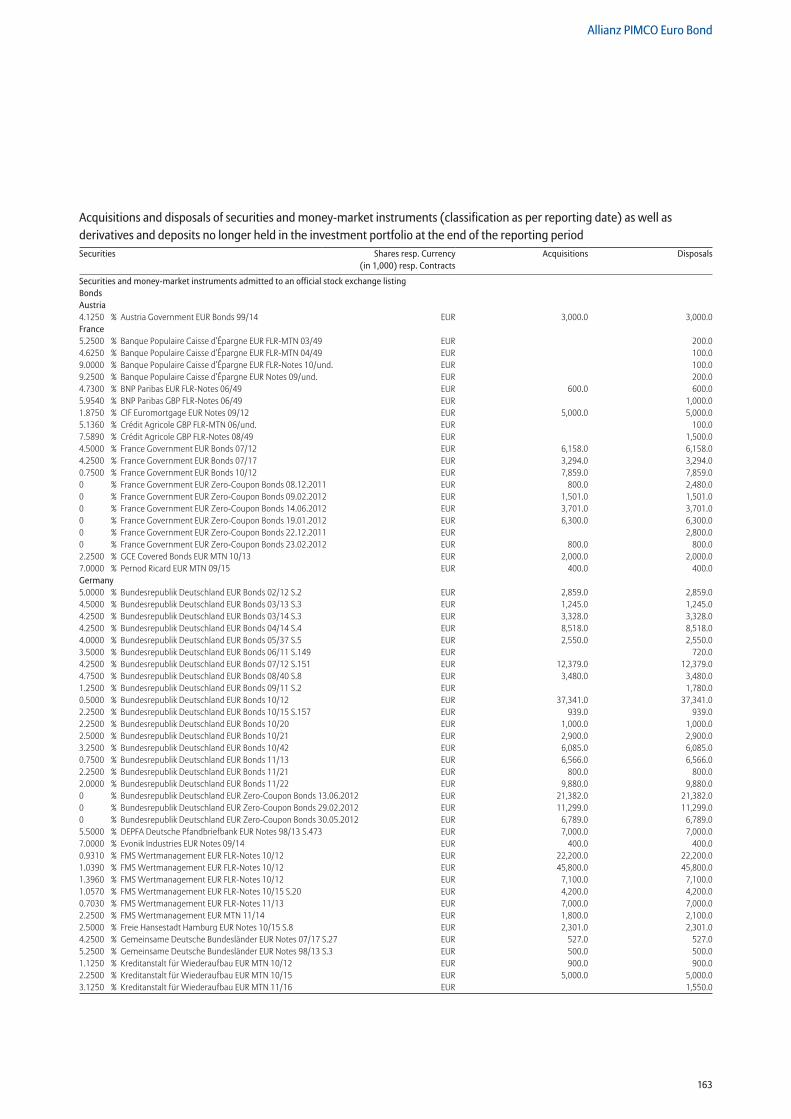
163
Allianz PIMCO Euro Bond
Securities and money-market instruments admitted to an official stock exchange listing Bonds Austria 4.1250 % Austria Government EUR Bonds 99/14 EUR 3,000.0 3,000.0France 5.2500 % Banque Populaire Caisse d’Épargne EUR FLR-MTN 03/49 EUR 200.04.6250 % Banque Populaire Caisse d’Épargne EUR FLR-MTN 04/49 EUR 100.09.0000 % Banque Populaire Caisse d’Épargne EUR FLR-Notes 10/und. EUR 100.09.2500 % Banque Populaire Caisse d’Épargne EUR Notes 09/und. EUR 200.04.7300 % BNP Paribas EUR FLR-Notes 06/49 EUR 600.0 600.05.9540 % BNP Paribas GBP FLR-Notes 06/49 EUR 1,000.01.8750 % CIF Euromortgage EUR Notes 09/12 EUR 5,000.0 5,000.05.1360 % Crédit Agricole GBP FLR-MTN 06/und. EUR 100.07.5890 % Crédit Agricole GBP FLR-Notes 08/49 EUR 1,500.04.5000 % France Government EUR Bonds 07/12 EUR 6,158.0 6,158.04.2500 % France Government EUR Bonds 07/17 EUR 3,294.0 3,294.00.7500 % France Government EUR Bonds 10/12 EUR 7,859.0 7,859.00 % France Government EUR Zero-Coupon Bonds 08.12.2011 EUR 800.0 2,480.00 % France Government EUR Zero-Coupon Bonds 09.02.2012 EUR 1,501.0 1,501.00 % France Government EUR Zero-Coupon Bonds 14.06.2012 EUR 3,701.0 3,701.00 % France Government EUR Zero-Coupon Bonds 19.01.2012 EUR 6,300.0 6,300.00 % France Government EUR Zero-Coupon Bonds 22.12.2011 EUR 2,800.00 % France Government EUR Zero-Coupon Bonds 23.02.2012 EUR 800.0 800.02.2500 % GCE Covered Bonds EUR MTN 10/13 EUR 2,000.0 2,000.07.0000 % Pernod Ricard EUR MTN 09/15 EUR 400.0 400.0Germany 5.0000 % Bundesrepublik Deutschland EUR Bonds 02/12 S.2 EUR 2,859.0 2,859.04.5000 % Bundesrepublik Deutschland EUR Bonds 03/13 S.3 EUR 1,245.0 1,245.04.2500 % Bundesrepublik Deutschland EUR Bonds 03/14 S.3 EUR 3,328.0 3,328.04.2500 % Bundesrepublik Deutschland EUR Bonds 04/14 S.4 EUR 8,518.0 8,518.04.0000 % Bundesrepublik Deutschland EUR Bonds 05/37 S.5 EUR 2,550.0 2,550.03.5000 % Bundesrepublik Deutschland EUR Bonds 06/11 S.149 EUR 720.04.2500 % Bundesrepublik Deutschland EUR Bonds 07/12 S.151 EUR 12,379.0 12,379.04.7500 % Bundesrepublik Deutschland EUR Bonds 08/40 S.8 EUR 3,480.0 3,480.01.2500 % Bundesrepublik Deutschland EUR Bonds 09/11 S.2 EUR 1,780.00.5000 % Bundesrepublik Deutschland EUR Bonds 10/12 EUR 37,341.0 37,341.02.2500 % Bundesrepublik Deutschland EUR Bonds 10/15 S.157 EUR 939.0 939.02.2500 % Bundesrepublik Deutschland EUR Bonds 10/20 EUR 1,000.0 1,000.02.5000 % Bundesrepublik Deutschland EUR Bonds 10/21 EUR 2,900.0 2,900.03.2500 % Bundesrepublik Deutschland EUR Bonds 10/42 EUR 6,085.0 6,085.00.7500 % Bundesrepublik Deutschland EUR Bonds 11/13 EUR 6,566.0 6,566.02.2500 % Bundesrepublik Deutschland EUR Bonds 11/21 EUR 800.0 800.02.0000 % Bundesrepublik Deutschland EUR Bonds 11/22 EUR 9,880.0 9,880.00 % Bundesrepublik Deutschland EUR Zero-Coupon Bonds 13.06.2012 EUR 21,382.0 21,382.00 % Bundesrepublik Deutschland EUR Zero-Coupon Bonds 29.02.2012 EUR 11,299.0 11,299.00 % Bundesrepublik Deutschland EUR Zero-Coupon Bonds 30.05.2012 EUR 6,789.0 6,789.05.5000 % DEPFA Deutsche Pfandbriefbank EUR Notes 98/13 S.473 EUR 7,000.0 7,000.07.0000 % Evonik Industries EUR Notes 09/14 EUR 400.0 400.00.9310 % FMS Wertmanagement EUR FLR-Notes 10/12 EUR 22,200.0 22,200.01.0390 % FMS Wertmanagement EUR FLR-Notes 10/12 EUR 45,800.0 45,800.01.3960 % FMS Wertmanagement EUR FLR-Notes 10/12 EUR 7,100.0 7,100.01.0570 % FMS Wertmanagement EUR FLR-Notes 10/15 S.20 EUR 4,200.0 4,200.00.7030 % FMS Wertmanagement EUR FLR-Notes 11/13 EUR 7,000.0 7,000.02.2500 % FMS Wertmanagement EUR MTN 11/14 EUR 1,800.0 2,100.02.5000 % Freie Hansestadt Hamburg EUR Notes 10/15 S.8 EUR 2,301.0 2,301.04.2500 % Gemeinsame Deutsche Bundesländer EUR Notes 07/17 S.27 EUR 527.0 527.05.2500 % Gemeinsame Deutsche Bundesländer EUR Notes 98/13 S.3 EUR 500.0 500.01.1250 % Kreditanstalt für Wiederaufbau EUR MTN 10/12 EUR 900.0 900.02.2500 % Kreditanstalt für Wiederaufbau EUR MTN 10/15 EUR 5,000.0 5,000.03.1250 % Kreditanstalt für Wiederaufbau EUR MTN 11/16 EUR 1,550.0
Acquisitions and disposals of securities and money-market instruments (classification as per reporting date) as well as derivatives and deposits no longer held in the investment portfolio at the end of the reporting periodSecurities Shares resp. Currency
(in 1,000) resp. ContractsAcquisitions Disposals
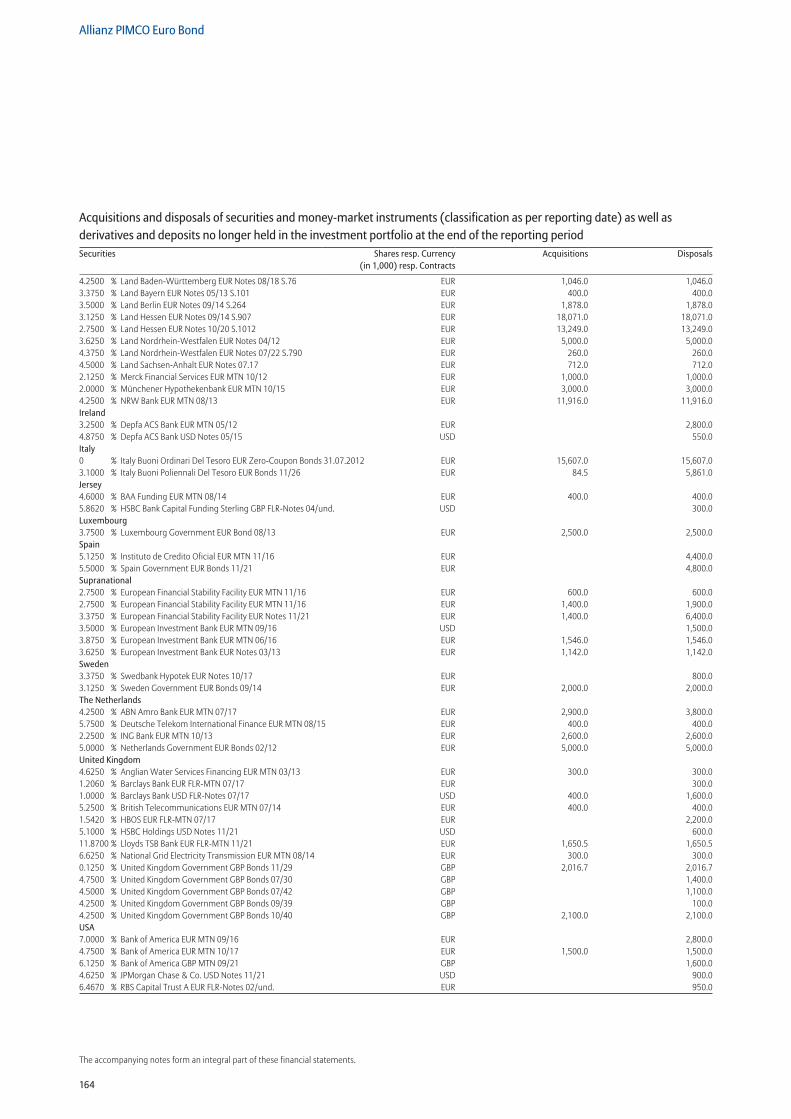
164
Allianz PIMCO Euro Bond
The accompanying notes form an integral part of these financial statements.
4.2500 % Land Baden-Württemberg EUR Notes 08/18 S.76 EUR 1,046.0 1,046.03.3750 % Land Bayern EUR Notes 05/13 S.101 EUR 400.0 400.03.5000 % Land Berlin EUR Notes 09/14 S.264 EUR 1,878.0 1,878.03.1250 % Land Hessen EUR Notes 09/14 S.907 EUR 18,071.0 18,071.02.7500 % Land Hessen EUR Notes 10/20 S.1012 EUR 13,249.0 13,249.03.6250 % Land Nordrhein-Westfalen EUR Notes 04/12 EUR 5,000.0 5,000.04.3750 % Land Nordrhein-Westfalen EUR Notes 07/22 S.790 EUR 260.0 260.04.5000 % Land Sachsen-Anhalt EUR Notes 07.17 EUR 712.0 712.02.1250 % Merck Financial Services EUR MTN 10/12 EUR 1,000.0 1,000.02.0000 % Münchener Hypothekenbank EUR MTN 10/15 EUR 3,000.0 3,000.04.2500 % NRW Bank EUR MTN 08/13 EUR 11,916.0 11,916.0Ireland 3.2500 % Depfa ACS Bank EUR MTN 05/12 EUR 2,800.04.8750 % Depfa ACS Bank USD Notes 05/15 USD 550.0Italy 0 % Italy Buoni Ordinari Del Tesoro EUR Zero-Coupon Bonds 31.07.2012 EUR 15,607.0 15,607.03.1000 % Italy Buoni Poliennali Del Tesoro EUR Bonds 11/26 EUR 84.5 5,861.0Jersey 4.6000 % BAA Funding EUR MTN 08/14 EUR 400.0 400.05.8620 % HSBC Bank Capital Funding Sterling GBP FLR-Notes 04/und. USD 300.0Luxembourg 3.7500 % Luxembourg Government EUR Bond 08/13 EUR 2,500.0 2,500.0Spain 5.1250 % Instituto de Credito Oficial EUR MTN 11/16 EUR 4,400.05.5000 % Spain Government EUR Bonds 11/21 EUR 4,800.0Supranational 2.7500 % European Financial Stability Facility EUR MTN 11/16 EUR 600.0 600.02.7500 % European Financial Stability Facility EUR MTN 11/16 EUR 1,400.0 1,900.03.3750 % European Financial Stability Facility EUR Notes 11/21 EUR 1,400.0 6,400.03.5000 % European Investment Bank EUR MTN 09/16 USD 1,500.03.8750 % European Investment Bank EUR MTN 06/16 EUR 1,546.0 1,546.03.6250 % European Investment Bank EUR Notes 03/13 EUR 1,142.0 1,142.0Sweden 3.3750 % Swedbank Hypotek EUR Notes 10/17 EUR 800.03.1250 % Sweden Government EUR Bonds 09/14 EUR 2,000.0 2,000.0The Netherlands 4.2500 % ABN Amro Bank EUR MTN 07/17 EUR 2,900.0 3,800.05.7500 % Deutsche Telekom International Finance EUR MTN 08/15 EUR 400.0 400.02.2500 % ING Bank EUR MTN 10/13 EUR 2,600.0 2,600.05.0000 % Netherlands Government EUR Bonds 02/12 EUR 5,000.0 5,000.0United Kingdom 4.6250 % Anglian Water Services Financing EUR MTN 03/13 EUR 300.0 300.01.2060 % Barclays Bank EUR FLR-MTN 07/17 EUR 300.01.0000 % Barclays Bank USD FLR-Notes 07/17 USD 400.0 1,600.05.2500 % British Telecommunications EUR MTN 07/14 EUR 400.0 400.01.5420 % HBOS EUR FLR-MTN 07/17 EUR 2,200.05.1000 % HSBC Holdings USD Notes 11/21 USD 600.011.8700 % Lloyds TSB Bank EUR FLR-MTN 11/21 EUR 1,650.5 1,650.56.6250 % National Grid Electricity Transmission EUR MTN 08/14 EUR 300.0 300.00.1250 % United Kingdom Government GBP Bonds 11/29 GBP 2,016.7 2,016.74.7500 % United Kingdom Government GBP Bonds 07/30 GBP 1,400.04.5000 % United Kingdom Government GBP Bonds 07/42 GBP 1,100.04.2500 % United Kingdom Government GBP Bonds 09/39 GBP 100.04.2500 % United Kingdom Government GBP Bonds 10/40 GBP 2,100.0 2,100.0USA 7.0000 % Bank of America EUR MTN 09/16 EUR 2,800.04.7500 % Bank of America EUR MTN 10/17 EUR 1,500.0 1,500.06.1250 % Bank of America GBP MTN 09/21 GBP 1,600.04.6250 % JPMorgan Chase & Co. USD Notes 11/21 USD 900.06.4670 % RBS Capital Trust A EUR FLR-Notes 02/und. EUR 950.0
Acquisitions and disposals of securities and money-market instruments (classification as per reporting date) as well as derivatives and deposits no longer held in the investment portfolio at the end of the reporting periodSecurities Shares resp. Currency
(in 1,000) resp. ContractsAcquisitions Disposals
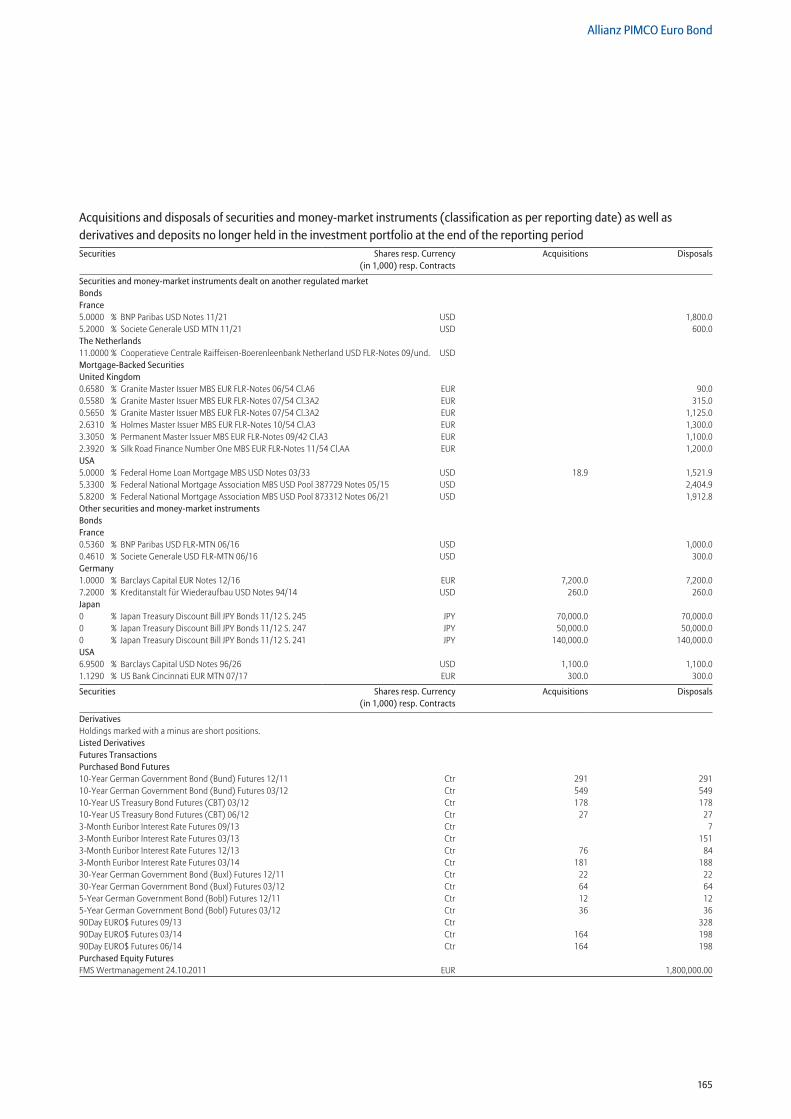
165
Allianz PIMCO Euro Bond
Securities and money-market instruments dealt on another regulated market Bonds France 5.0000 % BNP Paribas USD Notes 11/21 USD 1,800.05.2000 % Societe Generale USD MTN 11/21 USD 600.0The Netherlands 11.0000 % Cooperatieve Centrale Raiffeisen-Boerenleenbank Netherland USD FLR-Notes 09/und. USD Mortgage-Backed Securities United Kingdom 0.6580 % Granite Master Issuer MBS EUR FLR-Notes 06/54 Cl.A6 EUR 90.00.5580 % Granite Master Issuer MBS EUR FLR-Notes 07/54 Cl.3A2 EUR 315.00.5650 % Granite Master Issuer MBS EUR FLR-Notes 07/54 Cl.3A2 EUR 1,125.02.6310 % Holmes Master Issuer MBS EUR FLR-Notes 10/54 Cl.A3 EUR 1,300.03.3050 % Permanent Master Issuer MBS EUR FLR-Notes 09/42 Cl.A3 EUR 1,100.02.3920 % Silk Road Finance Number One MBS EUR FLR-Notes 11/54 Cl.AA EUR 1,200.0USA 5.0000 % Federal Home Loan Mortgage MBS USD Notes 03/33 USD 18.9 1,521.95.3300 % Federal National Mortgage Association MBS USD Pool 387729 Notes 05/15 USD 2,404.95.8200 % Federal National Mortgage Association MBS USD Pool 873312 Notes 06/21 USD 1,912.8Other securities and money-market instruments Bonds France 0.5360 % BNP Paribas USD FLR-MTN 06/16 USD 1,000.00.4610 % Societe Generale USD FLR-MTN 06/16 USD 300.0Germany 1.0000 % Barclays Capital EUR Notes 12/16 EUR 7,200.0 7,200.07.2000 % Kreditanstalt für Wiederaufbau USD Notes 94/14 USD 260.0 260.0Japan 0 % Japan Treasury Discount Bill JPY Bonds 11/12 S. 245 JPY 70,000.0 70,000.00 % Japan Treasury Discount Bill JPY Bonds 11/12 S. 247 JPY 50,000.0 50,000.00 % Japan Treasury Discount Bill JPY Bonds 11/12 S. 241 JPY 140,000.0 140,000.0USA 6.9500 % Barclays Capital USD Notes 96/26 USD 1,100.0 1,100.01.1290 % US Bank Cincinnati EUR MTN 07/17 EUR 300.0 300.0
Securities Shares resp. Currency (in 1,000) resp. Contracts
Acquisitions Disposals
DerivativesHoldings marked with a minus are short positions. Listed Derivatives Futures Transactions Purchased Bond Futures 10-Year German Government Bond (Bund) Futures 12/11 Ctr 291 29110-Year German Government Bond (Bund) Futures 03/12 Ctr 549 54910-Year US Treasury Bond Futures (CBT) 03/12 Ctr 178 17810-Year US Treasury Bond Futures (CBT) 06/12 Ctr 27 273-Month Euribor Interest Rate Futures 09/13 Ctr 73-Month Euribor Interest Rate Futures 03/13 Ctr 1513-Month Euribor Interest Rate Futures 12/13 Ctr 76 843-Month Euribor Interest Rate Futures 03/14 Ctr 181 18830-Year German Government Bond (Buxl) Futures 12/11 Ctr 22 2230-Year German Government Bond (Buxl) Futures 03/12 Ctr 64 645-Year German Government Bond (Bobl) Futures 12/11 Ctr 12 125-Year German Government Bond (Bobl) Futures 03/12 Ctr 36 3690Day EURO$ Futures 09/13 Ctr 32890Day EURO$ Futures 03/14 Ctr 164 19890Day EURO$ Futures 06/14 Ctr 164 198Purchased Equity Futures FMS Wertmanagement 24.10.2011 EUR 1,800,000.00
Acquisitions and disposals of securities and money-market instruments (classification as per reporting date) as well as derivatives and deposits no longer held in the investment portfolio at the end of the reporting periodSecurities Shares resp. Currency
(in 1,000) resp. ContractsAcquisitions Disposals
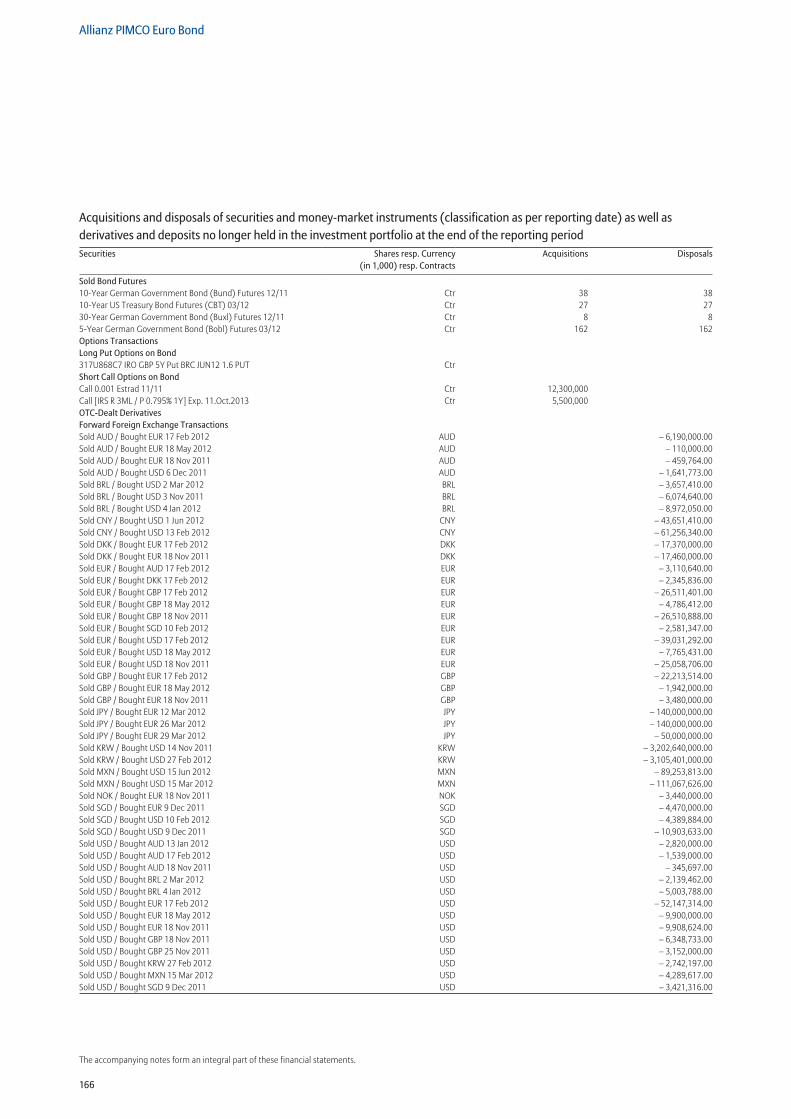
166
Allianz PIMCO Euro Bond
The accompanying notes form an integral part of these financial statements.
Sold Bond Futures 10-Year German Government Bond (Bund) Futures 12/11 Ctr 38 3810-Year US Treasury Bond Futures (CBT) 03/12 Ctr 27 2730-Year German Government Bond (Buxl) Futures 12/11 Ctr 8 85-Year German Government Bond (Bobl) Futures 03/12 Ctr 162 162Options Transactions Long Put Options on Bond 317U868C7 IRO GBP 5Y Put BRC JUN12 1.6 PUT Ctr Short Call Options on Bond Call 0.001 Estrad 11/11 Ctr 12,300,000 Call [IRS R 3ML / P 0.795% 1Y] Exp. 11.Oct.2013 Ctr 5,500,000 OTC-Dealt Derivatives Forward Foreign Exchange Transactions Sold AUD / Bought EUR 17 Feb 2012 AUD – 6,190,000.00Sold AUD / Bought EUR 18 May 2012 AUD – 110,000.00Sold AUD / Bought EUR 18 Nov 2011 AUD – 459,764.00Sold AUD / Bought USD 6 Dec 2011 AUD – 1,641,773.00Sold BRL / Bought USD 2 Mar 2012 BRL – 3,657,410.00Sold BRL / Bought USD 3 Nov 2011 BRL – 6,074,640.00Sold BRL / Bought USD 4 Jan 2012 BRL – 8,972,050.00Sold CNY / Bought USD 1 Jun 2012 CNY – 43,651,410.00Sold CNY / Bought USD 13 Feb 2012 CNY – 61,256,340.00Sold DKK / Bought EUR 17 Feb 2012 DKK – 17,370,000.00Sold DKK / Bought EUR 18 Nov 2011 DKK – 17,460,000.00Sold EUR / Bought AUD 17 Feb 2012 EUR – 3,110,640.00Sold EUR / Bought DKK 17 Feb 2012 EUR – 2,345,836.00Sold EUR / Bought GBP 17 Feb 2012 EUR – 26,511,401.00Sold EUR / Bought GBP 18 May 2012 EUR – 4,786,412.00Sold EUR / Bought GBP 18 Nov 2011 EUR – 26,510,888.00Sold EUR / Bought SGD 10 Feb 2012 EUR – 2,581,347.00Sold EUR / Bought USD 17 Feb 2012 EUR – 39,031,292.00Sold EUR / Bought USD 18 May 2012 EUR – 7,765,431.00Sold EUR / Bought USD 18 Nov 2011 EUR – 25,058,706.00Sold GBP / Bought EUR 17 Feb 2012 GBP – 22,213,514.00Sold GBP / Bought EUR 18 May 2012 GBP – 1,942,000.00Sold GBP / Bought EUR 18 Nov 2011 GBP – 3,480,000.00Sold JPY / Bought EUR 12 Mar 2012 JPY – 140,000,000.00Sold JPY / Bought EUR 26 Mar 2012 JPY – 140,000,000.00Sold JPY / Bought EUR 29 Mar 2012 JPY – 50,000,000.00Sold KRW / Bought USD 14 Nov 2011 KRW – 3,202,640,000.00Sold KRW / Bought USD 27 Feb 2012 KRW – 3,105,401,000.00Sold MXN / Bought USD 15 Jun 2012 MXN – 89,253,813.00Sold MXN / Bought USD 15 Mar 2012 MXN – 111,067,626.00Sold NOK / Bought EUR 18 Nov 2011 NOK – 3,440,000.00Sold SGD / Bought EUR 9 Dec 2011 SGD – 4,470,000.00Sold SGD / Bought USD 10 Feb 2012 SGD – 4,389,884.00Sold SGD / Bought USD 9 Dec 2011 SGD – 10,903,633.00Sold USD / Bought AUD 13 Jan 2012 USD – 2,820,000.00Sold USD / Bought AUD 17 Feb 2012 USD – 1,539,000.00Sold USD / Bought AUD 18 Nov 2011 USD – 345,697.00Sold USD / Bought BRL 2 Mar 2012 USD – 2,139,462.00Sold USD / Bought BRL 4 Jan 2012 USD – 5,003,788.00Sold USD / Bought EUR 17 Feb 2012 USD – 52,147,314.00Sold USD / Bought EUR 18 May 2012 USD – 9,900,000.00Sold USD / Bought EUR 18 Nov 2011 USD – 9,908,624.00Sold USD / Bought GBP 18 Nov 2011 USD – 6,348,733.00Sold USD / Bought GBP 25 Nov 2011 USD – 3,152,000.00Sold USD / Bought KRW 27 Feb 2012 USD – 2,742,197.00Sold USD / Bought MXN 15 Mar 2012 USD – 4,289,617.00Sold USD / Bought SGD 9 Dec 2011 USD – 3,421,316.00
Acquisitions and disposals of securities and money-market instruments (classification as per reporting date) as well as derivatives and deposits no longer held in the investment portfolio at the end of the reporting periodSecurities Shares resp. Currency
(in 1,000) resp. ContractsAcquisitions Disposals
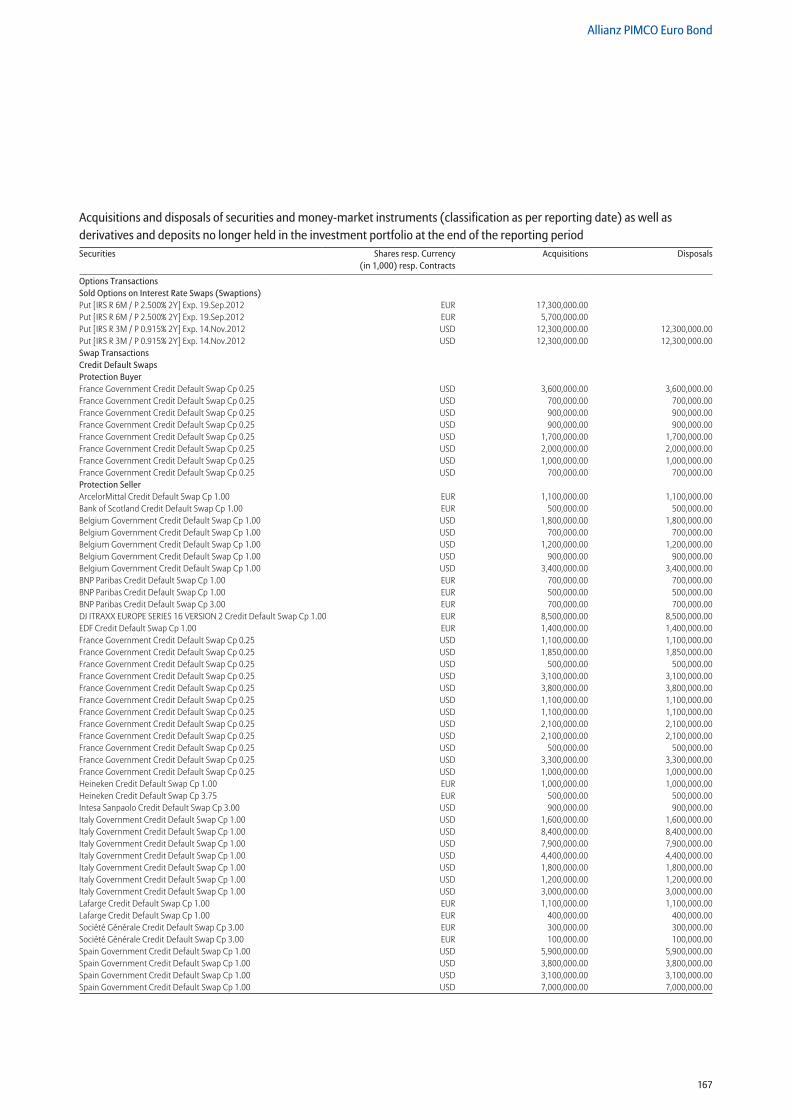
167
Allianz PIMCO Euro Bond
Options Transactions Sold Options on Interest Rate Swaps (Swaptions) Put [IRS R 6M / P 2.500% 2Y] Exp. 19.Sep.2012 EUR 17,300,000.00 Put [IRS R 6M / P 2.500% 2Y] Exp. 19.Sep.2012 EUR 5,700,000.00 Put [IRS R 3M / P 0.915% 2Y] Exp. 14.Nov.2012 USD 12,300,000.00 12,300,000.00Put [IRS R 3M / P 0.915% 2Y] Exp. 14.Nov.2012 USD 12,300,000.00 12,300,000.00Swap Transactions Credit Default Swaps Protection Buyer France Government Credit Default Swap Cp 0.25 USD 3,600,000.00 3,600,000.00France Government Credit Default Swap Cp 0.25 USD 700,000.00 700,000.00France Government Credit Default Swap Cp 0.25 USD 900,000.00 900,000.00France Government Credit Default Swap Cp 0.25 USD 900,000.00 900,000.00France Government Credit Default Swap Cp 0.25 USD 1,700,000.00 1,700,000.00France Government Credit Default Swap Cp 0.25 USD 2,000,000.00 2,000,000.00France Government Credit Default Swap Cp 0.25 USD 1,000,000.00 1,000,000.00France Government Credit Default Swap Cp 0.25 USD 700,000.00 700,000.00Protection Seller ArcelorMittal Credit Default Swap Cp 1.00 EUR 1,100,000.00 1,100,000.00Bank of Scotland Credit Default Swap Cp 1.00 EUR 500,000.00 500,000.00Belgium Government Credit Default Swap Cp 1.00 USD 1,800,000.00 1,800,000.00Belgium Government Credit Default Swap Cp 1.00 USD 700,000.00 700,000.00Belgium Government Credit Default Swap Cp 1.00 USD 1,200,000.00 1,200,000.00Belgium Government Credit Default Swap Cp 1.00 USD 900,000.00 900,000.00Belgium Government Credit Default Swap Cp 1.00 USD 3,400,000.00 3,400,000.00BNP Paribas Credit Default Swap Cp 1.00 EUR 700,000.00 700,000.00BNP Paribas Credit Default Swap Cp 1.00 EUR 500,000.00 500,000.00BNP Paribas Credit Default Swap Cp 3.00 EUR 700,000.00 700,000.00DJ ITRAXX EUROPE SERIES 16 VERSION 2 Credit Default Swap Cp 1.00 EUR 8,500,000.00 8,500,000.00EDF Credit Default Swap Cp 1.00 EUR 1,400,000.00 1,400,000.00France Government Credit Default Swap Cp 0.25 USD 1,100,000.00 1,100,000.00France Government Credit Default Swap Cp 0.25 USD 1,850,000.00 1,850,000.00France Government Credit Default Swap Cp 0.25 USD 500,000.00 500,000.00France Government Credit Default Swap Cp 0.25 USD 3,100,000.00 3,100,000.00France Government Credit Default Swap Cp 0.25 USD 3,800,000.00 3,800,000.00France Government Credit Default Swap Cp 0.25 USD 1,100,000.00 1,100,000.00France Government Credit Default Swap Cp 0.25 USD 1,100,000.00 1,100,000.00France Government Credit Default Swap Cp 0.25 USD 2,100,000.00 2,100,000.00France Government Credit Default Swap Cp 0.25 USD 2,100,000.00 2,100,000.00France Government Credit Default Swap Cp 0.25 USD 500,000.00 500,000.00France Government Credit Default Swap Cp 0.25 USD 3,300,000.00 3,300,000.00France Government Credit Default Swap Cp 0.25 USD 1,000,000.00 1,000,000.00Heineken Credit Default Swap Cp 1.00 EUR 1,000,000.00 1,000,000.00Heineken Credit Default Swap Cp 3.75 EUR 500,000.00 500,000.00Intesa Sanpaolo Credit Default Swap Cp 3.00 USD 900,000.00 900,000.00Italy Government Credit Default Swap Cp 1.00 USD 1,600,000.00 1,600,000.00Italy Government Credit Default Swap Cp 1.00 USD 8,400,000.00 8,400,000.00Italy Government Credit Default Swap Cp 1.00 USD 7,900,000.00 7,900,000.00Italy Government Credit Default Swap Cp 1.00 USD 4,400,000.00 4,400,000.00Italy Government Credit Default Swap Cp 1.00 USD 1,800,000.00 1,800,000.00Italy Government Credit Default Swap Cp 1.00 USD 1,200,000.00 1,200,000.00Italy Government Credit Default Swap Cp 1.00 USD 3,000,000.00 3,000,000.00Lafarge Credit Default Swap Cp 1.00 EUR 1,100,000.00 1,100,000.00Lafarge Credit Default Swap Cp 1.00 EUR 400,000.00 400,000.00Société Générale Credit Default Swap Cp 3.00 EUR 300,000.00 300,000.00Société Générale Credit Default Swap Cp 3.00 EUR 100,000.00 100,000.00Spain Government Credit Default Swap Cp 1.00 USD 5,900,000.00 5,900,000.00Spain Government Credit Default Swap Cp 1.00 USD 3,800,000.00 3,800,000.00Spain Government Credit Default Swap Cp 1.00 USD 3,100,000.00 3,100,000.00Spain Government Credit Default Swap Cp 1.00 USD 7,000,000.00 7,000,000.00
Acquisitions and disposals of securities and money-market instruments (classification as per reporting date) as well as derivatives and deposits no longer held in the investment portfolio at the end of the reporting periodSecurities Shares resp. Currency
(in 1,000) resp. ContractsAcquisitions Disposals
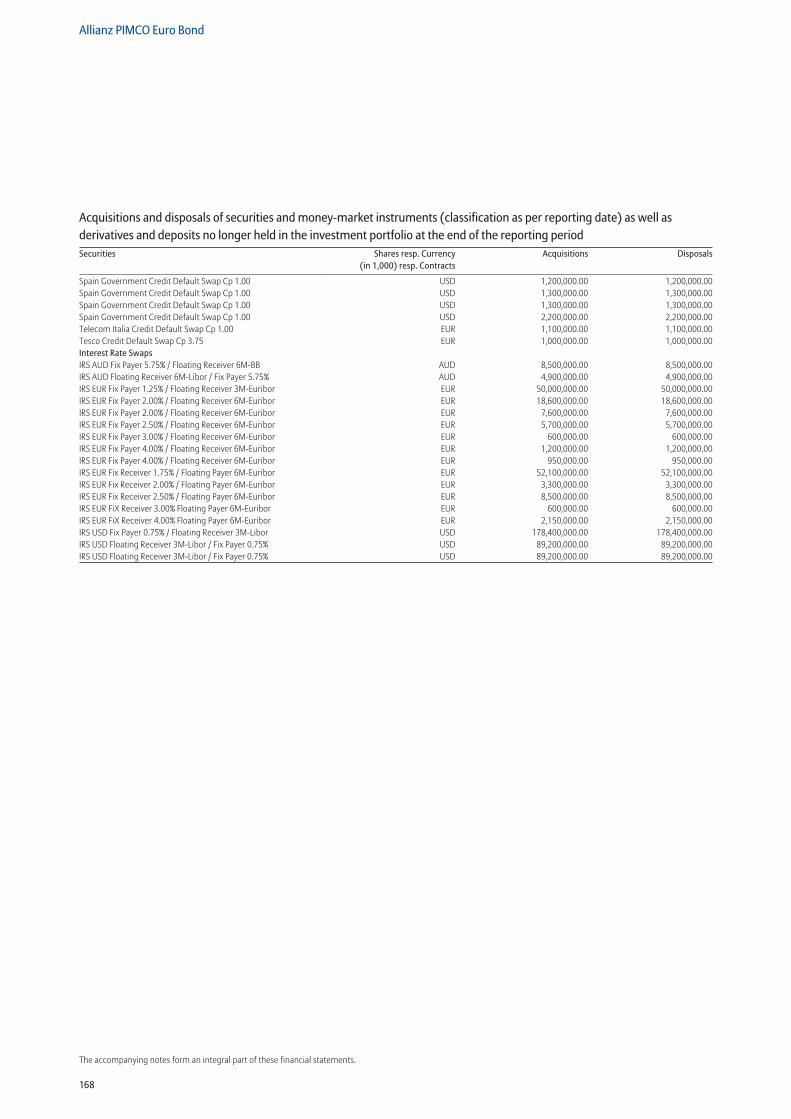
168
Allianz PIMCO Euro Bond
The accompanying notes form an integral part of these financial statements.
Spain Government Credit Default Swap Cp 1.00 USD 1,200,000.00 1,200,000.00Spain Government Credit Default Swap Cp 1.00 USD 1,300,000.00 1,300,000.00Spain Government Credit Default Swap Cp 1.00 USD 1,300,000.00 1,300,000.00Spain Government Credit Default Swap Cp 1.00 USD 2,200,000.00 2,200,000.00Telecom Italia Credit Default Swap Cp 1.00 EUR 1,100,000.00 1,100,000.00Tesco Credit Default Swap Cp 3.75 EUR 1,000,000.00 1,000,000.00Interest Rate Swaps IRS AUD Fix Payer 5.75% / Floating Receiver 6M-BB AUD 8,500,000.00 8,500,000.00IRS AUD Floating Receiver 6M-Libor / Fix Payer 5.75% AUD 4,900,000.00 4,900,000.00IRS EUR Fix Payer 1.25% / Floating Receiver 3M-Euribor EUR 50,000,000.00 50,000,000.00IRS EUR Fix Payer 2.00% / Floating Receiver 6M-Euribor EUR 18,600,000.00 18,600,000.00IRS EUR Fix Payer 2.00% / Floating Receiver 6M-Euribor EUR 7,600,000.00 7,600,000.00IRS EUR Fix Payer 2.50% / Floating Receiver 6M-Euribor EUR 5,700,000.00 5,700,000.00IRS EUR Fix Payer 3.00% / Floating Receiver 6M-Euribor EUR 600,000.00 600,000.00IRS EUR Fix Payer 4.00% / Floating Receiver 6M-Euribor EUR 1,200,000.00 1,200,000.00IRS EUR Fix Payer 4.00% / Floating Receiver 6M-Euribor EUR 950,000.00 950,000.00IRS EUR Fix Receiver 1.75% / Floating Payer 6M-Euribor EUR 52,100,000.00 52,100,000.00IRS EUR Fix Receiver 2.00% / Floating Payer 6M-Euribor EUR 3,300,000.00 3,300,000.00IRS EUR Fix Receiver 2.50% / Floating Payer 6M-Euribor EUR 8,500,000.00 8,500,000.00IRS EUR FiX Receiver 3.00% Floating Payer 6M-Euribor EUR 600,000.00 600,000.00IRS EUR FiX Receiver 4.00% Floating Payer 6M-Euribor EUR 2,150,000.00 2,150,000.00IRS USD Fix Payer 0.75% / Floating Receiver 3M-Libor USD 178,400,000.00 178,400,000.00IRS USD Floating Receiver 3M-Libor / Fix Payer 0.75% USD 89,200,000.00 89,200,000.00IRS USD Floating Receiver 3M-Libor / Fix Payer 0.75% USD 89,200,000.00 89,200,000.00
Acquisitions and disposals of securities and money-market instruments (classification as per reporting date) as well as derivatives and deposits no longer held in the investment portfolio at the end of the reporting periodSecurities Shares resp. Currency
(in 1,000) resp. ContractsAcquisitions Disposals
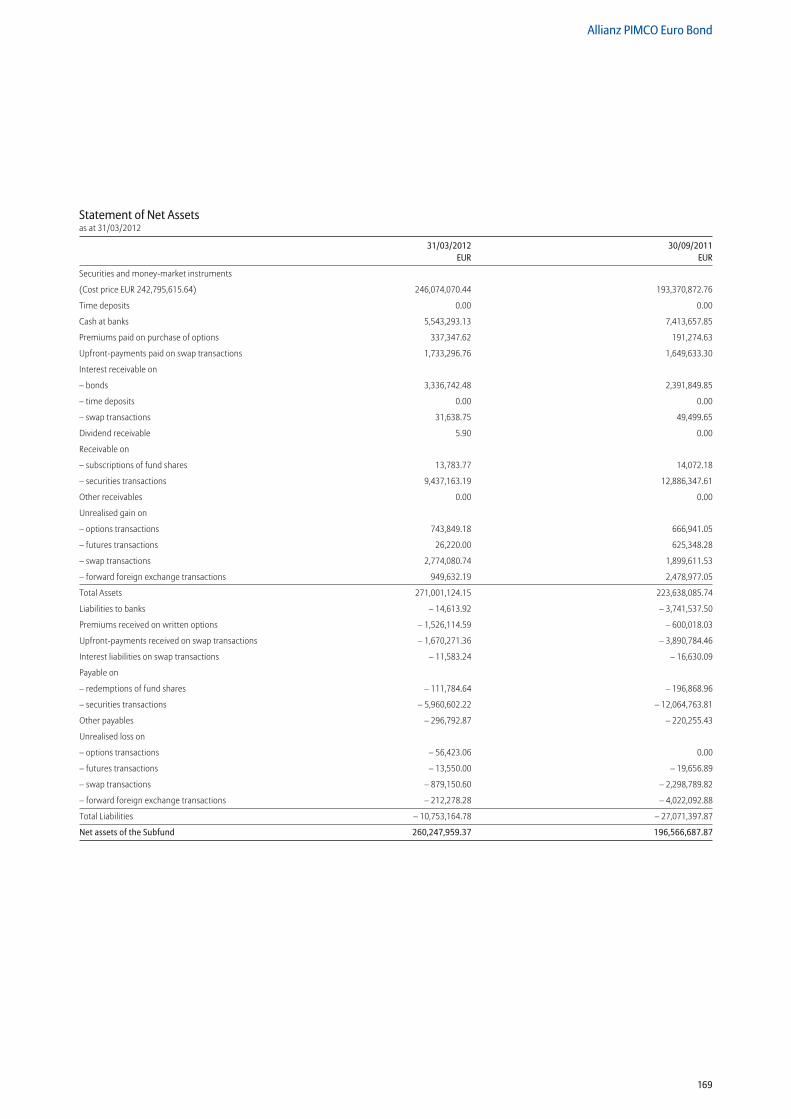
169
Allianz PIMCO Euro Bond
Statement of Net Assetsas at 31/03/2012
31/03/2012 30/09/2011 EUR EUR
Securities and money-market instruments
(Cost price EUR 242,795,615.64) 246,074,070.44 193,370,872.76
Time deposits 0.00 0.00
Cash at banks 5,543,293.13 7,413,657.85
Premiums paid on purchase of options 337,347.62 191,274.63
Upfront-payments paid on swap transactions 1,733,296.76 1,649,633.30
Interest receivable on
– bonds 3,336,742.48 2,391,849.85
– time deposits 0.00 0.00
– swap transactions 31,638.75 49,499.65
Dividend receivable 5.90 0.00
Receivable on
– subscriptions of fund shares 13,783.77 14,072.18
– securities transactions 9,437,163.19 12,886,347.61
Other receivables 0.00 0.00
Unrealised gain on
– options transactions 743,849.18 666,941.05
– futures transactions 26,220.00 625,348.28
– swap transactions 2,774,080.74 1,899,611.53
– forward foreign exchange transactions 949,632.19 2,478,977.05
Total Assets 271,001,124.15 223,638,085.74
Liabilities to banks – 14,613.92 – 3,741,537.50
Premiums received on written options – 1,526,114.59 – 600,018.03
Upfront-payments received on swap transactions – 1,670,271.36 – 3,890,784.46
Interest liabilities on swap transactions – 11,583.24 – 16,630.09
Payable on
– redemptions of fund shares – 111,784.64 – 196,868.96
– securities transactions – 5,960,602.22 – 12,064,763.81
Other payables – 296,792.87 – 220,255.43
Unrealised loss on
– options transactions – 56,423.06 0.00
– futures transactions – 13,550.00 – 19,656.89
– swap transactions – 879,150.60 – 2,298,789.82
– forward foreign exchange transactions – 212,278.28 – 4,022,092.88
Total Liabilities – 10,753,164.78 – 27,071,397.87
Net assets of the Subfund 260,247,959.37 196,566,687.87
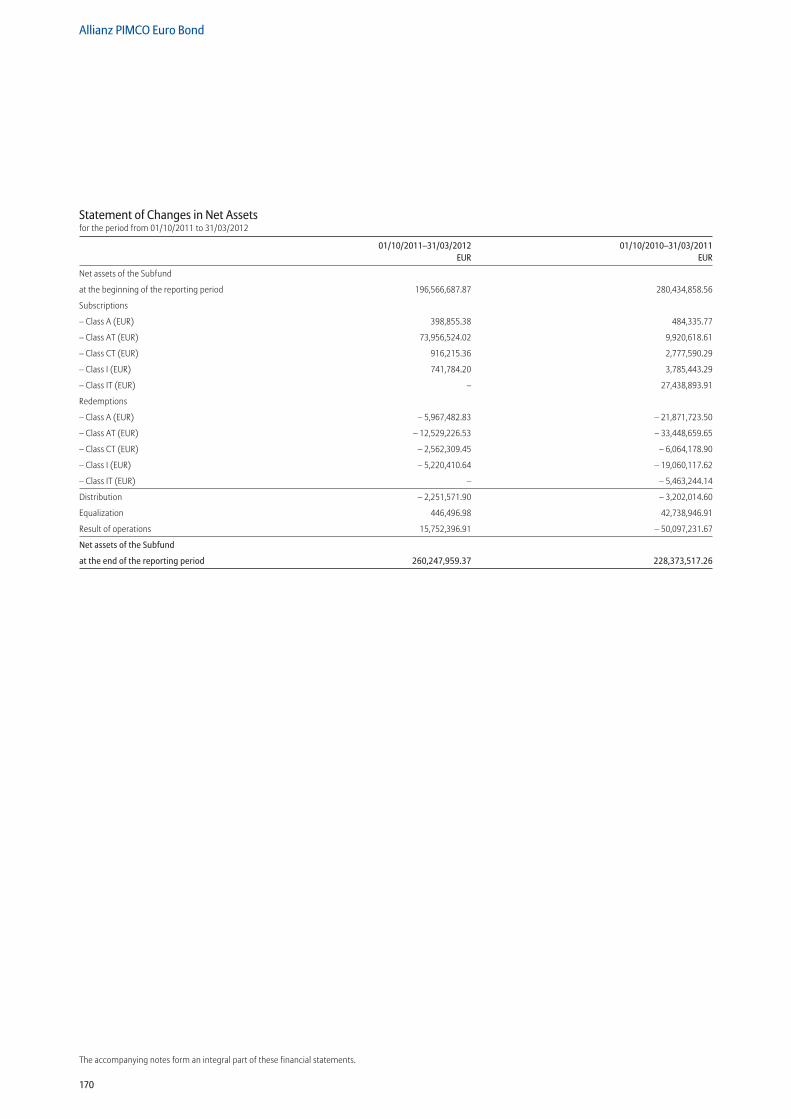
170
Allianz PIMCO Euro Bond
The accompanying notes form an integral part of these financial statements.
Statement of Changes in Net Assetsfor the period from 01/10/2011 to 31/03/2012
01/10/2011–31/03/2012 01/10/2010–31/03/2011 EUR EUR
Net assets of the Subfund
at the beginning of the reporting period 196,566,687.87 280,434,858.56
Subscriptions
– Class A (EUR) 398,855.38 484,335.77
– Class AT (EUR) 73,956,524.02 9,920,618.61
– Class CT (EUR) 916,215.36 2,777,590.29
– Class I (EUR) 741,784.20 3,785,443.29
– Class IT (EUR) – 27,438,893.91
Redemptions
– Class A (EUR) – 5,967,482.83 – 21,871,723.50
– Class AT (EUR) – 12,529,226.53 – 33,448,659.65
– Class CT (EUR) – 2,562,309.45 – 6,064,178.90
– Class I (EUR) – 5,220,410.64 – 19,060,117.62
– Class IT (EUR) – – 5,463,244.14
Distribution – 2,251,571.90 – 3,202,014.60
Equalization 446,496.98 42,738,946.91
Result of operations 15,752,396.91 – 50,097,231.67
Net assets of the Subfund
at the end of the reporting period 260,247,959.37 228,373,517.26
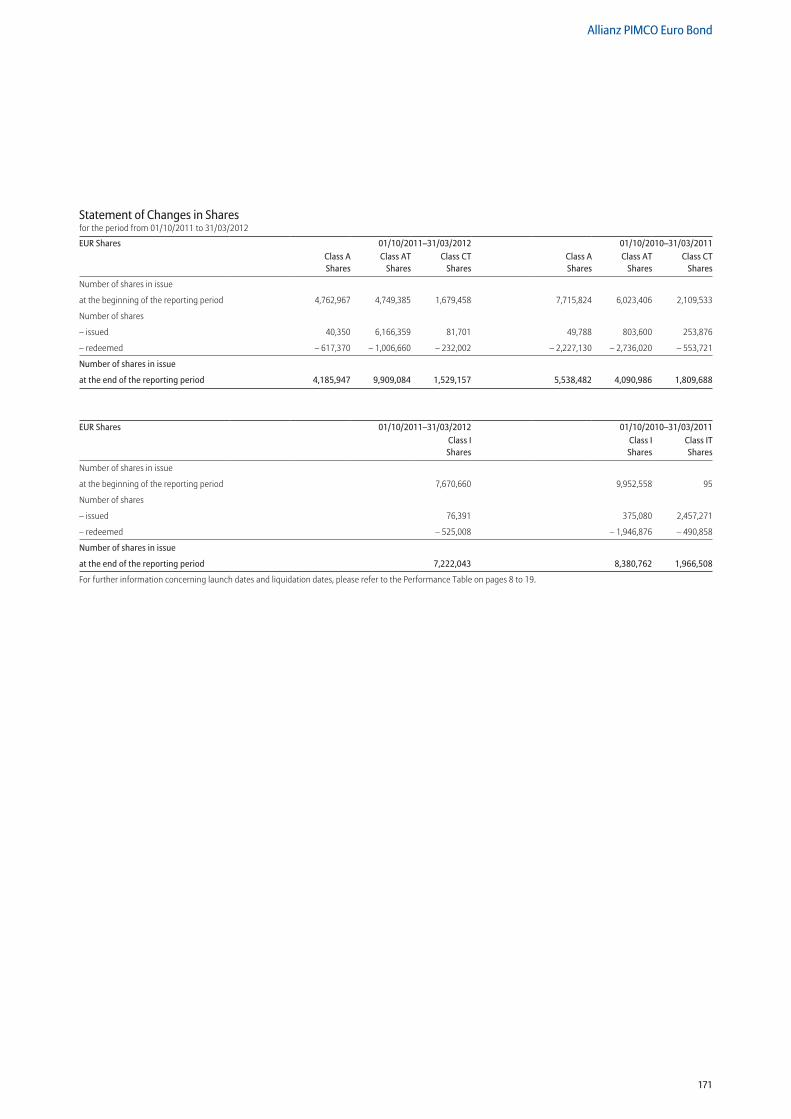
171
Allianz PIMCO Euro Bond
Statement of Changes in Sharesfor the period from 01/10/2011 to 31/03/2012
EUR Shares 01/10/2011–31/03/2012 01/10/2010–31/03/2011Class A Shares
Class AT Shares
Class CT Shares
Class A Shares
Class AT Shares
Class CT Shares
Number of shares in issue
at the beginning of the reporting period 4,762,967 4,749,385 1,679,458 7,715,824 6,023,406 2,109,533
Number of shares
– issued 40,350 6,166,359 81,701 49,788 803,600 253,876
– redeemed – 617,370 – 1,006,660 – 232,002 – 2,227,130 – 2,736,020 – 553,721
Number of shares in issue
at the end of the reporting period 4,185,947 9,909,084 1,529,157 5,538,482 4,090,986 1,809,688
EUR Shares 01/10/2011–31/03/2012 01/10/2010–31/03/2011Class I Shares
Class I Shares
Class IT Shares
Number of shares in issue
at the beginning of the reporting period 7,670,660 9,952,558 95
Number of shares
– issued 76,391 375,080 2,457,271
– redeemed – 525,008 – 1,946,876 – 490,858
Number of shares in issue
at the end of the reporting period 7,222,043 8,380,762 1,966,508
For further information concerning launch dates and liquidation dates, please refer to the Performance Table on pages 8 to 19.
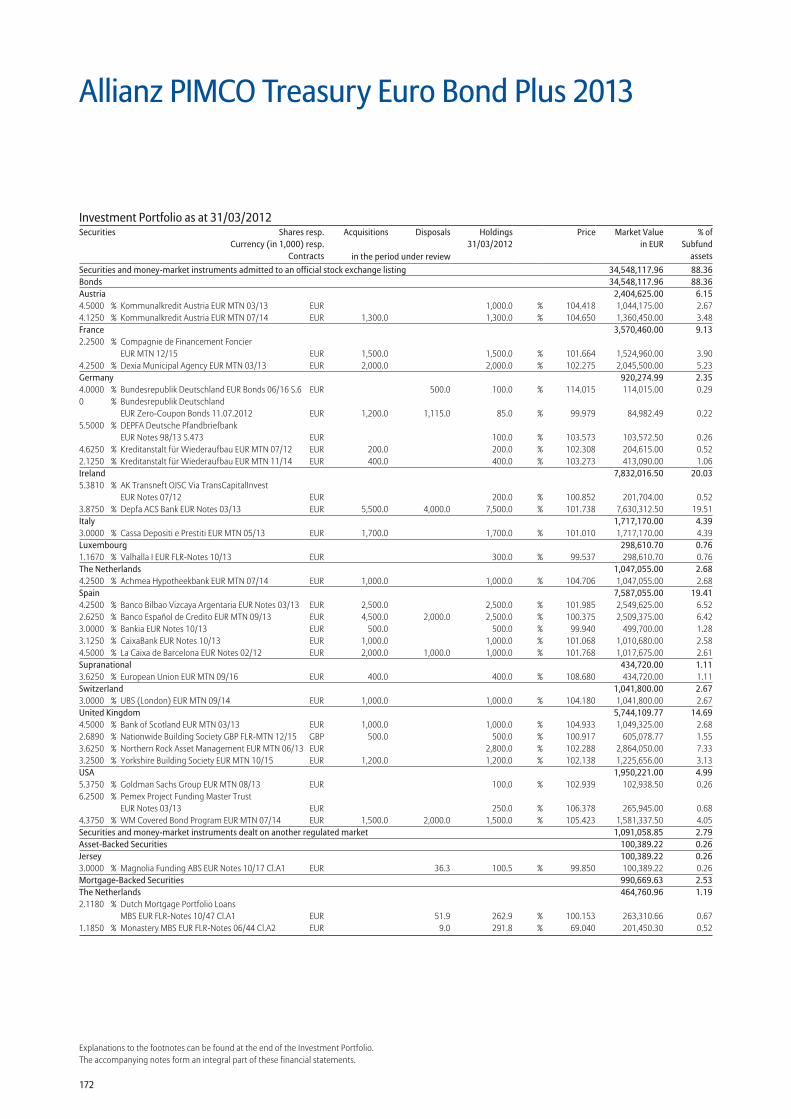
172
Explanations to the footnotes can be found at the end of the Investment Portfolio.The accompanying notes form an integral part of these financial statements.
Allianz PIMCO Treasury Euro Bond Plus 2013
Securities and money-market instruments admitted to an official stock exchange listing 34,548,117.96 88.36Bonds 34,548,117.96 88.36Austria 2,404,625.00 6.154.5000 % Kommunalkredit Austria EUR MTN 03/13 EUR 1,000.0 % 104.418 1,044,175.00 2.674.1250 % Kommunalkredit Austria EUR MTN 07/14 EUR 1,300.0 1,300.0 % 104.650 1,360,450.00 3.48France 3,570,460.00 9.132.2500 % Compagnie de Financement Foncier
EUR MTN 12/15 EUR 1,500.0 1,500.0 % 101.664 1,524,960.00 3.904.2500 % Dexia Municipal Agency EUR MTN 03/13 EUR 2,000.0 2,000.0 % 102.275 2,045,500.00 5.23Germany 920,274.99 2.354.0000 % Bundesrepublik Deutschland EUR Bonds 06/16 S.6 EUR 500.0 100.0 % 114.015 114,015.00 0.290 % Bundesrepublik Deutschland
EUR Zero-Coupon Bonds 11.07.2012 EUR 1,200.0 1,115.0 85.0 % 99.979 84,982.49 0.225.5000 % DEPFA Deutsche Pfandbriefbank
EUR Notes 98/13 S.473 EUR 100.0 % 103.573 103,572.50 0.264.6250 % Kreditanstalt für Wiederaufbau EUR MTN 07/12 EUR 200.0 200.0 % 102.308 204,615.00 0.522.1250 % Kreditanstalt für Wiederaufbau EUR MTN 11/14 EUR 400.0 400.0 % 103.273 413,090.00 1.06Ireland 7,832,016.50 20.035.3810 % AK Transneft OJSC Via TransCapitalInvest
EUR Notes 07/12 EUR 200.0 % 100.852 201,704.00 0.523.8750 % Depfa ACS Bank EUR Notes 03/13 EUR 5,500.0 4,000.0 7,500.0 % 101.738 7,630,312.50 19.51Italy 1,717,170.00 4.393.0000 % Cassa Depositi e Prestiti EUR MTN 05/13 EUR 1,700.0 1,700.0 % 101.010 1,717,170.00 4.39Luxembourg 298,610.70 0.761.1670 % Valhalla I EUR FLR-Notes 10/13 EUR 300.0 % 99.537 298,610.70 0.76The Netherlands 1,047,055.00 2.684.2500 % Achmea Hypotheekbank EUR MTN 07/14 EUR 1,000.0 1,000.0 % 104.706 1,047,055.00 2.68Spain 7,587,055.00 19.414.2500 % Banco Bilbao Vizcaya Argentaria EUR Notes 03/13 EUR 2,500.0 2,500.0 % 101.985 2,549,625.00 6.522.6250 % Banco Español de Credito EUR MTN 09/13 EUR 4,500.0 2,000.0 2,500.0 % 100.375 2,509,375.00 6.423.0000 % Bankia EUR Notes 10/13 EUR 500.0 500.0 % 99.940 499,700.00 1.283.1250 % CaixaBank EUR Notes 10/13 EUR 1,000.0 1,000.0 % 101.068 1,010,680.00 2.584.5000 % La Caixa de Barcelona EUR Notes 02/12 EUR 2,000.0 1,000.0 1,000.0 % 101.768 1,017,675.00 2.61Supranational 434,720.00 1.113.6250 % European Union EUR MTN 09/16 EUR 400.0 400.0 % 108.680 434,720.00 1.11Switzerland 1,041,800.00 2.673.0000 % UBS (London) EUR MTN 09/14 EUR 1,000.0 1,000.0 % 104.180 1,041,800.00 2.67United Kingdom 5,744,109.77 14.694.5000 % Bank of Scotland EUR MTN 03/13 EUR 1,000.0 1,000.0 % 104.933 1,049,325.00 2.682.6890 % Nationwide Building Society GBP FLR-MTN 12/15 GBP 500.0 500.0 % 100.917 605,078.77 1.553.6250 % Northern Rock Asset Management EUR MTN 06/13 EUR 2,800.0 % 102.288 2,864,050.00 7.333.2500 % Yorkshire Building Society EUR MTN 10/15 EUR 1,200.0 1,200.0 % 102.138 1,225,656.00 3.13USA 1,950,221.00 4.995.3750 % Goldman Sachs Group EUR MTN 08/13 EUR 100.0 % 102.939 102,938.50 0.266.2500 % Pemex Project Funding Master Trust
EUR Notes 03/13 EUR 250.0 % 106.378 265,945.00 0.684.3750 % WM Covered Bond Program EUR MTN 07/14 EUR 1,500.0 2,000.0 1,500.0 % 105.423 1,581,337.50 4.05Securities and money-market instruments dealt on another regulated market 1,091,058.85 2.79Asset-Backed Securities 100,389.22 0.26Jersey 100,389.22 0.263.0000 % Magnolia Funding ABS EUR Notes 10/17 Cl.A1 EUR 36.3 100.5 % 99.850 100,389.22 0.26Mortgage-Backed Securities 990,669.63 2.53The Netherlands 464,760.96 1.192.1180 % Dutch Mortgage Portfolio Loans
MBS EUR FLR-Notes 10/47 Cl.A1 EUR 51.9 262.9 % 100.153 263,310.66 0.671.1850 % Monastery MBS EUR FLR-Notes 06/44 Cl.A2 EUR 9.0 291.8 % 69.040 201,450.30 0.52
Investment Portfolio as at 31/03/2012Securities Shares resp.
Currency (in 1,000) resp.Contracts
Acquisitions Disposals Holdings 31/03/2012
Price Market Valuein EUR
% ofSubfund
assetsin the period under review
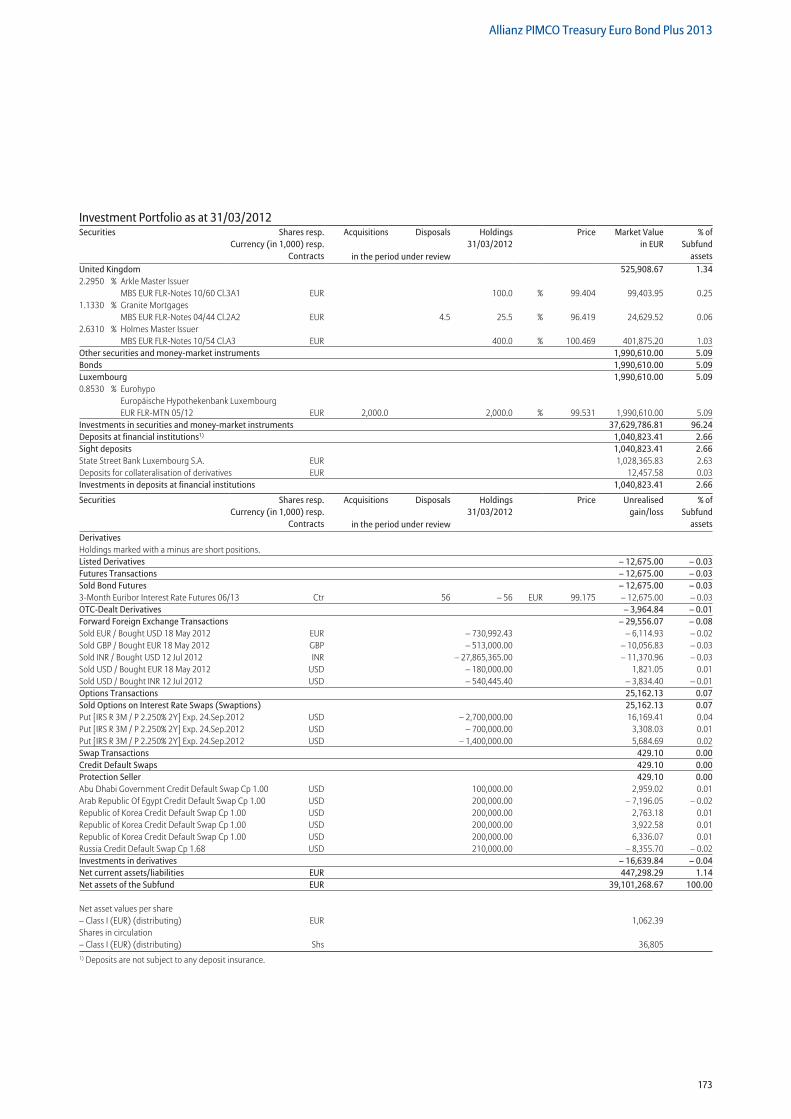
173
Allianz PIMCO Treasury Euro Bond Plus 2013
United Kingdom 525,908.67 1.342.2950 % Arkle Master Issuer
MBS EUR FLR-Notes 10/60 Cl.3A1 EUR 100.0 % 99.404 99,403.95 0.251.1330 % Granite Mortgages
MBS EUR FLR-Notes 04/44 Cl.2A2 EUR 4.5 25.5 % 96.419 24,629.52 0.062.6310 % Holmes Master Issuer
MBS EUR FLR-Notes 10/54 Cl.A3 EUR 400.0 % 100.469 401,875.20 1.03Other securities and money-market instruments 1,990,610.00 5.09Bonds 1,990,610.00 5.09Luxembourg 1,990,610.00 5.090.8530 % Eurohypo
Europäische Hypothekenbank Luxembourg EUR FLR-MTN 05/12 EUR 2,000.0 2,000.0 % 99.531 1,990,610.00 5.09
Investments in securities and money-market instruments 37,629,786.81 96.24Deposits at financial institutions1) 1,040,823.41 2.66Sight deposits 1,040,823.41 2.66State Street Bank Luxembourg S.A. EUR 1,028,365.83 2.63Deposits for collateralisation of derivatives EUR 12,457.58 0.03Investments in deposits at financial institutions 1,040,823.41 2.66
Securities Shares resp.Currency (in 1,000) resp.
Contracts
Acquisitions Disposals Holdings 31/03/2012
Price Unrealisedgain/loss
% ofSubfund
assetsin the period under reviewDerivativesHoldings marked with a minus are short positions. Listed Derivatives – 12,675.00 – 0.03Futures Transactions – 12,675.00 – 0.03Sold Bond Futures – 12,675.00 – 0.033-Month Euribor Interest Rate Futures 06/13 Ctr 56 – 56 EUR 99.175 – 12,675.00 – 0.03OTC-Dealt Derivatives – 3,964.84 – 0.01Forward Foreign Exchange Transactions – 29,556.07 – 0.08Sold EUR / Bought USD 18 May 2012 EUR – 730,992.43 – 6,114.93 – 0.02Sold GBP / Bought EUR 18 May 2012 GBP – 513,000.00 – 10,056.83 – 0.03Sold INR / Bought USD 12 Jul 2012 INR – 27,865,365.00 – 11,370.96 – 0.03Sold USD / Bought EUR 18 May 2012 USD – 180,000.00 1,821.05 0.01Sold USD / Bought INR 12 Jul 2012 USD – 540,445.40 – 3,834.40 – 0.01Options Transactions 25,162.13 0.07Sold Options on Interest Rate Swaps (Swaptions) 25,162.13 0.07Put [IRS R 3M / P 2.250% 2Y] Exp. 24.Sep.2012 USD – 2,700,000.00 16,169.41 0.04Put [IRS R 3M / P 2.250% 2Y] Exp. 24.Sep.2012 USD – 700,000.00 3,308.03 0.01Put [IRS R 3M / P 2.250% 2Y] Exp. 24.Sep.2012 USD – 1,400,000.00 5,684.69 0.02Swap Transactions 429.10 0.00Credit Default Swaps 429.10 0.00Protection Seller 429.10 0.00Abu Dhabi Government Credit Default Swap Cp 1.00 USD 100,000.00 2,959.02 0.01Arab Republic Of Egypt Credit Default Swap Cp 1.00 USD 200,000.00 – 7,196.05 – 0.02Republic of Korea Credit Default Swap Cp 1.00 USD 200,000.00 2,763.18 0.01Republic of Korea Credit Default Swap Cp 1.00 USD 200,000.00 3,922.58 0.01Republic of Korea Credit Default Swap Cp 1.00 USD 200,000.00 6,336.07 0.01Russia Credit Default Swap Cp 1.68 USD 210,000.00 – 8,355.70 – 0.02Investments in derivatives – 16,639.84 – 0.04Net current assets/liabilities EUR 447,298.29 1.14Net assets of the Subfund EUR 39,101,268.67 100.00
Net asset values per share – Class I (EUR) (distributing) EUR 1,062.39 Shares in circulation – Class I (EUR) (distributing) Shs 36,8051) Deposits are not subject to any deposit insurance.
Investment Portfolio as at 31/03/2012Securities Shares resp.
Currency (in 1,000) resp.Contracts
Acquisitions Disposals Holdings 31/03/2012
Price Market Valuein EUR
% ofSubfund
assetsin the period under review
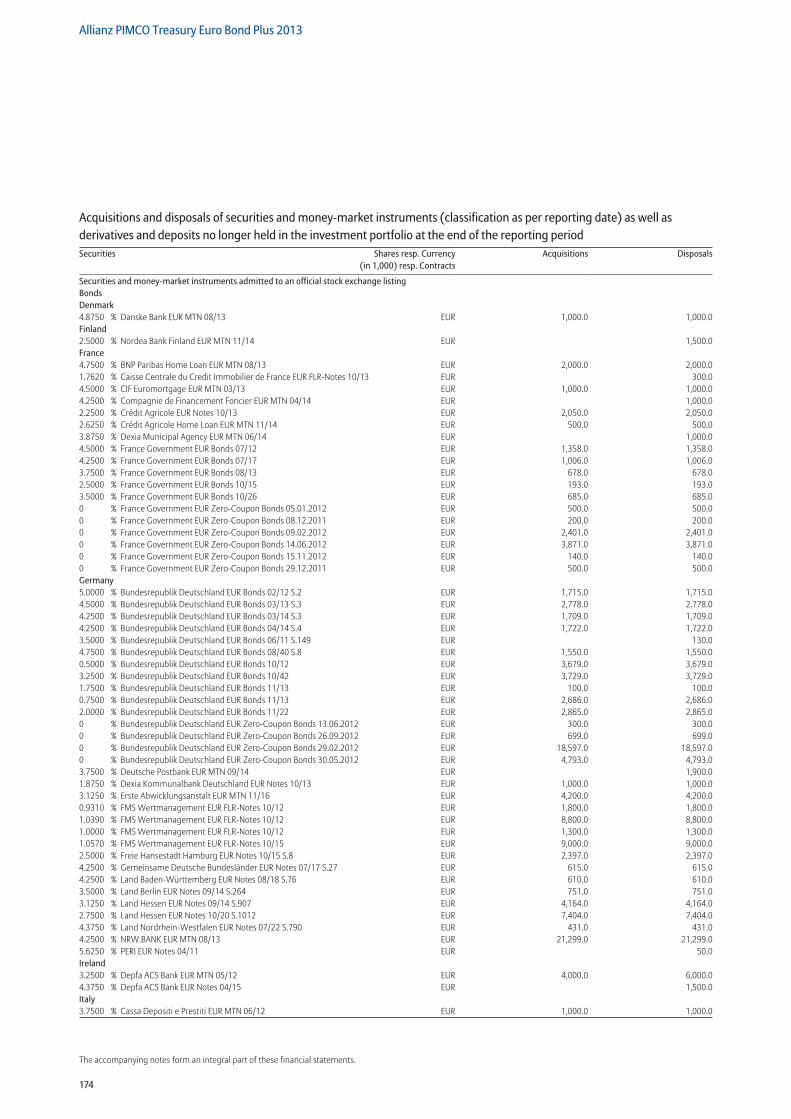
174
Allianz PIMCO Treasury Euro Bond Plus 2013
The accompanying notes form an integral part of these financial statements.
Securities and money-market instruments admitted to an official stock exchange listing Bonds Denmark 4.8750 % Danske Bank EUR MTN 08/13 EUR 1,000.0 1,000.0Finland 2.5000 % Nordea Bank Finland EUR MTN 11/14 EUR 1,500.0France 4.7500 % BNP Paribas Home Loan EUR MTN 08/13 EUR 2,000.0 2,000.01.7620 % Caisse Centrale du Credit Immobilier de France EUR FLR-Notes 10/13 EUR 300.04.5000 % CIF Euromortgage EUR MTN 03/13 EUR 1,000.0 1,000.04.2500 % Compagnie de Financement Foncier EUR MTN 04/14 EUR 1,000.02.2500 % Crédit Agricole EUR Notes 10/13 EUR 2,050.0 2,050.02.6250 % Crédit Agricole Home Loan EUR MTN 11/14 EUR 500.0 500.03.8750 % Dexia Municipal Agency EUR MTN 06/14 EUR 1,000.04.5000 % France Government EUR Bonds 07/12 EUR 1,358.0 1,358.04.2500 % France Government EUR Bonds 07/17 EUR 1,006.0 1,006.03.7500 % France Government EUR Bonds 08/13 EUR 678.0 678.02.5000 % France Government EUR Bonds 10/15 EUR 193.0 193.03.5000 % France Government EUR Bonds 10/26 EUR 685.0 685.00 % France Government EUR Zero-Coupon Bonds 05.01.2012 EUR 500.0 500.00 % France Government EUR Zero-Coupon Bonds 08.12.2011 EUR 200.0 200.00 % France Government EUR Zero-Coupon Bonds 09.02.2012 EUR 2,401.0 2,401.00 % France Government EUR Zero-Coupon Bonds 14.06.2012 EUR 3,871.0 3,871.00 % France Government EUR Zero-Coupon Bonds 15.11.2012 EUR 140.0 140.00 % France Government EUR Zero-Coupon Bonds 29.12.2011 EUR 500.0 500.0Germany 5.0000 % Bundesrepublik Deutschland EUR Bonds 02/12 S.2 EUR 1,715.0 1,715.04.5000 % Bundesrepublik Deutschland EUR Bonds 03/13 S.3 EUR 2,778.0 2,778.04.2500 % Bundesrepublik Deutschland EUR Bonds 03/14 S.3 EUR 1,709.0 1,709.04.2500 % Bundesrepublik Deutschland EUR Bonds 04/14 S.4 EUR 1,722.0 1,722.03.5000 % Bundesrepublik Deutschland EUR Bonds 06/11 S.149 EUR 130.04.7500 % Bundesrepublik Deutschland EUR Bonds 08/40 S.8 EUR 1,550.0 1,550.00.5000 % Bundesrepublik Deutschland EUR Bonds 10/12 EUR 3,679.0 3,679.03.2500 % Bundesrepublik Deutschland EUR Bonds 10/42 EUR 3,729.0 3,729.01.7500 % Bundesrepublik Deutschland EUR Bonds 11/13 EUR 100.0 100.00.7500 % Bundesrepublik Deutschland EUR Bonds 11/13 EUR 2,686.0 2,686.02.0000 % Bundesrepublik Deutschland EUR Bonds 11/22 EUR 2,865.0 2,865.00 % Bundesrepublik Deutschland EUR Zero-Coupon Bonds 13.06.2012 EUR 300.0 300.00 % Bundesrepublik Deutschland EUR Zero-Coupon Bonds 26.09.2012 EUR 699.0 699.00 % Bundesrepublik Deutschland EUR Zero-Coupon Bonds 29.02.2012 EUR 18,597.0 18,597.00 % Bundesrepublik Deutschland EUR Zero-Coupon Bonds 30.05.2012 EUR 4,793.0 4,793.03.7500 % Deutsche Postbank EUR MTN 09/14 EUR 1,900.01.8750 % Dexia Kommunalbank Deutschland EUR Notes 10/13 EUR 1,000.0 1,000.03.1250 % Erste Abwicklungsanstalt EUR MTN 11/16 EUR 4,200.0 4,200.00.9310 % FMS Wertmanagement EUR FLR-Notes 10/12 EUR 1,800.0 1,800.01.0390 % FMS Wertmanagement EUR FLR-Notes 10/12 EUR 8,800.0 8,800.01.0000 % FMS Wertmanagement EUR FLR-Notes 10/12 EUR 1,300.0 1,300.01.0570 % FMS Wertmanagement EUR FLR-Notes 10/15 EUR 9,000.0 9,000.02.5000 % Freie Hansestadt Hamburg EUR Notes 10/15 S.8 EUR 2,397.0 2,397.04.2500 % Gemeinsame Deutsche Bundesländer EUR Notes 07/17 S.27 EUR 615.0 615.04.2500 % Land Baden-Württemberg EUR Notes 08/18 S.76 EUR 610.0 610.03.5000 % Land Berlin EUR Notes 09/14 S.264 EUR 751.0 751.03.1250 % Land Hessen EUR Notes 09/14 S.907 EUR 4,164.0 4,164.02.7500 % Land Hessen EUR Notes 10/20 S.1012 EUR 7,404.0 7,404.04.3750 % Land Nordrhein-Westfalen EUR Notes 07/22 S.790 EUR 431.0 431.04.2500 % NRW.BANK EUR MTN 08/13 EUR 21,299.0 21,299.05.6250 % PERI EUR Notes 04/11 EUR 50.0Ireland 3.2500 % Depfa ACS Bank EUR MTN 05/12 EUR 4,000.0 6,000.04.3750 % Depfa ACS Bank EUR Notes 04/15 EUR 1,500.0Italy 3.7500 % Cassa Depositi e Prestiti EUR MTN 06/12 EUR 1,000.0 1,000.0
Acquisitions and disposals of securities and money-market instruments (classification as per reporting date) as well as derivatives and deposits no longer held in the investment portfolio at the end of the reporting periodSecurities Shares resp. Currency
(in 1,000) resp. ContractsAcquisitions Disposals
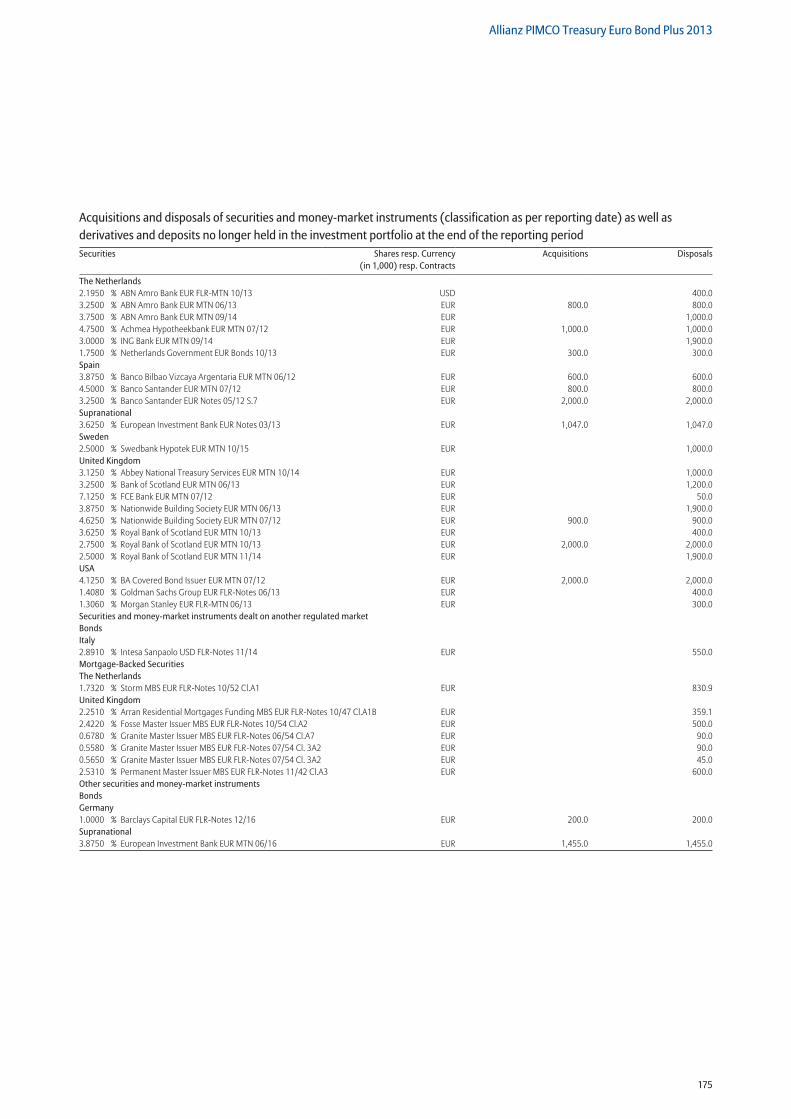
175
Allianz PIMCO Treasury Euro Bond Plus 2013
The Netherlands 2.1950 % ABN Amro Bank EUR FLR-MTN 10/13 USD 400.03.2500 % ABN Amro Bank EUR MTN 06/13 EUR 800.0 800.03.7500 % ABN Amro Bank EUR MTN 09/14 EUR 1,000.04.7500 % Achmea Hypotheekbank EUR MTN 07/12 EUR 1,000.0 1,000.03.0000 % ING Bank EUR MTN 09/14 EUR 1,900.01.7500 % Netherlands Government EUR Bonds 10/13 EUR 300.0 300.0Spain 3.8750 % Banco Bilbao Vizcaya Argentaria EUR MTN 06/12 EUR 600.0 600.04.5000 % Banco Santander EUR MTN 07/12 EUR 800.0 800.03.2500 % Banco Santander EUR Notes 05/12 S.7 EUR 2,000.0 2,000.0Supranational 3.6250 % European Investment Bank EUR Notes 03/13 EUR 1,047.0 1,047.0Sweden 2.5000 % Swedbank Hypotek EUR MTN 10/15 EUR 1,000.0United Kingdom 3.1250 % Abbey National Treasury Services EUR MTN 10/14 EUR 1,000.03.2500 % Bank of Scotland EUR MTN 06/13 EUR 1,200.07.1250 % FCE Bank EUR MTN 07/12 EUR 50.03.8750 % Nationwide Building Society EUR MTN 06/13 EUR 1,900.04.6250 % Nationwide Building Society EUR MTN 07/12 EUR 900.0 900.03.6250 % Royal Bank of Scotland EUR MTN 10/13 EUR 400.02.7500 % Royal Bank of Scotland EUR MTN 10/13 EUR 2,000.0 2,000.02.5000 % Royal Bank of Scotland EUR MTN 11/14 EUR 1,900.0USA 4.1250 % BA Covered Bond Issuer EUR MTN 07/12 EUR 2,000.0 2,000.01.4080 % Goldman Sachs Group EUR FLR-Notes 06/13 EUR 400.01.3060 % Morgan Stanley EUR FLR-MTN 06/13 EUR 300.0Securities and money-market instruments dealt on another regulated market Bonds Italy 2.8910 % Intesa Sanpaolo USD FLR-Notes 11/14 EUR 550.0Mortgage-Backed Securities The Netherlands 1.7320 % Storm MBS EUR FLR-Notes 10/52 Cl.A1 EUR 830.9United Kingdom 2.2510 % Arran Residential Mortgages Funding MBS EUR FLR-Notes 10/47 Cl.A1B EUR 359.12.4220 % Fosse Master Issuer MBS EUR FLR-Notes 10/54 Cl.A2 EUR 500.00.6780 % Granite Master Issuer MBS EUR FLR-Notes 06/54 Cl.A7 EUR 90.00.5580 % Granite Master Issuer MBS EUR FLR-Notes 07/54 Cl. 3A2 EUR 90.00.5650 % Granite Master Issuer MBS EUR FLR-Notes 07/54 Cl. 3A2 EUR 45.02.5310 % Permanent Master Issuer MBS EUR FLR-Notes 11/42 Cl.A3 EUR 600.0Other securities and money-market instruments Bonds Germany 1.0000 % Barclays Capital EUR FLR-Notes 12/16 EUR 200.0 200.0Supranational 3.8750 % European Investment Bank EUR MTN 06/16 EUR 1,455.0 1,455.0
Acquisitions and disposals of securities and money-market instruments (classification as per reporting date) as well as derivatives and deposits no longer held in the investment portfolio at the end of the reporting periodSecurities Shares resp. Currency
(in 1,000) resp. ContractsAcquisitions Disposals
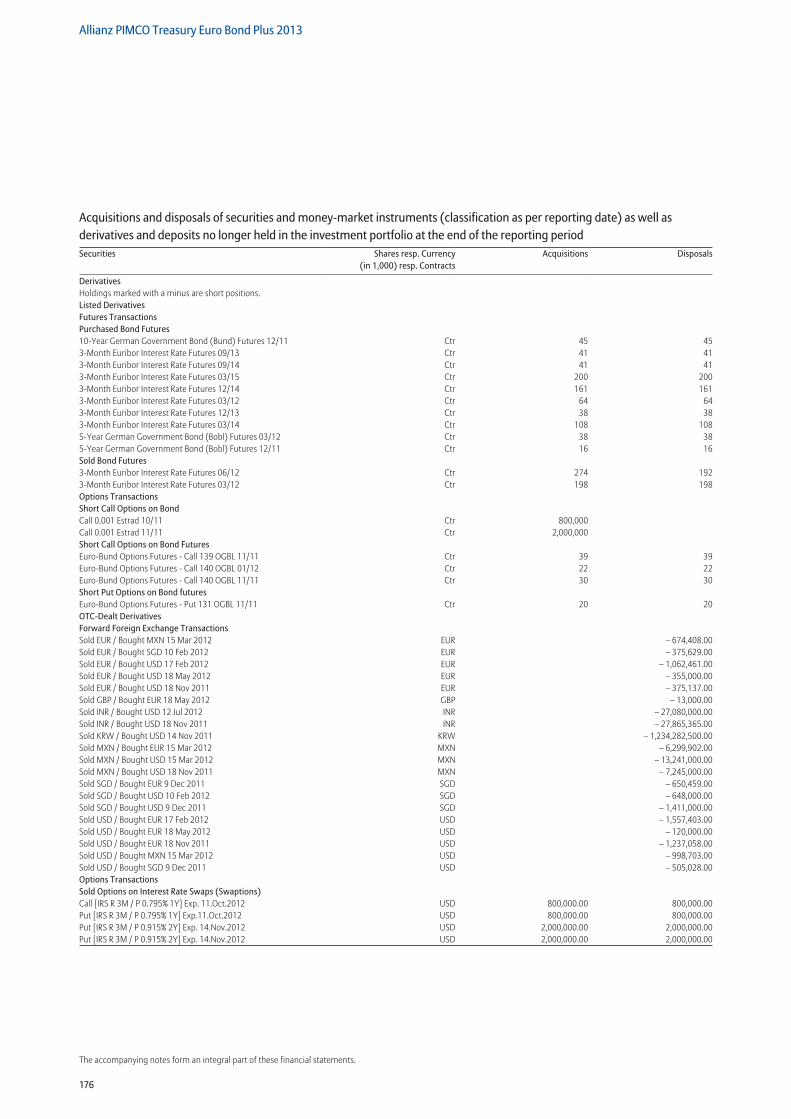
176
Allianz PIMCO Treasury Euro Bond Plus 2013
The accompanying notes form an integral part of these financial statements.
Derivatives Holdings marked with a minus are short positions. Listed Derivatives Futures Transactions Purchased Bond Futures 10-Year German Government Bond (Bund) Futures 12/11 Ctr 45 453-Month Euribor Interest Rate Futures 09/13 Ctr 41 413-Month Euribor Interest Rate Futures 09/14 Ctr 41 413-Month Euribor Interest Rate Futures 03/15 Ctr 200 2003-Month Euribor Interest Rate Futures 12/14 Ctr 161 1613-Month Euribor Interest Rate Futures 03/12 Ctr 64 643-Month Euribor Interest Rate Futures 12/13 Ctr 38 383-Month Euribor Interest Rate Futures 03/14 Ctr 108 1085-Year German Government Bond (Bobl) Futures 03/12 Ctr 38 385-Year German Government Bond (Bobl) Futures 12/11 Ctr 16 16Sold Bond Futures 3-Month Euribor Interest Rate Futures 06/12 Ctr 274 1923-Month Euribor Interest Rate Futures 03/12 Ctr 198 198Options Transactions Short Call Options on Bond Call 0.001 Estrad 10/11 Ctr 800,000 Call 0.001 Estrad 11/11 Ctr 2,000,000 Short Call Options on Bond Futures Euro-Bund Options Futures - Call 139 OGBL 11/11 Ctr 39 39Euro-Bund Options Futures - Call 140 OGBL 01/12 Ctr 22 22Euro-Bund Options Futures - Call 140 OGBL 11/11 Ctr 30 30Short Put Options on Bond futures Euro-Bund Options Futures - Put 131 OGBL 11/11 Ctr 20 20OTC-Dealt Derivatives Forward Foreign Exchange Transactions Sold EUR / Bought MXN 15 Mar 2012 EUR – 674,408.00Sold EUR / Bought SGD 10 Feb 2012 EUR – 375,629.00Sold EUR / Bought USD 17 Feb 2012 EUR – 1,062,461.00Sold EUR / Bought USD 18 May 2012 EUR – 355,000.00Sold EUR / Bought USD 18 Nov 2011 EUR – 375,137.00Sold GBP / Bought EUR 18 May 2012 GBP – 13,000.00Sold INR / Bought USD 12 Jul 2012 INR – 27,080,000.00Sold INR / Bought USD 18 Nov 2011 INR – 27,865,365.00Sold KRW / Bought USD 14 Nov 2011 KRW – 1,234,282,500.00Sold MXN / Bought EUR 15 Mar 2012 MXN – 6,299,902.00Sold MXN / Bought USD 15 Mar 2012 MXN – 13,241,000.00Sold MXN / Bought USD 18 Nov 2011 MXN – 7,245,000.00Sold SGD / Bought EUR 9 Dec 2011 SGD – 650,459.00Sold SGD / Bought USD 10 Feb 2012 SGD – 648,000.00Sold SGD / Bought USD 9 Dec 2011 SGD – 1,411,000.00Sold USD / Bought EUR 17 Feb 2012 USD – 1,557,403.00Sold USD / Bought EUR 18 May 2012 USD – 120,000.00Sold USD / Bought EUR 18 Nov 2011 USD – 1,237,058.00Sold USD / Bought MXN 15 Mar 2012 USD – 998,703.00Sold USD / Bought SGD 9 Dec 2011 USD – 505,028.00Options Transactions Sold Options on Interest Rate Swaps (Swaptions) Call [IRS R 3M / P 0.795% 1Y] Exp. 11.Oct.2012 USD 800,000.00 800,000.00Put [IRS R 3M / P 0.795% 1Y] Exp.11.Oct.2012 USD 800,000.00 800,000.00Put [IRS R 3M / P 0.915% 2Y] Exp. 14.Nov.2012 USD 2,000,000.00 2,000,000.00Put [IRS R 3M / P 0.915% 2Y] Exp. 14.Nov.2012 USD 2,000,000.00 2,000,000.00
Acquisitions and disposals of securities and money-market instruments (classification as per reporting date) as well as derivatives and deposits no longer held in the investment portfolio at the end of the reporting periodSecurities Shares resp. Currency
(in 1,000) resp. ContractsAcquisitions Disposals
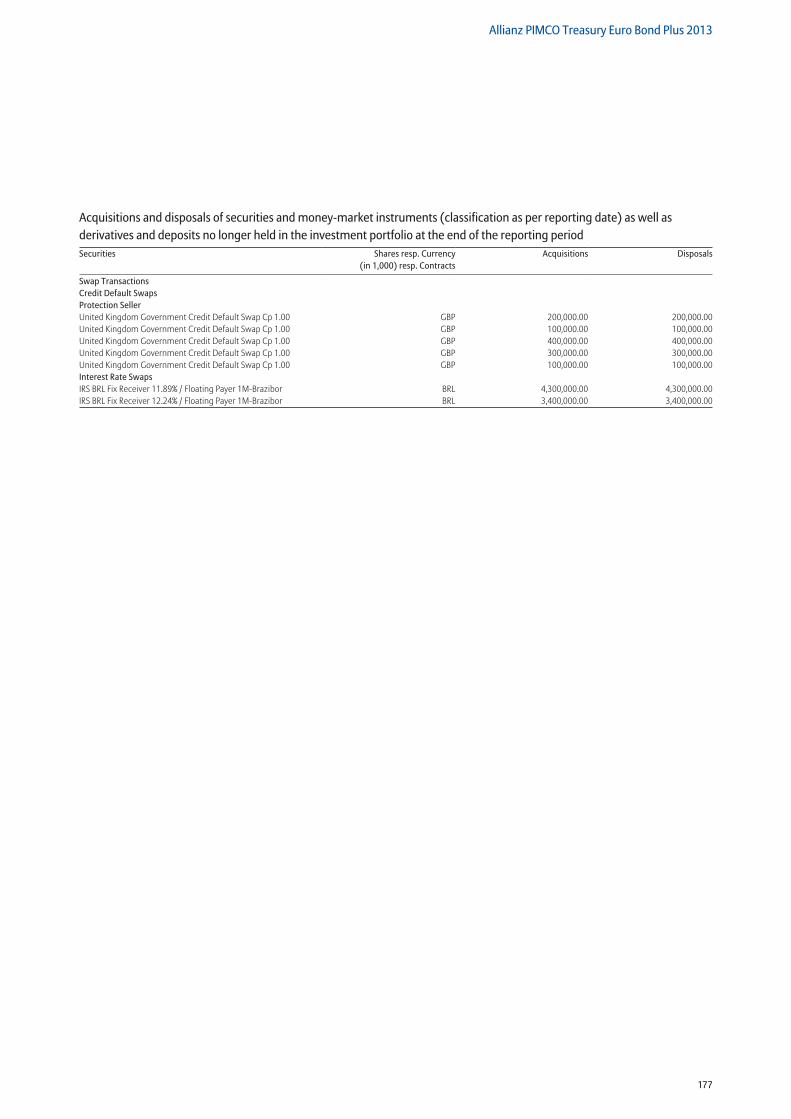
177
Allianz PIMCO Treasury Euro Bond Plus 2013
Swap Transactions Credit Default Swaps Protection Seller United Kingdom Government Credit Default Swap Cp 1.00 GBP 200,000.00 200,000.00United Kingdom Government Credit Default Swap Cp 1.00 GBP 100,000.00 100,000.00United Kingdom Government Credit Default Swap Cp 1.00 GBP 400,000.00 400,000.00United Kingdom Government Credit Default Swap Cp 1.00 GBP 300,000.00 300,000.00United Kingdom Government Credit Default Swap Cp 1.00 GBP 100,000.00 100,000.00Interest Rate Swaps IRS BRL Fix Receiver 11.89% / Floating Payer 1M-Brazibor BRL 4,300,000.00 4,300,000.00IRS BRL Fix Receiver 12.24% / Floating Payer 1M-Brazibor BRL 3,400,000.00 3,400,000.00
Acquisitions and disposals of securities and money-market instruments (classification as per reporting date) as well as derivatives and deposits no longer held in the investment portfolio at the end of the reporting periodSecurities Shares resp. Currency
(in 1,000) resp. ContractsAcquisitions Disposals
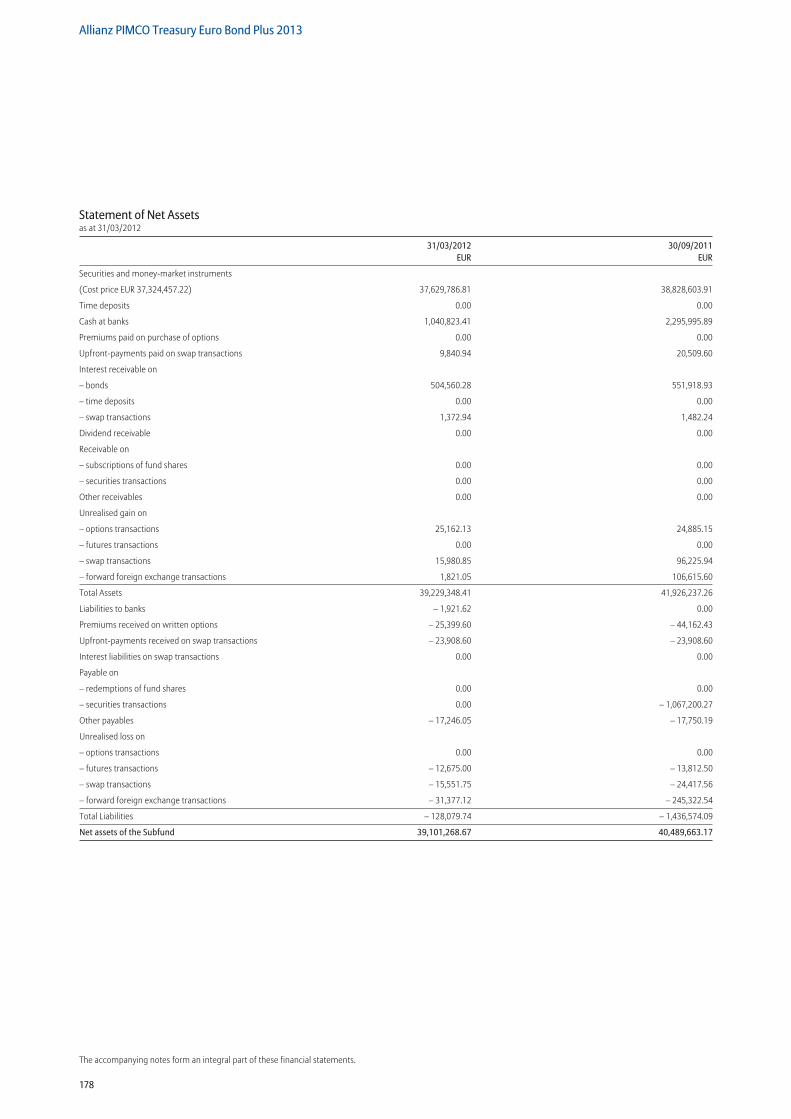
178
Allianz PIMCO Treasury Euro Bond Plus 2013
The accompanying notes form an integral part of these financial statements.
Statement of Net Assetsas at 31/03/2012
31/03/2012 30/09/2011 EUR EUR
Securities and money-market instruments
(Cost price EUR 37,324,457.22) 37,629,786.81 38,828,603.91
Time deposits 0.00 0.00
Cash at banks 1,040,823.41 2,295,995.89
Premiums paid on purchase of options 0.00 0.00
Upfront-payments paid on swap transactions 9,840.94 20,509.60
Interest receivable on
– bonds 504,560.28 551,918.93
– time deposits 0.00 0.00
– swap transactions 1,372.94 1,482.24
Dividend receivable 0.00 0.00
Receivable on
– subscriptions of fund shares 0.00 0.00
– securities transactions 0.00 0.00
Other receivables 0.00 0.00
Unrealised gain on
– options transactions 25,162.13 24,885.15
– futures transactions 0.00 0.00
– swap transactions 15,980.85 96,225.94
– forward foreign exchange transactions 1,821.05 106,615.60
Total Assets 39,229,348.41 41,926,237.26
Liabilities to banks – 1,921.62 0.00
Premiums received on written options – 25,399.60 – 44,162.43
Upfront-payments received on swap transactions – 23,908.60 – 23,908.60
Interest liabilities on swap transactions 0.00 0.00
Payable on
– redemptions of fund shares 0.00 0.00
– securities transactions 0.00 – 1,067,200.27
Other payables – 17,246.05 – 17,750.19
Unrealised loss on
– options transactions 0.00 0.00
– futures transactions – 12,675.00 – 13,812.50
– swap transactions – 15,551.75 – 24,417.56
– forward foreign exchange transactions – 31,377.12 – 245,322.54
Total Liabilities – 128,079.74 – 1,436,574.09
Net assets of the Subfund 39,101,268.67 40,489,663.17
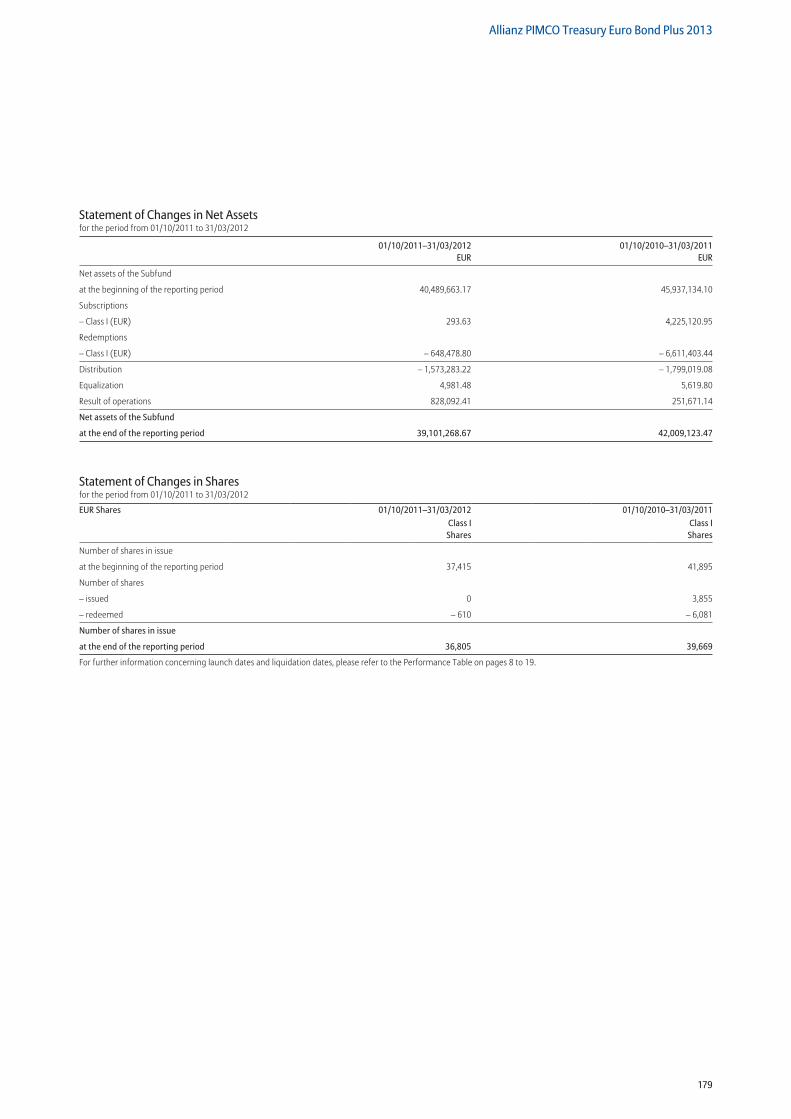
179
Allianz PIMCO Treasury Euro Bond Plus 2013
Statement of Changes in Net Assetsfor the period from 01/10/2011 to 31/03/2012
01/10/2011–31/03/2012 01/10/2010–31/03/2011 EUR EUR
Net assets of the Subfund
at the beginning of the reporting period 40,489,663.17 45,937,134.10
Subscriptions
– Class I (EUR) 293.63 4,225,120.95
Redemptions
– Class I (EUR) – 648,478.80 – 6,611,403.44
Distribution – 1,573,283.22 – 1,799,019.08
Equalization 4,981.48 5,619.80
Result of operations 828,092.41 251,671.14
Net assets of the Subfund
at the end of the reporting period 39,101,268.67 42,009,123.47
Statement of Changes in Sharesfor the period from 01/10/2011 to 31/03/2012
EUR Shares 01/10/2011–31/03/2012 01/10/2010–31/03/2011Class I Shares
Class I Shares
Number of shares in issue
at the beginning of the reporting period 37,415 41,895
Number of shares
– issued 0 3,855
– redeemed – 610 – 6,081
Number of shares in issue
at the end of the reporting period 36,805 39,669
For further information concerning launch dates and liquidation dates, please refer to the Performance Table on pages 8 to 19.
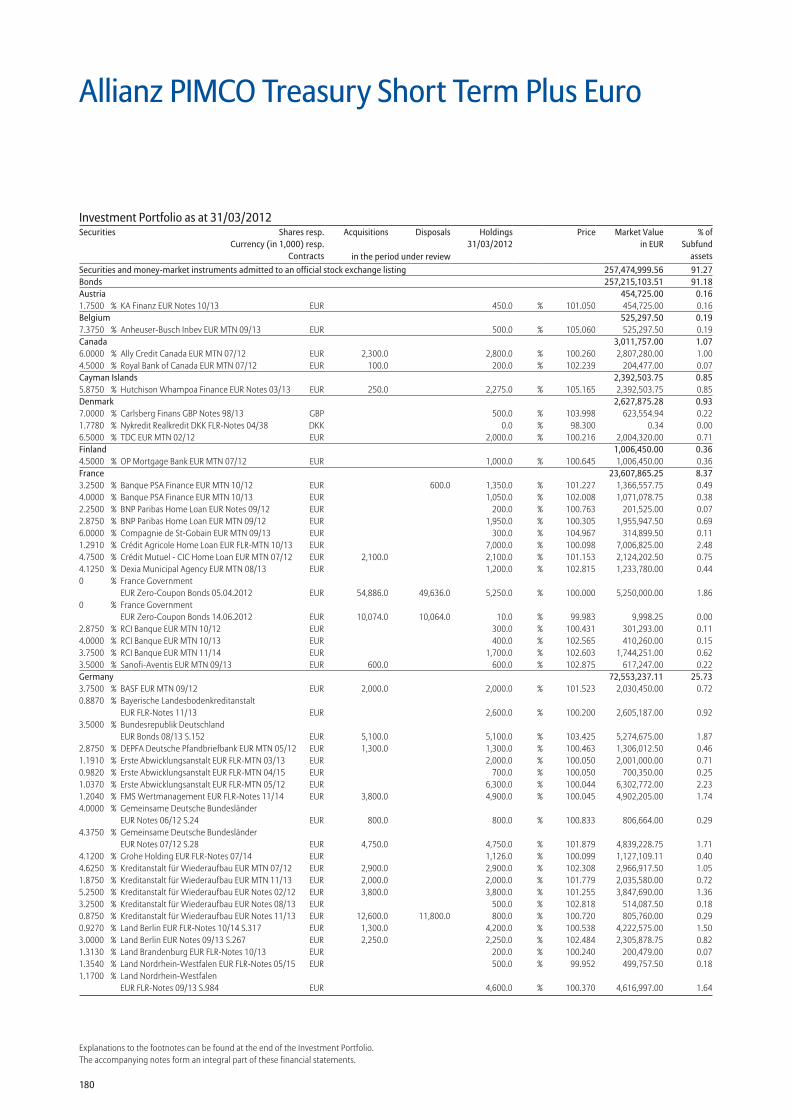
180
Explanations to the footnotes can be found at the end of the Investment Portfolio.The accompanying notes form an integral part of these financial statements.
Securities and money-market instruments admitted to an official stock exchange listing 257,474,999.56 91.27Bonds 257,215,103.51 91.18Austria 454,725.00 0.161.7500 % KA Finanz EUR Notes 10/13 EUR 450.0 % 101.050 454,725.00 0.16Belgium 525,297.50 0.197.3750 % Anheuser-Busch Inbev EUR MTN 09/13 EUR 500.0 % 105.060 525,297.50 0.19Canada 3,011,757.00 1.076.0000 % Ally Credit Canada EUR MTN 07/12 EUR 2,300.0 2,800.0 % 100.260 2,807,280.00 1.004.5000 % Royal Bank of Canada EUR MTN 07/12 EUR 100.0 200.0 % 102.239 204,477.00 0.07Cayman Islands 2,392,503.75 0.855.8750 % Hutchison Whampoa Finance EUR Notes 03/13 EUR 250.0 2,275.0 % 105.165 2,392,503.75 0.85Denmark 2,627,875.28 0.937.0000 % Carlsberg Finans GBP Notes 98/13 GBP 500.0 % 103.998 623,554.94 0.221.7780 % Nykredit Realkredit DKK FLR-Notes 04/38 DKK 0.0 % 98.300 0.34 0.006.5000 % TDC EUR MTN 02/12 EUR 2,000.0 % 100.216 2,004,320.00 0.71Finland 1,006,450.00 0.364.5000 % OP Mortgage Bank EUR MTN 07/12 EUR 1,000.0 % 100.645 1,006,450.00 0.36France 23,607,865.25 8.373.2500 % Banque PSA Finance EUR MTN 10/12 EUR 600.0 1,350.0 % 101.227 1,366,557.75 0.494.0000 % Banque PSA Finance EUR MTN 10/13 EUR 1,050.0 % 102.008 1,071,078.75 0.382.2500 % BNP Paribas Home Loan EUR Notes 09/12 EUR 200.0 % 100.763 201,525.00 0.072.8750 % BNP Paribas Home Loan EUR MTN 09/12 EUR 1,950.0 % 100.305 1,955,947.50 0.696.0000 % Compagnie de St-Gobain EUR MTN 09/13 EUR 300.0 % 104.967 314,899.50 0.111.2910 % Crédit Agricole Home Loan EUR FLR-MTN 10/13 EUR 7,000.0 % 100.098 7,006,825.00 2.484.7500 % Crédit Mutuel - CIC Home Loan EUR MTN 07/12 EUR 2,100.0 2,100.0 % 101.153 2,124,202.50 0.754.1250 % Dexia Municipal Agency EUR MTN 08/13 EUR 1,200.0 % 102.815 1,233,780.00 0.440 % France Government
EUR Zero-Coupon Bonds 05.04.2012 EUR 54,886.0 49,636.0 5,250.0 % 100.000 5,250,000.00 1.860 % France Government
EUR Zero-Coupon Bonds 14.06.2012 EUR 10,074.0 10,064.0 10.0 % 99.983 9,998.25 0.002.8750 % RCI Banque EUR MTN 10/12 EUR 300.0 % 100.431 301,293.00 0.114.0000 % RCI Banque EUR MTN 10/13 EUR 400.0 % 102.565 410,260.00 0.153.7500 % RCI Banque EUR MTN 11/14 EUR 1,700.0 % 102.603 1,744,251.00 0.623.5000 % Sanofi-Aventis EUR MTN 09/13 EUR 600.0 600.0 % 102.875 617,247.00 0.22Germany 72,553,237.11 25.733.7500 % BASF EUR MTN 09/12 EUR 2,000.0 2,000.0 % 101.523 2,030,450.00 0.720.8870 % Bayerische Landesbodenkreditanstalt
EUR FLR-Notes 11/13 EUR 2,600.0 % 100.200 2,605,187.00 0.923.5000 % Bundesrepublik Deutschland
EUR Bonds 08/13 S.152 EUR 5,100.0 5,100.0 % 103.425 5,274,675.00 1.872.8750 % DEPFA Deutsche Pfandbriefbank EUR MTN 05/12 EUR 1,300.0 1,300.0 % 100.463 1,306,012.50 0.461.1910 % Erste Abwicklungsanstalt EUR FLR-MTN 03/13 EUR 2,000.0 % 100.050 2,001,000.00 0.710.9820 % Erste Abwicklungsanstalt EUR FLR-MTN 04/15 EUR 700.0 % 100.050 700,350.00 0.251.0370 % Erste Abwicklungsanstalt EUR FLR-MTN 05/12 EUR 6,300.0 % 100.044 6,302,772.00 2.231.2040 % FMS Wertmanagement EUR FLR-Notes 11/14 EUR 3,800.0 4,900.0 % 100.045 4,902,205.00 1.744.0000 % Gemeinsame Deutsche Bundesländer
EUR Notes 06/12 S.24 EUR 800.0 800.0 % 100.833 806,664.00 0.294.3750 % Gemeinsame Deutsche Bundesländer
EUR Notes 07/12 S.28 EUR 4,750.0 4,750.0 % 101.879 4,839,228.75 1.714.1200 % Grohe Holding EUR FLR-Notes 07/14 EUR 1,126.0 % 100.099 1,127,109.11 0.404.6250 % Kreditanstalt für Wiederaufbau EUR MTN 07/12 EUR 2,900.0 2,900.0 % 102.308 2,966,917.50 1.051.8750 % Kreditanstalt für Wiederaufbau EUR MTN 11/13 EUR 2,000.0 2,000.0 % 101.779 2,035,580.00 0.725.2500 % Kreditanstalt für Wiederaufbau EUR Notes 02/12 EUR 3,800.0 3,800.0 % 101.255 3,847,690.00 1.363.2500 % Kreditanstalt für Wiederaufbau EUR Notes 08/13 EUR 500.0 % 102.818 514,087.50 0.180.8750 % Kreditanstalt für Wiederaufbau EUR Notes 11/13 EUR 12,600.0 11,800.0 800.0 % 100.720 805,760.00 0.290.9270 % Land Berlin EUR FLR-Notes 10/14 S.317 EUR 1,300.0 4,200.0 % 100.538 4,222,575.00 1.503.0000 % Land Berlin EUR Notes 09/13 S.267 EUR 2,250.0 2,250.0 % 102.484 2,305,878.75 0.821.3130 % Land Brandenburg EUR FLR-Notes 10/13 EUR 200.0 % 100.240 200,479.00 0.071.3540 % Land Nordrhein-Westfalen EUR FLR-Notes 05/15 EUR 500.0 % 99.952 499,757.50 0.181.1700 % Land Nordrhein-Westfalen
EUR FLR-Notes 09/13 S.984 EUR 4,600.0 % 100.370 4,616,997.00 1.64
Allianz PIMCO Treasury Short Term Plus Euro
Investment Portfolio as at 31/03/2012Securities Shares resp.
Currency (in 1,000) resp.Contracts
Acquisitions Disposals Holdings 31/03/2012
Price Market Valuein EUR
% ofSubfund
assetsin the period under review
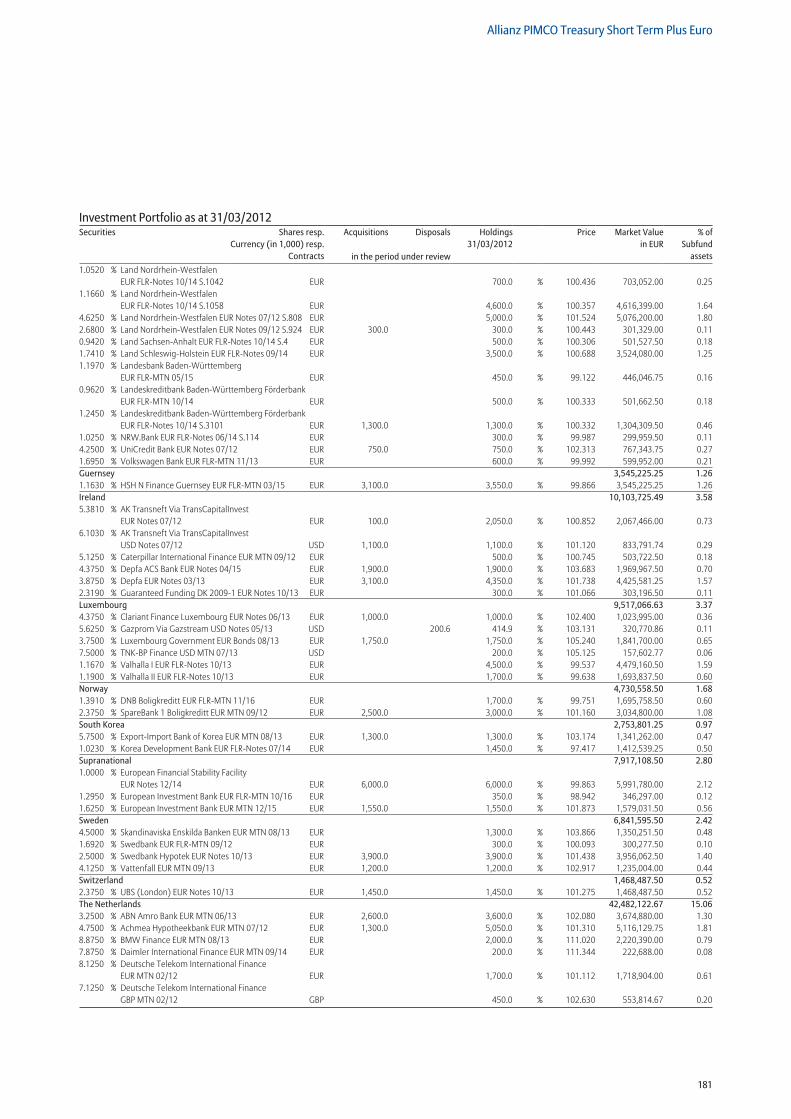
181
Allianz PIMCO Treasury Short Term Plus Euro
1.0520 % Land Nordrhein-Westfalen EUR FLR-Notes 10/14 S.1042 EUR 700.0 % 100.436 703,052.00 0.25
1.1660 % Land Nordrhein-Westfalen EUR FLR-Notes 10/14 S.1058 EUR 4,600.0 % 100.357 4,616,399.00 1.64
4.6250 % Land Nordrhein-Westfalen EUR Notes 07/12 S.808 EUR 5,000.0 % 101.524 5,076,200.00 1.802.6800 % Land Nordrhein-Westfalen EUR Notes 09/12 S.924 EUR 300.0 300.0 % 100.443 301,329.00 0.110.9420 % Land Sachsen-Anhalt EUR FLR-Notes 10/14 S.4 EUR 500.0 % 100.306 501,527.50 0.181.7410 % Land Schleswig-Holstein EUR FLR-Notes 09/14 EUR 3,500.0 % 100.688 3,524,080.00 1.251.1970 % Landesbank Baden-Württemberg
EUR FLR-MTN 05/15 EUR 450.0 % 99.122 446,046.75 0.160.9620 % Landeskreditbank Baden-Württemberg Förderbank
EUR FLR-MTN 10/14 EUR 500.0 % 100.333 501,662.50 0.181.2450 % Landeskreditbank Baden-Württemberg Förderbank
EUR FLR-Notes 10/14 S.3101 EUR 1,300.0 1,300.0 % 100.332 1,304,309.50 0.461.0250 % NRW.Bank EUR FLR-Notes 06/14 S.114 EUR 300.0 % 99.987 299,959.50 0.114.2500 % UniCredit Bank EUR Notes 07/12 EUR 750.0 750.0 % 102.313 767,343.75 0.271.6950 % Volkswagen Bank EUR FLR-MTN 11/13 EUR 600.0 % 99.992 599,952.00 0.21Guernsey 3,545,225.25 1.261.1630 % HSH N Finance Guernsey EUR FLR-MTN 03/15 EUR 3,100.0 3,550.0 % 99.866 3,545,225.25 1.26Ireland 10,103,725.49 3.585.3810 % AK Transneft Via TransCapitalInvest
EUR Notes 07/12 EUR 100.0 2,050.0 % 100.852 2,067,466.00 0.736.1030 % AK Transneft Via TransCapitalInvest
USD Notes 07/12 USD 1,100.0 1,100.0 % 101.120 833,791.74 0.295.1250 % Caterpillar International Finance EUR MTN 09/12 EUR 500.0 % 100.745 503,722.50 0.184.3750 % Depfa ACS Bank EUR Notes 04/15 EUR 1,900.0 1,900.0 % 103.683 1,969,967.50 0.703.8750 % Depfa EUR Notes 03/13 EUR 3,100.0 4,350.0 % 101.738 4,425,581.25 1.572.3190 % Guaranteed Funding DK 2009-1 EUR Notes 10/13 EUR 300.0 % 101.066 303,196.50 0.11Luxembourg 9,517,066.63 3.374.3750 % Clariant Finance Luxembourg EUR Notes 06/13 EUR 1,000.0 1,000.0 % 102.400 1,023,995.00 0.365.6250 % Gazprom Via Gazstream USD Notes 05/13 USD 200.6 414.9 % 103.131 320,770.86 0.113.7500 % Luxembourg Government EUR Bonds 08/13 EUR 1,750.0 1,750.0 % 105.240 1,841,700.00 0.657.5000 % TNK-BP Finance USD MTN 07/13 USD 200.0 % 105.125 157,602.77 0.061.1670 % Valhalla I EUR FLR-Notes 10/13 EUR 4,500.0 % 99.537 4,479,160.50 1.591.1900 % Valhalla II EUR FLR-Notes 10/13 EUR 1,700.0 % 99.638 1,693,837.50 0.60Norway 4,730,558.50 1.681.3910 % DNB Boligkreditt EUR FLR-MTN 11/16 EUR 1,700.0 % 99.751 1,695,758.50 0.602.3750 % SpareBank 1 Boligkreditt EUR MTN 09/12 EUR 2,500.0 3,000.0 % 101.160 3,034,800.00 1.08South Korea 2,753,801.25 0.975.7500 % Export-Import Bank of Korea EUR MTN 08/13 EUR 1,300.0 1,300.0 % 103.174 1,341,262.00 0.471.0230 % Korea Development Bank EUR FLR-Notes 07/14 EUR 1,450.0 % 97.417 1,412,539.25 0.50Supranational 7,917,108.50 2.801.0000 % European Financial Stability Facility
EUR Notes 12/14 EUR 6,000.0 6,000.0 % 99.863 5,991,780.00 2.121.2950 % European Investment Bank EUR FLR-MTN 10/16 EUR 350.0 % 98.942 346,297.00 0.121.6250 % European Investment Bank EUR MTN 12/15 EUR 1,550.0 1,550.0 % 101.873 1,579,031.50 0.56Sweden 6,841,595.50 2.424.5000 % Skandinaviska Enskilda Banken EUR MTN 08/13 EUR 1,300.0 % 103.866 1,350,251.50 0.481.6920 % Swedbank EUR FLR-MTN 09/12 EUR 300.0 % 100.093 300,277.50 0.102.5000 % Swedbank Hypotek EUR Notes 10/13 EUR 3,900.0 3,900.0 % 101.438 3,956,062.50 1.404.1250 % Vattenfall EUR MTN 09/13 EUR 1,200.0 1,200.0 % 102.917 1,235,004.00 0.44Switzerland 1,468,487.50 0.522.3750 % UBS (London) EUR Notes 10/13 EUR 1,450.0 1,450.0 % 101.275 1,468,487.50 0.52The Netherlands 42,482,122.67 15.063.2500 % ABN Amro Bank EUR MTN 06/13 EUR 2,600.0 3,600.0 % 102.080 3,674,880.00 1.304.7500 % Achmea Hypotheekbank EUR MTN 07/12 EUR 1,300.0 5,050.0 % 101.310 5,116,129.75 1.818.8750 % BMW Finance EUR MTN 08/13 EUR 2,000.0 % 111.020 2,220,390.00 0.797.8750 % Daimler International Finance EUR MTN 09/14 EUR 200.0 % 111.344 222,688.00 0.088.1250 % Deutsche Telekom International Finance
EUR MTN 02/12 EUR 1,700.0 % 101.112 1,718,904.00 0.617.1250 % Deutsche Telekom International Finance
GBP MTN 02/12 GBP 450.0 % 102.630 553,814.67 0.20
Investment Portfolio as at 31/03/2012Securities Shares resp.
Currency (in 1,000) resp.Contracts
Acquisitions Disposals Holdings 31/03/2012
Price Market Valuein EUR
% ofSubfund
assetsin the period under review
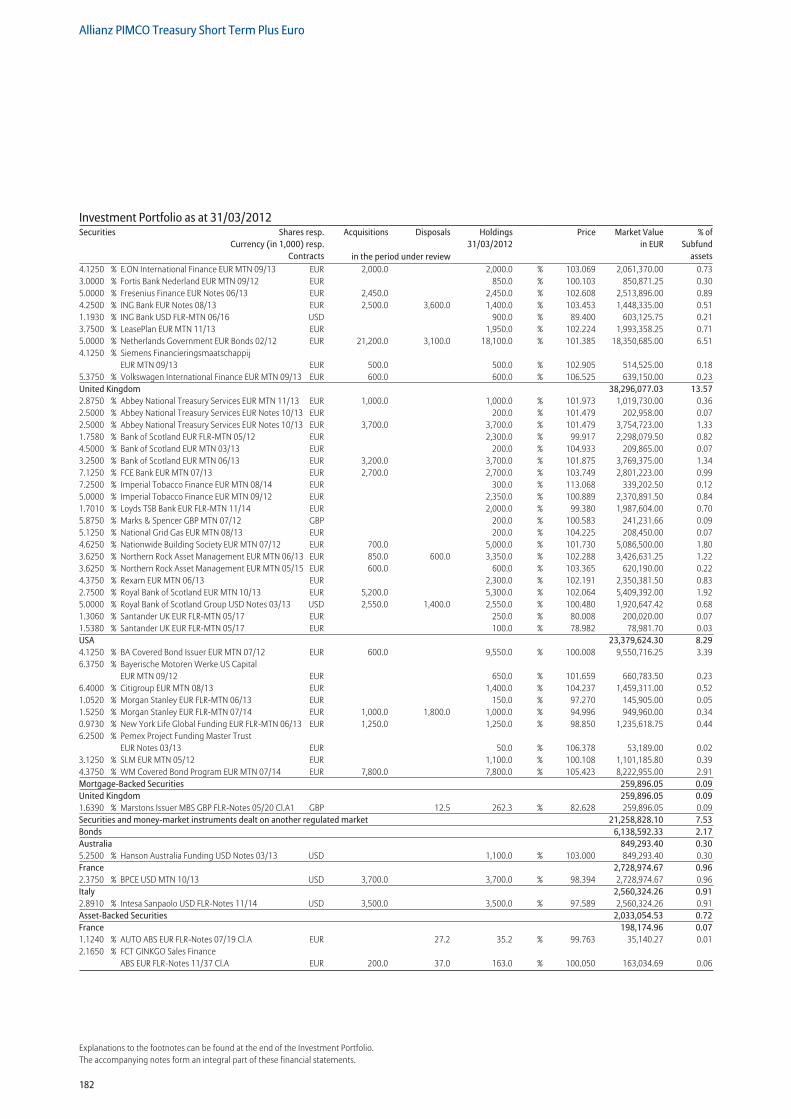
182
Allianz PIMCO Treasury Short Term Plus Euro
Explanations to the footnotes can be found at the end of the Investment Portfolio.The accompanying notes form an integral part of these financial statements.
4.1250 % E.ON International Finance EUR MTN 09/13 EUR 2,000.0 2,000.0 % 103.069 2,061,370.00 0.733.0000 % Fortis Bank Nederland EUR MTN 09/12 EUR 850.0 % 100.103 850,871.25 0.305.0000 % Fresenius Finance EUR Notes 06/13 EUR 2,450.0 2,450.0 % 102.608 2,513,896.00 0.894.2500 % ING Bank EUR Notes 08/13 EUR 2,500.0 3,600.0 1,400.0 % 103.453 1,448,335.00 0.511.1930 % ING Bank USD FLR-MTN 06/16 USD 900.0 % 89.400 603,125.75 0.213.7500 % LeasePlan EUR MTN 11/13 EUR 1,950.0 % 102.224 1,993,358.25 0.715.0000 % Netherlands Government EUR Bonds 02/12 EUR 21,200.0 3,100.0 18,100.0 % 101.385 18,350,685.00 6.514.1250 % Siemens Financieringsmaatschappij
EUR MTN 09/13 EUR 500.0 500.0 % 102.905 514,525.00 0.185.3750 % Volkswagen International Finance EUR MTN 09/13 EUR 600.0 600.0 % 106.525 639,150.00 0.23United Kingdom 38,296,077.03 13.572.8750 % Abbey National Treasury Services EUR MTN 11/13 EUR 1,000.0 1,000.0 % 101.973 1,019,730.00 0.362.5000 % Abbey National Treasury Services EUR Notes 10/13 EUR 200.0 % 101.479 202,958.00 0.072.5000 % Abbey National Treasury Services EUR Notes 10/13 EUR 3,700.0 3,700.0 % 101.479 3,754,723.00 1.331.7580 % Bank of Scotland EUR FLR-MTN 05/12 EUR 2,300.0 % 99.917 2,298,079.50 0.824.5000 % Bank of Scotland EUR MTN 03/13 EUR 200.0 % 104.933 209,865.00 0.073.2500 % Bank of Scotland EUR MTN 06/13 EUR 3,200.0 3,700.0 % 101.875 3,769,375.00 1.347.1250 % FCE Bank EUR MTN 07/13 EUR 2,700.0 2,700.0 % 103.749 2,801,223.00 0.997.2500 % Imperial Tobacco Finance EUR MTN 08/14 EUR 300.0 % 113.068 339,202.50 0.125.0000 % Imperial Tobacco Finance EUR MTN 09/12 EUR 2,350.0 % 100.889 2,370,891.50 0.841.7010 % Loyds TSB Bank EUR FLR-MTN 11/14 EUR 2,000.0 % 99.380 1,987,604.00 0.705.8750 % Marks & Spencer GBP MTN 07/12 GBP 200.0 % 100.583 241,231.66 0.095.1250 % National Grid Gas EUR MTN 08/13 EUR 200.0 % 104.225 208,450.00 0.074.6250 % Nationwide Building Society EUR MTN 07/12 EUR 700.0 5,000.0 % 101.730 5,086,500.00 1.803.6250 % Northern Rock Asset Management EUR MTN 06/13 EUR 850.0 600.0 3,350.0 % 102.288 3,426,631.25 1.223.6250 % Northern Rock Asset Management EUR MTN 05/15 EUR 600.0 600.0 % 103.365 620,190.00 0.224.3750 % Rexam EUR MTN 06/13 EUR 2,300.0 % 102.191 2,350,381.50 0.832.7500 % Royal Bank of Scotland EUR MTN 10/13 EUR 5,200.0 5,300.0 % 102.064 5,409,392.00 1.925.0000 % Royal Bank of Scotland Group USD Notes 03/13 USD 2,550.0 1,400.0 2,550.0 % 100.480 1,920,647.42 0.681.3060 % Santander UK EUR FLR-MTN 05/17 EUR 250.0 % 80.008 200,020.00 0.071.5380 % Santander UK EUR FLR-MTN 05/17 EUR 100.0 % 78.982 78,981.70 0.03USA 23,379,624.30 8.294.1250 % BA Covered Bond Issuer EUR MTN 07/12 EUR 600.0 9,550.0 % 100.008 9,550,716.25 3.396.3750 % Bayerische Motoren Werke US Capital
EUR MTN 09/12 EUR 650.0 % 101.659 660,783.50 0.236.4000 % Citigroup EUR MTN 08/13 EUR 1,400.0 % 104.237 1,459,311.00 0.521.0520 % Morgan Stanley EUR FLR-MTN 06/13 EUR 150.0 % 97.270 145,905.00 0.051.5250 % Morgan Stanley EUR FLR-MTN 07/14 EUR 1,000.0 1,800.0 1,000.0 % 94.996 949,960.00 0.340.9730 % New York Life Global Funding EUR FLR-MTN 06/13 EUR 1,250.0 1,250.0 % 98.850 1,235,618.75 0.446.2500 % Pemex Project Funding Master Trust
EUR Notes 03/13 EUR 50.0 % 106.378 53,189.00 0.023.1250 % SLM EUR MTN 05/12 EUR 1,100.0 % 100.108 1,101,185.80 0.394.3750 % WM Covered Bond Program EUR MTN 07/14 EUR 7,800.0 7,800.0 % 105.423 8,222,955.00 2.91Mortgage-Backed Securities 259,896.05 0.09United Kingdom 259,896.05 0.091.6390 % Marstons Issuer MBS GBP FLR-Notes 05/20 Cl.A1 GBP 12.5 262.3 % 82.628 259,896.05 0.09Securities and money-market instruments dealt on another regulated market 21,258,828.10 7.53Bonds 6,138,592.33 2.17Australia 849,293.40 0.305.2500 % Hanson Australia Funding USD Notes 03/13 USD 1,100.0 % 103.000 849,293.40 0.30France 2,728,974.67 0.962.3750 % BPCE USD MTN 10/13 USD 3,700.0 3,700.0 % 98.394 2,728,974.67 0.96Italy 2,560,324.26 0.912.8910 % Intesa Sanpaolo USD FLR-Notes 11/14 USD 3,500.0 3,500.0 % 97.589 2,560,324.26 0.91Asset-Backed Securities 2,033,054.53 0.72France 198,174.96 0.071.1240 % AUTO ABS EUR FLR-Notes 07/19 Cl.A EUR 27.2 35.2 % 99.763 35,140.27 0.012.1650 % FCT GINKGO Sales Finance
ABS EUR FLR-Notes 11/37 Cl.A EUR 200.0 37.0 163.0 % 100.050 163,034.69 0.06
Investment Portfolio as at 31/03/2012Securities Shares resp.
Currency (in 1,000) resp.Contracts
Acquisitions Disposals Holdings 31/03/2012
Price Market Valuein EUR
% ofSubfund
assetsin the period under review
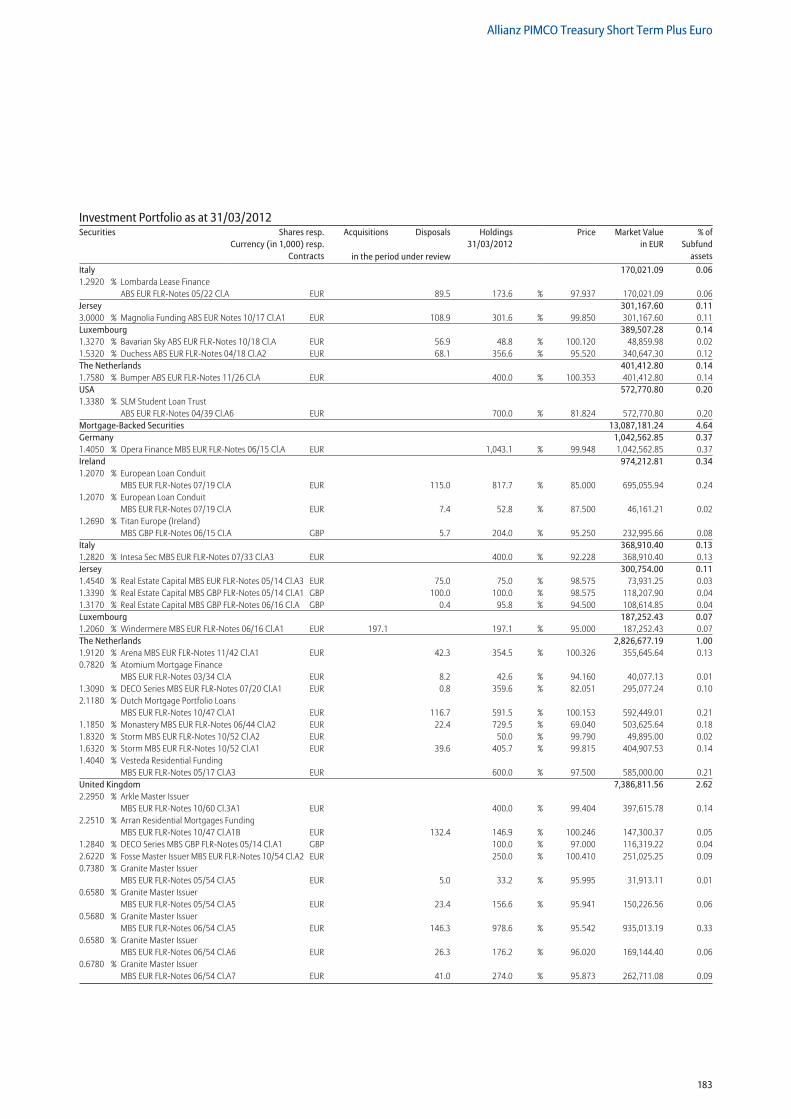
183
Allianz PIMCO Treasury Short Term Plus Euro
Italy 170,021.09 0.061.2920 % Lombarda Lease Finance
ABS EUR FLR-Notes 05/22 Cl.A EUR 89.5 173.6 % 97.937 170,021.09 0.06Jersey 301,167.60 0.113.0000 % Magnolia Funding ABS EUR Notes 10/17 Cl.A1 EUR 108.9 301.6 % 99.850 301,167.60 0.11Luxembourg 389,507.28 0.141.3270 % Bavarian Sky ABS EUR FLR-Notes 10/18 Cl.A EUR 56.9 48.8 % 100.120 48,859.98 0.021.5320 % Duchess ABS EUR FLR-Notes 04/18 Cl.A2 EUR 68.1 356.6 % 95.520 340,647.30 0.12The Netherlands 401,412.80 0.141.7580 % Bumper ABS EUR FLR-Notes 11/26 Cl.A EUR 400.0 % 100.353 401,412.80 0.14USA 572,770.80 0.201.3380 % SLM Student Loan Trust
ABS EUR FLR-Notes 04/39 Cl.A6 EUR 700.0 % 81.824 572,770.80 0.20Mortgage-Backed Securities 13,087,181.24 4.64Germany 1,042,562.85 0.371.4050 % Opera Finance MBS EUR FLR-Notes 06/15 Cl.A EUR 1,043.1 % 99.948 1,042,562.85 0.37Ireland 974,212.81 0.341.2070 % European Loan Conduit
MBS EUR FLR-Notes 07/19 Cl.A EUR 115.0 817.7 % 85.000 695,055.94 0.241.2070 % European Loan Conduit
MBS EUR FLR-Notes 07/19 Cl.A EUR 7.4 52.8 % 87.500 46,161.21 0.021.2690 % Titan Europe (Ireland)
MBS GBP FLR-Notes 06/15 CI.A GBP 5.7 204.0 % 95.250 232,995.66 0.08Italy 368,910.40 0.131.2820 % Intesa Sec MBS EUR FLR-Notes 07/33 Cl.A3 EUR 400.0 % 92.228 368,910.40 0.13Jersey 300,754.00 0.111.4540 % Real Estate Capital MBS EUR FLR-Notes 05/14 Cl.A3 EUR 75.0 75.0 % 98.575 73,931.25 0.031.3390 % Real Estate Capital MBS GBP FLR-Notes 05/14 Cl.A1 GBP 100.0 100.0 % 98.575 118,207.90 0.041.3170 % Real Estate Capital MBS GBP FLR-Notes 06/16 Cl.A GBP 0.4 95.8 % 94.500 108,614.85 0.04Luxembourg 187,252.43 0.071.2060 % Windermere MBS EUR FLR-Notes 06/16 Cl.A1 EUR 197.1 197.1 % 95.000 187,252.43 0.07The Netherlands 2,826,677.19 1.001.9120 % Arena MBS EUR FLR-Notes 11/42 Cl.A1 EUR 42.3 354.5 % 100.326 355,645.64 0.130.7820 % Atomium Mortgage Finance
MBS EUR FLR-Notes 03/34 Cl.A EUR 8.2 42.6 % 94.160 40,077.13 0.011.3090 % DECO Series MBS EUR FLR-Notes 07/20 Cl.A1 EUR 0.8 359.6 % 82.051 295,077.24 0.102.1180 % Dutch Mortgage Portfolio Loans
MBS EUR FLR-Notes 10/47 Cl.A1 EUR 116.7 591.5 % 100.153 592,449.01 0.211.1850 % Monastery MBS EUR FLR-Notes 06/44 Cl.A2 EUR 22.4 729.5 % 69.040 503,625.64 0.181.8320 % Storm MBS EUR FLR-Notes 10/52 Cl.A2 EUR 50.0 % 99.790 49,895.00 0.021.6320 % Storm MBS EUR FLR-Notes 10/52 Cl.A1 EUR 39.6 405.7 % 99.815 404,907.53 0.141.4040 % Vesteda Residential Funding
MBS EUR FLR-Notes 05/17 Cl.A3 EUR 600.0 % 97.500 585,000.00 0.21United Kingdom 7,386,811.56 2.622.2950 % Arkle Master Issuer
MBS EUR FLR-Notes 10/60 Cl.3A1 EUR 400.0 % 99.404 397,615.78 0.142.2510 % Arran Residential Mortgages Funding
MBS EUR FLR-Notes 10/47 Cl.A1B EUR 132.4 146.9 % 100.246 147,300.37 0.051.2840 % DECO Series MBS GBP FLR-Notes 05/14 Cl.A1 GBP 100.0 % 97.000 116,319.22 0.042.6220 % Fosse Master Issuer MBS EUR FLR-Notes 10/54 Cl.A2 EUR 250.0 % 100.410 251,025.25 0.090.7380 % Granite Master Issuer
MBS EUR FLR-Notes 05/54 Cl.A5 EUR 5.0 33.2 % 95.995 31,913.11 0.010.6580 % Granite Master Issuer
MBS EUR FLR-Notes 05/54 Cl.A5 EUR 23.4 156.6 % 95.941 150,226.56 0.060.5680 % Granite Master Issuer
MBS EUR FLR-Notes 06/54 Cl.A5 EUR 146.3 978.6 % 95.542 935,013.19 0.330.6580 % Granite Master Issuer
MBS EUR FLR-Notes 06/54 Cl.A6 EUR 26.3 176.2 % 96.020 169,144.40 0.060.6780 % Granite Master Issuer
MBS EUR FLR-Notes 06/54 Cl.A7 EUR 41.0 274.0 % 95.873 262,711.08 0.09
Investment Portfolio as at 31/03/2012Securities Shares resp.
Currency (in 1,000) resp.Contracts
Acquisitions Disposals Holdings 31/03/2012
Price Market Valuein EUR
% ofSubfund
assetsin the period under review
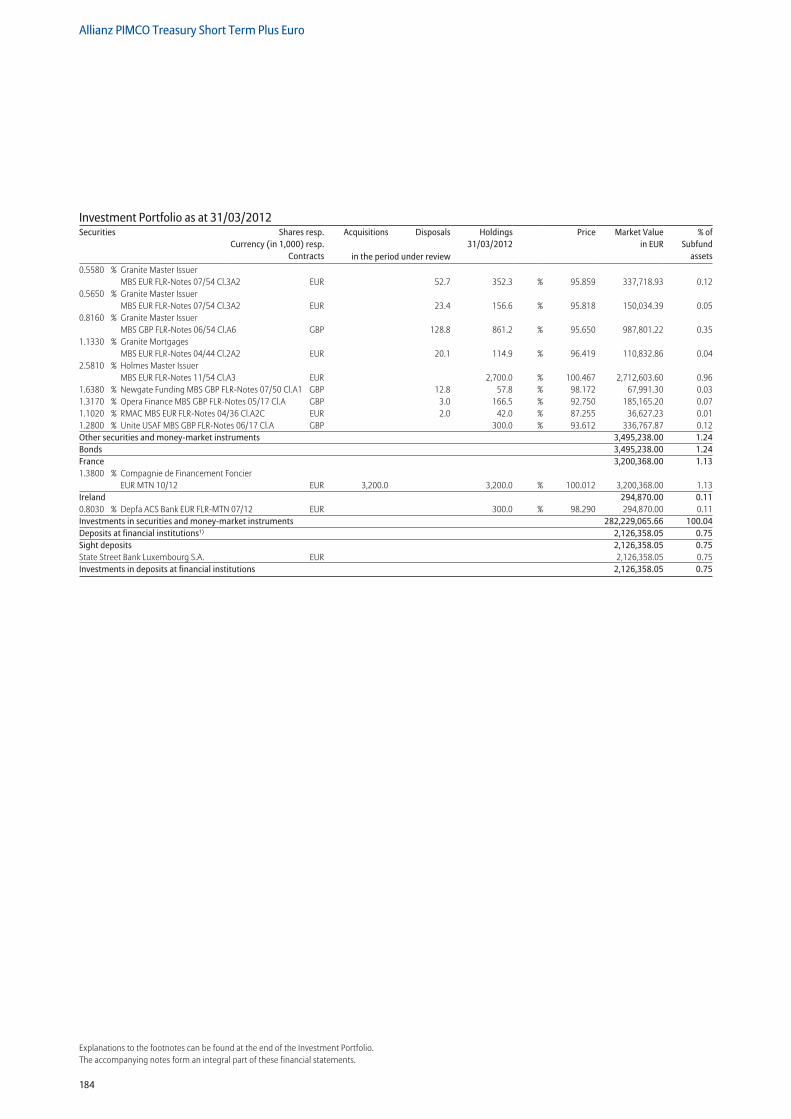
184
Allianz PIMCO Treasury Short Term Plus Euro
Explanations to the footnotes can be found at the end of the Investment Portfolio.The accompanying notes form an integral part of these financial statements.
0.5580 % Granite Master Issuer MBS EUR FLR-Notes 07/54 Cl.3A2 EUR 52.7 352.3 % 95.859 337,718.93 0.12
0.5650 % Granite Master Issuer MBS EUR FLR-Notes 07/54 Cl.3A2 EUR 23.4 156.6 % 95.818 150,034.39 0.05
0.8160 % Granite Master Issuer MBS GBP FLR-Notes 06/54 Cl.A6 GBP 128.8 861.2 % 95.650 987,801.22 0.35
1.1330 % Granite Mortgages MBS EUR FLR-Notes 04/44 Cl.2A2 EUR 20.1 114.9 % 96.419 110,832.86 0.04
2.5810 % Holmes Master Issuer MBS EUR FLR-Notes 11/54 Cl.A3 EUR 2,700.0 % 100.467 2,712,603.60 0.96
1.6380 % Newgate Funding MBS GBP FLR-Notes 07/50 Cl.A1 GBP 12.8 57.8 % 98.172 67,991.30 0.031.3170 % Opera Finance MBS GBP FLR-Notes 05/17 Cl.A GBP 3.0 166.5 % 92.750 185,165.20 0.071.1020 % RMAC MBS EUR FLR-Notes 04/36 Cl.A2C EUR 2.0 42.0 % 87.255 36,627.23 0.011.2800 % Unite USAF MBS GBP FLR-Notes 06/17 Cl.A GBP 300.0 % 93.612 336,767.87 0.12Other securities and money-market instruments 3,495,238.00 1.24Bonds 3,495,238.00 1.24France 3,200,368.00 1.131.3800 % Compagnie de Financement Foncier
EUR MTN 10/12 EUR 3,200.0 3,200.0 % 100.012 3,200,368.00 1.13Ireland 294,870.00 0.110.8030 % Depfa ACS Bank EUR FLR-MTN 07/12 EUR 300.0 % 98.290 294,870.00 0.11Investments in securities and money-market instruments 282,229,065.66 100.04Deposits at financial institutions1) 2,126,358.05 0.75Sight deposits 2,126,358.05 0.75State Street Bank Luxembourg S.A. EUR 2,126,358.05 0.75Investments in deposits at financial institutions 2,126,358.05 0.75
Investment Portfolio as at 31/03/2012Securities Shares resp.
Currency (in 1,000) resp.Contracts
Acquisitions Disposals Holdings 31/03/2012
Price Market Valuein EUR
% ofSubfund
assetsin the period under review
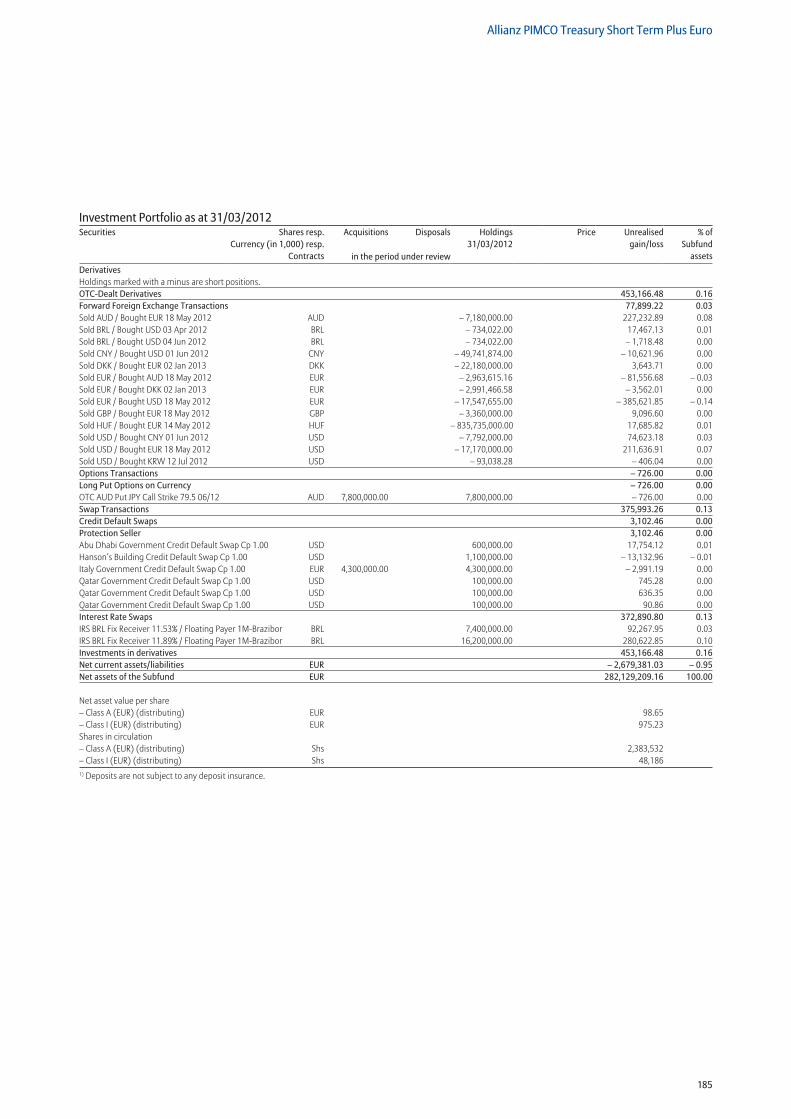
185
Allianz PIMCO Treasury Short Term Plus Euro
Derivatives Holdings marked with a minus are short positions. OTC-Dealt Derivatives 453,166.48 0.16Forward Foreign Exchange Transactions 77,899.22 0.03Sold AUD / Bought EUR 18 May 2012 AUD – 7,180,000.00 227,232.89 0.08Sold BRL / Bought USD 03 Apr 2012 BRL – 734,022.00 17,467.13 0.01Sold BRL / Bought USD 04 Jun 2012 BRL – 734,022.00 – 1,718.48 0.00Sold CNY / Bought USD 01 Jun 2012 CNY – 49,741,874.00 – 10,621.96 0.00Sold DKK / Bought EUR 02 Jan 2013 DKK – 22,180,000.00 3,643.71 0.00Sold EUR / Bought AUD 18 May 2012 EUR – 2,963,615.16 – 81,556.68 – 0.03Sold EUR / Bought DKK 02 Jan 2013 EUR – 2,991,466.58 – 3,562.01 0.00Sold EUR / Bought USD 18 May 2012 EUR – 17,547,655.00 – 385,621.85 – 0.14Sold GBP / Bought EUR 18 May 2012 GBP – 3,360,000.00 9,096.60 0.00Sold HUF / Bought EUR 14 May 2012 HUF – 835,735,000.00 17,685.82 0.01Sold USD / Bought CNY 01 Jun 2012 USD – 7,792,000.00 74,623.18 0.03Sold USD / Bought EUR 18 May 2012 USD – 17,170,000.00 211,636.91 0.07Sold USD / Bought KRW 12 Jul 2012 USD – 93,038.28 – 406.04 0.00Options Transactions – 726.00 0.00Long Put Options on Currency – 726.00 0.00OTC AUD Put JPY Call Strike 79.5 06/12 AUD 7,800,000.00 7,800,000.00 – 726.00 0.00Swap Transactions 375,993.26 0.13Credit Default Swaps 3,102.46 0.00Protection Seller 3,102.46 0.00Abu Dhabi Government Credit Default Swap Cp 1.00 USD 600,000.00 17,754.12 0.01Hanson’s Building Credit Default Swap Cp 1.00 USD 1,100,000.00 – 13,132.96 – 0.01Italy Government Credit Default Swap Cp 1.00 EUR 4,300,000.00 4,300,000.00 – 2,991.19 0.00Qatar Government Credit Default Swap Cp 1.00 USD 100,000.00 745.28 0.00Qatar Government Credit Default Swap Cp 1.00 USD 100,000.00 636.35 0.00Qatar Government Credit Default Swap Cp 1.00 USD 100,000.00 90.86 0.00Interest Rate Swaps 372,890.80 0.13IRS BRL Fix Receiver 11.53% / Floating Payer 1M-Brazibor BRL 7,400,000.00 92,267.95 0.03IRS BRL Fix Receiver 11.89% / Floating Payer 1M-Brazibor BRL 16,200,000.00 280,622.85 0.10Investments in derivatives 453,166.48 0.16Net current assets/liabilities EUR – 2,679,381.03 – 0.95Net assets of the Subfund EUR 282,129,209.16 100.00
Net asset value per share – Class A (EUR) (distributing) EUR 98.65 – Class I (EUR) (distributing) EUR 975.23 Shares in circulation – Class A (EUR) (distributing) Shs 2,383,532 – Class I (EUR) (distributing) Shs 48,1861) Deposits are not subject to any deposit insurance.
Investment Portfolio as at 31/03/2012Securities Shares resp.
Currency (in 1,000) resp.Contracts
Acquisitions Disposals Holdings 31/03/2012
Price Unrealisedgain/loss
% ofSubfund
assetsin the period under review
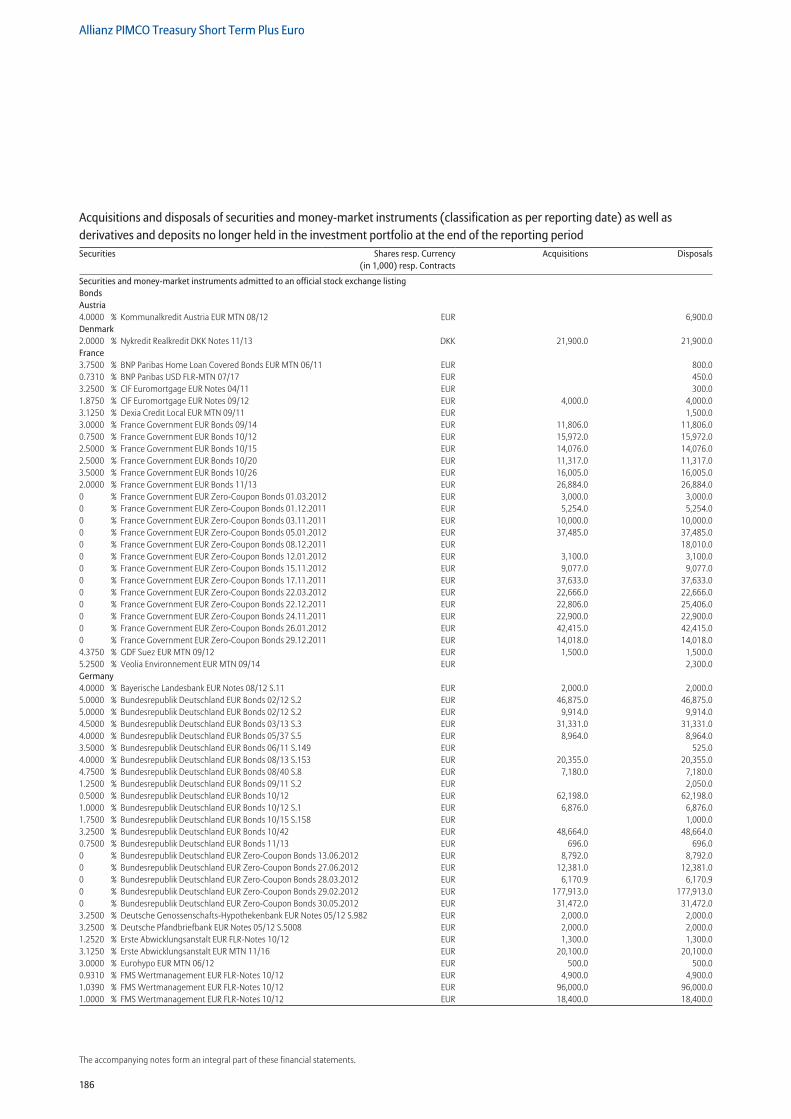
186
Allianz PIMCO Treasury Short Term Plus Euro
The accompanying notes form an integral part of these financial statements.
Securities and money-market instruments admitted to an official stock exchange listing Bonds Austria 4.0000 % Kommunalkredit Austria EUR MTN 08/12 EUR 6,900.0Denmark 2.0000 % Nykredit Realkredit DKK Notes 11/13 DKK 21,900.0 21,900.0France 3.7500 % BNP Paribas Home Loan Covered Bonds EUR MTN 06/11 EUR 800.00.7310 % BNP Paribas USD FLR-MTN 07/17 EUR 450.03.2500 % CIF Euromortgage EUR Notes 04/11 EUR 300.01.8750 % CIF Euromortgage EUR Notes 09/12 EUR 4,000.0 4,000.03.1250 % Dexia Credit Local EUR MTN 09/11 EUR 1,500.03.0000 % France Government EUR Bonds 09/14 EUR 11,806.0 11,806.00.7500 % France Government EUR Bonds 10/12 EUR 15,972.0 15,972.02.5000 % France Government EUR Bonds 10/15 EUR 14,076.0 14,076.02.5000 % France Government EUR Bonds 10/20 EUR 11,317.0 11,317.03.5000 % France Government EUR Bonds 10/26 EUR 16,005.0 16,005.02.0000 % France Government EUR Bonds 11/13 EUR 26,884.0 26,884.00 % France Government EUR Zero-Coupon Bonds 01.03.2012 EUR 3,000.0 3,000.00 % France Government EUR Zero-Coupon Bonds 01.12.2011 EUR 5,254.0 5,254.00 % France Government EUR Zero-Coupon Bonds 03.11.2011 EUR 10,000.0 10,000.00 % France Government EUR Zero-Coupon Bonds 05.01.2012 EUR 37,485.0 37,485.00 % France Government EUR Zero-Coupon Bonds 08.12.2011 EUR 18,010.00 % France Government EUR Zero-Coupon Bonds 12.01.2012 EUR 3,100.0 3,100.00 % France Government EUR Zero-Coupon Bonds 15.11.2012 EUR 9,077.0 9,077.00 % France Government EUR Zero-Coupon Bonds 17.11.2011 EUR 37,633.0 37,633.00 % France Government EUR Zero-Coupon Bonds 22.03.2012 EUR 22,666.0 22,666.00 % France Government EUR Zero-Coupon Bonds 22.12.2011 EUR 22,806.0 25,406.00 % France Government EUR Zero-Coupon Bonds 24.11.2011 EUR 22,900.0 22,900.00 % France Government EUR Zero-Coupon Bonds 26.01.2012 EUR 42,415.0 42,415.00 % France Government EUR Zero-Coupon Bonds 29.12.2011 EUR 14,018.0 14,018.04.3750 % GDF Suez EUR MTN 09/12 EUR 1,500.0 1,500.05.2500 % Veolia Environnement EUR MTN 09/14 EUR 2,300.0Germany 4.0000 % Bayerische Landesbank EUR Notes 08/12 S.11 EUR 2,000.0 2,000.05.0000 % Bundesrepublik Deutschland EUR Bonds 02/12 S.2 EUR 46,875.0 46,875.05.0000 % Bundesrepublik Deutschland EUR Bonds 02/12 S.2 EUR 9,914.0 9,914.04.5000 % Bundesrepublik Deutschland EUR Bonds 03/13 S.3 EUR 31,331.0 31,331.04.0000 % Bundesrepublik Deutschland EUR Bonds 05/37 S.5 EUR 8,964.0 8,964.03.5000 % Bundesrepublik Deutschland EUR Bonds 06/11 S.149 EUR 525.04.0000 % Bundesrepublik Deutschland EUR Bonds 08/13 S.153 EUR 20,355.0 20,355.04.7500 % Bundesrepublik Deutschland EUR Bonds 08/40 S.8 EUR 7,180.0 7,180.01.2500 % Bundesrepublik Deutschland EUR Bonds 09/11 S.2 EUR 2,050.00.5000 % Bundesrepublik Deutschland EUR Bonds 10/12 EUR 62,198.0 62,198.01.0000 % Bundesrepublik Deutschland EUR Bonds 10/12 S.1 EUR 6,876.0 6,876.01.7500 % Bundesrepublik Deutschland EUR Bonds 10/15 S.158 EUR 1,000.03.2500 % Bundesrepublik Deutschland EUR Bonds 10/42 EUR 48,664.0 48,664.00.7500 % Bundesrepublik Deutschland EUR Bonds 11/13 EUR 696.0 696.00 % Bundesrepublik Deutschland EUR Zero-Coupon Bonds 13.06.2012 EUR 8,792.0 8,792.00 % Bundesrepublik Deutschland EUR Zero-Coupon Bonds 27.06.2012 EUR 12,381.0 12,381.00 % Bundesrepublik Deutschland EUR Zero-Coupon Bonds 28.03.2012 EUR 6,170.9 6,170.90 % Bundesrepublik Deutschland EUR Zero-Coupon Bonds 29.02.2012 EUR 177,913.0 177,913.00 % Bundesrepublik Deutschland EUR Zero-Coupon Bonds 30.05.2012 EUR 31,472.0 31,472.03.2500 % Deutsche Genossenschafts-Hypothekenbank EUR Notes 05/12 S.982 EUR 2,000.0 2,000.03.2500 % Deutsche Pfandbriefbank EUR Notes 05/12 S.5008 EUR 2,000.0 2,000.01.2520 % Erste Abwicklungsanstalt EUR FLR-Notes 10/12 EUR 1,300.0 1,300.03.1250 % Erste Abwicklungsanstalt EUR MTN 11/16 EUR 20,100.0 20,100.03.0000 % Eurohypo EUR MTN 06/12 EUR 500.0 500.00.9310 % FMS Wertmanagement EUR FLR-Notes 10/12 EUR 4,900.0 4,900.01.0390 % FMS Wertmanagement EUR FLR-Notes 10/12 EUR 96,000.0 96,000.01.0000 % FMS Wertmanagement EUR FLR-Notes 10/12 EUR 18,400.0 18,400.0
Acquisitions and disposals of securities and money-market instruments (classification as per reporting date) as well as derivatives and deposits no longer held in the investment portfolio at the end of the reporting periodSecurities Shares resp. Currency
(in 1,000) resp. ContractsAcquisitions Disposals
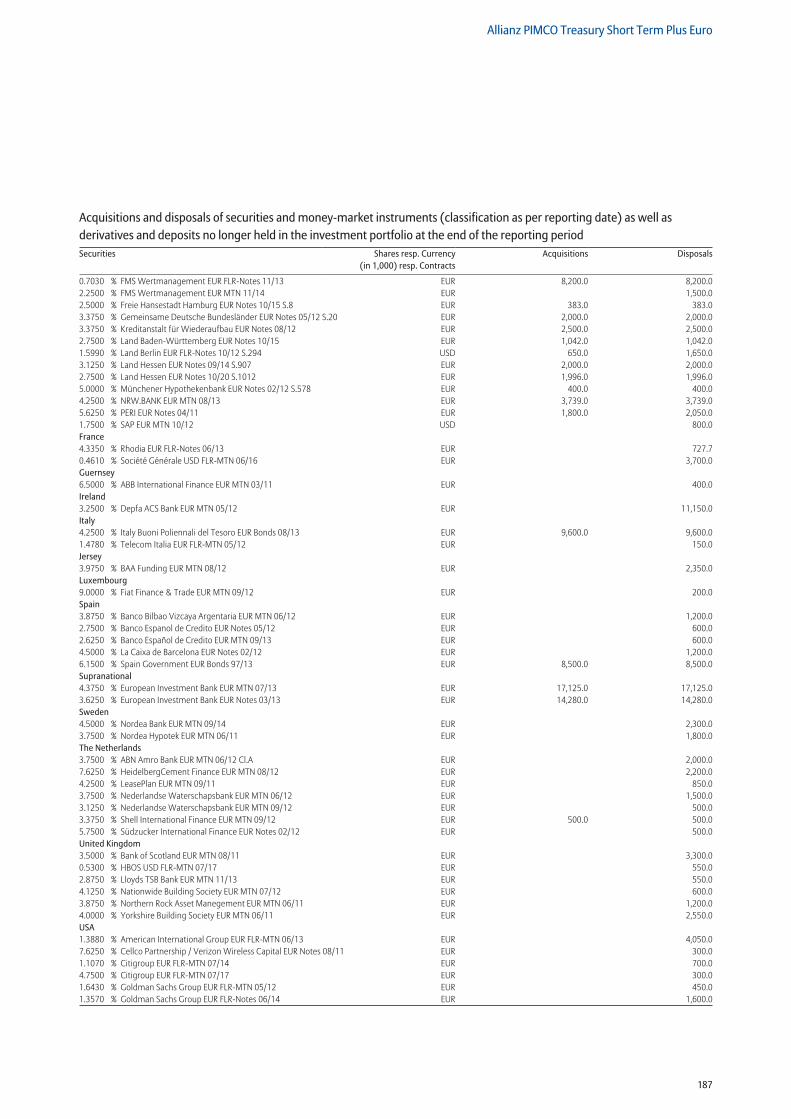
187
Allianz PIMCO Treasury Short Term Plus Euro
0.7030 % FMS Wertmanagement EUR FLR-Notes 11/13 EUR 8,200.0 8,200.02.2500 % FMS Wertmanagement EUR MTN 11/14 EUR 1,500.02.5000 % Freie Hansestadt Hamburg EUR Notes 10/15 S.8 EUR 383.0 383.03.3750 % Gemeinsame Deutsche Bundesländer EUR Notes 05/12 S.20 EUR 2,000.0 2,000.03.3750 % Kreditanstalt für Wiederaufbau EUR Notes 08/12 EUR 2,500.0 2,500.02.7500 % Land Baden-Württemberg EUR Notes 10/15 EUR 1,042.0 1,042.01.5990 % Land Berlin EUR FLR-Notes 10/12 S.294 USD 650.0 1,650.03.1250 % Land Hessen EUR Notes 09/14 S.907 EUR 2,000.0 2,000.02.7500 % Land Hessen EUR Notes 10/20 S.1012 EUR 1,996.0 1,996.05.0000 % Münchener Hypothekenbank EUR Notes 02/12 S.578 EUR 400.0 400.04.2500 % NRW.BANK EUR MTN 08/13 EUR 3,739.0 3,739.05.6250 % PERI EUR Notes 04/11 EUR 1,800.0 2,050.01.7500 % SAP EUR MTN 10/12 USD 800.0France 4.3350 % Rhodia EUR FLR-Notes 06/13 EUR 727.70.4610 % Société Générale USD FLR-MTN 06/16 EUR 3,700.0Guernsey 6.5000 % ABB International Finance EUR MTN 03/11 EUR 400.0Ireland 3.2500 % Depfa ACS Bank EUR MTN 05/12 EUR 11,150.0Italy 4.2500 % Italy Buoni Poliennali del Tesoro EUR Bonds 08/13 EUR 9,600.0 9,600.01.4780 % Telecom Italia EUR FLR-MTN 05/12 EUR 150.0Jersey 3.9750 % BAA Funding EUR MTN 08/12 EUR 2,350.0Luxembourg 9.0000 % Fiat Finance & Trade EUR MTN 09/12 EUR 200.0Spain 3.8750 % Banco Bilbao Vizcaya Argentaria EUR MTN 06/12 EUR 1,200.02.7500 % Banco Espanol de Credito EUR Notes 05/12 EUR 600.02.6250 % Banco Español de Credito EUR MTN 09/13 EUR 600.04.5000 % La Caixa de Barcelona EUR Notes 02/12 EUR 1,200.06.1500 % Spain Government EUR Bonds 97/13 EUR 8,500.0 8,500.0Supranational 4.3750 % European Investment Bank EUR MTN 07/13 EUR 17,125.0 17,125.03.6250 % European Investment Bank EUR Notes 03/13 EUR 14,280.0 14,280.0Sweden 4.5000 % Nordea Bank EUR MTN 09/14 EUR 2,300.03.7500 % Nordea Hypotek EUR MTN 06/11 EUR 1,800.0The Netherlands 3.7500 % ABN Amro Bank EUR MTN 06/12 Cl.A EUR 2,000.07.6250 % HeidelbergCement Finance EUR MTN 08/12 EUR 2,200.04.2500 % LeasePlan EUR MTN 09/11 EUR 850.03.7500 % Nederlandse Waterschapsbank EUR MTN 06/12 EUR 1,500.03.1250 % Nederlandse Waterschapsbank EUR MTN 09/12 EUR 500.03.3750 % Shell International Finance EUR MTN 09/12 EUR 500.0 500.05.7500 % Südzucker International Finance EUR Notes 02/12 EUR 500.0United Kingdom 3.5000 % Bank of Scotland EUR MTN 08/11 EUR 3,300.00.5300 % HBOS USD FLR-MTN 07/17 EUR 550.02.8750 % Lloyds TSB Bank EUR MTN 11/13 EUR 550.04.1250 % Nationwide Building Society EUR MTN 07/12 EUR 600.03.8750 % Northern Rock Asset Manegement EUR MTN 06/11 EUR 1,200.04.0000 % Yorkshire Building Society EUR MTN 06/11 EUR 2,550.0USA 1.3880 % American International Group EUR FLR-MTN 06/13 EUR 4,050.07.6250 % Cellco Partnership / Verizon Wireless Capital EUR Notes 08/11 EUR 300.01.1070 % Citigroup EUR FLR-MTN 07/14 EUR 700.04.7500 % Citigroup EUR FLR-MTN 07/17 EUR 300.01.6430 % Goldman Sachs Group EUR FLR-MTN 05/12 EUR 450.01.3570 % Goldman Sachs Group EUR FLR-Notes 06/14 EUR 1,600.0
Acquisitions and disposals of securities and money-market instruments (classification as per reporting date) as well as derivatives and deposits no longer held in the investment portfolio at the end of the reporting periodSecurities Shares resp. Currency
(in 1,000) resp. ContractsAcquisitions Disposals
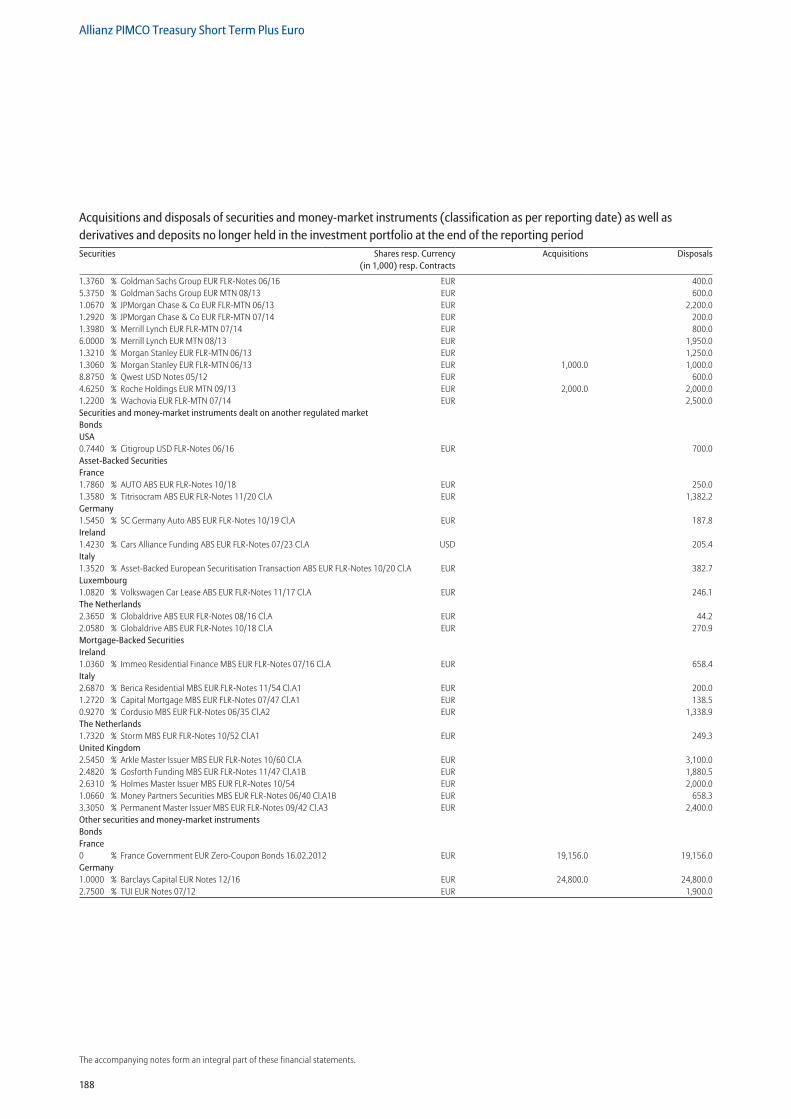
188
Allianz PIMCO Treasury Short Term Plus Euro
The accompanying notes form an integral part of these financial statements.
1.3760 % Goldman Sachs Group EUR FLR-Notes 06/16 EUR 400.05.3750 % Goldman Sachs Group EUR MTN 08/13 EUR 600.01.0670 % JPMorgan Chase & Co EUR FLR-MTN 06/13 EUR 2,200.01.2920 % JPMorgan Chase & Co EUR FLR-MTN 07/14 EUR 200.01.3980 % Merrill Lynch EUR FLR-MTN 07/14 EUR 800.06.0000 % Merrill Lynch EUR MTN 08/13 EUR 1,950.01.3210 % Morgan Stanley EUR FLR-MTN 06/13 EUR 1,250.01.3060 % Morgan Stanley EUR FLR-MTN 06/13 EUR 1,000.0 1,000.08.8750 % Qwest USD Notes 05/12 EUR 600.04.6250 % Roche Holdings EUR MTN 09/13 EUR 2,000.0 2,000.01.2200 % Wachovia EUR FLR-MTN 07/14 EUR 2,500.0Securities and money-market instruments dealt on another regulated market Bonds USA 0.7440 % Citigroup USD FLR-Notes 06/16 EUR 700.0Asset-Backed Securities France 1.7860 % AUTO ABS EUR FLR-Notes 10/18 EUR 250.0 1.3580 % Titrisocram ABS EUR FLR-Notes 11/20 Cl.A EUR 1,382.2Germany 1.5450 % SC Germany Auto ABS EUR FLR-Notes 10/19 Cl.A EUR 187.8Ireland 1.4230 % Cars Alliance Funding ABS EUR FLR-Notes 07/23 Cl.A USD 205.4Italy 1.3520 % Asset-Backed European Securitisation Transaction ABS EUR FLR-Notes 10/20 Cl.A EUR 382.7Luxembourg 1.0820 % Volkswagen Car Lease ABS EUR FLR-Notes 11/17 Cl.A EUR 246.1The Netherlands 2.3650 % Globaldrive ABS EUR FLR-Notes 08/16 Cl.A EUR 44.22.0580 % Globaldrive ABS EUR FLR-Notes 10/18 Cl.A EUR 270.9Mortgage-Backed Securities Ireland 1.0360 % Immeo Residential Finance MBS EUR FLR-Notes 07/16 Cl.A EUR 658.4Italy 2.6870 % Berica Residential MBS EUR FLR-Notes 11/54 Cl.A1 EUR 200.01.2720 % Capital Mortgage MBS EUR FLR-Notes 07/47 Cl.A1 EUR 138.50.9270 % Cordusio MBS EUR FLR-Notes 06/35 Cl.A2 EUR 1,338.9The Netherlands 1.7320 % Storm MBS EUR FLR-Notes 10/52 Cl.A1 EUR 249.3United Kingdom 2.5450 % Arkle Master Issuer MBS EUR FLR-Notes 10/60 Cl.A EUR 3,100.02.4820 % Gosforth Funding MBS EUR FLR-Notes 11/47 Cl.A1B EUR 1,880.52.6310 % Holmes Master Issuer MBS EUR FLR-Notes 10/54 EUR 2,000.01.0660 % Money Partners Securities MBS EUR FLR-Notes 06/40 Cl.A1B EUR 658.33.3050 % Permanent Master Issuer MBS EUR FLR-Notes 09/42 Cl.A3 EUR 2,400.0Other securities and money-market instruments Bonds France 0 % France Government EUR Zero-Coupon Bonds 16.02.2012 EUR 19,156.0 19,156.0Germany 1.0000 % Barclays Capital EUR Notes 12/16 EUR 24,800.0 24,800.02.7500 % TUI EUR Notes 07/12 EUR 1,900.0
Acquisitions and disposals of securities and money-market instruments (classification as per reporting date) as well as derivatives and deposits no longer held in the investment portfolio at the end of the reporting periodSecurities Shares resp. Currency
(in 1,000) resp. ContractsAcquisitions Disposals
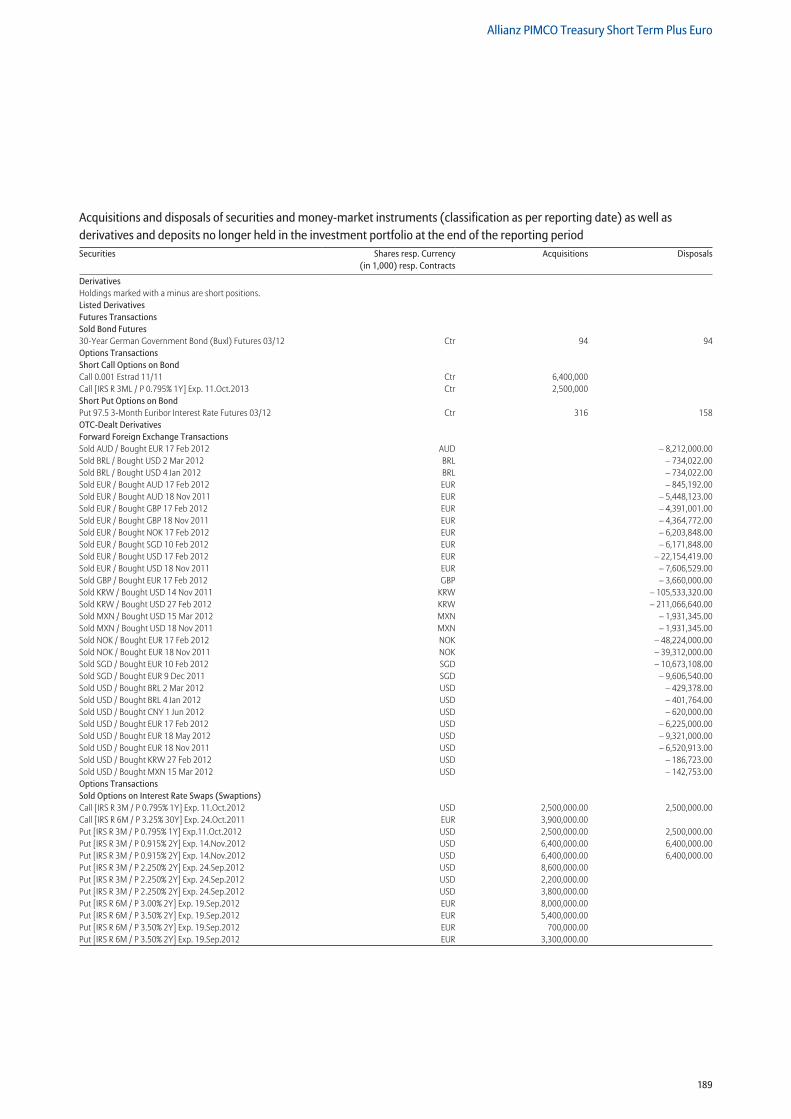
189
Allianz PIMCO Treasury Short Term Plus Euro
Derivatives Holdings marked with a minus are short positions. Listed Derivatives Futures Transactions Sold Bond Futures 30-Year German Government Bond (Buxl) Futures 03/12 Ctr 94 94Options Transactions Short Call Options on Bond Call 0.001 Estrad 11/11 Ctr 6,400,000 Call [IRS R 3ML / P 0.795% 1Y] Exp. 11.Oct.2013 Ctr 2,500,000 Short Put Options on Bond Put 97.5 3-Month Euribor Interest Rate Futures 03/12 Ctr 316 158OTC-Dealt Derivatives Forward Foreign Exchange Transactions Sold AUD / Bought EUR 17 Feb 2012 AUD – 8,212,000.00Sold BRL / Bought USD 2 Mar 2012 BRL – 734,022.00Sold BRL / Bought USD 4 Jan 2012 BRL – 734,022.00Sold EUR / Bought AUD 17 Feb 2012 EUR – 845,192.00Sold EUR / Bought AUD 18 Nov 2011 EUR – 5,448,123.00Sold EUR / Bought GBP 17 Feb 2012 EUR – 4,391,001.00Sold EUR / Bought GBP 18 Nov 2011 EUR – 4,364,772.00Sold EUR / Bought NOK 17 Feb 2012 EUR – 6,203,848.00Sold EUR / Bought SGD 10 Feb 2012 EUR – 6,171,848.00Sold EUR / Bought USD 17 Feb 2012 EUR – 22,154,419.00Sold EUR / Bought USD 18 Nov 2011 EUR – 7,606,529.00Sold GBP / Bought EUR 17 Feb 2012 GBP – 3,660,000.00Sold KRW / Bought USD 14 Nov 2011 KRW – 105,533,320.00Sold KRW / Bought USD 27 Feb 2012 KRW – 211,066,640.00Sold MXN / Bought USD 15 Mar 2012 MXN – 1,931,345.00Sold MXN / Bought USD 18 Nov 2011 MXN – 1,931,345.00Sold NOK / Bought EUR 17 Feb 2012 NOK – 48,224,000.00Sold NOK / Bought EUR 18 Nov 2011 NOK – 39,312,000.00Sold SGD / Bought EUR 10 Feb 2012 SGD – 10,673,108.00Sold SGD / Bought EUR 9 Dec 2011 SGD – 9,606,540.00Sold USD / Bought BRL 2 Mar 2012 USD – 429,378.00Sold USD / Bought BRL 4 Jan 2012 USD – 401,764.00Sold USD / Bought CNY 1 Jun 2012 USD – 620,000.00Sold USD / Bought EUR 17 Feb 2012 USD – 6,225,000.00Sold USD / Bought EUR 18 May 2012 USD – 9,321,000.00Sold USD / Bought EUR 18 Nov 2011 USD – 6,520,913.00Sold USD / Bought KRW 27 Feb 2012 USD – 186,723.00Sold USD / Bought MXN 15 Mar 2012 USD – 142,753.00Options Transactions Sold Options on Interest Rate Swaps (Swaptions) Call [IRS R 3M / P 0.795% 1Y] Exp. 11.Oct.2012 USD 2,500,000.00 2,500,000.00Call [IRS R 6M / P 3.25% 30Y] Exp. 24.Oct.2011 EUR 3,900,000.00 Put [IRS R 3M / P 0.795% 1Y] Exp.11.Oct.2012 USD 2,500,000.00 2,500,000.00Put [IRS R 3M / P 0.915% 2Y] Exp. 14.Nov.2012 USD 6,400,000.00 6,400,000.00Put [IRS R 3M / P 0.915% 2Y] Exp. 14.Nov.2012 USD 6,400,000.00 6,400,000.00Put [IRS R 3M / P 2.250% 2Y] Exp. 24.Sep.2012 USD 8,600,000.00 Put [IRS R 3M / P 2.250% 2Y] Exp. 24.Sep.2012 USD 2,200,000.00 Put [IRS R 3M / P 2.250% 2Y] Exp. 24.Sep.2012 USD 3,800,000.00 Put [IRS R 6M / P 3.00% 2Y] Exp. 19.Sep.2012 EUR 8,000,000.00 Put [IRS R 6M / P 3.50% 2Y] Exp. 19.Sep.2012 EUR 5,400,000.00 Put [IRS R 6M / P 3.50% 2Y] Exp. 19.Sep.2012 EUR 700,000.00 Put [IRS R 6M / P 3.50% 2Y] Exp. 19.Sep.2012 EUR 3,300,000.00
Acquisitions and disposals of securities and money-market instruments (classification as per reporting date) as well as derivatives and deposits no longer held in the investment portfolio at the end of the reporting periodSecurities Shares resp. Currency
(in 1,000) resp. ContractsAcquisitions Disposals
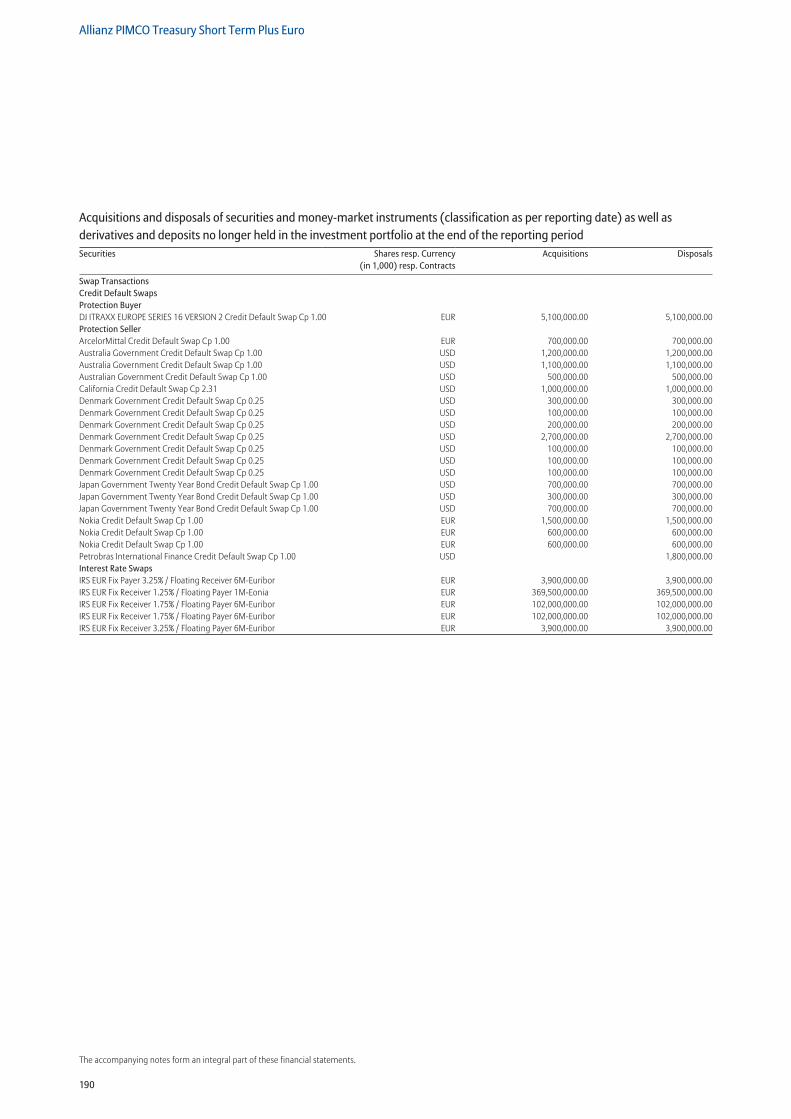
190
Allianz PIMCO Treasury Short Term Plus Euro
The accompanying notes form an integral part of these financial statements.
Swap Transactions Credit Default Swaps Protection Buyer DJ ITRAXX EUROPE SERIES 16 VERSION 2 Credit Default Swap Cp 1.00 EUR 5,100,000.00 5,100,000.00Protection Seller ArcelorMittal Credit Default Swap Cp 1.00 EUR 700,000.00 700,000.00Australia Government Credit Default Swap Cp 1.00 USD 1,200,000.00 1,200,000.00Australia Government Credit Default Swap Cp 1.00 USD 1,100,000.00 1,100,000.00Australian Government Credit Default Swap Cp 1.00 USD 500,000.00 500,000.00California Credit Default Swap Cp 2.31 USD 1,000,000.00 1,000,000.00Denmark Government Credit Default Swap Cp 0.25 USD 300,000.00 300,000.00Denmark Government Credit Default Swap Cp 0.25 USD 100,000.00 100,000.00Denmark Government Credit Default Swap Cp 0.25 USD 200,000.00 200,000.00Denmark Government Credit Default Swap Cp 0.25 USD 2,700,000.00 2,700,000.00Denmark Government Credit Default Swap Cp 0.25 USD 100,000.00 100,000.00Denmark Government Credit Default Swap Cp 0.25 USD 100,000.00 100,000.00Denmark Government Credit Default Swap Cp 0.25 USD 100,000.00 100,000.00Japan Government Twenty Year Bond Credit Default Swap Cp 1.00 USD 700,000.00 700,000.00Japan Government Twenty Year Bond Credit Default Swap Cp 1.00 USD 300,000.00 300,000.00Japan Government Twenty Year Bond Credit Default Swap Cp 1.00 USD 700,000.00 700,000.00Nokia Credit Default Swap Cp 1.00 EUR 1,500,000.00 1,500,000.00Nokia Credit Default Swap Cp 1.00 EUR 600,000.00 600,000.00Nokia Credit Default Swap Cp 1.00 EUR 600,000.00 600,000.00Petrobras International Finance Credit Default Swap Cp 1.00 USD 1,800,000.00Interest Rate Swaps IRS EUR Fix Payer 3.25% / Floating Receiver 6M-Euribor EUR 3,900,000.00 3,900,000.00IRS EUR Fix Receiver 1.25% / Floating Payer 1M-Eonia EUR 369,500,000.00 369,500,000.00IRS EUR Fix Receiver 1.75% / Floating Payer 6M-Euribor EUR 102,000,000.00 102,000,000.00IRS EUR Fix Receiver 1.75% / Floating Payer 6M-Euribor EUR 102,000,000.00 102,000,000.00IRS EUR Fix Receiver 3.25% / Floating Payer 6M-Euribor EUR 3,900,000.00 3,900,000.00
Acquisitions and disposals of securities and money-market instruments (classification as per reporting date) as well as derivatives and deposits no longer held in the investment portfolio at the end of the reporting periodSecurities Shares resp. Currency
(in 1,000) resp. ContractsAcquisitions Disposals
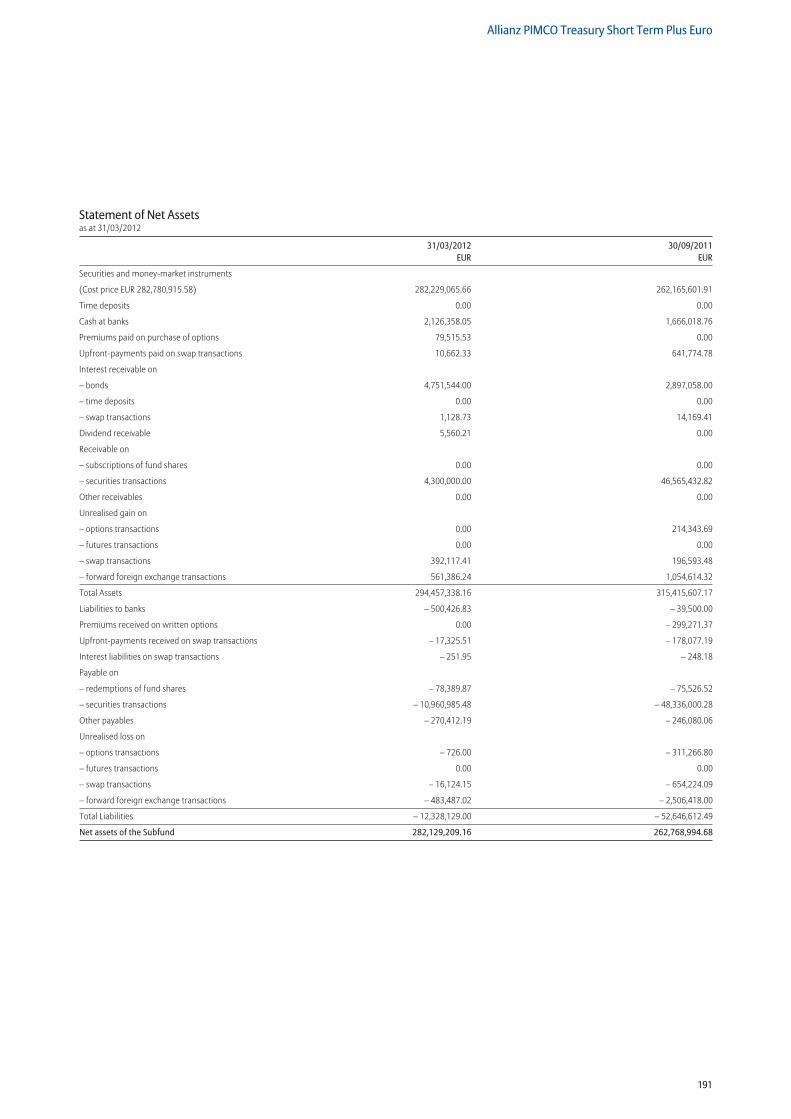
191
Allianz PIMCO Treasury Short Term Plus Euro
Statement of Net Assetsas at 31/03/2012
31/03/2012 30/09/2011 EUR EUR
Securities and money-market instruments
(Cost price EUR 282,780,915.58) 282,229,065.66 262,165,601.91
Time deposits 0.00 0.00
Cash at banks 2,126,358.05 1,666,018.76
Premiums paid on purchase of options 79,515.53 0.00
Upfront-payments paid on swap transactions 10,662.33 641,774.78
Interest receivable on
– bonds 4,751,544.00 2,897,058.00
– time deposits 0.00 0.00
– swap transactions 1,128.73 14,169.41
Dividend receivable 5,560.21 0.00
Receivable on
– subscriptions of fund shares 0.00 0.00
– securities transactions 4,300,000.00 46,565,432.82
Other receivables 0.00 0.00
Unrealised gain on
– options transactions 0.00 214,343.69
– futures transactions 0.00 0.00
– swap transactions 392,117.41 196,593.48
– forward foreign exchange transactions 561,386.24 1,054,614.32
Total Assets 294,457,338.16 315,415,607.17
Liabilities to banks – 500,426.83 – 39,500.00
Premiums received on written options 0.00 – 299,271.37
Upfront-payments received on swap transactions – 17,325.51 – 178,077.19
Interest liabilities on swap transactions – 251.95 – 248.18
Payable on
– redemptions of fund shares – 78,389.87 – 75,526.52
– securities transactions – 10,960,985.48 – 48,336,000.28
Other payables – 270,412.19 – 246,080.06
Unrealised loss on
– options transactions – 726.00 – 311,266.80
– futures transactions 0.00 0.00
– swap transactions – 16,124.15 – 654,224.09
– forward foreign exchange transactions – 483,487.02 – 2,506,418.00
Total Liabilities – 12,328,129.00 – 52,646,612.49
Net assets of the Subfund 282,129,209.16 262,768,994.68
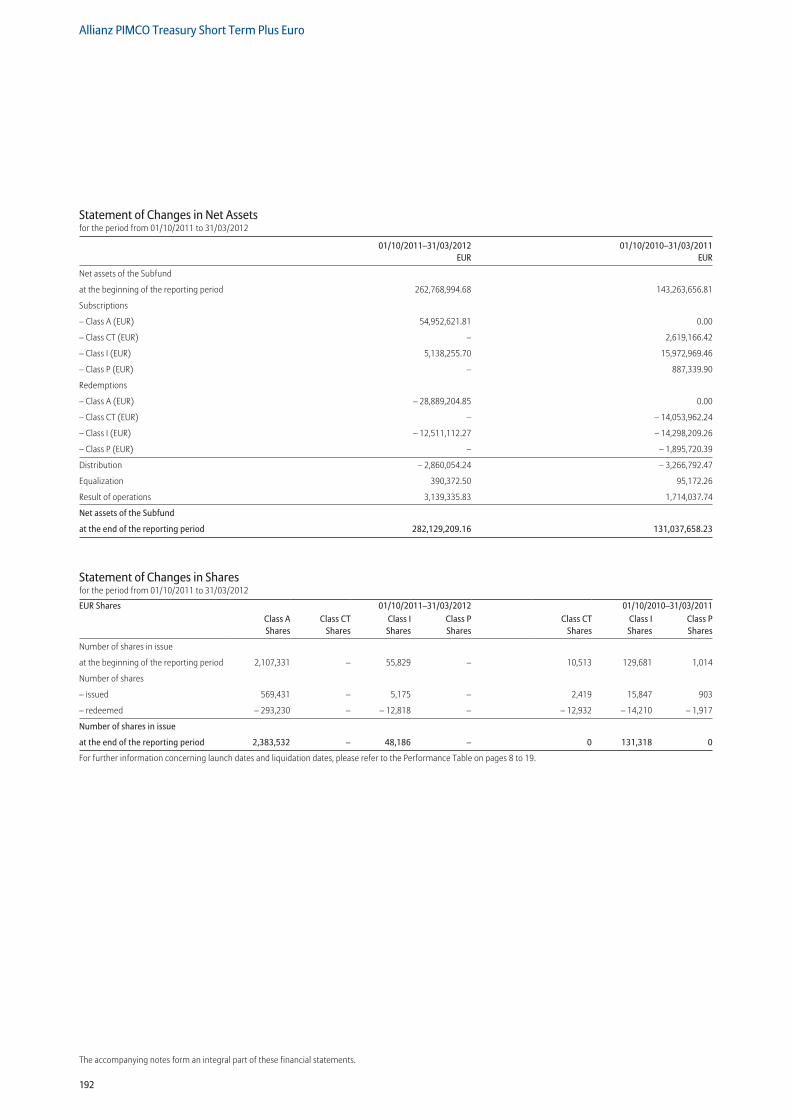
192
Allianz PIMCO Treasury Short Term Plus Euro
The accompanying notes form an integral part of these financial statements.
Statement of Changes in Net Assetsfor the period from 01/10/2011 to 31/03/2012
01/10/2011–31/03/2012 01/10/2010–31/03/2011 EUR EUR
Net assets of the Subfund
at the beginning of the reporting period 262,768,994.68 143,263,656.81
Subscriptions
– Class A (EUR) 54,952,621.81 0.00
– Class CT (EUR) – 2,619,166.42
– Class I (EUR) 5,138,255.70 15,972,969.46
– Class P (EUR) – 887,339.90
Redemptions
– Class A (EUR) – 28,889,204.85 0.00
– Class CT (EUR) – – 14,053,962.24
– Class I (EUR) – 12,511,112.27 – 14,298,209.26
– Class P (EUR) – – 1,895,720.39
Distribution – 2,860,054.24 – 3,266,792.47
Equalization 390,372.50 95,172.26
Result of operations 3,139,335.83 1,714,037.74
Net assets of the Subfund
at the end of the reporting period 282,129,209.16 131,037,658.23
Statement of Changes in Sharesfor the period from 01/10/2011 to 31/03/2012
EUR Shares 01/10/2011–31/03/2012 01/10/2010–31/03/2011Class A Shares
Class CT Shares
Class I Shares
Class P Shares
Class CT Shares
Class I Shares
Class P Shares
Number of shares in issue
at the beginning of the reporting period 2,107,331 – 55,829 – 10,513 129,681 1,014
Number of shares
– issued 569,431 – 5,175 – 2,419 15,847 903
– redeemed – 293,230 – – 12,818 – – 12,932 – 14,210 – 1,917
Number of shares in issue
at the end of the reporting period 2,383,532 – 48,186 – 0 131,318 0
For further information concerning launch dates and liquidation dates, please refer to the Performance Table on pages 8 to 19.
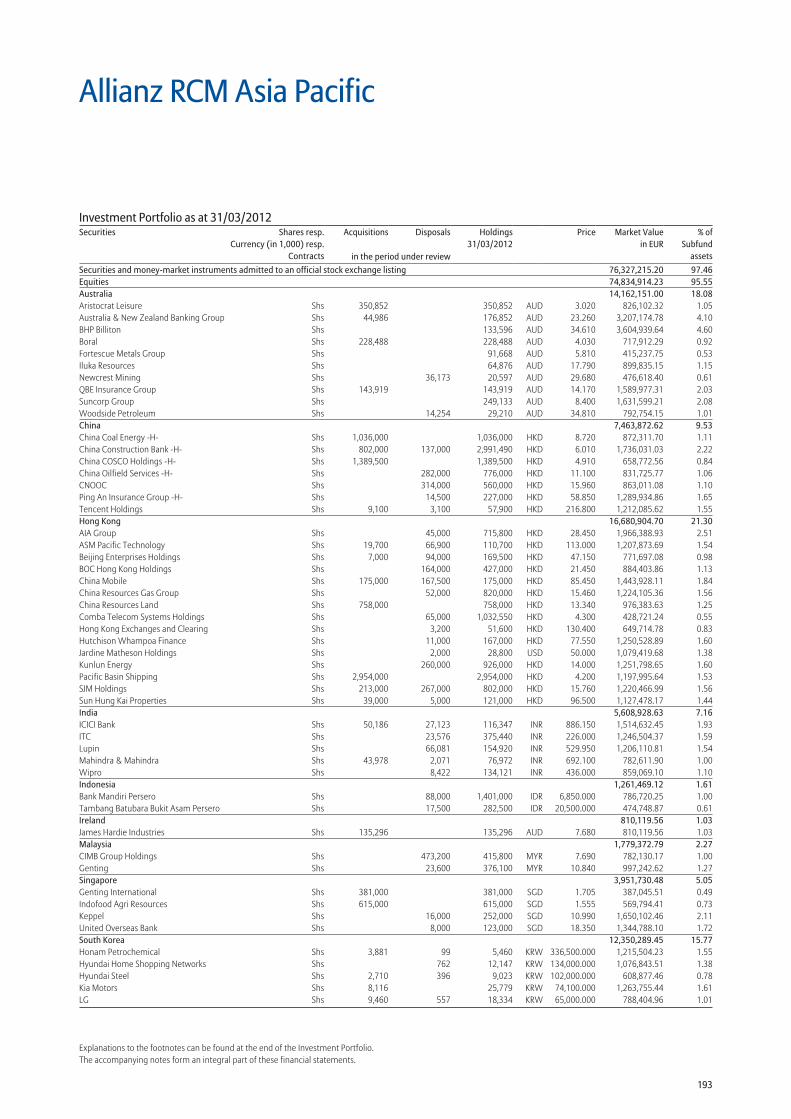
193
Explanations to the footnotes can be found at the end of the Investment Portfolio.The accompanying notes form an integral part of these financial statements.
Allianz RCM Asia Pacific
Securities and money-market instruments admitted to an official stock exchange listing 76,327,215.20 97.46Equities 74,834,914.23 95.55Australia 14,162,151.00 18.08Aristocrat Leisure Shs 350,852 350,852 AUD 3.020 826,102.32 1.05Australia & New Zealand Banking Group Shs 44,986 176,852 AUD 23.260 3,207,174.78 4.10BHP Billiton Shs 133,596 AUD 34.610 3,604,939.64 4.60Boral Shs 228,488 228,488 AUD 4.030 717,912.29 0.92Fortescue Metals Group Shs 91,668 AUD 5.810 415,237.75 0.53Iluka Resources Shs 64,876 AUD 17.790 899,835.15 1.15Newcrest Mining Shs 36,173 20,597 AUD 29.680 476,618.40 0.61QBE Insurance Group Shs 143,919 143,919 AUD 14.170 1,589,977.31 2.03Suncorp Group Shs 249,133 AUD 8.400 1,631,599.21 2.08Woodside Petroleum Shs 14,254 29,210 AUD 34.810 792,754.15 1.01China 7,463,872.62 9.53China Coal Energy -H- Shs 1,036,000 1,036,000 HKD 8.720 872,311.70 1.11China Construction Bank -H- Shs 802,000 137,000 2,991,490 HKD 6.010 1,736,031.03 2.22China COSCO Holdings -H- Shs 1,389,500 1,389,500 HKD 4.910 658,772.56 0.84China Oilfield Services -H- Shs 282,000 776,000 HKD 11.100 831,725.77 1.06CNOOC Shs 314,000 560,000 HKD 15.960 863,011.08 1.10Ping An Insurance Group -H- Shs 14,500 227,000 HKD 58.850 1,289,934.86 1.65Tencent Holdings Shs 9,100 3,100 57,900 HKD 216.800 1,212,085.62 1.55Hong Kong 16,680,904.70 21.30AIA Group Shs 45,000 715,800 HKD 28.450 1,966,388.93 2.51ASM Pacific Technology Shs 19,700 66,900 110,700 HKD 113.000 1,207,873.69 1.54Beijing Enterprises Holdings Shs 7,000 94,000 169,500 HKD 47.150 771,697.08 0.98BOC Hong Kong Holdings Shs 164,000 427,000 HKD 21.450 884,403.86 1.13China Mobile Shs 175,000 167,500 175,000 HKD 85.450 1,443,928.11 1.84China Resources Gas Group Shs 52,000 820,000 HKD 15.460 1,224,105.36 1.56China Resources Land Shs 758,000 758,000 HKD 13.340 976,383.63 1.25Comba Telecom Systems Holdings Shs 65,000 1,032,550 HKD 4.300 428,721.24 0.55Hong Kong Exchanges and Clearing Shs 3,200 51,600 HKD 130.400 649,714.78 0.83Hutchison Whampoa Finance Shs 11,000 167,000 HKD 77.550 1,250,528.89 1.60Jardine Matheson Holdings Shs 2,000 28,800 USD 50.000 1,079,419.68 1.38Kunlun Energy Shs 260,000 926,000 HKD 14.000 1,251,798.65 1.60Pacific Basin Shipping Shs 2,954,000 2,954,000 HKD 4.200 1,197,995.64 1.53SJM Holdings Shs 213,000 267,000 802,000 HKD 15.760 1,220,466.99 1.56Sun Hung Kai Properties Shs 39,000 5,000 121,000 HKD 96.500 1,127,478.17 1.44India 5,608,928.63 7.16ICICI Bank Shs 50,186 27,123 116,347 INR 886.150 1,514,632.45 1.93ITC Shs 23,576 375,440 INR 226.000 1,246,504.37 1.59Lupin Shs 66,081 154,920 INR 529.950 1,206,110.81 1.54Mahindra & Mahindra Shs 43,978 2,071 76,972 INR 692.100 782,611.90 1.00Wipro Shs 8,422 134,121 INR 436.000 859,069.10 1.10Indonesia 1,261,469.12 1.61Bank Mandiri Persero Shs 88,000 1,401,000 IDR 6,850.000 786,720.25 1.00Tambang Batubara Bukit Asam Persero Shs 17,500 282,500 IDR 20,500.000 474,748.87 0.61Ireland 810,119.56 1.03James Hardie Industries Shs 135,296 135,296 AUD 7.680 810,119.56 1.03Malaysia 1,779,372.79 2.27CIMB Group Holdings Shs 473,200 415,800 MYR 7.690 782,130.17 1.00Genting Shs 23,600 376,100 MYR 10.840 997,242.62 1.27Singapore 3,951,730.48 5.05Genting International Shs 381,000 381,000 SGD 1.705 387,045.51 0.49Indofood Agri Resources Shs 615,000 615,000 SGD 1.555 569,794.41 0.73Keppel Shs 16,000 252,000 SGD 10.990 1,650,102.46 2.11United Overseas Bank Shs 8,000 123,000 SGD 18.350 1,344,788.10 1.72South Korea 12,350,289.45 15.77Honam Petrochemical Shs 3,881 99 5,460 KRW 336,500.000 1,215,504.23 1.55Hyundai Home Shopping Networks Shs 762 12,147 KRW 134,000.000 1,076,843.51 1.38Hyundai Steel Shs 2,710 396 9,023 KRW 102,000.000 608,877.46 0.78Kia Motors Shs 8,116 25,779 KRW 74,100.000 1,263,755.44 1.61LG Shs 9,460 557 18,334 KRW 65,000.000 788,404.96 1.01
Investment Portfolio as at 31/03/2012Securities Shares resp.
Currency (in 1,000) resp.Contracts
Acquisitions Disposals Holdings 31/03/2012
Price Market Valuein EUR
% ofSubfund
assetsin the period under review
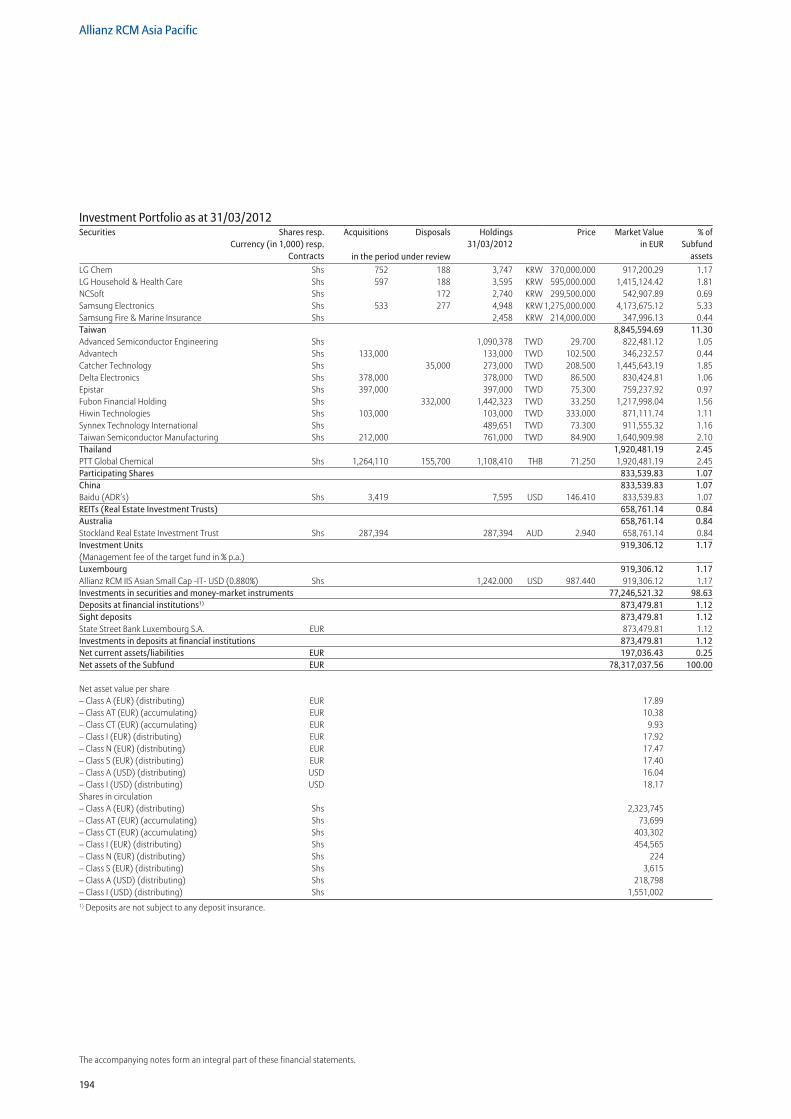
194
Allianz RCM Asia Pacific
The accompanying notes form an integral part of these financial statements.
LG Chem Shs 752 188 3,747 KRW 370,000.000 917,200.29 1.17LG Household & Health Care Shs 597 188 3,595 KRW 595,000.000 1,415,124.42 1.81NCSoft Shs 172 2,740 KRW 299,500.000 542,907.89 0.69Samsung Electronics Shs 533 277 4,948 KRW 1,275,000.000 4,173,675.12 5.33Samsung Fire & Marine Insurance Shs 2,458 KRW 214,000.000 347,996.13 0.44Taiwan 8,845,594.69 11.30Advanced Semiconductor Engineering Shs 1,090,378 TWD 29.700 822,481.12 1.05Advantech Shs 133,000 133,000 TWD 102.500 346,232.57 0.44Catcher Technology Shs 35,000 273,000 TWD 208.500 1,445,643.19 1.85Delta Electronics Shs 378,000 378,000 TWD 86.500 830,424.81 1.06Epistar Shs 397,000 397,000 TWD 75.300 759,237.92 0.97Fubon Financial Holding Shs 332,000 1,442,323 TWD 33.250 1,217,998.04 1.56Hiwin Technologies Shs 103,000 103,000 TWD 333.000 871,111.74 1.11Synnex Technology International Shs 489,651 TWD 73.300 911,555.32 1.16Taiwan Semiconductor Manufacturing Shs 212,000 761,000 TWD 84.900 1,640,909.98 2.10Thailand 1,920,481.19 2.45PTT Global Chemical Shs 1,264,110 155,700 1,108,410 THB 71.250 1,920,481.19 2.45Participating Shares 833,539.83 1.07China 833,539.83 1.07Baidu (ADR’s) Shs 3,419 7,595 USD 146.410 833,539.83 1.07REITs (Real Estate Investment Trusts) 658,761.14 0.84Australia 658,761.14 0.84Stockland Real Estate Investment Trust Shs 287,394 287,394 AUD 2.940 658,761.14 0.84Investment Units 919,306.12 1.17(Management fee of the target fund in % p.a.) Luxembourg 919,306.12 1.17Allianz RCM IIS Asian Small Cap -IT- USD (0.880%) Shs 1,242.000 USD 987.440 919,306.12 1.17Investments in securities and money-market instruments 77,246,521.32 98.63Deposits at financial institutions1) 873,479.81 1.12Sight deposits 873,479.81 1.12State Street Bank Luxembourg S.A. EUR 873,479.81 1.12Investments in deposits at financial institutions 873,479.81 1.12Net current assets/liabilities EUR 197,036.43 0.25Net assets of the Subfund EUR 78,317,037.56 100.00
Net asset value per share – Class A (EUR) (distributing) EUR 17.89 – Class AT (EUR) (accumulating) EUR 10.38 – Class CT (EUR) (accumulating) EUR 9.93 – Class I (EUR) (distributing) EUR 17.92 – Class N (EUR) (distributing) EUR 17.47 – Class S (EUR) (distributing) EUR 17.40 – Class A (USD) (distributing) USD 16.04 – Class I (USD) (distributing) USD 18.17Shares in circulation – Class A (EUR) (distributing) Shs 2,323,745– Class AT (EUR) (accumulating) Shs 73,699– Class CT (EUR) (accumulating) Shs 403,302– Class I (EUR) (distributing) Shs 454,565– Class N (EUR) (distributing) Shs 224– Class S (EUR) (distributing) Shs 3,615– Class A (USD) (distributing) Shs 218,798– Class I (USD) (distributing) Shs 1,551,0021) Deposits are not subject to any deposit insurance.
Investment Portfolio as at 31/03/2012Securities Shares resp.
Currency (in 1,000) resp.Contracts
Acquisitions Disposals Holdings 31/03/2012
Price Market Valuein EUR
% ofSubfund
assetsin the period under review
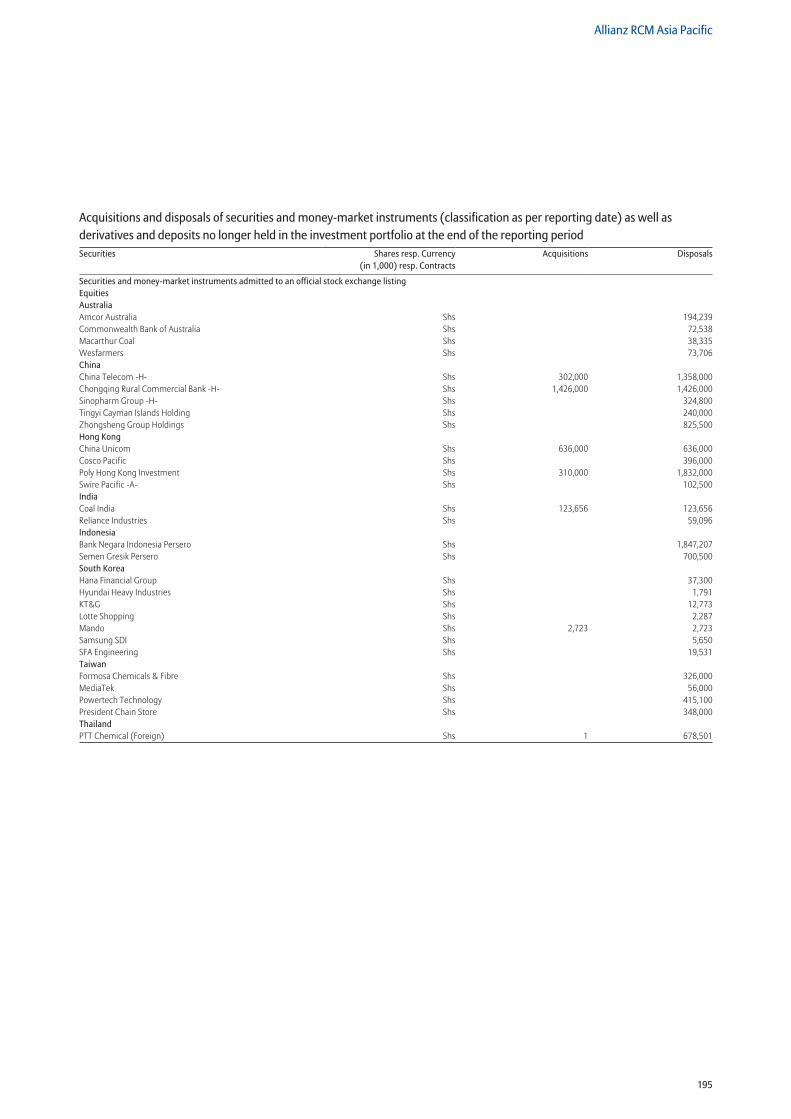
195
Allianz RCM Asia Pacific
Securities and money-market instruments admitted to an official stock exchange listing Equities Australia Amcor Australia Shs 194,239Commonwealth Bank of Australia Shs 72,538Macarthur Coal Shs 38,335Wesfarmers Shs 73,706China China Telecom -H- Shs 302,000 1,358,000Chongqing Rural Commercial Bank -H- Shs 1,426,000 1,426,000Sinopharm Group -H- Shs 324,800Tingyi Cayman Islands Holding Shs 240,000Zhongsheng Group Holdings Shs 825,500Hong Kong China Unicom Shs 636,000 636,000Cosco Pacific Shs 396,000Poly Hong Kong Investment Shs 310,000 1,832,000Swire Pacific -A- Shs 102,500India Coal India Shs 123,656 123,656Reliance Industries Shs 59,096Indonesia Bank Negara Indonesia Persero Shs 1,847,207Semen Gresik Persero Shs 700,500South Korea Hana Financial Group Shs 37,300Hyundai Heavy Industries Shs 1,791KT&G Shs 12,773Lotte Shopping Shs 2,287Mando Shs 2,723 2,723Samsung SDI Shs 5,650SFA Engineering Shs 19,531Taiwan Formosa Chemicals & Fibre Shs 326,000MediaTek Shs 56,000Powertech Technology Shs 415,100President Chain Store Shs 348,000Thailand PTT Chemical (Foreign) Shs 1 678,501
Acquisitions and disposals of securities and money-market instruments (classification as per reporting date) as well as derivatives and deposits no longer held in the investment portfolio at the end of the reporting periodSecurities Shares resp. Currency
(in 1,000) resp. ContractsAcquisitions Disposals
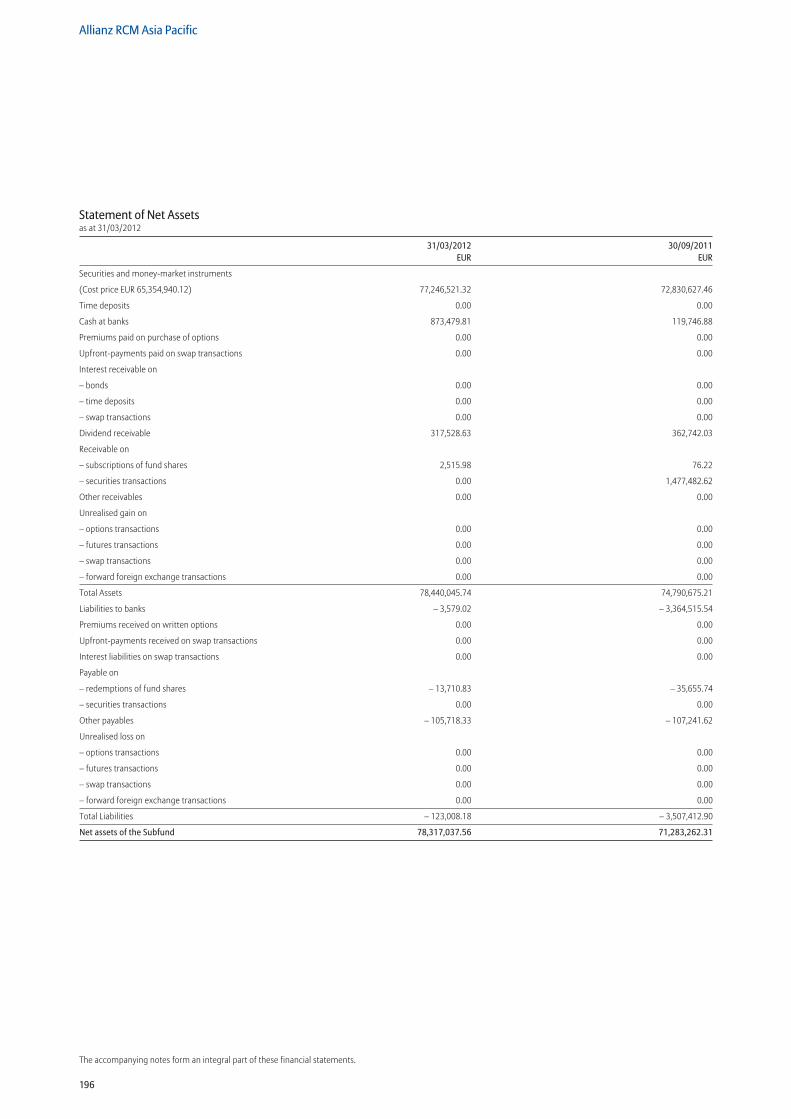
196
Allianz RCM Asia Pacific
The accompanying notes form an integral part of these financial statements.
Statement of Net Assetsas at 31/03/2012
31/03/2012 30/09/2011 EUR EUR
Securities and money-market instruments
(Cost price EUR 65,354,940.12) 77,246,521.32 72,830,627.46
Time deposits 0.00 0.00
Cash at banks 873,479.81 119,746.88
Premiums paid on purchase of options 0.00 0.00
Upfront-payments paid on swap transactions 0.00 0.00
Interest receivable on
– bonds 0.00 0.00
– time deposits 0.00 0.00
– swap transactions 0.00 0.00
Dividend receivable 317,528.63 362,742.03
Receivable on
– subscriptions of fund shares 2,515.98 76.22
– securities transactions 0.00 1,477,482.62
Other receivables 0.00 0.00
Unrealised gain on
– options transactions 0.00 0.00
– futures transactions 0.00 0.00
– swap transactions 0.00 0.00
– forward foreign exchange transactions 0.00 0.00
Total Assets 78,440,045.74 74,790,675.21
Liabilities to banks – 3,579.02 – 3,364,515.54
Premiums received on written options 0.00 0.00
Upfront-payments received on swap transactions 0.00 0.00
Interest liabilities on swap transactions 0.00 0.00
Payable on
– redemptions of fund shares – 13,710.83 – 35,655.74
– securities transactions 0.00 0.00
Other payables – 105,718.33 – 107,241.62
Unrealised loss on
– options transactions 0.00 0.00
– futures transactions 0.00 0.00
– swap transactions 0.00 0.00
– forward foreign exchange transactions 0.00 0.00
Total Liabilities – 123,008.18 – 3,507,412.90
Net assets of the Subfund 78,317,037.56 71,283,262.31
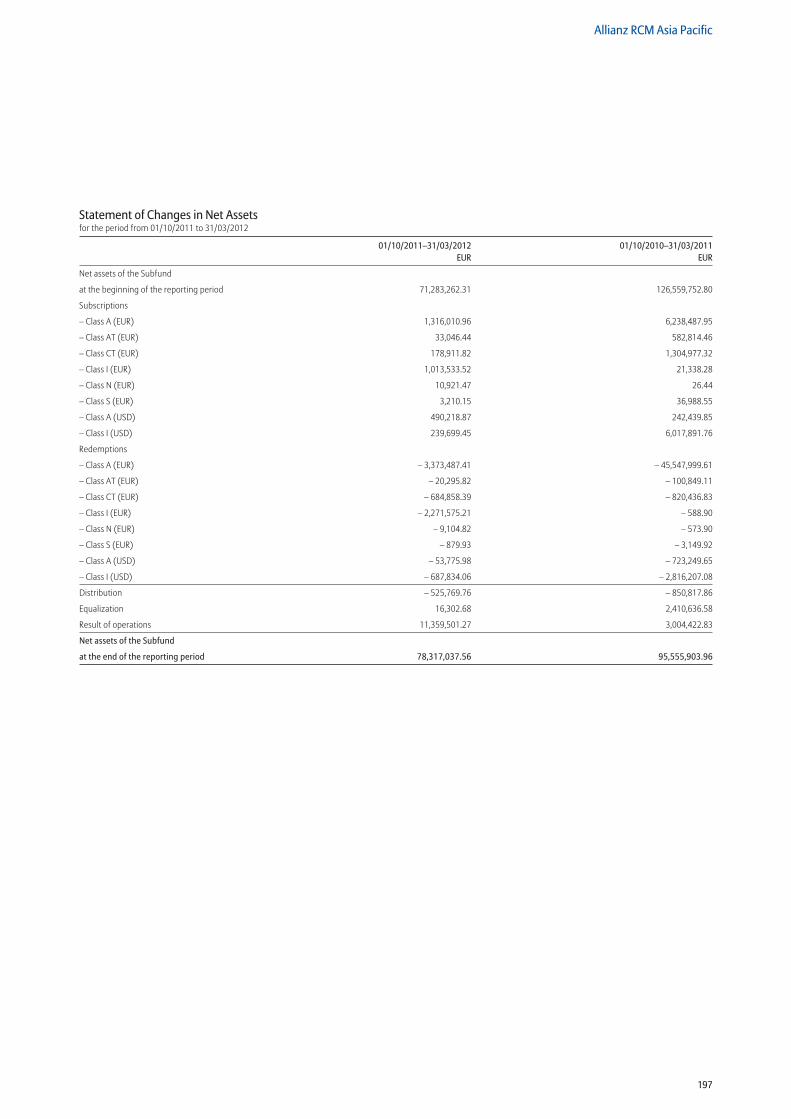
197
Allianz RCM Asia Pacific
Statement of Changes in Net Assetsfor the period from 01/10/2011 to 31/03/2012
01/10/2011–31/03/2012 01/10/2010–31/03/2011 EUR EUR
Net assets of the Subfund
at the beginning of the reporting period 71,283,262.31 126,559,752.80
Subscriptions
– Class A (EUR) 1,316,010.96 6,238,487.95
– Class AT (EUR) 33,046.44 582,814.46
– Class CT (EUR) 178,911.82 1,304,977.32
– Class I (EUR) 1,013,533.52 21,338.28
– Class N (EUR) 10,921.47 26.44
– Class S (EUR) 3,210.15 36,988.55
– Class A (USD) 490,218.87 242,439.85
– Class I (USD) 239,699.45 6,017,891.76
Redemptions
– Class A (EUR) – 3,373,487.41 – 45,547,999.61
– Class AT (EUR) – 20,295.82 – 100,849.11
– Class CT (EUR) – 684,858.39 – 820,436.83
– Class I (EUR) – 2,271,575.21 – 588.90
– Class N (EUR) – 9,104.82 – 573.90
– Class S (EUR) – 879.93 – 3,149.92
– Class A (USD) – 53,775.98 – 723,249.65
– Class I (USD) – 687,834.06 – 2,816,207.08
Distribution – 525,769.76 – 850,817.86
Equalization 16,302.68 2,410,636.58
Result of operations 11,359,501.27 3,004,422.83
Net assets of the Subfund
at the end of the reporting period 78,317,037.56 95,555,903.96
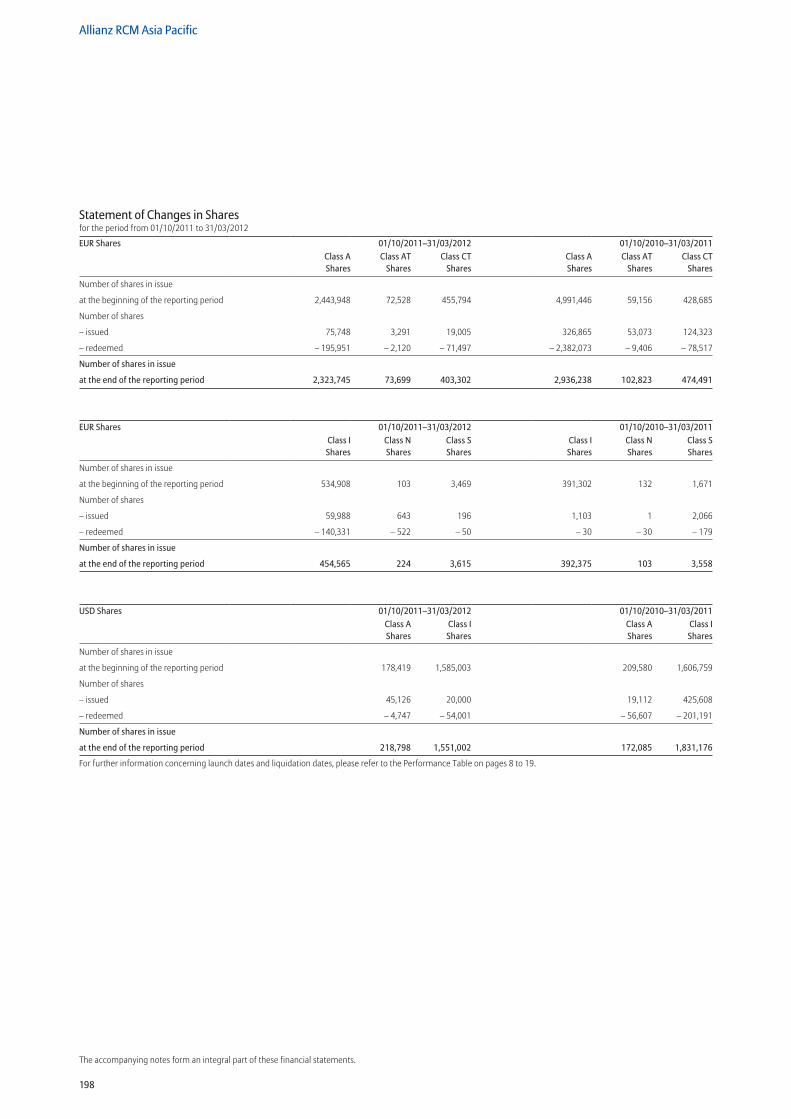
198
Allianz RCM Asia Pacific
The accompanying notes form an integral part of these financial statements.
Statement of Changes in Sharesfor the period from 01/10/2011 to 31/03/2012
EUR Shares 01/10/2011–31/03/2012 01/10/2010–31/03/2011Class A Shares
Class AT Shares
Class CT Shares
Class A Shares
Class AT Shares
Class CT Shares
Number of shares in issue
at the beginning of the reporting period 2,443,948 72,528 455,794 4,991,446 59,156 428,685
Number of shares
– issued 75,748 3,291 19,005 326,865 53,073 124,323
– redeemed – 195,951 – 2,120 – 71,497 – 2,382,073 – 9,406 – 78,517
Number of shares in issue
at the end of the reporting period 2,323,745 73,699 403,302 2,936,238 102,823 474,491
EUR Shares 01/10/2011–31/03/2012 01/10/2010–31/03/2011Class I
SharesClass N Shares
Class S Shares
Class I Shares
Class N Shares
Class S Shares
Number of shares in issue
at the beginning of the reporting period 534,908 103 3,469 391,302 132 1,671
Number of shares
– issued 59,988 643 196 1,103 1 2,066
– redeemed – 140,331 – 522 – 50 – 30 – 30 – 179
Number of shares in issue
at the end of the reporting period 454,565 224 3,615 392,375 103 3,558
USD Shares 01/10/2011–31/03/2012 01/10/2010–31/03/2011Class A Shares
Class I Shares
Class A Shares
Class I Shares
Number of shares in issue
at the beginning of the reporting period 178,419 1,585,003 209,580 1,606,759
Number of shares
– issued 45,126 20,000 19,112 425,608
– redeemed – 4,747 – 54,001 – 56,607 – 201,191
Number of shares in issue
at the end of the reporting period 218,798 1,551,002 172,085 1,831,176
For further information concerning launch dates and liquidation dates, please refer to the Performance Table on pages 8 to 19.
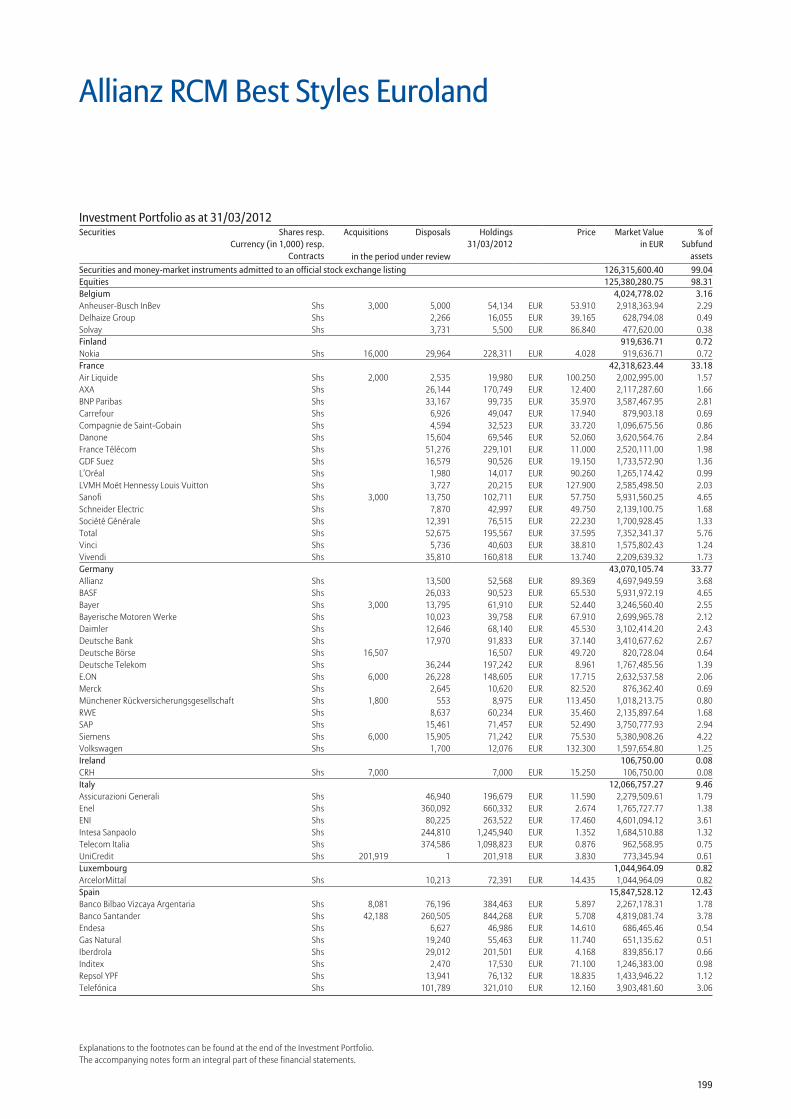
199
Explanations to the footnotes can be found at the end of the Investment Portfolio.The accompanying notes form an integral part of these financial statements.
Securities and money-market instruments admitted to an official stock exchange listing 126,315,600.40 99.04Equities 125,380,280.75 98.31Belgium 4,024,778.02 3.16Anheuser-Busch InBev Shs 3,000 5,000 54,134 EUR 53.910 2,918,363.94 2.29Delhaize Group Shs 2,266 16,055 EUR 39.165 628,794.08 0.49Solvay Shs 3,731 5,500 EUR 86.840 477,620.00 0.38Finland 919,636.71 0.72Nokia Shs 16,000 29,964 228,311 EUR 4.028 919,636.71 0.72France 42,318,623.44 33.18Air Liquide Shs 2,000 2,535 19,980 EUR 100.250 2,002,995.00 1.57AXA Shs 26,144 170,749 EUR 12.400 2,117,287.60 1.66BNP Paribas Shs 33,167 99,735 EUR 35.970 3,587,467.95 2.81Carrefour Shs 6,926 49,047 EUR 17.940 879,903.18 0.69Compagnie de Saint-Gobain Shs 4,594 32,523 EUR 33.720 1,096,675.56 0.86Danone Shs 15,604 69,546 EUR 52.060 3,620,564.76 2.84France Télécom Shs 51,276 229,101 EUR 11.000 2,520,111.00 1.98GDF Suez Shs 16,579 90,526 EUR 19.150 1,733,572.90 1.36L’Oréal Shs 1,980 14,017 EUR 90.260 1,265,174.42 0.99LVMH Moët Hennessy Louis Vuitton Shs 3,727 20,215 EUR 127.900 2,585,498.50 2.03Sanofi Shs 3,000 13,750 102,711 EUR 57.750 5,931,560.25 4.65Schneider Electric Shs 7,870 42,997 EUR 49.750 2,139,100.75 1.68Société Générale Shs 12,391 76,515 EUR 22.230 1,700,928.45 1.33Total Shs 52,675 195,567 EUR 37.595 7,352,341.37 5.76Vinci Shs 5,736 40,603 EUR 38.810 1,575,802.43 1.24Vivendi Shs 35,810 160,818 EUR 13.740 2,209,639.32 1.73Germany 43,070,105.74 33.77Allianz Shs 13,500 52,568 EUR 89.369 4,697,949.59 3.68BASF Shs 26,033 90,523 EUR 65.530 5,931,972.19 4.65Bayer Shs 3,000 13,795 61,910 EUR 52.440 3,246,560.40 2.55Bayerische Motoren Werke Shs 10,023 39,758 EUR 67.910 2,699,965.78 2.12Daimler Shs 12,646 68,140 EUR 45.530 3,102,414.20 2.43Deutsche Bank Shs 17,970 91,833 EUR 37.140 3,410,677.62 2.67Deutsche Börse Shs 16,507 16,507 EUR 49.720 820,728.04 0.64Deutsche Telekom Shs 36,244 197,242 EUR 8.961 1,767,485.56 1.39E.ON Shs 6,000 26,228 148,605 EUR 17.715 2,632,537.58 2.06Merck Shs 2,645 10,620 EUR 82.520 876,362.40 0.69Münchener Rückversicherungsgesellschaft Shs 1,800 553 8,975 EUR 113.450 1,018,213.75 0.80RWE Shs 8,637 60,234 EUR 35.460 2,135,897.64 1.68SAP Shs 15,461 71,457 EUR 52.490 3,750,777.93 2.94Siemens Shs 6,000 15,905 71,242 EUR 75.530 5,380,908.26 4.22Volkswagen Shs 1,700 12,076 EUR 132.300 1,597,654.80 1.25Ireland 106,750.00 0.08CRH Shs 7,000 7,000 EUR 15.250 106,750.00 0.08Italy 12,066,757.27 9.46Assicurazioni Generali Shs 46,940 196,679 EUR 11.590 2,279,509.61 1.79Enel Shs 360,092 660,332 EUR 2.674 1,765,727.77 1.38ENI Shs 80,225 263,522 EUR 17.460 4,601,094.12 3.61Intesa Sanpaolo Shs 244,810 1,245,940 EUR 1.352 1,684,510.88 1.32Telecom Italia Shs 374,586 1,098,823 EUR 0.876 962,568.95 0.75UniCredit Shs 201,919 1 201,918 EUR 3.830 773,345.94 0.61Luxembourg 1,044,964.09 0.82ArcelorMittal Shs 10,213 72,391 EUR 14.435 1,044,964.09 0.82Spain 15,847,528.12 12.43Banco Bilbao Vizcaya Argentaria Shs 8,081 76,196 384,463 EUR 5.897 2,267,178.31 1.78Banco Santander Shs 42,188 260,505 844,268 EUR 5.708 4,819,081.74 3.78Endesa Shs 6,627 46,986 EUR 14.610 686,465.46 0.54Gas Natural Shs 19,240 55,463 EUR 11.740 651,135.62 0.51Iberdrola Shs 29,012 201,501 EUR 4.168 839,856.17 0.66Inditex Shs 2,470 17,530 EUR 71.100 1,246,383.00 0.98Repsol YPF Shs 13,941 76,132 EUR 18.835 1,433,946.22 1.12Telefónica Shs 101,789 321,010 EUR 12.160 3,903,481.60 3.06
Allianz RCM Best Styles Euroland
Investment Portfolio as at 31/03/2012Securities Shares resp.
Currency (in 1,000) resp.Contracts
Acquisitions Disposals Holdings 31/03/2012
Price Market Valuein EUR
% ofSubfund
assetsin the period under review
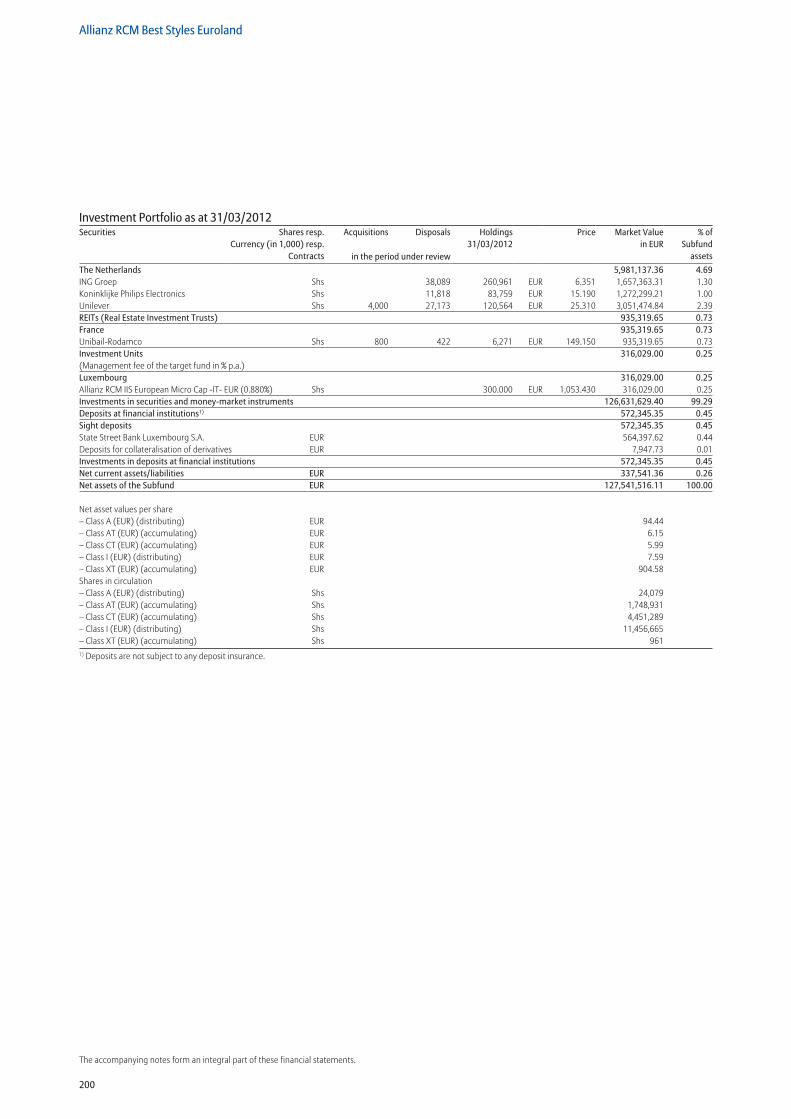
200
Allianz RCM Best Styles Euroland
The accompanying notes form an integral part of these financial statements.
The Netherlands 5,981,137.36 4.69ING Groep Shs 38,089 260,961 EUR 6.351 1,657,363.31 1.30Koninklijke Philips Electronics Shs 11,818 83,759 EUR 15.190 1,272,299.21 1.00Unilever Shs 4,000 27,173 120,564 EUR 25.310 3,051,474.84 2.39REITs (Real Estate Investment Trusts) 935,319.65 0.73France 935,319.65 0.73Unibail-Rodamco Shs 800 422 6,271 EUR 149.150 935,319.65 0.73Investment Units 316,029.00 0.25(Management fee of the target fund in % p.a.)Luxembourg 316,029.00 0.25Allianz RCM IIS European Micro Cap -IT- EUR (0.880%) Shs 300.000 EUR 1,053.430 316,029.00 0.25Investments in securities and money-market instruments 126,631,629.40 99.29Deposits at financial institutions1) 572,345.35 0.45Sight deposits 572,345.35 0.45State Street Bank Luxembourg S.A. EUR 564,397.62 0.44Deposits for collateralisation of derivatives EUR 7,947.73 0.01Investments in deposits at financial institutions 572,345.35 0.45Net current assets/liabilities EUR 337,541.36 0.26Net assets of the Subfund EUR 127,541,516.11 100.00
Net asset values per share – Class A (EUR) (distributing) EUR 94.44 – Class AT (EUR) (accumulating) EUR 6.15 – Class CT (EUR) (accumulating) EUR 5.99 – Class I (EUR) (distributing) EUR 7.59 – Class XT (EUR) (accumulating) EUR 904.58 Shares in circulation – Class A (EUR) (distributing) Shs 24,079 – Class AT (EUR) (accumulating) Shs 1,748,931 – Class CT (EUR) (accumulating) Shs 4,451,289 – Class I (EUR) (distributing) Shs 11,456,665 – Class XT (EUR) (accumulating) Shs 9611) Deposits are not subject to any deposit insurance.
Investment Portfolio as at 31/03/2012Securities Shares resp.
Currency (in 1,000) resp.Contracts
Acquisitions Disposals Holdings 31/03/2012
Price Market Valuein EUR
% ofSubfund
assetsin the period under review
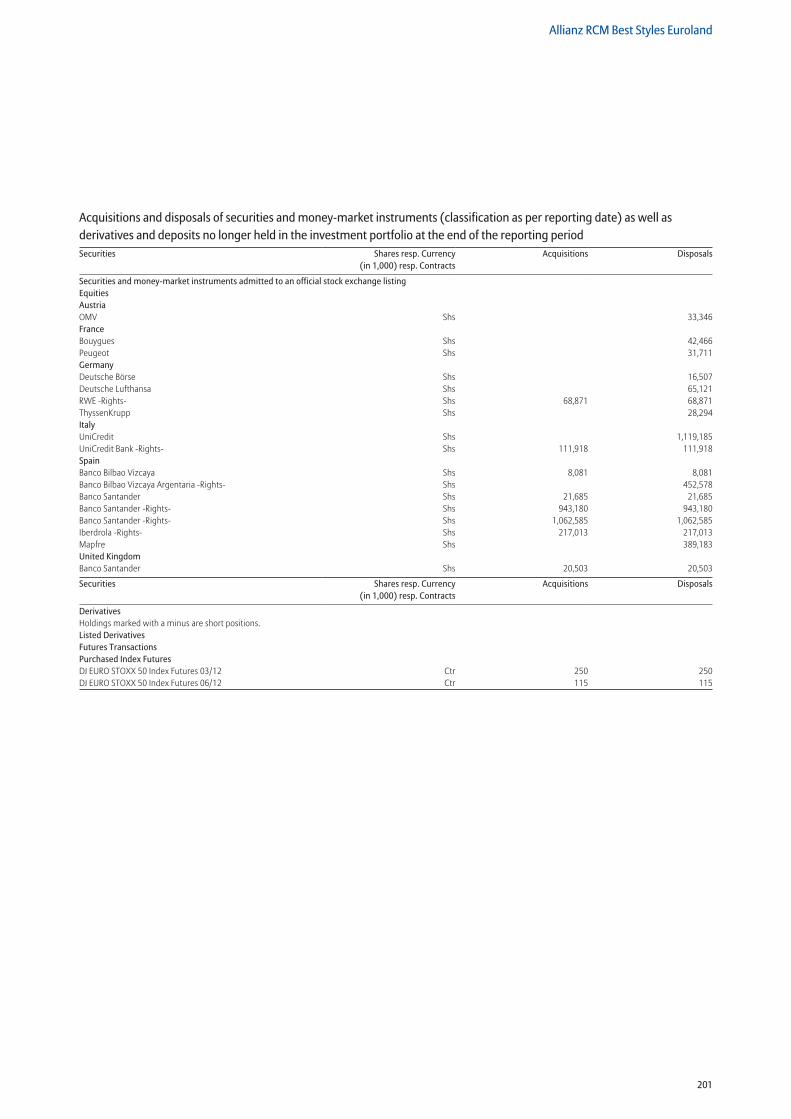
201
Allianz RCM Best Styles Euroland
Securities and money-market instruments admitted to an official stock exchange listing Equities Austria OMV Shs 33,346France Bouygues Shs 42,466Peugeot Shs 31,711Germany Deutsche Börse Shs 16,507Deutsche Lufthansa Shs 65,121RWE -Rights- Shs 68,871 68,871ThyssenKrupp Shs 28,294Italy UniCredit Shs 1,119,185UniCredit Bank -Rights- Shs 111,918 111,918Spain Banco Bilbao Vizcaya Shs 8,081 8,081Banco Bilbao Vizcaya Argentaria -Rights- Shs 452,578Banco Santander Shs 21,685 21,685Banco Santander -Rights- Shs 943,180 943,180Banco Santander -Rights- Shs 1,062,585 1,062,585Iberdrola -Rights- Shs 217,013 217,013Mapfre Shs 389,183United Kingdom Banco Santander Shs 20,503 20,503
Securities Shares resp. Currency (in 1,000) resp. Contracts
Acquisitions Disposals
Derivatives Holdings marked with a minus are short positions. Listed Derivatives Futures Transactions Purchased Index Futures DJ EURO STOXX 50 Index Futures 03/12 Ctr 250 250DJ EURO STOXX 50 Index Futures 06/12 Ctr 115 115
Acquisitions and disposals of securities and money-market instruments (classification as per reporting date) as well as derivatives and deposits no longer held in the investment portfolio at the end of the reporting periodSecurities Shares resp. Currency
(in 1,000) resp. ContractsAcquisitions Disposals

202
Allianz RCM Best Styles Euroland
The accompanying notes form an integral part of these financial statements.
Statement of Net Assetsas at 31/03/2012
31/03/2012 30/09/2011 EUR EUR
Securities and money-market instruments
(Cost price EUR 148,626,526.28) 126,631,629.40 140,416,063.48
Time deposits 0.00 0.00
Cash at banks 572,345.35 60,663.48
Premiums paid on purchase of options 0.00 0.00
Upfront-payments paid on swap transactions 0.00 0.00
Interest receivable on
– bonds 0.00 0.00
– time deposits 0.00 0.00
– swap transactions 0.00 0.00
Dividend receivable 451,347.69 531,026.77
Receivable on
– subscriptions of fund shares 2,524.82 15,024.77
– securities transactions 0.00 0.00
Other receivables 0.00 0.00
Unrealised gain on
– options transactions 0.00 0.00
– futures transactions 0.00 0.00
– swap transactions 0.00 0.00
– forward foreign exchange transactions 0.00 0.00
Total Assets 127,657,847.26 141,022,778.50
Liabilities to banks 0.00 0.00
Premiums received on written options 0.00 0.00
Upfront-payments received on swap transactions 0.00 0.00
Interest liabilities on swap transactions 0.00 0.00
Payable on
– redemptions of fund shares – 1,483.69 – 2,719.82
– securities transactions 0.00 0.00
Other payables – 114,847.46 – 114,297.50
Unrealised loss on
– options transactions 0.00 0.00
– futures transactions 0.00 0.00
– swap transactions 0.00 0.00
– forward foreign exchange transactions 0.00 0.00
Total Liabilities – 116,331.15 – 117,017.32
Net assets of the Subfund 127,541,516.11 140,905,761.18
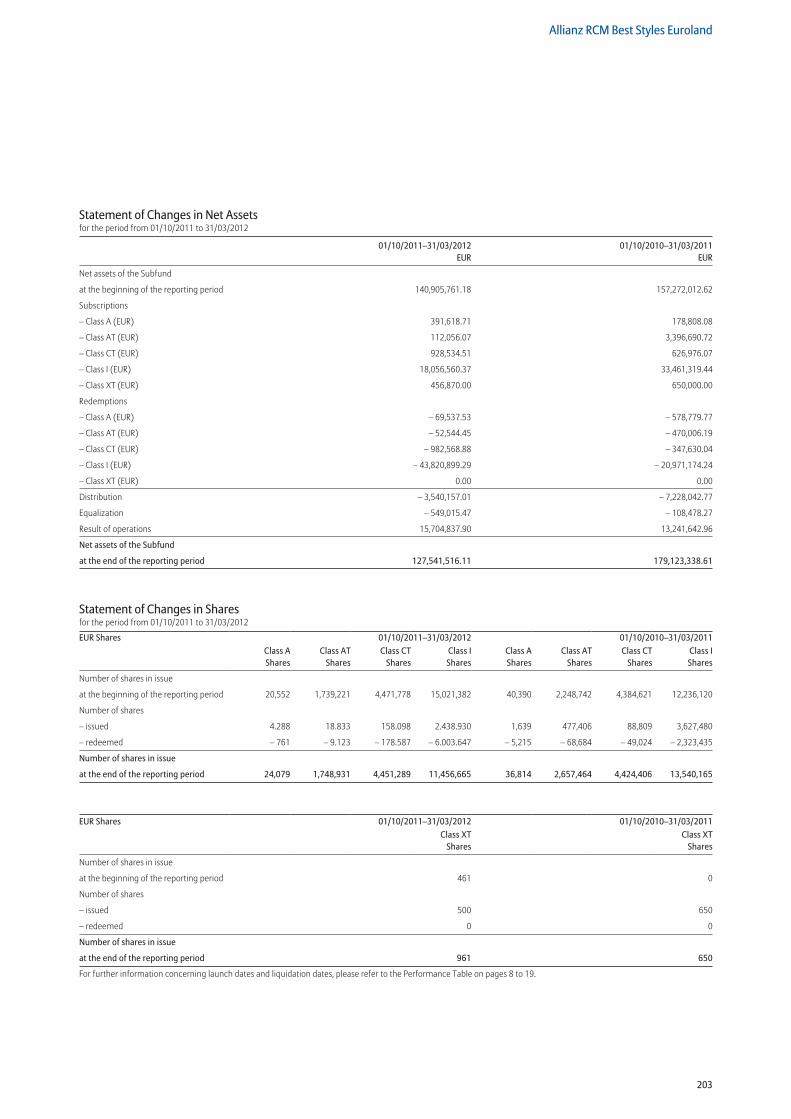
203
Allianz RCM Best Styles Euroland
Statement of Changes in Net Assetsfor the period from 01/10/2011 to 31/03/2012
01/10/2011–31/03/2012 01/10/2010–31/03/2011 EUR EUR
Net assets of the Subfund
at the beginning of the reporting period 140,905,761.18 157,272,012.62
Subscriptions
– Class A (EUR) 391,618.71 178,808.08
– Class AT (EUR) 112,056.07 3,396,690.72
– Class CT (EUR) 928,534.51 626,976.07
– Class I (EUR) 18,056,560.37 33,461,319.44
– Class XT (EUR) 456,870.00 650,000.00
Redemptions
– Class A (EUR) – 69,537.53 – 578,779.77
– Class AT (EUR) – 52,544.45 – 470,006.19
– Class CT (EUR) – 982,568.88 – 347,630.04
– Class I (EUR) – 43,820,899.29 – 20,971,174.24
– Class XT (EUR) 0.00 0.00
Distribution – 3,540,157.01 – 7,228,042.77
Equalization – 549,015.47 – 108,478.27
Result of operations 15,704,837.90 13,241,642.96
Net assets of the Subfund
at the end of the reporting period 127,541,516.11 179,123,338.61
Statement of Changes in Sharesfor the period from 01/10/2011 to 31/03/2012
EUR Shares 01/10/2011–31/03/2012 01/10/2010–31/03/2011Class A Shares
Class AT Shares
Class CT Shares
Class I Shares
Class A Shares
Class AT Shares
Class CT Shares
Class I Shares
Number of shares in issue
at the beginning of the reporting period 20,552 1,739,221 4,471,778 15,021,382 40,390 2,248,742 4,384,621 12,236,120
Number of shares
– issued 4.288 18.833 158.098 2.438.930 1,639 477,406 88,809 3,627,480
– redeemed – 761 – 9.123 – 178.587 – 6.003.647 – 5,215 – 68,684 – 49,024 – 2,323,435
Number of shares in issue
at the end of the reporting period 24,079 1,748,931 4,451,289 11,456,665 36,814 2,657,464 4,424,406 13,540,165
EUR Shares 01/10/2011–31/03/2012 01/10/2010–31/03/2011Class XT
SharesClass XT
Shares
Number of shares in issue
at the beginning of the reporting period 461 0
Number of shares
– issued 500 650
– redeemed 0 0
Number of shares in issue
at the end of the reporting period 961 650
For further information concerning launch dates and liquidation dates, please refer to the Performance Table on pages 8 to 19.
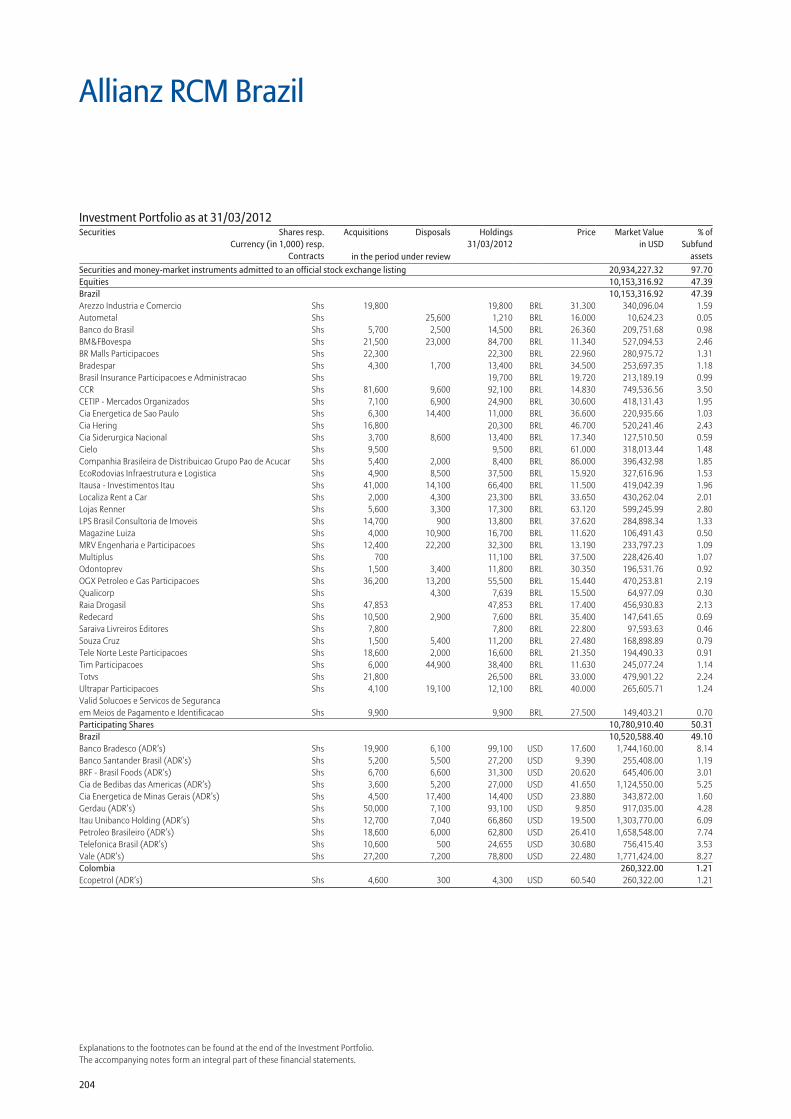
204
Explanations to the footnotes can be found at the end of the Investment Portfolio.The accompanying notes form an integral part of these financial statements.
Securities and money-market instruments admitted to an official stock exchange listing 20,934,227.32 97.70Equities 10,153,316.92 47.39Brazil 10,153,316.92 47.39Arezzo Industria e Comercio Shs 19,800 19,800 BRL 31.300 340,096.04 1.59Autometal Shs 25,600 1,210 BRL 16.000 10,624.23 0.05Banco do Brasil Shs 5,700 2,500 14,500 BRL 26.360 209,751.68 0.98BM&FBovespa Shs 21,500 23,000 84,700 BRL 11.340 527,094.53 2.46BR Malls Participacoes Shs 22,300 22,300 BRL 22.960 280,975.72 1.31Bradespar Shs 4,300 1,700 13,400 BRL 34.500 253,697.35 1.18Brasil Insurance Participacoes e Administracao Shs 19,700 BRL 19.720 213,189.19 0.99CCR Shs 81,600 9,600 92,100 BRL 14.830 749,536.56 3.50CETIP - Mercados Organizados Shs 7,100 6,900 24,900 BRL 30.600 418,131.43 1.95Cia Energetica de Sao Paulo Shs 6,300 14,400 11,000 BRL 36.600 220,935.66 1.03Cia Hering Shs 16,800 20,300 BRL 46.700 520,241.46 2.43Cia Siderurgica Nacional Shs 3,700 8,600 13,400 BRL 17.340 127,510.50 0.59Cielo Shs 9,500 9,500 BRL 61.000 318,013.44 1.48Companhia Brasileira de Distribuicao Grupo Pao de Acucar Shs 5,400 2,000 8,400 BRL 86.000 396,432.98 1.85EcoRodovias Infraestrutura e Logistica Shs 4,900 8,500 37,500 BRL 15.920 327,616.96 1.53Itausa - Investimentos Itau Shs 41,000 14,100 66,400 BRL 11.500 419,042.39 1.96Localiza Rent a Car Shs 2,000 4,300 23,300 BRL 33.650 430,262.04 2.01Lojas Renner Shs 5,600 3,300 17,300 BRL 63.120 599,245.99 2.80LPS Brasil Consultoria de Imoveis Shs 14,700 900 13,800 BRL 37.620 284,898.34 1.33Magazine Luiza Shs 4,000 10,900 16,700 BRL 11.620 106,491.43 0.50MRV Engenharia e Participacoes Shs 12,400 22,200 32,300 BRL 13.190 233,797.23 1.09Multiplus Shs 700 11,100 BRL 37.500 228,426.40 1.07Odontoprev Shs 1,500 3,400 11,800 BRL 30.350 196,531.76 0.92OGX Petroleo e Gas Participacoes Shs 36,200 13,200 55,500 BRL 15.440 470,253.81 2.19Qualicorp Shs 4,300 7,639 BRL 15.500 64,977.09 0.30Raia Drogasil Shs 47,853 47,853 BRL 17.400 456,930.83 2.13Redecard Shs 10,500 2,900 7,600 BRL 35.400 147,641.65 0.69Saraiva Livreiros Editores Shs 7,800 7,800 BRL 22.800 97,593.63 0.46Souza Cruz Shs 1,500 5,400 11,200 BRL 27.480 168,898.89 0.79Tele Norte Leste Participacoes Shs 18,600 2,000 16,600 BRL 21.350 194,490.33 0.91Tim Participacoes Shs 6,000 44,900 38,400 BRL 11.630 245,077.24 1.14Totvs Shs 21,800 26,500 BRL 33.000 479,901.22 2.24Ultrapar Participacoes Shs 4,100 19,100 12,100 BRL 40.000 265,605.71 1.24Valid Solucoes e Servicos de Seguranca em Meios de Pagamento e Identificacao Shs 9,900 9,900 BRL 27.500 149,403.21 0.70Participating Shares 10,780,910.40 50.31Brazil 10,520,588.40 49.10Banco Bradesco (ADR’s) Shs 19,900 6,100 99,100 USD 17.600 1,744,160.00 8.14Banco Santander Brasil (ADR’s) Shs 5,200 5,500 27,200 USD 9.390 255,408.00 1.19BRF - Brasil Foods (ADR’s) Shs 6,700 6,600 31,300 USD 20.620 645,406.00 3.01Cia de Bedibas das Americas (ADR’s) Shs 3,600 5,200 27,000 USD 41.650 1,124,550.00 5.25Cia Energetica de Minas Gerais (ADR’s) Shs 4,500 17,400 14,400 USD 23.880 343,872.00 1.60Gerdau (ADR’s) Shs 50,000 7,100 93,100 USD 9.850 917,035.00 4.28Itau Unibanco Holding (ADR’s) Shs 12,700 7,040 66,860 USD 19.500 1,303,770.00 6.09Petroleo Brasileiro (ADR’s) Shs 18,600 6,000 62,800 USD 26.410 1,658,548.00 7.74Telefonica Brasil (ADR’s) Shs 10,600 500 24,655 USD 30.680 756,415.40 3.53Vale (ADR’s) Shs 27,200 7,200 78,800 USD 22.480 1,771,424.00 8.27Colombia 260,322.00 1.21Ecopetrol (ADR’s) Shs 4,600 300 4,300 USD 60.540 260,322.00 1.21
Allianz RCM Brazil
Investment Portfolio as at 31/03/2012Securities Shares resp.
Currency (in 1,000) resp.Contracts
Acquisitions Disposals Holdings 31/03/2012
Price Market Valuein USD
% ofSubfund
assetsin the period under review
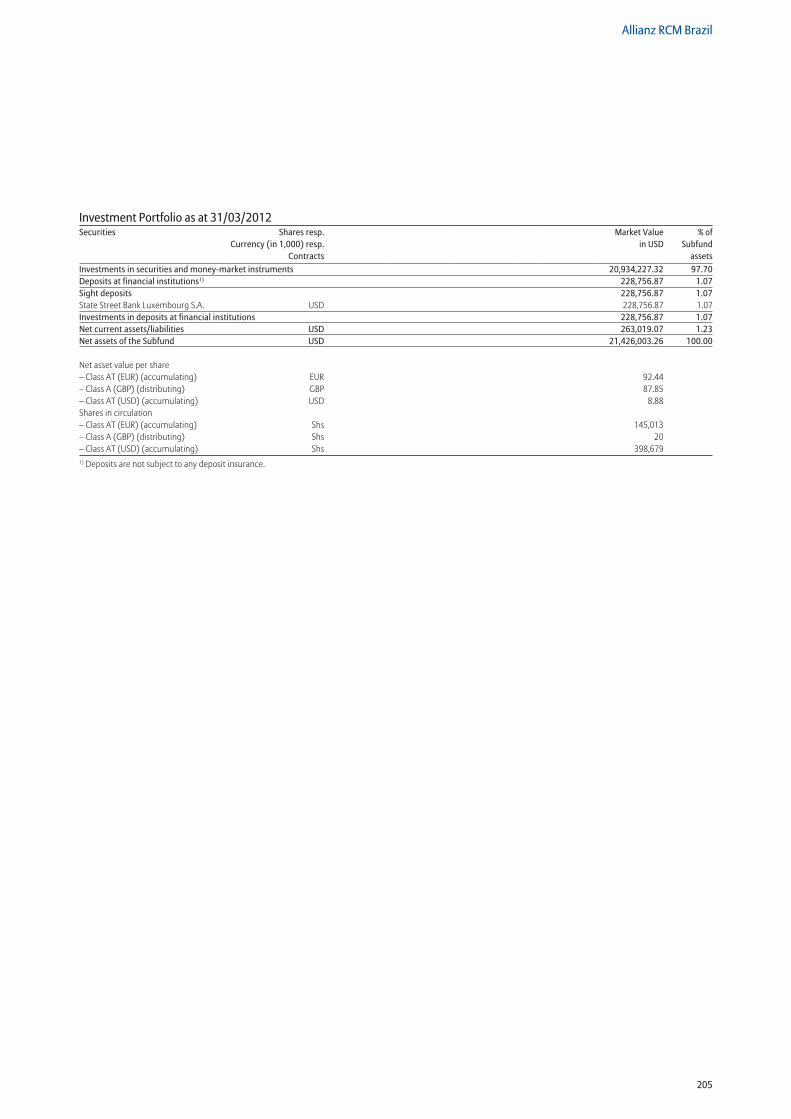
205
Allianz RCM Brazil
Investments in securities and money-market instruments 20,934,227.32 97.70Deposits at financial institutions1) 228,756.87 1.07Sight deposits 228,756.87 1.07State Street Bank Luxembourg S.A. USD 228,756.87 1.07Investments in deposits at financial institutions 228,756.87 1.07Net current assets/liabilities USD 263,019.07 1.23Net assets of the Subfund USD 21,426,003.26 100.00
Net asset value per share – Class AT (EUR) (accumulating) EUR 92.44 – Class A (GBP) (distributing) GBP 87.85 – Class AT (USD) (accumulating) USD 8.88 Shares in circulation – Class AT (EUR) (accumulating) Shs 145,013 – Class A (GBP) (distributing) Shs 20 – Class AT (USD) (accumulating) Shs 398,6791) Deposits are not subject to any deposit insurance.
Investment Portfolio as at 31/03/2012Securities Shares resp.
Currency (in 1,000) resp.Contracts
Market Valuein USD
% ofSubfund
assets
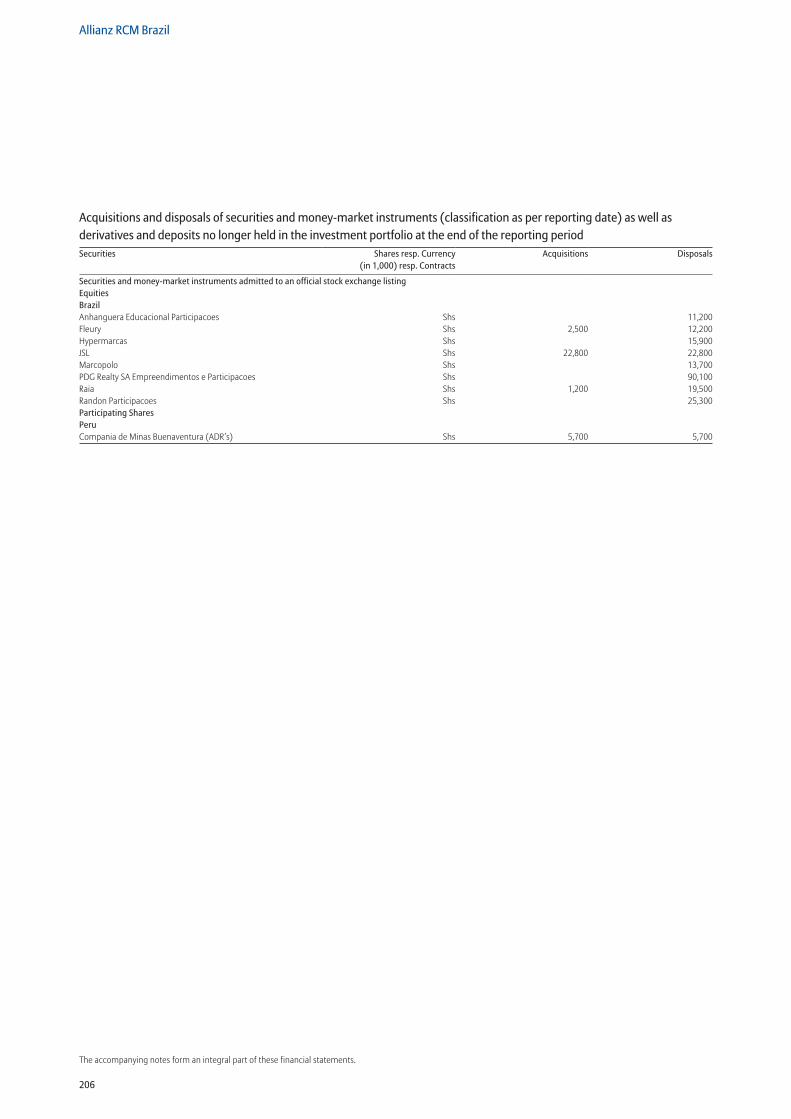
206
Allianz RCM Brazil
The accompanying notes form an integral part of these financial statements.
Securities and money-market instruments admitted to an official stock exchange listing Equities Brazil Anhanguera Educacional Participacoes Shs 11,200Fleury Shs 2,500 12,200Hypermarcas Shs 15,900JSL Shs 22,800 22,800Marcopolo Shs 13,700PDG Realty SA Empreendimentos e Participacoes Shs 90,100Raia Shs 1,200 19,500Randon Participacoes Shs 25,300Participating Shares Peru Compania de Minas Buenaventura (ADR’s) Shs 5,700 5,700
Acquisitions and disposals of securities and money-market instruments (classification as per reporting date) as well as derivatives and deposits no longer held in the investment portfolio at the end of the reporting periodSecurities Shares resp. Currency
(in 1,000) resp. ContractsAcquisitions Disposals
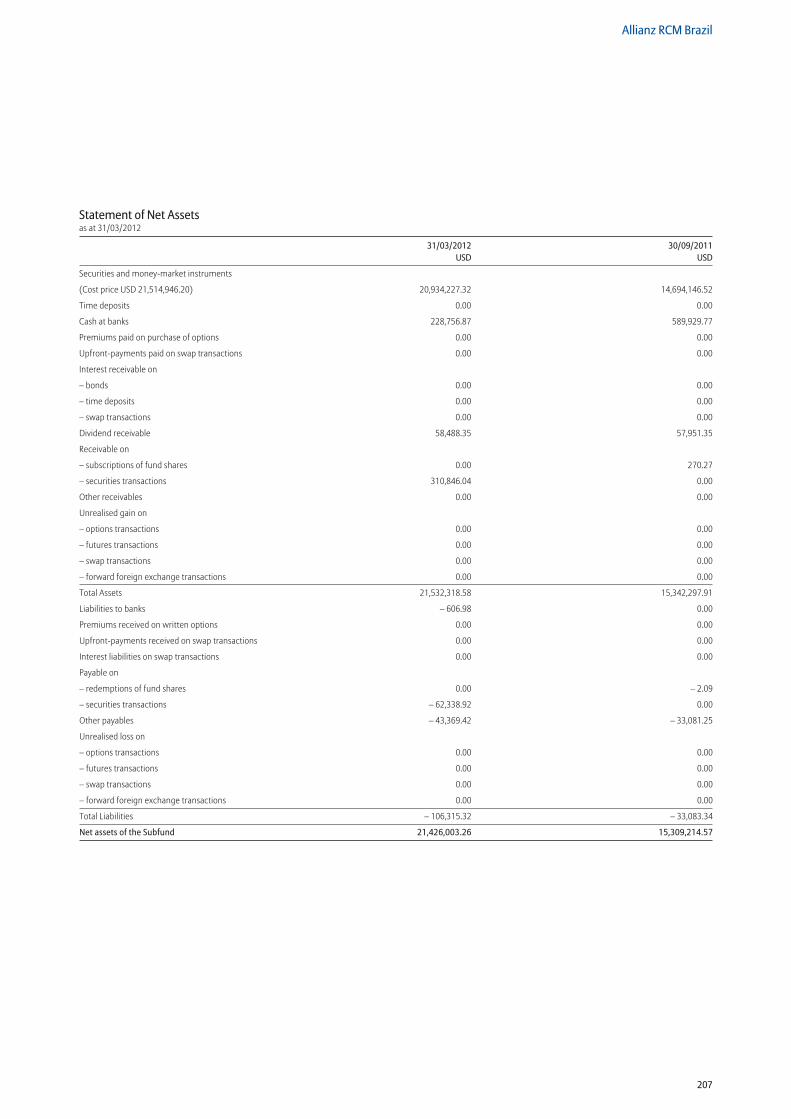
207
Allianz RCM Brazil
Statement of Net Assetsas at 31/03/2012
31/03/2012 30/09/2011 USD USD
Securities and money-market instruments
(Cost price USD 21,514,946.20) 20,934,227.32 14,694,146.52
Time deposits 0.00 0.00
Cash at banks 228,756.87 589,929.77
Premiums paid on purchase of options 0.00 0.00
Upfront-payments paid on swap transactions 0.00 0.00
Interest receivable on
– bonds 0.00 0.00
– time deposits 0.00 0.00
– swap transactions 0.00 0.00
Dividend receivable 58,488.35 57,951.35
Receivable on
– subscriptions of fund shares 0.00 270.27
– securities transactions 310,846.04 0.00
Other receivables 0.00 0.00
Unrealised gain on
– options transactions 0.00 0.00
– futures transactions 0.00 0.00
– swap transactions 0.00 0.00
– forward foreign exchange transactions 0.00 0.00
Total Assets 21,532,318.58 15,342,297.91
Liabilities to banks – 606.98 0.00
Premiums received on written options 0.00 0.00
Upfront-payments received on swap transactions 0.00 0.00
Interest liabilities on swap transactions 0.00 0.00
Payable on
– redemptions of fund shares 0.00 – 2.09
– securities transactions – 62,338.92 0.00
Other payables – 43,369.42 – 33,081.25
Unrealised loss on
– options transactions 0.00 0.00
– futures transactions 0.00 0.00
– swap transactions 0.00 0.00
– forward foreign exchange transactions 0.00 0.00
Total Liabilities – 106,315.32 – 33,083.34
Net assets of the Subfund 21,426,003.26 15,309,214.57
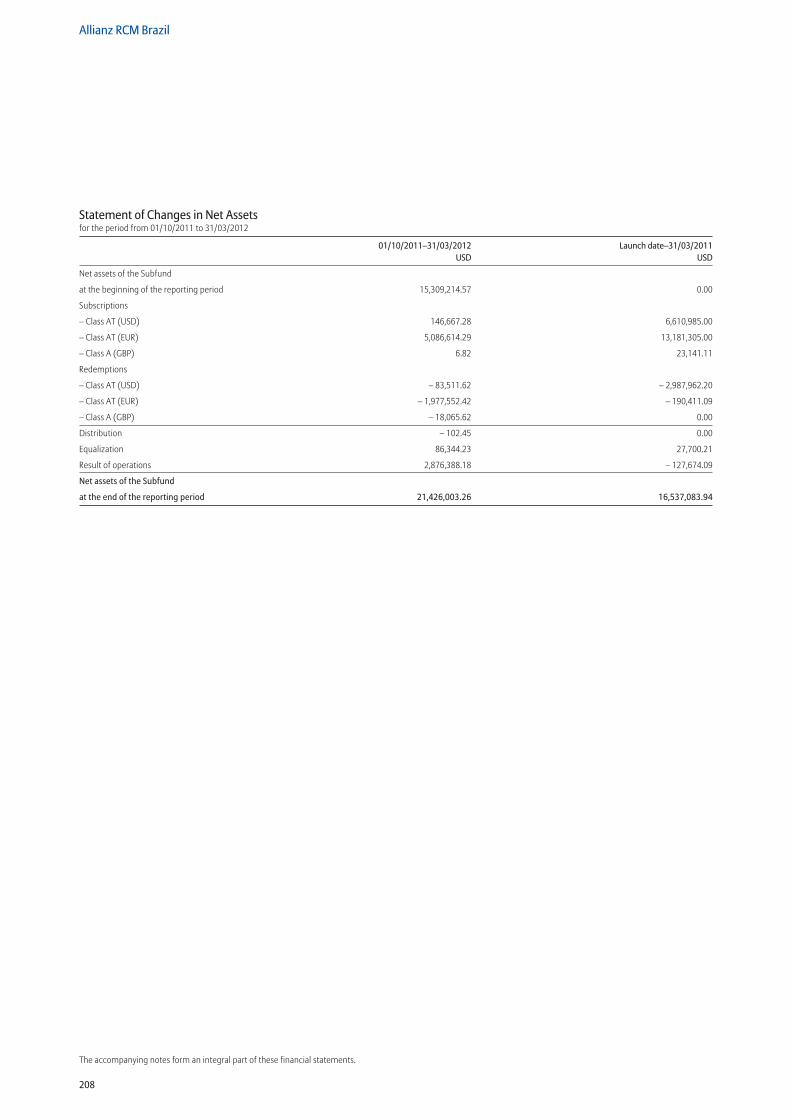
208
Allianz RCM Brazil
The accompanying notes form an integral part of these financial statements.
Statement of Changes in Net Assetsfor the period from 01/10/2011 to 31/03/2012
01/10/2011–31/03/2012 Launch date–31/03/2011 USD USD
Net assets of the Subfund
at the beginning of the reporting period 15,309,214.57 0.00
Subscriptions
– Class AT (USD) 146,667.28 6,610,985.00
– Class AT (EUR) 5,086,614.29 13,181,305.00
– Class A (GBP) 6.82 23,141.11
Redemptions
– Class AT (USD) – 83,511.62 – 2,987,962.20
– Class AT (EUR) – 1,977,552.42 – 190,411.09
– Class A (GBP) – 18,065.62 0.00
Distribution – 102.45 0.00
Equalization 86,344.23 27,700.21
Result of operations 2,876,388.18 – 127,674.09
Net assets of the Subfund
at the end of the reporting period 21,426,003.26 16,537,083.94
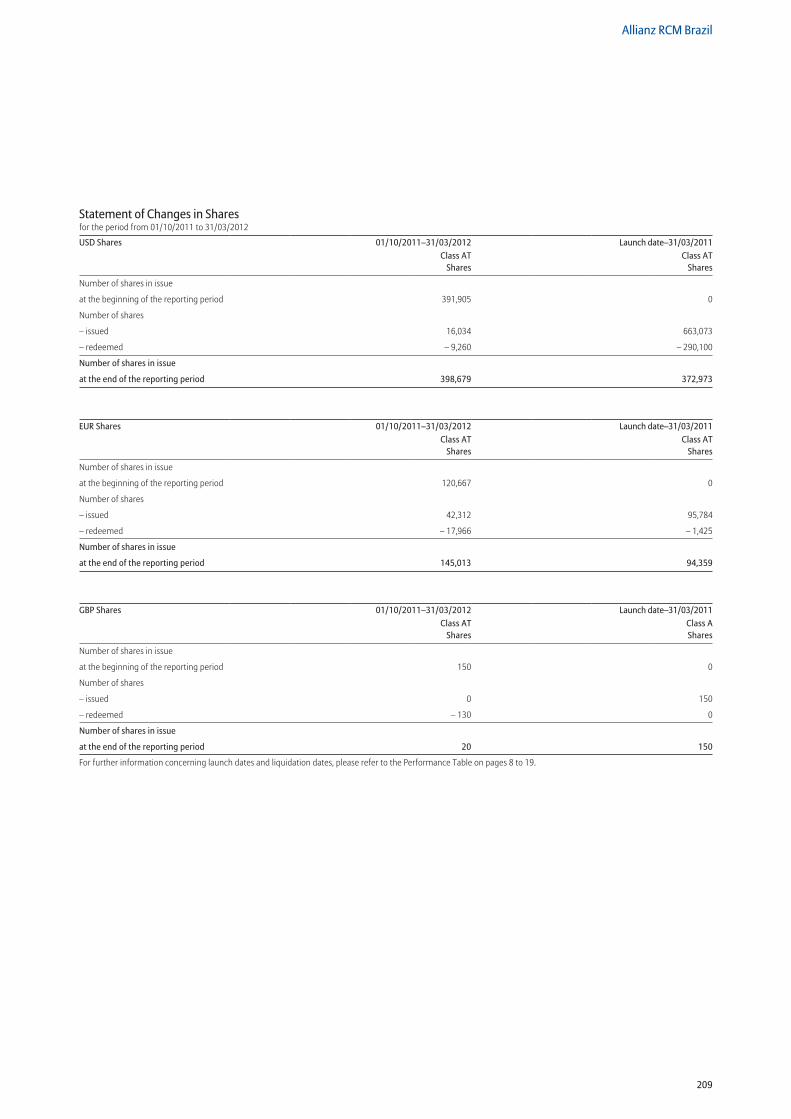
209
Allianz RCM Brazil
Statement of Changes in Sharesfor the period from 01/10/2011 to 31/03/2012
USD Shares 01/10/2011–31/03/2012 Launch date–31/03/2011Class AT
SharesClass AT
Shares
Number of shares in issue
at the beginning of the reporting period 391,905 0
Number of shares
– issued 16,034 663,073
– redeemed – 9,260 – 290,100
Number of shares in issue
at the end of the reporting period 398,679 372,973
EUR Shares 01/10/2011–31/03/2012 Launch date–31/03/2011Class AT
SharesClass AT
Shares
Number of shares in issue
at the beginning of the reporting period 120,667 0
Number of shares
– issued 42,312 95,784
– redeemed – 17,966 – 1,425
Number of shares in issue
at the end of the reporting period 145,013 94,359
GBP Shares 01/10/2011–31/03/2012 Launch date–31/03/2011Class AT
SharesClass A Shares
Number of shares in issue
at the beginning of the reporting period 150 0
Number of shares
– issued 0 150
– redeemed – 130 0
Number of shares in issue
at the end of the reporting period 20 150
For further information concerning launch dates and liquidation dates, please refer to the Performance Table on pages 8 to 19.
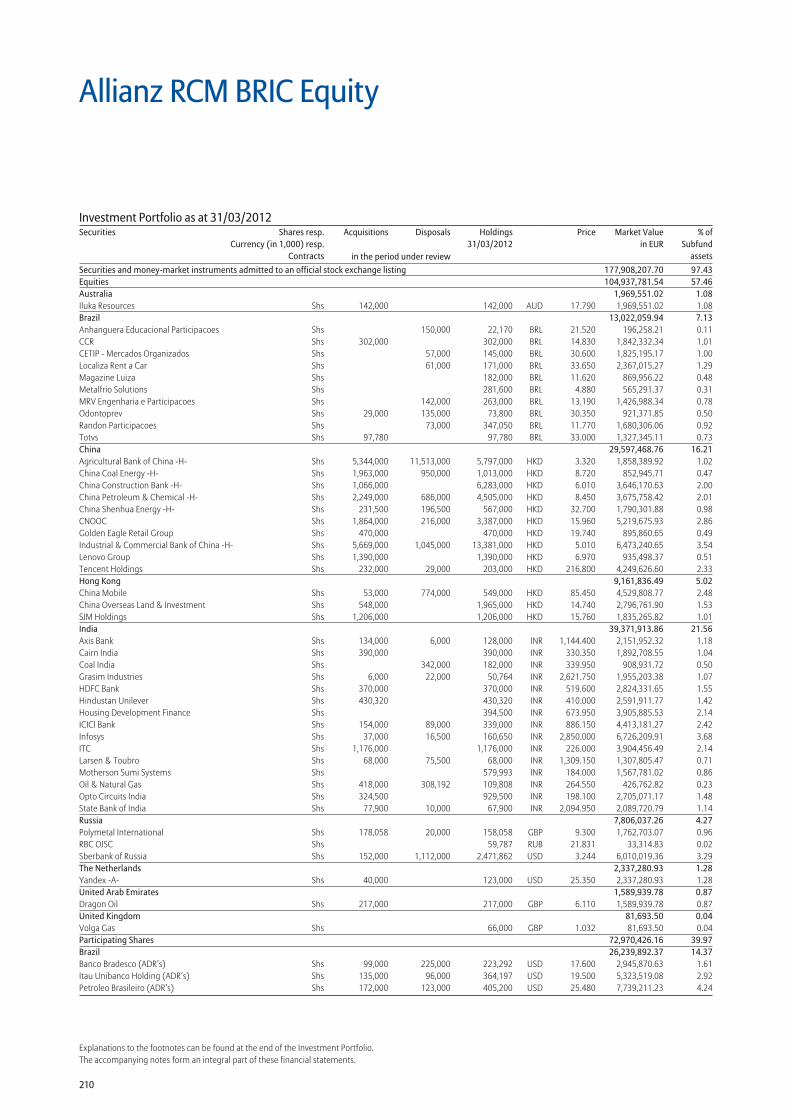
210
Explanations to the footnotes can be found at the end of the Investment Portfolio.The accompanying notes form an integral part of these financial statements.
Securities and money-market instruments admitted to an official stock exchange listing 177,908,207.70 97.43Equities 104,937,781.54 57.46Australia 1,969,551.02 1.08Iluka Resources Shs 142,000 142,000 AUD 17.790 1,969,551.02 1.08Brazil 13,022,059.94 7.13Anhanguera Educacional Participacoes Shs 150,000 22,170 BRL 21.520 196,258.21 0.11CCR Shs 302,000 302,000 BRL 14.830 1,842,332.34 1.01CETIP - Mercados Organizados Shs 57,000 145,000 BRL 30.600 1,825,195.17 1.00Localiza Rent a Car Shs 61,000 171,000 BRL 33.650 2,367,015.27 1.29Magazine Luiza Shs 182,000 BRL 11.620 869,956.22 0.48Metalfrio Solutions Shs 281,600 BRL 4.880 565,291.37 0.31MRV Engenharia e Participacoes Shs 142,000 263,000 BRL 13.190 1,426,988.34 0.78Odontoprev Shs 29,000 135,000 73,800 BRL 30.350 921,371.85 0.50Randon Participacoes Shs 73,000 347,050 BRL 11.770 1,680,306.06 0.92Totvs Shs 97,780 97,780 BRL 33.000 1,327,345.11 0.73China 29,597,468.76 16.21Agricultural Bank of China -H- Shs 5,344,000 11,513,000 5,797,000 HKD 3.320 1,858,389.92 1.02China Coal Energy -H- Shs 1,963,000 950,000 1,013,000 HKD 8.720 852,945.71 0.47China Construction Bank -H- Shs 1,066,000 6,283,000 HKD 6.010 3,646,170.63 2.00China Petroleum & Chemical -H- Shs 2,249,000 686,000 4,505,000 HKD 8.450 3,675,758.42 2.01China Shenhua Energy -H- Shs 231,500 196,500 567,000 HKD 32.700 1,790,301.88 0.98CNOOC Shs 1,864,000 216,000 3,387,000 HKD 15.960 5,219,675.93 2.86Golden Eagle Retail Group Shs 470,000 470,000 HKD 19.740 895,860.65 0.49Industrial & Commercial Bank of China -H- Shs 5,669,000 1,045,000 13,381,000 HKD 5.010 6,473,240.65 3.54Lenovo Group Shs 1,390,000 1,390,000 HKD 6.970 935,498.37 0.51Tencent Holdings Shs 232,000 29,000 203,000 HKD 216.800 4,249,626.60 2.33Hong Kong 9,161,836.49 5.02China Mobile Shs 53,000 774,000 549,000 HKD 85.450 4,529,808.77 2.48China Overseas Land & Investment Shs 548,000 1,965,000 HKD 14.740 2,796,761.90 1.53SJM Holdings Shs 1,206,000 1,206,000 HKD 15.760 1,835,265.82 1.01India 39,371,913.86 21.56Axis Bank Shs 134,000 6,000 128,000 INR 1,144.400 2,151,952.32 1.18Cairn India Shs 390,000 390,000 INR 330.350 1,892,708.55 1.04Coal India Shs 342,000 182,000 INR 339.950 908,931.72 0.50Grasim Industries Shs 6,000 22,000 50,764 INR 2,621.750 1,955,203.38 1.07HDFC Bank Shs 370,000 370,000 INR 519.600 2,824,331.65 1.55Hindustan Unilever Shs 430,320 430,320 INR 410.000 2,591,911.77 1.42Housing Development Finance Shs 394,500 INR 673.950 3,905,885.53 2.14ICICI Bank Shs 154,000 89,000 339,000 INR 886.150 4,413,181.27 2.42Infosys Shs 37,000 16,500 160,650 INR 2,850.000 6,726,209.91 3.68ITC Shs 1,176,000 1,176,000 INR 226.000 3,904,456.49 2.14Larsen & Toubro Shs 68,000 75,500 68,000 INR 1,309.150 1,307,805.47 0.71Motherson Sumi Systems Shs 579,993 INR 184.000 1,567,781.02 0.86Oil & Natural Gas Shs 418,000 308,192 109,808 INR 264.550 426,762.82 0.23Opto Circuits India Shs 324,500 929,500 INR 198.100 2,705,071.17 1.48State Bank of India Shs 77,900 10,000 67,900 INR 2,094.950 2,089,720.79 1.14Russia 7,806,037.26 4.27Polymetal International Shs 178,058 20,000 158,058 GBP 9.300 1,762,703.07 0.96RBC OJSC Shs 59,787 RUB 21.831 33,314.83 0.02Sberbank of Russia Shs 152,000 1,112,000 2,471,862 USD 3.244 6,010,019.36 3.29The Netherlands 2,337,280.93 1.28Yandex -A- Shs 40,000 123,000 USD 25.350 2,337,280.93 1.28United Arab Emirates 1,589,939.78 0.87Dragon Oil Shs 217,000 217,000 GBP 6.110 1,589,939.78 0.87United Kingdom 81,693.50 0.04Volga Gas Shs 66,000 GBP 1.032 81,693.50 0.04Participating Shares 72,970,426.16 39.97Brazil 26,239,892.37 14.37Banco Bradesco (ADR’s) Shs 99,000 225,000 223,292 USD 17.600 2,945,870.63 1.61Itau Unibanco Holding (ADR’s) Shs 135,000 96,000 364,197 USD 19.500 5,323,519.08 2.92Petroleo Brasileiro (ADR’s) Shs 172,000 123,000 405,200 USD 25.480 7,739,211.23 4.24
Allianz RCM BRIC Equity
Investment Portfolio as at 31/03/2012Securities Shares resp.
Currency (in 1,000) resp.Contracts
Acquisitions Disposals Holdings 31/03/2012
Price Market Valuein EUR
% ofSubfund
assetsin the period under review
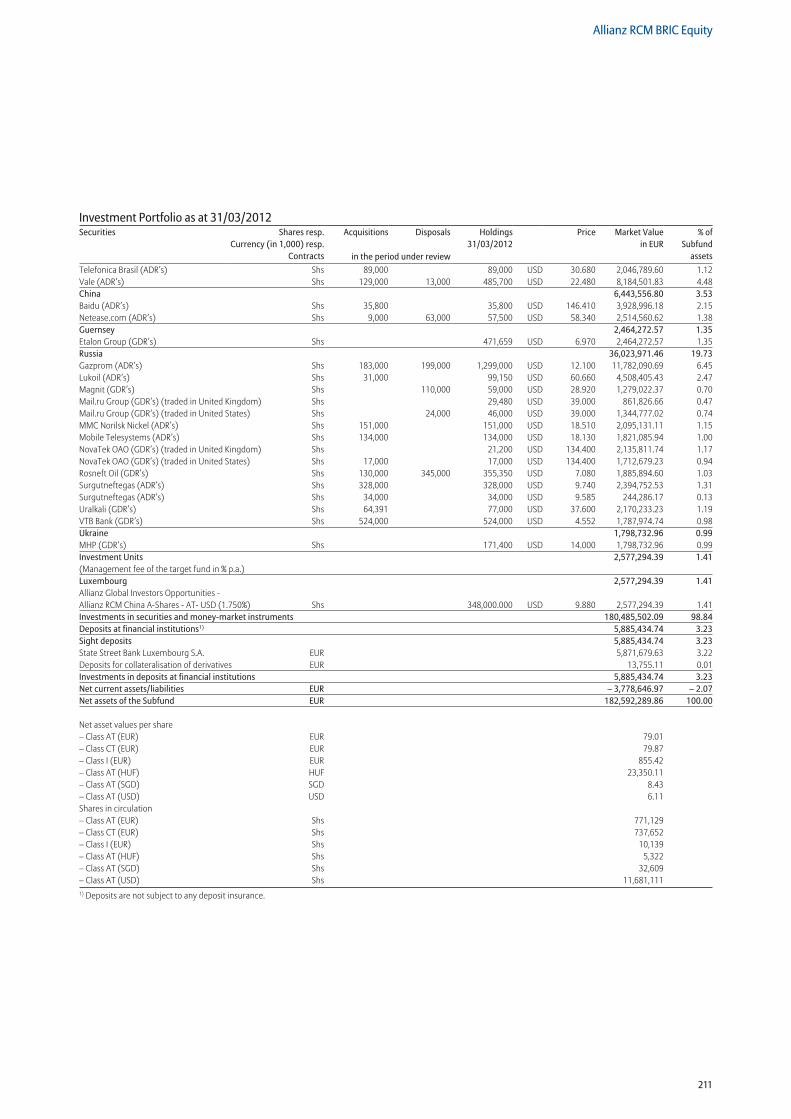
211
Allianz RCM BRIC Equity
Telefonica Brasil (ADR’s) Shs 89,000 89,000 USD 30.680 2,046,789.60 1.12Vale (ADR’s) Shs 129,000 13,000 485,700 USD 22.480 8,184,501.83 4.48China 6,443,556.80 3.53Baidu (ADR’s) Shs 35,800 35,800 USD 146.410 3,928,996.18 2.15Netease.com (ADR’s) Shs 9,000 63,000 57,500 USD 58.340 2,514,560.62 1.38Guernsey 2,464,272.57 1.35Etalon Group (GDR’s) Shs 471,659 USD 6.970 2,464,272.57 1.35Russia 36,023,971.46 19.73Gazprom (ADR’s) Shs 183,000 199,000 1,299,000 USD 12.100 11,782,090.69 6.45Lukoil (ADR’s) Shs 31,000 99,150 USD 60.660 4,508,405.43 2.47Magnit (GDR’s) Shs 110,000 59,000 USD 28.920 1,279,022.37 0.70Mail.ru Group (GDR’s) (traded in United Kingdom) Shs 29,480 USD 39.000 861,826.66 0.47Mail.ru Group (GDR’s) (traded in United States) Shs 24,000 46,000 USD 39.000 1,344,777.02 0.74MMC Norilsk Nickel (ADR’s) Shs 151,000 151,000 USD 18.510 2,095,131.11 1.15Mobile Telesystems (ADR’s) Shs 134,000 134,000 USD 18.130 1,821,085.94 1.00NovaTek OAO (GDR’s) (traded in United Kingdom) Shs 21,200 USD 134.400 2,135,811.74 1.17NovaTek OAO (GDR’s) (traded in United States) Shs 17,000 17,000 USD 134.400 1,712,679.23 0.94Rosneft Oil (GDR’s) Shs 130,000 345,000 355,350 USD 7.080 1,885,894.60 1.03Surgutneftegas (ADR’s) Shs 328,000 328,000 USD 9.740 2,394,752.53 1.31Surgutneftegas (ADR’s) Shs 34,000 34,000 USD 9.585 244,286.17 0.13Uralkali (GDR’s) Shs 64,391 77,000 USD 37.600 2,170,233.23 1.19VTB Bank (GDR’s) Shs 524,000 524,000 USD 4.552 1,787,974.74 0.98Ukraine 1,798,732.96 0.99MHP (GDR’s) Shs 171,400 USD 14.000 1,798,732.96 0.99Investment Units 2,577,294.39 1.41(Management fee of the target fund in % p.a.)Luxembourg 2,577,294.39 1.41Allianz Global Investors Opportunities - Allianz RCM China A-Shares - AT- USD (1.750%) Shs 348,000.000 USD 9.880 2,577,294.39 1.41Investments in securities and money-market instruments 180,485,502.09 98.84Deposits at financial institutions1) 5,885,434.74 3.23Sight deposits 5,885,434.74 3.23State Street Bank Luxembourg S.A. EUR 5,871,679.63 3.22Deposits for collateralisation of derivatives EUR 13,755.11 0.01Investments in deposits at financial institutions 5,885,434.74 3.23Net current assets/liabilities EUR – 3,778,646.97 – 2.07Net assets of the Subfund EUR 182,592,289.86 100.00
Net asset values per share – Class AT (EUR) EUR 79.01 – Class CT (EUR) EUR 79.87 – Class I (EUR) EUR 855.42 – Class AT (HUF) HUF 23,350.11 – Class AT (SGD) SGD 8.43 – Class AT (USD) USD 6.11 Shares in circulation – Class AT (EUR) Shs 771,129– Class CT (EUR) Shs 737,652– Class I (EUR) Shs 10,139– Class AT (HUF) Shs 5,322– Class AT (SGD) Shs 32,609– Class AT (USD) Shs 11,681,1111) Deposits are not subject to any deposit insurance.
Investment Portfolio as at 31/03/2012Securities Shares resp.
Currency (in 1,000) resp.Contracts
Acquisitions Disposals Holdings 31/03/2012
Price Market Valuein EUR
% ofSubfund
assetsin the period under review
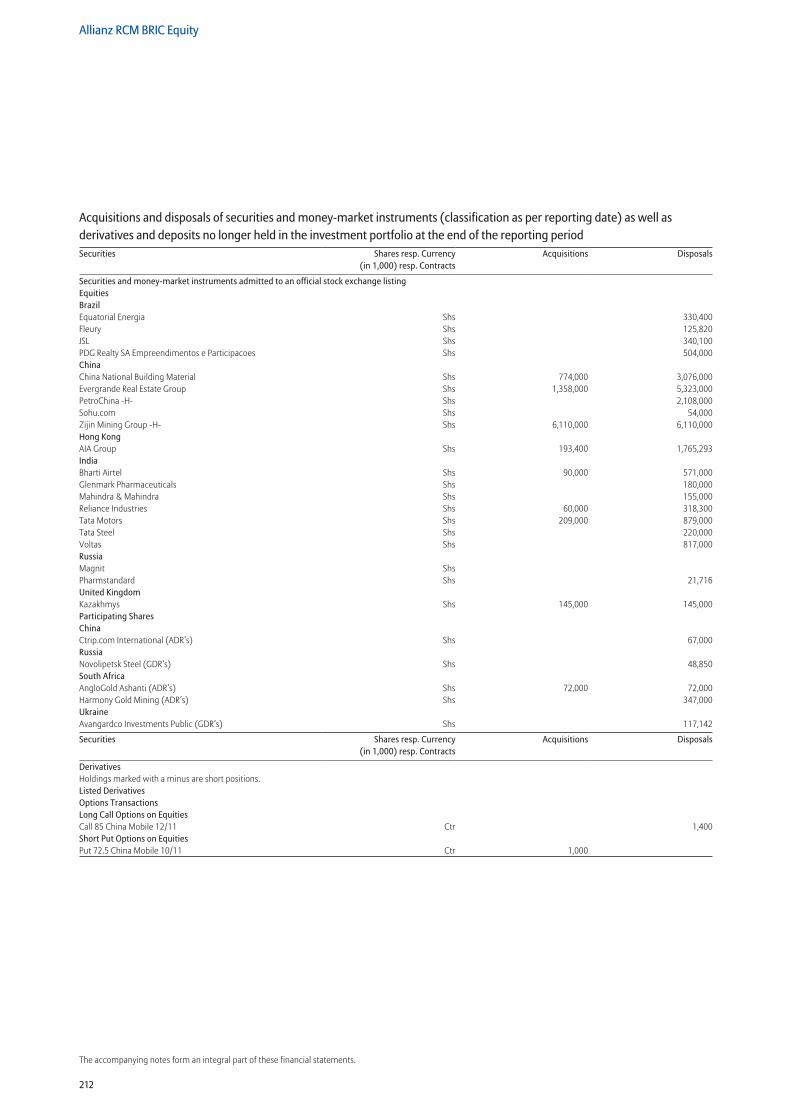
212
Allianz RCM BRIC Equity
The accompanying notes form an integral part of these financial statements.
Securities and money-market instruments admitted to an official stock exchange listing Equities Brazil Equatorial Energia Shs 330,400Fleury Shs 125,820JSL Shs 340,100PDG Realty SA Empreendimentos e Participacoes Shs 504,000China China National Building Material Shs 774,000 3,076,000Evergrande Real Estate Group Shs 1,358,000 5,323,000PetroChina -H- Shs 2,108,000Sohu.com Shs 54,000Zijin Mining Group -H- Shs 6,110,000 6,110,000Hong Kong AIA Group Shs 193,400 1,765,293India Bharti Airtel Shs 90,000 571,000Glenmark Pharmaceuticals Shs 180,000Mahindra & Mahindra Shs 155,000Reliance Industries Shs 60,000 318,300Tata Motors Shs 209,000 879,000Tata Steel Shs 220,000Voltas Shs 817,000Russia Magnit Shs Pharmstandard Shs 21,716United Kingdom Kazakhmys Shs 145,000 145,000Participating Shares China Ctrip.com International (ADR’s) Shs 67,000Russia Novolipetsk Steel (GDR’s) Shs 48,850South Africa AngloGold Ashanti (ADR’s) Shs 72,000 72,000Harmony Gold Mining (ADR’s) Shs 347,000Ukraine Avangardco Investments Public (GDR’s) Shs 117,142
Securities Shares resp. Currency (in 1,000) resp. Contracts
Acquisitions Disposals
DerivativesHoldings marked with a minus are short positions. Listed Derivatives Options Transactions Long Call Options on Equities Call 85 China Mobile 12/11 Ctr 1,400Short Put Options on Equities Put 72.5 China Mobile 10/11 Ctr 1,000
Acquisitions and disposals of securities and money-market instruments (classification as per reporting date) as well as derivatives and deposits no longer held in the investment portfolio at the end of the reporting periodSecurities Shares resp. Currency
(in 1,000) resp. ContractsAcquisitions Disposals
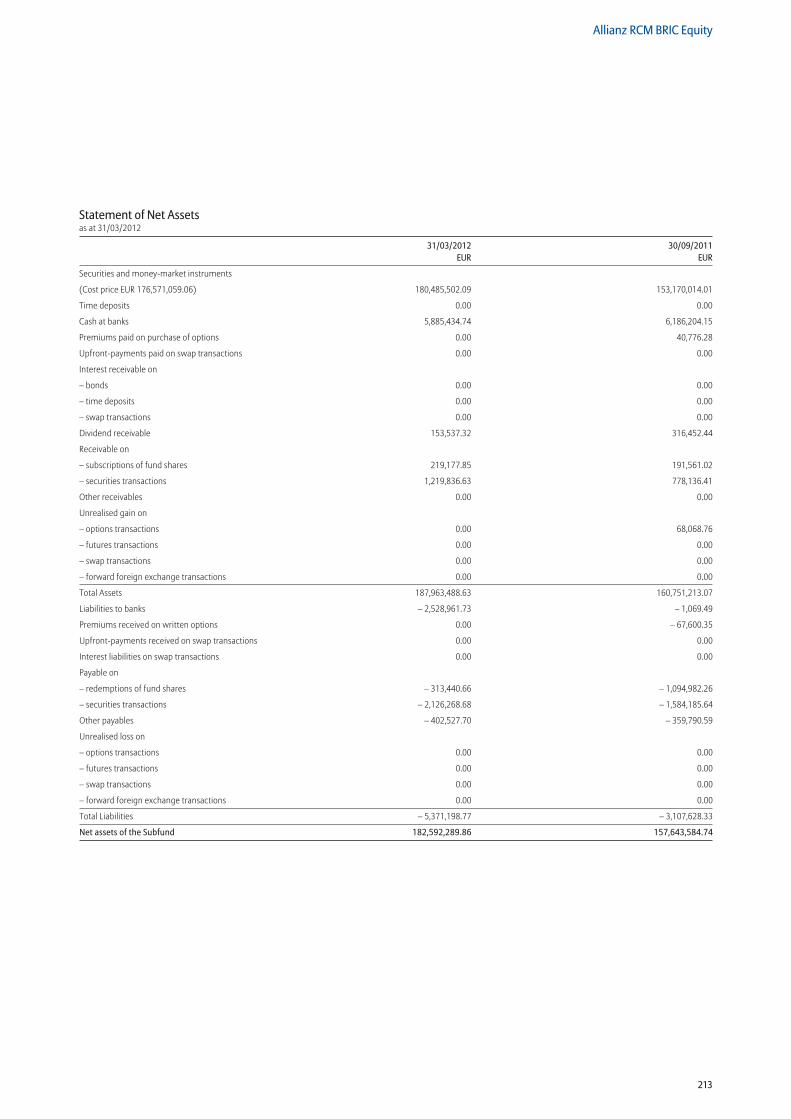
213
Allianz RCM BRIC Equity
Statement of Net Assetsas at 31/03/2012
31/03/2012 30/09/2011 EUR EUR
Securities and money-market instruments
(Cost price EUR 176,571,059.06) 180,485,502.09 153,170,014.01
Time deposits 0.00 0.00
Cash at banks 5,885,434.74 6,186,204.15
Premiums paid on purchase of options 0.00 40,776.28
Upfront-payments paid on swap transactions 0.00 0.00
Interest receivable on
– bonds 0.00 0.00
– time deposits 0.00 0.00
– swap transactions 0.00 0.00
Dividend receivable 153,537.32 316,452.44
Receivable on
– subscriptions of fund shares 219,177.85 191,561.02
– securities transactions 1,219,836.63 778,136.41
Other receivables 0.00 0.00
Unrealised gain on
– options transactions 0.00 68,068.76
– futures transactions 0.00 0.00
– swap transactions 0.00 0.00
– forward foreign exchange transactions 0.00 0.00
Total Assets 187,963,488.63 160,751,213.07
Liabilities to banks – 2,528,961.73 – 1,069.49
Premiums received on written options 0.00 – 67,600.35
Upfront-payments received on swap transactions 0.00 0.00
Interest liabilities on swap transactions 0.00 0.00
Payable on
– redemptions of fund shares – 313,440.66 – 1,094,982.26
– securities transactions – 2,126,268.68 – 1,584,185.64
Other payables – 402,527.70 – 359,790.59
Unrealised loss on
– options transactions 0.00 0.00
– futures transactions 0.00 0.00
– swap transactions 0.00 0.00
– forward foreign exchange transactions 0.00 0.00
Total Liabilities – 5,371,198.77 – 3,107,628.33
Net assets of the Subfund 182,592,289.86 157,643,584.74
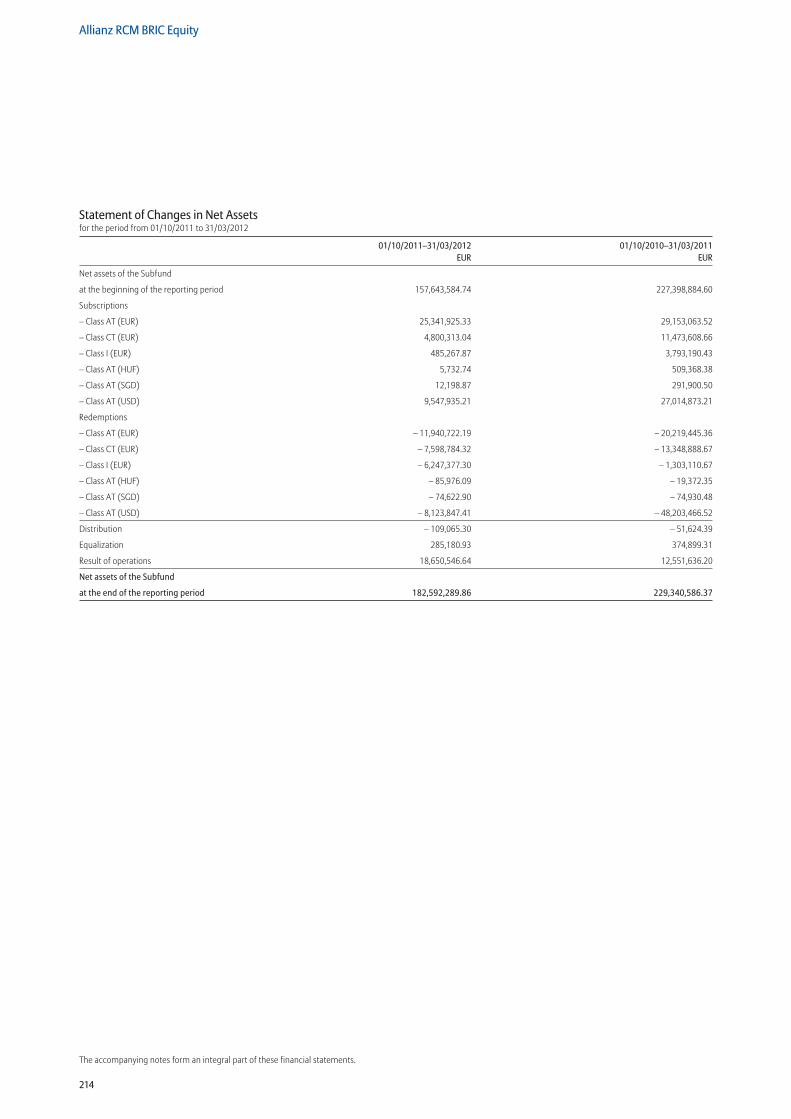
214
Allianz RCM BRIC Equity
The accompanying notes form an integral part of these financial statements.
Statement of Changes in Net Assetsfor the period from 01/10/2011 to 31/03/2012
01/10/2011–31/03/2012 01/10/2010–31/03/2011 EUR EUR
Net assets of the Subfund
at the beginning of the reporting period 157,643,584.74 227,398,884.60
Subscriptions
– Class AT (EUR) 25,341,925.33 29,153,063.52
– Class CT (EUR) 4,800,313.04 11,473,608.66
– Class I (EUR) 485,267.87 3,793,190.43
– Class AT (HUF) 5,732.74 509,368.38
– Class AT (SGD) 12,198.87 291,900.50
– Class AT (USD) 9,547,935.21 27,014,873.21
Redemptions
– Class AT (EUR) – 11,940,722.19 – 20,219,445.36
– Class CT (EUR) – 7,598,784.32 – 13,348,888.67
– Class I (EUR) – 6,247,377.30 – 1,303,110.67
– Class AT (HUF) – 85,976.09 – 19,372.35
– Class AT (SGD) – 74,622.90 – 74,930.48
– Class AT (USD) – 8,123,847.41 – 48,203,466.52
Distribution – 109,065.30 – 51,624.39
Equalization 285,180.93 374,899.31
Result of operations 18,650,546.64 12,551,636.20
Net assets of the Subfund
at the end of the reporting period 182,592,289.86 229,340,586.37
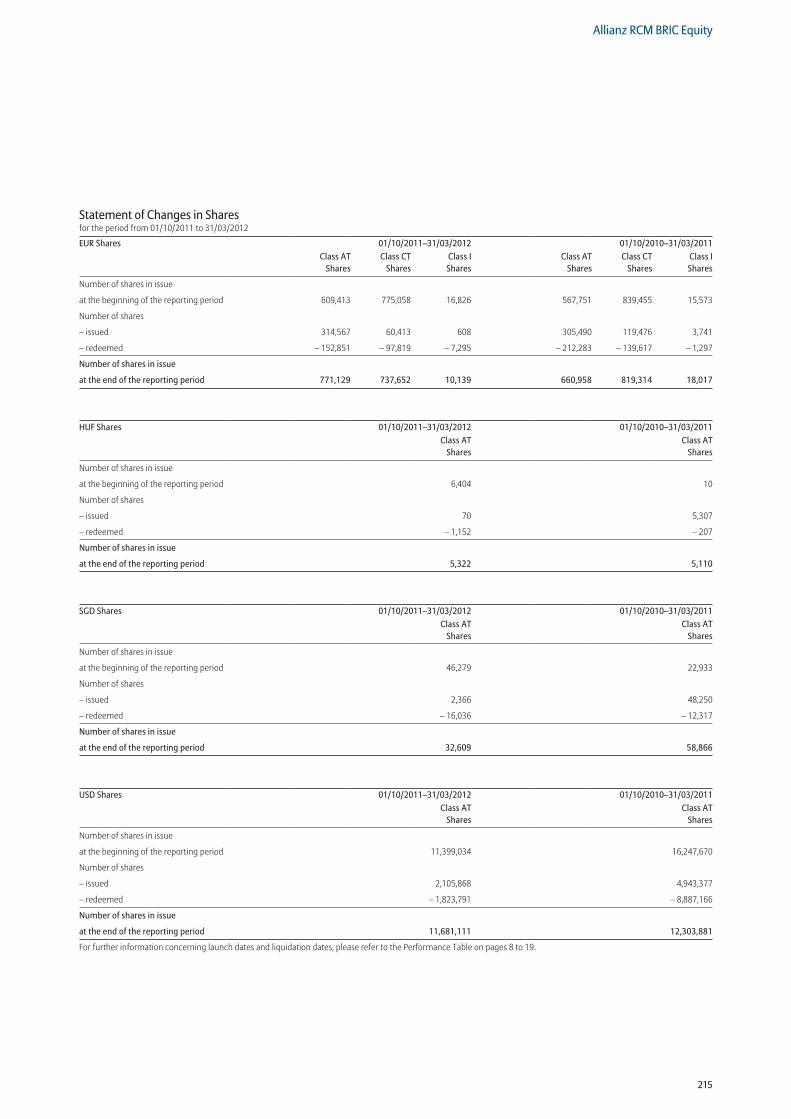
215
Allianz RCM BRIC Equity
Statement of Changes in Sharesfor the period from 01/10/2011 to 31/03/2012
EUR Shares 01/10/2011–31/03/2012 01/10/2010–31/03/2011Class AT
SharesClass CT
SharesClass I Shares
Class AT Shares
Class CT Shares
Class I Shares
Number of shares in issue
at the beginning of the reporting period 609,413 775,058 16,826 567,751 839,455 15,573
Number of shares
– issued 314,567 60,413 608 305,490 119,476 3,741
– redeemed – 152,851 – 97,819 – 7,295 – 212,283 – 139,617 – 1,297
Number of shares in issue
at the end of the reporting period 771,129 737,652 10,139 660,958 819,314 18,017
HUF Shares 01/10/2011–31/03/2012 01/10/2010–31/03/2011Class AT
SharesClass AT
Shares
Number of shares in issue
at the beginning of the reporting period 6,404 10
Number of shares
– issued 70 5,307
– redeemed – 1,152 – 207
Number of shares in issue
at the end of the reporting period 5,322 5,110
SGD Shares 01/10/2011–31/03/2012 01/10/2010–31/03/2011Class AT
SharesClass AT
Shares
Number of shares in issue
at the beginning of the reporting period 46,279 22,933
Number of shares
– issued 2,366 48,250
– redeemed – 16,036 – 12,317
Number of shares in issue
at the end of the reporting period 32,609 58,866
USD Shares 01/10/2011–31/03/2012 01/10/2010–31/03/2011Class AT
SharesClass AT
Shares
Number of shares in issue
at the beginning of the reporting period 11,399,034 16,247,670
Number of shares
– issued 2,105,868 4,943,377
– redeemed – 1,823,791 – 8,887,166
Number of shares in issue
at the end of the reporting period 11,681,111 12,303,881
For further information concerning launch dates and liquidation dates, please refer to the Performance Table on pages 8 to 19.
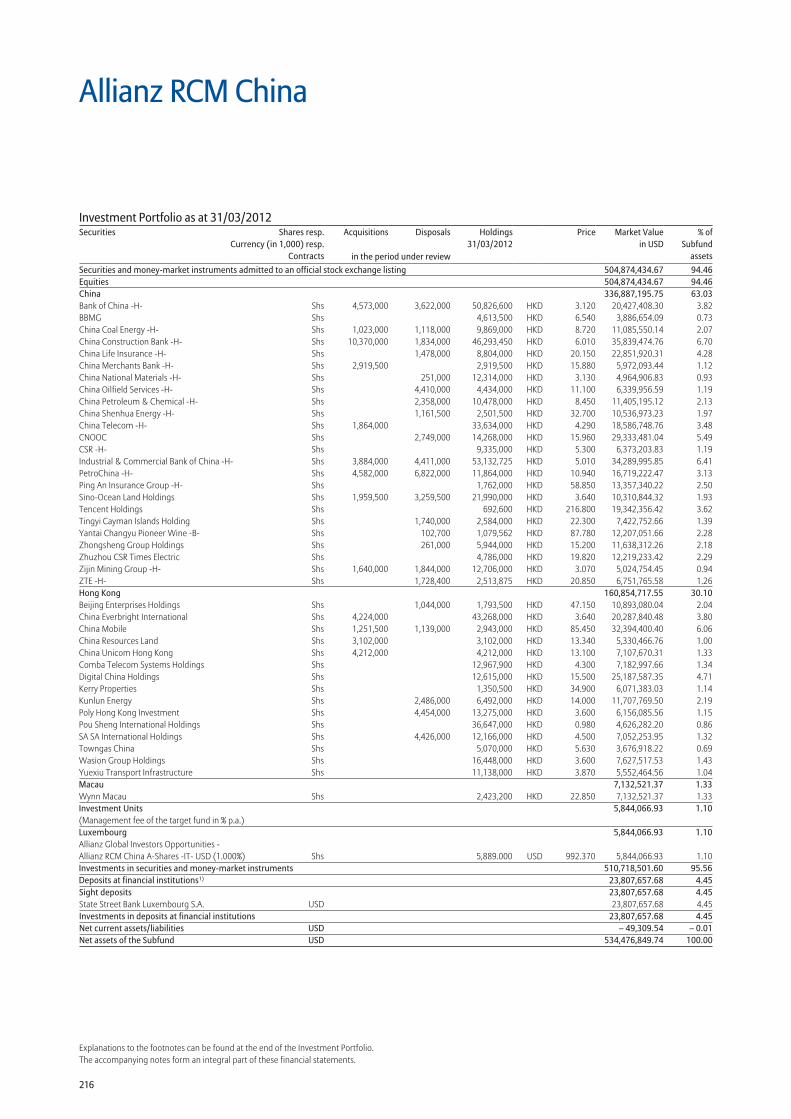
216
Explanations to the footnotes can be found at the end of the Investment Portfolio.The accompanying notes form an integral part of these financial statements.
Securities and money-market instruments admitted to an official stock exchange listing 504,874,434.67 94.46Equities 504,874,434.67 94.46China 336,887,195.75 63.03Bank of China -H- Shs 4,573,000 3,622,000 50,826,600 HKD 3.120 20,427,408.30 3.82BBMG Shs 4,613,500 HKD 6.540 3,886,654.09 0.73China Coal Energy -H- Shs 1,023,000 1,118,000 9,869,000 HKD 8.720 11,085,550.14 2.07China Construction Bank -H- Shs 10,370,000 1,834,000 46,293,450 HKD 6.010 35,839,474.76 6.70China Life Insurance -H- Shs 1,478,000 8,804,000 HKD 20.150 22,851,920.31 4.28China Merchants Bank -H- Shs 2,919,500 2,919,500 HKD 15.880 5,972,093.44 1.12China National Materials -H- Shs 251,000 12,314,000 HKD 3.130 4,964,906.83 0.93China Oilfield Services -H- Shs 4,410,000 4,434,000 HKD 11.100 6,339,956.59 1.19China Petroleum & Chemical -H- Shs 2,358,000 10,478,000 HKD 8.450 11,405,195.12 2.13China Shenhua Energy -H- Shs 1,161,500 2,501,500 HKD 32.700 10,536,973.23 1.97China Telecom -H- Shs 1,864,000 33,634,000 HKD 4.290 18,586,748.76 3.48CNOOC Shs 2,749,000 14,268,000 HKD 15.960 29,333,481.04 5.49CSR -H- Shs 9,335,000 HKD 5.300 6,373,203.83 1.19Industrial & Commercial Bank of China -H- Shs 3,884,000 4,411,000 53,132,725 HKD 5.010 34,289,995.85 6.41PetroChina -H- Shs 4,582,000 6,822,000 11,864,000 HKD 10.940 16,719,222.47 3.13Ping An Insurance Group -H- Shs 1,762,000 HKD 58.850 13,357,340.22 2.50Sino-Ocean Land Holdings Shs 1,959,500 3,259,500 21,990,000 HKD 3.640 10,310,844.32 1.93Tencent Holdings Shs 692,600 HKD 216.800 19,342,356.42 3.62Tingyi Cayman Islands Holding Shs 1,740,000 2,584,000 HKD 22.300 7,422,752.66 1.39Yantai Changyu Pioneer Wine -B- Shs 102,700 1,079,562 HKD 87.780 12,207,051.66 2.28Zhongsheng Group Holdings Shs 261,000 5,944,000 HKD 15.200 11,638,312.26 2.18Zhuzhou CSR Times Electric Shs 4,786,000 HKD 19.820 12,219,233.42 2.29Zijin Mining Group -H- Shs 1,640,000 1,844,000 12,706,000 HKD 3.070 5,024,754.45 0.94ZTE -H- Shs 1,728,400 2,513,875 HKD 20.850 6,751,765.58 1.26Hong Kong 160,854,717.55 30.10Beijing Enterprises Holdings Shs 1,044,000 1,793,500 HKD 47.150 10,893,080.04 2.04China Everbright International Shs 4,224,000 43,268,000 HKD 3.640 20,287,840.48 3.80China Mobile Shs 1,251,500 1,139,000 2,943,000 HKD 85.450 32,394,400.40 6.06China Resources Land Shs 3,102,000 3,102,000 HKD 13.340 5,330,466.76 1.00China Unicom Hong Kong Shs 4,212,000 4,212,000 HKD 13.100 7,107,670.31 1.33Comba Telecom Systems Holdings Shs 12,967,900 HKD 4.300 7,182,997.66 1.34Digital China Holdings Shs 12,615,000 HKD 15.500 25,187,587.35 4.71Kerry Properties Shs 1,350,500 HKD 34.900 6,071,383.03 1.14Kunlun Energy Shs 2,486,000 6,492,000 HKD 14.000 11,707,769.50 2.19Poly Hong Kong Investment Shs 4,454,000 13,275,000 HKD 3.600 6,156,085.56 1.15Pou Sheng International Holdings Shs 36,647,000 HKD 0.980 4,626,282.20 0.86SA SA International Holdings Shs 4,426,000 12,166,000 HKD 4.500 7,052,253.95 1.32Towngas China Shs 5,070,000 HKD 5.630 3,676,918.22 0.69Wasion Group Holdings Shs 16,448,000 HKD 3.600 7,627,517.53 1.43Yuexiu Transport Infrastructure Shs 11,138,000 HKD 3.870 5,552,464.56 1.04Macau 7,132,521.37 1.33Wynn Macau Shs 2,423,200 HKD 22.850 7,132,521.37 1.33Investment Units 5,844,066.93 1.10(Management fee of the target fund in % p.a.) Luxembourg 5,844,066.93 1.10Allianz Global Investors Opportunities - Allianz RCM China A-Shares -IT- USD (1.000%) Shs 5,889.000 USD 992.370 5,844,066.93 1.10Investments in securities and money-market instruments 510,718,501.60 95.56Deposits at financial institutions1) 23,807,657.68 4.45Sight deposits 23,807,657.68 4.45State Street Bank Luxembourg S.A. USD 23,807,657.68 4.45Investments in deposits at financial institutions 23,807,657.68 4.45Net current assets/liabilities USD – 49,309.54 – 0.01Net assets of the Subfund USD 534,476,849.74 100.00
Allianz RCM China
Investment Portfolio as at 31/03/2012Securities Shares resp.
Currency (in 1,000) resp.Contracts
Acquisitions Disposals Holdings 31/03/2012
Price Market Valuein USD
% ofSubfund
assetsin the period under review
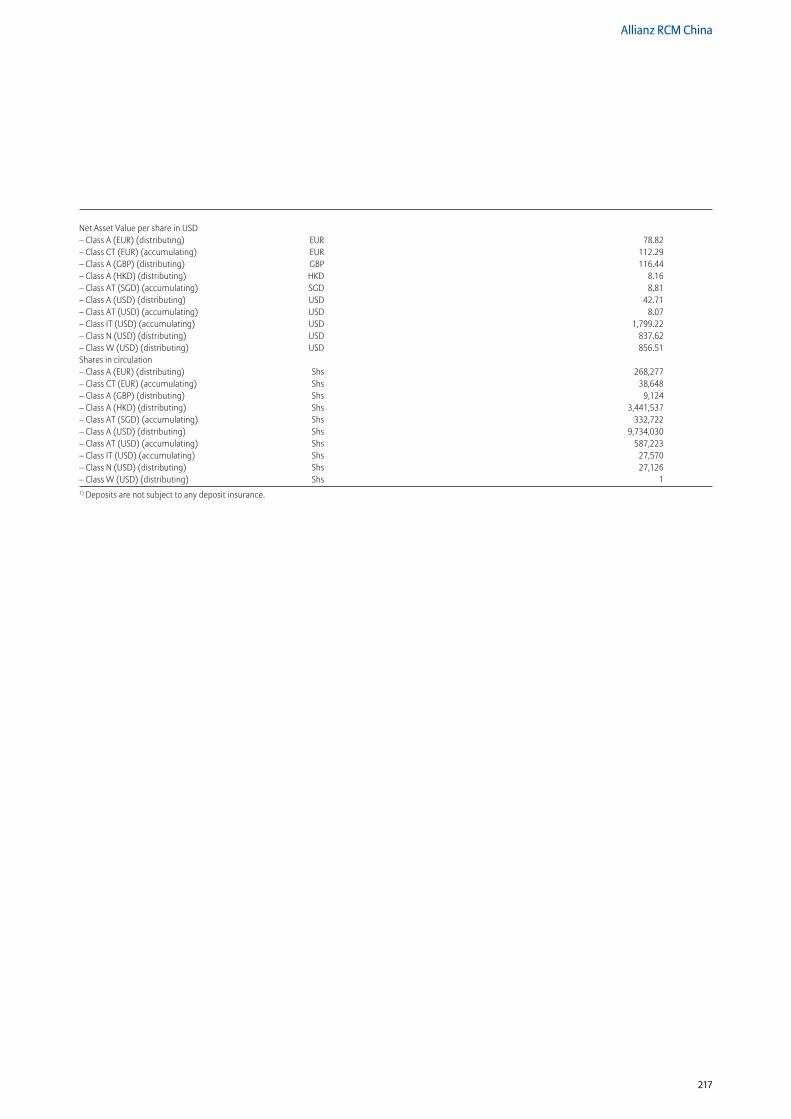
217
Allianz RCM China
Net Asset Value per share in USD – Class A (EUR) (distributing) EUR 78.82– Class CT (EUR) (accumulating) EUR 112.29– Class A (GBP) (distributing) GBP 116.44– Class A (HKD) (distributing) HKD 8.16– Class AT (SGD) (accumulating) SGD 8.81– Class A (USD) (distributing) USD 42.71– Class AT (USD) (accumulating) USD 8.07– Class IT (USD) (accumulating) USD 1,799.22 – Class N (USD) (distributing) USD 837.62– Class W (USD) (distributing) USD 856.51Shares in circulation – Class A (EUR) (distributing) Shs 268,277 – Class CT (EUR) (accumulating) Shs 38,648 – Class A (GBP) (distributing) Shs 9,124 – Class A (HKD) (distributing) Shs 3,441,537 – Class AT (SGD) (accumulating) Shs 332,722 – Class A (USD) (distributing) Shs 9,734,030 – Class AT (USD) (accumulating) Shs 587,223 – Class IT (USD) (accumulating) Shs 27,570 – Class N (USD) (distributing) Shs 27,126 – Class W (USD) (distributing) Shs 11) Deposits are not subject to any deposit insurance.
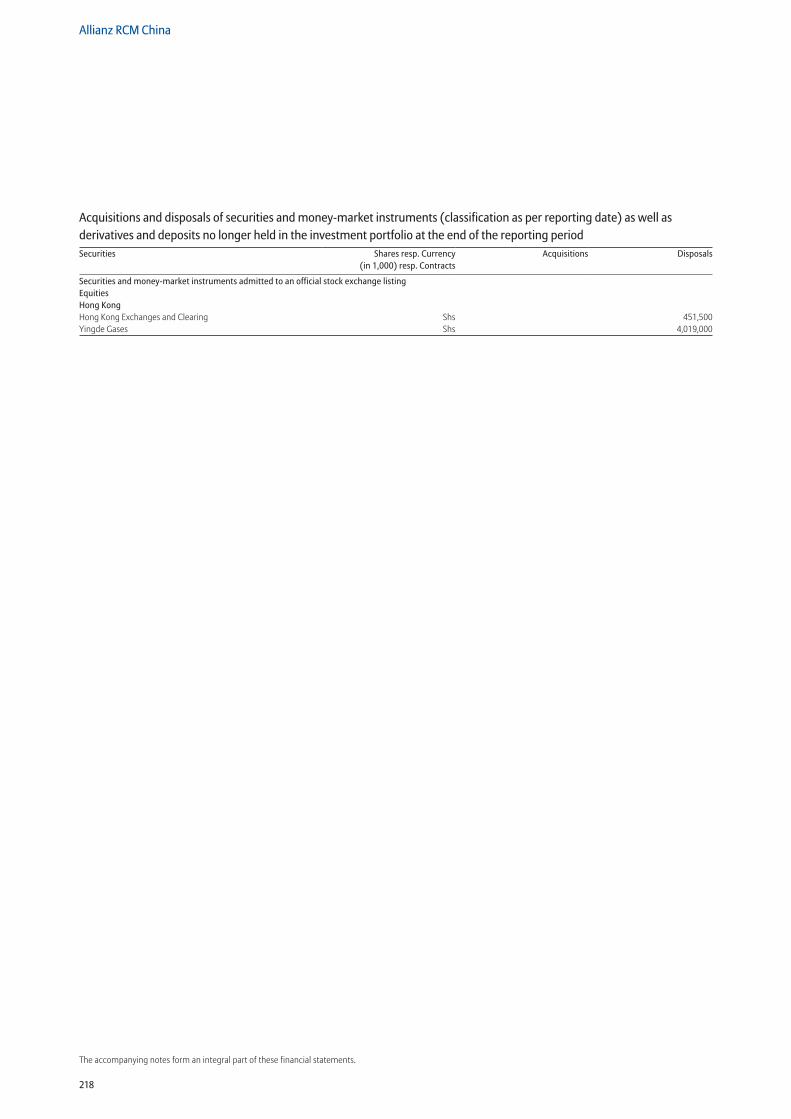
218
Allianz RCM China
The accompanying notes form an integral part of these financial statements.
Securities and money-market instruments admitted to an official stock exchange listing Equities Hong Kong Hong Kong Exchanges and Clearing Shs 451,500Yingde Gases Shs 4,019,000
Acquisitions and disposals of securities and money-market instruments (classification as per reporting date) as well as derivatives and deposits no longer held in the investment portfolio at the end of the reporting periodSecurities Shares resp. Currency
(in 1,000) resp. ContractsAcquisitions Disposals
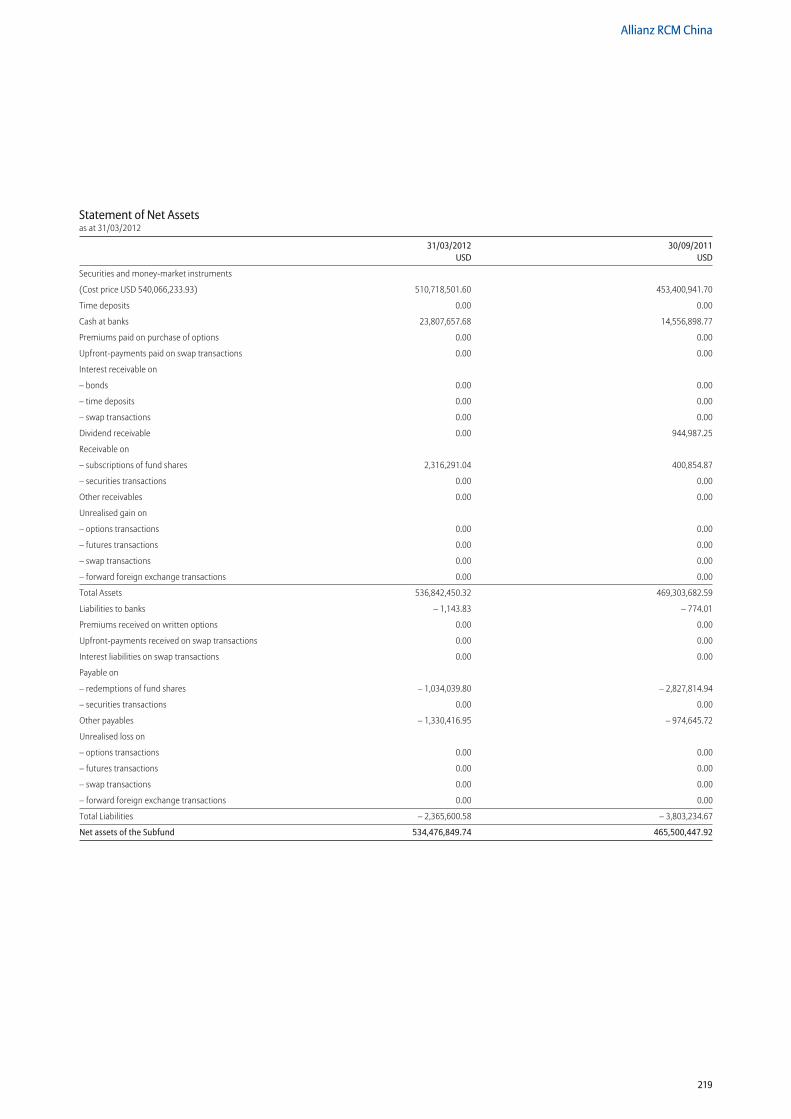
219
Allianz RCM China
Statement of Net Assetsas at 31/03/2012
31/03/2012 30/09/2011 USD USD
Securities and money-market instruments
(Cost price USD 540,066,233.93) 510,718,501.60 453,400,941.70
Time deposits 0.00 0.00
Cash at banks 23,807,657.68 14,556,898.77
Premiums paid on purchase of options 0.00 0.00
Upfront-payments paid on swap transactions 0.00 0.00
Interest receivable on
– bonds 0.00 0.00
– time deposits 0.00 0.00
– swap transactions 0.00 0.00
Dividend receivable 0.00 944,987.25
Receivable on
– subscriptions of fund shares 2,316,291.04 400,854.87
– securities transactions 0.00 0.00
Other receivables 0.00 0.00
Unrealised gain on
– options transactions 0.00 0.00
– futures transactions 0.00 0.00
– swap transactions 0.00 0.00
– forward foreign exchange transactions 0.00 0.00
Total Assets 536,842,450.32 469,303,682.59
Liabilities to banks – 1,143.83 – 774.01
Premiums received on written options 0.00 0.00
Upfront-payments received on swap transactions 0.00 0.00
Interest liabilities on swap transactions 0.00 0.00
Payable on
– redemptions of fund shares – 1,034,039.80 – 2,827,814.94
– securities transactions 0.00 0.00
Other payables – 1,330,416.95 – 974,645.72
Unrealised loss on
– options transactions 0.00 0.00
– futures transactions 0.00 0.00
– swap transactions 0.00 0.00
– forward foreign exchange transactions 0.00 0.00
Total Liabilities – 2,365,600.58 – 3,803,234.67
Net assets of the Subfund 534,476,849.74 465,500,447.92
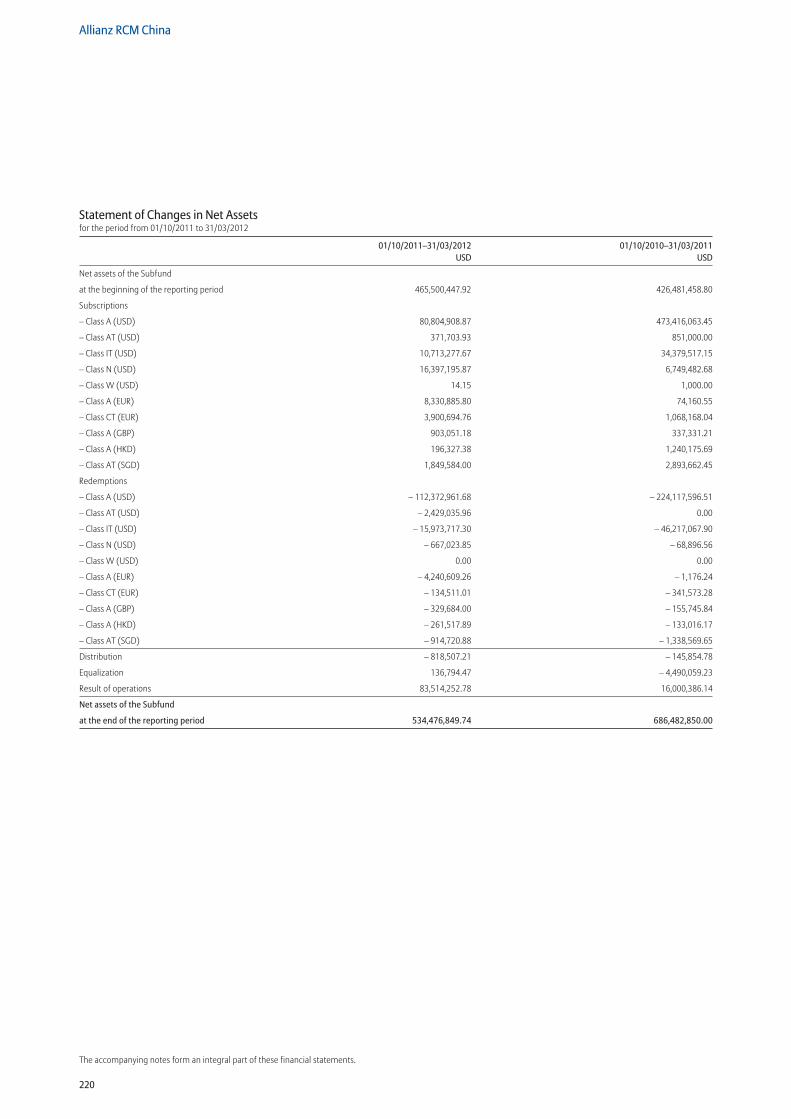
220
Allianz RCM China
The accompanying notes form an integral part of these financial statements.
Statement of Changes in Net Assetsfor the period from 01/10/2011 to 31/03/2012
01/10/2011–31/03/2012 01/10/2010–31/03/2011 USD USD
Net assets of the Subfund
at the beginning of the reporting period 465,500,447.92 426,481,458.80
Subscriptions
– Class A (USD) 80,804,908.87 473,416,063.45
– Class AT (USD) 371,703.93 851,000.00
– Class IT (USD) 10,713,277.67 34,379,517.15
– Class N (USD) 16,397,195.87 6,749,482.68
– Class W (USD) 14.15 1,000.00
– Class A (EUR) 8,330,885.80 74,160.55
– Class CT (EUR) 3,900,694.76 1,068,168.04
– Class A (GBP) 903,051.18 337,331.21
– Class A (HKD) 196,327.38 1,240,175.69
– Class AT (SGD) 1,849,584.00 2,893,662.45
Redemptions
– Class A (USD) – 112,372,961.68 – 224,117,596.51
– Class AT (USD) – 2,429,035.96 0.00
– Class IT (USD) – 15,973,717.30 – 46,217,067.90
– Class N (USD) – 667,023.85 – 68,896.56
– Class W (USD) 0.00 0.00
– Class A (EUR) – 4,240,609.26 – 1,176.24
– Class CT (EUR) – 134,511.01 – 341,573.28
– Class A (GBP) – 329,684.00 – 155,745.84
– Class A (HKD) – 261,517.89 – 133,016.17
– Class AT (SGD) – 914,720.88 – 1,338,569.65
Distribution – 818,507.21 – 145,854.78
Equalization 136,794.47 – 4,490,059.23
Result of operations 83,514,252.78 16,000,386.14
Net assets of the Subfund
at the end of the reporting period 534,476,849.74 686,482,850.00
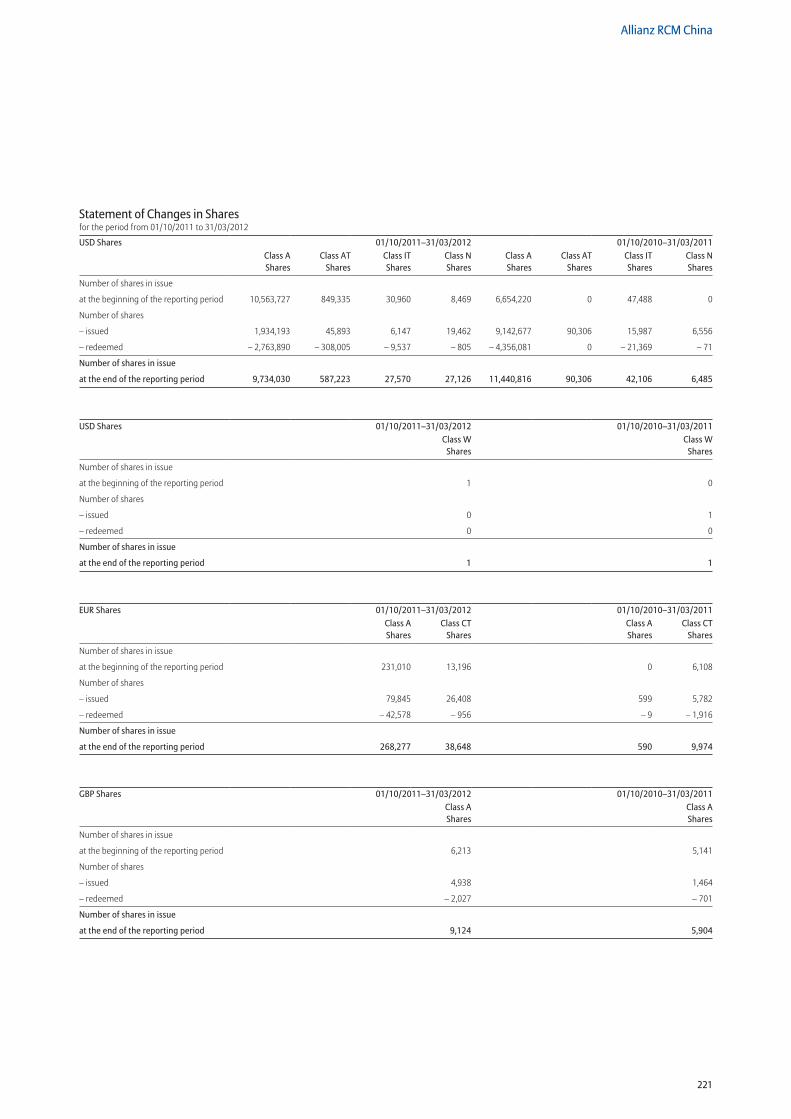
221
Allianz RCM China
Statement of Changes in Sharesfor the period from 01/10/2011 to 31/03/2012
USD Shares 01/10/2011–31/03/2012 01/10/2010–31/03/2011Class A Shares
Class AT Shares
Class IT Shares
Class N Shares
Class A Shares
Class AT Shares
Class IT Shares
Class N Shares
Number of shares in issue
at the beginning of the reporting period 10,563,727 849,335 30,960 8,469 6,654,220 0 47,488 0
Number of shares
– issued 1,934,193 45,893 6,147 19,462 9,142,677 90,306 15,987 6,556
– redeemed – 2,763,890 – 308,005 – 9,537 – 805 – 4,356,081 0 – 21,369 – 71
Number of shares in issue
at the end of the reporting period 9,734,030 587,223 27,570 27,126 11,440,816 90,306 42,106 6,485
USD Shares 01/10/2011–31/03/2012 01/10/2010–31/03/2011Class W
SharesClass W
Shares
Number of shares in issue
at the beginning of the reporting period 1 0
Number of shares
– issued 0 1
– redeemed 0 0
Number of shares in issue
at the end of the reporting period 1 1
EUR Shares 01/10/2011–31/03/2012 01/10/2010–31/03/2011Class A Shares
Class CT Shares
Class A Shares
Class CT Shares
Number of shares in issue
at the beginning of the reporting period 231,010 13,196 0 6,108
Number of shares
– issued 79,845 26,408 599 5,782
– redeemed – 42,578 – 956 – 9 – 1,916
Number of shares in issue
at the end of the reporting period 268,277 38,648 590 9,974
GBP Shares 01/10/2011–31/03/2012 01/10/2010–31/03/2011Class A Shares
Class A Shares
Number of shares in issue
at the beginning of the reporting period 6,213 5,141
Number of shares
– issued 4,938 1,464
– redeemed – 2,027 – 701
Number of shares in issue
at the end of the reporting period 9,124 5,904
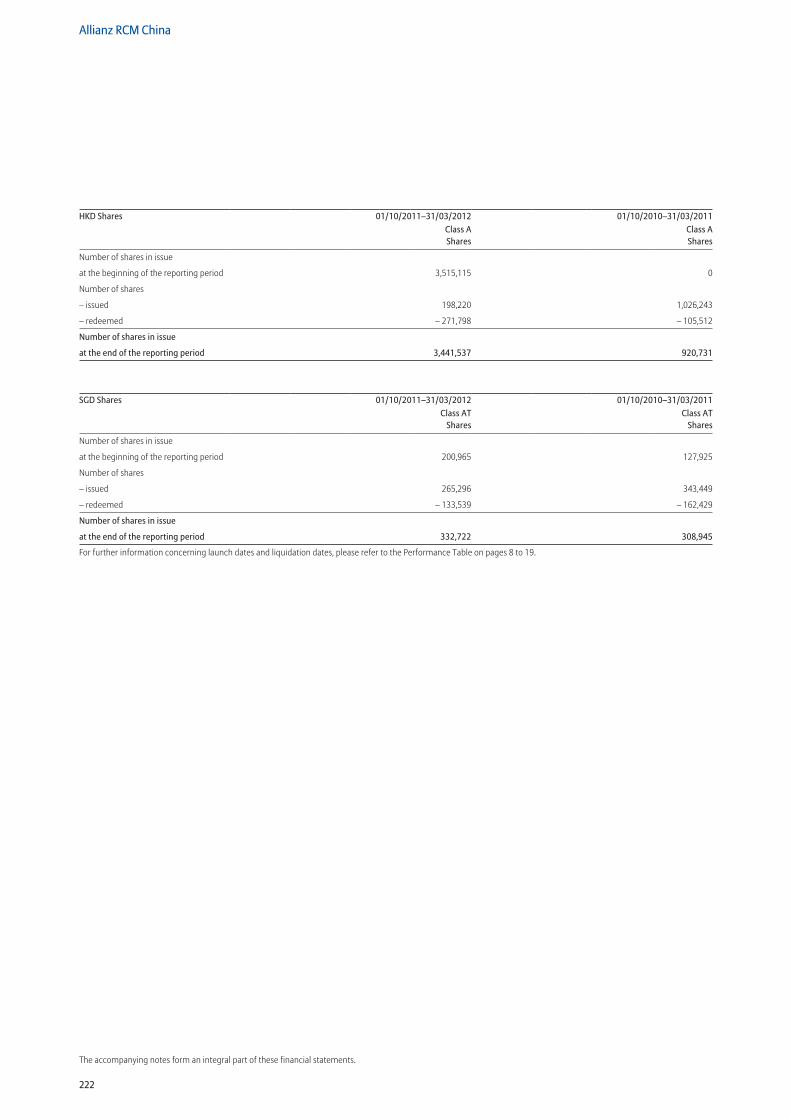
222
Allianz RCM China
The accompanying notes form an integral part of these financial statements.
HKD Shares 01/10/2011–31/03/2012 01/10/2010–31/03/2011Class A Shares
Class A Shares
Number of shares in issue
at the beginning of the reporting period 3,515,115 0
Number of shares
– issued 198,220 1,026,243
– redeemed – 271,798 – 105,512
Number of shares in issue
at the end of the reporting period 3,441,537 920,731
SGD Shares 01/10/2011–31/03/2012 01/10/2010–31/03/2011Class AT
SharesClass AT
Shares
Number of shares in issue
at the beginning of the reporting period 200,965 127,925
Number of shares
– issued 265,296 343,449
– redeemed – 133,539 – 162,429
Number of shares in issue
at the end of the reporting period 332,722 308,945
For further information concerning launch dates and liquidation dates, please refer to the Performance Table on pages 8 to 19.
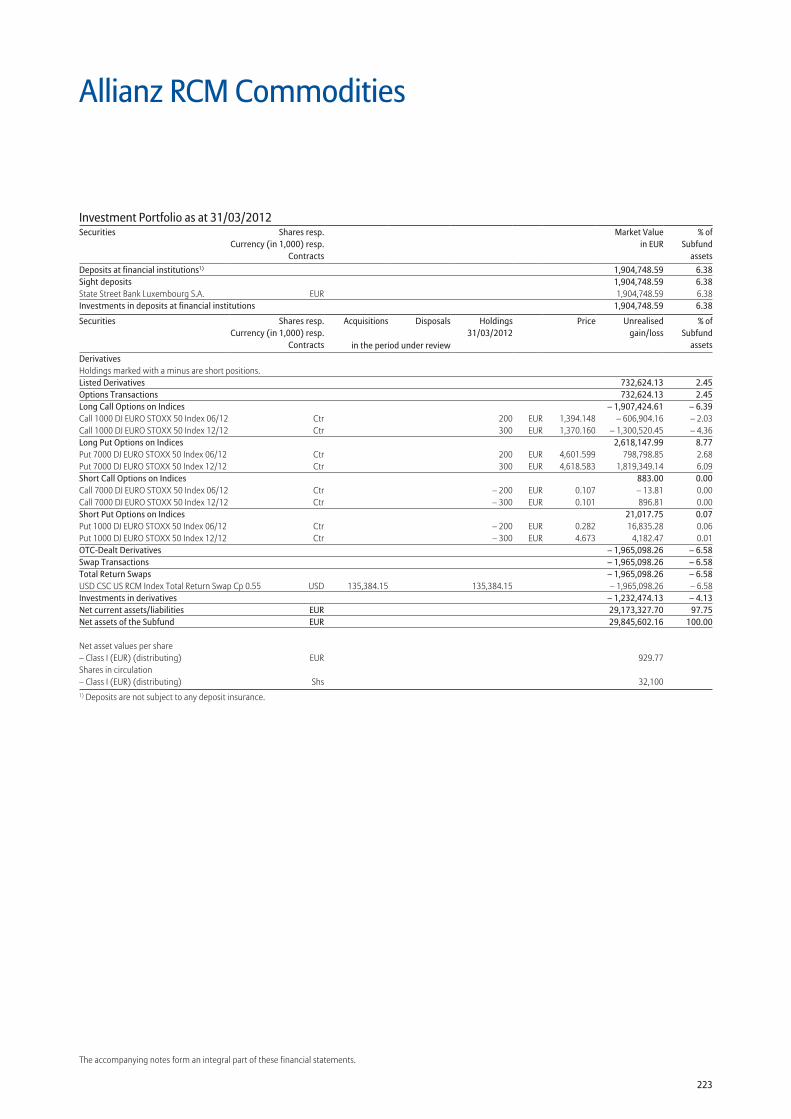
223
The accompanying notes form an integral part of these financial statements.
Allianz RCM Commodities
Deposits at financial institutions1) 1,904,748.59 6.38Sight deposits 1,904,748.59 6.38State Street Bank Luxembourg S.A. EUR 1,904,748.59 6.38Investments in deposits at financial institutions 1,904,748.59 6.38
Securities Shares resp.Currency (in 1,000) resp.
Contracts
Acquisitions Disposals Holdings 31/03/2012
Price Unrealisedgain/loss
% ofSubfund
assetsin the period under reviewDerivatives Holdings marked with a minus are short positions. Listed Derivatives 732,624.13 2.45Options Transactions 732,624.13 2.45Long Call Options on Indices – 1,907,424.61 – 6.39Call 1000 DJ EURO STOXX 50 Index 06/12 Ctr 200 EUR 1,394.148 – 606,904.16 – 2.03Call 1000 DJ EURO STOXX 50 Index 12/12 Ctr 300 EUR 1,370.160 – 1,300,520.45 – 4.36Long Put Options on Indices 2,618,147.99 8.77Put 7000 DJ EURO STOXX 50 Index 06/12 Ctr 200 EUR 4,601.599 798,798.85 2.68Put 7000 DJ EURO STOXX 50 Index 12/12 Ctr 300 EUR 4,618.583 1,819,349.14 6.09Short Call Options on Indices 883.00 0.00Call 7000 DJ EURO STOXX 50 Index 06/12 Ctr – 200 EUR 0.107 – 13.81 0.00Call 7000 DJ EURO STOXX 50 Index 12/12 Ctr – 300 EUR 0.101 896.81 0.00Short Put Options on Indices 21,017.75 0.07Put 1000 DJ EURO STOXX 50 Index 06/12 Ctr – 200 EUR 0.282 16,835.28 0.06Put 1000 DJ EURO STOXX 50 Index 12/12 Ctr – 300 EUR 4.673 4,182.47 0.01OTC-Dealt Derivatives – 1,965,098.26 – 6.58Swap Transactions – 1,965,098.26 – 6.58Total Return Swaps – 1,965,098.26 – 6.58USD CSC US RCM Index Total Return Swap Cp 0.55 USD 135,384.15 135,384.15 – 1,965,098.26 – 6.58Investments in derivatives – 1,232,474.13 – 4.13Net current assets/liabilities EUR 29,173,327.70 97.75Net assets of the Subfund EUR 29,845,602.16 100.00
Net asset values per share – Class I (EUR) (distributing) EUR 929.77 Shares in circulation – Class I (EUR) (distributing) Shs 32,100 1) Deposits are not subject to any deposit insurance.
Investment Portfolio as at 31/03/2012Securities Shares resp.
Currency (in 1,000) resp.Contracts
Market Valuein EUR
% ofSubfund
assets
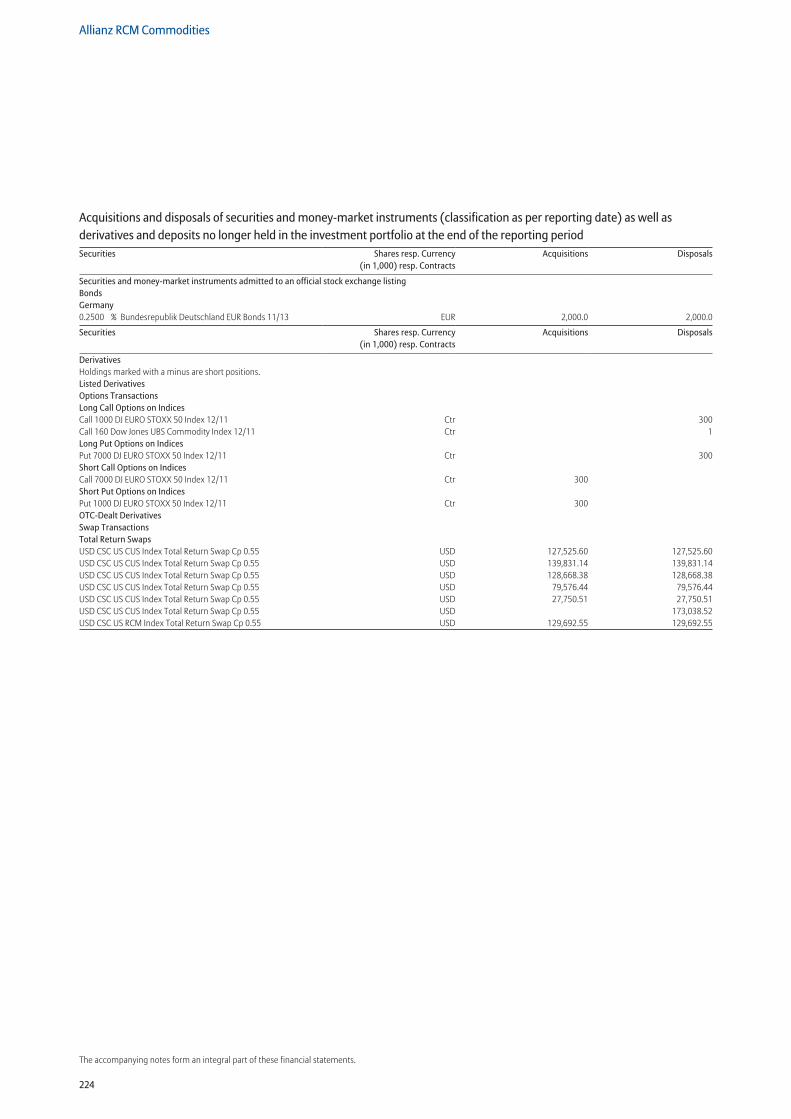
224
Allianz RCM Commodities
The accompanying notes form an integral part of these financial statements.
Securities and money-market instruments admitted to an official stock exchange listing Bonds Germany 0.2500 % Bundesrepublik Deutschland EUR Bonds 11/13 EUR 2,000.0 2,000.0
Securities Shares resp. Currency (in 1,000) resp. Contracts
Acquisitions Disposals
DerivativesHoldings marked with a minus are short positions. Listed Derivatives Options Transactions Long Call Options on Indices Call 1000 DJ EURO STOXX 50 Index 12/11 Ctr 300Call 160 Dow Jones UBS Commodity Index 12/11 Ctr 1Long Put Options on Indices Put 7000 DJ EURO STOXX 50 Index 12/11 Ctr 300Short Call Options on Indices Call 7000 DJ EURO STOXX 50 Index 12/11 Ctr 300 Short Put Options on Indices Put 1000 DJ EURO STOXX 50 Index 12/11 Ctr 300 OTC-Dealt Derivatives Swap Transactions Total Return Swaps USD CSC US CUS Index Total Return Swap Cp 0.55 USD 127,525.60 127,525.60USD CSC US CUS Index Total Return Swap Cp 0.55 USD 139,831.14 139,831.14USD CSC US CUS Index Total Return Swap Cp 0.55 USD 128,668.38 128,668.38USD CSC US CUS Index Total Return Swap Cp 0.55 USD 79,576.44 79,576.44USD CSC US CUS Index Total Return Swap Cp 0.55 USD 27,750.51 27,750.51USD CSC US CUS Index Total Return Swap Cp 0.55 USD 173,038.52USD CSC US RCM Index Total Return Swap Cp 0.55 USD 129,692.55 129,692.55
Acquisitions and disposals of securities and money-market instruments (classification as per reporting date) as well as derivatives and deposits no longer held in the investment portfolio at the end of the reporting periodSecurities Shares resp. Currency
(in 1,000) resp. ContractsAcquisitions Disposals
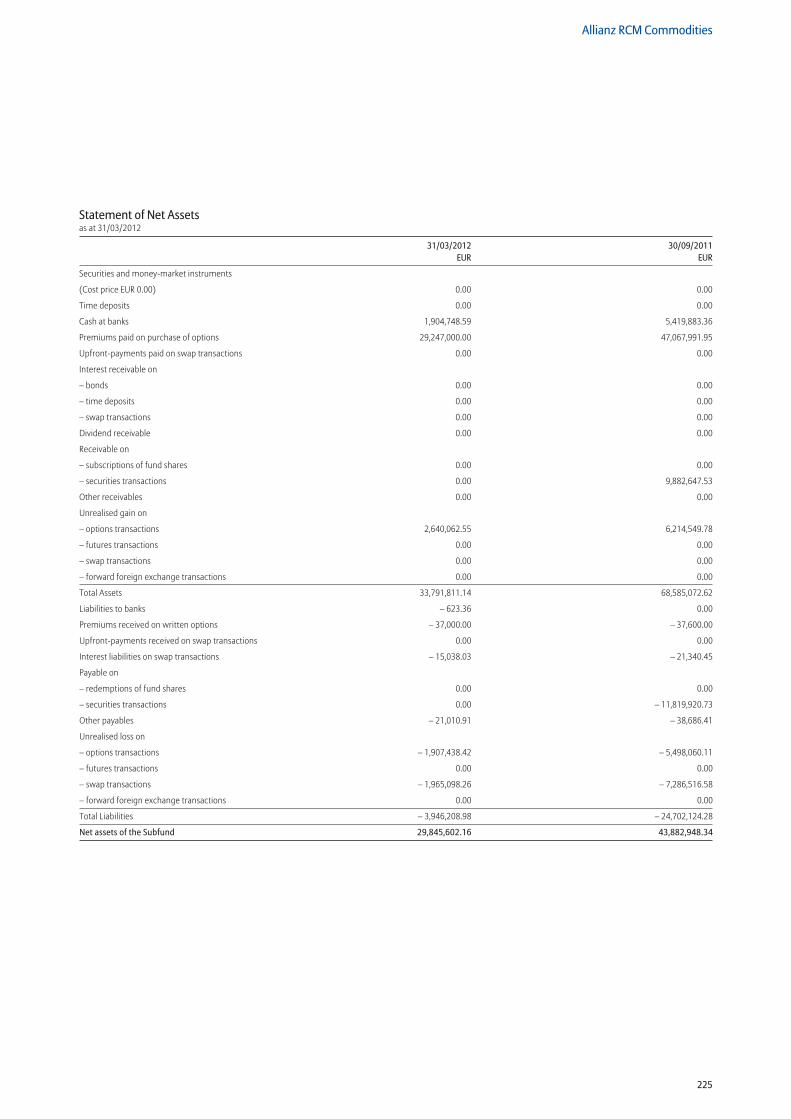
225
Allianz RCM Commodities
Statement of Net Assetsas at 31/03/2012
31/03/2012 30/09/2011 EUR EUR
Securities and money-market instruments
(Cost price EUR 0.00) 0.00 0.00
Time deposits 0.00 0.00
Cash at banks 1,904,748.59 5,419,883.36
Premiums paid on purchase of options 29,247,000.00 47,067,991.95
Upfront-payments paid on swap transactions 0.00 0.00
Interest receivable on
– bonds 0.00 0.00
– time deposits 0.00 0.00
– swap transactions 0.00 0.00
Dividend receivable 0.00 0.00
Receivable on
– subscriptions of fund shares 0.00 0.00
– securities transactions 0.00 9,882,647.53
Other receivables 0.00 0.00
Unrealised gain on
– options transactions 2,640,062.55 6,214,549.78
– futures transactions 0.00 0.00
– swap transactions 0.00 0.00
– forward foreign exchange transactions 0.00 0.00
Total Assets 33,791,811.14 68,585,072.62
Liabilities to banks – 623.36 0.00
Premiums received on written options – 37,000.00 – 37,600.00
Upfront-payments received on swap transactions 0.00 0.00
Interest liabilities on swap transactions – 15,038.03 – 21,340.45
Payable on
– redemptions of fund shares 0.00 0.00
– securities transactions 0.00 – 11,819,920.73
Other payables – 21,010.91 – 38,686.41
Unrealised loss on
– options transactions – 1,907,438.42 – 5,498,060.11
– futures transactions 0.00 0.00
– swap transactions – 1,965,098.26 – 7,286,516.58
– forward foreign exchange transactions 0.00 0.00
Total Liabilities – 3,946,208.98 – 24,702,124.28
Net assets of the Subfund 29,845,602.16 43,882,948.34
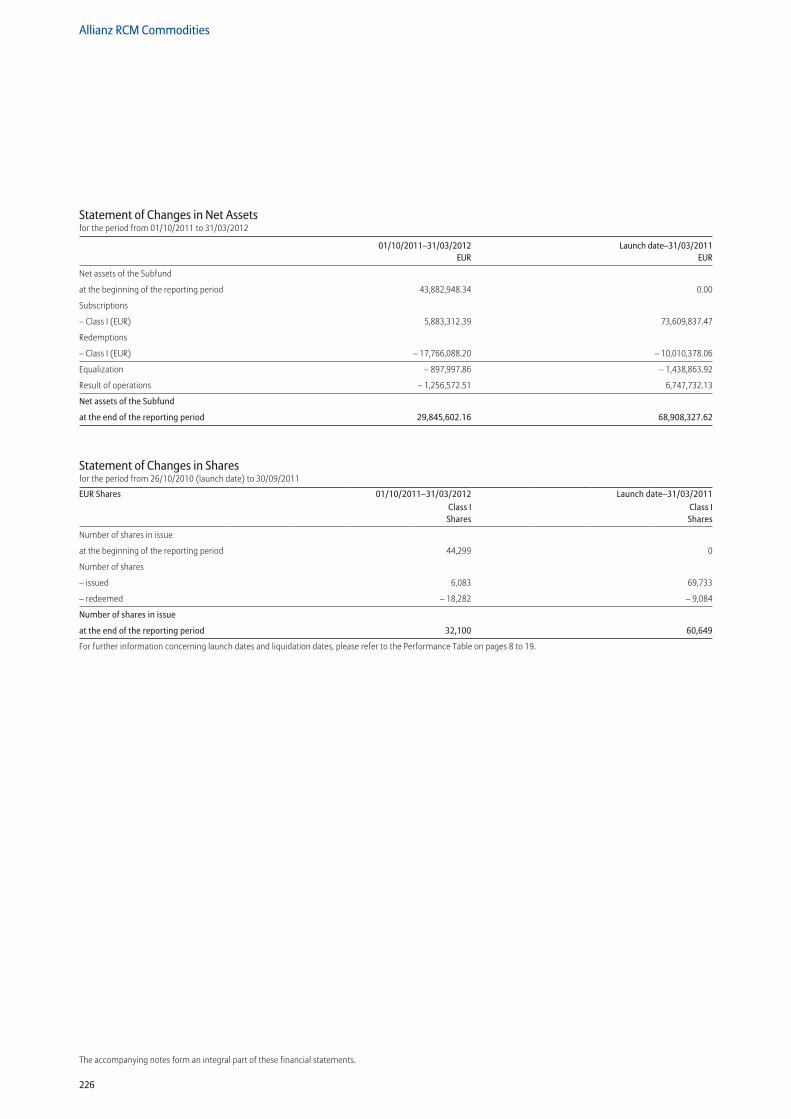
226
Allianz RCM Commodities
The accompanying notes form an integral part of these financial statements.
Statement of Changes in Net Assetsfor the period from 01/10/2011 to 31/03/2012
01/10/2011–31/03/2012 Launch date–31/03/2011 EUR EUR
Net assets of the Subfund
at the beginning of the reporting period 43,882,948.34 0.00
Subscriptions
– Class I (EUR) 5,883,312.39 73,609,837.47
Redemptions
– Class I (EUR) – 17,766,088.20 – 10,010,378.06
Equalization – 897,997.86 – 1,438,863.92
Result of operations – 1,256,572.51 6,747,732.13
Net assets of the Subfund
at the end of the reporting period 29,845,602.16 68,908,327.62
Statement of Changes in Sharesfor the period from 26/10/2010 (launch date) to 30/09/2011
EUR Shares 01/10/2011–31/03/2012 Launch date–31/03/2011Class I Shares
Class I Shares
Number of shares in issue
at the beginning of the reporting period 44,299 0
Number of shares
– issued 6,083 69,733
– redeemed – 18,282 – 9,084
Number of shares in issue
at the end of the reporting period 32,100 60,649
For further information concerning launch dates and liquidation dates, please refer to the Performance Table on pages 8 to 19.
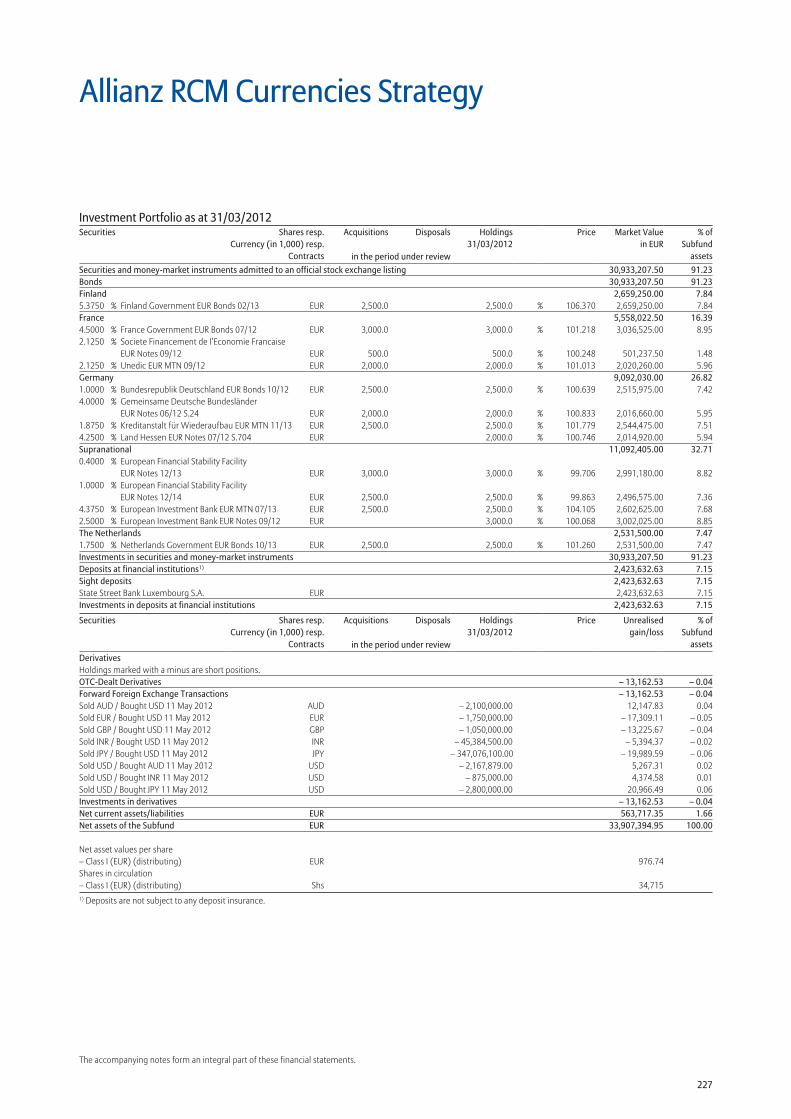
227
The accompanying notes form an integral part of these financial statements.
Securities and money-market instruments admitted to an official stock exchange listing 30,933,207.50 91.23Bonds 30,933,207.50 91.23Finland 2,659,250.00 7.845.3750 % Finland Government EUR Bonds 02/13 EUR 2,500.0 2,500.0 % 106.370 2,659,250.00 7.84France 5,558,022.50 16.394.5000 % France Government EUR Bonds 07/12 EUR 3,000.0 3,000.0 % 101.218 3,036,525.00 8.952.1250 % Societe Financement de l’Economie Francaise
EUR Notes 09/12 EUR 500.0 500.0 % 100.248 501,237.50 1.482.1250 % Unedic EUR MTN 09/12 EUR 2,000.0 2,000.0 % 101.013 2,020,260.00 5.96Germany 9,092,030.00 26.821.0000 % Bundesrepublik Deutschland EUR Bonds 10/12 EUR 2,500.0 2,500.0 % 100.639 2,515,975.00 7.424.0000 % Gemeinsame Deutsche Bundesländer
EUR Notes 06/12 S.24 EUR 2,000.0 2,000.0 % 100.833 2,016,660.00 5.951.8750 % Kreditanstalt für Wiederaufbau EUR MTN 11/13 EUR 2,500.0 2,500.0 % 101.779 2,544,475.00 7.514.2500 % Land Hessen EUR Notes 07/12 S.704 EUR 2,000.0 % 100.746 2,014,920.00 5.94Supranational 11,092,405.00 32.710.4000 % European Financial Stability Facility
EUR Notes 12/13 EUR 3,000.0 3,000.0 % 99.706 2,991,180.00 8.821.0000 % European Financial Stability Facility
EUR Notes 12/14 EUR 2,500.0 2,500.0 % 99.863 2,496,575.00 7.364.3750 % European Investment Bank EUR MTN 07/13 EUR 2,500.0 2,500.0 % 104.105 2,602,625.00 7.682.5000 % European Investment Bank EUR Notes 09/12 EUR 3,000.0 % 100.068 3,002,025.00 8.85The Netherlands 2,531,500.00 7.471.7500 % Netherlands Government EUR Bonds 10/13 EUR 2,500.0 2,500.0 % 101.260 2,531,500.00 7.47Investments in securities and money-market instruments 30,933,207.50 91.23Deposits at financial institutions1) 2,423,632.63 7.15Sight deposits 2,423,632.63 7.15State Street Bank Luxembourg S.A. EUR 2,423,632.63 7.15Investments in deposits at financial institutions 2,423,632.63 7.15
Securities Shares resp.Currency (in 1,000) resp.
Contracts
Acquisitions Disposals Holdings 31/03/2012
Price Unrealisedgain/loss
% ofSubfund
assetsin the period under reviewDerivatives Holdings marked with a minus are short positions.OTC-Dealt Derivatives – 13,162.53 – 0.04Forward Foreign Exchange Transactions – 13,162.53 – 0.04Sold AUD / Bought USD 11 May 2012 AUD – 2,100,000.00 12,147.83 0.04Sold EUR / Bought USD 11 May 2012 EUR – 1,750,000.00 – 17,309.11 – 0.05Sold GBP / Bought USD 11 May 2012 GBP – 1,050,000.00 – 13,225.67 – 0.04Sold INR / Bought USD 11 May 2012 INR – 45,384,500.00 – 5,394.37 – 0.02Sold JPY / Bought USD 11 May 2012 JPY – 347,076,100.00 – 19,989.59 – 0.06Sold USD / Bought AUD 11 May 2012 USD – 2,167,879.00 5,267.31 0.02Sold USD / Bought INR 11 May 2012 USD – 875,000.00 4,374.58 0.01Sold USD / Bought JPY 11 May 2012 USD – 2,800,000.00 20,966.49 0.06Investments in derivatives – 13,162.53 – 0.04Net current assets/liabilities EUR 563,717.35 1.66Net assets of the Subfund EUR 33,907,394.95 100.00
Net asset values per share – Class I (EUR) (distributing) EUR 976.74Shares in circulation – Class I (EUR) (distributing) Shs 34,7151) Deposits are not subject to any deposit insurance.
Allianz RCM Currencies Strategy
Investment Portfolio as at 31/03/2012Securities Shares resp.
Currency (in 1,000) resp.Contracts
Acquisitions Disposals Holdings 31/03/2012
Price Market Valuein EUR
% ofSubfund
assetsin the period under review
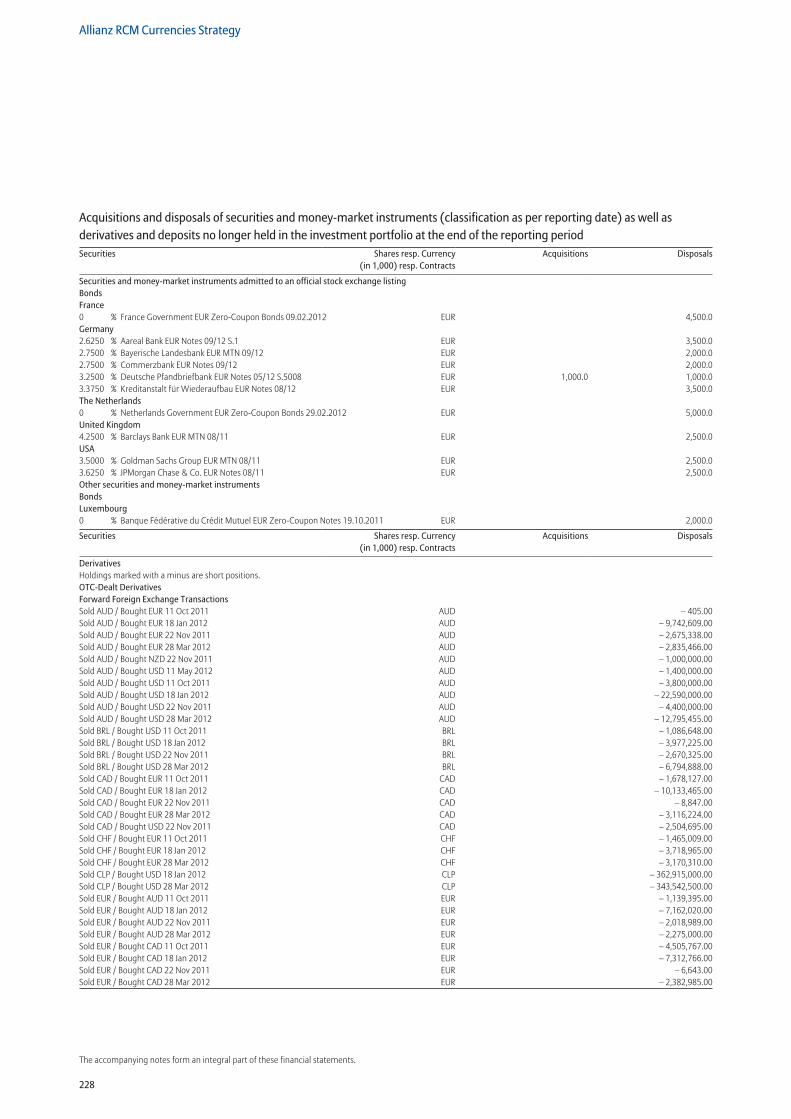
228
Allianz RCM Currencies Strategy
The accompanying notes form an integral part of these financial statements.
Securities and money-market instruments admitted to an official stock exchange listing Bonds France 0 % France Government EUR Zero-Coupon Bonds 09.02.2012 EUR 4,500.0Germany 2.6250 % Aareal Bank EUR Notes 09/12 S.1 EUR 3,500.02.7500 % Bayerische Landesbank EUR MTN 09/12 EUR 2,000.02.7500 % Commerzbank EUR Notes 09/12 EUR 2,000.03.2500 % Deutsche Pfandbriefbank EUR Notes 05/12 S.5008 EUR 1,000.0 1,000.03.3750 % Kreditanstalt für Wiederaufbau EUR Notes 08/12 EUR 3,500.0The Netherlands 0 % Netherlands Government EUR Zero-Coupon Bonds 29.02.2012 EUR 5,000.0United Kingdom 4.2500 % Barclays Bank EUR MTN 08/11 EUR 2,500.0USA 3.5000 % Goldman Sachs Group EUR MTN 08/11 EUR 2,500.03.6250 % JPMorgan Chase & Co. EUR Notes 08/11 EUR 2,500.0Other securities and money-market instruments Bonds Luxembourg 0 % Banque Fédérative du Crédit Mutuel EUR Zero-Coupon Notes 19.10.2011 EUR 2,000.0
Securities Shares resp. Currency (in 1,000) resp. Contracts
Acquisitions Disposals
DerivativesHoldings marked with a minus are short positions. OTC-Dealt Derivatives Forward Foreign Exchange Transactions Sold AUD / Bought EUR 11 Oct 2011 AUD – 405.00Sold AUD / Bought EUR 18 Jan 2012 AUD – 9,742,609.00Sold AUD / Bought EUR 22 Nov 2011 AUD – 2,675,338.00Sold AUD / Bought EUR 28 Mar 2012 AUD – 2,835,466.00Sold AUD / Bought NZD 22 Nov 2011 AUD – 1,000,000.00Sold AUD / Bought USD 11 May 2012 AUD – 1,400,000.00Sold AUD / Bought USD 11 Oct 2011 AUD – 3,800,000.00Sold AUD / Bought USD 18 Jan 2012 AUD – 22,590,000.00Sold AUD / Bought USD 22 Nov 2011 AUD – 4,400,000.00Sold AUD / Bought USD 28 Mar 2012 AUD – 12,795,455.00Sold BRL / Bought USD 11 Oct 2011 BRL – 1,086,648.00Sold BRL / Bought USD 18 Jan 2012 BRL – 3,977,225.00Sold BRL / Bought USD 22 Nov 2011 BRL – 2,670,325.00Sold BRL / Bought USD 28 Mar 2012 BRL – 6,794,888.00Sold CAD / Bought EUR 11 Oct 2011 CAD – 1,678,127.00Sold CAD / Bought EUR 18 Jan 2012 CAD – 10,133,465.00Sold CAD / Bought EUR 22 Nov 2011 CAD – 8,847.00Sold CAD / Bought EUR 28 Mar 2012 CAD – 3,116,224.00Sold CAD / Bought USD 22 Nov 2011 CAD – 2,504,695.00Sold CHF / Bought EUR 11 Oct 2011 CHF – 1,465,009.00Sold CHF / Bought EUR 18 Jan 2012 CHF – 3,718,965.00Sold CHF / Bought EUR 28 Mar 2012 CHF – 3,170,310.00Sold CLP / Bought USD 18 Jan 2012 CLP – 362,915,000.00Sold CLP / Bought USD 28 Mar 2012 CLP – 343,542,500.00Sold EUR / Bought AUD 11 Oct 2011 EUR – 1,139,395.00Sold EUR / Bought AUD 18 Jan 2012 EUR – 7,162,020.00Sold EUR / Bought AUD 22 Nov 2011 EUR – 2,018,989.00Sold EUR / Bought AUD 28 Mar 2012 EUR – 2,275,000.00Sold EUR / Bought CAD 11 Oct 2011 EUR – 4,505,767.00Sold EUR / Bought CAD 18 Jan 2012 EUR – 7,312,766.00Sold EUR / Bought CAD 22 Nov 2011 EUR – 6,643.00Sold EUR / Bought CAD 28 Mar 2012 EUR – 2,382,985.00
Acquisitions and disposals of securities and money-market instruments (classification as per reporting date) as well as derivatives and deposits no longer held in the investment portfolio at the end of the reporting periodSecurities Shares resp. Currency
(in 1,000) resp. ContractsAcquisitions Disposals
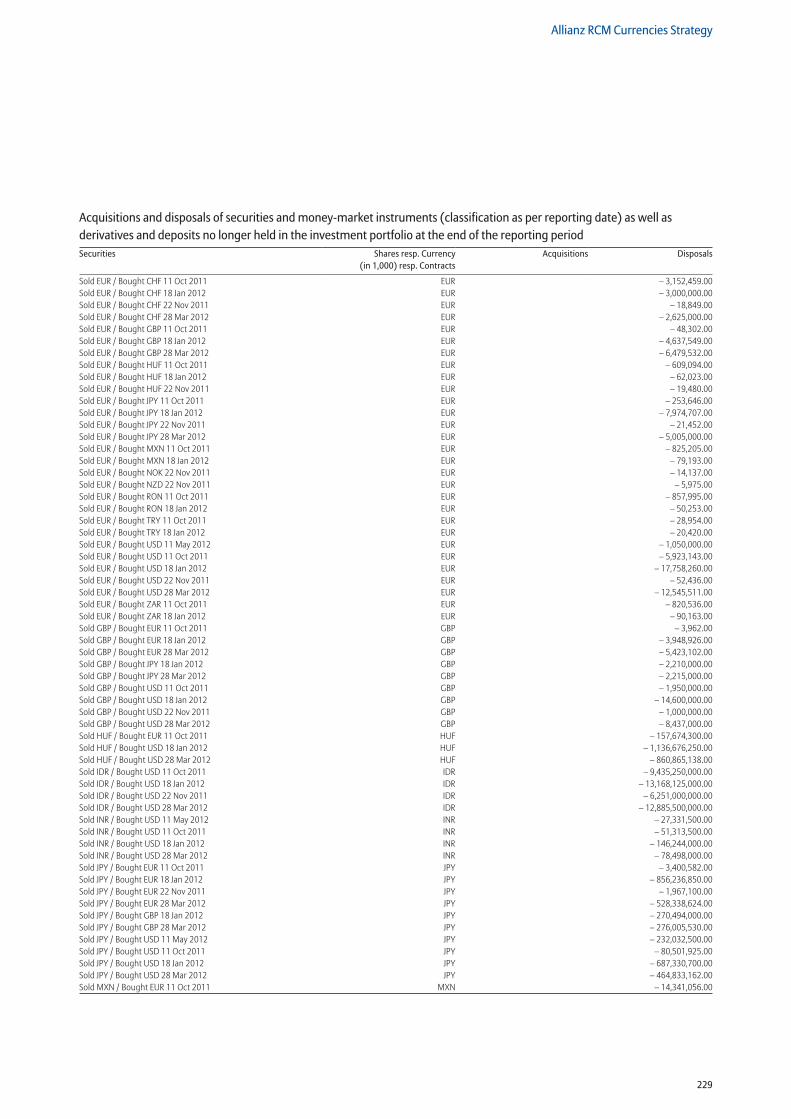
229
Allianz RCM Currencies Strategy
Sold EUR / Bought CHF 11 Oct 2011 EUR – 3,152,459.00Sold EUR / Bought CHF 18 Jan 2012 EUR – 3,000,000.00Sold EUR / Bought CHF 22 Nov 2011 EUR – 18,849.00Sold EUR / Bought CHF 28 Mar 2012 EUR – 2,625,000.00Sold EUR / Bought GBP 11 Oct 2011 EUR – 48,302.00Sold EUR / Bought GBP 18 Jan 2012 EUR – 4,637,549.00Sold EUR / Bought GBP 28 Mar 2012 EUR – 6,479,532.00Sold EUR / Bought HUF 11 Oct 2011 EUR – 609,094.00Sold EUR / Bought HUF 18 Jan 2012 EUR – 62,023.00Sold EUR / Bought HUF 22 Nov 2011 EUR – 19,480.00Sold EUR / Bought JPY 11 Oct 2011 EUR – 253,646.00Sold EUR / Bought JPY 18 Jan 2012 EUR – 7,974,707.00Sold EUR / Bought JPY 22 Nov 2011 EUR – 21,452.00Sold EUR / Bought JPY 28 Mar 2012 EUR – 5,005,000.00Sold EUR / Bought MXN 11 Oct 2011 EUR – 825,205.00Sold EUR / Bought MXN 18 Jan 2012 EUR – 79,193.00Sold EUR / Bought NOK 22 Nov 2011 EUR – 14,137.00Sold EUR / Bought NZD 22 Nov 2011 EUR – 5,975.00Sold EUR / Bought RON 11 Oct 2011 EUR – 857,995.00Sold EUR / Bought RON 18 Jan 2012 EUR – 50,253.00Sold EUR / Bought TRY 11 Oct 2011 EUR – 28,954.00Sold EUR / Bought TRY 18 Jan 2012 EUR – 20,420.00Sold EUR / Bought USD 11 May 2012 EUR – 1,050,000.00Sold EUR / Bought USD 11 Oct 2011 EUR – 5,923,143.00Sold EUR / Bought USD 18 Jan 2012 EUR – 17,758,260.00Sold EUR / Bought USD 22 Nov 2011 EUR – 52,436.00Sold EUR / Bought USD 28 Mar 2012 EUR – 12,545,511.00Sold EUR / Bought ZAR 11 Oct 2011 EUR – 820,536.00Sold EUR / Bought ZAR 18 Jan 2012 EUR – 90,163.00Sold GBP / Bought EUR 11 Oct 2011 GBP – 3,962.00Sold GBP / Bought EUR 18 Jan 2012 GBP – 3,948,926.00Sold GBP / Bought EUR 28 Mar 2012 GBP – 5,423,102.00Sold GBP / Bought JPY 18 Jan 2012 GBP – 2,210,000.00Sold GBP / Bought JPY 28 Mar 2012 GBP – 2,215,000.00Sold GBP / Bought USD 11 Oct 2011 GBP – 1,950,000.00Sold GBP / Bought USD 18 Jan 2012 GBP – 14,600,000.00Sold GBP / Bought USD 22 Nov 2011 GBP – 1,000,000.00Sold GBP / Bought USD 28 Mar 2012 GBP – 8,437,000.00Sold HUF / Bought EUR 11 Oct 2011 HUF – 157,674,300.00Sold HUF / Bought USD 18 Jan 2012 HUF – 1,136,676,250.00Sold HUF / Bought USD 28 Mar 2012 HUF – 860,865,138.00Sold IDR / Bought USD 11 Oct 2011 IDR – 9,435,250,000.00Sold IDR / Bought USD 18 Jan 2012 IDR – 13,168,125,000.00Sold IDR / Bought USD 22 Nov 2011 IDR – 6,251,000,000.00Sold IDR / Bought USD 28 Mar 2012 IDR – 12,885,500,000.00Sold INR / Bought USD 11 May 2012 INR – 27,331,500.00Sold INR / Bought USD 11 Oct 2011 INR – 51,313,500.00Sold INR / Bought USD 18 Jan 2012 INR – 146,244,000.00Sold INR / Bought USD 28 Mar 2012 INR – 78,498,000.00Sold JPY / Bought EUR 11 Oct 2011 JPY – 3,400,582.00Sold JPY / Bought EUR 18 Jan 2012 JPY – 856,236,850.00Sold JPY / Bought EUR 22 Nov 2011 JPY – 1,967,100.00Sold JPY / Bought EUR 28 Mar 2012 JPY – 528,338,624.00Sold JPY / Bought GBP 18 Jan 2012 JPY – 270,494,000.00Sold JPY / Bought GBP 28 Mar 2012 JPY – 276,005,530.00Sold JPY / Bought USD 11 May 2012 JPY – 232,032,500.00Sold JPY / Bought USD 11 Oct 2011 JPY – 80,501,925.00Sold JPY / Bought USD 18 Jan 2012 JPY – 687,330,700.00Sold JPY / Bought USD 28 Mar 2012 JPY – 464,833,162.00Sold MXN / Bought EUR 11 Oct 2011 MXN – 14,341,056.00
Acquisitions and disposals of securities and money-market instruments (classification as per reporting date) as well as derivatives and deposits no longer held in the investment portfolio at the end of the reporting periodSecurities Shares resp. Currency
(in 1,000) resp. ContractsAcquisitions Disposals
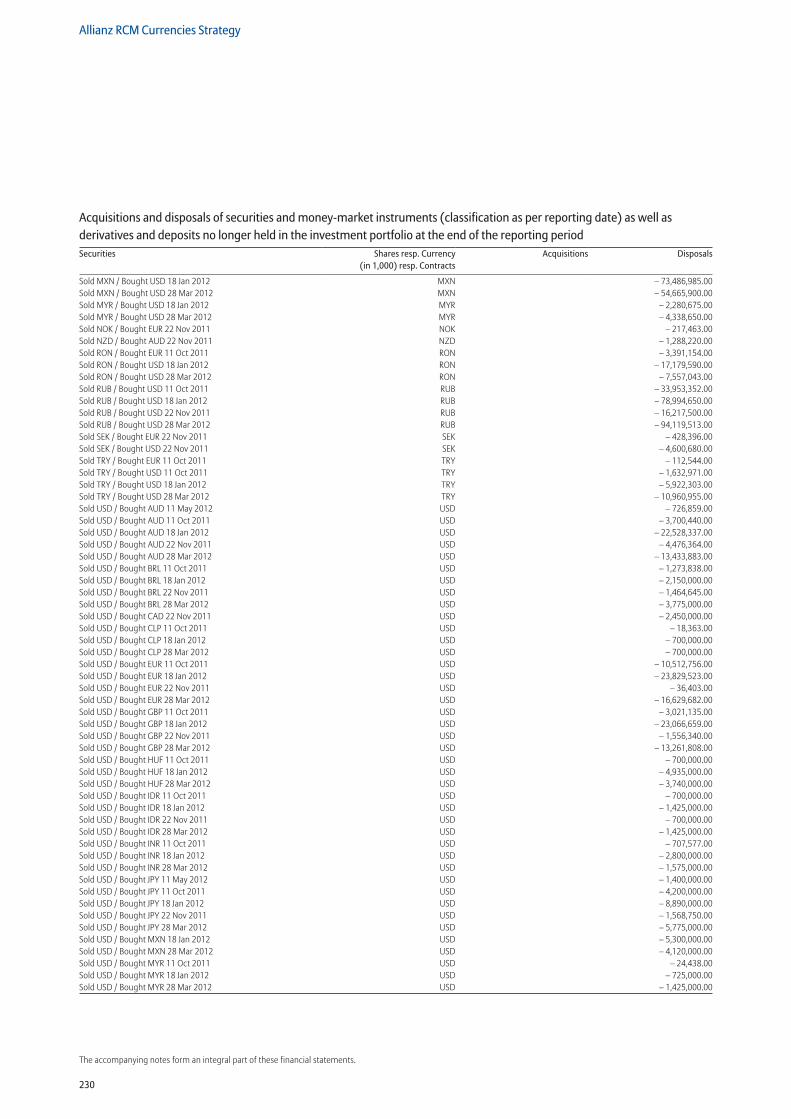
230
Allianz RCM Currencies Strategy
The accompanying notes form an integral part of these financial statements.
Sold MXN / Bought USD 18 Jan 2012 MXN – 73,486,985.00Sold MXN / Bought USD 28 Mar 2012 MXN – 54,665,900.00Sold MYR / Bought USD 18 Jan 2012 MYR – 2,280,675.00Sold MYR / Bought USD 28 Mar 2012 MYR – 4,338,650.00Sold NOK / Bought EUR 22 Nov 2011 NOK – 217,463.00Sold NZD / Bought AUD 22 Nov 2011 NZD – 1,288,220.00Sold RON / Bought EUR 11 Oct 2011 RON – 3,391,154.00Sold RON / Bought USD 18 Jan 2012 RON – 17,179,590.00Sold RON / Bought USD 28 Mar 2012 RON – 7,557,043.00Sold RUB / Bought USD 11 Oct 2011 RUB – 33,953,352.00Sold RUB / Bought USD 18 Jan 2012 RUB – 78,994,650.00Sold RUB / Bought USD 22 Nov 2011 RUB – 16,217,500.00Sold RUB / Bought USD 28 Mar 2012 RUB – 94,119,513.00Sold SEK / Bought EUR 22 Nov 2011 SEK – 428,396.00Sold SEK / Bought USD 22 Nov 2011 SEK – 4,600,680.00Sold TRY / Bought EUR 11 Oct 2011 TRY – 112,544.00Sold TRY / Bought USD 11 Oct 2011 TRY – 1,632,971.00Sold TRY / Bought USD 18 Jan 2012 TRY – 5,922,303.00Sold TRY / Bought USD 28 Mar 2012 TRY – 10,960,955.00Sold USD / Bought AUD 11 May 2012 USD – 726,859.00Sold USD / Bought AUD 11 Oct 2011 USD – 3,700,440.00Sold USD / Bought AUD 18 Jan 2012 USD – 22,528,337.00Sold USD / Bought AUD 22 Nov 2011 USD – 4,476,364.00Sold USD / Bought AUD 28 Mar 2012 USD – 13,433,883.00Sold USD / Bought BRL 11 Oct 2011 USD – 1,273,838.00Sold USD / Bought BRL 18 Jan 2012 USD – 2,150,000.00Sold USD / Bought BRL 22 Nov 2011 USD – 1,464,645.00Sold USD / Bought BRL 28 Mar 2012 USD – 3,775,000.00Sold USD / Bought CAD 22 Nov 2011 USD – 2,450,000.00Sold USD / Bought CLP 11 Oct 2011 USD – 18,363.00Sold USD / Bought CLP 18 Jan 2012 USD – 700,000.00Sold USD / Bought CLP 28 Mar 2012 USD – 700,000.00Sold USD / Bought EUR 11 Oct 2011 USD – 10,512,756.00Sold USD / Bought EUR 18 Jan 2012 USD – 23,829,523.00Sold USD / Bought EUR 22 Nov 2011 USD – 36,403.00Sold USD / Bought EUR 28 Mar 2012 USD – 16,629,682.00Sold USD / Bought GBP 11 Oct 2011 USD – 3,021,135.00Sold USD / Bought GBP 18 Jan 2012 USD – 23,066,659.00Sold USD / Bought GBP 22 Nov 2011 USD – 1,556,340.00Sold USD / Bought GBP 28 Mar 2012 USD – 13,261,808.00Sold USD / Bought HUF 11 Oct 2011 USD – 700,000.00Sold USD / Bought HUF 18 Jan 2012 USD – 4,935,000.00Sold USD / Bought HUF 28 Mar 2012 USD – 3,740,000.00Sold USD / Bought IDR 11 Oct 2011 USD – 700,000.00Sold USD / Bought IDR 18 Jan 2012 USD – 1,425,000.00Sold USD / Bought IDR 22 Nov 2011 USD – 700,000.00Sold USD / Bought IDR 28 Mar 2012 USD – 1,425,000.00Sold USD / Bought INR 11 Oct 2011 USD – 707,577.00Sold USD / Bought INR 18 Jan 2012 USD – 2,800,000.00Sold USD / Bought INR 28 Mar 2012 USD – 1,575,000.00Sold USD / Bought JPY 11 May 2012 USD – 1,400,000.00Sold USD / Bought JPY 11 Oct 2011 USD – 4,200,000.00Sold USD / Bought JPY 18 Jan 2012 USD – 8,890,000.00Sold USD / Bought JPY 22 Nov 2011 USD – 1,568,750.00Sold USD / Bought JPY 28 Mar 2012 USD – 5,775,000.00Sold USD / Bought MXN 18 Jan 2012 USD – 5,300,000.00Sold USD / Bought MXN 28 Mar 2012 USD – 4,120,000.00Sold USD / Bought MYR 11 Oct 2011 USD – 24,438.00Sold USD / Bought MYR 18 Jan 2012 USD – 725,000.00Sold USD / Bought MYR 28 Mar 2012 USD – 1,425,000.00
Acquisitions and disposals of securities and money-market instruments (classification as per reporting date) as well as derivatives and deposits no longer held in the investment portfolio at the end of the reporting periodSecurities Shares resp. Currency
(in 1,000) resp. ContractsAcquisitions Disposals
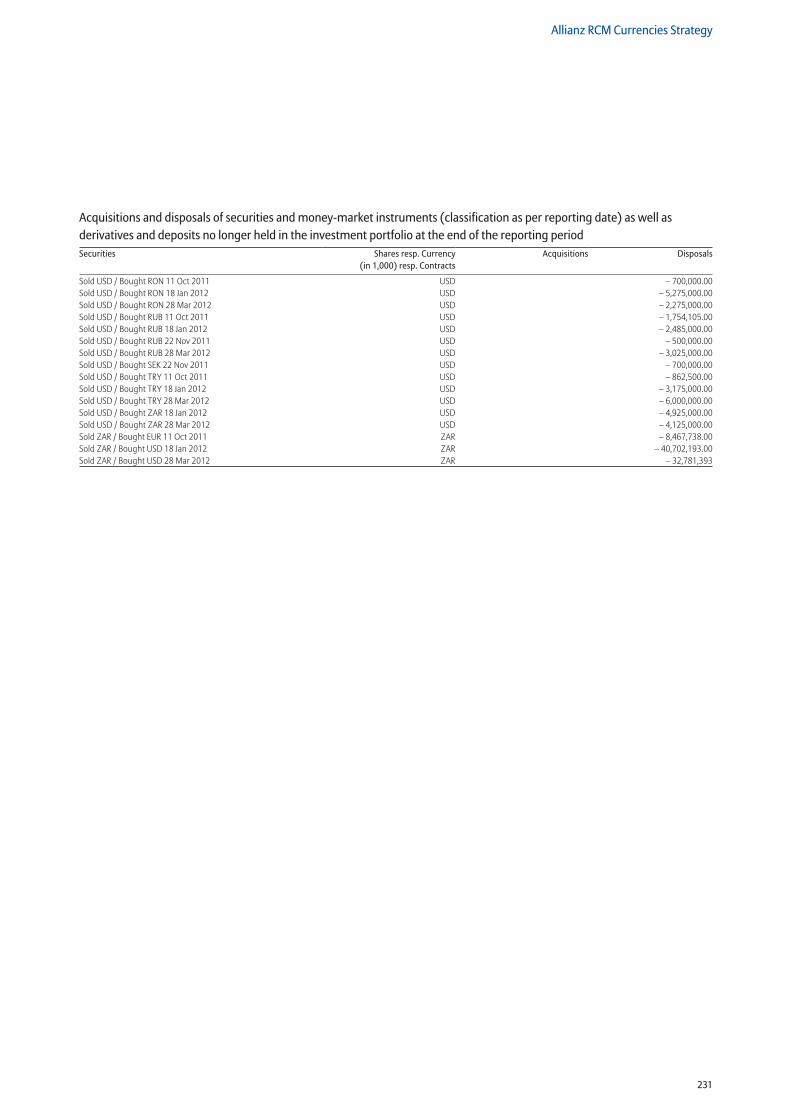
231
Allianz RCM Currencies Strategy
Sold USD / Bought RON 11 Oct 2011 USD – 700,000.00Sold USD / Bought RON 18 Jan 2012 USD – 5,275,000.00Sold USD / Bought RON 28 Mar 2012 USD – 2,275,000.00Sold USD / Bought RUB 11 Oct 2011 USD – 1,754,105.00Sold USD / Bought RUB 18 Jan 2012 USD – 2,485,000.00Sold USD / Bought RUB 22 Nov 2011 USD – 500,000.00Sold USD / Bought RUB 28 Mar 2012 USD – 3,025,000.00Sold USD / Bought SEK 22 Nov 2011 USD – 700,000.00Sold USD / Bought TRY 11 Oct 2011 USD – 862,500.00Sold USD / Bought TRY 18 Jan 2012 USD – 3,175,000.00Sold USD / Bought TRY 28 Mar 2012 USD – 6,000,000.00Sold USD / Bought ZAR 18 Jan 2012 USD – 4,925,000.00Sold USD / Bought ZAR 28 Mar 2012 USD – 4,125,000.00Sold ZAR / Bought EUR 11 Oct 2011 ZAR – 8,467,738.00Sold ZAR / Bought USD 18 Jan 2012 ZAR – 40,702,193.00Sold ZAR / Bought USD 28 Mar 2012 ZAR – 32,781,393
Acquisitions and disposals of securities and money-market instruments (classification as per reporting date) as well as derivatives and deposits no longer held in the investment portfolio at the end of the reporting periodSecurities Shares resp. Currency
(in 1,000) resp. ContractsAcquisitions Disposals
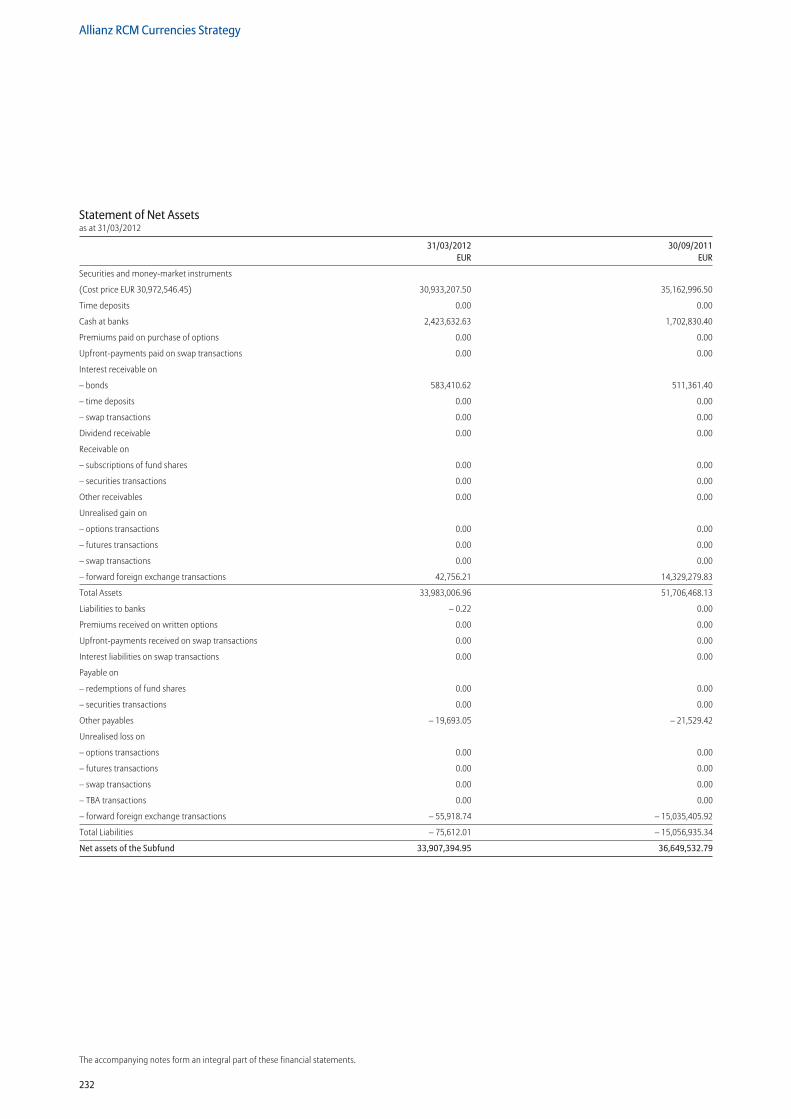
232
Allianz RCM Currencies Strategy
The accompanying notes form an integral part of these financial statements.
Statement of Net Assetsas at 31/03/2012
31/03/2012 30/09/2011 EUR EUR
Securities and money-market instruments
(Cost price EUR 30,972,546.45) 30,933,207.50 35,162,996.50
Time deposits 0.00 0.00
Cash at banks 2,423,632.63 1,702,830.40
Premiums paid on purchase of options 0.00 0.00
Upfront-payments paid on swap transactions 0.00 0.00
Interest receivable on
– bonds 583,410.62 511,361.40
– time deposits 0.00 0.00
– swap transactions 0.00 0.00
Dividend receivable 0.00 0.00
Receivable on
– subscriptions of fund shares 0.00 0.00
– securities transactions 0.00 0.00
Other receivables 0.00 0.00
Unrealised gain on
– options transactions 0.00 0.00
– futures transactions 0.00 0.00
– swap transactions 0.00 0.00
– forward foreign exchange transactions 42,756.21 14,329,279.83
Total Assets 33,983,006.96 51,706,468.13
Liabilities to banks – 0.22 0.00
Premiums received on written options 0.00 0.00
Upfront-payments received on swap transactions 0.00 0.00
Interest liabilities on swap transactions 0.00 0.00
Payable on
– redemptions of fund shares 0.00 0.00
– securities transactions 0.00 0.00
Other payables – 19,693.05 – 21,529.42
Unrealised loss on
– options transactions 0.00 0.00
– futures transactions 0.00 0.00
– swap transactions 0.00 0.00
– TBA transactions 0.00 0.00
– forward foreign exchange transactions – 55,918.74 – 15,035,405.92
Total Liabilities – 75,612.01 – 15,056,935.34
Net assets of the Subfund 33,907,394.95 36,649,532.79
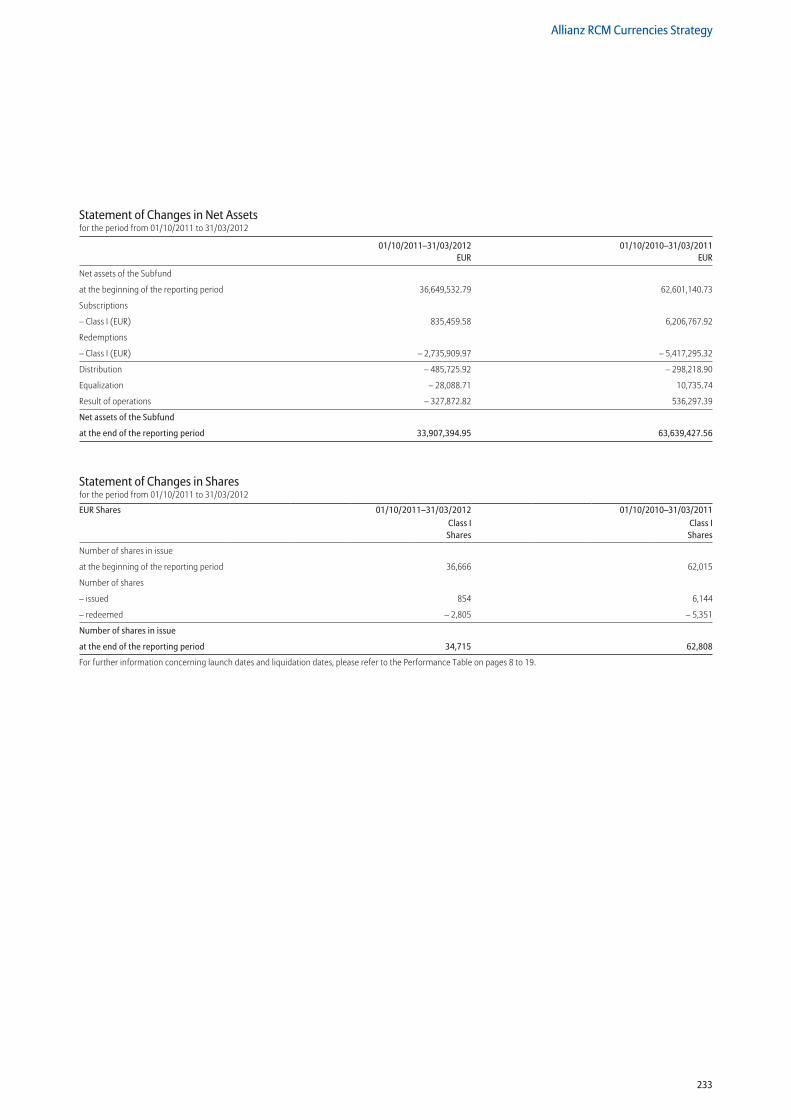
233
Allianz RCM Currencies Strategy
Statement of Changes in Net Assetsfor the period from 01/10/2011 to 31/03/2012
01/10/2011–31/03/2012 01/10/2010–31/03/2011 EUR EUR
Net assets of the Subfund
at the beginning of the reporting period 36,649,532.79 62,601,140.73
Subscriptions
– Class I (EUR) 835,459.58 6,206,767.92
Redemptions
– Class I (EUR) – 2,735,909.97 – 5,417,295.32
Distribution – 485,725.92 – 298,218.90
Equalization – 28,088.71 10,735.74
Result of operations – 327,872.82 536,297.39
Net assets of the Subfund
at the end of the reporting period 33,907,394.95 63,639,427.56
Statement of Changes in Sharesfor the period from 01/10/2011 to 31/03/2012
EUR Shares 01/10/2011–31/03/2012 01/10/2010–31/03/2011Class I Shares
Class I Shares
Number of shares in issue
at the beginning of the reporting period 36,666 62,015
Number of shares
– issued 854 6,144
– redeemed – 2,805 – 5,351
Number of shares in issue
at the end of the reporting period 34,715 62,808
For further information concerning launch dates and liquidation dates, please refer to the Performance Table on pages 8 to 19.
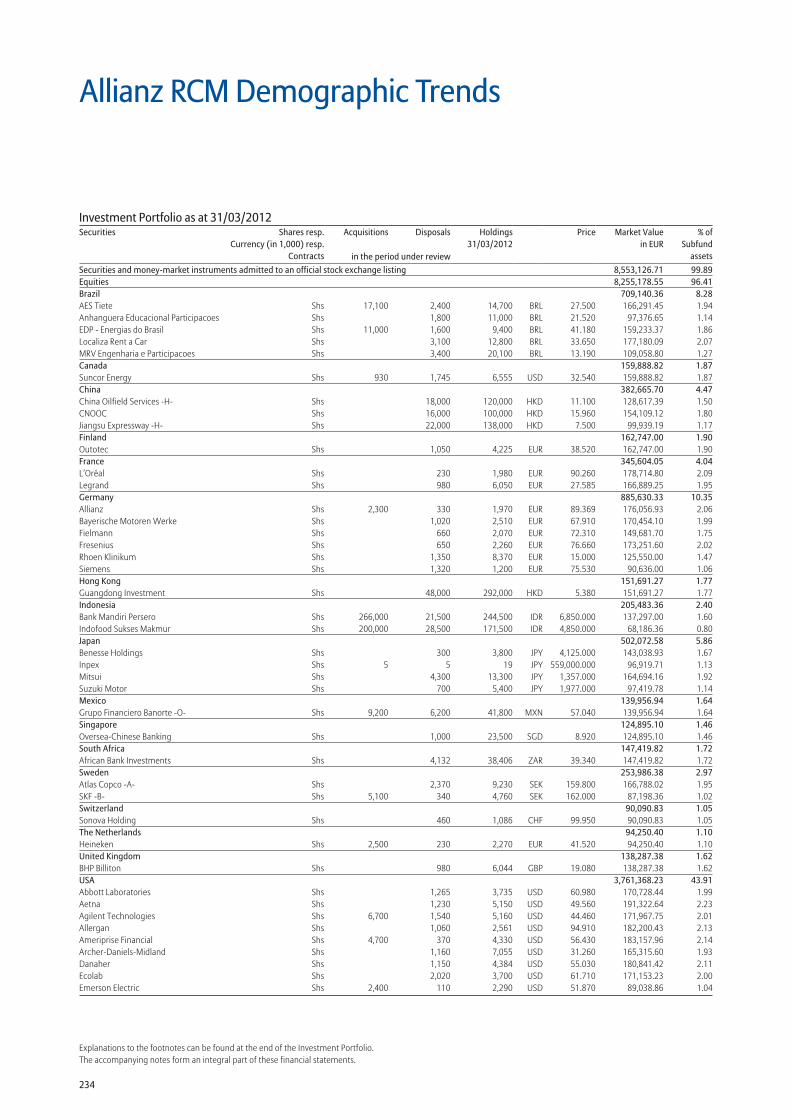
234
Explanations to the footnotes can be found at the end of the Investment Portfolio.The accompanying notes form an integral part of these financial statements.
Securities and money-market instruments admitted to an official stock exchange listing 8,553,126.71 99.89Equities 8,255,178.55 96.41Brazil 709,140.36 8.28AES Tiete Shs 17,100 2,400 14,700 BRL 27.500 166,291.45 1.94Anhanguera Educacional Participacoes Shs 1,800 11,000 BRL 21.520 97,376.65 1.14EDP - Energias do Brasil Shs 11,000 1,600 9,400 BRL 41.180 159,233.37 1.86Localiza Rent a Car Shs 3,100 12,800 BRL 33.650 177,180.09 2.07MRV Engenharia e Participacoes Shs 3,400 20,100 BRL 13.190 109,058.80 1.27Canada 159,888.82 1.87Suncor Energy Shs 930 1,745 6,555 USD 32.540 159,888.82 1.87China 382,665.70 4.47China Oilfield Services -H- Shs 18,000 120,000 HKD 11.100 128,617.39 1.50CNOOC Shs 16,000 100,000 HKD 15.960 154,109.12 1.80Jiangsu Expressway -H- Shs 22,000 138,000 HKD 7.500 99,939.19 1.17Finland 162,747.00 1.90Outotec Shs 1,050 4,225 EUR 38.520 162,747.00 1.90France 345,604.05 4.04L’Oréal Shs 230 1,980 EUR 90.260 178,714.80 2.09Legrand Shs 980 6,050 EUR 27.585 166,889.25 1.95Germany 885,630.33 10.35Allianz Shs 2,300 330 1,970 EUR 89.369 176,056.93 2.06Bayerische Motoren Werke Shs 1,020 2,510 EUR 67.910 170,454.10 1.99Fielmann Shs 660 2,070 EUR 72.310 149,681.70 1.75Fresenius Shs 650 2,260 EUR 76.660 173,251.60 2.02Rhoen Klinikum Shs 1,350 8,370 EUR 15.000 125,550.00 1.47Siemens Shs 1,320 1,200 EUR 75.530 90,636.00 1.06Hong Kong 151,691.27 1.77Guangdong Investment Shs 48,000 292,000 HKD 5.380 151,691.27 1.77Indonesia 205,483.36 2.40Bank Mandiri Persero Shs 266,000 21,500 244,500 IDR 6,850.000 137,297.00 1.60Indofood Sukses Makmur Shs 200,000 28,500 171,500 IDR 4,850.000 68,186.36 0.80Japan 502,072.58 5.86Benesse Holdings Shs 300 3,800 JPY 4,125.000 143,038.93 1.67Inpex Shs 5 5 19 JPY 559,000.000 96,919.71 1.13Mitsui Shs 4,300 13,300 JPY 1,357.000 164,694.16 1.92Suzuki Motor Shs 700 5,400 JPY 1,977.000 97,419.78 1.14Mexico 139,956.94 1.64Grupo Financiero Banorte -O- Shs 9,200 6,200 41,800 MXN 57.040 139,956.94 1.64Singapore 124,895.10 1.46Oversea-Chinese Banking Shs 1,000 23,500 SGD 8.920 124,895.10 1.46South Africa 147,419.82 1.72African Bank Investments Shs 4,132 38,406 ZAR 39.340 147,419.82 1.72Sweden 253,986.38 2.97Atlas Copco -A- Shs 2,370 9,230 SEK 159.800 166,788.02 1.95SKF -B- Shs 5,100 340 4,760 SEK 162.000 87,198.36 1.02Switzerland 90,090.83 1.05Sonova Holding Shs 460 1,086 CHF 99.950 90,090.83 1.05The Netherlands 94,250.40 1.10Heineken Shs 2,500 230 2,270 EUR 41.520 94,250.40 1.10United Kingdom 138,287.38 1.62BHP Billiton Shs 980 6,044 GBP 19.080 138,287.38 1.62USA 3,761,368.23 43.91Abbott Laboratories Shs 1,265 3,735 USD 60.980 170,728.44 1.99Aetna Shs 1,230 5,150 USD 49.560 191,322.64 2.23Agilent Technologies Shs 6,700 1,540 5,160 USD 44.460 171,967.75 2.01Allergan Shs 1,060 2,561 USD 94.910 182,200.43 2.13Ameriprise Financial Shs 4,700 370 4,330 USD 56.430 183,157.96 2.14Archer-Daniels-Midland Shs 1,160 7,055 USD 31.260 165,315.60 1.93Danaher Shs 1,150 4,384 USD 55.030 180,841.42 2.11Ecolab Shs 2,020 3,700 USD 61.710 171,153.23 2.00Emerson Electric Shs 2,400 110 2,290 USD 51.870 89,038.86 1.04
Allianz RCM Demographic Trends
Investment Portfolio as at 31/03/2012Securities Shares resp.
Currency (in 1,000) resp.Contracts
Acquisitions Disposals Holdings 31/03/2012
Price Market Valuein EUR
% ofSubfund
assetsin the period under review
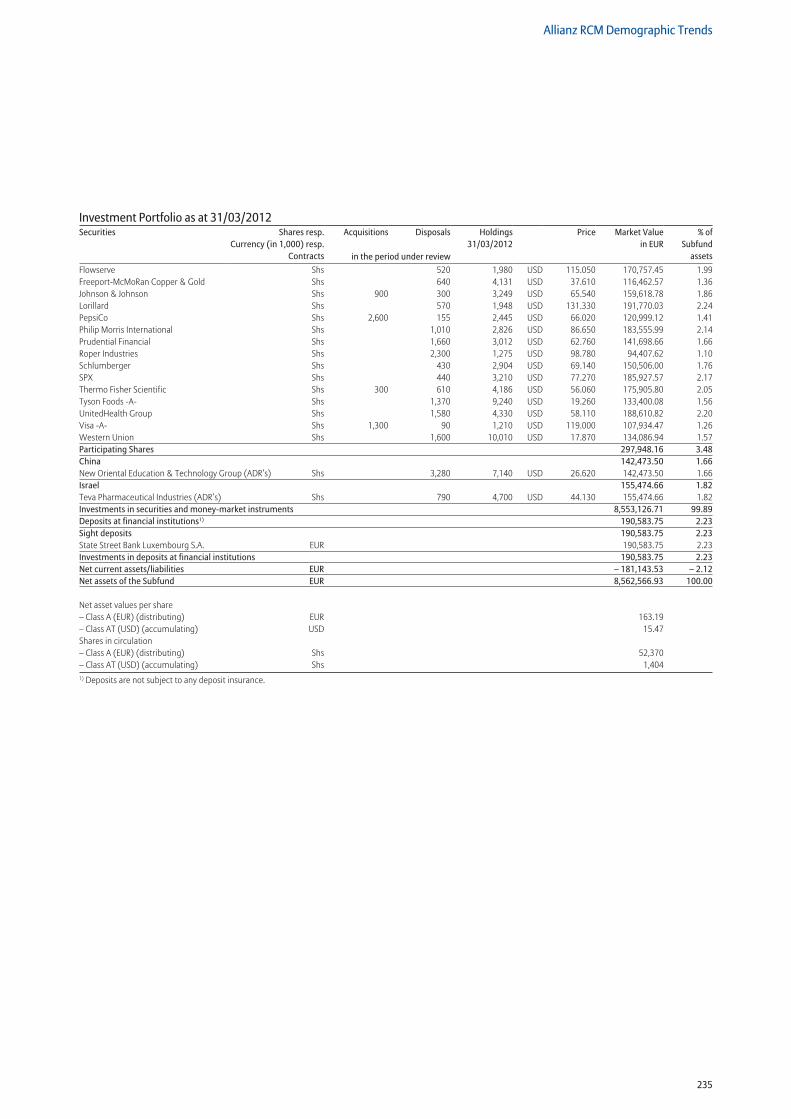
235
Allianz RCM Demographic Trends
Flowserve Shs 520 1,980 USD 115.050 170,757.45 1.99Freeport-McMoRan Copper & Gold Shs 640 4,131 USD 37.610 116,462.57 1.36Johnson & Johnson Shs 900 300 3,249 USD 65.540 159,618.78 1.86Lorillard Shs 570 1,948 USD 131.330 191,770.03 2.24PepsiCo Shs 2,600 155 2,445 USD 66.020 120,999.12 1.41Philip Morris International Shs 1,010 2,826 USD 86.650 183,555.99 2.14Prudential Financial Shs 1,660 3,012 USD 62.760 141,698.66 1.66Roper Industries Shs 2,300 1,275 USD 98.780 94,407.62 1.10Schlumberger Shs 430 2,904 USD 69.140 150,506.00 1.76SPX Shs 440 3,210 USD 77.270 185,927.57 2.17Thermo Fisher Scientific Shs 300 610 4,186 USD 56.060 175,905.80 2.05Tyson Foods -A- Shs 1,370 9,240 USD 19.260 133,400.08 1.56UnitedHealth Group Shs 1,580 4,330 USD 58.110 188,610.82 2.20Visa -A- Shs 1,300 90 1,210 USD 119.000 107,934.47 1.26Western Union Shs 1,600 10,010 USD 17.870 134,086.94 1.57Participating Shares 297,948.16 3.48China 142,473.50 1.66New Oriental Education & Technology Group (ADR’s) Shs 3,280 7,140 USD 26.620 142,473.50 1.66Israel 155,474.66 1.82Teva Pharmaceutical Industries (ADR’s) Shs 790 4,700 USD 44.130 155,474.66 1.82Investments in securities and money-market instruments 8,553,126.71 99.89Deposits at financial institutions1) 190,583.75 2.23Sight deposits 190,583.75 2.23State Street Bank Luxembourg S.A. EUR 190,583.75 2.23Investments in deposits at financial institutions 190,583.75 2.23Net current assets/liabilities EUR – 181,143.53 – 2.12Net assets of the Subfund EUR 8,562,566.93 100.00
Net asset values per share – Class A (EUR) (distributing) EUR 163.19– Class AT (USD) (accumulating) USD 15.47Shares in circulation – Class A (EUR) (distributing) Shs 52,370 – Class AT (USD) (accumulating) Shs 1,4041) Deposits are not subject to any deposit insurance.
Investment Portfolio as at 31/03/2012Securities Shares resp.
Currency (in 1,000) resp.Contracts
Acquisitions Disposals Holdings 31/03/2012
Price Market Valuein EUR
% ofSubfund
assetsin the period under review
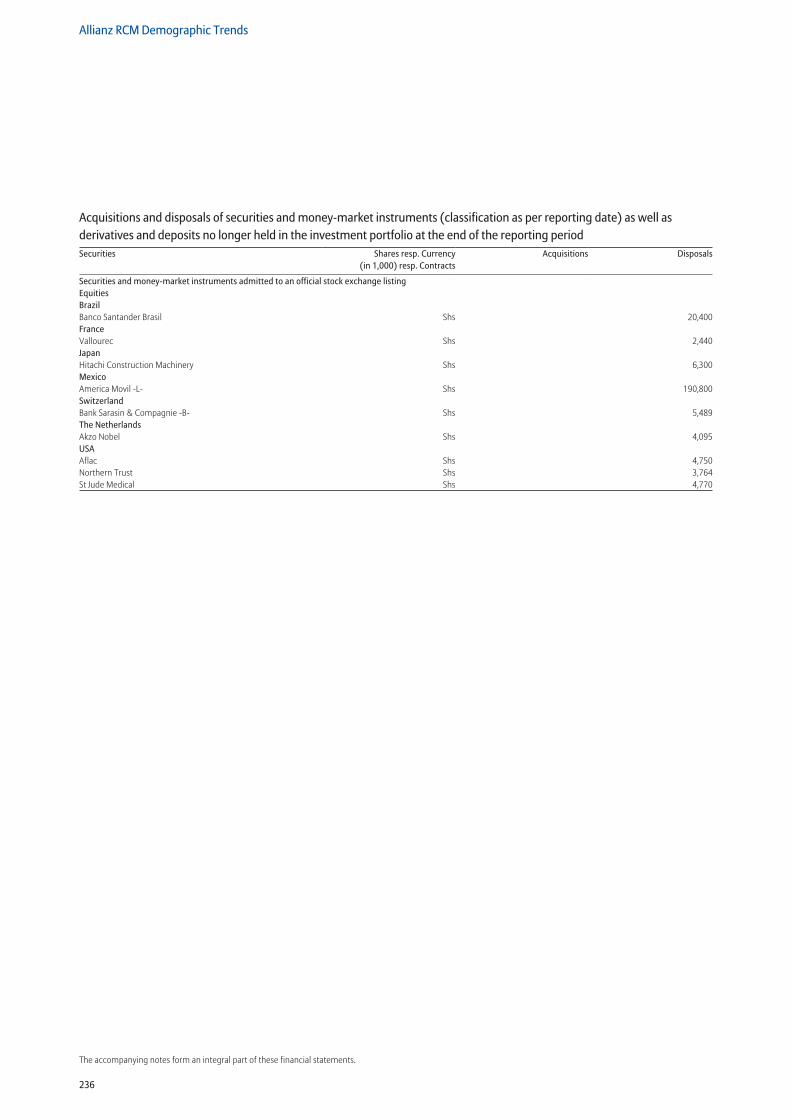
236
Allianz RCM Demographic Trends
The accompanying notes form an integral part of these financial statements.
Securities and money-market instruments admitted to an official stock exchange listing Equities Brazil Banco Santander Brasil Shs 20,400France Vallourec Shs 2,440Japan Hitachi Construction Machinery Shs 6,300Mexico America Movil -L- Shs 190,800Switzerland Bank Sarasin & Compagnie -B- Shs 5,489The Netherlands Akzo Nobel Shs 4,095USA Aflac Shs 4,750Northern Trust Shs 3,764St Jude Medical Shs 4,770
Acquisitions and disposals of securities and money-market instruments (classification as per reporting date) as well as derivatives and deposits no longer held in the investment portfolio at the end of the reporting periodSecurities Shares resp. Currency
(in 1,000) resp. ContractsAcquisitions Disposals
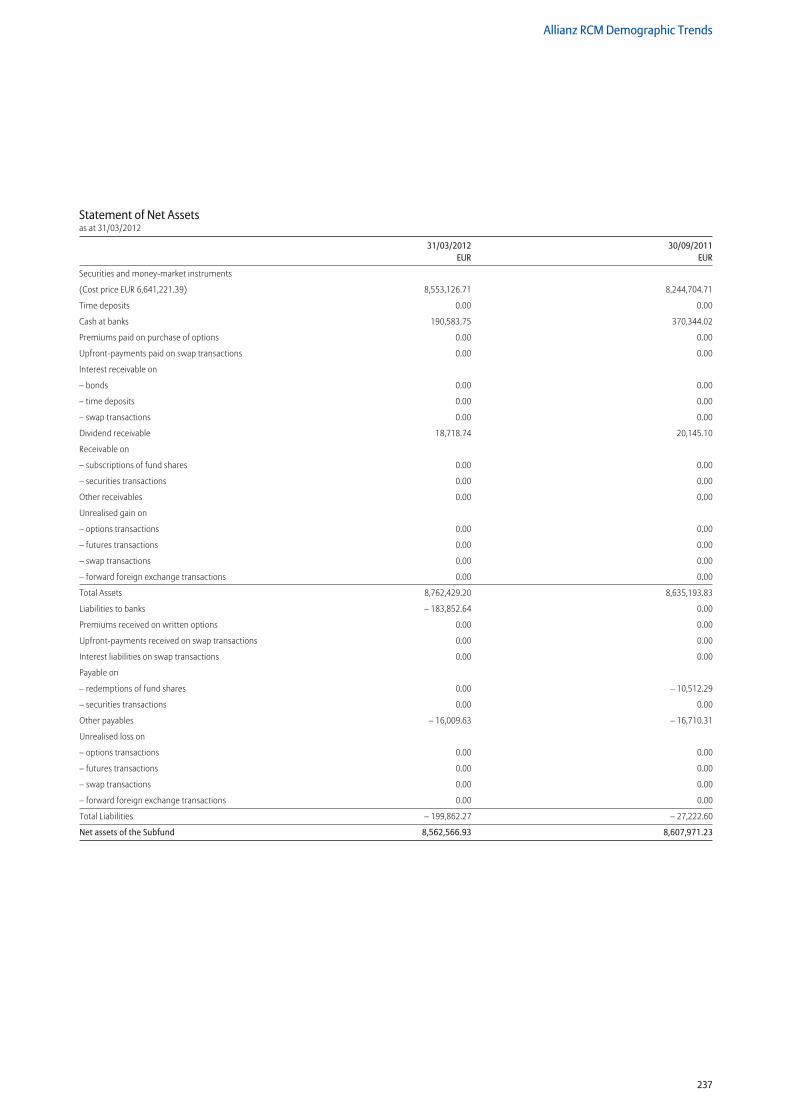
237
Allianz RCM Demographic Trends
Statement of Net Assetsas at 31/03/2012
31/03/2012 30/09/2011 EUR EUR
Securities and money-market instruments
(Cost price EUR 6,641,221.39) 8,553,126.71 8,244,704.71
Time deposits 0.00 0.00
Cash at banks 190,583.75 370,344.02
Premiums paid on purchase of options 0.00 0.00
Upfront-payments paid on swap transactions 0.00 0.00
Interest receivable on
– bonds 0.00 0.00
– time deposits 0.00 0.00
– swap transactions 0.00 0.00
Dividend receivable 18,718.74 20,145.10
Receivable on
– subscriptions of fund shares 0.00 0.00
– securities transactions 0.00 0.00
Other receivables 0.00 0.00
Unrealised gain on
– options transactions 0.00 0.00
– futures transactions 0.00 0.00
– swap transactions 0.00 0.00
– forward foreign exchange transactions 0.00 0.00
Total Assets 8,762,429.20 8,635,193.83
Liabilities to banks – 183,852.64 0.00
Premiums received on written options 0.00 0.00
Upfront-payments received on swap transactions 0.00 0.00
Interest liabilities on swap transactions 0.00 0.00
Payable on
– redemptions of fund shares 0.00 – 10,512.29
– securities transactions 0.00 0.00
Other payables – 16,009.63 – 16,710.31
Unrealised loss on
– options transactions 0.00 0.00
– futures transactions 0.00 0.00
– swap transactions 0.00 0.00
– forward foreign exchange transactions 0.00 0.00
Total Liabilities – 199,862.27 – 27,222.60
Net assets of the Subfund 8,562,566.93 8,607,971.23
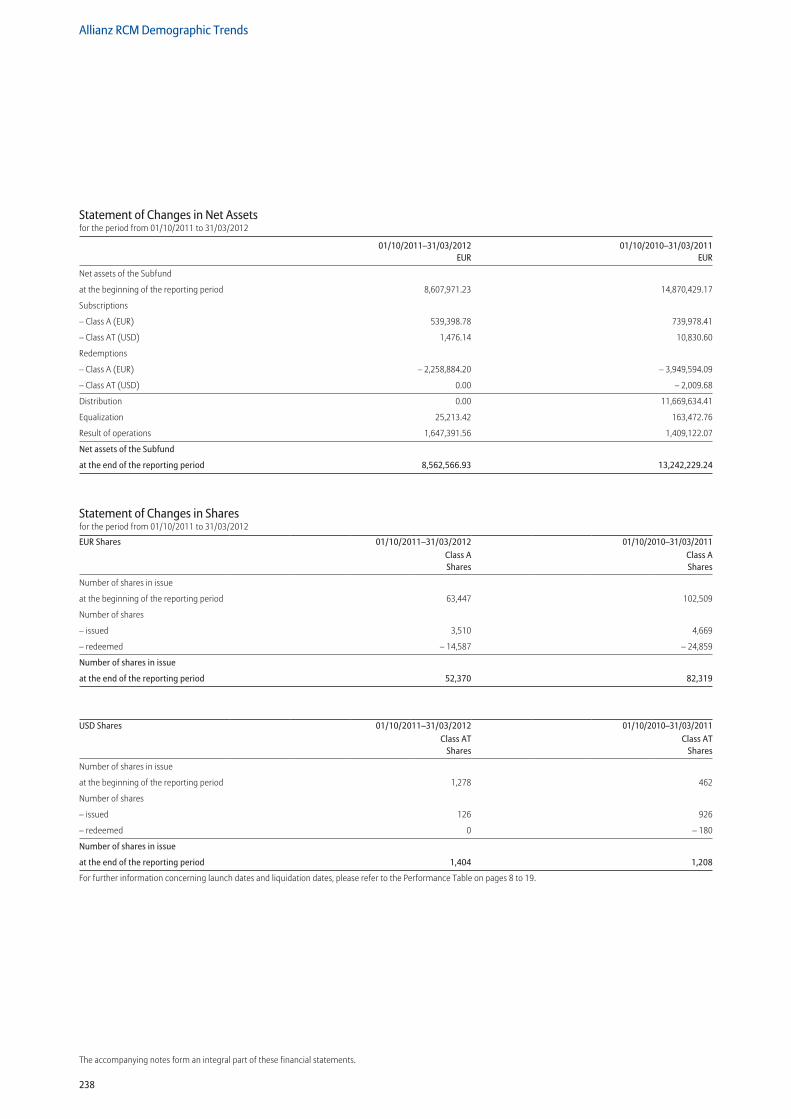
238
Allianz RCM Demographic Trends
The accompanying notes form an integral part of these financial statements.
Statement of Changes in Net Assetsfor the period from 01/10/2011 to 31/03/2012
01/10/2011–31/03/2012 01/10/2010–31/03/2011 EUR EUR
Net assets of the Subfund
at the beginning of the reporting period 8,607,971.23 14,870,429.17
Subscriptions
– Class A (EUR) 539,398.78 739,978.41
– Class AT (USD) 1,476.14 10,830.60
Redemptions
– Class A (EUR) – 2,258,884.20 – 3,949,594.09
– Class AT (USD) 0.00 – 2,009.68
Distribution 0.00 11,669,634.41
Equalization 25,213.42 163,472.76
Result of operations 1,647,391.56 1,409,122.07
Net assets of the Subfund
at the end of the reporting period 8,562,566.93 13,242,229.24
Statement of Changes in Sharesfor the period from 01/10/2011 to 31/03/2012
EUR Shares 01/10/2011–31/03/2012 01/10/2010–31/03/2011Class A Shares
Class A Shares
Number of shares in issue
at the beginning of the reporting period 63,447 102,509
Number of shares
– issued 3,510 4,669
– redeemed – 14,587 – 24,859
Number of shares in issue
at the end of the reporting period 52,370 82,319
USD Shares 01/10/2011–31/03/2012 01/10/2010–31/03/2011Class AT
SharesClass AT
Shares
Number of shares in issue
at the beginning of the reporting period 1,278 462
Number of shares
– issued 126 926
– redeemed 0 – 180
Number of shares in issue
at the end of the reporting period 1,404 1,208
For further information concerning launch dates and liquidation dates, please refer to the Performance Table on pages 8 to 19.
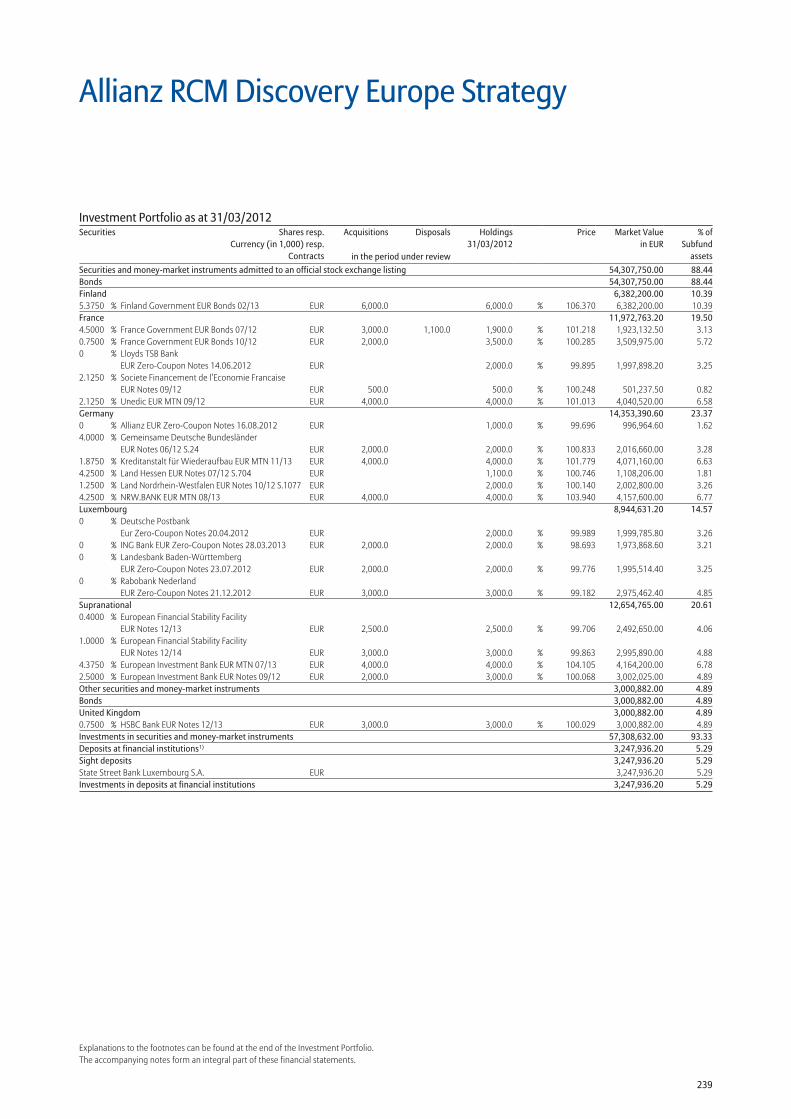
239
Explanations to the footnotes can be found at the end of the Investment Portfolio.The accompanying notes form an integral part of these financial statements.
Allianz RCM Discovery Europe Strategy
Securities and money-market instruments admitted to an official stock exchange listing 54,307,750.00 88.44Bonds 54,307,750.00 88.44Finland 6,382,200.00 10.395.3750 % Finland Government EUR Bonds 02/13 EUR 6,000.0 6,000.0 % 106.370 6,382,200.00 10.39France 11,972,763.20 19.504.5000 % France Government EUR Bonds 07/12 EUR 3,000.0 1,100.0 1,900.0 % 101.218 1,923,132.50 3.130.7500 % France Government EUR Bonds 10/12 EUR 2,000.0 3,500.0 % 100.285 3,509,975.00 5.720 % Lloyds TSB Bank
EUR Zero-Coupon Notes 14.06.2012 EUR 2,000.0 % 99.895 1,997,898.20 3.252.1250 % Societe Financement de l’Economie Francaise
EUR Notes 09/12 EUR 500.0 500.0 % 100.248 501,237.50 0.822.1250 % Unedic EUR MTN 09/12 EUR 4,000.0 4,000.0 % 101.013 4,040,520.00 6.58Germany 14,353,390.60 23.370 % Allianz EUR Zero-Coupon Notes 16.08.2012 EUR 1,000.0 % 99.696 996,964.60 1.624.0000 % Gemeinsame Deutsche Bundesländer
EUR Notes 06/12 S.24 EUR 2,000.0 2,000.0 % 100.833 2,016,660.00 3.281.8750 % Kreditanstalt für Wiederaufbau EUR MTN 11/13 EUR 4,000.0 4,000.0 % 101.779 4,071,160.00 6.634.2500 % Land Hessen EUR Notes 07/12 S.704 EUR 1,100.0 % 100.746 1,108,206.00 1.811.2500 % Land Nordrhein-Westfalen EUR Notes 10/12 S.1077 EUR 2,000.0 % 100.140 2,002,800.00 3.264.2500 % NRW.BANK EUR MTN 08/13 EUR 4,000.0 4,000.0 % 103.940 4,157,600.00 6.77Luxembourg 8,944,631.20 14.570 % Deutsche Postbank
Eur Zero-Coupon Notes 20.04.2012 EUR 2,000.0 % 99.989 1,999,785.80 3.260 % ING Bank EUR Zero-Coupon Notes 28.03.2013 EUR 2,000.0 2,000.0 % 98.693 1,973,868.60 3.210 % Landesbank Baden-Württemberg
EUR Zero-Coupon Notes 23.07.2012 EUR 2,000.0 2,000.0 % 99.776 1,995,514.40 3.250 % Rabobank Nederland
EUR Zero-Coupon Notes 21.12.2012 EUR 3,000.0 3,000.0 % 99.182 2,975,462.40 4.85Supranational 12,654,765.00 20.610.4000 % European Financial Stability Facility
EUR Notes 12/13 EUR 2,500.0 2,500.0 % 99.706 2,492,650.00 4.061.0000 % European Financial Stability Facility
EUR Notes 12/14 EUR 3,000.0 3,000.0 % 99.863 2,995,890.00 4.884.3750 % European Investment Bank EUR MTN 07/13 EUR 4,000.0 4,000.0 % 104.105 4,164,200.00 6.782.5000 % European Investment Bank EUR Notes 09/12 EUR 2,000.0 3,000.0 % 100.068 3,002,025.00 4.89Other securities and money-market instruments 3,000,882.00 4.89Bonds 3,000,882.00 4.89United Kingdom 3,000,882.00 4.890.7500 % HSBC Bank EUR Notes 12/13 EUR 3,000.0 3,000.0 % 100.029 3,000,882.00 4.89Investments in securities and money-market instruments 57,308,632.00 93.33Deposits at financial institutions1) 3,247,936.20 5.29Sight deposits 3,247,936.20 5.29State Street Bank Luxembourg S.A. EUR 3,247,936.20 5.29Investments in deposits at financial institutions 3,247,936.20 5.29
Investment Portfolio as at 31/03/2012Securities Shares resp.
Currency (in 1,000) resp.Contracts
Acquisitions Disposals Holdings 31/03/2012
Price Market Valuein EUR
% ofSubfund
assetsin the period under review
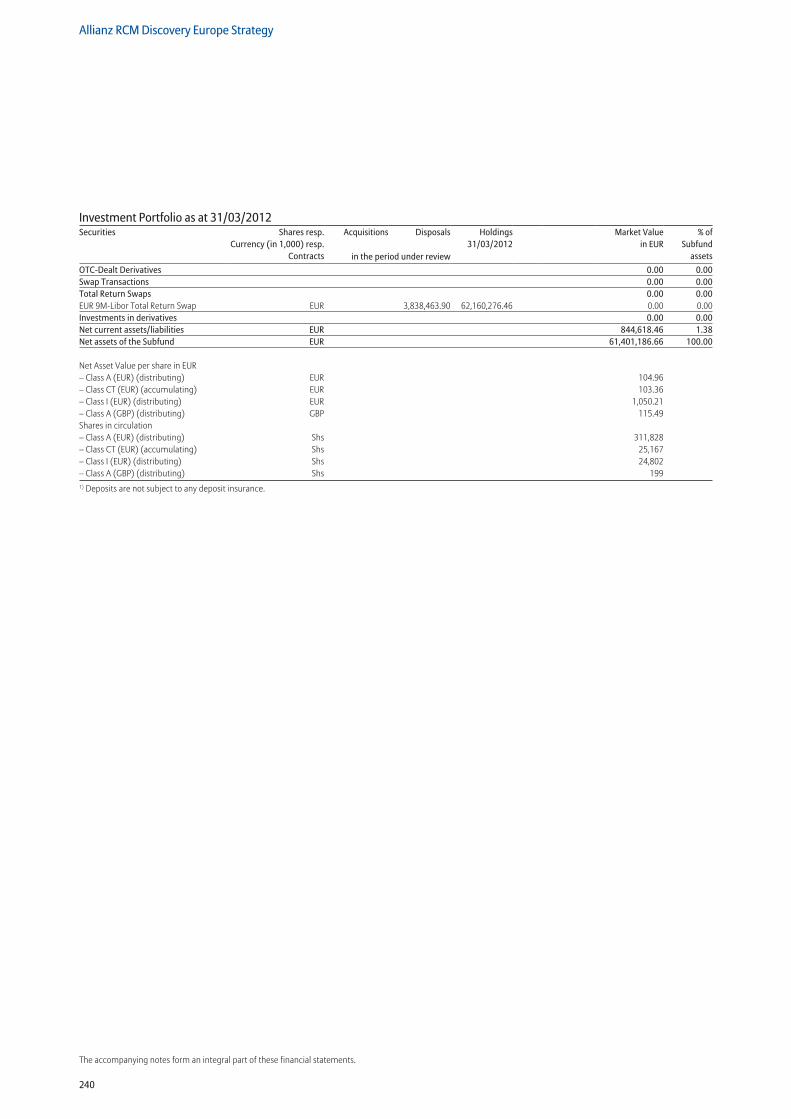
240
Allianz RCM Discovery Europe Strategy
The accompanying notes form an integral part of these financial statements.
OTC-Dealt Derivatives 0.00 0.00Swap Transactions 0.00 0.00Total Return Swaps 0.00 0.00EUR 9M-Libor Total Return Swap EUR 3,838,463.90 62,160,276.46 0.00 0.00Investments in derivatives 0.00 0.00Net current assets/liabilities EUR 844,618.46 1.38Net assets of the Subfund EUR 61,401,186.66 100.00
Net Asset Value per share in EUR – Class A (EUR) (distributing) EUR 104.96 – Class CT (EUR) (accumulating) EUR 103.36 – Class I (EUR) (distributing) EUR 1,050.21 – Class A (GBP) (distributing) GBP 115.49 Shares in circulation – Class A (EUR) (distributing) Shs 311,828 – Class CT (EUR) (accumulating) Shs 25,167 – Class I (EUR) (distributing) Shs 24,802 – Class A (GBP) (distributing) Shs 199 1) Deposits are not subject to any deposit insurance.
Investment Portfolio as at 31/03/2012Securities Shares resp.
Currency (in 1,000) resp.Contracts
Acquisitions Disposals Holdings 31/03/2012
Market Valuein EUR
% ofSubfund
assetsin the period under review
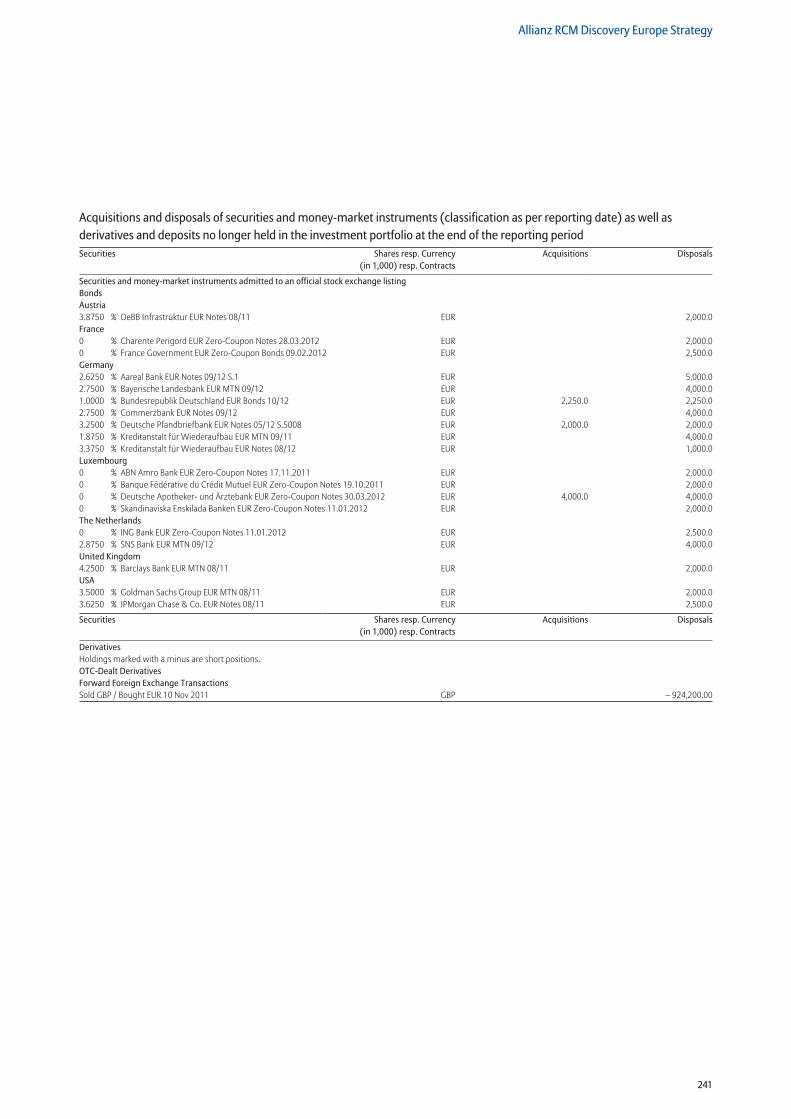
241
Allianz RCM Discovery Europe Strategy
Securities and money-market instruments admitted to an official stock exchange listing Bonds Austria 3.8750 % OeBB Infrastruktur EUR Notes 08/11 EUR 2,000.0France 0 % Charente Perigord EUR Zero-Coupon Notes 28.03.2012 EUR 2,000.00 % France Government EUR Zero-Coupon Bonds 09.02.2012 EUR 2,500.0Germany 2.6250 % Aareal Bank EUR Notes 09/12 S.1 EUR 5,000.02.7500 % Bayerische Landesbank EUR MTN 09/12 EUR 4,000.01.0000 % Bundesrepublik Deutschland EUR Bonds 10/12 EUR 2,250.0 2,250.02.7500 % Commerzbank EUR Notes 09/12 EUR 4,000.03.2500 % Deutsche Pfandbriefbank EUR Notes 05/12 S.5008 EUR 2,000.0 2,000.01.8750 % Kreditanstalt für Wiederaufbau EUR MTN 09/11 EUR 4,000.03.3750 % Kreditanstalt für Wiederaufbau EUR Notes 08/12 EUR 1,000.0Luxembourg 0 % ABN Amro Bank EUR Zero-Coupon Notes 17.11.2011 EUR 2,000.00 % Banque Fédérative du Crédit Mutuel EUR Zero-Coupon Notes 19.10.2011 EUR 2,000.00 % Deutsche Apotheker- und Ärztebank EUR Zero-Coupon Notes 30.03.2012 EUR 4,000.0 4,000.00 % Skandinaviska Enskilada Banken EUR Zero-Coupon Notes 11.01.2012 EUR 2,000.0The Netherlands 0 % ING Bank EUR Zero-Coupon Notes 11.01.2012 EUR 2,500.02.8750 % SNS Bank EUR MTN 09/12 EUR 4,000.0United Kingdom 4.2500 % Barclays Bank EUR MTN 08/11 EUR 2,000.0USA 3.5000 % Goldman Sachs Group EUR MTN 08/11 EUR 2,000.03.6250 % JPMorgan Chase & Co. EUR Notes 08/11 EUR 2,500.0
Securities Shares resp. Currency (in 1,000) resp. Contracts
Acquisitions Disposals
DerivativesHoldings marked with a minus are short positions. OTC-Dealt Derivatives Forward Foreign Exchange Transactions Sold GBP / Bought EUR 10 Nov 2011 GBP – 924,200.00
Acquisitions and disposals of securities and money-market instruments (classification as per reporting date) as well as derivatives and deposits no longer held in the investment portfolio at the end of the reporting periodSecurities Shares resp. Currency
(in 1,000) resp. ContractsAcquisitions Disposals
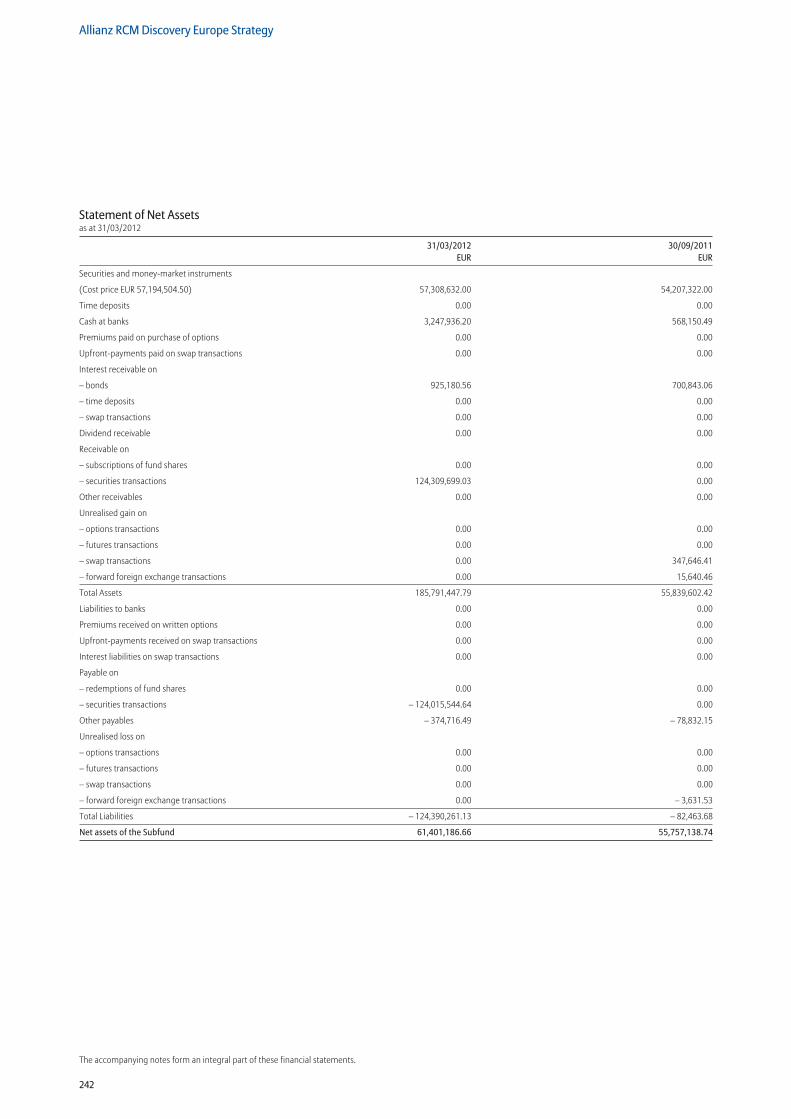
242
Allianz RCM Discovery Europe Strategy
The accompanying notes form an integral part of these financial statements.
Statement of Net Assetsas at 31/03/2012
31/03/2012 30/09/2011 EUR EUR
Securities and money-market instruments
(Cost price EUR 57,194,504.50) 57,308,632.00 54,207,322.00
Time deposits 0.00 0.00
Cash at banks 3,247,936.20 568,150.49
Premiums paid on purchase of options 0.00 0.00
Upfront-payments paid on swap transactions 0.00 0.00
Interest receivable on
– bonds 925,180.56 700,843.06
– time deposits 0.00 0.00
– swap transactions 0.00 0.00
Dividend receivable 0.00 0.00
Receivable on
– subscriptions of fund shares 0.00 0.00
– securities transactions 124,309,699.03 0.00
Other receivables 0.00 0.00
Unrealised gain on
– options transactions 0.00 0.00
– futures transactions 0.00 0.00
– swap transactions 0.00 347,646.41
– forward foreign exchange transactions 0.00 15,640.46
Total Assets 185,791,447.79 55,839,602.42
Liabilities to banks 0.00 0.00
Premiums received on written options 0.00 0.00
Upfront-payments received on swap transactions 0.00 0.00
Interest liabilities on swap transactions 0.00 0.00
Payable on
– redemptions of fund shares 0.00 0.00
– securities transactions – 124,015,544.64 0.00
Other payables – 374,716.49 – 78,832.15
Unrealised loss on
– options transactions 0.00 0.00
– futures transactions 0.00 0.00
– swap transactions 0.00 0.00
– forward foreign exchange transactions 0.00 – 3,631.53
Total Liabilities – 124,390,261.13 – 82,463.68
Net assets of the Subfund 61,401,186.66 55,757,138.74
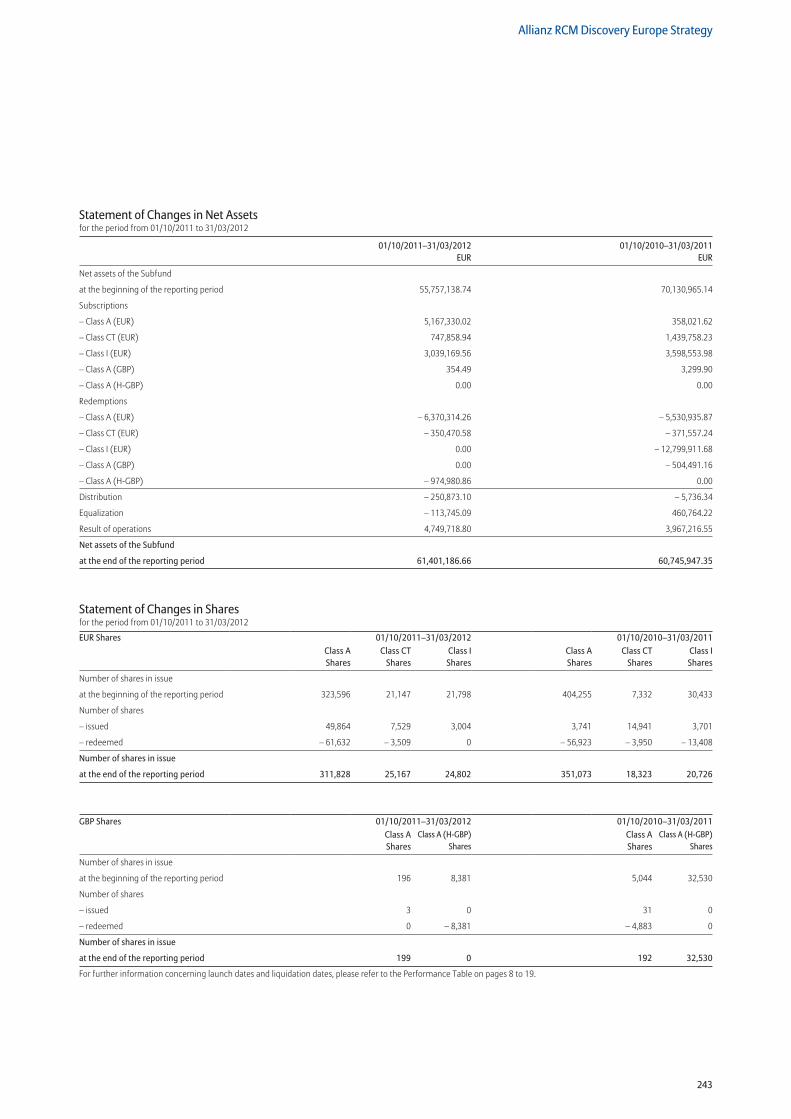
243
Allianz RCM Discovery Europe Strategy
Statement of Changes in Net Assetsfor the period from 01/10/2011 to 31/03/2012
01/10/2011–31/03/2012 01/10/2010–31/03/2011 EUR EUR
Net assets of the Subfund
at the beginning of the reporting period 55,757,138.74 70,130,965.14
Subscriptions
– Class A (EUR) 5,167,330.02 358,021.62
– Class CT (EUR) 747,858.94 1,439,758.23
– Class I (EUR) 3,039,169.56 3,598,553.98
– Class A (GBP) 354.49 3,299.90
– Class A (H-GBP) 0.00 0.00
Redemptions
– Class A (EUR) – 6,370,314.26 – 5,530,935.87
– Class CT (EUR) – 350,470.58 – 371,557.24
– Class I (EUR) 0.00 – 12,799,911.68
– Class A (GBP) 0.00 – 504,491.16
– Class A (H-GBP) – 974,980.86 0.00
Distribution – 250,873.10 – 5,736.34
Equalization – 113,745.09 460,764.22
Result of operations 4,749,718.80 3,967,216.55
Net assets of the Subfund
at the end of the reporting period 61,401,186.66 60,745,947.35
Statement of Changes in Sharesfor the period from 01/10/2011 to 31/03/2012
EUR Shares 01/10/2011–31/03/2012 01/10/2010–31/03/2011Class A Shares
Class CT Shares
Class I Shares
Class A Shares
Class CT Shares
Class I Shares
Number of shares in issue
at the beginning of the reporting period 323,596 21,147 21,798 404,255 7,332 30,433
Number of shares
– issued 49,864 7,529 3,004 3,741 14,941 3,701
– redeemed – 61,632 – 3,509 0 – 56,923 – 3,950 – 13,408
Number of shares in issue
at the end of the reporting period 311,828 25,167 24,802 351,073 18,323 20,726
GBP Shares 01/10/2011–31/03/2012 01/10/2010–31/03/2011Class A Shares
Class A (H-GBP)
SharesClass A Shares
Class A (H-GBP)
Shares
Number of shares in issue
at the beginning of the reporting period 196 8,381 5,044 32,530
Number of shares
– issued 3 0 31 0
– redeemed 0 – 8,381 – 4,883 0
Number of shares in issue
at the end of the reporting period 199 0 192 32,530
For further information concerning launch dates and liquidation dates, please refer to the Performance Table on pages 8 to 19.
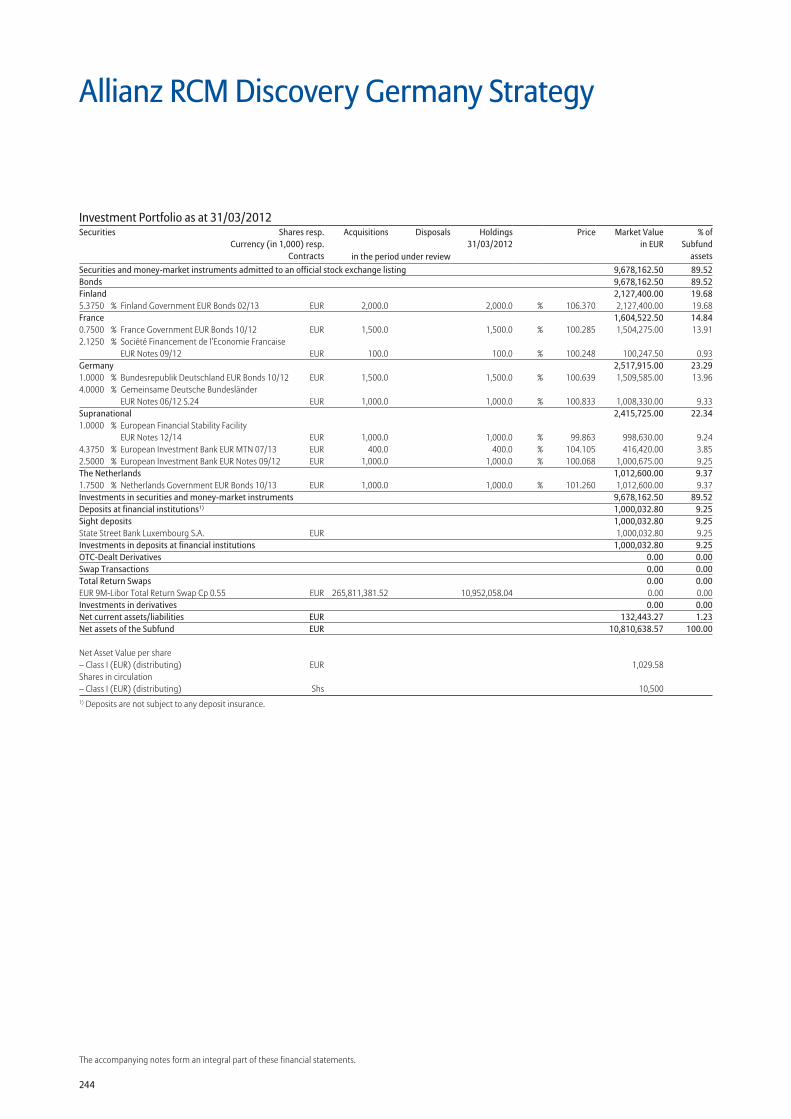
244
The accompanying notes form an integral part of these financial statements.
Allianz RCM Discovery Germany Strategy
Securities and money-market instruments admitted to an official stock exchange listing 9,678,162.50 89.52Bonds 9,678,162.50 89.52Finland 2,127,400.00 19.685.3750 % Finland Government EUR Bonds 02/13 EUR 2,000.0 2,000.0 % 106.370 2,127,400.00 19.68France 1,604,522.50 14.840.7500 % France Government EUR Bonds 10/12 EUR 1,500.0 1,500.0 % 100.285 1,504,275.00 13.912.1250 % Société Financement de l’Economie Francaise
EUR Notes 09/12 EUR 100.0 100.0 % 100.248 100,247.50 0.93Germany 2,517,915.00 23.291.0000 % Bundesrepublik Deutschland EUR Bonds 10/12 EUR 1,500.0 1,500.0 % 100.639 1,509,585.00 13.964.0000 % Gemeinsame Deutsche Bundesländer
EUR Notes 06/12 S.24 EUR 1,000.0 1,000.0 % 100.833 1,008,330.00 9.33Supranational 2,415,725.00 22.341.0000 % European Financial Stability Facility
EUR Notes 12/14 EUR 1,000.0 1,000.0 % 99.863 998,630.00 9.244.3750 % European Investment Bank EUR MTN 07/13 EUR 400.0 400.0 % 104.105 416,420.00 3.852.5000 % European Investment Bank EUR Notes 09/12 EUR 1,000.0 1,000.0 % 100.068 1,000,675.00 9.25The Netherlands 1,012,600.00 9.371.7500 % Netherlands Government EUR Bonds 10/13 EUR 1,000.0 1,000.0 % 101.260 1,012,600.00 9.37Investments in securities and money-market instruments 9,678,162.50 89.52Deposits at financial institutions1) 1,000,032.80 9.25Sight deposits 1,000,032.80 9.25State Street Bank Luxembourg S.A. EUR 1,000,032.80 9.25Investments in deposits at financial institutions 1,000,032.80 9.25OTC-Dealt Derivatives 0.00 0.00Swap Transactions 0.00 0.00Total Return Swaps 0.00 0.00EUR 9M-Libor Total Return Swap Cp 0.55 EUR 265,811,381.52 10,952,058.04 0.00 0.00Investments in derivatives 0.00 0.00Net current assets/liabilities EUR 132,443.27 1.23Net assets of the Subfund EUR 10,810,638.57 100.00
Net Asset Value per share – Class I (EUR) (distributing) EUR 1,029.58Shares in circulation – Class I (EUR) (distributing) Shs 10,5001) Deposits are not subject to any deposit insurance.
Investment Portfolio as at 31/03/2012Securities Shares resp.
Currency (in 1,000) resp.Contracts
Acquisitions Disposals Holdings 31/03/2012
Price Market Valuein EUR
% ofSubfund
assetsin the period under review
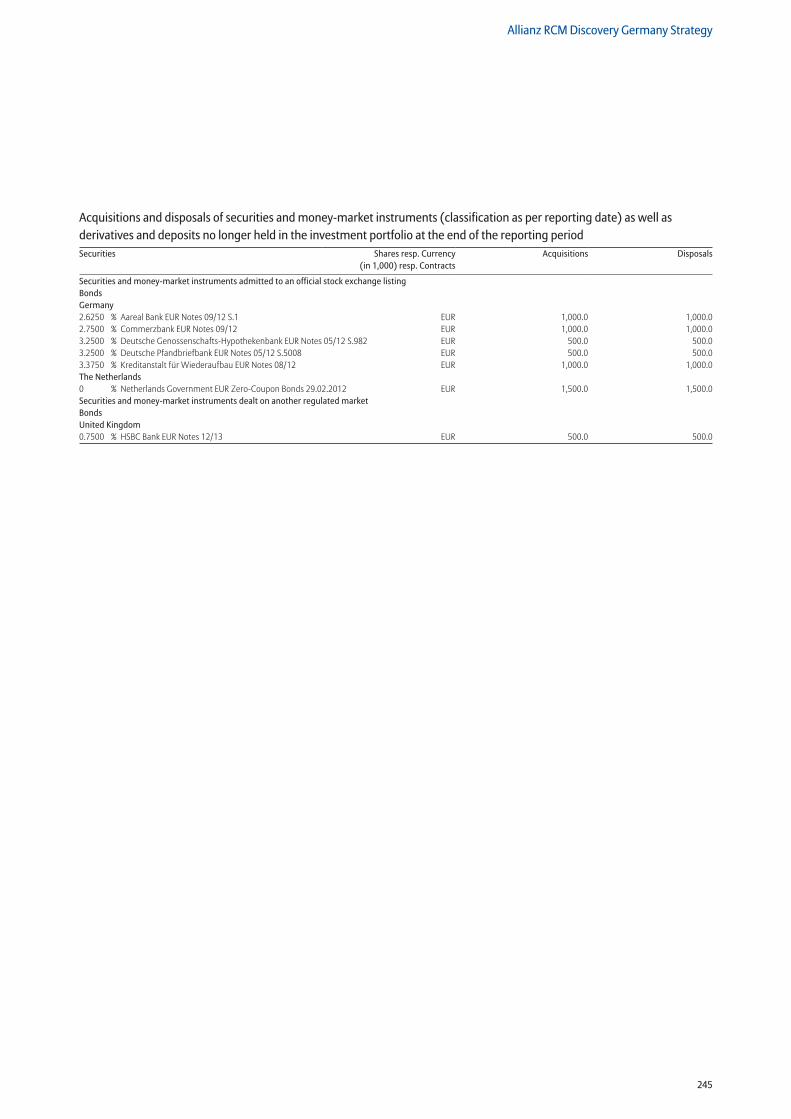
245
Allianz RCM Discovery Germany Strategy
Securities and money-market instruments admitted to an official stock exchange listing Bonds Germany 2.6250 % Aareal Bank EUR Notes 09/12 S.1 EUR 1,000.0 1,000.02.7500 % Commerzbank EUR Notes 09/12 EUR 1,000.0 1,000.03.2500 % Deutsche Genossenschafts-Hypothekenbank EUR Notes 05/12 S.982 EUR 500.0 500.03.2500 % Deutsche Pfandbriefbank EUR Notes 05/12 S.5008 EUR 500.0 500.03.3750 % Kreditanstalt für Wiederaufbau EUR Notes 08/12 EUR 1,000.0 1,000.0The Netherlands0 % Netherlands Government EUR Zero-Coupon Bonds 29.02.2012 EUR 1,500.0 1,500.0Securities and money-market instruments dealt on another regulated market Bonds United Kingdom 0.7500 % HSBC Bank EUR Notes 12/13 EUR 500.0 500.0
Acquisitions and disposals of securities and money-market instruments (classification as per reporting date) as well as derivatives and deposits no longer held in the investment portfolio at the end of the reporting periodSecurities Shares resp. Currency
(in 1,000) resp. ContractsAcquisitions Disposals
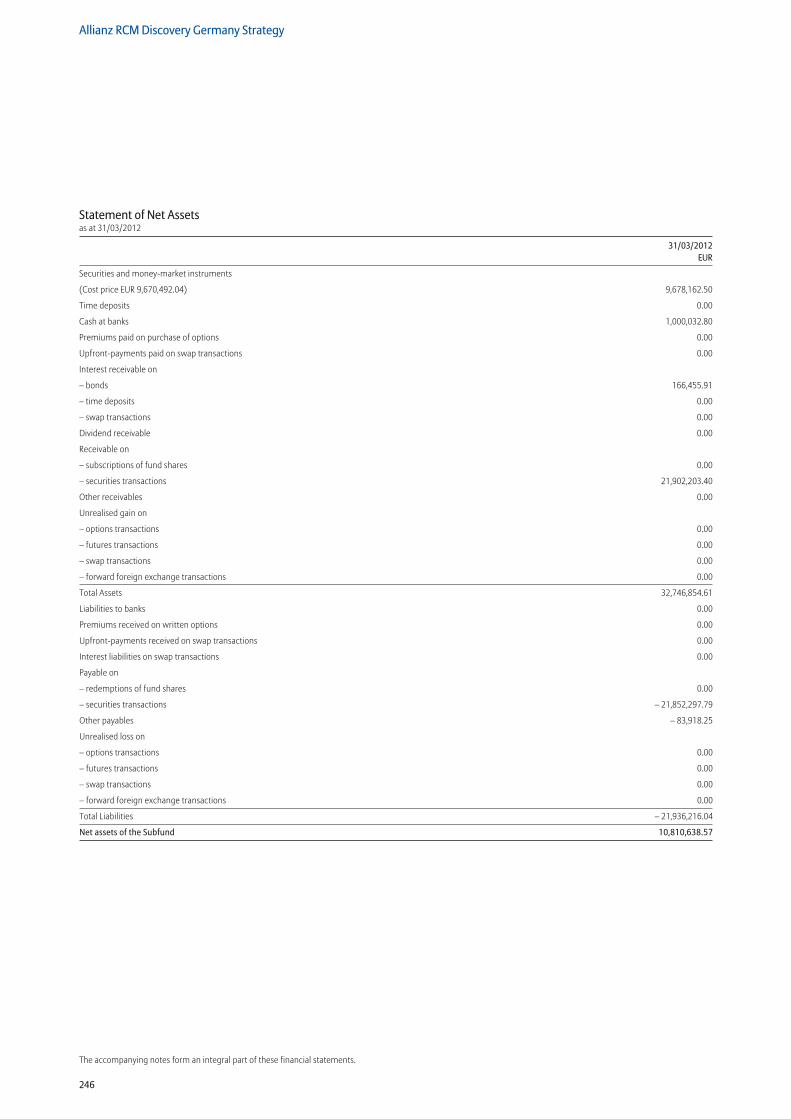
246
Allianz RCM Discovery Germany Strategy
The accompanying notes form an integral part of these financial statements.
Statement of Net Assetsas at 31/03/2012
31/03/2012 EUR
Securities and money-market instruments
(Cost price EUR 9,670,492.04) 9,678,162.50
Time deposits 0.00
Cash at banks 1,000,032.80
Premiums paid on purchase of options 0.00
Upfront-payments paid on swap transactions 0.00
Interest receivable on
– bonds 166,455.91
– time deposits 0.00
– swap transactions 0.00
Dividend receivable 0.00
Receivable on
– subscriptions of fund shares 0.00
– securities transactions 21,902,203.40
Other receivables 0.00
Unrealised gain on
– options transactions 0.00
– futures transactions 0.00
– swap transactions 0.00
– forward foreign exchange transactions 0.00
Total Assets 32,746,854.61
Liabilities to banks 0.00
Premiums received on written options 0.00
Upfront-payments received on swap transactions 0.00
Interest liabilities on swap transactions 0.00
Payable on
– redemptions of fund shares 0.00
– securities transactions – 21,852,297.79
Other payables – 83,918.25
Unrealised loss on
– options transactions 0.00
– futures transactions 0.00
– swap transactions 0.00
– forward foreign exchange transactions 0.00
Total Liabilities – 21,936,216.04
Net assets of the Subfund 10,810,638.57

247
Allianz RCM Discovery Germany Strategy
Statement of Changes in Net Assetsfor the period from 11/10/2011 (launch date) to 31/03/2012
11/10/2011–31/03/2012 EUR
Net assets of the Subfund
at the beginning of the reporting period 0.00
Subscriptions
– Class I (EUR) 10,500,000.00
Redemptions
– Class I (EUR) 0.00
Result of operations 310,638.57
Net assets of the Subfund
at the end of the reporting period 10,810,638.57
Statement of Changes in Sharesfor the period from 11/10/2011 (launch date) to 31/03/2012
EUR Shares 11/10/2011–31/03/2012Class I Shares
Number of shares in issue
at the beginning of the reporting period 0
Number of shares
– issued 10,500
– redeemed 0
Number of shares in issue
at the end of the reporting period 10,500
For further information concerning launch dates and liquidation dates, please refer to the Performance Table on pages 8 to 19.
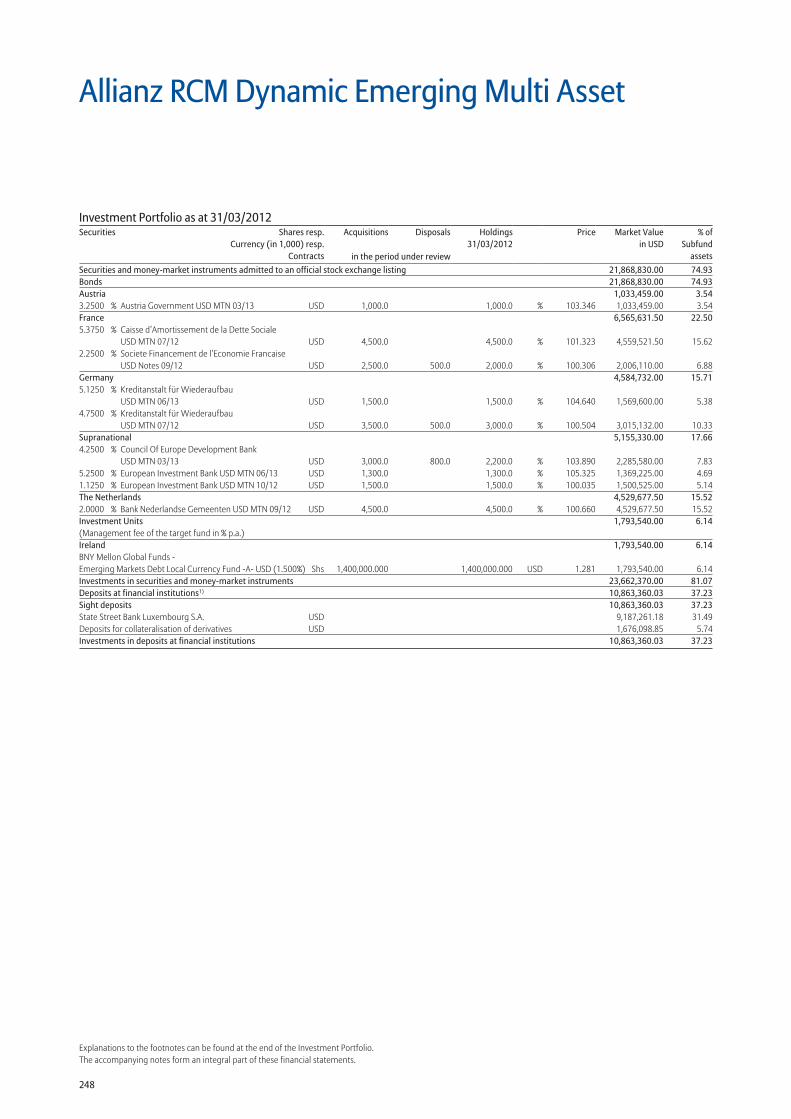
248
Explanations to the footnotes can be found at the end of the Investment Portfolio.The accompanying notes form an integral part of these financial statements.
Allianz RCM Dynamic Emerging Multi Asset
Securities and money-market instruments admitted to an official stock exchange listing 21,868,830.00 74.93Bonds 21,868,830.00 74.93Austria 1,033,459.00 3.543.2500 % Austria Government USD MTN 03/13 USD 1,000.0 1,000.0 % 103.346 1,033,459.00 3.54France 6,565,631.50 22.505.3750 % Caisse d’Amortissement de la Dette Sociale
USD MTN 07/12 USD 4,500.0 4,500.0 % 101.323 4,559,521.50 15.622.2500 % Societe Financement de l’Economie Francaise
USD Notes 09/12 USD 2,500.0 500.0 2,000.0 % 100.306 2,006,110.00 6.88Germany 4,584,732.00 15.715.1250 % Kreditanstalt für Wiederaufbau
USD MTN 06/13 USD 1,500.0 1,500.0 % 104.640 1,569,600.00 5.384.7500 % Kreditanstalt für Wiederaufbau
USD MTN 07/12 USD 3,500.0 500.0 3,000.0 % 100.504 3,015,132.00 10.33Supranational 5,155,330.00 17.664.2500 % Council Of Europe Development Bank
USD MTN 03/13 USD 3,000.0 800.0 2,200.0 % 103.890 2,285,580.00 7.835.2500 % European Investment Bank USD MTN 06/13 USD 1,300.0 1,300.0 % 105.325 1,369,225.00 4.691.1250 % European Investment Bank USD MTN 10/12 USD 1,500.0 1,500.0 % 100.035 1,500,525.00 5.14The Netherlands 4,529,677.50 15.522.0000 % Bank Nederlandse Gemeenten USD MTN 09/12 USD 4,500.0 4,500.0 % 100.660 4,529,677.50 15.52Investment Units 1,793,540.00 6.14(Management fee of the target fund in % p.a.)Ireland 1,793,540.00 6.14BNY Mellon Global Funds - Emerging Markets Debt Local Currency Fund -A- USD (1.500%) Shs 1,400,000.000 1,400,000.000 USD 1.281 1,793,540.00 6.14Investments in securities and money-market instruments 23,662,370.00 81.07Deposits at financial institutions1) 10,863,360.03 37.23Sight deposits 10,863,360.03 37.23State Street Bank Luxembourg S.A. USD 9,187,261.18 31.49Deposits for collateralisation of derivatives USD 1,676,098.85 5.74Investments in deposits at financial institutions 10,863,360.03 37.23
Investment Portfolio as at 31/03/2012Securities Shares resp.
Currency (in 1,000) resp.Contracts
Acquisitions Disposals Holdings 31/03/2012
Price Market Valuein USD
% ofSubfund
assetsin the period under review
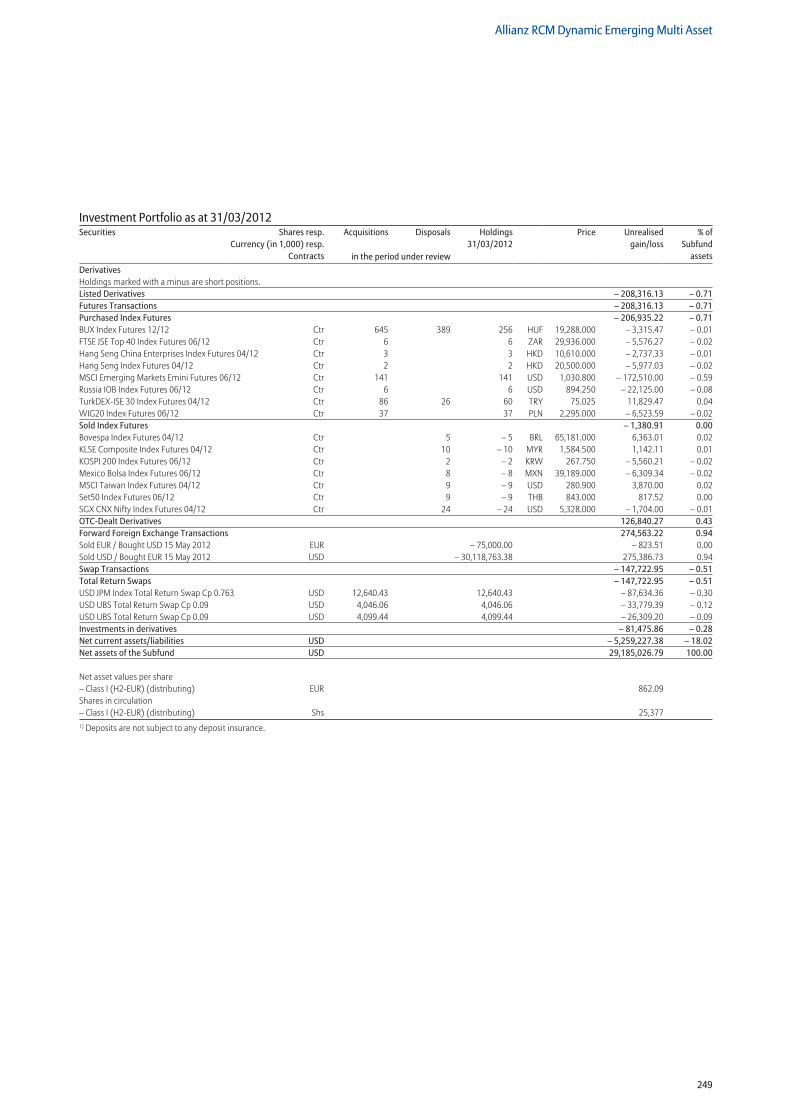
249
Allianz RCM Dynamic Emerging Multi Asset
Derivatives Holdings marked with a minus are short positions. Listed Derivatives – 208,316.13 – 0.71Futures Transactions – 208,316.13 – 0.71Purchased Index Futures – 206,935.22 – 0.71BUX Index Futures 12/12 Ctr 645 389 256 HUF 19,288.000 – 3,315.47 – 0.01FTSE JSE Top 40 Index Futures 06/12 Ctr 6 6 ZAR 29,936.000 – 5,576.27 – 0.02Hang Seng China Enterprises Index Futures 04/12 Ctr 3 3 HKD 10,610.000 – 2,737.33 – 0.01Hang Seng Index Futures 04/12 Ctr 2 2 HKD 20,500.000 – 5,977.03 – 0.02MSCI Emerging Markets Emini Futures 06/12 Ctr 141 141 USD 1,030.800 – 172,510.00 – 0.59Russia IOB Index Futures 06/12 Ctr 6 6 USD 894.250 – 22,125.00 – 0.08TurkDEX-ISE 30 Index Futures 04/12 Ctr 86 26 60 TRY 75.025 11,829.47 0.04WIG20 Index Futures 06/12 Ctr 37 37 PLN 2,295.000 – 6,523.59 – 0.02Sold Index Futures – 1,380.91 0.00Bovespa Index Futures 04/12 Ctr 5 – 5 BRL 65,181.000 6,363.01 0.02KLSE Composite Index Futures 04/12 Ctr 10 – 10 MYR 1,584.500 1,142.11 0.01KOSPI 200 Index Futures 06/12 Ctr 2 – 2 KRW 267.750 – 5,560.21 – 0.02Mexico Bolsa Index Futures 06/12 Ctr 8 – 8 MXN 39,189.000 – 6,309.34 – 0.02MSCI Taiwan Index Futures 04/12 Ctr 9 – 9 USD 280.900 3,870.00 0.02Set50 Index Futures 06/12 Ctr 9 – 9 THB 843.000 817.52 0.00SGX CNX Nifty Index Futures 04/12 Ctr 24 – 24 USD 5,328.000 – 1,704.00 – 0.01OTC-Dealt Derivatives 126,840.27 0.43Forward Foreign Exchange Transactions 274,563.22 0.94Sold EUR / Bought USD 15 May 2012 EUR – 75,000.00 – 823.51 0.00Sold USD / Bought EUR 15 May 2012 USD – 30,118,763.38 275,386.73 0.94Swap Transactions – 147,722.95 – 0.51Total Return Swaps – 147,722.95 – 0.51USD JPM Index Total Return Swap Cp 0.763 USD 12,640.43 12,640.43 – 87,634.36 – 0.30USD UBS Total Return Swap Cp 0.09 USD 4,046.06 4,046.06 – 33,779.39 – 0.12USD UBS Total Return Swap Cp 0.09 USD 4,099.44 4,099.44 – 26,309.20 – 0.09Investments in derivatives – 81,475.86 – 0.28Net current assets/liabilities USD – 5,259,227.38 – 18.02Net assets of the Subfund USD 29,185,026.79 100.00
Net asset values per share – Class I (H2-EUR) (distributing) EUR 862.09 Shares in circulation – Class I (H2-EUR) (distributing) Shs 25,3771) Deposits are not subject to any deposit insurance.
Investment Portfolio as at 31/03/2012Securities Shares resp.
Currency (in 1,000) resp.Contracts
Acquisitions Disposals Holdings 31/03/2012
Price Unrealisedgain/loss
% ofSubfund
assetsin the period under review
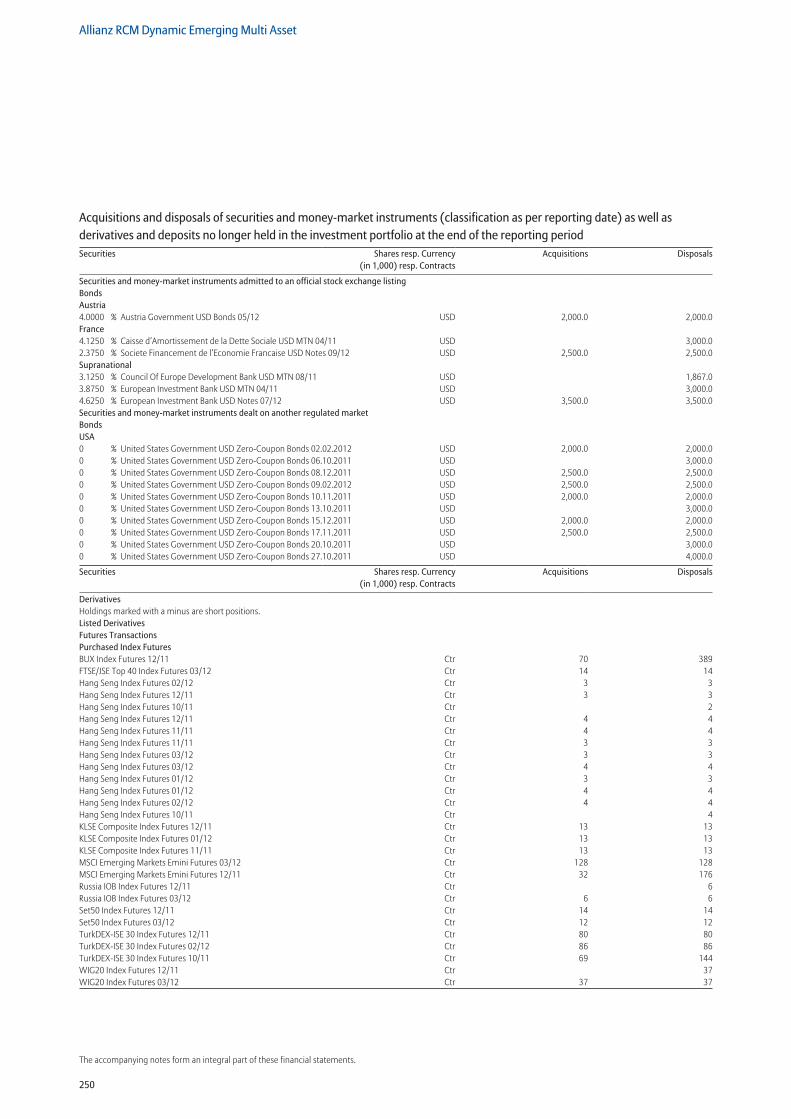
250
Allianz RCM Dynamic Emerging Multi Asset
The accompanying notes form an integral part of these financial statements.
Securities and money-market instruments admitted to an official stock exchange listing Bonds Austria 4.0000 % Austria Government USD Bonds 05/12 USD 2,000.0 2,000.0France 4.1250 % Caisse d’Amortissement de la Dette Sociale USD MTN 04/11 USD 3,000.02.3750 % Societe Financement de l’Economie Francaise USD Notes 09/12 USD 2,500.0 2,500.0Supranational 3.1250 % Council Of Europe Development Bank USD MTN 08/11 USD 1,867.03.8750 % European Investment Bank USD MTN 04/11 USD 3,000.04.6250 % European Investment Bank USD Notes 07/12 USD 3,500.0 3,500.0Securities and money-market instruments dealt on another regulated market Bonds USA 0 % United States Government USD Zero-Coupon Bonds 02.02.2012 USD 2,000.0 2,000.00 % United States Government USD Zero-Coupon Bonds 06.10.2011 USD 3,000.00 % United States Government USD Zero-Coupon Bonds 08.12.2011 USD 2,500.0 2,500.00 % United States Government USD Zero-Coupon Bonds 09.02.2012 USD 2,500.0 2,500.00 % United States Government USD Zero-Coupon Bonds 10.11.2011 USD 2,000.0 2,000.00 % United States Government USD Zero-Coupon Bonds 13.10.2011 USD 3,000.00 % United States Government USD Zero-Coupon Bonds 15.12.2011 USD 2,000.0 2,000.00 % United States Government USD Zero-Coupon Bonds 17.11.2011 USD 2,500.0 2,500.00 % United States Government USD Zero-Coupon Bonds 20.10.2011 USD 3,000.00 % United States Government USD Zero-Coupon Bonds 27.10.2011 USD 4,000.0
Securities Shares resp. Currency (in 1,000) resp. Contracts
Acquisitions Disposals
DerivativesHoldings marked with a minus are short positions. Listed Derivatives Futures Transactions Purchased Index Futures BUX Index Futures 12/11 Ctr 70 389FTSE/JSE Top 40 Index Futures 03/12 Ctr 14 14Hang Seng Index Futures 02/12 Ctr 3 3Hang Seng Index Futures 12/11 Ctr 3 3Hang Seng Index Futures 10/11 Ctr 2Hang Seng Index Futures 12/11 Ctr 4 4Hang Seng Index Futures 11/11 Ctr 4 4Hang Seng Index Futures 11/11 Ctr 3 3Hang Seng Index Futures 03/12 Ctr 3 3Hang Seng Index Futures 03/12 Ctr 4 4Hang Seng Index Futures 01/12 Ctr 3 3Hang Seng Index Futures 01/12 Ctr 4 4Hang Seng Index Futures 02/12 Ctr 4 4Hang Seng Index Futures 10/11 Ctr 4KLSE Composite Index Futures 12/11 Ctr 13 13KLSE Composite Index Futures 01/12 Ctr 13 13KLSE Composite Index Futures 11/11 Ctr 13 13MSCI Emerging Markets Emini Futures 03/12 Ctr 128 128MSCI Emerging Markets Emini Futures 12/11 Ctr 32 176Russia IOB Index Futures 12/11 Ctr 6Russia IOB Index Futures 03/12 Ctr 6 6Set50 Index Futures 12/11 Ctr 14 14Set50 Index Futures 03/12 Ctr 12 12TurkDEX-ISE 30 Index Futures 12/11 Ctr 80 80TurkDEX-ISE 30 Index Futures 02/12 Ctr 86 86TurkDEX-ISE 30 Index Futures 10/11 Ctr 69 144WIG20 Index Futures 12/11 Ctr 37WIG20 Index Futures 03/12 Ctr 37 37
Acquisitions and disposals of securities and money-market instruments (classification as per reporting date) as well as derivatives and deposits no longer held in the investment portfolio at the end of the reporting periodSecurities Shares resp. Currency
(in 1,000) resp. ContractsAcquisitions Disposals
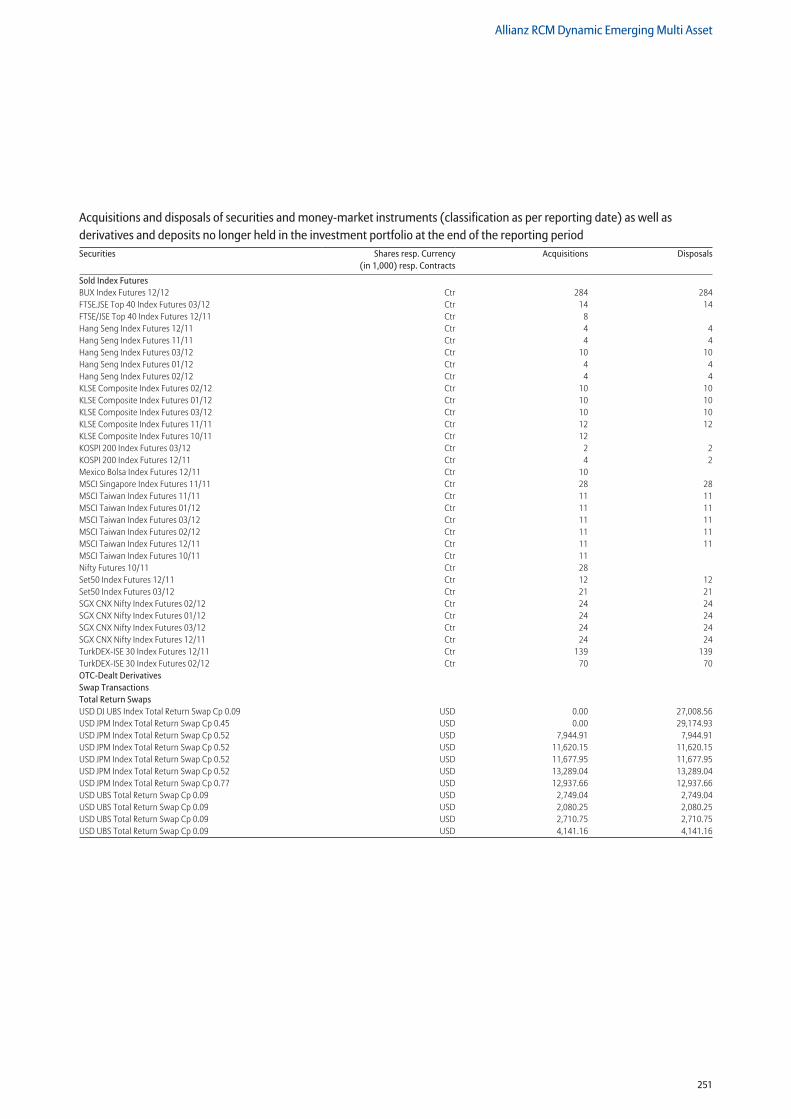
251
Allianz RCM Dynamic Emerging Multi Asset
Acquisitions and disposals of securities and money-market instruments (classification as per reporting date) as well as derivatives and deposits no longer held in the investment portfolio at the end of the reporting periodSecurities Shares resp. Currency
(in 1,000) resp. ContractsAcquisitions Disposals
Sold Index Futures BUX Index Futures 12/12 Ctr 284 284FTSE.JSE Top 40 Index Futures 03/12 Ctr 14 14FTSE/JSE Top 40 Index Futures 12/11 Ctr 8 Hang Seng Index Futures 12/11 Ctr 4 4Hang Seng Index Futures 11/11 Ctr 4 4Hang Seng Index Futures 03/12 Ctr 10 10Hang Seng Index Futures 01/12 Ctr 4 4Hang Seng Index Futures 02/12 Ctr 4 4KLSE Composite Index Futures 02/12 Ctr 10 10KLSE Composite Index Futures 01/12 Ctr 10 10KLSE Composite Index Futures 03/12 Ctr 10 10KLSE Composite Index Futures 11/11 Ctr 12 12KLSE Composite Index Futures 10/11 Ctr 12 KOSPI 200 Index Futures 03/12 Ctr 2 2KOSPI 200 Index Futures 12/11 Ctr 4 2Mexico Bolsa Index Futures 12/11 Ctr 10 MSCI Singapore Index Futures 11/11 Ctr 28 28MSCI Taiwan Index Futures 11/11 Ctr 11 11MSCI Taiwan Index Futures 01/12 Ctr 11 11MSCI Taiwan Index Futures 03/12 Ctr 11 11MSCI Taiwan Index Futures 02/12 Ctr 11 11MSCI Taiwan Index Futures 12/11 Ctr 11 11MSCI Taiwan Index Futures 10/11 Ctr 11 Nifty Futures 10/11 Ctr 28 Set50 Index Futures 12/11 Ctr 12 12Set50 Index Futures 03/12 Ctr 21 21SGX CNX Nifty Index Futures 02/12 Ctr 24 24SGX CNX Nifty Index Futures 01/12 Ctr 24 24SGX CNX Nifty Index Futures 03/12 Ctr 24 24SGX CNX Nifty Index Futures 12/11 Ctr 24 24TurkDEX-ISE 30 Index Futures 12/11 Ctr 139 139TurkDEX-ISE 30 Index Futures 02/12 Ctr 70 70OTC-Dealt Derivatives Swap Transactions Total Return Swaps USD DJ UBS Index Total Return Swap Cp 0.09 USD 0.00 27,008.56USD JPM Index Total Return Swap Cp 0.45 USD 0.00 29,174.93USD JPM Index Total Return Swap Cp 0.52 USD 7,944.91 7,944.91USD JPM Index Total Return Swap Cp 0.52 USD 11,620.15 11,620.15USD JPM Index Total Return Swap Cp 0.52 USD 11,677.95 11,677.95USD JPM Index Total Return Swap Cp 0.52 USD 13,289.04 13,289.04USD JPM Index Total Return Swap Cp 0.77 USD 12,937.66 12,937.66USD UBS Total Return Swap Cp 0.09 USD 2,749.04 2,749.04USD UBS Total Return Swap Cp 0.09 USD 2,080.25 2,080.25USD UBS Total Return Swap Cp 0.09 USD 2,710.75 2,710.75USD UBS Total Return Swap Cp 0.09 USD 4,141.16 4,141.16
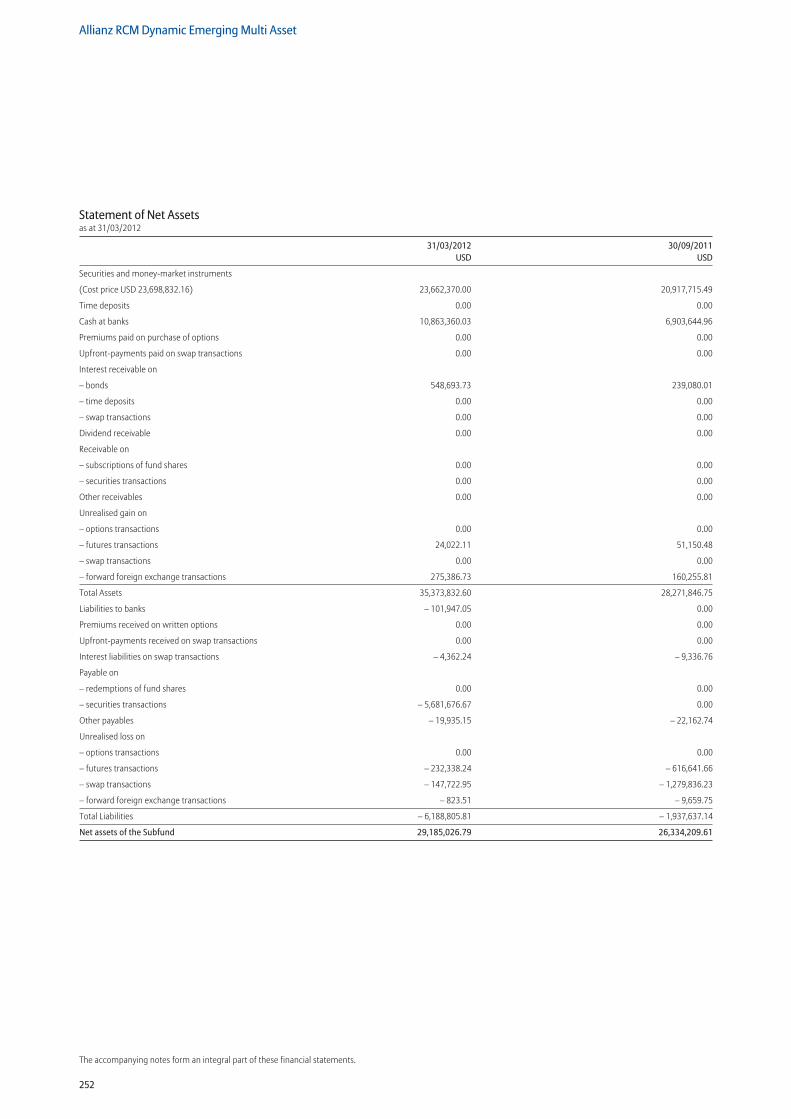
252
Allianz RCM Dynamic Emerging Multi Asset
The accompanying notes form an integral part of these financial statements.
Statement of Net Assetsas at 31/03/2012
31/03/2012 30/09/2011 USD USD
Securities and money-market instruments
(Cost price USD 23,698,832.16) 23,662,370.00 20,917,715.49
Time deposits 0.00 0.00
Cash at banks 10,863,360.03 6,903,644.96
Premiums paid on purchase of options 0.00 0.00
Upfront-payments paid on swap transactions 0.00 0.00
Interest receivable on
– bonds 548,693.73 239,080.01
– time deposits 0.00 0.00
– swap transactions 0.00 0.00
Dividend receivable 0.00 0.00
Receivable on
– subscriptions of fund shares 0.00 0.00
– securities transactions 0.00 0.00
Other receivables 0.00 0.00
Unrealised gain on
– options transactions 0.00 0.00
– futures transactions 24,022.11 51,150.48
– swap transactions 0.00 0.00
– forward foreign exchange transactions 275,386.73 160,255.81
Total Assets 35,373,832.60 28,271,846.75
Liabilities to banks – 101,947.05 0.00
Premiums received on written options 0.00 0.00
Upfront-payments received on swap transactions 0.00 0.00
Interest liabilities on swap transactions – 4,362.24 – 9,336.76
Payable on
– redemptions of fund shares 0.00 0.00
– securities transactions – 5,681,676.67 0.00
Other payables – 19,935.15 – 22,162.74
Unrealised loss on
– options transactions 0.00 0.00
– futures transactions – 232,338.24 – 616,641.66
– swap transactions – 147,722.95 – 1,279,836.23
– forward foreign exchange transactions – 823.51 – 9,659.75
Total Liabilities – 6,188,805.81 – 1,937,637.14
Net assets of the Subfund 29,185,026.79 26,334,209.61
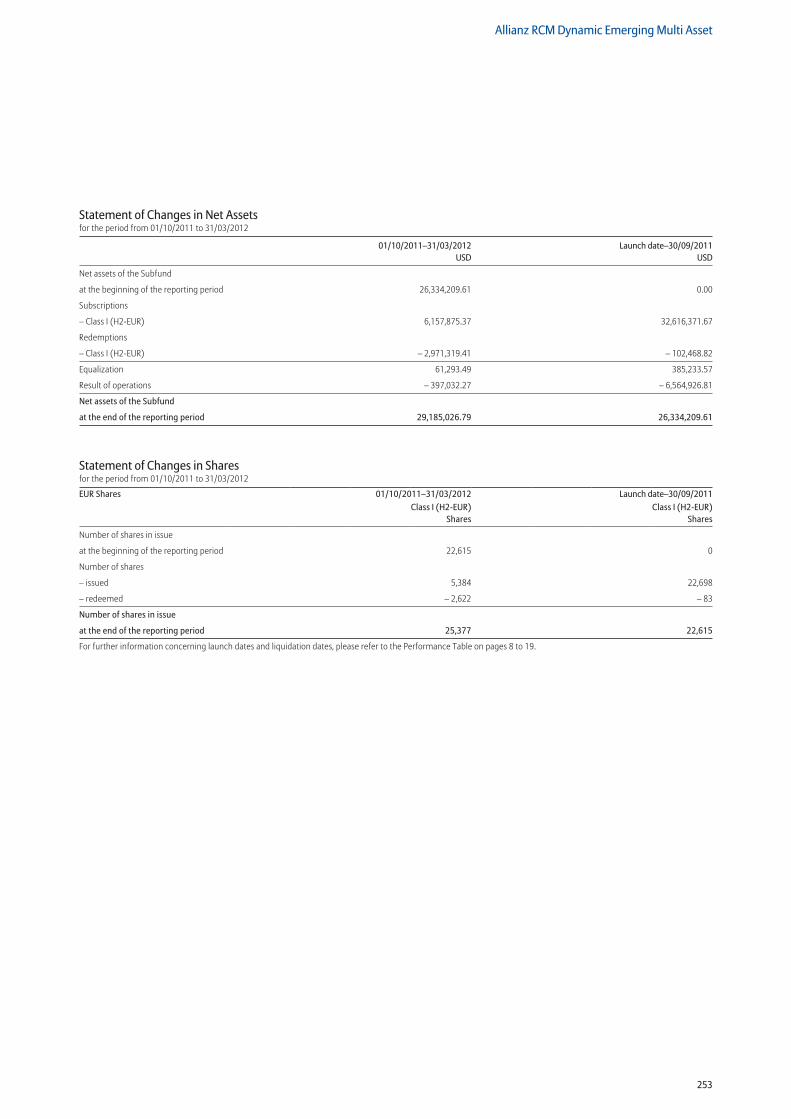
253
Allianz RCM Dynamic Emerging Multi Asset
Statement of Changes in Net Assetsfor the period from 01/10/2011 to 31/03/2012
01/10/2011–31/03/2012 Launch date–30/09/2011 USD USD
Net assets of the Subfund
at the beginning of the reporting period 26,334,209.61 0.00
Subscriptions
– Class I (H2-EUR) 6,157,875.37 32,616,371.67
Redemptions
– Class I (H2-EUR) – 2,971,319.41 – 102,468.82
Equalization 61,293.49 385,233.57
Result of operations – 397,032.27 – 6,564,926.81
Net assets of the Subfund
at the end of the reporting period 29,185,026.79 26,334,209.61
Statement of Changes in Sharesfor the period from 01/10/2011 to 31/03/2012
EUR Shares 01/10/2011–31/03/2012 Launch date–30/09/2011Class I (H2-EUR)
SharesClass I (H2-EUR)
Shares
Number of shares in issue
at the beginning of the reporting period 22,615 0
Number of shares
– issued 5,384 22,698
– redeemed – 2,622 – 83
Number of shares in issue
at the end of the reporting period 25,377 22,615
For further information concerning launch dates and liquidation dates, please refer to the Performance Table on pages 8 to 19.
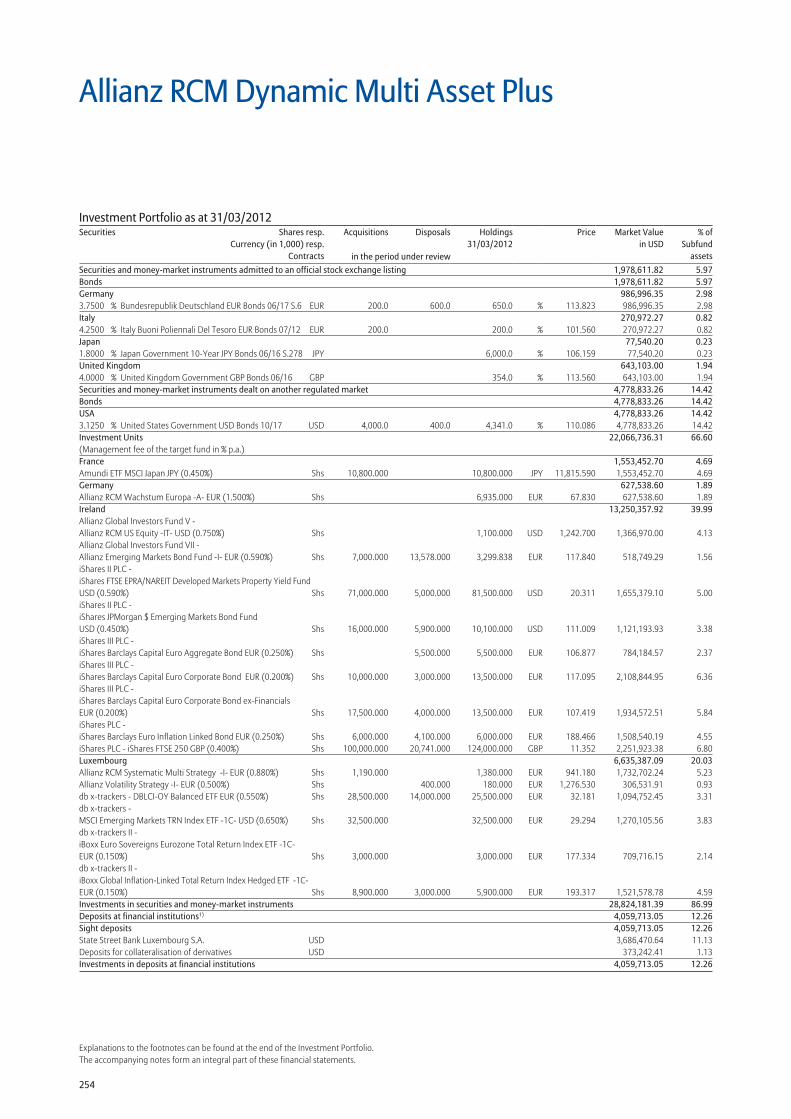
254
Explanations to the footnotes can be found at the end of the Investment Portfolio.The accompanying notes form an integral part of these financial statements.
Allianz RCM Dynamic Multi Asset Plus
Securities and money-market instruments admitted to an official stock exchange listing 1,978,611.82 5.97Bonds 1,978,611.82 5.97Germany 986,996.35 2.983.7500 % Bundesrepublik Deutschland EUR Bonds 06/17 S.6 EUR 200.0 600.0 650.0 % 113.823 986,996.35 2.98Italy 270,972.27 0.824.2500 % Italy Buoni Poliennali Del Tesoro EUR Bonds 07/12 EUR 200.0 200.0 % 101.560 270,972.27 0.82Japan 77,540.20 0.231.8000 % Japan Government 10-Year JPY Bonds 06/16 S.278 JPY 6,000.0 % 106.159 77,540.20 0.23United Kingdom 643,103.00 1.944.0000 % United Kingdom Government GBP Bonds 06/16 GBP 354.0 % 113.560 643,103.00 1.94Securities and money-market instruments dealt on another regulated market 4,778,833.26 14.42Bonds 4,778,833.26 14.42USA 4,778,833.26 14.423.1250 % United States Government USD Bonds 10/17 USD 4,000.0 400.0 4,341.0 % 110.086 4,778,833.26 14.42Investment Units 22,066,736.31 66.60(Management fee of the target fund in % p.a.) France 1,553,452.70 4.69Amundi ETF MSCI Japan JPY (0.450%) Shs 10,800.000 10,800.000 JPY 11,815.590 1,553,452.70 4.69Germany 627,538.60 1.89Allianz RCM Wachstum Europa -A- EUR (1.500%) Shs 6,935.000 EUR 67.830 627,538.60 1.89Ireland 13,250,357.92 39.99Allianz Global Investors Fund V - Allianz RCM US Equity -IT- USD (0.750%) Shs 1,100.000 USD 1,242.700 1,366,970.00 4.13Allianz Global Investors Fund VII - Allianz Emerging Markets Bond Fund -I- EUR (0.590%) Shs 7,000.000 13,578.000 3,299.838 EUR 117.840 518,749.29 1.56iShares II PLC - iShares FTSE EPRA/NAREIT Developed Markets Property Yield Fund USD (0.590%) Shs 71,000.000 5,000.000 81,500.000 USD 20.311 1,655,379.10 5.00iShares II PLC - iShares JPMorgan $ Emerging Markets Bond Fund USD (0.450%) Shs 16,000.000 5,900.000 10,100.000 USD 111.009 1,121,193.93 3.38iShares III PLC - iShares Barclays Capital Euro Aggregate Bond EUR (0.250%) Shs 5,500.000 5,500.000 EUR 106.877 784,184.57 2.37iShares III PLC - iShares Barclays Capital Euro Corporate Bond EUR (0.200%) Shs 10,000.000 3,000.000 13,500.000 EUR 117.095 2,108,844.95 6.36iShares III PLC - iShares Barclays Capital Euro Corporate Bond ex-Financials EUR (0.200%) Shs 17,500.000 4,000.000 13,500.000 EUR 107.419 1,934,572.51 5.84iShares PLC - iShares Barclays Euro Inflation Linked Bond EUR (0.250%) Shs 6,000.000 4,100.000 6,000.000 EUR 188.466 1,508,540.19 4.55iShares PLC - iShares FTSE 250 GBP (0.400%) Shs 100,000.000 20,741.000 124,000.000 GBP 11.352 2,251,923.38 6.80Luxembourg 6,635,387.09 20.03Allianz RCM Systematic Multi Strategy -I- EUR (0.880%) Shs 1,190.000 1,380.000 EUR 941.180 1,732,702.24 5.23Allianz Volatility Strategy -I- EUR (0.500%) Shs 400.000 180.000 EUR 1,276.530 306,531.91 0.93db x-trackers - DBLCI-OY Balanced ETF EUR (0.550%) Shs 28,500.000 14,000.000 25,500.000 EUR 32.181 1,094,752.45 3.31db x-trackers - MSCI Emerging Markets TRN Index ETF -1C- USD (0.650%) Shs 32,500.000 32,500.000 EUR 29.294 1,270,105.56 3.83db x-trackers II - iBoxx Euro Sovereigns Eurozone Total Return Index ETF -1C- EUR (0.150%) Shs 3,000.000 3,000.000 EUR 177.334 709,716.15 2.14db x-trackers II - iBoxx Global Inflation-Linked Total Return Index Hedged ETF -1C- EUR (0.150%) Shs 8,900.000 3,000.000 5,900.000 EUR 193.317 1,521,578.78 4.59Investments in securities and money-market instruments 28,824,181.39 86.99Deposits at financial institutions1) 4,059,713.05 12.26Sight deposits 4,059,713.05 12.26State Street Bank Luxembourg S.A. USD 3,686,470.64 11.13Deposits for collateralisation of derivatives USD 373,242.41 1.13Investments in deposits at financial institutions 4,059,713.05 12.26
Investment Portfolio as at 31/03/2012Securities Shares resp.
Currency (in 1,000) resp.Contracts
Acquisitions Disposals Holdings 31/03/2012
Price Market Valuein USD
% ofSubfund
assetsin the period under review
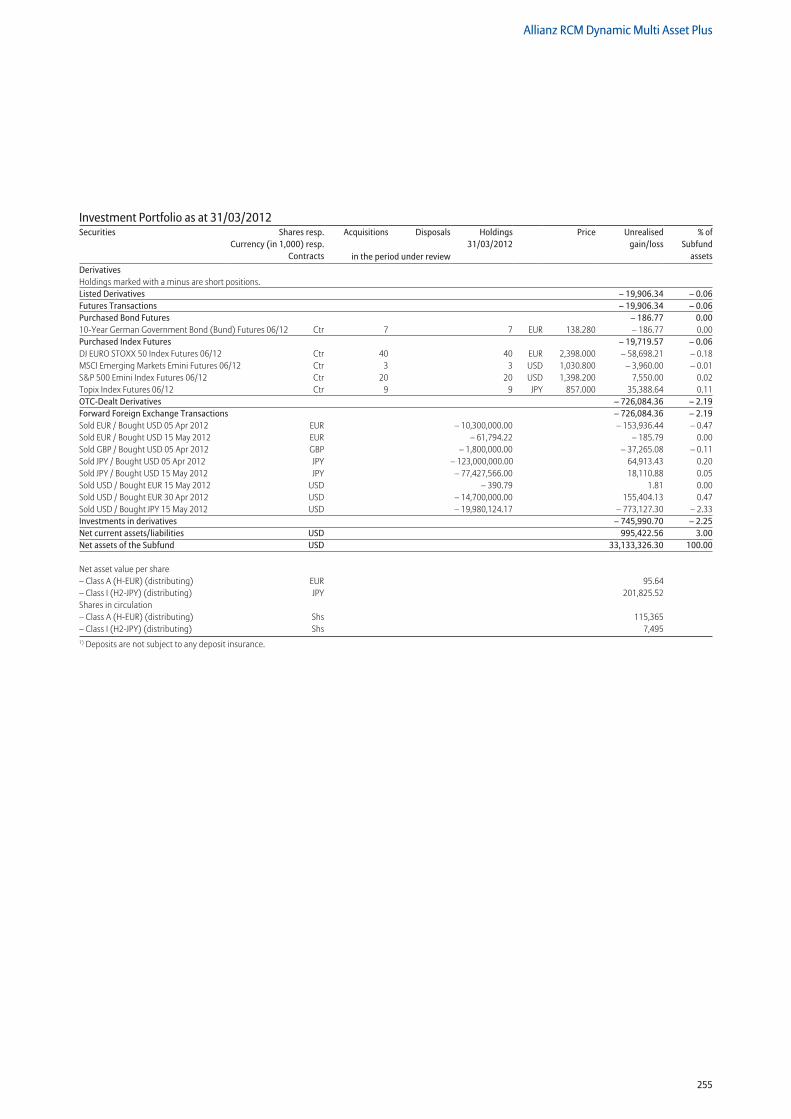
255
Allianz RCM Dynamic Multi Asset Plus
Derivatives Holdings marked with a minus are short positions. Listed Derivatives – 19,906.34 – 0.06Futures Transactions – 19,906.34 – 0.06Purchased Bond Futures – 186.77 0.0010-Year German Government Bond (Bund) Futures 06/12 Ctr 7 7 EUR 138.280 – 186.77 0.00Purchased Index Futures – 19,719.57 – 0.06DJ EURO STOXX 50 Index Futures 06/12 Ctr 40 40 EUR 2,398.000 – 58,698.21 – 0.18MSCI Emerging Markets Emini Futures 06/12 Ctr 3 3 USD 1,030.800 – 3,960.00 – 0.01S&P 500 Emini Index Futures 06/12 Ctr 20 20 USD 1,398.200 7,550.00 0.02Topix Index Futures 06/12 Ctr 9 9 JPY 857.000 35,388.64 0.11OTC-Dealt Derivatives – 726,084.36 – 2.19Forward Foreign Exchange Transactions – 726,084.36 – 2.19Sold EUR / Bought USD 05 Apr 2012 EUR – 10,300,000.00 – 153,936.44 – 0.47Sold EUR / Bought USD 15 May 2012 EUR – 61,794.22 – 185.79 0.00Sold GBP / Bought USD 05 Apr 2012 GBP – 1,800,000.00 – 37,265.08 – 0.11Sold JPY / Bought USD 05 Apr 2012 JPY – 123,000,000.00 64,913.43 0.20Sold JPY / Bought USD 15 May 2012 JPY – 77,427,566.00 18,110.88 0.05Sold USD / Bought EUR 15 May 2012 USD – 390.79 1.81 0.00Sold USD / Bought EUR 30 Apr 2012 USD – 14,700,000.00 155,404.13 0.47Sold USD / Bought JPY 15 May 2012 USD – 19,980,124.17 – 773,127.30 – 2.33Investments in derivatives – 745,990.70 – 2.25Net current assets/liabilities USD 995,422.56 3.00Net assets of the Subfund USD 33,133,326.30 100.00
Net asset value per share – Class A (H-EUR) (distributing) EUR 95.64 – Class I (H2-JPY) (distributing) JPY 201,825.52 Shares in circulation – Class A (H-EUR) (distributing) Shs 115,365 – Class I (H2-JPY) (distributing) Shs 7,4951) Deposits are not subject to any deposit insurance.
Investment Portfolio as at 31/03/2012Securities Shares resp.
Currency (in 1,000) resp.Contracts
Acquisitions Disposals Holdings 31/03/2012
Price Unrealisedgain/loss
% ofSubfund
assetsin the period under review
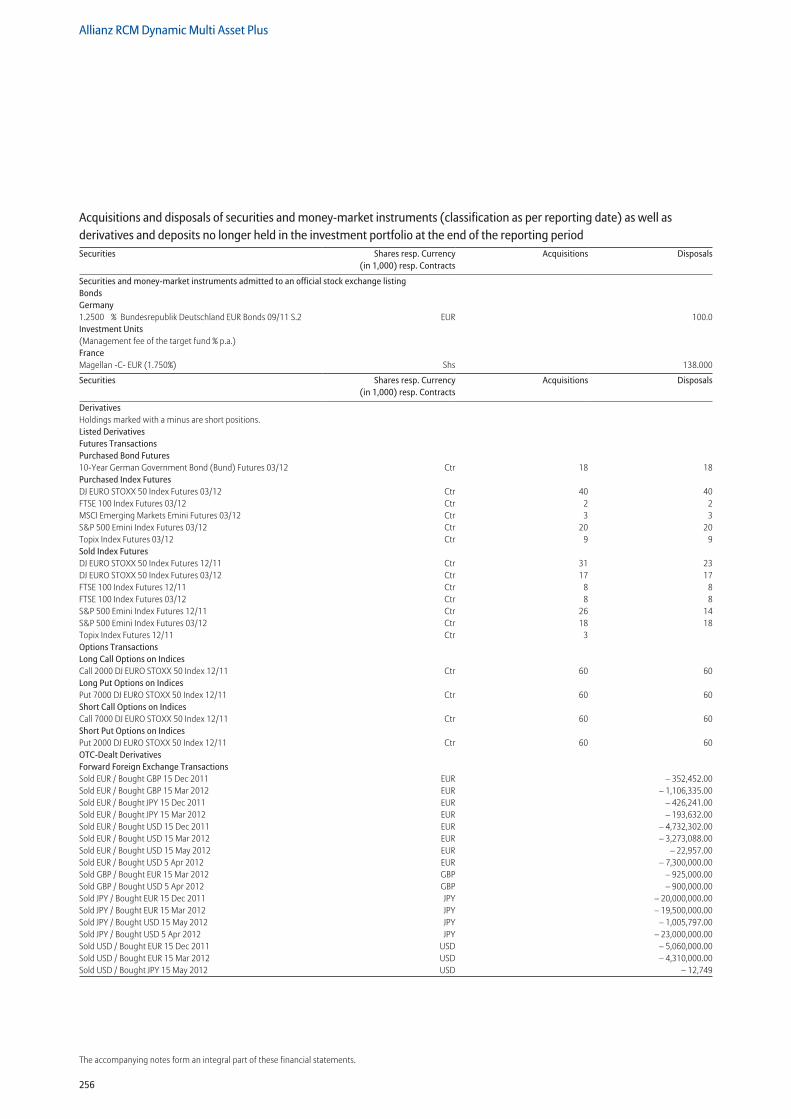
256
Allianz RCM Dynamic Multi Asset Plus
The accompanying notes form an integral part of these financial statements.
Securities and money-market instruments admitted to an official stock exchange listing Bonds Germany 1.2500 % Bundesrepublik Deutschland EUR Bonds 09/11 S.2 EUR 100.0Investment Units (Management fee of the target fund % p.a.) France Magellan -C- EUR (1.750%) Shs 138.000
Securities Shares resp. Currency (in 1,000) resp. Contracts
Acquisitions Disposals
DerivativesHoldings marked with a minus are short positions. Listed Derivatives Futures Transactions Purchased Bond Futures 10-Year German Government Bond (Bund) Futures 03/12 Ctr 18 18Purchased Index Futures DJ EURO STOXX 50 Index Futures 03/12 Ctr 40 40FTSE 100 Index Futures 03/12 Ctr 2 2MSCI Emerging Markets Emini Futures 03/12 Ctr 3 3S&P 500 Emini Index Futures 03/12 Ctr 20 20Topix Index Futures 03/12 Ctr 9 9Sold Index Futures DJ EURO STOXX 50 Index Futures 12/11 Ctr 31 23DJ EURO STOXX 50 Index Futures 03/12 Ctr 17 17FTSE 100 Index Futures 12/11 Ctr 8 8FTSE 100 Index Futures 03/12 Ctr 8 8S&P 500 Emini Index Futures 12/11 Ctr 26 14S&P 500 Emini Index Futures 03/12 Ctr 18 18Topix Index Futures 12/11 Ctr 3 Options Transactions Long Call Options on Indices Call 2000 DJ EURO STOXX 50 Index 12/11 Ctr 60 60Long Put Options on Indices Put 7000 DJ EURO STOXX 50 Index 12/11 Ctr 60 60Short Call Options on Indices Call 7000 DJ EURO STOXX 50 Index 12/11 Ctr 60 60Short Put Options on Indices Put 2000 DJ EURO STOXX 50 Index 12/11 Ctr 60 60OTC-Dealt Derivatives Forward Foreign Exchange Transactions Sold EUR / Bought GBP 15 Dec 2011 EUR – 352,452.00Sold EUR / Bought GBP 15 Mar 2012 EUR – 1,106,335.00Sold EUR / Bought JPY 15 Dec 2011 EUR – 426,241.00Sold EUR / Bought JPY 15 Mar 2012 EUR – 193,632.00Sold EUR / Bought USD 15 Dec 2011 EUR – 4,732,302.00Sold EUR / Bought USD 15 Mar 2012 EUR – 3,273,088.00Sold EUR / Bought USD 15 May 2012 EUR – 22,957.00Sold EUR / Bought USD 5 Apr 2012 EUR – 7,300,000.00Sold GBP / Bought EUR 15 Mar 2012 GBP – 925,000.00Sold GBP / Bought USD 5 Apr 2012 GBP – 900,000.00Sold JPY / Bought EUR 15 Dec 2011 JPY – 20,000,000.00Sold JPY / Bought EUR 15 Mar 2012 JPY – 19,500,000.00Sold JPY / Bought USD 15 May 2012 JPY – 1,005,797.00Sold JPY / Bought USD 5 Apr 2012 JPY – 23,000,000.00Sold USD / Bought EUR 15 Dec 2011 USD – 5,060,000.00Sold USD / Bought EUR 15 Mar 2012 USD – 4,310,000.00Sold USD / Bought JPY 15 May 2012 USD – 12,749
Acquisitions and disposals of securities and money-market instruments (classification as per reporting date) as well as derivatives and deposits no longer held in the investment portfolio at the end of the reporting periodSecurities Shares resp. Currency
(in 1,000) resp. ContractsAcquisitions Disposals
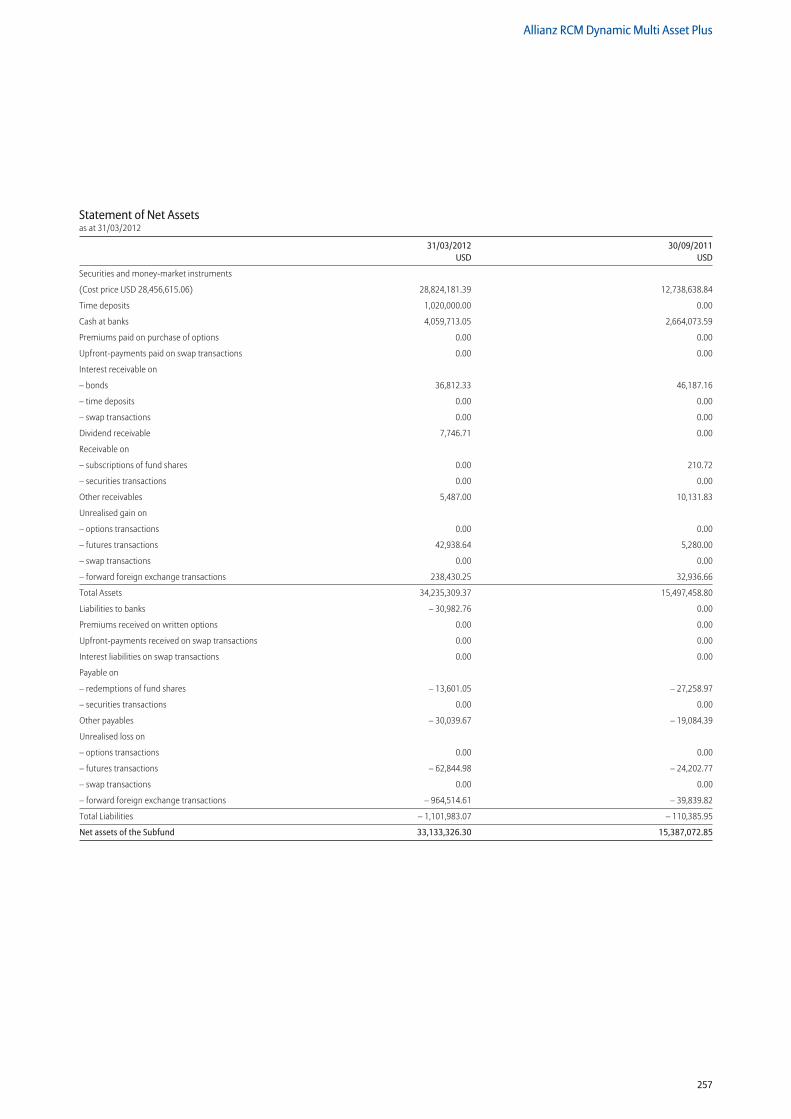
257
Allianz RCM Dynamic Multi Asset Plus
Statement of Net Assetsas at 31/03/2012
31/03/2012 30/09/2011 USD USD
Securities and money-market instruments
(Cost price USD 28,456,615.06) 28,824,181.39 12,738,638.84
Time deposits 1,020,000.00 0.00
Cash at banks 4,059,713.05 2,664,073.59
Premiums paid on purchase of options 0.00 0.00
Upfront-payments paid on swap transactions 0.00 0.00
Interest receivable on
– bonds 36,812.33 46,187.16
– time deposits 0.00 0.00
– swap transactions 0.00 0.00
Dividend receivable 7,746.71 0.00
Receivable on
– subscriptions of fund shares 0.00 210.72
– securities transactions 0.00 0.00
Other receivables 5,487.00 10,131.83
Unrealised gain on
– options transactions 0.00 0.00
– futures transactions 42,938.64 5,280.00
– swap transactions 0.00 0.00
– forward foreign exchange transactions 238,430.25 32,936.66
Total Assets 34,235,309.37 15,497,458.80
Liabilities to banks – 30,982.76 0.00
Premiums received on written options 0.00 0.00
Upfront-payments received on swap transactions 0.00 0.00
Interest liabilities on swap transactions 0.00 0.00
Payable on
– redemptions of fund shares – 13,601.05 – 27,258.97
– securities transactions 0.00 0.00
Other payables – 30,039.67 – 19,084.39
Unrealised loss on
– options transactions 0.00 0.00
– futures transactions – 62,844.98 – 24,202.77
– swap transactions 0.00 0.00
– forward foreign exchange transactions – 964,514.61 – 39,839.82
Total Liabilities – 1,101,983.07 – 110,385.95
Net assets of the Subfund 33,133,326.30 15,387,072.85
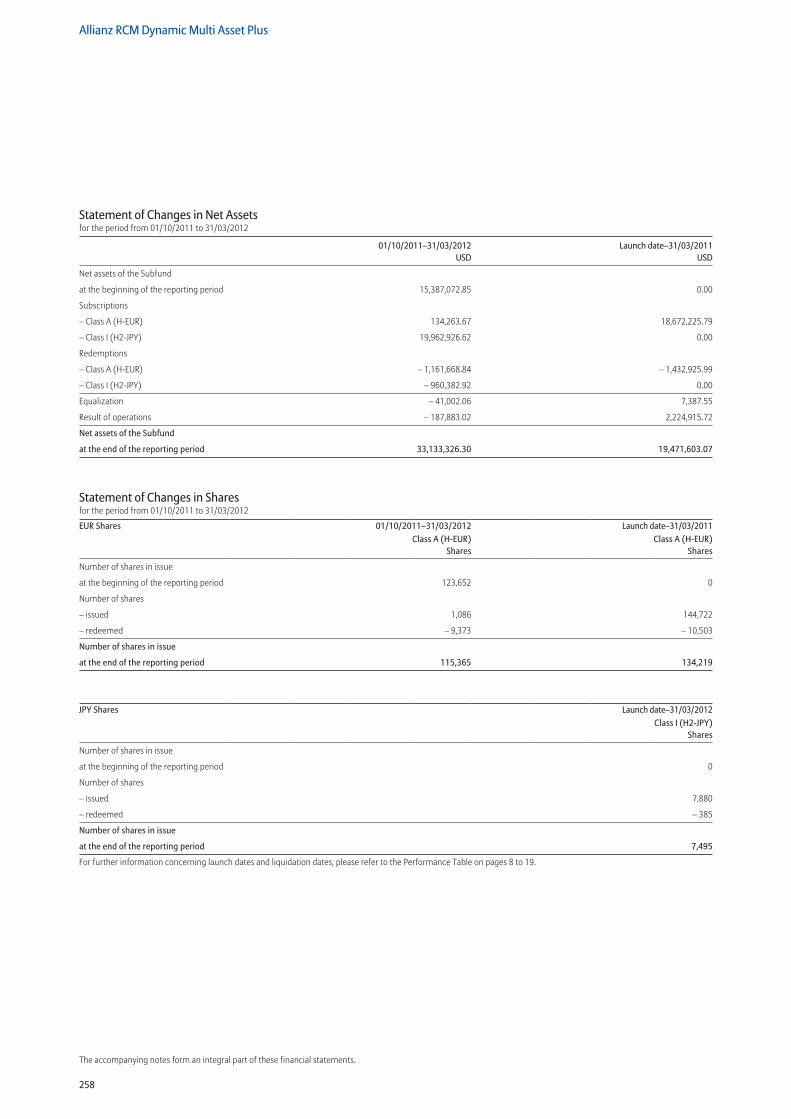
258
Allianz RCM Dynamic Multi Asset Plus
The accompanying notes form an integral part of these financial statements.
Statement of Changes in Net Assetsfor the period from 01/10/2011 to 31/03/2012
01/10/2011–31/03/2012 Launch date–31/03/2011 USD USD
Net assets of the Subfund
at the beginning of the reporting period 15,387,072.85 0.00
Subscriptions
– Class A (H-EUR) 134,263.67 18,672,225.79
– Class I (H2-JPY) 19,962,926.62 0.00
Redemptions
– Class A (H-EUR) – 1,161,668.84 – 1,432,925.99
– Class I (H2-JPY) – 960,382.92 0.00
Equalization – 41,002.06 7,387.55
Result of operations – 187,883.02 2,224,915.72
Net assets of the Subfund
at the end of the reporting period 33,133,326.30 19,471,603.07
Statement of Changes in Sharesfor the period from 01/10/2011 to 31/03/2012
EUR Shares 01/10/2011–31/03/2012 Launch date–31/03/2011Class A (H-EUR)
SharesClass A (H-EUR)
Shares
Number of shares in issue
at the beginning of the reporting period 123,652 0
Number of shares
– issued 1,086 144,722
– redeemed – 9,373 – 10,503
Number of shares in issue
at the end of the reporting period 115,365 134,219
JPY Shares Launch date–31/03/2012Class I (H2-JPY)
Shares
Number of shares in issue
at the beginning of the reporting period 0
Number of shares
– issued 7,880
– redeemed – 385
Number of shares in issue
at the end of the reporting period 7,495
For further information concerning launch dates and liquidation dates, please refer to the Performance Table on pages 8 to 19.
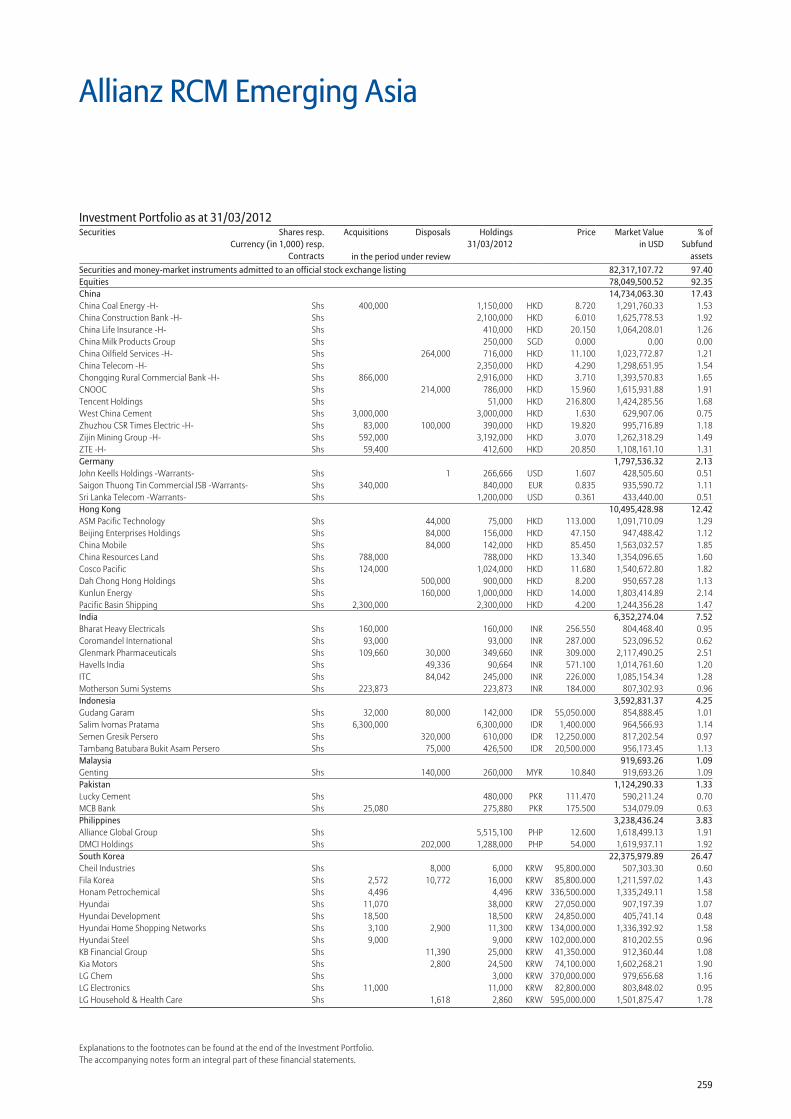
259
Explanations to the footnotes can be found at the end of the Investment Portfolio.The accompanying notes form an integral part of these financial statements.
Securities and money-market instruments admitted to an official stock exchange listing 82,317,107.72 97.40Equities 78,049,500.52 92.35China 14,734,063.30 17.43China Coal Energy -H- Shs 400,000 1,150,000 HKD 8.720 1,291,760.33 1.53China Construction Bank -H- Shs 2,100,000 HKD 6.010 1,625,778.53 1.92China Life Insurance -H- Shs 410,000 HKD 20.150 1,064,208.01 1.26China Milk Products Group Shs 250,000 SGD 0.000 0.00 0.00China Oilfield Services -H- Shs 264,000 716,000 HKD 11.100 1,023,772.87 1.21China Telecom -H- Shs 2,350,000 HKD 4.290 1,298,651.95 1.54Chongqing Rural Commercial Bank -H- Shs 866,000 2,916,000 HKD 3.710 1,393,570.83 1.65CNOOC Shs 214,000 786,000 HKD 15.960 1,615,931.88 1.91Tencent Holdings Shs 51,000 HKD 216.800 1,424,285.56 1.68West China Cement Shs 3,000,000 3,000,000 HKD 1.630 629,907.06 0.75Zhuzhou CSR Times Electric -H- Shs 83,000 100,000 390,000 HKD 19.820 995,716.89 1.18Zijin Mining Group -H- Shs 592,000 3,192,000 HKD 3.070 1,262,318.29 1.49ZTE -H- Shs 59,400 412,600 HKD 20.850 1,108,161.10 1.31Germany 1,797,536.32 2.13John Keells Holdings -Warrants- Shs 1 266,666 USD 1.607 428,505.60 0.51Saigon Thuong Tin Commercial JSB -Warrants- Shs 340,000 840,000 EUR 0.835 935,590.72 1.11Sri Lanka Telecom -Warrants- Shs 1,200,000 USD 0.361 433,440.00 0.51Hong Kong 10,495,428.98 12.42ASM Pacific Technology Shs 44,000 75,000 HKD 113.000 1,091,710.09 1.29Beijing Enterprises Holdings Shs 84,000 156,000 HKD 47.150 947,488.42 1.12China Mobile Shs 84,000 142,000 HKD 85.450 1,563,032.57 1.85China Resources Land Shs 788,000 788,000 HKD 13.340 1,354,096.65 1.60Cosco Pacific Shs 124,000 1,024,000 HKD 11.680 1,540,672.80 1.82Dah Chong Hong Holdings Shs 500,000 900,000 HKD 8.200 950,657.28 1.13Kunlun Energy Shs 160,000 1,000,000 HKD 14.000 1,803,414.89 2.14Pacific Basin Shipping Shs 2,300,000 2,300,000 HKD 4.200 1,244,356.28 1.47India 6,352,274.04 7.52Bharat Heavy Electricals Shs 160,000 160,000 INR 256.550 804,468.40 0.95Coromandel International Shs 93,000 93,000 INR 287.000 523,096.52 0.62Glenmark Pharmaceuticals Shs 109,660 30,000 349,660 INR 309.000 2,117,490.25 2.51Havells India Shs 49,336 90,664 INR 571.100 1,014,761.60 1.20ITC Shs 84,042 245,000 INR 226.000 1,085,154.34 1.28Motherson Sumi Systems Shs 223,873 223,873 INR 184.000 807,302.93 0.96Indonesia 3,592,831.37 4.25Gudang Garam Shs 32,000 80,000 142,000 IDR 55,050.000 854,888.45 1.01Salim Ivomas Pratama Shs 6,300,000 6,300,000 IDR 1,400.000 964,566.93 1.14Semen Gresik Persero Shs 320,000 610,000 IDR 12,250.000 817,202.54 0.97Tambang Batubara Bukit Asam Persero Shs 75,000 426,500 IDR 20,500.000 956,173.45 1.13Malaysia 919,693.26 1.09Genting Shs 140,000 260,000 MYR 10.840 919,693.26 1.09Pakistan 1,124,290.33 1.33Lucky Cement Shs 480,000 PKR 111.470 590,211.24 0.70MCB Bank Shs 25,080 275,880 PKR 175.500 534,079.09 0.63Philippines 3,238,436.24 3.83Alliance Global Group Shs 5,515,100 PHP 12.600 1,618,499.13 1.91DMCI Holdings Shs 202,000 1,288,000 PHP 54.000 1,619,937.11 1.92South Korea 22,375,979.89 26.47Cheil Industries Shs 8,000 6,000 KRW 95,800.000 507,303.30 0.60Fila Korea Shs 2,572 10,772 16,000 KRW 85,800.000 1,211,597.02 1.43Honam Petrochemical Shs 4,496 4,496 KRW 336,500.000 1,335,249.11 1.58Hyundai Shs 11,070 38,000 KRW 27,050.000 907,197.39 1.07Hyundai Development Shs 18,500 18,500 KRW 24,850.000 405,741.14 0.48Hyundai Home Shopping Networks Shs 3,100 2,900 11,300 KRW 134,000.000 1,336,392.92 1.58Hyundai Steel Shs 9,000 9,000 KRW 102,000.000 810,202.55 0.96KB Financial Group Shs 11,390 25,000 KRW 41,350.000 912,360.44 1.08Kia Motors Shs 2,800 24,500 KRW 74,100.000 1,602,268.21 1.90LG Chem Shs 3,000 KRW 370,000.000 979,656.68 1.16LG Electronics Shs 11,000 11,000 KRW 82,800.000 803,848.02 0.95LG Household & Health Care Shs 1,618 2,860 KRW 595,000.000 1,501,875.47 1.78
Allianz RCM Emerging Asia
Investment Portfolio as at 31/03/2012Securities Shares resp.
Currency (in 1,000) resp.Contracts
Acquisitions Disposals Holdings 31/03/2012
Price Market Valuein USD
% ofSubfund
assetsin the period under review
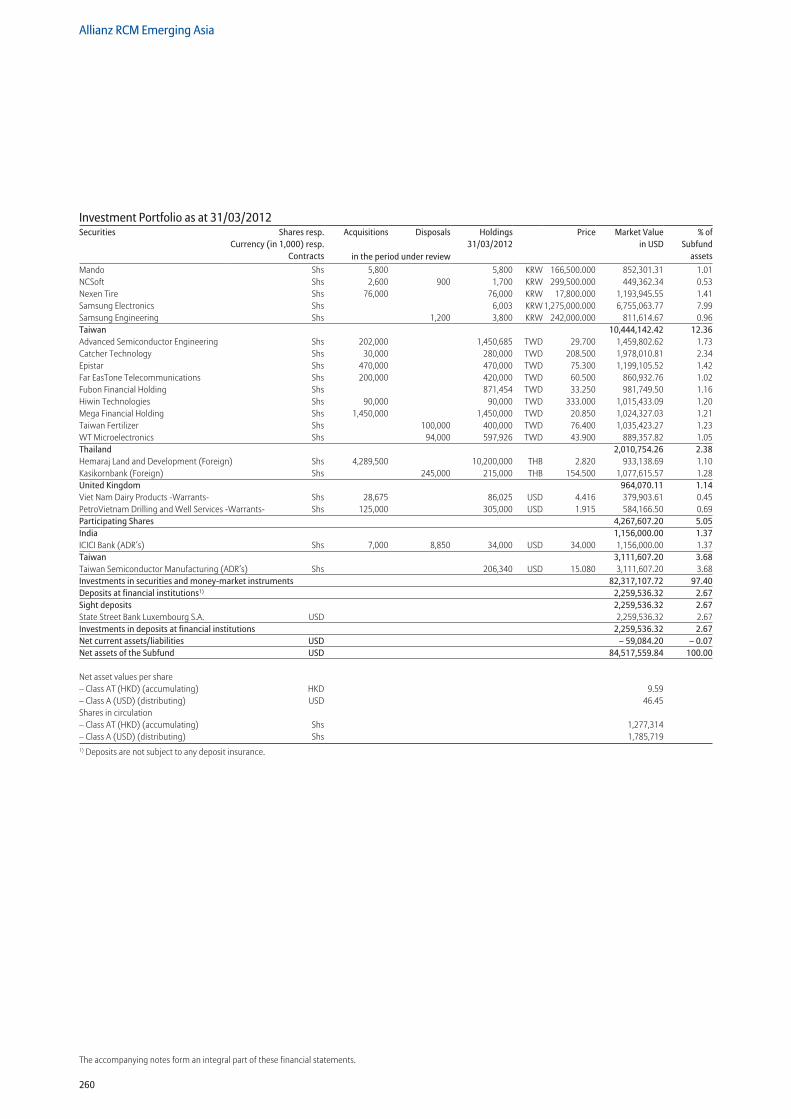
260
Allianz RCM Emerging Asia
The accompanying notes form an integral part of these financial statements.
Mando Shs 5,800 5,800 KRW 166,500.000 852,301.31 1.01NCSoft Shs 2,600 900 1,700 KRW 299,500.000 449,362.34 0.53Nexen Tire Shs 76,000 76,000 KRW 17,800.000 1,193,945.55 1.41Samsung Electronics Shs 6,003 KRW 1,275,000.000 6,755,063.77 7.99Samsung Engineering Shs 1,200 3,800 KRW 242,000.000 811,614.67 0.96Taiwan 10,444,142.42 12.36Advanced Semiconductor Engineering Shs 202,000 1,450,685 TWD 29.700 1,459,802.62 1.73Catcher Technology Shs 30,000 280,000 TWD 208.500 1,978,010.81 2.34Epistar Shs 470,000 470,000 TWD 75.300 1,199,105.52 1.42Far EasTone Telecommunications Shs 200,000 420,000 TWD 60.500 860,932.76 1.02Fubon Financial Holding Shs 871,454 TWD 33.250 981,749.50 1.16Hiwin Technologies Shs 90,000 90,000 TWD 333.000 1,015,433.09 1.20Mega Financial Holding Shs 1,450,000 1,450,000 TWD 20.850 1,024,327.03 1.21Taiwan Fertilizer Shs 100,000 400,000 TWD 76.400 1,035,423.27 1.23WT Microelectronics Shs 94,000 597,926 TWD 43.900 889,357.82 1.05Thailand 2,010,754.26 2.38Hemaraj Land and Development (Foreign) Shs 4,289,500 10,200,000 THB 2.820 933,138.69 1.10Kasikornbank (Foreign) Shs 245,000 215,000 THB 154.500 1,077,615.57 1.28United Kingdom 964,070.11 1.14Viet Nam Dairy Products -Warrants- Shs 28,675 86,025 USD 4.416 379,903.61 0.45PetroVietnam Drilling and Well Services -Warrants- Shs 125,000 305,000 USD 1.915 584,166.50 0.69Participating Shares 4,267,607.20 5.05India 1,156,000.00 1.37ICICI Bank (ADR’s) Shs 7,000 8,850 34,000 USD 34.000 1,156,000.00 1.37Taiwan 3,111,607.20 3.68Taiwan Semiconductor Manufacturing (ADR’s) Shs 206,340 USD 15.080 3,111,607.20 3.68Investments in securities and money-market instruments 82,317,107.72 97.40Deposits at financial institutions1) 2,259,536.32 2.67Sight deposits 2,259,536.32 2.67State Street Bank Luxembourg S.A. USD 2,259,536.32 2.67Investments in deposits at financial institutions 2,259,536.32 2.67Net current assets/liabilities USD – 59,084.20 – 0.07Net assets of the Subfund USD 84,517,559.84 100.00
Net asset values per share – Class AT (HKD) (accumulating) HKD 9.59 – Class A (USD) (distributing) USD 46.45 Shares in circulation – Class AT (HKD) (accumulating) Shs 1,277,314 – Class A (USD) (distributing) Shs 1,785,7191) Deposits are not subject to any deposit insurance.
Investment Portfolio as at 31/03/2012Securities Shares resp.
Currency (in 1,000) resp.Contracts
Acquisitions Disposals Holdings 31/03/2012
Price Market Valuein USD
% ofSubfund
assetsin the period under review
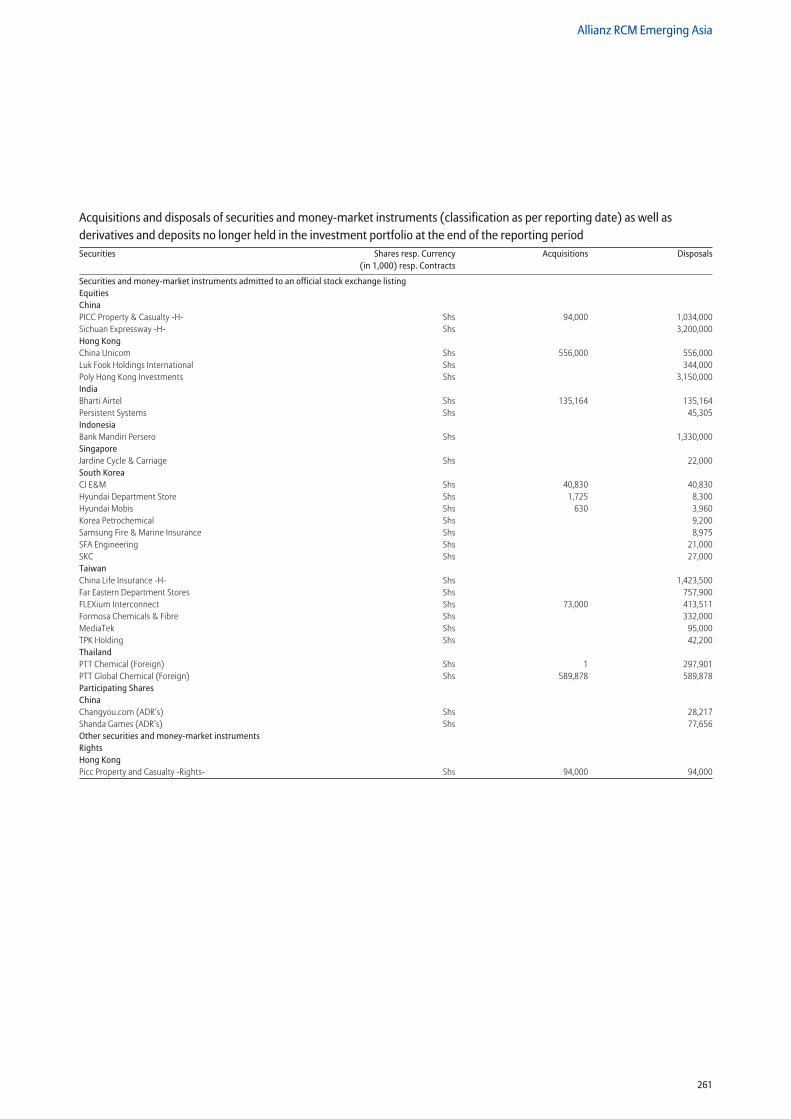
261
Allianz RCM Emerging Asia
Securities and money-market instruments admitted to an official stock exchange listing Equities China PICC Property & Casualty -H- Shs 94,000 1,034,000Sichuan Expressway -H- Shs 3,200,000Hong Kong China Unicom Shs 556,000 556,000Luk Fook Holdings International Shs 344,000Poly Hong Kong Investments Shs 3,150,000India Bharti Airtel Shs 135,164 135,164Persistent Systems Shs 45,305Indonesia Bank Mandiri Persero Shs 1,330,000Singapore Jardine Cycle & Carriage Shs 22,000South Korea CJ E&M Shs 40,830 40,830Hyundai Department Store Shs 1,725 8,300Hyundai Mobis Shs 630 3,960Korea Petrochemical Shs 9,200Samsung Fire & Marine Insurance Shs 8,975SFA Engineering Shs 21,000SKC Shs 27,000Taiwan China Life Insurance -H- Shs 1,423,500Far Eastern Department Stores Shs 757,900FLEXium Interconnect Shs 73,000 413,511Formosa Chemicals & Fibre Shs 332,000MediaTek Shs 95,000TPK Holding Shs 42,200Thailand PTT Chemical (Foreign) Shs 1 297,901PTT Global Chemical (Foreign) Shs 589,878 589,878Participating Shares China Changyou.com (ADR’s) Shs 28,217Shanda Games (ADR’s) Shs 77,656Other securities and money-market instruments Rights Hong Kong Picc Property and Casualty -Rights- Shs 94,000 94,000
Acquisitions and disposals of securities and money-market instruments (classification as per reporting date) as well as derivatives and deposits no longer held in the investment portfolio at the end of the reporting periodSecurities Shares resp. Currency
(in 1,000) resp. ContractsAcquisitions Disposals

262
Allianz RCM Emerging Asia
The accompanying notes form an integral part of these financial statements.
Statement of Net Assetsas at 31/03/2012
31/03/2012 30/09/2011 USD USD
Securities and money-market instruments
(Cost price USD 78,421,088.01) 82,317,107.72 81,599,668.86
Time deposits 0.00 0.00
Cash at banks 2,259,536.32 2,066,439.38
Premiums paid on purchase of options 0.00 0.00
Upfront-payments paid on swap transactions 0.00 0.00
Interest receivable on
– bonds 0.00 0.00
– time deposits 0.00 0.00
– swap transactions 0.00 0.00
Dividend receivable 124,399.17 125,890.34
Receivable on
– subscriptions of fund shares 208,007.39 89,739.79
– securities transactions 0.00 1,220,747.71
Other receivables 0.00 0.00
Unrealised gain on
– options transactions 0.00 0.00
– futures transactions 0.00 0.00
– swap transactions 0.00 0.00
– forward foreign exchange transactions 0.00 0.00
Total Assets 84,909,050.60 85,102,486.08
Liabilities to banks – 1,187.68 – 15,341.49
Premiums received on written options 0.00 0.00
Upfront-payments received on swap transactions 0.00 0.00
Interest liabilities on swap transactions 0.00 0.00
Payable on
– redemptions of fund shares – 212,835.20 – 521,915.02
– securities transactions 0.00 – 40,382.00
Other payables – 177,467.88 – 193,187.58
Unrealised loss on
– options transactions 0.00 0.00
– futures transactions 0.00 0.00
– swap transactions 0.00 0.00
– forward foreign exchange transactions 0.00 0.00
Total Liabilities – 391,490.76 – 770,826.09
Net assets of the Subfund 84,517,559.84 84,331,659.99
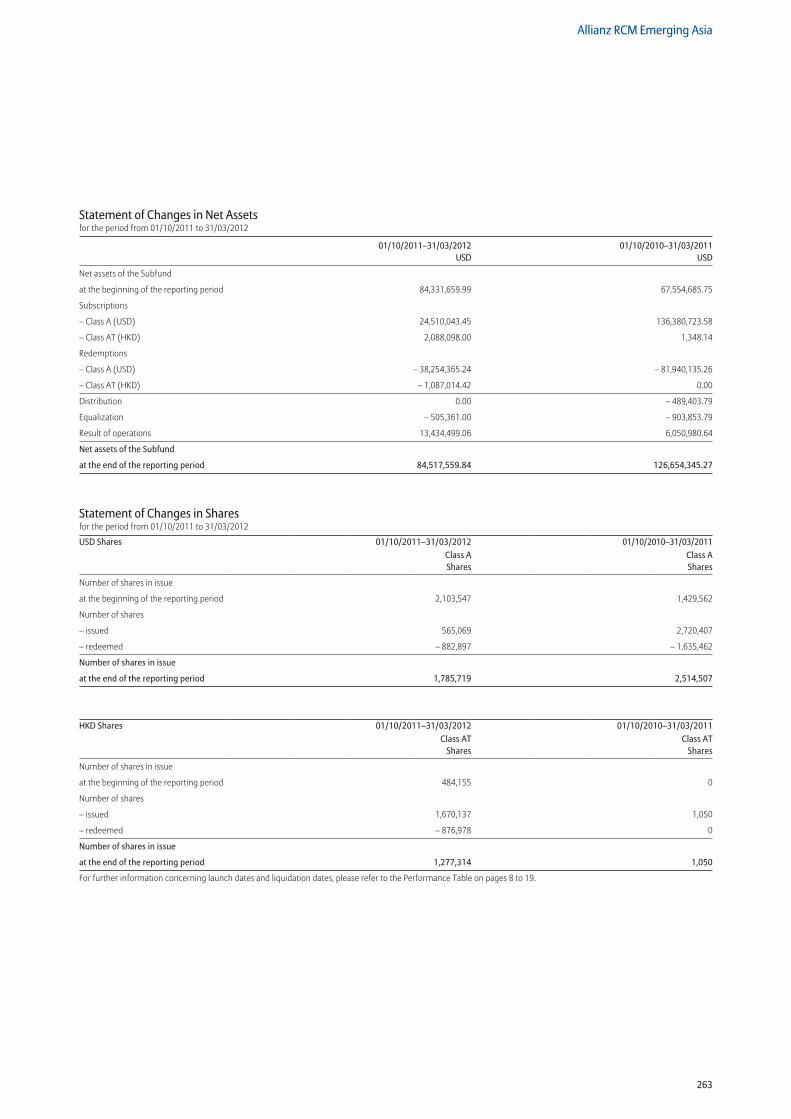
263
Allianz RCM Emerging Asia
Statement of Changes in Net Assetsfor the period from 01/10/2011 to 31/03/2012
01/10/2011–31/03/2012 01/10/2010–31/03/2011 USD USD
Net assets of the Subfund
at the beginning of the reporting period 84,331,659.99 67,554,685.75
Subscriptions
– Class A (USD) 24,510,043.45 136,380,723.58
– Class AT (HKD) 2,088,098.00 1,348.14
Redemptions
– Class A (USD) – 38,254,365.24 – 81,940,135.26
– Class AT (HKD) – 1,087,014.42 0.00
Distribution 0.00 – 489,403.79
Equalization – 505,361.00 – 903,853.79
Result of operations 13,434,499.06 6,050,980.64
Net assets of the Subfund
at the end of the reporting period 84,517,559.84 126,654,345.27
Statement of Changes in Sharesfor the period from 01/10/2011 to 31/03/2012
USD Shares 01/10/2011–31/03/2012 01/10/2010–31/03/2011Class A Shares
Class A Shares
Number of shares in issue
at the beginning of the reporting period 2,103,547 1,429,562
Number of shares
– issued 565,069 2,720,407
– redeemed – 882,897 – 1,635,462
Number of shares in issue
at the end of the reporting period 1,785,719 2,514,507
HKD Shares 01/10/2011–31/03/2012 01/10/2010–31/03/2011Class AT
SharesClass AT
Shares
Number of shares in issue
at the beginning of the reporting period 484,155 0
Number of shares
– issued 1,670,137 1,050
– redeemed – 876,978 0
Number of shares in issue
at the end of the reporting period 1,277,314 1,050
For further information concerning launch dates and liquidation dates, please refer to the Performance Table on pages 8 to 19.
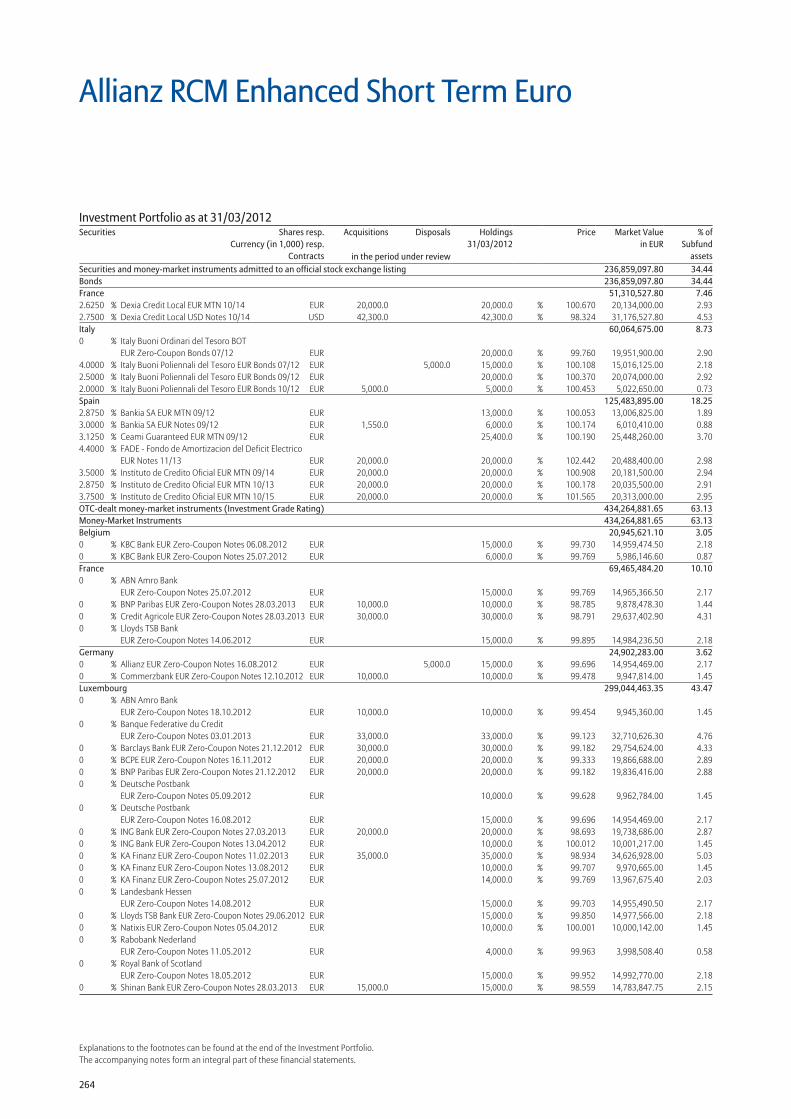
264
Explanations to the footnotes can be found at the end of the Investment Portfolio.The accompanying notes form an integral part of these financial statements.
Allianz RCM Enhanced Short Term Euro
Securities and money-market instruments admitted to an official stock exchange listing 236,859,097.80 34.44Bonds 236,859,097.80 34.44France 51,310,527.80 7.462.6250 % Dexia Credit Local EUR MTN 10/14 EUR 20,000.0 20,000.0 % 100.670 20,134,000.00 2.932.7500 % Dexia Credit Local USD Notes 10/14 USD 42,300.0 42,300.0 % 98.324 31,176,527.80 4.53Italy 60,064,675.00 8.730 % Italy Buoni Ordinari del Tesoro BOT
EUR Zero-Coupon Bonds 07/12 EUR 20,000.0 % 99.760 19,951,900.00 2.904.0000 % Italy Buoni Poliennali del Tesoro EUR Bonds 07/12 EUR 5,000.0 15,000.0 % 100.108 15,016,125.00 2.182.5000 % Italy Buoni Poliennali del Tesoro EUR Bonds 09/12 EUR 20,000.0 % 100.370 20,074,000.00 2.922.0000 % Italy Buoni Poliennali del Tesoro EUR Bonds 10/12 EUR 5,000.0 5,000.0 % 100.453 5,022,650.00 0.73Spain 125,483,895.00 18.252.8750 % Bankia SA EUR MTN 09/12 EUR 13,000.0 % 100.053 13,006,825.00 1.893.0000 % Bankia SA EUR Notes 09/12 EUR 1,550.0 6,000.0 % 100.174 6,010,410.00 0.883.1250 % Ceami Guaranteed EUR MTN 09/12 EUR 25,400.0 % 100.190 25,448,260.00 3.704.4000 % FADE - Fondo de Amortizacion del Deficit Electrico
EUR Notes 11/13 EUR 20,000.0 20,000.0 % 102.442 20,488,400.00 2.983.5000 % Instituto de Credito Oficial EUR MTN 09/14 EUR 20,000.0 20,000.0 % 100.908 20,181,500.00 2.942.8750 % Instituto de Credito Oficial EUR MTN 10/13 EUR 20,000.0 20,000.0 % 100.178 20,035,500.00 2.913.7500 % Instituto de Credito Oficial EUR MTN 10/15 EUR 20,000.0 20,000.0 % 101.565 20,313,000.00 2.95OTC-dealt money-market instruments (Investment Grade Rating) 434,264,881.65 63.13Money-Market Instruments 434,264,881.65 63.13Belgium 20,945,621.10 3.050 % KBC Bank EUR Zero-Coupon Notes 06.08.2012 EUR 15,000.0 % 99.730 14,959,474.50 2.180 % KBC Bank EUR Zero-Coupon Notes 25.07.2012 EUR 6,000.0 % 99.769 5,986,146.60 0.87France 69,465,484.20 10.100 % ABN Amro Bank
EUR Zero-Coupon Notes 25.07.2012 EUR 15,000.0 % 99.769 14,965,366.50 2.170 % BNP Paribas EUR Zero-Coupon Notes 28.03.2013 EUR 10,000.0 10,000.0 % 98.785 9,878,478.30 1.440 % Credit Agricole EUR Zero-Coupon Notes 28.03.2013 EUR 30,000.0 30,000.0 % 98.791 29,637,402.90 4.310 % Lloyds TSB Bank
EUR Zero-Coupon Notes 14.06.2012 EUR 15,000.0 % 99.895 14,984,236.50 2.18Germany 24,902,283.00 3.620 % Allianz EUR Zero-Coupon Notes 16.08.2012 EUR 5,000.0 15,000.0 % 99.696 14,954,469.00 2.170 % Commerzbank EUR Zero-Coupon Notes 12.10.2012 EUR 10,000.0 10,000.0 % 99.478 9,947,814.00 1.45Luxembourg 299,044,463.35 43.470 % ABN Amro Bank
EUR Zero-Coupon Notes 18.10.2012 EUR 10,000.0 10,000.0 % 99.454 9,945,360.00 1.450 % Banque Federative du Credit
EUR Zero-Coupon Notes 03.01.2013 EUR 33,000.0 33,000.0 % 99.123 32,710,626.30 4.760 % Barclays Bank EUR Zero-Coupon Notes 21.12.2012 EUR 30,000.0 30,000.0 % 99.182 29,754,624.00 4.330 % BCPE EUR Zero-Coupon Notes 16.11.2012 EUR 20,000.0 20,000.0 % 99.333 19,866,688.00 2.890 % BNP Paribas EUR Zero-Coupon Notes 21.12.2012 EUR 20,000.0 20,000.0 % 99.182 19,836,416.00 2.880 % Deutsche Postbank
EUR Zero-Coupon Notes 05.09.2012 EUR 10,000.0 % 99.628 9,962,784.00 1.450 % Deutsche Postbank
EUR Zero-Coupon Notes 16.08.2012 EUR 15,000.0 % 99.696 14,954,469.00 2.170 % ING Bank EUR Zero-Coupon Notes 27.03.2013 EUR 20,000.0 20,000.0 % 98.693 19,738,686.00 2.870 % ING Bank EUR Zero-Coupon Notes 13.04.2012 EUR 10,000.0 % 100.012 10,001,217.00 1.450 % KA Finanz EUR Zero-Coupon Notes 11.02.2013 EUR 35,000.0 35,000.0 % 98.934 34,626,928.00 5.030 % KA Finanz EUR Zero-Coupon Notes 13.08.2012 EUR 10,000.0 % 99.707 9,970,665.00 1.450 % KA Finanz EUR Zero-Coupon Notes 25.07.2012 EUR 14,000.0 % 99.769 13,967,675.40 2.030 % Landesbank Hessen
EUR Zero-Coupon Notes 14.08.2012 EUR 15,000.0 % 99.703 14,955,490.50 2.170 % Lloyds TSB Bank EUR Zero-Coupon Notes 29.06.2012 EUR 15,000.0 % 99.850 14,977,566.00 2.180 % Natixis EUR Zero-Coupon Notes 05.04.2012 EUR 10,000.0 % 100.001 10,000,142.00 1.450 % Rabobank Nederland
EUR Zero-Coupon Notes 11.05.2012 EUR 4,000.0 % 99.963 3,998,508.40 0.580 % Royal Bank of Scotland
EUR Zero-Coupon Notes 18.05.2012 EUR 15,000.0 % 99.952 14,992,770.00 2.180 % Shinan Bank EUR Zero-Coupon Notes 28.03.2013 EUR 15,000.0 15,000.0 % 98.559 14,783,847.75 2.15
Investment Portfolio as at 31/03/2012Securities Shares resp.
Currency (in 1,000) resp.Contracts
Acquisitions Disposals Holdings 31/03/2012
Price Market Valuein EUR
% ofSubfund
assetsin the period under review
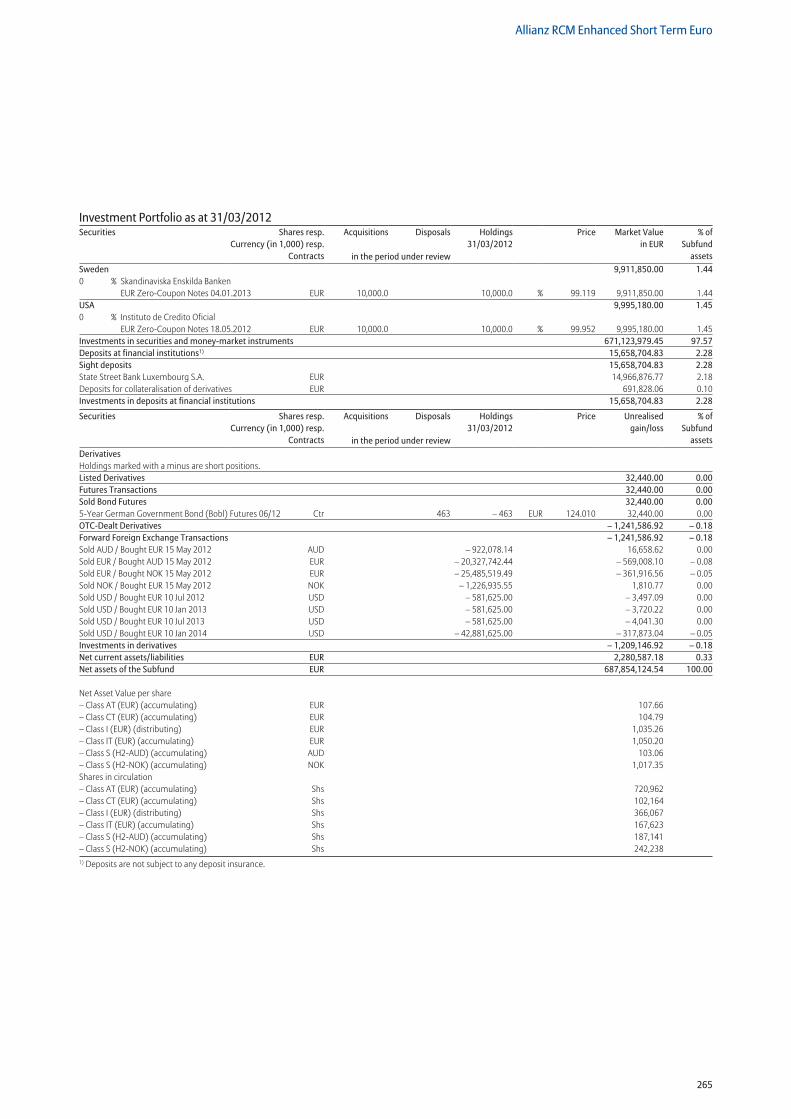
265
Allianz RCM Enhanced Short Term Euro
Sweden 9,911,850.00 1.440 % Skandinaviska Enskilda Banken
EUR Zero-Coupon Notes 04.01.2013 EUR 10,000.0 10,000.0 % 99.119 9,911,850.00 1.44USA 9,995,180.00 1.450 % Instituto de Credito Oficial
EUR Zero-Coupon Notes 18.05.2012 EUR 10,000.0 10,000.0 % 99.952 9,995,180.00 1.45Investments in securities and money-market instruments 671,123,979.45 97.57Deposits at financial institutions1) 15,658,704.83 2.28Sight deposits 15,658,704.83 2.28State Street Bank Luxembourg S.A. EUR 14,966,876.77 2.18Deposits for collateralisation of derivatives EUR 691,828.06 0.10Investments in deposits at financial institutions 15,658,704.83 2.28
Securities Shares resp.Currency (in 1,000) resp.
Contracts
Acquisitions Disposals Holdings 31/03/2012
Price Unrealisedgain/loss
% ofSubfund
assetsin the period under reviewDerivatives Holdings marked with a minus are short positions. Listed Derivatives 32,440.00 0.00Futures Transactions 32,440.00 0.00Sold Bond Futures 32,440.00 0.005-Year German Government Bond (Bobl) Futures 06/12 Ctr 463 – 463 EUR 124.010 32,440.00 0.00OTC-Dealt Derivatives – 1,241,586.92 – 0.18Forward Foreign Exchange Transactions – 1,241,586.92 – 0.18Sold AUD / Bought EUR 15 May 2012 AUD – 922,078.14 16,658.62 0.00Sold EUR / Bought AUD 15 May 2012 EUR – 20,327,742.44 – 569,008.10 – 0.08Sold EUR / Bought NOK 15 May 2012 EUR – 25,485,519.49 – 361,916.56 – 0.05Sold NOK / Bought EUR 15 May 2012 NOK – 1,226,935.55 1,810.77 0.00Sold USD / Bought EUR 10 Jul 2012 USD – 581,625.00 – 3,497.09 0.00Sold USD / Bought EUR 10 Jan 2013 USD – 581,625.00 – 3,720.22 0.00Sold USD / Bought EUR 10 Jul 2013 USD – 581,625.00 – 4,041.30 0.00Sold USD / Bought EUR 10 Jan 2014 USD – 42,881,625.00 – 317,873.04 – 0.05Investments in derivatives – 1,209,146.92 – 0.18Net current assets/liabilities EUR 2,280,587.18 0.33Net assets of the Subfund EUR 687,854,124.54 100.00
Net Asset Value per share – Class AT (EUR) (accumulating) EUR 107.66 – Class CT (EUR) (accumulating) EUR 104.79 – Class I (EUR) (distributing) EUR 1,035.26 – Class IT (EUR) (accumulating) EUR 1,050.20 – Class S (H2-AUD) (accumulating) AUD 103.06 – Class S (H2-NOK) (accumulating) NOK 1,017.35 Shares in circulation – Class AT (EUR) (accumulating) Shs 720,962– Class CT (EUR) (accumulating) Shs 102,164– Class I (EUR) (distributing) Shs 366,067– Class IT (EUR) (accumulating) Shs 167,623– Class S (H2-AUD) (accumulating) Shs 187,141– Class S (H2-NOK) (accumulating) Shs 242,2381) Deposits are not subject to any deposit insurance.
Investment Portfolio as at 31/03/2012Securities Shares resp.
Currency (in 1,000) resp.Contracts
Acquisitions Disposals Holdings 31/03/2012
Price Market Valuein EUR
% ofSubfund
assetsin the period under review
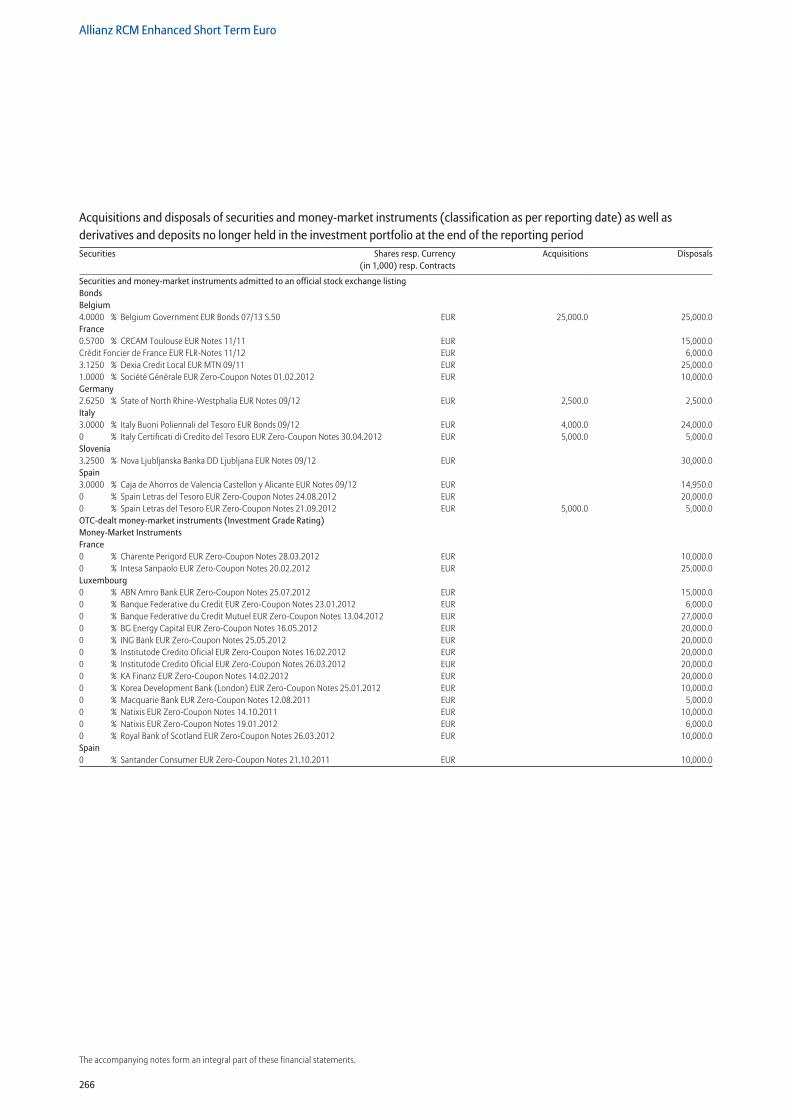
266
Allianz RCM Enhanced Short Term Euro
The accompanying notes form an integral part of these financial statements.
Securities and money-market instruments admitted to an official stock exchange listing Bonds Belgium 4.0000 % Belgium Government EUR Bonds 07/13 S.50 EUR 25,000.0 25,000.0France 0.5700 % CRCAM Toulouse EUR Notes 11/11 EUR 15,000.0Crédit Foncier de France EUR FLR-Notes 11/12 EUR 6,000.03.1250 % Dexia Credit Local EUR MTN 09/11 EUR 25,000.01.0000 % Société Générale EUR Zero-Coupon Notes 01.02.2012 EUR 10,000.0Germany 2.6250 % State of North Rhine-Westphalia EUR Notes 09/12 EUR 2,500.0 2,500.0Italy 3.0000 % Italy Buoni Poliennali del Tesoro EUR Bonds 09/12 EUR 4,000.0 24,000.00 % Italy Certificati di Credito del Tesoro EUR Zero-Coupon Notes 30.04.2012 EUR 5,000.0 5,000.0Slovenia 3.2500 % Nova Ljubljanska Banka DD Ljubljana EUR Notes 09/12 EUR 30,000.0Spain 3.0000 % Caja de Ahorros de Valencia Castellon y Alicante EUR Notes 09/12 EUR 14,950.00 % Spain Letras del Tesoro EUR Zero-Coupon Notes 24.08.2012 EUR 20,000.00 % Spain Letras del Tesoro EUR Zero-Coupon Notes 21.09.2012 EUR 5,000.0 5,000.0OTC-dealt money-market instruments (Investment Grade Rating) Money-Market Instruments France 0 % Charente Perigord EUR Zero-Coupon Notes 28.03.2012 EUR 10,000.00 % Intesa Sanpaolo EUR Zero-Coupon Notes 20.02.2012 EUR 25,000.0Luxembourg 0 % ABN Amro Bank EUR Zero-Coupon Notes 25.07.2012 EUR 15,000.00 % Banque Federative du Credit EUR Zero-Coupon Notes 23.01.2012 EUR 6,000.00 % Banque Federative du Credit Mutuel EUR Zero-Coupon Notes 13.04.2012 EUR 27,000.00 % BG Energy Capital EUR Zero-Coupon Notes 16.05.2012 EUR 20,000.00 % ING Bank EUR Zero-Coupon Notes 25.05.2012 EUR 20,000.00 % Institutode Credito Oficial EUR Zero-Coupon Notes 16.02.2012 EUR 20,000.00 % Institutode Credito Oficial EUR Zero-Coupon Notes 26.03.2012 EUR 20,000.00 % KA Finanz EUR Zero-Coupon Notes 14.02.2012 EUR 20,000.00 % Korea Development Bank (London) EUR Zero-Coupon Notes 25.01.2012 EUR 10,000.00 % Macquarie Bank EUR Zero-Coupon Notes 12.08.2011 EUR 5,000.00 % Natixis EUR Zero-Coupon Notes 14.10.2011 EUR 10,000.00 % Natixis EUR Zero-Coupon Notes 19.01.2012 EUR 6,000.00 % Royal Bank of Scotland EUR Zero-Coupon Notes 26.03.2012 EUR 10,000.0Spain 0 % Santander Consumer EUR Zero-Coupon Notes 21.10.2011 EUR 10,000.0
Acquisitions and disposals of securities and money-market instruments (classification as per reporting date) as well as derivatives and deposits no longer held in the investment portfolio at the end of the reporting periodSecurities Shares resp. Currency
(in 1,000) resp. ContractsAcquisitions Disposals
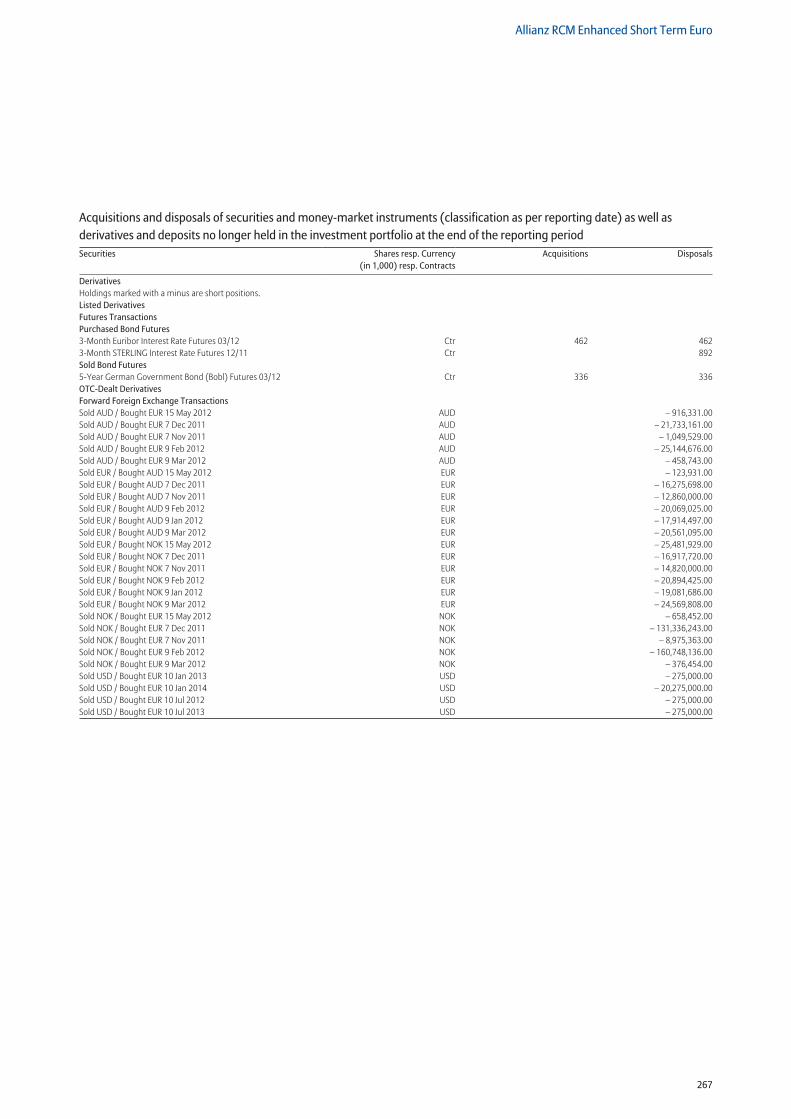
267
Allianz RCM Enhanced Short Term Euro
Derivatives Holdings marked with a minus are short positions. Listed Derivatives Futures Transactions Purchased Bond Futures 3-Month Euribor Interest Rate Futures 03/12 Ctr 462 4623-Month STERLING Interest Rate Futures 12/11 Ctr 892Sold Bond Futures 5-Year German Government Bond (Bobl) Futures 03/12 Ctr 336 336OTC-Dealt Derivatives Forward Foreign Exchange Transactions Sold AUD / Bought EUR 15 May 2012 AUD – 916,331.00Sold AUD / Bought EUR 7 Dec 2011 AUD – 21,733,161.00Sold AUD / Bought EUR 7 Nov 2011 AUD – 1,049,529.00Sold AUD / Bought EUR 9 Feb 2012 AUD – 25,144,676.00Sold AUD / Bought EUR 9 Mar 2012 AUD – 458,743.00Sold EUR / Bought AUD 15 May 2012 EUR – 123,931.00Sold EUR / Bought AUD 7 Dec 2011 EUR – 16,275,698.00Sold EUR / Bought AUD 7 Nov 2011 EUR – 12,860,000.00Sold EUR / Bought AUD 9 Feb 2012 EUR – 20,069,025.00Sold EUR / Bought AUD 9 Jan 2012 EUR – 17,914,497.00Sold EUR / Bought AUD 9 Mar 2012 EUR – 20,561,095.00Sold EUR / Bought NOK 15 May 2012 EUR – 25,481,929.00Sold EUR / Bought NOK 7 Dec 2011 EUR – 16,917,720.00Sold EUR / Bought NOK 7 Nov 2011 EUR – 14,820,000.00Sold EUR / Bought NOK 9 Feb 2012 EUR – 20,894,425.00Sold EUR / Bought NOK 9 Jan 2012 EUR – 19,081,686.00Sold EUR / Bought NOK 9 Mar 2012 EUR – 24,569,808.00Sold NOK / Bought EUR 15 May 2012 NOK – 658,452.00Sold NOK / Bought EUR 7 Dec 2011 NOK – 131,336,243.00Sold NOK / Bought EUR 7 Nov 2011 NOK – 8,975,363.00Sold NOK / Bought EUR 9 Feb 2012 NOK – 160,748,136.00Sold NOK / Bought EUR 9 Mar 2012 NOK – 376,454.00Sold USD / Bought EUR 10 Jan 2013 USD – 275,000.00Sold USD / Bought EUR 10 Jan 2014 USD – 20,275,000.00Sold USD / Bought EUR 10 Jul 2012 USD – 275,000.00Sold USD / Bought EUR 10 Jul 2013 USD – 275,000.00
Acquisitions and disposals of securities and money-market instruments (classification as per reporting date) as well as derivatives and deposits no longer held in the investment portfolio at the end of the reporting periodSecurities Shares resp. Currency
(in 1,000) resp. ContractsAcquisitions Disposals
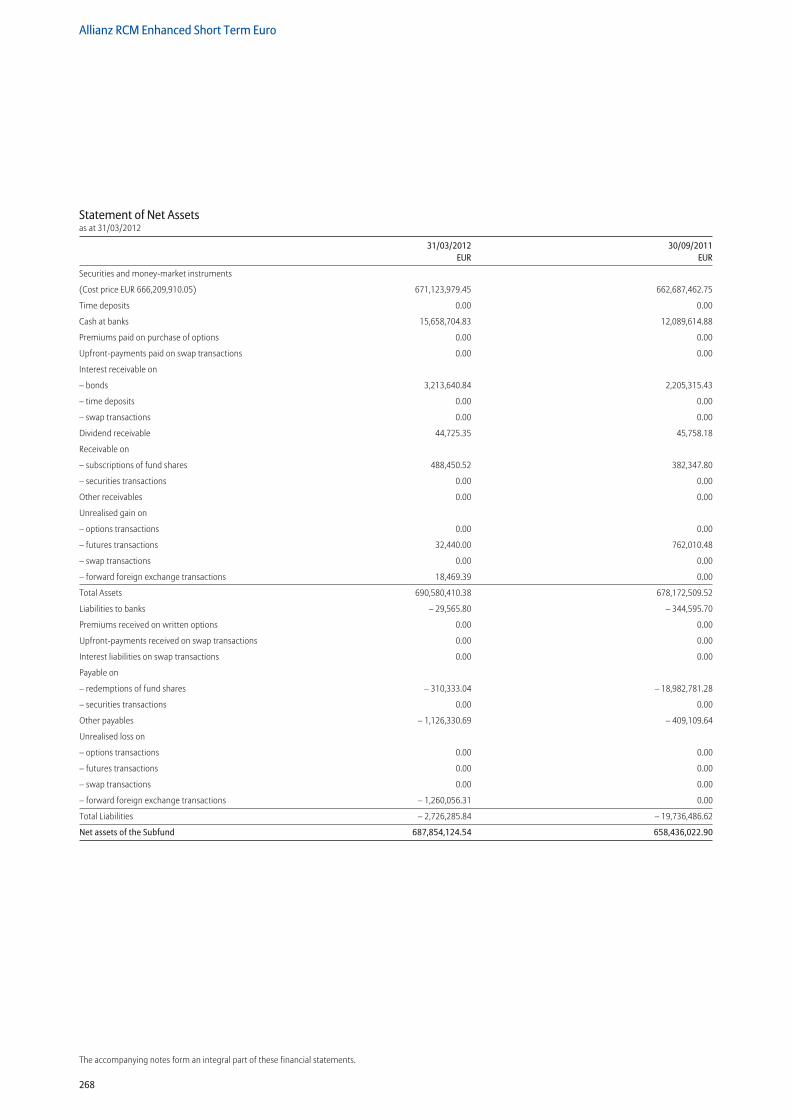
268
Allianz RCM Enhanced Short Term Euro
The accompanying notes form an integral part of these financial statements.
Statement of Net Assetsas at 31/03/2012
31/03/2012 30/09/2011 EUR EUR
Securities and money-market instruments
(Cost price EUR 666,209,910.05) 671,123,979.45 662,687,462.75
Time deposits 0.00 0.00
Cash at banks 15,658,704.83 12,089,614.88
Premiums paid on purchase of options 0.00 0.00
Upfront-payments paid on swap transactions 0.00 0.00
Interest receivable on
– bonds 3,213,640.84 2,205,315.43
– time deposits 0.00 0.00
– swap transactions 0.00 0.00
Dividend receivable 44,725.35 45,758.18
Receivable on
– subscriptions of fund shares 488,450.52 382,347.80
– securities transactions 0.00 0.00
Other receivables 0.00 0.00
Unrealised gain on
– options transactions 0.00 0.00
– futures transactions 32,440.00 762,010.48
– swap transactions 0.00 0.00
– forward foreign exchange transactions 18,469.39 0.00
Total Assets 690,580,410.38 678,172,509.52
Liabilities to banks – 29,565.80 – 344,595.70
Premiums received on written options 0.00 0.00
Upfront-payments received on swap transactions 0.00 0.00
Interest liabilities on swap transactions 0.00 0.00
Payable on
– redemptions of fund shares – 310,333.04 – 18,982,781.28
– securities transactions 0.00 0.00
Other payables – 1,126,330.69 – 409,109.64
Unrealised loss on
– options transactions 0.00 0.00
– futures transactions 0.00 0.00
– swap transactions 0.00 0.00
– forward foreign exchange transactions – 1,260,056.31 0.00
Total Liabilities – 2,726,285.84 – 19,736,486.62
Net assets of the Subfund 687,854,124.54 658,436,022.90
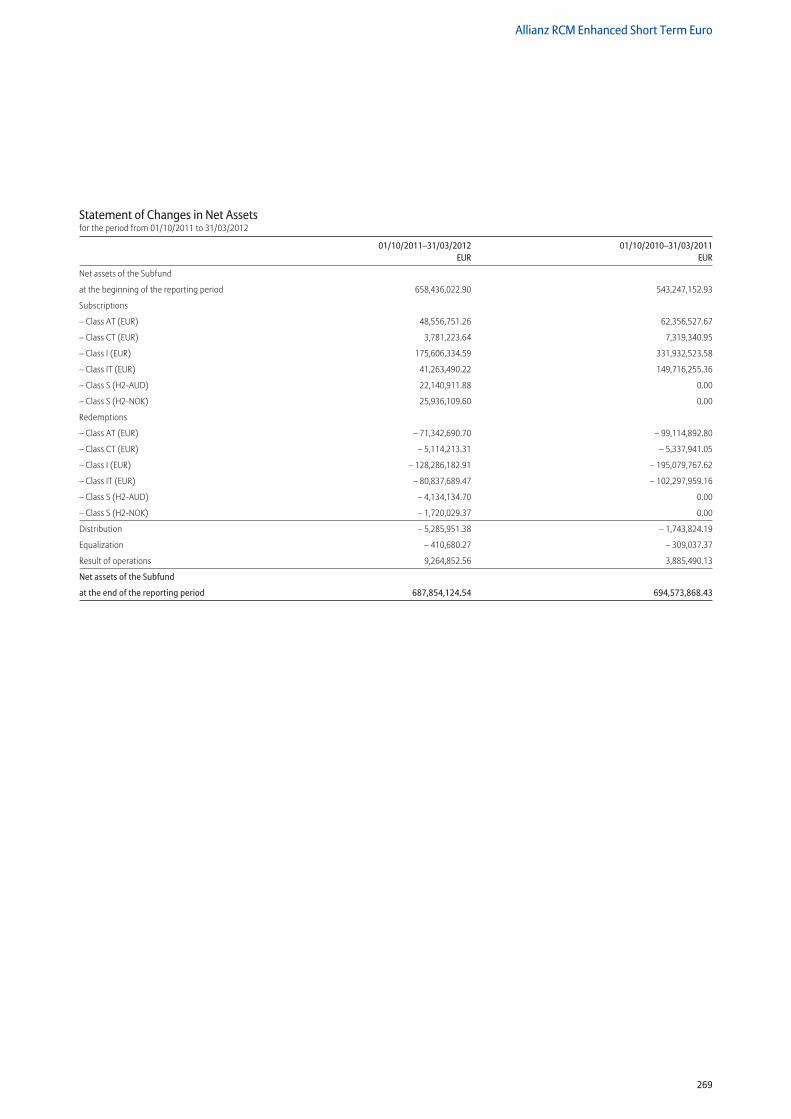
269
Allianz RCM Enhanced Short Term Euro
Statement of Changes in Net Assetsfor the period from 01/10/2011 to 31/03/2012
01/10/2011–31/03/2012 01/10/2010–31/03/2011 EUR EUR
Net assets of the Subfund
at the beginning of the reporting period 658,436,022.90 543,247,152.93
Subscriptions
– Class AT (EUR) 48,556,751.26 62,356,527.67
– Class CT (EUR) 3,781,223.64 7,319,340.95
– Class I (EUR) 175,606,334.59 331,932,523.58
– Class IT (EUR) 41,263,490.22 149,716,255.36
– Class S (H2-AUD) 22,140,911.88 0.00
– Class S (H2-NOK) 25,936,109.60 0.00
Redemptions
– Class AT (EUR) – 71,342,690.70 – 99,114,892.80
– Class CT (EUR) – 5,114,213.31 – 5,337,941.05
– Class I (EUR) – 128,286,182.91 – 195,079,767.62
– Class IT (EUR) – 80,837,689.47 – 102,297,959.16
– Class S (H2-AUD) – 4,134,134.70 0.00
– Class S (H2-NOK) – 1,720,029.37 0.00
Distribution – 5,285,951.38 – 1,743,824.19
Equalization – 410,680.27 – 309,037.37
Result of operations 9,264,852.56 3,885,490.13
Net assets of the Subfund
at the end of the reporting period 687,854,124.54 694,573,868.43
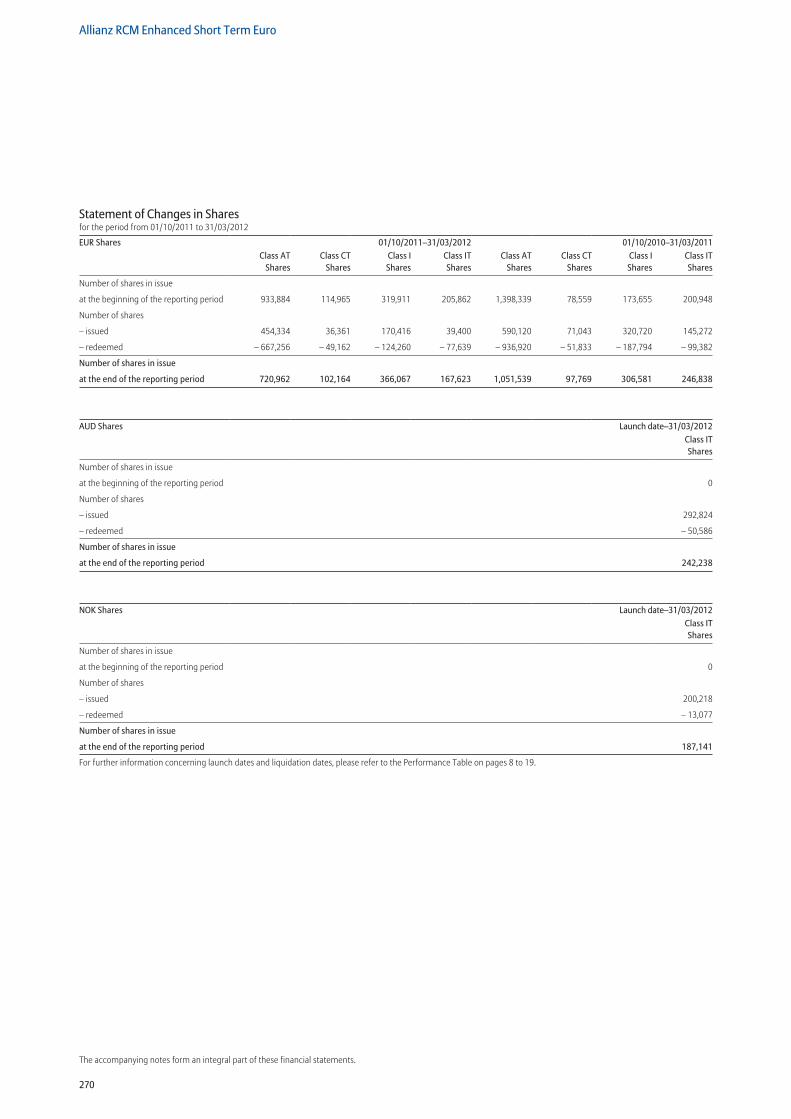
270
Allianz RCM Enhanced Short Term Euro
The accompanying notes form an integral part of these financial statements.
Statement of Changes in Sharesfor the period from 01/10/2011 to 31/03/2012
EUR Shares 01/10/2011–31/03/2012 01/10/2010–31/03/2011Class AT
SharesClass CT
SharesClass I Shares
Class IT Shares
Class AT Shares
Class CT Shares
Class I Shares
Class IT Shares
Number of shares in issue
at the beginning of the reporting period 933,884 114,965 319,911 205,862 1,398,339 78,559 173,655 200,948
Number of shares
– issued 454,334 36,361 170,416 39,400 590,120 71,043 320,720 145,272
– redeemed – 667,256 – 49,162 – 124,260 – 77,639 – 936,920 – 51,833 – 187,794 – 99,382
Number of shares in issue
at the end of the reporting period 720,962 102,164 366,067 167,623 1,051,539 97,769 306,581 246,838
AUD Shares Launch date–31/03/2012Class IT Shares
Number of shares in issue
at the beginning of the reporting period 0
Number of shares
– issued 292,824
– redeemed – 50,586
Number of shares in issue
at the end of the reporting period 242,238
NOK Shares Launch date–31/03/2012Class IT Shares
Number of shares in issue
at the beginning of the reporting period 0
Number of shares
– issued 200,218
– redeemed – 13,077
Number of shares in issue
at the end of the reporting period 187,141
For further information concerning launch dates and liquidation dates, please refer to the Performance Table on pages 8 to 19.
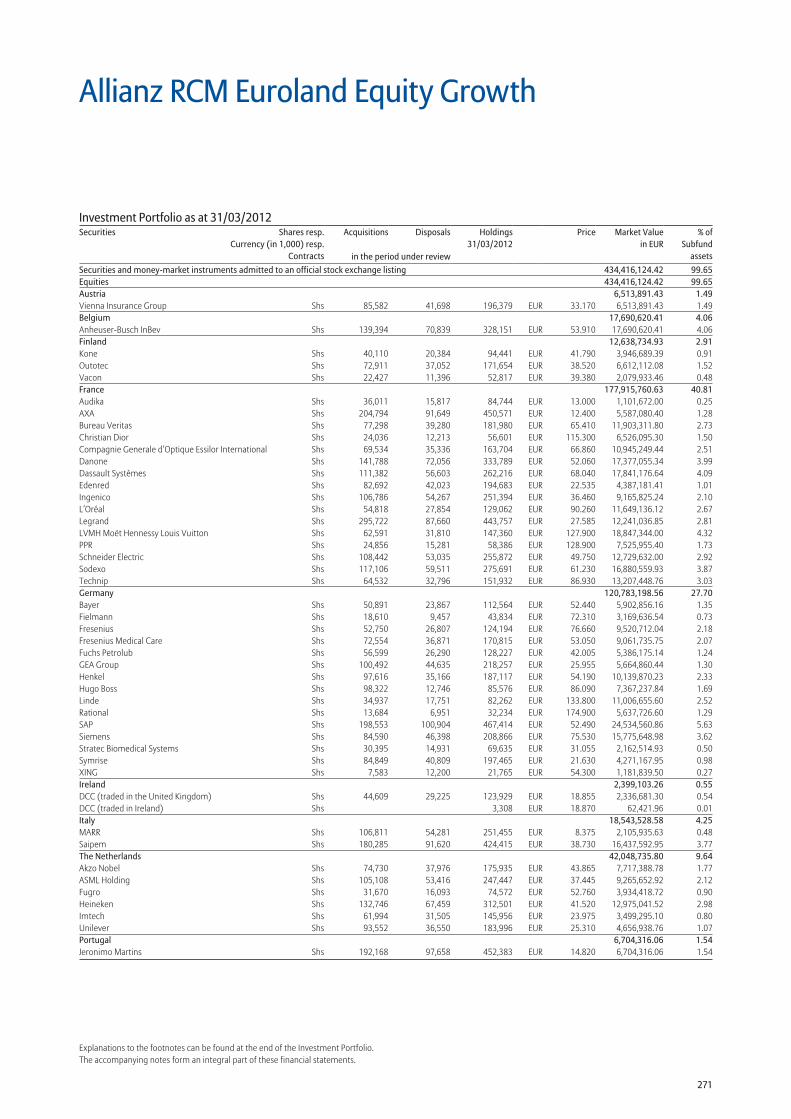
271
Explanations to the footnotes can be found at the end of the Investment Portfolio.The accompanying notes form an integral part of these financial statements.
Securities and money-market instruments admitted to an official stock exchange listing 434,416,124.42 99.65Equities 434,416,124.42 99.65Austria 6,513,891.43 1.49Vienna Insurance Group Shs 85,582 41,698 196,379 EUR 33.170 6,513,891.43 1.49Belgium 17,690,620.41 4.06Anheuser-Busch InBev Shs 139,394 70,839 328,151 EUR 53.910 17,690,620.41 4.06Finland 12,638,734.93 2.91Kone Shs 40,110 20,384 94,441 EUR 41.790 3,946,689.39 0.91Outotec Shs 72,911 37,052 171,654 EUR 38.520 6,612,112.08 1.52Vacon Shs 22,427 11,396 52,817 EUR 39.380 2,079,933.46 0.48France 177,915,760.63 40.81Audika Shs 36,011 15,817 84,744 EUR 13.000 1,101,672.00 0.25AXA Shs 204,794 91,649 450,571 EUR 12.400 5,587,080.40 1.28Bureau Veritas Shs 77,298 39,280 181,980 EUR 65.410 11,903,311.80 2.73Christian Dior Shs 24,036 12,213 56,601 EUR 115.300 6,526,095.30 1.50Compagnie Generale d’Optique Essilor International Shs 69,534 35,336 163,704 EUR 66.860 10,945,249.44 2.51Danone Shs 141,788 72,056 333,789 EUR 52.060 17,377,055.34 3.99Dassault Systèmes Shs 111,382 56,603 262,216 EUR 68.040 17,841,176.64 4.09Edenred Shs 82,692 42,023 194,683 EUR 22.535 4,387,181.41 1.01Ingenico Shs 106,786 54,267 251,394 EUR 36.460 9,165,825.24 2.10L’Oréal Shs 54,818 27,854 129,062 EUR 90.260 11,649,136.12 2.67Legrand Shs 295,722 87,660 443,757 EUR 27.585 12,241,036.85 2.81LVMH Moët Hennessy Louis Vuitton Shs 62,591 31,810 147,360 EUR 127.900 18,847,344.00 4.32PPR Shs 24,856 15,281 58,386 EUR 128.900 7,525,955.40 1.73Schneider Electric Shs 108,442 53,035 255,872 EUR 49.750 12,729,632.00 2.92Sodexo Shs 117,106 59,511 275,691 EUR 61.230 16,880,559.93 3.87Technip Shs 64,532 32,796 151,932 EUR 86.930 13,207,448.76 3.03Germany 120,783,198.56 27.70Bayer Shs 50,891 23,867 112,564 EUR 52.440 5,902,856.16 1.35Fielmann Shs 18,610 9,457 43,834 EUR 72.310 3,169,636.54 0.73Fresenius Shs 52,750 26,807 124,194 EUR 76.660 9,520,712.04 2.18Fresenius Medical Care Shs 72,554 36,871 170,815 EUR 53.050 9,061,735.75 2.07Fuchs Petrolub Shs 56,599 26,290 128,227 EUR 42.005 5,386,175.14 1.24GEA Group Shs 100,492 44,635 218,257 EUR 25.955 5,664,860.44 1.30Henkel Shs 97,616 35,166 187,117 EUR 54.190 10,139,870.23 2.33Hugo Boss Shs 98,322 12,746 85,576 EUR 86.090 7,367,237.84 1.69Linde Shs 34,937 17,751 82,262 EUR 133.800 11,006,655.60 2.52Rational Shs 13,684 6,951 32,234 EUR 174.900 5,637,726.60 1.29SAP Shs 198,553 100,904 467,414 EUR 52.490 24,534,560.86 5.63Siemens Shs 84,590 46,398 208,866 EUR 75.530 15,775,648.98 3.62Stratec Biomedical Systems Shs 30,395 14,931 69,635 EUR 31.055 2,162,514.93 0.50Symrise Shs 84,849 40,809 197,465 EUR 21.630 4,271,167.95 0.98XING Shs 7,583 12,200 21,765 EUR 54.300 1,181,839.50 0.27Ireland 2,399,103.26 0.55DCC (traded in the United Kingdom) Shs 44,609 29,225 123,929 EUR 18.855 2,336,681.30 0.54DCC (traded in Ireland) Shs 3,308 EUR 18.870 62,421.96 0.01Italy 18,543,528.58 4.25MARR Shs 106,811 54,281 251,455 EUR 8.375 2,105,935.63 0.48Saipem Shs 180,285 91,620 424,415 EUR 38.730 16,437,592.95 3.77The Netherlands 42,048,735.80 9.64Akzo Nobel Shs 74,730 37,976 175,935 EUR 43.865 7,717,388.78 1.77ASML Holding Shs 105,108 53,416 247,447 EUR 37.445 9,265,652.92 2.12Fugro Shs 31,670 16,093 74,572 EUR 52.760 3,934,418.72 0.90Heineken Shs 132,746 67,459 312,501 EUR 41.520 12,975,041.52 2.98Imtech Shs 61,994 31,505 145,956 EUR 23.975 3,499,295.10 0.80Unilever Shs 93,552 36,550 183,996 EUR 25.310 4,656,938.76 1.07Portugal 6,704,316.06 1.54Jeronimo Martins Shs 192,168 97,658 452,383 EUR 14.820 6,704,316.06 1.54
Allianz RCM Euroland Equity Growth
Investment Portfolio as at 31/03/2012Securities Shares resp.
Currency (in 1,000) resp.Contracts
Acquisitions Disposals Holdings 31/03/2012
Price Market Valuein EUR
% ofSubfund
assetsin the period under review
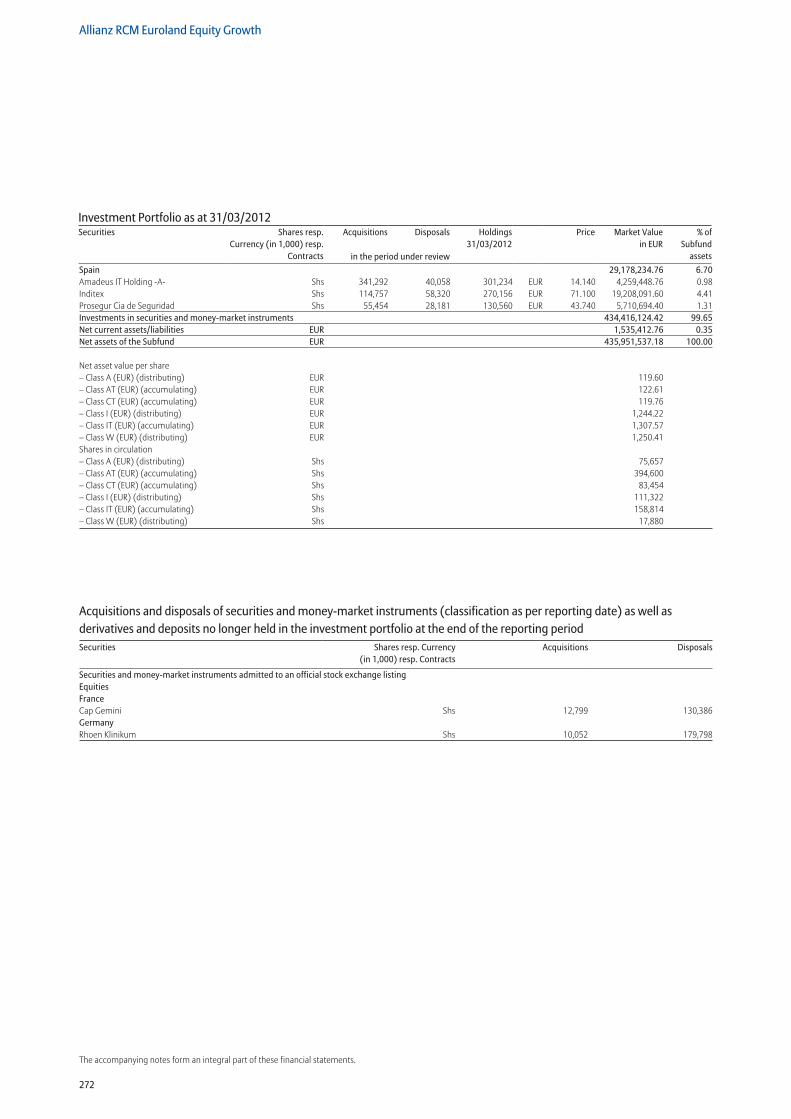
272
Allianz RCM Euroland Equity Growth
The accompanying notes form an integral part of these financial statements.
Spain 29,178,234.76 6.70Amadeus IT Holding -A- Shs 341,292 40,058 301,234 EUR 14.140 4,259,448.76 0.98Inditex Shs 114,757 58,320 270,156 EUR 71.100 19,208,091.60 4.41Prosegur Cia de Seguridad Shs 55,454 28,181 130,560 EUR 43.740 5,710,694.40 1.31Investments in securities and money-market instruments 434,416,124.42 99.65Net current assets/liabilities EUR 1,535,412.76 0.35Net assets of the Subfund EUR 435,951,537.18 100.00
Net asset value per share – Class A (EUR) (distributing) EUR 119.60 – Class AT (EUR) (accumulating) EUR 122.61 – Class CT (EUR) (accumulating) EUR 119.76 – Class I (EUR) (distributing) EUR 1,244.22 – Class IT (EUR) (accumulating) EUR 1,307.57 – Class W (EUR) (distributing) EUR 1,250.41 Shares in circulation – Class A (EUR) (distributing) Shs 75,657– Class AT (EUR) (accumulating) Shs 394,600– Class CT (EUR) (accumulating) Shs 83,454– Class I (EUR) (distributing) Shs 111,322– Class IT (EUR) (accumulating) Shs 158,814– Class W (EUR) (distributing) Shs 17,880
Investment Portfolio as at 31/03/2012Securities Shares resp.
Currency (in 1,000) resp.Contracts
Acquisitions Disposals Holdings 31/03/2012
Price Market Valuein EUR
% ofSubfund
assetsin the period under review
Securities and money-market instruments admitted to an official stock exchange listing Equities France Cap Gemini Shs 12,799 130,386Germany Rhoen Klinikum Shs 10,052 179,798
Acquisitions and disposals of securities and money-market instruments (classification as per reporting date) as well as derivatives and deposits no longer held in the investment portfolio at the end of the reporting periodSecurities Shares resp. Currency
(in 1,000) resp. ContractsAcquisitions Disposals
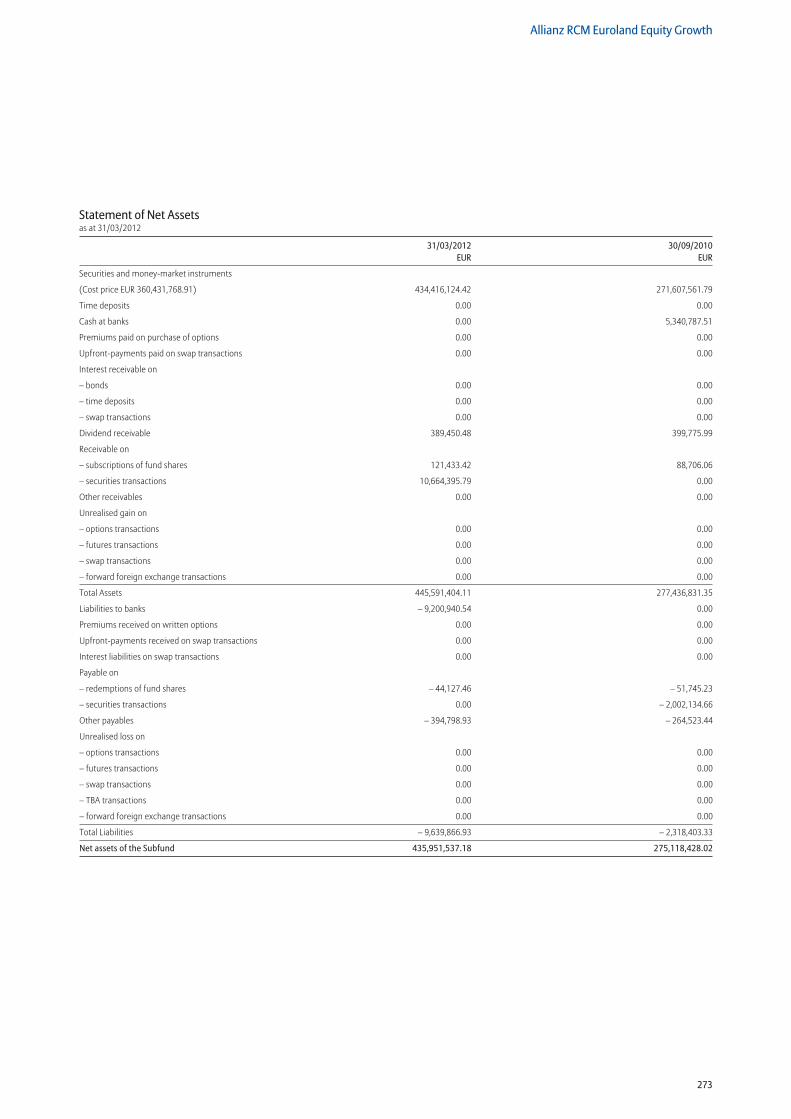
273
Allianz RCM Euroland Equity Growth
Statement of Net Assetsas at 31/03/2012
31/03/2012 30/09/2010 EUR EUR
Securities and money-market instruments
(Cost price EUR 360,431,768.91) 434,416,124.42 271,607,561.79
Time deposits 0.00 0.00
Cash at banks 0.00 5,340,787.51
Premiums paid on purchase of options 0.00 0.00
Upfront-payments paid on swap transactions 0.00 0.00
Interest receivable on
– bonds 0.00 0.00
– time deposits 0.00 0.00
– swap transactions 0.00 0.00
Dividend receivable 389,450.48 399,775.99
Receivable on
– subscriptions of fund shares 121,433.42 88,706.06
– securities transactions 10,664,395.79 0.00
Other receivables 0.00 0.00
Unrealised gain on
– options transactions 0.00 0.00
– futures transactions 0.00 0.00
– swap transactions 0.00 0.00
– forward foreign exchange transactions 0.00 0.00
Total Assets 445,591,404.11 277,436,831.35
Liabilities to banks – 9,200,940.54 0.00
Premiums received on written options 0.00 0.00
Upfront-payments received on swap transactions 0.00 0.00
Interest liabilities on swap transactions 0.00 0.00
Payable on
– redemptions of fund shares – 44,127.46 – 51,745.23
– securities transactions 0.00 – 2,002,134.66
Other payables – 394,798.93 – 264,523.44
Unrealised loss on
– options transactions 0.00 0.00
– futures transactions 0.00 0.00
– swap transactions 0.00 0.00
– TBA transactions 0.00 0.00
– forward foreign exchange transactions 0.00 0.00
Total Liabilities – 9,639,866.93 – 2,318,403.33
Net assets of the Subfund 435,951,537.18 275,118,428.02
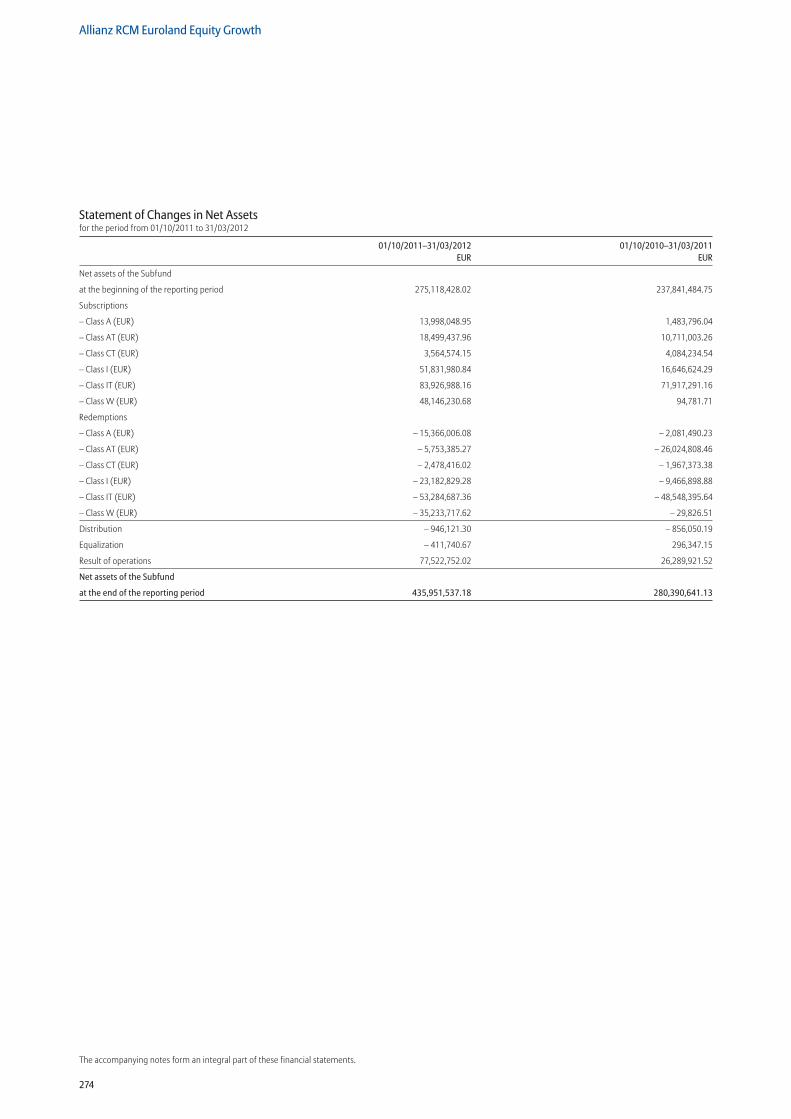
274
Allianz RCM Euroland Equity Growth
The accompanying notes form an integral part of these financial statements.
Statement of Changes in Net Assetsfor the period from 01/10/2011 to 31/03/2012
01/10/2011–31/03/2012 01/10/2010–31/03/2011 EUR EUR
Net assets of the Subfund
at the beginning of the reporting period 275,118,428.02 237,841,484.75
Subscriptions
– Class A (EUR) 13,998,048.95 1,483,796.04
– Class AT (EUR) 18,499,437.96 10,711,003.26
– Class CT (EUR) 3,564,574.15 4,084,234.54
– Class I (EUR) 51,831,980.84 16,646,624.29
– Class IT (EUR) 83,926,988.16 71,917,291.16
– Class W (EUR) 48,146,230.68 94,781.71
Redemptions
– Class A (EUR) – 15,366,006.08 – 2,081,490.23
– Class AT (EUR) – 5,753,385.27 – 26,024,808.46
– Class CT (EUR) – 2,478,416.02 – 1,967,373.38
– Class I (EUR) – 23,182,829.28 – 9,466,898.88
– Class IT (EUR) – 53,284,687.36 – 48,548,395.64
– Class W (EUR) – 35,233,717.62 – 29,826.51
Distribution – 946,121.30 – 856,050.19
Equalization – 411,740.67 296,347.15
Result of operations 77,522,752.02 26,289,921.52
Net assets of the Subfund
at the end of the reporting period 435,951,537.18 280,390,641.13
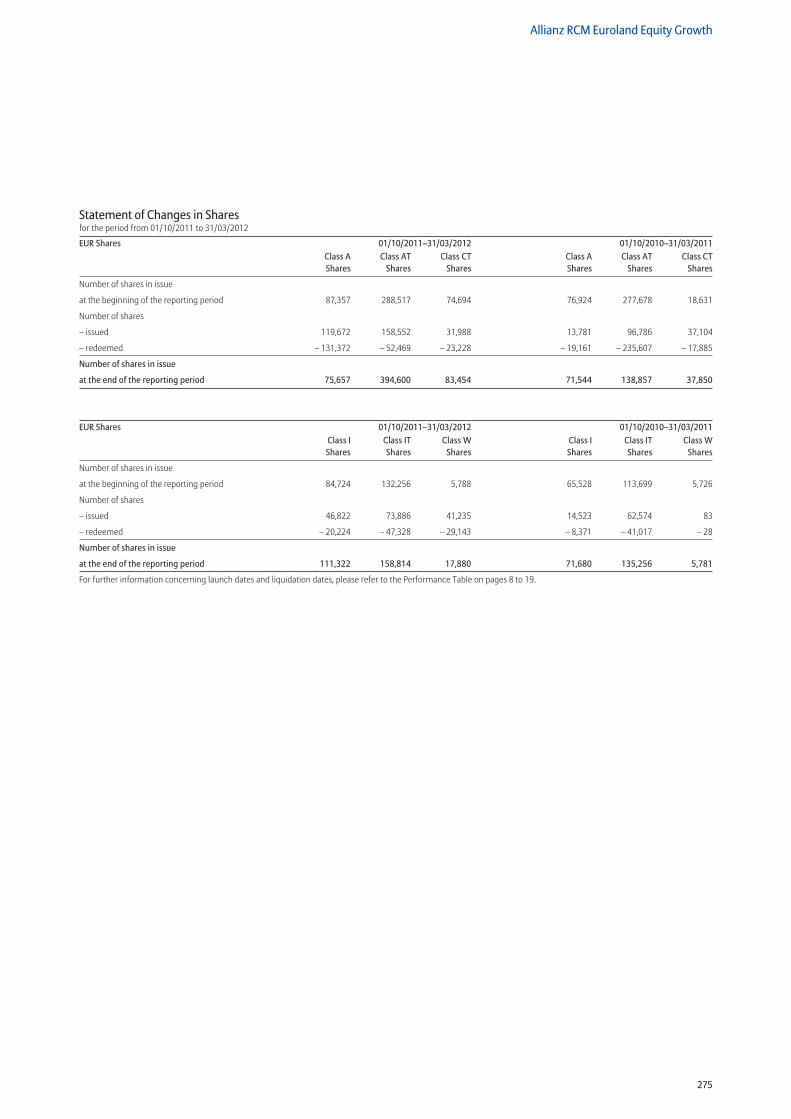
275
Allianz RCM Euroland Equity Growth
Statement of Changes in Sharesfor the period from 01/10/2011 to 31/03/2012
EUR Shares 01/10/2011–31/03/2012 01/10/2010–31/03/2011Class A Shares
Class AT Shares
Class CT Shares
Class A Shares
Class AT Shares
Class CT Shares
Number of shares in issue
at the beginning of the reporting period 87,357 288,517 74,694 76,924 277,678 18,631
Number of shares
– issued 119,672 158,552 31,988 13,781 96,786 37,104
– redeemed – 131,372 – 52,469 – 23,228 – 19,161 – 235,607 – 17,885
Number of shares in issue
at the end of the reporting period 75,657 394,600 83,454 71,544 138,857 37,850
EUR Shares 01/10/2011–31/03/2012 01/10/2010–31/03/2011Class I Shares
Class IT Shares
Class W Shares
Class I Shares
Class IT Shares
Class W Shares
Number of shares in issue
at the beginning of the reporting period 84,724 132,256 5,788 65,528 113,699 5,726
Number of shares
– issued 46,822 73,886 41,235 14,523 62,574 83
– redeemed – 20,224 – 47,328 – 29,143 – 8,371 – 41,017 – 28
Number of shares in issue
at the end of the reporting period 111,322 158,814 17,880 71,680 135,256 5,781
For further information concerning launch dates and liquidation dates, please refer to the Performance Table on pages 8 to 19.
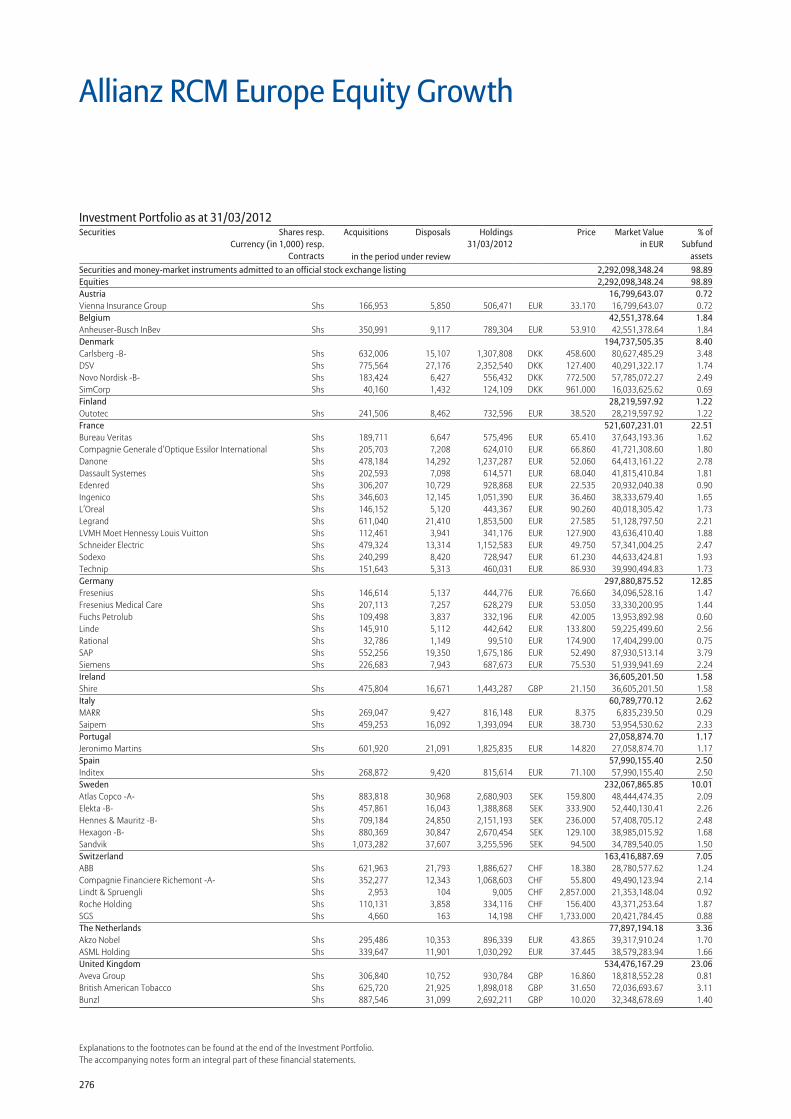
276
Explanations to the footnotes can be found at the end of the Investment Portfolio.The accompanying notes form an integral part of these financial statements.
Securities and money-market instruments admitted to an official stock exchange listing 2,292,098,348.24 98.89Equities 2,292,098,348.24 98.89Austria 16,799,643.07 0.72Vienna Insurance Group Shs 166,953 5,850 506,471 EUR 33.170 16,799,643.07 0.72Belgium 42,551,378.64 1.84Anheuser-Busch InBev Shs 350,991 9,117 789,304 EUR 53.910 42,551,378.64 1.84Denmark 194,737,505.35 8.40Carlsberg -B- Shs 632,006 15,107 1,307,808 DKK 458.600 80,627,485.29 3.48DSV Shs 775,564 27,176 2,352,540 DKK 127.400 40,291,322.17 1.74Novo Nordisk -B- Shs 183,424 6,427 556,432 DKK 772.500 57,785,072.27 2.49SimCorp Shs 40,160 1,432 124,109 DKK 961.000 16,033,625.62 0.69Finland 28,219,597.92 1.22Outotec Shs 241,506 8,462 732,596 EUR 38.520 28,219,597.92 1.22France 521,607,231.01 22.51Bureau Veritas Shs 189,711 6,647 575,496 EUR 65.410 37,643,193.36 1.62Compagnie Generale d’Optique Essilor International Shs 205,703 7,208 624,010 EUR 66.860 41,721,308.60 1.80Danone Shs 478,184 14,292 1,237,287 EUR 52.060 64,413,161.22 2.78Dassault Systemes Shs 202,593 7,098 614,571 EUR 68.040 41,815,410.84 1.81Edenred Shs 306,207 10,729 928,868 EUR 22.535 20,932,040.38 0.90Ingenico Shs 346,603 12,145 1,051,390 EUR 36.460 38,333,679.40 1.65L’Oreal Shs 146,152 5,120 443,367 EUR 90.260 40,018,305.42 1.73Legrand Shs 611,040 21,410 1,853,500 EUR 27.585 51,128,797.50 2.21LVMH Moet Hennessy Louis Vuitton Shs 112,461 3,941 341,176 EUR 127.900 43,636,410.40 1.88Schneider Electric Shs 479,324 13,314 1,152,583 EUR 49.750 57,341,004.25 2.47Sodexo Shs 240,299 8,420 728,947 EUR 61.230 44,633,424.81 1.93Technip Shs 151,643 5,313 460,031 EUR 86.930 39,990,494.83 1.73Germany 297,880,875.52 12.85Fresenius Shs 146,614 5,137 444,776 EUR 76.660 34,096,528.16 1.47Fresenius Medical Care Shs 207,113 7,257 628,279 EUR 53.050 33,330,200.95 1.44Fuchs Petrolub Shs 109,498 3,837 332,196 EUR 42.005 13,953,892.98 0.60Linde Shs 145,910 5,112 442,642 EUR 133.800 59,225,499.60 2.56Rational Shs 32,786 1,149 99,510 EUR 174.900 17,404,299.00 0.75SAP Shs 552,256 19,350 1,675,186 EUR 52.490 87,930,513.14 3.79Siemens Shs 226,683 7,943 687,673 EUR 75.530 51,939,941.69 2.24Ireland 36,605,201.50 1.58Shire Shs 475,804 16,671 1,443,287 GBP 21.150 36,605,201.50 1.58Italy 60,789,770.12 2.62MARR Shs 269,047 9,427 816,148 EUR 8.375 6,835,239.50 0.29Saipem Shs 459,253 16,092 1,393,094 EUR 38.730 53,954,530.62 2.33Portugal 27,058,874.70 1.17Jeronimo Martins Shs 601,920 21,091 1,825,835 EUR 14.820 27,058,874.70 1.17Spain 57,990,155.40 2.50Inditex Shs 268,872 9,420 815,614 EUR 71.100 57,990,155.40 2.50Sweden 232,067,865.85 10.01Atlas Copco -A- Shs 883,818 30,968 2,680,903 SEK 159.800 48,444,474.35 2.09Elekta -B- Shs 457,861 16,043 1,388,868 SEK 333.900 52,440,130.41 2.26Hennes & Mauritz -B- Shs 709,184 24,850 2,151,193 SEK 236.000 57,408,705.12 2.48Hexagon -B- Shs 880,369 30,847 2,670,454 SEK 129.100 38,985,015.92 1.68Sandvik Shs 1,073,282 37,607 3,255,596 SEK 94.500 34,789,540.05 1.50Switzerland 163,416,887.69 7.05ABB Shs 621,963 21,793 1,886,627 CHF 18.380 28,780,577.62 1.24Compagnie Financiere Richemont -A- Shs 352,277 12,343 1,068,603 CHF 55.800 49,490,123.94 2.14Lindt & Spruengli Shs 2,953 104 9,005 CHF 2,857.000 21,353,148.04 0.92Roche Holding Shs 110,131 3,858 334,116 CHF 156.400 43,371,253.64 1.87SGS Shs 4,660 163 14,198 CHF 1,733.000 20,421,784.45 0.88The Netherlands 77,897,194.18 3.36Akzo Nobel Shs 295,486 10,353 896,339 EUR 43.865 39,317,910.24 1.70ASML Holding Shs 339,647 11,901 1,030,292 EUR 37.445 38,579,283.94 1.66United Kingdom 534,476,167.29 23.06Aveva Group Shs 306,840 10,752 930,784 GBP 16.860 18,818,552.28 0.81British American Tobacco Shs 625,720 21,925 1,898,018 GBP 31.650 72,036,693.67 3.11Bunzl Shs 887,546 31,099 2,692,211 GBP 10.020 32,348,678.69 1.40
Allianz RCM Europe Equity Growth
Investment Portfolio as at 31/03/2012Securities Shares resp.
Currency (in 1,000) resp.Contracts
Acquisitions Disposals Holdings 31/03/2012
Price Market Valuein EUR
% ofSubfund
assetsin the period under review
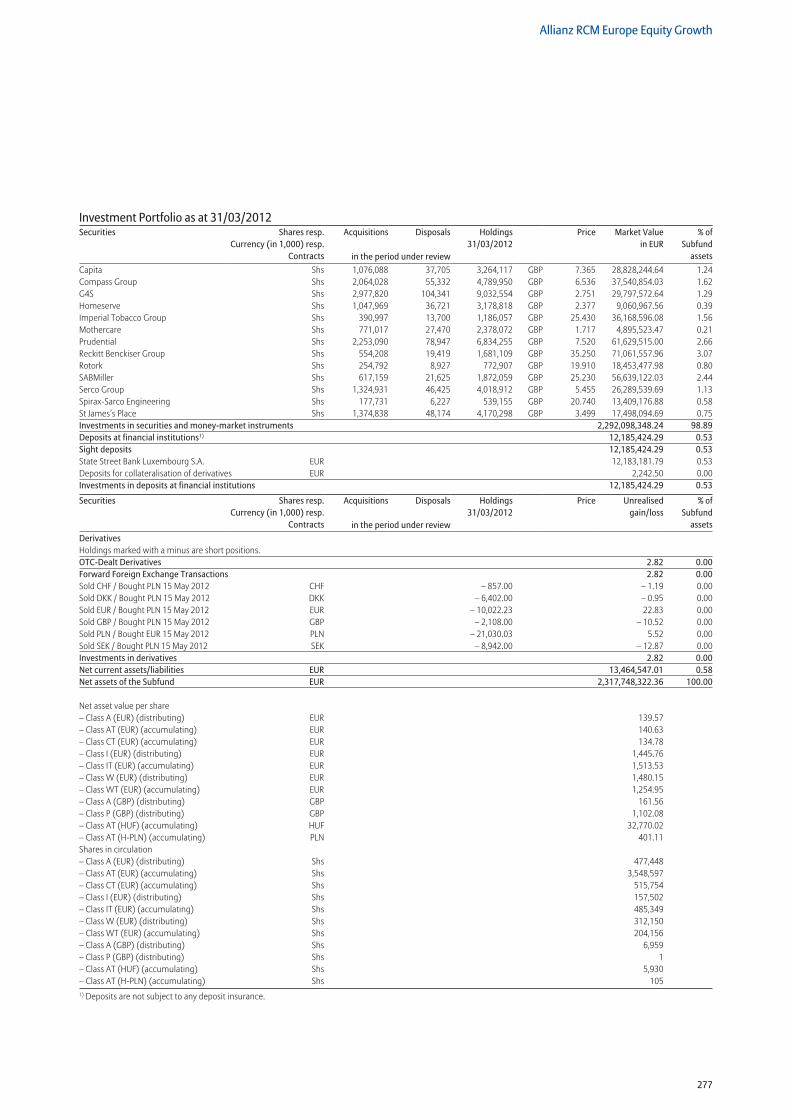
277
Allianz RCM Europe Equity Growth
Capita Shs 1,076,088 37,705 3,264,117 GBP 7.365 28,828,244.64 1.24Compass Group Shs 2,064,028 55,332 4,789,950 GBP 6.536 37,540,854.03 1.62G4S Shs 2,977,820 104,341 9,032,554 GBP 2.751 29,797,572.64 1.29Homeserve Shs 1,047,969 36,721 3,178,818 GBP 2.377 9,060,967.56 0.39Imperial Tobacco Group Shs 390,997 13,700 1,186,057 GBP 25.430 36,168,596.08 1.56Mothercare Shs 771,017 27,470 2,378,072 GBP 1.717 4,895,523.47 0.21Prudential Shs 2,253,090 78,947 6,834,255 GBP 7.520 61,629,515.00 2.66Reckitt Benckiser Group Shs 554,208 19,419 1,681,109 GBP 35.250 71,061,557.96 3.07Rotork Shs 254,792 8,927 772,907 GBP 19.910 18,453,477.98 0.80SABMiller Shs 617,159 21,625 1,872,059 GBP 25.230 56,639,122.03 2.44Serco Group Shs 1,324,931 46,425 4,018,912 GBP 5.455 26,289,539.69 1.13Spirax-Sarco Engineering Shs 177,731 6,227 539,155 GBP 20.740 13,409,176.88 0.58St James’s Place Shs 1,374,838 48,174 4,170,298 GBP 3.499 17,498,094.69 0.75Investments in securities and money-market instruments 2,292,098,348.24 98.89Deposits at financial institutions1) 12,185,424.29 0.53Sight deposits 12,185,424.29 0.53State Street Bank Luxembourg S.A. EUR 12,183,181.79 0.53Deposits for collateralisation of derivatives EUR 2,242.50 0.00Investments in deposits at financial institutions 12,185,424.29 0.53
Securities Shares resp.Currency (in 1,000) resp.
Contracts
Acquisitions Disposals Holdings 31/03/2012
Price Unrealisedgain/loss
% ofSubfund
assetsin the period under reviewDerivatives Holdings marked with a minus are short positions. OTC-Dealt Derivatives 2.82 0.00Forward Foreign Exchange Transactions 2.82 0.00Sold CHF / Bought PLN 15 May 2012 CHF – 857.00 – 1.19 0.00Sold DKK / Bought PLN 15 May 2012 DKK – 6,402.00 – 0.95 0.00Sold EUR / Bought PLN 15 May 2012 EUR – 10,022.23 22.83 0.00Sold GBP / Bought PLN 15 May 2012 GBP – 2,108.00 – 10.52 0.00Sold PLN / Bought EUR 15 May 2012 PLN – 21,030.03 5.52 0.00Sold SEK / Bought PLN 15 May 2012 SEK – 8,942.00 – 12.87 0.00Investments in derivatives 2.82 0.00Net current assets/liabilities EUR 13,464,547.01 0.58Net assets of the Subfund EUR 2,317,748,322.36 100.00
Net asset value per share – Class A (EUR) (distributing) EUR 139.57 – Class AT (EUR) (accumulating) EUR 140.63 – Class CT (EUR) (accumulating) EUR 134.78 – Class I (EUR) (distributing) EUR 1,445.76 – Class IT (EUR) (accumulating) EUR 1,513.53 – Class W (EUR) (distributing) EUR 1,480.15 – Class WT (EUR) (accumulating) EUR 1,254.95 – Class A (GBP) (distributing) GBP 161.56 – Class P (GBP) (distributing) GBP 1,102.08 – Class AT (HUF) (accumulating) HUF 32,770.02 – Class AT (H-PLN) (accumulating) PLN 401.11 Shares in circulation – Class A (EUR) (distributing) Shs 477,448 – Class AT (EUR) (accumulating) Shs 3,548,597 – Class CT (EUR) (accumulating) Shs 515,754 – Class I (EUR) (distributing) Shs 157,502 – Class IT (EUR) (accumulating) Shs 485,349 – Class W (EUR) (distributing) Shs 312,150 – Class WT (EUR) (accumulating) Shs 204,156 – Class A (GBP) (distributing) Shs 6,959 – Class P (GBP) (distributing) Shs 1 – Class AT (HUF) (accumulating) Shs 5,930 – Class AT (H-PLN) (accumulating) Shs 1051) Deposits are not subject to any deposit insurance.
Investment Portfolio as at 31/03/2012Securities Shares resp.
Currency (in 1,000) resp.Contracts
Acquisitions Disposals Holdings 31/03/2012
Price Market Valuein EUR
% ofSubfund
assetsin the period under review
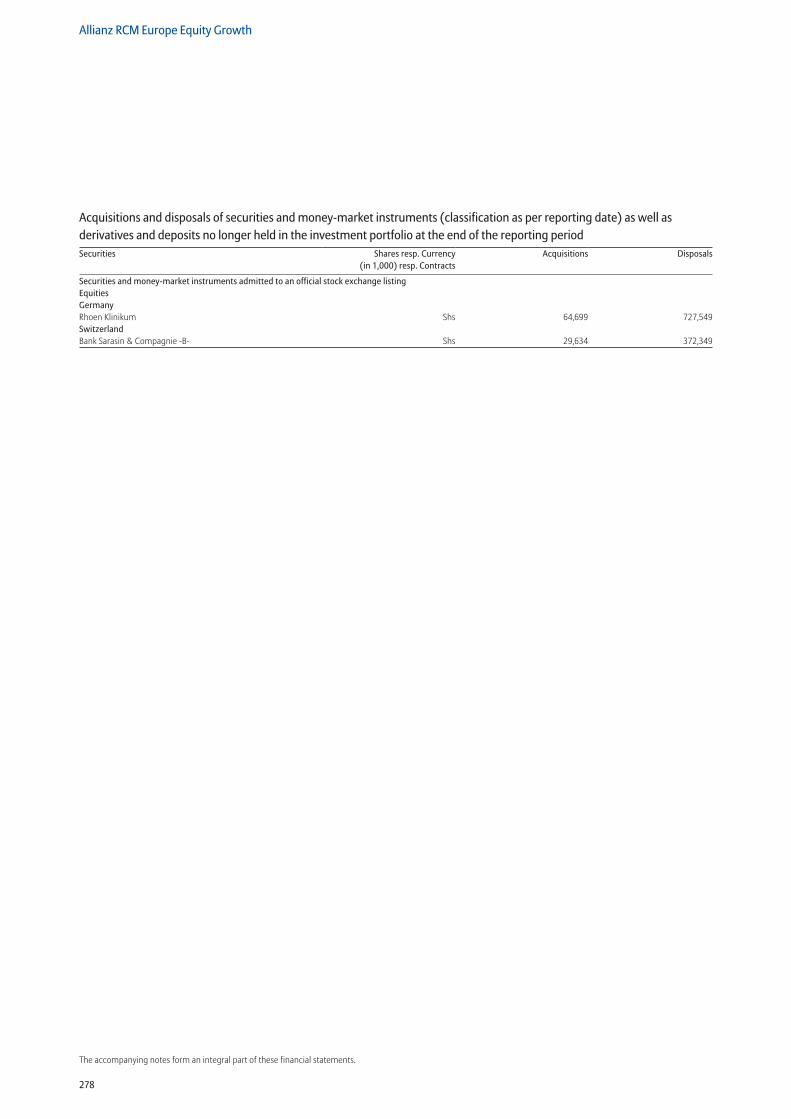
278
Allianz RCM Europe Equity Growth
The accompanying notes form an integral part of these financial statements.
Securities and money-market instruments admitted to an official stock exchange listing Equities Germany Rhoen Klinikum Shs 64,699 727,549Switzerland Bank Sarasin & Compagnie -B- Shs 29,634 372,349
Acquisitions and disposals of securities and money-market instruments (classification as per reporting date) as well as derivatives and deposits no longer held in the investment portfolio at the end of the reporting periodSecurities Shares resp. Currency
(in 1,000) resp. ContractsAcquisitions Disposals
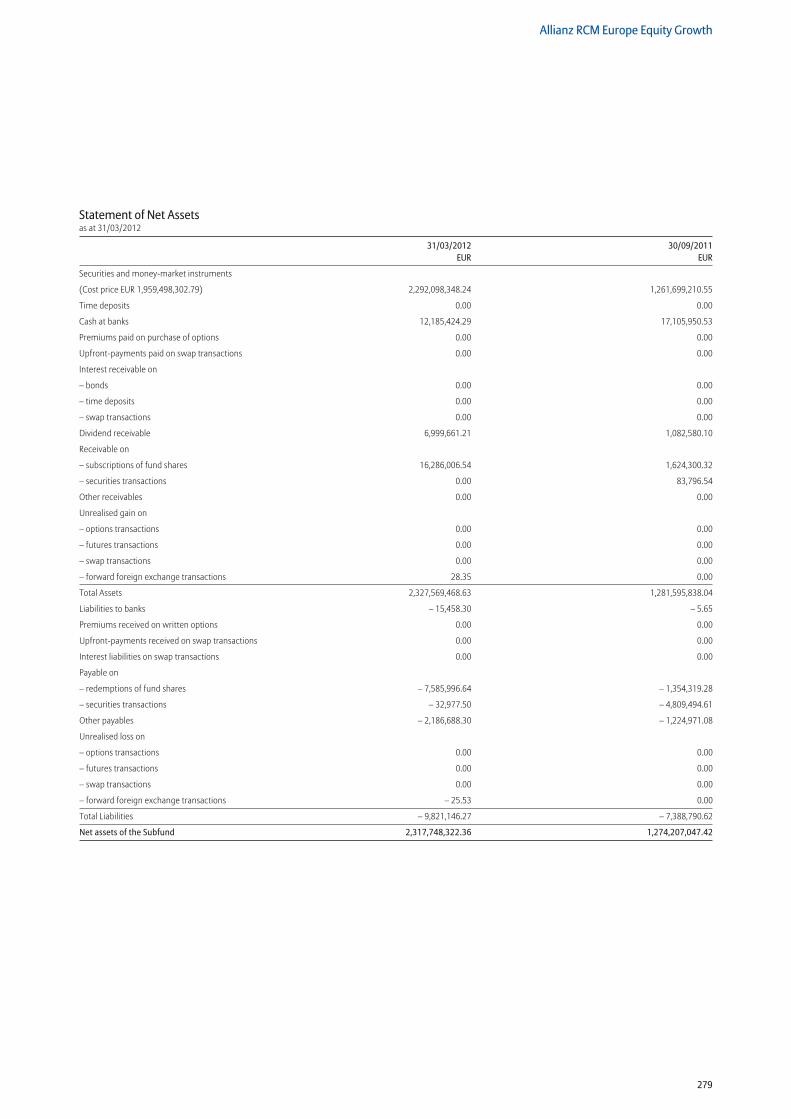
279
Allianz RCM Europe Equity Growth
Statement of Net Assetsas at 31/03/2012
31/03/2012 30/09/2011 EUR EUR
Securities and money-market instruments
(Cost price EUR 1,959,498,302.79) 2,292,098,348.24 1,261,699,210.55
Time deposits 0.00 0.00
Cash at banks 12,185,424.29 17,105,950.53
Premiums paid on purchase of options 0.00 0.00
Upfront-payments paid on swap transactions 0.00 0.00
Interest receivable on
– bonds 0.00 0.00
– time deposits 0.00 0.00
– swap transactions 0.00 0.00
Dividend receivable 6,999,661.21 1,082,580.10
Receivable on
– subscriptions of fund shares 16,286,006.54 1,624,300.32
– securities transactions 0.00 83,796.54
Other receivables 0.00 0.00
Unrealised gain on
– options transactions 0.00 0.00
– futures transactions 0.00 0.00
– swap transactions 0.00 0.00
– forward foreign exchange transactions 28.35 0.00
Total Assets 2,327,569,468.63 1,281,595,838.04
Liabilities to banks – 15,458.30 – 5.65
Premiums received on written options 0.00 0.00
Upfront-payments received on swap transactions 0.00 0.00
Interest liabilities on swap transactions 0.00 0.00
Payable on
– redemptions of fund shares – 7,585,996.64 – 1,354,319.28
– securities transactions – 32,977.50 – 4,809,494.61
Other payables – 2,186,688.30 – 1,224,971.08
Unrealised loss on
– options transactions 0.00 0.00
– futures transactions 0.00 0.00
– swap transactions 0.00 0.00
– forward foreign exchange transactions – 25.53 0.00
Total Liabilities – 9,821,146.27 – 7,388,790.62
Net assets of the Subfund 2,317,748,322.36 1,274,207,047.42
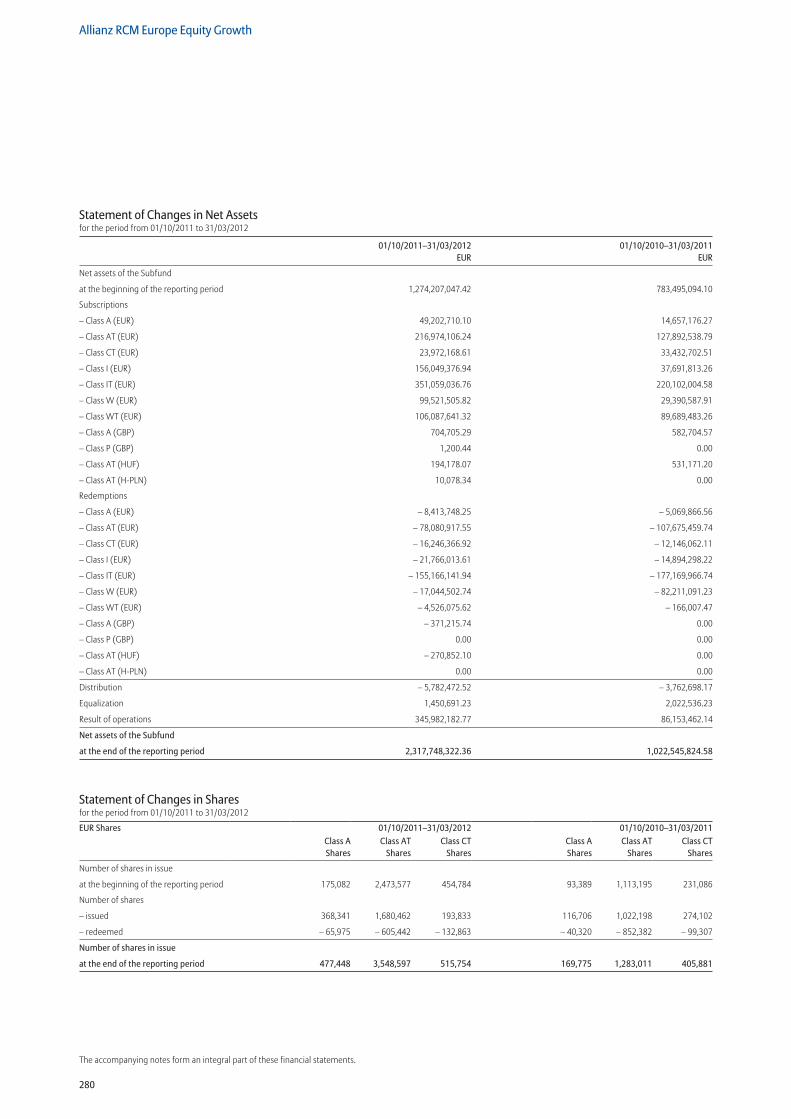
280
Allianz RCM Europe Equity Growth
The accompanying notes form an integral part of these financial statements.
Statement of Changes in Net Assetsfor the period from 01/10/2011 to 31/03/2012
01/10/2011–31/03/2012 01/10/2010–31/03/2011 EUR EUR
Net assets of the Subfund
at the beginning of the reporting period 1,274,207,047.42 783,495,094.10
Subscriptions
– Class A (EUR) 49,202,710.10 14,657,176.27
– Class AT (EUR) 216,974,106.24 127,892,538.79
– Class CT (EUR) 23,972,168.61 33,432,702.51
– Class I (EUR) 156,049,376.94 37,691,813.26
– Class IT (EUR) 351,059,036.76 220,102,004.58
– Class W (EUR) 99,521,505.82 29,390,587.91
– Class WT (EUR) 106,087,641.32 89,689,483.26
– Class A (GBP) 704,705.29 582,704.57
– Class P (GBP) 1,200.44 0.00
– Class AT (HUF) 194,178.07 531,171.20
– Class AT (H-PLN) 10,078.34 0.00
Redemptions
– Class A (EUR) – 8,413,748.25 – 5,069,866.56
– Class AT (EUR) – 78,080,917.55 – 107,675,459.74
– Class CT (EUR) – 16,246,366.92 – 12,146,062.11
– Class I (EUR) – 21,766,013.61 – 14,894,298.22
– Class IT (EUR) – 155,166,141.94 – 177,169,966.74
– Class W (EUR) – 17,044,502.74 – 82,211,091.23
– Class WT (EUR) – 4,526,075.62 – 166,007.47
– Class A (GBP) – 371,215.74 0.00
– Class P (GBP) 0.00 0.00
– Class AT (HUF) – 270,852.10 0.00
– Class AT (H-PLN) 0.00 0.00
Distribution – 5,782,472.52 – 3,762,698.17
Equalization 1,450,691.23 2,022,536.23
Result of operations 345,982,182.77 86,153,462.14
Net assets of the Subfund
at the end of the reporting period 2,317,748,322.36 1,022,545,824.58
Statement of Changes in Sharesfor the period from 01/10/2011 to 31/03/2012
EUR Shares 01/10/2011–31/03/2012 01/10/2010–31/03/2011Class A Shares
Class AT Shares
Class CT Shares
Class A Shares
Class AT Shares
Class CT Shares
Number of shares in issue
at the beginning of the reporting period 175,082 2,473,577 454,784 93,389 1,113,195 231,086
Number of shares
– issued 368,341 1,680,462 193,833 116,706 1,022,198 274,102
– redeemed – 65,975 – 605,442 – 132,863 – 40,320 – 852,382 – 99,307
Number of shares in issue
at the end of the reporting period 477,448 3,548,597 515,754 169,775 1,283,011 405,881
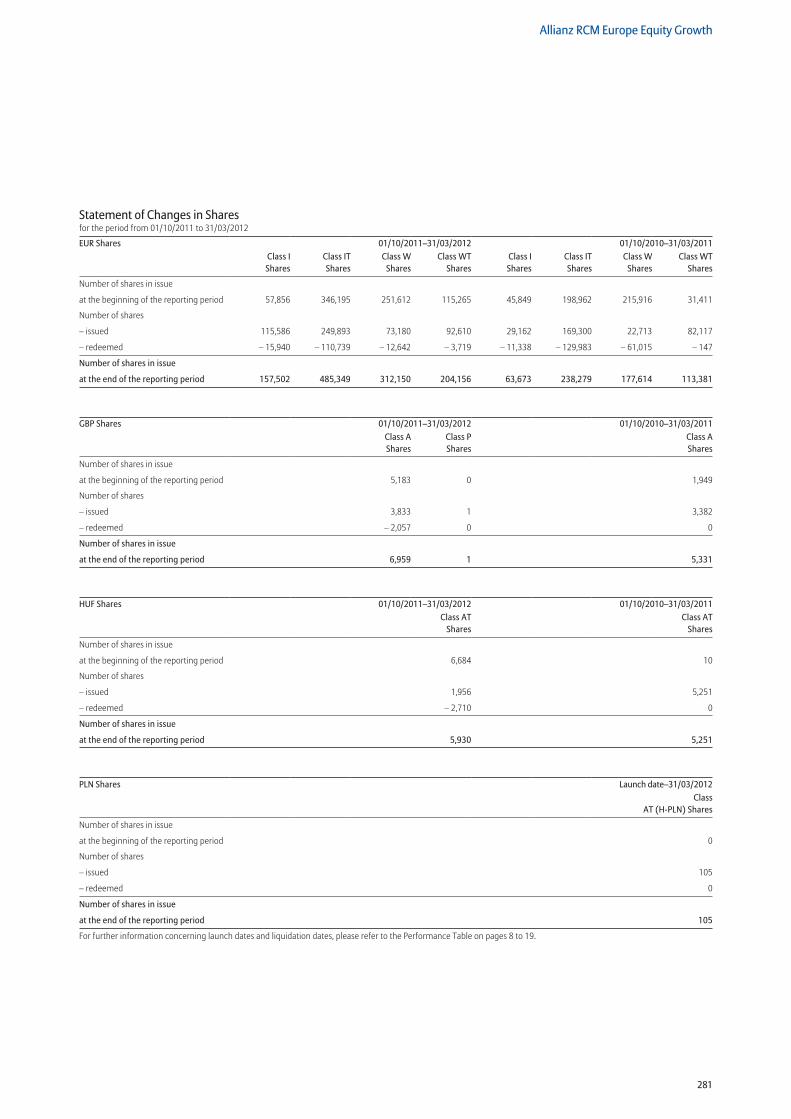
281
Allianz RCM Europe Equity Growth
Statement of Changes in Sharesfor the period from 01/10/2011 to 31/03/2012
EUR Shares 01/10/2011–31/03/2012 01/10/2010–31/03/2011Class I Shares
Class IT Shares
Class W Shares
Class WT Shares
Class I Shares
Class IT Shares
Class W Shares
Class WT Shares
Number of shares in issue
at the beginning of the reporting period 57,856 346,195 251,612 115,265 45,849 198,962 215,916 31,411
Number of shares
– issued 115,586 249,893 73,180 92,610 29,162 169,300 22,713 82,117
– redeemed – 15,940 – 110,739 – 12,642 – 3,719 – 11,338 – 129,983 – 61,015 – 147
Number of shares in issue
at the end of the reporting period 157,502 485,349 312,150 204,156 63,673 238,279 177,614 113,381
GBP Shares 01/10/2011–31/03/2012 01/10/2010–31/03/2011Class A Shares
Class P Shares
Class A Shares
Number of shares in issue
at the beginning of the reporting period 5,183 0 1,949
Number of shares
– issued 3,833 1 3,382
– redeemed – 2,057 0 0
Number of shares in issue
at the end of the reporting period 6,959 1 5,331
HUF Shares 01/10/2011–31/03/2012 01/10/2010–31/03/2011Class AT
SharesClass AT
Shares
Number of shares in issue
at the beginning of the reporting period 6,684 10
Number of shares
– issued 1,956 5,251
– redeemed – 2,710 0
Number of shares in issue
at the end of the reporting period 5,930 5,251
PLN Shares Launch date–31/03/2012Class
AT (H-PLN) Shares
Number of shares in issue
at the beginning of the reporting period 0
Number of shares
– issued 105
– redeemed 0
Number of shares in issue
at the end of the reporting period 105
For further information concerning launch dates and liquidation dates, please refer to the Performance Table on pages 8 to 19.
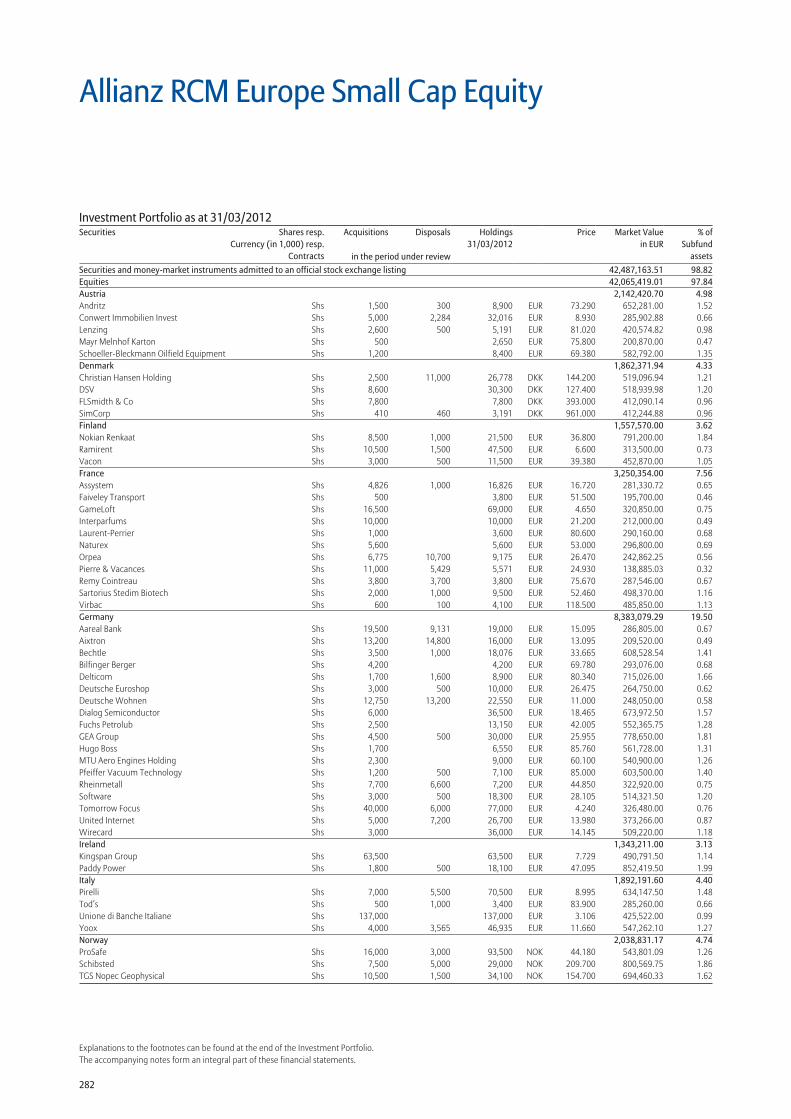
282
Explanations to the footnotes can be found at the end of the Investment Portfolio.The accompanying notes form an integral part of these financial statements.
Securities and money-market instruments admitted to an official stock exchange listing 42,487,163.51 98.82Equities 42,065,419.01 97.84Austria 2,142,420.70 4.98Andritz Shs 1,500 300 8,900 EUR 73.290 652,281.00 1.52Conwert Immobilien Invest Shs 5,000 2,284 32,016 EUR 8.930 285,902.88 0.66Lenzing Shs 2,600 500 5,191 EUR 81.020 420,574.82 0.98Mayr Melnhof Karton Shs 500 2,650 EUR 75.800 200,870.00 0.47Schoeller-Bleckmann Oilfield Equipment Shs 1,200 8,400 EUR 69.380 582,792.00 1.35Denmark 1,862,371.94 4.33Christian Hansen Holding Shs 2,500 11,000 26,778 DKK 144.200 519,096.94 1.21DSV Shs 8,600 30,300 DKK 127.400 518,939.98 1.20FLSmidth & Co Shs 7,800 7,800 DKK 393.000 412,090.14 0.96SimCorp Shs 410 460 3,191 DKK 961.000 412,244.88 0.96Finland 1,557,570.00 3.62Nokian Renkaat Shs 8,500 1,000 21,500 EUR 36.800 791,200.00 1.84Ramirent Shs 10,500 1,500 47,500 EUR 6.600 313,500.00 0.73Vacon Shs 3,000 500 11,500 EUR 39.380 452,870.00 1.05France 3,250,354.00 7.56Assystem Shs 4,826 1,000 16,826 EUR 16.720 281,330.72 0.65Faiveley Transport Shs 500 3,800 EUR 51.500 195,700.00 0.46GameLoft Shs 16,500 69,000 EUR 4.650 320,850.00 0.75Interparfums Shs 10,000 10,000 EUR 21.200 212,000.00 0.49Laurent-Perrier Shs 1,000 3,600 EUR 80.600 290,160.00 0.68Naturex Shs 5,600 5,600 EUR 53.000 296,800.00 0.69Orpea Shs 6,775 10,700 9,175 EUR 26.470 242,862.25 0.56Pierre & Vacances Shs 11,000 5,429 5,571 EUR 24.930 138,885.03 0.32Remy Cointreau Shs 3,800 3,700 3,800 EUR 75.670 287,546.00 0.67Sartorius Stedim Biotech Shs 2,000 1,000 9,500 EUR 52.460 498,370.00 1.16Virbac Shs 600 100 4,100 EUR 118.500 485,850.00 1.13Germany 8,383,079.29 19.50Aareal Bank Shs 19,500 9,131 19,000 EUR 15.095 286,805.00 0.67Aixtron Shs 13,200 14,800 16,000 EUR 13.095 209,520.00 0.49Bechtle Shs 3,500 1,000 18,076 EUR 33.665 608,528.54 1.41Bilfinger Berger Shs 4,200 4,200 EUR 69.780 293,076.00 0.68Delticom Shs 1,700 1,600 8,900 EUR 80.340 715,026.00 1.66Deutsche Euroshop Shs 3,000 500 10,000 EUR 26.475 264,750.00 0.62Deutsche Wohnen Shs 12,750 13,200 22,550 EUR 11.000 248,050.00 0.58Dialog Semiconductor Shs 6,000 36,500 EUR 18.465 673,972.50 1.57Fuchs Petrolub Shs 2,500 13,150 EUR 42.005 552,365.75 1.28GEA Group Shs 4,500 500 30,000 EUR 25.955 778,650.00 1.81Hugo Boss Shs 1,700 6,550 EUR 85.760 561,728.00 1.31MTU Aero Engines Holding Shs 2,300 9,000 EUR 60.100 540,900.00 1.26Pfeiffer Vacuum Technology Shs 1,200 500 7,100 EUR 85.000 603,500.00 1.40Rheinmetall Shs 7,700 6,600 7,200 EUR 44.850 322,920.00 0.75Software Shs 3,000 500 18,300 EUR 28.105 514,321.50 1.20Tomorrow Focus Shs 40,000 6,000 77,000 EUR 4.240 326,480.00 0.76United Internet Shs 5,000 7,200 26,700 EUR 13.980 373,266.00 0.87Wirecard Shs 3,000 36,000 EUR 14.145 509,220.00 1.18Ireland 1,343,211.00 3.13Kingspan Group Shs 63,500 63,500 EUR 7.729 490,791.50 1.14Paddy Power Shs 1,800 500 18,100 EUR 47.095 852,419.50 1.99Italy 1,892,191.60 4.40Pirelli Shs 7,000 5,500 70,500 EUR 8.995 634,147.50 1.48Tod’s Shs 500 1,000 3,400 EUR 83.900 285,260.00 0.66Unione di Banche Italiane Shs 137,000 137,000 EUR 3.106 425,522.00 0.99Yoox Shs 4,000 3,565 46,935 EUR 11.660 547,262.10 1.27Norway 2,038,831.17 4.74ProSafe Shs 16,000 3,000 93,500 NOK 44.180 543,801.09 1.26Schibsted Shs 7,500 5,000 29,000 NOK 209.700 800,569.75 1.86TGS Nopec Geophysical Shs 10,500 1,500 34,100 NOK 154.700 694,460.33 1.62
Allianz RCM Europe Small Cap Equity
Investment Portfolio as at 31/03/2012Securities Shares resp.
Currency (in 1,000) resp.Contracts
Acquisitions Disposals Holdings 31/03/2012
Price Market Valuein EUR
% ofSubfund
assetsin the period under review
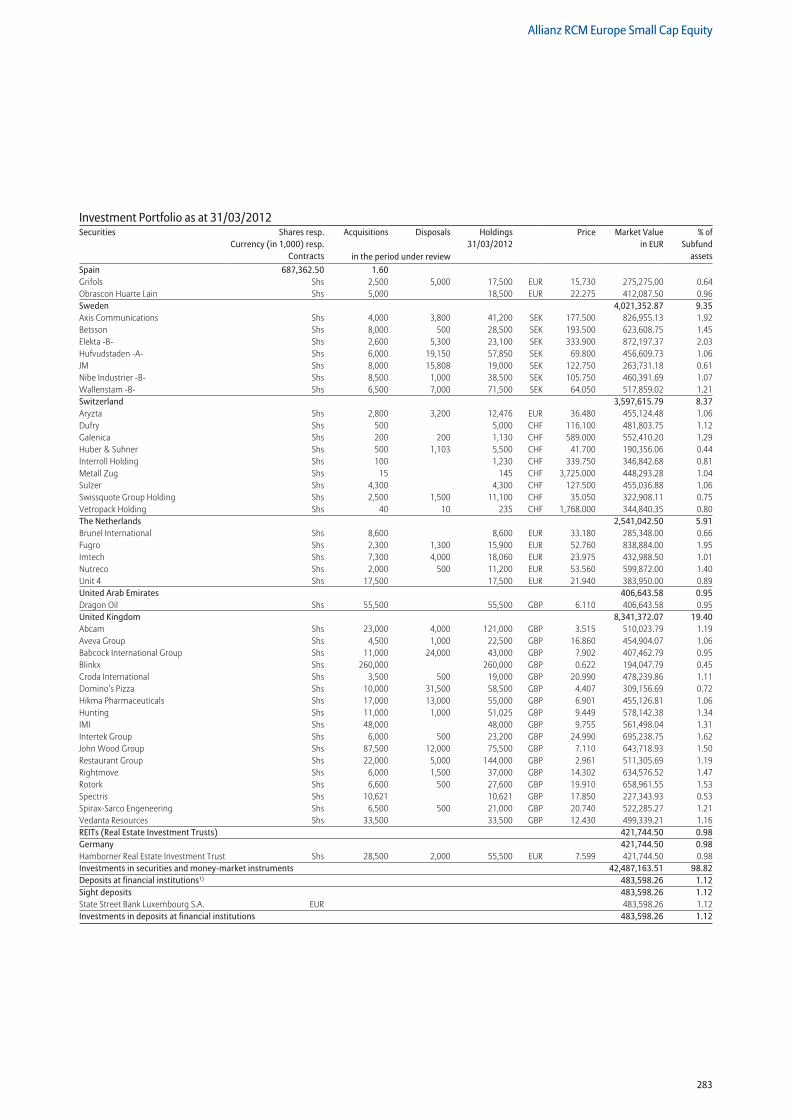
283
Allianz RCM Europe Small Cap Equity
Spain 687,362.50 1.60Grifols Shs 2,500 5,000 17,500 EUR 15.730 275,275.00 0.64Obrascon Huarte Lain Shs 5,000 18,500 EUR 22.275 412,087.50 0.96Sweden 4,021,352.87 9.35Axis Communications Shs 4,000 3,800 41,200 SEK 177.500 826,955.13 1.92Betsson Shs 8,000 500 28,500 SEK 193.500 623,608.75 1.45Elekta -B- Shs 2,600 5,300 23,100 SEK 333.900 872,197.37 2.03Hufvudstaden -A- Shs 6,000 19,150 57,850 SEK 69.800 456,609.73 1.06JM Shs 8,000 15,808 19,000 SEK 122.750 263,731.18 0.61Nibe Industrier -B- Shs 8,500 1,000 38,500 SEK 105.750 460,391.69 1.07Wallenstam -B- Shs 6,500 7,000 71,500 SEK 64.050 517,859.02 1.21Switzerland 3,597,615.79 8.37Aryzta Shs 2,800 3,200 12,476 EUR 36.480 455,124.48 1.06Dufry Shs 500 5,000 CHF 116.100 481,803.75 1.12Galenica Shs 200 200 1,130 CHF 589.000 552,410.20 1.29Huber & Suhner Shs 500 1,103 5,500 CHF 41.700 190,356.06 0.44Interroll Holding Shs 100 1,230 CHF 339.750 346,842.68 0.81Metall Zug Shs 15 145 CHF 3,725.000 448,293.28 1.04Sulzer Shs 4,300 4,300 CHF 127.500 455,036.88 1.06Swissquote Group Holding Shs 2,500 1,500 11,100 CHF 35.050 322,908.11 0.75Vetropack Holding Shs 40 10 235 CHF 1,768.000 344,840.35 0.80The Netherlands 2,541,042.50 5.91Brunel International Shs 8,600 8,600 EUR 33.180 285,348.00 0.66Fugro Shs 2,300 1,300 15,900 EUR 52.760 838,884.00 1.95Imtech Shs 7,300 4,000 18,060 EUR 23.975 432,988.50 1.01Nutreco Shs 2,000 500 11,200 EUR 53.560 599,872.00 1.40Unit 4 Shs 17,500 17,500 EUR 21.940 383,950.00 0.89United Arab Emirates 406,643.58 0.95Dragon Oil Shs 55,500 55,500 GBP 6.110 406,643.58 0.95United Kingdom 8,341,372.07 19.40Abcam Shs 23,000 4,000 121,000 GBP 3.515 510,023.79 1.19Aveva Group Shs 4,500 1,000 22,500 GBP 16.860 454,904.07 1.06Babcock International Group Shs 11,000 24,000 43,000 GBP 7.902 407,462.79 0.95Blinkx Shs 260,000 260,000 GBP 0.622 194,047.79 0.45Croda International Shs 3,500 500 19,000 GBP 20.990 478,239.86 1.11Domino’s Pizza Shs 10,000 31,500 58,500 GBP 4.407 309,156.69 0.72Hikma Pharmaceuticals Shs 17,000 13,000 55,000 GBP 6.901 455,126.81 1.06Hunting Shs 11,000 1,000 51,025 GBP 9.449 578,142.38 1.34IMI Shs 48,000 48,000 GBP 9.755 561,498.04 1.31Intertek Group Shs 6,000 500 23,200 GBP 24.990 695,238.75 1.62John Wood Group Shs 87,500 12,000 75,500 GBP 7.110 643,718.93 1.50Restaurant Group Shs 22,000 5,000 144,000 GBP 2.961 511,305.69 1.19Rightmove Shs 6,000 1,500 37,000 GBP 14.302 634,576.52 1.47Rotork Shs 6,600 500 27,600 GBP 19.910 658,961.55 1.53Spectris Shs 10,621 10,621 GBP 17.850 227,343.93 0.53Spirax-Sarco Engeneering Shs 6,500 500 21,000 GBP 20.740 522,285.27 1.21Vedanta Resources Shs 33,500 33,500 GBP 12.430 499,339.21 1.16REITs (Real Estate Investment Trusts) 421,744.50 0.98Germany 421,744.50 0.98Hamborner Real Estate Investment Trust Shs 28,500 2,000 55,500 EUR 7.599 421,744.50 0.98Investments in securities and money-market instruments 42,487,163.51 98.82Deposits at financial institutions1) 483,598.26 1.12Sight deposits 483,598.26 1.12State Street Bank Luxembourg S.A. EUR 483,598.26 1.12Investments in deposits at financial institutions 483,598.26 1.12
Investment Portfolio as at 31/03/2012Securities Shares resp.
Currency (in 1,000) resp.Contracts
Acquisitions Disposals Holdings 31/03/2012
Price Market Valuein EUR
% ofSubfund
assetsin the period under review
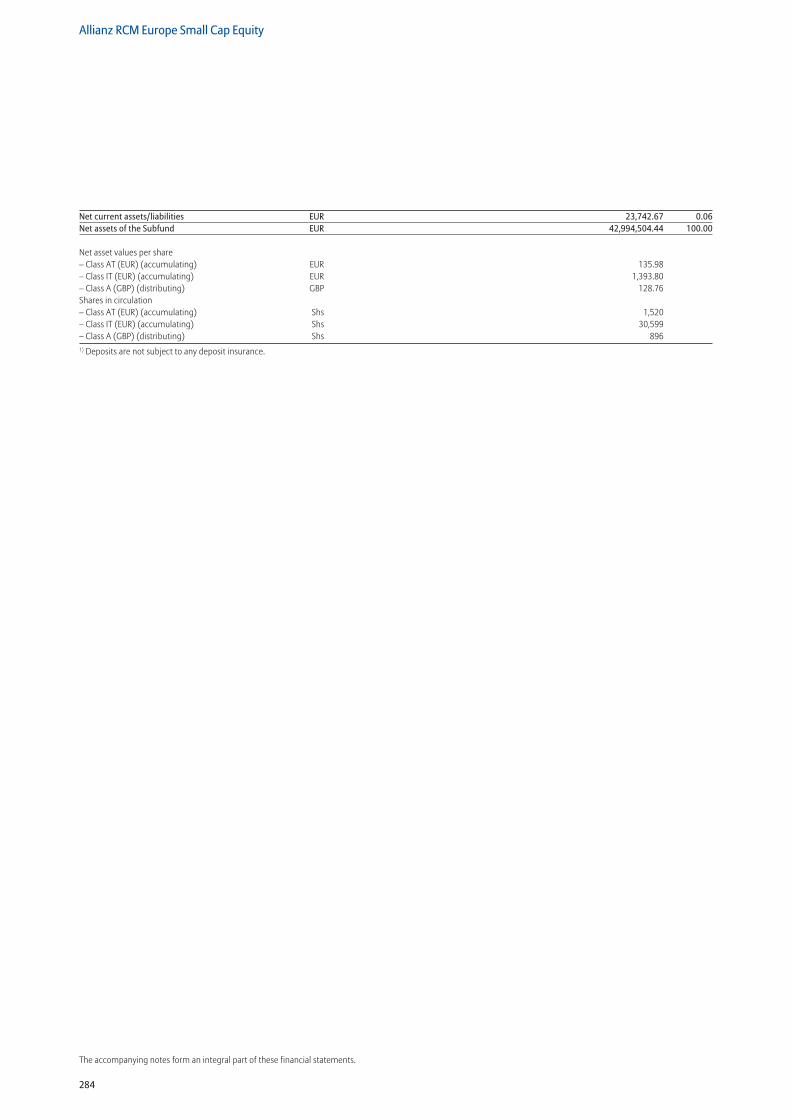
284
Allianz RCM Europe Small Cap Equity
The accompanying notes form an integral part of these financial statements.
Net current assets/liabilities EUR 23,742.67 0.06Net assets of the Subfund EUR 42,994,504.44 100.00
Net asset values per share – Class AT (EUR) (accumulating) EUR 135.98 – Class IT (EUR) (accumulating) EUR 1,393.80 – Class A (GBP) (distributing) GBP 128.76 Shares in circulation – Class AT (EUR) (accumulating) Shs 1,520– Class IT (EUR) (accumulating) Shs 30,599– Class A (GBP) (distributing) Shs 8961) Deposits are not subject to any deposit insurance.
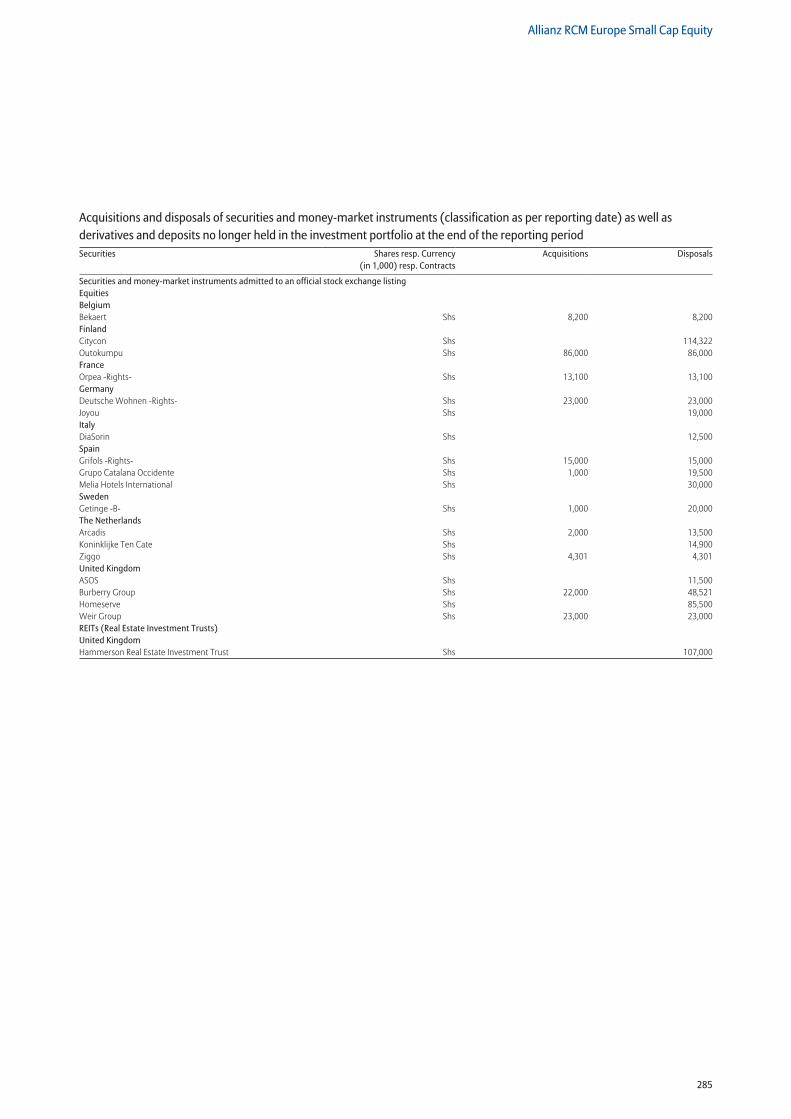
285
Allianz RCM Europe Small Cap Equity
Securities and money-market instruments admitted to an official stock exchange listing Equities Belgium Bekaert Shs 8,200 8,200Finland Citycon Shs 114,322Outokumpu Shs 86,000 86,000France Orpea -Rights- Shs 13,100 13,100Germany Deutsche Wohnen -Rights- Shs 23,000 23,000Joyou Shs 19,000Italy DiaSorin Shs 12,500Spain Grifols -Rights- Shs 15,000 15,000Grupo Catalana Occidente Shs 1,000 19,500Melia Hotels International Shs 30,000Sweden Getinge -B- Shs 1,000 20,000The Netherlands Arcadis Shs 2,000 13,500Koninklijke Ten Cate Shs 14,900Ziggo Shs 4,301 4,301United Kingdom ASOS Shs 11,500Burberry Group Shs 22,000 48,521Homeserve Shs 85,500Weir Group Shs 23,000 23,000REITs (Real Estate Investment Trusts) United Kingdom Hammerson Real Estate Investment Trust Shs 107,000
Acquisitions and disposals of securities and money-market instruments (classification as per reporting date) as well as derivatives and deposits no longer held in the investment portfolio at the end of the reporting periodSecurities Shares resp. Currency
(in 1,000) resp. ContractsAcquisitions Disposals
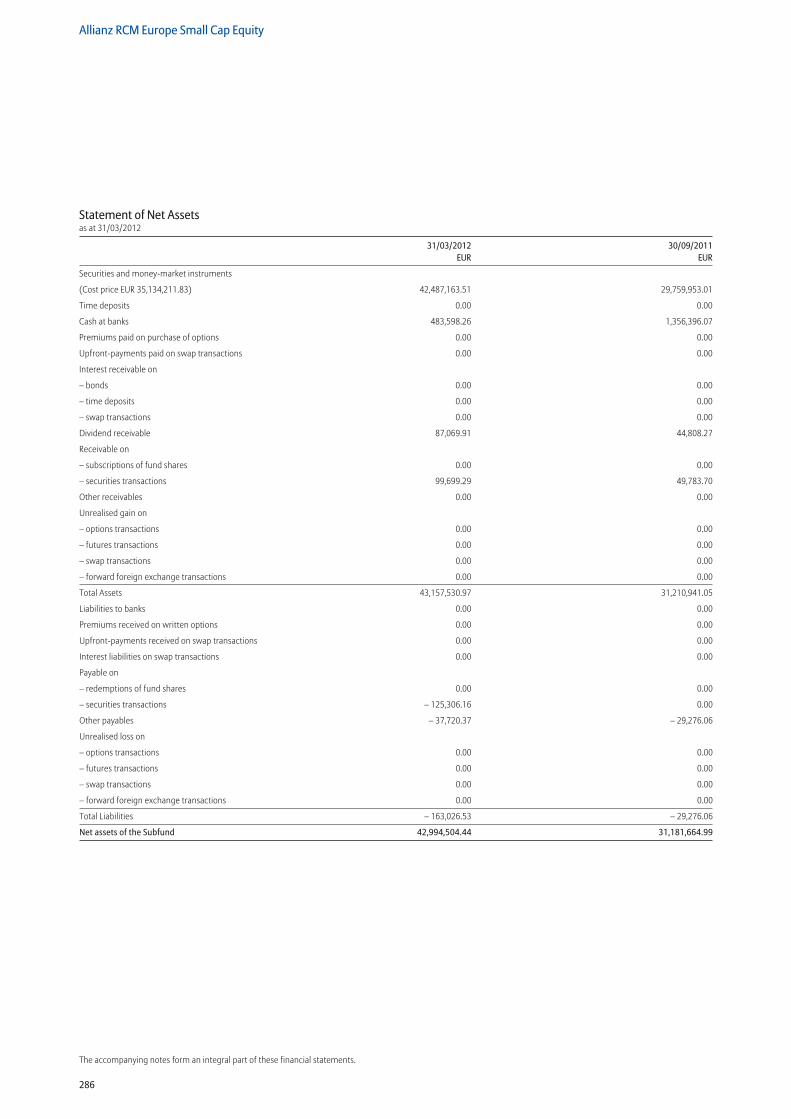
286
Allianz RCM Europe Small Cap Equity
The accompanying notes form an integral part of these financial statements.
Statement of Net Assetsas at 31/03/2012
31/03/2012 30/09/2011 EUR EUR
Securities and money-market instruments
(Cost price EUR 35,134,211.83) 42,487,163.51 29,759,953.01
Time deposits 0.00 0.00
Cash at banks 483,598.26 1,356,396.07
Premiums paid on purchase of options 0.00 0.00
Upfront-payments paid on swap transactions 0.00 0.00
Interest receivable on
– bonds 0.00 0.00
– time deposits 0.00 0.00
– swap transactions 0.00 0.00
Dividend receivable 87,069.91 44,808.27
Receivable on
– subscriptions of fund shares 0.00 0.00
– securities transactions 99,699.29 49,783.70
Other receivables 0.00 0.00
Unrealised gain on
– options transactions 0.00 0.00
– futures transactions 0.00 0.00
– swap transactions 0.00 0.00
– forward foreign exchange transactions 0.00 0.00
Total Assets 43,157,530.97 31,210,941.05
Liabilities to banks 0.00 0.00
Premiums received on written options 0.00 0.00
Upfront-payments received on swap transactions 0.00 0.00
Interest liabilities on swap transactions 0.00 0.00
Payable on
– redemptions of fund shares 0.00 0.00
– securities transactions – 125,306.16 0.00
Other payables – 37,720.37 – 29,276.06
Unrealised loss on
– options transactions 0.00 0.00
– futures transactions 0.00 0.00
– swap transactions 0.00 0.00
– forward foreign exchange transactions 0.00 0.00
Total Liabilities – 163,026.53 – 29,276.06
Net assets of the Subfund 42,994,504.44 31,181,664.99
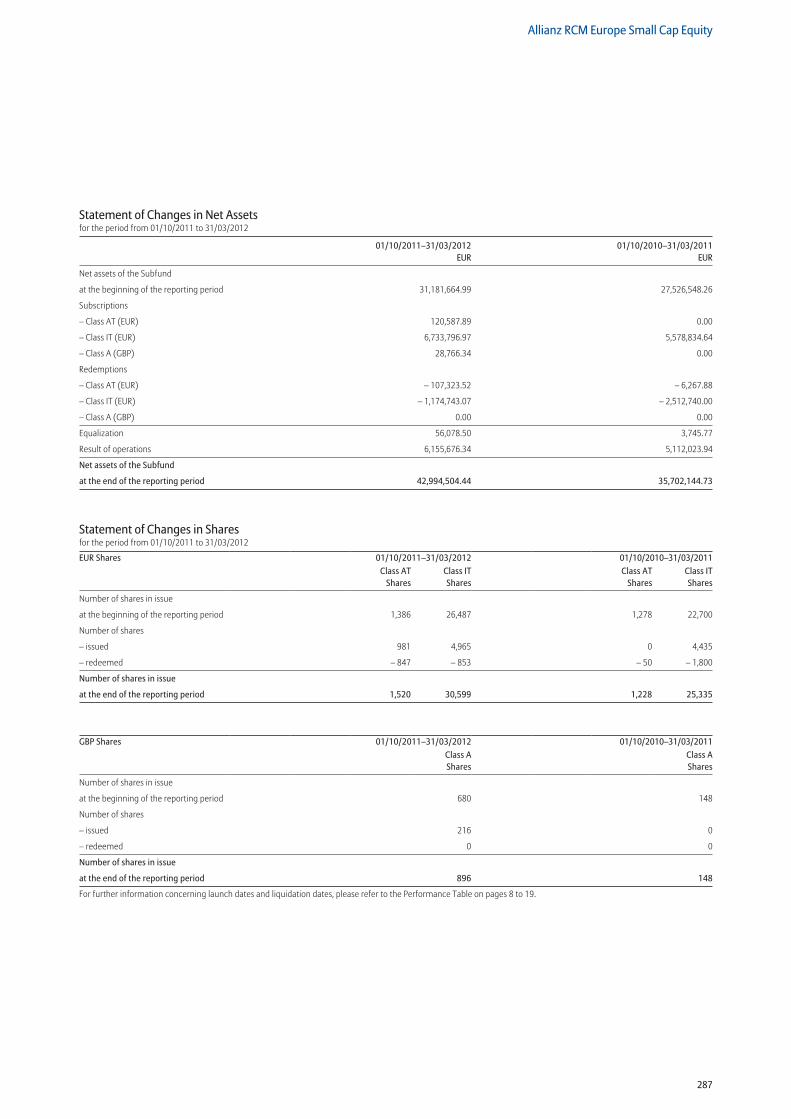
287
Allianz RCM Europe Small Cap Equity
Statement of Changes in Net Assetsfor the period from 01/10/2011 to 31/03/2012
01/10/2011–31/03/2012 01/10/2010–31/03/2011 EUR EUR
Net assets of the Subfund
at the beginning of the reporting period 31,181,664.99 27,526,548.26
Subscriptions
– Class AT (EUR) 120,587.89 0.00
– Class IT (EUR) 6,733,796.97 5,578,834.64
– Class A (GBP) 28,766.34 0.00
Redemptions
– Class AT (EUR) – 107,323.52 – 6,267.88
– Class IT (EUR) – 1,174,743.07 – 2,512,740.00
– Class A (GBP) 0.00 0.00
Equalization 56,078.50 3,745.77
Result of operations 6,155,676.34 5,112,023.94
Net assets of the Subfund
at the end of the reporting period 42,994,504.44 35,702,144.73
Statement of Changes in Sharesfor the period from 01/10/2011 to 31/03/2012
EUR Shares 01/10/2011–31/03/2012 01/10/2010–31/03/2011Class AT
SharesClass IT Shares
Class AT Shares
Class IT Shares
Number of shares in issue
at the beginning of the reporting period 1,386 26,487 1,278 22,700
Number of shares
– issued 981 4,965 0 4,435
– redeemed – 847 – 853 – 50 – 1,800
Number of shares in issue
at the end of the reporting period 1,520 30,599 1,228 25,335
GBP Shares 01/10/2011–31/03/2012 01/10/2010–31/03/2011Class A Shares
Class A Shares
Number of shares in issue
at the beginning of the reporting period 680 148
Number of shares
– issued 216 0
– redeemed 0 0
Number of shares in issue
at the end of the reporting period 896 148
For further information concerning launch dates and liquidation dates, please refer to the Performance Table on pages 8 to 19.
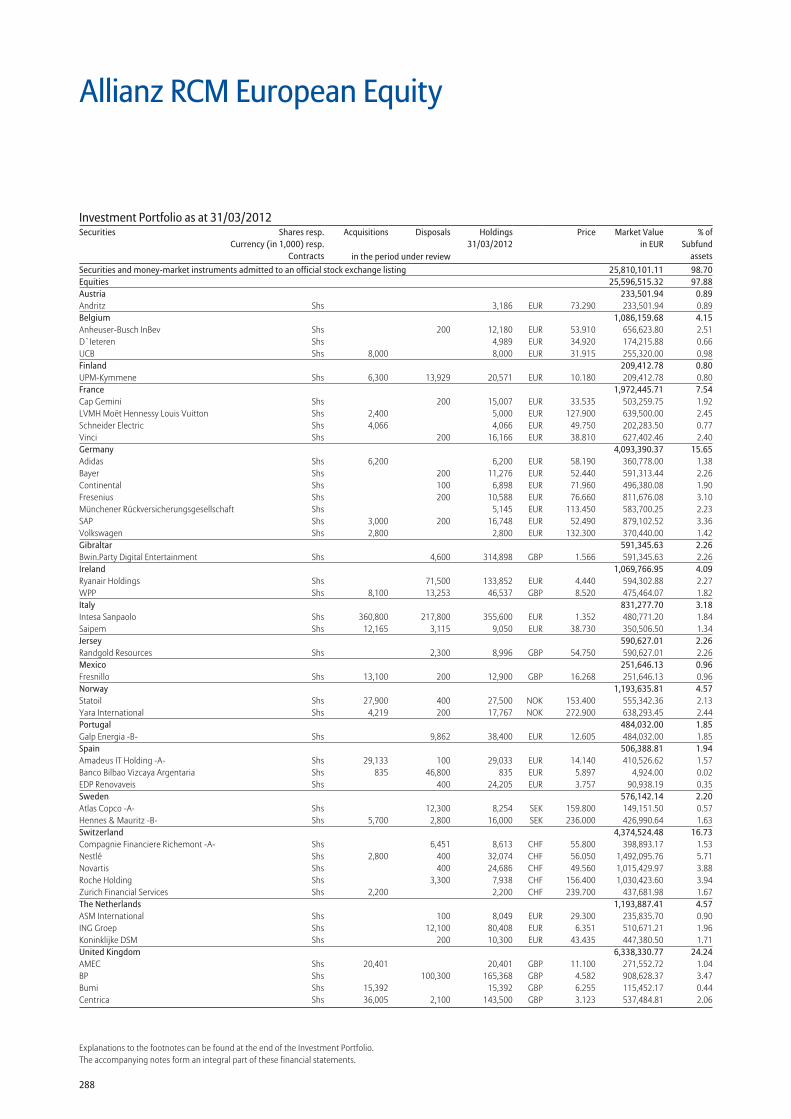
288
Explanations to the footnotes can be found at the end of the Investment Portfolio.The accompanying notes form an integral part of these financial statements.
Securities and money-market instruments admitted to an official stock exchange listing 25,810,101.11 98.70Equities 25,596,515.32 97.88Austria 233,501.94 0.89Andritz Shs 3,186 EUR 73.290 233,501.94 0.89Belgium 1,086,159.68 4.15Anheuser-Busch InBev Shs 200 12,180 EUR 53.910 656,623.80 2.51D`Ieteren Shs 4,989 EUR 34.920 174,215.88 0.66UCB Shs 8,000 8,000 EUR 31.915 255,320.00 0.98Finland 209,412.78 0.80UPM-Kymmene Shs 6,300 13,929 20,571 EUR 10.180 209,412.78 0.80France 1,972,445.71 7.54Cap Gemini Shs 200 15,007 EUR 33.535 503,259.75 1.92LVMH Moët Hennessy Louis Vuitton Shs 2,400 5,000 EUR 127.900 639,500.00 2.45Schneider Electric Shs 4,066 4,066 EUR 49.750 202,283.50 0.77Vinci Shs 200 16,166 EUR 38.810 627,402.46 2.40Germany 4,093,390.37 15.65Adidas Shs 6,200 6,200 EUR 58.190 360,778.00 1.38Bayer Shs 200 11,276 EUR 52.440 591,313.44 2.26Continental Shs 100 6,898 EUR 71.960 496,380.08 1.90Fresenius Shs 200 10,588 EUR 76.660 811,676.08 3.10Münchener Rückversicherungsgesellschaft Shs 5,145 EUR 113.450 583,700.25 2.23SAP Shs 3,000 200 16,748 EUR 52.490 879,102.52 3.36Volkswagen Shs 2,800 2,800 EUR 132.300 370,440.00 1.42Gibraltar 591,345.63 2.26Bwin.Party Digital Entertainment Shs 4,600 314,898 GBP 1.566 591,345.63 2.26Ireland 1,069,766.95 4.09Ryanair Holdings Shs 71,500 133,852 EUR 4.440 594,302.88 2.27WPP Shs 8,100 13,253 46,537 GBP 8.520 475,464.07 1.82Italy 831,277.70 3.18Intesa Sanpaolo Shs 360,800 217,800 355,600 EUR 1.352 480,771.20 1.84Saipem Shs 12,165 3,115 9,050 EUR 38.730 350,506.50 1.34Jersey 590,627.01 2.26Randgold Resources Shs 2,300 8,996 GBP 54.750 590,627.01 2.26Mexico 251,646.13 0.96Fresnillo Shs 13,100 200 12,900 GBP 16.268 251,646.13 0.96Norway 1,193,635.81 4.57Statoil Shs 27,900 400 27,500 NOK 153.400 555,342.36 2.13Yara International Shs 4,219 200 17,767 NOK 272.900 638,293.45 2.44Portugal 484,032.00 1.85Galp Energia -B- Shs 9,862 38,400 EUR 12.605 484,032.00 1.85Spain 506,388.81 1.94Amadeus IT Holding -A- Shs 29,133 100 29,033 EUR 14.140 410,526.62 1.57Banco Bilbao Vizcaya Argentaria Shs 835 46,800 835 EUR 5.897 4,924.00 0.02EDP Renovaveis Shs 400 24,205 EUR 3.757 90,938.19 0.35Sweden 576,142.14 2.20Atlas Copco -A- Shs 12,300 8,254 SEK 159.800 149,151.50 0.57Hennes & Mauritz -B- Shs 5,700 2,800 16,000 SEK 236.000 426,990.64 1.63Switzerland 4,374,524.48 16.73Compagnie Financiere Richemont -A- Shs 6,451 8,613 CHF 55.800 398,893.17 1.53Nestlé Shs 2,800 400 32,074 CHF 56.050 1,492,095.76 5.71Novartis Shs 400 24,686 CHF 49.560 1,015,429.97 3.88Roche Holding Shs 3,300 7,938 CHF 156.400 1,030,423.60 3.94Zurich Financial Services Shs 2,200 2,200 CHF 239.700 437,681.98 1.67The Netherlands 1,193,887.41 4.57ASM International Shs 100 8,049 EUR 29.300 235,835.70 0.90ING Groep Shs 12,100 80,408 EUR 6.351 510,671.21 1.96Koninklijke DSM Shs 200 10,300 EUR 43.435 447,380.50 1.71United Kingdom 6,338,330.77 24.24AMEC Shs 20,401 20,401 GBP 11.100 271,552.72 1.04BP Shs 100,300 165,368 GBP 4.582 908,628.37 3.47Bumi Shs 15,392 15,392 GBP 6.255 115,452.17 0.44Centrica Shs 36,005 2,100 143,500 GBP 3.123 537,484.81 2.06
Allianz RCM European Equity
Investment Portfolio as at 31/03/2012Securities Shares resp.
Currency (in 1,000) resp.Contracts
Acquisitions Disposals Holdings 31/03/2012
Price Market Valuein EUR
% ofSubfund
assetsin the period under review
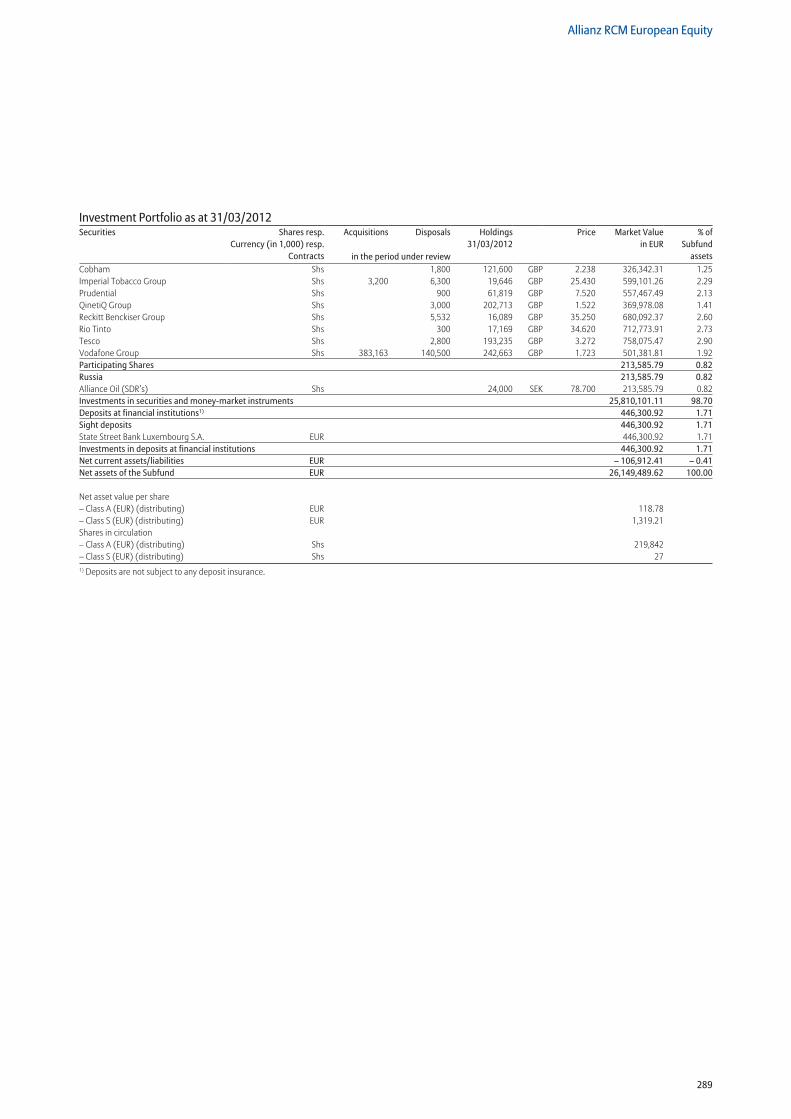
289
Allianz RCM European Equity
Cobham Shs 1,800 121,600 GBP 2.238 326,342.31 1.25Imperial Tobacco Group Shs 3,200 6,300 19,646 GBP 25.430 599,101.26 2.29Prudential Shs 900 61,819 GBP 7.520 557,467.49 2.13QinetiQ Group Shs 3,000 202,713 GBP 1.522 369,978.08 1.41Reckitt Benckiser Group Shs 5,532 16,089 GBP 35.250 680,092.37 2.60Rio Tinto Shs 300 17,169 GBP 34.620 712,773.91 2.73Tesco Shs 2,800 193,235 GBP 3.272 758,075.47 2.90Vodafone Group Shs 383,163 140,500 242,663 GBP 1.723 501,381.81 1.92Participating Shares 213,585.79 0.82Russia 213,585.79 0.82Alliance Oil (SDR’s) Shs 24,000 SEK 78.700 213,585.79 0.82Investments in securities and money-market instruments 25,810,101.11 98.70Deposits at financial institutions1) 446,300.92 1.71Sight deposits 446,300.92 1.71State Street Bank Luxembourg S.A. EUR 446,300.92 1.71Investments in deposits at financial institutions 446,300.92 1.71Net current assets/liabilities EUR – 106,912.41 – 0.41Net assets of the Subfund EUR 26,149,489.62 100.00
Net asset value per share – Class A (EUR) (distributing) EUR 118.78– Class S (EUR) (distributing) EUR 1,319.21Shares in circulation – Class A (EUR) (distributing) Shs 219,842 – Class S (EUR) (distributing) Shs 271) Deposits are not subject to any deposit insurance.
Investment Portfolio as at 31/03/2012Securities Shares resp.
Currency (in 1,000) resp.Contracts
Acquisitions Disposals Holdings 31/03/2012
Price Market Valuein EUR
% ofSubfund
assetsin the period under review
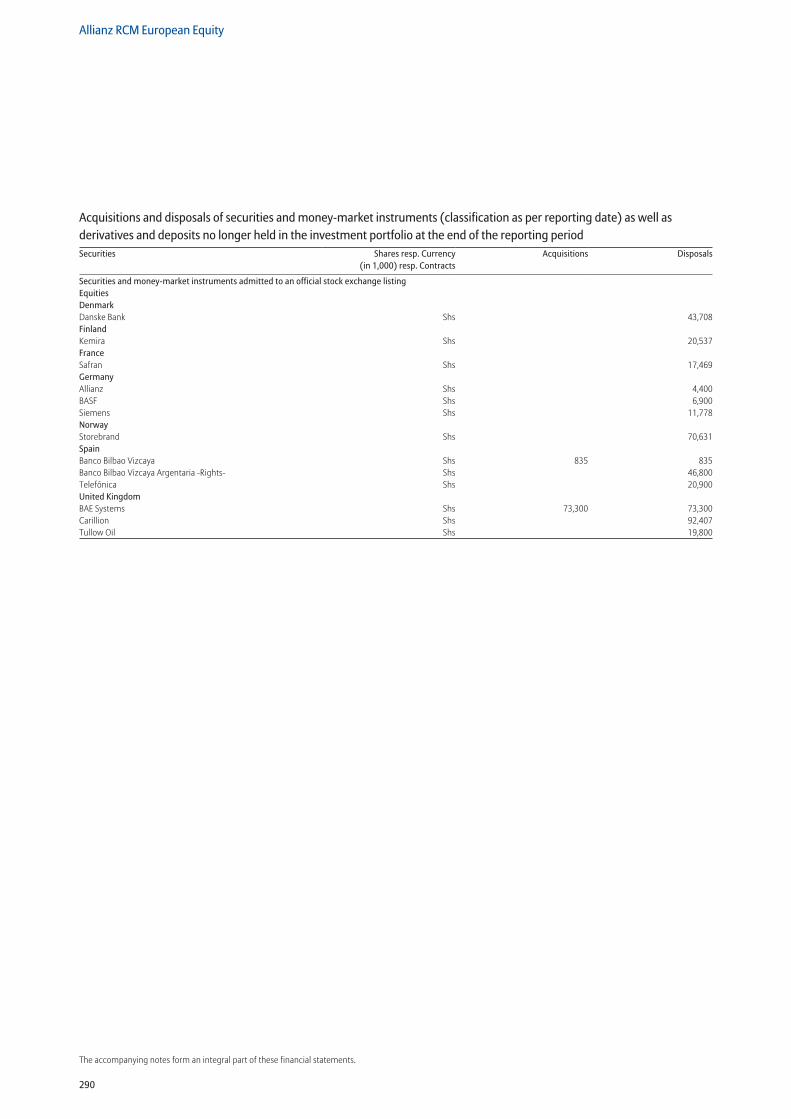
290
Allianz RCM European Equity
The accompanying notes form an integral part of these financial statements.
Securities and money-market instruments admitted to an official stock exchange listing Equities Denmark Danske Bank Shs 43,708Finland Kemira Shs 20,537France Safran Shs 17,469Germany Allianz Shs 4,400BASF Shs 6,900Siemens Shs 11,778Norway Storebrand Shs 70,631Spain Banco Bilbao Vizcaya Shs 835 835Banco Bilbao Vizcaya Argentaria -Rights- Shs 46,800Telefónica Shs 20,900United Kingdom BAE Systems Shs 73,300 73,300Carillion Shs 92,407Tullow Oil Shs 19,800
Acquisitions and disposals of securities and money-market instruments (classification as per reporting date) as well as derivatives and deposits no longer held in the investment portfolio at the end of the reporting periodSecurities Shares resp. Currency
(in 1,000) resp. ContractsAcquisitions Disposals
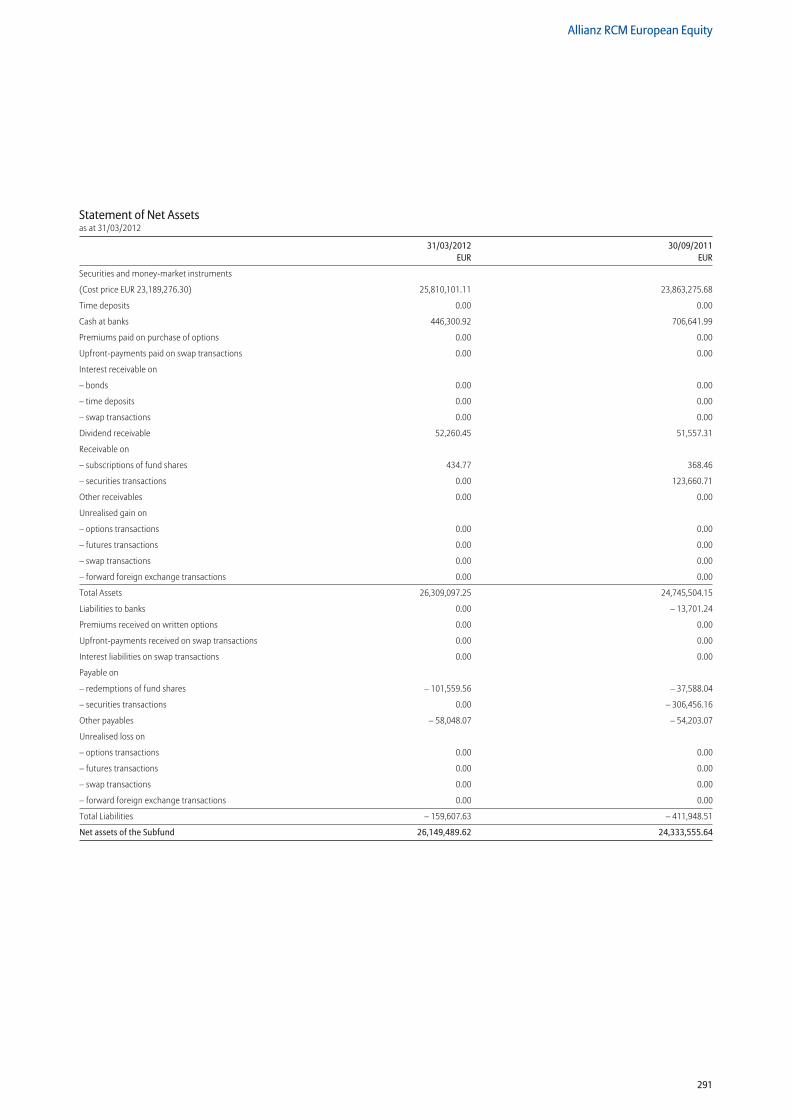
291
Allianz RCM European Equity
Statement of Net Assetsas at 31/03/2012
31/03/2012 30/09/2011 EUR EUR
Securities and money-market instruments
(Cost price EUR 23,189,276.30) 25,810,101.11 23,863,275.68
Time deposits 0.00 0.00
Cash at banks 446,300.92 706,641.99
Premiums paid on purchase of options 0.00 0.00
Upfront-payments paid on swap transactions 0.00 0.00
Interest receivable on
– bonds 0.00 0.00
– time deposits 0.00 0.00
– swap transactions 0.00 0.00
Dividend receivable 52,260.45 51,557.31
Receivable on
– subscriptions of fund shares 434.77 368.46
– securities transactions 0.00 123,660.71
Other receivables 0.00 0.00
Unrealised gain on
– options transactions 0.00 0.00
– futures transactions 0.00 0.00
– swap transactions 0.00 0.00
– forward foreign exchange transactions 0.00 0.00
Total Assets 26,309,097.25 24,745,504.15
Liabilities to banks 0.00 – 13,701.24
Premiums received on written options 0.00 0.00
Upfront-payments received on swap transactions 0.00 0.00
Interest liabilities on swap transactions 0.00 0.00
Payable on
– redemptions of fund shares – 101,559.56 – 37,588.04
– securities transactions 0.00 – 306,456.16
Other payables – 58,048.07 – 54,203.07
Unrealised loss on
– options transactions 0.00 0.00
– futures transactions 0.00 0.00
– swap transactions 0.00 0.00
– forward foreign exchange transactions 0.00 0.00
Total Liabilities – 159,607.63 – 411,948.51
Net assets of the Subfund 26,149,489.62 24,333,555.64
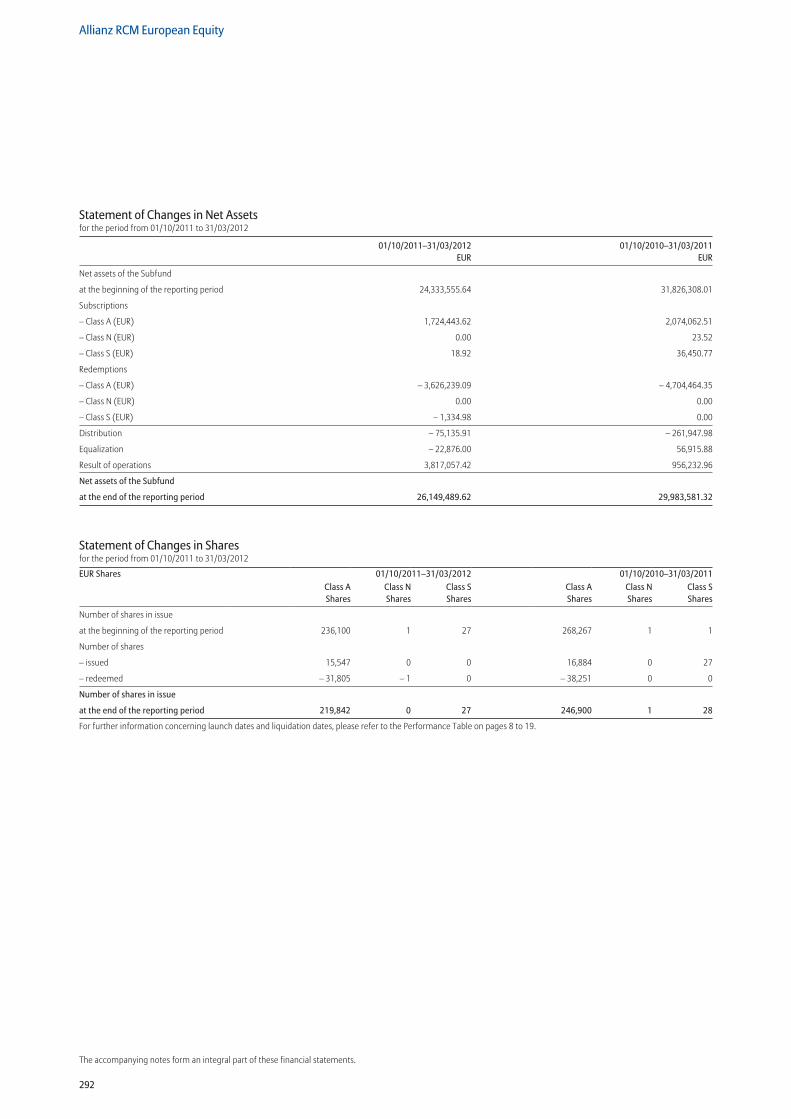
292
Allianz RCM European Equity
The accompanying notes form an integral part of these financial statements.
Statement of Changes in Net Assetsfor the period from 01/10/2011 to 31/03/2012
01/10/2011–31/03/2012 01/10/2010–31/03/2011 EUR EUR
Net assets of the Subfund
at the beginning of the reporting period 24,333,555.64 31,826,308.01
Subscriptions
– Class A (EUR) 1,724,443.62 2,074,062.51
– Class N (EUR) 0.00 23.52
– Class S (EUR) 18.92 36,450.77
Redemptions
– Class A (EUR) – 3,626,239.09 – 4,704,464.35
– Class N (EUR) 0.00 0.00
– Class S (EUR) – 1,334.98 0.00
Distribution – 75,135.91 – 261,947.98
Equalization – 22,876.00 56,915.88
Result of operations 3,817,057.42 956,232.96
Net assets of the Subfund
at the end of the reporting period 26,149,489.62 29,983,581.32
Statement of Changes in Sharesfor the period from 01/10/2011 to 31/03/2012
EUR Shares 01/10/2011–31/03/2012 01/10/2010–31/03/2011Class A Shares
Class N Shares
Class S Shares
Class A Shares
Class N Shares
Class S Shares
Number of shares in issue
at the beginning of the reporting period 236,100 1 27 268,267 1 1
Number of shares
– issued 15,547 0 0 16,884 0 27
– redeemed – 31,805 – 1 0 – 38,251 0 0
Number of shares in issue
at the end of the reporting period 219,842 0 27 246,900 1 28
For further information concerning launch dates and liquidation dates, please refer to the Performance Table on pages 8 to 19.
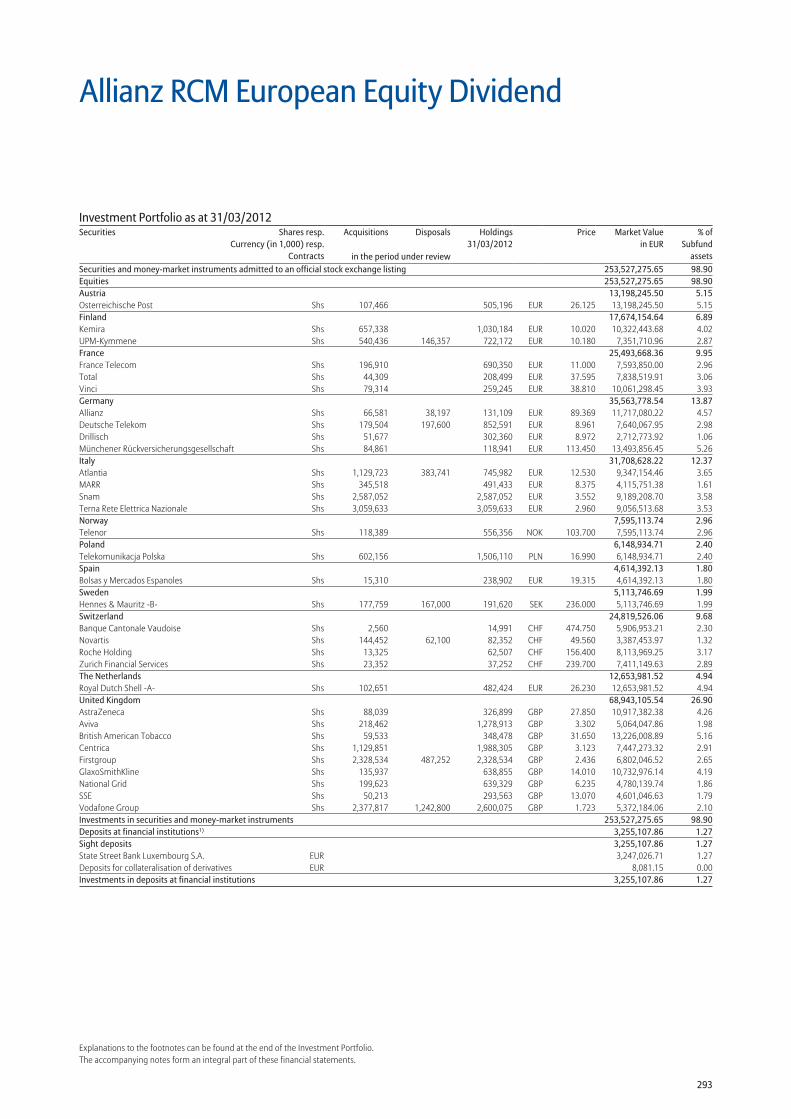
293
Explanations to the footnotes can be found at the end of the Investment Portfolio.The accompanying notes form an integral part of these financial statements.
Allianz RCM European Equity Dividend
Securities and money-market instruments admitted to an official stock exchange listing 253,527,275.65 98.90Equities 253,527,275.65 98.90Austria 13,198,245.50 5.15Osterreichische Post Shs 107,466 505,196 EUR 26.125 13,198,245.50 5.15Finland 17,674,154.64 6.89Kemira Shs 657,338 1,030,184 EUR 10.020 10,322,443.68 4.02UPM-Kymmene Shs 540,436 146,357 722,172 EUR 10.180 7,351,710.96 2.87France 25,493,668.36 9.95France Telecom Shs 196,910 690,350 EUR 11.000 7,593,850.00 2.96Total Shs 44,309 208,499 EUR 37.595 7,838,519.91 3.06Vinci Shs 79,314 259,245 EUR 38.810 10,061,298.45 3.93Germany 35,563,778.54 13.87Allianz Shs 66,581 38,197 131,109 EUR 89.369 11,717,080.22 4.57Deutsche Telekom Shs 179,504 197,600 852,591 EUR 8.961 7,640,067.95 2.98Drillisch Shs 51,677 302,360 EUR 8.972 2,712,773.92 1.06Münchener Rückversicherungsgesellschaft Shs 84,861 118,941 EUR 113.450 13,493,856.45 5.26Italy 31,708,628.22 12.37Atlantia Shs 1,129,723 383,741 745,982 EUR 12.530 9,347,154.46 3.65MARR Shs 345,518 491,433 EUR 8.375 4,115,751.38 1.61Snam Shs 2,587,052 2,587,052 EUR 3.552 9,189,208.70 3.58Terna Rete Elettrica Nazionale Shs 3,059,633 3,059,633 EUR 2.960 9,056,513.68 3.53Norway 7,595,113.74 2.96Telenor Shs 118,389 556,356 NOK 103.700 7,595,113.74 2.96Poland 6,148,934.71 2.40Telekomunikacja Polska Shs 602,156 1,506,110 PLN 16.990 6,148,934.71 2.40Spain 4,614,392.13 1.80Bolsas y Mercados Espanoles Shs 15,310 238,902 EUR 19.315 4,614,392.13 1.80Sweden 5,113,746.69 1.99Hennes & Mauritz -B- Shs 177,759 167,000 191,620 SEK 236.000 5,113,746.69 1.99Switzerland 24,819,526.06 9.68Banque Cantonale Vaudoise Shs 2,560 14,991 CHF 474.750 5,906,953.21 2.30Novartis Shs 144,452 62,100 82,352 CHF 49.560 3,387,453.97 1.32Roche Holding Shs 13,325 62,507 CHF 156.400 8,113,969.25 3.17Zurich Financial Services Shs 23,352 37,252 CHF 239.700 7,411,149.63 2.89The Netherlands 12,653,981.52 4.94Royal Dutch Shell -A- Shs 102,651 482,424 EUR 26.230 12,653,981.52 4.94United Kingdom 68,943,105.54 26.90AstraZeneca Shs 88,039 326,899 GBP 27.850 10,917,382.38 4.26Aviva Shs 218,462 1,278,913 GBP 3.302 5,064,047.86 1.98British American Tobacco Shs 59,533 348,478 GBP 31.650 13,226,008.89 5.16Centrica Shs 1,129,851 1,988,305 GBP 3.123 7,447,273.32 2.91Firstgroup Shs 2,328,534 487,252 2,328,534 GBP 2.436 6,802,046.52 2.65GlaxoSmithKline Shs 135,937 638,855 GBP 14.010 10,732,976.14 4.19National Grid Shs 199,623 639,329 GBP 6.235 4,780,139.74 1.86SSE Shs 50,213 293,563 GBP 13.070 4,601,046.63 1.79Vodafone Group Shs 2,377,817 1,242,800 2,600,075 GBP 1.723 5,372,184.06 2.10Investments in securities and money-market instruments 253,527,275.65 98.90Deposits at financial institutions1) 3,255,107.86 1.27Sight deposits 3,255,107.86 1.27State Street Bank Luxembourg S.A. EUR 3,247,026.71 1.27Deposits for collateralisation of derivatives EUR 8,081.15 0.00Investments in deposits at financial institutions 3,255,107.86 1.27
Investment Portfolio as at 31/03/2012Securities Shares resp.
Currency (in 1,000) resp.Contracts
Acquisitions Disposals Holdings 31/03/2012
Price Market Valuein EUR
% ofSubfund
assetsin the period under review
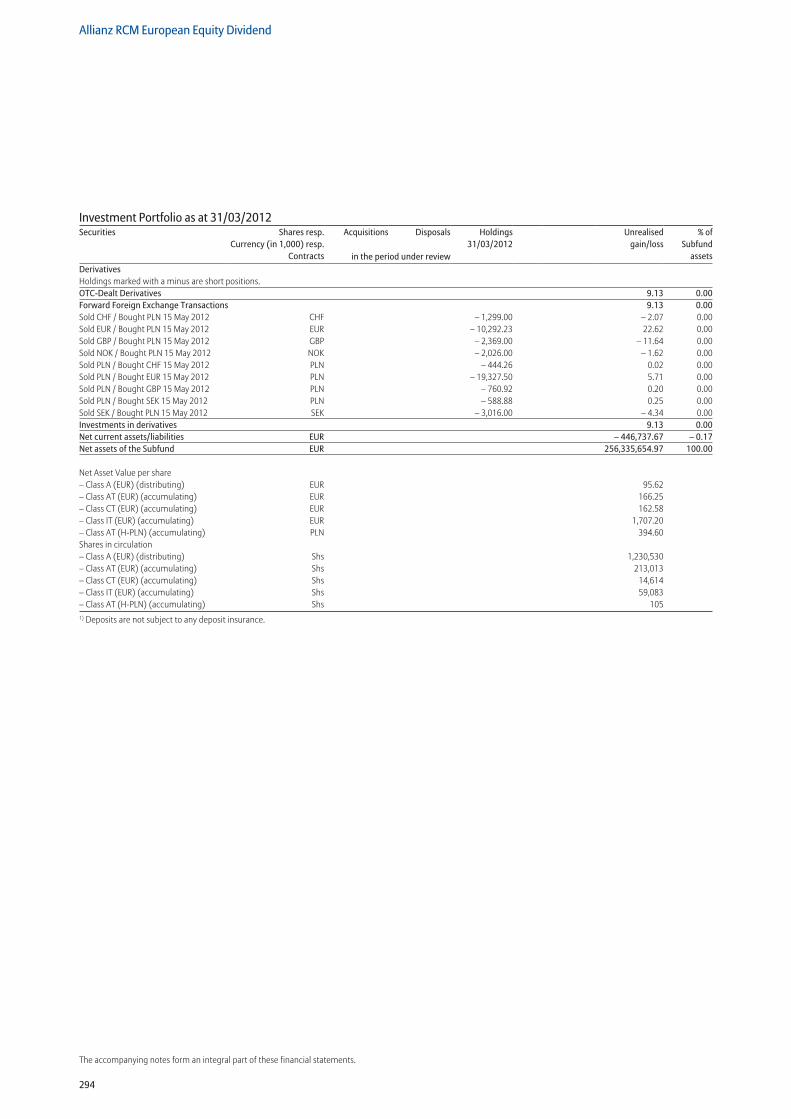
294
Allianz RCM European Equity Dividend
The accompanying notes form an integral part of these financial statements.
Derivatives Holdings marked with a minus are short positions. OTC-Dealt Derivatives 9.13 0.00Forward Foreign Exchange Transactions 9.13 0.00Sold CHF / Bought PLN 15 May 2012 CHF – 1,299.00 – 2.07 0.00Sold EUR / Bought PLN 15 May 2012 EUR – 10,292.23 22.62 0.00Sold GBP / Bought PLN 15 May 2012 GBP – 2,369.00 – 11.64 0.00Sold NOK / Bought PLN 15 May 2012 NOK – 2,026.00 – 1.62 0.00Sold PLN / Bought CHF 15 May 2012 PLN – 444.26 0.02 0.00Sold PLN / Bought EUR 15 May 2012 PLN – 19,327.50 5.71 0.00Sold PLN / Bought GBP 15 May 2012 PLN – 760.92 0.20 0.00Sold PLN / Bought SEK 15 May 2012 PLN – 588.88 0.25 0.00Sold SEK / Bought PLN 15 May 2012 SEK – 3,016.00 – 4.34 0.00Investments in derivatives 9.13 0.00Net current assets/liabilities EUR – 446,737.67 – 0.17Net assets of the Subfund EUR 256,335,654.97 100.00
Net Asset Value per share – Class A (EUR) (distributing) EUR 95.62 – Class AT (EUR) (accumulating) EUR 166.25 – Class CT (EUR) (accumulating) EUR 162.58 – Class IT (EUR) (accumulating) EUR 1,707.20 – Class AT (H-PLN) (accumulating) PLN 394.60 Shares in circulation – Class A (EUR) (distributing) Shs 1,230,530 – Class AT (EUR) (accumulating) Shs 213,013 – Class CT (EUR) (accumulating) Shs 14,614 – Class IT (EUR) (accumulating) Shs 59,083 – Class AT (H-PLN) (accumulating) Shs 1051) Deposits are not subject to any deposit insurance.
Investment Portfolio as at 31/03/2012Securities Shares resp.
Currency (in 1,000) resp.Contracts
Acquisitions Disposals Holdings 31/03/2012
Unrealisedgain/loss
% ofSubfund
assetsin the period under review
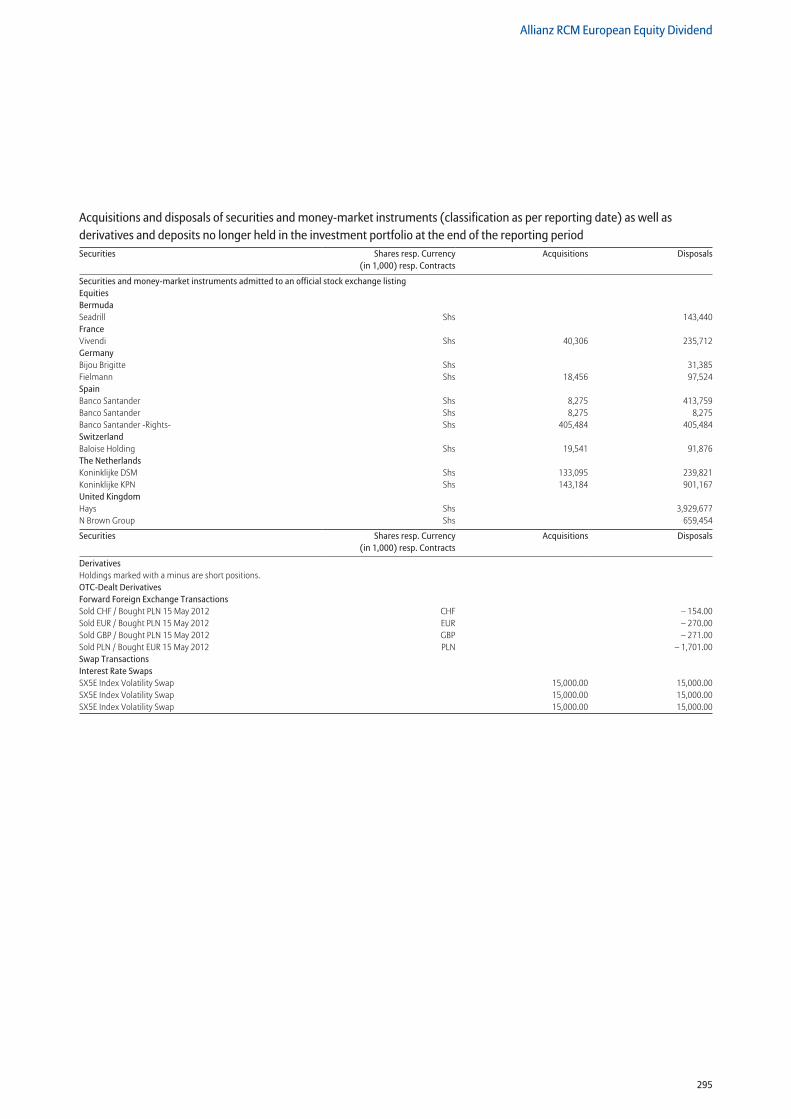
295
Allianz RCM European Equity Dividend
Securities and money-market instruments admitted to an official stock exchange listing Equities Bermuda Seadrill Shs 143,440France Vivendi Shs 40,306 235,712Germany Bijou Brigitte Shs 31,385Fielmann Shs 18,456 97,524Spain Banco Santander Shs 8,275 413,759Banco Santander Shs 8,275 8,275Banco Santander -Rights- Shs 405,484 405,484Switzerland Baloise Holding Shs 19,541 91,876The Netherlands Koninklijke DSM Shs 133,095 239,821Koninklijke KPN Shs 143,184 901,167United Kingdom Hays Shs 3,929,677N Brown Group Shs 659,454
Securities Shares resp. Currency (in 1,000) resp. Contracts
Acquisitions Disposals
DerivativesHoldings marked with a minus are short positions. OTC-Dealt Derivatives Forward Foreign Exchange Transactions Sold CHF / Bought PLN 15 May 2012 CHF – 154.00Sold EUR / Bought PLN 15 May 2012 EUR – 270.00Sold GBP / Bought PLN 15 May 2012 GBP – 271.00Sold PLN / Bought EUR 15 May 2012 PLN – 1,701.00Swap Transactions Interest Rate Swaps SX5E Index Volatility Swap 15,000.00 15,000.00SX5E Index Volatility Swap 15,000.00 15,000.00SX5E Index Volatility Swap 15,000.00 15,000.00
Acquisitions and disposals of securities and money-market instruments (classification as per reporting date) as well as derivatives and deposits no longer held in the investment portfolio at the end of the reporting periodSecurities Shares resp. Currency
(in 1,000) resp. ContractsAcquisitions Disposals
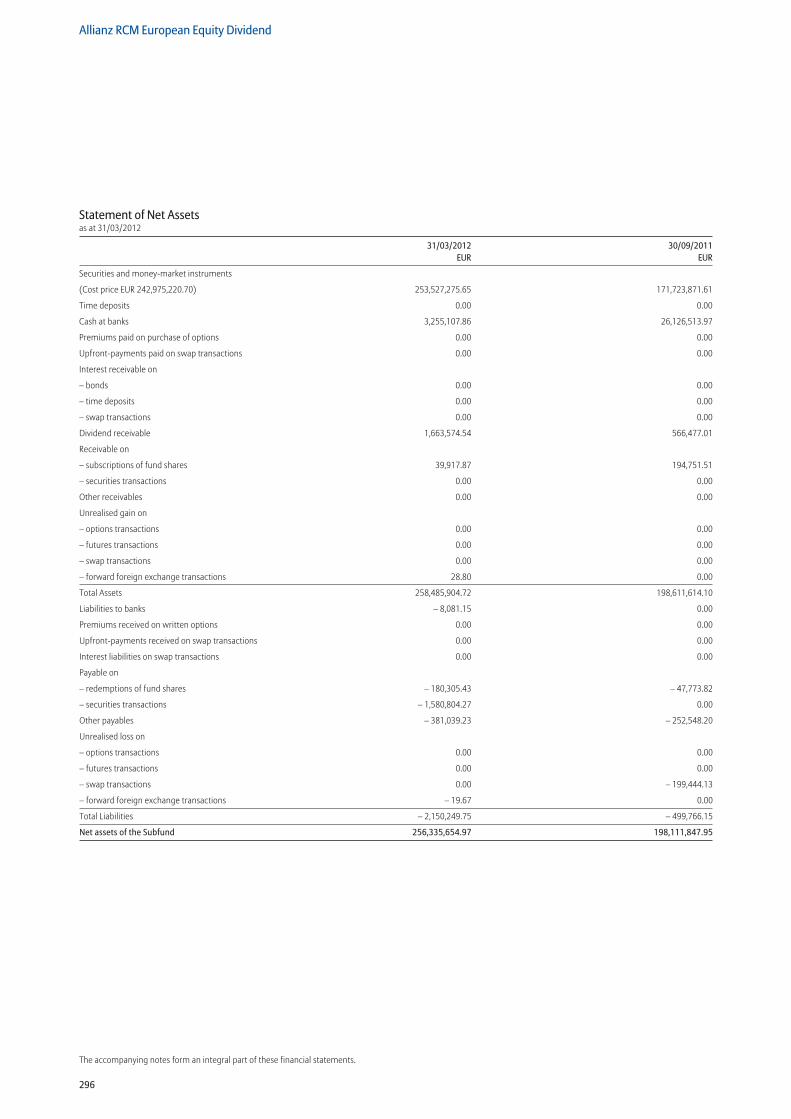
296
Allianz RCM European Equity Dividend
The accompanying notes form an integral part of these financial statements.
Statement of Net Assetsas at 31/03/2012
31/03/2012 30/09/2011 EUR EUR
Securities and money-market instruments
(Cost price EUR 242,975,220.70) 253,527,275.65 171,723,871.61
Time deposits 0.00 0.00
Cash at banks 3,255,107.86 26,126,513.97
Premiums paid on purchase of options 0.00 0.00
Upfront-payments paid on swap transactions 0.00 0.00
Interest receivable on
– bonds 0.00 0.00
– time deposits 0.00 0.00
– swap transactions 0.00 0.00
Dividend receivable 1,663,574.54 566,477.01
Receivable on
– subscriptions of fund shares 39,917.87 194,751.51
– securities transactions 0.00 0.00
Other receivables 0.00 0.00
Unrealised gain on
– options transactions 0.00 0.00
– futures transactions 0.00 0.00
– swap transactions 0.00 0.00
– forward foreign exchange transactions 28.80 0.00
Total Assets 258,485,904.72 198,611,614.10
Liabilities to banks – 8,081.15 0.00
Premiums received on written options 0.00 0.00
Upfront-payments received on swap transactions 0.00 0.00
Interest liabilities on swap transactions 0.00 0.00
Payable on
– redemptions of fund shares – 180,305.43 – 47,773.82
– securities transactions – 1,580,804.27 0.00
Other payables – 381,039.23 – 252,548.20
Unrealised loss on
– options transactions 0.00 0.00
– futures transactions 0.00 0.00
– swap transactions 0.00 – 199,444.13
– forward foreign exchange transactions – 19.67 0.00
Total Liabilities – 2,150,249.75 – 499,766.15
Net assets of the Subfund 256,335,654.97 198,111,847.95
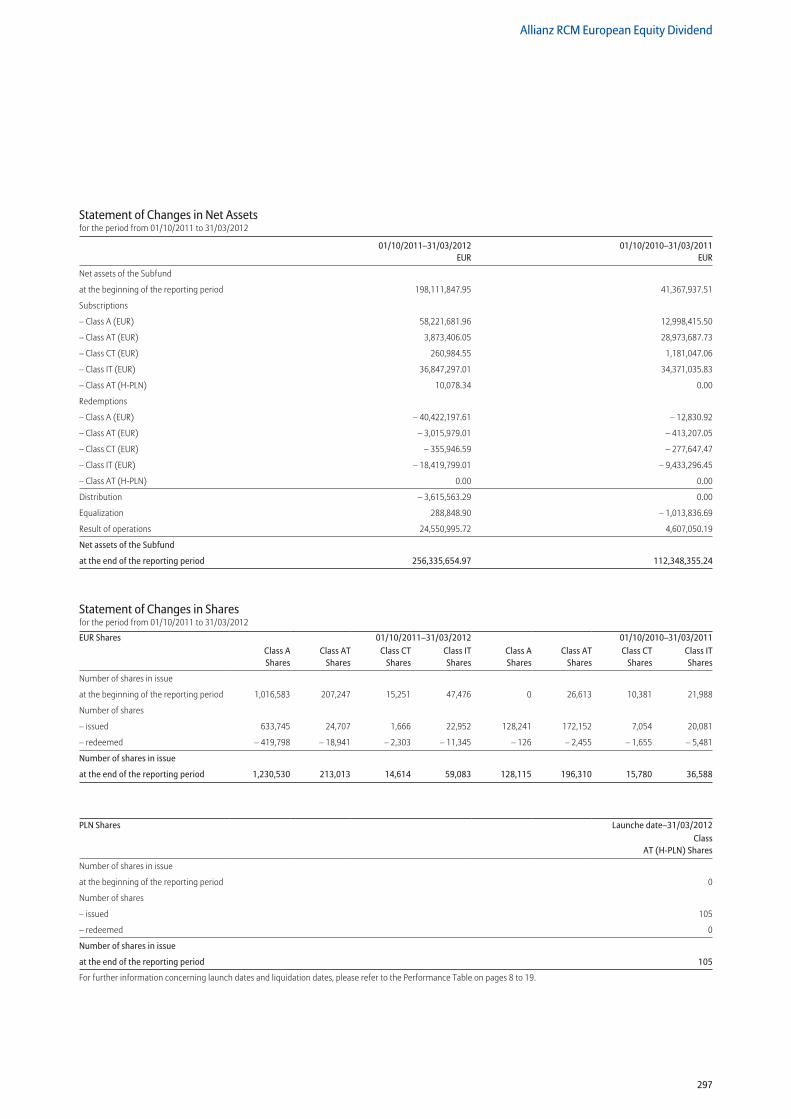
297
Allianz RCM European Equity Dividend
Statement of Changes in Net Assetsfor the period from 01/10/2011 to 31/03/2012
01/10/2011–31/03/2012 01/10/2010–31/03/2011 EUR EUR
Net assets of the Subfund
at the beginning of the reporting period 198,111,847.95 41,367,937.51
Subscriptions
– Class A (EUR) 58,221,681.96 12,998,415.50
– Class AT (EUR) 3,873,406.05 28,973,687.73
– Class CT (EUR) 260,984.55 1,181,047.06
– Class IT (EUR) 36,847,297.01 34,371,035.83
– Class AT (H-PLN) 10,078.34 0.00
Redemptions
– Class A (EUR) – 40,422,197.61 – 12,830.92
– Class AT (EUR) – 3,015,979.01 – 413,207.05
– Class CT (EUR) – 355,946.59 – 277,647.47
– Class IT (EUR) – 18,419,799.01 – 9,433,296.45
– Class AT (H-PLN) 0.00 0.00
Distribution – 3,615,563.29 0.00
Equalization 288,848.90 – 1,013,836.69
Result of operations 24,550,995.72 4,607,050.19
Net assets of the Subfund
at the end of the reporting period 256,335,654.97 112,348,355.24
Statement of Changes in Sharesfor the period from 01/10/2011 to 31/03/2012
EUR Shares 01/10/2011–31/03/2012 01/10/2010–31/03/2011Class A Shares
Class AT Shares
Class CT Shares
Class IT Shares
Class A Shares
Class AT Shares
Class CT Shares
Class IT Shares
Number of shares in issue
at the beginning of the reporting period 1,016,583 207,247 15,251 47,476 0 26,613 10,381 21,988
Number of shares
– issued 633,745 24,707 1,666 22,952 128,241 172,152 7,054 20,081
– redeemed – 419,798 – 18,941 – 2,303 – 11,345 – 126 – 2,455 – 1,655 – 5,481
Number of shares in issue
at the end of the reporting period 1,230,530 213,013 14,614 59,083 128,115 196,310 15,780 36,588
PLN Shares Launche date–31/03/2012Class
AT (H-PLN) Shares
Number of shares in issue
at the beginning of the reporting period 0
Number of shares
– issued 105
– redeemed 0
Number of shares in issue
at the end of the reporting period 105
For further information concerning launch dates and liquidation dates, please refer to the Performance Table on pages 8 to 19.
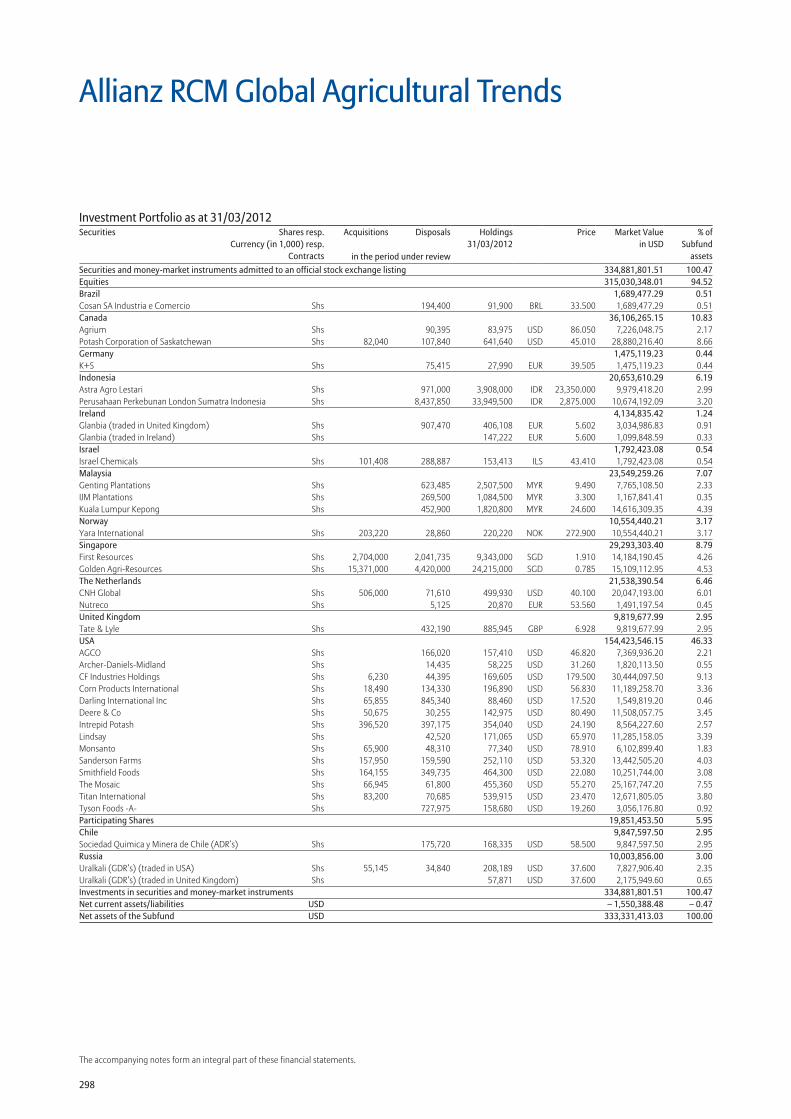
298
The accompanying notes form an integral part of these financial statements.
Allianz RCM Global Agricultural Trends
Securities and money-market instruments admitted to an official stock exchange listing 334,881,801.51 100.47Equities 315,030,348.01 94.52Brazil 1,689,477.29 0.51Cosan SA Industria e Comercio Shs 194,400 91,900 BRL 33.500 1,689,477.29 0.51Canada 36,106,265.15 10.83Agrium Shs 90,395 83,975 USD 86.050 7,226,048.75 2.17Potash Corporation of Saskatchewan Shs 82,040 107,840 641,640 USD 45.010 28,880,216.40 8.66Germany 1,475,119.23 0.44K+S Shs 75,415 27,990 EUR 39.505 1,475,119.23 0.44Indonesia 20,653,610.29 6.19Astra Agro Lestari Shs 971,000 3,908,000 IDR 23,350.000 9,979,418.20 2.99Perusahaan Perkebunan London Sumatra Indonesia Shs 8,437,850 33,949,500 IDR 2,875.000 10,674,192.09 3.20Ireland 4,134,835.42 1.24Glanbia (traded in United Kingdom) Shs 907,470 406,108 EUR 5.602 3,034,986.83 0.91Glanbia (traded in Ireland) Shs 147,222 EUR 5.600 1,099,848.59 0.33Israel 1,792,423.08 0.54Israel Chemicals Shs 101,408 288,887 153,413 ILS 43.410 1,792,423.08 0.54Malaysia 23,549,259.26 7.07Genting Plantations Shs 623,485 2,507,500 MYR 9.490 7,765,108.50 2.33IJM Plantations Shs 269,500 1,084,500 MYR 3.300 1,167,841.41 0.35Kuala Lumpur Kepong Shs 452,900 1,820,800 MYR 24.600 14,616,309.35 4.39Norway 10,554,440.21 3.17Yara International Shs 203,220 28,860 220,220 NOK 272.900 10,554,440.21 3.17Singapore 29,293,303.40 8.79First Resources Shs 2,704,000 2,041,735 9,343,000 SGD 1.910 14,184,190.45 4.26Golden Agri-Resources Shs 15,371,000 4,420,000 24,215,000 SGD 0.785 15,109,112.95 4.53The Netherlands 21,538,390.54 6.46CNH Global Shs 506,000 71,610 499,930 USD 40.100 20,047,193.00 6.01Nutreco Shs 5,125 20,870 EUR 53.560 1,491,197.54 0.45United Kingdom 9,819,677.99 2.95Tate & Lyle Shs 432,190 885,945 GBP 6.928 9,819,677.99 2.95USA 154,423,546.15 46.33AGCO Shs 166,020 157,410 USD 46.820 7,369,936.20 2.21Archer-Daniels-Midland Shs 14,435 58,225 USD 31.260 1,820,113.50 0.55CF Industries Holdings Shs 6,230 44,395 169,605 USD 179.500 30,444,097.50 9.13Corn Products International Shs 18,490 134,330 196,890 USD 56.830 11,189,258.70 3.36Darling International Inc Shs 65,855 845,340 88,460 USD 17.520 1,549,819.20 0.46Deere & Co Shs 50,675 30,255 142,975 USD 80.490 11,508,057.75 3.45Intrepid Potash Shs 396,520 397,175 354,040 USD 24.190 8,564,227.60 2.57Lindsay Shs 42,520 171,065 USD 65.970 11,285,158.05 3.39Monsanto Shs 65,900 48,310 77,340 USD 78.910 6,102,899.40 1.83Sanderson Farms Shs 157,950 159,590 252,110 USD 53.320 13,442,505.20 4.03Smithfield Foods Shs 164,155 349,735 464,300 USD 22.080 10,251,744.00 3.08The Mosaic Shs 66,945 61,800 455,360 USD 55.270 25,167,747.20 7.55Titan International Shs 83,200 70,685 539,915 USD 23.470 12,671,805.05 3.80Tyson Foods -A- Shs 727,975 158,680 USD 19.260 3,056,176.80 0.92Participating Shares 19,851,453.50 5.95Chile 9,847,597.50 2.95Sociedad Quimica y Minera de Chile (ADR’s) Shs 175,720 168,335 USD 58.500 9,847,597.50 2.95Russia 10,003,856.00 3.00Uralkali (GDR’s) (traded in USA) Shs 55,145 34,840 208,189 USD 37.600 7,827,906.40 2.35Uralkali (GDR’s) (traded in United Kingdom) Shs 57,871 USD 37.600 2,175,949.60 0.65Investments in securities and money-market instruments 334,881,801.51 100.47Net current assets/liabilities USD – 1,550,388.48 – 0.47Net assets of the Subfund USD 333,331,413.03 100.00
Investment Portfolio as at 31/03/2012Securities Shares resp.
Currency (in 1,000) resp.Contracts
Acquisitions Disposals Holdings 31/03/2012
Price Market Valuein USD
% ofSubfund
assetsin the period under review
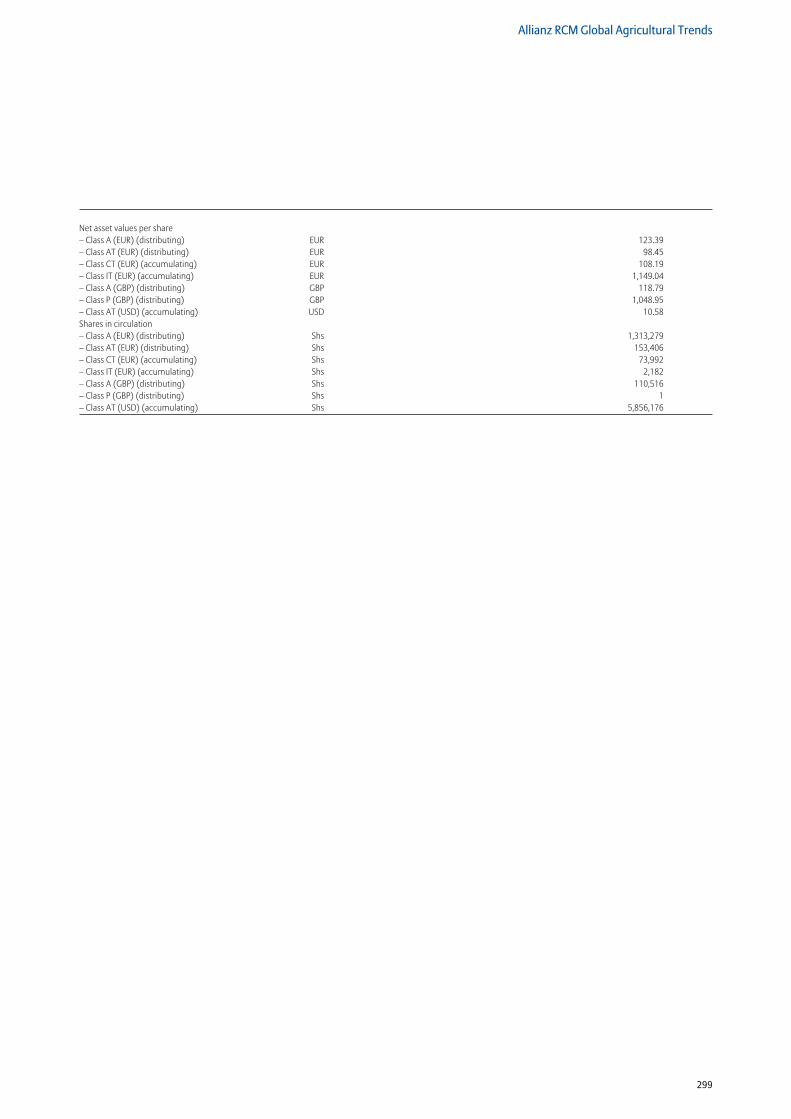
299
Allianz RCM Global Agricultural Trends
Net asset values per share – Class A (EUR) (distributing) EUR 123.39– Class AT (EUR) (distributing) EUR 98.45– Class CT (EUR) (accumulating) EUR 108.19– Class IT (EUR) (accumulating) EUR 1,149.04– Class A (GBP) (distributing) GBP 118.79– Class P (GBP) (distributing) GBP 1,048.95– Class AT (USD) (accumulating) USD 10.58Shares in circulation – Class A (EUR) (distributing) Shs 1,313,279 – Class AT (EUR) (distributing) Shs 153,406 – Class CT (EUR) (accumulating) Shs 73,992 – Class IT (EUR) (accumulating) Shs 2,182 – Class A (GBP) (distributing) Shs 110,516 – Class P (GBP) (distributing) Shs 1 – Class AT (USD) (accumulating) Shs 5,856,176
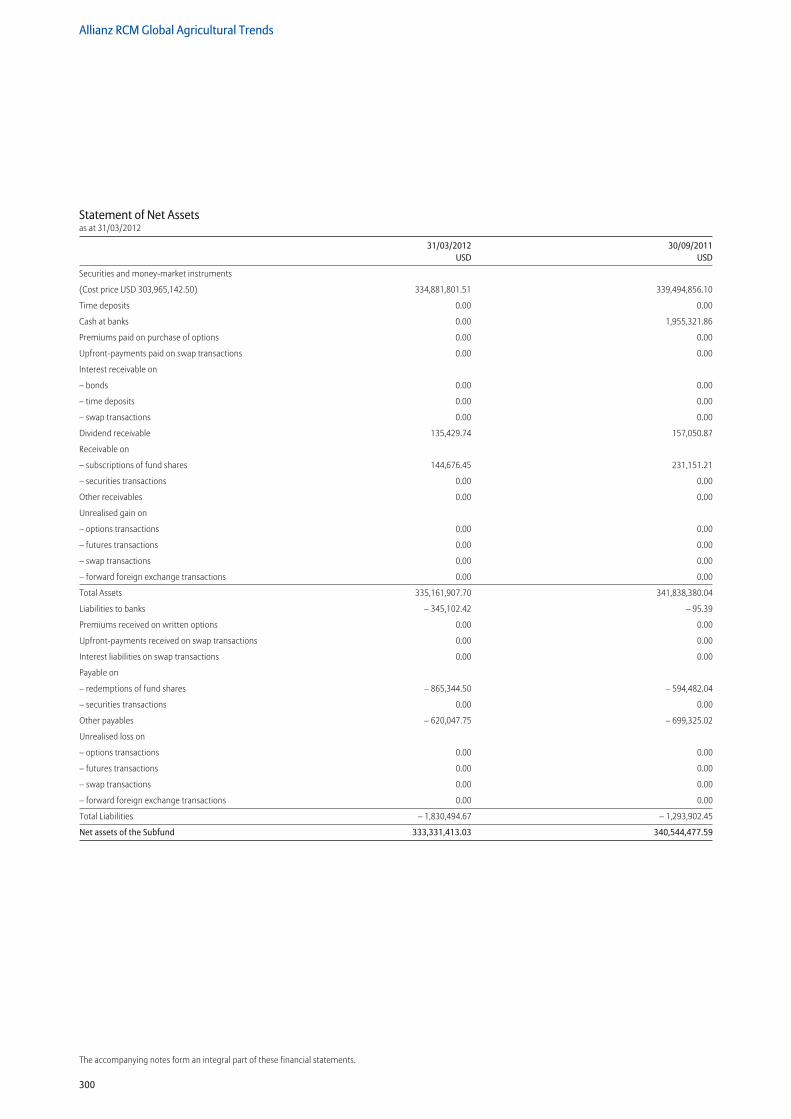
300
Allianz RCM Global Agricultural Trends
The accompanying notes form an integral part of these financial statements.
Statement of Net Assetsas at 31/03/2012
31/03/2012 30/09/2011 USD USD
Securities and money-market instruments
(Cost price USD 303,965,142.50) 334,881,801.51 339,494,856.10
Time deposits 0.00 0.00
Cash at banks 0.00 1,955,321.86
Premiums paid on purchase of options 0.00 0.00
Upfront-payments paid on swap transactions 0.00 0.00
Interest receivable on
– bonds 0.00 0.00
– time deposits 0.00 0.00
– swap transactions 0.00 0.00
Dividend receivable 135,429.74 157,050.87
Receivable on
– subscriptions of fund shares 144,676.45 231,151.21
– securities transactions 0.00 0.00
Other receivables 0.00 0.00
Unrealised gain on
– options transactions 0.00 0.00
– futures transactions 0.00 0.00
– swap transactions 0.00 0.00
– forward foreign exchange transactions 0.00 0.00
Total Assets 335,161,907.70 341,838,380.04
Liabilities to banks – 345,102.42 – 95.39
Premiums received on written options 0.00 0.00
Upfront-payments received on swap transactions 0.00 0.00
Interest liabilities on swap transactions 0.00 0.00
Payable on
– redemptions of fund shares – 865,344.50 – 594,482.04
– securities transactions 0.00 0.00
Other payables – 620,047.75 – 699,325.02
Unrealised loss on
– options transactions 0.00 0.00
– futures transactions 0.00 0.00
– swap transactions 0.00 0.00
– forward foreign exchange transactions 0.00 0.00
Total Liabilities – 1,830,494.67 – 1,293,902.45
Net assets of the Subfund 333,331,413.03 340,544,477.59
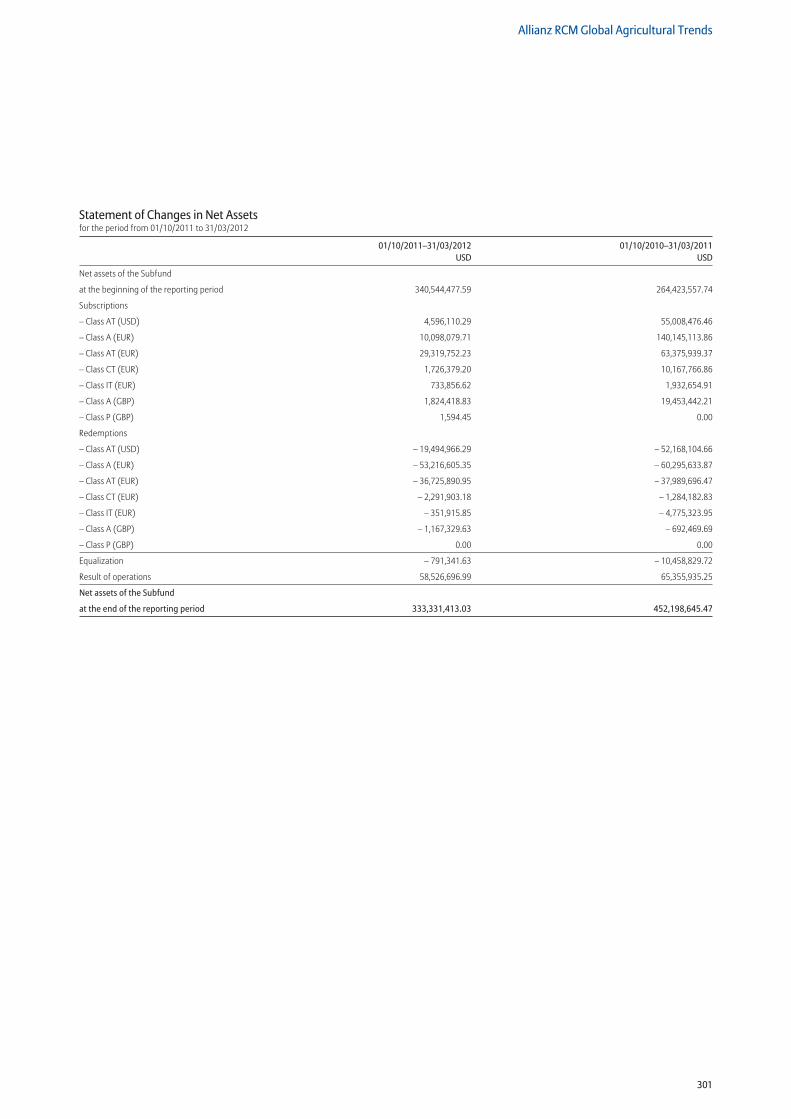
301
Allianz RCM Global Agricultural Trends
Statement of Changes in Net Assetsfor the period from 01/10/2011 to 31/03/2012
01/10/2011–31/03/2012 01/10/2010–31/03/2011 USD USD
Net assets of the Subfund
at the beginning of the reporting period 340,544,477.59 264,423,557.74
Subscriptions
– Class AT (USD) 4,596,110.29 55,008,476.46
– Class A (EUR) 10,098,079.71 140,145,113.86
– Class AT (EUR) 29,319,752.23 63,375,939.37
– Class CT (EUR) 1,726,379.20 10,167,766.86
– Class IT (EUR) 733,856.62 1,932,654.91
– Class A (GBP) 1,824,418.83 19,453,442.21
– Class P (GBP) 1,594.45 0.00
Redemptions
– Class AT (USD) – 19,494,966.29 – 52,168,104.66
– Class A (EUR) – 53,216,605.35 – 60,295,633.87
– Class AT (EUR) – 36,725,890.95 – 37,989,696.47
– Class CT (EUR) – 2,291,903.18 – 1,284,182.83
– Class IT (EUR) – 351,915.85 – 4,775,323.95
– Class A (GBP) – 1,167,329.63 – 692,469.69
– Class P (GBP) 0.00 0.00
Equalization – 791,341.63 – 10,458,829.72
Result of operations 58,526,696.99 65,355,935.25
Net assets of the Subfund
at the end of the reporting period 333,331,413.03 452,198,645.47
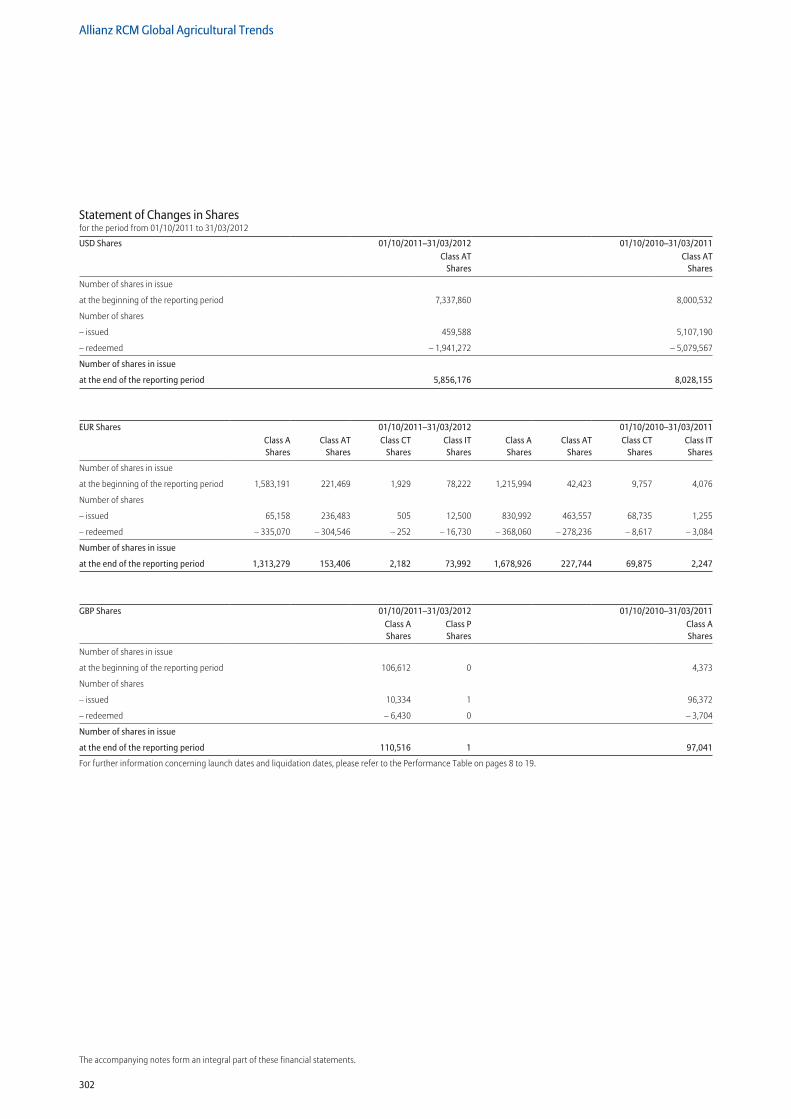
302
Allianz RCM Global Agricultural Trends
The accompanying notes form an integral part of these financial statements.
Statement of Changes in Sharesfor the period from 01/10/2011 to 31/03/2012
USD Shares 01/10/2011–31/03/2012 01/10/2010–31/03/2011Class AT
SharesClass AT
Shares
Number of shares in issue
at the beginning of the reporting period 7,337,860 8,000,532
Number of shares
– issued 459,588 5,107,190
– redeemed – 1,941,272 – 5,079,567
Number of shares in issue
at the end of the reporting period 5,856,176 8,028,155
EUR Shares 01/10/2011–31/03/2012 01/10/2010–31/03/2011Class A Shares
Class AT Shares
Class CT Shares
Class IT Shares
Class A Shares
Class AT Shares
Class CT Shares
Class IT Shares
Number of shares in issue
at the beginning of the reporting period 1,583,191 221,469 1,929 78,222 1,215,994 42,423 9,757 4,076
Number of shares
– issued 65,158 236,483 505 12,500 830,992 463,557 68,735 1,255
– redeemed – 335,070 – 304,546 – 252 – 16,730 – 368,060 – 278,236 – 8,617 – 3,084
Number of shares in issue
at the end of the reporting period 1,313,279 153,406 2,182 73,992 1,678,926 227,744 69,875 2,247
GBP Shares 01/10/2011–31/03/2012 01/10/2010–31/03/2011Class A Shares
Class P Shares
Class A Shares
Number of shares in issue
at the beginning of the reporting period 106,612 0 4,373
Number of shares
– issued 10,334 1 96,372
– redeemed – 6,430 0 – 3,704
Number of shares in issue
at the end of the reporting period 110,516 1 97,041
For further information concerning launch dates and liquidation dates, please refer to the Performance Table on pages 8 to 19.
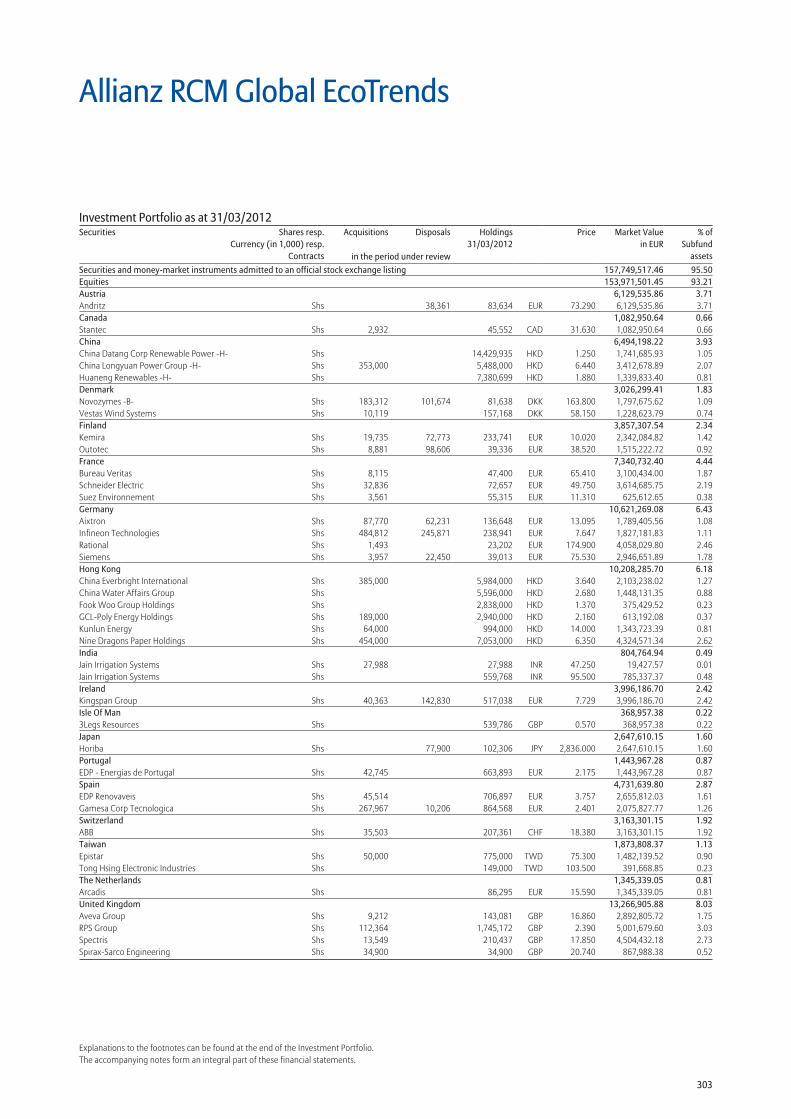
303
Explanations to the footnotes can be found at the end of the Investment Portfolio.The accompanying notes form an integral part of these financial statements.
Securities and money-market instruments admitted to an official stock exchange listing 157,749,517.46 95.50Equities 153,971,501.45 93.21Austria 6,129,535.86 3.71Andritz Shs 38,361 83,634 EUR 73.290 6,129,535.86 3.71Canada 1,082,950.64 0.66Stantec Shs 2,932 45,552 CAD 31.630 1,082,950.64 0.66China 6,494,198.22 3.93China Datang Corp Renewable Power -H- Shs 14,429,935 HKD 1.250 1,741,685.93 1.05China Longyuan Power Group -H- Shs 353,000 5,488,000 HKD 6.440 3,412,678.89 2.07Huaneng Renewables -H- Shs 7,380,699 HKD 1.880 1,339,833.40 0.81Denmark 3,026,299.41 1.83Novozymes -B- Shs 183,312 101,674 81,638 DKK 163.800 1,797,675.62 1.09Vestas Wind Systems Shs 10,119 157,168 DKK 58.150 1,228,623.79 0.74Finland 3,857,307.54 2.34Kemira Shs 19,735 72,773 233,741 EUR 10.020 2,342,084.82 1.42Outotec Shs 8,881 98,606 39,336 EUR 38.520 1,515,222.72 0.92France 7,340,732.40 4.44Bureau Veritas Shs 8,115 47,400 EUR 65.410 3,100,434.00 1.87Schneider Electric Shs 32,836 72,657 EUR 49.750 3,614,685.75 2.19Suez Environnement Shs 3,561 55,315 EUR 11.310 625,612.65 0.38Germany 10,621,269.08 6.43Aixtron Shs 87,770 62,231 136,648 EUR 13.095 1,789,405.56 1.08Infineon Technologies Shs 484,812 245,871 238,941 EUR 7.647 1,827,181.83 1.11Rational Shs 1,493 23,202 EUR 174.900 4,058,029.80 2.46Siemens Shs 3,957 22,450 39,013 EUR 75.530 2,946,651.89 1.78Hong Kong 10,208,285.70 6.18China Everbright International Shs 385,000 5,984,000 HKD 3.640 2,103,238.02 1.27China Water Affairs Group Shs 5,596,000 HKD 2.680 1,448,131.35 0.88Fook Woo Group Holdings Shs 2,838,000 HKD 1.370 375,429.52 0.23GCL-Poly Energy Holdings Shs 189,000 2,940,000 HKD 2.160 613,192.08 0.37Kunlun Energy Shs 64,000 994,000 HKD 14.000 1,343,723.39 0.81Nine Dragons Paper Holdings Shs 454,000 7,053,000 HKD 6.350 4,324,571.34 2.62India 804,764.94 0.49Jain Irrigation Systems Shs 27,988 27,988 INR 47.250 19,427.57 0.01Jain Irrigation Systems Shs 559,768 INR 95.500 785,337.37 0.48Ireland 3,996,186.70 2.42Kingspan Group Shs 40,363 142,830 517,038 EUR 7.729 3,996,186.70 2.42Isle Of Man 368,957.38 0.223Legs Resources Shs 539,786 GBP 0.570 368,957.38 0.22Japan 2,647,610.15 1.60Horiba Shs 77,900 102,306 JPY 2,836.000 2,647,610.15 1.60Portugal 1,443,967.28 0.87EDP - Energias de Portugal Shs 42,745 663,893 EUR 2.175 1,443,967.28 0.87Spain 4,731,639.80 2.87EDP Renovaveis Shs 45,514 706,897 EUR 3.757 2,655,812.03 1.61Gamesa Corp Tecnologica Shs 267,967 10,206 864,568 EUR 2.401 2,075,827.77 1.26Switzerland 3,163,301.15 1.92ABB Shs 35,503 207,361 CHF 18.380 3,163,301.15 1.92Taiwan 1,873,808.37 1.13Epistar Shs 50,000 775,000 TWD 75.300 1,482,139.52 0.90Tong Hsing Electronic Industries Shs 149,000 TWD 103.500 391,668.85 0.23The Netherlands 1,345,339.05 0.81Arcadis Shs 86,295 EUR 15.590 1,345,339.05 0.81United Kingdom 13,266,905.88 8.03Aveva Group Shs 9,212 143,081 GBP 16.860 2,892,805.72 1.75RPS Group Shs 112,364 1,745,172 GBP 2.390 5,001,679.60 3.03Spectris Shs 13,549 210,437 GBP 17.850 4,504,432.18 2.73Spirax-Sarco Engineering Shs 34,900 34,900 GBP 20.740 867,988.38 0.52
Allianz RCM Global EcoTrends
Investment Portfolio as at 31/03/2012Securities Shares resp.
Currency (in 1,000) resp.Contracts
Acquisitions Disposals Holdings 31/03/2012
Price Market Valuein EUR
% ofSubfund
assetsin the period under review
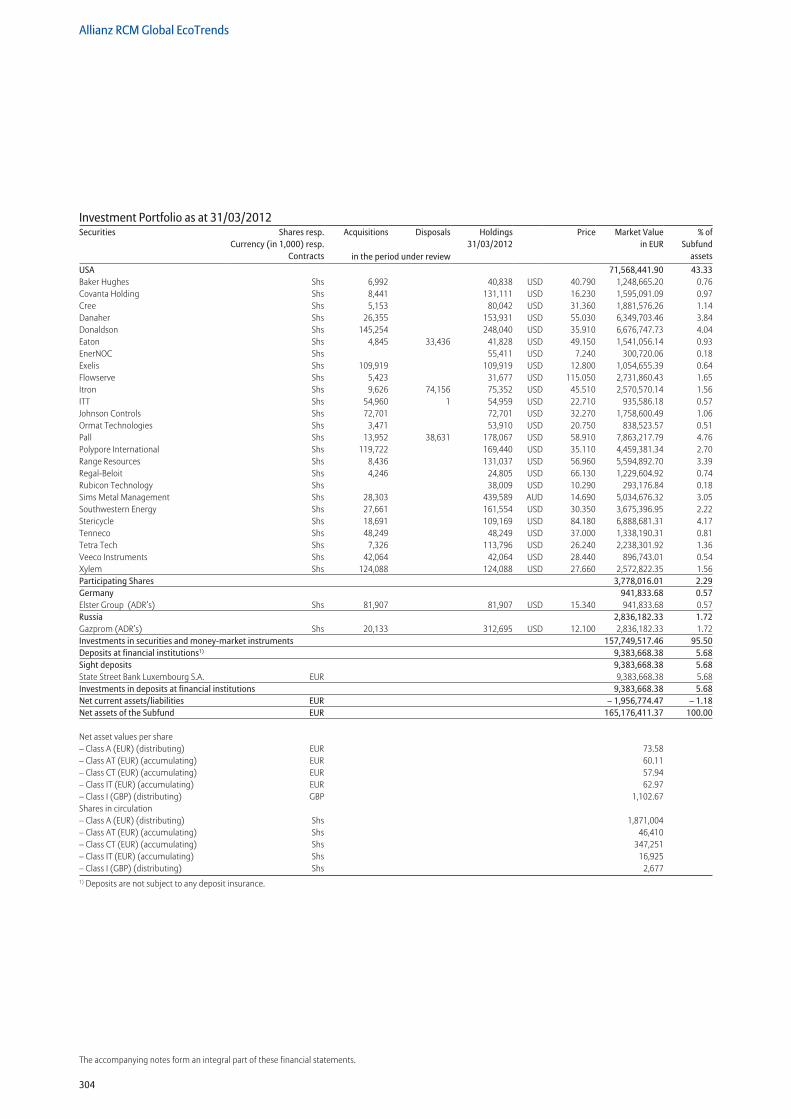
304
Allianz RCM Global EcoTrends
The accompanying notes form an integral part of these financial statements.
USA 71,568,441.90 43.33Baker Hughes Shs 6,992 40,838 USD 40.790 1,248,665.20 0.76Covanta Holding Shs 8,441 131,111 USD 16.230 1,595,091.09 0.97Cree Shs 5,153 80,042 USD 31.360 1,881,576.26 1.14Danaher Shs 26,355 153,931 USD 55.030 6,349,703.46 3.84Donaldson Shs 145,254 248,040 USD 35.910 6,676,747.73 4.04Eaton Shs 4,845 33,436 41,828 USD 49.150 1,541,056.14 0.93EnerNOC Shs 55,411 USD 7.240 300,720.06 0.18Exelis Shs 109,919 109,919 USD 12.800 1,054,655.39 0.64Flowserve Shs 5,423 31,677 USD 115.050 2,731,860.43 1.65Itron Shs 9,626 74,156 75,352 USD 45.510 2,570,570.14 1.56ITT Shs 54,960 1 54,959 USD 22.710 935,586.18 0.57Johnson Controls Shs 72,701 72,701 USD 32.270 1,758,600.49 1.06Ormat Technologies Shs 3,471 53,910 USD 20.750 838,523.57 0.51Pall Shs 13,952 38,631 178,067 USD 58.910 7,863,217.79 4.76Polypore International Shs 119,722 169,440 USD 35.110 4,459,381.34 2.70Range Resources Shs 8,436 131,037 USD 56.960 5,594,892.70 3.39Regal-Beloit Shs 4,246 24,805 USD 66.130 1,229,604.92 0.74Rubicon Technology Shs 38,009 USD 10.290 293,176.84 0.18Sims Metal Management Shs 28,303 439,589 AUD 14.690 5,034,676.32 3.05Southwestern Energy Shs 27,661 161,554 USD 30.350 3,675,396.95 2.22Stericycle Shs 18,691 109,169 USD 84.180 6,888,681.31 4.17Tenneco Shs 48,249 48,249 USD 37.000 1,338,190.31 0.81Tetra Tech Shs 7,326 113,796 USD 26.240 2,238,301.92 1.36Veeco Instruments Shs 42,064 42,064 USD 28.440 896,743.01 0.54Xylem Shs 124,088 124,088 USD 27.660 2,572,822.35 1.56Participating Shares 3,778,016.01 2.29Germany 941,833.68 0.57Elster Group (ADR’s) Shs 81,907 81,907 USD 15.340 941,833.68 0.57Russia 2,836,182.33 1.72Gazprom (ADR’s) Shs 20,133 312,695 USD 12.100 2,836,182.33 1.72Investments in securities and money-market instruments 157,749,517.46 95.50Deposits at financial institutions1) 9,383,668.38 5.68Sight deposits 9,383,668.38 5.68State Street Bank Luxembourg S.A. EUR 9,383,668.38 5.68Investments in deposits at financial institutions 9,383,668.38 5.68Net current assets/liabilities EUR – 1,956,774.47 – 1.18Net assets of the Subfund EUR 165,176,411.37 100.00
Net asset values per share – Class A (EUR) (distributing) EUR 73.58 – Class AT (EUR) (accumulating) EUR 60.11 – Class CT (EUR) (accumulating) EUR 57.94 – Class IT (EUR) (accumulating) EUR 62.97 – Class I (GBP) (distributing) GBP 1,102.67 Shares in circulation – Class A (EUR) (distributing) Shs 1,871,004 – Class AT (EUR) (accumulating) Shs 46,410 – Class CT (EUR) (accumulating) Shs 347,251– Class IT (EUR) (accumulating) Shs 16,925– Class I (GBP) (distributing) Shs 2,6771) Deposits are not subject to any deposit insurance.
Investment Portfolio as at 31/03/2012Securities Shares resp.
Currency (in 1,000) resp.Contracts
Acquisitions Disposals Holdings 31/03/2012
Price Market Valuein EUR
% ofSubfund
assetsin the period under review
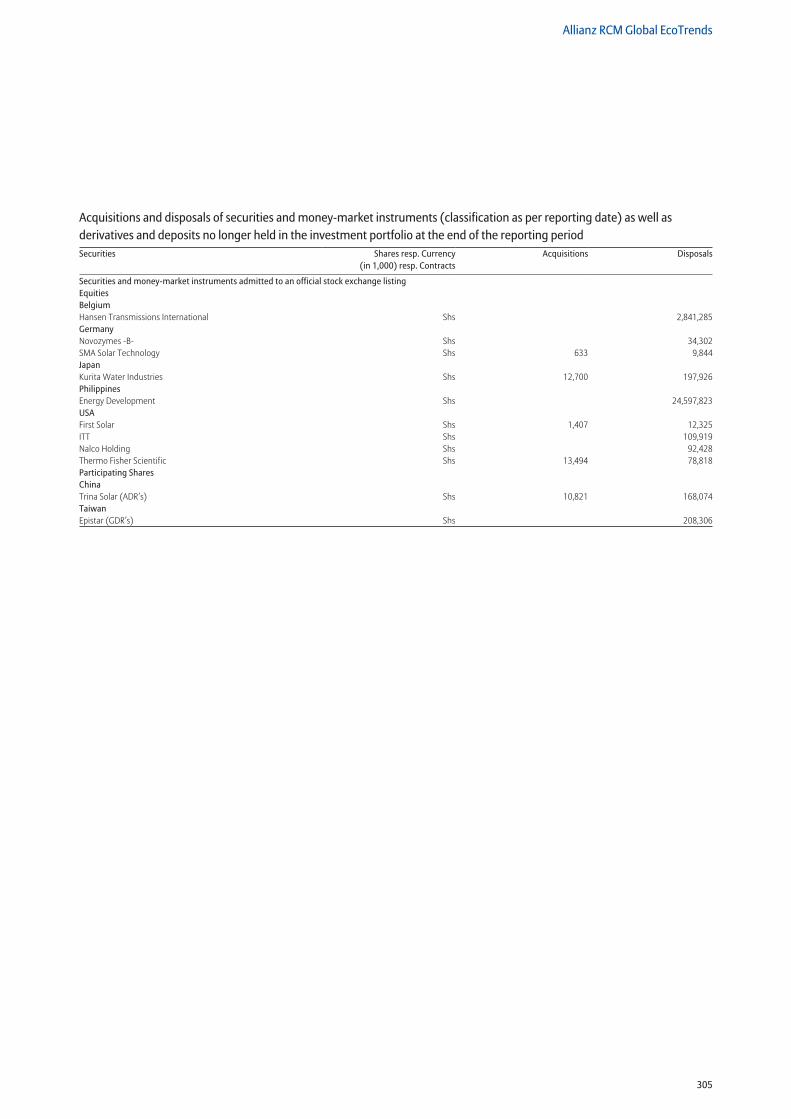
305
Allianz RCM Global EcoTrends
Securities and money-market instruments admitted to an official stock exchange listing Equities Belgium Hansen Transmissions International Shs 2,841,285Germany Novozymes -B- Shs 34,302SMA Solar Technology Shs 633 9,844Japan Kurita Water Industries Shs 12,700 197,926Philippines Energy Development Shs 24,597,823USA First Solar Shs 1,407 12,325ITT Shs 109,919Nalco Holding Shs 92,428Thermo Fisher Scientific Shs 13,494 78,818Participating Shares China Trina Solar (ADR’s) Shs 10,821 168,074Taiwan Epistar (GDR’s) Shs 208,306
Acquisitions and disposals of securities and money-market instruments (classification as per reporting date) as well as derivatives and deposits no longer held in the investment portfolio at the end of the reporting periodSecurities Shares resp. Currency
(in 1,000) resp. ContractsAcquisitions Disposals
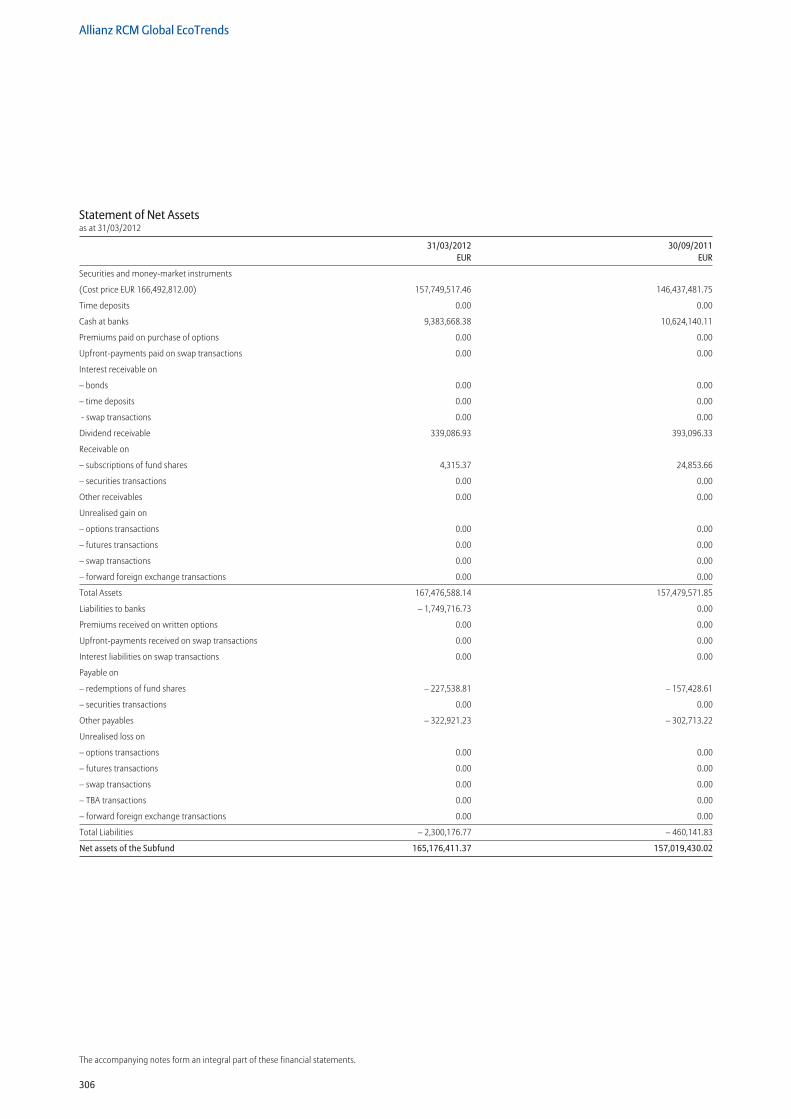
306
Allianz RCM Global EcoTrends
The accompanying notes form an integral part of these financial statements.
Statement of Net Assetsas at 31/03/2012
31/03/2012 30/09/2011 EUR EUR
Securities and money-market instruments
(Cost price EUR 166,492,812.00) 157,749,517.46 146,437,481.75
Time deposits 0.00 0.00
Cash at banks 9,383,668.38 10,624,140.11
Premiums paid on purchase of options 0.00 0.00
Upfront-payments paid on swap transactions 0.00 0.00
Interest receivable on
– bonds 0.00 0.00
– time deposits 0.00 0.00
- swap transactions 0.00 0.00
Dividend receivable 339,086.93 393,096.33
Receivable on
– subscriptions of fund shares 4,315.37 24,853.66
– securities transactions 0.00 0.00
Other receivables 0.00 0.00
Unrealised gain on
– options transactions 0.00 0.00
– futures transactions 0.00 0.00
– swap transactions 0.00 0.00
– forward foreign exchange transactions 0.00 0.00
Total Assets 167,476,588.14 157,479,571.85
Liabilities to banks – 1,749,716.73 0.00
Premiums received on written options 0.00 0.00
Upfront-payments received on swap transactions 0.00 0.00
Interest liabilities on swap transactions 0.00 0.00
Payable on
– redemptions of fund shares – 227,538.81 – 157,428.61
– securities transactions 0.00 0.00
Other payables – 322,921.23 – 302,713.22
Unrealised loss on
– options transactions 0.00 0.00
– futures transactions 0.00 0.00
– swap transactions 0.00 0.00
– TBA transactions 0.00 0.00
– forward foreign exchange transactions 0.00 0.00
Total Liabilities – 2,300,176.77 – 460,141.83
Net assets of the Subfund 165,176,411.37 157,019,430.02
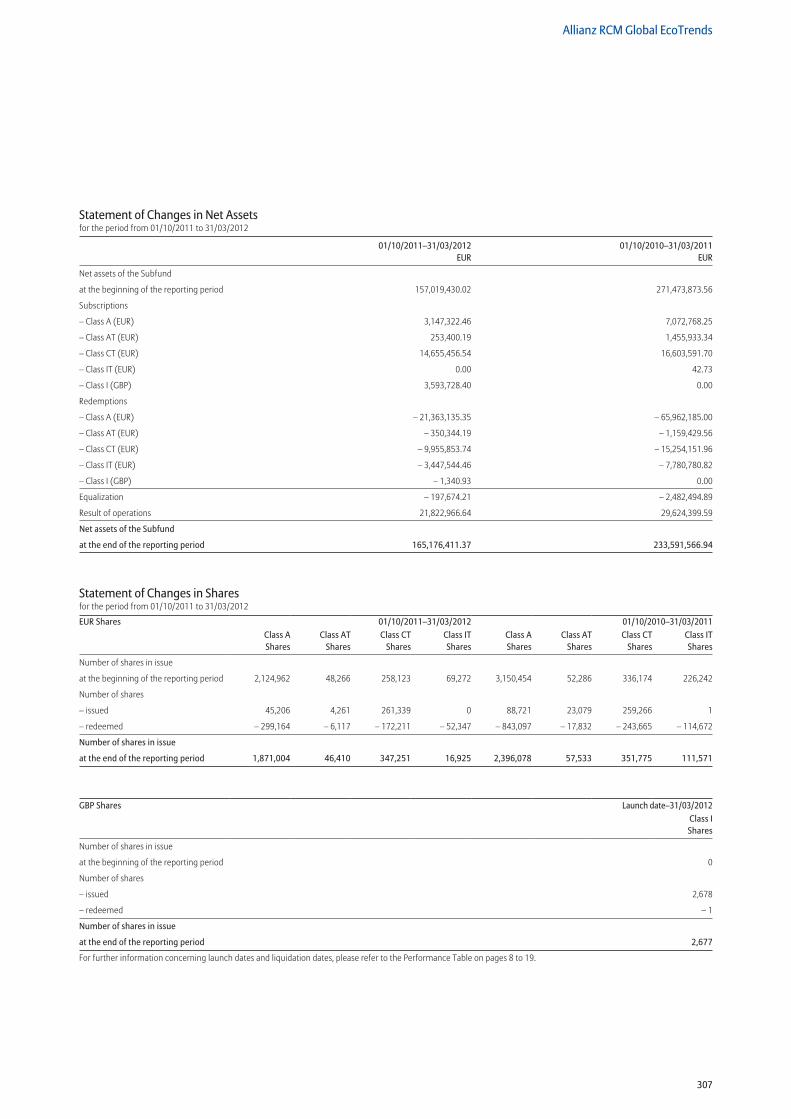
307
Allianz RCM Global EcoTrends
Statement of Changes in Net Assetsfor the period from 01/10/2011 to 31/03/2012
01/10/2011–31/03/2012 01/10/2010–31/03/2011 EUR EUR
Net assets of the Subfund
at the beginning of the reporting period 157,019,430.02 271,473,873.56
Subscriptions
– Class A (EUR) 3,147,322.46 7,072,768.25
– Class AT (EUR) 253,400.19 1,455,933.34
– Class CT (EUR) 14,655,456.54 16,603,591.70
– Class IT (EUR) 0.00 42.73
– Class I (GBP) 3,593,728.40 0.00
Redemptions
– Class A (EUR) – 21,363,135.35 – 65,962,185.00
– Class AT (EUR) – 350,344.19 – 1,159,429.56
– Class CT (EUR) – 9,955,853.74 – 15,254,151.96
– Class IT (EUR) – 3,447,544.46 – 7,780,780.82
– Class I (GBP) – 1,340.93 0.00
Equalization – 197,674.21 – 2,482,494.89
Result of operations 21,822,966.64 29,624,399.59
Net assets of the Subfund
at the end of the reporting period 165,176,411.37 233,591,566.94
Statement of Changes in Sharesfor the period from 01/10/2011 to 31/03/2012
EUR Shares 01/10/2011–31/03/2012 01/10/2010–31/03/2011Class A Shares
Class AT
SharesClass CT
SharesClass IT Shares
Class A Shares
Class AT
SharesClass CT
SharesClass IT Shares
Number of shares in issue
at the beginning of the reporting period 2,124,962 48,266 258,123 69,272 3,150,454 52,286 336,174 226,242
Number of shares
– issued 45,206 4,261 261,339 0 88,721 23,079 259,266 1
– redeemed – 299,164 – 6,117 – 172,211 – 52,347 – 843,097 – 17,832 – 243,665 – 114,672
Number of shares in issue
at the end of the reporting period 1,871,004 46,410 347,251 16,925 2,396,078 57,533 351,775 111,571
GBP Shares Launch date–31/03/2012Class I Shares
Number of shares in issue
at the beginning of the reporting period 0
Number of shares
– issued 2,678
– redeemed – 1
Number of shares in issue
at the end of the reporting period 2,677
For further information concerning launch dates and liquidation dates, please refer to the Performance Table on pages 8 to 19.
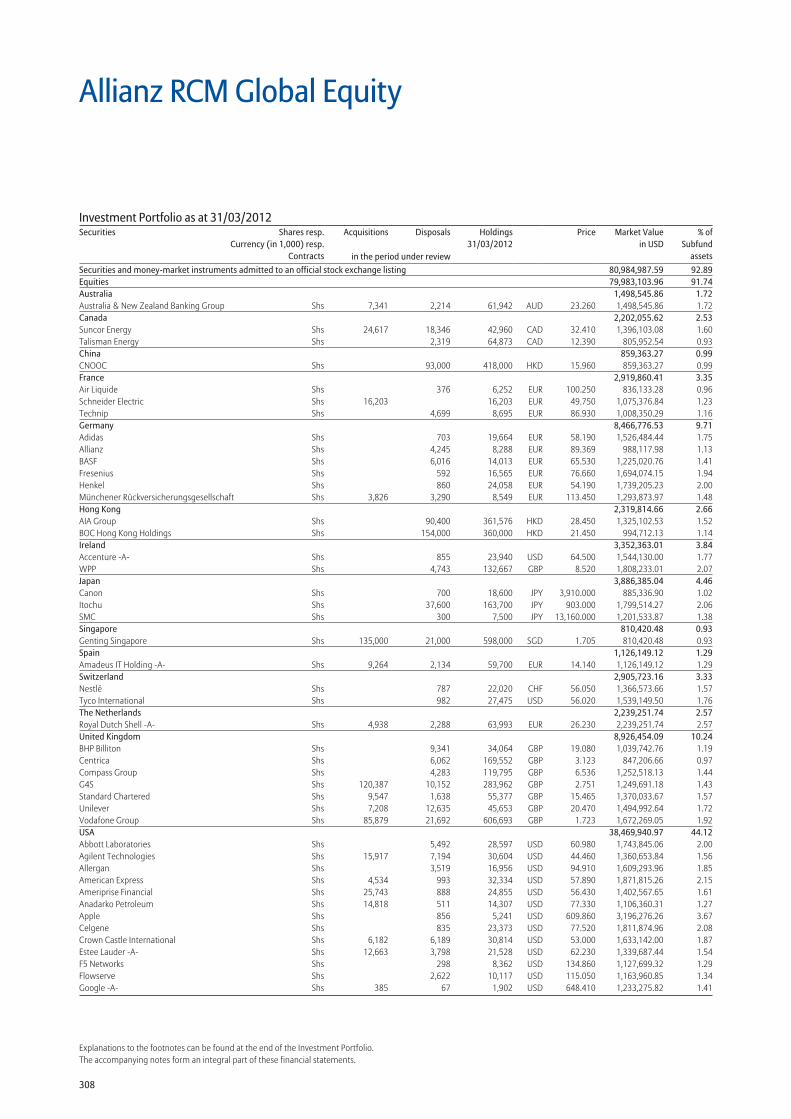
308
Explanations to the footnotes can be found at the end of the Investment Portfolio.The accompanying notes form an integral part of these financial statements.
Securities and money-market instruments admitted to an official stock exchange listing 80,984,987.59 92.89Equities 79,983,103.96 91.74Australia 1,498,545.86 1.72Australia & New Zealand Banking Group Shs 7,341 2,214 61,942 AUD 23.260 1,498,545.86 1.72Canada 2,202,055.62 2.53Suncor Energy Shs 24,617 18,346 42,960 CAD 32.410 1,396,103.08 1.60Talisman Energy Shs 2,319 64,873 CAD 12.390 805,952.54 0.93China 859,363.27 0.99CNOOC Shs 93,000 418,000 HKD 15.960 859,363.27 0.99France 2,919,860.41 3.35Air Liquide Shs 376 6,252 EUR 100.250 836,133.28 0.96Schneider Electric Shs 16,203 16,203 EUR 49.750 1,075,376.84 1.23Technip Shs 4,699 8,695 EUR 86.930 1,008,350.29 1.16Germany 8,466,776.53 9.71Adidas Shs 703 19,664 EUR 58.190 1,526,484.44 1.75Allianz Shs 4,245 8,288 EUR 89.369 988,117.98 1.13BASF Shs 6,016 14,013 EUR 65.530 1,225,020.76 1.41Fresenius Shs 592 16,565 EUR 76.660 1,694,074.15 1.94Henkel Shs 860 24,058 EUR 54.190 1,739,205.23 2.00Münchener Rückversicherungsgesellschaft Shs 3,826 3,290 8,549 EUR 113.450 1,293,873.97 1.48Hong Kong 2,319,814.66 2.66AIA Group Shs 90,400 361,576 HKD 28.450 1,325,102.53 1.52BOC Hong Kong Holdings Shs 154,000 360,000 HKD 21.450 994,712.13 1.14Ireland 3,352,363.01 3.84Accenture -A- Shs 855 23,940 USD 64.500 1,544,130.00 1.77WPP Shs 4,743 132,667 GBP 8.520 1,808,233.01 2.07Japan 3,886,385.04 4.46Canon Shs 700 18,600 JPY 3,910.000 885,336.90 1.02Itochu Shs 37,600 163,700 JPY 903.000 1,799,514.27 2.06SMC Shs 300 7,500 JPY 13,160.000 1,201,533.87 1.38Singapore 810,420.48 0.93Genting Singapore Shs 135,000 21,000 598,000 SGD 1.705 810,420.48 0.93Spain 1,126,149.12 1.29Amadeus IT Holding -A- Shs 9,264 2,134 59,700 EUR 14.140 1,126,149.12 1.29Switzerland 2,905,723.16 3.33Nestlé Shs 787 22,020 CHF 56.050 1,366,573.66 1.57Tyco International Shs 982 27,475 USD 56.020 1,539,149.50 1.76The Netherlands 2,239,251.74 2.57Royal Dutch Shell -A- Shs 4,938 2,288 63,993 EUR 26.230 2,239,251.74 2.57United Kingdom 8,926,454.09 10.24BHP Billiton Shs 9,341 34,064 GBP 19.080 1,039,742.76 1.19Centrica Shs 6,062 169,552 GBP 3.123 847,206.66 0.97Compass Group Shs 4,283 119,795 GBP 6.536 1,252,518.13 1.44G4S Shs 120,387 10,152 283,962 GBP 2.751 1,249,691.18 1.43Standard Chartered Shs 9,547 1,638 55,377 GBP 15.465 1,370,033.67 1.57Unilever Shs 7,208 12,635 45,653 GBP 20.470 1,494,992.64 1.72Vodafone Group Shs 85,879 21,692 606,693 GBP 1.723 1,672,269.05 1.92USA 38,469,940.97 44.12Abbott Laboratories Shs 5,492 28,597 USD 60.980 1,743,845.06 2.00Agilent Technologies Shs 15,917 7,194 30,604 USD 44.460 1,360,653.84 1.56Allergan Shs 3,519 16,956 USD 94.910 1,609,293.96 1.85American Express Shs 4,534 993 32,334 USD 57.890 1,871,815.26 2.15Ameriprise Financial Shs 25,743 888 24,855 USD 56.430 1,402,567.65 1.61Anadarko Petroleum Shs 14,818 511 14,307 USD 77.330 1,106,360.31 1.27Apple Shs 856 5,241 USD 609.860 3,196,276.26 3.67Celgene Shs 835 23,373 USD 77.520 1,811,874.96 2.08Crown Castle International Shs 6,182 6,189 30,814 USD 53.000 1,633,142.00 1.87Estee Lauder -A- Shs 12,663 3,798 21,528 USD 62.230 1,339,687.44 1.54F5 Networks Shs 298 8,362 USD 134.860 1,127,699.32 1.29Flowserve Shs 2,622 10,117 USD 115.050 1,163,960.85 1.34Google -A- Shs 385 67 1,902 USD 648.410 1,233,275.82 1.41
Allianz RCM Global Equity
Investment Portfolio as at 31/03/2012Securities Shares resp.
Currency (in 1,000) resp.Contracts
Acquisitions Disposals Holdings 31/03/2012
Price Market Valuein USD
% ofSubfund
assetsin the period under review
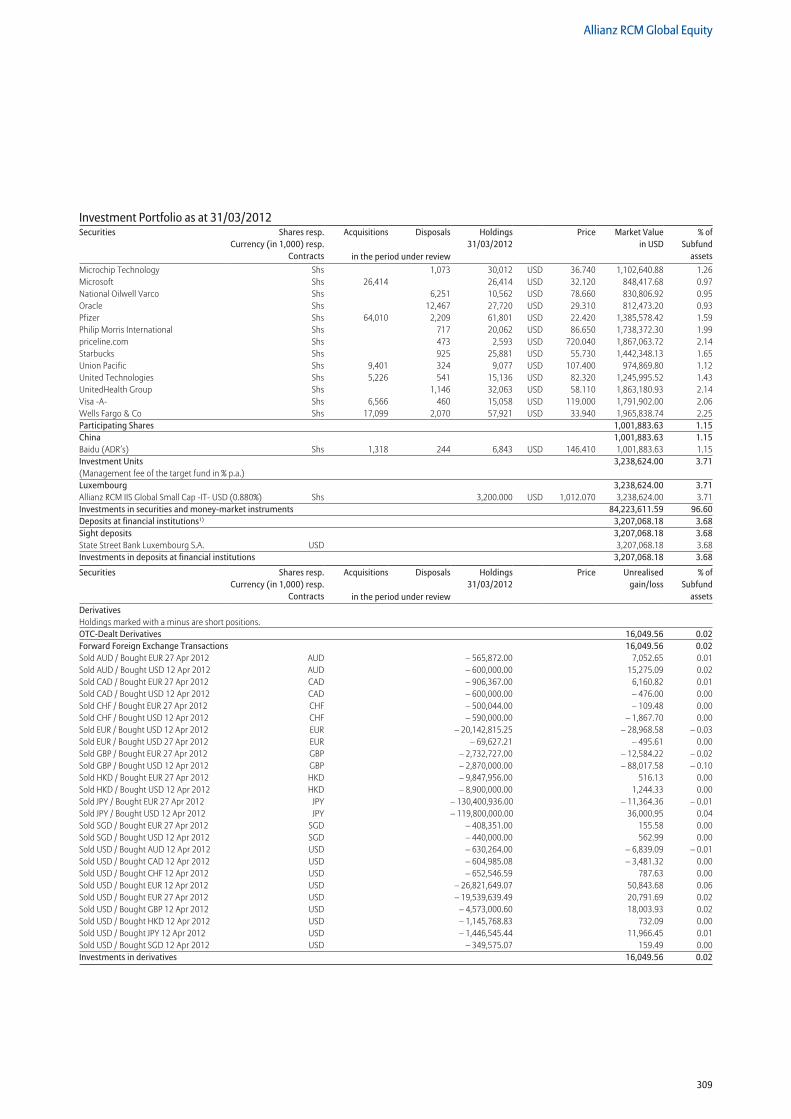
309
Allianz RCM Global Equity
Microchip Technology Shs 1,073 30,012 USD 36.740 1,102,640.88 1.26Microsoft Shs 26,414 26,414 USD 32.120 848,417.68 0.97National Oilwell Varco Shs 6,251 10,562 USD 78.660 830,806.92 0.95Oracle Shs 12,467 27,720 USD 29.310 812,473.20 0.93Pfizer Shs 64,010 2,209 61,801 USD 22.420 1,385,578.42 1.59Philip Morris International Shs 717 20,062 USD 86.650 1,738,372.30 1.99priceline.com Shs 473 2,593 USD 720.040 1,867,063.72 2.14Starbucks Shs 925 25,881 USD 55.730 1,442,348.13 1.65Union Pacific Shs 9,401 324 9,077 USD 107.400 974,869.80 1.12United Technologies Shs 5,226 541 15,136 USD 82.320 1,245,995.52 1.43UnitedHealth Group Shs 1,146 32,063 USD 58.110 1,863,180.93 2.14Visa -A- Shs 6,566 460 15,058 USD 119.000 1,791,902.00 2.06Wells Fargo & Co Shs 17,099 2,070 57,921 USD 33.940 1,965,838.74 2.25Participating Shares 1,001,883.63 1.15China 1,001,883.63 1.15Baidu (ADR’s) Shs 1,318 244 6,843 USD 146.410 1,001,883.63 1.15Investment Units 3,238,624.00 3.71(Management fee of the target fund in % p.a.) Luxembourg 3,238,624.00 3.71Allianz RCM IIS Global Small Cap -IT- USD (0.880%) Shs 3,200.000 USD 1,012.070 3,238,624.00 3.71Investments in securities and money-market instruments 84,223,611.59 96.60Deposits at financial institutions1) 3,207,068.18 3.68Sight deposits 3,207,068.18 3.68State Street Bank Luxembourg S.A. USD 3,207,068.18 3.68Investments in deposits at financial institutions 3,207,068.18 3.68
Securities Shares resp.Currency (in 1,000) resp.
Contracts
Acquisitions Disposals Holdings 31/03/2012
Price Unrealisedgain/loss
% ofSubfund
assetsin the period under reviewDerivatives Holdings marked with a minus are short positions. OTC-Dealt Derivatives 16,049.56 0.02Forward Foreign Exchange Transactions 16,049.56 0.02Sold AUD / Bought EUR 27 Apr 2012 AUD – 565,872.00 7,052.65 0.01Sold AUD / Bought USD 12 Apr 2012 AUD – 600,000.00 15,275.09 0.02Sold CAD / Bought EUR 27 Apr 2012 CAD – 906,367.00 6,160.82 0.01Sold CAD / Bought USD 12 Apr 2012 CAD – 600,000.00 – 476.00 0.00Sold CHF / Bought EUR 27 Apr 2012 CHF – 500,044.00 – 109.48 0.00Sold CHF / Bought USD 12 Apr 2012 CHF – 590,000.00 – 1,867.70 0.00Sold EUR / Bought USD 12 Apr 2012 EUR – 20,142,815.25 – 28,968.58 – 0.03Sold EUR / Bought USD 27 Apr 2012 EUR – 69,627.21 – 495.61 0.00Sold GBP / Bought EUR 27 Apr 2012 GBP – 2,732,727.00 – 12,584.22 – 0.02Sold GBP / Bought USD 12 Apr 2012 GBP – 2,870,000.00 – 88,017.58 – 0.10Sold HKD / Bought EUR 27 Apr 2012 HKD – 9,847,956.00 516.13 0.00Sold HKD / Bought USD 12 Apr 2012 HKD – 8,900,000.00 1,244.33 0.00Sold JPY / Bought EUR 27 Apr 2012 JPY – 130,400,936.00 – 11,364.36 – 0.01Sold JPY / Bought USD 12 Apr 2012 JPY – 119,800,000.00 36,000.95 0.04Sold SGD / Bought EUR 27 Apr 2012 SGD – 408,351.00 155.58 0.00Sold SGD / Bought USD 12 Apr 2012 SGD – 440,000.00 562.99 0.00Sold USD / Bought AUD 12 Apr 2012 USD – 630,264.00 – 6,839.09 – 0.01Sold USD / Bought CAD 12 Apr 2012 USD – 604,985.08 – 3,481.32 0.00Sold USD / Bought CHF 12 Apr 2012 USD – 652,546.59 787.63 0.00Sold USD / Bought EUR 12 Apr 2012 USD – 26,821,649.07 50,843.68 0.06Sold USD / Bought EUR 27 Apr 2012 USD – 19,539,639.49 20,791.69 0.02Sold USD / Bought GBP 12 Apr 2012 USD – 4,573,000.60 18,003.93 0.02Sold USD / Bought HKD 12 Apr 2012 USD – 1,145,768.83 732.09 0.00Sold USD / Bought JPY 12 Apr 2012 USD – 1,446,545.44 11,966.45 0.01Sold USD / Bought SGD 12 Apr 2012 USD – 349,575.07 159.49 0.00Investments in derivatives 16,049.56 0.02
Investment Portfolio as at 31/03/2012Securities Shares resp.
Currency (in 1,000) resp.Contracts
Acquisitions Disposals Holdings 31/03/2012
Price Market Valuein USD
% ofSubfund
assetsin the period under review
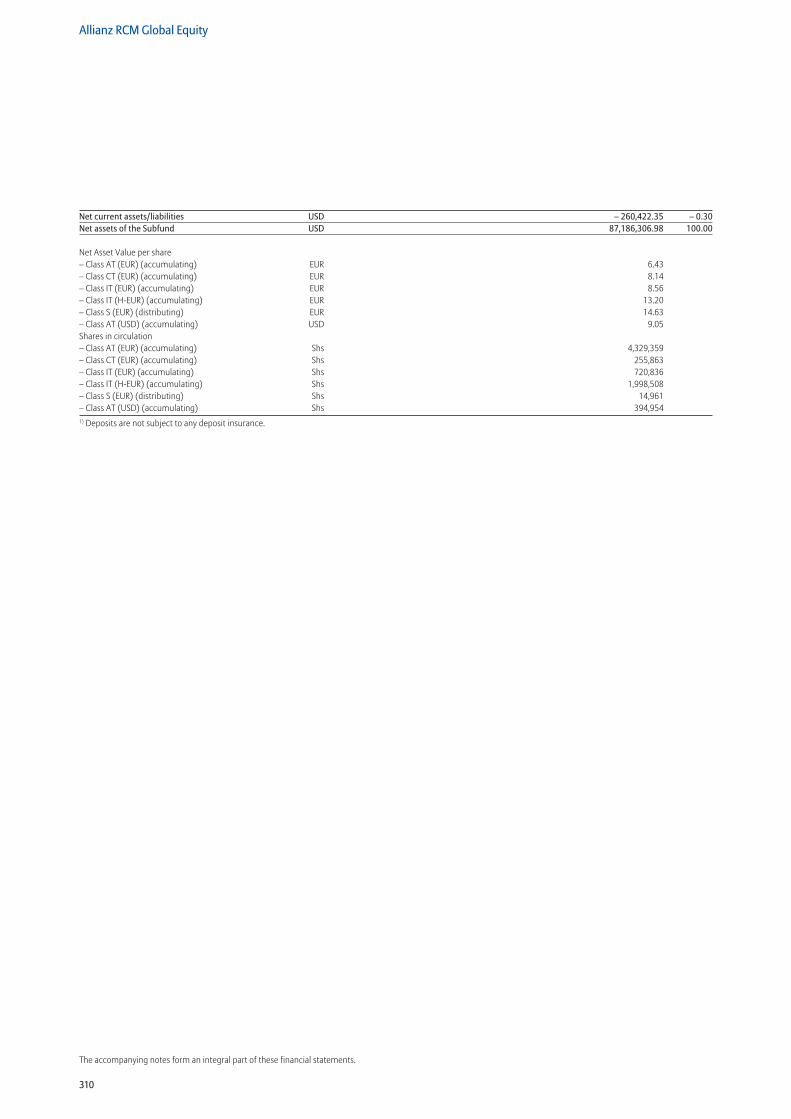
310
Allianz RCM Global Equity
The accompanying notes form an integral part of these financial statements.
Net current assets/liabilities USD – 260,422.35 – 0.30Net assets of the Subfund USD 87,186,306.98 100.00
Net Asset Value per share – Class AT (EUR) (accumulating) EUR 6.43– Class CT (EUR) (accumulating) EUR 8.14– Class IT (EUR) (accumulating) EUR 8.56– Class IT (H-EUR) (accumulating) EUR 13.20– Class S (EUR) (distributing) EUR 14.63– Class AT (USD) (accumulating) USD 9.05Shares in circulation – Class AT (EUR) (accumulating) Shs 4,329,359 – Class CT (EUR) (accumulating) Shs 255,863 – Class IT (EUR) (accumulating) Shs 720,836 – Class IT (H-EUR) (accumulating) Shs 1,998,508 – Class S (EUR) (distributing) Shs 14,961 – Class AT (USD) (accumulating) Shs 394,9541) Deposits are not subject to any deposit insurance.
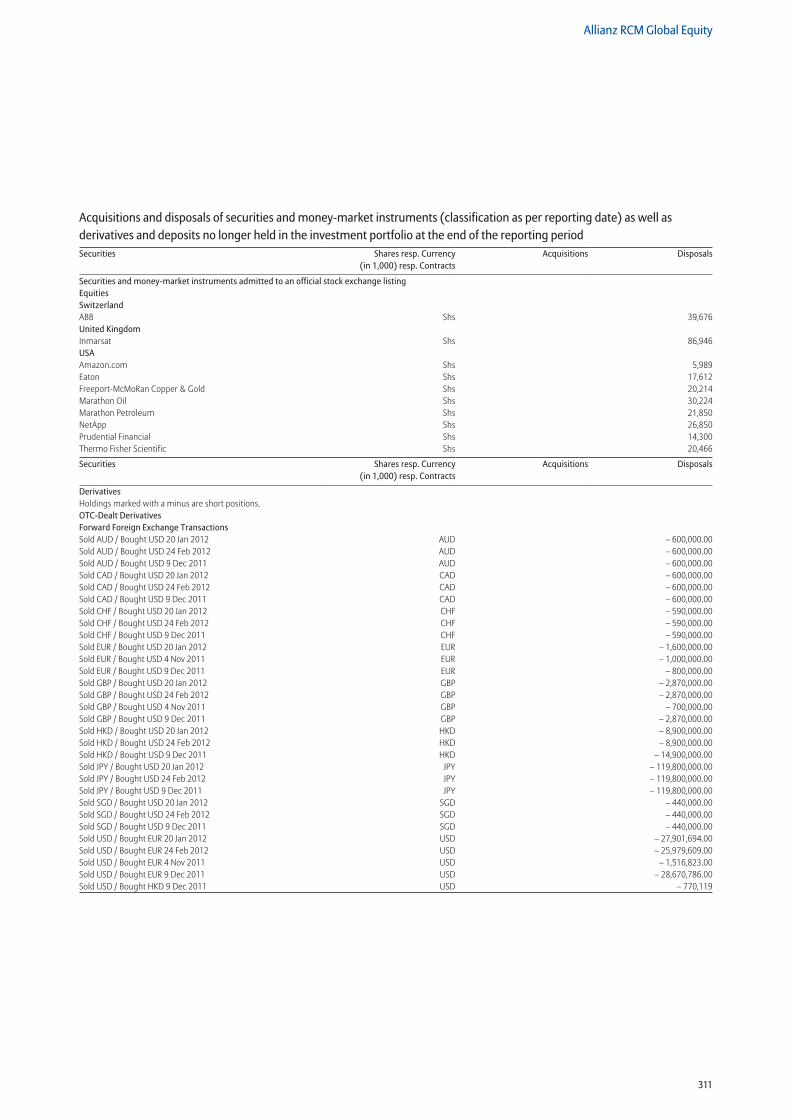
311
Allianz RCM Global Equity
Securities and money-market instruments admitted to an official stock exchange listing Equities Switzerland ABB Shs 39,676United Kingdom Inmarsat Shs 86,946USA Amazon.com Shs 5,989Eaton Shs 17,612Freeport-McMoRan Copper & Gold Shs 20,214Marathon Oil Shs 30,224Marathon Petroleum Shs 21,850NetApp Shs 26,850Prudential Financial Shs 14,300Thermo Fisher Scientific Shs 20,466
Securities Shares resp. Currency (in 1,000) resp. Contracts
Acquisitions Disposals
DerivativesHoldings marked with a minus are short positions. OTC-Dealt Derivatives Forward Foreign Exchange Transactions Sold AUD / Bought USD 20 Jan 2012 AUD – 600,000.00Sold AUD / Bought USD 24 Feb 2012 AUD – 600,000.00Sold AUD / Bought USD 9 Dec 2011 AUD – 600,000.00Sold CAD / Bought USD 20 Jan 2012 CAD – 600,000.00Sold CAD / Bought USD 24 Feb 2012 CAD – 600,000.00Sold CAD / Bought USD 9 Dec 2011 CAD – 600,000.00Sold CHF / Bought USD 20 Jan 2012 CHF – 590,000.00Sold CHF / Bought USD 24 Feb 2012 CHF – 590,000.00Sold CHF / Bought USD 9 Dec 2011 CHF – 590,000.00Sold EUR / Bought USD 20 Jan 2012 EUR – 1,600,000.00Sold EUR / Bought USD 4 Nov 2011 EUR – 1,000,000.00Sold EUR / Bought USD 9 Dec 2011 EUR – 800,000.00Sold GBP / Bought USD 20 Jan 2012 GBP – 2,870,000.00Sold GBP / Bought USD 24 Feb 2012 GBP – 2,870,000.00Sold GBP / Bought USD 4 Nov 2011 GBP – 700,000.00Sold GBP / Bought USD 9 Dec 2011 GBP – 2,870,000.00Sold HKD / Bought USD 20 Jan 2012 HKD – 8,900,000.00Sold HKD / Bought USD 24 Feb 2012 HKD – 8,900,000.00Sold HKD / Bought USD 9 Dec 2011 HKD – 14,900,000.00Sold JPY / Bought USD 20 Jan 2012 JPY – 119,800,000.00Sold JPY / Bought USD 24 Feb 2012 JPY – 119,800,000.00Sold JPY / Bought USD 9 Dec 2011 JPY – 119,800,000.00Sold SGD / Bought USD 20 Jan 2012 SGD – 440,000.00Sold SGD / Bought USD 24 Feb 2012 SGD – 440,000.00Sold SGD / Bought USD 9 Dec 2011 SGD – 440,000.00Sold USD / Bought EUR 20 Jan 2012 USD – 27,901,694.00Sold USD / Bought EUR 24 Feb 2012 USD – 25,979,609.00Sold USD / Bought EUR 4 Nov 2011 USD – 1,516,823.00Sold USD / Bought EUR 9 Dec 2011 USD – 28,670,786.00Sold USD / Bought HKD 9 Dec 2011 USD – 770,119
Acquisitions and disposals of securities and money-market instruments (classification as per reporting date) as well as derivatives and deposits no longer held in the investment portfolio at the end of the reporting periodSecurities Shares resp. Currency
(in 1,000) resp. ContractsAcquisitions Disposals

312
Allianz RCM Global Equity
The accompanying notes form an integral part of these financial statements.
Statement of Net Assetsas at 31/03/2012
31/03/2012 30/09/2011 USD USD
Securities and money-market instruments
(Cost price USD 70,065,871.68) 84,223,611.59 72,370,049.51
Time deposits 0.00 0.00
Cash at banks 3,207,068.18 1,314,162.25
Premiums paid on purchase of options 0.00 0.00
Upfront-payments paid on swap transactions 0.00 0.00
Interest receivable on
– bonds 0.00 0.00
– time deposits 0.00 0.00
– swap transactions 0.00 0.00
Dividend receivable 102,218.70 131,232.58
Receivable on
– subscriptions of fund shares 5,853.66 152.37
– securities transactions 0.00 0.00
Other receivables 6,028.50 6,028.50
Unrealised gain on
– options transactions 0.00 0.00
– futures transactions 0.00 0.00
– swap transactions 0.00 0.00
– forward foreign exchange transactions 170,253.50 38,538.08
Total Assets 87,715,034.13 73,860,163.29
Liabilities to banks – 263,698.28 0.00
Premiums received on written options 0.00 0.00
Upfront-payments received on swap transactions 0.00 0.00
Interest liabilities on swap transactions 0.00 0.00
Payable on
– redemptions of fund shares 0.00 – 19,712.95
– securities transactions 0.00 0.00
Other payables – 110,824.93 – 99,786.91
Unrealised loss on
– options transactions 0.00 0.00
– futures transactions 0.00 0.00
– swap transactions 0.00 0.00
– forward foreign exchange transactions – 154,203.94 – 113,100.73
Total Liabilities – 528,727.15 – 232,600.59
Net assets of the Subfund 87,186,306.98 73,627,562.70
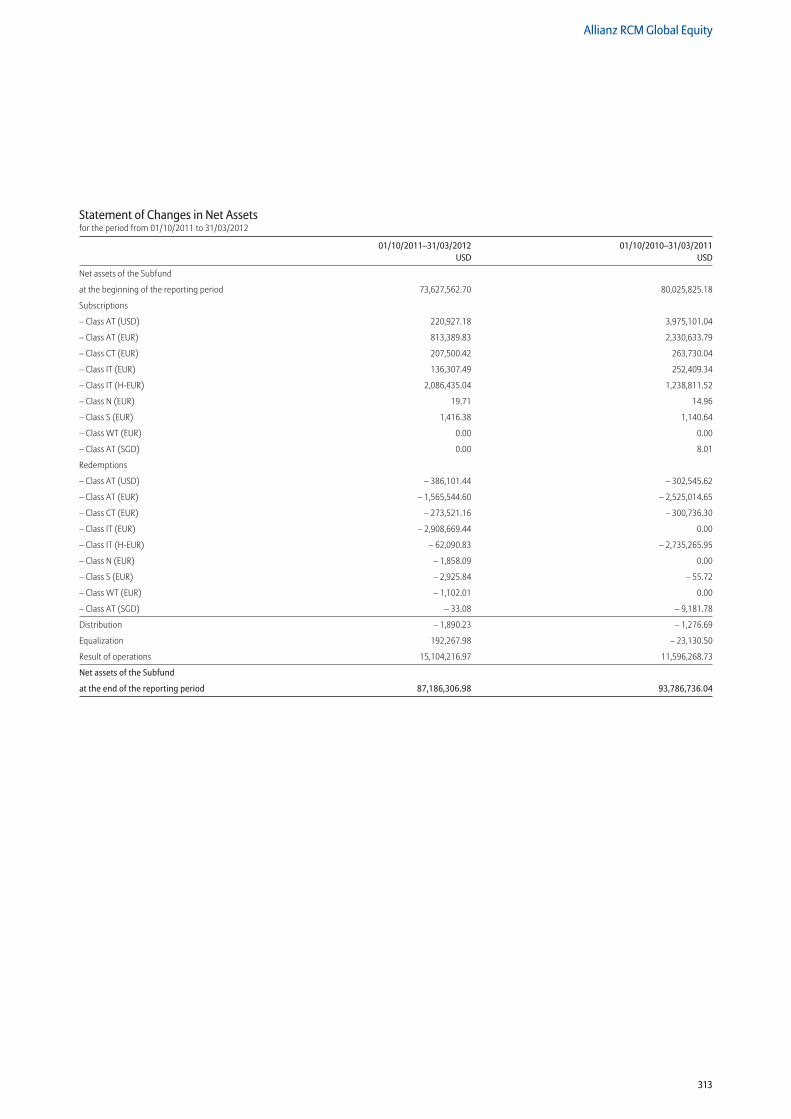
313
Allianz RCM Global Equity
Statement of Changes in Net Assetsfor the period from 01/10/2011 to 31/03/2012
01/10/2011–31/03/2012 01/10/2010–31/03/2011 USD USD
Net assets of the Subfund
at the beginning of the reporting period 73,627,562.70 80,025,825.18
Subscriptions
– Class AT (USD) 220,927.18 3,975,101.04
– Class AT (EUR) 813,389.83 2,330,633.79
– Class CT (EUR) 207,500.42 263,730.04
– Class IT (EUR) 136,307.49 252,409.34
– Class IT (H-EUR) 2,086,435.04 1,238,811.52
– Class N (EUR) 19.71 14.96
– Class S (EUR) 1,416.38 1,140.64
– Class WT (EUR) 0.00 0.00
– Class AT (SGD) 0.00 8.01
Redemptions
– Class AT (USD) – 386,101.44 – 302,545.62
– Class AT (EUR) – 1,565,544.60 – 2,525,014.65
– Class CT (EUR) – 273,521.16 – 300,736.30
– Class IT (EUR) – 2,908,669.44 0.00
– Class IT (H-EUR) – 62,090.83 – 2,735,265.95
– Class N (EUR) – 1,858.09 0.00
– Class S (EUR) – 2,925.84 – 55.72
– Class WT (EUR) – 1,102.01 0.00
– Class AT (SGD) – 33.08 – 9,181.78
Distribution – 1,890.23 – 1,276.69
Equalization 192,267.98 – 23,130.50
Result of operations 15,104,216.97 11,596,268.73
Net assets of the Subfund
at the end of the reporting period 87,186,306.98 93,786,736.04
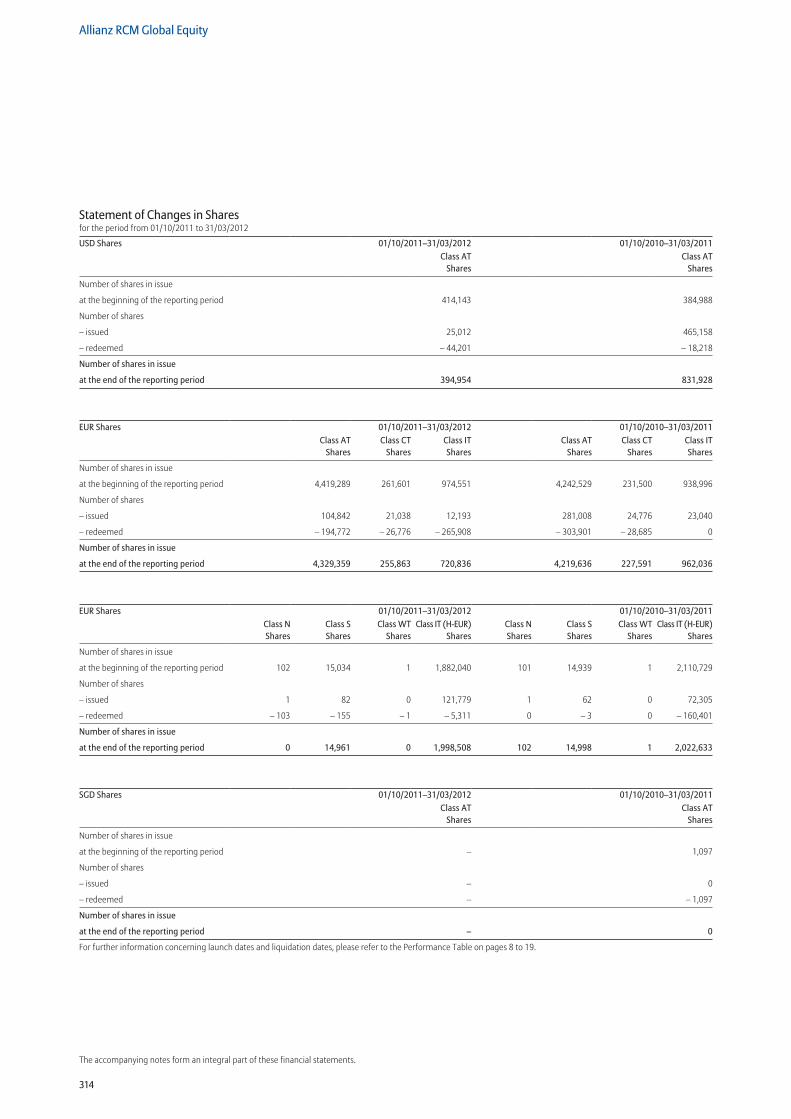
314
Allianz RCM Global Equity
The accompanying notes form an integral part of these financial statements.
Statement of Changes in Sharesfor the period from 01/10/2011 to 31/03/2012
USD Shares 01/10/2011–31/03/2012 01/10/2010–31/03/2011Class AT
SharesClass AT
Shares
Number of shares in issue
at the beginning of the reporting period 414,143 384,988
Number of shares
– issued 25,012 465,158
– redeemed – 44,201 – 18,218
Number of shares in issue
at the end of the reporting period 394,954 831,928
EUR Shares 01/10/2011–31/03/2012 01/10/2010–31/03/2011Class AT
SharesClass CT
SharesClass IT Shares
Class AT Shares
Class CT Shares
Class IT Shares
Number of shares in issue
at the beginning of the reporting period 4,419,289 261,601 974,551 4,242,529 231,500 938,996
Number of shares
– issued 104,842 21,038 12,193 281,008 24,776 23,040
– redeemed – 194,772 – 26,776 – 265,908 – 303,901 – 28,685 0
Number of shares in issue
at the end of the reporting period 4,329,359 255,863 720,836 4,219,636 227,591 962,036
EUR Shares 01/10/2011–31/03/2012 01/10/2010–31/03/2011Class N Shares
Class S Shares
Class WT Shares
Class IT (H-EUR)Shares
Class N Shares
Class S Shares
Class WT Shares
Class IT (H-EUR)Shares
Number of shares in issue
at the beginning of the reporting period 102 15,034 1 1,882,040 101 14,939 1 2,110,729
Number of shares
– issued 1 82 0 121,779 1 62 0 72,305
– redeemed – 103 – 155 – 1 – 5,311 0 – 3 0 – 160,401
Number of shares in issue
at the end of the reporting period 0 14,961 0 1,998,508 102 14,998 1 2,022,633
SGD Shares 01/10/2011–31/03/2012 01/10/2010–31/03/2011Class AT
SharesClass AT
Shares
Number of shares in issue
at the beginning of the reporting period – 1,097
Number of shares
– issued – 0
– redeemed – – 1,097
Number of shares in issue
at the end of the reporting period – 0
For further information concerning launch dates and liquidation dates, please refer to the Performance Table on pages 8 to 19.
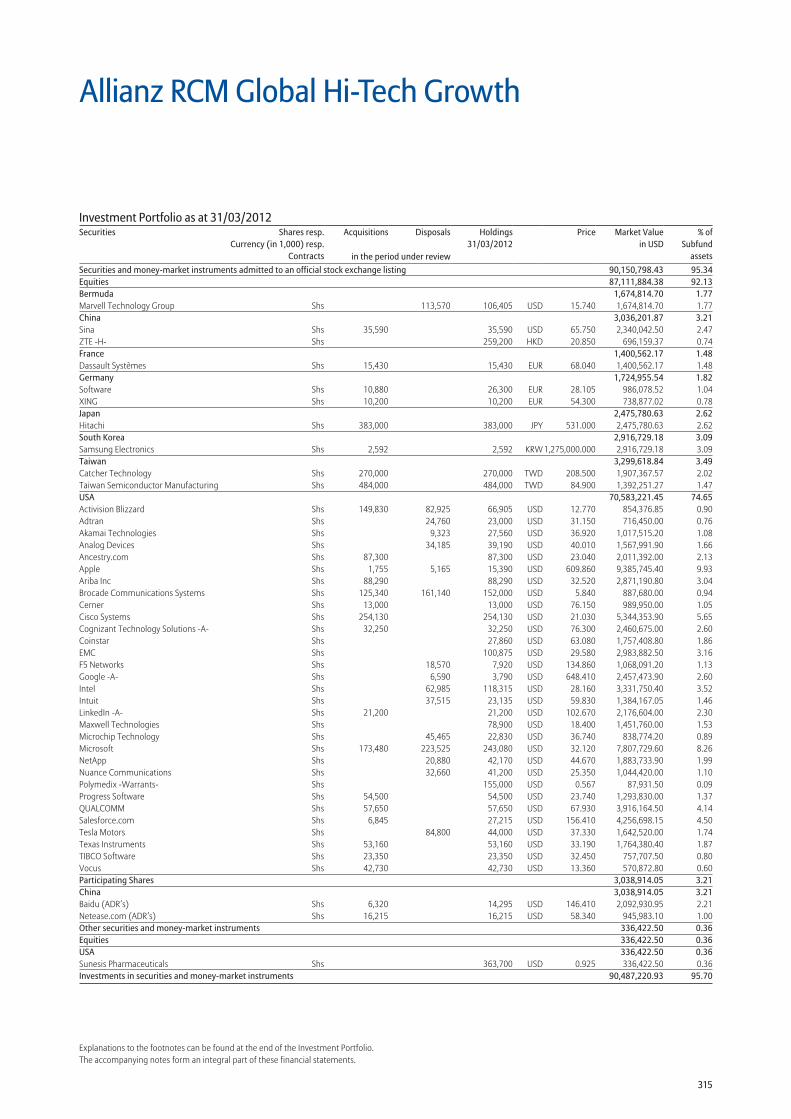
315
Explanations to the footnotes can be found at the end of the Investment Portfolio.The accompanying notes form an integral part of these financial statements.
Securities and money-market instruments admitted to an official stock exchange listing 90,150,798.43 95.34Equities 87,111,884.38 92.13Bermuda 1,674,814.70 1.77Marvell Technology Group Shs 113,570 106,405 USD 15.740 1,674,814.70 1.77China 3,036,201.87 3.21Sina Shs 35,590 35,590 USD 65.750 2,340,042.50 2.47ZTE -H- Shs 259,200 HKD 20.850 696,159.37 0.74France 1,400,562.17 1.48Dassault Systèmes Shs 15,430 15,430 EUR 68.040 1,400,562.17 1.48Germany 1,724,955.54 1.82Software Shs 10,880 26,300 EUR 28.105 986,078.52 1.04XING Shs 10,200 10,200 EUR 54.300 738,877.02 0.78Japan 2,475,780.63 2.62Hitachi Shs 383,000 383,000 JPY 531.000 2,475,780.63 2.62South Korea 2,916,729.18 3.09Samsung Electronics Shs 2,592 2,592 KRW 1,275,000.000 2,916,729.18 3.09Taiwan 3,299,618.84 3.49Catcher Technology Shs 270,000 270,000 TWD 208.500 1,907,367.57 2.02Taiwan Semiconductor Manufacturing Shs 484,000 484,000 TWD 84.900 1,392,251.27 1.47USA 70,583,221.45 74.65Activision Blizzard Shs 149,830 82,925 66,905 USD 12.770 854,376.85 0.90Adtran Shs 24,760 23,000 USD 31.150 716,450.00 0.76Akamai Technologies Shs 9,323 27,560 USD 36.920 1,017,515.20 1.08Analog Devices Shs 34,185 39,190 USD 40.010 1,567,991.90 1.66Ancestry.com Shs 87,300 87,300 USD 23.040 2,011,392.00 2.13Apple Shs 1,755 5,165 15,390 USD 609.860 9,385,745.40 9.93Ariba Inc Shs 88,290 88,290 USD 32.520 2,871,190.80 3.04Brocade Communications Systems Shs 125,340 161,140 152,000 USD 5.840 887,680.00 0.94Cerner Shs 13,000 13,000 USD 76.150 989,950.00 1.05Cisco Systems Shs 254,130 254,130 USD 21.030 5,344,353.90 5.65Cognizant Technology Solutions -A- Shs 32,250 32,250 USD 76.300 2,460,675.00 2.60Coinstar Shs 27,860 USD 63.080 1,757,408.80 1.86EMC Shs 100,875 USD 29.580 2,983,882.50 3.16F5 Networks Shs 18,570 7,920 USD 134.860 1,068,091.20 1.13Google -A- Shs 6,590 3,790 USD 648.410 2,457,473.90 2.60Intel Shs 62,985 118,315 USD 28.160 3,331,750.40 3.52Intuit Shs 37,515 23,135 USD 59.830 1,384,167.05 1.46LinkedIn -A- Shs 21,200 21,200 USD 102.670 2,176,604.00 2.30Maxwell Technologies Shs 78,900 USD 18.400 1,451,760.00 1.53Microchip Technology Shs 45,465 22,830 USD 36.740 838,774.20 0.89Microsoft Shs 173,480 223,525 243,080 USD 32.120 7,807,729.60 8.26NetApp Shs 20,880 42,170 USD 44.670 1,883,733.90 1.99Nuance Communications Shs 32,660 41,200 USD 25.350 1,044,420.00 1.10Polymedix -Warrants- Shs 155,000 USD 0.567 87,931.50 0.09Progress Software Shs 54,500 54,500 USD 23.740 1,293,830.00 1.37QUALCOMM Shs 57,650 57,650 USD 67.930 3,916,164.50 4.14Salesforce.com Shs 6,845 27,215 USD 156.410 4,256,698.15 4.50Tesla Motors Shs 84,800 44,000 USD 37.330 1,642,520.00 1.74Texas Instruments Shs 53,160 53,160 USD 33.190 1,764,380.40 1.87TIBCO Software Shs 23,350 23,350 USD 32.450 757,707.50 0.80Vocus Shs 42,730 42,730 USD 13.360 570,872.80 0.60Participating Shares 3,038,914.05 3.21China 3,038,914.05 3.21Baidu (ADR’s) Shs 6,320 14,295 USD 146.410 2,092,930.95 2.21Netease.com (ADR’s) Shs 16,215 16,215 USD 58.340 945,983.10 1.00Other securities and money-market instruments 336,422.50 0.36Equities 336,422.50 0.36USA 336,422.50 0.36Sunesis Pharmaceuticals Shs 363,700 USD 0.925 336,422.50 0.36Investments in securities and money-market instruments 90,487,220.93 95.70
Allianz RCM Global Hi-Tech Growth
Investment Portfolio as at 31/03/2012Securities Shares resp.
Currency (in 1,000) resp.Contracts
Acquisitions Disposals Holdings 31/03/2012
Price Market Valuein USD
% ofSubfund
assetsin the period under review
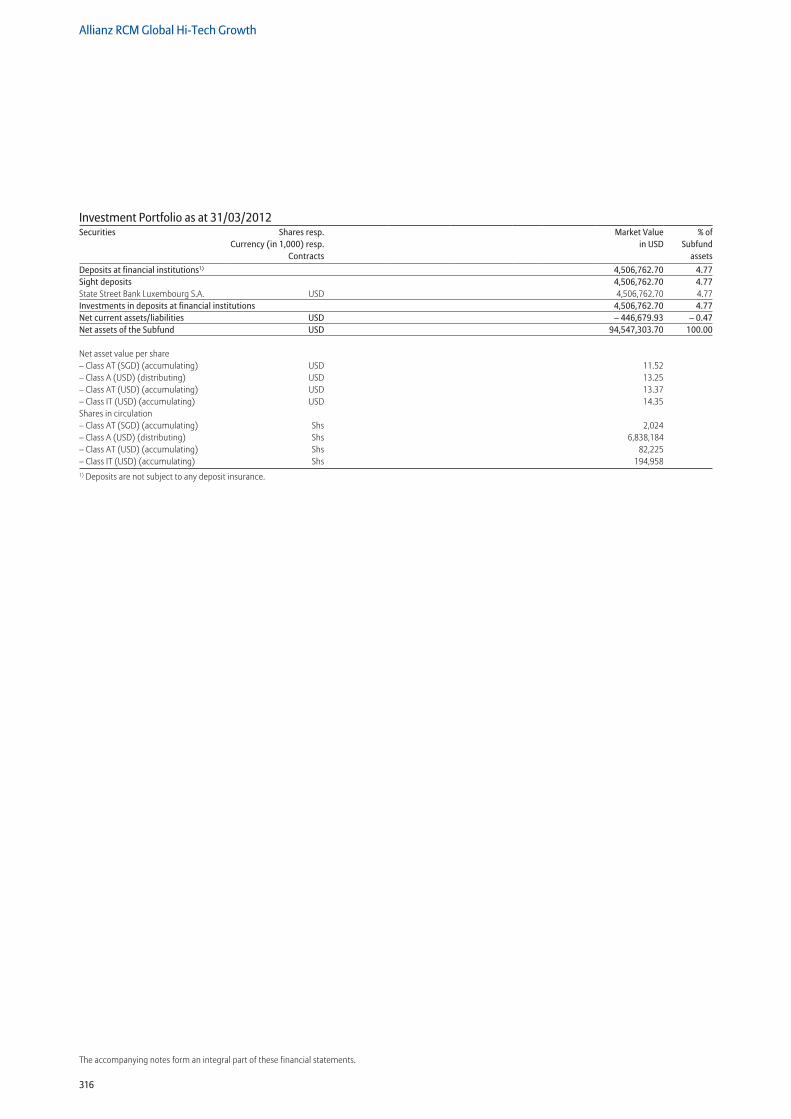
316
Allianz RCM Global Hi-Tech Growth
The accompanying notes form an integral part of these financial statements.
Deposits at financial institutions1) 4,506,762.70 4.77Sight deposits 4,506,762.70 4.77State Street Bank Luxembourg S.A. USD 4,506,762.70 4.77Investments in deposits at financial institutions 4,506,762.70 4.77Net current assets/liabilities USD – 446,679.93 – 0.47Net assets of the Subfund USD 94,547,303.70 100.00
Net asset value per share – Class AT (SGD) (accumulating) USD 11.52 – Class A (USD) (distributing) USD 13.25 – Class AT (USD) (accumulating) USD 13.37 – Class IT (USD) (accumulating) USD 14.35 Shares in circulation – Class AT (SGD) (accumulating) Shs 2,024 – Class A (USD) (distributing) Shs 6,838,184 – Class AT (USD) (accumulating) Shs 82,225 – Class IT (USD) (accumulating) Shs 194,9581) Deposits are not subject to any deposit insurance.
Investment Portfolio as at 31/03/2012Securities Shares resp.
Currency (in 1,000) resp.Contracts
Market Valuein USD
% ofSubfund
assets
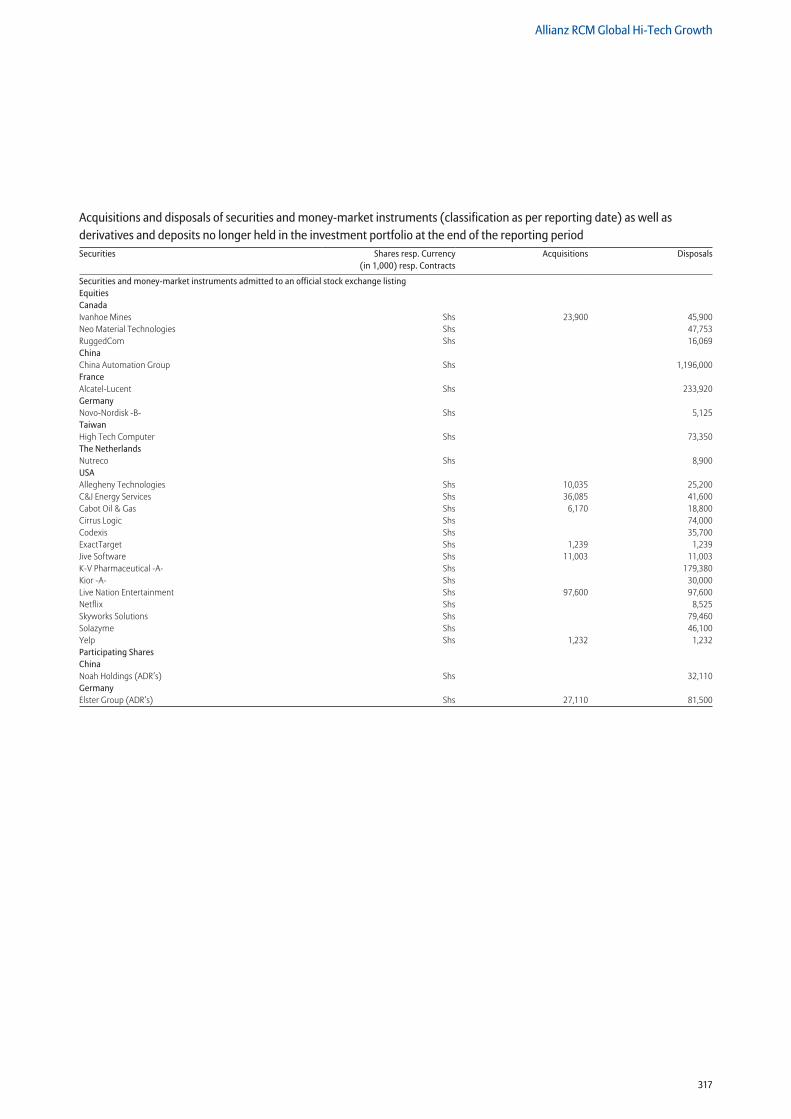
317
Allianz RCM Global Hi-Tech Growth
Securities and money-market instruments admitted to an official stock exchange listing Equities Canada Ivanhoe Mines Shs 23,900 45,900Neo Material Technologies Shs 47,753RuggedCom Shs 16,069China China Automation Group Shs 1,196,000France Alcatel-Lucent Shs 233,920Germany Novo-Nordisk -B- Shs 5,125Taiwan High Tech Computer Shs 73,350The Netherlands Nutreco Shs 8,900USA Allegheny Technologies Shs 10,035 25,200C&J Energy Services Shs 36,085 41,600Cabot Oil & Gas Shs 6,170 18,800Cirrus Logic Shs 74,000Codexis Shs 35,700ExactTarget Shs 1,239 1,239Jive Software Shs 11,003 11,003K-V Pharmaceutical -A- Shs 179,380Kior -A- Shs 30,000Live Nation Entertainment Shs 97,600 97,600Netflix Shs 8,525Skyworks Solutions Shs 79,460Solazyme Shs 46,100Yelp Shs 1,232 1,232Participating Shares China Noah Holdings (ADR’s) Shs 32,110Germany Elster Group (ADR’s) Shs 27,110 81,500
Acquisitions and disposals of securities and money-market instruments (classification as per reporting date) as well as derivatives and deposits no longer held in the investment portfolio at the end of the reporting periodSecurities Shares resp. Currency
(in 1,000) resp. ContractsAcquisitions Disposals

318
Allianz RCM Global Hi-Tech Growth
The accompanying notes form an integral part of these financial statements.
Statement of Net Assetsas at 31/03/2012
31/03/2012 30/09/2011 USD USD
Securities and money-market instruments
(Cost price USD 76,108,887.51) 90,487,220.93 68,495,760.85
Time deposits 0.00 0.00
Cash at banks 4,506,762.70 7,469,585.38
Premiums paid on purchase of options 0.00 0.00
Upfront-payments paid on swap transactions 0.00 0.00
Interest receivable on
– bonds 0.00 0.00
– time deposits 0.00 0.00
– swap transactions 0.00 0.00
Dividend receivable 44,542.10 32,853.66
Receivable on
– subscriptions of fund shares 50,654.90 14,192.93
– securities transactions 156,746.82 122,287.20
Other receivables 0.00 0.00
Unrealised gain on
– options transactions 0.00 0.00
– futures transactions 0.00 0.00
– swap transactions 0.00 0.00
– forward foreign exchange transactions 0.00 0.00
Total Assets 95,245,927.45 76,134,680.02
Liabilities to banks 0.00 0.00
Premiums received on written options 0.00 0.00
Upfront-payments received on swap transactions 0.00 0.00
Interest liabilities on swap transactions 0.00 0.00
Payable on
– redemptions of fund shares – 411,800.22 – 51,214.21
– securities transactions – 122,287.20 – 122,287.20
Other payables – 164,536.33 – 141,396.46
Unrealised loss on
– options transactions 0.00 0.00
– futures transactions 0.00 0.00
– swap transactions 0.00 0.00
– forward foreign exchange transactions 0.00 0.00
Total Liabilities – 698,623.75 – 314,897.87
Net assets of the Subfund 94,547,303.70 75,819,782.15
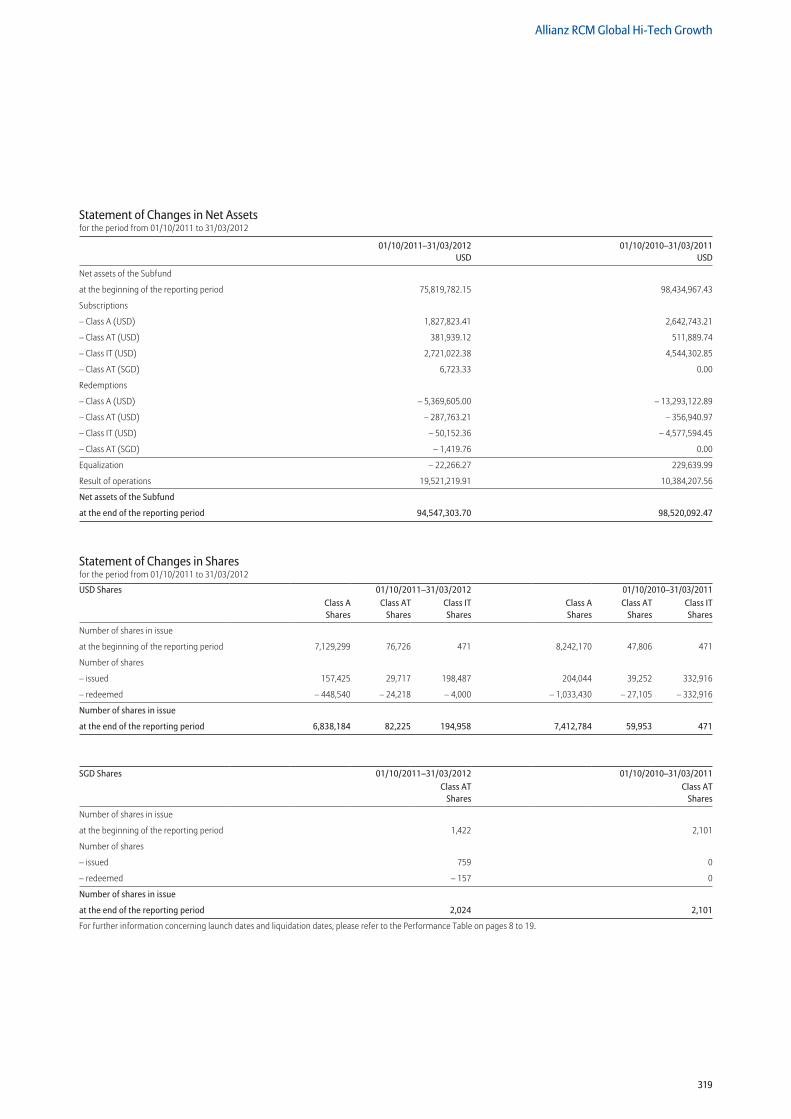
319
Allianz RCM Global Hi-Tech Growth
Statement of Changes in Net Assetsfor the period from 01/10/2011 to 31/03/2012
01/10/2011–31/03/2012 01/10/2010–31/03/2011 USD USD
Net assets of the Subfund
at the beginning of the reporting period 75,819,782.15 98,434,967.43
Subscriptions
– Class A (USD) 1,827,823.41 2,642,743.21
– Class AT (USD) 381,939.12 511,889.74
– Class IT (USD) 2,721,022.38 4,544,302.85
– Class AT (SGD) 6,723.33 0.00
Redemptions
– Class A (USD) – 5,369,605.00 – 13,293,122.89
– Class AT (USD) – 287,763.21 – 356,940.97
– Class IT (USD) – 50,152.36 – 4,577,594.45
– Class AT (SGD) – 1,419.76 0.00
Equalization – 22,266.27 229,639.99
Result of operations 19,521,219.91 10,384,207.56
Net assets of the Subfund
at the end of the reporting period 94,547,303.70 98,520,092.47
Statement of Changes in Sharesfor the period from 01/10/2011 to 31/03/2012
USD Shares 01/10/2011–31/03/2012 01/10/2010–31/03/2011Class A Shares
Class AT Shares
Class IT Shares
Class A Shares
Class AT Shares
Class IT Shares
Number of shares in issue
at the beginning of the reporting period 7,129,299 76,726 471 8,242,170 47,806 471
Number of shares
– issued 157,425 29,717 198,487 204,044 39,252 332,916
– redeemed – 448,540 – 24,218 – 4,000 – 1,033,430 – 27,105 – 332,916
Number of shares in issue
at the end of the reporting period 6,838,184 82,225 194,958 7,412,784 59,953 471
SGD Shares 01/10/2011–31/03/2012 01/10/2010–31/03/2011Class AT
SharesClass AT
Shares
Number of shares in issue
at the beginning of the reporting period 1,422 2,101
Number of shares
– issued 759 0
– redeemed – 157 0
Number of shares in issue
at the end of the reporting period 2,024 2,101
For further information concerning launch dates and liquidation dates, please refer to the Performance Table on pages 8 to 19.
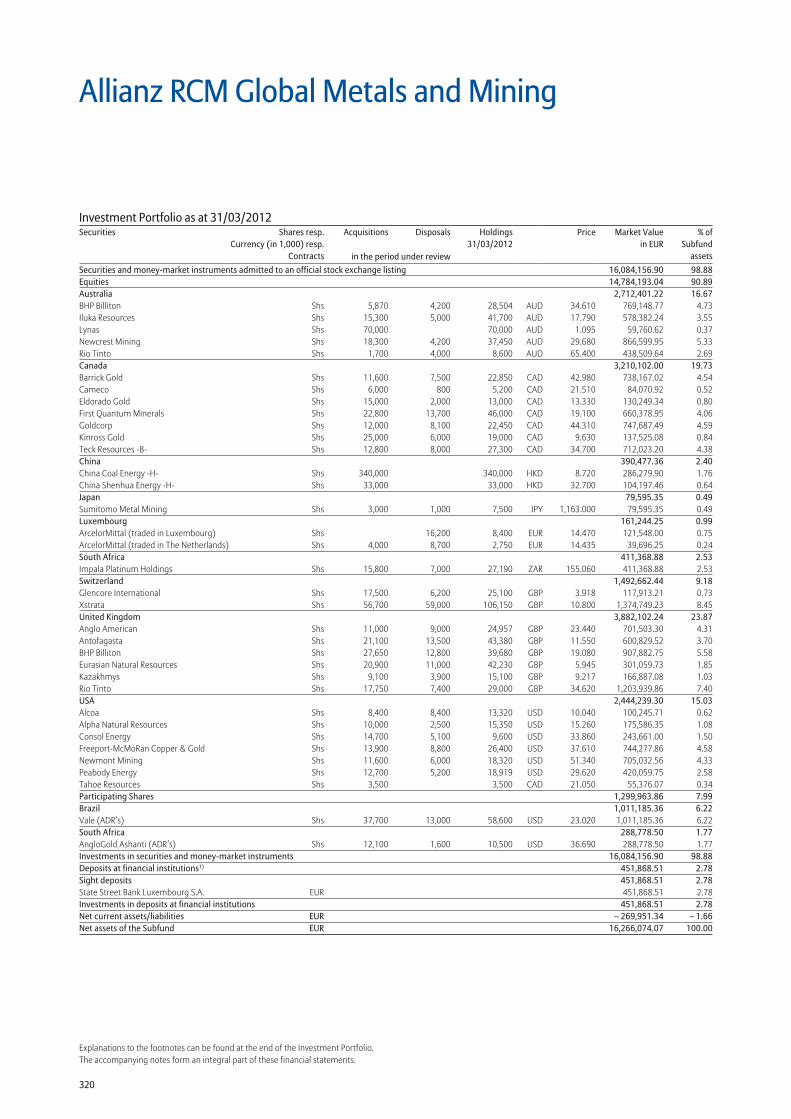
320
Explanations to the footnotes can be found at the end of the Investment Portfolio.The accompanying notes form an integral part of these financial statements.
Allianz RCM Global Metals and Mining
Securities and money-market instruments admitted to an official stock exchange listing 16,084,156.90 98.88Equities 14,784,193.04 90.89Australia 2,712,401.22 16.67BHP Billiton Shs 5,870 4,200 28,504 AUD 34.610 769,148.77 4.73Iluka Resources Shs 15,300 5,000 41,700 AUD 17.790 578,382.24 3.55Lynas Shs 70,000 70,000 AUD 1.095 59,760.62 0.37Newcrest Mining Shs 18,300 4,200 37,450 AUD 29.680 866,599.95 5.33Rio Tinto Shs 1,700 4,000 8,600 AUD 65.400 438,509.64 2.69Canada 3,210,102.00 19.73Barrick Gold Shs 11,600 7,500 22,850 CAD 42.980 738,167.02 4.54Cameco Shs 6,000 800 5,200 CAD 21.510 84,070.92 0.52Eldorado Gold Shs 15,000 2,000 13,000 CAD 13.330 130,249.34 0.80First Quantum Minerals Shs 22,800 13,700 46,000 CAD 19.100 660,378.95 4.06Goldcorp Shs 12,000 8,100 22,450 CAD 44.310 747,687.49 4.59Kinross Gold Shs 25,000 6,000 19,000 CAD 9.630 137,525.08 0.84Teck Resources -B- Shs 12,800 8,000 27,300 CAD 34.700 712,023.20 4.38China 390,477.36 2.40China Coal Energy -H- Shs 340,000 340,000 HKD 8.720 286,279.90 1.76China Shenhua Energy -H- Shs 33,000 33,000 HKD 32.700 104,197.46 0.64Japan 79,595.35 0.49Sumitomo Metal Mining Shs 3,000 1,000 7,500 JPY 1,163.000 79,595.35 0.49Luxembourg 161,244.25 0.99ArcelorMittal (traded in Luxembourg) Shs 16,200 8,400 EUR 14.470 121,548.00 0.75ArcelorMittal (traded in The Netherlands) Shs 4,000 8,700 2,750 EUR 14.435 39,696.25 0.24South Africa 411,368.88 2.53Impala Platinum Holdings Shs 15,800 7,000 27,190 ZAR 155.060 411,368.88 2.53Switzerland 1,492,662.44 9.18Glencore International Shs 17,500 6,200 25,100 GBP 3.918 117,913.21 0.73Xstrata Shs 56,700 59,000 106,150 GBP 10.800 1,374,749.23 8.45United Kingdom 3,882,102.24 23.87Anglo American Shs 11,000 9,000 24,957 GBP 23.440 701,503.30 4.31Antofagasta Shs 21,100 13,500 43,380 GBP 11.550 600,829.52 3.70BHP Billiton Shs 27,650 12,800 39,680 GBP 19.080 907,882.75 5.58Eurasian Natural Resources Shs 20,900 11,000 42,230 GBP 5.945 301,059.73 1.85Kazakhmys Shs 9,100 3,900 15,100 GBP 9.217 166,887.08 1.03Rio Tinto Shs 17,750 7,400 29,000 GBP 34.620 1,203,939.86 7.40USA 2,444,239.30 15.03Alcoa Shs 8,400 8,400 13,320 USD 10.040 100,245.71 0.62Alpha Natural Resources Shs 10,000 2,500 15,350 USD 15.260 175,586.35 1.08Consol Energy Shs 14,700 5,100 9,600 USD 33.860 243,661.00 1.50Freeport-McMoRan Copper & Gold Shs 13,900 8,800 26,400 USD 37.610 744,277.86 4.58Newmont Mining Shs 11,600 6,000 18,320 USD 51.340 705,032.56 4.33Peabody Energy Shs 12,700 5,200 18,919 USD 29.620 420,059.75 2.58Tahoe Resources Shs 3,500 3,500 CAD 21.050 55,376.07 0.34Participating Shares 1,299,963.86 7.99Brazil 1,011,185.36 6.22Vale (ADR’s) Shs 37,700 13,000 58,600 USD 23.020 1,011,185.36 6.22South Africa 288,778.50 1.77AngloGold Ashanti (ADR’s) Shs 12,100 1,600 10,500 USD 36.690 288,778.50 1.77Investments in securities and money-market instruments 16,084,156.90 98.88Deposits at financial institutions1) 451,868.51 2.78Sight deposits 451,868.51 2.78State Street Bank Luxembourg S.A. EUR 451,868.51 2.78Investments in deposits at financial institutions 451,868.51 2.78Net current assets/liabilities EUR – 269,951.34 – 1.66Net assets of the Subfund EUR 16,266,074.07 100.00
Investment Portfolio as at 31/03/2012Securities Shares resp.
Currency (in 1,000) resp.Contracts
Acquisitions Disposals Holdings 31/03/2012
Price Market Valuein EUR
% ofSubfund
assetsin the period under review
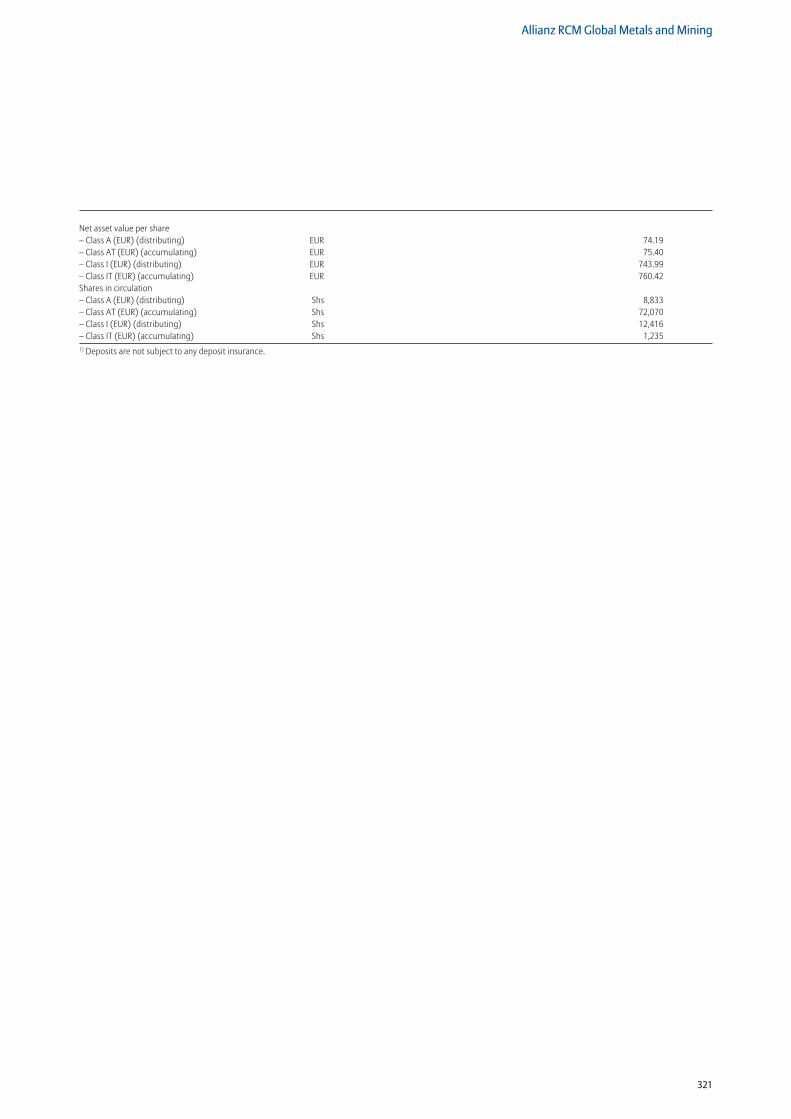
321
Allianz RCM Global Metals and Mining
Net asset value per share – Class A (EUR) (distributing) EUR 74.19 – Class AT (EUR) (accumulating) EUR 75.40 – Class I (EUR) (distributing) EUR 743.99 – Class IT (EUR) (accumulating) EUR 760.42 Shares in circulation – Class A (EUR) (distributing) Shs 8,833 – Class AT (EUR) (accumulating) Shs 72,070 – Class I (EUR) (distributing) Shs 12,416 – Class IT (EUR) (accumulating) Shs 1,2351) Deposits are not subject to any deposit insurance.
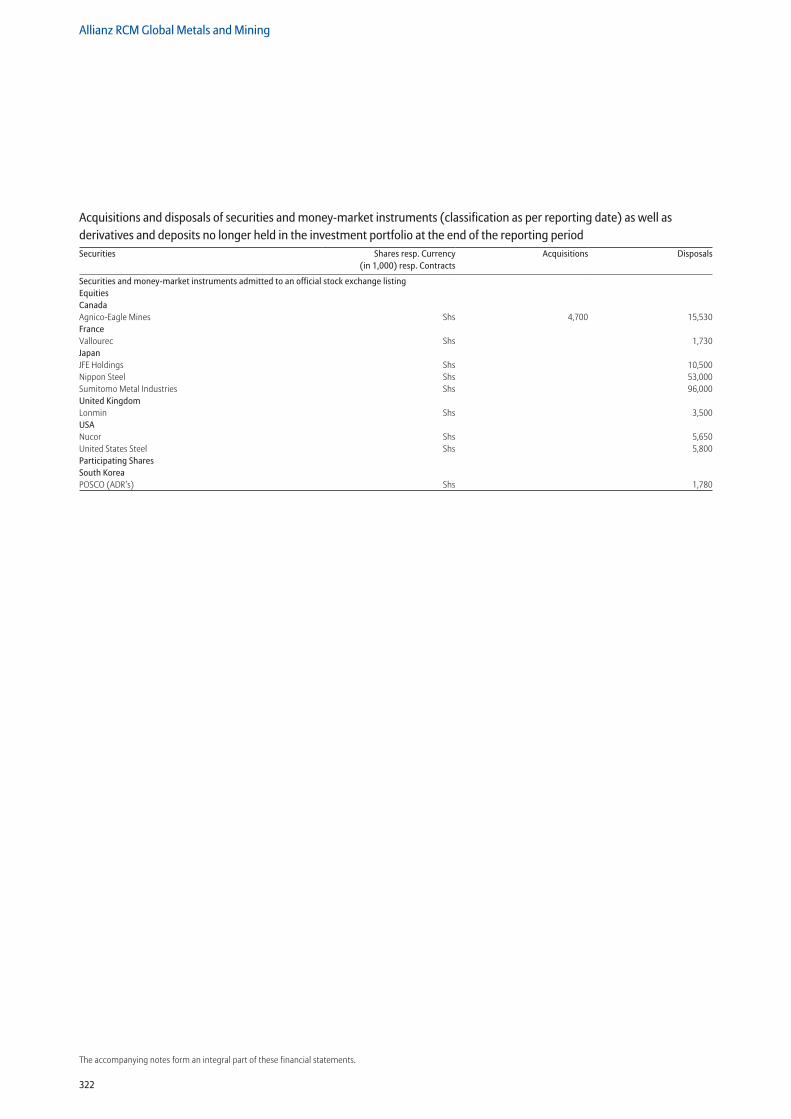
322
Allianz RCM Global Metals and Mining
The accompanying notes form an integral part of these financial statements.
Securities and money-market instruments admitted to an official stock exchange listing Equities Canada Agnico-Eagle Mines Shs 4,700 15,530France Vallourec Shs 1,730Japan JFE Holdings Shs 10,500Nippon Steel Shs 53,000Sumitomo Metal Industries Shs 96,000United Kingdom Lonmin Shs 3,500USA Nucor Shs 5,650United States Steel Shs 5,800Participating Shares South Korea POSCO (ADR’s) Shs 1,780
Acquisitions and disposals of securities and money-market instruments (classification as per reporting date) as well as derivatives and deposits no longer held in the investment portfolio at the end of the reporting periodSecurities Shares resp. Currency
(in 1,000) resp. ContractsAcquisitions Disposals

323
Allianz RCM Global Metals and Mining
Statement of Net Assetsas at 31/03/2012
31/03/2012 30/09/2011 EUR EUR
Securities and money-market instruments
(Cost price EUR 18,353,810.20) 16,084,156.90 11,950,762.87
Time deposits 0.00 0.00
Cash at banks 451,868.51 1,099,707.70
Premiums paid on purchase of options 0.00 0.00
Upfront-payments paid on swap transactions 0.00 0.00
Interest receivable on
– bonds 0.00 0.00
– time deposits 0.00 0.00
– swap transactions 0.00 0.00
Dividend receivable 53,511.85 31,093.15
Receivable on
– subscriptions of fund shares 11,031.00 0.00
– securities transactions 2,208,281.44 21,863.99
Other receivables 0.00 0.00
Unrealised gain on
– options transactions 0.00 0.00
– futures transactions 0.00 0.00
– swap transactions 0.00 0.00
– forward foreign exchange transactions 0.00 0.00
Total Assets 18,808,849.70 13,103,427.71
Liabilities to banks – 2,259.02 – 13,336.07
Premiums received on written options 0.00 0.00
Upfront-payments received on swap transactions 0.00 0.00
Interest liabilities on swap transactions 0.00 0.00
Payable on
– redemptions of fund shares – 2,521,514.40 0.00
– securities transactions 0.00 – 813,608.50
Other payables – 19,002.21 – 10,853.00
Unrealised loss on
– options transactions 0.00 0.00
– futures transactions 0.00 0.00
– swap transactions 0.00 0.00
– forward foreign exchange transactions 0.00 0.00
Total Liabilities – 2,542,775.63 – 837,797.57
Net assets of the Subfund 16,266,074.07 12,265,630.14
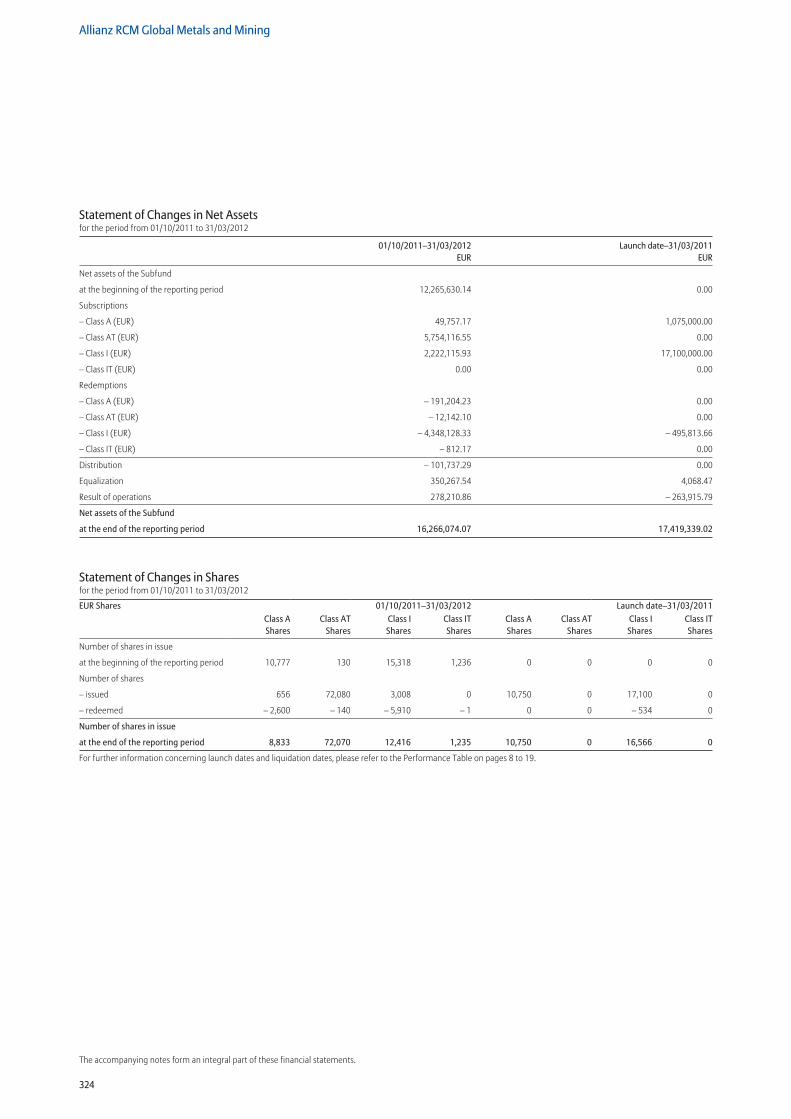
324
Allianz RCM Global Metals and Mining
The accompanying notes form an integral part of these financial statements.
Statement of Changes in Net Assetsfor the period from 01/10/2011 to 31/03/2012
01/10/2011–31/03/2012 Launch date–31/03/2011 EUR EUR
Net assets of the Subfund
at the beginning of the reporting period 12,265,630.14 0.00
Subscriptions
– Class A (EUR) 49,757.17 1,075,000.00
– Class AT (EUR) 5,754,116.55 0.00
– Class I (EUR) 2,222,115.93 17,100,000.00
– Class IT (EUR) 0.00 0.00
Redemptions
– Class A (EUR) – 191,204.23 0.00
– Class AT (EUR) – 12,142.10 0.00
– Class I (EUR) – 4,348,128.33 – 495,813.66
– Class IT (EUR) – 812.17 0.00
Distribution – 101,737.29 0.00
Equalization 350,267.54 4,068.47
Result of operations 278,210.86 – 263,915.79
Net assets of the Subfund
at the end of the reporting period 16,266,074.07 17,419,339.02
Statement of Changes in Sharesfor the period from 01/10/2011 to 31/03/2012
EUR Shares 01/10/2011–31/03/2012 Launch date–31/03/2011Class A Shares
Class AT Shares
Class I Shares
Class IT Shares
Class A Shares
Class AT Shares
Class I Shares
Class IT Shares
Number of shares in issue
at the beginning of the reporting period 10,777 130 15,318 1,236 0 0 0 0
Number of shares
– issued 656 72,080 3,008 0 10,750 0 17,100 0
– redeemed – 2,600 – 140 – 5,910 – 1 0 0 – 534 0
Number of shares in issue
at the end of the reporting period 8,833 72,070 12,416 1,235 10,750 0 16,566 0
For further information concerning launch dates and liquidation dates, please refer to the Performance Table on pages 8 to 19.
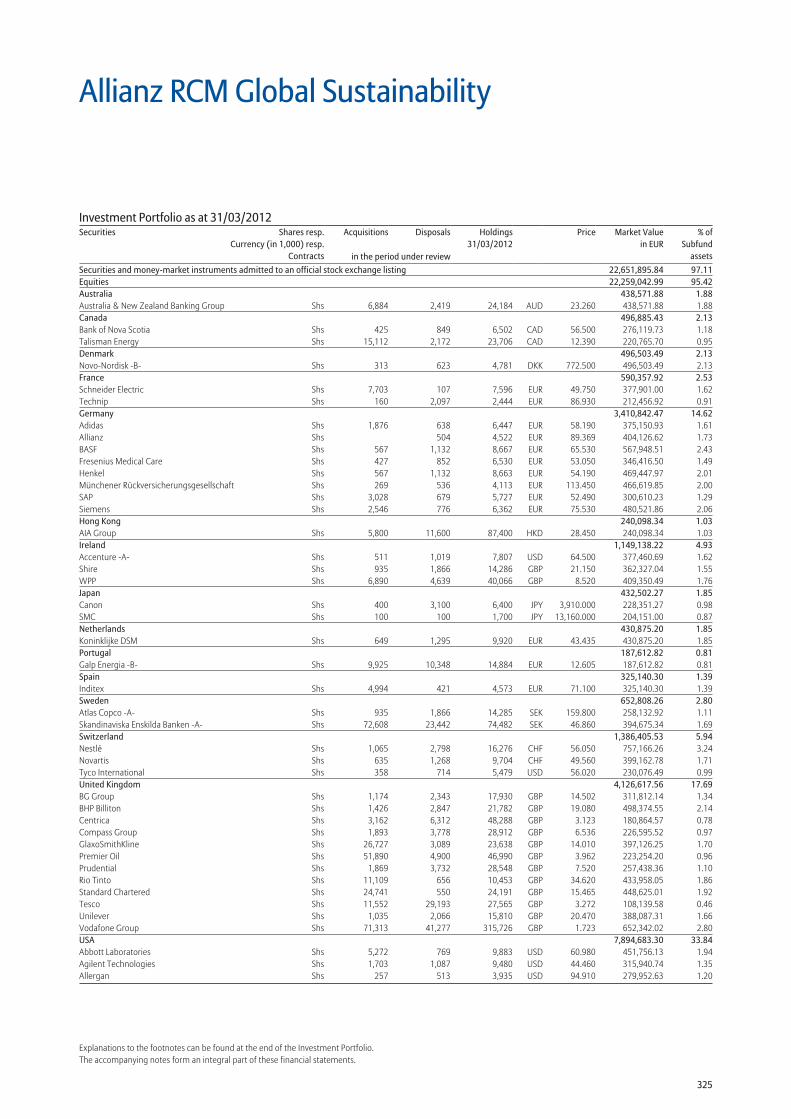
325
Explanations to the footnotes can be found at the end of the Investment Portfolio.The accompanying notes form an integral part of these financial statements.
Securities and money-market instruments admitted to an official stock exchange listing 22,651,895.84 97.11Equities 22,259,042.99 95.42Australia 438,571.88 1.88Australia & New Zealand Banking Group Shs 6,884 2,419 24,184 AUD 23.260 438,571.88 1.88Canada 496,885.43 2.13Bank of Nova Scotia Shs 425 849 6,502 CAD 56.500 276,119.73 1.18Talisman Energy Shs 15,112 2,172 23,706 CAD 12.390 220,765.70 0.95Denmark 496,503.49 2.13Novo-Nordisk -B- Shs 313 623 4,781 DKK 772.500 496,503.49 2.13France 590,357.92 2.53Schneider Electric Shs 7,703 107 7,596 EUR 49.750 377,901.00 1.62Technip Shs 160 2,097 2,444 EUR 86.930 212,456.92 0.91Germany 3,410,842.47 14.62Adidas Shs 1,876 638 6,447 EUR 58.190 375,150.93 1.61Allianz Shs 504 4,522 EUR 89.369 404,126.62 1.73BASF Shs 567 1,132 8,667 EUR 65.530 567,948.51 2.43Fresenius Medical Care Shs 427 852 6,530 EUR 53.050 346,416.50 1.49Henkel Shs 567 1,132 8,663 EUR 54.190 469,447.97 2.01Münchener Rückversicherungsgesellschaft Shs 269 536 4,113 EUR 113.450 466,619.85 2.00SAP Shs 3,028 679 5,727 EUR 52.490 300,610.23 1.29Siemens Shs 2,546 776 6,362 EUR 75.530 480,521.86 2.06Hong Kong 240,098.34 1.03AIA Group Shs 5,800 11,600 87,400 HKD 28.450 240,098.34 1.03Ireland 1,149,138.22 4.93Accenture -A- Shs 511 1,019 7,807 USD 64.500 377,460.69 1.62Shire Shs 935 1,866 14,286 GBP 21.150 362,327.04 1.55WPP Shs 6,890 4,639 40,066 GBP 8.520 409,350.49 1.76Japan 432,502.27 1.85Canon Shs 400 3,100 6,400 JPY 3,910.000 228,351.27 0.98SMC Shs 100 100 1,700 JPY 13,160.000 204,151.00 0.87Netherlands 430,875.20 1.85Koninklijke DSM Shs 649 1,295 9,920 EUR 43.435 430,875.20 1.85Portugal 187,612.82 0.81Galp Energia -B- Shs 9,925 10,348 14,884 EUR 12.605 187,612.82 0.81Spain 325,140.30 1.39Inditex Shs 4,994 421 4,573 EUR 71.100 325,140.30 1.39Sweden 652,808.26 2.80Atlas Copco -A- Shs 935 1,866 14,285 SEK 159.800 258,132.92 1.11Skandinaviska Enskilda Banken -A- Shs 72,608 23,442 74,482 SEK 46.860 394,675.34 1.69Switzerland 1,386,405.53 5.94Nestlé Shs 1,065 2,798 16,276 CHF 56.050 757,166.26 3.24Novartis Shs 635 1,268 9,704 CHF 49.560 399,162.78 1.71Tyco International Shs 358 714 5,479 USD 56.020 230,076.49 0.99United Kingdom 4,126,617.56 17.69BG Group Shs 1,174 2,343 17,930 GBP 14.502 311,812.14 1.34BHP Billiton Shs 1,426 2,847 21,782 GBP 19.080 498,374.55 2.14Centrica Shs 3,162 6,312 48,288 GBP 3.123 180,864.57 0.78Compass Group Shs 1,893 3,778 28,912 GBP 6.536 226,595.52 0.97GlaxoSmithKline Shs 26,727 3,089 23,638 GBP 14.010 397,126.25 1.70Premier Oil Shs 51,890 4,900 46,990 GBP 3.962 223,254.20 0.96Prudential Shs 1,869 3,732 28,548 GBP 7.520 257,438.36 1.10Rio Tinto Shs 11,109 656 10,453 GBP 34.620 433,958.05 1.86Standard Chartered Shs 24,741 550 24,191 GBP 15.465 448,625.01 1.92Tesco Shs 11,552 29,193 27,565 GBP 3.272 108,139.58 0.46Unilever Shs 1,035 2,066 15,810 GBP 20.470 388,087.31 1.66Vodafone Group Shs 71,313 41,277 315,726 GBP 1.723 652,342.02 2.80USA 7,894,683.30 33.84Abbott Laboratories Shs 5,272 769 9,883 USD 60.980 451,756.13 1.94Agilent Technologies Shs 1,703 1,087 9,480 USD 44.460 315,940.74 1.35Allergan Shs 257 513 3,935 USD 94.910 279,952.63 1.20
Allianz RCM Global Sustainability
Investment Portfolio as at 31/03/2012Securities Shares resp.
Currency (in 1,000) resp.Contracts
Acquisitions Disposals Holdings 31/03/2012
Price Market Valuein EUR
% ofSubfund
assetsin the period under review
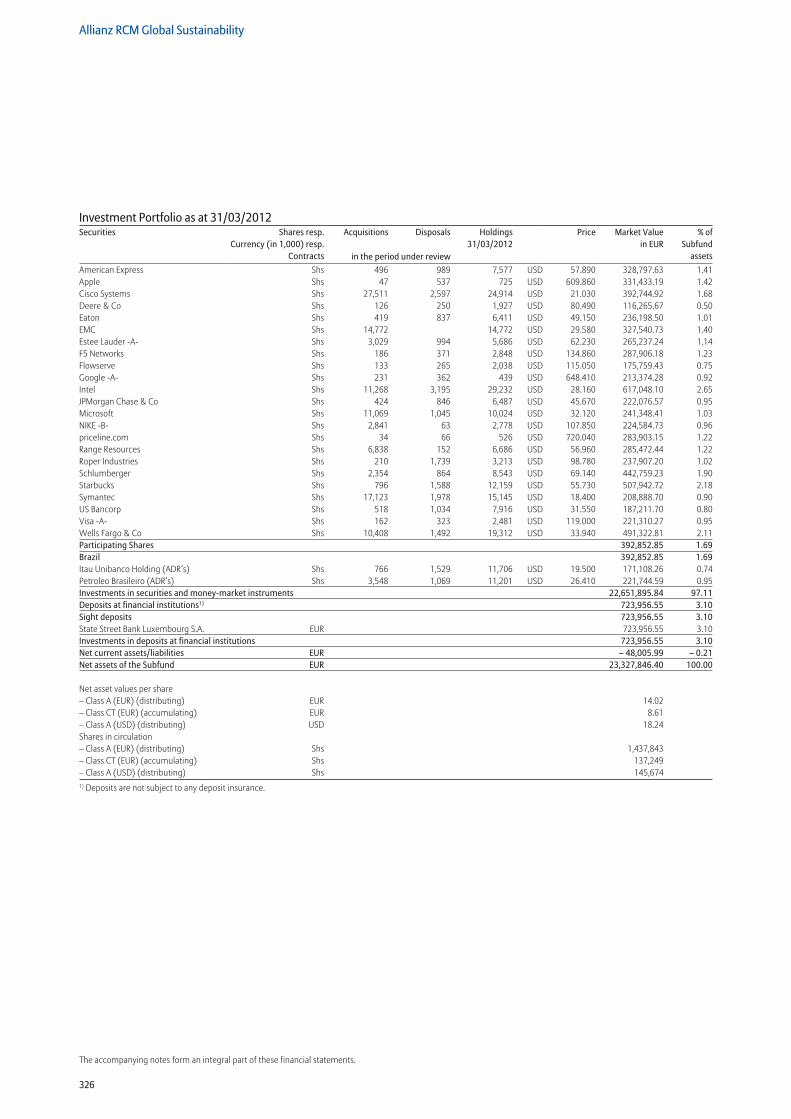
326
Allianz RCM Global Sustainability
The accompanying notes form an integral part of these financial statements.
American Express Shs 496 989 7,577 USD 57.890 328,797.63 1.41Apple Shs 47 537 725 USD 609.860 331,433.19 1.42Cisco Systems Shs 27,511 2,597 24,914 USD 21.030 392,744.92 1.68Deere & Co Shs 126 250 1,927 USD 80.490 116,265.67 0.50Eaton Shs 419 837 6,411 USD 49.150 236,198.50 1.01EMC Shs 14,772 14,772 USD 29.580 327,540.73 1.40Estee Lauder -A- Shs 3,029 994 5,686 USD 62.230 265,237.24 1.14F5 Networks Shs 186 371 2,848 USD 134.860 287,906.18 1.23Flowserve Shs 133 265 2,038 USD 115.050 175,759.43 0.75Google -A- Shs 231 362 439 USD 648.410 213,374.28 0.92Intel Shs 11,268 3,195 29,232 USD 28.160 617,048.10 2.65JPMorgan Chase & Co Shs 424 846 6,487 USD 45.670 222,076.57 0.95Microsoft Shs 11,069 1,045 10,024 USD 32.120 241,348.41 1.03NIKE -B- Shs 2,841 63 2,778 USD 107.850 224,584.73 0.96priceline.com Shs 34 66 526 USD 720.040 283,903.15 1.22Range Resources Shs 6,838 152 6,686 USD 56.960 285,472.44 1.22Roper Industries Shs 210 1,739 3,213 USD 98.780 237,907.20 1.02Schlumberger Shs 2,354 864 8,543 USD 69.140 442,759.23 1.90Starbucks Shs 796 1,588 12,159 USD 55.730 507,942.72 2.18Symantec Shs 17,123 1,978 15,145 USD 18.400 208,888.70 0.90US Bancorp Shs 518 1,034 7,916 USD 31.550 187,211.70 0.80Visa -A- Shs 162 323 2,481 USD 119.000 221,310.27 0.95Wells Fargo & Co Shs 10,408 1,492 19,312 USD 33.940 491,322.81 2.11Participating Shares 392,852.85 1.69Brazil 392,852.85 1.69Itau Unibanco Holding (ADR’s) Shs 766 1,529 11,706 USD 19.500 171,108.26 0.74Petroleo Brasileiro (ADR’s) Shs 3,548 1,069 11,201 USD 26.410 221,744.59 0.95Investments in securities and money-market instruments 22,651,895.84 97.11Deposits at financial institutions1) 723,956.55 3.10Sight deposits 723,956.55 3.10State Street Bank Luxembourg S.A. EUR 723,956.55 3.10Investments in deposits at financial institutions 723,956.55 3.10Net current assets/liabilities EUR – 48,005.99 – 0.21Net assets of the Subfund EUR 23,327,846.40 100.00
Net asset values per share – Class A (EUR) (distributing) EUR 14.02 – Class CT (EUR) (accumulating) EUR 8.61 – Class A (USD) (distributing) USD 18.24 Shares in circulation – Class A (EUR) (distributing) Shs 1,437,843 – Class CT (EUR) (accumulating) Shs 137,249 – Class A (USD) (distributing) Shs 145,6741) Deposits are not subject to any deposit insurance.
Investment Portfolio as at 31/03/2012Securities Shares resp.
Currency (in 1,000) resp.Contracts
Acquisitions Disposals Holdings 31/03/2012
Price Market Valuein EUR
% ofSubfund
assetsin the period under review
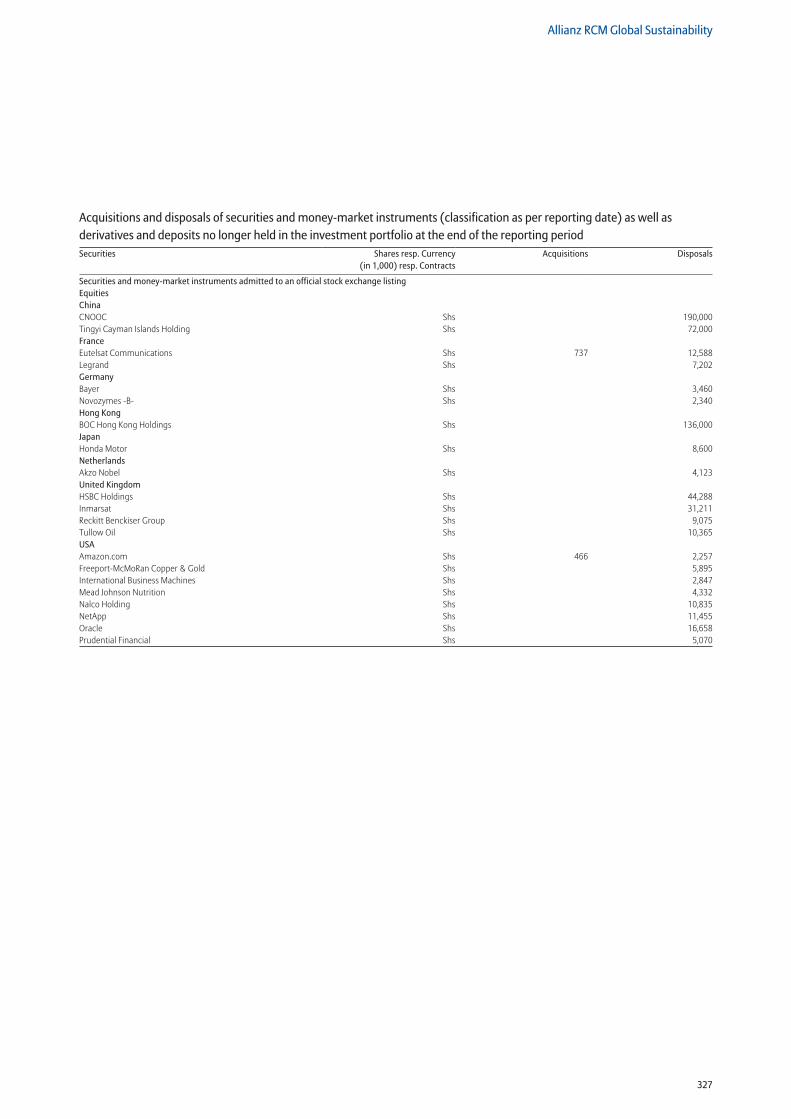
327
Allianz RCM Global Sustainability
Securities and money-market instruments admitted to an official stock exchange listing Equities China CNOOC Shs 190,000Tingyi Cayman Islands Holding Shs 72,000France Eutelsat Communications Shs 737 12,588Legrand Shs 7,202Germany Bayer Shs 3,460Novozymes -B- Shs 2,340Hong Kong BOC Hong Kong Holdings Shs 136,000Japan Honda Motor Shs 8,600Netherlands Akzo Nobel Shs 4,123United Kingdom HSBC Holdings Shs 44,288Inmarsat Shs 31,211Reckitt Benckiser Group Shs 9,075Tullow Oil Shs 10,365USA Amazon.com Shs 466 2,257Freeport-McMoRan Copper & Gold Shs 5,895International Business Machines Shs 2,847Mead Johnson Nutrition Shs 4,332Nalco Holding Shs 10,835NetApp Shs 11,455Oracle Shs 16,658Prudential Financial Shs 5,070
Acquisitions and disposals of securities and money-market instruments (classification as per reporting date) as well as derivatives and deposits no longer held in the investment portfolio at the end of the reporting periodSecurities Shares resp. Currency
(in 1,000) resp. ContractsAcquisitions Disposals
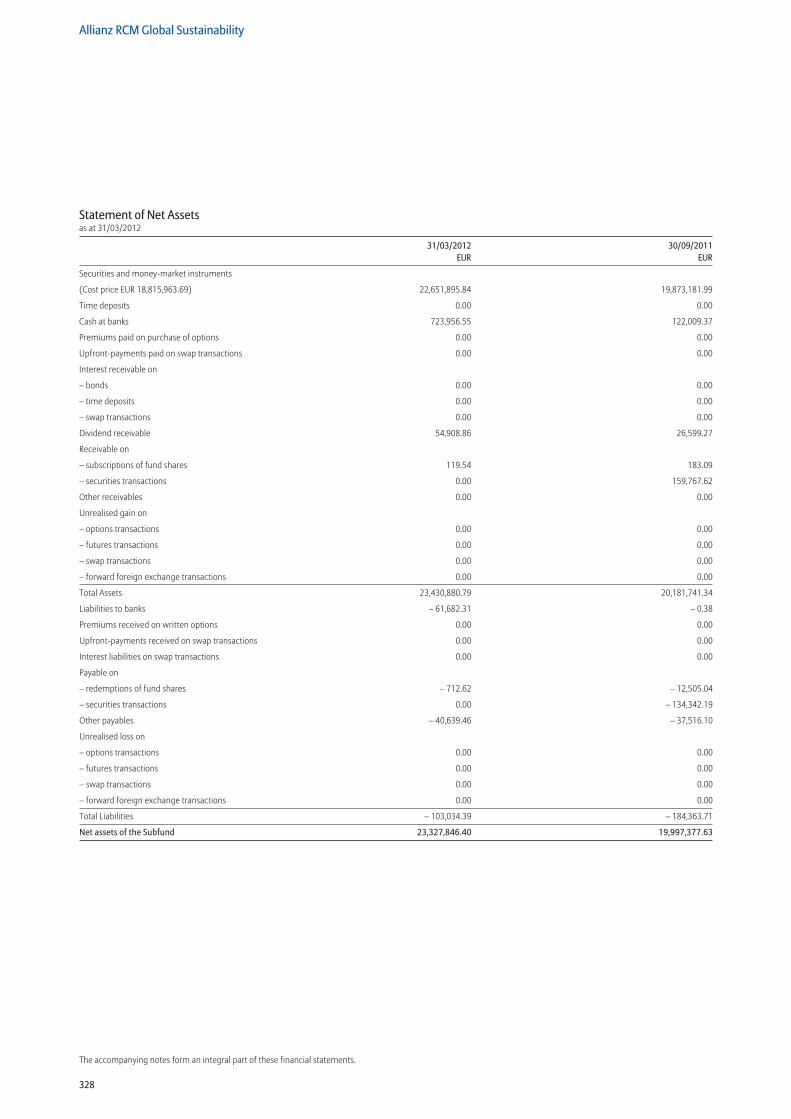
328
Allianz RCM Global Sustainability
The accompanying notes form an integral part of these financial statements.
Statement of Net Assetsas at 31/03/2012
31/03/2012 30/09/2011 EUR EUR
Securities and money-market instruments
(Cost price EUR 18,815,963.69) 22,651,895.84 19,873,181.99
Time deposits 0.00 0.00
Cash at banks 723,956.55 122,009.37
Premiums paid on purchase of options 0.00 0.00
Upfront-payments paid on swap transactions 0.00 0.00
Interest receivable on
– bonds 0.00 0.00
– time deposits 0.00 0.00
– swap transactions 0.00 0.00
Dividend receivable 54,908.86 26,599.27
Receivable on
– subscriptions of fund shares 119.54 183.09
– securities transactions 0.00 159,767.62
Other receivables 0.00 0.00
Unrealised gain on
– options transactions 0.00 0.00
– futures transactions 0.00 0.00
– swap transactions 0.00 0.00
– forward foreign exchange transactions 0.00 0.00
Total Assets 23,430,880.79 20,181,741.34
Liabilities to banks – 61,682.31 – 0.38
Premiums received on written options 0.00 0.00
Upfront-payments received on swap transactions 0.00 0.00
Interest liabilities on swap transactions 0.00 0.00
Payable on
– redemptions of fund shares – 712.62 – 12,505.04
– securities transactions 0.00 – 134,342.19
Other payables – 40,639.46 – 37,516.10
Unrealised loss on
– options transactions 0.00 0.00
– futures transactions 0.00 0.00
– swap transactions 0.00 0.00
– forward foreign exchange transactions 0.00 0.00
Total Liabilities – 103,034.39 – 184,363.71
Net assets of the Subfund 23,327,846.40 19,997,377.63
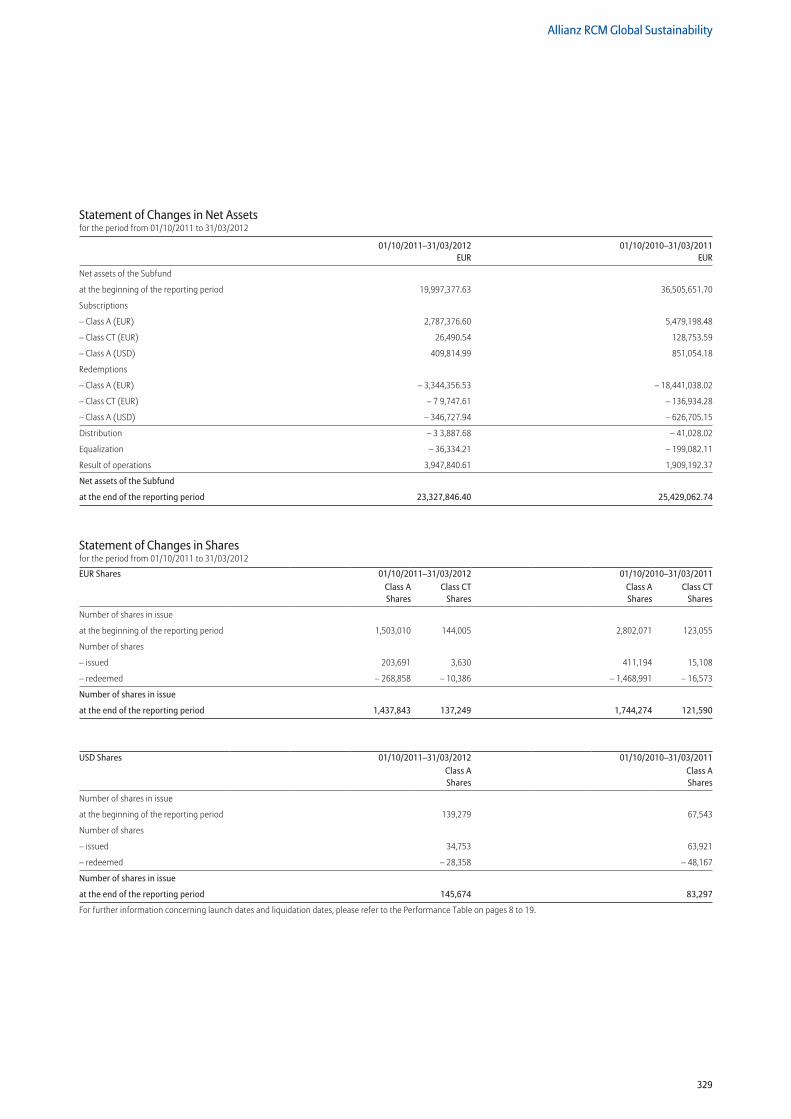
329
Allianz RCM Global Sustainability
Statement of Changes in Net Assetsfor the period from 01/10/2011 to 31/03/2012
01/10/2011–31/03/2012 01/10/2010–31/03/2011 EUR EUR
Net assets of the Subfund
at the beginning of the reporting period 19,997,377.63 36,505,651.70
Subscriptions
– Class A (EUR) 2,787,376.60 5,479,198.48
– Class CT (EUR) 26,490.54 128,753.59
– Class A (USD) 409,814.99 851,054.18
Redemptions
– Class A (EUR) – 3,344,356.53 – 18,441,038.02
– Class CT (EUR) – 7 9,747.61 – 136,934.28
– Class A (USD) – 346,727.94 – 626,705.15
Distribution – 3 3,887.68 – 41,028.02
Equalization – 36,334.21 – 199,082.11
Result of operations 3,947,840.61 1,909,192.37
Net assets of the Subfund
at the end of the reporting period 23,327,846.40 25,429,062.74
Statement of Changes in Sharesfor the period from 01/10/2011 to 31/03/2012
EUR Shares 01/10/2011–31/03/2012 01/10/2010–31/03/2011Class A Shares
Class CT Shares
Class A Shares
Class CT Shares
Number of shares in issue
at the beginning of the reporting period 1,503,010 144,005 2,802,071 123,055
Number of shares
– issued 203,691 3,630 411,194 15,108
– redeemed – 268,858 – 10,386 – 1,468,991 – 16,573
Number of shares in issue
at the end of the reporting period 1,437,843 137,249 1,744,274 121,590
USD Shares 01/10/2011–31/03/2012 01/10/2010–31/03/2011Class A Shares
Class A Shares
Number of shares in issue
at the beginning of the reporting period 139,279 67,543
Number of shares
– issued 34,753 63,921
– redeemed – 28,358 – 48,167
Number of shares in issue
at the end of the reporting period 145,674 83,297
For further information concerning launch dates and liquidation dates, please refer to the Performance Table on pages 8 to 19.
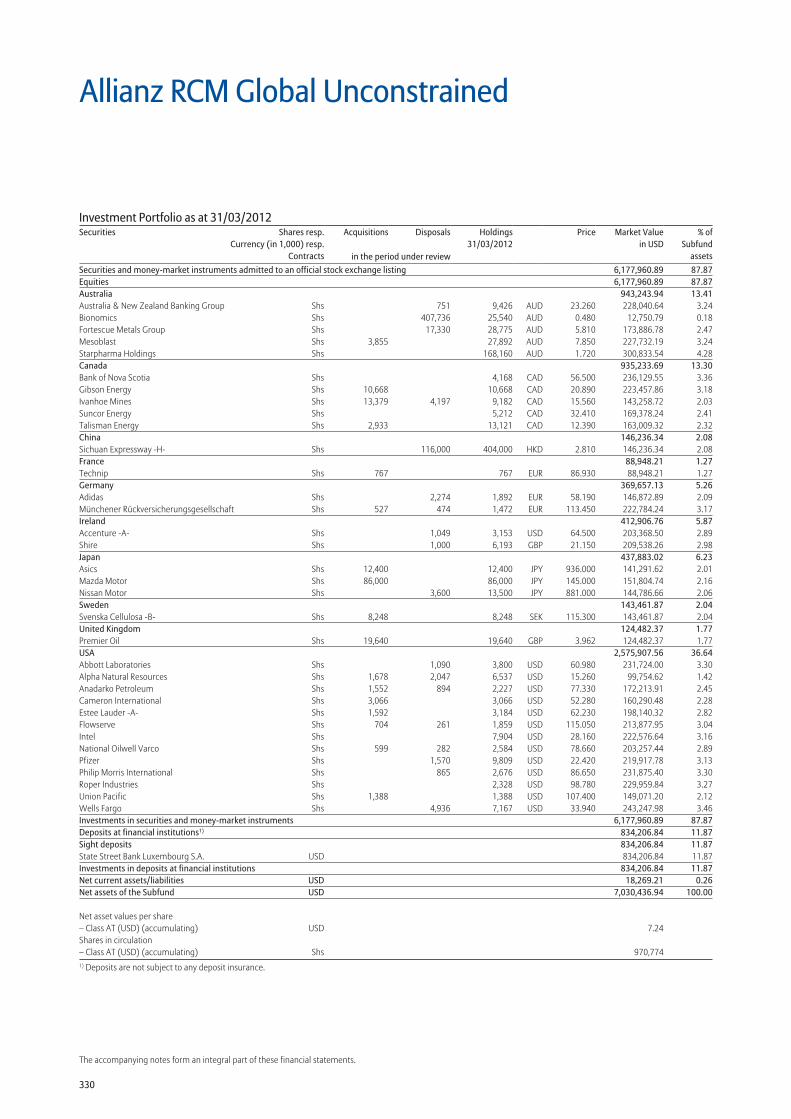
330
The accompanying notes form an integral part of these financial statements.
Securities and money-market instruments admitted to an official stock exchange listing 6,177,960.89 87.87Equities 6,177,960.89 87.87Australia 943,243.94 13.41Australia & New Zealand Banking Group Shs 751 9,426 AUD 23.260 228,040.64 3.24Bionomics Shs 407,736 25,540 AUD 0.480 12,750.79 0.18Fortescue Metals Group Shs 17,330 28,775 AUD 5.810 173,886.78 2.47Mesoblast Shs 3,855 27,892 AUD 7.850 227,732.19 3.24Starpharma Holdings Shs 168,160 AUD 1.720 300,833.54 4.28Canada 935,233.69 13.30Bank of Nova Scotia Shs 4,168 CAD 56.500 236,129.55 3.36Gibson Energy Shs 10,668 10,668 CAD 20.890 223,457.86 3.18Ivanhoe Mines Shs 13,379 4,197 9,182 CAD 15.560 143,258.72 2.03Suncor Energy Shs 5,212 CAD 32.410 169,378.24 2.41Talisman Energy Shs 2,933 13,121 CAD 12.390 163,009.32 2.32China 146,236.34 2.08Sichuan Expressway -H- Shs 116,000 404,000 HKD 2.810 146,236.34 2.08France 88,948.21 1.27Technip Shs 767 767 EUR 86.930 88,948.21 1.27Germany 369,657.13 5.26Adidas Shs 2,274 1,892 EUR 58.190 146,872.89 2.09Münchener Rückversicherungsgesellschaft Shs 527 474 1,472 EUR 113.450 222,784.24 3.17Ireland 412,906.76 5.87Accenture -A- Shs 1,049 3,153 USD 64.500 203,368.50 2.89Shire Shs 1,000 6,193 GBP 21.150 209,538.26 2.98Japan 437,883.02 6.23Asics Shs 12,400 12,400 JPY 936.000 141,291.62 2.01Mazda Motor Shs 86,000 86,000 JPY 145.000 151,804.74 2.16Nissan Motor Shs 3,600 13,500 JPY 881.000 144,786.66 2.06Sweden 143,461.87 2.04Svenska Cellulosa -B- Shs 8,248 8,248 SEK 115.300 143,461.87 2.04United Kingdom 124,482.37 1.77Premier Oil Shs 19,640 19,640 GBP 3.962 124,482.37 1.77USA 2,575,907.56 36.64Abbott Laboratories Shs 1,090 3,800 USD 60.980 231,724.00 3.30Alpha Natural Resources Shs 1,678 2,047 6,537 USD 15.260 99,754.62 1.42Anadarko Petroleum Shs 1,552 894 2,227 USD 77.330 172,213.91 2.45Cameron International Shs 3,066 3,066 USD 52.280 160,290.48 2.28Estee Lauder -A- Shs 1,592 3,184 USD 62.230 198,140.32 2.82Flowserve Shs 704 261 1,859 USD 115.050 213,877.95 3.04Intel Shs 7,904 USD 28.160 222,576.64 3.16National Oilwell Varco Shs 599 282 2,584 USD 78.660 203,257.44 2.89Pfizer Shs 1,570 9,809 USD 22.420 219,917.78 3.13Philip Morris International Shs 865 2,676 USD 86.650 231,875.40 3.30Roper Industries Shs 2,328 USD 98.780 229,959.84 3.27Union Pacific Shs 1,388 1,388 USD 107.400 149,071.20 2.12Wells Fargo Shs 4,936 7,167 USD 33.940 243,247.98 3.46Investments in securities and money-market instruments 6,177,960.89 87.87Deposits at financial institutions1) 834,206.84 11.87Sight deposits 834,206.84 11.87State Street Bank Luxembourg S.A. USD 834,206.84 11.87Investments in deposits at financial institutions 834,206.84 11.87Net current assets/liabilities USD 18,269.21 0.26Net assets of the Subfund USD 7,030,436.94 100.00
Net asset values per share – Class AT (USD) (accumulating) USD 7.24 Shares in circulation – Class AT (USD) (accumulating) Shs 970,7741) Deposits are not subject to any deposit insurance.
Allianz RCM Global Unconstrained
Investment Portfolio as at 31/03/2012Securities Shares resp.
Currency (in 1,000) resp.Contracts
Acquisitions Disposals Holdings 31/03/2012
Price Market Valuein USD
% ofSubfund
assetsin the period under review
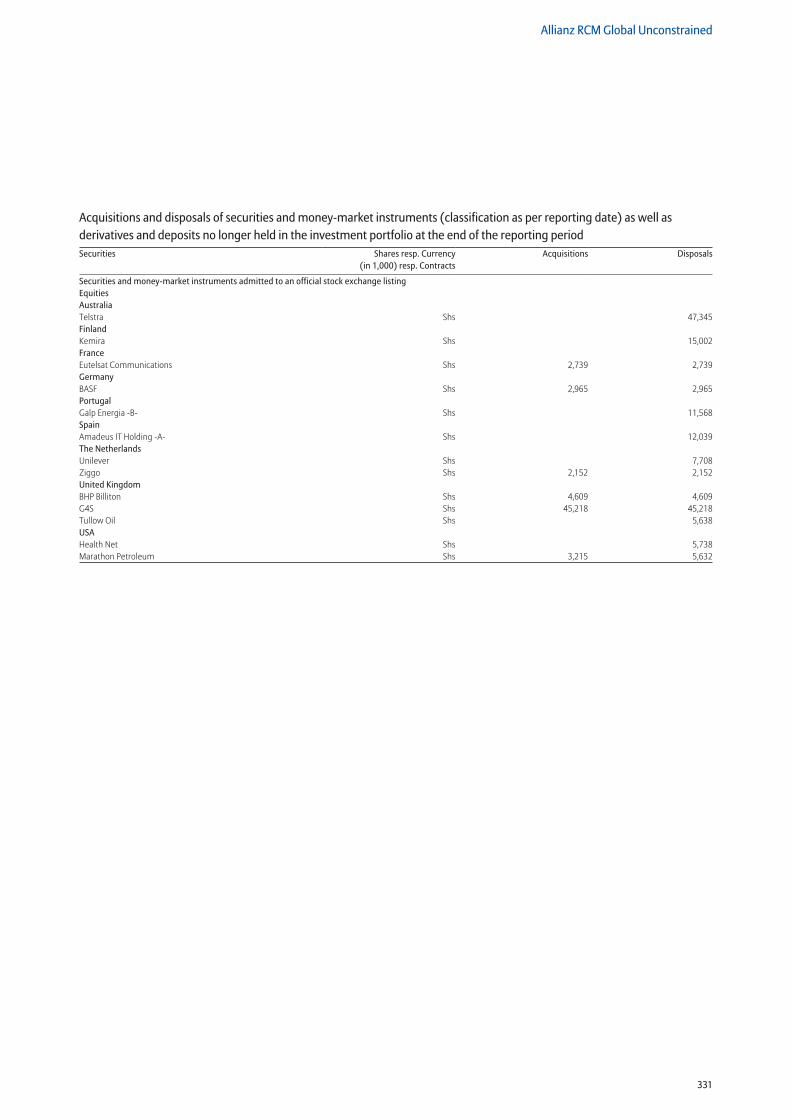
331
Allianz RCM Global Unconstrained
Securities and money-market instruments admitted to an official stock exchange listing Equities Australia Telstra Shs 47,345Finland Kemira Shs 15,002France Eutelsat Communications Shs 2,739 2,739Germany BASF Shs 2,965 2,965Portugal Galp Energia -B- Shs 11,568Spain Amadeus IT Holding -A- Shs 12,039The Netherlands Unilever Shs 7,708Ziggo Shs 2,152 2,152United Kingdom BHP Billiton Shs 4,609 4,609G4S Shs 45,218 45,218Tullow Oil Shs 5,638USA Health Net Shs 5,738Marathon Petroleum Shs 3,215 5,632
Acquisitions and disposals of securities and money-market instruments (classification as per reporting date) as well as derivatives and deposits no longer held in the investment portfolio at the end of the reporting periodSecurities Shares resp. Currency
(in 1,000) resp. ContractsAcquisitions Disposals
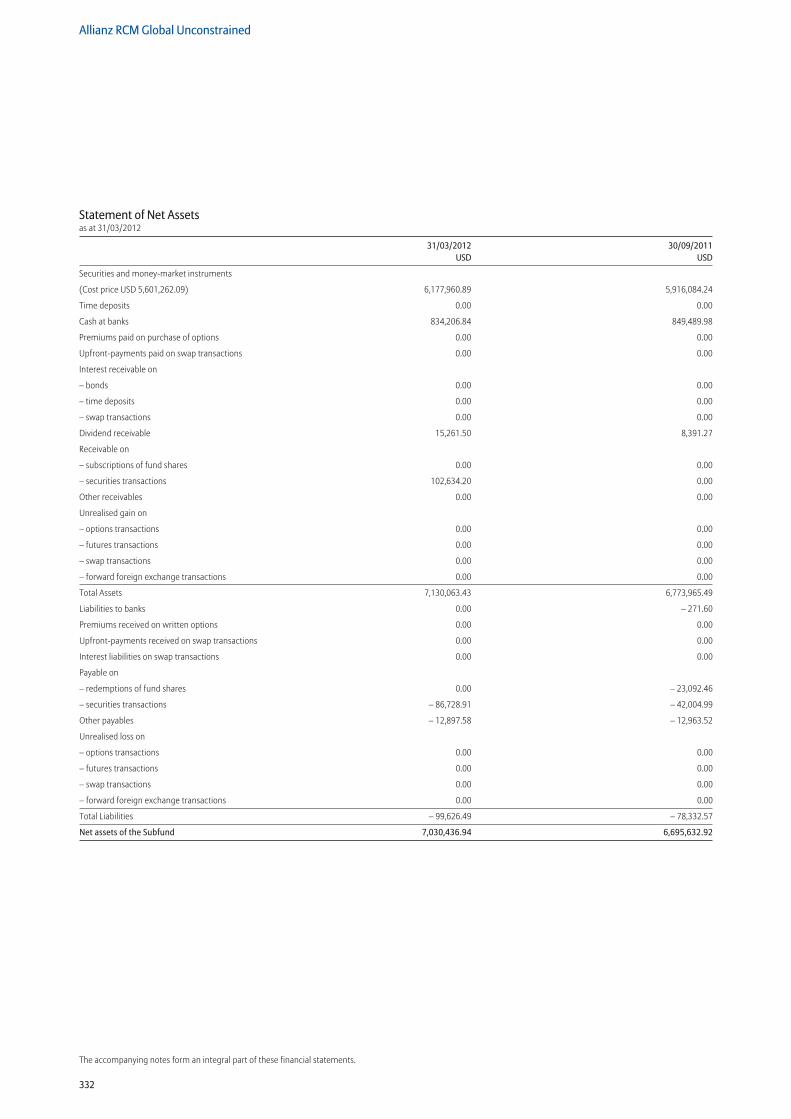
332
Allianz RCM Global Unconstrained
The accompanying notes form an integral part of these financial statements.
Statement of Net Assetsas at 31/03/2012
31/03/2012 30/09/2011 USD USD
Securities and money-market instruments
(Cost price USD 5,601,262.09) 6,177,960.89 5,916,084.24
Time deposits 0.00 0.00
Cash at banks 834,206.84 849,489.98
Premiums paid on purchase of options 0.00 0.00
Upfront-payments paid on swap transactions 0.00 0.00
Interest receivable on
– bonds 0.00 0.00
– time deposits 0.00 0.00
– swap transactions 0.00 0.00
Dividend receivable 15,261.50 8,391.27
Receivable on
– subscriptions of fund shares 0.00 0.00
– securities transactions 102,634.20 0.00
Other receivables 0.00 0.00
Unrealised gain on
– options transactions 0.00 0.00
– futures transactions 0.00 0.00
– swap transactions 0.00 0.00
– forward foreign exchange transactions 0.00 0.00
Total Assets 7,130,063.43 6,773,965.49
Liabilities to banks 0.00 – 271.60
Premiums received on written options 0.00 0.00
Upfront-payments received on swap transactions 0.00 0.00
Interest liabilities on swap transactions 0.00 0.00
Payable on
– redemptions of fund shares 0.00 – 23,092.46
– securities transactions – 86,728.91 – 42,004.99
Other payables – 12,897.58 – 12,963.52
Unrealised loss on
– options transactions 0.00 0.00
– futures transactions 0.00 0.00
– swap transactions 0.00 0.00
– forward foreign exchange transactions 0.00 0.00
Total Liabilities – 99,626.49 – 78,332.57
Net assets of the Subfund 7,030,436.94 6,695,632.92
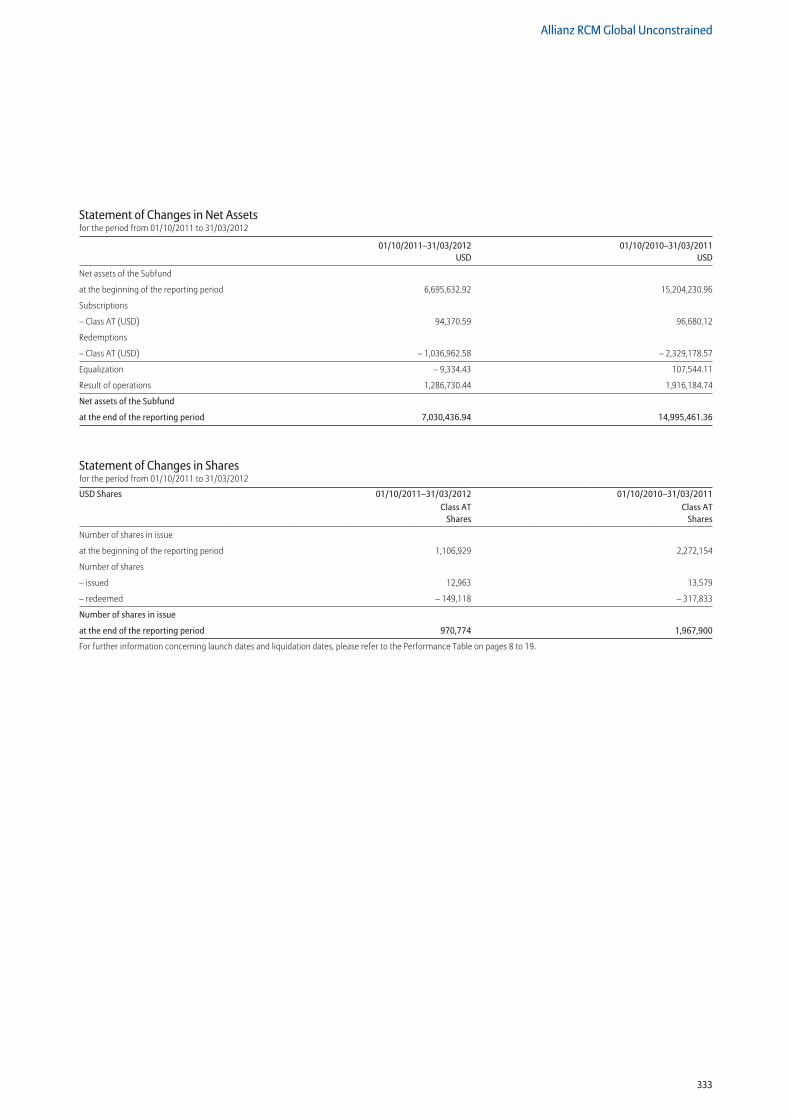
333
Allianz RCM Global Unconstrained
Statement of Changes in Net Assetsfor the period from 01/10/2011 to 31/03/2012
01/10/2011–31/03/2012 01/10/2010–31/03/2011 USD USD
Net assets of the Subfund
at the beginning of the reporting period 6,695,632.92 15,204,230.96
Subscriptions
– Class AT (USD) 94,370.59 96,680.12
Redemptions
– Class AT (USD) – 1,036,962.58 – 2,329,178.57
Equalization – 9,334.43 107,544.11
Result of operations 1,286,730.44 1,916,184.74
Net assets of the Subfund
at the end of the reporting period 7,030,436.94 14,995,461.36
Statement of Changes in Sharesfor the period from 01/10/2011 to 31/03/2012
USD Shares 01/10/2011–31/03/2012 01/10/2010–31/03/2011Class AT
SharesClass AT
Shares
Number of shares in issue
at the beginning of the reporting period 1,106,929 2,272,154
Number of shares
– issued 12,963 13,579
– redeemed – 149,118 – 317,833
Number of shares in issue
at the end of the reporting period 970,774 1,967,900
For further information concerning launch dates and liquidation dates, please refer to the Performance Table on pages 8 to 19.
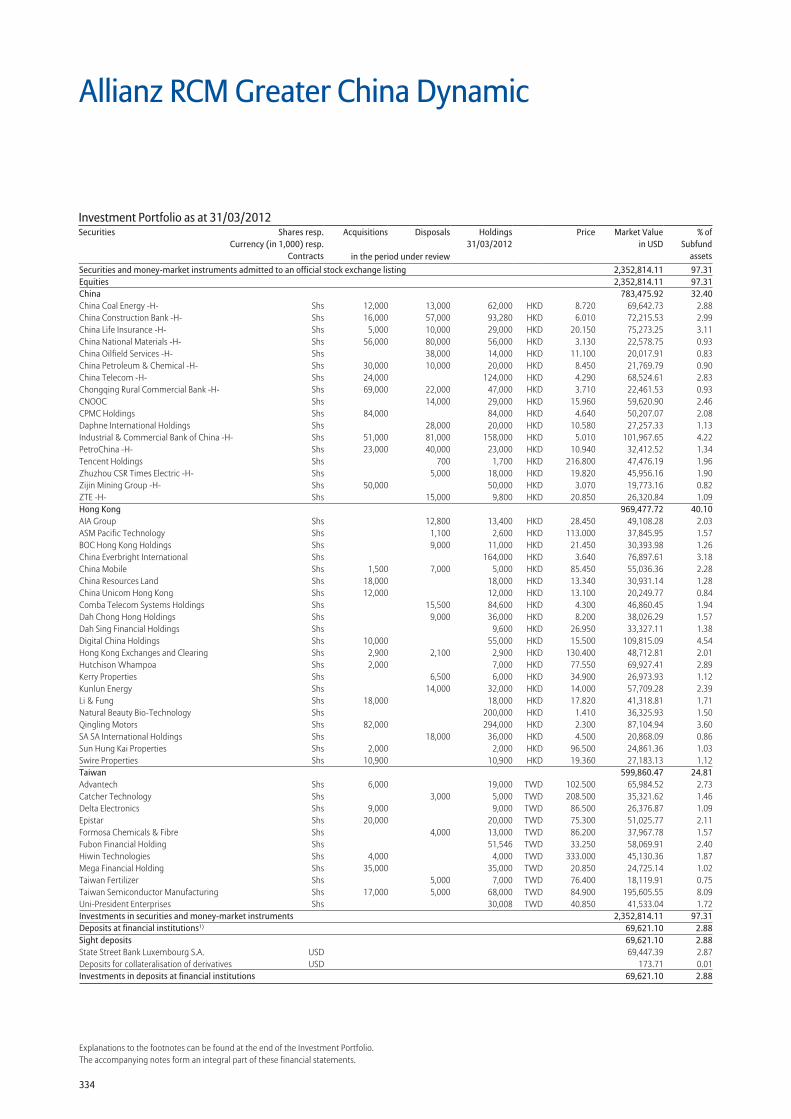
334
Explanations to the footnotes can be found at the end of the Investment Portfolio.The accompanying notes form an integral part of these financial statements.
Allianz RCM Greater China Dynamic
Securities and money-market instruments admitted to an official stock exchange listing 2,352,814.11 97.31Equities 2,352,814.11 97.31China 783,475.92 32.40China Coal Energy -H- Shs 12,000 13,000 62,000 HKD 8.720 69,642.73 2.88China Construction Bank -H- Shs 16,000 57,000 93,280 HKD 6.010 72,215.53 2.99China Life Insurance -H- Shs 5,000 10,000 29,000 HKD 20.150 75,273.25 3.11China National Materials -H- Shs 56,000 80,000 56,000 HKD 3.130 22,578.75 0.93China Oilfield Services -H- Shs 38,000 14,000 HKD 11.100 20,017.91 0.83China Petroleum & Chemical -H- Shs 30,000 10,000 20,000 HKD 8.450 21,769.79 0.90China Telecom -H- Shs 24,000 124,000 HKD 4.290 68,524.61 2.83Chongqing Rural Commercial Bank -H- Shs 69,000 22,000 47,000 HKD 3.710 22,461.53 0.93CNOOC Shs 14,000 29,000 HKD 15.960 59,620.90 2.46CPMC Holdings Shs 84,000 84,000 HKD 4.640 50,207.07 2.08Daphne International Holdings Shs 28,000 20,000 HKD 10.580 27,257.33 1.13Industrial & Commercial Bank of China -H- Shs 51,000 81,000 158,000 HKD 5.010 101,967.65 4.22PetroChina -H- Shs 23,000 40,000 23,000 HKD 10.940 32,412.52 1.34Tencent Holdings Shs 700 1,700 HKD 216.800 47,476.19 1.96Zhuzhou CSR Times Electric -H- Shs 5,000 18,000 HKD 19.820 45,956.16 1.90Zijin Mining Group -H- Shs 50,000 50,000 HKD 3.070 19,773.16 0.82ZTE -H- Shs 15,000 9,800 HKD 20.850 26,320.84 1.09Hong Kong 969,477.72 40.10AIA Group Shs 12,800 13,400 HKD 28.450 49,108.28 2.03ASM Pacific Technology Shs 1,100 2,600 HKD 113.000 37,845.95 1.57BOC Hong Kong Holdings Shs 9,000 11,000 HKD 21.450 30,393.98 1.26China Everbright International Shs 164,000 HKD 3.640 76,897.61 3.18China Mobile Shs 1,500 7,000 5,000 HKD 85.450 55,036.36 2.28China Resources Land Shs 18,000 18,000 HKD 13.340 30,931.14 1.28China Unicom Hong Kong Shs 12,000 12,000 HKD 13.100 20,249.77 0.84Comba Telecom Systems Holdings Shs 15,500 84,600 HKD 4.300 46,860.45 1.94Dah Chong Hong Holdings Shs 9,000 36,000 HKD 8.200 38,026.29 1.57Dah Sing Financial Holdings Shs 9,600 HKD 26.950 33,327.11 1.38Digital China Holdings Shs 10,000 55,000 HKD 15.500 109,815.09 4.54Hong Kong Exchanges and Clearing Shs 2,900 2,100 2,900 HKD 130.400 48,712.81 2.01Hutchison Whampoa Shs 2,000 7,000 HKD 77.550 69,927.41 2.89Kerry Properties Shs 6,500 6,000 HKD 34.900 26,973.93 1.12Kunlun Energy Shs 14,000 32,000 HKD 14.000 57,709.28 2.39Li & Fung Shs 18,000 18,000 HKD 17.820 41,318.81 1.71Natural Beauty Bio-Technology Shs 200,000 HKD 1.410 36,325.93 1.50Qingling Motors Shs 82,000 294,000 HKD 2.300 87,104.94 3.60SA SA International Holdings Shs 18,000 36,000 HKD 4.500 20,868.09 0.86Sun Hung Kai Properties Shs 2,000 2,000 HKD 96.500 24,861.36 1.03Swire Properties Shs 10,900 10,900 HKD 19.360 27,183.13 1.12Taiwan 599,860.47 24.81Advantech Shs 6,000 19,000 TWD 102.500 65,984.52 2.73Catcher Technology Shs 3,000 5,000 TWD 208.500 35,321.62 1.46Delta Electronics Shs 9,000 9,000 TWD 86.500 26,376.87 1.09Epistar Shs 20,000 20,000 TWD 75.300 51,025.77 2.11Formosa Chemicals & Fibre Shs 4,000 13,000 TWD 86.200 37,967.78 1.57Fubon Financial Holding Shs 51,546 TWD 33.250 58,069.91 2.40Hiwin Technologies Shs 4,000 4,000 TWD 333.000 45,130.36 1.87Mega Financial Holding Shs 35,000 35,000 TWD 20.850 24,725.14 1.02Taiwan Fertilizer Shs 5,000 7,000 TWD 76.400 18,119.91 0.75Taiwan Semiconductor Manufacturing Shs 17,000 5,000 68,000 TWD 84.900 195,605.55 8.09Uni-President Enterprises Shs 30,008 TWD 40.850 41,533.04 1.72Investments in securities and money-market instruments 2,352,814.11 97.31Deposits at financial institutions1) 69,621.10 2.88Sight deposits 69,621.10 2.88State Street Bank Luxembourg S.A. USD 69,447.39 2.87Deposits for collateralisation of derivatives USD 173.71 0.01Investments in deposits at financial institutions 69,621.10 2.88
Investment Portfolio as at 31/03/2012Securities Shares resp.
Currency (in 1,000) resp.Contracts
Acquisitions Disposals Holdings 31/03/2012
Price Market Valuein USD
% ofSubfund
assetsin the period under review
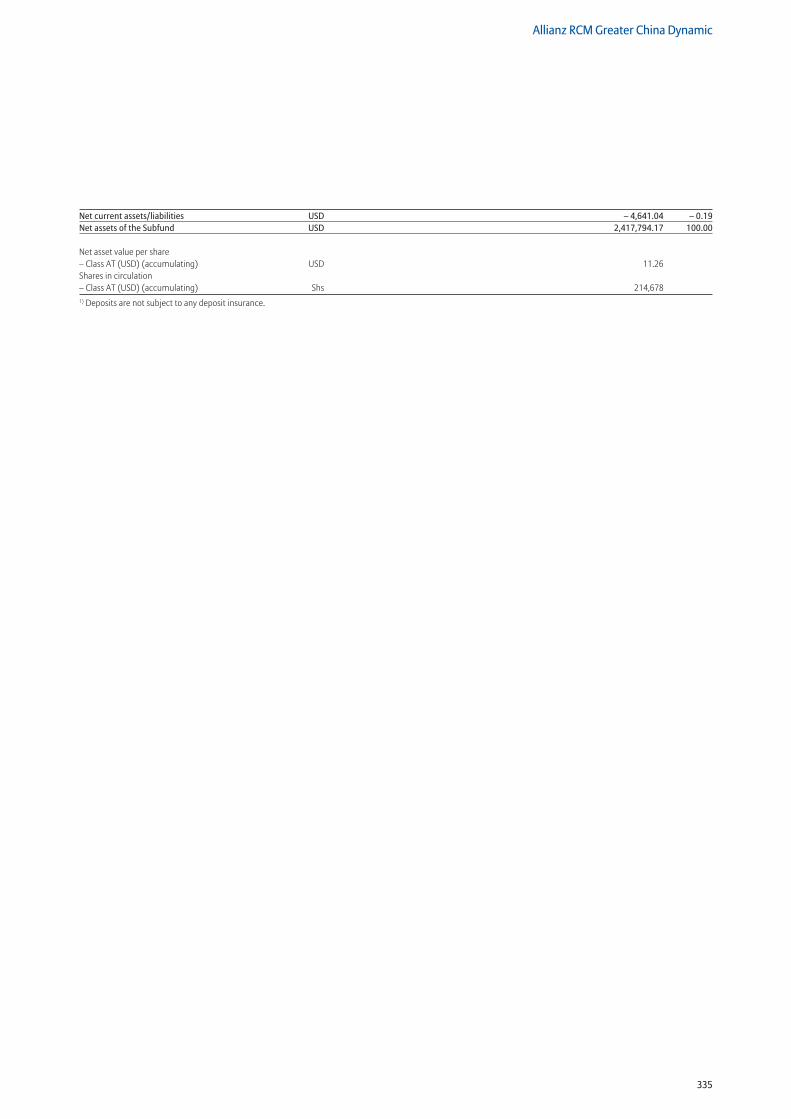
335
Allianz RCM Greater China Dynamic
Net current assets/liabilities USD – 4,641.04 – 0.19Net assets of the Subfund USD 2,417,794.17 100.00
Net asset value per share – Class AT (USD) (accumulating) USD 11.26 Shares in circulation – Class AT (USD) (accumulating) Shs 214,6781) Deposits are not subject to any deposit insurance.
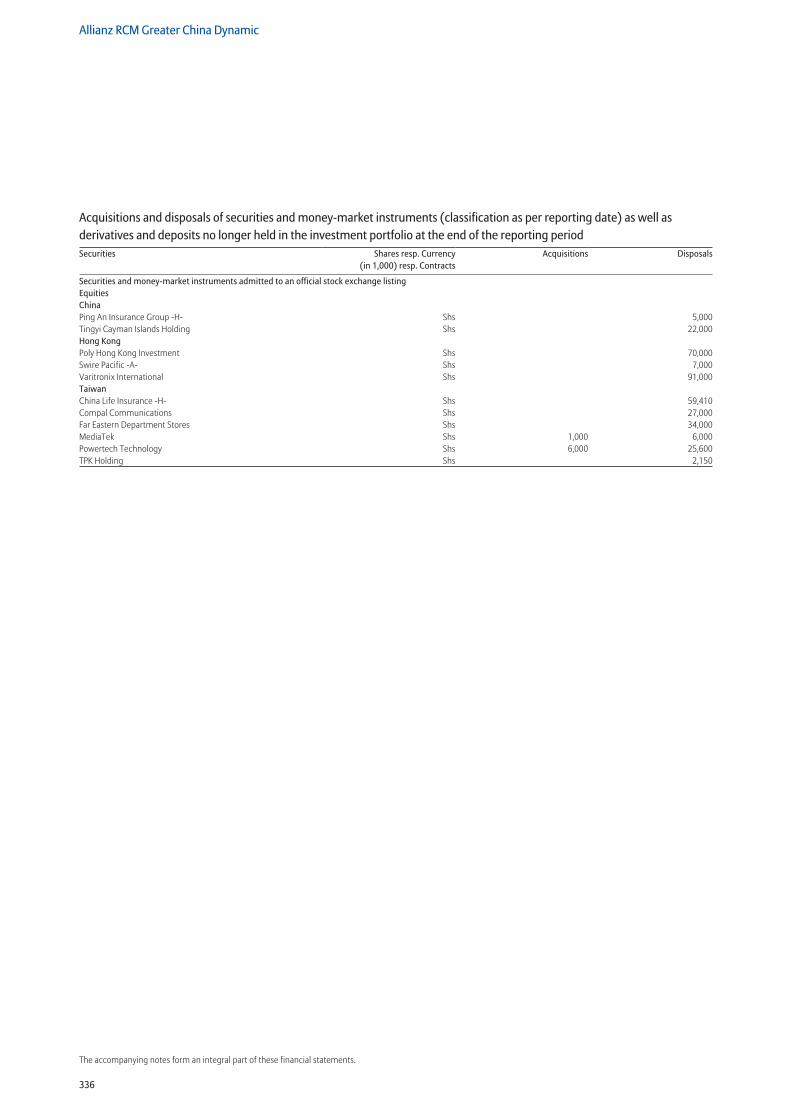
336
Allianz RCM Greater China Dynamic
The accompanying notes form an integral part of these financial statements.
Securities and money-market instruments admitted to an official stock exchange listing Equities China Ping An Insurance Group -H- Shs 5,000Tingyi Cayman Islands Holding Shs 22,000Hong Kong Poly Hong Kong Investment Shs 70,000Swire Pacific -A- Shs 7,000Varitronix International Shs 91,000Taiwan China Life Insurance -H- Shs 59,410Compal Communications Shs 27,000Far Eastern Department Stores Shs 34,000MediaTek Shs 1,000 6,000Powertech Technology Shs 6,000 25,600TPK Holding Shs 2,150
Acquisitions and disposals of securities and money-market instruments (classification as per reporting date) as well as derivatives and deposits no longer held in the investment portfolio at the end of the reporting periodSecurities Shares resp. Currency
(in 1,000) resp. ContractsAcquisitions Disposals
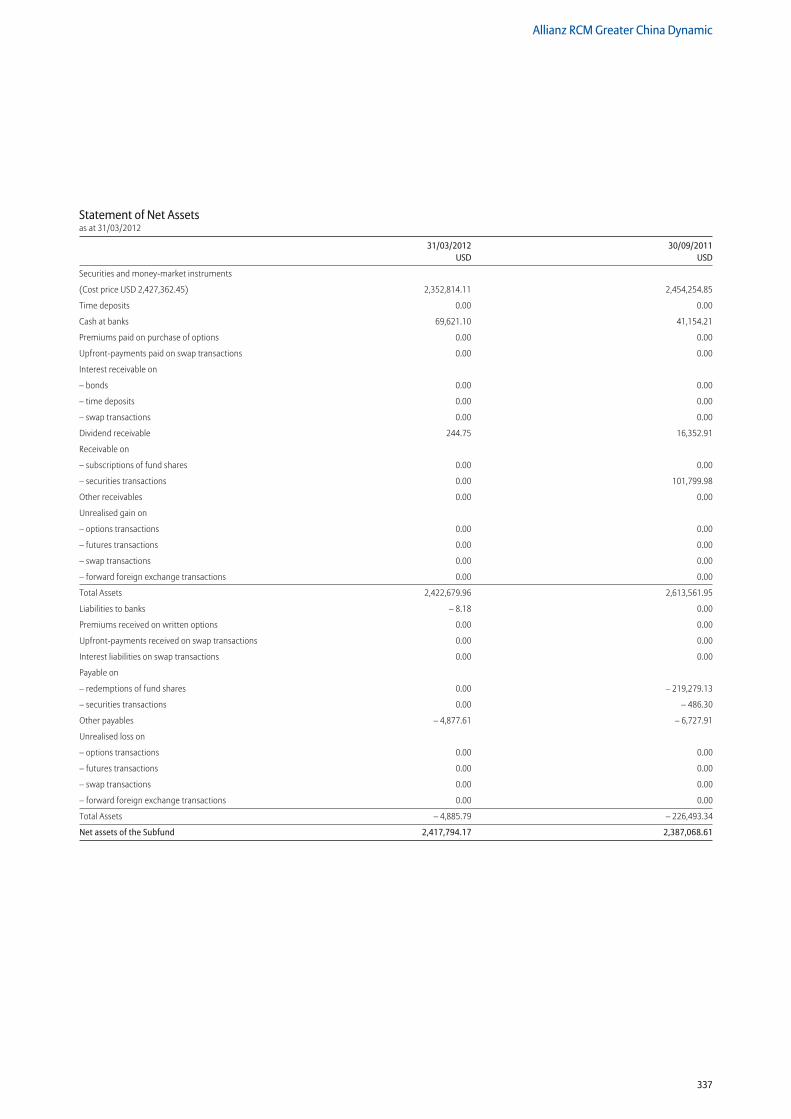
337
Allianz RCM Greater China Dynamic
Statement of Net Assetsas at 31/03/2012
31/03/2012 30/09/2011 USD USD
Securities and money-market instruments
(Cost price USD 2,427,362.45) 2,352,814.11 2,454,254.85
Time deposits 0.00 0.00
Cash at banks 69,621.10 41,154.21
Premiums paid on purchase of options 0.00 0.00
Upfront-payments paid on swap transactions 0.00 0.00
Interest receivable on
– bonds 0.00 0.00
– time deposits 0.00 0.00
– swap transactions 0.00 0.00
Dividend receivable 244.75 16,352.91
Receivable on
– subscriptions of fund shares 0.00 0.00
– securities transactions 0.00 101,799.98
Other receivables 0.00 0.00
Unrealised gain on
– options transactions 0.00 0.00
– futures transactions 0.00 0.00
– swap transactions 0.00 0.00
– forward foreign exchange transactions 0.00 0.00
Total Assets 2,422,679.96 2,613,561.95
Liabilities to banks – 8.18 0.00
Premiums received on written options 0.00 0.00
Upfront-payments received on swap transactions 0.00 0.00
Interest liabilities on swap transactions 0.00 0.00
Payable on
– redemptions of fund shares 0.00 – 219,279.13
– securities transactions 0.00 – 486.30
Other payables – 4,877.61 – 6,727.91
Unrealised loss on
– options transactions 0.00 0.00
– futures transactions 0.00 0.00
– swap transactions 0.00 0.00
– forward foreign exchange transactions 0.00 0.00
Total Assets – 4,885.79 – 226,493.34
Net assets of the Subfund 2,417,794.17 2,387,068.61
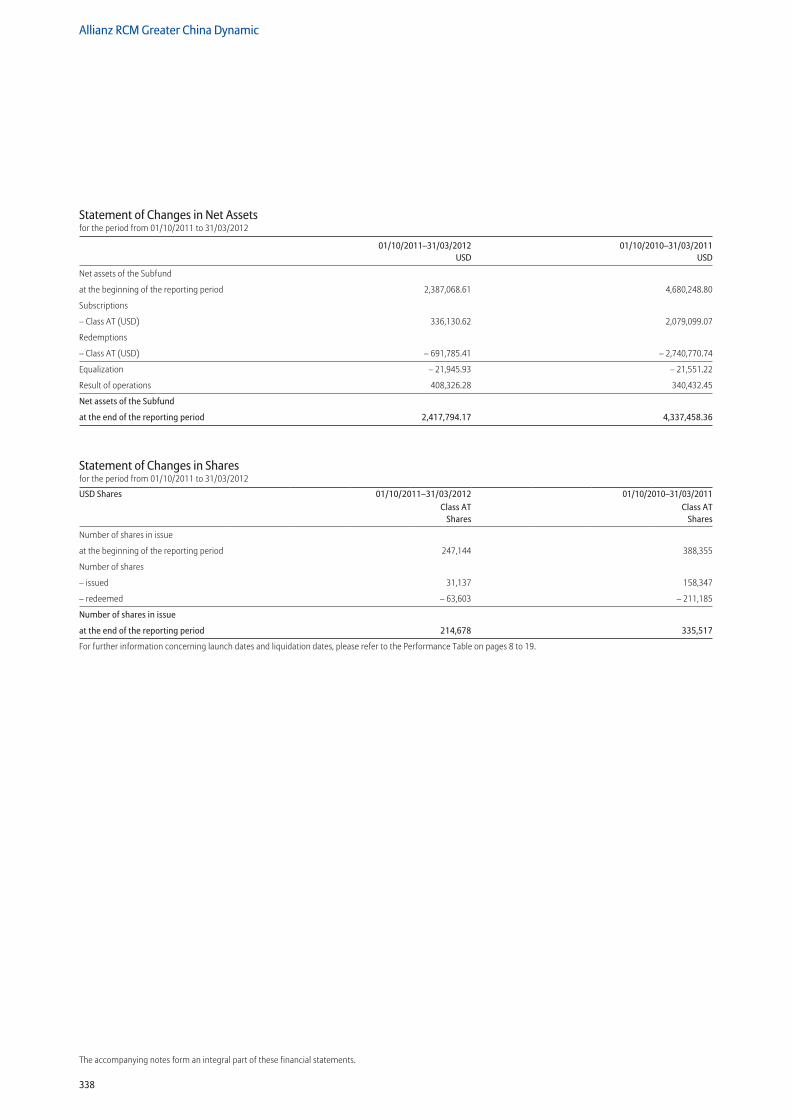
338
Allianz RCM Greater China Dynamic
The accompanying notes form an integral part of these financial statements.
Statement of Changes in Net Assetsfor the period from 01/10/2011 to 31/03/2012
01/10/2011–31/03/2012 01/10/2010–31/03/2011 USD USD
Net assets of the Subfund
at the beginning of the reporting period 2,387,068.61 4,680,248.80
Subscriptions
– Class AT (USD) 336,130.62 2,079,099.07
Redemptions
– Class AT (USD) – 691,785.41 – 2,740,770.74
Equalization – 21,945.93 – 21,551.22
Result of operations 408,326.28 340,432.45
Net assets of the Subfund
at the end of the reporting period 2,417,794.17 4,337,458.36
Statement of Changes in Sharesfor the period from 01/10/2011 to 31/03/2012
USD Shares 01/10/2011–31/03/2012 01/10/2010–31/03/2011Class AT
SharesClass AT
Shares
Number of shares in issue
at the beginning of the reporting period 247,144 388,355
Number of shares
– issued 31,137 158,347
– redeemed – 63,603 – 211,185
Number of shares in issue
at the end of the reporting period 214,678 335,517
For further information concerning launch dates and liquidation dates, please refer to the Performance Table on pages 8 to 19.
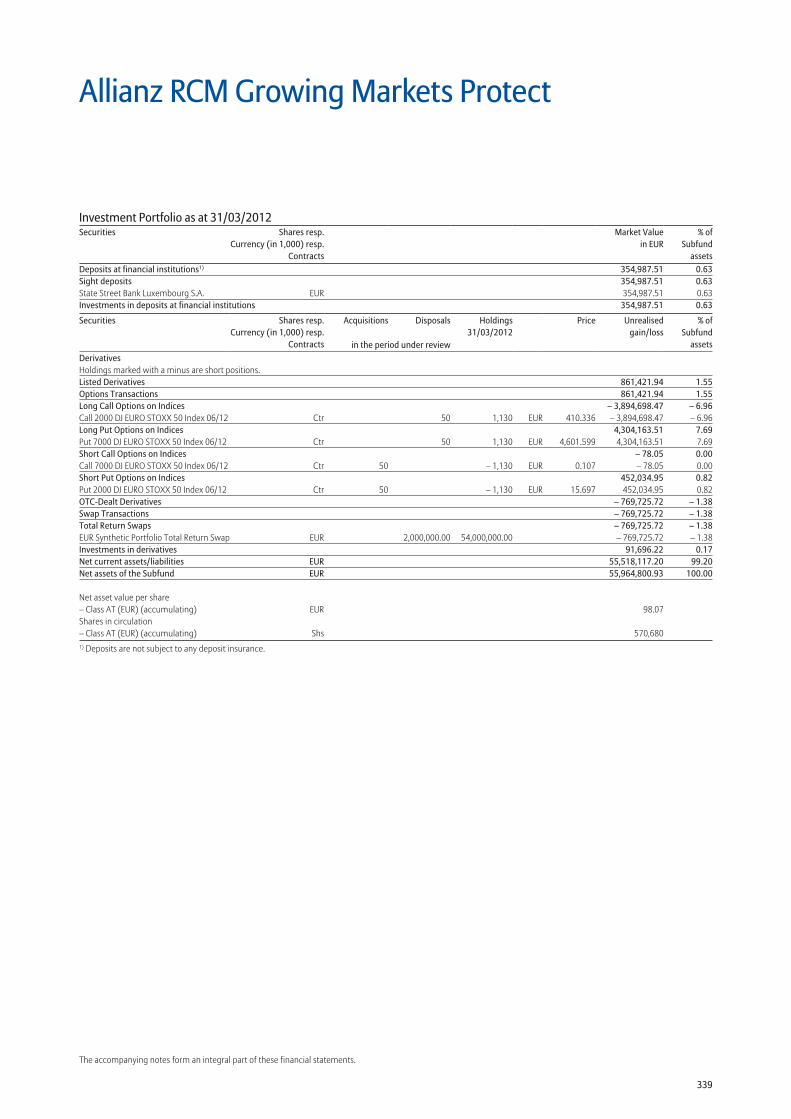
339
The accompanying notes form an integral part of these financial statements.
Allianz RCM Growing Markets Protect
Investment Portfolio as at 31/03/2012Securities Shares resp.
Currency (in 1,000) resp.Contracts
Market Valuein EUR
% ofSubfund
assetsDeposits at financial institutions1) 354,987.51 0.63Sight deposits 354,987.51 0.63State Street Bank Luxembourg S.A. EUR 354,987.51 0.63Investments in deposits at financial institutions 354,987.51 0.63
Securities Shares resp.Currency (in 1,000) resp.
Contracts
Acquisitions Disposals Holdings 31/03/2012
Price Unrealisedgain/loss
% ofSubfund
assetsin the period under reviewDerivatives Holdings marked with a minus are short positions. Listed Derivatives 861,421.94 1.55Options Transactions 861,421.94 1.55Long Call Options on Indices – 3,894,698.47 – 6.96Call 2000 DJ EURO STOXX 50 Index 06/12 Ctr 50 1,130 EUR 410.336 – 3,894,698.47 – 6.96Long Put Options on Indices 4,304,163.51 7.69Put 7000 DJ EURO STOXX 50 Index 06/12 Ctr 50 1,130 EUR 4,601.599 4,304,163.51 7.69Short Call Options on Indices – 78.05 0.00Call 7000 DJ EURO STOXX 50 Index 06/12 Ctr 50 – 1,130 EUR 0.107 – 78.05 0.00Short Put Options on Indices 452,034.95 0.82Put 2000 DJ EURO STOXX 50 Index 06/12 Ctr 50 – 1,130 EUR 15.697 452,034.95 0.82OTC-Dealt Derivatives – 769,725.72 – 1.38Swap Transactions – 769,725.72 – 1.38Total Return Swaps – 769,725.72 – 1.38EUR Synthetic Portfolio Total Return Swap EUR 2,000,000.00 54,000,000.00 – 769,725.72 – 1.38Investments in derivatives 91,696.22 0.17Net current assets/liabilities EUR 55,518,117.20 99.20Net assets of the Subfund EUR 55,964,800.93 100.00
Net asset value per share – Class AT (EUR) (accumulating) EUR 98.07Shares in circulation – Class AT (EUR) (accumulating) Shs 570,6801) Deposits are not subject to any deposit insurance.
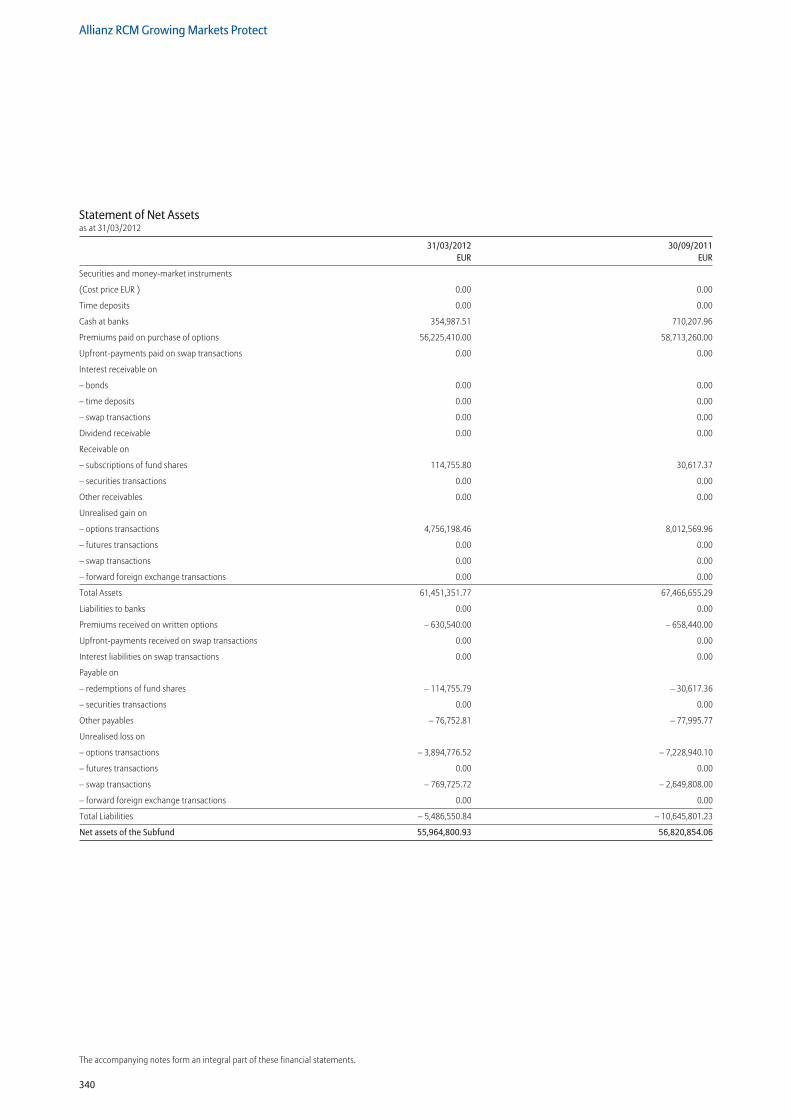
340
Allianz RCM Growing Markets Protect
The accompanying notes form an integral part of these financial statements.
Statement of Net Assetsas at 31/03/2012
31/03/2012 30/09/2011 EUR EUR
Securities and money-market instruments
(Cost price EUR ) 0.00 0.00
Time deposits 0.00 0.00
Cash at banks 354,987.51 710,207.96
Premiums paid on purchase of options 56,225,410.00 58,713,260.00
Upfront-payments paid on swap transactions 0.00 0.00
Interest receivable on
– bonds 0.00 0.00
– time deposits 0.00 0.00
– swap transactions 0.00 0.00
Dividend receivable 0.00 0.00
Receivable on
– subscriptions of fund shares 114,755.80 30,617.37
– securities transactions 0.00 0.00
Other receivables 0.00 0.00
Unrealised gain on
– options transactions 4,756,198.46 8,012,569.96
– futures transactions 0.00 0.00
– swap transactions 0.00 0.00
– forward foreign exchange transactions 0.00 0.00
Total Assets 61,451,351.77 67,466,655.29
Liabilities to banks 0.00 0.00
Premiums received on written options – 630,540.00 – 658,440.00
Upfront-payments received on swap transactions 0.00 0.00
Interest liabilities on swap transactions 0.00 0.00
Payable on
– redemptions of fund shares – 114,755.79 – 30,617.36
– securities transactions 0.00 0.00
Other payables – 76,752.81 – 77,995.77
Unrealised loss on
– options transactions – 3,894,776.52 – 7,228,940.10
– futures transactions 0.00 0.00
– swap transactions – 769,725.72 – 2,649,808.00
– forward foreign exchange transactions 0.00 0.00
Total Liabilities – 5,486,550.84 – 10,645,801.23
Net assets of the Subfund 55,964,800.93 56,820,854.06
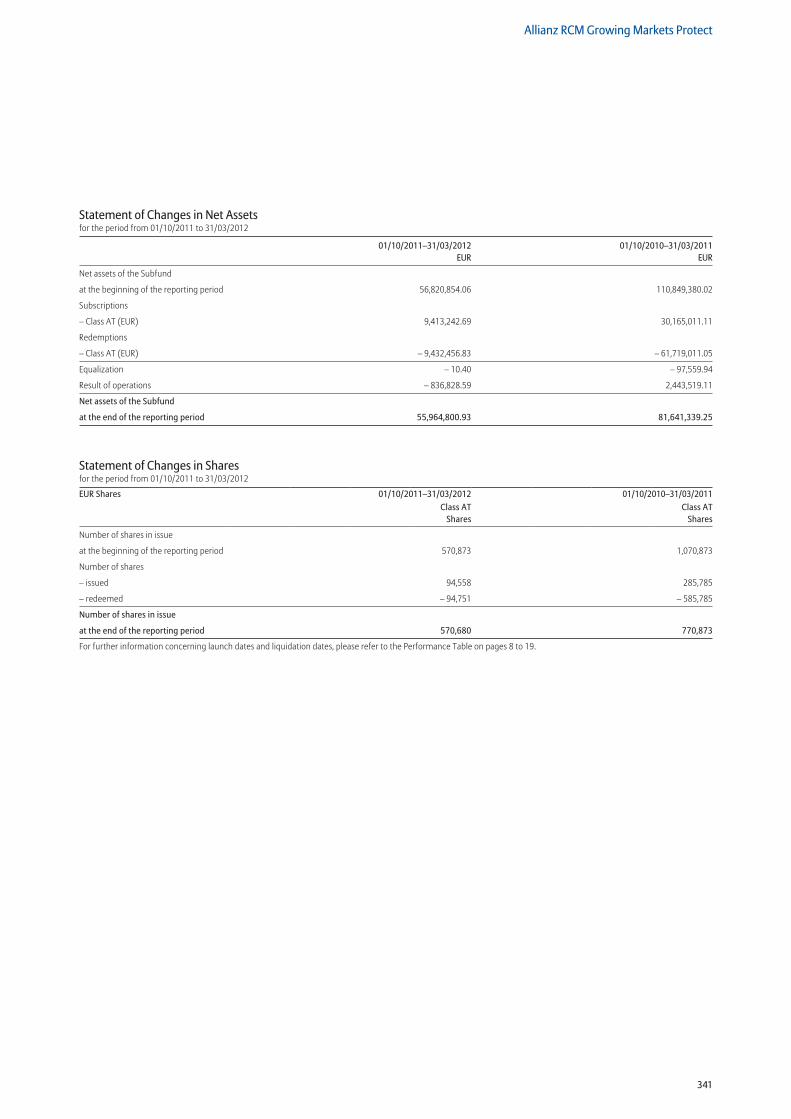
341
Allianz RCM Growing Markets Protect
Statement of Changes in Net Assetsfor the period from 01/10/2011 to 31/03/2012
01/10/2011–31/03/2012 01/10/2010–31/03/2011 EUR EUR
Net assets of the Subfund
at the beginning of the reporting period 56,820,854.06 110,849,380.02
Subscriptions
– Class AT (EUR) 9,413,242.69 30,165,011.11
Redemptions
– Class AT (EUR) – 9,432,456.83 – 61,719,011.05
Equalization – 10.40 – 97,559.94
Result of operations – 836,828.59 2,443,519.11
Net assets of the Subfund
at the end of the reporting period 55,964,800.93 81,641,339.25
Statement of Changes in Sharesfor the period from 01/10/2011 to 31/03/2012
EUR Shares 01/10/2011–31/03/2012 01/10/2010–31/03/2011Class AT
SharesClass AT
Shares
Number of shares in issue
at the beginning of the reporting period 570,873 1,070,873
Number of shares
– issued 94,558 285,785
– redeemed – 94,751 – 585,785
Number of shares in issue
at the end of the reporting period 570,680 770,873
For further information concerning launch dates and liquidation dates, please refer to the Performance Table on pages 8 to 19.
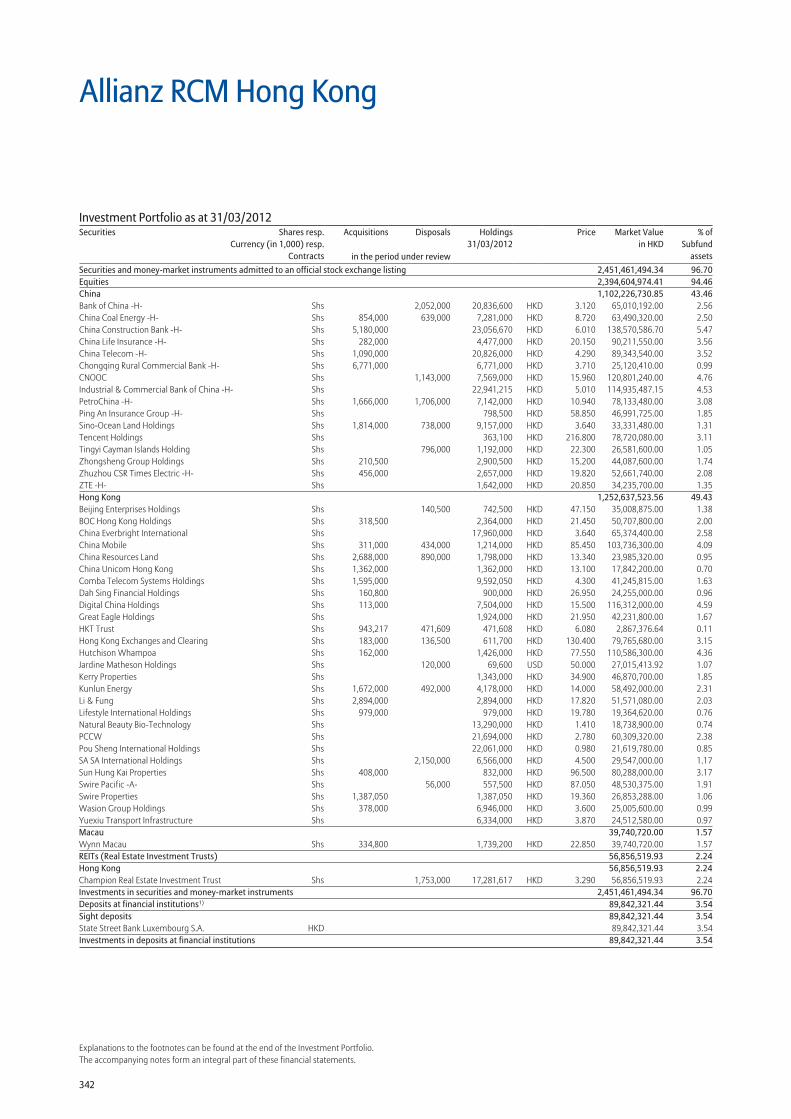
342
Explanations to the footnotes can be found at the end of the Investment Portfolio.The accompanying notes form an integral part of these financial statements.
Securities and money-market instruments admitted to an official stock exchange listing 2,451,461,494.34 96.70Equities 2,394,604,974.41 94.46China 1,102,226,730.85 43.46Bank of China -H- Shs 2,052,000 20,836,600 HKD 3.120 65,010,192.00 2.56China Coal Energy -H- Shs 854,000 639,000 7,281,000 HKD 8.720 63,490,320.00 2.50China Construction Bank -H- Shs 5,180,000 23,056,670 HKD 6.010 138,570,586.70 5.47China Life Insurance -H- Shs 282,000 4,477,000 HKD 20.150 90,211,550.00 3.56China Telecom -H- Shs 1,090,000 20,826,000 HKD 4.290 89,343,540.00 3.52Chongqing Rural Commercial Bank -H- Shs 6,771,000 6,771,000 HKD 3.710 25,120,410.00 0.99CNOOC Shs 1,143,000 7,569,000 HKD 15.960 120,801,240.00 4.76Industrial & Commercial Bank of China -H- Shs 22,941,215 HKD 5.010 114,935,487.15 4.53PetroChina -H- Shs 1,666,000 1,706,000 7,142,000 HKD 10.940 78,133,480.00 3.08Ping An Insurance Group -H- Shs 798,500 HKD 58.850 46,991,725.00 1.85Sino-Ocean Land Holdings Shs 1,814,000 738,000 9,157,000 HKD 3.640 33,331,480.00 1.31Tencent Holdings Shs 363,100 HKD 216.800 78,720,080.00 3.11Tingyi Cayman Islands Holding Shs 796,000 1,192,000 HKD 22.300 26,581,600.00 1.05Zhongsheng Group Holdings Shs 210,500 2,900,500 HKD 15.200 44,087,600.00 1.74Zhuzhou CSR Times Electric -H- Shs 456,000 2,657,000 HKD 19.820 52,661,740.00 2.08ZTE -H- Shs 1,642,000 HKD 20.850 34,235,700.00 1.35Hong Kong 1,252,637,523.56 49.43Beijing Enterprises Holdings Shs 140,500 742,500 HKD 47.150 35,008,875.00 1.38BOC Hong Kong Holdings Shs 318,500 2,364,000 HKD 21.450 50,707,800.00 2.00China Everbright International Shs 17,960,000 HKD 3.640 65,374,400.00 2.58China Mobile Shs 311,000 434,000 1,214,000 HKD 85.450 103,736,300.00 4.09China Resources Land Shs 2,688,000 890,000 1,798,000 HKD 13.340 23,985,320.00 0.95China Unicom Hong Kong Shs 1,362,000 1,362,000 HKD 13.100 17,842,200.00 0.70Comba Telecom Systems Holdings Shs 1,595,000 9,592,050 HKD 4.300 41,245,815.00 1.63Dah Sing Financial Holdings Shs 160,800 900,000 HKD 26.950 24,255,000.00 0.96Digital China Holdings Shs 113,000 7,504,000 HKD 15.500 116,312,000.00 4.59Great Eagle Holdings Shs 1,924,000 HKD 21.950 42,231,800.00 1.67HKT Trust Shs 943,217 471,609 471,608 HKD 6.080 2,867,376.64 0.11Hong Kong Exchanges and Clearing Shs 183,000 136,500 611,700 HKD 130.400 79,765,680.00 3.15Hutchison Whampoa Shs 162,000 1,426,000 HKD 77.550 110,586,300.00 4.36Jardine Matheson Holdings Shs 120,000 69,600 USD 50.000 27,015,413.92 1.07Kerry Properties Shs 1,343,000 HKD 34.900 46,870,700.00 1.85Kunlun Energy Shs 1,672,000 492,000 4,178,000 HKD 14.000 58,492,000.00 2.31Li & Fung Shs 2,894,000 2,894,000 HKD 17.820 51,571,080.00 2.03Lifestyle International Holdings Shs 979,000 979,000 HKD 19.780 19,364,620.00 0.76Natural Beauty Bio-Technology Shs 13,290,000 HKD 1.410 18,738,900.00 0.74PCCW Shs 21,694,000 HKD 2.780 60,309,320.00 2.38Pou Sheng International Holdings Shs 22,061,000 HKD 0.980 21,619,780.00 0.85SA SA International Holdings Shs 2,150,000 6,566,000 HKD 4.500 29,547,000.00 1.17Sun Hung Kai Properties Shs 408,000 832,000 HKD 96.500 80,288,000.00 3.17Swire Pacific -A- Shs 56,000 557,500 HKD 87.050 48,530,375.00 1.91Swire Properties Shs 1,387,050 1,387,050 HKD 19.360 26,853,288.00 1.06Wasion Group Holdings Shs 378,000 6,946,000 HKD 3.600 25,005,600.00 0.99Yuexiu Transport Infrastructure Shs 6,334,000 HKD 3.870 24,512,580.00 0.97Macau 39,740,720.00 1.57Wynn Macau Shs 334,800 1,739,200 HKD 22.850 39,740,720.00 1.57REITs (Real Estate Investment Trusts) 56,856,519.93 2.24Hong Kong 56,856,519.93 2.24Champion Real Estate Investment Trust Shs 1,753,000 17,281,617 HKD 3.290 56,856,519.93 2.24Investments in securities and money-market instruments 2,451,461,494.34 96.70Deposits at financial institutions1) 89,842,321.44 3.54Sight deposits 89,842,321.44 3.54State Street Bank Luxembourg S.A. HKD 89,842,321.44 3.54Investments in deposits at financial institutions 89,842,321.44 3.54
Allianz RCM Hong Kong
Investment Portfolio as at 31/03/2012Securities Shares resp.
Currency (in 1,000) resp.Contracts
Acquisitions Disposals Holdings 31/03/2012
Price Market Valuein HKD
% ofSubfund
assetsin the period under review
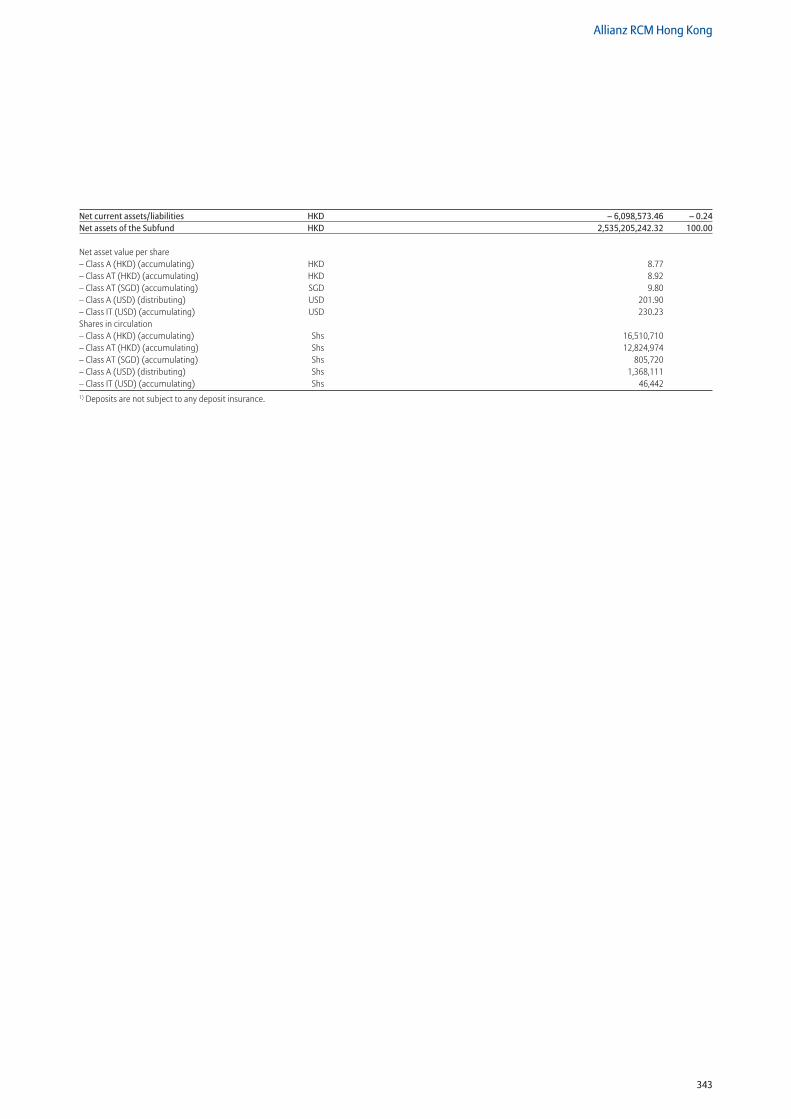
343
Allianz RCM Hong Kong
Net current assets/liabilities HKD – 6,098,573.46 – 0.24Net assets of the Subfund HKD 2,535,205,242.32 100.00
Net asset value per share – Class A (HKD) (accumulating) HKD 8.77 – Class AT (HKD) (accumulating) HKD 8.92 – Class AT (SGD) (accumulating) SGD 9.80 – Class A (USD) (distributing) USD 201.90 – Class IT (USD) (accumulating) USD 230.23 Shares in circulation – Class A (HKD) (accumulating) Shs 16,510,710 – Class AT (HKD) (accumulating) Shs 12,824,974 – Class AT (SGD) (accumulating) Shs 805,720 – Class A (USD) (distributing) Shs 1,368,111 – Class IT (USD) (accumulating) Shs 46,4421) Deposits are not subject to any deposit insurance.
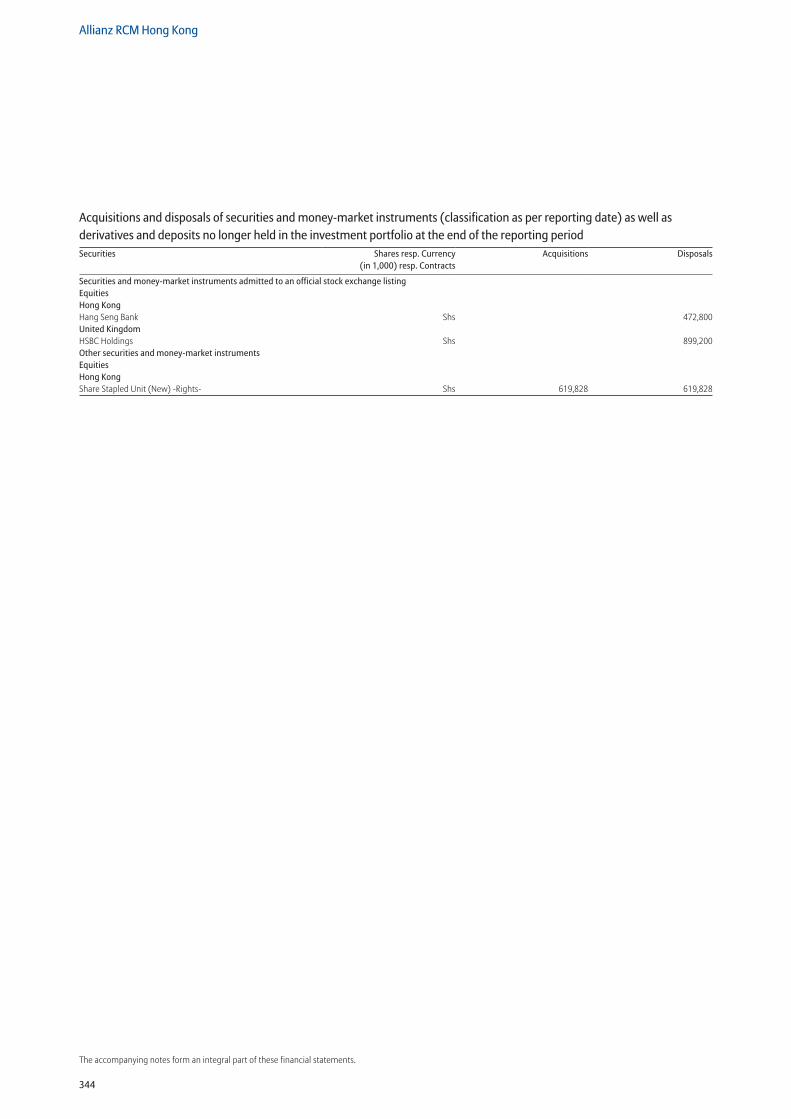
344
Allianz RCM Hong Kong
The accompanying notes form an integral part of these financial statements.
Securities and money-market instruments admitted to an official stock exchange listing Equities Hong Kong Hang Seng Bank Shs 472,800United Kingdom HSBC Holdings Shs 899,200Other securities and money-market instruments Equities Hong Kong Share Stapled Unit (New) -Rights- Shs 619,828 619,828
Acquisitions and disposals of securities and money-market instruments (classification as per reporting date) as well as derivatives and deposits no longer held in the investment portfolio at the end of the reporting periodSecurities Shares resp. Currency
(in 1,000) resp. ContractsAcquisitions Disposals

345
Allianz RCM Hong Kong
Statement of Net Assetsas at 31/03/2012
31/03/2012 30/09/2011 HKD1) HKD1)
Securities and money-market instruments
(Cost price HKD 2,460,128,819.22) 2,451,461,494.34 1,983,731,101.24
Time deposits 0.00 0.00
Cash at banks 89,842,321.44 72,626,390.56
Premiums paid on purchase of options 0.00 0.00
Upfront-payments paid on swap transactions 0.00 0.00
Interest receivable on
– bonds 0.00 0.00
– time deposits 0.00 0.00
– swap transactions 0.00 0.00
Dividend receivable 1,287,483.62 14,875,904.63
Receivable on
– subscriptions of fund shares 8,299,614.40 6,427,379.17
– securities transactions 0.00 0.00
Other receivables 1,448.33 1,448.33
Unrealised gain on
– options transactions 0.00 0.00
– futures transactions 0.00 0.00
– swap transactions 0.00 0.00
– forward foreign exchange transactions 0.00 0.00
Total Assets 2,550,892,362.13 2,077,662,223.93
Liabilities to banks – 2,859.08 – 17,376.86
Premiums received on written options 0.00 0.00
Upfront-payments received on swap transactions 0.00 0.00
Interest liabilities on swap transactions 0.00 0.00
Payable on
– redemptions of fund shares – 11,097,648.22 – 21,203,304.20
– securities transactions 0.00 0.00
Other payables – 4,586,612.51 – 4,081,510.91
Unrealised loss on
– options transactions 0.00 0.00
– futures transactions 0.00 0.00
– swap transactions 0.00 0.00
– forward foreign exchange transactions 0.00 0.00
Total Liabilities – 15,687,119.81 – 25,302,191.97
Net assets of the Subfund 2,535,205,242.32 2,052,360,031.961) The base currency of this Subfund has been changed from USD to HKD with effect from 1 October 2010. The share price has been quoted in HKD from this date.
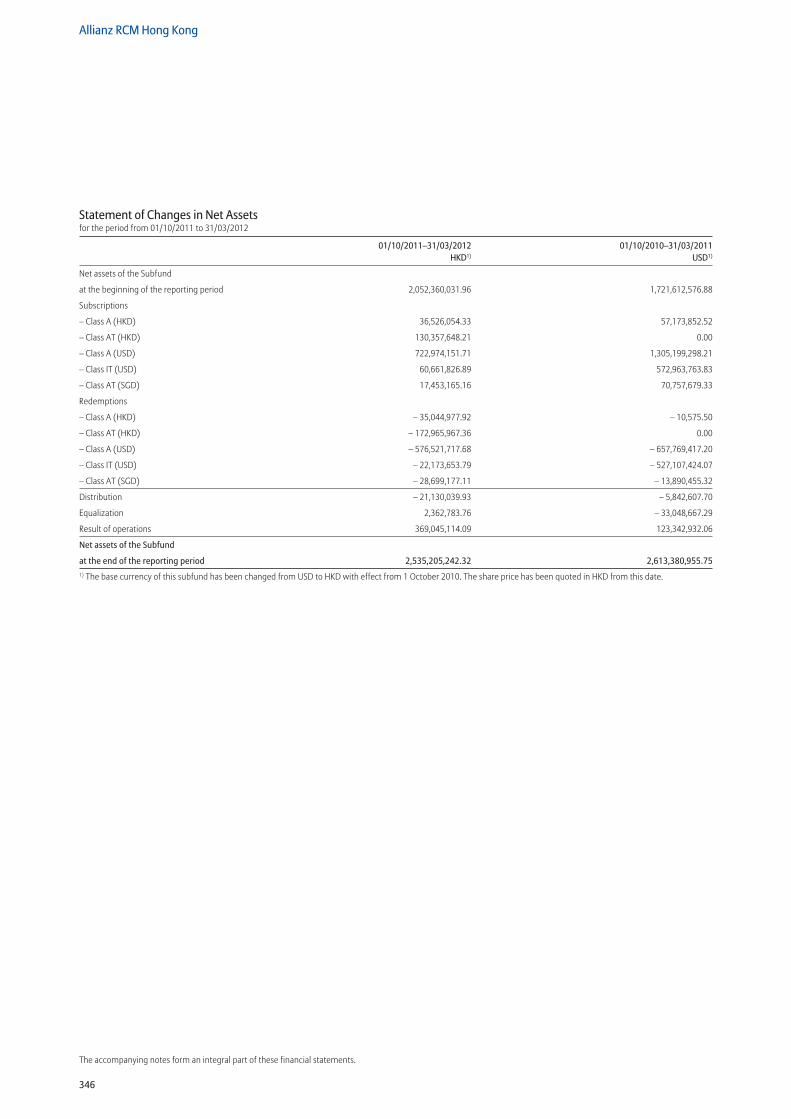
346
Allianz RCM Hong Kong
The accompanying notes form an integral part of these financial statements.
Statement of Changes in Net Assetsfor the period from 01/10/2011 to 31/03/2012
01/10/2011–31/03/2012 01/10/2010–31/03/2011 HKD1) USD1)
Net assets of the Subfund
at the beginning of the reporting period 2,052,360,031.96 1,721,612,576.88
Subscriptions
– Class A (HKD) 36,526,054.33 57,173,852.52
– Class AT (HKD) 130,357,648.21 0.00
– Class A (USD) 722,974,151.71 1,305,199,298.21
– Class IT (USD) 60,661,826.89 572,963,763.83
– Class AT (SGD) 17,453,165.16 70,757,679.33
Redemptions
– Class A (HKD) – 35,044,977.92 – 10,575.50
– Class AT (HKD) – 172,965,967.36 0.00
– Class A (USD) – 576,521,717.68 – 657,769,417.20
– Class IT (USD) – 22,173,653.79 – 527,107,424.07
– Class AT (SGD) – 28,699,177.11 – 13,890,455.32
Distribution – 21,130,039.93 – 5,842,607.70
Equalization 2,362,783.76 – 33,048,667.29
Result of operations 369,045,114.09 123,342,932.06
Net assets of the Subfund
at the end of the reporting period 2,535,205,242.32 2,613,380,955.751) The base currency of this subfund has been changed from USD to HKD with effect from 1 October 2010. The share price has been quoted in HKD from this date.
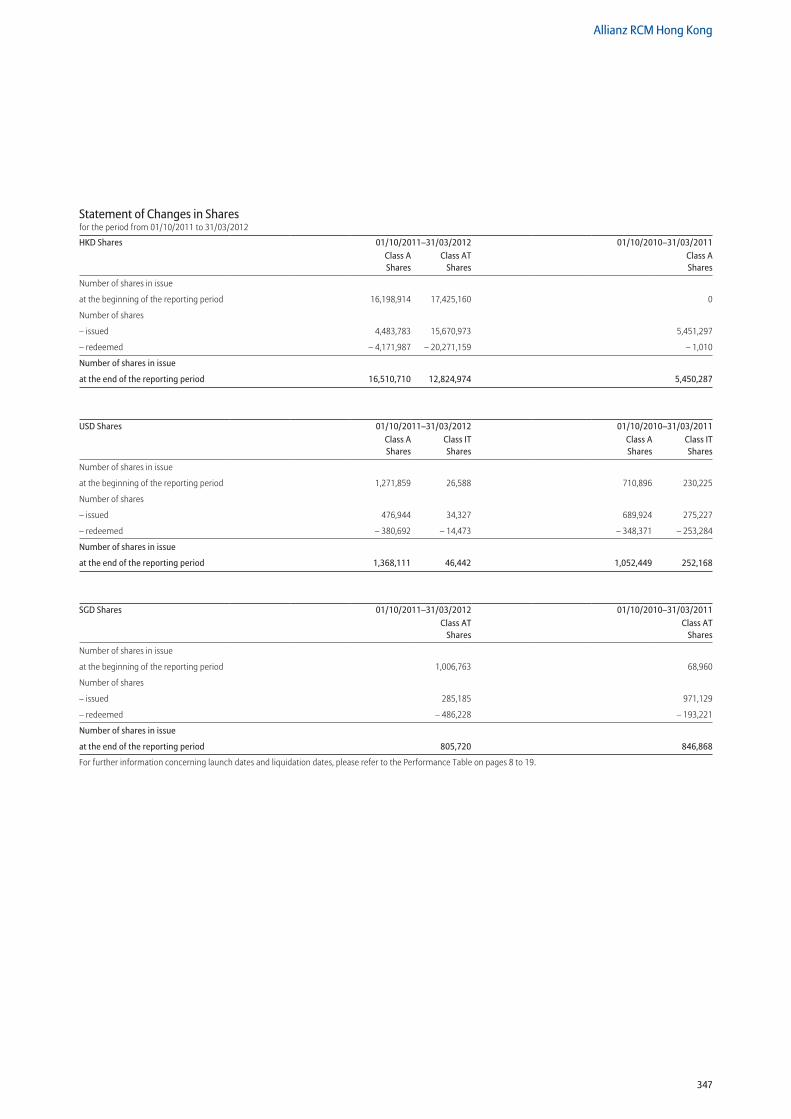
347
Allianz RCM Hong Kong
Statement of Changes in Sharesfor the period from 01/10/2011 to 31/03/2012
HKD Shares 01/10/2011–31/03/2012 01/10/2010–31/03/2011Class A Shares
Class AT Shares
Class A Shares
Number of shares in issue
at the beginning of the reporting period 16,198,914 17,425,160 0
Number of shares
– issued 4,483,783 15,670,973 5,451,297
– redeemed – 4,171,987 – 20,271,159 – 1,010
Number of shares in issue
at the end of the reporting period 16,510,710 12,824,974 5,450,287
USD Shares 01/10/2011–31/03/2012 01/10/2010–31/03/2011Class A Shares
Class IT Shares
Class A Shares
Class IT Shares
Number of shares in issue
at the beginning of the reporting period 1,271,859 26,588 710,896 230,225
Number of shares
– issued 476,944 34,327 689,924 275,227
– redeemed – 380,692 – 14,473 – 348,371 – 253,284
Number of shares in issue
at the end of the reporting period 1,368,111 46,442 1,052,449 252,168
SGD Shares 01/10/2011–31/03/2012 01/10/2010–31/03/2011Class AT
SharesClass AT
Shares
Number of shares in issue
at the beginning of the reporting period 1,006,763 68,960
Number of shares
– issued 285,185 971,129
– redeemed – 486,228 – 193,221
Number of shares in issue
at the end of the reporting period 805,720 846,868
For further information concerning launch dates and liquidation dates, please refer to the Performance Table on pages 8 to 19.
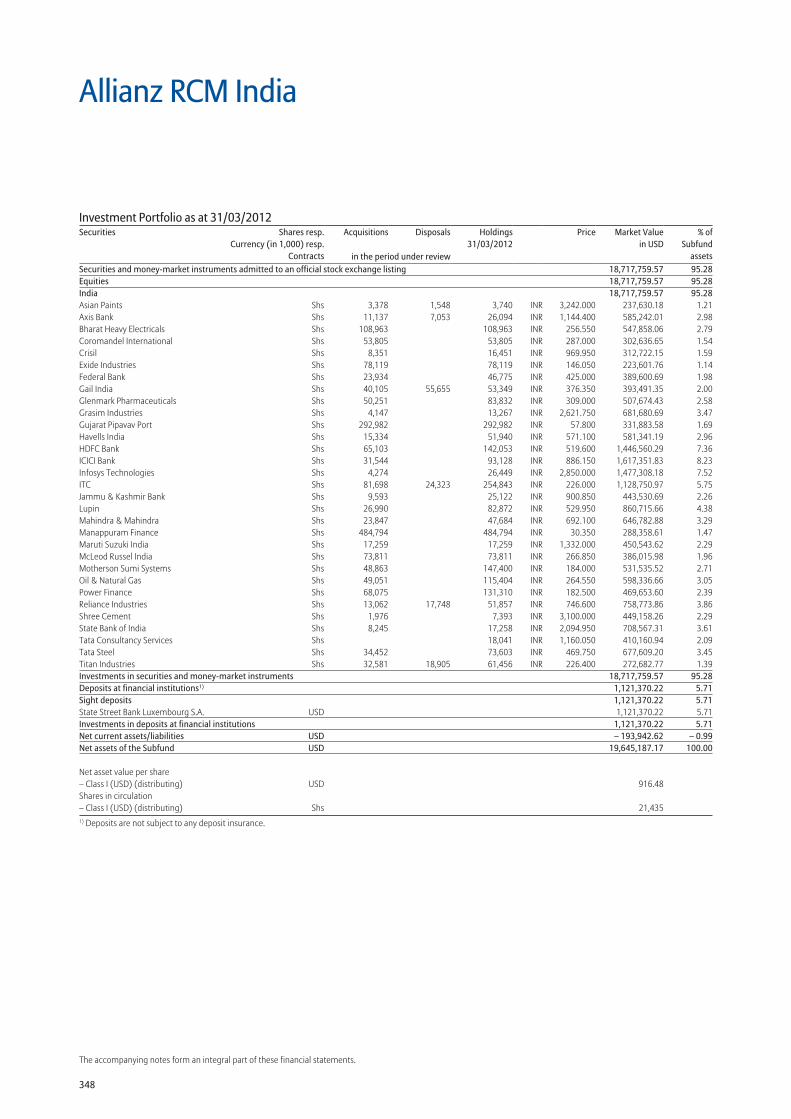
348
The accompanying notes form an integral part of these financial statements.
Allianz RCM India
Securities and money-market instruments admitted to an official stock exchange listing 18,717,759.57 95.28Equities 18,717,759.57 95.28India 18,717,759.57 95.28Asian Paints Shs 3,378 1,548 3,740 INR 3,242.000 237,630.18 1.21Axis Bank Shs 11,137 7,053 26,094 INR 1,144.400 585,242.01 2.98Bharat Heavy Electricals Shs 108,963 108,963 INR 256.550 547,858.06 2.79Coromandel International Shs 53,805 53,805 INR 287.000 302,636.65 1.54Crisil Shs 8,351 16,451 INR 969.950 312,722.15 1.59Exide Industries Shs 78,119 78,119 INR 146.050 223,601.76 1.14Federal Bank Shs 23,934 46,775 INR 425.000 389,600.69 1.98Gail India Shs 40,105 55,655 53,349 INR 376.350 393,491.35 2.00Glenmark Pharmaceuticals Shs 50,251 83,832 INR 309.000 507,674.43 2.58Grasim Industries Shs 4,147 13,267 INR 2,621.750 681,680.69 3.47Gujarat Pipavav Port Shs 292,982 292,982 INR 57.800 331,883.58 1.69Havells India Shs 15,334 51,940 INR 571.100 581,341.19 2.96HDFC Bank Shs 65,103 142,053 INR 519.600 1,446,560.29 7.36ICICI Bank Shs 31,544 93,128 INR 886.150 1,617,351.83 8.23Infosys Technologies Shs 4,274 26,449 INR 2,850.000 1,477,308.18 7.52ITC Shs 81,698 24,323 254,843 INR 226.000 1,128,750.97 5.75Jammu & Kashmir Bank Shs 9,593 25,122 INR 900.850 443,530.69 2.26Lupin Shs 26,990 82,872 INR 529.950 860,715.66 4.38Mahindra & Mahindra Shs 23,847 47,684 INR 692.100 646,782.88 3.29Manappuram Finance Shs 484,794 484,794 INR 30.350 288,358.61 1.47Maruti Suzuki India Shs 17,259 17,259 INR 1,332.000 450,543.62 2.29McLeod Russel India Shs 73,811 73,811 INR 266.850 386,015.98 1.96Motherson Sumi Systems Shs 48,863 147,400 INR 184.000 531,535.52 2.71Oil & Natural Gas Shs 49,051 115,404 INR 264.550 598,336.66 3.05Power Finance Shs 68,075 131,310 INR 182.500 469,653.60 2.39Reliance Industries Shs 13,062 17,748 51,857 INR 746.600 758,773.86 3.86Shree Cement Shs 1,976 7,393 INR 3,100.000 449,158.26 2.29State Bank of India Shs 8,245 17,258 INR 2,094.950 708,567.31 3.61Tata Consultancy Services Shs 18,041 INR 1,160.050 410,160.94 2.09Tata Steel Shs 34,452 73,603 INR 469.750 677,609.20 3.45Titan Industries Shs 32,581 18,905 61,456 INR 226.400 272,682.77 1.39Investments in securities and money-market instruments 18,717,759.57 95.28Deposits at financial institutions1) 1,121,370.22 5.71Sight deposits 1,121,370.22 5.71State Street Bank Luxembourg S.A. USD 1,121,370.22 5.71Investments in deposits at financial institutions 1,121,370.22 5.71Net current assets/liabilities USD – 193,942.62 – 0.99Net assets of the Subfund USD 19,645,187.17 100.00
Net asset value per share – Class I (USD) (distributing) USD 916.48Shares in circulation – Class I (USD) (distributing) Shs 21,4351) Deposits are not subject to any deposit insurance.
Investment Portfolio as at 31/03/2012Securities Shares resp.
Currency (in 1,000) resp.Contracts
Acquisitions Disposals Holdings 31/03/2012
Price Market Valuein USD
% ofSubfund
assetsin the period under review
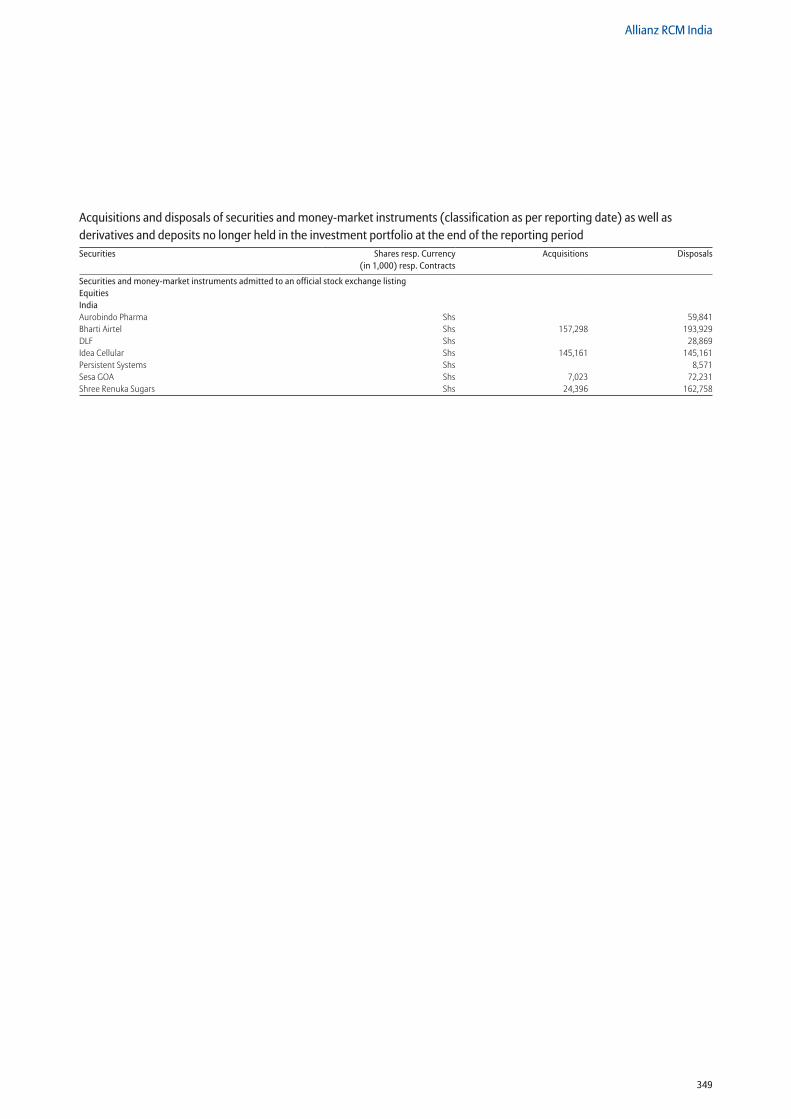
349
Allianz RCM India
Securities and money-market instruments admitted to an official stock exchange listing Equities India Aurobindo Pharma Shs 59,841Bharti Airtel Shs 157,298 193,929DLF Shs 28,869Idea Cellular Shs 145,161 145,161Persistent Systems Shs 8,571Sesa GOA Shs 7,023 72,231Shree Renuka Sugars Shs 24,396 162,758
Acquisitions and disposals of securities and money-market instruments (classification as per reporting date) as well as derivatives and deposits no longer held in the investment portfolio at the end of the reporting periodSecurities Shares resp. Currency
(in 1,000) resp. ContractsAcquisitions Disposals
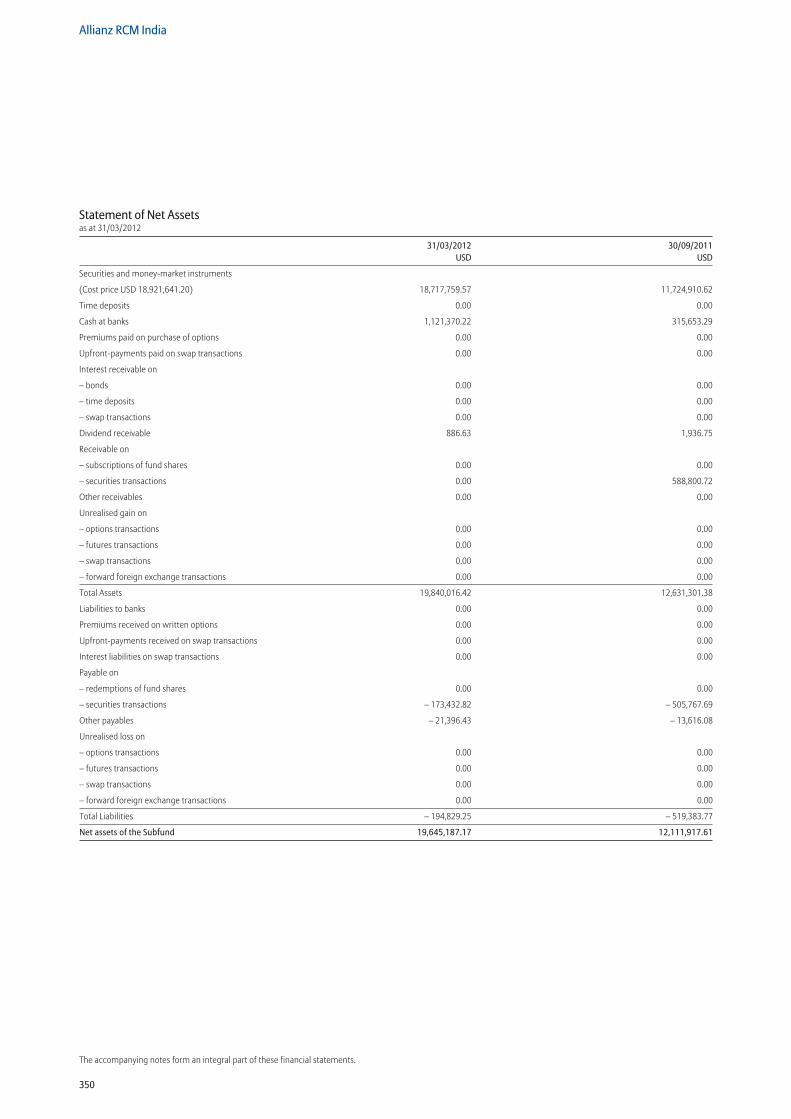
350
Allianz RCM India
The accompanying notes form an integral part of these financial statements.
Statement of Net Assetsas at 31/03/2012
31/03/2012 30/09/2011 USD USD
Securities and money-market instruments
(Cost price USD 18,921,641.20) 18,717,759.57 11,724,910.62
Time deposits 0.00 0.00
Cash at banks 1,121,370.22 315,653.29
Premiums paid on purchase of options 0.00 0.00
Upfront-payments paid on swap transactions 0.00 0.00
Interest receivable on
– bonds 0.00 0.00
– time deposits 0.00 0.00
– swap transactions 0.00 0.00
Dividend receivable 886.63 1,936.75
Receivable on
– subscriptions of fund shares 0.00 0.00
– securities transactions 0.00 588,800.72
Other receivables 0.00 0.00
Unrealised gain on
– options transactions 0.00 0.00
– futures transactions 0.00 0.00
– swap transactions 0.00 0.00
– forward foreign exchange transactions 0.00 0.00
Total Assets 19,840,016.42 12,631,301.38
Liabilities to banks 0.00 0.00
Premiums received on written options 0.00 0.00
Upfront-payments received on swap transactions 0.00 0.00
Interest liabilities on swap transactions 0.00 0.00
Payable on
– redemptions of fund shares 0.00 0.00
– securities transactions – 173,432.82 – 505,767.69
Other payables – 21,396.43 – 13,616.08
Unrealised loss on
– options transactions 0.00 0.00
– futures transactions 0.00 0.00
– swap transactions 0.00 0.00
– forward foreign exchange transactions 0.00 0.00
Total Liabilities – 194,829.25 – 519,383.77
Net assets of the Subfund 19,645,187.17 12,111,917.61
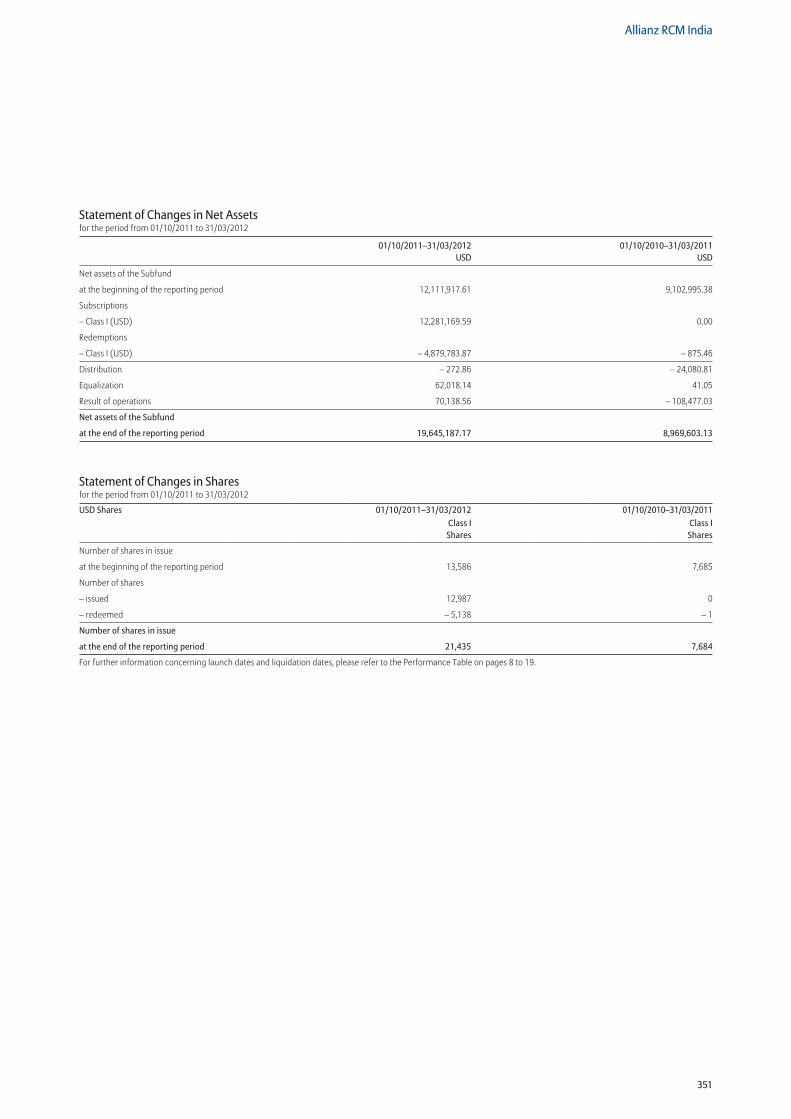
351
Allianz RCM India
Statement of Changes in Net Assetsfor the period from 01/10/2011 to 31/03/2012
01/10/2011–31/03/2012 01/10/2010–31/03/2011 USD USD
Net assets of the Subfund
at the beginning of the reporting period 12,111,917.61 9,102,995.38
Subscriptions
– Class I (USD) 12,281,169.59 0.00
Redemptions
– Class I (USD) – 4,879,783.87 – 875.46
Distribution – 272.86 – 24,080.81
Equalization 62,018.14 41.05
Result of operations 70,138.56 – 108,477.03
Net assets of the Subfund
at the end of the reporting period 19,645,187.17 8,969,603.13
Statement of Changes in Sharesfor the period from 01/10/2011 to 31/03/2012
USD Shares 01/10/2011–31/03/2012 01/10/2010–31/03/2011Class I Shares
Class I Shares
Number of shares in issue
at the beginning of the reporting period 13,586 7,685
Number of shares
– issued 12,987 0
– redeemed – 5,138 – 1
Number of shares in issue
at the end of the reporting period 21,435 7,684
For further information concerning launch dates and liquidation dates, please refer to the Performance Table on pages 8 to 19.
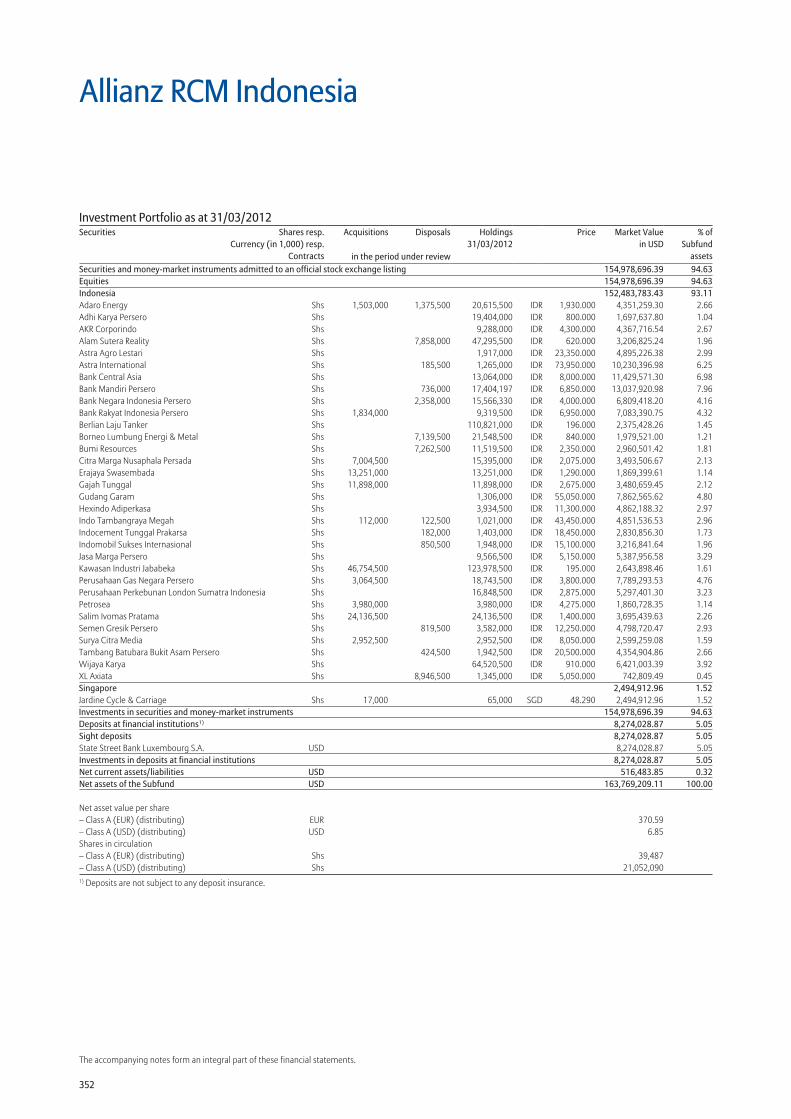
352
The accompanying notes form an integral part of these financial statements.
Allianz RCM Indonesia
Securities and money-market instruments admitted to an official stock exchange listing 154,978,696.39 94.63Equities 154,978,696.39 94.63Indonesia 152,483,783.43 93.11Adaro Energy Shs 1,503,000 1,375,500 20,615,500 IDR 1,930.000 4,351,259.30 2.66Adhi Karya Persero Shs 19,404,000 IDR 800.000 1,697,637.80 1.04AKR Corporindo Shs 9,288,000 IDR 4,300.000 4,367,716.54 2.67Alam Sutera Reality Shs 7,858,000 47,295,500 IDR 620.000 3,206,825.24 1.96Astra Agro Lestari Shs 1,917,000 IDR 23,350.000 4,895,226.38 2.99Astra International Shs 185,500 1,265,000 IDR 73,950.000 10,230,396.98 6.25Bank Central Asia Shs 13,064,000 IDR 8,000.000 11,429,571.30 6.98Bank Mandiri Persero Shs 736,000 17,404,197 IDR 6,850.000 13,037,920.98 7.96Bank Negara Indonesia Persero Shs 2,358,000 15,566,330 IDR 4,000.000 6,809,418.20 4.16Bank Rakyat Indonesia Persero Shs 1,834,000 9,319,500 IDR 6,950.000 7,083,390.75 4.32Berlian Laju Tanker Shs 110,821,000 IDR 196.000 2,375,428.26 1.45Borneo Lumbung Energi & Metal Shs 7,139,500 21,548,500 IDR 840.000 1,979,521.00 1.21Bumi Resources Shs 7,262,500 11,519,500 IDR 2,350.000 2,960,501.42 1.81Citra Marga Nusaphala Persada Shs 7,004,500 15,395,000 IDR 2,075.000 3,493,506.67 2.13Erajaya Swasembada Shs 13,251,000 13,251,000 IDR 1,290.000 1,869,399.61 1.14Gajah Tunggal Shs 11,898,000 11,898,000 IDR 2,675.000 3,480,659.45 2.12Gudang Garam Shs 1,306,000 IDR 55,050.000 7,862,565.62 4.80Hexindo Adiperkasa Shs 3,934,500 IDR 11,300.000 4,862,188.32 2.97Indo Tambangraya Megah Shs 112,000 122,500 1,021,000 IDR 43,450.000 4,851,536.53 2.96Indocement Tunggal Prakarsa Shs 182,000 1,403,000 IDR 18,450.000 2,830,856.30 1.73Indomobil Sukses Internasional Shs 850,500 1,948,000 IDR 15,100.000 3,216,841.64 1.96Jasa Marga Persero Shs 9,566,500 IDR 5,150.000 5,387,956.58 3.29Kawasan Industri Jababeka Shs 46,754,500 123,978,500 IDR 195.000 2,643,898.46 1.61Perusahaan Gas Negara Persero Shs 3,064,500 18,743,500 IDR 3,800.000 7,789,293.53 4.76Perusahaan Perkebunan London Sumatra Indonesia Shs 16,848,500 IDR 2,875.000 5,297,401.30 3.23Petrosea Shs 3,980,000 3,980,000 IDR 4,275.000 1,860,728.35 1.14Salim Ivomas Pratama Shs 24,136,500 24,136,500 IDR 1,400.000 3,695,439.63 2.26Semen Gresik Persero Shs 819,500 3,582,000 IDR 12,250.000 4,798,720.47 2.93Surya Citra Media Shs 2,952,500 2,952,500 IDR 8,050.000 2,599,259.08 1.59Tambang Batubara Bukit Asam Persero Shs 424,500 1,942,500 IDR 20,500.000 4,354,904.86 2.66Wijaya Karya Shs 64,520,500 IDR 910.000 6,421,003.39 3.92XL Axiata Shs 8,946,500 1,345,000 IDR 5,050.000 742,809.49 0.45Singapore 2,494,912.96 1.52Jardine Cycle & Carriage Shs 17,000 65,000 SGD 48.290 2,494,912.96 1.52Investments in securities and money-market instruments 154,978,696.39 94.63Deposits at financial institutions1) 8,274,028.87 5.05Sight deposits 8,274,028.87 5.05State Street Bank Luxembourg S.A. USD 8,274,028.87 5.05Investments in deposits at financial institutions 8,274,028.87 5.05Net current assets/liabilities USD 516,483.85 0.32Net assets of the Subfund USD 163,769,209.11 100.00
Net asset value per share – Class A (EUR) (distributing) EUR 370.59 – Class A (USD) (distributing) USD 6.85 Shares in circulation – Class A (EUR) (distributing) Shs 39,487 – Class A (USD) (distributing) Shs 21,052,090 1) Deposits are not subject to any deposit insurance.
Investment Portfolio as at 31/03/2012Securities Shares resp.
Currency (in 1,000) resp.Contracts
Acquisitions Disposals Holdings 31/03/2012
Price Market Valuein USD
% ofSubfund
assetsin the period under review
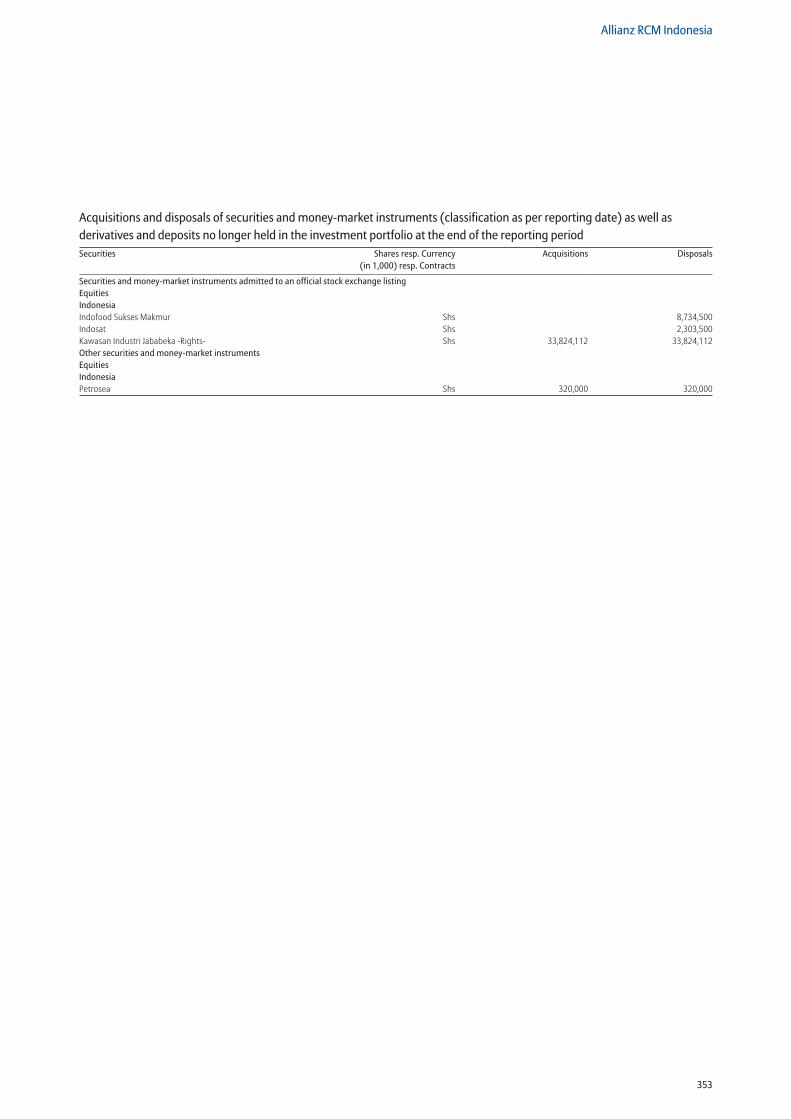
353
Allianz RCM Indonesia
Securities and money-market instruments admitted to an official stock exchange listing Equities Indonesia Indofood Sukses Makmur Shs 8,734,500Indosat Shs 2,303,500Kawasan Industri Jababeka -Rights- Shs 33,824,112 33,824,112Other securities and money-market instruments Equities Indonesia Petrosea Shs 320,000 320,000
Acquisitions and disposals of securities and money-market instruments (classification as per reporting date) as well as derivatives and deposits no longer held in the investment portfolio at the end of the reporting periodSecurities Shares resp. Currency
(in 1,000) resp. ContractsAcquisitions Disposals
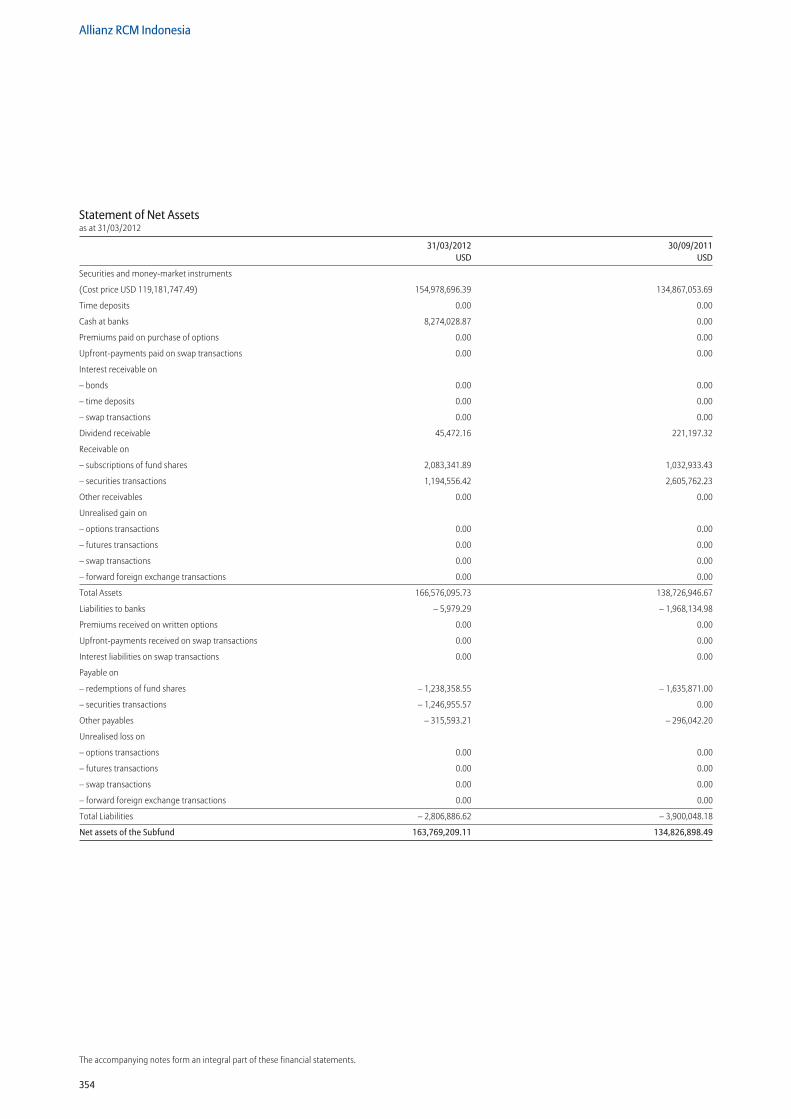
354
Allianz RCM Indonesia
The accompanying notes form an integral part of these financial statements.
Statement of Net Assetsas at 31/03/2012
31/03/2012 30/09/2011 USD USD
Securities and money-market instruments
(Cost price USD 119,181,747.49) 154,978,696.39 134,867,053.69
Time deposits 0.00 0.00
Cash at banks 8,274,028.87 0.00
Premiums paid on purchase of options 0.00 0.00
Upfront-payments paid on swap transactions 0.00 0.00
Interest receivable on
– bonds 0.00 0.00
– time deposits 0.00 0.00
– swap transactions 0.00 0.00
Dividend receivable 45,472.16 221,197.32
Receivable on
– subscriptions of fund shares 2,083,341.89 1,032,933.43
– securities transactions 1,194,556.42 2,605,762.23
Other receivables 0.00 0.00
Unrealised gain on
– options transactions 0.00 0.00
– futures transactions 0.00 0.00
– swap transactions 0.00 0.00
– forward foreign exchange transactions 0.00 0.00
Total Assets 166,576,095.73 138,726,946.67
Liabilities to banks – 5,979.29 – 1,968,134.98
Premiums received on written options 0.00 0.00
Upfront-payments received on swap transactions 0.00 0.00
Interest liabilities on swap transactions 0.00 0.00
Payable on
– redemptions of fund shares – 1,238,358.55 – 1,635,871.00
– securities transactions – 1,246,955.57 0.00
Other payables – 315,593.21 – 296,042.20
Unrealised loss on
– options transactions 0.00 0.00
– futures transactions 0.00 0.00
– swap transactions 0.00 0.00
– forward foreign exchange transactions 0.00 0.00
Total Liabilities – 2,806,886.62 – 3,900,048.18
Net assets of the Subfund 163,769,209.11 134,826,898.49

355
Allianz RCM Indonesia
Statement of Changes in Net Assetsfor the period from 01/10/2011 to 31/03/2012
01/10/2011–31/03/2012 01/10/2010–31/03/2011 USD USD
Net assets of the Subfund
at the beginning of the reporting period 134,826,898.49 150,552,000.87
Subscriptions
– Class A (USD) 67,065,343.21 177,917,420.61
– Class A (EUR) 10,731,254.22 20,680,216.44
Redemptions
– Class A (USD) – 57,559,870.22 – 162,507,319.43
– Class A (EUR) – 10,182,489.50 – 23,119,309.60
Distribution – 340,883.54 – 425,482.17
Equalization 72,873.44 12,211.79
Result of operations 19,156,083.01 9,112,903.50
Net assets of the Subfund
at the end of the reporting period 163,769,209.11 172,222,642.01
Statement of Changes in Sharesfor the period from 01/10/2011 to 31/03/2012
USD Shares 01/10/2011–31/03/2012 01/10/2010–31/03/2011Class A Shares
Class A Shares
Number of shares in issue
at the beginning of the reporting period 19,721,644 20,161,835
Number of shares
– issued 10,357,611 28,316,504
– redeemed – 9,027,165 – 25,839,128
Number of shares in issue
at the end of the reporting period 21,052,090 22,639,211
EUR Shares 01/10/2011–31/03/2012 01/10/2010–31/03/2011Class A Shares
Class A Shares
Number of shares in issue
at the beginning of the reporting period 38,056 56,941
Number of shares
– issued 22,994 45,249
– redeemed – 21,563 – 52,297
Number of shares in issue
at the end of the reporting period 39,487 49,893
For further information concerning launch dates and liquidation dates, please refer to the Performance Table on pages 8 to 19.
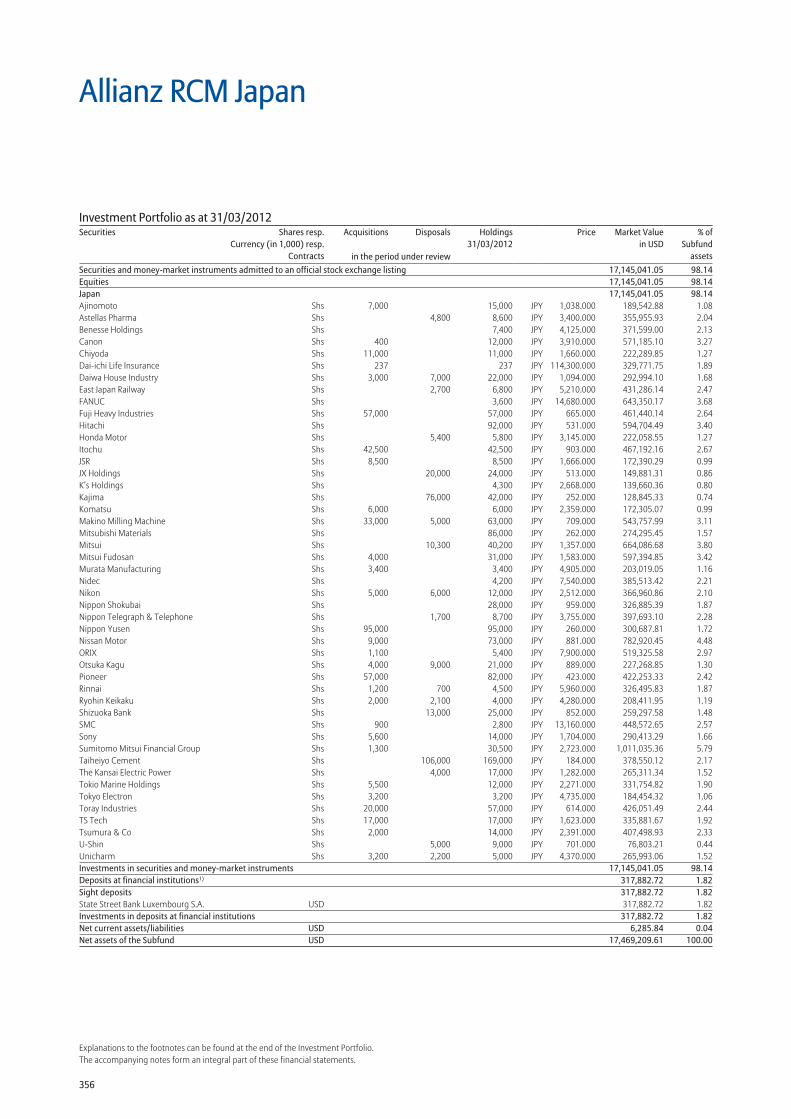
356
Explanations to the footnotes can be found at the end of the Investment Portfolio.The accompanying notes form an integral part of these financial statements.
Securities and money-market instruments admitted to an official stock exchange listing 17,145,041.05 98.14Equities 17,145,041.05 98.14Japan 17,145,041.05 98.14Ajinomoto Shs 7,000 15,000 JPY 1,038.000 189,542.88 1.08Astellas Pharma Shs 4,800 8,600 JPY 3,400.000 355,955.93 2.04Benesse Holdings Shs 7,400 JPY 4,125.000 371,599.00 2.13Canon Shs 400 12,000 JPY 3,910.000 571,185.10 3.27Chiyoda Shs 11,000 11,000 JPY 1,660.000 222,289.85 1.27Dai-ichi Life Insurance Shs 237 237 JPY 114,300.000 329,771.75 1.89Daiwa House Industry Shs 3,000 7,000 22,000 JPY 1,094.000 292,994.10 1.68East Japan Railway Shs 2,700 6,800 JPY 5,210.000 431,286.14 2.47FANUC Shs 3,600 JPY 14,680.000 643,350.17 3.68Fuji Heavy Industries Shs 57,000 57,000 JPY 665.000 461,440.14 2.64Hitachi Shs 92,000 JPY 531.000 594,704.49 3.40Honda Motor Shs 5,400 5,800 JPY 3,145.000 222,058.55 1.27Itochu Shs 42,500 42,500 JPY 903.000 467,192.16 2.67JSR Shs 8,500 8,500 JPY 1,666.000 172,390.29 0.99JX Holdings Shs 20,000 24,000 JPY 513.000 149,881.31 0.86K’s Holdings Shs 4,300 JPY 2,668.000 139,660.36 0.80Kajima Shs 76,000 42,000 JPY 252.000 128,845.33 0.74Komatsu Shs 6,000 6,000 JPY 2,359.000 172,305.07 0.99Makino Milling Machine Shs 33,000 5,000 63,000 JPY 709.000 543,757.99 3.11Mitsubishi Materials Shs 86,000 JPY 262.000 274,295.45 1.57Mitsui Shs 10,300 40,200 JPY 1,357.000 664,086.68 3.80Mitsui Fudosan Shs 4,000 31,000 JPY 1,583.000 597,394.85 3.42Murata Manufacturing Shs 3,400 3,400 JPY 4,905.000 203,019.05 1.16Nidec Shs 4,200 JPY 7,540.000 385,513.42 2.21Nikon Shs 5,000 6,000 12,000 JPY 2,512.000 366,960.86 2.10Nippon Shokubai Shs 28,000 JPY 959.000 326,885.39 1.87Nippon Telegraph & Telephone Shs 1,700 8,700 JPY 3,755.000 397,693.10 2.28Nippon Yusen Shs 95,000 95,000 JPY 260.000 300,687.81 1.72Nissan Motor Shs 9,000 73,000 JPY 881.000 782,920.45 4.48ORIX Shs 1,100 5,400 JPY 7,900.000 519,325.58 2.97Otsuka Kagu Shs 4,000 9,000 21,000 JPY 889.000 227,268.85 1.30Pioneer Shs 57,000 82,000 JPY 423.000 422,253.33 2.42Rinnai Shs 1,200 700 4,500 JPY 5,960.000 326,495.83 1.87Ryohin Keikaku Shs 2,000 2,100 4,000 JPY 4,280.000 208,411.95 1.19Shizuoka Bank Shs 13,000 25,000 JPY 852.000 259,297.58 1.48SMC Shs 900 2,800 JPY 13,160.000 448,572.65 2.57Sony Shs 5,600 14,000 JPY 1,704.000 290,413.29 1.66Sumitomo Mitsui Financial Group Shs 1,300 30,500 JPY 2,723.000 1,011,035.36 5.79Taiheiyo Cement Shs 106,000 169,000 JPY 184.000 378,550.12 2.17The Kansai Electric Power Shs 4,000 17,000 JPY 1,282.000 265,311.34 1.52Tokio Marine Holdings Shs 5,500 12,000 JPY 2,271.000 331,754.82 1.90Tokyo Electron Shs 3,200 3,200 JPY 4,735.000 184,454.32 1.06Toray Industries Shs 20,000 57,000 JPY 614.000 426,051.49 2.44TS Tech Shs 17,000 17,000 JPY 1,623.000 335,881.67 1.92Tsumura & Co Shs 2,000 14,000 JPY 2,391.000 407,498.93 2.33U-Shin Shs 5,000 9,000 JPY 701.000 76,803.21 0.44Unicharm Shs 3,200 2,200 5,000 JPY 4,370.000 265,993.06 1.52Investments in securities and money-market instruments 17,145,041.05 98.14Deposits at financial institutions1) 317,882.72 1.82Sight deposits 317,882.72 1.82State Street Bank Luxembourg S.A. USD 317,882.72 1.82Investments in deposits at financial institutions 317,882.72 1.82Net current assets/liabilities USD 6,285.84 0.04Net assets of the Subfund USD 17,469,209.61 100.00
Allianz RCM Japan
Investment Portfolio as at 31/03/2012Securities Shares resp.
Currency (in 1,000) resp.Contracts
Acquisitions Disposals Holdings 31/03/2012
Price Market Valuein USD
% ofSubfund
assetsin the period under review
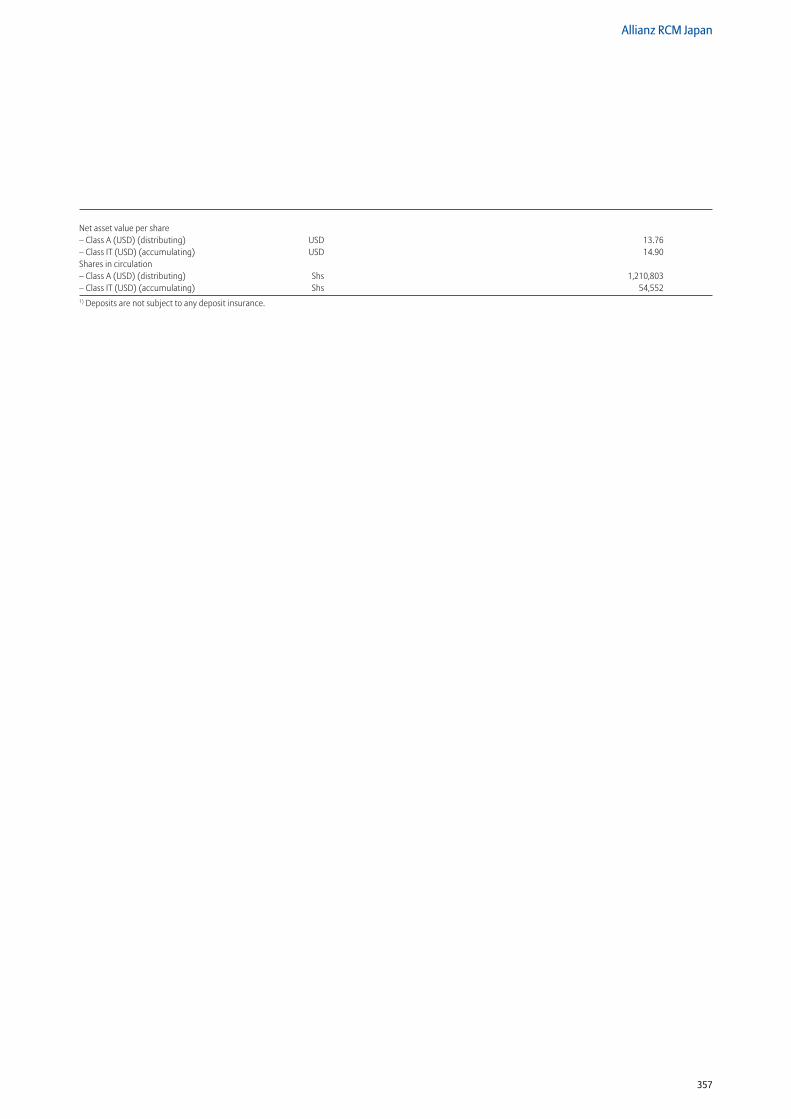
357
Allianz RCM Japan
Net asset value per share – Class A (USD) (distributing) USD 13.76– Class IT (USD) (accumulating) USD 14.90Shares in circulation – Class A (USD) (distributing) Shs 1,210,803 – Class IT (USD) (accumulating) Shs 54,5521) Deposits are not subject to any deposit insurance.
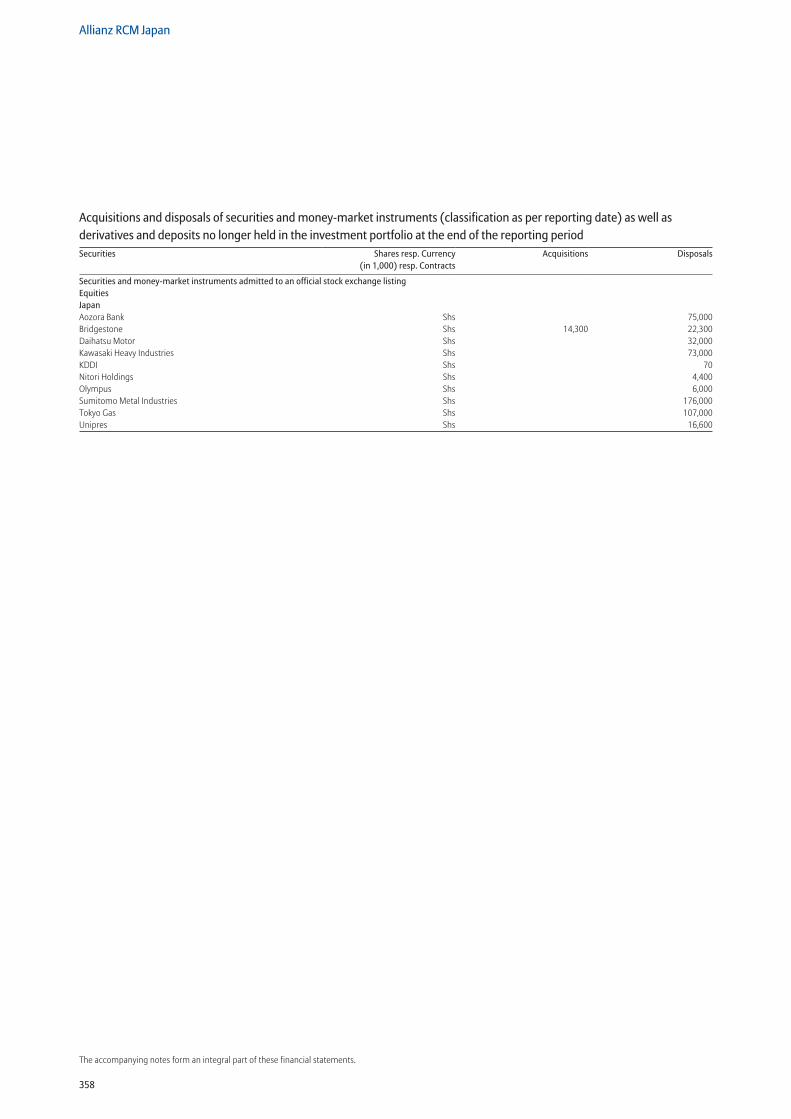
358
Allianz RCM Japan
The accompanying notes form an integral part of these financial statements.
Securities and money-market instruments admitted to an official stock exchange listing Equities Japan Aozora Bank Shs 75,000Bridgestone Shs 14,300 22,300Daihatsu Motor Shs 32,000Kawasaki Heavy Industries Shs 73,000KDDI Shs 70Nitori Holdings Shs 4,400Olympus Shs 6,000Sumitomo Metal Industries Shs 176,000Tokyo Gas Shs 107,000Unipres Shs 16,600
Acquisitions and disposals of securities and money-market instruments (classification as per reporting date) as well as derivatives and deposits no longer held in the investment portfolio at the end of the reporting periodSecurities Shares resp. Currency
(in 1,000) resp. ContractsAcquisitions Disposals
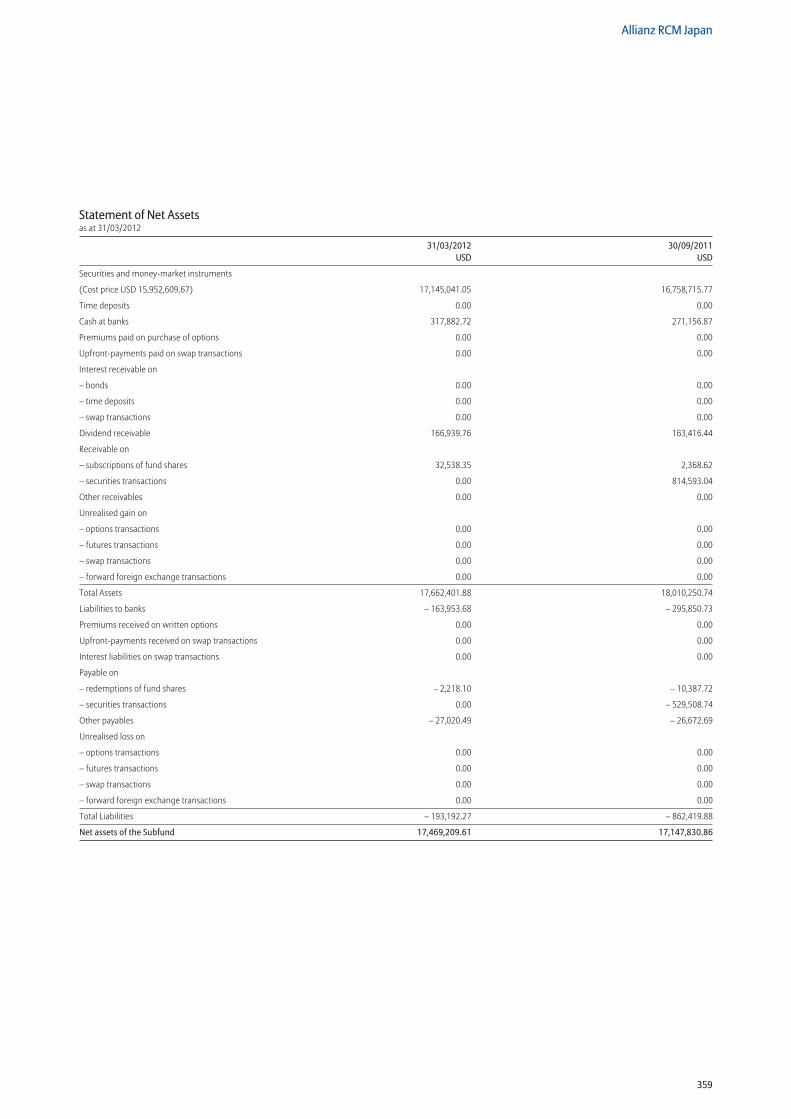
359
Allianz RCM Japan
Statement of Net Assetsas at 31/03/2012
31/03/2012 30/09/2011 USD USD
Securities and money-market instruments
(Cost price USD 15,952,609.67) 17,145,041.05 16,758,715.77
Time deposits 0.00 0.00
Cash at banks 317,882.72 271,156.87
Premiums paid on purchase of options 0.00 0.00
Upfront-payments paid on swap transactions 0.00 0.00
Interest receivable on
– bonds 0.00 0.00
– time deposits 0.00 0.00
– swap transactions 0.00 0.00
Dividend receivable 166,939.76 163,416.44
Receivable on
– subscriptions of fund shares 32,538.35 2,368.62
– securities transactions 0.00 814,593.04
Other receivables 0.00 0.00
Unrealised gain on
– options transactions 0.00 0.00
– futures transactions 0.00 0.00
– swap transactions 0.00 0.00
– forward foreign exchange transactions 0.00 0.00
Total Assets 17,662,401.88 18,010,250.74
Liabilities to banks – 163,953.68 – 295,850.73
Premiums received on written options 0.00 0.00
Upfront-payments received on swap transactions 0.00 0.00
Interest liabilities on swap transactions 0.00 0.00
Payable on
– redemptions of fund shares – 2,218.10 – 10,387.72
– securities transactions 0.00 – 529,508.74
Other payables – 27,020.49 – 26,672.69
Unrealised loss on
– options transactions 0.00 0.00
– futures transactions 0.00 0.00
– swap transactions 0.00 0.00
– forward foreign exchange transactions 0.00 0.00
Total Liabilities – 193,192.27 – 862,419.88
Net assets of the Subfund 17,469,209.61 17,147,830.86
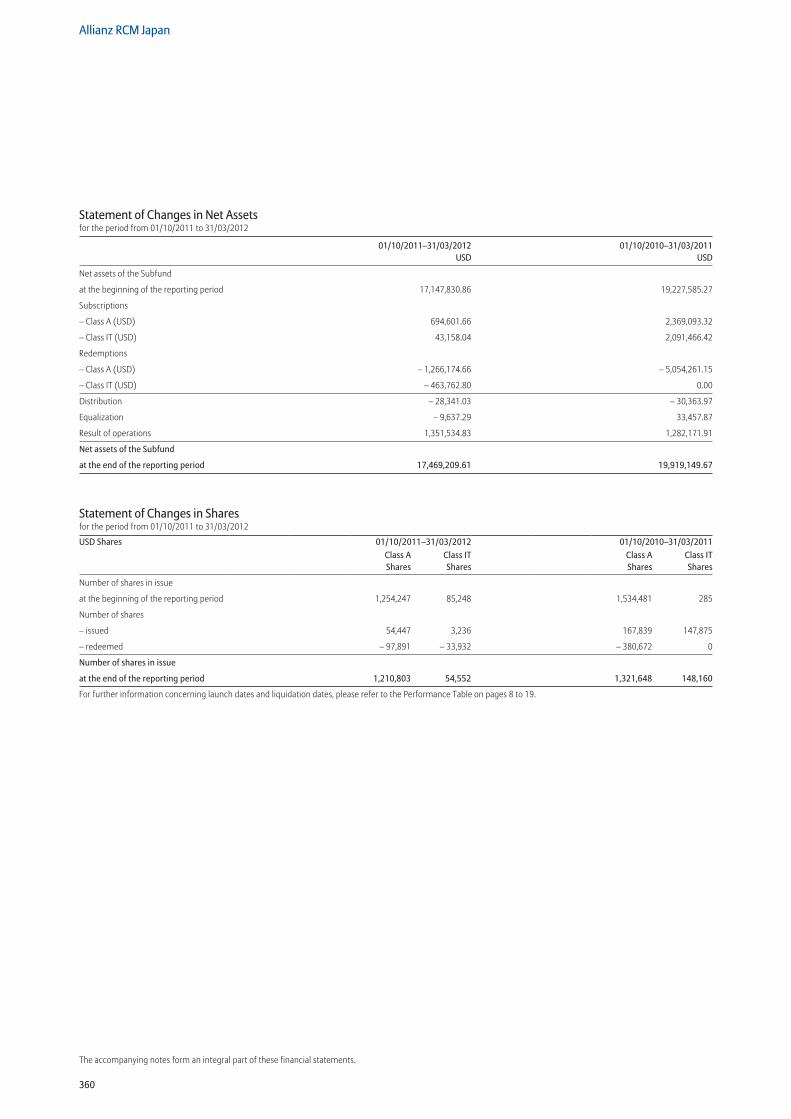
360
Allianz RCM Japan
The accompanying notes form an integral part of these financial statements.
Statement of Changes in Net Assetsfor the period from 01/10/2011 to 31/03/2012
01/10/2011–31/03/2012 01/10/2010–31/03/2011 USD USD
Net assets of the Subfund
at the beginning of the reporting period 17,147,830.86 19,227,585.27
Subscriptions
– Class A (USD) 694,601.66 2,369,093.32
– Class IT (USD) 43,158.04 2,091,466.42
Redemptions
– Class A (USD) – 1,266,174.66 – 5,054,261.15
– Class IT (USD) – 463,762.80 0.00
Distribution – 28,341.03 – 30,363.97
Equalization – 9,637.29 33,457.87
Result of operations 1,351,534.83 1,282,171.91
Net assets of the Subfund
at the end of the reporting period 17,469,209.61 19,919,149.67
Statement of Changes in Sharesfor the period from 01/10/2011 to 31/03/2012
USD Shares 01/10/2011–31/03/2012 01/10/2010–31/03/2011Class A Shares
Class IT Shares
Class A Shares
Class IT Shares
Number of shares in issue
at the beginning of the reporting period 1,254,247 85,248 1,534,481 285
Number of shares
– issued 54,447 3,236 167,839 147,875
– redeemed – 97,891 – 33,932 – 380,672 0
Number of shares in issue
at the end of the reporting period 1,210,803 54,552 1,321,648 148,160
For further information concerning launch dates and liquidation dates, please refer to the Performance Table on pages 8 to 19.
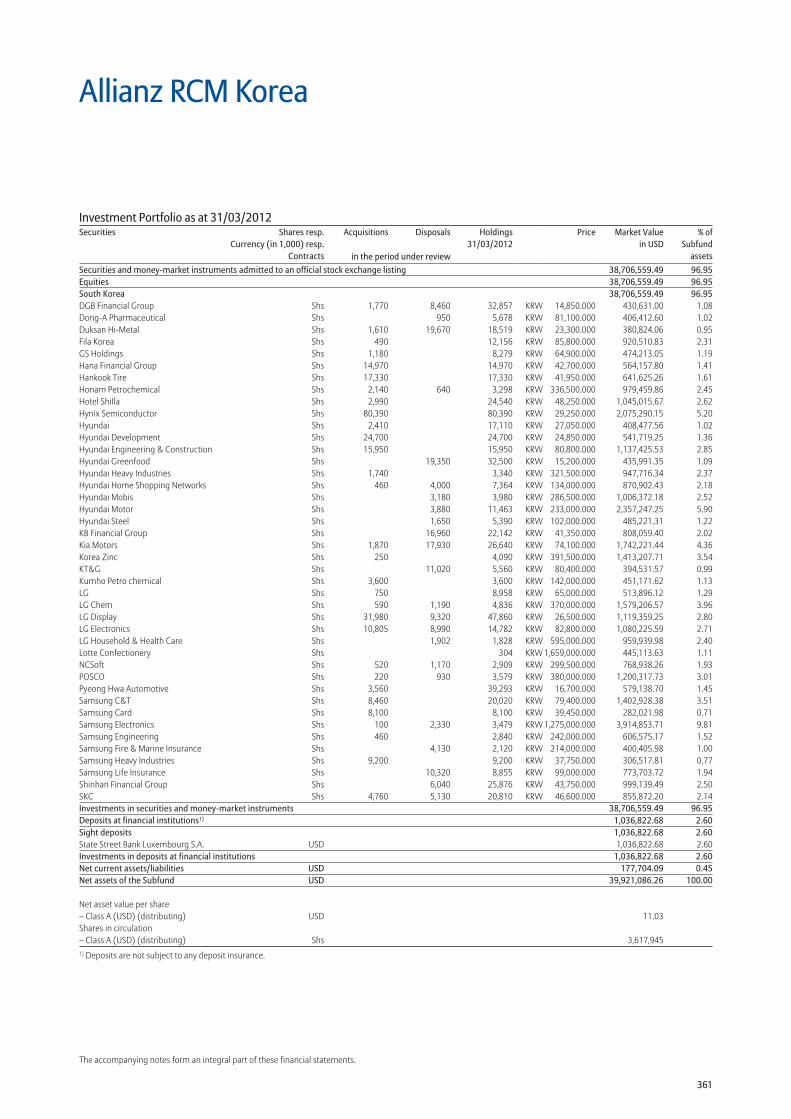
361
The accompanying notes form an integral part of these financial statements.
Allianz RCM Korea
Securities and money-market instruments admitted to an official stock exchange listing 38,706,559.49 96.95Equities 38,706,559.49 96.95South Korea 38,706,559.49 96.95DGB Financial Group Shs 1,770 8,460 32,857 KRW 14,850.000 430,631.00 1.08Dong-A Pharmaceutical Shs 950 5,678 KRW 81,100.000 406,412.60 1.02Duksan Hi-Metal Shs 1,610 19,670 18,519 KRW 23,300.000 380,824.06 0.95Fila Korea Shs 490 12,156 KRW 85,800.000 920,510.83 2.31GS Holdings Shs 1,180 8,279 KRW 64,900.000 474,213.05 1.19Hana Financial Group Shs 14,970 14,970 KRW 42,700.000 564,157.80 1.41Hankook Tire Shs 17,330 17,330 KRW 41,950.000 641,625.26 1.61Honam Petrochemical Shs 2,140 640 3,298 KRW 336,500.000 979,459.86 2.45Hotel Shilla Shs 2,990 24,540 KRW 48,250.000 1,045,015.67 2.62Hynix Semiconductor Shs 80,390 80,390 KRW 29,250.000 2,075,290.15 5.20Hyundai Shs 2,410 17,110 KRW 27,050.000 408,477.56 1.02Hyundai Development Shs 24,700 24,700 KRW 24,850.000 541,719.25 1.36Hyundai Engineering & Construction Shs 15,950 15,950 KRW 80,800.000 1,137,425.53 2.85Hyundai Greenfood Shs 19,350 32,500 KRW 15,200.000 435,991.35 1.09Hyundai Heavy Industries Shs 1,740 3,340 KRW 321,500.000 947,716.34 2.37Hyundai Home Shopping Networks Shs 460 4,000 7,364 KRW 134,000.000 870,902.43 2.18Hyundai Mobis Shs 3,180 3,980 KRW 286,500.000 1,006,372.18 2.52Hyundai Motor Shs 3,880 11,463 KRW 233,000.000 2,357,247.25 5.90Hyundai Steel Shs 1,650 5,390 KRW 102,000.000 485,221.31 1.22KB Financial Group Shs 16,960 22,142 KRW 41,350.000 808,059.40 2.02Kia Motors Shs 1,870 17,930 26,640 KRW 74,100.000 1,742,221.44 4.36Korea Zinc Shs 250 4,090 KRW 391,500.000 1,413,207.71 3.54KT&G Shs 11,020 5,560 KRW 80,400.000 394,531.57 0.99Kumho Petro chemical Shs 3,600 3,600 KRW 142,000.000 451,171.62 1.13LG Shs 750 8,958 KRW 65,000.000 513,896.12 1.29LG Chem Shs 590 1,190 4,836 KRW 370,000.000 1,579,206.57 3.96LG Display Shs 31,980 9,320 47,860 KRW 26,500.000 1,119,359.25 2.80LG Electronics Shs 10,805 8,990 14,782 KRW 82,800.000 1,080,225.59 2.71LG Household & Health Care Shs 1,902 1,828 KRW 595,000.000 959,939.98 2.40Lotte Confectionery Shs 304 KRW 1,659,000.000 445,113.63 1.11NCSoft Shs 520 1,170 2,909 KRW 299,500.000 768,938.26 1.93POSCO Shs 220 930 3,579 KRW 380,000.000 1,200,317.73 3.01Pyeong Hwa Automotive Shs 3,560 39,293 KRW 16,700.000 579,138.70 1.45Samsung C&T Shs 8,460 20,020 KRW 79,400.000 1,402,928.38 3.51Samsung Card Shs 8,100 8,100 KRW 39,450.000 282,021.98 0.71Samsung Electronics Shs 100 2,330 3,479 KRW 1,275,000.000 3,914,853.71 9.81Samsung Engineering Shs 460 2,840 KRW 242,000.000 606,575.17 1.52Samsung Fire & Marine Insurance Shs 4,130 2,120 KRW 214,000.000 400,405.98 1.00Samsung Heavy Industries Shs 9,200 9,200 KRW 37,750.000 306,517.81 0.77Samsung Life Insurance Shs 10,320 8,855 KRW 99,000.000 773,703.72 1.94Shinhan Financial Group Shs 6,040 25,876 KRW 43,750.000 999,139.49 2.50SKC Shs 4,760 5,130 20,810 KRW 46,600.000 855,872.20 2.14Investments in securities and money-market instruments 38,706,559.49 96.95Deposits at financial institutions1) 1,036,822.68 2.60Sight deposits 1,036,822.68 2.60State Street Bank Luxembourg S.A. USD 1,036,822.68 2.60Investments in deposits at financial institutions 1,036,822.68 2.60Net current assets/liabilities USD 177,704.09 0.45Net assets of the Subfund USD 39,921,086.26 100.00
Net asset value per share – Class A (USD) (distributing) USD 11.03 Shares in circulation – Class A (USD) (distributing) Shs 3,617,9451) Deposits are not subject to any deposit insurance.
Investment Portfolio as at 31/03/2012Securities Shares resp.
Currency (in 1,000) resp.Contracts
Acquisitions Disposals Holdings 31/03/2012
Price Market Valuein USD
% ofSubfund
assetsin the period under review
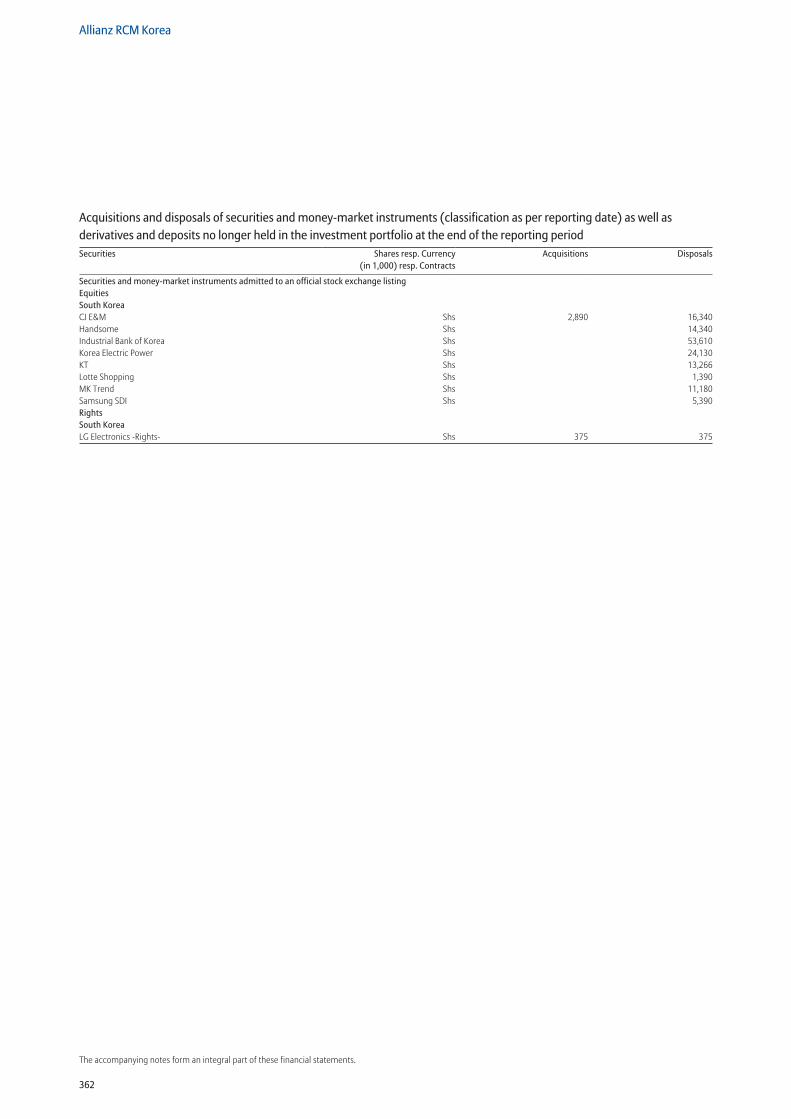
362
Allianz RCM Korea
The accompanying notes form an integral part of these financial statements.
Securities and money-market instruments admitted to an official stock exchange listing Equities South Korea CJ E&M Shs 2,890 16,340Handsome Shs 14,340Industrial Bank of Korea Shs 53,610Korea Electric Power Shs 24,130KT Shs 13,266Lotte Shopping Shs 1,390MK Trend Shs 11,180Samsung SDI Shs 5,390Rights South Korea LG Electronics -Rights- Shs 375 375
Acquisitions and disposals of securities and money-market instruments (classification as per reporting date) as well as derivatives and deposits no longer held in the investment portfolio at the end of the reporting periodSecurities Shares resp. Currency
(in 1,000) resp. ContractsAcquisitions Disposals
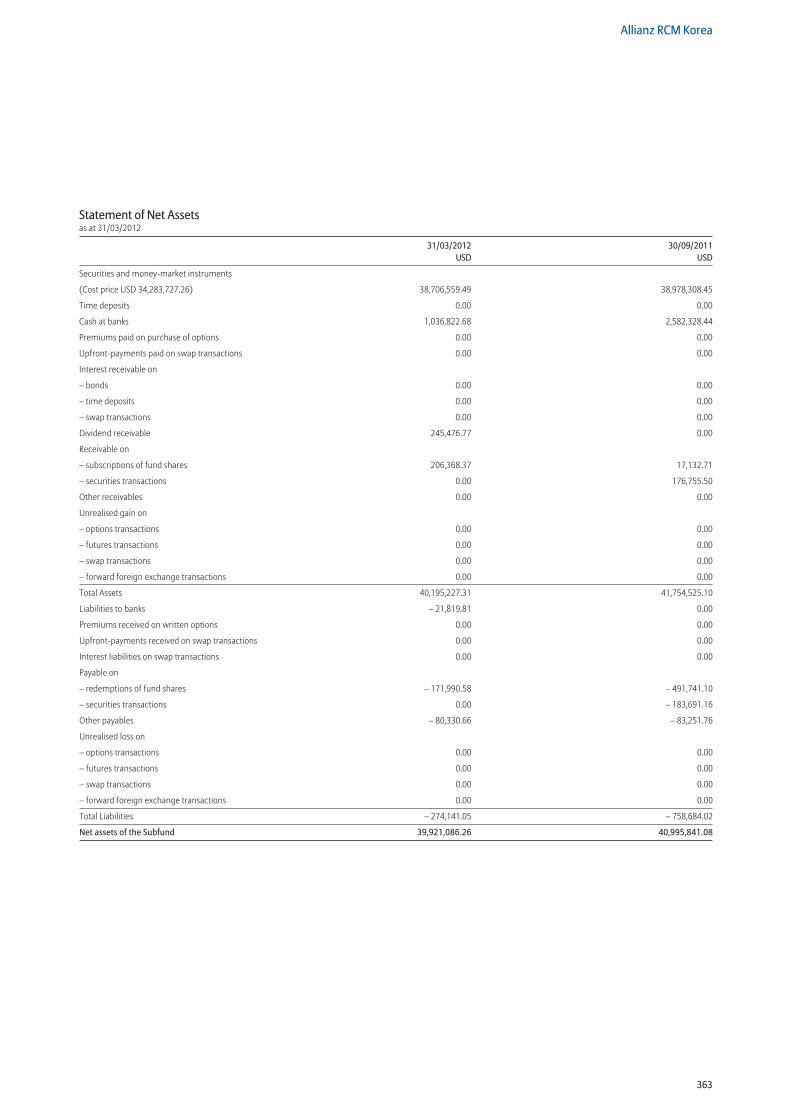
363
Allianz RCM Korea
Statement of Net Assetsas at 31/03/2012
31/03/2012 30/09/2011 USD USD
Securities and money-market instruments
(Cost price USD 34,283,727.26) 38,706,559.49 38,978,308.45
Time deposits 0.00 0.00
Cash at banks 1,036,822.68 2,582,328.44
Premiums paid on purchase of options 0.00 0.00
Upfront-payments paid on swap transactions 0.00 0.00
Interest receivable on
– bonds 0.00 0.00
– time deposits 0.00 0.00
– swap transactions 0.00 0.00
Dividend receivable 245,476.77 0.00
Receivable on
– subscriptions of fund shares 206,368.37 17,132.71
– securities transactions 0.00 176,755.50
Other receivables 0.00 0.00
Unrealised gain on
– options transactions 0.00 0.00
– futures transactions 0.00 0.00
– swap transactions 0.00 0.00
– forward foreign exchange transactions 0.00 0.00
Total Assets 40,195,227.31 41,754,525.10
Liabilities to banks – 21,819.81 0.00
Premiums received on written options 0.00 0.00
Upfront-payments received on swap transactions 0.00 0.00
Interest liabilities on swap transactions 0.00 0.00
Payable on
– redemptions of fund shares – 171,990.58 – 491,741.10
– securities transactions 0.00 – 183,691.16
Other payables – 80,330.66 – 83,251.76
Unrealised loss on
– options transactions 0.00 0.00
– futures transactions 0.00 0.00
– swap transactions 0.00 0.00
– forward foreign exchange transactions 0.00 0.00
Total Liabilities – 274,141.05 – 758,684.02
Net assets of the Subfund 39,921,086.26 40,995,841.08
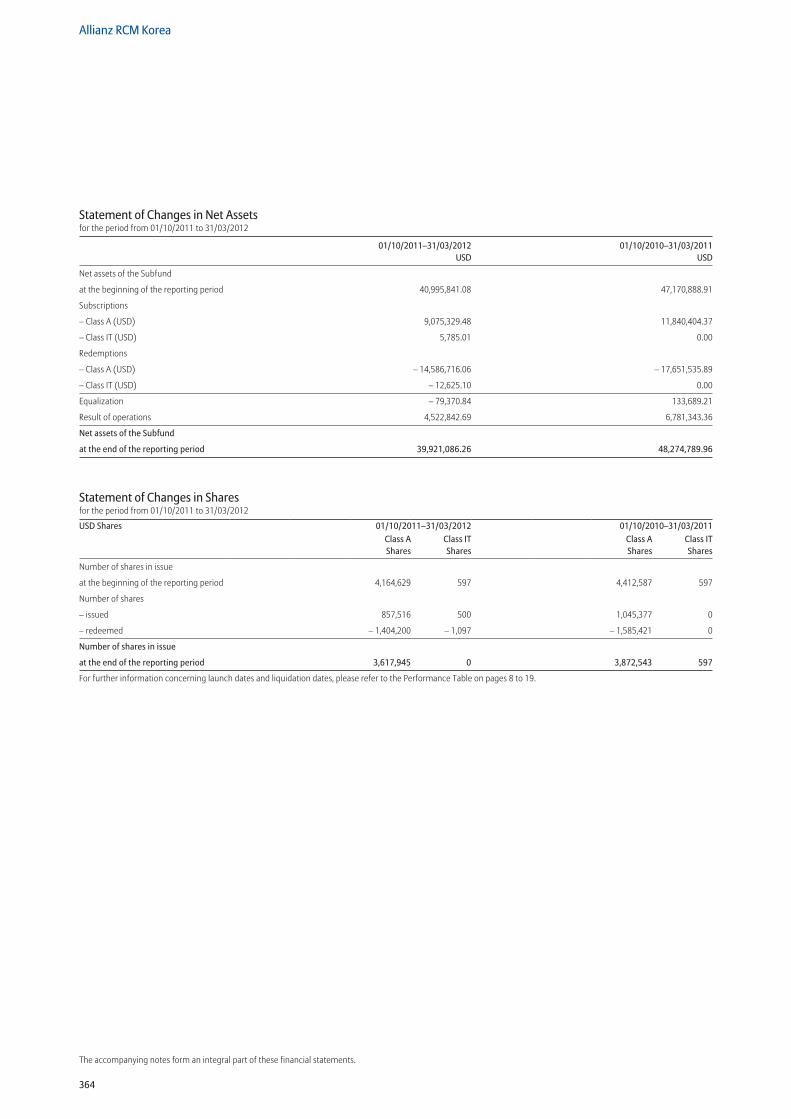
364
Allianz RCM Korea
The accompanying notes form an integral part of these financial statements.
Statement of Changes in Net Assetsfor the period from 01/10/2011 to 31/03/2012
01/10/2011–31/03/2012 01/10/2010–31/03/2011 USD USD
Net assets of the Subfund
at the beginning of the reporting period 40,995,841.08 47,170,888.91
Subscriptions
– Class A (USD) 9,075,329.48 11,840,404.37
– Class IT (USD) 5,785.01 0.00
Redemptions
– Class A (USD) – 14,586,716.06 – 17,651,535.89
– Class IT (USD) – 12,625.10 0.00
Equalization – 79,370.84 133,689.21
Result of operations 4,522,842.69 6,781,343.36
Net assets of the Subfund
at the end of the reporting period 39,921,086.26 48,274,789.96
Statement of Changes in Sharesfor the period from 01/10/2011 to 31/03/2012
USD Shares 01/10/2011–31/03/2012 01/10/2010–31/03/2011Class A Shares
Class IT Shares
Class A Shares
Class IT Shares
Number of shares in issue
at the beginning of the reporting period 4,164,629 597 4,412,587 597
Number of shares
– issued 857,516 500 1,045,377 0
– redeemed – 1,404,200 – 1,097 – 1,585,421 0
Number of shares in issue
at the end of the reporting period 3,617,945 0 3,872,543 597
For further information concerning launch dates and liquidation dates, please refer to the Performance Table on pages 8 to 19.
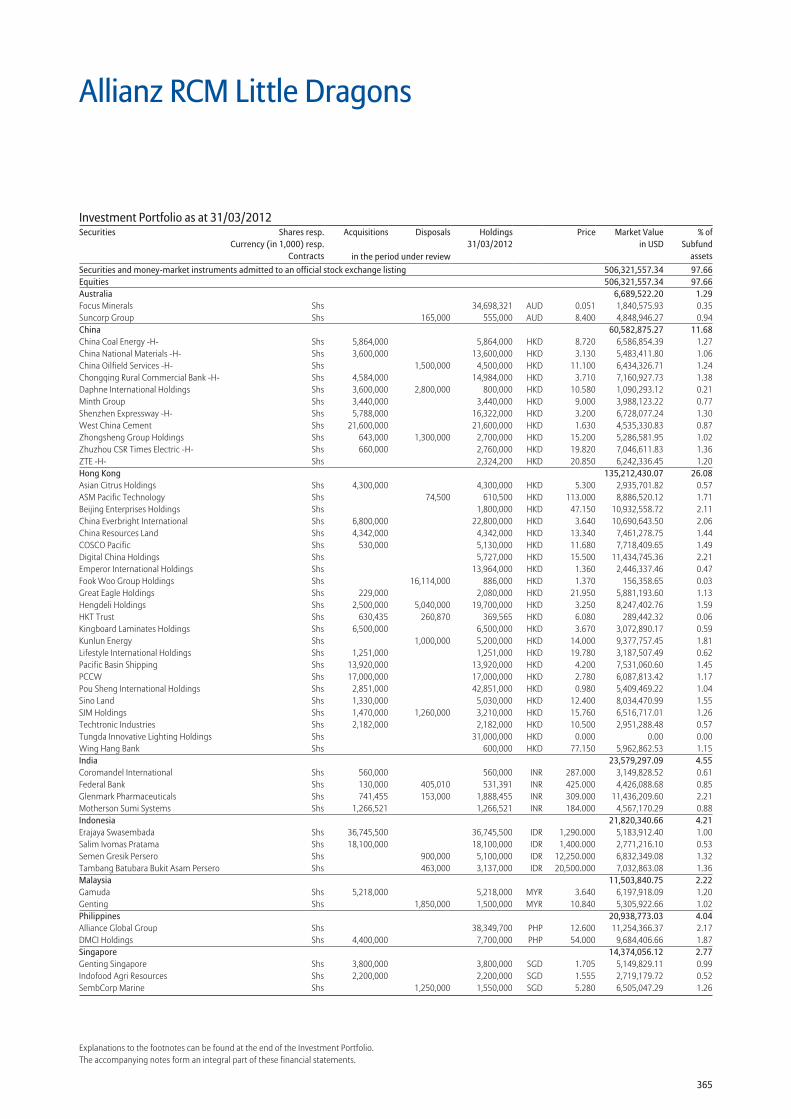
365
Explanations to the footnotes can be found at the end of the Investment Portfolio.The accompanying notes form an integral part of these financial statements.
Allianz RCM Little Dragons
Securities and money-market instruments admitted to an official stock exchange listing 506,321,557.34 97.66Equities 506,321,557.34 97.66Australia 6,689,522.20 1.29Focus Minerals Shs 34,698,321 AUD 0.051 1,840,575.93 0.35Suncorp Group Shs 165,000 555,000 AUD 8.400 4,848,946.27 0.94China 60,582,875.27 11.68China Coal Energy -H- Shs 5,864,000 5,864,000 HKD 8.720 6,586,854.39 1.27China National Materials -H- Shs 3,600,000 13,600,000 HKD 3.130 5,483,411.80 1.06China Oilfield Services -H- Shs 1,500,000 4,500,000 HKD 11.100 6,434,326.71 1.24Chongqing Rural Commercial Bank -H- Shs 4,584,000 14,984,000 HKD 3.710 7,160,927.73 1.38Daphne International Holdings Shs 3,600,000 2,800,000 800,000 HKD 10.580 1,090,293.12 0.21Minth Group Shs 3,440,000 3,440,000 HKD 9.000 3,988,123.22 0.77Shenzhen Expressway -H- Shs 5,788,000 16,322,000 HKD 3.200 6,728,077.24 1.30West China Cement Shs 21,600,000 21,600,000 HKD 1.630 4,535,330.83 0.87Zhongsheng Group Holdings Shs 643,000 1,300,000 2,700,000 HKD 15.200 5,286,581.95 1.02Zhuzhou CSR Times Electric -H- Shs 660,000 2,760,000 HKD 19.820 7,046,611.83 1.36ZTE -H- Shs 2,324,200 HKD 20.850 6,242,336.45 1.20Hong Kong 135,212,430.07 26.08Asian Citrus Holdings Shs 4,300,000 4,300,000 HKD 5.300 2,935,701.82 0.57ASM Pacific Technology Shs 74,500 610,500 HKD 113.000 8,886,520.12 1.71Beijing Enterprises Holdings Shs 1,800,000 HKD 47.150 10,932,558.72 2.11China Everbright International Shs 6,800,000 22,800,000 HKD 3.640 10,690,643.50 2.06China Resources Land Shs 4,342,000 4,342,000 HKD 13.340 7,461,278.75 1.44COSCO Pacific Shs 530,000 5,130,000 HKD 11.680 7,718,409.65 1.49Digital China Holdings Shs 5,727,000 HKD 15.500 11,434,745.36 2.21Emperor International Holdings Shs 13,964,000 HKD 1.360 2,446,337.46 0.47Fook Woo Group Holdings Shs 16,114,000 886,000 HKD 1.370 156,358.65 0.03Great Eagle Holdings Shs 229,000 2,080,000 HKD 21.950 5,881,193.60 1.13Hengdeli Holdings Shs 2,500,000 5,040,000 19,700,000 HKD 3.250 8,247,402.76 1.59HKT Trust Shs 630,435 260,870 369,565 HKD 6.080 289,442.32 0.06Kingboard Laminates Holdings Shs 6,500,000 6,500,000 HKD 3.670 3,072,890.17 0.59Kunlun Energy Shs 1,000,000 5,200,000 HKD 14.000 9,377,757.45 1.81Lifestyle International Holdings Shs 1,251,000 1,251,000 HKD 19.780 3,187,507.49 0.62Pacific Basin Shipping Shs 13,920,000 13,920,000 HKD 4.200 7,531,060.60 1.45PCCW Shs 17,000,000 17,000,000 HKD 2.780 6,087,813.42 1.17Pou Sheng International Holdings Shs 2,851,000 42,851,000 HKD 0.980 5,409,469.22 1.04Sino Land Shs 1,330,000 5,030,000 HKD 12.400 8,034,470.99 1.55SJM Holdings Shs 1,470,000 1,260,000 3,210,000 HKD 15.760 6,516,717.01 1.26Techtronic Industries Shs 2,182,000 2,182,000 HKD 10.500 2,951,288.48 0.57Tungda Innovative Lighting Holdings Shs 31,000,000 HKD 0.000 0.00 0.00Wing Hang Bank Shs 600,000 HKD 77.150 5,962,862.53 1.15India 23,579,297.09 4.55Coromandel International Shs 560,000 560,000 INR 287.000 3,149,828.52 0.61Federal Bank Shs 130,000 405,010 531,391 INR 425.000 4,426,088.68 0.85Glenmark Pharmaceuticals Shs 741,455 153,000 1,888,455 INR 309.000 11,436,209.60 2.21Motherson Sumi Systems Shs 1,266,521 1,266,521 INR 184.000 4,567,170.29 0.88Indonesia 21,820,340.66 4.21Erajaya Swasembada Shs 36,745,500 36,745,500 IDR 1,290.000 5,183,912.40 1.00Salim Ivomas Pratama Shs 18,100,000 18,100,000 IDR 1,400.000 2,771,216.10 0.53Semen Gresik Persero Shs 900,000 5,100,000 IDR 12,250.000 6,832,349.08 1.32Tambang Batubara Bukit Asam Persero Shs 463,000 3,137,000 IDR 20,500.000 7,032,863.08 1.36Malaysia 11,503,840.75 2.22Gamuda Shs 5,218,000 5,218,000 MYR 3.640 6,197,918.09 1.20Genting Shs 1,850,000 1,500,000 MYR 10.840 5,305,922.66 1.02Philippines 20,938,773.03 4.04Alliance Global Group Shs 38,349,700 PHP 12.600 11,254,366.37 2.17DMCI Holdings Shs 4,400,000 7,700,000 PHP 54.000 9,684,406.66 1.87Singapore 14,374,056.12 2.77Genting Singapore Shs 3,800,000 3,800,000 SGD 1.705 5,149,829.11 0.99Indofood Agri Resources Shs 2,200,000 2,200,000 SGD 1.555 2,719,179.72 0.52SembCorp Marine Shs 1,250,000 1,550,000 SGD 5.280 6,505,047.29 1.26
Investment Portfolio as at 31/03/2012Securities Shares resp.
Currency (in 1,000) resp.Contracts
Acquisitions Disposals Holdings 31/03/2012
Price Market Valuein USD
% ofSubfund
assetsin the period under review
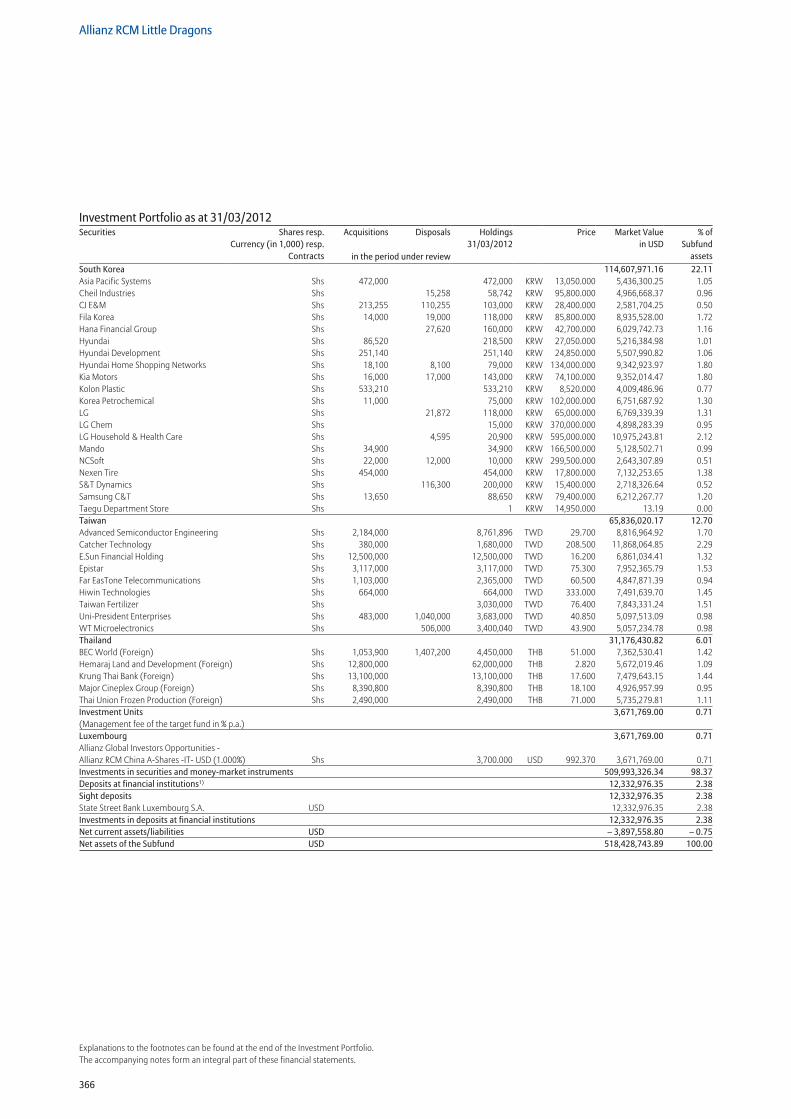
366
Allianz RCM Little Dragons
Explanations to the footnotes can be found at the end of the Investment Portfolio.The accompanying notes form an integral part of these financial statements.
South Korea 114,607,971.16 22.11Asia Pacific Systems Shs 472,000 472,000 KRW 13,050.000 5,436,300.25 1.05Cheil Industries Shs 15,258 58,742 KRW 95,800.000 4,966,668.37 0.96CJ E&M Shs 213,255 110,255 103,000 KRW 28,400.000 2,581,704.25 0.50Fila Korea Shs 14,000 19,000 118,000 KRW 85,800.000 8,935,528.00 1.72Hana Financial Group Shs 27,620 160,000 KRW 42,700.000 6,029,742.73 1.16Hyundai Shs 86,520 218,500 KRW 27,050.000 5,216,384.98 1.01Hyundai Development Shs 251,140 251,140 KRW 24,850.000 5,507,990.82 1.06Hyundai Home Shopping Networks Shs 18,100 8,100 79,000 KRW 134,000.000 9,342,923.97 1.80Kia Motors Shs 16,000 17,000 143,000 KRW 74,100.000 9,352,014.47 1.80Kolon Plastic Shs 533,210 533,210 KRW 8,520.000 4,009,486.96 0.77Korea Petrochemical Shs 11,000 75,000 KRW 102,000.000 6,751,687.92 1.30LG Shs 21,872 118,000 KRW 65,000.000 6,769,339.39 1.31LG Chem Shs 15,000 KRW 370,000.000 4,898,283.39 0.95LG Household & Health Care Shs 4,595 20,900 KRW 595,000.000 10,975,243.81 2.12Mando Shs 34,900 34,900 KRW 166,500.000 5,128,502.71 0.99NCSoft Shs 22,000 12,000 10,000 KRW 299,500.000 2,643,307.89 0.51Nexen Tire Shs 454,000 454,000 KRW 17,800.000 7,132,253.65 1.38S&T Dynamics Shs 116,300 200,000 KRW 15,400.000 2,718,326.64 0.52Samsung C&T Shs 13,650 88,650 KRW 79,400.000 6,212,267.77 1.20Taegu Department Store Shs 1 KRW 14,950.000 13.19 0.00Taiwan 65,836,020.17 12.70Advanced Semiconductor Engineering Shs 2,184,000 8,761,896 TWD 29.700 8,816,964.92 1.70Catcher Technology Shs 380,000 1,680,000 TWD 208.500 11,868,064.85 2.29E.Sun Financial Holding Shs 12,500,000 12,500,000 TWD 16.200 6,861,034.41 1.32Epistar Shs 3,117,000 3,117,000 TWD 75.300 7,952,365.79 1.53Far EasTone Telecommunications Shs 1,103,000 2,365,000 TWD 60.500 4,847,871.39 0.94Hiwin Technologies Shs 664,000 664,000 TWD 333.000 7,491,639.70 1.45Taiwan Fertilizer Shs 3,030,000 TWD 76.400 7,843,331.24 1.51Uni-President Enterprises Shs 483,000 1,040,000 3,683,000 TWD 40.850 5,097,513.09 0.98WT Microelectronics Shs 506,000 3,400,040 TWD 43.900 5,057,234.78 0.98Thailand 31,176,430.82 6.01BEC World (Foreign) Shs 1,053,900 1,407,200 4,450,000 THB 51.000 7,362,530.41 1.42Hemaraj Land and Development (Foreign) Shs 12,800,000 62,000,000 THB 2.820 5,672,019.46 1.09Krung Thai Bank (Foreign) Shs 13,100,000 13,100,000 THB 17.600 7,479,643.15 1.44Major Cineplex Group (Foreign) Shs 8,390,800 8,390,800 THB 18.100 4,926,957.99 0.95Thai Union Frozen Production (Foreign) Shs 2,490,000 2,490,000 THB 71.000 5,735,279.81 1.11Investment Units 3,671,769.00 0.71(Management fee of the target fund in % p.a.) Luxembourg 3,671,769.00 0.71Allianz Global Investors Opportunities - Allianz RCM China A-Shares -IT- USD (1.000%) Shs 3,700.000 USD 992.370 3,671,769.00 0.71Investments in securities and money-market instruments 509,993,326.34 98.37Deposits at financial institutions1) 12,332,976.35 2.38Sight deposits 12,332,976.35 2.38State Street Bank Luxembourg S.A. USD 12,332,976.35 2.38Investments in deposits at financial institutions 12,332,976.35 2.38Net current assets/liabilities USD – 3,897,558.80 – 0.75Net assets of the Subfund USD 518,428,743.89 100.00
Investment Portfolio as at 31/03/2012Securities Shares resp.
Currency (in 1,000) resp.Contracts
Acquisitions Disposals Holdings 31/03/2012
Price Market Valuein USD
% ofSubfund
assetsin the period under review
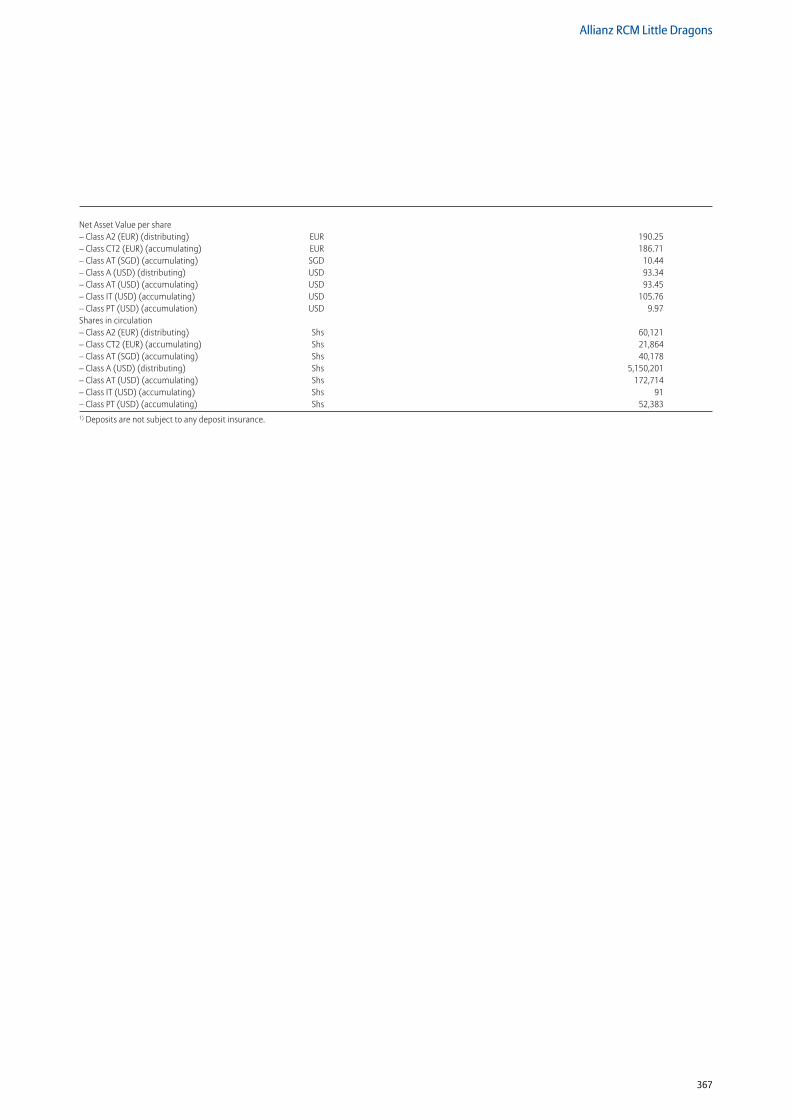
367
Allianz RCM Little Dragons
Net Asset Value per share – Class A2 (EUR) (distributing) EUR 190.25 – Class CT2 (EUR) (accumulating) EUR 186.71 – Class AT (SGD) (accumulating) SGD 10.44 – Class A (USD) (distributing) USD 93.34 – Class AT (USD) (accumulating) USD 93.45 – Class IT (USD) (accumulating) USD 105.76 – Class PT (USD) (accumulation) USD 9.97 Shares in circulation – Class A2 (EUR) (distributing) Shs 60,121 – Class CT2 (EUR) (accumulating) Shs 21,864– Class AT (SGD) (accumulating) Shs 40,178– Class A (USD) (distributing) Shs 5,150,201– Class AT (USD) (accumulating) Shs 172,714– Class IT (USD) (accumulating) Shs 91– Class PT (USD) (accumulating) Shs 52,3831) Deposits are not subject to any deposit insurance.
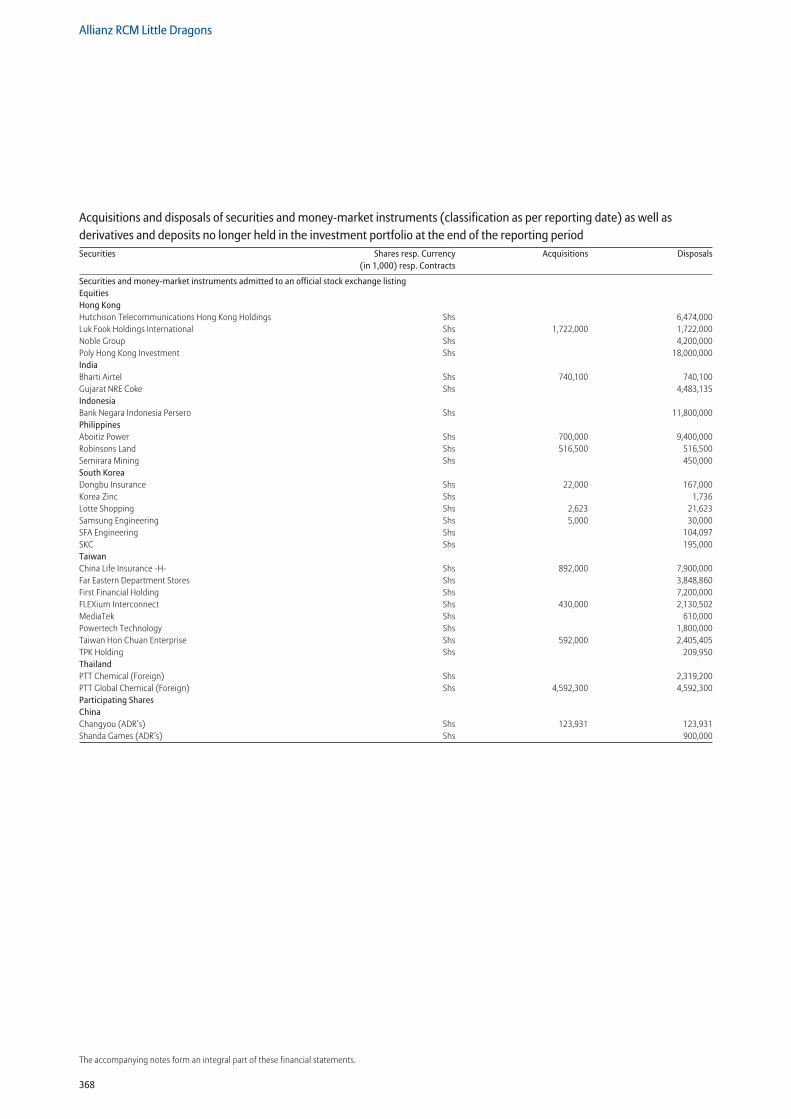
368
Allianz RCM Little Dragons
The accompanying notes form an integral part of these financial statements.
Securities and money-market instruments admitted to an official stock exchange listing Equities Hong Kong Hutchison Telecommunications Hong Kong Holdings Shs 6,474,000Luk Fook Holdings International Shs 1,722,000 1,722,000Noble Group Shs 4,200,000Poly Hong Kong Investment Shs 18,000,000India Bharti Airtel Shs 740,100 740,100Gujarat NRE Coke Shs 4,483,135Indonesia Bank Negara Indonesia Persero Shs 11,800,000Philippines Aboitiz Power Shs 700,000 9,400,000Robinsons Land Shs 516,500 516,500Semirara Mining Shs 450,000South Korea Dongbu Insurance Shs 22,000 167,000Korea Zinc Shs 1,736Lotte Shopping Shs 2,623 21,623Samsung Engineering Shs 5,000 30,000SFA Engineering Shs 104,097SKC Shs 195,000Taiwan China Life Insurance -H- Shs 892,000 7,900,000Far Eastern Department Stores Shs 3,848,860First Financial Holding Shs 7,200,000FLEXium Interconnect Shs 430,000 2,130,502MediaTek Shs 610,000Powertech Technology Shs 1,800,000Taiwan Hon Chuan Enterprise Shs 592,000 2,405,405TPK Holding Shs 209,950Thailand PTT Chemical (Foreign) Shs 2,319,200PTT Global Chemical (Foreign) Shs 4,592,300 4,592,300Participating Shares China Changyou (ADR’s) Shs 123,931 123,931Shanda Games (ADR’s) Shs 900,000
Acquisitions and disposals of securities and money-market instruments (classification as per reporting date) as well as derivatives and deposits no longer held in the investment portfolio at the end of the reporting periodSecurities Shares resp. Currency
(in 1,000) resp. ContractsAcquisitions Disposals
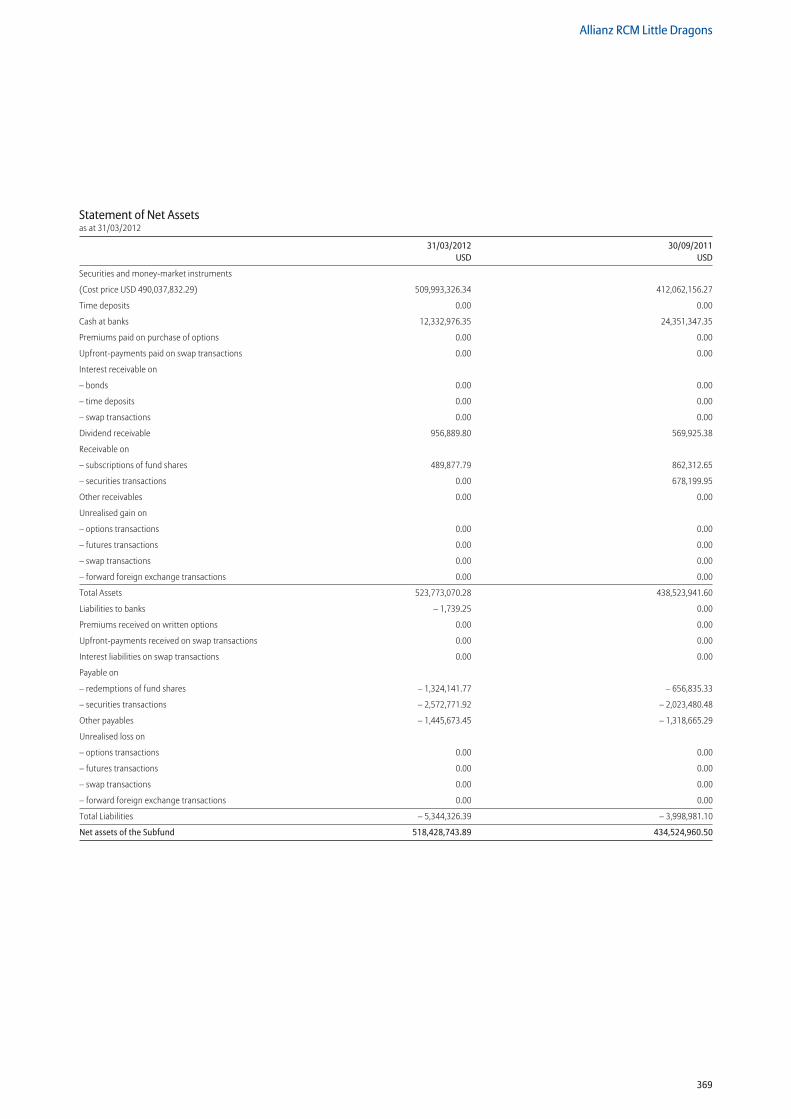
369
Allianz RCM Little Dragons
Statement of Net Assetsas at 31/03/2012
31/03/2012 30/09/2011 USD USD
Securities and money-market instruments
(Cost price USD 490,037,832.29) 509,993,326.34 412,062,156.27
Time deposits 0.00 0.00
Cash at banks 12,332,976.35 24,351,347.35
Premiums paid on purchase of options 0.00 0.00
Upfront-payments paid on swap transactions 0.00 0.00
Interest receivable on
– bonds 0.00 0.00
– time deposits 0.00 0.00
– swap transactions 0.00 0.00
Dividend receivable 956,889.80 569,925.38
Receivable on
– subscriptions of fund shares 489,877.79 862,312.65
– securities transactions 0.00 678,199.95
Other receivables 0.00 0.00
Unrealised gain on
– options transactions 0.00 0.00
– futures transactions 0.00 0.00
– swap transactions 0.00 0.00
– forward foreign exchange transactions 0.00 0.00
Total Assets 523,773,070.28 438,523,941.60
Liabilities to banks – 1,739.25 0.00
Premiums received on written options 0.00 0.00
Upfront-payments received on swap transactions 0.00 0.00
Interest liabilities on swap transactions 0.00 0.00
Payable on
– redemptions of fund shares – 1,324,141.77 – 656,835.33
– securities transactions – 2,572,771.92 – 2,023,480.48
Other payables – 1,445,673.45 – 1,318,665.29
Unrealised loss on
– options transactions 0.00 0.00
– futures transactions 0.00 0.00
– swap transactions 0.00 0.00
– forward foreign exchange transactions 0.00 0.00
Total Liabilities – 5,344,326.39 – 3,998,981.10
Net assets of the Subfund 518,428,743.89 434,524,960.50
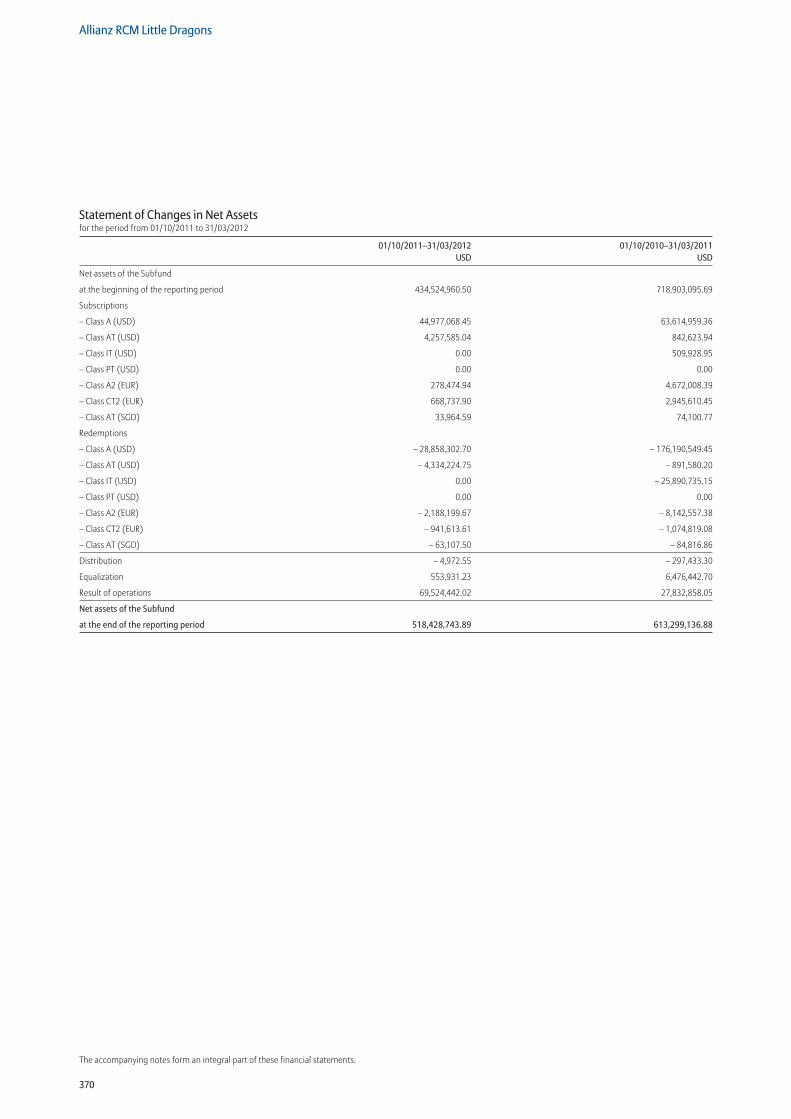
370
Allianz RCM Little Dragons
The accompanying notes form an integral part of these financial statements.
Statement of Changes in Net Assetsfor the period from 01/10/2011 to 31/03/2012
01/10/2011–31/03/2012 01/10/2010–31/03/2011 USD USD
Net assets of the Subfund
at the beginning of the reporting period 434,524,960.50 718,903,095.69
Subscriptions
– Class A (USD) 44,977,068.45 63,614,959.36
– Class AT (USD) 4,257,585.04 842,623.94
– Class IT (USD) 0.00 509,928.95
– Class PT (USD) 0.00 0.00
– Class A2 (EUR) 278,474.94 4,672,008.39
– Class CT2 (EUR) 668,737.90 2,945,610.45
– Class AT (SGD) 33,964.59 74,100.77
Redemptions
– Class A (USD) – 28,858,302.70 – 176,190,549.45
– Class AT (USD) – 4,334,224.75 – 891,580.20
– Class IT (USD) 0.00 – 25,890,735.15
– Class PT (USD) 0.00 0.00
– Class A2 (EUR) – 2,188,199.67 – 8,142,557.38
– Class CT2 (EUR) – 941,613.61 – 1,074,819.08
– Class AT (SGD) – 63,107.50 – 84,816.86
Distribution – 4,972.55 – 297,433.30
Equalization 553,931.23 6,476,442.70
Result of operations 69,524,442.02 27,832,858.05
Net assets of the Subfund
at the end of the reporting period 518,428,743.89 613,299,136.88
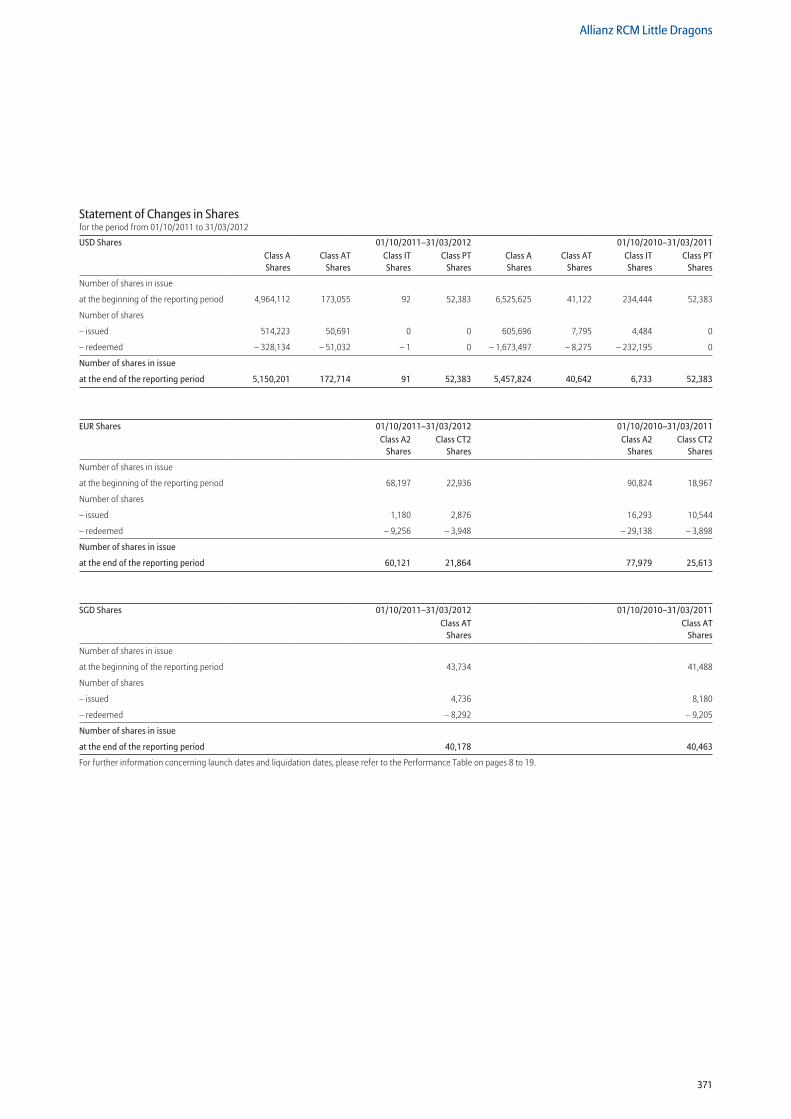
371
Allianz RCM Little Dragons
Statement of Changes in Sharesfor the period from 01/10/2011 to 31/03/2012
USD Shares 01/10/2011–31/03/2012 01/10/2010–31/03/2011Class A Shares
Class AT Shares
Class IT Shares
Class PT Shares
Class A Shares
Class AT Shares
Class IT Shares
Class PT Shares
Number of shares in issue
at the beginning of the reporting period 4,964,112 173,055 92 52,383 6,525,625 41,122 234,444 52,383
Number of shares
– issued 514,223 50,691 0 0 605,696 7,795 4,484 0
– redeemed – 328,134 – 51,032 – 1 0 – 1,673,497 – 8,275 – 232,195 0
Number of shares in issue
at the end of the reporting period 5,150,201 172,714 91 52,383 5,457,824 40,642 6,733 52,383
EUR Shares 01/10/2011–31/03/2012 01/10/2010–31/03/2011Class A2
SharesClass CT2
SharesClass A2
SharesClass CT2
Shares
Number of shares in issue
at the beginning of the reporting period 68,197 22,936 90,824 18,967
Number of shares
– issued 1,180 2,876 16,293 10,544
– redeemed – 9,256 – 3,948 – 29,138 – 3,898
Number of shares in issue
at the end of the reporting period 60,121 21,864 77,979 25,613
SGD Shares 01/10/2011–31/03/2012 01/10/2010–31/03/2011Class AT
SharesClass AT
Shares
Number of shares in issue
at the beginning of the reporting period 43,734 41,488
Number of shares
– issued 4,736 8,180
– redeemed – 8,292 – 9,205
Number of shares in issue
at the end of the reporting period 40,178 40,463
For further information concerning launch dates and liquidation dates, please refer to the Performance Table on pages 8 to 19.
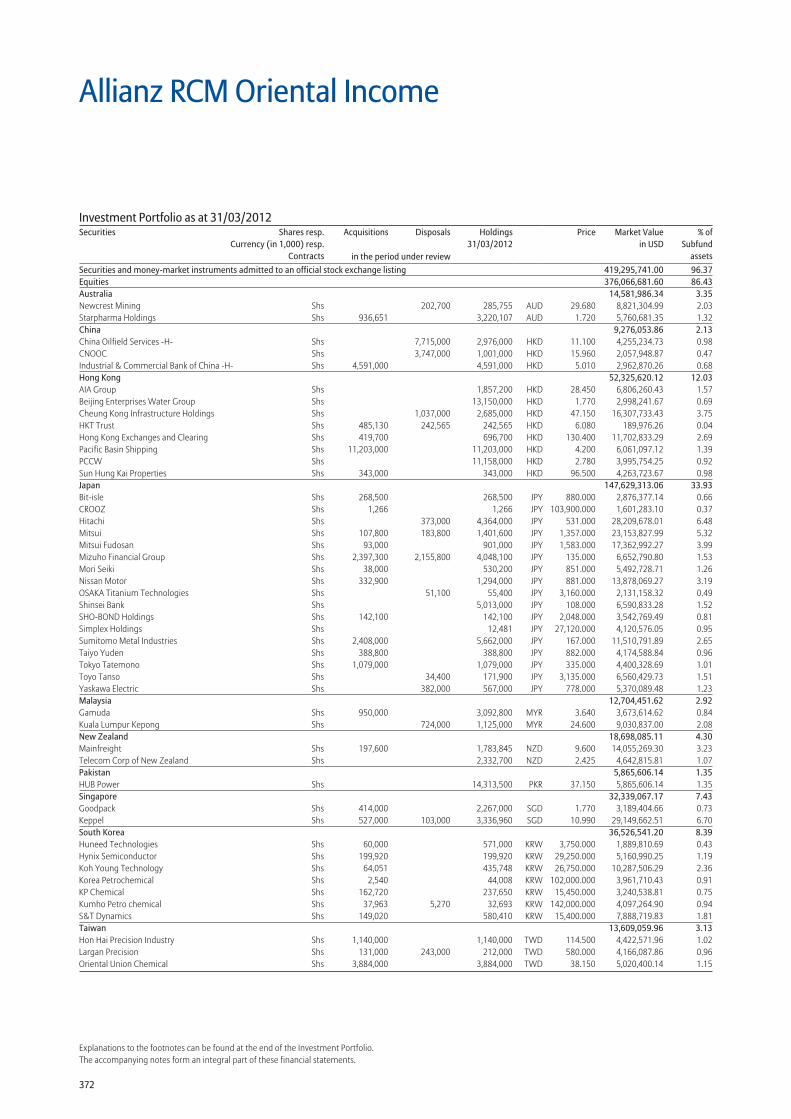
372
Explanations to the footnotes can be found at the end of the Investment Portfolio.The accompanying notes form an integral part of these financial statements.
Allianz RCM Oriental Income
Securities and money-market instruments admitted to an official stock exchange listing 419,295,741.00 96.37Equities 376,066,681.60 86.43Australia 14,581,986.34 3.35Newcrest Mining Shs 202,700 285,755 AUD 29.680 8,821,304.99 2.03Starpharma Holdings Shs 936,651 3,220,107 AUD 1.720 5,760,681.35 1.32China 9,276,053.86 2.13China Oilfield Services -H- Shs 7,715,000 2,976,000 HKD 11.100 4,255,234.73 0.98CNOOC Shs 3,747,000 1,001,000 HKD 15.960 2,057,948.87 0.47Industrial & Commercial Bank of China -H- Shs 4,591,000 4,591,000 HKD 5.010 2,962,870.26 0.68Hong Kong 52,325,620.12 12.03AIA Group Shs 1,857,200 HKD 28.450 6,806,260.43 1.57Beijing Enterprises Water Group Shs 13,150,000 HKD 1.770 2,998,241.67 0.69Cheung Kong Infrastructure Holdings Shs 1,037,000 2,685,000 HKD 47.150 16,307,733.43 3.75HKT Trust Shs 485,130 242,565 242,565 HKD 6.080 189,976.26 0.04Hong Kong Exchanges and Clearing Shs 419,700 696,700 HKD 130.400 11,702,833.29 2.69Pacific Basin Shipping Shs 11,203,000 11,203,000 HKD 4.200 6,061,097.12 1.39PCCW Shs 11,158,000 HKD 2.780 3,995,754.25 0.92Sun Hung Kai Properties Shs 343,000 343,000 HKD 96.500 4,263,723.67 0.98Japan 147,629,313.06 33.93Bit-isle Shs 268,500 268,500 JPY 880.000 2,876,377.14 0.66CROOZ Shs 1,266 1,266 JPY 103,900.000 1,601,283.10 0.37Hitachi Shs 373,000 4,364,000 JPY 531.000 28,209,678.01 6.48Mitsui Shs 107,800 183,800 1,401,600 JPY 1,357.000 23,153,827.99 5.32Mitsui Fudosan Shs 93,000 901,000 JPY 1,583.000 17,362,992.27 3.99Mizuho Financial Group Shs 2,397,300 2,155,800 4,048,100 JPY 135.000 6,652,790.80 1.53Mori Seiki Shs 38,000 530,200 JPY 851.000 5,492,728.71 1.26Nissan Motor Shs 332,900 1,294,000 JPY 881.000 13,878,069.27 3.19OSAKA Titanium Technologies Shs 51,100 55,400 JPY 3,160.000 2,131,158.32 0.49Shinsei Bank Shs 5,013,000 JPY 108.000 6,590,833.28 1.52SHO-BOND Holdings Shs 142,100 142,100 JPY 2,048.000 3,542,769.49 0.81Simplex Holdings Shs 12,481 JPY 27,120.000 4,120,576.05 0.95Sumitomo Metal Industries Shs 2,408,000 5,662,000 JPY 167.000 11,510,791.89 2.65Taiyo Yuden Shs 388,800 388,800 JPY 882.000 4,174,588.84 0.96Tokyo Tatemono Shs 1,079,000 1,079,000 JPY 335.000 4,400,328.69 1.01Toyo Tanso Shs 34,400 171,900 JPY 3,135.000 6,560,429.73 1.51Yaskawa Electric Shs 382,000 567,000 JPY 778.000 5,370,089.48 1.23Malaysia 12,704,451.62 2.92Gamuda Shs 950,000 3,092,800 MYR 3.640 3,673,614.62 0.84Kuala Lumpur Kepong Shs 724,000 1,125,000 MYR 24.600 9,030,837.00 2.08New Zealand 18,698,085.11 4.30Mainfreight Shs 197,600 1,783,845 NZD 9.600 14,055,269.30 3.23Telecom Corp of New Zealand Shs 2,332,700 NZD 2.425 4,642,815.81 1.07Pakistan 5,865,606.14 1.35HUB Power Shs 14,313,500 PKR 37.150 5,865,606.14 1.35Singapore 32,339,067.17 7.43Goodpack Shs 414,000 2,267,000 SGD 1.770 3,189,404.66 0.73Keppel Shs 527,000 103,000 3,336,960 SGD 10.990 29,149,662.51 6.70South Korea 36,526,541.20 8.39Huneed Technologies Shs 60,000 571,000 KRW 3,750.000 1,889,810.69 0.43Hynix Semiconductor Shs 199,920 199,920 KRW 29,250.000 5,160,990.25 1.19Koh Young Technology Shs 64,051 435,748 KRW 26,750.000 10,287,506.29 2.36Korea Petrochemical Shs 2,540 44,008 KRW 102,000.000 3,961,710.43 0.91KP Chemical Shs 162,720 237,650 KRW 15,450.000 3,240,538.81 0.75Kumho Petro chemical Shs 37,963 5,270 32,693 KRW 142,000.000 4,097,264.90 0.94S&T Dynamics Shs 149,020 580,410 KRW 15,400.000 7,888,719.83 1.81Taiwan 13,609,059.96 3.13Hon Hai Precision Industry Shs 1,140,000 1,140,000 TWD 114.500 4,422,571.96 1.02Largan Precision Shs 131,000 243,000 212,000 TWD 580.000 4,166,087.86 0.96Oriental Union Chemical Shs 3,884,000 3,884,000 TWD 38.150 5,020,400.14 1.15
Investment Portfolio as at 31/03/2012Securities Shares resp.
Currency (in 1,000) resp.Contracts
Acquisitions Disposals Holdings 31/03/2012
Price Market Valuein USD
% ofSubfund
assetsin the period under review
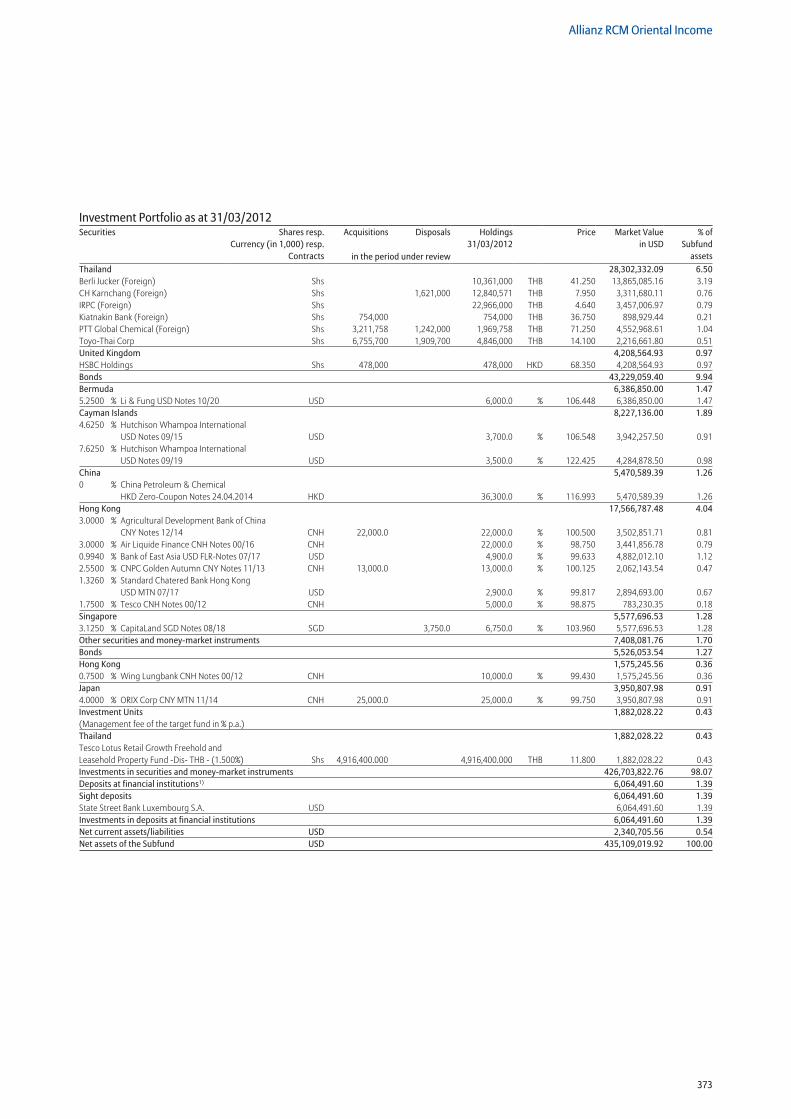
373
Allianz RCM Oriental Income
Thailand 28,302,332.09 6.50Berli Jucker (Foreign) Shs 10,361,000 THB 41.250 13,865,085.16 3.19CH Karnchang (Foreign) Shs 1,621,000 12,840,571 THB 7.950 3,311,680.11 0.76IRPC (Foreign) Shs 22,966,000 THB 4.640 3,457,006.97 0.79Kiatnakin Bank (Foreign) Shs 754,000 754,000 THB 36.750 898,929.44 0.21PTT Global Chemical (Foreign) Shs 3,211,758 1,242,000 1,969,758 THB 71.250 4,552,968.61 1.04Toyo-Thai Corp Shs 6,755,700 1,909,700 4,846,000 THB 14.100 2,216,661.80 0.51United Kingdom 4,208,564.93 0.97HSBC Holdings Shs 478,000 478,000 HKD 68.350 4,208,564.93 0.97Bonds 43,229,059.40 9.94Bermuda 6,386,850.00 1.475.2500 % Li & Fung USD Notes 10/20 USD 6,000.0 % 106.448 6,386,850.00 1.47Cayman Islands 8,227,136.00 1.894.6250 % Hutchison Whampoa International
USD Notes 09/15 USD 3,700.0 % 106.548 3,942,257.50 0.917.6250 % Hutchison Whampoa International
USD Notes 09/19 USD 3,500.0 % 122.425 4,284,878.50 0.98China 5,470,589.39 1.260 % China Petroleum & Chemical
HKD Zero-Coupon Notes 24.04.2014 HKD 36,300.0 % 116.993 5,470,589.39 1.26Hong Kong 17,566,787.48 4.043.0000 % Agricultural Development Bank of China
CNY Notes 12/14 CNH 22,000.0 22,000.0 % 100.500 3,502,851.71 0.813.0000 % Air Liquide Finance CNH Notes 00/16 CNH 22,000.0 % 98.750 3,441,856.78 0.790.9940 % Bank of East Asia USD FLR-Notes 07/17 USD 4,900.0 % 99.633 4,882,012.10 1.122.5500 % CNPC Golden Autumn CNY Notes 11/13 CNH 13,000.0 13,000.0 % 100.125 2,062,143.54 0.471.3260 % Standard Chatered Bank Hong Kong
USD MTN 07/17 USD 2,900.0 % 99.817 2,894,693.00 0.671.7500 % Tesco CNH Notes 00/12 CNH 5,000.0 % 98.875 783,230.35 0.18Singapore 5,577,696.53 1.283.1250 % CapitaLand SGD Notes 08/18 SGD 3,750.0 6,750.0 % 103.960 5,577,696.53 1.28Other securities and money-market instruments 7,408,081.76 1.70Bonds 5,526,053.54 1.27Hong Kong 1,575,245.56 0.360.7500 % Wing Lungbank CNH Notes 00/12 CNH 10,000.0 % 99.430 1,575,245.56 0.36Japan 3,950,807.98 0.914.0000 % ORIX Corp CNY MTN 11/14 CNH 25,000.0 25,000.0 % 99.750 3,950,807.98 0.91Investment Units 1,882,028.22 0.43(Management fee of the target fund in % p.a.) Thailand 1,882,028.22 0.43Tesco Lotus Retail Growth Freehold and Leasehold Property Fund -Dis- THB - (1.500%) Shs 4,916,400.000 4,916,400.000 THB 11.800 1,882,028.22 0.43Investments in securities and money-market instruments 426,703,822.76 98.07Deposits at financial institutions1) 6,064,491.60 1.39Sight deposits 6,064,491.60 1.39State Street Bank Luxembourg S.A. USD 6,064,491.60 1.39Investments in deposits at financial institutions 6,064,491.60 1.39Net current assets/liabilities USD 2,340,705.56 0.54Net assets of the Subfund USD 435,109,019.92 100.00
Investment Portfolio as at 31/03/2012Securities Shares resp.
Currency (in 1,000) resp.Contracts
Acquisitions Disposals Holdings 31/03/2012
Price Market Valuein USD
% ofSubfund
assetsin the period under review
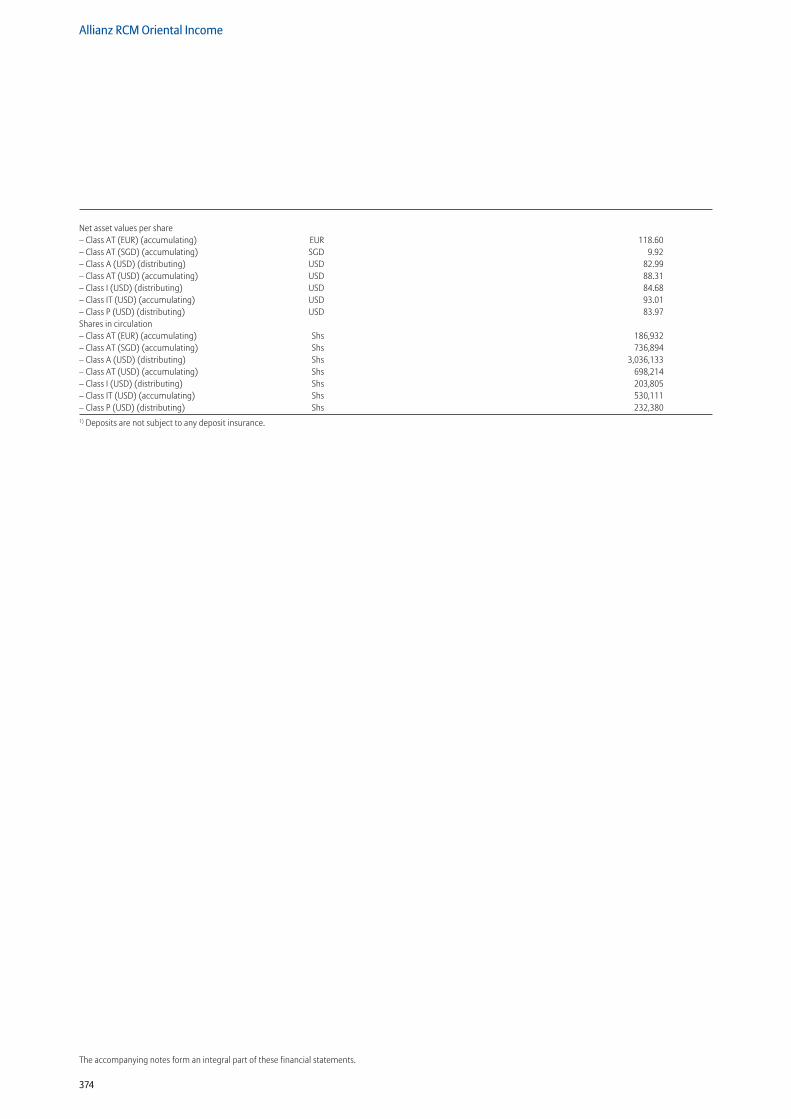
374
Allianz RCM Oriental Income
The accompanying notes form an integral part of these financial statements.
Net asset values per share – Class AT (EUR) (accumulating) EUR 118.60 – Class AT (SGD) (accumulating) SGD 9.92 – Class A (USD) (distributing) USD 82.99– Class AT (USD) (accumulating) USD 88.31– Class I (USD) (distributing) USD 84.68– Class IT (USD) (accumulating) USD 93.01– Class P (USD) (distributing) USD 83.97Shares in circulation – Class AT (EUR) (accumulating) Shs 186,932– Class AT (SGD) (accumulating) Shs 736,894– Class A (USD) (distributing) Shs 3,036,133– Class AT (USD) (accumulating) Shs 698,214– Class I (USD) (distributing) Shs 203,805– Class IT (USD) (accumulating) Shs 530,111– Class P (USD) (distributing) Shs 232,3801) Deposits are not subject to any deposit insurance.
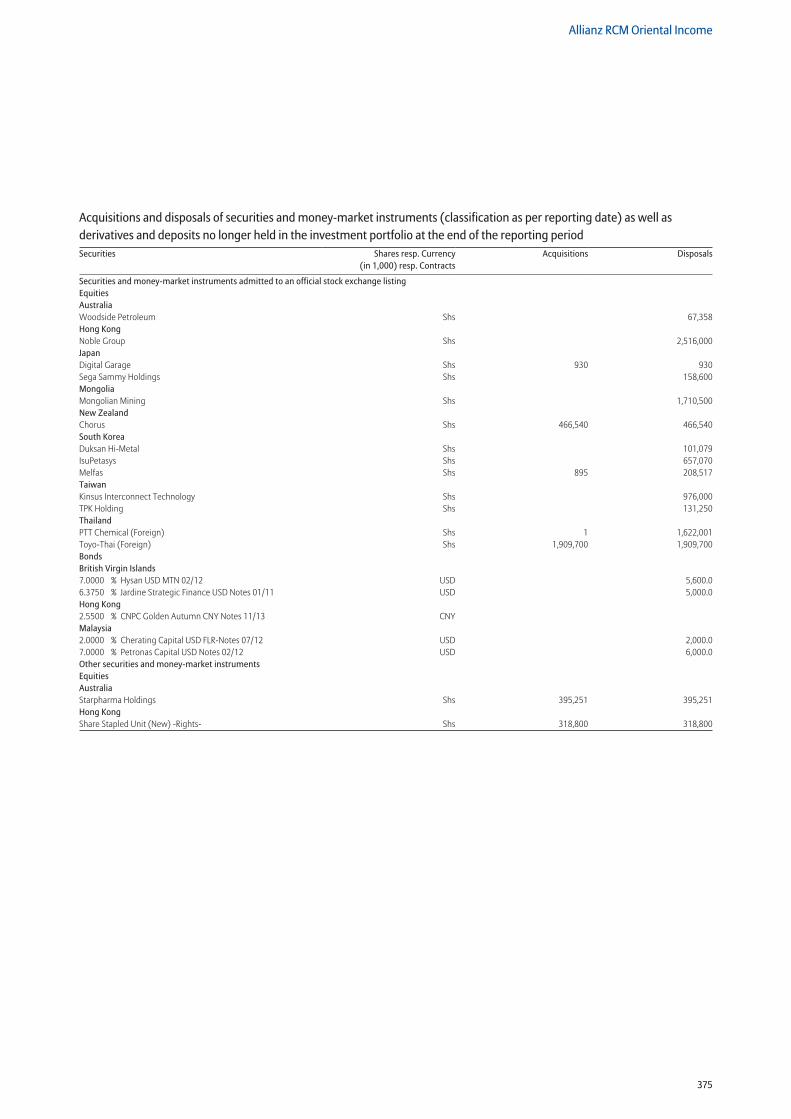
375
Allianz RCM Oriental Income
Securities and money-market instruments admitted to an official stock exchange listing Equities Australia Woodside Petroleum Shs 67,358Hong Kong Noble Group Shs 2,516,000Japan Digital Garage Shs 930 930Sega Sammy Holdings Shs 158,600Mongolia Mongolian Mining Shs 1,710,500New Zealand Chorus Shs 466,540 466,540South Korea Duksan Hi-Metal Shs 101,079IsuPetasys Shs 657,070Melfas Shs 895 208,517Taiwan Kinsus Interconnect Technology Shs 976,000TPK Holding Shs 131,250Thailand PTT Chemical (Foreign) Shs 1 1,622,001Toyo-Thai (Foreign) Shs 1,909,700 1,909,700Bonds British Virgin Islands 7.0000 % Hysan USD MTN 02/12 USD 5,600.06.3750 % Jardine Strategic Finance USD Notes 01/11 USD 5,000.0Hong Kong 2.5500 % CNPC Golden Autumn CNY Notes 11/13 CNY Malaysia 2.0000 % Cherating Capital USD FLR-Notes 07/12 USD 2,000.07.0000 % Petronas Capital USD Notes 02/12 USD 6,000.0Other securities and money-market instruments Equities Australia Starpharma Holdings Shs 395,251 395,251Hong Kong Share Stapled Unit (New) -Rights- Shs 318,800 318,800
Acquisitions and disposals of securities and money-market instruments (classification as per reporting date) as well as derivatives and deposits no longer held in the investment portfolio at the end of the reporting periodSecurities Shares resp. Currency
(in 1,000) resp. ContractsAcquisitions Disposals

376
Allianz RCM Oriental Income
The accompanying notes form an integral part of these financial statements.
Statement of Net Assetsas at 31/03/2012
31/03/2012 30/09/2011 USD USD
Securities and money-market instruments
(Cost price USD 361,903,924.55) 426,703,822.76 376,671,791.98
Time deposits 0.00 0.00
Cash at banks 6,064,491.60 30,071,007.45
Premiums paid on purchase of options 0.00 0.00
Upfront-payments paid on swap transactions 0.00 0.00
Interest receivable on
– bonds 376,973.95 640,670.00
– time deposits 0.00 0.00
– swap transactions 0.00 0.00
Dividend receivable 2,476,010.82 1,537,582.74
Receivable on
– subscriptions of fund shares 602,896.58 326,128.14
– securities transactions 4,882,974.33 544,261.35
Other receivables 0.00 0.00
Unrealised gain on
– options transactions 0.00 0.00
– futures transactions 0.00 0.00
– swap transactions 0.00 0.00
– forward foreign exchange transactions 0.00 0.00
Total Assets 441,107,170.04 409,791,441.66
Liabilities to banks – 14,576.49 – 157.15
Premiums received on written options 0.00 0.00
Upfront-payments received on swap transactions 0.00 0.00
Interest liabilities on swap transactions 0.00 0.00
Payable on
– redemptions of fund shares – 902,799.74 – 4,305,404.86
– securities transactions – 4,450,201.23 – 536,671.83
Other payables – 630,572.66 – 629,911.21
Unrealised loss on
– options transactions 0.00 0.00
– futures transactions 0.00 0.00
– swap transactions 0.00 0.00
– forward foreign exchange transactions 0.00 0.00
Total Liabilities – 5,998,150.12 – 5,472,145.05
Net assets of the Subfund 435,109,019.92 404,319,296.61
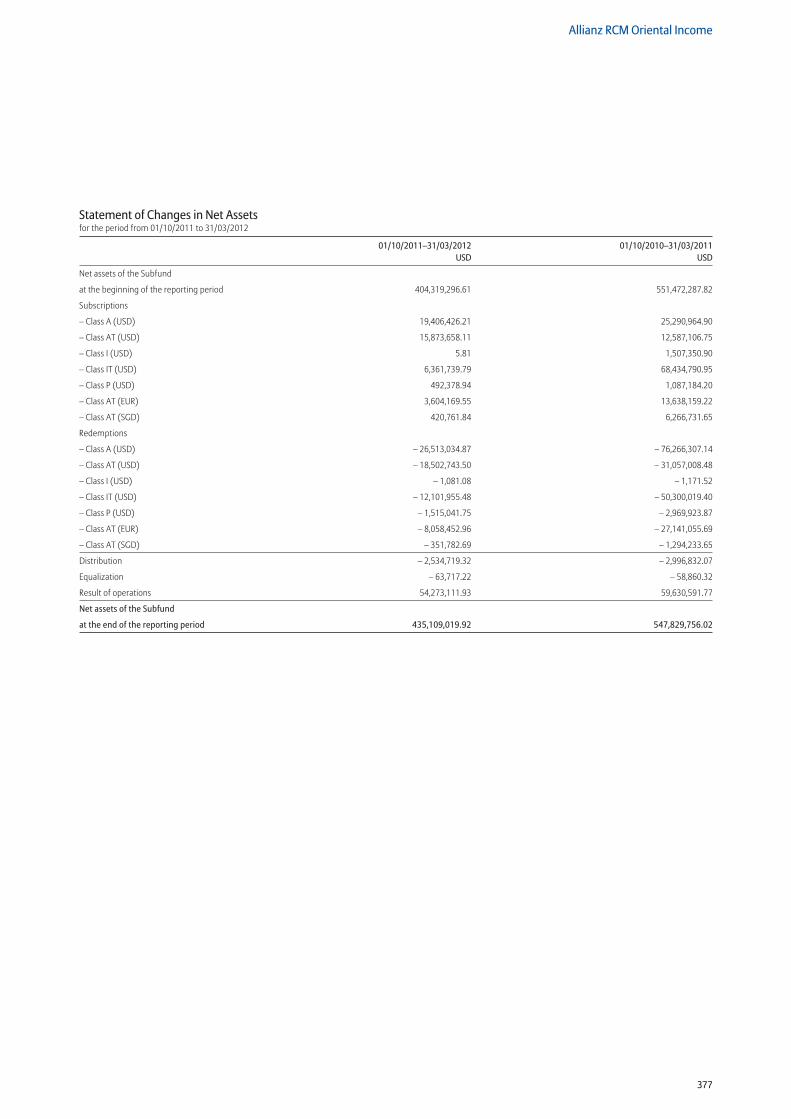
377
Allianz RCM Oriental Income
Statement of Changes in Net Assetsfor the period from 01/10/2011 to 31/03/2012
01/10/2011–31/03/2012 01/10/2010–31/03/2011 USD USD
Net assets of the Subfund
at the beginning of the reporting period 404,319,296.61 551,472,287.82
Subscriptions
– Class A (USD) 19,406,426.21 25,290,964.90
– Class AT (USD) 15,873,658.11 12,587,106.75
– Class I (USD) 5.81 1,507,350.90
– Class IT (USD) 6,361,739.79 68,434,790.95
– Class P (USD) 492,378.94 1,087,184.20
– Class AT (EUR) 3,604,169.55 13,638,159.22
– Class AT (SGD) 420,761.84 6,266,731.65
Redemptions
– Class A (USD) – 26,513,034.87 – 76,266,307.14
– Class AT (USD) – 18,502,743.50 – 31,057,008.48
– Class I (USD) – 1,081.08 – 1,171.52
– Class IT (USD) – 12,101,955.48 – 50,300,019.40
– Class P (USD) – 1,515,041.75 – 2,969,923.87
– Class AT (EUR) – 8,058,452.96 – 27,141,055.69
– Class AT (SGD) – 351,782.69 – 1,294,233.65
Distribution – 2,534,719.32 – 2,996,832.07
Equalization – 63,717.22 – 58,860.32
Result of operations 54,273,111.93 59,630,591.77
Net assets of the Subfund
at the end of the reporting period 435,109,019.92 547,829,756.02
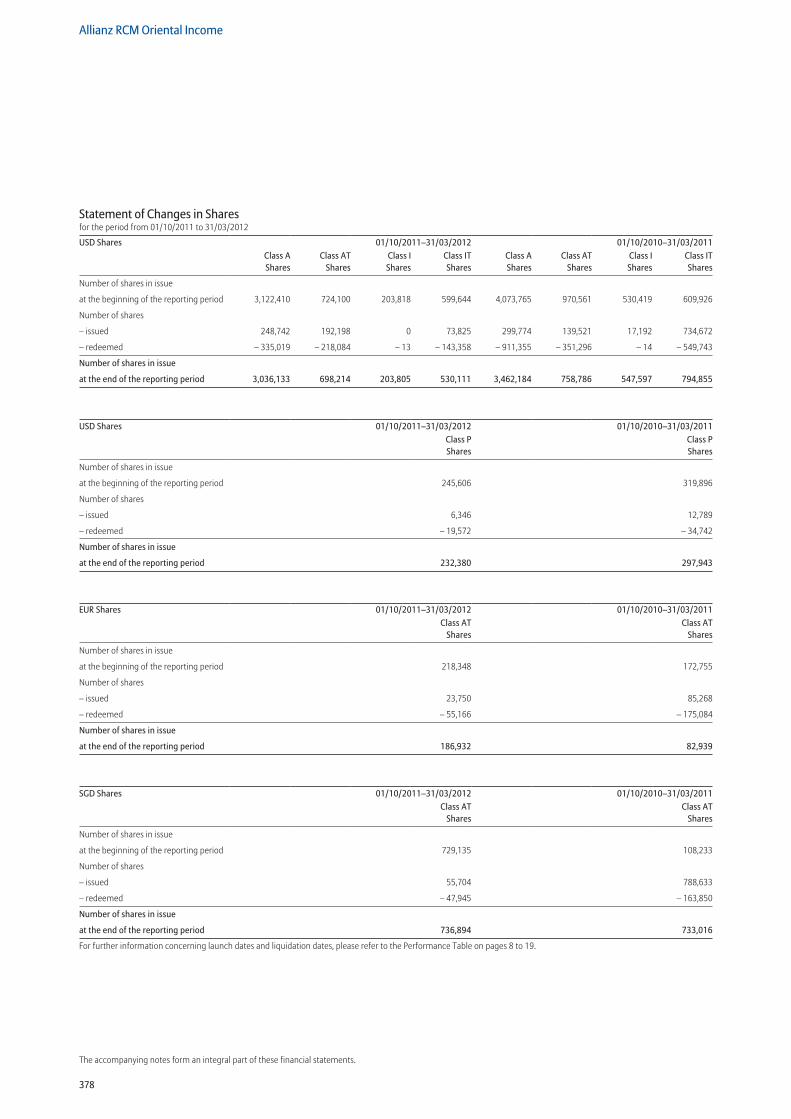
378
Allianz RCM Oriental Income
The accompanying notes form an integral part of these financial statements.
Statement of Changes in Sharesfor the period from 01/10/2011 to 31/03/2012
USD Shares 01/10/2011–31/03/2012 01/10/2010–31/03/2011Class A Shares
Class AT Shares
Class I Shares
Class IT Shares
Class A Shares
Class AT Shares
Class I Shares
Class IT Shares
Number of shares in issue
at the beginning of the reporting period 3,122,410 724,100 203,818 599,644 4,073,765 970,561 530,419 609,926
Number of shares
– issued 248,742 192,198 0 73,825 299,774 139,521 17,192 734,672
– redeemed – 335,019 – 218,084 – 13 – 143,358 – 911,355 – 351,296 – 14 – 549,743
Number of shares in issue
at the end of the reporting period 3,036,133 698,214 203,805 530,111 3,462,184 758,786 547,597 794,855
USD Shares 01/10/2011–31/03/2012 01/10/2010–31/03/2011Class P Shares
Class P Shares
Number of shares in issue
at the beginning of the reporting period 245,606 319,896
Number of shares
– issued 6,346 12,789
– redeemed – 19,572 – 34,742
Number of shares in issue
at the end of the reporting period 232,380 297,943
EUR Shares 01/10/2011–31/03/2012 01/10/2010–31/03/2011Class AT
SharesClass AT
Shares
Number of shares in issue
at the beginning of the reporting period 218,348 172,755
Number of shares
– issued 23,750 85,268
– redeemed – 55,166 – 175,084
Number of shares in issue
at the end of the reporting period 186,932 82,939
SGD Shares 01/10/2011–31/03/2012 01/10/2010–31/03/2011Class AT
SharesClass AT
Shares
Number of shares in issue
at the beginning of the reporting period 729,135 108,233
Number of shares
– issued 55,704 788,633
– redeemed – 47,945 – 163,850
Number of shares in issue
at the end of the reporting period 736,894 733,016
For further information concerning launch dates and liquidation dates, please refer to the Performance Table on pages 8 to 19.
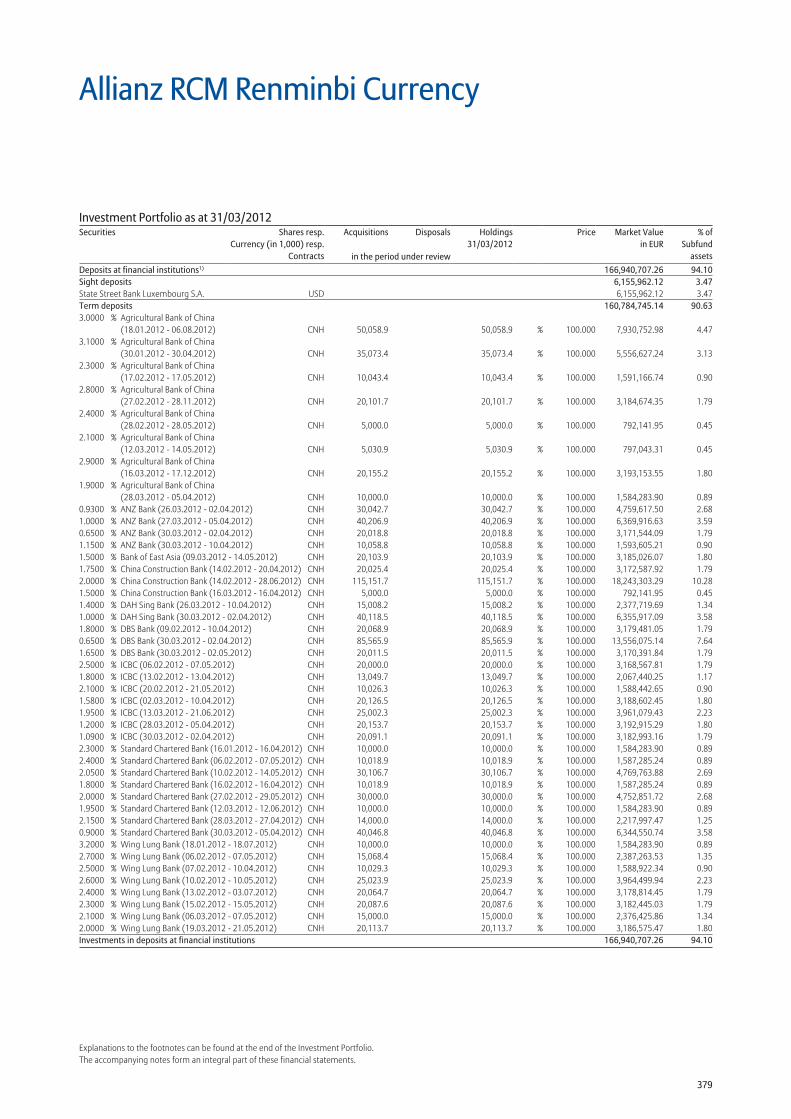
379
Explanations to the footnotes can be found at the end of the Investment Portfolio.The accompanying notes form an integral part of these financial statements.
Allianz RCM Renminbi Currency
Deposits at financial institutions1) 166,940,707.26 94.10Sight deposits 6,155,962.12 3.47State Street Bank Luxembourg S.A. USD 6,155,962.12 3.47Term deposits 160,784,745.14 90.633.0000 % Agricultural Bank of China
(18.01.2012 - 06.08.2012) CNH 50,058.9 50,058.9 % 100.000 7,930,752.98 4.473.1000 % Agricultural Bank of China
(30.01.2012 - 30.04.2012) CNH 35,073.4 35,073.4 % 100.000 5,556,627.24 3.132.3000 % Agricultural Bank of China
(17.02.2012 - 17.05.2012) CNH 10,043.4 10,043.4 % 100.000 1,591,166.74 0.902.8000 % Agricultural Bank of China
(27.02.2012 - 28.11.2012) CNH 20,101.7 20,101.7 % 100.000 3,184,674.35 1.792.4000 % Agricultural Bank of China
(28.02.2012 - 28.05.2012) CNH 5,000.0 5,000.0 % 100.000 792,141.95 0.452.1000 % Agricultural Bank of China
(12.03.2012 - 14.05.2012) CNH 5,030.9 5,030.9 % 100.000 797,043.31 0.452.9000 % Agricultural Bank of China
(16.03.2012 - 17.12.2012) CNH 20,155.2 20,155.2 % 100.000 3,193,153.55 1.801.9000 % Agricultural Bank of China
(28.03.2012 - 05.04.2012) CNH 10,000.0 10,000.0 % 100.000 1,584,283.90 0.890.9300 % ANZ Bank (26.03.2012 - 02.04.2012) CNH 30,042.7 30,042.7 % 100.000 4,759,617.50 2.681.0000 % ANZ Bank (27.03.2012 - 05.04.2012) CNH 40,206.9 40,206.9 % 100.000 6,369,916.63 3.590.6500 % ANZ Bank (30.03.2012 - 02.04.2012) CNH 20,018.8 20,018.8 % 100.000 3,171,544.09 1.791.1500 % ANZ Bank (30.03.2012 - 10.04.2012) CNH 10,058.8 10,058.8 % 100.000 1,593,605.21 0.901.5000 % Bank of East Asia (09.03.2012 - 14.05.2012) CNH 20,103.9 20,103.9 % 100.000 3,185,026.07 1.801.7500 % China Construction Bank (14.02.2012 - 20.04.2012) CNH 20,025.4 20,025.4 % 100.000 3,172,587.92 1.792.0000 % China Construction Bank (14.02.2012 - 28.06.2012) CNH 115,151.7 115,151.7 % 100.000 18,243,303.29 10.281.5000 % China Construction Bank (16.03.2012 - 16.04.2012) CNH 5,000.0 5,000.0 % 100.000 792,141.95 0.451.4000 % DAH Sing Bank (26.03.2012 - 10.04.2012) CNH 15,008.2 15,008.2 % 100.000 2,377,719.69 1.341.0000 % DAH Sing Bank (30.03.2012 - 02.04.2012) CNH 40,118.5 40,118.5 % 100.000 6,355,917.09 3.581.8000 % DBS Bank (09.02.2012 - 10.04.2012) CNH 20,068.9 20,068.9 % 100.000 3,179,481.05 1.790.6500 % DBS Bank (30.03.2012 - 02.04.2012) CNH 85,565.9 85,565.9 % 100.000 13,556,075.14 7.641.6500 % DBS Bank (30.03.2012 - 02.05.2012) CNH 20,011.5 20,011.5 % 100.000 3,170,391.84 1.792.5000 % ICBC (06.02.2012 - 07.05.2012) CNH 20,000.0 20,000.0 % 100.000 3,168,567.81 1.791.8000 % ICBC (13.02.2012 - 13.04.2012) CNH 13,049.7 13,049.7 % 100.000 2,067,440.25 1.172.1000 % ICBC (20.02.2012 - 21.05.2012) CNH 10,026.3 10,026.3 % 100.000 1,588,442.65 0.901.5800 % ICBC (02.03.2012 - 10.04.2012) CNH 20,126.5 20,126.5 % 100.000 3,188,602.45 1.801.9500 % ICBC (13.03.2012 - 21.06.2012) CNH 25,002.3 25,002.3 % 100.000 3,961,079.43 2.231.2000 % ICBC (28.03.2012 - 05.04.2012) CNH 20,153.7 20,153.7 % 100.000 3,192,915.29 1.801.0900 % ICBC (30.03.2012 - 02.04.2012) CNH 20,091.1 20,091.1 % 100.000 3,182,993.16 1.792.3000 % Standard Chartered Bank (16.01.2012 - 16.04.2012) CNH 10,000.0 10,000.0 % 100.000 1,584,283.90 0.892.4000 % Standard Chartered Bank (06.02.2012 - 07.05.2012) CNH 10,018.9 10,018.9 % 100.000 1,587,285.24 0.892.0500 % Standard Chartered Bank (10.02.2012 - 14.05.2012) CNH 30,106.7 30,106.7 % 100.000 4,769,763.88 2.691.8000 % Standard Chartered Bank (16.02.2012 - 16.04.2012) CNH 10,018.9 10,018.9 % 100.000 1,587,285.24 0.892.0000 % Standard Chartered Bank (27.02.2012 - 29.05.2012) CNH 30,000.0 30,000.0 % 100.000 4,752,851.72 2.681.9500 % Standard Chartered Bank (12.03.2012 - 12.06.2012) CNH 10,000.0 10,000.0 % 100.000 1,584,283.90 0.892.1500 % Standard Chartered Bank (28.03.2012 - 27.04.2012) CNH 14,000.0 14,000.0 % 100.000 2,217,997.47 1.250.9000 % Standard Chartered Bank (30.03.2012 - 05.04.2012) CNH 40,046.8 40,046.8 % 100.000 6,344,550.74 3.583.2000 % Wing Lung Bank (18.01.2012 - 18.07.2012) CNH 10,000.0 10,000.0 % 100.000 1,584,283.90 0.892.7000 % Wing Lung Bank (06.02.2012 - 07.05.2012) CNH 15,068.4 15,068.4 % 100.000 2,387,263.53 1.352.5000 % Wing Lung Bank (07.02.2012 - 10.04.2012) CNH 10,029.3 10,029.3 % 100.000 1,588,922.34 0.902.6000 % Wing Lung Bank (10.02.2012 - 10.05.2012) CNH 25,023.9 25,023.9 % 100.000 3,964,499.94 2.232.4000 % Wing Lung Bank (13.02.2012 - 03.07.2012) CNH 20,064.7 20,064.7 % 100.000 3,178,814.45 1.792.3000 % Wing Lung Bank (15.02.2012 - 15.05.2012) CNH 20,087.6 20,087.6 % 100.000 3,182,445.03 1.792.1000 % Wing Lung Bank (06.03.2012 - 07.05.2012) CNH 15,000.0 15,000.0 % 100.000 2,376,425.86 1.342.0000 % Wing Lung Bank (19.03.2012 - 21.05.2012) CNH 20,113.7 20,113.7 % 100.000 3,186,575.47 1.80Investments in deposits at financial institutions 166,940,707.26 94.10
Investment Portfolio as at 31/03/2012Securities Shares resp.
Currency (in 1,000) resp.Contracts
Acquisitions Disposals Holdings 31/03/2012
Price Market Valuein EUR
% ofSubfund
assetsin the period under review
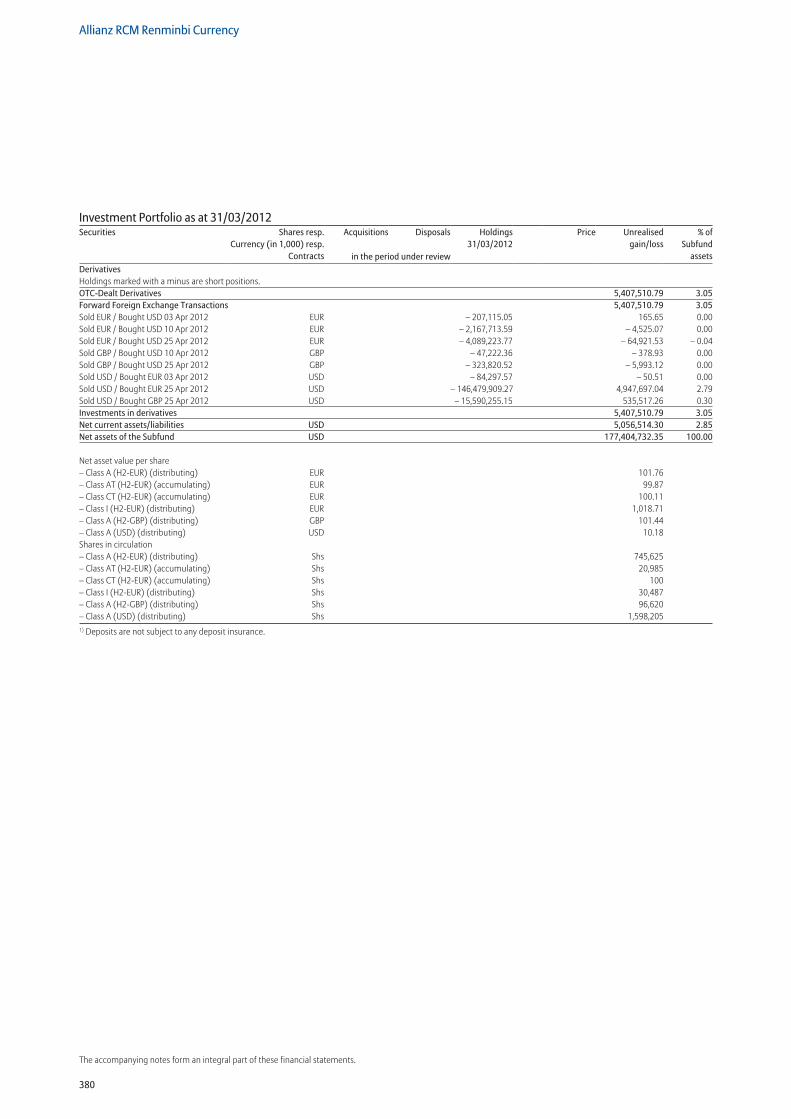
380
Allianz RCM Renminbi Currency
The accompanying notes form an integral part of these financial statements.
Derivatives Holdings marked with a minus are short positions. OTC-Dealt Derivatives 5,407,510.79 3.05Forward Foreign Exchange Transactions 5,407,510.79 3.05Sold EUR / Bought USD 03 Apr 2012 EUR – 207,115.05 165.65 0.00Sold EUR / Bought USD 10 Apr 2012 EUR – 2,167,713.59 – 4,525.07 0.00Sold EUR / Bought USD 25 Apr 2012 EUR – 4,089,223.77 – 64,921.53 – 0.04Sold GBP / Bought USD 10 Apr 2012 GBP – 47,222.36 – 378.93 0.00Sold GBP / Bought USD 25 Apr 2012 GBP – 323,820.52 – 5,993.12 0.00Sold USD / Bought EUR 03 Apr 2012 USD – 84,297.57 – 50.51 0.00Sold USD / Bought EUR 25 Apr 2012 USD – 146,479,909.27 4,947,697.04 2.79Sold USD / Bought GBP 25 Apr 2012 USD – 15,590,255.15 535,517.26 0.30Investments in derivatives 5,407,510.79 3.05Net current assets/liabilities USD 5,056,514.30 2.85Net assets of the Subfund USD 177,404,732.35 100.00
Net asset value per share – Class A (H2-EUR) (distributing) EUR 101.76 – Class AT (H2-EUR) (accumulating) EUR 99.87 – Class CT (H2-EUR) (accumulating) EUR 100.11 – Class I (H2-EUR) (distributing) EUR 1,018.71 – Class A (H2-GBP) (distributing) GBP 101.44 – Class A (USD) (distributing) USD 10.18 Shares in circulation – Class A (H2-EUR) (distributing) Shs 745,625 – Class AT (H2-EUR) (accumulating) Shs 20,985 – Class CT (H2-EUR) (accumulating) Shs 100 – Class I (H2-EUR) (distributing) Shs 30,487 – Class A (H2-GBP) (distributing) Shs 96,620 – Class A (USD) (distributing) Shs 1,598,2051) Deposits are not subject to any deposit insurance.
Investment Portfolio as at 31/03/2012Securities Shares resp.
Currency (in 1,000) resp.Contracts
Acquisitions Disposals Holdings 31/03/2012
Price Unrealisedgain/loss
% ofSubfund
assetsin the period under review
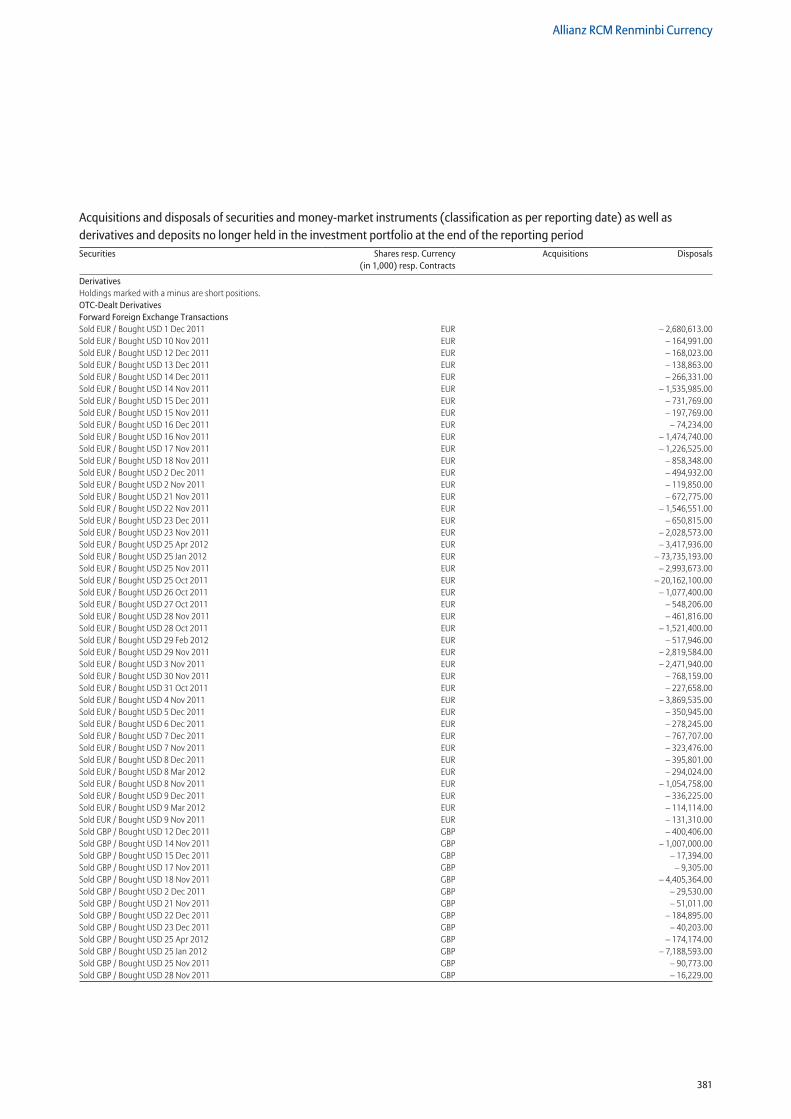
381
Allianz RCM Renminbi Currency
Derivatives Holdings marked with a minus are short positions. OTC-Dealt Derivatives Forward Foreign Exchange Transactions Sold EUR / Bought USD 1 Dec 2011 EUR – 2,680,613.00Sold EUR / Bought USD 10 Nov 2011 EUR – 164,991.00Sold EUR / Bought USD 12 Dec 2011 EUR – 168,023.00Sold EUR / Bought USD 13 Dec 2011 EUR – 138,863.00Sold EUR / Bought USD 14 Dec 2011 EUR – 266,331.00Sold EUR / Bought USD 14 Nov 2011 EUR – 1,535,985.00Sold EUR / Bought USD 15 Dec 2011 EUR – 731,769.00Sold EUR / Bought USD 15 Nov 2011 EUR – 197,769.00Sold EUR / Bought USD 16 Dec 2011 EUR – 74,234.00Sold EUR / Bought USD 16 Nov 2011 EUR – 1,474,740.00Sold EUR / Bought USD 17 Nov 2011 EUR – 1,226,525.00Sold EUR / Bought USD 18 Nov 2011 EUR – 858,348.00Sold EUR / Bought USD 2 Dec 2011 EUR – 494,932.00Sold EUR / Bought USD 2 Nov 2011 EUR – 119,850.00Sold EUR / Bought USD 21 Nov 2011 EUR – 672,775.00Sold EUR / Bought USD 22 Nov 2011 EUR – 1,546,551.00Sold EUR / Bought USD 23 Dec 2011 EUR – 650,815.00Sold EUR / Bought USD 23 Nov 2011 EUR – 2,028,573.00Sold EUR / Bought USD 25 Apr 2012 EUR – 3,417,936.00Sold EUR / Bought USD 25 Jan 2012 EUR – 73,735,193.00Sold EUR / Bought USD 25 Nov 2011 EUR – 2,993,673.00Sold EUR / Bought USD 25 Oct 2011 EUR – 20,162,100.00Sold EUR / Bought USD 26 Oct 2011 EUR – 1,077,400.00Sold EUR / Bought USD 27 Oct 2011 EUR – 548,206.00Sold EUR / Bought USD 28 Nov 2011 EUR – 461,816.00Sold EUR / Bought USD 28 Oct 2011 EUR – 1,521,400.00Sold EUR / Bought USD 29 Feb 2012 EUR – 517,946.00Sold EUR / Bought USD 29 Nov 2011 EUR – 2,819,584.00Sold EUR / Bought USD 3 Nov 2011 EUR – 2,471,940.00Sold EUR / Bought USD 30 Nov 2011 EUR – 768,159.00Sold EUR / Bought USD 31 Oct 2011 EUR – 227,658.00Sold EUR / Bought USD 4 Nov 2011 EUR – 3,869,535.00Sold EUR / Bought USD 5 Dec 2011 EUR – 350,945.00Sold EUR / Bought USD 6 Dec 2011 EUR – 278,245.00Sold EUR / Bought USD 7 Dec 2011 EUR – 767,707.00Sold EUR / Bought USD 7 Nov 2011 EUR – 323,476.00Sold EUR / Bought USD 8 Dec 2011 EUR – 395,801.00Sold EUR / Bought USD 8 Mar 2012 EUR – 294,024.00Sold EUR / Bought USD 8 Nov 2011 EUR – 1,054,758.00Sold EUR / Bought USD 9 Dec 2011 EUR – 336,225.00Sold EUR / Bought USD 9 Mar 2012 EUR – 114,114.00Sold EUR / Bought USD 9 Nov 2011 EUR – 131,310.00Sold GBP / Bought USD 12 Dec 2011 GBP – 400,406.00Sold GBP / Bought USD 14 Nov 2011 GBP – 1,007,000.00Sold GBP / Bought USD 15 Dec 2011 GBP – 17,394.00Sold GBP / Bought USD 17 Nov 2011 GBP – 9,305.00Sold GBP / Bought USD 18 Nov 2011 GBP – 4,405,364.00Sold GBP / Bought USD 2 Dec 2011 GBP – 29,530.00Sold GBP / Bought USD 21 Nov 2011 GBP – 51,011.00Sold GBP / Bought USD 22 Dec 2011 GBP – 184,895.00Sold GBP / Bought USD 23 Dec 2011 GBP – 40,203.00Sold GBP / Bought USD 25 Apr 2012 GBP – 174,174.00Sold GBP / Bought USD 25 Jan 2012 GBP – 7,188,593.00Sold GBP / Bought USD 25 Nov 2011 GBP – 90,773.00Sold GBP / Bought USD 28 Nov 2011 GBP – 16,229.00
Acquisitions and disposals of securities and money-market instruments (classification as per reporting date) as well as derivatives and deposits no longer held in the investment portfolio at the end of the reporting periodSecurities Shares resp. Currency
(in 1,000) resp. ContractsAcquisitions Disposals
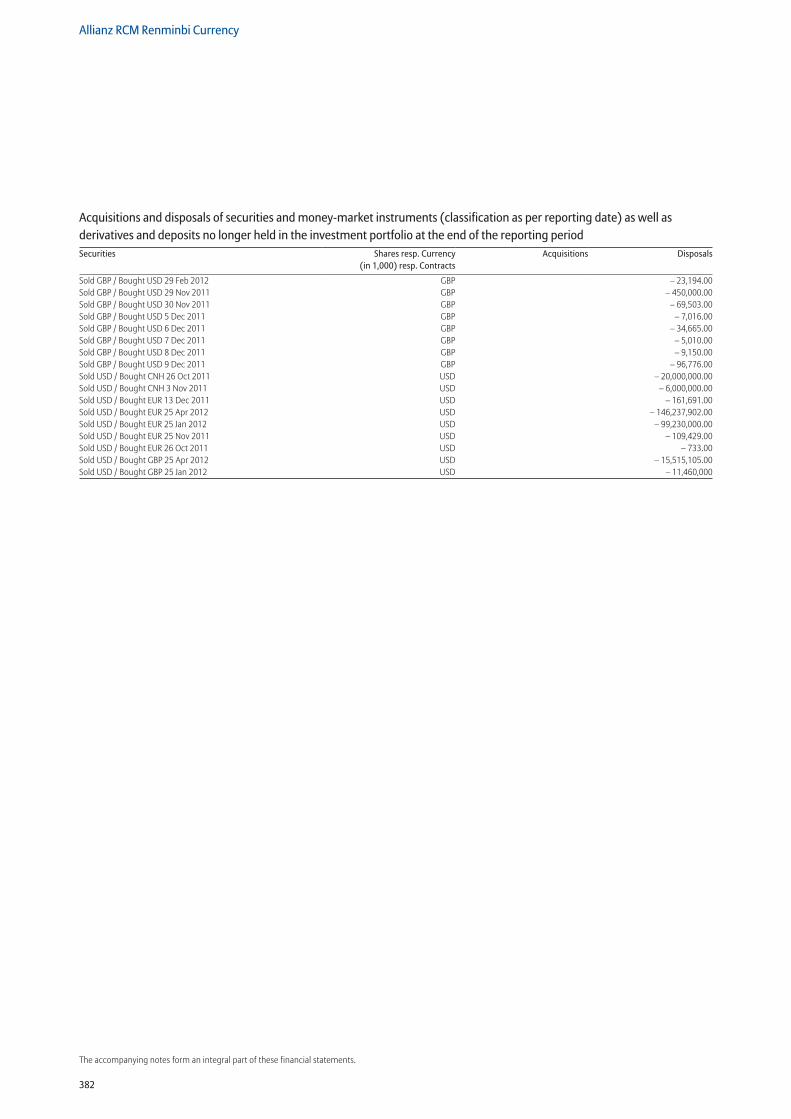
382
Allianz RCM Renminbi Currency
The accompanying notes form an integral part of these financial statements.
Sold GBP / Bought USD 29 Feb 2012 GBP – 23,194.00Sold GBP / Bought USD 29 Nov 2011 GBP – 450,000.00Sold GBP / Bought USD 30 Nov 2011 GBP – 69,503.00Sold GBP / Bought USD 5 Dec 2011 GBP – 7,016.00Sold GBP / Bought USD 6 Dec 2011 GBP – 34,665.00Sold GBP / Bought USD 7 Dec 2011 GBP – 5,010.00Sold GBP / Bought USD 8 Dec 2011 GBP – 9,150.00Sold GBP / Bought USD 9 Dec 2011 GBP – 96,776.00Sold USD / Bought CNH 26 Oct 2011 USD – 20,000,000.00Sold USD / Bought CNH 3 Nov 2011 USD – 6,000,000.00Sold USD / Bought EUR 13 Dec 2011 USD – 161,691.00Sold USD / Bought EUR 25 Apr 2012 USD – 146,237,902.00Sold USD / Bought EUR 25 Jan 2012 USD – 99,230,000.00Sold USD / Bought EUR 25 Nov 2011 USD – 109,429.00Sold USD / Bought EUR 26 Oct 2011 USD – 733.00Sold USD / Bought GBP 25 Apr 2012 USD – 15,515,105.00Sold USD / Bought GBP 25 Jan 2012 USD – 11,460,000
Acquisitions and disposals of securities and money-market instruments (classification as per reporting date) as well as derivatives and deposits no longer held in the investment portfolio at the end of the reporting periodSecurities Shares resp. Currency
(in 1,000) resp. ContractsAcquisitions Disposals
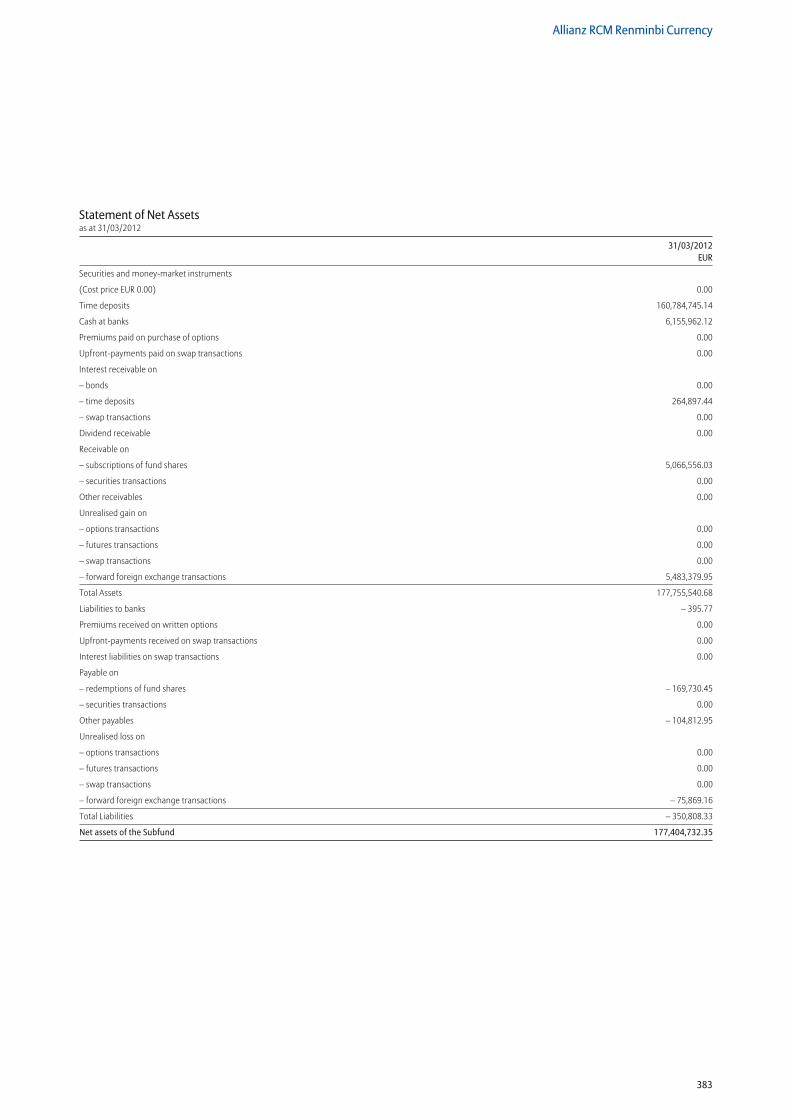
383
Allianz RCM Renminbi Currency
Statement of Net Assetsas at 31/03/2012
31/03/2012 EUR
Securities and money-market instruments
(Cost price EUR 0.00) 0.00
Time deposits 160,784,745.14
Cash at banks 6,155,962.12
Premiums paid on purchase of options 0.00
Upfront-payments paid on swap transactions 0.00
Interest receivable on
– bonds 0.00
– time deposits 264,897.44
– swap transactions 0.00
Dividend receivable 0.00
Receivable on
– subscriptions of fund shares 5,066,556.03
– securities transactions 0.00
Other receivables 0.00
Unrealised gain on
– options transactions 0.00
– futures transactions 0.00
– swap transactions 0.00
– forward foreign exchange transactions 5,483,379.95
Total Assets 177,755,540.68
Liabilities to banks – 395.77
Premiums received on written options 0.00
Upfront-payments received on swap transactions 0.00
Interest liabilities on swap transactions 0.00
Payable on
– redemptions of fund shares – 169,730.45
– securities transactions 0.00
Other payables – 104,812.95
Unrealised loss on
– options transactions 0.00
– futures transactions 0.00
– swap transactions 0.00
– forward foreign exchange transactions – 75,869.16
Total Liabilities – 350,808.33
Net assets of the Subfund 177,404,732.35
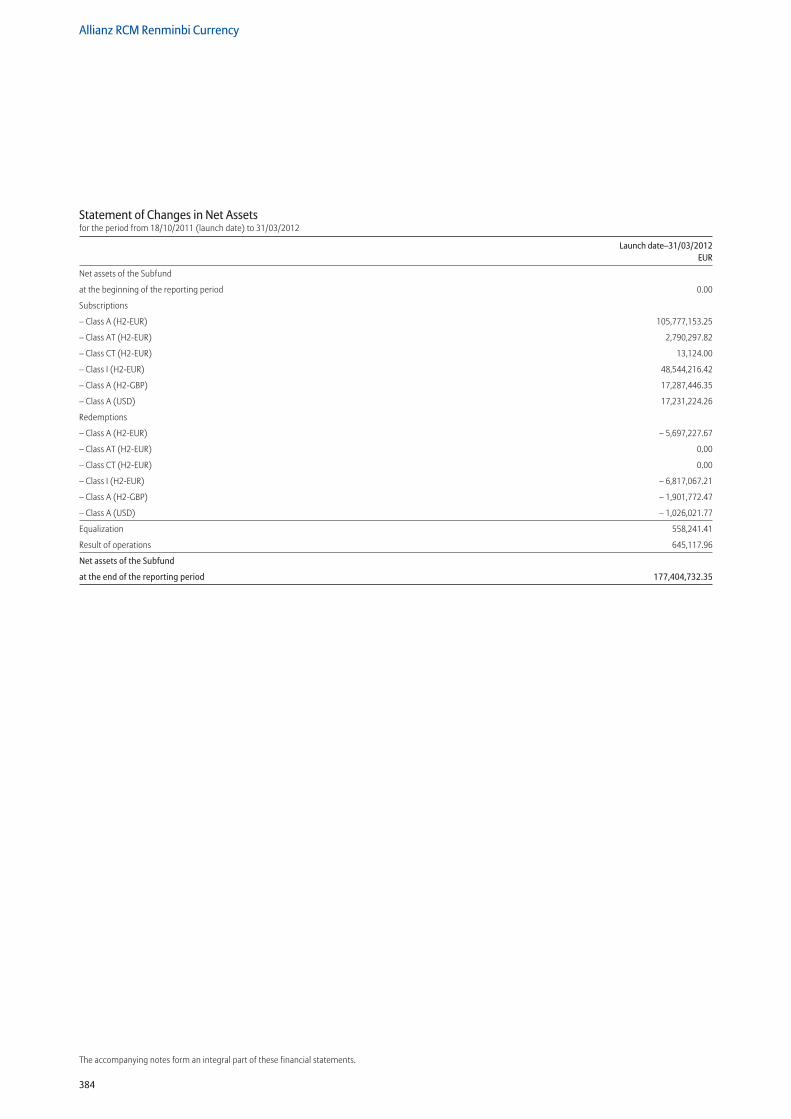
384
Allianz RCM Renminbi Currency
The accompanying notes form an integral part of these financial statements.
Statement of Changes in Net Assetsfor the period from 18/10/2011 (launch date) to 31/03/2012
Launch date–31/03/2012 EUR
Net assets of the Subfund
at the beginning of the reporting period 0.00
Subscriptions
– Class A (H2-EUR) 105,777,153.25
– Class AT (H2-EUR) 2,790,297.82
– Class CT (H2-EUR) 13,124.00
– Class I (H2-EUR) 48,544,216.42
– Class A (H2-GBP) 17,287,446.35
– Class A (USD) 17,231,224.26
Redemptions
– Class A (H2-EUR) – 5,697,227.67
– Class AT (H2-EUR) 0.00
– Class CT (H2-EUR) 0.00
– Class I (H2-EUR) – 6,817,067.21
– Class A (H2-GBP) – 1,901,772.47
– Class A (USD) – 1,026,021.77
Equalization 558,241.41
Result of operations 645,117.96
Net assets of the Subfund
at the end of the reporting period 177,404,732.35
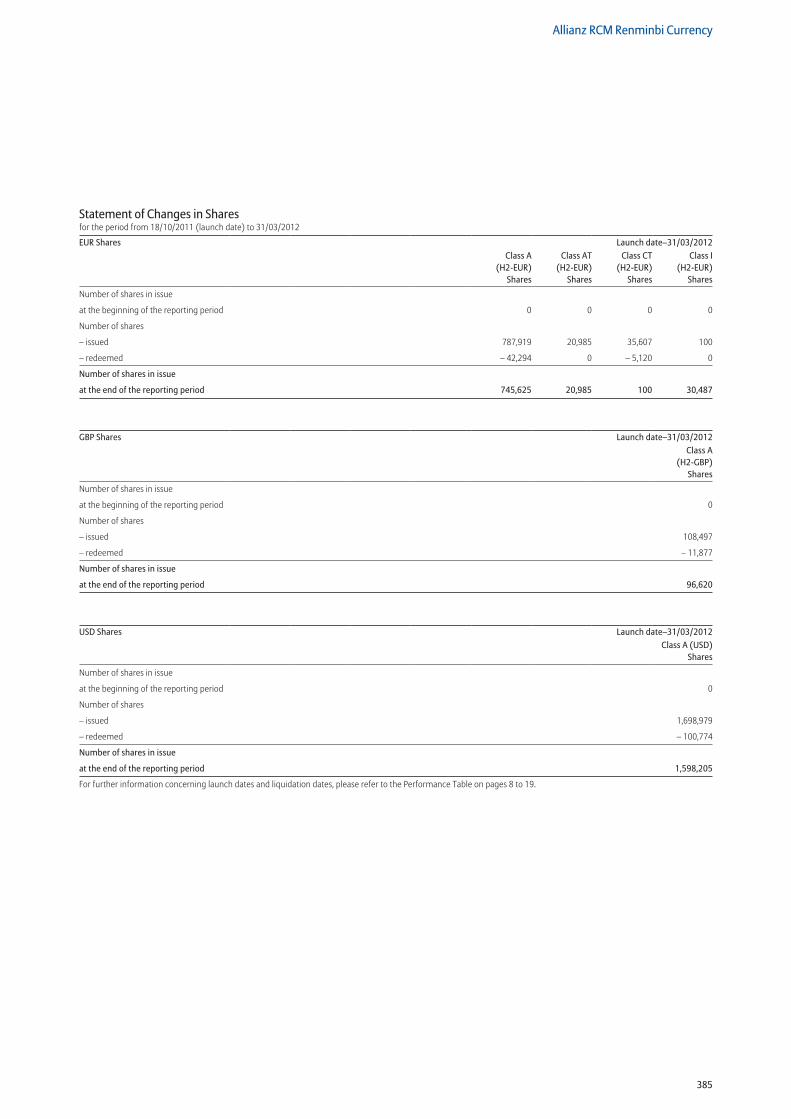
385
Allianz RCM Renminbi Currency
Statement of Changes in Sharesfor the period from 18/10/2011 (launch date) to 31/03/2012
EUR Shares Launch date–31/03/2012Class A
(H2-EUR) Shares
Class AT (H2-EUR)
Shares
Class CT (H2-EUR)
Shares
Class I (H2-EUR)
Shares
Number of shares in issue
at the beginning of the reporting period 0 0 0 0
Number of shares
– issued 787,919 20,985 35,607 100
– redeemed – 42,294 0 – 5,120 0
Number of shares in issue
at the end of the reporting period 745,625 20,985 100 30,487
GBP Shares Launch date–31/03/2012Class A
(H2-GBP) Shares
Number of shares in issue
at the beginning of the reporting period 0
Number of shares
– issued 108,497
– redeemed – 11,877
Number of shares in issue
at the end of the reporting period 96,620
USD Shares Launch date–31/03/2012Class A (USD)
Shares
Number of shares in issue
at the beginning of the reporting period 0
Number of shares
– issued 1,698,979
– redeemed – 100,774
Number of shares in issue
at the end of the reporting period 1,598,205
For further information concerning launch dates and liquidation dates, please refer to the Performance Table on pages 8 to 19.
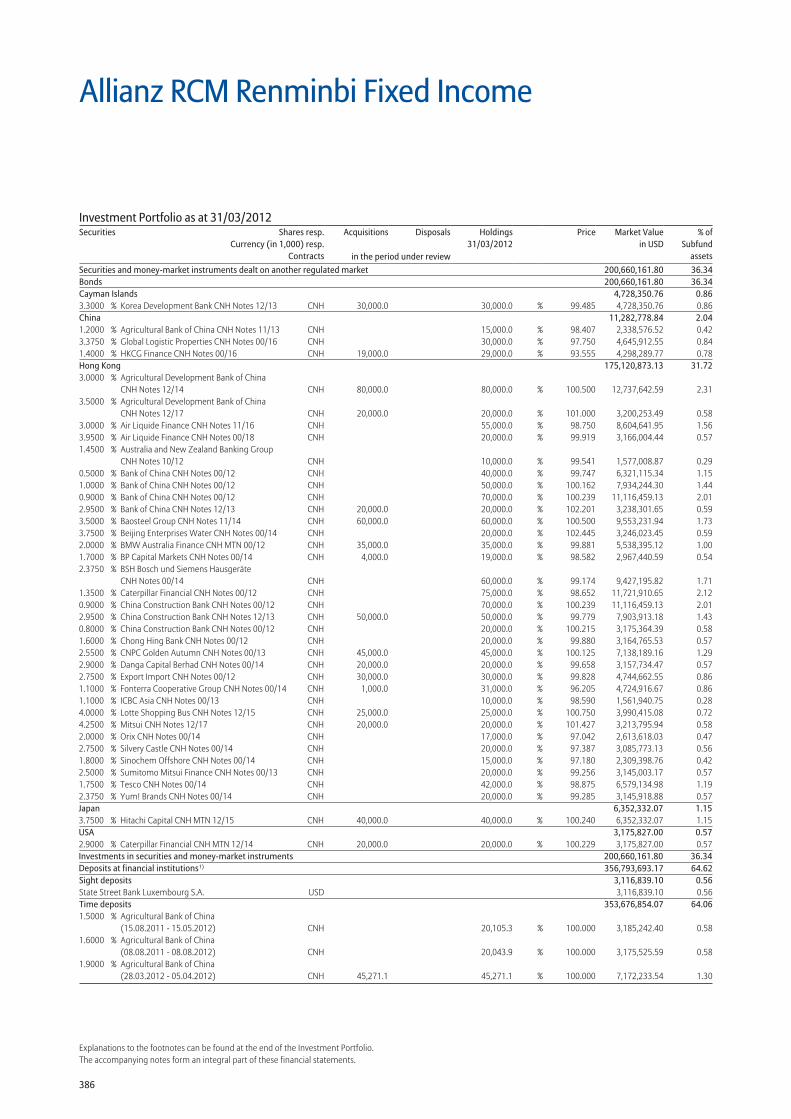
386
Explanations to the footnotes can be found at the end of the Investment Portfolio.The accompanying notes form an integral part of these financial statements.
Securities and money-market instruments dealt on another regulated market 200,660,161.80 36.34Bonds 200,660,161.80 36.34Cayman Islands 4,728,350.76 0.863.3000 % Korea Development Bank CNH Notes 12/13 CNH 30,000.0 30,000.0 % 99.485 4,728,350.76 0.86China 11,282,778.84 2.041.2000 % Agricultural Bank of China CNH Notes 11/13 CNH 15,000.0 % 98.407 2,338,576.52 0.423.3750 % Global Logistic Properties CNH Notes 00/16 CNH 30,000.0 % 97.750 4,645,912.55 0.841.4000 % HKCG Finance CNH Notes 00/16 CNH 19,000.0 29,000.0 % 93.555 4,298,289.77 0.78Hong Kong 175,120,873.13 31.723.0000 % Agricultural Development Bank of China
CNH Notes 12/14 CNH 80,000.0 80,000.0 % 100.500 12,737,642.59 2.313.5000 % Agricultural Development Bank of China
CNH Notes 12/17 CNH 20,000.0 20,000.0 % 101.000 3,200,253.49 0.583.0000 % Air Liquide Finance CNH Notes 11/16 CNH 55,000.0 % 98.750 8,604,641.95 1.563.9500 % Air Liquide Finance CNH Notes 00/18 CNH 20,000.0 % 99.919 3,166,004.44 0.571.4500 % Australia and New Zealand Banking Group
CNH Notes 10/12 CNH 10,000.0 % 99.541 1,577,008.87 0.290.5000 % Bank of China CNH Notes 00/12 CNH 40,000.0 % 99.747 6,321,115.34 1.151.0000 % Bank of China CNH Notes 00/12 CNH 50,000.0 % 100.162 7,934,244.30 1.440.9000 % Bank of China CNH Notes 00/12 CNH 70,000.0 % 100.239 11,116,459.13 2.012.9500 % Bank of China CNH Notes 12/13 CNH 20,000.0 20,000.0 % 102.201 3,238,301.65 0.593.5000 % Baosteel Group CNH Notes 11/14 CNH 60,000.0 60,000.0 % 100.500 9,553,231.94 1.733.7500 % Beijing Enterprises Water CNH Notes 00/14 CNH 20,000.0 % 102.445 3,246,023.45 0.592.0000 % BMW Australia Finance CNH MTN 00/12 CNH 35,000.0 35,000.0 % 99.881 5,538,395.12 1.001.7000 % BP Capital Markets CNH Notes 00/14 CNH 4,000.0 19,000.0 % 98.582 2,967,440.59 0.542.3750 % BSH Bosch und Siemens Hausgeräte
CNH Notes 00/14 CNH 60,000.0 % 99.174 9,427,195.82 1.711.3500 % Caterpillar Financial CNH Notes 00/12 CNH 75,000.0 % 98.652 11,721,910.65 2.120.9000 % China Construction Bank CNH Notes 00/12 CNH 70,000.0 % 100.239 11,116,459.13 2.012.9500 % China Construction Bank CNH Notes 12/13 CNH 50,000.0 50,000.0 % 99.779 7,903,913.18 1.430.8000 % China Construction Bank CNH Notes 00/12 CNH 20,000.0 % 100.215 3,175,364.39 0.581.6000 % Chong Hing Bank CNH Notes 00/12 CNH 20,000.0 % 99.880 3,164,765.53 0.572.5500 % CNPC Golden Autumn CNH Notes 00/13 CNH 45,000.0 45,000.0 % 100.125 7,138,189.16 1.292.9000 % Danga Capital Berhad CNH Notes 00/14 CNH 20,000.0 20,000.0 % 99.658 3,157,734.47 0.572.7500 % Export Import CNH Notes 00/12 CNH 30,000.0 30,000.0 % 99.828 4,744,662.55 0.861.1000 % Fonterra Cooperative Group CNH Notes 00/14 CNH 1,000.0 31,000.0 % 96.205 4,724,916.67 0.861.1000 % ICBC Asia CNH Notes 00/13 CNH 10,000.0 % 98.590 1,561,940.75 0.284.0000 % Lotte Shopping Bus CNH Notes 12/15 CNH 25,000.0 25,000.0 % 100.750 3,990,415.08 0.724.2500 % Mitsui CNH Notes 12/17 CNH 20,000.0 20,000.0 % 101.427 3,213,795.94 0.582.0000 % Orix CNH Notes 00/14 CNH 17,000.0 % 97.042 2,613,618.03 0.472.7500 % Silvery Castle CNH Notes 00/14 CNH 20,000.0 % 97.387 3,085,773.13 0.561.8000 % Sinochem Offshore CNH Notes 00/14 CNH 15,000.0 % 97.180 2,309,398.76 0.422.5000 % Sumitomo Mitsui Finance CNH Notes 00/13 CNH 20,000.0 % 99.256 3,145,003.17 0.571.7500 % Tesco CNH Notes 00/14 CNH 42,000.0 % 98.875 6,579,134.98 1.192.3750 % Yum! Brands CNH Notes 00/14 CNH 20,000.0 % 99.285 3,145,918.88 0.57Japan 6,352,332.07 1.153.7500 % Hitachi Capital CNH MTN 12/15 CNH 40,000.0 40,000.0 % 100.240 6,352,332.07 1.15USA 3,175,827.00 0.572.9000 % Caterpillar Financial CNH MTN 12/14 CNH 20,000.0 20,000.0 % 100.229 3,175,827.00 0.57Investments in securities and money-market instruments 200,660,161.80 36.34Deposits at financial institutions1) 356,793,693.17 64.62Sight deposits 3,116,839.10 0.56State Street Bank Luxembourg S.A. USD 3,116,839.10 0.56Time deposits 353,676,854.07 64.061.5000 % Agricultural Bank of China
(15.08.2011 - 15.05.2012) CNH 20,105.3 % 100.000 3,185,242.40 0.581.6000 % Agricultural Bank of China
(08.08.2011 - 08.08.2012) CNH 20,043.9 % 100.000 3,175,525.59 0.581.9000 % Agricultural Bank of China
(28.03.2012 - 05.04.2012) CNH 45,271.1 45,271.1 % 100.000 7,172,233.54 1.30
Allianz RCM Renminbi Fixed Income
Investment Portfolio as at 31/03/2012Securities Shares resp.
Currency (in 1,000) resp.Contracts
Acquisitions Disposals Holdings 31/03/2012
Price Market Valuein USD
% ofSubfund
assetsin the period under review
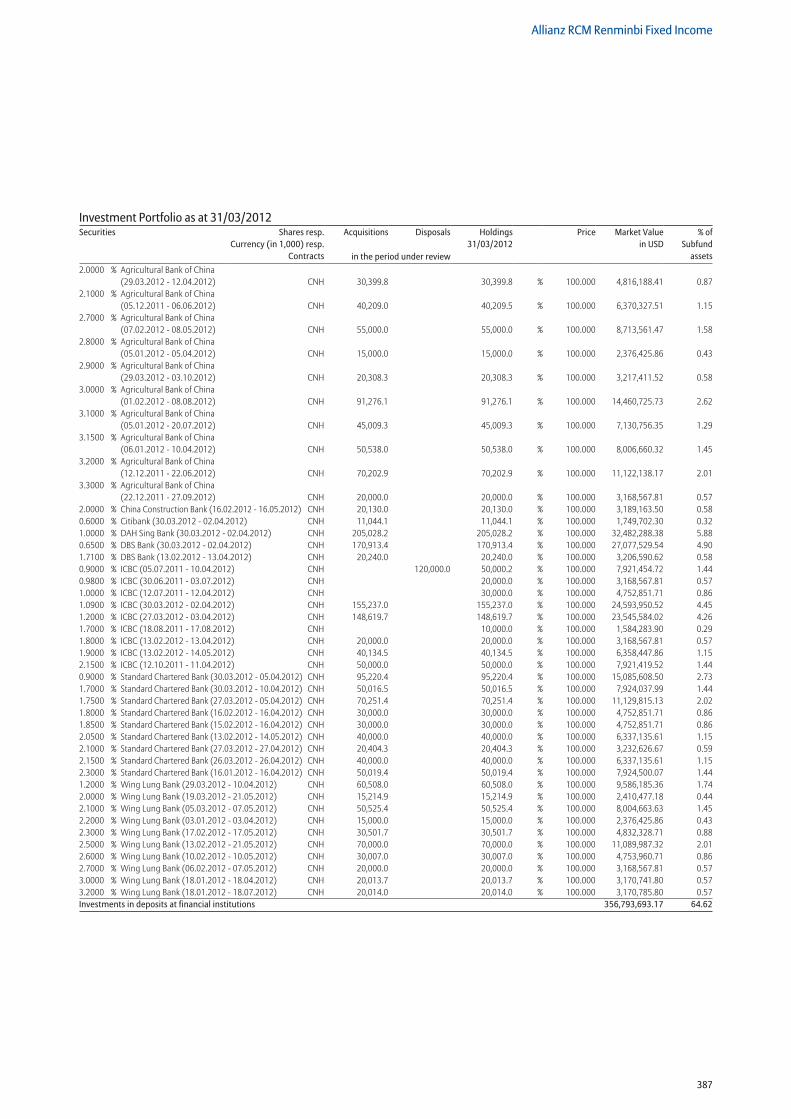
387
Allianz RCM Renminbi Fixed Income
2.0000 % Agricultural Bank of China (29.03.2012 - 12.04.2012) CNH 30,399.8 30,399.8 % 100.000 4,816,188.41 0.87
2.1000 % Agricultural Bank of China (05.12.2011 - 06.06.2012) CNH 40,209.0 40,209.5 % 100.000 6,370,327.51 1.15
2.7000 % Agricultural Bank of China (07.02.2012 - 08.05.2012) CNH 55,000.0 55,000.0 % 100.000 8,713,561.47 1.58
2.8000 % Agricultural Bank of China (05.01.2012 - 05.04.2012) CNH 15,000.0 15,000.0 % 100.000 2,376,425.86 0.43
2.9000 % Agricultural Bank of China (29.03.2012 - 03.10.2012) CNH 20,308.3 20,308.3 % 100.000 3,217,411.52 0.58
3.0000 % Agricultural Bank of China (01.02.2012 - 08.08.2012) CNH 91,276.1 91,276.1 % 100.000 14,460,725.73 2.62
3.1000 % Agricultural Bank of China (05.01.2012 - 20.07.2012) CNH 45,009.3 45,009.3 % 100.000 7,130,756.35 1.29
3.1500 % Agricultural Bank of China (06.01.2012 - 10.04.2012) CNH 50,538.0 50,538.0 % 100.000 8,006,660.32 1.45
3.2000 % Agricultural Bank of China (12.12.2011 - 22.06.2012) CNH 70,202.9 70,202.9 % 100.000 11,122,138.17 2.01
3.3000 % Agricultural Bank of China (22.12.2011 - 27.09.2012) CNH 20,000.0 20,000.0 % 100.000 3,168,567.81 0.57
2.0000 % China Construction Bank (16.02.2012 - 16.05.2012) CNH 20,130.0 20,130.0 % 100.000 3,189,163.50 0.580.6000 % Citibank (30.03.2012 - 02.04.2012) CNH 11,044.1 11,044.1 % 100.000 1,749,702.30 0.321.0000 % DAH Sing Bank (30.03.2012 - 02.04.2012) CNH 205,028.2 205,028.2 % 100.000 32,482,288.38 5.880.6500 % DBS Bank (30.03.2012 - 02.04.2012) CNH 170,913.4 170,913.4 % 100.000 27,077,529.54 4.901.7100 % DBS Bank (13.02.2012 - 13.04.2012) CNH 20,240.0 20,240.0 % 100.000 3,206,590.62 0.580.9000 % ICBC (05.07.2011 - 10.04.2012) CNH 120,000.0 50,000.2 % 100.000 7,921,454.72 1.440.9800 % ICBC (30.06.2011 - 03.07.2012) CNH 20,000.0 % 100.000 3,168,567.81 0.571.0000 % ICBC (12.07.2011 - 12.04.2012) CNH 30,000.0 % 100.000 4,752,851.71 0.861.0900 % ICBC (30.03.2012 - 02.04.2012) CNH 155,237.0 155,237.0 % 100.000 24,593,950.52 4.451.2000 % ICBC (27.03.2012 - 03.04.2012) CNH 148,619.7 148,619.7 % 100.000 23,545,584.02 4.261.7000 % ICBC (18.08.2011 - 17.08.2012) CNH 10,000.0 % 100.000 1,584,283.90 0.291.8000 % ICBC (13.02.2012 - 13.04.2012) CNH 20,000.0 20,000.0 % 100.000 3,168,567.81 0.571.9000 % ICBC (13.02.2012 - 14.05.2012) CNH 40,134.5 40,134.5 % 100.000 6,358,447.86 1.152.1500 % ICBC (12.10.2011 - 11.04.2012) CNH 50,000.0 50,000.0 % 100.000 7,921,419.52 1.440.9000 % Standard Chartered Bank (30.03.2012 - 05.04.2012) CNH 95,220.4 95,220.4 % 100.000 15,085,608.50 2.731.7000 % Standard Chartered Bank (30.03.2012 - 10.04.2012) CNH 50,016.5 50,016.5 % 100.000 7,924,037.99 1.441.7500 % Standard Chartered Bank (27.03.2012 - 05.04.2012) CNH 70,251.4 70,251.4 % 100.000 11,129,815.13 2.021.8000 % Standard Chartered Bank (16.02.2012 - 16.04.2012) CNH 30,000.0 30,000.0 % 100.000 4,752,851.71 0.861.8500 % Standard Chartered Bank (15.02.2012 - 16.04.2012) CNH 30,000.0 30,000.0 % 100.000 4,752,851.71 0.862.0500 % Standard Chartered Bank (13.02.2012 - 14.05.2012) CNH 40,000.0 40,000.0 % 100.000 6,337,135.61 1.152.1000 % Standard Chartered Bank (27.03.2012 - 27.04.2012) CNH 20,404.3 20,404.3 % 100.000 3,232,626.67 0.592.1500 % Standard Chartered Bank (26.03.2012 - 26.04.2012) CNH 40,000.0 40,000.0 % 100.000 6,337,135.61 1.152.3000 % Standard Chartered Bank (16.01.2012 - 16.04.2012) CNH 50,019.4 50,019.4 % 100.000 7,924,500.07 1.441.2000 % Wing Lung Bank (29.03.2012 - 10.04.2012) CNH 60,508.0 60,508.0 % 100.000 9,586,185.36 1.742.0000 % Wing Lung Bank (19.03.2012 - 21.05.2012) CNH 15,214.9 15,214.9 % 100.000 2,410,477.18 0.442.1000 % Wing Lung Bank (05.03.2012 - 07.05.2012) CNH 50,525.4 50,525.4 % 100.000 8,004,663.63 1.452.2000 % Wing Lung Bank (03.01.2012 - 03.04.2012) CNH 15,000.0 15,000.0 % 100.000 2,376,425.86 0.432.3000 % Wing Lung Bank (17.02.2012 - 17.05.2012) CNH 30,501.7 30,501.7 % 100.000 4,832,328.71 0.882.5000 % Wing Lung Bank (13.02.2012 - 21.05.2012) CNH 70,000.0 70,000.0 % 100.000 11,089,987.32 2.012.6000 % Wing Lung Bank (10.02.2012 - 10.05.2012) CNH 30,007.0 30,007.0 % 100.000 4,753,960.71 0.862.7000 % Wing Lung Bank (06.02.2012 - 07.05.2012) CNH 20,000.0 20,000.0 % 100.000 3,168,567.81 0.573.0000 % Wing Lung Bank (18.01.2012 - 18.04.2012) CNH 20,013.7 20,013.7 % 100.000 3,170,741.80 0.573.2000 % Wing Lung Bank (18.01.2012 - 18.07.2012) CNH 20,014.0 20,014.0 % 100.000 3,170,785.80 0.57Investments in deposits at financial institutions 356,793,693.17 64.62
Investment Portfolio as at 31/03/2012Securities Shares resp.
Currency (in 1,000) resp.Contracts
Acquisitions Disposals Holdings 31/03/2012
Price Market Valuein USD
% ofSubfund
assetsin the period under review
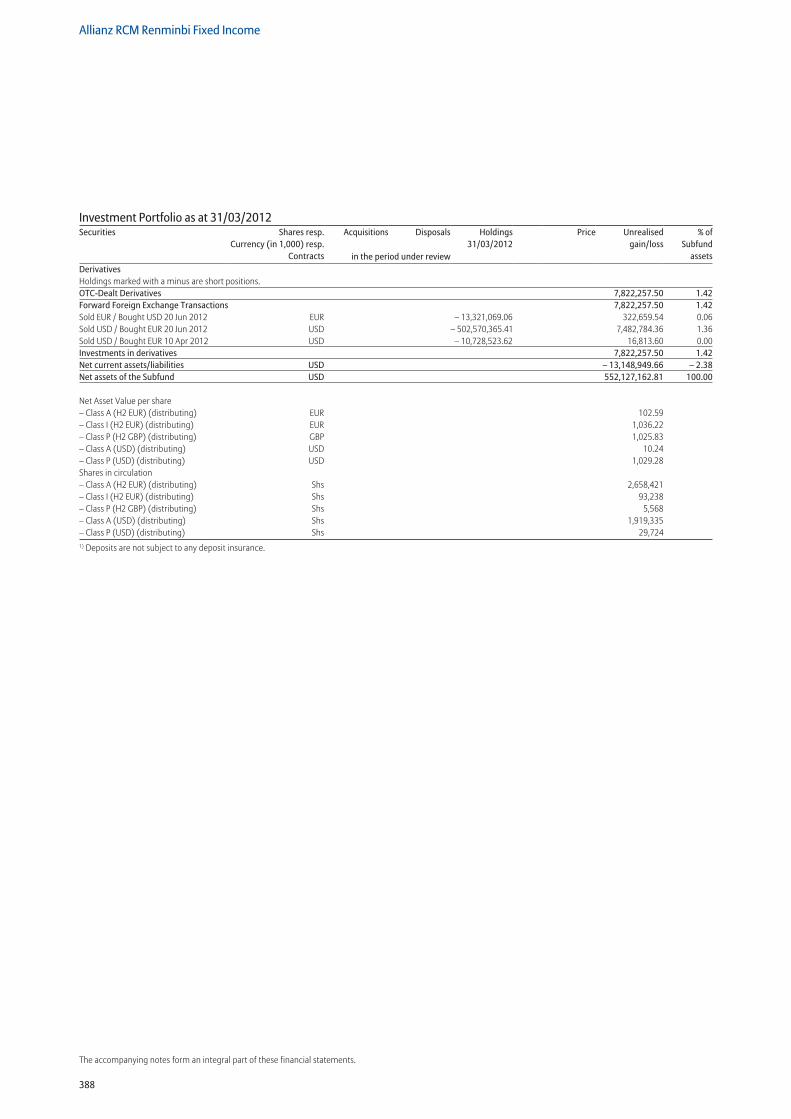
388
Allianz RCM Renminbi Fixed Income
The accompanying notes form an integral part of these financial statements.
Derivatives Holdings marked with a minus are short positions. OTC-Dealt Derivatives 7,822,257.50 1.42Forward Foreign Exchange Transactions 7,822,257.50 1.42Sold EUR / Bought USD 20 Jun 2012 EUR – 13,321,069.06 322,659.54 0.06Sold USD / Bought EUR 20 Jun 2012 USD – 502,570,365.41 7,482,784.36 1.36Sold USD / Bought EUR 10 Apr 2012 USD – 10,728,523.62 16,813.60 0.00Investments in derivatives 7,822,257.50 1.42Net current assets/liabilities USD – 13,148,949.66 – 2.38Net assets of the Subfund USD 552,127,162.81 100.00
Net Asset Value per share – Class A (H2 EUR) (distributing) EUR 102.59 – Class I (H2 EUR) (distributing) EUR 1,036.22 – Class P (H2 GBP) (distributing) GBP 1,025.83 – Class A (USD) (distributing) USD 10.24 – Class P (USD) (distributing) USD 1,029.28 Shares in circulation – Class A (H2 EUR) (distributing) Shs 2,658,421 – Class I (H2 EUR) (distributing) Shs 93,238 – Class P (H2 GBP) (distributing) Shs 5,568 – Class A (USD) (distributing) Shs 1,919,335 – Class P (USD) (distributing) Shs 29,7241) Deposits are not subject to any deposit insurance.
Investment Portfolio as at 31/03/2012Securities Shares resp.
Currency (in 1,000) resp.Contracts
Acquisitions Disposals Holdings 31/03/2012
Price Unrealisedgain/loss
% ofSubfund
assetsin the period under review
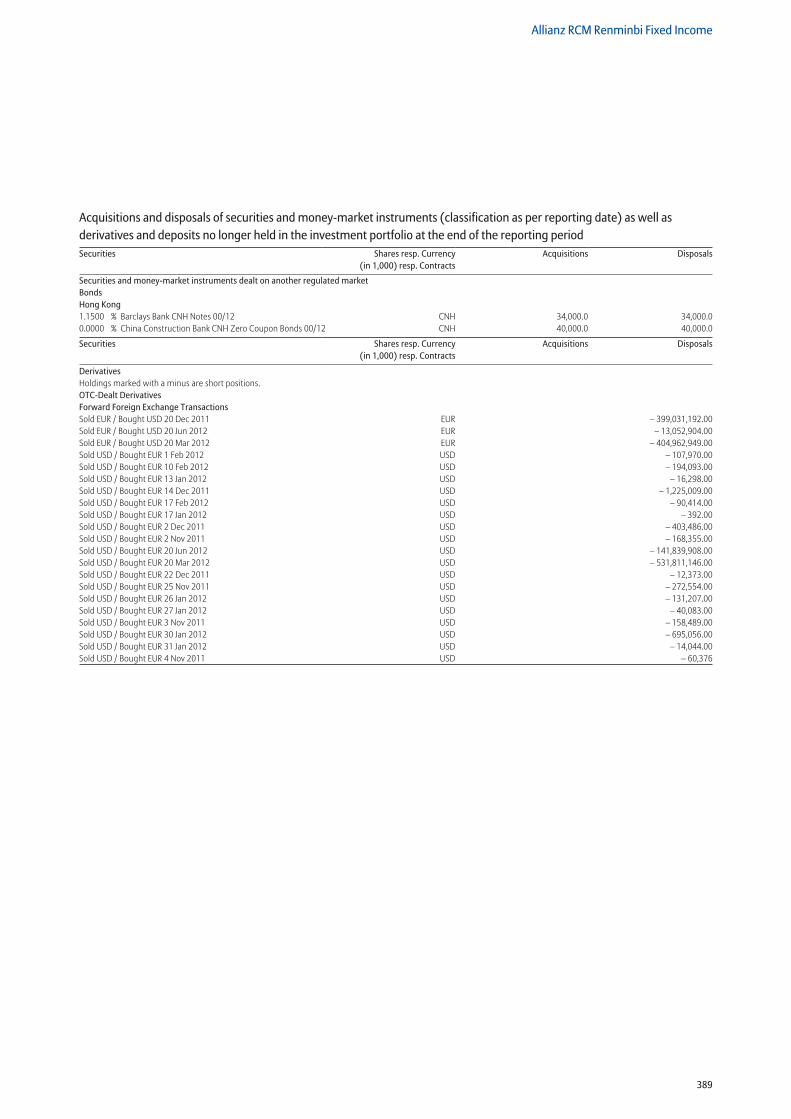
389
Allianz RCM Renminbi Fixed Income
Acquisitions and disposals of securities and money-market instruments (classification as per reporting date) as well as derivatives and deposits no longer held in the investment portfolio at the end of the reporting periodSecurities Shares resp. Currency
(in 1,000) resp. ContractsAcquisitions Disposals
Securities and money-market instruments dealt on another regulated market Bonds Hong Kong 1.1500 % Barclays Bank CNH Notes 00/12 CNH 34,000.0 34,000.00.0000 % China Construction Bank CNH Zero Coupon Bonds 00/12 CNH 40,000.0 40,000.0
Securities Shares resp. Currency (in 1,000) resp. Contracts
Acquisitions Disposals
DerivativesHoldings marked with a minus are short positions. OTC-Dealt Derivatives Forward Foreign Exchange Transactions Sold EUR / Bought USD 20 Dec 2011 EUR – 399,031,192.00Sold EUR / Bought USD 20 Jun 2012 EUR – 13,052,904.00Sold EUR / Bought USD 20 Mar 2012 EUR – 404,962,949.00Sold USD / Bought EUR 1 Feb 2012 USD – 107,970.00Sold USD / Bought EUR 10 Feb 2012 USD – 194,093.00Sold USD / Bought EUR 13 Jan 2012 USD – 16,298.00Sold USD / Bought EUR 14 Dec 2011 USD – 1,225,009.00Sold USD / Bought EUR 17 Feb 2012 USD – 90,414.00Sold USD / Bought EUR 17 Jan 2012 USD – 392.00Sold USD / Bought EUR 2 Dec 2011 USD – 403,486.00Sold USD / Bought EUR 2 Nov 2011 USD – 168,355.00Sold USD / Bought EUR 20 Jun 2012 USD – 141,839,908.00Sold USD / Bought EUR 20 Mar 2012 USD – 531,811,146.00Sold USD / Bought EUR 22 Dec 2011 USD – 12,373.00Sold USD / Bought EUR 25 Nov 2011 USD – 272,554.00Sold USD / Bought EUR 26 Jan 2012 USD – 131,207.00Sold USD / Bought EUR 27 Jan 2012 USD – 40,083.00Sold USD / Bought EUR 3 Nov 2011 USD – 158,489.00Sold USD / Bought EUR 30 Jan 2012 USD – 695,056.00Sold USD / Bought EUR 31 Jan 2012 USD – 14,044.00Sold USD / Bought EUR 4 Nov 2011 USD – 60,376
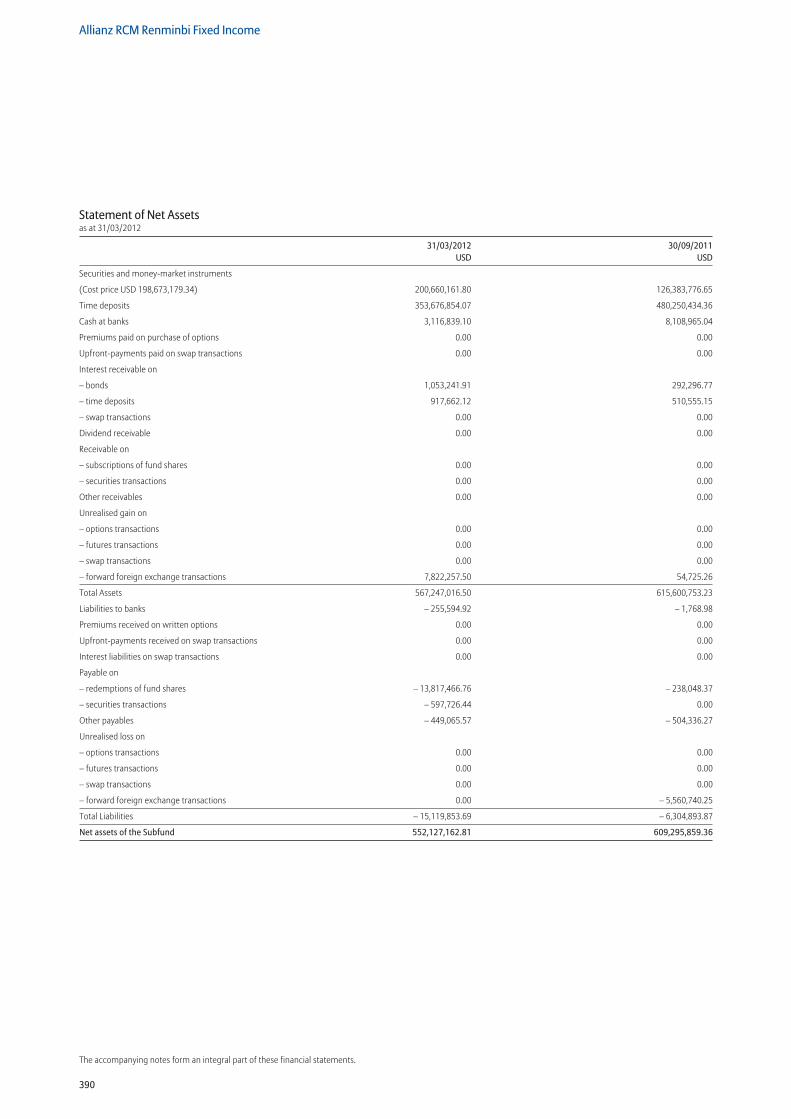
390
Allianz RCM Renminbi Fixed Income
The accompanying notes form an integral part of these financial statements.
Statement of Net Assetsas at 31/03/2012
31/03/2012 30/09/2011 USD USD
Securities and money-market instruments
(Cost price USD 198,673,179.34) 200,660,161.80 126,383,776.65
Time deposits 353,676,854.07 480,250,434.36
Cash at banks 3,116,839.10 8,108,965.04
Premiums paid on purchase of options 0.00 0.00
Upfront-payments paid on swap transactions 0.00 0.00
Interest receivable on
– bonds 1,053,241.91 292,296.77
– time deposits 917,662.12 510,555.15
– swap transactions 0.00 0.00
Dividend receivable 0.00 0.00
Receivable on
– subscriptions of fund shares 0.00 0.00
– securities transactions 0.00 0.00
Other receivables 0.00 0.00
Unrealised gain on
– options transactions 0.00 0.00
– futures transactions 0.00 0.00
– swap transactions 0.00 0.00
– forward foreign exchange transactions 7,822,257.50 54,725.26
Total Assets 567,247,016.50 615,600,753.23
Liabilities to banks – 255,594.92 – 1,768.98
Premiums received on written options 0.00 0.00
Upfront-payments received on swap transactions 0.00 0.00
Interest liabilities on swap transactions 0.00 0.00
Payable on
– redemptions of fund shares – 13,817,466.76 – 238,048.37
– securities transactions – 597,726.44 0.00
Other payables – 449,065.57 – 504,336.27
Unrealised loss on
– options transactions 0.00 0.00
– futures transactions 0.00 0.00
– swap transactions 0.00 0.00
– forward foreign exchange transactions 0.00 – 5,560,740.25
Total Liabilities – 15,119,853.69 – 6,304,893.87
Net assets of the Subfund 552,127,162.81 609,295,859.36
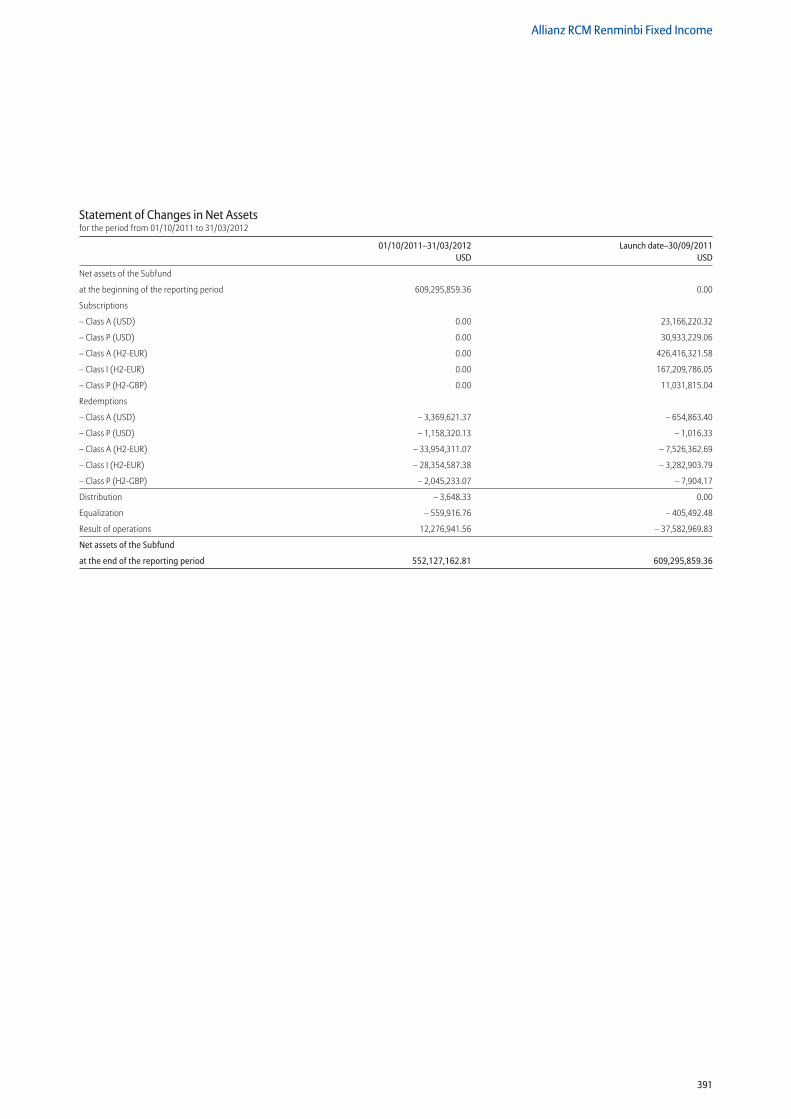
391
Allianz RCM Renminbi Fixed Income
Statement of Changes in Net Assetsfor the period from 01/10/2011 to 31/03/2012
01/10/2011–31/03/2012 Launch date–30/09/2011 USD USD
Net assets of the Subfund
at the beginning of the reporting period 609,295,859.36 0.00
Subscriptions
– Class A (USD) 0.00 23,166,220.32
– Class P (USD) 0.00 30,933,229.06
– Class A (H2-EUR) 0.00 426,416,321.58
– Class I (H2-EUR) 0.00 167,209,786.05
– Class P (H2-GBP) 0.00 11,031,815.04
Redemptions
– Class A (USD) – 3,369,621.37 – 654,863.40
– Class P (USD) – 1,158,320.13 – 1,016.33
– Class A (H2-EUR) – 33,954,311.07 – 7,526,362.69
– Class I (H2-EUR) – 28,354,587.38 – 3,282,903.79
– Class P (H2-GBP) – 2,045,233.07 – 7,904.17
Distribution – 3,648.33 0.00
Equalization – 559,916.76 – 405,492.48
Result of operations 12,276,941.56 – 37,582,969.83
Net assets of the Subfund
at the end of the reporting period 552,127,162.81 609,295,859.36
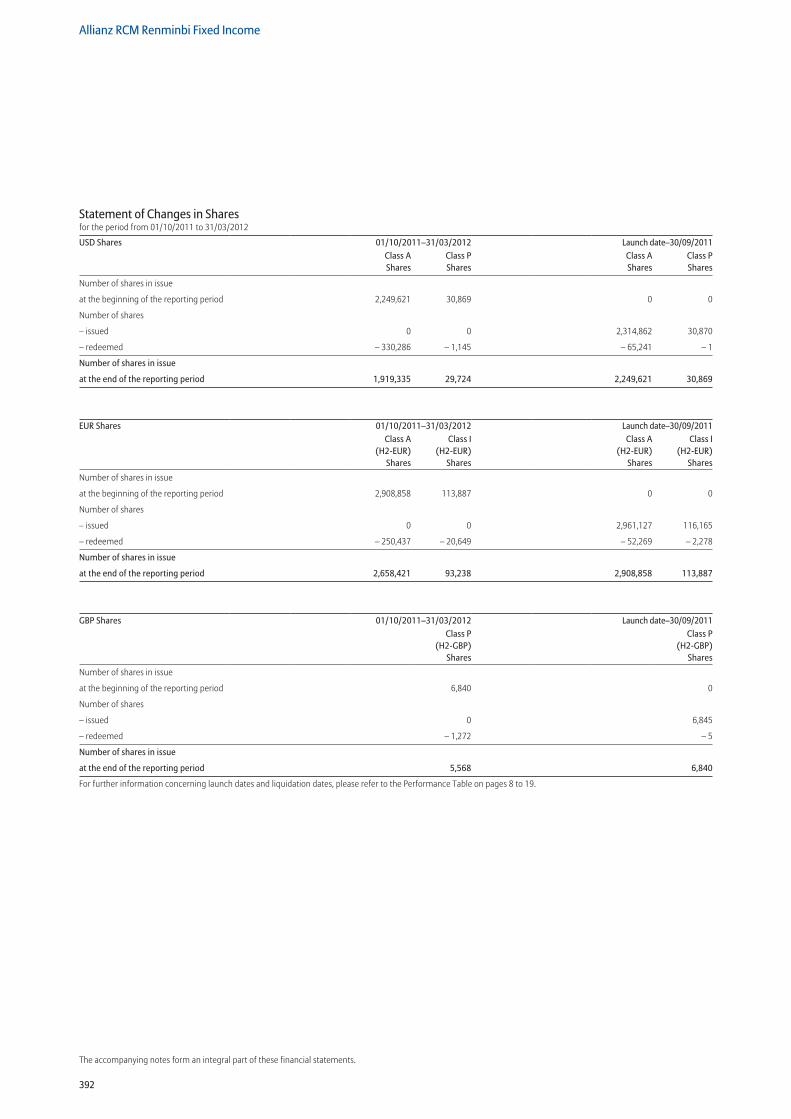
392
Allianz RCM Renminbi Fixed Income
The accompanying notes form an integral part of these financial statements.
Statement of Changes in Sharesfor the period from 01/10/2011 to 31/03/2012
USD Shares 01/10/2011–31/03/2012 Launch date–30/09/2011Class A Shares
Class P Shares
Class A Shares
Class P Shares
Number of shares in issue
at the beginning of the reporting period 2,249,621 30,869 0 0
Number of shares
– issued 0 0 2,314,862 30,870
– redeemed – 330,286 – 1,145 – 65,241 – 1
Number of shares in issue
at the end of the reporting period 1,919,335 29,724 2,249,621 30,869
EUR Shares 01/10/2011–31/03/2012 Launch date–30/09/2011Class A
(H2-EUR) Shares
Class I (H2-EUR)
Shares
Class A (H2-EUR)
Shares
Class I (H2-EUR)
Shares
Number of shares in issue
at the beginning of the reporting period 2,908,858 113,887 0 0
Number of shares
– issued 0 0 2,961,127 116,165
– redeemed – 250,437 – 20,649 – 52,269 – 2,278
Number of shares in issue
at the end of the reporting period 2,658,421 93,238 2,908,858 113,887
GBP Shares 01/10/2011–31/03/2012 Launch date–30/09/2011Class P
(H2-GBP) Shares
Class P (H2-GBP)
Shares
Number of shares in issue
at the beginning of the reporting period 6,840 0
Number of shares
– issued 0 6,845
– redeemed – 1,272 – 5
Number of shares in issue
at the end of the reporting period 5,568 6,840
For further information concerning launch dates and liquidation dates, please refer to the Performance Table on pages 8 to 19.
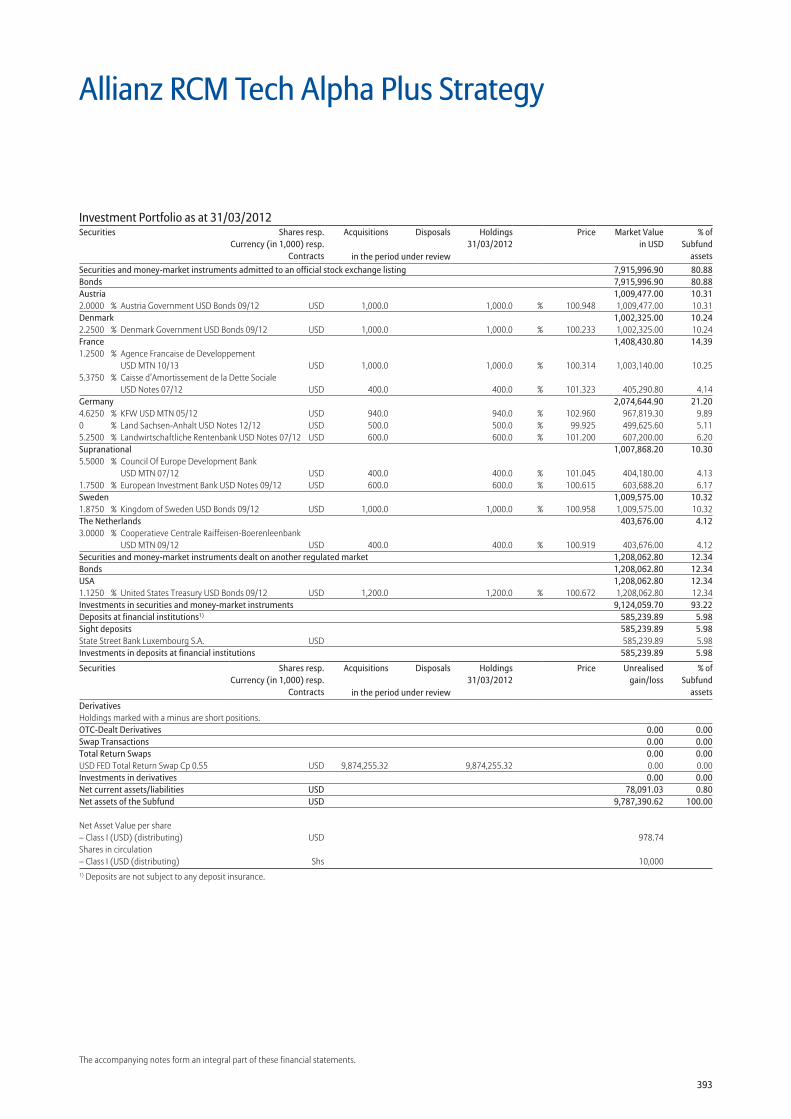
393
The accompanying notes form an integral part of these financial statements.
Allianz RCM Tech Alpha Plus Strategy
Securities and money-market instruments admitted to an official stock exchange listing 7,915,996.90 80.88Bonds 7,915,996.90 80.88Austria 1,009,477.00 10.312.0000 % Austria Government USD Bonds 09/12 USD 1,000.0 1,000.0 % 100.948 1,009,477.00 10.31Denmark 1,002,325.00 10.242.2500 % Denmark Government USD Bonds 09/12 USD 1,000.0 1,000.0 % 100.233 1,002,325.00 10.24France 1,408,430.80 14.391.2500 % Agence Francaise de Developpement
USD MTN 10/13 USD 1,000.0 1,000.0 % 100.314 1,003,140.00 10.255.3750 % Caisse d’Amortissement de la Dette Sociale
USD Notes 07/12 USD 400.0 400.0 % 101.323 405,290.80 4.14Germany 2,074,644.90 21.204.6250 % KFW USD MTN 05/12 USD 940.0 940.0 % 102.960 967,819.30 9.890 % Land Sachsen-Anhalt USD Notes 12/12 USD 500.0 500.0 % 99.925 499,625.60 5.115.2500 % Landwirtschaftliche Rentenbank USD Notes 07/12 USD 600.0 600.0 % 101.200 607,200.00 6.20Supranational 1,007,868.20 10.305.5000 % Council Of Europe Development Bank
USD MTN 07/12 USD 400.0 400.0 % 101.045 404,180.00 4.131.7500 % European Investment Bank USD Notes 09/12 USD 600.0 600.0 % 100.615 603,688.20 6.17Sweden 1,009,575.00 10.321.8750 % Kingdom of Sweden USD Bonds 09/12 USD 1,000.0 1,000.0 % 100.958 1,009,575.00 10.32The Netherlands 403,676.00 4.123.0000 % Cooperatieve Centrale Raiffeisen-Boerenleenbank
USD MTN 09/12 USD 400.0 400.0 % 100.919 403,676.00 4.12Securities and money-market instruments dealt on another regulated market 1,208,062.80 12.34Bonds 1,208,062.80 12.34USA 1,208,062.80 12.341.1250 % United States Treasury USD Bonds 09/12 USD 1,200.0 1,200.0 % 100.672 1,208,062.80 12.34Investments in securities and money-market instruments 9,124,059.70 93.22Deposits at financial institutions1) 585,239.89 5.98Sight deposits 585,239.89 5.98State Street Bank Luxembourg S.A. USD 585,239.89 5.98Investments in deposits at financial institutions 585,239.89 5.98
Securities Shares resp.Currency (in 1,000) resp.
Contracts
Acquisitions Disposals Holdings 31/03/2012
Price Unrealisedgain/loss
% ofSubfund
assetsin the period under reviewDerivatives Holdings marked with a minus are short positions. OTC-Dealt Derivatives 0.00 0.00Swap Transactions 0.00 0.00Total Return Swaps 0.00 0.00USD FED Total Return Swap Cp 0.55 USD 9,874,255.32 9,874,255.32 0.00 0.00Investments in derivatives 0.00 0.00Net current assets/liabilities USD 78,091.03 0.80Net assets of the Subfund USD 9,787,390.62 100.00
Net Asset Value per share – Class I (USD) (distributing) USD 978.74Shares in circulation – Class I (USD (distributing) Shs 10,0001) Deposits are not subject to any deposit insurance.
Investment Portfolio as at 31/03/2012Securities Shares resp.
Currency (in 1,000) resp.Contracts
Acquisitions Disposals Holdings 31/03/2012
Price Market Valuein USD
% ofSubfund
assetsin the period under review
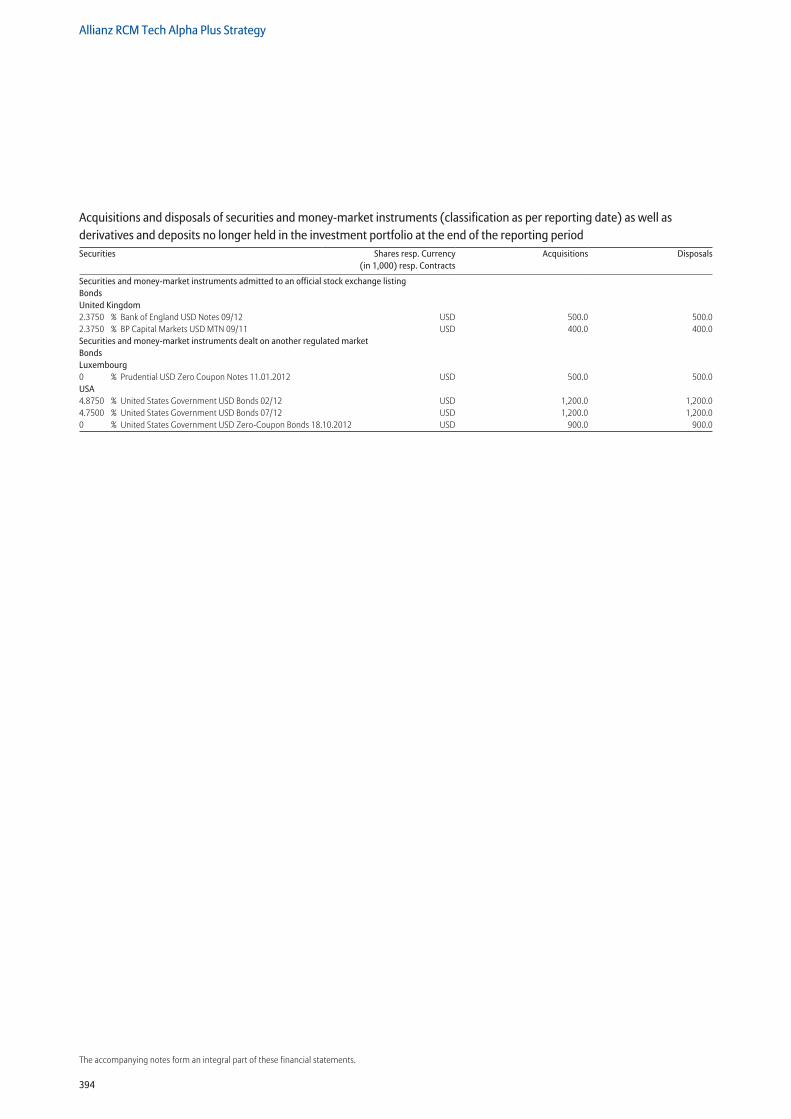
394
Allianz RCM Tech Alpha Plus Strategy
The accompanying notes form an integral part of these financial statements.
Securities and money-market instruments admitted to an official stock exchange listing Bonds United Kingdom 2.3750 % Bank of England USD Notes 09/12 USD 500.0 500.02.3750 % BP Capital Markets USD MTN 09/11 USD 400.0 400.0Securities and money-market instruments dealt on another regulated market Bonds Luxembourg 0 % Prudential USD Zero Coupon Notes 11.01.2012 USD 500.0 500.0USA 4.8750 % United States Government USD Bonds 02/12 USD 1,200.0 1,200.04.7500 % United States Government USD Bonds 07/12 USD 1,200.0 1,200.00 % United States Government USD Zero-Coupon Bonds 18.10.2012 USD 900.0 900.0
Acquisitions and disposals of securities and money-market instruments (classification as per reporting date) as well as derivatives and deposits no longer held in the investment portfolio at the end of the reporting periodSecurities Shares resp. Currency
(in 1,000) resp. ContractsAcquisitions Disposals
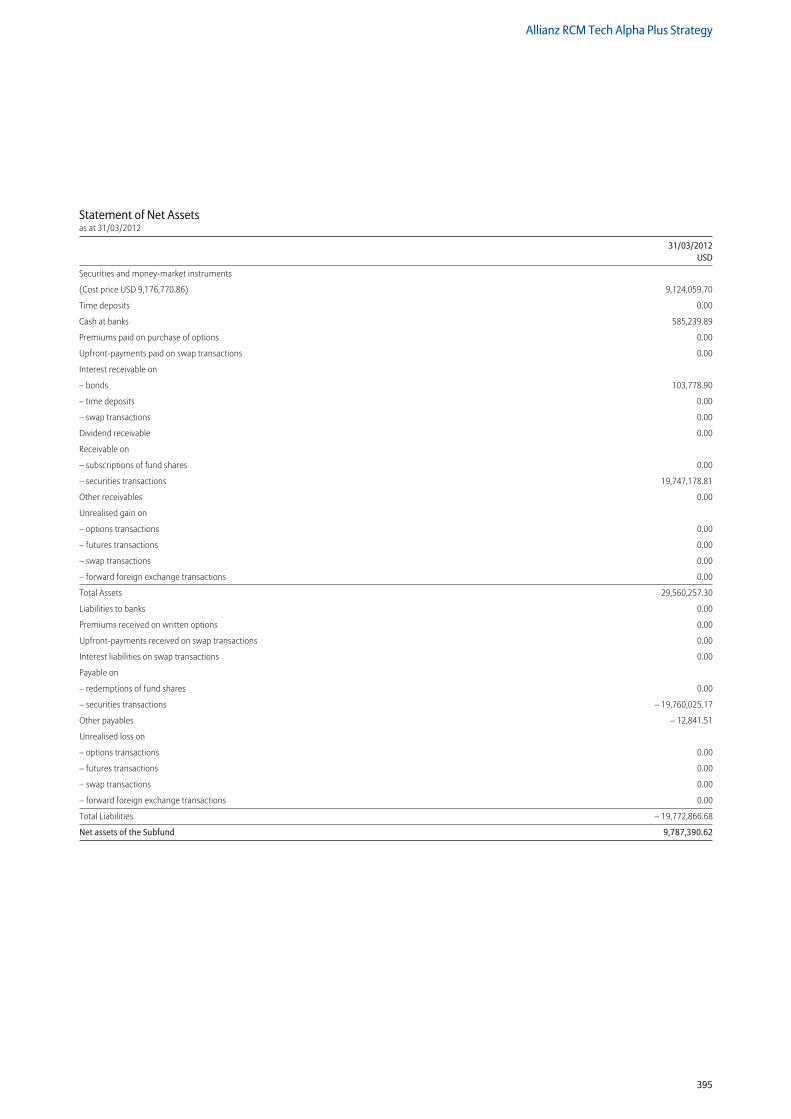
395
Allianz RCM Tech Alpha Plus Strategy
Statement of Net Assetsas at 31/03/2012
31/03/2012 USD
Securities and money-market instruments
(Cost price USD 9,176,770.86) 9,124,059.70
Time deposits 0.00
Cash at banks 585,239.89
Premiums paid on purchase of options 0.00
Upfront-payments paid on swap transactions 0.00
Interest receivable on
– bonds 103,778.90
– time deposits 0.00
– swap transactions 0.00
Dividend receivable 0.00
Receivable on
– subscriptions of fund shares 0.00
– securities transactions 19,747,178.81
Other receivables 0.00
Unrealised gain on
– options transactions 0.00
– futures transactions 0.00
– swap transactions 0.00
– forward foreign exchange transactions 0.00
Total Assets 29,560,257.30
Liabilities to banks 0.00
Premiums received on written options 0.00
Upfront-payments received on swap transactions 0.00
Interest liabilities on swap transactions 0.00
Payable on
– redemptions of fund shares 0.00
– securities transactions – 19,760,025.17
Other payables – 12,841.51
Unrealised loss on
– options transactions 0.00
– futures transactions 0.00
– swap transactions 0.00
– forward foreign exchange transactions 0.00
Total Liabilities – 19,772,866.68
Net assets of the Subfund 9,787,390.62
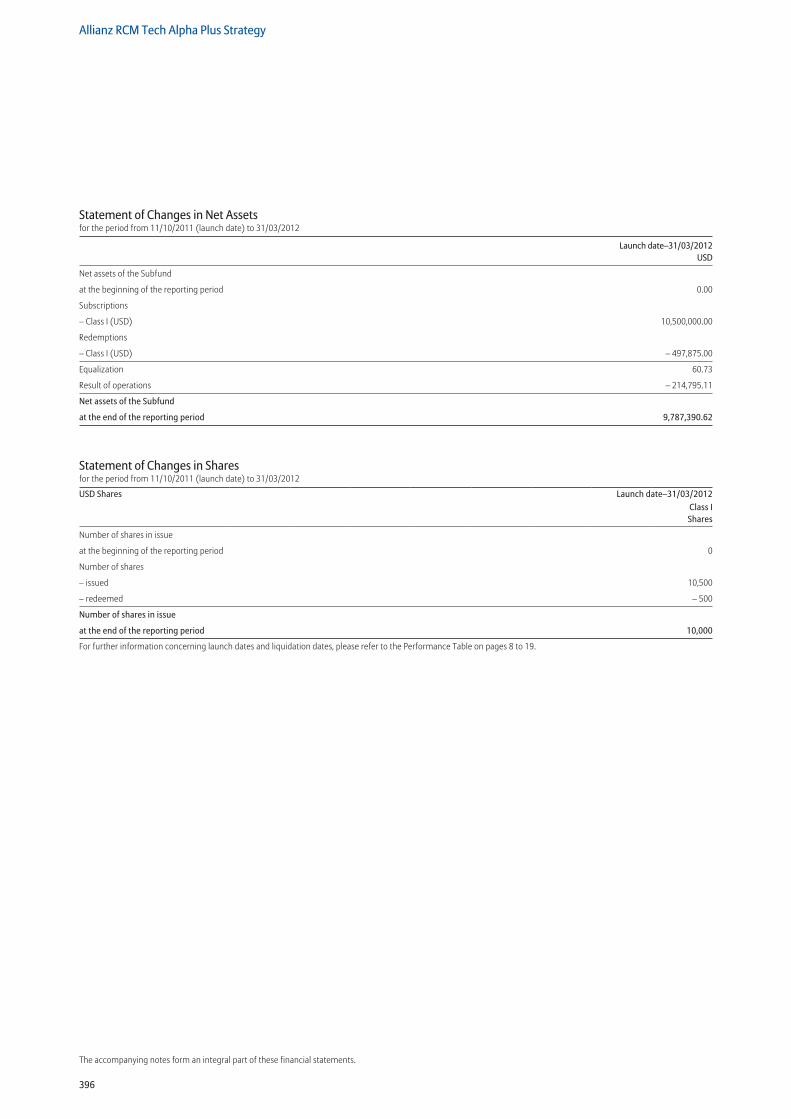
396
Allianz RCM Tech Alpha Plus Strategy
The accompanying notes form an integral part of these financial statements.
Statement of Changes in Net Assetsfor the period from 11/10/2011 (launch date) to 31/03/2012
Launch date–31/03/2012 USD
Net assets of the Subfund
at the beginning of the reporting period 0.00
Subscriptions
– Class I (USD) 10,500,000.00
Redemptions
– Class I (USD) – 497,875.00
Equalization 60.73
Result of operations – 214,795.11
Net assets of the Subfund
at the end of the reporting period 9,787,390.62
Statement of Changes in Sharesfor the period from 11/10/2011 (launch date) to 31/03/2012
USD Shares Launch date–31/03/2012Class I Shares
Number of shares in issue
at the beginning of the reporting period 0
Number of shares
– issued 10,500
– redeemed – 500
Number of shares in issue
at the end of the reporting period 10,000
For further information concerning launch dates and liquidation dates, please refer to the Performance Table on pages 8 to 19.
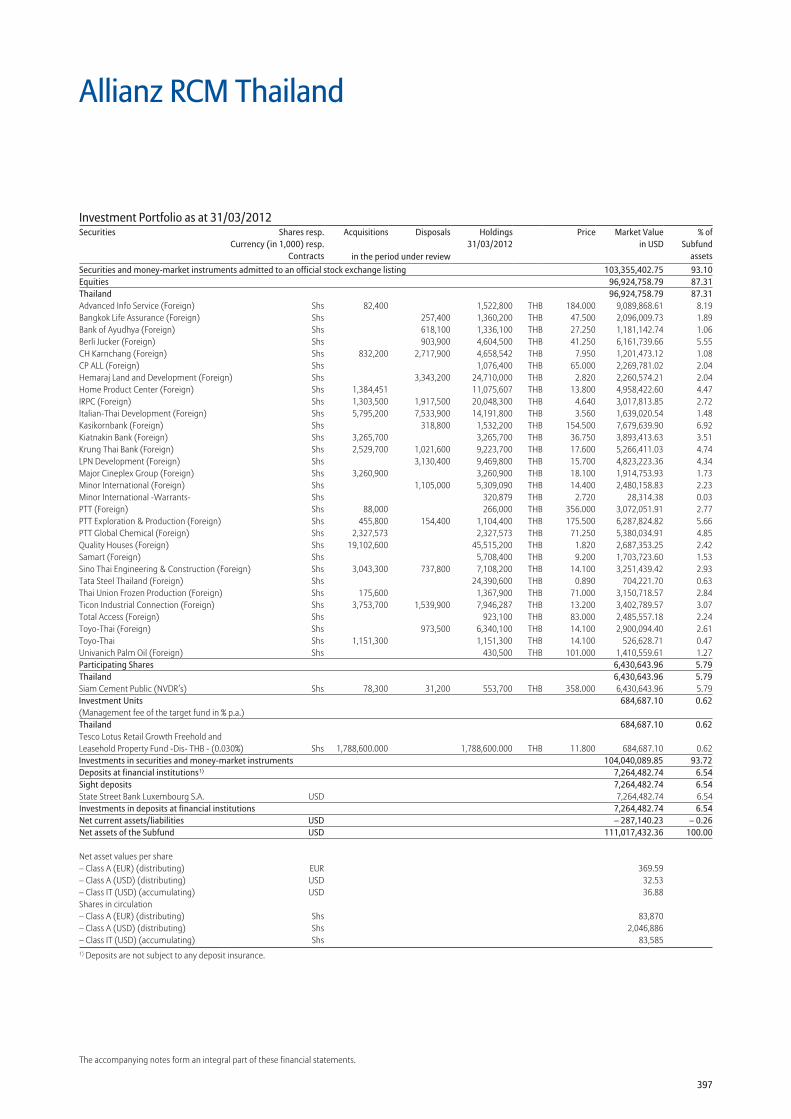
397
The accompanying notes form an integral part of these financial statements.
Securities and money-market instruments admitted to an official stock exchange listing 103,355,402.75 93.10Equities 96,924,758.79 87.31Thailand 96,924,758.79 87.31Advanced Info Service (Foreign) Shs 82,400 1,522,800 THB 184.000 9,089,868.61 8.19Bangkok Life Assurance (Foreign) Shs 257,400 1,360,200 THB 47.500 2,096,009.73 1.89Bank of Ayudhya (Foreign) Shs 618,100 1,336,100 THB 27.250 1,181,142.74 1.06Berli Jucker (Foreign) Shs 903,900 4,604,500 THB 41.250 6,161,739.66 5.55CH Karnchang (Foreign) Shs 832,200 2,717,900 4,658,542 THB 7.950 1,201,473.12 1.08CP ALL (Foreign) Shs 1,076,400 THB 65.000 2,269,781.02 2.04Hemaraj Land and Development (Foreign) Shs 3,343,200 24,710,000 THB 2.820 2,260,574.21 2.04Home Product Center (Foreign) Shs 1,384,451 11,075,607 THB 13.800 4,958,422.60 4.47IRPC (Foreign) Shs 1,303,500 1,917,500 20,048,300 THB 4.640 3,017,813.85 2.72Italian-Thai Development (Foreign) Shs 5,795,200 7,533,900 14,191,800 THB 3.560 1,639,020.54 1.48Kasikornbank (Foreign) Shs 318,800 1,532,200 THB 154.500 7,679,639.90 6.92Kiatnakin Bank (Foreign) Shs 3,265,700 3,265,700 THB 36.750 3,893,413.63 3.51Krung Thai Bank (Foreign) Shs 2,529,700 1,021,600 9,223,700 THB 17.600 5,266,411.03 4.74LPN Development (Foreign) Shs 3,130,400 9,469,800 THB 15.700 4,823,223.36 4.34Major Cineplex Group (Foreign) Shs 3,260,900 3,260,900 THB 18.100 1,914,753.93 1.73Minor International (Foreign) Shs 1,105,000 5,309,090 THB 14.400 2,480,158.83 2.23Minor International -Warrants- Shs 320,879 THB 2.720 28,314.38 0.03PTT (Foreign) Shs 88,000 266,000 THB 356.000 3,072,051.91 2.77PTT Exploration & Production (Foreign) Shs 455,800 154,400 1,104,400 THB 175.500 6,287,824.82 5.66PTT Global Chemical (Foreign) Shs 2,327,573 2,327,573 THB 71.250 5,380,034.91 4.85Quality Houses (Foreign) Shs 19,102,600 45,515,200 THB 1.820 2,687,353.25 2.42Samart (Foreign) Shs 5,708,400 THB 9.200 1,703,723.60 1.53Sino Thai Engineering & Construction (Foreign) Shs 3,043,300 737,800 7,108,200 THB 14.100 3,251,439.42 2.93Tata Steel Thailand (Foreign) Shs 24,390,600 THB 0.890 704,221.70 0.63Thai Union Frozen Production (Foreign) Shs 175,600 1,367,900 THB 71.000 3,150,718.57 2.84Ticon Industrial Connection (Foreign) Shs 3,753,700 1,539,900 7,946,287 THB 13.200 3,402,789.57 3.07Total Access (Foreign) Shs 923,100 THB 83.000 2,485,557.18 2.24Toyo-Thai (Foreign) Shs 973,500 6,340,100 THB 14.100 2,900,094.40 2.61Toyo-Thai Shs 1,151,300 1,151,300 THB 14.100 526,628.71 0.47Univanich Palm Oil (Foreign) Shs 430,500 THB 101.000 1,410,559.61 1.27Participating Shares 6,430,643.96 5.79Thailand 6,430,643.96 5.79Siam Cement Public (NVDR’s) Shs 78,300 31,200 553,700 THB 358.000 6,430,643.96 5.79Investment Units 684,687.10 0.62(Management fee of the target fund in % p.a.) Thailand 684,687.10 0.62Tesco Lotus Retail Growth Freehold and Leasehold Property Fund -Dis- THB - (0.030%) Shs 1,788,600.000 1,788,600.000 THB 11.800 684,687.10 0.62Investments in securities and money-market instruments 104,040,089.85 93.72Deposits at financial institutions1) 7,264,482.74 6.54Sight deposits 7,264,482.74 6.54State Street Bank Luxembourg S.A. USD 7,264,482.74 6.54Investments in deposits at financial institutions 7,264,482.74 6.54Net current assets/liabilities USD – 287,140.23 – 0.26Net assets of the Subfund USD 111,017,432.36 100.00 Net asset values per share – Class A (EUR) (distributing) EUR 369.59 – Class A (USD) (distributing) USD 32.53 – Class IT (USD) (accumulating) USD 36.88 Shares in circulation – Class A (EUR) (distributing) Shs 83,870 – Class A (USD) (distributing) Shs 2,046,886 – Class IT (USD) (accumulating) Shs 83,5851) Deposits are not subject to any deposit insurance.
Allianz RCM Thailand
Investment Portfolio as at 31/03/2012Securities Shares resp.
Currency (in 1,000) resp.Contracts
Acquisitions Disposals Holdings 31/03/2012
Price Market Valuein USD
% ofSubfund
assetsin the period under review
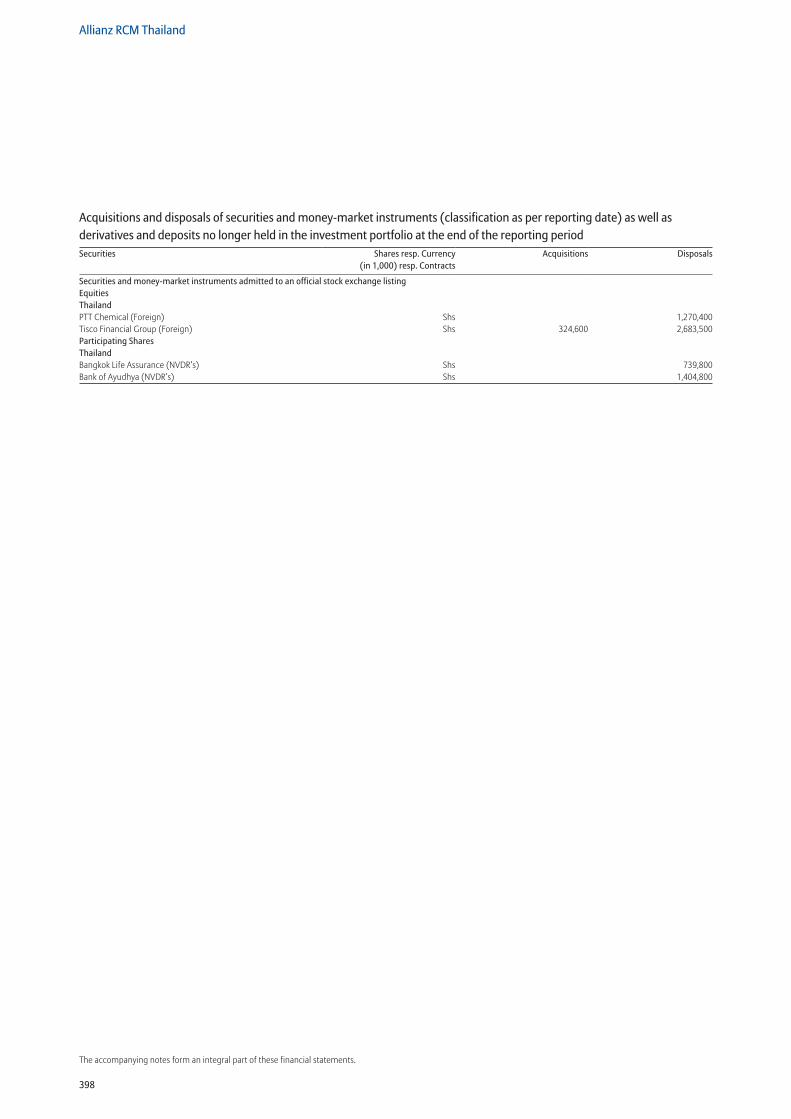
398
Allianz RCM Thailand
The accompanying notes form an integral part of these financial statements.
Securities and money-market instruments admitted to an official stock exchange listing Equities Thailand PTT Chemical (Foreign) Shs 1,270,400Tisco Financial Group (Foreign) Shs 324,600 2,683,500Participating Shares Thailand Bangkok Life Assurance (NVDR’s) Shs 739,800Bank of Ayudhya (NVDR’s) Shs 1,404,800
Acquisitions and disposals of securities and money-market instruments (classification as per reporting date) as well as derivatives and deposits no longer held in the investment portfolio at the end of the reporting periodSecurities Shares resp. Currency
(in 1,000) resp. ContractsAcquisitions Disposals
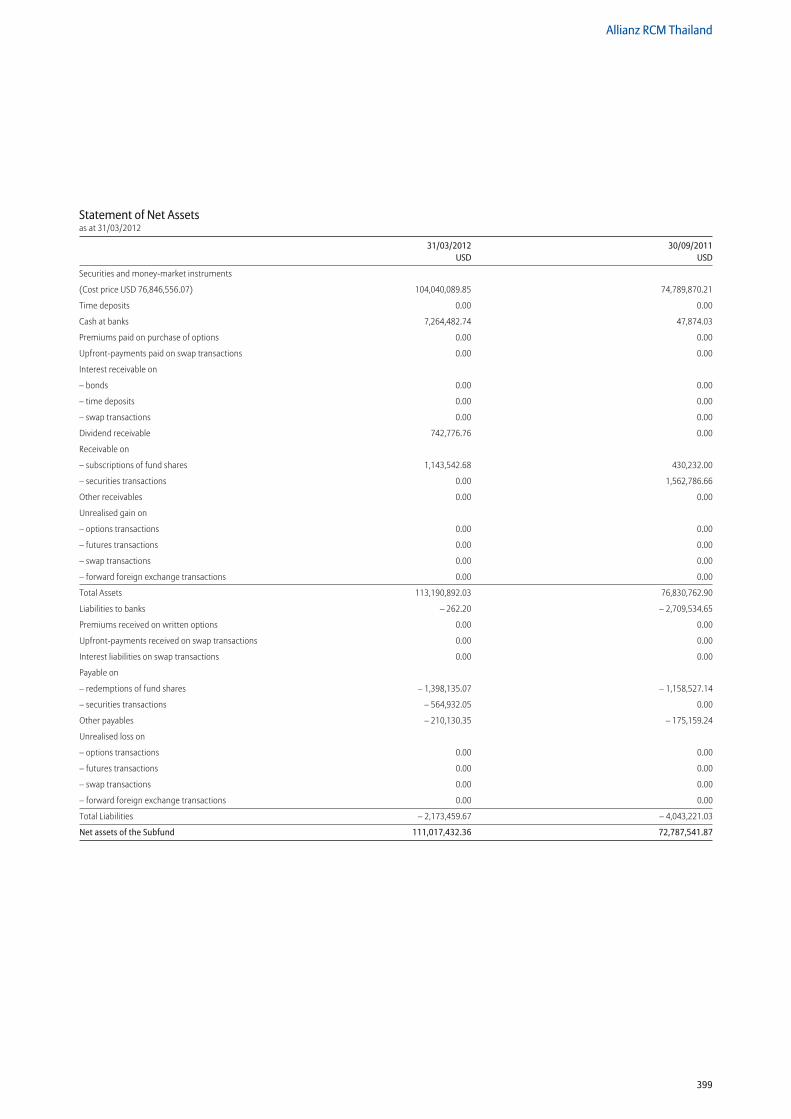
399
Allianz RCM Thailand
Statement of Net Assetsas at 31/03/2012
31/03/2012 30/09/2011 USD USD
Securities and money-market instruments
(Cost price USD 76,846,556.07) 104,040,089.85 74,789,870.21
Time deposits 0.00 0.00
Cash at banks 7,264,482.74 47,874.03
Premiums paid on purchase of options 0.00 0.00
Upfront-payments paid on swap transactions 0.00 0.00
Interest receivable on
– bonds 0.00 0.00
– time deposits 0.00 0.00
– swap transactions 0.00 0.00
Dividend receivable 742,776.76 0.00
Receivable on
– subscriptions of fund shares 1,143,542.68 430,232.00
– securities transactions 0.00 1,562,786.66
Other receivables 0.00 0.00
Unrealised gain on
– options transactions 0.00 0.00
– futures transactions 0.00 0.00
– swap transactions 0.00 0.00
– forward foreign exchange transactions 0.00 0.00
Total Assets 113,190,892.03 76,830,762.90
Liabilities to banks – 262.20 – 2,709,534.65
Premiums received on written options 0.00 0.00
Upfront-payments received on swap transactions 0.00 0.00
Interest liabilities on swap transactions 0.00 0.00
Payable on
– redemptions of fund shares – 1,398,135.07 – 1,158,527.14
– securities transactions – 564,932.05 0.00
Other payables – 210,130.35 – 175,159.24
Unrealised loss on
– options transactions 0.00 0.00
– futures transactions 0.00 0.00
– swap transactions 0.00 0.00
– forward foreign exchange transactions 0.00 0.00
Total Liabilities – 2,173,459.67 – 4,043,221.03
Net assets of the Subfund 111,017,432.36 72,787,541.87
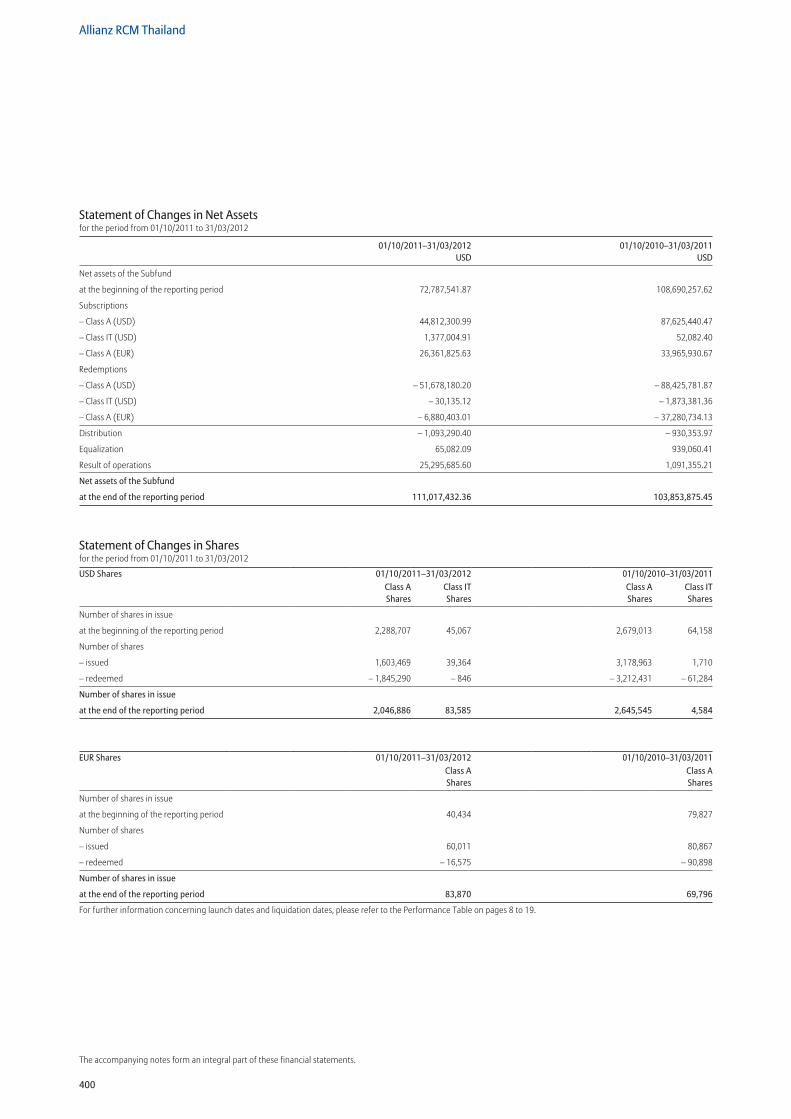
400
Allianz RCM Thailand
The accompanying notes form an integral part of these financial statements.
Statement of Changes in Net Assetsfor the period from 01/10/2011 to 31/03/2012
01/10/2011–31/03/2012 01/10/2010–31/03/2011 USD USD
Net assets of the Subfund
at the beginning of the reporting period 72,787,541.87 108,690,257.62
Subscriptions
– Class A (USD) 44,812,300.99 87,625,440.47
– Class IT (USD) 1,377,004.91 52,082.40
– Class A (EUR) 26,361,825.63 33,965,930.67
Redemptions
– Class A (USD) – 51,678,180.20 – 88,425,781.87
– Class IT (USD) – 30,135.12 – 1,873,381.36
– Class A (EUR) – 6,880,403.01 – 37,280,734.13
Distribution – 1,093,290.40 – 930,353.97
Equalization 65,082.09 939,060.41
Result of operations 25,295,685.60 1,091,355.21
Net assets of the Subfund
at the end of the reporting period 111,017,432.36 103,853,875.45
Statement of Changes in Sharesfor the period from 01/10/2011 to 31/03/2012
USD Shares 01/10/2011–31/03/2012 01/10/2010–31/03/2011Class A Shares
Class IT Shares
Class A Shares
Class IT Shares
Number of shares in issue
at the beginning of the reporting period 2,288,707 45,067 2,679,013 64,158
Number of shares
– issued 1,603,469 39,364 3,178,963 1,710
– redeemed – 1,845,290 – 846 – 3,212,431 – 61,284
Number of shares in issue
at the end of the reporting period 2,046,886 83,585 2,645,545 4,584
EUR Shares 01/10/2011–31/03/2012 01/10/2010–31/03/2011Class A Shares
Class A Shares
Number of shares in issue
at the beginning of the reporting period 40,434 79,827
Number of shares
– issued 60,011 80,867
– redeemed – 16,575 – 90,898
Number of shares in issue
at the end of the reporting period 83,870 69,796
For further information concerning launch dates and liquidation dates, please refer to the Performance Table on pages 8 to 19.
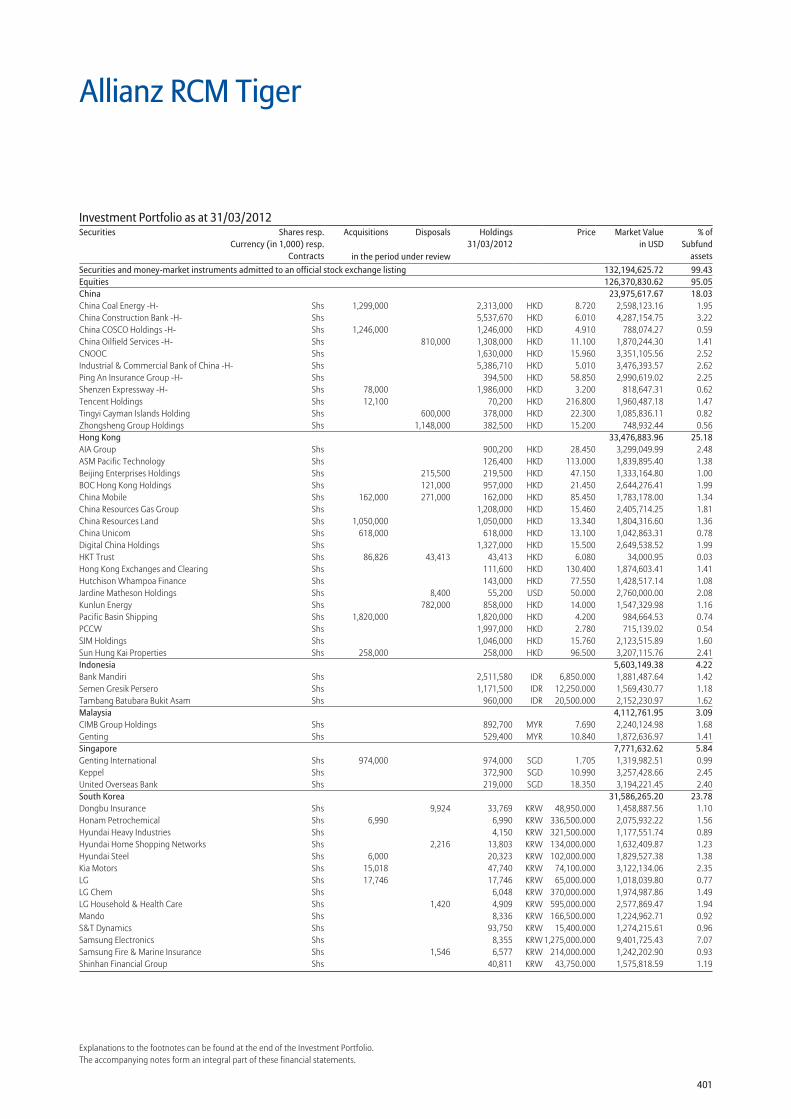
401
Explanations to the footnotes can be found at the end of the Investment Portfolio.The accompanying notes form an integral part of these financial statements.
Securities and money-market instruments admitted to an official stock exchange listing 132,194,625.72 99.43Equities 126,370,830.62 95.05China 23,975,617.67 18.03China Coal Energy -H- Shs 1,299,000 2,313,000 HKD 8.720 2,598,123.16 1.95China Construction Bank -H- Shs 5,537,670 HKD 6.010 4,287,154.75 3.22China COSCO Holdings -H- Shs 1,246,000 1,246,000 HKD 4.910 788,074.27 0.59China Oilfield Services -H- Shs 810,000 1,308,000 HKD 11.100 1,870,244.30 1.41CNOOC Shs 1,630,000 HKD 15.960 3,351,105.56 2.52Industrial & Commercial Bank of China -H- Shs 5,386,710 HKD 5.010 3,476,393.57 2.62Ping An Insurance Group -H- Shs 394,500 HKD 58.850 2,990,619.02 2.25Shenzen Expressway -H- Shs 78,000 1,986,000 HKD 3.200 818,647.31 0.62Tencent Holdings Shs 12,100 70,200 HKD 216.800 1,960,487.18 1.47Tingyi Cayman Islands Holding Shs 600,000 378,000 HKD 22.300 1,085,836.11 0.82Zhongsheng Group Holdings Shs 1,148,000 382,500 HKD 15.200 748,932.44 0.56Hong Kong 33,476,883.96 25.18AIA Group Shs 900,200 HKD 28.450 3,299,049.99 2.48ASM Pacific Technology Shs 126,400 HKD 113.000 1,839,895.40 1.38Beijing Enterprises Holdings Shs 215,500 219,500 HKD 47.150 1,333,164.80 1.00BOC Hong Kong Holdings Shs 121,000 957,000 HKD 21.450 2,644,276.41 1.99China Mobile Shs 162,000 271,000 162,000 HKD 85.450 1,783,178.00 1.34China Resources Gas Group Shs 1,208,000 HKD 15.460 2,405,714.25 1.81China Resources Land Shs 1,050,000 1,050,000 HKD 13.340 1,804,316.60 1.36China Unicom Shs 618,000 618,000 HKD 13.100 1,042,863.31 0.78Digital China Holdings Shs 1,327,000 HKD 15.500 2,649,538.52 1.99HKT Trust Shs 86,826 43,413 43,413 HKD 6.080 34,000.95 0.03Hong Kong Exchanges and Clearing Shs 111,600 HKD 130.400 1,874,603.41 1.41Hutchison Whampoa Finance Shs 143,000 HKD 77.550 1,428,517.14 1.08Jardine Matheson Holdings Shs 8,400 55,200 USD 50.000 2,760,000.00 2.08Kunlun Energy Shs 782,000 858,000 HKD 14.000 1,547,329.98 1.16Pacific Basin Shipping Shs 1,820,000 1,820,000 HKD 4.200 984,664.53 0.74PCCW Shs 1,997,000 HKD 2.780 715,139.02 0.54SJM Holdings Shs 1,046,000 HKD 15.760 2,123,515.89 1.60Sun Hung Kai Properties Shs 258,000 258,000 HKD 96.500 3,207,115.76 2.41Indonesia 5,603,149.38 4.22Bank Mandiri Shs 2,511,580 IDR 6,850.000 1,881,487.64 1.42Semen Gresik Persero Shs 1,171,500 IDR 12,250.000 1,569,430.77 1.18Tambang Batubara Bukit Asam Shs 960,000 IDR 20,500.000 2,152,230.97 1.62Malaysia 4,112,761.95 3.09CIMB Group Holdings Shs 892,700 MYR 7.690 2,240,124.98 1.68Genting Shs 529,400 MYR 10.840 1,872,636.97 1.41Singapore 7,771,632.62 5.84Genting International Shs 974,000 974,000 SGD 1.705 1,319,982.51 0.99Keppel Shs 372,900 SGD 10.990 3,257,428.66 2.45United Overseas Bank Shs 219,000 SGD 18.350 3,194,221.45 2.40South Korea 31,586,265.20 23.78Dongbu Insurance Shs 9,924 33,769 KRW 48,950.000 1,458,887.56 1.10Honam Petrochemical Shs 6,990 6,990 KRW 336,500.000 2,075,932.22 1.56Hyundai Heavy Industries Shs 4,150 KRW 321,500.000 1,177,551.74 0.89Hyundai Home Shopping Networks Shs 2,216 13,803 KRW 134,000.000 1,632,409.87 1.23Hyundai Steel Shs 6,000 20,323 KRW 102,000.000 1,829,527.38 1.38Kia Motors Shs 15,018 47,740 KRW 74,100.000 3,122,134.06 2.35LG Shs 17,746 17,746 KRW 65,000.000 1,018,039.80 0.77LG Chem Shs 6,048 KRW 370,000.000 1,974,987.86 1.49LG Household & Health Care Shs 1,420 4,909 KRW 595,000.000 2,577,869.47 1.94Mando Shs 8,336 KRW 166,500.000 1,224,962.71 0.92S&T Dynamics Shs 93,750 KRW 15,400.000 1,274,215.61 0.96Samsung Electronics Shs 8,355 KRW 1,275,000.000 9,401,725.43 7.07Samsung Fire & Marine Insurance Shs 1,546 6,577 KRW 214,000.000 1,242,202.90 0.93Shinhan Financial Group Shs 40,811 KRW 43,750.000 1,575,818.59 1.19
Allianz RCM Tiger
Investment Portfolio as at 31/03/2012Securities Shares resp.
Currency (in 1,000) resp.Contracts
Acquisitions Disposals Holdings 31/03/2012
Price Market Valuein USD
% ofSubfund
assetsin the period under review
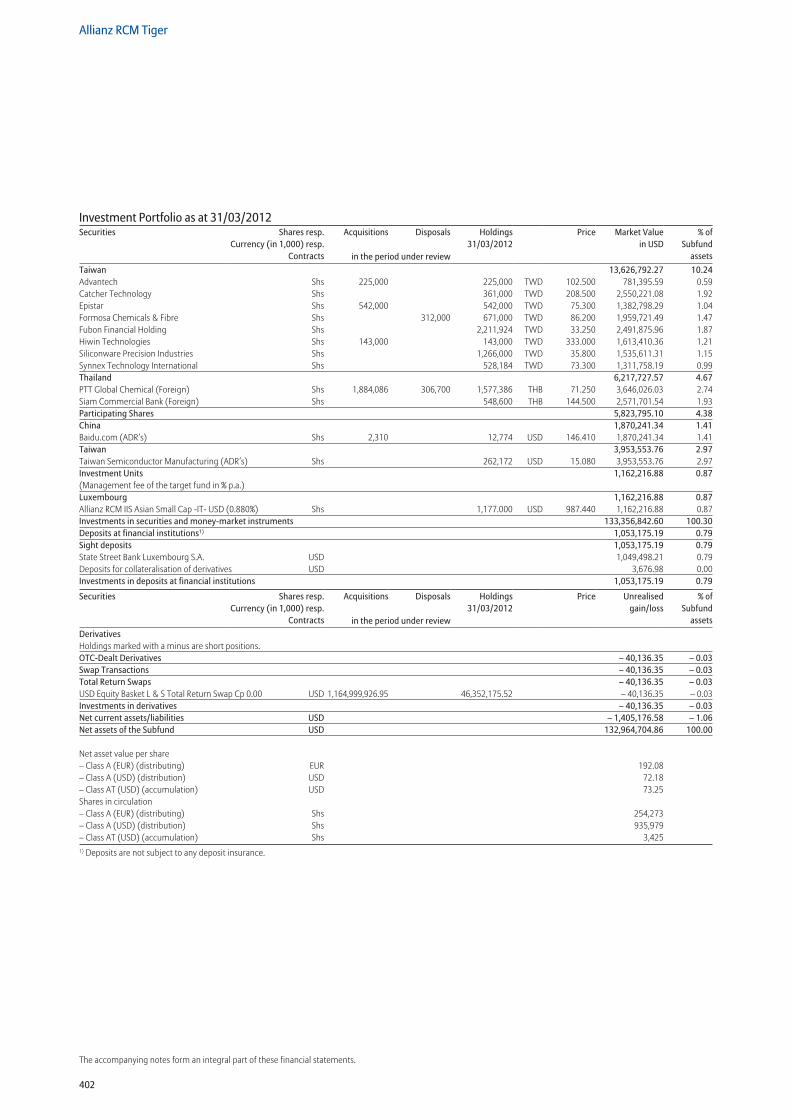
402
Allianz RCM Tiger
The accompanying notes form an integral part of these financial statements.
Taiwan 13,626,792.27 10.24Advantech Shs 225,000 225,000 TWD 102.500 781,395.59 0.59Catcher Technology Shs 361,000 TWD 208.500 2,550,221.08 1.92Epistar Shs 542,000 542,000 TWD 75.300 1,382,798.29 1.04Formosa Chemicals & Fibre Shs 312,000 671,000 TWD 86.200 1,959,721.49 1.47Fubon Financial Holding Shs 2,211,924 TWD 33.250 2,491,875.96 1.87Hiwin Technologies Shs 143,000 143,000 TWD 333.000 1,613,410.36 1.21Siliconware Precision Industries Shs 1,266,000 TWD 35.800 1,535,611.31 1.15Synnex Technology International Shs 528,184 TWD 73.300 1,311,758.19 0.99Thailand 6,217,727.57 4.67PTT Global Chemical (Foreign) Shs 1,884,086 306,700 1,577,386 THB 71.250 3,646,026.03 2.74Siam Commercial Bank (Foreign) Shs 548,600 THB 144.500 2,571,701.54 1.93Participating Shares 5,823,795.10 4.38China 1,870,241.34 1.41Baidu.com (ADR’s) Shs 2,310 12,774 USD 146.410 1,870,241.34 1.41Taiwan 3,953,553.76 2.97Taiwan Semiconductor Manufacturing (ADR’s) Shs 262,172 USD 15.080 3,953,553.76 2.97Investment Units 1,162,216.88 0.87(Management fee of the target fund in % p.a.) Luxembourg 1,162,216.88 0.87Allianz RCM IIS Asian Small Cap -IT- USD (0.880%) Shs 1,177.000 USD 987.440 1,162,216.88 0.87Investments in securities and money-market instruments 133,356,842.60 100.30Deposits at financial institutions1) 1,053,175.19 0.79Sight deposits 1,053,175.19 0.79State Street Bank Luxembourg S.A. USD 1,049,498.21 0.79Deposits for collateralisation of derivatives USD 3,676.98 0.00Investments in deposits at financial institutions 1,053,175.19 0.79
Securities Shares resp.Currency (in 1,000) resp.
Contracts
Acquisitions Disposals Holdings 31/03/2012
Price Unrealisedgain/loss
% ofSubfund
assetsin the period under reviewDerivatives Holdings marked with a minus are short positions. OTC-Dealt Derivatives – 40,136.35 – 0.03Swap Transactions – 40,136.35 – 0.03Total Return Swaps – 40,136.35 – 0.03USD Equity Basket L & S Total Return Swap Cp 0.00 USD 1,164,999,926.95 46,352,175.52 – 40,136.35 – 0.03Investments in derivatives – 40,136.35 – 0.03Net current assets/liabilities USD – 1,405,176.58 – 1.06Net assets of the Subfund USD 132,964,704.86 100.00
Net asset value per share – Class A (EUR) (distributing) EUR 192.08 – Class A (USD) (distribution) USD 72.18 – Class AT (USD) (accumulation) USD 73.25 Shares in circulation – Class A (EUR) (distributing) Shs 254,273 – Class A (USD) (distribution) Shs 935,979– Class AT (USD) (accumulation) Shs 3,4251) Deposits are not subject to any deposit insurance.
Investment Portfolio as at 31/03/2012Securities Shares resp.
Currency (in 1,000) resp.Contracts
Acquisitions Disposals Holdings 31/03/2012
Price Market Valuein USD
% ofSubfund
assetsin the period under review
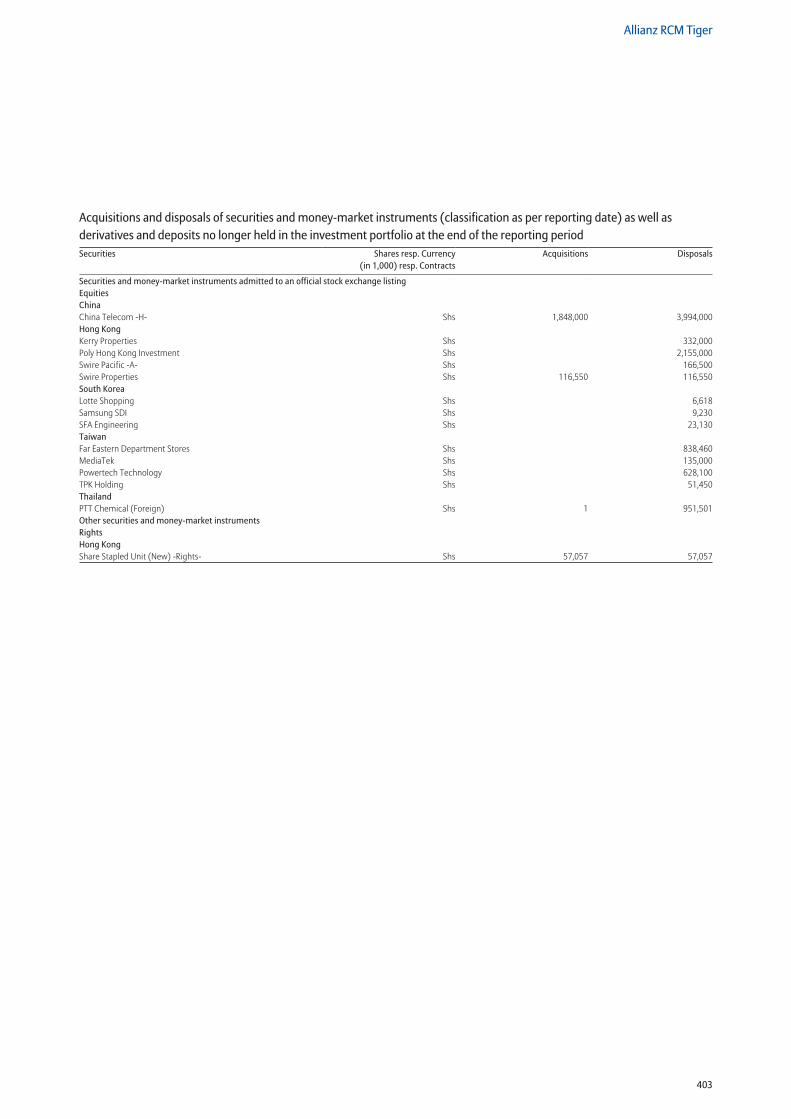
403
Allianz RCM Tiger
Securities and money-market instruments admitted to an official stock exchange listing Equities China China Telecom -H- Shs 1,848,000 3,994,000Hong Kong Kerry Properties Shs 332,000Poly Hong Kong Investment Shs 2,155,000Swire Pacific -A- Shs 166,500Swire Properties Shs 116,550 116,550South Korea Lotte Shopping Shs 6,618Samsung SDI Shs 9,230SFA Engineering Shs 23,130Taiwan Far Eastern Department Stores Shs 838,460MediaTek Shs 135,000Powertech Technology Shs 628,100TPK Holding Shs 51,450Thailand PTT Chemical (Foreign) Shs 1 951,501Other securities and money-market instruments Rights Hong Kong Share Stapled Unit (New) -Rights- Shs 57,057 57,057
Acquisitions and disposals of securities and money-market instruments (classification as per reporting date) as well as derivatives and deposits no longer held in the investment portfolio at the end of the reporting periodSecurities Shares resp. Currency
(in 1,000) resp. ContractsAcquisitions Disposals
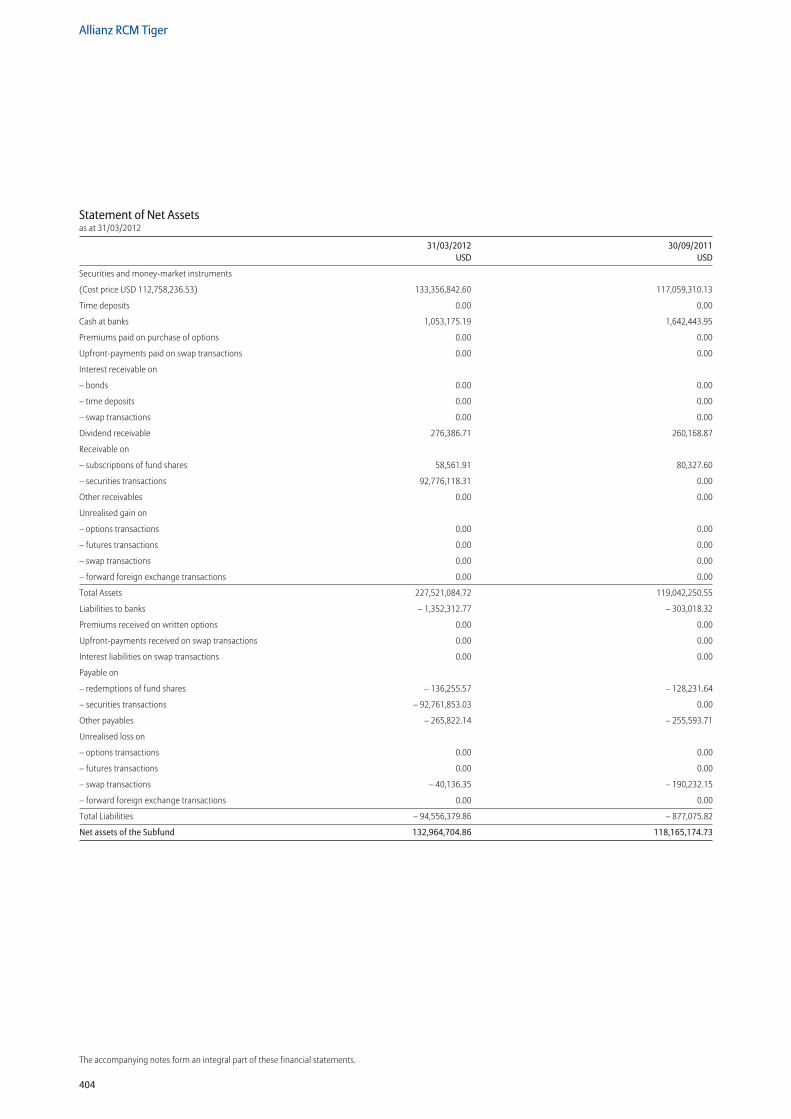
404
Allianz RCM Tiger
The accompanying notes form an integral part of these financial statements.
Statement of Net Assetsas at 31/03/2012
31/03/2012 30/09/2011 USD USD
Securities and money-market instruments
(Cost price USD 112,758,236.53) 133,356,842.60 117,059,310.13
Time deposits 0.00 0.00
Cash at banks 1,053,175.19 1,642,443.95
Premiums paid on purchase of options 0.00 0.00
Upfront-payments paid on swap transactions 0.00 0.00
Interest receivable on
– bonds 0.00 0.00
– time deposits 0.00 0.00
– swap transactions 0.00 0.00
Dividend receivable 276,386.71 260,168.87
Receivable on
– subscriptions of fund shares 58,561.91 80,327.60
– securities transactions 92,776,118.31 0.00
Other receivables 0.00 0.00
Unrealised gain on
– options transactions 0.00 0.00
– futures transactions 0.00 0.00
– swap transactions 0.00 0.00
– forward foreign exchange transactions 0.00 0.00
Total Assets 227,521,084.72 119,042,250.55
Liabilities to banks – 1,352,312.77 – 303,018.32
Premiums received on written options 0.00 0.00
Upfront-payments received on swap transactions 0.00 0.00
Interest liabilities on swap transactions 0.00 0.00
Payable on
– redemptions of fund shares – 136,255.57 – 128,231.64
– securities transactions – 92,761,853.03 0.00
Other payables – 265,822.14 – 255,593.71
Unrealised loss on
– options transactions 0.00 0.00
– futures transactions 0.00 0.00
– swap transactions – 40,136.35 – 190,232.15
– forward foreign exchange transactions 0.00 0.00
Total Liabilities – 94,556,379.86 – 877,075.82
Net assets of the Subfund 132,964,704.86 118,165,174.73
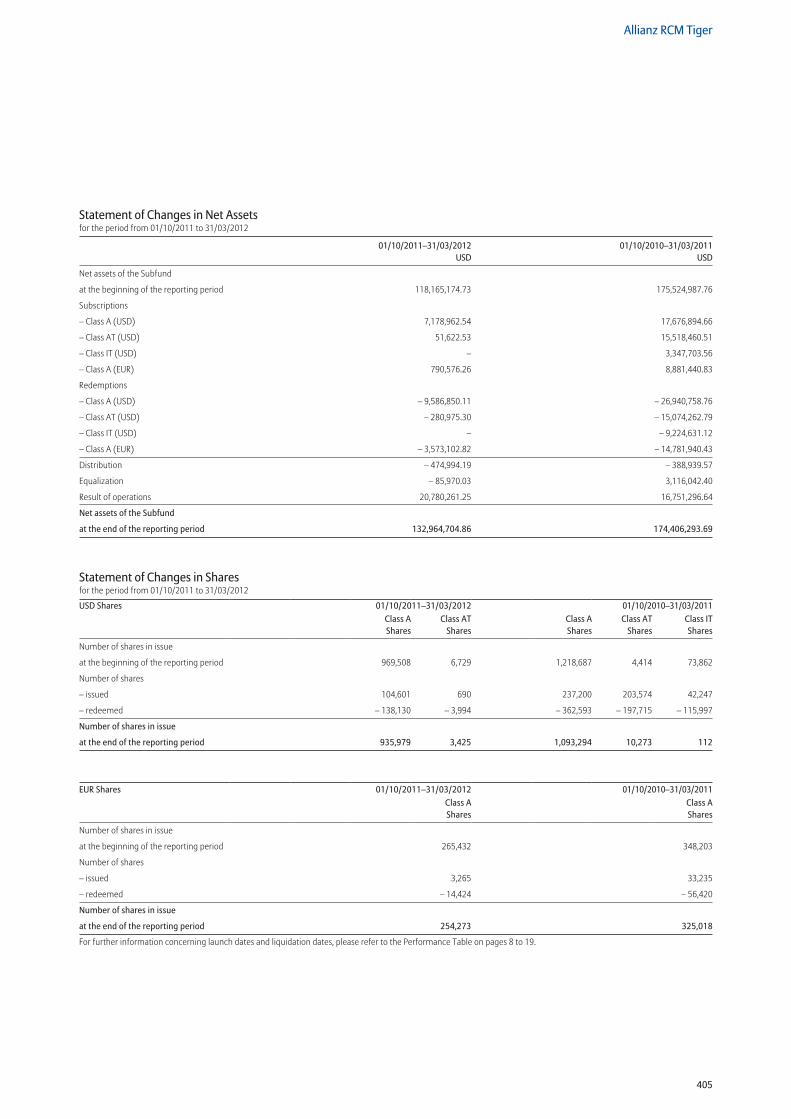
405
Allianz RCM Tiger
Statement of Changes in Net Assetsfor the period from 01/10/2011 to 31/03/2012
01/10/2011–31/03/2012 01/10/2010–31/03/2011 USD USD
Net assets of the Subfund
at the beginning of the reporting period 118,165,174.73 175,524,987.76
Subscriptions
– Class A (USD) 7,178,962.54 17,676,894.66
– Class AT (USD) 51,622.53 15,518,460.51
– Class IT (USD) – 3,347,703.56
– Class A (EUR) 790,576.26 8,881,440.83
Redemptions
– Class A (USD) – 9,586,850.11 – 26,940,758.76
– Class AT (USD) – 280,975.30 – 15,074,262.79
– Class IT (USD) – – 9,224,631.12
– Class A (EUR) – 3,573,102.82 – 14,781,940.43
Distribution – 474,994.19 – 388,939.57
Equalization – 85,970.03 3,116,042.40
Result of operations 20,780,261.25 16,751,296.64
Net assets of the Subfund
at the end of the reporting period 132,964,704.86 174,406,293.69
Statement of Changes in Sharesfor the period from 01/10/2011 to 31/03/2012
USD Shares 01/10/2011–31/03/2012 01/10/2010–31/03/2011Class A Shares
Class AT Shares
Class A Shares
Class AT Shares
Class IT Shares
Number of shares in issue
at the beginning of the reporting period 969,508 6,729 1,218,687 4,414 73,862
Number of shares
– issued 104,601 690 237,200 203,574 42,247
– redeemed – 138,130 – 3,994 – 362,593 – 197,715 – 115,997
Number of shares in issue
at the end of the reporting period 935,979 3,425 1,093,294 10,273 112
EUR Shares 01/10/2011–31/03/2012 01/10/2010–31/03/2011Class A Shares
Class A Shares
Number of shares in issue
at the beginning of the reporting period 265,432 348,203
Number of shares
– issued 3,265 33,235
– redeemed – 14,424 – 56,420
Number of shares in issue
at the end of the reporting period 254,273 325,018
For further information concerning launch dates and liquidation dates, please refer to the Performance Table on pages 8 to 19.
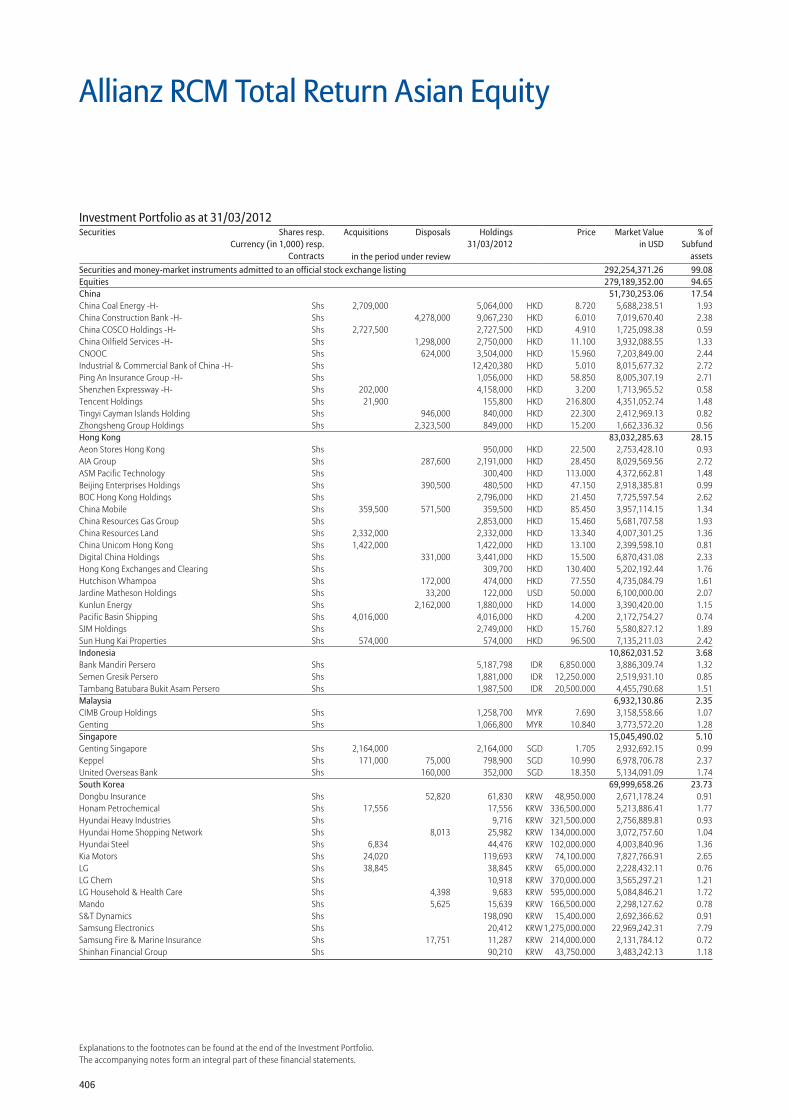
406
Explanations to the footnotes can be found at the end of the Investment Portfolio.The accompanying notes form an integral part of these financial statements.
Securities and money-market instruments admitted to an official stock exchange listing 292,254,371.26 99.08Equities 279,189,352.00 94.65China 51,730,253.06 17.54China Coal Energy -H- Shs 2,709,000 5,064,000 HKD 8.720 5,688,238.51 1.93China Construction Bank -H- Shs 4,278,000 9,067,230 HKD 6.010 7,019,670.40 2.38China COSCO Holdings -H- Shs 2,727,500 2,727,500 HKD 4.910 1,725,098.38 0.59China Oilfield Services -H- Shs 1,298,000 2,750,000 HKD 11.100 3,932,088.55 1.33CNOOC Shs 624,000 3,504,000 HKD 15.960 7,203,849.00 2.44Industrial & Commercial Bank of China -H- Shs 12,420,380 HKD 5.010 8,015,677.32 2.72Ping An Insurance Group -H- Shs 1,056,000 HKD 58.850 8,005,307.19 2.71Shenzhen Expressway -H- Shs 202,000 4,158,000 HKD 3.200 1,713,965.52 0.58Tencent Holdings Shs 21,900 155,800 HKD 216.800 4,351,052.74 1.48Tingyi Cayman Islands Holding Shs 946,000 840,000 HKD 22.300 2,412,969.13 0.82Zhongsheng Group Holdings Shs 2,323,500 849,000 HKD 15.200 1,662,336.32 0.56Hong Kong 83,032,285.63 28.15Aeon Stores Hong Kong Shs 950,000 HKD 22.500 2,753,428.10 0.93AIA Group Shs 287,600 2,191,000 HKD 28.450 8,029,569.56 2.72ASM Pacific Technology Shs 300,400 HKD 113.000 4,372,662.81 1.48Beijing Enterprises Holdings Shs 390,500 480,500 HKD 47.150 2,918,385.81 0.99BOC Hong Kong Holdings Shs 2,796,000 HKD 21.450 7,725,597.54 2.62China Mobile Shs 359,500 571,500 359,500 HKD 85.450 3,957,114.15 1.34China Resources Gas Group Shs 2,853,000 HKD 15.460 5,681,707.58 1.93China Resources Land Shs 2,332,000 2,332,000 HKD 13.340 4,007,301.25 1.36China Unicom Hong Kong Shs 1,422,000 1,422,000 HKD 13.100 2,399,598.10 0.81Digital China Holdings Shs 331,000 3,441,000 HKD 15.500 6,870,431.08 2.33Hong Kong Exchanges and Clearing Shs 309,700 HKD 130.400 5,202,192.44 1.76Hutchison Whampoa Shs 172,000 474,000 HKD 77.550 4,735,084.79 1.61Jardine Matheson Holdings Shs 33,200 122,000 USD 50.000 6,100,000.00 2.07Kunlun Energy Shs 2,162,000 1,880,000 HKD 14.000 3,390,420.00 1.15Pacific Basin Shipping Shs 4,016,000 4,016,000 HKD 4.200 2,172,754.27 0.74SJM Holdings Shs 2,749,000 HKD 15.760 5,580,827.12 1.89Sun Hung Kai Properties Shs 574,000 574,000 HKD 96.500 7,135,211.03 2.42Indonesia 10,862,031.52 3.68Bank Mandiri Persero Shs 5,187,798 IDR 6,850.000 3,886,309.74 1.32Semen Gresik Persero Shs 1,881,000 IDR 12,250.000 2,519,931.10 0.85Tambang Batubara Bukit Asam Persero Shs 1,987,500 IDR 20,500.000 4,455,790.68 1.51Malaysia 6,932,130.86 2.35CIMB Group Holdings Shs 1,258,700 MYR 7.690 3,158,558.66 1.07Genting Shs 1,066,800 MYR 10.840 3,773,572.20 1.28Singapore 15,045,490.02 5.10Genting Singapore Shs 2,164,000 2,164,000 SGD 1.705 2,932,692.15 0.99Keppel Shs 171,000 75,000 798,900 SGD 10.990 6,978,706.78 2.37United Overseas Bank Shs 160,000 352,000 SGD 18.350 5,134,091.09 1.74South Korea 69,999,658.26 23.73Dongbu Insurance Shs 52,820 61,830 KRW 48,950.000 2,671,178.24 0.91Honam Petrochemical Shs 17,556 17,556 KRW 336,500.000 5,213,886.41 1.77Hyundai Heavy Industries Shs 9,716 KRW 321,500.000 2,756,889.81 0.93Hyundai Home Shopping Network Shs 8,013 25,982 KRW 134,000.000 3,072,757.60 1.04Hyundai Steel Shs 6,834 44,476 KRW 102,000.000 4,003,840.96 1.36Kia Motors Shs 24,020 119,693 KRW 74,100.000 7,827,766.91 2.65LG Shs 38,845 38,845 KRW 65,000.000 2,228,432.11 0.76LG Chem Shs 10,918 KRW 370,000.000 3,565,297.21 1.21LG Household & Health Care Shs 4,398 9,683 KRW 595,000.000 5,084,846.21 1.72Mando Shs 5,625 15,639 KRW 166,500.000 2,298,127.62 0.78S&T Dynamics Shs 198,090 KRW 15,400.000 2,692,366.62 0.91Samsung Electronics Shs 20,412 KRW 1,275,000.000 22,969,242.31 7.79Samsung Fire & Marine Insurance Shs 17,751 11,287 KRW 214,000.000 2,131,784.12 0.72Shinhan Financial Group Shs 90,210 KRW 43,750.000 3,483,242.13 1.18
Allianz RCM Total Return Asian Equity
Investment Portfolio as at 31/03/2012Securities Shares resp.
Currency (in 1,000) resp.Contracts
Acquisitions Disposals Holdings 31/03/2012
Price Market Valuein USD
% ofSubfund
assetsin the period under review
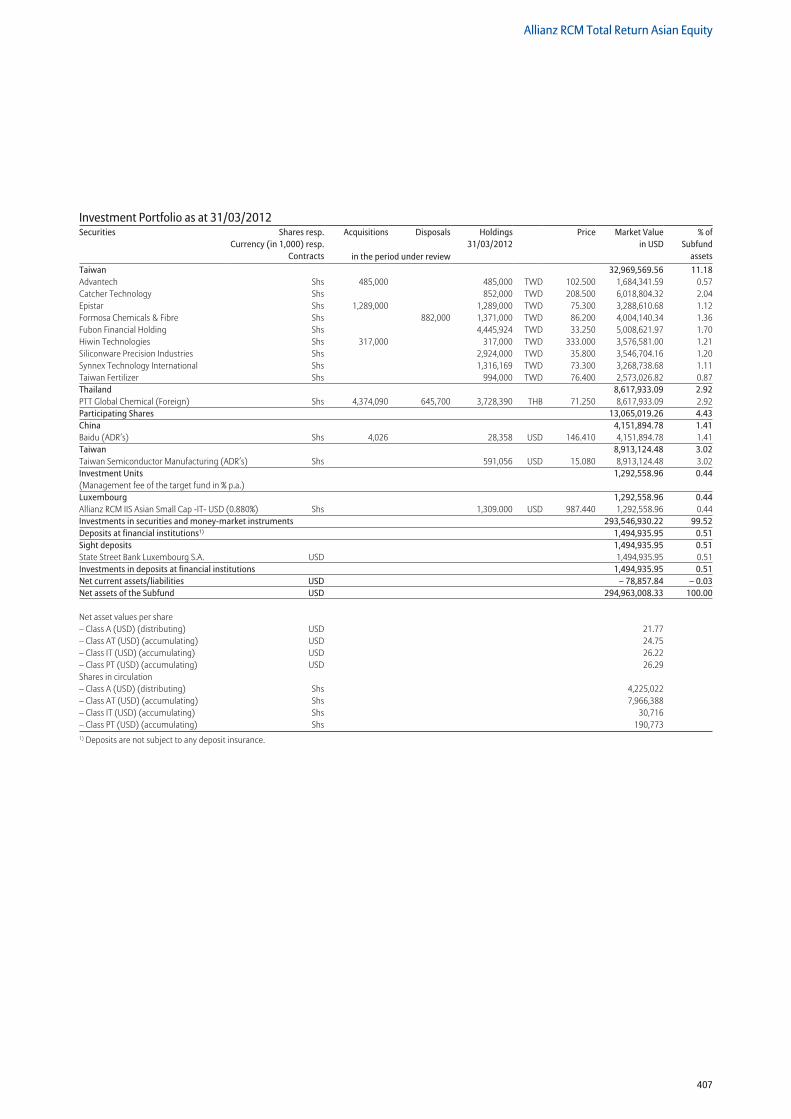
407
Allianz RCM Total Return Asian Equity
Taiwan 32,969,569.56 11.18Advantech Shs 485,000 485,000 TWD 102.500 1,684,341.59 0.57Catcher Technology Shs 852,000 TWD 208.500 6,018,804.32 2.04Epistar Shs 1,289,000 1,289,000 TWD 75.300 3,288,610.68 1.12Formosa Chemicals & Fibre Shs 882,000 1,371,000 TWD 86.200 4,004,140.34 1.36Fubon Financial Holding Shs 4,445,924 TWD 33.250 5,008,621.97 1.70Hiwin Technologies Shs 317,000 317,000 TWD 333.000 3,576,581.00 1.21Siliconware Precision Industries Shs 2,924,000 TWD 35.800 3,546,704.16 1.20Synnex Technology International Shs 1,316,169 TWD 73.300 3,268,738.68 1.11Taiwan Fertilizer Shs 994,000 TWD 76.400 2,573,026.82 0.87Thailand 8,617,933.09 2.92PTT Global Chemical (Foreign) Shs 4,374,090 645,700 3,728,390 THB 71.250 8,617,933.09 2.92Participating Shares 13,065,019.26 4.43China 4,151,894.78 1.41Baidu (ADR’s) Shs 4,026 28,358 USD 146.410 4,151,894.78 1.41Taiwan 8,913,124.48 3.02Taiwan Semiconductor Manufacturing (ADR’s) Shs 591,056 USD 15.080 8,913,124.48 3.02Investment Units 1,292,558.96 0.44(Management fee of the target fund in % p.a.) Luxembourg 1,292,558.96 0.44Allianz RCM IIS Asian Small Cap -IT- USD (0.880%) Shs 1,309.000 USD 987.440 1,292,558.96 0.44Investments in securities and money-market instruments 293,546,930.22 99.52Deposits at financial institutions1) 1,494,935.95 0.51Sight deposits 1,494,935.95 0.51State Street Bank Luxembourg S.A. USD 1,494,935.95 0.51Investments in deposits at financial institutions 1,494,935.95 0.51Net current assets/liabilities USD – 78,857.84 – 0.03Net assets of the Subfund USD 294,963,008.33 100.00
Net asset values per share – Class A (USD) (distributing) USD 21.77 – Class AT (USD) (accumulating) USD 24.75 – Class IT (USD) (accumulating) USD 26.22– Class PT (USD) (accumulating) USD 26.29Shares in circulation – Class A (USD) (distributing) Shs 4,225,022 – Class AT (USD) (accumulating) Shs 7,966,388 – Class IT (USD) (accumulating) Shs 30,716 – Class PT (USD) (accumulating) Shs 190,7731) Deposits are not subject to any deposit insurance.
Investment Portfolio as at 31/03/2012Securities Shares resp.
Currency (in 1,000) resp.Contracts
Acquisitions Disposals Holdings 31/03/2012
Price Market Valuein USD
% ofSubfund
assetsin the period under review
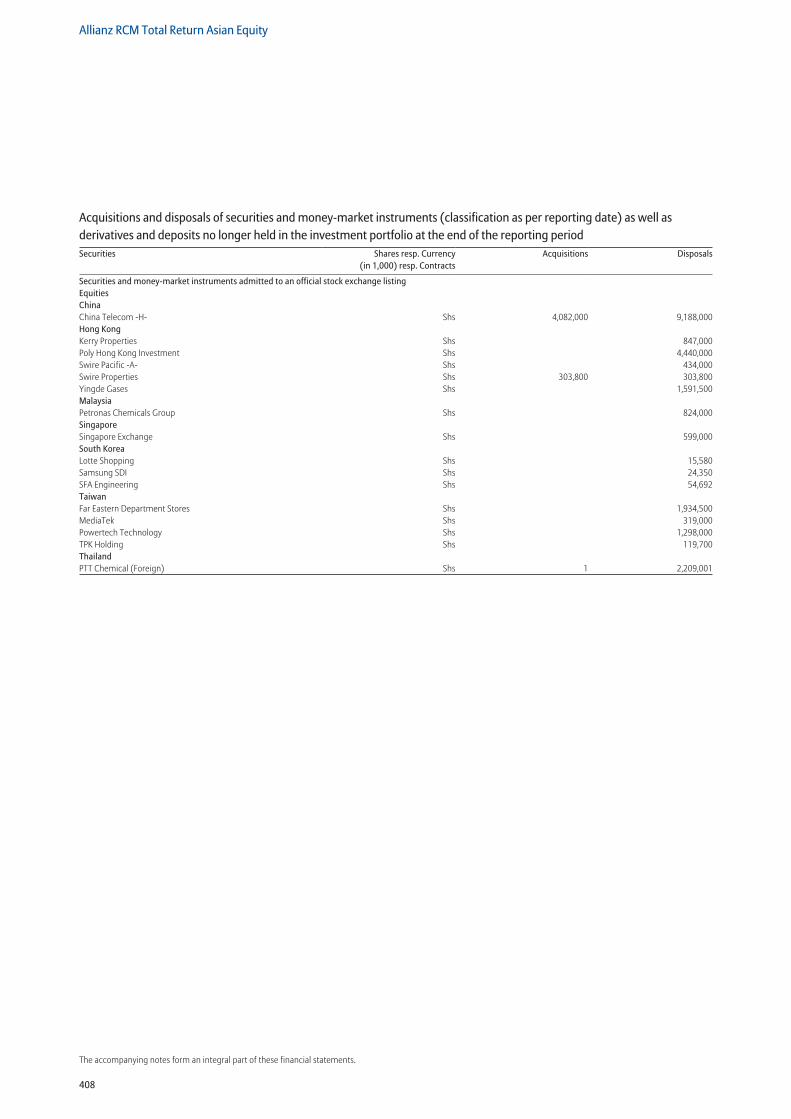
408
Allianz RCM Total Return Asian Equity
The accompanying notes form an integral part of these financial statements.
Securities and money-market instruments admitted to an official stock exchange listing Equities China China Telecom -H- Shs 4,082,000 9,188,000Hong Kong Kerry Properties Shs 847,000Poly Hong Kong Investment Shs 4,440,000Swire Pacific -A- Shs 434,000Swire Properties Shs 303,800 303,800Yingde Gases Shs 1,591,500Malaysia Petronas Chemicals Group Shs 824,000Singapore Singapore Exchange Shs 599,000South Korea Lotte Shopping Shs 15,580Samsung SDI Shs 24,350SFA Engineering Shs 54,692Taiwan Far Eastern Department Stores Shs 1,934,500MediaTek Shs 319,000Powertech Technology Shs 1,298,000TPK Holding Shs 119,700Thailand PTT Chemical (Foreign) Shs 1 2,209,001
Acquisitions and disposals of securities and money-market instruments (classification as per reporting date) as well as derivatives and deposits no longer held in the investment portfolio at the end of the reporting periodSecurities Shares resp. Currency
(in 1,000) resp. ContractsAcquisitions Disposals

409
Allianz RCM Total Return Asian Equity
Statement of Net Assetsas at 31/03/2012
31/03/2012 30/09/2011 USD USD
Securities and money-market instruments
(Cost price USD 234,700,944.01) 293,546,930.22 277,787,916.10
Time deposits 0.00 0.00
Cash at banks 1,494,935.95 3,991,232.30
Premiums paid on purchase of options 0.00 0.00
Upfront-payments paid on swap transactions 0.00 0.00
Interest receivable on
– bonds 0.00 0.00
– time deposits 0.00 0.00
– swap transactions 0.00 0.00
Dividend receivable 620,918.63 599,998.20
Receivable on
– subscriptions of fund shares 843,903.69 49,695.66
– securities transactions 634,908.44 0.00
Other receivables 0.00 0.00
Unrealised gain on
– options transactions 0.00 0.00
– futures transactions 0.00 0.00
– swap transactions 0.00 0.00
– forward foreign exchange transactions 0.00 0.00
Total Assets 297,141,596.93 282,428,842.26
Liabilities to banks – 669,314.26 – 2,485,654.63
Premiums received on written options 0.00 0.00
Upfront-payments received on swap transactions 0.00 0.00
Interest liabilities on swap transactions 0.00 0.00
Payable on
– redemptions of fund shares – 889,038.37 – 1,643,278.13
– securities transactions – 84,236.57 0.00
Other payables – 535,999.40 – 555,742.50
Unrealised loss on
– options transactions 0.00 0.00
– futures transactions 0.00 0.00
– swap transactions 0.00 0.00
– forward foreign exchange transactions 0.00 0.00
Total Liabilities – 2,178,588.60 – 4,684,675.26
Net assets of the Subfund 294,963,008.33 277,744,167.00
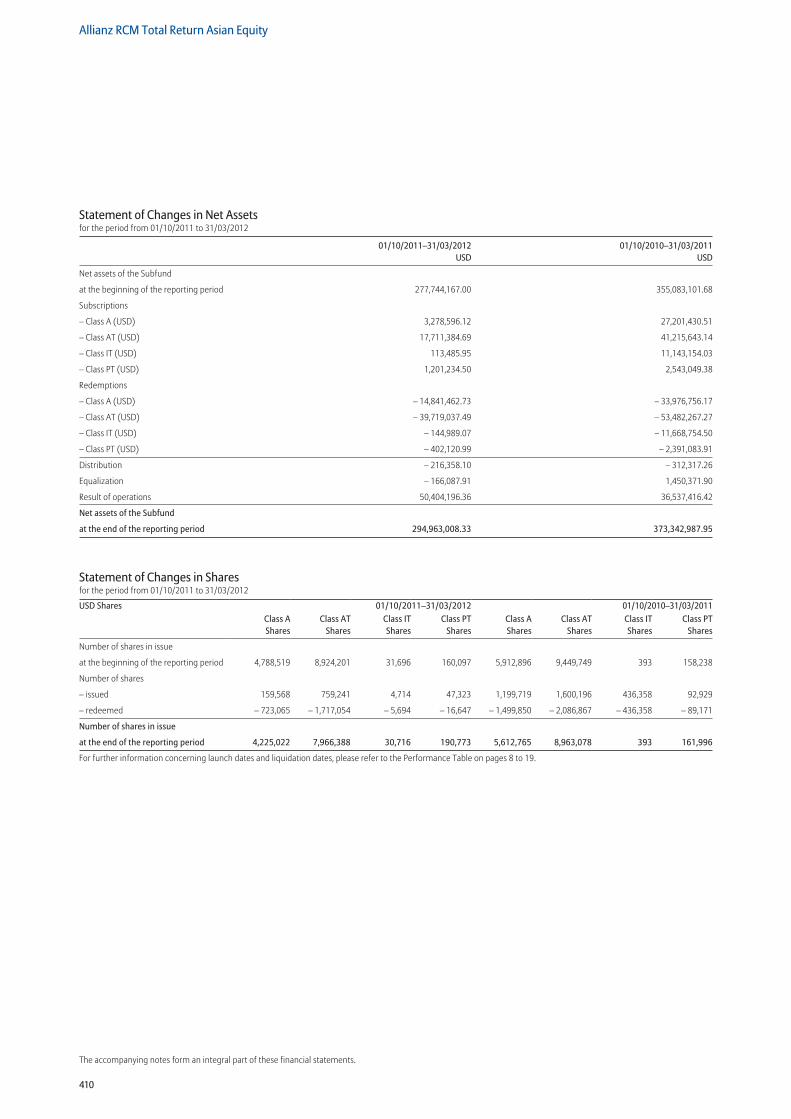
410
Allianz RCM Total Return Asian Equity
The accompanying notes form an integral part of these financial statements.
Statement of Changes in Net Assetsfor the period from 01/10/2011 to 31/03/2012
01/10/2011–31/03/2012 01/10/2010–31/03/2011 USD USD
Net assets of the Subfund
at the beginning of the reporting period 277,744,167.00 355,083,101.68
Subscriptions
– Class A (USD) 3,278,596.12 27,201,430.51
– Class AT (USD) 17,711,384.69 41,215,643.14
– Class IT (USD) 113,485.95 11,143,154.03
– Class PT (USD) 1,201,234.50 2,543,049.38
Redemptions
– Class A (USD) – 14,841,462.73 – 33,976,756.17
– Class AT (USD) – 39,719,037.49 – 53,482,267.27
– Class IT (USD) – 144,989.07 – 11,668,754.50
– Class PT (USD) – 402,120.99 – 2,391,083.91
Distribution – 216,358.10 – 312,317.26
Equalization – 166,087.91 1,450,371.90
Result of operations 50,404,196.36 36,537,416.42
Net assets of the Subfund
at the end of the reporting period 294,963,008.33 373,342,987.95
Statement of Changes in Sharesfor the period from 01/10/2011 to 31/03/2012
USD Shares 01/10/2011–31/03/2012 01/10/2010–31/03/2011Class A Shares
Class AT Shares
Class IT Shares
Class PT Shares
Class A Shares
Class AT Shares
Class IT Shares
Class PT Shares
Number of shares in issue
at the beginning of the reporting period 4,788,519 8,924,201 31,696 160,097 5,912,896 9,449,749 393 158,238
Number of shares
– issued 159,568 759,241 4,714 47,323 1,199,719 1,600,196 436,358 92,929
– redeemed – 723,065 – 1,717,054 – 5,694 – 16,647 – 1,499,850 – 2,086,867 – 436,358 – 89,171
Number of shares in issue
at the end of the reporting period 4,225,022 7,966,388 30,716 190,773 5,612,765 8,963,078 393 161,996
For further information concerning launch dates and liquidation dates, please refer to the Performance Table on pages 8 to 19.
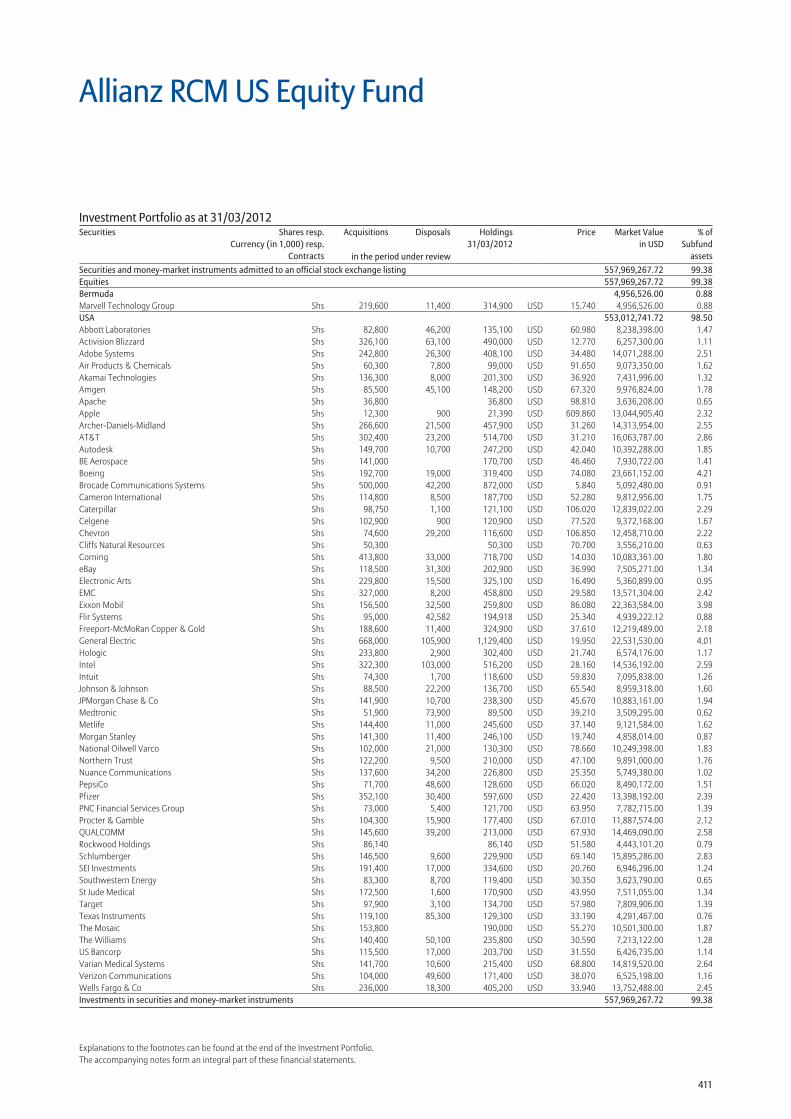
411
Explanations to the footnotes can be found at the end of the Investment Portfolio.The accompanying notes form an integral part of these financial statements.
Securities and money-market instruments admitted to an official stock exchange listing 557,969,267.72 99.38Equities 557,969,267.72 99.38Bermuda 4,956,526.00 0.88Marvell Technology Group Shs 219,600 11,400 314,900 USD 15.740 4,956,526.00 0.88USA 553,012,741.72 98.50Abbott Laboratories Shs 82,800 46,200 135,100 USD 60.980 8,238,398.00 1.47Activision Blizzard Shs 326,100 63,100 490,000 USD 12.770 6,257,300.00 1.11Adobe Systems Shs 242,800 26,300 408,100 USD 34.480 14,071,288.00 2.51Air Products & Chemicals Shs 60,300 7,800 99,000 USD 91.650 9,073,350.00 1.62Akamai Technologies Shs 136,300 8,000 201,300 USD 36.920 7,431,996.00 1.32Amgen Shs 85,500 45,100 148,200 USD 67.320 9,976,824.00 1.78Apache Shs 36,800 36,800 USD 98.810 3,636,208.00 0.65Apple Shs 12,300 900 21,390 USD 609.860 13,044,905.40 2.32Archer-Daniels-Midland Shs 266,600 21,500 457,900 USD 31.260 14,313,954.00 2.55AT&T Shs 302,400 23,200 514,700 USD 31.210 16,063,787.00 2.86Autodesk Shs 149,700 10,700 247,200 USD 42.040 10,392,288.00 1.85BE Aerospace Shs 141,000 170,700 USD 46.460 7,930,722.00 1.41Boeing Shs 192,700 19,000 319,400 USD 74.080 23,661,152.00 4.21Brocade Communications Systems Shs 500,000 42,200 872,000 USD 5.840 5,092,480.00 0.91Cameron International Shs 114,800 8,500 187,700 USD 52.280 9,812,956.00 1.75Caterpillar Shs 98,750 1,100 121,100 USD 106.020 12,839,022.00 2.29Celgene Shs 102,900 900 120,900 USD 77.520 9,372,168.00 1.67Chevron Shs 74,600 29,200 116,600 USD 106.850 12,458,710.00 2.22Cliffs Natural Resources Shs 50,300 50,300 USD 70.700 3,556,210.00 0.63Corning Shs 413,800 33,000 718,700 USD 14.030 10,083,361.00 1.80eBay Shs 118,500 31,300 202,900 USD 36.990 7,505,271.00 1.34Electronic Arts Shs 229,800 15,500 325,100 USD 16.490 5,360,899.00 0.95EMC Shs 327,000 8,200 458,800 USD 29.580 13,571,304.00 2.42Exxon Mobil Shs 156,500 32,500 259,800 USD 86.080 22,363,584.00 3.98Flir Systems Shs 95,000 42,582 194,918 USD 25.340 4,939,222.12 0.88Freeport-McMoRan Copper & Gold Shs 188,600 11,400 324,900 USD 37.610 12,219,489.00 2.18General Electric Shs 668,000 105,900 1,129,400 USD 19.950 22,531,530.00 4.01Hologic Shs 233,800 2,900 302,400 USD 21.740 6,574,176.00 1.17Intel Shs 322,300 103,000 516,200 USD 28.160 14,536,192.00 2.59Intuit Shs 74,300 1,700 118,600 USD 59.830 7,095,838.00 1.26Johnson & Johnson Shs 88,500 22,200 136,700 USD 65.540 8,959,318.00 1.60JPMorgan Chase & Co Shs 141,900 10,700 238,300 USD 45.670 10,883,161.00 1.94Medtronic Shs 51,900 73,900 89,500 USD 39.210 3,509,295.00 0.62Metlife Shs 144,400 11,000 245,600 USD 37.140 9,121,584.00 1.62Morgan Stanley Shs 141,300 11,400 246,100 USD 19.740 4,858,014.00 0.87National Oilwell Varco Shs 102,000 21,000 130,300 USD 78.660 10,249,398.00 1.83Northern Trust Shs 122,200 9,500 210,000 USD 47.100 9,891,000.00 1.76Nuance Communications Shs 137,600 34,200 226,800 USD 25.350 5,749,380.00 1.02PepsiCo Shs 71,700 48,600 128,600 USD 66.020 8,490,172.00 1.51Pfizer Shs 352,100 30,400 597,600 USD 22.420 13,398,192.00 2.39PNC Financial Services Group Shs 73,000 5,400 121,700 USD 63.950 7,782,715.00 1.39Procter & Gamble Shs 104,300 15,900 177,400 USD 67.010 11,887,574.00 2.12QUALCOMM Shs 145,600 39,200 213,000 USD 67.930 14,469,090.00 2.58Rockwood Holdings Shs 86,140 86,140 USD 51.580 4,443,101.20 0.79Schlumberger Shs 146,500 9,600 229,900 USD 69.140 15,895,286.00 2.83SEI Investments Shs 191,400 17,000 334,600 USD 20.760 6,946,296.00 1.24Southwestern Energy Shs 83,300 8,700 119,400 USD 30.350 3,623,790.00 0.65St Jude Medical Shs 172,500 1,600 170,900 USD 43.950 7,511,055.00 1.34Target Shs 97,900 3,100 134,700 USD 57.980 7,809,906.00 1.39Texas Instruments Shs 119,100 85,300 129,300 USD 33.190 4,291,467.00 0.76The Mosaic Shs 153,800 190,000 USD 55.270 10,501,300.00 1.87The Williams Shs 140,400 50,100 235,800 USD 30.590 7,213,122.00 1.28US Bancorp Shs 115,500 17,000 203,700 USD 31.550 6,426,735.00 1.14Varian Medical Systems Shs 141,700 10,600 215,400 USD 68.800 14,819,520.00 2.64Verizon Communications Shs 104,000 49,600 171,400 USD 38.070 6,525,198.00 1.16Wells Fargo & Co Shs 236,000 18,300 405,200 USD 33.940 13,752,488.00 2.45Investments in securities and money-market instruments 557,969,267.72 99.38
Allianz RCM US Equity Fund
Investment Portfolio as at 31/03/2012Securities Shares resp.
Currency (in 1,000) resp.Contracts
Acquisitions Disposals Holdings 31/03/2012
Price Market Valuein USD
% ofSubfund
assetsin the period under review
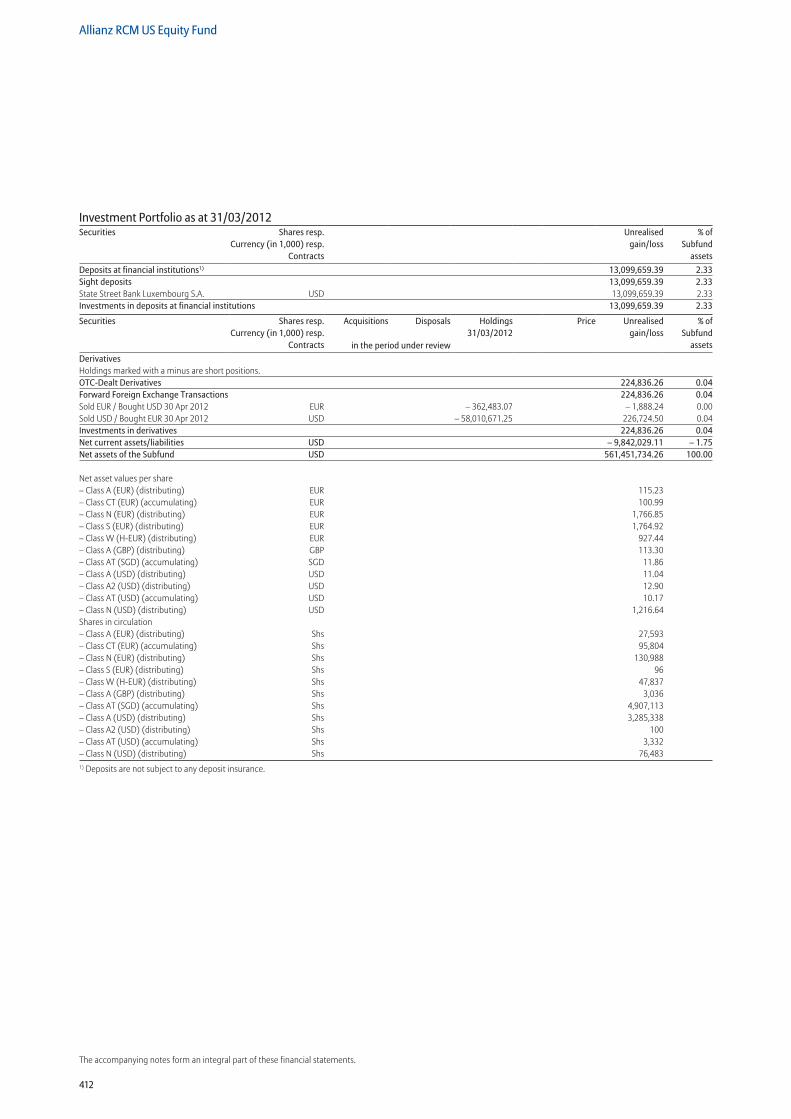
412
Allianz RCM US Equity Fund
The accompanying notes form an integral part of these financial statements.
Deposits at financial institutions1) 13,099,659.39 2.33Sight deposits 13,099,659.39 2.33State Street Bank Luxembourg S.A. USD 13,099,659.39 2.33Investments in deposits at financial institutions 13,099,659.39 2.33
Securities Shares resp.Currency (in 1,000) resp.
Contracts
Acquisitions Disposals Holdings 31/03/2012
Price Unrealisedgain/loss
% ofSubfund
assetsin the period under reviewDerivatives Holdings marked with a minus are short positions. OTC-Dealt Derivatives 224,836.26 0.04Forward Foreign Exchange Transactions 224,836.26 0.04Sold EUR / Bought USD 30 Apr 2012 EUR – 362,483.07 – 1,888.24 0.00Sold USD / Bought EUR 30 Apr 2012 USD – 58,010,671.25 226,724.50 0.04Investments in derivatives 224,836.26 0.04Net current assets/liabilities USD – 9,842,029.11 – 1.75Net assets of the Subfund USD 561,451,734.26 100.00
Net asset values per share – Class A (EUR) (distributing) EUR 115.23 – Class CT (EUR) (accumulating) EUR 100.99 – Class N (EUR) (distributing) EUR 1,766.85 – Class S (EUR) (distributing) EUR 1,764.92 – Class W (H-EUR) (distributing) EUR 927.44 – Class A (GBP) (distributing) GBP 113.30 – Class AT (SGD) (accumulating) SGD 11.86 – Class A (USD) (distributing) USD 11.04 – Class A2 (USD) (distributing) USD 12.90 – Class AT (USD) (accumulating) USD 10.17 – Class N (USD) (distributing) USD 1,216.64 Shares in circulation – Class A (EUR) (distributing) Shs 27,593 – Class CT (EUR) (accumulating) Shs 95,804 – Class N (EUR) (distributing) Shs 130,988 – Class S (EUR) (distributing) Shs 96 – Class W (H-EUR) (distributing) Shs 47,837 – Class A (GBP) (distributing) Shs 3,036 – Class AT (SGD) (accumulating) Shs 4,907,113 – Class A (USD) (distributing) Shs 3,285,338 – Class A2 (USD) (distributing) Shs 100 – Class AT (USD) (accumulating) Shs 3,332 – Class N (USD) (distributing) Shs 76,4831) Deposits are not subject to any deposit insurance.
Investment Portfolio as at 31/03/2012Securities Shares resp.
Currency (in 1,000) resp.Contracts
Unrealisedgain/loss
% ofSubfund
assets
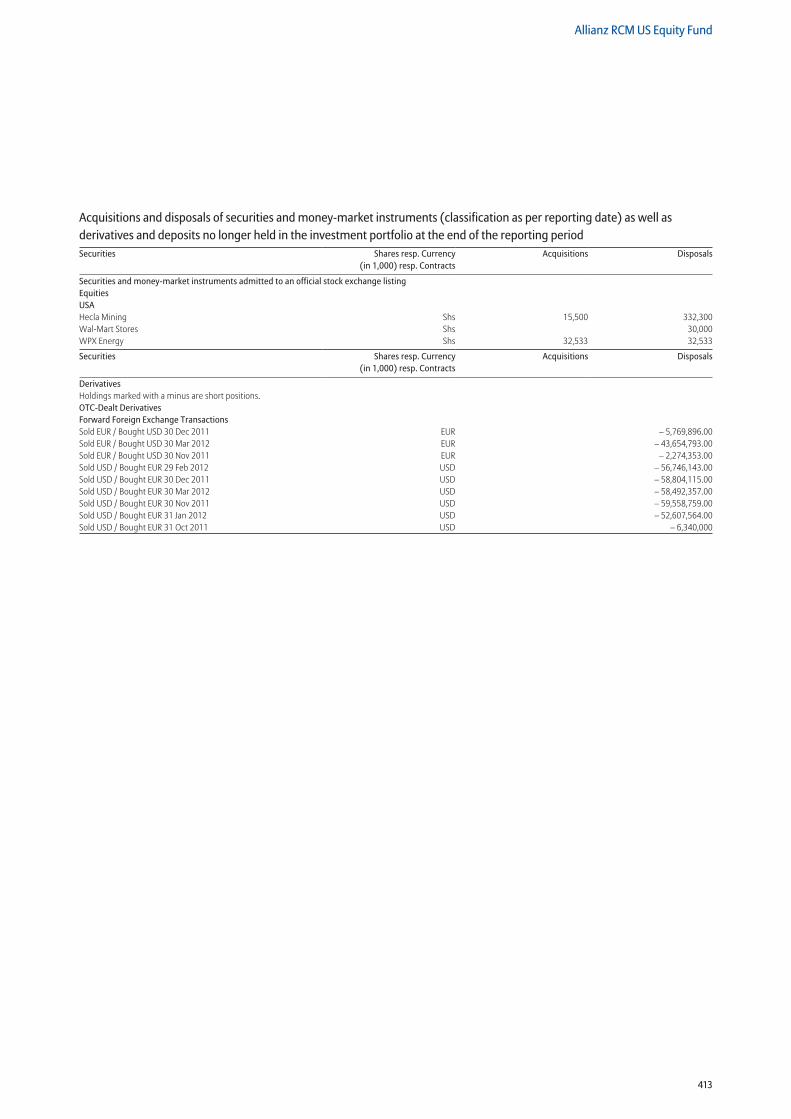
413
Allianz RCM US Equity Fund
Securities and money-market instruments admitted to an official stock exchange listing Equities USA Hecla Mining Shs 15,500 332,300Wal-Mart Stores Shs 30,000WPX Energy Shs 32,533 32,533
Securities Shares resp. Currency (in 1,000) resp. Contracts
Acquisitions Disposals
DerivativesHoldings marked with a minus are short positions. OTC-Dealt Derivatives Forward Foreign Exchange Transactions Sold EUR / Bought USD 30 Dec 2011 EUR – 5,769,896.00Sold EUR / Bought USD 30 Mar 2012 EUR – 43,654,793.00Sold EUR / Bought USD 30 Nov 2011 EUR – 2,274,353.00Sold USD / Bought EUR 29 Feb 2012 USD – 56,746,143.00Sold USD / Bought EUR 30 Dec 2011 USD – 58,804,115.00Sold USD / Bought EUR 30 Mar 2012 USD – 58,492,357.00Sold USD / Bought EUR 30 Nov 2011 USD – 59,558,759.00Sold USD / Bought EUR 31 Jan 2012 USD – 52,607,564.00Sold USD / Bought EUR 31 Oct 2011 USD – 6,340,000
Acquisitions and disposals of securities and money-market instruments (classification as per reporting date) as well as derivatives and deposits no longer held in the investment portfolio at the end of the reporting periodSecurities Shares resp. Currency
(in 1,000) resp. ContractsAcquisitions Disposals

414
Allianz RCM US Equity Fund
The accompanying notes form an integral part of these financial statements.
Statement of Net Assetsas at 31/03/2012
31/03/2012 30/09/2011 USD USD
Securities and money-market instruments
(Cost price USD 525,872,954.36) 557,969,267.72 209,511,598.70
Time deposits 0.00 0.00
Cash at banks 13,099,659.39 1,557,959.35
Premiums paid on purchase of options 0.00 0.00
Upfront-payments paid on swap transactions 0.00 0.00
Interest receivable on
– bonds 0.00 0.00
– time deposits 0.00 0.00
– swap transactions 0.00 0.00
Dividend receivable 528,245.75 184,431.40
Receivable on
– subscriptions of fund shares 60,298.17 470,733.68
– securities transactions 0.00 92,330.42
Other receivables 0.00 0.00
Unrealised gain on
– options transactions 0.00 0.00
– futures transactions 0.00 0.00
– swap transactions 0.00 0.00
– forward foreign exchange transactions 226,724.50 0.00
Total Assets 571,884,195.53 211,817,053.55
Liabilities to banks – 12,074.11 – 796.99
Premiums received on written options 0.00 0.00
Upfront-payments received on swap transactions 0.00 0.00
Interest liabilities on swap transactions 0.00 0.00
Payable on
– redemptions of fund shares – 9,941,507.63 – 236,321.67
– securities transactions 0.00 – 682,657.78
Other payables – 476,991.29 – 237,136.55
Unrealised loss on
– options transactions 0.00 0.00
– futures transactions 0.00 0.00
– swap transactions 0.00 0.00
– forward foreign exchange transactions – 1,888.24 – 398,282.70
Total Liabilities – 10,432,461.27 – 1,555,195.69
Net assets of the Subfund 561,451,734.26 210,261,857.86
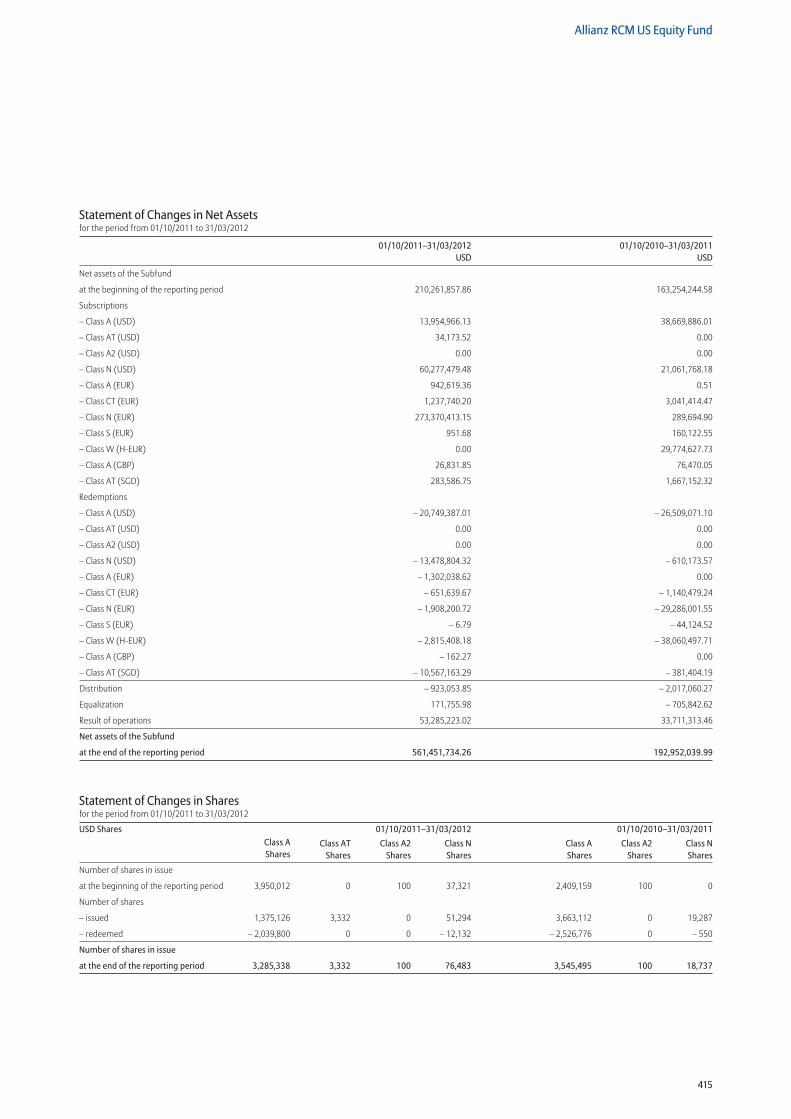
415
Allianz RCM US Equity Fund
Statement of Changes in Net Assetsfor the period from 01/10/2011 to 31/03/2012
01/10/2011–31/03/2012 01/10/2010–31/03/2011 USD USD
Net assets of the Subfund
at the beginning of the reporting period 210,261,857.86 163,254,244.58
Subscriptions
– Class A (USD) 13,954,966.13 38,669,886.01
– Class AT (USD) 34,173.52 0.00
– Class A2 (USD) 0.00 0.00
– Class N (USD) 60,277,479.48 21,061,768.18
– Class A (EUR) 942,619.36 0.51
– Class CT (EUR) 1,237,740.20 3,041,414.47
– Class N (EUR) 273,370,413.15 289,694.90
– Class S (EUR) 951.68 160,122.55
– Class W (H-EUR) 0.00 29,774,627.73
– Class A (GBP) 26,831.85 76,470.05
– Class AT (SGD) 283,586.75 1,667,152.32
Redemptions
– Class A (USD) – 20,749,387.01 – 26,509,071.10
– Class AT (USD) 0.00 0.00
– Class A2 (USD) 0.00 0.00
– Class N (USD) – 13,478,804.32 – 610,173.57
– Class A (EUR) – 1,302,038.62 0.00
– Class CT (EUR) – 651,639.67 – 1,140,479.24
– Class N (EUR) – 1,908,200.72 – 29,286,001.55
– Class S (EUR) – 6.79 – 44,124.52
– Class W (H-EUR) – 2,815,408.18 – 38,060,497.71
– Class A (GBP) – 162.27 0.00
– Class AT (SGD) – 10,567,163.29 – 381,404.19
Distribution – 923,053.85 – 2,017,060.27
Equalization 171,755.98 – 705,842.62
Result of operations 53,285,223.02 33,711,313.46
Net assets of the Subfund
at the end of the reporting period 561,451,734.26 192,952,039.99
Statement of Changes in Sharesfor the period from 01/10/2011 to 31/03/2012
USD Shares 01/10/2011–31/03/2012 01/10/2010–31/03/2011Class A Shares
Class AT Shares
Class A2 Shares
Class N Shares
Class A Shares
Class A2 Shares
Class N Shares
Number of shares in issue
at the beginning of the reporting period 3,950,012 0 100 37,321 2,409,159 100 0
Number of shares
– issued 1,375,126 3,332 0 51,294 3,663,112 0 19,287
– redeemed – 2,039,800 0 0 – 12,132 – 2,526,776 0 – 550
Number of shares in issue
at the end of the reporting period 3,285,338 3,332 100 76,483 3,545,495 100 18,737
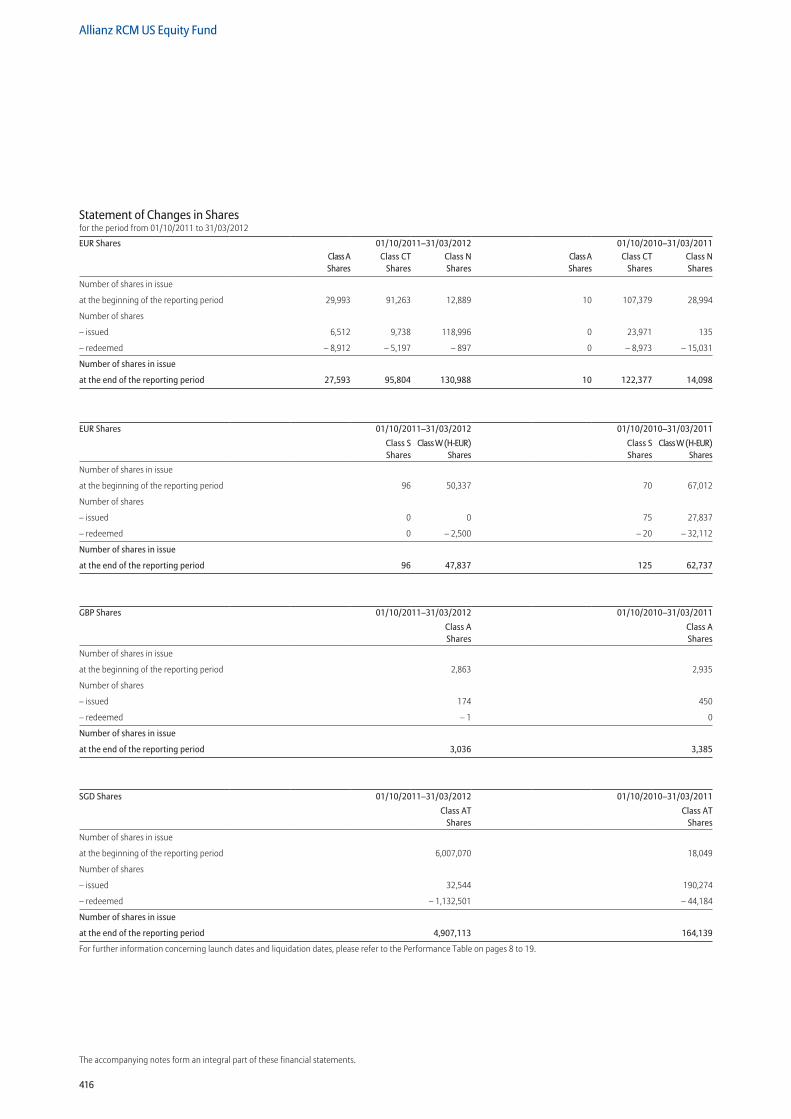
416
Allianz RCM US Equity Fund
The accompanying notes form an integral part of these financial statements.
Statement of Changes in Sharesfor the period from 01/10/2011 to 31/03/2012
EUR Shares 01/10/2011–31/03/2012 01/10/2010–31/03/2011Class A Shares
Class CT Shares
Class N Shares
Class A Shares
Class CT Shares
Class N Shares
Number of shares in issue
at the beginning of the reporting period 29,993 91,263 12,889 10 107,379 28,994
Number of shares
– issued 6,512 9,738 118,996 0 23,971 135
– redeemed – 8,912 – 5,197 – 897 0 – 8,973 – 15,031
Number of shares in issue
at the end of the reporting period 27,593 95,804 130,988 10 122,377 14,098
EUR Shares 01/10/2011–31/03/2012 01/10/2010–31/03/2011Class S Shares
Class W (H-EUR)Shares
Class S Shares
Class W (H-EUR)Shares
Number of shares in issue
at the beginning of the reporting period 96 50,337 70 67,012
Number of shares
– issued 0 0 75 27,837
– redeemed 0 – 2,500 – 20 – 32,112
Number of shares in issue
at the end of the reporting period 96 47,837 125 62,737
GBP Shares 01/10/2011–31/03/2012 01/10/2010–31/03/2011Class A Shares
Class A Shares
Number of shares in issue
at the beginning of the reporting period 2,863 2,935
Number of shares
– issued 174 450
– redeemed – 1 0
Number of shares in issue
at the end of the reporting period 3,036 3,385
SGD Shares 01/10/2011–31/03/2012 01/10/2010–31/03/2011Class AT
SharesClass AT
Shares
Number of shares in issue
at the beginning of the reporting period 6,007,070 18,049
Number of shares
– issued 32,544 190,274
– redeemed – 1,132,501 – 44,184
Number of shares in issue
at the end of the reporting period 4,907,113 164,139
For further information concerning launch dates and liquidation dates, please refer to the Performance Table on pages 8 to 19.
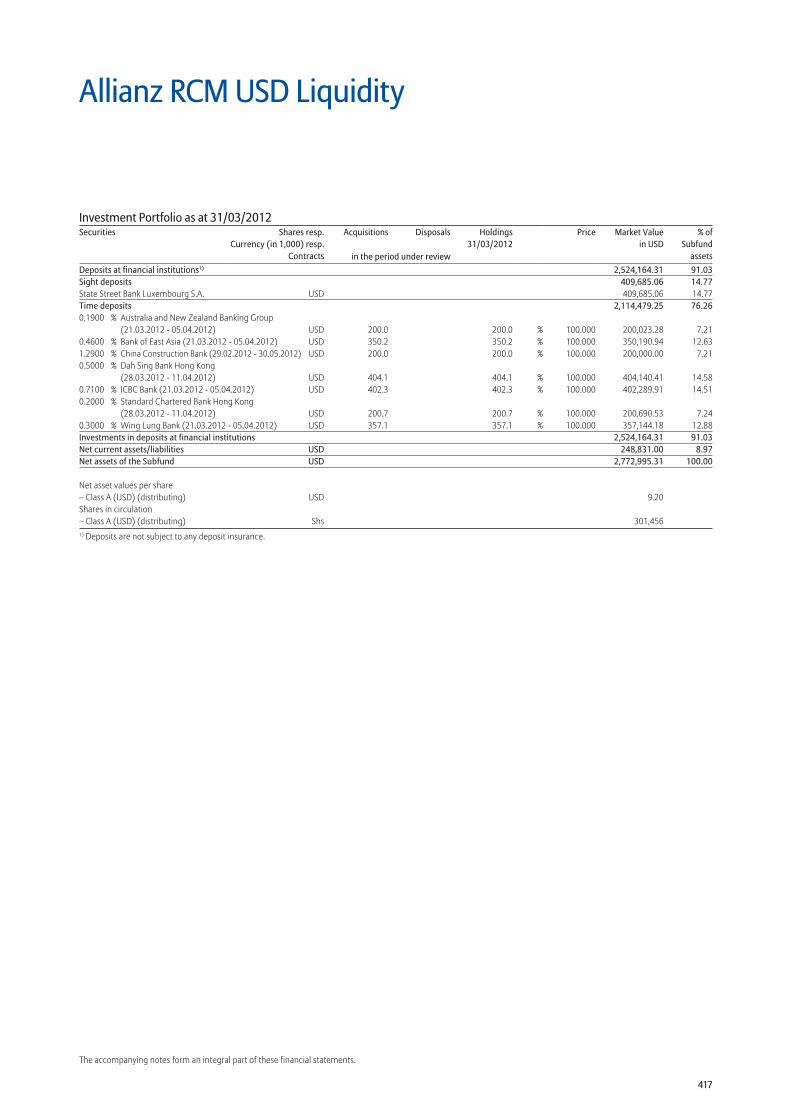
417
The accompanying notes form an integral part of these financial statements.
Allianz RCM USD Liquidity
Deposits at financial institutions1) 2,524,164.31 91.03Sight deposits 409,685.06 14.77State Street Bank Luxembourg S.A. USD 409,685.06 14.77Time deposits 2,114,479.25 76.260.1900 % Australia and New Zealand Banking Group
(21.03.2012 - 05.04.2012) USD 200.0 200.0 % 100.000 200,023.28 7.210.4600 % Bank of East Asia (21.03.2012 - 05.04.2012) USD 350.2 350.2 % 100.000 350,190.94 12.631.2900 % China Construction Bank (29.02.2012 - 30.05.2012) USD 200.0 200.0 % 100.000 200,000.00 7.210.5000 % Dah Sing Bank Hong Kong
(28.03.2012 - 11.04.2012) USD 404.1 404.1 % 100.000 404,140.41 14.580.7100 % ICBC Bank (21.03.2012 - 05.04.2012) USD 402.3 402.3 % 100.000 402,289.91 14.510.2000 % Standard Chartered Bank Hong Kong
(28.03.2012 - 11.04.2012) USD 200.7 200.7 % 100.000 200,690.53 7.240.3000 % Wing Lung Bank (21.03.2012 - 05.04.2012) USD 357.1 357.1 % 100.000 357,144.18 12.88Investments in deposits at financial institutions 2,524,164.31 91.03Net current assets/liabilities USD 248,831.00 8.97Net assets of the Subfund USD 2,772,995.31 100.00
Net asset values per share – Class A (USD) (distributing) USD 9.20 Shares in circulation – Class A (USD) (distributing) Shs 301,4561) Deposits are not subject to any deposit insurance.
Investment Portfolio as at 31/03/2012Securities Shares resp.
Currency (in 1,000) resp.Contracts
Acquisitions Disposals Holdings 31/03/2012
Price Market Valuein USD
% ofSubfund
assetsin the period under review
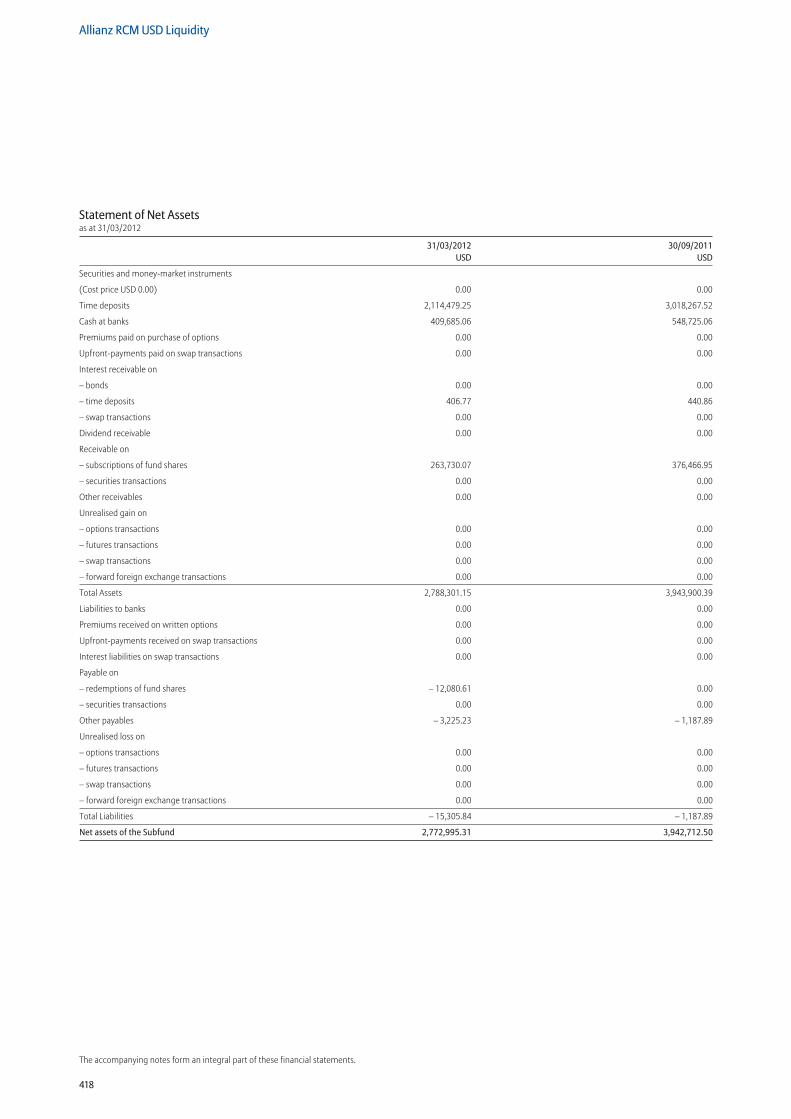
418
Allianz RCM USD Liquidity
The accompanying notes form an integral part of these financial statements.
Statement of Net Assetsas at 31/03/2012
31/03/2012 30/09/2011 USD USD
Securities and money-market instruments
(Cost price USD 0.00) 0.00 0.00
Time deposits 2,114,479.25 3,018,267.52
Cash at banks 409,685.06 548,725.06
Premiums paid on purchase of options 0.00 0.00
Upfront-payments paid on swap transactions 0.00 0.00
Interest receivable on
– bonds 0.00 0.00
– time deposits 406.77 440.86
– swap transactions 0.00 0.00
Dividend receivable 0.00 0.00
Receivable on
– subscriptions of fund shares 263,730.07 376,466.95
– securities transactions 0.00 0.00
Other receivables 0.00 0.00
Unrealised gain on
– options transactions 0.00 0.00
– futures transactions 0.00 0.00
– swap transactions 0.00 0.00
– forward foreign exchange transactions 0.00 0.00
Total Assets 2,788,301.15 3,943,900.39
Liabilities to banks 0.00 0.00
Premiums received on written options 0.00 0.00
Upfront-payments received on swap transactions 0.00 0.00
Interest liabilities on swap transactions 0.00 0.00
Payable on
– redemptions of fund shares – 12,080.61 0.00
– securities transactions 0.00 0.00
Other payables – 3,225.23 – 1,187.89
Unrealised loss on
– options transactions 0.00 0.00
– futures transactions 0.00 0.00
– swap transactions 0.00 0.00
– forward foreign exchange transactions 0.00 0.00
Total Liabilities – 15,305.84 – 1,187.89
Net assets of the Subfund 2,772,995.31 3,942,712.50
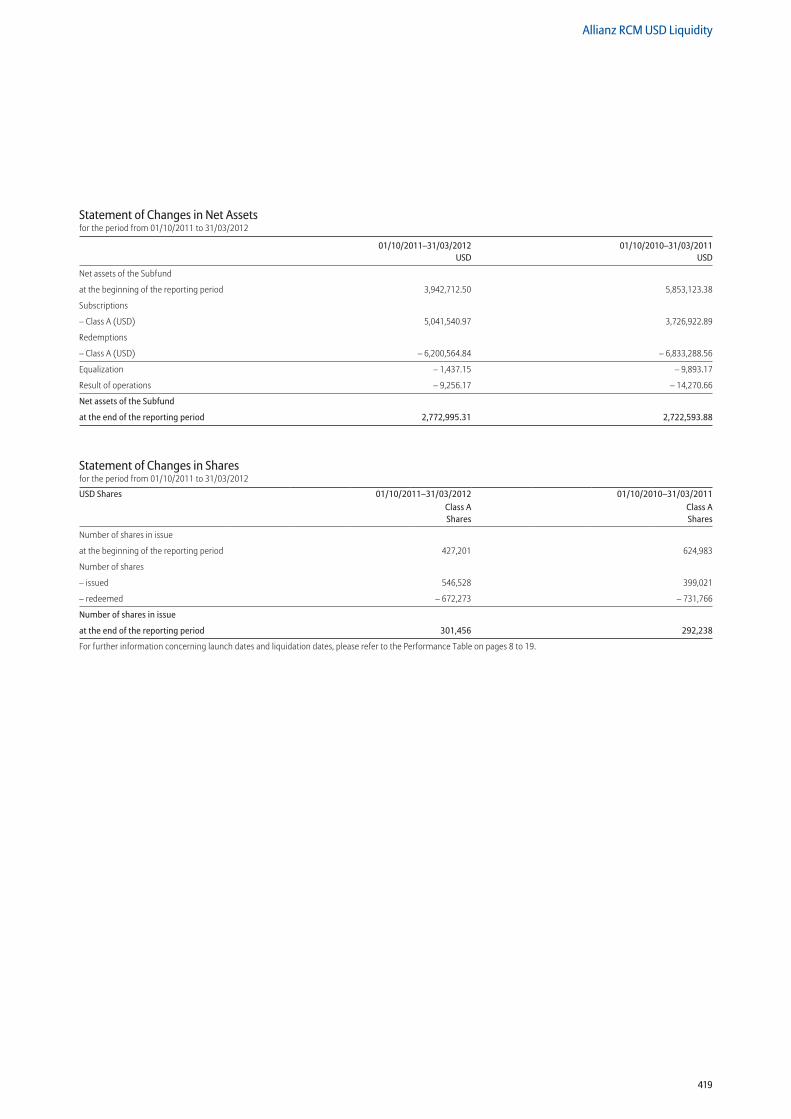
419
Allianz RCM USD Liquidity
Statement of Changes in Net Assetsfor the period from 01/10/2011 to 31/03/2012
01/10/2011–31/03/2012 01/10/2010–31/03/2011 USD USD
Net assets of the Subfund
at the beginning of the reporting period 3,942,712.50 5,853,123.38
Subscriptions
– Class A (USD) 5,041,540.97 3,726,922.89
Redemptions
– Class A (USD) – 6,200,564.84 – 6,833,288.56
Equalization – 1,437.15 – 9,893.17
Result of operations – 9,256.17 – 14,270.66
Net assets of the Subfund
at the end of the reporting period 2,772,995.31 2,722,593.88
Statement of Changes in Sharesfor the period from 01/10/2011 to 31/03/2012
USD Shares 01/10/2011–31/03/2012 01/10/2010–31/03/2011Class A Shares
Class A Shares
Number of shares in issue
at the beginning of the reporting period 427,201 624,983
Number of shares
– issued 546,528 399,021
– redeemed – 672,273 – 731,766
Number of shares in issue
at the end of the reporting period 301,456 292,238
For further information concerning launch dates and liquidation dates, please refer to the Performance Table on pages 8 to 19.
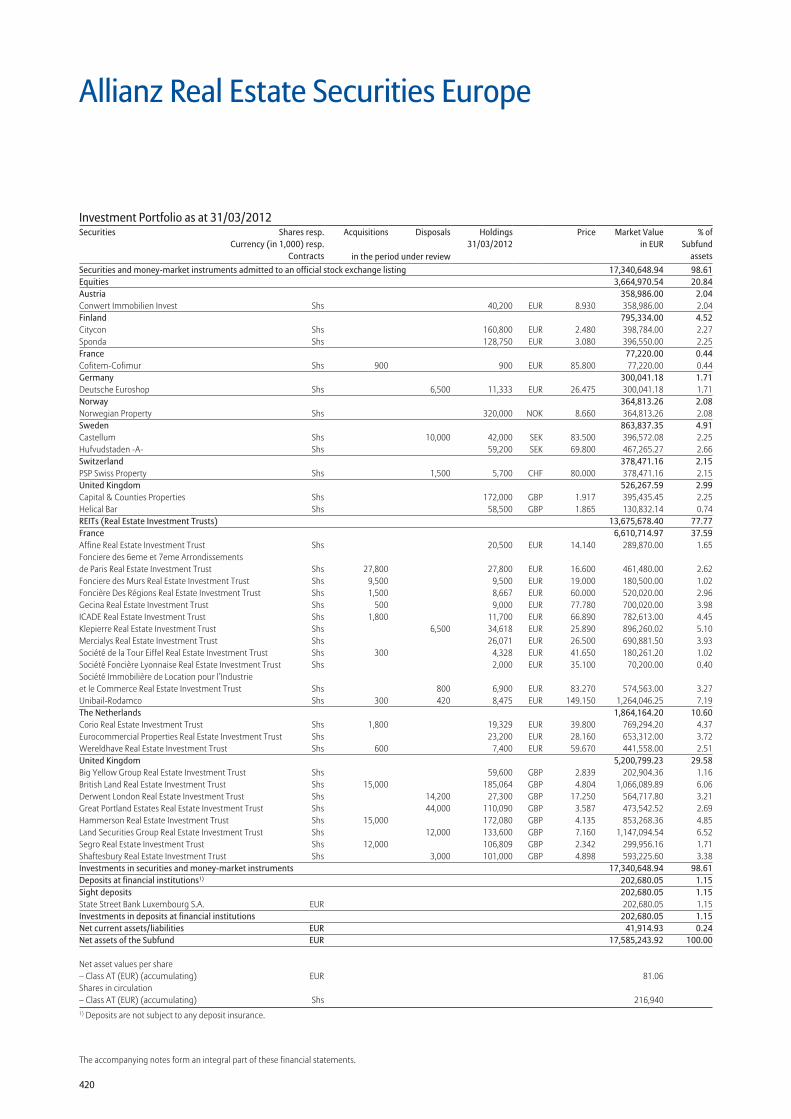
420
The accompanying notes form an integral part of these financial statements.
Allianz Real Estate Securities Europe
Securities and money-market instruments admitted to an official stock exchange listing 17,340,648.94 98.61Equities 3,664,970.54 20.84Austria 358,986.00 2.04Conwert Immobilien Invest Shs 40,200 EUR 8.930 358,986.00 2.04Finland 795,334.00 4.52Citycon Shs 160,800 EUR 2.480 398,784.00 2.27Sponda Shs 128,750 EUR 3.080 396,550.00 2.25France 77,220.00 0.44Cofitem-Cofimur Shs 900 900 EUR 85.800 77,220.00 0.44Germany 300,041.18 1.71Deutsche Euroshop Shs 6,500 11,333 EUR 26.475 300,041.18 1.71Norway 364,813.26 2.08Norwegian Property Shs 320,000 NOK 8.660 364,813.26 2.08Sweden 863,837.35 4.91Castellum Shs 10,000 42,000 SEK 83.500 396,572.08 2.25Hufvudstaden -A- Shs 59,200 SEK 69.800 467,265.27 2.66Switzerland 378,471.16 2.15PSP Swiss Property Shs 1,500 5,700 CHF 80.000 378,471.16 2.15United Kingdom 526,267.59 2.99Capital & Counties Properties Shs 172,000 GBP 1.917 395,435.45 2.25Helical Bar Shs 58,500 GBP 1.865 130,832.14 0.74REITs (Real Estate Investment Trusts) 13,675,678.40 77.77France 6,610,714.97 37.59Affine Real Estate Investment Trust Shs 20,500 EUR 14.140 289,870.00 1.65Fonciere des 6eme et 7eme Arrondissements de Paris Real Estate Investment Trust Shs 27,800 27,800 EUR 16.600 461,480.00 2.62Fonciere des Murs Real Estate Investment Trust Shs 9,500 9,500 EUR 19.000 180,500.00 1.02Foncière Des Régions Real Estate Investment Trust Shs 1,500 8,667 EUR 60.000 520,020.00 2.96Gecina Real Estate Investment Trust Shs 500 9,000 EUR 77.780 700,020.00 3.98ICADE Real Estate Investment Trust Shs 1,800 11,700 EUR 66.890 782,613.00 4.45Klepierre Real Estate Investment Trust Shs 6,500 34,618 EUR 25.890 896,260.02 5.10Mercialys Real Estate Investment Trust Shs 26,071 EUR 26.500 690,881.50 3.93Société de la Tour Eiffel Real Estate Investment Trust Shs 300 4,328 EUR 41.650 180,261.20 1.02Société Foncière Lyonnaise Real Estate Investment Trust Shs 2,000 EUR 35.100 70,200.00 0.40Société Immobilière de Location pour l’Industrie et le Commerce Real Estate Investment Trust Shs 800 6,900 EUR 83.270 574,563.00 3.27Unibail-Rodamco Shs 300 420 8,475 EUR 149.150 1,264,046.25 7.19The Netherlands 1,864,164.20 10.60Corio Real Estate Investment Trust Shs 1,800 19,329 EUR 39.800 769,294.20 4.37Eurocommercial Properties Real Estate Investment Trust Shs 23,200 EUR 28.160 653,312.00 3.72Wereldhave Real Estate Investment Trust Shs 600 7,400 EUR 59.670 441,558.00 2.51United Kingdom 5,200,799.23 29.58Big Yellow Group Real Estate Investment Trust Shs 59,600 GBP 2.839 202,904.36 1.16British Land Real Estate Investment Trust Shs 15,000 185,064 GBP 4.804 1,066,089.89 6.06Derwent London Real Estate Investment Trust Shs 14,200 27,300 GBP 17.250 564,717.80 3.21Great Portland Estates Real Estate Investment Trust Shs 44,000 110,090 GBP 3.587 473,542.52 2.69Hammerson Real Estate Investment Trust Shs 15,000 172,080 GBP 4.135 853,268.36 4.85Land Securities Group Real Estate Investment Trust Shs 12,000 133,600 GBP 7.160 1,147,094.54 6.52Segro Real Estate Investment Trust Shs 12,000 106,809 GBP 2.342 299,956.16 1.71Shaftesbury Real Estate Investment Trust Shs 3,000 101,000 GBP 4.898 593,225.60 3.38Investments in securities and money-market instruments 17,340,648.94 98.61Deposits at financial institutions1) 202,680.05 1.15Sight deposits 202,680.05 1.15State Street Bank Luxembourg S.A. EUR 202,680.05 1.15Investments in deposits at financial institutions 202,680.05 1.15Net current assets/liabilities EUR 41,914.93 0.24Net assets of the Subfund EUR 17,585,243.92 100.00
Net asset values per share – Class AT (EUR) (accumulating) EUR 81.06 Shares in circulation – Class AT (EUR) (accumulating) Shs 216,9401) Deposits are not subject to any deposit insurance.
Investment Portfolio as at 31/03/2012Securities Shares resp.
Currency (in 1,000) resp.Contracts
Acquisitions Disposals Holdings 31/03/2012
Price Market Valuein EUR
% ofSubfund
assetsin the period under review
421
Allianz Real Estate Securities Europe
Securities and money-market instruments admitted to an official stock exchange listing Equities France Fonciere des Murs -Warrants- Shs 9,500 9,500
Acquisitions and disposals of securities and money-market instruments (classification as per reporting date) as well as derivatives and deposits no longer held in the investment portfolio at the end of the reporting periodSecurities Shares resp. Currency
(in 1,000) resp. ContractsAcquisitions Disposals
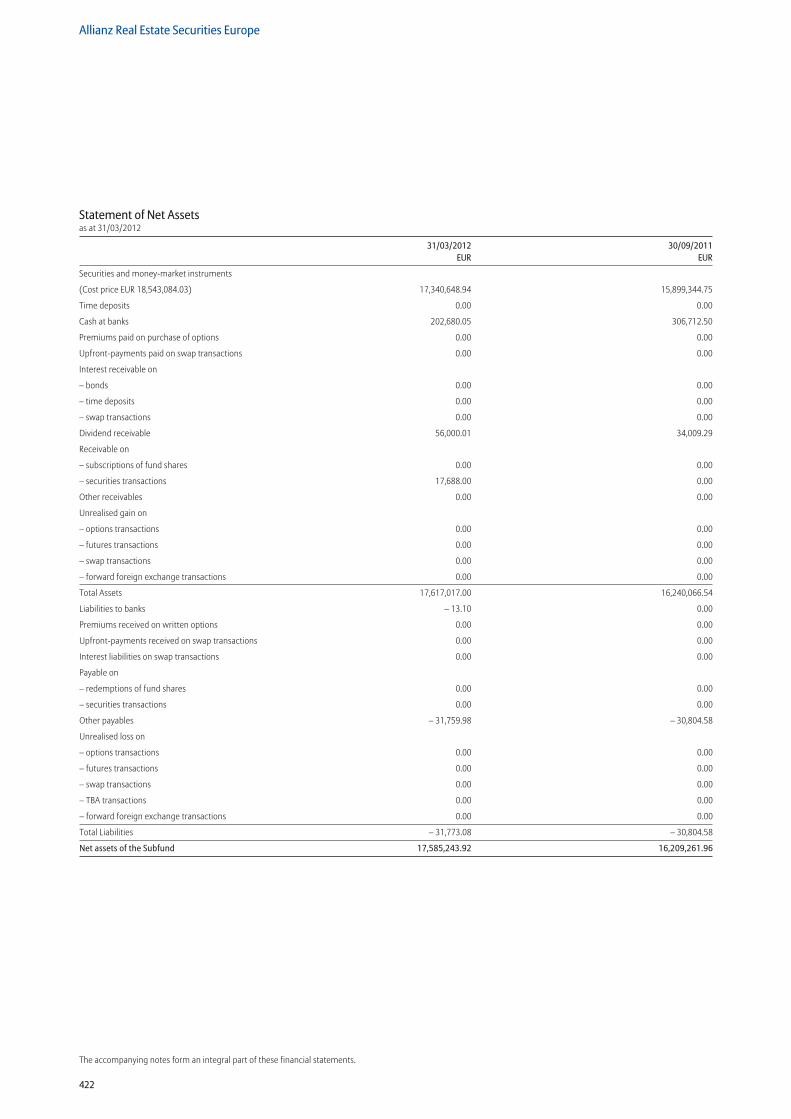
422
Allianz Real Estate Securities Europe
The accompanying notes form an integral part of these financial statements.
Statement of Net Assetsas at 31/03/2012
31/03/2012 30/09/2011 EUR EUR
Securities and money-market instruments
(Cost price EUR 18,543,084.03) 17,340,648.94 15,899,344.75
Time deposits 0.00 0.00
Cash at banks 202,680.05 306,712.50
Premiums paid on purchase of options 0.00 0.00
Upfront-payments paid on swap transactions 0.00 0.00
Interest receivable on
– bonds 0.00 0.00
– time deposits 0.00 0.00
– swap transactions 0.00 0.00
Dividend receivable 56,000.01 34,009.29
Receivable on
– subscriptions of fund shares 0.00 0.00
– securities transactions 17,688.00 0.00
Other receivables 0.00 0.00
Unrealised gain on
– options transactions 0.00 0.00
– futures transactions 0.00 0.00
– swap transactions 0.00 0.00
– forward foreign exchange transactions 0.00 0.00
Total Assets 17,617,017.00 16,240,066.54
Liabilities to banks – 13.10 0.00
Premiums received on written options 0.00 0.00
Upfront-payments received on swap transactions 0.00 0.00
Interest liabilities on swap transactions 0.00 0.00
Payable on
– redemptions of fund shares 0.00 0.00
– securities transactions 0.00 0.00
Other payables – 31,759.98 – 30,804.58
Unrealised loss on
– options transactions 0.00 0.00
– futures transactions 0.00 0.00
– swap transactions 0.00 0.00
– TBA transactions 0.00 0.00
– forward foreign exchange transactions 0.00 0.00
Total Liabilities – 31,773.08 – 30,804.58
Net assets of the Subfund 17,585,243.92 16,209,261.96
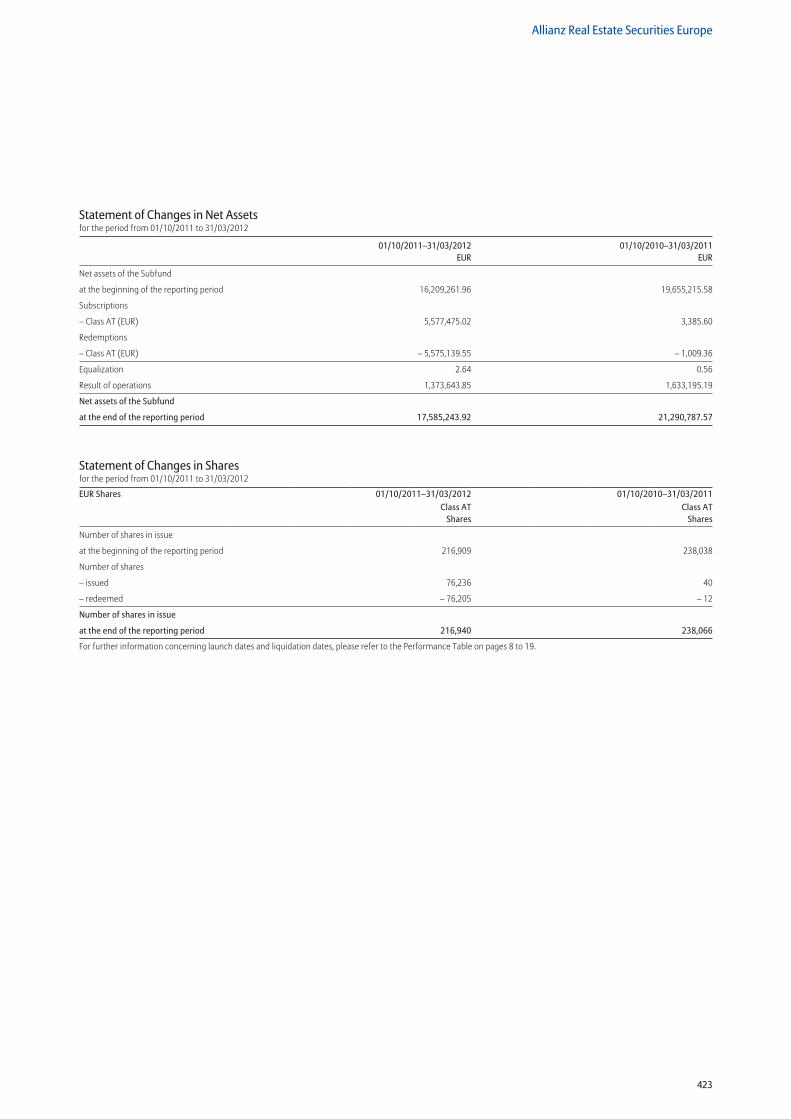
423
Allianz Real Estate Securities Europe
Statement of Changes in Net Assetsfor the period from 01/10/2011 to 31/03/2012
01/10/2011–31/03/2012 01/10/2010–31/03/2011 EUR EUR
Net assets of the Subfund
at the beginning of the reporting period 16,209,261.96 19,655,215.58
Subscriptions
– Class AT (EUR) 5,577,475.02 3,385.60
Redemptions
– Class AT (EUR) – 5,575,139.55 – 1,009.36
Equalization 2.64 0.56
Result of operations 1,373,643.85 1,633,195.19
Net assets of the Subfund
at the end of the reporting period 17,585,243.92 21,290,787.57
Statement of Changes in Sharesfor the period from 01/10/2011 to 31/03/2012
EUR Shares 01/10/2011–31/03/2012 01/10/2010–31/03/2011Class AT
SharesClass AT
Shares
Number of shares in issue
at the beginning of the reporting period 216,909 238,038
Number of shares
– issued 76,236 40
– redeemed – 76,205 – 12
Number of shares in issue
at the end of the reporting period 216,940 238,066
For further information concerning launch dates and liquidation dates, please refer to the Performance Table on pages 8 to 19.
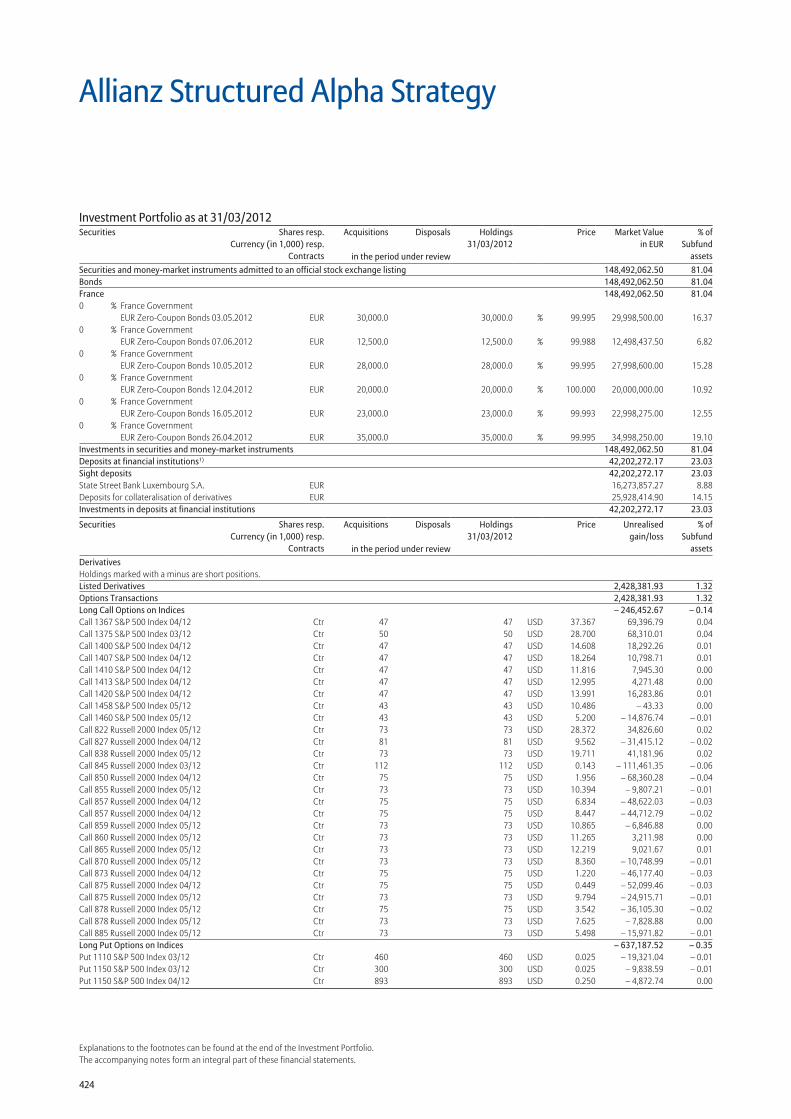
424
Explanations to the footnotes can be found at the end of the Investment Portfolio.The accompanying notes form an integral part of these financial statements.
Allianz Structured Alpha Strategy
Securities and money-market instruments admitted to an official stock exchange listing 148,492,062.50 81.04Bonds 148,492,062.50 81.04France 148,492,062.50 81.040 % France Government
EUR Zero-Coupon Bonds 03.05.2012 EUR 30,000.0 30,000.0 % 99.995 29,998,500.00 16.370 % France Government
EUR Zero-Coupon Bonds 07.06.2012 EUR 12,500.0 12,500.0 % 99.988 12,498,437.50 6.820 % France Government
EUR Zero-Coupon Bonds 10.05.2012 EUR 28,000.0 28,000.0 % 99.995 27,998,600.00 15.280 % France Government
EUR Zero-Coupon Bonds 12.04.2012 EUR 20,000.0 20,000.0 % 100.000 20,000,000.00 10.920 % France Government
EUR Zero-Coupon Bonds 16.05.2012 EUR 23,000.0 23,000.0 % 99.993 22,998,275.00 12.550 % France Government
EUR Zero-Coupon Bonds 26.04.2012 EUR 35,000.0 35,000.0 % 99.995 34,998,250.00 19.10Investments in securities and money-market instruments 148,492,062.50 81.04Deposits at financial institutions1) 42,202,272.17 23.03Sight deposits 42,202,272.17 23.03State Street Bank Luxembourg S.A. EUR 16,273,857.27 8.88Deposits for collateralisation of derivatives EUR 25,928,414.90 14.15Investments in deposits at financial institutions 42,202,272.17 23.03
Securities Shares resp.Currency (in 1,000) resp.
Contracts
Acquisitions Disposals Holdings 31/03/2012
Price Unrealisedgain/loss
% ofSubfund
assetsin the period under reviewDerivatives Holdings marked with a minus are short positions. Listed Derivatives 2,428,381.93 1.32Options Transactions 2,428,381.93 1.32Long Call Options on Indices – 246,452.67 – 0.14Call 1367 S&P 500 Index 04/12 Ctr 47 47 USD 37.367 69,396.79 0.04Call 1375 S&P 500 Index 03/12 Ctr 50 50 USD 28.700 68,310.01 0.04Call 1400 S&P 500 Index 04/12 Ctr 47 47 USD 14.608 18,292.26 0.01Call 1407 S&P 500 Index 04/12 Ctr 47 47 USD 18.264 10,798.71 0.01Call 1410 S&P 500 Index 04/12 Ctr 47 47 USD 11.816 7,945.30 0.00Call 1413 S&P 500 Index 04/12 Ctr 47 47 USD 12.995 4,271.48 0.00Call 1420 S&P 500 Index 04/12 Ctr 47 47 USD 13.991 16,283.86 0.01Call 1458 S&P 500 Index 05/12 Ctr 43 43 USD 10.486 – 43.33 0.00Call 1460 S&P 500 Index 05/12 Ctr 43 43 USD 5.200 – 14,876.74 – 0.01Call 822 Russell 2000 Index 05/12 Ctr 73 73 USD 28.372 34,826.60 0.02Call 827 Russell 2000 Index 04/12 Ctr 81 81 USD 9.562 – 31,415.12 – 0.02Call 838 Russell 2000 Index 05/12 Ctr 73 73 USD 19.711 41,181.96 0.02Call 845 Russell 2000 Index 03/12 Ctr 112 112 USD 0.143 – 111,461.35 – 0.06Call 850 Russell 2000 Index 04/12 Ctr 75 75 USD 1.956 – 68,360.28 – 0.04Call 855 Russell 2000 Index 05/12 Ctr 73 73 USD 10.394 – 9,807.21 – 0.01Call 857 Russell 2000 Index 04/12 Ctr 75 75 USD 6.834 – 48,622.03 – 0.03Call 857 Russell 2000 Index 04/12 Ctr 75 75 USD 8.447 – 44,712.79 – 0.02Call 859 Russell 2000 Index 05/12 Ctr 73 73 USD 10.865 – 6,846.88 0.00Call 860 Russell 2000 Index 05/12 Ctr 73 73 USD 11.265 3,211.98 0.00Call 865 Russell 2000 Index 05/12 Ctr 73 73 USD 12.219 9,021.67 0.01Call 870 Russell 2000 Index 05/12 Ctr 73 73 USD 8.360 – 10,748.99 – 0.01Call 873 Russell 2000 Index 04/12 Ctr 75 75 USD 1.220 – 46,177.40 – 0.03Call 875 Russell 2000 Index 04/12 Ctr 75 75 USD 0.449 – 52,099.46 – 0.03Call 875 Russell 2000 Index 05/12 Ctr 73 73 USD 9.794 – 24,915.71 – 0.01Call 878 Russell 2000 Index 05/12 Ctr 75 75 USD 3.542 – 36,105.30 – 0.02Call 878 Russell 2000 Index 05/12 Ctr 73 73 USD 7.625 – 7,828.88 0.00Call 885 Russell 2000 Index 05/12 Ctr 73 73 USD 5.498 – 15,971.82 – 0.01Long Put Options on Indices – 637,187.52 – 0.35Put 1110 S&P 500 Index 03/12 Ctr 460 460 USD 0.025 – 19,321.04 – 0.01Put 1150 S&P 500 Index 03/12 Ctr 300 300 USD 0.025 – 9,838.59 – 0.01Put 1150 S&P 500 Index 04/12 Ctr 893 893 USD 0.250 – 4,872.74 0.00
Investment Portfolio as at 31/03/2012Securities Shares resp.
Currency (in 1,000) resp.Contracts
Acquisitions Disposals Holdings 31/03/2012
Price Market Valuein EUR
% ofSubfund
assetsin the period under review
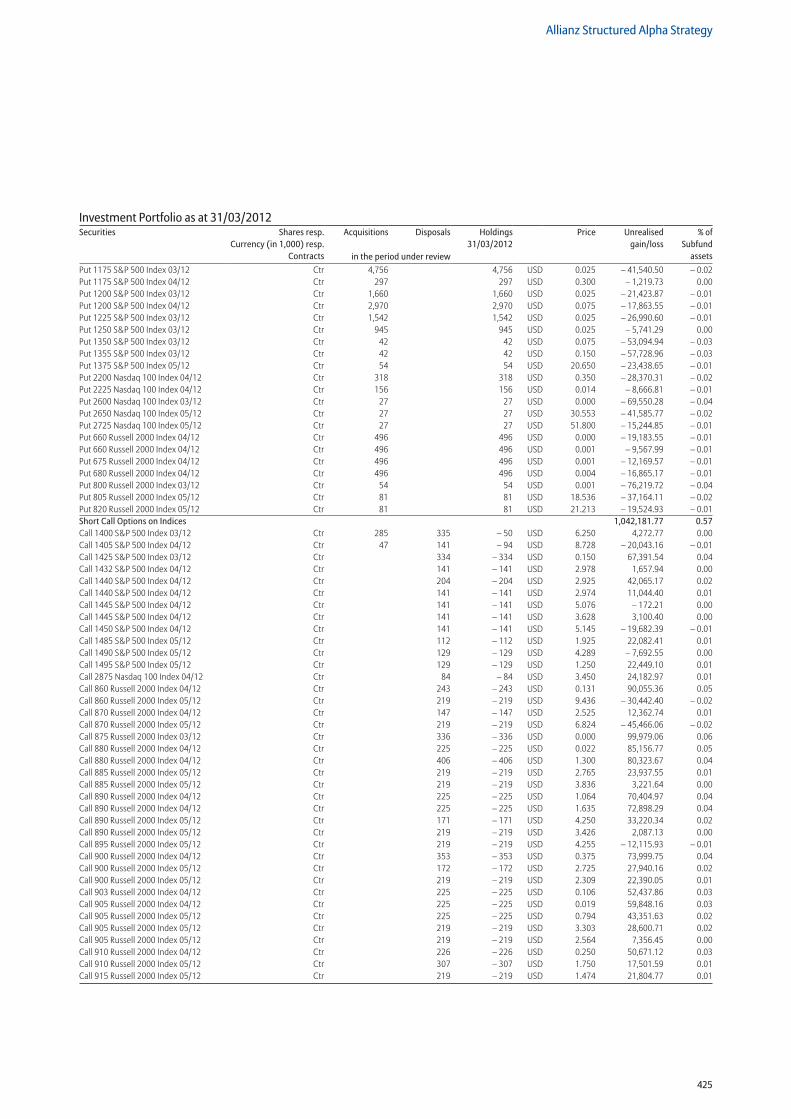
425
Allianz Structured Alpha Strategy
Put 1175 S&P 500 Index 03/12 Ctr 4,756 4,756 USD 0.025 – 41,540.50 – 0.02Put 1175 S&P 500 Index 04/12 Ctr 297 297 USD 0.300 – 1,219.73 0.00Put 1200 S&P 500 Index 03/12 Ctr 1,660 1,660 USD 0.025 – 21,423.87 – 0.01Put 1200 S&P 500 Index 04/12 Ctr 2,970 2,970 USD 0.075 – 17,863.55 – 0.01Put 1225 S&P 500 Index 03/12 Ctr 1,542 1,542 USD 0.025 – 26,990.60 – 0.01Put 1250 S&P 500 Index 03/12 Ctr 945 945 USD 0.025 – 5,741.29 0.00Put 1350 S&P 500 Index 03/12 Ctr 42 42 USD 0.075 – 53,094.94 – 0.03Put 1355 S&P 500 Index 03/12 Ctr 42 42 USD 0.150 – 57,728.96 – 0.03Put 1375 S&P 500 Index 05/12 Ctr 54 54 USD 20.650 – 23,438.65 – 0.01Put 2200 Nasdaq 100 Index 04/12 Ctr 318 318 USD 0.350 – 28,370.31 – 0.02Put 2225 Nasdaq 100 Index 04/12 Ctr 156 156 USD 0.014 – 8,666.81 – 0.01Put 2600 Nasdaq 100 Index 03/12 Ctr 27 27 USD 0.000 – 69,550.28 – 0.04Put 2650 Nasdaq 100 Index 05/12 Ctr 27 27 USD 30.553 – 41,585.77 – 0.02Put 2725 Nasdaq 100 Index 05/12 Ctr 27 27 USD 51.800 – 15,244.85 – 0.01Put 660 Russell 2000 Index 04/12 Ctr 496 496 USD 0.000 – 19,183.55 – 0.01Put 660 Russell 2000 Index 04/12 Ctr 496 496 USD 0.001 – 9,567.99 – 0.01Put 675 Russell 2000 Index 04/12 Ctr 496 496 USD 0.001 – 12,169.57 – 0.01Put 680 Russell 2000 Index 04/12 Ctr 496 496 USD 0.004 – 16,865.17 – 0.01Put 800 Russell 2000 Index 03/12 Ctr 54 54 USD 0.001 – 76,219.72 – 0.04Put 805 Russell 2000 Index 05/12 Ctr 81 81 USD 18.536 – 37,164.11 – 0.02Put 820 Russell 2000 Index 05/12 Ctr 81 81 USD 21.213 – 19,524.93 – 0.01Short Call Options on Indices 1,042,181.77 0.57Call 1400 S&P 500 Index 03/12 Ctr 285 335 – 50 USD 6.250 4,272.77 0.00Call 1405 S&P 500 Index 04/12 Ctr 47 141 – 94 USD 8.728 – 20,043.16 – 0.01Call 1425 S&P 500 Index 03/12 Ctr 334 – 334 USD 0.150 67,391.54 0.04Call 1432 S&P 500 Index 04/12 Ctr 141 – 141 USD 2.978 1,657.94 0.00Call 1440 S&P 500 Index 04/12 Ctr 204 – 204 USD 2.925 42,065.17 0.02Call 1440 S&P 500 Index 04/12 Ctr 141 – 141 USD 2.974 11,044.40 0.01Call 1445 S&P 500 Index 04/12 Ctr 141 – 141 USD 5.076 – 172.21 0.00Call 1445 S&P 500 Index 04/12 Ctr 141 – 141 USD 3.628 3,100.40 0.00Call 1450 S&P 500 Index 04/12 Ctr 141 – 141 USD 5.145 – 19,682.39 – 0.01Call 1485 S&P 500 Index 05/12 Ctr 112 – 112 USD 1.925 22,082.41 0.01Call 1490 S&P 500 Index 05/12 Ctr 129 – 129 USD 4.289 – 7,692.55 0.00Call 1495 S&P 500 Index 05/12 Ctr 129 – 129 USD 1.250 22,449.10 0.01Call 2875 Nasdaq 100 Index 04/12 Ctr 84 – 84 USD 3.450 24,182.97 0.01Call 860 Russell 2000 Index 04/12 Ctr 243 – 243 USD 0.131 90,055.36 0.05Call 860 Russell 2000 Index 05/12 Ctr 219 – 219 USD 9.436 – 30,442.40 – 0.02Call 870 Russell 2000 Index 04/12 Ctr 147 – 147 USD 2.525 12,362.74 0.01Call 870 Russell 2000 Index 05/12 Ctr 219 – 219 USD 6.824 – 45,466.06 – 0.02Call 875 Russell 2000 Index 03/12 Ctr 336 – 336 USD 0.000 99,979.06 0.06Call 880 Russell 2000 Index 04/12 Ctr 225 – 225 USD 0.022 85,156.77 0.05Call 880 Russell 2000 Index 04/12 Ctr 406 – 406 USD 1.300 80,323.67 0.04Call 885 Russell 2000 Index 05/12 Ctr 219 – 219 USD 2.765 23,937.55 0.01Call 885 Russell 2000 Index 05/12 Ctr 219 – 219 USD 3.836 3,221.64 0.00Call 890 Russell 2000 Index 04/12 Ctr 225 – 225 USD 1.064 70,404.97 0.04Call 890 Russell 2000 Index 04/12 Ctr 225 – 225 USD 1.635 72,898.29 0.04Call 890 Russell 2000 Index 05/12 Ctr 171 – 171 USD 4.250 33,220.34 0.02Call 890 Russell 2000 Index 05/12 Ctr 219 – 219 USD 3.426 2,087.13 0.00Call 895 Russell 2000 Index 05/12 Ctr 219 – 219 USD 4.255 – 12,115.93 – 0.01Call 900 Russell 2000 Index 04/12 Ctr 353 – 353 USD 0.375 73,999.75 0.04Call 900 Russell 2000 Index 05/12 Ctr 172 – 172 USD 2.725 27,940.16 0.02Call 900 Russell 2000 Index 05/12 Ctr 219 – 219 USD 2.309 22,390.05 0.01Call 903 Russell 2000 Index 04/12 Ctr 225 – 225 USD 0.106 52,437.86 0.03Call 905 Russell 2000 Index 04/12 Ctr 225 – 225 USD 0.019 59,848.16 0.03Call 905 Russell 2000 Index 05/12 Ctr 225 – 225 USD 0.794 43,351.63 0.02Call 905 Russell 2000 Index 05/12 Ctr 219 – 219 USD 3.303 28,600.71 0.02Call 905 Russell 2000 Index 05/12 Ctr 219 – 219 USD 2.564 7,356.45 0.00Call 910 Russell 2000 Index 04/12 Ctr 226 – 226 USD 0.250 50,671.12 0.03Call 910 Russell 2000 Index 05/12 Ctr 307 – 307 USD 1.750 17,501.59 0.01Call 915 Russell 2000 Index 05/12 Ctr 219 – 219 USD 1.474 21,804.77 0.01
Investment Portfolio as at 31/03/2012Securities Shares resp.
Currency (in 1,000) resp.Contracts
Acquisitions Disposals Holdings 31/03/2012
Price Unrealisedgain/loss
% ofSubfund
assetsin the period under review
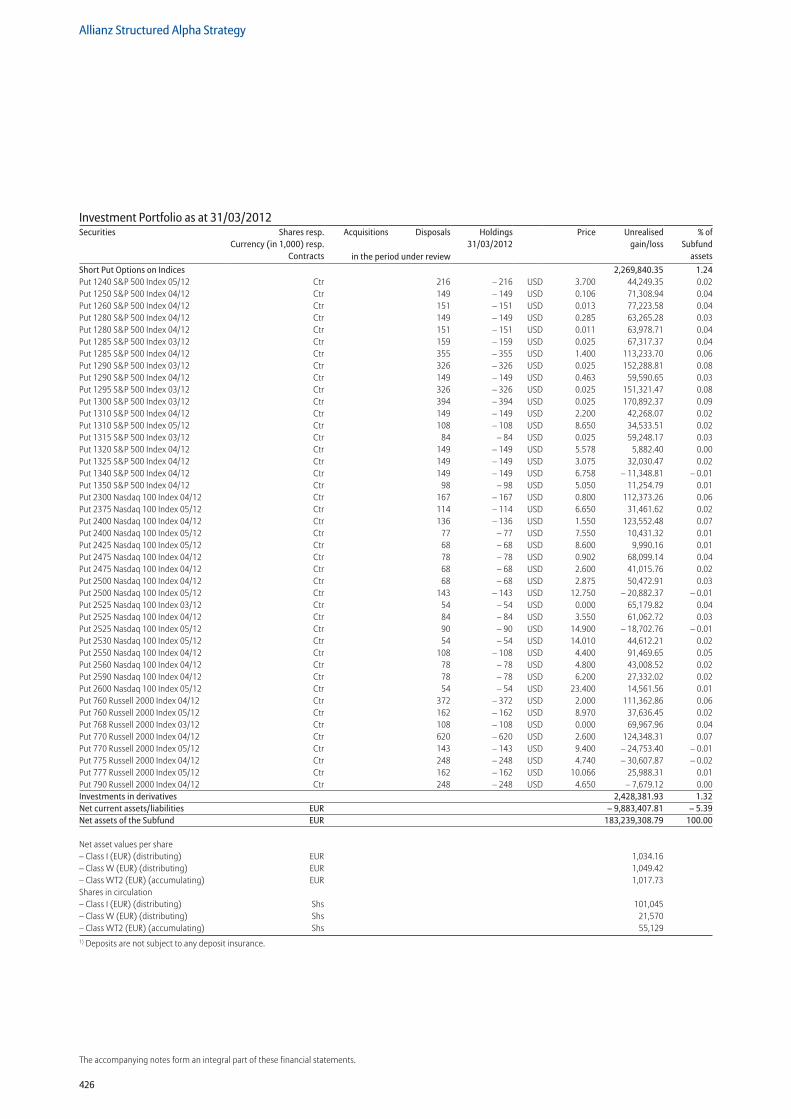
426
Allianz Structured Alpha Strategy
The accompanying notes form an integral part of these financial statements.
Short Put Options on Indices 2,269,840.35 1.24Put 1240 S&P 500 Index 05/12 Ctr 216 – 216 USD 3.700 44,249.35 0.02Put 1250 S&P 500 Index 04/12 Ctr 149 – 149 USD 0.106 71,308.94 0.04Put 1260 S&P 500 Index 04/12 Ctr 151 – 151 USD 0.013 77,223.58 0.04Put 1280 S&P 500 Index 04/12 Ctr 149 – 149 USD 0.285 63,265.28 0.03Put 1280 S&P 500 Index 04/12 Ctr 151 – 151 USD 0.011 63,978.71 0.04Put 1285 S&P 500 Index 03/12 Ctr 159 – 159 USD 0.025 67,317.37 0.04Put 1285 S&P 500 Index 04/12 Ctr 355 – 355 USD 1.400 113,233.70 0.06Put 1290 S&P 500 Index 03/12 Ctr 326 – 326 USD 0.025 152,288.81 0.08Put 1290 S&P 500 Index 04/12 Ctr 149 – 149 USD 0.463 59,590.65 0.03Put 1295 S&P 500 Index 03/12 Ctr 326 – 326 USD 0.025 151,321.47 0.08Put 1300 S&P 500 Index 03/12 Ctr 394 – 394 USD 0.025 170,892.37 0.09Put 1310 S&P 500 Index 04/12 Ctr 149 – 149 USD 2.200 42,268.07 0.02Put 1310 S&P 500 Index 05/12 Ctr 108 – 108 USD 8.650 34,533.51 0.02Put 1315 S&P 500 Index 03/12 Ctr 84 – 84 USD 0.025 59,248.17 0.03Put 1320 S&P 500 Index 04/12 Ctr 149 – 149 USD 5.578 5,882.40 0.00Put 1325 S&P 500 Index 04/12 Ctr 149 – 149 USD 3.075 32,030.47 0.02Put 1340 S&P 500 Index 04/12 Ctr 149 – 149 USD 6.758 – 11,348.81 – 0.01Put 1350 S&P 500 Index 04/12 Ctr 98 – 98 USD 5.050 11,254.79 0.01Put 2300 Nasdaq 100 Index 04/12 Ctr 167 – 167 USD 0.800 112,373.26 0.06Put 2375 Nasdaq 100 Index 05/12 Ctr 114 – 114 USD 6.650 31,461.62 0.02Put 2400 Nasdaq 100 Index 04/12 Ctr 136 – 136 USD 1.550 123,552.48 0.07Put 2400 Nasdaq 100 Index 05/12 Ctr 77 – 77 USD 7.550 10,431.32 0.01Put 2425 Nasdaq 100 Index 05/12 Ctr 68 – 68 USD 8.600 9,990.16 0.01Put 2475 Nasdaq 100 Index 04/12 Ctr 78 – 78 USD 0.902 68,099.14 0.04Put 2475 Nasdaq 100 Index 04/12 Ctr 68 – 68 USD 2.600 41,015.76 0.02Put 2500 Nasdaq 100 Index 04/12 Ctr 68 – 68 USD 2.875 50,472.91 0.03Put 2500 Nasdaq 100 Index 05/12 Ctr 143 – 143 USD 12.750 – 20,882.37 – 0.01Put 2525 Nasdaq 100 Index 03/12 Ctr 54 – 54 USD 0.000 65,179.82 0.04Put 2525 Nasdaq 100 Index 04/12 Ctr 84 – 84 USD 3.550 61,062.72 0.03Put 2525 Nasdaq 100 Index 05/12 Ctr 90 – 90 USD 14.900 – 18,702.76 – 0.01Put 2530 Nasdaq 100 Index 05/12 Ctr 54 – 54 USD 14.010 44,612.21 0.02Put 2550 Nasdaq 100 Index 04/12 Ctr 108 – 108 USD 4.400 91,469.65 0.05Put 2560 Nasdaq 100 Index 04/12 Ctr 78 – 78 USD 4.800 43,008.52 0.02Put 2590 Nasdaq 100 Index 04/12 Ctr 78 – 78 USD 6.200 27,332.02 0.02Put 2600 Nasdaq 100 Index 05/12 Ctr 54 – 54 USD 23.400 14,561.56 0.01Put 760 Russell 2000 Index 04/12 Ctr 372 – 372 USD 2.000 111,362.86 0.06Put 760 Russell 2000 Index 05/12 Ctr 162 – 162 USD 8.970 37,636.45 0.02Put 768 Russell 2000 Index 03/12 Ctr 108 – 108 USD 0.000 69,967.96 0.04Put 770 Russell 2000 Index 04/12 Ctr 620 – 620 USD 2.600 124,348.31 0.07Put 770 Russell 2000 Index 05/12 Ctr 143 – 143 USD 9.400 – 24,753.40 – 0.01Put 775 Russell 2000 Index 04/12 Ctr 248 – 248 USD 4.740 – 30,607.87 – 0.02Put 777 Russell 2000 Index 05/12 Ctr 162 – 162 USD 10.066 25,988.31 0.01Put 790 Russell 2000 Index 04/12 Ctr 248 – 248 USD 4.650 – 7,679.12 0.00Investments in derivatives 2,428,381.93 1.32Net current assets/liabilities EUR – 9,883,407.81 – 5.39Net assets of the Subfund EUR 183,239,308.79 100.00
Net asset values per share – Class I (EUR) (distributing) EUR 1,034.16 – Class W (EUR) (distributing) EUR 1,049.42 – Class WT2 (EUR) (accumulating) EUR 1,017.73 Shares in circulation – Class I (EUR) (distributing) Shs 101,045 – Class W (EUR) (distributing) Shs 21,570 – Class WT2 (EUR) (accumulating) Shs 55,1291) Deposits are not subject to any deposit insurance.
Investment Portfolio as at 31/03/2012Securities Shares resp.
Currency (in 1,000) resp.Contracts
Acquisitions Disposals Holdings 31/03/2012
Price Unrealisedgain/loss
% ofSubfund
assetsin the period under review
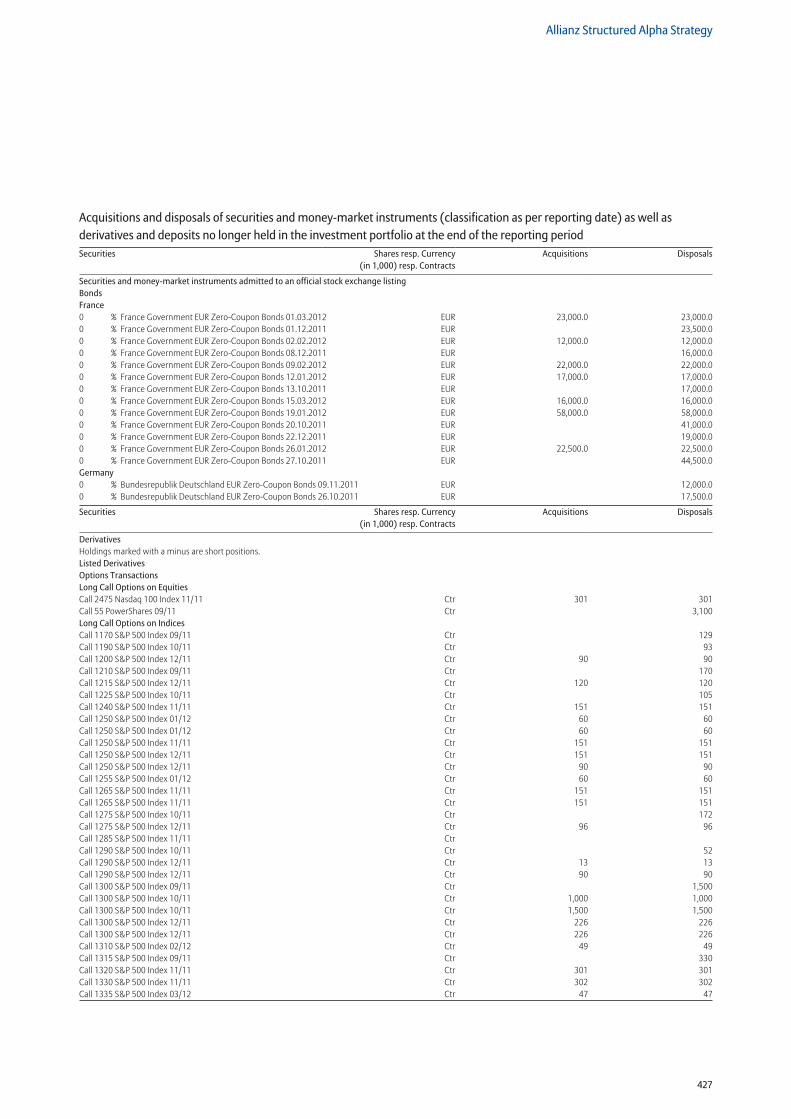
427
Allianz Structured Alpha Strategy
Securities and money-market instruments admitted to an official stock exchange listing Bonds France 0 % France Government EUR Zero-Coupon Bonds 01.03.2012 EUR 23,000.0 23,000.00 % France Government EUR Zero-Coupon Bonds 01.12.2011 EUR 23,500.00 % France Government EUR Zero-Coupon Bonds 02.02.2012 EUR 12,000.0 12,000.00 % France Government EUR Zero-Coupon Bonds 08.12.2011 EUR 16,000.00 % France Government EUR Zero-Coupon Bonds 09.02.2012 EUR 22,000.0 22,000.00 % France Government EUR Zero-Coupon Bonds 12.01.2012 EUR 17,000.0 17,000.00 % France Government EUR Zero-Coupon Bonds 13.10.2011 EUR 17,000.00 % France Government EUR Zero-Coupon Bonds 15.03.2012 EUR 16,000.0 16,000.00 % France Government EUR Zero-Coupon Bonds 19.01.2012 EUR 58,000.0 58,000.00 % France Government EUR Zero-Coupon Bonds 20.10.2011 EUR 41,000.00 % France Government EUR Zero-Coupon Bonds 22.12.2011 EUR 19,000.00 % France Government EUR Zero-Coupon Bonds 26.01.2012 EUR 22,500.0 22,500.00 % France Government EUR Zero-Coupon Bonds 27.10.2011 EUR 44,500.0Germany 0 % Bundesrepublik Deutschland EUR Zero-Coupon Bonds 09.11.2011 EUR 12,000.00 % Bundesrepublik Deutschland EUR Zero-Coupon Bonds 26.10.2011 EUR 17,500.0
Securities Shares resp. Currency (in 1,000) resp. Contracts
Acquisitions Disposals
DerivativesHoldings marked with a minus are short positions. Listed Derivatives Options Transactions Long Call Options on Equities Call 2475 Nasdaq 100 Index 11/11 Ctr 301 301Call 55 PowerShares 09/11 Ctr 3,100Long Call Options on Indices Call 1170 S&P 500 Index 09/11 Ctr 129Call 1190 S&P 500 Index 10/11 Ctr 93Call 1200 S&P 500 Index 12/11 Ctr 90 90Call 1210 S&P 500 Index 09/11 Ctr 170Call 1215 S&P 500 Index 12/11 Ctr 120 120Call 1225 S&P 500 Index 10/11 Ctr 105Call 1240 S&P 500 Index 11/11 Ctr 151 151Call 1250 S&P 500 Index 01/12 Ctr 60 60Call 1250 S&P 500 Index 01/12 Ctr 60 60Call 1250 S&P 500 Index 11/11 Ctr 151 151Call 1250 S&P 500 Index 12/11 Ctr 151 151Call 1250 S&P 500 Index 12/11 Ctr 90 90Call 1255 S&P 500 Index 01/12 Ctr 60 60Call 1265 S&P 500 Index 11/11 Ctr 151 151Call 1265 S&P 500 Index 11/11 Ctr 151 151Call 1275 S&P 500 Index 10/11 Ctr 172Call 1275 S&P 500 Index 12/11 Ctr 96 96Call 1285 S&P 500 Index 11/11 Ctr Call 1290 S&P 500 Index 10/11 Ctr 52Call 1290 S&P 500 Index 12/11 Ctr 13 13Call 1290 S&P 500 Index 12/11 Ctr 90 90Call 1300 S&P 500 Index 09/11 Ctr 1,500Call 1300 S&P 500 Index 10/11 Ctr 1,000 1,000Call 1300 S&P 500 Index 10/11 Ctr 1,500 1,500Call 1300 S&P 500 Index 12/11 Ctr 226 226Call 1300 S&P 500 Index 12/11 Ctr 226 226Call 1310 S&P 500 Index 02/12 Ctr 49 49Call 1315 S&P 500 Index 09/11 Ctr 330Call 1320 S&P 500 Index 11/11 Ctr 301 301Call 1330 S&P 500 Index 11/11 Ctr 302 302Call 1335 S&P 500 Index 03/12 Ctr 47 47
Acquisitions and disposals of securities and money-market instruments (classification as per reporting date) as well as derivatives and deposits no longer held in the investment portfolio at the end of the reporting periodSecurities Shares resp. Currency
(in 1,000) resp. ContractsAcquisitions Disposals
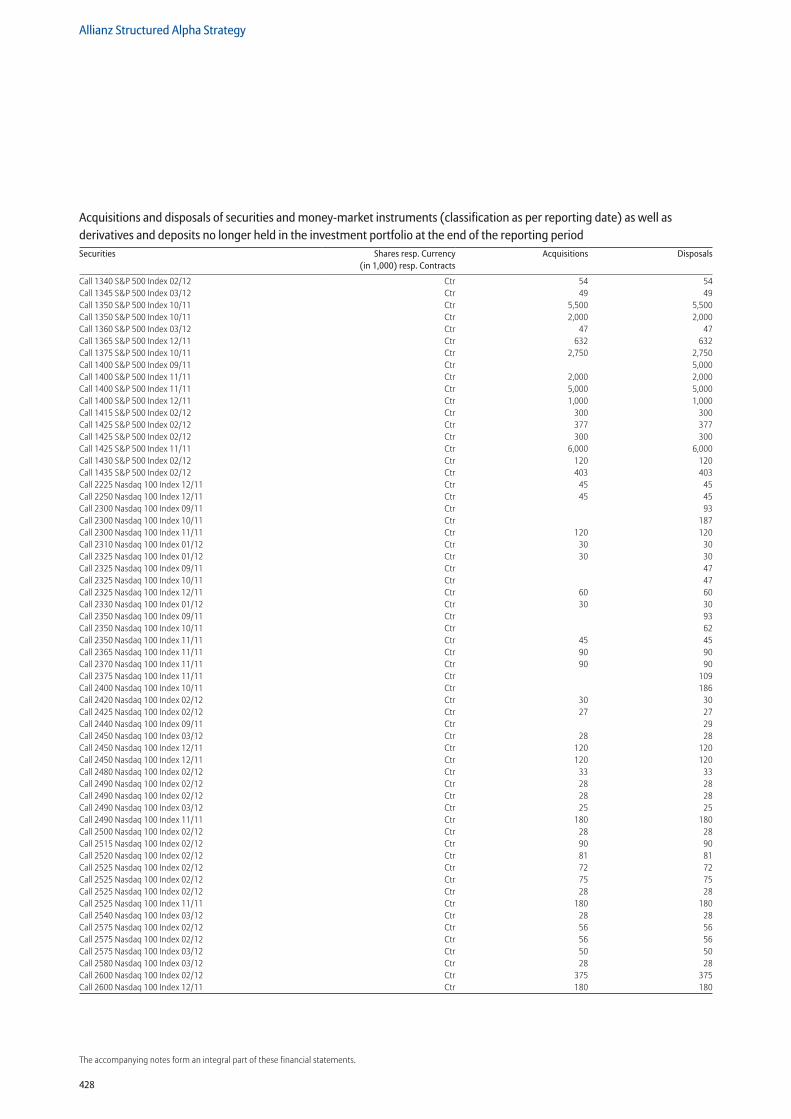
428
Allianz Structured Alpha Strategy
The accompanying notes form an integral part of these financial statements.
Call 1340 S&P 500 Index 02/12 Ctr 54 54Call 1345 S&P 500 Index 03/12 Ctr 49 49Call 1350 S&P 500 Index 10/11 Ctr 5,500 5,500Call 1350 S&P 500 Index 10/11 Ctr 2,000 2,000Call 1360 S&P 500 Index 03/12 Ctr 47 47Call 1365 S&P 500 Index 12/11 Ctr 632 632Call 1375 S&P 500 Index 10/11 Ctr 2,750 2,750Call 1400 S&P 500 Index 09/11 Ctr 5,000Call 1400 S&P 500 Index 11/11 Ctr 2,000 2,000Call 1400 S&P 500 Index 11/11 Ctr 5,000 5,000Call 1400 S&P 500 Index 12/11 Ctr 1,000 1,000Call 1415 S&P 500 Index 02/12 Ctr 300 300Call 1425 S&P 500 Index 02/12 Ctr 377 377Call 1425 S&P 500 Index 02/12 Ctr 300 300Call 1425 S&P 500 Index 11/11 Ctr 6,000 6,000Call 1430 S&P 500 Index 02/12 Ctr 120 120Call 1435 S&P 500 Index 02/12 Ctr 403 403Call 2225 Nasdaq 100 Index 12/11 Ctr 45 45Call 2250 Nasdaq 100 Index 12/11 Ctr 45 45Call 2300 Nasdaq 100 Index 09/11 Ctr 93Call 2300 Nasdaq 100 Index 10/11 Ctr 187Call 2300 Nasdaq 100 Index 11/11 Ctr 120 120Call 2310 Nasdaq 100 Index 01/12 Ctr 30 30Call 2325 Nasdaq 100 Index 01/12 Ctr 30 30Call 2325 Nasdaq 100 Index 09/11 Ctr 47Call 2325 Nasdaq 100 Index 10/11 Ctr 47Call 2325 Nasdaq 100 Index 12/11 Ctr 60 60Call 2330 Nasdaq 100 Index 01/12 Ctr 30 30Call 2350 Nasdaq 100 Index 09/11 Ctr 93Call 2350 Nasdaq 100 Index 10/11 Ctr 62Call 2350 Nasdaq 100 Index 11/11 Ctr 45 45Call 2365 Nasdaq 100 Index 11/11 Ctr 90 90Call 2370 Nasdaq 100 Index 11/11 Ctr 90 90Call 2375 Nasdaq 100 Index 11/11 Ctr 109Call 2400 Nasdaq 100 Index 10/11 Ctr 186Call 2420 Nasdaq 100 Index 02/12 Ctr 30 30Call 2425 Nasdaq 100 Index 02/12 Ctr 27 27Call 2440 Nasdaq 100 Index 09/11 Ctr 29Call 2450 Nasdaq 100 Index 03/12 Ctr 28 28Call 2450 Nasdaq 100 Index 12/11 Ctr 120 120Call 2450 Nasdaq 100 Index 12/11 Ctr 120 120Call 2480 Nasdaq 100 Index 02/12 Ctr 33 33Call 2490 Nasdaq 100 Index 02/12 Ctr 28 28Call 2490 Nasdaq 100 Index 02/12 Ctr 28 28Call 2490 Nasdaq 100 Index 03/12 Ctr 25 25Call 2490 Nasdaq 100 Index 11/11 Ctr 180 180Call 2500 Nasdaq 100 Index 02/12 Ctr 28 28Call 2515 Nasdaq 100 Index 02/12 Ctr 90 90Call 2520 Nasdaq 100 Index 02/12 Ctr 81 81Call 2525 Nasdaq 100 Index 02/12 Ctr 72 72Call 2525 Nasdaq 100 Index 02/12 Ctr 75 75Call 2525 Nasdaq 100 Index 02/12 Ctr 28 28Call 2525 Nasdaq 100 Index 11/11 Ctr 180 180Call 2540 Nasdaq 100 Index 03/12 Ctr 28 28Call 2575 Nasdaq 100 Index 02/12 Ctr 56 56Call 2575 Nasdaq 100 Index 02/12 Ctr 56 56Call 2575 Nasdaq 100 Index 03/12 Ctr 50 50Call 2580 Nasdaq 100 Index 03/12 Ctr 28 28Call 2600 Nasdaq 100 Index 02/12 Ctr 375 375Call 2600 Nasdaq 100 Index 12/11 Ctr 180 180
Acquisitions and disposals of securities and money-market instruments (classification as per reporting date) as well as derivatives and deposits no longer held in the investment portfolio at the end of the reporting periodSecurities Shares resp. Currency
(in 1,000) resp. ContractsAcquisitions Disposals
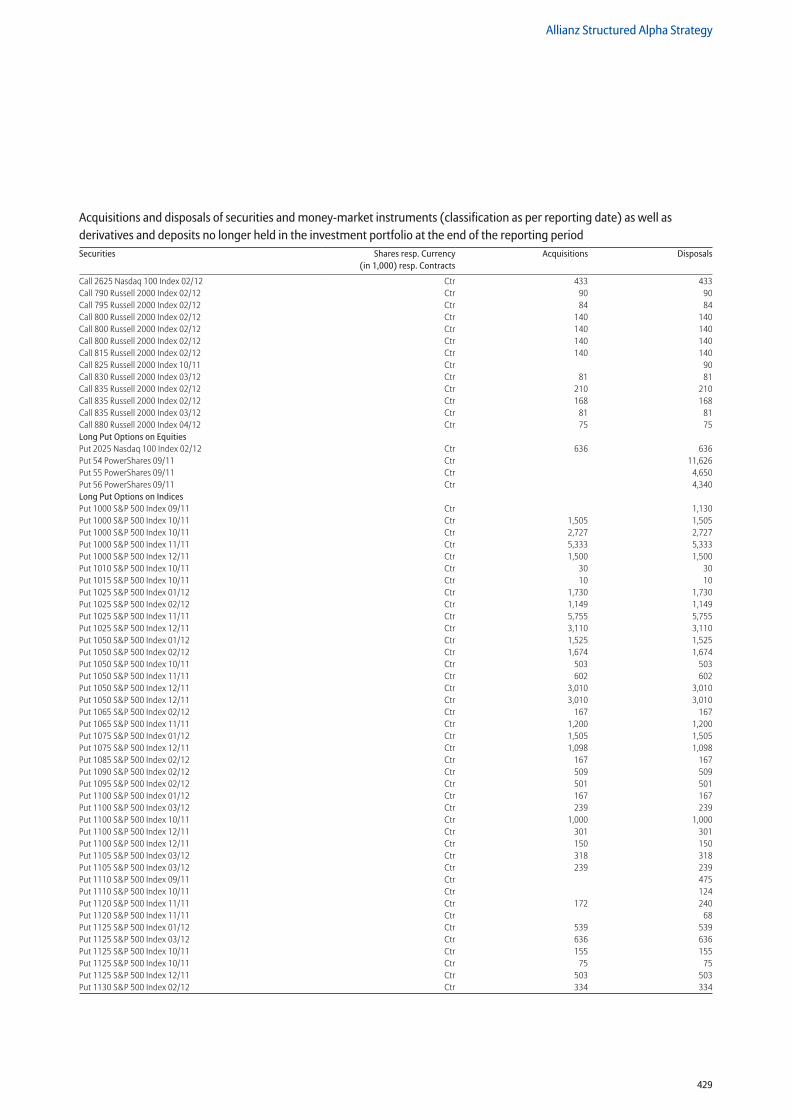
429
Allianz Structured Alpha Strategy
Call 2625 Nasdaq 100 Index 02/12 Ctr 433 433Call 790 Russell 2000 Index 02/12 Ctr 90 90Call 795 Russell 2000 Index 02/12 Ctr 84 84Call 800 Russell 2000 Index 02/12 Ctr 140 140Call 800 Russell 2000 Index 02/12 Ctr 140 140Call 800 Russell 2000 Index 02/12 Ctr 140 140Call 815 Russell 2000 Index 02/12 Ctr 140 140Call 825 Russell 2000 Index 10/11 Ctr 90Call 830 Russell 2000 Index 03/12 Ctr 81 81Call 835 Russell 2000 Index 02/12 Ctr 210 210Call 835 Russell 2000 Index 02/12 Ctr 168 168Call 835 Russell 2000 Index 03/12 Ctr 81 81Call 880 Russell 2000 Index 04/12 Ctr 75 75Long Put Options on Equities Put 2025 Nasdaq 100 Index 02/12 Ctr 636 636Put 54 PowerShares 09/11 Ctr 11,626Put 55 PowerShares 09/11 Ctr 4,650Put 56 PowerShares 09/11 Ctr 4,340Long Put Options on Indices Put 1000 S&P 500 Index 09/11 Ctr 1,130Put 1000 S&P 500 Index 10/11 Ctr 1,505 1,505Put 1000 S&P 500 Index 10/11 Ctr 2,727 2,727Put 1000 S&P 500 Index 11/11 Ctr 5,333 5,333Put 1000 S&P 500 Index 12/11 Ctr 1,500 1,500Put 1010 S&P 500 Index 10/11 Ctr 30 30Put 1015 S&P 500 Index 10/11 Ctr 10 10Put 1025 S&P 500 Index 01/12 Ctr 1,730 1,730Put 1025 S&P 500 Index 02/12 Ctr 1,149 1,149Put 1025 S&P 500 Index 11/11 Ctr 5,755 5,755Put 1025 S&P 500 Index 12/11 Ctr 3,110 3,110Put 1050 S&P 500 Index 01/12 Ctr 1,525 1,525Put 1050 S&P 500 Index 02/12 Ctr 1,674 1,674Put 1050 S&P 500 Index 10/11 Ctr 503 503Put 1050 S&P 500 Index 11/11 Ctr 602 602Put 1050 S&P 500 Index 12/11 Ctr 3,010 3,010Put 1050 S&P 500 Index 12/11 Ctr 3,010 3,010Put 1065 S&P 500 Index 02/12 Ctr 167 167Put 1065 S&P 500 Index 11/11 Ctr 1,200 1,200Put 1075 S&P 500 Index 01/12 Ctr 1,505 1,505Put 1075 S&P 500 Index 12/11 Ctr 1,098 1,098Put 1085 S&P 500 Index 02/12 Ctr 167 167Put 1090 S&P 500 Index 02/12 Ctr 509 509Put 1095 S&P 500 Index 02/12 Ctr 501 501Put 1100 S&P 500 Index 01/12 Ctr 167 167Put 1100 S&P 500 Index 03/12 Ctr 239 239Put 1100 S&P 500 Index 10/11 Ctr 1,000 1,000Put 1100 S&P 500 Index 12/11 Ctr 301 301Put 1100 S&P 500 Index 12/11 Ctr 150 150Put 1105 S&P 500 Index 03/12 Ctr 318 318Put 1105 S&P 500 Index 03/12 Ctr 239 239Put 1110 S&P 500 Index 09/11 Ctr 475Put 1110 S&P 500 Index 10/11 Ctr 124Put 1120 S&P 500 Index 11/11 Ctr 172 240Put 1120 S&P 500 Index 11/11 Ctr 68Put 1125 S&P 500 Index 01/12 Ctr 539 539Put 1125 S&P 500 Index 03/12 Ctr 636 636Put 1125 S&P 500 Index 10/11 Ctr 155 155Put 1125 S&P 500 Index 10/11 Ctr 75 75Put 1125 S&P 500 Index 12/11 Ctr 503 503Put 1130 S&P 500 Index 02/12 Ctr 334 334
Acquisitions and disposals of securities and money-market instruments (classification as per reporting date) as well as derivatives and deposits no longer held in the investment portfolio at the end of the reporting periodSecurities Shares resp. Currency
(in 1,000) resp. ContractsAcquisitions Disposals
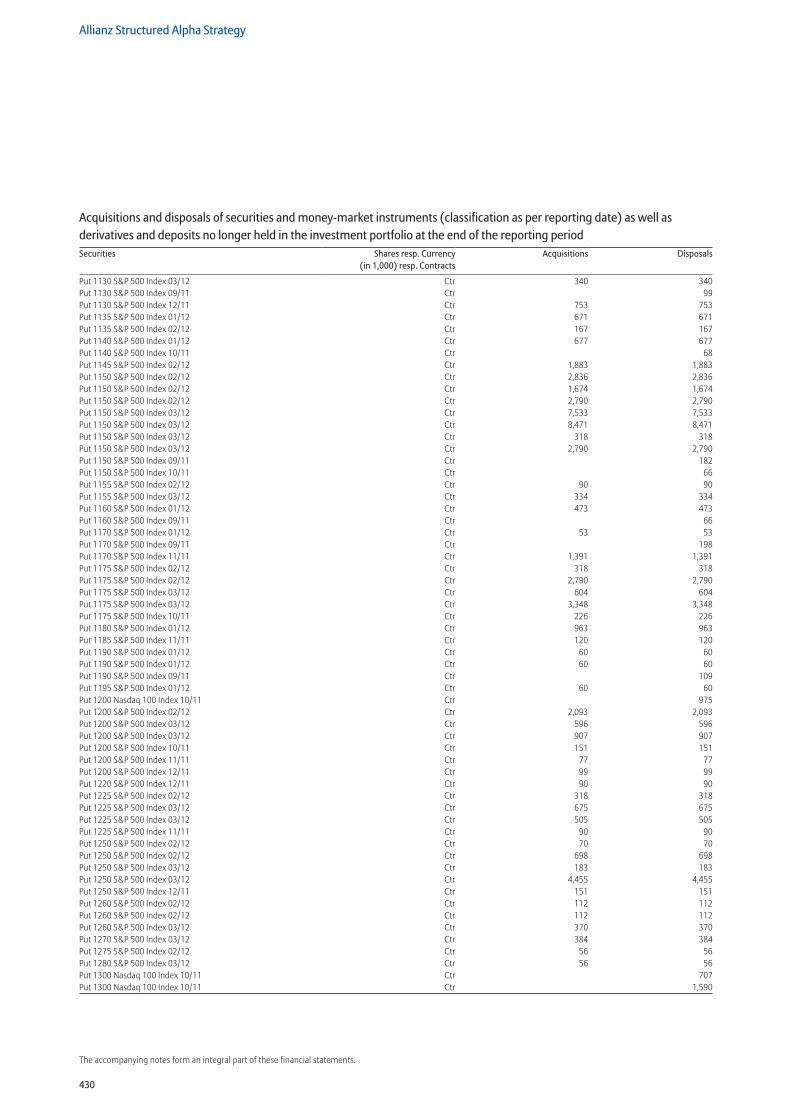
430
Allianz Structured Alpha Strategy
The accompanying notes form an integral part of these financial statements.
Put 1130 S&P 500 Index 03/12 Ctr 340 340Put 1130 S&P 500 Index 09/11 Ctr 99Put 1130 S&P 500 Index 12/11 Ctr 753 753Put 1135 S&P 500 Index 01/12 Ctr 671 671Put 1135 S&P 500 Index 02/12 Ctr 167 167Put 1140 S&P 500 Index 01/12 Ctr 677 677Put 1140 S&P 500 Index 10/11 Ctr 68Put 1145 S&P 500 Index 02/12 Ctr 1,883 1,883Put 1150 S&P 500 Index 02/12 Ctr 2,836 2,836Put 1150 S&P 500 Index 02/12 Ctr 1,674 1,674Put 1150 S&P 500 Index 02/12 Ctr 2,790 2,790Put 1150 S&P 500 Index 03/12 Ctr 7,533 7,533Put 1150 S&P 500 Index 03/12 Ctr 8,471 8,471Put 1150 S&P 500 Index 03/12 Ctr 318 318Put 1150 S&P 500 Index 03/12 Ctr 2,790 2,790Put 1150 S&P 500 Index 09/11 Ctr 182Put 1150 S&P 500 Index 10/11 Ctr 66Put 1155 S&P 500 Index 02/12 Ctr 90 90Put 1155 S&P 500 Index 03/12 Ctr 334 334Put 1160 S&P 500 Index 01/12 Ctr 473 473Put 1160 S&P 500 Index 09/11 Ctr 66Put 1170 S&P 500 Index 01/12 Ctr 53 53Put 1170 S&P 500 Index 09/11 Ctr 198Put 1170 S&P 500 Index 11/11 Ctr 1,391 1,391Put 1175 S&P 500 Index 02/12 Ctr 318 318Put 1175 S&P 500 Index 02/12 Ctr 2,790 2,790Put 1175 S&P 500 Index 03/12 Ctr 604 604Put 1175 S&P 500 Index 03/12 Ctr 3,348 3,348Put 1175 S&P 500 Index 10/11 Ctr 226 226Put 1180 S&P 500 Index 01/12 Ctr 963 963Put 1185 S&P 500 Index 11/11 Ctr 120 120Put 1190 S&P 500 Index 01/12 Ctr 60 60Put 1190 S&P 500 Index 01/12 Ctr 60 60Put 1190 S&P 500 Index 09/11 Ctr 109Put 1195 S&P 500 Index 01/12 Ctr 60 60Put 1200 Nasdaq 100 Index 10/11 Ctr 975Put 1200 S&P 500 Index 02/12 Ctr 2,093 2,093Put 1200 S&P 500 Index 03/12 Ctr 596 596Put 1200 S&P 500 Index 03/12 Ctr 907 907Put 1200 S&P 500 Index 10/11 Ctr 151 151Put 1200 S&P 500 Index 11/11 Ctr 77 77Put 1200 S&P 500 Index 12/11 Ctr 99 99Put 1220 S&P 500 Index 12/11 Ctr 90 90Put 1225 S&P 500 Index 02/12 Ctr 318 318Put 1225 S&P 500 Index 03/12 Ctr 675 675Put 1225 S&P 500 Index 03/12 Ctr 505 505Put 1225 S&P 500 Index 11/11 Ctr 90 90Put 1250 S&P 500 Index 02/12 Ctr 70 70Put 1250 S&P 500 Index 02/12 Ctr 698 698Put 1250 S&P 500 Index 03/12 Ctr 183 183Put 1250 S&P 500 Index 03/12 Ctr 4,455 4,455Put 1250 S&P 500 Index 12/11 Ctr 151 151Put 1260 S&P 500 Index 02/12 Ctr 112 112Put 1260 S&P 500 Index 02/12 Ctr 112 112Put 1260 S&P 500 Index 03/12 Ctr 370 370Put 1270 S&P 500 Index 03/12 Ctr 384 384Put 1275 S&P 500 Index 02/12 Ctr 56 56Put 1280 S&P 500 Index 03/12 Ctr 56 56Put 1300 Nasdaq 100 Index 10/11 Ctr 707Put 1300 Nasdaq 100 Index 10/11 Ctr 1,590
Acquisitions and disposals of securities and money-market instruments (classification as per reporting date) as well as derivatives and deposits no longer held in the investment portfolio at the end of the reporting periodSecurities Shares resp. Currency
(in 1,000) resp. ContractsAcquisitions Disposals
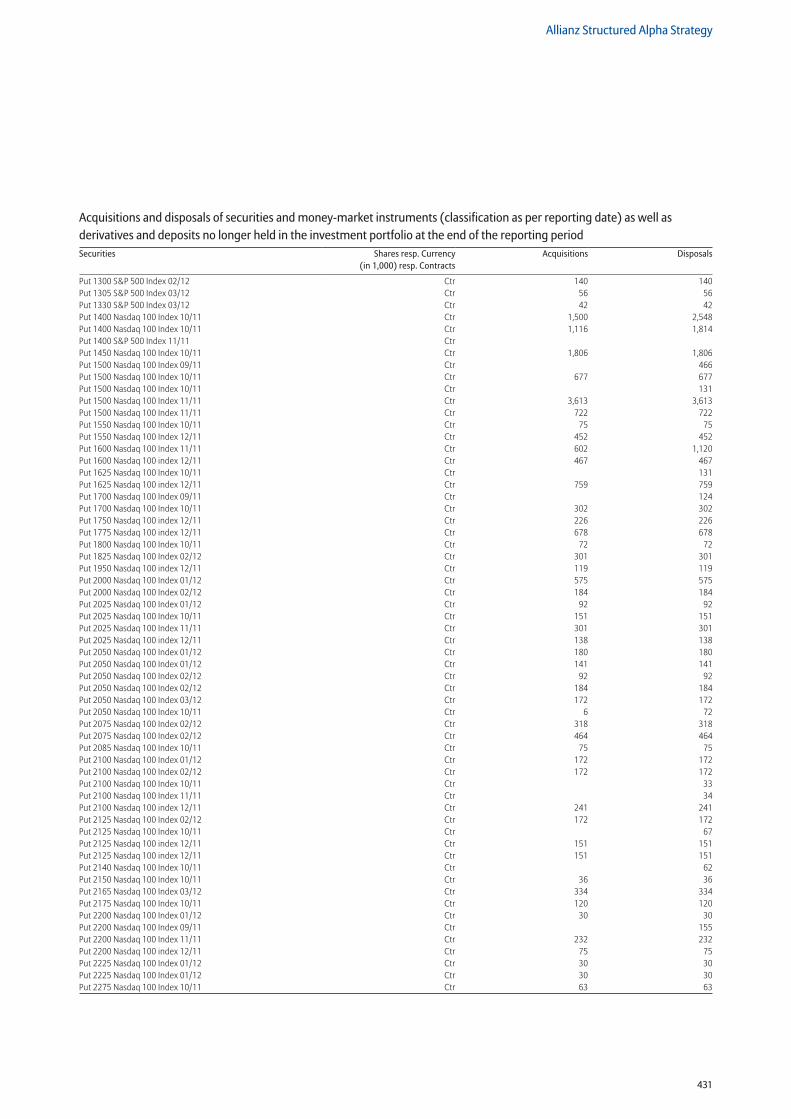
431
Allianz Structured Alpha Strategy
Put 1300 S&P 500 Index 02/12 Ctr 140 140Put 1305 S&P 500 Index 03/12 Ctr 56 56Put 1330 S&P 500 Index 03/12 Ctr 42 42Put 1400 Nasdaq 100 Index 10/11 Ctr 1,500 2,548Put 1400 Nasdaq 100 Index 10/11 Ctr 1,116 1,814Put 1400 S&P 500 Index 11/11 Ctr Put 1450 Nasdaq 100 Index 10/11 Ctr 1,806 1,806Put 1500 Nasdaq 100 Index 09/11 Ctr 466Put 1500 Nasdaq 100 Index 10/11 Ctr 677 677Put 1500 Nasdaq 100 Index 10/11 Ctr 131Put 1500 Nasdaq 100 Index 11/11 Ctr 3,613 3,613Put 1500 Nasdaq 100 Index 11/11 Ctr 722 722Put 1550 Nasdaq 100 Index 10/11 Ctr 75 75Put 1550 Nasdaq 100 Index 12/11 Ctr 452 452Put 1600 Nasdaq 100 Index 11/11 Ctr 602 1,120Put 1600 Nasdaq 100 index 12/11 Ctr 467 467Put 1625 Nasdaq 100 Index 10/11 Ctr 131Put 1625 Nasdaq 100 index 12/11 Ctr 759 759Put 1700 Nasdaq 100 Index 09/11 Ctr 124Put 1700 Nasdaq 100 Index 10/11 Ctr 302 302Put 1750 Nasdaq 100 index 12/11 Ctr 226 226Put 1775 Nasdaq 100 index 12/11 Ctr 678 678Put 1800 Nasdaq 100 Index 10/11 Ctr 72 72Put 1825 Nasdaq 100 Index 02/12 Ctr 301 301Put 1950 Nasdaq 100 index 12/11 Ctr 119 119Put 2000 Nasdaq 100 Index 01/12 Ctr 575 575Put 2000 Nasdaq 100 Index 02/12 Ctr 184 184Put 2025 Nasdaq 100 Index 01/12 Ctr 92 92Put 2025 Nasdaq 100 Index 10/11 Ctr 151 151Put 2025 Nasdaq 100 Index 11/11 Ctr 301 301Put 2025 Nasdaq 100 index 12/11 Ctr 138 138Put 2050 Nasdaq 100 Index 01/12 Ctr 180 180Put 2050 Nasdaq 100 Index 01/12 Ctr 141 141Put 2050 Nasdaq 100 Index 02/12 Ctr 92 92Put 2050 Nasdaq 100 Index 02/12 Ctr 184 184Put 2050 Nasdaq 100 Index 03/12 Ctr 172 172Put 2050 Nasdaq 100 Index 10/11 Ctr 6 72Put 2075 Nasdaq 100 Index 02/12 Ctr 318 318Put 2075 Nasdaq 100 Index 02/12 Ctr 464 464Put 2085 Nasdaq 100 Index 10/11 Ctr 75 75Put 2100 Nasdaq 100 Index 01/12 Ctr 172 172Put 2100 Nasdaq 100 Index 02/12 Ctr 172 172Put 2100 Nasdaq 100 Index 10/11 Ctr 33Put 2100 Nasdaq 100 Index 11/11 Ctr 34Put 2100 Nasdaq 100 index 12/11 Ctr 241 241Put 2125 Nasdaq 100 Index 02/12 Ctr 172 172Put 2125 Nasdaq 100 Index 10/11 Ctr 67Put 2125 Nasdaq 100 index 12/11 Ctr 151 151Put 2125 Nasdaq 100 index 12/11 Ctr 151 151Put 2140 Nasdaq 100 Index 10/11 Ctr 62Put 2150 Nasdaq 100 Index 10/11 Ctr 36 36Put 2165 Nasdaq 100 Index 03/12 Ctr 334 334Put 2175 Nasdaq 100 Index 10/11 Ctr 120 120Put 2200 Nasdaq 100 Index 01/12 Ctr 30 30Put 2200 Nasdaq 100 Index 09/11 Ctr 155Put 2200 Nasdaq 100 Index 11/11 Ctr 232 232Put 2200 Nasdaq 100 index 12/11 Ctr 75 75Put 2225 Nasdaq 100 Index 01/12 Ctr 30 30Put 2225 Nasdaq 100 Index 01/12 Ctr 30 30Put 2275 Nasdaq 100 Index 10/11 Ctr 63 63
Acquisitions and disposals of securities and money-market instruments (classification as per reporting date) as well as derivatives and deposits no longer held in the investment portfolio at the end of the reporting periodSecurities Shares resp. Currency
(in 1,000) resp. ContractsAcquisitions Disposals
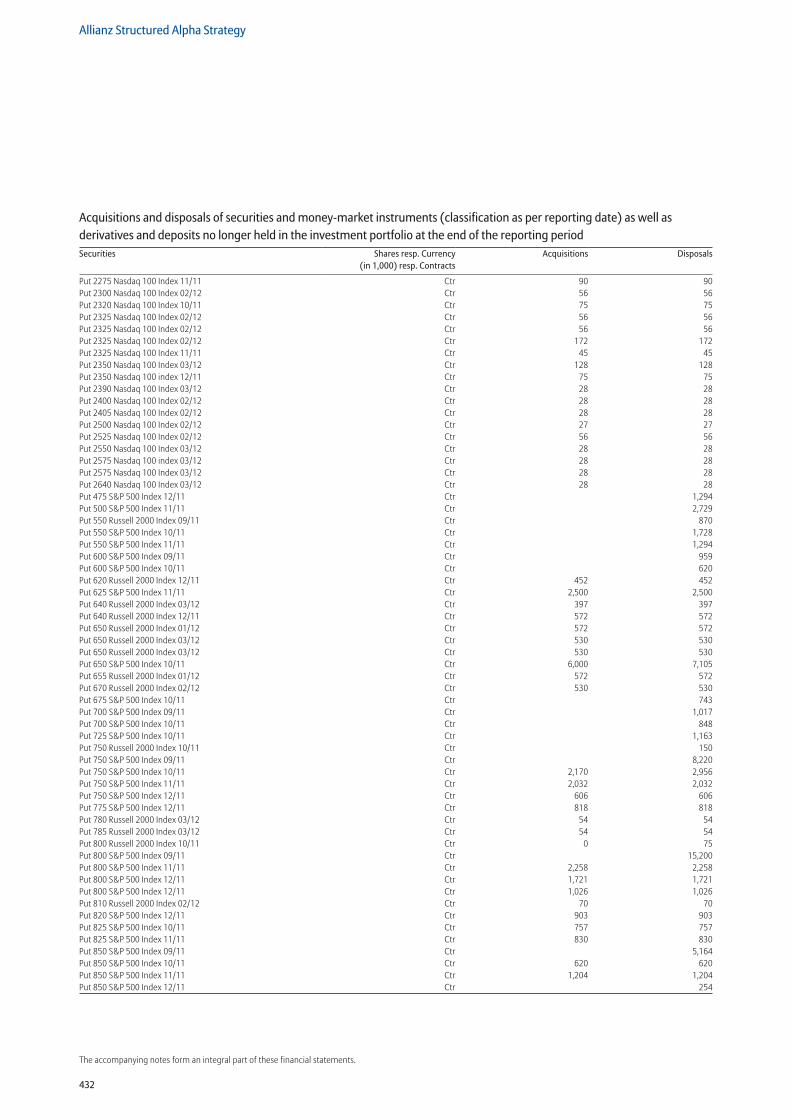
432
Allianz Structured Alpha Strategy
The accompanying notes form an integral part of these financial statements.
Put 2275 Nasdaq 100 Index 11/11 Ctr 90 90Put 2300 Nasdaq 100 Index 02/12 Ctr 56 56Put 2320 Nasdaq 100 Index 10/11 Ctr 75 75Put 2325 Nasdaq 100 Index 02/12 Ctr 56 56Put 2325 Nasdaq 100 Index 02/12 Ctr 56 56Put 2325 Nasdaq 100 Index 02/12 Ctr 172 172Put 2325 Nasdaq 100 Index 11/11 Ctr 45 45Put 2350 Nasdaq 100 Index 03/12 Ctr 128 128Put 2350 Nasdaq 100 index 12/11 Ctr 75 75Put 2390 Nasdaq 100 Index 03/12 Ctr 28 28Put 2400 Nasdaq 100 Index 02/12 Ctr 28 28Put 2405 Nasdaq 100 Index 02/12 Ctr 28 28Put 2500 Nasdaq 100 Index 02/12 Ctr 27 27Put 2525 Nasdaq 100 Index 02/12 Ctr 56 56Put 2550 Nasdaq 100 Index 03/12 Ctr 28 28Put 2575 Nasdaq 100 index 03/12 Ctr 28 28Put 2575 Nasdaq 100 Index 03/12 Ctr 28 28Put 2640 Nasdaq 100 Index 03/12 Ctr 28 28Put 475 S&P 500 Index 12/11 Ctr 1,294Put 500 S&P 500 Index 11/11 Ctr 2,729Put 550 Russell 2000 Index 09/11 Ctr 870Put 550 S&P 500 Index 10/11 Ctr 1,728Put 550 S&P 500 Index 11/11 Ctr 1,294Put 600 S&P 500 Index 09/11 Ctr 959Put 600 S&P 500 Index 10/11 Ctr 620Put 620 Russell 2000 Index 12/11 Ctr 452 452Put 625 S&P 500 Index 11/11 Ctr 2,500 2,500Put 640 Russell 2000 Index 03/12 Ctr 397 397Put 640 Russell 2000 Index 12/11 Ctr 572 572Put 650 Russell 2000 Index 01/12 Ctr 572 572Put 650 Russell 2000 Index 03/12 Ctr 530 530Put 650 Russell 2000 Index 03/12 Ctr 530 530Put 650 S&P 500 Index 10/11 Ctr 6,000 7,105Put 655 Russell 2000 Index 01/12 Ctr 572 572Put 670 Russell 2000 Index 02/12 Ctr 530 530Put 675 S&P 500 Index 10/11 Ctr 743Put 700 S&P 500 Index 09/11 Ctr 1,017Put 700 S&P 500 Index 10/11 Ctr 848Put 725 S&P 500 Index 10/11 Ctr 1,163Put 750 Russell 2000 Index 10/11 Ctr 150Put 750 S&P 500 Index 09/11 Ctr 8,220Put 750 S&P 500 Index 10/11 Ctr 2,170 2,956Put 750 S&P 500 Index 11/11 Ctr 2,032 2,032Put 750 S&P 500 Index 12/11 Ctr 606 606Put 775 S&P 500 Index 12/11 Ctr 818 818Put 780 Russell 2000 Index 03/12 Ctr 54 54Put 785 Russell 2000 Index 03/12 Ctr 54 54Put 800 Russell 2000 Index 10/11 Ctr 0 75Put 800 S&P 500 Index 09/11 Ctr 15,200Put 800 S&P 500 Index 11/11 Ctr 2,258 2,258Put 800 S&P 500 Index 12/11 Ctr 1,721 1,721Put 800 S&P 500 Index 12/11 Ctr 1,026 1,026Put 810 Russell 2000 Index 02/12 Ctr 70 70Put 820 S&P 500 Index 12/11 Ctr 903 903Put 825 S&P 500 Index 10/11 Ctr 757 757Put 825 S&P 500 Index 11/11 Ctr 830 830Put 850 S&P 500 Index 09/11 Ctr 5,164Put 850 S&P 500 Index 10/11 Ctr 620 620Put 850 S&P 500 Index 11/11 Ctr 1,204 1,204Put 850 S&P 500 Index 12/11 Ctr 254
Acquisitions and disposals of securities and money-market instruments (classification as per reporting date) as well as derivatives and deposits no longer held in the investment portfolio at the end of the reporting periodSecurities Shares resp. Currency
(in 1,000) resp. ContractsAcquisitions Disposals
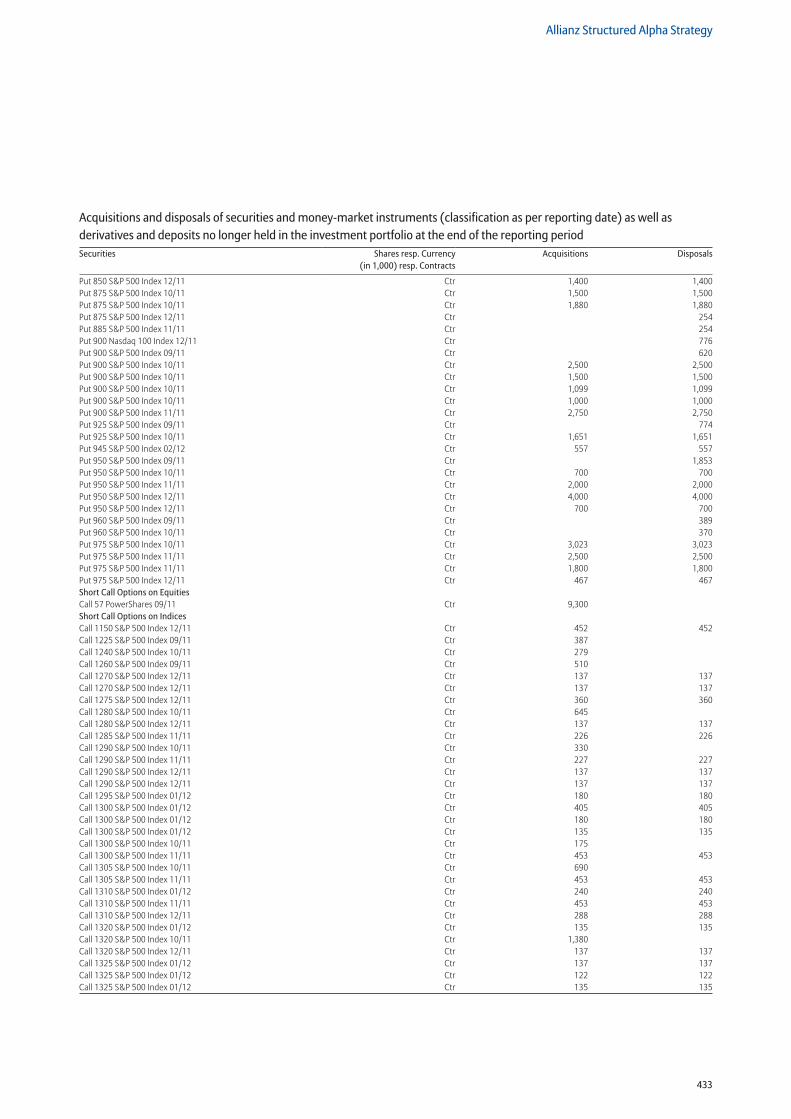
433
Allianz Structured Alpha Strategy
Put 850 S&P 500 Index 12/11 Ctr 1,400 1,400Put 875 S&P 500 Index 10/11 Ctr 1,500 1,500Put 875 S&P 500 Index 10/11 Ctr 1,880 1,880Put 875 S&P 500 Index 12/11 Ctr 254Put 885 S&P 500 Index 11/11 Ctr 254Put 900 Nasdaq 100 Index 12/11 Ctr 776Put 900 S&P 500 Index 09/11 Ctr 620Put 900 S&P 500 Index 10/11 Ctr 2,500 2,500Put 900 S&P 500 Index 10/11 Ctr 1,500 1,500Put 900 S&P 500 Index 10/11 Ctr 1,099 1,099Put 900 S&P 500 Index 10/11 Ctr 1,000 1,000Put 900 S&P 500 Index 11/11 Ctr 2,750 2,750Put 925 S&P 500 Index 09/11 Ctr 774Put 925 S&P 500 Index 10/11 Ctr 1,651 1,651Put 945 S&P 500 Index 02/12 Ctr 557 557Put 950 S&P 500 Index 09/11 Ctr 1,853Put 950 S&P 500 Index 10/11 Ctr 700 700Put 950 S&P 500 Index 11/11 Ctr 2,000 2,000Put 950 S&P 500 Index 12/11 Ctr 4,000 4,000Put 950 S&P 500 Index 12/11 Ctr 700 700Put 960 S&P 500 Index 09/11 Ctr 389Put 960 S&P 500 Index 10/11 Ctr 370Put 975 S&P 500 Index 10/11 Ctr 3,023 3,023Put 975 S&P 500 Index 11/11 Ctr 2,500 2,500Put 975 S&P 500 Index 11/11 Ctr 1,800 1,800Put 975 S&P 500 Index 12/11 Ctr 467 467Short Call Options on Equities Call 57 PowerShares 09/11 Ctr 9,300 Short Call Options on Indices Call 1150 S&P 500 Index 12/11 Ctr 452 452Call 1225 S&P 500 Index 09/11 Ctr 387 Call 1240 S&P 500 Index 10/11 Ctr 279 Call 1260 S&P 500 Index 09/11 Ctr 510 Call 1270 S&P 500 Index 12/11 Ctr 137 137Call 1270 S&P 500 Index 12/11 Ctr 137 137Call 1275 S&P 500 Index 12/11 Ctr 360 360Call 1280 S&P 500 Index 10/11 Ctr 645 Call 1280 S&P 500 Index 12/11 Ctr 137 137Call 1285 S&P 500 Index 11/11 Ctr 226 226Call 1290 S&P 500 Index 10/11 Ctr 330 Call 1290 S&P 500 Index 11/11 Ctr 227 227Call 1290 S&P 500 Index 12/11 Ctr 137 137Call 1290 S&P 500 Index 12/11 Ctr 137 137Call 1295 S&P 500 Index 01/12 Ctr 180 180Call 1300 S&P 500 Index 01/12 Ctr 405 405Call 1300 S&P 500 Index 01/12 Ctr 180 180Call 1300 S&P 500 Index 01/12 Ctr 135 135Call 1300 S&P 500 Index 10/11 Ctr 175 Call 1300 S&P 500 Index 11/11 Ctr 453 453Call 1305 S&P 500 Index 10/11 Ctr 690 Call 1305 S&P 500 Index 11/11 Ctr 453 453Call 1310 S&P 500 Index 01/12 Ctr 240 240Call 1310 S&P 500 Index 11/11 Ctr 453 453Call 1310 S&P 500 Index 12/11 Ctr 288 288Call 1320 S&P 500 Index 01/12 Ctr 135 135Call 1320 S&P 500 Index 10/11 Ctr 1,380 Call 1320 S&P 500 Index 12/11 Ctr 137 137Call 1325 S&P 500 Index 01/12 Ctr 137 137Call 1325 S&P 500 Index 01/12 Ctr 122 122Call 1325 S&P 500 Index 01/12 Ctr 135 135
Acquisitions and disposals of securities and money-market instruments (classification as per reporting date) as well as derivatives and deposits no longer held in the investment portfolio at the end of the reporting periodSecurities Shares resp. Currency
(in 1,000) resp. ContractsAcquisitions Disposals
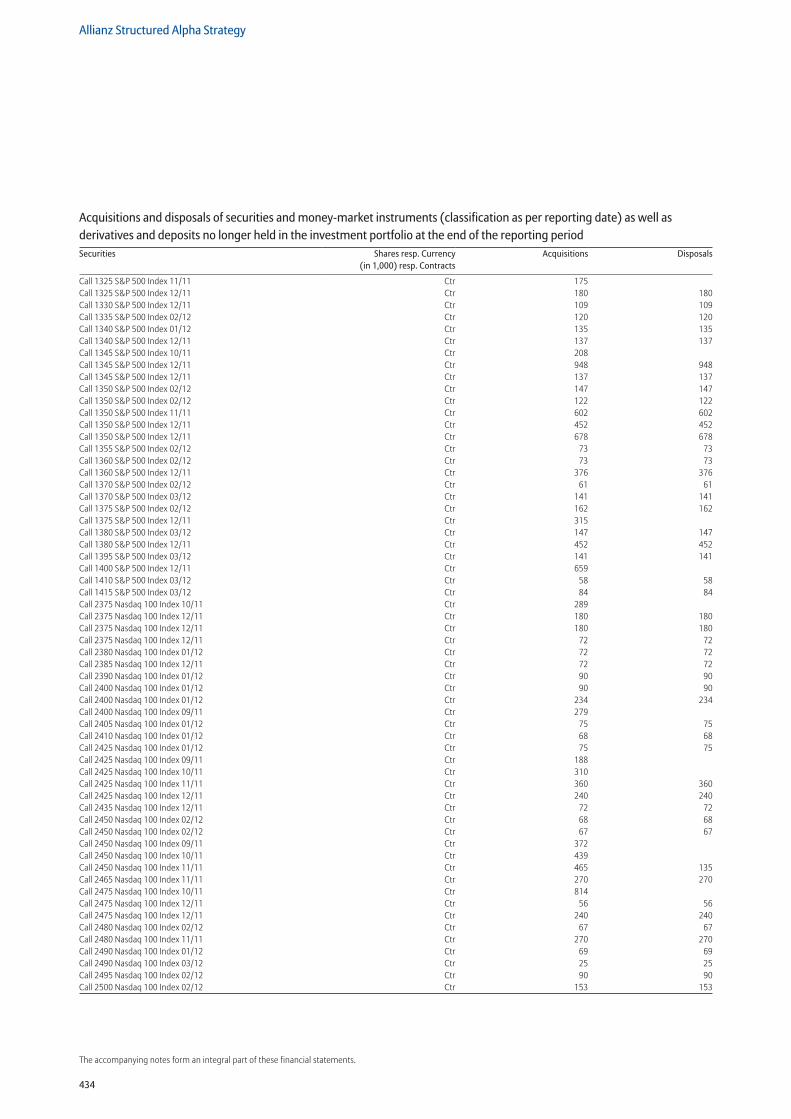
434
Allianz Structured Alpha Strategy
The accompanying notes form an integral part of these financial statements.
Call 1325 S&P 500 Index 11/11 Ctr 175 Call 1325 S&P 500 Index 12/11 Ctr 180 180Call 1330 S&P 500 Index 12/11 Ctr 109 109Call 1335 S&P 500 Index 02/12 Ctr 120 120Call 1340 S&P 500 Index 01/12 Ctr 135 135Call 1340 S&P 500 Index 12/11 Ctr 137 137Call 1345 S&P 500 Index 10/11 Ctr 208 Call 1345 S&P 500 Index 12/11 Ctr 948 948Call 1345 S&P 500 Index 12/11 Ctr 137 137Call 1350 S&P 500 Index 02/12 Ctr 147 147Call 1350 S&P 500 Index 02/12 Ctr 122 122Call 1350 S&P 500 Index 11/11 Ctr 602 602Call 1350 S&P 500 Index 12/11 Ctr 452 452Call 1350 S&P 500 Index 12/11 Ctr 678 678Call 1355 S&P 500 Index 02/12 Ctr 73 73Call 1360 S&P 500 Index 02/12 Ctr 73 73Call 1360 S&P 500 Index 12/11 Ctr 376 376Call 1370 S&P 500 Index 02/12 Ctr 61 61Call 1370 S&P 500 Index 03/12 Ctr 141 141Call 1375 S&P 500 Index 02/12 Ctr 162 162Call 1375 S&P 500 Index 12/11 Ctr 315 Call 1380 S&P 500 Index 03/12 Ctr 147 147Call 1380 S&P 500 Index 12/11 Ctr 452 452Call 1395 S&P 500 Index 03/12 Ctr 141 141Call 1400 S&P 500 Index 12/11 Ctr 659 Call 1410 S&P 500 Index 03/12 Ctr 58 58Call 1415 S&P 500 Index 03/12 Ctr 84 84Call 2375 Nasdaq 100 Index 10/11 Ctr 289 Call 2375 Nasdaq 100 Index 12/11 Ctr 180 180Call 2375 Nasdaq 100 Index 12/11 Ctr 180 180Call 2375 Nasdaq 100 Index 12/11 Ctr 72 72Call 2380 Nasdaq 100 Index 01/12 Ctr 72 72Call 2385 Nasdaq 100 Index 12/11 Ctr 72 72Call 2390 Nasdaq 100 Index 01/12 Ctr 90 90Call 2400 Nasdaq 100 Index 01/12 Ctr 90 90Call 2400 Nasdaq 100 Index 01/12 Ctr 234 234Call 2400 Nasdaq 100 Index 09/11 Ctr 279 Call 2405 Nasdaq 100 Index 01/12 Ctr 75 75Call 2410 Nasdaq 100 Index 01/12 Ctr 68 68Call 2425 Nasdaq 100 Index 01/12 Ctr 75 75Call 2425 Nasdaq 100 Index 09/11 Ctr 188 Call 2425 Nasdaq 100 Index 10/11 Ctr 310 Call 2425 Nasdaq 100 Index 11/11 Ctr 360 360Call 2425 Nasdaq 100 Index 12/11 Ctr 240 240Call 2435 Nasdaq 100 Index 12/11 Ctr 72 72Call 2450 Nasdaq 100 Index 02/12 Ctr 68 68Call 2450 Nasdaq 100 Index 02/12 Ctr 67 67Call 2450 Nasdaq 100 Index 09/11 Ctr 372 Call 2450 Nasdaq 100 Index 10/11 Ctr 439 Call 2450 Nasdaq 100 Index 11/11 Ctr 465 135Call 2465 Nasdaq 100 Index 11/11 Ctr 270 270Call 2475 Nasdaq 100 Index 10/11 Ctr 814 Call 2475 Nasdaq 100 Index 12/11 Ctr 56 56Call 2475 Nasdaq 100 Index 12/11 Ctr 240 240Call 2480 Nasdaq 100 Index 02/12 Ctr 67 67Call 2480 Nasdaq 100 Index 11/11 Ctr 270 270Call 2490 Nasdaq 100 Index 01/12 Ctr 69 69Call 2490 Nasdaq 100 Index 03/12 Ctr 25 25Call 2495 Nasdaq 100 Index 02/12 Ctr 90 90Call 2500 Nasdaq 100 Index 02/12 Ctr 153 153
Acquisitions and disposals of securities and money-market instruments (classification as per reporting date) as well as derivatives and deposits no longer held in the investment portfolio at the end of the reporting periodSecurities Shares resp. Currency
(in 1,000) resp. ContractsAcquisitions Disposals
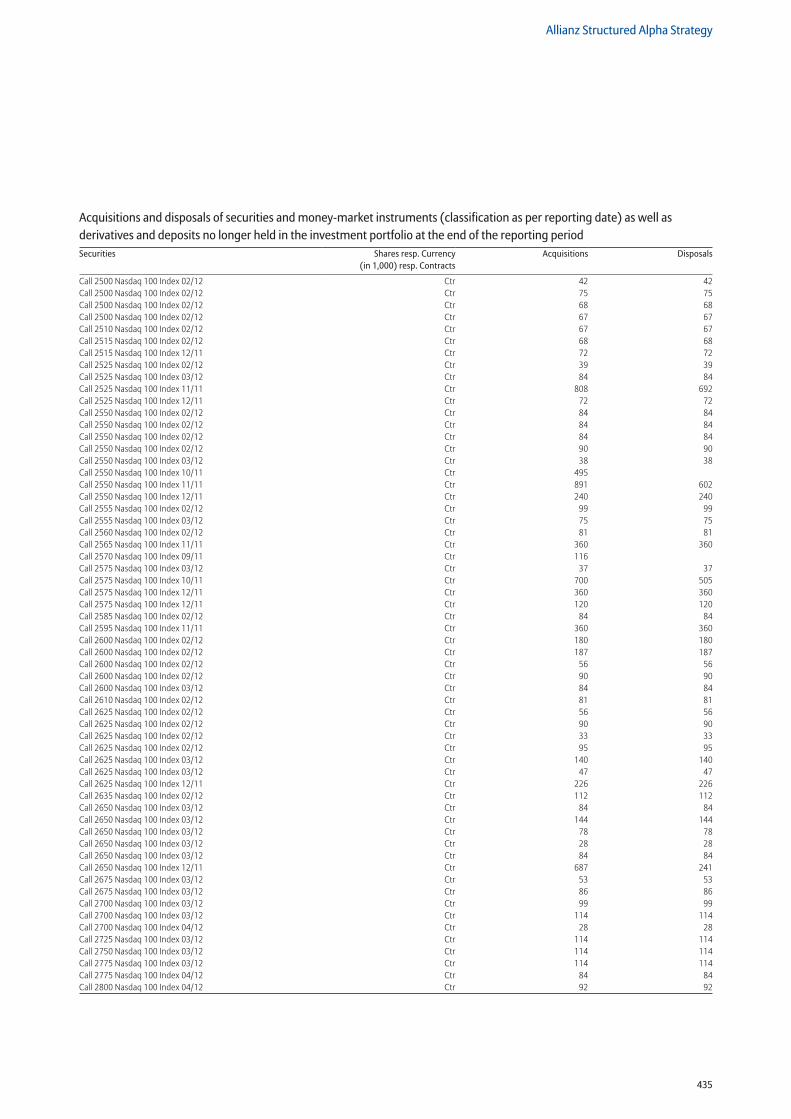
435
Allianz Structured Alpha Strategy
Call 2500 Nasdaq 100 Index 02/12 Ctr 42 42Call 2500 Nasdaq 100 Index 02/12 Ctr 75 75Call 2500 Nasdaq 100 Index 02/12 Ctr 68 68Call 2500 Nasdaq 100 Index 02/12 Ctr 67 67Call 2510 Nasdaq 100 Index 02/12 Ctr 67 67Call 2515 Nasdaq 100 Index 02/12 Ctr 68 68Call 2515 Nasdaq 100 Index 12/11 Ctr 72 72Call 2525 Nasdaq 100 Index 02/12 Ctr 39 39Call 2525 Nasdaq 100 Index 03/12 Ctr 84 84Call 2525 Nasdaq 100 Index 11/11 Ctr 808 692Call 2525 Nasdaq 100 Index 12/11 Ctr 72 72Call 2550 Nasdaq 100 Index 02/12 Ctr 84 84Call 2550 Nasdaq 100 Index 02/12 Ctr 84 84Call 2550 Nasdaq 100 Index 02/12 Ctr 84 84Call 2550 Nasdaq 100 Index 02/12 Ctr 90 90Call 2550 Nasdaq 100 Index 03/12 Ctr 38 38Call 2550 Nasdaq 100 Index 10/11 Ctr 495 Call 2550 Nasdaq 100 Index 11/11 Ctr 891 602Call 2550 Nasdaq 100 Index 12/11 Ctr 240 240Call 2555 Nasdaq 100 Index 02/12 Ctr 99 99Call 2555 Nasdaq 100 Index 03/12 Ctr 75 75Call 2560 Nasdaq 100 Index 02/12 Ctr 81 81Call 2565 Nasdaq 100 Index 11/11 Ctr 360 360Call 2570 Nasdaq 100 Index 09/11 Ctr 116 Call 2575 Nasdaq 100 Index 03/12 Ctr 37 37Call 2575 Nasdaq 100 Index 10/11 Ctr 700 505Call 2575 Nasdaq 100 Index 12/11 Ctr 360 360Call 2575 Nasdaq 100 Index 12/11 Ctr 120 120Call 2585 Nasdaq 100 Index 02/12 Ctr 84 84Call 2595 Nasdaq 100 Index 11/11 Ctr 360 360Call 2600 Nasdaq 100 Index 02/12 Ctr 180 180Call 2600 Nasdaq 100 Index 02/12 Ctr 187 187Call 2600 Nasdaq 100 Index 02/12 Ctr 56 56Call 2600 Nasdaq 100 Index 02/12 Ctr 90 90Call 2600 Nasdaq 100 Index 03/12 Ctr 84 84Call 2610 Nasdaq 100 Index 02/12 Ctr 81 81Call 2625 Nasdaq 100 Index 02/12 Ctr 56 56Call 2625 Nasdaq 100 Index 02/12 Ctr 90 90Call 2625 Nasdaq 100 Index 02/12 Ctr 33 33Call 2625 Nasdaq 100 Index 02/12 Ctr 95 95Call 2625 Nasdaq 100 Index 03/12 Ctr 140 140Call 2625 Nasdaq 100 Index 03/12 Ctr 47 47Call 2625 Nasdaq 100 Index 12/11 Ctr 226 226Call 2635 Nasdaq 100 Index 02/12 Ctr 112 112Call 2650 Nasdaq 100 Index 03/12 Ctr 84 84Call 2650 Nasdaq 100 Index 03/12 Ctr 144 144Call 2650 Nasdaq 100 Index 03/12 Ctr 78 78Call 2650 Nasdaq 100 Index 03/12 Ctr 28 28Call 2650 Nasdaq 100 Index 03/12 Ctr 84 84Call 2650 Nasdaq 100 Index 12/11 Ctr 687 241Call 2675 Nasdaq 100 Index 03/12 Ctr 53 53Call 2675 Nasdaq 100 Index 03/12 Ctr 86 86Call 2700 Nasdaq 100 Index 03/12 Ctr 99 99Call 2700 Nasdaq 100 Index 03/12 Ctr 114 114Call 2700 Nasdaq 100 Index 04/12 Ctr 28 28Call 2725 Nasdaq 100 Index 03/12 Ctr 114 114Call 2750 Nasdaq 100 Index 03/12 Ctr 114 114Call 2775 Nasdaq 100 Index 03/12 Ctr 114 114Call 2775 Nasdaq 100 Index 04/12 Ctr 84 84Call 2800 Nasdaq 100 Index 04/12 Ctr 92 92
Acquisitions and disposals of securities and money-market instruments (classification as per reporting date) as well as derivatives and deposits no longer held in the investment portfolio at the end of the reporting periodSecurities Shares resp. Currency
(in 1,000) resp. ContractsAcquisitions Disposals
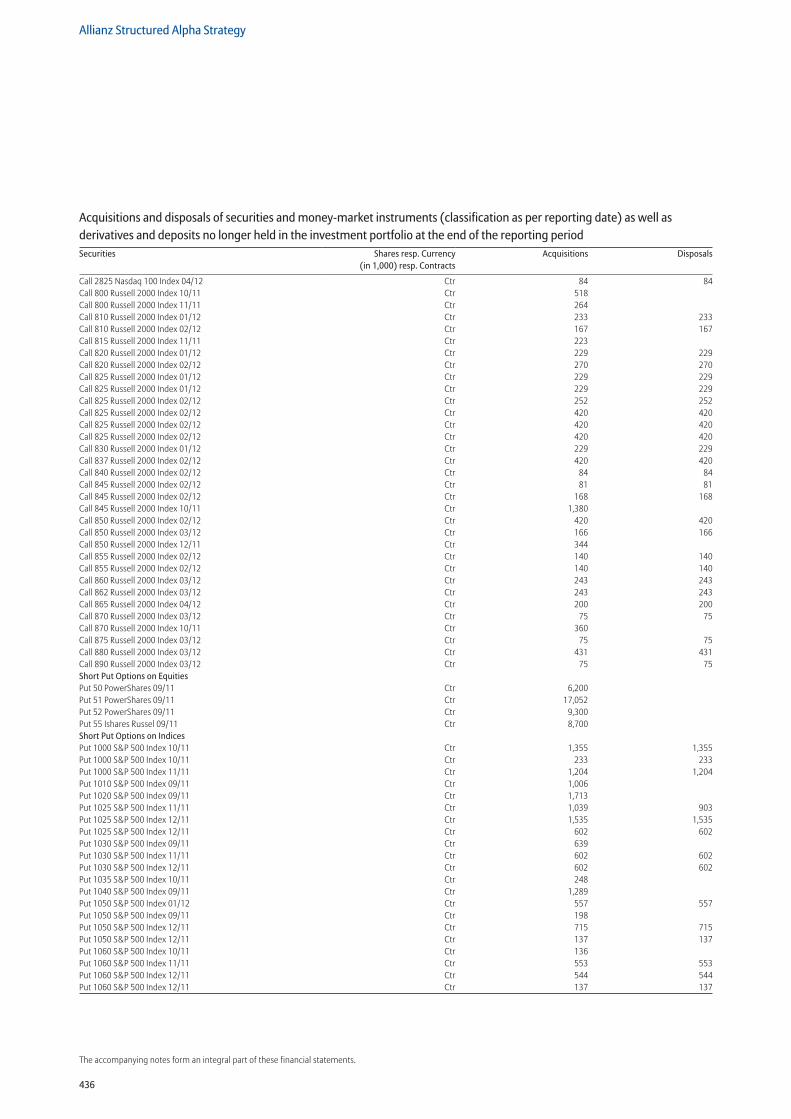
436
Allianz Structured Alpha Strategy
The accompanying notes form an integral part of these financial statements.
Call 2825 Nasdaq 100 Index 04/12 Ctr 84 84Call 800 Russell 2000 Index 10/11 Ctr 518 Call 800 Russell 2000 Index 11/11 Ctr 264 Call 810 Russell 2000 Index 01/12 Ctr 233 233Call 810 Russell 2000 Index 02/12 Ctr 167 167Call 815 Russell 2000 Index 11/11 Ctr 223 Call 820 Russell 2000 Index 01/12 Ctr 229 229Call 820 Russell 2000 Index 02/12 Ctr 270 270Call 825 Russell 2000 Index 01/12 Ctr 229 229Call 825 Russell 2000 Index 01/12 Ctr 229 229Call 825 Russell 2000 Index 02/12 Ctr 252 252Call 825 Russell 2000 Index 02/12 Ctr 420 420Call 825 Russell 2000 Index 02/12 Ctr 420 420Call 825 Russell 2000 Index 02/12 Ctr 420 420Call 830 Russell 2000 Index 01/12 Ctr 229 229Call 837 Russell 2000 Index 02/12 Ctr 420 420Call 840 Russell 2000 Index 02/12 Ctr 84 84Call 845 Russell 2000 Index 02/12 Ctr 81 81Call 845 Russell 2000 Index 02/12 Ctr 168 168Call 845 Russell 2000 Index 10/11 Ctr 1,380 Call 850 Russell 2000 Index 02/12 Ctr 420 420Call 850 Russell 2000 Index 03/12 Ctr 166 166Call 850 Russell 2000 Index 12/11 Ctr 344 Call 855 Russell 2000 Index 02/12 Ctr 140 140Call 855 Russell 2000 Index 02/12 Ctr 140 140Call 860 Russell 2000 Index 03/12 Ctr 243 243Call 862 Russell 2000 Index 03/12 Ctr 243 243Call 865 Russell 2000 Index 04/12 Ctr 200 200Call 870 Russell 2000 Index 03/12 Ctr 75 75Call 870 Russell 2000 Index 10/11 Ctr 360 Call 875 Russell 2000 Index 03/12 Ctr 75 75Call 880 Russell 2000 Index 03/12 Ctr 431 431Call 890 Russell 2000 Index 03/12 Ctr 75 75Short Put Options on Equities Put 50 PowerShares 09/11 Ctr 6,200 Put 51 PowerShares 09/11 Ctr 17,052 Put 52 PowerShares 09/11 Ctr 9,300 Put 55 Ishares Russel 09/11 Ctr 8,700 Short Put Options on Indices Put 1000 S&P 500 Index 10/11 Ctr 1,355 1,355Put 1000 S&P 500 Index 10/11 Ctr 233 233Put 1000 S&P 500 Index 11/11 Ctr 1,204 1,204Put 1010 S&P 500 Index 09/11 Ctr 1,006 Put 1020 S&P 500 Index 09/11 Ctr 1,713 Put 1025 S&P 500 Index 11/11 Ctr 1,039 903Put 1025 S&P 500 Index 12/11 Ctr 1,535 1,535Put 1025 S&P 500 Index 12/11 Ctr 602 602Put 1030 S&P 500 Index 09/11 Ctr 639 Put 1030 S&P 500 Index 11/11 Ctr 602 602Put 1030 S&P 500 Index 12/11 Ctr 602 602Put 1035 S&P 500 Index 10/11 Ctr 248 Put 1040 S&P 500 Index 09/11 Ctr 1,289 Put 1050 S&P 500 Index 01/12 Ctr 557 557Put 1050 S&P 500 Index 09/11 Ctr 198 Put 1050 S&P 500 Index 12/11 Ctr 715 715Put 1050 S&P 500 Index 12/11 Ctr 137 137Put 1060 S&P 500 Index 10/11 Ctr 136 Put 1060 S&P 500 Index 11/11 Ctr 553 553Put 1060 S&P 500 Index 12/11 Ctr 544 544Put 1060 S&P 500 Index 12/11 Ctr 137 137
Acquisitions and disposals of securities and money-market instruments (classification as per reporting date) as well as derivatives and deposits no longer held in the investment portfolio at the end of the reporting periodSecurities Shares resp. Currency
(in 1,000) resp. ContractsAcquisitions Disposals
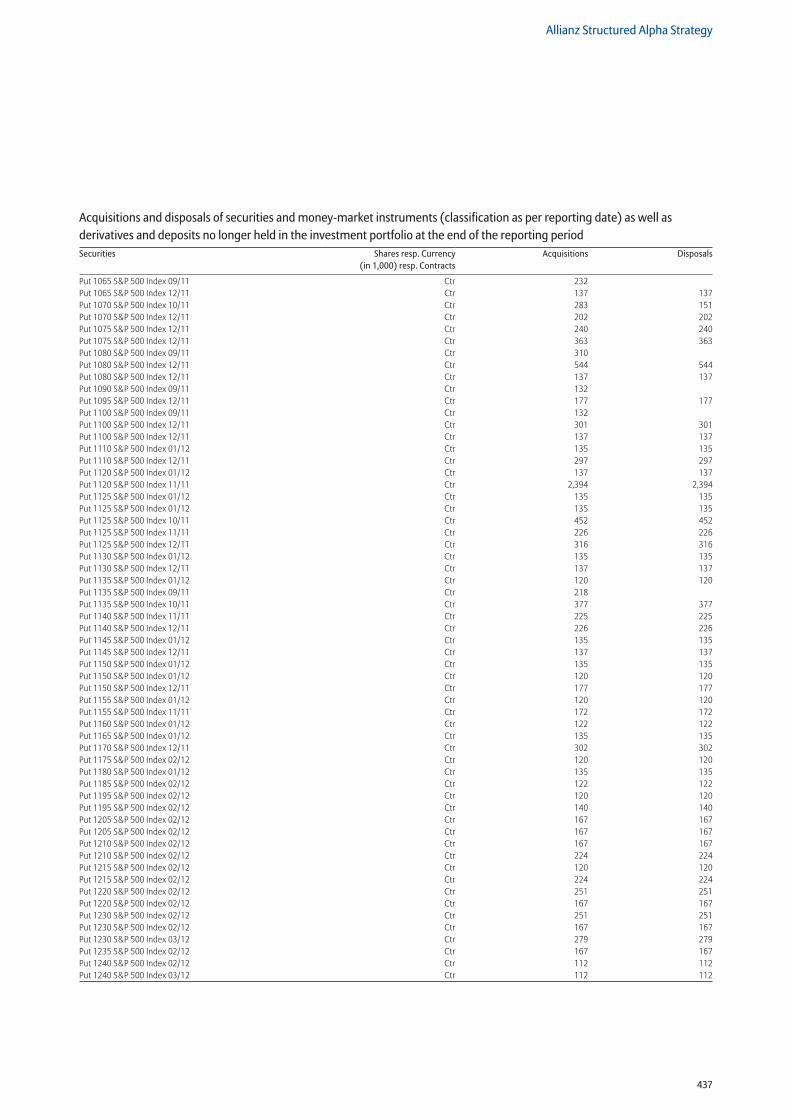
437
Allianz Structured Alpha Strategy
Put 1065 S&P 500 Index 09/11 Ctr 232 Put 1065 S&P 500 Index 12/11 Ctr 137 137Put 1070 S&P 500 Index 10/11 Ctr 283 151Put 1070 S&P 500 Index 12/11 Ctr 202 202Put 1075 S&P 500 Index 12/11 Ctr 240 240Put 1075 S&P 500 Index 12/11 Ctr 363 363Put 1080 S&P 500 Index 09/11 Ctr 310 Put 1080 S&P 500 Index 12/11 Ctr 544 544Put 1080 S&P 500 Index 12/11 Ctr 137 137Put 1090 S&P 500 Index 09/11 Ctr 132 Put 1095 S&P 500 Index 12/11 Ctr 177 177Put 1100 S&P 500 Index 09/11 Ctr 132 Put 1100 S&P 500 Index 12/11 Ctr 301 301Put 1100 S&P 500 Index 12/11 Ctr 137 137Put 1110 S&P 500 Index 01/12 Ctr 135 135Put 1110 S&P 500 Index 12/11 Ctr 297 297Put 1120 S&P 500 Index 01/12 Ctr 137 137Put 1120 S&P 500 Index 11/11 Ctr 2,394 2,394Put 1125 S&P 500 Index 01/12 Ctr 135 135Put 1125 S&P 500 Index 01/12 Ctr 135 135Put 1125 S&P 500 Index 10/11 Ctr 452 452Put 1125 S&P 500 Index 11/11 Ctr 226 226Put 1125 S&P 500 Index 12/11 Ctr 316 316Put 1130 S&P 500 Index 01/12 Ctr 135 135Put 1130 S&P 500 Index 12/11 Ctr 137 137Put 1135 S&P 500 Index 01/12 Ctr 120 120Put 1135 S&P 500 Index 09/11 Ctr 218 Put 1135 S&P 500 Index 10/11 Ctr 377 377Put 1140 S&P 500 Index 11/11 Ctr 225 225Put 1140 S&P 500 Index 12/11 Ctr 226 226Put 1145 S&P 500 Index 01/12 Ctr 135 135Put 1145 S&P 500 Index 12/11 Ctr 137 137Put 1150 S&P 500 Index 01/12 Ctr 135 135Put 1150 S&P 500 Index 01/12 Ctr 120 120Put 1150 S&P 500 Index 12/11 Ctr 177 177Put 1155 S&P 500 Index 01/12 Ctr 120 120Put 1155 S&P 500 Index 11/11 Ctr 172 172Put 1160 S&P 500 Index 01/12 Ctr 122 122Put 1165 S&P 500 Index 01/12 Ctr 135 135Put 1170 S&P 500 Index 12/11 Ctr 302 302Put 1175 S&P 500 Index 02/12 Ctr 120 120Put 1180 S&P 500 Index 01/12 Ctr 135 135Put 1185 S&P 500 Index 02/12 Ctr 122 122Put 1195 S&P 500 Index 02/12 Ctr 120 120Put 1195 S&P 500 Index 02/12 Ctr 140 140Put 1205 S&P 500 Index 02/12 Ctr 167 167Put 1205 S&P 500 Index 02/12 Ctr 167 167Put 1210 S&P 500 Index 02/12 Ctr 167 167Put 1210 S&P 500 Index 02/12 Ctr 224 224Put 1215 S&P 500 Index 02/12 Ctr 120 120Put 1215 S&P 500 Index 02/12 Ctr 224 224Put 1220 S&P 500 Index 02/12 Ctr 251 251Put 1220 S&P 500 Index 02/12 Ctr 167 167Put 1230 S&P 500 Index 02/12 Ctr 251 251Put 1230 S&P 500 Index 02/12 Ctr 167 167Put 1230 S&P 500 Index 03/12 Ctr 279 279Put 1235 S&P 500 Index 02/12 Ctr 167 167Put 1240 S&P 500 Index 02/12 Ctr 112 112Put 1240 S&P 500 Index 03/12 Ctr 112 112
Acquisitions and disposals of securities and money-market instruments (classification as per reporting date) as well as derivatives and deposits no longer held in the investment portfolio at the end of the reporting periodSecurities Shares resp. Currency
(in 1,000) resp. ContractsAcquisitions Disposals
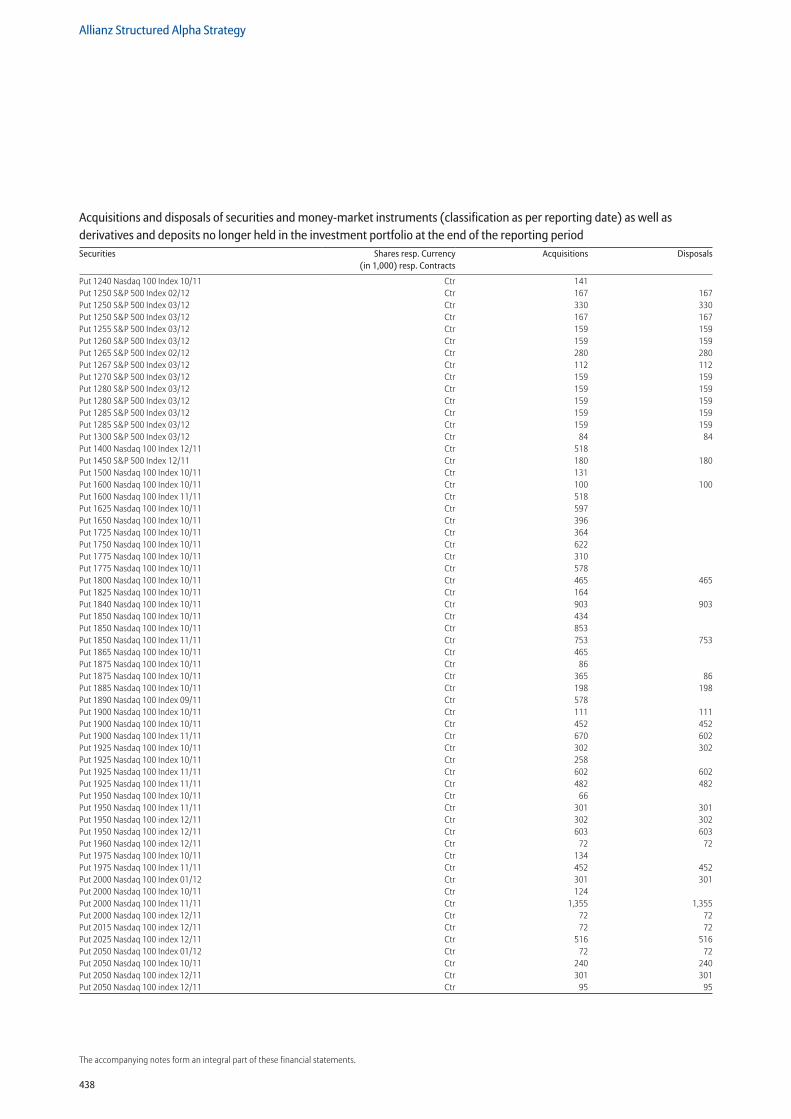
438
Allianz Structured Alpha Strategy
The accompanying notes form an integral part of these financial statements.
Put 1240 Nasdaq 100 Index 10/11 Ctr 141 Put 1250 S&P 500 Index 02/12 Ctr 167 167Put 1250 S&P 500 Index 03/12 Ctr 330 330Put 1250 S&P 500 Index 03/12 Ctr 167 167Put 1255 S&P 500 Index 03/12 Ctr 159 159Put 1260 S&P 500 Index 03/12 Ctr 159 159Put 1265 S&P 500 Index 02/12 Ctr 280 280Put 1267 S&P 500 Index 03/12 Ctr 112 112Put 1270 S&P 500 Index 03/12 Ctr 159 159Put 1280 S&P 500 Index 03/12 Ctr 159 159Put 1280 S&P 500 Index 03/12 Ctr 159 159Put 1285 S&P 500 Index 03/12 Ctr 159 159Put 1285 S&P 500 Index 03/12 Ctr 159 159Put 1300 S&P 500 Index 03/12 Ctr 84 84Put 1400 Nasdaq 100 Index 12/11 Ctr 518 Put 1450 S&P 500 Index 12/11 Ctr 180 180Put 1500 Nasdaq 100 Index 10/11 Ctr 131 Put 1600 Nasdaq 100 Index 10/11 Ctr 100 100Put 1600 Nasdaq 100 Index 11/11 Ctr 518 Put 1625 Nasdaq 100 Index 10/11 Ctr 597 Put 1650 Nasdaq 100 Index 10/11 Ctr 396 Put 1725 Nasdaq 100 Index 10/11 Ctr 364 Put 1750 Nasdaq 100 Index 10/11 Ctr 622 Put 1775 Nasdaq 100 Index 10/11 Ctr 310 Put 1775 Nasdaq 100 Index 10/11 Ctr 578 Put 1800 Nasdaq 100 Index 10/11 Ctr 465 465Put 1825 Nasdaq 100 Index 10/11 Ctr 164 Put 1840 Nasdaq 100 Index 10/11 Ctr 903 903Put 1850 Nasdaq 100 Index 10/11 Ctr 434 Put 1850 Nasdaq 100 Index 10/11 Ctr 853 Put 1850 Nasdaq 100 Index 11/11 Ctr 753 753Put 1865 Nasdaq 100 Index 10/11 Ctr 465 Put 1875 Nasdaq 100 Index 10/11 Ctr 86 Put 1875 Nasdaq 100 Index 10/11 Ctr 365 86Put 1885 Nasdaq 100 Index 10/11 Ctr 198 198Put 1890 Nasdaq 100 Index 09/11 Ctr 578 Put 1900 Nasdaq 100 Index 10/11 Ctr 111 111Put 1900 Nasdaq 100 Index 10/11 Ctr 452 452Put 1900 Nasdaq 100 Index 11/11 Ctr 670 602Put 1925 Nasdaq 100 Index 10/11 Ctr 302 302Put 1925 Nasdaq 100 Index 10/11 Ctr 258 Put 1925 Nasdaq 100 Index 11/11 Ctr 602 602Put 1925 Nasdaq 100 Index 11/11 Ctr 482 482Put 1950 Nasdaq 100 Index 10/11 Ctr 66 Put 1950 Nasdaq 100 Index 11/11 Ctr 301 301Put 1950 Nasdaq 100 index 12/11 Ctr 302 302Put 1950 Nasdaq 100 index 12/11 Ctr 603 603Put 1960 Nasdaq 100 index 12/11 Ctr 72 72Put 1975 Nasdaq 100 Index 10/11 Ctr 134 Put 1975 Nasdaq 100 Index 11/11 Ctr 452 452Put 2000 Nasdaq 100 Index 01/12 Ctr 301 301Put 2000 Nasdaq 100 Index 10/11 Ctr 124 Put 2000 Nasdaq 100 Index 11/11 Ctr 1,355 1,355Put 2000 Nasdaq 100 index 12/11 Ctr 72 72Put 2015 Nasdaq 100 index 12/11 Ctr 72 72Put 2025 Nasdaq 100 index 12/11 Ctr 516 516Put 2050 Nasdaq 100 Index 01/12 Ctr 72 72Put 2050 Nasdaq 100 Index 10/11 Ctr 240 240Put 2050 Nasdaq 100 index 12/11 Ctr 301 301Put 2050 Nasdaq 100 index 12/11 Ctr 95 95
Acquisitions and disposals of securities and money-market instruments (classification as per reporting date) as well as derivatives and deposits no longer held in the investment portfolio at the end of the reporting periodSecurities Shares resp. Currency
(in 1,000) resp. ContractsAcquisitions Disposals
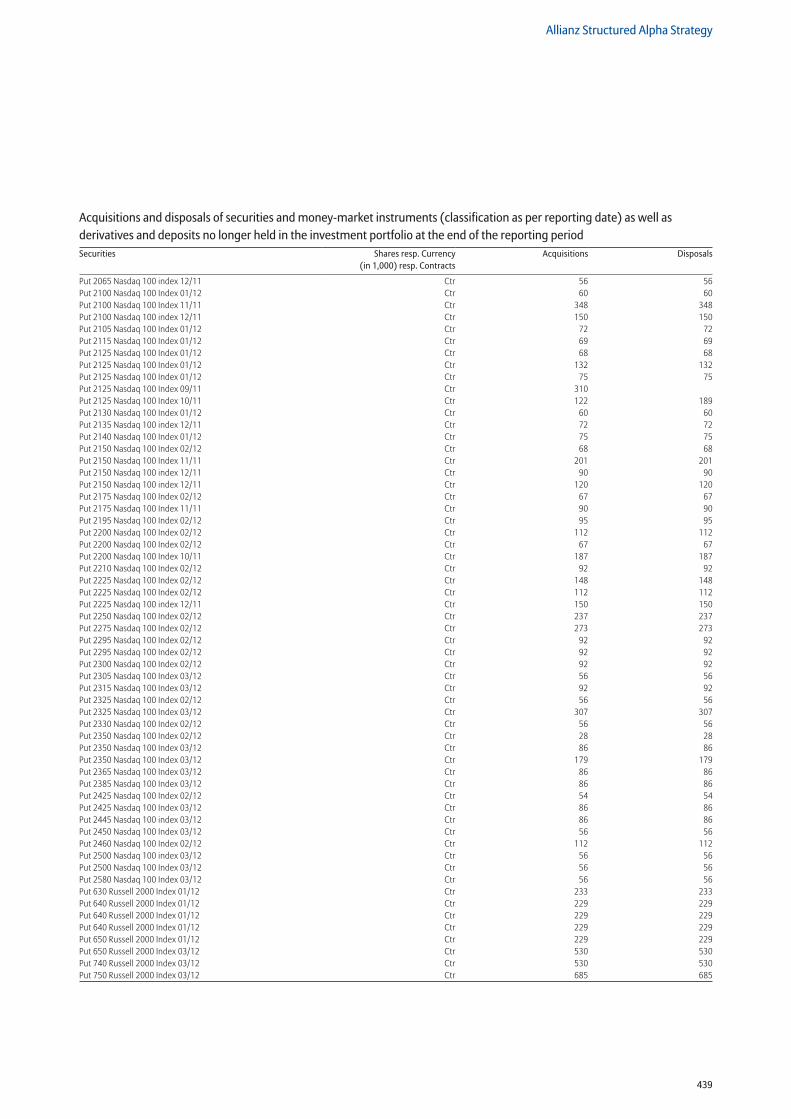
439
Allianz Structured Alpha Strategy
Put 2065 Nasdaq 100 index 12/11 Ctr 56 56Put 2100 Nasdaq 100 Index 01/12 Ctr 60 60Put 2100 Nasdaq 100 Index 11/11 Ctr 348 348Put 2100 Nasdaq 100 index 12/11 Ctr 150 150Put 2105 Nasdaq 100 Index 01/12 Ctr 72 72Put 2115 Nasdaq 100 Index 01/12 Ctr 69 69Put 2125 Nasdaq 100 Index 01/12 Ctr 68 68Put 2125 Nasdaq 100 Index 01/12 Ctr 132 132Put 2125 Nasdaq 100 Index 01/12 Ctr 75 75Put 2125 Nasdaq 100 Index 09/11 Ctr 310 Put 2125 Nasdaq 100 Index 10/11 Ctr 122 189Put 2130 Nasdaq 100 Index 01/12 Ctr 60 60Put 2135 Nasdaq 100 index 12/11 Ctr 72 72Put 2140 Nasdaq 100 Index 01/12 Ctr 75 75Put 2150 Nasdaq 100 Index 02/12 Ctr 68 68Put 2150 Nasdaq 100 Index 11/11 Ctr 201 201Put 2150 Nasdaq 100 index 12/11 Ctr 90 90Put 2150 Nasdaq 100 index 12/11 Ctr 120 120Put 2175 Nasdaq 100 Index 02/12 Ctr 67 67Put 2175 Nasdaq 100 Index 11/11 Ctr 90 90Put 2195 Nasdaq 100 Index 02/12 Ctr 95 95Put 2200 Nasdaq 100 Index 02/12 Ctr 112 112Put 2200 Nasdaq 100 Index 02/12 Ctr 67 67Put 2200 Nasdaq 100 Index 10/11 Ctr 187 187Put 2210 Nasdaq 100 Index 02/12 Ctr 92 92Put 2225 Nasdaq 100 Index 02/12 Ctr 148 148Put 2225 Nasdaq 100 Index 02/12 Ctr 112 112Put 2225 Nasdaq 100 index 12/11 Ctr 150 150Put 2250 Nasdaq 100 Index 02/12 Ctr 237 237Put 2275 Nasdaq 100 Index 02/12 Ctr 273 273Put 2295 Nasdaq 100 Index 02/12 Ctr 92 92Put 2295 Nasdaq 100 Index 02/12 Ctr 92 92Put 2300 Nasdaq 100 Index 02/12 Ctr 92 92Put 2305 Nasdaq 100 Index 03/12 Ctr 56 56Put 2315 Nasdaq 100 Index 03/12 Ctr 92 92Put 2325 Nasdaq 100 Index 02/12 Ctr 56 56Put 2325 Nasdaq 100 Index 03/12 Ctr 307 307Put 2330 Nasdaq 100 Index 02/12 Ctr 56 56Put 2350 Nasdaq 100 Index 02/12 Ctr 28 28Put 2350 Nasdaq 100 Index 03/12 Ctr 86 86Put 2350 Nasdaq 100 Index 03/12 Ctr 179 179Put 2365 Nasdaq 100 Index 03/12 Ctr 86 86Put 2385 Nasdaq 100 Index 03/12 Ctr 86 86Put 2425 Nasdaq 100 Index 02/12 Ctr 54 54Put 2425 Nasdaq 100 Index 03/12 Ctr 86 86Put 2445 Nasdaq 100 index 03/12 Ctr 86 86Put 2450 Nasdaq 100 Index 03/12 Ctr 56 56Put 2460 Nasdaq 100 Index 02/12 Ctr 112 112Put 2500 Nasdaq 100 index 03/12 Ctr 56 56Put 2500 Nasdaq 100 Index 03/12 Ctr 56 56Put 2580 Nasdaq 100 Index 03/12 Ctr 56 56Put 630 Russell 2000 Index 01/12 Ctr 233 233Put 640 Russell 2000 Index 01/12 Ctr 229 229Put 640 Russell 2000 Index 01/12 Ctr 229 229Put 640 Russell 2000 Index 01/12 Ctr 229 229Put 650 Russell 2000 Index 01/12 Ctr 229 229Put 650 Russell 2000 Index 03/12 Ctr 530 530Put 740 Russell 2000 Index 03/12 Ctr 530 530Put 750 Russell 2000 Index 03/12 Ctr 685 685
Acquisitions and disposals of securities and money-market instruments (classification as per reporting date) as well as derivatives and deposits no longer held in the investment portfolio at the end of the reporting periodSecurities Shares resp. Currency
(in 1,000) resp. ContractsAcquisitions Disposals
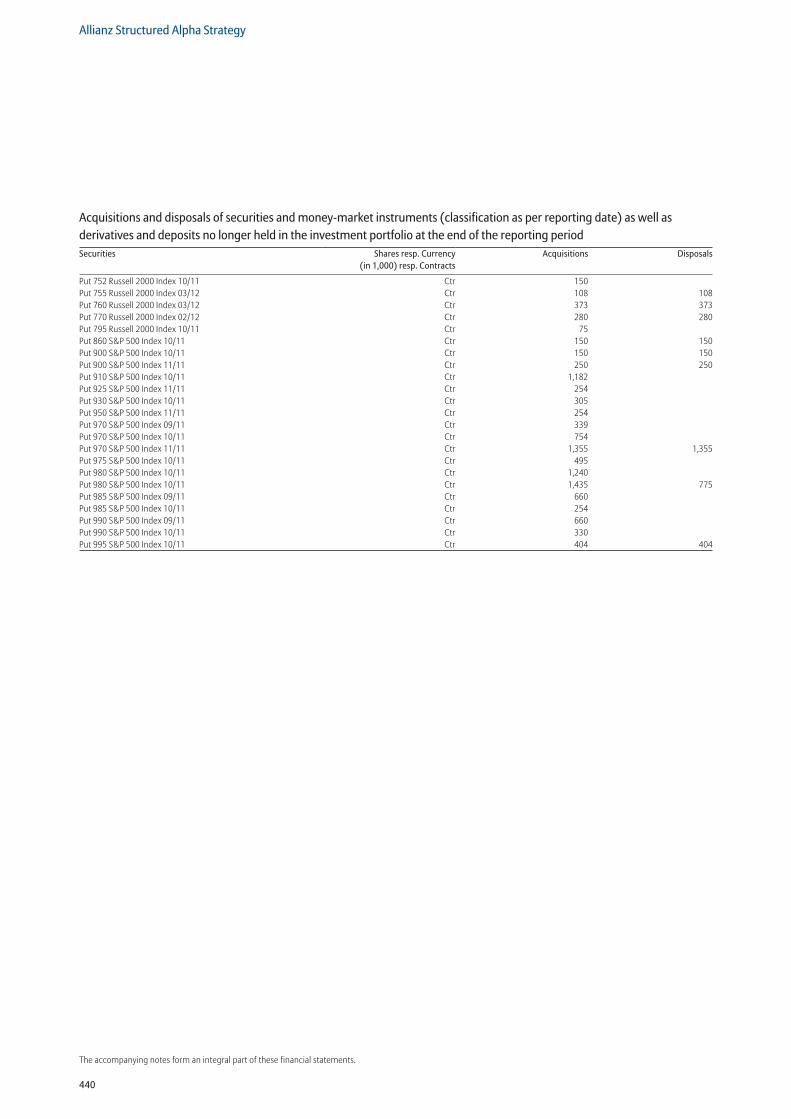
440
Allianz Structured Alpha Strategy
The accompanying notes form an integral part of these financial statements.
Put 752 Russell 2000 Index 10/11 Ctr 150 Put 755 Russell 2000 Index 03/12 Ctr 108 108Put 760 Russell 2000 Index 03/12 Ctr 373 373Put 770 Russell 2000 Index 02/12 Ctr 280 280Put 795 Russell 2000 Index 10/11 Ctr 75 Put 860 S&P 500 Index 10/11 Ctr 150 150Put 900 S&P 500 Index 10/11 Ctr 150 150Put 900 S&P 500 Index 11/11 Ctr 250 250Put 910 S&P 500 Index 10/11 Ctr 1,182 Put 925 S&P 500 Index 11/11 Ctr 254 Put 930 S&P 500 Index 10/11 Ctr 305 Put 950 S&P 500 Index 11/11 Ctr 254 Put 970 S&P 500 Index 09/11 Ctr 339 Put 970 S&P 500 Index 10/11 Ctr 754 Put 970 S&P 500 Index 11/11 Ctr 1,355 1,355Put 975 S&P 500 Index 10/11 Ctr 495 Put 980 S&P 500 Index 10/11 Ctr 1,240 Put 980 S&P 500 Index 10/11 Ctr 1,435 775Put 985 S&P 500 Index 09/11 Ctr 660 Put 985 S&P 500 Index 10/11 Ctr 254 Put 990 S&P 500 Index 09/11 Ctr 660 Put 990 S&P 500 Index 10/11 Ctr 330 Put 995 S&P 500 Index 10/11 Ctr 404 404
Acquisitions and disposals of securities and money-market instruments (classification as per reporting date) as well as derivatives and deposits no longer held in the investment portfolio at the end of the reporting periodSecurities Shares resp. Currency
(in 1,000) resp. ContractsAcquisitions Disposals
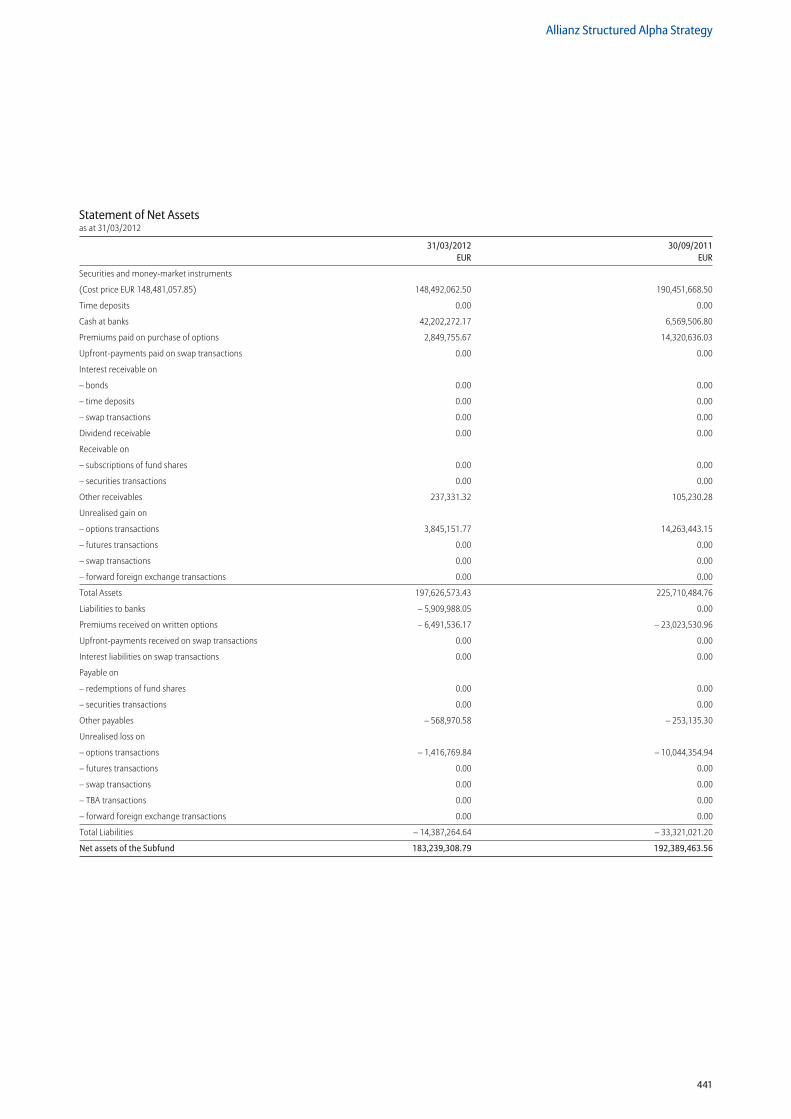
441
Allianz Structured Alpha Strategy
Statement of Net Assetsas at 31/03/2012
31/03/2012 30/09/2011 EUR EUR
Securities and money-market instruments
(Cost price EUR 148,481,057.85) 148,492,062.50 190,451,668.50
Time deposits 0.00 0.00
Cash at banks 42,202,272.17 6,569,506.80
Premiums paid on purchase of options 2,849,755.67 14,320,636.03
Upfront-payments paid on swap transactions 0.00 0.00
Interest receivable on
– bonds 0.00 0.00
– time deposits 0.00 0.00
– swap transactions 0.00 0.00
Dividend receivable 0.00 0.00
Receivable on
– subscriptions of fund shares 0.00 0.00
– securities transactions 0.00 0.00
Other receivables 237,331.32 105,230.28
Unrealised gain on
– options transactions 3,845,151.77 14,263,443.15
– futures transactions 0.00 0.00
– swap transactions 0.00 0.00
– forward foreign exchange transactions 0.00 0.00
Total Assets 197,626,573.43 225,710,484.76
Liabilities to banks – 5,909,988.05 0.00
Premiums received on written options – 6,491,536.17 – 23,023,530.96
Upfront-payments received on swap transactions 0.00 0.00
Interest liabilities on swap transactions 0.00 0.00
Payable on
– redemptions of fund shares 0.00 0.00
– securities transactions 0.00 0.00
Other payables – 568,970.58 – 253,135.30
Unrealised loss on
– options transactions – 1,416,769.84 – 10,044,354.94
– futures transactions 0.00 0.00
– swap transactions 0.00 0.00
– TBA transactions 0.00 0.00
– forward foreign exchange transactions 0.00 0.00
Total Liabilities – 14,387,264.64 – 33,321,021.20
Net assets of the Subfund 183,239,308.79 192,389,463.56
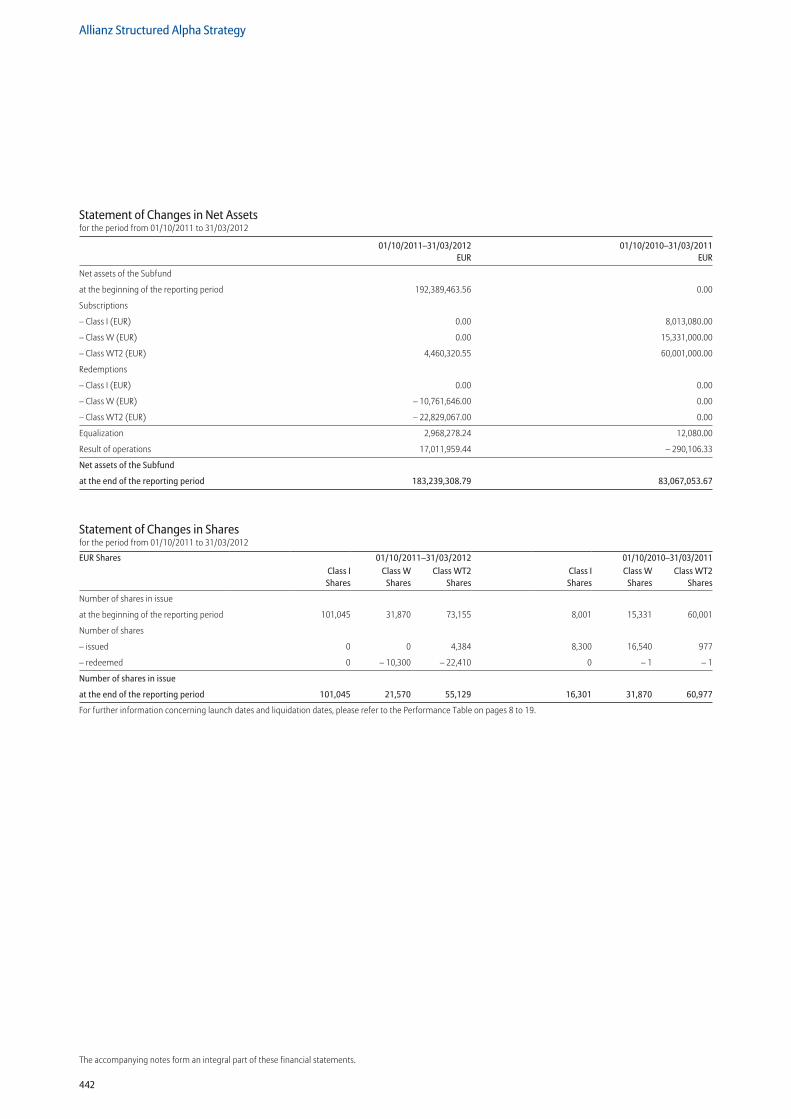
442
Allianz Structured Alpha Strategy
The accompanying notes form an integral part of these financial statements.
Statement of Changes in Net Assetsfor the period from 01/10/2011 to 31/03/2012
01/10/2011–31/03/2012 01/10/2010–31/03/2011 EUR EUR
Net assets of the Subfund
at the beginning of the reporting period 192,389,463.56 0.00
Subscriptions
– Class I (EUR) 0.00 8,013,080.00
– Class W (EUR) 0.00 15,331,000.00
– Class WT2 (EUR) 4,460,320.55 60,001,000.00
Redemptions
– Class I (EUR) 0.00 0.00
– Class W (EUR) – 10,761,646.00 0.00
– Class WT2 (EUR) – 22,829,067.00 0.00
Equalization 2,968,278.24 12,080.00
Result of operations 17,011,959.44 – 290,106.33
Net assets of the Subfund
at the end of the reporting period 183,239,308.79 83,067,053.67
Statement of Changes in Sharesfor the period from 01/10/2011 to 31/03/2012
EUR Shares 01/10/2011–31/03/2012 01/10/2010–31/03/2011Class I Shares
Class W Shares
Class WT2 Shares
Class I Shares
Class W Shares
Class WT2 Shares
Number of shares in issue
at the beginning of the reporting period 101,045 31,870 73,155 8,001 15,331 60,001
Number of shares
– issued 0 0 4,384 8,300 16,540 977
– redeemed 0 – 10,300 – 22,410 0 – 1 – 1
Number of shares in issue
at the end of the reporting period 101,045 21,570 55,129 16,301 31,870 60,977
For further information concerning launch dates and liquidation dates, please refer to the Performance Table on pages 8 to 19.
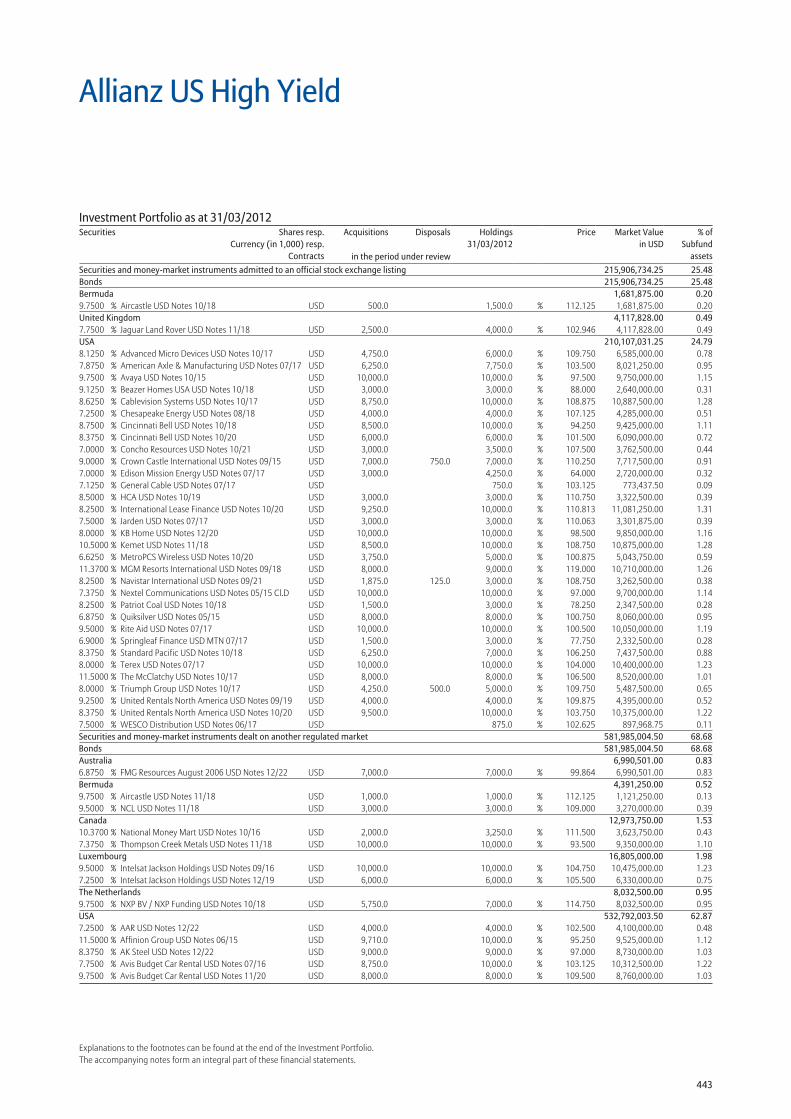
443
Explanations to the footnotes can be found at the end of the Investment Portfolio.The accompanying notes form an integral part of these financial statements.
Allianz US High Yield
Securities and money-market instruments admitted to an official stock exchange listing 215,906,734.25 25.48Bonds 215,906,734.25 25.48Bermuda 1,681,875.00 0.209.7500 % Aircastle USD Notes 10/18 USD 500.0 1,500.0 % 112.125 1,681,875.00 0.20United Kingdom 4,117,828.00 0.497.7500 % Jaguar Land Rover USD Notes 11/18 USD 2,500.0 4,000.0 % 102.946 4,117,828.00 0.49USA 210,107,031.25 24.798.1250 % Advanced Micro Devices USD Notes 10/17 USD 4,750.0 6,000.0 % 109.750 6,585,000.00 0.787.8750 % American Axle & Manufacturing USD Notes 07/17 USD 6,250.0 7,750.0 % 103.500 8,021,250.00 0.959.7500 % Avaya USD Notes 10/15 USD 10,000.0 10,000.0 % 97.500 9,750,000.00 1.159.1250 % Beazer Homes USA USD Notes 10/18 USD 3,000.0 3,000.0 % 88.000 2,640,000.00 0.318.6250 % Cablevision Systems USD Notes 10/17 USD 8,750.0 10,000.0 % 108.875 10,887,500.00 1.287.2500 % Chesapeake Energy USD Notes 08/18 USD 4,000.0 4,000.0 % 107.125 4,285,000.00 0.518.7500 % Cincinnati Bell USD Notes 10/18 USD 8,500.0 10,000.0 % 94.250 9,425,000.00 1.118.3750 % Cincinnati Bell USD Notes 10/20 USD 6,000.0 6,000.0 % 101.500 6,090,000.00 0.727.0000 % Concho Resources USD Notes 10/21 USD 3,000.0 3,500.0 % 107.500 3,762,500.00 0.449.0000 % Crown Castle International USD Notes 09/15 USD 7,000.0 750.0 7,000.0 % 110.250 7,717,500.00 0.917.0000 % Edison Mission Energy USD Notes 07/17 USD 3,000.0 4,250.0 % 64.000 2,720,000.00 0.327.1250 % General Cable USD Notes 07/17 USD 750.0 % 103.125 773,437.50 0.098.5000 % HCA USD Notes 10/19 USD 3,000.0 3,000.0 % 110.750 3,322,500.00 0.398.2500 % International Lease Finance USD Notes 10/20 USD 9,250.0 10,000.0 % 110.813 11,081,250.00 1.317.5000 % Jarden USD Notes 07/17 USD 3,000.0 3,000.0 % 110.063 3,301,875.00 0.398.0000 % KB Home USD Notes 12/20 USD 10,000.0 10,000.0 % 98.500 9,850,000.00 1.1610.5000 % Kemet USD Notes 11/18 USD 8,500.0 10,000.0 % 108.750 10,875,000.00 1.286.6250 % MetroPCS Wireless USD Notes 10/20 USD 3,750.0 5,000.0 % 100.875 5,043,750.00 0.5911.3700 % MGM Resorts International USD Notes 09/18 USD 8,000.0 9,000.0 % 119.000 10,710,000.00 1.268.2500 % Navistar International USD Notes 09/21 USD 1,875.0 125.0 3,000.0 % 108.750 3,262,500.00 0.387.3750 % Nextel Communications USD Notes 05/15 Cl.D USD 10,000.0 10,000.0 % 97.000 9,700,000.00 1.148.2500 % Patriot Coal USD Notes 10/18 USD 1,500.0 3,000.0 % 78.250 2,347,500.00 0.286.8750 % Quiksilver USD Notes 05/15 USD 8,000.0 8,000.0 % 100.750 8,060,000.00 0.959.5000 % Rite Aid USD Notes 07/17 USD 10,000.0 10,000.0 % 100.500 10,050,000.00 1.196.9000 % Springleaf Finance USD MTN 07/17 USD 1,500.0 3,000.0 % 77.750 2,332,500.00 0.288.3750 % Standard Pacific USD Notes 10/18 USD 6,250.0 7,000.0 % 106.250 7,437,500.00 0.888.0000 % Terex USD Notes 07/17 USD 10,000.0 10,000.0 % 104.000 10,400,000.00 1.2311.5000 % The McClatchy USD Notes 10/17 USD 8,000.0 8,000.0 % 106.500 8,520,000.00 1.018.0000 % Triumph Group USD Notes 10/17 USD 4,250.0 500.0 5,000.0 % 109.750 5,487,500.00 0.659.2500 % United Rentals North America USD Notes 09/19 USD 4,000.0 4,000.0 % 109.875 4,395,000.00 0.528.3750 % United Rentals North America USD Notes 10/20 USD 9,500.0 10,000.0 % 103.750 10,375,000.00 1.227.5000 % WESCO Distribution USD Notes 06/17 USD 875.0 % 102.625 897,968.75 0.11Securities and money-market instruments dealt on another regulated market 581,985,004.50 68.68Bonds 581,985,004.50 68.68Australia 6,990,501.00 0.836.8750 % FMG Resources August 2006 USD Notes 12/22 USD 7,000.0 7,000.0 % 99.864 6,990,501.00 0.83Bermuda 4,391,250.00 0.529.7500 % Aircastle USD Notes 11/18 USD 1,000.0 1,000.0 % 112.125 1,121,250.00 0.139.5000 % NCL USD Notes 11/18 USD 3,000.0 3,000.0 % 109.000 3,270,000.00 0.39Canada 12,973,750.00 1.5310.3700 % National Money Mart USD Notes 10/16 USD 2,000.0 3,250.0 % 111.500 3,623,750.00 0.437.3750 % Thompson Creek Metals USD Notes 11/18 USD 10,000.0 10,000.0 % 93.500 9,350,000.00 1.10Luxembourg 16,805,000.00 1.989.5000 % Intelsat Jackson Holdings USD Notes 09/16 USD 10,000.0 10,000.0 % 104.750 10,475,000.00 1.237.2500 % Intelsat Jackson Holdings USD Notes 12/19 USD 6,000.0 6,000.0 % 105.500 6,330,000.00 0.75The Netherlands 8,032,500.00 0.959.7500 % NXP BV / NXP Funding USD Notes 10/18 USD 5,750.0 7,000.0 % 114.750 8,032,500.00 0.95USA 532,792,003.50 62.877.2500 % AAR USD Notes 12/22 USD 4,000.0 4,000.0 % 102.500 4,100,000.00 0.4811.5000 % Affinion Group USD Notes 06/15 USD 9,710.0 10,000.0 % 95.250 9,525,000.00 1.128.3750 % AK Steel USD Notes 12/22 USD 9,000.0 9,000.0 % 97.000 8,730,000.00 1.037.7500 % Avis Budget Car Rental USD Notes 07/16 USD 8,750.0 10,000.0 % 103.125 10,312,500.00 1.229.7500 % Avis Budget Car Rental USD Notes 11/20 USD 8,000.0 8,000.0 % 109.500 8,760,000.00 1.03
Investment Portfolio as at 31/03/2012Securities Shares resp.
Currency (in 1,000) resp.Contracts
Acquisitions Disposals Holdings 31/03/2012
Price Market Valuein USD
% ofSubfund
assetsin the period under review
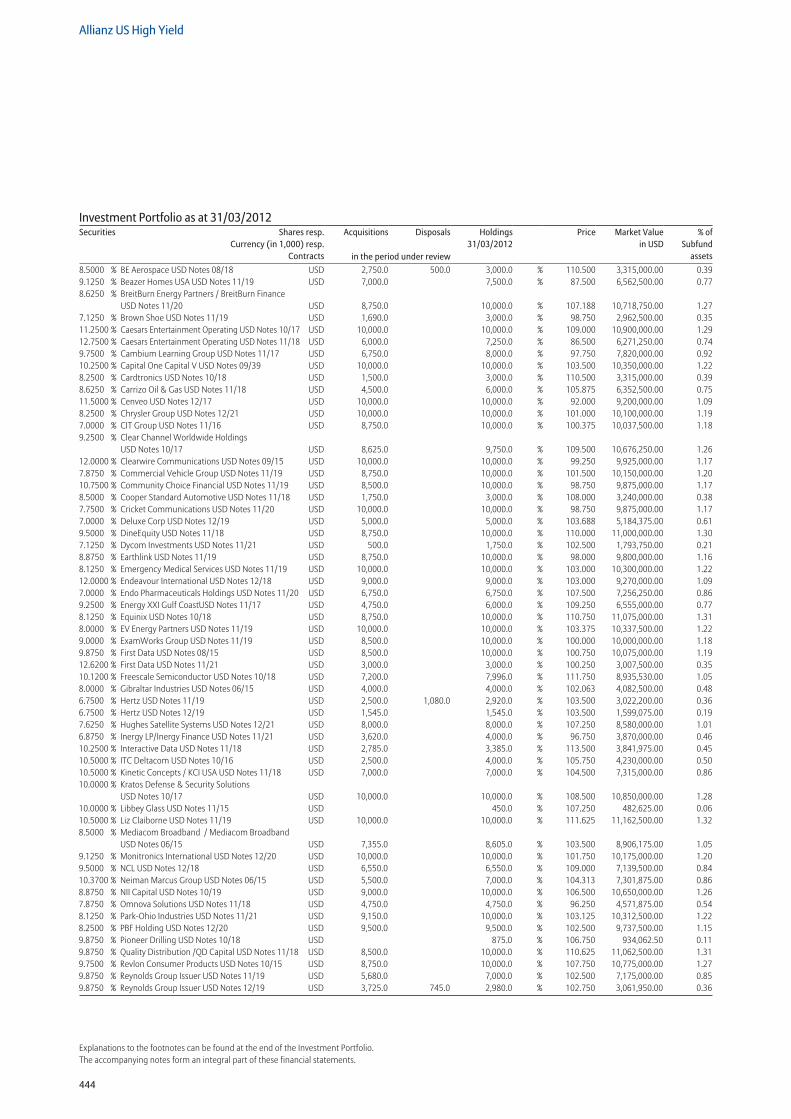
444
Allianz US High Yield
Explanations to the footnotes can be found at the end of the Investment Portfolio.The accompanying notes form an integral part of these financial statements.
8.5000 % BE Aerospace USD Notes 08/18 USD 2,750.0 500.0 3,000.0 % 110.500 3,315,000.00 0.399.1250 % Beazer Homes USA USD Notes 11/19 USD 7,000.0 7,500.0 % 87.500 6,562,500.00 0.778.6250 % BreitBurn Energy Partners / BreitBurn Finance
USD Notes 11/20 USD 8,750.0 10,000.0 % 107.188 10,718,750.00 1.277.1250 % Brown Shoe USD Notes 11/19 USD 1,690.0 3,000.0 % 98.750 2,962,500.00 0.3511.2500 % Caesars Entertainment Operating USD Notes 10/17 USD 10,000.0 10,000.0 % 109.000 10,900,000.00 1.2912.7500 % Caesars Entertainment Operating USD Notes 11/18 USD 6,000.0 7,250.0 % 86.500 6,271,250.00 0.749.7500 % Cambium Learning Group USD Notes 11/17 USD 6,750.0 8,000.0 % 97.750 7,820,000.00 0.9210.2500 % Capital One Capital V USD Notes 09/39 USD 10,000.0 10,000.0 % 103.500 10,350,000.00 1.228.2500 % Cardtronics USD Notes 10/18 USD 1,500.0 3,000.0 % 110.500 3,315,000.00 0.398.6250 % Carrizo Oil & Gas USD Notes 11/18 USD 4,500.0 6,000.0 % 105.875 6,352,500.00 0.7511.5000 % Cenveo USD Notes 12/17 USD 10,000.0 10,000.0 % 92.000 9,200,000.00 1.098.2500 % Chrysler Group USD Notes 12/21 USD 10,000.0 10,000.0 % 101.000 10,100,000.00 1.197.0000 % CIT Group USD Notes 11/16 USD 8,750.0 10,000.0 % 100.375 10,037,500.00 1.189.2500 % Clear Channel Worldwide Holdings
USD Notes 10/17 USD 8,625.0 9,750.0 % 109.500 10,676,250.00 1.2612.0000 % Clearwire Communications USD Notes 09/15 USD 10,000.0 10,000.0 % 99.250 9,925,000.00 1.177.8750 % Commercial Vehicle Group USD Notes 11/19 USD 8,750.0 10,000.0 % 101.500 10,150,000.00 1.2010.7500 % Community Choice Financial USD Notes 11/19 USD 8,500.0 10,000.0 % 98.750 9,875,000.00 1.178.5000 % Cooper Standard Automotive USD Notes 11/18 USD 1,750.0 3,000.0 % 108.000 3,240,000.00 0.387.7500 % Cricket Communications USD Notes 11/20 USD 10,000.0 10,000.0 % 98.750 9,875,000.00 1.177.0000 % Deluxe Corp USD Notes 12/19 USD 5,000.0 5,000.0 % 103.688 5,184,375.00 0.619.5000 % DineEquity USD Notes 11/18 USD 8,750.0 10,000.0 % 110.000 11,000,000.00 1.307.1250 % Dycom Investments USD Notes 11/21 USD 500.0 1,750.0 % 102.500 1,793,750.00 0.218.8750 % Earthlink USD Notes 11/19 USD 8,750.0 10,000.0 % 98.000 9,800,000.00 1.168.1250 % Emergency Medical Services USD Notes 11/19 USD 10,000.0 10,000.0 % 103.000 10,300,000.00 1.2212.0000 % Endeavour International USD Notes 12/18 USD 9,000.0 9,000.0 % 103.000 9,270,000.00 1.097.0000 % Endo Pharmaceuticals Holdings USD Notes 11/20 USD 6,750.0 6,750.0 % 107.500 7,256,250.00 0.869.2500 % Energy XXI Gulf CoastUSD Notes 11/17 USD 4,750.0 6,000.0 % 109.250 6,555,000.00 0.778.1250 % Equinix USD Notes 10/18 USD 8,750.0 10,000.0 % 110.750 11,075,000.00 1.318.0000 % EV Energy Partners USD Notes 11/19 USD 10,000.0 10,000.0 % 103.375 10,337,500.00 1.229.0000 % ExamWorks Group USD Notes 11/19 USD 8,500.0 10,000.0 % 100.000 10,000,000.00 1.189.8750 % First Data USD Notes 08/15 USD 8,500.0 10,000.0 % 100.750 10,075,000.00 1.1912.6200 % First Data USD Notes 11/21 USD 3,000.0 3,000.0 % 100.250 3,007,500.00 0.3510.1200 % Freescale Semiconductor USD Notes 10/18 USD 7,200.0 7,996.0 % 111.750 8,935,530.00 1.058.0000 % Gibraltar Industries USD Notes 06/15 USD 4,000.0 4,000.0 % 102.063 4,082,500.00 0.486.7500 % Hertz USD Notes 11/19 USD 2,500.0 1,080.0 2,920.0 % 103.500 3,022,200.00 0.366.7500 % Hertz USD Notes 12/19 USD 1,545.0 1,545.0 % 103.500 1,599,075.00 0.197.6250 % Hughes Satellite Systems USD Notes 12/21 USD 8,000.0 8,000.0 % 107.250 8,580,000.00 1.016.8750 % Inergy LP/Inergy Finance USD Notes 11/21 USD 3,620.0 4,000.0 % 96.750 3,870,000.00 0.4610.2500 % Interactive Data USD Notes 11/18 USD 2,785.0 3,385.0 % 113.500 3,841,975.00 0.4510.5000 % ITC Deltacom USD Notes 10/16 USD 2,500.0 4,000.0 % 105.750 4,230,000.00 0.5010.5000 % Kinetic Concepts / KCI USA USD Notes 11/18 USD 7,000.0 7,000.0 % 104.500 7,315,000.00 0.8610.0000 % Kratos Defense & Security Solutions
USD Notes 10/17 USD 10,000.0 10,000.0 % 108.500 10,850,000.00 1.2810.0000 % Libbey Glass USD Notes 11/15 USD 450.0 % 107.250 482,625.00 0.0610.5000 % Liz Claiborne USD Notes 11/19 USD 10,000.0 10,000.0 % 111.625 11,162,500.00 1.328.5000 % Mediacom Broadband / Mediacom Broadband
USD Notes 06/15 USD 7,355.0 8,605.0 % 103.500 8,906,175.00 1.059.1250 % Monitronics International USD Notes 12/20 USD 10,000.0 10,000.0 % 101.750 10,175,000.00 1.209.5000 % NCL USD Notes 12/18 USD 6,550.0 6,550.0 % 109.000 7,139,500.00 0.8410.3700 % Neiman Marcus Group USD Notes 06/15 USD 5,500.0 7,000.0 % 104.313 7,301,875.00 0.868.8750 % NII Capital USD Notes 10/19 USD 9,000.0 10,000.0 % 106.500 10,650,000.00 1.267.8750 % Omnova Solutions USD Notes 11/18 USD 4,750.0 4,750.0 % 96.250 4,571,875.00 0.548.1250 % Park-Ohio Industries USD Notes 11/21 USD 9,150.0 10,000.0 % 103.125 10,312,500.00 1.228.2500 % PBF Holding USD Notes 12/20 USD 9,500.0 9,500.0 % 102.500 9,737,500.00 1.159.8750 % Pioneer Drilling USD Notes 10/18 USD 875.0 % 106.750 934,062.50 0.119.8750 % Quality Distribution /QD Capital USD Notes 11/18 USD 8,500.0 10,000.0 % 110.625 11,062,500.00 1.319.7500 % Revlon Consumer Products USD Notes 10/15 USD 8,750.0 10,000.0 % 107.750 10,775,000.00 1.279.8750 % Reynolds Group Issuer USD Notes 11/19 USD 5,680.0 7,000.0 % 102.500 7,175,000.00 0.859.8750 % Reynolds Group Issuer USD Notes 12/19 USD 3,725.0 745.0 2,980.0 % 102.750 3,061,950.00 0.36
Investment Portfolio as at 31/03/2012Securities Shares resp.
Currency (in 1,000) resp.Contracts
Acquisitions Disposals Holdings 31/03/2012
Price Market Valuein USD
% ofSubfund
assetsin the period under review
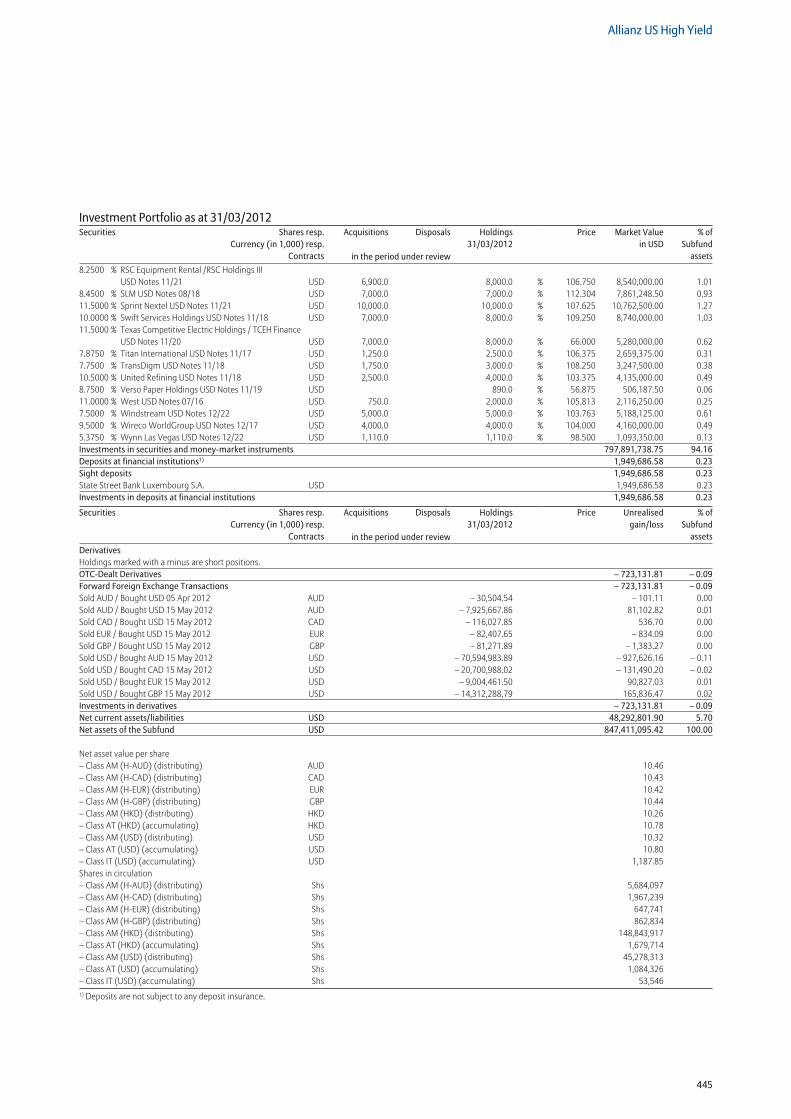
445
Allianz US High Yield
8.2500 % RSC Equipment Rental /RSC Holdings III USD Notes 11/21 USD 6,900.0 8,000.0 % 106.750 8,540,000.00 1.01
8.4500 % SLM USD Notes 08/18 USD 7,000.0 7,000.0 % 112.304 7,861,248.50 0.9311.5000 % Sprint Nextel USD Notes 11/21 USD 10,000.0 10,000.0 % 107.625 10,762,500.00 1.2710.0000 % Swift Services Holdings USD Notes 11/18 USD 7,000.0 8,000.0 % 109.250 8,740,000.00 1.0311.5000 % Texas Competitive Electric Holdings / TCEH Finance
USD Notes 11/20 USD 7,000.0 8,000.0 % 66.000 5,280,000.00 0.627.8750 % Titan International USD Notes 11/17 USD 1,250.0 2,500.0 % 106.375 2,659,375.00 0.317.7500 % TransDigm USD Notes 11/18 USD 1,750.0 3,000.0 % 108.250 3,247,500.00 0.3810.5000 % United Refining USD Notes 11/18 USD 2,500.0 4,000.0 % 103.375 4,135,000.00 0.498.7500 % Verso Paper Holdings USD Notes 11/19 USD 890.0 % 56.875 506,187.50 0.0611.0000 % West USD Notes 07/16 USD 750.0 2,000.0 % 105.813 2,116,250.00 0.257.5000 % Windstream USD Notes 12/22 USD 5,000.0 5,000.0 % 103.763 5,188,125.00 0.619.5000 % Wireco WorldGroup USD Notes 12/17 USD 4,000.0 4,000.0 % 104.000 4,160,000.00 0.495.3750 % Wynn Las Vegas USD Notes 12/22 USD 1,110.0 1,110.0 % 98.500 1,093,350.00 0.13Investments in securities and money-market instruments 797,891,738.75 94.16Deposits at financial institutions1) 1,949,686.58 0.23Sight deposits 1,949,686.58 0.23State Street Bank Luxembourg S.A. USD 1,949,686.58 0.23Investments in deposits at financial institutions 1,949,686.58 0.23
Securities Shares resp.Currency (in 1,000) resp.
Contracts
Acquisitions Disposals Holdings 31/03/2012
Price Unrealisedgain/loss
% ofSubfund
assetsin the period under reviewDerivatives Holdings marked with a minus are short positions. OTC-Dealt Derivatives – 723,131.81 – 0.09Forward Foreign Exchange Transactions – 723,131.81 – 0.09Sold AUD / Bought USD 05 Apr 2012 AUD – 30,504.54 – 101.11 0.00Sold AUD / Bought USD 15 May 2012 AUD – 7,925,667.86 81,102.82 0.01Sold CAD / Bought USD 15 May 2012 CAD – 116,027.85 536.70 0.00Sold EUR / Bought USD 15 May 2012 EUR – 82,407.65 – 834.09 0.00Sold GBP / Bought USD 15 May 2012 GBP – 81,271.89 – 1,383.27 0.00Sold USD / Bought AUD 15 May 2012 USD – 70,594,983.89 – 927,626.16 – 0.11Sold USD / Bought CAD 15 May 2012 USD – 20,700,988.02 – 131,490.20 – 0.02Sold USD / Bought EUR 15 May 2012 USD – 9,004,461.50 90,827.03 0.01Sold USD / Bought GBP 15 May 2012 USD – 14,312,288.79 165,836.47 0.02Investments in derivatives – 723,131.81 – 0.09Net current assets/liabilities USD 48,292,801.90 5.70Net assets of the Subfund USD 847,411,095.42 100.00
Net asset value per share – Class AM (H-AUD) (distributing) AUD 10.46 – Class AM (H-CAD) (distributing) CAD 10.43 – Class AM (H-EUR) (distributing) EUR 10.42 – Class AM (H-GBP) (distributing) GBP 10.44 – Class AM (HKD) (distributing) HKD 10.26 – Class AT (HKD) (accumulating) HKD 10.78 – Class AM (USD) (distributing) USD 10.32 – Class AT (USD) (accumulating) USD 10.80 – Class IT (USD) (accumulating) USD 1,187.85 Shares in circulation – Class AM (H-AUD) (distributing) Shs 5,684,097 – Class AM (H-CAD) (distributing) Shs 1,967,239 – Class AM (H-EUR) (distributing) Shs 647,741 – Class AM (H-GBP) (distributing) Shs 862,834 – Class AM (HKD) (distributing) Shs 148,843,917 – Class AT (HKD) (accumulating) Shs 1,679,714 – Class AM (USD) (distributing) Shs 45,278,313 – Class AT (USD) (accumulating) Shs 1,084,326 – Class IT (USD) (accumulating) Shs 53,5461) Deposits are not subject to any deposit insurance.
Investment Portfolio as at 31/03/2012Securities Shares resp.
Currency (in 1,000) resp.Contracts
Acquisitions Disposals Holdings 31/03/2012
Price Market Valuein USD
% ofSubfund
assetsin the period under review
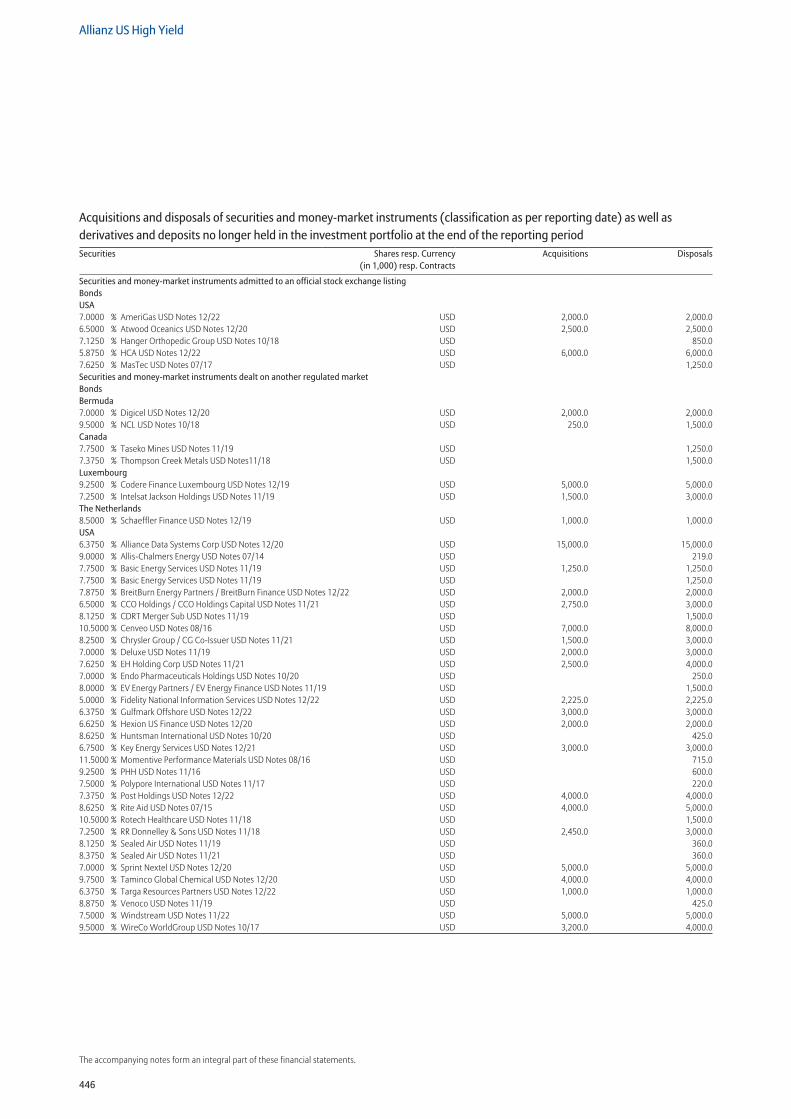
446
Allianz US High Yield
The accompanying notes form an integral part of these financial statements.
Securities and money-market instruments admitted to an official stock exchange listing Bonds USA 7.0000 % AmeriGas USD Notes 12/22 USD 2,000.0 2,000.06.5000 % Atwood Oceanics USD Notes 12/20 USD 2,500.0 2,500.07.1250 % Hanger Orthopedic Group USD Notes 10/18 USD 850.05.8750 % HCA USD Notes 12/22 USD 6,000.0 6,000.07.6250 % MasTec USD Notes 07/17 USD 1,250.0Securities and money-market instruments dealt on another regulated market Bonds Bermuda 7.0000 % Digicel USD Notes 12/20 USD 2,000.0 2,000.09.5000 % NCL USD Notes 10/18 USD 250.0 1,500.0Canada 7.7500 % Taseko Mines USD Notes 11/19 USD 1,250.07.3750 % Thompson Creek Metals USD Notes11/18 USD 1,500.0Luxembourg 9.2500 % Codere Finance Luxembourg USD Notes 12/19 USD 5,000.0 5,000.07.2500 % Intelsat Jackson Holdings USD Notes 11/19 USD 1,500.0 3,000.0The Netherlands 8.5000 % Schaeffler Finance USD Notes 12/19 USD 1,000.0 1,000.0USA 6.3750 % Alliance Data Systems Corp USD Notes 12/20 USD 15,000.0 15,000.09.0000 % Allis-Chalmers Energy USD Notes 07/14 USD 219.07.7500 % Basic Energy Services USD Notes 11/19 USD 1,250.0 1,250.07.7500 % Basic Energy Services USD Notes 11/19 USD 1,250.07.8750 % BreitBurn Energy Partners / BreitBurn Finance USD Notes 12/22 USD 2,000.0 2,000.06.5000 % CCO Holdings / CCO Holdings Capital USD Notes 11/21 USD 2,750.0 3,000.08.1250 % CDRT Merger Sub USD Notes 11/19 USD 1,500.010.5000 % Cenveo USD Notes 08/16 USD 7,000.0 8,000.08.2500 % Chrysler Group / CG Co-Issuer USD Notes 11/21 USD 1,500.0 3,000.07.0000 % Deluxe USD Notes 11/19 USD 2,000.0 3,000.07.6250 % EH Holding Corp USD Notes 11/21 USD 2,500.0 4,000.07.0000 % Endo Pharmaceuticals Holdings USD Notes 10/20 USD 250.08.0000 % EV Energy Partners / EV Energy Finance USD Notes 11/19 USD 1,500.05.0000 % Fidelity National Information Services USD Notes 12/22 USD 2,225.0 2,225.06.3750 % Gulfmark Offshore USD Notes 12/22 USD 3,000.0 3,000.06.6250 % Hexion US Finance USD Notes 12/20 USD 2,000.0 2,000.08.6250 % Huntsman International USD Notes 10/20 USD 425.06.7500 % Key Energy Services USD Notes 12/21 USD 3,000.0 3,000.011.5000 % Momentive Performance Materials USD Notes 08/16 USD 715.09.2500 % PHH USD Notes 11/16 USD 600.07.5000 % Polypore International USD Notes 11/17 USD 220.07.3750 % Post Holdings USD Notes 12/22 USD 4,000.0 4,000.08.6250 % Rite Aid USD Notes 07/15 USD 4,000.0 5,000.010.5000 % Rotech Healthcare USD Notes 11/18 USD 1,500.07.2500 % RR Donnelley & Sons USD Notes 11/18 USD 2,450.0 3,000.08.1250 % Sealed Air USD Notes 11/19 USD 360.08.3750 % Sealed Air USD Notes 11/21 USD 360.07.0000 % Sprint Nextel USD Notes 12/20 USD 5,000.0 5,000.09.7500 % Taminco Global Chemical USD Notes 12/20 USD 4,000.0 4,000.06.3750 % Targa Resources Partners USD Notes 12/22 USD 1,000.0 1,000.08.8750 % Venoco USD Notes 11/19 USD 425.07.5000 % Windstream USD Notes 11/22 USD 5,000.0 5,000.09.5000 % WireCo WorldGroup USD Notes 10/17 USD 3,200.0 4,000.0
Acquisitions and disposals of securities and money-market instruments (classification as per reporting date) as well as derivatives and deposits no longer held in the investment portfolio at the end of the reporting periodSecurities Shares resp. Currency
(in 1,000) resp. ContractsAcquisitions Disposals
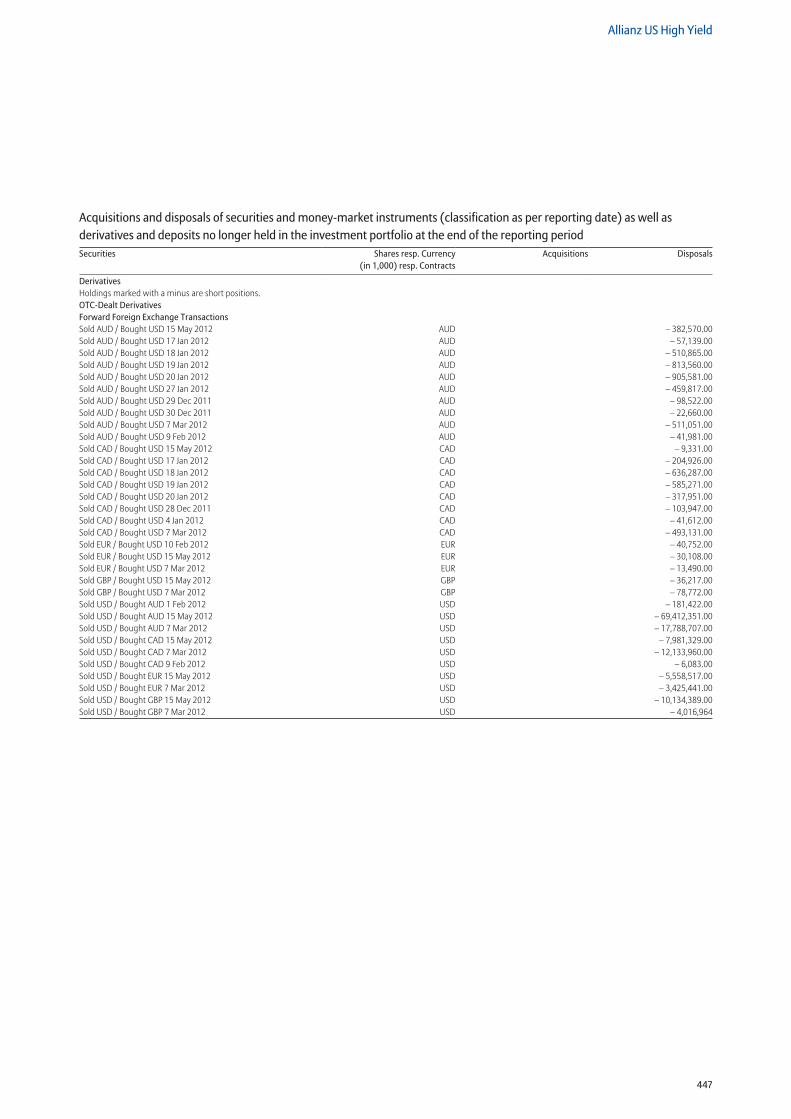
447
Allianz US High Yield
Derivatives Holdings marked with a minus are short positions. OTC-Dealt Derivatives Forward Foreign Exchange Transactions Sold AUD / Bought USD 15 May 2012 AUD – 382,570.00Sold AUD / Bought USD 17 Jan 2012 AUD – 57,139.00Sold AUD / Bought USD 18 Jan 2012 AUD – 510,865.00Sold AUD / Bought USD 19 Jan 2012 AUD – 813,560.00Sold AUD / Bought USD 20 Jan 2012 AUD – 905,581.00Sold AUD / Bought USD 27 Jan 2012 AUD – 459,817.00Sold AUD / Bought USD 29 Dec 2011 AUD – 98,522.00Sold AUD / Bought USD 30 Dec 2011 AUD – 22,660.00Sold AUD / Bought USD 7 Mar 2012 AUD – 511,051.00Sold AUD / Bought USD 9 Feb 2012 AUD – 41,981.00Sold CAD / Bought USD 15 May 2012 CAD – 9,331.00Sold CAD / Bought USD 17 Jan 2012 CAD – 204,926.00Sold CAD / Bought USD 18 Jan 2012 CAD – 636,287.00Sold CAD / Bought USD 19 Jan 2012 CAD – 585,271.00Sold CAD / Bought USD 20 Jan 2012 CAD – 317,951.00Sold CAD / Bought USD 28 Dec 2011 CAD – 103,947.00Sold CAD / Bought USD 4 Jan 2012 CAD – 41,612.00Sold CAD / Bought USD 7 Mar 2012 CAD – 493,131.00Sold EUR / Bought USD 10 Feb 2012 EUR – 40,752.00Sold EUR / Bought USD 15 May 2012 EUR – 30,108.00Sold EUR / Bought USD 7 Mar 2012 EUR – 13,490.00Sold GBP / Bought USD 15 May 2012 GBP – 36,217.00Sold GBP / Bought USD 7 Mar 2012 GBP – 78,772.00Sold USD / Bought AUD 1 Feb 2012 USD – 181,422.00Sold USD / Bought AUD 15 May 2012 USD – 69,412,351.00Sold USD / Bought AUD 7 Mar 2012 USD – 17,788,707.00Sold USD / Bought CAD 15 May 2012 USD – 7,981,329.00Sold USD / Bought CAD 7 Mar 2012 USD – 12,133,960.00Sold USD / Bought CAD 9 Feb 2012 USD – 6,083.00Sold USD / Bought EUR 15 May 2012 USD – 5,558,517.00Sold USD / Bought EUR 7 Mar 2012 USD – 3,425,441.00Sold USD / Bought GBP 15 May 2012 USD – 10,134,389.00Sold USD / Bought GBP 7 Mar 2012 USD – 4,016,964
Acquisitions and disposals of securities and money-market instruments (classification as per reporting date) as well as derivatives and deposits no longer held in the investment portfolio at the end of the reporting periodSecurities Shares resp. Currency
(in 1,000) resp. ContractsAcquisitions Disposals
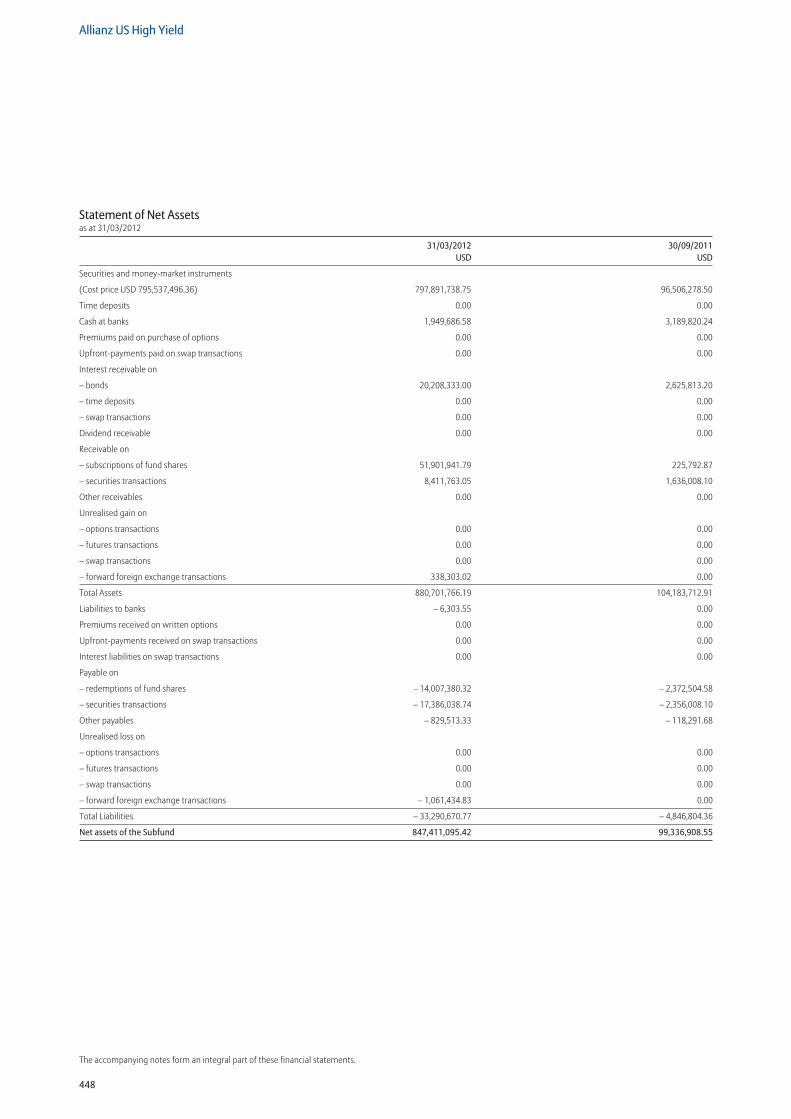
448
Allianz US High Yield
The accompanying notes form an integral part of these financial statements.
Statement of Net Assetsas at 31/03/2012
31/03/2012 30/09/2011 USD USD
Securities and money-market instruments
(Cost price USD 795,537,496.36) 797,891,738.75 96,506,278.50
Time deposits 0.00 0.00
Cash at banks 1,949,686.58 3,189,820.24
Premiums paid on purchase of options 0.00 0.00
Upfront-payments paid on swap transactions 0.00 0.00
Interest receivable on
– bonds 20,208,333.00 2,625,813.20
– time deposits 0.00 0.00
– swap transactions 0.00 0.00
Dividend receivable 0.00 0.00
Receivable on
– subscriptions of fund shares 51,901,941.79 225,792.87
– securities transactions 8,411,763.05 1,636,008.10
Other receivables 0.00 0.00
Unrealised gain on
– options transactions 0.00 0.00
– futures transactions 0.00 0.00
– swap transactions 0.00 0.00
– forward foreign exchange transactions 338,303.02 0.00
Total Assets 880,701,766.19 104,183,712.91
Liabilities to banks – 6,303.55 0.00
Premiums received on written options 0.00 0.00
Upfront-payments received on swap transactions 0.00 0.00
Interest liabilities on swap transactions 0.00 0.00
Payable on
– redemptions of fund shares – 14,007,380.32 – 2,372,504.58
– securities transactions – 17,386,038.74 – 2,356,008.10
Other payables – 829,513.33 – 118,291.68
Unrealised loss on
– options transactions 0.00 0.00
– futures transactions 0.00 0.00
– swap transactions 0.00 0.00
– forward foreign exchange transactions – 1,061,434.83 0.00
Total Liabilities – 33,290,670.77 – 4,846,804.36
Net assets of the Subfund 847,411,095.42 99,336,908.55

449
Allianz US High Yield
Statement of Changes in Net Assetsfor the period from 01/10/2011 to 31/03/2012
01/10/2011–31/03/2012 01/10/2010–31/03/2011 USD USD
Net assets of the Subfund
at the beginning of the reporting period 99,336,908.55 26,932,250.32
Subscriptions
– Class AM (USD) 460,251,628.27 31,161,448.44
– Class AT (USD) 11,762,042.73 0.00
– Class IT (USD) 44,155,894.23 8,060,195.74
– Class AM (H-AUD) 68,740,807.42 0.00
– Class AM (H-CAD) 22,462,993.19 0.00
– Class AM (H-EUR) 9,010,907.79 0.00
– Class AM (H-GBP) 14,370,477.46 0.00
– Class AM (HKD) 226,910,516.74 0.00
– Class AT (HKD) 2,342,806.70 0.00
Redemptions
– Class AM (USD) – 74,251,520.40 – 1,896,968.64
– Class AT (USD) – 210,523.52 0.00
– Class IT (USD) – 7,496,276.63 – 1,380,000.00
– Class AM (H-AUD) – 6,208,918.19 0.00
– Class AM (H-CAD) – 2,058,995.78 0.00
– Class AM (H-EUR) – 77,857.41 0.00
– Class AM (H-GBP) – 114,312.37 0.00
– Class AM (HKD) – 30,848,225.07 0.00
– Class AT (HKD) – 11,683.16 0.00
Distribution – 9,535,561.65 – 370,192.20
Equalization – 15,026,842.20 – 1,164,794.05
Result of operations 33,906,828.72 4,096,482.14
Net assets of the Subfund
at the end of the reporting period 847,411,095.42 65,438,421.75
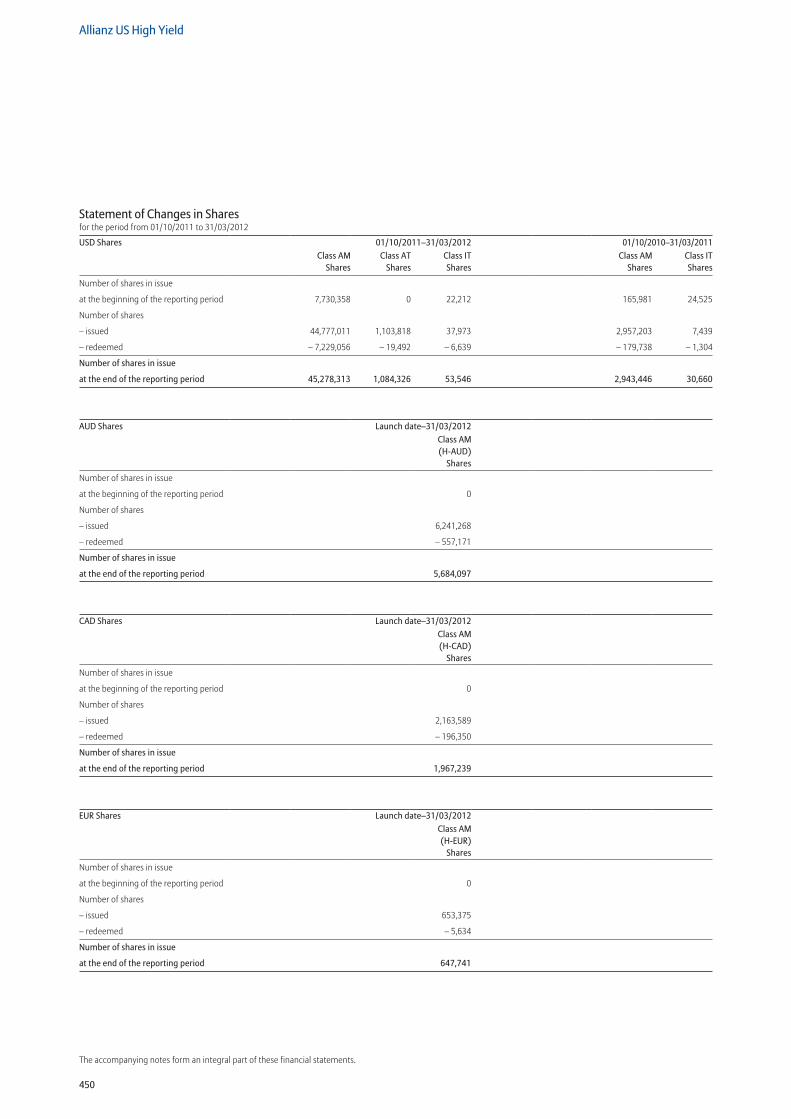
450
Allianz US High Yield
The accompanying notes form an integral part of these financial statements.
Statement of Changes in Sharesfor the period from 01/10/2011 to 31/03/2012
USD Shares 01/10/2011–31/03/2012 01/10/2010–31/03/2011Class AM
SharesClass AT
SharesClass IT Shares
Class AM Shares
Class IT Shares
Number of shares in issue
at the beginning of the reporting period 7,730,358 0 22,212 165,981 24,525
Number of shares
– issued 44,777,011 1,103,818 37,973 2,957,203 7,439
– redeemed – 7,229,056 – 19,492 – 6,639 – 179,738 – 1,304
Number of shares in issue
at the end of the reporting period 45,278,313 1,084,326 53,546 2,943,446 30,660
AUD Shares Launch date–31/03/2012Class AM (H-AUD)
Shares
Number of shares in issue
at the beginning of the reporting period 0
Number of shares
– issued 6,241,268
– redeemed – 557,171
Number of shares in issue
at the end of the reporting period 5,684,097
CAD Shares Launch date–31/03/2012Class AM (H-CAD)
Shares
Number of shares in issue
at the beginning of the reporting period 0
Number of shares
– issued 2,163,589
– redeemed – 196,350
Number of shares in issue
at the end of the reporting period 1,967,239
EUR Shares Launch date–31/03/2012Class AM (H-EUR)
Shares
Number of shares in issue
at the beginning of the reporting period 0
Number of shares
– issued 653,375
– redeemed – 5,634
Number of shares in issue
at the end of the reporting period 647,741
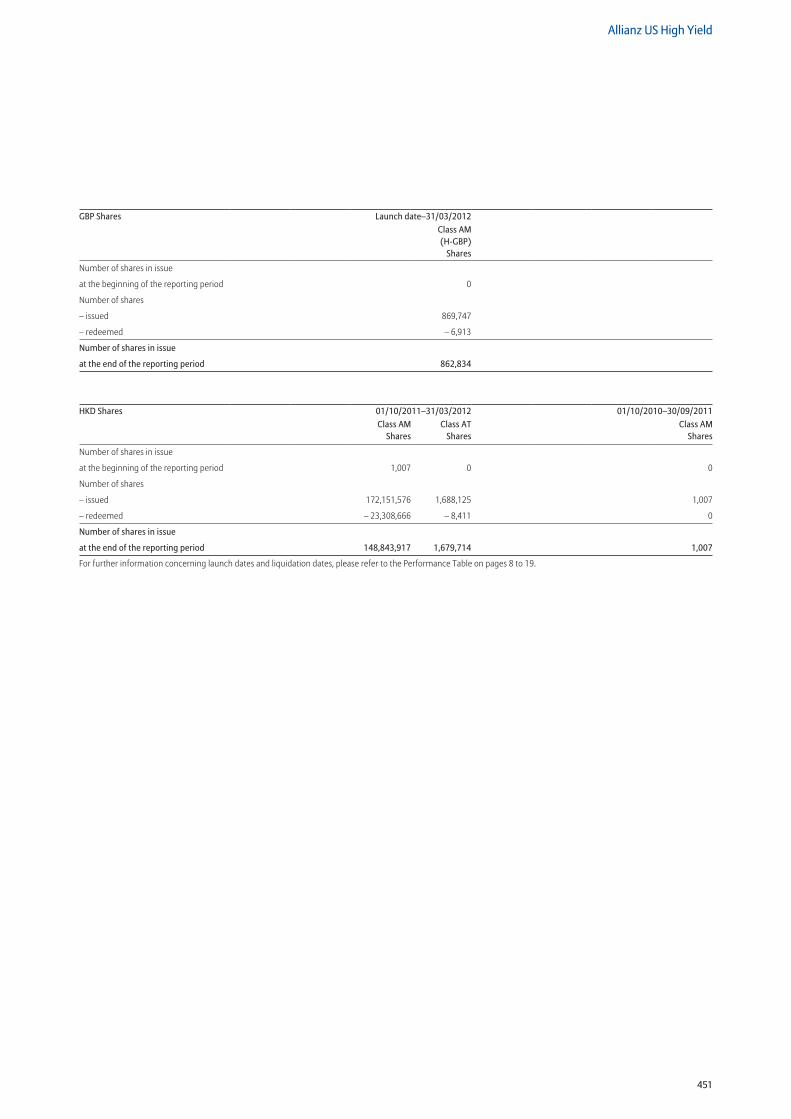
451
Allianz US High Yield
GBP Shares Launch date–31/03/2012Class AM (H-GBP)
Shares
Number of shares in issue
at the beginning of the reporting period 0
Number of shares
– issued 869,747
– redeemed – 6,913
Number of shares in issue
at the end of the reporting period 862,834
HKD Shares 01/10/2011–31/03/2012 01/10/2010–30/09/2011Class AM
SharesClass AT
SharesClass AM
Shares
Number of shares in issue
at the beginning of the reporting period 1,007 0 0
Number of shares
– issued 172,151,576 1,688,125 1,007
– redeemed – 23,308,666 – 8,411 0
Number of shares in issue
at the end of the reporting period 148,843,917 1,679,714 1,007
For further information concerning launch dates and liquidation dates, please refer to the Performance Table on pages 8 to 19.
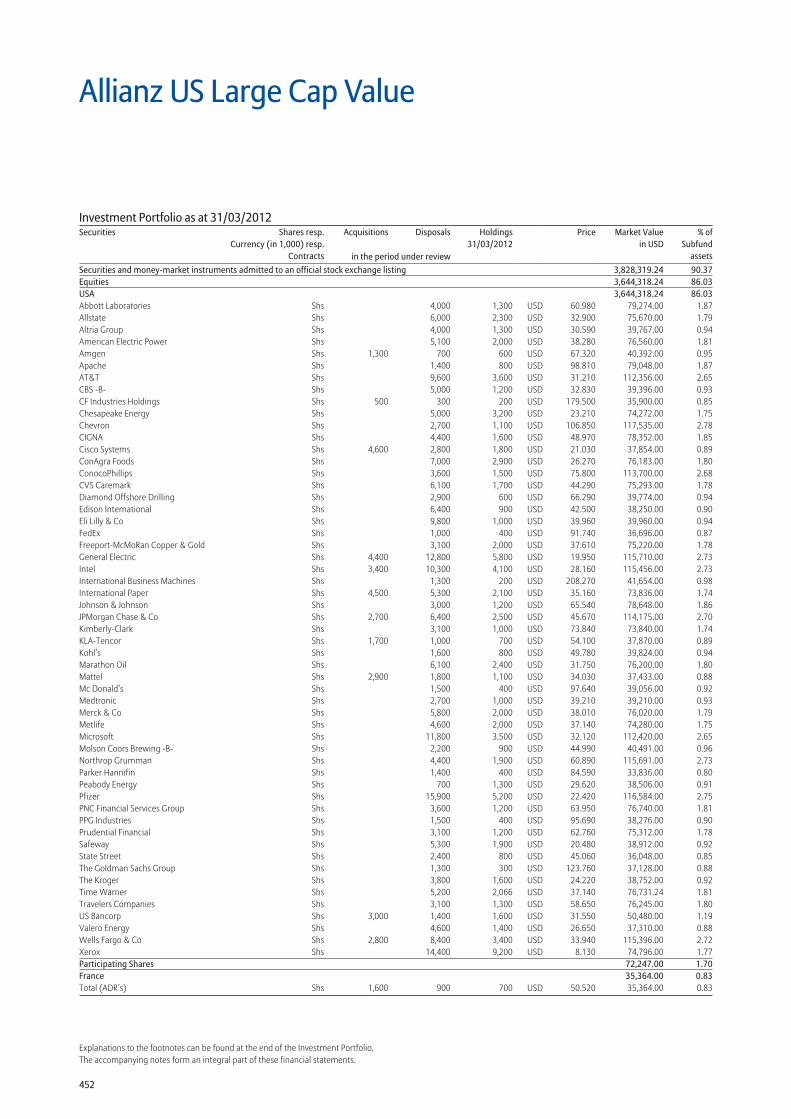
452
Explanations to the footnotes can be found at the end of the Investment Portfolio.The accompanying notes form an integral part of these financial statements.
Securities and money-market instruments admitted to an official stock exchange listing 3,828,319.24 90.37Equities 3,644,318.24 86.03USA 3,644,318.24 86.03Abbott Laboratories Shs 4,000 1,300 USD 60.980 79,274.00 1.87Allstate Shs 6,000 2,300 USD 32.900 75,670.00 1.79Altria Group Shs 4,000 1,300 USD 30.590 39,767.00 0.94American Electric Power Shs 5,100 2,000 USD 38.280 76,560.00 1.81Amgen Shs 1,300 700 600 USD 67.320 40,392.00 0.95Apache Shs 1,400 800 USD 98.810 79,048.00 1.87AT&T Shs 9,600 3,600 USD 31.210 112,356.00 2.65CBS -B- Shs 5,000 1,200 USD 32.830 39,396.00 0.93CF Industries Holdings Shs 500 300 200 USD 179.500 35,900.00 0.85Chesapeake Energy Shs 5,000 3,200 USD 23.210 74,272.00 1.75Chevron Shs 2,700 1,100 USD 106.850 117,535.00 2.78CIGNA Shs 4,400 1,600 USD 48.970 78,352.00 1.85Cisco Systems Shs 4,600 2,800 1,800 USD 21.030 37,854.00 0.89ConAgra Foods Shs 7,000 2,900 USD 26.270 76,183.00 1.80ConocoPhillips Shs 3,600 1,500 USD 75.800 113,700.00 2.68CVS Caremark Shs 6,100 1,700 USD 44.290 75,293.00 1.78Diamond Offshore Drilling Shs 2,900 600 USD 66.290 39,774.00 0.94Edison International Shs 6,400 900 USD 42.500 38,250.00 0.90Eli Lilly & Co Shs 9,800 1,000 USD 39.960 39,960.00 0.94FedEx Shs 1,000 400 USD 91.740 36,696.00 0.87Freeport-McMoRan Copper & Gold Shs 3,100 2,000 USD 37.610 75,220.00 1.78General Electric Shs 4,400 12,800 5,800 USD 19.950 115,710.00 2.73Intel Shs 3,400 10,300 4,100 USD 28.160 115,456.00 2.73International Business Machines Shs 1,300 200 USD 208.270 41,654.00 0.98International Paper Shs 4,500 5,300 2,100 USD 35.160 73,836.00 1.74Johnson & Johnson Shs 3,000 1,200 USD 65.540 78,648.00 1.86JPMorgan Chase & Co Shs 2,700 6,400 2,500 USD 45.670 114,175.00 2.70Kimberly-Clark Shs 3,100 1,000 USD 73.840 73,840.00 1.74KLA-Tencor Shs 1,700 1,000 700 USD 54.100 37,870.00 0.89Kohl’s Shs 1,600 800 USD 49.780 39,824.00 0.94Marathon Oil Shs 6,100 2,400 USD 31.750 76,200.00 1.80Mattel Shs 2,900 1,800 1,100 USD 34.030 37,433.00 0.88Mc Donald’s Shs 1,500 400 USD 97.640 39,056.00 0.92Medtronic Shs 2,700 1,000 USD 39.210 39,210.00 0.93Merck & Co Shs 5,800 2,000 USD 38.010 76,020.00 1.79Metlife Shs 4,600 2,000 USD 37.140 74,280.00 1.75Microsoft Shs 11,800 3,500 USD 32.120 112,420.00 2.65Molson Coors Brewing -B- Shs 2,200 900 USD 44.990 40,491.00 0.96Northrop Grumman Shs 4,400 1,900 USD 60.890 115,691.00 2.73Parker Hannifin Shs 1,400 400 USD 84.590 33,836.00 0.80Peabody Energy Shs 700 1,300 USD 29.620 38,506.00 0.91Pfizer Shs 15,900 5,200 USD 22.420 116,584.00 2.75PNC Financial Services Group Shs 3,600 1,200 USD 63.950 76,740.00 1.81PPG Industries Shs 1,500 400 USD 95.690 38,276.00 0.90Prudential Financial Shs 3,100 1,200 USD 62.760 75,312.00 1.78Safeway Shs 5,300 1,900 USD 20.480 38,912.00 0.92State Street Shs 2,400 800 USD 45.060 36,048.00 0.85The Goldman Sachs Group Shs 1,300 300 USD 123.760 37,128.00 0.88The Kroger Shs 3,800 1,600 USD 24.220 38,752.00 0.92Time Warner Shs 5,200 2,066 USD 37.140 76,731.24 1.81Travelers Companies Shs 3,100 1,300 USD 58.650 76,245.00 1.80US Bancorp Shs 3,000 1,400 1,600 USD 31.550 50,480.00 1.19Valero Energy Shs 4,600 1,400 USD 26.650 37,310.00 0.88Wells Fargo & Co Shs 2,800 8,400 3,400 USD 33.940 115,396.00 2.72Xerox Shs 14,400 9,200 USD 8.130 74,796.00 1.77Participating Shares 72,247.00 1.70France 35,364.00 0.83Total (ADR’s) Shs 1,600 900 700 USD 50.520 35,364.00 0.83
Allianz US Large Cap Value
Investment Portfolio as at 31/03/2012Securities Shares resp.
Currency (in 1,000) resp.Contracts
Acquisitions Disposals Holdings 31/03/2012
Price Market Valuein USD
% ofSubfund
assetsin the period under review
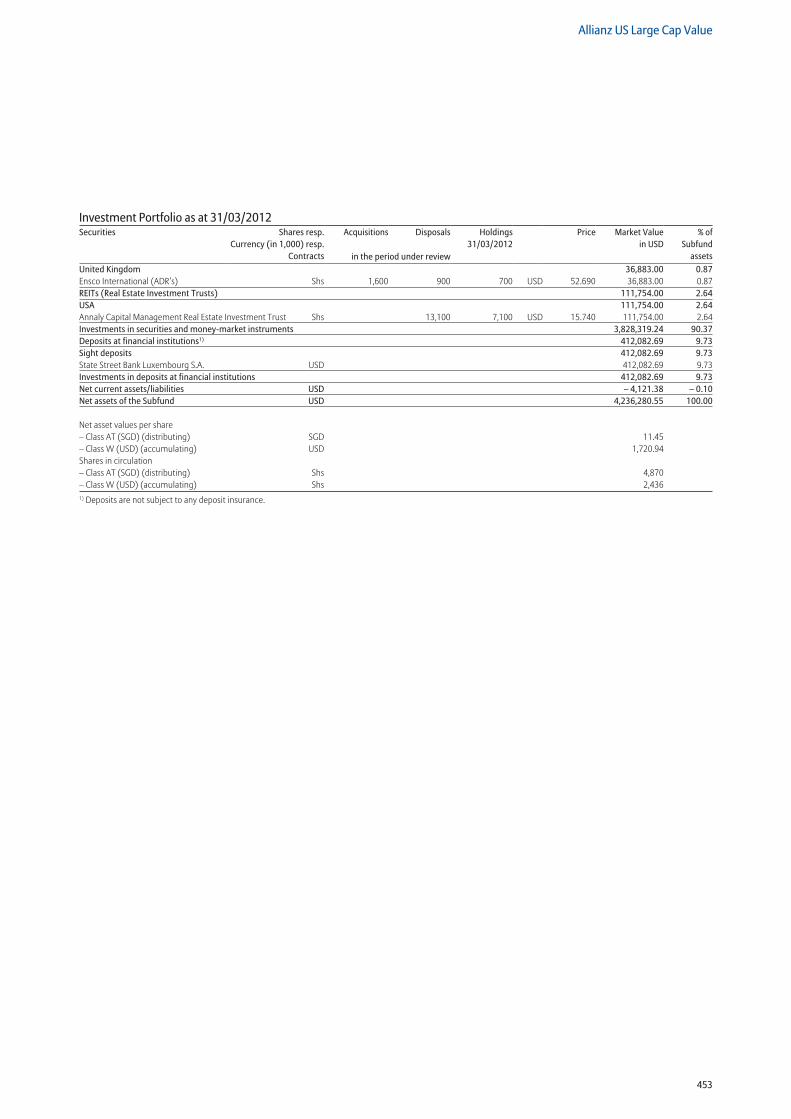
453
Allianz US Large Cap Value
United Kingdom 36,883.00 0.87Ensco International (ADR’s) Shs 1,600 900 700 USD 52.690 36,883.00 0.87REITs (Real Estate Investment Trusts) 111,754.00 2.64USA 111,754.00 2.64Annaly Capital Management Real Estate Investment Trust Shs 13,100 7,100 USD 15.740 111,754.00 2.64Investments in securities and money-market instruments 3,828,319.24 90.37Deposits at financial institutions1) 412,082.69 9.73Sight deposits 412,082.69 9.73State Street Bank Luxembourg S.A. USD 412,082.69 9.73Investments in deposits at financial institutions 412,082.69 9.73Net current assets/liabilities USD – 4,121.38 – 0.10Net assets of the Subfund USD 4,236,280.55 100.00
Net asset values per share – Class AT (SGD) (distributing) SGD 11.45– Class W (USD) (accumulating) USD 1,720.94Shares in circulation – Class AT (SGD) (distributing) Shs 4,870 – Class W (USD) (accumulating) Shs 2,4361) Deposits are not subject to any deposit insurance.
Investment Portfolio as at 31/03/2012Securities Shares resp.
Currency (in 1,000) resp.Contracts
Acquisitions Disposals Holdings 31/03/2012
Price Market Valuein USD
% ofSubfund
assetsin the period under review
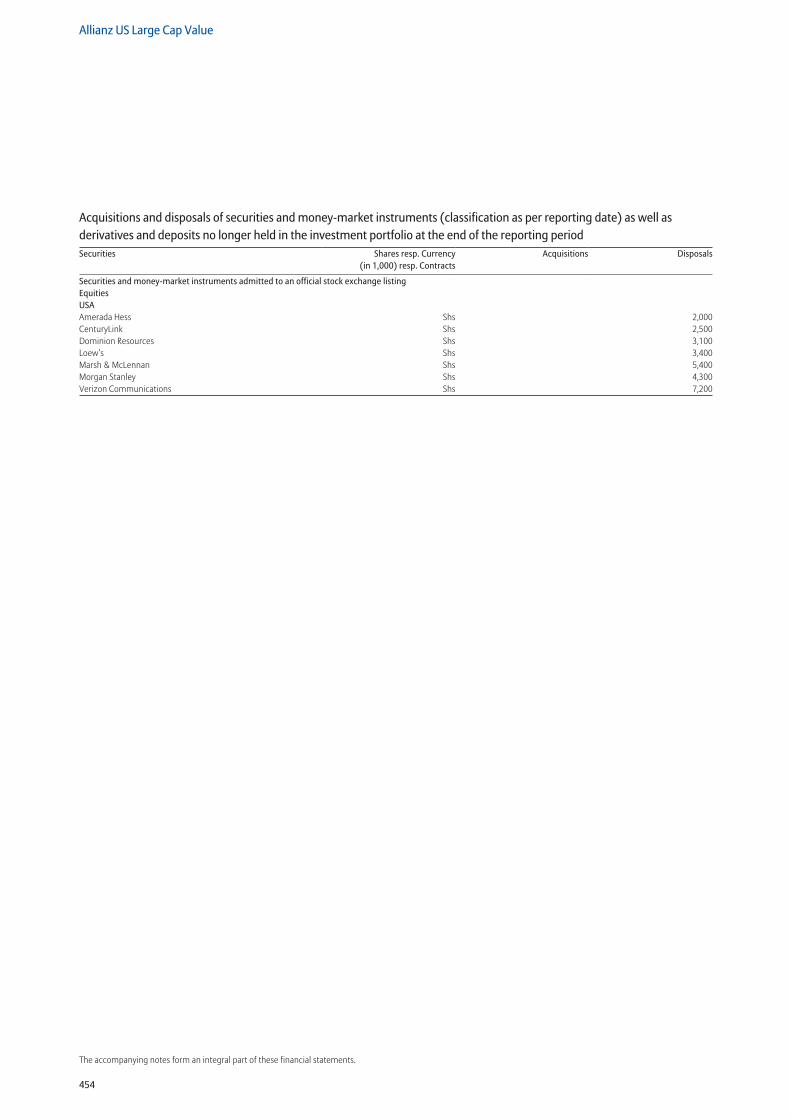
454
Allianz US Large Cap Value
The accompanying notes form an integral part of these financial statements.
Securities and money-market instruments admitted to an official stock exchange listing Equities USA Amerada Hess Shs 2,000CenturyLink Shs 2,500Dominion Resources Shs 3,100Loew’s Shs 3,400Marsh & McLennan Shs 5,400Morgan Stanley Shs 4,300Verizon Communications Shs 7,200
Acquisitions and disposals of securities and money-market instruments (classification as per reporting date) as well as derivatives and deposits no longer held in the investment portfolio at the end of the reporting periodSecurities Shares resp. Currency
(in 1,000) resp. ContractsAcquisitions Disposals
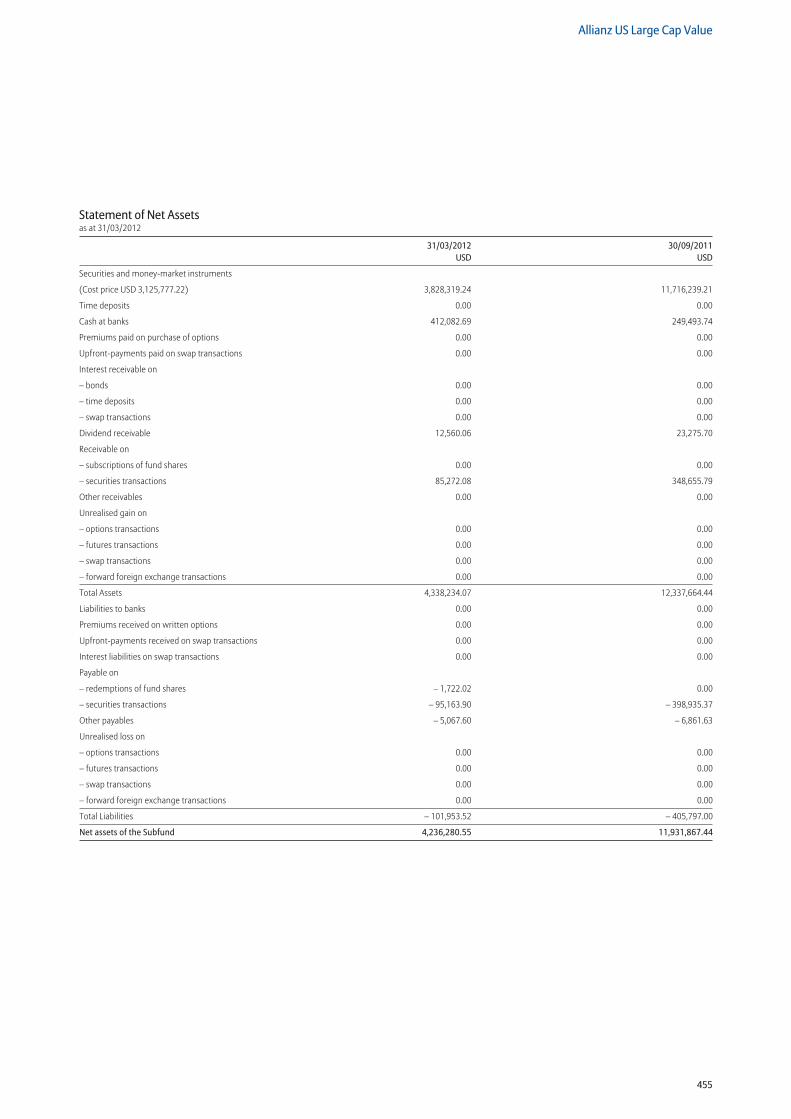
455
Allianz US Large Cap Value
Statement of Net Assetsas at 31/03/2012
31/03/2012 30/09/2011 USD USD
Securities and money-market instruments
(Cost price USD 3,125,777.22) 3,828,319.24 11,716,239.21
Time deposits 0.00 0.00
Cash at banks 412,082.69 249,493.74
Premiums paid on purchase of options 0.00 0.00
Upfront-payments paid on swap transactions 0.00 0.00
Interest receivable on
– bonds 0.00 0.00
– time deposits 0.00 0.00
– swap transactions 0.00 0.00
Dividend receivable 12,560.06 23,275.70
Receivable on
– subscriptions of fund shares 0.00 0.00
– securities transactions 85,272.08 348,655.79
Other receivables 0.00 0.00
Unrealised gain on
– options transactions 0.00 0.00
– futures transactions 0.00 0.00
– swap transactions 0.00 0.00
– forward foreign exchange transactions 0.00 0.00
Total Assets 4,338,234.07 12,337,664.44
Liabilities to banks 0.00 0.00
Premiums received on written options 0.00 0.00
Upfront-payments received on swap transactions 0.00 0.00
Interest liabilities on swap transactions 0.00 0.00
Payable on
– redemptions of fund shares – 1,722.02 0.00
– securities transactions – 95,163.90 – 398,935.37
Other payables – 5,067.60 – 6,861.63
Unrealised loss on
– options transactions 0.00 0.00
– futures transactions 0.00 0.00
– swap transactions 0.00 0.00
– forward foreign exchange transactions 0.00 0.00
Total Liabilities – 101,953.52 – 405,797.00
Net assets of the Subfund 4,236,280.55 11,931,867.44
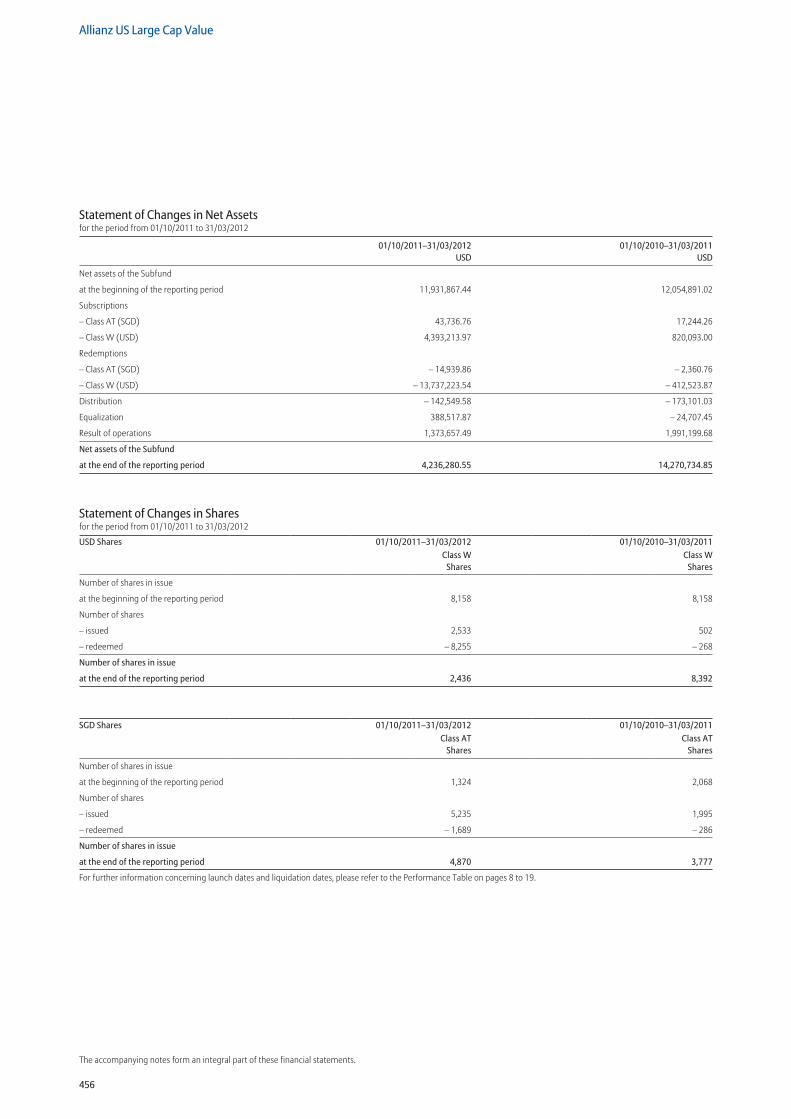
456
Allianz US Large Cap Value
The accompanying notes form an integral part of these financial statements.
Statement of Changes in Net Assetsfor the period from 01/10/2011 to 31/03/2012
01/10/2011–31/03/2012 01/10/2010–31/03/2011 USD USD
Net assets of the Subfund
at the beginning of the reporting period 11,931,867.44 12,054,891.02
Subscriptions
– Class AT (SGD) 43,736.76 17,244.26
– Class W (USD) 4,393,213.97 820,093.00
Redemptions
– Class AT (SGD) – 14,939.86 – 2,360.76
– Class W (USD) – 13,737,223.54 – 412,523.87
Distribution – 142,549.58 – 173,101.03
Equalization 388,517.87 – 24,707.45
Result of operations 1,373,657.49 1,991,199.68
Net assets of the Subfund
at the end of the reporting period 4,236,280.55 14,270,734.85
Statement of Changes in Sharesfor the period from 01/10/2011 to 31/03/2012
USD Shares 01/10/2011–31/03/2012 01/10/2010–31/03/2011Class W
SharesClass W
Shares
Number of shares in issue
at the beginning of the reporting period 8,158 8,158
Number of shares
– issued 2,533 502
– redeemed – 8,255 – 268
Number of shares in issue
at the end of the reporting period 2,436 8,392
SGD Shares 01/10/2011–31/03/2012 01/10/2010–31/03/2011Class AT
SharesClass AT
Shares
Number of shares in issue
at the beginning of the reporting period 1,324 2,068
Number of shares
– issued 5,235 1,995
– redeemed – 1,689 – 286
Number of shares in issue
at the end of the reporting period 4,870 3,777
For further information concerning launch dates and liquidation dates, please refer to the Performance Table on pages 8 to 19.
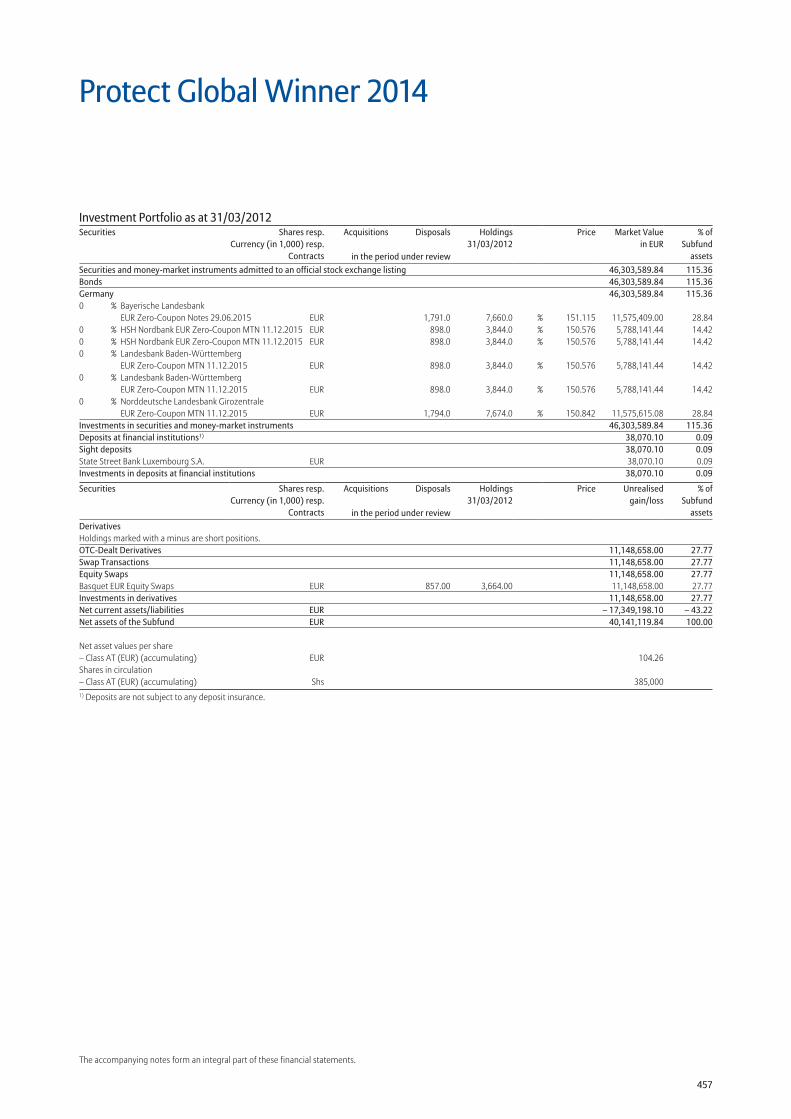
457
The accompanying notes form an integral part of these financial statements.
Securities and money-market instruments admitted to an official stock exchange listing 46,303,589.84 115.36Bonds 46,303,589.84 115.36Germany 46,303,589.84 115.360 % Bayerische Landesbank
EUR Zero-Coupon Notes 29.06.2015 EUR 1,791.0 7,660.0 % 151.115 11,575,409.00 28.840 % HSH Nordbank EUR Zero-Coupon MTN 11.12.2015 EUR 898.0 3,844.0 % 150.576 5,788,141.44 14.420 % HSH Nordbank EUR Zero-Coupon MTN 11.12.2015 EUR 898.0 3,844.0 % 150.576 5,788,141.44 14.420 % Landesbank Baden-Württemberg
EUR Zero-Coupon MTN 11.12.2015 EUR 898.0 3,844.0 % 150.576 5,788,141.44 14.420 % Landesbank Baden-Württemberg
EUR Zero-Coupon MTN 11.12.2015 EUR 898.0 3,844.0 % 150.576 5,788,141.44 14.420 % Norddeutsche Landesbank Girozentrale
EUR Zero-Coupon MTN 11.12.2015 EUR 1,794.0 7,674.0 % 150.842 11,575,615.08 28.84Investments in securities and money-market instruments 46,303,589.84 115.36Deposits at financial institutions1) 38,070.10 0.09Sight deposits 38,070.10 0.09State Street Bank Luxembourg S.A. EUR 38,070.10 0.09Investments in deposits at financial institutions 38,070.10 0.09
Securities Shares resp.Currency (in 1,000) resp.
Contracts
Acquisitions Disposals Holdings 31/03/2012
Price Unrealisedgain/loss
% ofSubfund
assetsin the period under reviewDerivatives Holdings marked with a minus are short positions. OTC-Dealt Derivatives 11,148,658.00 27.77Swap Transactions 11,148,658.00 27.77Equity Swaps 11,148,658.00 27.77Basquet EUR Equity Swaps EUR 857.00 3,664.00 11,148,658.00 27.77Investments in derivatives 11,148,658.00 27.77Net current assets/liabilities EUR – 17,349,198.10 – 43.22Net assets of the Subfund EUR 40,141,119.84 100.00
Net asset values per share – Class AT (EUR) (accumulating) EUR 104.26Shares in circulation – Class AT (EUR) (accumulating) Shs 385,0001) Deposits are not subject to any deposit insurance.
Protect Global Winner 2014
Investment Portfolio as at 31/03/2012Securities Shares resp.
Currency (in 1,000) resp.Contracts
Acquisitions Disposals Holdings 31/03/2012
Price Market Valuein EUR
% ofSubfund
assetsin the period under review
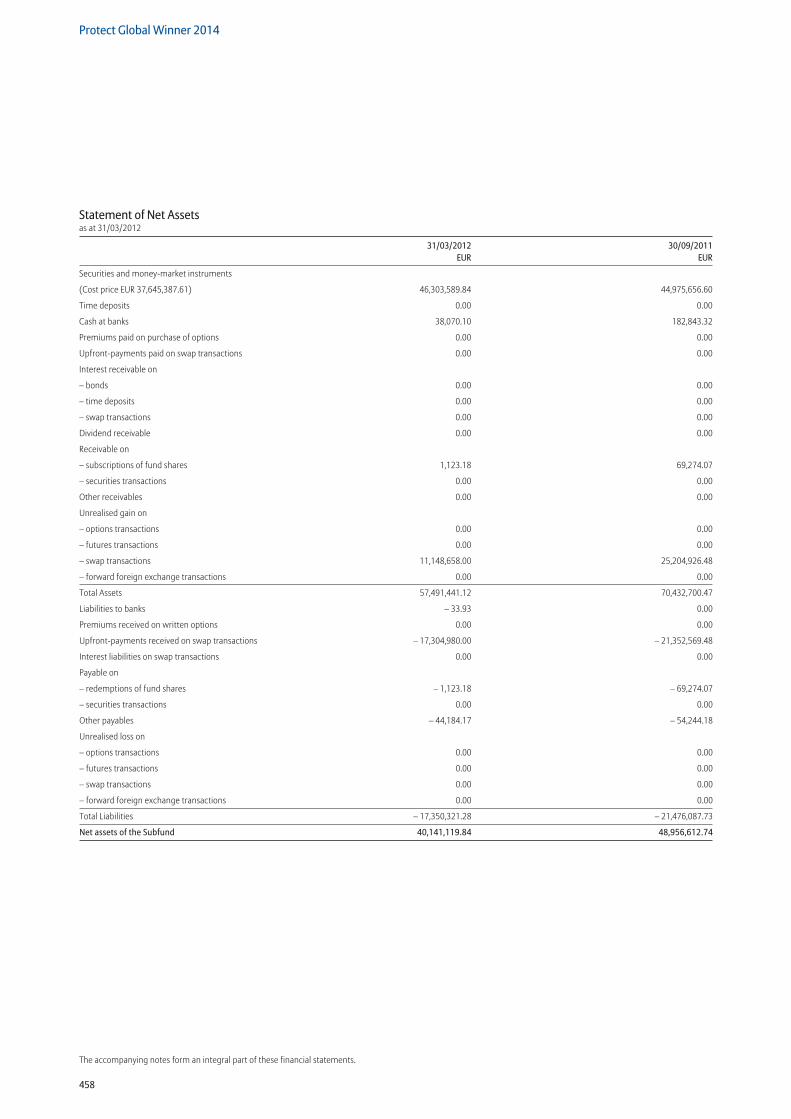
458
Protect Global Winner 2014
The accompanying notes form an integral part of these financial statements.
Statement of Net Assetsas at 31/03/2012
31/03/2012 30/09/2011 EUR EUR
Securities and money-market instruments
(Cost price EUR 37,645,387.61) 46,303,589.84 44,975,656.60
Time deposits 0.00 0.00
Cash at banks 38,070.10 182,843.32
Premiums paid on purchase of options 0.00 0.00
Upfront-payments paid on swap transactions 0.00 0.00
Interest receivable on
– bonds 0.00 0.00
– time deposits 0.00 0.00
– swap transactions 0.00 0.00
Dividend receivable 0.00 0.00
Receivable on
– subscriptions of fund shares 1,123.18 69,274.07
– securities transactions 0.00 0.00
Other receivables 0.00 0.00
Unrealised gain on
– options transactions 0.00 0.00
– futures transactions 0.00 0.00
– swap transactions 11,148,658.00 25,204,926.48
– forward foreign exchange transactions 0.00 0.00
Total Assets 57,491,441.12 70,432,700.47
Liabilities to banks – 33.93 0.00
Premiums received on written options 0.00 0.00
Upfront-payments received on swap transactions – 17,304,980.00 – 21,352,569.48
Interest liabilities on swap transactions 0.00 0.00
Payable on
– redemptions of fund shares – 1,123.18 – 69,274.07
– securities transactions 0.00 0.00
Other payables – 44,184.17 – 54,244.18
Unrealised loss on
– options transactions 0.00 0.00
– futures transactions 0.00 0.00
– swap transactions 0.00 0.00
– forward foreign exchange transactions 0.00 0.00
Total Liabilities – 17,350,321.28 – 21,476,087.73
Net assets of the Subfund 40,141,119.84 48,956,612.74
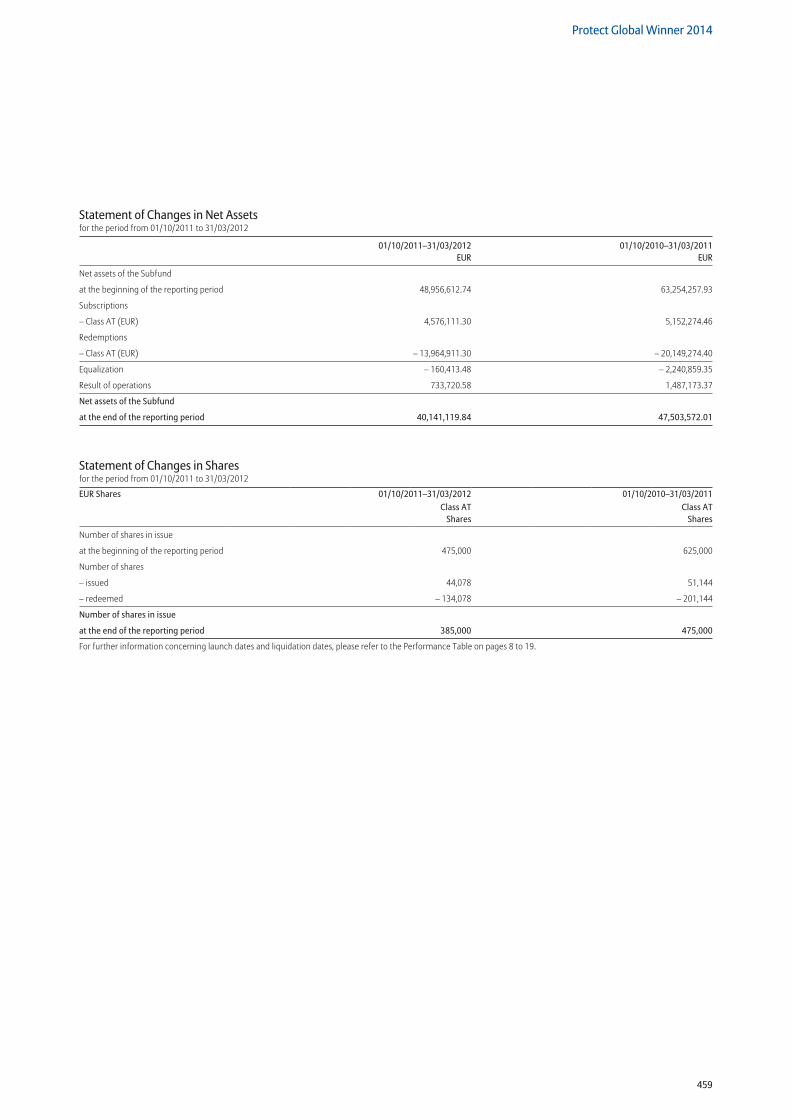
459
Protect Global Winner 2014
Statement of Changes in Net Assetsfor the period from 01/10/2011 to 31/03/2012
01/10/2011–31/03/2012 01/10/2010–31/03/2011 EUR EUR
Net assets of the Subfund
at the beginning of the reporting period 48,956,612.74 63,254,257.93
Subscriptions
– Class AT (EUR) 4,576,111.30 5,152,274.46
Redemptions
– Class AT (EUR) – 13,964,911.30 – 20,149,274.40
Equalization – 160,413.48 – 2,240,859.35
Result of operations 733,720.58 1,487,173.37
Net assets of the Subfund
at the end of the reporting period 40,141,119.84 47,503,572.01
Statement of Changes in Sharesfor the period from 01/10/2011 to 31/03/2012
EUR Shares 01/10/2011–31/03/2012 01/10/2010–31/03/2011Class AT
SharesClass AT
Shares
Number of shares in issue
at the beginning of the reporting period 475,000 625,000
Number of shares
– issued 44,078 51,144
– redeemed – 134,078 – 201,144
Number of shares in issue
at the end of the reporting period 385,000 475,000
For further information concerning launch dates and liquidation dates, please refer to the Performance Table on pages 8 to 19.
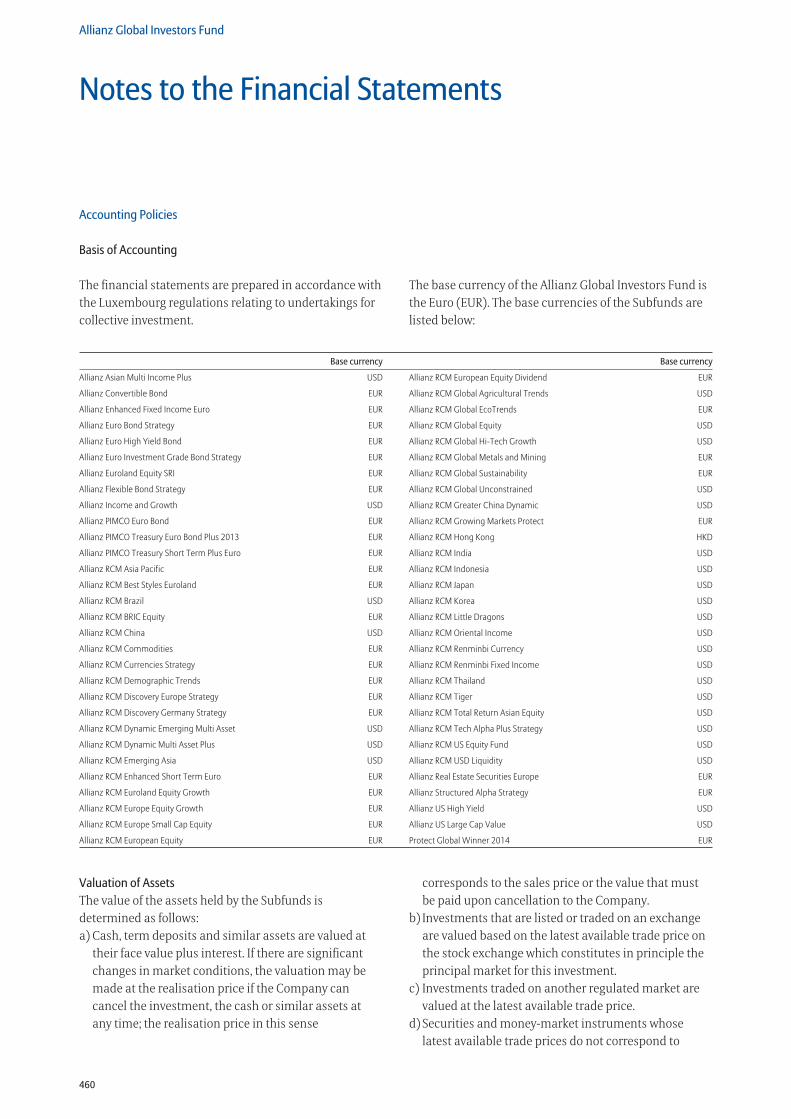
460
Allianz Global Investors Fund
Notes to the Financial Statements
Accounting Policies
Basis of Accounting
The financial statements are prepared in accordance with the Luxembourg regulations relating to undertakings for collective investment.
The base currency of the Allianz Global Investors Fund is the Euro (EUR). The base currencies of the Subfunds are listed below:
Base currency Base currency
Allianz Asian Multi Income Plus USD
Allianz Convertible Bond EUR
Allianz Enhanced Fixed Income Euro EUR
Allianz Euro Bond Strategy EUR
Allianz Euro High Yield Bond EUR
Allianz Euro Investment Grade Bond Strategy EUR
Allianz Euroland Equity SRI EUR
Allianz Flexible Bond Strategy EUR
Allianz Income and Growth USD
Allianz PIMCO Euro Bond EUR
Allianz PIMCO Treasury Euro Bond Plus 2013 EUR
Allianz PIMCO Treasury Short Term Plus Euro EUR
Allianz RCM Asia Pacific EUR
Allianz RCM Best Styles Euroland EUR
Allianz RCM Brazil USD
Allianz RCM BRIC Equity EUR
Allianz RCM China USD
Allianz RCM Commodities EUR
Allianz RCM Currencies Strategy EUR
Allianz RCM Demographic Trends EUR
Allianz RCM Discovery Europe Strategy EUR
Allianz RCM Discovery Germany Strategy EUR
Allianz RCM Dynamic Emerging Multi Asset USD
Allianz RCM Dynamic Multi Asset Plus USD
Allianz RCM Emerging Asia USD
Allianz RCM Enhanced Short Term Euro EUR
Allianz RCM Euroland Equity Growth EUR
Allianz RCM Europe Equity Growth EUR
Allianz RCM Europe Small Cap Equity EUR
Allianz RCM European Equity EUR
Allianz RCM European Equity Dividend EUR
Allianz RCM Global Agricultural Trends USD
Allianz RCM Global EcoTrends EUR
Allianz RCM Global Equity USD
Allianz RCM Global Hi-Tech Growth USD
Allianz RCM Global Metals and Mining EUR
Allianz RCM Global Sustainability EUR
Allianz RCM Global Unconstrained USD
Allianz RCM Greater China Dynamic USD
Allianz RCM Growing Markets Protect EUR
Allianz RCM Hong Kong HKD
Allianz RCM India USD
Allianz RCM Indonesia USD
Allianz RCM Japan USD
Allianz RCM Korea USD
Allianz RCM Little Dragons USD
Allianz RCM Oriental Income USD
Allianz RCM Renminbi Currency USD
Allianz RCM Renminbi Fixed Income USD
Allianz RCM Thailand USD
Allianz RCM Tiger USD
Allianz RCM Total Return Asian Equity USD
Allianz RCM Tech Alpha Plus Strategy USD
Allianz RCM US Equity Fund USD
Allianz RCM USD Liquidity USD
Allianz Real Estate Securities Europe EUR
Allianz Structured Alpha Strategy EUR
Allianz US High Yield USD
Allianz US Large Cap Value USD
Protect Global Winner 2014 EUR
Valuation of AssetsThe value of the assets held by the Subfunds is determined as follows:a) Cash, term deposits and similar assets are valued at
their face value plus interest. If there are significant changes in market conditions, the valuation may be made at the realisation price if the Company can cancel the investment, the cash or similar assets at any time; the realisation price in this sense
corresponds to the sales price or the value that must be paid upon cancellation to the Company.
b) Investments that are listed or traded on an exchange are valued based on the latest available trade price on the stock exchange which constitutes in principle the principal market for this investment.
c) Investments traded on another regulated market are valued at the latest available trade price.
d) Securities and money-market instruments whose latest available trade prices do not correspond to
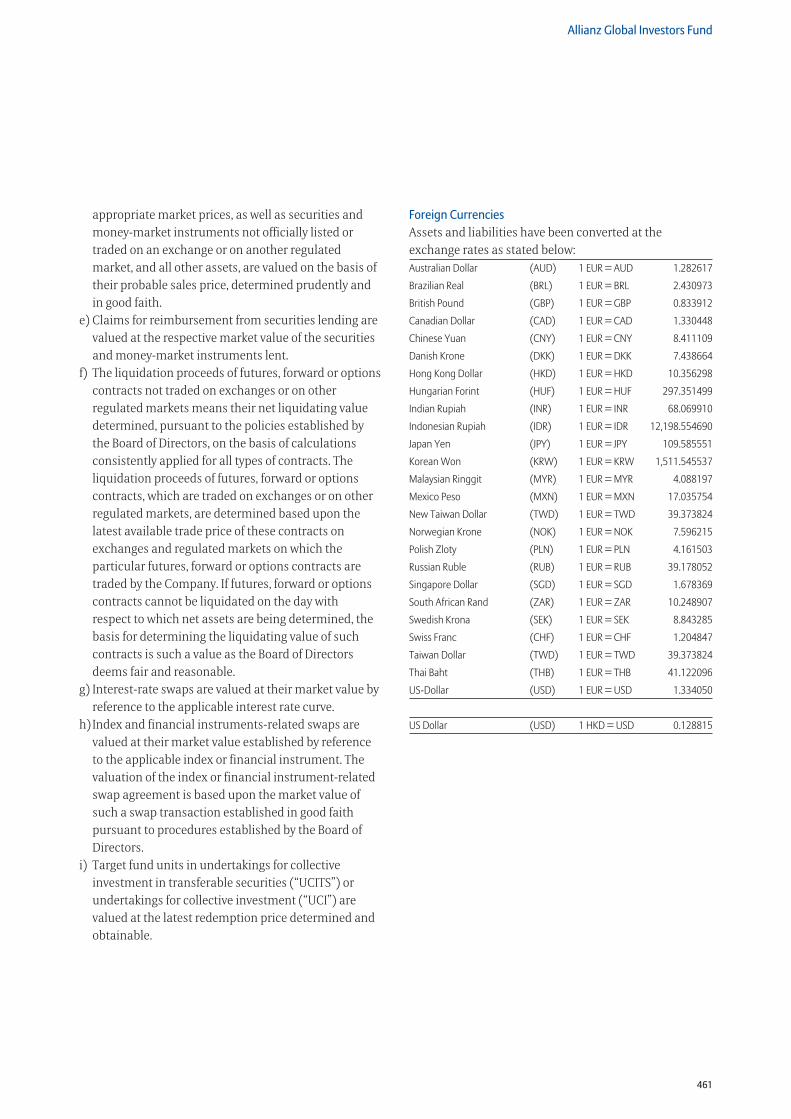
461
Allianz Global Investors Fund
appropriate market prices, as well as securities and money-market instruments not officially listed or traded on an exchange or on another regulated market, and all other assets, are valued on the basis of their probable sales price, determined prudently and in good faith.
e) Claims for reimbursement from securities lending are valued at the respective market value of the securities and money-market instruments lent.
f) The liquidation proceeds of futures, forward or options contracts not traded on exchanges or on other regulated markets means their net liquidating value determined, pursuant to the policies established by the Board of Directors, on the basis of calculations consistently applied for all types of contracts. The liquidation proceeds of futures, forward or options contracts, which are traded on exchanges or on other regulated markets, are determined based upon the latest available trade price of these contracts on exchanges and regulated markets on which the particular futures, forward or options contracts are traded by the Company. If futures, forward or options contracts cannot be liquidated on the day with respect to which net assets are being determined, the basis for determining the liquidating value of such contracts is such a value as the Board of Directors deems fair and reasonable.
g) Interest-rate swaps are valued at their market value by reference to the applicable interest rate curve.
h) Index and financial instruments-related swaps are valued at their market value established by reference to the applicable index or financial instrument. The valuation of the index or financial instrument-related swap agreement is based upon the market value of such a swap transaction established in good faith pursuant to procedures established by the Board of Directors.
i) Target fund units in undertakings for collective investment in transferable securities (“UCITS”) or undertakings for collective investment (“UCI”) are valued at the latest redemption price determined and obtainable.
Foreign CurrenciesAssets and liabilities have been converted at the exchange rates as stated below:Australian Dollar (AUD) 1 EUR = AUD 1.282617
Brazilian Real (BRL) 1 EUR = BRL 2.430973
British Pound (GBP) 1 EUR = GBP 0.833912
Canadian Dollar (CAD) 1 EUR = CAD 1.330448
Chinese Yuan (CNY) 1 EUR = CNY 8.411109
Danish Krone (DKK) 1 EUR = DKK 7.438664
Hong Kong Dollar (HKD) 1 EUR = HKD 10.356298
Hungarian Forint (HUF) 1 EUR = HUF 297.351499
Indian Rupiah (INR) 1 EUR = INR 68.069910
Indonesian Rupiah (IDR) 1 EUR = IDR 12,198.554690
Japan Yen (JPY) 1 EUR = JPY 109.585551
Korean Won (KRW) 1 EUR = KRW 1,511.545537
Malaysian Ringgit (MYR) 1 EUR = MYR 4.088197
Mexico Peso (MXN) 1 EUR = MXN 17.035754
New Taiwan Dollar (TWD) 1 EUR = TWD 39.373824
Norwegian Krone (NOK) 1 EUR = NOK 7.596215
Polish Zloty (PLN) 1 EUR = PLN 4.161503
Russian Ruble (RUB) 1 EUR = RUB 39.178052
Singapore Dollar (SGD) 1 EUR = SGD 1.678369
South African Rand (ZAR) 1 EUR = ZAR 10.248907
Swedish Krona (SEK) 1 EUR = SEK 8.843285
Swiss Franc (CHF) 1 EUR = CHF 1.204847
Taiwan Dollar (TWD) 1 EUR = TWD 39.373824
Thai Baht (THB) 1 EUR = THB 41.122096
US-Dollar (USD) 1 EUR = USD 1.334050
US Dollar (USD) 1 HKD = USD 0.128815
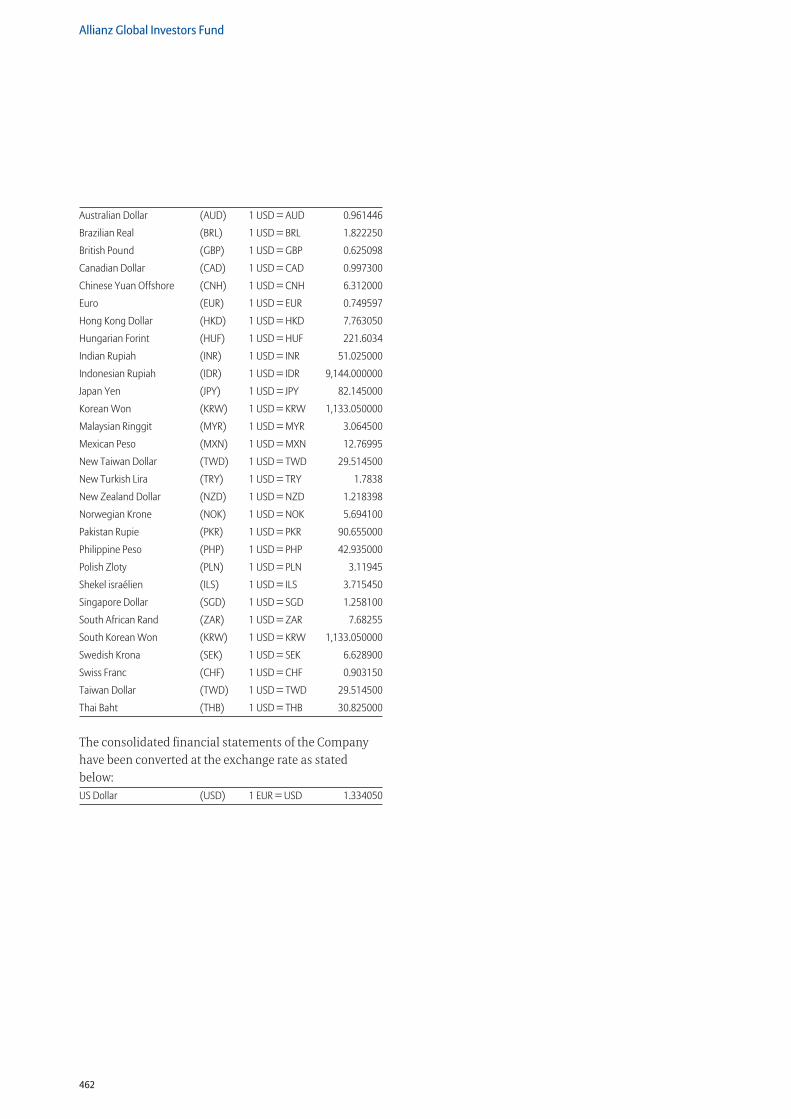
462
Allianz Global Investors Fund
Australian Dollar (AUD) 1 USD = AUD 0.961446
Brazilian Real (BRL) 1 USD = BRL 1.822250
British Pound (GBP) 1 USD = GBP 0.625098
Canadian Dollar (CAD) 1 USD = CAD 0.997300
Chinese Yuan Offshore (CNH) 1 USD = CNH 6.312000
Euro (EUR) 1 USD = EUR 0.749597
Hong Kong Dollar (HKD) 1 USD = HKD 7.763050
Hungarian Forint (HUF) 1 USD = HUF 221.6034
Indian Rupiah (INR) 1 USD = INR 51.025000
Indonesian Rupiah (IDR) 1 USD = IDR 9,144.000000
Japan Yen (JPY) 1 USD = JPY 82.145000
Korean Won (KRW) 1 USD = KRW 1,133.050000
Malaysian Ringgit (MYR) 1 USD = MYR 3.064500
Mexican Peso (MXN) 1 USD = MXN 12.76995
New Taiwan Dollar (TWD) 1 USD = TWD 29.514500
New Turkish Lira (TRY) 1 USD = TRY 1.7838
New Zealand Dollar (NZD) 1 USD = NZD 1.218398
Norwegian Krone (NOK) 1 USD = NOK 5.694100
Pakistan Rupie (PKR) 1 USD = PKR 90.655000
Philippine Peso (PHP) 1 USD = PHP 42.935000
Polish Zloty (PLN) 1 USD = PLN 3.11945
Shekel israélien (ILS) 1 USD = ILS 3.715450
Singapore Dollar (SGD) 1 USD = SGD 1.258100
South African Rand (ZAR) 1 USD = ZAR 7.68255
South Korean Won (KRW) 1 USD = KRW 1,133.050000
Swedish Krona (SEK) 1 USD = SEK 6.628900
Swiss Franc (CHF) 1 USD = CHF 0.903150
Taiwan Dollar (TWD) 1 USD = TWD 29.514500
Thai Baht (THB) 1 USD = THB 30.825000
The consolidated financial statements of the Company have been converted at the exchange rate as stated below:US Dollar (USD) 1 EUR = USD 1.334050

This page is left blank intentionally.
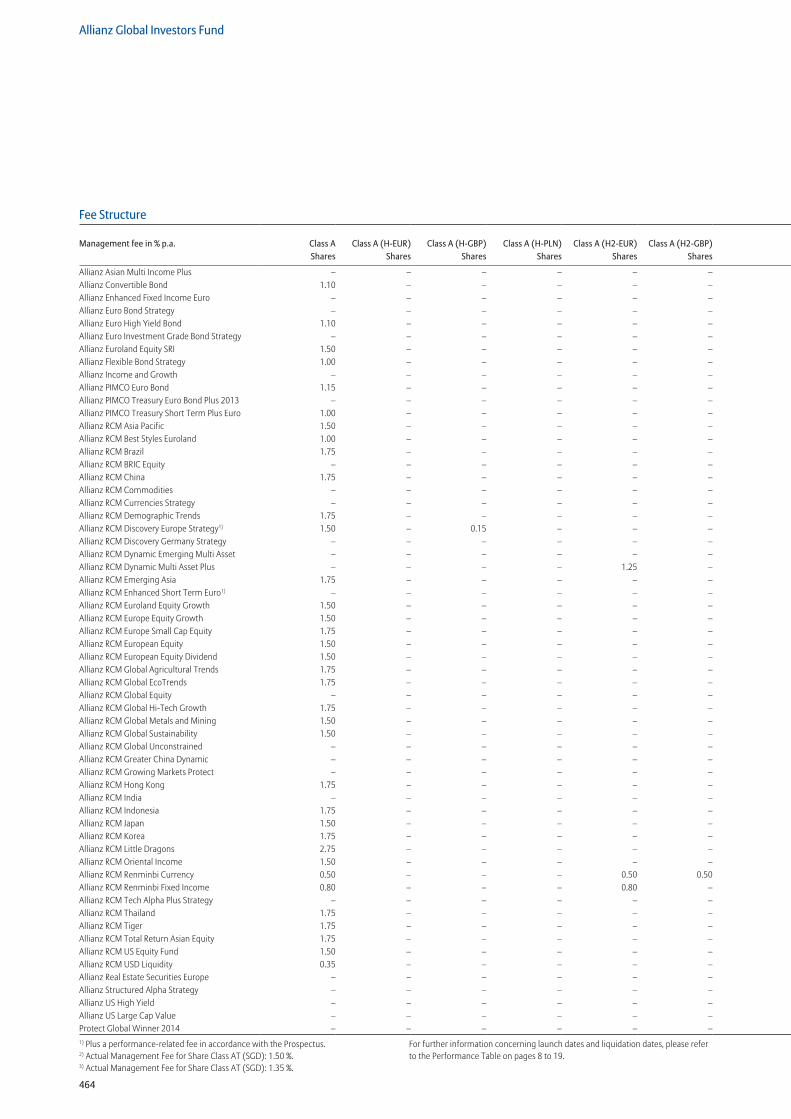
464
Allianz Global Investors Fund
1) Plus a performance-related fee in accordance with the Prospectus.2) Actual Management Fee for Share Class AT (SGD): 1.50 %.3) Actual Management Fee for Share Class AT (SGD): 1.35 %.
For further information concerning launch dates and liquidation dates, please refer to the Performance Table on pages 8 to 19.
Fee StructureManagement fee in % p.a.
Management fee in % p.a. Class A Class A (H-EUR) Class A (H-GBP) Class A (H-PLN) Class A (H2-EUR) Class A (H2-GBP) Class A2 Class AM Class AM (H-AUD) Class AM (H-CAD) Class AM (H-EUR) Class AM (H-GBP) Class AT Class AT (H-PLN)Shares Shares Shares Shares Shares Shares Shares Shares Shares Shares Shares Shares Shares Shares
Allianz Asian Multi Income Plus – – – – – – – 1.25 – – – – 1.25 –Allianz Convertible Bond 1.10 – – – – – – – – – – – 1.10 –Allianz Enhanced Fixed Income Euro – – – – – – – – – – – – – –Allianz Euro Bond Strategy – – – – – – – – – – – – – –Allianz Euro High Yield Bond 1.10 – – – – – – – – – – – 1.10 1.10Allianz Euro Investment Grade Bond Strategy – – – – – – – – – – – – – –Allianz Euroland Equity SRI 1.50 – – – – – – – – – – – – –Allianz Flexible Bond Strategy 1.00 – – – – – – – – – – – – –Allianz Income and Growth – – – – – – – – – – – – 1.25 –Allianz PIMCO Euro Bond 1.15 – – – – – – – – – – – 1.15 –Allianz PIMCO Treasury Euro Bond Plus 2013 – – – – – – – – – – – – – –Allianz PIMCO Treasury Short Term Plus Euro 1.00 – – – – – – – – – – – – –Allianz RCM Asia Pacific 1.50 – – – – – – – – – – – 1.50 –Allianz RCM Best Styles Euroland 1.00 – – – – – – – – – – – 1.00 –Allianz RCM Brazil 1.75 – – – – – – – – – – – 1.75 –Allianz RCM BRIC Equity – – – – – – – – – – – – 1.75 –Allianz RCM China 1.75 – – – – – – – – – – – 1.753) –Allianz RCM Commodities – – – – – – – – – – – – – –Allianz RCM Currencies Strategy – – – – – – – – – – – – – –Allianz RCM Demographic Trends 1.75 – – – – – – – – – – – 1.75 –Allianz RCM Discovery Europe Strategy1) 1.50 – 0.15 – – – – – – – – – – –Allianz RCM Discovery Germany Strategy – – – – – – – – – – – – – –Allianz RCM Dynamic Emerging Multi Asset – – – – – – – – – – – – – –Allianz RCM Dynamic Multi Asset Plus – – – – 1.25 – – – – – – – – –Allianz RCM Emerging Asia 1.75 – – – – – – – – – – – 1.75 –Allianz RCM Enhanced Short Term Euro1) – – – – – – – – – – – – 0.35 –Allianz RCM Euroland Equity Growth 1.50 – – – – – – – – – – – 1.50 –Allianz RCM Europe Equity Growth 1.50 – – – – – – – – – – – 1.50 –Allianz RCM Europe Small Cap Equity 1.75 – – – – – – – – – – – 1.75 –Allianz RCM European Equity 1.50 – – – – – – – – – – – – –Allianz RCM European Equity Dividend 1.50 – – – – – – – – – – – 1.50 –Allianz RCM Global Agricultural Trends 1.75 – – – – – – – – – – – 1.75 –Allianz RCM Global EcoTrends 1.75 – – – – – – – – – – – 1.75 –Allianz RCM Global Equity – – – – – – – – – – – – 1.50 –Allianz RCM Global Hi-Tech Growth 1.75 – – – – – – – – – – – 1.752) –Allianz RCM Global Metals and Mining 1.50 – – – – – – – – – – – 1.50 –Allianz RCM Global Sustainability 1.50 – – – – – – – – – – – – –Allianz RCM Global Unconstrained – – – – – – – – – – – – 1.75 –Allianz RCM Greater China Dynamic – – – – – – – – – – – – 1.75 –Allianz RCM Growing Markets Protect – – – – – – – – – – – – 1.25 –Allianz RCM Hong Kong 1.75 – – – – – – – – – – – 1.752) –Allianz RCM India – – – – – – – – – – – – – –Allianz RCM Indonesia 1.75 – – – – – – – – – – – – –Allianz RCM Japan 1.50 – – – – – – – – – – – – –Allianz RCM Korea 1.75 – – – – – – – – – – – – –Allianz RCM Little Dragons 2.75 – – – – – 1.75 – – – – – 2.753) –Allianz RCM Oriental Income 1.50 – – – – – – – – – – – 1.50 –Allianz RCM Renminbi Currency 0.50 – – – 0.50 0.50 – – – – – – – –Allianz RCM Renminbi Fixed Income 0.80 – – – 0.80 – – – – – – – – –Allianz RCM Tech Alpha Plus Strategy – – – – – – – – – – – – – –Allianz RCM Thailand 1.75 – – – – – – – – – – – – –Allianz RCM Tiger 1.75 – – – – – – – – – – – 1.75 –Allianz RCM Total Return Asian Equity 1.75 – – – – – – – – – – – 1.75 –Allianz RCM US Equity Fund 1.50 – – – – – 1.50 – – – – – 1.50 –Allianz RCM USD Liquidity 0.35 – – – – – – – – – – – – –Allianz Real Estate Securities Europe – – – – – – – – – – – – 1.75 –Allianz Structured Alpha Strategy – – – – – – – – – – – – – –Allianz US High Yield – – – – – – – 1.20 1.20 1.20 1.20 1.20 1.20 –Allianz US Large Cap Value – – – – – – – – – – – – 1.50 –Protect Global Winner 2014 – – – – – – – – – – – – 1.00 –
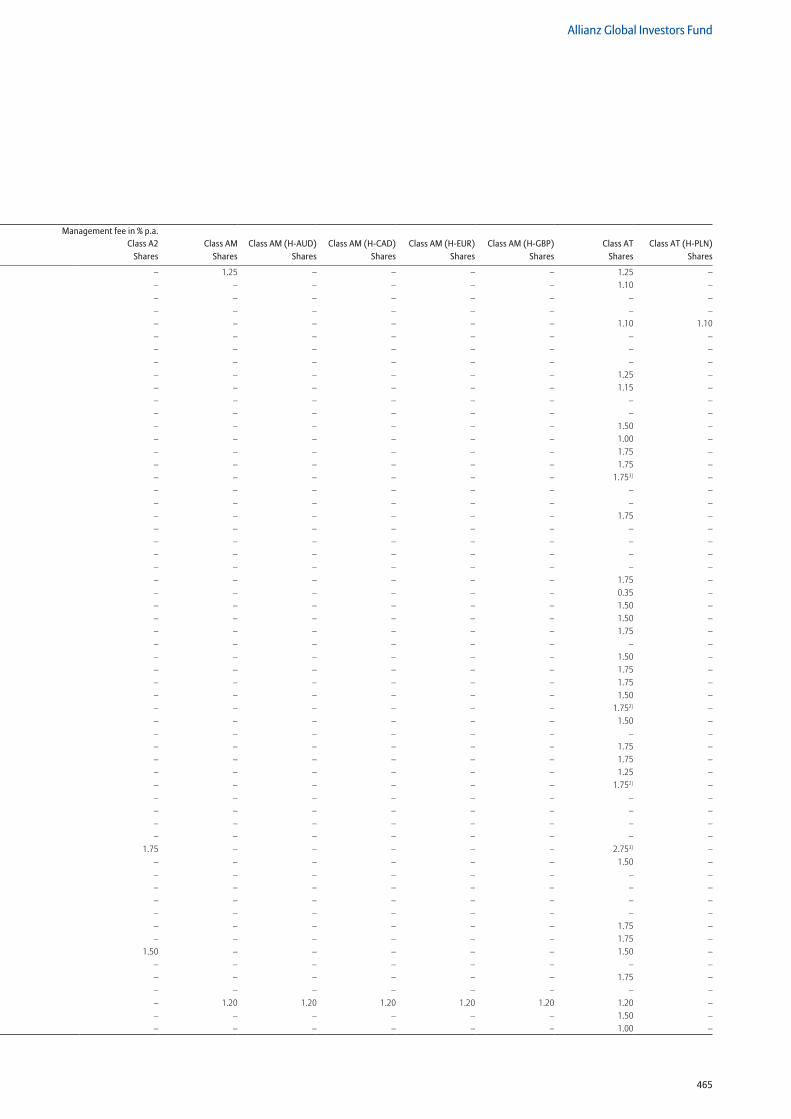
465
Allianz Global Investors Fund
Fee StructureManagement fee in % p.a.
Management fee in % p.a. Class A Class A (H-EUR) Class A (H-GBP) Class A (H-PLN) Class A (H2-EUR) Class A (H2-GBP) Class A2 Class AM Class AM (H-AUD) Class AM (H-CAD) Class AM (H-EUR) Class AM (H-GBP) Class AT Class AT (H-PLN)Shares Shares Shares Shares Shares Shares Shares Shares Shares Shares Shares Shares Shares Shares
Allianz Asian Multi Income Plus – – – – – – – 1.25 – – – – 1.25 –Allianz Convertible Bond 1.10 – – – – – – – – – – – 1.10 –Allianz Enhanced Fixed Income Euro – – – – – – – – – – – – – –Allianz Euro Bond Strategy – – – – – – – – – – – – – –Allianz Euro High Yield Bond 1.10 – – – – – – – – – – – 1.10 1.10Allianz Euro Investment Grade Bond Strategy – – – – – – – – – – – – – –Allianz Euroland Equity SRI 1.50 – – – – – – – – – – – – –Allianz Flexible Bond Strategy 1.00 – – – – – – – – – – – – –Allianz Income and Growth – – – – – – – – – – – – 1.25 –Allianz PIMCO Euro Bond 1.15 – – – – – – – – – – – 1.15 –Allianz PIMCO Treasury Euro Bond Plus 2013 – – – – – – – – – – – – – –Allianz PIMCO Treasury Short Term Plus Euro 1.00 – – – – – – – – – – – – –Allianz RCM Asia Pacific 1.50 – – – – – – – – – – – 1.50 –Allianz RCM Best Styles Euroland 1.00 – – – – – – – – – – – 1.00 –Allianz RCM Brazil 1.75 – – – – – – – – – – – 1.75 –Allianz RCM BRIC Equity – – – – – – – – – – – – 1.75 –Allianz RCM China 1.75 – – – – – – – – – – – 1.753) –Allianz RCM Commodities – – – – – – – – – – – – – –Allianz RCM Currencies Strategy – – – – – – – – – – – – – –Allianz RCM Demographic Trends 1.75 – – – – – – – – – – – 1.75 –Allianz RCM Discovery Europe Strategy1) 1.50 – 0.15 – – – – – – – – – – –Allianz RCM Discovery Germany Strategy – – – – – – – – – – – – – –Allianz RCM Dynamic Emerging Multi Asset – – – – – – – – – – – – – –Allianz RCM Dynamic Multi Asset Plus – – – – 1.25 – – – – – – – – –Allianz RCM Emerging Asia 1.75 – – – – – – – – – – – 1.75 –Allianz RCM Enhanced Short Term Euro1) – – – – – – – – – – – – 0.35 –Allianz RCM Euroland Equity Growth 1.50 – – – – – – – – – – – 1.50 –Allianz RCM Europe Equity Growth 1.50 – – – – – – – – – – – 1.50 –Allianz RCM Europe Small Cap Equity 1.75 – – – – – – – – – – – 1.75 –Allianz RCM European Equity 1.50 – – – – – – – – – – – – –Allianz RCM European Equity Dividend 1.50 – – – – – – – – – – – 1.50 –Allianz RCM Global Agricultural Trends 1.75 – – – – – – – – – – – 1.75 –Allianz RCM Global EcoTrends 1.75 – – – – – – – – – – – 1.75 –Allianz RCM Global Equity – – – – – – – – – – – – 1.50 –Allianz RCM Global Hi-Tech Growth 1.75 – – – – – – – – – – – 1.752) –Allianz RCM Global Metals and Mining 1.50 – – – – – – – – – – – 1.50 –Allianz RCM Global Sustainability 1.50 – – – – – – – – – – – – –Allianz RCM Global Unconstrained – – – – – – – – – – – – 1.75 –Allianz RCM Greater China Dynamic – – – – – – – – – – – – 1.75 –Allianz RCM Growing Markets Protect – – – – – – – – – – – – 1.25 –Allianz RCM Hong Kong 1.75 – – – – – – – – – – – 1.752) –Allianz RCM India – – – – – – – – – – – – – –Allianz RCM Indonesia 1.75 – – – – – – – – – – – – –Allianz RCM Japan 1.50 – – – – – – – – – – – – –Allianz RCM Korea 1.75 – – – – – – – – – – – – –Allianz RCM Little Dragons 2.75 – – – – – 1.75 – – – – – 2.753) –Allianz RCM Oriental Income 1.50 – – – – – – – – – – – 1.50 –Allianz RCM Renminbi Currency 0.50 – – – 0.50 0.50 – – – – – – – –Allianz RCM Renminbi Fixed Income 0.80 – – – 0.80 – – – – – – – – –Allianz RCM Tech Alpha Plus Strategy – – – – – – – – – – – – – –Allianz RCM Thailand 1.75 – – – – – – – – – – – – –Allianz RCM Tiger 1.75 – – – – – – – – – – – 1.75 –Allianz RCM Total Return Asian Equity 1.75 – – – – – – – – – – – 1.75 –Allianz RCM US Equity Fund 1.50 – – – – – 1.50 – – – – – 1.50 –Allianz RCM USD Liquidity 0.35 – – – – – – – – – – – – –Allianz Real Estate Securities Europe – – – – – – – – – – – – 1.75 –Allianz Structured Alpha Strategy – – – – – – – – – – – – – –Allianz US High Yield – – – – – – – 1.20 1.20 1.20 1.20 1.20 1.20 –Allianz US Large Cap Value – – – – – – – – – – – – 1.50 –Protect Global Winner 2014 – – – – – – – – – – – – 1.00 –
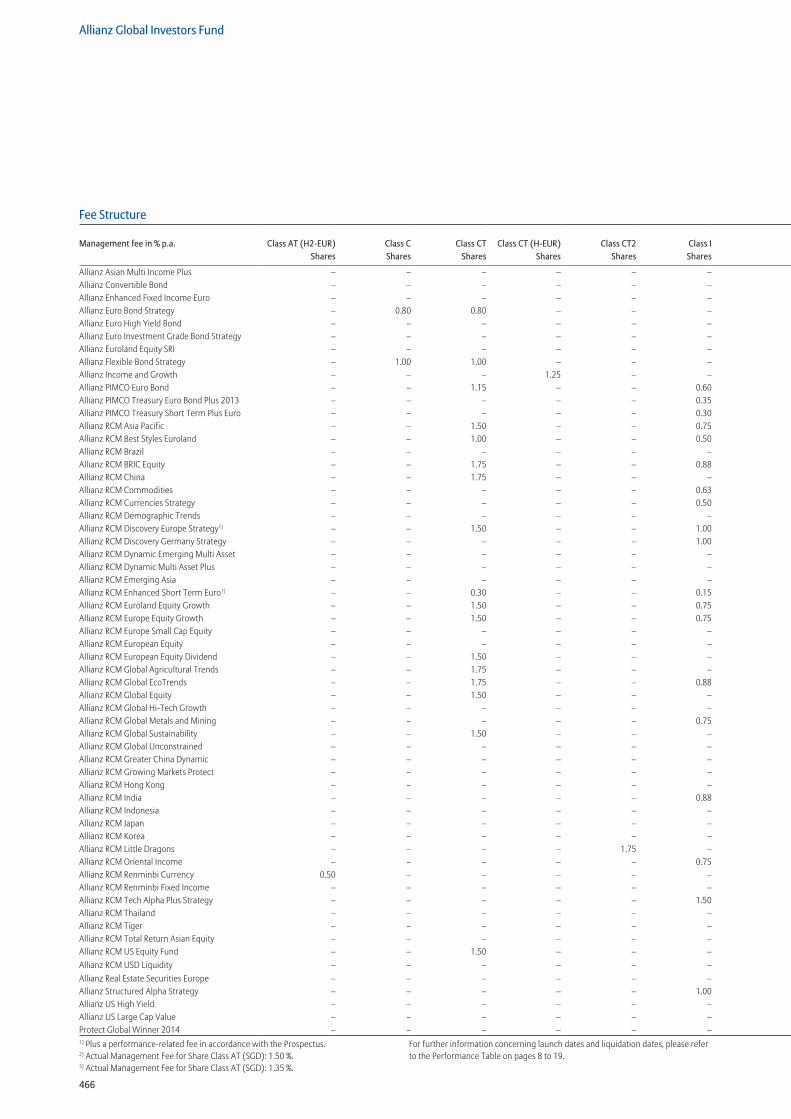
466
Allianz Global Investors Fund
1) Plus a performance-related fee in accordance with the Prospectus.2) Actual Management Fee for Share Class AT (SGD): 1.50 %.3) Actual Management Fee for Share Class AT (SGD): 1.35 %.
For further information concerning launch dates and liquidation dates, please refer to the Performance Table on pages 8 to 19.
Fee StructureManagement fee in % p.a.
Management fee in % p.a. Class AT (H2-EUR) Class C Class CT Class CT (H-EUR) Class CT2 Class I Class I (H-EUR) Class I (H2-EUR) Class I (H2-JPY) Class I (H-PLN) Class IM (H-EUR) Class IT Class IT (H-EUR) Class NShares Shares Shares Shares Shares Shares Shares Shares Shares Shares Shares Shares Shares Shares
Allianz Asian Multi Income Plus – – – – – – – – – – – 0.70 – –Allianz Convertible Bond – – – – – – – – – – – 0.60 – –Allianz Enhanced Fixed Income Euro – – – – – – – – – – – – – –Allianz Euro Bond Strategy – 0.80 0.80 – – – – – – – – 0.40 – –Allianz Euro High Yield Bond – – – – – – – – – 0.60 – 0.60 – –Allianz Euro Investment Grade Bond Strategy – – – – – – – – – – – 0.45 – –Allianz Euroland Equity SRI – – – – – – – – – – – – – 0.45Allianz Flexible Bond Strategy – 1.00 1.00 – – – – – – – – 0.60 – –Allianz Income and Growth – – – 1.25 – – 0.65 – – – 0.65 – 0.65 –Allianz PIMCO Euro Bond – – 1.15 – – 0.60 – – – – – – – –Allianz PIMCO Treasury Euro Bond Plus 2013 – – – – – 0.35 – – – – – – – –Allianz PIMCO Treasury Short Term Plus Euro – – – – – 0.30 – – – – – – – –Allianz RCM Asia Pacific – – 1.50 – – 0.75 – – – – – – – 0.45Allianz RCM Best Styles Euroland – – 1.00 – – 0.50 – – – – – – – –Allianz RCM Brazil – – – – – – – – – – – – – –Allianz RCM BRIC Equity – – 1.75 – – 0.88 – – – – – – – –Allianz RCM China – – 1.75 – – – – – – – – 0.88 – 0.53Allianz RCM Commodities – – – – – 0.63 – – – – – – – –Allianz RCM Currencies Strategy – – – – – 0.50 – – – – – – – –Allianz RCM Demographic Trends – – – – – – – – – – – – – –Allianz RCM Discovery Europe Strategy1) – – 1.50 – – 1.00 – – – – – – – –Allianz RCM Discovery Germany Strategy – – – – – 1.00 – – – – – – – –Allianz RCM Dynamic Emerging Multi Asset – – – – – – – 0.75 – – – – – –Allianz RCM Dynamic Multi Asset Plus – – – – – – – – 0.63 – – – – –Allianz RCM Emerging Asia – – – – – – – – – – – – – –Allianz RCM Enhanced Short Term Euro1) – – 0.30 – – 0.15 – – – – – 0.15 – –Allianz RCM Euroland Equity Growth – – 1.50 – – 0.75 – – – – – 0.75 – –Allianz RCM Europe Equity Growth – – 1.50 – – 0.75 – – – – – 0.75 – –Allianz RCM Europe Small Cap Equity – – – – – – – – – – – 0.88 – –Allianz RCM European Equity – – – – – – – – – – – – – 0.45Allianz RCM European Equity Dividend – – 1.50 – – – – – – – – 0.75 – –Allianz RCM Global Agricultural Trends – – 1.75 – – – – – – – – 0.88 – –Allianz RCM Global EcoTrends – – 1.75 – – 0.88 – – – – – 0.88 – –Allianz RCM Global Equity – – 1.50 – – – – – – – – 0.75 0.75 0.45Allianz RCM Global Hi-Tech Growth – – – – – – – – – – – 0.88 – –Allianz RCM Global Metals and Mining – – – – – 0.75 – – – – – 0.75 – –Allianz RCM Global Sustainability – – 1.50 – – – – – – – – – – –Allianz RCM Global Unconstrained – – – – – – – – – – – – – –Allianz RCM Greater China Dynamic – – – – – – – – – – – – – –Allianz RCM Growing Markets Protect – – – – – – – – – – – – – –Allianz RCM Hong Kong – – – – – – – – – – – 0.88 – –Allianz RCM India – – – – – 0.88 – – – – – – – –Allianz RCM Indonesia – – – – – – – – – – – – – –Allianz RCM Japan – – – – – – – – – – – 0.75 – –Allianz RCM Korea – – – – – – – – – – – 0.88 – –Allianz RCM Little Dragons – – – – 1.75 – – – – – – 0.88 – –Allianz RCM Oriental Income – – – – – 0.75 – – – – – 0.75 – –Allianz RCM Renminbi Currency 0.50 – – – – – – 0.40 – – – – – –Allianz RCM Renminbi Fixed Income – – – – – – – 0.40 – – – – – –Allianz RCM Tech Alpha Plus Strategy – – – – – 1.50 – – – – – – – –Allianz RCM Thailand – – – – – – – – – – – 0.88 – –Allianz RCM Tiger – – – – – – – – – – – – – –Allianz RCM Total Return Asian Equity – – – – – – – – – – – 0.88 – –Allianz RCM US Equity Fund – – 1.50 – – – – – – – – – – 0.45Allianz RCM USD Liquidity – – – – – – – – – – – – – –Allianz Real Estate Securities Europe – – – – – – – – – – – – – –Allianz Structured Alpha Strategy – – – – – 1.00 – – – – – – – –Allianz US High Yield – – – – – – – – – – – 0.60 – –Allianz US Large Cap Value – – – – – – – – – – – – – –Protect Global Winner 2014 – – – – – – – – – – – – – –
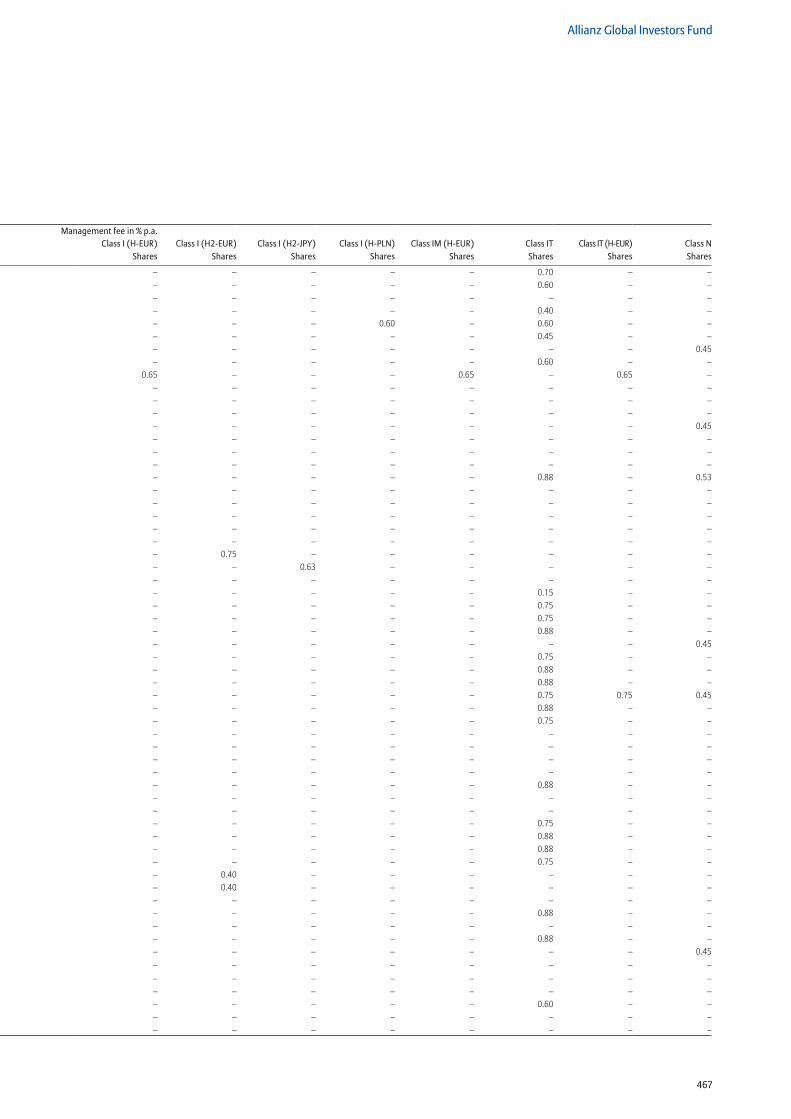
467
Allianz Global Investors Fund
Fee StructureManagement fee in % p.a.
Management fee in % p.a. Class AT (H2-EUR) Class C Class CT Class CT (H-EUR) Class CT2 Class I Class I (H-EUR) Class I (H2-EUR) Class I (H2-JPY) Class I (H-PLN) Class IM (H-EUR) Class IT Class IT (H-EUR) Class NShares Shares Shares Shares Shares Shares Shares Shares Shares Shares Shares Shares Shares Shares
Allianz Asian Multi Income Plus – – – – – – – – – – – 0.70 – –Allianz Convertible Bond – – – – – – – – – – – 0.60 – –Allianz Enhanced Fixed Income Euro – – – – – – – – – – – – – –Allianz Euro Bond Strategy – 0.80 0.80 – – – – – – – – 0.40 – –Allianz Euro High Yield Bond – – – – – – – – – 0.60 – 0.60 – –Allianz Euro Investment Grade Bond Strategy – – – – – – – – – – – 0.45 – –Allianz Euroland Equity SRI – – – – – – – – – – – – – 0.45Allianz Flexible Bond Strategy – 1.00 1.00 – – – – – – – – 0.60 – –Allianz Income and Growth – – – 1.25 – – 0.65 – – – 0.65 – 0.65 –Allianz PIMCO Euro Bond – – 1.15 – – 0.60 – – – – – – – –Allianz PIMCO Treasury Euro Bond Plus 2013 – – – – – 0.35 – – – – – – – –Allianz PIMCO Treasury Short Term Plus Euro – – – – – 0.30 – – – – – – – –Allianz RCM Asia Pacific – – 1.50 – – 0.75 – – – – – – – 0.45Allianz RCM Best Styles Euroland – – 1.00 – – 0.50 – – – – – – – –Allianz RCM Brazil – – – – – – – – – – – – – –Allianz RCM BRIC Equity – – 1.75 – – 0.88 – – – – – – – –Allianz RCM China – – 1.75 – – – – – – – – 0.88 – 0.53Allianz RCM Commodities – – – – – 0.63 – – – – – – – –Allianz RCM Currencies Strategy – – – – – 0.50 – – – – – – – –Allianz RCM Demographic Trends – – – – – – – – – – – – – –Allianz RCM Discovery Europe Strategy1) – – 1.50 – – 1.00 – – – – – – – –Allianz RCM Discovery Germany Strategy – – – – – 1.00 – – – – – – – –Allianz RCM Dynamic Emerging Multi Asset – – – – – – – 0.75 – – – – – –Allianz RCM Dynamic Multi Asset Plus – – – – – – – – 0.63 – – – – –Allianz RCM Emerging Asia – – – – – – – – – – – – – –Allianz RCM Enhanced Short Term Euro1) – – 0.30 – – 0.15 – – – – – 0.15 – –Allianz RCM Euroland Equity Growth – – 1.50 – – 0.75 – – – – – 0.75 – –Allianz RCM Europe Equity Growth – – 1.50 – – 0.75 – – – – – 0.75 – –Allianz RCM Europe Small Cap Equity – – – – – – – – – – – 0.88 – –Allianz RCM European Equity – – – – – – – – – – – – – 0.45Allianz RCM European Equity Dividend – – 1.50 – – – – – – – – 0.75 – –Allianz RCM Global Agricultural Trends – – 1.75 – – – – – – – – 0.88 – –Allianz RCM Global EcoTrends – – 1.75 – – 0.88 – – – – – 0.88 – –Allianz RCM Global Equity – – 1.50 – – – – – – – – 0.75 0.75 0.45Allianz RCM Global Hi-Tech Growth – – – – – – – – – – – 0.88 – –Allianz RCM Global Metals and Mining – – – – – 0.75 – – – – – 0.75 – –Allianz RCM Global Sustainability – – 1.50 – – – – – – – – – – –Allianz RCM Global Unconstrained – – – – – – – – – – – – – –Allianz RCM Greater China Dynamic – – – – – – – – – – – – – –Allianz RCM Growing Markets Protect – – – – – – – – – – – – – –Allianz RCM Hong Kong – – – – – – – – – – – 0.88 – –Allianz RCM India – – – – – 0.88 – – – – – – – –Allianz RCM Indonesia – – – – – – – – – – – – – –Allianz RCM Japan – – – – – – – – – – – 0.75 – –Allianz RCM Korea – – – – – – – – – – – 0.88 – –Allianz RCM Little Dragons – – – – 1.75 – – – – – – 0.88 – –Allianz RCM Oriental Income – – – – – 0.75 – – – – – 0.75 – –Allianz RCM Renminbi Currency 0.50 – – – – – – 0.40 – – – – – –Allianz RCM Renminbi Fixed Income – – – – – – – 0.40 – – – – – –Allianz RCM Tech Alpha Plus Strategy – – – – – 1.50 – – – – – – – –Allianz RCM Thailand – – – – – – – – – – – 0.88 – –Allianz RCM Tiger – – – – – – – – – – – – – –Allianz RCM Total Return Asian Equity – – – – – – – – – – – 0.88 – –Allianz RCM US Equity Fund – – 1.50 – – – – – – – – – – 0.45Allianz RCM USD Liquidity – – – – – – – – – – – – – –Allianz Real Estate Securities Europe – – – – – – – – – – – – – –Allianz Structured Alpha Strategy – – – – – 1.00 – – – – – – – –Allianz US High Yield – – – – – – – – – – – 0.60 – –Allianz US Large Cap Value – – – – – – – – – – – – – –Protect Global Winner 2014 – – – – – – – – – – – – – –
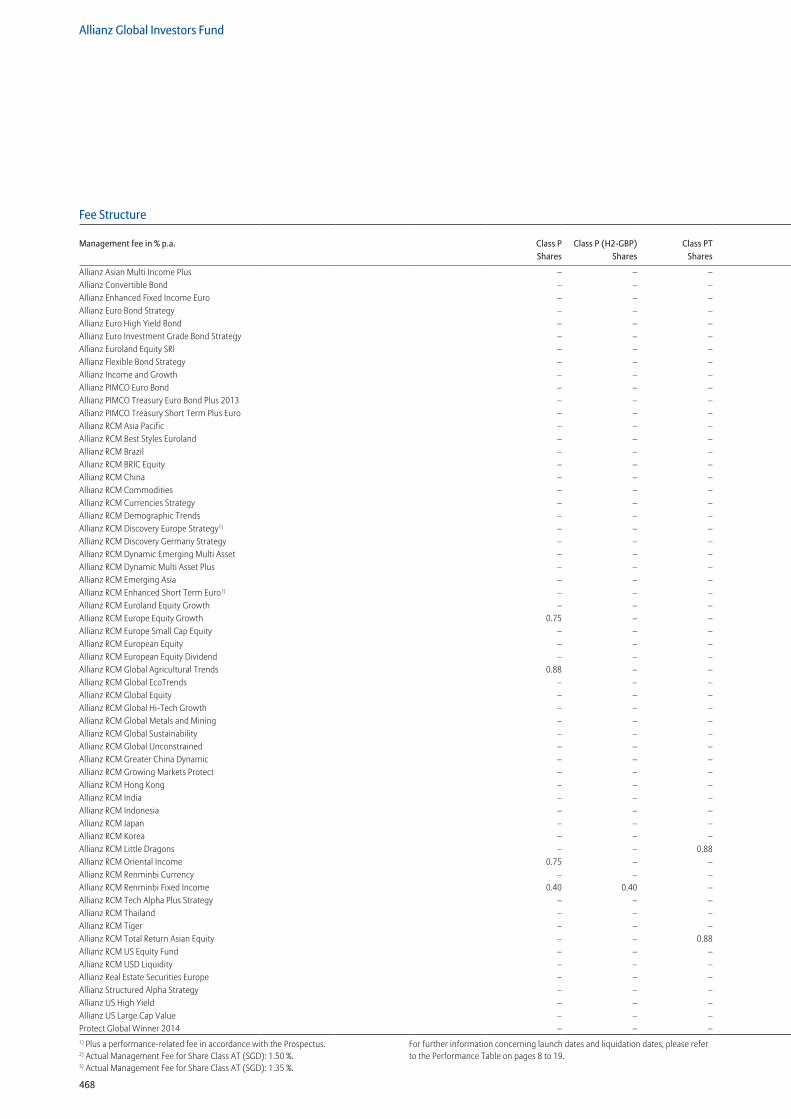
468
Allianz Global Investors Fund
1) Plus a performance-related fee in accordance with the Prospectus.2) Actual Management Fee for Share Class AT (SGD): 1.50 %.3) Actual Management Fee for Share Class AT (SGD): 1.35 %.
For further information concerning launch dates and liquidation dates, please refer to the Performance Table on pages 8 to 19.
Fee StructureManagement fee in % p.a.
Management fee in % p.a. Class P Class P (H2-GBP) Class PT Class S Class S (H2-AUD) Class S (H2-NOK) Class W Class W (H-EUR) Class WT Class WT2 Class XT Shares Shares Shares Shares Shares Shares Shares Shares Shares Shares Shares
Allianz Asian Multi Income Plus – – – – – – – – – – –Allianz Convertible Bond – – – – – – – – – – –Allianz Enhanced Fixed Income Euro – – – – – – 0.20 – – – –Allianz Euro Bond Strategy – – – – – – – – – – –Allianz Euro High Yield Bond – – – – – – – – – – –Allianz Euro Investment Grade Bond Strategy – – – – – – – – – – –Allianz Euroland Equity SRI – – – – – – – – – – –Allianz Flexible Bond Strategy – – – – – – – – – – –Allianz Income and Growth – – – – – – – – – – –Allianz PIMCO Euro Bond – – – – – – – – – – –Allianz PIMCO Treasury Euro Bond Plus 2013 – – – – – – – – – – –Allianz PIMCO Treasury Short Term Plus Euro – – – – – – – – – – –Allianz RCM Asia Pacific – – – 0.75 – – – – – – –Allianz RCM Best Styles Euroland – – – – – – – – – – 0.00Allianz RCM Brazil – – – – – – – – – – –Allianz RCM BRIC Equity – – – – – – – – – – –Allianz RCM China – – – – – – 0.53 – – – –Allianz RCM Commodities – – – – – – – – – – –Allianz RCM Currencies Strategy – – – – – – – – – – –Allianz RCM Demographic Trends – – – – – – – – – – –Allianz RCM Discovery Europe Strategy1) – – – – – – – – – – –Allianz RCM Discovery Germany Strategy – – – – – – – – – – –Allianz RCM Dynamic Emerging Multi Asset – – – – – – – – – – –Allianz RCM Dynamic Multi Asset Plus – – – – – – – – – – –Allianz RCM Emerging Asia – – – – – – – – – – –Allianz RCM Enhanced Short Term Euro1) – – – – 0.35 0.35 – – – – –Allianz RCM Euroland Equity Growth – – – – – – 0.45 – – – –Allianz RCM Europe Equity Growth 0.75 – – – – – 0.45 – 0.45 – –Allianz RCM Europe Small Cap Equity – – – – – – – – – – –Allianz RCM European Equity – – – 0.75 – – – – – – –Allianz RCM European Equity Dividend – – – – – – – – – – –Allianz RCM Global Agricultural Trends 0.88 – – – – – – – – – –Allianz RCM Global EcoTrends – – – – – – – – – – –Allianz RCM Global Equity – – – 0.75 – – – – 0.45 – –Allianz RCM Global Hi-Tech Growth – – – – – – – – – – –Allianz RCM Global Metals and Mining – – – – – – – – – – –Allianz RCM Global Sustainability – – – – – – – – – – –Allianz RCM Global Unconstrained – – – – – – – – – – –Allianz RCM Greater China Dynamic – – – – – – – – – – –Allianz RCM Growing Markets Protect – – – – – – – – – – –Allianz RCM Hong Kong – – – – – – – – – – –Allianz RCM India – – – – – – – – – – –Allianz RCM Indonesia – – – – – – – – – – –Allianz RCM Japan – – – – – – – – – – –Allianz RCM Korea – – – – – – – – – – –Allianz RCM Little Dragons – – 0.88 – – – – – – – –Allianz RCM Oriental Income 0.75 – – – – – – – – – –Allianz RCM Renminbi Currency – – – – – – – – – – –Allianz RCM Renminbi Fixed Income 0.40 0.40 – – – – – – – – –Allianz RCM Tech Alpha Plus Strategy – – – – – – – – – – –Allianz RCM Thailand – – – – – – – – – – –Allianz RCM Tiger – – – – – – – – – – –Allianz RCM Total Return Asian Equity – – 0.88 – – – – – – – –Allianz RCM US Equity Fund – – – 0.75 – – – 0.45 – – –Allianz RCM USD Liquidity – – – – – – – – – – –Allianz Real Estate Securities Europe – – – – – – – – – – –Allianz Structured Alpha Strategy – – – – – – 0.00 – – 2.50 –Allianz US High Yield – – – – – – – – – – –Allianz US Large Cap Value – – – – – – 0.45 – – – –Protect Global Winner 2014 – – – – – – – – – – –
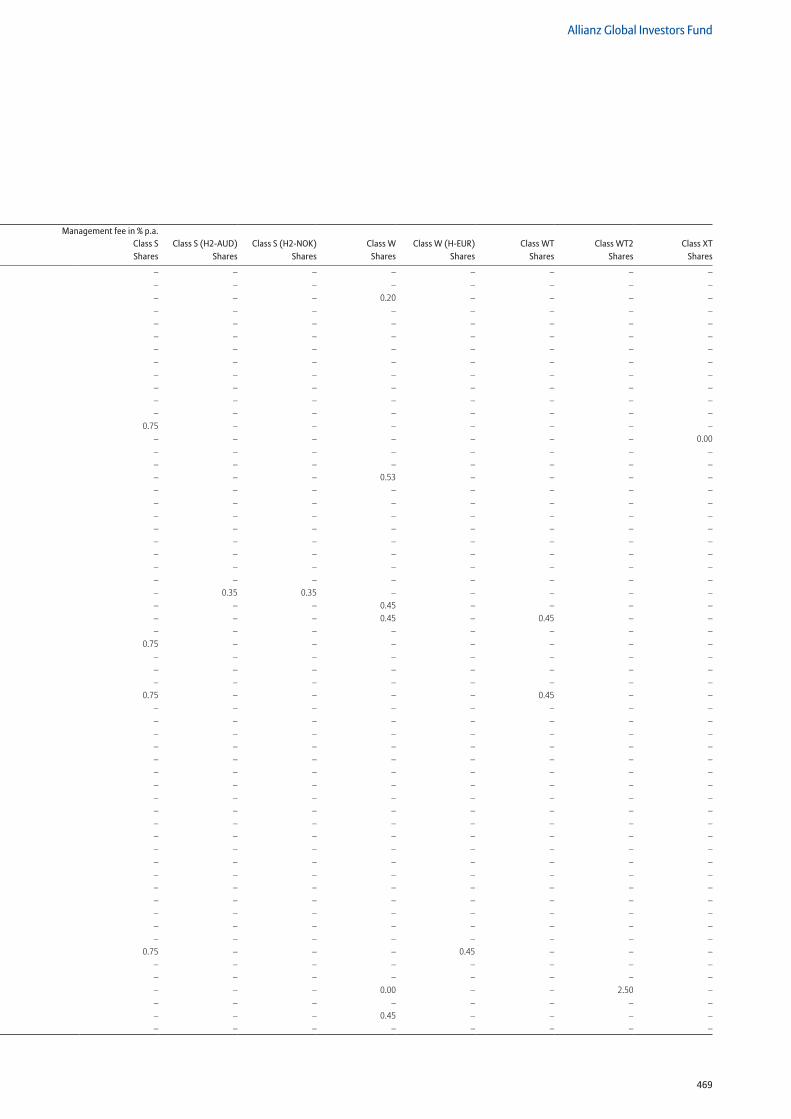
469
Allianz Global Investors Fund
Fee StructureManagement fee in % p.a.
Management fee in % p.a. Class P Class P (H2-GBP) Class PT Class S Class S (H2-AUD) Class S (H2-NOK) Class W Class W (H-EUR) Class WT Class WT2 Class XT Shares Shares Shares Shares Shares Shares Shares Shares Shares Shares Shares
Allianz Asian Multi Income Plus – – – – – – – – – – –Allianz Convertible Bond – – – – – – – – – – –Allianz Enhanced Fixed Income Euro – – – – – – 0.20 – – – –Allianz Euro Bond Strategy – – – – – – – – – – –Allianz Euro High Yield Bond – – – – – – – – – – –Allianz Euro Investment Grade Bond Strategy – – – – – – – – – – –Allianz Euroland Equity SRI – – – – – – – – – – –Allianz Flexible Bond Strategy – – – – – – – – – – –Allianz Income and Growth – – – – – – – – – – –Allianz PIMCO Euro Bond – – – – – – – – – – –Allianz PIMCO Treasury Euro Bond Plus 2013 – – – – – – – – – – –Allianz PIMCO Treasury Short Term Plus Euro – – – – – – – – – – –Allianz RCM Asia Pacific – – – 0.75 – – – – – – –Allianz RCM Best Styles Euroland – – – – – – – – – – 0.00Allianz RCM Brazil – – – – – – – – – – –Allianz RCM BRIC Equity – – – – – – – – – – –Allianz RCM China – – – – – – 0.53 – – – –Allianz RCM Commodities – – – – – – – – – – –Allianz RCM Currencies Strategy – – – – – – – – – – –Allianz RCM Demographic Trends – – – – – – – – – – –Allianz RCM Discovery Europe Strategy1) – – – – – – – – – – –Allianz RCM Discovery Germany Strategy – – – – – – – – – – –Allianz RCM Dynamic Emerging Multi Asset – – – – – – – – – – –Allianz RCM Dynamic Multi Asset Plus – – – – – – – – – – –Allianz RCM Emerging Asia – – – – – – – – – – –Allianz RCM Enhanced Short Term Euro1) – – – – 0.35 0.35 – – – – –Allianz RCM Euroland Equity Growth – – – – – – 0.45 – – – –Allianz RCM Europe Equity Growth 0.75 – – – – – 0.45 – 0.45 – –Allianz RCM Europe Small Cap Equity – – – – – – – – – – –Allianz RCM European Equity – – – 0.75 – – – – – – –Allianz RCM European Equity Dividend – – – – – – – – – – –Allianz RCM Global Agricultural Trends 0.88 – – – – – – – – – –Allianz RCM Global EcoTrends – – – – – – – – – – –Allianz RCM Global Equity – – – 0.75 – – – – 0.45 – –Allianz RCM Global Hi-Tech Growth – – – – – – – – – – –Allianz RCM Global Metals and Mining – – – – – – – – – – –Allianz RCM Global Sustainability – – – – – – – – – – –Allianz RCM Global Unconstrained – – – – – – – – – – –Allianz RCM Greater China Dynamic – – – – – – – – – – –Allianz RCM Growing Markets Protect – – – – – – – – – – –Allianz RCM Hong Kong – – – – – – – – – – –Allianz RCM India – – – – – – – – – – –Allianz RCM Indonesia – – – – – – – – – – –Allianz RCM Japan – – – – – – – – – – –Allianz RCM Korea – – – – – – – – – – –Allianz RCM Little Dragons – – 0.88 – – – – – – – –Allianz RCM Oriental Income 0.75 – – – – – – – – – –Allianz RCM Renminbi Currency – – – – – – – – – – –Allianz RCM Renminbi Fixed Income 0.40 0.40 – – – – – – – – –Allianz RCM Tech Alpha Plus Strategy – – – – – – – – – – –Allianz RCM Thailand – – – – – – – – – – –Allianz RCM Tiger – – – – – – – – – – –Allianz RCM Total Return Asian Equity – – 0.88 – – – – – – – –Allianz RCM US Equity Fund – – – 0.75 – – – 0.45 – – –Allianz RCM USD Liquidity – – – – – – – – – – –Allianz Real Estate Securities Europe – – – – – – – – – – –Allianz Structured Alpha Strategy – – – – – – 0.00 – – 2.50 –Allianz US High Yield – – – – – – – – – – –Allianz US Large Cap Value – – – – – – 0.45 – – – –Protect Global Winner 2014 – – – – – – – – – – –
470
Allianz Global Investors Fund
Administration Fee
In return for the payment of the administration fee the Management Company releases the Company from the following, conclusive enumerated commissions and expenditures:
– the administration and custody fee of the Custodian;– the fee of the Registrar and Transfer Agent;– costs of the preparation (including translation) and
dissemination of the Prospectus, Simplified Prospectus, Articles of Incorporation as well as annual, semi-annual and, if any, interim reports and other reports and notifications to Shareholders;
– costs of publishing the Prospectus, Simplified Prospectus, Articles of Incorporation, annual, semi-annual and, if any, interim reports, other reports and notifications to Shareholders, tax information, as well as Subscription and Redemption Prices, and official announcements made to the Shareholders;
– costs of auditing the Company and its Subfunds by the auditor;
– costs of registering the Shares for public distribution and/or the maintenance of such registration;
– costs of preparing share certificates and, if any, coupons and coupon renewals;
– paying agent and information agent fees;– costs of assessing the Subfunds by nationally and
internationally recognised rating agencies;– expenses in connection with the establishment of a
Subfund;– costs related to the use of index names, in particular
licence fees;– costs and fees incurred by the Company and by third
parties authorised by the Company relating to the acquisition, use and maintenance of in-house or thirdparty computer systems used by Investment Managers and Investment Advisors;
– costs related to obtaining and maintaining a status authorising the direct investment in assets in a country or to act directly as a contracting partner in markets in a country;
– costs and expenses by the Company, the Custodian and third parties authorised by the Company or the Custodian in connection with monitoring of investment limits and restrictions;
– costs for calculating the risk and performance figures and the calculation of performance-related fees for the
Management Company by third parties appointed to do so;
– costs related to obtaining information about general Shareholders’ meetings of companies or about other meetings of the owners of assets as well as costs related to direct participation or participation through authorised third parties in such meetings;
– postage, telephone, fax and telex fees.
Merger of Subfunds
For Subfunds concerned by mergers that happened during the period (absorbing Subfunds), shareholders, while recomputing the average price of subscriptions/redemptions, might not obtain a figure that fit with the highest issue price and lowest redemption price disclosed in the notes to the financial statements. This is due to the specific tax neutral treatment of the assets transferred to the absorbing Subfund.
471
Allianz Global Investors Fund
Retrocession of Management Fees
The investment management fees of certain underlying funds, in which some Subfunds invest, are partially or totally rebated by the investment managers of such underlying funds which have entered into agreements with Allianz Global Investors Luxembourg S.A. Those amounts have been classified under caption other Income.
Taxation
The Company is not liable to any Luxembourg tax on profits or income, nor is any income earned by any Subfund of the Company liable to any Luxembourg withholding tax.
The Company is, however, liable in Luxembourg to a tax of 0.05 % p.a. of its net asset value on equity, balanced and bond funds and of 0.01 % p.a. on money-market funds and their institutional share classes and the institutional share classes of equity, balanced and bond funds. This tax is payable quarterly based on the net asset value of the Subfunds at the end of the relevant quarter.
Securities Prices
In accordance with the Prospectus the net asset values have been calculated by reference to the valuation day.
The financial statements presented in this report have been prepared on the basis of the latest calculated and published net asset values in the period.
Fair Value Pricing
A fair value pricing model is used for several Subfunds. A fair value pricing model means that the value of certain assets will be adjusted to more accurately reflect their fair value based upon certain criteria. Such adjustments may occur during monitoring periods as defined by the Board of Directors from time to time, if a single country equity risk exposure (excluding equity exposure held via target funds) of a Subfund reaches or exceeds a certain trigger level, as defined by the Board of Directors from time to time, on the first Valuation Day of the respectivemonitoring period and, at the respective Subfund’s deadline for receipt of applications, the main stock exchange of the respective country is already closed during normal course of business. If the aforementioned conditions are fulfilled the value of Subfund’s assets which form part of the respective single country equity risk exposure based on the closing prices of the relevant country’s main stock exchange is compared to their estimated value at the moment when the Subfund’sNet Asset Value is calculated; the estimation is based on the movement of index orientated instruments since the close of business of the respective country’s main stock exchange. If such comparison leads to a deviation in Subfunds estimated Net Asset Value by, at least, a certain trigger level, as defined by the Board of Directors from time to time, the Subfund’s Net Asset Value will be adjusted accordingly to the extent that the unadjusted value would not represent their actual value.
472
Allianz Global Investors Fund
Soft Commission Agreements/Commission Sharing Arrangements
“Soft Commission Agreements/Commission Sharing Arrangements have been undertaken in respect of the Company.
The Company may pay, or be responsible for payment of, soft commissions only insofar as:
a) the Management Company and/or the Investment Managers, as the case may be, act at all times in the best interest of the Company and the shareholders when entering into soft commission arrangements;
b) the goods and/or services provided by the broker-dealers relate directly to the activities of the Management Company and/or the Investment Managers, as the case may be, and such activities are of demonstrable benefits to the Shareholders; and
c) any such soft commission is paid by the Management Company and/or the Investment Managers, as the case may be, to broker-dealers which are corporate entities and not individuals.
During the Fund’s fiscal year, services which are paid for through or by soft commissions were in majority limited to research, market analysis as well as data and quotation services.”
Transactions with Connected Parties
The Company has entered into agreements with the Management Company Allianz Global Investors Luxembourg S.A. under which management and performance fees are payable.
Information on the management fee rates charged to the funds is shown in the table on pages 464–469. Further details on fees payable by the Company can be found in the current prospectus.
As at 31 March 2012, the Company held investments into other funds that were managed by the Management Company or other companies belonging to the same group as the Management Company. There were no transactions with connected brokers during the fiscal year.
Collateral Management
For some Subfunds, AllianzGI Lux has implemented collateral management processes to mitigate counterparty risks with OTC-counterparties. OTC-transactions are effected on the basis of standardised contracts that also provide for respective requirements in relation to accepted type of eligible collateral and discounts for collateral valuation (“haircuts”). The collateral management is performed by collateral managers, normally the respective investment manager of the Subfund.
473
Allianz Global Investors Fund
Distribution
Funds with monthly/quarterly distributions 01/10/2011 – 31/03/2012Distribution
for sharesex-date pay-date in AUD in CAD in EUR in GBP in HKD in USD
Allianz Asian Multi Income Plus AM 17/10/2011 19/10/2011 – – – – – 0.05400
Allianz Asian Multi Income Plus AM 15/11/2011 17/11/2011 – – – – – 0.05400
Allianz Asian Multi Income Plus AM 15/12/2011 19/12/2011 – – – – – 0.05400
Allianz Asian Multi Income Plus AM 16/01/2012 18/01/2012 – – – – – 0.05400
Allianz Asian Multi Income Plus AM 15/02/2012 17/02/2012 – – – – – 0.05400
Allianz Asian Multi Income Plus AM 15/03/2012 19/03/2012 – – – – – 0.05400
Allianz Asian Multi Income Plus AM 17/10/2011 21/10/2011 – – – – 0.05000 –
Allianz Asian Multi Income Plus AM 15/11/2011 21/11/2011 – – – – 0.05000 –
Allianz Asian Multi Income Plus AM 15/12/2011 21/12/2011 – – – – 0.05000 –
Allianz Asian Multi Income Plus AM 16/01/2012 20/01/2012 – – – – 0.05000 –
Allianz Asian Multi Income Plus AM 15/02/2012 21/02/2012 – – – – 0.05000 –
Allianz Asian Multi Income Plus AM 15/03/2012 21/03/2012 – – – – 0.05000 –
Allianz PIMCO Euro Bond A 15/03/2012 19/03/2012 – – 0.0100 – – –
Allianz US High Yield AM 17/10/2012 19/10/2012 – – – – – 0.06670
Allianz US High Yield AM 15/11/2012 17/11/2012 – – – – – 0.06670
Allianz US High Yield AM 15/12/2012 19/12/2012 – – – – – 0.06670
Allianz US High Yield AM 17/01/2012 19/01/2012 – – – – – 0.06670
Allianz US High Yield AM 15/02/2012 17/02/2012 – – – – – 0.06670
Allianz US High Yield AM 15/03/2012 19/03/2012 – – – – – 0.06670
Allianz US High Yield AM 17/10/2011 21/10/2011 – – – – 0.06670 –
Allianz US High Yield AM 15/11/2011 21/11/2011 – – – – 0.06670 –
Allianz US High Yield AM 15/12/2011 21/12/2011 – – – – 0.06670 –
Allianz US High Yield AM 17/01/2012 26/01/2012 – – – – 0.06670 –
Allianz US High Yield AM 15/02/2012 22/02/2012 – – – – 0.06670 –
Allianz US High Yield AM 15/03/2012 21/03/2012 – – – – 0.06670 –
Allianz US High Yield AM (H-AUD) 17/01/2012 20/01/2012 0.13445 – – – – –
Allianz US High Yield AM (H-AUD) 15/02/2012 21/02/2012 0.09167 – – – – –
Allianz US High Yield AM (H-AUD) 15/03/2012 20/03/2012 0.09170 – – – – –
Allianz US High Yield AM (H-CAD) 17/01/2012 19/01/2012 – 0.10388 – – – –
Allianz US High Yield AM (H-CAD) 15/02/2012 17/02/2012 – 0.07083 – – – –
Allianz US High Yield AM (H-CAD) 15/03/2012 19/03/2012 – 0.07080 – – – –
Allianz US High Yield AM (H-EUR) 17/01/2012 19/01/2012 – – 0.09778 – – –
Allianz US High Yield AM (H-EUR) 15/02/2012 17/02/2012 – – 0.06667 – – –
Allianz US High Yield AM (H-EUR) 15/03/2012 19/03/2012 – – 0.06670 – – –
Allianz US High Yield AM (H-GBP) 17/01/2012 19/01/2012 – – – 0.09778 – –
Allianz US High Yield AM (H-GBP) 15/02/2012 17/02/2012 – – – 0.06667 – –
Allianz US High Yield AM (H-GBP) 15/03/2012 19/03/2012 – – – 0.06670 – –
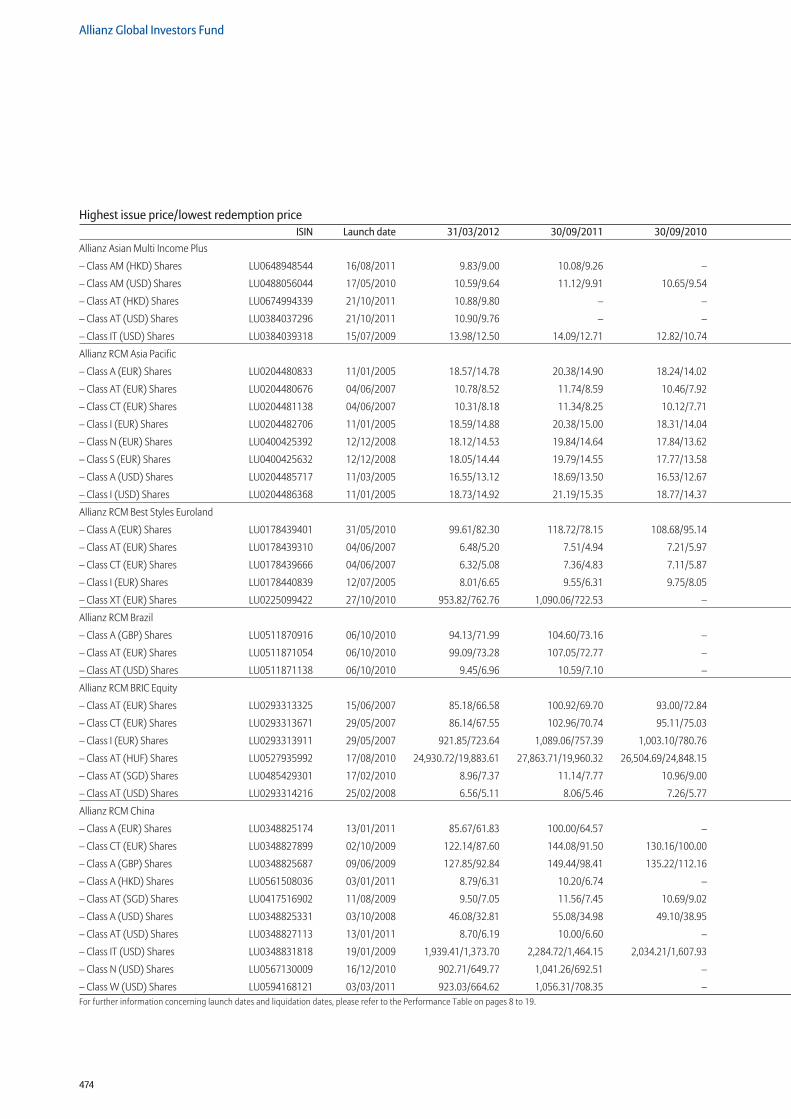
474
Allianz Global Investors Fund
For further information concerning launch dates and liquidation dates, please refer to the Performance Table on pages 8 to 19.
Allianz Asian Multi Income Plus
– Class AM (HKD) Shares LU0648948544 16/08/2011 9.83/9.00 10.08/9.26 – – – – – – – –
– Class AM (USD) Shares LU0488056044 17/05/2010 10.59/9.64 11.12/9.91 10.65/9.54 – – – – – – –
– Class AT (HKD) Shares LU0674994339 21/10/2011 10.88/9.80 – – – – – – – – –
– Class AT (USD) Shares LU0384037296 21/10/2011 10.90/9.76 – – – – – – – – –
– Class IT (USD) Shares LU0384039318 15/07/2009 13.98/12.50 14.09/12.71 12.82/10.74 10.85/10.00 – – – – – –
Allianz RCM Asia Pacific
– Class A (EUR) Shares LU0204480833 11/01/2005 18.57/14.78 20.38/14.90 18.24/14.02 14.90/9.33 25.00/12.57 22.89/14.38 16.33/11.59 13.24/9.96 – –
– Class AT (EUR) Shares LU0204480676 04/06/2007 10.78/8.52 11.74/8.59 10.46/7.92 8.42/5.22 13.85/7.03 12.67/9.25 – – – –
– Class CT (EUR) Shares LU0204481138 04/06/2007 10.31/8.18 11.34/8.25 10.12/7.71 8.21/5.12 13.42/6.90 12.29/9.24 – – – –
– Class I (EUR) Shares LU0204482706 11/01/2005 18.59/14.88 20.38/15.00 18.31/14.04 14.92/9.39 23.96/12.64 21.92/14.46 15.59/11.66 12.68/9.96 – –
– Class N (EUR) Shares LU0400425392 12/12/2008 18.12/14.53 19.84/14.64 17.84/13.62 14.47/9.33 – – – – – –
– Class S (EUR) Shares LU0400425632 12/12/2008 18.05/14.44 19.79/14.55 17.77/13.58 14.43/9.32 – – – – – –
– Class A (USD) Shares LU0204485717 11/03/2005 16.55/13.12 18.69/13.50 16.53/12.67 14.67/7.81 24.23/12.16 21.83/12.70 14.62/9.95 11.26/9.23 – –
– Class I (USD) Shares LU0204486368 11/01/2005 18.73/14.92 21.19/15.35 18.77/14.37 16.65/8.91 26.33/13.87 23.72/13.99 15.10/10.77 11.61/9.96 – –
Allianz RCM Best Styles Euroland
– Class A (EUR) Shares LU0178439401 31/05/2010 99.61/82.30 118.72/78.15 108.68/95.14 – – – – – – –
– Class AT (EUR) Shares LU0178439310 04/06/2007 6.48/5.20 7.51/4.94 7.21/5.97 6.93/4.22 10.31/6.67 10.56/8.90 – – – –
– Class CT (EUR) Shares LU0178439666 04/06/2007 6.32/5.08 7.36/4.83 7.11/5.87 6.88/4.18 10.00/6.62 10.26/8.90 – – – –
– Class I (EUR) Shares LU0178440839 12/07/2005 8.01/6.65 9.55/6.31 9.75/8.05 9.96/5.84 14.31/9.58 14.64/12.32 12.37/9.97 10.61/9.91 – –
– Class XT (EUR) Shares LU0225099422 27/10/2010 953.82/762.76 1,090.06/722.53 – – – – – – – –
Allianz RCM Brazil
– Class A (GBP) Shares LU0511870916 06/10/2010 94.13/71.99 104.60/73.16 – – – – – – – –
– Class AT (EUR) Shares LU0511871054 06/10/2010 99.09/73.28 107.05/72.77 – – – – – – – –
– Class AT (USD) Shares LU0511871138 06/10/2010 9.45/6.96 10.59/7.10 – – – – – – – –
Allianz RCM BRIC Equity
– Class AT (EUR) Shares LU0293313325 15/06/2007 85.18/66.58 100.92/69.70 93.00/72.84 73.91/37.22 139.42/64.22 122.45/71.36 – – – –
– Class CT (EUR) Shares LU0293313671 29/05/2007 86.14/67.55 102.96/70.74 95.11/75.03 76.13/38.61 76.13/38.61 124.47/74.04 – – – –
– Class I (EUR) Shares LU0293313911 29/05/2007 921.85/723.64 1,089.06/757.39 1,003.10/780.76 792.06/395.60 1,398.59/682.11 1,227.54/728.83 – – – –
– Class AT (HUF) Shares LU0527935992 17/08/2010 24,930.72/19,883.61 27,863.71/19,960.32 26,504.69/24,848.15 – – – – – – –
– Class AT (SGD) Shares LU0485429301 17/02/2010 8.96/7.37 11.14/7.77 10.96/9.00 – – – – – – –
– Class AT (USD) Shares LU0293314216 25/02/2008 6.56/5.11 8.06/5.46 7.26/5.77 6.30/2.70 11.00/5.39 – – – – –
Allianz RCM China
– Class A (EUR) Shares LU0348825174 13/01/2011 85.67/61.83 100.00/64.57 – – – – – – – –
– Class CT (EUR) Shares LU0348827899 02/10/2009 122.14/87.60 144.08/91.50 130.16/100.00 – – – – – – –
– Class A (GBP) Shares LU0348825687 09/06/2009 127.85/92.84 149.44/98.41 135.22/112.16 117.14/98.45 – – – – – –
– Class A (HKD) Shares LU0561508036 03/01/2011 8.79/6.31 10.20/6.74 – – – – – – – –
– Class AT (SGD) Shares LU0417516902 11/08/2009 9.50/7.05 11.56/7.45 10.69/9.02 10.03/9.27 – – – – – –
– Class A (USD) Shares LU0348825331 03/10/2008 46.08/32.81 55.08/34.98 49.10/38.95 43.88/18.61 – – – – – –
– Class AT (USD) Shares LU0348827113 13/01/2011 8.70/6.19 10.00/6.60 – – – – – – – –
– Class IT (USD) Shares LU0348831818 19/01/2009 1,939.41/1,373.70 2,284.72/1,464.15 2,034.21/1,607.93 1,794.46/930.93 – – – – – –
– Class N (USD) Shares LU0567130009 16/12/2010 902.71/649.77 1,041.26/692.51 – – – – – – – –
– Class W (USD) Shares LU0594168121 03/03/2011 923.03/664.62 1,056.31/708.35 – – – – – – – –
Highest issue price/lowest redemption priceISIN Launch date 31/03/2012 30/09/2011 30/09/2010 30/09/2009 30/09/2008 30/09/2007 30/09/2006 30/09/2005 30/09/2004 30/09/2003
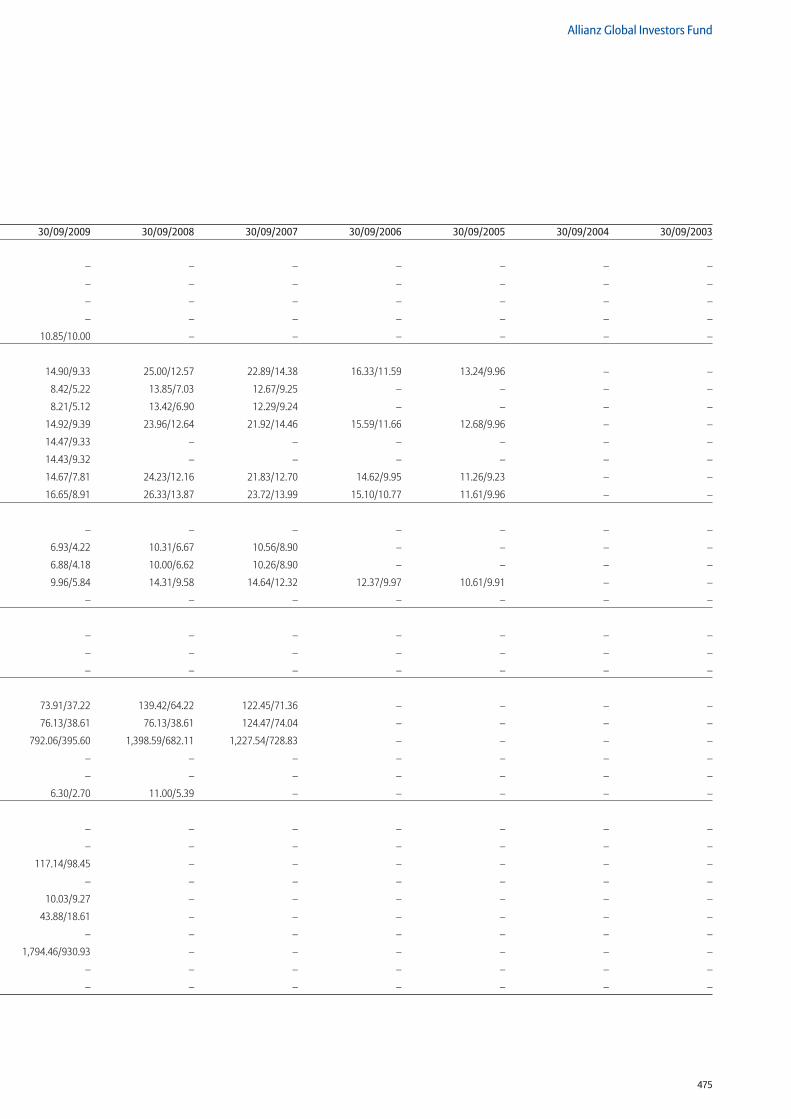
475
Allianz Global Investors Fund
Allianz Asian Multi Income Plus
– Class AM (HKD) Shares LU0648948544 16/08/2011 9.83/9.00 10.08/9.26 – – – – – – – –
– Class AM (USD) Shares LU0488056044 17/05/2010 10.59/9.64 11.12/9.91 10.65/9.54 – – – – – – –
– Class AT (HKD) Shares LU0674994339 21/10/2011 10.88/9.80 – – – – – – – – –
– Class AT (USD) Shares LU0384037296 21/10/2011 10.90/9.76 – – – – – – – – –
– Class IT (USD) Shares LU0384039318 15/07/2009 13.98/12.50 14.09/12.71 12.82/10.74 10.85/10.00 – – – – – –
Allianz RCM Asia Pacific
– Class A (EUR) Shares LU0204480833 11/01/2005 18.57/14.78 20.38/14.90 18.24/14.02 14.90/9.33 25.00/12.57 22.89/14.38 16.33/11.59 13.24/9.96 – –
– Class AT (EUR) Shares LU0204480676 04/06/2007 10.78/8.52 11.74/8.59 10.46/7.92 8.42/5.22 13.85/7.03 12.67/9.25 – – – –
– Class CT (EUR) Shares LU0204481138 04/06/2007 10.31/8.18 11.34/8.25 10.12/7.71 8.21/5.12 13.42/6.90 12.29/9.24 – – – –
– Class I (EUR) Shares LU0204482706 11/01/2005 18.59/14.88 20.38/15.00 18.31/14.04 14.92/9.39 23.96/12.64 21.92/14.46 15.59/11.66 12.68/9.96 – –
– Class N (EUR) Shares LU0400425392 12/12/2008 18.12/14.53 19.84/14.64 17.84/13.62 14.47/9.33 – – – – – –
– Class S (EUR) Shares LU0400425632 12/12/2008 18.05/14.44 19.79/14.55 17.77/13.58 14.43/9.32 – – – – – –
– Class A (USD) Shares LU0204485717 11/03/2005 16.55/13.12 18.69/13.50 16.53/12.67 14.67/7.81 24.23/12.16 21.83/12.70 14.62/9.95 11.26/9.23 – –
– Class I (USD) Shares LU0204486368 11/01/2005 18.73/14.92 21.19/15.35 18.77/14.37 16.65/8.91 26.33/13.87 23.72/13.99 15.10/10.77 11.61/9.96 – –
Allianz RCM Best Styles Euroland
– Class A (EUR) Shares LU0178439401 31/05/2010 99.61/82.30 118.72/78.15 108.68/95.14 – – – – – – –
– Class AT (EUR) Shares LU0178439310 04/06/2007 6.48/5.20 7.51/4.94 7.21/5.97 6.93/4.22 10.31/6.67 10.56/8.90 – – – –
– Class CT (EUR) Shares LU0178439666 04/06/2007 6.32/5.08 7.36/4.83 7.11/5.87 6.88/4.18 10.00/6.62 10.26/8.90 – – – –
– Class I (EUR) Shares LU0178440839 12/07/2005 8.01/6.65 9.55/6.31 9.75/8.05 9.96/5.84 14.31/9.58 14.64/12.32 12.37/9.97 10.61/9.91 – –
– Class XT (EUR) Shares LU0225099422 27/10/2010 953.82/762.76 1,090.06/722.53 – – – – – – – –
Allianz RCM Brazil
– Class A (GBP) Shares LU0511870916 06/10/2010 94.13/71.99 104.60/73.16 – – – – – – – –
– Class AT (EUR) Shares LU0511871054 06/10/2010 99.09/73.28 107.05/72.77 – – – – – – – –
– Class AT (USD) Shares LU0511871138 06/10/2010 9.45/6.96 10.59/7.10 – – – – – – – –
Allianz RCM BRIC Equity
– Class AT (EUR) Shares LU0293313325 15/06/2007 85.18/66.58 100.92/69.70 93.00/72.84 73.91/37.22 139.42/64.22 122.45/71.36 – – – –
– Class CT (EUR) Shares LU0293313671 29/05/2007 86.14/67.55 102.96/70.74 95.11/75.03 76.13/38.61 76.13/38.61 124.47/74.04 – – – –
– Class I (EUR) Shares LU0293313911 29/05/2007 921.85/723.64 1,089.06/757.39 1,003.10/780.76 792.06/395.60 1,398.59/682.11 1,227.54/728.83 – – – –
– Class AT (HUF) Shares LU0527935992 17/08/2010 24,930.72/19,883.61 27,863.71/19,960.32 26,504.69/24,848.15 – – – – – – –
– Class AT (SGD) Shares LU0485429301 17/02/2010 8.96/7.37 11.14/7.77 10.96/9.00 – – – – – – –
– Class AT (USD) Shares LU0293314216 25/02/2008 6.56/5.11 8.06/5.46 7.26/5.77 6.30/2.70 11.00/5.39 – – – – –
Allianz RCM China
– Class A (EUR) Shares LU0348825174 13/01/2011 85.67/61.83 100.00/64.57 – – – – – – – –
– Class CT (EUR) Shares LU0348827899 02/10/2009 122.14/87.60 144.08/91.50 130.16/100.00 – – – – – – –
– Class A (GBP) Shares LU0348825687 09/06/2009 127.85/92.84 149.44/98.41 135.22/112.16 117.14/98.45 – – – – – –
– Class A (HKD) Shares LU0561508036 03/01/2011 8.79/6.31 10.20/6.74 – – – – – – – –
– Class AT (SGD) Shares LU0417516902 11/08/2009 9.50/7.05 11.56/7.45 10.69/9.02 10.03/9.27 – – – – – –
– Class A (USD) Shares LU0348825331 03/10/2008 46.08/32.81 55.08/34.98 49.10/38.95 43.88/18.61 – – – – – –
– Class AT (USD) Shares LU0348827113 13/01/2011 8.70/6.19 10.00/6.60 – – – – – – – –
– Class IT (USD) Shares LU0348831818 19/01/2009 1,939.41/1,373.70 2,284.72/1,464.15 2,034.21/1,607.93 1,794.46/930.93 – – – – – –
– Class N (USD) Shares LU0567130009 16/12/2010 902.71/649.77 1,041.26/692.51 – – – – – – – –
– Class W (USD) Shares LU0594168121 03/03/2011 923.03/664.62 1,056.31/708.35 – – – – – – – –
Highest issue price/lowest redemption priceISIN Launch date 31/03/2012 30/09/2011 30/09/2010 30/09/2009 30/09/2008 30/09/2007 30/09/2006 30/09/2005 30/09/2004 30/09/2003
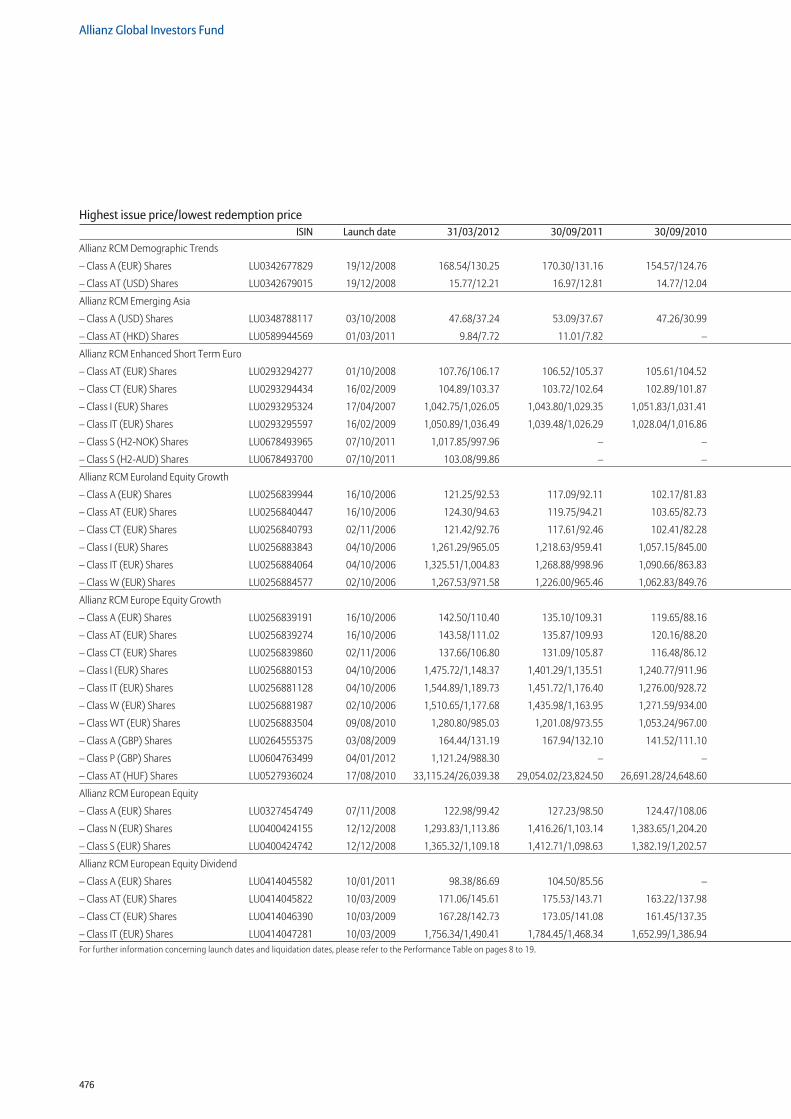
476
Allianz Global Investors Fund
For further information concerning launch dates and liquidation dates, please refer to the Performance Table on pages 8 to 19.
Allianz RCM Demographic Trends
– Class A (EUR) Shares LU0342677829 19/12/2008 168.54/130.25 170.30/131.16 154.57/124.76 131.19/96.41 – – – – – –
– Class AT (USD) Shares LU0342679015 19/12/2008 15.77/12.21 16.97/12.81 14.77/12.04 13.72/8.62 – – – – – –
Allianz RCM Emerging Asia
– Class A (USD) Shares LU0348788117 03/10/2008 47.68/37.24 53.09/37.67 47.26/30.99 31.51/17.65 – – – – – –
– Class AT (HKD) Shares LU0589944569 01/03/2011 9.84/7.72 11.01/7.82 – – – – – – – –
Allianz RCM Enhanced Short Term Euro
– Class AT (EUR) Shares LU0293294277 01/10/2008 107.76/106.17 106.52/105.37 105.61/104.52 104.55/100.00 – – – – – –
– Class CT (EUR) Shares LU0293294434 16/02/2009 104.89/103.37 103.72/102.64 102.89/101.87 101.90/99.89 – – – – – –
– Class I (EUR) Shares LU0293295324 17/04/2007 1,042.75/1,026.05 1,043.80/1,029.35 1,051.83/1,031.41 1,063.79/1,022.75 1,046.05/1,006.99 1,015.50/1,000.00 – – – –
– Class IT (EUR) Shares LU0293295597 16/02/2009 1,050.89/1,036.49 1,039.48/1,026.29 1,028.04/1,016.86 1,016.92/998.99 – – – – – –
– Class S (H2-NOK) Shares LU0678493965 07/10/2011 1,017.85/997.96 – – – – – – – – –
– Class S (H2-AUD) Shares LU0678493700 07/10/2011 103.08/99.86 – – – – – – – – –
Allianz RCM Euroland Equity Growth
– Class A (EUR) Shares LU0256839944 16/10/2006 121.25/92.53 117.09/92.11 102.17/81.83 86.36/55.95 119.67/78.74 121.51/97.84 106.52/81.91 – – –
– Class AT (EUR) Shares LU0256840447 16/10/2006 124.30/94.63 119.75/94.21 103.65/82.73 87.31/56.58 119.67/79.43 121.53/97.84 106.52/81.91 – – –
– Class CT (EUR) Shares LU0256840793 02/11/2006 121.42/92.76 117.61/92.46 102.41/82.28 86.91/56.54 117.36/79.64 119.39/99.61 105.36/83.40 – – –
– Class I (EUR) Shares LU0256883843 04/10/2006 1,261.29/965.05 1,218.63/959.41 1,057.15/845.00 890.94/574.90 1,170.56/816.24 1,186.32/1,000.00 1,033.67/830.94 – – –
– Class IT (EUR) Shares LU0256884064 04/10/2006 1,325.51/1,004.83 1,268.88/998.96 1,090.66/863.83 910.79/587.69 1,170.21/822.24 1,185.97/1,000.00 1,033.67/830.94 – – –
– Class W (EUR) Shares LU0256884577 02/10/2006 1,267.53/971.58 1,226.00/965.46 1,062.83/849.76 895.66/576.59 1,170.71/806.01 1,186.08/997.87 1,026.63/823.84 – – –
Allianz RCM Europe Equity Growth
– Class A (EUR) Shares LU0256839191 16/10/2006 142.50/110.40 135.10/109.31 119.65/88.16 92.28/58.16 123.17/83.25 122.93/96.07 108.06/80.26 – – –
– Class AT (EUR) Shares LU0256839274 16/10/2006 143.58/111.02 135.87/109.93 120.16/88.20 92.33/58.18 123.21/83.27 122.93/96.07 108.06/80.26 – – –
– Class CT (EUR) Shares LU0256839860 02/11/2006 137.66/106.80 131.09/105.87 116.48/86.12 90.18/57.06 118.62/81.93 118.58/95.75 104.62/80.00 – – –
– Class I (EUR) Shares LU0256880153 04/10/2006 1,475.72/1,148.37 1,401.29/1,135.51 1,240.77/911.96 954.39/598.87 1,216.5/864.60 1,211.49/996.26 1,067.86/829.20 – – –
– Class IT (EUR) Shares LU0256881128 04/10/2006 1,544.89/1,189.73 1,451.72/1,176.40 1,276.00/928.72 971.94/609.87 1,216.37/869.83 1,211.36/996.26 1,067.86/829.20 – – –
– Class W (EUR) Shares LU0256881987 02/10/2006 1,510.65/1,177.68 1,435.98/1,163.95 1,271.59/934.00 977.36/612.29 1,215.81/872.16 1,211.17/994.04 1,053.13/816.34 – – –
– Class WT (EUR) Shares LU0256883504 09/08/2010 1,280.80/985.03 1,201.08/973.55 1,053.24/967.00 – – – – – – –
– Class A (GBP) Shares LU0264555375 03/08/2009 164.44/131.19 167.94/132.10 141.52/111.10 115.92/99.30 – – – – – –
– Class P (GBP) Shares LU0604763499 04/01/2012 1,121.24/988.30 – – – – – – – – –
– Class AT (HUF) Shares LU0527936024 17/08/2010 33,115.24/26,039.38 29,054.02/23,824.50 26,691.28/24,648.60 – – – – – – –
Allianz RCM European Equity
– Class A (EUR) Shares LU0327454749 07/11/2008 122.98/99.42 127.23/98.50 124.47/108.06 113.66/78.92 – – – – – –
– Class N (EUR) Shares LU0400424155 12/12/2008 1,293.83/1,113.86 1,416.26/1,103.14 1,383.65/1,204.20 1,268.37/874.74 – – – – – –
– Class S (EUR) Shares LU0400424742 12/12/2008 1,365.32/1,109.18 1,412.71/1,098.63 1,382.19/1,202.57 1,265.23/874.07 – – – – – –
Allianz RCM European Equity Dividend
– Class A (EUR) Shares LU0414045582 10/01/2011 98.38/86.69 104.50/85.56 – – – – – – – –
– Class AT (EUR) Shares LU0414045822 10/03/2009 171.06/145.61 175.53/143.71 163.22/137.98 143.47/100.00 – – – – – –
– Class CT (EUR) Shares LU0414046390 10/03/2009 167.28/142.73 173.05/141.08 161.45/137.35 142.95/100.00 – – – – – –
– Class IT (EUR) Shares LU0414047281 10/03/2009 1,756.34/1,490.41 1,784.45/1,468.34 1,652.99/1,386.94 1,440.84/1,000.00 – – – – – –
Highest issue price/lowest redemption priceISIN Launch date 31/03/2012 30/09/2011 30/09/2010 30/09/2009 30/09/2008 30/09/2007 30/09/2006 30/09/2005 30/09/2004 30/09/2003
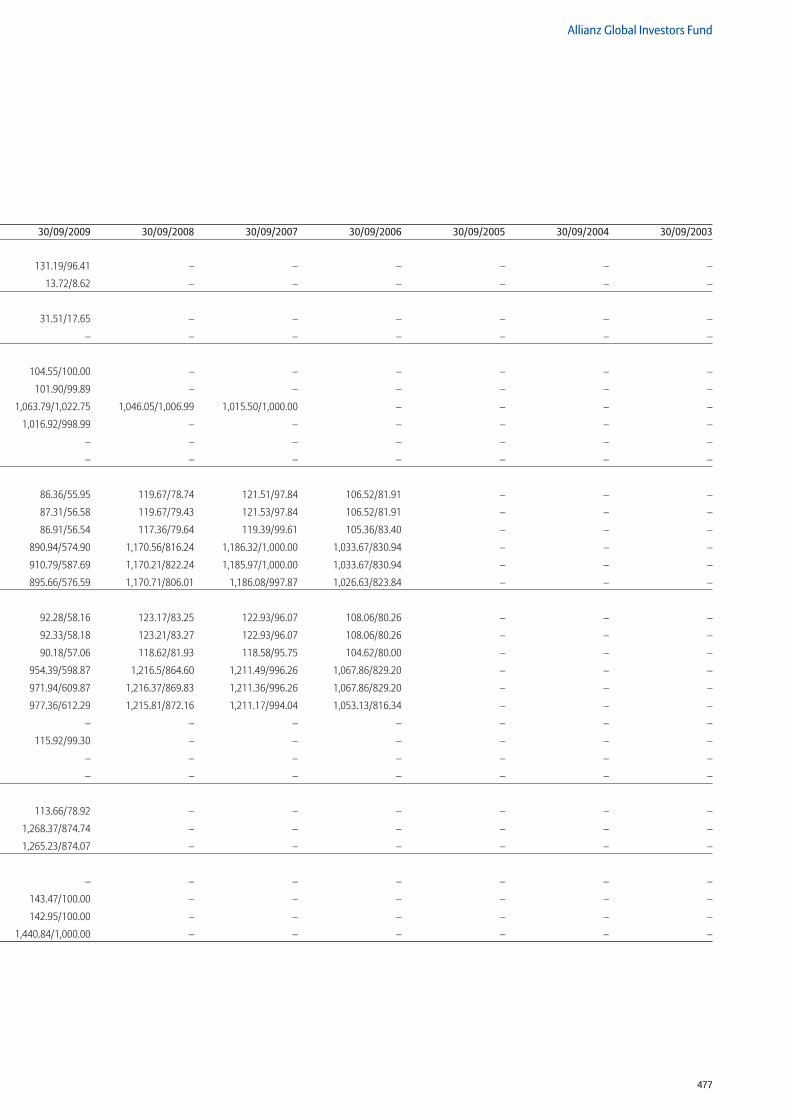
477
Allianz Global Investors Fund
Allianz RCM Demographic Trends
– Class A (EUR) Shares LU0342677829 19/12/2008 168.54/130.25 170.30/131.16 154.57/124.76 131.19/96.41 – – – – – –
– Class AT (USD) Shares LU0342679015 19/12/2008 15.77/12.21 16.97/12.81 14.77/12.04 13.72/8.62 – – – – – –
Allianz RCM Emerging Asia
– Class A (USD) Shares LU0348788117 03/10/2008 47.68/37.24 53.09/37.67 47.26/30.99 31.51/17.65 – – – – – –
– Class AT (HKD) Shares LU0589944569 01/03/2011 9.84/7.72 11.01/7.82 – – – – – – – –
Allianz RCM Enhanced Short Term Euro
– Class AT (EUR) Shares LU0293294277 01/10/2008 107.76/106.17 106.52/105.37 105.61/104.52 104.55/100.00 – – – – – –
– Class CT (EUR) Shares LU0293294434 16/02/2009 104.89/103.37 103.72/102.64 102.89/101.87 101.90/99.89 – – – – – –
– Class I (EUR) Shares LU0293295324 17/04/2007 1,042.75/1,026.05 1,043.80/1,029.35 1,051.83/1,031.41 1,063.79/1,022.75 1,046.05/1,006.99 1,015.50/1,000.00 – – – –
– Class IT (EUR) Shares LU0293295597 16/02/2009 1,050.89/1,036.49 1,039.48/1,026.29 1,028.04/1,016.86 1,016.92/998.99 – – – – – –
– Class S (H2-NOK) Shares LU0678493965 07/10/2011 1,017.85/997.96 – – – – – – – – –
– Class S (H2-AUD) Shares LU0678493700 07/10/2011 103.08/99.86 – – – – – – – – –
Allianz RCM Euroland Equity Growth
– Class A (EUR) Shares LU0256839944 16/10/2006 121.25/92.53 117.09/92.11 102.17/81.83 86.36/55.95 119.67/78.74 121.51/97.84 106.52/81.91 – – –
– Class AT (EUR) Shares LU0256840447 16/10/2006 124.30/94.63 119.75/94.21 103.65/82.73 87.31/56.58 119.67/79.43 121.53/97.84 106.52/81.91 – – –
– Class CT (EUR) Shares LU0256840793 02/11/2006 121.42/92.76 117.61/92.46 102.41/82.28 86.91/56.54 117.36/79.64 119.39/99.61 105.36/83.40 – – –
– Class I (EUR) Shares LU0256883843 04/10/2006 1,261.29/965.05 1,218.63/959.41 1,057.15/845.00 890.94/574.90 1,170.56/816.24 1,186.32/1,000.00 1,033.67/830.94 – – –
– Class IT (EUR) Shares LU0256884064 04/10/2006 1,325.51/1,004.83 1,268.88/998.96 1,090.66/863.83 910.79/587.69 1,170.21/822.24 1,185.97/1,000.00 1,033.67/830.94 – – –
– Class W (EUR) Shares LU0256884577 02/10/2006 1,267.53/971.58 1,226.00/965.46 1,062.83/849.76 895.66/576.59 1,170.71/806.01 1,186.08/997.87 1,026.63/823.84 – – –
Allianz RCM Europe Equity Growth
– Class A (EUR) Shares LU0256839191 16/10/2006 142.50/110.40 135.10/109.31 119.65/88.16 92.28/58.16 123.17/83.25 122.93/96.07 108.06/80.26 – – –
– Class AT (EUR) Shares LU0256839274 16/10/2006 143.58/111.02 135.87/109.93 120.16/88.20 92.33/58.18 123.21/83.27 122.93/96.07 108.06/80.26 – – –
– Class CT (EUR) Shares LU0256839860 02/11/2006 137.66/106.80 131.09/105.87 116.48/86.12 90.18/57.06 118.62/81.93 118.58/95.75 104.62/80.00 – – –
– Class I (EUR) Shares LU0256880153 04/10/2006 1,475.72/1,148.37 1,401.29/1,135.51 1,240.77/911.96 954.39/598.87 1,216.5/864.60 1,211.49/996.26 1,067.86/829.20 – – –
– Class IT (EUR) Shares LU0256881128 04/10/2006 1,544.89/1,189.73 1,451.72/1,176.40 1,276.00/928.72 971.94/609.87 1,216.37/869.83 1,211.36/996.26 1,067.86/829.20 – – –
– Class W (EUR) Shares LU0256881987 02/10/2006 1,510.65/1,177.68 1,435.98/1,163.95 1,271.59/934.00 977.36/612.29 1,215.81/872.16 1,211.17/994.04 1,053.13/816.34 – – –
– Class WT (EUR) Shares LU0256883504 09/08/2010 1,280.80/985.03 1,201.08/973.55 1,053.24/967.00 – – – – – – –
– Class A (GBP) Shares LU0264555375 03/08/2009 164.44/131.19 167.94/132.10 141.52/111.10 115.92/99.30 – – – – – –
– Class P (GBP) Shares LU0604763499 04/01/2012 1,121.24/988.30 – – – – – – – – –
– Class AT (HUF) Shares LU0527936024 17/08/2010 33,115.24/26,039.38 29,054.02/23,824.50 26,691.28/24,648.60 – – – – – – –
Allianz RCM European Equity
– Class A (EUR) Shares LU0327454749 07/11/2008 122.98/99.42 127.23/98.50 124.47/108.06 113.66/78.92 – – – – – –
– Class N (EUR) Shares LU0400424155 12/12/2008 1,293.83/1,113.86 1,416.26/1,103.14 1,383.65/1,204.20 1,268.37/874.74 – – – – – –
– Class S (EUR) Shares LU0400424742 12/12/2008 1,365.32/1,109.18 1,412.71/1,098.63 1,382.19/1,202.57 1,265.23/874.07 – – – – – –
Allianz RCM European Equity Dividend
– Class A (EUR) Shares LU0414045582 10/01/2011 98.38/86.69 104.50/85.56 – – – – – – – –
– Class AT (EUR) Shares LU0414045822 10/03/2009 171.06/145.61 175.53/143.71 163.22/137.98 143.47/100.00 – – – – – –
– Class CT (EUR) Shares LU0414046390 10/03/2009 167.28/142.73 173.05/141.08 161.45/137.35 142.95/100.00 – – – – – –
– Class IT (EUR) Shares LU0414047281 10/03/2009 1,756.34/1,490.41 1,784.45/1,468.34 1,652.99/1,386.94 1,440.84/1,000.00 – – – – – –
Highest issue price/lowest redemption priceISIN Launch date 31/03/2012 30/09/2011 30/09/2010 30/09/2009 30/09/2008 30/09/2007 30/09/2006 30/09/2005 30/09/2004 30/09/2003
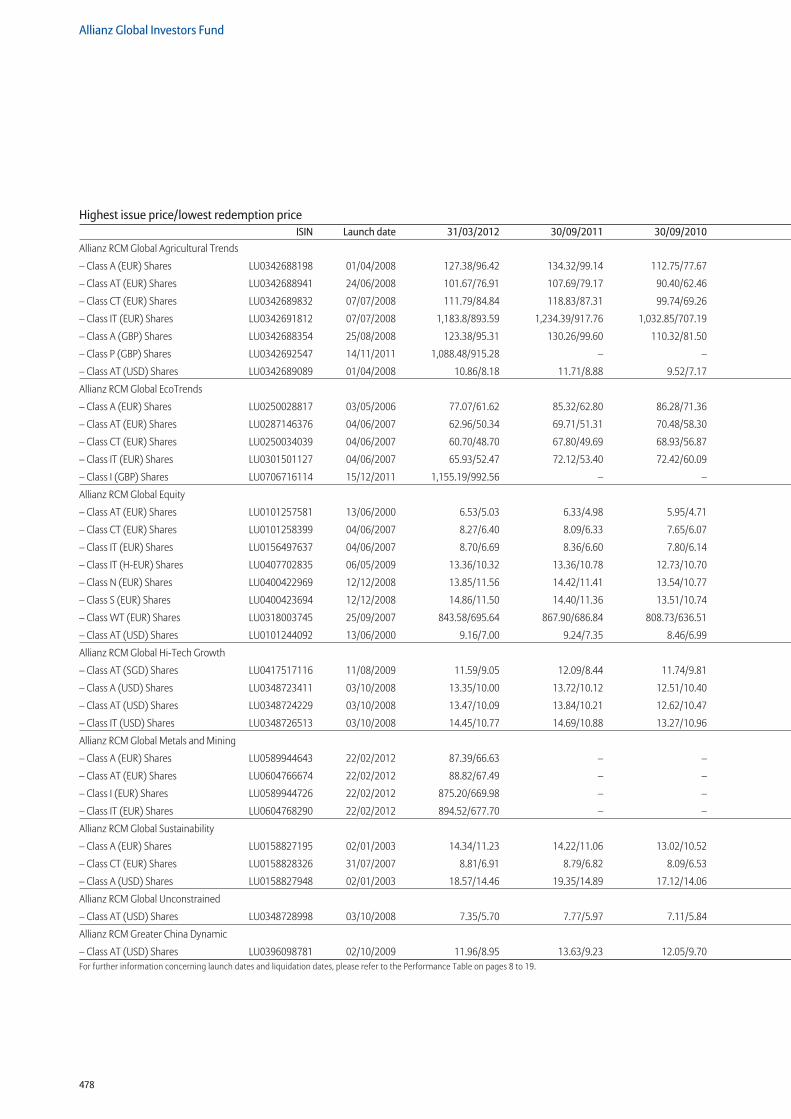
478
Allianz Global Investors Fund
Highest issue price/lowest redemption priceISIN Launch date 31/03/2012 30/09/2011 30/09/2010 30/09/2009 30/09/2008 30/09/2007 30/09/2006 30/09/2005 30/09/2004 30/09/2003
Allianz RCM Global Agricultural Trends
– Class A (EUR) Shares LU0342688198 01/04/2008 127.38/96.42 134.32/99.14 112.75/77.67 84.91/60.21 132.34/82.81 – – – – –
– Class AT (EUR) Shares LU0342688941 24/06/2008 101.67/76.91 107.69/79.17 90.40/62.46 68.47/48.43 105.00/66.78 – – – – –
– Class CT (EUR) Shares LU0342689832 07/07/2008 111.79/84.84 118.83/87.31 99.74/69.26 76.25/53.89 104.22/74.37 – – – – –
– Class IT (EUR) Shares LU0342691812 07/07/2008 1,183.8/893.59 1,234.39/917.76 1,032.85/707.19 765.24/545.44 1,011.74/746.35 – – – – –
– Class A (GBP) Shares LU0342688354 25/08/2008 123.38/95.31 130.26/99.60 110.32/81.50 85.86/59.08 106.83/76.59 – – – – –
– Class P (GBP) Shares LU0342692547 14/11/2011 1,088.48/915.28 – – – – – – – – –
– Class AT (USD) Shares LU0342689089 01/04/2008 10.86/8.18 11.71/8.88 9.52/7.17 7.75/4.89 13.18/7.65 – – – – –
Allianz RCM Global EcoTrends
– Class A (EUR) Shares LU0250028817 03/05/2006 77.07/61.62 85.32/62.80 86.28/71.36 100.28/58.88 160.18/98.69 140.14/85.29 107.29/79.54 – – –
– Class AT (EUR) Shares LU0287146376 04/06/2007 62.96/50.34 69.71/51.31 70.48/58.30 81.66/48.10 130.43/80.36 114.08/91.83 – – – –
– Class CT (EUR) Shares LU0250034039 04/06/2007 60.70/48.70 67.80/49.69 68.93/56.87 80.80/47.44 126.08/79.52 110.74/91.70 – – – –
– Class IT (EUR) Shares LU0301501127 04/06/2007 65.93/52.47 72.12/53.40 72.42/60.09 82.68/48.90 124.90/81.36 108.97/92.02 – – – –
– Class I (GBP) Shares LU0706716114 15/12/2011 1,155.19/992.56 – – – – – – – – –
Allianz RCM Global Equity
– Class AT (EUR) Shares LU0101257581 13/06/2000 6.53/5.03 6.33/4.98 5.95/4.71 5.84/3.87 8.49/5.62 8.23/6.72 7.46/5.86 6.47/4.76 5.72/4.70 5.47/4.04
– Class CT (EUR) Shares LU0101258399 04/06/2007 8.27/6.40 8.09/6.33 7.65/6.07 7.55/5.00 10.69/7.25 10.33/9.14 – – – –
– Class IT (EUR) Shares LU0156497637 04/06/2007 8.70/6.69 8.36/6.60 7.80/6.14 7.56/5.01 10.44/7.25 10.10/9.12 – – – –
– Class IT (H-EUR) Shares LU0407702835 06/05/2009 13.36/10.32 13.36/10.78 12.73/10.70 11.36/9.52 – – – – – –
– Class N (EUR) Shares LU0400422969 12/12/2008 13.85/11.56 14.42/11.41 13.54/10.77 11.31/8.75 – – – – – –
– Class S (EUR) Shares LU0400423694 12/12/2008 14.86/11.50 14.40/11.36 13.51/10.74 11.28/8.75 – – – – – –
– Class WT (EUR) Shares LU0318003745 25/09/2007 843.58/695.64 867.90/686.84 808.73/636.51 774.32/516.61 1,055.76/743.03 1,021.11/1,000.00 – – – –
– Class AT (USD) Shares LU0101244092 13/06/2000 9.16/7.00 9.24/7.35 8.46/6.99 8.55/5.13 12.77/8.45 12.10/8.89 9.91/7.33 8.13/6.36 7.17/5.72 6.18/4.62
Allianz RCM Global Hi-Tech Growth
– Class AT (SGD) Shares LU0417517116 11/08/2009 11.59/9.05 12.09/8.44 11.74/9.81 10.62/9.86 – – – – – –
– Class A (USD) Shares LU0348723411 03/10/2008 13.35/10.00 13.72/10.12 12.51/10.40 11.01/6.82 – – – – – –
– Class AT (USD) Shares LU0348724229 03/10/2008 13.47/10.09 13.84/10.21 12.62/10.47 11.08/6.86 – – – – – –
– Class IT (USD) Shares LU0348726513 03/10/2008 14.45/10.77 14.69/10.88 13.27/10.96 11.59/7.14 – – – – – –
Allianz RCM Global Metals and Mining
– Class A (EUR) Shares LU0589944643 22/02/2012 87.39/66.63 – – – – – – – – –
– Class AT (EUR) Shares LU0604766674 22/02/2012 88.82/67.49 – – – – – – – – –
– Class I (EUR) Shares LU0589944726 22/02/2012 875.20/669.98 – – – – – – – – –
– Class IT (EUR) Shares LU0604768290 22/02/2012 894.52/677.70 – – – – – – – – –
Allianz RCM Global Sustainability
– Class A (EUR) Shares LU0158827195 02/01/2003 14.34/11.23 14.22/11.06 13.02/10.52 12.04/7.85 17.42/11.54 17.44/14.25 16.18/12.33 13.68/10.30 12.04/10.08 11.45/8.44
– Class CT (EUR) Shares LU0158828326 31/07/2007 8.81/6.91 8.79/6.82 8.09/6.53 7.50/4.89 10.62/7.19 10.35/9.39 – – – –
– Class A (USD) Shares LU0158827948 02/01/2003 18.57/14.46 19.35/14.89 17.12/14.06 16.47/9.66 24.31/16.22 23.56/17.79 20.37/14.50 16.10/12.79 14.48/11.42 12.38/8.96
Allianz RCM Global Unconstrained
– Class AT (USD) Shares LU0348728998 03/10/2008 7.35/5.70 7.77/5.97 7.11/5.84 7.04/4.30 – – – – – –
Allianz RCM Greater China Dynamic
– Class AT (USD) Shares LU0396098781 02/10/2009 11.96/8.95 13.63/9.23 12.05/9.70 – – – – – – –For further information concerning launch dates and liquidation dates, please refer to the Performance Table on pages 8 to 19.
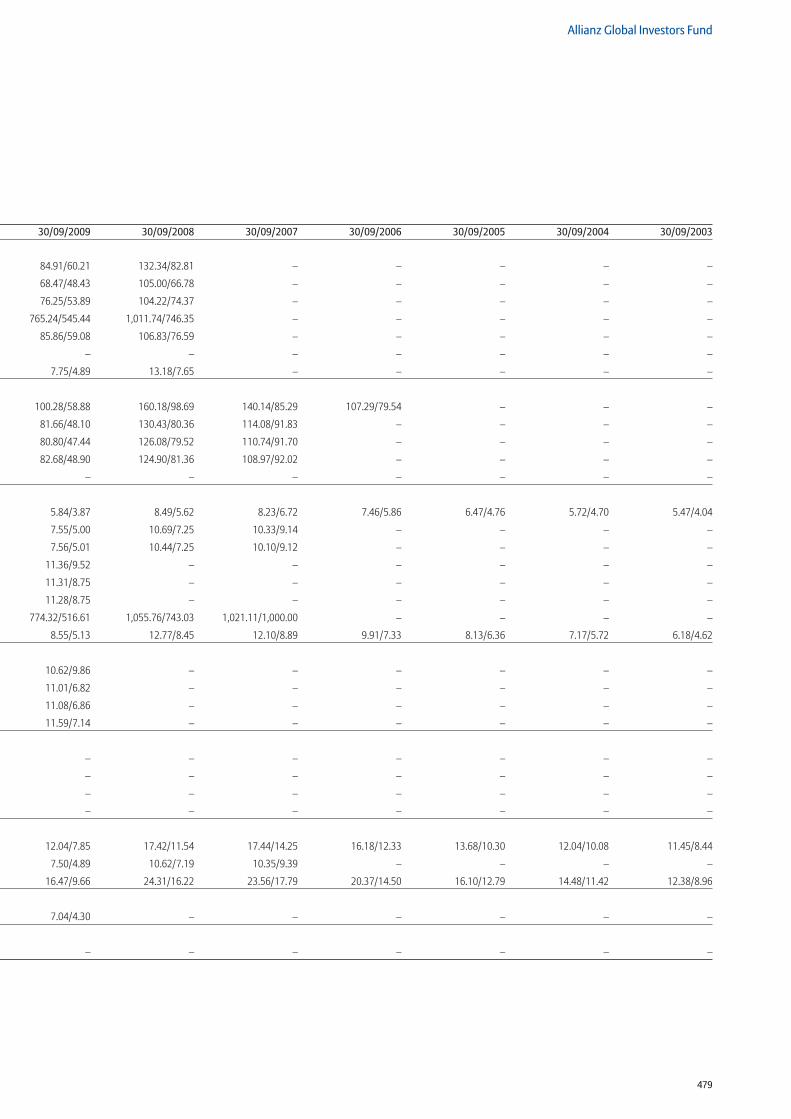
479
Allianz Global Investors Fund
Highest issue price/lowest redemption priceISIN Launch date 31/03/2012 30/09/2011 30/09/2010 30/09/2009 30/09/2008 30/09/2007 30/09/2006 30/09/2005 30/09/2004 30/09/2003
Allianz RCM Global Agricultural Trends
– Class A (EUR) Shares LU0342688198 01/04/2008 127.38/96.42 134.32/99.14 112.75/77.67 84.91/60.21 132.34/82.81 – – – – –
– Class AT (EUR) Shares LU0342688941 24/06/2008 101.67/76.91 107.69/79.17 90.40/62.46 68.47/48.43 105.00/66.78 – – – – –
– Class CT (EUR) Shares LU0342689832 07/07/2008 111.79/84.84 118.83/87.31 99.74/69.26 76.25/53.89 104.22/74.37 – – – – –
– Class IT (EUR) Shares LU0342691812 07/07/2008 1,183.8/893.59 1,234.39/917.76 1,032.85/707.19 765.24/545.44 1,011.74/746.35 – – – – –
– Class A (GBP) Shares LU0342688354 25/08/2008 123.38/95.31 130.26/99.60 110.32/81.50 85.86/59.08 106.83/76.59 – – – – –
– Class P (GBP) Shares LU0342692547 14/11/2011 1,088.48/915.28 – – – – – – – – –
– Class AT (USD) Shares LU0342689089 01/04/2008 10.86/8.18 11.71/8.88 9.52/7.17 7.75/4.89 13.18/7.65 – – – – –
Allianz RCM Global EcoTrends
– Class A (EUR) Shares LU0250028817 03/05/2006 77.07/61.62 85.32/62.80 86.28/71.36 100.28/58.88 160.18/98.69 140.14/85.29 107.29/79.54 – – –
– Class AT (EUR) Shares LU0287146376 04/06/2007 62.96/50.34 69.71/51.31 70.48/58.30 81.66/48.10 130.43/80.36 114.08/91.83 – – – –
– Class CT (EUR) Shares LU0250034039 04/06/2007 60.70/48.70 67.80/49.69 68.93/56.87 80.80/47.44 126.08/79.52 110.74/91.70 – – – –
– Class IT (EUR) Shares LU0301501127 04/06/2007 65.93/52.47 72.12/53.40 72.42/60.09 82.68/48.90 124.90/81.36 108.97/92.02 – – – –
– Class I (GBP) Shares LU0706716114 15/12/2011 1,155.19/992.56 – – – – – – – – –
Allianz RCM Global Equity
– Class AT (EUR) Shares LU0101257581 13/06/2000 6.53/5.03 6.33/4.98 5.95/4.71 5.84/3.87 8.49/5.62 8.23/6.72 7.46/5.86 6.47/4.76 5.72/4.70 5.47/4.04
– Class CT (EUR) Shares LU0101258399 04/06/2007 8.27/6.40 8.09/6.33 7.65/6.07 7.55/5.00 10.69/7.25 10.33/9.14 – – – –
– Class IT (EUR) Shares LU0156497637 04/06/2007 8.70/6.69 8.36/6.60 7.80/6.14 7.56/5.01 10.44/7.25 10.10/9.12 – – – –
– Class IT (H-EUR) Shares LU0407702835 06/05/2009 13.36/10.32 13.36/10.78 12.73/10.70 11.36/9.52 – – – – – –
– Class N (EUR) Shares LU0400422969 12/12/2008 13.85/11.56 14.42/11.41 13.54/10.77 11.31/8.75 – – – – – –
– Class S (EUR) Shares LU0400423694 12/12/2008 14.86/11.50 14.40/11.36 13.51/10.74 11.28/8.75 – – – – – –
– Class WT (EUR) Shares LU0318003745 25/09/2007 843.58/695.64 867.90/686.84 808.73/636.51 774.32/516.61 1,055.76/743.03 1,021.11/1,000.00 – – – –
– Class AT (USD) Shares LU0101244092 13/06/2000 9.16/7.00 9.24/7.35 8.46/6.99 8.55/5.13 12.77/8.45 12.10/8.89 9.91/7.33 8.13/6.36 7.17/5.72 6.18/4.62
Allianz RCM Global Hi-Tech Growth
– Class AT (SGD) Shares LU0417517116 11/08/2009 11.59/9.05 12.09/8.44 11.74/9.81 10.62/9.86 – – – – – –
– Class A (USD) Shares LU0348723411 03/10/2008 13.35/10.00 13.72/10.12 12.51/10.40 11.01/6.82 – – – – – –
– Class AT (USD) Shares LU0348724229 03/10/2008 13.47/10.09 13.84/10.21 12.62/10.47 11.08/6.86 – – – – – –
– Class IT (USD) Shares LU0348726513 03/10/2008 14.45/10.77 14.69/10.88 13.27/10.96 11.59/7.14 – – – – – –
Allianz RCM Global Metals and Mining
– Class A (EUR) Shares LU0589944643 22/02/2012 87.39/66.63 – – – – – – – – –
– Class AT (EUR) Shares LU0604766674 22/02/2012 88.82/67.49 – – – – – – – – –
– Class I (EUR) Shares LU0589944726 22/02/2012 875.20/669.98 – – – – – – – – –
– Class IT (EUR) Shares LU0604768290 22/02/2012 894.52/677.70 – – – – – – – – –
Allianz RCM Global Sustainability
– Class A (EUR) Shares LU0158827195 02/01/2003 14.34/11.23 14.22/11.06 13.02/10.52 12.04/7.85 17.42/11.54 17.44/14.25 16.18/12.33 13.68/10.30 12.04/10.08 11.45/8.44
– Class CT (EUR) Shares LU0158828326 31/07/2007 8.81/6.91 8.79/6.82 8.09/6.53 7.50/4.89 10.62/7.19 10.35/9.39 – – – –
– Class A (USD) Shares LU0158827948 02/01/2003 18.57/14.46 19.35/14.89 17.12/14.06 16.47/9.66 24.31/16.22 23.56/17.79 20.37/14.50 16.10/12.79 14.48/11.42 12.38/8.96
Allianz RCM Global Unconstrained
– Class AT (USD) Shares LU0348728998 03/10/2008 7.35/5.70 7.77/5.97 7.11/5.84 7.04/4.30 – – – – – –
Allianz RCM Greater China Dynamic
– Class AT (USD) Shares LU0396098781 02/10/2009 11.96/8.95 13.63/9.23 12.05/9.70 – – – – – – –
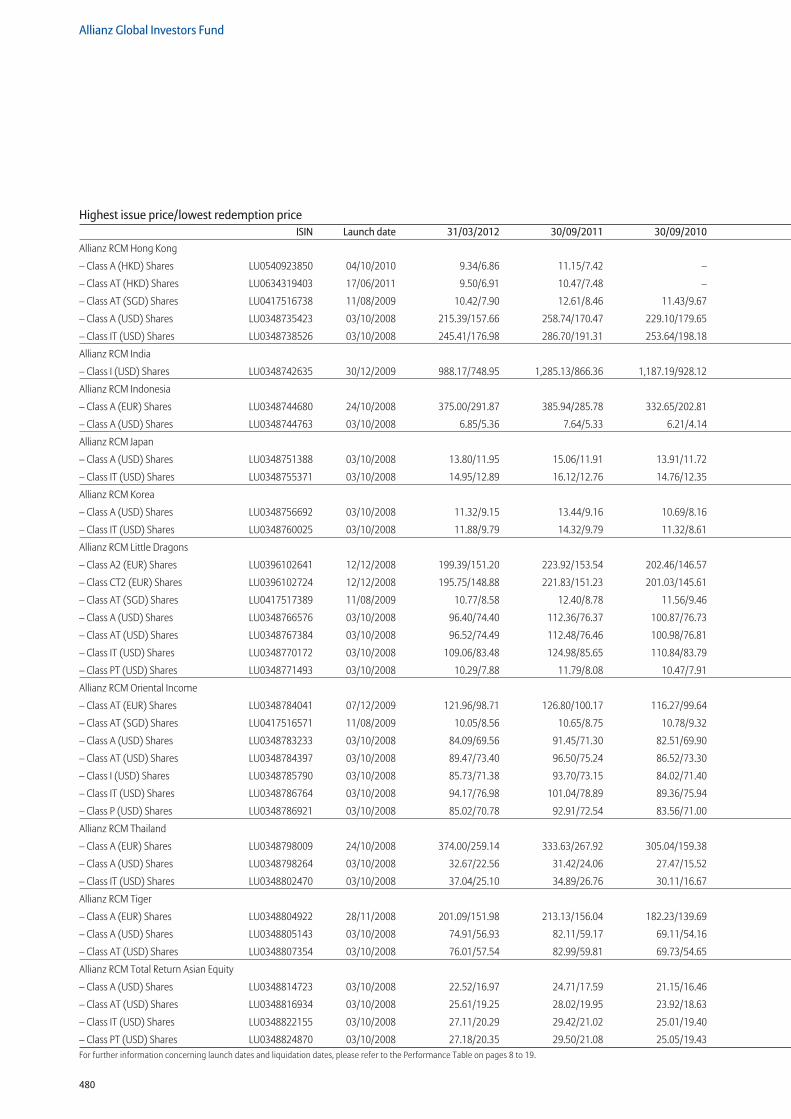
480
Allianz Global Investors Fund
Allianz RCM Hong Kong
– Class A (HKD) Shares LU0540923850 04/10/2010 9.34/6.86 11.15/7.42 – – – – – – – –
– Class AT (HKD) Shares LU0634319403 17/06/2011 9.50/6.91 10.47/7.48 – – – – – – – –
– Class AT (SGD) Shares LU0417516738 11/08/2009 10.42/7.90 12.61/8.46 11.43/9.67 10.29/9.40 – – – – – –
– Class A (USD) Shares LU0348735423 03/10/2008 215.39/157.66 258.74/170.47 229.10/179.65 197.01/86.71 – – – – – –
– Class IT (USD) Shares LU0348738526 03/10/2008 245.41/176.98 286.70/191.31 253.64/198.18 210.89/92.10 – – – – – –
Allianz RCM India
– Class I (USD) Shares LU0348742635 30/12/2009 988.17/748.95 1,285.13/866.36 1,187.19/928.12 – – – – – – –
Allianz RCM Indonesia
– Class A (EUR) Shares LU0348744680 24/10/2008 375.00/291.87 385.94/285.78 332.65/202.81 216.34/79.15 – – – – – –
– Class A (USD) Shares LU0348744763 03/10/2008 6.85/5.36 7.64/5.33 6.21/4.14 4.40/1.40 – – – – – –
Allianz RCM Japan
– Class A (USD) Shares LU0348751388 03/10/2008 13.80/11.95 15.06/11.91 13.91/11.72 12.82/8.47 – – – – – –
– Class IT (USD) Shares LU0348755371 03/10/2008 14.95/12.89 16.12/12.76 14.76/12.35 13.49/8.88 – – – – – –
Allianz RCM Korea
– Class A (USD) Shares LU0348756692 03/10/2008 11.32/9.15 13.44/9.16 10.69/8.16 9.37/4.48 – – – – – –
– Class IT (USD) Shares LU0348760025 03/10/2008 11.88/9.79 14.32/9.79 11.32/8.61 9.82/4.67 – – – – – –
Allianz RCM Little Dragons
– Class A2 (EUR) Shares LU0396102641 12/12/2008 199.39/151.20 223.92/153.54 202.46/146.57 154.24/96.08 – – – – – –
– Class CT2 (EUR) Shares LU0396102724 12/12/2008 195.75/148.88 221.83/151.23 201.03/145.61 153.50/95.95 – – – – – –
– Class AT (SGD) Shares LU0417517389 11/08/2009 10.77/8.58 12.40/8.78 11.56/9.46 10.30/9.53 – – – – – –
– Class A (USD) Shares LU0348766576 03/10/2008 96.40/74.40 112.36/76.37 100.87/76.73 84.49/41.80 – – – – – –
– Class AT (USD) Shares LU0348767384 03/10/2008 96.52/74.49 112.48/76.46 100.98/76.81 84.55/41.83 – – – – – –
– Class IT (USD) Shares LU0348770172 03/10/2008 109.06/83.48 124.98/85.65 110.84/83.79 91.01/44.28 – – – – – –
– Class PT (USD) Shares LU0348771493 03/10/2008 10.29/7.88 11.79/8.08 10.47/7.91 8.59/4.18 – – – – – –
Allianz RCM Oriental Income
– Class AT (EUR) Shares LU0348784041 07/12/2009 121.96/98.71 126.80/100.17 116.27/99.64 – – – – – – –
– Class AT (SGD) Shares LU0417516571 11/08/2009 10.05/8.56 10.65/8.75 10.78/9.32 10.44/9.76 – – – – – –
– Class A (USD) Shares LU0348783233 03/10/2008 84.09/69.56 91.45/71.30 82.51/69.90 79.51/48.05 – – – – – –
– Class AT (USD) Shares LU0348784397 03/10/2008 89.47/73.40 96.50/75.24 86.52/73.30 82.30/49.74 – – – – – –
– Class I (USD) Shares LU0348785790 03/10/2008 85.73/71.38 93.70/73.15 84.02/71.40 81.29/48.81 – – – – – –
– Class IT (USD) Shares LU0348786764 03/10/2008 94.17/76.98 101.04/78.89 89.36/75.94 84.79/50.91 – – – – – –
– Class P (USD) Shares LU0348786921 03/10/2008 85.02/70.78 92.91/72.54 83.56/71.00 80.83/48.55 – – – – – –
Allianz RCM Thailand
– Class A (EUR) Shares LU0348798009 24/10/2008 374.00/259.14 333.63/267.92 305.04/159.38 171.15/88.47 – – – – – –
– Class A (USD) Shares LU0348798264 03/10/2008 32.67/22.56 31.42/24.06 27.47/15.52 16.78/7.46 – – – – – –
– Class IT (USD) Shares LU0348802470 03/10/2008 37.04/25.10 34.89/26.76 30.11/16.67 18.00/7.94 – – – – – –
Allianz RCM Tiger
– Class A (EUR) Shares LU0348804922 28/11/2008 201.09/151.98 213.13/156.04 182.23/139.69 147.61/93.36 – – – – – –
– Class A (USD) Shares LU0348805143 03/10/2008 74.91/56.93 82.11/59.17 69.11/54.16 61.35/30.49 – – – – – –
– Class AT (USD) Shares LU0348807354 03/10/2008 76.01/57.54 82.99/59.81 69.73/54.65 61.40/30.51 – – – – – –
Allianz RCM Total Return Asian Equity
– Class A (USD) Shares LU0348814723 03/10/2008 22.52/16.97 24.71/17.59 21.15/16.46 18.24/8.96 – – – – – –
– Class AT (USD) Shares LU0348816934 03/10/2008 25.61/19.25 28.02/19.95 23.92/18.63 20.52/10.08 – – – – – –
– Class IT (USD) Shares LU0348822155 03/10/2008 27.11/20.29 29.42/21.02 25.01/19.40 21.22/10.35 – – – – – –
– Class PT (USD) Shares LU0348824870 03/10/2008 27.18/20.35 29.50/21.08 25.05/19.43 21.27/10.37 – – – – – –For further information concerning launch dates and liquidation dates, please refer to the Performance Table on pages 8 to 19.
Highest issue price/lowest redemption priceISIN Launch date 31/03/2012 30/09/2011 30/09/2010 30/09/2009 30/09/2008 30/09/2007 30/09/2006 30/09/2005 30/09/2004 30/09/2003
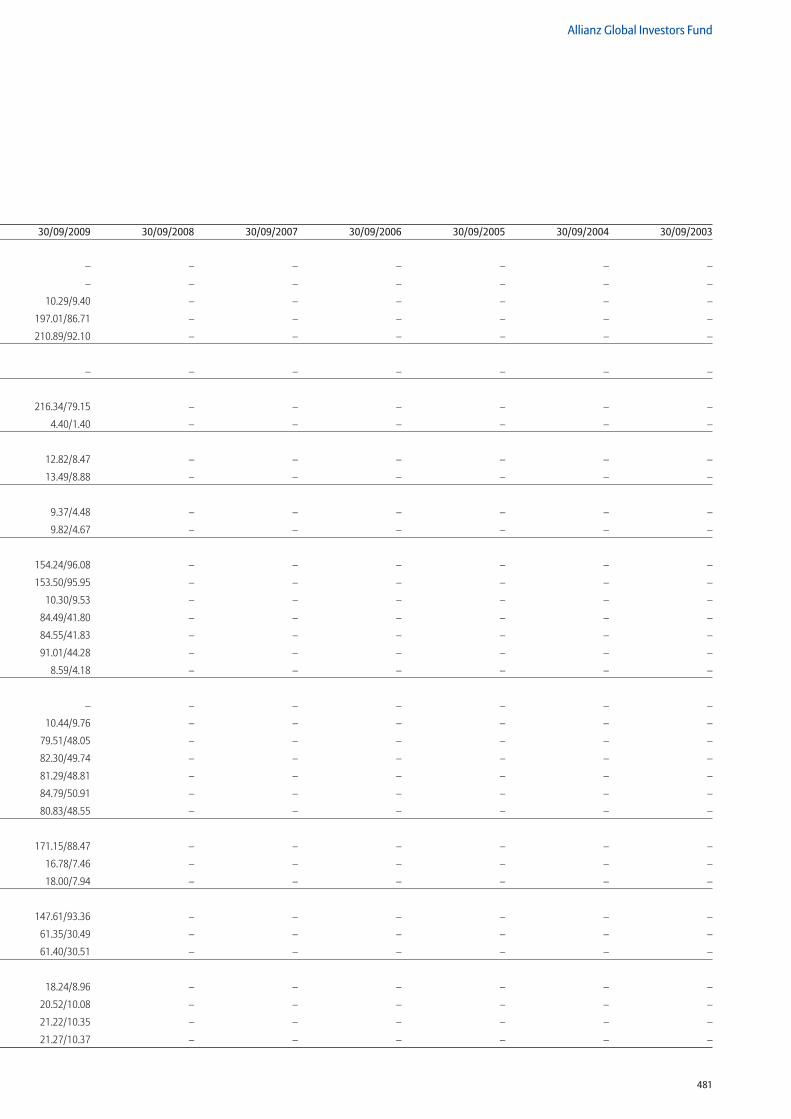
481
Allianz Global Investors Fund
Allianz RCM Hong Kong
– Class A (HKD) Shares LU0540923850 04/10/2010 9.34/6.86 11.15/7.42 – – – – – – – –
– Class AT (HKD) Shares LU0634319403 17/06/2011 9.50/6.91 10.47/7.48 – – – – – – – –
– Class AT (SGD) Shares LU0417516738 11/08/2009 10.42/7.90 12.61/8.46 11.43/9.67 10.29/9.40 – – – – – –
– Class A (USD) Shares LU0348735423 03/10/2008 215.39/157.66 258.74/170.47 229.10/179.65 197.01/86.71 – – – – – –
– Class IT (USD) Shares LU0348738526 03/10/2008 245.41/176.98 286.70/191.31 253.64/198.18 210.89/92.10 – – – – – –
Allianz RCM India
– Class I (USD) Shares LU0348742635 30/12/2009 988.17/748.95 1,285.13/866.36 1,187.19/928.12 – – – – – – –
Allianz RCM Indonesia
– Class A (EUR) Shares LU0348744680 24/10/2008 375.00/291.87 385.94/285.78 332.65/202.81 216.34/79.15 – – – – – –
– Class A (USD) Shares LU0348744763 03/10/2008 6.85/5.36 7.64/5.33 6.21/4.14 4.40/1.40 – – – – – –
Allianz RCM Japan
– Class A (USD) Shares LU0348751388 03/10/2008 13.80/11.95 15.06/11.91 13.91/11.72 12.82/8.47 – – – – – –
– Class IT (USD) Shares LU0348755371 03/10/2008 14.95/12.89 16.12/12.76 14.76/12.35 13.49/8.88 – – – – – –
Allianz RCM Korea
– Class A (USD) Shares LU0348756692 03/10/2008 11.32/9.15 13.44/9.16 10.69/8.16 9.37/4.48 – – – – – –
– Class IT (USD) Shares LU0348760025 03/10/2008 11.88/9.79 14.32/9.79 11.32/8.61 9.82/4.67 – – – – – –
Allianz RCM Little Dragons
– Class A2 (EUR) Shares LU0396102641 12/12/2008 199.39/151.20 223.92/153.54 202.46/146.57 154.24/96.08 – – – – – –
– Class CT2 (EUR) Shares LU0396102724 12/12/2008 195.75/148.88 221.83/151.23 201.03/145.61 153.50/95.95 – – – – – –
– Class AT (SGD) Shares LU0417517389 11/08/2009 10.77/8.58 12.40/8.78 11.56/9.46 10.30/9.53 – – – – – –
– Class A (USD) Shares LU0348766576 03/10/2008 96.40/74.40 112.36/76.37 100.87/76.73 84.49/41.80 – – – – – –
– Class AT (USD) Shares LU0348767384 03/10/2008 96.52/74.49 112.48/76.46 100.98/76.81 84.55/41.83 – – – – – –
– Class IT (USD) Shares LU0348770172 03/10/2008 109.06/83.48 124.98/85.65 110.84/83.79 91.01/44.28 – – – – – –
– Class PT (USD) Shares LU0348771493 03/10/2008 10.29/7.88 11.79/8.08 10.47/7.91 8.59/4.18 – – – – – –
Allianz RCM Oriental Income
– Class AT (EUR) Shares LU0348784041 07/12/2009 121.96/98.71 126.80/100.17 116.27/99.64 – – – – – – –
– Class AT (SGD) Shares LU0417516571 11/08/2009 10.05/8.56 10.65/8.75 10.78/9.32 10.44/9.76 – – – – – –
– Class A (USD) Shares LU0348783233 03/10/2008 84.09/69.56 91.45/71.30 82.51/69.90 79.51/48.05 – – – – – –
– Class AT (USD) Shares LU0348784397 03/10/2008 89.47/73.40 96.50/75.24 86.52/73.30 82.30/49.74 – – – – – –
– Class I (USD) Shares LU0348785790 03/10/2008 85.73/71.38 93.70/73.15 84.02/71.40 81.29/48.81 – – – – – –
– Class IT (USD) Shares LU0348786764 03/10/2008 94.17/76.98 101.04/78.89 89.36/75.94 84.79/50.91 – – – – – –
– Class P (USD) Shares LU0348786921 03/10/2008 85.02/70.78 92.91/72.54 83.56/71.00 80.83/48.55 – – – – – –
Allianz RCM Thailand
– Class A (EUR) Shares LU0348798009 24/10/2008 374.00/259.14 333.63/267.92 305.04/159.38 171.15/88.47 – – – – – –
– Class A (USD) Shares LU0348798264 03/10/2008 32.67/22.56 31.42/24.06 27.47/15.52 16.78/7.46 – – – – – –
– Class IT (USD) Shares LU0348802470 03/10/2008 37.04/25.10 34.89/26.76 30.11/16.67 18.00/7.94 – – – – – –
Allianz RCM Tiger
– Class A (EUR) Shares LU0348804922 28/11/2008 201.09/151.98 213.13/156.04 182.23/139.69 147.61/93.36 – – – – – –
– Class A (USD) Shares LU0348805143 03/10/2008 74.91/56.93 82.11/59.17 69.11/54.16 61.35/30.49 – – – – – –
– Class AT (USD) Shares LU0348807354 03/10/2008 76.01/57.54 82.99/59.81 69.73/54.65 61.40/30.51 – – – – – –
Allianz RCM Total Return Asian Equity
– Class A (USD) Shares LU0348814723 03/10/2008 22.52/16.97 24.71/17.59 21.15/16.46 18.24/8.96 – – – – – –
– Class AT (USD) Shares LU0348816934 03/10/2008 25.61/19.25 28.02/19.95 23.92/18.63 20.52/10.08 – – – – – –
– Class IT (USD) Shares LU0348822155 03/10/2008 27.11/20.29 29.42/21.02 25.01/19.40 21.22/10.35 – – – – – –
– Class PT (USD) Shares LU0348824870 03/10/2008 27.18/20.35 29.50/21.08 25.05/19.43 21.27/10.37 – – – – – –
Highest issue price/lowest redemption priceISIN Launch date 31/03/2012 30/09/2011 30/09/2010 30/09/2009 30/09/2008 30/09/2007 30/09/2006 30/09/2005 30/09/2004 30/09/2003
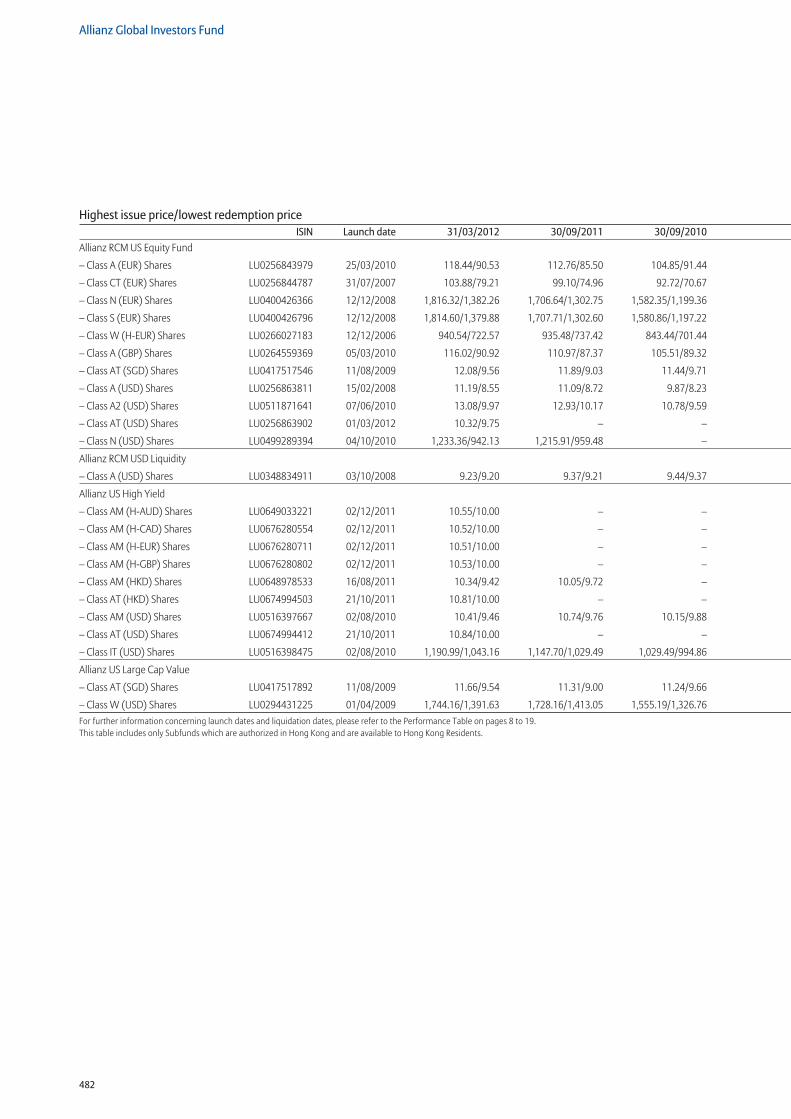
482
Allianz Global Investors Fund
Allianz RCM US Equity Fund
– Class A (EUR) Shares LU0256843979 25/03/2010 118.44/90.53 112.76/85.50 104.85/91.44 – – – – – – –
– Class CT (EUR) Shares LU0256844787 31/07/2007 103.88/79.21 99.10/74.96 92.72/70.67 80.49/51.51 105.04/73.05 103.64/96.13 – – – –
– Class N (EUR) Shares LU0400426366 12/12/2008 1,816.32/1,382.26 1,706.64/1,302.75 1,582.35/1,199.36 1,247.30/864.06 – – – – – –
– Class S (EUR) Shares LU0400426796 12/12/2008 1,814.60/1,379.88 1,707.71/1,302.60 1,580.86/1,197.22 1,245.43/863.65 – – – – – –
– Class W (H-EUR) Shares LU0266027183 12/12/2006 940.54/722.57 935.48/737.42 843.44/701.44 878.29/451.32 1,166.52/869.41 1,139.13/972.80 – – – –
– Class A (GBP) Shares LU0264559369 05/03/2010 116.02/90.92 110.97/87.37 105.51/89.32 – – – – – – –
– Class AT (SGD) Shares LU0417517546 11/08/2009 12.08/9.56 11.89/9.03 11.44/9.71 10.49/9.82 – – – – – –
– Class A (USD) Shares LU0256863811 15/02/2008 11.19/8.55 11.09/8.72 9.87/8.23 9.04/5.21 11.18/8.94 – – – – –
– Class A2 (USD) Shares LU0511871641 07/06/2010 13.08/9.97 12.93/10.17 10.78/9.59 – – – – – – –
– Class AT (USD) Shares LU0256863902 01/03/2012 10.32/9.75 – – – – – – – – –
– Class N (USD) Shares LU0499289394 04/10/2010 1,233.36/942.13 1,215.91/959.48 – – – – – – – –
Allianz RCM USD Liquidity
– Class A (USD) Shares LU0348834911 03/10/2008 9.23/9.20 9.37/9.21 9.44/9.37 9.50/9.44 – – – – – –
Allianz US High Yield
– Class AM (H-AUD) Shares LU0649033221 02/12/2011 10.55/10.00 – – – – – – – – –
– Class AM (H-CAD) Shares LU0676280554 02/12/2011 10.52/10.00 – – – – – – – – –
– Class AM (H-EUR) Shares LU0676280711 02/12/2011 10.51/10.00 – – – – – – – – –
– Class AM (H-GBP) Shares LU0676280802 02/12/2011 10.53/10.00 – – – – – – – – –
– Class AM (HKD) Shares LU0648978533 16/08/2011 10.34/9.42 10.05/9.72 – – – – – – – –
– Class AT (HKD) Shares LU0674994503 21/10/2011 10.81/10.00 – – – – – – – – –
– Class AM (USD) Shares LU0516397667 02/08/2010 10.41/9.46 10.74/9.76 10.15/9.88 – – – – – – –
– Class AT (USD) Shares LU0674994412 21/10/2011 10.84/10.00 – – – – – – – – –
– Class IT (USD) Shares LU0516398475 02/08/2010 1,190.99/1,043.16 1,147.70/1,029.49 1,029.49/994.86 – – – – – – –
Allianz US Large Cap Value
– Class AT (SGD) Shares LU0417517892 11/08/2009 11.66/9.54 11.31/9.00 11.24/9.66 10.41/9.76 – – – – – –
– Class W (USD) Shares LU0294431225 01/04/2009 1,744.16/1,391.63 1,728.16/1,413.05 1,555.19/1,326.76 1,404.96/1,044.34 – – – – – –For further information concerning launch dates and liquidation dates, please refer to the Performance Table on pages 8 to 19.This table includes only Subfunds which are authorized in Hong Kong and are available to Hong Kong Residents.
Highest issue price/lowest redemption priceISIN Launch date 31/03/2012 30/09/2011 30/09/2010 30/09/2009 30/09/2008 30/09/2007 30/09/2006 30/09/2005 30/09/2004 30/09/2003
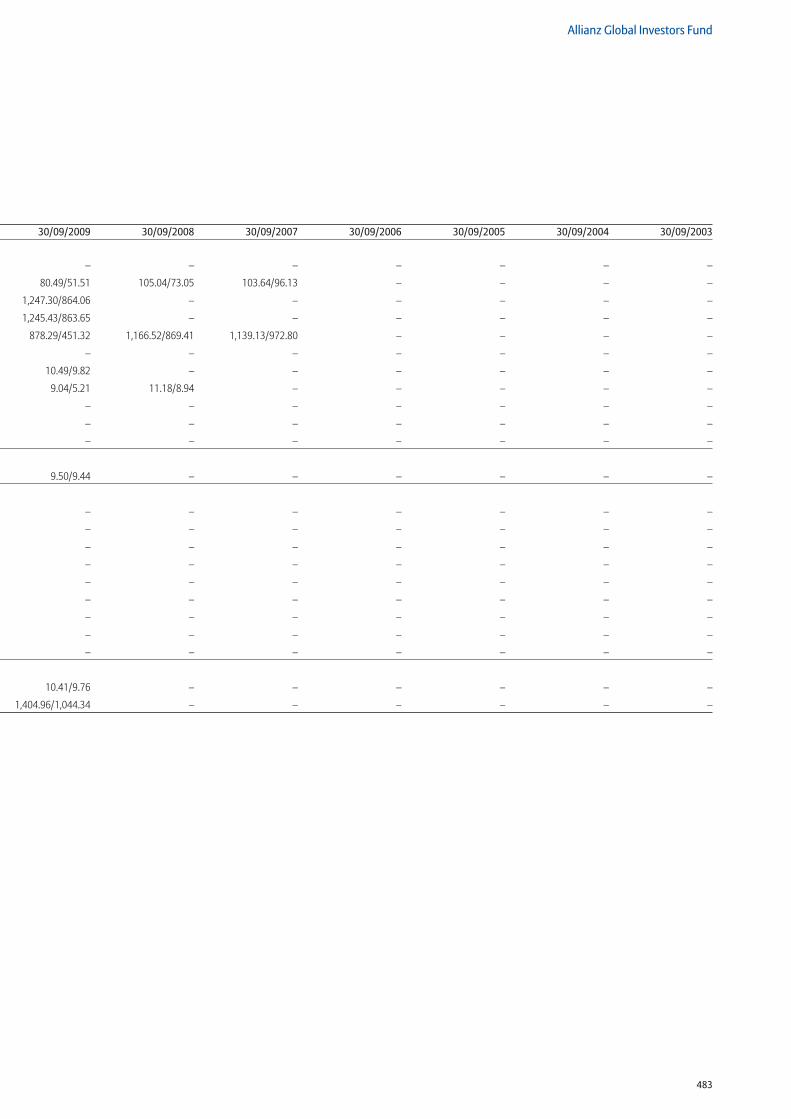
483
Allianz Global Investors Fund
Allianz RCM US Equity Fund
– Class A (EUR) Shares LU0256843979 25/03/2010 118.44/90.53 112.76/85.50 104.85/91.44 – – – – – – –
– Class CT (EUR) Shares LU0256844787 31/07/2007 103.88/79.21 99.10/74.96 92.72/70.67 80.49/51.51 105.04/73.05 103.64/96.13 – – – –
– Class N (EUR) Shares LU0400426366 12/12/2008 1,816.32/1,382.26 1,706.64/1,302.75 1,582.35/1,199.36 1,247.30/864.06 – – – – – –
– Class S (EUR) Shares LU0400426796 12/12/2008 1,814.60/1,379.88 1,707.71/1,302.60 1,580.86/1,197.22 1,245.43/863.65 – – – – – –
– Class W (H-EUR) Shares LU0266027183 12/12/2006 940.54/722.57 935.48/737.42 843.44/701.44 878.29/451.32 1,166.52/869.41 1,139.13/972.80 – – – –
– Class A (GBP) Shares LU0264559369 05/03/2010 116.02/90.92 110.97/87.37 105.51/89.32 – – – – – – –
– Class AT (SGD) Shares LU0417517546 11/08/2009 12.08/9.56 11.89/9.03 11.44/9.71 10.49/9.82 – – – – – –
– Class A (USD) Shares LU0256863811 15/02/2008 11.19/8.55 11.09/8.72 9.87/8.23 9.04/5.21 11.18/8.94 – – – – –
– Class A2 (USD) Shares LU0511871641 07/06/2010 13.08/9.97 12.93/10.17 10.78/9.59 – – – – – – –
– Class AT (USD) Shares LU0256863902 01/03/2012 10.32/9.75 – – – – – – – – –
– Class N (USD) Shares LU0499289394 04/10/2010 1,233.36/942.13 1,215.91/959.48 – – – – – – – –
Allianz RCM USD Liquidity
– Class A (USD) Shares LU0348834911 03/10/2008 9.23/9.20 9.37/9.21 9.44/9.37 9.50/9.44 – – – – – –
Allianz US High Yield
– Class AM (H-AUD) Shares LU0649033221 02/12/2011 10.55/10.00 – – – – – – – – –
– Class AM (H-CAD) Shares LU0676280554 02/12/2011 10.52/10.00 – – – – – – – – –
– Class AM (H-EUR) Shares LU0676280711 02/12/2011 10.51/10.00 – – – – – – – – –
– Class AM (H-GBP) Shares LU0676280802 02/12/2011 10.53/10.00 – – – – – – – – –
– Class AM (HKD) Shares LU0648978533 16/08/2011 10.34/9.42 10.05/9.72 – – – – – – – –
– Class AT (HKD) Shares LU0674994503 21/10/2011 10.81/10.00 – – – – – – – – –
– Class AM (USD) Shares LU0516397667 02/08/2010 10.41/9.46 10.74/9.76 10.15/9.88 – – – – – – –
– Class AT (USD) Shares LU0674994412 21/10/2011 10.84/10.00 – – – – – – – – –
– Class IT (USD) Shares LU0516398475 02/08/2010 1,190.99/1,043.16 1,147.70/1,029.49 1,029.49/994.86 – – – – – – –
Allianz US Large Cap Value
– Class AT (SGD) Shares LU0417517892 11/08/2009 11.66/9.54 11.31/9.00 11.24/9.66 10.41/9.76 – – – – – –
– Class W (USD) Shares LU0294431225 01/04/2009 1,744.16/1,391.63 1,728.16/1,413.05 1,555.19/1,326.76 1,404.96/1,044.34 – – – – – –For further information concerning launch dates and liquidation dates, please refer to the Performance Table on pages 8 to 19.This table includes only Subfunds which are authorized in Hong Kong and are available to Hong Kong Residents.
Highest issue price/lowest redemption priceISIN Launch date 31/03/2012 30/09/2011 30/09/2010 30/09/2009 30/09/2008 30/09/2007 30/09/2006 30/09/2005 30/09/2004 30/09/2003
484
Allianz Global Investors Fund
All payments to shareholders (redemption proceeds, any dividends and other payments) can be made through the German Paying Agent listed in the “Directory”. Applications for redemption and conversion may be submitted through the German Paying Agent.
With respect to sales in the Federal Republic of Germany, the Subscription, the Redemption and, if applicable, Conversion prices are published on the website www.allianzglobalinvestors.de. Any announcements to investors are published in the Börsen-Zeitung (published in Frankfurt/Main) and on the websitewww.allianzglobalinvestors.de. For selected share classes (e.g. share classes exclusively for institutional investors or share classes whose bases of taxation are not published in the Federal Republic of Germany) publication can be performed on one of the websites www.allianzglobalinvestors.eu, www.allianzgi-partner.de or www.allianzgi-b2b.eu.
In addition, in accordance with § 122 paragraph 1 sentence 5 of the InvG a durable medium within the meaning of § 42a of the InvG is used to inform investors in the Federal Republic of Germany in the following cases:
– Suspension of the redemption of Shares in a Sub-Fund,– Termination of the management of the Company/a
Sub-Fund or liquidation of the Company/a Sub-Fund,– Amendments to the terms and conditions that are not
reconcilable with previous investment principles, affect material investor rights, or concern fees or expense reimbursements payable from a Sub-Fund, including background information on the amendments and the rights of investors,
– In the case of a merger of a Sub-Fund with another fund, the merger information in accordance with Article 43 of Directive 2009/65/EC,
– In the case of conversion of a Sub-Fund into a feeder fund or, if applicable, changes to a master fund, the information to be prepared in accordance with Article 64 of Directive 2009/65/EC.
Note for Investors in the Federal Republic of Germany
The Prospectus, the Key Investor Information, the Articles of Incorporation, current annual and semi-annual reports, the Subscription, Redemption and, if applicable, Conversion prices, as well as the additional documentation listed under “Available Documentation” may be obtained in hard copy without charge from the Information Agent listed in the “Directory” and without charge on the website www.allianzglobalinvestors.de. For selected share classes (e.g. share classes exclusively for institutional investors or share classes whose bases of taxation are not published in the Federal Republic of Germany) publication can be performed on one of the websites www.allianzglobalinvestors.eu, www.allianzgi-partner.de or www.allianzgi-b2b.eu. The custodian agreement is available for inspection without charge at the Information Agent.
485
Allianz Global Investors Fund
Note for Investors in the Republic of Austria
Distribution of shares of the Subfunds Allianz Flexible Bond Strategy, Allianz Euro High Yield Bond, Allianz Euroland Equity SRI, Allianz Income and Growth, Allianz PIMCO Treasury Short Term Plus Euro, Allianz RCM Asia Pacific, Allianz RCM Brazil, Allianz RCM BRIC Equity, Allianz RCM China, Allianz RCM Discovery Europe Strategy, Allianz RCM Dynamic Multi Asset Plus, Allianz Enhanced Short Term Euro, Allianz RCM Euroland Equity Growth, Allianz RCM Europe Equity Growth, Allianz RCM Europe Small Cap Equity, Allianz RCM European Equity Dividend, Allianz RCM Global Agricultural Trends, Allianz RCM Global EcoTrends, Allianz RCM Global Equity, Allianz Global Metals and Mining, Allianz RCM Global Sustainability, Allianz RCM Global Unconstrained, Allianz RCM Growing Markets Protect, Allianz RCM Hong Kong, Allianz RCM Oriental Income, Allianz RCM Tiger, Allianz RCM Total Return Asian Equity, Allianz RCM US Equity Fund, Allianz RCM Renminbi Currency, Allianz US High Yield and Allianz US Large Cap Value in the Republic of Austria were notified to the Finanzmarktaufsicht (Vienna) in accordance with § 140 InvFG.
Paying and Information Agents
Allianz Investmentbank AGHietzinger Kai 101–105A-1130 Vienna
Redemption applications for Shares of the above Subfunds can be submitted to the Austrian Paying and Information Agents, who can pay out redemption proceeds, distributions, if any, and other payments in cash in Euro to the shareholders at their request.
In addition, all necessary investor information can be obtained without charge at the Austrian Paying and Information Agent, such as:– the Prospectus– the Key Investor Information– the Articles of Incorporation– the Annual and Semi-Annual Reports as well as the
subscription, redemption and conversion prices.
It is recommended to the investors to check the acquisition of shares of the subfunds if for the respective share class the required fiscal data are published via Oesterreichische Kontrollbank.
Appointment of Austrian Representative to the Tax Authorities in the Republic of Austria
The following financial institution has been appointed the Austrian representative to the tax authorities for certification of distribution-like income as defined in InvFG 2011 § 186 Para. 2 line 2:
Allianz Investmentbank AGHietzinger Kai 101–105A-1130 Vienna
486
Allianz Global Investors Fund
1. Representative and Paying Agent in Switzerland
BNP Paribas Securities Services, Paris, Succursale de Zurich, Selnaustrasse 16, CH-8002 Zurich, is Representative and Paying Agent in Switzerland for the Shares distributed in Switzerland.
2. Place where the relevant documents may be obtained
The Prospectus and the Key Investor Information, the Articles of Incorporation as well as the Annual and Semi-Annual reports may be obtained without charge from the Representative in Switzerland.
3. Publications
Publications in Switzerland are made in the “Schweizerisches Handelsamtsblatt” and on www.fundinfo.com. In Switzerland, Subscription and Redemption Prices together and/or the Net Asset Value (with the indication “commissions excluded”) of the Shares are published daily on www.fundinfo.com.
4. Payment of remunerations and distribution remuneration
Out of the annual management fee trailer fees may be paid to distributors and reimbursements may be made to investors in accordance with Luxembourg law or the regulations in the respective jurisdictions where the Shares are distributed.
In connection with distribution in Switzerland, the Management Company may pay reimbursements to the following qualified investors who, from the commercial perspective, hold the Shares of collective investment schemes for third parties:
– life insurance companies– pension funds and other retirement provision
institutions– investment foundations– Swiss fund management companies– foreign fund management companies and providers– investment companies.
In connection with distribution in Switzerland, the Management Company may pay distribution remunerations to the following distributors and sales partners:
– distributors subject to the duty to obtain authorization pursuant to Art. 19.1 CISA
– distributors exempt from the duty to obtain authorization pursuant to Art. 19.4 CISA and Art. 8 CISO
– sales partners who place units in collective investment schemes exclusively with institutional investors with professional treasury facilities
– sales partners who place units in collective investment schemes exclusively on the basis of a written asset management mandate.
5. Place of performance and jurisdiction
The place of performance and jurisdiction for Shares distributed in Switzerland is at the registered office of the Representative in Switzerland.
Note for Investors in Switzerland
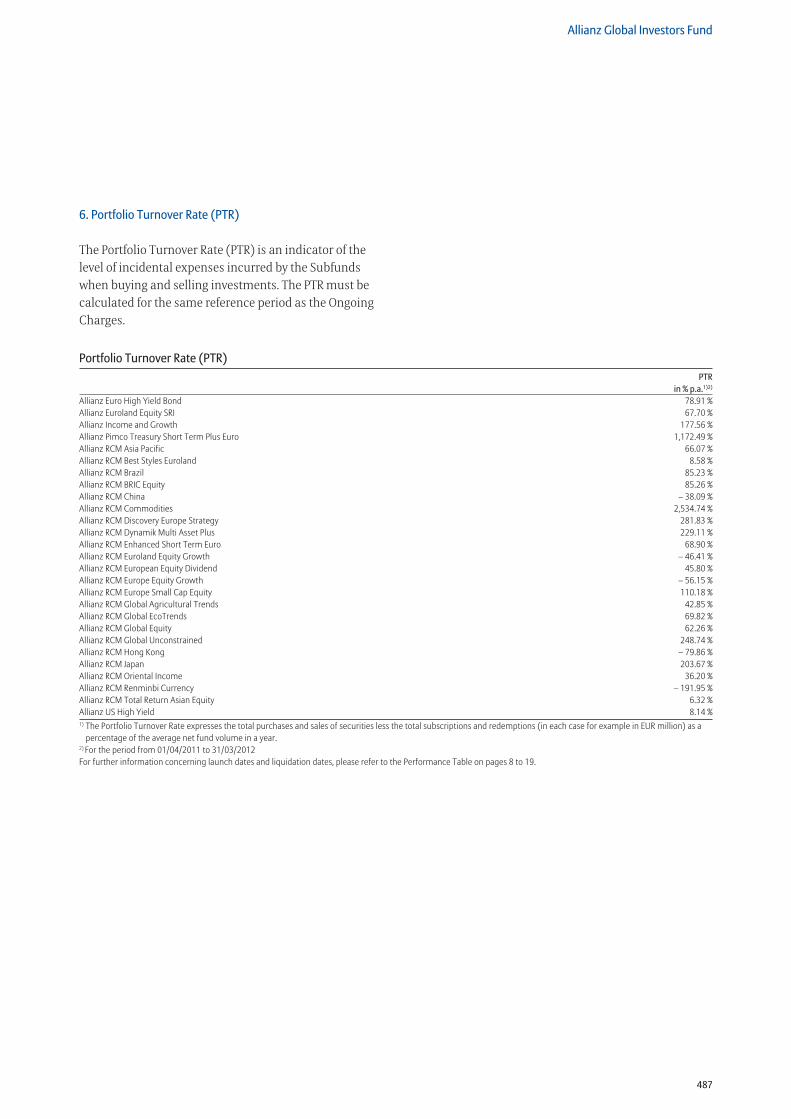
487
Allianz Global Investors Fund
6. Portfolio Turnover Rate (PTR)
The Portfolio Turnover Rate (PTR) is an indicator of the level of incidental expenses incurred by the Subfunds when buying and selling investments. The PTR must be calculated for the same reference period as the Ongoing Charges.
Portfolio Turnover Rate (PTR) PTR in % p.a.1)2)
Allianz Euro High Yield Bond 78.91 % Allianz Euroland Equity SRI 67.70 % Allianz Income and Growth 177.56 % Allianz Pimco Treasury Short Term Plus Euro 1,172.49 % Allianz RCM Asia Pacific 66.07 % Allianz RCM Best Styles Euroland 8.58 % Allianz RCM Brazil 85.23 % Allianz RCM BRIC Equity 85.26 % Allianz RCM China – 38.09 % Allianz RCM Commodities 2,534.74 % Allianz RCM Discovery Europe Strategy 281.83 % Allianz RCM Dynamik Multi Asset Plus 229.11 % Allianz RCM Enhanced Short Term Euro 68.90 % Allianz RCM Euroland Equity Growth – 46.41 % Allianz RCM European Equity Dividend 45.80 % Allianz RCM Europe Equity Growth – 56.15 % Allianz RCM Europe Small Cap Equity 110.18 % Allianz RCM Global Agricultural Trends 42.85 % Allianz RCM Global EcoTrends 69.82 % Allianz RCM Global Equity 62.26 % Allianz RCM Global Unconstrained 248.74 % Allianz RCM Hong Kong – 79.86 % Allianz RCM Japan 203.67 % Allianz RCM Oriental Income 36.20 % Allianz RCM Renminbi Currency – 191.95 % Allianz RCM Total Return Asian Equity 6.32 % Allianz US High Yield 8.14 %1) The Portfolio Turnover Rate expresses the total purchases and sales of securities less the total subscriptions and redemptions (in each case for example in EUR million) as a
percentage of the average net fund volume in a year.2) For the period from 01/04/2011 to 31/03/2012For further information concerning launch dates and liquidation dates, please refer to the Performance Table on pages 8 to 19.
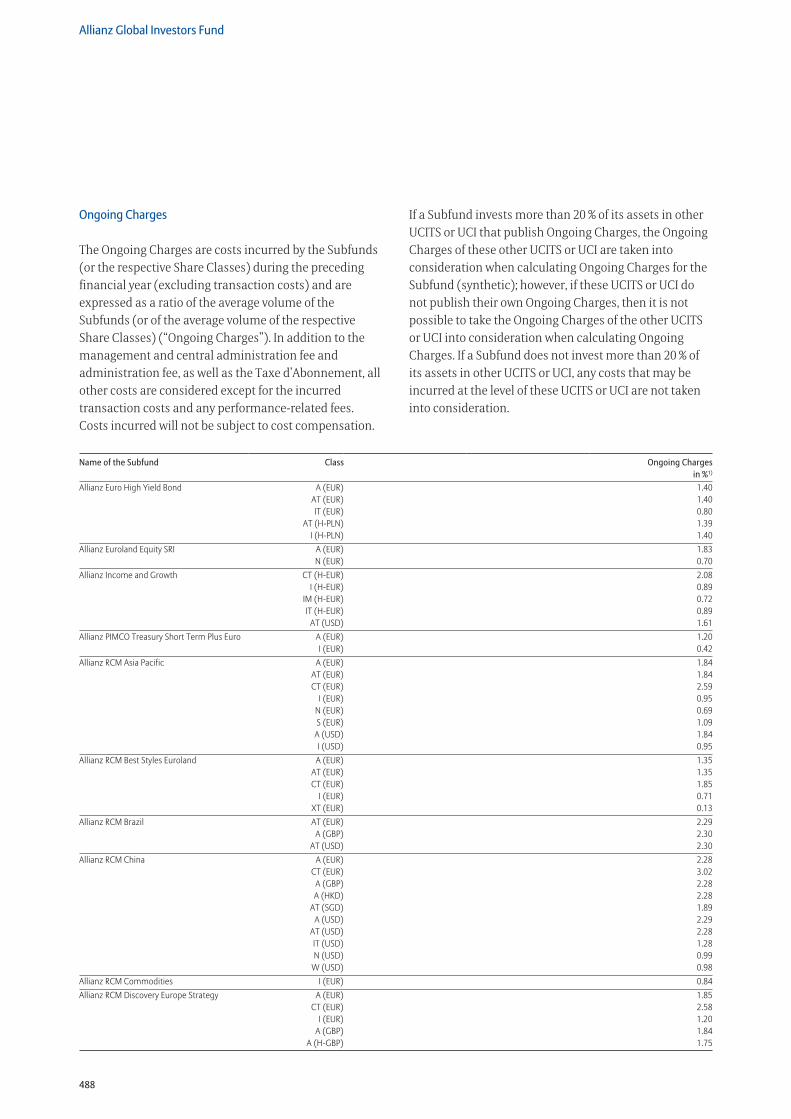
488
Allianz Global Investors Fund
Ongoing Charges
The Ongoing Charges are costs incurred by the Subfunds (or the respective Share Classes) during the preceding financial year (excluding transaction costs) and are expressed as a ratio of the average volume of the Subfunds (or of the average volume of the respective Share Classes) (“Ongoing Charges”). In addition to the management and central administration fee and administration fee, as well as the Taxe d’Abonnement, all other costs are considered except for the incurred transaction costs and any performance-related fees. Costs incurred will not be subject to cost compensation.
Name of the Subfund Class Ongoing Charges in %1)
Allianz Euro High Yield Bond A (EUR) 1.40 AT (EUR) 1.40 IT (EUR) 0.80 AT (H-PLN) 1.39 I (H-PLN) 1.40Allianz Euroland Equity SRI A (EUR) 1.83 N (EUR) 0.70Allianz Income and Growth CT (H-EUR) 2.08 I (H-EUR) 0.89 IM (H-EUR) 0.72 IT (H-EUR) 0.89 AT (USD) 1.61Allianz PIMCO Treasury Short Term Plus Euro A (EUR) 1.20 I (EUR) 0.42Allianz RCM Asia Pacific A (EUR) 1.84 AT (EUR) 1.84 CT (EUR) 2.59 I (EUR) 0.95 N (EUR) 0.69 S (EUR) 1.09 A (USD) 1.84 I (USD) 0.95Allianz RCM Best Styles Euroland A (EUR) 1.35 AT (EUR) 1.35 CT (EUR) 1.85 I (EUR) 0.71 XT (EUR) 0.13Allianz RCM Brazil AT (EUR) 2.29 A (GBP) 2.30 AT (USD) 2.30Allianz RCM China A (EUR) 2.28 CT (EUR) 3.02 A (GBP) 2.28 A (HKD) 2.28 AT (SGD) 1.89 A (USD) 2.29 AT (USD) 2.28 IT (USD) 1.28 N (USD) 0.99 W (USD) 0.98Allianz RCM Commodities I (EUR) 0.84Allianz RCM Discovery Europe Strategy A (EUR) 1.85 CT (EUR) 2.58 I (EUR) 1.20 A (GBP) 1.84 A (H-GBP) 1.75
If a Subfund invests more than 20 % of its assets in other UCITS or UCI that publish Ongoing Charges, the Ongoing Charges of these other UCITS or UCI are taken into consideration when calculating Ongoing Charges for the Subfund (synthetic); however, if these UCITS or UCI do not publish their own Ongoing Charges, then it is not possible to take the Ongoing Charges of the other UCITS or UCI into consideration when calculating Ongoing Charges. If a Subfund does not invest more than 20 % of its assets in other UCITS or UCI, any costs that may be incurred at the level of these UCITS or UCI are not taken into consideration.
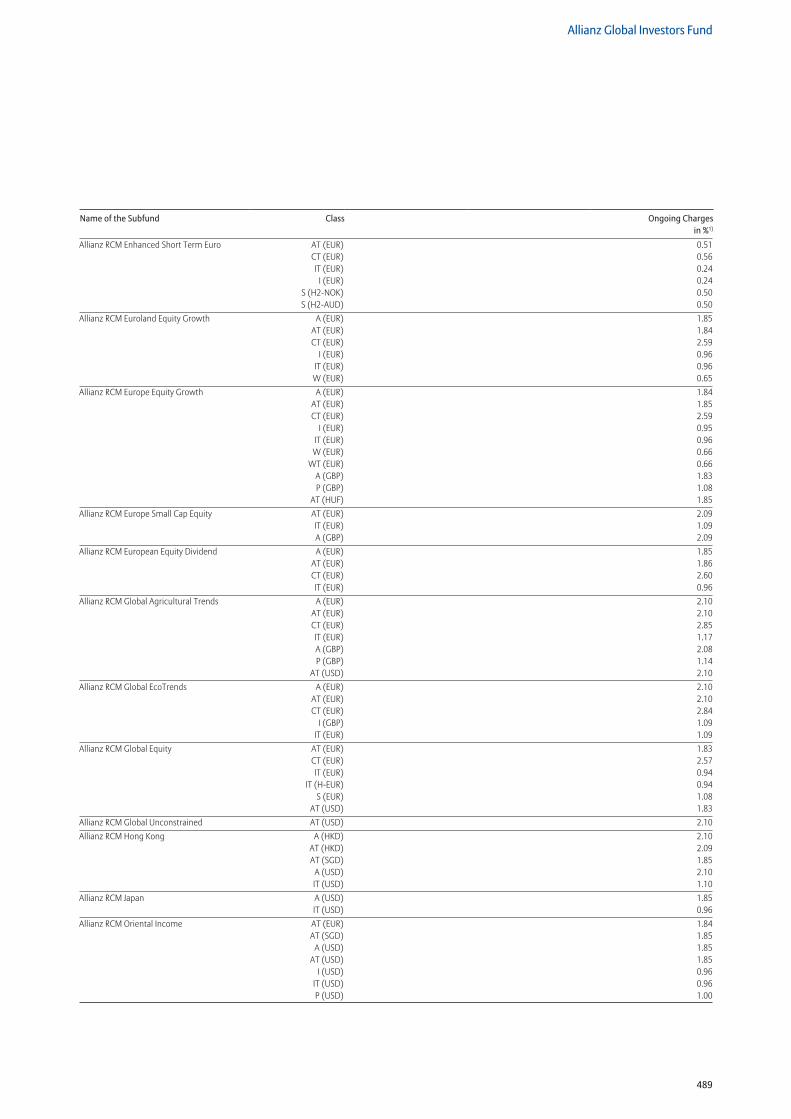
489
Allianz Global Investors Fund
Allianz RCM Enhanced Short Term Euro AT (EUR) 0.51 CT (EUR) 0.56 IT (EUR) 0.24 I (EUR) 0.24 S (H2-NOK) 0.50 S (H2-AUD) 0.50Allianz RCM Euroland Equity Growth A (EUR) 1.85 AT (EUR) 1.84 CT (EUR) 2.59 I (EUR) 0.96 IT (EUR) 0.96 W (EUR) 0.65Allianz RCM Europe Equity Growth A (EUR) 1.84 AT (EUR) 1.85 CT (EUR) 2.59 I (EUR) 0.95 IT (EUR) 0.96 W (EUR) 0.66 WT (EUR) 0.66 A (GBP) 1.83 P (GBP) 1.08 AT (HUF) 1.85Allianz RCM Europe Small Cap Equity AT (EUR) 2.09 IT (EUR) 1.09 A (GBP) 2.09Allianz RCM European Equity Dividend A (EUR) 1.85 AT (EUR) 1.86 CT (EUR) 2.60 IT (EUR) 0.96 Allianz RCM Global Agricultural Trends A (EUR) 2.10 AT (EUR) 2.10 CT (EUR) 2.85 IT (EUR) 1.17 A (GBP) 2.08 P (GBP) 1.14 AT (USD) 2.10Allianz RCM Global EcoTrends A (EUR) 2.10 AT (EUR) 2.10 CT (EUR) 2.84 I (GBP) 1.09 IT (EUR) 1.09Allianz RCM Global Equity AT (EUR) 1.83 CT (EUR) 2.57 IT (EUR) 0.94 IT (H-EUR) 0.94 S (EUR) 1.08 AT (USD) 1.83Allianz RCM Global Unconstrained AT (USD) 2.10Allianz RCM Hong Kong A (HKD) 2.10 AT (HKD) 2.09 AT (SGD) 1.85 A (USD) 2.10 IT (USD) 1.10Allianz RCM Japan A (USD) 1.85 IT (USD) 0.96Allianz RCM Oriental Income AT (EUR) 1.84 AT (SGD) 1.85 A (USD) 1.85 AT (USD) 1.85 I (USD) 0.96 IT (USD) 0.96 P (USD) 1.00
Name of the Subfund Class Ongoing Charges in %1)
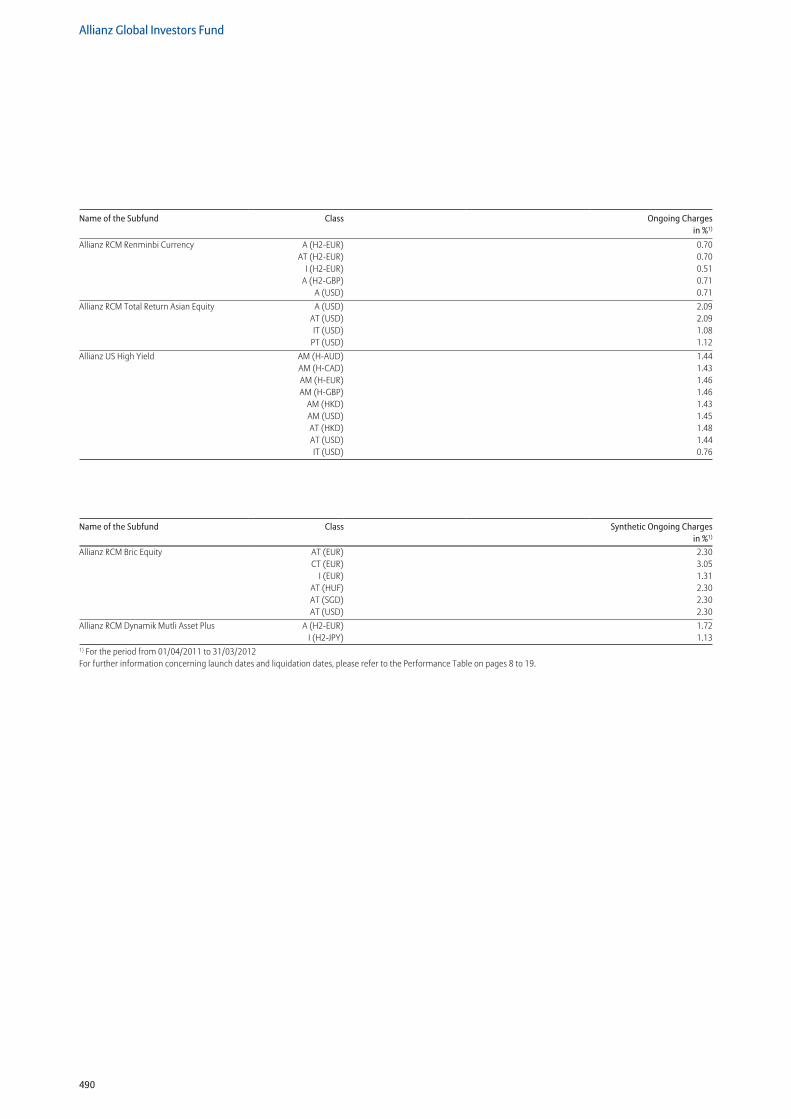
490
Allianz Global Investors Fund
Name of the Subfund Class Synthetic Ongoing Charges in %1)
Allianz RCM Bric Equity AT (EUR) 2.30 CT (EUR) 3.05 I (EUR) 1.31 AT (HUF) 2.30 AT (SGD) 2.30 AT (USD) 2.30Allianz RCM Dynamik Mutli Asset Plus A (H2-EUR) 1.72 I (H2-JPY) 1.131) For the period from 01/04/2011 to 31/03/2012 For further information concerning launch dates and liquidation dates, please refer to the Performance Table on pages 8 to 19.
Allianz RCM Renminbi Currency A (H2-EUR) 0.70 AT (H2-EUR) 0.70 I (H2-EUR) 0.51 A (H2-GBP) 0.71 A (USD) 0.71Allianz RCM Total Return Asian Equity A (USD) 2.09 AT (USD) 2.09 IT (USD) 1.08 PT (USD) 1.12Allianz US High Yield AM (H-AUD) 1.44 AM (H-CAD) 1.43 AM (H-EUR) 1.46 AM (H-GBP) 1.46 AM (HKD) 1.43 AM (USD) 1.45 AT (HKD) 1.48 AT (USD) 1.44 IT (USD) 0.76
Name of the Subfund Class Ongoing Charges in %1)
491
Allianz Global Investors Fund
Directory
Board of Directors
ChairmanDr. Thomas Wiesemann Chief Executive Officer Global SolutionsAllianz Global Investors Holding GmbHMunich
Members of the Board of DirectorsJean-Christoph ArntzChief Executive OfficerAllianz Global Investors Luxembourg S.A.Senningerberg
Daniel LehmannManaging DirectorAllianz Global Investors GmbHFrankfurt/Main
George McKayChief Operating Officer Asia PacificAllianz Global Investors Asia Pacific GmbHMunich
Markus NillesMember of the Board of ManagementAllianz Global Investors Luxembourg S.A.Senningerberg
Registered Office of the Company6A, route de Trèves L-2633 Senningerberg
Management Company and Central AdministrationAllianz Global Investors Luxembourg S.A.6A, route de TrèvesL-2633 Senningerberg
Shareholders’ equity as at 31 December 2011:EUR 122 million
Investment Manager/ Sub-Investment ManagerAllianz Global Investors Capital LLC (“AGI Capital”)600 West Broadway, 31st FloorSan Diego, CA 92101USA
Allianz Global Investors France SA (“AllianzGI France”)20, rue Le Peletier75444 Paris, Cedex 09France
Allianz Global Investors Italia SGR S.p.A. (“Allianz Italia”)Piazza Velasca 7/920122 MilanItaly
Allianz Global Investors Kapitalanlagegesellschaft mbH (“AllianzGI KAG”)Mainzer Landstraße 11–13D-60329 Frankfurt/Main
AllianzGI KAG is part of the Allianz Global InvestorsGroup, a company of the Allianz Group. AllianzGI KAG was established in 1955 as a capital investment company named DEUTSCHER INVESTMENT-TRUST Gesellschaft für Wertpapieranlagen mbH; as of 31 December 2011 AllianzGI KAG managed assets worth approximately EUR 24.2 billion. AllianzGI KAG is also the parent company of the Management Company.
Allianz Global Investors Singapore Limited (“AllianzGI Singapore”)3 Temasek Avenue, # 07–05 Centennial TowerSingapore 039190
Commerzbank AGKaiserplatzD-60261 Frankfurt/Main
NFJ Investment Group LLC (“NFJ Investment Group”)2100 Ross Avenue, Suite 700Dallas, Texas 75201USA
PIMCO Europe Ltd. (“PIMCO Europe”)103, Wigmore Street First FloorLondon W1U 1QSUnited Kingdom
PIMCO Deutschland GmbH (“PIMCO GmbH”)Seidlstraße 24–24aD-80335 MünchenGermany
RCM Asia Pacific Limited (“RCM AP”)27/F, ICBC Tower3 Garden RoadCentralHong Kong
RCM Capital Management LLC (“RCM USA”)555 Mission Street Suite 1700San Francisco CA 94105USA
RCM Japan Co., Ltd. (“RCM Japan”)14th Floor, Izumi Garden Tower1-6-1 Roppongi, Minato-kuTokyo106-6014Japan
RCM (UK) Ltd. (“RCM UK”)PO Box 191155 BishopsgateGB-London EC2M 3ADUnited Kingdom
Custodian, Subsequent Monitoring of Investment Limits and Restrictions, Fund Accounting and NAV CalculationState Street Bank Luxembourg S.A.49, Avenue J.F. KennedyL-1855 Luxembourg
Registrar and Transfer AgentRBC Dexia Investors Services Bank S.A.14, Porte de FranceL-4360 Esch-sur-Alzette
492
Allianz Global Investors Fund
Distributors
Main Distributor in Europe (with the exception of Germany)Allianz Global Investors Europe GmbHSeidlstraße 24–24aD-80635 Munich
in LuxembourgAllianz Global Investors Luxembourg S.A.6A, route de TrèvesL-2633 Senningerberg
in the Federal Republic of GermanyCommerzbank AGKaiserplatzD-60261 Frankfurt/Main
in FranceAllianz Global Investors France SA20, rue le PeletierF-75444 ParisCedex 09, France
in GreeceAllianz Mutual Fund Management Hellas S.A.110 Athinon Ave, Building CGR-10442 Athens
in HungaryCitibank Europe plc Hungarian Branch OfficeSzabadság tér 7HU-1051 Budapest
in ItalyAllianz Bank Financial Advisors S.p.A.Piazzale Lodi 3I-20137 Milan
in the NetherlandsAllianz Global Investors Europe GmbH – the Netherlands branchBuizerdlaan 12NL-3435 SB Nieuwegein
in PortugalBanco Electrónico de Serviço Total S.A.Rua Alexandre Herculano, 38–4°P-1250-011 Lisbon
in SpainAllianz Global Investors Europe GmbH Sucursal en EspañaRamírez de Arellano, 35, Planta 4ªE-28046 Madrid
in the United KingdomAllianz Global Investors (UK) Ltd.155 BishopsgateGB-London EC2M 3AD
Allianz Global Investors Europe GmbH UK Branch155 BishopsgateGB-London EC2M 3AD
RCM (UK) Ltd.155 BishopsgateGB-London EC2M 3AD
Main Distributor in AsiaAllianz Global Investors Hong Kong Limited27/F, ICBC Tower3 Garden RoadCentralHong Kong
Main Distributor in Switzerland(only for Allianz Euro High Yield Bond, Allianz Euroland Equity SRI, Allianz Income and Growth, Allianz PIMCO Treasury Short Term Plus Euro, Allianz RCM Asia Pacific, Allianz RCM Best Styles Euroland, Allianz RCM Brazil, Allianz RCM BRIC Equity, Allianz RCM China, Allianz RCM Commodities, Allianz RCM Discovery Europe Strategy, Allianz RCM Dynamic Multi Asset Plus, Allianz RCM Enhanced Short Term Euro, Allianz RCM Euroland Equity Growth, Allianz RCM Europe Small Cap Equity, Allianz RCM Europe Equity Growth, Allianz RCM European Equity Dividend, Allianz RCM Global Agricultural Trends, Allianz RCM Global EcoTrends, Allianz RCM Global Equity, Allianz RCM Global Metals and Mining, Allianz RCM Global Unconstrained, Allianz RCM Hong Kong, Allianz RCM Japan, Allianz RCM Oriental Income, Allianz RCM Total Return Asian Equity,Allianz RCM Renminbi Currency and Allianz US High Equity)
Allianz Global Investors Europe GmbH Zurich Branch Bleicherweg 19PostfachCH-8022 Zurich
Information Agent in the Federal Republic of GermanyAllianz Global Investors Kapitalanlagegesellschaft mbH (“AllianzGI KAG”)Mainzer Landstraße 11–13D-60329 Frankfurt/Main
Sales & Product ServicesE-mail: [email protected]
Paying Agent in the Federal Republic of GermanyCommerzbank AGKaiserplatzD-60261 Frankfurt/Main
Paying and Information Agents
in LuxembourgState Street Bank Luxembourg S.A.49, Avenue J.F. KennedyL-1855 Luxembourg
in Austria(only for Allianz US Large Cap Value, Allianz Flexible Bond Strategy, Allianz Euro High Yield Bond, Allianz Euroland Equity SRI, Allianz Income and Growth, Allianz PIMCO Treasury Short Term Plus Euro, Allianz RCM Asia Pacific, Allianz RCM Brazil, Allianz RCM BRIC Equity, Allianz RCM China, Allianz RCM Discovery Europe Strategy, Allianz RCM Dynamic Multi Asset Plus, Allianz RCM Enhanced Short Term Euro, Allianz RCM Euroland Equity Growth, Allianz RCM Europe Equity Growth, Allianz RCM Europe Small Cap Equity, Allianz RCM European Equity Dividend, Allianz RCM Global Agricultural Trends, Allianz RCM Global EcoTrends, Allianz RCM Global Equity, Allianz RCM Global Metals and Mining, Allianz RCM Global Sustainability, Allianz RCM Global Unconstrained, Allianz RCM Growing Markets Protect, Allianz RCM Hong Kong, Allianz RCM Oriental Income, Allianz RCM Tiger, Allianz RCM Total Return Asian Equity, Allianz RCM US Equity Fund, Allianz RCM Renminbi Currency and Allianz US High Yield)
Allianz Investmentbank AGHietzinger Kai 101–105A-1130 Vienna
in BelgiumRBC Dexia Investor Services Belgium S.A.Place Rogier 11B-1210 Bruxelles
493
Allianz Global Investors Fund
in FranceSociété Générale29, boulevard HaussmannF-75009 Paris
in IrelandAllianz Global Investors Ireland Limited2nd Floor, Block EIveagh CourtHarcourt RoadIRE-Dublin 2
in ItalyAllfunds Bank S.A. – Milan branchVia Santa Margherita, 7I-20121 Milan
Allianz Bank Financial Advisors S.p.A.Piazzale Lodi 3I-20122 Milan
BNP Paribas Securities ServicesVia Ansperto No. 5 I-20123 Milan
Société Générale Securities Services S.p.A.Sede legale Via Benigno Crespi, 19/A – MAC 2 – I-20159 Milan
in PortugalBanco Electrónico de Serviço Total S.A.Rua Alexandre Herculano, 38–4°P-1250-011 Lisbon
in SwedenSkandinaviska Enskilda Banken AB (publ)Kungsträdgårdsg 8SE-10640 Stockholm
in Switzerland(only for Allianz Euro High Yield Bond, Allianz Euroland Equity SRI, Allianz Income and Growth, Allianz PIMCO Treasury Short Term Plus Euro, Allianz RCM Asia Pacific, Allianz RCM Best Styles Euroland, Allianz RCM Brazil, Allianz RCM BRIC Equity, Allianz RCM China, Allianz RCM Commodities, Allianz RCM Discovery Europe Strategy, Allianz RCM Dynamic Multi Asset Plus, Allianz RCM Enhanced Short Term Euro, Allianz RCM Euroland Equity Growth, Allianz RCM Europe Small Cap Equity, Allianz RCM Europe Equity Growth, Allianz RCM European Equity Dividend, Allianz RCM Global Agricultural Trends, Allianz RCM Global EcoTrends, Allianz RCM Global Equity, Allianz RCM Global Metals and Mining, Allianz RCM Global Unconstrained, Allianz RCM Hong Kong, Allianz RCM Japan, Allianz RCM Oriental Income, Allianz RCM Total Return Asian Equity,Allianz RCM Renminbi Currency and Allianz US High Equity)
BNP Paribas Securities Services, Paris Succursale de ZurichSelnaustrasse 16CH-8002 Zurich
Appointment of Austrian Representative to the Tax Authorities in the Republic of AustriaThe following financial institution has been appointed the Austrian representative to the tax authorities for certification of distribution-like income as defined in InvFG 2011 § 186 Para. 2 line 2 InvFG:
Allianz Investmentbank AGHietzinger Kai 101–105A-1130 Vienna
Appointment of Denmark Representative Nordea Bank Denmark A/SIssuer Services, Securities ServicesHermes Hus, Helgeshøj Allé 33Postbox 850DK-0900 Copenhagen C
UK Facilities AgentAllianz Global Investors Europe GmbH UK Branch
155 BishopsgateGB-London EC2M 3AD
The Prospectus and the Key Investor Information, the Articles of Incorporation, the respective annual and semi-annual reports, price information as well as information on the redemption procedure can be obtained free of charge from the the above address.
Any complaints may be sent to The ComplaintsOfficer at the above address. A copy of our complaints process leaflet is available on request. Eligible complainants may also refer their complaint to the Financial Ombudsman Service if they are not satisfied with the final response from Allianz Global Investors Europe GmbH UK Branch.
AuditorPricewaterhouseCoopers S.à r.l.400, Route d’EschB.P. 1443L-1014 Luxembourg
The Management Company is, in its country of incorporation, subject to public supervision with regard to the investment business.
The Management Company notified the Bundesanstalt für Finanzdienstleistungsaufsicht (BaFin) of its intention to market shares of all Subfunds in Germany. The rights resulting from this notification have not lapsed.
Dated: 31 March 2012