Quilter Investors OEIC
449
Quilter Investors OEIC Interim Report and Financial Statements (unaudited) For the period from 1 January 2018 to 30 June 2018
-
Upload
khangminh22 -
Category
Documents
-
view
1 -
download
0
Transcript of Quilter Investors OEIC

Quilter Investors OEIC
Interim Report and Financial Statements (unaudited) For the period from 1 January 2018 to 30 June 2018

Quilter Investors OEIC
Contents
Quilter Investors OEIC
Company Information 8
Report of the Directors of Quilter Investors OEIC 14
Authorised Corporate Director’s report 16
Cross Holdings 19
Statement of the Authorised Corporate Director’s responsibilities 20
Statement of the Depositary’s Responsibilities in Respect of the Scheme and Report of the Depositary to the Shareholders of the Quilter Investors OEIC 21
Quilter Investors Asia Pacific (ex Japan) Equity Fund 22
Investment Manager's review 22 Performance record 23 Portfolio statement 26 Statement of total return 29 Statement of change in net assets attributable to shareholders 29 Balance sheet 30 Notes to the financial statements 31
Quilter Investors Asia Pacific (ex Japan) Large-Cap Equity Fund 32
Investment Manager's review 32 Performance record 33 Portfolio statement 37 Statement of total return 40 Statement of change in net assets attributable to shareholders 40 Balance sheet 41 Notes to the financial statements 42
Quilter Investors Bond 1 Fund 43
Investment Manager's review 43 Performance record 44 Portfolio statement 46 Statement of total return 50 Statement of change in net assets attributable to shareholders 50 Balance sheet 51 Notes to the financial statements 52 Distribution table 53
Quilter Investors Bond 2 Fund 54
Investment Manager's review 54 Performance record 55 Portfolio statement 57 Statement of total return 64 Statement of change in net assets attributable to shareholders 64 Balance sheet 65 Notes to the financial statements 66 Distribution table 67
Quilter Investors Bond 3 Fund 68
Investment Manager's review 68 Performance record 69 Portfolio statement 71 Statement of total return 90 Statement of change in net assets attributable to shareholders 90 Balance sheet 91 Notes to the financial statements 92 Distribution table 93

Quilter Investors OEIC
Contents (continued)
Quilter Investors OEIC
Quilter Investors China Equity Fund 94
Investment Manager's review 94 Performance record 95 Portfolio statement 98 Statement of total return 101 Statement of change in net assets attributable to shareholders 101 Balance sheet 102 Notes to the financial statements 103 Distribution table 104
Quilter Investors Corporate Bond Fund 105
Investment Manager's review 105 Performance record 106 Portfolio statement 108 Statement of total return 112 Statement of change in net assets attributable to shareholders 112 Balance sheet 113 Notes to the financial statements 114 Distribution table 115
Quilter Investors Diversified Bond Fund 116
Investment Manager's review 116 Performance record 117 Portfolio statement 119 Statement of total return 123 Statement of change in net assets attributable to shareholders 123 Balance sheet 124 Notes to the financial statements 125 Distribution table 126
Quilter Investors Emerging Markets Bond Fund 127
Investment Manager's review 127 Performance record 128 Portfolio statement 130 Statement of total return 137 Statement of change in net assets attributable to shareholders 137 Balance sheet 138 Notes to the financial statements 139 Distribution table 140
Quilter Investors Emerging Markets Equity Fund 141
Investment Manager's review 141 Performance record 142 Portfolio statement 144 Statement of total return 146 Statement of change in net assets attributable to shareholders 146 Balance sheet 147 Notes to the financial statements 148
Quilter Investors Emerging Markets Equity Growth Fund 149
Investment Manager's review 149 Performance record 150 Portfolio statement 154 Statement of total return 157 Statement of change in net assets attributable to shareholders 157 Balance sheet 158 Notes to the financial statements 159
Quilter Investors Emerging Markets Equity Income Fund 160
Investment Manager's review 160 Performance record 161 Portfolio statement 163 Statement of total return 167 Statement of change in net assets attributable to shareholders 167 Balance sheet 168 Notes to the financial statements 169 Distribution table 170

Quilter Investors OEIC
Contents (continued)
Quilter Investors OEIC
Quilter Investors Europe (ex UK) Equity Fund 171
Investment Manager's review 171 Performance record 172 Portfolio statement 175 Statement of total return 178 Statement of change in net assets attributable to shareholders 178 Balance sheet 179 Notes to the financial statements 180
Quilter Investors Europe (ex UK) Equity Growth Fund 181
Investment Manager's review 181 Performance record 182 Portfolio statement 185 Statement of total return 187 Statement of change in net assets attributable to shareholders 187 Balance sheet 188 Notes to the financial statements 189
Quilter Investors Europe (ex UK) Equity Income Fund 190
Investment Manager's review 190 Performance record 191 Portfolio statement 193 Statement of total return 196 Statement of change in net assets attributable to shareholders 196 Balance sheet 197 Notes to the financial statements 198
Quilter Investors Europe (ex UK) Small/Mid-Cap Equity Fund 199
Investment Manager's review 199 Performance record 200 Portfolio statement 202 Statement of total return 204 Statement of change in net assets attributable to shareholders 204 Balance sheet 205 Notes to the financial statements 206
Quilter Investors Foundation 3 Fund 207
Investment Manager's review 207 Performance record 208 Portfolio statement 212 Statement of total return 215 Statement of change in net assets attributable to shareholders 215 Balance sheet 216 Notes to the financial statements 217 Distribution table 218
Quilter Investors Foundation 4 Fund 219
Investment Manager's review 219 Performance record 220 Portfolio Statement 224 Statement of total return 230 Statement of change in net assets attributable to shareholders 230 Balance sheet 231 Notes to the financial statements 232 Distribution table 233
Quilter Investors Foundation 5 Fund 234
Investment Manager's review 234 Performance record 235 Portfolio Statement 238 Statement of total return 241 Statement of change in net assets attributable to shareholders 241 Balance sheet 242 Notes to the financial statements 243 Distribution table 244

Quilter Investors OEIC
Contents (continued)
Quilter Investors OEIC
Quilter Investors Gilt Index Fund 245
Investment Manager's review 245 Performance record 246 Portfolio statement 250 Statement of total return 251 Statement of change in net assets attributable to shareholders 251 Balance sheet 252 Notes to the financial statements 253 Distribution table 254
Quilter Investors Global Equity Absolute Return Fund 255
Investment Manager's review 255 Performance record 256 Portfolio statement 258 Statement of total return 259 Statement of change in net assets attributable to shareholders 259 Balance sheet 260 Notes to the financial statements 261
Quilter Investors Global Equity Growth Fund 262
Investment Manager's review 262 Performance record 263 Portfolio statement 266 Statement of total return 270 Statement of change in net assets attributable to shareholders 270 Balance sheet 271 Notes to the financial statements 272
Quilter Investors Global Equity Index Fund 273
Investment Manager's review 273 Performance record 274 Portfolio statement 276 Statement of total return 277 Statement of change in net assets attributable to shareholders 277 Balance sheet 278 Notes to the financial statements 279 Distribution table 280
Quilter Investors Global Equity Value Fund 281
Investment Manager's review 281 Performance record 283 Portfolio statement 287 Statement of total return 290 Statement of change in net assets attributable to shareholders 290 Balance sheet 291 Notes to the financial statements 292 Distribution table 293
Quilter Investors Global Property Securities Fund 295
Investment Manager's review 295 Performance record 297 Portfolio statement 300 Statement of total return 304 Statement of change in net assets attributable to shareholders 304 Balance sheet 305 Notes to the financial statements 306 Distribution table 307
Quilter Investors High Yield Bond Fund 308
Investment Manager's review 308 Performance record 309 Portfolio statement 313 Statement of total return 318 Statement of change in net assets attributable to shareholders 318 Balance sheet 319 Notes to the financial statements 320 Distribution table 321
Quilter Investors OEIC
Contents (continued)
Quilter Investors OEIC
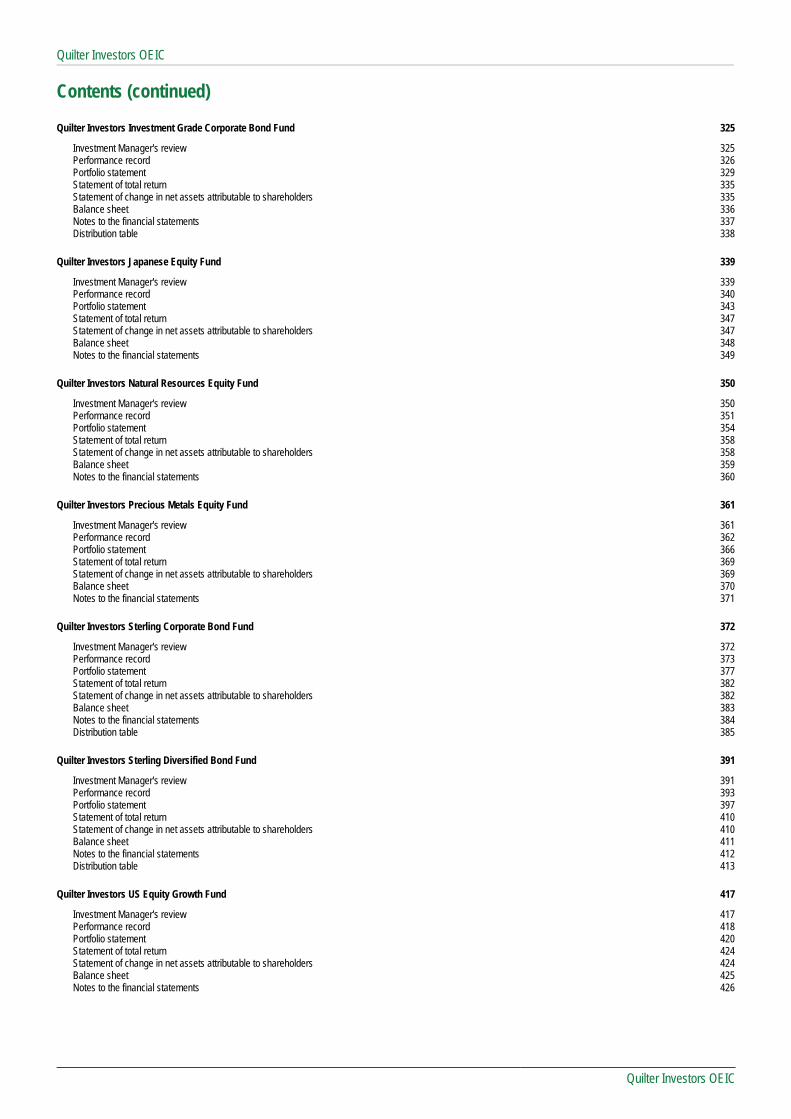
Quilter Investors Investment Grade Corporate Bond Fund 325
Investment Manager's review 325 Performance record 326 Portfolio statement 329 Statement of total return 335 Statement of change in net assets attributable to shareholders 335 Balance sheet 336 Notes to the financial statements 337 Distribution table 338
Quilter Investors Japanese Equity Fund 339
Investment Manager's review 339 Performance record 340 Portfolio statement 343 Statement of total return 347 Statement of change in net assets attributable to shareholders 347 Balance sheet 348 Notes to the financial statements 349
Quilter Investors Natural Resources Equity Fund 350
Investment Manager's review 350 Performance record 351 Portfolio statement 354 Statement of total return 358 Statement of change in net assets attributable to shareholders 358 Balance sheet 359 Notes to the financial statements 360
Quilter Investors Precious Metals Equity Fund 361
Investment Manager's review 361 Performance record 362 Portfolio statement 366 Statement of total return 369 Statement of change in net assets attributable to shareholders 369 Balance sheet 370 Notes to the financial statements 371
Quilter Investors Sterling Corporate Bond Fund 372
Investment Manager's review 372 Performance record 373 Portfolio statement 377 Statement of total return 382 Statement of change in net assets attributable to shareholders 382 Balance sheet 383 Notes to the financial statements 384 Distribution table 385
Quilter Investors Sterling Diversified Bond Fund 391
Investment Manager's review 391 Performance record 393 Portfolio statement 397 Statement of total return 410 Statement of change in net assets attributable to shareholders 410 Balance sheet 411 Notes to the financial statements 412 Distribution table 413
Quilter Investors US Equity Growth Fund 417
Investment Manager's review 417 Performance record 418 Portfolio statement 420 Statement of total return 424 Statement of change in net assets attributable to shareholders 424 Balance sheet 425 Notes to the financial statements 426

Quilter Investors OEIC
Contents (continued) Page
Quilter Investors OEIC
Quilter Investors US Equity Income Fund 427
Investment Manager's review 427 Performance record 428 Portfolio statement 430 Statement of total return 433 Statement of change in net assets attributable to shareholders 433 Balance sheet 434 Notes to the financial statements 435 Distribution table 436
Quilter Investors US Equity Small/Mid-Cap Fund 437
Investment Manager's review 437 Performance record 438 Portfolio statement 442 Statement of total return 447 Statement of change in net assets attributable to shareholders 447 Balance sheet 448 Notes to the financial statements 449
Disclaimer: No marketing notification has been submitted for the following sub-funds of the Company: Quilter Investors Asia Pacific (ex Japan) Large-Cap Equity Fund, Quilter Investors Bond 1 Fund, Quilter Investors Bond 2 Fund, Quilter Investors Bond 3 Fund, Quilter Investors China Equity Fund, Quilter Investors Corporate Bond Fund, Quilter Investors Diversified Bond Fund, Quilter Investors Emerging Markets Bond Fund, Quilter Investors Emerging Markets Equity Fund, Quilter Investors Emerging Markets Equity Growth Fund, Quilter Investors Emerging Markets Equity Income Fund, Quilter Investors Europe (ex UK) Equity Fund, Quilter Investors Europe (ex UK) Equity Growth Fund, Quilter Investors Europe (ex UK) Equity Income Fund, Quilter Investors Europe (ex UK) Small/Mid-Cap Equity Fund, Quilter Investors Foundation 3 Fund, Quilter Investors Foundation 4 Fund, Quilter Investors Foundation 5 Fund, Quilter Investors Gilt Index Fund, Quilter Investors Global Equity Absolute Return Fund, Quilter Investors Global Equity Growth Fund, Quilter Investors Global Equity Index Fund, Quilter Investors Global Property Securities Fund, Quilter Investors Investment Grade Corporate Bond Fund, Quilter Investors Japanese Equity Fund, Quilter Investors Precious Metals Equity Fund, Quilter Investors Sterling Corporate Bond Fund, Quilter Investors Sterling Diversified Bond Fund, Quilter Investors US Equity Growth Fund, Quilter Investors US Equity Income Fund, Quilter Investors US Equity Small/Mid Cap Fund and Quilter Investors Absolute Return Government Bond Fund. Accordingly, shares of these sub-funds must not be marketed in Germany.

Quilter Investors OEIC
Company Information
Quilter Investors OEIC
8
Authorised Corporate Director (“ACD”)
Quilter Investors Limited (formerly Old Mutual Investment Management Limited) Millennium Bridge House 2 Lambeth Hill London EC4V 4AJ
Authorised and regulated by the Financial Conduct Authority.
Legal Adviser
Macfarlanes LLP 20 Cursitor Street London EC4A 1LT
Auditor
KPMG LLP Saltire Court 20 Castle Terrace Edinburgh EH1 2EG
Administrator
Citibank Europe plc 1, North Wall Quay Dublin 1 Ireland
Authorised by the Central Bank of Ireland (Central Bank) under the Investment Intermediaries Act. 1995
Registrar
DST Financial Services International Ltd (formerly International Financial Data Services) DST House Saint Nicholas Lane Basildon Essex SS15 5FS
The register of shareholders can be inspected at the above address.
Directors of the ACD M Dean J Brescia (resigned 29 June 2018) P Simpson J Little (appointed 14 February 2018) – Non-Executive Director C Turner (appointed 14 February 2018) – Non-Executive Director

Quilter Investors OEIC
Company Information (continued)
Quilter Investors OEIC
9
Investment Advisers
Quilter Investors Asia Pacific (ex Japan) Equity Fund: Aberdeen Asset Managers Limited 10 Queens Terrace Aberdeen AB10 1YG
Authorised and regulated by the Financial Conduct Authority.
Quilter Investors Asia Pacific (ex Japan) Large-Cap Equity Fund Invesco Asset Management Limited Perpetual Park Perpetual Park Drive Henley-on-Thames Oxfordshire RG9 1HH
Authorised and regulated by the Financial Conduct Authority.
Quilter Investors Bond 1 Fund: TwentyFour Asset Management LLP 24 Cornhill London EC3V 3ND
Authorised and regulated by the Financial Conduct Authority.
Quilter Investors Bond 2 Fund: FIL Pensions Management Oakhill House, 130 Tonbridge Road Hildenborough Tonbridge Kent TN11 9DZ
Authorised and regulated by the Financial Conduct Authority.
Quilter Investors Bond 3 Fund: JPMorgan Asset Management (UK) Limited Finsbury Dials 20 Finsbury Street London EC2Y 9AQ
Authorised and regulated by the Financial Conduct Authority.
Quilter Investors China Equity Fund: Henderson Global Investors Limited 201 Bishopsgate London EC2M 3AE
Authorised and regulated by the Financial Conduct Authority.
Quilter Investors Corporate Bond Fund Old Mutual Global Investors (UK) Limited Millennium Bridge House 2 Lambeth Hill London EC4P 4WR
Authorised and regulated by the Financial Conduct Authority.
Quilter Investors Diversified Bond Fund Old Mutual Global Investors (UK) Limited Millennium Bridge House 2 Lambeth Hill London EC4P 4WR
Authorised and regulated by the Financial Conduct Authority.

Quilter Investors OEIC
Company Information (continued)
Quilter Investors OEIC
10
Investment Advisers (continued) Quilter Investors Emerging Markets Bond Fund Old Mutual Global Investors (UK) Limited Millennium Bridge House 2 Lambeth Hill London EC4P 4WR Authorised and regulated by the Financial Conduct Authority. Quilter Investors Emerging Markets Equity Fund Old Mutual Global Investors (UK) Limited Millennium Bridge House 2 Lambeth Hill London EC4P 4WR Authorised and regulated by the Financial Conduct Authority. Quilter Investors Emerging Markets Equity Growth Fund JPMorgan Asset Management (UK) Limited Finsbury Dials 20 Finsbury Street London EC2Y 9AQ Authorised and regulated by the Financial Conduct Authority. Quilter Investors Emerging Markets Equity Income Fund Wells Capital Management Incorporated 525 Market Street San Francisco, CA 94105 USA Regulated by the US Securities and Exchange Commission. Quilter Investors Europe (ex UK) Equity Fund Henderson Global Investors Limited 201 Bishopsgate London EC2M 3AE Authorised and regulated by the Financial Conduct Authority. Quilter Investors Europe (ex UK) Equity Growth Fund Threadneedle Asset Management Limited 60 St Mary Axe London EC3A 8JQ Authorised and regulated by the Financial Conduct Authority. Quilter Investors Europe (ex UK) Equity Income Fund Schroder Investment Management Limited 31 Gresham Street London EC2V 7QA Authorised and regulated by the Financial Conduct Authority. Quilter Investors Europe (ex UK) Small/Mid-Cap Equity Fund Old Mutual Global Investors (UK) Limited Millennium Bridge House 2 Lambeth Hill London EC4P 4WR Authorised and regulated by the Financial Conduct Authority.

Quilter Investors OEIC
Company Information (continued)
Quilter Investors OEIC
11
Investment Advisers (continued)
Quilter Investors Foundation 4 Fund: Old Mutual Global Investors (UK) Limited Millennium Bridge House 2 Lambeth Hill London EC4P 4WR
Authorised and regulated by the Financial Conduct Authority.
Quilter Investors Gilt Index Fund: BlackRock Investment Management (UK) Limited 12 Throgmorton Avenue London EC2N 2DL
Authorised and regulated by the Financial Conduct Authority.
Quilter Investors Global Equity Absolute Return Fund: Old Mutual Global Investors (UK) Limited Millennium Bridge House 2 Lambeth Hill London EC4P 4WR
Authorised and regulated by the Financial Conduct Authority.
Quilter Investors Global Equity Growth Fund: FIL Pensions Management Oakhill House, 130 Tonbridge Road Hildenborough Tonbridge Kent TN11 9DZ
Authorised and regulated by the Financial Conduct Authority.
Quilter Investors Global Equity Index Fund BlackRock Investment Management (UK) Limited 12 Throgmorton Avenue London EC2N 2DL
Authorised and regulated by the Financial Conduct Authority.
Quilter Investors Global Equity Value Fund Newton Investment Management Limited (sub-adviser) BNY Mellon Centre 160 Queen Victoria Street London EC4V 4L
Authorised and regulated by the Financial Conduct Authority.
Quilter Investors Global Property Securities Fund: Northwood Securities LLC 575 Fifth Avenue 23rd Floor New York NY 10017 USA
Regulated by the US Securities and Exchange Commission.

Quilter Investors OEIC
Company Information (continued)
Quilter Investors OEIC
12
Investment Advisers (continued)
Quilter Investors High Yield Bond Fund: Threadneedle Asset Management Limited 60 St Mary Axe London EC3A 8JQ
Authorised and regulated by the Financial Conduct Authority.
Quilter Investors Investment Grade Corporate Bond Fund: Invesco Asset Management Limited Perpetual Park Perpetual Park Drive Henley-on-Thames Oxfordshire RG9 1HH
Authorised and regulated by the Financial Conduct Authority.
Quilter Investors Japanese Equity Fund: Schroder Investment Management Limited 31 Gresham Street London EC2V 7QA
Authorised and regulated by the Financial Conduct Authority.
Quilter Investors Natural Resources Equity Fund: JPMorgan Asset Management (UK) Limited Finsbury Dials 20 Finsbury Street London EC2Y 9AQ Authorised and regulated by the Financial Conduct Authority. Quilter Investors Precious Metals Equity Fund: BlackRock Investment Management (UK) Limited 12 Throgmorton Avenue London EC2N 2DL
Authorised and regulated by the Financial Conduct Authority.
Quilter Investors Sterling Corporate Bond Fund: FIL Pensions Management Oakhill House 130 Tonbridge Road Hildenborough Tonbridge Kent TN11 9DZ
Authorised and regulated by the Financial Conduct Authority.
Quilter Investors Sterling Diversified Bond Fund: FIL Pensions Management Oakhill House, 130 Tonbridge Road Hildenborough Tonbridge Kent TN11 9DZ
Authorised and regulated by the Financial Conduct Authority.
Quilter Investors US Equity Growth Fund: JPMorgan Asset Management (UK) Limited Finsbury Dials 20 Finsbury Street London EC2Y 9AQ
Authorised and regulated by the Financial Conduct Authority.
Quilter Investors OEIC
Company Information (continued)
Quilter Investors OEIC
13
Investment Advisers (continued)
Quilter Investors US Equity Income Fund BNY Mellon Asset Management North America Corporation (sub-adviser) BNY Mellon Centre 160 Queen Victoria Street London EC4V 4LA
Authorised and regulated by the Financial Conduct Authority. Quilter Investors US Equity Small/Mid-Cap Fund: Schroder Investment Management Limited 31 Gresham Street London EC2V 7QA
Authorised and regulated by the Financial Conduct Authority.
Quilter Investors Limited, a member of the Quilter plc Group of companies, is authorised and regulated by the Financial Conduct Authority. FCA Register number 208543. Registered Office: Millennium Bridge House, 2 Lambeth Hill, London, EC4V 4AJ, United Kingdom. Registered Number: 4227837 England. www.quilterinvestors.com

Quilter Investors OEIC
Report of the Directors of Quilter Investors OEIC
Quilter Investors OEIC
14
Directors’ report
The Directors present the report and financial statements for the Quilter Investors OEIC (“the Company”) for the period from 1 January 2018 to 30 June 2018.
Authorised status
The Company is an Open-Ended Investment Company incorporated as an Investment Company with Variable Capital (“ICVC”) under Regulation 12 (authorisation) of the Open-Ended Investment Company (“OEIC”) Regulations. It is incorporated in the United Kingdom and authorised by the Financial Conduct Authority under the OEIC Regulations 2001 and the Collective Investment Schemes Sourcebook (“the Regulations”). It is a UCITS scheme for the purposes of that part of the Financial Conduct Authority’s Handbook of Rules and Guidance which deals with regulated collective investment schemes (the “Sourcebook”).
Liability
The Company is under the “Protected cell” regime. As such each sub-fund has a specific portfolio of securities to which that sub-fund’s assets and liabilities are attributable. So far as investors are concerned each sub-fund will be treated as a separate entity. The assets of a sub-fund shall not be used or made available to discharge (directly or indirectly) the liabilities of, or claims against, any other person or body, including the Company and any other sub-fund and shall not be available for any such purpose.
Old Mutual reorganisation
On 19 December 2017, Quilter plc (previously Old Mutual Wealth Management Limited) announced it had agreed to sell its single strategy asset management business to the single strategy management team and funds managed by TA Associates, the global growth private equity firm. The transaction completed on 29 June 2018. On 25 April 2018, Old Mutual Investment Management Limited ceased to be part of the Old Mutual Global Investors Group and became a direct subsidiary of Quilter plc. On 27 April 2018, as part of its role as authorised fund manager, Old Mutual Investment Management Limited (OMIML) took over as investment manager of the Company. On 29 June 2018, Old Mutual Investment Management Limited changed its name to Quilter Investors Limited.
Fund launch
The Company launched the following sub-funds.
Sub-fund name Share class Launch date
Quilter Investors Corporate Bond Fund Accumulation U2 GBP 21 June 2018
Quilter Investors Diversified Bond Fund Accumulation U2 GBP 21 June 2018
Quilter Investors Emerging Markets Bond Fund Accumulation U2 GBP 21 June 2018
Quilter Investors Emerging Markets Equity Fund Accumulation U2 GBP 28 June 2018
Quilter Investors Emerging Markets Equity Income Fund Accumulation U2 GBP 8 June 2018
Quilter Investors Europe (ex UK) Small/Mid-Cap Equity Fund Accumulation U2 GBP 28 June 2018
Quilter Investors Global Equity Absolute Return Fund Accumulation U2 GBP 21 June 2018
Quilter Investors US Equity Income Fund Accumulation U2 GBP 8 June 2018


Quilter Investors OEIC
Authorised Corporate Director’s report
Quilter Investors OEIC
16
The purpose of this report is to provide details of the progress of the Fund, and its sub-funds contained within. The report provides details of the performance and the portfolio of each of the sub-funds.
Net asset value of sub-funds
30 June 2018 31 December 2017
Net asset value of
sub-fund
Shares in
issue
Net asset value per
share
Net asset value of
sub-fund
Shares in
issue
Net asset value per
share
Quilter Investors Asia Pacific (ex Japan) Equity Fund
- Accumulation ‘A’ £8,330,467 6,237,024 133.56p £10,357,062 7,671,088 135.01p
- Accumulation ‘A’ EUR £487,343 419,534 116.16p £435,684 371,033 117.42p
- Accumulation ‘A’ USD £37,670 37,949 99.26p £41,607 41,463 100.35p
- Accumulation ‘U2’ £170,348,435 107,487,583 158.48p £155,099,331 97,319,929 159.37p
Quilter Investors Asia Pacific (ex Japan) Large-Cap Equity Fund
- Accumulation ‘A’ £22,269,964 12,106,513 183.95p £24,360,467 12,559,316 193.96p
- Accumulation ‘A’ EUR £31,578 24,305 129.92p £1,370 1,000 136.96p
- Accumulation ‘A’ USD £699,749 570,882 122.57p £472,982 365,955 129.25p
- Accumulation ‘U2’ £172,748,396 87,420,362 197.61p £157,789,786 76,068,954 207.43p
- Income ‘U2’ £11,263 6,326 178.04p £7,467 3,995 186.90p
Quilter Investors Bond 1 Fund
- Income ‘A’ £194,296,931 434,031,528 44.77p £221,264,105 476,965,034 46.39p
Quilter Investors Bond 2 Fund
- Accumulation ‘A’ £125,818,652 137,065,221 91.79p £144,631,825 154,769,973 93.45p
- Income ‘A’ £91,585,583 204,070,555 44.88p £95,935,597 205,964,391 46.58p
Quilter Investors Bond 3 Fund
- Income ‘A’ £187,575,925 587,266,761 31.94p £97,037,480 292,773,278 33.14p
Quilter Investors China Equity Fund
- Accumulation ‘A’ £53,206,198 24,594,248 216.34p £56,200,860 26,368,952 213.13p
- Accumulation ‘A’ EUR £33,956 24,408 139.12p £33,454 24,408 137.06p
- Accumulation ‘A’ USD £1,648,052 1,305,491 126.24p £277,437 223,052 124.38p
- Accumulation ‘U2’ £45,012,432 21,004,364 214.30p £42,371,848 20,160,985 210.17p
Quilter Investors Corporate Bond Fund*
- Accumulation ‘U2’ £148,895,403 149,716,245 99.45p - - -
Quilter Investors Diversified Bond Fund*
- Accumulation ‘U2’ £103,764,067 106,002,647 97.89p - - -
Quilter Investors Emerging Markets Bond Fund*
- Accumulation ‘U2’ £30,155,519 3,127,106 964.33p - - -
Quilter Investors Emerging Markets Equity Fund*
- Accumulation ‘U2’ £75,316,464 7,807,366 964.68p - - -
Quilter Investors Emerging Markets Equity Growth Fund
- Accumulation ‘A’ £6,961,742 5,003,396 139.14p £7,460,608 5,088,568 146.62p
- Accumulation ‘A’ EUR £1,200 1,000 119.99p £1,264 1,000 126.47p
- Accumulation ‘A’ USD £565,223 507,811 111.31p £445,012 379,358 117.31p
- Accumulation ‘U2’ £112,422,838 65,750,381 170.98p £93,449,047 52,097,990 179.37p
- Income ‘U2’ £7,468 4,943 151.07p £7,793 4,917 158.47p
Quilter Investors Emerging Markets Equity Income Fund*
- Accumulation ‘U2’ £63,369,608 66,749,480 94.94p - - -
Quilter Investors Europe (ex UK) Equity Fund
- Accumulation ‘A’ £28,077,771 18,423,087 152.41p £30,470,020 19,815,612 153.77p
- Accumulation ‘A’ EUR £1,026 1,000 102.61p £1,035 1,000 103.55p
- Accumulation ‘A’ USD £400,377 467,565 85.63p £634,683 734,527 86.41p
- Accumulation ‘U2’ £224,205,885 156,109,031 143.62p £212,273,994 147,164,951 144.24p

Quilter Investors OEIC
Authorised Corporate Director’s report
Quilter Investors OEIC
17
Net asset value of sub-funds (continued)
30 June 2018 31 December 2017
Net asset value of
sub-fund
Shares in
issue
Net asset value per
share
Net asset value of
sub-fund
Shares in
issue
Net asset value per
share
Quilter Investors Europe (ex UK) Equity Growth Fund
- Accumulation ‘A’ £6,878,893 4,390,887 156.66p £7,137,381 4,562,514 156.44p
- Accumulation ‘A’ EUR £29,841 28,697 103.99p £29,799 28,697 103.84p
- Accumulation ‘A’ USD £320,128 345,156 92.75p £251,390 271,429 92.62p
- Accumulation ‘U2’ £70,912,568 45,361,969 156.33p £75,352,379 48,486,197 155.41p
Quilter Investors Europe (ex UK) Equity Income Fund
- Accumulation ‘U2’ £74,176,815 65,982,788 112.42p £80,521,533 71,794,010 112.16p
Quilter Investors Europe (ex UK) Small/Mid-Cap Equity Fund*
- Accumulation ‘U2’ £29,726,650 2,963,438 1,003.11p - - -
Quilter Investors Foundation 3 Fund
- Accumulation ‘O’ EUR Hedged £3,514,578 3,425,580 102.60p £3,960,257 3,717,991 106.52p
- Accumulation ‘O’ USD Hedged £5,918,948 6,381,030 92.76p £6,129,043 6,640,431 92.30p
- Accumulation ‘R’ £1,283,773 1,029,723 124.67p £594,632 464,158 128.11p
- Income ‘R’ £48,183 41,718 115.50p £5,151 4,311 119.49p
- Accumulation ‘U1’ £1,210,225 968,328 124.98p £1,020,735 794,936 128.40p
- Income ‘U1’ £149,677 129,554 115.53p £153,115 128,063 119.56p
Quilter Investors Foundation 4 Fund
- Accumulation ‘A’ £48,737,212 36,838,277 132.30p £52,197,025 38,366,879 136.05p
- Accumulation ‘O’ EUR Hedged £2,461,708 2,224,698 110.65p £3,088,975 2,692,353 114.73p
- Accumulation ‘O’ USD Hedged £42,270,072 42,368,742 99.77p £43,988,861 44,380,852 99.12p
- Accumulation ‘R’ £312,994,820 232,430,345 134.66p £337,254,379 244,116,208 138.15p
- Accumulation ‘U1’ £5,017,212 3,722,035 134.80p £4,463,428 3,227,699 138.29p
Quilter Investors Foundation 5 Fund
- Accumulation ‘A’ £48,257,697 34,523,500 139.78p £53,007,389 36,883,591 143.72p
- Accumulation ‘O’ USD Hedged £20,921,079 19,849,470 105.40p £22,175,979 21,176,022 104.72p
- Accumulation ‘R’ £3,754,864 2,638,227 142.33p £4,069,846 2,787,760 145.99p
- Accumulation ‘U1’ £748,473 525,005 142.56p £963,266 658,798 146.22p
Quilter Investors Gilt Index Fund
- Accumulation ‘A’ £41,926,216 48,450,840 86.53p £42,473,337 49,124,150 86.46p
- Income ‘A’ £81,842 118,387 69.13p £87,328 124,724 70.02p
- Income ‘R’ £2,737,239 3,894,995 70.28p £2,744,118 3,861,053 71.07p
- Accumulation 'U2' £263,244,882 211,447,146 124.50p £222,797,381 179,463,409 124.15p
- Income 'U2' £12,811 11,522 111.19p £14,730 13,107 112.39p
Quilter Investors Global Equity Absolute Return Fund*
- Accumulation 'U2' £301,705,600 30,991,500 973.51p - - -
Quilter Investors Global Equity Growth Fund
- Accumulation ‘A’ £35,623,297 19,218,446 185.36p £35,553,961 19,852,417 179.09p
- Accumulation ‘A’ EUR £8,478 7,226 117.33p £8,191 7,226 113.36p
- Accumulation ‘A’ USD £299,061 289,123 103.44p £848,766 849,114 99.96p
- Accumulation ‘U2’ £316,045 171,035 184.78p £226,408 127,385 177.74p
Quilter Investors Global Equity Index Fund
- Accumulation ‘U2’ £212,317,588 119,200,153 178.12p £159,093,271 91,568,802 173.74p
Quilter Investors Global Equity Value Fund
- Accumulation ‘A’ EUR £3,042 2,950 103.12p £2,992 2,950 101.43p
- Accumulation ‘A’ USD £206,044 208,347 98.89p £280,676 288,449 97.31p
- Income ‘A’ £28,909,982 20,977,603 137.81p £31,391,781 22,700,261 138.29p
- Accumulation ‘U2’ £267,722,329 153,943,791 173.91p £212,485,874 124,762,784 170.31p
- Income ‘U2’ £56,724 39,174 144.80p £24,936 17,236 144.67p

Quilter Investors OEIC
Authorised Corporate Director’s report
Quilter Investors OEIC
18
Net asset value of sub-funds (continued)
30 June 2018 31 December 2017
Net asset value of
sub-fund
Shares in
issue
Net asset value per
share
Net asset value of
sub-fund
Shares in
issue
Net asset value per
share
Quilter Investors Global Property Securities Fund
- Accumulation ‘A’ EUR £955 1,000 95.52p £924 1,000 92.42p
- Accumulation ‘A’ USD £9,823,231 20,621,842 47.64p £10,069,922 21,892,576 46.00p
- Income ‘A’ GBP Hedged £19,951,780 46,080,943 43.30p £21,520,865 49,553,129 43.43p
- Income ‘R’ GBP Hedged £16,160,411 36,701,469 44.03p £14,756,993 33,536,942 44.00p
Quilter Investors High Yield Bond Fund
- Accumulation ‘A’ EUR Hedged £2,899 2,995 96.79p £2,957 2,995 98.75p
- Accumulation ‘A’ USD Hedged £113,959 129,742 87.84p £301,603 351,142 85.89p
- Income ‘A’ £19,760,542 20,005,218 98.78p £21,441,235 20,965,170 102.27p
- Accumulation ‘U2’ £234,566 196,494 119.38p £214,295 177,798 120.53p
- Income ‘U2’ £24,980 25,129 99.41p £24,114 23,518 102.53p
Quilter Investors Investment Grade Corporate Bond Fund
- Income ‘A’ £51,294,508 £49,494,348 103.64p £56,025,682 52,916,975 105.87p
- Accumulation ‘U2’ £149,057,795 £128,482,422 116.01p £127,018,209 108,292,743 117.29p
- Income ‘U2’ £16,872 £16,352 103.18p £18,599 17,646 105.41p
Quilter Investors Japanese Equity Fund
- Accumulation ‘A’ £42,658,205 23,421,847 182.13p £50,764,893 27,673,125 183.44p
- Accumulation ‘A’ EUR £37,449 32,182 116.37p £37,719 32,182 117.21p
- Accumulation ‘A’ USD £87,668 87,591 100.09p £99,240 98,443 100.81p
- Accumulation ‘U2’ £194,901,154 104,934,611 185.74p £140,760,271 75,580,250 186.24p
Quilter Investors Natural Resources Equity Fund
- Accumulation ‘A’ £19,456,298 17,830,417 109.12p £20,406,323 19,584,053 104.20p
- Accumulation ‘A’ EUR £35,087 24,994 140.38p £33,504 24,994 134.05p
- Accumulation ‘A’ USD £574,756 460,605 124.78p £532,444 446,841 119.16p
- Accumulation ‘U2’ £106,003 93,471 113.41p £101,262 93,928 107.81p
Quilter Investors Precious Metals Equity Fund
- Accumulation ‘A’ £18,394,911 20,867,817 88.15p £22,851,511 23,347,827 97.87p
- Accumulation ‘A’ EUR £841 1,000 84.13p £934 1,000 93.41p
- Accumulation ‘A’ USD £496,943 477,922 103.98p £101,887 88,246 115.46p
- Accumulation ‘U2’ £224,263,300 208,209,726 107.71p £242,085,655 203,491,818 118.97p
- Income ‘U2’ - - - £33 25 135.11p
Quilter Investors Sterling Corporate Bond Fund
- Accumulation ‘A’ EUR Hedged £922 1,000 92.20p £942 1,000 94.23p
- Accumulation ‘A’ USD Hedged £61,247 71,483 85.68p £34,145 40,627 84.05p
- Income ‘A’ £26,544,104 24,701,915 107.46p £29,702,383 26,841,868 110.66p
- Accumulation ‘U2’ £34,303,292 27,930,628 122.82p £29,753,891 23,914,955 124.42p
- Income ‘U2’ £24,070 22,638 106.32p £26,165 23,899 109.48p
Quilter Investors Sterling Diversified Bond Fund
- Accumulation ‘A’ EUR Hedged £891 1,000 89.05p £919 1,000 91.91p
- Accumulation ‘A’ USD Hedged £230,240 283,101 81.33p £181,690 225,998 80.39p
- Income ‘A’ £11,543,665 11,285,868 102.28p £12,993,791 12,307,505 105.58p
- Accumulation ‘U2’ £140,595,526 120,943,863 116.25p £119,003,758 100,193,976 118.77p
- Income ‘U2’ £34,402 33,060 104.06p £36,609 34,084 107.41p
Quilter Investors US Equity Growth Fund
- Accumulation ‘A’ £23,446,995 10,317,041 227.26p £22,226,896 10,976,863 202.49p
- Accumulation ‘U2’ £99,990,034 81,307,986 122.98p £73,553,421 67,430,256 109.08p
Quilter Investors OEIC
Authorised Corporate Director’s report
Quilter Investors OEIC
19
Net asset value of sub-funds (continued)
30 June 2018 31 December 2017
Net asset value of
sub-fund
Shares in
issue
Net asset value per
share
Net asset value of
sub-fund
Shares in
issue
Net asset value per
share
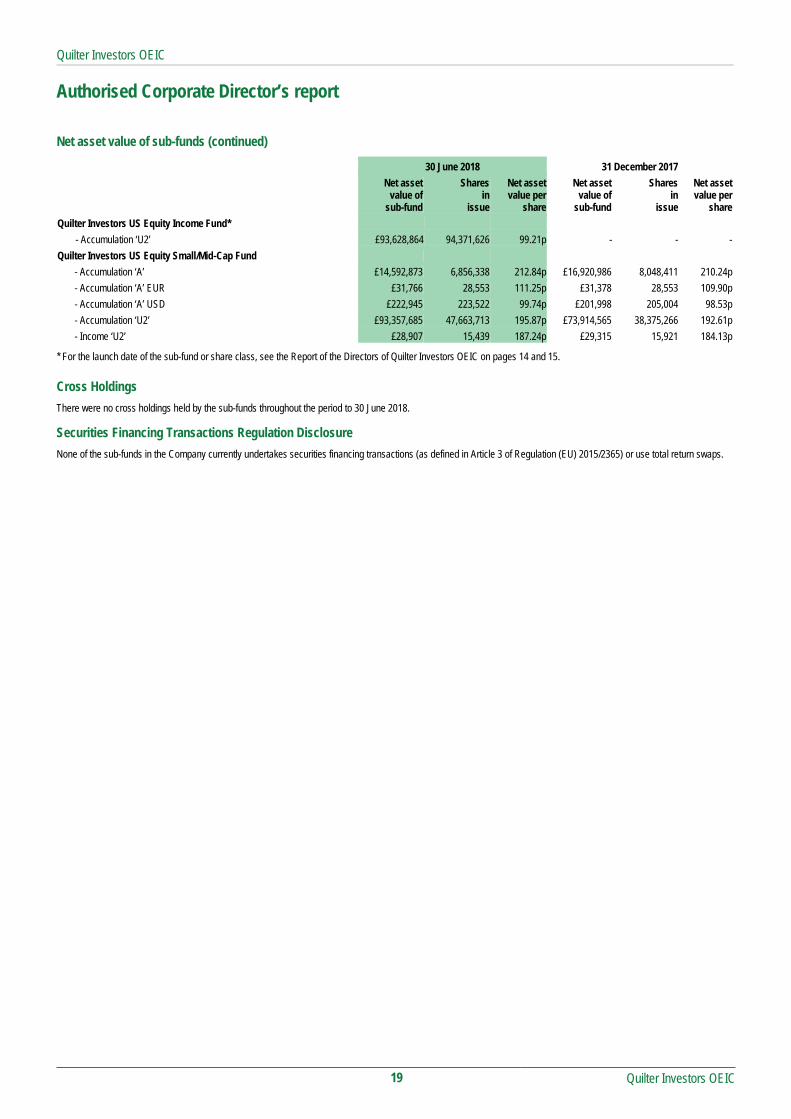
Quilter Investors US Equity Income Fund*
- Accumulation ‘U2’ £93,628,864 94,371,626 99.21p - - -
Quilter Investors US Equity Small/Mid-Cap Fund
- Accumulation ‘A’ £14,592,873 6,856,338 212.84p £16,920,986 8,048,411 210.24p
- Accumulation ‘A’ EUR £31,766 28,553 111.25p £31,378 28,553 109.90p
- Accumulation ‘A’ USD £222,945 223,522 99.74p £201,998 205,004 98.53p
- Accumulation ‘U2’ £93,357,685 47,663,713 195.87p £73,914,565 38,375,266 192.61p
- Income ‘U2’ £28,907 15,439 187.24p £29,315 15,921 184.13p
* For the launch date of the sub-fund or share class, see the Report of the Directors of Quilter Investors OEIC on pages 14 and 15.
Cross Holdings There were no cross holdings held by the sub-funds throughout the period to 30 June 2018.
Securities Financing Transactions Regulation Disclosure
None of the sub-funds in the Company currently undertakes securities financing transactions (as defined in Article 3 of Regulation (EU) 2015/2365) or use total return swaps.

Quilter Investors OEIC
Statement of the Authorised Corporate Director’s responsibilities
Quilter Investors OEIC
20
The COLL Rules require the ACD to prepare financial statements for each annual accounting period which give a true and fair view of the financial position of the Company and of the net income and net gains or losses on the property of the Company for the period.
In preparing the financial statements the ACD is responsible for:
selecting suitable accounting policies and then apply them consistently;
making judgements and estimates that are reasonable and prudent;
following UK accounting standards, including FRS 102 The Financial Reporting Standard applicable in the UK and Republic of Ireland;
complying with the disclosure requirements of the Statement of Recommended Practice for UK Authorised Funds issued by the Investment Management Association in
May 2014;
keeping proper accounting records which enable it to demonstrate that the financial statements as prepared comply with the above requirements;
assessing the Company and its sub-funds’ ability to continue as a going concern, disclosing, as applicable, matters related to going concern;
using the going concern basis of accounting unless they either intend to liquidate the Company or its sub-funds or to cease operations, or have no realistic alternative but
to do so;
such internal control as they determine is necessary to enable the preparation of financial statements that are free from material misstatement, whether due to fraud or
error; and
taking reasonable steps for the prevention and detection of fraud and irregularities.
The ACD is responsible for the management of the Company in accordance with its Instrument of Incorporation, the Prospectus and the COLL Rules.

Quilter Investors OEIC
Statement of the Depositary’s Responsibilities in Respect of the Scheme and Report of the Depositary to the Shareholders of Quilter Investors OEIC (“the Company”)
Quilter Investors OEIC
21
for the period from 1 January 2018 to 30 June 2018
The Depositary is responsible for the safekeeping of all of the property of the Company (other than tangible moveable property) which is entrusted to it and for the collection of revenue that arises from that property.
It is the duty of the Depositary to take reasonable care to ensure that the Company is managed by the Authorised Corporate Director in accordance with the Financial Conduct Authority’s Collective Investment Schemes Sourcebook (“the Sourcebook”), the Open-Ended Investment Companies Regulations 2001 (SI 2001/1228) (the OEIC Regulations), the Company’s Instrument of Incorporation and the Prospectus, as appropriate, concerning: the pricing of and dealing in Shares in the Company; the application of income of the Company; and the investment and borrowing powers applicable to the Company.
Having carried out procedures and enquiries considered duly necessary to discharge our responsibilities as Depositary of the Company, based on information and explanations provided to us, we believe that, in all material respects, the Company, acting through the Authorised Corporate Director:
(i) has carried out the issue, sale, redemption and cancellation, and calculation of the price of the Company’s shares and the application of the Company’s income in accordance with the Sourcebook, and where applicable, the OEIC regulations, the Company’s Instrument of Incorporation and Prospectus;
(ii) has, observed the investment and borrowing powers and restrictions applicable to the Company; and
(iii) has, otherwise, ensured the proper operation of the Company.
Citibank Europe plc, UK Branch Depositary 24 August 2018

Quilter Investors Asia Pacific (ex Japan) Equity Fund
Quilter Investors Asia Pacific (ex Japan) Equity Fund
Quilter Investors OEIC
22
Launch date 17 July 2013
IA Sector Asia Pacific ex Japan
Investment adviser Aberdeen Asset Managers Limited
Net asset value £179,203,915
Objective
The objective of the sub-fund is to achieve capital growth.
Policy
The sub-fund primarily invests, directly and indirectly, in shares of companies listed or located in Asia and Australasia, excluding Japan. The sub-fund may at times be concentrated in terms of the number of investments it holds.
The sub-fund may also invest in other transferable securities, collective investment schemes (including those managed or operated by the ACD), warrants, money market instruments, deposits and derivatives.
The sub-fund may only use derivatives for efficient portfolio management purposes.
The sub-fund is managed by an investment adviser selected by the ACD for their expected ability to manage the sub-fund according to the investment objective and policy. The ACD continuously monitors and may periodically make changes to this appointment.
Investment Manager’s review
Market Review
The first half of 2018 was a mixed bag for the region. In the first few months of the year Australian banks, which formed a significant part of the index, remained under pressure amid intensifying regulatory scrutiny. Meanwhile, in China, the mainland market was lifted by Chinese technology stocks as they overcame interim volatility to chalk up gains. Tech stocks had a good start to the quarter, and also rose on expectations that they will benefit from a proposal to allow the companies to trade their stocks onshore via issuing Chinese depositary receipts, or CDRs.
As we entered the second half of the period, the Singapore market saw profit-taking after a period of sustained strength, while overall performance in India lifted portfolio returns. The market held up better than its regional peers as encouraging outlooks for growth and corporate earnings buoyed performance.
Performance
The sub-fund recorded a small loss at the start of the year before recovering in the second half of the period, as positive stock selection outweighed negative asset allocation. Australia, Singapore and India were key contributors to returns at the start of the year. In Australia, the sub-fund benefited from positive stock selection and from being underweight to the market. Our overweight to Singapore helped, as the market proved to be more resilient amid the regional sell-off. More importantly, our holdings in Singapore banks OCBC and DBS added to relative performance on the back of good results which were supported by higher incomes from net interest and fees, and improving asset quality. We expect this trajectory to sustain. City Developments, our core property exposure, continued to ride on a recovering property market. Elsewhere, even though our overweight to India hurt performance as the market was weaker than its regional peers, positive stock selection there benefited the sub-fund, although our underweight exposure to China detracted.
In the final half of the period, the sub-fund underperformance of the benchmark was due largely to the overall performance in Singapore. Property counter City Developments was a major detractor. It slid on concerns over the sustainability of the recent strength in the property sector in its home market. Also in Southeast Asia, some of the holdings we have there weighed heavily on performance. Thailand’s Siam Cement was the top detractor. It fell alongside the broader decline in the Thai market, while concerns remained over weak demand for cement in the country. Elsewhere, our underweight to Australia also cost performance as it remained one of the more resilient economies amid tumultuous global markets. However, our choice of stocks in Australia was a major contributor and miners Rio Tinto and BHP Billiton did well on higher commodity prices. We benefited from our position in our India fund as well as our individual holdings in Kotak Mahindra Bank, which held up well despite difficulties faced by the domestic credit market, and Tata Consultancy, as it delivered a steady and resilient performance on the back of sharp competitive advantages in its home market.
Risk and Reward Profile
The calculated risk and reward category, as shown above, uses a method of calculation derived from EU rules. It is based on the rate at which the returns of the sub-fund have moved up and down in the past (i.e. volatility) and is not a guide to the future risk and reward category of the sub-fund. The category shown is not a target or guarantee and may shift over time. Even the lowest category 1 does not mean a risk-free investment. The seven-category scale is nonlinear, for example, 2 is not twice as risky as 1.
Sub-funds in category 5 have in the past shown moderately high volatility. With a sub-fund of category 5, you have a moderately high risk of losing money but your chance for gains is also moderately high.
Investment risk - there is no guarantee that the sub-fund will achieve its objective. A capital loss of some or all of the amount invested may occur.
Geographic concentration risk - a fall in the Asia Pacific markets may have a significant impact on the value of the sub-fund because it primarily invests in these markets.
Emerging markets risk - less developed countries may face more political, economic or structural challenges than developed countries.
Concentration risk (number of investments) - the sub-fund may at times hold a smaller number of investments, and therefore a fall in the value of a single investment may have a greater impact on the sub-fund’s value than if it held a larger number of investments.
Liquidity risk - some investments may become hard to value or sell at a desired time and price. In extreme circumstances this may affect the sub-fund’s ability to meet redemption requests upon demand.
Currency risk (EUR share class) - the sub-fund is denominated in British Pounds but holds assets denominated in other currencies. This share class is denominated in Euro. The value of your shares may rise and fall as a result of exchange rate movements between these currencies.
Currency risk (GBP share class) - the sub-fund is denominated in British Pounds but holds assets denominated in other currencies. The value of your shares may rise and fall as a result of exchange rate movements between these currencies.
Currency risk (USD share class) - the sub-fund is denominated in British Pounds but holds assets denominated in other currencies. This share class is denominated in US Dollars. The value of your shares may rise and fall as a result of exchange rate movements between these currencies.
Derivative risk - the sub-fund may use derivatives to reduce costs and/or the overall risk of the sub-fund (i.e. Efficient Portfolio Management (EPM)). Derivatives involve a level of risk, however, for EPM they should not increase the overall riskiness of the sub-fund. Derivatives also involve counterparty risk where the institutions acting as counterparty to derivatives may not meet their contractual obligations.
Capital erosion risk - the sub-fund takes its charges from the income of the sub-fund in the first instance. The impact of sub-fund charges may be material on the value of any income you receive from your investment. There is potential for capital erosion if insufficient income is generated by the sub-fund to cover these charges. Capital erosion may have the effect of reducing the level of income generated.
For full details of the sub-fund's risks, please see the section in the prospectus headed "Risks".
.

Quilter Investors Asia Pacific (ex Japan) Equity Fund
Quilter Investors OEIC
23
Performance Record Comparative Tables
1 January 2018 to 1 January 2017 to 1 January 2016 to Accumulation 'A' 30 June 2018 31 December 2017 31 December 2016 p/share p/share p/share
Change in net assets per share Opening net asset value per share 135.01 112.01 88.88
Return before operating charges* (0.12) 25.43 25.03 Operating charges** (1.33) (2.43) (1.90)
Return after operating charges* (1.45) 23.00 23.13
Distributions - (0.40) (0.77) Retained distributions - 0.40 0.77
Closing net asset value per share 133.56 135.01 112.01
* after direct transaction costs of*** 0.05 0.11 0.10
Performance Return after charges (1.07)% 20.53% 26.02%
Other information Closing net asset value (£) 8,330,467 10,357,062 9,812,772 Closing number of shares 6,237,024 7,671,088 8,760,478 Operating charges**** 1.97% 1.90% 1.90% Direct transaction costs*** 0.07% 0.09% 0.10%
Prices pence per share pence per share pence per share Highest share price 141.1 137.3 119.3 Lowest share price 129.8 112.4 80.92
1 January 2018 to 1 January 2017 to 1 January 2016 to Accumulation 'A' EUR 30 June 2018 31 December 2017 31 December 2016 p/share p/share p/share
Change in net assets per share Opening net asset value per share 117.42 101.80 77.19
Return before operating charges* (0.11) 17.77 26.12 Operating charges** (1.15) (2.15) (1.51)
Return after operating charges* (1.26) 15.62 24.61
Distributions - (0.44) (5.07) Retained distributions - 0.44 5.07
Closing net asset value per share 116.16 117.42 101.80
* after direct transaction costs of*** 0.04 0.10 0.08
Performance Return after charges (1.07)% 15.34% 31.88%
Other information Closing net asset value (£) 487,343 435,684 78,201 Closing number of shares 419,534 371,033 76,816 Operating charges**** 1.97% 1.90% 1.90% Direct transaction costs*** 0.07% 0.09% 0.10%
Prices cents per share cents per share cents per share Highest share price 139.5 135.5 116.7 Lowest share price 129.4 113.9 90.25

Quilter Investors Asia Pacific (ex Japan) Equity Fund
Quilter Investors OEIC
24
Comparative Tables (continued) 1 January 2018 to 1 January 2017 to 1 January 2016 to Accumulation 'A' USD 30 June 2018 31 December 2017 31 December 2016 p/share p/share p/share
Change in net assets per share Opening net asset value per share 100.35 83.26 66.03
Return before operating charges* (0.10) 18.90 18.69 Operating charges** (0.99) (1.81) (1.46)
Return after operating charges* (1.09) 17.09 17.23
Distributions - (0.29) (0.59) Retained distributions - 0.29 0.59
Closing net asset value per share 99.26 100.35 83.26
* after direct transaction costs of*** 0.04 0.08 0.07
Performance Return after charges (1.09)% 20.53% 26.09%
Other information Closing net asset value (£) 37,670 41,607 28,061 Closing number of shares 37,949 41,463 33,703 Operating charges**** 1.97% 1.90% 1.90% Direct transaction costs*** 0.07% 0.09% 0.10%
Prices cents per share cents per share cents per share Highest share price 147.5 136.1 111.2 Lowest share price 129.4 102.8 85.66
1 January 2018 to 1 January 2017 to 1 January 2016 to Accumulation 'U2' 30 June 2018 31 December 2017 31 December 2016 p/share p/share p/share
Change in net assets per share Opening net asset value per share 159.37 130.85 102.74
Return before operating charges* (0.16) 29.80 29.11 Operating charges** (0.73) (1.28) (1.00)
Return after operating charges* (0.89) 28.52 28.11
Distributions - (2.03) (2.13) Retained distributions - 2.03 2.13
Closing net asset value per share 158.48 159.37 130.85
* after direct transaction costs of*** 0.06 0.13 0.11
Performance Return after charges (0.56)% 21.80% 27.36%
Other information Closing net asset value (£) 170,348,435 155,099,331 84,400,113 Closing number of shares 107,487,583 97,319,929 64,502,914 Operating charges**** 0.92% 0.85% 0.85% Direct transaction costs*** 0.07% 0.09% 0.10%
Prices pence per share pence per share pence per share Highest share price 166.7 161.9 139.1 Lowest share price 153.7 131.3 93.66
** The operating charges include all costs borne by the sub-fund, except for direct transaction costs.
*** The direct transaction costs are made up of fees and commissions paid to agents, advisers, brokers and dealers, levies by regulatory agencies and securities exchanges as well as transfer taxes and duties. They do not include any difference between the quoted bid and offer prices or internal administrative or holding costs. These costs arise as a result of transactions undertaken both for efficient portfolio management and the meeting of the sub-fund’s objectives. These costs exclude any effect of dilution adjustments used to offset the costs.
**** The operating charges percentage is the ratio of the sub-fund's ongoing charges (excluding interest on borrowings) to the average net assets of the sub-fund.

Quilter Investors Asia Pacific (ex Japan) Equity Fund
Quilter Investors OEIC
25
Performance 6 months to
30 June 2018
1 year to
30 June 2018
3 years to
30 June 2018
5 years to
30 June 2018
Quilter Investors Asia Pacific (ex Japan) Equity Fund* (0.63)% 5.09% 38.90% -
MSCI AC Asia Pacific ex Japan Net (benchmark) (1.80)% 7.80% 46.36% 64.69%
IA Asia Pacific ex Japan (sector average) (1.85)% 7.57% 46.74% 65.49%
Quartile ranking 2 3 3 -
* Accumulation ‘U2’ shares
Data Source – Factset. Figures are calculated on a total return and single price basis, with net income reinvested into the sub-fund.
Portfolio allocation
Asia Pacific (excluding Japan) 81.98%
Europe 9.06%
United Kingdom 6.13%
Net other assets 2.83%
Total 100.00%
Asset allocation
Equities 97.17%
Net other assets 2.83%
Total 100.00%
Percentage of
Major holdings portfolio
Aberdeen Global China Equity Fund 'A' 6.44%
Samsung Electronics (Preference shares) 5.17%
Tencent 4.45%
Taiwan Semiconductor Manufacturing 4.35%
Oversea-Chinese Banking 3.11%
AIA 2.95%
Aberdeen Global Indian Equity Fund - Z2 Accumulation (USD) 2.62%
Jardine Strategic 2.61%
Bank Central Asia 2.56%
Rio Tinto (UK Listing) 2.43%
Number of holdings 64
Total Purchases and Sales for the period
2018 2017
£’000 £’000
Total purchases for the 6 month period to 30 June 34,693 34,441
Total sales for the 6 month period to 30 June 19,560 12,826

Quilter Investors Asia Pacific (ex Japan) Equity Fund
Portfolio statement as at 30 June 2018
Quilter Investors OEIC
26
Market Percentage of
Value total net assets Holding Investment £’000 %
United Kingdom 6.13% (31 December 2017 6.85%)
United Kingdom Equities 6.13% (31 December 2017 6.85%) 10,100 Aberdeen Asian Smaller Companies Investment Trust 103 0.06 14,900 Aberdeen New Thai Investment Trust 78 0.04
568,627 HSBC (UK Listing) 4,057 2.27 103,453 Rio Tinto (UK Listing) 4,361 2.43 343,430 Standard Chartered (UK Listing) 2,387 1.33
10,986 6.13
Overseas 91.04% (31 December 2017 90.33%)
Asia Pacific (excluding Japan) 81.98% (31 December 2017 80.65%)
Australia Equities 4.08% (31 December 2017 3.90%) 209,307 BHP Billiton (UK Listing) 3,587 2.00
34,475 CSL 3,724 2.08
7,311 4.08
China Equities 10.59% (31 December 2017 6.26%) 510,500 Anhui Conch Cement 2,226 1.24
7,462 Autohome 574 0.32 23,026 Huazhu 739 0.41
1,242,000 PetroChina 718 0.40 446,000 Ping An Insurance China 3,121 1.74
3,300 Sunny Optical Technology 47 0.03 208,600 Tencent 7,964 4.45 112,000 Wuxi Biologics Cayman 939 0.52
89,900 Yum China 2,648 1.48
18,976 10.59
Hong Kong Equities 17.57% (31 December 2017 18.14%) 794,200 AIA 5,285 2.95 195,200 ASM Pacific Technology 1,874 1.05 510,500 China Mobile 3,449 1.92
1,234,000 China Resources Land 3,160 1.76 611,000 Hang Lung 1,298 0.72 375,000 Hang Lung Properties 589 0.33 149,352 Hong Kong Exchanges and Clearing 3,416 1.91
55,900 Jardine Matheson 2,684 1.50 168,600 Jardine Strategic 4,681 2.61
1,084,500 Swire Pacific 'B' 1,462 0.82 1,278,600 Swire Properties 3,590 2.00
31,488 17.57
India Equities 10.56% (31 December 2017 9.87%) 213,179 Grasim Industries 2,383 1.33
68,200 HDFC Bank 1,598 0.89 35,200 Hero MotoCorp 1,354 0.76 55,670 Hindustan Unilever 1,012 0.56
195,500 Housing Development Finance 4,145 2.31

Quilter Investors Asia Pacific (ex Japan) Equity Fund
Portfolio statement (continued) as at 30 June 2018
Quilter Investors OEIC
27
Market Percentage of
Value total net assets Holding Investment £’000 %
India Equities (continued) 886,123 ITC 2,608 1.46 138,000 Kotak Mahindra Bank 2,059 1.15 157,344 Tata Consultancy Services 3,224 1.80
12,900 Ultratech Cement 544 0.30
18,927 10.56
Indonesia Equities 5.16% (31 December 2017 5.69%) 10,170,000 Astra 3,551 1.98
4,055,900 Bank Central Asia 4,588 2.56 450,200 Unilever Indonesia 1,100 0.62
9,239 5.16
Malaysia Equities 0.96% (31 December 2017 1.75%) 397,050 Public Bank 1,725 0.96
1,725 0.96
Philippines Equities 3.72% (31 December 2017 3.88%) 145,040 Ayala 1,885 1.05
4,903,800 Ayala Land 2,647 1.48 1,693,902 Bank of the Philippine Islands 2,137 1.19
6,669 3.72
Singapore Equities 11.55% (31 December 2017 13.56%) 568,400 City Developments 3,465 1.93 229,554 DBS Group 3,407 1.90 881,400 Keppel 3,510 1.96
230 Keppel REIT - - 856,752 Oversea-Chinese Banking 5,562 3.11 847,700 Singapore Technologies Engineering 1,556 0.87 994,400 Singapore Telecommunications 1,708 0.95 100,042 United Overseas Bank 1,493 0.83
20,701 11.55
South Korea Equities 9.32% (31 December 2017 9.92%) 8,648 Amorepacific 729 0.41 5,512 Amorepacific (Preference shares) 580 0.32 8,977 E-Mart 1,557 0.87 4,600 LG Chem 1,048 0.59 6,773 NAVER 3,520 1.96
361,100 Samsung Electronics (Preference shares) 9,272 5.17
16,706 9.32
Taiwan Equities 5.45% (31 December 2017 4.75%) 627,000 Taiwan Mobile 1,729 0.97
1,446,000 Taiwan Semiconductor Manufacturing 7,797 4.35 8,500 Taiwan Semiconductor Manufacturing ADR 232 0.13
9,758 5.45
Thailand Equities 3.02% (31 December 2017 2.93%) 2,974,200 Bangkok Dusit Medical Services 1,701 0.95
392,300 Siam Cement (Foreign reg) 3,713 2.07
5,414 3.02
Quilter Investors Asia Pacific (ex Japan) Equity Fund
Portfolio statement (continued) as at 30 June 2018
Quilter Investors OEIC
28
Market Percentage of
Value total net assets Holding Investment £’000 %
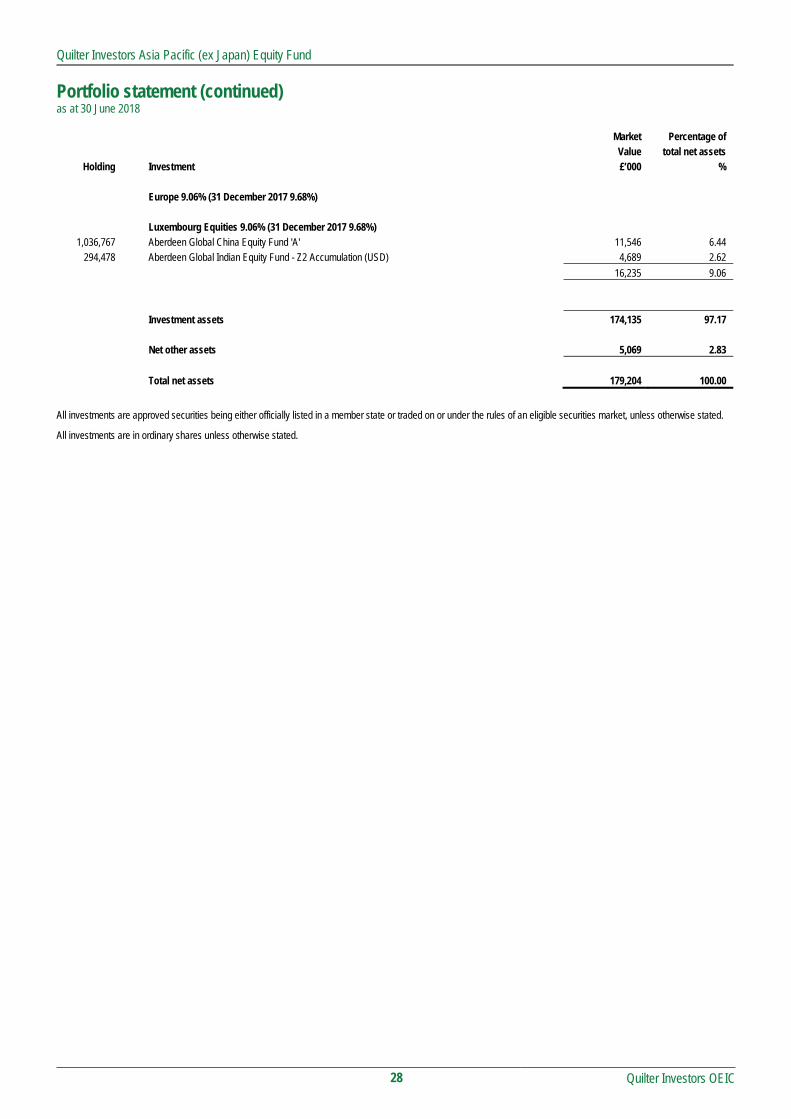
Europe 9.06% (31 December 2017 9.68%) Luxembourg Equities 9.06% (31 December 2017 9.68%)
1,036,767 Aberdeen Global China Equity Fund 'A' 11,546 6.44 294,478 Aberdeen Global Indian Equity Fund - Z2 Accumulation (USD) 4,689 2.62
16,235 9.06
Investment assets 174,135 97.17
Net other assets 5,069 2.83
Total net assets 179,204 100.00
All investments are approved securities being either officially listed in a member state or traded on or under the rules of an eligible securities market, unless otherwise stated.
All investments are in ordinary shares unless otherwise stated.

Quilter Investors Asia Pacific (ex Japan) Equity Fund
Quilter Investors OEIC
29
Statement of total return for the period from 1 January 2018 to 30 June 2018 01.01.18 to 01.01.18 to 01.01.17 to 01.01.17 to
30.06.18 30.06.18 30.06.17 30.06.17
Note £'000 £'000 £'000 £'000
Income
Net capital (losses)/gains (2,409) 14,567
Revenue 2,659 1,497
Expenses (857) (544)
Interest payable and similar charges (3) -
Net revenue before taxation 1,799 953
Taxation (316) (76)
Net revenue after taxation 1,483 877
Total return before distributions (926) 15,444
Distributions 2 12 69
Change in net assets attributable to
shareholders from investment activities (914) 15,513
Statement of change in net assets attributable to shareholders for the period from 1 January 2018 to 30 June 2018 01.01.18 to 01.01.18 to 01.01.17 to 01.01.17 to
30.06.18 30.06.18 30.06.17 30.06.17
£'000 £'000 £'000 £'000
Opening net assets attributable to shareholders 165,934* 94,319
Amounts received on issue of shares 25,854 35,731
Amounts paid on cancellation of shares (11,729) (14,137)
14,125 21,594
Dilution adjustment 59 94
Change in net assets attributable to
shareholders from investment activities (914) 15,513
Closing net assets attributable to shareholders 179,204 131,520* * Section 3.30 of the SORP issued by the Investment Management Association in May 2014 requires comparative figures for the above statement. For interim financial
statements this will result in the closing comparative net assets not being equal to net assets at the start of the current period.

Quilter Investors Asia Pacific (ex Japan) Equity Fund
Quilter Investors OEIC
30
Balance sheet as at 30 June 2018 30.06.18 31.12.17
£'000 £'000
Assets
Fixed assets
Investments 174,135 161,262
Current assets
Debtors 1,669 725
Cash and bank balances 4,394 4,123
Total assets 180,198 166,110
Liabilities
Creditors
Bank overdrafts (8) -
Other creditors (986) (176)
Total liabilities (994) (176)
Net assets attributable to shareholders 179,204 165,934

Quilter Investors Asia Pacific (ex Japan) Equity Fund
Notes to the financial statements for the period from 1 January 2018 to 30 June 2018
Quilter Investors OEIC
31
1 Accounting policies The financial statements have been prepared under the historical cost basis, as modified by the revaluation of investments, and in accordance with the Statement of Recommended Practice (SORP) for Authorised Funds, issued by the Investment Management Association in May 2014.
The accounting policies applied are consistent with those disclosed within the annual Financial Statements for the year ended 31 December 2017.
2 Distributions The distributions take account of revenue received on the issue of shares and revenue deducted on the cancellation of shares, and comprise:
01.01.18 to 01.01.17 to 30.06.18 30.06.17 £'000 £'000 Revenue deducted on cancellation of shares 48 29 Revenue received on issue of shares (60) (98) Distributions (12) (69)
Reconciliation of distributions: Net revenue after taxation 1,483 877 Overseas capital gains tax 171 - Undistributed net revenue carried forward (1,666) (946) Distributions (12) (69)

Quilter Investors Asia Pacific (ex Japan) Large-Cap Equity Fund
Quilter Investors Asia Pacific (ex Japan) Large-Cap Equity Fund
Quilter Investors OEIC
32
Launch date 10 July 2013
IA Sector Asia Pacific ex Japan
Investment adviser Invesco Asset Management Limited
Net asset value £195,760,950
Objective
The objective of the sub-fund is to achieve capital growth.
Policy
The sub-fund primarily invests, directly and indirectly, in shares of companies listed or located in Asia and Australasia, excluding Japan. The sub-fund may at times be concentrated in terms of the number of investments it holds.
The sub-fund invests a minimum of 60% of scheme property in large-cap companies.
The sub-fund may also invest in other transferable securities, collective investment schemes (including those managed or operated by the ACD), warrants, money market instruments, deposits and derivatives.
The sub-fund may only use derivatives for efficient portfolio management purposes.
The sub-fund is managed by an investment adviser selected by the ACD for their expected ability to manage the sub-fund according to the investment objective and policy. The ACD continuously monitors and may periodically make changes to this appointment.
Investment Manager’s review
Market Review
Asian equity market performance in the six month period was mixed, with divergence between countries and sectors. The inflation scare that rocked markets in early February sharpened investor focus on areas of the market that might be affected by a change in the outlook for interest rates, with current account deficit countries such as the Philippines, Indonesia and India all underperforming at the start of the year.
Towards the end of the period, global trade tensions dampened investor sentiment. This, and fears that the US Federal Reserve may increase interest rates more than anticipated, contributed to US dollar strength, which negatively affected ASEAN markets in particular. The Korean market underperformed despite a positive inter-Korea summit which saw South and North Korea relations improve. China’s equity market was among the better performers despite concerns that the Chinese economy is slowing. Elsewhere, the central banks in India and the Philippines raised interest rates as inflationary pressures continued to build and their currencies weakened.
Performance
The sub-fund had mixed performance during the period, as it underperformed its benchmark in the first part of the period, weighed down by Chinese internet companies NetEase and Bitauto, before recovering towards the end of the period due to investment in the energy sector.
In the first three months of the year the biggest detractors included NetEase, which saw online gaming revenues slow and an increase in marketing expenses for both its gaming and e-commerce businesses, with concerns that this may continue. Other notable detractors in the first part of the period included: Korea Electric Power, whose earnings disappointed due to the higher cost of coal, and an unfavourable power generation mix tilted towards LNG and Minth, which gave back some of its recent outperformance due to concerns over the impact of rising raw material costs. In commodity-related stocks, Woodside Petroleum surprised with an AUD$2.5bn (£1.4bn) rights issue to help fund its acquisition of Exxon's stake in the Scarborough gas field, which we think is a good deal. Gigabyte Technology was the biggest contributor in the first half of the period, holding onto strong gains as management guided for double-digit revenue growth and improving margins in 2018.
Towards the end of the period CNOOC and Woodside Petroleum benefited from oil price strength while the Chinese internet companies, JD.com and Sohu, were amongst the biggest contributors as they recovered from some recent underperformance. Infosys added value on expectations that its growth in digital solutions will accelerate as management focus on winning new large digital contacts. Elsewhere BAT Malaysia made strong gains on expectations that the new government will clamp down on the illicit cigarette trade as it looks to raise tax revenues.
Recently, we have seen some volatility in Asian equity markets largely due to uncertainty surrounding problems in some emerging markets outside Asia, trade concerns and geopolitical tensions. Elsewhere across Asia, current account balances have improved over the last few years and inflation remains contained. Against this backdrop, earnings growth estimates for 2018 are currently around 12.6%, and although we do not expect significant upgrades from here, this expectation is underpinned by a number of factors.
Risk and Reward Profile
The calculated risk and reward category, as shown above, uses a method of calculation derived from EU rules. It is based on the rate at which the returns of the sub-fund have moved up and down in the past (i.e. volatility) and is not a guide to the future risk and reward category of the sub-fund. The category shown is not a target or guarantee and may shift over time. Even the lowest category 1 does not mean a risk-free investment. The seven-category scale is nonlinear, for example, 2 is not twice as risky as 1.
Sub-funds in category 5 have in the past shown moderately high volatility. With a sub-fund of category 5, you have a moderately high risk of losing money but your chance for gains is also moderately high.
Investment risk - there is no guarantee that the sub-fund will achieve its objective. A capital loss of some or all of the amount invested may occur.
Geographic concentration risk - a fall in the Asia Pacific markets may have a significant impact on the value of the sub-fund because it primarily invests in these markets.
Emerging markets risk - less developed countries may face more political, economic or structural challenges than developed countries.
Concentration risk (number of investments) - the sub-fund may at times hold a smaller number of investments, and therefore a fall in the value of a single investment may have a greater impact on the sub-fund’s value than if it held a larger number of investments.
Liquidity risk - some investments may become hard to value or sell at a desired time and price. In extreme circumstances this may affect the sub-fund’s ability to meet redemption requests upon demand.
Currency risk (EUR share class) - the sub-fund is denominated in British Pounds but holds assets denominated in other currencies. This share class is denominated in Euro. The value of your shares may rise and fall as a result of exchange rate movements between these currencies.
Currency risk (GBP share class) - the sub-fund is denominated in British Pounds but holds assets denominated in other currencies. The value of your shares may rise and fall as a result of exchange rate movements between these currencies.
Currency risk (USD share class) - the sub-fund is denominated in British Pounds but holds assets denominated in other currencies. This share class is denominated in US Dollars. The value of your shares may rise and fall as a result of exchange rate movements between these currencies.
Derivative risk - the sub-fund may use derivatives to reduce costs and/or the overall risk of the sub-fund (i.e. Efficient Portfolio Management (EPM)). Derivatives involve a level of risk, however, for EPM they should not increase the overall riskiness of the sub-fund. Derivatives also involve counterparty risk where the institutions acting as counterparty to derivatives may not meet their contractual obligations.
Capital erosion risk - the sub-fund takes its charges from the income of the sub-fund in the first instance. The impact of sub-fund charges may be material on the value of any income you receive from your investment. There is potential for capital erosion if insufficient income is generated by the sub-fund to cover these charges. Capital erosion may have the effect of reducing the level of income generated.
For full details of the sub-fund's risks, please see the section in the prospectus headed "Risks".

Quilter Investors Asia Pacific (ex Japan) Large-Cap Equity Fund
Quilter Investors OEIC
33
Performance Records Comparative Tables 1 January 2018 to 1 January 2017 to 1 January 2016 to Accumulation 'A' 30 June 2018 31 December 2017 31 December 2016 p/share p/share p/share Change in net assets per share
Opening net asset value per share 193.96 144.53 106.38
Return before operating charges* (8.40) 52.30 40.19 Operating charges** (1.61) (2.87) (2.04)
Return after operating charges* (10.01) 49.43 38.15
Distributions - (0.90) (1.02) Retained distributions - 0.90 1.02
Closing net asset value per share 183.95 193.96 144.53
* after direct transaction costs of*** 0.08 0.29 0.20
Performance Return after charges (5.16)% 34.20% 35.86%
Other information Closing net asset value (£) 22,269,964 24,360,467 19,632,080 Closing number of shares 12,106,513 12,559,316 13,583,373 Operating charges**** 1.72% 1.65% 1.65% Direct transaction costs*** 0.08% 0.17% 0.16%
Prices pence per share pence per share pence per share Highest share price 200.6 195.2 154.2 Lowest share price 177.9 145.1 94.27
1 January 2018 to 1 January 2017 to 1 January 2016 to Accumulation 'A' EUR† 30 June 2018 31 December 2017 31 December 2016 p/share p/share p/share Change in net assets per share
Opening net asset value per share 136.96 102.08 79.00
Return before operating charges* (5.91) 36.91 24.23 Operating charges** (1.13) (2.03) (1.15)
Return after operating charges* (7.04) 34.88 23.08
Distributions - (0.63) (0.61) Retained distributions - 0.63 0.61
Closing net asset value per share 129.92 136.96 102.08
* after direct transaction costs of*** 0.05 0.21 0.11
Performance Return after charges (5.14)% 34.17% 29.22%
Other information Closing net asset value (£) 31,578 1,370 1,021 Closing number of shares 24,305 1,000 1,000 Operating charges**** 1.72% 1.65% 1.65% Direct transaction costs*** 0.08% 0.17% 0.16%
Prices cents per share cents per share cents per share Highest share price 160.8 155.1 122.0 Lowest share price 143.7 119.4 75.94

Quilter Investors Asia Pacific (ex Japan) Large-Cap Equity Fund
Quilter Investors OEIC
34
Comparative Tables (continued) 1 January 2018 to 1 January 2017 to 1 January 2016 to Accumulation 'A' USD 30 June 2018 31 December 2017 31 December 2016 p/share p/share p/share Change in net assets per share
Opening net asset value per share 129.25 96.31 70.85
Return before operating charges* (5.61) 34.88 26.89 Operating charges** (1.07) (1.94) (1.43)
Return after operating charges* (6.68) 32.94 25.46
Distributions - (0.66) (0.73) Retained distributions - 0.66 0.73
Closing net asset value per share 122.57 129.25 96.31
* after direct transaction costs of*** 0.05 0.20 0.14
Performance Return after charges (5.17)% 34.20% 35.94%
Other information Closing net asset value (£) 699,749 472,982 177,208 Closing number of shares 570,882 365,955 183,991 Operating charges**** 1.72% 1.65% 1.65% Direct transaction costs*** 0.08% 0.17% 0.16%
Prices cents per share cents per share cents per share Highest share price 188.0 175.2 125.8 Lowest share price 159.9 118.9 91.34
1 January 2018 to 1 January 2017 to 1 January 2016 to Accumulation 'U2' 30 June 2018 31 December 2017 31 December 2016 p/share p/share p/share Change in net assets per share
Opening net asset value per share 207.43 153.20 111.74
Return before operating charges* (9.00) 55.63 42.45 Operating charges** (0.82) (1.40) (0.99)
Return after operating charges* (9.82) 54.23 41.46
Distributions - (2.62) (2.27) Retained distributions - 2.62 2.27
Closing net asset value per share 197.61 207.43 153.20
* after direct transaction costs of*** 0.08 0.31 0.22
Performance Return after charges (4.73)% 35.40% 37.10%
Other information Closing net asset value (£) 172,748,396 157,789,786 89,955,642 Closing number of shares 87,420,362 76,068,954 58,718,313 Operating charges**** 0.82% 0.75% 0.75% Direct transaction costs*** 0.08% 0.17% 0.16%
Prices pence per share pence per share pence per share Highest share price 214.7 208.8 163.2 Lowest share price 190.7 153.8 99.14

Quilter Investors Asia Pacific (ex Japan) Large-Cap Equity Fund
Quilter Investors OEIC
35
Comparative Tables (continued) 1 January 2018 to 1 January 2017 to 1 January 2016 to Income 'U2' 30 June 2018 31 December 2017 31 December 2016 p/share p/share p/share Change in net assets per share
Opening net asset value per share 186.90 139.80 103.50
Return before operating charges* (8.12) 50.76 39.28 Operating charges** (0.74) (1.29) (0.89)
Return after operating charges* (8.86) 49.47 38.39
Distributions - (2.37) (2.09) Retained distributions - - -
Closing net asset value per share 178.04 186.90 139.80
* after direct transaction costs of*** 0.07 0.29 0.19
Performance Return after charges (4.74)% 35.39% 37.09%
Other information Closing net asset value (£) 11,263 7,467 2,894 Closing number of shares 6,326 3,995 2,070 Operating charges**** 0.82% 0.75% 0.75% Direct transaction costs*** 0.08% 0.17% 0.16%
Prices pence per share pence per share pence per share Highest share price 193.5 190.5 151.1 Lowest share price 171.9 140.7 91.83
† From 31 March 2016 ** The operating charges include all costs borne by the sub-fund, except for direct transaction costs.
*** The direct transaction costs are made up of fees and commissions paid to agents, advisers, brokers and dealers, levies by regulatory agencies and securities exchanges as well as transfer taxes and duties. They do not include any difference between the quoted bid and offer prices or internal administrative or holding costs. These costs arise as a result of transactions undertaken both for efficient portfolio management and the meeting of the sub-fund’s objectives. These costs exclude any effect of dilution adjustments used to offset the costs.
**** The operating charges percentage is ratio of the sub-fund's ongoing charges (excluding interest on borrowings) to the average net assets of the sub-fund. If the share class launched during the period the operating charges figures are annualised.

Quilter Investors Asia Pacific (ex Japan) Large-Cap Equity Fund
Quilter Investors OEIC
36
Performance
6 months to30 June 2018
1 year to 30 June 2018
3 years to 30 June 2018
5 years to 30 June 2018
Quilter Investors Asia Pacific (ex Japan) Large-Cap Equity Fund* (4.80)% 7.02% 67.82% -
MSCI AC Asia Pacific ex Japan Net (benchmark) (1.80)% 7.80% 46.36% 64.69%
IA Asia Pacific ex Japan (sector average) (1.85)% 7.57% 46.74% 65.49%
Quartile ranking 4 3 1 -
* Accumulation ‘U2’ shares
Data Source – Factset. Figures are calculated on a total return and single price basis, with net income reinvested into the sub-fund.
Portfolio allocation
Asia Pacific (excluding Japan) 90.21%
Africa 2.72%
Japan 2.37%
United Kingdom 1.95%
Net other assets 2.75%
Total 100.00%
Asset allocation
Equities 97.25%
Net other assets 2.75%
Total 100.00%
Percentage of
Major holdings portfolio
JD.com ADR 3.89%
Samsung Electronics 3.66%
Baidu ADR 3.53%
Woodside Petroleum 3.37%
NetEase ADR 2.88%
Infosys 2.87%
CNOOC (HK Listing) 2.86%
United Overseas Bank 2.77%
CK Hutchison 2.77%
Taiwan Semiconductor Manufacturing 2.75%
Number of holdings 61
Total Purchases and Sales for the period
2018 2017
£’000 £’000
Total purchases for the 6 month period to 30 June 40,774 38,183
Total sales for the 6 month period to 30 June 18,196 21,425

Quilter Investors Asia Pacific (ex Japan) Large-Cap Equity Fund
Portfolio statement as at 30 June 2018
Quilter Investors OEIC
37
Market Percentage of
Value total net assets Holding Investment £'000 %
United Kingdom 1.95% (31 December 2017 2.78%)
United Kingdom Equities 1.95% (31 December 2017 2.78%)
534,800 HSBC (UK Listing) 3,815 1.95
3,815 1.95
Overseas 95.30% (31 December 2017 94.45%)
Africa 2.72% (31 December 2017 0.00%)
South Africa Equities 2.72% (31 December 2017 0.00%)
8,257 Naspers 1,542 0.79
104,320 Naspers ADR 3,777 1.93
5,319 2.72
Asia Pacific (excluding Japan) 90.21% (31 December 2017 91.47%)
Australia Equities 12.09% (31 December 2017 11.01%)
1,341,305 Alumina 2,099 1.07
3,070,822 Fairfax Media 1,284 0.66
1,882,453 Metcash 2,746 1.40
274,358 Newcrest Mining 3,340 1.71
542,378 Origin Energy 3,046 1.56
835,915 QBE Insurance 4,549 2.32
332,150 Woodside Petroleum 6,602 3.37
23,666 12.09
China Equities 21.58% (31 December 2017 22.88%)
12,890 51job ADR 927 0.47
37,487 Baidu ADR 6,908 3.53
4,880,000 Bank of China 1,837 0.94
109,468 Bitauto 1,981 1.01
41,800 Changyou.com 523 0.27
4,261,000 CNOOC (HK Listing) 5,588 2.86
3,890,000 Dongfeng Motor 3,128 1.60
1,366,000 FIH Mobile 159 0.08
257,078 JD.com ADR 7,617 3.89
620,000 Minth 1,985 1.01
30,065 NetEase ADR 5,643 2.88
2,336,000 Qingdao Port International 1,330 0.68
43,260 Sohu.com 1,178 0.60
90,000 Tencent 3,436 1.76
42,240 21.58

Quilter Investors Asia Pacific (ex Japan) Large-Cap Equity Fund
Portfolio statement (continued) as at 30 June 2018
Quilter Investors OEIC
38
Market Percentage of
Value total net assets
Holding Investment £'000 %
Hong Kong Equities 8.52% (31 December 2017 8.22%)
494,800 AIA 3,292 1.68
631,000 China Mobile 4,263 2.18
334,824 CK Asset 2,023 1.03
670,824 CK Hutchison 5,414 2.77
915,200 HKR 427 0.22
6,057,000 Pacific Basin Shipping 1,257 0.64
16,676 8.52
India Equities 8.52% (31 December 2017 7.57%)
191,459 Housing Development Finance 4,059 2.07
484,423 ICICI Bank ADR 2,905 1.48
386,544 Infosys 5,627 2.87
116,216 Tata Consultancy Services 2,382 1.22
249,276 UPL 1,712 0.88
16,685 8.52
Indonesia Equities 0.68% (31 December 2017 1.01%)
3,603,300 Bank Negara Indonesia 1,344 0.68
1,344 0.68
Malaysia Equities 0.49% (31 December 2017 0.57%)
148,400 British American Tobacco Malaysia 963 0.49
963 0.49
Philippines Equities 0.44% (31 December 2017 0.87%)
37,856,000 Filinvest Land 756 0.39
96,110 Robinsons Retail 108 0.05
864 0.44
Singapore Equities 2.77% (31 December 2017 2.55%)
363,600 United Overseas Bank 5,427 2.77
5,427 2.77
South Korea Equities 20.38% (31 December 2017 21.81%)
16,100 E-Mart 2,793 1.43
58,597 Hyundai Motor (Preference shares 2nd) 3,629 1.85
77,917 Hyundai Steel 2,799 1.43
113,421 KB Financial 4,089 2.09
195,506 Korea Electric Power 4,266 2.18
59,151 LG 2,908 1.49
225,243 Samsung Electronics 7,175 3.66
135,085 Samsung Electronics (Preference shares) 3,468 1.77
29,627 Samsung Fire & Marine Insurance 5,341 2.73
116,047 Shinhan Financial 3,427 1.75
39,895 20.38

Quilter Investors Asia Pacific (ex Japan) Large-Cap Equity Fund
Portfolio statement (continued) as at 30 June 2018
Quilter Investors OEIC
39
Market Percentage of
Value total net assets
Holding Investment £'000 %
Taiwan Equities 12.47% (31 December 2017 12.57%)
735,000 Asustek Computer 5,101 2.61
2,754,398 China Life Insurance 2,204 1.13
1,327,000 Delta Electronics 3,611 1.84
1,038,000 Gigabyte Technology 1,741 0.89
1,094,139 Hon Hai Precision Industry 2,270 1.16
548,000 MediaTek 4,097 2.09
998,000 Taiwan Semiconductor Manufacturing 5,381 2.75
24,405 12.47
Thailand Equities 2.27% (31 December 2017 2.41%)
176,800 Bangkok Bank (Foreign Reg) 806 0.41
813,500 Bangkok Bank NVDR 3,644 1.86
4,450 2.27
Hong Kong Dollar Denominated Derivatives 0.00% (31 December 2017 0.00%)
Hong Kong Dollar Denominated Forward Exchange Contracts 0.00% (31 December 2017 0.00%)
HK$73,002 Hong Kong Dollar v Sterling Forward Exchange Contract - -
- -
Japan 2.37% (31 December 2017 2.98%)
Japan Equities 2.37% (31 December 2017 2.98%)
379,600 Inpex 2,998 1.53
148,300 Nexon 1,640 0.84
4,638 2.37
Investment assets 190,387 97.25
Net other assets 5,374 2.75
Total net assets 195,761 100.00
All investments are approved securities being either officially listed in a member state or traded on or under the rules of an eligible securities market, unless otherwise stated.
All investments are in ordinary shares unless otherwise stated.

Quilter Investors Asia Pacific (ex Japan) Large-Cap Equity Fund
Quilter Investors OEIC
40
Statement of total return for the period from 1 January 2018 to 30 June 2018 01.01.18 to 01.01.18 to 01.01.17 to 01.01.17 to
30.06.18 30.06.18 30.06.17 30.06.17
Note £'000 £'000 £'000 £'000
Income
Net capital (losses)/gains (9,797) 23,075
Revenue 1,943 1,428
Expenses (873) (597)
Interest payable and similar charges (27) -
Net revenue before taxation 1,043 831
Taxation (337) (124)
Net revenue after taxation 706 707
Total return before distributions (9,091) 23,782
Distributions 2 14 28
Change in net assets attributable to
shareholders from investment activities (9,077) 23,810
Statement of change in net assets attributable to shareholders for the period from 1 January 2018 to 30 June 2018 01.01.18 to 01.01.18 to 01.01.17 to 01.01.17 to
30.06.18 30.06.18 30.06.17 30.06.17
£'000 £'000 £'000 £'000
Opening net assets attributable to shareholders 182,632* 109,769
Amounts received on issue of shares 28,215 37,277
Amounts paid on cancellation of shares (6,058) (18,898)
22,157 18,379
Dilution adjustment 49 111
Change in net assets attributable to
shareholders from investment activities (9,077) 23,810
Closing net assets attributable to shareholders 195,761 152,069* * Section 3.30 of the SORP issued by the Investment Management Association in May 2014 requires comparative figures for the above statement. For interim financial
statements this will result in the closing comparative net assets not being equal to net assets at the start of the current period.

Quilter Investors Asia Pacific (ex Japan) Large-Cap Equity Fund
Quilter Investors OEIC
41
Balance sheet as at 30 June 2018 30.06.18 31.12.17
£'000 £’000
Assets
Fixed assets
Investments 190,387 177,565
Current assets
Debtors 1,409 1,273
Cash and bank balances 4,402 4,075
Total assets 196,198 182,913
Liabilities
Creditors
Other creditors (437) (281)
Total liabilities (437) (281)
Net assets attributable to shareholders 195,761 182,632

Quilter Investors Asia Pacific (ex Japan) Large-Cap Equity Fund
Notes to the financial statements for the period 1 from January 2018 to 30 June 2018
Quilter Investors OEIC
42
1 Accounting policies The financial statements have been prepared under the historical cost basis, as modified by the revaluation of investments, and in accordance with the Statement of Recommended Practice (SORP) for Authorised Funds, issued by the Investment Management Association in May 2014.
The accounting policies applied are consistent with those disclosed within the annual Financial Statements for the year ended 31 December 2017.
2 Distributions The distributions take account of revenue received on the issue of shares and revenue deducted on the cancellation of shares, and comprise:
01.01.18 to 01.01.17 to 30.06.18 30.06.17 £'000 £'000 Revenue deducted on cancellation of shares 13 17 Revenue received on issue of shares (27) (45) Distributions (14) (28)
Reconciliation of distributions: Net revenue after taxation 706 707 Overseas capital gains tax 154 - Undistributed net revenue carried forward (874) (735) Distributions (14) (28)

Quilter Investors Bond 1 Fund
Quilter Investors Bond 1 Fund
Quilter Investors OEIC
43
Launch date 20 August 2003
IA Sector Sterling Strategic Bond
Investment adviser TwentyFour Asset Management LLP
Net asset value £194,296,931
Objective
To achieve a combination of income and capital growth through investment in a well-diversified portfolio consisting of predominantly Sterling denominated fixed interest securities. The sub-fund is permitted to invest in overseas bonds and any non-Sterling currency exposure will be hedged back into Sterling to remove the risk of exchange rate fluctuation.
Policy
The sub-fund predominantly invests in a well diversified portfolio of UK fixed interest securities. The Investment Manager has appointed a specialist manager to manage the sub-fund, and continuously monitors this appointment. Investments may be made through collective investment schemes or through directly invested portfolios.
The sub-fund may use derivative instruments and forward transactions for the purposes of meeting the investment objective and/or efficient portfolio management. The use of derivatives for this purpose may affect the volatility or risk profile of the sub-fund although this is not the ACD’s intention.
Investment Manager’s Review
Market Review
Risk markets took over from where they left off in 2017, with a strong start which lasted a full three weeks into January with little pause for breath. This enabled fixed income credit markets across the globe to tighten while rates and risk free markets made small losses. However, the near perfect start to the year was spoilt somewhat as February was a turbulent month for markets, with political rhetoric and central bank activity combining to heighten underlying uncertainty. In February the US Fed welcomed its new chairman, Jerome Powell, who almost immediately had to submit the semi-annual monetary policy report to Congress. March saw a continuation of the cautious sentiment driving markets, closing what was a turbulent first quarter of the year. A combination of US import tariffs, tech sector weakness and political upheaval both in Europe and in the US, combined to create challenging conditions for investors, while the Fed decided to raise rates for a sixth time to 1.5-1.75%. April provided some respite for investors. However, despite an encouraging start to the earning season, risk assets failed to sustain a noteworthy rally; underlying our belief that, despite stable fundamentals, 2018 will continue to be a challenging year for investors and supporting our view for a more defensive bias to the portfolio.
June proved to be a very challenging month for investors as strong, but inconsistent, economic data was offset by a combination of mixed central bank rhetoric, an escalation in the international trade tariff dispute, and a pick-up in geopolitical risk both in Europe and further afield. In Europe, the political focus was very much on Italy, before it reached an 11th hour solution, and ultimately formed a government. The deal resulted in a sharp relief rally for Italian Government BTPs, but volatility quickly returned as the new government announced controversial comments ahead of their first meeting with their EU peers. Meanwhile, the Fed, as expected, raised rates by a quarter point to 1.75-2% in June. However, it was the minutes that grabbed most attention, with the dot plots adding an additional hike in 2018 (moving from 3 to 4 hikes for the year) and the commentary being seen as the most hawkish since the current rate hiking cycle started at the end of 2015.
Performance
Despite a challenging six month period, the general increase in market volatility at the start of the year resulted in some opportunities, and the portfolio managers were able to source favoured credits at more attractive levels in the secondary market. However, volumes in the market were disappointing and selling by real money investors was limited as the corporate new issue market in Europe was light given the time of year. Away from that, the portfolio managers maintained a relatively short duration for the sub-fund, on the back of more hawkish rhetoric by the Fed and the BoE.
In March, as the yield curve continued to flatten, and increasingly became the source of risk and volatility, the portfolio managers continued with the strategy of very methodically and very gradually increasing the government bond holdings and the
associated duration; as the rate curve moved higher and breakeven yields become more attractive. To this end, the government bond sector was increased from 14% to 19%, while 4% of the 2-yr (Dec ’19) holdings were switched into 5yr treasuries, taking the overall duration of the sub-fund marginally longer, from 2.56yrs to 2.66yrs. This is likely to be a year-long theme within the sub-fund as the cycle ages and rates move higher.
The theme of gradually reducing credit risk while adding to government bond positions continued into the second half of the period, and in June Australian positions increased to 11%, and a new position was opened in short dated Italian governments following the yield spike post the elections. The portfolio managers felt the market had overreacted to the eurosceptic commentaries, with short dated Italian yields being double those in Portugal. In aggregate, government positions stood at 27% and were once again positive contributors to performance in a very difficult month.
Credit risk reduction continued in the emerging market sector, but new for June was to further reduce dollar credit exposure, in particular to high yield, where spreads had remained close to cycle lows and stood out as being particularly expensive. High yield US was in fact the most positive contributor to performance during June.
Risk and Reward Profile
The calculated risk and reward category, as shown above, uses a method of calculation derived from EU rules. It is based on the rate at which the returns of the sub-fund have moved up and down in the past (i.e. volatility) and is not a guide to the future risk and reward category of the sub-fund. The category shown is not a target or guarantee and may shift over time. Even the lowest category 1 does not mean a risk-free investment. The seven-category scale is nonlinear, for example, 2 is not twice as risky as 1.
Sub-funds in category 3 have in the past shown moderately low volatility. With a sub-fund of category 3, you have a moderately low risk of losing money but your chance for gains is also moderately low.
Investment risk - there is no guarantee that the sub-fund will achieve its objective. A capital loss of some or all of the amount invested may occur.
Credit risk - the issuer of a bond or a similar investment within the sub-fund may not pay income or repay capital to the sub-fund when due. Bonds which are rated below investment grade are considered to have a higher risk exposure with respect to meeting their payment obligations.
Interest rate risk - investments in bonds are affected by interest rates and inflation trends which may affect the value of the sub-fund.
Liquidity risk - some investments may become hard to value or sell at a desired time and price. In extreme circumstances this may affect the sub-fund’s ability to meet redemption requests upon demand.
Currency risk - the sub-fund is denominated in British Pounds and may use techniques to try to reduce the effects of changes in the exchange rate between the currency of the underlying investments and the base currency (i.e. the reporting currency) of the sub-fund. These techniques may not eliminate all the currency risk. The value of your shares may rise and fall as a result of exchange rate movements.
Derivative risk - the sub-fund uses derivatives to generate returns and/or to reduce costs and the overall risk of the sub-fund. Using derivatives can involve a higher level of risk. A small movement in the price of an underlying investment may result in a disproportionately large movement in the price of the derivative investment. Derivatives also involve counterparty risk where the institutions acting as counterparty to derivatives may not meet their contractual obligations.
Capital erosion risk - the sub-fund takes its charges from capital of the sub-fund. Investors should be aware that there is potential for capital erosion if insufficient capital growth is achieved by the sub-fund to cover the charges. Capital erosion may have the effect of reducing the level of income generated.
For full details of the sub-fund's risks, please see the section in the prospectus headed "Risks".

Quilter Investors Bond 1 Fund
Quilter Investors OEIC
44
Performance Records Comparative Tables
1 January 2018 to 1 January 2017 to 1 January 2016 to Income 'A' 30 June 2018 31 December 2017 31 December 2016 p/share p/share p/share
Change in net assets per share Opening net asset value per share 46.39 45.27 45.59
Return before operating charges* (0.27) 3.94 2.34 Operating charges** (0.23) (0.46) (0.44)
Return after operating charges* (0.50) 3.48 1.90
Distributions (1.12) (2.36) (2.22) Retained distributions - - -
Closing net asset value per share 44.77 46.39 45.27
* after direct transaction costs of*** - - -
Performance Return after charges (1.08)% 7.69% 4.17%
Other information Closing net asset value (£) 194,296,931 221,264,105 240,034,339 Closing number of shares 434,031,528 476,965,034 530,190,678 Operating charges**** 1.00% 0.99% 0.99% Direct transaction costs*** - - -
Prices pence per share pence per share pence per share Highest share price 47.27 47.27 46.07 Lowest share price 45.34 45.21 42.86
** The operating charges include all costs borne by the sub-fund, except for direct transaction costs.
*** The direct transaction costs are made up of fees and commissions paid to agents, advisers, brokers and dealers, levies by regulatory agencies and securities exchanges as well as transfer taxes and duties. They do not include any difference between the quoted bid and offer prices or internal administrative or holding costs. These costs arise as a result of transactions undertaken both for efficient portfolio management and the meeting of the sub-fund’s objectives. These costs exclude any effect of dilution adjustments used to offset the costs.
**** The operating charges percentage is the ratio of the sub-fund's ongoing charges (excluding interest on borrowings) to the average net assets of the sub-fund.

Quilter Investors Bond 1 Fund
Quilter Investors OEIC
45
Performance 6 months to
30 June 2018
1 year to
30 June 2018
3 years to
30 June 2018
5 years to
30 June 2018
Quilter Investors Bond 1 Fund* (0.56)% 2.63% 9.09% 28.96%
ICE LIBOR - GBP 3 Month (benchmark) 0.31% 0.50% 1.47% 2.57%
IA Sterling Strategic Bond (sector average) (1.53)% 0.41% 10.90% 23.36%
Quartile ranking 1 1 3 1
* Income ‘A’ shares
Data Source – Factset. Figures are calculated on a total return and single price basis, with net income reinvested into the sub-fund. Portfolio allocation
Europe 42.55%
United Kingdom 25.69%
North America 16.54%
Asia Pacific (excluding Japan) 11.99%
Overseas derivatives (0.05)%
United Kingdom derivatives (0.50)%
Net other assets 3.78%
Total 100.00%
Asset allocation
Sterling Denominated Debt Securities 34.95%
Euro Denominated Debt Securities 27.62%
US Dollar Denominated Debt Securities 22.90%
Australian Denominated Dollar Debt Securities 11.30%
Overseas derivatives (0.05)%
United Kingdom derivatives (0.50)%
Net other assets 3.78%
Total 100.00%
Percentage of
Major holdings portfolio
Australia Government Bond 2% 21/12/2021 7.86%
US Treasury 2.5% 31/03/2023 4.10%
Italy Buoni Poliennali Del Tesoro 0.95% 01/03/2023 4.09%
Australia Government Bond 2.25% 21/11/2022 3.44%
Coventry Building Society 6.375% Perpetual 2.88%
Penta CLO 4 DAC 2.6% 17/12/2030 2.52%
Halcyon Loan Advisors European Funding 3.2% 25/07/2030 1.83%
Nationwide Building Society 10.25% Perpetual 1.82%
Transocean Phoenix 2 7.75% 15/10/2024 1.68%
Garfunkelux Holdco 3 8.5% 01/11/2022 1.63%
Number of holdings 108
Total Purchases and Sales for the period
2018 2017
£’000 £’000
Total purchases for the 6 month period to 30 June 105,371 200,127
Total sales for the 6 month period to 30 June 130,143 221,761

Quilter Investors Bond 1 Fund
Portfolio statement as at 30 June 2018
Quilter Investors OEIC
46
Market Percentage of
Value total net assets Holding Investment £’000 %
Sterling 34.45% (31 December 2017 44.33%)
Sterling Denominated Fixed Rate Corporate Bonds 31.35% (31 December 2017 42.20%) £1,050,000 Aldermore 8.5% 28/10/2026 1,191 0.61
£650,000 Aldermore 11.875% Perpetual 681 0.35 £1,026,000 America Movil 6.375% 06/09/2073 1,083 0.56 £2,100,000 Assicurazioni Generali 6.416% Perpetual 2,157 1.11 £2,018,000 Aviva 5.9021% Perpetual 2,104 1.08
£810,000 Barclays 7.25% Perpetual 830 0.43 £1,670,000 Barclays 7.875% Perpetual 1,769 0.91 £2,290,000 Bracken MidCo1 10.5% 15/11/2021 2,382 1.23 £2,170,000 Cabot Financial 7.5% 01/10/2023 2,205 1.13 £1,450,000 Cabot Financial Luxembourg 8.375% 01/08/2020 1,465 0.75 £2,400,000 CNP Assurances 7.375% 30/09/2041 2,686 1.38 £5,500,000 Coventry Building Society 6.375% Perpetual 5,603 2.88
£750,000 Direct Line Insurance 4.75% Perpetual 684 0.35 £1,900,000 ELM for Swiss Reinsurance 6.3024% Perpetual 1,943 1.00
£945,000 esure 6.75% 19/12/2024 1,093 0.56 £3,280,000 Garfunkelux Holdco 3 8.5% 01/11/2022 3,178 1.63
£900,000 Gazprom OAO Via Gaz Capital 4.25% 06/04/2024 916 0.47 £1,150,000 Hiscox 6.125% 24/11/2045 1,260 0.65 £2,420,000 Jerrold Finco 6.125% 15/01/2024 2,425 1.25
£730,000 Lloyds Bank 13% Perpetual 1,286 0.66 £23,204 Nationwide Building Society 10.25% Perpetual 3,529 1.82
£950,000 New Look 6.5% 01/07/2022 479 0.25 £1,650,000 Oaknorth Bank 7.75% 01/06/2028 1,627 0.84 £1,217,000 Orange 5.75% Perpetual 1,309 0.67 £2,150,000 Paragon 7.25% 09/09/2026 2,279 1.17 £1,700,000 Pension Insurance 6.5% 03/07/2024 1,898 0.98 £1,559,000 Petrobras Global Finance 6.25% 14/12/2026 1,567 0.81 £2,000,000 Petroleos Mexicanos 3.75% 16/11/2025 1,878 0.97 £1,200,000 Phoenix 5.75% Perpetual 1,101 0.57 £1,000,000 QBE Insurance 6.115% 24/05/2042 1,082 0.56
£200,000 Shawbrook 8.5% 28/10/2025 210 0.11 £1,829,000 Standard Chartered Bank 5.375% Perpetual 1,901 0.98 £1,660,000 Standard Life 6.546% Perpetual 1,773 0.91 £1,400,000 Towd Point Mortgage Funding 2016-Granite1 F 3.75434% 20/07/2046 1,412 0.73
£770,000 Virgin Money UK 7.875% Perpetual 776 0.40 £1,100,000 Virgin Money UK 8.75% Perpetual 1,142 0.59
60,904 31.35
Sterling Denominated Variable Rate Corporate Bonds 3.60% (31 December 2017 2.61%) £1,258,850 Honours 0.71856% 10/04/2029 1,180 0.61 £2,100,000 Legal & General 5.875% Perpetual 2,137 1.10 £1,515,000 Nationwide Building Society 6.875% Perpetual 1,547 0.79 £1,625,000 Trinity Square 2015-1 4.18588% 15/07/2051 1,684 0.87
£450,000 Warwick Finance Residential Mortgages 1 2.83575% 21/09/2049 452 0.23
7,000 3.60
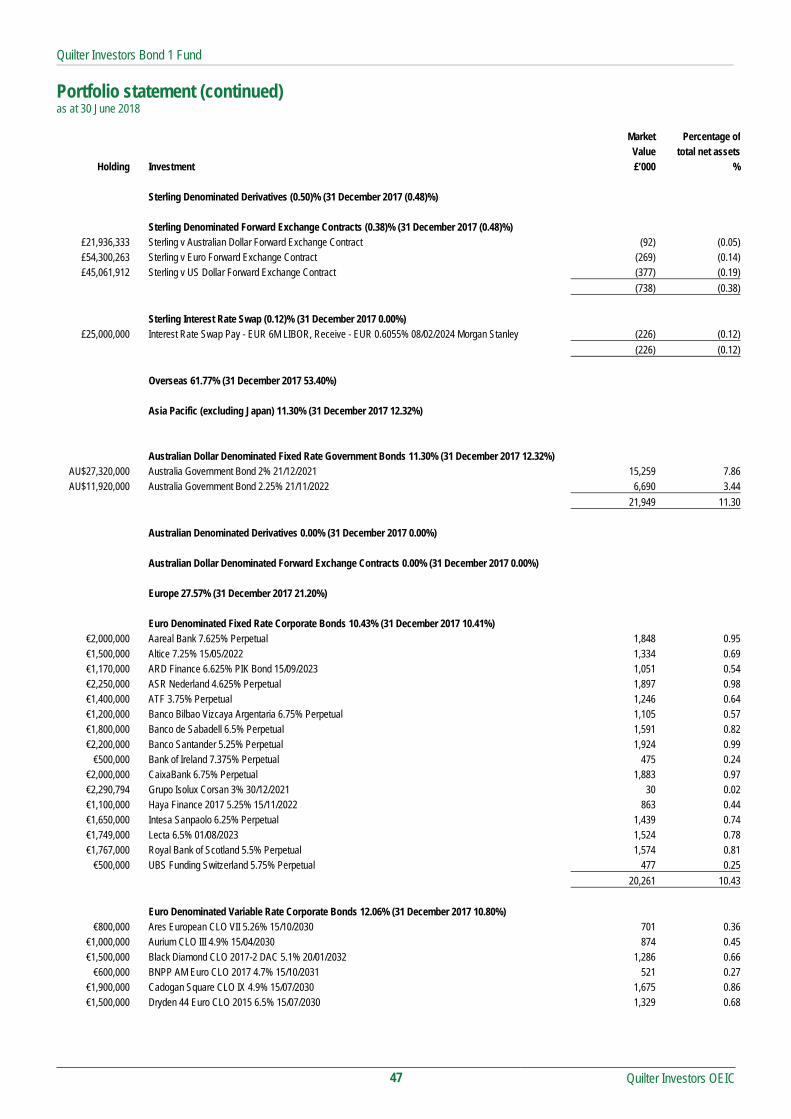
Quilter Investors Bond 1 Fund
Portfolio statement (continued) as at 30 June 2018
Quilter Investors OEIC
47
Market Percentage of Value total net assets
Holding Investment £’000 %
Sterling Denominated Derivatives (0.50)% (31 December 2017 (0.48)%)
Sterling Denominated Forward Exchange Contracts (0.38)% (31 December 2017 (0.48)%) £21,936,333 Sterling v Australian Dollar Forward Exchange Contract (92) (0.05)£54,300,263 Sterling v Euro Forward Exchange Contract (269) (0.14)£45,061,912 Sterling v US Dollar Forward Exchange Contract (377) (0.19)
(738) (0.38)
Sterling Interest Rate Swap (0.12)% (31 December 2017 0.00%) £25,000,000 Interest Rate Swap Pay - EUR 6M LIBOR, Receive - EUR 0.6055% 08/02/2024 Morgan Stanley (226) (0.12)
(226) (0.12)
Overseas 61.77% (31 December 2017 53.40%)
Asia Pacific (excluding Japan) 11.30% (31 December 2017 12.32%)
Australian Dollar Denominated Fixed Rate Government Bonds 11.30% (31 December 2017 12.32%) AU$27,320,000 Australia Government Bond 2% 21/12/2021 15,259 7.86AU$11,920,000 Australia Government Bond 2.25% 21/11/2022 6,690 3.44
21,949 11.30
Australian Denominated Derivatives 0.00% (31 December 2017 0.00%) Australian Dollar Denominated Forward Exchange Contracts 0.00% (31 December 2017 0.00%)
Europe 27.57% (31 December 2017 21.20%)
Euro Denominated Fixed Rate Corporate Bonds 10.43% (31 December 2017 10.41%) €2,000,000 Aareal Bank 7.625% Perpetual 1,848 0.95€1,500,000 Altice 7.25% 15/05/2022 1,334 0.69€1,170,000 ARD Finance 6.625% PIK Bond 15/09/2023 1,051 0.54€2,250,000 ASR Nederland 4.625% Perpetual 1,897 0.98€1,400,000 ATF 3.75% Perpetual 1,246 0.64€1,200,000 Banco Bilbao Vizcaya Argentaria 6.75% Perpetual 1,105 0.57€1,800,000 Banco de Sabadell 6.5% Perpetual 1,591 0.82€2,200,000 Banco Santander 5.25% Perpetual 1,924 0.99
€500,000 Bank of Ireland 7.375% Perpetual 475 0.24€2,000,000 CaixaBank 6.75% Perpetual 1,883 0.97€2,290,794 Grupo Isolux Corsan 3% 30/12/2021 30 0.02€1,100,000 Haya Finance 2017 5.25% 15/11/2022 863 0.44€1,650,000 Intesa Sanpaolo 6.25% Perpetual 1,439 0.74€1,749,000 Lecta 6.5% 01/08/2023 1,524 0.78€1,767,000 Royal Bank of Scotland 5.5% Perpetual 1,574 0.81
€500,000 UBS Funding Switzerland 5.75% Perpetual 477 0.25
20,261 10.43
Euro Denominated Variable Rate Corporate Bonds 12.06% (31 December 2017 10.80%) €800,000 Ares European CLO VII 5.26% 15/10/2030 701 0.36
€1,000,000 Aurium CLO III 4.9% 15/04/2030 874 0.45€1,500,000 Black Diamond CLO 2017-2 DAC 5.1% 20/01/2032 1,286 0.66
€600,000 BNPP AM Euro CLO 2017 4.7% 15/10/2031 521 0.27€1,900,000 Cadogan Square CLO IX 4.9% 15/07/2030 1,675 0.86€1,500,000 Dryden 44 Euro CLO 2015 6.5% 15/07/2030 1,329 0.68

Quilter Investors Bond 1 Fund
Portfolio statement (continued) as at 30 June 2018
Quilter Investors OEIC
48
Market Percentage of Value total net assets
Holding Investment £’000 % Euro Denominated Variable Rate Corporate Bonds (continued)
€1,000,000 GLG Euro CLO II 3.8% 15/01/2030 896 0.46 €1,000,000 Halcyon Loan Advisors European Funding 2014 5.55% 15/04/2030 900 0.46 €1,000,000 Halcyon Loan Advisors European Funding 2016 6.45% 20/01/2030 903 0.47 €4,000,000 Halcyon Loan Advisors European Funding 3.2% 25/07/2030 3,562 1.83 €1,000,000 Man GLG Euro CLO I DAC 2.45% 15/10/2030 867 0.45 €1,000,000 Man GLG Euro CLO I DAC 4.85% 15/10/2030 855 0.44 €5,550,000 Penta CLO 4 DAC 2.6% 17/12/2030 4,899 2.52 €2,000,000 Phoenix Park 4.772% 29/07/2027 1,771 0.91 €1,150,000 Royal Bank of Scotland 2.006% Perpetual 1,000 0.52 €1,542,000 St Paul's CLO VII 5.65% 30/04/2030 1,396 0.72
23,435 12.06
Euro Denominated Fixed Rate Government Bonds 5.13% (31 December 2017 0.00%) €2,299,000 Italy Buoni Poliennali Del Tesoro 0.35% 15/06/2020 2,023 1.04 €9,295,000 Italy Buoni Poliennali Del Tesoro 0.95% 01/03/2023 7,943 4.09
9,966 5.13
Spain Equities 0.00% (31 December 2017 0.00%) 5,628 Grupo Isolux Corsan (Warrants 30/12/2021) 1 -
1 -
Euro Denominated Derivatives (0.05)% (31 December 2017 (0.01)%)
Euro Denominated Forward Exchange Contracts 0.00% (31 December 2017 0.02%)
Euro Interest Rate Swap (0.05)% (31 December 2017 (0.03)%) €10,000,000 Interest Rate Swap Pay - EUR 6M LIBOR, Receive - EUR 0.859% 23/02/2027 Morgan Stanley (104) (0.05)
(104) (0.05)
US Dollar 22.90% (31 December 2017 19.88%)
US Dollar Denominated Fixed Rate Corporate Bonds 15.91% (31 December 2017 16.14%) $1,000,000 AT Securities 5.25% Perpetual 695 0.36 $3,475,000 Cheniere Corpus Christi 7% 30/06/2024 2,886 1.49 $1,275,000 CHS/Community Health Systems 6.25% 31/03/2023 887 0.46
$500,000 Coca-Cola Icecek AS 4.215% 19/09/2024 353 0.18 $1,175,000 Community Health Systems 5.125% 01/08/2021 829 0.43 $1,298,000 Conduent Finance 10.5% 15/12/2024 1,159 0.60 $2,175,000 Credit Suisse 7.5% Perpetual 1,709 0.88 $2,075,000 CSC 10.875% 15/10/2025 1,822 0.94 $2,300,000 EP Energy 8% 29/11/2024 1,763 0.91 $1,910,000 HBOS Capital Funding 6.85% Perpetual 1,467 0.75 $2,300,000 Hidrovias International Finance 5.95% 24/01/2025 1,582 0.81 $1,300,000 Kernel 8.75% 31/01/2022 979 0.50
$350,000 Nufarm Australia 5.75% 30/04/2026 259 0.13 $1,200,000 Societe Generale 7.875% Perpetual 938 0.48 $2,250,000 Sprint 7.875% 15/09/2023 1,781 0.92 $2,300,000 Standard Chartered 7.75% Perpetual 1,795 0.92 $1,350,000 Suzano Austria 7% 16/03/2047 1,058 0.54
$250,000 Titan 6.5% 30/11/2023 189 0.10 $4,029,000 Transocean Phoenix 2 7.75% 15/10/2024 3,262 1.68 $1,245,000 Turkcell Iletisim Hizmetleri 5.75% 15/10/2025 910 0.47

Quilter Investors Bond 1 Fund
Portfolio statement (continued) as at 30 June 2018
Quilter Investors OEIC
49
Market Percentage of Value total net assets
Holding Investment £’000 % US Dollar Denominated Fixed Rate Corporate Bonds (continued)
$500,000 Turkcell Iletisim Hizmetleri 5.8% 11/04/2028 344 0.18 $1,095,000 Turkiye Garanti Bankasi 5.875% 16/03/2023 786 0.40 $2,160,000 TV Azteca 8.25% 09/08/2024 1,598 0.82 $2,428,000 VTR Finance 6.875% 15/01/2024 1,857 0.96
30,908 15.91
US Dollar Denominated Variable Rate Corporate Bonds 0.39% (31 December 2017 0.28%) $1,030,000 AXA 6.463% Perpetual 765 0.39
765 0.39
US Dollar Denominated Fixed Rate Government Bonds 6.60% (31 December 2017 3.48%) $3,100,000 African Export-Import Bank 4.125% 20/06/2024 2,241 1.16 $3,500,000 US Treasury 1% 30/11/2019 2,610 1.34
$10,580,000 US Treasury 2.5% 31/03/2023 7,972 4.10
12,823 6.60
US Dollar Denominated Derivatives 0.00% (31 December 2017 (0.02)%)
US Dollar Denominated Forward Exchange Contracts 0.00% (31 December 2017 (0.02)%)
Investment assets* 186,944 96.22
Net other assets 7,353 3.78
Total net assets 194,297 100.00
* Including investment liabilities.
All investments are approved securities being either officially listed in a member state or traded on or under the rules of an eligible securities market, unless otherwise stated.

Quilter Investors Bond 1 Fund
Quilter Investors OEIC
50
Statement of total return
for the period from 1 January 2018 to 30 June 2018 01.01.18 to 01.01.18 to 01.01.17 to 01.01.17 to
30.06.18 30.06.18 30.06.17 30.06.17
Note £'000 £'000 £'000 £'000
Income
Net capital (losses)/gains (6,147) 7,023
Revenue 5,101 6,082
Expenses (1,044) (1,172)
Interest payable and similar charges (5) (5)
Net revenue before taxation 4,052 4,905
Taxation - -
Net revenue after taxation 4,052 4,905
Total return before distributions (2,095) 11,928
Distributions 2 (5,096) (6,077)
Change in net assets attributable to
shareholders from investment activities (7,191) 5,851
Statement of change in net assets attributable to shareholders for the period from 1 January 2018 to 30 June 2018 01.01.18 to 01.01.18 to 01.01.17 to 01.01.17 to
30.06.18 30.06.18 30.06.17 30.06.17
£'000 £'000 £'000 £'000
Opening net assets attributable to shareholders 221,264* 240,034
Amounts received on issue of shares 4,376 1,471
Amounts paid on cancellation of shares (24,179) (32,130)
(19,803) (30,659)
Dilution adjustment 27 96
Change in net assets attributable to
shareholders from investment activities (7,191) 5,851
Closing net assets attributable to shareholders 194,297 215,322* * Section 3.30 of the SORP issued by the Investment Management Association in May 2014 requires comparative figures for the above statement. For interim financial
statements this will result in the closing comparative net assets not being equal to net assets at the start of the current period.
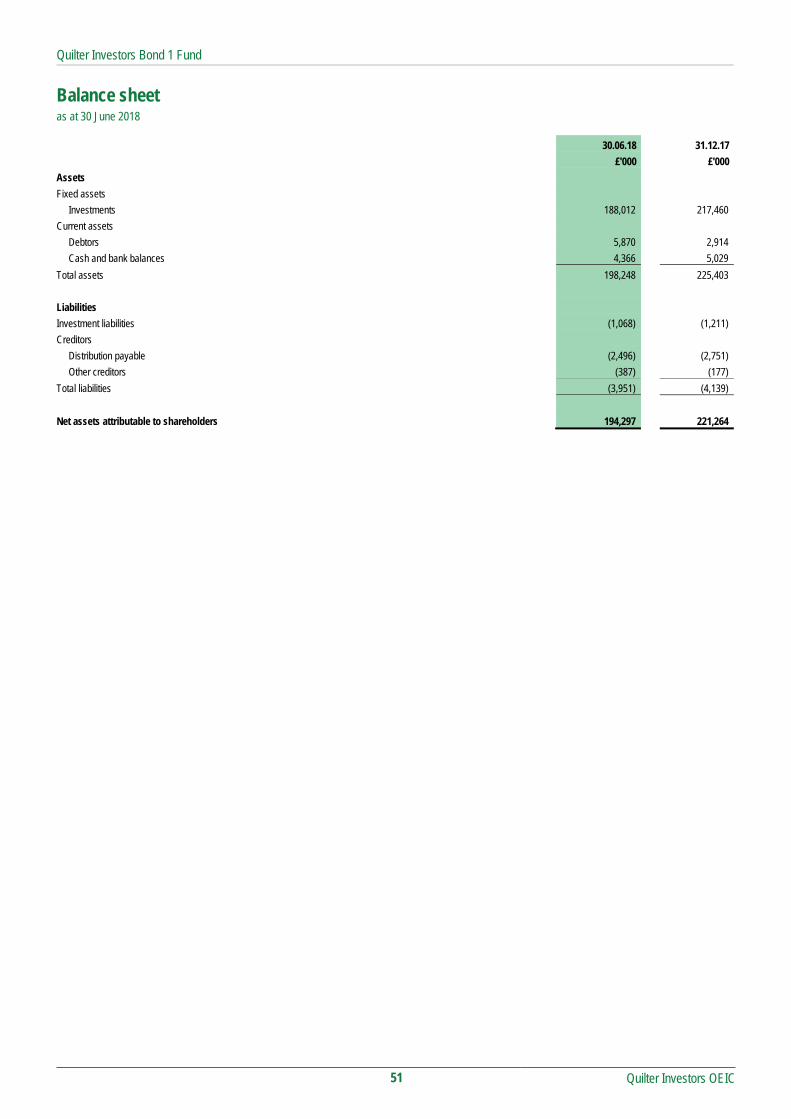
Quilter Investors Bond 1 Fund
Quilter Investors OEIC
51
Balance sheet as at 30 June 2018
30.06.18 31.12.17
£'000 £'000
Assets
Fixed assets
Investments 188,012 217,460
Current assets
Debtors 5,870 2,914
Cash and bank balances 4,366 5,029
Total assets 198,248 225,403
Liabilities
Investment liabilities (1,068) (1,211)
Creditors
Distribution payable (2,496) (2,751)
Other creditors (387) (177)
Total liabilities (3,951) (4,139)
Net assets attributable to shareholders 194,297 221,264

Quilter Investors Bond 1 Fund
Notes to the financial statements for the period from 1 January 2018 to 30 June 2018
Quilter Investors OEIC
52
1 Accounting policies
The financial statements have been prepared under the historical cost basis, as modified by the revaluation of investments, and in accordance with the Statement of Recommended Practice (SORP) for Authorised Funds, issued by the Investment Management Association in May 2014.
The accounting policies applied are consistent with those disclosed within the annual Financial Statements for the year ended 31 December 2017.
2 Distributions The distributions take account of revenue received on the issue of shares and revenue deducted on the cancellation of shares, and comprise:
01.01.18 to 01.01.17 to 30.06.18 30.06.17 £'000 £'000 First Interim – Income shares (31 March) 2,460 2,903 Second Interim – Income shares (30 June) 2,496 2,844 4,956 5,747 Revenue deducted on cancellation of shares 179 340 Revenue received on issue of shares (39) (10) Distributions 5,096 6,077
Reconciliation of distributions: Net revenue after taxation 4,052 4,905 Authorised Corporate Director's capitalised fee rebates 1,044 1,172 Distributions 5,096 6,077

Quilter Investors Bond 1 Fund
Distribution table
Quilter Investors OEIC
53
Second interim distribution Group 1: Shares purchased prior to 1 April 2018 Group 2: Shares purchased from 1 April 2018 to 30 June 2018
Revenue
pence per share Equalisation
pence per share*
Distribution paid 31.08.18
pence per share
Distribution paid 31.08.17
pence per share Income 'A' Shares Group 1 0.5751 - 0.5751 0.6127 Group 2 0.1759 0.3992 0.5751 0.6127
First interim distribution Group 1: Shares purchased prior to 1 January 2018 Group 2: Shares purchased from 1 January 2018 to 31 March 2018
Revenue
pence per share Equalisation
pence per share*
Distribution paid 31.05.18
pence per share
Distribution paid 31.05.17
pence per share Income 'A' Shares Group 1 0.5485 - 0.5485 0.5644 Group 2 0.1441 0.4044 0.5485 0.5644 * Equalisation only applies to shares purchased during the distribution period (Group 2 shares). It is the average amount of revenue included in the purchase price of all
Group 2 shares and is refunded to holders of these shares as a return of capital. Being capital, it is not liable to income tax but must be deducted from the cost of shares for capital gains tax purposes.

Quilter Investors Bond 2 Fund
Quilter Investors Bond 2 Fund
Quilter Investors OEIC
54
Launch date 19 April 2002
IA Sector UK Corporate Bonds
Investment adviser FIL Pensions Management
Net asset value £217,404,235
Objective
To achieve total return from a combination of income and capital growth through investment in a well-diversified portfolio consisting predominantly of Sterling denominated (or hedged back to Sterling) debt securities.
Policy
The Investment Manager has appointed a specialist manager to manage the sub-fund, and continuously monitors this appointment. Investments may be made through collective investment schemes or through directly invested portfolios.
The sub-fund may use derivative instruments and forward transactions for the purposes of meeting the investment objective and/or efficient portfolio management. The use of derivatives for this purpose may affect the volatility or risk profile of the sub-fund although this is not the ACD’s intention.
Investment Manager’s review
Market Background
Fixed income markets posted mixed returns over the period. US government bonds posted losses as the yield curve edged higher, due to concerns around a widening twin deficit and higher inflation. Moreover, central banks have affirmed contrasting yield divergence, with the US Federal Reserve’s (Fed) tightening monetary policy stance picking up pace as the Fed raised interest rates in March and June. In contrast, the Bank of England (BoE) backtracked on the expected interest rate rise amid disappointing economic data and focused on the looming Brexit deadline. The European Central Bank (ECB) also decided to taper asset purchases, and end it completely, by the end of the year. The period also witnessed political uncertainty in Italy, escalating trade war rhetoric and rising volatility in emerging markets, which stoked demand for safe haven assets. Short and long-dated German bund yields slid, supported by the ECB policymakers’ signal that interest rates would remain low. Ten-year UK government bond (Gilt) yields fell to the lowest level since the start of the year, before ending the period slightly higher as volatility normalised, while short dated gilt yields rose over the period. In credit markets, the global risk off sentiment and the fall in stock markets led credit spreads to widen, with both high yield and investment grade bonds posting negative returns.
The BoE seems intent on normalising interest rates, and current market pricing indicates an 80% likelihood of a rate rise at the next meeting. We believe the domestic growth story is not robust enough to make a clear case for significant monetary policy tightening. However, on balance, we expect interest rates to be tightened once this year, given the predisposition of the BoE’s Monetary Policy Committee.
Performance
The portfolio posted negative returns in the period, but outperformed the index. The overweight credit beta position and adverse selection was a key detractor from performance as credit spreads widened amid increased volatility. As a result, the bias towards a mix of sectors, including insurance and asset backed securities (ABS) held back returns. The overweight holdings in Phoenix Group and Scottish Widows were among the top detractors from performance from an issuer standpoint. The overweight in Dignity Finance was the top detractor at issuer level as the company issued profit warning. However, conservative positioning at the security and sector level partially offset these losses. Specifically, an underweight stance in banks supported returns. The portfolio’s term structure positioning was positive for both absolute and relative returns. Specifically, favourable positioning across the Gilt yield curve enhanced returns.
While the tightening of financial conditions has been well telegraphed, it coincides with the barrage of trade war threats and higher oil prices. We have already seen US dollar strength weighing heavily on emerging market sentiment. This leaves little room for miscommunication and/or policy error from global central banks at this stage of the cycle. While we continue to monitor steps towards policy normalisation, we expect the bond yields to remain low in historical context as systemic risk (namely global debt to GDP) is high and other structural issues, such as an ageing global population, appear to be intensifying.
On the credit front, we believe that the frequency of mishaps for the market to deal with has increased amid tightening liquidity, strengthening dollar and central bank transition towards monetary tightening. Therefore, going into the second half of the year, we expect the volatility to remain elevated. While valuations look more attractive than the start of the year, we believe the credit spreads could still move wider. As a result, we remain focused on high conviction views and avoiding any credit specific blow-ups.
Risk and Reward Profile
The calculated risk and reward category, as shown above, uses a method of calculation derived from EU rules. It is based on the rate at which the returns of the sub-fund have moved up and down in the past (i.e. volatility) and is not a guide to the future risk and reward category of the sub-fund. The category shown is not a target or guarantee and may shift over time. Even the lowest category 1 does not mean a risk-free investment. The seven-category scale is nonlinear, for example, 2 is not twice as risky as 1.
Sub-funds in category 3 have in the past shown moderate low volatility. With a sub-fund of category 3, you have a moderate low risk of losing money but your chance for gains is also moderately low.
Investment risk - there is no guarantee that the sub-fund will achieve its objective. A capital loss of some or all of the amount invested may occur.
Credit risk - the issuer of a Bond or a similar investment within the sub-fund may not pay income or repay capital to the sub-fund when due. Bonds which are rated below investment grade are considered to have a higher risk exposure with respect to meeting their payment obligations.
Interest rate risk - investments in bonds are affected by interest rates and inflation trends which may affect the value of the sub-fund.
Liquidity risk - some investments may become hard to value or sell at a desired time and price. In extreme circumstances this may affect the sub-fund’s ability to meet redemption requests upon demand.
Currency risk - the sub-fund is denominated in British Pounds and may use techniques to try to reduce the effects of changes in the exchange rate between the currency of the underlying investments and the base currency of the sub-fund. These techniques may not eliminate all the currency risk. The value of your shares may rise and fall as a result of exchange rate movements.
Derivative risk - the sub-fund uses derivatives to generate returns and/or to reduce costs and the overall risk of the sub-fund. Using derivatives can involve a higher level of risk. A small movement in the price of an underlying investment may result in a disproportionately large movement in the price of the derivative investment. Derivatives also involve counterparty risk where the institutions acting as counterparty to derivatives may not meet their contractual obligations.
Capital erosion risk - the sub-fund takes its charges from the capital of the sub-fund. Investors should be aware that there is potential for capital erosion if insufficient capital growth is achieved by the sub-fund to cover the charges. Capital erosion may have the effect of reducing the level of income generated.
For full details of the sub-fund's risks, please see the section in the prospectus headed "Risks".

Quilter Investors Bond 2 Fund
Quilter Investors OEIC
55
Performance Records Comparative Tables Accumulation 'A' 1 January 2018 to 1 January 2017 to 1 January 2016 to 30 June 2018 31 December 2017 31 December 2016 p/share p/share p/share
Change in net assets per share Opening net asset value per share 93.45 88.68 81.79
Return before operating charges* (1.20) 5.67 8.50 Operating charges** (0.46) (0.90) (0.86)
Return after operating charges* (1.66) 4.77 7.64
Distributions (1.76) (3.59) (3.75) Retained distribution 1.76 3.59 3.00
Closing net asset value per share 91.79 93.45 88.68
* after direct transaction costs of*** - - -
Performance Return after charges (1.77)% 5.38% 9.34%
Other information Closing net asset value (£) 125,818,652 144,631,825 161,438,913 Closing number of shares 137,065,221 154,769,973 182,036,793 Operating Charges**** 1.00% 0.99% 0.99% Direct transaction costs*** - -
Prices pence per share pence per share pence per share Highest share price 93.77 94.27 93.64 Lowest share price 91.15 87.77 81.62
Income 'A' 1 January 2018 to 1 January 2017 to 1 January 2016 to 30 June 2018 31 December 2017 31 December 2016 p/share p/share p/share
Change in net assets per share Opening net asset value per share 46.58 45.96 43.88
Return before operating charges* (0.59) 2.92 4.53 Operating charges** (0.23) (0.46) (0.46)
Return after operating charges* (0.82) 2.46 4.07
Distributions (0.88) (1.84) (1.99) Retained distribution - - -
Closing net asset value per share 44.88 46.58 45.96
* after direct transaction costs of*** - - -
Performance Return after charges (1.76)% 5.35% 9.28%
Other information Closing net asset value (£) 91,585,583 95,935,597 50,726,042 Closing number of shares 204,070,555 205,964,391 110,363,524 Operating Charges**** 1.00% 0.99% 0.99% Direct transaction costs*** - - -
Prices pence per share pence per share pence per share Highest share price 47.65 48.39 49.35 Lowest share price 45.44 45.49 43.78
** The operating charges include all costs borne by the sub-fund, except for direct transaction costs.
*** The direct transaction costs are made up of fees and commissions paid to agents, advisers, brokers and dealers, levies by regulatory agencies and securities exchanges as well as transfer taxes and duties. They do not include any difference between the quoted bid and offer prices or internal administrative or holding costs. These costs arise as a result of transactions undertaken both for efficient portfolio management and the meeting of the sub-fund’s objectives. These costs exclude any effect of dilution adjustments used to offset the costs.
**** The operating charges percentage is the ratio of the sub-fund's ongoing charges (excluding interest on borrowings) to the average net assets of the sub-fund.

Quilter Investors Bond 2 Fund
Quilter Investors OEIC
56
Performance 6 months to
30 June 2018
1 year to
30 June 2018
3 years to
30 June 2018
5 years to
30 June 2018
Quilter Investors Bond 2 Fund* (2.11)% (0.35)% 12.14% 23.14%
BofA Merrill Lynch Euro-Sterling Index (E0L0) (benchmark) (1.24)% 0.78% 15.67% 31.69%
IA Sterling Corporate Bond (sector average) (1.46)% 0.63% 13.69% 27.57%
Quartile ranking 4 4 4 4
* Accumulation ‘A’ shares
Data Source – Factset. Figures are calculated on a total return and single price basis, with net income reinvested into the sub-fund.
Portfolio allocation
United Kingdom 70.40%
Europe 14.02%
North America 13.22%
Asia Pacific (excluding Japan) 1.38%
Middle East 0.43%
United Kingdom Derivatives (0.23)%
Overseas Derivatives (0.10)%
Net other assets 0.88%
Total 100.00%
Asset allocation
Sterling Denominated Debt Securities 93.33%
US Dollar Denominated Debt Securities 4.40%
Euro Denominated Debt Securities 1.72%
United Kingdom Derivatives (0.23)%
Overseas Derivatives (0.10)%
Net other assets 0.88%
Total 100.00%
Percentage of
Major holdings portfolio
United Kingdom Gilt 1.25% 22/07/2027 2.61%
United Kingdom Gilt 6% 07/12/2028 1.53%
Electricite de France 6% 22/01/2114 1.42%
United Kingdom Gilt 2.75% 07/09/2024 1.42%
United Kingdom Gilt 3.5% 22/01/2045 1.32%
Network Rail Infrastructure Finance 4.75% 29/11/2035 1.31%
European Investment Bank 4.5% 07/06/2029 1.29%
United Kingdom Gilt 2% 07/09/2025 1.20%
Aspire Defence Finance 4.674% 31/03/2040 'B' 0.99%
United Kingdom Gilt 3.5% 22/07/2068 0.92%
Number of holdings 250
Total Purchases and Sales for the period
2018 2017
£’000 £’000
Total purchases for the 6 month period to 30 June 59,730 63,208
Total sales for the 6 month period to 30 June 72,112 82,779

Quilter Investors Bond 2 Fund
Portfolio statement as at 30 June 2018
Quilter Investors OEIC
57
Market Percentage of
Value total net assets Holding Investment £’000 %
United Kingdom 93.10% (31 December 2017 91.22%)
Sterling Denominated Corporate Bonds 81.46% (31 December 2017 70.54%)
Sterling Denominated Fixed Rate Corporate Bonds 80.46% (31 December 2017 69.64%) £800,000 AA 2.75% 31/07/2023 762 0.35 £550,000 AA 6.269% 31/07/2025 616 0.28 £350,000 Admiral 5.5% 25/07/2024 383 0.18 £900,000 Akelius Residential Property AB 2.375% 15/08/2025 868 0.40 £250,000 America Movil 5.75% 28/06/2030 316 0.15 £750,000 Anglian Water Services Financing 4.5% 05/10/2027 878 0.40 £850,000 Annington Funding 2.646% 12/07/2025 846 0.39 £800,000 Annington Funding 3.685% 12/07/2034 818 0.38 £874,000 Annington Funding 3.935% 12/07/2047 905 0.42
£1,500,000 APT Pipelines 4.25% 26/11/2024 1,642 0.76 £350,000 Arqiva Financing 4.04% 30/06/2020 363 0.17 £475,000 Arqiva Financing 5.34% 30/06/2030 558 0.26 £629,646 Arsenal Securities 5.1418% 01/09/2029 697 0.32
£1,298,990 Aspire Defence Finance 4.674% 31/03/2040 'A' 1,580 0.73 £1,762,915 Aspire Defence Finance 4.674% 31/03/2040 'B' 2,145 0.99
£400,000 Assicurazioni Generali 6.269% Perpetual 402 0.18 £450,000 Assicurazioni Generali 6.416% Perpetual 462 0.21 £850,000 AT&T 4.375% 14/09/2029 936 0.43 £800,000 AT&T 7% 30/04/2040 1,160 0.53
£1,100,000 Aviva 6.125% Perpetual (GBP) 1,198 0.55 £850,000 Aviva 6.875% 20/05/2058 1,027 0.47 £900,000 AXA 5.625% 16/01/2054 960 0.44
£1,000,000 Bank of America 2.3% 25/07/2025 984 0.45 £1,150,000 Barclays 2.375% 06/10/2023 1,128 0.52
£600,000 Barclays 3.25% 12/02/2027 586 0.27 £600,000 Barclays 3.25% 17/01/2033 547 0.25 £750,000 Barclays Bank 4.25% 12/01/2022 826 0.38 £350,000 Barclays Bank 5.75% 14/09/2026 401 0.18
£1,000,000 Barclays Bank 10% 21/05/2021 1,199 0.55 £700,000 BAT Capital 2.125% 15/08/2025 678 0.31 £500,000 BAT International Finance 2.25% 09/09/2052 377 0.17 £500,000 BAT International Finance 4% 04/09/2026 543 0.25 £350,000 BAT International Finance 4% 23/11/2055 380 0.17 £300,000 BAT International Finance 6.375% 12/12/2019 321 0.15 £852,894 Bishopsgate Asset Finance 4.808% 14/08/2044 931 0.43 £209,152 BL Superstores Finance 4.482% 04/10/2025 237 0.11 £800,000 BPCE 5.25% 16/04/2029 905 0.42 £750,000 British Land 5.357% 31/03/2028 900 0.41
£1,000,000 BUPA Finance 5% 25/04/2023 1,083 0.50 £600,000 BUPA Finance 5% 08/12/2026 646 0.30
£1,500,000 Channel Link Enterprises Finance 3.043% 30/06/2050 1,492 0.69 £600,000 Clydesdale Bank 4.625% 08/06/2026 722 0.33 £600,000 Commerzbank 6.625% 30/08/2019 633 0.29
£1,550,000 Co-operative Bank 4.75% 11/11/2021 1,671 0.77 £800,000 CPUK Finance 2.666% 28/02/2020 813 0.37
£1,000,000 CPUK Finance 7.239% 28/02/2024 1,237 0.57

Quilter Investors Bond 2 Fund
Portfolio statement (continued) as at 30 June 2018
Quilter Investors OEIC
58
Market Percentage of Value total net assets
Holding Investment £’000 % Sterling Denominated Fixed Rate Corporate Bonds (continued)
£543,563 CTRL Section 1 Finance 5.234% 02/05/2035 684 0.31 £750,000 Daily Mail & General Trust 6.375% 21/06/2027 863 0.40 £750,000 Dali Capital 4.79924% 21/12/2037 935 0.43
£72,289 Delamare Finance 5.5457% 19/02/2029 81 0.04 £1,200,000 Deutsche Bahn Finance 1.375% 07/07/2025 1,174 0.54 £1,000,000 Deutsche Bank 1.75% 16/12/2021 960 0.44 £1,100,000 Digital Stout 3.3% 19/07/2029 1,106 0.51 £1,423,549 Dignity Finance 3.5456% 31/12/2034 1,512 0.70
£300,000 Dignity Finance 4.6956% 31/12/2049 288 0.13 £800,000 Direct Line Insurance 9.25% 27/04/2042 976 0.45
£1,250,000 DONG Energy 4.875% 12/01/2032 1,523 0.70 £1,300,000 Dwr Cymru Financing 2.5% 31/03/2036 1,274 0.59
£750,000 E.ON International Finance 6.75% 27/01/2039 1,117 0.51 £1,300,000 Edinburgh Investment Trust 7.75% 30/09/2022 1,575 0.72
£500,000 EDP Finance 8.625% 04/01/2024 652 0.30 £800,000 Electricite de France 5.5% 17/10/2041 1,004 0.46
£1,100,000 Electricite de France 6% 23/01/2114 1,421 0.65 £500,000 Enel 6.625% 15/09/2076 546 0.25 £292,000 Enel Finance International 5.625% 14/08/2024 339 0.16 £890,000 Enterprise Inns 6.375% 26/09/2031 979 0.45 £750,000 ENW Finance 6.125% 21/07/2021 850 0.39
£2,200,000 European Investment Bank 4.5% 07/06/2029 2,799 1.29 £1,382,000 Eversholt Funding 6.697% 22/02/2035 1,783 0.82
£800,000 First Hydro Finance 9% 31/07/2021 970 0.45 £250,000 GE Capital UK Funding Unlimited 5.875% 18/01/2033 326 0.15 £500,000 GE Capital UK Funding Unlimited 6.25% 05/05/2038 696 0.32 £190,000 GE Capital UK Funding Unlimited 8% 14/01/2039 313 0.14
£75,000 Gesb 8.35% 15/11/2018 76 0.03 £600,000 GKN 5.375% 19/09/2022 658 0.30 £750,000 Global Switch 4.375% 13/12/2022 825 0.38 £500,000 Great Rolling Stock 6.25% 27/07/2020 546 0.25 £244,708 Great Rolling Stock 6.875% 27/07/2035 310 0.14 £685,628 Greene King Finance 4.0643% 15/03/2035 732 0.34 £400,000 Hastings Finance 3% 24/05/2025 399 0.18 £400,000 HBOS Sterling Finance Jersey 7.881% Perpetual 583 0.27 £850,000 Heathrow Funding 2.75% 09/08/2049 760 0.35
£1,300,000 Heathrow Funding 6.45% 10/12/2031 1,793 0.82 £776,256 Highbury Finance 7.017% 20/03/2023 901 0.41
£1,100,000 Hiscox 2% 14/12/2022 1,100 0.51 £1,250,000 Housing & Care 21 3.288% 08/11/2049 1,263 0.58
£750,000 Housing Finance 8.625% 13/11/2023 976 0.45 £1,250,000 HSBC 2.175% 27/06/2023 1,243 0.57 £1,400,000 HSBC 2.256% 13/11/2026 1,344 0.62
£600,000 HSBC Bank 5.375% 22/08/2033 730 0.34 £1,200,000 HSBC Bank Capital Funding Sterling 1 5.844% Perpetual 1,509 0.69
£700,000 Imperial Brands Finance 8.125% 15/03/2024 901 0.41 £750,000 Imperial Tobacco Finance 5.5% 28/09/2026 886 0.41 £800,000 Income Contingent Student Loans 2.5% 24/07/2056 745 0.34 £500,000 Innogy Finance 4.75% 31/01/2034 588 0.27
£1,000,000 Innogy Finance 6.125% 06/07/2039 1,402 0.64 £500,000 Innogy Finance 6.25% 03/06/2030 657 0.30 £216,420 Intu Debenture 5.562% 31/12/2027 247 0.11

Quilter Investors Bond 2 Fund
Portfolio statement (continued) as at 30 June 2018
Quilter Investors OEIC
59
Market Percentage of Value total net assets
Holding Investment £’000 % Sterling Denominated Fixed Rate Corporate Bonds (continued)
£800,000 Intu SGS Finance 3.875% 17/03/2023 846 0.39 £1,032,713 Juturna European Loan Conduit No 16 5.0636% 10/08/2033 1,248 0.57
£200,000 Kennedy Wilson Europe Real Estate 3.95% 30/06/2022 208 0.10 £1,250,000 Koninklijke 5.75% 17/09/2029 1,540 0.71
£600,000 Liberty Living Finance 3.375% 28/11/2029 604 0.28 £400,000 Libra Longhurst Treasury No 2 3.25% 15/05/2043 401 0.18
£1,000,000 Lloyds Bank 5.125% 07/03/2025 1,213 0.56 £1,650,000 Lloyds Banking 2.25% 16/10/2024 1,600 0.74
£675,000 London & Quadrant Housing Trust 2.625% 28/02/2028 673 0.31 £850,000 London Merchant Securities 6.5% 16/03/2026 1,071 0.49 £750,000 Lunar Funding I 6.125% 09/06/2027 926 0.43 £550,000 Majedie Investments 7.25% 31/03/2025 684 0.31 £800,000 Manchester Airport Funding 4.75% 31/03/2034 971 0.45 £650,000 Marks & Spencer 3% 08/12/2023 659 0.30
£1,000,000 Marston's Issuer 5.1576% 15/10/2027 990 0.46 £700,000 McKesson 3.125% 17/02/2029 695 0.32 £341,596 Meadowhall Finance 4.986% 12/01/2032 416 0.19
£33,336 Mitchells & Butlers Finance 5.574% 15/12/2030 38 0.02 £500,000 Motability Operations 2.375% 14/03/2032 481 0.22 £600,000 Motability Operations 3.625% 10/03/2036 668 0.31 £650,000 National Express 2.5% 11/11/2023 644 0.30
£1,000,000 National Grid Gas Finance 2.125% 22/09/2028 946 0.44 £1,200,000 National Grid Gas Finance 2.75% 22/09/2046 1,085 0.50 £1,250,000 National Westminster Bank 6.5% 07/09/2021 1,413 0.65
£382,002 Nats En Route 5.25% 31/03/2026 438 0.20 £2,000,000 Network Rail Infrastructure Finance 4.75% 29/11/2035 2,849 1.31 £1,000,000 New York Life Global Funding 1.75% 15/12/2022 1,007 0.46
£588,000 NewRiver REIT 3.5% 07/03/2028 579 0.27 £450,000 NGG Finance 5.625% 18/06/2073 490 0.23 £400,000 Northern Gas Networks Finance 5.875% 08/07/2019 418 0.19
£1,000,000 Northumbrian Water Finance 1.625% 11/10/2026 930 0.43 £850,000 Northumbrian Water Finance 2.375% 05/10/2027 827 0.38 £700,000 Northumbrian Water Finance 6.875% 06/02/2023 850 0.39 £550,000 Notting Hill Housing Trust 3.25% 12/10/2048 542 0.25
£1,300,000 Orbit Capital 3.375% 14/06/2048 1,320 0.61 £75,000 Peel Land & Property Investments 8.375% 30/04/2040 110 0.05
£750,000 Penarian Housing Finance 3.212% 07/06/2052 737 0.34 £400,000 PGH Capital 4.125% 20/07/2022 410 0.19
£1,000,000 Phoenix 5.75% Perpetual 918 0.42 £700,000 Porterbrook Rail Finance 6.5% 20/10/2020 774 0.36 £350,000 Porterbrook Rail Finance 7.125% 20/10/2026 456 0.21 £617,684 Premiertel 6.175% 08/05/2032 696 0.32 £500,000 Prologis 2.25% 30/06/2029 474 0.22 £400,000 Provident Financial 7% 04/06/2023 407 0.19 £800,000 Prudential 5.7% 19/12/2063 871 0.40
£1,500,000 RAC Bond 4.87% 06/05/2026 1,561 0.72 £600,000 RL Finance No. 3 6.125% 13/11/2028 663 0.30 £650,000 RL Finance No. 2 6.125% 30/11/2043 718 0.33 £977,013 RMPA Services 5.337% 30/09/2038 1,228 0.56
£1,000,000 Royal Bank of Canada 1.125% 22/12/2021 994 0.46 £1,000,000 Santander UK 2.92% 08/05/2026 994 0.46

Quilter Investors Bond 2 Fund
Portfolio statement (continued) as at 30 June 2018
Quilter Investors OEIC
60
Market Percentage of Value total net assets
Holding Investment £’000 % Sterling Denominated Fixed Rate Corporate Bonds (continued)
£1,800,000 Santander UK 5.125% 14/04/2021 1,989 0.91 £1,300,000 Santander UK 5.25% 16/02/2029 1,689 0.78
£900,000 Scottish Investment Trust 5.75% 17/04/2030 1,150 0.53 £1,000,000 Scottish Widows 7% 16/06/2043 1,199 0.55
£750,000 Severn Trent Utilities Finance 3.625% 16/01/2026 803 0.37 £700,000 SGSP Australia Assets 5.125% 11/02/2021 760 0.35
£1,500,000 Shaftesbury Carnaby 2.487% 30/09/2031 1,422 0.65 £150,000 SMFG Preferred Capital GBP 2 10.231% Perpetual 237 0.11 £600,000 Society of Lloyd's 4.875% 07/02/2047 631 0.29 £500,000 South East Water Finance 5.6577% 30/09/2019 524 0.24 £700,000 South Eastern Power Networks 5.625% 30/09/2030 894 0.41 £300,000 South Eastern Power Networks 6.375% 12/11/2031 414 0.19 £700,000 Southern Gas Networks 4.875% 05/10/2023 800 0.37
£1,000,000 SPD Finance UK 5.875% 17/07/2026 1,246 0.57 £150,000 SSE 3.875% Perpetual 152 0.07 £278,361 Telereal Securitisation 5.3887% 10/12/2031 331 0.15 £720,567 Telereal Securitisation 5.5534% 10/12/2031 863 0.40 £600,473 Telereal Securitisation 5.9478% 10/12/2031 735 0.34 £922,000 Telereal Securitisation 6.1645% 10/12/2031 1,134 0.52 £600,000 Temple Bar Investment Trust 5.5% 08/03/2021 650 0.30 £696,781 Tesco Property Finance 2 6.0517% 13/10/2039 821 0.38
£1,070,425 Tesco Property Finance 3 5.744% 13/04/2040 1,241 0.57 £541,713 Tesco Property Finance 5 5.6611% 13/10/2041 622 0.29 £400,000 Thames Water Utilities Cayman Finance 2.375% 03/05/2023 391 0.18 £450,000 Thames Water Utilities Cayman Finance 2.875% 03/05/2027 434 0.20
£1,000,000 Thames Water Utilities Cayman Finance 5.5% 11/02/2041 1,345 0.62 £750,000 Thames Water Utilities Cayman Finance 7.738% 09/04/2058 1,417 0.65 £750,000 THFC Funding No 2 6.35% 08/07/2039 1,102 0.51 £495,000 THFC Funding No 3 5.2% 11/10/2043 654 0.30 £500,000 Time Warner Cable 5.75% 02/06/2031 567 0.26 £344,042 Trafford Centre Finance 6.5% 28/07/2033 461 0.21
£1,550,000 Transport for London 3.875% 23/07/2042 1,938 0.89 £950,000 TSB Banking Group 5.75% 06/05/2026 1,001 0.46
£1,183,245 Unique Pub Finance 5.659% 30/06/2027 1,302 0.60 £366,400 Unique Pub Finance 6.542% 30/03/2021 386 0.18 £400,000 UNITE USAF II 3.374% 30/06/2023 426 0.20
£1,200,000 University of Southampton 2.25% 11/04/2057 1,093 0.50 £1,085,737 UPP Bond 1 Issuer 4.9023% 28/02/2040 1,319 0.61
£650,000 Virgin Media Secured Finance 6.25% 28/03/2029 677 0.31 £450,000 Vodafone 3% 12/08/2056 386 0.18
£1,000,000 Vodafone 3.375% 08/08/2049 930 0.43 £400,000 Wales & West Utilities Finance 4.625% 13/12/2023 455 0.21 £350,000 Wales & West Utilities Finance 5% 07/03/2028 424 0.19 £700,000 Wales & West Utilities Finance 6.25% 30/11/2021 808 0.37 £580,000 Western Power Distribution 3.625% 06/11/2023 609 0.28 £800,000 Western Power Distribution South Wales 5.75% 23/03/2040 1,109 0.51 £400,000 Western Power Distribution West Midlands 3.875% 17/10/2024 436 0.20 £600,000 Westfield America Management 2.625% 30/03/2029 590 0.27
£1,200,000 Wheatley Capital 4.375% 28/11/2044 1,411 0.65 £1,064,000 WM Treasury 2 3.25% 20/10/2048 1,065 0.49
£643,753 Wods Transmission 3.446% 24/08/2034 691 0.32 £250,000 Yorkshire Building Society 3.375% 13/09/2028 235 0.11 £900,000 Yorkshire Water Services Bradford Finance 6.375% 19/08/2039 1,373 0.63 £550,000 Zurich Finance UK 6.625% Perpetual 618 0.28
174,923 80.46

Quilter Investors Bond 2 Fund
Portfolio statement (continued) as at 30 June 2018
Quilter Investors OEIC
61
Market Percentage of Value total net assets
Holding Investment £’000 %
Sterling Denominated Variable Rate Corporate Bonds 1.00% (31 December 2017 0.90%) £14,368 Marston's Issuer 2.16088% 15/07/2020 14 0.01
£1,377,000 Mitchells & Butlers Finance 1.23075% 15/12/2033 1,171 0.54 £235,000 Ribbon Finance 2018 1.53662% 20/04/2028 236 0.11
£75,000 Royal Bank of Scotland 9.5% Perpetual 76 0.03 £700,000 Spirit Issuer 3.36813% 28/12/2031 677 0.31
2,174 1.00
Sterling Denominated Government Bonds 11.87% (31 December 2017 20.58%)
Sterling Denominated Fixed Rate Government Bonds 11.87% (31 December 2017 20.58%) £1,858,000 Province of Alberta Canada 1% 15/11/2021 1,841 0.85 £1,000,000 SNCF Reseau 5.25% 07/12/2028 1,305 0.60 £1,000,000 Transport for London 4% 07/04/2064 1,435 0.66 £5,700,000 United Kingdom Gilt 1.25% 22/07/2027 5,665 2.61 £2,450,000 United Kingdom Gilt 2% 07/09/2025 2,600 1.20 £2,800,000 United Kingdom Gilt 2.75% 07/09/2024 3,080 1.42 £2,100,000 United Kingdom Gilt 3.5% 22/01/2045 2,881 1.32 £1,200,000 United Kingdom Gilt 3.5% 22/07/2068 2,007 0.92
£750,000 United Kingdom Gilt 4.25% 07/12/2049 1,215 0.56 £200,000 United Kingdom Gilt 4.5% 07/09/2034 282 0.13 £100,000 United Kingdom Gilt 4.5% 07/12/2042 155 0.07
£2,300,000 United Kingdom Gilt 6% 07/12/2028 3,338 1.53
25,804 11.87
Sterling Denominated Derivatives (0.23)% (31 December 2017 0.10%)
Sterling Denominated Forward Exchange Contracts (0.16)% (31 December 2017 0.17%) £3,568,117 Sterling v Euro Forward Exchange Contract (26) (0.01)
£10,792,242 Sterling v US Dollar Forward Exchange Contract (326) (0.15)
(352) (0.16)
Sterling Denominated Futures Contracts (0.07)% (31 December 2017 (0.07)%) (150) Long Gilt Futures September 2018 (158) (0.07)
(158) (0.07)
Overseas 6.02% (31 December 2017 7.08%)
Europe 1.70% (31 December 2017 1.21%)
Euro Denominated Corporate Bonds 1.72% (31 December 2017 1.22%)
Euro Denominated Fixed Rate Corporate Bonds 1.72% (31 December 2017 1.22%) €300,000 Abertis Infraestructuras 1.375% 20/05/2026 255 0.12 €800,000 ADLER Real Estate 1.875% 27/04/2023 688 0.32 €725,142 Channel Link Enterprises Finance 5.892% 30/06/2041 877 0.40 €275,000 Roadster Finance Designated Activity 1.625% 09/12/2024 240 0.11
€1,250,000 Roadster Finance Designated Activity 2.375% 08/12/2027 1,076 0.49 €700,000 Unibail-Rodamco 2.125% Perpetual 606 0.28
3,742 1.72

Quilter Investors Bond 2 Fund
Portfolio statement (continued) as at 30 June 2018
Quilter Investors OEIC
62
Market Percentage of Value total net assets
Holding Investment £’000 % Euro Denominated Derivatives (0.02)% (31 December 2017 (0.01)%)
Euro Denominated Futures Contracts (0.01)% (31 December 2017 0.01%) (4) Euro-Bobl Futures September 2018 (2) -
(13) Euro-Bund Futures September 2018 (18) (0.01) (1) Euro-Buxl 30 Year Bond Futures September 2018 (2) -
(22) (0.01)
Euro Credit Default Swap (0.01)% (31 December 2017 (0.02)%) €5,250,000 Buy Protection on CDS iTraxx Europe Senior Financials Series 20 Version 1 20/02/2018 Morgan Stanley (17) (0.01)
(17) (0.01)
North America 4.32% (31 December 2017 5.87%)
US Dollar Denominated Corporate Bonds 3.55% (31 December 2017 5.27%)
US Dollar Denominated Fixed Rate Corporate Bonds 3.55% (31 December 2017 5.27%) $400,000 21st Century Fox America 4.75% 15/09/2044 310 0.14 $400,000 21st Century Fox America 5.4% 01/10/2043 335 0.15
$1,350,000 Abu Dhabi Crude Oil Pipeline 4.6% 02/11/2047 939 0.43 $3,950,000 Electricite de France 6% 22/01/2114 3,094 1.42
$500,000 Enterprise Products Operating 4.875% 16/08/2077 358 0.17 $350,000 General Electric 4.125% 09/10/2042 246 0.11 $150,000 Reynolds American 6.15% 15/09/2043 129 0.06 $750,000 Swire Pacific MTN Financing 4.5% 09/10/2023 590 0.27 $200,000 Telefonica Emisiones 5.213% 08/03/2047 147 0.07 $900,000 Time Warner Cable 5.875% 15/11/2040 672 0.31 $250,000 Verizon Communications 5.012% 21/08/2054 178 0.08 $900,000 Verizon Communications 5.15% 15/09/2023 729 0.34
7,727 3.55
US Dollar Denominated Government Bonds 0.85% (31 December 2017 0.60%)
US Dollar Denominated Fixed Rate Government Bonds 0.85% (31 December 2017 0.60%) $2,000,000 US Treasury 2% 30/04/2024 1,458 0.67
$500,000 US Treasury 3% 15/02/2048 382 0.18
1,840 0.85
US Dollar Denominated Derivatives (0.08)% (31 December 2017 0.00%)
US Dollar Denominated Forward Exchange Contracts 0.01% (31 December 2017 (0.01)%) $1,777,000 US Dollar v Sterling Forward Exchange Contract 27 0.01
$202,000 US Dollar v Sterling Forward Exchange Contract 4 -
31 0.01
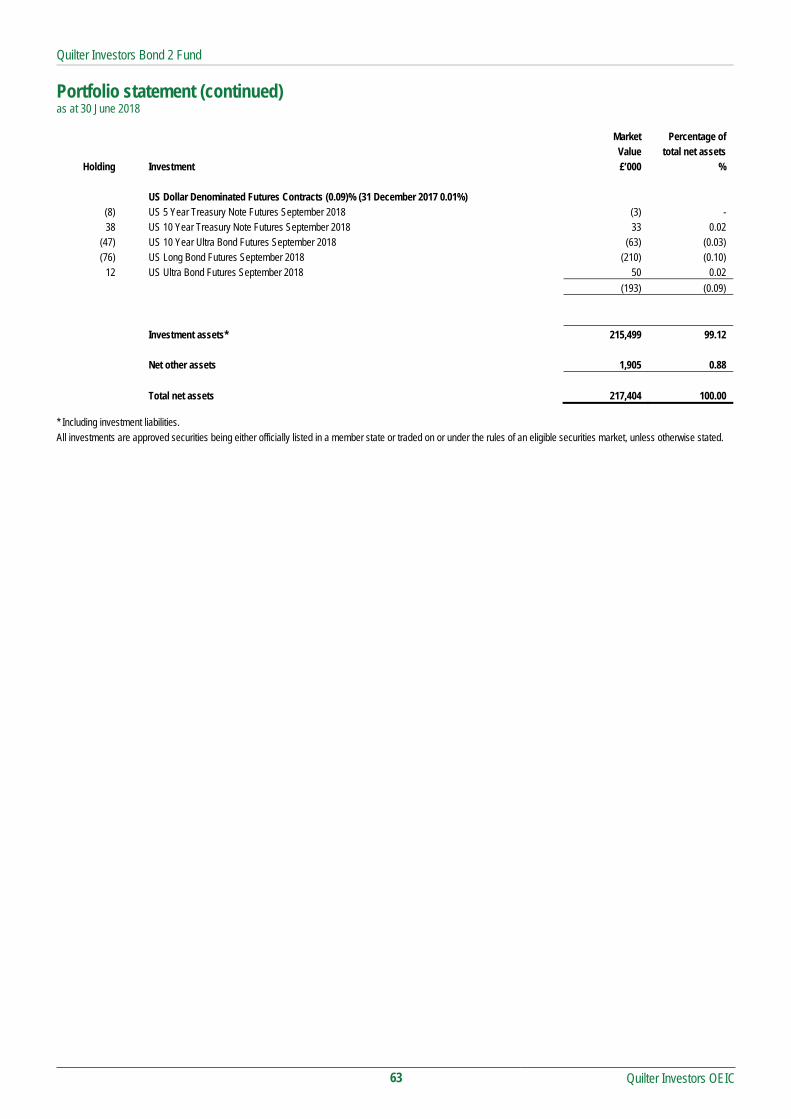
Quilter Investors Bond 2 Fund
Portfolio statement (continued) as at 30 June 2018
Quilter Investors OEIC
63
Market Percentage of Value total net assets
Holding Investment £’000 %
US Dollar Denominated Futures Contracts (0.09)% (31 December 2017 0.01%) (8) US 5 Year Treasury Note Futures September 2018 (3) - 38 US 10 Year Treasury Note Futures September 2018 33 0.02
(47) US 10 Year Ultra Bond Futures September 2018 (63) (0.03) (76) US Long Bond Futures September 2018 (210) (0.10)
12 US Ultra Bond Futures September 2018 50 0.02
(193) (0.09)
Investment assets* 215,499 99.12
Net other assets 1,905 0.88
Total net assets 217,404 100.00 * Including investment liabilities.
All investments are approved securities being either officially listed in a member state or traded on or under the rules of an eligible securities market, unless otherwise stated.

Quilter Investors Bond 2 Fund
Quilter Investors OEIC
64
Statement of total return for the period from 1 January 2018 to 30 June 2018 01.01.18 to 01.01.18 to 01.01.17 to 01.01.17 to
30.06.18 30.06.18 30.06.17 30.06.17
Note £'000 £'000 £'000 £'000
Income
Net capital (losses)/gains (6,920) 4,202
Revenue 3,784 3,987
Expenses (1,149) (1,112)
Interest payable and similar charges - (1)
Net revenue before taxation 2,635 2,874
Taxation - -
Net revenue after taxation 2,635 2,874
Total return before distributions (4,285) 7,076
Distributions 2 (4,401) (4,478)
Change in net assets attributable to
shareholders from investment activities (8,686) 2,598
Statement of change in net assets attributable to shareholders for the period from 1 January 2018 to 30 June 2018 01.01.18 to 01.01.18 to 01.01.17 to 01.01.17 to
30.06.18 30.06.18 30.06.17 30.06.17
£'000 £'000 £'000 £'000
Opening net assets attributable to shareholders 240,567* 212,165
Amounts received on issue of shares 799 30,240
Amounts paid on cancellation of shares (17,749) (51,473)
(16,950) (21,233)
Dilution adjustment 64 189
Change in net assets attributable to
shareholders from investment activities (8,686) 2,598
Retained distribution on accumulation shares 2,409 2,830
Closing net assets attributable to shareholders 217,404 196,549* * Section 3.30 of the SORP issued by the Investment Management Association in May 2014 requires comparative figures for the above statement. For interim financial
statements this will result in the closing comparative net assets not being equal to net assets at the start of the current period.

Quilter Investors Bond 2 Fund
Quilter Investors OEIC
65
Balance sheet as at 30 June 2018 30.06.18 31.12.17
£'000 £'000
Assets
Fixed assets
Investments 216,324 236,742
Current assets
Debtors 3,375 3,109
Cash and bank balances 2,401 3,041
Total assets 222,100 242,892
Liabilities
Investment liabilities (825) (261)
Creditors
Distribution payable (1,788) (1,872)
Other creditors (2,083) (192)
Total liabilities (4,696) (2,325)
Net assets attributable to shareholders 217,404 240,567

Quilter Investors Bond 2 Fund
Notes to the financial statements for the period from 1 January 2018 to 30 June 2018
Quilter Investors OEIC
66
1 Accounting policies The financial statements have been prepared under the historical cost basis, as modified by the revaluation of investments, and in accordance with the Statement of Recommended Practice (SORP) for Authorised Funds, issued by the Investment Management Association in May 2014.
The accounting policies applied are consistent with those disclosed within the annual Financial Statements for the year ended 31 December 2017.
2 Distributions The distributions take account of revenue received on the issue of shares and revenue deducted on the cancellation of shares, and comprises:
01.01.18 to 01.01.17 to 30.06.18 30.06.17 £'000 £'000 Interim – Accumulation shares (30 June) 2,409 2,830 Interim – Income shares (30 June) 1,788 1,065 4,197 3,895 Revenue deducted on cancellation of shares 211 779 Revenue received on issue of shares (7) (196) Distributions 4,401 4,478
Reconciliation of distributions: Net revenue after taxation 2,635 2,874 Capitalised fees 1,148 1,112 Effective yield adjustment 618 492 Distributions 4,401 4,478

Quilter Investors Bond 2 Fund
Distribution table
Quilter Investors OEIC
67
Interim distribution Group 1: Shares purchased prior to 1 January 2018 Group 2: Shares purchased from 1 January 2018 to 30 June 2018
Revenue
pence per share Equalisation
pence per share*
Distribution paid 31.08.18
pence per share
Distribution paid 31.08.17
pence per share Accumulation 'A' Shares Group 1 1.7577 - 1.7577 1.8010 Group 2 1.0664 0.6913 1.7577 1.8010 Income 'A' Shares Group 1 0.8763 - 0.8763 0.9333 Group 2 0.2278 0.6485 0.8763 0.9333 * Equalisation only applies to shares purchased during the distribution period (Group 2 shares). It is the average amount of revenue included in the purchase price of all
Group 2 shares and is refunded to holders of these shares as a return of capital. Being capital, it is not liable to income tax but must be deducted from the cost of shares for capital gains tax purposes.

Quilter Investors Bond 3 Fund
Quilter Investors Bond 3 Fund
Quilter Investors OEIC
68
Launch date 14 January 2005
IA Sector Unclassified
Investment adviser JPMorgan Asset Management (UK) Limited
Net asset value £187,575,925
Objective
To achieve total return through a combination of income and capital growth from a diversified portfolio predominantly composed of fixed and variable rate debt securities.
Policy
The sub-fund invests in both Sterling and non-Sterling denominated securities. Any non-Sterling denominated securities will normally be hedged to minimise currency risk. The Investment Manager has appointed a specialist manager to manage the sub-fund, and continuously monitors this appointment.
The sub-fund may use derivative instruments and forward transactions for the purposes of meeting the investment objective and/or efficient portfolio management. The use of derivatives for this purpose may affect the volatility or risk profile of the sub-fund although this is not the ACD’s intention.
Investment Manager’s review
Market Review
2018 started with a strong tone across credit markets. Spreads were tighter with higher beta asset classes such as high yield the quickest out the blocks. There was very little negative news flow to knock the tightening trend off course, while the macroeconomic backdrop appeared to be on an improving trend across the developed and emerging markets. Although excess returns were posting impressive returns, total returns were placed under some pressure from underlying government bond yields that steadily rose throughout the first six weeks of the year. These moves could be attributed to market participants pricing in a faster pace of monetary tightening from the world’s largest central banks. February saw volatility pick up significantly across financial markets, led by a sell-off in equities. March brought further weakness in credit spreads as monetary policy induced volatility was replaced by headlines surrounding trade wars between China and the US. Technical factors also helped to soften the tone as supply picked up and outflows persisted across the opportunity set.
The second half of the period saw bouts of volatility that affected almost all credit asset classes. April got underway on a fairly positive tone, as spreads tightened against a backdrop of robust synchronised global growth and receding geo-political risks related to US/China trade wars. Emerging market corporates were the outlier within our opportunity set, with spreads wider due to increasing idiosyncratic risks stemming from Russia, Argentina and Turkey.
Spreads reversed their tightening trend throughout May and June, mainly in response to Italian political developments in May, weaker growth data and the re-emergence of trade war rhetoric from the Trump administration. European high yield and subordinated bank capital were the notable underperformers given their exposure to Italian risk, while emerging market corporates continued their widening theme as the region continued to be plagued by issues from within their own economies as well as the added threat of rising tariffs. The one bright spot amid the turmoil was the relatively strong performance seen in the US high yield space.
Performance
The portfolio produced a relatively flat performance over the period, with positive returns in April offset by negative returns in May and June.
The US high yield allocation stood at around 35% of market value at the end of the period, which is the largest allocation across the opportunity set. We like the fundamental backdrop of the asset class that is posting stable earnings and leverage metrics, while default rates remain well below their long term averages. The portfolio’s allocation has an up in quality bias with a focus on BB credits. The US high yield exposure proved to be a stand out performer over the second half of the period as the only asset class to produce positive returns on an unhedged basis.
Towards the end of the period, other positive contributors to portfolio performance included the returns from the convertibles allocation, which were able to remain in positive territory, while the hedges implemented on the portfolio helped to dampen some of the downside volatility. We bought protection on the iTraxx Senior
Financials index in June, which was additive to returns, while the short duration of the portfolio helped performance in the middle of the period, when government bond yields marched higher. Finally, the sale of Mriya Agro within the legacy portfolio was additive to returns given that the securities were sold at a significant mark up relative to their fair valuation.
The worst performing asset classes in the second half of the period were the allocations to European High Yield and subordinated bank debt which make up 17% and 15% of the portfolio’s market value respectively. The emerging market corporate exposure was the largest detractor to returns relative to its size in the portfolio (4%). Within the European high yield and emerging market corporate holdings, we have a preference for short duration securities that have attractive break-evens and a strong volatility adjusted return profile. Italian names were prominent among the worst performing credits within the portfolio in the second half of the six month period. Names such as Intesa San Paolo, Monte dei Paschi and Wind Tre were notable detractors however the contagion into peripheral Europe was also noteworthy with Spanish names such as Caixa Bank and Telefonica also underperforming.
Risk and Reward Profile
The calculated risk and reward category, as shown above, uses a method of calculation derived from EU rules. It is based on the rate at which the returns of the sub-fund have moved up and down in the past (i.e. volatility) and is not a guide to the future risk and reward category of the sub-fund. The category shown is not a target or guarantee and may shift over time. Even the lowest category 1 does not mean a risk-free investment. The seven-category scale is nonlinear, for example, 2 is not twice as risky as 1.
Sub-funds in category 4 have in the past shown moderate volatility. With a sub-fund of category 4, you have a moderate risk of losing money but your chance for gains is also moderate. Investment risk - there is no guarantee that the sub-fund will achieve its objective. A capital loss of some or all of the amount invested may occur. Emerging markets risk - less developed countries may face more political, economic or structural challenges than developed countries. Credit risk - the issuer of a bond or a similar investment within the sub-fund may not pay income or repay capital to the sub-fund when due. Bonds which are rated below investment grade are considered to have a higher risk exposure with respect to meeting their payment obligations.
Interest rate risk - investments in bonds are affected by interest rates and inflation trends which may affect the value of the sub-fund.
Liquidity risk - some investments may become hard to value or sell at a desired time and price, in extreme circumstances this may affect the sub-fund's ability to meet redemption requests upon demand.
Currency risk - the sub-fund is denominated in British Pounds and may use techniques to try to reduce the effects of changes in the exchange rate between the currency of the underlying investments and the base currency (i.e. the reporting currency) of the sub-fund. These techniques may not eliminate all the currency risk. The value of your shares may rise and fall as a result of exchange rate movements.
Derivative risk - the sub-fund uses derivatives to generate returns and/or to reduce costs and the overall risk of the sub-fund. Using derivatives can involve a higher level of risk. A small movement in the price of an underlying investment may result in a disproportionately large movement in the price of the derivative investment. Derivatives also involve counterparty risk where the institutions acting as counterparty to derivatives may not meet their contractual obligations.
Capital erosion risk - the sub-fund takes its charges from capital of the sub-fund. Investors should be aware that there is potential for capital erosion if insufficient capital growth is achieved by the sub-fund to cover the charges. Capital erosion may have the effect of reducing the level of income generated.
For full details of the sub-fund's risks, please see the section in the prospectus headed "Risks".

Quilter Investors Bond 3 Fund
Quilter Investors OEIC
69
Performance Records Comparative Tables Income 'A' 1 January 2018 to 1 January 2017 to 1 January 2016 to 30 June 2018 31 December 2017 31 December 2016 p/share p/share p/share
Change in net assets per share Opening net asset value per share 33.14 36.26 31.68
Return before operating charges* (0.37) (0.54) 7.80 Operating charges** (0.19) (0.43) (0.40)
Return after operating charges* (0.56) (0.97) 7.40
Distributions (0.64) (2.15) (2.82) Retained distributions - - -
Closing net asset value per share 31.94 33.14 36.26
* after direct transaction costs of*** - - -
Performance Return after charges (1.69)% (2.68)% 23.36%
Other information Closing net asset value (£) 187,575,925 97,037,480 123,505,512 Closing number of shares 587,266,761 292,773,278 340,568,113 Operating charges**** 1.19% 1.19% 1.19% Direct transaction costs*** 0.01% - -
Prices pence per share pence per share pence per share Highest share price 34.97 36.74 36.77 Lowest share price 32.37 34.29 30.40
Income 'R'† 1 January 2018 to 1 January 2017 to 1 January 2016 to 30 June 2018 31 December 2017 31 December 2016 p/share p/share p/share
Change in net assets per share Opening net asset value per share - 36.97 32.17
Return before operating charges* - 0.64 7.95 Operating charges** - (0.10) (0.28)
Return after operating charges* - 0.54 7.67
Distributions - (0.57) (2.87) Retained distributions - - -
Closing net asset value per share - 36.94 36.97
* after direct transaction costs of*** - - -
Performance Return after charges - 1.46% 23.84%
Other information Closing net asset value (£) - - 192,417 Closing number of shares - - 520,450 Operating charges**** - 0.84% 0.84% Direct transaction costs*** - - -
Prices pence per share pence per share pence per share Highest share price - 37.82 37.48 Lowest share price - 36.75 30.88
† Share class closed on 19 April 2017. ** The operating charges include all costs borne by the sub-fund, except for direct transaction costs. Since the sub-fund invests less than 10% of net assets in
underlying sub-funds there is no inclusion of a synthetic element for underlying sub-funds OCF. *** The direct transaction costs are made up of fees and commissions paid to agents, advisers, brokers and dealers, levies by regulatory agencies and securities
exchanges as well as transfer taxes and duties. They do not include any difference between the quoted bid and offer prices or internal administrative or holding costs. These costs arise as a result of transactions undertaken both for efficient portfolio management and the meeting of the sub-fund’s objectives. These costs exclude any effect of dilution adjustments used to offset the costs.
**** The operating charges percentage is the ratio of the sub-fund's ongoing charges (excluding interest on borrowings) to the average net assets of the sub-fund.

Quilter Investors Bond 3 Fund
Quilter Investors OEIC
70
Performance
6 months to
30 June 2018
1 year to
30 June 2018
3 years to
30 June 2018
5 years to
30 June 2018
Quilter Investors Bond 3 Fund* (4.07)% (3.86)% 6.22% 2.02%Bloomberg Barclays US Aggregate Credit – Corporate – High Yield – 2% Issuer Capped (GBP Hedged) (benchmark) (1.59)% 0.15% 13.25% 26.50%
* Income ‘A’ shares
Data Source – Factset. Figures are calculated on a total return and single price basis, with net income reinvested into the sub-fund. Portfolio allocation
North America 53.86%
Europe 29.44%
United Kingdom 8.11%
Collective Investment Scheme 3.08%
Asia Pacific (excluding Japan) 1.05%
South America 1.05%
Middle East 0.17%
Japan 0.15%
Africa 0.08%
Overseas Derivatives (0.28)%
United Kingdom Derivatives (0.99)%
Net other assets 4.28%
Total 100.00%
Asset allocation
US Dollar Denominated Debt Securities 61.17%
Euro Denominated Debt Securities 27.51%
Sterling Denominated Debt Securities 3.21%
Collective Investment Scheme 3.08%
United States Equities 1.39%
Cayman Islands Equities 0.60%
Canada Equities 0.03%
Overseas Derivatives (0.28)%
United Kingdom Derivatives (0.99)%
Net other assets 4.28%
Total 100.00%
Major holdings Percentage
of portfolio
JPMorgan Global High Yield Bond Fund - X Accumulation USD 3.08%
GMX Resources 1.23%
Royal Bank of Scotland 6% 19/12/2023 0.68%
Banro 10% 01/03/2021 0.63%
Citigroup 6.25% Perpetual 0.52%
Societe Generale 8% Perpetual 0.48%
Telefonica Europe 5.875% Perpetual 0.46%
Credit Suisse 7.5% Perpetual 0.46%
UBS Funding Switzerland 5.75% Perpetual 0.46%
Banco Bilbao Vizcaya Argentaria 8.875% Perpetual 0.42%
Number of holdings 843
Total Purchases and Sales for the period
2018 2017
£’000 £’000
Total purchases for the 6 month period to 30 June 227,557 37,766
Total sales for the 6 month period to 30 June 121,713 49,359

Quilter Investors Bond 3 Fund
Portfolio statement as at 30 June 2018
Quilter Investors OEIC
71
Market Percentage of Value total net assets
Holding Investment £000 %
Sterling 2.22% (31 December 2017 0.51%)
Sterling Denominated Fixed Rate Corporate Bonds 3.10% (31 December 2017 0.00%) £400,000 Barclays 7.25% Perpetual 410 0.22 £500,000 BHP Billiton Finance 6.5% 22/10/2077 561 0.30 £250,000 CPUK Finance 4.25% 28/08/2022 251 0.13 £400,000 Enel 6.625% 15/09/2076 437 0.23 £300,000 Enel Finance International 5.625% 14/08/2024 349 0.19 £400,000 Gatwick Funding 5.25% 23/01/2024 461 0.25 £200,000 Glencore Finance Europe 6% 03/04/2022 226 0.12 £400,000 Heathrow Finance 3.875% 01/03/2027 381 0.20 £200,000 Heathrow Funding 6.75% 03/12/2026 262 0.14 £100,000 Iceland Bondco 4.625% 15/03/2025 90 0.05 £150,000 Iceland Bondco 79 6.75% 15/07/2024 154 0.08 £100,000 Jaguar Land Rover Automotive 3.875% 01/03/2023 97 0.05 £200,000 Lloyds Banking 7.625% Perpetual 218 0.12 £200,000 NGG Finance 5.625% 18/06/2073 218 0.12 £400,000 Pennon 2.875% Perpetual 399 0.21 £200,000 Porterbrook Rail Finance 6.5% 20/10/2020 221 0.12 £350,000 Tesco 6.125% 24/02/2022 397 0.21 £150,000 Vantiv 3.875% 15/11/2025 142 0.07 £200,000 Welltower 4.8% 20/11/2028 228 0.12 £300,000 Yorkshire Building Society 3.5% 21/04/2026 314 0.17
5,816 3.10
Sterling Denominated Variable Rate Corporate Bonds 0.11% (31 December 2017 0.00%) £200,000 Nationwide Building Society 6.875% Perpetual 204 0.11
204 0.11
Sterling Denominated Derivatives (0.99)% (31 December 2017 0.51%)
Sterling Denominated Forward Exchange Contracts (0.98)% (31 December 2017 0.51%) £71,042 Sterling v Canadian Dollar Forward Exchange Contract - - £77,277 Sterling v Euro Forward Exchange Contract (1) -
£126,180 Sterling v Euro Forward Exchange Contract (2) - £165,764 Sterling v Euro Forward Exchange Contract (2) - £191,148 Sterling v Euro Forward Exchange Contract (2) - £409,158 Sterling v Euro Forward Exchange Contract (2) -
£22,977,260 Sterling v Euro Forward Exchange Contract (268) (0.15) £30,729,573 Sterling v Euro Forward Exchange Contract (358) (0.19)
£10,773 Sterling v US Dollar Forward Exchange Contract - - £13,710 Sterling v US Dollar Forward Exchange Contract - -
£2,192 Sterling v US Dollar Forward Exchange Contract - - £2,483 Sterling v US Dollar Forward Exchange Contract - -
£20,459 Sterling v US Dollar Forward Exchange Contract - - £23,805 Sterling v US Dollar Forward Exchange Contract - - £37,419 Sterling v US Dollar Forward Exchange Contract (1) - £67,010 Sterling v US Dollar Forward Exchange Contract (1) -
£142,639 Sterling v US Dollar Forward Exchange Contract (2) - £142,895 Sterling v US Dollar Forward Exchange Contract (2) -
£96,549 Sterling v US Dollar Forward Exchange Contract (2) - £928,779 Sterling v US Dollar Forward Exchange Contract (9) (0.01)

Quilter Investors Bond 3 Fund
Portfolio statement (continued) as at 30 June 2018
Quilter Investors OEIC
72
Market Percentage of
Value total net assets Holding Investment £000 %
Sterling Denominated Forward Exchange Contracts (continued)
£4,242,516 Sterling v US Dollar Forward Exchange Contract (40) (0.02) £7,542,676 Sterling v US Dollar Forward Exchange Contract (71) (0.04) £8,222,120 Sterling v US Dollar Forward Exchange Contract (78) (0.04)
£46,011,385 Sterling v US Dollar Forward Exchange Contract (435) (0.23) £59,843,967 Sterling v US Dollar Forward Exchange Contract (566) (0.30)
(1,842) (0.98)
Sterling Denominated Futures Contracts (0.01)% (31 December 2017 0.00%) (13) Long Gilt Futures September 2018 (27) (0.01)
(27) (0.01)
Overseas 90.42% (31 December 2017 78.88%)
Asia Pacific (excluding Japan) 0.00% (31 December 2017 0.03%)
Hong Kong Equities 0.00% (31 December 2017 0.03%)
Europe 27.49% (31 December 2017 0.82%)
Euro Denominated Fixed Rate Corporate Bonds 22.90% (31 December 2017 0.82%) €200,000 Aabar Investments 0.5% 27/03/2020 165 0.09 €200,000 ABN AMRO Bank 2.875% 18/01/2028 187 0.10 €700,000 ABN AMRO Bank 5.75% Perpetual 656 0.35 €200,000 Adient Global 3.5% 15/08/2024 164 0.09 €100,000 Adler Pelzer 4.125% 01/04/2024 89 0.05 €258,000 AIB 1.5% 29/03/2023 226 0.12 €200,000 Alliander 1.625% Perpetual 173 0.09 €600,000 Allied Irish Banks 4.125% 26/11/2025 556 0.30 €400,000 Allied Irish Banks 7.375% Perpetual 387 0.21 €375,000 Altice 6.25% 15/02/2025 317 0.17 €225,000 Altice 7.25% 15/05/2022 200 0.11 €200,000 Altice Finco 4.75% 15/01/2028 150 0.08 €150,000 Altice France 5.625% 15/05/2024 138 0.07 €600,000 America Movil 6.375% 06/09/2073 611 0.33 €150,000 Aramark International Finance 3.125% 01/04/2025 135 0.07 €600,000 ArcelorMittal 3.125% 14/01/2022 570 0.30 €350,000 Ardagh Packaging Finance 2.75% 15/03/2024 306 0.16 €250,000 Ardagh Packaging Finance 6.75% 15/05/2024 238 0.13 €300,000 Areva 3.125% 20/03/2023 265 0.14 €200,000 Axalta Coating Systems 4.25% 15/08/2024 184 0.10 €250,000 Ball 4.375% 15/12/2023 247 0.13 €400,000 Banca Monte dei Paschi di Siena 5.375% 18/01/2028 288 0.15 €800,000 Banco Bilbao Vizcaya Argentaria 8.875% Perpetual 794 0.42 €400,000 Banco Santander 6.75% Perpetual 380 0.20 €400,000 Bank of Ireland 7.375% Perpetual 380 0.20 €200,000 Bankia 3.375% 15/03/2027 180 0.10 €500,000 Bankinter 2.5% 06/04/2027 444 0.24 €200,000 Barclays 2% 07/02/2028 169 0.09 €200,000 Barclays 2.625% 11/11/2025 180 0.10 €383,000 Becton Dickinson 1.401% 24/05/2023 343 0.18 €200,000 Brisa Concessao Rodoviaria 1.875% 30/04/2025 181 0.10 €300,000 CaixaBank 3.5% 15/02/2027 279 0.15 €800,000 CaixaBank 6.75% Perpetual 753 0.40 €400,000 Casino Guichard Perrachon 4.561% 25/01/2023 361 0.19

Quilter Investors Bond 3 Fund
Portfolio statement (continued) as at 30 June 2018
Quilter Investors OEIC
73
Market Percentage of Value total net assets
Holding Investment £000 %
Euro Denominated Fixed Rate Corporate Bonds (continued) €150,000 CBR Fashion Finance 5.125% 01/10/2022 113 0.06 €100,000 Cellnex Telecom 2.875% 18/04/2025 89 0.05 €300,000 Centrica 3% 10/04/2076 271 0.14 €100,000 Cirsa Funding Luxembourg 5.75% 15/05/2021 91 0.05 €250,000 CNH Industrial Finance Europe 2.875% 27/09/2021 236 0.13 €250,000 Commerzbank 4% 23/03/2026 234 0.12 €100,000 Commerzbank 7.75% 16/03/2021 104 0.06 €100,000 Constellium 4.25% 15/02/2026 86 0.05 €400,000 Cooperatieve Rabobank UA 6.625% Perpetual 398 0.21 €300,000 Coty 4% 15/04/2023 262 0.14 €200,000 Credit Agricole 6.5% Perpetual 191 0.10 €400,000 Credit Mutuel Arkea 1.875% 25/10/2029 326 0.17 €200,000 Crown European 3.375% 15/05/2025 179 0.10 €300,000 Crown European 4% 15/07/2022 289 0.15 €450,000 Crystal Almond 10% 01/11/2021 422 0.23 €200,000 CTC BondCo 5.25% 15/12/2025 168 0.09 €400,000 Danske Bank 5.875% Perpetual 385 0.21 €300,000 Deutsche Bank 1.75% 17/01/2028 243 0.13 €200,000 Deutsche Bank 4.5% 19/05/2026 178 0.10 €300,000 Douglas GmbH 6.25% 15/07/2022 261 0.14 €200,000 Dufry One 2.5% 15/10/2024 176 0.09 €200,000 EC Finance 2.375% 15/11/2022 174 0.09 €600,000 EDP - Energias de Portugal 5.375% 16/09/2075 572 0.30 €293,103 eDreams ODIGEO 8.5% 01/08/2021 269 0.14 €250,000 eircom Finance 4.5% 31/05/2022 225 0.12 €300,000 Elis 1.875% 15/02/2023 262 0.14 €100,000 Enel 2.5% 24/11/2078 83 0.04 €125,000 Enel 5% 15/01/2075 116 0.06 €450,000 Equinix 2.875% 01/10/2025 375 0.20 €200,000 Europcar 4.125% 15/11/2024 173 0.09 €300,000 EVOCA 7% 15/10/2023 279 0.15 €300,000 Fiat Chrysler Automobiles 3.75% 29/03/2024 282 0.15 €250,000 Fiat Chrysler Finance Europe 4.75% 15/07/2022 244 0.13 €100,000 Fnac Darty 3.25% 30/09/2023 91 0.05 €150,000 Galapagos/Luxembourg 5.375% 15/06/2021 114 0.06 €300,000 Gas Natural Fenosa Finance 4.125% Perpetual 276 0.15 €150,000 Horizon Holdings I 7.25% 01/08/2023 138 0.07 €500,000 Horizon Parent 8.25% 15/02/2022 459 0.24 €300,000 Huntsman International 4.25% 01/04/2025 302 0.16 €100,000 Iberdrola International 1.875% Perpetual 84 0.05 €350,000 IHO Verwaltungs 3.25% 15/09/2023 313 0.17 €125,000 IHO Verwaltungs 3.75% 15/09/2026 113 0.06 €150,000 INEOS 5.375% 01/08/2024 139 0.07 €350,000 International Game Technology 4.75% 15/02/2023 331 0.18 €100,000 Intesa Sanpaolo 3.928% 15/09/2026 89 0.05 €400,000 Intesa Sanpaolo 7.75% Perpetual 382 0.20 €250,000 IQVIA 2.875% 15/09/2025 207 0.11 €100,000 Iron Mountain 3% 15/01/2025 88 0.05 €100,000 KBC 1.625% 18/09/2029 86 0.05 €300,000 KBC 1.875% 11/03/2027 271 0.14 €300,000 Kirk Beauty One 8.75% 15/07/2023 248 0.13 €250,000 Kronos 3.75% 15/09/2025 213 0.11 €200,000 La Financiere Atalian 4% 15/05/2024 167 0.09 €500,000 Leonardo 4.875% 24/03/2025 505 0.27

Quilter Investors Bond 3 Fund
Portfolio statement (continued) as at 30 June 2018
Quilter Investors OEIC
74
Market Percentage of Value total net assets
Holding Investment £000 %
Euro Denominated Fixed Rate Corporate Bonds (continued) €100,000 LKQ Italia Bondco 3.875% 01/04/2024 92 0.05 €150,000 Loxam 4.25% 15/04/2024 138 0.07 €200,000 Loxam SAS 3.5% 15/04/2022 182 0.10 €400,000 Matterhorn Telecom 4.875% 01/05/2023 355 0.19 €200,000 Nationwide Building Society 2% 25/07/2029 174 0.09 €150,000 NewCo Sab MidCo 5.375% 15/04/2025 129 0.07 €225,000 Nidda BondCo 5% 30/09/2025 182 0.10 €200,000 Nidda Healthcare 3.5% 30/09/2024 167 0.09 €200,000 Nomad Foods Bondco 3.25% 15/05/2024 176 0.09 €100,000 Nyrstar Netherlands 6.875% 15/03/2024 82 0.04 €200,000 Nyrstar Netherlands 8.5% 15/09/2019 180 0.10 €200,000 OI European 3.125% 15/11/2024 179 0.10 €300,000 Orange 4% Perpetual 286 0.15 €200,000 Origin Energy Finance 4% 16/09/2074 182 0.10 €350,000 OTE 3.5% 09/07/2020 321 0.17
€6,400,000 Pescanova 5.125% 20/04/2017† 57 0.03 €2,550,000 Pescanova 6.75% 05/03/2015† 23 0.01 €7,700,000 Pescanova 8.75% 17/02/2019 68 0.04
€250,000 Peugeot 2.375% 14/04/2023 232 0.12 €200,000 Picard Bondco 5.5% 30/11/2024 166 0.09 €250,000 ProGroup 3% 31/03/2026 215 0.11 €600,000 Quintiles IMS 3.5% 15/10/2024 533 0.28 €200,000 Repsol Finance 4.5% 25/03/2075 185 0.10 €750,000 Repsol International Finance 3.875% Perpetual 689 0.37 €350,000 Rexel 2.125% 15/06/2025 292 0.16 €200,000 Saipem Finance International 2.75% 05/04/2022 179 0.10 €500,000 SES 4.625% Perpetual 456 0.24 €350,000 SFR 5.375% 15/05/2022 318 0.17 €350,000 SIG Combibloc 7.75% 15/02/2023 321 0.17 €350,000 Silgan 3.25% 15/03/2025 314 0.17 €720,000 Sky 2.25% 17/11/2025 681 0.36
€97,200 SMCP 5.875% 01/05/2023 91 0.05 €450,000 Smurfit Kappa Acquisitions 2.375% 01/02/2024 402 0.21
€1,150,000 SNS Bank 6.25% 26/10/2020 46 0.02 €300,000 SoftBank 4% 30/07/2022 280 0.15 €600,000 Solvay Finance 5.118% Perpetual 576 0.31 €300,000 SPIE 3.125% 22/03/2024 265 0.14 €200,000 Synlab Bondco 6.25% 01/07/2022 182 0.10 €200,000 Synlab Unsecured Bondco 8.25% 01/07/2023 187 0.10 €325,000 Telecom Italia 3.25% 16/01/2023 305 0.16 €350,000 Telecom Italia 3.625% 25/05/2026 326 0.17 €100,000 Telecom Italia Finance 7.75% 24/01/2033 121 0.06 €600,000 Telefonica Europe 3% Perpetual 497 0.26 €300,000 Telefonica Europe 3.75% Perpetual 266 0.14 €900,000 Telefonica Europe 5.875% Perpetual 867 0.46 €100,000 Telenet Finance Luxembourg Notes 3.5% 01/03/2028 84 0.04 €135,000 Telenet Finance VI Luxembourg 4.875% 15/07/2027 127 0.07 €200,000 Telia 3% 04/04/2078 180 0.10 €475,000 Tesco Corporate Treasury Services 2.5% 01/07/2024 445 0.24 €450,000 thyssenkrupp 2.5% 25/02/2025 415 0.22 €500,000 TOTAL 2.25% Perpetual 452 0.24 €500,000 TOTAL 2.708% Perpetual 452 0.24 €900,000 UBS Funding Switzerland 5.75% Perpetual 858 0.46 €200,000 UniCredit 9.25% Perpetual 198 0.11

Quilter Investors Bond 3 Fund
Portfolio statement (continued) as at 30 June 2018
Quilter Investors OEIC
75
Market Percentage of Value total net assets
Holding Investment £000 %
Euro Denominated Fixed Rate Corporate Bonds (continued) €300,000 Unitymedia GmbH 3.75% 15/01/2027 277 0.15 €125,000 Unitymedia Hessen 3.5% 15/01/2027 115 0.06 €700,000 Unitymedia Hessen 4% 15/01/2025 648 0.35 €400,000 UPCB Finance IV 4% 15/01/2027 358 0.19 €200,000 Valeant Pharmaceuticals 4.5% 15/05/2023 167 0.09 €200,000 Vallourec 2.25% 30/09/2024 141 0.08 €150,000 Vallourec 6.625% 15/10/2022 135 0.07 €360,000 Verisure 6% 01/11/2022 331 0.18 €200,000 Verisure Midholding 5.75% 01/12/2023 172 0.09 €300,000 Virgin Media Finance 4.5% 15/01/2025 268 0.14 €300,000 Volkswagen International Finance 2.7% Perpetual 259 0.14 €300,000 Volkswagen International Finance 3.75% Perpetual 274 0.15 €150,000 Volvo Car 2% 24/01/2025 128 0.07 €150,000 WEPA Hygieneprodukte GmbH 3.75% 15/05/2024 126 0.07 €225,000 WFS Global 9.5% 15/07/2022 209 0.11 €200,000 Wind Tre 3.125% 20/01/2025 143 0.08 €175,000 WMG Acquisition 4.125% 01/11/2024 160 0.09 €300,000 Worldpay Finance 3.75% 15/11/2022 286 0.15 €375,000 Ziggo Bond Finance 4.625% 15/01/2025 328 0.17 €200,000 Ziggo Secured Finance 3.75% 15/01/2025 174 0.09
42,943 22.90
Euro Denominated Variable Rate Corporate Bonds 4.61% (31 December 2017 0.00%) €100,000 Autodis 4.375% 01/05/2022 89 0.05 €500,000 Bank of America 0.451% 04/05/2023 444 0.24 €400,000 Bank of America 0.529% 14/09/2020 359 0.19 €300,000 Bank of Ireland 4.25% 11/06/2024 272 0.14 €600,000 BPCE 0.177% 23/03/2023 523 0.28 €300,000 Cabot Financial Luxembourg II 5.875% 15/11/2021 268 0.14 €600,000 Citigroup 0.177% 21/03/2023 529 0.28 €300,000 Galapagos/Luxembourg 4.429% 15/06/2021 236 0.12 €275,000 Garfunkelux Holdco 3 4.5% 01/09/2023 217 0.11 €846,000 Goldman Sachs 0.129% 16/12/2020 749 0.40 €400,000 Goldman Sachs 0.422% 29/10/2019 357 0.19 €600,000 Hema Bondco I 6.25% 15/07/2022 509 0.27 €400,000 HSBC 0.179% 05/10/2023 352 0.19 €200,000 KBC 5.625% Perpetual 180 0.10 €627,000 Koninklijke Ahold Delhaize 0% 19/03/2021 556 0.30 €250,000 Monitchem HoldCo 3 4.429% 15/06/2021 219 0.12 €400,000 Morgan Stanley 0.052% 09/11/2021 353 0.19 €400,000 Natwest Markets 0.079% 02/03/2020 354 0.19 €400,000 NGG Finance 4.25% 18/06/2076 375 0.20 €475,000 Novafives 4.5% 15/06/2025 411 0.22 €500,000 Paprec 3.5% 31/03/2025 444 0.24 €400,000 Picard 3% 30/11/2023 345 0.18 €225,000 Synlab Bondco 3.5% 01/07/2022 198 0.10 €150,000 Tendam Brands 5.25% 15/09/2024 126 0.07 €250,000 Wind Tre 2.75% 20/01/2024 184 0.10
8,649 4.61

Quilter Investors Bond 3 Fund
Portfolio statement (continued) as at 30 June 2018
Quilter Investors OEIC
76
Market Percentage of Value total net assets
Holding Investment £000 %
Euro Denominated Derivatives (0.02)% (31 December 2017 0.00%)
Euro Denominated Forward Exchange Contracts 0.01% (31 December 2017 0.00%) €524,029 Euro v Sterling Forward Exchange Contract 5 0.01 €408,378 Euro v Sterling Forward Exchange Contract 4 - €756,886 Euro v Sterling Forward Exchange Contract 3 - €178,331 Euro v Sterling Forward Exchange Contract 2 - €150,313 Euro v Sterling Forward Exchange Contract 1 -
€59,007 Euro v Sterling Forward Exchange Contract 1 - €72,059 Euro v Sterling Forward Exchange Contract - - €78,946 Euro v Sterling Forward Exchange Contract - - €89,577 Euro v Sterling Forward Exchange Contract - -
16 0.01
Euro Denominated Futures Contracts (0.02)% (31 December 2017 0.00%) (36) Euro-Bobl Futures September 2018 (11) (0.01) (23) Euro-Bund Futures September 2018 (21) (0.01) (48) Euro-Schatz Futures September 2018 (4) -
(36) (0.02)
Euro Credit Default Swap (0.01)% (31 December 2017 0.00%) €7,600,000 Buy Protection CDS 1% iTraxx Europe Senior Financials Series 29 Version 1 5years Citigroup (30) (0.02)
€930,000 Buy Protection CDS 1% iTraxx Europe Series 29 Version 1 5years 20/6/2023 Citigroup 11 0.01 €950,000 Buy Protection CDS BMW 20/06/2023 Goldman Sachs (11) (0.01)
€1,050,000 Buy Protection CDS BMW Finance 0.125% 12/1/2021 SNR 20/9/2023 Merrill Lynch (12) (0.01) €1,100,000 Buy Protection CDS Carrefour 1.75% 22/5/19 SNR EMTN 20/06/2023 Merrill Lynch (3) - €1,000,000 Buy Protection CDS Rolls Royce 20/06/2023 Goldman Sachs (10) -
€575,000 Buy Protection CDS Unilever 20/06/2023 Goldman Sachs (17) (0.01) €575,000 Buy Protection CDS Vodafone Group 20/06/2023 Goldman Sachs (4) - €425,000 Sell Protection CDS Arcelormittal 20/06/2023 Goldman Sachs 60 0.03 €425,000 Sell Protection CDS Telefonica Emisiones 2.736% 29/5/2019 GTD SNR 20/6/2023 Merrill Lynch (1) -
(17) (0.01)
North America 62.93% (31 December 2017 77.99%)
Canada Equities 0.03% (31 December 2017 0.18%) 314,862 Jaguar Mining 62 0.03
62 0.03
Cayman Islands Equities 0.60% (31 December 2017 0.22%) 775 Reichhold GP 570 0.30 775 Reichhold LP 570 0.30
1,140 0.60
US Dollar Denominated Fixed Rate Corporate Bonds 57.69% (31 December 2017 66.59%) $200,000 ABJA Investment 5.45% 24/01/2028 129 0.07 $200,000 ABQ Finance 3.5% 22/02/2022 146 0.08 $360,000 Acadia Healthcare 6.5% 01/03/2024 281 0.15 $145,000 ACE Cash Express 12% 15/12/2022 119 0.06 $800,000 ADT 4.125% 15/06/2023 569 0.30 $249,808 Advanced Lighting 2nd Lien Term Loan 0% 01/06/2019 143 0.08 $160,000 AECOM 5.125% 15/03/2027 114 0.06 $144,000 AECOM 5.875% 15/10/2024 113 0.06
$1,000,000 AerCap Ireland Capital 3.65% 21/07/2027 693 0.37 $208,000 Ahern Rentals 7.375% 15/05/2023 154 0.08

Quilter Investors Bond 3 Fund
Portfolio statement (continued) as at 30 June 2018
Quilter Investors OEIC
77
Market Percentage of Value total net assets
Holding Investment £000 %
US Dollar Denominated Fixed Rate Corporate Bonds (continued) $138,000 Aircastle 7.625% 15/04/2020 111 0.06
$79,000 AK Steel 7% 15/03/2027 57 0.03 $76,000 AK Steel 7.5% 15/07/2023 60 0.03
$138,000 Albertsons 5.75% 15/03/2025 92 0.05 $559,000 Albertsons 6.625% 15/06/2024 403 0.22 $200,000 Alcoa Nederland 6.75% 30/09/2024 160 0.09 $319,000 Alliance Data Systems 5.375% 01/08/2022 243 0.13 $287,000 Alliance Data Systems 5.875% 01/11/2021 220 0.12 $195,000 Allison Transmission 4.75% 01/10/2027 138 0.07 $220,000 Ally Financial 4.625% 30/03/2025 164 0.09
$99,000 Ally Financial 8% 01/11/2031 89 0.05 $125,000 Ally Financial 8% Guaranteed Notes 01/11/2031 113 0.06 $200,000 Altice Financing 6.625% 15/02/2023 150 0.08 $200,000 Altice Luxembourg 7.625% 15/02/2025 138 0.07 $450,000 Altice US Finance I 5.5% 15/05/2026 330 0.18 $330,000 Altria 3.875% 16/09/2046 221 0.12 $125,000 AMC Entertainment 5.75% 15/06/2025 93 0.05 $195,000 AMC Entertainment 6.125% 15/05/2027 143 0.08 $255,000 AMC Networks 4.75% 01/08/2025 187 0.10 $500,000 American Airlines 2017-2 Class AA Pass Through Trust 3.35% 15/10/2029 360 0.19 $529,000 American Axle & Manufacturing 6.25% 01/04/2025 399 0.21
$64,000 American Axle & Manufacturing 6.25% 15/03/2026 47 0.03 $157,000 American Axle & Manufacturing 6.5% 01/04/2027 118 0.06 $520,000 American International 3.9% 01/04/2026 383 0.20 $650,000 American Tower 3.6% 15/01/2028 459 0.24 $122,000 AmeriGas Partners 5.5% 20/05/2025 90 0.05
$80,000 AmeriGas Partners 5.625% 20/05/2024 60 0.03 $155,000 AMN Healthcare 5.125% 01/10/2024 115 0.06 $400,000 Anadarko Petroleum 3.45% 15/07/2024 293 0.16 $345,000 Anheuser-Busch InBev Finance 4.9% 01/02/2046 269 0.14 $150,000 Anixter 5.5% 01/03/2023 118 0.06 $135,000 Antero Resources 5.125% 01/12/2022 103 0.06 $584,000 Arconic 5.125% 01/10/2024 439 0.23 $750,000 Arconic 5.9% 01/02/2027 571 0.30 $240,000 Ardagh Packaging Finance 7.25% 15/05/2024 189 0.10 $435,000 AT&T 3.4% 15/05/2025 311 0.17 $210,000 AT&T 5.25% 01/03/2037 158 0.08 $107,000 Athabasca Oil 9.875% 24/02/2022 84 0.05
$8,190,000 ATP Oil & Gas 11.875% 01/05/2015 (Defaulted)*† - - $200,000 Australia & New Zealand Banking Group 6.75% Perpetual 155 0.08
$65,000 Avis Budget Car Rental 5.25% 15/03/2025 45 0.02 $390,000 Baker Hughes 3.337% 15/12/2027 276 0.15 $350,000 Bakrie Telecom 11.5% 07/05/2015† 1 -
$30,000 Ball 4.875% 15/03/2026 23 0.01 $200,000 Banco ABC Brasil 7.875% 08/04/2020 159 0.08 $368,297 Banco Cruzeiro do Sul Brazil 7% 08/07/2013 (Defaulted)*† - -
$2,645,000 Banco Cruzeiro do Sul Brazil 7% 08/07/2013 (Defaulted)† 20 0.01 $791,782 Banco Cruzeiro do Sul Brazil 7.625% 21/04/2014 (Defaulted)*† - -
$5,590,000 Banco Cruzeiro do Sul Brazil 7.625% 21/04/2014 (Defaulted)† 43 0.02 $6,750,000 Banco Cruzeiro do Sul Brazil 8% 17/09/2012 (Defaulted)† 51 0.03
$964,478 Banco Cruzeiro do Sul Brazil 8% 17/09/2012 (Defaulted)*† - - $5,628,000 Banco Cruzeiro do Sul Brazil 8.25% 20/01/2016 (Defaulted)† 43 0.02
$783,302 Banco Cruzeiro do Sul Brazil 8.25% 20/01/2016 (Defaulted)*† - - $3,633,000 Banco Cruzeiro do Sul Brazil 8.5% 20/02/2015 (Defaulted)† 28 0.02

Quilter Investors Bond 3 Fund
Portfolio statement (continued) as at 30 June 2018
Quilter Investors OEIC
78
Market Percentage of Value total net assets
Holding Investment £000 %
US Dollar Denominated Fixed Rate Corporate Bonds (continued) $502,288 Banco Cruzeiro do Sul Brazil 8.5% 20/02/2015 (Defaulted)*† - -
$2,500,000 Banco Cruzeiro do Sul Brazil 8.875% 22/09/2020 (Defaulted)* - - $200,000 Banco Daycoval 5.75% 19/03/2019 153 0.08 $200,000 Banco Regional SAECA 8.125% 24/01/2019 155 0.08 $150,000 Banco Votorantim 7.375% 21/01/2020 118 0.06 $400,000 Bank of America 3.004% 20/12/2023 295 0.16 $420,000 Bank of America 3.95% 21/04/2025 313 0.17 $280,000 Bank of Ireland 4.125% 19/09/2027 201 0.11 $650,000 Bank of New York Mellon 4.625% Perpetual 470 0.25
$2,000,000 Banro 10% 01/03/2021 1,187 0.63 $200,000 Batelco International Finance No 1 4.25% 01/05/2020 146 0.08 $470,000 Becton Dickinson 3.363% 06/06/2024 344 0.18 $320,000 Berry Global 4.5% 15/02/2026 227 0.12
$3,325,000 BLT Finance 7.5% 15/05/2014† 6 - $135,000 Blue Cube Spinco 10% 15/10/2025 119 0.06
$55,000 Blue Racer Midstream 6.125% 15/11/2022 42 0.02 $200,000 Bluestar Finance 3.125% 30/09/2019 151 0.08 $164,000 Bombardier 6% 15/10/2022 124 0.07 $570,000 Bombardier 6.125% 15/01/2023 434 0.23
$75,000 Bombardier 8.75% 01/12/2021 63 0.03 $320,000 Booz Allen Hamilton 5.125% 01/05/2025 238 0.13
$94,000 Boyne USA 7.25% 01/05/2025 74 0.04 $680,000 BPCE 3.5% 23/10/2027 470 0.25 $570,000 BPCE 5.15% 21/07/2024 439 0.23 $215,000 Brink's 4.625% 15/10/2027 153 0.08
$29,000 Bristow 8.75% 01/03/2023 22 0.01 $450,000 Buckeye Partners 4.35% 15/10/2024 338 0.18
$17,000 Buckeye Partners 6.375% 22/01/2078 12 0.01 $62,000 BWX Technologies 5.375% 15/07/2026 48 0.03
$127,000 Cablevision Systems 8% 15/04/2020 101 0.05 $47,000 California Resources 8% 15/12/2022 32 0.02
$418,000 Calpine 5.25% 01/06/2026 299 0.16 $80,000 Calpine 5.875% 15/01/2024 60 0.03
$133,000 Calpine 6% 15/01/2022 103 0.06 $150,000 Camelot Finance 7.875% 15/10/2024 114 0.06 $204,000 Carrizo Oil & Gas 6.25% 15/04/2023 157 0.08 $470,000 CCO Capital 5.5% 01/05/2026 347 0.18 $332,000 CCO Capital 5.75% 01/09/2023 255 0.14 $374,000 CCO Capital 5.75% 15/02/2026 279 0.15 $155,000 CCO Capital 5.875% 01/05/2027 115 0.06 $200,000 Cemex 6.125% 05/05/2025 154 0.08 $700,000 Cemex 7.75% 16/04/2026 573 0.31 $250,000 Cemig Geracao e Transmissao 9.25% 05/12/2024 193 0.10 $200,000 Cenovus Energy 5.2% 15/09/2043 142 0.08 $505,000 Centene 6.125% 15/02/2024 403 0.22 $200,000 Centrais Eletricas Brasileiras 6.875% 30/07/2019 155 0.08 $285,000 CenturyLink 6.45% 15/06/2021 222 0.12 $245,000 Chemours 7% 15/05/2025 200 0.11
$60,000 Cheniere Corpus Christi 5.875% 31/03/2025 48 0.03 $345,000 Cheniere Corpus Christi 7% 30/06/2024 287 0.15
$48,000 Cheniere Energy Partners 5.25% 01/10/2025 36 0.02 $80,000 Chesapeake Energy 5.75% 15/03/2023 58 0.03
$190,000 Chesapeake Energy 8% 15/01/2025 147 0.08 $5,000,000 China Medical Technologies 6.25% 15/12/2016*† - -

Quilter Investors Bond 3 Fund
Portfolio statement (continued) as at 30 June 2018
Quilter Investors OEIC
79
Market Percentage of Value total net assets
Holding Investment £000 %
US Dollar Denominated Fixed Rate Corporate Bonds (continued) $275,000 China Minmetals 3.75% Perpetual 192 0.10 $353,000 CHS/Community Health Systems 6.25% 31/03/2023 245 0.13 $211,000 CHS/Community Health Systems 8.125% 30/06/2024 132 0.07 $265,000 Cincinnati Bell 7% 15/07/2024 184 0.10 $153,000 Cinemark USA 4.875% 01/06/2023 114 0.06 $396,000 CIT 5% 15/08/2022 305 0.16
$62,000 CIT 5.25% 07/03/2025 48 0.03 $80,000 CITGO Petroleum 6.25% 15/08/2022 61 0.03
$1,000,000 Citigroup 3.142% 24/01/2023 746 0.40 $540,000 Citigroup 4.3% 20/11/2026 400 0.21 $680,000 Citigroup 5.95% Perpetual 520 0.28
$1,230,000 Citigroup 6.25% Perpetual 974 0.52 $146,000 Clear Channel Worldwide 6.5% 15/11/2022 USD1000 113 0.06 $147,000 Clear Channel Worldwide 6.5% 15/11/2022 USD2000 114 0.06 $223,000 Clear Channel Worldwide 7.625% 15/03/2020 169 0.09 $250,000 Clearwater Paper 4.5% 01/02/2023 177 0.09
$44,000 Clearwater Paper 5.375% 01/02/2025 30 0.02 $322,000 CNG 9.375% 15/05/2020 243 0.13 $225,000 Commercial Metals 4.875% 15/05/2023 166 0.09 $320,000 CommScope Technologies 5% 15/03/2027 229 0.12 $200,000 Comunicaciones Celulares SA Via Comcel Trust 6.875% 06/02/2024 156 0.08 $500,000 Concordia International 7% 15/04/2023 23 0.01
$1,000,000 Concordia International 9% 01/04/2022 681 0.36 $250,000 Constellium 6.625% 01/03/2025 191 0.10 $160,000 Cornerstone Chemical 6.75% 15/08/2024 119 0.06
$1,300,000 Corp GEO 9.25% 30/06/2020* - - $314,000 Covanta 5.875% 01/03/2024 235 0.13 $850,000 Cox Communications 3.35% 15/09/2026 600 0.32 $800,000 Credit Agricole 8.125% Perpetual 644 0.34 $500,000 Credit Agricole/London 3.25% 04/10/2024 357 0.19 $200,000 Credit Suisse 6.5% 08/08/2023 162 0.09
$1,100,000 Credit Suisse 7.5% Perpetual 864 0.46 $93,000 Crestwood Midstream Partners 6.25% 01/04/2023 72 0.04
$160,000 Crown Americas 4.75% 01/02/2026 116 0.06 $480,000 CSC 5.375% 01/02/2028 337 0.18 $675,000 CSC 5.5% 15/04/2027 489 0.26 $200,000 CSC 10.875% 15/10/2025 176 0.09
$40,000 CSI Compressco Finance 7.5% 01/04/2025 31 0.02 $260,000 Ctrip.com International 1% 01/07/2020 209 0.11 $145,000 CURO Financial Technologies 12% 01/03/2022 120 0.06 $572,000 CVR Partners 9.25% 15/06/2023 448 0.24 $200,000 Cypress Semiconductor 4.5% 15/01/2022 203 0.11 $185,000 CyrusOne Finance 5.375% 15/03/2027 140 0.07 $234,000 Dana Financing Luxembourg Sarl 5.75% 15/04/2025 176 0.09 $550,000 DaVita 5% 01/05/2025 393 0.21 $121,000 DCP Midstream Operating 3.875% 15/03/2023 89 0.05 $177,000 DCP Midstream Operating 6.75% 15/09/2037 143 0.08
$77,000 Dean Foods 6.5% 15/03/2023 56 0.03 $154,000 Delek Logistics Partners 6.75% 15/05/2025 117 0.06 $646,690 Dflt-Avaya Escrow 10.5% Perpetual* - -
$82,000 Diamond Offshore Drilling 7.875% 15/08/2025 64 0.03 $341,000 Diebold Nixdorf 8.5% 15/04/2024 249 0.13 $200,000 DIP Sukuk 4.291% 20/02/2019 152 0.08 $255,000 DISH DBS 5.875% 15/07/2022 182 0.10 $281,000 DISH DBS 5.875% 15/11/2024 180 0.10
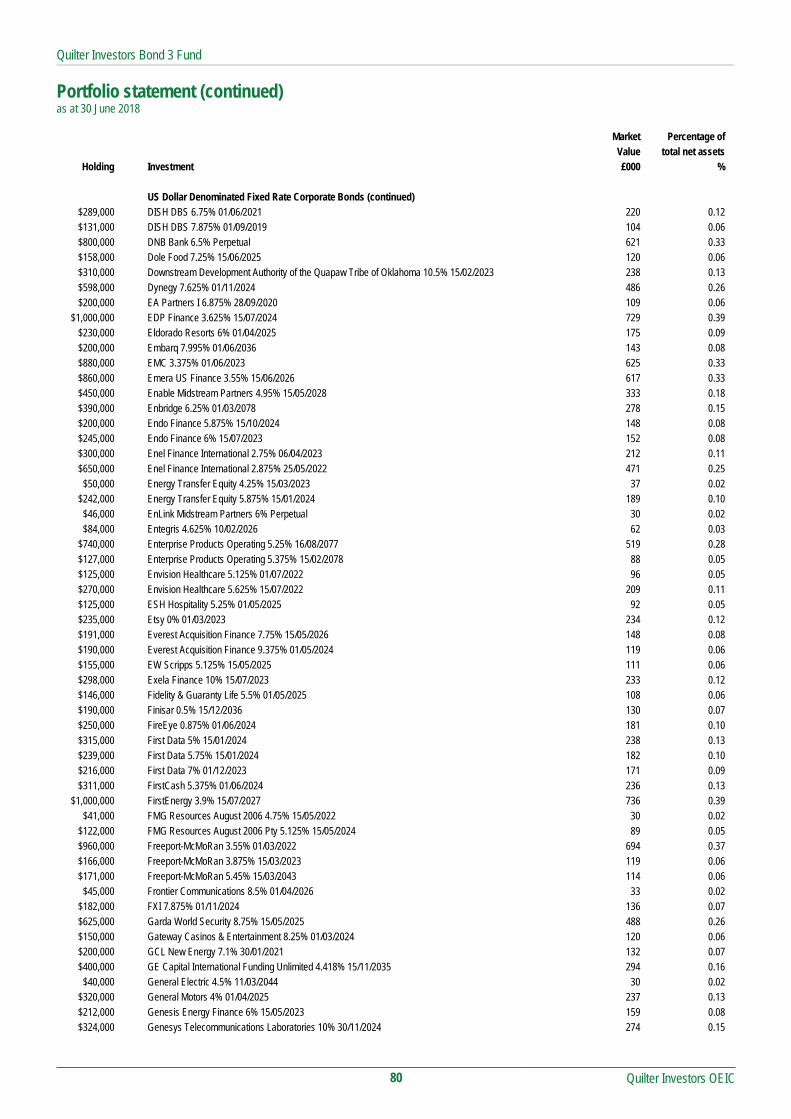
Quilter Investors Bond 3 Fund
Portfolio statement (continued) as at 30 June 2018
Quilter Investors OEIC
80
Market Percentage of Value total net assets
Holding Investment £000 %
US Dollar Denominated Fixed Rate Corporate Bonds (continued) $289,000 DISH DBS 6.75% 01/06/2021 220 0.12 $131,000 DISH DBS 7.875% 01/09/2019 104 0.06 $800,000 DNB Bank 6.5% Perpetual 621 0.33 $158,000 Dole Food 7.25% 15/06/2025 120 0.06 $310,000 Downstream Development Authority of the Quapaw Tribe of Oklahoma 10.5% 15/02/2023 238 0.13 $598,000 Dynegy 7.625% 01/11/2024 486 0.26 $200,000 EA Partners I 6.875% 28/09/2020 109 0.06
$1,000,000 EDP Finance 3.625% 15/07/2024 729 0.39 $230,000 Eldorado Resorts 6% 01/04/2025 175 0.09 $200,000 Embarq 7.995% 01/06/2036 143 0.08 $880,000 EMC 3.375% 01/06/2023 625 0.33 $860,000 Emera US Finance 3.55% 15/06/2026 617 0.33 $450,000 Enable Midstream Partners 4.95% 15/05/2028 333 0.18 $390,000 Enbridge 6.25% 01/03/2078 278 0.15 $200,000 Endo Finance 5.875% 15/10/2024 148 0.08 $245,000 Endo Finance 6% 15/07/2023 152 0.08 $300,000 Enel Finance International 2.75% 06/04/2023 212 0.11 $650,000 Enel Finance International 2.875% 25/05/2022 471 0.25
$50,000 Energy Transfer Equity 4.25% 15/03/2023 37 0.02 $242,000 Energy Transfer Equity 5.875% 15/01/2024 189 0.10
$46,000 EnLink Midstream Partners 6% Perpetual 30 0.02 $84,000 Entegris 4.625% 10/02/2026 62 0.03
$740,000 Enterprise Products Operating 5.25% 16/08/2077 519 0.28 $127,000 Enterprise Products Operating 5.375% 15/02/2078 88 0.05 $125,000 Envision Healthcare 5.125% 01/07/2022 96 0.05 $270,000 Envision Healthcare 5.625% 15/07/2022 209 0.11 $125,000 ESH Hospitality 5.25% 01/05/2025 92 0.05 $235,000 Etsy 0% 01/03/2023 234 0.12 $191,000 Everest Acquisition Finance 7.75% 15/05/2026 148 0.08 $190,000 Everest Acquisition Finance 9.375% 01/05/2024 119 0.06 $155,000 EW Scripps 5.125% 15/05/2025 111 0.06 $298,000 Exela Finance 10% 15/07/2023 233 0.12 $146,000 Fidelity & Guaranty Life 5.5% 01/05/2025 108 0.06 $190,000 Finisar 0.5% 15/12/2036 130 0.07 $250,000 FireEye 0.875% 01/06/2024 181 0.10 $315,000 First Data 5% 15/01/2024 238 0.13 $239,000 First Data 5.75% 15/01/2024 182 0.10 $216,000 First Data 7% 01/12/2023 171 0.09 $311,000 FirstCash 5.375% 01/06/2024 236 0.13
$1,000,000 FirstEnergy 3.9% 15/07/2027 736 0.39 $41,000 FMG Resources August 2006 4.75% 15/05/2022 30 0.02
$122,000 FMG Resources August 2006 Pty 5.125% 15/05/2024 89 0.05 $960,000 Freeport-McMoRan 3.55% 01/03/2022 694 0.37 $166,000 Freeport-McMoRan 3.875% 15/03/2023 119 0.06 $171,000 Freeport-McMoRan 5.45% 15/03/2043 114 0.06
$45,000 Frontier Communications 8.5% 01/04/2026 33 0.02 $182,000 FXI 7.875% 01/11/2024 136 0.07 $625,000 Garda World Security 8.75% 15/05/2025 488 0.26 $150,000 Gateway Casinos & Entertainment 8.25% 01/03/2024 120 0.06 $200,000 GCL New Energy 7.1% 30/01/2021 132 0.07 $400,000 GE Capital International Funding Unlimited 4.418% 15/11/2035 294 0.16
$40,000 General Electric 4.5% 11/03/2044 30 0.02 $320,000 General Motors 4% 01/04/2025 237 0.13 $212,000 Genesis Energy Finance 6% 15/05/2023 159 0.08 $324,000 Genesys Telecommunications Laboratories 10% 30/11/2024 274 0.15

Quilter Investors Bond 3 Fund
Portfolio statement (continued) as at 30 June 2018
Quilter Investors OEIC
81
Market Percentage of Value total net assets
Holding Investment £000 %
US Dollar Denominated Fixed Rate Corporate Bonds (continued) $500,000 Glencore Funding 3% 27/10/2022 365 0.19 $218,000 Global Partners 6.25% 15/07/2022 161 0.09 $281,000 GLP Capital 5.375% 01/11/2023 219 0.12
$1,000,000 Golden Belt 1 Sukuk BSCC 0% 15/05/2012 (Defaulted)† 1 - $220,000 Golden Nugget 6.75% 15/10/2024 167 0.09
$1,065,000 Goldman Sachs 2.905% 24/07/2023 780 0.42 $853,000 Goldman Sachs 5% Perpetual 609 0.32 $160,000 Goldman Sachs 5.15% 22/05/2045 120 0.06 $200,000 GOME Retail 5% 10/03/2020 145 0.08 $781,055 Goodman Networks 8% 11/05/2022 404 0.22 $252,000 Goodyear Tire & Rubber 4.875% 15/03/2027 175 0.09 $350,000 Goodyear Tire & Rubber 5% 31/05/2026 249 0.13
$43,000 Graham 5.75% 01/06/2026 33 0.02 $160,000 Gray Television 5.125% 15/10/2024 116 0.06 $200,000 Guangxi Communications Investment Group 3% 04/11/2019 148 0.08 $190,000 Gulfport Energy 6.375% 15/01/2026 139 0.07 $495,000 Gymboree Escrow 9.125% 01/12/2018 2 - $520,000 Halliburton 3.5% 01/08/2023 393 0.21 $190,000 Hanesbrands 4.625% 15/05/2024 141 0.08 $160,000 Hanesbrands 4.875% 15/05/2026 118 0.06 $500,000 Harris 4.854% 27/04/2035 392 0.21 $370,000 HCA 5% 15/03/2024 282 0.15 $205,000 HCA 5.375% 01/02/2025 154 0.08 $660,000 HCA 5.875% 01/05/2023 520 0.28 $247,000 HCA 7.5% 15/02/2022 205 0.11 $160,000 Hecla Mining 6.875% 01/05/2021 123 0.07 $138,000 Hertz 5.5% 15/10/2024 82 0.04 $175,000 Hexion 6.625% 15/04/2020 125 0.07
$50,000 Hexion Nova Scotia Finance 9% 15/11/2020 32 0.02 $200,000 Hikma Pharmaceuticals 4.25% 10/04/2020 151 0.08 $409,000 Hilcorp Finance 5% 01/12/2024 303 0.16
$80,000 Holly Energy Partners 6% 01/08/2024 61 0.03 $255,000 Hologic 4.375% 15/10/2025 185 0.10 $110,000 Horizon Global 2.75% 01/07/2022 59 0.03 $350,000 HSBC 4.375% 23/11/2026 261 0.14 $200,000 HSBC 6.375% Perpetual 149 0.08 $400,000 HSBC 6.875% Perpetual 315 0.17 $200,000 HTA 9.125% 08/03/2022 146 0.08 $235,000 Huazhu 0.375% 01/11/2022 201 0.11
$35,000 Hudbay Minerals 7.25% 15/01/2023 28 0.02 $285,000 Hughes Satellite Systems 5.25% 01/08/2026 203 0.11 $150,000 Hughes Satellite Systems 6.625% 01/08/2026 107 0.06 $135,000 Huntington Bancshares 5.7% Perpetual 101 0.05 $366,000 Icahn Enterprises 6.25% 01/02/2022 283 0.15 $185,000 Icahn Enterprises Finance 6.75% 01/02/2024 142 0.08 $200,000 ICD Sukuk 5% 01/02/2027 151 0.08
$1,200 iHeartCommunications 14% 01/02/2021* - - $200,000 IHS Netherlands Holdco 9.5% 27/10/2021 146 0.08 $340,000 II-VI 0.25% 01/09/2022 293 0.16
$80,000 Infor Software Parent 7.125% 01/05/2021 61 0.03 $158,000 Infor US 6.5% 15/05/2022 120 0.06 $162,000 Informatica 7.125% 15/07/2023 125 0.07 $500,000 ING Bank 5.8% 25/09/2023 402 0.21
$74,000 Intelsat Connect Finance 12.5% 01/04/2022 56 0.03 $554,000 Intelsat Jackson 7.25% 15/10/2020 418 0.22

Quilter Investors Bond 3 Fund
Portfolio statement (continued) as at 30 June 2018
Quilter Investors OEIC
82
Market Percentage of Value total net assets
Holding Investment £000 %
US Dollar Denominated Fixed Rate Corporate Bonds (continued) $305,000 Intelsat Jackson 8% 15/02/2024 244 0.13 $105,000 Intelsat Jackson 9.75% 15/07/2025 84 0.05 $245,000 International Game Technology 6.25% 15/02/2022 191 0.10 $500,000 Intesa Sanpaolo 3.875% 14/07/2027 326 0.17 $400,000 Intesa Sanpaolo 5.71% 15/01/2026 277 0.15 $225,000 IRB 6.75% 15/02/2026 164 0.09 $200,000 Iron Mountain 4.875% 15/09/2027 141 0.08 $190,000 Iron Mountain 5.75% 15/08/2024 142 0.08 $200,000 Itau Unibanco 6.125% Perpetual 142 0.08 $550,000 ITC 3.25% 30/06/2026 394 0.21 $230,000 Jack Ohio Finance 1 6.75% 15/11/2021 179 0.10 $200,000 Jaguar Land Rover Automotive 4.5% 01/10/2027 136 0.07
$8,000 JB Poindexter 7.125% 15/04/2026 6 - $616,000 JBS USA Finance 5.875% 15/07/2024 445 0.24 $589,000 JBS USA Finance 7.25% 01/06/2021 454 0.24
$44,000 JC Penney 8.625% 15/03/2025 28 0.03 $300,000 JSL Europe 7.75% 26/07/2024 205 0.11 $200,000 JSW Steel 5.25% 13/04/2022 148 0.08 $200,000 KCA Deutag UK Finance 7.25% 15/05/2021 147 0.08 $130,000 KFC Holdings 4.75% 01/06/2027 93 0.05 $125,000 KFC Holdings 5.25% 01/06/2026 94 0.05 $290,000 Knowles 3.25% 01/11/2021 246 0.13
$95,000 Kraft Heinz Foods 4.375% 01/06/2046 63 0.03 $380,000 Kroger Co/The 2.65% 15/10/2026 256 0.14 $200,000 Kuwait Projects SPC 5% 15/03/2023 151 0.08 $195,000 L Brands 5.25% 01/02/2028 131 0.07 $155,000 Ladder Capital Finance 5.25% 15/03/2022 118 0.06 $155,000 Lamar Media 5.375% 15/01/2024 120 0.06 $405,000 Lennar 4.5% 30/04/2024 298 0.16 $308,000 Level 3 Financing 5.375% 01/05/2025 227 0.12 $200,000 Level 3 Financing 5.625% 01/02/2023 152 0.08 $150,000 Liberty Expedia 1% 30/06/2047 113 0.06 $318,000 Liberty Interactive 3.75% 15/02/2030 168 0.09 $300,000 Liquid Telecommunications Financing 8.5% 13/07/2022 227 0.12 $310,000 Live Nation Entertainment 2.5% 15/03/2023 245 0.13 $350,000 Lloyds Banking 3.574% 07/11/2028 245 0.13 $155,000 LPL 5.75% 15/09/2025 115 0.06 $100,000 MagnaChip Semiconductor 5% 01/03/2021 106 0.06 $415,000 Maple Escrow Subsidiary 4.057% 25/05/2023 317 0.17 $330,000 Martin Marietta Materials 3.5% 15/12/2027 232 0.12 $500,000 Masco 3.5% 15/11/2027 351 0.19 $190,000 Mattamy 6.5% 01/10/2025 141 0.08
$45,000 Mattel 3.15% 15/03/2023 30 0.02 $40,000 Mattel 6.75% 31/12/2025 29 0.02
$1,000,000 MF Global 9% 20/06/2038 228 0.12 $150,000 MGM Growth Properties Operating Partnership 5.625% 01/05/2024 115 0.06 $165,000 MGM Resorts International 7.75% 15/03/2022 137 0.07 $325,000 Microchip Technology 3.922% 01/06/2021 248 0.13 $200,000 Minerva Luxembourg 6.5% 20/09/2026 140 0.07 $680,000 Morgan Stanley 3.772% 24/01/2029 498 0.27 $205,000 MPH Acquisition 7.125% 01/06/2024 160 0.09
$42,000 MSCI 5.375% 15/05/2027 32 0.02 $225,000 Nabors Industries 5.5% 15/01/2023 165 0.09 $315,000 Nationstar Capital 6.5% 01/07/2021 239 0.13 $250,000 Nationwide Building Society 4% 14/09/2026 177 0.09

Quilter Investors Bond 3 Fund
Portfolio statement (continued) as at 30 June 2018
Quilter Investors OEIC
83
Market Percentage of Value total net assets
Holding Investment £000 %
US Dollar Denominated Fixed Rate Corporate Bonds (continued) $185,000 Navistar International 6.625% 01/11/2025 145 0.08 $255,000 Neiman Marcus 8% 15/10/2021 128 0.07 $160,000 Netflix 4.875% 15/04/2028 116 0.06
$74,000 Netflix 5.875% 15/11/2028 57 0.03 $270,000 New Albertsons 7.45% 01/08/2029 165 0.09 $215,000 New Albertsons 8% 01/05/2031 134 0.07 $115,000 New Home 7.25% 01/04/2022 89 0.05 $200,000 Newcrest Finance Pty 5.75% 15/11/2041 159 0.08
$5,173,737 Newland International Properties 9.5% 03/07/2017*† - - $200,000 Nexa Resources 5.375% 04/05/2027 147 0.08
$30,000 NGPL PipeCo 4.875% 15/08/2027 23 0.01 $255,000 Nielsen Luxembourg 5% 01/02/2025 185 0.10 $650,000 Noble Energy 3.85% 15/01/2028 472 0.25 $243,000 Noble International 7.875% 01/02/2026 190 0.10
$80,000 Nokia 3.375% 12/06/2022 59 0.03 $80,000 Nokia 4.375% 12/06/2027 57 0.03
$2,348,807 Northland Resources 15% 15/07/2019* - - $2,110,623 Northland Resources 4% 15/10/2020 10 0.01
$200,000 Nostrum Oil & Gas Finance 8% 25/07/2022 145 0.08 $629,000 NOVA Chemicals 4.875% 01/06/2024 455 0.24
$80,000 Novelis 5.875% 30/09/2026 58 0.03 $154,000 Novelis 6.25% 15/08/2024 117 0.06 $281,000 NRG Energy 7.25% 15/05/2026 227 0.12 $130,000 NRG Yield Operating 5% 15/09/2026 95 0.05 $120,000 Nuance Communications 1.5% 01/11/2035 88 0.05 $310,000 Nuance Communications 5.625% 15/12/2026 231 0.12
$54,000 Nufarm Australia 5.75% 30/04/2026 40 0.02 $155,000 Nutanix 0% 15/01/2023 147 0.08 $210,000 Oasis Petroleum 2.625% 15/09/2023 208 0.11 $280,000 ON Semiconductor 1% 01/12/2020 280 0.15 $340,000 ONEOK 4% 13/07/2027 250 0.13 $150,000 Open Text 5.875% 01/06/2026 117 0.06 $370,000 Oracle 2.65% 15/07/2026 259 0.14 $980,909 OSX 3 Leasing 13% 20/03/2015† 187 0.10 $305,000 Outfront Media Capital 5.875% 15/03/2025 233 0.12 $200,000 Overseas Chinese Town Asia 4.3% Perpetual 146 0.08 $540,000 Owens Corning 4.3% 15/07/2047 340 0.18 $245,000 Owens-Brockway Glass Container 5.375% 15/01/2025 182 0.10 $425,000 Pampa Energia 7.5% 24/01/2027 290 0.15 $414,000 Park Aerospace 4.5% 15/03/2023 301 0.16 $287,000 Park Aerospace 5.25% 15/08/2022 217 0.12
$75,000 PBF Finance 7% 15/11/2023 59 0.03 $30,000 PBF Logistics Finance 6.875% 15/05/2023 23 0.01 $47,000 Peabody Energy 6% 31/03/2022 36 0.02 $65,000 PetSmart 5.875% 01/06/2025 38 0.02
$111,000 PetSmart 8.875% 01/06/2025 54 0.03 $98,000 PetSmart Inc 7.125% 15/03/2023 49 0.03
$279,000 Pilgrim's Pride 5.75% 15/03/2025 204 0.11 $201,000 PolyOne 5.25% 15/03/2023 155 0.08 $375,000 Powerwave Technologies 2.75% 15/07/2041 1 -
$3,900,000 Powerwave Technologies 3.875% 01/10/2027 7 - $380,000 PPL Capital Funding 3.1% 15/05/2026 270 0.14 $125,000 Prime Finance 9.25% 15/05/2023 102 0.05 $155,000 QEP Resources 5.625% 01/03/2026 113 0.06 $200,000 QNB Finansbank/Turkey 6.25% 30/04/2019 152 0.08
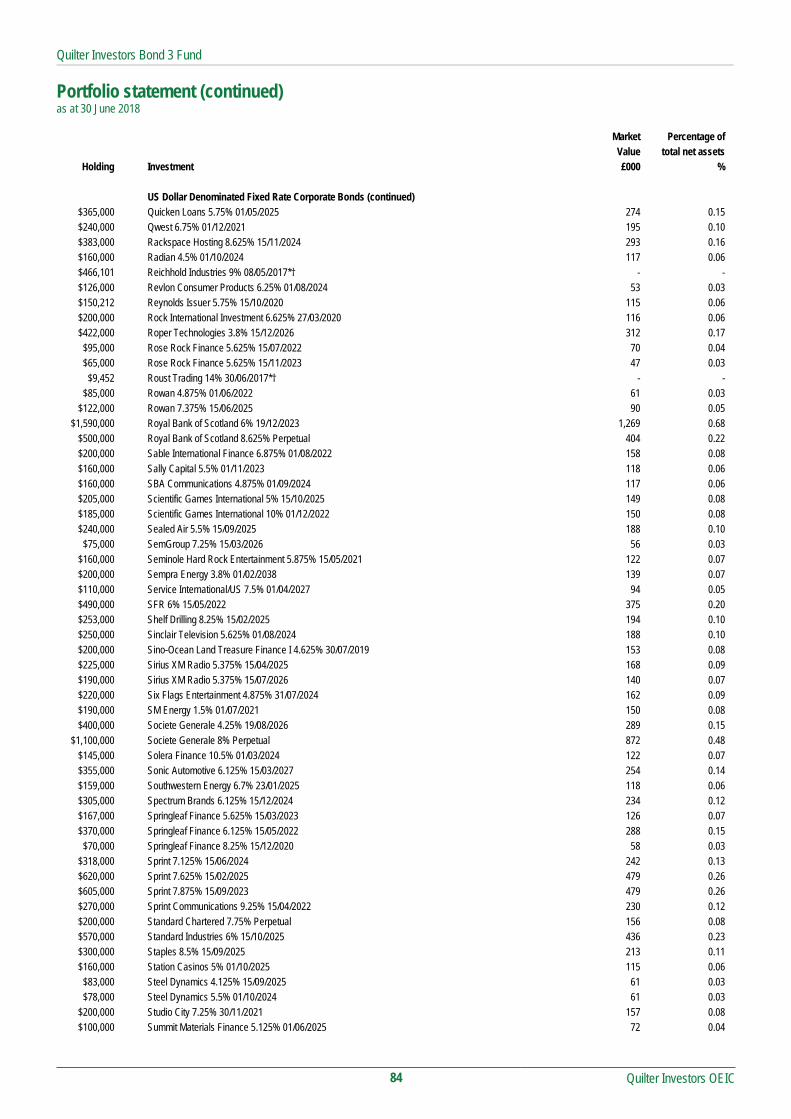
Quilter Investors Bond 3 Fund
Portfolio statement (continued) as at 30 June 2018
Quilter Investors OEIC
84
Market Percentage of Value total net assets
Holding Investment £000 %
US Dollar Denominated Fixed Rate Corporate Bonds (continued) $365,000 Quicken Loans 5.75% 01/05/2025 274 0.15 $240,000 Qwest 6.75% 01/12/2021 195 0.10 $383,000 Rackspace Hosting 8.625% 15/11/2024 293 0.16 $160,000 Radian 4.5% 01/10/2024 117 0.06 $466,101 Reichhold Industries 9% 08/05/2017*† - - $126,000 Revlon Consumer Products 6.25% 01/08/2024 53 0.03 $150,212 Reynolds Issuer 5.75% 15/10/2020 115 0.06 $200,000 Rock International Investment 6.625% 27/03/2020 116 0.06 $422,000 Roper Technologies 3.8% 15/12/2026 312 0.17
$95,000 Rose Rock Finance 5.625% 15/07/2022 70 0.04 $65,000 Rose Rock Finance 5.625% 15/11/2023 47 0.03
$9,452 Roust Trading 14% 30/06/2017*† - - $85,000 Rowan 4.875% 01/06/2022 61 0.03
$122,000 Rowan 7.375% 15/06/2025 90 0.05 $1,590,000 Royal Bank of Scotland 6% 19/12/2023 1,269 0.68
$500,000 Royal Bank of Scotland 8.625% Perpetual 404 0.22 $200,000 Sable International Finance 6.875% 01/08/2022 158 0.08 $160,000 Sally Capital 5.5% 01/11/2023 118 0.06 $160,000 SBA Communications 4.875% 01/09/2024 117 0.06 $205,000 Scientific Games International 5% 15/10/2025 149 0.08 $185,000 Scientific Games International 10% 01/12/2022 150 0.08 $240,000 Sealed Air 5.5% 15/09/2025 188 0.10
$75,000 SemGroup 7.25% 15/03/2026 56 0.03 $160,000 Seminole Hard Rock Entertainment 5.875% 15/05/2021 122 0.07 $200,000 Sempra Energy 3.8% 01/02/2038 139 0.07 $110,000 Service International/US 7.5% 01/04/2027 94 0.05 $490,000 SFR 6% 15/05/2022 375 0.20 $253,000 Shelf Drilling 8.25% 15/02/2025 194 0.10 $250,000 Sinclair Television 5.625% 01/08/2024 188 0.10 $200,000 Sino-Ocean Land Treasure Finance I 4.625% 30/07/2019 153 0.08 $225,000 Sirius XM Radio 5.375% 15/04/2025 168 0.09 $190,000 Sirius XM Radio 5.375% 15/07/2026 140 0.07 $220,000 Six Flags Entertainment 4.875% 31/07/2024 162 0.09 $190,000 SM Energy 1.5% 01/07/2021 150 0.08 $400,000 Societe Generale 4.25% 19/08/2026 289 0.15
$1,100,000 Societe Generale 8% Perpetual 872 0.48 $145,000 Solera Finance 10.5% 01/03/2024 122 0.07 $355,000 Sonic Automotive 6.125% 15/03/2027 254 0.14 $159,000 Southwestern Energy 6.7% 23/01/2025 118 0.06 $305,000 Spectrum Brands 6.125% 15/12/2024 234 0.12 $167,000 Springleaf Finance 5.625% 15/03/2023 126 0.07 $370,000 Springleaf Finance 6.125% 15/05/2022 288 0.15
$70,000 Springleaf Finance 8.25% 15/12/2020 58 0.03 $318,000 Sprint 7.125% 15/06/2024 242 0.13 $620,000 Sprint 7.625% 15/02/2025 479 0.26 $605,000 Sprint 7.875% 15/09/2023 479 0.26 $270,000 Sprint Communications 9.25% 15/04/2022 230 0.12 $200,000 Standard Chartered 7.75% Perpetual 156 0.08 $570,000 Standard Industries 6% 15/10/2025 436 0.23 $300,000 Staples 8.5% 15/09/2025 213 0.11 $160,000 Station Casinos 5% 01/10/2025 115 0.06
$83,000 Steel Dynamics 4.125% 15/09/2025 61 0.03 $78,000 Steel Dynamics 5.5% 01/10/2024 61 0.03
$200,000 Studio City 7.25% 30/11/2021 157 0.08 $100,000 Summit Materials Finance 5.125% 01/06/2025 72 0.04

Quilter Investors Bond 3 Fund
Portfolio statement (continued) as at 30 June 2018
Quilter Investors OEIC
85
Market Percentage of Value total net assets
Holding Investment £000 %
US Dollar Denominated Fixed Rate Corporate Bonds (continued) $300,000 Summit Materials Finance 6.125% 15/07/2023 232 0.12 $182,000 Summit Midstream Finance 5.5% 15/08/2022 136 0.07
$80,000 Sunoco Finance 4.875% 15/01/2023 59 0.03 $35,000 Sunoco Finance 5.5% 15/02/2026 25 0.01 $15,000 Sunoco Finance 5.875% 15/03/2028 11 0.01
$125,000 SUPERVALU 6.75% 01/06/2021 97 0.05 $314,000 SUPERVALU 7.75% 15/11/2022 245 0.13 $200,000 Suzano Trading 5.875% 23/01/2021 157 0.08 $200,000 Swedbank 5.5% Perpetual 152 0.08
$40,000 Tallgrass Energy Partners 5.5% 15/01/2028 30 0.02 $78,000 Tallgrass Energy Partners 5.5% 15/09/2024 60 0.03
$115,000 Targa Resources Partners Finance 4.25% 15/11/2023 84 0.05 $25,000 Targa Resources Partners Finance 5% 15/01/2028 18 0.01
$229,000 Targa Resources Partners Finance 5.125% 01/02/2025 172 0.09 $237,000 Team Health 6.375% 01/02/2025 154 0.08 $119,000 Teck Resources 4.75% 15/01/2022 90 0.05
$73,000 Teck Resources 6% 15/08/2040 54 0.03 $145,000 Teck Resources 6.125% 01/10/2035 112 0.06 $155,000 TEGNA 5.5% 15/09/2024 118 0.06 $305,000 Telecom Italia 5.303% 30/05/2024 226 0.12 $285,000 Telecom Italia Capital 6% 30/09/2034 206 0.11 $150,000 Telefonica Emisiones 5.213% 08/03/2047 110 0.06 $190,000 Tempur Sealy International 5.5% 15/06/2026 140 0.07 $587,000 Tenet Healthcare 4.5% 01/04/2021 443 0.24 $275,000 Tenet Healthcare 5.125% 01/05/2025 199 0.11 $605,000 Tenet Healthcare 6.75% 15/06/2023 457 0.24 $155,000 Tennant 5.625% 01/05/2025 117 0.06 $210,000 Teradyne 1.25% 15/12/2023 211 0.11 $149,000 Terex 5.625% 01/02/2025 113 0.06 $380,000 Terraform Global Operating 6.125% 01/03/2026 284 0.15 $225,000 TerraForm Power Operating 4.25% 31/01/2023 165 0.09 $410,000 Teva Pharmaceutical Finance Netherlands III 3.15% 01/10/2026 250 0.13 $200,000 Tewoo Finance No 3 4.625% 06/04/2020 145 0.08 $200,000 Theta Capital 7% 11/04/2022 123 0.07 $200,000 Times China 6.25% 23/01/2020 150 0.08 $620,000 T-Mobile USA 5.125% 15/04/2025 474 0.25 $119,000 T-Mobile USA 6.5% 15/01/2024 94 0.05 $260,000 Toll Brothers Finance 4.35% 15/02/2028 177 0.09 $200,000 Top Wise Excellence Enterprise 6% 16/03/2020 130 0.07 $275,000 TransCanada PipeLines 4.25% 15/05/2028 209 0.11 $315,000 TransDigm 6.375% 15/06/2026 237 0.13
$80,000 TransMontaigne Partners 6.125% 15/02/2026 61 0.03 $95,000 Transocean 6.8% 15/03/2038 60 0.03
$197,000 Transocean 7.5% 15/01/2026 152 0.08 $77,000 Transocean 9% 15/07/2023 63 0.03 $62,000 Transocean Guardian 5.875% 15/01/2024 47 0.03
$221,850 Transocean Proteus 6.25% 01/12/2024 171 0.09 $547,000 Trinseo Materials Finance 5.375% 01/09/2025 412 0.22
$77,000 Tronox 6.5% 15/04/2026 58 0.03 $155,000 Tronox Finance 5.75% 01/10/2025 114 0.06 $200,000 Turkiye Is Bankasi 5% 30/04/2020 146 0.08 $200,000 Turkiye Sise ve Cam Fabrikalari 4.25% 09/05/2020 148 0.08 $300,000 Tutor Perini 6.875% 01/05/2025 229 0.12 $700,000 UBS Funding Switzerland 2.65% 01/02/2022 513 0.27 $200,000 UBS Funding Switzerland 7.125% Perpetual 156 0.08

Quilter Investors Bond 3 Fund
Portfolio statement (continued) as at 30 June 2018
Quilter Investors OEIC
86
Market Percentage of Value total net assets
Holding Investment £000 %
US Dollar Denominated Fixed Rate Corporate Bonds (continued) $380,000 Ultra Resources 6.875% 15/04/2022 218 0.12 $118,000 Ultra Resources 7.125% 15/04/2025 63 0.03 $165,000 Union Andina de Cementos 5.875% 30/10/2021 129 0.07 $239,294 United Airlines 3.65% Asset Backed 04/07/2027 'B' 175 0.09 $250,000 United Airlines 3.65% Asset Backed 07/07/2026 'B' 183 0.10 $335,000 United Airlines 4.6% Asset Backed 01/03/2026 'B' 254 0.14 $266,000 United Continental 4.25% 01/10/2022 195 0.10 $190,000 United Continental 5% 01/02/2024 140 0.07 $985,000 United Rentals North America 4.625% 15/10/2025 717 0.38 $127,000 United States Steel 6.25% 15/03/2026 96 0.05
$78,000 United States Steel 6.875% 15/08/2025 60 0.03 $395,000 Univision Communications 5.125% 15/02/2025 280 0.15
$35,000 USA Compression Partners 6.875% 01/04/2026 28 0.02 $75,000 Valeant Pharmaceuticals 6.75% 15/08/2021 58 0.03
$327,000 Valeant Pharmaceuticals 7% 15/03/2024 260 0.14 $162,000 Valeant Pharmaceuticals 7.5% 15/07/2021 125 0.07 $540,000 Valeant Pharmaceuticals International 5.875% 15/05/2023 385 0.21 $195,000 Valeant Pharmaceuticals International 7.25% 15/07/2022 152 0.08
$52,000 Valeant Pharmaceuticals International 8.5% 31/01/2027 40 0.02 $250,000 Valeant Pharmaceuticals International 9% 15/12/2025 197 0.10 $195,000 Valvoline 4.375% 15/08/2025 139 0.07 $200,000 Vedanta Resources 6.375% 30/07/2022 144 0.08 $155,000 Venator Finance 5.75% 15/07/2025 113 0.06
$1,000,000 VEREIT Operating Partnership 4.6% 06/02/2024 761 0.41 $400,000 Verizon Communications 2.625% 15/08/2026 270 0.14 $522,000 Vertiv 9.25% 15/10/2024 392 0.21 $130,000 ViaSat 5.625% 15/09/2025 93 0.05 $255,908 VICI Properties 1 8% 15/10/2023 216 0.12 $215,000 Videotron 5.125% 15/04/2027 159 0.08 $400,000 Virgin Media Finance 5.25% 15/02/2022 291 0.16 $315,000 Virgin Media Secured Finance 5.25% 15/01/2026 223 0.12 $365,000 Vistra Energy 8.034% 02/02/2024 290 0.15 $330,000 Vocera Communications 1.5% 15/05/2023 283 0.15 $310,000 Vodafone 4.375% 30/05/2028 232 0.12 $158,000 Warner Media 2.95% 15/07/2026 108 0.06 $180,000 Wayfair 0.375% 01/09/2022 175 0.09
$84,000 Weatherford International 5.95% 15/04/2042 47 0.03 $3,000 Weatherford International 6.5% 01/08/2036 2 - $2,000 Weatherford International 6.75% 15/09/2040 1 - $6,000 Weatherford International 7% 15/03/2038 4 - $8,000 Weatherford International 7.75% 15/06/2021 6 -
$210,000 WellCare Health Plans 5.25% 01/04/2025 159 0.08 $175,000 Wells Fargo 4.4% 14/06/2046 121 0.06 $155,000 WESCO Distribution 5.375% 15/06/2024 116 0.06 $134,000 WESCO Distribution 5.375% 15/12/2021 104 0.06 $200,000 West China Cement 6.5% 11/09/2019 152 0.08 $160,000 Western Digital 4.75% 15/02/2026 118 0.06 $175,000 Western Gas Partners 4.5% 01/03/2028 128 0.07 $121,000 Whiting Petroleum 5.75% 15/03/2021 94 0.05
$82,000 Whiting Petroleum 6.625% 15/01/2026 64 0.03 $80,000 Williams 3.7% 15/01/2023 59 0.03
$163,000 Williams 4.55% 24/06/2024 124 0.07 $400,000 Williams Partners 4% 15/09/2025 298 0.16 $155,000 WMG Acquisition 5% 01/08/2023 117 0.06
$67,000 WMG Acquisition 5.5% 15/04/2026 51 0.03

Quilter Investors Bond 3 Fund
Portfolio statement (continued) as at 30 June 2018
Quilter Investors OEIC
87
Market Percentage of Value total net assets
Holding Investment £000 %
US Dollar Denominated Fixed Rate Corporate Bonds (continued) $48,000 WPX Energy 5.75% 01/06/2026 36 0.02
$400,000 WTT Investment/Hong Kong 5.5% 21/11/2022 289 0.15 $33,000 Wyndham Destinations 4.15% 01/04/2024 25 0.01 $34,000 Wyndham Destinations 4.5% 01/04/2027 25 0.01 $13,000 Wyndham Destinations 5.1% 01/10/2025 10 0.01 $71,000 Wyndham Hotels & Resorts 5.375% 15/04/2026 54 0.03
$120,000 XPO Logistics 6.125% 01/09/2023 94 0.05 $200,000 YPF 8.5% 23/03/2021 154 0.08
$4,250,000 Yuksel Insaat 9.5% 10/11/2015† 162 0.09 $160,000 Zayo Capital 5.75% 15/01/2027 120 0.06 $185,000 Zayo Capital 6.375% 15/05/2025 143 0.08 $250,000 Zillow 2% 01/12/2021 239 0.13
108,214 57.69
US Dollar Denominated Fixed Rate Government Bonds 0.17% (31 December 2017 1.93%) $200,000 Africa Finance 4.375% 29/04/2020 152 0.08 $200,000 Provincia de Buenos Aires/Argentina 9.95% 09/06/2021 158 0.09
310 0.17
US Dollar Denominated Variable Rate Corporate Bonds 3.31% (31 December 2017 0.89%) $28,000 Albertsons 6.08506% 15/01/2024 21 0.01
$385,000 Anheuser-Busch InBev Worldwide 3.05175% 12/01/2024 296 0.16 $516,015 Avangardco Investments Public 10% 29/10/2018 75 0.04 $310,000 Bank of America 3.02156% 21/07/2021 237 0.13 $370,000 Bank of America 3.13313% 05/02/2026 277 0.15 $920,000 Bank of America 5.875% Perpetual 684 0.36 $590,000 Barclays 3.71% 16/05/2024 445 0.24 $655,000 BMW US Capital 2.74903% 12/04/2021 500 0.27 $700,000 Capital One 3.50878% 30/01/2023 537 0.29 $300,000 Citigroup 3.39088% 08/12/2021 231 0.12 $645,000 Credit Suisse 3.869% 12/01/2029 460 0.25 $645,000 General Mills 2.89281% 16/04/2021 491 0.26 $130,000 Goldman Sachs 3.067% 27/12/2020 99 0.05 $333,000 Goldman Sachs 3.49063% 15/05/2026 250 0.13 $220,000 Goldman Sachs 3.91938% 29/11/2023 173 0.09 $249,000 HSBC 3.32563% 18/05/2024 189 0.10 $600,000 ING Groep 6.5% Perpetual 443 0.24 $200,000 Moon Wise Global 9% Perpetual 153 0.08 $300,000 Morgan Stanley 3.54% 20/01/2022 232 0.12 $530,000 Verizon Communications 3.33469% 16/03/2022 410 0.22
6,203 3.31
United States Equities 1.39% (31 December 2017 8.18%) 2,055 Avaya 30 0.02 2,637 Avaya Warrant 9 - 5,105 Dflt-Advanced Light* - -
103 Dflt-Advanced Light Warrant* - - 116 GMX Resources 2,301 1.23
64,969 Lumara Health 107 0.06 102,437 MLR Petroleum* - -
79,999 Saexploration 25 0.01 127 Saexploration Holdings 129 0.07
29,145 Saexploration Warrant 9 - 2,610 1.39

Quilter Investors Bond 3 Fund
Portfolio statement (continued) as at 30 June 2018
Quilter Investors OEIC
88
Market Percentage of Value total net assets
Holding Investment £000 %
US Dollar Denominated Derivatives (0.26)% (31 December 2017 0.00%)
US Dollar Denominated Forward Exchange Contracts 0.01% (31 December 2017 0.00%) $785,911 US Dollar v Sterling Forward Exchange Contract 13 0.01 $283,092 US Dollar v Sterling Forward Exchange Contract 3 - $390,374 US Dollar v Sterling Forward Exchange Contract 3 - $149,075 US Dollar v Sterling Forward Exchange Contract 2 - $220,951 US Dollar v Sterling Forward Exchange Contract 2 - $212,272 US Dollar v Sterling Forward Exchange Contract 1 -
$45,813 US Dollar v Sterling Forward Exchange Contract 1 - $90,477 US Dollar v Sterling Forward Exchange Contract 1 - $12,732 US Dollar v Sterling Forward Exchange Contract - - $16,260 US Dollar v Sterling Forward Exchange Contract - - $19,184 US Dollar v Sterling Forward Exchange Contract - -
$197,681 US Dollar v Sterling Forward Exchange Contract - - $2,531 US Dollar v Sterling Forward Exchange Contract - - $2,623 US Dollar v Sterling Forward Exchange Contract - -
$207,692 US Dollar v Sterling Forward Exchange Contract - - $21,989 US Dollar v Sterling Forward Exchange Contract - - $27,803 US Dollar v Sterling Forward Exchange Contract - - $28,262 US Dollar v Sterling Forward Exchange Contract - - $32,521 US Dollar v Sterling Forward Exchange Contract - - $45,962 US Dollar v Sterling Forward Exchange Contract - - $53,511 US Dollar v Sterling Forward Exchange Contract - - $59,339 US Dollar v Sterling Forward Exchange Contract - -
$9,919 US Dollar v Sterling Forward Exchange Contract - - 26 0.01
US Dollar Denominated Futures Contracts (0.05)% (31 December 2017 0.00%) (42) US 2 Year Treasury Note Futures September 2018 (2) -
(156) US 5 Year Treasury Note Futures September 2018 (67) (0.04) 42 US 10 Year Treasury Note Futures September 2018 33 0.02
(80) US 10 Year Ultra Bond Futures September 2018 (116) (0.06) 13 US Long Bond Futures September 2018 27 0.01 10 US Ultra Bond Futures September 2018 35 0.02
(90) (0.05)
US Dollar Denominated Options Contracts 0.05% (31 December 2017 0.00%) (18,900,000) Put CDX USD 5 Year Futures September 2018 Citi (104) (0.05)
18,900,000 Put CDX USD 5 Year Futures September 2018 Citi 196 0.10 92 0.05
US Dollar Credit Default Swap (0.27)% (31 December 2017 0.00%) $2,150,000 Buy Protection CDS Baxter 20/06/2023 Goldman Sachs (48) (0.03) $2,150,000 Buy Protection CDS Honeywell 20/06/2023 Goldman Sachs (48) (0.03) $2,150,000 Buy Protection CDS HP 20/06/2023 Goldman Sachs (33) (0.02) $2,150,000 Buy Protection CDS United Parcel Service 20/06/2023 Goldman Sachs (46) (0.02) $2,000,000 Buy Protection CDS Valero Energy 20/06/2023 Goldman Sachs (35) (0.02)
$10,600,000 Sell Protection CDS 1% CDX.NA.IG.30-IV 10years 20/6/2023 Citigroup (87) (0.04) $18,500,000 Sell Protection CDS 1% CDX.NA.IG.30-IV 10years 20/6/2023 Citigroup (206) (0.11)
(503) (0.27)

Quilter Investors Bond 3 Fund
Portfolio statement (continued) as at 30 June 2018
Quilter Investors OEIC
89
Market Percentage of Value total net assets
Holding Investment £000 %
South America 0.00% (31 December 2017 0.04%)
Brazil Equities 0.00% (31 December 2017 0.04%)
Collective Investment Scheme 3.08% (31 December 2017 0.00%) 47,127 JPMorgan Global High Yield Bond Fund - X Accumulation USD 5,775 3.08
5,775 3.08
Investment assets** 179,545 95.72
Net other assets 8,031 4.28
Total net assets 187,576 100.00 † Securities past maturity date. Consistent with investment strategy, Quilter Investors 3 holds investments in distressed debt securities. The Investment Adviser frequently assesses the value of these securities. * Market value less than £500. ** Including investment liabilities. All investments are approved securities being either officially listed in a member state or traded on or under the rules of an eligible securities market, unless otherwise stated.

Quilter Investors Bond 3 Fund
Quilter Investors OEIC
90
Statement of total return
for the period from 1 January 2018 to 30 June 2018 01.01.18 to 01.01.18 to 01.01.17 to 01.01.17 to
30.06.18 30.06.18 30.06.17 30.06.17
Note £'000 £'000 £'000 £'000
Income
Net capital losses (5,437) (1,849)
Revenue 3,254 3,372
Expenses (995) (682)
Interest payable and similar charges (3) (3)
Net revenue before taxation 2,256 2,687
Taxation (2) (3)
Net revenue after taxation 2,254 2,684
Total return before distributions (3,183) 835
Distributions 2 (3,248) (3,365)
Change in net assets attributable to
shareholders from investment activities (6,431) (2,530)
Statement of change in net assets attributable to shareholders for the period from 1 January 2018 to 30 June 2018 01.01.18 to 01.01.18 to 01.01.17 to 01.01.17 to
30.06.18 30.06.18 30.06.17 30.06.17
£'000 £'000 £'000 £'000
Opening net assets attributable to shareholders 97,037* 123,698
Amounts received on issue of shares 99,385 290
Amounts paid on cancellation of shares (3,047) (13,362)
96,338 (13,072)
Dilution adjustment 632 315
Change in net assets attributable to
shareholders from investment activities (6,431) (2,530)
Closing net assets attributable to shareholders 187,576 108,411*
* Section 3.30 of the SORP issued by the Investment Management Association in May 2014 requires comparative figures for the above statement. For interim financial
statements this will result in the closing comparative net assets not being equal to net assets at the start of the current period.

Quilter Investors Bond 3 Fund
Quilter Investors OEIC
91
Balance sheet
as at 30 June 2018 30.06.18 31.12.17
£'000 £'000
Assets
Fixed assets
Investments 182,330 77,051
Current assets
Debtors 3,029 1,222
Cash and bank balances 7,287 20,363
Total assets 192,646 98,636
Liabilities
Investment liabilities (2,785) (10)
Creditors
Distribution payable (2,044) (1,492)
Other creditors (241) (97)
Total liabilities (5,070) (1,599)
Net assets attributable to shareholders 187,576 97,037

Quilter Investors Bond 3 Fund
Notes to the financial statements for the period from 1 January 2018 to 30 June 2018
Quilter Investors OEIC
92
1 Accounting policies The financial statements have been prepared under the historical cost basis, as modified by the revaluation of investments, and in accordance with the Statement of Recommended Practice (SORP) for Authorised Funds, issued by the Investment Management Association in May 2014.
The accounting policies applied are consistent with those disclosed within the annual Financial Statements for the year ended 31 December 2017.
2 Distributions The distributions take account of revenue received on the issue of shares and revenue deducted on the cancellation of shares, and comprise:
01.01.18 to 01.01.17 to 30.06.18 30.06.17 £'000 £'000 First Interim – Income shares (31 March) 1,621 1,689 Second Interim – Income shares (30 June) 2,044 1,596 3,665 3,285 Revenue deducted on cancellation of shares 15 83 Revenue received on issue of shares (432) (3) Distributions 3,248 3,365
Reconciliation of distributions: Net revenue after taxation 2,254 2,684 Capitalised fees 995 681 Undistributed revenue carried forward (1) - Distributions 3,248 3,365

Quilter Investors Bond 3 Fund
Distribution table
Quilter Investors OEIC
93
Second Interim distribution Group 1: Shares purchased prior to 1 April 2018 Group 2: Shares purchased from 1 April 2018 to 30 June 2018
Revenue
pence per share Equalisation
pence per share*
Distribution paid 31.08.18
pence per share
Distribution paid 31.08.17
pence per share Income 'A' Shares Group 1 0.3480 - 0.3480 0.5219 Group 2 0.2614 0.0866 0.3480 0.5219
First Interim distribution Group 1: Shares purchased prior to 1 January 2018 Group 2: Shares purchased from 1 January 2018 to 31 March 2018
Revenue
pence per share Equalisation
pence per share*
Distribution paid 31.05.18
pence per share
Distribution paid 31.05.17
pence per share Income 'A' Shares Group 1 0.2872 - 0.2872 0.5527 Group 2 0.1386 0.1486 0.2872 0.5527 Income 'R' Shares† Group 1 - - - 0.5660 Group 2 - - - 0.5660 † Share class closed on 19 April 2017. * Equalisation only applies to shares purchased during the distribution period (Group 2 shares). It is the average amount of revenue included in the purchase price of all Group
2 shares and is refunded to holders of these shares as a return of capital. Being capital, it is not liable to income tax but must be deducted from the cost of shares for capital gains tax purposes.

Quilter Investors China Equity Fund
Quilter Investors China Equity Fund
Quilter Investors OEIC
94
Launch date 26 April 2013
IA Sector China/Greater China
Investment adviser Henderson Global Investors Limited
Net asset value £99,900,638
Objective
The sub-fund aims to achieve a combination of income and capital growth.
Policy
The sub-fund primarily invests, directly or indirectly, in shares of companies listed, located or that derive the majority of their economic activity from Hong Kong and China, even if listed elsewhere. The sub-fund may at times be concentrated in terms of the number of investments it holds.
The sub-fund may also invest in other transferable securities, collective investment schemes (including those managed or operated by the ACD), warrants, money market instruments, deposits and derivatives.
The sub-fund may use derivatives (i.e. financial contracts whose value is linked to the expected price movements of an underlying investment), with the aim of generating returns and reducing the overall costs and/or risks of the sub-fund.
The sub-fund is managed by an investment adviser selected by the ACD for their expected ability to manage the sub-fund according to the investment objective and policy. The ACD continuously monitors and may periodically make changes to this appointment.
Investment Manager’s review
Market Review
We started the year with 23 consecutive up days in the H-share index of Chinese shares listed in Hong Kong, and ended with Chinese equity markets falling precipitously in Hong Kong, Shanghai and Shenzhen in June. This fall proved worse for foreign investors as the Chinese yuan fell against the US dollar, perhaps finally succumbing to pressures that had previously hurt other emerging market currencies.
President Trump is taking a more antagonistic stance in his trade negotiations with China and the market does not like the uncertainty over the escalating tit-for-tat tariffs coming from Washington and Beijing. We do not know how this will end although we recognise that the US-China relationship is clearly more fractious than before as these two superpowers evolve economically and politically.
In the economy we see a range of mixed signals. They include financial distress in areas of the economy funded by off-balance sheet lending (wealth management product) channels and rising bond yields and spreads, alongside robust physical property markets and strong consumer confidence with upgrading tendencies across a range of items from noodles to liquor and shortages of heavy duty construction equipment.
Performance
In the six months to the end of June the sub-fund returned 1.94% compared to a rise of 0.51% in the benchmark MSCI Zhong Hua Index, generating outperformance of 1.43%. At the stock level, top contributors included many consumer driven businesses including domestic sportswear brand Li Ning, which staged a pleasing profit recovery after some challenging years; duty free shopping operator China International Travel Services; education company China Yuhua Education; and hypermarket operator and Alibaba investee Sun Art Retail. Investments in life insurer AIA Group and the Hong Kong Exchange also boosted returns. Detractors included Brilliance China Automotive that sold off as China relaxed joint venture rules for foreign players in the auto market. VIPshop fell as performance is yet to improve after being incorporated into the Tencent/JD.com ecosystem. In the internet space, shares in Netease fell and we sold our position on a stop-loss review.
We continued to reduce our financials weighting and by the end of June had totally sold our bank shares. We first bought back into the sector in April 2017 but have now sold as the sectors valuations have re-rated upwards and we have recently seen more signs of financial distress in areas of the economy relying on off-balance sheet lending that is being squeezed by the ongoing deleveraging efforts. We have been adding to our exposure to consumer sector companies such as noodle and beverage supplier Tingyi and have been adding back to automobile related companies whose shares look very good value. Shanghai and Shenzhen A-shares are now included in MSCI emerging market indices and we continue to build up our exposure to these markets through careful stock selection centred on the consumer.
Risk and Reward Profile
The calculated risk and reward category, as shown above, uses a method of calculation derived from EU rules. It is based on the rate at which the returns of the sub-fund have moved up and down in the past (i.e. volatility) and is not a guide to the future risk and reward category of the sub-fund. The category shown is not a target or guarantee and may shift over time. Even the lowest category 1 does not mean a risk-free investment. The seven-category scale is nonlinear, for example, 2 is not twice as risky as 1.
Sub-funds in category 6 have in the past shown relatively high volatility. With a sub-fund of category 6, you have a relatively high risk of losing money but your chance for gains is also relatively high.
Investment risk - there is no guarantee that the sub-fund will achieve its objective. A capital loss of some or all of the amount invested may occur.
Geographic concentration risk - a fall in the Chinese market may have a significant impact on the value of the sub-fund because it primarily invests in this market.
Emerging markets risk - less developed countries may face more political, economic or structural challenges than developed countries.
Stock Connect risk - the sub-fund may invest in China A-Shares through the China-Hong Kong Stock Connect (“Stock Connect”). Stock Connect is governed by regulations which are untested and subject to change. Trading limitations and restrictions on foreign ownership may constrain the sub-fund’s ability to pursue its investment strategy.
Concentration risk (number of investments) - the sub-fund may at times hold a smaller number of investments, and therefore a fall in the value of a single investment may have a greater impact on the sub-fund value than if it held a larger number of investments.
Liquidity risk - some investments may become hard to value or sell at a desired time and price. In extreme circumstances this may affect the sub-fund’s ability to meet redemption requests upon demand.
Currency risk (EUR share class) - the sub-fund is denominated in British Pounds but holds assets denominated in other currencies. This share class is denominated in Euro. The value of your shares may rise and fall as a result of exchange rate movements between these currencies.
Currency risk (GBP share class) - the sub-fund is denominated in British Pounds but holds assets denominated in other currencies. The value of your shares may rise and fall as a result of exchange rate movements between these currencies.
Currency risk (USD share class) - the sub-fund is denominated in British Pounds but holds assets denominated in other currencies. This share class is denominated in US Dollars. The value of your shares may rise and fall as a result of exchange rate movements between these currencies.
Derivative risk - the sub-fund may use derivatives to generate returns as well as to reduce costs and/or the overall risk of the sub-fund. Using derivatives can involve a higher level of risk. A small movement in the price of an underlying investment may result in a disproportionately large movement in the price of the derivative investment. Derivatives also involve counterparty risk where the institutions acting as counterparty to derivatives may not meet their contractual obligations.
Capital erosion risk - the sub-fund takes its charges from the income of the sub-fund in the first instance. The impact of sub-fund charges may be material on the value of any income you receive from your investment. There is potential for capital erosion if insufficient income is generated by the sub-fund to cover these charges. Capital erosion may have the effect of reducing the level of income generated.
For full details of the sub-fund's risks, please see the section in the prospectus headed "Risks".

Quilter Investors China Equity Fund
Quilter Investors OEIC
95
Performance Records Comparative Tables
1 January 2018 to 1 January 2017 to 1 January 2016 to Accumulation 'A' 30 June 2018 31 December 2017 31 December 2016 p/share p/share p/share
Change in net assets per share Opening net asset value per share 213.13 153.86 125.69
Return before operating charges* 5.15 62.52 30.54 Operating charges** (1.94) (3.25) (2.37)
Return after operating charges* 3.21 59.27 28.17
Distributions (0.49) (0.38) (0.40) Retained distributions 0.49 0.38 0.40
Closing net asset value per share 216.34 213.13 153.86
* after direct transaction costs of*** 0.48 0.87 0.59
Performance Return after charges 1.51% 38.52% 22.41%
Other information Closing net asset value (£) 53,206,198 56,200,860 47,375,654 Closing number of shares 24,594,248 26,368,952 30,790,560 Operating charges**** 1.78% 1.75% 1.75% Direct transaction costs*** 0.44% 0.47% 0.43%
Prices pence per share pence per share pence per share Highest share price 233.8 221.6 170.5 Lowest share price 202.4 153.6 104.3
1 January 2018 to 1 January 2017 to 1 January 2016 to Accumulation 'A' EUR† 30 June 2018 31 December 2017 31 December 2016 p/share p/share p/share Change in net assets per share
Opening net asset value per share 137.06 99.00 79.00
Return before operating charges* 3.32 40.22 21.29 Operating charges** (1.26) (2.16) (1.29)
Return after operating charges* 2.06 38.06 20.00
Distributions (0.32) (0.25) (0.51) Retained distributions 0.32 0.25 0.51
Closing net asset value per share 139.12 137.06 99.00
* after direct transaction costs of*** 0.31 0.56 0.31
Performance Return after charges 1.50% 38.44% 25.32%
Other information Closing net asset value (£) 33,956 33,454 24,163 Closing number of shares 24,408 24,408 24,408 Operating Charges**** 1.80% 1.80% 1.80% Direct transaction costs*** 0.44% 0.47% 0.43%
Prices cents per share cents per share cents per share Highest share price 171.3 160.7 122.2 Lowest share price 150.7 115.4 96.45
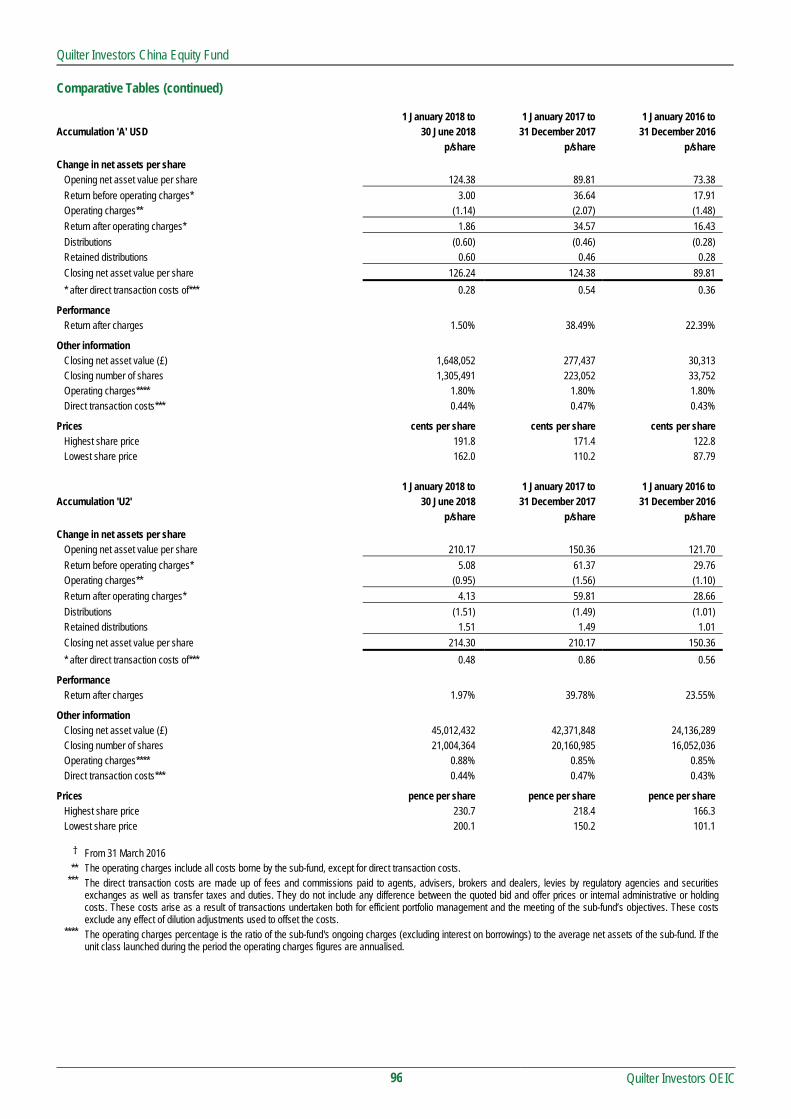
Quilter Investors China Equity Fund
Quilter Investors OEIC
96
Comparative Tables (continued) 1 January 2018 to 1 January 2017 to 1 January 2016 to Accumulation 'A' USD 30 June 2018 31 December 2017 31 December 2016 p/share p/share p/share
Change in net assets per share Opening net asset value per share 124.38 89.81 73.38
Return before operating charges* 3.00 36.64 17.91 Operating charges** (1.14) (2.07) (1.48)
Return after operating charges* 1.86 34.57 16.43
Distributions (0.60) (0.46) (0.28) Retained distributions 0.60 0.46 0.28
Closing net asset value per share 126.24 124.38 89.81
* after direct transaction costs of*** 0.28 0.54 0.36
Performance Return after charges 1.50% 38.49% 22.39%
Other information Closing net asset value (£) 1,648,052 277,437 30,313 Closing number of shares 1,305,491 223,052 33,752 Operating charges**** 1.80% 1.80% 1.80% Direct transaction costs*** 0.44% 0.47% 0.43%
Prices cents per share cents per share cents per share Highest share price 191.8 171.4 122.8 Lowest share price 162.0 110.2 87.79
1 January 2018 to 1 January 2017 to 1 January 2016 to Accumulation 'U2' 30 June 2018 31 December 2017 31 December 2016 p/share p/share p/share
Change in net assets per share Opening net asset value per share 210.17 150.36 121.70
Return before operating charges* 5.08 61.37 29.76 Operating charges** (0.95) (1.56) (1.10)
Return after operating charges* 4.13 59.81 28.66
Distributions (1.51) (1.49) (1.01) Retained distributions 1.51 1.49 1.01
Closing net asset value per share 214.30 210.17 150.36
* after direct transaction costs of*** 0.48 0.86 0.56
Performance Return after charges 1.97% 39.78% 23.55%
Other information Closing net asset value (£) 45,012,432 42,371,848 24,136,289 Closing number of shares 21,004,364 20,160,985 16,052,036 Operating charges**** 0.88% 0.85% 0.85% Direct transaction costs*** 0.44% 0.47% 0.43%
Prices pence per share pence per share pence per share Highest share price 230.7 218.4 166.3 Lowest share price 200.1 150.2 101.1
† From 31 March 2016 ** The operating charges include all costs borne by the sub-fund, except for direct transaction costs.
*** The direct transaction costs are made up of fees and commissions paid to agents, advisers, brokers and dealers, levies by regulatory agencies and securities exchanges as well as transfer taxes and duties. They do not include any difference between the quoted bid and offer prices or internal administrative or holding costs. These costs arise as a result of transactions undertaken both for efficient portfolio management and the meeting of the sub-fund’s objectives. These costs exclude any effect of dilution adjustments used to offset the costs.
**** The operating charges percentage is the ratio of the sub-fund's ongoing charges (excluding interest on borrowings) to the average net assets of the sub-fund. If the unit class launched during the period the operating charges figures are annualised.

Quilter Investors China Equity Fund
Quilter Investors OEIC
97
Performance
6 months to
30 June 2018
1 year to
30 June 2018
3 years to
30 June 2018
5 years to
30 June 2018
Quilter Investors China Equity Fund* 1.47% 19.03% 65.43% 131.27%
MSCI Zhong Hua Index (benchmark) 0.46% 16.08% 46.39% 97.81%
IA China/Greater China (sector average) 1.48% 17.40% 48.91% 102.72%
Quartile ranking 2 2 1 1
* Accumulation ‘U2’ shares
Data Source – Factset. Figures are calculated on a total return and single price basis, with net income reinvested into the sub-fund.
Portfolio allocation
Asia Pacific (excluding Japan) 95.15%
North America 3.83%
Net other assets 1.02%
Total 100.00%
Asset allocation
Equities 98.98%
Net other assets 1.02%
Total 100.00%
Major holdings Percentage of
portfolio
Alibaba ADR 9.12%
Tencent 8.76%
AIA 7.47%
Brilliance China Automotive 4.10%
Baidu ADR 3.89%
Kweichow Moutai 3.67%
China Petroleum & Chemical 3.34%
Midea 2.94%
Techtronic Industries 2.78%
CNOOC 2.68%
Number of holdings 42
Total Purchases and Sales for the period
2018 2017
£’000 £’000
Total purchases for the 6 month period to 30 June 79,858 59,136
Total sales for the 6 month period to 30 June 78,961 63,749

Quilter Investors China Equity Fund
Portfolio statement as at 30 June 2018
Quilter Investors OEIC
98
Market Percentage of Value total net assets
Holding Investment £’000 %
United Kingdom 0.00% (31 December 2017 3.00%) United Kingdom Equities 0.00% (31 December 2017 3.00%) Banks 0.00% (31 December 2017 3.00%) Overseas 98.98% (31 December 2017 94.71%) Asia Pacific (excluding Japan) 95.15% (31 December 2017 92.20%) China Equities 61.92% (31 December 2017 58.52%) Banks 0.00% (31 December 2017 13.00%) Beverages 3.67% (31 December 2017 0.00%)
43,638 Kweichow Moutai 3,668 3.67
3,668 3.67
Construction & Materials 2.17% (31 December 2017 0.00%)
562,926 Anhui Conch Cement 2,166 2.17
2,166 2.17
Electronic & Electrical Equipment 0.47% (31 December 2017 0.00%)
110,000 Hangzhou Hikvision Digital Technology 469 0.47
469 0.47
Financial Services 0.00% (31 December 2017 1.37%) Food Producers 4.93% (31 December 2017 0.00%)
706,100 Inner Mongolia Yili Industrial 2,264 2.26 1,512,000 Tingyi Cayman Islands 2,666 2.67
4,930 4.93
Gas, Water & Multiutilities 0.00% (31 December 2017 2.11%) General Retailers 13.36% (31 December 2017 10.03%)
43,688 58.com 2,246 2.25 63,581 Alibaba ADR 9,115 9.12
1,826,000 China Yuhua Education 988 0.99 121,000 Vipshop ADR 996 1.00
13,345 13.36
Household Goods & Home Construction 2.94% (31 December 2017 0.00%)
489,925 Midea 2,938 2.94
2,938 2.94
Industrial Engineering 1.23% (31 December 2017 0.00%)
1,175,000 Weichai Power 1,229 1.23
1,229 1.23
Industrial Metals & Mining 3.57% (31 December 2017 0.00%)
2,548,000 Angang Steel 1,737 1.74 2,046,300 Baoshan Iron & Steel 1,831 1.83
3,568 3.57

Quilter Investors China Equity Fund
Portfolio statement (continued) as at 30 June 2018
Quilter Investors OEIC
99
Market Percentage of Value total net assets
Holding Investment £’000 % Life Insurance 0.00% (31 December 2017 4.00%) Oil & Gas Producers 6.02% (31 December 2017 5.31%)
4,910,000 China Petroleum & Chemical 3,334 3.34 2,044,000 CNOOC 2,680 2.68
6,014 6.02
Oil Equipment, Services & Distribution 2.06% (31 December 2017 2.07%)
2,870,000 China Oilfield Services 2,057 2.06
2,057 2.06
Personal Goods 2.00% (31 December 2017 1.73%)
2,380,500 Li Ning 1,997 2.00
1,997 2.00
Pharmaceuticals & Biotechnology 1.06% (31 December 2017 0.00%)
190,500 Huadong Medicine 1,056 1.06
1,056 1.06
Real Estate Investment & Services 0.00% (31 December 2017 1.28%) Software & Computer Services 14.26% (31 December 2017 12.65%)
21,100 Baidu ADR 3,888 3.89 2,714,000 Chinasoft International 1,611 1.61
229,200 Tencent 8,750 8.76
14,249 14.26
Technology Hardware & Equipment 2.93% (31 December 2017 2.58%)
888,000 Focus Media Information Technology 975 0.98 800,000 Meitu 529 0.53
18,116 YY ADR 1,421 1.42
2,925 2.93
Travel & Leisure 1.25% (31 December 2017 2.39%)
544,902 China CYTS Tours 1,247 1.25
1,247 1.25
Hong Kong Equities 33.23% (31 December 2017 33.68%) Automobiles & Parts 4.10% (31 December 2017 1.85%)
2,990,000 Brilliance China Automotive 4,101 4.10
4,101 4.10
Financial Services 5.57% (31 December 2017 13.55%)
129,263 CICC Financial - China International Travel A (Warrants 30/03/2020) 958 0.96 100,627 CICC Financial - Shanghai International Airways A (Warrants 30/03/2020) 641 0.64 463,532 CICC Financial Trading 0% RVCV 10/02/2020 1,977 1.98
86,800 Hong Kong Exchanges and Clearing 1,985 1.99
5,561 5.57
Forestry & Paper 0.00% (31 December 2017 0.91%) Food Producers 1.99% (31 December 2017 0.00%)
3,216,000 WH 1,987 1.99
1,987 1.99

Quilter Investors China Equity Fund
Portfolio statement (continued) as at 30 June 2018
Quilter Investors OEIC
100
Market Percentage of Value total net assets
Holding Investment £’000 % General Industrials 0.97% (31 December 2017 0.00%)
120,000 Swire Pacific 'A' 967 0.97
967 0.97
General Retailers 4.27% (31 December 2017 2.06%)
2,012,600 Chow Tai Fook Jewellery 1,726 1.73 2,548,500 Sun Art Retail 2,536 2.54
4,262 4.27
Household Goods & Home Construction 2.78% (31 December 2017 0.00%)
655,500 Techtronic Industries 2,779 2.78
2,779 2.78
Industrial Transportation 1.43% (31 December 2017 0.00%)
6,873,000 Pacific Basin Shipping 1,427 1.43
1,427 1.43
Life Insurance 7.47% (31 December 2017 6.75%)
1,122,200 AIA 7,467 7.47
7,467 7.47
Mobile Telecommunications 0.00% (31 December 2017 2.39%) Personal Goods 2.08% (31 December 2017 0.00%)
7,430,000 Li & Fung 2,076 2.08
2,076 2.08
Real Estate Investment & Services 2.09% (31 December 2017 5.08%)
836,000 China Overseas Land & Investment 2,092 2.09
2,092 2.09
Travel & Leisure 0.48% (31 December 2017 1.09%)
206,000 IMAX China 478 0.48
478 0.48
North America 3.83% (31 December 2017 2.51%) United States Equities 3.83% (31 December 2017 2.51%) Automobiles & Parts 1.25% (31 December 2017 1.23%)
1,113,000 Nexteer Automotive 1,244 1.25
1,244 1.25
Household Goods & Home Construction 2.58% (31 December 2017 1.28%)
957,300 Samsonite International 2,581 2.58
2,581 2.58
Investment assets 98,880 98.98
Net other assets 1,021 1.02
Total net assets 99,901 100.00 All investments are approved securities being either officially listed in a member state or traded on or under the rules of an eligible securities market, unless otherwise stated.
All investments are in ordinary shares unless otherwise stated.

Quilter Investors China Equity Fund
Quilter Investors OEIC
101
Statement of total return
for the period from 1 January 2018 to 30 June 2018 01.01.18 to 01.01.18 to 01.01.17 to 01.01.17 to
30.06.18 30.06.18 30.06.17 30.06.17
Note £'000 £'000 £'000 £'000
Income
Net capital gains 1,400 13,823
Revenue 1,247 938
Expenses (705) (553)
Interest payable and similar charges (1) (2)
Net revenue before taxation 541 383
Taxation (82) (46)
Net revenue after taxation 459 337
Total return before distributions 1,859 14,160
Distributions 2 (459) (337)
Change in net assets attributable to
shareholders from investment activities 1,400 13,823
Statement of change in net assets attributable to shareholders for the period from 1 January 2018 to 30 June 2018 01.01.18 to 01.01.18 to 01.01.17 to 01.01.17 to
30.06.18 30.06.18 30.06.17 30.06.17
£'000 £'000 £'000 £'000
Opening net assets attributable to shareholders 98,884* 71,566
Amounts received on issue of shares 11,628 11,716
Amounts paid on cancellation of shares (12,461) (14,762)
(833) (3,046)
Dilution adjustment 5 37
Change in net assets attributable to
shareholders from investment activities 1,400 13,823
Retained distribution on accumulation shares 445 323
Closing net assets attributable to shareholders 99,901 82,703* * Section 3.30 of the SORP issued by the Investment Management Association in May 2014 requires comparative figures for the above statement. For interim financial
statements this will result in the closing comparative net assets not being equal to net assets at the start of the current period.

Quilter Investors China Equity Fund
Quilter Investors OEIC
102
Balance sheet
as at 30 June 2018
30.06.18 31.12.17
£'000 £’000
Assets
Fixed assets
Investments 98,880 96,617
Current assets
Debtors 1,264 219
Cash and bank balances 1,061 2,175
Total assets 101,205 99,011
Liabilities
Creditors
Bank overdrafts (328) -
Other creditors (976) (127)
Total liabilities (1,304) (127)
Net assets attributable to shareholders 99,901 98,884

Quilter Investors China Equity Fund
Notes to the financial statements for the period from 1 January 2018 to 30 June 2018
Quilter Investors OEIC
103
1 Accounting policies The financial statements have been prepared under the historical cost basis, as modified by the revaluation of investments, and in accordance with the Statement of Recommended Practice (SORP) for Authorised Funds, issued by the Investment Management Association in May 2014.
The accounting policies applied are consistent with those disclosed within the annual Financial Statements for the year ended 31 December 2017.
2 Distributions The distributions take account of revenue received on the issue of shares and revenue deducted on the cancellation of shares, and comprise:
01.01.18 to 01.01.17 to 30.06.18 30.06.17 £'000 £'000 Interim – Accumulation shares (30 June) 445 323 445 323 Revenue deducted on cancellation of shares 22 19 Revenue received on issue of shares (8) (5) Distributions 459 337

Quilter Investors China Equity Fund
Distribution table
Quilter Investors OEIC
104
Interim distribution Group 1: Shares purchased prior to 1 January 2018 Group 2: Shares purchased from 1 January 2018 to 30 June 2018
Revenue pence/cents
per share
Equalisation pence/cents
per share*
Distribution paid 31.08.18
pence/cents per share
Distribution paid 31.08.17
pence/cents per share Accumulation 'A' Shares Group 1 0.4900 - 0.4900 0.3828 Group 2 0.4873 0.0027 0.4900 0.3828 Accumulation 'A' EUR Shares Group 1 0.3618 - 0.3618 0.2819 Group 2 0.3618 0.0000 0.3618 0.2819 Accumulation 'A' USD Shares Group 1 0.7859 - 0.7859 0.6030 Group 2 0.7799 0.0060 0.7859 0.6030 Accumulation 'U2' Shares Group 1 1.5091 - 1.5091 1.2048 Group 2 1.2605 0.2486 1.5091 1.2048 * Equalisation only applies to shares purchased during the distribution period (Group 2 shares). It is the average amount of revenue included in the purchase price of all
Group 2 shares and is refunded to holders of these shares as a return of capital. Being capital, it is not liable to income tax but must be deducted from the cost of shares for capital gains tax purposes.

Quilter Investors Corporate Bond Fund
Quilter Investors Corporate Bond Fund
Quilter Investors OEIC
105
Launch date 21 June 2018
IA Sector Sterling Corporate
Investment adviser Old Mutual Global Investors (UK) Limited
Net asset value £148,895,403
Objective
The sub-fund aims to achieve a combination of income and capital growth.
Policy
The sub-fund primarily invests, directly or indirectly, in investment grade bonds issued by companies located anywhere in the world.
The sub-fund may also invest, directly or indirectly, in bonds issued by banks and governments located anywhere in the world.
The sub-fund may also invest in other transferable securities, collective investment schemes (including those managed or operated by the ACD) warrants, money market instruments, deposits, cash and derivatives.
The sub-fund may use derivatives and forward transactions for the purposes of meeting the investment objective or efficient portfolio management.
The sub-fund is managed by an investment adviser selected by the ACD for their expected ability to manage the sub-fund according to the investment objective and policy. The ACD continuously monitors and may periodically make changes to this appointment.
Investment Manager’s review
The sub-fund was launched on 21 June 2018.
The manager runs the sub-fund as a high-quality portfolio diversifier away from other asset classes that exhibit greater volatility, such as equities, whilst offering a steady income in excess of UK government bonds. The manager focuses on high-quality, resilient, investment grade companies, with active management of downside risk at the heart of the investment process.
The sub-fund’s current positioning is close to the benchmark in aggregate. While the sub-fund has marginally more credit spread than the benchmark, the duration (exposure to interest rate risk) of its corporate bond holdings is significantly shorter than the benchmark at 6.4 years. From a sector perspective, the sub-fund is overweight financials and technology, and underweight telecoms, utilities and healthcare.
Risk and Reward Profile
The calculated risk and reward category, as shown above, uses a method of calculation derived from EU rules. It is based on the rate at which the returns of the sub-fund have moved up and down in the past (i.e. volatility) and is not a guide to the future risk and reward category of the sub-fund. The category shown is not a target or guarantee and may shift over time. Even the lowest category 1 does not mean a risk-free investment. The seven-category scale is nonlinear, for example, 2 is not twice as risky as 1.
Sub-funds in category 3 have in the past shown moderately low volatility. With a sub-fund of category 3, you have a moderately low risk of losing money but your chance for gains is also moderately low.
Investment risk - there is no guarantee that the sub-fund will achieve its objective. A capital loss of some or all of the amount invested may occur.
Credit risk - the issuer of a bond or a similar investment within the sub-fund may not pay income or repay capital to the sub-fund when due. Bonds which are rated below investment grade are considered to have a higher risk exposure with respect to meeting their payment obligations. Interest rate risk - investments in bonds are affected by interest rates and inflation trends which may affect the value of the sub-fund. Liquidity risk - some investments may become hard to value or sell at a desired time and price. In extreme circumstances this may affect the sub-fund’s ability to meet redemption requests upon demand. Currency risk - the sub-fund is denominated in British Pounds but holds assets denominated in other currencies. The value of your shares may rise and fall as a result of exchange rate movements between these currencies. Derivative risk - the sub-fund may use derivatives to generate returns and/or to reduce costs and the overall risk of the sub-fund. Using derivatives can involve a higher level of risk. A small movement in the price of an underlying investment may result in a disproportionately large movement in the price of the derivative investment. Derivatives also involve counterparty risk where the institutions acting as counterparty to derivatives may not meet their contractual obligations. Capital erosion risk - the sub-fund takes its charges from the income of the sub-fund in the first instance. The impact of sub-fund charges may be material on the value of any income you receive from your investment. There is potential for capital erosion if insufficient income is generated by the sub-fund to cover the charges. Capital erosion may have the effect of reducing the level of income generated.
For a more detailed explanation of risks, please refer to the "Risks" section of the prospectus.

Quilter Investors Corporate Bond Fund
Quilter Investors OEIC
106
Performance Records Comparative Tables 21 June 2018 to Accumulation 'U2'† 30 June 2018 p/share
Change in net assets per share Opening net asset value per share 99.84
Return before operating charges* (0.38) Operating charges** (0.01)
Return after operating charges* (0.39)
Distributions (0.02) Retained distributions 0.02
Closing net asset value per share 99.45
* after direct transaction costs of*** -
Performance Return after charges (0.39)%
Other information Closing net asset value (£) 148,895,403 Closing number of shares 149,716,245 Operating charges**** 0.55% Direct transaction costs*** -
Prices pence per share Highest share price 100.10 Lowest share price 99.84
† From 21 June 2018 ** The operating charges include all costs borne by the sub-fund, except for direct transaction costs.
*** The direct transaction costs are made up of fees and commissions paid to agents, advisers, brokers and dealers, levies by regulatory agencies and securities exchanges as well as transfer taxes and duties. They do not include any difference between the quoted bid and offer prices or internal administrative or holding costs. These costs arise as a result of transactions undertaken both for efficient portfolio management and the meeting of the sub-fund’s objectives. These costs exclude any effect of dilution adjustments used to offset the costs.
**** The operating charges percentage is the ratio of the sub-fund's ongoing charges (excluding interest on borrowings) to the average net assets of the sub-fund. If the share class launched during the period the operating charges figures are annualised.

Quilter Investors Corporate Bond Fund
Quilter Investors OEIC
107
Performance As the sub-fund launched on 21 June 2018 there are no performance figures presented for the period under review.
Portfolio allocation
United Kingdom 53.01%
Europe 24.65%
North America 16.83%
Asia Pacific (excluding Japan) 1.08%
Japan 0.81%
United Kingdom derivatives 0.02%
Overseas derivatives (0.04)%
Net other assets 3.64%
Total 100.00%
Asset allocation
Sterling Denominated Debt Securities 74.18%
US Dollar Denominated Debt Securities 9.47%
Collective Investment Schemes 8.28%
Euro Denominated Debt Securities 4.45%
United Kingdom derivatives 0.02%
Overseas derivatives (0.04)%
Net other assets 3.64%
Total 100.00%
Major holdings Percentage of portfolio
Old Mutual Financials Contingent Capital Fund - F Income (USD) 6.46%
United Kingdom Gilt 1.5% 22/07/2047 4.97%
European Investment Bank 3.875% 08/06/2037 2.15%
Coventry Building Society 1.875% 24/10/2023 1.90%
Old Mutual Monthly Income High Yield Bond Fund Hedged-X Income 1.82%
Principality Building Society 2.375% 23/11/2023 1.35%
New York Life Global Funding 1.75% 15/12/2022 1.33%
DXC Technology 2.75% 15/01/2025 1.28%
Svenska Handelsbanken 1.625% 18/06/2022 1.18%
Vodafone 3.29031% 16/01/2024 1.12%
Number of holdings 144
Total Purchases and Sales for the period
2018
£’000
Total purchases for the period from 21 June to 30 June 144,254
Total sales for the period from 21 June to 30 June 350

Quilter Investors Corporate Bond Fund
Portfolio statement as at 30 June 2018
Quilter Investors OEIC
108
Market Percentage of Value total net assets
Holding Investment £’000 %
Sterling 74.19%
Sterling Denominated Fixed Rate Corporate Bonds 62.68% £701,000 A2Dominion Housing 3.5% 15/11/2028 715 0.48
£1,147,000 Admiral 5.5% 25/07/2024 1,254 0.84 £813,000 Affordable Housing Finance 2.893% 11/08/2043 929 0.62
£1,116,000 Anheuser-Busch 1.75% 07/03/2025 1,089 0.73 £956,000 Annington Funding 3.685% 12/07/2034 978 0.66 £797,000 Aroundtown 3% 16/10/2029 766 0.51 £478,000 AT&T 4.25% 01/06/2043 503 0.34 £129,000 AT&T 5.2% 18/11/2033 153 0.10 £470,000 Aviva 6.125% 14/11/2036 524 0.35 £956,000 Babcock 1.875% 05/10/2026 892 0.60 £637,000 Bank of America 2.3% 25/07/2025 627 0.42
£1,275,000 Barclays 3.25% 17/01/2033 1,163 0.78 £510,000 BASF 1.375% 21/06/2022 509 0.34 £414,000 BAT Capital 2.125% 15/08/2025 401 0.27
£1,036,000 Bazalgette Finance 2.375% 29/11/2027 1,014 0.68 £573,000 Becton Dickinson 3.02% 24/05/2025 580 0.39 £637,000 BG Energy Capital 5.125% 01/12/2025 773 0.52 £956,000 BP Capital Markets 1.177% 12/08/2023 929 0.62
£1,100,000 BP Capital Markets 2.274% 03/07/2026 1,101 0.74 £956,000 Brown-Forman 2.6% 07/07/2028 961 0.65 £701,000 Bunzl Finance 2.25% 11/06/2025 687 0.46 £510,000 BUPA Finance 2% 05/04/2024 504 0.34 £358,000 Centrica 4.375% 13/03/2029 406 0.27 £542,000 Centrica 5.25% 10/04/2075 566 0.38 £765,000 Chancellor Masters and Scholars of the University of Oxford 2.544% 08/12/2117 734 0.49 £637,000 Channel Link Enterprises Finance 3.043% 30/06/2050 634 0.43
£1,179,000 Close Brothers 4.25% 24/01/2027 1,229 0.83 £988,000 Commonwealth Bank of Australia 3% 04/09/2026 1,078 0.72 £478,000 Compass 2% 03/07/2029 461 0.31 £318,000 Compass 3.85% 26/06/2026 360 0.24
£2,869,000 Coventry Building Society 1.875% 24/10/2023 2,826 1.90 £605,000 CPUK Finance 3.588% 28/08/2025 638 0.43 £900,000 Daimler International Finance 1.5% 18/08/2021 897 0.60 £573,000 Digital Stout 3.3% 19/07/2029 576 0.39
£1,403,000 Dwr Cymru Financing 2.5% 31/03/2036 1,375 0.92 £1,913,000 DXC Technology 2.75% 15/01/2025 1,910 1.28
£600,000 E.ON International Finance 5.875% 30/10/2037 811 0.54 £950,000 East Japan Railway 4.5% 25/01/2036 1,212 0.81 £600,000 Electricite de France 5.5% 17/10/2041 753 0.51
£2,455,000 European Investment Bank 3.875% 08/06/2037 3,201 2.15 £589,000 Eversholt Funding 3.529% 07/08/2042 574 0.39 £800,000 Experian Finance 2.125% 27/09/2024 795 0.53 £573,000 Grainger 3.375% 24/04/2028 574 0.39 £786,186 Greene King Finance 4.0643% 15/03/2035 840 0.56
£1,144,511 Gwynt y Mor 2.778% 17/02/2034 1,170 0.79 £446,000 Hastings Finance 3% 24/05/2025 445 0.30 £558,000 Heathrow Funding 2.75% 09/08/2049 499 0.34 £317,559 Highbury Finance 7.017% 20/03/2023 369 0.25
£1,100,000 HSBC 2.175% 27/06/2023 1,094 0.73

Quilter Investors Corporate Bond Fund
Portfolio statement (continued) as at 30 June 2018
Quilter Investors OEIC
109
Market Percentage of Value total net assets
Holding Investment £’000 % Sterling Denominated Fixed Rate Corporate Bonds (continued)
£1,084,000 HSBC 2.256% 13/11/2026 1,040 0.70 £1,602,000 Income Contingent Student Loans 2.5% 24/07/2056 1,491 1.00
£350,000 Innogy Finance 6.125% 06/07/2039 491 0.33 £446,000 Just Group 3.5% 07/02/2025 432 0.29 £478,000 LafargeHolcim Sterling Finance 3% 12/05/2032 452 0.30 £510,000 Land Securities Capital Markets 1.974% 08/02/2024 512 0.34 £318,000 Land Securities Capital Markets 2.375% 29/03/2027 321 0.22 £605,000 Land Securities Capital Markets 2.399% 08/02/2029 610 0.41 £286,000 Land Securities Capital Markets 2.625% 22/09/2037 281 0.19 £956,000 Lloyds Bank 6% 08/02/2029 1,311 0.88 £956,000 London & Quadrant Housing Trust 2.625% 05/05/2026 970 0.65 £797,000 London & Quadrant Housing Trust 2.625% 28/02/2028 794 0.53 £637,000 Motability Operations 2.375% 14/03/2032 613 0.41 £542,000 Motability Operations 3.625% 10/03/2036 603 0.41 £318,000 National Grid Gas Finance 2.125% 22/09/2028 301 0.20
£1,275,000 National Grid Gas Finance 2.625% 22/09/2038 1,165 0.78 £956,000 Nationwide Building Society 3.25% 20/01/2028 1,007 0.68
£1,961,000 New York Life Global Funding 1.75% 15/12/2022 1,974 1.33 £494,000 NGG Finance 5.625% 18/06/2073 538 0.36 £956,000 Northumbrian Water Finance 2.375% 05/10/2027 930 0.62 £637,000 PGH Capital 4.125% 20/07/2022 652 0.44
£1,116,000 Places For People Treasury 2.875% 17/08/2026 1,096 0.74 £2,040,000 Principality Building Society 2.375% 23/11/2023 2,010 1.35 £1,403,000 Procter & Gamble 1.8% 03/05/2029 1,357 0.91
£924,000 Prologis 2.25% 30/06/2029 875 0.59 £573,000 Prudential 5% 20/07/2055 577 0.39 £478,000 Prudential 5.7% 19/12/2063 520 0.35
£1,132,000 Quilter 4.478% 28/02/2028 1,138 0.76 £892,000 RL Finance No. 2 6.125% 30/11/2043 986 0.66 £214,000 Saga 3.375% 12/05/2024 203 0.14 £637,000 Santander UK 10.0625% Perpetual 1,051 0.71 £892,000 Santander UK 5.25% 16/02/2029 1,159 0.78 £956,000 Scottish Widows 5.5% 16/06/2023 1,047 0.70
£1,195,000 Segro 2.875% 11/10/2037 1,151 0.77 £797,000 Skipton Building Society 1.75% 30/06/2022 785 0.53
£1,498,000 SpareBank 1 Boligkreditt AS 1.75% 18/12/2023 1,506 1.01 £892,000 SPD Finance UK 5.875% 17/07/2026 1,111 0.75
£1,307,000 Standard Life 5.5% 04/12/2042 1,442 0.97 £637,000 Student Finance 2.6663% 30/09/2024 634 0.43
£1,753,000 Svenska Handelsbanken 1.625% 18/06/2022 1,750 1.18 £1,100,000 Swedbank 1.625% 28/12/2022 1,094 0.73
£637,000 Telefonica Emisiones 5.375% 02/02/2026 744 0.50 £1,084,626 Telereal Secured Finance 4.01% 10/12/2031 1,157 0.78
£797,000 Telereal Securitisation 4.0902% 10/12/2033 834 0.56 £637,000 Time Warner Cable 5.75% 02/06/2031 722 0.49
£1,050,000 Total Capital International 1.75% 07/07/2025 1,042 0.70 £988,000 TP ICAP 5.25% 26/01/2024 1,012 0.68 £956,000 Transport for London 3.875% 23/07/2042 1,195 0.80 £956,000 UNITE USAF II 3.921% 30/06/2025 1,060 0.71 £478,000 University of Southampton 2.25% 11/04/2057 436 0.29 £478,000 Wellcome Trust 2.517% 07/02/2118 454 0.31 £956,000 Western Power Distribution 3.625% 06/11/2023 1,004 0.67

Quilter Investors Corporate Bond Fund
Portfolio statement (continued) as at 30 June 2018
Quilter Investors OEIC
110
Market Percentage of Value total net assets
Holding Investment £’000 % Sterling Denominated Fixed Rate Corporate Bonds (continued)
£1,068,000 Western Power Distribution South West 2.375% 16/05/2029 1,029 0.69 £542,000 Westfield America Management 2.625% 30/03/2029 533 0.36
£1,012,000 Yorkshire Building Society 3.5% 21/04/2026 1,059 0.71 Total 93,340 62.69
Sterling Denominated Variable Rate Corporate Bonds 5.77% £1,498,000 Bank of Montreal 1.06588% 16/04/2023 1,497 1.00
£830,354 Channel Link Enterprises Finance 1.35213% 30/12/2050 801 0.54 £700,000 Cooperatieve Rabobank 0.99925% 22/03/2021 700 0.47
£1,000,000 Landesbank Baden-Wuerttemberg 0.89344% 18/05/2021 1,000 0.67 £1,498,000 Royal Bank of Canada 0.89721% 08/06/2021 1,498 1.01 £1,594,000 Santander UK 1.00049% 13/04/2021 1,593 1.07 £1,498,000 Toronto-Dominion Bank 0.90283% 07/06/2021 1,499 1.01
Total 8,588 5.77
Sterling Denominated Fixed Rate Government Bonds 5.72% £797,000 Nederlandse Waterschapsbank 5.375% 07/06/2032 1,123 0.75
£7,789,810 United Kingdom Gilt 1.5% 22/07/2047 7,395 4.97 Total 8,518 5.72
Collective investment Schemes 8.28% 1,312,831 Old Mutual Financials Contingent Capital Fund - F Income (USD) 9,630 6.46
300,309 Old Mutual Monthly Income High Yield Bond Fund Hedged - X Income 2,708 1.82 12,338 8.28 Sterling Denominated Derivatives 0.02%
Sterling Denominated Forward Exchange Contracts 0.00% £352,852 Sterling v Euro Forward Exchange Contract (2) -
£6,506,326 Sterling v Euro Forward Exchange Contract (50) (0.03) £25,700,524 Sterling v US Dollar Forward Exchange Contract 51 0.03
£455,857 Sterling v US Dollar Forward Exchange Contract (3) - Total (4) -
Sterling Denominated Futures Contracts 0.02% 91 Long Gilt Futures September 2018 28 0.02
Total 28 0.02
Overseas 22.17%
Europe 12.73%
Euro Denominated Fixed Rate Corporate Bonds 4.45% €1,100,000 Aroundtown 2.125% Perpetual 882 0.59
€892,000 Barclays 2% 07/02/2028 755 0.51 €900,000 CaixaBank 2.25% 17/04/2030 750 0.50
€1,100,000 Hannover Rueck 1.125% 18/04/2028 956 0.64 €931,000 Innogy Finance 1.5% 31/07/2029 799 0.54
€3,650,000 Lehman Brothers 4.625% 14/03/2019 (Defaulted)* - - €1,147,000 Philip Morris International 1.875% 06/11/2037 926 0.62
€797,000 Royal Bank of Scotland 5.5% Perpetual 710 0.48 €600,000 Telefonica Europe 3% Perpetual 498 0.33 €400,000 Volkswagen International Finance 4.625% Perpetual 352 0.24
Total 6,628 4.45

Quilter Investors Corporate Bond Fund
Portfolio statement (continued) as at 30 June 2018
Quilter Investors OEIC
111
Market Percentage of
Value total net assets Holding Investment £’000 %
Euro Denominated Derivatives (0.01)%
Euro Denominated Futures Contracts (0.01)% (146) Euro-Bobl Futures September 2018 (9) (0.01)
Total (9) (0.01)
US Dollar 9.44%
US Dollar Denominated Fixed Rate Corporate Bonds 5.69% $797,000 21st Century Fox America 6.15% 01/03/2037 721 0.48
$1,498,000 Amazon.com 3.875% 22/08/2037 1,110 0.75 $2,136,000 Anglo American Capital 3.625% 11/09/2024 1,538 1.03 $1,514,000 BPCE 3.25% 11/01/2028 1,062 0.71 $1,977,000 Brighthouse Financial 3.7% 22/06/2027 1,337 0.90 $2,104,000 Citigroup 3.878% 24/01/2039 1,452 0.98
$605,000 Microsoft 3.45% 08/08/2036 440 0.30 $1,211,000 UBS Group Funding Switzerland 5% Perpetual 807 0.54
Total 8,467 5.69
US Dollar Denominated Variable Rate Corporate Bonds 3.78% $478,000 Caterpillar Financial Services 2.84% 15/05/2023 363 0.24
$2,008,000 Citigroup 3.57631% 01/07/2026 1,524 1.02 $1,275,000 HSBC 3.32563% 18/05/2024 967 0.65
$600,000 Royal Bank of Scotland 3.88506% 25/06/2024 456 0.31 $900,000 Royal Bank of Scotland 4.65438% Perpetual 661 0.44
$2,200,000 Vodafone 3.29031% 16/01/2024 1,668 1.12 Total 5,639 3.78
US Dollar Denominated Derivatives (0.03)%
US Dollar Denominated Forward Exchange Contracts 0.01% $2,994,738 US Dollar v Sterling Forward Exchange Contract 12 0.01
Total 12 0.01
US Dollar Denominated Futures Contracts (0.04)% (53) US 10 Year Treasury Note Futures September 2018 (22) (0.02) (82) US 5 Year Treasury Note Futures September 2018 (22) (0.01) (18) US Long Bond Futures September 2018 (22) (0.01)
Total (66) (0.04)
Investment assets** 143,479 96.36
Net other assets 5,416 3.64
Total net assets 148,895 100.00
* Market value less than £500.
** Including investment liabilities.
All investments are approved securities being either officially listed in a member state or traded on or under the rules of an eligible securities market, unless otherwise stated.

Quilter Investors Corporate Bond Fund
Quilter Investors OEIC
112
Statement of total return for the period from 21 June 2018 to 30 June 2018 21.06.18 to 21.06.18 to
30.06.18 30.06.18
Note £'000 £'000
Income
Net capital losses (605)
Revenue 44
Expenses (18)
Net revenue before taxation 26
Taxation -
Net revenue after taxation 26
Total return before distributions (579)
Distributions 2 (26)
Change in net assets attributable to
shareholders from investment activities (605)
Statement of change in net assets attributable to shareholders for the period from 21 June 2018 to 30 June 2018 21.06.18 to 21.06.18 to
30.06.18 30.06.18
£'000 £'000
Opening net assets attributable to shareholders -
Amounts transferred from Old Mutual Corporate Bond Fund 148,539
Amounts received on issue of shares 934
Amounts paid on cancellation of shares -
149,473
Dilution adjustment 1
Change in net assets attributable to
shareholders from investment activities (605)
Retained distribution on accumulation shares 26
Closing net assets attributable to shareholders 148,895

Quilter Investors Corporate Bond Fund
Quilter Investors OEIC
113
Balance sheet as at 30 June 2018 30.06.18
£'000
Assets
Fixed assets
Investments 143,609
Current assets
Debtors 1,844
Cash and bank balances 5,730
Total assets 151,183
Liabilities
Investment liabilities (130)
Creditors
Other creditors (2,158)
Total liabilities (2,288)
Net assets attributable to shareholders 148,895
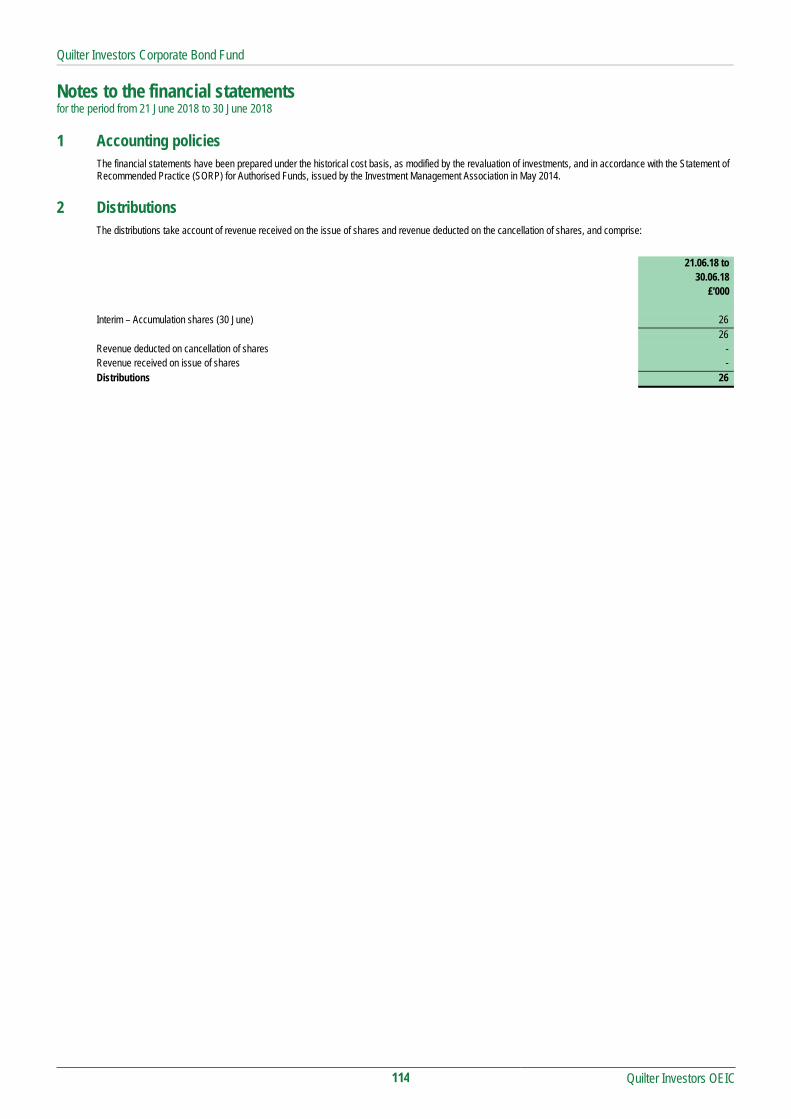
Quilter Investors Corporate Bond Fund
Notes to the financial statements for the period from 21 June 2018 to 30 June 2018
Quilter Investors OEIC
114
1 Accounting policies The financial statements have been prepared under the historical cost basis, as modified by the revaluation of investments, and in accordance with the Statement of Recommended Practice (SORP) for Authorised Funds, issued by the Investment Management Association in May 2014.
2 Distributions The distributions take account of revenue received on the issue of shares and revenue deducted on the cancellation of shares, and comprise:
21.06.18 to 30.06.18 £'000 Interim – Accumulation shares (30 June) 26 26 Revenue deducted on cancellation of shares - Revenue received on issue of shares - Distributions 26

Quilter Investors Corporate Bond Fund
Distribution table
Quilter Investors OEIC
115
Interim distribution Group 1: Shares purchased prior to 21 June 2018 Group 2: Shares purchased from 21 June 2018 to 30 June 2018
Net revenue
pence per share Equalisation
pence per share*
Distribution paid 31.08.18
pence per share Accumulation 'U2' Shares† Group 1 0.0173 - 0.0173 Group 2 0.0172 0.0001 0.0173 * Equalisation only applies to shares purchased during the distribution period (Group 2 shares). It is the average amount of revenue included in the purchase price of all
Group 2 shares and is refunded to holders of these shares as a return of capital. Being capital, it is not liable to income tax but must be deducted from the cost of shares for capital gains tax purposes.
† Fund Launched on 21 June 2018

Quilter Investors Diversified Bond Fund
Quilter Investors Diversified Bond Fund
Quilter Investors OEIC
116
Launch date 21 June 2018
IA Sector Sterling Strategic Bond
Investment adviser Old Mutual Global Investors (UK) Limited
Net asset value £103,764,067
Objective
The sub-fund aims to achieve a combination of income and capital growth.
Policy
The sub-fund primarily invests, directly or indirectly, in a diversified range of bonds with fixed and variable interest rates issued by companies, banks, public entities and governments located anywhere in the world.
The sub-fund may also invest in other transferable securities, collective investment schemes (including those managed or operated by the ACD) warrants, money market instruments, deposits, cash and derivatives.
The sub-fund may use derivatives and forward transactions for the purposes of meeting the investment objective or efficient portfolio management.
The sub-fund is managed by an investment adviser selected by the ACD for their expected ability to manage the sub-fund according to the investment objective and policy. The ACD continuously monitors and may periodically make changes to this appointment.
Investment Manager’s review
The sub-fund was launched on 21 June 2018.
The team manages the sub-fund by seeking a diversified range of investment-grade and high-yield bonds. In addition to bond exposure, the sub-fund is able to take positions in government bonds should the managers feel it is necessary.
The objective of the sub-fund is to provide a healthy monthly income while reducing volatility. The primary means with which the sub-fund does this is by buying good-quality, viable companies. The sensitivity of the sub-fund to interest rate risk, or duration, is kept low so as to allow the income return of the bonds to provide most of the total return. Duration is typically less than five years.
From a sector perspective, the sub-fund is overweight financial, oil, gas and technology credits against underweights in sovereigns, retailers and automotive manufacturers.
Risk and Reward Profile
The calculated risk and reward category, as shown above, uses a method of calculation derived from EU rules. It is based on the rate at which the returns of the sub-fund have moved up and down in the past (i.e. volatility) and is not a guide to the future risk and reward category of the sub-fund. The category shown is not a target or guarantee and may shift over time. Even the lowest category 1 does not mean a risk-free investment. The seven-category scale is nonlinear, for example, 2 is not twice as risky as 1.
Sub-funds in category 3 have in the past shown moderately low volatility. With a sub-fund of category 3, you have a moderately low risk of losing money but your chance for gains is also moderately low.
Investment risk - there is no guarantee that the sub-fund will achieve its objective. A capital loss of some or all of the amount invested may occur.
Credit risk - the issuer of a bond or a similar investment within the sub-fund may not pay income or repay capital to the sub-fund when due. Bonds which are rated below investment grade are considered to have a higher risk exposure with respect to meeting their payment obligations. Interest rate risk - investments in bonds are affected by interest rates and inflation trends which may affect the value of the sub-fund. Liquidity risk - some investments may become hard to value or sell at a desired time and price. In extreme circumstances this may affect the sub-fund’s ability to meet redemption requests upon demand. Currency risk - the sub-fund is denominated in British Pounds and may use techniques to try to reduce the effects of changes in the exchange rate between the currency of the underlying investments and the base currency of the sub-fund. These techniques may not eliminate all the currency risk. The value of your shares may rise and fall as a result of exchange rate movements. Derivative risk - the sub-fund may use derivatives to generate returns and/or to reduce costs and the overall risk of the sub-fund. Using derivatives can involve a higher level of risk. A small movement in the price of an underlying investment may result in a disproportionately large movement in the price of the derivative investment. Derivatives also involve counterparty risk where the institutions acting as counterparty to derivatives may not meet their contractual obligations. Capital erosion risk - the sub-fund takes its charges from the capital of the sub-fund. Investors should be aware that there is potential for capital erosion if insufficient capital growth is achieved by the sub-fund to cover the charges. Capital erosion may have the effect of reducing the level of income generated.
For a more detailed explanation of risks, please refer to the "Risks" section of the prospectus.

Quilter Investors Diversified Bond Fund
Quilter Investors OEIC
117
Performance Records Comparative Tables 21 June 2018 to Accumulation 'U2'† 30 June 2018 p/share
Change in net assets per share Opening net asset value per share 98.64
Return before operating charges* (0.73) Operating charges** (0.02)
Return after operating charges* (0.75)
Distributions (0.05) Retained distributions 0.05
Closing net asset value per share 97.89
* after direct transaction costs of*** -
Performance Return after charges (0.76)%
Other information Closing net asset value (£) 103,764,067 Closing number of shares 106,002,647 Operating charges**** 0.65% Direct transaction costs*** -
Prices pence per share Highest share price 99.07 Lowest share price 98.45
† From 21 June 2018 ** The operating charges include all costs borne by the sub-fund, except for direct transaction costs.
*** The direct transaction costs are made up of fees and commissions paid to agents, advisers, brokers and dealers, levies by regulatory agencies and securities exchanges as well as transfer taxes and duties. They do not include any difference between the quoted bid and offer prices or internal administrative or holding costs. These costs arise as a result of transactions undertaken both for efficient portfolio management and the meeting of the sub-fund’s objectives. These costs exclude any effect of dilution adjustments used to offset the costs.
**** The operating charges percentage is the ratio of the sub-fund's ongoing charges (excluding interest on borrowings) to the average net assets of the sub-fund. If the share class launched during the period the operating charges figures are annualised.

Quilter Investors Diversified Bond Fund
Quilter Investors OEIC
118
Performance As the sub-fund launched on 21 June 2018 there are no performance figures presented for the period under review.
Portfolio allocation
United Kingdom 36.84%
North America 31.08%
Europe 28.62%
Asia Pacific (excluding Japan) 0.13%
United Kingdom derivatives (0.09)%
Net other assets 3.42%
Total 100.00%
Asset allocation
US Dollar Denominated Debt Securities 37.56%
Sterling Denominated Debt Securities 27.01%
Euro Denominated Debt Securities 23.22%
Collective Investment Schemes 8.88%
United Kingdom derivatives (0.09)%
Net other assets 3.42%
Total 100.00%
Major holdings Percentage of
portfolio
Old Mutual Financials Contingent Capital Fund - F Income
(USD) 8.88%
Antero Resources 5% 01/03/2025 1.53%
Federal-Mogul LLC & Federal-Mogul Financing 5%
15/07/2024 1.52%
Virgin Media Receivables Financing Notes II 5.75%
15/04/2023 1.52%
US Treasury 1.5% 15/08/2026 1.42%
Vodafone 3.29031% 16/01/2024 1.14%
Premier Foods Finance 6.25% 15/10/2023 1.11%
Fairfax Financial 4.85% 17/04/2028 1.07%
Anglo American Capital 3.625% 11/09/2024 1.04%
American International 5.75% 01/04/2048 1.04%
Number of holdings 132
Total Purchases and Sales for the period
2018
£’000
Total purchases for the period from 21 June to 30 June 102,828
Total sales for the period from 21 June to 30 June 2,090

Quilter Investors Diversified Bond Fund
Portfolio statement as at 30 June 2018
Quilter Investors OEIC
119
Market Percentage of Value total net assets
Holding Investment £’000 %
Sterling 35.80%
Sterling Denominated Fixed Rate Corporate Bonds 25.97% £860,000 America Movil 6.375% 06/09/2073 908 0.87 £483,000 Annington Funding 2.646% 12/07/2025 481 0.46 £403,000 Aroundtown 3% 16/10/2029 387 0.37
£1,021,000 Arrow Global Finance 5.125% 15/09/2024 943 0.91 £610,000 Aviva 6.125% 14/11/2036 680 0.66 £376,000 BAT Capital 2.125% 15/08/2025 364 0.35 £671,000 Bazalgette Finance 2.375% 29/11/2027 657 0.63 £376,000 Becton Dickinson 3.02% 24/05/2025 381 0.37 £430,000 Bunzl Finance 2.25% 11/06/2025 422 0.41 £645,000 Centrica 5.25% 10/04/2075 674 0.65 £860,000 Close Brothers 4.25% 24/01/2027 896 0.86 £967,000 Coventry Building Society 6.375% Perpetual 985 0.95 £677,000 CPUK Finance 3.588% 28/08/2025 714 0.69 £268,000 Digital Stout Holding 2.75% 19/07/2024 270 0.26 £430,000 DS Smith 2.875% 26/07/2029 415 0.40
£1,021,000 DXC Technology 2.75% 15/01/2025 1,020 0.98 £600,000 Electricite de France 5.875% Perpetual 594 0.57 £600,000 Electricite de France 6% Perpetual 610 0.59 £698,000 Gazprom OAO Via Gaz Capital 4.25% 06/04/2024 711 0.68 £376,000 Grainger 3.375% 24/04/2028 376 0.36 £322,000 Hastings Finance 3% 24/05/2025 322 0.31 £671,000 Heathrow Finance 3.875% 01/03/2027 639 0.62 £800,000 HSBC 2.175% 27/06/2023 796 0.77
£1,115,000 Income Contingent Student Loans 2.5% 24/07/2056 1,038 1.00 £483,000 Just Group 3.5% 07/02/2025 468 0.45 £800,000 Metro Bank 5.5% 26/06/2028 773 0.75 £645,000 NGG Finance 5.625% 18/06/2073 702 0.68 £752,000 Pennon 2.875% Perpetual 751 0.72
£1,128,000 Premier Foods Finance 6.25% 15/10/2023 1,150 1.11 £779,000 Prudential 5.7% 19/12/2063 848 0.82 £940,000 Quilter 4.478% 28/02/2028 945 0.91 £510,000 RAC Bond 4.565% 06/05/2023 532 0.51 £430,000 Santander UK 10.0625% Perpetual 709 0.68 £967,000 Student Finance 2.6663% 30/09/2024 962 0.93 £683,885 Tesco Property Finance 4 5.8006% 13/10/2040 796 0.77 £698,000 TP ICAP 5.25% 26/01/2024 715 0.69
£1,558,000 Virgin Media Receivables Financing Notes II 5.75% 15/04/2023 1,580 1.52 £698,000 Western Power Distribution 3.625% 06/11/2023 733 0.71
26,947 25.97
Sterling Denominated Variable Rate Corporate Bonds 1.04% £1,075,000 Bank of Montreal 1.06588% 16/04/2023 1,074 1.04
1,074 1.04
Collective Investment Schemes 8.88%
1,255,990 Old Mutual Financials Contingent Capital Fund - F Income (USD) 9,213 8.88
9,213 8.88

Quilter Investors Diversified Bond Fund
Portfolio statement (continued) as at 30 June 2018
Quilter Investors OEIC
120
Market Percentage of Value total net assets
Holding Investment £’000 %
Sterling Denominated Derivatives (0.09)%
Sterling Denominated Forward Exchange Contracts (0.09)% £988,600 Sterling v Euro Forward Exchange Contract (5) - £881,631 Sterling v Euro Forward Exchange Contract (6) (0.01)
£22,882,194 Sterling v Euro Forward Exchange Contract (175) (0.17) £49,258,389 Sterling v US Dollar Forward Exchange Contract 98 0.09
£308,460 Sterling v US Dollar Forward Exchange Contract (2) -
(90) (0.09)
Overseas 60.78%
Europe 23.22%
Euro Denominated Fixed Rate Corporate Bonds 22.11% €1,100,000 ADLER Real Estate 3% 27/04/2026 949 0.91
€537,000 Akelius Residential Property 3.875% 05/10/2078 464 0.45 €806,000 American Tower 1.95% 22/05/2026 721 0.69 €800,000 Bankinter 8.625% Perpetual 798 0.77 €537,000 Cemex 2.75% 05/12/2024 460 0.44 €376,000 Colfax 3.25% 15/05/2025 334 0.32 €215,000 Constellium 4.25% 15/02/2026 185 0.18 €161,000 Crown European 2.875% 01/02/2026 135 0.13 €591,000 Darling Global Finance 3.625% 15/05/2026 523 0.50 €868,000 EC Finance 2.375% 15/11/2022 755 0.73
€1,182,000 Energo-Pro 4.5% 04/05/2024 1,002 0.97 €1,290,000 Equinix 2.875% 01/10/2025 1,076 1.04
€430,000 Europcar 4.125% 15/11/2024 372 0.36 €698,000 Fastighets AB Balder 3% 07/03/2078 591 0.57
€1,720,000 Federal-Mogul LLC & Federal-Mogul Financing 5% 15/07/2024 1,581 1.52 €600,000 Groupama 6.375% Perpetual 588 0.57 €900,000 Iliad 1.875% 25/04/2025 770 0.74
€1,075,000 INEOS 5.375% 01/08/2024 993 0.96 €645,000 Iron Mountain 3% 15/01/2025 565 0.54
€1,400,000 Lehman Brothers 4.625% 14/03/2019 (Defaulted)* - - €967,000 LKQ European 3.625% 01/04/2026 843 0.81
€1,075,000 Matterhorn Telecom 4% 15/11/2027 889 0.86 €682,000 Mylan 2.125% 23/05/2025 612 0.59 €483,000 NN 4.625% 13/01/2048 449 0.43 €376,000 OCI 5% 15/04/2023 339 0.33 €806,000 Orsted A/S 2.25% 24/11/3017 681 0.66 €376,000 ProGroup 3% 31/03/2026 324 0.31
€1,128,000 Royal Bank of Scotland 5.5% Perpetual 1,005 0.97 €900,000 Schmolz+Bickenbach Luxembourg Finance 5.625% 15/07/2022 804 0.78 €752,000 SES 4.625% Perpetual 686 0.66 €800,000 Smurfit Kappa Acquisitions 2.875% 15/01/2026 703 0.68 €752,000 Telecom Italia 2.375% 12/10/2027 626 0.60 €913,000 Telefonaktiebolaget LM Ericsson 1.875% 01/03/2024 791 0.76 €500,000 Telefonica Europe 3% Perpetual 415 0.40 €600,000 Volkswagen International Finance 4.625% Perpetual 528 0.51 €537,000 Wind Tre 3.125% 20/01/2025 384 0.37
22,941 22.11

Quilter Investors Diversified Bond Fund
Portfolio statement (continued) as at 30 June 2018
Quilter Investors OEIC
121
Market Percentage of Value total net assets
Holding Investment £’000 %
Euro Denominated Variable Rate Corporate Bonds 1.11% €671,000 Arrow Global Finance 3.75% 01/03/2026 571 0.55 €671,000 Novafives 4.5% 15/06/2025 581 0.56
1,152 1.11
US Dollar 37.56%
US Dollar Denominated Fixed Rate Corporate Bonds 31.69% $860,000 Adient Global 4.875% 15/08/2026 589 0.57 $728,000 AK Steel 6.375% 15/10/2025 513 0.49
$1,290,000 Altice Finco 7.625% 15/02/2025 895 0.86 $604,000 American Axle & Manufacturing 6.25% 01/04/2025 455 0.44
$1,451,000 American International 5.75% 01/04/2048 1,079 1.04 $1,505,000 Anglo American Capital 3.625% 11/09/2024 1,084 1.04 $2,096,000 Antero Resources 5% 01/03/2025 1,585 1.53 $1,182,000 Ardagh Packaging Finance 6% 15/02/2025 877 0.85 $1,075,000 Ardagh Packaging Finance 7.25% 15/05/2024 848 0.82 $1,500,000 AT Securities 5.25% Perpetual 1,043 1.01 $1,128,000 AT&T 3.4% 15/05/2025 806 0.78 $1,482,000 AT&T 4.3% 15/02/2030 1,060 1.02
$268,000 Beacon Escrow 4.875% 01/11/2025 188 0.18 $1,400,000 Charter Communications Operating 4.5% 01/02/2024 1,064 1.03
$591,000 DaVita 5.125% 15/07/2024 434 0.42 $967,000 Dell International 6.02% 15/06/2026 771 0.74
$1,075,000 Diamondback Energy 4.75% 01/11/2024 795 0.77 $744,000 Digital Realty Trust 3.7% 15/08/2027 538 0.52
$1,236,000 EDP Finance 3.625% 15/07/2024 900 0.87 $1,478,000 Fairfax Financial 4.85% 17/04/2028 1,110 1.07 $1,182,000 First Quantum Minerals 7.5% 01/04/2025 866 0.83 $1,128,000 HCA 5.25% 15/04/2025 864 0.83
$860,000 Inmarsat Finance 4.875% 15/05/2022 643 0.62 $913,000 Intesa Sanpaolo 5.017% 26/06/2024 628 0.61
$1,397,000 Ithaca Energy 8.125% 01/07/2019 1,054 1.02 $1,343,000 Lennar 4.75% 29/11/2027 958 0.92
$483,000 Levi Strauss 5% 01/05/2025 367 0.35 $1,128,000 LKQ 4.75% 15/05/2023 856 0.82
$752,000 Newfield Exploration 5.75% 30/01/2022 595 0.57 $591,000 NRG Energy 7.25% 15/05/2026 478 0.46
$1,290,000 NXP Funding LLC 4.125% 01/06/2021 982 0.95 $200,000 OBE Insurance 5.25% Perpetual 137 0.13 $860,000 Range Resources 5% 15/03/2023 636 0.61
$1,505,000 Rusal Capital 4.85% 01/02/2023* - - $1,075,000 Sky 3.75% 16/09/2024 812 0.78
$537,000 Starwood Property Trust 3.625% 01/02/2021 400 0.39 $188,000 Targa Resources Partners 5.875% 15/04/2026 144 0.14 $913,000 Telecom Italia 5.303% 30/05/2024 676 0.65 $268,000 Tencent 3.595% 19/01/2028 192 0.19 $430,000 Tenet Healthcare 6.75% 15/06/2023 325 0.31
$1,161,000 UBS 5.125% 15/05/2024 881 0.85 $1,021,000 United Rentals North America 4.625% 15/07/2023 777 0.75

Quilter Investors Diversified Bond Fund
Portfolio statement (continued) as at 30 June 2018
Quilter Investors OEIC
122
Market Percentage of Value total net assets
Holding Investment £’000 % US Dollar Denominated Fixed Rate Corporate Bonds (continued)
$1,075,000 Vale Overseas 6.25% 10/08/2026 886 0.85 $1,128,000 VTR Finance 6.875% 15/01/2024 Priv Placement 863 0.83
$591,000 Western Digital 4.75% 15/02/2026 437 0.42 $1,101,000 Ziggo Bond Finance 5.875% 15/01/2025 786 0.76
32,877 31.69
US Dollar Denominated Variable Rate Corporate Bonds 4.45% $241,000 Caterpillar Financial Services 2.84% 15/05/2023 183 0.18
$1,343,000 Citigroup 3.57631% 01/07/2026 1,019 0.98 $967,000 HSBC 3.32563% 18/05/2024 733 0.71 $322,000 Lloyds Bank 2.85313% 07/05/2021 245 0.23 $400,000 Royal Bank of Scotland 3.88506% 25/06/2024 304 0.29
$1,300,000 Royal Bank of Scotland 4.65438% Perpetual 955 0.92 $1,558,000 Vodafone 3.29031% 16/01/2024 1,181 1.14
4,620 4.45
US Dollar Denominated Fixed Rate Government Bonds 1.42% $2,150,000 US Treasury 1.5% 15/08/2026 1,477 1.42
1,477 1.42
US Dollar Denominated Derivatives 0.00%
US Dollar Denominated Forward Exchange Contracts 0.00% $496,092 US Dollar v Sterling Forward Exchange Contract 2 -
2 -
Investment assets** 100,213 96.58
Net other assets 3,551 3.42
Total net assets 103,764 100.00
* Market value less than £500.
** Including investment liabilities.
All investments are approved securities being either officially listed in a member state or traded on or under the rules of an eligible securities market, unless otherwise stated.

Quilter Investors Diversified Bond Fund
Quilter Investors OEIC
123
Statement of total return for the period from 21 June 2018 to 30 June 2018 21.06.18 to 21.06.18 to
30.06.18 30.06.18
Note £'000 £'000
Income
Net capital losses (843)
Revenue 54
Expenses (15)
Net revenue before taxation 39
Taxation -
Net revenue after taxation 39
Total return before distributions (804)
Distributions 2 (54)
Change in net assets attributable to
shareholders from investment activities (858)
Statement of change in net assets attributable to shareholders for the period from 21 June 2018 to 30 June 2018 21.06.18 to 21.06.18 to
30.06.18 30.06.18
£'000 £'000
Opening net assets attributable to shareholders -
Amounts transferred from Old Mutual Monthly Income Bond Fund 103,879
Amounts received on issue of shares 688
Amounts paid on cancellation of shares -
104,567
Dilution adjustment 1
Change in net assets attributable to
shareholders from investment activities (858)
Retained distribution on accumulation shares 54
Closing net assets attributable to shareholders 103,764

Quilter Investors Diversified Bond Fund
Quilter Investors OEIC
124
Balance sheet as at 30 June 2018 30.06.18
£'000
Assets
Fixed assets
Investments 100,401
Current assets
Debtors 1,853
Cash and bank balances 3,129
Total assets 105,383
Liabilities
Investment liabilities (188)
Creditors
Other creditors (1,431)
Total liabilities (1,619)
Net assets attributable to shareholders 103,764

Quilter Investors Diversified Bond Fund
Notes to the financial statements for the period from 21 June 2018 to 30 June 2018
Quilter Investors OEIC
125
1 Accounting policies The financial statements have been prepared under the historical cost basis, as modified by the revaluation of investments, and in accordance with the Statement of Recommended Practice (SORP) for Authorised Funds, issued by the Investment Management Association in May 2014.
2 Distributions The distributions take account of revenue received on the issue of shares and revenue deducted on the cancellation of shares, and comprise:
21.06.18 to 30.06.18 £'000 Interim – Accumulation shares (30 June) 54 54 Revenue deducted on cancellation of shares - Revenue received on issue of shares - Distributions 54
Reconciliation of distributions: Net revenue after taxation 39 Authorised Corporate Director’s capitalised fee rebates 15 Distributions 54

Quilter Investors Diversified Bond Fund
Distribution table
Quilter Investors OEIC
126
Interim distribution Group 1: Shares purchased prior to 21 June 2018 Group 2: Shares purchased from 21 June 2018 to 30 June 2018
Net revenue
pence per share Equalisation
pence per share*
Distribution paid 31.07.18
pence per share Accumulation 'U2' Shares† Group 1 0.0506 - 0.0506 Group 2 0.0506 0.0000 0.0506 * Equalisation only applies to shares purchased during the distribution period (Group 2 shares). It is the average amount of revenue included in the purchase price of all
Group 2 shares and is refunded to holders of these shares as a return of capital. Being capital, it is not liable to income tax but must be deducted from the cost of shares for capital gains tax purposes.
† Fund Launched on 21 June 2018

Quilter Investors Emerging Markets Bond Fund
Quilter Investors Emerging Markets Bond Fund
Quilter Investors OEIC
127
Launch date 21 June 2018
IA Sector Unclassified
Investment adviser Old Mutual Global Investors (UK) Limited
Net asset value £30,155,519
Objective
The sub-fund aims to achieve a combination of income and capital growth.
Policy
The sub-fund primarily invests, directly or indirectly, in local currency denominated bonds with fixed and variable interest rates issued by companies, banks, public entities and governments issued in emerging markets worldwide.
The sub-fund may also invest in other transferable securities, collective investment schemes (including those managed or operated by the ACD) warrants, money market instruments, deposits, cash and derivatives.
The sub-fund may use derivatives and forward transactions for the purposes of meeting the investment objective or efficient portfolio management.
The sub-fund is managed by an investment adviser selected by the ACD for their expected ability to manage the sub-fund according to the investment objective and policy. The ACD continuously monitors and may periodically make changes to this appointment.
Investment Manager’s review
The sub-fund was launched on 21 June 2018.
The manager runs the sub-funds using robust fundamental and quantitative analysis to take advantage of market inefficiencies in both rates and currencies. With a focus on diversification, the sub-fund invests in sovereign debt across Asia, Africa, the Middle East and Latin America. No countries are out of reach.
The sub-fund manager believes that the recent correction in emerging markets currencies should partly reverse in the months ahead, because the weakness is not in line with robust fundamentals. The manager favours oil exporting currencies like the Colombian peso as well as some currencies in central Europe. The manager also sees value in Indonesian debt, following the recent increase in interest rates.
Risk and Reward Profile
The calculated risk and reward category, as shown above, uses a method of calculation derived from EU rules. It is based on the rate at which the returns of the sub-fund have moved up and down in the past (i.e.volatility) and is not a guide to the future risk and reward category of the sub-fund. The category shown is not a target or guarantee and may shift over time. Even the lowest category 1 does not mean a risk-free investment. The seven-category scale is nonlinear, for example, 2 is not twice as risky as 1.
Sub-fund in category 5 have in the past shown moderately high volatility.With a sub-fund of category 5, you have a moderately high risk of losing money but your chance for gains is also moderately high.
Investment risk - there is no guarantee that the sub-fund will achieve its objective. A capital loss of some or all of the amount invested may occur.
Emerging markets risk - less developed countries may face more political, economic or structural challenges than developed countries.
Credit risk - the issuer of a bond or a similar investment within the sub-fund may not pay income or repay capital to the sub-fund when due.Bonds which are rated below investment grade are considered to have a higher risk exposure with respect to meeting their payment obligations.
Interest rate risk - investments in bonds are affected by interest rates and inflation trends which may affect the value of the sub-fund.
Liquidity risk - some investments may become hard to value or sell at a desired time and price. In extreme circumstances this may affect the sub-fund’s ability to meet redemption requests upon demand.
Currency risk - the sub-fund is denominated in US Dollars but holds assets denominated in other currencies. This share class is denominated in British Pounds. The value of your shares may rise and fall as a result of exchange rate movements between these currencies.
Derivative risk - the sub-fund may use derivatives to generate returns and/or to reduce costs and the overall risk of the sub-fund. Using derivatives can involve a higher level of risk. A small movement in the price of an underlying investment may result in a disproportionately large movement in the price of the derivative investment. Derivatives also involve counterparty risk where the institutions acting as counterparty to derivatives may not meet their contractual obligations.
Capital erosion risk - the sub-fund takes its charges from the capital of the sub-fund. Investors should be aware that there is potential for capital erosion if insufficient capital growth is achieved by the sub-fund to cover the charges. Capital erosion may have the effect of reducing the level of income generated.
For a more detailed explanation of risks, please refer to the "Risks" section of the prospectus.

Quilter Investors Emerging Markets Bond Fund
Quilter Investors OEIC
128
Performance Records Comparative Tables 21 June 2018 to Accumulation 'U2'† 30 June 2018 p/share
Change in net assets per share Opening net asset value per share 958.80
Return before operating charges* 5.77 Operating charges** (0.24)
Return after operating charges* 5.53
Distributions (0.87) Retained distributions 0.87
Closing net asset value per share 964.33
* after direct transaction costs of*** -
Performance Return after charges 0.58%
Other information Closing net asset value (£) 30,155,519 Closing number of shares 3,127,106 Operating charges**** 1.00% Direct transaction costs*** -
Prices pence per share Highest share price 968.0 Lowest share price 958.8
† From 21 June 2018 ** The operating charges include all costs borne by the sub-fund, except for direct transaction costs.
*** The direct transaction costs are made up of fees and commissions paid to agents, advisers, brokers and dealers, levies by regulatory agencies and securities exchanges as well as transfer taxes and duties. They do not include any difference between the quoted bid and offer prices or internal administrative or holding costs. These costs arise as a result of transactions undertaken both for efficient portfolio management and the meeting of the sub-fund’s objectives. These costs exclude any effect of dilution adjustments used to offset the costs.
**** The operating charges percentage is the ratio of the sub-fund's ongoing charges (excluding interest on borrowings) to the average net assets of the sub-fund. If the unit class launched during the period the operating charges figures are annualised.

Quilter Investors Emerging Markets Bond Fund
Quilter Investors OEIC
129
Performance As the sub-fund launched on 21 June 2018 there are no performance figures presented for the period under review.
Portfolio allocation
South America 26.25%
Europe 21.77%
Asia Pacific (excluding Japan) 16.43%
Africa 15.00%
North America 12.95%
Middle East 2.97%
Overseas Derivatives (0.01)%
Net other assets 4.64%
Total 100.00%
Asset allocation
Mexican Peso Denominated Debt Securities 11.50%
Brazilian Real Denominated Debt Securities 11.22%
Indonesia Rupiah Denominated Debt Securities 9.94%
Russian Ruble Denominated Debt Securities 9.09%
South African Rand Denominated Debt Securities 9.02%
Colombian Peso Denominated Debt Securities 8.76%
Turkish Lira Denominated Debt Securities 6.42%
Malaysian Ringgit Denominated Debt Securities 6.11%
Egyptian Pound Denominated Debt Securities 2.97%
Nigerian Naira Denominated Debt Securities 2.94%
Argentine Peso Denominated Debt Securities 2.63%
Peruvian Sol Denominated Debt Securities 2.41%
Polish Zloty Denominated Debt Securities 2.23%
Ghanaian Cedi Denominated Debt Securities 2.02%
Serbian Dinar Denominated Debt Securities 1.68%
Indian Rupee Denominated Debt Securities 1.47%
Ukrainian hryvnia Denominated Debt Securities 1.42%
Zambian Kwacha Denominated Debt Securities 1.02%
Uruguayan Peso Denominated Debt Securities 0.73%
Chilean Peso Denominated Debt Securities 0.50%
Thai Baht Denominated Debt Securities 0.38%
Romanian Leu Denominated Debt Securities 0.37%
Dominican Peso Denominated Debt Securities 0.36%
Hungarian Forint Denominated Debt Securities 0.18%
Overseas Derivatives (0.01)%
Net other assets 4.64%
Total 100.00%
Major holdings Percentage of
portfolio
Brazil Notas do Tesouro Nacional Serie F 10% 01/01/2023 2.67%
Turkey Government Bond 10.7% 17/02/2021 2.45%
Mexican Bonos 6.5% 09/06/2022 2.25%
Malaysia Government Bond 3.795% 30/09/2022 2.15%
Russian Federation 7.1% 16/10/2024 2.14%
Republic of South Africa Government Bond 10.5% 21/12/2026 2.03%
Republic of Columbia 10% 24/07/2024 1.93%
Turkey Government Bond 11% 02/03/2022 1.84%
Republic of Columbia 7.5% 26/08/2026 1.81%
Brazil Notas do Tesouro Nacional Serie F 10% 01/01/2021 1.72%
Number of holdings 126
Total Purchases and Sales for the period
2018
£’000
Total purchases for the period from 21 June to 30 June 29,115
Total sales for the period from 21 June to 30 June 434
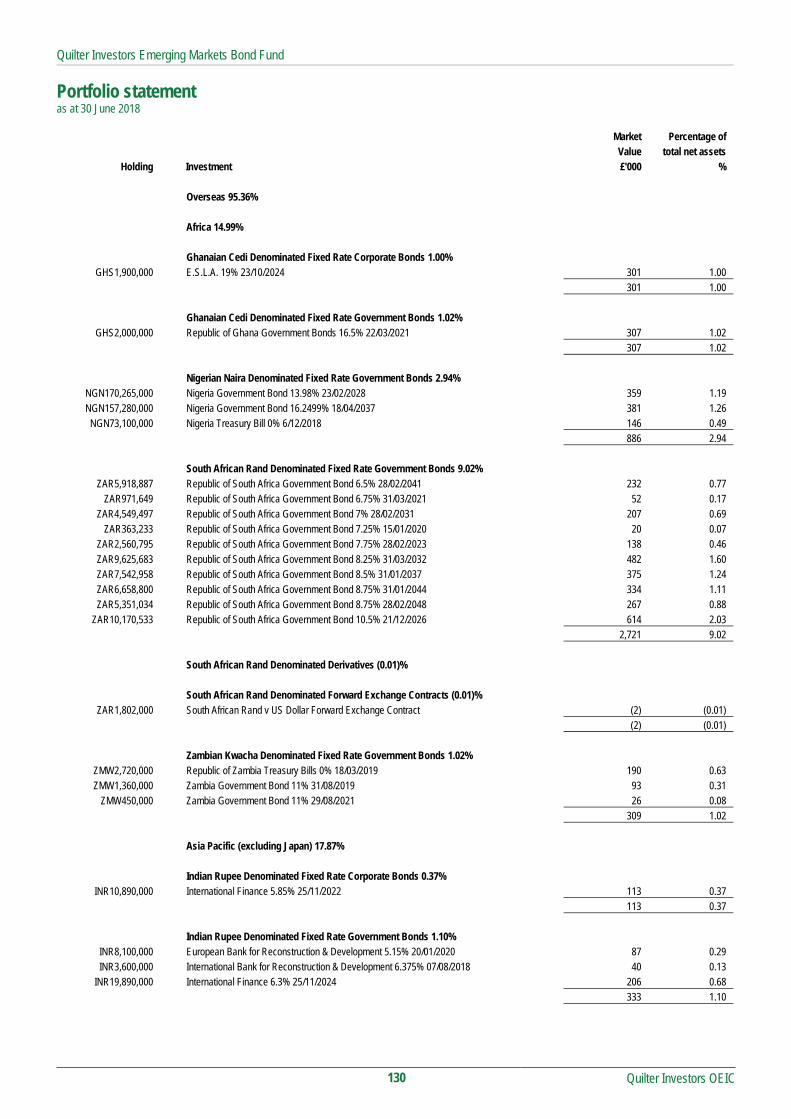
Quilter Investors Emerging Markets Bond Fund
Portfolio statement as at 30 June 2018
Quilter Investors OEIC
130
Market Percentage of Value total net assets
Holding Investment £'000 % Overseas 95.36% Africa 14.99% Ghanaian Cedi Denominated Fixed Rate Corporate Bonds 1.00%
GHS1,900,000 E.S.L.A. 19% 23/10/2024 301 1.00 301 1.00 Ghanaian Cedi Denominated Fixed Rate Government Bonds 1.02%
GHS2,000,000 Republic of Ghana Government Bonds 16.5% 22/03/2021 307 1.02 307 1.02 Nigerian Naira Denominated Fixed Rate Government Bonds 2.94%
NGN170,265,000 Nigeria Government Bond 13.98% 23/02/2028 359 1.19 NGN157,280,000 Nigeria Government Bond 16.2499% 18/04/2037 381 1.26
NGN73,100,000 Nigeria Treasury Bill 0% 6/12/2018 146 0.49 886 2.94 South African Rand Denominated Fixed Rate Government Bonds 9.02%
ZAR5,918,887 Republic of South Africa Government Bond 6.5% 28/02/2041 232 0.77 ZAR971,649 Republic of South Africa Government Bond 6.75% 31/03/2021 52 0.17
ZAR4,549,497 Republic of South Africa Government Bond 7% 28/02/2031 207 0.69 ZAR363,233 Republic of South Africa Government Bond 7.25% 15/01/2020 20 0.07
ZAR2,560,795 Republic of South Africa Government Bond 7.75% 28/02/2023 138 0.46 ZAR9,625,683 Republic of South Africa Government Bond 8.25% 31/03/2032 482 1.60 ZAR7,542,958 Republic of South Africa Government Bond 8.5% 31/01/2037 375 1.24 ZAR6,658,800 Republic of South Africa Government Bond 8.75% 31/01/2044 334 1.11 ZAR5,351,034 Republic of South Africa Government Bond 8.75% 28/02/2048 267 0.88
ZAR10,170,533 Republic of South Africa Government Bond 10.5% 21/12/2026 614 2.03 2,721 9.02 South African Rand Denominated Derivatives (0.01)% South African Rand Denominated Forward Exchange Contracts (0.01)%
ZAR1,802,000 South African Rand v US Dollar Forward Exchange Contract (2) (0.01) (2) (0.01) Zambian Kwacha Denominated Fixed Rate Government Bonds 1.02%
ZMW2,720,000 Republic of Zambia Treasury Bills 0% 18/03/2019 190 0.63 ZMW1,360,000 Zambia Government Bond 11% 31/08/2019 93 0.31
ZMW450,000 Zambia Government Bond 11% 29/08/2021 26 0.08 309 1.02 Asia Pacific (excluding Japan) 17.87% Indian Rupee Denominated Fixed Rate Corporate Bonds 0.37%
INR10,890,000 International Finance 5.85% 25/11/2022 113 0.37 113 0.37 Indian Rupee Denominated Fixed Rate Government Bonds 1.10%
INR8,100,000 European Bank for Reconstruction & Development 5.15% 20/01/2020 87 0.29 INR3,600,000 International Bank for Reconstruction & Development 6.375% 07/08/2018 40 0.13
INR19,890,000 International Finance 6.3% 25/11/2024 206 0.68 333 1.10

Quilter Investors Emerging Markets Bond Fund
Portfolio statement (continued) as at 30 June 2018
Quilter Investors OEIC
131
Market Percentage of Value total net assets
Holding Investment £'000 % Indonesia Rupiah Denominated Fixed Rate Government Bonds 9.94%
IDR3,800,000,000 Indonesia Treasury Bond 5.625% 15/05/2023 186 0.62 IDR5,400,000,000 Indonesia Treasury Bond 6.125% 15/05/2028 254 0.84 IDR7,000,000,000 Indonesia Treasury Bond 7% 15/05/2022 363 1.20 IDR1,000,000,000 Indonesia Treasury Bond 7.5% 15/05/2038 50 0.17 IDR3,400,000,000 Indonesia Treasury Bond 8.25% 15/05/2036 178 0.59 IDR5,700,000,000 Indonesia Treasury Bond 8.375% 15/03/2024 307 1.02 IDR8,600,000,000 Indonesia Treasury Bond 8.375% 15/09/2026 467 1.55 IDR3,800,000,000 Indonesia Treasury Bond 8.375% 15/03/2034 201 0.67 IDR7,000,000,000 Indonesia Treasury Bond 8.75% 15/05/2031 386 1.28 IDR8,000,000,000 Indonesia Treasury Bond 9% 15/03/2029 450 1.49 IDR2,500,000,000 Indonesia Treasury Bond 10.5% 15/08/2030 154 0.51
2,996 9.94 Malaysian Ringgit Denominated Fixed Rate Government Bonds 6.11%
MYR978,000 Malaysia Government Bond 3.48% 15/03/2023 180 0.60 MYR317,000 Malaysia Government Bond 3.759% 15/03/2019 60 0.20
MYR3,450,000 Malaysia Government Bond 3.795% 30/09/2022 648 2.15 MYR572,000 Malaysia Government Bond 3.844% 15/04/2033 98 0.32 MYR799,000 Malaysia Government Bond 3.899% 16/11/2027 145 0.48
MYR1,570,000 Malaysia Government Bond 4.059% 30/09/2024 294 0.97 MYR935,000 Malaysia Government Bond 4.392% 15/04/2026 177 0.59
MYR1,284,000 Malaysia Government Investment Issue 3.743% 26/08/2021 241 0.80 1,843 6.11 South Korean Won Denominated Forward Exchange Contracts 0.00%
KRW277,000,000 South Korean Won v US Dollar Forward Exchange Contract - - - - Thai Baht Denominated Fixed Rate Government Bonds 0.38%
THB2,270,000 Thailand Government Bond 3.4% 17/06/2036 53 0.17 THB2,306,000 Thailand Government Bond 4.875% 22/06/2029 63 0.21
116 0.38 Thai Baht Denominated Derivatives (0.03)% Thai Baht Denominated Forward Exchange Contracts (0.04)%
THB97,488,149 Thai Baht v US Dollar Forward Exchange Contract (12) (0.04) (12) (0.04) Thai Baht Interest Rate Swap 0.01%
THB43,000,000 Interest Rate Swap - Pay THB 6M Fixed, Receive 2.56% 25/6/2028 Merrill Lynch 4 0.01 4 0.01 Europe 21.34% Czech Koruna Denominated Derivatives (0.02)% Czech Koruna Denominated Forward Exchange Contracts (0.02)%
CZK46,741,628 Czech Koruna v US Dollar Forward Exchange Contract (6) (0.02) (6) (0.02) Hungarian Forint Denominated Fixed Rate Government Bonds 0.18%
HUF21,430,000 Hungary Government Bond 3% 27/10/2027 55 0.18 HUF120,000 Hungary Government Bond 7.5% 12/11/2020* - -
55 0.18
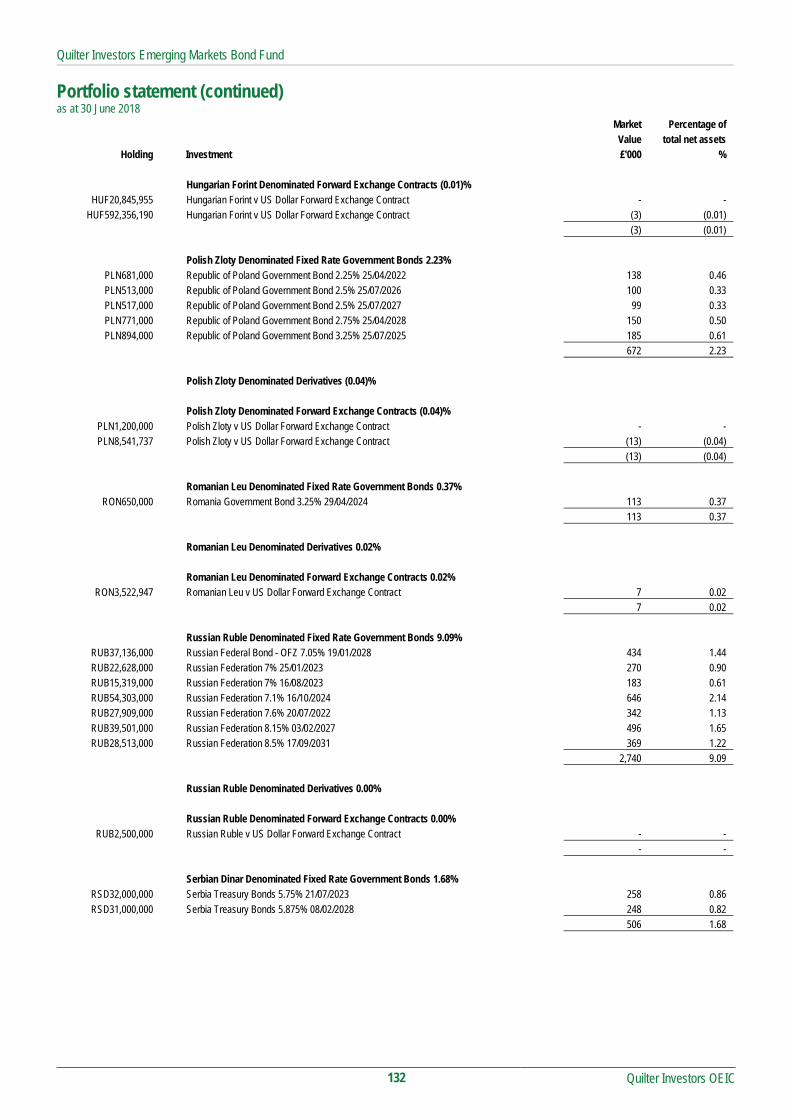
Quilter Investors Emerging Markets Bond Fund
Portfolio statement (continued) as at 30 June 2018
Quilter Investors OEIC
132
Market Percentage of Value total net assets
Holding Investment £'000 % Hungarian Forint Denominated Forward Exchange Contracts (0.01)%
HUF20,845,955 Hungarian Forint v US Dollar Forward Exchange Contract - - HUF592,356,190 Hungarian Forint v US Dollar Forward Exchange Contract (3) (0.01)
(3) (0.01) Polish Zloty Denominated Fixed Rate Government Bonds 2.23%
PLN681,000 Republic of Poland Government Bond 2.25% 25/04/2022 138 0.46 PLN513,000 Republic of Poland Government Bond 2.5% 25/07/2026 100 0.33 PLN517,000 Republic of Poland Government Bond 2.5% 25/07/2027 99 0.33 PLN771,000 Republic of Poland Government Bond 2.75% 25/04/2028 150 0.50 PLN894,000 Republic of Poland Government Bond 3.25% 25/07/2025 185 0.61
672 2.23 Polish Zloty Denominated Derivatives (0.04)% Polish Zloty Denominated Forward Exchange Contracts (0.04)%
PLN1,200,000 Polish Zloty v US Dollar Forward Exchange Contract - - PLN8,541,737 Polish Zloty v US Dollar Forward Exchange Contract (13) (0.04)
(13) (0.04) Romanian Leu Denominated Fixed Rate Government Bonds 0.37%
RON650,000 Romania Government Bond 3.25% 29/04/2024 113 0.37 113 0.37 Romanian Leu Denominated Derivatives 0.02% Romanian Leu Denominated Forward Exchange Contracts 0.02%
RON3,522,947 Romanian Leu v US Dollar Forward Exchange Contract 7 0.02 7 0.02 Russian Ruble Denominated Fixed Rate Government Bonds 9.09%
RUB37,136,000 Russian Federal Bond - OFZ 7.05% 19/01/2028 434 1.44 RUB22,628,000 Russian Federation 7% 25/01/2023 270 0.90 RUB15,319,000 Russian Federation 7% 16/08/2023 183 0.61 RUB54,303,000 Russian Federation 7.1% 16/10/2024 646 2.14 RUB27,909,000 Russian Federation 7.6% 20/07/2022 342 1.13 RUB39,501,000 Russian Federation 8.15% 03/02/2027 496 1.65 RUB28,513,000 Russian Federation 8.5% 17/09/2031 369 1.22
2,740 9.09 Russian Ruble Denominated Derivatives 0.00% Russian Ruble Denominated Forward Exchange Contracts 0.00%
RUB2,500,000 Russian Ruble v US Dollar Forward Exchange Contract - - - - Serbian Dinar Denominated Fixed Rate Government Bonds 1.68%
RSD32,000,000 Serbia Treasury Bonds 5.75% 21/07/2023 258 0.86 RSD31,000,000 Serbia Treasury Bonds 5.875% 08/02/2028 248 0.82
506 1.68

Quilter Investors Emerging Markets Bond Fund
Portfolio statement (continued) as at 30 June 2018
Quilter Investors OEIC
133
Market Percentage of
Value total net assets Holding Investment £'000 %
Turkish Lira Denominated Fixed Rate Government Bonds 6.42%
TRY1,400,000 Turkey Bond 10.6% 11/02/2026 177 0.59 TRY1,000,000 Turkey Government Bond 8.5% 10/07/2019 151 0.50 TRY1,300,000 Turkey Government Bond 8.8% 27/09/2023 158 0.52 TRY1,000,000 Turkey Government Bond 10.4% 27/03/2019 157 0.52 TRY5,200,000 Turkey Government Bond 10.7% 17/02/2021 738 2.45 TRY4,000,000 Turkey Government Bond 11% 02/03/2022 555 1.84
1,936 6.42 Turkish Lira Denominated Derivatives 0.00% Turkish Lira Denominated Forward Exchange Contracts 0.00%
TRY900,000 Turkish Lira v US Dollar Forward Exchange Contract (1) - (1) - Ukrainian hryvnia Denominated Fixed Rate Corporate Bonds 1.42%
UAH7,718,708 Citigroup Global Markets 12.75% 11/01/2019 220 0.73 UAH7,264,666 Citigroup Global Markets 14.2% 22/01/2021 209 0.69
429 1.42 Middle East 2.97% Egyptian Pound Denominated Fixed Rate Government Bonds 2.97%
EGP6,447,000 Egypt Government Bond 15.7% 07/11/2027 250 0.83 EGP2,724,000 Egypt Government Bond 18.4% 30/05/2024 119 0.39 EGP1,350,000 Egypt Treasury Bills 0% 02/10/2018 55 0.18 EGP3,625,000 Egypt Treasury Bills 0% 04/12/2018 142 0.47 EGP8,525,000 Egypt Treasury Bills 0% 25/12/2018 331 1.10
897 2.97 North America 12.02% Dominican Peso Denominated Fixed Rate Government Bonds 0.36%
DOP6,500,000 Dominican Republic Bond 11.25% 05/02/2027 107 0.36 107 0.36 Mexican Peso Denominated Fixed Rate Corporate Bonds 1.14%
MXN47,200 Petroleos Mexicanos 7.19% 12/09/2024 161 0.54 MXN33,500 Petroleos Mexicanos 7.47% 12/11/2026 112 0.37 MXN19,100 Petroleos Mexicanos 7.65% 24/11/2021 70 0.23
343 1.14 Mexican Peso Denominated Fixed Rate Government Bonds 10.36%
MXN2,720,000 International Finance 7.5% 18/01/2028 101 0.33 MXN47,200 Mexican Bonos 5.75% 05/03/2026 163 0.54 MXN37,200 Mexican Bonos 6.5% 10/06/2021 139 0.46
MXN183,600 Mexican Bonos 6.5% 09/06/2022 679 2.25 MXN97,200 Mexican Bonos 7.5% 03/06/2027 373 1.24 MXN51,700 Mexican Bonos 7.75% 29/05/2031 201 0.67 MXN24,500 Mexican Bonos 7.75% 23/11/2034 95 0.32 MXN48,900 Mexican Bonos 7.75% 13/11/2042 190 0.63 MXN33,200 Mexican Bonos 8% 11/06/2020 129 0.43 MXN10,000 Mexican Bonos 8% 07/11/2047 40 0.13
MXN131,400 Mexican Bonos 8% 07/12/2023 514 1.70

Quilter Investors Emerging Markets Bond Fund
Portfolio statement (continued) as at 30 June 2018
Quilter Investors OEIC
134
Market Percentage of Value total net assets
Holding Investment £'000 % Mexican Peso Denominated Fixed Rate Government Bonds (continued)
MXN48,300 Mexican Bonos 8.5% 31/05/2029 199 0.66 MXN50,400 Mexican Bonos 8.5% 18/11/2038 211 0.70 MXN18,700 Mexican Bonos 10% 20/11/2036 89 0.3
3,123 10.36 Mexican Peso Denominated Derivatives 0.01% Mexican Peso Denominated Forward Exchange Contracts 0.01%
MXN7,600,000 Mexican Peso v US Dollar Forward Exchange Contract 3 0.01 3 0.01 US Dollar Denominated Derivatives 0.15% US Dollar Denominated Forward Exchange Contracts 0.16%
$1,066,555 US Dollar v Argentine Peso Forward Exchange Contract 11 0.04 $394,990 US Dollar v Chilean Peso Forward Exchange Contract 5 0.02 $623,391 US Dollar v Colombian Peso Forward Exchange Contract 4 0.01 $381,058 US Dollar v Czech Koruna Forward Exchange Contract 1 - $867,675 US Dollar v Hungarian Forint Forward Exchange Contract 5 0.02 $604,257 US Dollar v Indian Rupe Forward Exchange Contract 4 0.01 $515,069 US Dollar v Indonesian Rupiah Forward Exchange Contract 3 0.01 $340,570 US Dollar v Mexican Peso Forward Exchange Contract (9) (0.03) $389,028 US Dollar v New Taiwan Dollar Forward Exchange Contract - - $271,456 US Dollar v Philippine Piso Forward Exchange Contract - -
$57,651 US Dollar v Russia Ruble Forward Exchange Contract (1) - $185,856 US Dollar v Russia Ruble Forward Exchange Contract (2) (0.01) $396,334 US Dollar v South African Rand Forward Exchange Contract 5 0.02 $413,607 US Dollar v South African Rand Forward Exchange Contract 3 0.01 $413,461 US Dollar v South African Rand Forward Exchange Contract 3 0.01 $408,062 US Dollar v South Korean Won Forward Exchange Contract 2 0.01 $244,240 US Dollar v South Korean Won Forward Exchange Contract 1 -
$4,499,763 US Dollar v Sterling Forward Exchange Contract 21 0.07 $385,381 US Dollar v Thai Baht Forward Exchange Contract 1 - $128,918 US Dollar v Turkish Lira Forward Exchange Contract - - $297,728 US Dollar v Turkish Lira Forward Exchange Contract (8) (0.03)
49 0.16 US Dollar Credit Default Swap (0.01)%
$360,000 Sell Protection CDS Petroleo Brasileiro Sa Petrobras 20/12/2019 HSBC Fixed Income OTC (3) (0.01) (3) (0.01) South America 26.17% Argentine Peso Denominated Fixed Rate Corporate Bonds 0.34%
ARS4,358,000 Provincia de Buenos Aires/Argentina 30.6557% 12/04/2025 102 0.34 102 0.34 Argentine Peso Denominated Fixed Rate Government Bonds 1.66%
ARS2,724,250 Argentina Treasury Bill 0% 14/09/2018 77 0.26 ARS3,269,100 Argentina Treasury Bill 0% 12/10/2018 90 0.30 ARS1,906,975 Argentina Treasury Bond BONCER 2.5% 22/07/2021 69 0.23 ARS2,179,400 Bonos de la Nacion Argentina con Ajuste por CER 3.75% 08/02/2019 71 0.23 ARS7,083,050 Bonos de la Nacion Argentina con Ajuste por CER 4% 06/03/2020 192 0.64
499 1.66

Quilter Investors Emerging Markets Bond Fund
Portfolio statement (continued) as at 30 June 2018
Quilter Investors OEIC
135
Market Percentage of Value total net assets
Holding Investment £'000 % Argentine Peso Denominated Variable Rate Government Bonds 0.63%
ARS4,040,970 Argentina Bonar Bonds 34.46618% 03/04/2022 101 0.34 ARS3,178,291 Argentina POM Politica Monetaria 40% 21/06/2020 88 0.29
189 0.63 Brazilian Real Denominated Fixed Rate Government Bonds 11.22%
BRL600 Brazil Letras do Tesouro Nacional 0% 01/01/2019 114 0.38 BRL1,000 Brazil Letras do Tesouro Nacional 0% 01/01/2020 175 0.58 BRL3,000 Brazil Letras do Tesouro Nacional 0% 01/07/2020 499 1.66 BRL2,500 Brazil Letras do Tesouro Nacional 0% 01/07/2021 373 1.24 BRL2,000 Brazil Letras do Tesouro Nacional 0% 01/01/2022 280 0.93 BRL2,600 Brazil Notas do Tesouro Nacional Serie F 10% 01/01/2021 520 1.72 BRL4,200 Brazil Notas do Tesouro Nacional Serie F 10% 01/01/2023 805 2.67 BRL1,000 Brazil Notas do Tesouro Nacional Serie F 10% 01/01/2025 185 0.61 BRL2,400 Brazil Notas do Tesouro Nacional Serie F 10% 01/01/2027 431 1.43
3,382 11.22 Brazilian Real Denominated Derivatives (0.01)% Brazilian Real Denominated Forward Exchange Contracts (0.01)%
BRL776,837 Brazilian Real v US Dollar Forward Exchange Contract (4) (0.01) (4) (0.01) Chilean Peso Denominated Fixed Rate Government Bonds 0.50%
CLP65,000,000 Bonos de la Tesoreria de la Republica en pesos 4.5% 01/03/2026 76 0.25 CLP65,000,000 Bonos de la Tesoreria de la Republica en pesos 5% 01/03/2035 75 0.25
151 0.50 Chilean Peso Denominated Derivatives 0.21% Chilean Peso Denominated Forward Exchange Contracts (0.05)%
CLP751,704,300 Chilean Peso v US Dollar Forward Exchange Contract (15) (0.05) (15) (0.05) Colombian Peso Denominated Fixed Rate Corporate Bonds 0.26%
COP284,000,000 Bogota Distrito Capital 9.75% 26/07/2028 79 0.26 79 0.26 Colombian Peso Denominated Fixed Rate Government Bonds 8.50%
COP390,000,000 Colombia Government Bond 4.375% 21/03/2023 95 0.32 COP1,300,000,000 Republic of Columbia 6% 28/04/2028 321 1.06 COP1,600,000,000 Republic of Columbia 7% 04/05/2022 429 1.42 COP2,000,000,000 Republic of Columbia 7.5% 26/08/2026 545 1.81
COP900,000,000 Republic of Columbia 7.75% 18/09/2030 248 0.82 COP1,900,000,000 Republic of Columbia 10% 24/07/2024 582 1.93 COP1,200,000,000 Republic of Columbia 11% 24/07/2020 344 1.14
2,564 8.50 Colombian Peso Denominated Derivatives (0.02)% Colombian Peso Denominated Forward Exchange Contracts (0.02)%
COP1,829,030,018 Colombian Peso v US Dollar Forward Exchange Contract - - COP1,300,000,000 Colombian Peso v US Dollar Forward Exchange Contract (5) (0.02)
(5) (0.02)

Quilter Investors Emerging Markets Bond Fund
Portfolio statement (continued) as at 30 June 2018
Quilter Investors OEIC
136
Market Percentage of Value total net assets
Holding Investment £'000 % Peruvian Sol Denominated Fixed Rate Government Bonds 2.41%
PEN508,000 Peru Government Bond 6.15% 12/08/2032 120 0.40 PEN860 Peru Government Bond 6.35% 12/08/2028 211 0.70 PEN363 Peru Government Bond 6.95% 12/08/2031 92 0.30
PEN1,103 Peru Government Bond 8.2% 12/08/2026 305 1.01 728 2.41 Peruvian Sol Denominated Derivatives 0.00% Peruvian Sol Denominated Forward Exchange Contracts 0.00%
PEN270,300 Peruvian Sol v US Dollar Forward Exchange Contract - - - - Uruguayan Peso Denominated Fixed Rate Government Bonds 0.73%
UYU3,621,254 Uruguay Government Bond 4.375% 15/12/2028 160 0.53 UYU2,270,000 Uruguay Notas del Tesoro 13.9% 29/07/2020 59 0.20
219 0.73
Investment assets** 28,758 95.36
Net other assets 1,398 4.64
Total net assets 30,156 100.00
* Market value less than £500.
** Including investment liabilities.
All investments are approved securities being either officially listed in a member state or traded on or under the rules of an eligible securities market, unless otherwise stated.

Quilter Investors Emerging Markets Bond Fund
Quilter Investors OEIC
137
Statement of total return for the period from 21 June 2018 to 30 June 2018 21.06.18 to 21.06.18 to
30.06.18 30.06.18
Note £'000 £'000
Income
Net capital gains 151
Revenue 27
Expenses (6)
Net revenue before taxation 21
Taxation -
Net revenue after taxation 21
Total return before distributions 172
Distributions 2 (27)
Change in net assets attributable to
shareholders from investment activities 145
Statement of change in net assets attributable to shareholders for the period from 21 June 2018 to 30 June 2018 21.06.18 to 21.06.18 to
30.06.18 30.06.18
£'000 £'000
Opening net assets attributable to shareholders -
Amounts transferred from Old Mutual Local Currency Emerging Markets Debt Fund 29,790
Amounts received on issue of shares 194
Amounts paid on cancellation of shares -
29,984
Change in net assets attributable to
shareholders from investment activities 145
Retained distribution on accumulation shares 27
Closing net assets attributable to shareholders 30,156
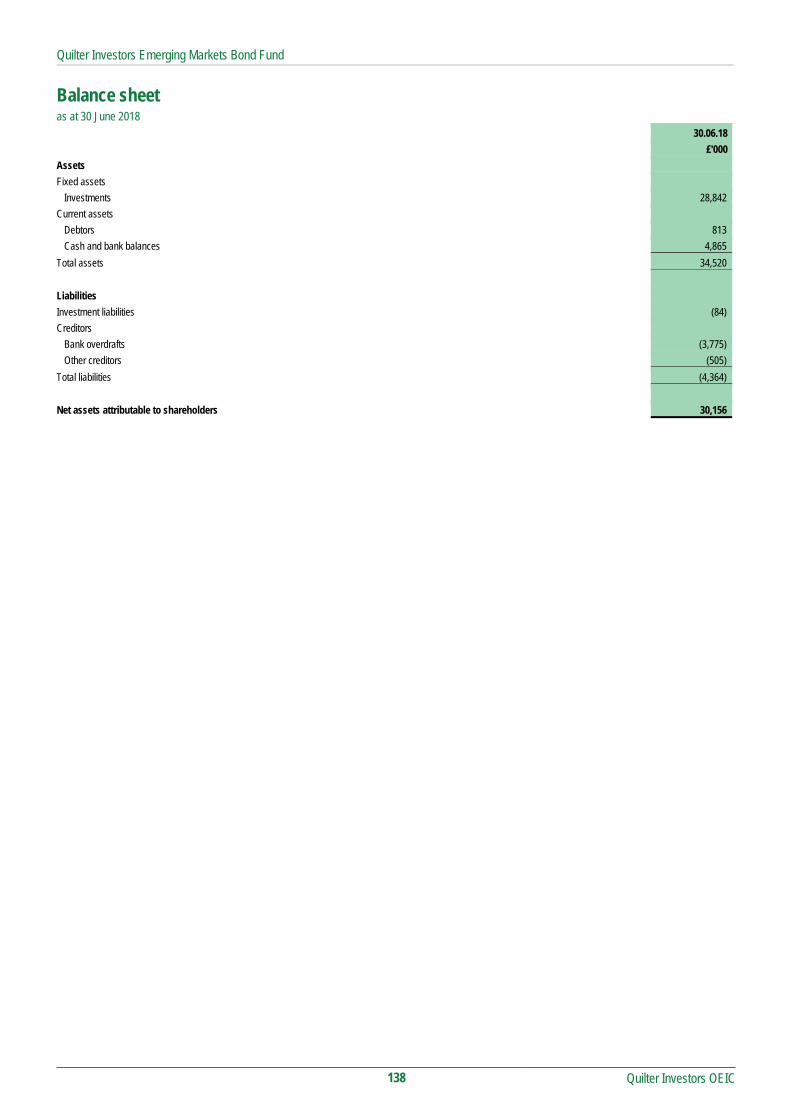
Quilter Investors Emerging Markets Bond Fund
Quilter Investors OEIC
138
Balance sheet as at 30 June 2018 30.06.18
£'000
Assets
Fixed assets
Investments 28,842
Current assets
Debtors 813
Cash and bank balances 4,865
Total assets 34,520
Liabilities
Investment liabilities (84)
Creditors
Bank overdrafts (3,775)
Other creditors (505)
Total liabilities (4,364)
Net assets attributable to shareholders 30,156

Quilter Investors Emerging Markets Bond Fund
Notes to the financial statements for the period from 21 June 2018 to 30 June 2018
Quilter Investors OEIC
139
1 Accounting policies The financial statements have been prepared under the historical cost basis, as modified by the revaluation of investments, and in accordance with the Statement of Recommended Practice (SORP) for Authorised Funds, issued by the Investment Management Association in May 2014.
2 Distributions The distributions take account of revenue received on the issue of shares and revenue deducted on the cancellation of shares, and comprise:
21.06.18 to 30.06.18 £'000 Interim – Accumulation shares (30 June) 27 27 Revenue deducted on cancellation of shares - Revenue received on issue of shares - Distributions 27
Reconciliation of distributions: Net revenue after taxation 21 Capitalised fees 6 Distributions 27

Quilter Investors Emerging Markets Bond Fund
Distribution table
Quilter Investors OEIC
140
Interim distribution Group 1: Shares purchased prior to 21 June 2018 Group 2: Shares purchased from 21 June 2018 to 30 June 2018
Revenue
pence per share Equalisation
pence per share*
Distribution paid 30.06.18
pence per share Accumulation 'U2' Shares† Group 1 0.8672 - 0.8672 Group 2 0.8630 0.0042 0.8672 * Equalisation only applies to shares purchased during the distribution period (Group 2 shares). It is the average amount of revenue included in the purchase price of all
Group 2 shares and is refunded to holders of these shares as a return of capital. Being capital, it is not liable to income tax but must be deducted from the cost of shares for capital gains tax purposes.
† Fund Launched on 21 June 2018

Quilter Investors Emerging Markets Equity Fund
Quilter Investors Emerging Markets Equity Fund
Quilter Investors OEIC
141
Launch date 28 June 2018
IA Sector Global Emerging Markets
Investment adviser Old Mutual Global Investors (UK) Limited
Net asset value £75,316,464
Objective
The sub-fund aims to achieve capital growth.
Policy
The sub-fund primarily invests, directly or indirectly, in shares of companies listed, traded or dealt in on a regulated market in emerging markets worldwide and companies that have a predominant proportion of their assets or business operations in these emerging market countries. The sub-fund may at times be concentrated in terms of the number of investments it holds.
The sub-fund may also invest in other transferable securities, collective investment schemes (including those managed or operated by the ACD) warrants, money market instruments, deposits, cash and derivatives.
The sub-fund may use derivatives and forward transactions for the purposes of meeting the investment objective or efficient portfolio management.
The sub-fund is managed by an investment adviser selected by the ACD for their expected ability to manage the sub-fund according to the investment objective and policy. The ACD continuously monitors and may periodically make changes to this appointment.
Investment Manager’s review
The sub-fund was launched on 28 June 2018.
The team manages the sub-fund with the objective of constructing a portfolio of 30-40 high-quality businesses operating in emerging markets that display high returns on invested capital and are bought at prices below their long-term intrinsic worth.
Equity markets in 2018 have been marked by greater volatility than in 2017, against the backdrop of divergent central bank monetary policy. Headlines surrounding global trade conflicts have added to a mood of uncertainty. Given the likelihood of continued strength in the US dollar, the sub-fund has scaled back its exposure to Latin America. From a sector perspective, the sub-fund remains overweight banks and technology at the expense of underweights in utilities and energy.
Risk and Reward Profile
The calculated risk and reward category, as shown above, uses a method of calculation derived from EU rules. It is based on the rate at which the returns of the sub-fund have moved up and down in the past (i.e. volatility) and is not a guide to the future risk and reward category of the sub-fund. The category shown is not a target or guarantee and may shift over time. Even the lowest category 1 does not mean a risk-free investment. The seven-category scale is nonlinear, for example, 2 is not twice as risky as 1.
Sub-funds in category 6 have in the past shown relatively high volatility. With a sub-fund of category 6, you have a relatively high risk of losing money but your chance for gains is also relatively high.
Investment risk - there is no guarantee that the sub-fund will achieve its objective. A capital loss of some or all of the amount invested may occur.
Emerging markets risk - less developed countries may face more political, economic or structural challenges than developed countries.
Concentration risk (number of investments) - the Fund may at times hold a smaller number of investments, and therefore a fall in the value of a single investment may have a greater impact on the Fund’s value than if it held a larger number of investments.
Smaller companies risk - smaller companies are subject to greater risk and reward potential. Investments may be volatile or difficult to buy or sell.
Liquidity risk - some investments may become hard to value or sell at a desired time and price. In extreme circumstances this may affect the Fund’s ability to meet redemption requests upon demand.
Currency risk - the Fund is denominated in British Pounds but holds assets denominated in other currencies. The value of your shares may rise and fall as a result of exchange rate movements between these currencies.
Derivative risk - the Fund may use derivatives to generate returns and/or to reduce costs and the overall risk of the Fund. Using derivatives can involve a higher level of risk. A small movement in the price of an underlying investment may result in a disproportionately large movement in the price of the derivative investment. Derivatives also involve counterparty risk where the institutions acting as counterparty to derivatives may not meet their contractual obligations.
Capital erosion risk - the Fund takes its charges from the capital of the Fund. Investors should be aware that there is potential for capital erosion if insufficient capital growth is achieved by the Fund to cover the charges. Capital erosion may have the effect of reducing the level of income generated.
For a more detailed explanation of risks, please refer to the "Risks"section of the prospectus.

Quilter Investors Emerging Markets Equity Fund
Quilter Investors OEIC
142
Performance Records Comparative Tables 28 June 2018 to Accumulation 'U2'† 30 June 2018 p/share
Change in net assets per share Opening net asset value per share 954.40
Return before operating charges* 10.33 Operating charges** (0.05)
Return after operating charges* 10.28
Distributions - Retained distributions -
Closing net asset value per share 964.68
* after direct transaction costs of*** 0.08
Performance Return after charges 1.08%
Other information Closing net asset value (£) 75,316,464 Closing number of shares 7,807,366 Operating charges**** 0.86% Direct transaction costs*** 1.54%
Prices pence per share Highest share price 968.10 Lowest share price 954.40
† From 28 June 2018 ** The operating charges include all costs borne by the sub-fund, except for direct transaction costs.
*** The direct transaction costs are made up of fees and commissions paid to agents, advisers, brokers and dealers, levies by regulatory agencies and securities exchanges as well as transfer taxes and duties. They do not include any difference between the quoted bid and offer prices or internal administrative or holding costs. These costs arise as a result of transactions undertaken both for efficient portfolio management and the meeting of the sub-fund’s objectives. These costs exclude any effect of dilution adjustments used to offset the costs.
**** The operating charges percentage is the ratio of the sub-fund's ongoing charges (excluding interest on borrowings) to the average net assets of the sub-fund. If the unit class launched during the period the operating charges figures are annualised.
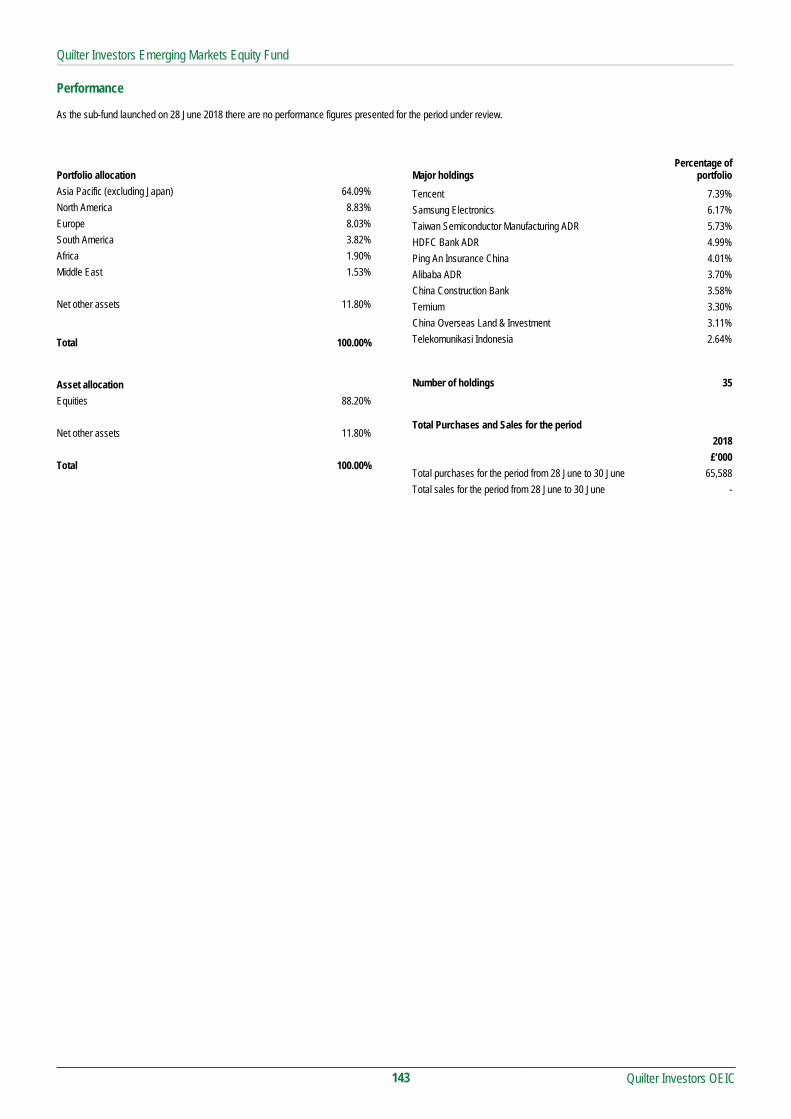
Quilter Investors Emerging Markets Equity Fund
Quilter Investors OEIC
143
Performance As the sub-fund launched on 28 June 2018 there are no performance figures presented for the period under review.
Portfolio allocation
Asia Pacific (excluding Japan) 64.09%
North America 8.83%
Europe 8.03%
South America 3.82%
Africa 1.90%
Middle East 1.53%
Net other assets 11.80%
Total 100.00%
Asset allocation
Equities 88.20%
Net other assets 11.80%
Total 100.00%
Major holdings Percentage of
portfolio
Tencent 7.39%
Samsung Electronics 6.17%
Taiwan Semiconductor Manufacturing ADR 5.73%
HDFC Bank ADR 4.99%
Ping An Insurance China 4.01%
Alibaba ADR 3.70%
China Construction Bank 3.58%
Ternium 3.30%
China Overseas Land & Investment 3.11%
Telekomunikasi Indonesia 2.64%
Number of holdings 35
Total Purchases and Sales for the period
2018
£’000
Total purchases for the period from 28 June to 30 June 65,588
Total sales for the period from 28 June to 30 June -

Quilter Investors Emerging Markets Equity Fund
Portfolio statement as at 30 June 2018
Quilter Investors OEIC
144
Market Percentage of
Value total net assets Holding Investment £'000 %
Overseas 88.20% Africa 1.90% South Africa Equities 1.90%
50,577 Aspen Pharmacare 704 0.93 768,972 Transaction Capital 727 0.97
1,431 1.90 Asia Pacific (excluding Japan) 64.09% China Equities 30.25%
465,460 ANTA Sports Products 1,876 2.49 8,738 Baidu ADR 1,610 2.14
19,438 Alibaba ADR 2,786 3.70 3,839,383 China Construction Bank 2,696 3.58 1,924,859 China Yongda Automobiles Services 1,436 1.91 1,057,955 JNBY Design 1,839 2.44
432,118 Ping An Insurance China 3,024 4.01 137,704 Sunny Optical Technology 1,949 2.59 145,739 Tencent 5,564 7.39
22,780 30.25 Hong Kong Equities 3.11%
935,589 China Overseas Land & Investment 2,341 3.11 2,341 3.11 India Equities 4.99%
46,709 HDFC Bank ADR 3,755 4.99 Total 3,755 4.99 Indonesia Equities 4.23%
3,322,541 Bank Mandiri 1,200 1.59 9,992,998 Telekomunikasi Indonesia 1,985 2.64
Total 3,185 4.23 Malaysia Equities 2.55%
3,288,800 My EG Services 598 0.79 1,177,300 Padini 1,322 1.76
Total 1,920 2.55 Philippines Equities 1.00%
57,782 Ayala 751 1.00 Total 751 1.00 South Korea Equities 12.23%
42,014 KB Financial 1,515 2.01 1,264 LG Household & Health Care 1,205 1.60 3,519 Medy-Tox 1,844 2.45
145,781 Samsung Electronics 4,644 6.17 Total 9,208 12.23 Taiwan Equities 5.73%
157,909 Taiwan Semiconductor Manufacturing ADR 4,318 5.73 Total 4,318 5.73

Quilter Investors Emerging Markets Equity Fund
Portfolio statement (continued) as at 30 June 2018
Quilter Investors OEIC
145
Market Percentage of Value total net assets
Holding Investment £'000 % Europe 8.03% Luxembourg Equities 3.30%
94,393 Ternium 2,488 3.30 Total 2,488 3.30 Europe 8.03% (continued) Poland Equities 1.37%
25,652 KRUK 1,031 1.37 Total 1,031 1.37
503,151 Russia Equities 1.74% Sberbank of Russia 1,311 1.74 Total 1,311 1.74 Turkey Equities 1.62%
131,739 Arcelik 335 0.44 219,204 Tofas Turk Otomobil Fabrikasi 889 1.18
Total 1,224 1.62 Middle East 1.53% United Arab Emirates Equities 1.53%
2,348,523 Abu Dhabi National Oil for Distribution 1,153 1.53 Total 1,153 1.53 North America 8.83% Mexico Equities 4.56%
348,795 Arca Continental 1,642 2.18 193,951 Gruma 1,796 2.38
Total 3,438 4.56 Panama Equities 2.44%
25,581 Copa 1,835 2.44 Total 1,835 2.44 United States Equities 1.83%
1,235,671 Nexteer Automotive 1,381 1.83 Total 1,381 1.83 South America 3.82% Brazil Equities 3.82%
276,476 Estacio Participacoes 1,303 1.73 338,859 Localiza Rent a Car 1,578 2.09
2,881 3.82
Investment assets 66,431 88.20
Net other assets 8,885 11.80
Total net assets 75,316 100.00
All investments are approved securities being either officially listed in a member state or traded on or under the rules of an eligible securities market, unless otherwise stated.

Quilter Investors Emerging Markets Equity Fund
Quilter Investors OEIC
146
Statement of total return for the period from 28 June 2018 to 30 June 2018 28.06.18 to 28.06.18 to
30.06.18 30.06.18
Note £'000 £'000
Income
Net capital gains 802
Revenue -
Expenses (2)
Net expense before taxation (2)
Taxation -
Net expense after taxation (2)
Total return before distributions 800
Distributions 2 -
Change in net assets attributable to
shareholders from investment activities 800
Statement of change in net assets attributable to shareholders for the period from 28 June 2018 to 30 June 2018 28.06.18 to 28.06.18 to
30.06.18 30.06.18
£'000 £'000
Opening net assets attributable to shareholders -
Amounts transferred from Old Mutual Global Emerging Markets Fund 74,366
Amounts received on issue of shares 150
Amounts paid on cancellation of shares -
74,516
Dilution adjustment -
Change in net assets attributable to
shareholders from investment activities 800
Retained distribution on accumulation shares -
Closing net assets attributable to shareholders 75,316

Quilter Investors Emerging Markets Equity Fund
Quilter Investors OEIC
147
Balance sheet as at 30 June 2018 30.06.18
£'000
Assets
Fixed assets
Investments 66,431
Current assets
Debtors 74,516
Cash and bank balances -
Total assets 140,947
Liabilities
Creditors
Bank overdrafts -
Other creditors (65,631)
Total liabilities (65,631)
Net assets attributable to shareholders 75,316

Quilter Investors Emerging Markets Equity Fund
Notes to the financial statements for the period from 28 June 2018 to 30 June 2018
Quilter Investors OEIC
148
1 Accounting policies The financial statements have been prepared under the historical cost basis, as modified by the revaluation of investments, and in accordance with the Statement of Recommended Practice (SORP) for Authorised Funds, issued by the Investment Management Association in May 2014.
2 Distributions The distributions take account of revenue received on the issue of shares and revenue deducted on the cancellation of shares, and comprise:
28.06.18 to 30.06.18 £'000 Revenue deducted on cancellation of shares - Revenue received on issue of shares - Distributions -
Reconciliation of distributions: Net expense after taxation (2) Net expense carried forward 2 Distributions -
Quilter Investors Emerging Markets Equity Growth Fund
Quilter Investors Emerging Markets Equity Growth Fund
Quilter Investors OEIC
149
Launch date 26 April 2013
IA Sector Global Emerging Markets
Investment adviser JPMorgan Asset Management (UK) Limited
Net asset value £119,958,471
Objective
The sub-fund aims to achieve capital growth.
Policy
The sub-fund primarily invests, directly and indirectly, in shares of companies listed, traded or dealt in on a regulated market in emerging markets worldwide and companies that have a predominant proportion of their assets or business operations in these emerging market countries.
The investment adviser typically has a preference to invest in shares of companies they believe to have the potential for growth. The sub-fund may at times be concentrated in terms of the number of investments it holds.
The sub-fund may also invest in other transferable securities, collective investment schemes (including those managed or operated by the ACD), warrants, money market instruments, deposits and derivatives.
The sub-fund may only use derivatives for efficient portfolio management purposes.
The sub-fund is managed by an investment adviser selected by the ACD for their expected ability to manage the sub-fund according to the investment objective and policy. The ACD continuously monitors and may periodically make changes to this appointment.
Investment Manager’s review
Market Review
Persistent and pervasive global growth in conjunction with earnings growth as well as a weak US dollar helped emerging markets (EM) sustain the momentum from 2017. Concerns of complacency eased with the market correction when volatility abruptly returned in early February as sentiments were knocked given rising inflation expectations and bond yields combined with concerns of a faster pace of rate hikes in the US. By market, Brazil and Russia led the way in the first part of the period, as both central banks continued on their easing sprees, cutting interest rates. South Africa was buoyed by the swearing in of new President Cyril Ramaphosa, but positive sentiment was short-lived as the market was one of the weakest, despite a central bank rate cut.
The second half of the period saw three consecutive negative months from EM as the asset class was weighed down by increasing concerns surrounding a strengthening US dollar and subsequent currency weakness, while EM assets came under immense pressure as the Federal Reserve continues to shrink its balance sheet, though at a gradual pace, while remaining in a rate-hike cycle. Latin America was the weakest region, led down by Brazil. Currency was the main driver for many key market declines - June saw the South African rand's (ZAR) worst month in over two years, while China saw the renminbi also fall sharply, the worst monthly decline since 1994. Towards the end of the period, MSCI announced that both Saudi Arabia and Argentina will move to be classified as Emerging Markets in 2019.
Performance
Stock selection in Brazil was a leading detractor from returns in the first three months of the year, with the underperformance predominantly driven by our exposure to Kroton Educacional, a leading educational services company. In contrast, at the start of the year, stock selection in India was the primary source of positive contribution to returns, led by Housing Development Finance Corp. This was partially offset by stock selection in China, which was a headwind to returns, mainly driven by positioning in financials, where lack of exposure to state owned banks hindered performance. Stock selection in and an underweight exposure to South Africa contributed to returns.
In the second half of the period, the portfolio outperformed its benchmark with stock selection and country allocation both contributing to returns. India was the leading contributor to performance, driven by stock selection and overweight exposure to the market. IT services broadly outperformed, aided by a weakening currency. As a result, our overweight in Tata Consultancy contributed to returns as encouraging fourth quarter results reported in April revealed an acceleration in revenue growth and margin expansion as concerns regarding US regulatory and tax pressure
subsides. Exposure in Argentina, where we are overweight as a result of stock selection, was a headwind towards the end of the period. This was offset by underweight exposure to Turkey, which aided performance. In South Africa, stock selection detracted from returns in the quarter.
Risk and Reward Profile
The calculated risk and reward category, as shown above, uses a method of calculation derived from EU rules. It is based on the rate at which the returns of the sub-fund have moved up and down in the past (i.e. volatility) and is not a guide to the future risk and reward category of the sub-fund. The category shown is not a target or guarantee and may shift over time. Even the lowest category 1 does not mean a risk-free investment. The seven-category scale is nonlinear, for example, 2 is not twice as risky as 1.
Sub-funds in category 6 have in the past shown relatively high volatility. With a sub-fund of category 6, you have a relatively high risk of losing money but your chance for gains is also relatively high.
Investment risk - there is no guarantee that the sub-fund will achieve its objective. A capital loss of some or all of the amount invested may occur.
Emerging markets risk - less developed countries may face more political, economic or structural challenges than developed countries.
Stock Connect risk - the sub-fund may invest in China A-Shares through the China-Hong Kong Stock Connect (“Stock Connect”). Stock Connect is governed by regulations which are untested and subject to change. Trading limitations and restrictions on foreign ownership may constrain the sub-fund’s ability to pursue its investment strategy.
Concentration risk (number of investments) - the sub-fund may at times hold a smaller number of investments, and therefore a fall in the value of a single investment may have a greater impact on the sub-fund’s value than if it held a larger number of investments.
Liquidity risk - some investments may become hard to value or sell at a desired time and price. In extreme circumstances this may affect the sub-fund’s ability to meet redemption requests upon demand.
Currency risk (EUR share class) - the sub-fund is denominated in British Pounds but holds assets denominated in other currencies. This share class is denominated in Euro. The value of your shares may rise and fall as a result of exchange rate movements between these currencies.
Currency risk (GBP share class) - the sub-fund is denominated in British Pounds but holds assets denominated in other currencies. The value of your shares may rise and fall as a result of exchange rate movements between these currencies.
Currency risk (USD share class) - the sub-fund is denominated in British Pounds but holds assets denominated in other currencies. This share class is denominated in US Dollars. The value of your shares may rise and fall as a result of exchange rate movements between these currencies.
Derivative risk - the sub-fund may use derivatives to reduce costs and/or the overall risk of the sub-fund (i.e. Efficient Portfolio Management (EPM)). Derivatives involve a level of risk, however, for EPM they should not increase the overall riskiness of the sub-fund. Derivatives also involve counterparty risk where the institutions acting as counterparty to derivatives may not meet their contractual obligations.
Capital erosion risk - the sub-fund takes its charges from the income of the sub-fund in the first instance. The impact of sub-fund charges may be material on the value of any income you receive from your investment. There is potential for capital erosion if insufficient income is generated by the sub-fund to cover these charges. Capital erosion may have the effect of reducing the level of income generated.
For full details of the sub-fund's risks, please see the section in the prospectus headed "Risks".

Quilter Investors Emerging Markets Equity Growth Fund
Quilter Investors OEIC
150
Performance Records Comparative Tables 1 January 2018 to 1 January 2017 to 1 January 2016 to Accumulation 'A' 30 June 2018 31 December 2017 31 December 2016 p/share p/share p/share
Change in net assets per share Opening net asset value per share 146.62 114.03 83.58
Return before operating charges* (6.22) 34.82 32.11 Operating charges** (1.26) (2.23) (1.66)
Return after operating charges* (7.48) 32.59 30.45
Distributions - - (0.31) Retained distributions - - 0.31
Closing net asset value per share 139.14 146.62 114.03
* after direct transaction costs of*** 0.09 0.15 0.14
Performance Return after charges (5.10)% 28.58% 36.43%
Other information Closing net asset value (£) 6,961,742 7,460,608 6,290,739 Closing number of shares 5,003,396 5,088,568 5,516,785 Operating charges**** 1.76% 1.68% 1.68% Direct transaction costs*** 0.12% 0.11% 0.14%
Prices pence per share pence per share pence per share Highest share price 153.2 150.1 123.3 Lowest share price 136.4 114.3 77.55
1 January 2018 to 1 January 2017 to 1 January 2016 to Accumulation 'A' EUR† 30 June 2018 31 December 2017 31 December 2016 p/share p/share p/share
Change in net assets per share Opening net asset value per share 126.47 98.53 78.00
Return before operating charges* (5.37) 30.01 21.77 Operating charges** (1.11) (2.07) (1.24)
Return after operating charges* (6.48) 27.94 20.53
Distributions - - (0.22) Retained distributions - - 0.22
Closing net asset value per share 119.99 126.47 98.53
* after direct transaction costs of*** 0.07 0.13 0.10
Performance Return after charges (5.12)% 28.36% 26.32%
Other information Closing net asset value (£) 1,200 1,264 985 Closing number of shares 1,000 1,000 1,000 Operating charges**** 1.80% 1.80% 1.80% Direct transaction costs*** 0.12% 0.11% 0.14%
Prices cents per share cents per share cents per share Highest share price 149.9 146.0 119.9 Lowest share price 134.0 115.1 96.78

Quilter Investors Emerging Markets Equity Growth Fund
Quilter Investors OEIC
151
Comparative Tables (continued) 1 January 2018 to 1 January 2017 to 1 January 2016 to Accumulation 'A' USD 30 June 2018 31 December 2017 31 December 2016 p/share p/share p/share
Change in net assets per share Opening net asset value per share 117.31 91.35 66.98
Return before operating charges* (4.97) 27.93 25.93 Operating charges** (1.03) (1.97) (1.56)
Return after operating charges* (6.00) 25.96 24.37
Distributions - - (0.21) Retained distributions - - 0.21
Closing net asset value per share 111.31 117.31 91.35
* after direct transaction costs of*** 0.07 0.13 0.12
Performance Return after charges (5.11)% 28.42% 36.38%
Other information Closing net asset value (£) 565,223 445,012 107,958 Closing number of shares 507,811 379,358 118,182 Operating charges**** 1.80% 1.80% 1.79% Direct transaction costs*** 0.12% 0.11% 0.14%
Prices cents per share cents per share cents per share Highest share price 172.4 159.1 122.6 Lowest share price 144.1 112.7 87.77
1 January 2018 to 1 January 2017 to 1 January 2016 to Accumulation 'U2' 30 June 2018 31 December 2017 31 December 2016 p/share p/share p/share
Change in net assets per share Opening net asset value per share 179.37 138.26 100.44
Return before operating charges* (7.64) 42.38 38.76 Operating charges** (0.75) (1.27) (0.94)
Return after operating charges* (8.39) 41.11 37.82
Distributions - (1.46) (1.47) Retained distributions - 1.46 1.47
Closing net asset value per share 170.98 179.37 138.26
* after direct transaction costs of*** 0.10 0.19 0.17
Performance Return after charges (4.68)% 29.73% 37.65%
Other information Closing net asset value (£) 112,422,838 93,449,047 48,426,907 Closing number of shares 65,750,381 52,097,990 35,025,824 Operating charges**** 0.86% 0.78% 0.78% Direct transaction costs*** 0.12% 0.11% 0.14%
Prices pence per share pence per share pence per share Highest share price 187.6 183.5 149.3 Lowest share price 167.3 138.6 93.26

Quilter Investors Emerging Markets Equity Growth Fund
Quilter Investors OEIC
152
Comparative Tables (continued) 1 January 2018 to 1 January 2017 to 1 January 2016 to Income 'U2' 30 June 2018 31 December 2017 31 December 2016 p/share p/share p/share Change in net assets per share
Opening net asset value per share 158.47 123.14 90.40
Return before operating charges* (6.73) 37.75 34.91 Operating charges** (0.67) (1.12) (0.85)
Return after operating charges* (7.40) 36.63 34.06
Distributions - (1.30) (1.32) Retained distributions - - -
Closing net asset value per share 151.07 158.47 123.14
* after direct transaction costs of*** 0.09 0.16 0.15
Performance Return after charges (4.67)% 29.71% 37.68%
Other information Closing net asset value (£) 7,468 7,793 18,241 Closing number of shares 4,943 4,917 14,813 Operating charges**** 0.86% 0.78% 0.78% Direct transaction costs*** 0.12% 0.11% 0.14%
Prices pence per share pence per share pence per share Highest share price 165.8 163.4 134.4 Lowest share price 147.8 123.7 83.94
† From 31 March 2016 ** The operating charges include all costs borne by the sub-fund, except for direct transaction costs. Since the sub-fund invests less than 10% of net assets in
underlying sub-funds there is no inclusion of a synthetic element for underlying sub-funds OCF. *** The direct transaction costs are made up of fees and commissions paid to agents, advisers, brokers and dealers, levies by regulatory agencies and securities
exchanges as well as transfer taxes and duties. They do not include any difference between the quoted bid and offer prices or internal administrative or holding costs. These costs arise as a result of transactions undertaken both for efficient portfolio management and the meeting of the sub-fund’s objectives. These costs exclude any effect of dilution adjustments used to offset the costs.
**** The operating charges percentage is the ratio of the sub-fund's ongoing charges (excluding interest on borrowings) to the average net assets of the sub-fund. If the share class launched during the period the operating charges figures are annualised.

Quilter Investors Emerging Markets Equity Growth Fund
Quilter Investors OEIC
153
Performance
6 months to
30 June 2018
1 year to
30 June 2018
3 years to
30 June 2018
5 years to
30 June 2018
Quilter Investors Emerging Markets Equity Growth Fund* (4.67)% 7.60% 53.31% 55.24%
MSCI Emerging Markets (benchmark) (4.36)% 6.46% 40.27% 46.71%
IA Global Emerging Markets (sector average) (5.65)% 4.29% 40.56% 46.42%
Quartile ranking 2 1 1 2
* Accumulation ‘U2’ shares
Data Source – Factset. Figures are calculated on a total return and single price basis, with net income reinvested into the sub-fund.
Portfolio allocation
Asia Pacific (excluding Japan) 70.47%
South America 10.97%
North America 6.54%
Europe 5.20%
Africa 4.92%
Middle East 0.90%
Net other assets 1.00%
Total 100.00%
Asset allocation
Equities 99.00%
Net other assets 1.00%
Total 100.00%
Major holdings Percentage of
portfolio
Tencent 7.45%
Alibaba ADR 6.18%
AIA 5.17%
Housing Development Finance 4.76%
Samsung Electronics 4.58%
Ping An Insurance China 4.16%
Taiwan Semiconductor Manufacturing ADR 3.99%
HDFC Bank 3.28%
Sberbank of Russia PJSC 2.58%
JD.com ADR 2.45%
Number of holdings 67
Total Purchases and Sales for the period
2018 2017
£’000 £’000
Total purchases for the 6 month period to 30 June 66,532 29,047
Total sales for the 6 month period to 30 June 29,992 15,011

Quilter Investors Emerging Markets Equity Growth Fund
Portfolio statement as at 30 June 2018
Quilter Investors OEIC
154
Market Percentage of
Value total net assets Holding Investment £’000 %
Overseas 99.00% (31 December 2017 98.48%)
Africa 4.92% (31 December 2017 7.11%)
South Africa Equities 4.92% (31 December 2017 7.11%) 123,184 Bid 1,848 1.54 110,099 Bidvest 1,184 0.99
15,871 Capitec Bank 754 0.63 170,842 FirstRand 595 0.49
49,122 Mr Price 609 0.51 239,490 Sanlam 917 0.76
5,907 4.92
Asia Pacific (excluding Japan) 70.47% (31 December 2017 65.45%)
Australia Equities 0.64% (31 December 2017 0.57%) 156,155 Oil Search 767 0.64
767 0.64
China Equities 26.25% (31 December 2017 24.63%) 81,500 AAC Technologies 873 0.73 51,697 Alibaba ADR 7,411 6.18
651,600 Fuyao Glass Industry 1,675 1.39 99,189 JD.com ADR 2,939 2.45 23,796 New Oriental Education & Technology ADR 1,700 1.42
713,000 Ping An Insurance China 4,990 4.16 144,000 Shenzhou 1,353 1.13 234,200 Tencent 8,941 7.45
54,713 Yum China 1,611 1.34
31,493 26.25
Hong Kong Equities 7.33% (31 December 2017 6.63%) 931,600 AIA 6,199 5.17
13,734 Jardine Matheson 660 0.55 457,000 Techtronic Industries 1,937 1.61
8,796 7.33
India Equities 19.40% (31 December 2017 17.16%) 55,089 Asian Paints 773 0.64
167,943 HDFC Bank 3,935 3.28 16,929 HDFC Bank ADR 1,361 1.14
364,113 HDFC Standard Life Insurance 1,840 1.53 269,448 Housing Development Finance 5,712 4.76 101,517 IndusInd Bank 2,183 1.82 569,680 ITC 1,677 1.40 106,683 Kotak Mahindra Bank 1,592 1.33 110,582 Tata Consultancy Services 2,266 1.89
26,101 Tata Motors ADR 382 0.32 36,639 Ultratech Cement 1,546 1.29
23,267 19.40

Quilter Investors Emerging Markets Equity Growth Fund
Portfolio statement (continued) as at 30 June 2018
Quilter Investors OEIC
155
Market Percentage of Value total net assets
Holding Investment £’000 % Indonesia Equities 2.33% (31 December 2017 2.67%)
2,188,378 Astra 764 0.64 1,358,800 Bank Central Asia 1,537 1.28 3,265,120 Bank Rakyat Indonesia 491 0.41
2,792 2.33
Macau Equities 0.70% (31 December 2017 0.65%)
206,400 Sands China 839 0.70
839 0.70
South Korea Equities 6.67% (31 December 2017 5.86%) 2,390 NAVER 1,242 1.03 3,639 NCSoft 922 0.77
172,480 Samsung Electronics 5,494 4.58 433 Samsung Electronics GDR 345 0.29
8,003 6.67
Taiwan Equities 6.29% (31 December 2017 6.28%) 14,000 Largan Precision 1,559 1.30
140,000 President Chain Store 1,207 1.00 175,009 Taiwan Semiconductor Manufacturing ADR 4,786 3.99
7,552 6.29
Thailand Equities 0.86% (31 December 2017 1.00%) 231,400 Kasikornbank 1,029 0.86
1,029 0.86
Europe 5.20% (31 December 2017 7.04%)
Luxembourg Equities 0.95% (31 December 2017 1.71%) 1,492,261 JPMorgan US Dollar Liquidity Fund - X Distributing 1,136 0.95
1,136 0.95
Russia Equities 3.75% (31 December 2017 4.75%) 8,293 Magnit 461 0.38
87,132 Sberbank of Russia ADR 943 0.79 1,188,394 Sberbank of Russia PJSC 3,097 2.58
4,501 3.75
Spain Equities 0.50% (31 December 2017 0.58%) 120,639 Prosegur Cia de Seguridad 598 0.50
598 0.50
Middle East 0.90% (31 December 2017 0.62%)
Egypt Equities 0.90% (31 December 2017 0.62%) 288,828 Commercial Bank Egypt 1,083 0.90
1,083 0.90

Quilter Investors Emerging Markets Equity Growth Fund
Portfolio statement (continued) as at 30 June 2018
Quilter Investors OEIC
156
All investments are approved securities being either officially listed in a member state or traded on or under the rules of an eligible securities market, unless otherwise stated.
All investments are in ordinary shares unless otherwise stated.
Market Percentage of Value total net assets
Holding Investment £’000 % North America 6.54% (31 December 2017 6.26%) Mexico Equities 3.49% (31 December 2017 3.26%)
310,619 Becle 345 0.29 18,500 Fomento Economico Mexicano ADR 1,225 1.02
393,680 Grupo Financiero Banorte 1,717 1.43 263,164 Infraestructura Energetica Nova 898 0.75
4,185 3.49
Panama Equities 1.15% (31 December 2017 1.41%)
19,173 Copa 1,375 1.15
1,375 1.15
United States Equities 1.90% (31 December 2017 1.59%) 24,293 EPAM Systems 2,275 1.90
2,275 1.90
South America 10.97% (31 December 2017 12.00%)
Argentina Equities 1.76% (31 December 2017 1.88%) 9,379 MercadoLibre 2,118 1.76
2,118 1.76
Brazil Equities 7.65% (31 December 2017 8.72%) 314,839 Ambev ADR 1,121 0.93 339,060 B3 SA Brasil Bolsa Balcao 1,360 1.13
80,443 Cielo 259 0.21 119,473 Itau Unibancog (Preference shares) 932 0.78
61,297 Itau Unibancog ADR 480 0.40 574,398 Kroton Educacional 1,063 0.89 224,179 Lojas Renner 1,257 1.05 287,072 Petrobras Distribuidora 1,032 0.86
72,107 Raia Drogasil 923 0.77 70,888 Ultrapar Participacoes 631 0.53 36,342 WEG 115 0.10
9,173 7.65
Peru Equities 1.56% (31 December 2017 1.40%) 11,122 Credicorp 1,874 1.56
1,874 1.56
Investment assets 118,763 99.00
Net other assets 1,195 1.00
Total net assets 119,958 100.00
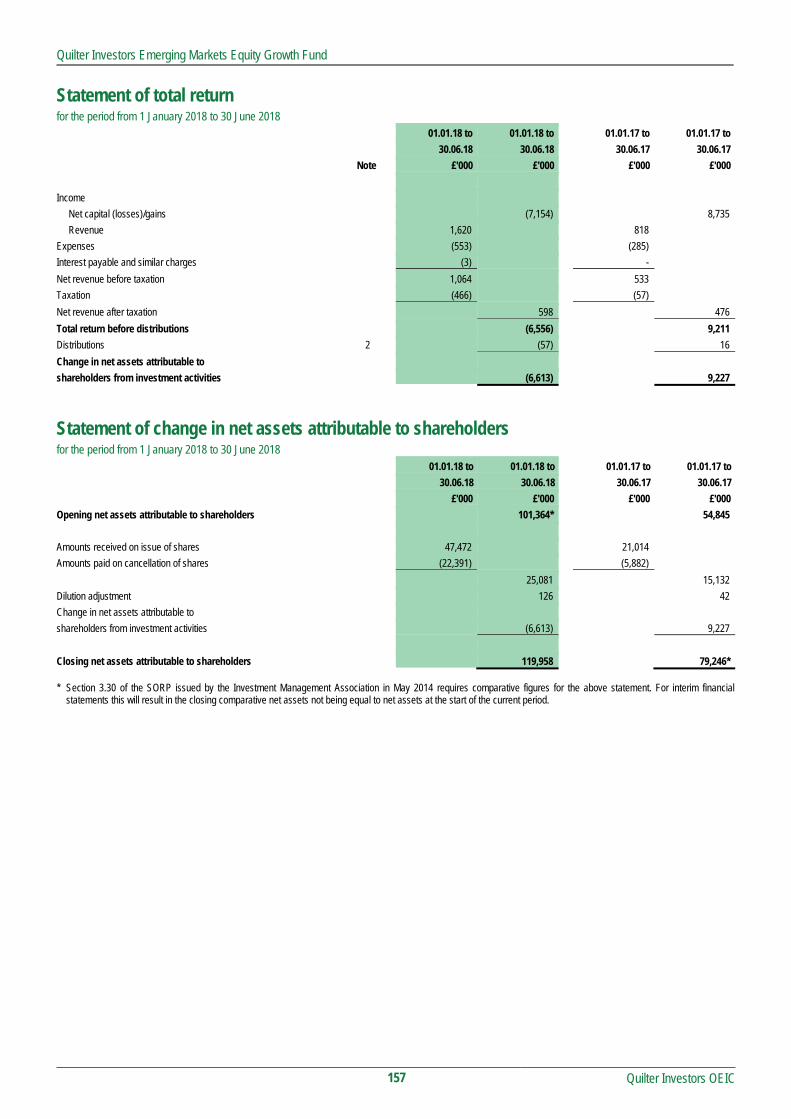
Quilter Investors Emerging Markets Equity Growth Fund
Quilter Investors OEIC
157
Statement of total return for the period from 1 January 2018 to 30 June 2018 01.01.18 to 01.01.18 to 01.01.17 to 01.01.17 to
30.06.18 30.06.18 30.06.17 30.06.17
Note £'000 £'000 £'000 £'000
Income
Net capital (losses)/gains (7,154) 8,735
Revenue 1,620 818
Expenses (553) (285)
Interest payable and similar charges (3) -
Net revenue before taxation 1,064 533
Taxation (466) (57)
Net revenue after taxation 598 476
Total return before distributions (6,556) 9,211
Distributions 2 (57) 16
Change in net assets attributable to
shareholders from investment activities (6,613) 9,227
Statement of change in net assets attributable to shareholders for the period from 1 January 2018 to 30 June 2018 01.01.18 to 01.01.18 to 01.01.17 to 01.01.17 to
30.06.18 30.06.18 30.06.17 30.06.17
£'000 £'000 £'000 £'000
Opening net assets attributable to shareholders 101,364* 54,845
Amounts received on issue of shares 47,472 21,014
Amounts paid on cancellation of shares (22,391) (5,882)
25,081 15,132
Dilution adjustment 126 42
Change in net assets attributable to
shareholders from investment activities (6,613) 9,227
Closing net assets attributable to shareholders 119,958 79,246* * Section 3.30 of the SORP issued by the Investment Management Association in May 2014 requires comparative figures for the above statement. For interim financial
statements this will result in the closing comparative net assets not being equal to net assets at the start of the current period.

Quilter Investors Emerging Markets Equity Growth Fund
Quilter Investors OEIC
158
Balance sheet as at 30 June 2018 30.06.18 31.12.17
£'000 £'000
Assets
Fixed assets
Investments 118,763 99,827
Current assets
Debtors 1,247 424
Cash and bank balances 347 1,695
Total assets 120,357 101,946
Liabilities
Creditors
Other creditors (399) (582)
Total liabilities (399) (582)
Net assets attributable to shareholders 119,958 101,364

Quilter Investors Emerging Markets Equity Growth Fund
Notes to the financial statements for the period from 1 January 2018 to 30 June 2018
Quilter Investors OEIC
159
1 Accounting policies The financial statements have been prepared under the historical cost basis, as modified by the revaluation of investments, and in accordance with the Statement of Recommended Practice (SORP) for Authorised Funds, issued by the Investment Management Association in May 2014.
The accounting policies applied are consistent with those disclosed within the annual Financial Statements for the year ended 31 December 2017.
2 Distributions The distributions take account of revenue received on the issue of shares and revenue deducted on the cancellation of shares, and comprise:
01.01.18 to 01.01.17 to 30.06.18 30.06.17 £'000 £'000 Revenue deducted on cancellation of shares 83 17 Revenue received on issue of shares (26) (33) Distributions 57 (16)
Reconciliation of distributions: Net revenue after taxation 598 476 Overseas capital gains tax 342 - Undistributed net revenue carried forward (883) (492) Distributions 57 (16)

Quilter Investors Emerging Markets Equity Income Fund
Quilter Investors Emerging Markets Equity Income Fund
Quilter Investors OEIC
160
Launch date 8 June 2018
IA Sector Global Emerging Markets
Investment adviser Wells Capital Management Incorporated
Net asset value £63,369,608
Objective
The sub-fund aims to achieve a combination of income and capital growth.
Policy
The sub-fund primarily invests, directly or indirectly, in shares of companies listed, traded or dealt in on a regulated market in emerging markets worldwide and companies that have a predominant proportion of their assets or business operations in these emerging market countries. The investment adviser typically has a preference to invest in shares of companies they believe are likely to provide dividend payments. The sub-fund may at times be concentrated in terms of the number of investments it holds.
The sub-fund may also invest in other transferable securities, collective investment schemes (including those managed or operated by the ACD) warrants, money market instruments, deposits, cash and derivatives.
The sub-fund may initially only use derivatives for efficient portfolio management purposes. The sub-fund may use derivatives for purposes other than efficient portfolio management, provided it has given shareholders 60 days’ notice of such change.
The sub-fund is managed by an investment adviser selected by the ACD for their expected ability to manage the sub-fund according to the investment objective and policy. The ACD continuously monitors and may periodically make changes to this appointment.
Investment Manager’s review
The sub-fund was launched on 8 June 2018.
The team aims to achieve a combination of income and capital growth by investing, directly or indirectly, in shares of companies listed, traded or dealt in emerging markets. Typically the preference is for companies likely to provide dividend payments with the manager focusing on companies with a sustainable high dividend yield backed by strong company financials and fundamentals.
The investment strategy includes both a top-down strategy, which includes an assessment of overall economic and market trends in each country, and a bottom-up strategy using fundamental research for security selection.
Risk and Reward Profile
The calculated risk and reward category, as shown above, uses a method of calculation derived from EU rules. It is based on the rate at which the returns of the sub-fund have moved up and down in the past (i.e. volatility) and is not a guide to the future risk and reward category of the sub-fund. The category shown is not a target or guarantee and may shift over time. Even the lowest category 1 does not mean a risk-free investment. The seven-category scale is nonlinear, for example, 2 is not twice as risky as 1.
Sub-fund in category 6 have in the past shown relatively high volatility. With a sub-fund of category 6, you have a relatively high risk of losing money but your chance for gains is also relatively high.
Investment risk - there is no guarantee that the sub-fund will achieve its objective. A capital loss of some or all of the amount invested may occur.
Emerging markets risk - less developed countries may face more political, economic or structural challenges than developed countries.
Concentration risk (number of investments) - the sub-fund may at times hold a smaller number of investments, and therefore a fall in the value of a single investment may have a greater impact on the sub-fund’s value than if it held a larger number of investments.
Smaller companies risk - smaller companies are subject to greater risk and reward potential. Investments may be volatile or difficult to buy or sell.
Liquidity risk - some investments may become hard to value or sell at a desired time and price. In extreme circumstances this may affect the sub-fund’s ability to meet redemption requests upon demand.
Currency risk - the sub-fund is denominated in British Pounds but holds assets denominated in other currencies. The value of your shares may rise and fall as a result of exchange rate movements between these currencies.
Derivative risk - the sub-fund may use derivatives to reduce costs and/or the overall risk of the sub-fund (i.e. Efficient Portfolio Management (EPM)). Derivatives involve a level of risk, however, for EPM they should not increase the overall riskiness of the sub-fund. Derivatives also involve counterparty risk where the institutions acting as counterparty to derivatives may not meet their contractual obligations.
Capital erosion risk - the sub-fund takes its charges from the capital of the sub-fund. Investors should be aware that there is potential for capital erosion if insufficient capital growth is achieved by the sub-fund to cover the charges. Capital erosion may have the effect of reducing the level of income generated.
For a more detailed explanation of risks, please refer to the "Risk Factors" section of the prospectus.

Quilter Investors Emerging Markets Equity Income Fund
Quilter Investors OEIC
161
Performance Records Comparative Tables 8 June 2018 to Accumulation 'U2'† 30 June 2018 p/share
Change in net assets per share Opening net asset value per share 100.00
Return before operating charges* (5.01) Operating charges** (0.05)
Return after operating charges* (5.06)
Distributions (0.37) Retained distributions 0.37
Closing net asset value per share 94.94
* after direct transaction costs of*** 0.11
Performance Return after charges (5.06)%
Other information Closing net asset value (£) 63,369,608 Closing number of shares 66,749,480 Operating charges**** 0.90% Direct transaction costs*** 1.95%
Prices pence per share Highest share price 100.0 Lowest share price 94.05
† From 8 June 2018 ** The operating charges include all costs borne by the sub-fund, except for direct transaction costs.
*** The direct transaction costs are made up of fees and commissions paid to agents, advisers, brokers and dealers, levies by regulatory agencies and securities exchanges as well as transfer taxes and duties. They do not include any difference between the quoted bid and offer prices or internal administrative or holding costs. These costs arise as a result of transactions undertaken both for efficient portfolio management and the meeting of the sub-fund’s objectives. These costs exclude any effect of dilution adjustments used to offset the costs.
**** The operating charges percentage is the ratio of the sub-fund's ongoing charges (excluding interest on borrowings) to the average net assets of the sub-fund. If the share class launched during the period the operating charges figures are annualised.
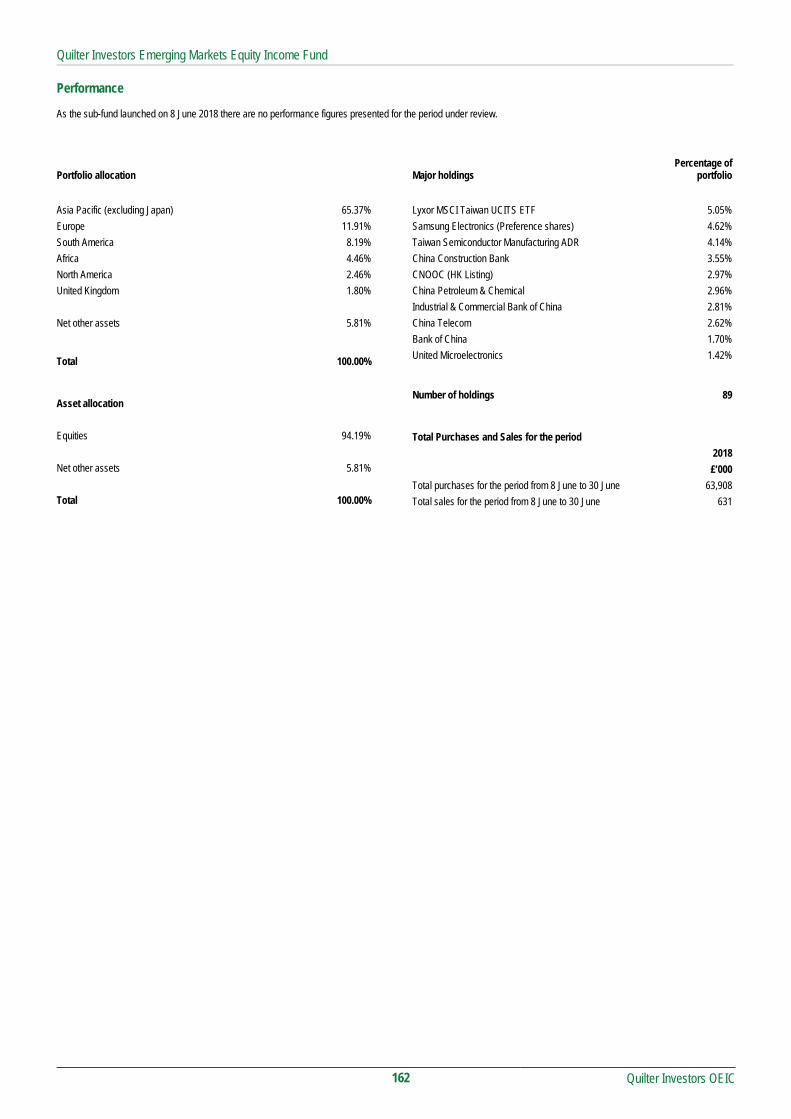
Quilter Investors Emerging Markets Equity Income Fund
Quilter Investors OEIC
162
Performance As the sub-fund launched on 8 June 2018 there are no performance figures presented for the period under review.
Portfolio allocation
Asia Pacific (excluding Japan) 65.37%
Europe 11.91%
South America 8.19%
Africa 4.46%
North America 2.46%
United Kingdom 1.80%
Net other assets 5.81%
Total 100.00%
Asset allocation
Equities 94.19%
Net other assets 5.81%
Total 100.00%
Major holdings Percentage of
portfolio
Lyxor MSCI Taiwan UCITS ETF 5.05%
Samsung Electronics (Preference shares) 4.62%
Taiwan Semiconductor Manufacturing ADR 4.14%
China Construction Bank 3.55%
CNOOC (HK Listing) 2.97%
China Petroleum & Chemical 2.96%
Industrial & Commercial Bank of China 2.81%
China Telecom 2.62%
Bank of China 1.70%
United Microelectronics 1.42%
Number of holdings 89
Total Purchases and Sales for the period
2018
£’000
Total purchases for the period from 8 June to 30 June 63,908
Total sales for the period from 8 June to 30 June 631

Quilter Investors Emerging Markets Equity Income Fund
Portfolio statement as at 30 June 2018
Quilter Investors OEIC
163
Market Percentage of Value total net assets
Holding Investment £’000 %
United Kingdom 1.80%
United Kingdom Equities 1.80% 26,553 Mondi 547 0.86 35,422 Anglo American 595 0.94
Total 1,142 1.80
Overseas 92.39%
Africa 4.46%
South Africa Equities 4.46% 66,317 Barclays Africa 575 0.91 52,708 Standard Bank 551 0.87 21,289 Mr Price 264 0.41 54,796 Truworths International 233 0.37
116,034 Sanlam 444 0.70 529,512 Growthpoint Properties 759 1.20
Total 2,826 4.46
Asia Pacific (excluding Japan) 65.37%
China Equities 24.52% 1,661,000 Agricultural Bank of China 'H' 591 0.93 2,860,000 Bank of China 1,076 1.70 3,200,000 China Construction Bank 2,247 3.55 3,139,000 Industrial & Commercial Bank of China 1,784 2.81
610,000 China Communications Construction 448 0.71 676,000 Huaneng Power International 341 0.54
4,658,000 China Telecom 1,658 2.62 835,000 China Lesso 403 0.64 618,000 Angang Steel 421 0.66 444,000 Zhejiang Expressway 301 0.47 151,000 China Life Insurance 'H' 296 0.47 972,000 PICC Property & Casualty 798 1.26
2,768,000 China Petroleum & Chemical 1,879 2.96 1,436,000 CNOOC (HK Listing) 1,883 2.97 1,512,000 China Communications Services 729 1.15 1,660,000 Lenovo 684 1.08
Total 15,539 24.52
Hong Kong Equities 8.69% 316,000 Xinyi Glass 293 0.46 352,000 China Resources Cement 271 0.43 580,000 China State Construction International 453 0.71 344,000 Guangdong Investment 414 0.65
1,010,000 Chow Tai Fook Jewellery 866 1.37 299,000 Sun Art Retail 298 0.47 200,000 China Merchants Port 308 0.49
96,000 China Mobile 649 1.02 300,000 China Overseas Land & Investment 751 1.19 222,000 China Resources Land 568 0.90 673,000 SJM 636 1.00
Total 5,507 8.69

Quilter Investors Emerging Markets Equity Income Fund
Portfolio statement (continued) as at 30 June 2018
Quilter Investors OEIC
164
Market Percentage of
Value total net assets Holding Investment £’000 %
India Equities 3.61%
8,539 HDFC Bank ADR 686 1.08 75,226 Vedanta 757 1.19 58,599 Infosys ADR 847 1.34
Total 2,290 3.61
Indonesia Equities 2.69% 3,883,300 Bank Rakyat Indonesia 584 0.92 4,054,500 Telekomunikasi Indonesia 805 1.27
681,500 Matahari Department Store 318 0.50 Total 1,707 2.69
Macau Equities 0.99% 154,000 Sands China 626 0.99
Total 626 0.99
Malaysia Equities 2.58% 277,100 CIMB 284 0.45
85,400 Public Bank 371 0.59 221,700 Bursa Malaysia 307 0.48 773,800 Sime Darby 356 0.56 342,700 Genting Malaysia 315 0.50
Total 1,633 2.58
Singapore Equities 1.02% 70,400 BOC Aviation 333 0.52
371,100 CapitaLand Retail China Trust 315 0.50 Total 648 1.02
South Korea Equities 12.68% 3,348 Hyundai Motor 286 0.45
16,781 KB Financial 605 0.95 19,416 Korea Electric Power 424 0.67 7,040 Coway 415 0.66 1,966 POSCO 441 0.70
114,119 Samsung Electronics (Preference shares) 2,930 4.62 5,107 SK Telecom 811 1.28
66,902 Korean Reinsurance 539 0.85 2,707 Samsung Fire & Marine Insurance 488 0.77 4,496 SK Innovation 619 0.98 6,352 S-Oil 475 0.75
Total 8,033 12.68
Taiwan Equities 5.56% 95,856 Taiwan Semiconductor Manufacturing ADR 2,621 4.14
430,700 United Microelectronics 901 1.42 Total 3,522 5.56
Thailand Equities 3.03% 100,700 Bangkok Bank (Foreign Reg) 459 0.72
1,142,500 Thai Beverage PCL 456 0.72 275,300 PTT PCL 302 0.48
2,741,200 Land & Houses 705 1.11 Total 1,922 3.03
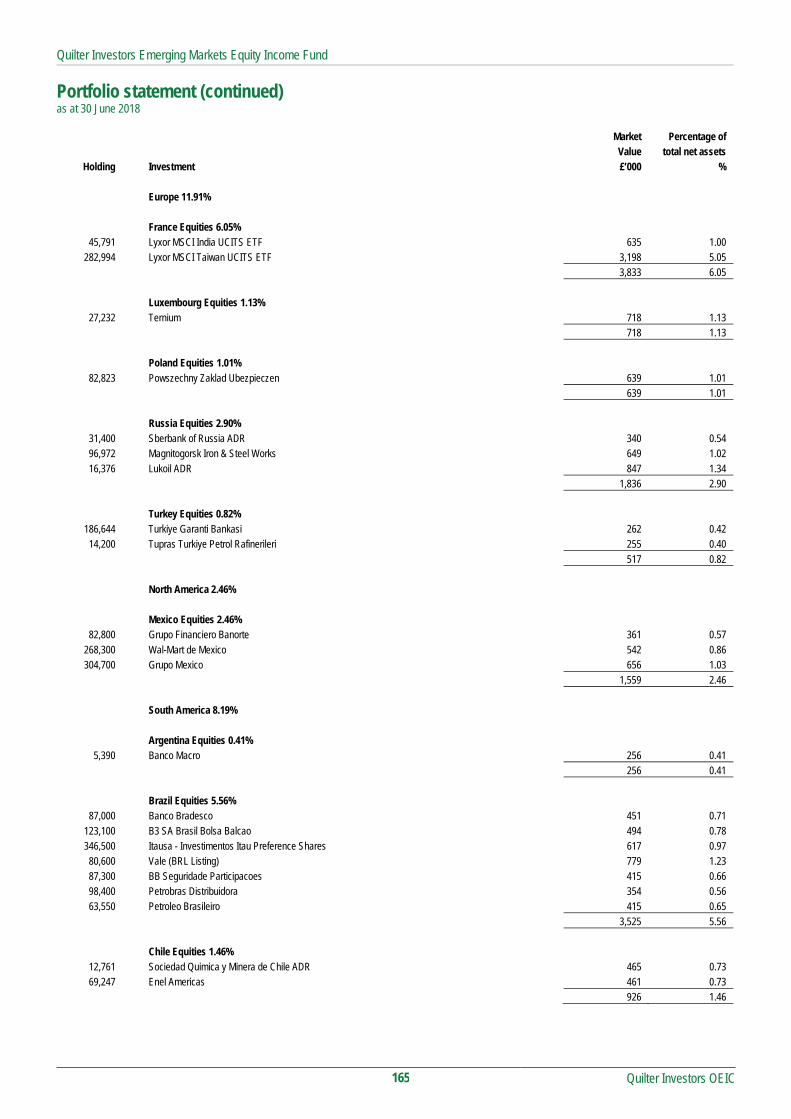
Quilter Investors Emerging Markets Equity Income Fund
Portfolio statement (continued) as at 30 June 2018
Quilter Investors OEIC
165
Market Percentage of
Value total net assets Holding Investment £’000 %
Europe 11.91%
France Equities 6.05% 45,791 Lyxor MSCI India UCITS ETF 635 1.00
282,994 Lyxor MSCI Taiwan UCITS ETF 3,198 5.05 Total 3,833 6.05
Luxembourg Equities 1.13% 27,232 Ternium 718 1.13
Total 718 1.13
Poland Equities 1.01% 82,823 Powszechny Zaklad Ubezpieczen 639 1.01
Total 639 1.01
Russia Equities 2.90% 31,400 Sberbank of Russia ADR 340 0.54 96,972 Magnitogorsk Iron & Steel Works 649 1.02 16,376 Lukoil ADR 847 1.34
Total 1,836 2.90
Turkey Equities 0.82% 186,644 Turkiye Garanti Bankasi 262 0.42
14,200 Tupras Turkiye Petrol Rafinerileri 255 0.40 Total 517 0.82
North America 2.46%
Mexico Equities 2.46% 82,800 Grupo Financiero Banorte 361 0.57
268,300 Wal-Mart de Mexico 542 0.86 304,700 Grupo Mexico 656 1.03
Total 1,559 2.46
South America 8.19%
Argentina Equities 0.41% 5,390 Banco Macro 256 0.41
Total 256 0.41
Brazil Equities 5.56% 87,000 Banco Bradesco 451 0.71
123,100 B3 SA Brasil Bolsa Balcao 494 0.78 346,500 Itausa - Investimentos Itau Preference Shares 617 0.97
80,600 Vale (BRL Listing) 779 1.23 87,300 BB Seguridade Participacoes 415 0.66 98,400 Petrobras Distribuidora 354 0.56 63,550 Petroleo Brasileiro 415 0.65
Total 3,525 5.56
Chile Equities 1.46% 12,761 Sociedad Quimica y Minera de Chile ADR 465 0.73 69,247 Enel Americas 461 0.73
Total 926 1.46

Quilter Investors Emerging Markets Equity Income Fund
Portfolio statement (continued) as at 30 June 2018
Quilter Investors OEIC
166
Market Percentage of
Value total net assets Holding Investment £’000 %
Peru Equities 0.76%
2,863 Credicorp 482 0.76 Total 482 0.76
Investment assets 59,686 94.19
Net other assets 3,684 5.81
Total net assets 63,370 100.00 All investments are approved securities being either officially listed in a member state or traded on or under the rules of an eligible securities market, unless otherwise stated.
All investments are in ordinary shares unless otherwise stated.

Quilter Investors Emerging Markets Equity Income Fund
Quilter Investors OEIC
167
Statement of total return for the period from 8 June 2018 to 30 June 2018 08.06.18 to 08.06.18 to
30.06.18 30.06.18
Note £'000 £'000
Income
Net capital losses (3,589)
Revenue 311
Expenses (33)
Net revenue before taxation 278
Taxation (33)
Net revenue after taxation 245
Total return before distributions (3,344)
Distributions 2 (245)
Change in net assets attributable to
shareholders from investment activities (3,589)
Statement of change in net assets attributable to shareholders for the period from 8 June 2018 to 30 June 2018 08.06.18 to 08.06.18 to
30.06.18 30.06.18
£'000 £'000
Opening net assets attributable to shareholders -
Amounts received on issue of shares 66,712
Amounts paid on cancellation of shares -
66,712
Dilution adjustment 1
Change in net assets attributable to
shareholders from investment activities (3,589)
Retained distribution on accumulation shares 246
Closing net assets attributable to shareholders 63,370

Quilter Investors Emerging Markets Equity Income Fund
Quilter Investors OEIC
168
Balance sheet as at 30 June 2018 30.06.18
£'000
Assets
Fixed assets
Investments 59,686
Current assets
Debtors 534
Cash and bank balances 3,183
Total assets 63,403
Liabilities
Creditors
Other creditors (33)
Total liabilities (33)
Net assets attributable to shareholders 63,370

Quilter Investors Emerging Markets Equity Income Fund
Notes to the financial statements for the period from 8 June 2018 to 30 June 2018
Quilter Investors OEIC
169
1 Accounting policies The financial statements have been prepared under the historical cost basis, as modified by the revaluation of investments, and in accordance with the Statement of Recommended Practice (SORP) for Authorised Funds, issued by the Investment Management Association in May 2014.
2 Distributions The distributions take account of revenue received on the issue of shares and revenue deducted on the cancellation of shares, and comprise:
08.06.18 to 30.06.18 £'000 Interim – Accumulation shares (30 June) 246 246 Revenue deducted on cancellation of shares - Revenue received on issue of shares (1) Distributions 245

Quilter Investors Emerging Markets Equity Income Fund
Distribution table
Quilter Investors OEIC
170
Interim distribution Group 1: Shares purchased prior to 8 June 2018 Group 2: Shares purchased from 8 June 2018 to 30 June 2018
Revenue
pence per share Equalisation
pence per share*
Distribution paid 30.06.18
pence per share Accumulation 'U2' Shares† Group 1 0.3686 - 0.3686 Group 2 0.3658 0.0028 0.3686 * Equalisation only applies to shares purchased during the distribution period (Group 2 shares). It is the average amount of revenue included in the purchase price of all
Group 2 shares and is refunded to holders of these shares as a return of capital. Being capital, it is not liable to income tax but must be deducted from the cost of shares for capital gains tax purposes.

Quilter Investors Europe (ex UK) Equity Fund
Quilter Investors Europe (ex UK) Equity Fund
Quilter Investors OEIC
171
Launch date 1 March 2013
IA Sector Europe ex UK
Investment adviser Henderson Global Investors Limited
Net asset value £252,685,059
Objective
The sub-fund aims to achieve capital growth.
Policy
The sub-fund primarily invests, directly and indirectly, in shares of companies listed or located in Europe, excluding the United Kingdom. The sub-fund may at times be concentrated in terms of the number of investments it holds.
The sub-fund may also invest in other transferable securities which may include shares in UK companies, collective investment schemes (including those managed or operated by the ACD), warrants, money market instruments, deposits and derivatives.
The sub-fund may only use derivatives for efficient portfolio management purposes.
The sub-fund is managed by an investment adviser selected by the ACD for their expected ability to manage the sub-fund according to the investment objective and policy. The ACD continuously monitors and may periodically make changes to this appointment.
Investment Manager’s review
Market Review
Markets do, eventually, remind us that momentum works both ways and the early weeks of 2018 served up just such a prompt, with markets seeing, in our view, a long-overdue correction in February. While European equities rebounded swiftly, there was a further sharp sell-off in June, courtesy of further disappointing economic data, undoing most of the progress from European markets in the second half of 2017.
While market sentiment has cooled in recent months, a situation that normally provides an investment opportunity for value-focused investors, it seems too early to abandon a defensive mindset. In particular, the narrow breadth of performance drivers in the US market continues to fuel uncertainty globally. The ‘FAANG’, stocks, as they are commonly known (Facebook, Apple, Amazon, Netflix, Google) – represent more than 60 per cent of the year-to-date total return on the S&P500 Index. It seems likely that this leadership will be challenged, necessitating a focus on stock-specific factors and sound trading discipline.
Performance
In this environment, good stock selection in financials, materials and consumer-related areas helped the sub-fund to avoid the worst of the market falls during the first half of 2018, with key contributions coming from the paper and packaging sector. The sub-fund benefited from its holding in Smurfit Kappa, which rejected an unsolicited bid from US peer International Paper in March. From the same sector, Finnish pulp and paper manufacturer UPM-Kymmene saw strong product price momentum in the first quarter.
Elsewhere, a holding in Autoliv – a key holding in the auto components sector – added value. Good Q4 results and strong guidance for 2018 fed through to broker upgrades, providing a window to take some profit on share price highs. Energy was the best performing sector in Europe during the second quarter, with a positive contribution from Galp Energia benefiting the sub-fund. Norwegian fish farming leader Marine Harvest – a recent addition to the portfolio – also contributed as global salmon consumption reached record levels. While stock selection in financials added to performance on a relative basis, there were a few individual disappointments, including Nordea Bank and ABN Amro, which lagged in a weak European banking environment. IT firm United Internet was downgraded by a local broker and a holding in British American Tobacco lagged on news of a lower-than-expected organic revenue increase for 2017.
Significant activity during the first half of 2018 included a new position in Safran from the aerospace sector. Exposure to capital goods was adjusted via the disposal of Siemens and the addition of Schneider Electric, which is demonstrating an improving growth rate, while trading on what looks like an attractive valuation. German sports retailer Adidas proved to be an excellent performer for the strategy in 2015/2016 and, following a stock derating, the name was reintroduced based on the company’s strong margin potential. The sub-fund’s presence in European banks was cut via the
disposal of Commerzbank, BNP Paribas, Société Générale and Banco Santander. In the insurance sector a position in Zurich Insurance was added to the portfolio, with the investment rationale driven by a positive delta to rising interest rates and a secure dividend. The position in AXA was closed, with shares lagging following news that the company has agreed to purchase property and casualty insurer XL Group. Profit was also taken on the holding in Volvo.
Risk and Reward Profile
The calculated risk and reward category, as shown above, uses a method of calculation derived from EU rules. It is based on the rate at which the returns of the sub-fund have moved up and down in the past (i.e. volatility) and is not a guide to the future risk and reward category of the sub-fund. The category shown is not a target or guarantee and may shift over time. Even the lowest category 1 does not mean a risk-free investment. The seven-category scale is nonlinear, for example, 2 is not twice as risky as 1.
Sub-funds in category 5 have in the past shown moderately high volatility. With a sub-fund of category 5, you have a moderately high risk of losing money but your chance for gains is also moderately high.
Investment risk - there is no guarantee that the sub-fund will achieve its objective. A capital loss of some or all of the amount invested may occur.
Geographic concentration risk - a fall in the European market may have a significant impact on the value of the sub-fund because it primarily invests in this market.
Concentration risk (number of investments) - the sub-fund may at times hold a smaller number of investments, and therefore a fall in the value of a single investment may have a greater impact on the sub-fund’s value than if it held a larger number of investments.
Liquidity risk - some investments may become hard to value or sell at a desired time and price. In extreme circumstances this may affect the sub-fund’s ability to meet redemption requests upon demand.
Currency risk (EUR share class) - the sub-fund is denominated in British Pounds but holds assets denominated in other currencies. This share class is denominated in Euro. The value of your shares may rise and fall as a result of exchange rate movements between these currencies.
Currency risk (GBP share class) - the sub-fund is denominated in British Pounds but holds assets denominated in other currencies. The value of your shares may rise and fall as a result of exchange rate movements between these currencies.
Currency risk (USD share class) - the sub-fund is denominated in British Pounds but holds assets denominated in other currencies. This share class is denominated in US Dollars. The value of your shares may rise and fall as a result of exchange rate movements between these currencies.
Derivative risk - the sub-fund may use derivatives to reduce costs and/or the overall risk of the sub-fund (i.e. Efficient Portfolio Management (EPM)). Derivatives involve a level of risk, however, for EPM they should not increase the overall riskiness of the sub-fund. Derivatives also involve counterparty risk where the institutions acting as counterparty to derivatives may not meet their contractual obligations.
Capital erosion risk - the sub-fund takes its charges from the income of the sub-fund in the first instance. The impact of sub-fund charges may be material on the value of any income you receive from your investment. There is potential for capital erosion if insufficient income is generated by the sub-fund to cover these charges. Capital erosion may have the effect of reducing the level of income generated.
For full details of the sub-fund's risks, please see the section in the prospectus headed "Risks".
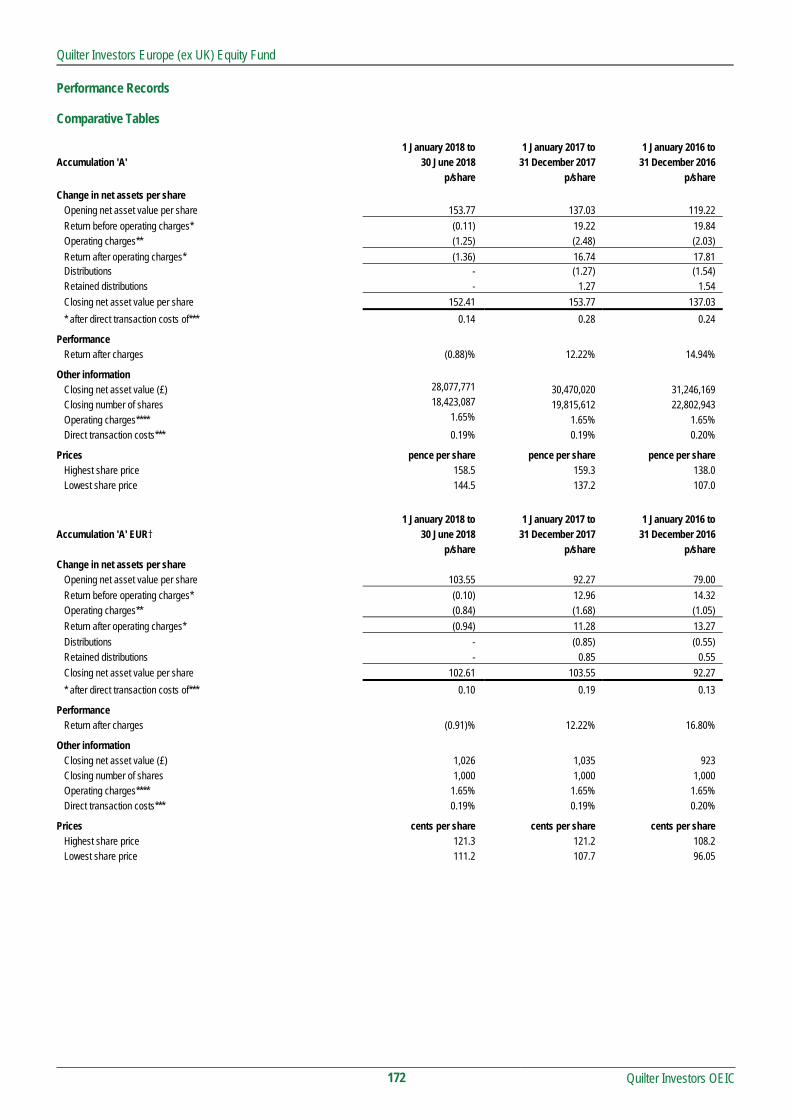
Quilter Investors Europe (ex UK) Equity Fund
Quilter Investors OEIC
172
Performance Records Comparative Tables 1 January 2018 to 1 January 2017 to 1 January 2016 to Accumulation 'A' 30 June 2018 31 December 2017 31 December 2016 p/share p/share p/share
Change in net assets per share Opening net asset value per share 153.77 137.03 119.22
Return before operating charges* (0.11) 19.22 19.84 Operating charges** (1.25) (2.48) (2.03)
Return after operating charges* (1.36) 16.74 17.81 Distributions - (1.27) (1.54) Retained distributions - 1.27 1.54
Closing net asset value per share 152.41 153.77 137.03
* after direct transaction costs of*** 0.14 0.28 0.24
Performance Return after charges (0.88)% 12.22% 14.94%
Other information Closing net asset value (£) 28,077,771 30,470,020 31,246,169 Closing number of shares 18,423,087 19,815,612 22,802,943 Operating charges**** 1.65% 1.65% 1.65% Direct transaction costs*** 0.19% 0.19% 0.20%
Prices pence per share pence per share pence per share Highest share price 158.5 159.3 138.0 Lowest share price 144.5 137.2 107.0
1 January 2018 to 1 January 2017 to 1 January 2016 to Accumulation 'A' EUR† 30 June 2018 31 December 2017 31 December 2016 p/share p/share p/share Change in net assets per share
Opening net asset value per share 103.55 92.27 79.00
Return before operating charges* (0.10) 12.96 14.32 Operating charges** (0.84) (1.68) (1.05)
Return after operating charges* (0.94) 11.28 13.27
Distributions - (0.85) (0.55) Retained distributions - 0.85 0.55
Closing net asset value per share 102.61 103.55 92.27
* after direct transaction costs of*** 0.10 0.19 0.13
Performance Return after charges (0.91)% 12.22% 16.80%
Other information Closing net asset value (£) 1,026 1,035 923 Closing number of shares 1,000 1,000 1,000 Operating charges**** 1.65% 1.65% 1.65% Direct transaction costs*** 0.19% 0.19% 0.20%
Prices cents per share cents per share cents per share Highest share price 121.3 121.2 108.2 Lowest share price 111.2 107.7 96.05

Quilter Investors Europe (ex UK) Equity Fund
Quilter Investors OEIC
173
Comparative Tables (continued) 1 January 2018 to 1 January 2017 to 1 January 2016 to Accumulation 'A' USD 30 June 2018 31 December 2017 31 December 2016 p/share p/share p/share Change in net assets per share
Opening net asset value per share 86.41 77.01 66.99
Return before operating charges* (0.08) 10.84 11.17 Operating charges** (0.70) (1.44) (1.15)
Return after operating charges* (0.78) 9.40 10.02
Distributions - (0.73) (0.90) Retained distributions - 0.73 0.90
Closing net asset value per share 85.63 86.41 77.01
* after direct transaction costs of*** 0.08 0.16 0.14
Performance Return after charges (0.90)% 12.21% 14.96%
Other information Closing net asset value (£) 400,377 634,683 99,810 Closing number of shares 467,565 734,527 129,606 Operating charges**** 1.65% 1.65% 1.65% Direct transaction costs*** 0.19% 0.19% 0.20%
Prices cents per share cents per share cents per share Highest share price 125.2 117.9 99.49 Lowest share price 111.9 94.89 86.79
1 January 2018 to 1 January 2017 to 1 January 2016 to Accumulation 'U2' 30 June 2018 31 December 2017 31 December 2016 p/share p/share p/share Change in net assets per share
Opening net asset value per share 144.24 127.41 109.86
Return before operating charges* (0.09) 17.89 18.41 Operating charges** (0.53) (1.06) (0.86)
Return after operating charges* (0.62) 16.83 17.55
Distributions - (2.45) (2.45) Retained distributions - 2.45 2.45
Closing net asset value per share 143.62 144.24 127.41
* after direct transaction costs of*** 0.14 0.26 0.13
Performance Return after charges (0.43)% 13.21% 15.97%
Other information Closing net asset value (£) 224,205,885 212,273,994 127,059,768 Closing number of shares 156,109,031 147,164,951 99,728,907 Operating charges**** 0.75% 0.75% 0.75% Direct transaction costs*** 0.19% 0.19% 0.20%
Prices pence per share pence per share pence per share Highest share price 148.8 149.2 128.10 Lowest share price 135.9 127.6 98.75
† From 31 March 2016 ** The operating charges include all costs borne by the sub-fund, except for direct transaction costs.
*** The direct transaction costs are made up of fees and commissions paid to agents, advisers, brokers and dealers, levies by regulatory agencies and securities exchanges as well as transfer taxes and duties. They do not include any difference between the quoted bid and offer prices or internal administrative or holding costs. These costs arise as a result of transactions undertaken both for efficient portfolio management and the meeting of the sub-fund’s objectives. These costs exclude any effect of dilution adjustments used to offset the costs.
**** The operating charges percentage is the ratio of the sub-fund’s ongoing charges (excluding interest on borrowings) to the average net assets of the sub-fund. If the share class launched during the period the operating charges figures are annualised.

Quilter Investors Europe (ex UK) Equity Fund
Quilter Investors OEIC
174
Performance
6 months to
30 June 2018
1 year to
30 June 2018
3 years to
30 June 2018
5 years to
30 June 2018
Quilter Investors Europe (ex UK) Equity Fund* (0.42)% 0.07% 32.38% 56.08%
FTSE World Europe ex UK (benchmark) (1.43)% 2.52% 40.30% 65.10%
IA Europe ex UK (sector average) (0.70)% 3.30% 40.18% 68.55%
Quartile ranking 2 4 4 4
* Accumulation ‘U2’ shares
Data Source – Factset. Figures are calculated on a total return and single price basis, with net income reinvested into the sub-fund. Portfolio allocation
Germany 18.77%
France 13.93%
Netherlands 12.24%
Switzerland 12.01%
Sweden 9.23%
Finland 6.43%
Denmark 5.93%
Spain 4.63%
Ireland 4.49%
Portugal 3.53%
Norway 3.16%
Italy 2.90%
United Kingdom 1.11%
Belgium 0.80%
Net other assets 0.84%
Total 100.00%
Asset allocation
Equities 99.16%
Net other assets 0.84%
Total 100.00%
Major holdings Percentage of
portfolio
Carlsberg 3.74%
SAP 3.63%
Galp Energia 3.53%
Nokian Renkaat 3.16%
Nestle 3.11%
Smurfit Kappa (Irish Listing) 3.07%
LafargeHolcim 2.87%
Autoliv SDR 2.63%
Bankinter 2.63%
Roche 2.54%
Number of holdings 68
Total Purchases and Sales for the period
2018 2017
£’000 £’000
Total purchases for the 6 month period to 30 June 139,214 121,003
Total sales for the 6 month period to 30 June 122,100 63,061

Quilter Investors Europe (ex UK) Equity Fund
Portfolio statement as at 30 June 2018
Quilter Investors OEIC
175
Market Percentage of
Value total net assets Holding Investment £'000 %
United Kingdom 1.11% (31 December 2017 1.57%)
United Kingdom Equities 1.11% (31 December 2017 1.57%) 347,052 CNH Industrial 2,799 1.11
2,799 1.11
Overseas 98.05% (31 December 2017 96.49%)
Europe 98.05% (31 December 2017 96.49%)
Belgium Equities 0.80% (31 December 2017 1.23%) 34,794 KBC 2,033 0.80
2,033 0.80
Denmark Equities 5.93% (31 December 2017 5.98%) 105,723 Carlsberg 9,451 3.74 157,102 Novo Nordisk 5,523 2.19
14,974 5.93
Finland Equities 6.43% (31 December 2017 4.02%) 94,265 Kone 3,634 1.44
226,766 Nokia 990 0.39 266,595 Nokian Renkaat 7,978 3.16 134,117 UPM-Kymmene 3,646 1.44
16,248 6.43
France Equities 13.93% (31 December 2017 13.90%) 43,131 Cie Generale des Etablissements Michelin 3,987 1.58 89,969 Legrand 5,029 1.99 16,255 L'Oreal 3,024 1.20 11,927 LVMH Moet Hennessy Louis Vuitton 3,008 1.19 16,313 Pernod Ricard 2,031 0.80 33,915 Safran 3,102 1.23 54,608 Schneider Electric 3,452 1.37
156,885 Tarkett 3,447 1.36 98,544 Total 4,562 1.81 34,568 Vinci 2,534 1.00 54,280 Vivendi 1,015 0.40
35,191 13.93
Germany Equities 18.77% (31 December 2017 19.22%) 18,429 adidas 3,057 1.21 23,353 Allianz 3,643 1.44 28,596 BASF 2,075 0.82 51,089 Bayer 4,298 1.70 18,055 Continental 3,143 1.24 48,516 Deutsche Boerse 4,898 1.94 48,460 Deutsche Post 1,202 0.48
315,494 E.ON 2,551 1.01 50,545 Fresenius 3,066 1.21 15,804 Henkel (Preference shares) 1,523 0.60 51,503 Merck 3,806 1.51
104,925 SAP 9,158 3.63 113,804 United Internet 5,002 1.98
47,422 18.77

Quilter Investors Europe (ex UK) Equity Fund
Portfolio statement (continued) as at 30 June 2018
Quilter Investors OEIC
176
Market Percentage of Value total net assets
Holding Investment £'000 %
Ireland Equities 4.49% (31 December 2017 2.89%) 258,500 Ryanair (Irish Listing) 3,586 1.42 250,295 Smurfit Kappa (Irish Listing) 7,774 3.07
11,360 4.49
Italy Equities 2.90% (31 December 2017 4.20%) 150,541 Assicurazioni Generali 1,906 0.75
45,360 Industria Macchine Automatiche 2,978 1.18 580,456 Intesa Sanpaolo 1,290 0.51
91,615 UniCredit 1,154 0.46
7,328 2.90
Netherlands Equities 12.24% (31 December 2017 14.11%) 139,243 ABN AMRO 2,736 1.08
41,634 Akzo Nobel 2,714 1.07 36,893 ASML 5,561 2.20 86,292 ING 947 0.37
162,569 Koninklijke Philips 5,255 2.08 1,182,513 PostNL 3,358 1.33
230,744 RELX (Dutch Listing) 3,736 1.48 132,335 Royal Dutch Shell 'A' (EUR Listing) 3,500 1.39
73,449 Unilever (Dutch Listing) 3,124 1.24
30,931 12.24
Norway Equities 3.16% (31 December 2017 3.27%) 224,630 DNB 3,333 1.32 302,772 Marine Harvest 4,641 1.84
7,974 3.16
Portugal Equities 3.53% (31 December 2017 3.22%) 622,669 Galp Energia 8,934 3.53
8,934 3.53
Spain Equities 4.63% (31 December 2017 3.90%) 41,271 Amadeus IT 2,463 0.98
892,287 Bankinter 6,643 2.63 111,817 Grifols 2,586 1.02
11,692 4.63
Sweden Equities 9.23% (31 December 2017 10.42%) 47,041 Atlas Copco 1,034 0.41 85,552 Autoliv SDR 6,654 2.63 47,041 Epiroc 373 0.15
115,929 Kinnevik 2,980 1.18 174,881 Nordea Bank 1,271 0.50 280,763 Svenska Handelsbanken 2,354 0.93 394,265 Trelleborg 6,360 2.52
85,552 Veoneer 2,299 0.91
23,325 9.23

Quilter Investors Europe (ex UK) Equity Fund
Portfolio statement (continued) as at 30 June 2018
Quilter Investors OEIC
177
Market Percentage of Value total net assets
Holding Investment £'000 %
Switzerland Equities 12.01% (31 December 2017 10.13%) 58,990 ABB 976 0.39
195,245 LafargeHolcim 7,252 2.87 6,891 Lonza 1,387 0.55
134,594 Nestle 7,864 3.11 63,374 Novartis 3,614 1.43 38,350 Roche 6,430 2.54 12,539 Zurich Insurance 2,817 1.12
30,340 12.01
Investment assets 250,551 99.16
Net other assets 2,134 0.84
Total net assets 252,685 100.00
All investments are approved securities being either officially listed in a member state or traded on or under the rules of an eligible securities market, unless otherwise stated.
All investments are in ordinary shares unless otherwise stated.

Quilter Investors Europe (ex UK) Equity Fund
Quilter Investors OEIC
178
Statement of total return for the period from 1 January 2018 to 30 June 2018 01.01.18 to 01.01.18 to 01.01.17 to 01.01.17 to
30.06.18 30.06.18 30.06.17 30.06.17
Note £'000 £'000 £'000 £'000
Income
Net capital (losses)/gains (5,401) 19,266
Revenue 7,050 4,662
Expenses (1,111) (846)
Interest payable and similar charges (6) (4)
Net revenue before taxation 5,933 3,812
Taxation (522) (454)
Net revenue after taxation 5,411 3,358
Total return before distributions 10 22,624
Distributions 2 (464) 474
Change in net assets attributable to
shareholders from investment activities (454) 23,098
Statement of change in net assets attributable to shareholders for the period from 1 January 2018 to 30 June 2018 01.01.18 to 01.01.18 to 01.01.17 to 01.01.17 to
30.06.18 30.06.18 30.06.17 30.06.17
£'000 £'000 £'000 £'000
Opening net assets attributable to shareholders 243,380* 158,407
Amounts received on issue of shares 63,009 58,745
Amounts paid on cancellation of shares (53,368) (4,037)
9,641 54,708
Dilution adjustment 118 73
Change in net assets attributable to
shareholders from investment activities (454) 23,098
Closing net assets attributable to shareholders 252,685 236,286* * Section 3.30 of the SORP issued by the Investment Management Association in May 2014 requires comparative figures for the above statement. For interim financial
statements this will result in the closing comparative net assets not being equal to net assets at the start of the current period.

Quilter Investors Europe (ex UK) Equity Fund
Quilter Investors OEIC
179
Balance sheet as at 30 June 2018 30.06.18 31.12.17
£'000 £’000
Assets
Fixed assets
Investments 250,551 238,657
Current assets
Debtors 1,654 1,471
Cash and bank balances 827 3,568
Total assets 253,032 243,696
Liabilities
Creditors
Other creditors (347) (316)
Total liabilities (347) (316)
Net assets attributable to shareholders 252,685 243,380

Quilter Investors Europe (ex UK) Equity Fund
Notes to the financial statements for the period from 1 January 2018 to 30 June 2018
Quilter Investors OEIC
180
1 Accounting policies The financial statements have been prepared under the historical cost basis, as modified by the revaluation of investments, and in accordance with the Statement of Recommended Practice (SORP) for Authorised Funds, issued by the Investment Management Association in May 2014.
The accounting policies applied are consistent with those disclosed within the annual Financial Statements for the year ended 31 December 2017.
2 Distributions The distribution takes account of revenue received on the issue of shares and revenue deducted on the cancellation of shares, and comprise:
01.01.18 to 01.01.17 to 30.06.18 30.06.17 £'000 £'000 Revenue deducted on cancellation of shares 941 14 Revenue received on issue of shares (477) (488) Distributions 464 (474)
Reconciliation of distributions: Net revenue after taxation 5,411 3,358 Undistributed net revenue carried forward (4,947) (3,832) Distributions 464 (474)

Quilter Investors Europe (ex UK) Equity Growth Fund
Quilter Investors Europe (ex UK) Equity Growth Fund
Quilter Investors OEIC
181
Launch date 12 April 2013
IA Sector Europe ex UK
Investment adviser Threadneedle Asset Management Limited
Net asset value £78,141,430
Objective
The sub-fund aims to achieve capital growth.
Policy
The sub-fund primarily invests, directly and indirectly, in shares of companies listed or located in Europe, excluding the United Kingdom.
The investment adviser typically has a preference to invest in shares of companies they believe to have the potential for growth. The sub-fund may at times be concentrated in terms of the number of investments it holds.
The sub-fund may also invest in other transferable securities which may include shares in UK companies, collective investment schemes (including those managed or operated by the ACD), warrants, money market instruments, deposits and derivatives.
The sub-fund may only use derivatives for efficient portfolio management purposes.
The sub-fund is managed by an investment adviser selected by the ACD for their expected ability to manage the sub-fund according to the investment objective and policy. The ACD continuously monitors and may periodically make changes to this appointment.
Investment Manager’s review
Market Review
Following a year of strong gains, this was a more volatile period for European equities; the portfolio’s benchmark index dipped by 1.4% in sterling terms over the six months to 30 June 2018.
Merger and acquisition (M&A) activity gathered pace in a variety of sectors including media and finance, and energy stocks were bolstered by strength in oil prices. However, markets were hit when the US exchanged protectionist threats with its major trading partners. Having previously announced that aluminium and steel imports from the European Union (EU) would be subject to tariffs, President Trump has now threatened to impose tariffs on vehicles imported from the region.
Stocks also came under pressure from rising political risk in the eurozone. After many weeks of fractious negotiations, Italy’s leading populist parties eventually agreed a coalition deal. There could be interesting times ahead as these parties challenge the EU on immigration, a basic income for the poor, and tax reductions which would stretch state finances. Spanish politics were eventful too as Prime Minister Rajoy lost a vote of confidence; he was succeeded by Pedro Sanchez, leader of the socialist PSOE. In Germany, Chancellor Angela Merkel started her fourth term in office.
The eurozone’s economic backdrop remains supportive, and interest rates are likely to stay low for some time as inflation is expected to remain subdued. UK interest rate rises are also on hold for the time being; the economic outlook is clouded by Brexit-related uncertainties. The European Central Bank’s stimulus programme will be tapered after September, before being wound up at the year end, if inflationary conditions permit. The announcement caused little turbulence in equity markets as it had been widely anticipated.
Performance
The portfolio outperformed its benchmark index on a gross basis over the review period, boosted by successful stock selection. Geographical and sector positioning added value too, especially the overweightings in Finland and technology, and the underweightings in Switzerland and financials.
New positions included Schneider Electric, Interxion and ASML. Schneider Electric is well positioned in digital, is benefiting from Chinese growth, and is deriving significant benefits from acquisitions. Interxion provides computing, network, storage and IT infrastructure on an outsourced basis. Its market share in Europe is large, and this is a growth sector. ASML produces semiconductor manufacturing equipment; it has a large market share and superior technology. The company is a leader in extreme ultraviolet (EUV) lithography technology, which offers exciting growth prospects.
Sales included Roche and Svenska Handelsbanken. After many years of strong performance relative to the sector, Svenska Handelsbanken is now suffering from competition and pricing pressure in the Swedish mortgage market. Pharmaceutical firm Roche is increasingly under pressure from the development of biosimilar drugs. Other sales included Autoliv; the vehicle safety firm had performed well since the demerger announcement, and was no longer so attractive on valuation grounds.
Dassault Systèmes (3D design-software) was the top performing stock. The firm saw a healthy cash flow increase, and strong revenue growth from new licences. L’Oréal and IMCD were also among the top relative performers. Detractors included Telenet; the Belgian cable firm experienced a tough competitive environment in the first quarter of 2018, which led to lacklustre revenue growth. Tele Columbus was another laggard; the cable group reported disappointing earnings, impacted by integration costs following a series of acquisitions.
Risk and Reward Profile
The calculated risk and reward category, as shown above, uses a method of calculation derived from EU rules. It is based on the rate at which the returns of the sub-fund have moved up and down in the past (i.e. volatility) and is not a guide to the future risk and reward category of the sub-fund. The category shown is not a target or guarantee and may shift over time. Even the lowest category 1 does not mean a risk-free investment. The seven-category scale is nonlinear, for example, 2 is not twice as risky as 1.
Sub-funds in category 5 have in the past shown moderately high volatility. With a sub-fund of category 5, you have a moderately high risk of losing money but your chance for gains is also moderately high.
Investment risk - there is no guarantee that the sub-fund will achieve its objective. A capital loss of some or all of the amount invested may occur.
Geographic concentration risk - a fall in the European market may have a significant impact on the value of the sub-fund because it primarily invests in this market.
Concentration risk (number of investments) - the sub-fund may at times hold a smaller number of investments, and therefore a fall in the value of a single investment may have a greater impact on the sub-fund’s value than if it held a larger number of investments.
Currency risk (EUR share class) - the sub-fund is denominated in British Pounds but holds assets denominated in other currencies. This share class is denominated in Euro. The value of your shares may rise and fall as a result of exchange rate movements between these currencies.
Currency risk (GBP share class) - the sub-fund is denominated in British Pounds but holds assets denominated in other currencies. The value of your shares may rise and fall as a result of exchange rate movements between these currencies.
Currency risk (US Dollar share class) - the sub-fund is denominated in British Pounds but holds assets denominated in other currencies. This share class is denominated in US Dollars. The value of your shares may rise and fall as a result of exchange rate movements between these currencies.
Derivative risk - the sub-fund may use derivatives to reduce costs and/or the overall risk of the sub-fund (i.e. Efficient Portfolio Management (EPM)). Derivatives involve a level of risk, however, for EPM they should not increase the overall riskiness of the sub-fund. Derivatives also involve counterparty risk where the institutions acting as counterparty to derivatives may not meet their contractual obligations.
Capital erosion risk - the sub-fund takes its charges from the income of the sub-fund in the first instance. The impact of sub-fund charges may be material on the value of any income you receive from your investment. There is potential for capital erosion if insufficient income is generated by the sub-fund to cover these charges. Capital erosion may have the effect of reducing the level of income generated.
For full details of the sub-fund's risks, please see the section in the prospectus headed "Risks".

Quilter Investors Europe (ex UK) Equity Growth Fund
Quilter Investors OEIC
182
Performance Records Comparative Tables 1 January 2018 to 1 January 2017 to 1 January 2016 to Accumulation 'A' 30 June 2018 31 December 2017 31 December 2016
p/share p/share p/share
Change in net assets per share Opening net asset value per share 156.44 132.40 118.63
Return before operating charges* 1.48 26.46 15.77 Operating charges** (1.26) (2.42) (2.00)
Return after operating charges* 0.22 24.04 13.77
Distributions - (0.53) (0.78) Retained distributions - 0.53 0.78
Closing net asset value per share 156.66 156.44 132.40
* after direct transaction costs of*** 0.08 0.20 0.19
Performance Return after charges 0.14% 18.16% 11.61%
Other information Closing net asset value (£) 6,878,893 7,137,381 6,655,635 Closing number of shares 4,390,887 4,562,514 5,026,907 Operating charges**** 1.64% 1.63% 1.63% Direct transaction costs*** 0.10% 0.14% 0.16%
Prices pence per share pence per share pence per share Highest share price 160.2 160.2 137.9 Lowest share price 148.1 132.0 107.5
1 January 2018 to 1 January 2017 to 1 January 2016 to Accumulation 'A' EUR† 30 June 2018 31 December 2017 31 December 2016
p/share p/share p/share
Change in net assets per share Opening net asset value per share 103.84 87.90 79.00
Return before operating charges* 0.99 17.57 9.96 Operating charges** (0.84) (1.63) (1.06)
Return after operating charges* 0.15 15.94 8.90
Distributions - (0.34) (0.19) Retained distributions - 0.34 0.19
Closing net asset value per share 103.99 103.84 87.90
* after direct transaction costs of*** 0.05 0.13 0.10
Performance Return after charges 0.14% 18.13% 11.27%
Other information Closing net asset value (£) 29,841 29,799 25,225 Closing number of shares 28,697 28,697 28,697 Operating charges**** 1.65% 1.65% 1.65% Direct transaction costs*** 0.10% 0.14% 0.16%
Prices cents per share cents per share cents per share Highest share price 121.2 120.1 104.3 Lowest share price 111.7 102.1 95.90

Quilter Investors Europe (ex UK) Equity Growth Fund
Quilter Investors OEIC
183
Comparative Tables (continued) 1 January 2018 to 1 January 2017 to 1 January 2016 to Accumulation 'A' USD 30 June 2018 31 December 2017 31 December 2016 p/share p/share p/share Change in net assets per share
Opening net asset value per share 92.62 78.43 70.29
Return before operating charges* 0.88 15.70 9.35 Operating charges** (0.75) (1.51) (1.21)
Return after operating charges* 0.13 14.19 8.14
Distributions - (0.31) (0.45) Retained distributions - 0.31 0.45
Closing net asset value per share 92.75 92.62 78.43
* after direct transaction costs of*** 0.05 0.12 0.12
Performance Return after charges 0.14% 18.09% 11.58%
Other information Closing net asset value (£) 320,128 251,390 15,005 Closing number of shares 345,156 271,429 19,133 Operating charges**** 1.65% 1.65% 1.65% Direct transaction costs*** 0.10% 0.14% 0.16%
Prices cents per share cents per share cents per share Highest share price 133.0 125.6 105.0 Lowest share price 121.0 96.0 91.71
1 January 2018 to 1 January 2017 to 1 January 2016 to Accumulation 'U2' 30 June 2018 31 December 2017 31 December 2016
p/share p/share p/share
Change in net assets per share Opening net asset value per share 155.41 130.36 115.74
Return before operating charges* 1.48 26.13 15.51 Operating charges** (0.56) (1.08) (0.89)
Return after operating charges* 0.92 25.05 14.62
Distributions - (1.85) (1.85) Retained distributions - 1.85 1.85
Closing net asset value per share 156.33 155.41 130.36
* after direct transaction costs of*** 0.08 0.20 0.19
Performance Return after charges 0.59% 19.22% 12.63%
Other information Closing net asset value (£) 70,912,568 75,352,379 31,812,593 Closing number of shares 45,361,969 48,486,197 24,403,152 Operating charges**** 0.74% 0.73% 0.73% Direct transaction costs*** 0.10% 0.14% 0.16%
Prices pence per share pence per share pence per share Highest share price 159.6 159.0 135.5 Lowest share price 147.4 130.0 105.0
† From 31 March 2016 ** The operating charges include all costs borne by the sub-fund, except for direct transaction costs.
*** The direct transaction costs are made up of fees and commissions paid to agents, advisers, brokers and dealers, levies by regulatory agencies and securities exchanges as well as transfer taxes and duties. They do not include any difference between the quoted bid and offer prices or internal administrative or holding costs. These costs arise as a result of transactions undertaken both for efficient portfolio management and the meeting of the sub-fund’s objectives. These costs exclude any effect of dilution adjustments used to offset the costs.
**** The operating charges percentage is the ratio of the sub-fund's ongoing charges (excluding interest on borrowings) to the average net assets of the sub-fund. If the share class launched during the period the operating charges figures are annualised.

Quilter Investors Europe (ex UK) Equity Growth Fund
Quilter Investors OEIC
184
Performance
6 months to
30 June 2018
1 year to
30 June 2018
3 years to
30 June 2018
5 years to
30 June 2018
Quilter Investors Europe (ex UK) Equity Growth Fund* 0.64% 5.03% 41.81% 64.38%
FTSE World Europe ex UK (benchmark) (1.43)% 2.52% 40.30% 65.10%
IA Europe ex UK (sector average) (0.70)% 3.30% 40.18% 68.55%
Quartile 1 2 2 3
* Accumulation ‘U2’ shares
Data Source – Factset. Figures are calculated on a total return and single price basis, with net income reinvested into the sub-fund.
Portfolio allocation
Europe 87.50%
United Kingdom 10.09%
Net other assets 2.41%
Total 100%
Asset allocation
Equities 97.59%
Net other assets 2.41%
Total 100%
Percentage of
Major holdings portfolio
Unilever (Dutch Listing) 5.27%
RELX (Dutch Listing) 4.82%
Pernod Ricard 4.48%
adidas 4.12%
Fresenius Medical Care 3.96%
Sampo 3.86%
Dassault Systemes 3.86%
L'Oreal 3.46%
IMCD 3.40%
Elis 3.14%
Number of holdings 39
Total Purchases and Sales for the period
2018 2017
£'000 £'000
Total purchases for the 6 month period to 30 June 24,607 30,806
Total sales for the 6 month period to 30 June 29,219 9,677
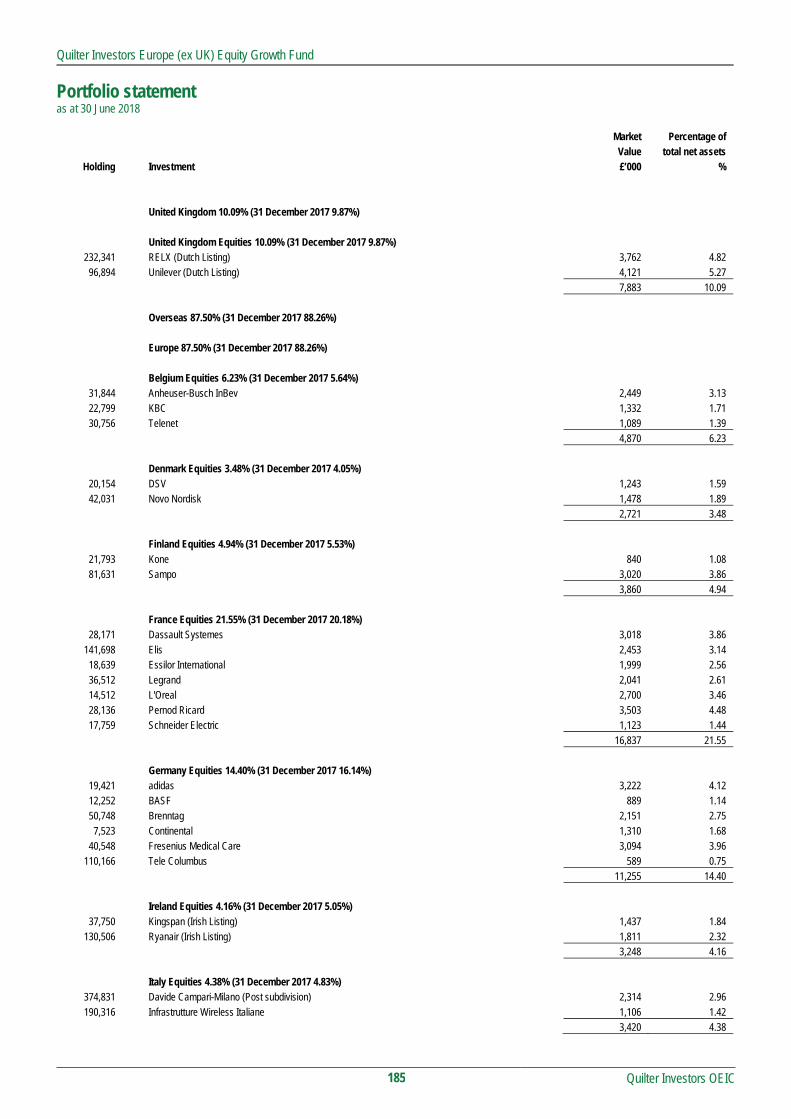
Quilter Investors Europe (ex UK) Equity Growth Fund
Portfolio statement as at 30 June 2018
Quilter Investors OEIC
185
Market Percentage of Value total net assets
Holding Investment £’000 %
United Kingdom 10.09% (31 December 2017 9.87%)
United Kingdom Equities 10.09% (31 December 2017 9.87%) 232,341 RELX (Dutch Listing) 3,762 4.82
96,894 Unilever (Dutch Listing) 4,121 5.27 Total 7,883 10.09
Overseas 87.50% (31 December 2017 88.26%)
Europe 87.50% (31 December 2017 88.26%)
Belgium Equities 6.23% (31 December 2017 5.64%) 31,844 Anheuser-Busch InBev 2,449 3.13 22,799 KBC 1,332 1.71 30,756 Telenet 1,089 1.39
Total 4,870 6.23
Denmark Equities 3.48% (31 December 2017 4.05%) 20,154 DSV 1,243 1.59 42,031 Novo Nordisk 1,478 1.89
Total 2,721 3.48
Finland Equities 4.94% (31 December 2017 5.53%) 21,793 Kone 840 1.08 81,631 Sampo 3,020 3.86
Total 3,860 4.94
France Equities 21.55% (31 December 2017 20.18%) 28,171 Dassault Systemes 3,018 3.86
141,698 Elis 2,453 3.14 18,639 Essilor International 1,999 2.56 36,512 Legrand 2,041 2.61 14,512 L'Oreal 2,700 3.46 28,136 Pernod Ricard 3,503 4.48 17,759 Schneider Electric 1,123 1.44
Total 16,837 21.55
Germany Equities 14.40% (31 December 2017 16.14%) 19,421 adidas 3,222 4.12 12,252 BASF 889 1.14 50,748 Brenntag 2,151 2.75 7,523 Continental 1,310 1.68
40,548 Fresenius Medical Care 3,094 3.96 110,166 Tele Columbus 589 0.75
Total 11,255 14.40
Ireland Equities 4.16% (31 December 2017 5.05%) 37,750 Kingspan (Irish Listing) 1,437 1.84
130,506 Ryanair (Irish Listing) 1,811 2.32 Total 3,248 4.16
Italy Equities 4.38% (31 December 2017 4.83%) 374,831 Davide Campari-Milano (Post subdivision) 2,314 2.96 190,316 Infrastrutture Wireless Italiane 1,106 1.42
Total 3,420 4.38

Quilter Investors Europe (ex UK) Equity Growth Fund
Portfolio statement (continued) as at 30 June 2018
Quilter Investors OEIC
186
Market Percentage of
Value total net assets Holding Investment £’000 %
Netherlands Equities 6.86% (31 December 2017 2.92%)
11,642 ASML 1,755 2.25 52,051 IMCD 2,658 3.40 20,110 InterXion 950 1.21
Total 5,363 6.86
Spain Equities 10.12% (31 December 2017 7.61%) 35,807 Amadeus IT 2,137 2.73 80,975 Cellnex Telecom 1,547 1.98
133,908 Grifols 2,170 2.78 79,153 Industria de Diseno Textil 2,052 2.63
Total 7,906 10.12
Sweden Equities 7.27% (31 December 2017 10.64%) 81,245 Assa Abloy 1,309 1.67 86,614 Atlas Copco 1,904 2.44
151,465 Epiroc 1,202 1.54 174,792 Nordea Bank 1,271 1.62
Total 5,686 7.27
Switzerland Equities 4.11% (31 December 2017 5.67%) 23,428 Cie Financiere Richemont 1,501 1.92 16,327 Sika 1,712 2.19
Total 3,213 4.11
Investment assets 76,262 97.59
Net other assets 1,879 2.41
Total net assets 78,141 100.00
All investments are approved securities being either officially listed in a member state or traded on or under the rules of an eligible securities market, unless otherwise stated.
All investments are in ordinary shares unless otherwise stated.

Quilter Investors Europe (ex UK) Equity Growth Fund
Quilter Investors OEIC
187
Statement of total return for the period from 1 January 2018 to 30 June 2018 01.01.18 to 01.01.18 to 01.01.17 to 01.01.17 to
30.06.18 30.06.18 30.06.17 30.06.17
Note £'000 £'000 £'000 £'000
Income
Net capital (losses)/gains (369) 6,052
Revenue 1,611 963
Expenses (343) (205)
Interest payable and similar charges (5) (3)
Net revenue before taxation 1,263 755
Taxation (102) (69)
Net revenue after taxation 1,161 686
Total return before distributions 792 6,738
Distributions 2 (183) 105
Change in net assets attributable to
shareholders from investment activities 609 6,843
Statement of change in net assets attributable to shareholders for the period from 1 January 2018 to 30 June 2018 01.01.18 to 01.01.18 to 01.01.17 to 01.01.17 to
30.06.18 30.06.18 30.06.17 30.06.17
£'000 £'000 £'000 £'000
Opening net assets attributable to shareholders 82,771* 38,508
Amounts received on issue of shares 14,462 22,239
Amounts paid on cancellation of shares (19,750) (1,432)
(5,288) 20,807
Dilution adjustment 49 38
Change in net assets attributable to
shareholders from investment activities 609 6,843
Closing net assets attributable to shareholders 78,141 66,196*
* Section 3.30 of the SORP issued by the Investment Management Association in May 2014 requires comparative figures for the above statement. For interim financial
statements this will result in the closing comparative net assets not being equal to net assets at the start of the current period.

Quilter Investors Europe (ex UK) Equity Growth Fund
Quilter Investors OEIC
188
Balance sheet as at 30 June 2018 30.06.18 31.12.17
£'000 £'000
Assets
Fixed assets
Investments 76,262 81,224
Current assets
Debtors 475 394
Cash and bank balances 1,458 1,224
Total assets 78,195 82,842
Liabilities
Creditors
Other creditors (54) (71)
Total liabilities (54) (71)
Net assets attributable to shareholders 78,141 82,771

Quilter Investors Europe (ex UK) Equity Growth Fund
Notes to the financial statements for the period from 1 January 2018 to 30 June 2018
Quilter Investors OEIC
189
1 Accounting policies The financial statements have been prepared under the historical cost basis, as modified by the revaluation of investments, and in accordance with the Statement of Recommended Practice (SORP) for Authorised Funds, issued by the Investment Management Association in May 2014.
The accounting policies applied are consistent with those disclosed within the annual Financial Statements for the year ended 31 December 2017.
2 Distributions The distributions take account of revenue received on the issue of shares and revenue deducted on the cancellation of shares, and comprise:
01.01.18 to 01.01.17 to 30.06.18 30.06.17 £'000 £'000 Revenue deducted on cancellation of shares 227 3 Revenue received on issue of shares (44) (108) Distributions 183 (105)
Reconciliation of distributions: Net revenue after taxation 1,161 686 Undistributed net revenue carried forward (978) (791) Distributions 183 (105)

Quilter Investors Europe (ex UK) Equity Income Fund
Quilter Investors Europe (ex UK) Equity Income Fund
Quilter Investors OEIC
190
Launch date 12 April 2017
IA Sector Europe ex UK
Investment adviser Schroder Investment Management Limited
Net asset value £74,176,815
Objective
The sub-fund aims to provide income and capital growth.
Policy
The sub-fund primarily invests, directly and indirectly, in shares of companies listed or located in Europe, excluding the United Kingdom.
The investment adviser typically has a preference to invest in shares of companies they believe are likely to provide dividend payments. The sub-fund may at times be concentrated in terms of the number of investments it holds.
The sub-fund may also invest in other transferable securities which may include shares in UK companies, collective investment schemes (including those managed or operated by the ACD), warrants, money market instruments, deposits and derivatives.
The sub-fund may only use derivatives for efficient portfolio management purposes.
The sub-fund is managed by an investment adviser selected by the ACD for their expected ability to manage the sub-fund according to the investment objective and policy. The ACD continuously monitors and may periodically make changes to this appointment
Investment Manager’s review
Market Review
The region’s stock markets began the year on a firmer footing but concerns related to the Italian political situation and the outlook for global trade contributed to a small decline during the period overall. Economic data from the eurozone pointed to steady growth but at a slower pace than last year. GDP growth for the first quarter was 0.4%, down from 0.7% in Q4 2017. The European Central Bank (ECB) announced that it expects to end its quantitative easing programme in December 2018. The ECB added that interest rates will remain at current levels through the summer of 2019.
Performance
For the six month period to 30 June 2018, the portfolio returned 0.3%* while the FTSE World Europe ex UK index returned -1.4% (*Source: Morningstar, 30 June 2018, Quilter Investors Europe (ex UK) Equity Income U2 GBP Acc).
The sub-fund outperformed the benchmark. Top contributors to relative returns included Petroleum Geo-Services, Eni and Lundin Petroleum. With the oil price strength perhaps this should be expected, although there was added performance as the seismic market appears to be tightening. Given the supply dynamics in the vessel market this is no surprise although it is gratifying our expectations seem to be playing out as quickly as we could have hoped. With regards to Eni, April saw the release of first quarter 2018 results and the company increased its 2018 hydrocarbon production forecast by 4%. Oil companies have been out of favour with the market since the fall in oil prices three years ago. Eni has a strong balance sheet after going through a process of de-gearing via a number of asset disposals. This allowed the firm to pay down nearly €4bn of debt in 2017.
Elsewhere, Netcompany Group was among the top contributors after strong performance post its listing. Other stocks who are immune to or benefit from the change of tone in the bond market did well, namely Teleperformance and Grand City Properties.
Banks lagged the market in the second quarter and this weighed on our holdings in Danske Bank and ING Group. However, this was more than offset by our lack of exposure to other lenders such as the major Spanish banks. Pandora was among the main detractors and we took the decision to exit the holding. Our concerns about the brand and lack of initial signs of life in trading offset in our eyes the potential of their product refresh strategy.
More generally, we now see clearer evidence of higher nominal economic growth becoming embedded, but from here it seems more likely momentum will fade, albeit our central case should be for still positive growth with higher inflation. This has on balance unfavourable implications for profits growth and revisions. Post-Brexit and
Trump political risk appears elevated but as usual this is well discounted in the market so this should not be seen as a reason to sell. In fact on a relative basis Europe appears a beacon of political stability, with the exception of Italy.
Notwithstanding currently benign politics and a reasonable economic environment, we should be cognisant of this cycle's increasing duration, and capital protection which must form part of our thinking at this stage. The difficulty is that the traditionally defensive areas of the market are expensive and the end of cycle must be likely to involve disruptions in the bond market – particularly as we believe inflation will make a return.
We will continue to use a pragmatic approach to try to generate the best stock picking returns we can, coupled with the ability to take larger positions in out-of-favour areas which offer the potential for significantly higher returns.
Risk and Reward Profile
The calculated risk and reward category, as shown above, uses a method of calculation derived from EU rules. It is based on the rate at which the returns of the sub-fund have moved up and down in the past (i.e. volatility) and is not a guide to the future risk and reward category of the sub-fund. The category shown is not a target or guarantee and may shift over time. Even the lowest category 1 does not mean a risk-free investment. The seven-category scale is nonlinear, for example, 2 is not twice as risky as 1.
Sub-funds in category 5 have in the past shown moderately high volatility. With a sub-fund of category 5, you have a moderately high risk of losing money but your chance for gains is also moderately high.
Investment risk - there is no guarantee that the sub-fund will achieve its objective. A capital loss of some or all of the amount invested may occur.
Geographic concentration risk - a fall in the European market may have a significant impact on the value of the sub-fund because it primarily invests in this market.
Concentration risk (number of investments) - the sub-fund may at times hold a smaller number of investments, and therefore a fall in the value of a single investment may have a greater impact on the sub-fund’s value than if it held a larger number of investments.
Currency risk - the sub-fund is denominated in British Pounds but holds assets denominated in other currencies. The value of your shares may rise and fall as a result of exchange rate movements between these currencies.
Derivative risk - the sub-fund may use derivatives to reduce costs and/or the overall risk of the sub-fund (i.e. Efficient Portfolio Management (EPM)). Derivatives involve a level of risk, however, for EPM they should not increase the overall riskiness of the sub-fund. Derivatives also involve counterparty risk where the institutions acting as counterparty to derivatives may not meet their contractual obligations.
Capital erosion risk - the sub-fund takes its charges from the capital of the sub-fund. Investors should be aware that there is potential for capital erosion if insufficient capital growth is achieved by the sub-fund to cover the charges. Capital erosion may have the effect of reducing the level of income generated.
For a more detailed explanation of risks, please refer to the "Risks" section of the prospectus.

Quilter Investors Europe (ex UK) Equity Income Fund
Quilter Investors OEIC
191
Performance Records
Comparative Tables
1 January 2018 to 12 April 2017 to Accumulation 'U2'† 30 June 2018 31 December 2017 p/share p/share
Change in net assets per share
Opening net asset value per share 112.16 100.00
Return before operating charges* 0.68 12.76 Operating charges** (0.42) (0.60)
Return after operating charges* 0.26 12.16
Distributions - (2.41) Retained distributions - 2.41
Closing net asset value per share 112.42 112.16
* after direct transaction costs of*** 0.10 0.23
Performance Return after charges 0.23% 12.16%
Other information Closing net asset value (£) 74,176,815 80,521,533 Closing number of shares 65,982,788 71,794,010 Operating charges**** 0.75% 0.75% Direct transaction costs*** 0.17% 0.29%
Prices pence per share pence per share Highest share price 116.7 115.6 Lowest share price 105.9 97.03
† From 12 April 2017 ** The operating charges include all costs borne by the sub-fund, except for direct transaction costs.
*** The direct transaction costs are made up of fees and commissions paid to agents, advisers, brokers and dealers, levies by regulatory agencies and securities exchanges as well as transfer taxes and duties. They do not include any difference between the quoted bid and offer prices or internal administrative or holding costs. These costs arise as a result of transactions undertaken both for efficient portfolio management and the meeting of the sub-fund’s objectives. These costs exclude any effect of dilution adjustments used to offset the costs.
**** The operating charges percentage is the ratio of the sub-fund's ongoing charges (excluding interest on borrowings) to the average net assets of the sub-fund. If the share class launched during the period the operating charges figures are annualised.

Quilter Investors Europe (ex UK) Equity Income Fund
Quilter Investors OEIC
192
Performance
6 months to
30 June 20181 year to
30 June 2018
Quilter Investors Europe (ex UK) Equity Income Fund* 0.27% 4.35%
FTSE World Europe ex UK (benchmark) (1.43)% 2.52%
IA Europe ex UK (sector average) (0.70)% 3.30%
* Accumulation ‘U2’ shares
Data Source – Factset. Figures are calculated on a total return and single price basis, with net income reinvested into the sub-fund.
Portfolio allocation
Europe 90.12%
United Kingdom 3.08%
Middle East 2.02%
Net other assets 4.78%
Total 100.00%
Asset allocation
Equities 95.22%
Net other assets 4.78%
Total 100.00%
Major holdings Percentage of
portfolio
Bayer 5.37%
Orange 4.97%
Altran Technologies 4.02%
Telefonica 3.84%
Total 3.73%
Koninklijke 3.69%
Lundin Petroleum 3.61%
Netcompany 3.08%
IPSOS 2.95%
Bankinter 2.81%
Number of holdings 43
Total Purchases and Sales for the period
2018 2017*
£’000 £’000
Total purchases for the 6 month period to 30 June 41,067 64,563
Total sales for the 6 month period to 30 June 45,983 6,929 * Total purchases and sales for the period from 12 April to 30 June

Quilter Investors Europe (ex UK) Equity Income Fund
Portfolio statement as at 30 June 2018
Quilter Investors OEIC
193
Market Percentage of Value total net assets
Holding Investment £'000 %
United Kingdom 3.08% (31 December 2017 1.14%)
United Kingdom Equities 3.08% (31 December 2017 1.14%) 763,030 IQE 796 1.07 124,485 Subsea 7 1,492 2.01
2,288 3.08
Overseas 92.14% (31 December 2017 94.50%)
Europe 90.12% (31 December 2017 94.50%)
Austria Equities 0.50% (31 December 2017 0.51%) 14,404 Porr 372 0.50
372 0.50
Belgium Equities 2.51% (31 December 2017 6.72%) 31,879 KBC 1,862 2.51
1,862 2.51
Denmark Equities 7.58% (31 December 2017 8.78%) 60,819 Danske Bank 1,440 1.94 81,875 Netcompany 2,282 3.08 54,046 Novo Nordisk 1,900 2.56
5,622 7.58
Finland Equities 2.15% (31 December 2017 4.07%) 41,978 Cargotec 1,595 2.15
1,595 2.15
France Equities 27.22% (31 December 2017 18.28%) 263,886 Altran Technologies 2,985 4.02
77,511 AXA 1,451 1.96 31,239 BNP Paribas 1,469 1.98 1,896 Iliad 231 0.31
84,425 IPSOS 2,191 2.95 93,116 Lagardere 1,881 2.54
289,203 Orange 3,684 4.97 25,360 Renault 1,638 2.21 14,113 Teleperformance 1,892 2.55 59,806 Total 2,769 3.73
20,191 27.22
Germany Equities 12.16% (31 December 2017 16.98%) 4,762 Allianz 743 1.00
38,199 Aurelius Equity Opportunities 1,729 2.33 47,303 Bayer 3,980 5.37 5,421 Continental 944 1.27
27,468 LANXESS 1,623 2.19
9,019 12.16

Quilter Investors Europe (ex UK) Equity Income Fund
Portfolio statement (continued) as at 30 June 2018
Quilter Investors OEIC
194
Market Percentage of Value total net assets
Holding Investment £'000 %
Italy Equities 3.30% (31 December 2017 1.24%) 133,184 Eni 1,873 2.52 258,632 Intesa Sanpaolo 575 0.78
2,448 3.30
Luxembourg Equities 1.89% (31 December 2017 1.74%) 72,318 Grand City Properties 1,402 1.89
1,402 1.89
Netherlands Equities 7.59% (31 December 2017 13.83%) 35,311 ABN AMRO 694 0.94 94,750 ING 1,040 1.40 86,329 Intertrust 1,160 1.56
1,335,610 Koninklijke 2,740 3.69
5,634 7.59
Norway Equities 3.27% (31 December 2017 1.85%) 97,725 Atea 1,061 1.43
379,772 Petroleum Geo-Services 1,367 1.84
2,428 3.27
Portugal Equities 2.21% (31 December 2017 0.00%) 114,164 Galp Energia 1,638 2.21
1,638 2.21
Spain Equities 9.99% (31 December 2017 12.80%) 279,847 Bankinter 2,084 2.81
44,389 Grifols 'B' 739 0.99 51,553 Grupo Catalana Occidente 1,742 2.35
439,906 Telefonica 2,846 3.84
7,411 9.99
Sweden Equities 4.09% (31 December 2017 4.37%) 79,680 Ahlsell 352 0.48
110,042 Lundin Petroleum 2,679 3.61
3,031 4.09
Switzerland Equities 5.66% (31 December 2017 3.33%) 5,120 Roche 858 1.16
19,603 Swiss Re 1,290 1.74 9,125 Zurich Insurance 2,050 2.76
4,198 5.66

Quilter Investors Europe (ex UK) Equity Income Fund
Portfolio statement (continued) as at 30 June 2018
Quilter Investors OEIC
195
Market Percentage of Value total net assets
Holding Investment £'000 %
Middle East 2.02% (31 December 2017 0.00%)
United Arab Emirates Equities 2.02% (31 December 2017 0.00%) 413,003 Borr Drilling 1,495 2.02
1,495 2.02
Investment assets 70,634 95.22
Net other assets 3,543 4.78
Total net assets 74,177 100.00
All investments are approved securities being either officially listed in a member state or traded on or under the rules of an eligible securities market, unless otherwise stated.
All investments are in ordinary shares unless otherwise stated

Quilter Investors Europe (ex UK) Equity Income Fund
Quilter Investors OEIC
196
Statement of total return for the period from 1 January 2018 to 30 June 2018 01.01.18 to 01.01.18 to 12.04.17 to 12.04.17 to
30.06.18 30.06.18 30.06.17 30.06.17
Note £'000 £'000 £'000 £'000
Income
Net capital (losses)/gains (1,315) 2,814
Revenue 2,293 1,090
Expenses (319) (89)
Interest payable and similar charges (7) -
Net revenue before taxation 1,967 1,001
Taxation (168) (89)
Net revenue after taxation 1,799 912
Total return before distributions 484 3,726
Distributions 2 (357) 134
Change in net assets attributable to
shareholders from investment activities 127 3,860
Statement of change in net assets attributable to shareholders for the period from 1 January 2018 to 30 June 2018
01.01.18 to 01.01.18 to 12.04.17 to 12.04.17 to
30.06.18 30.06.18 30.06.17 30.06.17
£'000 £'000 £'000 £'000
Opening net assets attributable to shareholders 80,522* -
Amounts received on issue of shares 12,850 59,386
Amounts paid on cancellation of shares (19,361) -
(6,511) 59,386
Dilution adjustment 39 20
Change in net assets attributable to
shareholders from investment activities 127 3,860
Closing net assets attributable to shareholders 74,177 63,266*
* Section 3.30 of the SORP issued by the Investment Management Association in May 2014 requires comparative figures for the above statement. For interim financial
statements this will result in the closing comparative net assets not being equal to net assets at the start of the current period.

Quilter Investors Europe (ex UK) Equity Income Fund
Quilter Investors OEIC
197
Balance sheet as at 30 June 2018 30.06.18 31.12.17
£'000 £'000
Assets
Fixed assets
Investments 70,634 77,012
Current assets
Debtors 1,029 410
Cash and bank balances 3,310 3,153
Total assets 74,973 80,575
Liabilities
Creditors
Other creditors (796) (53)
Total liabilities (796) (53)
Net assets attributable to shareholders 74,177 80,522

Quilter Investors Europe (ex UK) Equity Income Fund
Notes to the financial statements for the period from 1 January 2018 to 30 June 2018
Quilter Investors OEIC
198
1 Accounting policies The financial statements have been prepared under the historical cost basis, as modified by the revaluation of investments, and in accordance with the Statement of Recommended Practice (SORP) for Authorised Funds, issued by the Investment Management Association in May 2014.
The accounting policies applied are consistent with those disclosed within the annual Financial Statements for the year ended 31 December 2017.
2 Distributions
The distributions take account of revenue received on the issue of shares and revenue deducted on the cancellation of shares, and comprise:
01.01.18 to 12.04.17 to 30.06.18 30.06.17 £'000 £'000 Revenue deducted on cancellation of shares 426 - Revenue received on issue of shares (69) (134) Distributions 357 (134)
Reconciliation of distributions: Net revenue after taxation 1,799 912 Capitalised fees 319 89 Undistributed net revenue carried forward (1,761) (1,135) Distributions 357 (134)

Quilter Investors Europe (ex UK) Small/Mid-Cap Equity Fund
Quilter Investors Europe (ex UK) Small/Mid-Cap Equity Fund
Quilter Investors OEIC
199
Launch date 28 June 2018
IA Sector Europe ex UK
Investment adviser Old Mutual Global Investors (UK) Limited
Net asset value £29,726,650
Objective
The sub-fund aims to achieve capital growth.
Policy
The sub-fund primarily invests, directly or indirectly, in shares issued of companies listed or located in Europe excluding the United Kingdom. The sub-fund generally invests in small and mid-cap companies. The sub-fund may at times be concentrated in terms of the number of investments it holds.
The sub-fund may also invest in other transferable securities, collective investment schemes (including those managed or operated by the ACD) warrants, money market instruments, deposits, cash and derivatives.
The sub-fund may initially only use derivatives for efficient portfolio management purposes. The sub-fund may use derivatives for purposes other than efficient portfolio management, provided it has given shareholders 60 days’ notice of such change.
The sub-fund is managed by an investment adviser selected by the ACD for their expected ability to manage the sub-fund according to the investment objective and policy. The ACD continuously monitors and may periodically make changes to this appointment.
Investment Manager’s review
The sub-fund was launched on 28 June 2018.
The team aims to achieve long-term capital growth through investing in smaller companies in Europe, ex-UK. Stock picking forms an essential part of the manager’s process.
In terms of manager outlook, the new coalition in Italy, the fall of the government in Spain and continued tensions in the coalition in Germany have unsettled investors who worry that we are returning to the dark days of the euro crisis. Whilst the media headlines have turned ugly again this year there are reasons to remain cheerful. The rate of economic growth has moderated but shows no signs of turning negative, with uncertainty offset by a central bank that remains very accommodative and very positive pro-market developments in France. Worries about a global trade war are valid but have been partly offset by the weakness of the euro versus the dollar. European smaller companies markets have seen small declines in the first half of 2018, which combined with rising earnings has left valuations looking more reasonable from the elevated levels in late 2017.
Risk and Reward Profile
The calculated risk and reward category, as shown above, uses a method of calculation derived from EU rules. It is based on the rate at which the returns of the sub-fund have moved up and down in the past (i.e. volatility) and is not a guide to the future risk and reward category of the sub-fund. The category shown is not a target or guarantee and may shift over time. Even the lowest category 1 does not mean a risk-free investment. The seven-category scale is nonlinear, for example, 2 is not twice as risky as 1.
Sub-funds in category 5 have in the past shown moderately high volatility. With a sub-fund of category 5, you have a moderately high risk of losing money but your chance for gains is also moderately high.
Investment risk - there is no guarantee that the sub-fund will achieve its objective. A capital loss of some or all of the amount invested may occur.
Geographic concentration risk - a fall in the European market may have a significant impact on the value of the sub-fund because it primarily invests in this market.
Concentration risk (number of investments) - the sub-fund may at times hold a smaller number of investments, and therefore a fall in the value of a single investment may have a greater impact on the sub-fund’s value than if it held a larger number of investments.
Smaller companies risk - smaller companies are subject to greater risk and reward potential. Investments may be volatile or difficult to buy or sell.
Liquidity risk - some investments may become hard to value or sell at a desired time and price. In extreme circumstances this may affect the sub-fund’s ability to meet redemption requests upon demand.
Currency risk - the sub-fund is denominated in Euro but holds assets denominated in other currencies. This share class is denominated in British Pounds. The value of your shares may rise and fall as a result of exchange rate movements between these currencies.
Derivative risk - the sub-fund may use derivatives to reduce costs and/or the overall risk of the sub-fund (i.e. Efficient Portfolio Management (EPM)). Derivatives involve a level of risk, however, for EPM they should not increase the overall riskiness of the sub-fund. Derivatives also involve counterparty risk where the institutions acting as counterparty to derivatives may not meet their contractual obligations.
Capital erosion risk - the sub-fund takes its charges from the capital of the sub-fund. Investors should be aware that there is potential for capital erosion if insufficient capital growth is achieved by the sub-fund to cover the charges. Capital erosion may have the effect of reducing the level of income generated.
For a more detailed explanation of risks, please refer to the "Risk Factors" section of the prospectus.

Quilter Investors Europe (ex UK) Small/Mid-Cap Equity Fund
Quilter Investors OEIC
200
Performance Records Comparative Tables 28 June 2018 to Accumulation 'U2'† 30 June 2018 p/share
Change in net assets per share Opening net asset value per share 1,001.00
Return before operating charges* 2.15 Operating charges** (0.04)
Return after operating charges* 2.11
Distributions - Retained distributions -
Closing net asset value per share 1,003.11
* after direct transaction costs of*** 0.08
Performance Return after charges 0.21%
Other information Closing net asset value (£) 29,726,650 Closing number of shares 2,963,438 Operating charges**** 0.73% Direct transaction costs*** 1.40%
Prices pence per share Highest share price 1,004 Lowest share price 1,001
† From 28 June 2018 ** The operating charges include all costs borne by the sub-fund, except for direct transaction costs.
*** The direct transaction costs are made up of fees and commissions paid to agents, advisers, brokers and dealers, levies by regulatory agencies and securities exchanges as well as transfer taxes and duties. They do not include any difference between the quoted bid and offer prices or internal administrative or holding costs. These costs arise as a result of transactions undertaken both for efficient portfolio management and the meeting of the sub-fund’s objectives. These costs exclude any effect of dilution adjustments used to offset the costs.
**** The operating charges percentage is the ratio of the sub-fund's ongoing charges (excluding interest on borrowings) to the average net assets of the sub-fund. If the share class launched during the period the operating charges figures are annualised.

Quilter Investors Europe (ex UK) Small/Mid-Cap Equity Fund
Quilter Investors OEIC
201
Performance As the sub-fund launched on 28 June 2018 there are no performance figures presented for the period under review.
Portfolio allocation
Europe 95.20%
Net other assets 4.80%
Total 100.00%
Asset allocation
Equities 95.20%
Net other assets 4.80%
Total 100.00%
Major holdings Percentage of
portfolio
Europris 2.33%
Koninklijke Volkerwessels 2.33%
Teleperformance 2.25%
Cargotec 2.23%
Dermapharm 2.23%
SBM Offshore 2.20%
Corbion 2.19%
Atresmedia Corp de Medios de Comunicacion 2.19%
CompuGroup Medical 2.19%
Wienerberger 2.17%
Number of holdings 49
Total Purchases and Sales for the period
2018
£’000
Total purchases for the period from 28 June to 30 June 28,258
Total sales for the period from 28 June to 30 June -

Quilter Investors Europe (ex UK) Small/Mid-Cap Equity Fund
Portfolio statement as at 30 June 2018
Quilter Investors OEIC
202
Market Percentage of Value total net assets
Holding Investment £’000 %
Overseas 95.20%
Europe 95.20%
Austria Equities 2.17% 34,634 Wienerberger 646 2.17
646 2.17
Belgium Equities 7.85% 6,433 Barco 594 2.00
24,236 Bekaert 601 2.02 29,117 Ontex 495 1.66 82,797 X-Fab Silicon Foundries 645 2.17
2,335 7.85
Denmark Equities 2.60% 13,103 FLSmidth & Co 594 2.00 29,257 Matas 178 0.60
772 2.60
Finland Equities 4.38% 17,482 Cargotec 664 2.23 33,848 Vaisala 639 2.15
1,303 4.38
France Equities 15.43% 7,568 Alten 590 1.99 8,535 Fnac Darty 623 2.10
13,333 Nexity 634 2.13 12,321 Rubis 583 1.96 4,143 Sopra Steria 639 2.15
94,339 SRP 590 1.99 11,698 Tarkett 257 0.86 5,001 Teleperformance 670 2.25
4,586 15.43
Germany Equities 20.76% 11,563 AURELIUS Equity Opportunities 523 1.76 16,728 CompuGroup Medical 651 2.19 27,245 Dermapharm 663 2.23 60,521 Encavis 332 1.12 16,292 Home24 426 1.43 15,085 Leoni 575 1.93 7,230 Sixt 618 2.08
40,722 Takkt 565 1.90 33,906 Vapiano 599 2.01 58,817 va-Q-tec 599 2.02 32,291 VIB Vermoegen 621 2.09
6,172 20.76
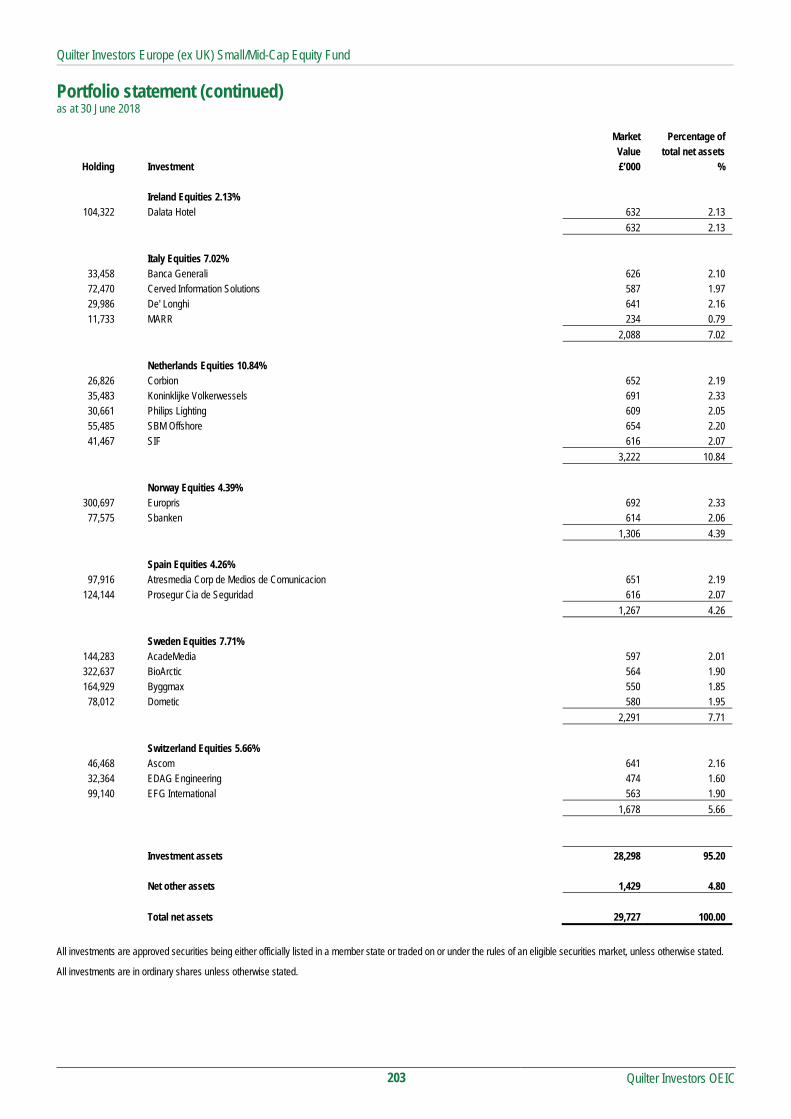
Quilter Investors Europe (ex UK) Small/Mid-Cap Equity Fund
Portfolio statement (continued) as at 30 June 2018
Quilter Investors OEIC
203
Market Percentage of Value total net assets
Holding Investment £’000 %
Ireland Equities 2.13% 104,322 Dalata Hotel 632 2.13
632 2.13
Italy Equities 7.02% 33,458 Banca Generali 626 2.10 72,470 Cerved Information Solutions 587 1.97 29,986 De' Longhi 641 2.16 11,733 MARR 234 0.79
2,088 7.02
Netherlands Equities 10.84% 26,826 Corbion 652 2.19 35,483 Koninklijke Volkerwessels 691 2.33 30,661 Philips Lighting 609 2.05 55,485 SBM Offshore 654 2.20 41,467 SIF 616 2.07
3,222 10.84
Norway Equities 4.39% 300,697 Europris 692 2.33
77,575 Sbanken 614 2.06
1,306 4.39
Spain Equities 4.26% 97,916 Atresmedia Corp de Medios de Comunicacion 651 2.19
124,144 Prosegur Cia de Seguridad 616 2.07
1,267 4.26
Sweden Equities 7.71% 144,283 AcadeMedia 597 2.01 322,637 BioArctic 564 1.90 164,929 Byggmax 550 1.85
78,012 Dometic 580 1.95
2,291 7.71
Switzerland Equities 5.66% 46,468 Ascom 641 2.16 32,364 EDAG Engineering 474 1.60 99,140 EFG International 563 1.90
1,678 5.66
Investment assets 28,298 95.20
Net other assets 1,429 4.80
Total net assets 29,727 100.00
All investments are approved securities being either officially listed in a member state or traded on or under the rules of an eligible securities market, unless otherwise stated.
All investments are in ordinary shares unless otherwise stated.

Quilter Investors Europe (ex UK) Small/Mid-Cap Equity Fund
Quilter Investors OEIC
204
Statement of total return for the period from 28 June 2018 to 30 June 2018 28.06.18 to 28.06.18 to
30.06.18 30.06.18
Note £'000 £'000
Income
Net capital gains 40
Revenue 39
Expenses -
Net revenue before taxation 39
Taxation (6)
Net revenue after taxation 33
Total return before distributions 73
Distributions 2 -
Change in net assets attributable to
shareholders from investment activities 73
Statement of change in net assets attributable to shareholders for the period from 28 June 2018 to 30 June 2018 28.06.18 to 28.06.18 to
30.06.18 30.06.18
£'000 £'000
Opening net assets attributable to shareholders -
Amounts transferred from Old Mutual European Equity (ex UK) Fund 29,595
Amounts received on issue of shares 59
Amounts paid on cancellation of shares -
29,654
Change in net assets attributable to
shareholders from investment activities 73
Closing net assets attributable to shareholders 29,727

Quilter Investors Europe (ex UK) Small/Mid-Cap Equity Fund
Quilter Investors OEIC
205
Balance sheet as at 30 June 2018 30.06.18
£'000
Assets
Fixed assets
Investments 28,298
Current assets
Debtors 29,687
Cash and bank balances 2
Total assets 57,987
Liabilities
Investment liabilities
Creditors
Other creditors (28,260)
Total liabilities (28,260)
Net assets attributable to shareholders 29,727
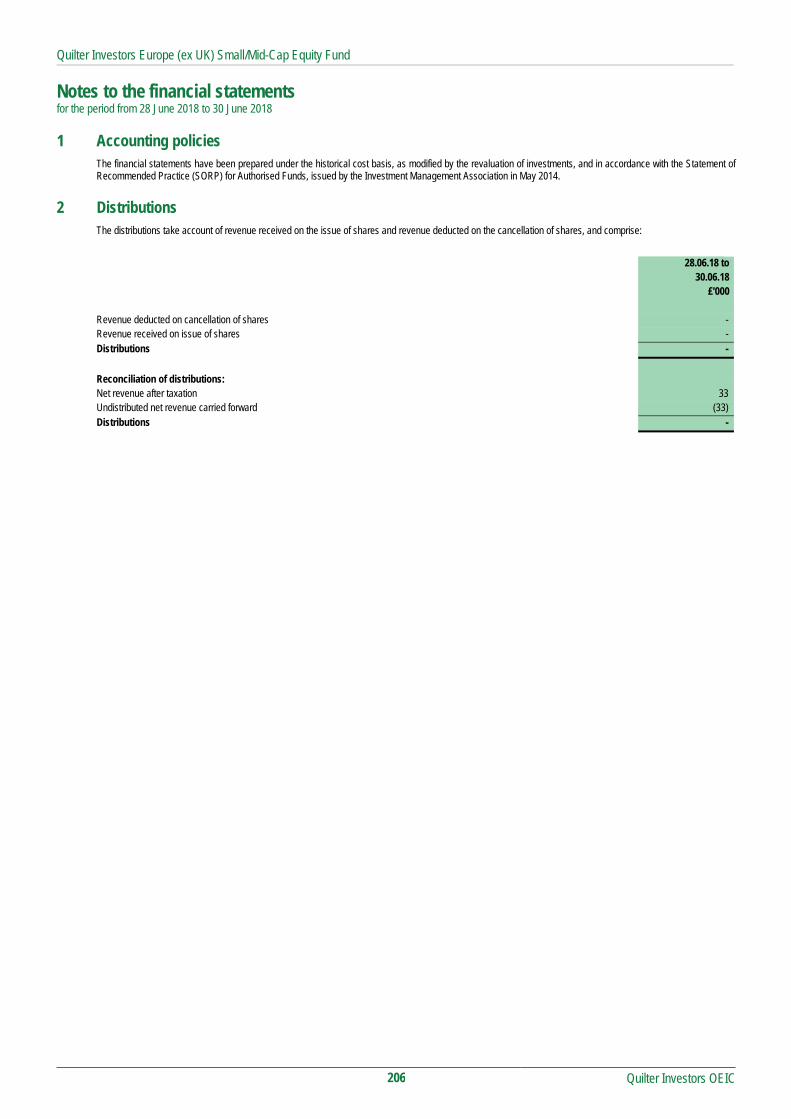
Quilter Investors Europe (ex UK) Small/Mid-Cap Equity Fund
Notes to the financial statements for the period from 28 June 2018 to 30 June 2018
Quilter Investors OEIC
206
1 Accounting policies The financial statements have been prepared under the historical cost basis, as modified by the revaluation of investments, and in accordance with the Statement of Recommended Practice (SORP) for Authorised Funds, issued by the Investment Management Association in May 2014.
2 Distributions The distributions take account of revenue received on the issue of shares and revenue deducted on the cancellation of shares, and comprise:
28.06.18 to 30.06.18 £'000 Revenue deducted on cancellation of shares - Revenue received on issue of shares - Distributions -
Reconciliation of distributions: Net revenue after taxation 33 Undistributed net revenue carried forward (33) Distributions -

Quilter Investors Foundation 3 Fund
Quilter Investors Foundation 3 Fund
Quilter Investors OEIC
207
Launch date 27 February 2014
IA Sector Mixed Investment 20-60% Shares
Investment adviser Quilter Investors Limited
Net asset value £12,125,384
Objective
The sub-fund aims to achieve an annual return of 3% above inflation over rolling five year periods.
Notwithstanding that the sub-fund aims to deliver a positive annual return over rolling five year periods, any capital invested is, in fact, at risk and there is no guarantee that a positive annual return will be generated over such specified period.
Policy
The sub-fund will gain exposure to a diversified portfolio of asset classes including, but not limited to, equities, fixed interest, property, commodities and currency. Typically the sub-fund will have a preference to lower risk asset classes such as fixed interest.
The sub-fund will gain exposure to these asset classes by investing in transferable securities, derivative instruments and forward transactions (for the purpose of meeting the investment objective or efficient portfolio management), as well as collective investment schemes and warrants. The sub-fund may hold liquidity in cash, near cash, money market instruments, and permitted deposits. There are no limits on the percentage of the sub-fund’s assets which may be invested in cash.
In accordance with the provisions of the Sourcebook, all investment in property and commodities will be indirect via transferable securities, collective investment schemes and/or derivatives. The use of derivatives for this purpose may affect the volatility or risk profile of the sub-fund although this is not the ACD’s intention.
Investment Manager’s review
Market Review
Equity and bond markets suffered a torrid start to the year. After UK and US stock markets both hit record highs in January, global equities suffered two major setbacks in the first three months of 2018. Thanks to a sudden hike in US inflation and fears of a more aggressive interest-rate posture in the US, markets sold off sharply on concerns of the global economy overheating.
After briefly recovering ground, markets tumbled a second time as President Trump’s trade-war rhetoric sparked worries of a global economic slowdown, and a data scandal at Facebook triggered a steep fall in tech-sector share prices.
In the second half of the period, markets recovered strongly, driven by the US as technology stocks recovered and overall strong corporate earnings helped push markets higher, with the Nasdaq index gaining almost 13% in the three months to 30 June.
Emerging markets, in contrast, had a disappointing six months, as the MSCI Emerging Markets index declined 4.2% in sterling terms over the period, driven by trade war rhetoric with the US, China concerns and weakening corporate fundamentals.
Performance
Following a disappointing start to the year given the wide market sell-off, performance of the portfolio improved significantly in the second half of the period. UK and US equities delivered strong returns, which helped offset the disappointing performance from emerging market equities.
Fixed income performance was a small negative towards the end of the period, with global bonds weighing on returns, with only emerging market debt delivering a slight positive for the three months to the end of June.
Alternatives, however, helped offset the disappointing performance from weaker asset classes, despite underperformance in the second half of the period from the alternative beta held through the Old Mutual STAR (Style Premia Absolute Return) Fund. The strongest performance in the asset class came from the long/short managers, particularly the Old Mutual UK Specialist Equity Fund, with a positive contribution also resulting from the Old Mutual Arbea Fund.
Risk and Reward Profile
The calculated risk and reward category, as shown above, uses a method of calculation derived from EU rules. It is based on the rate at which the returns of the sub-fund have moved up and down in the past (i.e. volatility) and is not a guide to the future risk and reward category of the sub-fund. The category shown is not a target or guarantee and may shift over time. Even the lowest category 1 does not mean a risk-free investment. The seven-category scale is nonlinear, for example, 2 is not twice as risky as 1.
Sub-funds in category 4 have in the past shown moderate volatility. With a sub-fund of category 4, you have a moderate risk of losing money but your chance for gains is also moderate.
Investment risk - the performance aim is not a guarantee, may not be achieved and a capital loss may occur. Sub-funds which have a higher performance aim generally take more risk to achieve this and so have a greater potential for the returns to be significantly different than expected.
Strategy risk - as the sub-fund invests in other collective investment schemes, which themselves invest in assets such as bonds, company shares, cash and currencies, it will be subject to the collective risks of these other sub-funds. This may include emerging markets risk and sub-investment grade credit risk.
Emerging markets risk - less developed countries may face more political, economic or structural challenges than developed countries.
Credit risk - the issuer of a bond or a similar investment within the sub-fund may not pay income or repay capital to the sub-fund when due. Bonds which are rated below investment grade are considered to have a higher risk exposure with respect to meeting their payment obligations.
Interest rate risk - investments in bonds are affected by interest rates and inflation trends which may affect the value of the sub-fund.
Currency risk (EUR share class) - the sub-fund is denominated in British Pounds but may hold assets denominated in, or with exposure to, other currencies. This share class is denominated in Euro. The hedging process may not give a precise hedge, and some currency risk may remain. The value of your shares may rise and fall as a result of exchange rate movements between these currencies.
Currency risk (GBP share class) - the sub-fund is denominated in British Pounds but may hold assets denominated in, or with exposure to, other currencies. The value of your shares may rise and fall as a result of exchange rate movements between these currencies.
Currency risk (USD share class) - the sub-fund is denominated in British Pounds but may hold assets denominated in, or with exposure to, other currencies. This share class is denominated in US Dollars. The hedging process may not give a precise hedge, and some currency risk may remain. The value of your shares may rise and fall as a result of exchange rate movements between these currencies.
Derivative risk - the sub-fund uses derivatives to generate returns and/or to reduce costs and the overall risk of the sub-fund. Using derivatives can involve a higher level of risk. A small movement in the price of an underlying investment may result in a disproportionately large movement in the price of the derivative investment. Derivatives also involve counterparty risk where the institutions acting as counterparty to derivatives may not meet their contractual obligations.
Capital erosion risk - the sub-fund takes charges from capital of the sub-fund. Investors should be aware that there is potential for capital erosion if insufficient capital growth is achieved by the sub-fund to cover the charges. Capital erosion may have the effect of reducing the level of income generated.
For full details of the sub-fund's risks, please see the section in the prospectus headed "Risks".

Quilter Investors Foundation 3 Fund
Quilter Investors OEIC
208
Performance Records Comparative Tables 1 January 2018 to 1 January 2017 to 1 January 2016 to Accumulation 'O' EUR Hedged 30 June 2018 31 December 2017 31 December 2016 p/share p/share p/share Change in net assets per share
Opening net asset value per share 106.52 94.75 71.96
Return before operating charges* (3.10) 13.35 24.09 Operating charges** (0.82) (1.58) (1.30)
Return after operating charges* (3.92) 11.77 22.79
Distributions (0.75) (2.24) (1.56) Retained distribution 0.75 2.24 1.56
Closing net asset value per share 102.60 106.52 94.75
* after direct transaction costs of*** - - -
Performance Return after charges (3.68)% 12.42% 31.67%
Other information Closing net asset value (£) 3,514,578 3,960,257 3,911,161 Closing number of shares 3,425,580 3,717,991 4,127,905 Operating Charges**** 1.58% 1.55% 1.54% Direct transaction costs*** - - -
Prices cents per share cents per share cents per share Highest share price 121.7 119.9 111.7 Lowest share price 115.0 110.4 92.05
1 January 2018 to 1 January 2017 to 1 January 2016 to Accumulation 'O' USD Hedged 30 June 2018 31 December 2017 31 December 2016 p/share p/share p/share Change in net assets per share
Opening net asset value per share 92.30 91.35 66.48
Return before operating charges* 1.16 2.39 26.05 Operating charges** (0.70) (1.44) (1.18)
Return after operating charges* 0.46 0.95 24.87
Distributions (0.66) (2.01) (1.41) Retained distribution 0.66 2.01 1.41
Closing net asset value per share 92.76 92.30 91.35
* after direct transaction costs of*** - - -
Performance Return after charges 0.50% 1.04% 37.41%
Other information Closing net asset value (£) 5,918,948 6,129,043 6,584,801 Closing number of shares 6,381,030 6,640,431 7,208,002 Operating charges**** 1.58% 1.55% 1.54% Direct transaction costs*** - - -
Prices cents per share cents per share cents per share Highest share price 126.6 124.6 113.4 Lowest share price 120.3 112.4 92.68
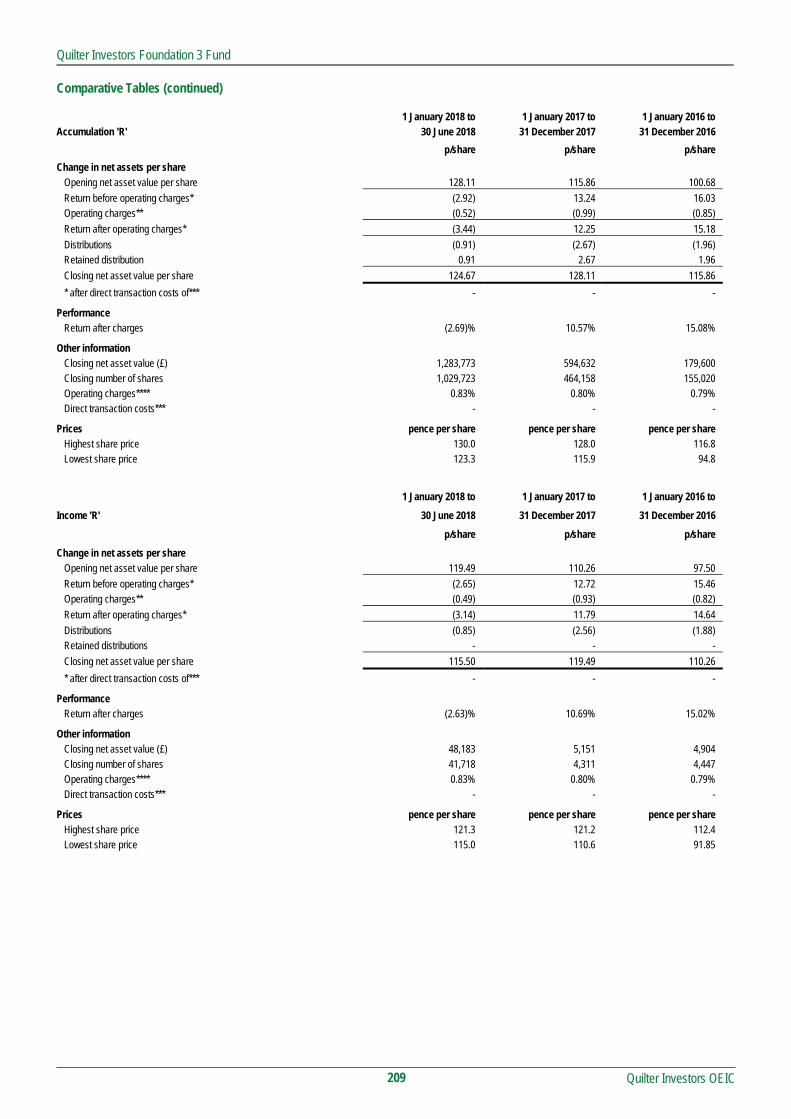
Quilter Investors Foundation 3 Fund
Quilter Investors OEIC
209
Comparative Tables (continued) 1 January 2018 to 1 January 2017 to 1 January 2016 to Accumulation 'R' 30 June 2018 31 December 2017 31 December 2016
p/share p/share p/share
Change in net assets per share Opening net asset value per share 128.11 115.86 100.68
Return before operating charges* (2.92) 13.24 16.03 Operating charges** (0.52) (0.99) (0.85)
Return after operating charges* (3.44) 12.25 15.18
Distributions (0.91) (2.67) (1.96) Retained distribution 0.91 2.67 1.96
Closing net asset value per share 124.67 128.11 115.86
* after direct transaction costs of*** - - -
Performance Return after charges (2.69)% 10.57% 15.08%
Other information Closing net asset value (£) 1,283,773 594,632 179,600 Closing number of shares 1,029,723 464,158 155,020 Operating charges**** 0.83% 0.80% 0.79% Direct transaction costs*** - - -
Prices pence per share pence per share pence per share Highest share price 130.0 128.0 116.8 Lowest share price 123.3 115.9 94.8
1 January 2018 to 1 January 2017 to 1 January 2016 to
Income 'R' 30 June 2018 31 December 2017 31 December 2016
p/share p/share p/share
Change in net assets per share Opening net asset value per share 119.49 110.26 97.50
Return before operating charges* (2.65) 12.72 15.46 Operating charges** (0.49) (0.93) (0.82)
Return after operating charges* (3.14) 11.79 14.64
Distributions (0.85) (2.56) (1.88) Retained distributions - - -
Closing net asset value per share 115.50 119.49 110.26
* after direct transaction costs of*** - - -
Performance Return after charges (2.63)% 10.69% 15.02%
Other information Closing net asset value (£) 48,183 5,151 4,904 Closing number of shares 41,718 4,311 4,447 Operating charges**** 0.83% 0.80% 0.79% Direct transaction costs*** - - -
Prices pence per share pence per share pence per share Highest share price 121.3 121.2 112.4 Lowest share price 115.0 110.6 91.85
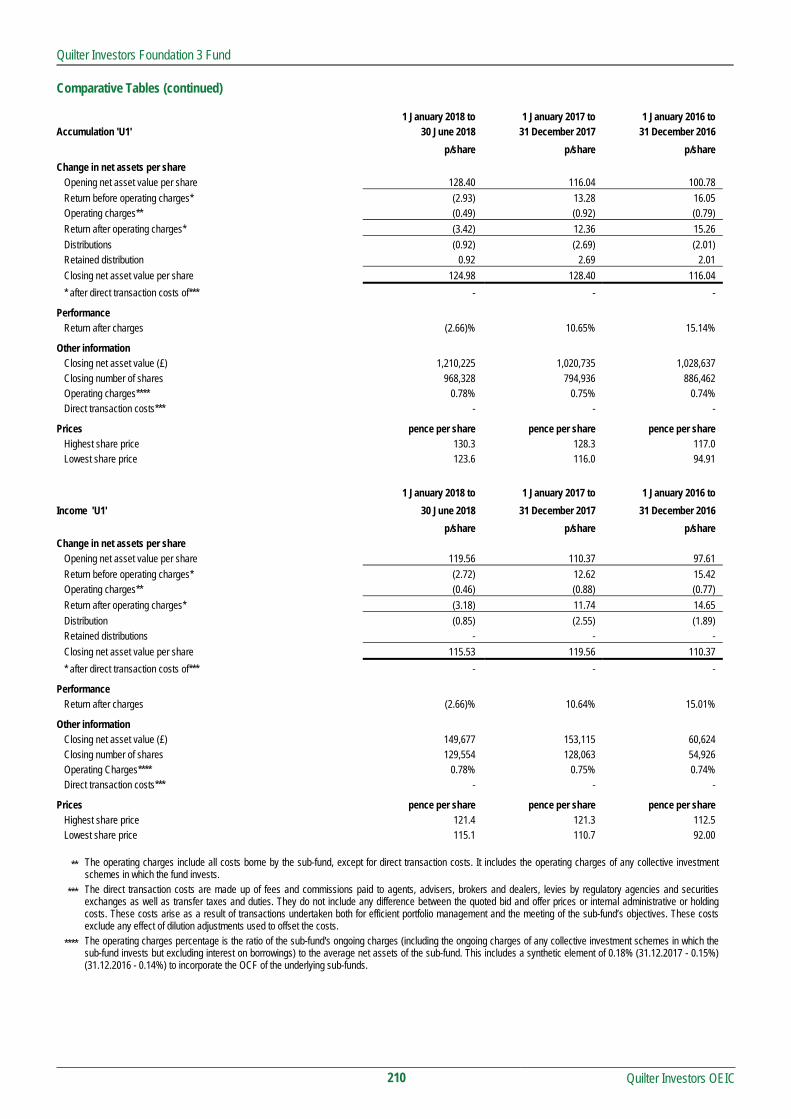
Quilter Investors Foundation 3 Fund
Quilter Investors OEIC
210
Comparative Tables (continued) 1 January 2018 to 1 January 2017 to 1 January 2016 to Accumulation 'U1' 30 June 2018 31 December 2017 31 December 2016
p/share p/share p/share
Change in net assets per share Opening net asset value per share 128.40 116.04 100.78
Return before operating charges* (2.93) 13.28 16.05 Operating charges** (0.49) (0.92) (0.79)
Return after operating charges* (3.42) 12.36 15.26
Distributions (0.92) (2.69) (2.01) Retained distribution 0.92 2.69 2.01
Closing net asset value per share 124.98 128.40 116.04
* after direct transaction costs of*** - - -
Performance Return after charges (2.66)% 10.65% 15.14%
Other information Closing net asset value (£) 1,210,225 1,020,735 1,028,637 Closing number of shares 968,328 794,936 886,462 Operating charges**** 0.78% 0.75% 0.74% Direct transaction costs*** - - -
Prices pence per share pence per share pence per share Highest share price 130.3 128.3 117.0 Lowest share price 123.6 116.0 94.91
1 January 2018 to 1 January 2017 to 1 January 2016 to
Income 'U1' 30 June 2018 31 December 2017 31 December 2016
p/share p/share p/share Change in net assets per share
Opening net asset value per share 119.56 110.37 97.61
Return before operating charges* (2.72) 12.62 15.42 Operating charges** (0.46) (0.88) (0.77)
Return after operating charges* (3.18) 11.74 14.65
Distribution (0.85) (2.55) (1.89) Retained distributions - - -
Closing net asset value per share 115.53 119.56 110.37
* after direct transaction costs of*** - - -
Performance Return after charges (2.66)% 10.64% 15.01%
Other information Closing net asset value (£) 149,677 153,115 60,624 Closing number of shares 129,554 128,063 54,926 Operating Charges**** 0.78% 0.75% 0.74% Direct transaction costs*** - - -
Prices pence per share pence per share pence per share Highest share price 121.4 121.3 112.5 Lowest share price 115.1 110.7 92.00
** The operating charges include all costs borne by the sub-fund, except for direct transaction costs. It includes the operating charges of any collective investment schemes in which the fund invests.
*** The direct transaction costs are made up of fees and commissions paid to agents, advisers, brokers and dealers, levies by regulatory agencies and securities exchanges as well as transfer taxes and duties. They do not include any difference between the quoted bid and offer prices or internal administrative or holding costs. These costs arise as a result of transactions undertaken both for efficient portfolio management and the meeting of the sub-fund’s objectives. These costs exclude any effect of dilution adjustments used to offset the costs.
**** The operating charges percentage is the ratio of the sub-fund's ongoing charges (including the ongoing charges of any collective investment schemes in which the sub-fund invests but excluding interest on borrowings) to the average net assets of the sub-fund. This includes a synthetic element of 0.18% (31.12.2017 - 0.15%) (31.12.2016 - 0.14%) to incorporate the OCF of the underlying sub-funds.

Quilter Investors Foundation 3 Fund
Quilter Investors OEIC
211
Performance
6 months to
30 June 2018
1 year to
30 June 2018
3 years to
30 June 2018
5 years to
30 June 2018
Quilter Investors Foundation 3 Fund* (2.27)% 2.46% 18.02% -
CPI UK+3 (benchmark) 2.33% 5.44% 15.26% 24.47%
IA Mixed Investment 20-60% Shares (sector average) (0.44)% 2.48% 18.02% 33.69%
Quartile ranking 4 3 2 -
* Accumulation ‘R’ shares
Data Source – Factset. Figures are calculated on a total return and single price basis, with net income reinvested into the sub-fund.
Portfolio allocation Overseas Equities 32.97% Overseas Bonds 29.10% United Kingdom Equities 14.45% United Kingdom Bonds 9.25% Overseas Alternative Investment Instruments 1.90% Derivatives 1.01% Net other assets 11.32% Total 100.00%
Asset allocation Fixed Income 56.30% Global Equity 39.00% Alternatives 17.10% UK Equity 0.70% Cash & Futures (13.10)%
Total 100.00%
Major holdings Percentage of portfolio Old Mutual UK Alpha Fund - U2 Accumulation 14.45% Old Mutual European Equity ex UK Fund - R Accumulation 11.74% Old Mutual Monthly Income High Yield Bond Fund Hedged - X Accumulation 11.00% iShares Emerging Markets Equity Index Fund - L Accumulation 9.85% Old Mutual Monthly Income Bond Fund - R Accumulation 8.40% Old Mutual Global Strategic Bond Fund - P Accumulation 8.21% Old Mutual Europe (ex UK) Smaller Companies Fund - U2 Accumulation 5.51% Oder Capital 0% 09/04/2024 4.97% UK Treasury 0% 20/08/2018 4.28% UK Treasury 0% 10/09/2018 4.06% Number of holdings 39
Total Purchases and Sales for the period
2018 2017
£’000 £’000
Total purchases for the 6 month period to 30 June 5,118 1,328
Total sales for the 6 month period to 30 June 5,004 1,500

Quilter Investors Foundation 3 Fund
Portfolio statement as at 30 June 2018
Quilter Investors OEIC
212
Market Percentage of
Value total net assets Holding Investment £’000 %
United Kingdom 23.68% (31 December 2017 26.36%)
United Kingdom Equities 14.45% (31 December 2017 15.80%) 1,241,697 Old Mutual UK Alpha Fund - U2 Accumulation 1,752 14.45
1,752 14.45
United Kingdom Bonds 9.25% (31 December 2017 10.96%) £110,000 UK Treasury 0% 09/07/2018 110 0.91 £520,000 UK Treasury 0% 20/08/2018 519 4.28 £493,900 UK Treasury 0% 10/09/2018 493 4.06
1,122 9.25
United Kingdom Derivatives (0.02)% (31 December 2017 (0.40)%)
Sterling Denominated Forward Exchange Contracts (0.16) % (31 December 2017 (0.06)%) £35,868 Sterling v Euro Forward Exchange Contract - -
£1,048,220 Sterling v Euro Forward Exchange Contract (16) (0.13) £12,379 Sterling v Mexican Peso Forward Exchange Contract (1) (0.01) £47,943 Sterling v US Dollar Forward Exchange Contract (1) (0.01) £61,634 Sterling v US Dollar Forward Exchange Contract (1) (0.01)
(19) (0.16)
Sterling Denominated Futures Contracts 0.14% (31 December 2017 (0.34)%) (21) FTSE 100 Index Futures September 2018 13 0.11
2 Long Gilt Futures September 2018 4 0.03
17 0.14
Overseas 65.00% (31 December 2017 64.55%)
Overseas Alternative Investment Instruments 1.90% (31 December 2017 6.93%) 23,705 Old Mutual Style Premia Absolute Return Fund 230 1.90
230 1.90
Overseas Equities 32.97% (31 December 2017 27.74%) 772,929 iShares Emerging Markets Equity Index Fund - L Accumulation 1,194 9.85
3,908 Oder Capital 0% 09/04/2024 603 4.97 38,349 Old Mutual Europe (ex UK) Smaller Companies Fund - U2 Accumulation 668 5.51
818,650 Old Mutual European Equity ex UK Fund - R Accumulation 1,424 11.74 6,754 Old Mutual Global Emerging Markets Fund - U2 Accumulation (GBP) 109 0.90
3,998 32.97
Overseas Bonds 29.10% (31 December 2017 29.89%) £120,000 Bank Nederlandse Gemeenten 1.875% 07/12/2018 121 1.00 MXN4000 Mexican Bonos 6.5% 10/06/2021 15 0.12
$6,000 Mexico Bond 3.625% 15/03/2022 5 0.04 868,069 Old Mutual Global Strategic Bond Fund - P Accumulation 995 8.21 900,309 Old Mutual Monthly Income Bond Fund - R Accumulation 1,019 8.40 117,415 Old Mutual Monthly Income High Yield Bond Fund Hedged - X Accumulation 1,334 11.00 $50,000 US Treasury Inflation Indexed 0.125% 15/04/2020 40 0.33
3,529 29.10

Quilter Investors Foundation 3 Fund
Portfolio statement (continued) as at 30 June 2018
Quilter Investors OEIC
213
Market Percentage of Value total net assets
Holding Investment £’000 %
Overseas Derivatives 1.03% (31 December 2017 (0.01)%)
Australian Dollar Denominated Forward Exchange Contracts 0.00% (31 December 2017 0.00%) AU$296,000 Australian Dollar v Sterling Forward Exchange Contract - -
- -
Australian Dollar Denominated Futures Contracts 0.03% (31 December 2017 0.02%) 2 SPI 200 Index Futures September 2018 4 0.03
4 0.03
Euro Denominated Forward Exchange Contracts 0.14% (31 December 2017 0.22%)
€4,024,940 Euro v Sterling Forward Exchange Contract 17 0.14
17 0.14
Euro Denominated Futures Contracts 0.15% (31 December 2017 0.22%) (1) Euro-Bund Futures September 2018 (1) (0.01)
(36) Europe Stoxx Banks Index Futures September 2018 19 0.16
18 0.15
Euro Denominated Options Contracts 0.00% (31 December 2017 (0.01)%) 14 Call Euro Stoxx Banks Futures July 2018 Merrill Lynch - - 14 Put Euro Stoxx Banks Futures July 2018 Merrill Lynch - -
- -
Hong Kong Dollar Denominated Forward Exchange Contracts 0.06% (31 December 2017 (0.08)%) HK$6,308,000 Hong Kong Dollar v Sterling Forward Exchange Contract 7 0.06
7 0.06
Hong Kong Dollar Denominated Futures Contracts (0.02)% (31 December 2017 0.06%) 4 Hang Seng Index Futures July 2018 (3) (0.02)
(3) (0.02)
Japanese Yen Denominated Forward Exchange Contracts 0.02% (31 December 2017 (0.02)%) ¥ 51,820,000 Japanese Yen v Sterling Denominated Forward Exchange Contract 3 0.02
3 0.02
Japanese Yen Denominated Futures Contracts (0.07)% (31 December 2017 0.08%) 3 TOPIX Index Futures September 2018 (9) (0.07)
(9) (0.07)
Swedish Krona Denominated Forward Exchange Contracts 0.00% (31 December 2017 0.00%)
SEK140,000 Swedish Krona v Euro Forward Exchange Contract - - SEK150,000 Swedish Krona v Euro Forward Exchange Contract - -
- -
US Dollar Denominated Forward Exchange Contracts 0.96% (31 December 2017 (0.78)%) $2,600,000 US Dollar v Sterling Forward Exchange Contract 22 0.18 $7,910,663 US Dollar v Sterling Forward Exchange Contract 94 0.78
116 0.96

Quilter Investors Foundation 3 Fund
Portfolio statement (continued) as at 30 June 2018
Quilter Investors OEIC
214
Market Percentage of Value total net assets
Holding Investment £’000 %
US Dollar Denominated Futures Contracts (0.26)% (31 December 2017 0.18%) 2 EMIN Russell 2000 Futures September 2018 (2) (0.02)
(1) S&P 500 E-Mini Futures September 2018 2 0.02 16 S&P 500 E-Mini Futures September 2018 (34) (0.28) 10 US 2 Year Treasury Note Futures September 2018 1 0.01
1 US 10 Year Ultra Bond Futures September 2018 1 0.01
(32) (0.26)
US Dollar Denominated Options Contracts (0.02)% (31 December 2017 0.00%) 7 Call Dow Jones Industrial Futures July 2018 Merrill Lynch - - 4 Call S&P 500 Index Futures July 2018 Merrill Lynch - -
(7) Put Dow Jones Industrial Futures July 2018 Merrill Lynch - - (2) Put S&P 500 Index Futures July 2018 Merrill Lynch (2) (0.02) 21 Put US 10 Year Treasury Note Futures July 2018 Merrill Lynch 1 0.01 (7) Put US 10 Year Treasury Note Futures July 2018 Merrill Lynch (1) (0.01)
(2) (0.02)
US Dollar Credit Default Swap 0.04% (31 December 2017 0.10%)
$(500,000) Buy Protection CDS CDX-NAHYS30V1 5Years 20/06/2023 Barclays Fixed Income OTC Barclays Fixed Income OTC (22) (0.18)
$2,400,000 Sell Protection CDS CDX-NAIGS30V1 5Years 20/06/2023 Barclays Fixed Income OTC Barclays Fixed Income OTC 27 0.22
5 0.04
Investment assets* 10,753 88.68
Net other assets 1,372 11.32
Total net assets 12,125 100.00
* Including investment liabilities.
All investments are approved securities being either officially listed in a member state or traded on or under the rules of an eligible securities market, unless otherwise stated.
All investments are in ordinary shares unless otherwise stated.

Quilter Investors Foundation 3 Fund
Quilter Investors OEIC
215
Statement of total return for the period from 1 January 2018 to 30 June 2018 01.01.18 to 01.01.18 to 01.01.17 to 01.01.17 to
30.06.18 30.06.18 30.06.17 30.06.17
Note £'000 £'000 £'000 £'000
Income
Net capital (losses)/gains (209) 285
Revenue 100 90
Expenses (74) (78)
Interest payable and similar charges - (1)
Net revenue before taxation 26 11
Taxation - -
Net revenue after taxation 26 11
Total return before distributions (183) 296
Distributions 2 (86) (80)
Change in net assets attributable to
shareholders from investment activities (269) 216
Statement of change in net assets attributable to shareholders for the period from 1 January 2018 to 30 June 2018 01.01.18 to 01.01.18 to 01.01.17 to 01.01.17 to
30.06.18 30.06.18 30.06.17 30.06.17
£'000 £'000 £'000 £'000
Opening net assets attributable to shareholders 11,863* 11,770
Amounts received on issue of shares 1,197 1,114
Amounts paid on cancellation of shares (753) (1,059)
444 55
Dilution adjustment 1 1
Change in net assets attributable to
shareholders from investment activities (269) 216
Retained distribution on accumulation shares 86 80
Closing net assets attributable to shareholders 12,125 12,122* * Section 3.30 of the SORP issued by the Investment Management Association in May 2014 requires comparative figures for the above statement. For interim financial
statements this will result in the closing comparative net assets not being equal to net assets at the start of the current period.

Quilter Investors Foundation 3 Fund
Quilter Investors OEIC
216
Balance sheet as at 30 June 2018
30.06.18 31.12.17
£’000 £’000
Assets
Fixed assets
Investments 10,846 10,976
Current assets
Debtors 34 71
Cash and bank balances 1,366 1,347
Total assets 12,246 12,394
Liabilities
Investment liabilities (93) (191)
Creditors
Bank overdrafts (15) (321)
Distribution payable (1) (2)
Other creditors (12) (17)
Total liabilities (121) (531)
Net assets attributable to shareholders 12,125 11,863

Quilter Investors Foundation 3 Fund
Notes to the financial statements for the period from 1 January 2018 to 30 June 2018
Quilter Investors OEIC
217
1 Accounting policies The Financial Statements have been prepared under the historical cost basis, as modified by the revaluation of investments, and in accordance with the Statement of Recommended Practice (SORP) for Authorised Funds, issued by the Investment Management Association in May 2014.
The accounting policies applied are consistent with those disclosed within the annual Financial Statements for the year ended 31 December 2017.
2 Distribution
The distributions take account of revenue received on the issue of shares and revenue deducted on the cancellation of shares, and comprise:
01.01.18 to 01.01.17 to 30.06.18 30.06.17 £'000 £'000 Interim – Accumulation shares (30 June) 86 80 Interim – Income shares (30 June) 1 1 87 81 Revenue deducted on cancellation of shares 2 4 Revenue received on issue of shares (3) (5) Distributions 86 80
Reconciliation of distributions: Net revenue after taxation 26 11 Authorised Corporate Director’s capitalised fee rebate (8) (5) Capitalised fees 74 78 Equalisation on Collective Investment Schemes 2 4 Tax relief on capitalised fees (8) (8) Distributions 86 80

Quilter Investors Foundation 3 Fund
Distribution table
Quilter Investors OEIC
218
Interim distribution Group 1: Shares purchased prior to 1 January 2018 Group 2: Shares purchased from 1 January 2018 to 30 June 2018
Revenue pence/cents
per share
Equalisation pence/cents
per share*
Distribution paid 31.08.18 pence/cents
per share
Distribution paid 31.08.17 pence/cents
per share Accumulation 'O' EUR Hedged Shares Group 1 0.8484 - 0.8484 0.7446 Group 2 0.8484 0.0000 0.8484 0.7446 Accumulation 'O' USD Hedged Shares Group 1 0.8652 - 0.8652 0.8077 Group 2 0.6466 0.2186 0.8652 0.8077 Accumulation 'R' Shares Group 1 0.9143 - 0.9143 0.7982 Group 2 0.6754 0.2389 0.9143 0.7982 Income 'R' Shares Group 1 0.8491 - 0.8491 0.7578 Group 2 0.5491 0.3000 0.8491 0.7578 Accumulation 'U1' Shares Group 1 0.9174 - 0.9174 0.8024 Group 2 0.4781 0.4393 0.9174 0.8024 Income 'U1' Shares Group 1 0.8548 - 0.8548 0.7619 Group 2 0.6429 0.2119 0.8548 0.7619 * Equalisation only applies to shares purchased during the period (Group 2 shares). It is the average amount of revenue included in the purchase price of all Group 2 shares
and is refunded to holders of these shares as a return of capital. Being capital, it is not liable to income tax but must be deducted from the cost of shares for capital gains tax purposes.

Quilter Investors Foundation 4 Fund
Quilter Investors Foundation 4 Fund
Quilter Investors OEIC
219
Launch date 27 February 2014
IA Sector Mixed Investment 40-85% Equity
Investment adviser Old Mutual Global Investors (UK) Limited
Net asset value £411,481,024
Objective
The sub-fund aims to achieve an annual return of 4% above inflation over rolling seven year periods.
Notwithstanding that the sub-fund aims to deliver a positive annual return over rolling seven year periods, any capital invested is, in fact, at risk and there is no guarantee that a positive annual return will be generated over such specified period.
Policy
The sub-fund will gain exposure to a diversified portfolio of asset classes including, but not limited to, equities, fixed interest, property, commodities and currency.
The sub-fund will gain exposure to these asset classes by investing in transferable securities, derivative instruments and forward transactions (for the purpose of meeting the investment objective or efficient portfolio management), as well as collective investment schemes and warrants. The sub-fund may hold liquidity in cash, near cash, money market instruments, and permitted deposits. There are no limits on the percentage of the sub-fund’s assets which may be invested in cash.
In accordance with the provisions of the Sourcebook, all investment in property and commodities will be indirect via transferable securities, collective investment schemes and/or derivatives. The use of derivatives for this purpose may affect the volatility or risk profile of the sub-fund although this is not the ACD’s intention.
Investment Manager’s review
Market Review
Equity and bond markets suffered a torrid start to the year. After UK and US stock markets both hit record highs in January, global equities suffered two major setbacks in the first three months of 2018. Thanks to a sudden hike in US inflation and fears of a more aggressive interest-rate posture in the US, markets sold off sharply on concerns of the global economy overheating.
After briefly recovering ground, markets tumbled a second time as President Trump’s trade-war rhetoric sparked worries of a global economic slowdown, and a data scandal at Facebook triggered a steep fall in tech-sector share prices.
In the second half of the period, markets recovered strongly, driven by the US as technology stocks recovered and overall strong corporate earnings helped push markets higher, with the Nasdaq index gaining almost 13% in the three months to 30 June.
Emerging markets, in contrast, had a disappointing six months, as the MSCI Emerging Markets index declined 4.2% in sterling terms over the period, driven by trade war rhetoric with the US, China concerns and weakening corporate fundamentals.
Performance
Following a disappointing start to the year given the wide market sell-off, performance of the portfolio improved significantly in the second half of the period. UK and US equities delivered strong returns, which helped offset the disappointing performance from emerging market equities.
Fixed income performance was a small negative towards the end of the period, with global bonds weighing on returns, with only emerging market debt delivering a slight positive for the three months to the end of June.
Alternatives, however, helped offset the disappointing performance from weaker asset classes, despite underperformance in the second half of the period from the alternative beta held through the Old Mutual STAR (Style Premia Absolute Return) Fund. The strongest performance in the asset class came from the long/short managers, particularly the Old Mutual UK Specialist Equity Fund, with a positive contribution also resulting from the Old Mutual Arbea Fund.
Risk and Reward Profile
The calculated risk and reward category, as shown above, uses a method of calculation derived from EU rules. It is based on the rate at which the returns of the sub-fund have moved up and down in the past (i.e. volatility) and is not a guide to the future risk and reward category of the sub-fund. The category shown is not a target or guarantee and may shift over time. Even the lowest category 1 does not mean a risk-free investment. The seven-category scale is nonlinear, for example, 2 is not twice as risky as 1.
Sub-funds in category 5 have in the past shown moderately high volatility. With a sub-fund of category 5, you have a moderately high risk of losing money but your chance for gains is also moderately high.
Investment risk - the performance aim is not a guarantee, may not be achieved and a capital loss may occur. Sub-funds which have a higher performance aim generally take more risk to achieve this and so have a greater potential for the returns to be significantly different than expected.
Strategy risk - as the sub-fund invests in other collective investment schemes, which themselves invest in assets such as bonds, company shares, cash and currencies, it will be subject to the collective risks of these other sub-funds. This may include emerging markets risk and sub-investment grade credit risk.
Emerging markets risk - less developed countries may face more political, economic or structural challenges than developed countries.
Credit risk - the issuer of a bond or a similar investment within the sub-fund may not pay income or repay capital to the sub-fund when due. Bonds which are rated below investment grade are considered to have a higher risk exposure with respect to meeting their payment obligations.
Interest rate risk - investments in bonds are affected by interest rates and inflation trends which may affect the value of the sub-fund.
Liquidity risk - some investments may become hard to value or sell at a desired time and price. In extreme circumstances this may affect the sub-fund’s ability to meet redemption requests upon demand.
Currency risk (EUR share class) - the sub-fund is denominated in British Pounds but may hold assets denominated in, or with exposure to, other currencies. This share class is denominated in Euro. The hedging process may not give a precise hedge, and some currency risk may remain. The value of your shares may rise and fall as a result of exchange rate movements between these currencies.
Currency risk (GBP share class) - the sub-fund is denominated in British Pounds but may hold assets denominated in, or with exposure to, other currencies. The value of your shares may rise and fall as a result of exchange rate movements between these currencies.
Currency risk (USD share class) - the sub-fund is denominated in British Pounds but may hold assets denominated in, or with exposure to, other currencies. This share class is denominated in US Dollars. The hedging process may not give a precise hedge, and some currency risk may remain. The value of your shares may rise and fall as a result of exchange rate movements between these currencies.
Derivative risk - the sub-fund uses derivatives to generate returns and/or to reduce costs and the overall risk of the sub-fund. Using derivatives can involve a higher level of risk. A small movement in the price of an underlying investment may result in a disproportionately large movement in the price of the derivative investment. Derivatives also involve counterparty risk where the institutions acting as counterparty to derivatives may not meet their contractual obligations.
Capital erosion risk - the sub-fund takes its charges from the income of the sub-fund in the first instance. The impact of sub-fund charges may be material on the value of any income you receive from your investment. There is potential for capital erosion if insufficient income is generated by the sub-fund to cover these charges. Capital erosion may have the effect of reducing the level of income generated.
For full details of the sub-fund's risks, please see the section in the prospectus headed "Risks".

Quilter Investors Foundation 4 Fund
Quilter Investors OEIC
220
Performance Records Comparative Tables 1 January 2018 to 1 January 2017 to 1 January 2016 toAccumulation 'A' 30 June 2018 31 December 2017 31 December 2016 p/share p/share p/shareChange in net assets per share
Opening net asset value per share 136.05 120.94 103.39
Return before operating charges* (2.85) 16.82 18.97 Operating charges** (0.90) (1.71) (1.42)
Return after operating charges* (3.75) 15.11 17.55
Distributions (0.32) (1.38) (1.26) Retained distribution 0.32 1.38 1.26
Closing net asset value per share 132.30 136.05 120.94
* after direct transaction costs of*** 0.03 0.05 0.06
Performance Return after charges (2.76)% 12.49% 16.97%
Other information Closing net asset value (£) 48,737,212 52,197,025 50,317,517 Closing number of shares 36,838,277 38,366,879 41,603,694 Operating Charges**** 1.36% 1.32% 1.30% Direct transaction costs*** 0.04% 0.04% 0.06%
Prices pence per share pence per share pence per share Highest share price 138.5 136.0 121.6 Lowest share price 128.6 120.8 94.05
1 January 2018 to 1 January 2017 to 1 January 2016 toAccumulation 'O' EUR Hedged 30 June 2018 31 December 2017 31 December 2016 p/share p/share p/shareChange in net assets per share
Opening net asset value per share 114.73 99.97 74.49
Return before operating charges* (3.19) 16.47 26.83 Operating charges** (0.89) (1.71) (1.35)
Return after operating charges* (4.08) 14.76 25.48
Distributions (0.12) (0.95) (0.83) Retained distribution 0.12 0.95 0.83
Closing net asset value per share 110.65 114.73 99.97
* after direct transaction costs of*** 0.02 0.04 0.05
Performance Return after charges (3.56)% 14.76% 34.21%
Other information Closing net asset value (£) 2,461,708 3,088,975 2,550,645 Closing number of shares 2,224,698 2,692,353 2,551,520 Operating Charges**** 1.61% 1.57% 1.55% Direct transaction costs*** 0.04% 0.04% 0.06%
Prices cents per share cents per share cents per share Highest share price 131.5 129.3 117.4 Lowest share price 121.8 116.4 92.14

Quilter Investors Foundation 4 Fund
Quilter Investors OEIC
221
Comparative Tables (continued) 1 January 2018 to 1 January 2017 to 1 January 2016 to Accumulation 'O' USD Hedged 30 June 2018 31 December 2017 31 December 2016 p/share p/share p/share Change in net assets per share
Opening net asset value per share 99.12 96.31 68.72
Return before operating charges* 1.42 4.36 28.82 Operating charges** (0.77) (1.55) (1.23)
Return after operating charges* 0.65 2.81 27.59
Distributions (0.13) (0.84) (0.76) Retained distributions 0.13 0.84 0.76
Closing net asset value per share 99.77 99.12 96.31
* after direct transaction costs of*** 0.02 0.04 0.04
Performance Return after charges 0.66% 2.92% 40.15%
Other information Closing net asset value (£) 42,270,072 43,988,861 48,049,066 Closing number of shares 42,368,742 44,380,852 49,888,957 Operating Charges**** 1.61% 1.57% 1.55% Direct transaction costs*** 0.04% 0.04% 0.06%
Prices cents per share cents per share cents per share Highest share price 136.4 133.9 119.2 Lowest share price 127.0 118.4 92.63
1 January 2018 to 1 January 2017 to 1 January 2016 to Accumulation 'R' 30 June 2018 31 December 2017 31 December 2016 p/share p/share p/share Change in net assets per share
Opening net asset value per share 138.15 122.33 104.16
Return before operating charges* (2.91) 16.90 19.05 Operating charges** (0.58) (1.08) (0.88)
Return after operating charges* (3.49) 15.82 18.17
Distributions (0.65) (1.92) (1.70) Retained distributions 0.65 1.92 1.70
Closing net asset value per share 134.66 138.15 122.33
* after direct transaction costs of*** 0.03 0.05 0.06
Performance Return after charges (2.53)% 12.93% 17.44%
Other information Closing net asset value (£) 312,994,820 337,254,379 333,168,881 Closing number of shares 232,430,345 244,116,208 272,354,382 Operating Charges**** 0.86% 0.82% 0.80% Direct transaction costs*** 0.04% 0.04% 0.06%
Prices pence per share pence per share pence per share Highest share price 140.7 138.1 122.9 Lowest share price 130.7 122.2 94.79

Quilter Investors Foundation 4 Fund
Quilter Investors OEIC
222
Comparative Tables (continued) 1 January 2018 to 1 January 2017 to 1 January 2016 to Accumulation 'U1' 30 June 2018 31 December 2017 31 December 2016 p/share p/share p/share Change in net assets per share
Opening net asset value per share 138.29 122.40 104.16
Return before operating charges* (2.94) 16.90 19.06 Operating charges** (0.55) (1.01) (0.82)
Return after operating charges* (3.49) 15.89 18.24
Distributions (0.67) (1.97) (1.73) Retained distribution 0.67 1.97 1.73
Closing net asset value per share 134.80 138.29 122.40
* after direct transaction costs of*** 0.03 0.05 0.06
Performance Return after charges (2.52)% 12.98% 17.51%
Other information Closing net asset value (£) 5,017,212 4,463,428 3,541,620 Closing number of shares 3,722,035 3,227,699 2,893,571 Operating Charges**** 0.81% 0.77% 0.75% Direct transaction costs*** 0.04% 0.04% 0.06%
Prices pence per share pence per share pence per share Highest share price 140.8 138.3 123.0 Lowest share price 130.9 122.3 94.80
** The operating charges include all costs borne by the sub-fund, except for direct transaction costs. It includes the operating charges of any collective investment
schemes in which the sub-fund invests. ***
The direct transaction costs are made up of fees and commissions paid to agents, advisers, brokers and dealers, levies by regulatory agencies and securities exchanges as well as transfer taxes and duties. They do not include any difference between the quoted bid and offer prices or internal administrative or holding costs. These costs arise as a result of transactions undertaken both for efficient portfolio management and the meeting of the sub-fund’s objectives. These costs exclude any effect of dilution adjustments used to offset the costs.
**** The operating charges percentage is the ratio of the sub-fund’s ongoing charges (including the ongoing charges of any collective investment schemes in which the sub-fund invests but excluding interest on borrowings) to the average net assets of the sub-fund. This includes a synthetic element of 0.21% (31.12.2017 - 0.17%) (31.12.2016 - 0.15%) to incorporate the OCF of the underlying sub-funds.

Quilter Investors Foundation 4 Fund
Quilter Investors OEIC
223
Performance
6 months to
30 June 2018
1 year to
30 June 2018
3 years to
30 June 2018
5 years to
30 June 2018
Quilter Investors Foundation 4 Fund* (2.46)% 3.54% 22.81% -
CPI UK+4 (benchmark) 2.82% 6.44% 18.60% 30.55%
IA Mixed Investment 40-85% Shares (sector average) 0.55% 4.94% 25.56% 46.63%
Quartile ranking 4 4 3 -
* Accumulation ‘R’ shares
Data Source – Factset. Figures are calculated on a total return and single price basis, with net income reinvested into the sub-fund.
Portfolio allocation United Kingdom 53.04% Europe 36.68% North America 0.72% Derivatives (0.46)% Net other assets 10.02% Total 100.00%
Asset allocation Global Equities 51.45% Fixed Income 27.15% Alternatives 18.40% Cash & Futures 7.40% UK Equities (4.40)%
Total 100.00%
Percentage of Major holdings portfolio Old Mutual European Equity ex UK Fund - R Accumulation 12.77% Old Mutual Monthly Income High Yield Bond Fund Hedged - X Accumulation 12.44% Old Mutual Global Strategic Bond Fund - P Accumulation 9.78% Old Mutual Monthly Income Bond Fund - R Accumulation 9.16% Old Mutual UK Alpha Fund - U2 Accumulation 7.62% Old Mutual Europe (ex UK) Smaller Companies Fund - U2 Accumulation 5.95% Oder Capital 0% 09/04/2024 5.62% iShares MSCI Emerging Markets UCITS ETF 4.69% UK Treasury 0% 10/09/2018 3.78% UK Treasury 0% 09/07/2018 2.43%
Number of holdings 106
Total Purchases and Sales for the period
2018 2017
£’000 £’000
Total purchases for the 6 month period to 30 June 298,168 118,422
Total sales for the 6 month period to 30 June 307,833 152,094

Quilter Investors Foundation 4 Fund
Portfolio statement as at 30 June 2018
Quilter Investors OEIC
224
Market Percentage of Value total net assets
Holding Investment £'000 %
United Kingdom 56.98% (31 December 2017 26.17%)
Collective Investment Scheme 39.33% (31 December 2017 0.00%) 30,214,664 Old Mutual European Equity ex UK Fund - R Accumulation 52,543 12.77 35,120,308 Old Mutual Global Strategic Bond Fund - P Accumulation 40,248 9.78 33,292,380 Old Mutual Monthly Income Bond Fund - R Accumulation 37,687 9.16 22,221,336 Old Mutual UK Alpha Fund - U2 Accumulation 31,354 7.62
161,832 39.33
Sterling Denominated Fixed Rate Corporate Bonds 1.09% (31 December 2017 2.99%) £4,500,000 African Development Bank 0.875% 13/12/2018 4,503 1.09
4,503 1.09
Sterling Denominated Variable Rate Corporate Bonds 1.10% (31 December 2017 0.18%) £4,500,000 European Investment Bank 0.87344% 17/02/2020 4,520 1.10
4,520 1.10
Sterling Denominated Fixed Rate Government Bonds 8.21% (31 December 2017 9.86%) £2,630,000 Caisse d'Amortissement de la Dette Sociale 3.75% 15/10/2018 2,652 0.64 £4,500,000 Kommunekredit 1.125% 07/12/2018 4,509 1.10
£10,000,000 UK Treasury 0% 09/07/2018 9,995 2.43 £15,564,900 UK Treasury 0% 10/09/2018 15,541 3.78
£1,080,000 UK Treasury 0% 20/08/2018 1,079 0.26
33,776 8.21
United Kingdom Equities 7.24% (31 December 2017 13.40%) 64,589 3i 583 0.14 19,093 AstraZeneca (UK Listing) 1,009 0.25 11,678 AVEVA 312 0.08
172,117 Aviva 869 0.21 537,527 Barclays 1,020 0.25
99,295 Biffa 249 0.06 33,558 Bodycote 328 0.08
261,486 BP 1,516 0.37 32,874 British American Tobacco 1,282 0.31
115,322 BT 251 0.06 71,554 Direct Line Insurance 246 0.06 93,493 DS Smith 490 0.12 25,494 Ds Smith Rights 89 0.02 43,771 Experian 822 0.20 10,163 Fevertree Drinks 344 0.08 86,530 GlaxoSmithKline 1,321 0.32
179,861 GVC CVR* - - 88,615 GVC Holdings 932 0.23 52,389 HomeServe 472 0.11
212,328 HSBC (UK Listing) 1,515 0.37 17,179 Imperial Brands 488 0.12 59,153 Indivior 225 0.05 49,781 International Consolidated Airlines (UK Listing) 332 0.08
1,471,182 Lloyds Banking 927 0.23 5,707 London Stock Exchange 257 0.06
220,982 Melrose Industries 471 0.11 95,601 Merlin Entertainments 371 0.09 25,586 Micro Focus International 342 0.08 20,580 Ocado 211 0.05

Quilter Investors Foundation 4 Fund
Portfolio statement (continued) as at 30 June 2018
Quilter Investors OEIC
225
Market Percentage of Value total net assets
Holding Investment £'000 %
United Kingdom Equities (continued) 55,366 OneSavings Bank 227 0.06
117,769 Pets at Home 152 0.04 61,388 Prudential 1,069 0.26 43,193 RELX (UK Listing) 703 0.17
220,639 Rentokil Initial 772 0.19 25,755 Rio Tinto (UK Listing) 1,086 0.26 88,534 RSA Insurance 601 0.15 87,541 Sabre Insurance 236 0.06 67,323 Sage 423 0.10 16,253 Severn Trent 322 0.08
567,134 Sherborne Investors 539 0.13 50,254 Smith & Nephew 706 0.17 62,631 SSP 401 0.10 43,616 St James's Place 502 0.12
104,163 Synthomer 549 0.13 56,075 Tate & Lyle 362 0.09
172,112 Taylor Wimpey 308 0.08 318,838 Tesco 826 0.20 107,607 TP ICAP 450 0.11
8,191 Unilever 346 0.08 612,036 Vodafone 1,124 0.27
18,242 Weir 361 0.09 11,219 Whitbread 447 0.11
29,786 7.24
United Kingdom Derivatives 0.01% (31 December 2017 (0.26)%)
Sterling Denominated Forward Exchange Contracts (0.10)% (31 December 2017 0.06%) £27,594 Sterling v Euro Forward Exchange Contract - - £30,180 Sterling v Euro Forward Exchange Contract - -
£22,865,711 Sterling v Euro Forward Exchange Contract (345) (0.08) £475,699 Sterling v Mexican Peso Forward Exchange Contract (35) (0.01) £448,393 Sterling v US Dollar Forward Exchange Contract - -
£85,677 Sterling v US Dollar Forward Exchange Contract (1) - £493,005 Sterling v US Dollar Forward Exchange Contract (5) -
£1,355,658 Sterling v US Dollar Forward Exchange Contract (16) (0.01)
(402) (0.10)
Sterling Denominated Futures Contracts 0.11% (31 December 2017 (0.32)%) (696) FTSE 100 Index Futures September 2018 445 0.11
1 Long Gilt Futures September 2018 2 - (5) Long Gilt Futures September 2018 (9) -
438 0.11
Overseas 33.00% (31 December 2017 62.46%)
Asia Pacific (excluding Japan) 0.10% (31 December 2017 0.50%)
Australian Dollar Denominated Fixed Rate Government Bonds 0.00% (31 December 2017 0.50%)
Australian Dollar Denominated Forward Exchange Contracts 0.00% (31 December 2017 0.00%) AU$15,200,000 Australian Dollar v Sterling Forward Exchange Contract (17) -
(17) -

Quilter Investors Foundation 4 Fund
Portfolio statement (continued) as at 30 June 2018
Quilter Investors OEIC
226
Market Percentage of Value total net assets
Holding Investment £'000 %
Australian Dollar Denominated Futures Contracts 0.06% (31 December 2017 0.02%) 103 SPI 200 Index Futures September 2018 228 0.06
228 0.06
Hong Kong Dollar Denominated Forward Exchange Contracts 0.10% (31 December 2017 (0.12)%)
HK$387,942,000 Hong Kong Dollar v Sterling Forward Exchange Contract 420 0.10
420 0.10
Hong Kong Dollar Denominated Futures Contracts (0.04)% (31 December 2017 0.10%) 248 Hang Seng Index Futures July 2018 (179) (0.04)
(179) (0.04)
Singapore Dollar Denominated Forward Exchange Contracts (0.01)% (31 December 2017 0.00%)
S$1,780,000 Singapore Dollar v US Dollar Forward Exchange Contract (37) (0.01)
(37) (0.01)
South Korean Won Denominated Forward Exchange Contracts (0.01)% (31 December 2017 0.00%)
KRW905,000,000 South Korean Won v US Dollar Forward Exchange Contract (25) (0.01)
(25) (0.01)
Japan (0.08)% (31 December 2017 1.76%)
Japanese Yen Denominated Fixed Rate Government Bonds 0.00% (31 December 2017 1.68%)
Japanese Yen Denominated Forward Exchange Contracts 0.04% (31 December 2017 (0.02)%) JPY2,729,450,000 Japanese Yen v Sterling Denominated Forward Exchange Contract 180 0.04
180 0.04
Japanese Yen Denominated Futures Contracts (0.12)% (31 December 2017 0.10%) 158 TOPIX Index Futures September 2018 (489) (0.12)
(489) (0.12)
Europe 32.85% (31 December 2017 52.67%)
Collective Investment Scheme 31.74% (31 December 2017 34.47%) 615,788 iShares MSCI Emerging Markets UCITS ETF 19,305 4.69 149,945 Oder Capital 0% 09/04/2024 23,144 5.62
1,405,298 Old Mutual Europe (ex UK) Smaller Companies Fund - U2 Accumulation 24,492 5.95 251,855 Old Mutual Global Emerging Markets Fund - U2 Accumulation (GBP) 4,054 0.99
4,505,044 Old Mutual Monthly Income High Yield Bond Fund Hedged - X Accumulation 51,174 12.44 865,741 Old Mutual Style Premia Absolute Return Fund 8,417 2.05
130,586 31.74
Euro Denominated Fixed Rate Corporate Bonds 0.00% (31 December 2017 1.22%)
Euro Denominated Fixed Rate Government Bonds 0.00% (31 December 2017 2.06%)
Belgium Equities 0.00% (31 December 2017 0.26%)
Denmark Equities 0.00% (31 December 2017 0.50%)
Finland Equities 0.00% (31 December 2017 0.21%)

Quilter Investors Foundation 4 Fund
Portfolio statement (continued) as at 30 June 2018
Quilter Investors OEIC
227
Market Percentage of Value total net assets
Holding Investment £'000 %
France Equities 0.00% (31 December 2017 2.59%)
Germany Equities 0.00% (31 December 2017 1.93%)
Ireland Equities 0.19% (31 December 2017 3.00%) 29,074 CRH (UK Listing) 782 0.19
782 0.19
Italy Equities 0.00% (31 December 2017 1.10%)
Luxembourg Equities 0.00% (31 December 2017 0.25%)
Netherlands Equities 0.53% (31 December 2017 1.98%) 79,552 Royal Dutch Shell 'B' 2,169 0.53
2,169 0.53
Norway Equities 0.00% (31 December 2017 0.24%)
Spain Equities 0.00% (31 December 2017 0.74%)
Sweden Equities 0.00% (31 December 2017 0.47%)
Switzerland Equities 0.29% (31 December 2017 1.60%) 324,061 Glencore 1,171 0.29
1,171 0.29
Euro Denominated Forward Exchange Contracts 0.00% (31 December 2017 0.01%) €2,843,590 Euro v Sterling Forward Exchange Contract 12 -
12 -
Euro Denominated Futures Contracts 0.10% (31 December 2017 0.13%) (18) Euro-Bund Futures September 2018 (21) (0.01)
(785) Europe Stoxx Banks Index Futures September 2018 423 0.11
402 0.10
Euro Denominated Options Contracts 0.00% (31 December 2017 (0.01)%) 506 Call Euro Stoxx Banks Futures July 2018 Merrill Lynch 2 - 506 Put Euro Stoxx Banks Futures July 2018 Merrill Lynch 14 -
16 -
Euro Credit Default Swap 0.00% (31 December 2017 (0.08)%)
Swedish Krona Denominated Forward Exchange Contracts 0.00% (31 December 2017 0.00%) SEK5,150,000 Swedish Krona v Euro Denominated Forward Exchange Contract (13) - SEK5,300,000 Swedish Krona v Euro Denominated Forward Exchange Contract (12) -
(25) -
North America 0.13% (31 December 2017 7.43%)
Canadian Dollar Denominated Fixed Rate Government Bonds 0.00% (31 December 2017 0.29%)
Mexican Peso Denominated Fixed Rate Government Bonds 0.12% (31 December 2017 0.11%) MXN136,000 Mexican Bonos 6.5% 10/06/2021 508 0.12
508 0.12

Quilter Investors Foundation 4 Fund
Portfolio statement (continued) as at 30 June 2018
Quilter Investors OEIC
228
Market Percentage of Value total net assets
Holding Investment £'000 %
US Dollar Denominated Fixed Rate Corporate Bonds 0.00% (31 December 2017 3.46%)
US Dollar Denominated Variable Rate Corporate Bonds 0.00% (31 December 2017 0.26%)
US Dollar Denominated Fixed Rate Government Bonds 0.41% (31 December 2017 3.73%) $242,000 Mexico Bond 3.625% 15/03/2022 183 0.04
$1,900,000 US Treasury Inflation Indexed 0.125% 15/04/2020 1,523 0.37
1,706 0.41
United States Equities 0.19% (31 December 2017 0.25%) 3,267 Carnival 142 0.03 3,690 Shire (UK Listing) 158 0.04 7,905 Worldpay 492 0.12
792 0.19
US Dollar Denominated Forward Exchange Contracts 0.52% (31 December 2017 (0.39)%) $1,360,262 US Dollar v Singapore Dollar Forward Exchange Contract 37 0.01
$848,077 US Dollar v South Korean Won Forward Exchange Contract 22 0.01 $170,719,384 US Dollar v Sterling Forward Exchange Contract 1,420 0.34
$56,501,664 US Dollar v Sterling Forward Exchange Contract 671 0.16 $191,026 US Dollar v Sterling Forward Exchange Contract 1 -
2,151 0.52
US Dollar Denominated Futures Contracts (0.66)% (31 December 2017 0.29%) 41 EMIN Russell 2000 Futures September 2018 (36) (0.01)
368 MSCI Emerging Markets Index Futures September 2018 (1,021) (0.25) (71) S&P 500 E-Mini Futures September 2018 151 0.04 856 S&P 500 E-Mini Futures September 2018 (1,824) (0.44)
8 S&P Mid 400 Futures September 2018 (28) (0.01) 12 US 2 Year Treasury Note Futures September 2018 1 -
2 US 2 Year Treasury Note Futures September 2018 - - 29 US 10 Year Ultra Bond Futures September 2018 33 0.01
(2,724) (0.66)
US Dollar Denominated Options Contracts (0.02)% (31 December 2017 0.00%) 239 Call Dow Jones Industrial Futures July 2018 Merrill Lynch - - 11 Call Nasdaq 100 E-Mini Futures September 2018 Merrill Lynch 9 -
146 Call S&P 500 Index Futures July 2018 Merrill Lynch 4 - (239) Put Dow Jones Industrial Futures July 2018 Merrill Lynch (15) -
(11) Put Nasdaq 100 E-Mini Futures September 2018 Merrill Lynch (18) - (73) Put S&P 500 Index Futures July 2018 Merrill Lynch (51) (0.02) 360 Put US 10 Year Treasury Note Futures July 2018 Merrill Lynch 13 -
(120) Put US 10 Year Treasury Note Futures July 2018 Merrill Lynch (18) -
(76) (0.02)
US Dollar Credit Default Swap (0.43)% (31 December 2017 (0.56)%) $26,100,000 Sell Protection CDS CDX-NAIGS30V1 5Years 20/06/2023 Barclays Fixed Income OTC 289 0.07 $46,500,000 Buy Protection CDS CDX-NAHYS30V1 5Years 20/06/2023 Barclays Fixed Income OTC (2,054) (0.50)
(1,765) (0.43)

Quilter Investors Foundation 4 Fund
Portfolio statement (continued) as at 30 June 2018
Quilter Investors OEIC
229
Market Percentage of Value total net assets
Holding Investment £'000 %
South America 0.00% (31 December 2017 0.10%)
Argentine Peso Denominated Variable Rate Government Bonds 0.00% (31 December 2017 0.09%)
Uruguayan Peso Denominated Fixed Rate Government Bonds 0.00% (31 December 2017 0.01%)
Investment assets** 370,239 89.98
Net other assets 41,242 10.02
Total net assets 411,481 100.00 * Market value less than £500. ** Including investment liabilities. All investments are approved securities being either officially listed in a member state or traded on or under the rules of an eligible securities market, unless otherwise stated. All investments are in ordinary shares unless otherwise stated.

Quilter Investors Foundation 4 Fund
Quilter Investors OEIC
230
Statement of total return for the period from 1 January 2018 to 30 June 2018 01.01.18 to 01.01.18 to 01.01.17 to 01.01.17 to
30.06.18 30.06.18 30.06.17 30.06.17
Note £'000 £'000 £'000 £'000
Income
Net capital (losses)/gains (11,290) 22,490
Revenue 3,388 4,161
Expenses (1,651) (1,726)
Interest payable and similar charges (183) (28)
Net revenue before taxation 1,554 2,407
Taxation (10) (118)
Net revenue after taxation 1,544 2,289
Total return before distributions (9,746) 24,779
Distributions 2 (1,718) (2,231)
Change in net assets attributable to
shareholders from investment activities (11,464) 22,548
Statement of change in net assets attributable to shareholders for the period from 1 January 2018 to 30 June 2018 01.01.18 to 01.01.18 to 01.01.17 to 01.01.17 to
30.06.18 30.06.18 30.06.17 30.06.17
£'000 £'000 £'000 £'000
Opening net assets attributable to shareholders 440,993* 437,628
Amounts received on issue of shares 5,785 3,832
Amounts paid on cancellation of shares (25,569) (28,934)
(19,784) (25,102)
Dilution adjustment 28 43
Change in net assets attributable to
shareholders from investment activities (11,464) 22,548
Retained distribution on accumulation shares 1,708 2,208
Closing net assets attributable to shareholders 411,481 437,325*
* Section 3.30 of the SORP issued by the Investment Management Association in May 2014 requires comparative figures for the above statement. For interim financial
statements this will result in the closing comparative net assets not being equal to net assets at the start of the current period.

Quilter Investors Foundation 4 Fund
Quilter Investors OEIC
231
Balance sheet as at 30 June 2018 30.06.18 31.12.17
£'000 £’000
Assets
Fixed assets
Investments 376,508 398,398
Current assets
Debtors 1,186 1,362
Cash and bank balances 41,455 57,725
Total assets 419,149 457,485
Liabilities
Investment liabilities (6,269) (7,549)
Creditors
Bank overdrafts (782) (8,056)
Other creditors (617) (887)
Total liabilities (7,668) (16,492)
Net assets attributable to shareholders 411,481 440,993
.
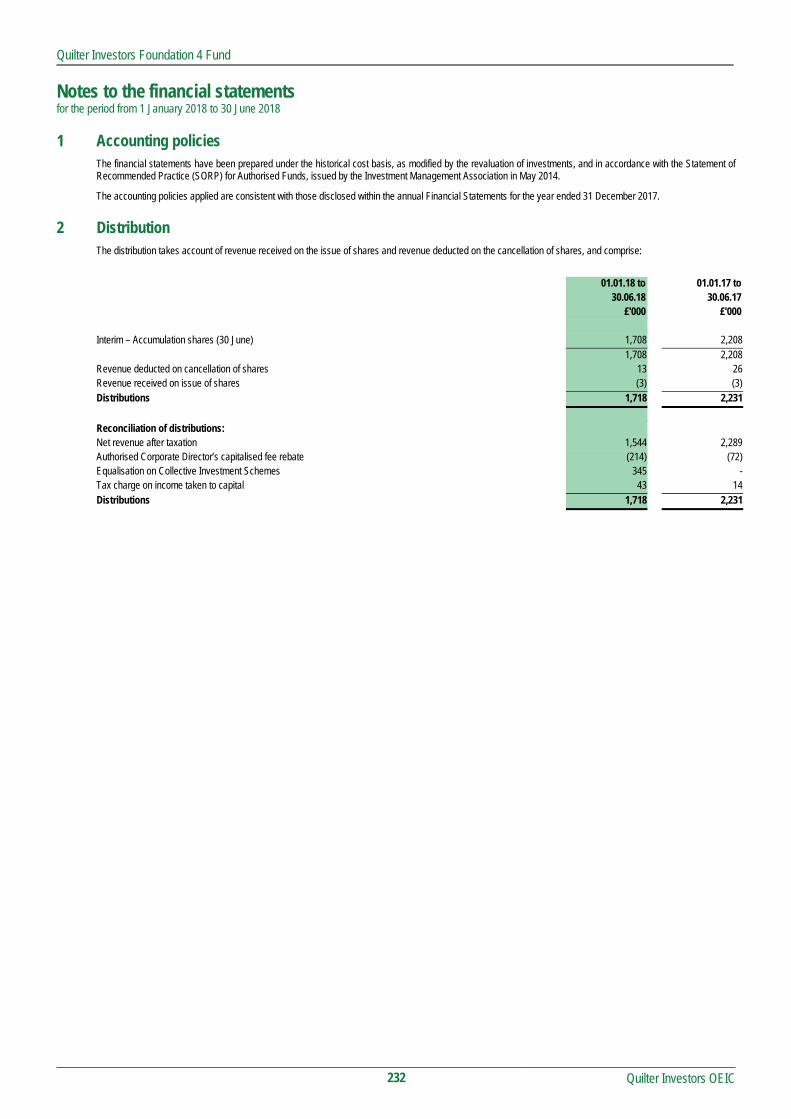
Quilter Investors Foundation 4 Fund
Notes to the financial statements for the period from 1 January 2018 to 30 June 2018
Quilter Investors OEIC
232
1 Accounting policies The financial statements have been prepared under the historical cost basis, as modified by the revaluation of investments, and in accordance with the Statement of Recommended Practice (SORP) for Authorised Funds, issued by the Investment Management Association in May 2014.
The accounting policies applied are consistent with those disclosed within the annual Financial Statements for the year ended 31 December 2017.
2 Distribution The distribution takes account of revenue received on the issue of shares and revenue deducted on the cancellation of shares, and comprise:
01.01.18 to 01.01.17 to 30.06.18 30.06.17 £'000 £'000 Interim – Accumulation shares (30 June) 1,708 2,208 1,708 2,208 Revenue deducted on cancellation of shares 13 26 Revenue received on issue of shares (3) (3) Distributions 1,718 2,231
Reconciliation of distributions: Net revenue after taxation 1,544 2,289 Authorised Corporate Director’s capitalised fee rebate (214) (72) Equalisation on Collective Investment Schemes 345 - Tax charge on income taken to capital 43 14 Distributions 1,718 2,231

Quilter Investors Foundation 4 Fund
Distribution table
Quilter Investors OEIC
233
Interim distribution Group 1: Shares purchased prior to 1 January 2018 Group 2: Shares purchased from 1 January 2018 to 30 June 2018
Revenue pence/cents
per share
Equalisation pence/cents
per share*
Distribution paid 31.08.18
pence/cents per share
Distribution paid 31.08.17
pence/cents per share Accumulation 'A' Shares Group 1 0.3218 - 0.3218 0.4240 Group 2 0.3218 0.0000 0.3218 0.4240 Accumulation 'O' EUR Hedged Group 1 0.1326 - 0.1326 0.2554 Group 2 0.1326 0.0000 0.1326 0.2554 Accumulation 'O' USD Hedged Group 1 0.1671 - 0.1671 0.2523 Group 2 0.1671 0.0000 0.1671 0.2523 Accumulation 'R' Shares Group 1 0.6488 - 0.6488 0.7480 Group 2 0.5070 0.1418 0.6488 0.7480 Accumulation 'U1' Shares Group 1 0.6720 - 0.6720 0.7781 Group 2 0.6129 0.0591 0.6720 0.7781 * Equalisation only applies to shares purchased during the period (Group 2 shares). It is the average amount of revenue included in the purchase price of all Group 2 shares
and is refunded to holders of these shares as a return of capital. Being capital, it is not liable to income tax but must be deducted from the cost of shares for capital gains tax purposes.

Quilter Investors Foundation 5 Fund
Quilter Investors Foundation 5 Fund
Quilter Investors OEIC
234
Launch date 27 February 2014
IA Sector Flexible
Investment adviser Quilter Investors Limited
Net asset value £73,682,113
Objective
The sub-fund aims to achieve an annual return of 5% above inflation over rolling ten year periods.
Notwithstanding that the sub-fund aims to deliver a positive annual return over rolling ten year periods, any capital invested is, in fact, at risk and there is no guarantee that a positive annual return will be generated over such specified period.
Policy
The sub-fund will gain exposure to a diversified portfolio of asset classes including, but not limited to, equities, fixed interest, property, commodities and currency. Typically the sub-fund will have a preference to asset classes providing a potential for growth such as equities.
The sub-fund will gain exposure to these asset classes by investing in transferable securities, derivative instruments and forward transactions (for the purpose of meeting the investment objective or efficient portfolio management), as well as collective investment schemes and warrants. The sub-fund may hold liquidity in cash, near cash, money market instruments, and permitted deposits. There are no limits on the percentage of the sub-fund’s assets which may be invested in cash.
In accordance with the provisions of the Sourcebook, all investment in property and commodities will be indirect via transferable securities, collective investment schemes and/or derivatives. The use of derivatives for this purpose may affect the volatility or risk profile of the sub-fund although this is not the ACD’s intention.
Investment Manager’s review
Market Review
Equity and bond markets suffered a torrid start to the year. After UK and US stock markets both hit record highs in January, global equities suffered two major setbacks in the first three months of 2018. Thanks to a sudden hike in US inflation and fears of a more aggressive interest-rate posture in the US, markets sold off sharply on concerns of the global economy overheating.
After briefly recovering ground, markets tumbled a second time as President Trump’s trade-war rhetoric sparked worries of a global economic slowdown, and a data scandal at Facebook triggered a steep fall in tech-sector share prices.
In the second half of the period, markets recovered strongly, driven by the US as technology stocks recovered and overall strong corporate earnings helped push markets higher, with the Nasdaq index gaining almost 13% in the three months to 30 June.
Emerging markets, in contrast, had a disappointing six months, as the MSCI Emerging Markets index declined 4.2% in sterling terms over the period, driven by trade war rhetoric with the US, China concerns and weakening corporate fundamentals.
Performance
Following a disappointing start to the year given the wide market sell-off, performance of the portfolio improved significantly in the second half of the period. UK and US equities delivered strong returns, which helped offset the disappointing performance from emerging market equities.
Fixed income performance was a small negative towards the end of the period, with global bonds weighing on returns, with only emerging market debt delivering a slight positive for the three months to the end of June.
Alternatives, however, helped offset the disappointing performance from weaker asset classes, despite underperformance in the second half of the period from the alternative beta held through the Old Mutual STAR (Style Premia Absolute Return) Fund. The strongest performance in the asset class came from the long/short managers, particularly the Old Mutual UK Specialist Equity Fund, with a positive contribution also resulting from the Old Mutual Arbea Fund.
Risk and Reward Profile
The calculated risk and reward category, as shown above, uses a method of calculation derived from EU rules. It is based on the rate at which the returns of the sub-fund have moved up and down in the past (i.e. volatility) and is not a guide to the future risk and reward category of the sub-fund. The category shown is not a target or guarantee and may shift over time. Even the lowest category 1 does not mean a risk-free investment. The seven-category scale is nonlinear, for example, 2 is not twice as risky as 1.
Sub-funds in category 6 have in the past shown relatively high volatility. With a sub-fund of category 6, you have a relatively high risk of losing money but your chance for gains is also relatively high.
Investment risk - the performance aim is not a guarantee, may not be achieved and a capital loss may occur. Sub-funds which have a higher performance aim generally take more risk to achieve this and so have a greater potential for the returns to be significantly different than expected.
Strategy risk - as the sub-fund invests in other collective investment schemes, which themselves invest in assets such as bonds, company shares, cash and currencies, it will be subject to the collective risks of these other sub-funds. This may include emerging markets risk and sub-investment grade credit risk.
Emerging markets risk - less developed countries may face more political, economic or structural challenges than developed countries.
Credit risk - the issuer of a bond or a similar investment within the sub-fund may not pay income or repay capital to the sub-fund when due. Bonds which are rated below investment grade are considered to have a higher risk exposure with respect to meeting their payment obligations.
Interest rate risk - investments in bonds are affected by interest rates and inflation trends which may affect the value of the sub-fund.
Currency risk (GBP share class) - the sub-fund is denominated in British Pounds but may hold assets denominated in, or with exposure to, other currencies. The value of your shares may rise and fall as a result of exchange rate movements between these currencies. Currency risk (USD share class) - the sub-fund is denominated in British Pounds but may hold assets denominated in, or with exposure to, other currencies. This share class is denominated in US Dollars. The hedging process may not give a precise hedge, and some currency risk may remain. The value of your shares may rise and fall as a result of exchange rate movements between these currencies.
Derivative risk - the sub-fund uses derivatives to generate returns and/or to reduce costs and the overall risk of the sub-fund. Using derivatives can involve a higher level of risk. A small movement in the price of an underlying investment may result in a disproportionately large movement in the price of the derivative investment. Derivatives also involve counterparty risk where the institutions acting as counterparty to derivatives may not meet their contractual obligations.
Capital erosion risk - the sub-fund takes its charges from the income of the sub-fund in the first instance. The impact of sub-fund charges may be material on the value of any income you receive from your investment. There is potential for capital erosion if insufficient income is generated by the sub-fund to cover these charges. Capital erosion may have the effect of reducing the level of income generated.
For full details of the sub-fund’s risks, please see the section in the prospectus headed “Risks”.

Quilter Investors Foundation 5 Fund
Quilter Investors OEIC
235
Performance Records Comparative Tables 1 January 2018 to 1 January 2017 to 1 January 2016 to Accumulation 'A' 30 June 2018 31 December 2017 31 December 2016 p/share p/share p/share
Change in net assets per share Opening net asset value per share 143.72 125.95 105.20
Return before operating charges* (2.99) 19.53 22.18 Operating charges** (0.95) (1.76) (1.43)
Return after operating charges* (3.94) 17.77 20.75
Distributions (0.32) (1.75) (1.13) Retained distributions 0.32 1.75 1.13
Closing net asset value per share 139.78 143.72 125.95
* after direct transaction costs of*** - - -
Performance Return after charges (2.74)% 14.11% 19.72%
Other information Closing net asset value (£) 48,257,697 53,007,389 49,264,817 Closing number of shares 34,523,500 36,883,591 39,115,831 Operating Charges**** 1.35% 1.30% 1.29% Direct transaction costs*** - - -
Prices pence per share pence per share pence per share Highest share price 147.9 143.7 126.3 Lowest share price 134.4 125.9 93.12
1 January 2018 to 1 January 2017 to 1 January 2016 to Accumulation 'O' USD Hedged 30 June 2018 31 December 2017 31 December 2016 p/share p/share p/share
Change in net assets per share Opening net asset value per share 104.72 100.30 69.94
Return before operating charges* 1.49 6.02 31.61 Operating charges** (0.81) (1.60) (1.25)
Return after operating charges* 0.68 4.42 30.36
Distributions (0.12) (1.16) (0.62) Retained distributions 0.12 1.16 0.62
Closing net asset value per share 105.40 104.72 100.30
* after direct transaction costs of*** - - -
Performance Return after charges 0.65% 4.41% 43.41%
Other information Closing net asset value (£) 20,921,079 22,175,979 22,846,496 Closing number of shares 19,849,470 21,176,022 22,777,116 Operating Charges**** 1.60% 1.55% 1.54% Direct transaction costs*** - - -
Prices cents per share cents per share cents per share Highest share price 145.8 141.5 123.8 Lowest share price 132.8 123.4 91.75
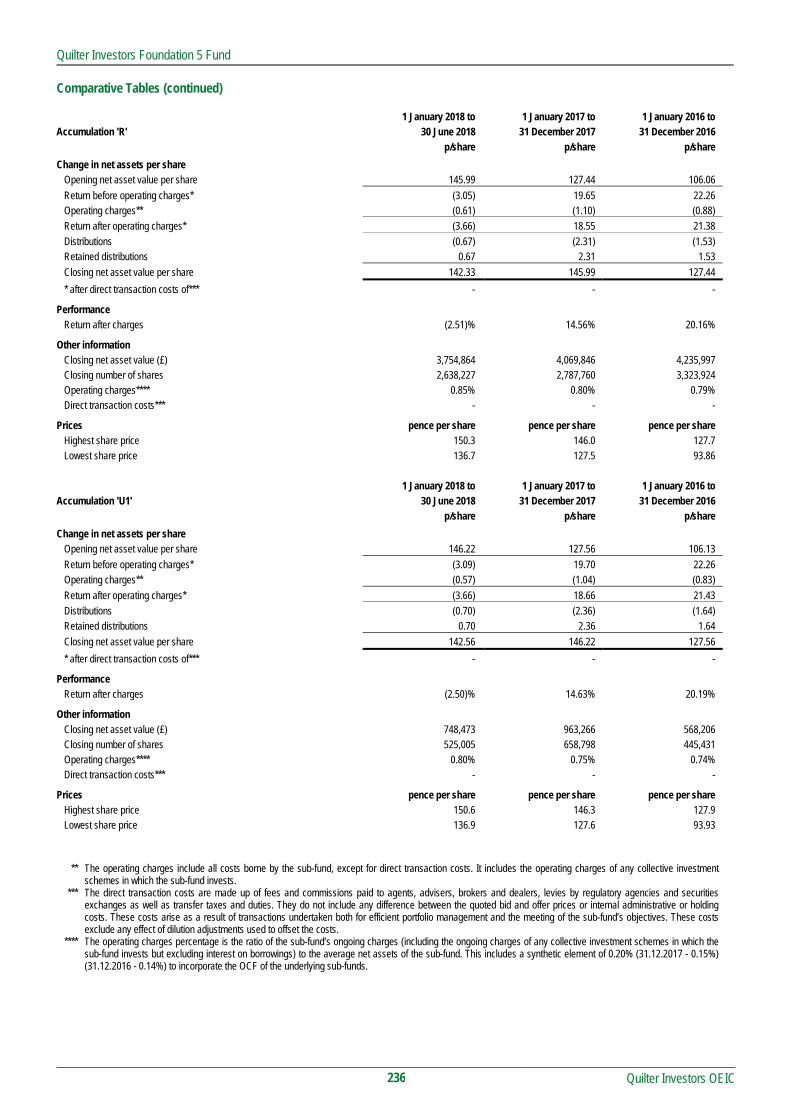
Quilter Investors Foundation 5 Fund
Quilter Investors OEIC
236
Comparative Tables (continued) 1 January 2018 to 1 January 2017 to 1 January 2016 to Accumulation 'R' 30 June 2018 31 December 2017 31 December 2016 p/share p/share p/share
Change in net assets per share Opening net asset value per share 145.99 127.44 106.06
Return before operating charges* (3.05) 19.65 22.26 Operating charges** (0.61) (1.10) (0.88)
Return after operating charges* (3.66) 18.55 21.38
Distributions (0.67) (2.31) (1.53) Retained distributions 0.67 2.31 1.53
Closing net asset value per share 142.33 145.99 127.44
* after direct transaction costs of*** - - -
Performance Return after charges (2.51)% 14.56% 20.16%
Other information Closing net asset value (£) 3,754,864 4,069,846 4,235,997 Closing number of shares 2,638,227 2,787,760 3,323,924 Operating charges**** 0.85% 0.80% 0.79% Direct transaction costs*** - - -
Prices pence per share pence per share pence per share Highest share price 150.3 146.0 127.7 Lowest share price 136.7 127.5 93.86
1 January 2018 to 1 January 2017 to 1 January 2016 to Accumulation 'U1' 30 June 2018 31 December 2017 31 December 2016 p/share p/share p/share
Change in net assets per share Opening net asset value per share 146.22 127.56 106.13
Return before operating charges* (3.09) 19.70 22.26 Operating charges** (0.57) (1.04) (0.83)
Return after operating charges* (3.66) 18.66 21.43
Distributions (0.70) (2.36) (1.64) Retained distributions 0.70 2.36 1.64
Closing net asset value per share 142.56 146.22 127.56
* after direct transaction costs of*** - - -
Performance Return after charges (2.50)% 14.63% 20.19%
Other information Closing net asset value (£) 748,473 963,266 568,206 Closing number of shares 525,005 658,798 445,431 Operating charges**** 0.80% 0.75% 0.74% Direct transaction costs*** - - -
Prices pence per share pence per share pence per share Highest share price 150.6 146.3 127.9 Lowest share price 136.9 127.6 93.93
** The operating charges include all costs borne by the sub-fund, except for direct transaction costs. It includes the operating charges of any collective investment schemes in which the sub-fund invests.
*** The direct transaction costs are made up of fees and commissions paid to agents, advisers, brokers and dealers, levies by regulatory agencies and securities exchanges as well as transfer taxes and duties. They do not include any difference between the quoted bid and offer prices or internal administrative or holding costs. These costs arise as a result of transactions undertaken both for efficient portfolio management and the meeting of the sub-fund’s objectives. These costs exclude any effect of dilution adjustments used to offset the costs.
**** The operating charges percentage is the ratio of the sub-fund’s ongoing charges (including the ongoing charges of any collective investment schemes in which the sub-fund invests but excluding interest on borrowings) to the average net assets of the sub-fund. This includes a synthetic element of 0.20% (31.12.2017 - 0.15%) (31.12.2016 - 0.14%) to incorporate the OCF of the underlying sub-funds.

Quilter Investors Foundation 5 Fund
Quilter Investors OEIC
237
Performance
6 months to
30 June 2018
1 year to
30 June 2018
3 years to
30 June 2018
5 years to
30 June 2018
Quilter Investors Foundation 5 Fund* (2.54)% 4.48% 25.95% -
CPI UK+5 (benchmark) 3.31% 7.43% 22.00% 36.85%
IA Flexible Investment (sector average) 0.22% 5.06% 27.96% 49.36%
Quartile ranking 4 3 3 -
* Accumulation ‘R’ shares
Data Source – Factset. Figures are calculated on a total return and single price basis, with net income reinvested into the sub-fund.
Portfolio allocation Overseas Equities 31.63% Overseas Bonds 30.16% United Kingdom Equities 15.19% Overseas Alternative Investment Instruments 7.35% United Kingdom Bonds 5.30% Derivatives (0.64)% Net other assets 11.01% Total 100.00%
Asset allocation Global Equities 70.60% Cash & Futures 18.90% Alternatives 15.60% Fixed Income 7.70% UK Equities (12.80)% Total 100.00%
Percentage of Major holdings portfolio Old Mutual UK Alpha Fund - U2 Accumulation 15.19% Old Mutual European Equity ex UK Fund - R Accumulation 12.45% Old Mutual Monthly Income High Yield Bond Fund Hedged - X Accumulation 12.02% iShares Emerging Markets Equity Index Fund - L Accumulation 10.28% Old Mutual Monthly Income Bond Fund - R Accumulation 9.08% Old Mutual Global Strategic Bond Fund - P Accumulation 8.58% Old Mutual Europe (ex UK) Smaller Companies Fund - U2 Accumulation 5.82% Oder Capital 0% 09/04/2024 5.33% UK Treasury 0% 10/09/2018 3.83% Old Mutual Global Emerging Markets Fund - U2 Accumulation (GBP) 3.08%
Number of holdings 44
Total Purchases and Sales for the period
2018 2017
£’000 £’000
Total purchases for the 6 month period to 30 June 22,639 3,111
Total sales for the 6 month period to 30 June 26,222 7,712

Quilter Investors Foundation 5 Fund
Portfolio statement as at 30 June 2018
Quilter Investors OEIC
238
Market Percentage of Value total net assets
Holding Investment £’000 %
United Kingdom 20.43% (31 December 2017 24.57%)
United Kingdom Equities 15.19% (31 December 2017 15.45%) 7,933,776 Old Mutual UK Alpha Fund - U2 Accumulation 11,195 15.19
11,195 15.19
United Kingdom Bonds 5.30% (31 December 2017 9.47%) £1,000,000 UK Treasury 0% 09/07/2018 999 1.36
£80,000 UK Treasury 0% 20/08/2018 80 0.11 £2,830,900 UK Treasury 0% 10/09/2018 2,826 3.83
3,905 5.30
United Kingdom Derivatives (0.06)% (31 December 2017 (0.35)%)
Sterling Denominated Forward Exchange Contracts (0.09)% (31 December 2017 0.00%) £1,514,581 Sterling v Euro Forward Exchange Contract (23) (0.03)
£83,115 Sterling v Mexican Peso Forward Exchange Contract (6) (0.01) £93,556 Sterling v US Dollar Forward Exchange Contract (1) -
£187,691 Sterling v US Dollar Forward Exchange Contract (2) - £326,338 Sterling v US Dollar Forward Exchange Contract (3) -
£2,998,737 Sterling v US Dollar Forward Exchange Contract (34) (0.05)
(69) (0.09)
Sterling Denominated Futures Contracts 0.03% (31 December 2017 (0.35)%) (120) FTSE 100 Index Futures September 2018 77 0.10
(1) Long Gilt Futures September 2018 (2) - (31) Long Gilt Futures September 2018 (55) (0.07)
20 0.03
Overseas 68.56% (31 December 2017 63.64%)
Overseas Equities 31.63% (31 December 2017 28.03%) 4,900,129 iShares Emerging Markets Equity Index Fund - L Accumulation 7,571 10.28
246,009 Old Mutual Europe (ex UK) Smaller Companies Fund - U2 Accumulation 4,287 5.82 5,277,062 Old Mutual European Equity ex UK Fund - R Accumulation 9,177 12.45
141,064 Old Mutual Global Emerging Markets Fund - U2 Accumulation (GBP) 2,271 3.08
23,306 31.63
Overseas Alternative Investment Instruments 7.35% (31 December 2017 6.67%) 25,464 Oder Capital 0% 09/04/2024 3,930 5.33
153,108 Old Mutual Style Premia Absolute Return Fund 1,488 2.02
5,418 7.35
Overseas Bonds 30.16% (31 December 2017 29.86%) MXN24,000 Mexican Bonos 6.5% 10/06/2021 90 0.12
$42,000 Mexico Bond 3.625% 15/03/2022 32 0.04 5,517,134 Old Mutual Global Strategic Bond Fund - P Accumulation 6,323 8.58 5,912,162 Old Mutual Monthly Income Bond Fund - R Accumulation 6,693 9.08
779,259 Old Mutual Monthly Income High Yield Bond Fund Hedged - X Accumulation 8,852 12.02 $290,000 US Treasury Inflation Indexed 0.125% 15/04/2020 232 0.32
22,222 30.16

Quilter Investors Foundation 5 Fund
Portfolio statement (continued) as at 30 June 2018
Quilter Investors OEIC
239
Market Percentage of
Value total net assets Holding Investment £’000 %
Overseas Derivatives (0.58)% (31 December 2017 (0.92)%)
Australian Dollar Denominated Forward Exchange Contracts 0.00% (31 December 2017 0.00%) AU$3,399,000 Australian Dollar v Sterling Forward Exchange Contract (4) -
(4) -
Australian Dollar Denominated Futures Contracts 0.07% (31 December 2017 0.02%) 23 SPI 200 Index Futures September 2018 51 0.07
Total 51 0.07
Euro Denominated Futures Contracts 0.03% (31 December 2017 0.02%) (3) Euro-Bund Futures September 2018 (4) (0.01)
(52) Europe Stoxx Banks Index Futures September 2018 28 0.04
Total 24 0.03
Euro Denominated Options Contracts 0.00% (31 December 2017 0.00%) 70 Call Euro Stoxx Banks Futures July 2018 Merrill Lynch - - 70 Put Euro Stoxx Banks Futures July 2018 Merrill Lynch 2 -
2 -
Hong Kong Dollar Denominated Forward Exchange Contracts 0.12% (31 December 2017 (0.17)%) HK$82,080,000 Hong Kong Dollar v Sterling Forward Exchange Contract 89 0.12
89 0.12
Hong Kong Dollar Denominated Futures Contracts (0.05)% (31 December 2017 0.15%) 51 Hang Seng Index Futures July 2018 (37) (0.05)
(37) (0.05)
Japanese Yen Denominated Forward Exchange Contracts 0.06% (31 December 2017 (0.03)%) ¥673,725,000 Japanese Yen v Sterling Denominated Forward Exchange Contract 44 0.06
Total 44 0.06
Japanese Yen Denominated Futures Contracts (0.16)% (31 December 2017 0.14%) 39 TOPIX Index Futures September 2018 (121) (0.16)
(121) (0.16)
Swedish Krona Denominated Forward Exchange Contracts 0.00% (31 December 2017 0.00%) SEK750,000 Swedish Krona v Euro Forward Exchange Contract (2) - SEK715,000 Swedish Krona v Euro Forward Exchange Contract (2) -
(4) -
US Dollar Denominated Forward Exchange Contracts 0.88% (31 December 2017 (0.66)%)
$28,001,114 US Dollar v Sterling Forward Exchange Contract 333 0.45 $37,820,000 US Dollar v Sterling Forward Exchange Contract 315 0.43
$181,133 US Dollar v Sterling Forward Exchange Contract - -
648 0.88
US Dollar Denominated Futures Contracts (0.77)% (31 December 2017 0.54%) 6 EMIN Russell 2000 Futures September 2018 (5) (0.01)
48 MSCI Emerging Markets Index Futures September 2018 (133) (0.18) (11) S&P 500 E-Mini Futures September 2018 23 0.03 199 S&P 500 E-Mini Futures September 2018 (424) (0.57)
2 S&P Mid 400 Futures September 2018 (7) (0.01)

Quilter Investors Foundation 5 Fund
Portfolio statement (continued) as at 30 June 2018
Quilter Investors OEIC
240
Market Percentage of
Value total net assets Holding Investment £’000 %
US Dollar Denominated Futures Contracts (continued)
3 US 2 Year Treasury Note Futures September 2018 - - (40) US 10 Year Treasury Note Futures September 2018 (28) (0.04)
5 US 10 Year Ultra Bond Futures September 2018 6 0.01
(568) (0.77)
US Dollar Denominated Options Contracts (0.02)% (31 December 2017 0.00%) 34 Call Dow Jones Industrial Futures July 2018 Merrill Lynch - -
2 Call Nasdaq 100 E-Mini Futures September 2018 Merrill Lynch 1 - 26 Call S&P 500 Index Futures July 2018 Merrill Lynch 1 -
(34) Put Dow Jones Industrial Futures July 2018 Merrill Lynch (2) - (2) Put Nasdaq 100 E-Mini Futures September 2018 Merrill Lynch (3) (0.01)
(13) Put S&P 500 Index Futures July 2018 Merrill Lynch (9) (0.01) 18 Put US 10 Year Treasury Note Futures July 2018 Merrill Lynch 1 - (6) Put US 10 Year Treasury Note Futures July 2018 Merrill Lynch (1) -
(12) (0.02)
US Dollar Credit Default Swap (0.74)% (31 December 2017 (0.93)%) $11,500,000 Buy Protection CDS CDX-NAHYS30V1 5Years 20/06/2023 Barclays Fixed Income OTC (508) (0.69)
$3,200,000 Buy Protection CDS CDX-NAIGS30V1 5Years 20/06/2023 Barclays Fixed Income OTC (35) (0.05)
(543) (0.74)
Investment assets* 65,566 88.99
Net other assets 8,116 11.01
Total net assets 73,682 100.00 * Includes other liabilities. All investments are approved securities being either officially listed in a member state or traded on or under the rules of an eligible securities market, unless otherwise stated.

Quilter Investors Foundation 5 Fund
Quilter Investors OEIC
241
Statement of total return for the period from 1 January 2018 to 30 June 2018 01.01.18 to 01.01.18 to 01.01.17 to 01.01.17 to
30.06.18 30.06.18 30.06.17 30.06.17
Note £'000 £'000 £'000 £'000
Income
Net capital (losses)/gains (1,596) 3,628
Revenue 641 621
Expenses (447) (463)
Interest payable and similar charges (1) (4)
Net revenue before taxation 193 154
Taxation - -
Net revenue after taxation 193 154
Total return before distributions (1,403) 3,782
Distributions 2 (156) (136)
Change in net assets attributable to
shareholders from investment activities (1,559) 3,646
Statement of change in net assets attributable to shareholders for the period from 1 January 2018 to 30 June 2018 01.01.18 to 01.01.18 to 01.01.17 to 01.01.17 to
30.06.18 30.06.18 30.06.17 30.06.17
£'000 £'000 £'000 £'000
Opening net assets attributable to shareholders 80,216* 76,916
Amounts received on issue of shares 592 803
Amounts paid on cancellation of shares (5,730) (4,057)
(5,138) (3,254)
Dilution adjustment 8 4
Change in net assets attributable to
shareholders from investment activities (1,559) 3,646
Retained distribution on accumulation shares 155 135
Closing net assets attributable to shareholders 73,682 77,447* * Section 3.30 of the SORP issued by the Investment Management Association in May 2014 requires comparative figures for the above statement. For interim financial
statements this will result in the closing comparative net assets not being equal to net assets at the start of the current period.

Quilter Investors Foundation 5 Fund
Quilter Investors OEIC
242
Balance sheet as at 30 June 2018 30.06.18 31.12.17
£'000 £’000
Assets
Fixed assets
Investments 67,017 72,499
Current assets
Debtors 215 56
Cash and bank balances 8,483 13,822
Total assets 75,715 86,377
Liabilities
Investment liabilities (1,451) (1,736)
Creditors
Bank overdrafts (353) (4,337)
Other creditors (229) (88)
Total liabilities (2,033) (6,161)
Net assets attributable to shareholders 73,682 80,216

Quilter Investors Foundation 5 Fund
Notes to the financial statements for the period from 1 January 2018 to 30 June 2018
Quilter Investors OEIC
243
1 Accounting policies The financial statements have been prepared under the historical cost basis, as modified by the revaluation of investments, and in accordance with the Statement of Recommended Practice (SORP) for Authorised Funds, issued by the Investment Management Association in May 2014.
The accounting policies applied are consistent with those disclosed within the annual Financial Statements for the year ended 31 December 2017.
2 Distribution The distribution takes account of revenue received on the issue of shares and revenue deducted on the cancellation of shares, and comprise:
01.01.18 to 01.01.17 to 30.06.18 30.06.17 £'000 £'000 Interim – Accumulation shares (30 June) 155 135 155 135 Revenue deducted on cancellation of shares 1 2 Revenue received on issue of shares - (1) Distributions 156 136
Reconciliation of distributions: Net revenue after taxation 193 154 Authorised Corporate Director’s capitalised fee rebate (50) (36) Equalisation on Collective Investment Schemes 3 11 Tax effect of fee rebates taken to capital 10 7 Distributions 156 136

Quilter Investors Foundation 5 Fund
Distribution table
Quilter Investors OEIC
244
Interim distribution Group 1: Shares purchased prior to 1 January 2018 Group 2: Shares purchased from 1 January 2018 to 30 June 2018
Net Revenue pence/cents
per share
Equalisation pence/cents
per share*
Distribution paid 31.08.18
pence/cents per share
Distribution paid 31.08.17
pence/cents per share Accumulation 'A' Shares Group 1 0.3176 - 0.3176 0.2605 Group 2 0.3176 0.0000 0.3176 0.2605 Accumulation 'O' USD Hedged Shares Group 1 0.1621 - 0.1621 0.0911 Group 2 0.1621 0.0000 0.1621 0.0911 Accumulation 'R' Shares Group 1 0.6666 - 0.6666 0.5801 Group 2 0.6619 0.0047 0.6666 0.5801 Accumulation 'U1' Shares Group 1 0.6970 - 0.6970 0.5997 Group 2 0.6879 0.0091 0.6970 0.5997 * Equalisation only applies to shares purchased during the distribution period (Group 2 shares). It is the average amount of revenue included in the purchase price of all
Group 2 shares and is refunded to holders of these shares as a return of capital. Being capital, it is not liable to income tax but must be deducted from the cost of shares for capital gains tax purposes.
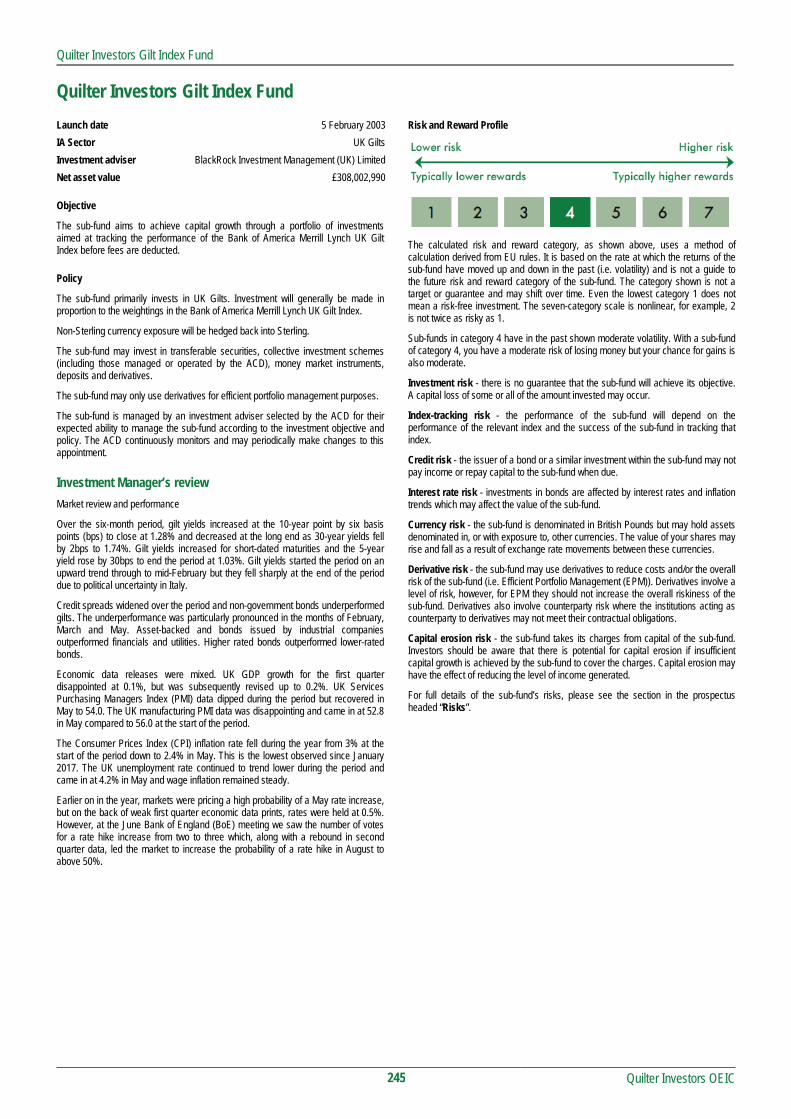
Quilter Investors Gilt Index Fund
Quilter Investors Gilt Index Fund
Quilter Investors OEIC
245
Launch date 5 February 2003
IA Sector UK Gilts
Investment adviser BlackRock Investment Management (UK) Limited
Net asset value £308,002,990
Objective
The sub-fund aims to achieve capital growth through a portfolio of investments aimed at tracking the performance of the Bank of America Merrill Lynch UK Gilt Index before fees are deducted.
Policy
The sub-fund primarily invests in UK Gilts. Investment will generally be made in proportion to the weightings in the Bank of America Merrill Lynch UK Gilt Index.
Non-Sterling currency exposure will be hedged back into Sterling.
The sub-fund may invest in transferable securities, collective investment schemes (including those managed or operated by the ACD), money market instruments, deposits and derivatives.
The sub-fund may only use derivatives for efficient portfolio management purposes.
The sub-fund is managed by an investment adviser selected by the ACD for their expected ability to manage the sub-fund according to the investment objective and policy. The ACD continuously monitors and may periodically make changes to this appointment.
Investment Manager’s review
Market review and performance
Over the six-month period, gilt yields increased at the 10-year point by six basis points (bps) to close at 1.28% and decreased at the long end as 30-year yields fell by 2bps to 1.74%. Gilt yields increased for short-dated maturities and the 5-year yield rose by 30bps to end the period at 1.03%. Gilt yields started the period on an upward trend through to mid-February but they fell sharply at the end of the period due to political uncertainty in Italy.
Credit spreads widened over the period and non-government bonds underperformed gilts. The underperformance was particularly pronounced in the months of February, March and May. Asset-backed and bonds issued by industrial companies outperformed financials and utilities. Higher rated bonds outperformed lower-rated bonds.
Economic data releases were mixed. UK GDP growth for the first quarter disappointed at 0.1%, but was subsequently revised up to 0.2%. UK Services Purchasing Managers Index (PMI) data dipped during the period but recovered in May to 54.0. The UK manufacturing PMI data was disappointing and came in at 52.8 in May compared to 56.0 at the start of the period.
The Consumer Prices Index (CPI) inflation rate fell during the year from 3% at the start of the period down to 2.4% in May. This is the lowest observed since January 2017. The UK unemployment rate continued to trend lower during the period and came in at 4.2% in May and wage inflation remained steady.
Earlier on in the year, markets were pricing a high probability of a May rate increase, but on the back of weak first quarter economic data prints, rates were held at 0.5%. However, at the June Bank of England (BoE) meeting we saw the number of votes for a rate hike increase from two to three which, along with a rebound in second quarter data, led the market to increase the probability of a rate hike in August to above 50%.
Risk and Reward Profile
The calculated risk and reward category, as shown above, uses a method of calculation derived from EU rules. It is based on the rate at which the returns of the sub-fund have moved up and down in the past (i.e. volatility) and is not a guide to the future risk and reward category of the sub-fund. The category shown is not a target or guarantee and may shift over time. Even the lowest category 1 does not mean a risk-free investment. The seven-category scale is nonlinear, for example, 2 is not twice as risky as 1.
Sub-funds in category 4 have in the past shown moderate volatility. With a sub-fund of category 4, you have a moderate risk of losing money but your chance for gains is also moderate.
Investment risk - there is no guarantee that the sub-fund will achieve its objective. A capital loss of some or all of the amount invested may occur.
Index-tracking risk - the performance of the sub-fund will depend on the performance of the relevant index and the success of the sub-fund in tracking that index.
Credit risk - the issuer of a bond or a similar investment within the sub-fund may not pay income or repay capital to the sub-fund when due.
Interest rate risk - investments in bonds are affected by interest rates and inflation trends which may affect the value of the sub-fund.
Currency risk - the sub-fund is denominated in British Pounds but may hold assets denominated in, or with exposure to, other currencies. The value of your shares may rise and fall as a result of exchange rate movements between these currencies.
Derivative risk - the sub-fund may use derivatives to reduce costs and/or the overall risk of the sub-fund (i.e. Efficient Portfolio Management (EPM)). Derivatives involve a level of risk, however, for EPM they should not increase the overall riskiness of the sub-fund. Derivatives also involve counterparty risk where the institutions acting as counterparty to derivatives may not meet their contractual obligations.
Capital erosion risk - the sub-fund takes its charges from capital of the sub-fund. Investors should be aware that there is potential for capital erosion if insufficient capital growth is achieved by the sub-fund to cover the charges. Capital erosion may have the effect of reducing the level of income generated.
For full details of the sub-fund’s risks, please see the section in the prospectus headed “Risks”.
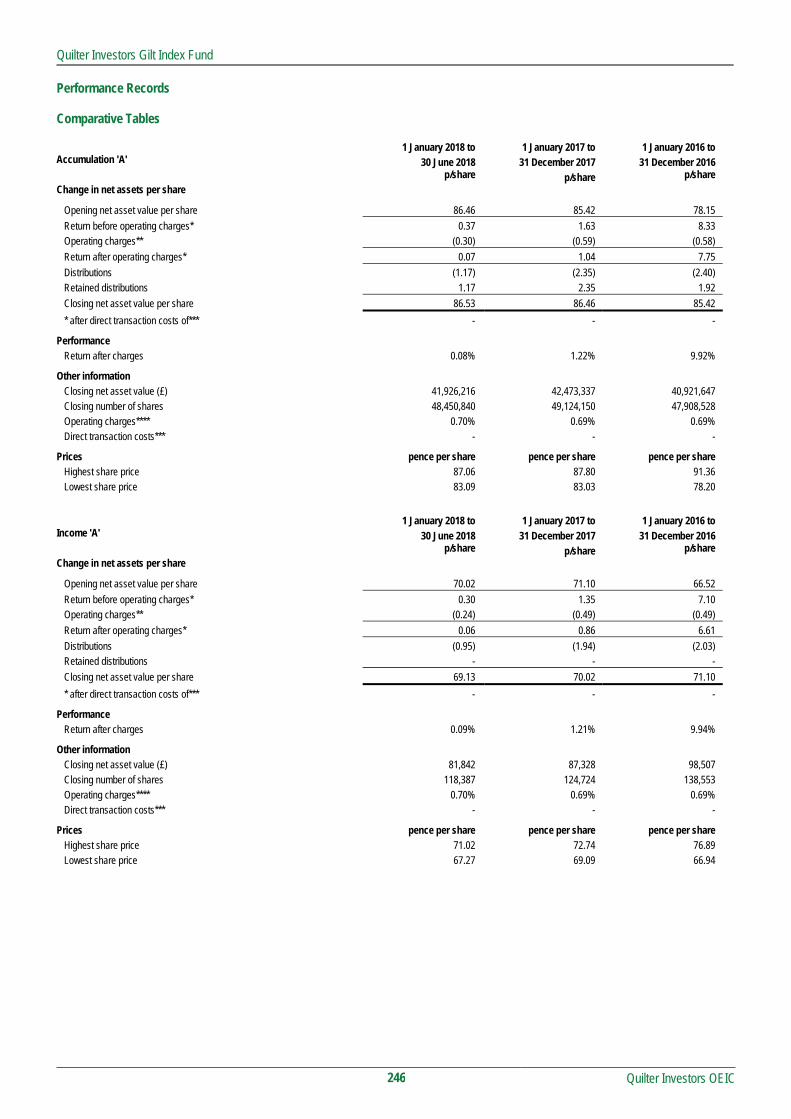
Quilter Investors Gilt Index Fund
Quilter Investors OEIC
246
Performance Records Comparative Tables 1 January 2018 to 1 January 2017 to 1 January 2016 to Accumulation 'A' 30 June 2018 31 December 2017 31 December 2016 p/share p/share p/share Change in net assets per share
Opening net asset value per share 86.46 85.42 78.15
Return before operating charges* 0.37 1.63 8.33 Operating charges** (0.30) (0.59) (0.58)
Return after operating charges* 0.07 1.04 7.75
Distributions (1.17) (2.35) (2.40) Retained distributions 1.17 2.35 1.92
Closing net asset value per share 86.53 86.46 85.42
* after direct transaction costs of*** - - -
Performance Return after charges 0.08% 1.22% 9.92%
Other information Closing net asset value (£) 41,926,216 42,473,337 40,921,647 Closing number of shares 48,450,840 49,124,150 47,908,528 Operating charges**** 0.70% 0.69% 0.69% Direct transaction costs*** - - -
Prices pence per share pence per share pence per share Highest share price 87.06 87.80 91.36 Lowest share price 83.09 83.03 78.20
1 January 2018 to 1 January 2017 to 1 January 2016 to Income 'A' 30 June 2018 31 December 2017 31 December 2016 p/share p/share p/share Change in net assets per share
Opening net asset value per share 70.02 71.10 66.52
Return before operating charges* 0.30 1.35 7.10 Operating charges** (0.24) (0.49) (0.49)
Return after operating charges* 0.06 0.86 6.61
Distributions (0.95) (1.94) (2.03) Retained distributions - - -
Closing net asset value per share 69.13 70.02 71.10
* after direct transaction costs of*** - - -
Performance Return after charges 0.09% 1.21% 9.94%
Other information Closing net asset value (£) 81,842 87,328 98,507 Closing number of shares 118,387 124,724 138,553 Operating charges**** 0.70% 0.69% 0.69% Direct transaction costs*** - - -
Prices pence per share pence per share pence per share Highest share price 71.02 72.74 76.89 Lowest share price 67.27 69.09 66.94

Quilter Investors Gilt Index Fund
Quilter Investors OEIC
247
Comparative Tables (continued) 1 January 2018 to 1 January 2017 to 1 January 2016 to Income 'R' 30 June 2018 31 December 2017 31 December 2016 p/share p/share p/share
Change in net assets per share Opening net asset value per share 71.07 71.95 67.13
Return before operating charges* 0.31 1.37 7.16 Operating charges** (0.14) (0.28) (0.28)
Return after operating charges* 0.17 1.09 6.88
Distributions (0.96) (1.97) (2.06) Retained distributions - - -
Closing net asset value per share 70.28 71.07 71.95
* after direct transaction costs of*** - - -
Performance Return after charges 0.24% 1.51% 10.25%
Other information Closing net asset value (£) 2,737,239 2,744,118 2,794,784 Closing number of shares 3,894,995 3,861,053 3,884,077 Operating charges**** 0.40% 0.39% 0.39%
Direct transaction costs*** - - -
Prices pence per share pence per share pence per share Highest share price 72.12 73.74 77.77 Lowest share price 68.34 69.96 67.56
1 January 2018 to 1 January 2017 to 1 January 2016 to Accumulation 'U2' 30 June 2018 31 December 2017 31 December 2016 p/share p/share p/share
Change in net assets per share Opening net asset value per share 124.15 122.16 111.33
Return before operating charges* 0.53 2.34 11.87 Operating charges** (0.18) (0.35) (0.35)
Return after operating charges* 0.35 1.99 11.52
Distributions (1.68) (3.36) (3.43) Retained distributions 1.68 3.36 2.74
Closing net asset value per share 124.50 124.15 122.16
* after direct transaction costs of*** - - -
Performance Return after charges 0.28% 1.63% 10.35%
Other information Closing net asset value (£) 263,244,882 222,797,381 142,556,067 Closing number of shares 211,447,146 179,463,409 116,695,708 Operating Charges**** 0.30% 0.29% 0.29% Direct transaction costs*** - - -
Prices pence per share pence per share pence per share Highest share price 125.2 125.9 130.5 Lowest share price 119.4 118.8 111.4
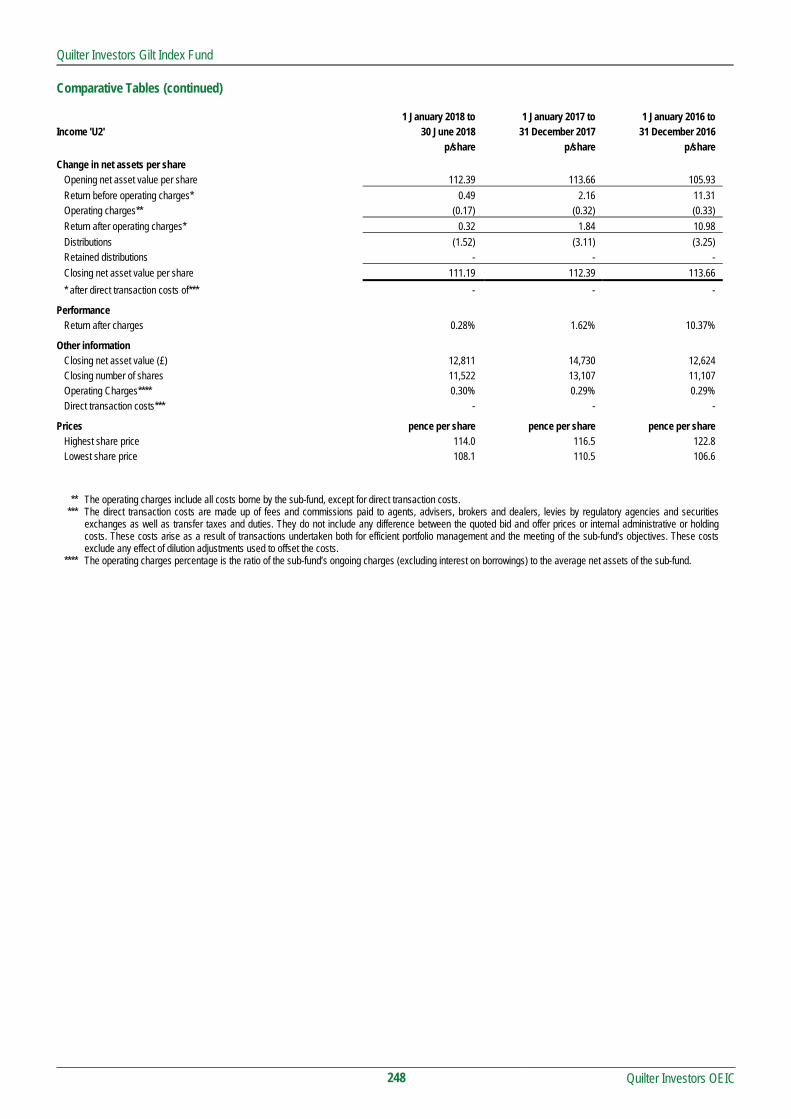
Quilter Investors Gilt Index Fund
Quilter Investors OEIC
248
Comparative Tables (continued) 1 January 2018 to 1 January 2017 to 1 January 2016 to Income 'U2' 30 June 2018 31 December 2017 31 December 2016 p/share p/share p/share
Change in net assets per share Opening net asset value per share 112.39 113.66 105.93
Return before operating charges* 0.49 2.16 11.31 Operating charges** (0.17) (0.32) (0.33)
Return after operating charges* 0.32 1.84 10.98
Distributions (1.52) (3.11) (3.25) Retained distributions - - -
Closing net asset value per share 111.19 112.39 113.66
* after direct transaction costs of*** - - -
Performance Return after charges 0.28% 1.62% 10.37%
Other information Closing net asset value (£) 12,811 14,730 12,624 Closing number of shares 11,522 13,107 11,107 Operating Charges**** 0.30% 0.29% 0.29% Direct transaction costs*** - - -
Prices pence per share pence per share pence per share Highest share price 114.0 116.5 122.8 Lowest share price 108.1 110.5 106.6
** The operating charges include all costs borne by the sub-fund, except for direct transaction costs. *** The direct transaction costs are made up of fees and commissions paid to agents, advisers, brokers and dealers, levies by regulatory agencies and securities
exchanges as well as transfer taxes and duties. They do not include any difference between the quoted bid and offer prices or internal administrative or holding costs. These costs arise as a result of transactions undertaken both for efficient portfolio management and the meeting of the sub-fund’s objectives. These costs exclude any effect of dilution adjustments used to offset the costs.
**** The operating charges percentage is the ratio of the sub-fund’s ongoing charges (excluding interest on borrowings) to the average net assets of the sub-fund.

Quilter Investors Gilt Index Fund
Quilter Investors OEIC
249
Performance
6 months to
30 June 2018
1 year to
30 June 2018
3 years to
30 June 2018
5 years to
30 June 2018
Quilter Investors Gilt Index Fund* 0.05% 1.44% 12.13% 21.58%
BofA Merrill Lynch UK Gilts (benchmark) 0.33% 2.01% 15.28% 29.06%
IA UK Gilts (sector average) 0.40% 2.05% 14.51% 27.53%
Quartile ranking 4 3 4 4
* Accumulation ‘A’ shares
Data Source – Factset. Figures are calculated on a total return and single price basis, with net income reinvested into the sub-fund.
Portfolio allocation United Kingdom 99.36% Net other assets 0.64%
Total 100.00% Asset allocation
Sterling Denominated Debt Securities 99.36% Net other assets 0.64%
Total 100.00%
Percentage of Major holdings portfolio
United Kingdom Gilt 4.25% 07/06/2032 3.50% United Kingdom Gilt 4.75% 07/12/2030 3.38% United Kingdom Gilt 4.5% 07/09/2034 3.28% United Kingdom Gilt 4.25% 07/12/2055 3.23% United Kingdom Gilt 5% 07/03/2025 3.19% United Kingdom Gilt 4.25% 07/03/2036 3.16% United Kingdom Gilt 4% 22/01/2060 3.13% United Kingdom Gilt 4% 07/03/2022 3.12% United Kingdom Gilt 4.5% 07/12/2042 3.05% United Kingdom Gilt 4.75% 07/12/2038 2.91%
Number of holdings 42
Total Purchases and Sales for the period
2018 2017
£'000 £'000
Total purchases for the 6 month period to 30 June 73,506 65,528
Total sales for the 6 month period to 30 June 29,578 25,020
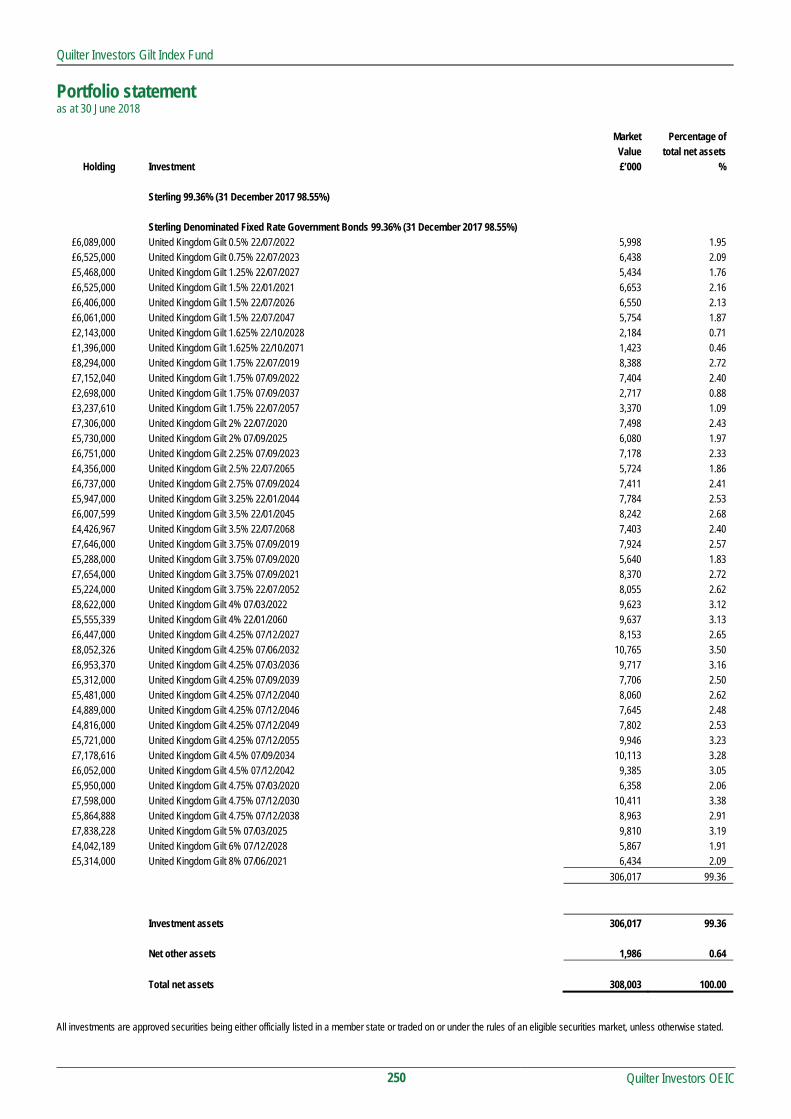
Quilter Investors Gilt Index Fund
Portfolio statement as at 30 June 2018
Quilter Investors OEIC
250
Market Percentage of
Value total net assets Holding Investment £’000 %
Sterling 99.36% (31 December 2017 98.55%)
Sterling Denominated Fixed Rate Government Bonds 99.36% (31 December 2017 98.55%) £6,089,000 United Kingdom Gilt 0.5% 22/07/2022 5,998 1.95 £6,525,000 United Kingdom Gilt 0.75% 22/07/2023 6,438 2.09 £5,468,000 United Kingdom Gilt 1.25% 22/07/2027 5,434 1.76 £6,525,000 United Kingdom Gilt 1.5% 22/01/2021 6,653 2.16 £6,406,000 United Kingdom Gilt 1.5% 22/07/2026 6,550 2.13 £6,061,000 United Kingdom Gilt 1.5% 22/07/2047 5,754 1.87 £2,143,000 United Kingdom Gilt 1.625% 22/10/2028 2,184 0.71 £1,396,000 United Kingdom Gilt 1.625% 22/10/2071 1,423 0.46 £8,294,000 United Kingdom Gilt 1.75% 22/07/2019 8,388 2.72 £7,152,040 United Kingdom Gilt 1.75% 07/09/2022 7,404 2.40 £2,698,000 United Kingdom Gilt 1.75% 07/09/2037 2,717 0.88 £3,237,610 United Kingdom Gilt 1.75% 22/07/2057 3,370 1.09 £7,306,000 United Kingdom Gilt 2% 22/07/2020 7,498 2.43 £5,730,000 United Kingdom Gilt 2% 07/09/2025 6,080 1.97 £6,751,000 United Kingdom Gilt 2.25% 07/09/2023 7,178 2.33 £4,356,000 United Kingdom Gilt 2.5% 22/07/2065 5,724 1.86 £6,737,000 United Kingdom Gilt 2.75% 07/09/2024 7,411 2.41 £5,947,000 United Kingdom Gilt 3.25% 22/01/2044 7,784 2.53 £6,007,599 United Kingdom Gilt 3.5% 22/01/2045 8,242 2.68 £4,426,967 United Kingdom Gilt 3.5% 22/07/2068 7,403 2.40 £7,646,000 United Kingdom Gilt 3.75% 07/09/2019 7,924 2.57 £5,288,000 United Kingdom Gilt 3.75% 07/09/2020 5,640 1.83 £7,654,000 United Kingdom Gilt 3.75% 07/09/2021 8,370 2.72 £5,224,000 United Kingdom Gilt 3.75% 22/07/2052 8,055 2.62 £8,622,000 United Kingdom Gilt 4% 07/03/2022 9,623 3.12 £5,555,339 United Kingdom Gilt 4% 22/01/2060 9,637 3.13 £6,447,000 United Kingdom Gilt 4.25% 07/12/2027 8,153 2.65 £8,052,326 United Kingdom Gilt 4.25% 07/06/2032 10,765 3.50 £6,953,370 United Kingdom Gilt 4.25% 07/03/2036 9,717 3.16 £5,312,000 United Kingdom Gilt 4.25% 07/09/2039 7,706 2.50 £5,481,000 United Kingdom Gilt 4.25% 07/12/2040 8,060 2.62 £4,889,000 United Kingdom Gilt 4.25% 07/12/2046 7,645 2.48 £4,816,000 United Kingdom Gilt 4.25% 07/12/2049 7,802 2.53 £5,721,000 United Kingdom Gilt 4.25% 07/12/2055 9,946 3.23 £7,178,616 United Kingdom Gilt 4.5% 07/09/2034 10,113 3.28 £6,052,000 United Kingdom Gilt 4.5% 07/12/2042 9,385 3.05 £5,950,000 United Kingdom Gilt 4.75% 07/03/2020 6,358 2.06 £7,598,000 United Kingdom Gilt 4.75% 07/12/2030 10,411 3.38 £5,864,888 United Kingdom Gilt 4.75% 07/12/2038 8,963 2.91 £7,838,228 United Kingdom Gilt 5% 07/03/2025 9,810 3.19 £4,042,189 United Kingdom Gilt 6% 07/12/2028 5,867 1.91 £5,314,000 United Kingdom Gilt 8% 07/06/2021 6,434 2.09
Total 306,017 99.36
Investment assets 306,017 99.36
Net other assets 1,986 0.64
Total net assets 308,003 100.00
All investments are approved securities being either officially listed in a member state or traded on or under the rules of an eligible securities market, unless otherwise stated.

Quilter Investors Gilt Index Fund
Quilter Investors OEIC
251
Statement of total return for the period from 1 January 2018 to 30 June 2018 01.01.18 to 01.01.18 to 01.01.17 to 01.01.17 to
30.06.18 30.06.18 30.06.17 30.06.17
Note £'000 £'000 £'000 £'000
Income
Net capital losses (166) (1,125)
Revenue 1,934 1,478
Expenses (503) (374)
Net revenue before taxation 1,431 1,104
Taxation - -
Net revenue after taxation 1,431 1,104
Total return before distributions 1,265 (21)
Distributions 2 (3,898) (2,908)
Change in net assets attributable to
shareholders from investment activities (2,633) (2,929)
Statement of change in net assets attributable to shareholders for the period from 1 January 2018 to 30 June 2018 01.01.18 to 01.01.18 to 01.01.17 to 01.01.17 to
30.06.18 30.06.18 30.06.17 30.06.17
£'000 £'000 £'000 £'000
Opening net assets attributable to shareholders 268,117* 186,384
Amounts received on issue of shares 40,526 53,614
Amounts paid on cancellation of shares (2,145) (15,179)
38,381 38,435
Dilution adjustment 15 16
Change in net assets attributable to
shareholders from investment activities (2,633) (2,929)
Retained distribution on accumulation shares 4,123 3,048
Closing net assets attributable to shareholders 308,003 224,954* * Section 3.30 of the SORP issued by the Investment Management Association in May 2014 requires comparative figures for the above statement. For interim financial
statements this will result in the closing comparative net assets not being equal to net assets at the start of the current period.

Quilter Investors Gilt Index Fund
Quilter Investors OEIC
252
Balance sheet
as at 30 June 2018
30.06.18 31.12.17
£'000 £’000
Assets
Fixed assets
Investments 306,017 264,220
Current assets
Debtors 5,975 2,512
Cash and bank balances 300 1,529
Total assets 312,292 268,261
Liabilities
Creditors
Distributions payable (39) (39)
Other creditors (4,250) (105)
Total liabilities (4,289) (144)
Net assets attributable to shareholders 308,003 268,117

Quilter Investors Gilt Index Fund
Notes to the financial statements for the period from 1 January 2018 to 30 June 2018
Quilter Investors OEIC
253
1 Accounting policies The financial statements have been prepared under the historical cost basis, as modified by the revaluation of investments, and in accordance with the Statement of Recommended Practice (SORP) for Authorised Funds, issued by the Investment Management Association in May 2014.
The accounting policies applied are consistent with those disclosed within the annual Financial Statements for the year ended 31 December 2017.
2 Distribution The distributions take account of revenue received on the issue of shares and revenue deducted on the cancellation of shares, and comprise:
01.01.18 to 01.01.17 to 30.06.18 30.06.17 £'000 £'000 Interim – Accumulation shares (30 June) 4,123 3,048 Interim – Income shares (30 June) 39 64 4,162 3,112 Revenue deducted on cancellation of shares 15 164 Revenue received on issue of shares (279) (368) Distributions 3,898 2,908
Reconciliation of distributions: Net revenue after taxation 1,431 1,104 Capitalised fees 503 374 Effective yield adjustment 1,964 1,430 Distributions 3,898 2,908

Quilter Investors Gilt Index Fund
Distribution table
Quilter Investors OEIC
254
Interim distribution Group 1: Shares purchased prior to 1 January 2018 Group 2: Shares purchased from 1 January 2018 to 30 June 2018
Net revenue
pence per share Equalisation
pence per share*
Distribution paid 31.08.18
pence per share
Distribution paid 31.08.17
pence per share Accumulation 'A' Shares Group 1 1.1701 - 1.1701 1.1808 Group 2 0.2961 0.8740 1.1701 1.1808 Income 'A' Shares Group 1 0.9472 - 0.9472 0.9825 Group 2 0.5781 0.3691 0.9472 0.9825 Income 'R' Shares Group 1 0.9625 - 0.9625 0.9952 Group 2 0.4110 0.5515 0.9625 0.9952 Accumulation 'U2' Shares Group 1 1.6819 - 1.6819 1.6904 Group 2 0.8310 0.8509 1.6819 1.6904 Income 'U2' Shares Group 1 1.5223 - 1.5223 1.5733 Group 2 0.9944 0.5279 1.5223 1.5733 * Equalisation only applies to shares purchased during the period (Group 2 shares). It is the average amount of revenue included in the purchase price of all Group 2 shares
and is refunded to holders of these shares as a return of capital. Being capital, it is not liable to income tax but must be deducted from the cost of shares for capital gains tax purposes.

Quilter Investors Global Equity Absolute Return Fund
Quilter Investors Global Equity Absolute Return Fund
Quilter Investors OEIC
255
Launch date 21 June 2018
IA Sector Targeted Absolute Return
Investment adviser Old Mutual Global Investors (UK) Limited
Net asset value £301,705,600
Objective
The sub-fund invests at least 85% of its assets in the Old Mutual Global Equity Absolute Return sub-fund (the Master sub-fund). The sub-fund may hold up to a maximum of 15% of its assets in money market instruments, deposits and cash.
The Master sub-fund aims to achieve capital appreciation while closely controlling risk. In addition, the Master sub-fund intends to deliver an absolute return over rolling 12 month periods that have a low correlation with equity and bond markets.
Notwithstanding that the Master sub-fund is expressed to be an “absolute return” sub-fund, any capital invested is, in fact, at risk. The Master sub-fund aims to deliver a positive absolute return over rolling 12 month periods, but there is no guarantee that such return will be generated over that specific time period or within another time period.
Policy
The Master sub-fund primarily invests (either directly or indirectly) in the shares of companies located anywhere in the world and listed or traded on recognised exchanges.
The Master sub-fund may invest through transferable securities, collective investment schemes (including those managed or operated by the ACD) warrants, money market instruments, deposits, cash and derivatives.
The Master sub-fund may have exposure to derivatives (i.e. financial contracts whose value is linked to the expected price movements of an underlying investment) for investment purposes and efficient portfolio management. The Master sub-fund may take long and short positions through the use of derivatives, which may result in the Master sub-fund being leveraged.
Investment Manager’s review
The sub-fund was launched on 21 June 2018.
The team manages the sub-fund by seeking a highly diversified, market neutral portfolio invested in large and mid-cap global equities.
Equity markets in 2018 have been marked by greater volatility than in 2017, against the backdrop of divergent central bank monetary policy. There are risks and opportunities inherent in the path towards monetary normalisation, the process by which central banks are unwinding emergency measures they put in place after the great financial crisis of 2007. Near term, further disruption and volatility spikes, as markets adjust to the new paradigm, cannot be ruled out. In addition, the continuation of elevated political instability within developed markets should not be discounted. In these circumstances, the managers feel it is important to maintain diversification in terms of their stock selection techniques, while achieving a balanced approach to investment style exposures across the portfolio. The sub-fund is managed with the objective of having a low correlation to global equity and bond markets.
Risk and Reward Profile
The calculated risk and reward category, as shown above, uses a method of calculation derived from EU rules. It is based on the rate at which the returns of the sub-fund have moved up and down in the past (i.e. volatility) and is not a guide to the future risk and reward category of the sub-fund. The category shown is not a target or guarantee and may shift over time. Even the lowest category 1 does not mean a risk-free investment. The seven-category scale is nonlinear, for example, 2 is not twice as risky as 1.
Sub-fund in category 4 have in the past shown moderate volatility. With a sub-fund of category 4, you have a moderate risk of losing money but your chance for gains is also moderate.
Investment risk - whilst the sub-fund aims to deliver above zero performance irrespective of market conditions, there can be no guarantee this aim will be achieved. A capital loss of some or all of the amount invested may occur.
Currency risk - the Master sub-fund is denominated in US Dollars. This share class is denominated in British Pounds. The hedging process may not give a precise hedge and some currency risk may remain. In addition, where the Master sub-fund holds assets denominated in currencies other than US Dollars, the value of your shares may rise and fall as a result of the exchange rate movements.
Derivative risk - the Master sub-fund may use derivatives to generate returns and/or to reduce costs and the overall risk of the Master sub-fund. Using derivatives can involve a higher level of risk. A small movement in the price of an underlying investment may result in a disproportionately large movement in the price of the derivative investment. Derivatives also involve counterparty risk where the institutions acting as counterparty to derivatives may not meet their contractual obligations.
Capital erosion risk - the sub-fund takes its charges from the income of the sub-fund in the first instance. The impact of sub-fund charges may be material on the value of any income you receive from your investment. There is potential for capital erosion if insufficient income is generated by the sub-fund to cover these charges. Capital erosion may have the effect of reducing the level of income generated.
For a more detailed explanation of risks, please refer to the "Risk Factors" section of the prospectus.

Quilter Investors Global Equity Absolute Return Fund
Quilter Investors OEIC
256
Performance Records Comparative Tables 21 June 2018 to Accumulation 'U2'† 30 June 2018 p/share
Change in net assets per share Opening net asset value per share 980.20
Return before operating charges* (6.53) Operating charges** (0.16)
Return after operating charges* (6.69)
Distributions - Retained distributions -
Closing net asset value per share 973.51
* after direct transaction costs of*** -
Performance Return after charges (0.68)%
Other information Closing net asset value (£) 301,705,600 Closing number of shares 30,991,500 Operating charges**** 0.66% Direct transaction costs*** -
Prices pence per share Highest share price 980.2 Lowest share price 970.5
† From 21 June 2018 ** The operating charges include all costs borne by the sub-fund, except for direct transaction costs.
*** The direct transaction costs are made up of fees and commissions paid to agents, advisers, brokers and dealers, levies by regulatory agencies and securities exchanges as well as transfer taxes and duties. They do not include any difference between the quoted bid and offer prices or internal administrative or holding costs. These costs arise as a result of transactions undertaken both for efficient portfolio management and the meeting of the sub-fund’s objectives. These costs exclude any effect of dilution adjustments used to offset the costs.
**** The operating charges percentage is the ratio of the sub-fund's ongoing charges (excluding interest on borrowings) to the average net assets of the sub-fund. If the unit class launched during the period the operating charges figures are annualised.

Quilter Investors Global Equity Absolute Return Fund
Quilter Investors OEIC
257
Performance As the sub-fund launched on 21 June 2018 there are no performance figures presented for the period under review.
Portfolio allocation
Collective Investment Schemes 99.57%
Net other assets 0.43%
Total 100.00%
Asset allocation
Collective Investment Schemes 99.57%
Net other assets 0.43%
Total 100.00%
Major holdings Percentage of
portfolio
Old Mutual Global Equity Absolute Return Fund - U2 Accumulation GBP Hedged
99.57%
Number of holdings 1
Total Purchases and Sales for the period
2018
£’000
Total purchases for the period from 21 June to 30 June 302,455
Total sales for the period from 21 June to 30 June -

Quilter Investors Global Equity Absolute Return Fund
Portfolio statement as at 30 June 2018
Quilter Investors OEIC
258
Market Percentage of Value total net assets
Holding Investment £'000 % Collective Investment Schemes 99.57%
244,444,867 Old Mutual Global Equity Absolute Return Fund - U2 Accumulation GBP Hedged 300,423 99.57 300,423 99.57
Investment assets 300,423 99.57
Net other assets 1,283 0.43
Total net assets 301,706 100.00 All investments are approved securities being either officially listed in a member state or traded on or under the rules of an eligible securities market, unless otherwise stated.

Quilter Investors Global Equity Absolute Return Fund
Quilter Investors OEIC
259
Statement of total return for the period from 21 June 2018 to 30 June 2018 21.06.18 to 21.06.18 to
30.06.18 30.06.18
Note £'000 £'000
Income
Net capital losses (2,032)
Revenue -
Expenses (44)
Net expense before taxation (44)
Taxation -
Net expense after taxation (44)
Total return before distributions (2,076)
Distributions 2 -
Change in net assets attributable to
shareholders from investment activities (2,076)
Statement of change in net assets attributable to shareholders for the period from 21 June 2018 to 30 June 2018 21.06.18 to 21.06.18 to
30.06.18 30.06.18
£'000 £'000
Opening net assets attributable to shareholders -
Amounts received on issue of shares 303,782
Amounts paid on cancellation of shares -
303,782
Dilution adjustment -
Change in net assets attributable to
shareholders from investment activities (2,076)
Closing net assets attributable to shareholders 301,706

Quilter Investors Global Equity Absolute Return Fund
Quilter Investors OEIC
260
Balance sheet as at 30 June 2018 30.06.18
£'000
Assets
Fixed assets
Investments 300,423
Current assets
Debtors 1,223
Cash and bank balances 624
Total assets 302,270
Liabilities
Creditors
Other creditors (564)
Total liabilities (564)
Net assets attributable to shareholders 301,706

Quilter Investors Global Equity Absolute Return Fund
Notes to the financial statements for the period from 21 June 2018 to 30 June 2018
Quilter Investors OEIC
261
1 Accounting policies The financial statements have been prepared under the historical cost basis, as modified by the revaluation of investments, and in accordance with the Statement of Recommended Practice (SORP) for Authorised Funds, issued by the Investment Management Association in May 2014.
2 Distributions The distributions take account of revenue received on the issue of shares and revenue deducted on the cancellation of shares, and comprise:
21.06.18 to 30.06.18 £'000 Revenue deducted on cancellation of shares - Revenue received on issue of shares - Distributions -
Reconciliation of distributions: Net expense after taxation (44) Net expense carried forward 44 Distributions -

Quilter Investors Global Equity Growth Fund
Quilter Investors Global Equity Growth Fund
Quilter Investors OEIC
262
Launch date 24 April 2013
IA Sector Global
Investment adviser FIL Pensions Management
Net asset value £36,246,881
Objective
The sub-fund aims to achieve capital growth.
Policy
The sub-fund primarily invests, directly and indirectly, in shares issued by companies located anywhere in the world.
The investment adviser typically has a preference to invest in shares of companies they believe to have the potential for growth. The sub-fund may at times be concentrated in terms of the number of investments it holds.
The sub-fund may also invest in other transferable securities, collective investment schemes (including those managed or operated by the ACD), warrants, money market instruments, deposits and derivatives.
The sub-fund may only use derivatives for efficient portfolio management purposes.
The sub-fund is managed by an investment adviser selected by the ACD for their expected ability to manage the sub-fund according to the investment objective and policy. The ACD continuously monitors and may periodically make changes to this appointment.
Investment Manager’s review
Market Review
2018 started on a strong note for global equities, boosted by a supportive macroeconomic backdrop, moderately rising inflation, tightening labour markets, positive corporate earnings outlook and the confirmation of a major tax reform in the US. The increased confidence among corporates is also evidenced in the heightened merger and acquisition (M&As) deal activity this year. Despite a seemingly benign backdrop, the last few months have been characterised by a spike in market volatility. Higher US wage growth led to fears of faster interest rate hikes by the US Federal Reserve (Fed), while concerns over the US administration’s approach to global trade, especially relating to ongoing trade frictions with China; and tensions in the Korean peninsula also hampered market sentiment. Investors were also concerned over the implications of the political turmoil in Italy and Spain in the eurozone.
Performance
Favourable market positioning and robust stock selection, particularly in the consumer discretionary, healthcare and financials sectors ensured that the sub-fund generated strong positive returns and outperformed the index over the review period. In particular, UK online retailer Ocado Group rose sharply following the announcement of a new partnership agreement with US grocer Kroger, under which the latter will use Ocado’s technology on an exclusive basis in the US. Indian restaurant company Jubilant FoodWorks reported strong quarterly profits on higher same store sales and better cost management. Conversely, the lack of exposure to online retailer Amazon hurt relative returns, as its shares rose on strong quarterly results.
Strong earnings releases boosted certain key healthcare and financials holdings in the portfolio. Sartorius Stedim Biotech, a leading international equipment supplier for the biopharmaceuticals industry, continues to witness a rebound in order intake. Healthcare equipment and services company Abiomed, which has the best-in-class growth profile and a strong position in the heart pump market, was a key contributor to performance. India-based Kotak Mahindra Bank’s solid quarterly results reflected strong loan growth and a sequential improvement in net interest margins.
Meanwhile, despite reporting solid results and an acceleration in organic growth, shares in tooling and industrial materials supplier Kennametal declined. Some Indian banks, including Bank of Baroda declined sharply due to a confluence of negative news flow, including a large fraud at Punjab National Bank, tighter provisioning norms from the Reserve Bank of India and continued pressure from bond yields. Nonetheless, Bank of Baroda is one of the better positioned Indian public sector bank in terms of growth and capital. In the beverages sector, Molson Coors Brewing traded lower following the release of its earnings, which were below expectations due to volume weakness in the US beer market. The holding was closed.
The outlook for US equities appears positive, supported by the passage of the tax reform bill. From a valuation perspective, regions outside the US appear relatively more favourable, and the recent sell-off in emerging markets has thrown up some interesting opportunities. Eurozone growth remains strong and relative valuations are attractive. Japan continues to make economic progress and should benefit from a pickup in global demand. However, normalisation of interest rates and concerns over global trade frictions pose risks to markets. Stock-specific fundamentals will remain the key driver of equity returns, and consequently, the portfolio continues to focus on companies that demonstrate strong pricing power, are led by talented management teams and are available at reasonable valuations.
Risk and Reward Profile
The calculated risk and reward category, as shown above, uses a method of calculation derived from EU rules. It is based on the rate at which the returns of the sub-fund have moved up and down in the past (i.e. volatility) and is not a guide to the future risk and reward category of the sub-fund. The category shown is not a target or guarantee and may shift over time. Even the lowest category 1 does not mean a risk-free investment. The seven-category scale is nonlinear, for example, 2 is not twice as risky as 1.
Sub-funds in category 5 have in the past shown moderately high volatility. With a sub-fund of category 5, you have a moderately high risk of losing money but your chance for gains is also moderately high.
Investment risk - there is no guarantee that the sub-fund will achieve its objective. A capital loss of some or all of the amount invested may occur.
Emerging markets risk - less developed countries may face more political, economic or structural challenges than developed countries.
Concentration risk (number of investments) - the sub-fund may at times hold a smaller number of investments, and therefore a fall in the value of a single investment may have a greater impact on the sub-fund’s value than if it held a larger number of investments.
Liquidity risk - some investments may become hard to value or sell at a desired time and price. In extreme circumstances this may affect the sub-fund’s ability to meet redemption requests upon demand.
Currency risk (EUR share class) - the sub-fund is denominated in British Pounds but holds assets denominated in other currencies. This share class is denominated in Euro. The value of your shares may rise and fall as a result of exchange rate movements between these currencies.
Currency risk (GBP share class) - the sub-fund is denominated in British Pounds but holds assets denominated in other currencies. The value of your shares may rise and fall as a result of exchange rate movements between these currencies.
Currency risk (USD share class) - the sub-fund is denominated in British Pounds but holds assets denominated in other currencies. This share class is denominated in US Dollars. The value of your shares may rise and fall as a result of exchange rate movements between these currencies.
Derivative risk - the sub-fund may use derivatives to reduce costs and/or the overall risk of the sub-fund (i.e. Efficient Portfolio Management (EPM)). Derivatives involve a level of risk, however, for EPM they should not increase the overall riskiness of the sub-fund. Derivatives also involve counterparty risk where the institutions acting as counterparty to derivatives may not meet their contractual obligations.
Capital erosion risk - the sub-fund takes its charges from the income of the sub-fund in the first instance. The impact of sub-fund charges may be material on the value of any income you receive from your investment. There is potential for capital erosion if insufficient income is generated by the sub-fund to cover these charges. Capital erosion may have the effect of reducing the level of income generated.
For full details of the sub-fund's risks, please see the section in the prospectus headed "Risks".

Quilter Investors Global Equity Growth Fund
Quilter Investors OEIC
263
Performance Records Comparative Tables 1 January 2018 to 1 January 2017 to 1 January 2016 to Accumulation 'A' 30 June 2018 31 December 2017 31 December 2016 p/share p/share p/share
Change in net assets per share Opening net asset value per share 179.09 155.58 124.36
Return before operating charges* 7.76 26.29 33.45 Operating charges** (1.49) (2.78) (2.23)
Return after operating charges* 6.27 23.51 31.22
Distributions - - - Retained distributions - - -
Closing net asset value per share 185.36 179.09 155.58
* after direct transaction costs of*** 0.04 0.11 0.17
Performance Return after charges 3.50% 15.11% 25.10%
Other information Closing net asset value (£) 35,623,297 35,553,961 34,113,113 Closing number of shares 19,218,446 19,852,417 21,925,960 Operating charges**** 1.68% 1.65% 1.65% Direct transaction costs*** 0.05% 0.06% 0.13%
Prices pence per share pence per share pence per share Highest share price 188.3 180.1 156.8 Lowest share price 167.3 155.2 109.3
1 January 2018 to 1 January 2017 to 1 January 2016 to Accumulation 'A' EUR† 30 June 2018 31 December 2017 31 December 2016 p/share p/share p/share
Change in net assets per share Opening net asset value per share 113.36 98.50 79.00
Return before operating charges* 4.91 16.67 20.61 Operating charges** (0.94) (1.81) (1.11)
Return after operating charges* 3.97 14.86 19.50
Distributions - - - Retained distributions - - -
Closing net asset value per share 117.33 113.36 98.50
* after direct transaction costs of*** 0.03 0.07 0.09
Performance Return after charges 3.50% 15.09% 24.68%
Other information Closing net asset value (£) 8,478 8,191 985 Closing number of shares 7,226 7,226 1,000 Operating charges**** 1.68% 1.65% 1.65% Direct transaction costs*** 0.05% 0.06% 0.13%
Prices cents per share cents per share cents per share Highest share price 136.4 129.1 116.6 Lowest share price 121.2 114.7 97.71

Quilter Investors Global Equity Growth Fund
Quilter Investors OEIC
264
Comparative Tables (continued) 1 January 2018 to 1 January 2017 to 1 January 2016 to Accumulation 'A' USD 30 June 2018 31 December 2017 31 December 2016 p/share p/share p/share Change in net assets per share
Opening net asset value per share 99.96 86.83 69.36
Return before operating charges* 4.31 14.72 18.79 Operating charges** (0.83) (1.59) (1.32)
Return after operating charges* 3.48 13.13 17.47
Distributions - - - Retained distributions - - -
Closing net asset value per share 103.44 99.96 86.83
* after direct transaction costs of*** 0.02 0.06 0.10
Performance Return after charges 3.48% 15.12% 25.19%
Other information Closing net asset value (£) 299,061 848,766 92,343 Closing number of shares 289,123 849,114 106,347 Operating charges**** 1.68% 1.65% 1.65% Direct transaction costs*** 0.05% 0.06% 0.13%
Prices cents per share cents per share cents per share Highest share price 144.0 135.0 108.7 Lowest share price 130.8 106.5 88.68 1 January 2018 to 1 January 2017 to 1 January 2016 to
Accumulation 'U2' 30 June 2018 31 December 2017 31 December 2016 p/share p/share p/share
Change in net assets per share Opening net asset value per share 177.74 153.04 121.20
Return before operating charges* 7.73 25.96 32.83 Operating charges** (0.69) (1.26) (0.99)
Return after operating charges* 7.04 24.70 31.84
Distributions - (1.35) (1.06) Retained distributions - 1.35 1.06
Closing net asset value per share 184.78 177.74 153.04
* after direct transaction costs of*** 0.04 0.11 0.17
Performance Return after charges 3.96% 16.14% 26.27%
Other information Closing net asset value (£) 316,045 226,408 94,199 Closing number of shares 171,035 127,385 61,553 Operating charges**** 0.78% 0.75% 0.75% Direct transaction costs*** 0.05% 0.06% 0.13%
Prices pence per share pence per share pence per share Highest share price 187.6 178.7 154.3 Lowest share price 166.3 152.7 106.7
† From 31 March 2016 ** The operating charges include all costs borne by the sub-fund, except for direct transaction costs.
*** The direct transaction costs are made up of fees and commissions paid to agents, advisers, brokers and dealers, levies by regulatory agencies and securities exchanges as well as transfer taxes and duties. They do not include any difference between the quoted bid and offer prices or internal administrative or holding costs. These costs arise as a result of transactions undertaken both for efficient portfolio management and the meeting of the sub-fund’s objectives. These costs exclude any effect of dilution adjustments used to offset the costs.
**** The operating charges percentage is the ratio of the sub-fund's ongoing charges (excluding interest on borrowings) to the average net assets of the sub-fund. If the share class launched during the period the operating charges figures are annualised.

Quilter Investors Global Equity Growth Fund
Quilter Investors OEIC
265
Performance
6 months to
30 June 2018
1 year to
30 June 2018
3 years to
30 June 2018
5 years to
30 June 2018
Quilter Investors Global Equity Growth Fund* 4.00% 12.62% 56.39% 93.11%
MSCI AC World (benchmark) 2.02% 8.94% 50.84% 80.12%
IA Global (sector average) 2.68% 9.33% 46.99% 76.27%
Quartile ranking 2 1 1 1
* Accumulation ‘U2’ shares
Data Source – Factset. Figures are calculated on a total return and single price basis, with net income reinvested into the sub-fund. Portfolio allocation
North America 53.49%
Europe 22.48%
Asia Pacific (excluding Japan) 7.44%
United Kingdom 6.57%
Japan 6.44%
Africa 0.90%
Net other assets 2.68%
Total 100.00%
Asset allocation
Equities 97.32%
Net other assets 2.68%
Total 100.00%
Percentage of
Major holdings portfolio
Microsoft 2.25%
Alphabet 'A' 1.99%
Royal Dutch Shell 'A' (EUR Listing) 1.94%
Merck (US Listing) 1.72%
JPMorgan Chase 1.53%
Intuit 1.52%
Wells Fargo 1.46%
Canadian Natural Resources 1.45%
Intel 1.45%
Kotak Mahindra Bank 1.42%
Number of holdings 103
Total Purchases and Sales for the period
2018 2017
£’000 £’000
Total purchases for the 6 month period to 30 June 9,713 7,990
Total sales for the 6 month period to 30 June 11,211 9,379

Quilter Investors Global Equity Growth Fund
Portfolio statement as at 30 June 2018
Quilter Investors OEIC
266
Market Percentage of Value total net assets
Holding Investment £'000 %
United Kingdom 6.57% (31 December 2017 6.15%)
United Kingdom Equities 6.57% (31 December 2017 6.15%) 153,620 Barclays 291 0.80
73,065 Beazley 424 1.17 46,995 Ocado 483 1.33 61,374 Sports Direct 246 0.68 25,400 Standard Chartered (HK Listing) 179 0.49 28,483 Standard Chartered (UK Listing) 198 0.55
155,807 Tesco 404 1.12 106,495 Vivo Energy 156 0.43
2,381 6.57
Africa 0.90% (31 December 2017 1.20%)
South Africa Equities 0.90% (31 December 2017 1.20%) 1,757 Naspers 328 0.90
328 0.90
Asia Pacific (excluding Japan) 7.44% (31 December 2017 9.36%)
Australia Equities 0.53% (31 December 2017 0.58%) 94,645 South32 192 0.53
192 0.53
China Equities 1.53% (31 December 2017 2.40%) 90,800 China Pacific Insurance 267 0.73
700,000 Lenovo 289 0.80
556 1.53
India Equities 3.83% (31 December 2017 3.23%) 83,775 Bank of Baroda 105 0.29 24,696 Jubilant Foodworks 383 1.06 34,550 Kotak Mahindra Bank 515 1.42 35,545 Reliance Industries 384 1.06
1,387 3.83
Singapore Equities 0.18% (31 December 2017 0.22%) 94,800 Delfi 66 0.18
66 0.18
South Korea Equities 0.81% (31 December 2017 0.98%) 563 NAVER 293 0.81
293 0.81
Thailand Equities 0.56% (31 December 2017 1.95%) 511,100 Thai Beverage PCL 204 0.56
204 0.56

Quilter Investors Global Equity Growth Fund
Portfolio statement (continued) as at 30 June 2018
Quilter Investors OEIC
267
Market Percentage of Value total net assets
Holding Investment £'000 %
Europe 22.48% (31 December 2017 17.58%)
Austria Equities 0.00% (31 December 2017 0.66%)
Denmark Equities 1.82% (31 December 2017 1.06%) 1,903 Genmab 222 0.61
11,372 Novozymes 437 1.21
659 1.82
France Equities 2.09% (31 December 2017 2.23%) 6,380 BNP Paribas 300 0.83 5,811 Sartorius Stedim Biotech 459 1.26
759 2.09
Germany Equities 7.87% (31 December 2017 5.70%) 5,198 Bayer 437 1.20 4,424 Beiersdorf 381 1.05 4,269 Deutsche Boerse 431 1.19
10,654 Deutsche Wohnen 390 1.08 5,275 SAP 460 1.27 4,405 Siemens 441 1.22 2,461 Volkswagen (Preference shares) 312 0.86
2,852 7.87
Netherlands Equities 2.87% (31 December 2017 1.45%) 4,007 NXP Semiconductors 336 0.93
26,632 Royal Dutch Shell 'A' (EUR Listing) 704 1.94
1,040 2.87
Spain Equities 1.05% (31 December 2017 1.00%) 14,657 Industria de Diseno Textil 380 1.05
380 1.05
Sweden Equities 3.14% (31 December 2017 1.36%) 23,825 Assa Abloy 384 1.06 18,182 Elekta 181 0.50 1,725 Spotify Technology 220 0.61
60,675 Telefonaktiebolaget 353 0.97
1,138 3.14
Switzerland Equities 3.64% (31 December 2017 4.12%) 87,178 Glencore 315 0.87 5,446 Julius Baer 243 0.67 8,348 LafargeHolcim 310 0.86 2,682 Roche 450 1.24
1,318 3.64
Japan 6.44% (31 December 2017 8.41%)
Japan Equities 6.44% (31 December 2017 8.41%) 900 Keyence 387 1.07
1,400 Nintendo 349 0.96 34,100 ORIX 410 1.13 15,100 Recruit 318 0.88 4,200 SoftBank 230 0.63 8,400 Sony 327 0.90
10,400 Sumitomo Mitsui 314 0.87
2,335 6.44

Quilter Investors Global Equity Growth Fund
Portfolio statement (continued) as at 30 June 2018
Quilter Investors OEIC
268
Market Percentage of Value total net assets
Holding Investment £'000 %
North America 53.49% (31 December 2017 54.28%)
Canada Equities 4.15% (31 December 2017 2.36%) 5,441 Agnico Eagle Mines 185 0.51
19,855 Canadian Natural Resources 527 1.45 771 Fairfax Financial 327 0.90
20,766 Fairfax India 259 0.72 3,749 Franco-Nevada (US Listing) 206 0.57
1,504 4.15
Mexico Equities 0.87% (31 December 2017 0.94%) 4,753 Fomento Economico Mexicano ADR 315 0.87
315 0.87
United States Equities 48.47% (31 December 2017 50.98%) 930 ABIOMED 293 0.81
4,520 Akamai Technologies 249 0.69 843 Alphabet 'A' 723 1.99
3,492 American Tower 383 1.06 5,564 American Water Works 362 1.00 5,208 AmerisourceBergen 341 0.94 2,336 Apple 330 0.91
12,922 Baker Hughes 324 0.89 13,809 Bank of America 301 0.83 4,163 BioMarin Pharmaceutical 289 0.80
12,309 Booz Allen Hamilton 407 1.12 6,089 Bunge 322 0.89
15,536 Cabot Oil & Gas 280 0.77 7,944 CBS 339 0.94 3,475 CME 433 1.19
14,233 Coca-Cola 471 1.30 7,656 Colgate-Palmolive 378 1.04 3,142 Concho Resources 328 0.91 5,065 CytomX Therapeutics 88 0.24 4,965 Dell Technologies 322 0.89
14,276 eBay 393 1.08 5,604 Edgewell Personal Care 210 0.58 1,865 Estee Lauder 202 0.56
10,171 Flowserve 310 0.86 9,366 General Electric 99 0.27 3,008 Heron Therapeutics 94 0.26
14,020 Intel 526 1.45 4,287 International Business Machines 457 1.26 3,557 Intuit 552 1.52 6,960 JPMorgan Chase 556 1.53 6,196 Leidos 277 0.76
13,555 Merck (US Listing) 622 1.72 10,880 Microsoft 817 2.25 8,658 Monster Beverage 374 1.03
16,606 Mosaic 358 0.99 11,333 Mylan 313 0.86 1,780 Newell Brands 35 0.10

Quilter Investors Global Equity Growth Fund
Portfolio statement (continued) as at 30 June 2018
Quilter Investors OEIC
269
Market Percentage of Value total net assets
Holding Investment £'000 % United States Equities (continued)
14,531 Oracle 485 1.34 8,422 QUALCOMM 358 0.99 2,760 Royal Gold 192 0.53 3,334 SBA Communications Class A 418 1.15 4,854 Schlumberger 248 0.68 9,794 TripAdvisor 422 1.16 4,561 Union Pacific 488 1.35 4,735 Visa 478 1.32 7,847 Voya Financial 282 0.78 5,480 Walt Disney 437 1.21
12,937 Wells Fargo 528 1.46 2,782 Weyerhaeuser 76 0.21
17,570 48.47
Investment assets 35,277 97.32
Net other assets 970 2.68
Total net assets 36,247 100.00
All investments are approved securities being either officially listed in a member state or traded on or under the rules of an eligible securities market, unless otherwise stated.
All investments are in ordinary shares unless otherwise stated.

Quilter Investors Global Equity Growth Fund
Quilter Investors OEIC
270
Statement of total return
for the period from 1 January 2018 to 30 June 2018 01.01.18 to 01.01.18 to 01.01.17 to 01.01.17 to
30.06.18 30.06.18 30.06.17 30.06.17
Note £'000 £'000 £'000 £'000
Income
Net capital gains 1,232 2,220
Revenue 374 364
Expenses (289) (274)
Net revenue before taxation 85 90
Taxation (84) (39)
Net revenue after taxation 1 51
Total return before distributions 1,233 2,271
Distributions 2 - -
Change in net assets attributable to
shareholders from investment activities 1,233 2,271
Statement of change in net assets attributable to shareholders for the period from 1 January 2018 to 30 June 2018 01.01.18 to 01.01.18 to 01.01.17 to 01.01.17 to
30.06.18 30.06.18 30.06.17 30.06.17
£'000 £'000 £'000 £'000
Opening net assets attributable to shareholders 36,637* 34,301
Amounts received on issue of shares 1,051 770
Amounts paid on cancellation of shares (2,676) (2,504)
(1,625) (1,734)
Dilution adjustment 2 2
Change in net assets attributable to
shareholders from investment activities 1,233 2,271
Closing net assets attributable to shareholders 36,247 34,840* * Section 3.30 of the SORP issued by the Investment Management Association in May 2014 requires comparative figures for the above statement. For interim financial
statements this will result in the closing comparative net assets not being equal to net assets at the start of the current period.

Quilter Investors Global Equity Growth Fund
Quilter Investors OEIC
271
Balance sheet
as at 30 June 2018 30.06.18 31.12.17
£'000 £'000
Assets
Fixed assets
Investments 35,277 35,530
Current assets
Debtors 323 64
Cash and bank balances 946 1,121
Total assets 36,546 36,715
Liabilities
Creditors
Other creditors (299) (78)
Total liabilities (299) (78)
Net assets attributable to shareholders 36,247 36,637

Quilter Investors Global Equity Growth Fund
Notes to the financial statements for the period from 1 January 2018 to 30 June 2018
Quilter Investors OEIC
272
1 Accounting policies The financial statements have been prepared under the historical cost basis, as modified by the revaluation of investments, and in accordance with the Statement of Recommended Practice (SORP) for Authorised Funds, issued by the Investment Management Association in May 2014.
The accounting policies applied are consistent with those disclosed within the annual Financial Statements for the year ended 31 December 2017.
2 Distributions The distributions take account of revenue received on the issue of shares and revenue deducted on the cancellation of shares, and comprise:
01.01.18 to 01.01.17 to 30.06.18 30.06.17 £'000 £'000 Revenue deducted on cancellation of shares 1 1 Revenue received on issue of shares (1) (1) Distributions - -
Reconciliation of distributions: Net revenue after taxation 1 51 Overseas capital gains tax 41 - Undistributed net revenue carried forward (42) (51) Distributions - -

Quilter Investors Global Equity Index Fund
Quilter Investors Global Equity Index Fund
Quilter Investors OEIC
273
Objective
To achieve capital growth through a portfolio of investments aimed at tracking the performance of the FTSE Developed ex UK Index.
Policy
The sub-fund will invest primarily in collective investment schemes, including those managed and operated by the Investment Adviser, which aim to track the performance of developed market indices around the world by investing in the shares of companies that make up those indices. Investment will be made in proportion to the geographical weightings in the FTSE Developed ex UK Index.
The sub-fund may invest in transferable securities, warrants, money market instruments, deposits and derivatives.
The sub-fund may only use derivatives for efficient portfolio management purposes.
The sub-fund is managed by an investment adviser selected by the ACD for their expected ability to manage the sub-fund according to the investment objective and policy. The ACD continuously monitors and may periodically make changes to this appointment.
Investment Manager’s review
Market Review and performance
Global equities, as represented by the MSCI World Index, returned 0.74% (in US dollar terms) in the first half of 2018.
At the start of 2018, European equity markets fell in-line with the broader market amid increased market volatility and trade protectionism worries. From a single country standpoint, the UK detracted the most from the index’s total return. Rising gilt yields diminished the attractiveness of defensive sectors, while ongoing political uncertainty weighed on broader market sentiment. In the eurozone, Italy contributed the highest amount to the index’s total return out of other eurozone members after the Italian elections did not meaningfully impact risk-sentiment. Separately, sovereign bonds in the region sold-off. The benchmark 10-year German bund yield increased 0.07% while the same tenor of gilts increased 0.16%. On the economic front, GDP growth stabilised while PMIs were slightly weaker. Still, consumer confidence indicators remained relatively elevated by historical standards as the unemployment rate has continued its downward trajectory across the region.
In the US, the economy remained healthy in the first three months of 2018, despite what the US equity market’s lacklustre performance would suggest. The unemployment rate remained at multi-decade lows, consumer confidence was high by historical standards, and both the ISM manufacturing and non-manufacturing components accelerated. This supported the Federal Reserve’s decision to increase interest rates in March and to revise higher their rate hike expectations for 2019. The combination of increased interest rate expectations, a strong economic backdrop, in addition to technical issues regarding the deficit drove selling in US Treasuries, and the 10-year US Treasury yield increased by 33 basis points (bps) in the first half of the period to 2.75%.
In the final three months of the period, the fluid headlines regarding the acrimonious G7 summit in Quebec, the US imposition of steel and aluminum imports, and the US withdrawal from the Iranian nuclear deal all increased trade war fears. Elsewhere, European fragmentation remained an important risk factor throughout the second half of the period. The formation of Italy’s populist coalition government intensified European political risk. Momentum for eurozone reform also showed signs of weakness as negotiations over immigration policy within the German coalition government broke down. Additionally, a stronger US dollar also weighed on unhedged developed market equity returns.
Australian firms in the materials and energy sectors outperformed in the second half of the period as the country was spared from the US steel and aluminium tariffs. The UK also contributed significantly to the index’s total return over the final three months, with the energy sector in the lead. Relatively strong UK growth was also supportive, apparent from the country reaching its lowest unemployment rate since 1975. Less positively, Japanese equities under performed as cyclicals and export sensitive names were particularly hit by US protectionism headlines.
In the US, economic prints throughout the second half of the period also indicated strong economic conditions. Core personal consumption expenditure (PCE) hit the Federal Reserve’s target rate of 2%, supporting their decision to raise interest rates in June. The bank has also signalled two additional hikes this year. The average level of the CBOE Volatility Index (VIX) was 15.3 in the three months to 30 June, lower than the 17.4 experienced in the first three months of the year. From a sector perspective, information technology (+9.62%) and energy (+7.03%) had the strongest returns. The weakest returns were seen in telecommunication services (-8.14%) and financials (-5.81%).
Risk and Reward Profile
The calculated risk and reward category, as shown above, uses a method of calculation derived from EU rules. It is based on the rate at which the returns of the sub-fund have moved up and down in the past (i.e. volatility) and is not a guide to the future risk and reward category of the sub-fund. The category shown is not a target or guarantee and may shift over time. Even the lowest category 1 does not mean a risk-free investment. The seven-category scale is nonlinear, for example, 2 is not twice as risky as 1.
Sub-funds in category 5 have in the past shown moderately high volatility. With a sub-fund of category 5, you have a moderately high risk of losing money but your chance for gains is also moderately high.
Investment risk - there is no guarantee that the sub-fund will achieve its objective. A capital loss of some or all of the amount invested may occur.
Index-tracking risk - the performance of the sub-fund will depend on the performance of the relevant index and the success of the sub-fund in tracking that index.
Strategy risk - as the sub-fund invests in other collective investment schemes, it will be subject to the collective risks of these other sub-funds. This may include Smaller companies risk.
Currency risk - the sub-fund is denominated in British Pounds but may hold assets denominated in, or with exposure to, other currencies. The value of your shares may rise and fall as a result of exchange rate movements between these currencies.
Derivative risk - the sub-fund may use derivatives to reduce costs and/or the overall risk of the sub-fund (i.e. Efficient Portfolio Management (EPM)). Derivatives involve a level of risk, however, for EPM they should not increase the overall riskiness of the sub-fund. Derivatives also involve counterparty risk where the institutions acting as counterparty to derivatives may not meet their contractual obligations.
Capital erosion risk - the sub-fund takes its charges from the income of the sub-fund in the first instance. The impact of sub-fund charges may be material on the value of any income you receive from your investment. There is potential for capital erosion if insufficient income is generated by the sub-fund to cover these charges. Capital erosion may have the effect of reducing the level of income generated.
For full details of the sub-fund's risks, please see the section in the prospectus headed "Risks".
Launch date 25 February 2014
IA Sector Global
Investment adviser BlackRock Investment Management (UK) Limited
Net asset value £212,317,588

Quilter Investors Global Equity Index Fund
Quilter Investors OEIC
274
Performance Records Comparative Tables 1 January 2018 to 1 January 2017 to 1 January 2016 to Accumulation 'U2' 30 June 2018 31 December 2017 31 December 2016 p/share p/share p/share
Change in net assets per share Opening net asset value per share 173.74 154.61 119.06
Return before operating charges* 4.64 19.64 35.92 Operating charges** (0.26) (0.51) (0.37)
Return after operating charges* 4.38 19.13 35.55
Distributions (0.92) (2.47) (2.29) Retained distributions 0.92 2.47 2.29
Closing net asset value per share 178.12 173.74 154.61
* after direct transaction costs of*** - 0.01 -
Performance Return after charges 2.52% 12.37% 29.86%
Other information Closing net asset value (£) 212,317,588 159,093,271 104,620,397 Closing number of shares 119,200,153 91,568,802 67,667,659 Operating charges**** 0.30% 0.31% 0.28% Direct transaction costs*** - - -
Prices pence per share pence per share pence per share Highest share price 181.0 175.6 156.1 Lowest share price 161.9 153.7 107.3
** The operating charges include all costs borne by the sub-fund, except for direct transaction costs. It includes the operating charges of any collective investment
schemes in which the sub-fund invests. *** The direct transaction costs are made up of fees and commissions paid to agents, advisers, brokers and dealers, levies by regulatory agencies and securities
exchanges as well as transfer taxes and duties. They do not include any difference between the quoted bid and offer prices or internal administrative or holding costs. These costs arise as a result of transactions undertaken both for efficient portfolio management and the meeting of the sub-fund’s objectives. These costs exclude any effect of dilution adjustments used to offset the costs.
**** The operating charges percentage is the ratio of the sub-fund's ongoing charges (including the ongoing charges of any collective investment schemes in which the sub-fund invests but excluding interest on borrowings) to the average net assets of the sub-fund. This includes a synthetic element of 0.05% (31.12.2017 - 0.04%) (31.12.2016 - 0.03%) to incorporate the OCF of the underlying sub-funds.

Quilter Investors Global Equity Index Fund
Quilter Investors OEIC
275
Performance
6 months to 30 June 2018
1 year to 30 June 2018
3 years to 30 June 2018
5 years to 30 June 2018
Quilter Investors Global Equity Index Fund* 2.41% 9.12% 54.37% -
FTSE Developed ex UK Index (benchmark) 2.67% 9.30% 54.44% 87.89%
IA Global (sector average) 2.68% 9.33% 46.99% 76.27%
Quartile ranking 2 2 2 -
* Accumulation ‘U2’ shares
Data Source – Factset. Figures are calculated on a total return and single price basis, with net income reinvested into the sub-fund. Portfolio allocation
Global Equities 99.80%
Net other assets 0.20%
Total 100.00%
Asset allocation
Equities 99.80%
Net other assets 0.20%
Total 100.00%
Major holdings Percentage of
portfolio
BlackRock US Equity Tracker Fund - L Accumulation 19.45%
iShares North American Equity Index Fund - L Accumulation 19.44%
BlackRock North America Index Fund - Institutional Accumulation (USD) 18.70%
iShares Continental European Equity Index Fund - L Accumulation 13.64%
iShares Japan Equity Index Fund - L Accumulation 9.10%
iShares Core S&P 500 UCITS ETF 8.36%
iShares Pacific ex Japan Equity Index Fund - L Accumulation 6.69%
iShares Core EURO STOXX 50 UCITS ETF 2.81%
iShares Core MSCI Japan IMI UCITS ETF 0.99%
BlackRock Europe Ex-UK Index Fund - Institutional Accumulation (EUR)
0.62%
Number of holdings 10
Total Purchases and Sales for the period
2018 2017
£'000 £'000
Total purchases for the 6 month period to 30 June 62,654 42,621
Total sales for the 6 month period to 30 June 13,789 15,405

Quilter Investors Global Equity Index Fund
Portfolio statement as at 30 June 2018
Quilter Investors OEIC
276
Market Percentage of Value total net assets
Holding Investment £'000 %
Overseas 99.80% (31 December 2017 99.84%)
Overseas Equities 99.80% (31 December 2017 99.84%) 103,976 BlackRock Europe Ex-UK Index Fund - Institutional Accumulation (EUR) 1,321 0.62
2,490,646 BlackRock North America Index Fund - Institutional Accumulation (USD) 39,704 18.70 15,860,574 BlackRock US Equity Tracker Fund - L Accumulation 41,285 19.45 11,851,130 iShares Continental European Equity Index Fund - L Accumulation 28,952 13.64
63,834 iShares Core EURO STOXX 50 UCITS ETF 5,972 2.81 65,087 iShares Core MSCI Japan IMI UCITS ETF 2,108 0.99 88,268 iShares Core S&P 500 UCITS ETF 17,746 8.36
8,554,664 iShares Japan Equity Index Fund - L Accumulation 19,317 9.10 11,736,826 iShares North American Equity Index Fund - L Accumulation 41,278 19.44
4,402,358 iShares Pacific ex Japan Equity Index Fund - L Accumulation 14,202 6.69
211,885 99.80
Investment assets 211,885 99.80
Net other assets 433 0.20
Total net assets 212,318 100.00
All investments are approved securities being either officially listed in a member state or traded on or under the rules of an eligible securities market, unless otherwise stated. All investments are in ordinary shares unless otherwise stated.

Quilter Investors Global Equity Index Fund
Quilter Investors OEIC
277
Statement of total return for the period from 1 January 2018 to 30 June 2018 01.01.18 to 01.01.18 to 01.01.17 to 01.01.17 to
30.06.18 30.06.18 30.06.17 30.06.17
Note £'000 £'000 £'000 £'000
Income
Net capital gains 3,262 4,902
Revenue 1,045 762
Expenses (219) (150)
Net revenue before taxation 826 612
Taxation - -
Net revenue after taxation 826 612
Total return before distributions 4,088 5,514
Distributions 2 (857) (613)
Change in net assets attributable to
shareholders from investment activities 3,231 4,901
Statement of change in net assets attributable to shareholders for the period from 1 January 2018 to 30 June 2018 01.01.18 to 01.01.18 to 01.01.17 to 01.01.17 to
30.06.18 30.06.18 30.06.17 30.06.17
£'000 £'000 £'000 £'000
Opening net assets attributable to shareholders 159,093* 104,620
Amounts received on issue of shares 50,620 31,922
Amounts paid on cancellation of shares (1,754) (4,710)
48,866 27,212
Dilution adjustment 30 50
Change in net assets attributable to
shareholders from investment activities 3,231 4,901
Retained distribution on accumulation shares 1,098 772
Closing net assets attributable to shareholders 212,318 137,555* * Section 3.30 of the SORP issued by the Investment Management Association in May 2014 requires comparative figures for the above statement. For interim financial
statements this will result in the closing comparative net assets not being equal to net assets at the start of the current period.
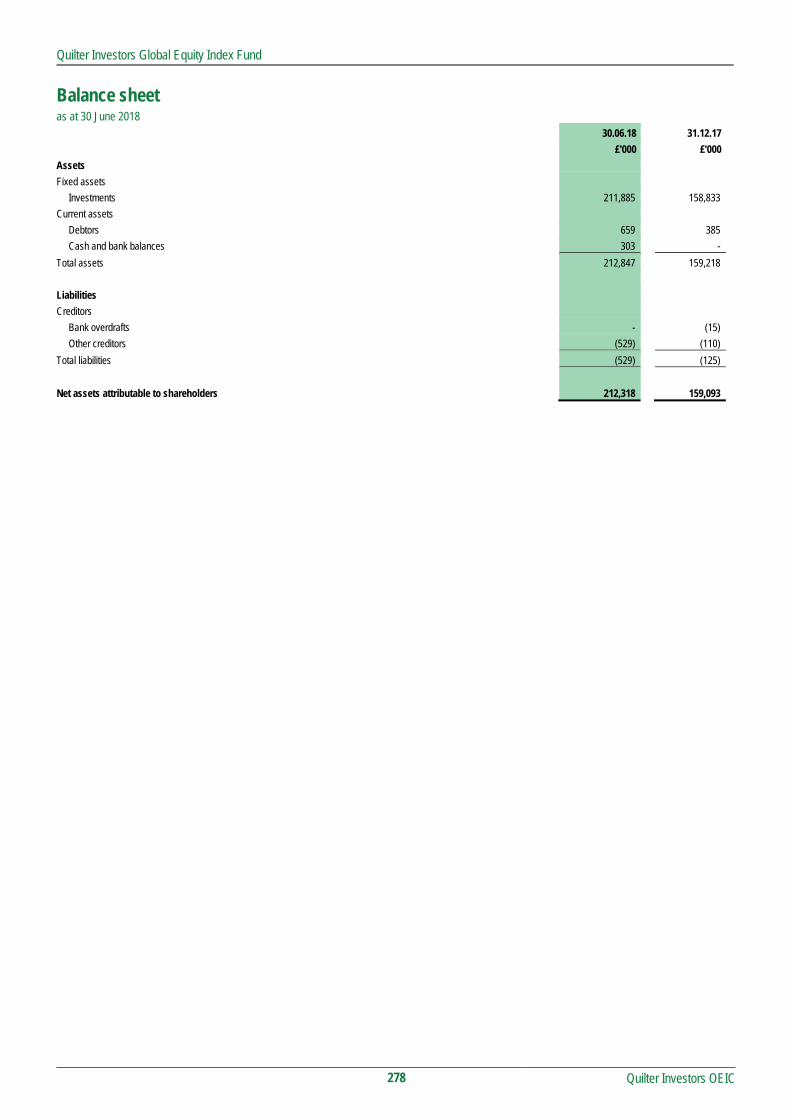
Quilter Investors Global Equity Index Fund
Quilter Investors OEIC
278
Balance sheet as at 30 June 2018 30.06.18 31.12.17
£'000 £'000
Assets
Fixed assets
Investments 211,885 158,833
Current assets
Debtors 659 385
Cash and bank balances 303 -
Total assets 212,847 159,218
Liabilities
Creditors
Bank overdrafts - (15)
Other creditors (529) (110)
Total liabilities (529) (125)
Net assets attributable to shareholders 212,318 159,093

Quilter Investors Global Equity Index Fund
Notes to the financial statements for the period from 1 January 2018 to 30 June 2018
Quilter Investors OEIC
279
1 Accounting policies The financial statements have been prepared under the historical cost basis, as modified by the revaluation of investments, and in accordance with the Statement of Recommended Practice (SORP) for Authorised Funds, issued by the Investment Management Association in May 2014.
The accounting policies applied are consistent with those disclosed within the annual Financial Statements for the year ended 31 December 2017.
2 Distributions The distributions take account of revenue received on the issue of shares and revenue deducted on the cancellation of shares, and comprise:
01.01.18 to 01.01.17 to 30.06.18 30.06.17 £'000 £'000 Interim – Accumulation shares (30 June) 1,098 772 1,098 772 Revenue deducted on cancellation of shares 7 14 Revenue received on issue of shares (248) (173) Distributions 857 613
Reconciliation of distributions: Net revenue after taxation 826 612 Equalisation on Collective Investment Schemes 31 1 Distributions 857 613

Quilter Investors Global Equity Index Fund
Distribution table
Quilter Investors OEIC
280
Interim distribution Group 1: Shares purchased prior to 1 January 2018 Group 2: Shares purchased from 1 January 2018 to 30 June 2018
Revenue pence per share
Equalisation pence per share*
Distribution paid 31.08.18
pence per share
Distribution paid 31.08.17
pence per share Accumulation 'U2' Shares Group 1 0.9208 - 0.9208 0.9151 Group 2 0.0718 0.8490 0.9208 0.9151 * Equalisation only applies to shares purchased during the distribution period (Group 2 shares). It is the average amount of revenue included in the purchase price of all Group
2 shares and is refunded to holders of these shares as a return of capital. Being capital, it is not liable to income tax but must be deducted from the cost of shares for capital gains tax purposes.

Quilter Investors Global Equity Value Fund
Quilter Investors Global Equity Value Fund
Quilter Investors OEIC
281
Objective
The sub-fund aims to achieve a combination of income and capital growth.
Policy
The sub-fund primarily invests, directly and indirectly, in shares issued by companies located anywhere in the world.
The investment adviser typically has a preference to invest in shares of companies they believe to be undervalued. The sub-fund may at times be concentrated in terms of the number of investments it holds.
The sub-fund may also invest in other transferable securities, collective investment schemes (including those managed or operated by the ACD) warrants, money market instruments, deposits and derivatives.
The sub-fund may only use derivatives for efficient portfolio management purposes.
The sub-fund is managed by an investment adviser selected by the ACD for their expected ability to manage the sub-fund according to the investment objective and policy. The ACD continuously monitors and may periodically make changes to this appointment.
Investment Manager’s review
Market Review
The first three months of 2018 witnessed the return of volatility to global equity markets. Having experienced a somewhat calm period characterised by unbroken gains since late 2016, global equities, in aggregate, registered a modest decline over the quarter. The first few trading sessions of the year struck a decidedly bullish tone, with particularly strong momentum witnessed among the so-called ‘FAANG’ (Facebook, Amazon, Apple, Netflix and Alphabet's Google) group of prominent technology stocks. In the second half of the period politics came to the fore as the major determinant of investor sentiment, displacing the actions of central bankers, who, remaining true to their prior commitments, continued progressively to move towards policy normalisation. We believe the sub-fund’s strict yield criteria stand it in good stead for navigating periods of volatility, and we are comfortable that the sub-fund remains exposed to haven-like companies with good-quality balance sheets, with a lower weighting in more cyclical areas of the market.
Performance
At the start of 2018 the sub-fund generated a negative performance and underperformed its comparative index over the quarter, net of fees, before recovering in the second half of the period. In the first three months we established new positions in American advertising agency Omnicom and mobile-technology company Qualcomm. The majority of the underperformance occurred as markets continued their upward march in January, when more defensive equities, including several of the sub-fund’s holdings in the consumer goods sector, performed poorly in contrast to more cyclical areas of the market. The sub-fund performed relatively better during the sharp declines seen in early February but did not rally as much as the index during the rest of the month. However, relative performance recovered strongly in March when markets became unsettled once again. At the sector level, the sub-fund’s significant overweight to consumer goods was the biggest detractor at the start of the year, with a number of stocks in this area lagging the wider market. This was especially the case with tobacco companies and food and drink producers.
In the second half of the period, the sub-fund’s significant underweight in financials and industrials was beneficial as these sectors lagged the index during the three months to the end of June. Stock selection in both these sectors also boosted relative performance, with US payroll and human resources outsourcing company Paychex a positive contributor. Elsewhere, several of the sub-fund’s less economically sensitive stocks, which had performed poorly in contrast to more cyclical areas of the market earlier in the year, rebounded towards the end of the first half of the year. These included new addition PepsiCo, beverages company Diageo and pharmaceutical company Merck. The sub-fund’s zero weighting in the ‘FAANG’ group of prominent technology stocks such as Facebook and Apple was detrimental
to relative performance. We cannot hold these companies as they do not meet the fund’s yield criteria. However, a number of the fund’s more mature technology holdings were among the biggest positive contributors to performance. These included Indian business technology services company Infosys, a position we had built up during the start of the year.
Risk and Reward Profile
Classes A, and U2
The calculated risk and reward category, as shown above, uses a method of calculation derived from EU rules. It is based on the rate at which the returns of the sub-fund have moved up and down in the past (i.e. volatility) and is not a guide to the future risk and reward category of the sub-fund. The category shown is not a target or guarantee and may shift over time. Even the lowest category 1 does not mean a risk-free investment. The seven-category scale is nonlinear, for example, 2 is not twice as risky as 1.
Sub-funds in category 5 have in the past shown moderately high volatility. With a sub-fund of category 5, you have a moderately high risk of losing money but your chance for gains is also moderately high.
Investment risk - there is no guarantee that the sub-fund will achieve its objective. A capital loss of some or all of the amount invested may occur.
Emerging markets risk - less developed countries may face more political, economic or structural challenges than developed countries.
Concentration risk (number of investments) - the sub-fund may at times hold a smaller number of investments, and therefore a fall in the value of a single investment may have a greater impact on the sub-fund’s value than if it held a larger number of investments. Smaller companies risk - smaller companies are subject to greater risk and reward potential. Investments may be volatile or difficult to buy or sell. Liquidity risk - some investments may become hard to value or sell at a desired time and price. In extreme circumstances this may affect the sub-fund’s ability to meet redemption requests upon demand.
Currency risk (EUR share class) - the sub-fund is denominated in British Pounds but holds assets denominated in other currencies. This share class is denominated in Euro. The value of your shares may rise and fall as a result of exchange rate movements between these currencies.
Currency risk (GBP share class) - the sub-fund is denominated in British Pounds but holds assets denominated in other currencies. The value of your shares may rise and fall as a result of exchange rate movements between these currencies.
Derivative risk - the sub-fund may use derivatives to reduce costs and/or the overall risk of the sub-fund (i.e. Efficient Portfolio Management (EPM)). Derivatives involve a level of risk, however, for EPM they should not increase the overall riskiness of the sub-fund. Derivatives also involve counterparty risk where the institutions acting as counterparty to derivatives may not meet their contractual obligations.
Capital erosion risk - the sub-fund takes its charges from the capital of the sub-fund. Investors should be aware that there is potential for capital erosion if insufficient capital growth is achieved by the sub-fund to cover the charges. Capital erosion may have the effect of reducing the level of income generated.
For full details of the sub-fund's risks, please see the section in the prospectus headed "Risks".
Launch date 26 April 2013
IA Sector Global Equity Income
Investment adviser Newton Investment Management Limited
Net asset value £296,898,121

Quilter Investors Global Equity Value Fund
Quilter Investors Global Equity Value Fund
Quilter Investors OEIC
282
Risk and Reward Profile
Class A US$
The calculated risk and reward category, as shown above, uses a method of calculation derived from EU rules. It is based on the rate at which the returns of the sub-fund have moved up and down in the past (i.e. volatility) and is not a guide to the future risk and reward category of the sub-fund. The category shown is not a target or guarantee and may shift over time. Even the lowest category 1 does not mean a risk-free investment. The seven-category scale is nonlinear, for example, 2 is not twice as risky as 1.
Sub-funds in category 4 have in the past shown moderately high volatility. With a sub-fund of category 4, you have a moderate risk of losing money but your chance for gains is also moderate.
Investment risk - there is no guarantee that the sub-fund will achieve its objective. A capital loss of some or all of the amount invested may occur.
Emerging markets risk - less developed countries may face more political, economic or structural challenges than developed countries.
Concentration risk (number of investments) - the sub-fund may at times hold a smaller number of investments, and therefore a fall in the value of a single investment may have a greater impact on the sub-fund’s value than if it held a larger number of investments. Smaller companies risk - smaller companies are subject to greater risk and reward potential. Investments may be volatile or difficult to buy or sell. Liquidity risk - some investments may become hard to value or sell at a desired time and price. In extreme circumstances this may affect the sub-fund’s ability to meet redemption requests upon demand.
Currency risk (USD share class) - the sub-fund is denominated in British Pounds but holds assets denominated in other currencies. This share class is denominated in US Dollars. The value of your shares may rise and fall as a result of exchange rate movements between these currencies.
Derivative risk - the sub-fund may use derivatives to reduce costs and/or the overall risk of the sub-fund (i.e. Efficient Portfolio Management (EPM)). Derivatives involve a level of risk, however, for EPM they should not increase the overall riskiness of the sub-fund. Derivatives also involve counterparty risk where the institutions acting as counterparty to derivatives may not meet their contractual obligations.
Capital erosion risk - the sub-fund takes its charges from the capital of the sub-fund. Investors should be aware that there is potential for capital erosion if insufficient capital growth is achieved by the sub-fund to cover the charges. Capital erosion may have the effect of reducing the level of income generated.
For full details of the sub-fund's risks, please see the section in the prospectus headed "Risks".

Quilter Investors Global Equity Value Fund
Quilter Investors OEIC
283
Performance Records Comparative Tables
1 January 2018 to 1 January 2017 to 1 January 2016 to Accumulation 'A' EUR† 30 June 2018 31 December 2017 31 December 2016 p/share p/share p/share Change in net assets per share
Opening net asset value per share 101.43 94.94 79.00
Return before operating charges* 2.52 8.13 17.05 Operating charges** (0.83) (1.64) (1.11)
Return after operating charges* 1.69 6.49 15.94
Distributions (2.01) (3.15) (2.10) Retained distributions 2.01 3.15 2.10
Closing net asset value per share 103.12 101.43 94.94
* after direct transaction costs of*** 0.04 0.10 0.08
Performance Return after charges 1.67% 6.84% 20.18%
Other information Closing net asset value (£) 3,042 2,992 2,801 Closing number of shares 2,950 2,950 2,950 Operating charges**** 1.68% 1.65% 1.62% Direct transaction costs*** 0.08% 0.10% 0.12%
Prices cents per share cents per share cents per share Highest share price 118.1 117.1 112.7 Lowest share price 107.2 108.0 99.49
1 January 2018 to 1 January 2017 to 1 January 2016 to Accumulation 'A' USD 30 June 2018 31 December 2017 31 December 2016
p/share p/share p/share
Change in net assets per share Opening net asset value per share 97.31 91.20 71.25
Return before operating charges* 2.37 7.69 21.38 Operating charges** (0.79) (1.58) (1.43)
Return after operating charges* 1.58 6.11 19.95
Distributions (1.92) (3.29) (2.63) Retained distributions 1.92 3.29 2.63
Closing net asset value per share 98.89 97.31 91.20
* after direct transaction costs of*** 0.04 0.10 0.10
Performance Return after charges 1.62% 6.70% 28.00%
Other information Closing net asset value (£) 206,044 280,676 216,325 Closing number of shares 208,347 288,449 237,209 Operating charges**** 1.68% 1.65% 1.62% Direct transaction costs*** 0.08% 0.10% 0.12%
Prices cents per share cents per share cents per share Highest share price 138.3 131.7 117.7 Lowest share price 127.0 112.1 98.29

Quilter Investors Global Equity Value Fund
Quilter Investors OEIC
284
Comparative Tables (continued)
1 January 2018 to 1 January 2017 to 1 January 2016 to Income 'A' 30 June 2018 31 December 2017 31 December 2016 p/share p/share p/share Change in net assets per share
Opening net asset value per share 138.29 133.74 107.84
Return before operating charges* 3.37 11.16 31.82 Operating charges** (1.12) (2.24) (1.97)
Return after operating charges* 2.25 8.92 29.85
Distributions (2.73) (4.37) (3.95) Retained distributions - - -
Closing net asset value per share 137.81 138.29 133.74
* after direct transaction costs of*** 0.06 0.14 0.15
Performance Return after charges 1.63% 6.67% 27.68%
Other information Closing net asset value (£) 28,909,982 31,391,781 37,714,682 Closing number of shares 20,977,603 22,700,261 28,200,348 Operating charges**** 1.67% 1.62% 1.62% Direct transaction costs*** 0.08% 0.10% 0.12%
Prices pence per share pence per share pence per share Highest share price 140.2 143.8 135.9 Lowest share price 127.5 131.7 105.3
1 January 2018 to 1 January 2017 to 1 January 2016 to Accumulation 'U2' 30 June 2018 31 December 2017 31 December 2016 p/share p/share p/share Change in net assets per share
Opening net asset value per share 170.31 158.24 122.61
Return before operating charges* 4.28 13.35 36.73 Operating charges** (0.68) (1.28) (1.10)
Return after operating charges* 3.60 12.07 35.63
Distributions (3.38) (5.25) (4.56) Retained distributions 3.38 5.25 4.56
Closing net asset value per share 173.91 170.31 158.24
* after direct transaction costs of*** 0.07 0.17 0.17
Performance Return after charges 2.11% 7.63% 29.06%
Other information Closing net asset value (£) 267,722,329 212,485,874 113,734,029 Closing number of shares 153,943,791 124,762,784 71,876,521 Operating charges**** 0.82% 0.77% 0.77% Direct transaction costs*** 0.08% 0.10% 0.12%
Prices pence per share pence per share pence per share Highest share price 174.4 172.2 159.6 Lowest share price 157.3 155.9 119.8

Quilter Investors Global Equity Value Fund
Quilter Investors OEIC
285
Comparative Tables (continued) 1 January 2018 to 1 January 2017 to 1 January 2016 to Income 'U2' 30 June 2018 31 December 2017 31 December 2016
p/share p/share p/share
Change in net assets per share
Opening net asset value per share 144.67 138.73 110.95
Return before operating charges* 3.57 11.60 32.83 Operating charges** (0.58) (1.11) (0.97)
Return after operating charges* 2.99 10.49 31.86
Distributions (2.86) (4.55) (4.08) Retained distributions - - -
Closing net asset value per share 144.80 144.67 138.73
* after direct transaction costs of*** 0.06 0.14 0.15
Performance Return after charges 2.07% 7.56% 28.72%
Other information Closing net asset value (£) 56,724 24,936 23,917 Closing number of shares 39,174 17,236 17,240 Operating charges**** 0.82% 0.77% 0.77% Direct transaction costs*** 0.08% 0.10% 0.12%
Prices pence per share pence per share pence per share Highest share price 147.3 149.8 140.7 Lowest share price 133.7 136.7 108.3
† From 31 March 2016 ** The operating charges include all costs borne by the sub-fund, except for direct transaction costs.
*** The direct transaction costs are made up of fees and commissions paid to agents, advisers, brokers and dealers, levies by regulatory agencies and securities exchanges as well as transfer taxes and duties. They do not include any difference between the quoted bid and offer prices or internal administrative or holding costs. These costs arise as a result of transactions undertaken both for efficient portfolio management and the meeting of the sub-fund’s objectives. These costs exclude any effect of dilution adjustments used to offset the costs.
**** The operating charges percentage is the ratio of the sub-fund's ongoing charges (excluding interest on borrowings) to the average net assets of the sub-fund. If the share class launched during the period the operating charges figures are annualised.
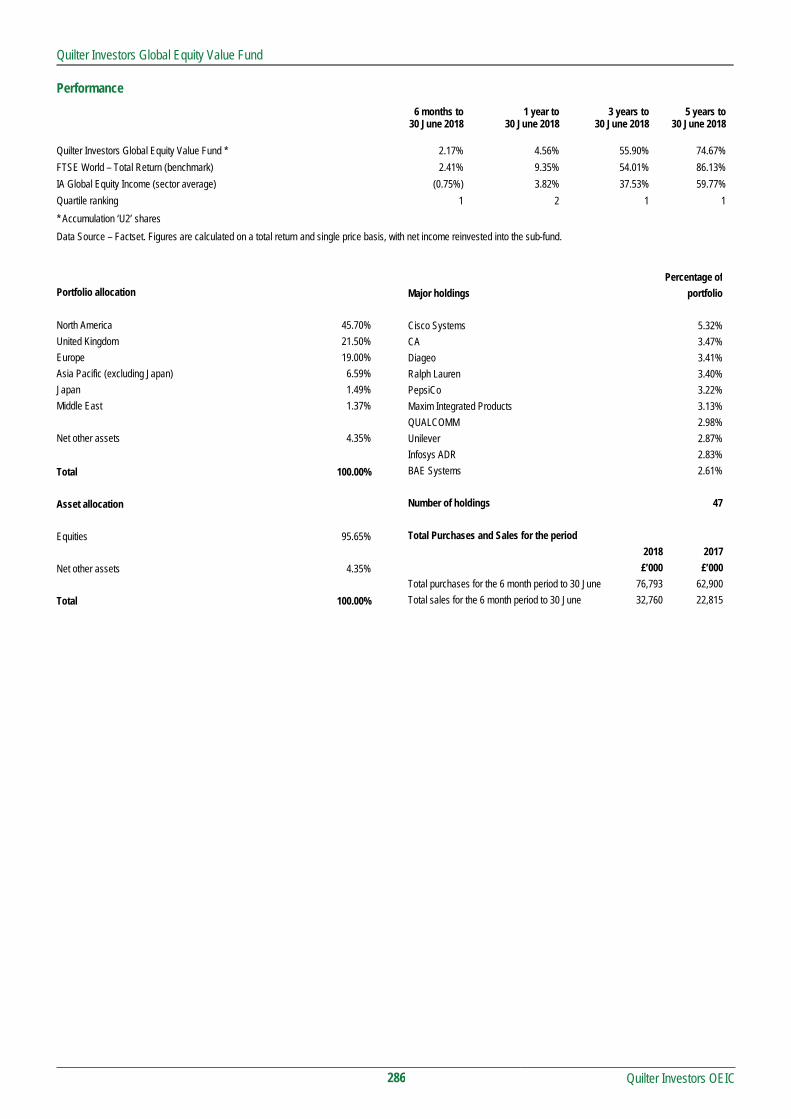
Quilter Investors Global Equity Value Fund
Quilter Investors OEIC
286
Performance
6 months to30 June 2018
1 year to 30 June 2018
3 years to 30 June 2018
5 years to 30 June 2018
Quilter Investors Global Equity Value Fund * 2.17% 4.56% 55.90% 74.67%
FTSE World – Total Return (benchmark) 2.41% 9.35% 54.01% 86.13%
IA Global Equity Income (sector average) (0.75%) 3.82% 37.53% 59.77%
Quartile ranking 1 2 1 1
* Accumulation ‘U2’ shares
Data Source – Factset. Figures are calculated on a total return and single price basis, with net income reinvested into the sub-fund.
Portfolio allocation
North America 45.70%
United Kingdom 21.50%
Europe 19.00%
Asia Pacific (excluding Japan) 6.59%
Japan 1.49%
Middle East 1.37%
Net other assets 4.35%
Total 100.00%
Asset allocation
Equities 95.65%
Net other assets 4.35%
Total 100.00%
Percentage of
Major holdings portfolio
Cisco Systems 5.32%
CA 3.47%
Diageo 3.41%
Ralph Lauren 3.40%
PepsiCo 3.22%
Maxim Integrated Products 3.13%
QUALCOMM 2.98%
Unilever 2.87%
Infosys ADR 2.83%
BAE Systems 2.61%
Number of holdings 47
Total Purchases and Sales for the period
2018 2017
£’000 £’000
Total purchases for the 6 month period to 30 June 76,793 62,900
Total sales for the 6 month period to 30 June 32,760 22,815

Quilter Investors Global Equity Value Fund
Portfolio statement as at 30 June 2018
Quilter Investors OEIC
287
Market Percentage of Value total net assets
Holding Investment £’000 %
United Kingdom 21.50% (31 December 2017 22.23%)
United Kingdom Equities 21.50% (31 December 2017 22.23%) 1,196,654 BAE Systems 7,752 2.61
113,486 British American Tobacco 4,425 1.49 104,810 British American Tobacco ADR 4,049 1.37
4,418,819 Centrica 7,068 2.38 368,125 Diageo 10,114 3.41 927,538 Informa 7,715 2.60 458,428 RELX (Dutch Listing) 7,422 2.50 311,263 UBM 3,362 1.13 201,845 Unilever 8,521 2.87
1,847,434 Vodafone 3,392 1.14
63,820 21.50
Overseas 74.15% (31 December 2017 74.94%)
Asia Pacific (excluding Japan) 6.59% (31 December 2017 4.23%)
Australia Equities 0.99% (31 December 2017 1.07%) 547,373 Dexus Property 2,951 0.99
2,951 0.99
Hong Kong Equities 1.45% (31 December 2017 1.47%) 618,000 Link REIT 4,295 1.45
4,295 1.45
India Equities 2.83% (31 December 2017 0.51%) 581,354 Infosys ADR 8,407 2.83
8,407 2.83
New Zealand Equities 0.36% (31 December 2017 0.37%) 563,879 Spark New Zealand 1,082 0.36
1,082 0.36
South Korea Equities 0.96% (31 December 2017 0.81%) 467,630 Macquarie Korea Infrastructure Fund 2,858 0.96
2,858 0.96
Japan 1.49% (31 December 2017 1.72%)
Japan Equities 1.49% (31 December 2017 1.72%) 207,600 Japan Tobacco 4,416 1.49
4,416 1.49
Europe 19.00% (31 December 2017 22.96%)
France Equities 4.94% (31 December 2017 5.29%) 91,983 Sanofi 5,637 1.90
338,213 Television Francaise 1 2,707 0.91 136,249 Total 6,308 2.13
14,652 4.94

Quilter Investors Global Equity Value Fund
Portfolio statement (continued) as at 30 June 2018
Quilter Investors OEIC
288
Market Percentage of Value total net assets
Holding Investment £’000 %
Italy Equities 0.00% (31 December 2017 0.99%)
Netherlands Equities 2.44% (31 December 2017 3.19%) 274,345 Royal Dutch Shell 'A' (GBP Listing) 7,254 2.44
7,254 2.44
Norway Equities 1.82% (31 December 2017 2.18%) 801,447 Orkla 5,394 1.82
5,394 1.82
Sweden Equities 1.51% (31 December 2017 2.14%)
401,569 Hennes & Mauritz 4,497 1.51
4,497 1.51
Switzerland Equities 8.29% (31 December 2017 9.17%) 81,117 Nestle 4,739 1.60
132,936 Novartis 7,582 2.55 34,882 Roche 5,849 1.97 28,690 Zurich Insurance 6,445 2.17
24,615 8.29
Middle East 1.37% (31 December 2017 1.53%)
Israel Equities 1.37% (31 December 2017 1.53%) 787,898 Bank Hapoalim 4,055 1.37
4,055 1.37
North America 45.70% (31 December 2017 44.50%)
United States Equities 45.70% (31 December 2017 44.50%) 381,195 CA 10,302 3.47 483,182 Cisco Systems 15,790 5.32 152,646 CMS Energy 5,467 1.84 580,926 Coty 6,176 2.08
56,616 Emerson Electric 2,955 0.99 114,633 Eversource Energy 5,083 1.71 137,577 Gilead Sciences 7,364 2.48 209,676 Maxim Integrated Products 9,297 3.13
22,312 McDonald's 2,654 0.89 122,056 Merck (US Listing) 5,602 1.89 131,872 Omnicom 7,665 2.58
96,990 Paychex 5,016 1.69 115,513 PepsiCo 9,554 3.22
84,507 Philip Morris International 5,252 1.77 72,588 Principal Financial 2,926 0.99 81,229 Procter & Gamble 4,826 1.63

Quilter Investors Global Equity Value Fund
Portfolio statement (continued) as at 30 June 2018
Quilter Investors OEIC
289
Market Percentage of Value total net assets
Holding Investment £’000 % United States Equities (continued)
208,217 QUALCOMM 8,858 2.98 104,522 Ralph Lauren 10,097 3.40
85,010 Verizon Communications 3,291 1.11 486,195 Western Union 7,512 2.53
135,687 45.70
Investment assets 283,983 95.65
Net other assets 12,915 4.35
Total net assets 296,898 100.00
All investments are approved securities being either officially listed in a member state or traded on or under the rules of an eligible securities market, unless otherwise stated.
All investments are in ordinary shares unless otherwise stated.

Quilter Investors Global Equity Value Fund
Quilter Investors OEIC
290
Statement of total return for the period from 1 January 2018 to 30 June 2018 01.01.18 to 01.01.18 to 01.01.17 to 01.01.17 to
30.06.18 30.06.18 30.06.17 30.06.17
Note £'000 £'000 £'000 £'000
Income
Net capital gains 2,710 5,016
Revenue 5,986 3,513
Expenses (1,197) (784)
Net revenue before taxation 4,789 2,729
Taxation (545) (325)
Net revenue after taxation 4,244 2,404
Total return before distributions 6,954 7,420
Distributions 2 (5,409) (3,168)
Change in net assets attributable to
shareholders from investment activities 1,545 4,252
Statement of change in net assets attributable to shareholders for the period from 1 January 2018 to 30 June 2018 01.01.18 to 01.01.18 to 01.01.17 to 01.01.17 to
30.06.18 30.06.18 30.06.17 30.06.17
£'000 £'000 £'000 £'000
Opening net assets attributable to shareholders 244,186* 151,692
Amounts received on issue of shares 49,406 54,028
Amounts paid on cancellation of shares (3,390) (16,961)
46,016 37,067
Dilution adjustment 74 89
Change in net assets attributable to
shareholders from investment activities 1,545 4,252
Retained distribution on accumulation shares 5,077 2,824
Closing net assets attributable to shareholders 296,898 195,924* * Section 3.30 of the SORP issued by the Investment Management Association in May 2014 requires comparative figures for the above statement. For interim financial
statements this will result in the closing comparative net assets not being equal to net assets at the start of the current period.

Quilter Investors Global Equity Value Fund
Quilter Investors OEIC
291
Balance sheet as at 30 June 2018 30.06.18 31.12.17
£'000 £'000
Assets
Fixed assets
Investments 283,983 237,271
Current assets
Debtors 2,264 1,613
Cash and bank balances 11,440 5,808
Total assets 297,687 244,692
Liabilities
Creditors
Distribution payable (406) (198)
Other creditors (383) (308)
Total liabilities (789) (506)
Net assets attributable to shareholders 296,898 244,186

Quilter Investors Global Equity Value Fund
Notes to the financial statements for the period from 1 January 2018 to 30 June 2018
Quilter Investors OEIC
292
1 Accounting policies The financial statements have been prepared under the historical cost basis, as modified by the revaluation of investments, and in accordance with the Statement of Recommended Practice (SORP) for Authorised Funds, issued by the Investment Management Association in May 2014.
The accounting policies applied are consistent with those disclosed within the annual Financial Statements for the year ended 31 December 2017.
2 Distributions The distributions take account of revenue received on the issue of shares and revenue deducted on the cancellation of shares, and comprise:
01.01.18 to 01.01.17 to 30.06.18 30.06.17 £'000 £'000 Interim – Accumulation shares (31 March) 1,373 1,070 Interim – Income shares (31 March) 171 288 Interim – Accumulation shares (30 June) 3,704 1,754 Interim – Income shares (30 June) 406 364 5,654 3,476 Revenue deducted on cancellation of shares 13 28 Revenue received on issue of shares (258) (336) Distributions 5,409 3,168
Reconciliation of distributions: Net revenue after taxation 4,244 2,404 Capitalised fees 1,196 784 Tax relief on capitalised fees (31) (20) Distributions 5,409 3,168

Quilter Investors Global Equity Value Fund
Distribution table
Quilter Investors OEIC
293
Second Interim distribution Group 1: Shares purchased prior to 1 April 2018 Group 2: Shares purchased from 1 April 2018 to 30 June 2018
Revenue pence/cents
per share
Equalisation pence/cents
per share*
Distribution paid 31.08.18
pence/cents per share
Distribution paid 31.08.17
pence/cents per share Accumulation 'A' EUR Shares Group 1 1.6102 - 1.6102 1.2271 Group 2 1.6102 0.0000 1.6102 1.2271 Accumulation 'A' USD Shares Group 1 1.7935 - 1.7935 1.3376 Group 2 1.7935 0.0000 1.7935 1.3376 Income 'A' Shares Group 1 1.9336 - 1.9336 1.4994 Group 2 0.8664 1.0672 1.9336 1.4994 Accumulation 'U2' Shares Group 1 2.4041 - 2.4041 1.7940 Group 2 1.0825 1.3216 2.4041 1.7940 Income 'U2' Shares Group 1 2.0296 - 2.0296 1.5662 Group 2 0.2364 1.7932 2.0296 1.5662

Quilter Investors Global Equity Value Fund
Distribution table (continued)
Quilter Investors OEIC
294
First Interim distribution Group 1: Shares purchased prior to 1 January 2018 Group 2: Shares purchased from 1 January 2018 to 31 March 2018
Revenue pence/cents
per share
Equalisation pence/cents
per share*
Distribution paid 31.05.18
pence/cents per share
Distribution paid 31.05.17
pence/cents per share Accumulation 'A' EUR Shares Group 1 0.6626 - 0.6626 0.9251 Group 2 0.6626 0.0000 0.6626 0.9251 Accumulation 'A' USD Shares Group 1 0.7845 - 0.7845 0.9486 Group 2 0.5291 0.2554 0.7845 0.9486 Income 'A' Shares Group 1 0.7929 - 0.7929 1.1169 Group 2 0.4025 0.3904 0.7929 1.1169 Accumulation 'U2' Shares Group 1 0.9780 - 0.9780 1.3240 Group 2 0.5424 0.4356 0.9780 1.3240 Income 'U2' Shares Group 1 0.8309 - 0.8309 1.1600 Group 2 0.4881 0.3428 0.8309 1.1600 * Equalisation only applies to shares purchased during the distribution period (Group 2 shares). It is the average amount of revenue included in the purchase price of all Group
2 shares and is refunded to holders of these shares as a return of capital. Being capital, it is not liable to income tax but must be deducted from the cost of shares for capital gains tax purposes.

Quilter Investors Global Property Securities Fund
Quilter Investors Global Property Securities Fund
Quilter Investors OEIC
295
Launch date 3 October 2005
IA Sector Property
Investment adviser Northwood Securities LLC
Net asset value £45,936,377
Objective
The sub-fund aims to achieve long term capital growth and income through investment in a globally diversified portfolio of property related securities.
Policy
The emphasis of the sub-fund is investment in property related securities of entities which generate rental income. Investment will be in transferable securities which are primarily Real Estate Investment Trusts (REITs) or real estate companies.
For efficient portfolio management purposes, investment may also be made into derivatives or forward transactions. The ACD considers that the use of derivatives for this purpose is not likely to affect the volatility or risk profile of the sub-fund.
The Investment Manager has appointed a specialist Investment Adviser to manage the sub-fund, and continuously monitors their suitability.
Investment Manager’s review
Market Review
The first half of the period was rife with unexpected political events, such as the sudden efforts by South Korea to entertain a rapprochement with North Korea. Other, somewhat less profound, political developments — such as the Japanese scandal involving Abe and his finance minister Aso, a weakening of Merkel’s hold on power in Germany, and political turmoil in Spain and Italy — would be expected to have some impact on investor confidence and market volatility. However, the developments that appeared to have the most significant global impact were US-oriented, including inflation fears; Facebook’s data sales and the impact on the technology sector; trade war concerns and surging volatility. The property sector was affected by concerns about rising interest rates in many markets and the general weakness in equities as the first three months came to a close, but there was a high degree of variation across individual companies and markets. By quarter-end, property companies were trading below the underlying values of their portfolios, with the notable exception of companies focused on logistics.
In the second half of the period, as markets began to stabilise global investors were confronted with a series of new challenges that arose late in the period as political turmoil and efforts to reduce quantitative easing (QE), combined with the prospect of a global trade war that was totally unexpected. On the political front, elections in Italy, Germany and Spain contributed to concerns about the stability of the EU market, although investor concerns abated somewhat by the end of the period as solid economic data offset political issues. The most notable development in the real estate sector has been the rise of the “anti-retail trade” – investing in logistics facilities (which used to be known simply as warehouses). The warehouse is becoming the new retail “store” and the largest REIT in the sector, Prologis, estimates that for every lost square foot of retail space, demand for warehouse space rises by two square feet.
Performance
Asia had a good start to 2018, contributing positively to the sub-fund. Performance was driven by our non-benchmark exposure to Chinese developers and, to a lesser extent, stock selection in Hong Kong and China. Japan had a strong first three months after a flattish end to 2017, resulting in a small negative contribution to the sub-fund due to our underweight position in the country. The sub-fund benefited from its lack of exposure to REITS in Singapore and Hong Kong — REITS in these markets, and in Australia, were affected by concerns over rising interest rates. Stock selection in Australia detracted, though the impact on the sub-fund was mitigated by our underweight position in the country. In terms of individuals stocks, the key contributors from Asia in the first half of the period were China Resources Land, China Overseas Land, Sumitomo Realty and Development and City Development.
European property stocks declined almost 5% in the first three months of 2018, as a sharp increase in bond yields triggered a substantial sell-off after a strong start to the year. The more highly-levered companies, such as the German residential names and Swedish stocks, were hit hardest. The former made up for this poor performance at the end of the first half of the period, as softening economic data suggested that interest rates may be lower for longer.
In the second half of the period Asia detracted from performance, driven by stock selection in Japan, Singapore and Australia, in Japan, Daiwa House and Aeon Mall were the two culprits. The European listed real estate sector rebounded in the second half of the period from the poor performance at the start of the year to show a small positive return for the half year. All of the performance was realised in the month of April when the sector was still recovering from the big dip in February when bond yields increased sharply. In spite of geopolitical noise property stocks have essentially traded sideways since.
North American real estate securities bounced back strongly towards the end of the six months, marking a sharp turnaround from the first three months. North American REITs are now in the green for the year. The biggest contributor to performance was the position in Education Realty Trust which announced it would be taken private.

Quilter Investors Global Property Securities Fund
Quilter Investors Global Property Securities Fund
Quilter Investors OEIC
296
Risk and Reward Profile
The calculated risk and reward category, as shown above, uses a method of calculation derived from EU rules. It is based on the rate at which the returns of the sub-fund have moved up and down in the past (i.e. volatility) and is not a guide to the future risk and reward category of the sub-fund. The category shown is not a target or guarantee and may shift over time. Even the lowest category 1 does not mean a risk-free investment. The seven-category scale is nonlinear, for example, 2 is not twice as risky as 1.
Sub-funds in category 5 have in the past shown moderately high volatility. With a sub-fund of category 5, you have a moderately high risk of losing money but your chance for gains is also moderately high.
Investment risk - there is no guarantee that the sub-fund will achieve its objective. A capital loss of some or all of the amount invested may occur.
Strategy risk - investments in property-related companies are subject to risks associated with direct property ownership.
Concentration risk (number of investments) - the sub-fund may at times hold a smaller number of investments, and therefore a fall in the value of a single investment may have a greater impact on the sub-fund’s value than if it held a larger number of investments.
Smaller companies risk - smaller companies are subject to greater risk and reward potential. Investments may be volatile or difficult to buy or sell.
Liquidity risk - some investments may become hard to value or sell at a desired time and price. In extreme circumstances this may affect the sub-fund’s ability to meet redemption requests upon demand.
Currency risk (EUR share class) - the sub-fund is denominated in British Pounds and may use techniques to try to reduce the effects of changes in the exchange rate between the currency of the underlying investments and the base currency of the sub-fund. These techniques may not eliminate all the currency risk. This share class is denominated in Euro. The hedging process may not give a precise hedge, and some currency risk may remain. The value of your shares may rise and fall as a result of exchange rate movements between these currencies.
Currency risk (GBP share class) - the sub-fund is denominated in British Pounds and may use techniques to try to reduce the effects of changes in the exchange rate between the currency of the underlying investments and the base currency of the sub-fund. These techniques may not eliminate all the currency risk. The value of your shares may rise and fall as a result of exchange rate movements.
Currency risk (USD share class) - the sub-fund is denominated in British Pounds and may use techniques to try to reduce the effects of changes in the exchange rate between the currency of the underlying investments and the base currency of the sub-fund. These techniques may not eliminate all the currency risk. This share class is denominated in US Dollars. The hedging process may not give a precise hedge, and some currency risk may remain. The value of your shares may rise and fall as a result of exchange rate movements between these currencies.
Derivative risk - the sub-fund may use derivatives to reduce costs and/or the overall risk of the sub-fund (i.e. Efficient Portfolio Management (EPM)). Derivatives involve a level of risk, however, for EPM they should not increase the overall riskiness of the sub-fund. Derivatives also involve counterparty risk where the institutions acting as counterparty to derivatives may not meet their contractual obligations.
Capital erosion risk - the sub-fund takes its charges from the capital of the sub-fund. Investors should be aware that there is potential for capital erosion if insufficient capital growth is achieved by the sub-fund to cover the charges. Capital erosion may have the effect of reducing the level of income generated.
For full details of the sub-fund's risks, please see the section in the prospectus headed "Risks".
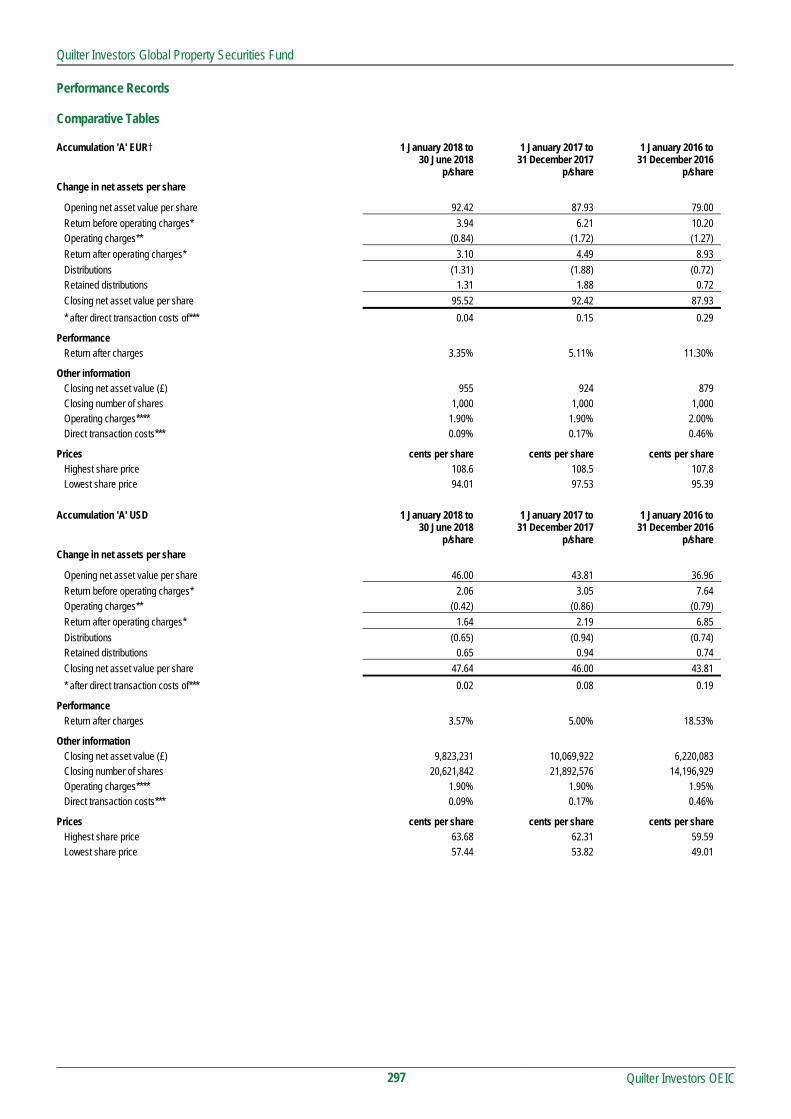
Quilter Investors Global Property Securities Fund
Quilter Investors OEIC
297
Performance Records Comparative Tables
Accumulation 'A' EUR† 1 January 2018 to
30 June 2018 1 January 2017 to
31 December 2017 1 January 2016 to
31 December 2016 p/share p/share p/share Change in net assets per share
Opening net asset value per share 92.42 87.93 79.00
Return before operating charges* 3.94 6.21 10.20 Operating charges** (0.84) (1.72) (1.27)
Return after operating charges* 3.10 4.49 8.93
Distributions (1.31) (1.88) (0.72) Retained distributions 1.31 1.88 0.72
Closing net asset value per share 95.52 92.42 87.93
* after direct transaction costs of*** 0.04 0.15 0.29
Performance Return after charges 3.35% 5.11% 11.30%
Other information Closing net asset value (£) 955 924 879 Closing number of shares 1,000 1,000 1,000 Operating charges**** 1.90% 1.90% 2.00% Direct transaction costs*** 0.09% 0.17% 0.46%
Prices cents per share cents per share cents per share Highest share price 108.6 108.5 107.8 Lowest share price 94.01 97.53 95.39
Accumulation 'A' USD 1 January 2018 to 30 June 2018
1 January 2017 to 31 December 2017
1 January 2016 to 31 December 2016
p/share p/share p/share Change in net assets per share
Opening net asset value per share 46.00 43.81 36.96
Return before operating charges* 2.06 3.05 7.64 Operating charges** (0.42) (0.86) (0.79)
Return after operating charges* 1.64 2.19 6.85
Distributions (0.65) (0.94) (0.74) Retained distributions 0.65 0.94 0.74
Closing net asset value per share 47.64 46.00 43.81
* after direct transaction costs of*** 0.02 0.08 0.19
Performance Return after charges 3.57% 5.00% 18.53%
Other information Closing net asset value (£) 9,823,231 10,069,922 6,220,083 Closing number of shares 20,621,842 21,892,576 14,196,929 Operating charges**** 1.90% 1.90% 1.95% Direct transaction costs*** 0.09% 0.17% 0.46%
Prices cents per share cents per share cents per share Highest share price 63.68 62.31 59.59 Lowest share price 57.44 53.82 49.01

Quilter Investors Global Property Securities Fund
Quilter Investors OEIC
298
Comparative Tables (continued)
Income 'A' GBP Hedged 1 January 2018 to
30 June 2018 1 January 2017 to
31 December 2017 1 January 2016 to
31 December 2016 p/share p/share p/share
Change in net assets per share Opening net asset value per share 43.43 39.94 41.29
Return before operating charges* 0.89 5.15 0.22 Operating charges** (0.40) (0.79) (0.79)
Return after operating charges* 0.49 4.36 (0.57)
Distributions (0.62) (0.87) (0.78) Retained distributions - - -
Closing net asset value per share 43.30 43.43 39.94
* after direct transaction costs of*** 0.02 0.07 0.19
Performance Return after charges 1.13% 10.92% (1.38)%
Other information Closing net asset value (£) 19,951,780 21,520,865 24,229,061 Closing number of shares 46,080,943 49,553,129 60,665,406 Operating charges**** 1.90% 1.90% 1.94% Direct transaction costs*** 0.09% 0.17% 0.46%
Prices pence per share pence per share pence per share Highest share price 44.16 44.19 43.23 Lowest share price 39.76 39.47 36.44
Income 'R' GBP Hedged 1 January 2018 to
30 June 2018 1 January 2017 to
31 December 2017 1 January 2016 to
31 December 2016 p/share p/share p/share
Change in net assets per share Opening net asset value per share 44.00 40.28 39.89
Return before operating charges* 0.91 5.09 1.65 Operating charges** (0.25) (0.49) (0.49)
Return after operating charges* 0.66 4.60 1.16
Distributions (0.63) (0.88) (0.77) Retained distributions - - -
Closing net asset value per share 44.03 44.00 40.28
* after direct transaction costs of*** 0.02 0.07 0.19
Performance Return after charges 1.50% 11.42% 2.91%
Other information Closing net asset value (£) 16,160,411 14,756,993 18,083,347 Closing number of shares 36,701,469 33,536,942 44,890,789 Operating charges**** 1.15% 1.15% 1.20% Direct transaction costs*** 0.09% 0.17% 0.46%
Prices pence per share pence per share pence per share Highest share price 44.86 44.81 43.54 Lowest share price 40.36 39.89 36.71
† From 31 March 2016 ** The operating charges include all costs borne by the sub-fund, except for direct transaction costs.
*** The direct transaction costs are made up of fees and commissions paid to agents, advisers, brokers and dealers, levies by regulatory agencies and securities exchanges as well as transfer taxes and duties. They do not include any difference between the quoted bid and offer prices or internal administrative or holding costs. These costs arise as a result of transactions undertaken both for efficient portfolio management and the meeting of the sub-fund’s objectives. These costs exclude any effect of dilution adjustments used to offset the costs.
**** The operating charges percentage is the ratio of the sub-fund's ongoing charges (excluding interest on borrowings) to the average net assets of the sub-fund. If the share class launched during the period the operating charges figures are annualised.

Quilter Investors Global Property Securities Fund
Quilter Investors OEIC
299
Performance
6 months to
30 June 2018
1 year to
30 June 2018
3 years to
30 June 2018
5 years to
30 June 2018
Quilter Investors Global Property Securities Fund* 0.74% 7.68% 18.19% 33.75%
SLAC SFI - Composite (benchmark) 0.36% 5.64% 18.13% 33.64%
* Accumulation ‘A’ USD shares
Data Source – Factset. Figures are calculated on a total return and single price basis, with net income reinvested into the sub-fund.
Portfolio allocation North America 49.86% Asia Pacific (excluding Japan) 17.61% Europe 13.46% Japan 8.51% United Kingdom 3.30% United Kingdom Derivatives (0.42)% Net other assets 7.68% Total 100.00% Asset allocation Equities 92.74% Derivatives (0.42)% Net other assets 7.68% Total 100.00%
Major holdings Percentage of Taubman Centers 3.21% Unibail-Rodamco-Westfield 2.77% Simon Property 2.77% Stockland 2.71% Healthcare Trust of America 2.53% Sumitomo Realty & Development 2.48% Terreno Realty 2.47% DCT Industrial Trust 2.45% Mitsui Fudosan 2.38% Equity LifeStyle Properties 2.36% Number of holdings 47 Total Purchases and Sales for the period 2018 2017 £’000 £’000 Total purchases for the 6 month period to 30 June 3,083 11,062 Total sales for the 6 month period to 30 June 6,535 13,173

Quilter Investors Global Property Securities Fund
Portfolio statement as at 30 June 2018
Quilter Investors OEIC
300
Market Percentage of Value total net assets
Holding Investment £’000 %
United Kingdom 2.88% (31 December 2017 4.30%)
United Kingdom Equities 3.30% (31 December 2017 3.95%) 69,543 Great Portland Estates 492 1.07 61,100 Unite 522 1.14
146,186 Urban & Civic 500 1.09
1,514 3.30
United Kingdom Derivatives (0.42)% (31 December 2017 0.35%)
Sterling Denominated Forward Exchange Contracts (0.42)% (31 December 2017 0.35%) £1,002,078 Sterling v Australian Dollar Denominated Forward Exchange Contract (3) (0.01)
£766,962 Sterling v Australian Dollar Denominated Forward Exchange Contract (3) (0.01) £1,924,789 Sterling v Euro Denominated Forward Exchange Contract (10) (0.02) £2,439,906 Sterling v Euro Denominated Forward Exchange Contract (13) (0.03) £1,780,859 Sterling v Hong Kong Dollar Denominated Forward Exchange Contract (13) (0.03) £2,277,942 Sterling v Hong Kong Dollar Denominated Forward Exchange Contract (17) (0.04) £1,785,360 Sterling v Japanese Yen Denominated Forward Exchange Contract 2 - £1,392,375 Sterling v Japanese Yen Denominated Forward Exchange Contract 1 -
£377,207 Sterling v Singapore Dollar Denominated Forward Exchange Contract (2) - £480,824 Sterling v Singapore Dollar Denominated Forward Exchange Contract (2) - £323,741 Sterling v Swedish Krona Denominated Forward Exchange Contract 2 0.01 £249,177 Sterling v Swedish Krona Denominated Forward Exchange Contract 1 -
£8,529 Sterling v Swedish Krona Denominated Forward Exchange Contract - - £126,440 Sterling v US Dollar Denominated Forward Exchange Contract (1) -
£57,337 Sterling v US Dollar Denominated Forward Exchange Contract (1) - £8,302,940 Sterling v US Dollar Denominated Forward Exchange Contract (59) (0.13)
£10,461,189 Sterling v US Dollar Denominated Forward Exchange Contract (75) (0.16)
(193) (0.42)
Overseas 89.44% (31 December 2017 93.17%)
Asia Pacific (excluding Japan) 17.61% (31 December 2017 19.82%)
Australia Equities 4.64% (31 December 2017 5.18%) 559,700 Stockland 1,247 2.71 609,718 Vicinity Centres 886 1.93
2,133 4.64
Hong Kong Equities 10.63% (31 December 2017 12.46%) 332,000 China Overseas Land & Investment 831 1.81 340,000 China Resources Land 871 1.90 481,000 Hang Lung Properties 755 1.64 202,000 Hysan Development 858 1.87 213,000 Kerry Properties 776 1.69 739,443 New World Development 792 1.72
4,883 10.63
Singapore Equities 2.34% (31 December 2017 2.18%) 176,000 City Developments 1,073 2.34
1,073 2.34

Quilter Investors Global Property Securities Fund
Portfolio statement (continued) as at 30 June 2018
Quilter Investors OEIC
301
Market Percentage of Value total net assets
Holding Investment £’000 %
Australian Dollar Denominated Derivatives 0.00% (31 December 2017 0.00%)
Australian Dollar Denominated Forward Exchange Contracts 0.00% (31 December 2017 0.00%) AU$49,957 Australian Dollar v Sterling Denominated Forward Exchange Contract - -
- -
Hong Kong Dollar Denominated Derivatives 0.00% (31 December 2017 0.00%)
Hong Kong Dollar Denominated Forward Exchange Contracts 0.00% (31 December 2017 0.00%) HKD765,208 Hong Kong Dollar v Sterling Denominated Forward Exchange Contract 1 - HKD800,148 Hong Kong Dollar v Sterling Denominated Forward Exchange Contract - -
1 -
Singapore Dollar Denominated Derivatives 0.00% (31 December 2017 0.00%)
Singapore Dollar Denominated Forward Exchange Contract 0.00% (31 December 2017 0.00%) S$26,127 Singapore Dollar v Sterling Denominated Forward Exchange Contract - -
- -
Europe 13.46% (31 December 2017 12.83%)
Belgium Equities 1.21% (31 December 2017 1.30%) 10,420 VGP 554 1.21
554 1.21
France Equities 4.65% (31 December 2017 5.46%) 40,886 Carmila 864 1.88 7,633 Unibail-Rodamco-Westfield 1,272 2.77
2,136 4.65
Germany Equities 3.48% (31 December 2017 2.50%) 16,625 ADO Properties 686 1.49 25,300 Vonovia 914 1.99
1,600 3.48
Ireland Equities 1.35% (31 December 2017 0.00%) 475,600 Green REIT 620 1.35
620 1.35
Spain Equities 1.18% (31 December 2017 1.54%) 49,363 Merlin Properties Socimi 544 1.18
544 1.18
Sweden Equities 1.59% (31 December 2017 2.03%) 80,900 Fabege 728 1.59
728 1.59
Euro Denominated Derivatives 0.00% (31 December 2017 0.00%)
Euro Denominated Forward Exchange Contracts 0.00% (31 December 2017 0.00%) €70,787 Euro v Sterling Denominated Forward Exchange Contract - -
- -

Quilter Investors Global Property Securities Fund
Portfolio statement (continued) as at 30 June 2018
Quilter Investors OEIC
302
Market Percentage of Value total net assets
Holding Investment £’000 %
Swedish Krona Denominated Derivatives 0.00% (31 December 2017 0.00%)
Swedish Krona Denominated Forward Exchange Contracts 0.00% (31 December 2017 0.00%) SEK99,866 Swedish Krona v Sterling Denominated Forward Exchange Contract - -
- -
Japan 8.51% (31 December 2017 8.71%)
Japan Equities 8.51% (31 December 2017 8.71%) 54,500 Aeon Mall 745 1.62 35,900 Daiwa House Industry 931 2.03 59,480 Mitsui Fudosan 1,093 2.38 40,637 Sumitomo Realty & Development 1,142 2.48
3,911 8.51
Japanese Yen Denominated Derivatives 0.00% (31 December 2017 0.00%)
Japanese Yen Denominated Forward Exchange Contracts 0.00% (31 December 2017 0.00%) ¥6,987,088 Japanese Yen v Sterling Denominated Forward Exchange Contract - -
- -
North America 49.86% (31 December 2017 51.81%)
United States Equities 49.86% (31 December 2017 51.82%) 21,200 Agree Realty 852 1.85 7,448 AvalonBay Communities 972 2.12
68,086 CareTrust REIT 875 1.91 121,042 Cousins Properties 887 1.93
22,390 DCT Industrial Trust 1,127 2.45 76,550 DDR 1,046 2.28 31,901 Douglas Emmett 961 2.09 15,535 Equity LifeStyle Properties 1,082 2.36 10,811 Extra Space Storage 824 1.79 56,800 Healthcare Trust of America 1,164 2.53 24,901 Highwoods Properties 955 2.08 11,336 Life Storage 841 1.83 13,821 Mid-America Apartment Communities 1,065 2.32 18,035 National Health Investors 1,024 2.23 44,944 NexPoint Residential Trust 972 2.12 78,740 Paramount 920 2.00 17,790 Regency Centers 846 1.84 9,756 Simon Property 1,271 2.77
79,277 Summit Hotel Properties 865 1.88 12,404 Sun Communities 922 2.01 65,405 Sunstone Hotel Investors 824 1.79 32,800 Taubman Centers 1,476 3.21 39,572 Terreno Realty 1,135 2.47
22,906 49.86

Quilter Investors Global Property Securities Fund
Portfolio statement (continued) as at 30 June 2018
Quilter Investors OEIC
303
Market Percentage of Value total net assets
Holding Investment £’000 %
US Dollar Denominated Derivatives 0.00% (31 December 2017 (0.01)%)
US Dollar Denominated Forward Exchange Contracts 0.00% (31 December 2017 (0.01)%) $173,933 US Dollar v Sterling Denominated Forward Exchange Contract (1) -
(1) -
Investment assets* 42,409 92.32
Net other assets 3,527 7.68
Total net assets 45,936 100.00 * Including investment liabilities.
All investments are approved securities being either officially listed in a member state or traded on or under the rules of an eligible securities market, unless otherwise stated.
All investments are in ordinary shares unless otherwise stated.

Quilter Investors Global Property Securities Fund
Quilter Investors OEIC
304
Statement of total return for the period from 1 January 2018 to 30 June 2018 01.01.18 to 01.01.18 to 01.01.17 to 01.01.17 to
30.06.18 30.06.18 30.06.17 30.06.17
Note £'000 £'000 £'000 £'000
Income
Net capital gains 337 1,912
Revenue 777 685
Expenses (361) (396)
Net revenue before taxation 416 289
Taxation (59) (65)
Net revenue after taxation 357 224
Total return before distributions 694 2,136
Distributions 2 (640) (542)
Change in net assets attributable to
shareholders from investment activities 54 1,594
Statement of change in net assets attributable to shareholders for the period from 1 January 2018 to 30 June 2018 01.01.18 to 01.01.18 to 01.01.17 to 01.01.17 to
30.06.18 30.06.18 30.06.17 30.06.17
£'000 £'000 £'000 £'000
Opening net assets attributable to shareholders 46,349* 48,533
Amounts received on issue of shares 3,030 5,611
Amounts paid on cancellation of shares (3,633) (8,104)
(603) (2,493)
Dilution adjustment 1 18
Change in net assets attributable to
shareholders from investment activities 54 1,594
Retained distribution on accumulation shares 135 112
Closing net assets attributable to shareholders 45,936 47,764* * Section 3.30 of the SORP issued by the Investment Management Association in May 2014 requires comparative figures for the above statement. For interim financial
statements this will result in the closing comparative net assets not being equal to net assets at the start of the current period.

Quilter Investors Global Property Securities Fund
Quilter Investors OEIC
305
Balance sheet as at 30 June 2018 30.06.18 31.12.17
£’000 £’000
Assets
Fixed assets
Investments 42,609 45,209
Current assets
Debtors 1,542 209
Cash and bank balances 2,607 1,456
Total assets 46,758 46,874
Liabilities
Investment liabilities (200) (33)
Creditors
Distribution payable (520) (347)
Other creditors (102) (145)
Total liabilities (822) (525)
Net assets attributable to shareholders 45,936 46,349

Quilter Investors Global Property Securities Fund
Notes to the financial statements for the period from 1 January 2018 to 30 June 2018
Quilter Investors OEIC
306
1 Accounting policies The financial statements have been prepared under the historical cost basis, as modified by the revaluation of investments, and in accordance with the Statement of Recommended Practice (SORP) for Authorised Funds, issued by the Investment Management Association in May 2014.
The accounting policies applied are consistent with those disclosed within the annual Financial Statements for the year ended 31 December 2017.
2 Distribution The distributions take account of revenue received on the issue of shares and revenue deducted on the cancellation of shares, and comprise:
01.01.18 to 01.01.17 to 30.06.18 30.06.17 £'000 £'000 Interim – Accumulation shares (30 June) 135 112 Interim – Income shares (30 June) 520 409 655 521 Revenue deducted on cancellation of shares 18 35 Revenue received on issue of shares (33) (14) 640 542
Reconciliation of distributions: Net revenue after taxation 357 224 Capitalised fees 361 396 Tax relief on capitalised fees (78) (78) Distributions 640 542

Quilter Investors Global Property Securities Fund
Distribution table
Quilter Investors OEIC
307
Interim distribution Group 1: Shares purchased prior to 1 January 2018 Group 2: Shares purchased from 1 January 2018 to 30 June 2018
Revenue pence/cents
per share
Equalisation pence/cents
per share*
Distribution paid 31.08.18 pence/cents
per share
Distribution paid 31.08.17 pence/cents
per share Accumulation 'A' EUR Shares Group 1 1.4776 - 1.4776 1.1858 Group 2 1.4776 0.0000 1.4776 1.1858 Accumulation 'A' USD Shares Group 1 0.8584 - 0.8584 0.6393 Group 2 0.3602 0.4982 0.8584 0.6393 Income 'A' GBP Hedged Shares Group 1 0.6237 - 0.6237 0.4533 Group 2 0.3128 0.3109 0.6237 0.4533 Income 'R' GBP Hedged Shares Group 1 0.6333 - 0.6333 0.4580 Group 2 0.1616 0.4717 0.6333 0.4580 * Equalisation only applies to shares purchased during the distribution period (Group 2 shares). It is the average amount of revenue included in the purchase price of all
Group 2 shares and is refunded to holders of these shares as a return of capital. Being capital, it is not liable to income tax but must be deducted from the cost of shares for capital gains tax purposes.

Quilter Investors High Yield Bond Fund
Quilter Investors High Yield Bond Fund
Quilter Investors OEIC
308
Launch date 24 April 2013
IA Sector Sterling High Yield
Investment adviser Threadneedle Asset Management Limited
Net asset value £20,136,946
Objective
The sub-fund aims to achieve income.
Policy
The sub-fund primarily invests in higher risk bonds and similar debt investments issued by companies, banks, public entities and governments located anywhere in the world.
The sub-fund may also invest in other transferable securities, collective investment schemes (including those managed or operated by the ACD), warrants, money market instruments, deposits and derivatives.
The sub-fund may only use derivatives for efficient portfolio management purposes.
The sub-fund is managed by an investment adviser selected by the ACD for their expected ability to manage the sub-fund according to the investment objective and policy. The ACD continuously monitors and may periodically make changes to this appointment.
Investment Manager’s review
Market Review
2018 opened strongly, with equity markets continuing to surge higher despite increased inflation expectations and higher core bond yields. Inflation fears subsequently took hold in February, leading to a sharp sell-off in risk assets and a significant spike in volatility. 10-year US Treasury yields climbed towards 3% after starting the year around 2.4%. They eventually touched five-year highs of 3.1% in May before retracing some of the move to close around 2.8%.
Political pressures further added to risk-asset uncertainty during the period. The risks of a global trade war escalated as the US progressed with its protectionist policy agenda, drawing retaliatory measures from those affected. Attention also focused on politics in Italy, where post-election struggles to form a government led to an exceptionally sharp sell-off in Italian government bonds (BTPs) in May.
In the macro space, the synchronised global growth momentum observed at the end of 2017 began to moderate and purchasing managers’ indices (PMIs) came off their highs, although remained in expansionary territory.
Developed market equities closed the period broadly unchanged whilst emerging markets underperformed. More generally, emerging market assets were under pressure as a consequence of increasing dollar strength and idiosyncratic issues in Argentina, Turkey and Indonesia.
Overall, it was a weaker period for European high yield, which returned -0.8%. After touching lows in January, spreads moved steadily higher and closed the period over 100 basis points (bps) wider at 406 bps.
Performance
In the primary market, deal volumes over the first three months trailed the high levels recorded during the opening quarter of 2017. This was followed by a burst of activity in April, which tailed off into the end of the period as market conditions deteriorated. Overall, there was a notable increase in the number of lower credit-quality new issues, although encouragingly, investors were able to push back to get loose covenants tightened up in several cases. We participated in a selection of deals, including Paprec, Teva and CCK. In the secondary market, we made a number of additions, including Casino, Vue, Vantiv, AllFunds and Interxion. Against this, we reduced positions in Virgin Media, Gazprom and Telefonica, and exited Manutencoop and Travelex, among others.
The sub-fund ended the period 27 bps ahead of the benchmark. The primary contributor to relative performance was the overweight in EnQuest, which rallied with the improving oil price. Additional gains came from a selection of underweight positions, including Casino, CMA CGM and Adient. More generally, the sub-fund’s selective overweight in single-Bs further aided returns. The primary detractors included New Look (underweight), Petrobras (underweight) and Telecom Italia (overweight).
Fundamentals remain strong, with growth momentum across the major geographies supporting corporate earnings. Default risk similarly remains benign in the US and
Europe. There are mixed signs of inflation and this remains the key pivot point for credit spreads, although volatility has reduced.
Valuations are more balanced with credit spreads in European high yield in the region of 400 bps, having widened around 34% year-to-date. Technicals are balanced: the asset class continues to experience outflows, but remains supported by ‘rising star’ upgrades, bond-to-loan refinancings and limited new issuance. In this environment of lower expected returns, and with central banks starting to pull back on liquidity, we continue to manage for downside risks.
Risk and Reward Profile
The calculated risk and reward category, as shown above, uses a method of calculation derived from EU rules. It is based on the rate at which the returns of the sub-fund have moved up and down in the past (i.e. volatility) and is not a guide to the future risk and reward category of the sub-fund. The category shown is not a target or guarantee and may shift over time. Even the lowest category 1 does not mean a risk-free investment. The seven-category scale is nonlinear, for example, 2 is not twice as risky as 1. Sub-funds in category 3 have in the past shown moderately low volatility. With a sub-fund of category 3, you have a moderately low risk of losing money but your chance for gains is also moderately low. Investment risk - There is no guarantee that the sub-fund will achieve its objective. A capital loss of some or all of the amount invested may occur. Credit risk - the issuer of a bond or a similar investment within the sub-fund may not pay income or repay capital to the sub-fund when due. Bonds which are rated below investment grade are considered to have a higher risk exposure with respect to meeting their payment obligations. Interest rate risk - investments in bonds are affected by interest rates and inflation trends which may affect the value of the sub-fund. Liquidity risk - some investments may become hard to value or sell at a desired time and price. In extreme circumstances this may affect the sub-fund’s ability to meet redemption requests upon demand. Currency risk (EUR share class) - the sub-fund is denominated in British Pounds but holds assets denominated in other currencies. This share class is denominated in Euro. The hedging process may not give a precise hedge, and some currency risk may remain. The value of your shares may rise and fall as a result of exchange rate movements between these currencies. Currency risk (GBP share class) - the sub-fund is denominated in British Pounds but holds assets denominated in other currencies. The value of your shares may rise and fall as a result of exchange rate movements between these currencies. Currency risk (USD share class) - the sub-fund is denominated in British Pounds but holds assets denominated in other currencies. This share class is denominated in US Dollars. The hedging process may not give a precise hedge, and some currency risk may remain. The value of your shares may rise and fall as a result of exchange rate movements between these currencies. Derivative risk - the sub-fund may use derivatives to reduce costs and/or the overall risk of the sub-fund (i.e. Efficient Portfolio Management (EPM)). Derivatives involve a level of risk, however, for EPM they should not increase the overall riskiness of the sub-fund. Derivatives also involve counterparty risk where the institutions acting as counterparty to derivatives may not meet their contractual obligations. Capital erosion risk - The sub-fund takes its charges from the capital of the sub-fund. Investors should be aware that there is potential for capital erosion if insufficient capital growth is achieved by the sub-fund to cover the charges. Capital erosion may have the effect of reducing the level of income generated. For full details of the sub-fund's risks, please see the section in the prospectus headed "Risks".

Quilter Investors High Yield Bond Fund
Quilter Investors OEIC
309
Performance Records Comparative Tables
Accumulation 'A' EUR Hedged† 1 January 2018 to
30 June 2018 1 January 2017 to
31 December 2017 1 January 2016 to
31 December 2016 p/share p/share p/share Change in net assets per share
Opening net asset value per share 98.75 90.89 79.02
Return before operating charges* (1.28) 9.37 13.80 Operating charges** (0.68) (1.35) (1.24)
Return after operating charges* (1.96) 8.02 12.56
Distributions (2.08) (4.59) (3.44) Retained distributions 2.08 4.43 2.75
Closing net asset value per share 96.79 98.75 90.89
* after direct transaction costs of*** - - -
Performance Return after charges (1.98)% 8.82% 15.89%
Other information Closing net asset value (£) 2,899 2,957 2,717 Closing number of shares 2,995 2,995 2,990 Operating charges**** 1.40% 1.40% 1.40% Direct transaction costs*** - - -
Prices cents per share cents per share cents per share Highest share price 112.0 112.2 106.8 Lowest share price 109.3 105.9 99.41
Accumulation 'A' USD Hedged 1 January 2018 to
30 June 2018 1 January 2017 to
31 December 2017 1 January 2016 to
31 December 2016
p/share p/share p/share
Change in net assets per share Opening net asset value per share 85.89 87.99 67.10
Return before operating charges* 2.54 (0.72) 22.76 Operating charges** (0.59) (1.23) (1.07)
Return after operating charges* 1.95 (1.95) 21.69
Distributions (1.80) (4.22) (4.01) Retained distributions 1.80 4.07 3.21
Closing net asset value per share 87.84 85.89 87.99
* after direct transaction costs of*** - - -
Performance Return after charges 2.28% (2.22)% 32.32%
Other information Closing net asset value (£) 113,959 301,603 5,298 Closing number of shares 129,742 351,142 6,021 Operating charges**** 1.40% 1.40% 1.40% Direct transaction costs*** - - -
Prices cents per share cents per share cents per share Highest share price 117.0 116.6 108.8 Lowest share price 115.3 108.2 97.08

Quilter Investors High Yield Bond Fund
Quilter Investors OEIC
310
Comparative Tables (continued)
Income 'A' 1 January 2018 to
30 June 2018 1 January 2017 to
31 December 2017 1 January 2016 to
31 December 2016
p/share p/share p/share
Change in net assets per share Opening net asset value per share 102.27 100.89 96.83
Return before operating charges* (0.62) 7.58 10.68 Operating charges** (0.71) (1.44) (1.39)
Return after operating charges* (1.33) 6.14 9.29
Distributions (2.16) (4.76) (5.23) Retained distributions - - -
Closing net asset value per share 98.78 102.27 100.89
* after direct transaction costs of*** - - -
Performance Return after charges (1.30)% 6.09% 9.59%
Other information Closing net asset value (£) 19,760,542 21,441,235 23,352,786 Closing number of shares 20,005,218 20,965,170 23,146,786 Operating charges**** 1.40% 1.40% 1.40% Direct transaction costs*** - - -
Prices pence per share pence per share pence per share Highest share price 103.0 103.8 102.9 Lowest share price 99.13 101.0 94.14
Accumulation 'U2' 1 January 2018 to
30 June 2018 1 January 2017 to
31 December 2017 1 January 2016 to
31 December 2016
p/share p/share p/share
Change in net assets per share Opening net asset value per share 120.53 112.69 104.45
Return before operating charges* (0.76) 8.81 10.08 Operating charges** (0.39) (0.77) (0.69)
Return after operating charges* (1.15) 8.04 9.39
Distributions (2.58) (5.65) (5.74) Retained distributions 2.58 5.45 4.59
Closing net asset value per share 119.38 120.53 112.69
* after direct transaction costs of*** - - -
Performance Return after charges (0.95)% 7.13% 8.99%
Other information Closing net asset value (£) 234,566 214,295 175,087 Closing number of shares 196,494 177,798 155,373 Operating charges***** 0.65% 0.65% 0.65% Direct transaction costs** - - -
Prices pence per share pence per share pence per share Highest share price 121.4 121.2 113.0 Lowest share price 119.4 112.7 102.1

Quilter Investors High Yield Bond Fund
Quilter Investors OEIC
311
Comparative Tables (continued)
Income 'U2' 1 January 2018 to
30 June 2018 1 January 2017 to
31 December 2017 1 January 2016 to
31 December 2016
p/share p/share p/share
Change in net assets per share Opening net asset value per share 102.53 100.40 95.64
Return before operating charges* (0.62) 7.56 10.58 Operating charges** (0.33) (0.67) (0.64)
Return after operating charges* (0.95) 6.89 9.94
Distributions (2.17) (4.76) (5.18) Retained distributions - - -
Closing net asset value per share 99.41 102.53 100.40
* after direct transaction costs of*** - - -
Performance Return after charges (0.93)% 6.86% 10.39%
Other information Closing net asset value (£) 24,980 24,114 21,121 Closing number of shares 25,129 23,518 21,037 Operating charges**** 0.65% 0.65% 0.65% Direct transaction costs*** - - -
Prices pence per share pence per share pence per share Highest share price 103.3 103.9 102.1 Lowest share price 99.77 100.5 93.07
† From 31 March 2016 ** The operating charges include all costs borne by the sub-fund, except for direct transaction costs.
*** The direct transaction costs are made up of fees and commissions paid to agents, advisers, brokers and dealers, levies by regulatory agencies and securities exchanges as well as transfer taxes and duties. They do not include any difference between the quoted bid and offer prices or internal administrative or holding costs. These costs arise as a result of transactions undertaken both for efficient portfolio management and the meeting of the sub-fund’s objectives. These costs exclude any effect of dilution adjustments used to offset the costs.
**** The operating charges percentage is the ratio of the sub-fund's ongoing charges (excluding interest on borrowings) to the average net assets of the sub-fund. If the share class is launched during the period the operating charges figures are annualised.

Quilter Investors High Yield Bond Fund
Quilter Investors OEIC
312
Performance
6 months to30 June 2018
1 year to 30 June 2018
3 years to 30 June 2018
5 years to30 June 2018
Quilter Investors High Yield Bond* (0.91)% 1.27% 12.54% 28.32%
ICE BofAML EUR Currency High Yield (3%) Constrained Index Excluding Sub- Financials (GBP Hedged) (benchmark) (0.80)% 1.79% 16.64% 34.77%
IA Sterling High Yield (sector average) (1.29)% 0.75% 12.29% 23.78%
Quartile ranking 2 2 2 2
* Accumulation ‘U2’ shares
Data Source – Factset. Figures are calculated on a total return and single price basis, with net income reinvested into the sub-fund.
Portfolio allocation
Europe 62.94%
United Kingdom 21.80%
North America 13.55%
Asia Pacific (excluding Japan) 0.90%
Japan 1.80%
Derivatives (0.95)%
Net other liabilities (0.04)%
Total 100.00%
Asset allocation
Euro Denominated Fixed Rate Corporate Bonds 72.92% Sterling Denominated Fixed Rate Corporate Bonds 21.90% US Dollar Denominated Fixed Rate Corporate Bonds 3.61% Euro Denominated Variable Rate Corporate Bonds 1.80% US Dollar Denominated Variable Rate Corporate Bonds 0.76% Derivatives (0.95)%
Net other liabilities (0.04)%
Total 100.00%
Major holdings Percentage of
portfolio
Fiat Chrysler Finance Europe 4.75% 22/03/2021 1.72%
Virgin Media Finance 6.375% 15/10/2024 1.21%
Credit Suisse 5.75% 18/09/2025 1.20%
UBS 4.75% 12/02/2026 1.18%
Iron Mountain UK 3.875% 15/11/2025 1.08%
Telefonica Europe 6.75% Perpetual 1.06%
Altice 7.25% 15/05/2022 1.03%
InterXion 6% 15/07/2020 1.03%
Koninklijke 6.875% 14/03/2073 1.03%
Quintiles IMS 3.5% 15/10/2024 1.01%
Number of holdings 177
Total Purchases and Sales for the period
2018 2017
£’000 £’000
Total purchases for the 6 month period to 30 June 4,670 5,992
Total sales for the 6 month period to 30 June 5,189 7,511

Quilter Investors High Yield Bond Fund
Portfolio statement as at 30 June 2018
Quilter Investors OEIC
313
Market Percentage of Value total net assets
Holding Investment £'000 %
Sterling 20.94% (31 December 2017 21.91%)
Sterling Denominated Fixed Rate Corporate Bonds 21.90% (31 December 2017 22.05%) £108,000 Arrow Global Finance 5.125% 15/09/2024 100 0.50
£70,000 Barclays Bank 14% Perpetual 77 0.38 £135,000 Cognita Financing 7.75% 15/08/2021 137 0.68 £100,000 Co-operative 2011 7.5% 08/07/2026 120 0.59 £100,000 CPUK Finance 4.25% 28/08/2022 100 0.50 £100,000 Drax Finco 4.25% 01/05/2022 100 0.50 £200,000 Garfunkelux Holdco 3 8.5% 01/11/2022 194 0.96 £169,000 Gazprom OAO Via Gaz Capital 4.25% 06/04/2024 172 0.85
£94,000 InterGen 7.5% 30/06/2021 94 0.47 £230,000 Iron Mountain UK 3.875% 15/11/2025 217 1.08 £193,000 Jaguar Land Rover Automotive 3.875% 01/03/2023 188 0.93 £140,000 KIRS Midco 3 8.375% 15/07/2023 141 0.70 £196,000 Koninklijke 6.875% 14/03/2073 207 1.03 £100,000 Leonardo-Finmeccanica 8% 16/12/2019 108 0.54 £100,000 Miller Homes 5.5% 15/10/2024 99 0.49 £200,000 Petrobras Global Finance 5.375% 01/10/2029 180 0.89 £106,000 Petrobras Global Finance 6.25% 14/12/2026 107 0.53 £100,000 Pinewood Finco 3.75% 01/12/2023 100 0.50 £100,000 Pinnacle Bidco 6.375% 15/02/2025 101 0.50 £100,000 RWE 7% Perpetual 102 0.51 £100,000 Shop Direct Funding 7.75% 15/11/2022 85 0.42 £200,000 Telefonica Europe 6.75% Perpetual 213 1.06
£62,000 Tesco 6.125% 24/02/2022 70 0.35 £89,354 Tesco Property Finance 1 7.6227% 13/07/2039 119 0.59
£101,204 Tesco Property Finance 3 5.744% 13/04/2040 117 0.58 £108,000 Thames Water Kemble Finance 7.75% 01/04/2019 112 0.56 £112,000 TVL Finance 8.5% 15/05/2023 117 0.58 £200,000 Vantiv 3.875% 15/11/2025 189 0.94 £235,000 Virgin Media Finance 6.375% 15/10/2024 244 1.21 £100,000 Virgin Media Receivables Financing Notes I 5.5% 15/09/2024 98 0.49 £100,000 Virgin Media Secured Finance 5% 15/04/2027 97 0.48
£90,000 Virgin Media Secured Finance 5.5% 15/01/2025 91 0.45 £110,000 Vue International Bidco 7.875% 15/07/2020 110 0.55 £100,000 William Hill 4.875% 07/09/2023 103 0.51
Total 4,409 21.90
Sterling Denominated Derivatives (0.96)% (31 December 2017 (0.14)%)
Sterling Denominated Forward Exchange Contracts (0.96)% (31 December 2017 (0.14)%) £44,070 Sterling v Euro Forward Exchange Contract - -
£15,062,035 Sterling v Euro Forward Exchange Contract (187) (0.93) £20,040 Sterling v US Dollar Forward Exchange Contract - -
£1,400 Sterling v US Dollar Forward Exchange Contract - - £892,650 Sterling v US Dollar Forward Exchange Contract (7) (0.03)
Total (194) (0.96)
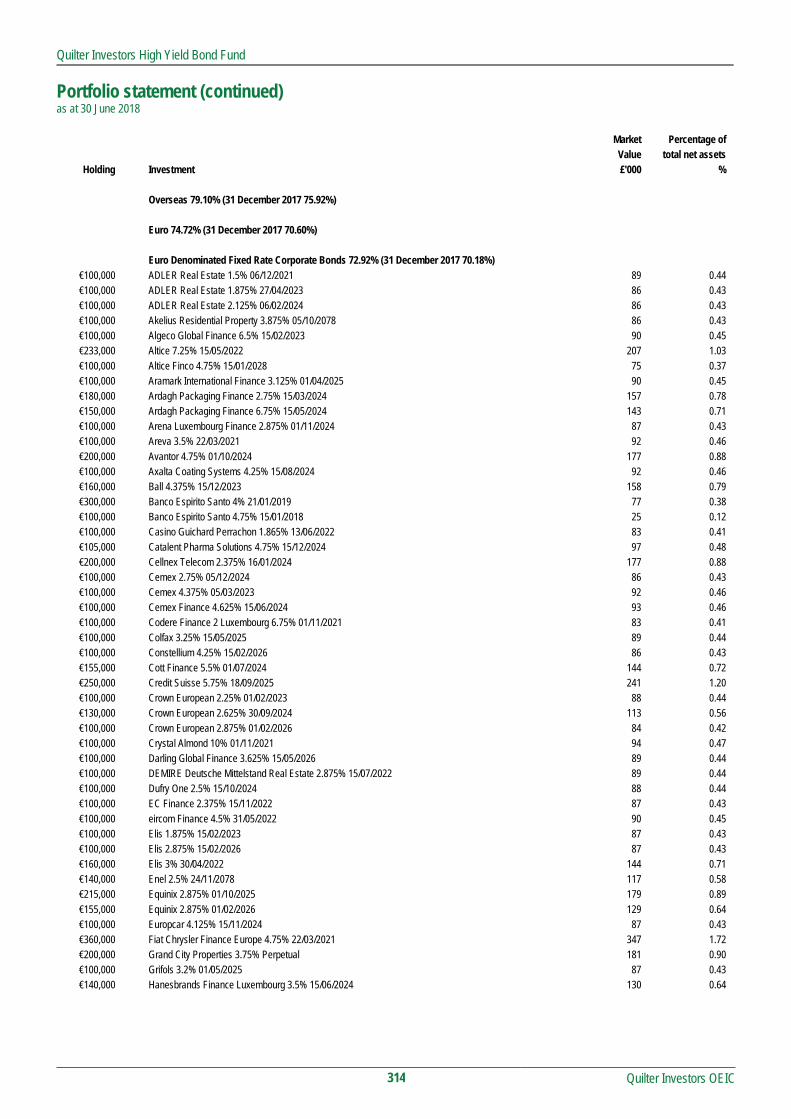
Quilter Investors High Yield Bond Fund
Portfolio statement (continued) as at 30 June 2018
Quilter Investors OEIC
314
Market Percentage of Value total net assets
Holding Investment £'000 %
Overseas 79.10% (31 December 2017 75.92%)
Euro 74.72% (31 December 2017 70.60%)
Euro Denominated Fixed Rate Corporate Bonds 72.92% (31 December 2017 70.18%) €100,000 ADLER Real Estate 1.5% 06/12/2021 89 0.44 €100,000 ADLER Real Estate 1.875% 27/04/2023 86 0.43 €100,000 ADLER Real Estate 2.125% 06/02/2024 86 0.43 €100,000 Akelius Residential Property 3.875% 05/10/2078 86 0.43 €100,000 Algeco Global Finance 6.5% 15/02/2023 90 0.45 €233,000 Altice 7.25% 15/05/2022 207 1.03 €100,000 Altice Finco 4.75% 15/01/2028 75 0.37 €100,000 Aramark International Finance 3.125% 01/04/2025 90 0.45 €180,000 Ardagh Packaging Finance 2.75% 15/03/2024 157 0.78 €150,000 Ardagh Packaging Finance 6.75% 15/05/2024 143 0.71 €100,000 Arena Luxembourg Finance 2.875% 01/11/2024 87 0.43 €100,000 Areva 3.5% 22/03/2021 92 0.46 €200,000 Avantor 4.75% 01/10/2024 177 0.88 €100,000 Axalta Coating Systems 4.25% 15/08/2024 92 0.46 €160,000 Ball 4.375% 15/12/2023 158 0.79 €300,000 Banco Espirito Santo 4% 21/01/2019 77 0.38 €100,000 Banco Espirito Santo 4.75% 15/01/2018 25 0.12 €100,000 Casino Guichard Perrachon 1.865% 13/06/2022 83 0.41 €105,000 Catalent Pharma Solutions 4.75% 15/12/2024 97 0.48 €200,000 Cellnex Telecom 2.375% 16/01/2024 177 0.88 €100,000 Cemex 2.75% 05/12/2024 86 0.43 €100,000 Cemex 4.375% 05/03/2023 92 0.46 €100,000 Cemex Finance 4.625% 15/06/2024 93 0.46 €100,000 Codere Finance 2 Luxembourg 6.75% 01/11/2021 83 0.41 €100,000 Colfax 3.25% 15/05/2025 89 0.44 €100,000 Constellium 4.25% 15/02/2026 86 0.43 €155,000 Cott Finance 5.5% 01/07/2024 144 0.72 €250,000 Credit Suisse 5.75% 18/09/2025 241 1.20 €100,000 Crown European 2.25% 01/02/2023 88 0.44 €130,000 Crown European 2.625% 30/09/2024 113 0.56 €100,000 Crown European 2.875% 01/02/2026 84 0.42 €100,000 Crystal Almond 10% 01/11/2021 94 0.47 €100,000 Darling Global Finance 3.625% 15/05/2026 89 0.44 €100,000 DEMIRE Deutsche Mittelstand Real Estate 2.875% 15/07/2022 89 0.44 €100,000 Dufry One 2.5% 15/10/2024 88 0.44 €100,000 EC Finance 2.375% 15/11/2022 87 0.43 €100,000 eircom Finance 4.5% 31/05/2022 90 0.45 €100,000 Elis 1.875% 15/02/2023 87 0.43 €100,000 Elis 2.875% 15/02/2026 87 0.43 €160,000 Elis 3% 30/04/2022 144 0.71 €140,000 Enel 2.5% 24/11/2078 117 0.58 €215,000 Equinix 2.875% 01/10/2025 179 0.89 €155,000 Equinix 2.875% 01/02/2026 129 0.64 €100,000 Europcar 4.125% 15/11/2024 87 0.43 €360,000 Fiat Chrysler Finance Europe 4.75% 22/03/2021 347 1.72 €200,000 Grand City Properties 3.75% Perpetual 181 0.90 €100,000 Grifols 3.2% 01/05/2025 87 0.43 €140,000 Hanesbrands Finance Luxembourg 3.5% 15/06/2024 130 0.64

Quilter Investors High Yield Bond Fund
Portfolio statement (continued) as at 30 June 2018
Quilter Investors OEIC
315
Market Percentage of Value total net assets
Holding Investment £'000 % Euro Denominated Fixed Rate Corporate Bonds (continued)
€100,000 Horizon Holdings I 7.25% 01/08/2023 92 0.46 €100,000 Horizon Parent 8.25% 15/02/2022 92 0.46 €141,000 IHO Verwaltungs 2.75% 15/09/2021 126 0.63 €100,000 IHO Verwaltungs 3.25% 15/09/2023 89 0.44 €196,000 Ineos Finance 4% 01/05/2023 176 0.88 €100,000 International Game Technology 3.5% 15/07/2024 88 0.44 €110,000 InterXion 4.75% 15/06/2025 98 0.48 €230,000 InterXion 6% 15/07/2020 207 1.03 €100,000 Intralot Capital Luxembourg 5.25% 15/09/2024 73 0.36 €225,000 Intrum Justitia 2.75% 15/07/2022 189 0.94 €100,000 Jaguar Land Rover Automotive 2.2% 15/01/2024 87 0.43 €100,000 Kronos 3.75% 15/09/2025 85 0.42
€84,000 LANXESS 4.5% 06/12/2076 80 0.40 €169,000 Leonardo-Finmeccanica 4.5% 19/01/2021 162 0.80 €100,000 LGE VI 7.125% 15/05/2024 94 0.47 €200,000 LHC3 4.125% 15/08/2024 177 0.88 €100,000 LHMC Finco Sarl 6.25% 20/12/2023 88 0.43 €110,000 Lincoln Finance 6.875% 15/04/2021 100 0.50 €103,000 LKQ European 3.625% 01/04/2026 90 0.45 €115,000 LKQ Italia Bondco 3.875% 01/04/2024 106 0.52 €100,000 LSF10 Wolverine Investments 5% 15/03/2024 88 0.43 €100,000 Matterhorn Telecom 3.875% 01/05/2022 89 0.44 €124,000 Matterhorn Telecom 4.875% 01/05/2023 110 0.55 €115,000 Mercury Bondco 7.125% 30/05/2021 105 0.52 €140,000 Mercury Bondco 8.25% 30/05/2021 129 0.64 €107,000 Merlin Entertainments 2.75% 15/03/2022 97 0.48 €100,000 Netflix 3.625% 15/05/2027 87 0.43 €111,000 Nexi Capital 4.125% 01/11/2023 96 0.48 €200,000 Origin Energy Finance 4% 16/09/2074 182 0.90 €100,000 Paprec 4% 31/03/2025 87 0.43 €100,000 Platin 1426 5.375% 15/06/2023 85 0.42 €100,000 ProGroup 3% 31/03/2026 86 0.43 €215,000 Quintiles IMS 3.25% 15/03/2025 185 0.92 €230,000 Quintiles IMS 3.5% 15/10/2024 204 1.01 €100,000 Rexel 2.125% 15/06/2025 84 0.41 €100,000 Safari Holding Verwaltungs 5.375% 30/11/2022 87 0.43 €135,000 Schaeffler Finance 3.25% 15/05/2025 126 0.62 €160,000 Schaeffler Finance 3.5% 15/05/2022 143 0.71 €120,000 Sealed Air 4.5% 15/09/2023 119 0.59 €150,000 SFR 5.375% 15/05/2022 136 0.68 €100,000 Silgan 3.25% 15/03/2025 90 0.44 €100,000 Smurfit Kappa Acquisitions 2.875% 15/01/2026 88 0.44 €100,000 Smurfit Kappa Acquisitions Unltd 2.375% 01/02/2024 89 0.44 €100,000 SoftBank 4% 19/09/2029 79 0.39 €100,000 SoftBank 4% 20/04/2023 91 0.45 €224,000 SoftBank 5% 15/04/2028 193 0.96 €100,000 Solvay Finance 5.118% Perpetual 96 0.48 €156,000 Solvay Finance 5.869% Perpetual 155 0.77 €100,000 Spectrum Brands 4% 01/10/2026 86 0.43 €100,000 SPIE 3.125% 22/03/2024 88 0.44 €200,000 Swissport Financing 6.75% 15/12/2021 183 0.91 €155,000 Synlab Unsecured Bondco 8.25% 01/07/2023 145 0.72 €100,000 Takko Luxembourg 2 SCA 5.375% 15/11/2023 80 0.40

Quilter Investors High Yield Bond Fund
Portfolio statement (continued) as at 30 June 2018
Quilter Investors OEIC
316
Market Percentage of Value total net assets
Holding Investment £'000 % Euro Denominated Fixed Rate Corporate Bonds (continued)
€100,000 Telecom Italia 3% 30/09/2025 90 0.45 €100,000 Telecom Italia 3.625% 19/01/2024 95 0.47 €100,000 Telecom Italia 3.625% 25/05/2026 93 0.46 €150,000 Telecom Italia 5.25% 10/02/2022 150 0.75 €164,000 Telecom Italia Finance 7.75% 24/01/2033 199 0.99 €100,000 Telefonica Europe 3.75% Perpetual 89 0.44 €200,000 Telefonica Europe 3.875% Perpetual 163 0.81 €100,000 Telefonica Europe 5% Perpetual 93 0.46 €100,000 Telenet Finance Luxembourg Notes 3.5% 01/03/2028 84 0.42 €101,000 TenneT 2.995% Perpetual 90 0.44 €152,000 Teva Pharmaceutical Finance (Netherlands II) 1.25% 31/03/2023 122 0.61 €103,000 Teva Pharmaceutical Finance Netherlands II 1.875% 31/03/2027 75 0.37 €100,000 Teva Pharmaceutical Finance Netherlands II 3.25% 15/04/2022 90 0.45 €100,000 Teva Pharmaceutical Finance Netherlands II 4.5% 01/03/2025 91 0.45 €135,000 Thomas Cook 6.25% 15/06/2022 126 0.63 €100,000 Thomas Cook Finance 2 3.875% 15/07/2023 89 0.44 €249,000 UBS 4.75% 12/02/2026 237 1.18 €170,000 Unitymedia Hessen 3.5% 15/01/2027 157 0.78 €120,000 Unitymedia Hessen 6.25% 15/01/2029 119 0.59 €100,000 UPC 3.875% 15/06/2029 82 0.41 €130,000 Valeant Pharmaceuticals 4.5% 15/05/2023 108 0.54 €155,000 Verallia Packaging 5.125% 01/08/2022 141 0.70 €100,000 Volvo Car AB 2% 24/01/2025 86 0.42 €105,000 WEPA Hygieneprodukte GmbH 3.75% 15/05/2024 88 0.44 €100,000 Wind Tre 2.625% 20/01/2023 74 0.37 €110,000 Wind Tre 3.125% 20/01/2025 79 0.39 €160,000 Ziggo Bond Finance 4.625% 15/01/2025 140 0.69
€71,000 Ziggo Secured Finance 3.75% 15/01/2025 62 0.31 Total 14,684 72.92
Euro Denominated Variable Rate Corporate Bonds 1.80% (31 December 2017 0.42%) €100,000 Paprec 3.5% 31/03/2025 89 0.44 €200,000 Telefonica Europe 4.2% Perpetual 183 0.91 €100,000 Vonovia Finance 4.625% 08/04/2074 91 0.45
Total 363 1.80
Euro Denominated Derivatives 0.00% (31 December 2017 0.00%) Euro Denominated Forward Exchange Contracts 0.00% (31 December 2017 0.00%)
€167,120 Euro v Sterling Forward Exchange Contract 1 - €51,403 Euro v Sterling Forward Exchange Contract - - €44,660 Euro v Sterling Forward Exchange Contract - - €19,000 Euro v Sterling Forward Exchange Contract - -
€3,301 Euro v Sterling Forward Exchange Contract - - Total 1 -

Quilter Investors High Yield Bond Fund
Portfolio statement (continued) as at 30 June 2018
Quilter Investors OEIC
317
Market Percentage of Value total net assets
Holding Investment £'000 %
US Dollar 4.38% (31 December 2017 5.32%)
US Dollar Denominated Fixed Rate Corporate Bonds 3.61% (31 December 2017 4.63%) $100,000 Cott 5.5% 01/04/2025 74 0.37 $213,284 EnQuest 7% 15/04/2022 147 0.73
$30,000 Equinix 5.375% 15/05/2027 23 0.11 $70,000 Hertz 7.625% 01/06/2022 51 0.25
$186,982 OSX 3 Leasing 13% 20/03/2015 36 0.18 $200,000 SFR 6% 15/05/2022 153 0.76 $200,000 Unitymedia Hessen 5% 15/01/2025 154 0.76
$46,000 Valeant Pharmaceuticals 5.5% 01/11/2025 34 0.17 $28,000 Valeant Pharmaceuticals 6.5% 15/03/2022 22 0.11 $42,000 Valeant Pharmaceuticals 7% 15/03/2024 33 0.17
Total 727 3.61
US Dollar Denominated Variable Rate Corporate Bonds 0.76% (31 December 2017 0.70%) $200,000 Credit Agricole 8.125% 19/09/2033 153 0.76
Total 153 0.76
US Dollar Denominated Derivatives 0.01% (31 December 2017 (0.01)%)
US Dollar Denominated Forward Exchange Contracts 0.01% (31 December 2017 (0.01)%) $178,815 US Dollar v Sterling Forward Exchange Contract 2 0.01
Total 2 0.01
Investment assets* 20,145 100.04
Net other liabilities (8) (0.04)
Total net assets 20,137 100.00
* Including investment liabilities.
All investments are approved securities being either officially listed in a member state or traded on or under the rules of an eligible securities market, unless otherwise stated.

Quilter Investors High Yield Bond Fund
Quilter Investors OEIC
318
Statement of total return
for the period from 1 January 2018 to 30 June 2018 01.01.18 to 01.01.18 to 01.01.17 to 01.01.17 to
30.06.18 30.06.18 30.06.17 30.06.17
Note £'000 £'000 £'000 £'000
Income
Net capital (losses)/gains (597) 556
Revenue 468 607
Expenses (146) (160)
Interest payable and similar charges (1) -
Net revenue before taxation 321 447
Taxation - -
Net revenue after taxation 321 447
Total return before distributions (276) 1,003
Distributions 2 (453) (591)
Change in net assets attributable to
shareholders from investment activities (729) 412
Statement of change in net assets attributable to shareholders for the period from 1 January 2018 to 30 June 2018 01.01.18 to 01.01.18 to 01.01.17 to 01.01.17 to
30.06.18 30.06.18 30.06.17 30.06.17
£'000 £'000 £'000 £'000
Opening net assets attributable to shareholders 21,984* 23,557
Amounts received on issue of shares 631 717
Amounts paid on cancellation of shares (1,763) (1,683)
(1,132) (966)
Dilution adjustment 5 4
Change in net assets attributable to
shareholders from investment activities (729) 412
Retained distribution on accumulation shares 9 8
Closing net assets attributable to shareholders 20,137 23,015*
* Section 3.30 of the SORP issued by the Investment Management Association in May 2014 requires comparative figures for the above statement. For interim financial
statements this will result in the closing comparative net assets not being equal to net assets at the start of the current period.

Quilter Investors High Yield Bond Fund
Quilter Investors OEIC
319
Balance sheet as at 30 June 2018 30.06.18 31.12.17
£'000 £'000
Assets
Fixed assets
Investments 20,339 21,551
Current assets
Debtors 312 344
Cash and bank balances 121 293
Total assets 20,772 22,188
Liabilities
Investment liabilities (194) (44)
Creditors
Bank overdrafts (107) -
Distribution payable (71) (67)
Other creditors (263) (93)
Total liabilities (635) (204)
Net assets attributable to shareholders 20,137 21,984

Quilter Investors High Yield Bond Fund
Notes to the financial statements for the period from 1 January 2018 to 30 June 2018
Quilter Investors OEIC
320
1 Accounting policies The financial statements have been prepared under the historical cost basis, as modified by the revaluation of investments, and in accordance with the Statement of Recommended Practice (SORP) for Authorised Funds, issued by the Investment Management Association in May 2014.
The accounting policies applied are consistent with those disclosed within the annual Financial Statements for the year ended 31 December 2017.
2 Distributions
The distributions take account of revenue received on the issue of shares and revenue deducted on the cancellation of shares, and comprise:
01.01.18 to 01.01.17 to 30.06.18 30.06.17 £'000 £'000
First Interim – Accumulation shares (31 January) 2 1
First Interim – Income shares (31 January) 77 109
Second Interim – Accumulation shares (28 February) 2 1
Second Interim – Income shares (28 February) 71 88
Third Interim – Accumulation shares (31 March) 2 2
Third Interim – Income shares (31 March) 73 109
Fourth Interim – Accumulation shares (30 April) 1 1
Fourth Interim – Income shares (30 April) 78 78
Fifth Interim – Accumulation shares (31 May) 1 2
Fifth Interim – Income shares (31 May) 72 105
Sixth Interim – Accumulation shares (30 June) 1 2
Sixth Interim – Income shares (30 June) 71 91
451 589
Revenue deducted on cancellation of shares 3 4
Revenue received on issue of shares (1) (2)
Distributions 453 591
Reconciliation of distributions:
Net revenue after taxation 321 447
Capitalised fees 132 144
Distributions 453 591

Quilter Investors High Yield Bond Fund
Distribution table
Quilter Investors OEIC
321
Sixth Interim distribution Group 1: Shares purchased prior to 1 June 2018 Group 2: Shares purchased from 1 June 2018 to 30 June 2018
Revenue
pence per share Equalisation
pence per share*
Distribution paid 31.07.18
pence per share
Distribution paid 31.07.17
pence per share Accumulation 'A' EUR Shares Group 1 0.3863 - 0.3863 0.4643 Group 2 0.3863 0.0000 0.3863 0.4643 Accumulation 'A' USD Hedged Shares Group 1 0.4079 - 0.4079 0.4611 Group 2 0.4079 0.0000 0.4079 0.4611 Income 'A' Shares Group 1 0.3551 - 0.3551 0.4145 Group 2 0.1673 0.1878 0.3551 0.4145 Accumulation 'U2' Shares Group 1 0.4274 - 0.4274 0.4703 Group 2 0.2487 0.1787 0.4274 0.4703 Income 'U2' Shares Group 1 0.3568 - 0.3568 0.4140 Group 2 0.0394 0.3174 0.3568 0.4140
Fifth Interim distribution Group 1: Shares purchased prior to 1 May 2018 Group 2: Shares purchased from 1 May 2018 to 31 May 2018
Revenue
pence per share Equalisation
pence per share*
Distribution paid 30.06.18
pence per share
Distribution paid 30.06.17
pence per share Accumulation 'A' EUR Shares Group 1 0.4203 - 0.4203 0.4514 Group 2 0.4203 0.0000 0.4203 0.4514 Accumulation 'A' USD Hedged Shares Group 1 0.3810 - 0.3810 0.5123 Group 2 0.3810 0.0000 0.3810 0.5123 Income 'A' Shares Group 1 0.3532 - 0.3532 0.4729 Group 2 0.1481 0.2051 0.3532 0.4729 Accumulation 'U2' Shares Group 1 0.4203 - 0.4203 0.5376 Group 2 0.3086 0.1117 0.4203 0.5376 Income 'U2' Shares Group 1 0.3548 - 0.3548 0.4716 Group 2 0.2340 0.1208 0.3548 0.4716

Quilter Investors High Yield Bond Fund
Distribution table (continued)
Quilter Investors OEIC
322
Fourth distribution Group 1: Shares purchased prior to 1 April 2018 Group 2: Shares purchased from 1 April 2018 to 30 April 2018
Revenue
pence per share Equalisation
pence per share*
Distribution paid 31.05.18
pence per share
Distribution paid 31.05.17
pence per share Accumulation 'A' EUR Shares Group 1 0.4141 - 0.4141 0.3705 Group 2 0.4141 0.0000 0.4141 0.3705 Accumulation 'A' USD Hedged Shares Group 1 0.4295 - 0.4295 0.3877 Group 2 0.1075 0.3220 0.4295 0.3877 Income 'A' Shares Group 1 0.3831 - 0.3831 0.3500 Group 2 0.1616 0.2215 0.3831 0.3500 Accumulation 'U2' Shares Group 1 0.4573 - 0.4573 0.3962 Group 2 0.3182 0.1391 0.4573 0.3962 Income 'U2' Shares Group 1 0.3848 - 0.3848 0.3492 Group 2 0.2696 0.1152 0.3848 0.3492
Third Interim distribution Group 1: Shares purchased prior to 1 March 2018 Group 2: Shares purchased from 1 March 2018 to 31 March 2018
Revenue
pence per share Equalisation
pence per share*
Distribution paid 30.04.18
pence per share
Distribution paid 30.04.17
pence per share Accumulation 'A' EUR shares Group 1 0.3947 - 0.3947 0.5205 Group 2 0.3947 0.0000 0.3947 0.5205 Accumulation 'A' USD Hedged Shares Group 1 0.4143 - 0.4143 0.5336 Group 2 0.4143 0.0000 0.4143 0.5336 Income 'A' Shares Group 1 0.3585 - 0.3585 0.4885 Group 2 0.2311 0.1274 0.3585 0.4885 Accumulation 'U2' Shares Group 1 0.4268 - 0.4268 0.5502 Group 2 0.1928 0.2340 0.4268 0.5502 Income 'U2' Shares Group 1 0.3546 - 0.3546 0.4870 Group 2 0.2569 0.0977 0.3546 0.4870

Quilter Investors High Yield Bond Fund
Distribution table (continued)
Quilter Investors OEIC
323
Second Interim distribution Group 1: Shares purchased prior to 1 February 2018 Group 2: Shares purchased from 1 February 2018 to 28 February 2018
Revenue
pence per share Equalisation
pence per share*
Distribution paid 31.03.18
pence per share
Distribution paid 31.03.17
pence per share Accumulation 'A' EUR shares Group 1 0.3733 - 0.3733 0.3237 Group 2 0.3733 0.0000 0.3733 0.3237 Accumulation 'A' USD Hedged Shares Group 1 0.3873 - 0.3873 0.3264 Group 2 0.3873 0.0000 0.3873 0.3264 Income 'A' Shares Group 1 0.3437 - 0.3437 0.3075 Group 2 0.2571 0.0866 0.3437 0.3075 Accumulation 'U2' Shares Group 1 0.4069 - 0.4069 0.3451 Group 2 0.1591 0.2478 0.4069 0.3451 Income 'U2' Shares Group 1 0.3448 - 0.3448 0.3067 Group 2 0.2315 0.1133 0.3448 0.3067

Quilter Investors High Yield Bond Fund
Distribution table (continued)
Quilter Investors OEIC
324
First Interim distribution Group 1: Shares purchased prior to 1 January 2018 Group 2: Shares purchased from 1 January 2018 to 31 January 2018
Revenue
pence per share Equalisation
pence per share*
Distribution paid 28.02.18
pence per share
Distribution paid 28.02.17
pence per share Accumulation 'A' EUR shares Group 1 0.3720 - 0.3720 0.4010 Group 2 0.3720 0.0000 0.3720 0.4010 Accumulation 'A' USD Hedged Shares Group 1 0.4415 - 0.4415 0.4075 Group 2 0.0922 0.3493 0.4415 0.4075 Income 'A' Shares Group 1 0.3693 - 0.3693 0.3795 Group 2 0.1864 0.1829 0.3693 0.3795 Accumulation 'U2' Shares Group 1 0.4385 - 0.4385 0.4236 Group 2 0.3249 0.1136 0.4385 0.4236 Income 'U2' Shares Group 1 0.3703 - 0.3703 0.3780 Group 2 0.2780 0.0923 0.3703 0.3780 * Equalisation only applies to shares purchased during the distribution period (Group 2 shares). It is the average amount of revenue included in the purchase price of all
Group 2 shares and is refunded to holders of these shares as a return of capital. Being capital, it is not liable to income tax but must be deducted from the cost of shares for capital gains tax purposes.

Quilter Investors Investment Grade Corporate Bond Fund
Quilter Investors Investment Grade Corporate Bond Fund
Quilter Investors OEIC
325
Launch date 28 May 2013
IA Sector Sterling Corporate Bond
Investment adviser Invesco Asset Management Limited
Net asset value £200,369,175
Objective
The sub-fund aims to achieve a combination of income and capital growth.
Policy
The sub-fund primarily invests, directly and indirectly, in investment grade bonds issued by companies located anywhere in the world.
The sub-fund may also invest in bonds and similar debt investments issued by banks and governments located anywhere in the world.
The sub-fund may also invest in other transferable securities, collective investment schemes (including those managed or operated by the ACD), warrants, money market instruments, deposits and derivatives.
The sub-fund may use derivatives (i.e. financial contracts whose value is linked to the expected price movements of an underlying investment), with the aim of generating returns and reducing the overall costs and/or risks of the sub-fund.
The sub-fund is managed by an investment adviser selected by the ACD for their expected ability to manage the sub-fund according to the investment objective and policy. The ACD continuously monitors and may periodically make changes to this appointment.
Investment Manager’s review Market Review
Against a backdrop of rising government bond yields, in the first three months of 2018, the sterling investment grade corporate bond market delivered its first calendar quarter loss since the fourth quarter of 2016. The year actually began with corporate bond markets in relatively buoyant mood following the US government’s decision to implement tax reforms. Sentiment turned in February as stronger economic data raised expectations about the speed at which central banks might need to raise interest rates. In the second half of the period, one of the key influences on sterling corporate bonds was the market’s changing expectations of Bank of England (BoE) policy. During April, it was widely expected that the BoE would hike UK interest rates in May. However, first quarter economic data saw this expectation diminish with the BoE leaving rates on hold at 0.5%. Expectations started to rise again during June and by the end of the period, the market put the probability of an August hike at 65%. The premium over government bonds that investment grade corporate sterling issuers need to pay to borrow increased from 138 basis points (bps) at 31 March 2018 to 152bps at 30 June 2018.
Performance
Reflective of the more challenging backdrop for bond markets the sub-fund’s return was broadly flat towards the end of the period. Because of the rise in government bond yields, the biggest detractor from returns at the start of the year was interest rate sensitivity (duration). Our strategy of only holding half the duration of the broader sterling corporate bond market helped to limit losses and contributed to the outperformance versus the peer group. Towards the end of the period, the sub-fund benefited from positive performance from its allocation to the Telecoms sector. The contribution from the sub-fund’s exposure to financials was mixed with the more senior tiers of banks capital structure adding to returns while the more junior tiers detracted.
Risk and Reward Profile
The calculated risk and reward category, as shown above, uses a method of calculation derived from EU rules. It is based on the rate at which the returns of the sub-fund have moved up and down in the past (i.e. volatility) and is not a guide to the future risk and reward category of the sub-fund. The category shown is not a target or guarantee and may shift over time. Even the lowest category 1 does not mean a risk-free investment. The seven-category scale is nonlinear, for example, 2 is not twice as risky as 1.
Sub-funds in category 3 have in the past shown moderately low volatility. With a sub-fund of category 3, you have a moderately low risk of losing money but your chance for gains is also moderately low.
Investment risk - there is no guarantee that the sub-fund will achieve its objective. A capital loss of some or all of the amount invested may occur.
Credit risk - the issuer of a bond or a similar investment within the sub-fund may not pay income or repay capital to the sub-fund when due. Bonds which are rated below investment grade are considered to have a higher risk exposure with respect to meeting their payment obligations.
Interest rate risk - investments in bonds are affected by interest rates and inflation trends which may affect the value of the sub-fund.
Liquidity risk - some investments may become hard to value or sell at a desired time and price. In extreme circumstances this may affect the sub-fund’s ability to meet redemption requests upon demand.
Currency risk - the sub-fund is denominated in British Pounds but holds assets denominated in other currencies. The value of your shares may rise and fall as a result of exchange rate movements between these currencies.
Derivative risk - the sub-fund uses derivatives to generate returns and/or to reduce costs and the overall risk of the sub-fund. Using derivatives can involve a higher level of risk. A small movement in the price of an underlying investment may result in a disproportionately large movement in the price of the derivative investment. Derivatives also involve counterparty risk where the institutions acting as counterparty to derivatives may not meet their contractual obligations.
Capital erosion risk - the sub-fund takes its charges from the income of the sub-fund in the first instance. The impact of sub-fund charges may be material on the value of any income you receive from your investment. There is potential for capital erosion if insufficient income is generated by the sub-fund to cover these charges. Capital erosion may have the effect of reducing the level of income generated.
For full details of the sub-fund's risks, please see the section in the prospectus headed "Risks".

Quilter Investors Investment Grade Corporate Bond Fund
Quilter Investors OEIC
326
Performance Records Comparative Tables 1 January 2018 to 1 January 2017 to 1 January 2016 to Income 'A' 30 June 2018 31 December 2017 31 December 2016 p/share p/share p/share
Change in net assets per share Opening net asset value per share 105.87 103.44 100.12
Return before operating charges* (0.83) 5.83 7.08 Operating charges** (0.60) (1.22) (1.19)
Return after operating charges* (1.43) 4.61 5.89
Distributions (0.80) (2.18) (2.57) Retained distributions - - -
Closing net asset value per share 103.64 105.87 103.44
* after direct transaction costs of*** - - -
Performance Return after charges (1.35)% 4.46% 5.88%
Other information Closing net asset value (£) 51,294,508 56,025,682 63,469,420 Closing number of shares 49,494,348 52,916,975 61,360,097 Operating charges**** 1.15% 1.15% 1.15% Direct transaction costs*** - - -
Prices pence per share pence per share pence per share Highest share price 107.4 107.7 107.6 Lowest share price 104.8 103.8 98.92
1 January 2018 to 1 January 2017 to 1 January 2016 to Accumulation 'U2' 30 June 2018 31 December 2017 31 December 2016 p/share p/share p/share
Change in net assets per share
Opening net asset value per share 117.29 111.66 105.46
Return before operating charges* (0.93) 6.32 7.53 Operating charges** (0.35) (0.69) (0.66)
Return after operating charges* (1.28) 5.63 6.87
Distributions (1.21) (3.00) (3.34) Retained distributions 1.21 3.00 2.67
Closing net asset value per share 116.01 117.29 111.66
* after direct transaction costs of*** - - -
Performance Return after charges (1.09)% 5.04% 6.51%
Other information Closing net asset value (£) 149,057,795 127,018,209 91,325,966 Closing number of shares 128,482,422 108,292,743 81,791,998 Operating charges**** 0.60% 0.60% 0.60% Direct transaction costs*** - - -
Prices pence per share pence per share pence per share Highest share price 118.0 117.9 114.9 Lowest share price 116.1 112.1 104.3
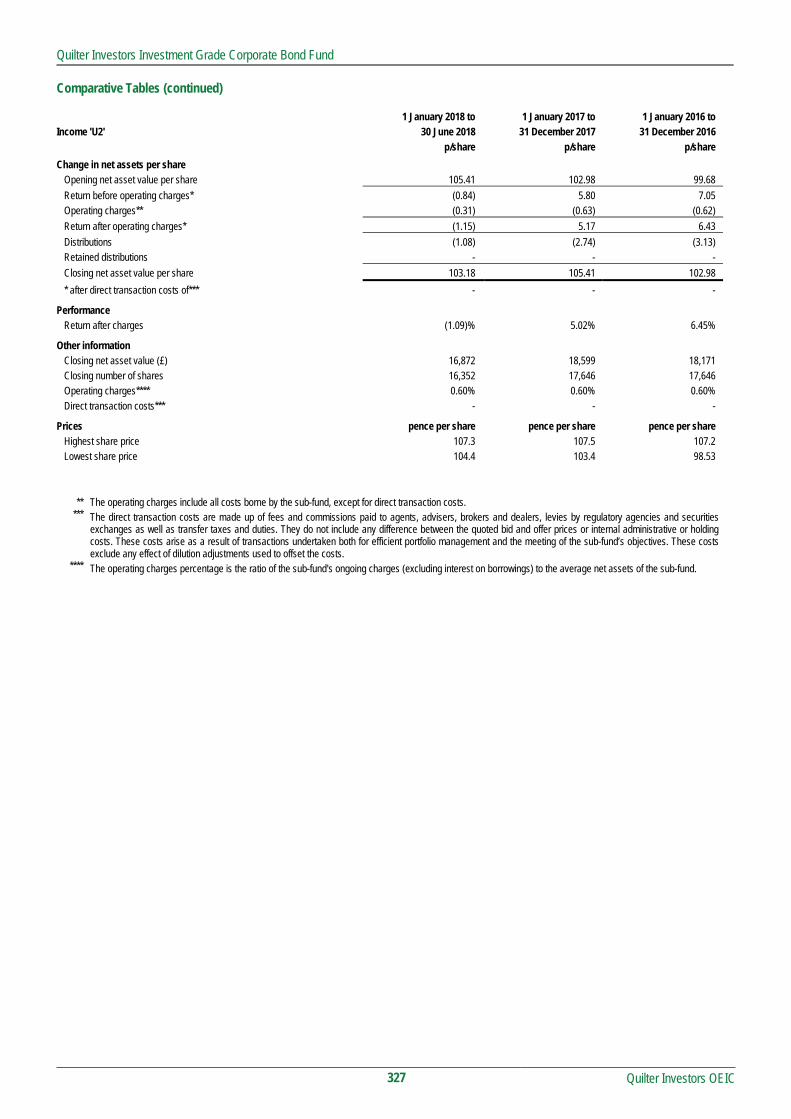
Quilter Investors Investment Grade Corporate Bond Fund
Quilter Investors OEIC
327
Comparative Tables (continued) 1 January 2018 to 1 January 2017 to 1 January 2016 to Income 'U2' 30 June 2018 31 December 2017 31 December 2016 p/share p/share p/share
Change in net assets per share
Opening net asset value per share 105.41 102.98 99.68
Return before operating charges* (0.84) 5.80 7.05 Operating charges** (0.31) (0.63) (0.62)
Return after operating charges* (1.15) 5.17 6.43
Distributions (1.08) (2.74) (3.13) Retained distributions - - -
Closing net asset value per share 103.18 105.41 102.98
* after direct transaction costs of*** - - -
Performance Return after charges (1.09)% 5.02% 6.45%
Other information Closing net asset value (£) 16,872 18,599 18,171 Closing number of shares 16,352 17,646 17,646 Operating charges**** 0.60% 0.60% 0.60% Direct transaction costs*** - - -
Prices pence per share pence per share pence per share Highest share price 107.3 107.5 107.2 Lowest share price 104.4 103.4 98.53
** The operating charges include all costs borne by the sub-fund, except for direct transaction costs.
*** The direct transaction costs are made up of fees and commissions paid to agents, advisers, brokers and dealers, levies by regulatory agencies and securities exchanges as well as transfer taxes and duties. They do not include any difference between the quoted bid and offer prices or internal administrative or holding costs. These costs arise as a result of transactions undertaken both for efficient portfolio management and the meeting of the sub-fund’s objectives. These costs exclude any effect of dilution adjustments used to offset the costs.
**** The operating charges percentage is the ratio of the sub-fund's ongoing charges (excluding interest on borrowings) to the average net assets of the sub-fund.

Quilter Investors Investment Grade Corporate Bond Fund
Quilter Investors OEIC
328
Performance
6 months to 30 June 2018
1 year to 30 June 2018
3 years to 30 June 2018
5 years to 30 June 2018
Quilter Investors Investment Grade Corporate Bond Fund* (1.10)% 0.69% 11.58% 22.33%
IA Sterling Corporate Bond Sector Average (benchmark) (1.48)% 0.65% 14.68% 29.18%
IA Sterling Corporate Bond (sector average) (1.46)% 0.63% 13.69% 27.57%
Quartile ranking 2 2 4 4
* Accumulation ‘U2’ shares
Data Source – Factset. Figures are calculated on a total return and single price basis, with net income reinvested into the sub-fund.
Portfolio allocation
United Kingdom 57.73%
Europe 22.08%
North America 12.49%
United Kingdom Derivatives (0.19)%
Net other assets 7.89%
Total 100.00% Asset allocation Sterling Denominated Debt Securities 79.66% US Dollar Denominated Debt Securities 12.64% United Kingdom Derivatives (0.19)%
Net other assets 7.89%
Total 100.00%
Major holdings
Percentage of portfolio
European Investment Bank 0.87344% 17/02/2020 2.92%
Barclays Bank 10% 21/05/2021 2.52%
Barclays Bank 14% Perpetual 1.96%
Nationwide Building Society 1.23855% 25/04/2019 1.72%
Vodafone 8.125% 26/11/2018 1.48%
BAT Capital 2.125% 15/08/2025 1.45%
Santander UK 5.125% 14/04/2021 1.38%
Siemens Financieringsmaatschappij 2.75% 10/09/2025 1.32%
Rolls-Royce 6.75% 30/04/2019 1.30%
BP Capital Markets 4.325% 10/12/2018 1.27%
Number of holdings 210
Total Purchases and Sales for the period
2018 2017
£’000 £’000
Total purchases for the 6 month period to 30 June 42,682 39,566
Total sales for the 6 month period to 30 June 22,689 32,036

Quilter Investors Investment Grade Corporate Bond Fund
Portfolio statement as at 30 June 2018
Quilter Investors OEIC
329
Market Percentage of Value total net assets
Holding Investment £’000 %
Sterling 79.47% (31 December 2017 81.09%)
Sterling Denominated Corporate Bonds 77.14% (31 December 2017 78.08%)
Sterling Denominated Fixed Rate Corporate Bonds 67.93% (31 December 2017 68.54%) £300,000 Admiral 5.5% 25/07/2024 328 0.16 £200,000 American International 5% 26/04/2023 225 0.11 £282,000 Amgen 5.5% 07/12/2026 344 0.17 £257,000 Anglian Water Services Financing 4.5% 05/10/2027 301 0.15
£1,580,000 Anheuser-Busch 1.75% 07/03/2025 1,542 0.77 £800,000 Apple 3.05% 31/07/2029 862 0.43 £584,000 Arqiva Financing 4.882% 31/12/2032 650 0.32 £810,000 Aviva 6.125% Perpetual (GBP) 882 0.44 £554,000 Aviva 6.875% 20/05/2058 670 0.33 £396,000 Aviva 6.875% Perpetual 413 0.21
£1,209,000 AXA 5.453% Perpetual 1,268 0.63 £682,000 AXA 6.6862% Perpetual 775 0.39 £650,000 Bank of America 2.3% 25/07/2025 640 0.32 £500,000 Bank of America 5.5% 04/12/2019 529 0.26 £150,000 Bank of America 7% 31/07/2028 204 0.10 £283,000 Barclays Bank 9.5% 07/08/2021 337 0.17
£4,211,000 Barclays Bank 10% 21/05/2021 5,051 2.52 £250,000 Barclays Bank 5.3304% Perpetual 254 0.13 £150,000 Barclays Bank 7.125% Perpetual 162 0.08 £386,000 Barclays Bank 9.25% Perpetual 454 0.23
£3,554,000 Barclays Bank 14% Perpetual 3,927 1.96 £3,000,000 BAT Capital 2.125% 15/08/2025 2,906 1.45 £1,000,000 BAT International Finance 1.75% 05/07/2021 1,001 0.50
£250,000 BAT International Finance 2.25% 09/09/2052 188 0.09 £1,500,000 BMW Finance 0.875% 16/08/2022 1,451 0.72 £1,500,000 BMW US Capital 2% 20/11/2019 1,513 0.76
£740,000 BP Capital Markets 1.177% 12/08/2023 719 0.36 £2,500,000 BP Capital Markets 4.325% 10/12/2018 2,535 1.27
£800,000 British Land 2.375% 14/09/2029 765 0.38 £142,000 British Land 5.264% 24/09/2035 179 0.09 £414,000 British Land 5.357% 31/03/2028 497 0.25 £800,000 British Land White 2015 0% 09/06/2020 766 0.38 £250,000 BUPA Finance 3.375% 17/06/2021 263 0.13 £470,000 BUPA Finance 5% 08/12/2026 506 0.25 £187,000 Centrica 4.375% 13/03/2029 212 0.11 £600,000 Centrica 7% 19/09/2018 607 0.30
£50,000 Cheltenham & Gloucester 11.75% Perpetual 108 0.05 £1,000,000 Citigroup 5.125% 12/12/2018 1,017 0.51
£500,000 CNP Assurances 7.375% 30/09/2041 560 0.28 £1,000,000 Cooperatieve Rabobank 2.25% 23/03/2022 1,024 0.51
£514,000 Coventry Building Society 6% 16/10/2019 545 0.27 £1,060,000 Credit Suisse 2.125% 12/09/2025 1,010 0.50
£500,000 Credit Suisse Funding Guernsey 2.75% 08/08/2025 495 0.25 £361,444 Delamare Finance 5.5457% 19/02/2029 404 0.20 £500,000 Deutsche Bank 1.875% 28/02/2020 494 0.25 £318,000 Deutsche Telekom International Finance 6.5% 08/04/2022 374 0.19 £100,000 Direct Line Insurance 9.25% 27/04/2042 122 0.06

Quilter Investors Investment Grade Corporate Bond Fund
Portfolio statement (continued) as at 30 June 2018
Quilter Investors OEIC
330
Market Percentage of Value total net assets
Holding Investment £’000 % Sterling Denominated Fixed Rate Corporate Bonds (continued)
£900,000 E.ON International Finance 6% 30/10/2019 954 0.48 £267,000 Eastern Power Networks 4.75% 30/09/2021 294 0.15
£2,000,000 EE Finance 4.375% 28/03/2019 2,045 1.02 £600,000 Electricite de France 5.5% 17/10/2041 753 0.38 £100,000 Electricite de France 5.875% Perpetual 99 0.05
£1,200,000 Electricite de France 6% Perpetual 1,220 0.61 £300,000 ELM for Swiss Reinsurance 6.3024% Perpetual 307 0.15 £396,000 Eversholt Funding 6.697% 22/02/2035 511 0.25 £535,000 Fidelity International 6.75% 19/10/2020 592 0.30 £175,000 Fidelity International 7.125% 13/02/2024 211 0.11 £248,000 G4S 7.75% 13/05/2019 261 0.13 £106,000 GE Capital UK Funding 5.875% 04/11/2020 116 0.06 £703,000 GE Capital UK Funding 5.875% 18/01/2033 916 0.46
£1,500,000 GlaxoSmithKline Capital 3.375% 20/12/2027 1,634 0.82 £370,000 Grainger 3.375% 24/04/2028 370 0.18 £325,478 Great Rolling Stock 6.875% 27/07/2035 412 0.21
£79,298 Grosvenor UK Finance 6.5% 29/09/2026 102 0.05 £457,000 Guardian Royal Exchange 6.625% 21/08/2023 554 0.28 £119,000 HBOS Capital Funding 6.461% Perpetual 121 0.06 £499,000 Heathrow Funding 5.225% 15/02/2023 572 0.29 £300,000 Heathrow Funding 7.075% 04/08/2028 411 0.21 £396,000 HSBC 6% 29/03/2040 509 0.25 £500,000 Iberdrola Finanzas 6% 01/07/2022 579 0.29
£50,000 Iberdrola Finanzas 7.375% 29/01/2024 63 0.03 £120,000 Imperial Tobacco Finance 4.875% 07/06/2032 138 0.07
£1,185,000 Imperial Tobacco Finance 7.75% 24/06/2019 1,258 0.63 £1,452,000 Imperial Tobacco Finance 9% 17/02/2022 1,807 0.90
£750,000 Innogy Finance 5.5% 06/07/2022 856 0.43 £1,250,000 Innogy Finance 5.625% 06/12/2023 1,470 0.73 £1,000,000 InterContinental Hotels 2.125% 24/08/2026 947 0.47 £1,000,000 John Lewis 4.25% 18/12/2034 994 0.50 £1,497,000 John Lewis 8.375% 08/04/2019 1,575 0.79
£600,000 Legal & General 5.375% 27/10/2045 646 0.32 £1,500,000 Lloyds Bank 7.625% 22/04/2025 1,929 0.96
£42,000 Lloyds Bank 9.625% 06/04/2023 54 0.03 £1,241,000 Lloyds Bank 13% Perpetual 2,187 1.09 £1,000,000 Marks & Spencer 4.75% 12/06/2025 1,093 0.55 £2,500,000 National Grid Gas Finance 1.125% 22/09/2021 2,468 1.23 £2,000,000 National Westminster Bank 6.5% 07/09/2021 2,261 1.13
£304,000 National Westminster Bank 7.125% Perpetual 344 0.17 £50,000 Nationwide Building Society 5.769% Perpetual 54 0.03
£200,000 Nationwide Building Society 7.859% Perpetual 247 0.12 £1,080,000 Nestle 1% 11/06/2021 1,072 0.54 £1,000,000 NGG Finance 5.625% 18/06/2073 1,089 0.54
£235,000 NIE Finance 6.375% 02/06/2026 302 0.15 £500,000 Orange 5.75% Perpetual 538 0.27
£2,000,000 Orange 5.875% Perpetual 2,150 1.07 £240,000 Pennon 2.875% Perpetual 240 0.12
£1,976,000 Pfizer 2.735% 15/06/2043 1,938 0.97 £340,000 PGH Capital 4.125% 20/07/2022 348 0.17 £601,000 PGH Capital 5.75% 07/07/2021 662 0.33

Quilter Investors Investment Grade Corporate Bond Fund
Portfolio statement (continued) as at 30 June 2018
Quilter Investors OEIC
331
Market Percentage of Value total net assets
Holding Investment £’000 % Sterling Denominated Fixed Rate Corporate Bonds (continued)
£1,000,000 Procter & Gamble 1.375% 03/05/2025 975 0.49 £1,000,000 Prudential 1.75% 27/11/2018 1,003 0.50
£980,000 Prudential 5% 20/07/2055 988 0.49 £400,000 RAC Bond 4.87% 06/05/2026 416 0.21 £400,000 RL Finance Bonds No 3 6.125% 13/11/2028 442 0.22
£1,000,000 RL Finance No. 2 6.125% 30/11/2043 1,105 0.55 £2,500,000 Rolls-Royce 6.75% 30/04/2019 2,614 1.30
£26,000 Rothschild Continuation Finance 9% Perpetual 33 0.02 £1,710,000 Royal Bank of Canada 1.125% 22/12/2021 1,700 0.85 £1,400,000 Royal Bank of Scotland 2.875% 19/09/2026 1,380 0.69 £2,500,000 Santander UK 5.125% 14/04/2021 2,762 1.38
£65,000 Santander UK 7.125% Perpetual 75 0.04 £42,000 Santander UK 7.375% Perpetual 44 0.02
£476,000 Santander UK 10.0625% Perpetual 785 0.39 £220,000 Scotland Gas Networks 3.25% 08/03/2027 231 0.12 £200,000 Scottish Widows 5.5% 16/06/2023 219 0.11 £770,000 Severn Trent Utilities Finance 2.75% 05/12/2031 758 0.38
£1,000,000 Shaftesbury Carnaby 2.487% 30/09/2031 948 0.47 £1,020,000 Shaftesbury Chinatown 2.348% 30/09/2027 979 0.49 £2,500,000 Siemens Financieringsmaatschappij 2.75% 10/09/2025 2,647 1.32
£130,000 Society of Lloyd's 4.875% 07/02/2047 137 0.07 £190,000 Southern Gas Networks 2.5% 03/02/2025 192 0.10
£1,235,000 Southern Gas Networks 4.875% 05/10/2023 1,412 0.70 £300,000 Southern Water Services Finance 6.125% 31/03/2019 311 0.16 £306,000 SP Manweb 4.875% 20/09/2027 364 0.18 £707,000 SPD Finance UK 5.875% 17/07/2026 881 0.44 £200,000 SSE 3.875% Perpetual 202 0.10
£1,231,000 SSE 5% 01/10/2018 1,243 0.62 £250,000 Standard Chartered Bank 5.375% Perpetual 260 0.13
£1,785,000 Standard Life 5.5% 04/12/2042 1,970 0.98 £389,000 Standard Life 6.546% Perpetual 415 0.21 £345,000 Standard Life 6.75% Perpetual 450 0.22 £300,000 Suez 5.375% 02/12/2030 385 0.19 £428,000 Tate & Lyle International Finance 6.75% 25/11/2019 460 0.23 £744,000 Telefonica Emisiones 5.375% 02/02/2026 869 0.43 £700,000 Telefonica Emisiones 5.597% 12/03/2020 746 0.37
£1,638,000 Tesco Personal Finance 5% 21/11/2020 1,700 0.85 £850,000 Tesco Personal Finance 5.2% 24/08/2018 854 0.43
£1,567,757 Tesco Property Finance 2 6.0517% 13/10/2039 1,848 0.92 £778,491 Tesco Property Finance 3 5.744% 13/04/2040 903 0.45 £717,031 Tesco Property Finance 5 5.6611% 13/10/2041 824 0.41 £100,000 Thames Water Utilities Cayman Finance 3.5% 25/02/2028 106 0.05 £257,000 Thames Water Utilities Cayman Finance 5.75% 13/09/2030 287 0.14 £450,000 Time Warner Cable 5.75% 02/06/2031 510 0.25 £680,000 Unilever 1.125% 03/02/2022 675 0.34
£2,500,000 Unilever 2% 19/12/2018 2,511 1.25 £680,000 Verizon Communications 3.125% 02/11/2035 648 0.32 £781,000 Virgin Money 2.25% 21/04/2020 787 0.39 £300,000 Vodafone 3% 12/08/2056 257 0.13 £500,000 Vodafone 3.375% 08/08/2049 465 0.23
£2,878,000 Vodafone 8.125% 26/11/2018 2,956 1.48 £107,000 Wales & West Utilities Finance 5% 07/03/2028 130 0.06 £490,000 Walgreens Boots Alliance 2.875% 20/11/2020 504 0.25 £951,000 Wellcome Trust 2.517% 07/02/2118 902 0.45

Quilter Investors Investment Grade Corporate Bond Fund
Portfolio statement (continued) as at 30 June 2018
Quilter Investors OEIC
332
Market Percentage of Value total net assets
Holding Investment £’000 % Sterling Denominated Fixed Rate Corporate Bonds (continued)
£107,000 Wessex Water Services Finance 4% 24/09/2021 115 0.06 £160,000 Western Power Distribution 3.625% 06/11/2023 168 0.08 £200,000 Western Power Distribution East Midlands 5.25% 17/01/2023 229 0.11 £307,000 Western Power Distribution West Midlands 3.875% 17/10/2024 335 0.17
£1,000,000 Whitbread 3.375% 16/10/2025 1,012 0.51 £2,214,000 WM Morrison Supermarkets 4.625% 08/12/2023 2,487 1.24 £1,000,000 WM Morrison Supermarkets 4.75% 04/07/2029 1,156 0.58
£203,000 WPP Finance 6.375% 06/11/2020 225 0.11 £200,000 Yorkshire Building Society 3.5% 21/04/2026 209 0.10 £300,000 Yorkshire Water Services Bradford Finance 4.965% 13/06/2033 357 0.18 £170,000 Zurich Finance UK 6.625% Perpetual 191 0.10
136,104 67.93
Sterling Denominated Variable Rate Corporate Bonds 9.21% (31 December 2017 9.54%) £1,000,000 Cooperatieve Rabobank UA 0.99925% 22/03/2021 999 0.50
£500,000 Engie 4.625% Perpetual 505 0.25 £5,820,000 European Investment Bank 0.87344% 17/02/2020 5,846 2.92 £1,800,000 Income Contingent Student Loans 1.62137% 24/07/2056 1,801 0.90
£168,000 Legal & General 5.875% Perpetual 171 0.08 £1,000,000 Nationwide Building Society 0.97633% 06/06/2019 1,001 0.50 £3,440,000 Nationwide Building Society 1.23855% 25/04/2019 3,451 1.72 £1,590,000 Royal Bank of Scotland 0.90031% 15/05/2020 1,592 0.79
£235,000 Royal Bank of Scotland 9.5% Perpetual 237 0.12 £1,354,000 Santander UK 1.24315% 08/07/2019 1,359 0.68
£500,000 Total Capital 0.97975% 01/07/2019 501 0.25 £1,000,000 Toyota Motor Finance (Netherlands) 0.86413% 30/09/2019 1,000 0.50
18,463 9.21
Sterling Denominated Government Bonds 2.52% (31 December 2017 2.79%)
Sterling Denominated Fixed Rate Government Bonds 2.52% (31 December 2017 2.79%) £2,500,000 European Investment Bank 1.5% 01/02/2019 2,513 1.26 £2,500,000 European Investment Bank 4.75% 15/10/2018 2,529 1.26
5,042 2.52
Sterling Denominated Derivatives (0.19)% (31 December 2017 0.22%)
Sterling Denominated Forward Exchange Contracts (0.15)% (31 December 2017 0.28%) £1,505,474 Sterling v US Dollar Forward Exchange Contract (13) (0.01) £1,507,390 Sterling v US Dollar Forward Exchange Contract (10) (0.01)
£147,104 Sterling v US Dollar Forward Exchange Contract (5) - £147,260 Sterling v US Dollar Forward Exchange Contract (5) -
£2,218,109 Sterling v US Dollar Forward Exchange Contract (62) (0.03) £2,253,059 Sterling v US Dollar Forward Exchange Contract (27) (0.01)
£226,034 Sterling v US Dollar Forward Exchange Contract (2) - £378,832 Sterling v US Dollar Forward Exchange Contract (1) -
£6,313,460 Sterling v US Dollar Forward Exchange Contract (142) (0.07) £7,958,881 Sterling v US Dollar Forward Exchange Contract (14) (0.01)
£741,676 Sterling v US Dollar Forward Exchange Contract (18) (0.01) £913,437 Sterling v US Dollar Forward Exchange Contract 3 -
(296) (0.15)

Quilter Investors Investment Grade Corporate Bond Fund
Portfolio statement (continued) as at 30 June 2018
Quilter Investors OEIC
333
Market Percentage of Value total net assets
Holding Investment £’000 %
Sterling Denominated Futures Contracts (0.04)% (31 December 2017 (0.06)%) (60) Long Gilt Futures September 2018 (81) (0.04)
(81) (0.04)
Overseas 12.64% (31 December 2017 11.73%)
US Dollar 12.64% (31 December 2017 11.73%)
US Dollar Denominated Corporate Bonds 12.64% (31 December 2017 11.77%)
US Dollar Denominated Fixed Rate Corporate Bonds 11.51% (31 December 2017 11.15%) $200,000 ABN AMRO Bank 4.75% 28/07/2025 151 0.07
$1,200,000 Apple 3.85% 04/05/2043 873 0.44 $2,000,000 AT&T 5.25% 01/03/2037 1,500 0.75
$424,000 AXA 6.379% Perpetual 344 0.17 $550,000 Bayer US Finance II 4.625% 25/06/2038 413 0.21 $100,000 BNP Paribas 7.195% Perpetual 80 0.04 $700,000 BNP Paribas 7.195% Perpetual '144A 564 0.28 $943,000 BP Capital Markets 2.75% 10/05/2023 693 0.35
$1,500,000 Credit Suisse 6.5% 08/08/2023 1,212 0.60 $750,000 HSBC 6.5% Perpetual 548 0.27 $500,000 Lloyds Bank 12% Perpetual '144A 466 0.23
$66,117 Lloyds Banking 6.657% Perpetual 54 0.03 $855,000 Marks & Spencer 7.125% 01/12/2037 729 0.36
$2,500,000 Nationwide Building Society 4.125% 18/10/2032 1,737 0.87 $2,300,000 Shell International Finance 3.25% 11/05/2025 1,711 0.85 $1,500,000 Sky 3.75% 16/09/2024 1,133 0.57 $3,220,000 Standard Life Aberdeen 4.25% 30/06/2048 2,307 1.15
$500,000 Telecom Italia 5.303% 30/05/2024 370 0.18 $190,000 Time Warner Cable 6.55% 01/05/2037 153 0.08 $260,000 Total Capital 3.7% 15/01/2024 200 0.10
$1,800,000 UBS 5.125% 15/05/2024 1,366 0.68 $1,500,000 UBS Group Funding Switzerland 5% Perpetual 1,000 0.50 $2,330,000 Verizon Communications 4.272% 15/01/2036 1,627 0.81 $2,200,000 Verizon Communications 4.4% 01/11/2034 1,574 0.79 $1,500,000 Vodafone 2.95% 19/02/2023 1,100 0.55
$400,000 Vodafone 5% 30/05/2038 300 0.15 $576,000 Vodafone 6.15% 27/02/2037 480 0.24 $500,000 Walgreens Boots Alliance 3.8% 18/11/2024 375 0.19
23,060 11.51
US Dollar Denominated Variable Rate Corporate Bonds 1.13% (31 December 2017 0.62%) $1,300,000 HSBC Bank 2.75% Perpetual 762 0.38 $1,000,000 HSBC Bank 2.8125% Perpetual 586 0.29 $1,000,000 National Westminster Bank 2.5625% Perpetual 624 0.31
$400,000 Royal Bank of Scotland 4.65438% Perpetual 294 0.15
2,266 1.13

Quilter Investors Investment Grade Corporate Bond Fund
Portfolio statement (continued) as at 30 June 2018
Quilter Investors OEIC
334
Market Percentage of Value total net assets
Holding Investment £’000 % United States Derivatives 0.00% (31 December 2017 (0.04)%) US Dollar Denominated Forward Exchange Contracts 0.00% (31 December 2017 (0.04)%)
Investment assets* 184,558 92.11
Net other assets 15,811 7.89
Total net assets 200,369 100.00
* Including investment liabilities.
All investments are approved securities being either officially listed in a member state or traded on or under the rules of an eligible securities market, unless otherwise stated.

Quilter Investors Investment Grade Corporate Bond Fund
Quilter Investors OEIC
335
Statement of total return for the period from 1 January 2018 to 30 June 2018 01.01.18 to 01.01.18 to 01.01.17 to 01.01.17 to
30.06.18 30.06.18 30.06.17 30.06.17
Note £'000 £'000 £'000 £'000
Income
Net capital (losses)/gains (4,111) 2,847
Revenue 2,548 2,780
Expenses (716) (666)
Interest payable and similar charges (1) (4)
Net revenue before taxation 1,831 2,110
Taxation - -
Net revenue after taxation 1,831 2,110
Total return before distributions (2,280) 4,957
Distributions 2 (1,831) (2,110)
Change in net assets attributable to
shareholders from investment activities (4,111) 2,847
Statement of change in net assets attributable to shareholders for the period from 1 January 2018 to 30 June 2018 01.01.18 to 01.01.18 to 01.01.17 to 01.01.17 to
30.06.18 30.06.18 30.06.17 30.06.17
£'000 £'000 £'000 £'000
Opening net assets attributable to shareholders 183,062* 154,814
Amounts received on issue of shares 24,717 27,221
Amounts paid on cancellation of shares (4,900) (25,146)
19,817 2,075
Dilution adjustment 47 110
Change in net assets attributable to
shareholders from investment activities (4,111) 2,847
Retained distribution on accumulation shares 1,554 1,373
Closing net assets attributable to shareholders 200,369 161,219* * Section 3.30 of the SORP issued by the Investment Management Association in May 2014 requires comparative figures for the above statement. For interim financial
statements this will result in the closing comparative net assets not being equal to net assets at the start of the current period.

Quilter Investors Investment Grade Corporate Bond Fund
Quilter Investors OEIC
336
Balance sheet as at 30 June 2018 30.06.18 31.12.17
£'000 £’000
Assets
Fixed assets
Investments 184,938 170,102
Current assets
Debtors 3,427 3,410
Cash and bank balances 13,469 10,494
Total assets 201,834 184,006
Liabilities
Investment liabilities (380) (180)
Creditors
Distribution payable (397) (545)
Other creditors (688) (219)
Total liabilities (1,465) (944)
Net assets attributable to shareholders 200,369 183,062

Quilter Investors Investment Grade Corporate Bond Fund
Notes to the financial statements for the period from 1 January 2018 to 30 June 2018
Quilter Investors OEIC
337
1 Accounting policies The financial statements have been prepared under the historical cost basis, as modified by the revaluation of investments, and in accordance with the Statement of Recommended Practice (SORP) for Authorised Funds, issued by the Investment Management Association in May 2014.
The accounting policies applied are consistent with those disclosed within the annual Financial Statements for the year ended 31 December 2017.
2 Distributions The distributions take account of revenue received on the issue of shares and revenue deducted on the cancellation of shares, and comprise:
01.01.18 to 01.01.17 to 30.06.18 30.06.17 £'000 £'000 Interim – Accumulation shares (30 June) 1,554 1,373 Interim – Income shares (30 June) 397 652 1,951 2,025 Revenue deducted on cancellation of shares 18 266 Revenue received on issue of shares (138) (181) Distributions 1,831 2,110

Quilter Investors Investment Grade Corporate Bond Fund
Distribution table
Quilter Investors OEIC
338
Interim distribution Group 1: Shares purchased prior to 1 January 2018 Group 2: Shares purchased from 1 January 2018 to 30 June 2018
Revenue
pence per share Equalisation
pence per share*
Distribution paid 31.08.18
pence per share
Distribution paid 31.08.17
pence per share
Income 'A' Shares
Group 1 0.8017 - 0.8017 1.1531
Group 2 0.3064 0.4953 0.8017 1.1531
Accumulation 'U2' Shares
Group 1 1.2093 - 1.2093 1.5544
Group 2 0.5569 0.6524 1.2093 1.5544
Income 'U2' Shares
Group 1 1.0837 - 1.0837 1.4334
Group 2 0.6494 0.4343 1.0837 1.4334
* Equalisation only applies to shares purchased during the distribution period (Group 2 shares). It is the average amount of revenue included in the purchase price of all Group
2 shares and is refunded to holders of these shares as a return of capital. Being capital, it is not liable to income tax but must be deducted from the cost of shares for capital gains tax purposes.

Quilter Investors Japanese Equity Fund
Quilter Investors Japanese Equity Fund
Quilter Investors OEIC
339
Launch date 1 March 2013
IA Sector Japan
Investment adviser Schroder Investment Management Limited
Net asset value £237,684,476
Objective
The sub-fund aims to achieve capital growth.
Policy
The sub-fund primarily invests, directly and indirectly, in shares of companies listed or located in Japan. The sub-fund may at times be concentrated in terms of the number of investments it holds.
The sub-fund may also invest in other transferable securities, collective investment schemes (including those managed or operated by the ACD), warrants, money market instruments, deposits and derivatives.
The sub-fund may only use derivatives for efficient portfolio management purposes.
The sub-fund is managed by an investment adviser selected by the ACD for their expected ability to manage the sub-fund according to the investment objective and policy. The ACD continuously monitors and may periodically make changes to this appointment.
Investment Manager’s review
Market Review
The Japanese equity market suffered from generally weak global sentiment in the first half of 2018, while the yen appreciated against sterling. Much of the period was very quiet in terms of Japan-specific news, with investors focused instead on escalations in trade tension between the US and China, and increased strains within the European Union. Away from politics, forward looking economic indicators had been pointing towards a recovery from the short-term GDP decline seen in the first quarter. Data on the real economy released at the end of June subsequently confirmed a more positive picture.
Performance
The sub-fund returned -0.8%* net of fees underperforming the benchmark return of 0.4%*, with negative impacts equally split between stock selection and sector allocation. *(Source: Morningstar, 30 June 2018, Quilter Investors Japanese Equity A (GBP) Acc)
Sector performances reflected the increasing trade friction, with shipping companies underperforming along with many economic-sensitive areas. Banks also underperformed while more defensive areas such as pharmaceuticals and utilities outperformed. The largest negative contribution came from Disco, a specialist maker of precision equipment for semiconductor production. The stock has been a consistent positive contributor for the previous two years but saw some profit taking in the early part of 2018. Overall, however, there were few outliers among the largest negative, or positive, contributors in the first half and the sub-fund’s underperformance was actually generated from a range of small negative impacts together with the general underperformance of “value” as a style during this period.
Positions sold in the first half of 2018 included Mitsui OSK, a major shipping line, Mitsubishi Corp, a general trading company, and Okinawa Electric Power, a regional utility company. A range of new holdings were added, the most significant of which was Toyota Industries, a member of the Toyota group which focuses on fork-lift trucks and auto parts. New additions were also made in two chemical companies, Kureha and Daicel, and Japan Post Holdings which now looks undervalued after weak performance since its flotation at the end of 2015.
Risk and Reward Profile
The calculated risk and reward category, as shown above, uses a method of calculation derived from EU rules. It is based on the rate at which the returns of the sub-fund have moved up and down in the past (i.e. volatility) and is not a guide to the future risk and reward category of the sub-fund. The category shown is not a target or guarantee and may shift over time. Even the lowest category 1 does not mean a risk-free investment. The seven-category scale is nonlinear, for example, 2 is not twice as risky as 1.
Sub-funds in category 5 have in the past shown relatively moderately high volatility. With a sub-fund of category 5, you have a moderately high risk of losing money but your chance for gains is also moderately high.
Investment risk - there is no guarantee that the sub-fund will achieve its objective. A capital loss of some or all of the amount invested may occur.
Geographic concentration risk - a fall in the Japanese market may have a significant impact on the value of the sub-fund because it primarily invests in this market.
Concentration risk (number of investments) - the sub-fund may at times hold a smaller number of investments, and therefore a fall in the value of a single investment may have a greater impact on the sub-fund’s value than if it held a larger number of investments.
Liquidity risk - some investments may become hard to value or sell at a desired time and price. In extreme circumstances this may affect the sub-fund’s ability to meet redemption requests upon demand.
Currency risk (EUR share class) - the sub-fund is denominated in British Pounds but holds assets denominated in other currencies. This share class is denominated in Euro. The value of your shares may rise and fall as a result of exchange rate movements between these currencies.
Currency risk (GBP share class) - the sub-fund is denominated in British Pounds but holds assets denominated in other currencies. The value of your shares may rise and fall as a result of exchange rate movements between these currencies.
Currency risk (USD share class) - the sub-fund is denominated in British Pounds but holds assets denominated in other currencies. This share class is denominated in US Dollars. The value of your shares may rise and fall as a result of exchange rate movements between these currencies.
Derivative risk - the sub-fund may use derivatives to reduce costs and/or the overall risk of the sub-fund (i.e. Efficient Portfolio Management (EPM)). Derivatives involve a level of risk, however, for EPM they should not increase the overall riskiness of the sub-fund. Derivatives also involve counterparty risk where the institutions acting as counterparty to derivatives may not meet their contractual obligations.
Capital erosion risk - the sub-fund takes charges from the income of the sub-fund in the first instance. The impact of sub-fund charges may be material on the value of any income you receive from your investment. There is potential for capital erosion if insufficient income is generated by the sub-fund to cover these charges. Capital erosion may have the effect of reducing the level of income generated.
For full details of the sub-fund's risks, please see the section in the prospectus headed "Risks".
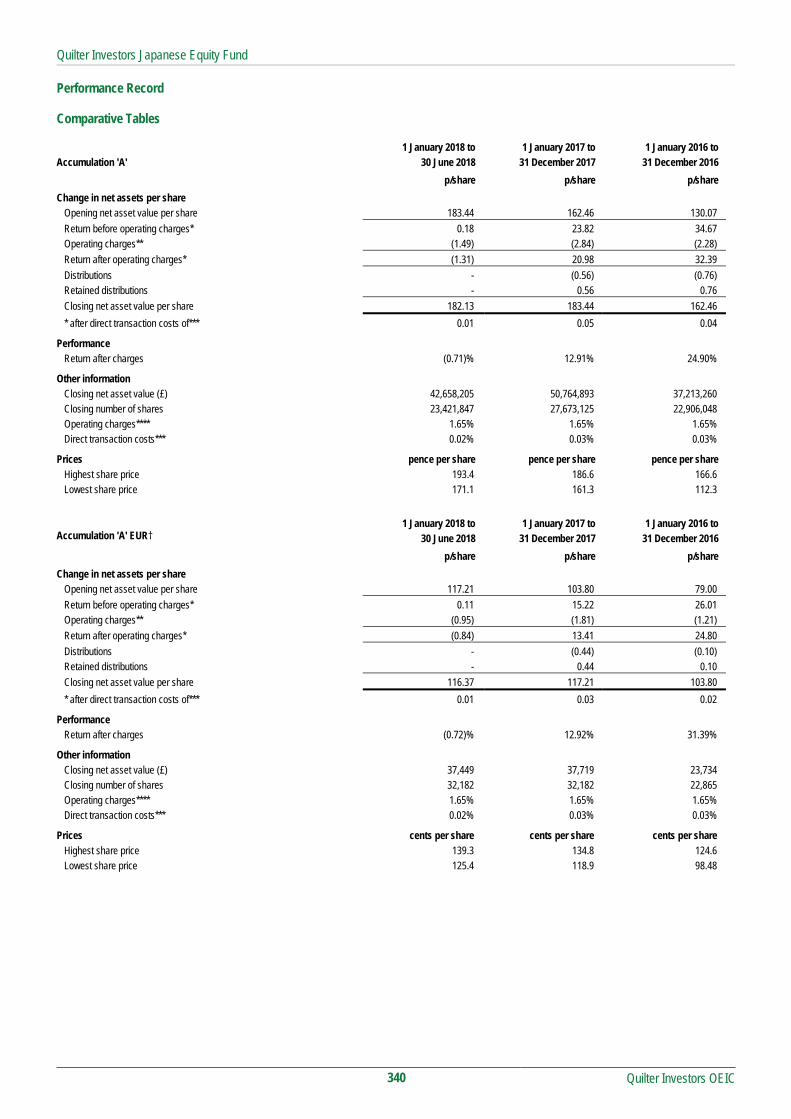
Quilter Investors Japanese Equity Fund
Quilter Investors OEIC
340
Performance Record Comparative Tables 1 January 2018 to 1 January 2017 to 1 January 2016 to Accumulation 'A' 30 June 2018 31 December 2017 31 December 2016
p/share p/share p/share
Change in net assets per share Opening net asset value per share 183.44 162.46 130.07
Return before operating charges* 0.18 23.82 34.67 Operating charges** (1.49) (2.84) (2.28)
Return after operating charges* (1.31) 20.98 32.39
Distributions - (0.56) (0.76) Retained distributions - 0.56 0.76
Closing net asset value per share 182.13 183.44 162.46
* after direct transaction costs of*** 0.01 0.05 0.04
Performance Return after charges (0.71)% 12.91% 24.90%
Other information Closing net asset value (£) 42,658,205 50,764,893 37,213,260 Closing number of shares 23,421,847 27,673,125 22,906,048 Operating charges**** 1.65% 1.65% 1.65% Direct transaction costs*** 0.02% 0.03% 0.03%
Prices pence per share pence per share pence per share Highest share price 193.4 186.6 166.6 Lowest share price 171.1 161.3 112.3
1 January 2018 to 1 January 2017 to 1 January 2016 to Accumulation 'A' EUR† 30 June 2018 31 December 2017 31 December 2016 p/share p/share p/share
Change in net assets per share Opening net asset value per share 117.21 103.80 79.00
Return before operating charges* 0.11 15.22 26.01 Operating charges** (0.95) (1.81) (1.21)
Return after operating charges* (0.84) 13.41 24.80
Distributions - (0.44) (0.10) Retained distributions - 0.44 0.10
Closing net asset value per share 116.37 117.21 103.80
* after direct transaction costs of*** 0.01 0.03 0.02
Performance Return after charges (0.72)% 12.92% 31.39%
Other information Closing net asset value (£) 37,449 37,719 23,734 Closing number of shares 32,182 32,182 22,865 Operating charges**** 1.65% 1.65% 1.65% Direct transaction costs*** 0.02% 0.03% 0.03%
Prices cents per share cents per share cents per share Highest share price 139.3 134.8 124.6 Lowest share price 125.4 118.9 98.48

Quilter Investors Japanese Equity Fund
Quilter Investors OEIC
341
Comparative Tables (continued) 1 January 2018 to 1 January 2017 to 1 January 2016 to Accumulation 'A' USD 30 June 2018 31 December 2017 31 December 2016
p/share p/share p/share
Change in net assets per share Opening net asset value per share 100.81 89.28 71.46
Return before operating charges* 0.10 13.10 19.09 Operating charges** (0.82) (1.57) (1.27)
Return after operating charges* (0.72) 11.53 17.82
Distributions - (0.34) (0.44) Retained distributions - 0.34 0.44
Closing net asset value per share 100.09 100.81 89.28
* after direct transaction costs of*** 0.01 0.03 0.02
Performance Return after charges (0.71)% 12.91% 24.94%
Other information Closing net asset value (£) 87,668 99,240 45,491 Closing number of shares 87,591 98,443 50,954 Operating charges**** 1.65% 1.65% 1.65% Direct transaction costs*** 0.02% 0.03% 0.03%
Prices cents per share cents per share cents per shareHighest share price 146.6 136.7 113.6 Lowest share price 131.9 109.0 89.76
1 January 2018 to 1 January 2017 to 1 January 2016 to Accumulation 'U2' 30 June 2018 31 December 2017 31 December 2016
p/share p/share p/share
Change in net assets per share Opening net asset value per share 186.24 163.46 129.70
Return before operating charges* 0.19 24.09 34.81 Operating charges** (0.69) (1.31) (1.05)
Return after operating charges* (0.50) 22.78 33.76
Distributions - (2.14) (2.02) Retained distributions - 2.14 2.02
Closing net asset value per share 185.74 186.24 163.46
* after direct transaction costs of*** 0.01 0.05 0.04
Performance Return after charges (0.27)% 13.94% 26.03%
Other information Closing net asset value (£) 194,901,154 140,760,271 59,056,431 Closing number of shares 104,934,611 75,580,250 36,128,417 Operating charges**** 0.75% 0.75% 0.75% Direct transaction costs*** 0.02% 0.03% 0.03%
Prices pence per share pence per share pence per share Highest share price 196.4 189.2 167.3 Lowest share price 174.1 162.4 112.1
† From 31 March 2016 ** The operating charges include all costs borne by the sub-fund, except for direct transaction costs.
*** The direct transaction costs are made up of fees and commissions paid to agents, advisers, brokers and dealers, levies by regulatory agencies and securities exchanges as well as transfer taxes and duties. They do not include any difference between the quoted bid and offer prices or internal administrative or holding costs. These costs arise as a result of transactions undertaken both for efficient portfolio management and the meeting of the sub-fund’s objectives. These costs exclude any effect of dilution adjustments used to offset the costs.
**** The operating charges percentage is the ratio of the sub-fund's ongoing charges (excluding interest on borrowings) to the average net assets of the sub-fund. If the share class launched during the period the operating charges figures are annualised.

Quilter Investors Japanese Equity Fund
Quilter Investors OEIC
342
Performance
6 months to 30 June 2018
1 year to 30 June 2018
3 years to 30 June 2018
5 years to 30 June 2018
Quilter Investors Japanese Equity Fund* (0.32)% 9.85% 45.89% 76.08%
Topix 1st Section (benchmark) 0.39% 9.45% 48.90% 74.16%
IA Japan (sector average) 0.12% 11.20% 48.45% 74.00%
Quartile ranking 3 2 2 2
* Accumulation ‘U2’ shares
Data Source – Factset. Figures are calculated on a total return and single price basis, with net income reinvested into the sub-fund.
Portfolio allocation
Automobiles & Parts 12.33%
Industrial Engineering 9.43%
Electronic & Electrical Equipment 7.87%
Banks 6.49%
Travel & Leisure 6.44%
General Retailers 5.92%
Pharmaceuticals & Biotechnology 4.52%
Industrial Transportation 4.32%
Support Services 4.14%
Technology Hardware & Equipment 4.08%
Chemicals 3.22%
Construction & Materials 3.13%
Mobile Telecommunications 3.11%
Nonlife Insurance 2.93%
Financial Services 2.75%
Fixed Line Telecommunications 2.71%
Oil & Gas Producers 2.22%
Real Estate Investment & Services 2.17%
Life Insurance 2.04%
General Industrials 1.85%
Household Goods & Home Construction 1.48%
Industrial Metals & Mining 1.29%
Tobacco 0.58%
Leisure Goods 0.53%
Personal Goods 0.48%
Beverages 0.40%
Health Care Equipment & Services 0.37%
Media 0.13%
Software & Computer Services 0.02%
Net other assets 3.05%
Total 100%
Asset allocation
Equities 96.95%
Net other assets 3.05%
Total 100%
Major holdings Percentage of
Portfolio
Toyota Motor 4.17%
Sumitomo Mitsui Financial 3.31%
KDDI 3.11%
Bridgestone 3.02%
TDK 2.99%
Nippon Telegraph & Telephone 2.71%
East Japan Railway 2.71%
Sankyu 2.57%
Mitsui 2.53%
JX 2.22%
Number of holdings 88
Total Purchases and Sales for the period
2018 2017
£'000 £'000
Total purchases for the 6 month period to 30 June 59,185 61,578
Total sales for the 6 month period to 30 June 12,329 3,429

Quilter Investors Japanese Equity Fund
Portfolio statement as at 30 June 2018
Quilter Investors OEIC
343
Market Percentage of
Value total net assets Holding Investment £’000 %
Overseas 96.95% (31 December 2017 97.29%)
Japan 96.95% (31 December 2017 97.29%)
Japan Equities 96.95% (31 December 2017 97.29%)
Automobiles & Parts 12.33% (31 December 2017 13.03%) 240,900 Bridgestone 7,170 3.02
71,400 Honda Motor 1,595 0.67 67,200 JTEKT 696 0.29 86,500 Koito Manufacturing 4,350 1.83
204,500 Sumitomo Electric Industries 2,316 0.98 33,100 Toyota Industries 1,412 0.59
201,000 Toyota Motor 9,915 4.17 124,100 Unipres 1,848 0.78
29,302 12.33
Banks 6.49% (31 December 2017 7.23%) 93,500 77 Bank 1,554 0.65
483,000 Fukuoka Financial 1,848 0.78 960,500 Mitsubishi UFJ Financial 4,164 1.75 265,600 Sumitomo Mitsui Financial 7,857 3.31
15,423 6.49
Beverages 0.40% (31 December 2017 0.46%) 49,700 Sapporo 949 0.40
949 0.40
Chemicals 3.22% (31 December 2017 3.24%) 91,500 Daicel 771 0.32
211,100 Inabata 2,232 0.94 16,900 Kureha 920 0.39
2,600 Nippon Shokubai 143 0.06 283,000 Nippon Soda 1,192 0.50 185,500 Sakata INX 1,845 0.78
68,100 T&K Toka 557 0.23
7,660 3.22
Construction & Materials 3.13% (31 December 2017 3.60%) 243,400 Haseko 2,559 1.07 140,200 Sanki Engineering 1,044 0.44
54,000 SK Kaken 3,845 1.62
7,448 3.13
Electricity 0.00% (31 December 2017 0.34%)
Electronic & Electrical Equipment 7.87% (31 December 2017 6.76%) 37,100 Enplas 787 0.33
112,700 HI-LEX 2,168 0.91 631,000 Hitachi 3,389 1.43
20,800 Murata Manufacturing 2,658 1.12 15,700 Nidec 1,794 0.75 91,200 TDK 7,102 2.99 87,500 Techno Associe 796 0.34
18,694 7.87

Quilter Investors Japanese Equity Fund
Portfolio statement (continued) as at 30 June 2018
Quilter Investors OEIC
344
Market Percentage of
Value total net assets Holding Investment £’000 %
Financial Services 2.75% (31 December 2017 2.78%) 132,500 Hitachi Capital 2,607 1.09 732,200 Nomura 2,708 1.14 253,100 Tokai Tokyo Financial 1,229 0.52
6,544 2.75
Fixed Line Telecommunications 2.71% (31 December 2017 2.63%) 186,200 Nippon Telegraph & Telephone 6,450 2.71
6,450 2.71
General Industrials 1.85% (31 December 2017 0.29%) 62,400 IHI 1,655 0.69
199,500 ITOCHU 2,752 1.16
4,407 1.85
General Retailers 5.92% (31 December 2017 6.29%) 87,000 AT 1,736 0.73 31,700 Don Quijotegs 1,158 0.49
177,100 H2O Retailing 2,153 0.91 51,800 Izumi 2,438 1.03 96,500 Nafco 1,224 0.51
107,500 Seven & I 3,568 1.50 472,700 Yamada Denki 1,789 0.75
14,066 5.92
Health Care Equipment & Services 0.37% (31 December 2017 0.31%) 30,700 Ship Healthcare 882 0.37
882 0.37
Household Goods & Home Construction 1.48% (31 December 2017 1.33%) 270,300 Sekisui Chemical 3,511 1.48
3,511 1.48
Industrial Engineering 9.43% (31 December 2017 10.66%) 29,200 Disco 3,797 1.60
341,300 Isuzu Motors 3,449 1.45 160,300 JGC 2,462 1.04 344,200 Mitsubishi Electric 3,485 1.47
72,600 Nabtesco 1,701 0.72 232,000 Nippon Thompson 1,382 0.58
98,700 Shimadzu 2,271 0.95 13,200 SMC 3,688 1.55 29,000 Tsubakimoto Chain 175 0.07
22,410 9.43
Industrial Metals & Mining 1.29% (31 December 2017 1.59%) 69,400 Dowags 1,626 0.69 99,300 JFE 1,430 0.60
3,056 1.29
Industrial Transportation 4.32% (31 December 2017 4.19%) 168,700 Hitachi Transport System 3,290 1.38
55,300 Kintetsu World Express 869 0.37 153,100 Sankyu 6,109 2.57
10,268 4.32

Quilter Investors Japanese Equity Fund
Portfolio statement (continued) as at 30 June 2018
Quilter Investors OEIC
345
Market Percentage of
Value total net assets Holding Investment £’000 %
Leisure Goods 0.53% (31 December 2017 0.21%) 20,100 Bandai Namco 631 0.27
2,500 Nintendo 622 0.26
1,253 0.53
Life Insurance 2.04% (31 December 2017 1.87%) 77,900 Japan Post 650 0.27
367,500 T&D 4,203 1.77
4,853 2.04
Media 0.13% (31 December 2017 0.16%) 53,200 Chubu-Nippon Broadcasting 303 0.13
303 0.13
Mobile Telecommunications 3.11% (31 December 2017 2.60%) 355,400 KDDI 7,401 3.11
7,401 3.11
Nonlife Insurance 2.93% (31 December 2017 3.09%) 81,100 Sompo 2,497 1.05
125,200 Tokio Marine 4,467 1.88
6,964 2.93
Oil & Gas Producers 2.22% (31 December 2017 1.86%) 997,500 JX 5,279 2.22
5,279 2.22
Personal Goods 0.48% (31 December 2017 0.74%) 27,300 ABC-Mart 1,138 0.48
1,138 0.48
Pharmaceuticals & Biotechnology 4.52% (31 December 2017 3.74%) 189,300 Astellas Pharma 2,197 0.92 107,800 Otsuka 3,974 1.67 344,900 Santen Pharmaceutical 4,577 1.93
10,748 4.52
Real Estate Investment & Services 2.17% (31 December 2017 2.34%) 99,700 Iida 1,464 0.62
122,300 Mitsui Fudosan 2,247 0.94 85,800 Nomura Real Estate 1,450 0.61
5,161 2.17
Software & Computer Services 0.02% (31 December 2017 0.00%) 2,400 SRA 50 0.02
50 0.02
Support Services 4.14% (31 December 2017 4.99%) 76,500 Advan 508 0.21 52,500 Glory 1,118 0.47
474,200 Mitsui 6,019 2.53 104,200 Recruit 2,196 0.93
9,841 4.14

Quilter Investors Japanese Equity Fund
Portfolio statement (continued) as at 30 June 2018
Quilter Investors OEIC
346
Market Percentage of
Value total net assets Holding Investment £’000 %
Technology Hardware & Equipment 4.08% (31 December 2017 4.12%) 102,800 Canon 2,566 1.08 109,800 Fujifilm 3,263 1.37 692,000 Fujitsu 3,196 1.34
90,900 Renesas Electronics 677 0.29
9,702 4.08
Tobacco 0.58% (31 December 2017 0.59%) 64,700 Japan Tobacco 1,376 0.58
1,376 0.58
Travel & Leisure 6.44% (31 December 2017 6.25%) 24,100 Central Japan Railway 3,802 1.60 88,200 East Japan Railway 6,432 2.71
187,600 Japan Airlines 5,068 2.13
15,302 6.44
Investment assets 230,441 96.95
Net other assets 7,243 3.05
Total net assets 237,684 100.00
All investments are approved securities being either officially listed in a member state or traded on or under the rules of an eligible securities market, unless otherwise stated.
All investments are in ordinary shares unless otherwise stated.

Quilter Investors Japanese Equity Fund
Quilter Investors OEIC
347
Statement of total return for the period from 1 January 2018 to 30 June 2018 01.01.18 to 01.01.18 to 01.01.17 to 01.01.17 to
30.06.18 30.06.18 30.06.17 30.06.17
Note £'000 £'000 £'000 £'000
Income
Net capital (losses)/gains (2,368) 1,837
Revenue 2,555 1,389
Expenses (984) (587)
Net revenue before taxation 1,571 802
Taxation (249) (143)
Net revenue after taxation 1,322 659
Total return before distributions (1,046) 2,496
Distributions 2 235 253
Change in net assets attributable to
shareholders from investment activities (811) 2,749
Statement of change in net assets attributable to shareholders for the period from 1 January 2018 to 30 June 2018 01.01.18 to 01.01.18 to 01.01.17 to 01.01.17 to
30.06.18 30.06.18 30.06.17 30.06.17
£'000 £'000 £'000 £'000
Opening net assets attributable to shareholders 191,662* 96,339
Amounts received on issue of shares 57,332 63,820
Amounts paid on cancellation of shares (10,570) (6,346)
46,762 57,474
Dilution adjustment 71 91
Change in net assets attributable to
shareholders from investment activities (811) 2,749
Closing net assets attributable to shareholders 237,684 156,653* * Section 3.30 of the SORP issued by the Investment Management Association in May 2014 requires comparative figures for the above statement. For interim financial
statements this will result in the closing comparative net assets not being equal to net assets at the start of the current period.

Quilter Investors Japanese Equity Fund
Quilter Investors OEIC
348
Balance sheet as at 30 June 2018 30.06.18 31.12.17
£'000 £'000
Assets
Fixed assets
Investments 230,441 186,461
Current assets
Debtors 2,432 774
Cash and bank balances 5,994 4,639
Total assets 238,867 191,874
Liabilities
Creditors
Other creditors (1,183) (212)
Total liabilities (1,183) (212)
Net assets attributable to shareholders 237,684 191,662

Quilter Investors Japanese Equity Fund
Notes to the financial statements for the period from 1 January 2018 to 30 June 2018
Quilter Investors OEIC
349
1 Accounting policies The financial statements have been prepared under the historical cost basis, as modified by the revaluation of investments, and in accordance with the Statement of Recommended Practice (SORP) for Authorised Funds, issued by the Investment Management Association in May 2014.
The accounting policies applied are consistent with those disclosed within the annual Financial Statements for the year ended 31 December 2017.
2 Distributions
The distributions take account of revenue received on the issue of shares and revenue deducted on the cancellation of shares, and comprise:
01.01.18 to 01.01.17 to 30.06.18 30.06.17 £'000 £'000 Revenue deducted on cancellation of shares 24 14 Revenue received on issue of shares (259) (267) Distributions (235) (253)
Reconciliation of distributions: Net revenue after taxation 1,322 659 Undistributed net revenue carried forward (1,557) (912) Distributions (235) (253)

Quilter Investors Natural Resources Equity Fund
Quilter Investors Natural Resources Equity Fund
Quilter Investors OEIC
350
Launch date 30 April 2013
IA Sector Specialist
Investment adviser JPMorgan Asset Management (UK) Limited
Net asset value £20,172,144
Objective
The sub-fund aims to achieve capital growth.
Policy
The sub-fund primarily invests, directly and indirectly, in shares issued by companies located anywhere in the world, that are engaged in natural resources and commodities businesses. The sub-fund may at times be concentrated in terms of the number of investments it holds.
The sub-fund may also invest in other transferable securities, collective investment schemes (including those managed or operated by the ACD), warrants, money market instruments, deposits and derivatives.
The sub-fund may only use derivatives for efficient portfolio management purposes.
The sub-fund is managed by an investment adviser selected by the ACD for their expected ability to manage the sub-fund according to the investment objective and policy. The ACD continuously monitors and may periodically make changes to this appointment.
Investment Manager’s review
Market Review
Whilst the mining sector outperformed the energy sector in the first three months of 2018, both sectors delivered negative absolute returns during a period that saw the abrupt return of volatility to global markets. The correction in commodities was exacerbated by the possibility of a looming trade war between the US and China. Iron ore fell over the first half of the period, following reports of a sharp rise of steel inventories in March as demand has not rebounded as much as the market was expecting. Base metals were not immune from concerns around global trade and a strengthening dollar with aluminium (-11.5%), copper (-6.8%) and lead (-6.8%) faring the worst. Of the other non-ferrous metals, nickel (+5.4%) proved to be the exception as strong demand for industrial uses particularly from China saw the metal demonstrate resilience. Oil was a beneficiary of rising geopolitical tension with the price rising over concerns that Washington could reintroduce sanctions against Iran, OPEC’s third largest producer. Also a beneficiary of geopolitical uncertainty, gold endured a turbulent quarter selling off sharply as the possibility of tighter monetary policy in the US weighed on the yellow metal before rallying as uncertainty rose over global tensions around trade.
Performance of the natural resources sector was more positive in the second half of the period, and outperformed the broader equity market as represented by the MSCI World Index. The energy sector outperformed the mining sector but both sectors delivered positive absolute returns in a period where market volatility remained elevated. Oil rose throughout the second half of the period, despite the decision by OPEC that they will boost oil production by one million barrels a day. Base metals registered a small gain with nickel (+11.9%) the top performer as optimism around electric vehicles and a tight market helped push up prices. Aluminium (+6.4%) also enjoyed gains following sanctions by the US against Russian aluminium producer, Rusal, sent the prices higher as concerns mounted over tightening supply. Iron ore delivered a positive return as optimism around Chinese steel mills potentially replenishing their stockpiles was counterbalanced by negative trade rhetoric. The conflicting forces of geopolitical tensions and the prospect of further interest rate rises saw gold decline this quarter.
Performance
Sub-fund performance in the first half of the period was roughly in line with its comparator, with the main driver of underperformance being stock selection in the “diamonds & other” and “gold & precious metals” sectors. Stock selection in the “oil & gas exploration & production” sector however dampened these negative returns and was the leading contributor. GeoPark was the leading contributor following the announcement of stronger than expected year end. Osisko Mining was the leading detractor as investors grew impatient regarding the release of a discovered resource.
Performance improved towards the end of the period, outperforming its benchmark for the three months to 30 June 2018. The main driver of the outperformance was stock selection and an overweight position to the oil & gas exploration & production sector and stock selection in the integrated oil & gas sector. GeoPark rose sharply
following their announcement of further expansion in the Neuquen basin in Argentina. The leading contributor in the portfolio came from the base metals sector with Arizona Mining performing particularly well following a $1.3bn bid from diversified mining group, South32. The sector which detracted the most in the second half of the period, was gold & precious metals where stock selection negatively impacted returns. Osisko Mining, the Canadian gold developer was the leading stock detractor.
Risk and Reward Profile
The calculated risk and reward category, as shown above, uses a method of calculation derived from EU rules. It is based on the rate at which the returns of the sub-fund have moved up and down in the past (i.e. volatility) and is not a guide to the future risk and reward category of the sub-fund. The category shown is not a target or guarantee and may shift over time. Even the lowest category 1 does not mean a risk-free investment. The seven-category scale is nonlinear, for example, 2 is not twice as risky as 1.
Sub-funds in category 6 have in the past shown relatively high volatility. With a sub-fund of category 6, you have a relatively high risk of losing money but your chance for gains is also relatively high.
Investment risk - there is no guarantee that the sub-fund will achieve its objective. A capital loss of some or all of the amount invested may occur.
Sector concentration risk - the sub-fund's investments are concentrated in natural resource companies, and may be subject to a greater degree of risk and volatility than a sub-fund following a more diversified strategy.
Emerging markets risk - less developed countries may face more political, economic or structural challenges than developed countries.
Concentration risk (number of investments) - the sub-fund may at times hold a smaller number of investments, and therefore a fall in the value of a single investment may have a greater impact on the sub-fund’s value than if it held a larger number of investments.
Smaller companies risk - smaller companies are subject to greater risk and reward potential. Investments may be volatile or difficult to buy or sell.
Liquidity risk - some investments may become hard to value or sell at a desired time and price. In extreme circumstances this may affect the sub-fund’s ability to meet redemption requests upon demand.
Currency risk (EUR share class) - the sub-fund is denominated in British Pounds but holds assets denominated in other currencies. This share class is denominated in Euro. The value of your shares may rise and fall as a result of exchange rate movements between these currencies.
Currency risk (GBP share class) - the sub-fund is denominated in British Pounds but holds assets denominated in other currencies. The value of your shares may rise and fall as a result of exchange rate movements between these currencies.
Currency risk (USD share class) - the sub-fund is denominated in British Pounds but may hold assets denominated in other currencies. This share class is denominated in US Dollars. The value of your shares may rise and fall as a result of exchange rate movements between these currencies.
Derivative risk - the sub-fund may use derivatives to reduce costs and/or the overall risk of the sub-fund (i.e. Efficient Portfolio Management (EPM)). Derivatives involve a level of risk, however, for EPM they should not increase the overall riskiness of the sub-fund. Derivatives also involve counterparty risk where the institutions acting as counterparty to derivatives may not meet their contractual obligations.
Capital erosion risk - the sub-fund takes its charges from the income of the sub-fund in the first instance. The impact of sub-fund charges may be material on the value of any income you receive from your investment. There is potential for capital erosion if insufficient income is generated by the sub-fund to cover these charges. Capital erosion may have the effect of reducing the level of income generated.
For full details of the sub-fund's risks, please see the section in the prospectus headed "Risks".

Quilter Investors Natural Resources Equity Fund
Quilter Investors OEIC
351
Performance Records Comparative Tables 1 January 2018 to 1 January 2017 to 1 January 2016 to Accumulation 'A' 30 June 2018 31 December 2017 31 December 2016 p/share p/share p/share Change in net assets per share
Opening net asset value per share 104.20 94.94 52.10
Return before operating charges* 5.79 10.85 44.04 Operating charges** (0.87) (1.59) (1.20)
Return after operating charges* 4.92 9.26 42.84
Distributions - (0.51) 0.13 Retained distributions - 0.51 (0.13)
Closing net asset value per share 109.12 104.20 94.94
* after direct transaction costs of*** 0.07 0.06 0.07
Performance Return after charges 4.72% 9.75% 82.23%
Other information Closing net asset value (£) 19,456,298 20,406,323 24,438,641 Closing number of shares 17,830,417 19,584,053 25,740,773 Operating charges**** 1.68% 1.65% 1.65% Direct transaction costs*** 0.13% 0.07% 0.10%
Prices pence per share pence per share pence per share Highest share price 112.9 104.7 95.74 Lowest share price 95.27 86.22 44.29
1 January 2018 to 1 January 2017 to 1 January 2016 to Accumulation 'A' EUR† 30 June 2018 31 December 2017 31 December 2016 p/share p/share p/share Change in net assets per share
Opening net asset value per share 134.05 122.14 79.00
Return before operating charges* 7.45 13.96 44.53 Operating charges** (1.12) (2.05) (1.39)
Return after operating charges* 6.33 11.91 43.14
Distributions - (0.65) 0.08 Retained distributions - 0.65 (0.08)
Closing net asset value per share 140.38 134.05 122.14
* after direct transaction costs of*** 0.08 0.08 0.11
Performance Return after charges 4.72% 9.75% 54.61%
Other information Closing net asset value (£) 35,087 33,504 30,528 Closing number of shares 24,994 24,994 24,994 Operating charges**** 1.68% 1.65% 1.66% Direct transaction costs*** 0.13% 0.07% 0.10%
Prices cents per share cents per share cents per share Highest share price 165.4 158.5 146.8 Lowest share price 139.9 127.0 96.38

Quilter Investors Natural Resources Equity Fund
Quilter Investors OEIC
352
Comparative Tables (continued) 1 January 2018 to 1 January 2017 to 1 January 2016 to Accumulation 'A' USD 30 June 2018 31 December 2017 31 December 2016 p/share p/share p/share Change in net assets per share
Opening net asset value per share 119.16 108.57 59.56
Return before operating charges* 6.61 12.40 50.62 Operating charges** (0.99) (1.81) (1.61)
Return after operating charges* 5.62 10.59 49.01
Distributions - (0.66) 0.19 Retained distributions - 0.66 (0.19)
Closing net asset value per share 124.78 119.16 108.57
* after direct transaction costs of*** 0.07 0.07 0.10
Performance Return after charges 4.72% 9.75% 82.29%
Other information Closing net asset value (£) 574,756 532,444 266,012 Closing number of shares 460,605 446,841 245,006 Operating Charges**** 1.68% 1.65% 1.65% Direct transaction costs*** 0.13% 0.07% 0.10%
Prices cents per share cents per share cents per share Highest share price 173.7 160.9 138.3 Lowest share price 153.2 126.0 71.52
1 January 2018 to 1 January 2017 to 1 January 2016 to Accumulation 'U2' 30 June 2018 31 December 2017 31 December 2016 p/share p/share p/share Change in net assets per share
Opening net asset value per share 107.81 97.38 52.95
Return before operating charges* 6.02 11.18 45.00 Operating charges** (0.42) (0.75) (0.57)
Return after operating charges* 5.60 10.43 44.43
Distributions - (1.43) 0.82 Retained distributions - 1.43 (0.82)
Closing net asset value per share 113.41 107.81 97.38
* after direct transaction costs of*** 0.07 0.07 0.08
Performance Return after charges 5.19% 10.71% 83.91%
Other information Closing net asset value (£) 106,003 101,262 74,642 Closing number of shares 93,471 93,928 76,653 Operating Charges**** 0.78% 0.75% 0.75% Direct transaction costs*** 0.13% 0.07% 0.10%
Prices pence per share pence per share pence per share Highest share price 117.2 107.7 98.16 Lowest share price 98.80 88.68 45.05
† From 31 March 2016 ** The operating charges include all costs borne by the sub-fund, except for direct transaction costs.
*** The direct transaction costs are made up of fees and commissions paid to agents, advisers, brokers and dealers, levies by regulatory agencies and securities exchanges as well as transfer taxes and duties. They do not include any difference between the quoted bid and offer prices or internal administrative or holding costs. These costs arise as a result of transactions undertaken both for efficient portfolio management and the meeting of the sub-fund’s objectives. These costs exclude any effect of dilution adjustments used to offset the costs.
**** The operating charges percentage is the ratio of the sub-fund's ongoing charges (excluding interest on borrowings) to the average net assets of the sub-fund. If the share class launched during the period the operating charges figures are annualised.

Quilter Investors Natural Resources Equity Fund
Quilter Investors OEIC
353
Performance
6 months to 30 June 2018
1 year to 30 June 2018
3 years to 30 June 2018
5 years to 30 June 2018
Quilter Investors Natural Resources Equity Fund* 5.20% 24.22% 55.25% 29.58%
JPM Global Natural Resources Composite (benchmark) 3.44% 20.88% 70.32% 45.08%
JPM Global Natural Resources Composite (sector average) (1.36)% 4.13% 29.77% 40.14%
Quartile ranking 1 1 1 3
* Accumulation ‘U2’ shares
Data Source – Factset. Figures are calculated on a total return and single price basis, with net income reinvested into the sub-fund.
Portfolio allocation North America 38.38% Europe 28.27% Asia Pacific (excluding Japan) 13.62% United Kingdom 13.32% South America 5.57% Net other assets 0.84% Total 100.00%
Asset allocation Equities 99.16% Net other assets 0.84%
Total 100.00%
Major holdings Percentage of portfolio BHP Billiton (UK Listing) 9.05% Royal Dutch Shell 'B' 6.76% Rio Tinto (UK Listing) 6.25% Glencore 5.50% Chevron 3.96% Total 3.25% Vale (US Listing) 3.18% Lundin Petroleum 3.16% BP 3.15% Parex Resources 3.08% Number of holdings 122
Total Purchases and Sales for the period
2018 2017
£'000 £'000
Total purchases for the 6 month period to 30 June 3,255 2,547
Total sales for the 6 month period to 30 June 4,982 5,397
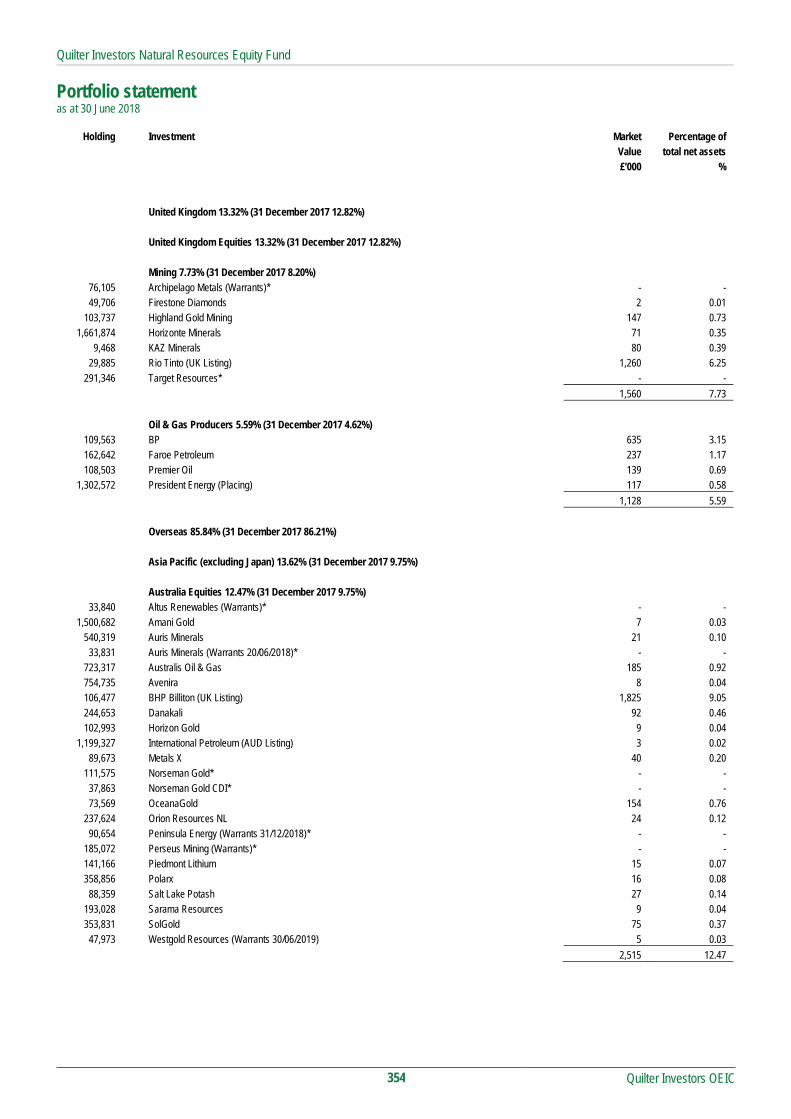
Quilter Investors Natural Resources Equity Fund
Portfolio statement as at 30 June 2018
Quilter Investors OEIC
354
Holding Investment Market Percentage of
Value total net assets £'000 %
United Kingdom 13.32% (31 December 2017 12.82%)
United Kingdom Equities 13.32% (31 December 2017 12.82%)
Mining 7.73% (31 December 2017 8.20%) 76,105 Archipelago Metals (Warrants)* - - 49,706 Firestone Diamonds 2 0.01
103,737 Highland Gold Mining 147 0.73 1,661,874 Horizonte Minerals 71 0.35
9,468 KAZ Minerals 80 0.39 29,885 Rio Tinto (UK Listing) 1,260 6.25
291,346 Target Resources* - -
1,560 7.73
Oil & Gas Producers 5.59% (31 December 2017 4.62%) 109,563 BP 635 3.15 162,642 Faroe Petroleum 237 1.17 108,503 Premier Oil 139 0.69
1,302,572 President Energy (Placing) 117 0.58
1,128 5.59
Overseas 85.84% (31 December 2017 86.21%)
Asia Pacific (excluding Japan) 13.62% (31 December 2017 9.75%)
Australia Equities 12.47% (31 December 2017 9.75%) 33,840 Altus Renewables (Warrants)* - -
1,500,682 Amani Gold 7 0.03 540,319 Auris Minerals 21 0.10
33,831 Auris Minerals (Warrants 20/06/2018)* - - 723,317 Australis Oil & Gas 185 0.92 754,735 Avenira 8 0.04 106,477 BHP Billiton (UK Listing) 1,825 9.05 244,653 Danakali 92 0.46 102,993 Horizon Gold 9 0.04
1,199,327 International Petroleum (AUD Listing) 3 0.02 89,673 Metals X 40 0.20
111,575 Norseman Gold* - - 37,863 Norseman Gold CDI* - - 73,569 OceanaGold 154 0.76
237,624 Orion Resources NL 24 0.12 90,654 Peninsula Energy (Warrants 31/12/2018)* - -
185,072 Perseus Mining (Warrants)* - - 141,166 Piedmont Lithium 15 0.07 358,856 Polarx 16 0.08
88,359 Salt Lake Potash 27 0.14 193,028 Sarama Resources 9 0.04 353,831 SolGold 75 0.37
47,973 Westgold Resources (Warrants 30/06/2019) 5 0.03
2,515 12.47

Quilter Investors Natural Resources Equity Fund
Portfolio statement (continued) as at 30 June 2018
Quilter Investors OEIC
355
Holding Investment Market Percentage of
Value total net assets £'000 %
China Equities 1.15% (31 December 2017 0.00%) 177,000 CNOOC (HK Listing) 232 1.15 146,000 Real Gold Mining* - -
232 1.15
Europe 28.27% (31 December 2017 27.79%)
France Equities 3.25% (31 December 2017 2.92%) 14,149 Total 655 3.25
655 3.25
Guernsey Equities 0.00% (31 December 2017 0.00%) 10,878 Kerogen Shale* - -
- -
Italy Equities 0.00% (31 December 2017 0.53%)
Monaco Equities 0.40% (31 December 2017 0.31%) 5,913 Endeavour Mining 80 0.40
80 0.40
Netherlands Equities 6.76% (31 December 2017 3.74%) 49,982 Royal Dutch Shell 'B' 1,363 6.76
1,363 6.76
Norway Equities 3.92% (31 December 2017 3.30%) 15,234 Aker 433 2.14 78,668 Norsk Hydro 358 1.78
791 3.92
Portugal Equities 2.41% (31 December 2017 2.34%) 33,957 Galp Energia 487 2.41
487 2.41
Russia Equities 0.97% (31 December 2017 3.15%) 14,391 MMC Norilsk Nickel ADR 196 0.97
196 0.97
Sweden Equities 5.06% (31 December 2017 5.52%) 15,614 Boliden 383 1.90 26,154 Lundin Petroleum 637 3.16
1,020 5.06
Switzerland Equities 5.50% (31 December 2017 5.98%) 306,694 Glencore 1,109 5.50
1,109 5.50
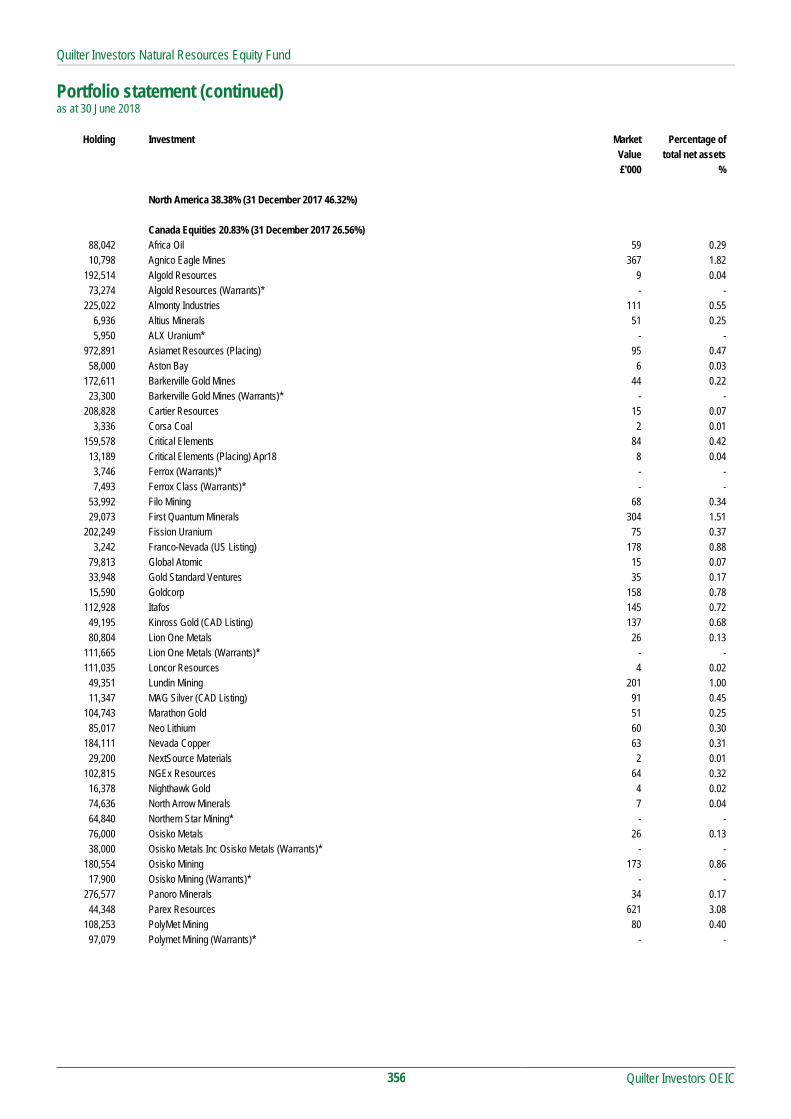
Quilter Investors Natural Resources Equity Fund
Portfolio statement (continued) as at 30 June 2018
Quilter Investors OEIC
356
Holding Investment Market Percentage of
Value total net assets £'000 %
North America 38.38% (31 December 2017 46.32%)
Canada Equities 20.83% (31 December 2017 26.56%) 88,042 Africa Oil 59 0.29 10,798 Agnico Eagle Mines 367 1.82
192,514 Algold Resources 9 0.04 73,274 Algold Resources (Warrants)* - -
225,022 Almonty Industries 111 0.55 6,936 Altius Minerals 51 0.25 5,950 ALX Uranium* - -
972,891 Asiamet Resources (Placing) 95 0.47 58,000 Aston Bay 6 0.03
172,611 Barkerville Gold Mines 44 0.22 23,300 Barkerville Gold Mines (Warrants)* - -
208,828 Cartier Resources 15 0.07 3,336 Corsa Coal 2 0.01
159,578 Critical Elements 84 0.42 13,189 Critical Elements (Placing) Apr18 8 0.04 3,746 Ferrox (Warrants)* - - 7,493 Ferrox Class (Warrants)* - -
53,992 Filo Mining 68 0.34 29,073 First Quantum Minerals 304 1.51
202,249 Fission Uranium 75 0.37 3,242 Franco-Nevada (US Listing) 178 0.88
79,813 Global Atomic 15 0.07 33,948 Gold Standard Ventures 35 0.17 15,590 Goldcorp 158 0.78
112,928 Itafos 145 0.72 49,195 Kinross Gold (CAD Listing) 137 0.68 80,804 Lion One Metals 26 0.13
111,665 Lion One Metals (Warrants)* - - 111,035 Loncor Resources 4 0.02
49,351 Lundin Mining 201 1.00 11,347 MAG Silver (CAD Listing) 91 0.45
104,743 Marathon Gold 51 0.25 85,017 Neo Lithium 60 0.30
184,111 Nevada Copper 63 0.31 29,200 NextSource Materials 2 0.01
102,815 NGEx Resources 64 0.32 16,378 Nighthawk Gold 4 0.02 74,636 North Arrow Minerals 7 0.04 64,840 Northern Star Mining* - - 76,000 Osisko Metals 26 0.13 38,000 Osisko Metals Inc Osisko Metals (Warrants)* - -
180,554 Osisko Mining 173 0.86 17,900 Osisko Mining (Warrants)* - -
276,577 Panoro Minerals 34 0.17 44,348 Parex Resources 621 3.08
108,253 PolyMet Mining 80 0.40 97,079 Polymet Mining (Warrants)* - -
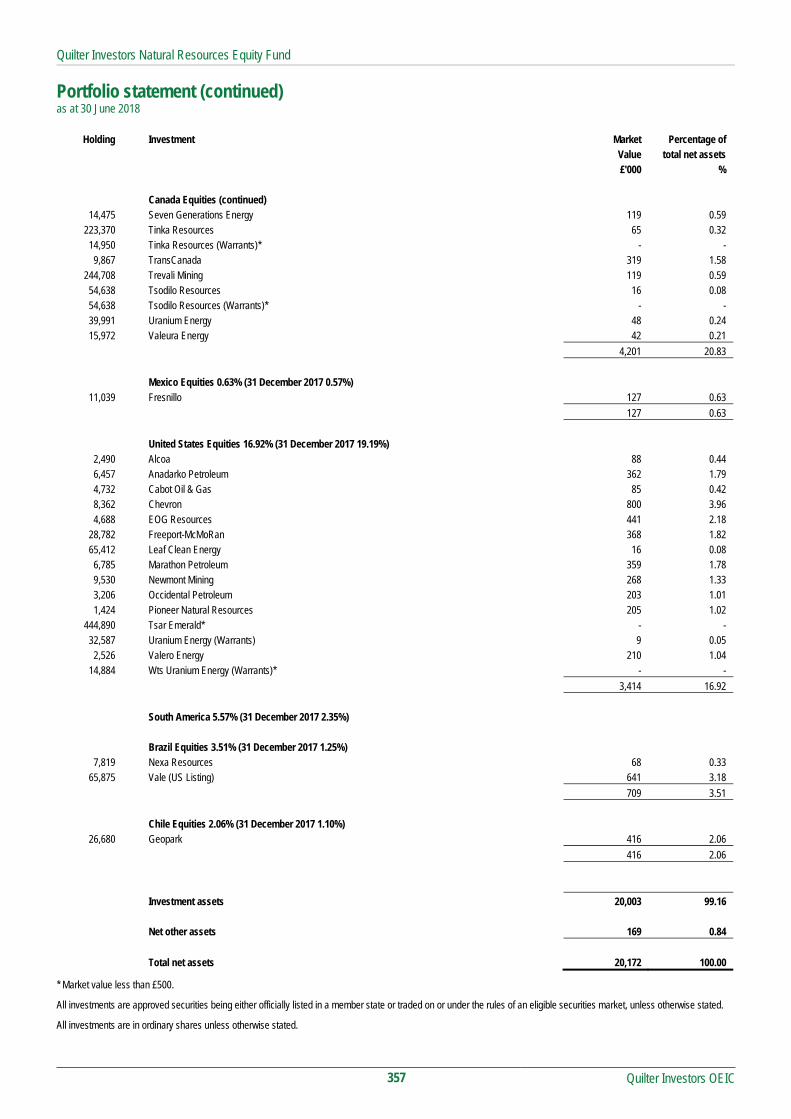
Quilter Investors Natural Resources Equity Fund
Portfolio statement (continued) as at 30 June 2018
Quilter Investors OEIC
357
Holding Investment Market Percentage of
Value total net assets £'000 % Canada Equities (continued)
14,475 Seven Generations Energy 119 0.59 223,370 Tinka Resources 65 0.32
14,950 Tinka Resources (Warrants)* - - 9,867 TransCanada 319 1.58
244,708 Trevali Mining 119 0.59 54,638 Tsodilo Resources 16 0.08 54,638 Tsodilo Resources (Warrants)* - - 39,991 Uranium Energy 48 0.24 15,972 Valeura Energy 42 0.21
4,201 20.83
Mexico Equities 0.63% (31 December 2017 0.57%) 11,039 Fresnillo 127 0.63
127 0.63
United States Equities 16.92% (31 December 2017 19.19%) 2,490 Alcoa 88 0.44 6,457 Anadarko Petroleum 362 1.79 4,732 Cabot Oil & Gas 85 0.42 8,362 Chevron 800 3.96 4,688 EOG Resources 441 2.18
28,782 Freeport-McMoRan 368 1.82 65,412 Leaf Clean Energy 16 0.08 6,785 Marathon Petroleum 359 1.78 9,530 Newmont Mining 268 1.33 3,206 Occidental Petroleum 203 1.01 1,424 Pioneer Natural Resources 205 1.02
444,890 Tsar Emerald* - - 32,587 Uranium Energy (Warrants) 9 0.05 2,526 Valero Energy 210 1.04
14,884 Wts Uranium Energy (Warrants)* - -
3,414 16.92
South America 5.57% (31 December 2017 2.35%)
Brazil Equities 3.51% (31 December 2017 1.25%) 7,819 Nexa Resources 68 0.33
65,875 Vale (US Listing) 641 3.18
709 3.51
Chile Equities 2.06% (31 December 2017 1.10%) 26,680 Geopark 416 2.06
416 2.06
Investment assets 20,003 99.16
Net other assets 169 0.84
Total net assets 20,172 100.00
* Market value less than £500.
All investments are approved securities being either officially listed in a member state or traded on or under the rules of an eligible securities market, unless otherwise stated.
All investments are in ordinary shares unless otherwise stated.

Quilter Investors Natural Resources Equity Fund
Quilter Investors OEIC
358
Statement of total return for the period from 1 January 2018 to 30 June 2018 01.01.18 to 01.01.18 to 01.01.17 to 01.01.17 to
30.06.18 30.06.18 30.06.17 30.06.17
Note £'000 £'000 £'000 £'000
Income
Net capital gains/(losses) 835 (1,620)
Revenue 270 285
Expenses (160) (186)
Net revenue before taxation 110 99
Taxation (12) (15)
Net revenue after taxation 98 84
Total return before distributions 933 (1,536)
Distributions 2 (4) (9)
Change in net assets attributable to
shareholders from investment activities 929 (1,545)
Statement of change in net assets attributable to shareholders for the period from 1 January 2018 to 30 June 2018 01.01.18 to 01.01.18 to 01.01.17 to 01.01.17 to
30.06.18 30.06.18 30.06.17 30.06.17
£'000 £'000 £'000 £'000
Opening net assets attributable to shareholders 21,074* 24,810
Amounts received on issue of shares 1,263 1,752
Amounts paid on cancellation of shares (3,101) (5,230)
(1,838) (3,478)
Dilution adjustment 7 14
Change in net assets attributable to
shareholders from investment activities 929 (1,545)
Closing net assets attributable to shareholders 20,172 19,801* * Section 3.30 of the SORP issued by the Investment Management Association in May 2014 requires comparative figures for the above statement. For interim financial
statements this will result in the closing comparative net assets not being equal to net assets at the start of the current period.

Quilter Investors Natural Resources Equity Fund
Quilter Investors OEIC
359
Balance sheet
as at 30 June 2018
30.06.18 31.12.17
£'000 £'000
Assets
Fixed assets
Investments 20,003 20,870
Current assets
Debtors 66 47
Cash and bank balances 226 289
Total assets 20,295 21,206
Liabilities
Creditors
Other creditors (123) (132)
Total liabilities (123) (132)
Net assets attributable to shareholders 20,172 21,074

Quilter Investors Natural Resources Equity Fund
Notes to the financial statements for the period from 1 January 2018 to 30 June 2018
Quilter Investors OEIC
360
1 Accounting policies The financial statements have been prepared under the historical cost basis, as modified by the revaluation of investments, and in accordance with the Statement of Recommended Practice (SORP) for Authorised Funds, issued by the Investment Management Association in May 2014.
The accounting policies applied are consistent with those disclosed within the annual Financial Statements for the year ended 31 December 2017.
2 Distributions The distributions take account of revenue received on the issue of units and revenue deducted on the cancellation of units, and comprise:
01.01.18 to 01.01.17 to 30.06.18 30.06.17 £'000 £'000 Revenue deducted on cancellation of shares 6 10 Revenue received on issue of shares (2) (1) Distributions 4 9
Reconciliation of distributions: Net revenue after taxation 98 84
Undistributed net revenue carried forward (94) (75) Distributions 4 9
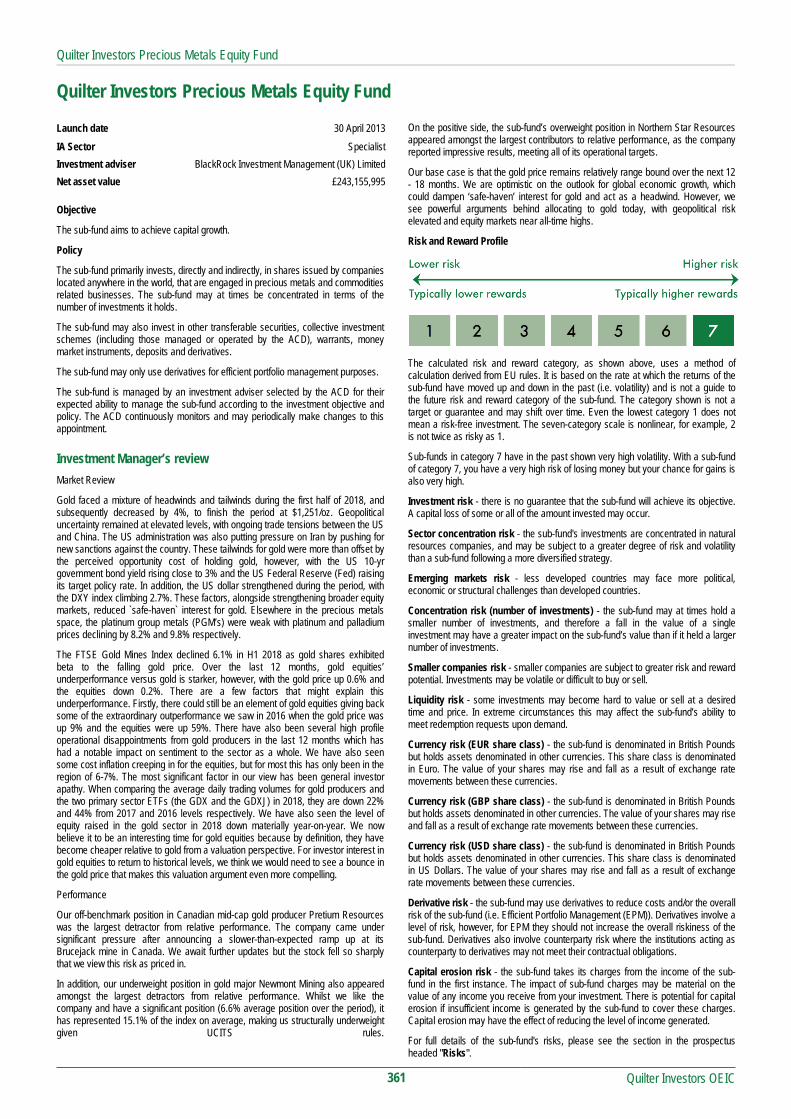
Quilter Investors Precious Metals Equity Fund
Quilter Investors Precious Metals Equity Fund
Quilter Investors OEIC
361
Launch date 30 April 2013
IA Sector Specialist
Investment adviser BlackRock Investment Management (UK) Limited
Net asset value £243,155,995
Objective
The sub-fund aims to achieve capital growth.
Policy
The sub-fund primarily invests, directly and indirectly, in shares issued by companies located anywhere in the world, that are engaged in precious metals and commodities related businesses. The sub-fund may at times be concentrated in terms of the number of investments it holds.
The sub-fund may also invest in other transferable securities, collective investment schemes (including those managed or operated by the ACD), warrants, money market instruments, deposits and derivatives.
The sub-fund may only use derivatives for efficient portfolio management purposes.
The sub-fund is managed by an investment adviser selected by the ACD for their expected ability to manage the sub-fund according to the investment objective and policy. The ACD continuously monitors and may periodically make changes to this appointment.
Investment Manager’s review
Market Review
Gold faced a mixture of headwinds and tailwinds during the first half of 2018, and subsequently decreased by 4%, to finish the period at $1,251/oz. Geopolitical uncertainty remained at elevated levels, with ongoing trade tensions between the US and China. The US administration was also putting pressure on Iran by pushing for new sanctions against the country. These tailwinds for gold were more than offset by the perceived opportunity cost of holding gold, however, with the US 10-yr government bond yield rising close to 3% and the US Federal Reserve (Fed) raising its target policy rate. In addition, the US dollar strengthened during the period, with the DXY index climbing 2.7%. These factors, alongside strengthening broader equity markets, reduced `safe-haven` interest for gold. Elsewhere in the precious metals space, the platinum group metals (PGM’s) were weak with platinum and palladium prices declining by 8.2% and 9.8% respectively.
The FTSE Gold Mines Index declined 6.1% in H1 2018 as gold shares exhibited beta to the falling gold price. Over the last 12 months, gold equities’ underperformance versus gold is starker, however, with the gold price up 0.6% and the equities down 0.2%. There are a few factors that might explain this underperformance. Firstly, there could still be an element of gold equities giving back some of the extraordinary outperformance we saw in 2016 when the gold price was up 9% and the equities were up 59%. There have also been several high profile operational disappointments from gold producers in the last 12 months which has had a notable impact on sentiment to the sector as a whole. We have also seen some cost inflation creeping in for the equities, but for most this has only been in the region of 6-7%. The most significant factor in our view has been general investor apathy. When comparing the average daily trading volumes for gold producers and the two primary sector ETFs (the GDX and the GDXJ) in 2018, they are down 22% and 44% from 2017 and 2016 levels respectively. We have also seen the level of equity raised in the gold sector in 2018 down materially year-on-year. We now believe it to be an interesting time for gold equities because by definition, they have become cheaper relative to gold from a valuation perspective. For investor interest in gold equities to return to historical levels, we think we would need to see a bounce in the gold price that makes this valuation argument even more compelling.
Performance
Our off-benchmark position in Canadian mid-cap gold producer Pretium Resources was the largest detractor from relative performance. The company came under significant pressure after announcing a slower-than-expected ramp up at its Brucejack mine in Canada. We await further updates but the stock fell so sharply that we view this risk as priced in.
In addition, our underweight position in gold major Newmont Mining also appeared amongst the largest detractors from relative performance. Whilst we like the company and have a significant position (6.6% average position over the period), it has represented 15.1% of the index on average, making us structurally underweight given UCITS rules.
On the positive side, the sub-fund’s overweight position in Northern Star Resources appeared amongst the largest contributors to relative performance, as the company reported impressive results, meeting all of its operational targets.
Our base case is that the gold price remains relatively range bound over the next 12 - 18 months. We are optimistic on the outlook for global economic growth, which could dampen ‘safe-haven’ interest for gold and act as a headwind. However, we see powerful arguments behind allocating to gold today, with geopolitical risk elevated and equity markets near all-time highs.
Risk and Reward Profile
The calculated risk and reward category, as shown above, uses a method of calculation derived from EU rules. It is based on the rate at which the returns of the sub-fund have moved up and down in the past (i.e. volatility) and is not a guide to the future risk and reward category of the sub-fund. The category shown is not a target or guarantee and may shift over time. Even the lowest category 1 does not mean a risk-free investment. The seven-category scale is nonlinear, for example, 2 is not twice as risky as 1.
Sub-funds in category 7 have in the past shown very high volatility. With a sub-fund of category 7, you have a very high risk of losing money but your chance for gains is also very high.
Investment risk - there is no guarantee that the sub-fund will achieve its objective. A capital loss of some or all of the amount invested may occur.
Sector concentration risk - the sub-fund's investments are concentrated in natural resources companies, and may be subject to a greater degree of risk and volatility than a sub-fund following a more diversified strategy.
Emerging markets risk - less developed countries may face more political, economic or structural challenges than developed countries.
Concentration risk (number of investments) - the sub-fund may at times hold a smaller number of investments, and therefore a fall in the value of a single investment may have a greater impact on the sub-fund’s value than if it held a larger number of investments.
Smaller companies risk - smaller companies are subject to greater risk and reward potential. Investments may be volatile or difficult to buy or sell.
Liquidity risk - some investments may become hard to value or sell at a desired time and price. In extreme circumstances this may affect the sub-fund’s ability to meet redemption requests upon demand.
Currency risk (EUR share class) - the sub-fund is denominated in British Pounds but holds assets denominated in other currencies. This share class is denominated in Euro. The value of your shares may rise and fall as a result of exchange rate movements between these currencies.
Currency risk (GBP share class) - the sub-fund is denominated in British Pounds but holds assets denominated in other currencies. The value of your shares may rise and fall as a result of exchange rate movements between these currencies.
Currency risk (USD share class) - the sub-fund is denominated in British Pounds but holds assets denominated in other currencies. This share class is denominated in US Dollars. The value of your shares may rise and fall as a result of exchange rate movements between these currencies.
Derivative risk - the sub-fund may use derivatives to reduce costs and/or the overall risk of the sub-fund (i.e. Efficient Portfolio Management (EPM)). Derivatives involve a level of risk, however, for EPM they should not increase the overall riskiness of the sub-fund. Derivatives also involve counterparty risk where the institutions acting as counterparty to derivatives may not meet their contractual obligations.
Capital erosion risk - the sub-fund takes its charges from the income of the sub-fund in the first instance. The impact of sub-fund charges may be material on the value of any income you receive from your investment. There is potential for capital erosion if insufficient income is generated by the sub-fund to cover these charges. Capital erosion may have the effect of reducing the level of income generated.
For full details of the sub-fund's risks, please see the section in the prospectus headed "Risks".

Quilter Investors Precious Metals Equity Fund
Quilter Investors OEIC
362
Performance Records Comparative Tables
1 January 2018 to 1 January 2017 to 1 January 2016 to Accumulation 'A' 30 June 2018 31 December 2017 31 December 2016 p/share p/share p/share
Change in net assets per share Opening net asset value per share 97.87 101.64 58.07
Return before operating charges* (8.87) (1.80) 45.46 Operating charges** (0.85) (1.97) (1.89)
Return after operating charges* (9.72) (3.77) 43.57
Distributions - - - Retained distributions - - -
Closing net asset value per share 88.15 97.87 101.64
* after direct transaction costs of*** 0.05 0.13 0.47
Performance Return after charges (9.93)% (3.71)% 75.03%
Other information Closing net asset value (£) 18,394,911 22,851,511 27,269,325 Closing number of shares 20,867,817 23,347,827 26,830,315 Operating charges**** 1.93% 1.90% 1.90% Direct transaction costs*** 0.12% 0.12% 0.47%
Prices pence per share pence per share pence per share Highest share price 99.94 119.1 138.2 Lowest share price 83.49 91.79 55.33
1 January 2018 to 1 January 2017 to 1 January 2016 to Accumulation 'A' EUR† 30 June 2018 31 December 2017 31 December 2016 p/share p/share p/share
Change in net assets per share Opening net asset value per share 93.41 97.01 78.00
Return before operating charges* (8.47) (1.72) 20.99 Operating charges** (0.81) (1.88) (1.98)
Return after operating charges* (9.28) (3.60) 19.01
Distributions - - - Retained distributions - - -
Closing net asset value per share 84.13 93.41 97.01
* after direct transaction costs of*** 0.05 0.12 0.49
Performance Return after charges (9.93)% (3.71)% 24.37%
Other information Closing net asset value (£) 841 934 970 Closing number of shares 1,000 1,000 1,000 Operating charges**** 1.93% 1.90% 1.90% Direct transaction costs*** 0.12% 0.12% 0.47%
Prices cents per share cents per share cents per share Highest share price 107.6 133.4 153.6 Lowest share price 91.20 99.69 98.85

Quilter Investors Precious Metals Equity Fund
Quilter Investors OEIC
363
Comparative Tables (continued) 1 January 2018 to 1 January 2017 to 1 January 2016 to Accumulation 'A' USD 30 June 2018 31 December 2017 31 December 2016 p/share p/share p/share
Change in net assets per share Opening net asset value per share 115.46 119.92 68.48
Return before operating charges* (10.49) (2.11) 53.86 Operating charges** (0.99) (2.35) (2.42)
Return after operating charges* (11.48) (4.46) 51.44
Distributions - - - Retained distributions - - -
Closing net asset value per share 103.98 115.46 119.92
* after direct transaction costs of*** 0.06 0.15 0.60
Performance Return after charges (9.94)% (3.72)% 75.12%
Other information Closing net asset value (£) 496,943 101,887 71,950 Closing number of shares 477,922 88,246 60,000 Operating charges**** 1.93% 1.90% 1.90% Direct transaction costs*** 0.12% 0.12% 0.47%
Prices cents per share cents per share cents per share Highest share price 164.0 176.2 211.6 Lowest share price 136.2 144.3 92.41
1 January 2018 to 1 January 2017 to 1 January 2016 to Accumulation 'U2' 30 June 2018 31 December 2017 31 December 2016 p/share p/share p/share
Change in net assets per share Opening net asset value per share 118.97 122.26 69.12
Return before operating charges* (10.79) (2.23) 54.18 Operating charges** (0.47) (1.06) (1.04)
Return after operating charges* (11.26) (3.29) 53.14
Distributions - (0.23) - Retained distributions - 0.23 -
Closing net asset value per share 107.71 118.97 122.26
* after direct transaction costs of*** 0.06 0.16 0.57
Performance Return after charges (9.46)% (2.69)% 76.88%
Other information Closing net asset value (£) 224,263,300 242,085,655 126,872,173 Closing number of shares 208,209,726 203,491,818 103,774,902 Operating charges**** 0.88% 0.85% 0.85% Direct transaction costs*** 0.12% 0.12% 0.47%
Prices pence per share pence per share pence per share Highest share price 121.5 143.4 165.5 Lowest share price 101.7 111.5 65.90

Quilter Investors Precious Metals Equity Fund
Quilter Investors OEIC
364
Comparative Tables (continued) 1 January 2018 to 1 January 2017 to 1 January 2016 to Income 'U2'†† 30 June 2018 31 December 2017 31 December 2016 p/share p/share p/share
Change in net assets per share Opening net asset value per share 135.11 139.58 77.95
Return before operating charges* (7.05) (3.24) 62.89 Operating charges** (0.46) (1.23) (1.26)
Return after operating charges* (7.51) (4.47) 61.63
Distributions - - - Retained distributions - - -
Closing net asset value per share 127.60 135.11 139.58
* after direct transaction costs of*** 0.07 0.18 0.70
Performance Return after charges (5.56)% (3.20)% 79.06%
Other information Closing net asset value (£) - 33 1,204 Closing number of shares - 25 862 Operating charges**** 0.88% 0.85% 0.85% Direct transaction costs*** 0.12% 0.12% 0.47%
Prices pence per share pence per share pence per share Highest share price 138.8 163.8 189.0 Lowest share price 116.3 127.8 74.49
† From 31 March 2016
†† Closed on 4 June 2018 ** The operating charges include all costs borne by the sub-fund, except for direct transaction costs.
*** The direct transaction costs are made up of fees and commissions paid to agents, advisers, brokers and dealers, levies by regulatory agencies and securities exchanges as well as transfer taxes and duties. They do not include any difference between the quoted bid and offer prices or internal administrative or holding costs. These costs arise as a result of transactions undertaken both for efficient portfolio management and the meeting of the sub-fund’s objectives. These costs exclude any effect of dilution adjustments used to offset the costs.
**** The operating charges percentage is the ratio of the sub-fund's ongoing charges (excluding interest on borrowings) to the average net assets of the sub-fund. If the share class launched during the period the operating charges figures are annualised.

Quilter Investors Precious Metals Equity Fund
Quilter Investors OEIC
365
Performance 6 months to
30 June 2018
1 year to
30 June 2018
3 years to
30 June 2018
5 years to
30 June 2018
Quilter Investors Precious Metals Equity Fund* (9.42)% (10.24)% 36.52% 22.29%
FTSE Gold Mines Index (benchmark) (3.74)% (1.83)% 59.46% 20.06%
FTSE Gold Mines Index (sector average) (1.36)% 4.13% 29.77% 40.14%
Quartile ranking 4 4 2 3
* Accumulation ‘U2’ shares
Data Source – Factset. Figures are calculated on a total return and single price basis, with net income reinvested into the sub-fund.
Portfolio allocation
North America 60.04%
Asia Pacific (excluding Japan) 18.11%
United Kingdom 10.51%
Europe 9.06%
Africa 0.91%
South America 0.90%
Net other assets 0.47%
Total 100.00%
Asset allocation
Equities 99.52% Bonds 0.01%
Net other assets 0.47%
Total 100.00%
Major holdings Percentage of portfolio
Newcrest Mining 9.68%
Agnico Eagle Mines 9.51%
Randgold Resources ADR 7.02%
Newmont Mining 6.42%
Franco-Nevada (CAD Listing) 4.84%
Goldcorp 4.83%
Wheaton Precious Metals 4.41%
Kinross Gold (CAD Listing) 4.20%
Northern Star Resources 4.00%
Fresnillo 3.78%
Number of holdings 52
Total Purchases and Sales for the period
2018 2017
£’000 £’000
Total purchases for the 6 month period to 30 June 75,418 106,790
Total sales for the 6 month period to 30 June 70,290 54,415

Quilter Investors Precious Metals Equity Fund
Portfolio statement as at 30 June 2018
Quilter Investors OEIC
366
Market Percentage of Value total net assets
Holding Investment £’000 % United Kingdom 10.51% (31 December 2017 13.52%)
United Kingdom Equities 10.51% (31 December 2017 13.52%)
930,767 Acacia Mining 1,149 0.47 4,944,244 Centamin 5,876 2.42
25,308 Randgold Resources 1,469 0.60 298,191 Randgold Resources ADR 17,068 7.02
25,562 10.51
Overseas 89.02% (31 December 2017 85.97%) Africa 0.91% (31 December 2017 2.24%) South Africa Equities 0.91% (31 December 2017 2.24%)
3,842,206 Petra Diamonds 2,203 0.91
2,203 0.91
Asia Pacific (excluding Japan) 18.11% (31 December 2017 16.87%) Australia Equities 18.11% (31 December 2017 16.87%)
3,000,000 Apollo Minerals 396 0.16 7,192,811 Beadell Resources 270 0.11
128,111 BHP Billiton (UK Listing) 2,196 0.90 1,932,699 Newcrest Mining 23,529 9.68 2,395,129 Northern Star Resources 9,728 4.00 2,168,409 OceanaGold 4,545 1.87 6,032,471 Oklo Resources 998 0.41 1,450,000 Oklo Resources (Placing) 309 0.13 2,017,378 Westgold Resources 2,032 0.84
223,475 Westgold Resources (Warrants 30/06/2019) 24 0.01
44,027 18.11
Europe 9.06% (31 December 2017 5.89%) Belgium Equities 0.58% (31 December 2017 0.00%)
32,451 Umicore 1,420 0.58
1,420 0.58
Ireland Equities 2.31% (31 December 2017 0.85%)
5,614,563 BlackRock Institutional Cash Series Sterling Liquidity Fund - Income 5,615 2.31
5,615 2.31
Monaco Equities 3.40% (31 December 2017 2.19%)
607,005 Endeavour Mining 8,258 3.40
8,258 3.40
Russia Equities 1.98% (31 December 2017 2.85%)
192,264 Polyus PJSC 4,821 1.98
4,821 1.98
Switzerland Equities 0.79% (31 December 2017 0.00%)
530,524 Glencore 1,918 0.79
1,918 0.79

Quilter Investors Precious Metals Equity Fund
Portfolio statement (continued) as at 30 June 2018
Quilter Investors OEIC
367
Market Percentage of Value total net assets
Holding Investment £’000 % North America 60.04% (31 December 2017 60.02%) US Dollar Denominated Fixed Rate Corporate Bonds 0.01% (31 December 2017 0.01%)
$46,000 Banro 10% 01/03/2021 27 0.01
27 0.01
North America Equities 60.03% (31 December 2017 60.01%) Canada Equities 49.23% (31 December 2017 49.62%)
680,998 Agnico Eagle Mines 23,130 9.51 1,859,526 Alamos Gold (CAD Regd) 7,903 3.25
83,095 Alamos Gold (USD Regd) 354 0.15 1,615,000 Atlantic Gold 1,530 0.63 4,530,062 B2Gold 8,846 3.64 1,590,928 Belo Sun Mining 206 0.08 1,425,258 Centerra Gold (CAD Listing) 6,000 2.47 2,226,467 Dalradian Resources 1,841 0.76
286,841 Detour Gold 1,957 0.80 3,325,105 Eldorado Gold 2,463 1.01
213,898 Franco-Nevada (CAD Listing) 11,776 4.84 1,119,273 Gold Standard Ventures 1,144 0.47 1,159,070 Goldcorp 11,742 4.83 3,662,301 Kinross Gold (CAD Listing) 10,222 4.20
578,833 MAG Silver (CAD Listing) 4,621 1.90 42,230 MAG Silver (USD Listing) 339 0.14
560,638 Mountain Province Diamonds 1,014 0.42 819,989 Nevsun Resources 2,011 0.83 113,240 Osisko Gold Royalties 800 0.33 891,071 Osisko Mining 855 0.35 171,021 Osisko Mining (Warrants)* - - 860,961 Pretium Resources 4,697 1.93 519,857 TMAC Resources 1,609 0.66 599,905 Torex Gold Resources 3,941 1.62 648,927 Wheaton Precious Metals 10,715 4.41
119,716 49.23
Mexico Equities 4.38% (31 December 2017 4.48%)
801,527 Fresnillo 9,198 3.78 111,479 Industrias Penoles 1,452 0.60
10,650 4.38
United States Equities 6.42% (31 December 2017 5.91%)
554,480 Newmont Mining 15,618 6.42
15,618 6.42

Quilter Investors Precious Metals Equity Fund
Portfolio statement (continued) as at 30 June 2018
Quilter Investors OEIC
368
Market Percentage of Value total net assets
Holding Investment £’000 % South America 0.90% (31 December 2017 0.95%) South America Equities 0.90% (31 December 2017 0.95%) Peru Equities 0.90% (31 December 2017 0.95%)
20,238 Cia de Minas Buenaventura 203 0.08 162,801 Cia de Minas Buenaventura ADR 1,690 0.70
1,543,845 Volcan Cia Minera 290 0.12
2,183 0.90
Investment assets 242,018 99.53
Net other assets 1,138 0.47
Total net assets 243,156 100.00
* Market value less than £500.
All investments are approved securities being either officially listed in a member state or traded on or under the rules of an eligible securities market, unless otherwise stated.
All investments are in ordinary shares unless otherwise stated.
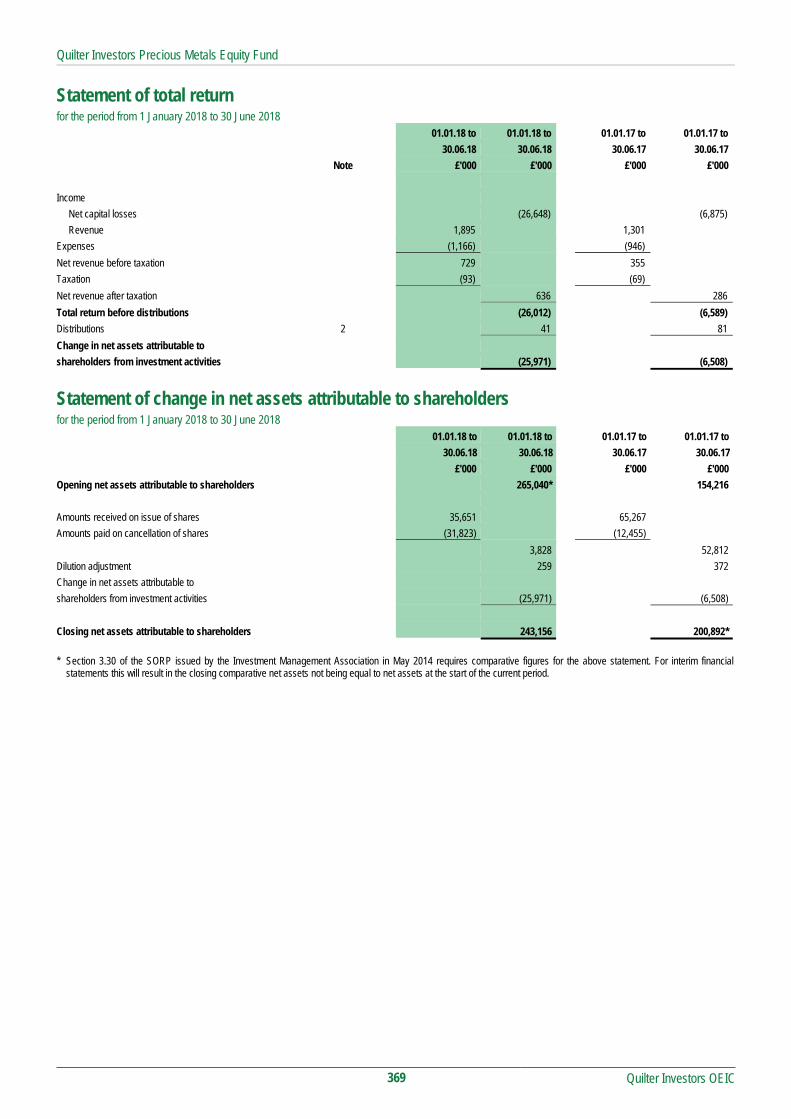
Quilter Investors Precious Metals Equity Fund
Quilter Investors OEIC
369
Statement of total return for the period from 1 January 2018 to 30 June 2018 01.01.18 to 01.01.18 to 01.01.17 to 01.01.17 to
30.06.18 30.06.18 30.06.17 30.06.17
Note £'000 £'000 £'000 £'000
Income
Net capital losses (26,648) (6,875)
Revenue 1,895 1,301
Expenses (1,166) (946)
Net revenue before taxation 729 355
Taxation (93) (69)
Net revenue after taxation 636 286
Total return before distributions (26,012) (6,589)
Distributions 2 41 81
Change in net assets attributable to
shareholders from investment activities (25,971) (6,508)
Statement of change in net assets attributable to shareholders for the period from 1 January 2018 to 30 June 2018 01.01.18 to 01.01.18 to 01.01.17 to 01.01.17 to
30.06.18 30.06.18 30.06.17 30.06.17
£'000 £'000 £'000 £'000
Opening net assets attributable to shareholders 265,040* 154,216
Amounts received on issue of shares 35,651 65,267
Amounts paid on cancellation of shares (31,823) (12,455)
3,828 52,812
Dilution adjustment 259 372
Change in net assets attributable to
shareholders from investment activities (25,971) (6,508)
Closing net assets attributable to shareholders 243,156 200,892* * Section 3.30 of the SORP issued by the Investment Management Association in May 2014 requires comparative figures for the above statement. For interim financial
statements this will result in the closing comparative net assets not being equal to net assets at the start of the current period.

Quilter Investors Precious Metals Equity Fund
Quilter Investors OEIC
370
Balance sheet as at 30 June 2018 30.06.18 31.12.17
£'000 £'000
Assets
Fixed assets
Investments 242,018 263,686
Current assets
Debtors 1,066 975
Cash and bank balances 348 664
Total assets 243,432 265,325
Liabilities
Creditors
Bank overdrafts - (28)
Other creditors (276) (257)
Total liabilities (276) (285)
Net assets attributable to shareholders 243,156 265,040

Quilter Investors Precious Metals Equity Fund
Notes to the financial statements for the period from 1 January 2018 to 30 June 2018
Quilter Investors OEIC
371
1 Accounting policies The financial statements have been prepared under the historical cost basis, as modified by the revaluation of investments, and in accordance with the Statement of Recommended Practice (SORP) for Authorised Funds, issued by the Investment Management Association in May 2014.
The accounting policies applied are consistent with those disclosed within the annual Financial Statements for the year ended 31 December 2017.
2 Distributions The distributions take account of revenue received on the issue of shares and revenue deducted on the cancellation of shares, and comprise:
01.01.18 to 01.01.17 to 30.06.18 30.06.17 £'000 £'000 Revenue deducted on cancellation of shares 5 21 Revenue received on issue of shares (46) (102) Distributions (41) (81)
Reconciliation of distributions: Net revenue after taxation 636 286 Undistributed revenue carried forward (677) (367) Distributions (41) (81)

Quilter Investors Sterling Corporate Bond Fund
Quilter Investors Sterling Corporate Bond Fund
Quilter Investors OEIC
372
Launch date 14 November 2013
IA Sector Sterling Corporate
Investment adviser FIL Pensions Management
Net asset value £60,933,635
Objective
The sub-fund aims to achieve a combination of income and capital growth.
Policy
The sub-fund primarily invests, directly and indirectly, in investment grade Sterling-denominated bonds (or hedged back to Sterling) issued by companies located anywhere in the world.
The sub-fund may also invest in bonds and similar debt investments issued by banks and governments located anywhere in the world.
The sub-fund may also invest in other transferable securities, collective investment schemes (including those managed or operated by the ACD), warrants, money market instruments, deposits and derivatives.
The sub-fund may use derivatives (i.e. financial contracts whose value is linked to the expected price movements of an underlying investment), with the aim of generating returns and reducing the overall costs and/or risks of the sub-fund.
The sub-fund is managed by an investment adviser selected by the ACD for their expected ability to manage the sub-fund according to the investment objective and policy. The ACD continuously monitors and may periodically make changes to this appointment.
Investment Manager’s review
Market Review
Fixed income markets posted mixed returns over the period. US government bonds posted losses as the yield curve edged higher, due to concerns around a widening twin deficit and higher inflation. Moreover, central banks have affirmed contrasting yield divergence, with the US Federal Reserve’s (Fed) tightening monetary policy stance picking up pace as the Fed raised interest rates in March and June. In contrast, the Bank of England (BoE) backtracked on the expected interest rate rise amid disappointing economic data and focused on the looming Brexit deadline. The European Central Bank (ECB) also decided to taper asset purchases, and end it completely, by the end of the year. The period also witnessed political uncertainty in Italy, escalating trade war rhetoric and rising volatility in emerging markets, which stoked demand for safe haven assets. Short and long-dated German bund yields slid, supported by the ECB policymakers’ signal that interest rates would remain low. Ten-year UK government bond (Gilt) yields fell to the lowest level since the start of the year, before ending the period slightly higher as volatility normalised, while short dated gilt yields rose over the period. In credit markets, the global risk-off sentiment and the fall in stock markets led credit spreads to widen, with both high yield and investment grade bonds posting negative returns.
The BoE seems intent on normalising interest rates, and current market pricing indicates an 80% likelihood of a rate rise at the next meeting. We believe the domestic growth story is not robust enough to make a clear case for significant monetary policy tightening. However, on balance, we expect interest rates to be tightened once this year, given the predisposition of the BoE’s Monetary Policy Committee.
Performance
The portfolio posted negative returns but outperformed the index. The overweight credit beta position and adverse selection was a key detractor from performance as credit spreads widened amid increased volatility. As a result, the bias towards a mix of sectors, including insurance and asset backed securities (ABS) held back returns. The overweight holdings in Phoenix Group and Scottish Widows were among the top detractors from performance from an issuer standpoint. However, conservative positioning at the security and sector level partially offset these losses. Specifically, an underweight stance in banks supported returns. The portfolio’s term structure positioning was positive for both absolute and relative returns. Specifically, favourable positioning across the gilt yield curve enhanced returns.
While the tightening of financial conditions has been well telegraphed, it coincides with the barrage of trade war threats and higher oil prices. We have already seen US dollar strength weighing heavily on emerging market sentiment.
This leaves little room for miscommunication and/or policy error from global central banks at this stage of the cycle. While we continue to monitor steps towards policy normalisation, we expect the bond yields to remain low in historical context.
On the credit front, we believe that the frequency of mishaps for the market to deal with has increased amid tightening liquidity, strengthening dollar and central bank transition towards monetary tightening. Therefore, going into the second half of the year, we expect the volatility to remain elevated. Risk and Reward Profile
The calculated risk and reward category, as shown above, uses a method of calculation derived from EU rules. It is based on the rate at which the returns of the sub-fund have moved up and down in the past (i.e. volatility) and is not a guide to the future risk and reward category of the sub-fund. The category shown is not a target or guarantee and may shift over time. Even the lowest category 1 does not mean a risk-free investment. The seven-category scale is nonlinear, for example, 2 is not twice as risky as 1.
Sub-funds in category 3 have in the past shown moderately low volatility. With a sub-fund of category 3, you have a moderately low risk of losing money but your chance for gains is also moderately low.
Investment risk - there is no guarantee that the sub-fund will achieve its objective. A capital loss of some or all of the amount invested may occur.
Credit risk - the issuer of a bond or a similar investment within the sub-fund may not pay income or repay capital to the sub-fund when due. Bonds which are rated below investment grade are considered to have a higher risk exposure with respect to meeting their payment obligations.
Interest rate risk - investments in bonds are affected by interest rates and inflation trends which may affect the value of the sub-fund.
Liquidity risk - some investments may become hard to value or sell at a desired time and price. In extreme circumstances this may affect the sub-fund’s ability to meet redemption requests upon demand.
Currency risk (EUR share class) - the sub-fund is denominated in British Pounds and may use techniques to try to reduce the effects of changes in the exchange rate between the currency of the underlying investments and the base currency of the sub-fund. These techniques may not eliminate all the currency risk. This share class is denominated in Euro. The value of your shares may rise and fall as a result of exchange rate movements between the currencies.
Currency risk (GBP share class) - the sub-fund is denominated in British Pounds and may use techniques to try to reduce the effects of changes in the exchange rate between the currency of the underlying investments and the base currency of the sub-fund. These techniques may not eliminate all the currency risk. The value of your shares may rise and fall as a result of exchange rate movements.
Currency risk (USD share class) - the sub-fund is denominated in British Pounds and may use techniques to try to reduce the effects of changes in the exchange rate between the currency of the underlying investments and the base currency of the sub-fund. These techniques may not eliminate all the currency risk. This share class is denominated in US Dollars. The value of your shares may rise and fall as a result of exchange rate movements between the currencies.
Derivative risk - the sub-fund may use derivatives to generate returns as well as to reduce costs and/or the overall risk of the sub-fund. Using derivatives can involve a higher level of risk. A small movement in the price of an underlying investment may result in a disproportionately large movement in the price of the derivative investment. Derivatives also involve counterparty risk where the institutions acting as counterparty to derivatives may not meet their contractual obligations.
Capital erosion risk - the sub-fund takes its charges from the income of the sub-fund in the first instance. The impact of sub-fund charges may be material on the value of any income you receive from your investment. There is potential for capital erosion if insufficient income is generated by the sub-fund to cover these charges. Capital erosion may have the effect of reducing the level of income generated.
For full details of the sub-fund's risks, please see the section in the prospectus headed "Risks".

Quilter Investors Sterling Corporate Bond Fund
Quilter Investors OEIC
373
Performance Records Comparative Tables 1 January 2018 to 1 January 2017 to 1 January 2016 to Accumulation 'A' EUR Hedged† 30 June 2018 31 December 2017 31 December 2016 p/share p/share p/share
Change in net assets per share Opening net asset value per share 94.23 87.68 79.00
Return before operating charges* (1.59) 7.51 9.75 Operating charges** (0.44) (0.87) (0.68)
Return after operating charges* (2.03) 6.64 9.07
Distributions (1.33) (2.70) (1.95) Retained distributions 1.33 2.61 1.56
Closing net asset value per share 92.20 94.23 87.68
* after direct transaction costs of*** - - -
Performance
Return after charges (2.16)% 7.57% 11.48%
Other information
Closing net asset value (£) 922 942 877 Closing number of shares 1,000 1,000 1,000 Operating charges**** 0.95% 0.95% 0.95% Direct transaction costs*** - - -
Prices cents per share cents per share cents per share Highest share price 107.3 107.8 108.5 Lowest share price 104.3 101.8 98.92
1 January 2018 to 1 January 2017 to 1 January 2016 to Accumulation 'A' USD Hedged†† 30 June 2018 31 December 2017 31 December 2016 p/share p/share p/share
Change in net assets per share Opening net asset value per share 84.05 87.00 72.00
Return before operating charges* 2.02 (2.06) 15.98 Operating charges** (0.39) (0.81) (0.57)
Return after operating charges* 1.63 (2.87) 15.41
Distributions (1.16) (2.54) (2.04) Retained distributions 1.16 2.46 1.63
Closing net asset value per share 85.68 84.05 87.00
* after direct transaction costs of*** - - -
Performance Return after charges 1.94% (3.29)% 21.40%
Other information Closing net asset value (£) 61,247 34,145 870 Closing number of shares 71,483 40,627 1,000 Operating charges**** 0.95% 0.95% 0.95% Direct transaction costs*** - - -
Prices cents per share cents per share cents per share Highest share price 114.8 114.5 112.9 Lowest share price 112.2 106.9 100.6

Quilter Investors Sterling Corporate Bond Fund
Quilter Investors OEIC
374
Comparative Tables (continued) 1 January 2018 to 1 January 2017 to 1 January 2016 to Income 'A' 30 June 2018 31 December 2017 31 December 2016 p/share p/share p/share
Change in net assets per share Opening net asset value per share 110.66 108.31 102.52
Return before operating charges* (1.15) 6.65 10.27 Operating charges** (0.51) (1.05) (1.03)
Return after operating charges* (1.66) 5.60 9.24
Distributions (1.54) (3.25) (3.45) Retained distributions - - -
Closing net asset value per share 107.46 110.66 108.31
* after direct transaction costs of*** - - -
Performance Return after charges (1.50)% 5.17% 9.01%
Other information Closing net asset value (£) 26,544,104 29,702,383 35,584,626 Closing number of shares 24,701,915 26,841,868 32,853,106 Operating charges**** 0.95% 0.95% 0.95% Direct transaction costs*** - - -
Prices pence per share pence per share pence per share Highest share price 111.8 113.0 115.7 Lowest share price 107.9 108.0 103.6
1 January 2018 to 1 January 2017 to 1 January 2016 to Accumulation 'U2' 30 June 2018 31 December 2017 31 December 2016 p/share p/share p/share
Change in net assets per share Opening net asset value per share 124.42 117.81 108.32
Return before operating charges* (1.29) 7.34 10.91 Operating charges** (0.31) (0.60) (0.58)
Return after operating charges* (1.60) 6.74 10.33
Distributions (2.02) (4.14) (4.21) Retained distributions 2.02 4.01 3.37
Closing net asset value per share 122.82 124.42 117.81
* after direct transaction costs of*** - - -
Performance Return after charges (1.29)% 5.72% 9.54%
Other information Closing net asset value (£) 34,303,292 29,753,891 83,815,713 Closing number of shares 27,930,628 23,914,955 71,146,100 Operating charges**** 0.50% 0.50% 0.50% Direct transaction costs*** - - -
Prices pence per share pence per share pence per share Highest share price 125.7 125.6 124.4 Lowest share price 122.8 117.5 109.2

Quilter Investors Sterling Corporate Bond Fund
Quilter Investors OEIC
375
Comparative Tables (continued) 1 January 2018 to 1 January 2017 to 1 January 2016 to Income 'U2' 30 June 2018 31 December 2017 31 December 2016 p/share p/share p/share
Change in net assets per share Opening net asset value per share 109.48 107.16 101.42
Return before operating charges* (1.12) 6.58 10.17 Operating charges** (0.27) (0.55) (0.53)
Return after operating charges* (1.39) 6.03 9.64
Distributions (1.77) (3.71) (3.90) Retained distributions - - -
Closing net asset value per share 106.32 109.48 107.16
* after direct transaction costs of*** - - -
Performance Return after charges (1.27)% 5.63% 9.51%
Other information Closing net asset value (£) 24,070 26,165 26,115 Closing number of shares 22,638 23,899 24,370 Operating charges**** 0.50% 0.50% 0.50% Direct transaction costs*** - - -
Prices pence per share pence per share pence per share Highest share price 110.7 111.8 114.5 Lowest share price 106.8 106.9 102.6
† From 31 March 2016
†† From 1 March 2016 ** The operating charges include all costs borne by the sub-fund, except for direct transaction costs.
*** The direct transaction costs are made up of fees and commissions paid to agents, advisers, brokers and dealers, levies by regulatory agencies and securities exchanges as well as transfer taxes and duties. They do not include any difference between the quoted bid and offer prices or internal administrative or holding costs. These costs arise as a result of transactions undertaken both for efficient portfolio management and the meeting of the sub-fund’s objectives. These costs exclude any effect of dilution adjustments used to offset the costs.
**** The operating charges percentage is the ratio of the sub-fund's ongoing charges (excluding interest on borrowings) to the average net assets of the sub-fund. If the share class launched during the period the operating charges figures are annualised.

Quilter Investors Sterling Corporate Bond Fund
Quilter Investors OEIC
376
Performance
6 months to
30 June 2018
1 year to
30 June 2018
3 years to
30 June 2018
5 years to
30 June 2018
Quilter Investors Sterling Corporate Bond Fund (1.43)% 1.06% 13.80% -
ICE BofA Merrill Lynch Euro-Sterling Index (E0LO) (benchmark) (1.24)% 0.78% 15.67% 31.69%
IA Sterling Corporate Bond (sector average) (1.46)% 0.63% 13.69% 27.57%
Quartile ranking 2 1 3 -
* Accumulation ‘U2’ shares
Data Source – Factset. Figures are calculated on a total return and single price basis, with net income reinvested into the sub-fund.
Portfolio allocation
United Kingdom 74.48%
North America 11.62%
Europe 11.08%
Asia Pacific (excluding Japan) 1.02%
Middle East 0.40%
Overseas Derivatives (0.07)%
United Kingdom Derivatives (0.29)%
Net other assets 1.76%
Total 100.00%
Asset Allocation
Sterling Denominated Debt Securities 94.63%
US Dollar Denominated Debt Securities 2.39%
Euro Denominated Debt Securities 1.58%
Overseas Derivatives (0.07)%
United Kingdom Derivatives (0.29)%
Net other assets 1.76%
Total 100.00%
Major holdings Percentage of portfolio
United Kingdom Gilt 1.5% 22/07/2026 2.94%
United Kingdom Gilt 2.5% 22/07/2065 2.80%
United Kingdom Gilt 1.25% 22/07/2027 2.61%
United Kingdom Gilt 6% 07/12/2028 1.79%
Co-operative Bank 4.75% 11/11/2021 1.68%
United Kingdom Gilt 2.75% 07/09/2024 1.63%
United Kingdom Gilt 4.75% 07/12/2030 1.57%
United Kingdom Gilt 1.25% 22/07/2018 1.31%
Transport for London 4% 07/04/2064 1.30%
New York Life Global Funding 1.75% 15/12/2022 1.24%
Number of holdings 191
Total Purchases and Sales for the period
2018 2017
£'000 £'000
Total purchases for the 6 month period to 30 June 17,731 33,717
Total sales for the 6 month period to 30 June 13,896 78,982
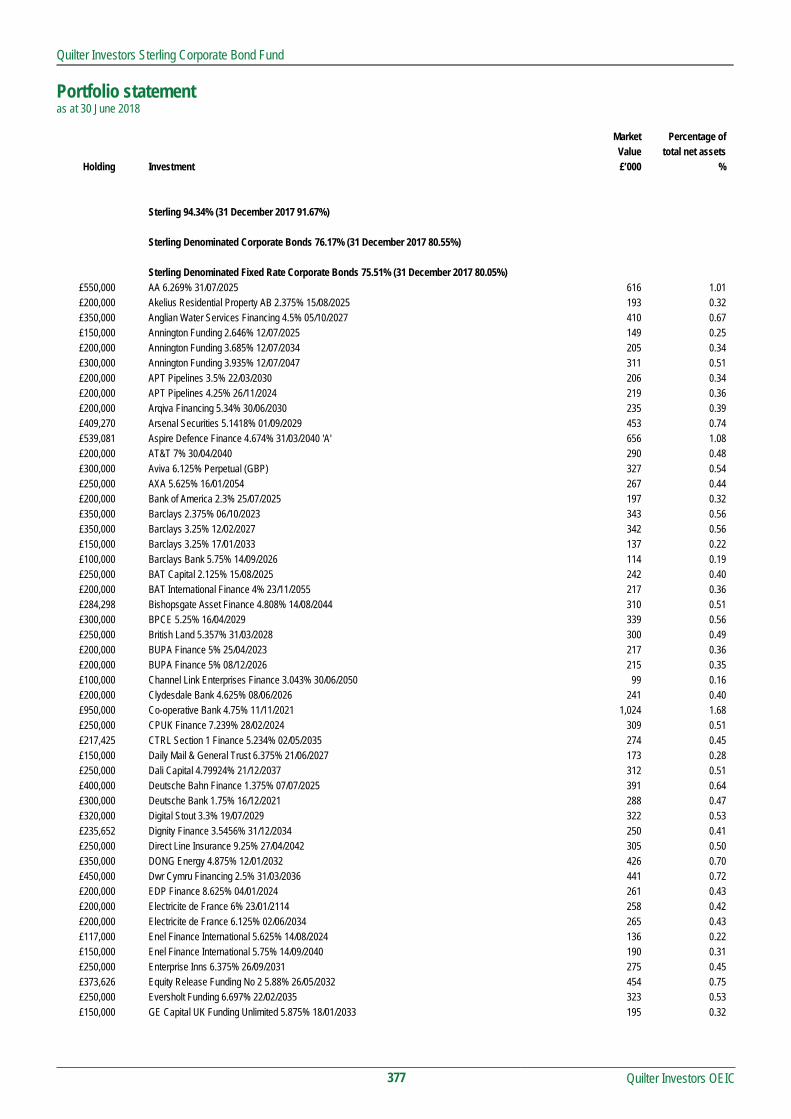
Quilter Investors Sterling Corporate Bond Fund
Portfolio statement as at 30 June 2018
Quilter Investors OEIC
377
Market Percentage of Value total net assets
Holding Investment £’000 %
Sterling 94.34% (31 December 2017 91.67%)
Sterling Denominated Corporate Bonds 76.17% (31 December 2017 80.55%)
Sterling Denominated Fixed Rate Corporate Bonds 75.51% (31 December 2017 80.05%) £550,000 AA 6.269% 31/07/2025 616 1.01 £200,000 Akelius Residential Property AB 2.375% 15/08/2025 193 0.32 £350,000 Anglian Water Services Financing 4.5% 05/10/2027 410 0.67 £150,000 Annington Funding 2.646% 12/07/2025 149 0.25 £200,000 Annington Funding 3.685% 12/07/2034 205 0.34 £300,000 Annington Funding 3.935% 12/07/2047 311 0.51 £200,000 APT Pipelines 3.5% 22/03/2030 206 0.34 £200,000 APT Pipelines 4.25% 26/11/2024 219 0.36 £200,000 Arqiva Financing 5.34% 30/06/2030 235 0.39 £409,270 Arsenal Securities 5.1418% 01/09/2029 453 0.74 £539,081 Aspire Defence Finance 4.674% 31/03/2040 'A' 656 1.08 £200,000 AT&T 7% 30/04/2040 290 0.48 £300,000 Aviva 6.125% Perpetual (GBP) 327 0.54 £250,000 AXA 5.625% 16/01/2054 267 0.44 £200,000 Bank of America 2.3% 25/07/2025 197 0.32 £350,000 Barclays 2.375% 06/10/2023 343 0.56 £350,000 Barclays 3.25% 12/02/2027 342 0.56 £150,000 Barclays 3.25% 17/01/2033 137 0.22 £100,000 Barclays Bank 5.75% 14/09/2026 114 0.19 £250,000 BAT Capital 2.125% 15/08/2025 242 0.40 £200,000 BAT International Finance 4% 23/11/2055 217 0.36 £284,298 Bishopsgate Asset Finance 4.808% 14/08/2044 310 0.51 £300,000 BPCE 5.25% 16/04/2029 339 0.56 £250,000 British Land 5.357% 31/03/2028 300 0.49 £200,000 BUPA Finance 5% 25/04/2023 217 0.36 £200,000 BUPA Finance 5% 08/12/2026 215 0.35 £100,000 Channel Link Enterprises Finance 3.043% 30/06/2050 99 0.16 £200,000 Clydesdale Bank 4.625% 08/06/2026 241 0.40 £950,000 Co-operative Bank 4.75% 11/11/2021 1,024 1.68 £250,000 CPUK Finance 7.239% 28/02/2024 309 0.51 £217,425 CTRL Section 1 Finance 5.234% 02/05/2035 274 0.45 £150,000 Daily Mail & General Trust 6.375% 21/06/2027 173 0.28 £250,000 Dali Capital 4.79924% 21/12/2037 312 0.51 £400,000 Deutsche Bahn Finance 1.375% 07/07/2025 391 0.64 £300,000 Deutsche Bank 1.75% 16/12/2021 288 0.47 £320,000 Digital Stout 3.3% 19/07/2029 322 0.53 £235,652 Dignity Finance 3.5456% 31/12/2034 250 0.41 £250,000 Direct Line Insurance 9.25% 27/04/2042 305 0.50 £350,000 DONG Energy 4.875% 12/01/2032 426 0.70 £450,000 Dwr Cymru Financing 2.5% 31/03/2036 441 0.72 £200,000 EDP Finance 8.625% 04/01/2024 261 0.43 £200,000 Electricite de France 6% 23/01/2114 258 0.42 £200,000 Electricite de France 6.125% 02/06/2034 265 0.43 £117,000 Enel Finance International 5.625% 14/08/2024 136 0.22 £150,000 Enel Finance International 5.75% 14/09/2040 190 0.31 £250,000 Enterprise Inns 6.375% 26/09/2031 275 0.45 £373,626 Equity Release Funding No 2 5.88% 26/05/2032 454 0.75 £250,000 Eversholt Funding 6.697% 22/02/2035 323 0.53 £150,000 GE Capital UK Funding Unlimited 5.875% 18/01/2033 195 0.32

Quilter Investors Sterling Corporate Bond Fund
Portfolio statement (continued) as at 30 June 2018
Quilter Investors OEIC
378
Market Percentage of Value total net assets
Holding Investment £’000 % Sterling Denominated Fixed Rate Corporate Bonds (continued)
£77,000 GE Capital UK Funding Unlimited 6.25% 05/05/2038 107 0.18 £60,000 GE Capital UK Funding Unlimited 8% 14/01/2039 99 0.16 £25,000 Gesb 8.35% 15/11/2018 26 0.04
£150,000 GKN 5.375% 19/09/2022 165 0.27 £250,000 Global Switch 4.375% 13/12/2022 275 0.45 £250,000 Great Rolling Stock 6.25% 27/07/2020 273 0.45
£67,175 Great Rolling Stock 6.875% 27/07/2035 85 0.14 £274,251 Greene King Finance 4.0643% 15/03/2035 293 0.48 £100,000 Hastings Finance 3% 24/05/2025 100 0.16 £100,000 HBOS Sterling Finance Jersey 7.881% Perpetual 146 0.24 £450,000 Heathrow Funding 4.625% 31/10/2046 554 0.91 £200,000 Heathrow Funding 6.45% 10/12/2031 276 0.45 £211,706 Highbury Finance 7.017% 20/03/2023 246 0.40 £350,000 Hiscox 2% 14/12/2022 350 0.57 £400,000 Housing & Care 21 3.288% 08/11/2049 404 0.66 £250,000 Housing Finance 8.625% 13/11/2023 325 0.53 £300,000 HSBC 2.175% 27/06/2023 298 0.49 £300,000 HSBC 2.256% 13/11/2026 288 0.47 £150,000 HSBC Bank 5.375% 22/08/2033 182 0.30 £500,000 HSBC Bank Capital Funding Sterling 1 5.844% Perpetual 629 1.03 £300,000 Imperial Tobacco Finance 4.875% 07/06/2032 346 0.57 £150,000 Imperial Tobacco Finance 9% 17/02/2022 187 0.31 £250,000 Income Contingent Student Loans 2.5% 24/07/2056 233 0.38 £200,000 Innogy Finance 6.125% 06/07/2039 280 0.46 £250,000 Innogy Finance 6.25% 03/06/2030 328 0.54
£43,284 Intu Debenture 5.562% 31/12/2027 49 0.08 £300,000 Intu SGS Finance 3.875% 17/03/2023 317 0.52 £291,741 Juturna European Loan Conduit No 16 5.0636% 10/08/2033 353 0.58 £250,000 Koninklijke 5.75% 17/09/2029 308 0.51 £150,000 Liberty Living Finance 3.375% 28/11/2029 151 0.25 £200,000 Libra Longhurst Treasury No 2 3.25% 15/05/2043 200 0.33 £300,000 Lloyds Bank 5.125% 07/03/2025 364 0.60 £200,000 Lloyds Bank 6% 08/02/2029 274 0.45 £200,000 Lloyds Banking 2.25% 16/10/2024 194 0.32 £150,000 London & Quadrant Housing Trust 2.625% 28/02/2028 149 0.25 £300,000 London Merchant Securities 6.5% 16/03/2026 378 0.62 £399,197 Longstone Finance 4.791% 19/04/2030 460 0.75 £250,000 Lunar Funding I 6.125% 09/06/2027 309 0.51 £200,000 Majedie Investments 7.25% 31/03/2025 249 0.41 £200,000 Manchester Airport Funding 4.75% 31/03/2034 243 0.40 £250,000 Marston's Issuer 5.1576% 15/10/2027 247 0.41 £188,666 Mitchells & Butlers Finance 6.013% 15/12/2028 218 0.36 £300,000 Motability Operations 3.625% 10/03/2036 334 0.55 £200,000 National Express 2.5% 11/11/2023 198 0.33 £750,000 National Grid Gas Finance 2.75% 22/09/2046 678 1.11 £400,000 National Westminster Bank 6.5% 07/09/2021 452 0.74 £500,000 Network Rail Infrastructure Finance 4.75% 29/11/2035 712 1.17 £750,000 New York Life Global Funding 1.75% 15/12/2022 755 1.24 £196,000 NewRiver REIT 3.5% 07/03/2028 193 0.32 £100,000 NGG Finance 5.625% 18/06/2073 109 0.18 £300,000 Northern Gas Networks Finance 4.875% 30/06/2027 358 0.59 £200,000 Northern Ireland Electricity Networks 6.875% 18/09/2018 202 0.33 £250,000 Northumbrian Water Finance 2.375% 05/10/2027 243 0.40

Quilter Investors Sterling Corporate Bond Fund
Portfolio statement (continued) as at 30 June 2018
Quilter Investors OEIC
379
Market Percentage of Value total net assets
Holding Investment £’000 % Sterling Denominated Fixed Rate Corporate Bonds (continued)
£200,000 Notting Hill Housing Trust 3.25% 12/10/2048 197 0.32 £500,000 Orbit Capital 3.375% 14/06/2048 508 0.83 £200,000 Penarian Housing Finance 3.212% 07/06/2052 196 0.32 £200,000 PGH Capital 4.125% 20/07/2022 205 0.34 £400,000 Phoenix 5.75% Perpetual 367 0.60 £200,000 Porterbrook Rail Finance 7.125% 20/10/2026 261 0.43 £343,158 Premiertel 6.175% 08/05/2032 387 0.63 £125,000 Prologis 2.25% 30/06/2029 118 0.19 £200,000 Provident Financial 7% 04/06/2023 203 0.33 £200,000 Prudential 5.7% 19/12/2063 218 0.36 £250,000 RAC Bond 4.87% 06/05/2026 260 0.43 £200,000 RL Finance Bonds No 3 6.125% 13/11/2028 221 0.36 £351,725 RMPA Services 5.337% 30/09/2038 442 0.73 £400,000 Santander UK 2.92% 08/05/2026 397 0.65 £400,000 Santander UK 5.25% 16/02/2029 520 0.85 £300,000 Scottish Widows 7% 16/06/2043 360 0.59 £400,000 Shaftesbury Carnaby 2.487% 30/09/2031 379 0.62 £200,000 Society of Lloyds 4.75% 30/10/2024 215 0.35 £200,000 Society of Lloyd's 4.875% 07/02/2047 210 0.35 £200,000 South Eastern Power Networks 6.375% 12/11/2031 276 0.45 £400,000 Southern Gas Networks 4.875% 05/10/2023 457 0.75 £300,000 SP Manweb 4.875% 20/09/2027 357 0.59 £300,000 SPD Finance UK 5.875% 17/07/2026 374 0.61 £150,000 SSE 3.875% Perpetual 152 0.25 £200,000 Standard Life 5.5% 04/12/2042 221 0.36 £200,000 Telefonica Emisiones 5.445% 08/10/2029 241 0.40 £278,361 Telereal Securitisation 5.3887% 10/12/2031 331 0.54 £115,250 Telereal Securitisation 6.1645% 10/12/2031 142 0.23 £200,000 Temple Bar Investment Trust 5.5% 08/03/2021 217 0.36
£97,311 Tesco Property Finance 3 5.744% 13/04/2040 113 0.19 £492,467 Tesco Property Finance 5 5.6611% 13/10/2041 566 0.93 £250,000 Thames Water Utilities Cayman Finance 2.875% 03/05/2027 241 0.40 £300,000 Thames Water Utilities Cayman Finance 5.5% 11/02/2041 404 0.66 £300,000 Thames Water Utilities Cayman Finance 7.738% 09/04/2058 567 0.93 £200,000 THFC Funding No 2 6.35% 08/07/2039 294 0.48 £200,000 Time Warner Cable 5.75% 02/06/2031 227 0.37 £300,000 TSB Banking Group 5.75% 06/05/2026 316 0.52 £343,523 Unique Pub Finance 5.659% 30/06/2027 378 0.62 £229,000 Unique Pub Finance 6.542% 30/03/2021 241 0.40 £400,000 University of Southampton 2.25% 11/04/2057 364 0.60 £377,648 UPP Bond 1 Issuer 4.9023% 28/02/2040 459 0.75 £100,000 Vodafone 3% 12/08/2056 86 0.14 £250,000 Vodafone 3.375% 08/08/2049 232 0.38 £158,000 Western Power Distribution 3.625% 06/11/2023 166 0.27 £300,000 Western Power Distribution East Midlands 5.25% 17/01/2023 343 0.56 £300,000 Western Power Distribution South Wales 5.75% 23/03/2040 416 0.68 £200,000 Westfield America Management 2.625% 30/03/2029 197 0.32 £200,000 Wheatley Capital 4.375% 28/11/2044 235 0.39 £453,205 White City Property Finance 5.1202% 17/04/2035 558 0.91 £100,000 WM Treasury 2 3.25% 20/10/2048 100 0.16 £413,841 Wods Transmission 3.446% 24/08/2034 444 0.73 £250,000 Yorkshire Water Services Bradford Finance 6.375% 19/08/2039 381 0.63 £300,000 Zurich Finance UK 6.625% Perpetual 337 0.55
Total 46,011 75.51

Quilter Investors Sterling Corporate Bond Fund
Portfolio statement (continued) as at 30 June 2018
Quilter Investors OEIC
380
Market Percentage of
Value total net assets Holding Investment £’000 %
Sterling Denominated Variable Rate Corporate Bonds 0.66% (31 December 2017 0.50%)
£4,789 Marston's Issuer 2.16088% 15/07/2020 5 0.01 £108,000 Ribbon Finance 2018 1.53662% 20/04/2028 108 0.18 £300,000 Spirit Issuer 3.36813% 28/12/2031 290 0.47
Total 403 0.66
Sterling Denominated Government Bonds 18.46% (31 December 2017 11.21%)
Sterling Denominated Fixed Rate Government Bonds 18.46% (31 December 2017 11.21%) £500,000 Province of Alberta Canada 1% 15/11/2021 495 0.81 £300,000 SNCF Reseau 5.25% 07/12/2028 392 0.64 £550,000 Transport for London 4% 07/04/2064 789 1.30 £800,000 United Kingdom Gilt 1.25% 22/07/2018 800 1.31
£1,600,000 United Kingdom Gilt 1.25% 22/07/2027 1,590 2.61 £1,750,000 United Kingdom Gilt 1.5% 22/07/2026 1,789 2.94 £1,300,000 United Kingdom Gilt 2.5% 22/07/2065 1,708 2.80
£900,000 United Kingdom Gilt 2.75% 07/09/2024 990 1.63 £100,000 United Kingdom Gilt 3.5% 22/07/2068 167 0.27 £200,000 United Kingdom Gilt 4.25% 07/12/2049 324 0.53 £100,000 United Kingdom Gilt 4.5% 07/12/2042 155 0.26 £700,000 United Kingdom Gilt 4.75% 07/12/2030 959 1.57 £750,000 United Kingdom Gilt 6% 07/12/2028 1,089 1.79
Total 11,247 18.46
Sterling Denominated Derivatives (0.29)% (31 December 2017 (0.09)%)
Sterling Denominated Forward Exchange Contracts (0.12)% (31 December 2017 0.13%) £919,554 Sterling v Euro Forward Exchange Contract (7) (0.01)
£2,114,955 Sterling v US Dollar Forward Exchange Contract (64) (0.11) Total (71) (0.12)
Sterling Denominated Futures Contracts (0.17)% (31 December 2017 (0.22)%) (80) Long Gilt Futures September 2018 (102) (0.17)
Total (102) (0.17)
Overseas 3.90% (31 December 2017 5.80%)
Europe 1.55% (31 December 2017 1.17%)
Euro Denominated Corporate Bonds 1.58% (31 December 2017 1.21%)
Euro Denominated Fixed Rate Corporate Bonds 1.58% (31 December 2017 1.21%) €300,000 ADLER Real Estate 1.875% 27/04/2023 258 0.42 €298,588 Channel Link Enterprises Finance 5.892% 30/06/2041 361 0.59 €100,000 Roadster Finance Designated Activity 1.625% 09/12/2024 87 0.14 €100,000 Roadster Finance Designated Activity 2.375% 08/12/2027 86 0.14 €200,000 Unibail-Rodamco 2.125% Perpetual 173 0.29
Total 965 1.58 Euro Denominated Derivatives (0.03)% (31 December 2017 (0.04)%)
Euro Denominated Forward Exchange Contracts 0.00% (31 December 2017 0.00%) €1,043 Euro v Sterling Forward Exchange Contract - -
Total - -

Quilter Investors Sterling Corporate Bond Fund
Portfolio statement (continued) as at 30 June 2018
Quilter Investors OEIC
381
Market Percentage of
Value total net assets Holding Investment £’000 %
Euro Denominated Futures Contracts (0.01)% (31 December 2017 0.01%)
(2) Euro-Bobl Futures September 2018 (1) - (1) Euro-Bund Futures September 2018 (1) - (1) Euro-Buxl 30 Year Bond Futures September 2018 (2) (0.01)
Total (4) (0.01)
Euro Credit Default Swap (0.02)% (31 December 2017 (0.05)%) € (1,750,000) Buy Protection CDS iTraxx Indice 20/2/2019 Merill Lynch (14) (0.02)
Total (14) (0.02)
US Dollar 2.35% (31 December 2017 4.63%)
US Dollar Denominated Corporate Bonds 2.20% (31 December 2017 4.66%)
US Dollar Denominated Fixed Rate Corporate Bonds 2.20% (31 December 2017 4.66%) $350,000 Abu Dhabi Crude Oil Pipeline 4.6% 02/11/2047 244 0.40 $800,000 Electricite de France 6% 22/01/2114 627 1.03 $200,000 Enterprise Products Operating 4.875% 16/08/2077 143 0.24 $400,000 Verizon Communications 5.15% 15/09/2023 324 0.53
Total 1,338 2.20
US Dollar Denominated Government Bonds 0.19% (31 December 2017 0.00%)
US Dollar Denominated Fixed Rate Government Bonds 0.19% (31 December 2017 0.00%) $150,000 US Treasury 3% 15/02/2048 115 0.19
Total 115 0.19
US Dollar Denominated Derivatives (0.04)% (31 December 2017 (0.03)%)
US Dollar Denominated Forward Exchange Contracts 0.03% (31 December 2017 0.00%) $906,000 US Dollar v Sterling Forward Exchange Contract 14 0.03
$45,000 US Dollar v Sterling Forward Exchange Contract 1 - $81,030 US Dollar v Sterling Forward Exchange Contract 1 -
Total 16 0.03
US Dollar Denominated Futures Contracts (0.07)% (31 December 2017 (0.03)%) (3) US 5 Year Treasury Note Futures September 2018 (1) - 67 US 10 Year Treasury Note Futures September 2018 59 0.10
(29) US 10 Year Ultra Bond Futures September 2018 (39) (0.07) (27) US Long Bond Futures September 2018 (75) (0.12)
3 US Ultra Bond Futures September 2018 12 0.02 Total (44) (0.07)
Investment assets* 59,860 98.24
Net other assets 1,074 1.76
Total net assets 60,934 100.00
* Including investment liabilities.
All investments are approved securities being either officially listed in a member state or traded on or under the rules of an eligible securities market, unless otherwise stated.

Quilter Investors Sterling Corporate Bond Fund
Quilter Investors OEIC
382
Statement of total return for the period from 1 January 2018 to 30 June 2018 01.01.18 to 01.01.18 to 01.01.17 to 01.01.17 to
30.06.18 30.06.18 30.06.17 30.06.17
Note £'000 £'000 £'000 £'000
Income
Net capital (losses)/gains (1,594) 2,357
Revenue 964 1,897
Expenses (213) (362)
Interest payable and similar charges - (1)
Net revenue before taxation 751 1,534
Taxation - -
Net revenue after taxation 751 1,534
Total return before distributions (843) 3,891
Distributions 2 (923) (1,914)
Change in net assets attributable to
shareholders from investment activities (1,766) 1,977
Statement of change in net assets attributable to shareholders for the period from 1 January 2018 to 30 June 2018 01.01.18 to 01.01.18 to 01.01.17 to 01.01.17 to
30.06.18 30.06.18 30.06.17 30.06.17
£'000 £'000 £'000 £'000
Opening net assets attributable to shareholders 59,518* 119,428
Amounts received on issue of shares 6,749 21,450
Amounts paid on cancellation of shares (4,106) (70,727)
2,643 (49,277)
Dilution adjustment 10 339
Change in net assets attributable to
shareholders from investment activities (1,766) 1,977
Retained distribution on accumulation shares 529 1,265
Closing net assets attributable to shareholders 60,934 73,732 * Section 3.30 of the SORP issued by the Investment Management Association in May 2014 requires comparative figures for the above statement. For interim financial
statements this will result in the closing comparative net assets not being equal to net assets at the start of the current period.

Quilter Investors Sterling Corporate Bond Fund
Quilter Investors OEIC
383
Balance sheet as at 30 June 2018 30.06.18 31.12.17
£'000 £'000
Assets
Fixed assets
Investments 60,166 58,209
Current assets
Debtors 973 874
Cash and bank balances 404 853
Total assets 61,534 59,936
Liabilities
Investment liabilities (306) (197)
Creditors
Bank overdrafts (25) -
Distribution payable (59) (67)
Other creditors (219) (154)
Total liabilities (609) (418)
Net assets attributable to shareholders 60,934 59,518

Quilter Investors Sterling Corporate Bond Fund
Notes to the financial statements for the period from 1 January 2018 to 30 June 2018
Quilter Investors OEIC
384
1 Accounting policies The financial statements have been prepared under the historical cost basis, as modified by the revaluation of investments, and in accordance with the Statement of Recommended Practice (SORP) for Authorised Funds, issued by the Investment Management Association in May 2014.
The accounting policies applied are consistent with those disclosed within the annual Financial Statements for the year ended 31 December 2017.
2 Distributions The distributions take account of revenue received on the issue of shares and revenue deducted on the cancellation of shares, and comprise:
01.01.18 to 01.01.17 to 30.06.18 30.06.17 £'000 £'000 First Interim – Accumulation shares (31 January) 90 258 First Interim – Income shares (31 January) 74 87 Second Interim – Accumulation shares (28 February) 79 246 Second Interim – Income shares (28 February) 63 78 Third Interim – Accumulation shares (31 March) 87 286 Third Interim – Income shares (31 March) 66 83 Fourth Interim – Accumulation shares (30 April) 94 205 Fourth Interim – Income shares (30 April) 70 80 Fifth Interim – Accumulation shares (31 May) 91 239 Fifth Interim – Income shares (31 May) 66 86 Sixth Interim – Accumulation shares (30 June) 88 128 Sixth Interim – Income shares (30 June) 59 85 927 1,861 Revenue deducted on cancellation of shares 5 82 Revenue received on issue of shares (9) (29) Distributions 923 1,914
Reconciliation of distributions: Net revenue after taxation 751 1,534 Effective yield adjustment 172 380 Distributions 923 1,914

Quilter Investors Sterling Corporate Bond Fund
Distribution table
Quilter Investors OEIC
385
Sixth Interim distribution Group 1: Shares purchased prior to 1 June 2018 Group 2: Shares purchased from 1 June 2018 to 30 June 2018
Revenue pence/cents
per share
Equalisation pence/cents
per share*
Distribution paid 31.07.18
pence/cents per share
Distribution paid 31.07.17
pence/cents per share
Accumulation 'A' EUR Hedged Shares
Group 1 0.2314 - 0.2314 0.2629 Group 2 0.2314 0.0000 0.2314 0.2629 Accumulation 'A' USD Hedged Shares Group 1 0.2443 - 0.2443 0.2972 Group 2 0.2443 0.0000 0.2443 0.2972 Income 'A' Shares Group 1 0.2370 - 0.2370 0.2949 Group 2 0.1796 0.0574 0.2370 0.2949 Accumulation'U2' Shares Group 1 0.3142 - 0.3142 0.3705 Group 2 0.1830 0.1312 0.3142 0.3705 Income 'U2' Shares Group 1 0.2729 - 0.2729 0.3317 Group 2 0.2061 0.0668 0.2729 0.3317

Quilter Investors Sterling Corporate Bond Fund
Distribution table (continued)
Quilter Investors OEIC
386
Fifth Interim distribution Group 1: Shares purchased prior to 1 May 2018 Group 2: Shares purchased from 1 May 2018 to 31 May 2018
Revenue pence/cents
per share Equalisation
pence/cents per share*
Distribution paid 30.06.18
pence/cents per share
Distribution paid 30.06.17
pence/cents per share
Accumulation 'A' EUR Hedged Shares
Group 1 0.2488 - 0.2488 0.2794 Group 2 0.2488 0.0000 0.2488 0.2794 Accumulation 'A' USD Hedged Shares Group 1 0.2639 - 0.2639 0.2953 Group 2 0.2288 0.0351 0.2639 0.2953 Income 'A' Shares Group 1 0.2546 - 0.2546 0.2965 Group 2 0.0995 0.1551 0.2546 0.2965 Accumulation'U2' Shares Group 1 0.3384 - 0.3384 0.3755 Group 2 0.1665 0.1719 0.3384 0.3755 Income 'U2' Shares Group 1 0.2970 - 0.2970 0.3378 Group 2 0.2310 0.0660 0.2970 0.3378

Quilter Investors Sterling Corporate Bond Fund
Distribution table (continued)
Quilter Investors OEIC
387
Fourth Interim distribution Group 1: Shares purchased prior to 1 April 2018 Group 2: Shares purchased from 1 April 2018 to 30 April 2018
Revenue pence/cents
per share
Equalisation pence/cents
per share*
Distribution paid 31.05.18
pence/cents per share
Distribution paid 31.05.17
pence/cents per share
Accumulation 'A' EUR Hedged Shares
Group 1 0.2530 - 0.2530 0.2508 Group 2 0.2530 0.0000 0.2530 0.2508 Accumulation 'A' USD Hedged Shares Group 1 0.2711 - 0.2711 0.2705 Group 2 0.0572 0.2139 0.2711 0.2705 Income 'A' Shares Group 1 0.2681 - 0.2681 0.2677 Group 2 0.1732 0.0949 0.2681 0.2677 Accumulation'U2' Shares Group 1 0.3526 - 0.3526 0.3344 Group 2 0.1741 0.1785 0.3526 0.3344 Income 'U2' Shares Group 1 0.3081 - 0.3081 0.3028 Group 2 0.1667 0.1414 0.3081 0.3028

Quilter Investors Sterling Corporate Bond Fund
Distribution table (continued)
Quilter Investors OEIC
388
Third Interim distribution Group 1: Shares purchased prior to 1 March 2018 Group 2: Shares purchased from 1 March 2018 to 31 March 2018
Revenue pence/cents
per share
Equalisation pence/cents
per share*
Distribution paid 30.04.18
pence/cents per share
Distribution paid 30.04.17
pence/cents per share
Accumulation 'A' EUR Hedged Shares
Group 1 0.2533 - 0.2533 0.2658 Group 2 0.2533 0.0000 0.2533 0.2658 Accumulation 'A' USD Hedged Shares Group 1 0.2672 - 0.2672 0.2802 Group 2 0.0517 0.2155 0.2672 0.2802 Income 'A' Shares Group 1 0.2569 - 0.2569 0.2768 Group 2 0.0389 0.2180 0.2569 0.2768 Accumulation 'U2' Shares Group 1 0.3345 - 0.3345 0.3481 Group 2 0.1470 0.1875 0.3345 0.3481 Income 'U2' Shares Group 1 0.2932 - 0.2932 0.3150 Group 2 0.1984 0.0948 0.2932 0.3150

Quilter Investors Sterling Corporate Bond Fund
Distribution table (continued)
Quilter Investors OEIC
389
Second Interim distribution Group 1: Shares purchased prior to 1 February 2018 Group 2: Shares purchased from 1 February 2018 to 28 February 2018
Revenue pence/cents
per share
Equalisation pence/cents
per share*
Distribution paid 31.03.18
pence per share
Distribution paid 31.03.17
pence per share
Accumulation 'A' EUR Hedged Shares
Group 1 0.2311 - 0.2311 0.1913 Group 2 0.2311 0.0000 0.2311 0.1913 Accumulation 'A' USD Hedged Shares Group 1 0.2483 - 0.2483 0.1953 Group 2 0.1680 0.0803 0.2483 0.1953 Income 'A' Shares Group 1 0.2420 - 0.2420 0.2028 Group 2 0.1625 0.0795 0.2420 0.2028 Accumulation 'U2' Shares Group 1 0.3154 - 0.3154 0.2516 Group 2 0.1549 0.1605 0.3154 0.2516 Income 'U2' Shares Group 1 0.2766 - 0.2766 0.2325 Group 2 0.1848 0.0918 0.2766 0.2325

Quilter Investors Sterling Corporate Bond Fund
Distribution table (continued)
Quilter Investors OEIC
390
First Interim distribution Group 1: Shares purchased prior to 1 January 2018 Group 2: Shares purchased from 1 January 2018 to 31 January 2018
Revenue pence/cents
per share
Equalisation pence/cents
per share*
Distribution paid 28.02.18
pence per share
Distribution paid 28.02.17
pence per share
Accumulation 'A' EUR Hedged Shares
Group 1 0.2945 - 0.2945 0.2121 Group 2 0.2945 0.0000 0.2945 0.2121 Accumulation 'A' USD Hedged Shares Group 1 0.2962 - 0.2962 0.2231 Group 2 0.2962 0.0000 0.2962 0.2231 Income 'A' Shares Group 1 0.2828 - 0.2828 0.2165 Group 2 0.1442 0.1386 0.2828 0.2165 Accumulation 'U2' Shares Group 1 0.3674 - 0.3674 0.2753 Group 2 0.1506 0.2168 0.3674 0.2753 Income 'U2' Shares Group 1 0.3207 - 0.3207 0.2464 Group 2 0.2397 0.0810 0.3207 0.2464 * Equalisation only applies to shares purchased during the distribution period (Group 2 shares). It is the average amount of revenue included in the purchase price of all
Group 2 shares and is refunded to holders of these shares as a return of capital. Being capital, it is not liable to income tax but must be deducted from the cost of shares for capital gains tax purposes.

Quilter Investors Sterling Diversified Bond Fund
Quilter Investors Sterling Diversified Bond Fund
Quilter Investors OEIC
391
Launch date 30 April 2013
IA Sector Sterling Strategic Bond
Investment adviser FIL Pensions Management
Net asset value £152,404,724
Objective and policy
The sub-fund aims to achieve a combination of income and capital growth.
The sub-fund primarily invests in a diversified range of Sterling-denominated bonds (or hedged back to Sterling) and similar debt investments with fixed and variable interest rates issued by companies, banks, public entities and governments located anywhere in the world.
The sub-fund may also invest in other transferable securities, collective investment schemes (including those managed or operated by the ACD), warrants, money market instruments, deposits and derivatives.
The sub-fund may use derivatives (i.e. financial contracts whose value is linked to the expected price movements of an underlying investment), with the aim of generating returns and reducing the overall costs and/or risks of the sub-fund.
The sub-fund is managed by an investment adviser selected by the ACD for their expected ability to manage the sub-fund according to the investment objective and policy. The ACD continuously monitors and may periodically make changes to this appointment.
Investment Manager’s review
Market Review
Fixed income markets posted mixed returns over the period. US government bonds posted losses as the yield curve edged higher, due to concerns around a widening twin deficit and higher inflation. Moreover, central banks have affirmed contrasting yield divergence, with the US Federal Reserve’s (Fed) tightening monetary policy stance picking up pace as the Fed raised interest rates in March and June. In contrast, the Bank of England (BoE) backtracked on the expected interest rate rise amid disappointing economic data and focused on the looming Brexit deadline. The European Central Bank (ECB) also decided to taper asset purchases, and end it completely, by the end of the year. The period also witnessed political uncertainty in Italy, escalating trade war rhetoric and rising volatility in emerging markets, which stoked demand for safe haven assets. Short and long-dated German bund yields slid, supported by the ECB policymakers’ signal that interest rates would remain low. Ten-year UK government bond (Gilt) yields fell to the lowest level since the start of the year, before ending the period slightly higher as volatility normalised, while short dated gilt yields rose over the period. In credit markets, the global risk-off sentiment and the fall in stock markets led credit spreads to widen, with both high yield and investment grade bonds posting negative returns.
Performance
The sub-fund posted negative returns over the period with both corporate exposure and interest rate risk positioning weighing on returns. Credit spreads widened amid political uncertainty in Italy, escalating trade war rhetoric and rising volatility in emerging markets. Against this backdrop, exposure to European high yield names across a range of sectors weighed on returns. Holdings in Italian names such as Wind and Telecom Italia were the biggest detractor from issuer standpoint. Small exposure to emerging market names also held back returns at the margin. However, conservative positioning at the security and sector level partially offset the losses. The exposure to index credit default swaps (used to reduce credit risk in the portfolio) partially offset the negative effect from widening credit spreads. Similarly, modest exposure to financials minimised the severity of losses. On the duration front, the sub-fund’s skew towards US dollar duration weighed on returns as US treasury yields rose due to a combination of better economic data, monetary tightening signals from central banks, US tax reforms and/or expectations of rising US deficit. This was partially offset by exposure to euro interest rate risk as German bund yields fell amid demand for safe haven assets stoked by increased volatility in peripheral countries.
While the tightening of financial conditions has been well telegraphed, it coincides with the barrage of trade war threats and higher oil prices. We have already seen US dollar strength weighing heavily on emerging market sentiment. This leaves little room for miscommunication and/or policy error from global central banks at this stage of the cycle. While we continue to monitor steps towards policy normalisation, we expect the bond yields to remain low in historical context.
On the credit front, we believe that the frequency of mishaps for the market to deal with has increased amid tightening liquidity, strengthening dollar and central bank transition towards monetary tightening. Therefore, going into the second half of the year, we expect the volatility to remain elevated.
Risk and Reward Profile
The calculated risk and reward category, as shown above, uses a method of calculation derived from EU rules. It is based on the rate at which the returns of the sub-fund have moved up and down in the past (i.e. volatility) and is not a guide to the future risk and reward category of the sub-fund. The category shown is not a target or guarantee and may shift over time. Even the lowest category 1 does not mean a risk-free investment. The seven-category scale is nonlinear, for example, 2 is not twice as risky as 1.
Sub-funds in category 3 have in the past shown moderately low volatility. With a sub-fund of category 3, you have a moderately low risk of losing money but your chance for gains is also moderately low.
Investment risk - there is no guarantee that the sub-fund will achieve its objective. A capital loss of some or all of the amount invested may occur.
Credit risk - the issuer of a bond or a similar investment within the sub-fund may not pay income or repay capital to the sub-fund when due. Bonds which are rated below investment grade are considered to have a higher risk exposure with respect to meeting their payment obligations.
Interest rate risk - investments in bonds are affected by interest rates and inflation trends which may affect the value of the sub-fund.
Liquidity risk - some investments may become hard to value or sell at a desired time and price. In extreme circumstances this may affect the sub-fund’s ability to meet redemption requests upon demand.
Currency risk (EUR share class) - the sub-fund is denominated in British Pounds and may use techniques to try to reduce the effects of changes in the exchange rate between the currency of the underlying investments and the base currency of the sub-fund. These techniques may not eliminate all the currency risk. This share class is denominated in Euro. The hedging process may not give a precise hedge, and some currency risk may remain. The value of your shares may rise and fall as a result of exchange rate movements between these currencies.
Currency risk (GBP share class) - the sub-fund is denominated in British Pounds and may use techniques to try to reduce the effects of changes in the exchange rate between the currency of the underlying investments and the base currency of the sub-fund. These techniques may not eliminate all the currency risk. The value of your shares may rise and fall as a result of exchange rate movements.
Currency risk (USD share class) - the sub-fund is denominated in British Pounds and may use techniques to try to reduce the effects of changes in the exchange rate between the currency of the underlying investments and the base currency of the sub-fund. These techniques may not eliminate all the currency risk. This share class is denominated in US Dollars. The hedging process may not give a precise hedge, and some currency risk may remain. The value of your shares may rise and fall as a result of exchange rate movements between these currencies.
Derivative risk - the sub-fund uses derivatives to generate returns and/or to reduce costs and the overall risk of the sub-fund. Using derivatives can involve a higher level of risk. A small movement in the price of an underlying investment may result in a disproportionately large movement in the price of the derivative investment. Derivatives also involve counterparty risk where the institutions acting as counterparty to derivatives may not meet their contractual obligations.
Capital erosion risk - the sub-fund takes its charges from the income of the sub-fund in the first instance. The impact of sub-fund charges may be material on the value of any income you receive from your investment. There is potential for capital erosion if insufficient income is generated by the sub-fund to cover these charges. Capital erosion may have the effect of reducing the level of income generated.
For full details of the sub-fund's risks, please see the section in the prospectus headed "Risks".

Quilter Investors Sterling Diversified Bond Fund
Quilter Investors Sterling Diversified Bond Fund
Quilter Investors OEIC
392

Quilter Investors Sterling Diversified Bond Fund
Quilter Investors OEIC
393
Performance Records Comparative Tables 1 January 2018 to 1 January 2017 to 1 January 2016 to Accumulation 'A' EUR Hedged† 30 June 2018 31 December 2017 31 December 2016 p/share p/share p/share
Change in net assets per share Opening net asset value per share 91.91 86.47 78.07
Return before operating charges* (2.35) 6.55 9.42 Operating charges** (0.51) (1.04) (0.74)
Return after operating charges* (2.86) 5.51 8.68
Distributions (0.64) (1.63) (1.42) Retained distributions 0.64 1.56 1.14
Closing net asset value per share 89.05 91.91 86.47
* after direct transaction costs of*** - - -
Performance Return after charges (3.11)% 6.37% 11.12%
Other information Closing net asset value (£) 891 919 864 Closing number of shares 1,000 1,000 1,000 Operating charges**** 1.15% 1.15% 1.15% Direct transaction costs*** - - -
Prices cents per share cents per share cents per share Highest share price 104.2 104.7 105.9 Lowest share price 100.8 101.3 100.0
1 January 2018 to 1 January 2017 to 1 January 2016 to Accumulation 'A' USD Hedged 30 June 2018 31 December 2017 31 December 2016 p/share p/share p/share
Change in net assets per share Opening net asset value per share 80.39 84.12 66.50
Return before operating charges* 1.39 (2.72) 18.88 Operating charges** (0.45) (0.95) (0.91)
Return after operating charges* 0.94 (3.67) 17.97
Distributions (0.58) (1.53) (1.76) Retained distributions 0.58 1.47 1.41
Closing net asset value per share 81.33 80.39 84.12
* after direct transaction costs of*** - - -
Performance Return after charges 1.17% (4.36)% 27.02%
Other information Closing net asset value (£) 230,240 181,690 57,935 Closing number of shares 283,101 225,998 68,875 Operating charges**** 1.15% 1.15% 1.15% Direct transaction costs*** - - -
Prices cents per share cents per share cents per share Highest share price 109.3 109.1 108.0 Lowest share price 107.0 104.2 98.42
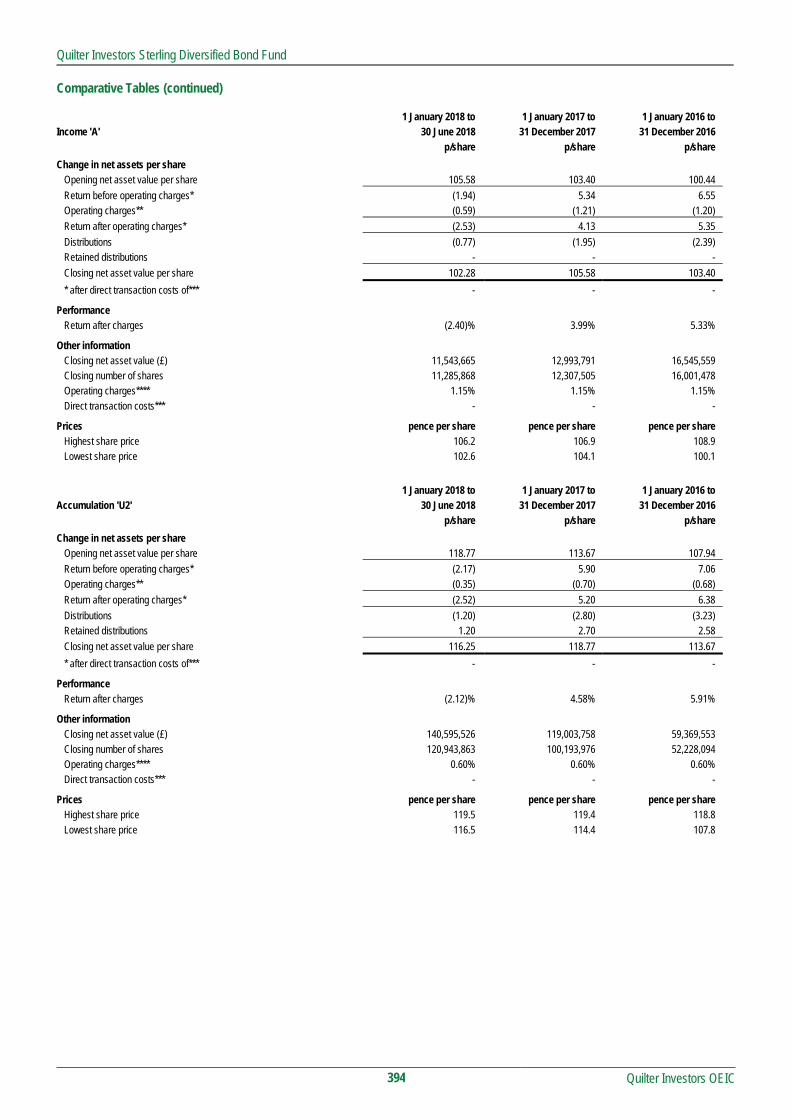
Quilter Investors Sterling Diversified Bond Fund
Quilter Investors OEIC
394
Comparative Tables (continued) 1 January 2018 to 1 January 2017 to 1 January 2016 to Income 'A' 30 June 2018 31 December 2017 31 December 2016 p/share p/share p/share
Change in net assets per share Opening net asset value per share 105.58 103.40 100.44
Return before operating charges* (1.94) 5.34 6.55 Operating charges** (0.59) (1.21) (1.20)
Return after operating charges* (2.53) 4.13 5.35
Distributions (0.77) (1.95) (2.39) Retained distributions - - -
Closing net asset value per share 102.28 105.58 103.40
* after direct transaction costs of*** - - -
Performance Return after charges (2.40)% 3.99% 5.33%
Other information Closing net asset value (£) 11,543,665 12,993,791 16,545,559 Closing number of shares 11,285,868 12,307,505 16,001,478 Operating charges**** 1.15% 1.15% 1.15% Direct transaction costs*** - - -
Prices pence per share pence per share pence per share Highest share price 106.2 106.9 108.9 Lowest share price 102.6 104.1 100.1
1 January 2018 to 1 January 2017 to 1 January 2016 to Accumulation 'U2' 30 June 2018 31 December 2017 31 December 2016 p/share p/share p/share
Change in net assets per share Opening net asset value per share 118.77 113.67 107.94
Return before operating charges* (2.17) 5.90 7.06 Operating charges** (0.35) (0.70) (0.68)
Return after operating charges* (2.52) 5.20 6.38
Distributions (1.20) (2.80) (3.23) Retained distributions 1.20 2.70 2.58
Closing net asset value per share 116.25 118.77 113.67
* after direct transaction costs of*** - - -
Performance Return after charges (2.12)% 4.58% 5.91%
Other information Closing net asset value (£) 140,595,526 119,003,758 59,369,553 Closing number of shares 120,943,863 100,193,976 52,228,094 Operating charges**** 0.60% 0.60% 0.60% Direct transaction costs*** - - -
Prices pence per share pence per share pence per share Highest share price 119.5 119.4 118.8 Lowest share price 116.5 114.4 107.8

Quilter Investors Sterling Diversified Bond Fund
Quilter Investors OEIC
395
Comparative Tables (continued) 1 January 2018 to 1 January 2017 to 1 January 2016 to Income 'U2' 30 June 2018 31 December 2017 31 December 2016 p/share p/share p/share
Change in net assets per share Opening net asset value per share 107.41 105.19 102.18
Return before operating charges* (1.96) 5.43 6.67 Operating charges** (0.31) (0.64) (0.64)
Return after operating charges* (2.27) 4.79 6.03
Distributions (1.08) (2.57) (3.02) Retained distributions - - -
Closing net asset value per share 104.06 107.41 105.19
* after direct transaction costs of*** - - -
Performance Return after charges (2.11)% 4.55% 5.90%
Other information Closing net asset value (£) 34,402 36,609 35,302 Closing number of shares 33,060 34,084 33,559 Operating charges**** 0.60% 0.60% 0.60% Direct transaction costs*** - - -
Prices pence per share pence per share pence per share Highest share price 108.1 108.8 110.9 Lowest share price 104.4 105.9 101.9
† From 31 March 2016 ** The operating charges include all costs borne by the sub-fund, except for direct transaction costs.
*** The direct transaction costs are made up of fees and commissions paid to agents, advisers, brokers and dealers, levies by regulatory agencies and securities exchanges as well as transfer taxes and duties. They do not include any difference between the quoted bid and offer prices or internal administrative or holding costs. These costs arise as a result of transactions undertaken both for efficient portfolio management and the meeting of the sub-fund’s objectives. These costs exclude any effect of dilution adjustments used to offset the costs.
**** The operating charges percentage is the ratio of the sub-fund’s ongoing charges (excluding interest on borrowings) to the average net assets of the sub-fund. If the share class launched during the period the operating charges figures are annualised.

Quilter Investors Sterling Diversified Bond Fund
Quilter Investors OEIC
396
Performance
6 months to
30 June 2018
1 year to
30 June 2018
3 years to
30 June 2018
5 years to
30 June 2018
Quilter Investors Sterling Diversified Bond Fund* (2.18)% (0.68)% 7.36% 20.65%
IA Sterling Strategic Bond Sector Average (benchmark) (1.51)% 0.42% 11.29% 24.39%
IA Sterling Strategic Bond (sector average) (1.53)% 0.41% 10.90% 23.36%
Quartile ranking 4 4 4 3
* Accumulation ‘U2’ shares
Data Source – Factset. Figures are calculated on a total return and single price basis, with net income reinvested into the sub-fund.
Portfolio allocation United Kingdom 43.39% North America 30.28% Europe 21.06% Asia Pacific (excluding Japan) 1.59% South America 0.87% Middle East 0.40% United Kingdom Derivatives (0.87)% Overseas Derivatives (0.08)% Net other assets 3.36% Total 100.00%
Asset allocation Sterling Denominated Debt Securities 46.75% US Dollar Denominated Debt Securities 28.55% Euro Denominated Debt Securities 17.12% Canadian Dollar Denominated Debt Securities 4.61% Mexican Peso Denominated Debt Securities 0.31% Indonesian Rupiah Denominated Debt Securities 0.25% United Kingdom Derivatives (0.87)% Overseas Derivatives (0.08)% Net other assets 3.36%
Total 100.00%
Major holdings Percentage of portfolio United Kingdom Gilt 1.25% 22/07/2018 23.01% US Treasury 4% 15/08/2018 4.91% Canadian Government Bond 3.75% 01/06/2019 4.61% United Kingdom Gilt 6% 07/12/2028 3.19% Bundesrepublik Deutschland Bundesanleihe 0.5% 15/02/2028 2.34% US Treasury 2.375% 15/05/2027 2.04% United Kingdom Gilt 2% 07/09/2025 1.88% US Treasury 1.125% 30/09/2021 1.43% US Treasury 1.5% 15/08/2026 1.13% US Treasury 1.375% 30/09/2023 0.93%
Number of holdings 372
Total Purchases and Sales for the period
2018 2017
£’000 £’000
Total purchases for the 6 month period to 30 June 117,131 42,082
Total sales for the 6 month period to 30 June 91,427 20,077
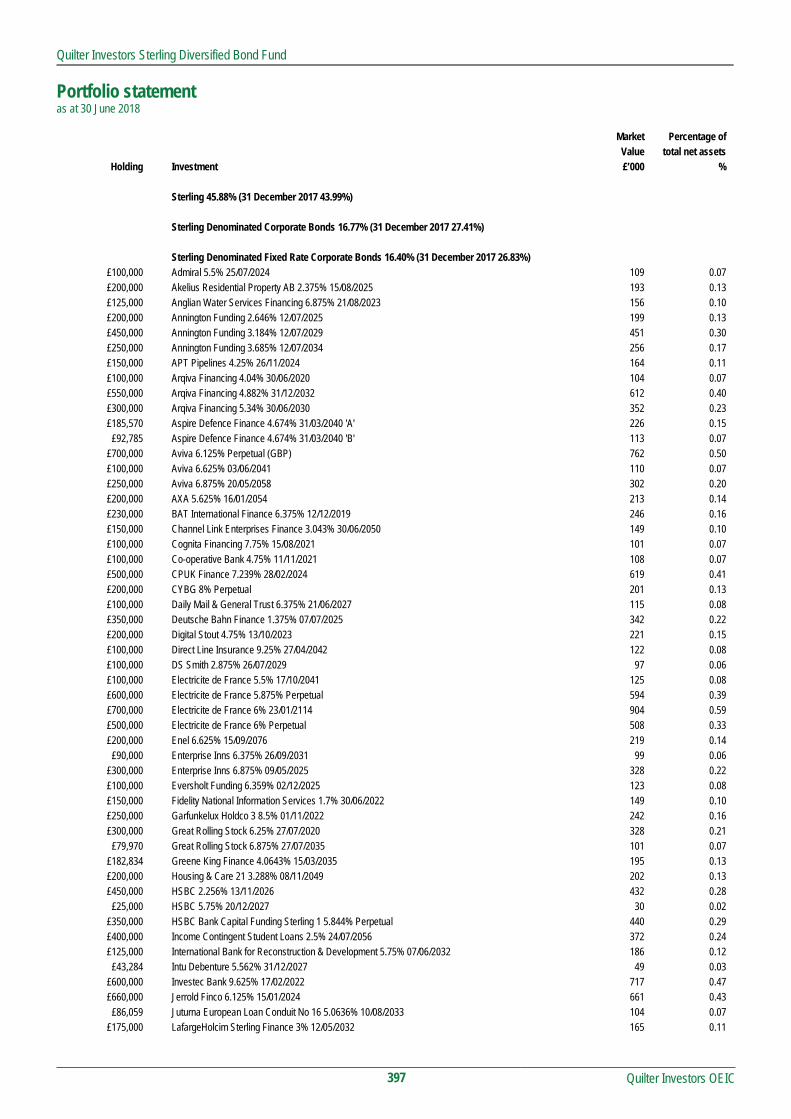
Quilter Investors Sterling Diversified Bond Fund
Portfolio statement as at 30 June 2018
Quilter Investors OEIC
397
Market Percentage of Value total net assets
Holding Investment £’000 %
Sterling 45.88% (31 December 2017 43.99%)
Sterling Denominated Corporate Bonds 16.77% (31 December 2017 27.41%)
Sterling Denominated Fixed Rate Corporate Bonds 16.40% (31 December 2017 26.83%) £100,000 Admiral 5.5% 25/07/2024 109 0.07 £200,000 Akelius Residential Property AB 2.375% 15/08/2025 193 0.13 £125,000 Anglian Water Services Financing 6.875% 21/08/2023 156 0.10 £200,000 Annington Funding 2.646% 12/07/2025 199 0.13 £450,000 Annington Funding 3.184% 12/07/2029 451 0.30 £250,000 Annington Funding 3.685% 12/07/2034 256 0.17 £150,000 APT Pipelines 4.25% 26/11/2024 164 0.11 £100,000 Arqiva Financing 4.04% 30/06/2020 104 0.07 £550,000 Arqiva Financing 4.882% 31/12/2032 612 0.40 £300,000 Arqiva Financing 5.34% 30/06/2030 352 0.23 £185,570 Aspire Defence Finance 4.674% 31/03/2040 'A' 226 0.15
£92,785 Aspire Defence Finance 4.674% 31/03/2040 'B' 113 0.07 £700,000 Aviva 6.125% Perpetual (GBP) 762 0.50 £100,000 Aviva 6.625% 03/06/2041 110 0.07 £250,000 Aviva 6.875% 20/05/2058 302 0.20 £200,000 AXA 5.625% 16/01/2054 213 0.14 £230,000 BAT International Finance 6.375% 12/12/2019 246 0.16 £150,000 Channel Link Enterprises Finance 3.043% 30/06/2050 149 0.10 £100,000 Cognita Financing 7.75% 15/08/2021 101 0.07 £100,000 Co-operative Bank 4.75% 11/11/2021 108 0.07 £500,000 CPUK Finance 7.239% 28/02/2024 619 0.41 £200,000 CYBG 8% Perpetual 201 0.13 £100,000 Daily Mail & General Trust 6.375% 21/06/2027 115 0.08 £350,000 Deutsche Bahn Finance 1.375% 07/07/2025 342 0.22 £200,000 Digital Stout 4.75% 13/10/2023 221 0.15 £100,000 Direct Line Insurance 9.25% 27/04/2042 122 0.08 £100,000 DS Smith 2.875% 26/07/2029 97 0.06 £100,000 Electricite de France 5.5% 17/10/2041 125 0.08 £600,000 Electricite de France 5.875% Perpetual 594 0.39 £700,000 Electricite de France 6% 23/01/2114 904 0.59 £500,000 Electricite de France 6% Perpetual 508 0.33 £200,000 Enel 6.625% 15/09/2076 219 0.14
£90,000 Enterprise Inns 6.375% 26/09/2031 99 0.06 £300,000 Enterprise Inns 6.875% 09/05/2025 328 0.22 £100,000 Eversholt Funding 6.359% 02/12/2025 123 0.08 £150,000 Fidelity National Information Services 1.7% 30/06/2022 149 0.10 £250,000 Garfunkelux Holdco 3 8.5% 01/11/2022 242 0.16 £300,000 Great Rolling Stock 6.25% 27/07/2020 328 0.21
£79,970 Great Rolling Stock 6.875% 27/07/2035 101 0.07 £182,834 Greene King Finance 4.0643% 15/03/2035 195 0.13 £200,000 Housing & Care 21 3.288% 08/11/2049 202 0.13 £450,000 HSBC 2.256% 13/11/2026 432 0.28
£25,000 HSBC 5.75% 20/12/2027 30 0.02 £350,000 HSBC Bank Capital Funding Sterling 1 5.844% Perpetual 440 0.29 £400,000 Income Contingent Student Loans 2.5% 24/07/2056 372 0.24 £125,000 International Bank for Reconstruction & Development 5.75% 07/06/2032 186 0.12
£43,284 Intu Debenture 5.562% 31/12/2027 49 0.03 £600,000 Investec Bank 9.625% 17/02/2022 717 0.47 £660,000 Jerrold Finco 6.125% 15/01/2024 661 0.43
£86,059 Juturna European Loan Conduit No 16 5.0636% 10/08/2033 104 0.07 £175,000 LafargeHolcim Sterling Finance 3% 12/05/2032 165 0.11

Quilter Investors Sterling Diversified Bond Fund
Portfolio statement (continued) as at 30 June 2018
Quilter Investors OEIC
398
Market Percentage of Value total net assets
Holding Investment £’000 % Sterling Denominated Fixed Rate Corporate Bonds (continued)
£500,000 Lloyds Bank 5.75% 09/07/2025 532 0.35 £450,000 Lloyds Banking 2.25% 16/10/2024 436 0.29 £330,000 Mclaren Finance 5% 01/08/2022 322 0.21
£75,910 Meadowhall Finance 4.986% 12/01/2032 92 0.06 £100,000 Northern Gas Networks Finance 5.875% 08/07/2019 104 0.07 £100,000 Northern Powergrid Yorkshire 2.5% 01/04/2025 102 0.07 £250,000 Northumbrian Water Finance 6.875% 06/02/2023 303 0.20 £100,000 Old Mutual 8% 03/06/2021 110 0.07 £250,000 PGH Capital 4.125% 20/07/2022 256 0.17 £100,000 Porterbrook Rail Finance 5.5% 20/04/2019 103 0.07 £200,000 Porterbrook Rail Finance 6.5% 20/10/2020 221 0.15 £100,000 Porterbrook Rail Finance 7.125% 20/10/2026 130 0.09 £100,000 Rabobank 6.91% Perpetual 146 0.10 £100,000 RAC Bond 4.565% 06/05/2023 104 0.07 £250,000 RAC Bond 5% 06/11/2022 236 0.15 £200,000 RL Finance No 3 6.125% 13/11/2028 221 0.14 £200,000 Santander UK 7.375% Step Perpetual 208 0.14 £275,000 Shaftesbury Carnaby 2.487% 30/09/2031 261 0.17 £450,000 SMFG Preferred Capital GBP 2 10.231% Perpetual 711 0.47 £100,000 Southern Gas Networks 5.125% 02/11/2018 101 0.07 £600,000 Southern Water Services Finance 5% 31/03/2021 656 0.43 £200,000 Southern Water Services Finance 6.125% 31/03/2019 207 0.14 £250,000 Student Finance 2.6663% 30/09/2024 249 0.16 £100,000 Telecom Italia 5.875% 19/05/2023 110 0.07 £100,000 Telefonica Emisiones 5.597% 12/03/2020 107 0.07
£61,858 Telereal Securitisation 5.3887% 10/12/2031 73 0.05 £89,354 Tesco Property Finance 1 7.6227% 13/07/2039 119 0.08
£391,939 Tesco Property Finance 2 6.0517% 13/10/2039 462 0.30 £291,934 Tesco Property Finance 3 5.744% 13/04/2040 339 0.22
£98,493 Tesco Property Finance 5 5.6611% 13/10/2041 113 0.07 £500,000 Thames Water Utilities Cayman Finance 3.5% 25/02/2028 530 0.35 £500,000 Thames Water Utilities Cayman Finance 5.5% 11/02/2041 673 0.44 £450,000 Thames Water Utilities Cayman Finance 7.738% 09/04/2058 850 0.56 £305,353 Unique Pub Finance 5.659% 30/06/2027 336 0.22
£91,600 Unique Pub Finance 6.542% 30/03/2021 96 0.06 £410,000 Virgin Media Receivables Financing Notes I 5.5% 15/09/2024 403 0.26 £600,000 Virgin Media Secured Finance 5.125% 15/01/2025 609 0.40 £100,000 Wales & West Utilities Finance 6.25% 30/11/2021 115 0.07 £200,000 Westfield America Management 2.625% 30/03/2029 197 0.13 £100,000 Yorkshire Water Services Odsal Finance 6.454% 28/05/2027 133 0.09
24,992 16.40
Sterling Denominated Variable Rate Corporate Bonds 0.37% (31 December 2017 0.58%) £559,450 Together Asset Backed Securitisation 1.62919% 12/03/2049 562 0.37
562 0.37
Sterling Denominated Government Bonds 29.98% (31 December 2017 16.02%)
Sterling Denominated Fixed Rate Government Bonds 29.98% (31 December 2017 16.02%) £300,000 International Bank for Reconstruction & Development 0.625% 15/12/2023 290 0.19
£35,050,000 United Kingdom Gilt 1.25% 22/07/2018 35,062 23.01 £300,000 United Kingdom Gilt 1.25% 22/07/2027 298 0.20
£1,000,000 United Kingdom Gilt 1.5% 22/07/2026 1,022 0.67 £2,700,000 United Kingdom Gilt 2% 07/09/2025 2,865 1.88
£100,000 United Kingdom Gilt 4.25% 07/03/2036 140 0.09 £150,000 United Kingdom Gilt 4.25% 07/09/2039 218 0.14

Quilter Investors Sterling Diversified Bond Fund
Portfolio statement (continued) as at 30 June 2018
Quilter Investors OEIC
399
Market Percentage of Value total net assets
Holding Investment £’000 % Sterling Denominated Fixed Rate Government Bonds (continued)
£150,000 United Kingdom Gilt 4.25% 07/12/2046 235 0.15 £250,000 United Kingdom Gilt 4.25% 07/12/2049 405 0.27 £100,000 United Kingdom Gilt 4.5% 07/12/2042 155 0.10 £100,000 United Kingdom Gilt 4.75% 07/12/2030 137 0.09
£3,350,000 United Kingdom Gilt 6% 07/12/2028 4,862 3.19
45,689 29.98
Sterling Denominated Derivatives (0.87)% (31 December 2017 0.56%)
Sterling Denominated Forward Exchange Contracts (0.92)% (31 December 2017 0.66%) £6,986,630 Sterling v Canadian Dollar Forward Exchange Contract (49) (0.03)
£203,281 Sterling v Euro Forward Exchange Contract (1) - £248,175 Sterling v Euro Forward Exchange Contract (1) - £195,739 Sterling v Euro Forward Exchange Contract (1) - £169,541 Sterling v Euro Forward Exchange Contract (2) - £188,746 Sterling v Euro Forward Exchange Contract (2) - £353,718 Sterling v Euro Forward Exchange Contract (3) - £460,309 Sterling v Euro Forward Exchange Contract (4) - £679,704 Sterling v Euro Forward Exchange Contract (4) - £487,075 Sterling v Euro Forward Exchange Contract (6) - £874,579 Sterling v Euro Forward Exchange Contract (13) (0.01) £921,536 Sterling v Euro Forward Exchange Contract (14) (0.01)
£21,896,663 Sterling v Euro Forward Exchange Contract (159) (0.10) £768,482 Sterling v Hungarian Forint Forward Exchange Contract 28 0.02 £870,896 Sterling v Hungarian Forint Forward Exchange Contract 10 0.01 £362,378 Sterling v Hungarian Forint Forward Exchange Contract 10 0.01 £758,223 Sterling v Hungarian Forint Forward Exchange Contract 4 - £102,791 Sterling v Hungarian Forint Forward Exchange Contract 3 - £354,168 Sterling v Mexican Peso Forward Exchange Contract (11) (0.01) £550,383 Sterling v Mexican Peso Forward Exchange Contract (15) (0.01) £405,079 Sterling v New Zealand Dollar Forward Exchange Contract - - £359,359 Sterling v Polish Zloty Forward Exchange Contract 4 - £431,644 Sterling v Polish Zloty Forward Exchange Contract 4 - £364,230 Sterling v Polish Zloty Forward Exchange Contract 2 - £151,839 Sterling v Polish Zloty Forward Exchange Contract - -
£1,480,098 Sterling v Shekel Forward Exchange Contract (14) (0.01) £243,882 Sterling v South African Rand Denominated Forward Exchange Contract 14 0.01 £138,600 Sterling v Turkish Lira Forward Exchange Contract 3 - £138,849 Sterling v Turkish Lira Forward Exchange Contract (1) - £138,570 Sterling v Turkish Lira Forward Exchange Contract (7) - £283,530 Sterling v Turkish Lira Forward Exchange Contract (10) (0.01)
£7,555,340 Sterling v US Dollar Forward Exchange Contract 30 0.02 £303,055 Sterling v US Dollar Forward Exchange Contract (1) - £260,751 Sterling v US Dollar Forward Exchange Contract (2) - £441,765 Sterling v US Dollar Forward Exchange Contract (2) - £380,844 Sterling v US Dollar Forward Exchange Contract (3) - £230,129 Sterling v US Dollar Forward Exchange Contract (8) (0.01) £437,029 Sterling v US Dollar Forward Exchange Contract (8) (0.01) £489,951 Sterling v US Dollar Forward Exchange Contract (8) (0.01) £437,228 Sterling v US Dollar Forward Exchange Contract (9) (0.01) £578,265 Sterling v US Dollar Forward Exchange Contract (16) (0.01)
£1,591,165 Sterling v US Dollar Forward Exchange Contract (17) (0.01) £452,039 Sterling v US Dollar Forward Exchange Contract (17) (0.01)
£36,872,019 Sterling v US Dollar Forward Exchange Contract (1,113) (0.73)
(1,409) (0.92)

Quilter Investors Sterling Diversified Bond Fund
Portfolio statement (continued) as at 30 June 2018
Quilter Investors OEIC
400
Market Percentage of
Value total net assets Holding Investment £’000 %
Sterling Denominated Futures Contracts (0.03)% (31 December 2017 (0.09)%)
(34) Long Gilt Futures September 2018 (43) (0.03)
(43) (0.03)
Sterling Interest Rate Swap 0.08% (31 December 2017 (0.01)%) £(1,800,000) Interest Rate Swap Pay - 1.1632%, Receive - 6M LIBOR 18/08/2027 Morgan Stanley 49 0.03 £(1,100,000) Interest Rate Swap Pay - 6M LIBOR-BBA, Receive - 1.4858% 31/05/2028 Morgan Stanley (2) - £(1,200,000) Interest Rate Swap Pay - 1.5572%, Receive - 6M LIBOR-BBA 01/03/2028 Morgan Stanley (7) - £(1,500,000) Interest Rate Swap Pay - 1.5%, Receive - 6M LIBOR 03/03/2037 Morgan Stanley 31 0.02
£(100,000) Interest Rate Swap Pay - 1.4947%, Receive - 6M LIBOR-BBA 15/05/2037 Morgan Stanley 2 - £(1,000,000) Interest Rate Swap Pay - 1.46%, Receive - 6M LIBOR 03/03/2037 Morgan Stanley 35 0.02
£(500,000) Interest Rate Swap Pay - 1.274%, Receive - 6M LIBOR 27/07/2027 Morgan Stanley 9 0.01 £(40,000) Interest Rate Swap Pay - 1.2267%, Receive - 6M LIBOR 14/09/2027 Morgan Stanley 1 -
118 0.08
Overseas 50.76% (31 December 2017 52.08%)
Africa (0.02)% (31 December 2017 1.11%)
South African Rand Denominated Government Bond 0.00% (31 December 2017 1.11%)
South African Rand Denominated Fixed Rate Government Bond 0.00% (31 December 2017 1.11%)
South African Rand Denominated Derivatives (0.02)% (31 December 2017 0.00%)
South African Rand Denominated Forward Exchange Contracts (0.02)% (31 December 2017 0.00%) ZAR2,742,000 South African Rand v Sterling Denominated Forward Exchange Contract (1) - ZAR1,770,000 South African Rand v Sterling Denominated Forward Exchange Contract (7) - ZAR2,442,000 South African Rand v Sterling Denominated Forward Exchange Contract (8) (0.01) ZAR2,477,000 South African Rand v Sterling Denominated Forward Exchange Contract (9) (0.01)
(25) (0.02)
Asia Pacific (excluding Japan) 0.25% (31 December 2017 3.21%)
Indonesia Rupiah Fixed Rate Corporate Bonds 0.25% (31 December 2017 0.00%) IDR7,240,000,000 Wijaya Karya Persero Tbk PT 7.7% 31/01/2021 373 0.25
373 0.25
New Zealand Dollar Fixed Rate Government Bonds 0.00% (31 December 2017 3.16%)
Australian Dollar Denominated Forward Exchange Contracts 0.00% (31 December 2017 0.04%)
Australian Dollar Interest Rate Swap 0.00% (31 December 2017 0.00%) AU$(1,100,000) Interest Rate Swap Pay - 2.8443%, Receive - 6M BBR 22/12/2027 Morgan Stanley (3) -
AU$(400,000) Interest Rate Swap Pay - 2.815%, Receive - 6M BBR-BBSW 03/04/2028 Morgan Stanley - - AU$(4,100,000) Interest Rate Swap Pay - 2.8123%, Receive - 6M BBR-BBSW 29/06/2028 Morgan Stanley - -
AU$(900,000) Interest Rate Swap Pay - 2.7385%, Receive - 6M BBR 15/12/2027 Morgan Stanley 2 -
(1) -
Indonesian Rupiah Denominated Forward Exchange Contracts (0.01)% (31 December 2017 0.00%) IDR12,387,730,000 Indonesian Rupiah v US Dollar Forward Exchange Contract (1) -
IDR1,453,961,000 Indonesian Rupiah v US Dollar Forward Exchange Contract (1) - IDR13,507,384,000 Indonesian Rupiah v US Dollar Forward Exchange Contract (12) (0.01)
(14) (0.01)

Quilter Investors Sterling Diversified Bond Fund
Portfolio statement (continued) as at 30 June 2018
Quilter Investors OEIC
401
Market Percentage of
Value total net assets Holding Investment £’000 %
New Zealand Dollar Denominated Forward Exchange Contracts 0.00% (31 December 2017 0.00%)
NZ$789,000 New Zealand Dollar v Sterling Denominated Forward Exchange Contract - -
- -
New Zealand Dollar Interest Rate Swap 0.02% (31 December 2017 0.01%) NZ$(1,410,000) Interest Rate Swap Pay - 3M BBR-FRA, Receive - 3.2575% 02/10/2027 Morgan Stanley 17 0.01
NZ$(600,000) Interest Rate Swap Pay - 3M BBR-FRA, Receive - 3.25% 08/01/2028 Morgan Stanley 7 0.01 NZ$(500,000) Interest Rate Swap Pay - 3M BBR-FRA, Receive - 3.22% 08/01/2028 Morgan Stanley 5 0.01 NZ$(400,000) Interest Rate Swap Pay - 3M BBR-FRA, Receive - 3.145% 08/01/2028 Morgan Stanley 3 - NZ$(100,000) Interest Rate Swap Pay - 3M BBR-FRA, Receive - 3.13% 22/11/2027 Morgan Stanley 1 - NZ$(500,000) Interest Rate Swap Pay - 3M BBR-FRA, Receive - 3.1025% 18/12/2027 Morgan Stanley 3 - NZ$(600,000) Interest Rate Swap Pay - 3M BBR-FRA, Receive - 3.075% 08/01/2028 Morgan Stanley 2 - NZ$(500,000) Interest Rate Swap Pay - 3M BBR-FRA, Receive - 3.0325% 08/01/2028 Morgan Stanley - - NZ$(300,000) Interest Rate Swap Pay - 3M BBR-FRA , Receive - 3.235% 30/10/2027 Morgan Stanley 3 -
NZ$(1,600,000) Interest Rate Swap Pay - 3.241%, Receive - 3M BBR-FRA 11/06/2028 Morgan Stanley (16) (0.01)
25 0.02
South Korean Won Denominated Forward Exchange Contracts (0.01)% (31 December 2017 0.00%) KRW623,750,000 South Korean Won v US Dollar Forward Exchange Contract (15) (0.01)
(15) (0.01)
Japan (0.02)% (31 December 2017 0.00%)
Japanese Yen Denominated Derivatives (0.02)% (31 December 2017 0.00%)
Japanese Yen Interest Rate Swap (0.02)% (31 December 2017 0.00%) ¥(342,200,000) Interest Rate Swap Pay - 6M LIBOR-BBA, Receive - 0.2873% 02/07/2028 Morgan Stanley 9 0.01 ¥(172,800,000) Interest Rate Swap Pay - 0.3802%, Receive - 6M LIBOR-BBA 14/02/2028 Morgan Stanley (16) (0.01) ¥(78,600,000) Interest Rate Swap Pay - 0.37895%, Receive - 6M LIBOR-BBA 05/02/2028 Morgan Stanley (7) (0.01)
¥(114,500,000) Interest Rate Swap Pay - 0.3592%, Receive - 6M LIBOR-BBA 19/02/2028 Morgan Stanley (9) (0.01) ¥(27,700,000) Interest Rate Swap Pay - 0.3007%, Receive - 6M LIBOR-BBA 04/04/2028 Morgan Stanley (1) - ¥(31,900,000) Interest Rate Swap Pay - 0.271%, Receive - 6M LIBOR 22/11/2027 Morgan Stanley (1) - ¥(84,330,000) Interest Rate Swap Pay - 0.27%, Receive - 6M LIBOR 31/07/2027 Morgan Stanley (3) - ¥(13,700,000) Interest Rate Swap Pay - 0.2532%, Receive - 6M LIBOR 19/09/2027 Morgan Stanley - -
(28) (0.02)
Europe 16.67% (31 December 2017 14.63%)
Euro Denominated Fixed Rate Corporate Bonds 13.09% (31 December 2017 12.45%) €1,050,000 ADLER Real Estate 2.125% 06/02/2024 902 0.59
€300,000 ADLER Real Estate 3% 27/04/2026 259 0.17 €100,000 Annington Funding 1.65% 12/07/2024 88 0.06 €200,000 Areva 3.125% 20/03/2023 176 0.12 €200,000 Areva 3.25% 04/09/2020 183 0.12 €425,000 AT&T 2.35% 05/09/2029 380 0.25 €125,000 AT&T 3.15% 04/09/2036 111 0.07 €350,000 Barclays Bank 6.625% 30/03/2022 366 0.24 €250,000 BAT Finance 2.25% 16/01/2030 221 0.14 €300,000 Bayer Capital 1.5% 26/06/2026 267 0.17 €200,000 Bayer Capital 2.125% 15/12/2029 179 0.12 €350,000 Bevco Lux Sarl 1.75% 09/02/2023 309 0.20 €400,000 CaixaBank 2.25% 17/04/2030 333 0.22 €300,000 Cemex 2.75% 05/12/2024 257 0.17

Quilter Investors Sterling Diversified Bond Fund
Portfolio statement (continued) as at 30 June 2018
Quilter Investors OEIC
402
Market Percentage of Value total net assets
Holding Investment £’000 % Euro Denominated Fixed Rate Corporate Bonds (continued)
€500,000 Channel Link Enterprises Finance 2.706% 30/06/2050 464 0.30 €298,588 Channel Link Enterprises Finance 5.892% 30/06/2041 361 0.24 €100,000 CNRC Capital 1.871% 07/12/2021 90 0.06
€1,000,000 Credit Agricole Cariparma 1.75% 15/01/2038 829 0.54 €250,000 Crown European 2.25% 01/02/2023 219 0.14 €200,000 DS Smith 1.375% 26/07/2024 175 0.11 €475,000 Enel 2.5% 24/11/2078 396 0.26 €400,000 Enel 3.375% 24/11/2081 334 0.22 €400,000 Equinix 2.875% 01/02/2026 334 0.22 €200,000 Eurofins Scientific SE 3.25% Perpetual 167 0.11 €600,000 Globalworth Real Estate Investments 3% 29/03/2025 528 0.35 €200,000 Grand City Properties 3.75% Perpetual 181 0.12 €250,000 Holcim Finance Luxembourg 1.75% 29/08/2029 208 0.14 €600,000 IHO Verwaltungs 3.75% 15/09/2026 542 0.36 €250,000 Intesa Sanpaolo 7% Perpetual 226 0.15 €200,000 Intrum Justitia 2.75% 15/07/2022 168 0.11 €200,000 Intrum Justitia 3.125% 15/07/2024 165 0.11 €100,000 JAB 1.75% 25/06/2026 88 0.06 €200,000 JAB 2.5% 25/06/2029 178 0.12 €150,000 Leonardo 1.5% 07/06/2024 125 0.08 €220,000 LHMC Finco Sarl 6.25% 20/12/2023 193 0.13 €300,000 Mercury Bondco 7.125% 30/05/2021 275 0.18 €650,000 NEW Areva 4.875% 23/09/2024 604 0.40 €350,000 Nidda Healthcare 3.5% 30/09/2024 292 0.19 €300,000 O2 Telefonica Deutschland Finanzierungs 1.75% 05/07/2025 265 0.17 €225,000 OI European 3.125% 15/11/2024 201 0.13 €450,000 Paprec 4% 31/03/2025 394 0.26 €400,000 Quintiles IMS 3.25% 15/03/2025 344 0.23 €175,000 Roadster Finance Designated Activity 1.625% 09/12/2024 153 0.10 €150,000 Roadster Finance Designated Activity 2.375% 08/12/2027 129 0.08 €670,000 Sigma Holdco 5.75% 15/05/2026 554 0.36 €175,000 Silgan 3.25% 15/03/2025 157 0.10 €505,000 Smurfit Kappa Acquisitions Unltd 2.375% 01/02/2024 452 0.30 €100,000 Smurfit Kappa Acquisitions 2.75% 01/02/2025 90 0.06 €375,000 Telecom Italia 2.375% 12/10/2027 312 0.20 €400,000 Telefonica Europe 2.625% Perpetual 331 0.22 €100,000 Telefonica Europe 3.75% Perpetual 89 0.06 €100,000 Telefonica Europe 5.875% Perpetual 96 0.06 €800,000 Telenet Finance Luxembourg Notes 3.5% 01/03/2028 671 0.44 €350,000 Terna Rete Elettrica Nazionale 1.375% 26/07/2027 298 0.20 €150,000 Teva Pharmaceutical Finance Netherlands II 4.5% 01/03/2025 136 0.09 €320,000 Titan Global Finance 2.375% 16/11/2024 267 0.17
€1,300,000 Unibail-Rodamco 0.125% 14/05/2021 1,154 0.76 €400,000 Unibail-Rodamco 2.125% Perpetual 346 0.23 €500,000 Unibail-Rodamco 2.875% Perpetual 428 0.28 €100,000 Unitymedia Hessen 3.5% 15/01/2027 92 0.06
€90,000 Verisure 6% 01/11/2022 83 0.05 €150,000 Verizon Communications 1.875% 26/10/2029 131 0.09 €100,000 Verizon Communications 2.875% 15/01/2038 87 0.06 €600,000 Volkswagen International Finance 3.375% Perpetual 523 0.34 €400,000 Volkswagen International Finance 4.625% Perpetual 352 0.23 €460,000 Volvo Car AB 2% 24/01/2025 394 0.26 €350,000 Wind Tre 3.125% 20/01/2025 250 0.16
19,952 13.09
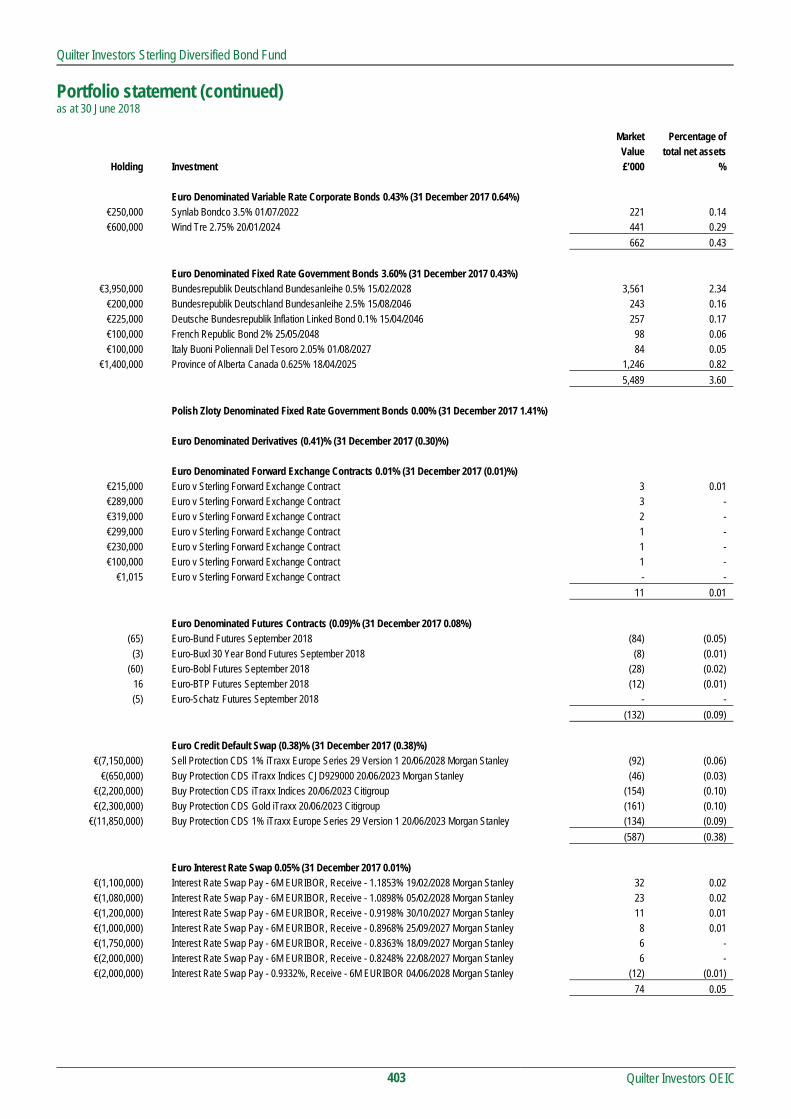
Quilter Investors Sterling Diversified Bond Fund
Portfolio statement (continued) as at 30 June 2018
Quilter Investors OEIC
403
Market Percentage of
Value total net assets Holding Investment £’000 %
Euro Denominated Variable Rate Corporate Bonds 0.43% (31 December 2017 0.64%)
€250,000 Synlab Bondco 3.5% 01/07/2022 221 0.14 €600,000 Wind Tre 2.75% 20/01/2024 441 0.29
662 0.43
Euro Denominated Fixed Rate Government Bonds 3.60% (31 December 2017 0.43%) €3,950,000 Bundesrepublik Deutschland Bundesanleihe 0.5% 15/02/2028 3,561 2.34
€200,000 Bundesrepublik Deutschland Bundesanleihe 2.5% 15/08/2046 243 0.16 €225,000 Deutsche Bundesrepublik Inflation Linked Bond 0.1% 15/04/2046 257 0.17 €100,000 French Republic Bond 2% 25/05/2048 98 0.06 €100,000 Italy Buoni Poliennali Del Tesoro 2.05% 01/08/2027 84 0.05
€1,400,000 Province of Alberta Canada 0.625% 18/04/2025 1,246 0.82
5,489 3.60
Polish Zloty Denominated Fixed Rate Government Bonds 0.00% (31 December 2017 1.41%)
Euro Denominated Derivatives (0.41)% (31 December 2017 (0.30)%)
Euro Denominated Forward Exchange Contracts 0.01% (31 December 2017 (0.01)%) €215,000 Euro v Sterling Forward Exchange Contract 3 0.01 €289,000 Euro v Sterling Forward Exchange Contract 3 - €319,000 Euro v Sterling Forward Exchange Contract 2 - €299,000 Euro v Sterling Forward Exchange Contract 1 - €230,000 Euro v Sterling Forward Exchange Contract 1 - €100,000 Euro v Sterling Forward Exchange Contract 1 -
€1,015 Euro v Sterling Forward Exchange Contract - -
11 0.01
Euro Denominated Futures Contracts (0.09)% (31 December 2017 0.08%) (65) Euro-Bund Futures September 2018 (84) (0.05) (3) Euro-Buxl 30 Year Bond Futures September 2018 (8) (0.01)
(60) Euro-Bobl Futures September 2018 (28) (0.02) 16 Euro-BTP Futures September 2018 (12) (0.01) (5) Euro-Schatz Futures September 2018 - -
(132) (0.09)
Euro Credit Default Swap (0.38)% (31 December 2017 (0.38)%) €(7,150,000) Sell Protection CDS 1% iTraxx Europe Series 29 Version 1 20/06/2028 Morgan Stanley (92) (0.06)
€(650,000) Buy Protection CDS iTraxx Indices CJD929000 20/06/2023 Morgan Stanley (46) (0.03) €(2,200,000) Buy Protection CDS iTraxx Indices 20/06/2023 Citigroup (154) (0.10) €(2,300,000) Buy Protection CDS Gold iTraxx 20/06/2023 Citigroup (161) (0.10)
€(11,850,000) Buy Protection CDS 1% iTraxx Europe Series 29 Version 1 20/06/2023 Morgan Stanley (134) (0.09)
(587) (0.38)
Euro Interest Rate Swap 0.05% (31 December 2017 0.01%) €(1,100,000) Interest Rate Swap Pay - 6M EURIBOR, Receive - 1.1853% 19/02/2028 Morgan Stanley 32 0.02 €(1,080,000) Interest Rate Swap Pay - 6M EURIBOR, Receive - 1.0898% 05/02/2028 Morgan Stanley 23 0.02 €(1,200,000) Interest Rate Swap Pay - 6M EURIBOR, Receive - 0.9198% 30/10/2027 Morgan Stanley 11 0.01 €(1,000,000) Interest Rate Swap Pay - 6M EURIBOR, Receive - 0.8968% 25/09/2027 Morgan Stanley 8 0.01 €(1,750,000) Interest Rate Swap Pay - 6M EURIBOR, Receive - 0.8363% 18/09/2027 Morgan Stanley 6 - €(2,000,000) Interest Rate Swap Pay - 6M EURIBOR, Receive - 0.8248% 22/08/2027 Morgan Stanley 6 - €(2,000,000) Interest Rate Swap Pay - 0.9332%, Receive - 6M EURIBOR 04/06/2028 Morgan Stanley (12) (0.01)
74 0.05

Quilter Investors Sterling Diversified Bond Fund
Portfolio statement (continued) as at 30 June 2018
Quilter Investors OEIC
404
Market Percentage of
Value total net assets Holding Investment £’000 %
Hungarian Forint Denominated Forward Exchange Contracts (0.03)% (31 December 2017 0.00%)
HUF106,838,000 Hungarian Forint v Sterling Denominated Forward Exchange Contract (5) - HUF345,737,000 Hungarian Forint v Sterling Denominated Forward Exchange Contract (20) (0.01) HUF312,366,000 Hungarian Forint v Sterling Denominated Forward Exchange Contract (26) (0.02)
(51) (0.03)
Polish Zloty Denominated Forward Exchange Contracts (0.01)% (31 December 2017 0.00%) PLN718,000 Polish Zloty v Sterling Forward Exchange Contract 1 -
PLN3,351,000 Polish Zloty v Sterling Forward Exchange Contract (2) - PLN3,155,000 Polish Zloty v Sterling Forward Exchange Contract (8) (0.01)
(9) (0.01)
Russian Ruble Denominated Forward Exchange Contracts 0.00% (31 December 2017 0.00%) RUB24,667,000 Russian Ruble v US Dollar Forward Exchange Contract 5 - RUB24,282,000 Russian Ruble v US Dollar Forward Exchange Contract (2) -
3 -
Turkish Lira Denominated Forward Exchange Contracts 0.00% (31 December 2017 0.00%) TRY2,375,000 Turkish Lira v Sterling Denominated Forward Exchange Contract 10 0.01
TRY949,000 Turkish Lira v Sterling Denominated Forward Exchange Contract 6 - TRY781,000 Turkish Lira v Sterling Denominated Forward Exchange Contract 3 -
TRY3,622,000 Turkish Lira v Sterling Denominated Forward Exchange Contract (14) (0.01)
5 -
Swedish Krona Interest Rate Swap 0.00% (31 December 2017 0.00%) SEK(3,900,000) Interest Rate Swap Pay - 3M STIBOR-SIDE, Receive - 1.3703% 26/02/2028 Morgan Stanley 8 - SEK(4,600,000) Interest Rate Swap Pay - 1.24%, Receive - 3M STIBOR-SIDE 30/10/2027 Morgan Stanley (6) -
SEK(350,000) Interest Rate Swap Pay - 1.119%, Receive - 3M STIBOR-SIDE 22/11/2027 Morgan Stanley - -
2 -
Swiss Franc Interest Rate Swap 0.00% (31 December 2017 0.00%) CHF(1,300,000) Interest Rate Swap Pay - 6M LIBOR, Receive - 0.4125% 04/06/2028 Morgan Stanley 1 -
CHF(400,000) Interest Rate Swap Pay - 6M LIBOR, Receive - 0.41% 04/04/2028 Morgan Stanley 1 - CHF(800,000) Interest Rate Swap Pay - 6M LIBOR, Receive - 0.2985% 31/07/2027 Morgan Stanley (2) - CHF(860,000) Interest Rate Swap Pay - 6M LIBOR, Receive - 0.21% 18/09/2027 Citigroup (8) -
(8) -
Middle East 0.00% (31 December 2017 0.00%)
Israeli New Shekel Denominated Derivatives 0.00% (31 December 2017 0.00%)
Israeli New Shekel Denominated Forward Exchange Contracts 0.00% (31 December 2017 0.00%) ILS7,176,000 Israeli New Shekel v Sterling Denominated Forward Exchange Contract - -
- -
North America 33.91% (31 December 2017 33.13%)
US Dollar Denominated Bonds 28.55% (31 December 2017 26.65%)
US Dollar Denominated Fixed Rate Corporate Bonds 15.78% (31 December 2017 15.70%) $200,000 21st Century Fox America 4.75% 15/09/2044 155 0.10 $250,000 21st Century Fox America 6.15% 15/02/2041 227 0.15 $500,000 Abu Dhabi Crude Oil Pipeline 4.6% 02/11/2047 348 0.23 $200,000 AES Andres 7.95% 11/05/2026 157 0.10 $150,000 AES Argentina Generacion 7.75% 02/02/2024 108 0.07

Quilter Investors Sterling Diversified Bond Fund
Portfolio statement (continued) as at 30 June 2018
Quilter Investors OEIC
405
Market Percentage of Value total net assets
Holding Investment £’000 % US Dollar Denominated Fixed Rate Corporate Bonds (continued)
$225,000 Andeavor 3.8% 01/04/2028 161 0.11 $50,000 Andeavor Logistics 4.25% 01/12/2027 37 0.02
$100,000 Andeavor Logistics 5.2% 01/12/2047 74 0.05 $185,000 APX 7.625% 01/09/2023 123 0.08 $700,000 Argentum Netherlands for Zurich Insurance 5.125% 01/06/2048 510 0.33 $500,000 AT Securities 5.25% Perpetual 348 0.23 $100,000 AT&T 4.8% 15/06/2044 69 0.04 $300,000 AT&T 5.65% 15/02/2047 230 0.15 $350,000 Bank of Nova Scotia 4.65% Perpetual 241 0.16 $250,000 BAT Capital 3.557% 15/08/2027 177 0.12 $250,000 BAT Capital 4.39% 15/08/2037 178 0.12 $325,000 BAT International Finance 3.25% 07/06/2022 242 0.16 $200,000 BAT International Finance 3.95% 15/06/2025 148 0.10 $215,000 Blue Cube Spinco 9.75% 15/10/2023 186 0.12 $320,000 Brink's 4.625% 15/10/2027 227 0.15 $975,000 Celgene 3.9% 20/02/2028 704 0.46 $750,000 Charter Communications Operating 4.2% 15/03/2028 534 0.35 $200,000 Charter Communications Operating 5.375% 01/05/2047 139 0.09 $250,000 CIFI 5.375% Perpetual 167 0.11 $250,000 Coca-Cola Icecek AS 4.215% 19/09/2024 177 0.12 $200,000 Cornerstone Chemical 6.75% 15/08/2024 149 0.10 $180,000 Crown Americas 4.75% 01/02/2026 130 0.08 $400,000 CVS Health 4.3% 25/03/2028 300 0.20 $200,000 CVS Health 4.78% 25/03/2038 150 0.10 $200,000 Diamondback Energy 5.375% 31/05/2025 152 0.10
$50,000 Diamondback Energy 5.375% 31/05/2025 144A 38 0.02 $800,000 Electricite de France 6% 22/01/2114 627 0.41 $400,000 Enel Finance 3.5% 06/04/2028 272 0.18 $300,000 Enterprise Products Operating 4.875% 16/08/2077 215 0.14 $700,000 Envision Energy Overseas Capital 7.5% 26/04/2021 500 0.33 $925,000 EQT Midstream Partners 5.5% 15/07/2028 703 0.46 $450,000 FAGE International 5.625% 15/08/2026 313 0.20 $650,000 General Electric 4.125% 09/10/2042 457 0.30 $525,000 Greenko Dutch 5.25% 24/07/2024 362 0.24 $250,000 Hologic 4.625% 01/02/2028 180 0.12 $350,000 Huaneng Hong Kong Capital 3.6% Perpetual 242 0.16 $200,000 IHS Netherlands 9.5% 27/10/2021 146 0.10 $200,000 IHS Netherlands Holdco 9.5% 27/10/2021 146 0.10 $400,000 Inkia Energy 5.875% 09/11/2027 285 0.19 $550,000 KCA Deutag UK Finance 9.625% 01/04/2023 424 0.28
$81,000 Kraft Heinz Foods 3.5% 06/06/2022 61 0.04 $50,000 Kraft Heinz Foods 5% 15/07/2035 37 0.02
$700,000 Kraft Heinz Foods 7.125% 01/08/2039 642 0.42 $600,000 Light Servicos de Eletricidade 7.25% 03/05/2023 430 0.28 $300,000 Longfor Properties 4.5% 16/01/2028 207 0.14 $800,000 Mexico City Airport Trust 5.5% 31/07/2047 535 0.35 $500,000 Mosaic 4.05% 15/11/2027 362 0.24 $650,000 Neptune Energy Bondco 6.625% 15/05/2025 480 0.31 $200,000 New Metro Global 5% 08/08/2022 133 0.09 $900,000 NTPC 4.5% 19/03/2028 665 0.44 $700,000 Nuoxi Capital 4.7% 24/01/2021 496 0.33 $325,000 Olin 5% 01/02/2030 233 0.15
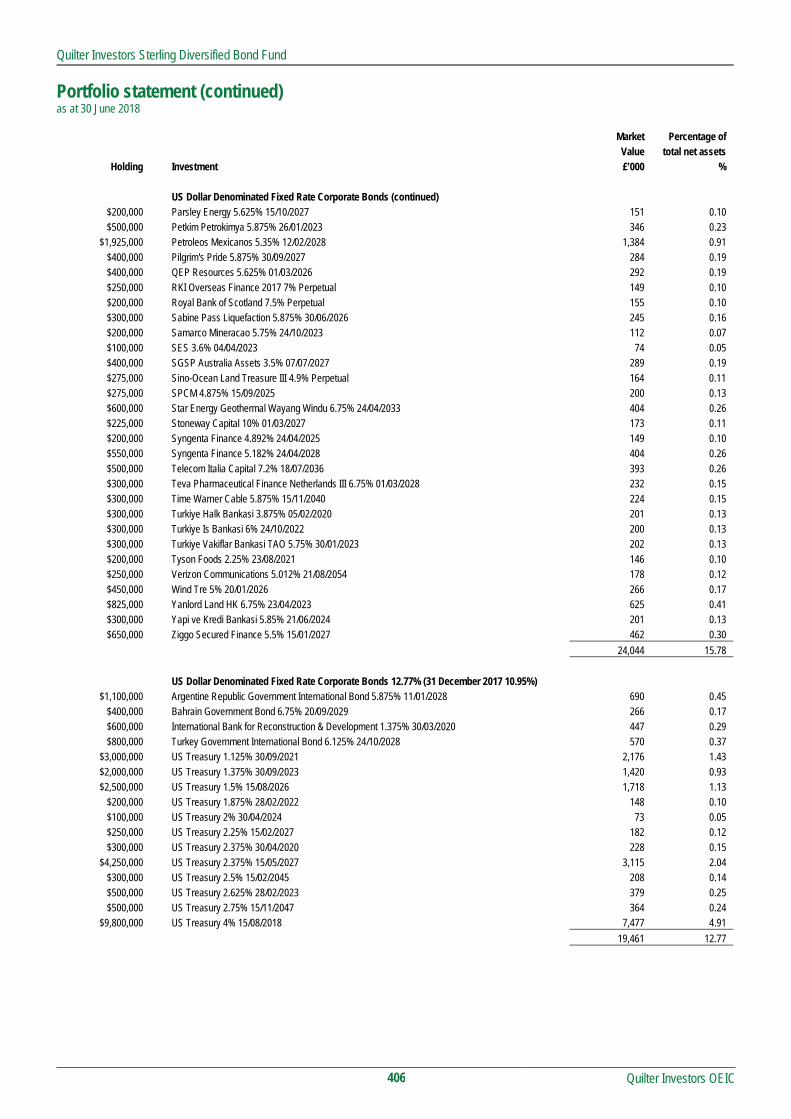
Quilter Investors Sterling Diversified Bond Fund
Portfolio statement (continued) as at 30 June 2018
Quilter Investors OEIC
406
Market Percentage of Value total net assets
Holding Investment £’000 % US Dollar Denominated Fixed Rate Corporate Bonds (continued)
$200,000 Parsley Energy 5.625% 15/10/2027 151 0.10 $500,000 Petkim Petrokimya 5.875% 26/01/2023 346 0.23
$1,925,000 Petroleos Mexicanos 5.35% 12/02/2028 1,384 0.91 $400,000 Pilgrim's Pride 5.875% 30/09/2027 284 0.19 $400,000 QEP Resources 5.625% 01/03/2026 292 0.19 $250,000 RKI Overseas Finance 2017 7% Perpetual 149 0.10 $200,000 Royal Bank of Scotland 7.5% Perpetual 155 0.10 $300,000 Sabine Pass Liquefaction 5.875% 30/06/2026 245 0.16 $200,000 Samarco Mineracao 5.75% 24/10/2023 112 0.07 $100,000 SES 3.6% 04/04/2023 74 0.05 $400,000 SGSP Australia Assets 3.5% 07/07/2027 289 0.19 $275,000 Sino-Ocean Land Treasure III 4.9% Perpetual 164 0.11 $275,000 SPCM 4.875% 15/09/2025 200 0.13 $600,000 Star Energy Geothermal Wayang Windu 6.75% 24/04/2033 404 0.26 $225,000 Stoneway Capital 10% 01/03/2027 173 0.11 $200,000 Syngenta Finance 4.892% 24/04/2025 149 0.10 $550,000 Syngenta Finance 5.182% 24/04/2028 404 0.26 $500,000 Telecom Italia Capital 7.2% 18/07/2036 393 0.26 $300,000 Teva Pharmaceutical Finance Netherlands III 6.75% 01/03/2028 232 0.15 $300,000 Time Warner Cable 5.875% 15/11/2040 224 0.15 $300,000 Turkiye Halk Bankasi 3.875% 05/02/2020 201 0.13 $300,000 Turkiye Is Bankasi 6% 24/10/2022 200 0.13 $300,000 Turkiye Vakiflar Bankasi TAO 5.75% 30/01/2023 202 0.13 $200,000 Tyson Foods 2.25% 23/08/2021 146 0.10 $250,000 Verizon Communications 5.012% 21/08/2054 178 0.12 $450,000 Wind Tre 5% 20/01/2026 266 0.17 $825,000 Yanlord Land HK 6.75% 23/04/2023 625 0.41 $300,000 Yapi ve Kredi Bankasi 5.85% 21/06/2024 201 0.13 $650,000 Ziggo Secured Finance 5.5% 15/01/2027 462 0.30
24,044 15.78
US Dollar Denominated Fixed Rate Corporate Bonds 12.77% (31 December 2017 10.95%) $1,100,000 Argentine Republic Government International Bond 5.875% 11/01/2028 690 0.45
$400,000 Bahrain Government Bond 6.75% 20/09/2029 266 0.17 $600,000 International Bank for Reconstruction & Development 1.375% 30/03/2020 447 0.29 $800,000 Turkey Government International Bond 6.125% 24/10/2028 570 0.37
$3,000,000 US Treasury 1.125% 30/09/2021 2,176 1.43 $2,000,000 US Treasury 1.375% 30/09/2023 1,420 0.93 $2,500,000 US Treasury 1.5% 15/08/2026 1,718 1.13
$200,000 US Treasury 1.875% 28/02/2022 148 0.10 $100,000 US Treasury 2% 30/04/2024 73 0.05 $250,000 US Treasury 2.25% 15/02/2027 182 0.12 $300,000 US Treasury 2.375% 30/04/2020 228 0.15
$4,250,000 US Treasury 2.375% 15/05/2027 3,115 2.04 $300,000 US Treasury 2.5% 15/02/2045 208 0.14 $500,000 US Treasury 2.625% 28/02/2023 379 0.25 $500,000 US Treasury 2.75% 15/11/2047 364 0.24
$9,800,000 US Treasury 4% 15/08/2018 7,477 4.91
19,461 12.77

Quilter Investors Sterling Diversified Bond Fund
Portfolio statement (continued) as at 30 June 2018
Quilter Investors OEIC
407
Market Percentage of Value total net assets
Holding Investment £’000 %
US Dollar Denominated Derivatives 0.37% (31 December 2017 0.02%)
US Dollar Denominated Forward Exchange Contracts 0.13% (31 December 2017 (0.08)%) $177,573 US Dollar v Brazilian Real Forward Exchange Contract 10 0.01 $194,848 US Dollar v Brazilian Real Forward Exchange Contract 8 0.01 $301,862 US Dollar v Brazilian Real Forward Exchange Contract 6 - $289,255 US Dollar v Brazilian Real Forward Exchange Contract 5 -
$95,668 US Dollar v Brazilian Real Forward Exchange Contract 2 - $391,518 US Dollar v Colombian Peso Forward Exchange Contract 10 0.01 $766,192 US Dollar v Indonesian Rupiah Forward Exchange Contract 4 - $610,800 US Dollar v Indonesian Rupiah Forward Exchange Contract - - $286,919 US Dollar v Russia Ruble Forward Exchange Contract - - $200,110 US Dollar v Russia Ruble Forward Exchange Contract (1) - $637,471 US Dollar v Russia Ruble Forward Exchange Contract (7) - $977,631 US Dollar v South Korean Won Forward Exchange Contract 29 0.02 $241,985 US Dollar v South Korean Won Forward Exchange Contract 6 - $901,209 US Dollar v South Korean Won Forward Exchange Contract - - $301,953 US Dollar v South Korean Won Forward Exchange Contract (1) -
$969,000 US Dollar v Sterling Forward Exchange Contract 26 0.02 $1,171,000 US Dollar v Sterling Forward Exchange Contract 25 0.02 $965,000 US Dollar v Sterling Forward Exchange Contract 17 0.01 $501,000 US Dollar v Sterling Forward Exchange Contract 10 0.01 $459,000 US Dollar v Sterling Forward Exchange Contract 6 0.01 $602,000 US Dollar v Sterling Forward Exchange Contract 6 0.01 $460,000 US Dollar v Sterling Forward Exchange Contract 6 - $674,000 US Dollar v Sterling Forward Exchange Contract 5 - $241,000 US Dollar v Sterling Forward Exchange Contract 5 - $256,000 US Dollar v Sterling Forward Exchange Contract 5 - $292,000 US Dollar v Sterling Forward Exchange Contract 5 - $303,402 US Dollar v Sterling Forward Exchange Contract 4 - $386,000 US Dollar v Sterling Forward Exchange Contract 4 - $304,000 US Dollar v Sterling Forward Exchange Contract 3 - $985,000 US Dollar v Sterling Forward Exchange Contract 3 - $233,000 US Dollar v Sterling Forward Exchange Contract 2 -
$588,000 US Dollar v Sterling Forward Exchange Contract 2 -
205 0.13
US Dollar Denominated Futures Contracts 0.19% (31 December 2017 (0.10)%) 52 US 10 Year Treasury Note Futures September 2018 46 0.03
277 US 10 Year Ultra Bond Futures September 2018 228 0.15 1 US 2 Year Treasury Note Futures September 2018 - -
16 US 5 Year Treasury Note Futures September 2018 5 - 1 US Long Bond Futures September 2018 3 - 2 US Ultra Bond Futures September 2018 8 0.01
290 0.19
US Dollar Interest Rate Swap 0.05% (31 December 2017 (0.03)%)
$(400,000) Interest Rate Swap Pay - 3M LIBOR, Receive - 2.8443% 05/03/2028 Morgan Stanley (2) - $(80,000) Interest Rate Swap Pay - 2.9572%, Receive - 3M LIBOR 26/02/2028 Morgan Stanley - -
$(900,000) Interest Rate Swap Pay - 2.7777%, Receive - 3M LIBOR 05/02/2028 Morgan Stanley 8 - $(1,400,000) Interest Rate Swap Pay - 2.71%, Receive - 6M LIBOR 06/03/2047 Morgan Stanley 46 0.03
$(900,000) Interest Rate Swap Pay - 2.4577%, Receive - 3M LIBOR 08/01/2028 Morgan Stanley 26 0.02
78 0.05

Quilter Investors Sterling Diversified Bond Fund
Portfolio statement (continued) as at 30 June 2018
Quilter Investors OEIC
408
Market Percentage of Value total net assets
Holding Investment £’000 %
US Dollar Credit Default Swap (0.00)% (31 December 2017 0.23%) $(9,100,000) Sell Protection CDX Indices DAF332000 20/06/2028 Merrill Lynch (75) (0.05)
$(99,000) Sell Protection CDX Indices BEI389000 20/06/2022 JP Morgan 5 - $(250,000) Sell Protection CDX Indices BEI389000 20/06/2022 JP Morgan 3 -
$(99,000) Sell Protection CDX Indices BEI389000 20/06/2022 JP Morgan 5 - $(1,750,000) Sell Protection CDS CDX Na HY S29 20/12/2022 JP Morgan 86 0.06
$(50,000) Sell Protection CDS CDX Na HY S29 20/12/2022 JP Morgan 2 - $(396,000) Sell Protection CDS CDX Na HY S28 20/06/2022 Morgan Stanley 21 0.02
$(1,000,000) Buy Protection CDX Indices CXPHY529 20/12/2022 JPMorgan 49 0.03 $(7,226,500) Buy Protection CDX Indices CXPEM528 20/12/2020 Citigroup 152 0.10
$(14,850,000) Buy Protection CDX Indices CJD955000 20/06/2023 Merrill Lynch (165) (0.11) $(8,000,000) Buy Protection CDX Indices CCDXIG529 20/12/2022 Citigroup (102) (0.07) $(1,550,000) Buy Protection CDS Mexico Government Bond 4.15% 20/12/2022 Morgan Stanley 9 0.01 $(1,550,000) Buy Protection CDS Mexico Government Bond 4.15% 20/12/2022 Citigroup 9 0.01
(1) -
Canadian Dollar Denominated Bonds 4.61% (31 December 2017 5.52%)
Canadian Dollar Fixed Rate Government Bond 4.61% (31 December 2017 5.52%) C$12,000,000 Canadian Government Bond 3.75% 01/06/2019 7,023 4.61
7,023 4.61
Canadian Dollar Denominated Derivatives 0.03% (31 December 2017 0.01%)
Canadian Dollar Denominated Forward Exchange Contracts 0.00% (31 December 2017 0.01%)
Canadian Dollar Denominated Futures Contracts 0.00% (31 December 2017 0.00%) (57) Canada 10 Year Bond Futures September 2018 2 -
2 -
Canadian Dollar Interest Rate Swap 0.03% (31 December 2017 0.00%)
C$(700,000) Interest Rate Swap Pay - 2.345% , Receive - 3M BA-CDOR 26/10/2027 Morgan Stanley 6 - C$(1,080,000) Interest Rate Swap Pay - 2.253%, Receive - 3M BA-CDOR 27/07/2027 Morgan Stanley 14 0.01
C$(500,000) Interest Rate Swap Pay - 2.213%, Receive - 3M BA-CDOR 30/11/2027 Morgan Stanley 8 0.01 C$(1,500,000) Interest Rate Swap Pay - 3M BA-CDOR, Receive - 2.715% 07/06/2028 Morgan Stanley 13 0.01 C$(1,300,000) Interest Rate Swap Pay - 3M BA-CDOR, Receive - 2.5575% 01/03/2028 Morgan Stanley 1 - C$(2,100,000) Interest Rate Swap Pay - 2.517%, Receive - 3M BA-CDOR 29/03/2028 Morgan Stanley 2 -
C$(950,000) Interest Rate Swap Pay - 2.37%, Receive - 3M BA-CDOR 14/09/2027 Morgan Stanley 7 -
51 0.03
Mexican Peso Denominated Bond 0.31% (31 December 2017 0.93%)
Mexican Peso Fixed Rate Government Bond 0.31% (31 December 2017 0.93%) MXN20,000 Mexican Udibonos 4% 15/11/2040 479 0.31
479 0.31
Mexican Peso Denominated Forward Exchange Contracts 0.02% (31 December 2017 0.00%) MXN6,194,000 Mexican Peso v Sterling Forward Exchange Contract 11 0.01 MXN4,037,000 Mexican Peso v Sterling Forward Exchange Contract 10 0.01 MXN3,855,000 Mexican Peso v Sterling Forward Exchange Contract 6 - MXN3,854,000 Mexican Peso v Sterling Forward Exchange Contract 5 - MXN5,681,000 Mexican Peso v Sterling Forward Exchange Contract 3 -
35 0.02

Quilter Investors Sterling Diversified Bond Fund
Portfolio statement (continued) as at 30 June 2018
Quilter Investors OEIC
409
Market Percentage of Value total net assets
Holding Investment £’000 %
Mexican Peso Interest Rate Swap 0.02% (31 December 2017 0.00%) MXN(57,600,000) Interest Rate Swap Pay - 6M LIBOR, Receive - 8.15% 19/05/2028 JP Morgan 24 0.02
24 0.02
South America (0.03)% (31 December 2017 0.00%)
Brazilian Real Denominated Derivatives (0.01)% (31 December 2017 0.00%)
Brazilian Real Denominated Forward Exchange Contracts (0.01)% (31 December 2017 0.00%) R$693,000 Brazilian Real v US Dollar Forward Exchange Contract (10) (0.01) R$751,000 Brazilian Real v US Dollar Forward Exchange Contract (3) -
(13) (0.01)
Colombian Peso Denominated Derivatives (0.02)% (31 December 2017 0.00%)
Colombian Peso Denominated Forward Exchange Contracts (0.02)% (31 December 2017 0.00%)
COL$2,748,314,000 Colombian Peso v US Dollar Forward Exchange Contract (24) (0.02) COL$883,508,000 Colombian Peso v US Dollar Forward Exchange Contract (2) -
(26) (0.02)
Investment assets* 147,287 96.64
Net other assets 5,118 3.36
Total net assets 152,405 100.00
* Including investment liabilities.
All investments are approved securities being either officially listed in a member state or traded on or under the rules of an eligible securities market, unless otherwise stated.

Quilter Investors Sterling Diversified Bond Fund
Quilter Investors OEIC
410
Statement of total return for the period from 1 January 2018 to 30 June 2018 01.01.18 to 01.01.18 to 01.01.17 to 01.01.17 to
30.06.18 30.06.18 30.06.17 30.06.17
Note £'000 £'000 £'000 £'000
Income
Net capital (losses)/gains (4,506) 1,312
Revenue 1,863 1,334
Expenses (454) (297)
Interest payable and similar charges (7) (1)
Net revenue before taxation 1,402 1,036
Taxation - -
Net revenue after taxation 1,402 1,036
Total return before distributions (3,104) 2,348
Distributions 2 (1,402) (1,036)
Change in net assets attributable to
shareholders from investment activities (4,506) 1,312
Statement of change in net assets attributable to shareholders for the period from 1 January 2018 to 30 June 2018 01.01.18 to 01.01.18 to 01.01.17 to 01.01.17 to
30.06.18 30.06.18 30.06.17 30.06.17
£'000 £'000 £'000 £'000
Opening net assets attributable to shareholders 132,217* 76,009
Amounts received on issue of shares 24,834 23,151
Amounts paid on cancellation of shares (1,517) (3,792)
23,317 19,359
Dilution adjustment 47 49
Change in net assets attributable to
shareholders from investment activities (4,506) 1,312
Retained distributions on accumulation shares 1,330 852
Closing net assets attributable to shareholders 152,405 97,581* * Section 3.30 of the SORP issued by the Investment Management Association in May 2014 requires comparative figures for the above statement. For interim financial
statements this will result in the closing comparative net assets not being equal to net assets at the start of the current period.

Quilter Investors Sterling Diversified Bond Fund
Quilter Investors OEIC
411
Balance sheet as at 30 June 2018 30.06.18 31.12.17
£'000 £’000
Assets
Fixed assets
Investments 150,186 128,446
Current assets
Debtors 2,077 1,919
Cash and bank balances 3,657 3,386
Total assets 155,920 133,751
Liabilities
Investment liabilities (2,899) (1,424)
Creditors
Bank overdrafts (9) (2)
Distributions payable (13) (19)
Other creditors (594) (89)
Total liabilities (3,515) (1,534)
Net assets attributable to shareholders 152,405 132,217

Quilter Investors Sterling Diversified Bond Fund
Notes to the financial statements for the period from 1 January 2018 to 30 June 2018
Quilter Investors OEIC
412
1 Accounting policies The financial statements have been prepared under the historical cost basis, as modified by the revaluation of investments, and in accordance with the Statement of Recommended Practice (SORP) for Authorised Funds, issued by the Investment Management Association in May 2014.
The accounting policies applied are consistent with those disclosed within the annual Financial Statements for the year ended 31 December 2017.
2 Distributions The distributions take account of revenue received on the issue of shares and revenue deducted on the cancellation of shares, and comprise:
01.01.18 to 01.01.17 to 30.06.18 30.06.17 £'000 £'000 First Interim – Accumulation shares (31 January) 218 124 First Interim – Income shares (31 January) 16 23 Second Interim – Accumulation shares (28 February) 235 160 Second Interim – Income shares (28 February) 19 31 Third Interim – Accumulation shares (31 March) 183 158 Third Interim – Income shares (31 March) 12 27 Fourth Interim – Accumulation shares (30 April) 231 135 Fourth Interim – Income shares (30 April) 15 21 Fifth Interim – Accumulation shares (31 May) 239 170 Fifth Interim – Income shares (31 May) 16 24 Sixth Interim – Accumulation shares (30 June) 224 162 Sixth Interim – Income shares (30 June) 13 21 1,421 1,056 Revenue deducted on cancellation of shares 1 3 Revenue received on issue of shares (20) (23) Distributions 1,402 1,036

Quilter Investors Sterling Diversified Bond Fund
Distribution table
Quilter Investors OEIC
413
Sixth Interim distribution Group 1: Shares purchased prior to 1 June 2018 Group 2: Shares purchased from 1 June 2018 to 30 June 2018
Revenue pence/cents
per share
Equalisation pence/cents
per share*
Distribution paid 31.07.18
pence/cents per share
Distribution paid 31.07.17
pence/cents per share Accumulation 'A' EUR Hedged Shares Group 1 0.1129 - 0.1129 0.0967 Group 2 0.1129 0.0000 0.1129 0.0967 Accumulation 'A' USD Hedged Shares Group 1 0.1219 - 0.1219 0.1592 Group 2 0.1219 0.0000 0.1219 0.1592 Income 'A' Shares Group 1 0.1185 - 0.1185 0.1573 Group 2 0.0923 0.0262 0.1185 0.1573 Accumulation 'U2' Shares Group 1 0.1854 - 0.1854 0.2275 Group 2 0.1108 0.0746 0.1854 0.2275 Income 'U2' Shares Group 1 0.1662 - 0.1662 0.2086 Group 2 0.0913 0.0749 0.1662 0.2086
Fifth Interim distribution Group 1: Shares purchased prior to 1 May 2018 Group 2: Shares purchased from 1 May 2018 to 31 May 2018
Revenue pence/cents
per share
Equalisation pence/cents
per share*
Distribution paid 30.06.18
pence/cents per share
Distribution paid 30.06.17
pence/cents per share Accumulation 'A' EUR Hedged Shares Group 1 0.1427 - 0.1427 0.1798 Group 2 0.1427 0.0000 0.1427 0.1798 Accumulation 'A' USD Hedged Shares Group 1 0.1374 - 0.1374 0.1782 Group 2 0.1374 0.0000 0.1374 0.1782 Income 'A' Shares Group 1 0.1400 - 0.1400 0.1776 Group 2 0.0407 0.0993 0.1400 0.1776 Accumulation'U2' Shares Group 1 0.2074 - 0.2074 0.2549 Group 2 0.0845 0.1229 0.2074 0.2549 Income 'U2' Shares Group 1 0.1874 - 0.1874 0.2338 Group 2 0.0812 0.1062 0.1874 0.2338

Quilter Investors Sterling Diversified Bond Fund
Distribution table (continued)
Quilter Investors OEIC
414
Fourth Interim distribution Group 1: Shares purchased prior to 1 April 2018 Group 2: Shares purchased from 1 April 2018 to 30 April 2018
Revenue pence/cents
per share
Equalisation pence/cents
per share*
Distribution paid 31.05.18
pence/cents per share
Distribution paid 31.05.17
pence/cents per share Accumulation 'A' EUR Hedged Shares Group 1 0.1078 - 0.1078 0.1372 Group 2 0.1078 0.0000 0.1078 0.1372 Accumulation 'A' USD Hedged Shares Group 1 0.1322 - 0.1322 0.1522 Group 2 0.0640 0.0682 0.1322 0.1522 Income 'A' Shares Group 1 0.1308 - 0.1308 0.1490 Group 2 0.0579 0.0729 0.1308 0.1490 Accumulation 'U2' Shares Group 1 0.2045 - 0.2045 0.2097 Group 2 0.1128 0.0917 0.2045 0.2097 Income 'U2' Shares Group 1 0.1840 - 0.1840 0.1942 Group 2 0.1020 0.0820 0.1840 0.1942
Third Interim distribution Group 1: Shares purchased prior to 1 March 2018 Group 2: Shares purchased from 1 March 2018 to 31 March 2018
Revenue pence/cents
per share
Equalisation pence/cents
per share*
Distribution paid 30.04.18
pence/cents per share
Distribution paid 30.04.17
pence/cents per share Accumulation 'A' EUR Hedged Shares Group 1 0.0787 - 0.0787 0.1935 Group 2 0.0787 0.0000 0.0787 0.1935 Accumulation 'A' USD Hedged Shares Group 1 0.1055 - 0.1055 0.1888 Group 2 0.1055 0.0000 0.1055 0.1888 Income 'A' Shares Group 1 0.1014 - 0.1014 0.1858 Group 2 0.0823 0.0191 0.1014 0.1858 Accumulation'U2' Shares Group 1 0.1658 - 0.1658 0.2588 Group 2 0.0694 0.0964 0.1658 0.2588 Income 'U2' Shares Group 1 0.1490 - 0.1490 0.2387 Group 2 0.0731 0.0759 0.1490 0.2387

Quilter Investors Sterling Diversified Bond Fund
Distribution table (continued)
Quilter Investors OEIC
415
Second Interim distribution Group 1: Shares purchased prior to 1 February 2018 Group 2: Shares purchased from 1 February 2018 to 28 February 2018
Revenue pence/cents
per share
Equalisation pence/cents
per share*
Distribution paid 31.03.18
pence/cents per share
Distribution paid 31.03.17
pence/cents per share Accumulation 'A' EUR Hedged Shares Group 1 0.1677 - 0.1677 0.1584 Group 2 0.1677 0.0000 0.1677 0.1584 Accumulation 'A' USD Hedged Shares Group 1 0.1563 - 0.1563 0.1628 Group 2 0.0407 0.1156 0.1563 0.1628 Income 'A' Shares Group 1 0.1536 - 0.1536 0.1653 Group 2 0.0829 0.0707 0.1536 0.1653 Accumulation 'U2' Shares Group 1 0.2230 - 0.2230 0.2209 Group 2 0.1169 0.1061 0.2230 0.2209 Income 'U2' Shares Group 1 0.2008 - 0.2008 0.2037 Group 2 0.1233 0.0775 0.2008 0.2037

Quilter Investors Sterling Diversified Bond Fund
Distribution table (continued)
Quilter Investors OEIC
416
First Interim distribution Group 1: Shares purchased prior to 1 January 2018 Group 2: Shares purchased from 1 January 2018 to 31 January 2018
Revenue pence/cents
per share
Equalisation pence/cents
per share*
Distribution paid 28.02.18
pence/cents per share
Distribution paid 28.02.17
pence/cents per share Accumulation 'A' EUR Hedged Shares Group 1 0.1194 - 0.1194 0.1449 Group 2 0.1194 0.0000 0.1194 0.1449 Accumulation 'A' USD Hedged Shares Group 1 0.1444 - 0.1444 0.1215 Group 2 0.0738 0.0706 0.1444 0.1215 Income 'A' Shares Group 1 0.1306 - 0.1306 0.1227 Group 2 0.0582 0.0724 0.1306 0.1227 Accumulation 'U2' Shares Group 1 0.2117 - 0.2117 0.1794 Group 2 0.0873 0.1244 0.2117 0.1794 Income 'U2' Shares Group 1 0.1903 - 0.1903 0.1658 Group 2 0.0903 0.1000 0.1903 0.1658 * Equalisation only applies to shares purchased during the distribution period (Group 2 shares). It is the average amount of revenue included in the purchase price of all
Group 2 shares and is refunded to holders of these shares as a return of capital. Being capital, it is not liable to income tax but must be deducted from the cost of shares for capital gains tax purposes.

Quilter Investors US Equity Growth Fund
Quilter Investors US Equity Growth Fund
Quilter Investors OEIC
417
Launch date 1 March 2013
IA Sector North America
Investment adviser JPMorgan Asset Management (UK) Limited
Net asset value £123,437,029
Objective
The sub-fund aims to achieve capital growth.
Policy
The sub-fund primarily invests, directly and indirectly, in shares of companies listed or located in the US.
The investment adviser typically has a preference to invest in shares of companies they believe to have the potential for growth. The sub-fund may at times be concentrated in terms of the number of investments it holds.
The sub-fund may also invest in other transferable securities, collective investment schemes (including those managed or operated by the ACD), warrants, money market instruments, deposits and derivatives.
The sub-fund may only use derivatives for efficient portfolio management purposes.
The sub-fund is managed by an investment adviser selected by the ACD for their expected ability to manage the sub-fund according to the investment objective and policy. The ACD continuously monitors and may periodically make changes to this appointment.
Investment Manager’s review
Market Review
Volatility returned to the US equity markets at the start of 2018, partially driven by concerns over interest rate movements, trade policy and the long-term implications of the Tax Cut and Jobs Act. In the first three months of 2018, the S&P 500 saw six trading days of +/- 2% moves, compared to 2017 in which there were zero days with that level of price change. January was a strong month for large cap stocks and the market in general, but February faced a return to volatility and the worst monthly decline in two years. This was followed by weak market performance in March, with a sector rotation towards real estate and utilities and away from more cyclical sectors.
In the second half of the period, the forward P/E for the S&P 500 Index finished at 16.1x at the end of June, matching the 25-year average for the index. The energy sector was particularly strong in the second half, followed by the consumer discretionary sector, while the weakest performers were the industrials and financials sectors. Small cap stocks as measured by the Russell 2000 Index outperformed large cap stocks as represented by the S&P 500, while growth outperformed value as the Russell 3000 Growth Index outperformed the Russell 3000 Value Index in the three months to 30 June. The Federal Reserve implemented two rate hikes in the six months, raising the target rate to a range of 1.75% - 2.00%, and increasing its expectations for rate hikes this year to four from three. The US administration announced plans to impose a 25% tariff on USD$50bn (£38.1bn) worth of annual Chinese imports. This represents a fraction of total trade between the US and China and only 0.3% of US GDP, but the market is still working to get its arms around the potential implications for growth and profitability for global companies.
Portfolio Review
From a stylistic perspective, the first three months of 2018 was a favourable market environment as stocks with higher growth characteristics continued to be rewarded across the market cap spectrum. Outperformance for the strategy was driven by stock selection in a variety of sectors led by financials and technology. Stock selection in producer durables modestly detracted. Our slight overweight exposure to energy also detracted from performance although this was offset by stock selection.
At the individual stock level, overweight positions in Netflix and Amazon were top contributors during the first half of the period. Shares of Netflix traded up sharply following a positive fourth quarter earnings print that showed strong subscription revenue growth. Amazon’s outperformance in the start of 2018 was largely driven by the announcement of their fourth quarter results, which demonstrated increasing adoption and profitability in the Amazon Web Services cloud computing platform.
In the second half of the period the portfolio outperformed the Russell 3000 Growth Index benchmark, as stylistically, stocks with higher growth characteristics continued to be rewarded. This was favourable for our approach. Outperformance was driven by stock selection in health care followed by technology. Stock selection in financial services and energy modestly detracted. At the individual stock level, overweight positions in Wayfair and Netflix were top contributors during the three months to 30 June. Netflix continued to be a top contributor on the back of a strong earnings release. Results showed streaming revenue growth accelerate to 43% year over year and greater than expected net subscriber additions. Overweight positions in Mohawk Industries and Stanley Black & Decker detracted from performance.
From a positioning perspective, we are finding attractive opportunities in financials, which remains the largest overweight in the portfolio followed by technology. Our overweight position in technology expanded towards the end of the period, as we initiated new positions and added to select names where our conviction has increased. We have notable underweights in consumer staples and consumer discretionary. We increased our consumer discretionary underweight as we eliminated positions where we lost conviction.
Risk and Reward Profile
The calculated risk and reward category, as shown above, uses a method of calculation derived from EU rules. It is based on the rate at which the returns of the sub-fund have moved up and down in the past (i.e. volatility) and is not a guide to the future risk and reward category of the sub-fund. The category shown is not a target or guarantee and may shift over time. Even the lowest category 1 does not mean a risk-free investment. The seven-category scale is nonlinear, for example, 2 is not twice as risky as 1.
Sub-funds in category 5 have in the past shown moderately high volatility. With a sub-fund of category 5, you have a moderately high risk of losing money but your chance for gains is also moderately high.
Investment risk - there is no guarantee that the sub-fund will achieve its objective. A capital loss of some or all of the amount invested may occur.
Geographic concentration risk - a fall in the US market may have a significant impact on the value of the sub-fund because it primarily invests in this market.
Concentration risk (number of investments) - the sub-fund may at times hold a smaller number of investments, and therefore a fall in the value of a single investment may have a greater impact on the sub-fund’s value than if it held a larger number of investments.
Smaller companies risk - smaller companies are subject to greater risk and reward potential. Investments may be volatile or difficult to buy or sell.
Currency risk - the sub-fund is denominated in British Pounds but holds assets denominated in other currencies. The value of your shares may rise and fall as a result of exchange rate movements between these currencies.
Derivative risk - the sub-fund may use derivatives to reduce costs and/or the overall risk of the sub-fund (i.e. Efficient Portfolio Management (EPM)). Derivatives involve a level of risk, however, for EPM they should not increase the overall riskiness of the sub-fund. Derivatives also involve counterparty risk where the institutions acting as counterparty to derivatives may not meet their contractual obligations.
Capital erosion risk - the sub-fund takes its charges from the capital of the sub- fund. Investors should be aware that there is potential for capital erosion if insufficient capital growth is achieved by the sub fund to cover the charges. Capital erosion may have the effect of reducing the level of income generated.
For a more detailed explanation of risks, please refer to the "Risks" section of the prospectus.

Quilter Investors US Equity Growth Fund
Quilter Investors OEIC
418
Performance Records Comparative Tables
Accumulation 'A' 1 January 2018 to
30 June 2018 1 January 2017 to
31 December 2017 1 January 2016 to
31 December 2016
p/share p/share p/share
Change in net assets per share Opening net asset value per share 202.49 175.32 134.89
Return before operating charges* 26.50 30.26 42.79 Operating charges** (1.73) (3.09) (2.36)
Return after operating charges* 24.77 27.17 40.43
Distributions - - - Retained distributions - - -
Closing net asset value per share 227.26 202.49 175.32
* after direct transaction costs of*** 0.02 0.07 0.19
Performance Return after charges 12.23% 15.50% 29.97%
Other information Closing net asset value (£) 23,446,995 22,226,896 23,448,979 Closing number of shares 10,317,041 10,976,863 13,374,696 Operating charges**** 1.65% 1.64% 1.62% Direct transaction costs*** 0.02% 0.04% 0.13%
Prices pence per share pence per share pence per share Highest share price 236.0 205.8 178.1 Lowest share price 193.5 174.3 117.3
Accumulation 'U2'† 1 January 2018 to
30 June 2018 1 January 2017 to
31 December 2017 1 January 2016 to
31 December 2016 p/share p/share p/share Change in net assets per share
Opening net asset value per share 109.08 100.00 -
Return before operating charges* 14.33 9.52 - Operating charges** (0.43) (0.44) -
Return after operating charges* 13.90 9.08 -
Distributions - - - Retained distributions - - -
Closing net asset value per share 122.98 109.08 -
* after direct transaction costs of*** 0.01 0.02 -
Performance Return after charges 12.74% 9.08% -
Other information Closing net asset value (£) 99,990,034 73,553,421 - Closing number of shares 81,307,986 67,430,256 - Operating charges**** 0.75% 0.75% - Direct transaction costs*** 0.02% 0.04% -
Prices pence per share pence per share pence per share Highest share price 127.7 110.8 - Lowest share price 104.3 98.13 -
† From 8 June 2017 ** The operating charges include all costs borne by the sub-fund, except for direct transaction costs.
*** The direct transaction costs are made up of fees and commissions paid to agents, advisers, brokers and dealers, levies by regulatory agencies and securities exchanges as well as transfer taxes and duties. They do not include any difference between the quoted bid and offer prices or internal administrative or holding costs. These costs arise as a result of transactions undertaken both for efficient portfolio management and the meeting of the sub-fund’s objectives. These costs exclude any effect of dilution adjustments used to offset the costs.
**** The operating charges percentage is the ratio of the sub-fund's ongoing charges (excluding interest on borrowings) to the average net assets of the sub-fund. If the share class launched during the period the operating charges figures are annualised.

Quilter Investors US Equity Growth Fund
Quilter Investors OEIC
419
Performance
6 months to30 June 2018
1 year to 30 June 2018
3 years to 30 June 2018
5 years to 30 June 2018
Quilter Investors US Equity Growth Fund* 12.03% 23.61% 77.92% 121.44%
Russell 3000 Growth (benchmark) 9.88% 20.03% 74.19% 122.09%
IA North America (sector average) 5.53% 12.53% 59.76% 105.21%
Quartile ranking 1 1 1 1
* Accumulation ‘A’ shares
Data Source – Factset. Figures are calculated on a total return and single price basis, with net income reinvested into the sub-fund.
Portfolio allocation
North America 95.08%
Europe 1.71%
Net other assets 3.21%
Total 100.00%
Asset allocation
Equities 96.79%
Net other assets 3.21%
Total 100.00%
Percentage of
Major holdings portfolio
Amazon.com 5.87%
Alphabet 'C' 5.68%
Apple 5.62%
UnitedHealth 3.46%
Facebook 3.03%
Waste Connections (USA Listing) 2.63%
Microsoft 2.36%
Mastercard 2.25%
Visa 2.08%
Netflix 1.94%
Number of holdings 85
Total Purchases and Sales for the period
2018 2017
£’000 £’000
Total purchases for the 6 month period to 30 June 38,109 84,398
Total sales for the 6 month period to 30 June 23,789 22,442

Quilter Investors US Equity Growth Fund
Portfolio statement as at 30 June 2018
Quilter Investors OEIC
420
Market Percentage of Value total net assets
Holding Investment £’000 %
North America 95.08% (31 December 2017 96.12%)
Canada Equities 0.65% (31 December 2017 3.38%)
Personal Goods 0.65% (31 December 2017 0.60%) 8,443 Lululemon Athletica 803 0.65
803 0.65
Support Services 0.00% (31 December 2017 2.78%)
United States Equities 94.43% (31 December 2017 92.74%)
Aerospace & Defence 1.61% (31 December 2017 0.00%) 7,800 Boeing 1,987 1.61
1,987 1.61
Automobiles & Parts 1.83% (31 December 2017 2.76%) 38,425 LKQ 929 0.75 2,021 Tesla 538 0.44 8,909 Wabco 792 0.64
2,259 1.83
Banks 2.35% (31 December 2017 2.36%) 13,052 Comerica 907 0.74 26,793 East West 1,346 1.09 8,673 First Republic Bank 644 0.52
2,897 2.35
Beverages 0.15% (31 December 2017 0.68%) 4,200 Monster Beverage 181 0.15
181 0.15
Construction & Materials 2.51% (31 December 2017 3.62%) 10,954 Eagle Materials 877 0.71 18,225 Fortune Brands Home & Security 741 0.60 10,070 Lennox International 1,486 1.20
3,104 2.51
Electronic & Electrical Equipment 0.79% (31 December 2017 0.90%) 14,638 Amphenol 970 0.79
970 0.79
Financial Services 9.24% (31 December 2017 9.28%) 2,409 BlackRock 920 0.75
53,255 Charles Schwab 2,096 1.70 18,541 Mastercard 2,781 2.25 14,352 Nasdaq 1,000 0.81 13,119 S&P Global 2,034 1.65 25,448 Visa 2,570 2.08
11,401 9.24
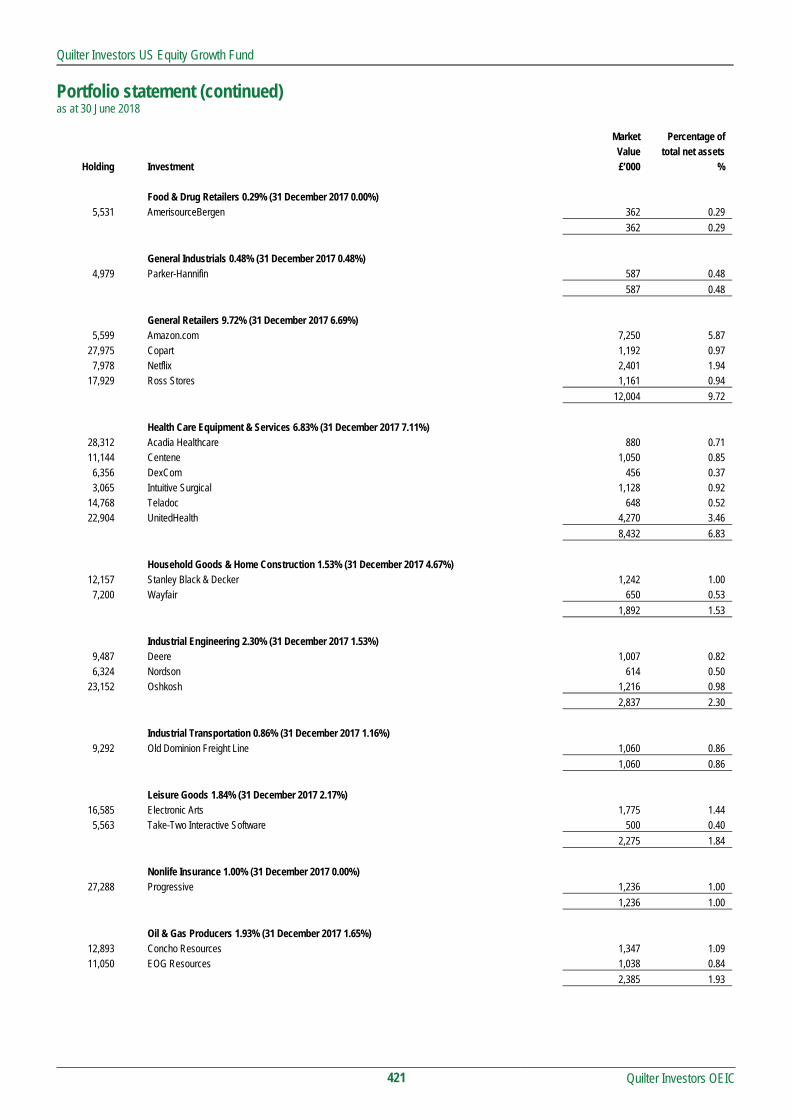
Quilter Investors US Equity Growth Fund
Portfolio statement (continued) as at 30 June 2018
Quilter Investors OEIC
421
Market Percentage of Value total net assets
Holding Investment £’000 %
Food & Drug Retailers 0.29% (31 December 2017 0.00%) 5,531 AmerisourceBergen 362 0.29
362 0.29
General Industrials 0.48% (31 December 2017 0.48%) 4,979 Parker-Hannifin 587 0.48
587 0.48
General Retailers 9.72% (31 December 2017 6.69%) 5,599 Amazon.com 7,250 5.87
27,975 Copart 1,192 0.97 7,978 Netflix 2,401 1.94
17,929 Ross Stores 1,161 0.94
12,004 9.72
Health Care Equipment & Services 6.83% (31 December 2017 7.11%) 28,312 Acadia Healthcare 880 0.71 11,144 Centene 1,050 0.85 6,356 DexCom 456 0.37 3,065 Intuitive Surgical 1,128 0.92
14,768 Teladoc 648 0.52 22,904 UnitedHealth 4,270 3.46
8,432 6.83
Household Goods & Home Construction 1.53% (31 December 2017 4.67%) 12,157 Stanley Black & Decker 1,242 1.00 7,200 Wayfair 650 0.53
1,892 1.53
Industrial Engineering 2.30% (31 December 2017 1.53%) 9,487 Deere 1,007 0.82 6,324 Nordson 614 0.50
23,152 Oshkosh 1,216 0.98
2,837 2.30
Industrial Transportation 0.86% (31 December 2017 1.16%) 9,292 Old Dominion Freight Line 1,060 0.86
1,060 0.86
Leisure Goods 1.84% (31 December 2017 2.17%) 16,585 Electronic Arts 1,775 1.44 5,563 Take-Two Interactive Software 500 0.40
2,275 1.84
Nonlife Insurance 1.00% (31 December 2017 0.00%) 27,288 Progressive 1,236 1.00
1,236 1.00
Oil & Gas Producers 1.93% (31 December 2017 1.65%) 12,893 Concho Resources 1,347 1.09 11,050 EOG Resources 1,038 0.84
2,385 1.93

Quilter Investors US Equity Growth Fund
Portfolio statement (continued) as at 30 June 2018
Quilter Investors OEIC
422
Market Percentage of Value total net assets
Holding Investment £’000 %
Pharmaceuticals & Biotechnology 4.73% (31 December 2017 4.75%) 13,205 Exact Sciences 608 0.49 25,822 Exelixis 417 0.34 6,291 Illumina 1,319 1.07 7,180 Intercept Pharmaceuticals 436 0.35
18,735 Revance Therapeutics 397 0.32 3,656 Sage Therapeutics 422 0.34
10,962 Spark Therapeutics 689 0.56 96,711 TherapeuticsMD 490 0.40 9,421 Vertex Pharmaceuticals 1,058 0.86
5,836 4.73
Real Estate Investment & Services 0.91% (31 December 2017 0.95%) 31,140 CBRE 1,122 0.91
1,122 0.91
Software & Computer Services 22.80% (31 December 2017 20.51%) 9,611 Adobe Systems 1,754 1.42 8,265 Alphabet 'C' 7,009 5.68 4,566 Arista Networks 897 0.73
25,079 Facebook 3,745 3.03 11,090 Gartner 1,127 0.91 28,816 GoDaddy 1,530 1.24 9,825 Guidewire Software 660 0.53
38,791 Microsoft 2,912 2.36 9,201 Palo Alto Networks 1,435 1.16 7,793 Red Hat 799 0.65
16,852 SailPoint Technologies 319 0.26 21,856 salesforce.com 2,248 1.82 10,721 ServiceNow 1,407 1.14 12,480 Splunk 933 0.76 12,974 Square 607 0.49 13,208 Veeva Systems 766 0.62
28,148 22.80
Support Services 7.08% (31 December 2017 4.08%) 40,200 Evolent Health 670 0.54 12,879 Fastenal 478 0.39 19,858 Global Payments 1,662 1.35 23,637 PayPal 1,484 1.20 56,739 Waste Connections (USA Listing) 3,240 2.63 19,373 Worldpay 1,203 0.97
8,737 7.08
Technology Hardware & Equipment 11.04% (31 December 2017 12.27%) 49,183 Apple 6,943 5.62 26,326 Applied Materials 907 0.74 7,903 Broadcom 1,473 1.19
18,156 Cavium 1,205 0.98 49,739 Corning 1,022 0.83 11,339 NVIDIA 2,079 1.68
13,629 11.04
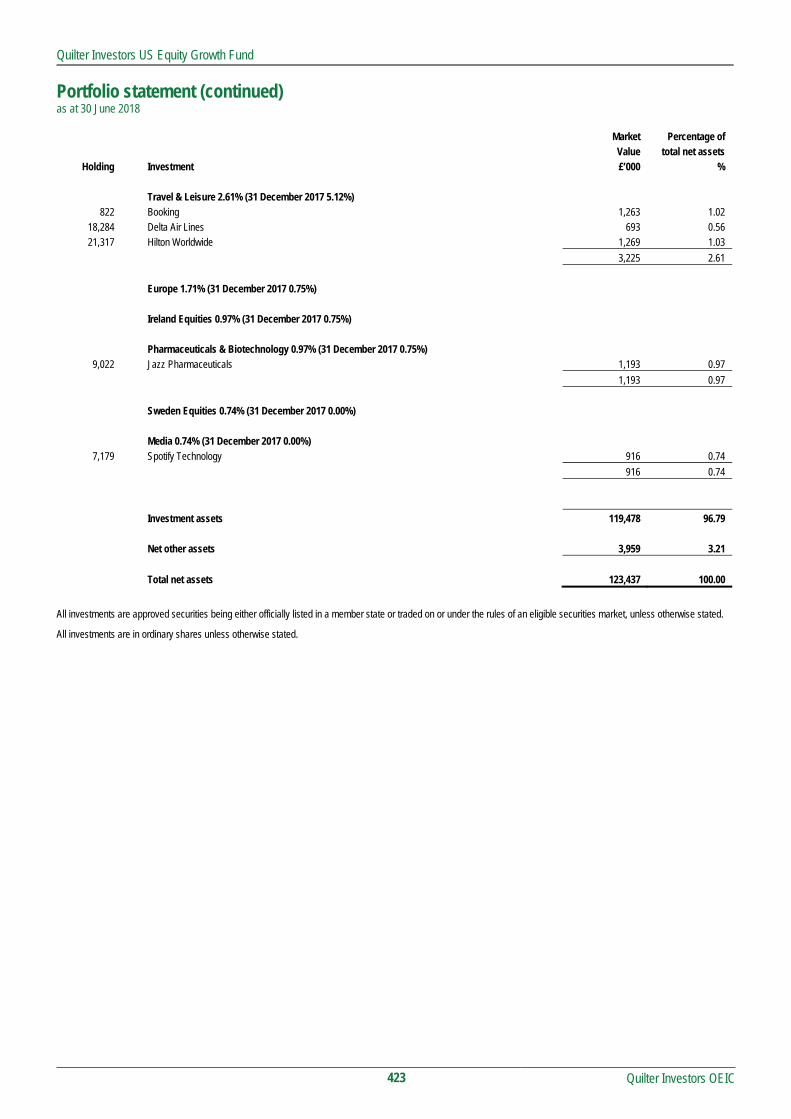
Quilter Investors US Equity Growth Fund
Portfolio statement (continued) as at 30 June 2018
Quilter Investors OEIC
423
Market Percentage of Value total net assets
Holding Investment £’000 %
Travel & Leisure 2.61% (31 December 2017 5.12%) 822 Booking 1,263 1.02
18,284 Delta Air Lines 693 0.56 21,317 Hilton Worldwide 1,269 1.03
3,225 2.61
Europe 1.71% (31 December 2017 0.75%)
Ireland Equities 0.97% (31 December 2017 0.75%)
Pharmaceuticals & Biotechnology 0.97% (31 December 2017 0.75%) 9,022 Jazz Pharmaceuticals 1,193 0.97
1,193 0.97
Sweden Equities 0.74% (31 December 2017 0.00%)
Media 0.74% (31 December 2017 0.00%) 7,179 Spotify Technology 916 0.74
916 0.74
Investment assets 119,478 96.79
Net other assets 3,959 3.21
Total net assets 123,437 100.00
All investments are approved securities being either officially listed in a member state or traded on or under the rules of an eligible securities market, unless otherwise stated.
All investments are in ordinary shares unless otherwise stated.

Quilter Investors US Equity Growth Fund
Quilter Investors OEIC
424
Statement of total return for the period from 1 January 2018 to 30 June 2018 01.01.18 to 01.01.18 to 01.01.17 to 01.01.17 to
30.06.18 30.06.18 30.06.17 30.06.17
Note £'000 £'000 £'000 £'000
Income
Net capital gains 12,350 231
Revenue 295 153
Expenses (469) (197)
Net expense before taxation (174) (44)
Taxation (42) (22)
Net expense after taxation (216) (66)
Total return before distributions 12,134 165
Distributions 2 - 4
Change in net assets attributable to
shareholders from investment activities 12,134 169
Statement of change in net assets attributable to shareholders for the period from 1 January 2018 to 30 June 2018 01.01.18 to 01.01.18 to 01.01.17 to 01.01.17 to
30.06.18 30.06.18 30.06.17 30.06.17
£'000 £'000 £'000 £'000
Opening net assets attributable to shareholders 95,780* 23,449
Amounts received on issue of shares 27,922 67,625
Amounts paid on cancellation of shares (12,413) (2,994)
15,509 64,631
Dilution adjustment 14 74
Change in net assets attributable to
shareholders from investment activities 12,134 169
Closing net assets attributable to shareholders 123,437 88,323*
* Section 3.30 of the SORP issued by the Investment Management Association in May 2014 requires comparative figures for the above statement. For interim financial
statements this will result in the closing comparative net assets not being equal to net assets at the start of the current period.

Quilter Investors US Equity Growth Fund
Quilter Investors OEIC
425
Balance sheet as at 30 June 2018 30.06.18 31.12.17
£'000 £'000
Assets
Fixed assets
Investments 119,478 92,784
Current assets
Debtors 1,552 269
Cash and bank balances 2,680 2,929
Total assets 123,710 95,982
Liabilities
Creditors
Other creditors (273) (202)
Total liabilities (273) (202)
Net assets attributable to shareholders 123,437 95,780
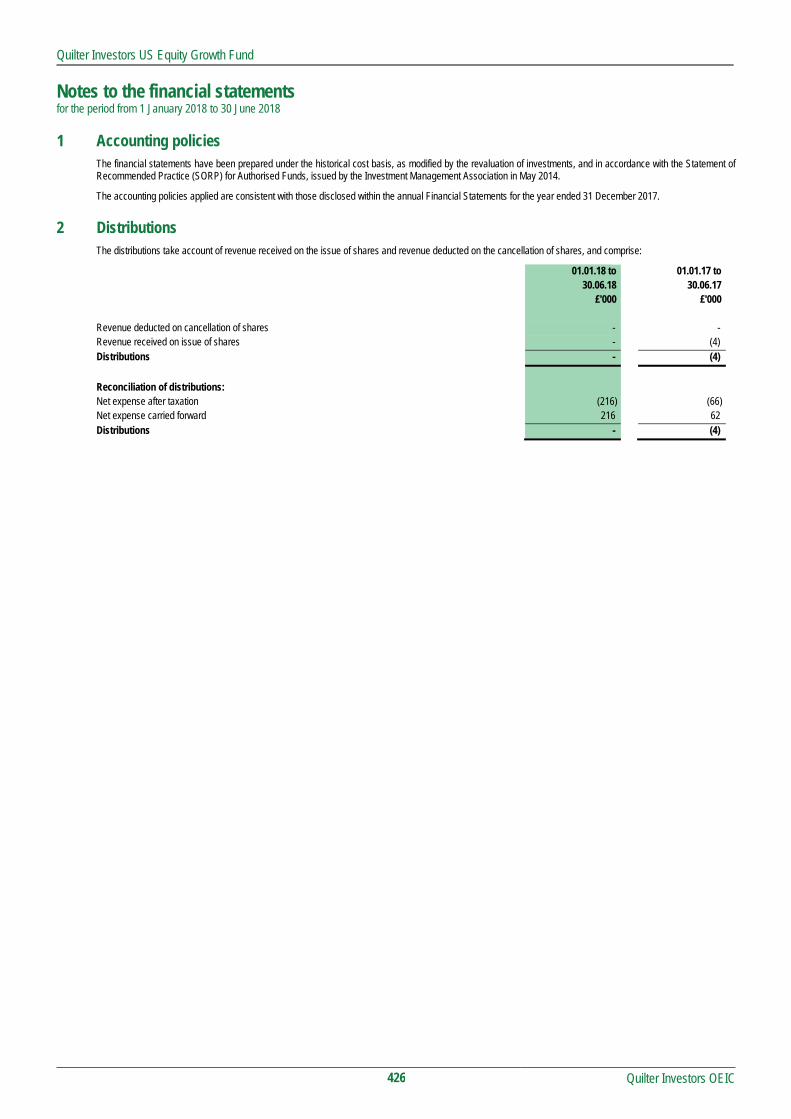
Quilter Investors US Equity Growth Fund
Notes to the financial statements for the period from 1 January 2018 to 30 June 2018
Quilter Investors OEIC
426
1 Accounting policies The financial statements have been prepared under the historical cost basis, as modified by the revaluation of investments, and in accordance with the Statement of Recommended Practice (SORP) for Authorised Funds, issued by the Investment Management Association in May 2014.
The accounting policies applied are consistent with those disclosed within the annual Financial Statements for the year ended 31 December 2017.
2 Distributions
The distributions take account of revenue received on the issue of shares and revenue deducted on the cancellation of shares, and comprise:
01.01.18 to 01.01.17 to 30.06.18 30.06.17 £'000 £'000 Revenue deducted on cancellation of shares - - Revenue received on issue of shares - (4) Distributions - (4)
Reconciliation of distributions: Net expense after taxation (216) (66) Net expense carried forward 216 62 Distributions - (4)

Quilter Investors US Equity Income Fund
Quilter Investors US Equity Income Fund
Quilter Investors OEIC
427
Launch date 8 June 2018
IA Sector North America
Investment adviser BNY Mellon Investment Management EMEA Limited
Net asset value £93,628,864
Objective
The sub-fund aims to achieve a combination of income and capital growth.
Policy
The sub-fund primarily invests, directly or indirectly, in shares of companies listed or located in the US. The investment adviser typically has a preference to invest in shares of companies they believe are likely to provide dividend payments. The sub-fund may at times be concentrated in terms of the number of investments it holds.
The sub-fund may also invest in other transferable securities, collective investment schemes (including those managed or operated by the ACD) warrants, money market instruments, deposits, cash and derivatives.
The sub-fund may use derivatives and forward transactions for the purposes of meeting the investment objective or efficient portfolio management.
The sub-fund is managed by an investment adviser selected by the ACD for their expected ability to manage the sub-fund according to the investment objective and policy. The ACD continuously monitors and may periodically make changes to this appointment.
Investment Manager’s review
Market Review
Markets whipsawed in the first three months of the year. After posting record gains in January, markets declined dramatically during the first week of February as a result of the US labour report, which posted higher than - expected wage inflation. The news caused investors in low volatility strategies to quickly unwind their positions, sparking a sharp spike in the Volatility Index. At the end of the first three months of 2018, heightened fears of the global implications of new US tariffs further weighed on results.
In the second half of the period, however, US markets led major indices, buoyed by a stronger dollar and political uncertainty in the eurozone. In the US, the Federal Reserve (Fed) increased interest rates by 25 basis points at its mid-June meeting, in line with expectations. Despite trade tensions, better-than-expected US data underpinned the market rebound and inflation reached its 2% target during the period. The US remained near full employment, while and non-farm payrolls and personal spending trends exceeded expectations. Consumer confidence slipped modestly in June but remained strong overall. Meanwhile, the US dollar gained against a basket of major currencies. We believe the stimulus provided by tax reform and the spending bill will outweigh the negative effect of potential tariffs. Economic activity in the US and abroad has held up well and appears to be sustainable over our investment horizon.
Performance
At the start of 2018 the sub-fund generated a negative performance and underperformed its comparative index over the quarter, net of fees, before recovering in the second half of the period. We are overweight financials, energy and telecommunication services. Although Financials is the largest absolute weight in the sub-fund due to attractive valuations and exposure to an improving economy, towards the end of the period we selectively trimmed our holdings in financials and industrials and increased our weighting in telecommunications. We are underweight information technology, consumer discretionary and healthcare, and in information technology, we rotated out of software and trimmed positions in communications equipment to fund purchases in the semiconductors and semiconductor equipment segment.
After a period of weakness and volatility in the first three months of 2018, earnings growth and an accelerating US economy buoyed the US equity market. We believe several factors support further equity gains in 2018. The S&P 500 Index’s price-to-earning ratio stands at approximately 17x for 2018 and 15x for 2019. These levels are not particularly high for a low interest rate environment but they are high enough to temper our expectations to modest mid-to-high single-digit total returns for the broad market in 2018. Dividend growth will be enhanced by US tax reform, which reduces corporate tax rates and allows US companies to repatriate and distribute cash to shareholders or reinvest it back into their business. We believe increasing dividends will prove advantageous to income investors over the next few years as bond yields rise in response to better gross domestic product growth.
Risk and Reward Profile
The calculated risk and reward category, as shown above, uses a method of calculation derived from EU rules. It is based on the rate at which the returns of the sub-fund have moved up and down in the past (i.e. volatility) and is not a guide to the future risk and reward category of the sub-fund. The category shown is not a target or guarantee and may shift over time. Even the lowest category 1 does not mean a risk-free investment. The seven-category scale is nonlinear, for example, 2 is not twice as risky as 1.
Sub-funds in category 5 have in the past shown moderately high volatility. With a sub-fund of category 5, you have a moderately high risk of losing money but your chance for gains is also moderately high.
Investment risk - there is no guarantee that the sub-fund will achieve its objective. A capital loss of some or all of the amount invested may occur.
Geographic concentration risk - a fall in the US market may have a significant impact on the value of the sub-fund because it primarily invests in this market.
Concentration risk (number of investments) - the sub-fund may at times hold a smaller number of investments, and therefore a fall in the value of a single investment may have a greater impact on the sub-fund’s value than if it held a larger number of investments. Currency risk - the sub-fund is denominated in British Pounds but may hold assets denominated in, or with exposure to, other currencies. The value of your shares may rise and fall as a result of exchange rate movements between these currencies. Derivative risk - the sub-fund may use derivatives to generate returns and/or to reduce costs and the overall risk of the sub-fund. Using derivatives can involve a higher level of risk. A small movement in the price of an underlying investment may result in a disproportionately large movement in the price of the derivative investment. Derivatives also involve counterparty risk where the institutions acting as counterparty to derivatives may not meet their contractual obligations. Capital erosion risk - the sub-fund takes its charges from the capital of the sub-fund. Investors should be aware that there is potential for capital erosion if insufficient capital growth is achieved by the sub-fund to cover the charges. Capital erosion may have the effect of reducing the level of income generated.
For a more detailed explanation of risks, please refer to the "Risks" section of the prospectus.
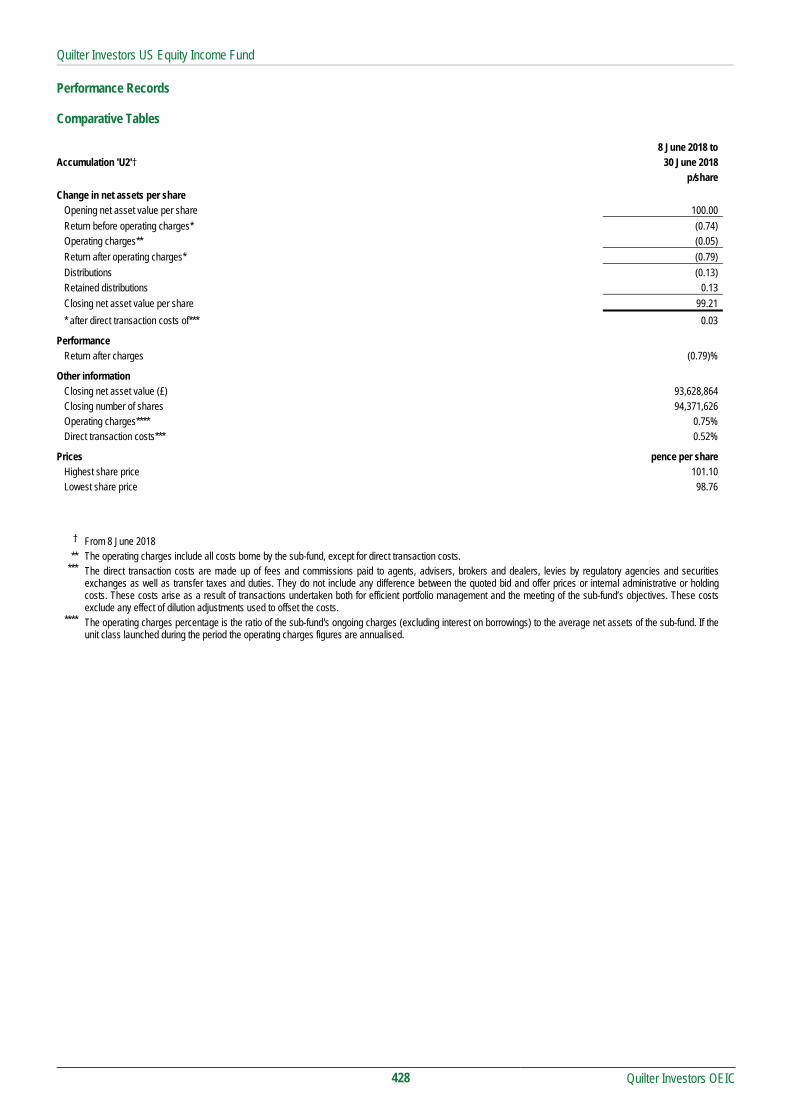
Quilter Investors US Equity Income Fund
Quilter Investors OEIC
428
Performance Records Comparative Tables 8 June 2018 to Accumulation 'U2'† 30 June 2018 p/share
Change in net assets per share Opening net asset value per share 100.00
Return before operating charges* (0.74) Operating charges** (0.05)
Return after operating charges* (0.79)
Distributions (0.13) Retained distributions 0.13
Closing net asset value per share 99.21
* after direct transaction costs of*** 0.03
Performance Return after charges (0.79)%
Other information Closing net asset value (£) 93,628,864 Closing number of shares 94,371,626 Operating charges**** 0.75% Direct transaction costs*** 0.52%
Prices pence per share Highest share price 101.10 Lowest share price 98.76
† From 8 June 2018 ** The operating charges include all costs borne by the sub-fund, except for direct transaction costs.
*** The direct transaction costs are made up of fees and commissions paid to agents, advisers, brokers and dealers, levies by regulatory agencies and securities exchanges as well as transfer taxes and duties. They do not include any difference between the quoted bid and offer prices or internal administrative or holding costs. These costs arise as a result of transactions undertaken both for efficient portfolio management and the meeting of the sub-fund’s objectives. These costs exclude any effect of dilution adjustments used to offset the costs.
**** The operating charges percentage is the ratio of the sub-fund's ongoing charges (excluding interest on borrowings) to the average net assets of the sub-fund. If the unit class launched during the period the operating charges figures are annualised.

Quilter Investors US Equity Income Fund
Quilter Investors OEIC
429
Performance As the sub-fund launched on 8 June 2018 there are no performance figures presented for the period under review.
Portfolio allocation
Banks 22.78%
Oil & Gas Producers 9.52%
Technology Hardware & Equipment 9.33%
Fixed Line Telecommunications 6.21%
Pharmaceuticals & Biotechnology 5.31%
Electricity 5.10%
Food Producers 4.99%
Real Estate Investment Trusts 4.40%
Chemicals 4.29%
Aerospace & Defence 3.30%
Financial Services 3.07%
Media 2.68%
Nonlife Insurance 2.42%
Travel & Leisure 2.20%
Beverages 2.14%
Software & Computer Services 1.64%
Construction & Materials 1.49%
General Industrials 1.16%
Health Care Equipment & Services 1.09%
Food & Drug Retailers 0.98%
Support Services 0.77%
Automobiles & Parts 0.74%
Oil Equipment, Services & Distribution 0.72%
Industrial Engineering 0.68%
Net other assets 2.99%
Total 100.00%
Asset allocation
Equities 97.01%
Net other assets 2.99%
Total 100.00%
Major holdings Percentage of
portfolio
JPMorgan Chase 4.64%
Bank of America 4.40%
US Bancorp 4.10%
BB&T 3.85%
Cisco Systems 3.66%
Verizon Communications 3.64%
Occidental Petroleum 3.40%
Merck (US Listing) 2.79%
Apple 2.79%
Kellogg 2.75%
Number of holdings 54
Total Purchases and Sales for the period
2018
£’000
Total purchases for the period from 8 June to 30 June 95,083
Total sales for the period from 8 June to 30 June 3,316

Quilter Investors US Equity Income Fund
Portfolio statement as at 30 June 2018
Quilter Investors OEIC
430
Market Percentage of Value total net assets
Holding Investment £’000 %
North America 97.01%
United States Equities 97.01%
Aerospace & Defence 3.30% 9,995 Raytheon 1,467 1.57
17,128 United Technologies 1,624 1.73 Total 3,091 3.30
Automobiles & Parts 0.74% 22,568 General Motors 696 0.74
Total 696 0.74
Banks 22.78% 188,770 Bank of America 4,120 4.40
93,589 BB&T 3,607 3.85 16,239 Citi 827 0.88 54,423 JPMorgan Chase 4,347 4.64 12,054 PN Financial Services 1,244 1.33 35,300 SunTrust Banks 1,765 1.89
101,527 US Bancorp 3,835 4.10 38,694 Wells Fargo 1,579 1.69
Total 21,324 22.78
Beverages 2.14% 29,215 Coca-Cola 967 1.03 12,566 PepsiCo 1,039 1.11
Total 2,006 2.14
Chemicals 4.29% 48,630 CF Industries 1,639 1.75 47,307 DowDuPont 2,382 2.54
Total 4,021 4.29
Construction & Materials 1.49% 14,398 Vulcan Materials 1,392 1.49
Total 1,392 1.49
Electricity 5.10% 87,443 FirstEnergy 2,408 2.57 41,540 NextEra Energy Partners 1,435 1.53 42,948 PPL 935 1.00
Total 4,778 5.10
Financial Services 3.07% 8,373 Ameriprise Financial 883 0.94
54,166 Morgan Stanley 1,991 2.13 Total 2,874 3.07
Fixed Line Telecommunications 6.21% 98,235 AT&T 2,407 2.57 88,034 Verizon Communications 3,408 3.64
Total 5,815 6.21

Quilter Investors US Equity Income Fund
Portfolio statement (continued) as at 30 June 2018
Quilter Investors OEIC
431
Market Percentage of Value total net assets
Holding Investment £’000 % Food & Drug Retailers 0.98%
18,364 CVS Health 919 0.98 Total 919 0.98
Food Producers 4.99% 44,670 Conagra Brands 1,217 1.30 48,584 Kellogg 2,576 2.75 18,519 Kraft Heinz 883 0.94
Total 4,676 4.99
General Industrials 1.16% 9,948 Honeywell International 1,084 1.16
Total 1,084 1.16
Health Care Equipment & Services 1.09% 5,466 UnitedHealth 1,019 1.09
Total 1,019 1.09
Industrial Engineering 0.68% 11,548 Dover 639 0.68
Total 639 0.68
Media 2.68% 36,826 Comcast 915 0.98 27,353 Omnicom 1,590 1.70
Total 2,505 2.68
Nonlife Insurance 2.42% 39,183 American International 1,587 1.70 17,462 Hartford Financial Services 677 0.72
Total 2,264 2.42
Oil & Gas Producers 9.52% 22,511 Exxon Mobil 1,404 1.50 18,176 Marathon Petroleum 961 1.03 50,097 Occidental Petroleum 3,180 3.40 20,615 Phillips 66 1,754 1.87 19,431 Valero Energy 1,614 1.72
Total 8,913 9.52
Oil Equipment, Services & Distribution 0.72% 13,188 Schlumberger 673 0.72
Total 673 0.72
Pharmaceuticals & Biotechnology 5.31% 56,873 Merck (US Listing) 2,610 2.79 85,256 Pfizer 2,360 2.52
Total 4,970 5.31
Real Estate Investment Trusts 4.40% 36,720 Lamar Advertising 1,911 2.04 92,359 Outfront Media 1,373 1.47 55,147 Uniti 834 0.89
Total 4,118 4.40
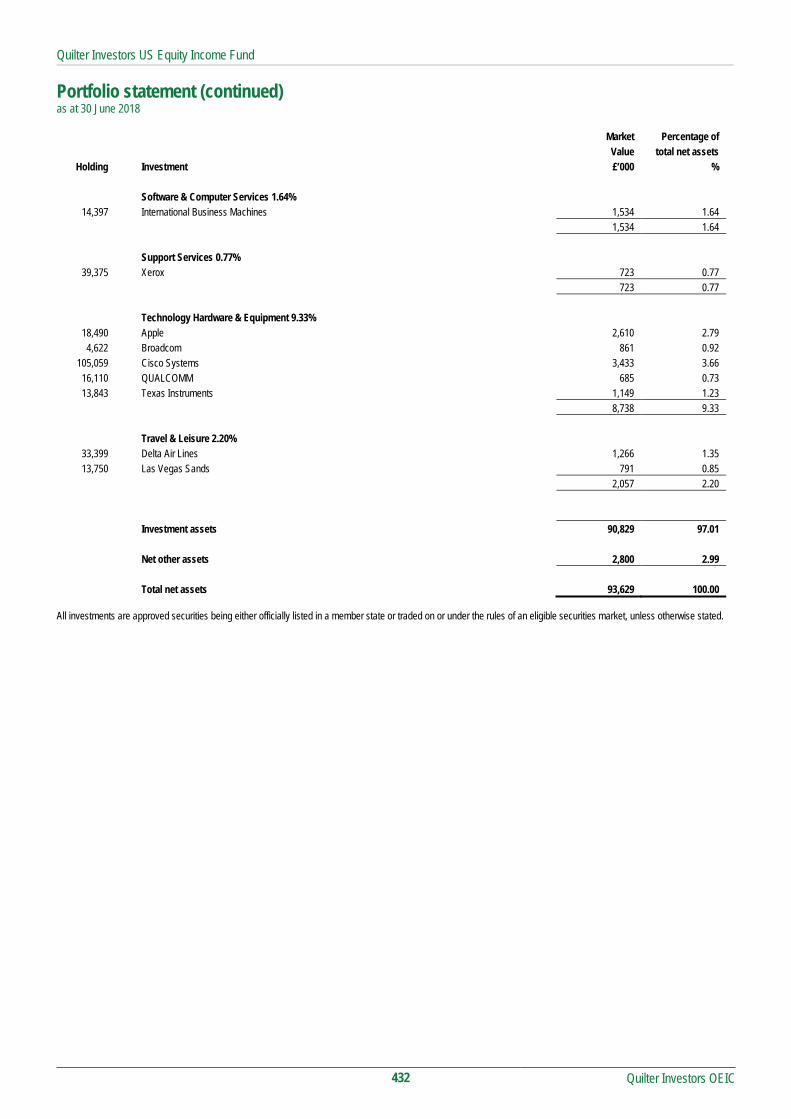
Quilter Investors US Equity Income Fund
Portfolio statement (continued) as at 30 June 2018
Quilter Investors OEIC
432
All investments are approved securities being either officially listed in a member state or traded on or under the rules of an eligible securities market, unless otherwise stated.
Market Percentage of Value total net assets
Holding Investment £’000 % Software & Computer Services 1.64%
14,397 International Business Machines 1,534 1.64 Total 1,534 1.64
Support Services 0.77% 39,375 Xerox 723 0.77
Total 723 0.77
Technology Hardware & Equipment 9.33% 18,490 Apple 2,610 2.79 4,622 Broadcom 861 0.92
105,059 Cisco Systems 3,433 3.66 16,110 QUALCOMM 685 0.73 13,843 Texas Instruments 1,149 1.23
Total 8,738 9.33
Travel & Leisure 2.20% 33,399 Delta Air Lines 1,266 1.35 13,750 Las Vegas Sands 791 0.85
Total 2,057 2.20
Investment assets 90,829 97.01
Net other assets 2,800 2.99
Total net assets 93,629 100.00

Quilter Investors US Equity Income Fund
Quilter Investors OEIC
433
Statement of total return for the period from 8 June 2018 to 30 June 2018 08.06.18 to 08.06.18 to
30.06.18 30.06.18
Note £'000 £'000
Income
Net capital losses (831)
Revenue 152
Expenses (40)
Net revenue before taxation 112
Taxation (23)
Net revenue after taxation 89
Total return before distributions (742)
Distributions 2 (121)
Change in net assets attributable to
shareholders from investment activities (863)
Statement of change in net assets attributable to shareholders for the period from 8 June 2018 to 30 June 2018 08.06.18 to 08.06.18 to
30.06.18 30.06.18
£'000 £'000
Opening net assets attributable to shareholders -
Amounts received on issue of shares 94,370
Amounts paid on cancellation of shares -
94,370
Dilution adjustment -
Change in net assets attributable to
shareholders from investment activities (863)
Retained distribution on accumulation shares 122
Closing net assets attributable to shareholders 93,629
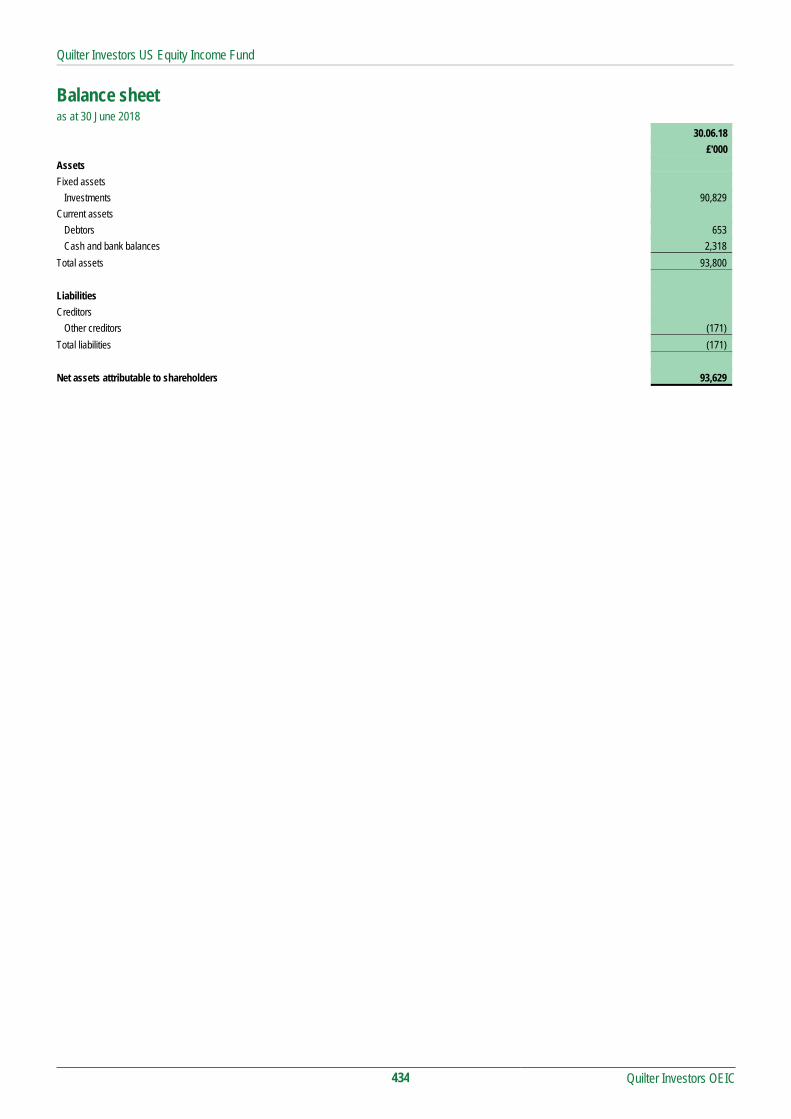
Quilter Investors US Equity Income Fund
Quilter Investors OEIC
434
Balance sheet as at 30 June 2018 30.06.18
£'000
Assets
Fixed assets
Investments 90,829
Current assets
Debtors 653
Cash and bank balances 2,318
Total assets 93,800
Liabilities
Creditors
Other creditors (171)
Total liabilities (171)
Net assets attributable to shareholders 93,629

Quilter Investors US Equity Income Fund
Notes to the financial statements for the period from 8 June 2018 to 30 June 2018
Quilter Investors OEIC
435
1 Accounting policies The financial statements have been prepared under the historical cost basis, as modified by the revaluation of investments, and in accordance with the Statement of Recommended Practice (SORP) for Authorised Funds, issued by the Investment Management Association in May 2014.
2 Distributions The distributions take account of revenue received on the issue of shares and revenue deducted on the cancellation of shares, and comprise:
08.06.18 to 30.06.18 £'000 Interim – Accumulation shares (30 June) 122 122 Revenue received on issue of shares (1) Distributions 121
Reconciliation of distributions: Net revenue after taxation 89 Capitalised fees 40 Tax relief on capitalised fees (8) Distributions 121

Quilter Investors US Equity Income Fund
Distribution table
Quilter Investors OEIC
436
Interim distribution Group 1: Shares purchased prior to 8 June 2018 Group 2: Shares purchased from 8 June 2018 to 30 June 2018
Net revenue
pence per share Equalisation
pence per share*
Distribution paid 30.06.18
pence per share Accumulation 'U2' Shares† Group 1 0.1290 - 0.1290 Group 2 0.1278 0.0012 0.1290 * Equalisation only applies to shares purchased during the distribution period (Group 2 shares). It is the average amount of revenue included in the purchase price of all
Group 2 shares and is refunded to holders of these shares as a return of capital. Being capital, it is not liable to income tax but must be deducted from the cost of shares for capital gains tax purposes.
† Fund Launched on 8 June 2018

Quilter Investors US Equity Small/Mid-Cap Fund
Quilter Investors US Equity Small/Mid-Cap Fund
Quilter Investors OEIC
437
Launch date 1 March 2013
IA Sector North America
Investment adviser Schroder Investment Management Limited
Net asset value £108,234,176
Objective
The sub-fund aims to achieve a combination of income and capital growth.
Policy
The sub-fund primarily invests, directly and indirectly, in shares of companies listed or located in the US.
The sub-fund invests a minimum of 60% of scheme property in small and mid-cap companies. The sub-fund may at times be concentrated in terms of the number of investments it holds.
The sub-fund may also invest in other transferable securities, collective investment schemes (including those managed or operated by the ACD), warrants, money market instruments, deposits and derivatives.
The sub-fund may only use derivatives for efficient portfolio management purposes.
The sub-fund is managed by an investment adviser selected by the ACD for their expected ability to manage the sub-fund according to the investment objective and policy. The ACD continuously monitors and may periodically make changes to this appointment.
Investment Manager’s review
Market review
US shares started the year well, but after a very volatile February have spent most of the rest of the period trying to regain the earlier all-time highs. UK investors also benefited from a rise in the dollar against sterling.
The US’s new tax bill has had an important impact on American business, with smaller companies experiencing a larger positive effect due to their higher level of effective taxes relative to large companies. Combined with the good economy, profit expectations are quite robust. Unfortunately valuations have been creeping up, with small caps looking more expensive relative to history on forward earnings, although they still appear to be fairly valued versus large cap.
The developing “tit for tat” tariff spat between the US and China, US and Canada, US and the EU, etc. is gathering an unsettling momentum. We are not quite at the point where we are willing to describe this as a trade war but if we continue on this path then we will approach the point where we will have to do so. This could be expected to be a problem for the US economy and most of the economies around the world. In the medium-term, tariffs and trade wars may be expected to have a larger negative impact on US large cap stocks. A greater percentage of their revenues come from non-US sources than small cap companies.
Within the mid cap market, the strongest shares were early-stage biotech stocks and the smallest–sized stocks, both of which benefited from speculative market interest. One theme among laggard stocks were more highly-geared companies, as bond yields rose. Both factors hurt the sub-fund’s performance.
Performance
The portfolio returned 1.2%*, underperforming the benchmark return of 8.1%* over the period. *(Source: Morningstar, 30 June 2018, Quilter Investors US Equity Small/Mid-Cap Fund A GBP Acc)
Stock selection detracted most value in health care, financial services and producer durables. The majority of the lag in health care came from the medical & dental instruments & supplies industry, particularly a holding in Dentsply Sirona, a manufacturer of dental products and technologies, due to uncertainty around management changes. Since then a new CEO has been appointed but the stock continued to struggle as a result of potential strategy changes.
On the positive side the best performing holding was Advance Auto Parts, Inc., a retailer of aftermarket auto parts, following solid earnings reports. The share also benefited from positive industry trends as well as increased investor confidence that margin improvement initiatives are gaining traction.
There were modest changes to the positions, such as an increase to the overweight in materials & processing by adding Sensient Technologies Corporation and GrafTech International Ltd. The portfolio’s underweight to health care increased after DexCom was sold.
Risk and Reward Profile
The calculated risk and reward category, as shown above, uses a method of calculation derived from EU rules. It is based on the rate at which the returns of the sub-fund have moved up and down in the past (i.e. volatility) and is not a guide to the future risk and reward category of the sub-fund. The category shown is not a target or guarantee and may shift over time. Even the lowest category 1 does not mean a risk-free investment. The seven-category scale is nonlinear, for example, 2 is not twice as risky as 1.
Sub-funds in category 5 have in the past shown moderately high volatility. With a sub-fund of category 5, you have a moderately high risk of losing money but your chance for gains is also moderately high.
Investment risk - there is no guarantee that the sub-fund will achieve its objective. A capital loss of some or all of the amount invested may occur.
Geographic concentration risk - a fall in the US and Canadian markets may have a significant impact on the value of the sub-fund because it primarily invests in these markets.
Concentration risk (number of investments) - the sub-fund may at times hold a smaller number of investments, and therefore a fall in the value of a single investment may have a greater impact on the sub-fund’s value than if it held a larger number of investments.
Liquidity risk - some investments may become hard to value or sell at a desired time and price. In extreme circumstances this may affect the sub-fund’s ability to meet redemption requests upon demand.
Currency risk (EUR share class) - the sub-fund is denominated in British Pounds but holds assets denominated in other currencies. This share class is denominated in Euro. The value of your shares may rise and fall as a result of exchange rate movements between these currencies.
Currency risk (GBP share class) - the sub-fund is denominated in British Pounds but holds assets denominated in other currencies. The value of your shares may rise and fall as a result of exchange rate movements between these currencies.
Currency risk (USD share class) - the sub-fund is denominated in British Pounds but holds assets denominated in other currencies. This share class is denominated in US Dollars. The value of your shares may rise and fall as a result of exchange rate movements between these currencies.
Derivative risk - the sub-fund may use derivatives to reduce costs and/or the overall risk of the sub-fund (i.e. Efficient Portfolio Management (EPM)). Derivatives involve a level of risk, however, for EPM they should not increase the overall riskiness of the sub-fund. Derivatives also involve counterparty risk where the institutions acting as counterparty to derivatives may not meet their contractual obligations. Capital erosion risk - the sub-fund takes its charges from the income of the sub-fund in the first instance. The impact of sub-fund charges may be material on the value of any income you receive from your investment. There is potential for capital erosion if insufficient income is generated by the sub-fund to cover these charges. Capital erosion may have the effect of reducing the level of income generated. For full details of the sub-fund's risks, please see the section in the prospectus headed "Risks".

Quilter Investors US Equity Small/Mid-Cap Fund
Quilter Investors OEIC
438
Performance Records Comparative Tables Accumulation 'A' 1 January 2018 to 1 January 2017 to 1 January 2016 to 30 June 2018 31 December 2017 31 December 2016 p/share p/share p/share
Change in net assets per share Opening net asset value per share 210.24 200.92 142.37
Return before operating charges* 4.27 12.68 61.28 Operating charges** (1.67) (3.36) (2.73)
Return after operating charges* 2.60 9.32 58.55
Distributions - - - Retained distributions - - -
Closing net asset value per share 212.84 210.24 200.92
* after direct transaction costs of*** 0.02 0.17 0.27
Performance Return after charges 1.24% 4.64% 41.13%
Other information Closing net asset value (£) 14,592,873 16,920,986 20,014,324 Closing number of shares 6,856,338 8,048,411 9,961,494 Operating charges**** 1.65% 1.65% 1.65% Direct transaction costs*** 0.02% 0.08% 0.16%
Prices pence per share pence per share pence per share Highest share price 218.0 212.6 203.9 Lowest share price 190.7 194.4 129.8
Accumulation 'A' EUR† 1 January 2018 to 1 January 2017 to 1 January 2016 to 30 June 2018 31 December 2017 31 December 2016 p/share p/share p/share Change in net assets per share
Opening net asset value per share 109.90 105.02 79.00
Return before operating charges* 2.22 6.64 27.21 Operating charges** (0.87) (1.76) (1.19)
Return after operating charges* 1.35 4.88 26.02
Distributions - - - Retained distributions - - -
Closing net asset value per share 111.25 109.90 105.02
* after direct transaction costs of*** 0.01 0.09 0.16
Performance Return after charges 1.23% 4.65% 32.94%
Other information Closing net asset value (£) 31,766 31,378 33,559 Closing number of shares 28,553 28,553 31,954 Operating charges**** 1.65% 1.65% 1.65% Direct transaction costs*** 0.02% 0.08% 0.16%
Prices cents per share cents per share cents per share Highest share price 130.1 134.8 125.6 Lowest share price 114.3 118.9 98.66

Quilter Investors US Equity Small/Mid-Cap Fund
Quilter Investors OEIC
439
Comparative Tables (continued) Accumulation 'A' USD 1 January 2018 to 1 January 2017 to 1 January 2016 to 30 June 2018 31 December 2017 31 December 2016 p/share p/share p/share Change in net assets per share
Opening net asset value per share 98.53 94.16 66.68
Return before operating charges* 1.99 5.95 28.83 Operating charges** (0.78) (1.58) (1.35)
Return after operating charges* 1.21 4.37 27.48
Distributions - - - Retained distributions - - -
Closing net asset value per share 99.74 98.53 94.16
* after direct transaction costs of*** 0.01 0.08 0.13
Performance Return after charges 1.23% 4.64% 41.21%
Other information Closing net asset value (£) 222,945 201,998 152,835 Closing number of shares 223,522 205,004 162,318 Operating charges**** 1.65% 1.65% 1.65% Direct transaction costs*** 0.02% 0.08% 0.16%
Prices cents per share cents per share cents per shareHighest share price 139.0 133.3 118.5 Lowest share price 126.5 115.7 88.02
Accumulation 'U2' 1 January 2018 to 1 January 2017 to 1 January 2016 to 30 June 2018 31 December 2017 31 December 2016 p/share p/share p/share Change in net assets per share
Opening net asset value per share 192.61 182.44 128.16
Return before operating charges* 3.96 11.57 55.54 Operating charges** (0.70) (1.40) (1.26)
Return after operating charges* 3.26 10.17 54.28
Distributions - (0.30) (0.43) Retained distributions - 0.30 0.43
Closing net asset value per share 195.87 192.61 182.44
* after direct transaction costs of*** 0.02 0.16 0.27
Performance Return after charges 1.69% 5.57% 42.35%
Other information Closing net asset value (£) 93,357,685 73,914,565 31,069,359 Closing number of shares 47,663,713 38,375,266 17,030,261 Operating charges**** 0.75% 0.75% 0.75% Direct transaction costs*** 0.02% 0.08% 0.16%
Prices pence per share pence per share pence per share Highest share price 200.5 194.2 185.1 Lowest share price 175.1 177.7 116.9

Quilter Investors US Equity Small/Mid-Cap Fund
Quilter Investors OEIC
440
Comparative Tables (continued)
1 January 2018 to 1 January 2017 to 1 January 2016 to Income 'U2' 30 June 2018 31 December 2017 31 December 2016
p/share p/share p/share
Change in net assets per share Opening net asset value per share 184.13 174.66 122.95
Return before operating charges* 3.78 11.09 53.23 Operating charges** (0.67) (1.34) (1.10)
Return after operating charges* 3.11 9.75 52.13
Distributions - (0.28) (0.42) Retained distributions - - -
Closing net asset value per share 187.24 184.13 174.66
* after direct transaction costs of*** 0.02 0.15 0.24
Performance Return after charges 1.69% 5.58% 42.40%
Other information Closing net asset value (£) 28,907 29,315 27,297 Closing number of shares 15,439 15,921 15,628 Operating charges**** 0.75% 0.75% 0.75% Direct transaction costs*** 0.02% 0.08% 0.16%
Prices pence per share pence per share pence per share Highest share price 191.7 185.9 177.7 Lowest share price 167.4 170.1 112.2
† From 31 March 2016 ** The operating charges include all costs borne by the sub-fund, except for direct transaction costs.
*** The direct transaction costs are made up of fees and commissions paid to agents, advisers, brokers and dealers, levies by regulatory agencies and securities exchanges as well as transfer taxes and duties. They do not include any difference between the quoted bid and offer prices or internal administrative or holding costs. These costs arise as a result of transactions undertaken both for efficient portfolio management and the meeting of the sub-fund’s objectives. These costs exclude any effect of dilution adjustments used to offset the costs.
**** The operating charges percentage is the ratio of the sub-fund's ongoing charges (excluding interest on borrowings) to the average net assets of the sub-fund. If the share class launched during the period the operating charges figures are annualised.

Quilter Investors US Equity Small/Mid-Cap Fund
Quilter Investors OEIC
441
Performance
6 months to30 June 2018
1 year to 30 June 2018
3 years to30 June 2018
5 years to 30 June 2018
Quilter Investors US Equity Small/Mid-Cap Fund* 1.66% 5.94% 55.63% 109.06%
Russell 2500 Total Return (benchmark) 8.05% 14.37% 59.85% 105.05%
IA North America (sector average) 5.53% 12.53% 59.76% 105.21%
Quartile ranking 4 4 3 2
* Accumulation ‘U2’ shares
Data Source – Factset. Figures are calculated on a total return and single price basis, with net income reinvested into the sub-fund. Portfolio allocation
North America 89.50%
Europe 0.39%
Derivatives (0.04)%
Net other assets 10.15%
Total 100.00%
Asset allocation
Equities 89.89%
Derivatives (0.04)%
Net other assets 10.15%
Total 100.00%
Major holdings Percentage of portfolio
Advance Auto Parts 2.26%
Aramark 2.04%
KAR Auction Services 2.03%
Fortune Brands Home & Security 1.56%
Hexcel 1.43%
ServiceMaster Global 1.42%
Catalent 1.38%
VeriSign 1.33%
Equity LifeStyle Properties 1.33%
Arrow Electronics 1.27%
Number of holdings 112
Total Purchases and Sales for the period
2018 2017
£’000 £’000
Total purchases for the 6 month period to 30 June 24,485 39,263
Total sales for the 6 month period to 30 June 12,800 15,874

Quilter Investors US Equity Small/Mid-Cap Fund
Portfolio statement as at 30 June 2018
Quilter Investors OEIC
442
Market Percentage of Value total net assets
Holding Investment £’000 % North America 89.46% (31 December 2017 91.63%)
United States Equities 89.02% (31 December 2017 91.04%) Aerospace & Defence 1.43% (31 December 2017 1.37%)
30,715 Hexcel 1,544 1.43 1,544 1.43 Automobiles & Parts 1.32% (31 December 2017 2.25%)
16,519 BorgWarner 550 0.51 53,973 Valvoline 874 0.81
1,424 1.32 Banks 9.02% (31 December 2017 8.15%)
39,073 CenterState Bank 900 0.83 25,675 Chemical Financial 1,095 1.01 26,046 Commerce Bancshares 1,283 1.19 11,404 East West 573 0.53 5,100 FCB Financial 233 0.21
77,882 First Horizon National 1,067 0.99 4,379 First Republic Bank 325 0.30
34,639 United Community Banks 822 0.76 15,152 Webster Financial 739 0.68 9,168 Westamerica Bancorporation 401 0.37
29,457 Western Alliance Bank 1,294 1.20 25,515 Zions Banco 1,033 0.95
9,765 9.02 Chemicals 1.77% (31 December 2017 1.05%)
21,812 Ashland Global 1,296 1.20 11,331 Sensient Technologies 617 0.57
1,913 1.77 Construction & Materials 4.97% (31 December 2017 4.41%)
41,568 Fortune Brands Home & Security 1,689 1.56 8,571 Lennox International 1,265 1.17
13,556 MasTec 516 0.48 18,777 Owens Corning 899 0.83 8,787 Valmont Industries 1,005 0.93
5,374 4.97 Electricity 2.32% (31 December 2017 2.65%)
29,060 Alliant Energy 937 0.86 15,848 Evergy 672 0.62 12,935 IDACORP 907 0.84
2,516 2.32 Electronic & Electrical Equipment 2.96% (31 December 2017 1.84%)
24,055 Arrow Electronics 1,376 1.27 72,841 GrafTech International 1,023 0.95 14,562 PerkinElmer 802 0.74
3,201 2.96

Quilter Investors US Equity Small/Mid-Cap Fund
Portfolio statement (continued) as at 30 June 2018
Quilter Investors OEIC
443
Market Percentage of Value total net assets
Holding Investment £’000 %
Equity Investment Instruments 0.40% (31 December 2017 0.35%) 34,685 Ares Capital 434 0.40
434 0.40 Financial Services 2.64% (31 December 2017 2.53%)
5,772 Affiliated Managers 665 0.62 12,326 GCI Liberty 423 0.39 14,515 Raymond James Financial 1,000 0.92 52,620 Santander Consumer 764 0.71
2,852 2.64 Food & Drug Retailers 0.93% (31 December 2017 1.20%)
35,771 Performance Food 1,010 0.93 1,010 0.93 Food Producers 0.60% (31 December 2017 0.71%)
28,825 Hain Celestial 654 0.60 654 0.60 Gas, Water & Multiutilities 0.80% (31 December 2017 0.81%)
43,641 NiSource 868 0.80 868 0.80 General Industrials 3.01% (31 December 2017 3.11%)
13,760 Carlisle 1,137 1.05 32,360 Crown 1,097 1.01 93,203 Graphic Packaging 1,026 0.95
3,260 3.01 General Retailers 6.93% (31 December 2017 5.55%)
23,773 Advance Auto Parts 2,445 2.26 52,940 KAR Auction Services 2,197 2.03 23,834 Nordstrom 950 0.88 9,080 Rollins 363 0.34
33,819 ServiceMaster Global 1,542 1.42 7,497 6.93 Health Care Equipment & Services 4.79% (31 December 2017 5.87%)
4,913 Cooper 877 0.81 32,244 Dentsply Sirona 1,071 0.99 19,580 Henry Schein 1,083 1.00 21,533 K2M 369 0.34 4,961 Masimo 373 0.34 6,240 Universal Health Services 532 0.49
11,792 West Pharmaceutical Services 885 0.82 5,190 4.79 Household Goods & Home Construction 0.72% (31 December 2017 2.43%)
12,397 Spectrum Brands 782 0.72 782 0.72

Quilter Investors US Equity Small/Mid-Cap Fund
Portfolio statement (continued) as at 30 June 2018
Quilter Investors OEIC
444
Market Percentage of Value total net assets
Holding Investment £’000 %
Industrial Engineering 3.00% (31 December 2017 4.41%) 20,591 AGCO 948 0.88 15,102 Allison Transmission 459 0.42 9,777 IDEX 1,008 0.93 8,550 Nordson 831 0.77
3,246 3.00 Industrial Metals & Mining 0.88% (31 December 2017 0.91%)
8,508 Reliance Steel & Aluminum 568 0.52 11,143 Steel Dynamics 389 0.36
957 0.88 Industrial Transportation 1.11% (31 December 2017 1.55%)
10,278 Kirby 653 0.60 10,246 Ryder System 547 0.51
1,200 1.11 Leisure Goods 1.20% (31 December 2017 1.04%)
27,081 Brunswick 1,295 1.20 1,295 1.20 Life Insurance 1.07% (31 December 2017 0.88%)
18,743 Torchmark 1,157 1.07 1,157 1.07 Media 2.69% (31 December 2017 2.82%)
506 Cable One 284 0.26 21,018 Dolby Laboratories 988 0.91 1,176 Graham 526 0.49
132,639 TEGNA 1,114 1.03 2,912 2.69 Nonlife Insurance 3.25% (31 December 2017 4.02%)
27,523 Arthur J Gallagher 1,364 1.26 39,972 Brown & Brown 838 0.77 12,967 Reinsurance Group of America 1,316 1.22
3,518 3.25 Oil & Gas Producers 2.57% (31 December 2017 1.91%)
83,320 Gulfport Energy 786 0.73 50,453 Newfield Exploration 1,163 1.07 36,307 Parsley Energy 835 0.77
2,784 2.57 Oil Equipment, Services & Distribution 0.00% (31 December 2017 0.47%) Personal Goods 0.57% (31 December 2017 0.75%)
5,324 PVH 613 0.57 613 0.57 Pharmaceuticals & Biotechnology 1.95% (31 December 2017 2.53%)
47,618 Catalent 1,495 1.38 17,091 Intra-Cellular Therapies 231 0.21 16,432 Pacira Pharmaceuticals 388 0.36
2,114 1.95

Quilter Investors US Equity Small/Mid-Cap Fund
Portfolio statement (continued) as at 30 June 2018
Quilter Investors OEIC
445
Market Percentage of Value total net assets
Holding Investment £’000 % Real Estate Investment Trusts 6.68% (31 December 2017 5.96%)
7,664 Alexandria Real Estate Equities 737 0.68 71,520 Brixmor Property 963 0.89 23,157 Douglas Emmett 698 0.65 20,624 Equity LifeStyle Properties 1,436 1.33 23,774 Gramercy Property Trust 494 0.46 23,566 Lamar Advertising 1,226 1.13 11,119 Mid-America Apartment Communities 857 0.79 6,495 SBA Communications Class A 815 0.75
7,226 6.68 Software & Computer Services 6.21% (31 December 2017 5.86%)
19,913 Cadence Design Systems 653 0.60 9,346 Gartner 950 0.88
29,252 Leidos 1,306 1.21 14,855 Match 443 0.41 16,274 PTC 1,158 1.07 11,843 Synopsys 766 0.71 13,787 VeriSign 1,444 1.33
6,720 6.21 Support Services 4.66% (31 December 2017 6.44%)
29,722 CoreLogic 1,173 1.08 12,976 Genpact 286 0.26 5,041 Maxar Technologies (CAD Listing) 187 0.17 3,595 Maxar Technologies (USD Listing) 135 0.13
12,166 MSC Industrial Direct 789 0.73 18,219 Stericycle 896 0.83 7,321 Verisk Analytics 593 0.55
17,302 Waste Connections (USA Listing) 988 0.91 5,047 4.66 Technology Hardware & Equipment 3.87% (31 December 2017 3.69%)
54,101 Ciena 1,073 0.99 10,956 Dycom Industries 788 0.73 35,449 Integrated Device Technology 857 0.79 8,460 Microchip Technology 582 0.54
52,165 ON Semiconductor 884 0.82 4,184 3.87 Travel & Leisure 4.70% (31 December 2017 3.52%)
78,041 Aramark 2,210 2.04 49,803 Extended Stay America 814 0.75 63,821 Sabre 1,196 1.11 32,356 Spirit Airlines 871 0.80
5,091 4.70 US Dollar Denominated Derivatives (0.04)% (31 December 2017 0.00%) US Dollar Denominated Futures Contracts (0.04)% (31 December 2017 0.00%)
14 EMIN Russell 2000 Futures September 2018 (13) (0.01) 9 S&P Mid 400 Futures September 2018 (30) (0.03)
(43) (0.04)

Quilter Investors US Equity Small/Mid-Cap Fund
Portfolio statement (continued) as at 30 June 2018
Quilter Investors OEIC
446
Market Percentage of Value total net assets
Holding Investment £’000 % Bermuda Equities 0.48% (31 December 2017 0.59%) Nonlife Insurance 0.48% (31 December 2017 0.59%)
5,759 RenaissanceRe 525 0.48 525 0.48 Europe 0.39% (31 December 2017 0.39%) Netherlands Equities 0.39% (31 December 2017 0.39%) Oil Equipment, Services & Distribution 0.39% (31 December 2017 0.39%)
4,415 Core Laboratories 421 0.39 421 0.39
Investment assets* 97,251 89.85 Net other assets 10,983 10.15 Total net assets 108,234 100.00
* Including investment liabilities.
All investments are approved securities being either officially listed in a member state or traded on or under the rules of an eligible securities market, unless otherwise stated.
All investments are in ordinary shares unless otherwise stated.

Quilter Investors US Equity Small/Mid-Cap Fund
Quilter Investors OEIC
447
Statement of total return
for the period from 1 January 2018 to 30 June 2018 01.01.18 to 01.01.18 to 01.01.17 to 01.01.17 to
30.06.18 30.06.18 30.06.17 30.06.17
Note £'000 £'000 £'000 £'000
Income
Net capital gains 2,136 594
Revenue 537 365
Expenses (430) (344)
Interest payable and similar charges - (4)
Net revenue before taxation 107 17
Taxation (71) (47)
Net revenue/(expense) after taxation 36 (30)
Total return before distributions 2,172 564
Distributions 2 4 5
Change in net assets attributable to
shareholders from investment activities 2,176 569
Statement of change in net assets attributable to shareholders for the period from 1 January 2018 to 30 June 2018 01.01.18 to 01.01.18 to 01.01.17 to 01.01.17 to
30.06.18 30.06.18 30.06.17 30.06.17
£'000 £'000 £'000 £'000
Opening net assets attributable to shareholders 91,098* 51,297
Amounts received on issue of shares 20,502 31,524
Amounts paid on cancellation of shares (5,560) (6,051)
14,942 25,473
Dilution adjustment 18 34
Change in net assets attributable to
shareholders from investment activities 2,176 569
Closing net assets attributable to shareholders 108,234 77,373* * Section 3.30 of the SORP issued by the Investment Management Association in May 2014 requires comparative figures for the above statement. For interim financial
statements this will result in the closing comparative net assets not being equal to net assets at the start of the current period.

Quilter Investors US Equity Small/Mid-Cap Fund
Quilter Investors OEIC
448
Balance sheet
as at 30 June 2018 30.06.18 31.12.17
£'000 £'000
Assets
Fixed assets
Investments 97,294 83,826
Current assets
Debtors 600 576
Cash and bank balances 10,527 6,946
Total assets 108,421 91,348
Liabilities
Investment liabilities (43) -
Creditors
Other creditors (144) (250)
Total liabilities (187) (250)
Net assets attributable to shareholders 108,234 91,098
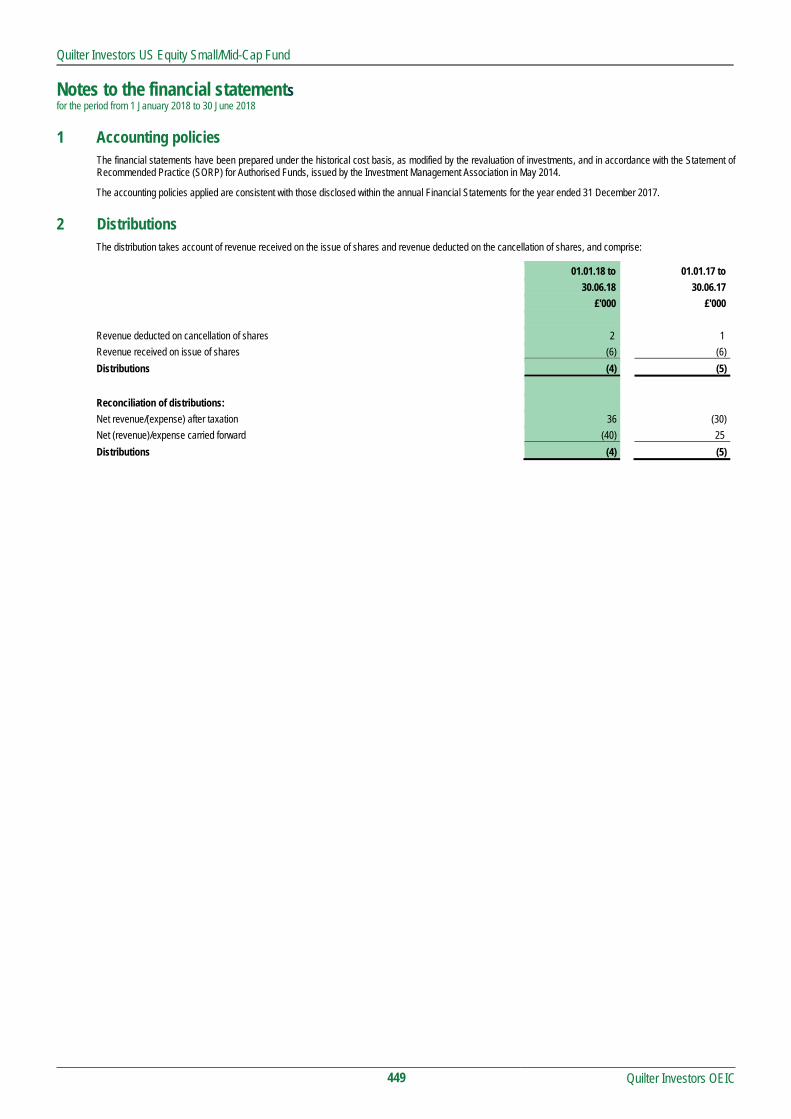
Quilter Investors US Equity Small/Mid-Cap Fund
Notes to the financial statements for the period from 1 January 2018 to 30 June 2018
Quilter Investors OEIC
449
1 Accounting policies The financial statements have been prepared under the historical cost basis, as modified by the revaluation of investments, and in accordance with the Statement of Recommended Practice (SORP) for Authorised Funds, issued by the Investment Management Association in May 2014.
The accounting policies applied are consistent with those disclosed within the annual Financial Statements for the year ended 31 December 2017.
2 Distributions The distribution takes account of revenue received on the issue of shares and revenue deducted on the cancellation of shares, and comprise:
01.01.18 to 01.01.17 to
30.06.18 30.06.17
£'000 £'000
Revenue deducted on cancellation of shares 2 1
Revenue received on issue of shares (6) (6)
Distributions (4) (5)
Reconciliation of distributions:
Net revenue/(expense) after taxation 36 (30)
Net (revenue)/expense carried forward (40) 25
Distributions (4) (5)