KMIF COVER.indd - Kenanga Investors
52
ANNUAL REPORT For the Financial Year Ended 31 January 2018 KENANGA MALAYSIAN INC FUND
-
Upload
khangminh22 -
Category
Documents
-
view
2 -
download
0
Transcript of KMIF COVER.indd - Kenanga Investors
ANNUAL REPORT
For the Financial Year Ended 31 January 2018
KENANGA MALAYSIAN INC FUND


KENANGA MALAYSIAN INC FUND
Contents Page
Corporate Directory ii
Directory of Manager’s Offi ces iii
Fund Information 1
Manager’s Report 2 - 6
Fund Performance 7 - 9
Trustee’s Report 10
Independent Auditors’ Report 11 - 13
Statement by the Manager 14
Financial Statement 15 - 42

ii Kenanga Malaysian Inc Fund Annual Report
CORPORATE DIRECTORY
Manager: Kenanga Investors Berhad (Company No. 353563-P) Registered Offi ce Business Offi ceLevel 17, Kenanga Tower Level 14, Kenanga Tower237, Jalan Tun Razak 237, Jalan Tun Razak50400 Kuala Lumpur, Malaysia 50400 Kuala Lumpur, MalaysiaTel: 03-2172 2888 Tel: 03-2172 3000Fax: 03-2172 2999 Tel: 03-2172 3080 E-mail: [email protected] Website: www.KenangaInvestors.com.my
Board Of Directors Investment CommitteeDatuk Syed Ahmad Alwee Alsree (Chairman) Dato’ Bruce Kho Yaw Huat (Chairman)Syed Zafi len Syed Alwee (Independent Syed Zafi len Syed Alwee (Independent Director) Member)Peter John Rayner (Independent Peter John Rayner (Independent Director) Member)Imran Devindran bin Abdullah (Independent Imran Devindran bin Abdullah (Independent Director) Member)Dato’ Bruce Kho Yaw Huat Ismitz Matthew De AlwisIsmitz Matthew De Alwis
Company Secretary: Norliza Abd Samad (MAICSA 7011089)Level 17, Kenanga Tower, 237, Jalan Tun Razak, 50400 Kuala Lumpur, Malaysia
Trustee: CIMB Commerce Trustee Berhad (Company No. 313031-A)Registered Offi ce Business Offi ceLevel 13, Menara CIMB Level 21, Menara CIMBJalan Stesen Sentral 2 Jalan Stesen Sentral 2Kuala Lumpur Sentral Kuala Lumpur Sentral50490 Kuala Lumpur 50490 Kuala LumpurTel: 03-2261 8888 Tel: 03-2261 8888Fax: 03-2261 0099 Fax: 03-2261 9889Website: www.cimb.com
Auditor: Ernst & Young (AF: 0039)Level 23A, Menara Milenium, Jalan Damanlela, Pusat Bandar Damansara, 50490 Kuala Lumpur.Tel: 03-7495 8000 Fax: 03-2095 5332
Tax Adviser: Ernst & Young Tax Consultants Sdn Bhd (Company No. 179793-K)Level 23A, Menara Milenium, Jalan Damanlela, Pusat Bandar Damansara, 50490 Kuala Lumpur.Tel: 03-7495 8000 Fax: 03-2095 5332
Membership: Federation Of Investment Managers Malaysia (FIMM)19-06-1, 6th Floor, Wisma Tune, 19, Lorong Dungun, Damansara Heights, 50490 Kuala Lumpur, Malaysia.Tel: 03-2093 2600 Fax: 03-2093 2700 Website: www.fi mm.com.my
iiiKenanga Malaysian Inc Fund Annual Report
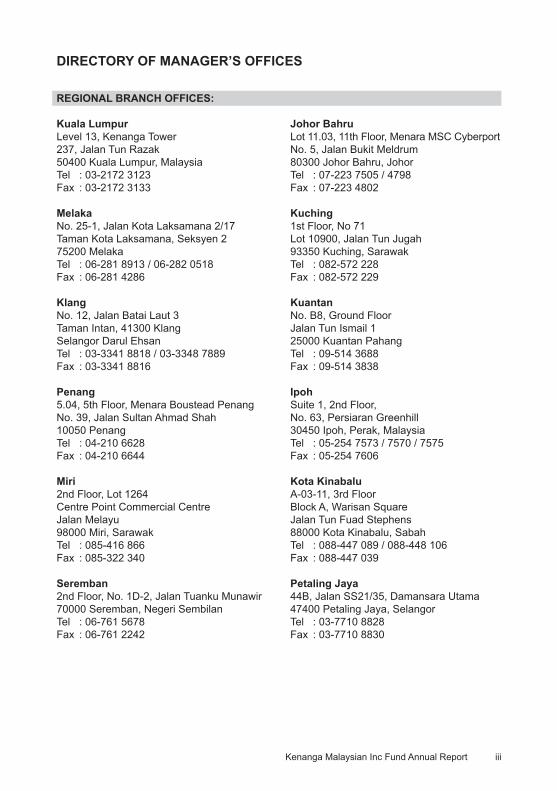
REGIONAL BRANCH OFFICES:
Kuala LumpurLevel 13, Kenanga Tower237, Jalan Tun Razak50400 Kuala Lumpur, MalaysiaTel : 03-2172 3123 Fax : 03-2172 3133
MelakaNo. 25-1, Jalan Kota Laksamana 2/17Taman Kota Laksamana, Seksyen 275200 MelakaTel : 06-281 8913 / 06-282 0518Fax : 06-281 4286
KlangNo. 12, Jalan Batai Laut 3Taman Intan, 41300 KlangSelangor Darul EhsanTel : 03-3341 8818 / 03-3348 7889 Fax : 03-3341 8816
Penang5.04, 5th Floor, Menara Boustead Penang No. 39, Jalan Sultan Ahmad Shah 10050 PenangTel : 04-210 6628Fax : 04-210 6644
Miri 2nd Floor, Lot 1264Centre Point Commercial CentreJalan Melayu98000 Miri, Sarawak Tel : 085-416 866 Fax : 085-322 340
Seremban 2nd Floor, No. 1D-2, Jalan Tuanku Munawir 70000 Seremban, Negeri Sembilan Tel : 06-761 5678 Fax : 06-761 2242
Johor BahruLot 11.03, 11th Floor, Menara MSC CyberportNo. 5, Jalan Bukit Meldrum80300 Johor Bahru, JohorTel : 07-223 7505 / 4798 Fax : 07-223 4802
Kuching1st Floor, No 71Lot 10900, Jalan Tun Jugah93350 Kuching, SarawakTel : 082-572 228 Fax : 082-572 229
KuantanNo. B8, Ground FloorJalan Tun Ismail 125000 Kuantan PahangTel : 09-514 3688Fax : 09-514 3838
IpohSuite 1, 2nd Floor,No. 63, Persiaran Greenhill30450 Ipoh, Perak, MalaysiaTel : 05-254 7573 / 7570 / 7575Fax : 05-254 7606
Kota KinabaluA-03-11, 3rd FloorBlock A, Warisan SquareJalan Tun Fuad Stephens88000 Kota Kinabalu, SabahTel : 088-447 089 / 088-448 106 Fax : 088-447 039
Petaling Jaya44B, Jalan SS21/35, Damansara Utama47400 Petaling Jaya, Selangor Tel : 03-7710 8828 Fax : 03-7710 8830
DIRECTORY OF MANAGER’S OFFICES

1 Kenanga Malaysian Inc Fund Annual Report
1. FUND INFORMATION
1.1 Fund Name
Kenanga Malaysian Inc Fund (KMIF or the Fund)
1.2 Fund Category / Type
Equity / Growth
1.3 Investment Objective
The Fund aims to provide consistent annual returns and medium to long-term capital appreciation by investing in Malaysian securities with global reach.
1.4 Investment Strategy
The Fund seeks to maximise total returns by providing investors with capital appreciation and income (if any), while reducing risk through diversifi ed investments mainly in equities and money market instruments.
1.5 Duration
The Fund was launched on 9 November 2007 and it shall exist as long as it appears to the Manager and the Trustee that it is in the interests of the unitholders for it to continue.
1.6 Performance Benchmark
FTSE-Bursa Malaysia 100 Index
1.7 Distribution Policy
The Fund intends to pay income by way of distribution or by the creation of additional units after the end of each Accrual Period or any specifi ed period, where possible.
1.8 Breakdown of unit holdings of KMIF as at 31 January 2018
Size of holdings No. of unit holders No. of units held 5,000 and below 3,824 4,442,398 5,001-10,000 835 6,018,456 10,001-50,000 1,936 43,239,310 50,001-500,000 554 58,087,393 500,001 and above 39 116,603,215 Total 7,188 228,390,772

2Kenanga Malaysian Inc Fund Annual Report
2. MANAGER’S REPORT
2.1 Explanation on whether the Fund has achieved its investment objective.
The Fund has appreciated by 21.91% in Net Asset Value terms for the period under review, thus achieving the Fund’s stated objective of medium to long term capital appreciation.
2.2 Comparison between the Fund’s performance and performance of the benchmark
Performance Chart Since Launch (9/11/2007 - 31/01/2018)Kenanga Malaysian Inc Fund vs FTSE-Bursa Malaysia 100 Index
Source: Lipper
2.3 Investment strategies and policies employed during the fi nancial year under review
For the fi nancial year under review, the Fund continued with its strategy of investing in companies with sustainable business models and competent management. These are also companies that trade at a discount to their intrinsic/fair value.
Themes favoured for the year under review included construction and infrastructure stocks, exporters, GLC reform/restructuring plays and commodities.
2.4 The Fund’s asset allocation as at 31 January 2018 and comparison with the previous fi nancial year
Asset 31 Jan 2018 31 Jan 2017Listed investment securities 89.4% 79.2%Short term deposits and cash 10.6% 20.8%
Reason for the differences in asset allocation
As at 31 January 2018, the asset allocation of the Fund stood at around 89.4% in equities and the balance of around 10.6% in liquidity. The investment level increased as the fund manager took a more positive view of the market and deployed liquidity.

3 Kenanga Malaysian Inc Fund Annual Report
2.5 Fund performance analysis based on NAV per unit (adjusted for income distribution; if any) since last review period
Period under review Kenanga Malaysian Inc Fund 21.91% FTSE-Bursa Malaysia 100 Index (FBM-100) 14.18%
Source: Lipper
For the year under review, the Fund appreciated 21.91%, outperforming the 14.18% increase in the FBM100. The outperformance was mainly due to better stock selection.
2.6 Review of the market
Market Review
Asian equity markets started January 2017 with a positive rally, thanks to the spilled over optimism from the US markets as Dow Jones hit all-time high of above 20,000 points.The FBMS Index continued its surge in February and March courtesy to persistent foreign buying after being absent in the domestic market for more than 3 years. March 2017 also recorded the largest foreign infl ow of RM4.4bil (Mac 16: RM6.1bil foreign net infl ow) after three consecutive years (2014-2016) of foreigners’ net selling totaling about RM30bil. Malaysia recorded 4Q2016 GDP growth of 4.5% yoy, above estimate of 4.4%, bringing 2016 growth to 4.2%. In Feb 2017, two major FDI milestones were announced: a) the launch of Digital Free Trade Zone with Alibaba setting up a regional distribution hub in KLIA Aeropolis; and b) US$7b investment by Saudi Aramco in RAPID refi nery and petrochemical project. There was no surprise monetary actions from the central banks in 1Q2017, both ECB and BOJ stay pat but Fed hiked 25bps as widely expected. The Bank Negara’s annual report released by end March provided GDP growth forecast of 4.3%-4.8% and CPI projection of 3%-4%, which were well within market expectations.
The market charted another positive month in April but took a breather in May which is always a seasonally slow month. The US launched a military strike on a Syrian government airbase in response to a chemical weapons attack killing civilians and later dropped the largest conventional bomb on an ISIS area in eastern Afghanistan. North Korea also unveiled its new missile technology where US President Donald Trump was hoping on China to rein in North Korea’s military aggression. In EU, UK Prime Minister Theresa May called for snap UK general election to strengthen her political grips before Brexit negotiation. Meanwhile, Emmanuel Macron defeated Marine Le Pen in the French presidential election which removed the risk of France leaving EU. In a widely expected move, OPEC and non-members agreed to extend production cuts by another nine months to March 2018.
On the local front, Bank Negara announced liberalisation of MGS. The market and corporates was however shocked by a surprised announcement from TRX City voiding the sales of 60%-stake in Bandar Malaysia to IWH-CREC consortium done in 2015. Mid-small caps started a price correction as investors took profi t following a strong rally since beginning of the year. Malaysia also reported 1Q2017 GDP of 5.6% yoy which was above the 4.8% forecast, which is the strongest growth rate since 1Q2015.

4Kenanga Malaysian Inc Fund Annual Report
2.6 Review of the market (contd.)
Market Review (contd.)
Asian markets continued to perform well in June with key indices reaching all-time high. As a widely expected move, US Fed raised interest rates for the second time in 2017 by 25bps after upgrading GDP growth forecast to 2.2% and unemployment rate to 4.3% for 2017. Sector wise, Technology suffered a minor selldown in June as investors rotate into fi nancial and energy stocks for value.
The International Monetary Fund (IMF) remained confi dent that the global economic recovery is on a fi rmer footing this year on expectations of accelerating growth in the Euro-zone, Japan and China. In the July 2017 update of its World Economic Outlook (WEO), the IMF kept its global GDP forecast at 3.5% for 2017 and 3.6% for 2018 – unchanged from its April 2017 outlook.
Major European and Asian Indexes fell early August with concerns over North Korea, Hurricane Harvey, Spain terror attacks and the US political environment. Stronger economic data and positive corporate earnings propped up August numbers. The Jackson Hole Economic Policy Symposium accentuates the challenges faced by central bankers to spur wage infl ation despite falling global unemployment, as speeches from Janet Yellen and Mario Draghi avoided monetary policy, focusing on regulatory reforms and market risks. The third round of negotiations between UK and EU has begun, with a multi-year transitional agreement likely to arrive after March 2019.
The regional markets were jittery in September as sabre rattling by North Korea sent investors into selling mode while heightened expectations of another US interest rate hike and balance sheet contraction this year following comments from Federal Reserve offi cials also added to the downbeat sentiment. Meanwhile, the Asian Development Bank came out a report and remained confi dent that the global economic recovery is on a fi rmer footing this year as controlled growth moderation in China is balanced by expected healthy growth elsewhere.
Regional markets fared better in October compared to previous month driven by a recovery in tech stocks and easing geopolitical tension between China and Korea following the year-long standoff over deployment of anti-missile systems. Following this, both economies agreed to a currency swap agreement, which was key rerating catalyst for China-centric Korean equities.
The month of November started off with the Bank of England raising UK interest rates for fi rst time since 2007. The Bank of England raised rates by 25bps but the Pound still fell as gloomy forecasts for growth appeared to rule out the prospect of steep increases in the cost of credit before 2020. As largely expected, President Donald Trump has named Jerome Powell as the next Federal Reserve Chairman.
Key markets saw 2017 ended with mixed performance amid thin trading volume towards the end of the year. All three major US indices ended 2017 with the best annual gains since 2013. Nasdaq recorded the biggest yearly gain of 28.2% followed by Dow Jones and S&P500 which advanced by 25.1% and 19.4% each respectively.

5 Kenanga Malaysian Inc Fund Annual Report
2.6 Review of the market (contd.)
Market Review (contd.)
The US Fed started to double the pace of its balance sheet reduction from USD10b to USD20b and will increase it by USD10b every three months. Meanwhile, ECB’s plan is to reduce asset purchases from EUR60b to EUR30b until at least September. Bank of Japan reduced purchase of 10 to 25-year bonds and 25 to 40-year bonds by JPY10b each.
China’s December data were broadly within expectations but 4Q17 GDP growth was higher than expected and brought 2017 GDP growth to 6.9%, the fi rst pick-up since 2010. After the US Government shutdown ended, President Trump slapped steep tariffs of 20-50% on imported washing machines and solar panels. Korea stock exchange announced KRX300 Index to be launched on Feb 5, another bright spot for small-mid caps.
In January 2018, MSCI Asia Pacifi c ex-Japan posted the best monthly return since March 2016, gained 7.5% and outperformed MSCI World’s 1%. Leaders were HSCEI, Hang Seng and SHCOMP. Upward revision on global growth forecast, USD weakness and increasing commodities prices presented an upbeat sentiment. Financials re-rated on better macroeconomic backdrop, Internet sector recovered after remaining subdued for the previous two months as investors rotated into value stocks but Technology hardware was still plagued by smartphone shipment concern.
Brent and WTI crude oil were up 3% and 7% respectively due to strong demand in extremely cold winter. MYR, THB and RMB top the list of best-performing currencies, while PHP, KRW and HKD among the worst-performing.
On the domestic front, FBMKLCI closed 4% higher driven by fi nancials that rallied on 25bps OPR hike by Bank Negara and the outperformance of PNB-related companies. Net infl ows expanded by another RM3.4b in January after total infl ows of RM10.8b in 2017, and international reserves continued to grow to USD103b as at Jan 22. Other key news include the tender submission for MRT Circle Line by three Malaysian consortiums and a Chinese joint-venture.
Market Outlook
Sentiment turned negative stepping into February with all markets reversing their earlier gains and Malaysia was no exception. We believe fundamentals have not changed materially to warrant a trend reversal, although equities valuations have admittedly turned overly expensive for certain markets, rendering this correction somewhat timely.
Specifi cally for Malaysia, our positive view is supported by the strong economic growth, improving corporate earnings, whilst the appreciating MYR is supportive of fund fl ows. Post election, we anticipate the return of foreign fl ows and certain themes like rising FDI, China’s Belt Road Initiatives, railway construction awards, GLC transformation should become more discerning in 2H, providing the positive backdrop.

6Kenanga Malaysian Inc Fund Annual Report
2.6 Review of the market (contd.)
Strategy
With the timeline of GE14 closing in, we will tactically be more defensive and adopt buy-on-weakness strategy in the next 3 months. Post-election, we anticipate the return of foreign fl ows and certain themes like rising FDI, China’s Belt Road Initiatives, railway construction awards, GLC transformation should become more discerning in 2H, providing the positive backdrop
.2.7 Distribution
For the fi nancial year under review, the Fund did not declare any income distribution.
2.8 Details of any unit split exercise
The Fund did not carry out any unit split exercise during the fi nancial year under review.
2.9 Signifi cant changes in the state of affair of the Fund during the fi nancial year
The fund has revised its investment policy and strategy by investing into global equities markets effect from 2 February 2018.
Kindly refer to our Supplemental Master Prospectus dated 2 February 2018 for further details.
2.10 Circumstances that materially affect any interests of the unit holders
During the fi nancial year under review, there were no circumstances that materially affected any interests of the unitholders.
2.11 Rebates & Soft commissions
Any rebates received are channelled back to the Fund. On the other hand, soft commissions received from the stockbrokers for goods and services such as technical analysis software, fundamental database, fi nancial wire services, stock quotation system and portfolio management software incidental to investment management of the Fund shall be retained by the Manager. For the fi nancial year under review, the Manager has received soft commissions from stockbrokers.

7 Kenanga Malaysian Inc Fund Annual Report
3. FUND PERFORMANCE
3.1 Details of portfolio composition of the Fund for the last three fi nancial years as at 31 January are as follow:
a. Distribution among industry sectors and category of investments:
FY FY FY 2018 2017 2016 % % %
Trading/Services 32.8 22.4 17.1Industrial products 12.5 9.5 16.2Finance 11.3 9.2 9.1Constructions 10.9 18.8 9.0Consumer products 9.2 5.7 7.9Technology 5.1 2.2 5.2Properties 4.8 5.4 5.0Hotel 0.3 - -Special Purpose Acquisition Company 0.2 0.7 0.2Plantations - 3.5 3.2Real Estate Investment Trusts 1.7 1.8 -Warrants 0.4 - -Loan stocks 0.2 - -Short term deposits and cash 10.6 20.8 27.1 100.0 100.0 100.0
Note: The above mentioned percentages are based on total investment market value plus cash.
b. Distribution among markets
The Fund invests in local listed investment securities and cash instruments only.
8Kenanga Malaysian Inc Fund Annual Report
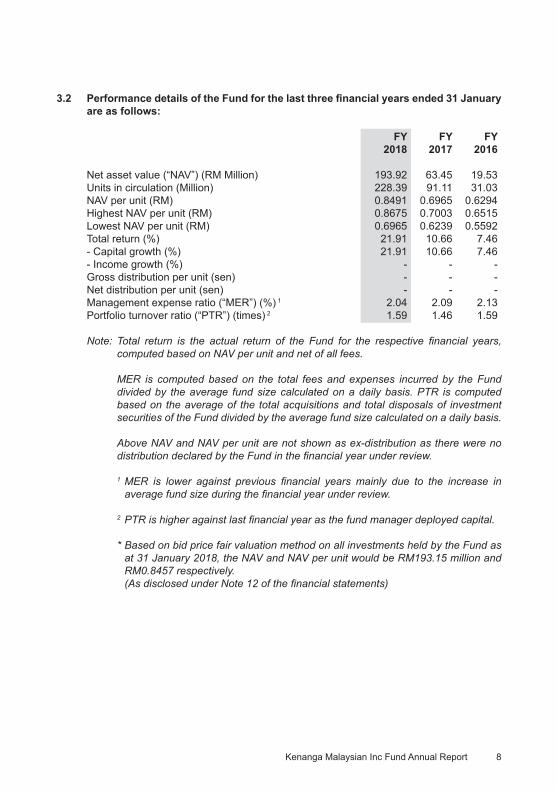
3.2 Performance details of the Fund for the last three fi nancial years ended 31 January are as follows:
FY FY FY 2018 2017 2016
Net asset value (“NAV”) (RM Million) 193.92 63.45 19.53Units in circulation (Million) 228.39 91.11 31.03NAV per unit (RM) 0.8491 0.6965 0.6294Highest NAV per unit (RM) 0.8675 0.7003 0.6515Lowest NAV per unit (RM) 0.6965 0.6239 0.5592Total return (%) 21.91 10.66 7.46- Capital growth (%) 21.91 10.66 7.46- Income growth (%) - - -Gross distribution per unit (sen) - - -Net distribution per unit (sen) - - -Management expense ratio (“MER”) (%) 1 2.04 2.09 2.13Portfolio turnover ratio (“PTR”) (times) 2 1.59 1.46 1.59
Note: Total return is the actual return of the Fund for the respective fi nancial years, computed based on NAV per unit and net of all fees.
MER is computed based on the total fees and expenses incurred by the Fund divided by the average fund size calculated on a daily basis. PTR is computed based on the average of the total acquisitions and total disposals of investment securities of the Fund divided by the average fund size calculated on a daily basis.
Above NAV and NAV per unit are not shown as ex-distribution as there were no distribution declared by the Fund in the fi nancial year under review.
1 MER is lower against previous fi nancial years mainly due to the increase in average fund size during the fi nancial year under review.
2 PTR is higher against last fi nancial year as the fund manager deployed capital.
* Based on bid price fair valuation method on all investments held by the Fund as at 31 January 2018, the NAV and NAV per unit would be RM193.15 million and RM0.8457 respectively.
(As disclosed under Note 12 of the fi nancial statements)

9 Kenanga Malaysian Inc Fund Annual Report
3.3 Average total return of the Fund
1 Year 3 Years 5 Years 31 Jan 17 31 Jan 15 31 Jan 13 - 31 Jan 18 - 31 Jan 18 - 31 Jan 18
Kenanga Malaysian Inc Fund 21.91% 12.83% 12.54%
FTSE-Bursa Malaysia 100 Index 14.18% 3.22% 3.88%
Source: Lipper
3.4 Annual total return of the Fund
Period Period under review 1 Year 1 Year 1 Year from 31 Jan 17 31 Jan 16 31 Jan 15 31 Jan 14 31 Dec 12 - 31 Jan 18 - 31 Jan 17 - 31 Jan 16 - 31 Jan 15 - 31 Jan 14 Kenanga Malaysian Inc Fund 21.91% 10.66% 7.46% 8.26% 13.85%
FTSE-Bursa Malaysia 100 Index 14.18% 1.43% -5.83% -1.62% 7.73%
Source: Lipper
Investors are reminded that past performance is not necessarily indicative of future performance. Unit prices and investment returns may fl uctuate.

10Kenanga Malaysian Inc Fund Annual Report
4 TRUSTEE’S REPORT TO THE UNIT HOLDERS OF KENANGA MALAYSIAN INC FUND
We, CIMB Commerce Trustee Berhad being the trustee of Kenanga Malaysian Inc Fund (“the Fund”), are of the opinion that Kenanga Investors Berhad (“the Manager”), acting in the capacity as Manager of the Fund, has fulfi lled its duties in the following manner for the fi nancial year ended 31 January 2018.
a) The Fund has been managed in accordance with the limitations imposed on the
investment powers of the Manager under the Deed, the Securities Commission Malaysia’s Guidelines on Unit Trust Funds, the Capital Markets and Services Act 2007 (as amended from time to time) and other applicable laws;
b) Valuation and pricing for the Fund has been carried out in accordance with the Deed and relevant regulatory requirements; and
c) Creation and cancellation of units have been carried out in accordance with the Deed
and relevant regulatory requirements.
For and on behalf of CIMB Commerce Trustee Berhad Lee Kooi Yoke Chief Operating Offi cer
Kuala Lumpur, Malaysia
28 March 2018

11 Kenanga Malaysian Inc Fund Annual Report
5 INDEPENDENT AUDITORS’ REPORT TO THE UNIT HOLDERS OF KENANGA MALAYSIAN INC FUND REPORT ON THE AUDIT OF THE FINANCIAL STATEMENTS
Opinion
We have audited the fi nancial statements of Kenanga Malaysian Inc Fund (“the Fund”), which comprise the statement of fi nancial position as at 31 January 2018, and the statement of comprehensive income, statement of changes in net asset value and statement of cash fl ows of the Fund for the fi nancial year then ended, and notes to the fi nancial statements, including a summary of signifi cant accounting policies and other explanatory information, as set out on pages 15 to 42.
In our opinion, the accompanying fi nancial statements give a true and fair view of the fi nancial position of the Fund as at 31 December 2017 and of its fi nancial performance and cash fl ows for the fi nancial year then ended in accordance with Malaysian Financial Reporting Standards and International Financial Reporting Standards.
Basis for opinion
We conducted our audit in accordance with approved standards of auditing in Malaysia and International Standards on Auditing. Our responsibilities under those standards are further described in the Auditors’ responsibilities for the audit of the fi nancial statements section of our report. We believe that the audit evidence we have obtained is suffi cient and appropriate to provide a basis for our audit opinion.
Independence and other ethical responsibilities
We are independent of the Fund in accordance with the By-Laws (on Professional Ethics, Conduct and Practice) of the Malaysian Institute of Accountants (“By-Laws”) and the International Ethics Standards Board for Accountants’ Code of Ethics for Professional Accountants (“IESBA Code”), and we have fulfi lled our other ethical responsibilities in accordance with the By-Laws and the IESBA Code.
Information other than the fi nancial statements and auditors’ report thereon
The Manager of the Fund (“the Manager”) is responsible for the other information. The other information comprises the information included in the annual report of the Fund, but does not include the fi nancial statements of the Fund and our auditors’ report thereon.
Our opinion on the fi nancial statements of the Fund does not cover the other information and we do not express any form of assurance conclusion thereon.
In connection with our audit of the fi nancial statements of the Fund, our responsibility is to read the other information and, in doing so, consider whether the other information is materially inconsistent with the fi nancial statements of the Fund or our knowledge obtained in the audit or otherwise appears to be materially misstated.
If, based on the work we have performed, we conclude that there is a material misstatement of this other information, we are required to report that fact. We have nothing to report in this regard.

12Kenanga Malaysian Inc Fund Annual Report
5 INDEPENDENT AUDITORS’ REPORT TO THE UNIT HOLDERS OF KENANGA MALAYSIAN INC FUND (CONTD.)
Responsibilities of the Manager and Trustee for the fi nancial statements
The Manager is responsible for the preparation of fi nancial statements of the Fund that give a true and fair view in accordance with Malaysia Financial Reporting Standards and International Financial Reporting Standards. The Manager is also responsible for such internal control as the Manager determines is necessary to enable the preparation of fi nancial statements of the Fund that are free from material misstatement, whether due to fraud or error.
In preparing the fi nancial statements of the Fund, the Manager is responsible for assessing the Fund’s ability to continue as a going concern, disclosing, as applicable, matters related to going concern and using the going concern basis of accounting unless the Manager either intends to liquidate the Fund or to cease operations, or has no realistic alternative but to do so.
The Trustee is responsible for overseeing the Fund’s fi nancial reporting process. The Trustee is also responsible for ensuring that the Manager maintains proper accounting and other records as are necessary to enable true and fair presentation of these fi nancial statements.
Auditors’ responsibility for the audit of the fi nancial statements
Our objectives are to obtain reasonable assurance about whether the fi nancial statements of the Fund as a whole are free from material misstatement, whether due to fraud or error, and to issue an auditors’ report that includes our opinion. Reasonable assurance is a high level of assurance, but is not a guarantee that an audit conducted in accordance with approved standards on auditing in Malaysia and International Standards on Auditing will always detect a material misstatement when it exists. Misstatements can arise from fraud or error and are considered material if, individually or in the aggregate, they could reasonably be expected to infl uence the economic decisions of users taken on the basis of these fi nancial statements.
As part of an audit in accordance with approved standards of auditing in Malaysia and International Standards on Auditing, we exercise professional judgment and maintain professional scepticism throughout the audit. We also:
• Identify and assess the risks of material misstatement of the fi nancial statements of the Fund, whether due to fraud or error, design and perform audit procedures responsive to those risks, and obtain audit evidence that is suffi cient and appropriate to provide a basis for our opinion. The risk of not detecting a material misstatement resulting from fraud is higher than for one resulting from error, as fraud may involve collusion, forgery, intentional omissions, misrepresentations, or the override of internal control.
• Obtain an understanding of internal control relevant to the audit in order to design audit procedures that are appropriate in the circumstances, but not for the purpose of expressing an opinion on the effectiveness of the Fund’s internal control.

13 Kenanga Malaysian Inc Fund Annual Report
5 INDEPENDENT AUDITORS’ REPORT TO THE UNIT HOLDERS OF KENANGA MALAYSIAN INC FUND (CONTD.)
Auditors’ responsibility for the audit of the fi nancial statements (contd.)
• Evaluate the appropriateness of accounting policies used and the reasonableness of accounting estimates and related disclosures made by the Manager.
• Conclude on the appropriateness of the Manager’s use of the going concern basis of accounting and, based on the audit evidence obtained, whether a material uncertainty exists related to events or conditions that may cast signifi cant doubt on the Fund’s ability to continue as a going concern. If we conclude that a material uncertainty exists, we are required to draw attention in our auditors’ report to the related disclosures in the fi nancial statements of the Fund or, if such disclosures are inadequate, to modify our opinion. Our conclusions are based on the audit evidence obtained up to the date of our auditors’ report. However, future events or conditions may cause the Fund to cease to continue as a going concern.
• Evaluate the overall presentation, structure and content of the fi nancial statements of the Fund, including the disclosures, and whether the fi nancial statements of the Fund represent the underlying transactions and events in a manner that achieves fair presentation.
We communicate with the Manager regarding, among other matters, the planned scope
and timing of the audit and signifi cant audit fi ndings, including any signifi cant defi ciencies in internal control that we identify during our audit.
Other matters
This report is made solely to the unitholders of the Fund, as a body, in accordance with the Guidelines on Unit Trust Funds issued by the Securities Commission Malaysia and for no other purpose. We do not assume responsibility to any other person for the content of this report.
Ernst & Young Chan Hooi LamAF: 0039 No.02844/02/2020 JChartered Accountants Chartered Accountant
Kuala Lumpur, Malaysia
28 March 2018

14Kenanga Malaysian Inc Fund Annual Report
6. STATEMENT BY THE MANAGER
I, Ismitz Matthew De Alwis, being a director of Kenanga Investors Berhad, do hereby state that, in the opinion of the Manager, the accompanying statement of fi nancial position as at 31 January 2018 and the related statement of comprehensive income, statement of changes in net asset value and statement of cash fl ows for the fi nancial year ended 31 January 2018 together with notes thereto, are drawn up in accordance with Malaysian Financial Reporting Standards and International Financial Reporting Standards so as to give a true and fair view of the fi nancial position of Kenanga Malaysian Inc Fund as at 31 January 2018 and of its fi nancial performance and cash fl ows for the fi nancial year then ended and comply with the requirements of the Deed.
For and on behalf of the Manager KENANGA INVESTORS BERHAD
ISMITZ MATTHEW DE ALWIS Executive Director/Chief Executive Offi cer
Kuala Lumpur, Malaysia
28 March 2018

The accompanying notes form an integral part of the fi nancial statements.
Kenanga Malaysian Inc Fund Annual Report15
7. FINANCIAL STATEMENT
7.1 STATEMENT OF COMPREHENSIVE INCOME FOR THE FINANCIAL YEAR ENDED 31 JANUARY 2018
Note 2018 2017 RM RM
INVESTMENT INCOME
Dividend income 3,594,030 1,024,507 Interest income 505,191 209,932 Net gain from investments: - Financial assets at fair value through profi t or loss (“FVTPL”) 4 21,518,386 3,666,134 25,617,607 4,900,573
EXPENSES
Manager’s fee 5 2,294,745 681,932 Trustee’s fee 6 63,761 18,942 Auditors’ remuneration 12,000 7,000 Tax agent’s fee 4,000 4,000 Administration expenses 224,121 80,700 Brokerage and other transaction costs 1,093,667 367,320 3,692,294 1,159,894
NET INCOME BEFORE TAX 21,925,313 3,740,679
Income tax 7 - -
NET INCOME AFTER TAX, REPRESENTING TOTAL COMPREHENSIVE INCOME FOR THE FINANCIAL YEAR 21,925,313 3,740,679
Net income after tax is made up as follows: Realised gain 7,410,982 1,454,379 Unrealised gain 4 14,514,331 2,286,300 21,925,313 3,740,679

The accompanying notes form an integral part of the fi nancial statements.
Kenanga Malaysian Inc Fund Annual Report 16
7.2 STATEMENT OF FINANCIAL POSITION AS AT 31 JANUARY 2018
Note 2018 2017 RM RM
ASSETS
INVESTMENTS
Financial assets at FVTPL 4 179,908,603 50,174,355 Short term deposits 8 21,200,000 13,156,276 201,108,603 63,330,631
OTHER ASSETS
Amount due from Manager 1,611,224 142,399 Amount due from licensed fi nancial institutions 8,266,388 121,529Other receivables 9 135,117 51,161 Cash at bank 100,857 6,878 10,113,586 321,967
TOTAL ASSETS 211,222,189 63,652,598
LIABILITIES
Amount due to Trustee 7,679 2,644 Amount due from licensed fi nancial institutions 18,027,953 301,733Other payables 10 40,548 33,700 TOTAL LIABILITIES 18,076,180 338,077
EQUITY
Unit holders’ contribution 176,734,770 68,828,595 Retained earning/(Accumulated loss) 16,411,239 (5,514,074)NET ASSET VALUE (“NAV”) ATTRIBUTABLE TO UNIT HOLDERS 11 193,146,009 63,314,521
TOTAL LIABILITIES AND EQUITY 211,222,189 63,652,598
NUMBER OF UNITS IN CIRCULATION 11(a) 228,390,772 91,106,187
NET ASSET VALUE PER UNIT (RM) 12 0.8457 0.6950

The accompanying notes form an integral part of the fi nancial statements.
Kenanga Malaysian Inc Fund Annual Report17
7.3 STATEMENT OF CHANGES IN NET ASSET VALUE FOR THE FINANCIAL YEAR ENDED 31 JANUARY 2018
Retained earnings/ Unit holders’ (Accumulated Total Note contribution loss) NAV RM RM RM
2018At beginning of the fi nancial year 68,828,595 (5,514,074) 63,314,521 Total comprehensive income - 21,925,313 21,925,313 Creation of units 11(a) 140,994,565 - 140,994,565 Cancellation of units 11(a) (36,326,385) - (36,326,385)Distribution equalisation 11(a) 3,237,995 - 3,237,995 At end of the fi nancial year 176,734,770 16,411,239 193,146,009
2017At beginning of the fi nancial year 28,714,867 (9,254,753) 19,460,114 Total comprehensive income - 3,740,679 3,740,679 Creation of units 11(a) 43,094,961 - 43,094,961 Cancellation of units 11(a) (3,836,299) - (3,836,299)Distribution equalisation 11(a) 855,066 - 855,066 At end of the fi nancial year 68,828,595 (5,514,074) 63,314,521

The accompanying notes form an integral part of the fi nancial statements.
Kenanga Malaysian Inc Fund Annual Report 18
7.4 STATEMENT OF CASH FLOWS FOR THE FINANCIAL YEAR ENDED 31 JANUARY 2018
2018 2017 RM RM
CASH FLOWS FROM OPERATING AND INVESTING ACTIVITIES
Proceeds from sale of fi nancial assets at FVTPL 140,768,594 39,254,019 Dividends received 3,507,519 990,222 Interest from deposits received 507,746 204,596 Tax agent’s fee paid (3,500) (4,000)Auditors’ remuneration paid (9,500) (7,000)Trustee’s fee paid (58,726) (17,025)Payment for other fees and expenses (169,867) (60,420)Manager’s fee paid (2,110,654) (615,756)Purchase of fi nancial assets at FVTPL (240,547,168) (71,699,975)Cash used in operating and investing activities (98,115,556) (31,955,339)Income tax refunded - 42,269 Net cash used in operating and investing activities (98,115,556) (31,913,070)
CASH FLOWS FROM FINANCING ACTIVITIES
Cash received from units created 143,828,720 43,820,203 Cash paid on units cancelled (37,575,461) (3,938,275)Net cash generated from fi nancing activities 106,253,259 39,881,928
NET INCREASE IN CASH AND CASH EQUIVALENTS 8,137,703 7,968,858CASH AND CASH EQUIVALENTS AT BEGINNING OF THE FINANCIAL YEAR 13,163,154 5,194,296CASH AND CASH EQUIVALENTS AT END OF THE FINANCIAL YEAR 21,300,857 13,163,154
Cash and cash equivalents comprise: Cash at bank 100,857 6,878 Short term deposits 21,200,000 13,156,276 21,300,857 13,163,154

19 Kenanga Malaysian Inc Fund Annual Report
7.5 NOTES TO THE FINANCIAL STATEMENTS FOR FOR THE FINANCIAL YEAR ENDED 31 JANUARY 2018
1. THE FUND, THE MANAGER AND THEIR PRINCIPAL ACTIVITIES
Kenanga Malaysian Inc Fund (“the Fund”) was constituted pursuant to the executed Master Deed dated 29 August 2007 (collectively, together with deeds supplemental thereto, referred to as “the Deed”) between the Manager, Kenanga Investors Berhad, and HSBC (Malaysia) Trustee Berhad (“the Trustee” prior to 3 December 2013). The Fund has changed its trustee to CIMB Commerce Trustee Berhad (“the Trustee” with effect from 3 December 2013). The aforesaid change was effected on 3 December 2013 via a Fourth Master Supplemental Deed dated 1 October 2013. The Fund commenced operations on 9 November 2007 and will continue to be in operation until terminated in accordance with Part 12 of the Deed.
Kenanga Investors Berhad is a wholly-owned subsidiary of Kenanga Investment Bank Berhad. Prior to 1 November 2016, Kenanga Investment Bank Berhad was a wholly-owned subsidiary of K & N Kenanga Holdings Berhad that was listed on the Main Market of Bursa Malaysia Securities Berhad. Pursuant to an internal reorganisation exercise completed on 1 November 2016, Kenanga Investment Bank Berhad has become the holding company of K & N Kenanga Holdings Berhad. On 2 November 2016, Kenanga Investment Bank Berhad has assumed the listing status of K & N Kenanga Holdings Berhad. All of these companies are incorporated in Malaysia.
The principal place of business of the Manager is Level 14, Kenanga Tower, 237, Jalan Tun Razak, 50400 Kuala Lumpur.
The Fund seeks to provide consistent annual returns and medium to long term capital appreciation by investing in Malaysian securities with global reach.
The fi nancial statements were authorised for issue by the Chief Executive Offi cer of the Manager on 28 March 2018.
2. FINANCIAL RISK MANAGEMENT OBJECTIVES AND POLICIES
The Fund is exposed to a variety of risks including market risk (which includes interest rate risk and price risk), credit risk and liquidity risk. Whilst these are the most important types of fi nancial risks inherent in each type of fi nancial instruments, the Manager and the Trustee would like to highlight that this list does not purport to constitute an exhaustive list of all the risks inherent in an investment in the Fund.
The Fund has an approved set of investment guidelines and policies as well as internal
controls which sets out its overall business strategies to manage these risks to optimise returns and preserve capital for the unit holders, consistent with the long term objectives of the Fund.
20Kenanga Malaysian Inc Fund Annual Report
2. FINANCIAL RISK MANAGEMENT OBJECTIVES AND POLICIES (CONTD.) a. Market risk
Market risk is the risk that the fair value or future cash fl ows of a fi nancial instrument will fl uctuate because of changes in market prices. Market risk includes interest rate risk and price risk.
Market risk arises when the value of the investments fl uctuates in response to the activities of individual companies, general market or economic conditions. It stems from the fact that there are economy-wide perils, which threaten all businesses. Hence, investors are exposed to market uncertainties. Fluctuation in the investments’ prices caused by uncertainties in the economic, political and social environment will affect the NAV of the Fund.
The Manager manages the risk of unfavourable changes in prices by cautious review of the investments and continuous monitoring of their performance and risk profi les.
i. Interest rate risk
Interest rate risk refers to how the changes in the interest rate environment would affect the performance of Fund’s investments. Rate offered by the fi nancial institutions will fl uctuate according to the Overnight Policy Rate determined by Bank Negara Malaysia and this has direct correlation with the Fund’s investments in deposits.
The Fund is not exposed to signifi cant interest rate risk as its deposits are short term in nature and have fi xed interest rates.
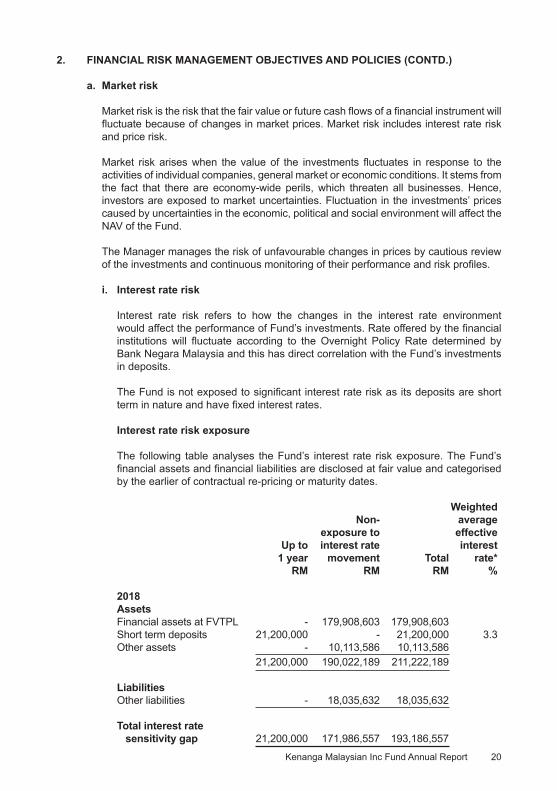
Interest rate risk exposure
The following table analyses the Fund’s interest rate risk exposure. The Fund’s fi nancial assets and fi nancial liabilities are disclosed at fair value and categorised by the earlier of contractual re-pricing or maturity dates.
Weighted Non- average exposure to effective Up to interest rate interest 1 year movement Total rate* RM RM RM %
2018 Assets Financial assets at FVTPL - 179,908,603 179,908,603 Short term deposits 21,200,000 - 21,200,000 3.3Other assets - 10,113,586 10,113,586 21,200,000 190,022,189 211,222,189
LiabilitiesOther liabilities - 18,035,632 18,035,632
Total interest rate sensitivity gap 21,200,000 171,986,557 193,186,557

21 Kenanga Malaysian Inc Fund Annual Report
2. FINANCIAL RISK MANAGEMENT OBJECTIVES AND POLICIES (CONTD.) a. Market risk (contd.)
i. Interest rate risk (contd.)
Interest rate risk exposure (contd.)
Weighted Non- average exposure to effective Up to interest rate interest 1 year movement Total rate* RM RM RM %
2017 Assets Financial assets at FVTPL - 50,174,355 50,174,355Short term deposits 13,156,276 - 13,156,276 3.0Other assets - 321,967 321,967 13,156,276 50,496,322 63,652,598
LiabilitiesOther liabilities - 304,377 304,377
Total interest rate sensitivity gap 13,156,276 50,191,945 63,348,221
* Computed based on assets with exposure to interest rate movement only.
ii. Price risk
Price risk is the risk of unfavourable changes in the fair values of listed equity securities, listed collective investment schemes, listed warrants and listed loan stocks. The Fund invests in listed equity securities, listed collective investment schemes, listed warrants and listed loan stocks which are exposed to price fl uctuations. This may then affect the NAV per unit of the Fund.
Price risk sensitivity
The Manager’s best estimate of the effect on the profi t for the fi nancial year due to a reasonably possible change in investments in listed equity securities, listed collective investment schemes, listed warrants and listed loan stocks with all other variables held constant is indicated in the table below:
Effects on profi t for Changes in price the fi nancial year Increase/(Decrease) Increase/(Decrease) Basis points RM
2018 Financial assets at FVTPL 5/(5) 89,954/(89,954) 2017 Financial assets at FVTPL 5/(5) 25,087/(25,087)

22Kenanga Malaysian Inc Fund Annual Report
2. FINANCIAL RISK MANAGEMENT OBJECTIVES AND POLICIES (CONTD.) a. Market risk (contd.)
ii. Price risk (contd.)
Price risk sensitivity (contd.)
In practice, the actual trading results may differ from the sensitivity analysis above and the difference could be material.
Price risk concentration
The following table sets out the Fund’s exposure and concentration to price risk based on its portfolio of fi nancial instruments as at the reporting date.
Fair value Percentage of NAV 2018 2017 2018 2017 RM RM % %
Financial assets at FVTPL 179,908,603 50,174,355 93.1 79.2
The Fund’s concentration of price risk from the Fund’s listed equity securities, listed collective investment schemes, listed warrants and listed loan stocks analysed by sector is as follows:
Fair value Percentage of NAV 2018 2017 2018 2017 RM RM % %
Trading/Services 65,895,529 14,201,315 34.1 22.4Industrial products 25,171,266 6,043,943 13.0 9.6Finance 22,752,962 5,829,919 11.8 9.2Constructions 21,884,180 11,895,300 11.3 18.8Consumer products 18,412,558 3,613,279 9.5 5.7Technology 10,246,194 1,357,734 5.3 2.1Properties 9,723,422 3,429,884 5.1 5.4Hotel 583,442 - 0.3 -Special Purpose Acquisition Company 481,233 445,397 0.3 0.7Plantations - 2,195,426 - 3.5Real Estate Investments Trusts 3,478,994 1,162,158 1.8 1.8Warrants 821,080 - 0.4 -Loan stocks 457,743 - 0.2 - 179,908,603 50,174,355 93.1 79.2
b. Credit risk
Credit risk is the risk that the counterparty to a fi nancial instrument will cause a fi nancial loss to the Fund by failing to discharge an obligation. The Manager manages the credit risk by undertaking credit evaluation to minimise such risk.

23 Kenanga Malaysian Inc Fund Annual Report
2. FINANCIAL RISK MANAGEMENT OBJECTIVES AND POLICIES (CONTD.) b. Credit risk (contd.)
i. Credit risk exposure
As at the reporting date, the Fund’s maximum exposure to credit risk is represented by the carrying amount of each class of fi nancial asset recognised in the statement of fi nancial position.
ii. Financial assets that are either past due or impaired
As at the reporting date, there are no fi nancial assets that are either past due or impaired.
iii. Credit quality of fi nancial assets
The Fund invests in deposits with fi nancial institutions licensed under the Financial Services Act 2013 and Islamic Financial Services Act 2013. The following table analyses the licensed fi nancial institutions by rating category:
Short term deposits
Percentage of total short term deposits Percentage of NAV 2018 2017 2018 2017 % % % %
RatingP1 - 100.0 - 20.8WR 100.0 - 11.0 - 100.0 100.0 11.0 20.8
c. Liquidity risk
Liquidity risk is defi ned as the risk that the Fund will encounter diffi culty in meeting obligations associated with fi nancial liabilities that are to be settled by delivering cash or another fi nancial asset. Exposure to liquidity risk arises because of the possibility that the Fund could be required to pay its liabilities or cancel its units earlier than expected. The Fund is exposed to cancellation of its units on a regular basis. Units sold to unit holders by the Manager are cancellable at the unit holders’ option based on the Fund’s NAV per unit at the time of cancellation calculated in accordance with the Deed.
The liquid assets comprise cash, short term deposits with licensed fi nancial institutions and other instruments, which are capable of being converted into cash within 7 days.
24Kenanga Malaysian Inc Fund Annual Report
2. FINANCIAL RISK MANAGEMENT OBJECTIVES AND POLICIES (CONTD.) c. Liquidity risk (contd.)
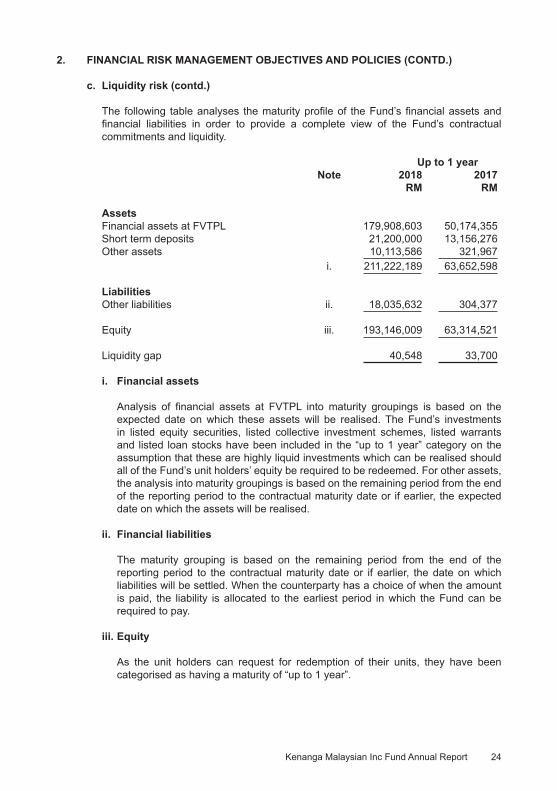
The following table analyses the maturity profi le of the Fund’s fi nancial assets and fi nancial liabilities in order to provide a complete view of the Fund’s contractual commitments and liquidity.
Up to 1 year Note 2018 2017 RM RM
AssetsFinancial assets at FVTPL 179,908,603 50,174,355 Short term deposits 21,200,000 13,156,276 Other assets 10,113,586 321,967 i. 211,222,189 63,652,598
LiabilitiesOther liabilities ii. 18,035,632 304,377
Equity iii. 193,146,009 63,314,521
Liquidity gap 40,548 33,700
i. Financial assets
Analysis of fi nancial assets at FVTPL into maturity groupings is based on the expected date on which these assets will be realised. The Fund’s investments in listed equity securities, listed collective investment schemes, listed warrants and listed loan stocks have been included in the “up to 1 year” category on the assumption that these are highly liquid investments which can be realised should all of the Fund’s unit holders’ equity be required to be redeemed. For other assets, the analysis into maturity groupings is based on the remaining period from the end of the reporting period to the contractual maturity date or if earlier, the expected date on which the assets will be realised.
ii. Financial liabilities
The maturity grouping is based on the remaining period from the end of the reporting period to the contractual maturity date or if earlier, the date on which liabilities will be settled. When the counterparty has a choice of when the amount is paid, the liability is allocated to the earliest period in which the Fund can be required to pay.
iii. Equity
As the unit holders can request for redemption of their units, they have been categorised as having a maturity of “up to 1 year”.

25 Kenanga Malaysian Inc Fund Annual Report
2. FINANCIAL RISK MANAGEMENT OBJECTIVES AND POLICIES (CONTD.)
d. Regulatory reportings
It is the Manager’s responsibility to ensure full compliance of all requirements under the Guidelines on Unit Trust Funds issued by Securities Commission Malaysia. Any breach of any such requirement will be reported in the mandatory reporting to Securities Commission Malaysia on a monthly basis.
3. SUMMARY OF SIGNIFICANT ACCOUNTING POLICIES
a. Basis of accounting
The fi nancial statements of the Fund have been prepared in accordance with Malaysian Financial Reporting Standards (“MFRS”) as issued by the Malaysian Accounting Standards Board (“MASB”) and International Financial Reporting Standards (“IFRS”) as issued by the International Accounting Standards Board (“IASB”).
The accounting policies adopted are consistent with those of the previous fi nancial year except for the adoption of the new and amended MFRS which became effective for the Fund on 1 February 2017. The adoption of the new and amended MFRS did not have any signifi cant impact on the fi nancial position or performance of the Fund.
The fi nancial statements have been prepared on the historical cost basis except as disclosed in the accounting policies below.
b. Standards, amendments and interpretations issued but not yet effective
As at the reporting date, the following Standards, Amendments and Interpretation Committee’s (“IC”) Interpretations that have been issued by MASB will be effective for the Fund in future periods. The Fund intends to adopt the relevant standards when they become effective.
Effective for fi nancial period beginning onDescription or after
Amendments to MFRS contained in the documents entitled “Annual improvements to MFRS Standards 2014 - 2016 Cycle” 1 January 2018Amendments to MFRS 1: First-time Adoption of Malaysian Financial Reporting Standards contained in the documents entitled “Annual Improvements to MFRS Standards 2014-2016 Cycle” 1 January 2018Amendments to MFRS 128: Investment in Associates and Joint Ventures contained in the documents entitled “Annual improvements to MFRS Standards 2014 - 2016 Cycle” 1 January 2018MFRS 9: Financial Instruments 1 January 2018MFRS 15: Revenue from Contracts with Customers 1 January 2018Clarifi cations to MFRS 15: Revenue from Contracts with Customers 1 January 2018Amendments to MFRS 2: Classifi cation and Measurement of Shared-based Payment Transactions 1 January 2018

26Kenanga Malaysian Inc Fund Annual Report
3. SUMMARY OF SIGNIFICANT ACCOUNTING POLICIES (CONTD.)
b. Standards, amendments and interpretations issued but not yet effective (contd.)
Effective for fi nancial period beginning onDescription or after Temporary exemption from MFRS 9 subject to certain criteria being met for annual periods beginningAmendments to MFRS 4: Applying MFRS 9 Financial on or after Instruments with MFRS 4 Insurance Contracts 1 January 2018Amendments to MFRS 140: Transfers of Investment Property 1 January 2018IC Interpretation 22: Foreign Currency Transactions and Advance Consideration 1 January 2018Amendments to MFRS contained in the documents entitled “Annual improvements to MFRS Standards 2015 - 2017 Cycle” 1 January 2019Amendments to MFRS 3: Business Combinations contained in the documents entitled “Annual improvements to MFRS Standards 2015 - 2017 Cycle” 1 January 2019Amendments to MFRS 11: Joint Arrangements contained in the documents entitled “Annual improvements to MFRS Standards 2015 - 2017 Cycle” 1 January 2019Amendments to MFRS 112: Income Tax Consequences of Payments on Financial Instruments Classifi ed as Equity contained in the documents entitled “Annual improvements to MFRS Standards 2015 - 2017 Cycle” 1 January 2019Amendments to MFRS 123: Borrowing Costs Eligible for Capitalisation contained in the documents entitled “Annual improvements to MFRS Standards 2015 - 2017 Cycle” 1 January 2019MFRS 16: Leases 1 January 2019Amendments to MFRS 9: Prepayment Features with Negative Compensation 1 January 2019Amendment to MFRS 128: Long-term interests in Associates and Joint Ventures 1 January 2019IC Interpretation 23: Uncertainty Over Income Tax Treatments 1 January 2019MFRS 17: Insurance Contracts 1 January 2021Amendments to MFRS 10 and MFRS 128: Sale or Contribution To be announced of Assets between an Investor and its Associate or Joint Venture by MASB
The Fund will adopt the above pronouncements when they become effective in the respective fi nancial periods. These pronouncements are not expected to have any signifi cant impact to the fi nancial statements of the Fund upon their initial application, other than MFRS 9.

27 Kenanga Malaysian Inc Fund Annual Report
3. SUMMARY OF SIGNIFICANT ACCOUNTING POLICIES (CONTD.)
b. Standards, amendments and interpretations issued but not yet effective (contd.)
MFRS 9 replaces MFRS 139 on the following requirements: classifi cation and measurement of fi nancial assets and fi nancial liabilities as defi ned in MFRS 139, impairment methodology and hedge accounting. The Fund does not expect any change in classifi cation and any potential fi nancial material impact arising from the adoption of this standard.
c. Financial assets
Financial assets are recognised in the statement of fi nancial position when, and only when, the Fund becomes a party to the contractual provisions of the fi nancial instruments.
When fi nancial assets are recognised initially, they are measured at fair value, plus, in the case of fi nancial assets not at FVTPL, directly attributable transaction costs.
The Fund determines the classifi cation of its fi nancial assets at initial recognition.
i. Financial assets at FVTPL
Financial assets are classifi ed as fi nancial assets at FVTPL if they are held for trading or are designated as such upon initial recognition.
Financial assets held for trading include listed equity securities, listed collective investment schemes, listed warrants and listed loan stocks acquired principally for the purpose of selling in the near term.
Subsequent to initial recognition, fi nancial assets at FVTPL are measured at fair value. Changes in the fair value of those fi nancial instruments are recorded in profi t or loss.
Interest earned and dividend revenue elements of such instruments are recorded separately in “interest income” and “dividend income”, respectively.
ii. Receivables
Financial assets with fi xed or determinable payments that are not quoted in an active market are classifi ed as receivables.
Subsequent to initial recognition, receivables are measured at amortised cost using the effective interest method. Gain or loss is recognised in profi t or loss when the receivable is derecognised or impaired, and through the amortisation process.
A fi nancial asset is derecognised when the contractual right to receive cash fl ows from the asset has expired. On derecognition of a fi nancial asset, the difference between the carrying amount and the sum of the consideration received is recognised in profi t or loss.

28Kenanga Malaysian Inc Fund Annual Report
3. SUMMARY OF SIGNIFICANT ACCOUNTING POLICIES (CONTD.)
d. Impairment of fi nancial assets
The Fund assesses at each reporting date whether there is any objective evidence that a fi nancial asset is impaired.
To determine whether there is objective evidence that an impairment loss on fi nancial assets has been incurred, the Fund considers factors such as the probability of insolvency or signifi cant fi nancial diffi culties of the debtor and default or signifi cant delay in payments.
If any such evidence exists, the amount of impairment loss is measured as the difference between the asset’s carrying amount and the present value of estimated future cash fl ows discounted at the fi nancial asset’s original effective interest rate. The impairment loss is recognised in profi t or loss.
The carrying amount of the fi nancial asset is reduced by the impairment loss directly for all fi nancial assets, with the exception of receivables, where the carrying amount is reduced through the use of an allowance account. When a receivable becomes uncollectible, it is written off against the allowance account.
If, in a subsequent year, the amount of the impairment loss decreases and the decrease can be related objectively to an event occurring after the impairment was recognised, the previously recognised impairment loss is reversed to the extent that the carrying amount of the assets does not exceed its amortised cost at the reversal date. The amount of reversal is recognised in profi t or loss.
e. Income
Income is recognised to the extent that it is probable that the economic benefi ts will fl ow to the Fund and the income can be reliably measured. Income is measured at the fair value of consideration received or receivable.
Interest income is recognised using the effective interest method.
Dividend income is recognised on declared basis, when the right to receive the dividend is established.
The realised gain or loss on sale of investments is measured as the difference between the net disposal proceeds and the carrying amount of the investment.
f. Cash and cash equivalents
For the purposes of the statement of cash fl ows, cash and cash equivalents include cash at bank and short term deposits with licensed fi nancial institutions with insignifi cant risk of changes in value.

29 Kenanga Malaysian Inc Fund Annual Report
3. SUMMARY OF SIGNIFICANT ACCOUNTING POLICIES (CONTD.)
g. Income tax
Income tax on the profi t or loss for the fi nancial year comprises current tax. Current tax is the expected amount of income taxes payable in respect of the taxable profi t for the fi nancial year.
As no temporary differences have been identifi ed, no deferred tax has been recognised.
h. Unrealised reserves
Unrealised reserves represent the net gain or loss arising from carrying investments at their fair values at reporting date. This reserve is not distributable.
i. Financial liabilities
Financial liabilities are classifi ed according to the substance of the contractual arrangements entered into and the defi nitions of a fi nancial liability.
Financial liabilities are recognised in the statement of fi nancial position when, and only when, the Fund becomes a party to the contractual provisions of the fi nancial instrument. The Fund’s fi nancial liabilities are classifi ed as other fi nancial liabilities. The Fund’s fi nancial liabilities are recognised initially at fair value and subsequently measured at amortised cost using the effective interest method.
A fi nancial liability is derecognised when the obligation under the liability is extinguished. Gains and losses are recognised in profi t or loss when the liabilities are derecognised, and through the amortisation process.
j. Unit holders’ contribution – NAV attributable to unit holders
The unit holders’ contribution to the Fund is classifi ed as equity instruments. Distribution equalisation represents the average amount of undistributed net income
included in the creation or cancellation price of units. This amount is either refunded to unit holders by way of distribution and/or adjusted accordingly when units are released back to the Trustee.
k. Functional and presentation currency
The fi nancial statements of the Fund are measured using the currency of the primary economic environment in which the Fund operates (“the functional currency”). The fi nancial statements are presented in Ringgit Malaysia (“RM”), which is also the Fund’s functional currency.
l. Distribution
Distributions are at the discretion of the Manager. A distribution to the Fund’s unit holders is accounted for as a deduction from retained earnings.

30Kenanga Malaysian Inc Fund Annual Report
3. SUMMARY OF SIGNIFICANT ACCOUNTING POLICIES (CONTD.)
m. Signifi cant accounting judgments and estimates
The preparation of fi nancial statements requires the use of certain accounting estimates and exercise of judgment. Estimates and judgments are continually evaluated and are based on past experience, reasonable expectations of future events and other factors.
i. Critical judgments made in applying accounting policies
There are no major judgments made by the Manager in applying the Fund’s accounting policies.
ii. Key sources of estimation uncertainty
There are no key assumptions concerning the future and other key sources of estimation uncertainty at the reporting date, that have a signifi cant risk of causing a material adjustment to the carrying amounts of assets and liabilities within the next fi nancial year.
4. FINANCIAL ASSETS AT FVTPL
2018 2017 RM RM
Financial assets held for trading, at FVTPL: Listed equity securities 175,150,786 49,012,197 Listed collective investment schemes 3,478,994 1,162,158 Listed warrants 821,080 - Listed loan stocks 457,743 - 179,908,603 50,174,355
Net gain on fi nancial assets at FVTPL comprised: Realised gain on disposals 7,004,055 1,379,834 Unrealised changes in fair values 14,514,331 2,286,300 21,518,386 3,666,134
Details of fi nancial assets at FVTPL as at 31 January 2018:
Aggregate Percentage Quantity cost Fair value of NAV RM RM %
Listed equity securities
Trading/ServicesAirAsia Berhad 1,009,400 3,863,218 4,178,916 2.2 Axiata Group Berhad 332,000 1,841,504 1,885,760 1.0 Bumi Armada Berhad 5,376,300 4,658,931 4,516,092 2.3 Century Logistics Holdings Berhad 360,000 422,036 349,200 0.2Chin Hin Group Berhad 1,053,300 1,411,044 1,200,762 0.6 Dialog Group Berhad 1,820,000 3,715,637 4,659,200 2.4
31 Kenanga Malaysian Inc Fund Annual Report
4. FINANCIAL ASSETS AT FVTPL (CONTD.)
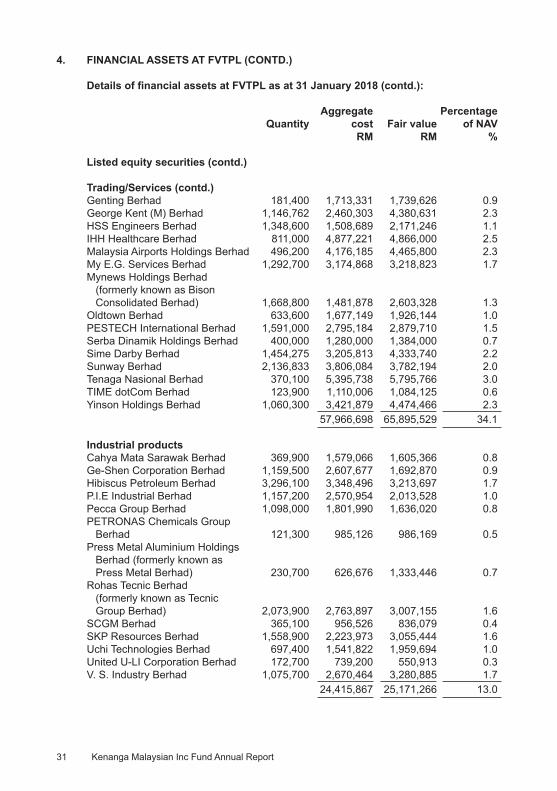
Details of fi nancial assets at FVTPL as at 31 January 2018 (contd.):
Aggregate Percentage Quantity cost Fair value of NAV RM RM %
Listed equity securities (contd.)
Trading/Services (contd.)Genting Berhad 181,400 1,713,331 1,739,626 0.9 George Kent (M) Berhad 1,146,762 2,460,303 4,380,631 2.3HSS Engineers Berhad 1,348,600 1,508,689 2,171,246 1.1 IHH Healthcare Berhad 811,000 4,877,221 4,866,000 2.5 Malaysia Airports Holdings Berhad 496,200 4,176,185 4,465,800 2.3 My E.G. Services Berhad 1,292,700 3,174,868 3,218,823 1.7 Mynews Holdings Berhad (formerly known as Bison Consolidated Berhad) 1,668,800 1,481,878 2,603,328 1.3 Oldtown Berhad 633,600 1,677,149 1,926,144 1.0 PESTECH International Berhad 1,591,000 2,795,184 2,879,710 1.5 Serba Dinamik Holdings Berhad 400,000 1,280,000 1,384,000 0.7 Sime Darby Berhad 1,454,275 3,205,813 4,333,740 2.2 Sunway Berhad 2,136,833 3,806,084 3,782,194 2.0 Tenaga Nasional Berhad 370,100 5,395,738 5,795,766 3.0 TIME dotCom Berhad 123,900 1,110,006 1,084,125 0.6 Yinson Holdings Berhad 1,060,300 3,421,879 4,474,466 2.3 57,966,698 65,895,529 34.1
Industrial productsCahya Mata Sarawak Berhad 369,900 1,579,066 1,605,366 0.8 Ge-Shen Corporation Berhad 1,159,500 2,607,677 1,692,870 0.9 Hibiscus Petroleum Berhad 3,296,100 3,348,496 3,213,697 1.7 P.I.E Industrial Berhad 1,157,200 2,570,954 2,013,528 1.0 Pecca Group Berhad 1,098,000 1,801,990 1,636,020 0.8PETRONAS Chemicals Group Berhad 121,300 985,126 986,169 0.5 Press Metal Aluminium Holdings Berhad (formerly known as Press Metal Berhad) 230,700 626,676 1,333,446 0.7 Rohas Tecnic Berhad (formerly known as Tecnic Group Berhad) 2,073,900 2,763,897 3,007,155 1.6 SCGM Berhad 365,100 956,526 836,079 0.4 SKP Resources Berhad 1,558,900 2,223,973 3,055,444 1.6 Uchi Technologies Berhad 697,400 1,541,822 1,959,694 1.0 United U-LI Corporation Berhad 172,700 739,200 550,913 0.3 V. S. Industry Berhad 1,075,700 2,670,464 3,280,885 1.7 24,415,867 25,171,266 13.0

32Kenanga Malaysian Inc Fund Annual Report
4. FINANCIAL ASSETS AT FVTPL (CONTD.)
Details of fi nancial assets at FVTPL as at 31 January 2018 (contd.):
Aggregate Percentage Quantity cost Fair value of NAV RM RM %
Listed equity securities (contd.)
FinanceAEON Credit Service (M) Berhad 218,750 2,243,290 2,931,250 1.5 Bursa Malaysia Berhad 336,100 3,504,472 3,656,768 1.9 CIMB Group Holdings Berhad 937,555 6,110,150 6,797,274 3.5 Hong Leong Financial Group Berhad 157,000 2,942,101 2,910,780 1.5 Public Bank Berhad 178,000 3,938,766 3,912,440 2.1 RCE Capital Berhad 1,696,300 2,709,383 2,544,450 1.3 21,448,162 22,752,962 11.8
ConstructionsAhmad Zaki Resources Berhad 1,595,600 1,654,948 1,515,820 0.8 Econpile Holdings Berhad 2,122,100 2,716,209 2,631,404 1.4 Gabungan AQRS Berhad 2,301,700 3,020,223 4,442,281 2.3 Kerjaya Prospek Group Berhad 420,600 1,121,945 1,707,636 0.9 MGB Berhad (formerly known as ML Global Berhad) 2,560,600 2,730,331 4,045,748 2.1 Sunway Construction Group Berhad 717,100 1,427,629 1,828,605 0.9 TRC Synergy Berhad 2,637,700 2,143,094 2,044,218 1.0 YTL Corporation Berhad 2,413,466 3,422,498 3,668,468 1.9 18,236,877 21,884,180 11.3
Consumer productsAjinomoto (Malaysia) Berhad 91,300 2,028,929 1,873,476 1.0CCK Consolidated Holdings Berhad 2,908,800 2,848,882 3,257,856 1.7CCM Duopharma Biotech Berhad 669,414 1,634,446 1,860,971 1.0Fraser & Neave Holdings Bhd 132,600 3,685,285 3,863,964 2.0Lay Hong Berhad 2,301,400 2,145,338 2,243,865 1.1NTPM Holdings Berhad 455,100 366,270 263,958 0.1OCR Group Berhad (formerly known as O&C Resources Berhad) 811,000 483,470 425,775 0.2Padini Holdings Berhad 576,700 2,566,409 2,935,403 1.5Salutica Berhad 1,533,900 2,241,407 1,687,290 0.9 18,000,436 18,412,558 9.5
TechnologyGlobetronics Technology Bhd. 710,500 4,420,964 4,476,150 2.3 Inari Amertron Berhad 1,201,000 2,810,667 3,963,300 2.1 KESM Industries Berhad 90,700 1,228,535 1,806,744 0.9 8,460,166 10,246,194 5.3

33 Kenanga Malaysian Inc Fund Annual Report
4. FINANCIAL ASSETS AT FVTPL (CONTD.)
Details of fi nancial assets at FVTPL as at 31 January 2018 (contd.):
Aggregate Percentage Quantity cost Fair value of NAV RM RM %
Listed equity securities (contd.)
PropertiesLBS Bina Group Berhad - ordinary shares 1,726,500 3,151,001 4,074,540 2.1 LBS Bina Group Berhad - preference shares 264,300 290,730 303,945 0.2 Malton Berhad 1,329,200 1,702,410 1,242,802 0.7 Paramount Corporation Berhad 1,527,900 2,693,348 2,903,010 1.5 Sunsuria Berhad 959,300 1,286,667 1,199,125 0.6 9,124,156 9,723,422 5.1
HotelLandmarks Berhad 674,500 638,007 583,442 0.3
Special Purpose Acquisition Company Red Sena Berhad 1,023,900 419,168 481,233 0.3
Total listed equity securities 158,739,537 175,150,786 90.7
Listed collective investment scheme
Real Estate Investments TrustsYTL Hospitality Real Estate Investment Trust 2,948,300 3,444,831 3,478,994 1.8
Total listed collective investment scheme 3,444,831 3,478,994 1.8
Listed warrants
SCGM Berhad-WA 35,680 - 10,169 -Sunway Berhad-WB 1,461,100 647,461 810,911 0.4
Total listed warrants 647,461 821,080 0.4
Listed loan stocks
AEON Credit Service (M) Berhad 378,300 378,300 457,743 0.2
Total listed loan stocks 378,300 457,743 0.2

34Kenanga Malaysian Inc Fund Annual Report
4. FINANCIAL ASSETS AT FVTPL (CONTD.)
Details of fi nancial assets at FVTPL as at 31 January 2018 (contd.):
Aggregate Percentage Quantity cost Fair value of NAV RM RM %
Total fi nancial assets at FVTPL 163,210,129 179,908,603 93.1
Unrealised gain on fi nancial assets at FVTPL 16,698,474
5. MANAGER’S FEE
The Manager’s fee is computed on a daily basis at a rate not exceeding 2.00% per annum of the NAV of the Fund as provided under Division 13.1 of the Deed.
The Manager is currently charging Manager’s fee of 1.80% per annum of the NAV of the Fund for the current and previous fi nancial years.
6. TRUSTEE’S FEE
Pursuant to the Fifth Master Supplemental Deed dated 25 July 2014, the Trustee’s fee is computed at a rate not exceeding 0.05% per annum of the NAV of the Fund effective from 1 August 2014.
The Trustee’s fee is currently calculated at 0.05% per annum of the NAV of the Fund for the current and previous fi nancial years.

35 Kenanga Malaysian Inc Fund Annual Report
7. INCOME TAX
Income tax is calculated at the Malaysian statutory tax rate of 24% of the estimated assessable income for the current and previous fi nancial years.
Income tax is calculated on investment income less partial deduction for permitted expenses as provided for under Section 63B of the Income Tax Act, 1967.
A reconciliation of income tax expense applicable to net income before tax at the statutory income tax rate to income tax expense at the effective income tax rate of the Fund is as follows:
2018 2017 RM RM
Net income before tax 21,925,313 3,740,679
Tax at Malaysian statutory tax rate of 24% (2017: 24%) 5,262,075 897,763Tax effect of: Income not subject to tax (6,148,226) (1,176,138) Expenses not deductible for tax purposes 325,796 108,624 Restriction on tax deductible expenses for unit trust fund 560,355 169,751 Income tax for the fi nancial year - -
8. SHORT TERM DEPOSITS
Short term deposits are held with licensed fi nancial institutions in Malaysia at the prevailing interest rates.
9. OTHER RECEIVABLES
2018 2017 RM RM
Dividend receivable 131,788 45,277 Interest receivable from short term deposits 3,329 5,884 135,117 51,161
10. OTHER PAYABLES
2018 2017 RM RM
Accrual for auditors’ remuneration 9,500 7,000 Accrual for tax agent’s fees 7,500 7,000 Provision for printing and other expenses 23,548 19,700 40,548 33,700

36Kenanga Malaysian Inc Fund Annual Report
11. NET ASSET VALUE ATTRIBUTABLE TO UNIT HOLDERS
NAV attributed to unit holders is represented by:
Note 2018 2017 RM RM
Unit holders’ contribution (a) 176,734,770 68,828,595Retained earnings: Realised reserves (287,235) (7,698,217) Unrealised reserves 16,698,474 2,184,143 16,411,239 (5,514,074)
193,146,009 63,314,521
(a) Unit holders’ contribution
2018 2017 No. of units RM No. of units RM
At beginning of the fi nancial year 91,106,187 68,828,595 31,031,029 28,714,867 Add: Creation of units 183,955,107 140,994,565 65,910,016 43,094,961 Less: Cancellation of units (46,670,522) (36,326,385) (5,834,858) (3,836,299)Distribution equalisation - 3,237,995 - 855,066 At end of the fi nancial year 228,390,772 176,734,770 91,106,187 68,828,595
The number of units legally or benefi cially held by the Manager, Kenanga Investors Berhad and parties related to the Manager as at 31 January 2018 were nil (2017: nil).
12. NET ASSET VALUE PER UNIT
In line with the adoption of MFRS 139, fi nancial assets at FVTPL have been valued at the bid prices at the close of business. In accordance with the Deed, the calculation of NAV attributable to unit holders per unit for the creation and cancellation of units is computed based on fi nancial assets at FVTPL valued at the last done market price.
A reconciliation of NAV attributable to unit holders for creation/cancellation of units and the NAV attributable to unit holders per the fi nancial statements is as follows:
2018 2017 RM RM/Unit RM RM/Unit
NAV attributable to unit holders for creation/cancellation of units 193,915,875 0.8491 63,452,299 0.6965 Effects of adopting bid prices as fair value (769,866) (0.0034) (137,778) (0.0015)NAV attributable to unit holders per statement of fi nancial position 193,146,009 0.8457 63,314,521 0.6950

37 Kenanga Malaysian Inc Fund Annual Report
13. PORTFOLIO TURNOVER RATIO (“PTR”)
PTR for the fi nancial year is 1.59 times (2017: 1.46 times).
PTR is the ratio of average sum of acquisitions and disposals of investments of the Fund for the fi nancial year to the average NAV of the Fund, calculated on a daily basis.
14. MANAGEMENT EXPENSE RATIO (“MER”)
MER for the fi nancial year is 2.04% (2017: 2.09%).
MER is the ratio of total fees and recovered expenses of the Fund expressed as a percentage of the Fund’s average NAV, calculated on a daily basis.
15. TRANSACTIONS WITH LICENSED FINANCIAL INSTITUTIONS
Brokerage, stamp duty Transaction Percentage and clearing Percentage value of total fee of total RM % RM %
Macquarie Capital Securities (Malaysia) Sdn Bhd 64,627,320 17.9 178,081 17.6 Kenanga Investment Bank Berhad* 63,947,998 17.7 168,218 16.6 CLSA Securities Malaysia Sdn Bhd 56,501,870 15.7 152,307 15.0 Affi n Hwang Investment Bank Berhad 33,426,382 9.3 94,598 9.3 Maybank Investment Bank Berhad 26,658,109 7.4 75,696 7.5 CIMB Investment Bank Berhad 24,331,594 6.7 73,517 7.3 UOB Kay Hian Securities (M) Sdn Bhd 21,473,970 5.9 60,660 6.0 RHB Investment Bank Berhad 20,950,436 5.8 75,231 7.4 Credit Suisse Securities (Malaysia) Sdn Bhd 18,686,925 5.2 51,263 5.1 JPMorgan Securities (Malaysia) Sdn Bhd 10,415,061 2.9 26,535 2.6 Others 20,025,458 5.5 56,574 5.6 361,045,123 100.0 1,012,680 100.0
* Kenanga Investment Bank Berhad is a related party of Kenanga Investors Berhad. The above transactions values are in respect of listed equity securities, listed collective
investment schemes and listed warrants.
The directors of the Manager are of the opinion that the transactions with the related party have been entered into in the normal course of business and have been established on terms and conditions that are not materially different from that obtainable in transactions with unrelated parties. The Manager is of the opinion that the above dealings have been transacted on an arm’s length basis.
38Kenanga Malaysian Inc Fund Annual Report
16. SEGMENTAL REPORTING
a. Business segments
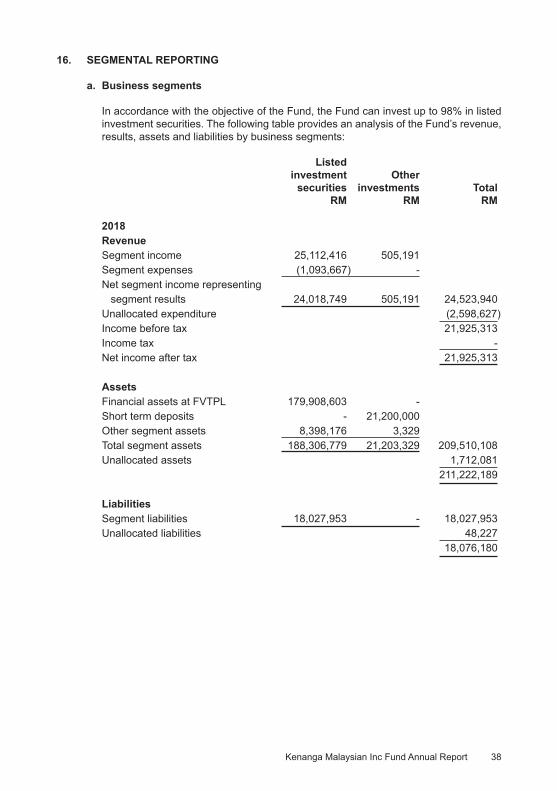
In accordance with the objective of the Fund, the Fund can invest up to 98% in listed investment securities. The following table provides an analysis of the Fund’s revenue, results, assets and liabilities by business segments:
Listed investment Other securities investments Total RM RM RM
2018RevenueSegment income 25,112,416 505,191 Segment expenses (1,093,667) - Net segment income representing segment results 24,018,749 505,191 24,523,940 Unallocated expenditure (2,598,627)Income before tax 21,925,313 Income tax -Net income after tax 21,925,313
AssetsFinancial assets at FVTPL 179,908,603 - Short term deposits - 21,200,000 Other segment assets 8,398,176 3,329 Total segment assets 188,306,779 21,203,329 209,510,108 Unallocated assets 1,712,081 211,222,189
LiabilitiesSegment liabilities 18,027,953 - 18,027,953 Unallocated liabilities 48,227 18,076,180

39 Kenanga Malaysian Inc Fund Annual Report
16. SEGMENTAL REPORTING (CONTD.)
a. Business segments (contd.)
Listed investment Other securities investments Total RM RM RM
2017RevenueSegment income 4,690,641 209,932 Segment expenses (367,320) - Net segment income representing segment results 4,323,321 209,932 4,533,253 Unallocated expenditure (792,574)Income before tax 3,740,679 Income tax - Net income after tax 3,740,679
AssetsFinancial assets at FVTPL 50,174,355 - Short term deposits - 13,156,276 Other segment assets 166,806 5,884 Total segment assets 50,341,161 13,162,160 63,503,321 Unallocated assets 149,277 63,652,598
LiabilitiesSegment liabilities 301,733 - 301,733 Unallocated liabilities 36,344 338,077
b. Geographical segments
As all of the Fund’s investments are located in Malaysia, disclosure by geographical segments is not relevant.
17. FINANCIAL INSTRUMENTS
a. Classifi cation of fi nancial instruments
The Fund’s fi nancial assets and fi nancial liabilities are measured on an ongoing basis at either fair value or at amortised cost based on their respective classifi cation. The signifi cant accounting policies in Note 3 describe how the classes of fi nancial instruments are measured, and how income and expenses, including fair value gains and losses, are recognised.

40Kenanga Malaysian Inc Fund Annual Report
17. FINANCIAL INSTRUMENTS (CONTD.)
a. Classifi cation of fi nancial instruments (contd.)
The following table analyses the fi nancial assets and fi nancial liabilities of the Fund in the statement of fi nancial position by the class of fi nancial instruments to which they are assigned and therefore by the measurement basis.
Financial assets Financial at FVTPL Receivables liabilities Total RM RM RM RM
2018AssetsListed equity securities 175,150,786 - - 175,150,786 Listed collective investment scheme 3,478,994 - - 3,478,994 Listed warrants 821,080 - - 821,080 Listed loan stocks 457,743 - - 457,743 Short term deposits - 21,200,000 - 21,200,000 Amount due from Manager - 1,611,224 - 1,611,224 Amount due to licensed fi nancial institutions - 8,266,388 - 8,266,388Other receivables - 135,117 - 135,117 Cash at bank - 100,857 - 100,857 179,908,603 31,313,586 - 211,222,189
Liabilities Amount due to Trustee - - 7,679 7,679 Amount due to licensed fi nancial institutions - - 18,027,953 18,027,953 - - 18,035,632 18,035,632
2017 Assets Listed equity securities 49,012,197 - - 49,012,197Listed collective investment schemes 1,162,158 - - 1,162,158 Short term deposits - 13,156,276 - 13,156,276 Amount due from Manager - 142,399 - 142,399 Amount due to licensed fi nancial institutions - 121,529 - 121,529Other receivables - 51,161 - 51,161 Cash at bank - 6,878 - 6,878 50,174,355 13,478,243 - 63,652,598
Liabilities Amount due to Trustee - - 2,644 2,644 Amount due to licensed fi nancial institutions - - 301,733 301,733 - - 304,377 304,377
41 Kenanga Malaysian Inc Fund Annual Report
17. FINANCIAL INSTRUMENTS (CONTD.)
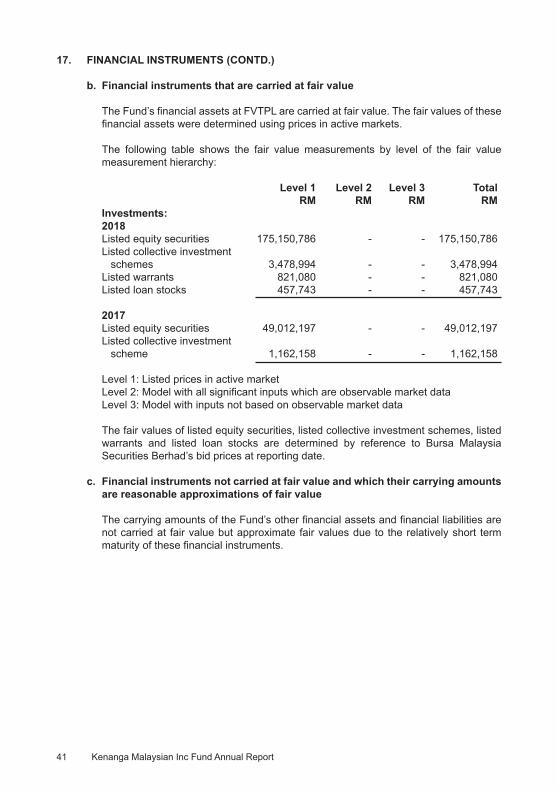
b. Financial instruments that are carried at fair value
The Fund’s fi nancial assets at FVTPL are carried at fair value. The fair values of these fi nancial assets were determined using prices in active markets.
The following table shows the fair value measurements by level of the fair value measurement hierarchy:
Level 1 Level 2 Level 3 Total RM RM RM RMInvestments:2018Listed equity securities 175,150,786 - - 175,150,786 Listed collective investment schemes 3,478,994 - - 3,478,994 Listed warrants 821,080 - - 821,080 Listed loan stocks 457,743 - - 457,743
2017 Listed equity securities 49,012,197 - - 49,012,197Listed collective investment scheme 1,162,158 - - 1,162,158
Level 1: Listed prices in active market Level 2: Model with all signifi cant inputs which are observable market data Level 3: Model with inputs not based on observable market data
The fair values of listed equity securities, listed collective investment schemes, listed warrants and listed loan stocks are determined by reference to Bursa Malaysia Securities Berhad’s bid prices at reporting date.
c. Financial instruments not carried at fair value and which their carrying amounts are reasonable approximations of fair value
The carrying amounts of the Fund’s other fi nancial assets and fi nancial liabilities are not carried at fair value but approximate fair values due to the relatively short term maturity of these fi nancial instruments.

42Kenanga Malaysian Inc Fund Annual Report
18. CAPITAL MANAGEMENT
The capital of the Fund can vary depending on the demand for creation and cancellation of units to the Fund.
The Fund’s objectives for managing capital are:
a. To invest in investments meeting the description, risk exposure and expected return indicated in its prospectus;
b. To maintain suffi cient liquidity to meet the expenses of the Fund, and to meet cancellation requests as they arise; and
c. To maintain suffi cient fund size to make the operations of the Fund cost-effi cient.
No changes were made to the capital management objectives, policies or processes during the current and previous fi nancial years.
19. SUBSEQUENT EVENT
With effect from 2 February 2018, the Fund has revised its investment policy and stategy by investing into global equities markets including, but not limited to, Singapore, Indonesia, Thailand, Philippines, India, Hong Kong, China, Japan, Korea, Taiwan, Australia, Vietnam, United States of America and United Kingdom.

This page has been intentionally left blank

This page has been intentionally left blank

This page has been intentionally left blank


Investor Services Center Head Offi ce, Kuala LumpurToll Free Line: 1 800 88 3737 Level 14, Kenanga Tower, 237, Jalan Tun RazakFax: +603 2172 3133 50400 Kuala Lumpur, MalaysiaEmail: [email protected] Tel: 03-2172 3000 Fax: 03-2172 3080