investors perception on stock market
15
ijcrb.webs.com INTERDISCIPLINARY JOURNAL OF CONTEMPORARY RESEARCH IN BUSINESS COPY RIGHT © 2012 Institute of Interdisciplinary Business Research 712 DECEMBER 2012 VOL 4, NO 8 Investors’ Perception for Stock Market: Evidences from National Capital Region of India Dr. Gagan Kukreja Assistant Professor , Department of Accounting College of Business & Finance, Ahlia University P. O. Box 10878 , Kingdom of Bahrain Abstract This study aims to measure the investors’ perception towards Indian capital market with reference to National Capital Region (NCR) investors of India. This research is a descriptive research study, in which, systematic sampling technique is used. Trail survey is used to select the sample size, validity and reliability of the instrument. 120 samples are selected for this study. Major findings of this study include, age has significant impact on investment, and educational qualification has significant impact on tax advantages. 119 functional variables are used in this study to measure investors’ perception. These variables have 72% impact on measuring investor perception. Charges, liquidity and investment attributes are mediating factor for investors’ perception. Investment influences and investment benefits are having high relevance. Keywords: Investment attributes, Investment benefits, Liquidity, Profitability 1. Introduction When it comes to money and investing , we are not always as rationally as we think we are – that is why there is a whole field of study that explains our sometimes- strange behavior. Where do you fit in as investors? Insight from the theory and findings of behavior may help you answer this question. In 2001, Dalbar, a financial services firm released a study entitled “Quantitative Analysis of Investors’ Behavior”, which concluded that average investors fail to achieve market- index return. It found that in the 17 years period to December 2000, the S&P 500 returned an average of 16.29 % per year, while the typically equity investors achieved only 5.32 % for the same period – 9 % difference. It was also found that during the same period the average fixed security income was 6.08 % per year, while the long term governed bond index reaped 11.33 %. Capital Markets serves as an intermediary between individuals, governments and businesses with excess funds to those individuals, governments and businesses who have shortage of funds. It
Transcript of investors perception on stock market

ijcrb.webs.com
INTERDISCIPLINARY JOURNAL OF CONTEMPORARY RESEARCH IN BUSINESS
COPY RIGHT © 2012 Institute of Interdisciplinary Business Research 712
DECEMBER 2012
VOL 4, NO 8
Investors’ Perception for Stock Market:
Evidences from National Capital Region of India
Dr. Gagan Kukreja
Assistant Professor , Department of Accounting
College of Business & Finance, Ahlia University
P. O. Box 10878 , Kingdom of Bahrain
Abstract This study aims to measure the investors’ perception towards Indian capital market with
reference to National Capital Region (NCR) investors of India. This research is a descriptive
research study, in which, systematic sampling technique is used. Trail survey is used to select the
sample size, validity and reliability of the instrument. 120 samples are selected for this study.
Major findings of this study include, age has significant impact on investment, and educational
qualification has significant impact on tax advantages. 119 functional variables are used in this
study to measure investors’ perception. These variables have 72% impact on measuring investor
perception. Charges, liquidity and investment attributes are mediating factor for investors’
perception. Investment influences and investment benefits are having high relevance.
Keywords: Investment attributes, Investment benefits, Liquidity, Profitability
1. Introduction
When it comes to money and investing , we are not always as rationally as we think we are – that
is why there is a whole field of study that explains our sometimes- strange behavior. Where do
you fit in as investors? Insight from the theory and findings of behavior may help you answer
this question. In 2001, Dalbar, a financial services firm released a study entitled “Quantitative
Analysis of Investors’ Behavior”, which concluded that average investors fail to achieve market-
index return. It found that in the 17 years period to December 2000, the S&P 500 returned an
average of 16.29 % per year, while the typically equity investors achieved only 5.32 % for the
same period – 9 % difference. It was also found that during the same period the average fixed
security income was 6.08 % per year, while the long term governed bond index reaped 11.33 %.
Capital Markets serves as an intermediary between individuals, governments and businesses with
excess funds to those individuals, governments and businesses who have shortage of funds. It

ijcrb.webs.com
INTERDISCIPLINARY JOURNAL OF CONTEMPORARY RESEARCH IN BUSINESS
COPY RIGHT © 2012 Institute of Interdisciplinary Business Research 713
DECEMBER 2012
VOL 4, NO 8
promotes economic efficiency by directing funds from those who do not have an immediate use
for these funds to those who are in need of funds. It also channels money provided by savers and
depository institutions to borrowers and investees through a variety of financial instruments like
stocks and bonds called securities.
Going public refers to the process by which companies make their shares available to the public.
In doing so, a company sells partial ownership of its business to each investor, or “shareholder.”
This method of raising money is called “equity financing.” There are other ways that companies
can raise capital, such as selling debt through bonds and related securities.
An Initial Public Offerings (IPO) refers to the first issue of shares a company makes available to
the general public. It is a one-time transaction between a company and its shareholders. This sale
of new shares takes place in a market is called the “Primary Market.” Companies that want to list
their shares on an exchange must meet stringent financial, public distribution and management
standards set by the exchange. After these standards are met, companies are listed on the
exchange and shares are available to the general public. After a company launches its IPO,
shares are bought and sold in what is called the “Secondary Market.” Bonds are not traded on an
exchange, but sold through investment dealers in an Over the Counter (OTC) environment. The
secondary debt market is comprised of government and corporate bonds with maturities ranging
from one year to perpetuity in theory, although those starting with maturities of more than 20
years are not common. Issues that have remaining terms 12 years are usually considered to be
part of the long-term market. Derivatives are a special kind of financial instruments. Their value
is based on the characteristics and value of some other underlying asset, including commodities,
bonds, equities or currency.
1.1 Statement of the problem
Technological enablement and rapid growth of Indian capital market since the new economic
policy of 1991 has given more importance to investors. Investor behaviour also tend to move into
savings to investment, short-term trading of capital market instruments. More number of brokers
also entered into the capital market due to the liberalised regulation in capital market. Brokers
are providing number of services under single umbrella to the investors based on their need. So,
this study aims to discover that how these services are perceived by the investors and how these
services are utilised by the investors.

ijcrb.webs.com
INTERDISCIPLINARY JOURNAL OF CONTEMPORARY RESEARCH IN BUSINESS
COPY RIGHT © 2012 Institute of Interdisciplinary Business Research 714
DECEMBER 2012
VOL 4, NO 8
1.2 Objectives of the study
The researcher will identify and evaluate the factors influencing investors’ perception towards
investment in Indian capital market. The researcher is choosing NCR (includes Faridabad-
Ballabhgarh, Gurgaon-Manesar, Sonipat-Bahadurgarh, Sonipat-Kundli, Ghaziabad-Loni
Bulandshahar and Noida-Greater Noida) for the study since majority of investments in stock
market is coming from Metropolitans cities in India. The investment pattern of the respondents
will be examined and accordingly suggestions will be put forward for informed investment in
securities offered in Indian Capital market.
2. Review of the literature
Shanmnga Sundaram V (2011) examined the impact of behavioural dimensions of investors in
Capital market and found that investor decisions are influenced by psychological factors as well
as behavioural dimensions and this psychological effect is created by the fear of losing money,
sudden decline in stock indices, greed and lack of confidence about their decision making
capability. Lovric M. et al., (2008), presented a description model of individual investor
behaviour in which investment decisions are seen as an iterative process of interactions between
the investor and the investment environment. The investment process was influenced by a
number of interdependent variables. They suggested that this conceptual model can be used to
build stylized representations of individual investors and further studied using the paradigm of
agent-based artificial financial markets. Szyska Adam (2008) analysed how investors’
psychology changes the vision of financial markets and discussed the consequences of the new
view of finance by capital market practitioners-investors, corporate policy makers and concluded
with some thoughts on the future development of the capital market theory. Hvidkjaer S (2008)
analysed the relationship between retail investor trading behaviour and the cross section of future
stock returns. The result suggests that stocks favoured by retail investors subsequently
experience prolonged underperformance relative to stock out of favour with them. This results
link the systematic component of retail investor behaviour to future returns, i.e., informed
investors might begin selling stocks that they believe to be overvalued. The overvaluation that
these investors perceived could be driven by changes in firms fundamental values.
Mittal M. and Vyas R.K. (2008) explored the relationship between various demographic factors
and the investment personality exhibited by the investors. Empirical evidence suggested that
factors such as income, education and marital status affect an individual’s investment decision.
ijcrb.webs.com
INTERDISCIPLINARY JOURNAL OF CONTEMPORARY RESEARCH IN BUSINESS
COPY RIGHT © 2012 Institute of Interdisciplinary Business Research 715
DECEMBER 2012
VOL 4, NO 8
Further the results revealed that investors in India can be classified into four dominant
investment personalities namely casual, technical, informed and cautions. Rajarajan V (1998,
2000 and 2003) classified investors on the basis of their demographics. He found the investors'
characteristics on the basis of their investment size and the percentage of risky assets to total
financial investments had declined as the investor moves up through various stages in life cycle.
Further, he noted investors' lifestyles based characteristics. Annaert et al., (2005), indicate the
impact of information asymmetric problem on investor behaviour, this is another subject in
behavioural finance field. Most of these researches pay close attention to behavioural finance,
especially in financial products choices and behaviour of individual investor.
Gerela.S.T. and Balsara. K.A (2001) reviewed the risk management system at the Bombay Stock
Exchange (BSE). They reported that the BSE has strengthened the risk management measures to
maintain the market integrity. The introduction of the modified carry forward system, coupled
with the Bombay Online Trade (BOLT) expansion to cities all over India, has led to a significant
increase in the liquidity and volumes at the exchange. As a consequence, the risk management
function at the BSE has assumed greater importance. Nair Rajagopala and Elsamma Joseph
(1999) revealed the various risks experienced by investors in corporate securities and the
measures adopted for reducing risks. They opined that calculated risk might reduce the intensity
of loss of investing. As per their study, many investors were holding shares of those companies
that were non-existent. They opined that investors may accept risks inherent in equity, but they
may not be willing to reconcile to the risk of fraud. Promoters should not be allowed to loot the
genuine investors by their fraudulent acts. The above researches present a detailed picture about
the various facets of investment studies that have taken place in the past. In the present study, the
findings of many of these studies are validated and updated.
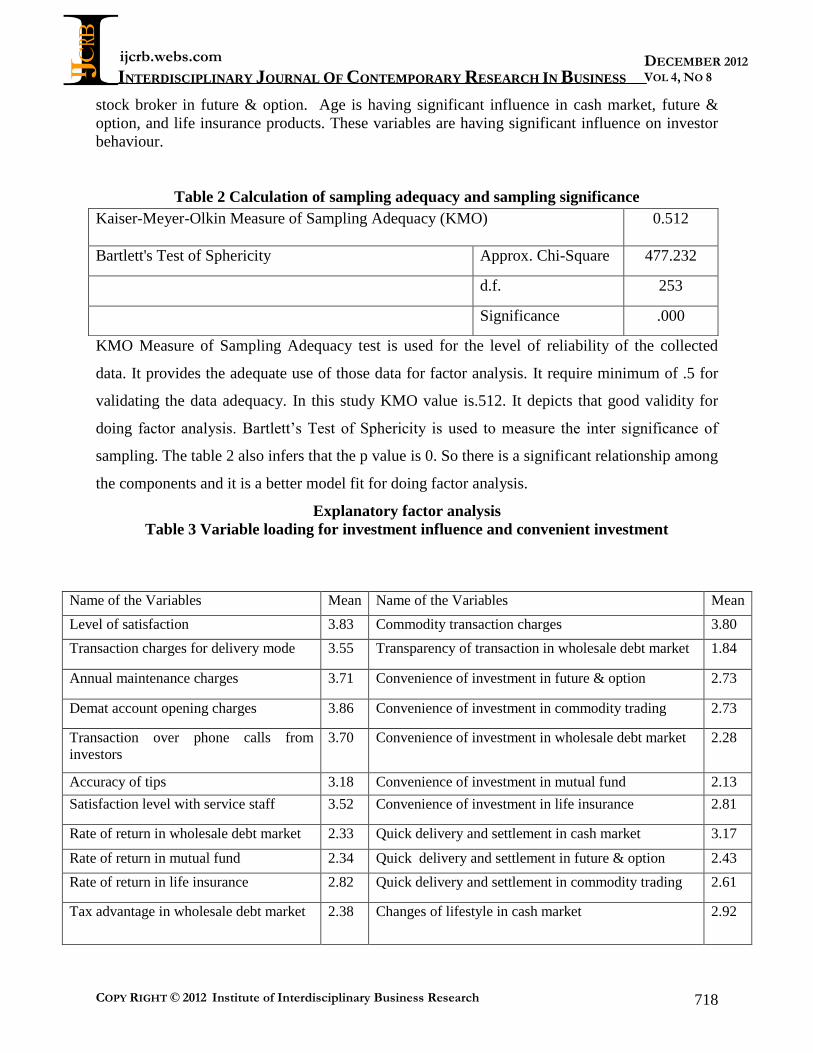
3. Research methodology
Primarily this type of research is descriptive in nature. Descriptive research includes surveys and
fact-finding enquiries of different kinds. The major purpose of descriptive research is description
of the state of affairs as it exists at present. The population size in this research is very large
number of investors and changing time to time. Sample size calculated by using population mean
through trail survey. Finally, 120 sample where collected based on the nature of population.
Systematic sampling is used in this research. The researcher selected every 5th visitor from the
Angel broking office in NCR. Data were collected from July and August, 2012. The task of
ijcrb.webs.com
INTERDISCIPLINARY JOURNAL OF CONTEMPORARY RESEARCH IN BUSINESS
COPY RIGHT © 2012 Institute of Interdisciplinary Business Research 716
DECEMBER 2012
VOL 4, NO 8
data collection begins after research problems have been identified and defined and research
design chalked out. Data is the foundation for all kinds of research. Primary and secondary data
is used in this research. Researcher used questionnaire for collecting the primary data from the
investor. Secondary data is collected from various journals, books, magazines, websites and trade
magazines for previous researches so that the research gap can be identified and filled though
this research. KMO and Bartlett’s test, explanatory factor analysis using Principal Component
Analysis (PCA), Chi-square test and Cronbach’s Alpha test is used throughout the research.
3.1 Research hypothesis
H0: There is no significant difference among the variables. If the p value is more than .05, it is
more than of significance level (rejected region). Hence it is conferred that there is no significant
association between variable
Ha: There is significant difference among the variables. If the P value is less than .05, it is less
than of significance level (accepted region). Hence it is conferred that there is significant
association between variable.
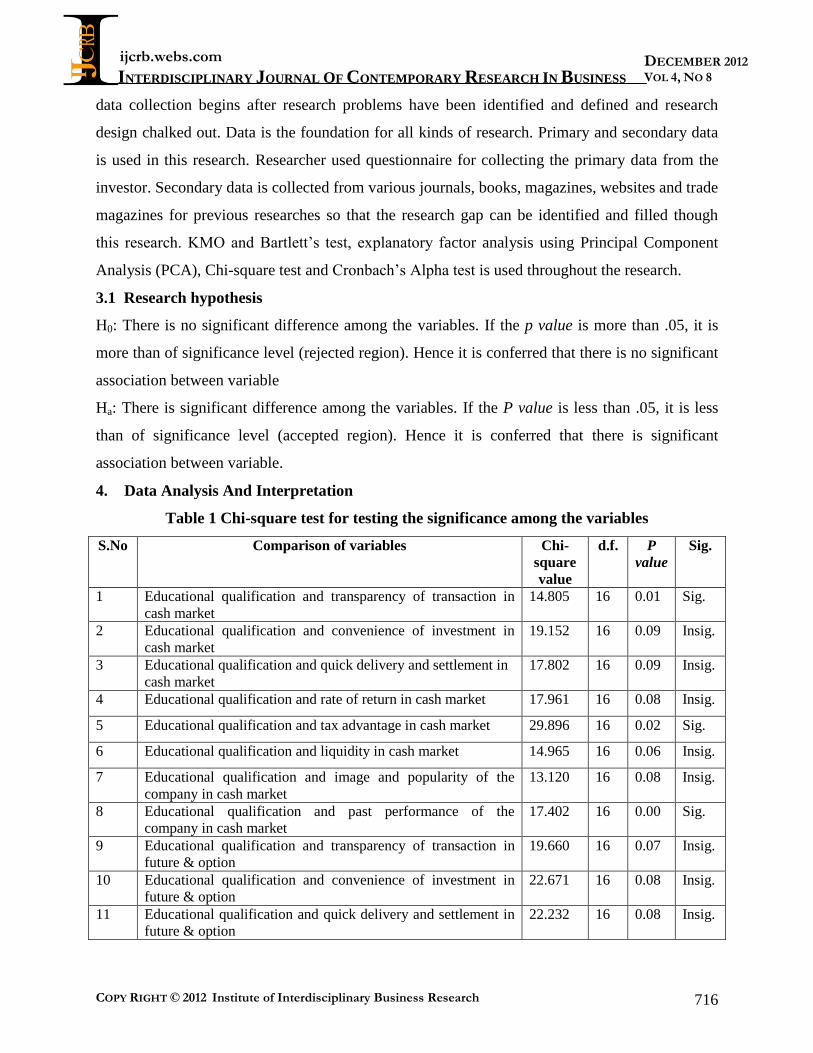
4. Data Analysis And Interpretation
Table 1 Chi-square test for testing the significance among the variables
S.No Comparison of variables Chi-
square
value
d.f. P
value
Sig.
1 Educational qualification and transparency of transaction in
cash market
14.805 16 0.01 Sig.
2 Educational qualification and convenience of investment in
cash market
19.152 16 0.09 Insig.
3 Educational qualification and quick delivery and settlement in
cash market
17.802 16 0.09 Insig.
4 Educational qualification and rate of return in cash market 17.961 16 0.08 Insig.
5 Educational qualification and tax advantage in cash market 29.896 16 0.02 Sig.
6 Educational qualification and liquidity in cash market 14.965 16 0.06 Insig.
7 Educational qualification and image and popularity of the
company in cash market
13.120 16 0.08 Insig.
8 Educational qualification and past performance of the
company in cash market
17.402 16 0.00 Sig.
9 Educational qualification and transparency of transaction in
future & option
19.660 16 0.07 Insig.
10 Educational qualification and convenience of investment in
future & option
22.671 16 0.08 Insig.
11 Educational qualification and quick delivery and settlement in
future & option
22.232 16 0.08 Insig.

ijcrb.webs.com
INTERDISCIPLINARY JOURNAL OF CONTEMPORARY RESEARCH IN BUSINESS
COPY RIGHT © 2012 Institute of Interdisciplinary Business Research 717
DECEMBER 2012
VOL 4, NO 8
12 Educational qualification and rate of return in future & option 15.463 16 0.08 Insig.
13 Educational qualification and tax advantage in future & option 18.520 16 0.07 Insig.
14 Educational qualification and liquidity in future & option 20.316 16 0.07 Insig.
15 Educational qualification and image and popularity of the
company in future &option
21.296 16 0.06 Insig.
16 Educational qualification and past performance of the
company in future & option
19.332 16 0.06 Insig.
17 Occupation and risk and uncertainty in cash market 23.089 16 0.06 Insig.
18 Occupation and investment pattern in cash market 25.035 16 0.00 Sig.
19 Occupation and size of investment in cash market 20.214 16 0.07 Insig.
20 Occupation and changes of lifestyle in cash market 27.911 16 0.11 Insig.
21 Occupation and thrift of savings in cash market 19.022 16 0.72 Insig.
22 Occupation and grievances of investors in cash market 13.891 16 0.091 Insig.
23 Occupation and services of the stock broker in cash market 6.224 16 0.04 Sig.
24 Occupation and advertisement campaign in cash market 15.003 16 0.15 Insig.
25 Occupation and risk and uncertainty in future & option 20.819 16 0.03 Sig.
26 Occupation and investment pattern in future & option 21.934 16 0.58 Insig.
27 Occupation and size of investment in future & option 19.491 16 0.04 Sig.
28 Occupation and changes of lifestyle in future & option 11.556 16 0.42 Insig.
29 Occupation and thrift of savings in future & option 11.394 16 0.25 Insig.
30 Occupation and grievances of investors in future & option 22.074 16 0.32 Insig.
31 Occupation and services of the stock broker in future & option 24.064 16 0.01 Sig.
32 Occupation and advertisement campaign in future & option 22.411 16 0.87 Insig.
33 Age and cash market 29.090 12 0.00 Sig.
34 Age and future & option 10.924 12 0.01 Sig.
35 Age and commodity trading 12.501 9 0.36 Insig.
36 Age and wholesale debt market 11.813 12 0.66 Insig.
37 Age and mutual fund 9.618 9 0.31 Insig.
38 Age and life insurance 25.713 9 0.01 Sig.
The above table depicts that the relationship among the variables. It is used to find out the
influencing variables to determine the investor behaviour towards investment in capital market.
Educational qualification has significant influence on transparency of transaction, tax advantage,
past performance of the company in cash market. Occupation has significant influence on
investment pattern, services of the stock broker, risk and uncertainty in future & option, and size
of investment in future & option. Further, Occupation has significant influence on services of the
ijcrb.webs.com
INTERDISCIPLINARY JOURNAL OF CONTEMPORARY RESEARCH IN BUSINESS
COPY RIGHT © 2012 Institute of Interdisciplinary Business Research 718
DECEMBER 2012
VOL 4, NO 8
stock broker in future & option. Age is having significant influence in cash market, future &
option, and life insurance products. These variables are having significant influence on investor
behaviour.
Table 2 Calculation of sampling adequacy and sampling significance
KMO Measure of Sampling Adequacy test is used for the level of reliability of the collected
data. It provides the adequate use of those data for factor analysis. It require minimum of .5 for
validating the data adequacy. In this study KMO value is.512. It depicts that good validity for
doing factor analysis. Bartlett’s Test of Sphericity is used to measure the inter significance of
sampling. The table 2 also infers that the p value is 0. So there is a significant relationship among
the components and it is a better model fit for doing factor analysis.
Explanatory factor analysis
Table 3 Variable loading for investment influence and convenient investment
Kaiser-Meyer-Olkin Measure of Sampling Adequacy (KMO) 0.512
Bartlett's Test of Sphericity Approx. Chi-Square 477.232
d.f. 253
Significance .000
Name of the Variables Mean Name of the Variables Mean
Level of satisfaction 3.83 Commodity transaction charges 3.80
Transaction charges for delivery mode 3.55 Transparency of transaction in wholesale debt market 1.84
Annual maintenance charges 3.71 Convenience of investment in future & option 2.73
Demat account opening charges 3.86 Convenience of investment in commodity trading 2.73
Transaction over phone calls from
investors
3.70 Convenience of investment in wholesale debt market 2.28
Accuracy of tips 3.18 Convenience of investment in mutual fund 2.13
Satisfaction level with service staff 3.52 Convenience of investment in life insurance 2.81
Rate of return in wholesale debt market 2.33 Quick delivery and settlement in cash market 3.17
Rate of return in mutual fund 2.34 Quick delivery and settlement in future & option 2.43
Rate of return in life insurance 2.82 Quick delivery and settlement in commodity trading 2.61
Tax advantage in wholesale debt market 2.38 Changes of lifestyle in cash market 2.92

ijcrb.webs.com
INTERDISCIPLINARY JOURNAL OF CONTEMPORARY RESEARCH IN BUSINESS
COPY RIGHT © 2012 Institute of Interdisciplinary Business Research 719
DECEMBER 2012
VOL 4, NO 8
Tax advantage in mutual fund 2.21 Changes of lifestyle in mutual fund 1.81
Tax advantage in life insurance 2.83 Changes of lifestyle in life insurance 2.38
Liquidity in cash market 3.45 Grievances of investors in cash market 3.01
Liquidity in future & option 3.04 Grievances of investors in future & option 2.47
Liquidity in commodity trading 2.83 Grievances of investors in commodity trading 2.38
Thrift of savings in wholesale debt
market
2.24 Services of the stock broker in cash market 3.12
Advertisement campaign in capital
market
3.10 Services of the stock broker in commodity trading 2.71
Image and popularity of the company in
mutual fund
2.26 Advertisement campaign in wholesale debt market 2.03
Image and popularity of the company in
life insurance
2.62 Advertisement campaign in life insurance 2.66
Past performance of the company in
wholesale debt market
2.43 Image and popularity of the company in future &
option
2.97
Past performance of the company in
mutual fund
2.40 Image and popularity of the company in commodity
trading
2.64
Past performance of the company in life
insurance
3.04 Mean score for Convenient investment 2.61
Risk and uncertainty in future and option 2.91 Eigen value 12.12
Risk and uncertainty in commodity
trading
2.83 Variance 10%
Investment pattern in wholesale debt
market
2.46 Reliability (Cronbach's Alpha) .781
Investment pattern in mutual fund 2.36
Investment pattern in life insurance 2.85
Mean score for investment influence 2.78
Eigen value 22.84
Variance 19%
Reliability (Cronbach's Alpha) .937

ijcrb.webs.com
INTERDISCIPLINARY JOURNAL OF CONTEMPORARY RESEARCH IN BUSINESS
COPY RIGHT © 2012 Institute of Interdisciplinary Business Research 720
DECEMBER 2012
VOL 4, NO 8
Variables extracted from the rotated component matrix under Varimax technique. Factor 1 is
labelled as investment influence. This factor influence about 19% to the investor behaviour. This
construct is having .937 i.e. 93.7% of reliability of the instrument for measuring investment
influences. Factor 2 is labelled as convenient investment. This factor influence about 10% to the
investor behaviour. This construct is having .781 i.e. 78.1% of reliability of the instrument for
measuring convenient investment.
Table 4 Variable loading for investment benefits and service satisfaction
Name of the Variables Mean Name of the Variables Mean
Transparency of transaction in mutual
fund
1.81 Future & option transaction
charges
3.70
Transparency of transaction in life
insurance
2.31 Charges for mutual fund 3.55
Quick delivery and settlement in
wholesale debt market
2.16 Tips provided by the research
team of stock broker
3.21
Quick delivery and settlement in mutual
fund
1.86 Cash market 3.77
Quick delivery and settlement in life
insurance
2.51 Size of investment in mutual fund 2.11
Rate of return in cash market 3.44 Size of investment in life
insurance
2.54
Tax advantage in cash market 3.25 Thrift of savings in future &
option
2.43
Liquidity in wholesale debt market 2.07 Grievances of investors in
wholesale debt market
2.00
Changes of lifestyle in commodity
trading
2.35 Grievances of investors in mutual
fund
1.88
Changes of lifestyle in wholesale debt
market
1.88 Grievances of investors in life
insurance
2.43
Thrift of savings in commodity trading 2.35 Services of the stock broker
mutual fund
2.10
Past performance of the company in
commodity trading
2.52 Services of the stock broker life
insurance
2.63
Risk and uncertainty in cash market 3.41 Advertisement campaign in future
& option
2.74
Risk and uncertainty in wholesale debt
market
2.14 Advertisement campaign in
commodity trading
2.68
Risk and uncertainty in mutual fund 2.28 Size of investment in future &
option
2.99
Investment pattern in cash market 3.39 Size of investment in commodity
trading
2.89
Investment pattern in future & option 2.83 Size of investment in wholesale 2.17
ijcrb.webs.com
INTERDISCIPLINARY JOURNAL OF CONTEMPORARY RESEARCH IN BUSINESS
COPY RIGHT © 2012 Institute of Interdisciplinary Business Research 721
DECEMBER 2012
VOL 4, NO 8
debt market
Investment pattern in commodity
trading
2.62 Image and popularity of the
company in wholesale debt market
2.28
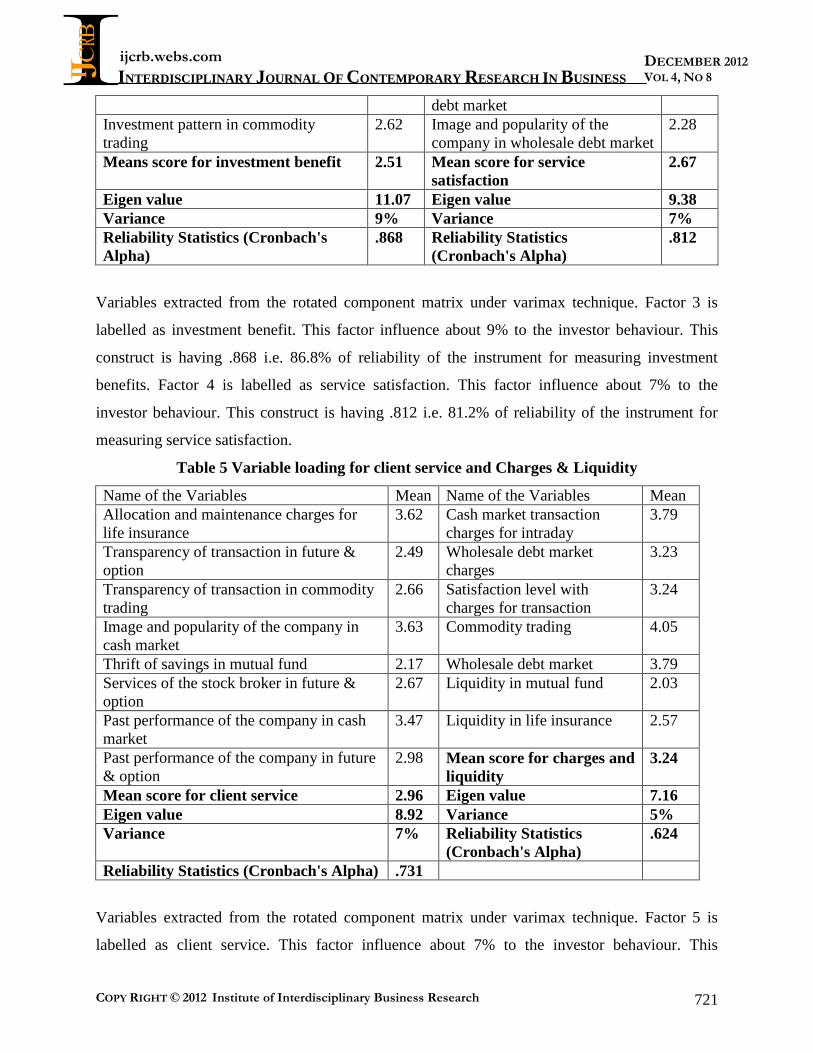
Means score for investment benefit 2.51 Mean score for service
satisfaction
2.67
Eigen value 11.07 Eigen value 9.38
Variance 9% Variance 7%
Reliability Statistics (Cronbach's
Alpha)
.868 Reliability Statistics
(Cronbach's Alpha)
.812
Variables extracted from the rotated component matrix under varimax technique. Factor 3 is
labelled as investment benefit. This factor influence about 9% to the investor behaviour. This
construct is having .868 i.e. 86.8% of reliability of the instrument for measuring investment
benefits. Factor 4 is labelled as service satisfaction. This factor influence about 7% to the
investor behaviour. This construct is having .812 i.e. 81.2% of reliability of the instrument for
measuring service satisfaction.
Table 5 Variable loading for client service and Charges & Liquidity
Name of the Variables Mean Name of the Variables Mean
Allocation and maintenance charges for
life insurance
3.62 Cash market transaction
charges for intraday
3.79
Transparency of transaction in future &
option
2.49 Wholesale debt market
charges
3.23
Transparency of transaction in commodity
trading
2.66 Satisfaction level with
charges for transaction
3.24
Image and popularity of the company in
cash market
3.63 Commodity trading 4.05
Thrift of savings in mutual fund 2.17 Wholesale debt market 3.79
Services of the stock broker in future &
option
2.67 Liquidity in mutual fund 2.03
Past performance of the company in cash
market
3.47 Liquidity in life insurance 2.57
Past performance of the company in future
& option
2.98 Mean score for charges and
liquidity
3.24
Mean score for client service 2.96 Eigen value 7.16
Eigen value 8.92 Variance 5%
Variance 7% Reliability Statistics
(Cronbach's Alpha)
.624
Reliability Statistics (Cronbach's Alpha) .731
Variables extracted from the rotated component matrix under varimax technique. Factor 5 is
labelled as client service. This factor influence about 7% to the investor behaviour. This

ijcrb.webs.com
INTERDISCIPLINARY JOURNAL OF CONTEMPORARY RESEARCH IN BUSINESS
COPY RIGHT © 2012 Institute of Interdisciplinary Business Research 722
DECEMBER 2012
VOL 4, NO 8
construct is having .731 i.e. 73.1% of reliability of the instrument for measuring client service.
Factor 6 is labelled as charges and liquidity. This factor influence about 5% to the investor
behaviour. This construct is having .624 i.e. 62.4% of reliability of the instrument for measuring
charges and liquidity.
Table 6 Variable loading for investment attributes and satisfaction of alternate choice
Name of the Variables Mean Name of the Variables Mean
Confirmation of trading 4.18 Rate of return in future & option 2.88
Mutual fund 2.75 Thrift of savings in life insurance 2.82
Thrift of savings in cash market 3.26 Services of the stock broker in
wholesale debt market
2.05
Size of investment in cash market 3.22 Mean score for satisfaction of
alternate choice
2.58
Risk and uncertainty in life insurance 2.85 Eigen value 5.60
Mean score for investment
attributes
3.25 Variance 4%
Eigen value 6.44 Reliability Statistics (Cronbach's
Alpha)
.529
Variance 5%
Reliability Statistics (Cronbach's
Alpha)
.602
Variables extracted from the rotated component matrix under varimax technique. Factor 7 is
labelled as investment attributes. This factor influence about 5% to the investor behaviour. This
construct is having .602 i.e. 60.2% of reliability of the instrument for measuring investment
attributes. Factor 8 is labelled as satisfaction of alternate choices. This factor influence about 4%
to the investor behaviour. This construct is having .529 i.e. 52.9% of reliability of the instrument
for measuring satisfaction of alternate choices.
ijcrb.webs.com
INTERDISCIPLINARY JOURNAL OF CONTEMPORARY RESEARCH IN BUSINESS
COPY RIGHT © 2012 Institute of Interdisciplinary Business Research 723
DECEMBER 2012
VOL 4, NO 8
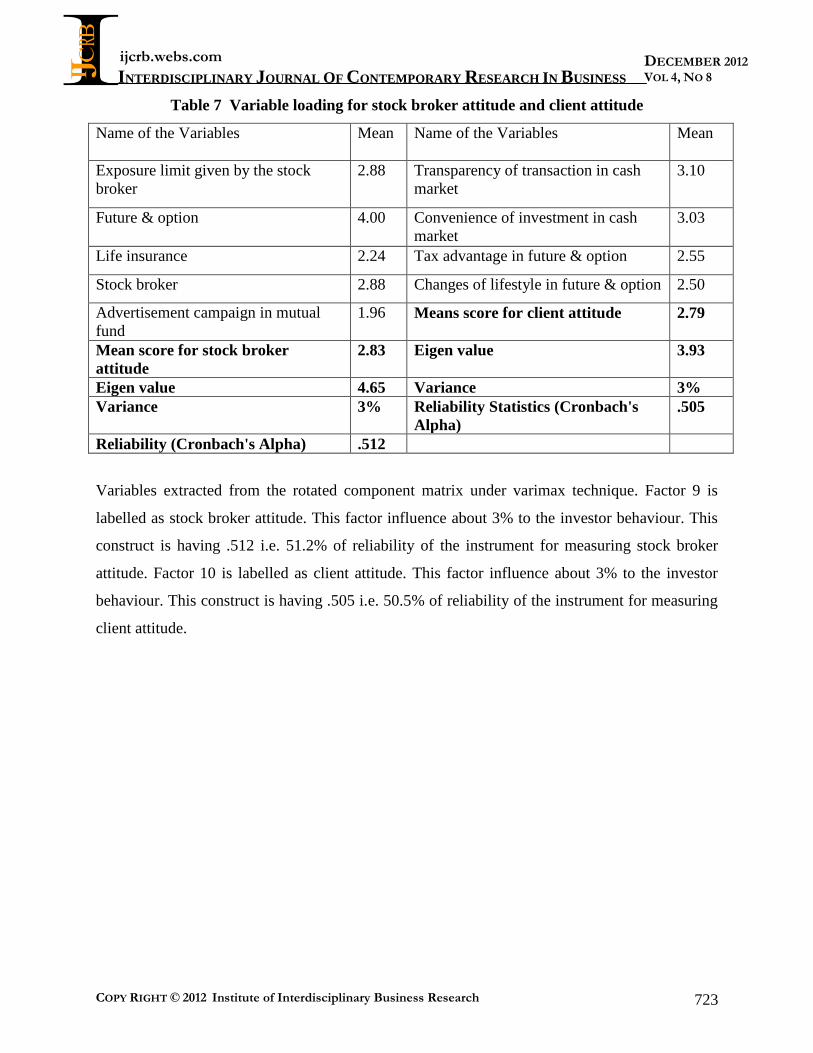
Table 7 Variable loading for stock broker attitude and client attitude
Name of the Variables Mean Name of the Variables Mean
Exposure limit given by the stock
broker
2.88 Transparency of transaction in cash
market
3.10
Future & option 4.00 Convenience of investment in cash
market
3.03
Life insurance 2.24 Tax advantage in future & option 2.55
Stock broker 2.88 Changes of lifestyle in future & option 2.50
Advertisement campaign in mutual
fund
1.96 Means score for client attitude 2.79
Mean score for stock broker
attitude
2.83 Eigen value 3.93
Eigen value 4.65 Variance 3%
Variance 3% Reliability Statistics (Cronbach's
Alpha)
.505
Reliability (Cronbach's Alpha) .512
Variables extracted from the rotated component matrix under varimax technique. Factor 9 is
labelled as stock broker attitude. This factor influence about 3% to the investor behaviour. This
construct is having .512 i.e. 51.2% of reliability of the instrument for measuring stock broker
attitude. Factor 10 is labelled as client attitude. This factor influence about 3% to the investor
behaviour. This construct is having .505 i.e. 50.5% of reliability of the instrument for measuring
client attitude.
ijcrb.webs.com
INTERDISCIPLINARY JOURNAL OF CONTEMPORARY RESEARCH IN BUSINESS
COPY RIGHT © 2012 Institute of Interdisciplinary Business Research 724
DECEMBER 2012
VOL 4, NO 8
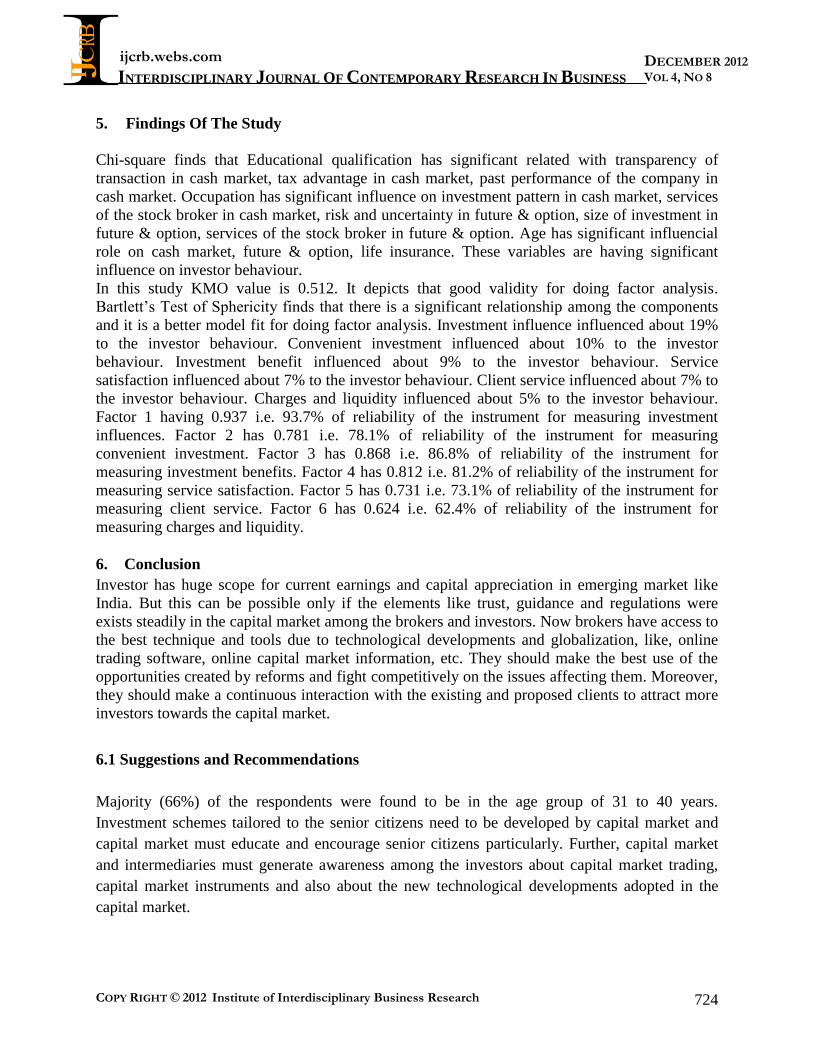
5. Findings Of The Study
Chi-square finds that Educational qualification has significant related with transparency of
transaction in cash market, tax advantage in cash market, past performance of the company in
cash market. Occupation has significant influence on investment pattern in cash market, services
of the stock broker in cash market, risk and uncertainty in future & option, size of investment in
future & option, services of the stock broker in future & option. Age has significant influencial
role on cash market, future & option, life insurance. These variables are having significant
influence on investor behaviour.
In this study KMO value is 0.512. It depicts that good validity for doing factor analysis.
Bartlett’s Test of Sphericity finds that there is a significant relationship among the components
and it is a better model fit for doing factor analysis. Investment influence influenced about 19%
to the investor behaviour. Convenient investment influenced about 10% to the investor
behaviour. Investment benefit influenced about 9% to the investor behaviour. Service
satisfaction influenced about 7% to the investor behaviour. Client service influenced about 7% to
the investor behaviour. Charges and liquidity influenced about 5% to the investor behaviour.
Factor 1 having 0.937 i.e. 93.7% of reliability of the instrument for measuring investment
influences. Factor 2 has 0.781 i.e. 78.1% of reliability of the instrument for measuring
convenient investment. Factor 3 has 0.868 i.e. 86.8% of reliability of the instrument for
measuring investment benefits. Factor 4 has 0.812 i.e. 81.2% of reliability of the instrument for
measuring service satisfaction. Factor 5 has 0.731 i.e. 73.1% of reliability of the instrument for
measuring client service. Factor 6 has 0.624 i.e. 62.4% of reliability of the instrument for
measuring charges and liquidity.
6. Conclusion
Investor has huge scope for current earnings and capital appreciation in emerging market like
India. But this can be possible only if the elements like trust, guidance and regulations were
exists steadily in the capital market among the brokers and investors. Now brokers have access to
the best technique and tools due to technological developments and globalization, like, online
trading software, online capital market information, etc. They should make the best use of the
opportunities created by reforms and fight competitively on the issues affecting them. Moreover,
they should make a continuous interaction with the existing and proposed clients to attract more
investors towards the capital market.
6.1 Suggestions and Recommendations
Majority (66%) of the respondents were found to be in the age group of 31 to 40 years.
Investment schemes tailored to the senior citizens need to be developed by capital market and
capital market must educate and encourage senior citizens particularly. Further, capital market
and intermediaries must generate awareness among the investors about capital market trading,
capital market instruments and also about the new technological developments adopted in the
capital market.

ijcrb.webs.com
INTERDISCIPLINARY JOURNAL OF CONTEMPORARY RESEARCH IN BUSINESS
COPY RIGHT © 2012 Institute of Interdisciplinary Business Research 725
DECEMBER 2012
VOL 4, NO 8
Brokers should develop a confidence among the clients to make online trade themselves through
seminars, technical sessions etc. this in turn helps to improve the standard of capital market.
Brokers should also make critical assessment of various types of risk based on full information
collected through various sources and advise the clients in their best interest, not their interest
only.As the brokers play a role of intermediation in the capital market, government should come
forward with measures to provide, needed relief in the form of grants or aids to help them to
improve their business.
ijcrb.webs.com
INTERDISCIPLINARY JOURNAL OF CONTEMPORARY RESEARCH IN BUSINESS
COPY RIGHT © 2012 Institute of Interdisciplinary Business Research 726
DECEMBER 2012
VOL 4, NO 8
References
Annaert, J., Ceuster, D., Marc, J.K., and Hyfte, W.V., 2005. The value of asset allocation
advice: Evidence from the Economist’s quarterly portfolio poll. Journal of Banking
andFinance 29, pp. 661–680.
Gerela. S. T. and Balsara. K. A, Risk Management and Margin System at the BSE, The
Economic Times, Investors Year Book (2000-01) P.51.
Hvidkjaer S (2008), Small Trades and the Cross-section of Stock Returns, The Review of
Financial Studies, Vol. 21, No.3, pp. 1123-1151.
Lovric M, Kaymak U and Spronk J (2008), A Conceptual Model of Investor Behaviour,
Erasmus Research Institute of Management (ERIM), Report series Researchin Management,
Vol7, No1, pp. 30-45.
Mittal M and Vyas R.K, (2008), Personality Type and Investment Choice. An empirical
study, The Icfai University Journal of Behavioural Finance, Vol. V, No.3, pp. 6-22.
Rajagopala Nair and Elsamma Joseph, Risk Management in Monthly, Vol. Corporate
Securities,Tlle Mailngeii~eiltAcco~ci~taiit, 34, No. 10, October 1999, p.737.
Rajarajan.V (1998) Stages in Life Cycle and Investment Pattern, The Indian Journal
ofCommerce, Vol.51, No. 2 & 3, April-September 1998, pp.27-36.
Rajarajan.V (2000), Investors’ Lifestyles and Investment Characteristics, Finance India,Vol.
XIV, No. 2, June 2000, pp.465-478.
Rajarajan.V (2003), Investors’ Demographics and Risk Bearing Capacity, Finance India,Vol.
XVII, No. 2, June 2003, pp.565-576.
Shanmngasundaram V, The impact of behavioural bias of investors in Capital market, South
Asia Journal of Socio Political Studies, SAJOSPS, Vol.10,No1,pp.99-102
Szyszka Adam (2008), From the Efficient Market Hypothesis to Behavioural Finance-How
Investors Psychology changes the vision of Financial Markets, The Icfai Journal of Finance,
Vol.2, No.1, pp.68-76.