
ENABLING SUCCESS - Investors - Computacenter
210
Y E A R S 1981-2021 ENABLING SUCCESS Computacenter plc Annual Report and Accounts 2021
-
Upload
khangminh22 -
Category
Documents
-
view
12 -
download
0
Transcript of ENABLING SUCCESS - Investors - Computacenter
YEARS
1981-2021
ENABLING SUCCESS
Computacenter plc Annual Report and Accounts 2021
COMPUTACENTER’S COVERAGE REGIONAL HEADQUARTERSINTEGRATION CENTERSSERVICE CENTERS
LIVERMORE, CA, US
INDIANAPOLIS, IN, US
ALPHARETTA, GA, US
BODEGRAVEN, NETHERLANDS
BRUSSELS, BELGIUM
HATFIELD, BRAINTREE, UK
GONESSE, PARIS, FRANCE
ZURICH, SWITZERLAND
KERPEN, GERMANY
DALLAS, TX, US
MEXICO CITY, MEXICO
MARKHAM, ON, CANADA
BARCELONA, SPAIN
HATFIELD, MILTON KEYNES,NOTTINGHAM, SHEFFIELD, UK
LYON, MONTPELLIER, PARIS, PERPIGNAN, FRANCE
BUDAPEST, HUNGARY
CLUJ, ROMANIA
BERLIN, DRESDEN, ERFURT, KERPEN, GERMANY
POZNAN, POLAND
CAPE TOWN, SOUTH AFRICA
KUALA LUMPUR, MALAYSIA
BANGALORE, INDIA
SAN FRANCISCO, CA, US
ATLANTA, GA, US
HATFIELD, UK, EMEA
KUALA LUMPUR, MALAYSIA, APAC
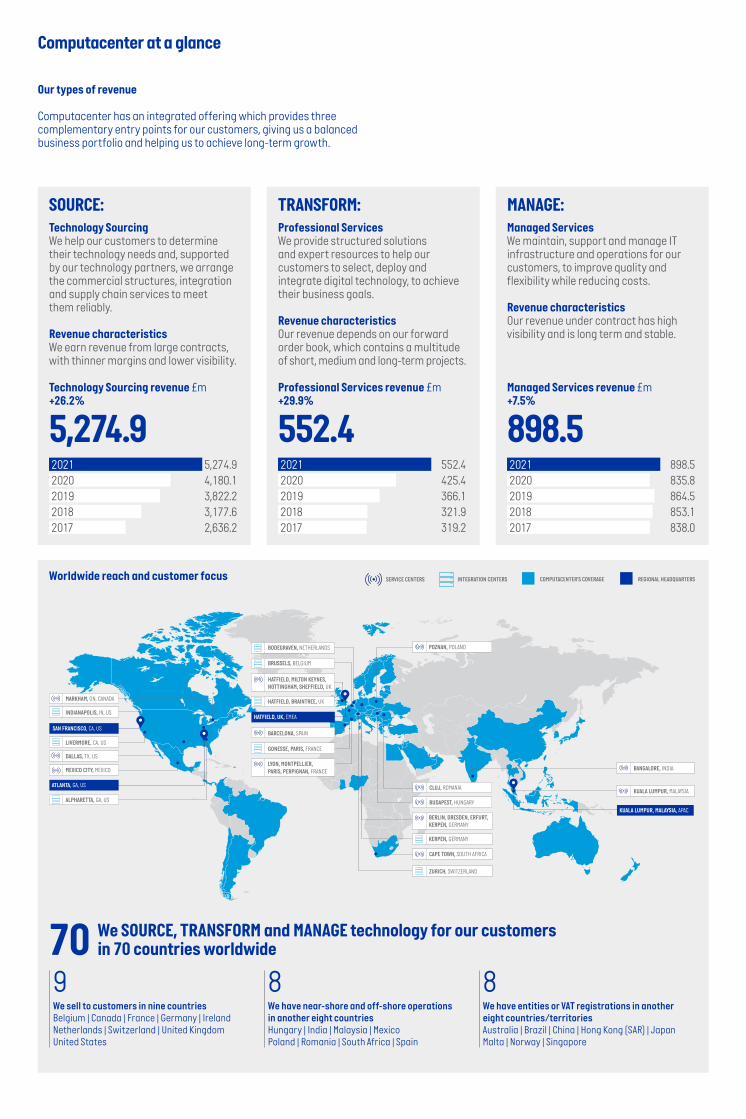
Our types of revenue
Computacenter has an integrated offering which provides three complementary entry points for our customers, giving us a balanced business portfolio and helping us to achieve long-term growth.
9We sell to customers in nine countriesBelgium | Canada | France | Germany | Ireland Netherlands | Switzerland | United Kingdom United States
8We have near-shore and off-shore operations in another eight countriesHungary | India | Malaysia | Mexico Poland | Romania | South Africa | Spain
8We have entities or VAT registrations in another eight countries/territoriesAustralia | Brazil | China | Hong Kong (SAR) | Japan Malta | Norway | Singapore
We SOURCE, TRANSFORM and MANAGE technology for our customers in 70 countries worldwide
Computacenter at a glance
SOURCE: Technology SourcingWe help our customers to determine their technology needs and, supported by our technology partners, we arrange the commercial structures, integration and supply chain services to meet them reliably.
Revenue characteristicsWe earn revenue from large contracts, with thinner margins and lower visibility.
Worldwide reach and customer focus
TRANSFORM: Professional ServicesWe provide structured solutions and expert resources to help our customers to select, deploy and integrate digital technology, to achieve their business goals.
Revenue characteristicsOur revenue depends on our forward order book, which contains a multitude of short, medium and long-term projects.
MANAGE: Managed ServicesWe maintain, support and manage IT infrastructure and operations for our customers, to improve quality and flexibility while reducing costs.
Revenue characteristicsOur revenue under contract has high visibility and is long term and stable.
20212020201920182017
5,274.94,180.13,822.23,177.62,636.2
20212020201920182017
552.4425.4366.1321.9319.2
20212020201920182017
898.5835.8864.5853.1838.0
Technology Sourcing revenue £m +26.2%
5,274.9Professional Services revenue £m+29.9%
552.4Managed Services revenue £m+7.5%
898.5
70
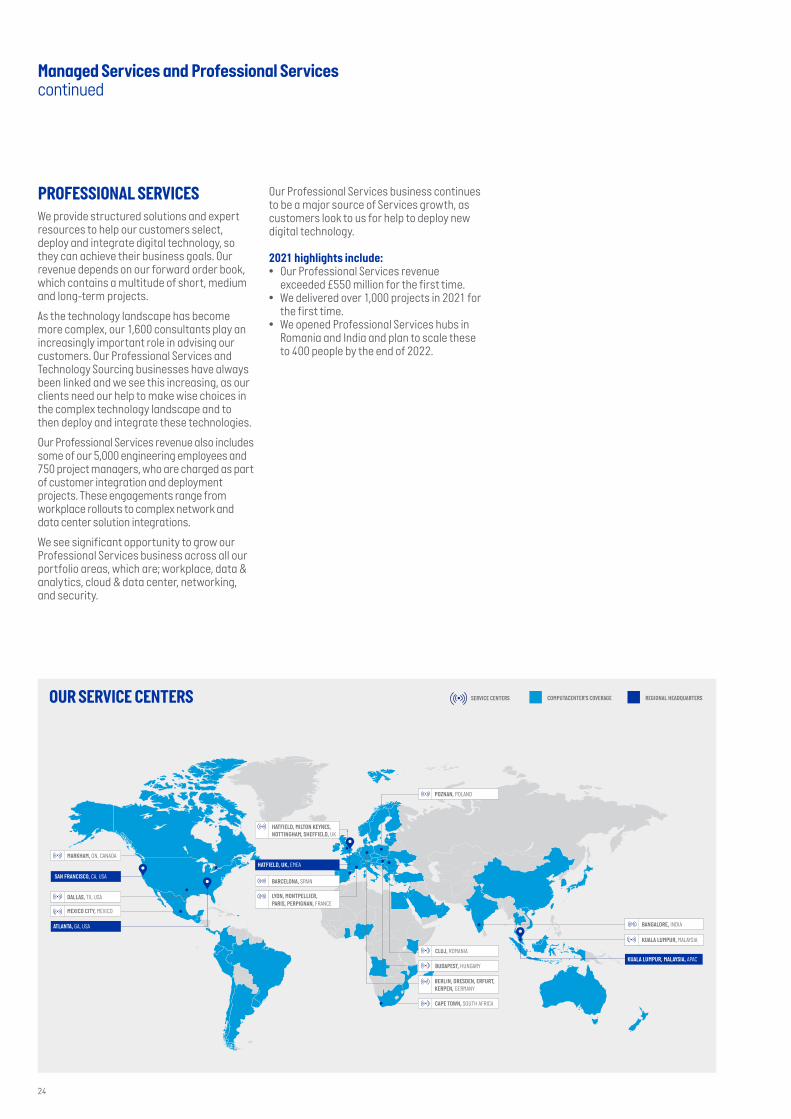
COMPUTACENTER’S COVERAGE REGIONAL HEADQUARTERSINTEGRATION CENTERSSERVICE CENTERS
LIVERMORE, CA, USA
ALPHARETTA, GA, USA
BODEGRAVEN, NETHERLANDS
BRUSSELS, BELGIUM
HATFIELD, BRAINTREE, UK
GONESSE, PARIS, FRANCE
ZURICH, SWITZERLAND
KERPEN, GERMANY
DALLAS, TX, USA
MEXICO CITY, MEXICO
MARKHAM, ON, CANADA
BARCELONA, SPAIN
HATFIELD, MILTON KEYNES,NOTTINGHAM, SHEFFIELD, UK
LYON, MONTPELLIER, PARIS, PERPIGNAN, FRANCE
BUDAPEST, HUNGARY
CLUJ, ROMANIA
BERLIN, DRESDEN, ERFURT, KERPEN, GERMANY
POZNAN, POLAND
CAPE TOWN, SOUTH AFRICA
KUALA LUMPUR, MALAYSIA
BANGALORE, INDIA
SAN FRANCISCO, CA, USA
ATLANTA, GA, USA
HATFIELD, UK, EMEA
KUALA LUMPUR, MALAYSIA, APAC

Our Purpose – Enabling Success
Our Purpose is Enabling Success by building long-term trust with our customers, our partners, our people and our communities. If we do this, we will earn the trust and loyalty of our shareholders.
WE’RE PROUD OF WHAT WE’VE ACHIEVED
WE CAN HELP OUR CUSTOMERS DELIVER FASTER
AND TOGETHER, BECOMING THE BEST
BUT WE COULD BE EVEN BETTER
BY ACTING WITH PACE AND CONFIDENCE
WE’LL BE THE TRUSTED ENABLERS OF SUCCESS
• Together, we’ve created a can-do culture where people matter and are encouraged to thrive.
• Our business has grown in capability, reach and reputation.
• We’ve built powerful partnerships with the world’s leading technology partners.
• We deliver digital technology to some of the world’s greatest organisations.
• Our customers can be confident in our skills and solutions.
• They can trust our independence and experience.
• Our partners can rely on our reach and scale.
• This means we can help customers make wise choices in a complex and changing world.
• We’ll understand what our customers need so we remain fundamental to their success.
• We’ll work hard to keep our promises and always be honest and straightforward.
• We’ll build more collaborative relationships and continue to treat people as we expect to be treated.
• We’ll act for the long term and always strive to improve what we do.
• We have many opportunities to better enable our people and improve our business.
• As we grow, we need to remain agile and relevant to our customers.
• We must never forget what makes us different and why customers rely on us.
• We are giving our teams the freedom to make responsible decisions that meet customer needs faster.
• Investing to make our services more innovative and competitive.
• Building on the capabilities of our people, supported by better systems and processes.
• Focusing on delivering digital technology at scale, where we can play to our strengths.
• Our customers will strongly recommend us for the way we help them achieve their goals.
• We’ll be the preferred route to market for technology partners.
• People will want to join and stay with us, and be proud of our reputation, as we learn, earn and have fun.
• We’ll be a trusted, agile and innovative provider of digital technology around the world.

20212020201920182017
6,725.85,441.35,052.84,352.63,793.4
20212020201920182017
66.350.710.130.326.1
20212020201920182017
248.0206.6141.0108.1111.7
20212020201920182017
165.6126.4
92.575.765.1
20212020201920182017
160.9133.8
89.070.166.5
20212020201920182017
255.6200.5146.3118.2106.2
2021 highlights
Our strong financial and operational performance in 2021 has been facilitated by the consistent implementation of our strategy. It has also been underpinned by our focus on the long-term consequences of our decision-making across the organisation, and the actions we have taken to understand the needs, views and interests of our stakeholders.
Following the very strong growth of adjusted1 diluted earnings per share that the Company achieved in 2020, we grew again by over 30 per cent in constant currency2 during the year. Our profit results for both the first and second halves of the year are individually greater than any full-year profit we achieved prior to 2019.
We have achieved improvement across each of the four key metrics that the Board uses to measure performance against our strategic priorities.
We have seen progress in the delivery of our sustainability strategy, Winning Together for our people and our planet. Our Scopes 1 and 2 carbon emissions have fallen by 62 per cent in 2021, from 13,856 metric tonnes of CO2e in 2020 to 5,210 metric tonnes, we were certified as a Top Employer across a number of our major operating geographies, and we were recognised at the CRN Women in Channel Awards 2021 for our community outreach programme.
We continue to work diligently to enable the consistent delivery of value for our stakeholders, and make decisions to ensure the long-term sustainable success of our organisation and the achievement of Our Purpose.
The result for the year benefited from £1,105.1 million of revenue (2020: £232.6 million), and £13.9 million of adjusted1 profit before tax (2020: £3.3 million), resulting from all acquisitions made since 1 January 2020. All figures reported throughout this Annual Report and Accounts include the results of these acquired entities. The results of these acquisitions are excluded where narrative discussion refers to ‘organic’ growth in this Annual Report and Accounts.
1. Adjusted administrative expense, adjusted operating profit or loss, adjusted profit or loss before tax, adjusted tax, adjusted profit or loss, adjusted earnings per share and adjusted diluted earnings per share are, as appropriate, each stated before: exceptional and other adjusting items, including gains or losses on business acquisitions and disposals, amortisation of acquired intangibles, utilisation of deferred tax assets (where initial recognition was as an exceptional item or a fair value adjustment on acquisition), and the related tax effect of these exceptional and other adjusting items, as Management does not consider these items when reviewing the underlying performance of the Segment or the Group as a whole. A reconciliation to adjusted measures is provided on page 71 of the Group Finance Director’s review, which details the impact of exceptional and other adjusted items when compared to the non-Generally Accepted Accounting Practice (GAAP) financial measures, in addition to those reported in accordance with IFRS. Further detail is provided within note 4 to the Consolidated Financial Statements, Segment Information.
2. We evaluate the long-term performance and trends within our strategic priorities on a constant-currency basis. The performance of the Group and its overseas Segments are also shown, where indicated, in constant currency. The constant currency presentation, which is a non-GAAP measure, excludes the impact of fluctuations in foreign currency exchange rates. We believe providing constant currency information gives valuable supplemental detail regarding our results of operations, consistent with how we evaluate our performance. We calculate constant currency percentages by converting our prior-year local currency financial results using the current year average exchange rates and comparing these recalculated amounts to our current year results or by presenting the results in the equivalent local currency amounts. Wherever the performance of the Group, or its overseas Segments, are presented in constant currency, or equivalent local currency amounts, the equivalent prior-year measure is also presented in the reported pound sterling equivalent, using the exchange rates prevailing at the time. 2021 highlights, as shown above, are provided in the reported pound sterling equivalent.
3. Adjusted net funds or adjusted net debt includes cash and cash equivalents, other short- or long-term borrowings and current asset investments. Following the adoption of IFRS 16, this measure excludes all lease liabilities. A table reconciling this measure, including the impact of lease liabilities, is provided within note 31 to the Consolidated Financial Statements, Analysis of Changes in Net Funds.
4. Gross invoiced income is based on the value of invoices raised to customers, net of the impact of credit notes. This reflects the cash movements from revenue, to assist Management and the users of the Annual Report and Accounts in understanding revenue growth on a ‘Principal’ basis and to assist in their assessment of working capital movements in the Consolidated Statement of Financial Position and Consolidated Cash Flow Statement. This measure allows an alternative view of growth in adjusted gross profit, based on the product mix differences and the accounting treatment thereon. Gross invoiced income includes all items recognised on an ‘Agency’ basis within revenue, on a gross income billed to customers basis, as adjusted for deferred and accrued revenue. A reconciliation of revenue to gross invoiced income is provided within note 4 to the Consolidated Financial Statements, Segment Information.
The term Group refers to Computacenter plc and its subsidiaries.
Revenue £m+23.6%
6,725.8 66.3 248.0
165.6160.9255.6
Adjusted1 profit before tax £m+27.5%
Dividend per share Pence+30.8%
Diluted earnings per share Pence+20.3%
Profit before tax £m+20.0%
Adjusted1 diluted earnings per share Pence +31.0%

CIOPEOPLE
BUSINESS
SOURCE
TRANSFORMMANAGE
ENABLING SUCCESS BY BUILDING LONG-TERM TRUSTCentred around our customers
Who we areComputacenter is a leading independent technology partner, trusted by large corporate and public sector organisations.
What we doWe help our customers to Source, Transform and Manage their technology infrastructure, to deliver digital transformation, enabling people and their business.
Our ambition• Strongly recommended by customers for
the way we help them achieve their goals.• The preferred route to market for our
technology partners.• People want to join and stay with us, be
proud of our reputation, as we learn, earn and have fun.
• Trusted as an agile and innovative provider of digital technology around the world.
Strategic report IFC 2021 highlights02 Our customers04 Chair’s statement06 Chief Executive’s strategic review08 Our strategic priorities10 Our approach to market17 Our business model18 Technology Sourcing22 Managed Services and Professional
Services26 Our Performance in 202140 Sustainability strategy62 Task Force on Climate-related Financial
Disclosures65 Section 172 statement65 Non-financial information statement66 Stakeholder engagement70 Group Finance Director’s review80 Principal risks and uncertainties
Governance87 Chair’s governance overview88 Board of Directors90 Corporate governance report95 Nomination Committee report97 Risk and internal control99 Audit Committee report106 Directors’ remuneration report126 Directors’ report131 Directors’ Responsibilities
Financial Statements133 Independent Auditor’s Report to the
members of Computacenter plc140 Consolidated Income Statement141 Consolidated Statement of
Comprehensive Income142 Consolidated Balance Sheet143 Consolidated Statement of Changes
in Equity144 Consolidated Cash Flow Statement145 Notes to the Consolidated Financial
Statements194 Company Balance Sheet195 Company Statement of Changes in Equity196 Notes to the Company Financial
Statements202 Group five-year financial review202 Financial calendar203 Corporate information204 Principal offices
01
Strategic ReportAnnual Report and Accounts 2021
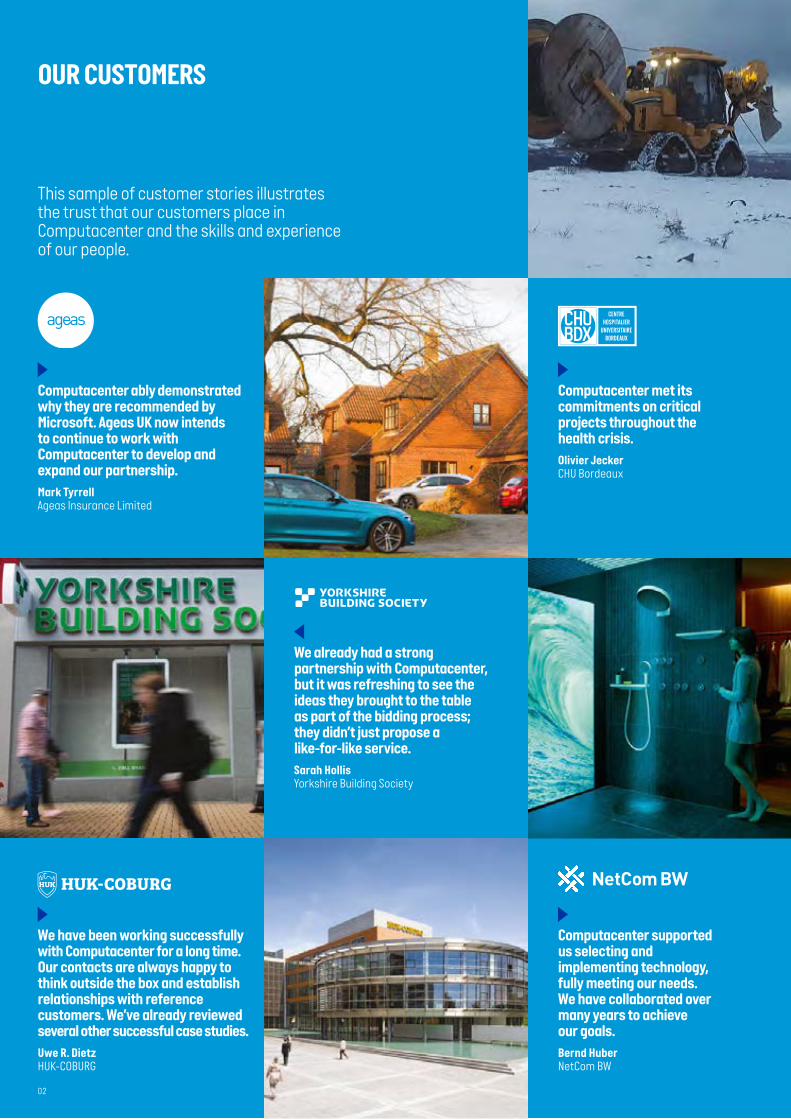
This sample of customer stories illustrates the trust that our customers place in Computacenter and the skills and experience of our people.
We already had a strong partnership with Computacenter, but it was refreshing to see the ideas they brought to the table as part of the bidding process; they didn’t just propose a like-for-like service.Sarah HollisYorkshire Building Society
Computacenter ably demonstrated why they are recommended by Microsoft. Ageas UK now intends to continue to work with Computacenter to develop and expand our partnership.Mark TyrrellAgeas Insurance Limited
We have been working successfully with Computacenter for a long time. Our contacts are always happy to think outside the box and establish relationships with reference customers. We’ve already reviewed several other successful case studies. Uwe R. DietzHUK-COBURG
Computacenter supported us selecting and implementing technology, fully meeting our needs. We have collaborated over many years to achieve our goals.Bernd HuberNetCom BW
Computacenter met its commitments on critical projects throughout the health crisis.Olivier JeckerCHU Bordeaux
02
OUR CUSTOMERS

Computacenter TeraMach was instrumental in helping us build a world-class network in a very remote, isolated First Nation community.Peter LeatonSichuun Inc.
Sichuu u
Computacenter can provide IT experts of all kinds, and we have taken advantage of this.Benjamin SteinHansgrohe SE
Computacenter has done something no other partner or OEM has been able to do, through the team’s perseverance and willingness to ‘do the right thing’. Staying focused on the mission, proof of concept and strategic value speaks highly of Computacenter’s maturity as a partner.Allan LamkinPaul Hastings
Computacenter are a long-standing supplier and partner to the CAA and their knowledge of our environment and the systems in use made them the outstanding candidate to deliver the project.Simon SheeranCivil Aviation Authority
Computacenter’s Cisco® expertise and maintenance services provide great support for our server and network components. The cooperation with the on-site technicians is as smooth as the support from the partner services: High-Touch Expert Care at Cisco®.Torsten NöckerArvato Systems
We gave Computacenter an opportunity to show what they were capable of, and they approached it in a really, really professional way, delving into so many areas we wouldn’t have been able to do in-house.Stephanie RoddyKellogg’s
03

ENABLING SUCCESSBY DELIVERING CONSISTENT GROWTH
We are unwavering in our focus on continuing to strengthen and grow Computacenter to enable the success of all our stakeholders.Peter RyanChair
04
Chair’sstatement

We are extremely concerned and saddened by the ongoing situation in Ukraine following the invasion by Russia. We offer our deepest sympathies and support to Ukraine. Computacenter will be launching a campaign page for its employees to donate to Disaster Emergency Committee (DEC) – Ukraine Humanitarian Appeal. Computacenter will make a corporate donation and also match funds raised by our employees.
Sanctions have been widely imposed by a number of national governments and the European Union on the Russian Federation, related organisations and individuals (Sanctioned Parties). We have undertaken, as a consequence, a review of our operations to ensure that we are not directly or indirectly conducting business activities with Sanctioned Parties, supplying sanctioned or restricted goods or software services, or conducting business activities with individuals and organisations who are known to be closely related to Sanctioned Parties. We have also implemented review processes to ensure that we modify our activities to adhere to any future changes in sanctions requirements.
Whilst the scope of our business in Russia and Ukraine is extremely limited, we recognise the likely short- to medium-term impact of the situation on the global macro-economic environment, including an exacerbation of supply chain issues currently being experienced.
Computacenter in 2021The Computacenter team continued to execute incredibly well in 2021 and delivered our 17th consecutive year of adjusted1 diluted earnings per share (EPS) growth, which was fitting as the Company celebrated its 40th anniversary.
Across the 40 years Computacenter has navigated many trends in technology, adapted to be able to deliver what customers valued, evolved a culture that attracted great talent and sustained an environment that persuaded a significant number of our people to build their careers here.
During this journey, the Company has significantly expanded its technology partner base, services portfolio, geographic markets and customers it serves. This has created the foundation for the sustained growth we delivered in 2021. We are also pleased with the performance of the acquired American businesses and the addressable market potential that it highlights.
The continuing Covid-19 pandemic The global pandemic has continued to weigh heavily on our people, customers, partners and communities around the world and we send our thoughts and best wishes to all those who have been affected. The leadership team has resolutely focused on both the human
and business aspects of this crisis, and the results from our recent employee survey indicate that this difficult balance was achieved.
Financial performance and dividendRevenue for the full-year increased to £6,725.8 million (2020: £5,441.3 million), with the Group generating adjusted1 profit before tax of £255.6 million (2020: £200.5 million), and adjusted1 diluted EPS of 165.6 pence (2020: 126.4 pence).
We are proposing an increase in the final dividend to 49.4 pence per share, reflecting both our performance and confidence in the outlook for the Group. If approved by shareholders at Computacenter’s 2022 Annual General Meeting, this will bring the full-year dividend for 2021 to 66.3 pence per share. This represents an increase of 30.8 per cent over that paid for 2020. This remains in line with our stated long-term dividend policy of paying a dividend that is covered between 2.0 and 2.5 times by adjusted1 diluted EPS.
The Group’s cash position finished strongly at the end of the year, with adjusted net funds3 of £241.4 million as at 31 December 2021. The Board continues to review our approach to capital allocation, so that it ensures balance sheet efficiency and appropriate returns for shareholders. Whilst our use of cash continues to prioritise the organic growth and development of our business, and merger and acquisitions activity which aligns with our strategy, where available opportunities to invest in this way are limited, the Board will consider returning value to shareholders.
The Board in 2021During 2021, there was one significant change to the Board. Minnow Powell decided to retire from his roles as Chair of the Audit Committee and Non-Executive Director.
We followed a robust process to identify his successor, led by the Nomination Committee and assisted by an external search firm. This produced an impressive and diverse list of candidates and we were delighted to announce the appointment of Pauline Campbell as his successor as Audit Committee Chair. Pauline had recently retired from a long and successful career in the audit profession with PwC.
Pauline’s appointment results in at least half the Board (excluding the Chair) remaining as Independent Non-Executive Directors. It also means we have just over 33 per cent female representation on the Board, in line with the recommendations from the Hampton-Alexander review.
Environmental, social and governanceThe Board has continued its focus on sustainability, diversity and inclusion and ensuring our governance practices evolve. These subjects are regarded as very important by both the Board and the people across Computacenter. You will find considerable detail on our approach to people (pages 44-51), planet (pages 52-61), Governance (pages 86-131) and the recommendations of the Task Force on Climate-related Financial Disclosures (TCFD) (pages 62-64).
In terms of concrete commitments, we aim to be Carbon Neutral in 2022 for Scopes 1 and 2 emissions. Scopes 1 and 2 emissions include all of our direct emissions, such as our facilities and some of our indirect emissions such as electricity purchased. This will be achieved by a combination of increases in our own renewable energy generation, continued investment in energy-efficient lighting and equipment, the purchase of electricity generated by renewable sources and the purchase of carbon offsetting credits.
The Board has also agreed a target of being Net Zero for Scopes 1, 2 and 3 emissions by 2040, ten years ahead of our previous target. Scope 3 emissions include all other indirect emissions, including our business travel and transportation, as well as those from sources that we do not own or directly control, including our supply chain.
The year aheadWe are unwavering in our focus on continuing to strengthen and grow Computacenter to enable the success of all our stakeholders. I thank them all for their continued trust and support.
The demand drivers for our business look strong as we enter 2022. Many market commentators have noted a global acceleration in the efforts of governments and businesses to take advantage of the opportunities afforded by digital transformation. This is true across all areas of how organisations run their internal operations effectively and how they engage with their customers and broader stakeholder communities. In concrete terms, there is more demand for technology and services to support the vast array of transformation projects and this, combined with our business momentum, makes us believe that 2022 will be another year of continued progress.
Peter RyanChair23 March 2022
05
Strategic ReportAnnual Report and Accounts 2021

060606
ENABLING SUCCESSBY BUILDING LONG-TERM TRUST
Strategic priority 1
To lead with and grow our Services business
STRATEGIC PRIORITIES
I would like to take this opportunity to thank all of our people for their hard work and dedication, which has been reflected in the final result for the year.Mike NorrisChief Executive Officer
06
Chief Executive’sstrategic review

2021 was an excellent year for Computacenter. Our relentless focus on understanding and addressing the needs of our customers, and taking decisions that prioritise the long-term success of our Company, has again served us well. Our strong in-year growth has been underpinned by recent investments we have made. These have spread the business geographically, increased our productivity, broadened the range of offerings we deliver for our customers, and positioned us well to take advantage of buoyant market conditions during the year.
Our focus remains on consistent financial performance and the delivery of value for our stakeholders. Following the very strong growth of adjusted1 diluted EPS that the Company achieved in 2020, we grew again by over 30 per cent in constant currency2 during the year. The Group has now doubled its profit over the past three years, a feat we last achieved in the middle of the 1990s, prior to becoming a public company.
Our financial success can only be achieved through the delivery of superb quality to our customers. I would like to take this opportunity to thank all of our people for their hard work and dedication, which is reflected in our financial outcome for 2021, as well as a recent independent survey of client satisfaction carried out by Whitelane Research.
There has been high demand for Professional Services skills across the Group, as many of our customers have continued to roll out new digital solutions to their users and their own customers. Our ability to recruit and retain employees in this area is therefore crucial to our success. At a Group level, Computacenter recruited 3,200 new people into our business in 2021, bringing our total number of employees to over 18,000.
While Professional Services was the main driver of Services growth during the year, we also saw improved performance from our Managed Services business. We have strengthened our offerings to the marketplace, grown our off-shore capability and increased the use of automation to deliver solutions to customers. These
measures have both improved service to our customers and resulted in the highest gross margins we have ever achieved in this area of the business.
Technology Sourcing saw significant demand for software and hardware across all of our main operating geographies, as customers invested in new technology to support their businesses. While supply chain shortages were an issue, these gave us an opportunity to outperform our competition through the performance of our well-developed supply chain. Many of our larger customers are highly reliant on deploying new technology and they have taken to ordering much further in advance. While this gives us greater visibility, it has also meant an increase in the inventory we are carrying. We do expect our inventory to return to more normal levels as supply chain constraints ease. We have continued to invest in our Integration Centers to increase service quality and throughput volumes, as we expect demand to continue to grow.
Our German business had an outstanding year and continues to go from strength to strength, particularly in Professional Services and Technology Sourcing. We performed solidly in the UK, with some major renewals and an outstanding performance from Technology Sourcing. In France, although our performance was slightly disappointing, we successfully integrated the acquisition we made in late 2020. The financial performance of the acquisition was in line with expectations, and we are confident we will turn this around in the coming years. We saw a significant upturn in performance from our Belgian business, as well as better performances from our businesses in the Netherlands and Switzerland.
In North America, we have brought together the acquisitions made in 2018 and 2020. Although there remains work to do on integrating back-office systems, the Management teams are now highly integrated. We are extremely excited by the opportunity for future organic and inorganic growth in North America and very pleased with the 2021 performance there.
Throughout 2021, we continued to invest in our operations, particularly in India, Romania, Poland and South Africa. We now have a total workforce in near-shore and off-shore operations of approximately 3,000 people.
The strong cash generation we have achieved over many years continued last year, despite the increase in inventory. The strength of our balance sheet gives us strategic options as we move forward, either through further acquisitions or the return of cash to our shareholders.
Our Management team remained unchanged throughout 2021. Kevin James, who first started at Computacenter in 1990 and has been our Chief Commercial Officer for the last four years, has decided to retire at the end of the first quarter in 2022. I would like to thank Kevin for his loyal and dedicated service to Computacenter and congratulate John Beard, who steps up into Kevin‘s role. John joined Computacenter as a graduate trainee back in 1995 and is a great example of our strength in depth. Computacenter’s continued investment in people over many years has enabled this smooth transition, along with many others, and holds us in good stead for the future.
As always, I would like to thank our customers for the faith they continue to show in us. We will always remember that they have a choice. Our job is to make sure that their decision to place business with Computacenter above the competition is the right one.
We look forward to the challenge of 2022 and continuing our success.
Mike NorrisChief Executive Officer23 March 2022
Strategic priority 4
To innovate our Services offerings to build future growth opportunities
Strategic priority 3
To retain and maximise the relationship with our customers over the long term
Strategic priority 2
To improve our Services productivity and enhance our competitiveness
07
Strategic ReportAnnual Report and Accounts 2021

We go into 2022 with a Contract Base of £821 million. Our Managed Services business has seen more progress in 2021 than it has for a number of years and while customer demand to reduce cost has continued the deflationary pressure on the business, our efforts to win market share have more than made up for this.
Progress in 2021Our Contract Base was up from £798 million to £821 million in constant currency at the end of 2021, which was entirely due to organic growth. We have been pleased with how successfully we have onboarded new contracts, from both a customer service and financial viewpoint.
Target for 2022The momentum that has built up in our business in 2021 and the weakness of some competition in the marketplace gives us confidence for further growth in the coming year. We must continue our drive for automation and offshoring, to enhance our competitiveness and win market share.
How we define Services Contract BaseThis is the annual value of our committed Managed Services contract spend as at the year end.
The prior-year comparatives are restated on a constant currency2
basis to provide a better indicator of underlying growth.
Technology encourages standardisation and commoditisation. Organisations such as ours must therefore differentiate the way we deliver value to customers. We do this by rigorously applying effective processes and utilising the right resources, including automation and robotics, in suitable locations. This allows us to best meet the needs of our global customers, at a competitive price.
Progress in 2021The progress we have made in Services revenue per head over the last few years, and particularly in 2021, has arguably been our greatest success. This has enhanced our margin in both Managed and Professional Services, due to high utilisation and the steady growth in automation within our business, and is highly encouraging.
Target for 2022While we believe progress in this area will continue in 2022, any further gains will be more difficult to achieve, given that we have already removed significant problem contracts.
How we define Services revenue generated per Services headThis is our Group Services revenue divided by the number of employees directly involved in providing either our Managed Services or Professional Services offerings.
The prior-year comparatives are restated on a constant currency2
basis to provide a better indicator of underlying growth.
To lead with and grow our Services business
To improve our Services productivity and enhance our competitiveness
Services Contract Base £m+2.9%
821
Services revenue generated per Services head £’000+10.5%
105.520212020201920182017
105.595.591.287.488.5
20212020201920182017
821798780772748
Strategic priority 1 Strategic priority 2
08
Our strategic priorities

Computacenter focuses on the large account market in both the public and private sectors, and looks to maintain these customers for the long term. The number of large customers we have is directly related to our long-term profitability. Growing the number of customers who contribute more than £1 million of margin is therefore a key driver for Computacenter.
Progress in 2021We finished 2021 with 165 customers generating greater than £1 million of gross margin, up by 10 customers on the previous year. This growth was entirely organic and particularly strong in the UK and Germany, our most established businesses.
Target for 2022We have invested heavily in our sales force across western Europe over the last two years to enable further gains within our established businesses, which we hope to see continue in 2022. This is coupled with the significant upside opportunity in North America, where the opportunity for market share gain is vast.
How we define customer accounts with contributions of over £1 millionA customer account is the consolidated spend by a customer and all of its subsidiaries. Where our customer account exceeds £1 million of contribution to Group gross profit, it is included within this measure.
The prior-year comparatives are restated on a constant currency2
basis to provide a better indicator of underlying growth.
Annual Services revenue, which comprises our Managed Services and Professional Services businesses, is the key measure for this strategic priority. Our portfolio and Services development activities are focused on improving our differentiation and building competitive advantage, laying the foundation for future Services growth.
Progress in 2021The growth of 17.8 per cent was assisted by our two acquisitions in November 2020. However, we still saw organic growth of 9.2 per cent. While our Professional Services business continued its strong gains of recent years, it was encouraging to see our Managed Services business producing an enhanced performance.
Target for 2022Our ability to hire people in our core geographies, particularly certain skills, will always be key to growth within the Services business. However, this is a challenge we have stepped up to in recent years and we intend to continue to meet it. There is a major opportunity to increase our Services share within our North American business, which is very underdeveloped compared to Europe. While this will take longer than a year, we are looking to make progress in 2022.
How we define Services revenueServices revenue is the combined revenue of our Professional Services and Managed Services business.
The prior-year comparatives are restated on a constant currency2
basis to provide a better indicator of underlying growth.
To retain and maximise the relationship with our customers over the long term
To innovate our Services offerings to build future growth opportunities
Number of customer accounts with contributions of over £1 million+6.5%
165
Services revenue £m+17.8%
1,45120212020201920182017
165155131116107
20212020201920182017
1,4511,2311,2151,1561,143
Strategic priority 3 Strategic priority 4
09
Strategic ReportAnnual Report and Accounts 2021

OUR COMPLETE CUSTOMER OFFEROur comprehensive capabilities help customers to Source, Transform and Manage digital technology across the domains of workplace, applications & data, cloud & data center, networking, and security.
SOURCEOur powerful partnerships with the leading technology partners in the market allow us to help our customers make informed and wise choices in the selection of digital technology. With the investments in our Integration Centers, underpinned by our people, systems and processes, we can help our customers to integrate and deploy digital technology at scale across the world. Increasingly, our customers are asking us to take more responsibility in this area and help them deliver faster, both for their people and to underpin the digital strategies for their businesses.
TRANSFORMBy combining leading technology from our technology partners with the skills of our own project managers, consultants, engineers and test facilities, we support customers from initial planning through to their digital transformations going live.
We provide end-to-end solutions and Services, within or across the five technology domains, which enable genuine realisation of business goals. Our engagements range from long-term complex transformation programmes to shorter-term or expert-leasing based consulting and implementations.
MANAGEWe use a broad range of operational skills, across our network of international Service Centers and distributed engineering teams, to operate and manage our customers’ IT. This increases quality and flexibility, while reducing costs. Our Services currently deliver engagement and enablement for over 3.7 million users.
Across all domains of our portfolio, we sell defined Managed Services, with related service-level agreements and either fixed or consumption-based pricing. Where customers want more flexibility or control, we also provide support and skills on a more transactional basis. Complementing our Technology Sourcing services, we offer a range of product lifecycle and maintenance Services, often on a per-device basis.
EVOLVING A DIFFERENTIATED AND COMPLETE CUSTOMER OFFEROur customers are confident in our skills and capabilities to help them make the right choices in the complex and fast-changing world of digital technology. To maintain this trust, we invest to stay relevant and competitive and ensure we have a complete offering of services, which we can deliver at scale.
This section describes Computacenter’s breadth of capability and our go-to-market messaging.
Members of the Group Development team10
Our approach to market

TRANSFORM
SOURCE
MANAGE
Workplace Cloud & Data Center
Applications & Data
Networking Security
OUR BREADTH OF SKILLSOur portfolio of Sourcing, Transformation and Managed Services spans all relevant infrastructure areas, ensuring our customers have access to a reliable, secure and flexible technology platform to accelerate their business.
SERVICE CENTERSOur Service Centers deliver a range of shared and dedicated capabilities including:
Service Desk Our goal is to provide a faster and smarter response to people. We deliver end-to-end support, locally and globally, and provide a ‘follow-the-sun’ service. Our global Service Desks handle over 1.1 million contacts per month, using 25 languages, at a price point and quality tailored to meet customer priorities. We leverage analytics, chatbots and intelligent automation to improve our agent productivity and each customer’s experience.
Remote Infrastructure Management The scale of our operation means we can support users and systems anywhere in the world, 24 hours a day, seven days a week. From private and public clouds to user devices, our infrastructure services manage and improve availability, performance and security.
Field & Maintenance ServicesOur field engineering operations allow customers access to both dedicated and on-demand engineering to support both the deployment of new technology and ongoing support of both infrastructure and users. Our engineering teams are supported by partners in both our larger operating countries and worldwide, allowing us to scale quickly to meet peaks in customer demand as well as offering customers global reach. Our field engineering teams are supported by maintenance logistics operations for infrastructure support.
Professional Services HubsFrom our remote Professional Services Hubs in Romania and India, we help customers assess their current IT environment, identify improvement potential, implement and integrate new technologies, and migrate solutions to the latest version or a new platform.
Both the near-shore hub in Romania (centred on Cluj and with a large portion of German speakers) and the off-shore hub in India (centred on Bangalore) give us access to skills, as well as cost arbitrage benefits.
Integration Centers Our Integration Centers act as a critical link in supporting customers to manage the deployment of new technology. We provide logistical services including stock-holding to help manage product availability and schedule deliveries, as well as technical services to configure and integrate technology from different technology partners.
These are complex and scalable operations, underpinned by our IT infrastructure, and provide a bridge between our Technology Sourcing and our Services businesses. As we continue to build our Integration Center capabilities internationally, we can also help customers to address their sustainability challenges by minimising the shipment distances for supply of product.
11
Strategic ReportAnnual Report and Accounts 2021
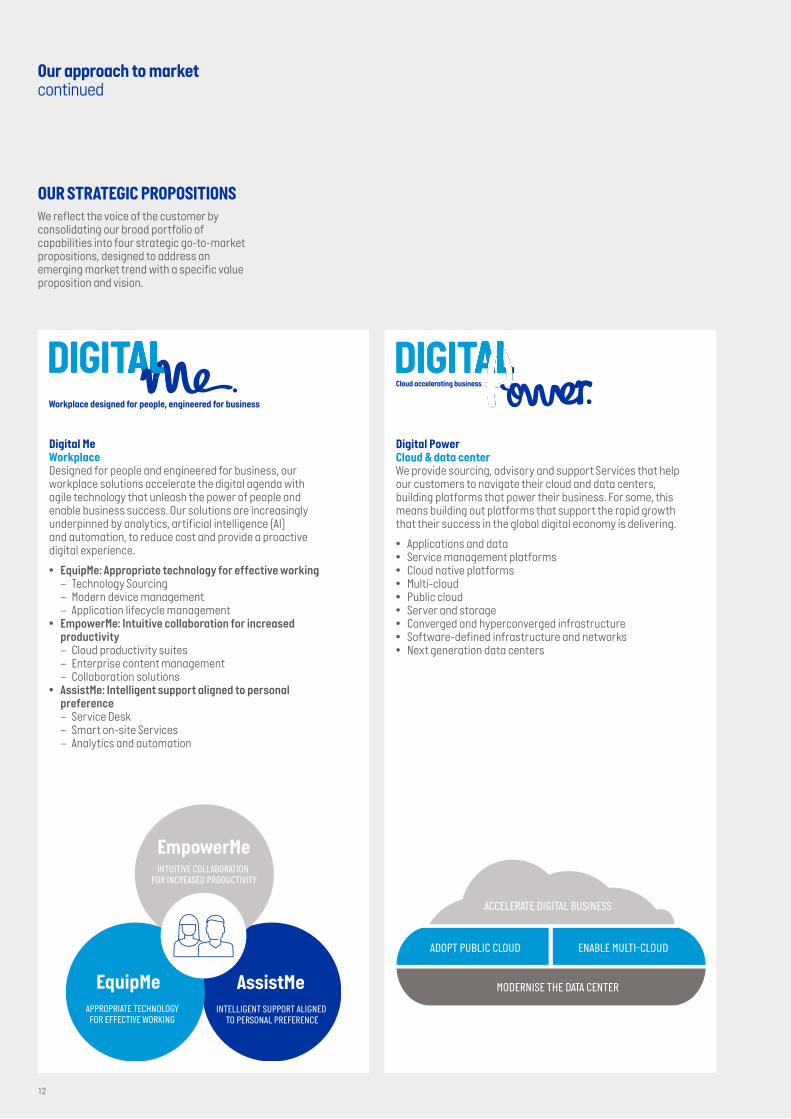
OUR STRATEGIC PROPOSITIONSWe reflect the voice of the customer by consolidating our broad portfolio of capabilities into four strategic go-to-market propositions, designed to address an emerging market trend with a specific value proposition and vision.
Digital Me WorkplaceDesigned for people and engineered for business, our workplace solutions accelerate the digital agenda with agile technology that unleash the power of people and enable business success. Our solutions are increasingly underpinned by analytics, artificial intelligence (AI) and automation, to reduce cost and provide a proactive digital experience.
• EquipMe: Appropriate technology for effective working– Technology Sourcing– Modern device management– Application lifecycle management
• EmpowerMe: Intuitive collaboration for increased productivity – Cloud productivity suites– Enterprise content management – Collaboration solutions
• AssistMe: Intelligent support aligned to personal preference – Service Desk– Smart on-site Services– Analytics and automation
Digital Power Cloud & data centerWe provide sourcing, advisory and support Services that help our customers to navigate their cloud and data centers, building platforms that power their business. For some, this means building out platforms that support the rapid growth that their success in the global digital economy is delivering.
• Applications and data• Service management platforms• Cloud native platforms• Multi-cloud • Public cloud• Server and storage• Converged and hyperconverged infrastructure• Software-defined infrastructure and networks• Next generation data centers
AssistMeINTELLIGENT SUPPORT ALIGNED
TO PERSONAL PREFERENCE
EquipMeAPPROPRIATE TECHNOLOGY
FOR EFFECTIVE WORKING
EmpowerMeINTUITIVE COLLABORATION
FOR INCREASED PRODUCTIVITY
ACCELERATE DIGITAL BUSINESS
ADOPT PUBLIC CLOUD ENABLE MULTI-CLOUD
MODERNISE THE DATA CENTER
12
Our approach to marketcontinued
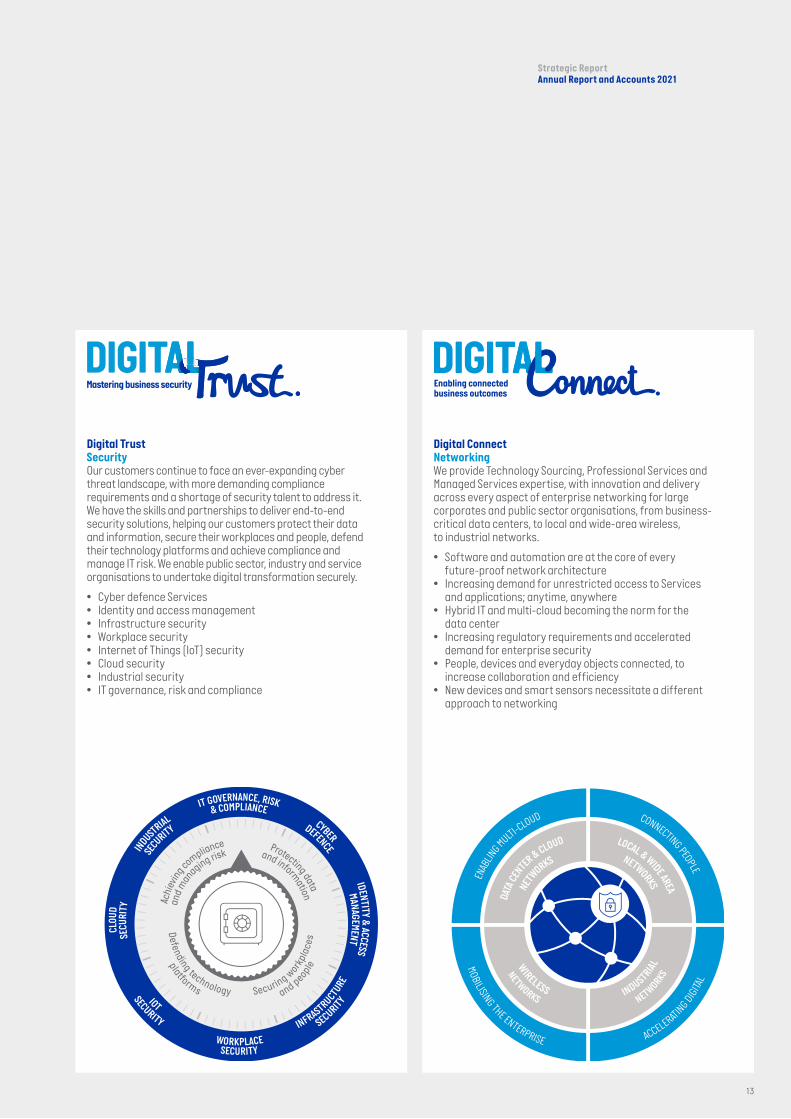
Digital TrustSecurity Our customers continue to face an ever-expanding cyber threat landscape, with more demanding compliance requirements and a shortage of security talent to address it. We have the skills and partnerships to deliver end-to-end security solutions, helping our customers protect their data and information, secure their workplaces and people, defend their technology platforms and achieve compliance and manage IT risk. We enable public sector, industry and service organisations to undertake digital transformation securely.
• Cyber defence Services• Identity and access management• Infrastructure security• Workplace security• Internet of Things (IoT) security• Cloud security• Industrial security• IT governance, risk and compliance
Digital ConnectNetworkingWe provide Technology Sourcing, Professional Services and Managed Services expertise, with innovation and delivery across every aspect of enterprise networking for large corporates and public sector organisations, from business-critical data centers, to local and wide-area wireless, to industrial networks.
• Software and automation are at the core of every future-proof network architecture
• Increasing demand for unrestricted access to Services and applications; anytime, anywhere
• Hybrid IT and multi-cloud becoming the norm for the data center
• Increasing regulatory requirements and accelerated demand for enterprise security
• People, devices and everyday objects connected, to increase collaboration and efficiency
• New devices and smart sensors necessitate a different approach to networking
NETWORKSNETW
ORKS
LOCAL & WIDE AREA
DATA
CENTER & CLOUD
WIRELESS INDUSTRIA
L
NETWORKS NETWORKS
ENAB
LING MULTI-CLOUD CONNECTING PEOPLE
MOBILISING THE ENTERPRISE ACCELERATING DIGITA
L
13
Strategic ReportAnnual Report and Accounts 2021

Major trend 1
Speed Agility becoming a competitive advantageWhile we see customers investing in IT, they continue to face pressure to deliver efficiencies and return on investment. At the same time, what was on top of our customers’ agendas yesterday may not be there tomorrow: the global pandemic has stressed the importance of adaptability at pace. Organisations are adopting new change methodologies, and IT departments have to innovate at speed, in order for their organisations to remain serious contenders in the marketplace. To do so, they are also using technologies where service is primarily provided with or through software, and augmented with analytics and AI.
What this means for ComputacenterBeing independent of our technology partners remains a key strength for us. We can assess our customers’ business requirements quickly and help them to select and integrate the appropriate solution and service model, in an increasingly complex environment. At the same time, we need to keep up with the pace of innovation and invest in new skills, so that our offerings remain relevant to our customers.
“In 2020, the Covid-19 pandemic gave multiple organizations an impetus for change, and it may be a catalyst for changes already taking place in the nature of work. The crisis has been for many companies a wake-up call to finally get moving. Now we see potential to go beyond traditional transformation and move toward agility.”
McKinsey & Company, Organizing for speed: Agile as a means to transformation in Japan, Nov. 2020
Major trend 2
Resilience Ensuring secure digital deliveryThe accelerated adoption of new and sometimes immature technologies, as well as remote working models during the pandemic, increases the risk of security and privacy breaches. Additionally, our customers have to react to changing regulatory requirements and security legislation. To protect themselves from financial and reputational losses and to meet compliance requirements, customers often implement rigid and fragmented security concepts that inhibit innovation and fast reactions to market changes.
What this means for Computacenter Our strong security practice, with over 200 security consultants, represents a competitive advantage and differentiates us from many of our competitors. We help our customers to implement an end-to-end security concept, allowing them to stay ahead of criminal threats and remain compliant with regulatory requirements.
“Technology plays a central role in society today. It supports initiatives by business and government, enables worldwide communications and drives innovation. As technology has become more prevalent, so has the reality of cyber attacks targeting corporations, governments and individuals. Over the last five years, the World Economic Forum has consistently rated cyber attacks as a substantial global risk and the latest reports from ENISA further highlight the complexity of the threat landscape, suggesting that these attacks are increasingly sophisticated, targeted and widespread.“
ENISA (European Union Agency for Cybersecurity), Addressing the EU Cybersecurity skills shortage and gap through higher education, Nov. 2021
THE COMPETITIVE MARKETIn addition to the major trends described above, a number of factors are influencing the way we compete in our markets.
Market segments – Save to innovateWith IT budgets staying flat or growing very slowly, IT decision makers need to reduce costs in order to fund new digital initiatives. Procurement departments also push to reduce costs in existing contracts and legacy platforms, which puts pressure on renewals, and we therefore continue to drive efficiencies in our scale operations to remain competitive. This includes various initiatives from implementing automation to significant investments in our off-shore Service Centers.
At the same time, we help Chief Information Officers to select, implement and manage technology platforms such as multi-cloud, big data and the IoT, to become the foundation for new digital business models and applications. Our ability to select the right solutions from a wide range of options, paired with our security and networking skills, put us in a good position to exploit these digital business markets.
Shifting buying centres The traditional buying centres in our industry are our customers’ IT and procurement departments. However, customers are now
STAYING ABREAST OF CHANGES IN THE GLOBAL MARKETTo stay competitive, our customers need to respond faster and more effectively to changing business conditions and unpredictable external factors. This means they have to innovate and enrich the digital experiences of their people and customers, in a secure and sustainable manner.
In turn, we need to act with pace and confidence, to help our customers make the most of their existing technology and select new investments that support their digital agenda, in this increasingly complex and fast-changing environment.
This section looks at the major trends that are changing our markets and considers our competitive environment.
Five major trends are shaping our markets worldwide.
14
Our approach to marketcontinued
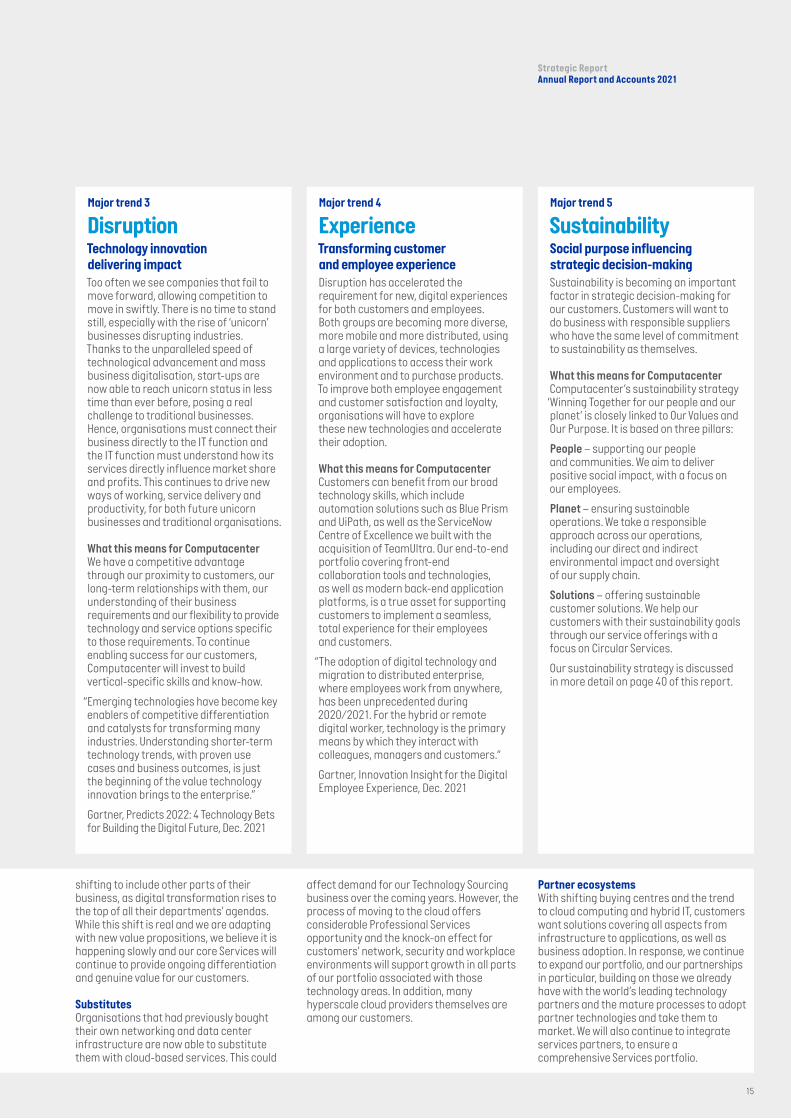
Major trend 3
DisruptionTechnology innovation delivering impactToo often we see companies that fail to move forward, allowing competition to move in swiftly. There is no time to stand still, especially with the rise of ‘unicorn’ businesses disrupting industries. Thanks to the unparalleled speed of technological advancement and mass business digitalisation, start-ups are now able to reach unicorn status in less time than ever before, posing a real challenge to traditional businesses. Hence, organisations must connect their business directly to the IT function and the IT function must understand how its services directly influence market share and profits. This continues to drive new ways of working, service delivery and productivity, for both future unicorn businesses and traditional organisations.
What this means for Computacenter We have a competitive advantage through our proximity to customers, our long-term relationships with them, our understanding of their business requirements and our flexibility to provide technology and service options specific to those requirements. To continue enabling success for our customers, Computacenter will invest to build vertical-specific skills and know-how.
“Emerging technologies have become key enablers of competitive differentiation and catalysts for transforming many industries. Understanding shorter-term technology trends, with proven use cases and business outcomes, is just the beginning of the value technology innovation brings to the enterprise.”
Gartner, Predicts 2022: 4 Technology Bets for Building the Digital Future, Dec. 2021
Major trend 4
Experience Transforming customer and employee experienceDisruption has accelerated the requirement for new, digital experiences for both customers and employees. Both groups are becoming more diverse, more mobile and more distributed, using a large variety of devices, technologies and applications to access their work environment and to purchase products. To improve both employee engagement and customer satisfaction and loyalty, organisations will have to explore these new technologies and accelerate their adoption.
What this means for Computacenter Customers can benefit from our broad technology skills, which include automation solutions such as Blue Prism and UiPath, as well as the ServiceNow Centre of Excellence we built with the acquisition of TeamUltra. Our end-to-end portfolio covering front-end collaboration tools and technologies, as well as modern back-end application platforms, is a true asset for supporting customers to implement a seamless, total experience for their employees and customers.
“The adoption of digital technology and migration to distributed enterprise, where employees work from anywhere, has been unprecedented during 2020/2021. For the hybrid or remote digital worker, technology is the primary means by which they interact with colleagues, managers and customers.“
Gartner, Innovation Insight for the Digital Employee Experience, Dec. 2021
Major trend 5
SustainabilitySocial purpose influencing strategic decision-makingSustainability is becoming an important factor in strategic decision-making for our customers. Customers will want to do business with responsible suppliers who have the same level of commitment to sustainability as themselves.
What this means for Computacenter Computacenter’s sustainability strategy ‘Winning Together for our people and our planet’ is closely linked to Our Values and Our Purpose. It is based on three pillars:
People – supporting our people and communities. We aim to deliver positive social impact, with a focus on our employees.
Planet – ensuring sustainable operations. We take a responsible approach across our operations, including our direct and indirect environmental impact and oversight of our supply chain.
Solutions – offering sustainable customer solutions. We help our customers with their sustainability goals through our service offerings with a focus on Circular Services.
Our sustainability strategy is discussed in more detail on page 40 of this report.
shifting to include other parts of their business, as digital transformation rises to the top of all their departments’ agendas. While this shift is real and we are adapting with new value propositions, we believe it is happening slowly and our core Services will continue to provide ongoing differentiation and genuine value for our customers.
SubstitutesOrganisations that had previously bought their own networking and data center infrastructure are now able to substitute them with cloud-based services. This could
affect demand for our Technology Sourcing business over the coming years. However, the process of moving to the cloud offers considerable Professional Services opportunity and the knock-on effect for customers’ network, security and workplace environments will support growth in all parts of our portfolio associated with those technology areas. In addition, many hyperscale cloud providers themselves are among our customers.
Partner ecosystemsWith shifting buying centres and the trend to cloud computing and hybrid IT, customers want solutions covering all aspects from infrastructure to applications, as well as business adoption. In response, we continue to expand our portfolio, and our partnerships in particular, building on those we already have with the world’s leading technology partners and the mature processes to adopt partner technologies and take them to market. We will also continue to integrate services partners, to ensure a comprehensive Services portfolio.
15
Strategic ReportAnnual Report and Accounts 2021

HOW WE CREATE SUSTAINABLE VALUEComputacenter is a leading independent technology partner, trusted by large corporate and public sector organisations. We help our customers to Source, Transform and Manage their technology infrastructure to deliver digital transformation, enabling people and their business.
Our business model is customer-centric, based on enabling success by building long-term trust with our customers, our people and our partners. This underpins our value to our communities and our shareholders. In doing so, we leverage the long-term investment in our infrastructure and physical assets and place great confidence in the depth of skills and knowledge of our teams.
Our customersWe deliver digital technology to some of the world’s greatest organisations. Our target market is the largest 1,000 corporate and government organisations in each of the nine countries in which we sell. Our operational model supports this aim through having account managers, sales specialists, consultants, and project and service managers aligned to our customers, to build strong customer intimacy. We give our customer teams the freedom to make responsible decisions that meet customer needs faster. The majority of our customers have been trading with us for over 10 years, showing the value of these trusted relationships and our financial stability. We have a balanced spread of business with most of our customers, supporting them through Technology Sourcing, as well as Professional and Managed Services, as each part of our customer offering supports the others.
More information about how we create value is on pages 10 to 16.
Our peopleTogether, we have created a can-do culture where people matter and are encouraged to thrive. Computacenter employs over 18,000 people worldwide. This includes more than 5,000 engineers, 5,000 support operatives in our Service Centers, 1,600 project and service managers and 1,600 consultants. These service delivery teams are backed by the skills and experience of our sales and business services teams. Our aim is that people want to join and stay with us, and be proud of our reputation, as we learn, earn and have fun.
More information about how we attract, retain and develop our people is on pages 44 to 51.
Our partnersWe have built powerful partnerships with the world’s leading technology partners, who can rely on our reach and scale. We are among the largest partners in EMEA for each of the technology partners, who are increasingly recognising us for our achievements at a global level. We use our technology understanding to build solutions for our customers across all parts of our portfolio. We aim for our customers to be confident in our skills and solutions and trust in our independence and experience. This means we can help our customers to make wise choices in a complex and changing world.
More information about our partners and Technology Sourcing is on pages 18 to 21.
Our brandOur brand and reputation are underpinned by our Winning Together Values. We maintain a strong brand by putting customers first, being straightforward, keeping promises and considering the long term, while understanding that people matter and inspiring success.
Our Purpose is Enabling Success by building long-term trust with our customers, people, technology partners, and communities. We aim to be strongly recommended by customers for the way we help them achieve their goals, ensuring customer referenceability. Where we make acquisitions, we usually transition the acquired business quickly to the Computacenter brand and embed our values.
More information about our values can be found on page 45.
Our infrastructure and physical assetsWe sell to customers in nine countries and have supporting near-shore and off-shore operations in another seven countries. We have entities or VAT registrations in another eight countries or territories. We source for, and support, customers across more than 70 countries worldwide. Our customers demand that our operations are delivered to high industry standards and we have a range of ISO certifications, including ISO 27001, ISO 9001, ISO 20000-1, ISO 14001 and ISO 45001.
Our Service Centers and Integration Centers are indicated on the map located on the inside front cover of this document.
Our Service Centers help us to support our Managed Services contracts. They are underpinned by a common technology infrastructure, to allow customers to be supported by multiple centers.
Our Integration Centers allow us to stage, test and integrate technology for our customers around the world.
We have a number of underlying systems that support our business, including our SAP ERP solution, systems that connect us to our customers’ sourcing functions, and systems that underpin our Managed Services.
Our propositionsWe drive engagement with our customers through our strategic propositions, which are underpinned by a range of service offerings designed to deliver solutions to our customers.
More information about these can be found on pages 12 to 13.
16
Our approach to marketcontinued
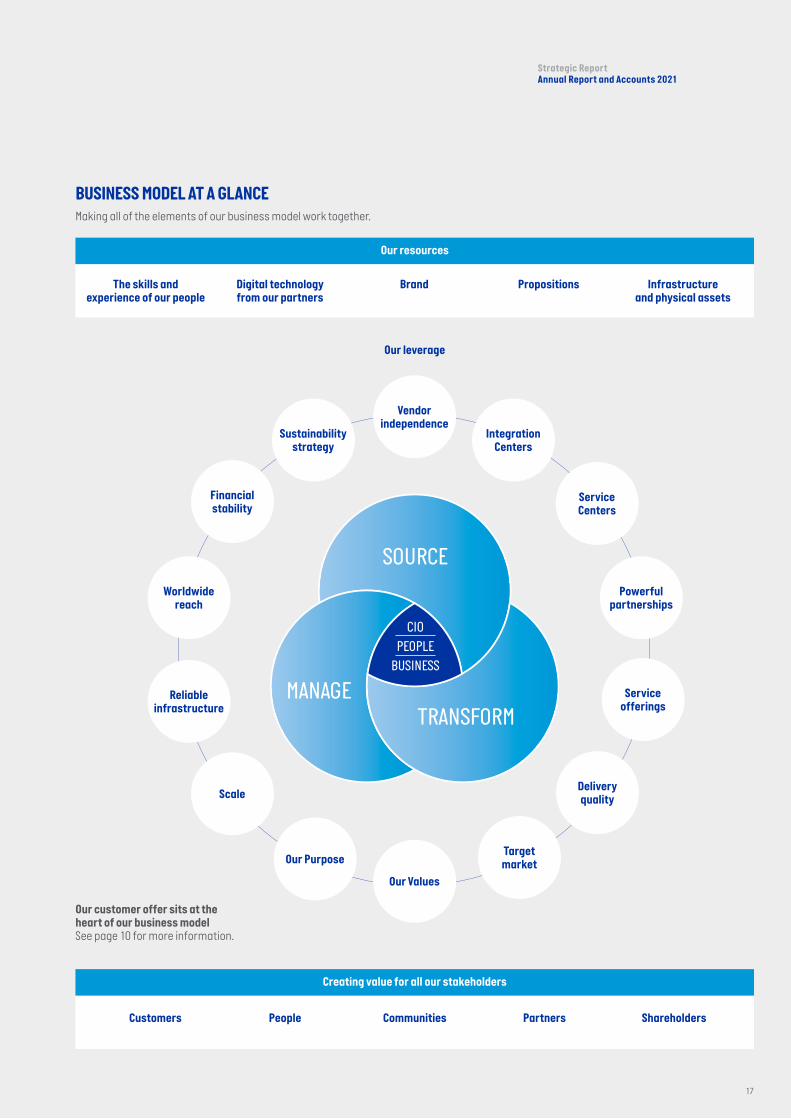
Our resources
Our leverage
Creating value for all our stakeholders
Customers People Communities Partners Shareholders
The skills and experience of our people
Digital technology from our partners
Brand Propositions Infrastructure and physical assets
BUSINESS MODEL AT A GLANCEMaking all of the elements of our business model work together.
Our customer offer sits at the heart of our business modelSee page 10 for more information.
CIOPEOPLE
BUSINESS
SOURCE
TRANSFORMMANAGE
Our Purpose
Service Centers
Our Values
Vendor independence
Service offerings
Target market
Integration Centers
Powerful partnerships
Delivery qualityScale
Reliable infrastructure
Worldwide reach
Financial stability
Sustainability strategy
17
Strategic ReportAnnual Report and Accounts 2021

Technology Sourcing
OUR PARTNERS CAN RELY ON OUR REACH AND SCALETechnology Sourcing is our traditional core business and we continue to see it as both fundamental to our customers and a significant growth driver. We help our customers to determine their technology needs and, supported by our technology partners, we provide the commercial structures, integration and supply chain services to meet those needs reliably. We earn revenue from large contracts, with thinner margins and lower visibility than for Services, but with amazing customer loyalty, which we earn through reliability, agility and scale.
Integration Center – Livermore, United StatesOur facility next to Silicon Valley, close to major hyperscale customers.
Integration Center – Hatfield, United KingdomTechnical Services: volume configuration.
OUR INTEGRATION CENTERS
Zurich, Switzerland
Livermore, United States
Kerpen, Germany
Hatfield, United Kingdom
Gonesse, France
Brussels, Belgium
Bodegraven, Netherlands
Alpharetta, United States
Members of the Group Technology Sourcing team18

Integration Center – Kerpen, GermanyLong-term investment in the German market through our Kerpen facility which opened in 2020.
We provide our customers with huge flexibility, adapting our processes to fit their often very specific quotation, order management, shipment, receipt and documentation requirements. This flexibility comes from our significant long-term investment in our people, systems and Integration Centers. Our supply chain services range from pre-configuration of all types of technology to end-of-use management. Our customers value our ability to support them across the entire hardware and software lifecycle and to act as a partner who can deliver at scale and, increasingly, globally.
Growth driversA number of key drivers in the market are underpinning our customers’ continuing investment in new digital technology. In particular, our customers want to:
• modernise their workplaces, to enable people through better technology that attracts and retains talent, increases collaboration and drives closer customer proximity;
• transform their legacy applications, data centers and processes, and adopt cloud technology, to be more scalable, flexible and agile;
• ensure that their networks and communications can support their digitisation and future operational models and that everything is secure; and
• connect their people, data and IoT devices, to better leverage existing know-how and improve the efficiency and productivity of their workforce.
Technology Sourcing is a serviceWe integrate and deploy across workplace, data center, networking and security. Our investment in Integration Centers in the United Kingdom, Germany, France, Belgium, the Netherlands and the United States gives us the scale to meet the most demanding customer requirements.
The importance to our customers of the scale and resilience of our Integration Center infrastructure was demonstrated in 2020 by our ability to support their deployment of new technology at incredible pace, in response to the Covid-19 pandemic. The customer demand for our Integration Center services has continued through 2021 with high utilisation and workload driven by both the volume of customer deployment projects as well as helping customers by managing inventory availability, as global supply chains have remained challenged.
Our customers are increasingly relying on our ability to help them manage product availability while deploying technology internationally and at scale.Kevin JamesGroup Chief Commercial Officer
Strategic ReportAnnual Report and Accounts 2021
19

Technology Sourcingcontinued
Computacenter’s long-term investments in systems and infrastructure have positioned us as a trusted partner for major organisations needing to deploy technology at scale. In 2021, we have continued to invest in our capabilities:
• We have significantly upgraded the IT network and security at each of our main European Integration Centers to allow us to download Autopilot configurations for customers, reducing the time taken by users when receiving new devices.
• We have gone live with a new export compliance system across the Group that automates the compliance process when exporting items from an Integration Center in one country to another.
• We have started the rollout of new quotation and opportunity management systems across the Group.
• In March 2021, we acquired ITL logistics, a German business which employs 80 people, to strengthen our supply chain capabilities in Germany and the European Union. ITL logistics operates regional warehouses where IT products are held, configured, repaired and disposed of and also operates its own IT logistics fleet with technical couriers who deliver and collect IT products across Europe. These capabilities are being integrated into our supply chain solutions and Circular Services solutions in Germany, providing greater flexibility and improved service levels for our customers.
Powerful partnerships The increasing pace of technological change and the diversity of the technology partner landscape has made our technology partner independence more critical to our customers. We are trusted to provide impartial and knowledgeable advice and to integrate solutions comprising products from multiple technology partners.
Computacenter is one of the largest value-added resellers (VAR) worldwide for most of the major technology partners. We invest heavily in working closely with them, to ensure we can effectively help our customers to Source, Transform and Manage their IT infrastructure. The breadth and depth of our technology partnerships allows us to help our customers navigate the complexity and speed of change in the current market.
Our expertise in our technology partners’ solutions is significant, with our people holding more than 12,000 technical certifications. Our strong working relationships and our desire to collaborate and seek innovation and new services help us remain relevant, so we are increasingly seen as the partner of choice.
Through our close working relationships with technology partners and major customers we are helping to minimise the impact of global industry supply chain issues, which we expect to continue throughout 2022.
We are not just working with our established technology partners. There is increasing demand for new technology partners and innovative approaches, which are often integrated with core partner technology to provide complete solutions. Our ability to design, source, integrate, deploy and support means we can add material value in delivering new digital solutions. This is reflected in another year of awards and recognition across the Group.
For example: Cisco – 14 awards overall including
– Global Enterprise Partner of the Year – EMEAR Partner of the Year – EMEA Security Partner of the Year – DE Partner of the Year, Enterprise Partner
of the Year – UK Partner of the Year, Enterprise Partner
of the Year, Security Partner of the Year – FR Capital Partner of the Year – BE CX Partner of the Year – Canada Breakout Partner of the Year
Dell Technologies – EMEA Partner of the YearF5 – DE Partner of the YearHPE – US Solution Provider of the YearHPE – Northern Europe Solution Provider of the YearHP Inc. – UK 5* Sustainability AwardMicrosoft – Global Surface Partner of the YearNetApp – Awarded Global Star Partner NetApp – EMEA Partner of the YearSamsung – UK Elite Partner of the YearVMware – EMEA Partner of the Year
ITL logistics – GermanyThe acquisition of ITL logistics in Germany helps improve our supply chain flexibility and service levels.
20

Gold Integrator
Our established technology partnersWe hold over 200 technology accreditations and our people hold over 12,000 technical certifications.
Group annual sales event – Manchester, United KingdomBuilding Powerful Partnerships with the world’s leading technology partners.
21
Strategic ReportAnnual Report and Accounts 2021

OUR CUSTOMERS CAN BE CONFIDENT IN OUR SKILLS AND EXPERIENCEWe employ over 13,000 people globally to deliver services to our customers. These range from IT strategy, advisory, transformation and deployment services (Professional Services) to support, maintenance and managed services (Managed Services).
SELECTION OF OUR SERVICE CENTERS
Members of the Group Delivery and Group Commercial Management teams
Milton Keynes, United Kingdom
Barcelona, Spain
Poznan, Poland
Montpellier, France
Kuala Lumpur, Malaysia
Budapest, Hungary
Berlin, Germany
Bangalore, India
Cape Town, South Africa
Mexico City, Mexico
In 2021, we have continued to demonstrate the resilience of our infrastructure, the benefits of the scale of our operations and the skills and commitment of our people.Julie O’HaraGroup Delivery Director
22
Managed Services and Professional Services

Group Delivery – London, United KingdomGroup Delivery extended leadership team meeting.
MANAGED SERVICESWe maintain, support and manage IT infrastructure and operations for our customers, to improve quality and flexibility while reducing costs. Despite competitive pricing in the market, our revenue under contract has high visibility, is long term and stable. We see this recurring income as a strategic means of balancing our business, as well as being essential to our Source, Transform and Manage customer offer. Customers ask us to reduce their costs by running some of their support operations, as well as taking end-to-end responsibility for sourcing, deploying, transforming and then providing the ongoing managed support of digital projects.
We have continued to improve the predictability of our Services, to the benefit of our customers and our own business. As our customers’ businesses continue to evolve and be challenged, we will continue to adapt our offerings to remain relevant and competitive. We see significant opportunities to add value to our customers.
Our Service Centers are the core of our Managed Services capability and we have continued to invest in improving and updating the technology underpinning them. We have completed the implementation of a ScienceLogic-based support platform for
our infrastructure operations and continued development of our Artificial Intelligence, Automation and Analytics (AIMY) collection of tools.
We are also making a significant investment in a ServiceNow-based global solution to modernise the way in which we can deliver workplace services, including Device-as-a-Service (DaaS), integrating our services from Service Centers, Integration Centers and field engineering. We expect this solution to be supporting key customers from 2022.
While the pandemic demonstrated the resilience of our Services and infrastructure, we are also investing to ensure that our core IT Service Management (ITSM) systems are modernised and allow us to provide the capabilities our customers will need in the future. Our new ITSM systems will start to be available to some customers from 2022 but the full replacement and migration programme will take over three years, minimising disruption to customers.
Our people have continued to show enormous resilience and commitment in responding to customer challenges through 2021, despite the changing Covid-19 situation and regulations in different countries. We are very proud of what they have achieved. We have continued to demonstrate the resilience of our infrastructure, the benefits of scale of our operations and the skills and commitment of our people.
2021 highlights include:• Successful go-live of 23 new service
contracts, supporting customers across more than 50 countries, including three major new services.
• Significant expansion of our off-shore Service Center in Bangalore, India, where we now have 850 people at the end of 2021 and will grow to over 1,200 in 2022.
• Expansion of our near-shore Service Center in Poznan, Poland, where we expect to have approximately 300 people by the end of 2022.
• Reducing our Managed Services ‘cost to serve’, to ensure we remain competitive in the evolving market. This is demonstrated by the increase in our Services revenue per Services head of 10.5 per cent to approximately £105,500 (see page 8), demonstrating the progress in services efficiency.
Strategic ReportAnnual Report and Accounts 2021
23
COMPUTACENTER’S COVERAGE REGIONAL HEADQUARTERSINTEGRATION CENTERSSERVICE CENTERS
LIVERMORE, CA, USA
ALPHARETTA, GA, USA
BODEGRAVEN, NETHERLANDS
BRUSSELS, BELGIUM
HATFIELD, BRAINTREE, UK
GONESSE, PARIS, FRANCE
ZURICH, SWITZERLAND
KERPEN, GERMANY
DALLAS, TX, USA
MEXICO CITY, MEXICO
MARKHAM, ON, CANADA
BARCELONA, SPAIN
HATFIELD, MILTON KEYNES,NOTTINGHAM, SHEFFIELD, UK
LYON, MONTPELLIER, PARIS, PERPIGNAN, FRANCE
BUDAPEST, HUNGARY
CLUJ, ROMANIA
BERLIN, DRESDEN, ERFURT, KERPEN, GERMANY
POZNAN, POLAND
CAPE TOWN, SOUTH AFRICA
KUALA LUMPUR, MALAYSIA
BANGALORE, INDIA
SAN FRANCISCO, CA, USA
ATLANTA, GA, USA
HATFIELD, UK, EMEA
KUALA LUMPUR, MALAYSIA, APAC
PROFESSIONAL SERVICESWe provide structured solutions and expert resources to help our customers select, deploy and integrate digital technology, so they can achieve their business goals. Our revenue depends on our forward order book, which contains a multitude of short, medium and long-term projects.
As the technology landscape has become more complex, our 1,600 consultants play an increasingly important role in advising our customers. Our Professional Services and Technology Sourcing businesses have always been linked and we see this increasing, as our clients need our help to make wise choices in the complex technology landscape and to then deploy and integrate these technologies.
Our Professional Services revenue also includes some of our 5,000 engineering employees and 750 project managers, who are charged as part of customer integration and deployment projects. These engagements range from workplace rollouts to complex network and data center solution integrations.
We see significant opportunity to grow our Professional Services business across all our portfolio areas, which are; workplace, data & analytics, cloud & data center, networking, and security.
Our Professional Services business continues to be a major source of Services growth, as customers look to us for help to deploy new digital technology.
2021 highlights include:• Our Professional Services revenue
exceeded £550 million for the first time.• We delivered over 1,000 projects in 2021 for
the first time.• We opened Professional Services hubs in
Romania and India and plan to scale these to 400 people by the end of 2022.
COMPUTACENTER’S COVERAGE REGIONAL HEADQUARTERSSERVICE CENTERS
DALLAS, TX, USA
MEXICO CITY, MEXICO
MARKHAM, ON, CANADA
BARCELONA, SPAIN
HATFIELD, MILTON KEYNES,NOTTINGHAM, SHEFFIELD, UK
LYON, MONTPELLIER, PARIS, PERPIGNAN, FRANCE
BUDAPEST, HUNGARY
CLUJ, ROMANIA
BERLIN, DRESDEN, ERFURT, KERPEN, GERMANY
POZNAN, POLAND
CAPE TOWN, SOUTH AFRICA
KUALA LUMPUR, MALAYSIA
BANGALORE, INDIA
SAN FRANCISCO, CA, USA
ATLANTA, GA, USA
HATFIELD, UK, EMEA
KUALA LUMPUR, MALAYSIA, APAC
OUR SERVICE CENTERS
24
Managed Services and Professional Servicescontinued

Group annual sales event – Berlin, GermanyOur customers and technology partners depend on our breadth of services skills and experience to deploy the latest digital technology at scale.
Engineering and Maintenance ServicesWe help customers support and maintain their technology across the world.
25
Strategic ReportAnnual Report and Accounts 2021

GROUP
Financial performance Our strong financial and operational performance in 2021 saw the Company deliver its 17th consecutive year of adjusted1 diluted earnings per share growth. This continues to demonstrate the resilience of our business model, and reinforces our position as having the largest Services business of any VAR, as well as the largest VAR capability of any Services business worldwide.
The Group’s revenues increased by 23.6 per cent to £6,725.8 million (2020: £5,441.3 million) and were 26.9 per cent higher in constant currency2. This is the first time that the Group has exceeded £6 billion of revenues in a year, and saw revenues in the second half of the year higher than any of the annual revenues recorded by the Group up to and including 2016. Gross invoiced income4 increased by 21.1 per cent to £6,923.5 million (2020: £5,715.0 million).
The Group has more than doubled its adjusted1 profit before tax over the last three years. This is the first time that we have achieved such an increase since we have been a public company. The Group made a profit before tax of £248.0 million, an increase of 20.0 per cent (2020: £206.6 million). The Group’s adjusted1 profit before tax increased by 27.5 per cent to £255.6 million (2020: £200.5 million) and by 31.5 per cent in constant currency2. The adjusted1 profit before tax results for both the first and second halves of the year are individually greater than any full-year adjusted1 profit before tax we achieved prior to 2019 and each would be the third-largest annual profit in the Group’s history.
The difference between profit before tax and adjusted1 profit before tax relates to the net charge of £7.6 million (2020: gain of £6.1 million) from exceptional and other adjusting items. In the current year, this comprises the amortisation of the acquired intangible assets resulting from the Group’s 2018
acquisition of FusionStorm and the 2020 acquisition of Pivot. Further information on these can be found on page 73.
With the increase in the Group’s profit after tax, the diluted earnings per share (EPS) increased by 20.3 per cent to 160.9 pence for the year (2020: 133.8 pence). Adjusted1 diluted EPS, the Group’s primary EPS measure, increased by 31.0 per cent to 165.6 pence (2020: 126.4 pence) in 2021.
The result has benefited from £1,105.1 million of revenue (2020: £232.6 million), and £13.9 million of adjusted1 profit before tax (2020: £3.3 million), from all acquisitions made since 1 January 2020. All figures reported throughout this Annual Report and Accounts include the results of these acquired entities. Excluding the impact of the acquisitions made since 1 January 2020, revenues grew organically by 10.9 per cent on a constant currency2 basis.
Trading across all of our major geographies, apart from France, was pleasing throughout the year, with particular strength at the end of the second quarter, and in our traditionally strongest month of December.
The Group only received €0.2 million of government employment-related assistance during the year, which was entirely related to the Group’s Belgian operations and ceased in May 2021. A further $1.3 million was recognised as a credit to the income statement in North America during the year, due to funds received relating to a payroll protection programme in Pivot that was applied for prior to acquisition. This has subsequently been converted to a permanent grant by the US Federal Government. The year saw continuing, but reduced, challenges from Covid-19, with most of our major geographies experiencing lockdowns or restrictions on office-based working during the year. The vast majority of our employees worked from home for significant periods during the year,
although we were generally able to perform services on customer sites as required. We thank all of our people for the flexibility and dedication they have shown to cope with the continually changing external environment and acknowledge their successes, as they have driven the Company to new heights of performance.
The Group has seen business with key industrial customers return to near pre-pandemic levels, after this spend was largely suppressed during 2020. Combined with strong public sector activity, this has continued to create organic revenue growth opportunities for the Group. As in 2020, we benefited from some Covid-19-related cost savings, but to a much lower extent. Additionally, there was no further pandemic-related surge in spend on Technology Sourcing, compared to the prior year. Whilst demand has remained high, the driver has shifted from short-term pandemic responses to more medium-term re-engineering of IT structures, as organisations employ digital transformation to cope with the ever-evolving technology landscape and increasing cyber threats.
Revenues from public sector customers, such as local and central government, increased by 10.1 per cent, against growth with non-public sector customers of 29.9 per cent. Public sector accounts have grown less than last year, whereas demand from other customer sectors has recovered strongly as the marketplace normalises towards pre-Covid-19 patterns. The public sector now accounts for 28.2 per cent of our revenues (2020: 32.0 per cent). While significant volumes of this public sector business were at lower than normal gross margins, particularly through the first quarter of the year, we maintained efficiencies and reduced costs within business delivery areas, so that margins remained very close to the record levels seen in 2020.
Revenue £m+23.6%
6,725.8Adjusted1 profit before tax £m+27.5%
255.6Revenue by business type
1. Source 78.4%
2. Transform 8.2%
3. Manage 13.4%
1
2
3
26
Our performance in 2021

Our strong financial and operational performance in 2021saw the Company deliver its 17th consecutive year of earnings per share growth.Mike NorrisChief Executive Officer
Throughout the year, product shortages have materially impacted the supply of key equipment for our customers, with some orders being materially delayed or only partly fulfilled. Whilst product availability increased during December, the unexpected impact on working capital through the year was significant. Inventory levels have increased across the business, as a result of carrying stock for orders that we cannot deliver without a critical part or, increasingly through the year and particularly in North America, where customers have ordered early and subsequently delayed delivery, as data center facilities are not ready. We do not expect inventory to return to normal levels until there is a longer-term supply improvement.
The Group had £341.3 million of inventory as at 31 December 2021, an increase of 61.5 per cent on the balance sheet as at 31 December 2020 of £211.3 million. Over three quarters of this increase was attributable to our North American Segment, which had closing inventory of £212.5 million (2020: £103.2 million).
While supply has been restricted, demand has continued to rise, with our product order backlogs across all geographies at all-time highs and considerably larger than at the end of 2020. This gives us a high degree of confidence that the Technology Sourcing business will be well placed to benefit in the year ahead.
The Group has seen significant currency translation headwinds as the pound sterling has strengthened against other currencies, particularly the US dollar and the euro. This has reduced profitability in the year. Had exchange rates in 2021 been equivalent to the average rates seen in 2020, adjusted1 profit before tax would be £7.6 million higher, with revenues £234.0 million higher in 2021. Further information on currency impacts is available on page 78 of the Group Finance Director’s review.
We remain alert to ongoing product shortages, and further strengthening of the pound would create a stronger FX translation headwind.
Looking at our performance by geography, the UK in particular has seen very strong demand continue from both public and private sector customers, with increased software sourcing and enterprise technology orders driving growth. Professional Services growth has surged, as customers have restarted delayed projects and invested in the ongoing transformation of their IT environments.
The German business has seen similar growth patterns to the UK. Technology Sourcing delivered good growth as large industrial customers, particularly in automotive, have returned to normal trading patterns with less disruption from Covid-19. We were pleased to sign a new supply framework agreement with our largest customer in Germany, ensuring that the partnership remains central to the success of both businesses.
In North America, the mid-market customers who materially reduced spend during 2020 continued to return and complemented our ongoing and growing success with hyperscale (data center-based) customers, driving good
Members of the Group Executive team
Strategic ReportAnnual Report and Accounts 2021
27

overall organic revenue and profit performance. The addition of the Pivot acquisition in the second half of 2020 has further contributed to the Segment, with a full year of performance and complementary capabilities that support our overall North American growth ambitions.
The French business had a slightly disappointing 2021, with reductions in Technology Sourcing performance compounding the impact of the previously announced non-renewal of the Group’s largest Managed Services contract. The integration of Computacenter NS remains on track, with the transition to our Group ERP system successfully completed. Computacenter NS performed in line with our forecasts and contributed an adjusted1 loss before tax of £3.8 million, which also worsened the overall French Segment result. As we have noted previously, we recognised an exceptional gain of £14.0 million on consolidation of the subsidiary in the 2020 Annual Report and Accounts, following the acquisition of the business. This gain arose from cash maintained by the vendor within the acquired balance sheet that was primarily to compensate the Group for future losses. Under IFRS it is not possible to allocate the exceptional gain against future incurred operating losses, but it is important to remember when considering the commercial context of the Computacenter NS performance and our short to medium-term expectations for the business. We consider that the exceptional gain reflects the losses that the acquired business will incur over the medium term, as it is brought onto a sustainable footing.
The International Segment has improved significantly on 2020, with a good finish to the year. All of the primary European trading entities saw improved performance with Belgium, Switzerland and the Netherlands all experiencing encouraging growth in both revenues and profitability, and the commencement of a global contract with a large industrial customer led from the Netherlands.
With both organic and acquired revenues increasing during the year, profits increased as costs across the Group remained lower than pre-Covid-19 levels and margins remained high. Overall, Group gross margins were broadly flat at 12.9 per cent of revenues (2020: 13.2 per cent).
Administrative expenses increased by 20.5 per cent in constant currency2, significantly behind the growth in gross profit as pre-pandemic costs continued to return in a controlled manner. As offices once again re-open across our major geographies, we expect costs to return but at a lower level than before the Covid-19 crisis, with the business having learned to be leaner and more efficient.
Technology Sourcing performanceThe Group’s Technology Sourcing revenue increased by 26.2 per cent to £5,274.9 million (2020: £4,180.1 million) and by 29.7 per cent on a constant currency2 basis.
The result benefited from £977.5 million of revenue from the acquisitions made since 1 January 2020 (2020: £212.0 million) with £967.7 million of this as a result of the Pivot acquisition (2020: £209.5 million). Excluding these revenues, Technology Sourcing organic revenue growth was 11.5 per cent on a constant currency2 basis.
The UK Technology Sourcing business saw continued excellent growth, with the focus moving from workplace contracts driven by the remote working needs of the Covid-19 environment to the higher margin enterprise product.
In Germany, Technology Sourcing revenue returned strongly to growth, in particular as automotive and other industrial customers increased spend through large framework agreements, following the sector-related Covid-19 and supply chain issues. We signed a key framework agreement with our biggest customer in Germany, allowing us to approach 2022 with confidence.
The French Technology Sourcing revenue declined on an organic basis, due to reduced demand in the year from some major customers.
The North American Technology Sourcing business saw revenues improve on an organic basis. Our hyperscale customers have significantly increased demand, and the mid-market core of the business has remained stable after a slowdown in 2020. The acquisition of Pivot has added material volume to the Segment, with the business lines, geographical footprint and technical capabilities almost entirely complementary to the pre-acquisition US business. The combined operation provides opportunities to reach a wider addressable market and to cross-sell across our portfolio.
Overall Group Technology Sourcing margins reduced by 33 basis points during the year, partially due to customer and product mix changes.
Services performance During the year we experienced the highest growth in our Services revenue for the last 20 years. The Group’s Services revenue increased by 15.0 per cent to £1,450.9 million (2020: £1,261.2 million) and by 17.8 per cent on a constant currency2 basis. Within this, the Group’s Professional Services revenue increased by 29.9 per cent to £552.4 million (2020: £425.4 million), and by 33.1 per cent on a constant currency2 basis, while the Group’s Managed Services revenue increased by 7.5 per cent to £898.5 million (2020: £835.8 million), and by 10.1 per cent on a constant currency2 basis.
The overall Services result benefited from £127.6 million of revenue from the acquisitions made since 1 January 2020 (2020: £20.6 million). Excluding these revenues, Services organic revenue growth was 9.2 per cent on a constant currency2 basis.
UK Services revenue saw good growth, primarily due to a significant increase in Professional Services with some new Managed Services customers adding momentum during the second half of the year. Professional Services continued its strong start to the year, as customers re-engaged with our consultancy expertise to assist their post-pandemic IT requirements. Managed Services strengthened through the year, as we converted opportunities within the still healthy pipeline into contracts and continued to realise efficiencies across the existing portfolio.
Our German Managed Services have grown strongly, as customer volumes have returned to pre-Covid-19 levels with further contract wins and expanded scopes within some existing contracts. The Professional Services business continues to see very strong growth year after year, with the limiting factor being the supply of appropriate resource. This has been helped by the recent investment in our near-shoring initiative in Romania.
Our French Services business saw further sharp falls in Services revenue on an organic basis. The French Professional Services business is more reliant on on-site activity than the equivalent businesses in the UK or Germany and continues to face significant disruption from Covid-19 and the resulting government response. The French Managed Services business declined, as expected, following the non-renewal of a large global outsourcing contract at the end of the contract term in 2019, which did not impact revenues until the second half of 2020.
28
Our performance in 2021continued
In North America, Professional Services revenue has recovered as projects delayed by Covid-19 restarted. Mid-market customers, which generate much of the Professional Services revenue in the US, were the weakest business area during the pandemic and experienced a recovery during 2021.
Overall Group Services margins increased by 60 basis points during the year. The continued reduction of travel costs, lower subcontractor costs and improved Professional Services utilisation, coupled with improving Managed Services volume, have all contributed to this increase.
OutlookThe more than doubling of profits that Computacenter has achieved over the last three years has been the result of deliberate actions that we have previously taken to enable growth. Our acquisitions in North America and Western Europe have materially increased our total addressable market. The organic investments we have made, including the expansion of our sales force, recruiting technical expertise and investing in systems to enhance our productivity, have been substantial. Collectively, these have put us in a position to take advantage of the ongoing buoyant market conditions, as our customers invest in digitalising their businesses.
While we live in uncertain times and much work remains to be done, these investments and current market conditions make us confident that 2022 will be a year of further progress.
Given the profile of our profitability in 2021, we have a more challenging comparison in the first half of 2022 compared to the second, due to the fact that an abnormally high percentage of our profits came in the first half of the year.
As a business, we feel as confident as we have ever been about our target market, competitive position and investment strategy, and we look forward to the future in 2022 and beyond with enthusiasm and excitement.
Group annual sales event – Manchester, United KingdomMike Norris presenting to Computacenter teams.
Strategic ReportAnnual Report and Accounts 2021
29

UNITED KINGDOM
Financial performanceRevenues in the UK business increased by 9.9 per cent to £1,948.6 million (2020: £1,773.4 million) with gross invoiced income4 increasing by 5.8 per cent to £2,063.7 million (2020: £1,949.8 million).
The UK business increased revenues in both Technology Sourcing and Services. While the global pandemic continues to create challenges in some of our core markets, we have seen acceleration in demand for consultancy and project services, and in software sourcing needs. We have also secured some significant Managed Services contracts, which will deliver benefit in the long term. Although some existing contracts were not renewed, overall, Managed Services revenue saw good growth during the year.
During 2021, our customers increasingly benefited from our expanded international presence, to meet their global Technology Sourcing and Services requirements.
We have continued to invest in our people, further expanding our sales force to engage new customers and drive growth through existing customers. While we are already seeing the benefit of new trading relationships arising from this expansion, the return will be realised through the longer-term development of a broader client base. This investment has helped to increase the number of customers where we generate greater than £1 million of gross profit, from 52 to 55 in 2021.
Our hybrid-working approach has proved successful, which is reflected in our recent employee engagement survey results. We are pleased to have retained our unique culture despite the challenges of remote working, and proud to have been recognised as a Top Employer in the UK. We continue to make changes to our facilities to allow the gradual return of our people to the office, whilst our people continue to work flexibly and collaboratively in line with our customers’ needs.
Overall margins in the UK reduced slightly by 29 basis points, with the gross profit margin decreasing from 14.1 per cent to 13.8 per cent of revenues. Gross profit grew by 7.6 per cent to £268.2 million (2020: £249.2 million).
Adjusted1 administrative expenses increased by only 4.0 per cent to £165.3 million (2020: £158.9 million), significantly behind the growth of the business. This is an increase on the 1.3 per cent growth in adjusted1 administrative expenses seen in 2020, following additional investments in the sales force during 2021 to better target our addressable customer opportunity.
This resulted in adjusted1 operating profit growing by 14.0 per cent to £102.9 million (2020: £90.3 million).
Technology Sourcing performanceTechnology Sourcing revenue increased by 10.4 per cent to £1,466.4 million (2020: £1,328.0 million).
Revenues increased in line with expectations. While demand for workplace technology has remained higher than pre-pandemic levels, the exceptional spend attributed to customers’ Covid-19 responses has softened, resulting in a decline in workplace technology during the year, as expected. The enterprise Technology Sourcing business has seen the predicted return to growth, with customers investing in networking, security and data center hardware and software solutions, with a particular focus on international Technology Sourcing.
While supply chain constraints in some product categories have led to unpredictable availability, we have been able to meet the needs of our customers and, in parallel, we have built a strong product order book for the year ahead. The Technology Sourcing order book as at 31 December 2021 was 26 per cent higher than at 31 December 2020.
Technology Sourcing margins reduced by 62 basis points compared to the prior year. However, Technology Sourcing gross profit increased by 3.5 per cent, reflecting the higher revenue.
Revenue £m +9.9%
1,948.6Adjusted1 operating profit £m +14.0%
102.9Services Contract Base £m +3.7%
311.2
20212020201920182017
1,948.61,773.41,597.01,611.31,468.2
Revenue by business type
1. Source 75.3%
2. Transform 7.9%
3. Manage 16.8%
1
2
3
30
Our performance in 2021continued

Members of the UK leadership team
Our customers have increasingly benefited from our expanded international presence, to meet their global Technology Sourcing and Services requirements.Neil HallManaging Director, UK and Ireland
Services performanceServices revenue increased by 8.3 per cent to £482.2 million (2020: £445.4 million). Professional Services grew 19.8 per cent to £154.6 million (2020: £129.1 million). Managed Services grew by 3.6 per cent to £327.6 million (2020: £316.3 million).
While the pandemic has continued to affect where customers are focusing their investment in some of our core markets, we are pleased with the increase in demand for our Professional Services skills and resources, with a notable increase in cloud advisory and transformation services, as well as networking and security project activity.
We have developed a strong Professional Services pipeline for 2022, which should result in continued growth in enterprise Professional Services in particular.
Managed Services revenues grew moderately during the year, with some significant long-term contracts secured in the financial services sector. We have successfully implemented the contracts awarded during 2020, giving us confidence in the long-term value of these arrangements.
We have experienced increased competitive pressure in our public sector Managed Services business, with some losses during this period. Our competitive position improves when the scope includes Technology Sourcing embedded within a Managed Services opportunity. We are pleased to have won a significant Managed Services contract with a large financial services customer, with a worldwide support coverage requirement including Technology Sourcing embedded in the contract, in a ‘Device-as-a-Service’ model.
While the in-year growth has been pleasing, the losses during the year combined with longer buying cycles for significant Managed Services campaigns currently underway will make continued growth challenging in 2022.
Services margins increased by 97 basis points over the year, as we continue to operate an efficient blend of expert resources and automated solutions. The use of our off-shore capabilities has increased materially, with customers keen to benefit from a right-shore model. One major contract which commenced during the year added approximately 150 employees in Bangalore, India. Service quality and innovation in our Bangalore Service Center has been high and we anticipate further leverage of this capability.
Strategic ReportAnnual Report and Accounts 2021
31

GERMANY
The overall economic situation in Germany has largely stabilised with only a few sectors, such as the tourism and retail industries, still struggling with pandemic-related problems. Industries relevant to our business, such as automotive, healthcare, consulting, technology and the public sector, are almost all back in IT investment mode, as they accelerate their digitisation efforts to assist with solving their business IT challenges. This has led to an increased demand for infrastructure refreshes and digitisation projects. In addition, the expansion of existing network infrastructure, implementation of ever-increasing security requirements and the continual modernisation of workplace environments are all positive factors for our business.
We recorded some pleasing successes with developing our customer base and concluding renewals and new business. We again increased the number of customers contributing more than £1 million of gross profit from 51 to 55. In the public sector, we were able to renew some very large volume framework contracts and win new ones. In addition, we achieved further important successes and concluded long-term contracts in the emerging application development business line.
In the automotive sector, we renewed and concluded long-term contracts with one of our most important customers, for both worldwide network operations and field and on-site workplace services. We secured and expanded a workplace services contract for one of the world’s largest global chemical groups. In addition, we won an infrastructure Managed Services contract with a federal state bank, and a workplace Managed Services contract with a telecommunications provider. Towards the end of the year, we again concluded a long-term contract with a very large German hyperscaler and software provider. This contract secures significant
Technology Sourcing and Services volumes in the area of data center and networking.
We see the potential for top-line growth in 2022, which should also lead to an increase in earnings. We will invest significantly in our sales capacity, to support long-term customer development and, above all, to expand our customer base. In addition, we plan to significantly expand our Professional Services resources (consulting, project and engineering), although this will certainly be a challenge in the current labour market. These investments will have an impact on the short-term overall result, but from a medium to long-term perspective, they are the right actions to ensure growth.
Financial performanceTotal revenue increased by 11.6 per cent to €2,352.5 million (2020: €2,108.2 million) and by 7.7 per cent in reported pound sterling equivalents2. Gross invoiced income4 increased by 12.1 per cent to €2,386.0 million (2020: €2,129.2 million).
The 2021 financial year was characterised by revenue growth in all three business areas. We recorded significant growth of 11.8 per cent in Technology Sourcing, which is a pleasing result considering the availability problems with almost all hardware products. The strong relationships with our technology partners, as well as the skills and experience in our Computacenter teams, had a very positive effect on performance. In addition, we were able to ensure availability for our customers for important projects and plans through significantly increased stocking of products at our Integration Center in Kerpen.
We also showed good growth in both Professional Services and Managed Services. We are seeing continued high demand for technology refreshes and digitisation projects. This growth was made possible by the actions we started in the previous year to expand our near-shore and off-shore
capacity, as well as the expansion of our German capacity, especially in consulting. The good growth in Managed Services was particularly pleasing. In a persistently difficult and demanding market segment, we gained new clients and expanded existing contracts.
Overall margins in Germany increased by 52 basis points, with gross profit increasing from 14.9 per cent to 15.4 per cent of revenues. Gross profit grew by 15.7 per cent to €363.2 million (2020: €313.8 million) and by 11.5 per cent in reported pound sterling equivalents2.
Along with the growth in revenue, we also recorded good contribution growth. While we maintained product margins at a level in line with the previous year, we significantly increased the Services margin, especially in Managed Services. This was due in particular to actions to optimise existing contracts, as well as the significantly reduced number of problem contracts. In addition, almost all new take-on projects were completed within or below the expected range of costs. In Professional Services, we maintained healthy margin levels, benefiting from a continuing high remote delivery level and from strong utilisation. However, the measures to retain existing employees and recruit new employees have increased costs and will require further investments in the future.
Adjusted1 administrative expenses increased by 7.7 per cent to €202.5 million (2020: €188.1 million), and by 4.1 per cent in reported pound sterling equivalents2.
Indirect costs were in line with expectations. We again benefited from lower travel, event and meeting costs which had a positive impact on the cost base. However, increased commissions due to the higher contribution, as well as proportionate costs for the planned expansion in sales employees, have increased the cost base. Stocking costs also increased, as we maintained product availability within Technology Sourcing.
Revenue €m +11.6%
2,352.5Adjusted1 operating profit €m +27.8%
160.7Services Contract Base €m +0.1%
370.3
Revenue by business type
1. Source 69.2%
2. Transform 13.5%
3. Manage 17.2%
32
Our performance in 2021continued
20212020201920182017
2,352.52,108.22,161.92,115.71,954.2
1
2
3

Adjusted1 operating profit for the German business increased by 27.8 per cent to €160.7 million (2020: €125.7 million) and by 22.4 per cent in reported pound sterling equivalents2.
The growth in earnings for the year was primarily due to good overall business growth and an increase in the Services margin.
For 2022, it is important to continue to develop in Services, to use market demand to grow the Technology Sourcing business and to profit from the new contracts won in Managed Services. We will also invest in the sales force and in scaling the capacity of our Professional Services business.
Technology Sourcing performanceTechnology Sourcing revenue grew by 11.8 per cent to €1,628.9 million (2020: €1,457.4 million) and by 7.8 per cent in reported pound sterling equivalents2. Technology Sourcing margins decreased by 24 basis points over last year but remained at a high level.
This area delivered a pleasing performance, despite the worldwide supply problems for hardware products. We again benefited from good growth in the public sector and healthcare sector. Compared to the previous year, we saw increased demand, especially from customers in the automotive and related supplier industries. We recorded very good growth in workplace, saw good network and security business and slight growth in data center business.
The Technology Sourcing order book at 31 December 2021 was 138.6 per cent higher than at 31 December 2020.
Margins remained at a very high level in all areas, with slight improvements in the workplace business offsetting minor reductions elsewhere, and leading to a slight overall decrease of 24 basis points.
Services performanceServices revenue grew by 11.2 per cent to €723.6 million (2020: €650.8 million) and by 7.5 per cent in reported pound sterling equivalents2. This included Professional Services growth of 21.2 per cent to €318.4 million (2020: €262.8 million), an increase of 17.1 per cent in reported pound sterling equivalents2, and an increase in Managed Services of 4.4 per cent to €405.2 million (2020: €388.0 million), an increase of 1.0 per cent in reported pound sterling equivalents2.
We achieved good growth and a significant improvement in earnings in both Professional Services, which is our project and consulting business, and in Managed Services, our maintenance and management business.
As in previous years, we benefited from our strong consulting and project business in 2021. Here, we see increasing demand for the support of international projects in field, home office and on-site services, as well as continuing high demand for the realisation of digitalisation projects. We were able to successfully leverage the near-shore services in Cluj, Romania, which we started in the second quarter of 2021 and have since expanded to more than 80 people.
We are continuing with our plan of having 400 extra people in the area of consulting and engineering in 2022 and have once again significantly expanded our recruiting activities for this purpose.
Our Managed Services business also developed positively over the year. We see a stagnating market dominated by a few global participants, but we were able to hold our ground, win new contracts and expand our existing business. Profitability also increased thanks to good contract management and the stabilisation or expiry of some of our problem or loss-making contracts. Nevertheless, this business will continue to be challenging in the future and growth will only be possible by winning new contracts.
Overall, the Services margin was 225 basis points higher than last year.
We will invest significantly in our sales capacity, to support long-term customer development and, above all, to expand our customer base.Reiner LouisManaging Director, Germany
Members of the German leadership team
33
Strategic ReportAnnual Report and Accounts 2021

FRANCE
In November 2020, we completed the acquisition of BT’s domestic services operations in France. This subsidiary has been renamed Computacenter NS. Our 2021 results therefore include the full-year financial performance of Computacenter NS, whereas we only had two months in the 2020 results.
Financial performanceTotal revenue increased by 0.8 per cent to €760.0 million (2020: €753.9 million). In reported pound sterling equivalents2, total revenue was down 2.9 per cent.
As noted in our first half results, we were determined to deliver a positive operational result for the full year. Thanks to a good second half performance, we achieved this goal. However, the year as a whole was challenging for our French business. We have seen declining performance in all areas of the business and as Computacenter NS was loss-making on acquisition, it further reduced our profit for 2021, as expected.
The acquired business, Computacenter NS, recorded revenues of €69.6 million (2020: €15.0 million) with an adjusted1 operating loss of €4.9 million (2020: €1.6 million), which was broadly in line with our plan for the year.
Excluding the revenues earned within Computacenter NS, Computacenter France total revenue declined by 6.6 per cent to €690.4 million (2020: €738.9 million).
Throughout the year, we were confronted by the challenge of worldwide component shortages, and corresponding delivery issues in Technology Sourcing, mainly in the workplace area. This impacted our public sector business, as we fulfil multiple public sector framework contracts in this area. Our private sector performance was not immune from the worldwide shortages but it showed encouraging growth in the networking area and therefore compensated better for the shortages in other areas.
We continued to integrate Computacenter NS, strengthening our capabilities in our networking and security offerings. In November 2021, we reached an important milestone by finalising the migration of Computacenter NS into our Group ERP systems, giving us the opportunity to further align processes and resources. As anticipated at the time of the acquisition, we had to relocate some office locations for Computacenter NS. In June 2021, we opened our new sales and administrative office in the centre of Paris. Despite difficult circumstances due to Covid-19, this office has been welcomed by customers, employees and technology partners as a perfect location to meet and collaborate. We continue to review our strategy for another three locations in the Paris region and aim to reach a conclusion towards the end of 2022. From a business integration point of view, we celebrated winning some pleasing network maintenance contracts towards the end of the year.
We remain confident that our strategy to target large public and private sector organisations, the further development of our Group offerings and the continued focus on cost control offer the best route to reach growth in 2022.
Overall, margins in France decreased by 64 basis points, with gross profit decreasing from 11.1 per cent to 10.4 per cent of revenues. Excluding the impact of Computacenter NS, margins increased by 15 basis points, with gross profit increasing from 10.9 per cent to 11.0 per cent of revenues.
Overall gross profit decreased by 4.9 per cent to €79.2 million (2020: €83.3 million) and reduced by 8.5 per cent in reported pound sterling equivalents2. Excluding the €3.2 million of gross profit earned within Computacenter NS (2020: €3.1 million), the Computacenter France gross profit decreased by 5.2 per cent to €76.0 million (2020: €80.2 million).
Adjusted1 administrative expenses increased by 8.9 per cent to €75.0 million (2020: €68.9 million), and by 5.2 per cent in reported pound sterling equivalents2 as we have continued to invest to support growth. Excluding the €8.2 million of adjusted1 administrative expenses incurred within Computacenter NS (2020: €4.7 million), Computacenter France administrative expenses increased by 4.0 per cent to €66.8 million (2020: €64.2 million).
Adjusted1 operating profit for the combined French business decreased by 70.8 per cent to €4.2 million (2020: €14.4 million), and by 73.1 per cent in reported pound sterling equivalents2. As noted in our 2020 Annual Report and Accounts, the Computacenter NS business was loss-making on acquisition, and it therefore reduced our combined profit for 2021 as expected. Excluding the €4.9 million operating loss from the activities of Computacenter NS (2020: €1.6 million), the Computacenter France business made €9.1 million of operating profit in 2021 (2020: €16.0 million).
Technology Sourcing performanceTechnology Sourcing revenue decreased by 5.1 per cent to €560.0 million (2020: €590.0 million) and by 8.5 per cent in reported pound sterling equivalents2. Excluding the €11.3 million of Technology Sourcing revenues within Computacenter NS (2020: €2.7 million), Computacenter France Technology Sourcing revenues decreased by 6.6 per cent to €548.7 million (2020: €587.3 million).
Despite a decline in revenues, it was a very busy year in Technology Sourcing. The volume of outstanding Technology Sourcing orders placed with us by our customers increased significantly across the whole year, due to the worldwide component shortages. If we had been able to ship all products within normal timescales and thereby maintain a back-order position comparable with 2020, we would have generated good growth in overall revenues. The Technology Sourcing order book
Revenue €m +0.8%
760.0Adjusted1 operating profit €m -70.8%
4.2Services Contract Base €m +1.8%
149.8
20212020201920182017
760.0753.9715.8557.4581.3
Revenue by business type
1. Source 73.7%
2. Transform 5.8%
3. Manage 20.5%
1
2
3
34
Our performance in 2021continued

at 31 December 2021 was 74.6 per cent higher than at 31 December 2020.
Despite the challenge of product shortages, the private sector showed a revenue increase in Technology Sourcing, mainly thanks to some networking contracts. Towards the end of the year in particular we saw increased activity within our customer base, albeit still lower than before Covid-19. Our public sector business had a challenging year in Technology Sourcing, as we noticed a declining spending pattern for the majority of these customers.
We expect that the worldwide shortages will remain a challenge in 2022 but are hopeful that we will be able to provide better visibility of delivery dates for our customers and eventually see an overall reduction in delays. To ensure this, we are staying in close contact with technology partners, both at local and Group levels.
Overall, Technology Sourcing margins increased by 36 basis points. Excluding the impact of Computacenter NS, Technology Sourcing margins increased by 39 basis points.
Services performanceServices revenue increased by 22.0 per cent to €200.0 million (2020: €163.9 million) and by 17.5 per cent in reported pound sterling equivalents2. Professional Services revenue increased by 10.3 per cent to €44.1 million (2020: €40.0 million), which was an increase of 6.4 per cent in reported pound sterling equivalents2. Managed Services revenues increased by 25.8 per cent to €155.9 million
(2020: €123.9 million), an increase of 21.0 per cent in reported pound sterling equivalents2.
Excluding the Services revenues within Computacenter NS, the Computacenter France Services revenues decreased by 6.5 per cent to €141.7 million (2020: €151.6 million). Professional Services revenue decreased by 15.4 per cent to €31.3 million (2020: €37.0 million), with Managed Services revenues decreasing by 3.7 per cent to €110.4 million (2020: €114.6 million).
The main impact on Services revenue came from a global outsourcing contract that ended in the first half of 2020, which we knew was going to reduce 2021 revenues compared to last year. Apart from a loss-making contract in the network operations area, we have been able to maintain our Managed Services margins.
In 2020, the first year of the Covid-19 crisis, many customers postponed or cancelled their upcoming Managed Services tenders. As expected, many of these campaigns restarted in 2021. We have been very busy responding to tenders and won a significant number of new contracts. We are in the process of onboarding these contracts. Once fully operational, they will allow us to maintain our 2022 Contract Base, by compensating for a Computacenter NS contract that we knew on acquisition would end in 2021.
In addition to winning new contracts, we have been able to extend our Services scope in three of our largest existing Managed Services contracts.
Our Professional Services business in the private sector faced a challenging year with a decline in revenues, mainly due to the complicated Covid-19 situation and the lack of additional project opportunities we normally have within our Managed Services contracts. Public sector performance was flat in Professional Services.
With the Computacenter NS business now integrated further into our organisation, we believe we have a good opportunity to grow our Professional and Managed Services businesses significantly in 2022. With the integration and our continued effort to further develop and train our entire Services teams, we should be able to position skilled professionals in a market with high demand for specialised resources.
Services margins decreased by 351 basis points over last year. Excluding the impact of Computacenter NS, Services margins decreased by 74 basis points.
We remain confident that our continued customer focus on large public and private sector organisations, the further development of our Group offerings and the continued focus on cost control offer the best route to reach growth in 2022.Lieven BergmansManaging Director, France
Members of the French leadership team
Strategic ReportAnnual Report and Accounts 2021
35
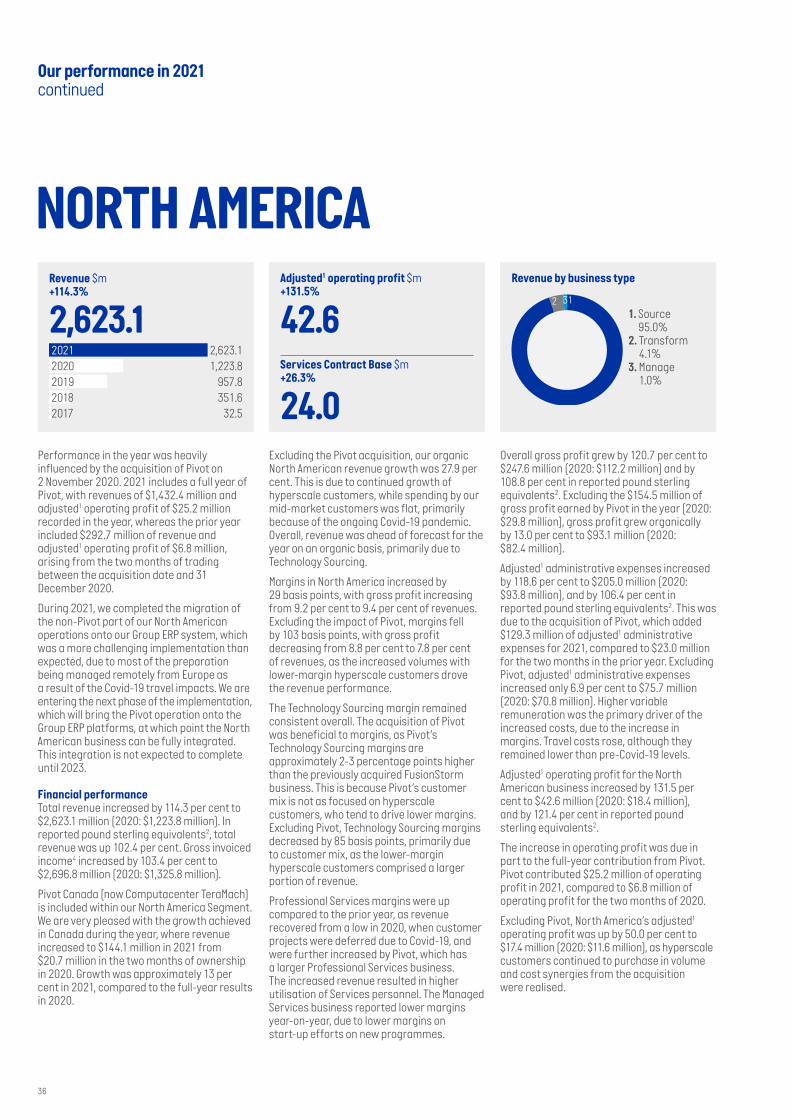
NORTH AMERICA
Performance in the year was heavily influenced by the acquisition of Pivot on 2 November 2020. 2021 includes a full year of Pivot, with revenues of $1,432.4 million and adjusted1 operating profit of $25.2 million recorded in the year, whereas the prior year included $292.7 million of revenue and adjusted1 operating profit of $6.8 million, arising from the two months of trading between the acquisition date and 31 December 2020.
During 2021, we completed the migration of the non-Pivot part of our North American operations onto our Group ERP system, which was a more challenging implementation than expected, due to most of the preparation being managed remotely from Europe as a result of the Covid-19 travel impacts. We are entering the next phase of the implementation, which will bring the Pivot operation onto the Group ERP platforms, at which point the North American business can be fully integrated. This integration is not expected to complete until 2023.
Financial performanceTotal revenue increased by 114.3 per cent to $2,623.1 million (2020: $1,223.8 million). In reported pound sterling equivalents2, total revenue was up 102.4 per cent. Gross invoiced income4 increased by 103.4 per cent to $2,696.8 million (2020: $1,325.8 million).
Pivot Canada (now Computacenter TeraMach) is included within our North America Segment. We are very pleased with the growth achieved in Canada during the year, where revenue increased to $144.1 million in 2021 from $20.7 million in the two months of ownership in 2020. Growth was approximately 13 per cent in 2021, compared to the full-year results in 2020.
Excluding the Pivot acquisition, our organic North American revenue growth was 27.9 per cent. This is due to continued growth of hyperscale customers, while spending by our mid-market customers was flat, primarily because of the ongoing Covid-19 pandemic. Overall, revenue was ahead of forecast for the year on an organic basis, primarily due to Technology Sourcing.
Margins in North America increased by 29 basis points, with gross profit increasing from 9.2 per cent to 9.4 per cent of revenues. Excluding the impact of Pivot, margins fell by 103 basis points, with gross profit decreasing from 8.8 per cent to 7.8 per cent of revenues, as the increased volumes with lower-margin hyperscale customers drove the revenue performance.
The Technology Sourcing margin remained consistent overall. The acquisition of Pivot was beneficial to margins, as Pivot’s Technology Sourcing margins are approximately 2-3 percentage points higher than the previously acquired FusionStorm business. This is because Pivot’s customer mix is not as focused on hyperscale customers, who tend to drive lower margins. Excluding Pivot, Technology Sourcing margins decreased by 85 basis points, primarily due to customer mix, as the lower-margin hyperscale customers comprised a larger portion of revenue.
Professional Services margins were up compared to the prior year, as revenue recovered from a low in 2020, when customer projects were deferred due to Covid-19, and were further increased by Pivot, which has a larger Professional Services business. The increased revenue resulted in higher utilisation of Services personnel. The Managed Services business reported lower margins year-on-year, due to lower margins on start-up efforts on new programmes.
Revenue $m +114.3%
2,623.1Adjusted1 operating profit $m +131.5%
42.6Services Contract Base $m +26.3%
24.0
20212020201920182017
2,623.11,223.8
957.8351.6
32.5
Overall gross profit grew by 120.7 per cent to $247.6 million (2020: $112.2 million) and by 108.8 per cent in reported pound sterling equivalents2. Excluding the $154.5 million of gross profit earned by Pivot in the year (2020: $29.8 million), gross profit grew organically by 13.0 per cent to $93.1 million (2020: $82.4 million).
Adjusted1 administrative expenses increased by 118.6 per cent to $205.0 million (2020: $93.8 million), and by 106.4 per cent in reported pound sterling equivalents2. This was due to the acquisition of Pivot, which added $129.3 million of adjusted1 administrative expenses for 2021, compared to $23.0 million for the two months in the prior year. Excluding Pivot, adjusted1 administrative expenses increased only 6.9 per cent to $75.7 million (2020: $70.8 million). Higher variable remuneration was the primary driver of the increased costs, due to the increase in margins. Travel costs rose, although they remained lower than pre-Covid-19 levels.
Adjusted1 operating profit for the North American business increased by 131.5 per cent to $42.6 million (2020: $18.4 million), and by 121.4 per cent in reported pound sterling equivalents2.
The increase in operating profit was due in part to the full-year contribution from Pivot. Pivot contributed $25.2 million of operating profit in 2021, compared to $6.8 million of operating profit for the two months of 2020.
Excluding Pivot, North America’s adjusted1 operating profit was up by 50.0 per cent to $17.4 million (2020: $11.6 million), as hyperscale customers continued to purchase in volume and cost synergies from the acquisition were realised.
Revenue by business type
1. Source 95.0%
2. Transform 4.1%
3. Manage 1.0%
12 3
36
Our performance in 2021continued

Technology Sourcing performanceTechnology Sourcing revenue increased by 109.5 per cent to $2,490.8 million (2020: $1,189.2 million) and by 97.8 per cent in reported pound sterling equivalents2.
The addition of Pivot resulted in significant growth in our Technology Sourcing business. Pivot contributed $1,327.9 million of Technology Sourcing revenue (2020: $280.0 million for the two months from acquisition). Excluding Pivot, Technology Sourcing revenue increased by 27.9 per cent on an organic basis, as hyperscale customers increased their volumes, and mid-market customers remained consistent. We benefited from significant continuing investments by our customers, as they digitise their operations and modernise their infrastructure.
Excluding the impact of Pivot, North American Technology Sourcing margins decreased by 85 basis points on an organic basis over the same period last year, as a result of the growth in revenue being driven by hyperscale and large customers, which generally have lower margins. Partially offsetting this decrease was the addition of Pivot volume, which generally has higher margins due primarily to customer mix. We also continue to evolve our partner management organisation with the larger scale provided by Pivot and are seeing an improvement in margins as a result. Including the results of Pivot, Technology Sourcing margins increased by 38 basis points overall.
Services performanceServices revenue increased by 282.4 per cent to $132.3 million (2020: $34.6 million) and by 258.6 per cent in reported pound sterling equivalents2. Professional Services increased by 316.0 per cent to $106.5 million (2020: $25.6 million), which was an increase of 295.4 per cent in reported pound sterling equivalents2. Managed Services increased by 186.7 per cent to $25.8 million (2020: $9.0 million), an increase of 158.3 per cent in reported pound sterling equivalents2. Services revenue growth was driven by having a full year of Pivot, combined with significant growth in Pivot’s deployment services, which are part of our Professional Services.
Pivot recorded Services revenues of $104.5 million (2020: $12.8 million) comprising Professional Services revenues of $87.4 million (2020: $10.2 million) and Managed Services revenues of $17.1 million (2020: $2.6 million).
Excluding the Services revenues within Pivot, the North American Services revenues increased by 27.5 per cent to $27.8 million (2020: $21.8 million). Professional Services revenue increased 24.0 per cent to $19.1 million (2020: $15.4 million) with Managed Services revenues up 35.9 per cent at $8.7 million (2020: $6.4 million).
Project activity recovered after a slow 2020, when customers either delayed expected spend or cancelled projects while they responded to Covid-19. The increase was also driven by a Managed Services win in the United States market, representing the first significant Managed Services contract win led from North America.
Services margins decreased by 592 basis points and are now 1,082 basis points below the overall combined Group Services margin. While contribution from Services increased with the greater volume and the addition of a full year of Pivot, margins were down from the prior year, as the new Managed Services contract was in the first year, where we often earn lower margins, and deployment services average margins are lower than other parts of the Services portfolio.
Revenue growth in North America was driven by the acquisition of Pivot; however, organically, excluding the Pivot business, North American revenue was up a strong 27.9 per cent.Kevin ShankPresident, North America
Members of the North American leadership team
Strategic ReportAnnual Report and Accounts 2021
37
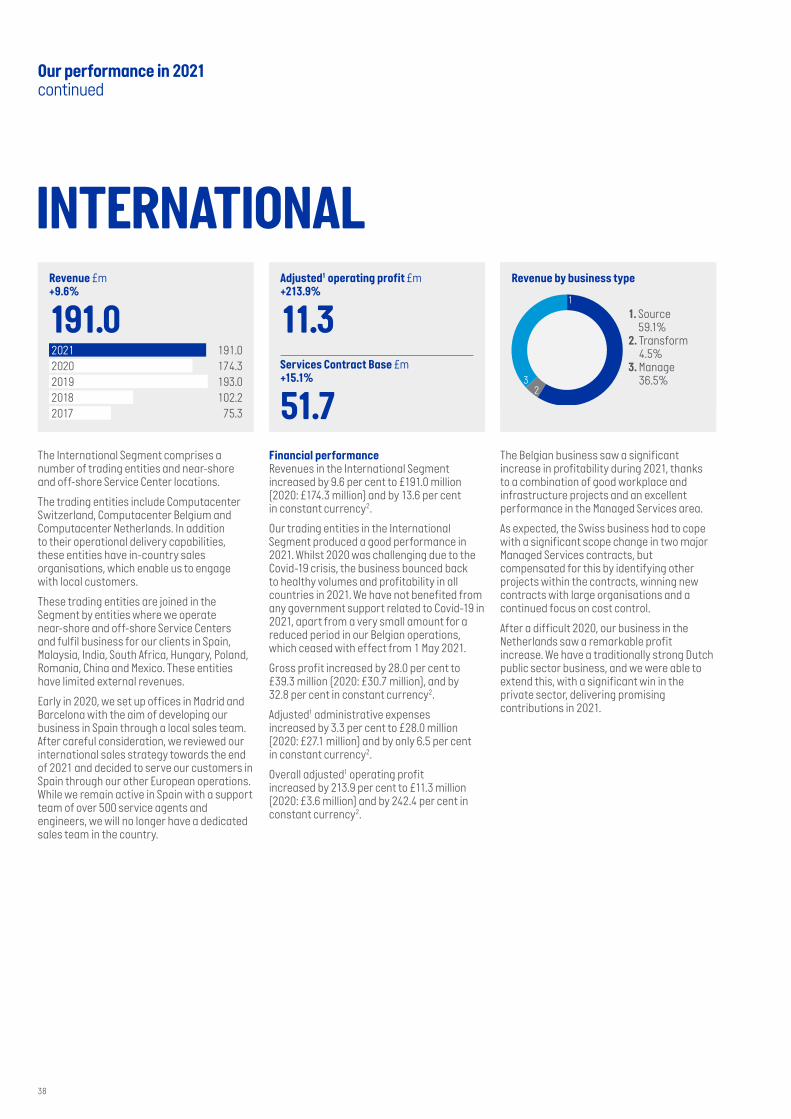
INTERNATIONAL
The International Segment comprises a number of trading entities and near-shore and off-shore Service Center locations.
The trading entities include Computacenter Switzerland, Computacenter Belgium and Computacenter Netherlands. In addition to their operational delivery capabilities, these entities have in-country sales organisations, which enable us to engage with local customers.
These trading entities are joined in the Segment by entities where we operate near-shore and off-shore Service Centers and fulfil business for our clients in Spain, Malaysia, India, South Africa, Hungary, Poland, Romania, China and Mexico. These entities have limited external revenues.
Early in 2020, we set up offices in Madrid and Barcelona with the aim of developing our business in Spain through a local sales team. After careful consideration, we reviewed our international sales strategy towards the end of 2021 and decided to serve our customers in Spain through our other European operations. While we remain active in Spain with a support team of over 500 service agents and engineers, we will no longer have a dedicated sales team in the country.
Financial performanceRevenues in the International Segment increased by 9.6 per cent to £191.0 million (2020: £174.3 million) and by 13.6 per cent in constant currency2.
Our trading entities in the International Segment produced a good performance in 2021. Whilst 2020 was challenging due to the Covid-19 crisis, the business bounced back to healthy volumes and profitability in all countries in 2021. We have not benefited from any government support related to Covid-19 in 2021, apart from a very small amount for a reduced period in our Belgian operations, which ceased with effect from 1 May 2021.
Gross profit increased by 28.0 per cent to £39.3 million (2020: £30.7 million), and by 32.8 per cent in constant currency2.
Adjusted1 administrative expenses increased by 3.3 per cent to £28.0 million (2020: £27.1 million) and by only 6.5 per cent in constant currency2.
Overall adjusted1 operating profit increased by 213.9 per cent to £11.3 million (2020: £3.6 million) and by 242.4 per cent in constant currency2.
Revenue £m +9.6%
191.0Adjusted1 operating profit £m +213.9%
11.3Services Contract Base £m +15.1%
51.7
20212020201920182017
191.0174.3193.0102.2
75.3
The Belgian business saw a significant increase in profitability during 2021, thanks to a combination of good workplace and infrastructure projects and an excellent performance in the Managed Services area.
As expected, the Swiss business had to cope with a significant scope change in two major Managed Services contracts, but compensated for this by identifying other projects within the contracts, winning new contracts with large organisations and a continued focus on cost control.
After a difficult 2020, our business in the Netherlands saw a remarkable profit increase. We have a traditionally strong Dutch public sector business, and we were able to extend this, with a significant win in the private sector, delivering promising contributions in 2021.
Revenue by business type
1. Source 59.1%
2. Transform 4.5%
3. Manage 36.5%
1
23
38
Our performance in 2021continued

Technology Sourcing performanceTechnology Sourcing revenue increased by 2.1 per cent to £112.8 million (2020: £110.5 million) and by 5.9 per cent in constant currency2.
The International Segment was affected by worldwide component shortages, and we faced challenges to deliver goods on time to our customers. Despite these difficult circumstances, our teams worked hard to keep customers informed about the availability of goods and possible alternatives.
As part of one of the world’s largest VARs, we are well supported by the Group to address local priorities with our technology partners. We have also been successful in delivering extended Services to local customers by leveraging Group capabilities, both on a local and international scale.
We have invested locally in partnerships and certifications to strengthen our relationships with technology partners. For example, we have strengthened our relationship with Apple in both the Netherlands and Switzerland. Our Belgian operation was the first partner in Belgium to achieve the Cisco IOT Advantage Specialization and was rewarded with the Cisco Customer Experience award.
As in all other regions, we expect that the worldwide component shortages will continue to challenge us in 2022 but we are committed to working closely with our customers and technology partners to keep the impact to a minimum.
Services performanceServices revenue increased by 22.6 per cent to £78.2 million (2020: £63.8 million) and by 26.9 per cent in constant currency2. Professional Services revenue increased by 18.1 per cent to £8.5 million (2020: £7.2 million), which was an increase of 23.2 per cent in constant currency2, whilst Managed Services increased by 23.1 per cent to £69.7 million (2020: £56.6 million), which was an increase of 27.4 per cent in constant currency2.
In general, we were pleased with the performance of our Services business.
Our Professional Services business suffered from the Covid-19 crisis in 2020 and recovered well in 2021, although we estimate that activity has still not returned to pre-pandemic levels.
In Belgium, we secured and extended our main Managed Services contracts. In Switzerland, we have fully optimised our delivery model and identified project extensions in our largest Managed Services contracts. Our Dutch operations also grew in Services, although we see opportunities to do significantly better in 2022.
2020 was a difficult year for the International Segment, and we were pleased by the way we returned to good business levels in 2021. Furthermore, we see good opportunities to grow our business. In each of the operations, we have identified opportunities to grow by exploring new business sectors (such as the public sector in Belgium and private sector in the Netherlands), or customers, for example by further developing international customers, based on our success in this area in 2021. We therefore have confidence that there is still plenty of scope to grow further in 2022.
We have invested locally in partnerships and certifications to strengthen our relationships with technology partners.Lieven BergmansManaging Director, Rest of Europe
Members of the Rest of Europe leadership team – part of International
Strategic ReportAnnual Report and Accounts 2021
39

Sustainability strategy
WINNING TOGETHER FOR OUR PEOPLE AND OUR PLANETOur Purpose is Enabling Success by building long-term trust with our customers, our partners, our people and our communities. To achieve this, we have been actively committed for many years to a leading environmental, social and governance (ESG) approach, which we recognise is essential to ensuring the long-term future of our Company, our people and our planet. We are now bringing together our various ESG activities into a single sustainability strategy.
YEARS
1981-2021
We’re proud of what we’ve achieved and we’ll continue to improve, invest and innovate. We’ll be the best that we can be – a company that our people, customers, partners and communities can be proud of.Mo SiddiqiGroup Development Director
40

600tonnes of reusable raw materials generated through industrial recycling
455,000assets (main and peripheral) redeployed to customers saving them £50 million
128,000tonnes of carbon avoided through reuse of assets (redeployment and remarketing)
3,200new people hired
50,000candidate applicationsreceived
74%reduction in carbon emissions per employeesince 2019
1.8m kWhof electricity generated by Hatfield solar farm
82%Sustainable engagement in employee survey
73%of Group electricity usage is now from green energy sources
TOP EMPLOYER INSTITUTE CERTIFICATIONin the United Kingdom and Germany
Group emissions performance over time (metric tonnes)
20212020201920182017
5,21013,85619,80819,74122,662
20212020201920182017
0.782.553.914.536.20
20212020201920182017
0.300.841.231.301.54
Per £1 million of revenueTotal Scopes 1 and 2 emissions Per employee
CARBON NEUTRALFOR SCOPES 1 AND 2 EMISSIONS IN 2022
WE AIM TO BE
2021 HIGHLIGHTS
41
Strategic ReportAnnual Report and Accounts 2021
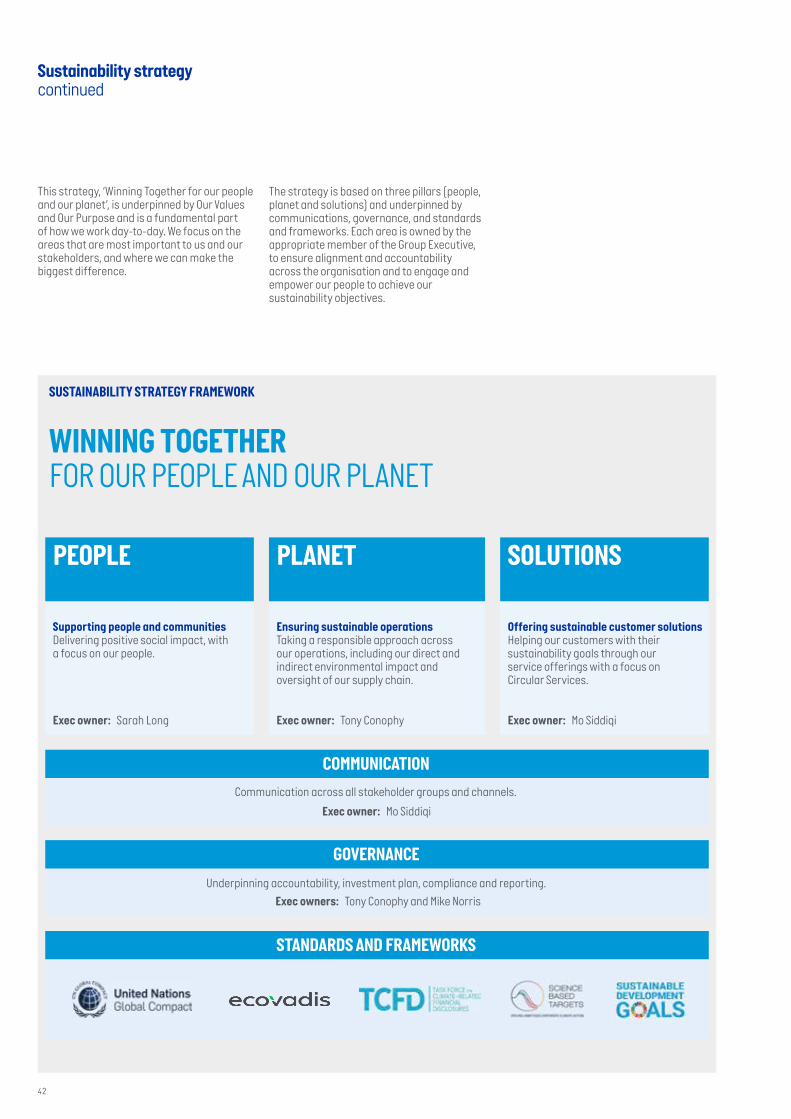
Sustainability strategycontinued
This strategy, ‘Winning Together for our people and our planet’, is underpinned by Our Values and Our Purpose and is a fundamental part of how we work day-to-day. We focus on the areas that are most important to us and our stakeholders, and where we can make the biggest difference.
The strategy is based on three pillars (people, planet and solutions) and underpinned by communications, governance, and standards and frameworks. Each area is owned by the appropriate member of the Group Executive, to ensure alignment and accountability across the organisation and to engage and empower our people to achieve our sustainability objectives.
WINNING TOGETHER FOR OUR PEOPLE AND OUR PLANET
SUSTAINABILITY STRATEGY FRAMEWORK
Supporting people and communitiesDelivering positive social impact, with a focus on our people.
Ensuring sustainable operationsTaking a responsible approach across our operations, including our direct and indirect environmental impact and oversight of our supply chain.
Communication across all stakeholder groups and channels.
Underpinning accountability, investment plan, compliance and reporting.
Offering sustainable customer solutionsHelping our customers with their sustainability goals through our service offerings with a focus on Circular Services.
Exec owner: Sarah Long Exec owner: Tony Conophy
Exec owner: Mo Siddiqi
Exec owners: Tony Conophy and Mike Norris
Exec owner: Mo Siddiqi
COMMUNICATION
GOVERNANCE
STANDARDS AND FRAMEWORKS
PEOPLE SOLUTIONSPLANET
42

STANDARDS AND FRAMEWORKS
Our sustainability strategy is aligned to the below global standards and frameworks that are essential for compliance or most relevant to our key stakeholders. In addition, we align to other standards and initiatives as appropriate in specific countries.
UN Sustainable Development GoalsWe are focused on where we can take meaningful action aligned to nine of the UN Sustainable Development Goals.
Ensure healthy lives and promote wellbeing for all at all agesWe will support the mental and physical wellbeing of our employees by ensuring that our people have quality working lives and feel safe and protected.
Ensure sustainable consumption and production patterns We will work with our technology partners and customers to promote sustainable technology sourcing, supported by our own Circular Services solutions.
Ensure inclusive and equitable quality education and promote lifelong learning opportunities for allWe will work to remove barriers that exist in our local societies, creating employment, training and educational opportunities.
Take urgent action to combat climate change and its impacts We will continue to take action to reduce our climate impacts both direct and indirect, aligned to science based targets.
Achieve gender equality and empower all women and girls We will continue to work towards achieving a balanced gender mix in a male-dominated industry.
Promote peaceful and inclusive societies for sustainable development, provide access to justice for all, and build effective, accountable, and inclusive institutions at all levels We will continue to be an ethical business while being mindful of the impact we can have on people and communities.
Task Force on Climate-related Financial DisclosuresThis is now a mandatory reporting requirement and is covered in detail on page 62.
Science Based Targets InitiativeComputacenter has committed to this standard for carbon reduction plans aligned to the Paris agreement. We will make an SBTi submission in 2022 and the feedback will support our carbon reduction roadmap for the next few years. We expect to be Carbon Neutral for Scopes 1 and 2 in 2022. We have a Net Zero (Scopes 1, 2 and 3) target by 2040, but we will aim to achieve this earlier, as the measurement standards for Scope 3 emissions and our corresponding roadmap become clearer.
UN Global CompactComputacenter has been a proud signatory of the UNGC since 2007 and we are committed to supporting the 10 core principles of the UNGC, including embedding them within our supply chain.
Principles 1-6 cover human rights and labour. We support these through our people-related policies within the ‘people’ section of our sustainability strategy on page 44.
Principles 7-9 cover the environment and we discuss this in detail in the ‘planet’ section of our sustainability strategy.
Principle 10 covers anti-corruption and our zero-tolerance approach to bribery and corruption is discussed on page 48.
EcoVadisEcoVadis is an overall sustainability framework selected by some of our customers, which we have also chosen to use as a key benchmark.
We have achieved Silver and Gold EcoVadis ratings in different countries and expect to progress further over the next two years.
Promote sustained, inclusive, and sustainable economic growth, full and productive employment, and decent work for all We will maintain high standards of employment for our people and will work with our supply chain to build resilience and decent work.
Build resilient infrastructure, promote inclusive and sustainable industrialisation, and foster innovation We will be responsible as a business to make a positive impact in our industry and wider communities.
Reduce inequality within and among countries We will continue to foster an environment which enables employees to speak openly and ensure they have the knowledge they need to promote a positive and inclusive environment for all.
43
Strategic ReportAnnual Report and Accounts 2021

Sustainability strategycontinued
Our Group headquarters – Hatfield, United Kingdom
PEOPLE VISION
Our business is about technology. But first of all, it’s about people.The desire to deliver great outcomes for our customers drives our people and underpins our people vision and culture. We aspire to recruit and retain the best talent. We then help our people to be their best through development and training, fostering engagement and inspiring leadership. Each of these aspects is discussed below.
Our culture is underpinned by our values and directly supports Our Purpose, which enables our people to understand how we deliver successfully for our customers and the business and the role they play in doing so.
Attracting talentOur Future Talent programme develops the next generation of professionals through an innovative, focused and flexible approach to apprenticeships and graduates. In 2021, we increased our intake to this programme with 403 hires, of which 31 per cent were women.
We continued to recruit significantly in 2021, with more than 3,200 new hires, an increase of approximately 50 per cent from 2020. Recruitment has been significant in Germany and India in particular, with the United Kingdom, South Africa and North America also increasing headcount. We also started
business operations in Romania as a near-shore Professional Services hub and have built a team of over 80 people, with a focus on software development.
In an increasingly competitive talent market, we have invested in our in-house sourcing capacity, employer branding and marketing, and run several campaigns, enabling us to increase applications by around 50 per cent in the fourth quarter of 2021. In total we received over 50,000 candidate applications. Our blended learning training for professional interviewing helps us to secure talent and ensure we have robust and fair hiring processes and decision-making, which in turn promotes diversity. This is supported by a Group-wide AI-based language testing solution.
We use premium analytical tools to support our workforce planning and talent acquisition strategy, allowing us to significantly accelerate recruitment and improve the candidate experience. We also rolled out our Group applicant tracking system to the United States, with India, South Africa, Romania and the Netherlands to follow. Due to the pandemic, fewer apprentices were able to work on customer sites during 2021. We therefore increased e-learning, contributing to an exceptional exam pass rate of 98 per cent.
PEOPLE
Our people are key to our success and the first pillar of our approach to sustainability. Our social value strategy primarily focuses on supporting our people, ensuring effective leadership, promoting our values and rewarding and recognising performance. We also promote initiatives that support our communities, both inside and outside our business.
Supporting people and communities
82%Sustainable engagement in employee survey
3,200new people hired
50,000candidate applications received
TOP EMPLOYER INSTITUTE CERTIFICATION in the United Kingdom and Germany
44

OUR WINNING TOGETHER VALUESThese are the values on which we built this Company and they are the values on which we will continue to grow Computacenter.
WE DO IT TOGETHER BY
Understanding people matterWe’re committed to being diverse and inclusive. We build strong, rewarding, supportive relationships. And we treat people as we expect them to treat us.
Considering the long termWe’re building a sustainable business for the long term. This leads our decisions and actions and helps people really trust us.
Inspiring successWe’re proud of the people we work with. We do our best to support each other through the downs and we always celebrate the ups.
WE WIN BY
Putting customers firstWe work hard to get to know our customers and really understand their needs. This lets us use our experience to help them in the right way at the right time.
Being straightforwardWe’re practical and pragmatic. We believe in solutions over talk. We express ourselves in the clearest possible way. And we’re open and honest in all of our dealings.
Keeping promisesWe do our very best to keep our promises. And when that’s difficult, we help our customers find other ways of solving their problems.
To attract diverse talent, we continue to run outreach programmes with schools, universities and charities. Examples include promoting awareness of women in tech, attracting black and minority ethnic talent and people with disabilities, and programmes targeting young people from disadvantaged backgrounds.
We have continued to receive external recognition as an employer, including Top Employer Institute certification in the United Kingdom and Germany. We have also been ranked among the top five per cent of companies on Kununu, a German employer rating platform.
Talent management and learningComputacenter’s positive and customer-focused culture contributes to an average length of service of over nine years, with many people returning after taking roles elsewhere or having career breaks.
Future Focus, our continuous performance management tool, continued its global rollout in 2021. The process enables continuous dialogue and feedback, especially when working remotely, and specifically addresses personal wellbeing under stress during the
pandemic. We have published education and communication material for managers and our people, to help them make the most of the system.
In 2021, we designed an approach to develop and retain talent, aligned with Future Focus. This allows employees to drive their own development plans, with the support of their managers. We also conducted a global rollout of several e-learning platforms and initiated a project to find a Group-wide learning partner to act as a strategic adviser for content and partner management.
Our Winning Together ValuesOur Company values are at the core of what we do and bind us across our global community. They are the values on which we built this Company and they are the values on which we will continue to grow Computacenter. Our values are integral to shaping our culture and building a common sense of purpose, and they are critical to our ability to scale. We continue to monitor and reinforce our values, while respecting and embracing local cultures and ways of working.
Understanding people matter
Considering the long term
Inspiring success
Putting customers first
Being straightforward
Keeping promises
Winning Together
A highlight from our recent employee survey was that people felt ‘able to be themselves’ at Computacenter, reflecting the work done on diversity and inclusion by teams across the Company.Sarah LongChief People Officer
45
Strategic ReportAnnual Report and Accounts 2021
Sustainability strategycontinued
Fostering engagementWe know that engagement is key to our success and that a highly engaged workforce helps us deliver better outcomes for our customers. We have a number of different forums for engaging with our people. These include our People Panel, surveys, unions and our employee assistance programmes. We also have Works Councils in several European countries, as well as an overall European Works Council. These meet regularly with the Group Executive team and other senior managers.
Ros Rivaz is our nominated Non-Executive Director aligned to our people. She engages with groups such as our European Works Councils and our UK National Forum and attends People Panel and Employee Impact Group sessions. This allows her to gain direct insight from our people and share it with the Board, ensuring that their input is taken into account. These interactions are highly appreciated by the employee groups and feedback regarding Ros’s engagement is unanimously positive.
The pandemic has required us to remain connected with our people in different ways, recognising the pressures they face at home and at work. We communicate regularly on any changes to working practices, following government guidance, while also implementing our hybrid-working principles. These balance the need to be together for collaboration, learning, development and engagement, while enabling home and remote working, and recognising our peoples’ preferences. This process is supported by local ‘spotlight’ surveys, which we run to collect feedback from groups of our people.
During November 2021, we ran a comprehensive global employee survey, which reviewed all aspects of how our people feel about working at Computacenter. We were pleased with the results, gaining a score of 82 per cent for sustainable engagement. Sustainable Engagement includes traditional engagement (connection to the Company) as well as enablement (support for productivity) and energy (overall wellbeing).
The positives we took from the survey are that our people:
• feel well supported and respected by their managers;
• trust the decisions made by our leadership and management teams;
• feel they have good opportunities for personal growth and development;
• feel ‘able to be themselves’ at Computacenter, reflecting our work on diversity and inclusion and the surveys we run to listen to employee opinion; and
• feel positive about being part of Computacenter and have high expectations
of an ongoing career, recognising Computacenter as a good employer.
At a Group level, areas for improvement are:
• creating a clear understanding of strategy at the team and individual level;
• better communication and management of change;
• better communication and promotion of our environmental responsibilities and actions; and
• ensuring systems and processes are geared to providing excellent customer service.
The detailed results of the employee survey down to team level have been shared with all team managers across the Group. They are being supported by the Human Resources (HR) team to develop action plans for their specific areas, based on the feedback from their teams.
At a Group level, we will launch a plan to address the main areas for improvement which will include:
• improved cascade messaging on strategy, ensuring we help all teams understand the value they add;
• launch of the new sustainability strategy with regular updates, supported by a communication programme for individual areas throughout the year; and
• communication of an IT systems development and update roadmap for the next few years, which we have already started.
Developing leadersWe expect leaders to be role models and to drive responsible business for the long term. Our values underpin our leadership principles of collaboration, being inclusive, having an open mindset, innovation and leading as a coach. These attributes are used when recruiting future leaders and in our development programmes. In 2021, we continued to develop our ‘Culture at CC’ workshops, to reflect on our leadership principles, discuss what it means to be a leader and communicate the support available to leaders to help achieve their goals.
Almost 500 leaders completed development courses during 2021. We also enhanced our Leadership Suite, launching Leadership Basics for aspiring leaders and the New Leaders Roadmap, which includes Mastering Personal Leadership training. Purposeful Leader, our flagship senior programme, rolled out globally and our Experienced Leader roadmap was finalised for delivery in 2022.
In addition, we piloted a Leadership Excellence course, to help leaders assess their strengths and development needs with their teams. Other pilot programmes for both leaders and
employees have been designed to help manage, implement and communicate change.
We ran cultural awareness training to ensure our people have the right knowledge and skills to work effectively and collaboratively across cultures. Exploring ‘How We Work’ also equips leaders to manage employees across different countries, including legislative elements and best practice.
During 2021, we ran our enhanced succession planning process and completed plans for all executives, leaders and critical roles. The programme will continue in 2022.
Diversity and inclusion (D&I) and wellbeingOne of the most important factors in Computacenter’s growth is ensuring that all our people are valued and supported to reach their full potential. We are therefore committed to improving workforce diversity and preventing discrimination on grounds of age, race, religion and nationality, and we have policies to support this. The Group has a dedicated D&I manager, who works closely with our HR managers and business partners to embed D&I into our people plans.
To focus our D&I work we target six pillars, which were developed by our people. These pillars are: gender, culture, age, accessibility and wellbeing, LGBTQ+, and life balance. Key themes that run alongside the six pillars are recruitment and retention, and organisational culture.
Our key objectives this year include improving our gender balance and promoting ethnic diversity and inclusion, and we made significant progress in 2021. We launched new development programmes, including our ‘Leading Together’ programme for our most senior women, to focus on their development and how they can inspire future female leaders. Our ‘Ethnic Diversity Development’ Programme resulted in a new pilot in the United Kingdom to develop and advance our people from ethnic minority backgrounds. We also completed one of two pilots for a D&I programme to make our people more aware of their behaviours and how they can create an equitable and inclusive environment.
Another priority is to promote wellbeing. Each country has an ‘Employee Assistance’ programme, enabling everyone to get specialist wellbeing support. We have also launched our Group-wide wellbeing app, Be Well. This offers content ranging from live exercise classes to mindfulness tips and healthy recipes, helping our people to stay physically and mentally healthy. In 2021, we ran a global step challenge, to drive engagement, promote wellbeing and encourage people to get active. This challenge saw great participation from all countries.
46

Promote WELLBEINGProactively promote our people to look after their own physical and mental wellbeing.
Speak FREELYCreate an environment which enables employees to speak openly, and to identify actions to improve employee experience.
Help EDUCATEFacilitate the delivery of targeted education to every Computacenter employee, to equip them with the knowledge they need to promote a positive and inclusive environment for all.
Be ACCESSIBLESupport and drive initiatives to improve the accessibility of Computacenter, removing any barriers that prevent people achieving their potential.
DATAEnsure we have
the data that enables us to measure the
success of ongoing work.
We also continued our online training on mental health for line managers and offered courses on subjects such as stress. Our awareness programme for our people runs quarterly campaigns on wellbeing topics.
Gender diversity The table below shows our gender diversity at the year end:
2021 2020
Women Men Women Men
Board 3 6 2 7Senior managers 28 94 25 98Other employees 4,726 13,135 4,196 12,340Total 4,757 13,235 4,223 12,445
Although the proportion of women we employ is in line with industry norms, we are committed to increasing it. Initiatives specifically aimed at improving gender diversity include our ‘Growing Together’ programme of activity designed to create a gender-diverse talent pool in middle and senior-level roles by providing development opportunities specifically focused on our female employees. In 2021, we were proud to have reached more than 100 delegates who had attended the programme since it began. We have seen good
growth in the number of female senior leaders across the Group, with an increase of 4.4 per cent in the year.
We were proud to have two winners at the 2021 CRN Women in Channel Awards and to receive two corporate awards, the Health and Wellbeing Recognition Award and the Best Community Outreach Programme, for our commitment to school and community outreach with a focus on diversity. In Germany, we had two winners in the Women’s IT Network awards. We were also recognised by Brigitte Magazine as one of the best places in Germany for women to work.
One of our key successes this year was the growth of our first Employee Impact Group (EIG), focusing on ethnic diversity. Its members come from across the Company and it helps employees to create sustainable change. The EIG has hosted a range of activities including our Breaking Barriers event, co-hosted with CRN, which saw over 180 professionals from the sector join expert speakers and industry leaders to share advice and best practice on making our industry more inclusive to people from ethnic minority backgrounds.
We have now launched two new EIGs on Gender, and Wellbeing and Accessibility. Their steering groups have begun to design a Group-wide approach to these topics, which can be delivered locally.
EMPLOYEE IMPACT GROUPS
Our Employee Impact Groups help give our people the opportunity to influence and create a working culture they are proud to be part of.
EIGs are a great way to give employees a voice that is not only heard but acted on by the business. They change the narrative by enabling employees to be at the heart of solutions and drive beneficial change via actions over words.Colin WilliamsEthnic Diversity Steering Group member
47
Strategic ReportAnnual Report and Accounts 2021
Sustainability strategycontinued
In our recent employee survey, we achieved positive results for the inclusion questions, showing that our people believe we support equality of opportunity and that they can be themselves at work without worrying about not being accepted.
Our investment in wellbeing has been further supported with the introduction of a dedicated wellbeing manager. This has allowed us to focus our wellbeing strategy on the areas that our people need and has already led to further Mental Health First Aiders being trained, the launch of menopause guidelines and support network, and signing up to participate in the Mind Workplace Wellbeing Index.
Reward and recognitionPay for performance is at the heart of our reward philosophy. As well as ensuring that our people are paid in line with any legislative requirements, including national minimum wages and equal pay, our goal is to align pay with each employee’s contribution. As part of this, we carry out annual pay reviews for all our employees across the globe.
In March 2020, we launched a global peer-to-peer recognition tool called ‘Bravo!’ This allows our people to immediately recognise and thank one another for their valuable contributions in the workplace. The tool also allows managers to award points for exceptional performance and practice, which are redeemable with selected retailers or may be donated to selected charities in-country. The next step in our journey with Bravo! was the launch of Bronze, Silver and Gold awards in 2021. These rewards are specifically targeted at those who demonstrate our values to the highest possible standard.
Supporting communitiesWe recognise the importance of delivering social value for our communities and we support our people to take part in activities where they can make the most difference.
Our main aims are to:
• demonstrate our commitment to the wider community;
• motivate employees by encouraging team-building activities in a worthwhile cause; and
• promote Computacenter’s Winning Together Values to customers, our people and other stakeholders.
We continue to support initiatives to raise money for local charities, as well as supporting activities proposed and run by our employees. Some examples are below.
The impact of the floods in Western Europe was particularly relevant to our employees this year. In response, we donated a total of €25,000 to ‘Aktion: Deutschland hilft’ and the German Red Cross. We also supported affected employees and the wider community, establishing a platform where employees could offer practical help and allowing 220 days of paid time off for those supporting the recovery effort.
In the UK, we support the charity partners selected by employees – Make-a-Wish Foundation, British Heart Foundation and Dementia UK – through fundraising steered by the Charity Committee. We also offer a Give as You Earn scheme, through which employees can make monthly contributions to any UK charity. Our Bravo! employee recognition scheme also allows employees to donate their voucher rewards to our chosen charities.
Our work with potential future talent is a key part of our strategy for delivering social value in our wider communities. Over the last few years, we have developed strong partnerships with a number of schools, universities and charities in the UK, with our community education outreach programme continuing to grow in 2021 and winning CRN’s award for ‘Best Community Outreach Programme’ in the UK tech channel.
In 2021 we reached over 5,000 students and young adults, and of those:
• 53 per cent identified as female;• 45 per cent identified as male;• 2 per cent identified as non-binary;• 35 per cent were from an ethnic minority
background;• 55 per cent came from a disadvantaged
background;• 25 per cent were in the care system; and• 20 per cent were disabled.
We committed further support for our wider communities when we first signed the UK Armed Forces Covenant. As part of our commitment to this and our investment in military service leaders, January 2022 saw the launch of our new Veteran Transition Programme in the UK. This is an exciting, frontline sales development programme that provides carefully selected rotations across key business functions. After successful completion, it leads to a role as a Solution Sales Specialist.
Ethics and conductComputacenter has a range of people-related polices, covering topics such as equality and respect at work, health and wellbeing, recognition and reward, and whistleblowing. Together, they are designed to ensure that our people are supported, protected and suitably recognised for the contribution they make, and that we are an inclusive and ethical employer, with a diverse, talented and motivated workforce.
Our people can report any HR policy compliance issues to their line manager or HR, or they can call our Safecall whistleblowing hotline, which allows them to report in confidence. All calls to the hotline are handled by an independent third party and the issues are monitored, resolved and reported to the Audit Committee. All other issues are dealt with operationally, through the HR function.
We also monitor other indicators of policy compliance, such as the number of grievance or disciplinary proceedings, which we aggregate at a country level. Our HR managers review this data to see if there are trends requiring management action. No material policy breaches were identified during the year, either through the whistleblowing hotline or our other compliance processes.
Anti-bribery and corruptionComputacenter has a well-established Anti-Bribery and Corruption compliance framework. This is underpinned by our Ethics Policy which, together with specific Anti-Bribery and Corruption and Fraud policies, provides a clear set of rules and expectations that are applied across our business. This is supported by employee training and guidance documentation.
The Anti-Bribery and Corruption compliance framework is overseen by the Group Legal and Compliance Director and our Compliance Steering Committee. It is regularly audited by our Internal Audit function. The framework is supported by our externally managed confidential whistleblowing hotline provided by Safecall, an industry recognised provider of such services. No material breaches of our policies were identified during the year.
We continued to reinforce our zero-tolerance approach to bribery and corruption throughout 2021, providing training as an integral part of our induction process and ensuring continued awareness of our whistleblowing hotline across the Group. This ensures that all employees, contractors, third parties and suppliers know that they are able to report any issues on a confidential basis.
48

Computacenter GroupCollection of Computacenter images illustrating the range of activities our people are involved with.
INSPIRING FUTURE GENERATIONS In partnership with schools, universities and charities we have reached over 5,000 students in 2021 providing:
• Advice on careers in STEM and promoting women and ethnic diversity in tech
• On-site visits at Computacenter• Speak to the expert days• Lessons about technology• Work experience for students• Assessment centre preparation workshops• Mock interviews and CV writing• Social media safe workshops• Apprenticeship challenges• Guidance to ensure work readiness• Career fairs• School employability strategy support, including those
with disabilities
In October 2021 we were proud to be recognised at the CRN Women in Channel Awards 2021 for our Community Outreach Programme.
49
Strategic ReportAnnual Report and Accounts 2021

I love our company and I feel privileged to say that. Energy is part of our DNA and that’s what makes Computacenter so special and admired by our customers, vendors and partners.
Robbie DegenClient Director, United Kingdom
I’ve been with Computacenter for 17 years and I’ve developed with this Company into a Group leadership role. I’m inspired to see our people come together to deliver the best possible services for our colleagues and customers around the world.
Inga OpelDelivery Enablement Director, Germany
Working at Computacenter is truly exciting. My co-workers are excellent – they know what needs to get done and how to do it. What I like most about working here is obvious – the people!
Rob DelucaService Manager,North America
From day one, Computacenter felt like home to me. Working here has allowed me to develop so much and good work is appreciated. I’m honoured to be working at a respected company with an incredible people culture.
Sylvie KnuthTransition & Take-on Specialist Associate, Germany
WINNING TOGETHERA selection of our people from across the Group, sharing their stories about what 2021 has meant for them and their customers.
YEARS
1981-2021
50
Sustainability strategycontinued
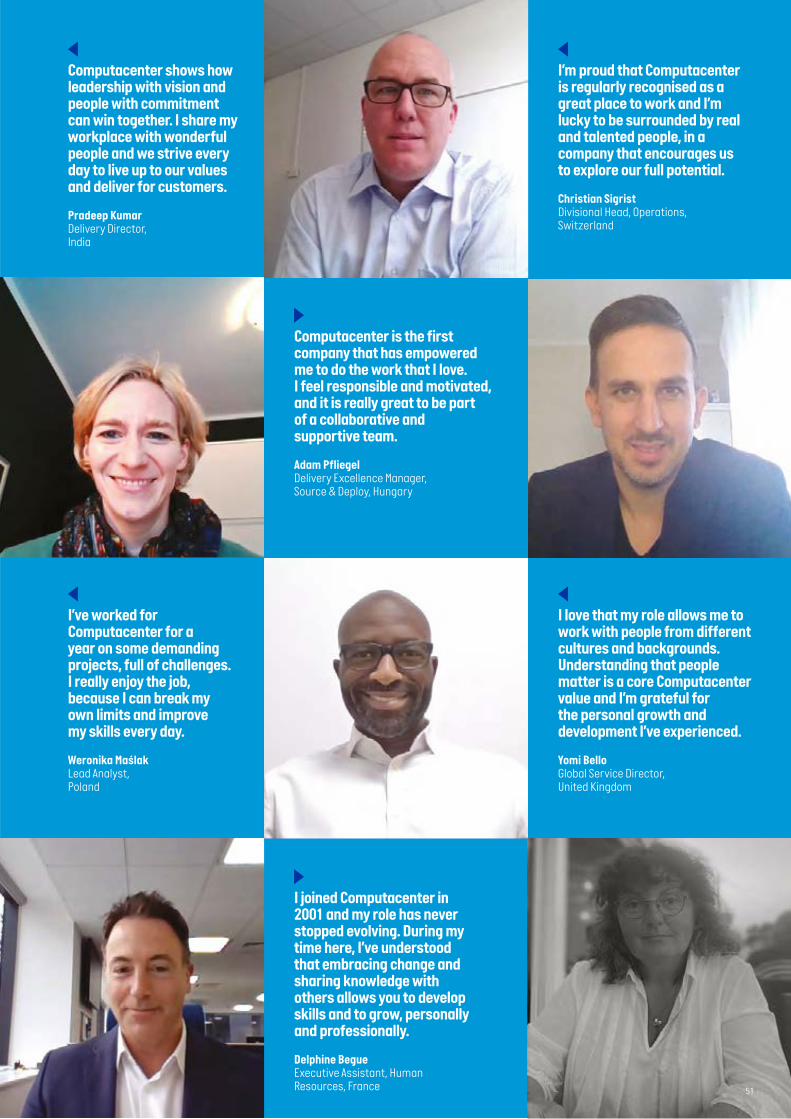
I’m proud that Computacenter is regularly recognised as a great place to work and I’m lucky to be surrounded by real and talented people, in a company that encourages us to explore our full potential.
Christian SigristDivisional Head, Operations, Switzerland
I love that my role allows me to work with people from different cultures and backgrounds. Understanding that people matter is a core Computacenter value and I’m grateful for the personal growth and development I’ve experienced.
Yomi BelloGlobal Service Director, United Kingdom
I joined Computacenter in 2001 and my role has never stopped evolving. During my time here, I’ve understood that embracing change and sharing knowledge with others allows you to develop skills and to grow, personally and professionally.
Delphine BegueExecutive Assistant, Human Resources, France
Computacenter shows how leadership with vision and people with commitment can win together. I share my workplace with wonderful people and we strive every day to live up to our values and deliver for customers.
Pradeep Kumar Delivery Director, India
Computacenter is the first company that has empowered me to do the work that I love. I feel responsible and motivated, and it is really great to be part of a collaborative and supportive team.
Adam PfliegelDelivery Excellence Manager, Source & Deploy, Hungary
I’ve worked for Computacenter for a year on some demanding projects, full of challenges. I really enjoy the job, because I can break my own limits and improve my skills every day.
Weronika Maślak Lead Analyst, Poland
51
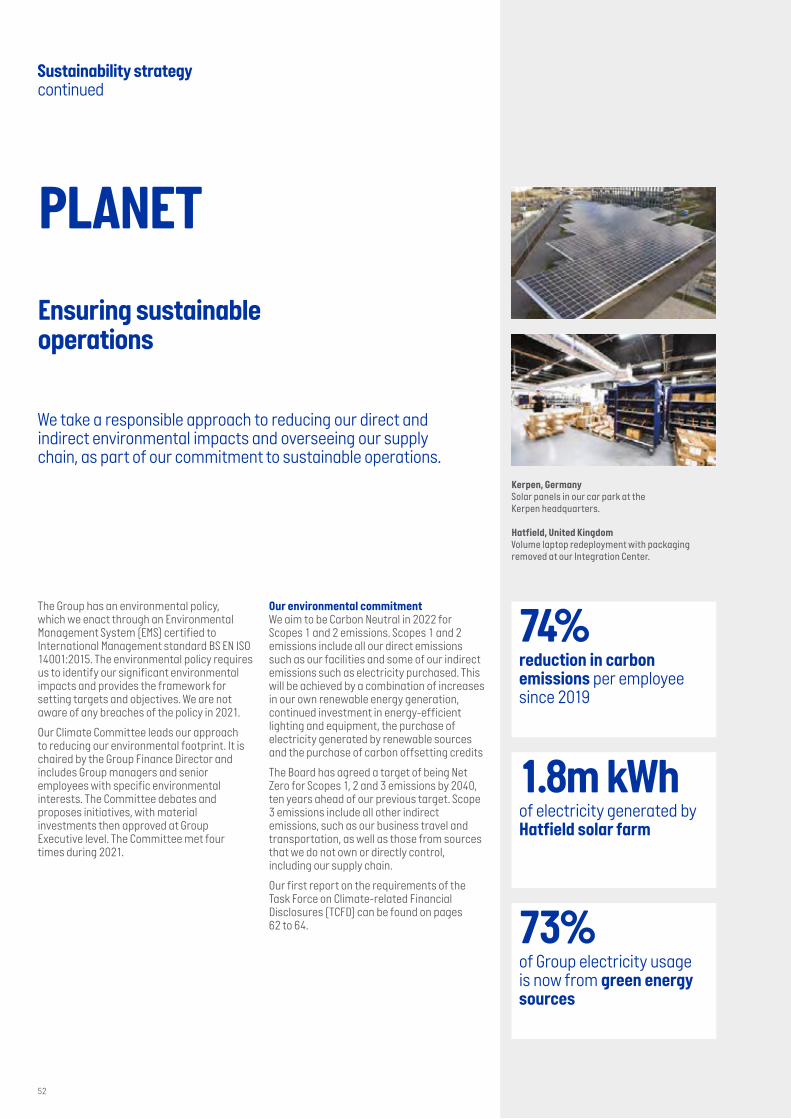
Sustainability strategycontinued
The Group has an environmental policy, which we enact through an Environmental Management System (EMS) certified to International Management standard BS EN ISO 14001:2015. The environmental policy requires us to identify our significant environmental impacts and provides the framework for setting targets and objectives. We are not aware of any breaches of the policy in 2021.
Our Climate Committee leads our approach to reducing our environmental footprint. It is chaired by the Group Finance Director and includes Group managers and senior employees with specific environmental interests. The Committee debates and proposes initiatives, with material investments then approved at Group Executive level. The Committee met four times during 2021.
Our environmental commitmentWe aim to be Carbon Neutral in 2022 for Scopes 1 and 2 emissions. Scopes 1 and 2 emissions include all our direct emissions such as our facilities and some of our indirect emissions such as electricity purchased. This will be achieved by a combination of increases in our own renewable energy generation, continued investment in energy-efficient lighting and equipment, the purchase of electricity generated by renewable sources and the purchase of carbon offsetting credits
The Board has agreed a target of being Net Zero for Scopes 1, 2 and 3 emissions by 2040, ten years ahead of our previous target. Scope 3 emissions include all other indirect emissions, such as our business travel and transportation, as well as those from sources that we do not own or directly control, including our supply chain.
Our first report on the requirements of the Task Force on Climate-related Financial Disclosures (TCFD) can be found on pages 62 to 64.
PLANET
Kerpen, GermanySolar panels in our car park at the Kerpen headquarters.
Hatfield, United KingdomVolume laptop redeployment with packaging removed at our Integration Center.
We take a responsible approach to reducing our direct and indirect environmental impacts and overseeing our supply chain, as part of our commitment to sustainable operations.
Ensuring sustainable operations
74%reduction in carbon emissions per employee since 2019
1.8m kWhof electricity generated by Hatfield solar farm
73%of Group electricity usage is now from green energy sources
52

Hatfield, United KingdomThe solar panels on the roof of our Hatfield Integration Center were one of the largest installations of its type in the UK in 2020.
Energy usageIn 2021, the Group consumed 38.5 million kWh of electricity, of which the UK accounted for 50 per cent. 73 per cent of the Group’s electricity usage came from renewable sources, a significant improvement from approximately 30 per cent in 2020.
We benefited from a full year of electricity generation from the 6,308 solar panels installed at our Hatfield (United Kingdom) Integration Center in 2020, which generated approximately 1.8 million kWh in 2021 and saved around 400 tonnes of annual CO2e (based on UK conversion factors). On 1 October 2021, the 1,700 solar panels installed at our Kerpen (Germany) Integration Center became operational. In addition, we have covered approximately 500 parking spaces at Kerpen with carports that include solar panels. These went live in the first quarter of 2022. In total, the solar installation at Kerpen can generate around 1.5 million kWh per annum. The car park structures at Kerpen have the additional benefit of protecting cars from sun and snow and will have car charging points attached to them. We have agreed a proposal for installation of solar panels at our Integration Center in Livermore, California, which will have the potential to generate around 0.75 million kWh per annum.
In addition to generating our own electricity, we source green energy for our operations in the UK and Germany. These agreements were in place throughout the prior year in Germany and for two months in 2020 in the UK, meaning we have had a full-year benefit in 2021 from the UK agreement. In total, we used 27.9 million kWh of renewable energy in 2021, resulting in a further reduction in our CO2e of approximately 4,953 tonnes.
We continue to find ways to reduce our energy usage. For example, as IT equipment in our offices needs replacing, we are rolling out display screens that also power users’ laptops and other devices, saving 50 to 60 per cent of the power of having separate chargers. This also results in cost savings from not buying docking stations. All new offices will have enhanced energy efficiency, and, for example, we have included energy efficient lighting in our new Paris office and our existing Roissy and Gonesse locations, after refurbishment.
In 2020, we refreshed the air conditioning system at our Manchester data center, so it uses free cooling from the environment when the outside temperature is low. This reduced energy consumption there by 14 per cent in 2021.
Being Carbon Neutral (Scopes 1 and 2) in 2022 will be a major milestone, based on a number of years of carbon reduction efforts across the business. We will be one of the first companies in our industry to achieve this.Tony ConophyGroup Finance Director
53
Strategic ReportAnnual Report and Accounts 2021

Sustainability strategycontinued
Greenhouse gas (GHG) emissionsThe Company is required to state the annual quantity of emissions from Group activities, in tonnes of carbon dioxide equivalent, which can be found below. Further details of our environmental policies and programmes can be found on our corporate website: computacenter.com.
Global GHG emissions (metric tonnes of CO2e)
Year 2021 2020
Scope 1 1,908 5,640Scope 2 3,302 8,216Total 5,210 13,856
Scope 1: combustion of fuel and refrigerants usage
Scope 2: electricity, heat, steam and cooling purchased for own use
Scopes 1 and 2 emissions fell from 13,856 metric tonnes of CO2e in 2020 to 5,210 metric tonnes in 2021, a reduction of 62 per cent. This reflects the benefits of the UK green energy contract, the Kerpen solar installation and the other initiatives we have undertaken, partially offset by a full year of the acquisitions the Group completed in 2020. Our UK business accounts for 22.1 per cent of total emissions.
The Group’s chosen intensity measurements for emissions as reported above are:
• 0.78 metric tonnes per £m of Group revenue (2020: 2.55 metric tonnes), a reduction of 69 per cent.
• 0.30 metric tonnes per Group employee (2020: 0.84 metric tonnes), a reduction of 63 per cent.
We have a target to achieve Net Zero for Scopes 1, 2 and 3 emissions by 2040. Our roadmap to achieve this is underpinned by Science Based Targets and includes the following initiatives:
• Continued investment in green energy, self-generating power solutions and reducing consumption through both implementing better technology products in our own environment and enhancing the efficiency of our facilities.
• Managing post-Covid-19 Group travel through a mixture of incentives, travel levies and technology-supported hybrid working and collaboration.
• Working with our technology partners on their own journey to Net Zero, to ensure that the products we purchase for resale do not increase our carbon footprint. Most of our technology partners are among the leaders in the global industry and share our commitment to Net Zero.
• Working with our wider supply chains to ensure they are aligned to our 2040 target and hence reducing emissions in areas such as transportation.
• Utilisation of our Circular Services operations to avoid carbon consumption with the reuse of technology assets and extraction of raw materials through redeployment, remarketing and recycling.
• Widening the adoption of our Circular Services portfolio with our customers, to enhance their carbon avoidance.
• Offset remaining emissions that cannot be removed using accredited Gold Standard (GS) carbon removal schemes. The GS is a voluntary carbon offset programme focused on progressing the United Nation’s Sustainable Development Goals and ensuring that projects benefit their neighbouring communities.
We will regularly review and refine our roadmap based on Science Based Targets, to ensure that the evolution of standards in this area is reflected.
MethodologyThis activity has been conducted as part of our UK EMS ISO 14001:2015 standard (EMS 71255). We have used the main requirements of the GHG Protocol Corporate Accounting and Reporting Standard (revised edition). Emission factors used are from the UK Government’s Conversion Factors supplied by DEFRA. We have different factors for each country, as electricity generation and CO2e efficiency vary by country. External consultants assisted with the implementation of our methodology which we continue to further refine and develop internally, to include the full requirements to collate the additional emissions, such as refrigerants.
Emissions performance over time (metric tonnes)
Group 2015 2016 2017 2018 2019 2020 2021
Total Scopes 1 and 2 emissions 24,795 25,518 22,662 19,741 19,808 13,856 5,210
Per £1 million of revenue 8.11 7.86 6.20 4.53 3.91 2.55 0.78
Per employee 1.92 1.80 1.54 1.30 1.23 0.84 0.30
Kerpen, GermanySolar panels covering our car park area.
Kerpen, GermanySolar panels on the roof of our Integration Center.
54

We have reported on all the emission sources required under the Companies Act 2006 (Strategic Report and Directors’ Reports) Regulations 2013. Group properties included in this report are all current locations in the United Kingdom, Germany, France, Belgium, Spain, South Africa, United States, Canada, Switzerland, Malaysia, Hungary, Mexico, India, Poland, and the Netherlands.
Limitations to data collectionLess than 5.0 per cent of emissions were estimated or based on an average energy usage per square foot of space occupied.
Commitment to Science Based Target initiative (SBTi)In 2021, the Group joined the global movement of leading companies aligning their businesses with the most ambitious aim of the Paris Agreement, to limit the global temperature rise to 1.5°C above pre-industrial levels. We will submit our targets to SBTi in 2022 for validation.
Carbon Disclosure Project (CDP)We participated in the CDP and improved our score from D to C in the most recent submission. We continue to target further improvements in our rating.
Procurement Policy Notice submissionAs a supplier to the UK Government, we are required to have a robust and documented carbon reduction plan. We therefore made the necessary Procurement Policy Notice submission during 2021. This is part of a broader pattern of government and public sector customers adding criteria for companies to meet, in order to remain eligible to supply goods or services to them.
Energy Savings Opportunity Scheme (ESOS)Computacenter complied with this legislation by submitting its energy report, which covered the period 1 April 2018 to 31 March 2019. The next submission is required in 2023.
TravelAlthough travel is a necessary part of conducting business, we want to ensure that all trips are truly needed. We have a target to reduce emissions from business travel by up to 35 per cent by 2025, compared to 2019. Covid-19 restrictions meant that we easily met this target in 2021, using 0.63 million kg of CO2 during business travel compared to 5.2 million kg in 2019. However, this is a challenging target to achieve in a normal year, given the Group’s growth. We are continuing to encourage the use of technology such as video conferencing as an alternative to travel and conducting a communications campaign to urge people to travel less.
From 1 October 2021, we have introduced a travel levy for all trips and hotel bookings across the Group. The levy is £10, €12 or $14, depending on the booker’s local currency. The levy raised around €50,000 during the fourth quarter of 2021. The money raised will be used to offset the travel element of our Scope 3 emissions. In addition, when people book flights, they can see the associated carbon emissions on the flight booking system, so they understand the impact and are encouraged to use alternatives. In Germany, where internal business flights are common, we have implemented a pilot programme to substitute flights for first class train travel, as the national railway company Deutsche Bahn achieves Net Zero emissions through offsets. This is expected to further reduce our CO2e impact in 2022.
Our employees have responded well to our introduction of a 110g/km CO2e limit for new company cars, with compliance at approximately 53 per cent in the United Kingdom and approximately 60 per cent in France. Our German and Dutch fleets will follow as the transition from legacy fleets evolves to more electric vehicles and plug-in hybrid cars and vans. We are installing electric vehicle charging points at our sites, as the need arises.
Service Center – Cape Town, South AfricaWe used the opportunity of a new building in Cape Town to move to a more energy-efficient facility, built to high environmental standards.
55
Strategic ReportAnnual Report and Accounts 2021

Materials usageMaterials include the packaging we use in our Integration Centers and the packaging our technology partners use when transporting goods to us. This category also includes items we mail and our use of single-use plastics.
Packaging materialsA number of customers are taking an increased interest in reducing the packaging that is supplied with their purchases, particularly single-use plastics. Some manufacturers are already supplying more cardboard-based internal packaging and have significantly reduced their plastic content and are looking to remove it completely in the next few years. Others have made progress in this area during 2021 but are still supplying plastic packaging. We have further improved our recycling channels and nearly all plastic bags are now either retained to be re-used or separated and collected for dedicated plastics recycling.
We regularly hold discussions with our technology partners about their use of packaging materials, to encourage them to reduce the volume of packaging and to substitute materials for those which can be reused or more easily recycled.
e-invoicingWe send around 100,000 sales invoices each month. Our investment in IT tools and programmes in recent years mean that, for example, in excess of 90 per cent of our UK invoices are now sent electronically, which reduces costs and our environmental impact. The implementation of an e-invoicing system in Germany is now in full effect, with the result that approximately 88 per cent of invoices in Germany are sent electronically.
Removal of pre-printed stationeryWe have largely removed pre-printed stationery across our offices and continue to work to minimise the need for printed documents, supported by our investments in systems and collaboration tools.
Single-use plasticsHaving already eliminated single-use items such as plastic cups and bottles at Hatfield and Kerpen in 2020, we have continued to prevent similar usage at our other major sites in 2021. As a result, we are substantially eliminating the use of these items across the Group.
Sustainability strategycontinued
Waste diverted from landfillWe look to send as little waste as possible to landfill and closely monitor recycling performance for materials such as plastics, paper and cardboard. In 2021, 34 per cent of waste in the United Kingdom was sent to landfill.
Packaging waste regulation Computacenter UK is registered as a distributor of product via the compliance company Paperpak, ensuring we have fully complied with this regulation since 2000.
LogisticsWe use logistics services to deliver products to our customers. Minimising the environmental footprint and the cost of these services requires us to employ the Integration Center nearest to the customer’s premises. As previously noted, we have negotiated with many UK customers to fulfil deliveries to their EU operations from Kerpen rather than Hatfield. This has the additional benefit of avoiding post-Brexit challenges at the border.
We are working with our various logistics suppliers to ensure that they are maximising the impact of their own sustainability strategies through, for example, the use of low emissions vehicles.
Hatfield, United KingdomLaptop configuration as part of lifecycle asset management services from our Integration Center.
56

Health and safetyWe are committed to providing safe and healthy workplaces. Our policy is that, so far as is reasonably practicable, we will create and maintain an environment that is committed to eliminating or reducing health and safety risks to employees, customers, suppliers, contractors, visitors and members of the public.
Our approach to health and safety is based on identifying and controlling hazards and preventing incidents, particularly those involving personal ill-health, injury and damage to equipment or property. We also investigate near misses, as an essential part of preventing future incidents.
It is vital that everyone concerned is made aware of their responsibilities for implementing our health and safety policy. All line managers are required to ensure that the policy is implemented within their areas of responsibility and employees must take reasonable care of their own health and safety and that of others who may be affected by what they do. Failing to observe the policy can result in disciplinary action.
We have continued to support our people in workplaces by providing appropriate face masks, cleaning materials and hand sanitisers throughout these facilities.
PerformanceThe table below shows the health and safety performance of our UK, Germany, and France businesses. The Accident Incident Rate (AIR) is the number of accidents per 1,000 employees and the Accident Frequency Rate (AFR) is the number of accidents per 100,000 working hours.
AIR AFR
2021 2020 2021 2020
UK 0.87 0.58 0.07 0.11Germany 1.99 1.62 0.42 0.34France 0.69 0.64 0.14 0.14
We have continued to offer health and safety training, for example covering display screen equipment, manual handling, environmental awareness, and safe driving.
In Germany, we have implemented a new Environment, Health and Safety (EHS) organisation, expanding the team and providing necessary training. The function covers Computacenter facilities and approximately 300 on-site locations and ensures there are dedicated contacts and responsibilities in place for all operations. Creating a central team has helped to deliver synergies and simplify processes. Among a wide range of initiatives, the function has implemented a new software solution, and carried out internal audits on EHS issues and occupational health and safety inspections at customer sites and in our offices. It has also trained fire safety officers, who will create fire safety regulations and evacuation training during 2022 and take over responsibility for fire safety from 2023.
The Group has continued to comply with all relevant health and safety legislation in all the countries in which we operate. This is monitored using appropriate tools, controls and measures, which form part of our overall compliance management system. This in turn is governed by the Group Compliance Manager and Compliance Steering Committee.
Responsible businessSupply chainWe work with a diverse set of suppliers, who play a key part in the success of our business. When selecting suppliers, we ensure that our terms of engagement are clear and that they support both our Group values and our wider sustainability objectives.
Onboarding of suppliers for most countries is managed by the Supplier Contract Management team. The team uses a standardised on-boarding process. Among other things, this validates that the request to add the supplier complies with our Business Ethics Policy, obtains a supplier self-assessment on several topics, including sustainability issues, and highlights to prospective suppliers key Computacenter policies, such as IT security, anti-bribery and corruption and our Supplier Code of Conduct. The Code of Conduct sets out the 10 principles in the UNGC, which include human rights, modern slavery, anti-bribery and corruption, and environmental matters.
Regulatory changes, particularly in Germany, will require us to be able to monitor supplier status on certain issues on a regular basis, in addition to the on-boarding process. We are therefore evaluating tools that will support our ability to do this. As part of this process, we will replace the existing questionnaire with a more concise set of questions covering only what we need to operate effectively and measure compliance. This will be combined with a refreshed Supplier Code of Conduct, which suppliers will either be asked to sign or, for major suppliers, confirm that their own ways of working align with the Code.
Human rights and modern slaveryFor Computacenter, human rights falls into two areas: protecting the rights of our employees and those within our supply chain. The human rights of our employees are covered by our Health & Safety policies and our Ethics & Conduct policies.
Human rights in the supply chain primarily relate to the risk of modern slavery. We published our most recent Modern Slavery Statement, covering our 2020 financial year, in the first half of 2021, with our report covering the 2021 year due to be published imminently.
The Group publicises its whistleblowing hotline to suppliers, to enable reporting of any suspected human rights issues. There were no such issues reported during the year.
57
Strategic ReportAnnual Report and Accounts 2021

Sustainability strategycontinued
Our customers not only expect Computacenter to be a sustainable supplier and partner but also to help them to achieve their own sustainability goals. Our activities here are in three areas: Circular Services, Technology Advisory and Asset Lifecycle services.
Offering sustainable customer solutions
Circular ServicesIn a traditional linear economy, goods are made, used and then disposed of. The circular economy means that we keep resources in use for as long as possible, extract the maximum value from them whilst in use, then recover and regenerate products and materials at the end of each service life.
Our subsidiary R.D. Trading Limited (RDC) is responsible for our Circular Services offering. The bedrock of the service is the audit, data-wiping and safety testing of every customer asset. Once in our system, the circular journey can then begin, bringing to customers the benefits, both financial and environmental, of redeploying, remarketing or recycling their old equipment. Putting customer assets to good use elsewhere within their business through redeployment saves money and carbon against purchasing new. Likewise, remarketing all functional assets that are no longer required generates cash, as well as reducing the carbon footprint of third parties buying new. In addition, recycling all the equipment that is too old or damaged removes potentially harmful materials from landfill, whilst extracting metal and plastic products that can be reused in manufacturing.
SOLUTIONS
RDC has put huge effort into ensuring the accuracy of our recycling management, with whole recycling facilities dedicated to testing, measuring and filming of controlled batches of our customers’ scrap, including systems, screens, servers, networking devices and printers. This has enabled us to provide detailed records of metal, circuit board and plastic material extracted from the waste stream.
Combining redeployment, remarketing and recycling with secure logistics and data management into an integrated package is at the core of Circular Services.
RDC’s capabilities are backed up by Circular Services delivered in Germany from our Kerpen Integration Center and recent acquisition, ITL. We extend these capabilities with partners worldwide to align with Computacenter’s global coverage.
128,000tonnes of carbon avoided through reuse of assets (redeployment and remarketing)
455,000assets (main and peripheral) redeployed to customers saving them £50 million
600tonnes of reusable raw materials generated through industrial recycling
Asset volume up 13% to
2.2 million(main and peripheral) with 7% increase in weight to 4,450 tonnes
870,000assets remarketed (main and peripheral) to third parties, returning over £22 million in cash to our customers
58

Braintree, United KingdomOur Circular Services Integration Center in Braintree is supplemented by facilities in Germany and partners worldwide.
REDEPLOYMENT
On-site data sanitisation
REMARKETING
Technical processing
RECYCLING
Secure transport Secure environment
By using our Circular Services, including redeployment, remarketing and recycling, our customers can avoid carbon emissions, helping them on their own journey to Net Zero.Gerry HackettManaging Director, RDC (Computacenter subsidiary)
59
Strategic ReportAnnual Report and Accounts 2021

Sustainability strategycontinued
Technology advisoryOur role as both a trusted independent technology advisor and provider of Technology Sourcing for our customers puts us in a unique position to help customers drive their sustainability strategies through a number of services.
Selection of the most sustainable technology productsAs one of the world’s largest VAR, we work with all the leading technology suppliers and make available EPEAT and EnergyStar energy usage ratings for the products we supply to our customers.
Supporting technology partnersWe work closely with our technology partners to understand their sustainability strategies, help them to achieve their sustainability goals and help our customers to make informed decisions. We are proud to have been recognised by HP as a 5 Star Sustainability Partner.
Sustainable supply chain optionsWe are the VAR with the best international capability in the world and this allows us to help both our customers and technology partners to leverage our Integration Centers in different regions for local supply rather than export, where possible. We still have much to do to minimise the need for export solutions but will continue to build the local capabilities and work with our technology partners to do so over the coming years.
Ways of working for usersTechnology is a huge enabler for our customers to allow different ways of working for their users. We can provide workstyle analysis to support the design of optimum options, as well as helping to deploy and run solutions such as Tech Centers and secure locker collection, which can all contribute to a sustainable hybrid working strategy.
Data privacy and securityAs new ways of working are deployed, these need to be underpinned by a strong security and compliance environment, which we can help to design, deploy and support.
Asset lifecycleOur role in helping customers to deploy and manage their technology assets also allows us to introduce sustainable processes and services into our core offerings.
Sustainable deploymentWe offer a range of services to allow customers to deploy technology with the minimum environmental impact. These include our trolley services, which allow us to deploy at scale in offices but remove packaging from technology (laptops, network devices and servers) at our Integration Centers, allowing environmentally friendly disposal at scale.
Asset managementUsing our new SmartHub, we will provide customers with better data on the assets including length of life, configuration and update status, to allow them to make more informed choices on redeployment and replacement, usually extending the life of most assets covered.
INFORM
RECO
VER PROCURE
DEPLOY
SUPPORT
SIMP
LE, S
ECUR
E REPL
ACEMENT
OFEN
D-OF
-LIF
E DEVICES
RIGHT TECHNOLOGYAND RIGHT SOLUTION
EASYREQUEST
AND
PURCHASEPROCESS
READY DEVICES
OUT OF THE BOX
TOKEEP YOU PRODUCTIVE
SEAMLESS REPLACEMENTS
RECOVER
SIMPLE, SECURE REPLACEMENT
OF END-OF-LIFE DEVICES
PROC
URE
EASY
REQ
UEST
AND
PURC
HASE
PRO
CESS
DEPLOYOUT-OF-THE-BOXREADY DEVICES
SUPPORT
SEAMLESS REPLACEMENTS
TO KEEP YOU PRODUCTIVE
INFORMRIGHT TECHNOLOGY
AND RIGHT SOLUTION
DELIVERINGPREDICTABLE IT
CONTROL AND OPTIMISE
Computacenter’s Device as a Service (DaaS) Lifecycle
Device as a ServiceOur asset lifecycle services are being brought together into our DaaS offering, which will allow us to manage the lifecycle of assets for our customers, underpinned by the highest sustainability standards.
60
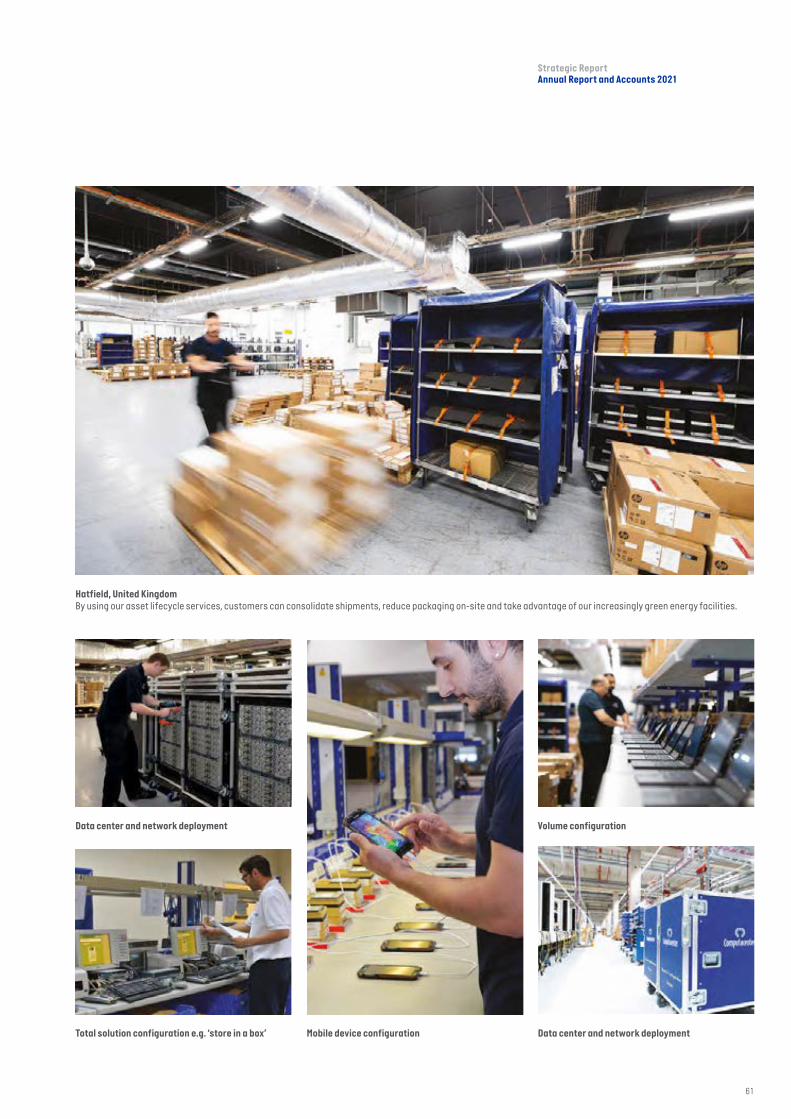
Data center and network deployment
Total solution configuration e.g. ‘store in a box’ Mobile device configuration
Volume configuration
Data center and network deployment
Hatfield, United KingdomBy using our asset lifecycle services, customers can consolidate shipments, reduce packaging on-site and take advantage of our increasingly green energy facilities.
61
Strategic ReportAnnual Report and Accounts 2021
Climate-related risks and opportunitiesWe support the aims of the Task Force on Climate-related Financial Disclosures (TCFD) in communicating the risks and opportunities arising from climate change. In accordance with the Financial Conduct Authority’s Policy Statement PS20/17, we are making disclosures consistent with the TCFD’s recommendations and recommended disclosures having considered all sector guidance, with the aim of providing all of our stakeholders with useful information relating to climate-related risks and opportunities relevant to our business. An exception relates to Scope 3 emissions, for which we aim to submit Science Based Targets during H1 2022; we have yet to define the basis of these emissions for which we will seek external support.
We supply technology products and services to our customers, which help them to reduce their own environmental impact by reducing business travel and increasing the flexibility of their workforce. This is supported by our Technology Sourcing infrastructure and through investments in our Integration Centers across Europe and North America to enable us to fulfil product more locally. Following our Brexit preparations, we have the ability to despatch products from our Kerpen Integration Center to customers in the European Union, which had previously been shipped from our Hatfield Integration Center. While we have been a net beneficiary of this change in terms of export administration and shipping cost, it has also helped to reduce global emissions.
GovernanceAs outlined on page 81, the Board has overall responsibility for managing risks and opportunities, including climate change risk. The Board has considered the risk to the business relevant to climate change but does not yet believe it is sufficiently material to be classed as a principal risk in its own right. The Board continues to monitor climate-related risk. It does so through its review of the Group’s principal risks related to any failure to meet our commitments or comply with applicable laws and regulations in relation to ESG matters.
The Board has delegated day-to-day oversight of climate change risk to the Climate Committee. This committee meets quarterly and leads on all climate-related initiatives. It consists of senior Managers and is chaired by the Group Finance Director, who also chairs the Group Risk Committee. The Group Risk Committee considers emerging risks, such as climate change, as necessary.
The Audit Committee is updated quarterly on discussions and outcomes from the Group Risk Committee meetings and the Board is updated at least annually on all risk matters, including climate-related issues where relevant. The Board has also endorsed the Group’s sustainability strategy, of which risk management and reporting form a part.
StrategyComputacenter’s exposure to climate-related risks and opportunities can be seen through the lens of our position as one of the world’s leading VAR. Our ability to procure technology products through leading technology partners, add value for our customers through our Professional Services expertise, and then ship or hold that product depends on:
• the resilience of our technology partners; • their ability to efficiently manufacture the
product on a timely basis; and • their ability to send it to our customers or to
us, in a timely and cost-efficient manner.
Our Services business depends on our people being able to access our service delivery locations and our customers’ locations, as well as the uninterrupted functioning of our operational infrastructure, such as our principal offices, Integration Centers and Service Centers.
Any physical or transitional climate-related risk which disturbs the equilibrium of our value chain could impact the execution of our strategy, our levels of customer service and satisfaction, and ultimately our financial performance. We have set out below those climate-related risks which we think could reasonably result in that happening, although for many of these their frequency and severity is difficult to predict. We have therefore based our analysis on certain assumptions, which we have also explained. Whilst none of these risks has yet impacted our business, we have also set out how we have responded to them in our strategy and financial planning.
Physical Risk: Extreme weather events and long-term changes in climate patternsSignificant changes in weather patterns in the medium to long term, both acute and chronic, could result in interruptions in our technology partners’ ability to manufacture and distribute on a timely basis, and could cause damage to our service delivery locations, including our Service Centers, Integration Centers and Data Centers, affecting our ability to run an uninterrupted service for our customers.
Most of our technology partners are substantial international businesses, who have the size, resilience, technological capability and investment capacity to mitigate the future risk of climate-related damage to their manufacturing and distribution process. We work with multiple technology partners, which mitigates against one organisation, area or region being impacted by extreme weather. We carry out a physical assessment of our service delivery locations across the globe, as part of our insurance risk assessment process, and ensure we have business contingency planning, so we can move our service delivery to alternative locations with minimal impact to service levels. None of our service delivery locations are at material risk of flooding from rivers or from sea level rises and, like many organisations during the Covid-19 pandemic, we have reduced our reliance on physical offices.
Transition Risk: Compliance and reputational riskAs we move towards a low-carbon economy, there are increasing compliance requirements emanating from the UK Government, regulatory authorities and standard-setters, as well as pressure from business stakeholders and market initiatives related to sustainability reporting, such as the TCFD. If we fail to meet these requirements and expectations, or if we fail to set and achieve our climate impact reduction targets, this is likely to harm our reputation and could cause customers to reduce their business with us.
We take our climate-related responsibilities seriously, which helps mitigate against this risk. We have had a Climate Committee in place since 2020. Recent initiatives have included the installation of a large number of solar panels at our Hatfield and Kerpen Integration Centers and we have contracts in place to use only green energy in our businesses in Germany and the UK. These and other initiatives (detailed on pages 52 to 61) have contributed to a reduction of our Scopes 1 and 2 emissions of 73 per cent since 2019 (see page 54). We have a target to be Carbon Neutral for our Scopes 1 and 2 emissions in 2022 and to reducing our Scopes 1, 2 and 3 emissions to Net Zero by 2040, backed by Science Based Targets. Our progress towards these targets will be monitored and reported on in future Annual Reports.
62
Task Force on Climate-related Financial Disclosures

Our initial assessment indicates that transition risks associated with the shift to a low-carbon economy are more likely to have an impact on our business in the short term, while physical risks (both acute and chronic) may become a greater issue in the longer term, if global temperature increases are not held within the 2°c limit envisaged by the Paris Agreement or we see the impacts of global warming of 1.5°c above pre-industrial levels, envisaged in the Intergovernmental Panel on Climate Change ‘Special Report’. More detail on the risks and opportunities arising from climate change, and the mitigating actions we are taking to address them, are shown below.
Short term (to 2030) Medium term (2030 to 2040) Long term (beyond 2040)
Higher transition risks associated with moving to a low-carbon economy • Reputational risk with investors,
customers and employees, if we do not adequately address climate change.
• Compliance risk if we fail to meet regulatory requirements, including emissions reporting obligations.
• Increased cost of climate-related levies/increased pricing of greenhouse gas (GHG) emissions.
• Changing customer behaviour.• Travel curbs.
Opportunities • Customers will continue to invest in their
IT infrastructure, to enable hybrid working practices which are carbon-reducing, and also to reduce the carbon footprint of their IT infrastructure. We will therefore continue to see high demand for modern, lower-carbon footprint technology products.
• Our Circular Services (redeployment, remarketing and recycling of technology products) will become increasingly important to our customers.
Continued transition risks• Increasing reputational risk with
investors, customers and employees, if we do not adequately address climate change.
• Continuing compliance risk if we fail to meet regulatory requirements, including emissions reporting obligations.
• Increased cost of climate-related levies/increased pricing of GHG emissions.
• Changing customer behaviour.• Travel curbs.
Opportunities • Continuing customer investment in
their IT infrastructure with continued high demand for modern, lower-carbon footprint, technology products.
• Our Circular Services will remain important to our customers.
Less significant increase in physical risks • Continued isolated extreme weather events
causing manageable business disruptions.• Higher summer temperatures and rapid
changes in temperature and humidity causing challenges for data center cooling.
Opportunities • Our ability to provide Circular Services by
ourselves will help us to differentiate, as customers will expect these services to be integrated into more of the technology products and services they procure, e.g., through ‘Device as a Service’ (DaaS).
• Customers will require our advice on the selection and deployment of technology products, to help them achieve their carbon reduction strategies.
Slight increase in transition and physical risks in the short term • Isolated and manageable business
disruptions caused by extreme weather events, such as flooding or drought.
• Ad-hoc supply chain interruptions.• Increased insurance costs due to
natural disasters.
Opportunities/Resilience• Our ability to supply technology products
locally in multiple regions (UK, EU, North America and APAC) will help large international customers to reduce shipment costs and the associated carbon footprint. This international coverage will also increase our resilience and help us provide greater supply chain resilience to our customers.
Increasing physical risks due to a failure to adequately transition to a low-carbon economy • Power outages due to restrictions on
use of fossil fuels.• Increasing cost of power.• Flooding due to increased sea level
(no strategic locations are at material risk).
• Increasing transport costs.• Telecoms and internet disruptions.
Opportunities/Resilience• We will continue to maintain
operational resilience through the geographical dispersion of our Service Centers.
• Our existing strengths as one of the world’s most international and Services-led VAR give us the opportunity to establish a leadership position in helping both customers and technology partners to achieve their sustainability goals.
Increased physical risks due to a failure to adequately transition to a low-carbon economy • Power outages due to restrictions on use of
fossil fuels.• Increased cost of power.• Flooding due to increased sea level (no
strategic locations are at material risk).• Pandemics due to new diseases caused by
climate and population changes.• Population changes – controls on population
growth, increasing migration, the need for automation etc.
• Increased transport costs.• Telecoms and internet disruptions.
Opportunities/Resilience • We will continue to maintain operational
resilience through the geographical dispersion of our Service Centers.
• Our existing strengths as one of the world’s most international and services-led VAR give us the opportunity to establish a leadership position in helping both customers and technology partners to achieve their sustainability goals.
The less than 2°c scenario assumes that we act responsibly, in line with business and society globally, to reduce GHG emissions. This may include the introduction of carbon pricing by national governments. In this scenario, we expect that transition risks pose the biggest threat to our business, with only a limited and manageable impact on our operations from physical risks. The greater than 2°c scenario assumes climate policy is less effective and emissions cause climate change above that envisaged in the Paris Agreement. Under this scenario, we would expect physical risks to become much more apparent in the longer term.
< 2°
c sc
enar
io>
2°c
scen
ario
63
Strategic ReportAnnual Report and Accounts 2021

Our strategy to address climate-related issues includes our commitment to be Carbon Neutral for our Scopes 1 and 2 emissions in 2022 and Net Zero for our Scopes 1, 2 and 3 emissions by 2040, with both commitments to be backed by Science Based Targets.
Risk managementOur risk management and control framework enables us to effectively identify, assess and manage climate-related risks. As summarised on page 81, the Board reviews climate change risk as part of its review of our principal risk relating to complying with our commitments and applicable laws and regulations in relation to environmental, social and governance matters. The process for identifying and assessing climate-related risk is the same as for all principal risks, as described on page 81. Each of our principal risks has an assigned risk owner, who is responsible for its management. This includes ensuring the effectiveness of internal controls and for overseeing risk mitigation plans. Each risk owner presents the controls and mitigations for peer review at least annually to the Group Risk Committee meetings. The Board also reviews the principal risks annually. We do not currently recognise climate change as a principal risk to the business.
The Group Finance Director chairs the Climate Committee that was established in 2020. The Climate Committee consists of Group managers and senior employees with specific environmental interests. The Committee’s aim is to debate and propose initiatives to continue to reduce our environmental impact, with some material investments to be approved at Group Executive level.
Metrics and targetsIn line with our current risk assessment and mitigation plan, we continue to largely concentrate on transition risks and our commitment to becoming a Net Zero business, as outlined above.
We have taken into account the cross-industry metric categories defined in the TCFD’s guidance on metrics, targets and transition plans (October 2021) in monitoring our transition to a low-carbon economy and the risks involved with it.
Metric category Target
GHG emissions We aim to reduce our Scopes 1 and 2 emissions to Carbon Neutral in 2022 and our Scopes 1, 2 and 3 emissions to Net Zero by 2040, backed by Science Based Targets.
Transition risk We have considered transition risks to achieving our strategic objectives across the Group as a whole. However, they are not considered material at this stage.
Physical risk We have assessed the Company’s locations close to water sources at risk of flooding or at risk of sea level change. None of the locations are strategic to our operations.
Climate-related opportunities Customers will need us to:
• supply and deploy modern, lower-carbon footprint technology products;• provide Circular Services for their technology estate and increasingly integrate these into
our Services;• provide local supply solutions, to minimise shipment-related carbon footprint; and• advise on selecting and deploying lower-carbon IT infrastructure, to help them meet their
sustainability goals.Capital deployment In recent years we have made significant investments to reduce our carbon footprint. These include
the following initiatives:
• Installing 6,308 solar panels at our Hatfield Integration Center at a cost of approximately £1.2 million; installing 1,764 solar panels at our Kerpen Integration Center and installing 2,016 solar panels over our Kerpen car park spaces at a cost of approximately €1 million. Combined, these will result in annual power generation of approx. 3.3 million kWh and the reduction in Scope 2 emissions of approximately 1,100 tonnes, based on a combination of UK and German conversion factors.
• Installing a further 1,200 solar panels on the roof of our Livermore Integration Center, which will complete in 2022, and is expected to generate 750,000 kWh and reduce Scope 2 emissions by 140 tonnes, based on local conversion factors.
• Purchasing ‘green’ electricity across our UK and Germany businesses at an incremental cost of £100,000, resulting in emissions reductions of 4,953 tonnes.
• Introducing electric vans in some of our logistics business areas and electric cars.• Acquisition of our RDC Circular Services subsidiary.
Overall, our GHG emissions are now 21 per cent of the 2015 number.Internal carbon prices While we have not introduced internal carbon pricing across our business as a whole, from
1 October 2021, we have introduced an internal levy of £10/€12/$14 per flight or hotel booking for the United Kingdom, France, Germany, Spain, Belgium and the United States, to purchase carbon credits each year to offset the CO2e emissions generated from these activities.
Remuneration For the year ended 31 December 2021, no executive discretionary bonus was linked to climate considerations, other than the Group Finance Director, who has one objective related to climate change management. However, this is being kept under review by the Remuneration Committee.
64
Task Force on Climate-related Financial Disclosurescontinued

Sections incorporated into Section 172 statement
Relevant information Page
• Our approach to market 10 to 16• Business model at a glance 17
• Technology Sourcing, Managed Services and Professional Services 18 to 25
• Our sustainability strategy 40 to 61
• TCFD disclosures 62 to 64
• Non-financial information statement and stakeholder engagement 65 to 69
• Viability statement and going concern 78 to 79
• Principal risks and uncertainties 80 to 85
• Board activity in 2021 91 to 92
When conducting any activity in his or her role as a Computacenter plc Director, our Board members must act in a way that they consider is most likely to promote the success of the Company for the benefit of its members as a whole, having regard to a number of factors set out in Section 172 of the Companies Act 2006. These include the interests of our employees, importance of fostering business relationships with our suppliers and customers, impact of our operations on the community and environment, likely consequences of any decision in the long term, desirability of the Company maintaining a reputation for high standards of business conduct and the need to act fairly as between the members of the Company. Each Director considers that they have acted in a manner consistent with his or her Section 172 duty throughout the year.
The Board understands that without our key stakeholders, the Company would not be able to successfully implement its strategy, and its purpose would be unachievable. Understanding their interests, views and concerns, and considering these when reviewing and discussing matters put before it for review or approval as part of its annual programme, is critical to enabling the Board to make informed decisions, and for each Director to discharge their duty under Section 172.
In the sections set out in the table below, we explain how the Company’s programme of engagement with our key stakeholders enables our Board members to do so.
In some cases, this engagement directly involves the Board or its members, and this is almost exclusively how engagement with our investors takes place. Given the size and geographic diversity of our business, the majority of engagement with our customers, technology partners, people and communities takes place at an operational level across the organisation. Where this is the case, the Board ensured that it had been updated on the
Computacenter aims to comply with the Non-Financial Reporting Directive requirements contained in Sections 414CA and 414CB of the Companies Act 2006. The table below sets out where more information on non-financial matters can be found within this Annual Report and Accounts (as well as on our website: computacenter.com). The due diligence carried out for each policy is contained within each respective policy’s documentation.
Reporting requirement Relevant information Page
1. Business model • Strategic priorities• Business model
817
2. Principal risks and impact of business activity • Viability Statement • Principal risks and uncertainties
7880
3. Employees • Employees• Diversity policy• Health and safety• Stakeholder engagement
44465766
4. Social matters • Supporting charity and community 48
5. Human rights • Human rights• Suppliers• Details of our Supplier Code of Conduct, as well as our approach
to protecting human rights, can be found on our website
5757
6. Anti-bribery and corruption • Whistleblowing• Our Code of Business Conduct and other related policies, can be
found on our website
48
7. Environmental matters • Environmental matters• Energy use and emissions • Greenhouse gas emissions
52 53 54
nature and outcomes of this engagement during the year.
We have also set out the factors listed under Section 172 which the Board considered when reviewing Board-level matters or making decisions during the year. These can be found on pages 91 to 92. The results of the Board’s decision making, and the outcomes produced by each Director discharging their Section 172 duty can be found throughout this Annual Report and Accounts. Therefore, the following sections have been incorporated by reference into this Section 172 statement and, where necessary, the Strategic Report.
65
Strategic ReportAnnual Report and Accounts 2021
Section 172 statement
Non-financial information statement

OUR KEY STAKEHOLDERS ENABLE COMPUTACENTER TO CREATE VALUE FOR THEM. Our people and technology partners provide us with leading digital technology and expertise that underpins the competitiveness of our customer offering. Our customers place their trust in us to Source, Transform and Manage their digital technology to support their organisations. Our investors support us by taking the decisions and providing us with the capital support that allows us to build a sustainable business for the long term, whilst the communities in
which we operate support the social, economic and personal interests of our other key stakeholders. Collectively, they are an indispensable part of how we do business. Having their support, and ensuring that we address their views, interests and concerns where we can do so, is of paramount importance to us.
Why we engage and what matters to them:Our Winning Together Values are unambiguous: we put our customers first, we keep our promises to them, and we always prioritise the long term in our dealings with them.
Our Purpose includes enabling the success of our customers by helping them to navigate the complex digital environment and to Source, Transform and Manage their digital technology. One of our principal risks is that we fail to invest appropriately to maintain our competitiveness. We can only support our customers and mitigate against this risk through a deep understanding of their current and likely future needs and views, ensuring that our offerings and investment decisions are aligned with these, and that we deliver a positive customer experience which drives long-term customer relationships.
Our collaboration with customers requires continuous two-way engagement, so we can adapt with them as their digital environments and related technology needs evolve. They expect us to be responsive and flexible to their requirements, delivering services to them in a way which reflects agreed terms and is safe and sustainable. Through clear communication with our customers, we are able to ensure that we have the capability to deliver what they are asking from us.
Our principal forms of engagement with them during the year were: • Day-to-day engagement through a wide variety of channels,
generally covering our performance and future opportunities, and including face-to-face and virtual meetings, customer training and workshops, as well as dialogue through dedicated client directors and account managers, our service support functions and, where necessary, our country-unit and Group Management teams.
• Regular meetings between our Chief Executive Officer and key customers, to discuss their view of Computacenter.
• Customer surveys and other structured mechanisms for obtaining feedback on our performance.
• Through the publication of supporting materials, including those on our website (computacenter.com) which summarise and provide further information on our customer offerings.
How the Board was kept informed of engagement outcomes, and considered the interests of our customers during discussions and decision making:In 2021, the Board received frequent updates on customer engagement from the Chief Executive Officer, which included details of significant contract bids and wins, and material customer issues where they arose.
These were supplemented by presentations from our in-country business leadership teams on key customers and their issues, including the management teams of our German and UK businesses. Subjects covered included maintaining and expanding long-term customer relationships, the impact of Covid-19 on significant customers, their demand and investment capacity for IT infrastructure and systems, and a review of independently-produced customer satisfaction data. The Board also completed a ‘deep-dive’ on a topic related to the Group’s strategic priorities at each of its scheduled meetings, which are based on likely future trends in customer behaviour and demand, and ensuring that the Group can adapt to these with its customer offerings.
Feedback and discussion from these engagement activities informed the Board’s decision to approve the Group’s three-year strategic plan for 2022-2024, the associated investment requirements required by that plan, the Group’s financial performance targets for 2022, as well as its review of potential acquisition and material contract bid opportunities.
The Board also approved an investment into our core IT Service Management (ITSM) systems, which will allow us to address the capabilities that our customers will need in the future, and reviewed and approved the Group’s ESG strategy having considered the expectations of our key customers in that area, and received regular ESG updates from the Group Finance Director and Group Development Director.
Further details of how the Board considered the interests of our customers in its decision-making can be found on pages 91 to 92.
Our customers
66
Stakeholder engagement

Why we engage and what matters to them:Our people are at the centre of what we do and are essential for our future growth. They implement and promote our culture, as set by the Board, on a day-to-day basis. Externally, they represent Computacenter when interacting with our other key stakeholders, building relationships, generating long-term trust, and developing knowledge of their requirements and preferred ways of operating.
We want to attract, retain and develop people who understand and promote our strategy, performance, culture, values and purpose. Failure to recruit and retain the right calibre of people to our talent pool is one of our principal risks (as set out on page 85). Clear, consistent and frequent engagement with our people, and the groups that represent them, helps us to mitigate this risk.
Our people expect us to provide fair and safe working conditions for them, and to help create an environment where they can get the best out of themselves. Engagement allows us to understand how we can continually strive to do this better.
Our principal forms of engagement with them during the year were:• The programme of engagement completed by Ros Rivaz, the
nominated Non-Executive Director for Workforce Engagement. • Weekly communications to all of our people from the Chief
Executive Officer, covering topics such as recent business performance and trends, as well as Board and senior Management views on those areas.
• Engagement with our Works Councils across Europe, including Germany, France, Spain, Belgium, Switzerland and the Netherlands, and additionally our European Works Council.
• The Group-wide Management structure and Whistleblowing hotline, and the activities of our Human Resources function, all of which ensure that issues and feedback raised by our people are considered and escalated, including to members of the Board and the Group Executive Committee if appropriate.
• Through our policies and training, which provide guidance on how we expect our people to represent Computacenter and conduct themselves.
• Through our biennial Group-wide employee survey.
How the Board was kept informed of engagement outcomes, and considered the interests of our people during discussions and decision-making:The Board received frequent updates during the year from Ros Rivaz on the outcomes of the Workforce Engagement Programme, which included feedback from our people on the Company’s response to the Covid-19 pandemic, indicating that it had been clear and timely with related communications, and had provided our people with appropriate support, both in respect of their needs relating to their role undertaken for Computacenter, and the provision of resources to support their mental wellbeing, particularly during Covid-19-related lockdowns.
Ros summarised the views provided to her on the effectiveness of working relationships between Management and our Works Councils, and noted that over time there would be appetite for the Company to provide clarity on its post-Covid-19 future working arrangements. She reported on her meeting with the Computacenter Employee Impact Group (EIG) for Ethnicity, including feedback that the EIG had received from our people on their views and experiences of how Computacenter ensures diversity and equality across the Group. Feedback provided informed the Board’s deep-dive review on the Group’s culture, including discussion of how this had developed over recent years, had been impacted by the Covid-19 pandemic and how it supported the implementation of the Group’s strategy.
The Board also received presentations from our in-country senior Management teams, which included detail on employee engagement activities and outcomes, as well as specific updates from the Chief People Officer on negotiations between the Group and its Works Councils related to matters of interest to both parties.
The Chief Executive Officer provided an update of progress made against internal gender diversity targets for senior Management positions throughout the organisation, which was considered by the Board when reviewing our Gender Pay Gap (GPG) reporting, the causes for the remaining GPG that exists, how this is linked to diversity and inclusion and actions required to reduce our GPG.
As part of his regular updates to the Board on financial and operational performance, the Chief Executive Officer also reported on common themes and trends from employee feedback, especially concerning the impact of Covid-19 on our people. During the year, and on the recommendation of the Chief Executive Officer, the Board approved the expansion of the Group’s Performance Share Plan to allow the issue of awards within additional jurisdictions following recent acquisitions made. Prior to the publication of the 2021 Annual Report and Accounts, the Board also reviewed and discussed the results of our biennial Group-wide employee survey, which was completed in the fourth quarter of the year. Detail of the outcomes of that survey can be found in the people section on page 46. Feedback from each of these engagement activities above also informed the Board in its discussions and decision-making around Computacenter’s Modern Slavery Act Statement and ESG strategy.
Further details of how the Board considered the interests of our people in its decision-making can be found on pages 91 to 92.
Our people
67
Strategic ReportAnnual Report and Accounts 2021

Why we engage and what matters to them:Our technology partners are critical for us and we invest time and effort in ensuring that our relationships with them remain robust and healthy, for mutual benefit. We aspire to be their preferred route to market for our chosen customer segments, and they benefit from our customer intimacy, which comes from our focus on long-term, multi-level strategic relationships.
Through engagement with our customer teams and by working in partnership, we add value and drive end-user satisfaction with our technology partners’ products. To facilitate that and enable us to grow together, we need to maintain strong and sustainable working relationships, on both a day-to-day and strategic level, covering operational, engagement and commercial support.
Our principal forms of engagement with them during the year were:• Our technology partners’ customer-aligned sales and technical
personnel, and our sales, technical and services teams engage regularly to ensure strong working partnerships, on a customer-by-customer basis.
• The Group technology services team formally engages with our technology partners on a day-to-day basis, as well as at management and executive level, to maintain strong partnerships and to continue to deliver operationally and strategically.
• Technology partners share product and strategy information at multiple formal and informal events during the year, to enable us to fully support our customers’ initiatives and business planning. This requires both technical and commercial engagement across Computacenter and includes inviting representatives of our technology partners to speak at our Group-wide annual sales meeting, where they communicate their latest technical innovations and their view of how our organisations can most effectively work together.
How the Board was kept informed of engagement outcomes, and considered the interests of our technology partners during discussions and decision-making: The majority of our engagement with technology partners takes place at an operational level. The Board received updates from the Chief Executive Officer, Chief Commercial Officer and other members of the senior Management team on the views of our technology partners, and reviewed the Group’s Technology Sourcing strategy and tooling capabilities with the Chief Commercial Officer. The Board reviewed specific project workstreams aimed at ensuring that the Group’s Technology Sourcing tooling systems and capabilities adequately supported the wider business, provided differentiation against the Group’s competitors and were able to support likely future customer demand and purchasing behaviours.
The updates it received informed the Board’s discussions and decision-making when approving the Group’s strategy and associated investments, and setting financial targets for the Group in 2022.
Further explanation on how we build powerful partnerships with our technology partners can be found on pages 18 to 21.
For further detail on how the Board considered the interests of our technology partners in its decision making during the year, please see pages 91 to 92.
Our technology partners Our communities
Why we engage and what matters to them:Our Purpose is Enabling Success by building long-term trust with our stakeholders. These include the communities in which we, and our other key stakeholders, live and work. Our local communities support our ability to do business and supporting them in return is a responsibility. Through doing so, we aim to inspire our people, to illustrate more widely our commitment to act like ‘people matter’ (one of our core values as an organisation), and to maintain and enhance our corporate reputation. Our local communities are interested in ensuring that our operations are sustainable and safe, so that the positive economic and social impact that Computacenter has on them is protected over the long term and increases over time. They expect us to engage with the social and environmental issues that matter to them, including in areas like equality, diversity and inclusion and the sustainable use of resources within our business operations. They also expect us to act ethically, to treat our stakeholders fairly and, where possible, to support them financially or with our time.
Our principal forms of engagement with them during the year were:• Our engagement is focused on school, community and university
outreach programmes with a focus on encouraging young people to take up Science, Technology, Engineering and Mathematics (STEM) careers, thereby addressing skills shortages, increasing diversity across STEM, improving social mobility and raising aspirations. Our school, community and university outreach programme won best Community Outreach Programme at the 2021 CRN Women in Channel Awards.
• Our employee volunteers have completed over 1,700 hours of community outreach volunteering.
• Most of our community engagement is through direct engagement between our people and our local communities, across all of our main operating geographies.
• For further information on our engagement with our local communities, please see our sustainability section on pages 44 to 61.
How the Board was kept informed of engagement outcomes, and considered community interests during discussions and decision-making: The Board received frequent updates from the Group Finance Director and the Group Development Director on our sustainability strategy, and the progress being made in implementing it. As part of these updates, it reviewed activities being undertaken by the Group to engage with and support our local communities, and our commitments and reporting relating to the environment and climate change. The Board considered the interests of our local communities, and the impact of our operations on them, when approving our revised targets for carbon emissions as set out on page 52, discussing the Group’s approach and objectives related to diversity and inclusion, and reviewing our Gender Pay Gap Reporting metrics and Modern Slavery Act Statement.
For further examples of where the Board has considered the interests of our local communities in its decision-making during the year, please see pages 91 and 92.
For further detail on actions we are taking to contribute towards the long-term future of our people and our planet, and to provide sustainable solutions for our customers, please see pages 44 to 61.
68
Stakeholder engagement continued
Why we engage and what matters to them:Our investors want an appropriate return on their investment in Computacenter.
To help them achieve this, they want to understand our strategy, our current or projected operational and financial performance, and our approach to environmental, social and governance (ESG) matters. Investors have different risk appetites, and different preferences for capital or income-based returns and the time horizon for delivering those returns.
Two-way engagement helps Management and the Board to understand shareholders’ range of views on specific issues and allows current and potential investors to make informed decisions concerning investment in Computacenter.
Our principal forms of engagement with them are: • The Chair and Company Secretary’s governance roadshow with
significant shareholders, following the release of the Annual Report and Accounts, and the Executive Director investor meetings and roadshows held throughout the year.
• The annual and interim results presentations to sell-side research analysts and institutional shareholders.
• The Company’s Annual General Meeting, although this was impacted by Covid-19-related restrictions in 2021.
• The Remuneration Committee Chair’s engagement with significant shareholders, proxy firms and other interested parties regarding Executive remuneration proposals, with further engagement alongside the Company Secretary after receiving responses.
• Through our investor website at investors.computacenter.com, our regulatory news service announcements, which include our annual and interim results, and our Annual Report and Accounts.
How the Board was kept informed of engagement outcomes, and considered the interests of investors during discussions and decision-making:The Board received updates from the Executive Directors on key issues raised at their investor roadshow meetings, and from the Chair on the governance roadshow.
Feedback from institutional shareholders was also reviewed through formal reports provided to the Board from the Company’s brokers, Credit Suisse and Investec. These summarised movements in institutional investor holdings in the Company and provided investors’ thoughts on their meetings with the Executive Directors following the release of the Company’s annual and interim results. The reports included existing and potential investors’ articulation of the investment case relating to the Company’s shares, and any perceived attractions or barriers to investing.
Feedback received from our investors focused on several areas, including the performance of the business and opportunities for future growth in the United States, the priorities for the Group’s use of cash including a range of views around the attractiveness of share buybacks and further acquisitions, and on the Group’s current valuation against peers across relevant sectors.
There was investor interest in understanding the extent to which increased demand for our Source, Transform and Manage propositions had been due to changed customer working behaviours related to Covid-19 (such as remote working capabilities), the likely sustainability of these changed behaviours, and understanding wider trends in customer preferences and behaviour which were likely to drive future demand, including the location and method by which the Group delivers its Managed Services offerings, amongst others.
The views of our investors informed Board discussions and decision-making concerning the quantum of dividend declarations (which the Board considered and balanced against other stakeholder interests concerning our balance sheet strength, investment capacity and long-term viability of the Group), resulting in a 2020 final dividend of 38.4 per share and a 2021 interim dividend of 16.9 per share being paid; the Board’s review of potential uses for the Group’s existing treasury shares, including their potential cancellation or use relating to the vesting of employee share option schemes, following which the Board decided to retain these as treasury shares and review options moving forward; approval of the Group’s dividend policy, which the Board decided to leave unchanged; three-year strategy plan; cash deposit and reserve strategy; and a review of the Group’s capital allocation, ESG strategy and Executive Director succession plans.
Through updates from the Remuneration Committee Chair, the Board was also made aware of the views of significant shareholders concerning the Company’s proposals for Executive remuneration in 2022. As set out in the Remuneration Committee report on page 106, shareholders who responded to the consultation process were broadly supportive of the change related to the increase in the Chief Executive Officer’s base salary for 2022.
For further examples of how the Board considered the interests of our investors during the year, please see pages 91 to 92.
Our investors
69
Strategic ReportAnnual Report and Accounts 2021

ENABLING SUCCESS BY CONTINUED INVESTMENT
We remain very encouraged by the resumption of longer-term IT transformations, on a scale and timeline that appear strengthened by the experiences of the last two years. Tony ConophyGroup Finance Director
During 2021, the Group benefited from continued strong organic revenue growth, balanced evenly between Technology Sourcing and Services. Growth across the Segments was excellent, apart from France where market conditions are weaker and some of our customers spent less. On top of the organic growth, the revenue increases from the acquisitions made in 2020 significantly boosted the top-line performance during the year.
The Technology Sourcing growth was driven by robust public sector activity in the UK and Germany, where the Group has a strong track record, and by the industrial enterprise sector in the UK and Germany, as these large sectors returned to more normal spending patterns and expanded their requirements. In addition, the rebound of the mid-market sectors in North America complemented the sustained growth seen in the hyperscale markets. As customers have less need to address immediate requirements caused by Covid-19, we remain very encouraged by the resumption of longer-term IT transformations, on a scale and timeline that appear strengthened by the experiences of the last two years. The strength of the overall Technology Sourcing result is driven by the spread of the customer base across multiple Segments and geographies, which create durability and sustainability within the business model.
Professional Services in Germany has continued its excellent recent track record, with another period of rapid growth, and the UK also saw robust Professional Services growth.
Our recently established presence in Cluj, Romania, has had a successful start as it builds towards a specialist offering of up to 500 professionals within Computacenter Romania. This will expand our Professional Services capacity and allow us to continue to capture the opportunities in this business line.
70
Group Finance Director’s review

Over 80 consultants within the Computacenter Romania Professional Services ‘Centre of Excellence’ are providing agile application services to customers in Germany, including software development, application migration and application support. In time, we will expand this capability to all other countries across the Computacenter Group.
Managed Services saw robust revenue increases in all geographies, apart from France. A number of contracts which are based on price times quantity, rather than a fixed periodic fee, resumed growth as call volumes began to return to pre-pandemic levels and the field engineer workforce saw significant increases in activity, as customer
sites began to reopen. In addition, we won a number of new deals during the year, with contracts signed and initial transitions progressing well. These contracts will support future growth in this area.
Services margins remained healthy and increased overall. We continued to enjoy increased utilisation of our now remote-working engineers, who no longer have to spend otherwise billable time travelling to customer sites, and a substantial reduction in the use of external contractors. We expect both of these trends to continue in the short to medium term, as more efficient ways of working have proven effective for the Group, our customers and our people. More importantly, the quality of the contract
portfolio continues to increase, as older underperforming contracts improve, and enhanced bid governance processes result in better margins on new contracts. Our French business suffered on an organic basis, as the full effect of the non-renewal of the Group’s largest Managed Services contract affected its year-on-year performance for the first time.
The business remains agile and innovative, enabling us to continue to adapt and support our customers, as they move beyond remote working towards the complexity of hybrid working and the required structural adaptations of their IT environments.
Reconciliation to adjusted1 measures for the year ended 2021
Reportedresults
£m
Adjustments
Adjusted1
full-year results
£m
Amortisation of acquired intangibles
£m
Exceptionalsand others
£m
Revenue 6,725.8 – – 6,725.8
Cost of sales (5,858.0) – – (5,858.0)
Gross profit 867.8 – – 867.8
Administrative expenses (612.6) 7.6 – (605.0)
Operating profit 255.2 7.6 – 262.8
Finance income 0.3 – – 0.3
Finance costs (7.5) – – (7.5)
Profit before tax 248.0 7.6 – 255.6
Income tax expense (61.5) (2.1) – (63.6)
Profit for the year 186.5 5.5 – 192.0
Reconciliation to adjusted1 measures for the year ended 2020
Reportedresults
£m
Adjustments
Adjusted1
full-year results
£m
Amortisation of acquired intangibles
£m
Exceptionalsand others
£m
Revenue 5,441.3 – – 5,441.3
Cost of sales (4,720.8) – – (4,720.8)
Gross profit 720.5 – – 720.5
Administrative expenses (522.0) 7.4 0.5 (514.1)
Operating profit 198.5 7.4 0.5 206.4
Gain on acquisition of subsidiary 14.0 – (14.0) –
Finance income 0.5 – – 0.5
Finance costs (6.4) – – (6.4)
Profit before tax 206.6 7.4 (13.5) 200.5
Income tax expense (52.4) (1.7) (0.7) (54.8)
Profit for the year 154.2 5.7 (14.2) 145.7
71
Strategic ReportAnnual Report and Accounts 2021

The revenue performance was driven through our biggest markets, the UK, Germany and North America, and was supported by strong gross margins across all business lines. Technology Sourcing margins were slightly reduced from 2020, as increasing volumes of lower-margin software sourcing deals diluted an otherwise excellent return from the higher-margin complex product lines. Both Technology Sourcing and Services continued to benefit from the ongoing reduction of expenses within costs of goods sold. Whilst some of these costs, such as travel, fleet and contractors, have partially come back as the Group increasingly returns to its pre-Covid-19 operational footing, we continue to carefully manage certain cost categories to ensure a permanent reduction in the overall cost base. We have implemented an internal carbon levy on travel, as part of our commitment to reduce business travel emissions by 35 per cent when compared to pre-Covid-19 levels in 2019. This emphasis on post-Covid-19 cost control is also reflected by the increase in gross profit (20.4 per cent) materially outstripping the growth in administrative expenses (17.7 per cent).
The Group result saw significant organic increases in adjusted1 operating profit across the UK, Germany, North America and the International Segments, with the decline in France the only disappointing result.
On 30 April 2021, we acquired ITL logistics GmbH (ITL), which employees 80 people in three locations in Germany. ITL provides IT logistics services, as well as IT services, for large companies and public sector clients in Europe. Through the acquisition, Computacenter is expanding its IT logistics services and now operates its own IT logistics fleet, with technical couriers who deliver and collect IT products across Europe. ITL also operates small regional warehouses, where IT products are held locally to meet customer service-level agreements. We intend to invest further in ITL, to strengthen its business in Europe.
The acquisition of Pivot and Computacenter NS on 2 November 2020 continues to add capability to the Group. Pivot increases the scale and breadth of our North American business, allowing us to serve a wider range of customers and products in more locations in the United States and Canada. Computacenter NS will, over time, enhance the network Services offering of our existing French business, improving our go-to-market propositions and aligning the business with our capabilities in Germany, albeit on a smaller scale. Much remains to be done to transform the business and bring it back to break-even and beyond.
The integration of Pivot and Computacenter NS continues, with significant projects underway to migrate to our Group ERP systems. In North America, FusionStorm and the legacy US business transitioned to the
Group ERP in early September 2021 and this was largely completed by 31 December 2021. Computacenter NS successfully completed its migration in the fourth quarter of 2021. Pivot will follow in 2023. Having these entities on our leading ERP platform technologies and toolsets will further unlock their potential for growth and efficiencies.
Combined, these acquisitions added £1,105.1 million of revenue (2020: £232.6 million) and £13.9 million of adjusted1 profit before tax (2020: £3.3 million) to the Group’s reported results.
A reconciliation to adjusted¹ measures is provided on page 71 of this Group Finance Director’s review. Further details are provided in note 2.5 to the Consolidated Financial Statements, adjusted measures. For the avoidance of duplication, further information on the Group’s financial performance can be found on pages 26 to 39 of this Strategic Report.
Profit before taxThe Group’s profit before tax for the year increased by 20.0 per cent to £248.0 million (2020: £206.6 million). Adjusted1 profit before tax increased by 27.5 per cent to £255.6 million (2020: £200.5 million) and by 31.5 per cent in constant currency2.
The difference between profit before tax and adjusted1 profit before tax relates to the Group’s net costs of £7.6 million (2020: net gain of £6.1 million) from exceptional and other adjusting items, which is the amortisation of acquired intangibles as a result of the acquisition of FusionStorm on 30 September 2018 and Pivot on 2 November 2020. Further information on these items can be found on page 73.
The Group adopted IFRS 16 ‘Leases’ from 1 January 2019, which has resulted in changes in accounting policies and adjustments to the amounts recognised in the Consolidated Financial Statements, as disclosed in the 2019 Annual Report and Accounts. The current period results include an overall decrease in profit before tax of £2.3 million, including on an adjusted1 basis, due to the impact of IFRS 16 (2020: £2.0 million).
Net finance chargeNet finance charge in the year amounted to £7.2 million (2020: £5.9 million). The main items included within the net charge for the year are £5.2 million of interest charged on lease liabilities recognised under IFRS 16 (2020: £4.5 million) and £1.5 million for the Pivot facility (2020: £0.4 million). Pivot was only part of the Group for two months of the prior year, so whilst overall the debt position is reduced at year end compared to the prior-year position, there is a full year of interest expense from the Pivot debt facility incurred in the current year.
There were no interest items excluded on an adjusted1 basis.
TaxationThe tax charge was £61.5 million (2020: £52.4 million) on profit before tax of £248.0 million (2020: £206.6 million). This represents a tax rate of 24.8 per cent (2020: 25.4 per cent).
In 2020, the tax rate reduced primarily due to the inclusion of the gain on acquisition of BT Services France of £14.0 million, recognised on consolidation of the acquired entity. This was not taxable, as no chargeable gain had been realised in any legal entity. During 2020, a tax credit of £0.7 million was recorded due to post-acquisition activity in FusionStorm. This benefit derived from payments which were settled by the vendor, out of the consideration paid, via post-acquisition capital contributions to FusionStorm. As this credit was related to the acquisition and not operational activity within FusionStorm, this is a one-off and material to the overall tax result, we classified this as an exceptional tax item, consistent with the treatment in 2018 and 2019.
The tax credit related to the amortisation of acquired intangibles was £2.1 million (2020: £1.7 million). The £7.6 million of amortisation of intangible assets is almost entirely a result of the recent North American acquisitions (2020: £7.4 million). As the amortisation is recognised outside of our adjusted1 profitability, the tax benefit on the amortisation is also reported outside of our adjusted1 tax charge.
The adjusted1 tax charge for the year was £63.6 million (2020: £54.8 million), on an adjusted1 profit before tax for the year of £255.6 million (2020: £200.5 million). The effective tax rate (ETR) was therefore 24.9 per cent (2020: 27.3 per cent) on an adjusted1 basis.
During the second half of the year a number of one-off tax items were processed that substantially reduced the tax charge, and therefore the adjusted1 ETR, for the year as a whole. Rebasing certain deferred tax assets for the adjustment in the UK Corporate Tax rate from 19 per cent to the 25 per cent rate that was substantively enacted on 11 March 2021, with effect from 1 April 2023, has resulted in a one-time credit to the tax expense of £3.1 million. Several other one-off items incurred in the year have reduced the tax expense by a further £2.4 million in aggregate. These include a programme of recharging the costs of our share-based payment schemes, our Sharesave and LTIP awards, to those jurisdictions outside of the UK that also benefit from these schemes which resulted in a positive tax impact for the Group in 2021 from catching up the 2020 recharging, and the closure of a number of historical tax positions in North America.
72
Group Finance Director’s reviewcontinued

The table below reconciles the tax charge to the adjusted1 tax charge for the years ended 31 December 2021 and 31 December 2020.
2021£m
2020£m
Statutory tax charge 61.5 52.4 Adjustments to exclude:Exceptional tax items – 0.7 Tax on amortisation of acquired intangibles 2.1 1.7 Adjusted1 tax charge 63.6 54.8 Effective Tax Rate 24.8% 25.4% Adjusted1 Effective Tax Rate 24.9% 27.3%
Profit for the yearThe profit for the year increased by 20.9 per cent to £186.5 million (2020: £154.2 million). The adjusted1 profit for the year increased by 31.8 per cent to £192.0 million (2020: £145.7 million) and by 35.7 per cent in constant currency2.
Exceptional and other adjusting itemsThe net loss from exceptional and other adjusting items in the year was £5.5 million (2020: gain of £8.5 million). Excluding the tax items noted above, which resulted in a gain of £2.1 million (2020: gain of £2.4 million), the profit before tax impact was a net loss from exceptional and other adjusting items of £7.6 million (2020: gain of £6.1 million).
There were no exceptional items in the year to 31 December 2021 (2020: gain of £13.5 million).
We have continued to exclude, as an ‘other adjusting item’, the amortisation of acquired intangible assets in calculating our adjusted1 results. Amortisation of intangible assets is non-cash, does not relate to the operational performance of the business, and is significantly affected by the timing and size of our acquisitions, which distorts the understanding of our Group and Segmental operating results.
The amortisation of acquired intangible assets was £7.6 million (2020: £7.4 million), primarily relating to the amortisation of the intangibles acquired as part of the recent North American acquisitions. The prior-year value includes the amortisation of a number of short-term acquired intangibles relating to the valuation of Pivot order backlogs, due to the expiration of the valued assets.
The acquisition of BT Services France on 2 November 2020 resulted in an exceptional gain of £14.0 million, which was recognised on consolidation of the subsidiary in the 2020 Annual Report and Accounts. The gain arose because the net assets acquired for consideration of €1 totalled £14.0 million after fair value adjustments, including £27.6 million of cash. The business acquired comprised BT’s domestic French services operation which, on acquisition, was loss making on a standalone basis. The Company considers that the exceptional gain reflects the future losses that the acquired business will incur over the medium term, as it is brought onto a sustainable footing through a combination of upskilling employees, cross-selling into the Group’s customers, alignment with Group processes and systems, and the general improvement of its operating activities.
Together, these combined items have resulted in a one-time credit benefit to the tax expense of £5.5 million. Excluding these items, the underlying adjusted1 tax expense would be £69.1 million, resulting in an adjusted1 ETR of 27.0 per cent. Had the one-off items not impacted during the year, and the Group result reflected an adjusted1 ETR of 27.0 per cent, the adjusted1 diluted EPS would have been 160.9 pence per share. Assuming an unchanged dividend payment policy from that described on page 74, the proposed final dividend, and the total dividend for the year, would have been 47.5 pence per share and 64.4 pence per share respectively. The ETR during the year was also lower than the previous year due to the large increase in profitability in the UK, which has lower tax rates than the Group average, particularly Germany and the US. The adjusted1 ETR is therefore outside the full-year range that we indicated in our 2021 Interim Results, which showed an ETR of 28.6 per cent (H1 2020: 28.1 per cent), due to the unforecasted positive impacts described above.
We expect that the ETR in 2022 will be subject to upwards pressure, due to an increasing reweighting of the geographic split of
adjusted1 profit before tax away from the UK to Germany and the US, where tax rates are substantially higher, and also as governments across our primary jurisdictions come under fiscal and political pressure to increase corporation tax rates. Looking further ahead, substantially enacted tax increases will take effect in the UK from 1 April 2023, with a rise from 19 per cent to 25 per cent.
The Group Tax Policy was reviewed during the year and approved by the Audit Committee and the Board, with no material changes from the prior year. We make every effort to pay all the tax attributable to profits earned in each jurisdiction that we operate in. We do not artificially inflate or reduce profits in one jurisdiction to provide a beneficial tax result in another and maintain approved transfer pricing policies and programmes, to meet local compliance requirements. Virtually all of the tax charge in 2021 was incurred in either the UK, German or US tax jurisdictions, as it was in 2020. Computacenter France, which now includes the BT Services France acquisition within a tax group, has returned to a lossmaking position, reducing the amount of tax paid locally.
There are no material tax risks across the Group. Computacenter will recognise provisions and accruals in respect of tax where there is a degree of estimation and uncertainty, including where it relates to transfer pricing, such that a balance cannot fully be determined until accepted by the relevant tax authorities. For 2021, the Group Transfer Pricing policy implemented in 2013 resulted in a licence fee of £30.3 million (2020: £27.9 million), charged by Computacenter UK to Computacenter Germany, Computacenter France and Computacenter Belgium. The licence fee is equivalent to 1.0 per cent of revenue and reflects the value of the best practice and know-how that is owned by Computacenter UK and used by the Group. It is consistent with the requirements of the Organisation for Economic Co-operation and Development (OECD) base erosion and profit shifting. The licence fee is recorded outside the Segmental results found in note 4 to the Consolidated Financial Statements, which analyses Segmental results down to adjusted1 operating profit.
73
Strategic ReportAnnual Report and Accounts 2021

DividendThe Board recognises the importance of dividends to shareholders and the Group prides itself on a long track record of paying dividends and other special one-off cash returns.
Computacenter’s approach to capital management is to ensure that the Group has a robust capital base and maintains a strong credit rating, whilst aiming to maximise shareholder value. The Group remains highly cash generative and adjusted net funds3 continues to increase on the Consolidated Balance Sheet, which allows acquisitions such as FusionStorm in 2018 and Pivot in 2020, alongside a number of other small acquisitions.
If further funds are not required for investment within the business, either for fixed assets, working capital support or acquisitions, and the distributable reserves are available in the Parent Company, we will aim to return the additional cash to investors through one-off returns of value, as we did in February 2018.
Dividends are paid from the standalone balance sheet of the Parent Company and, as at 31 December 2021, the distributable reserves were £199.3 million (31 December 2020: £268.1 million).
The Board is pleased to propose a final dividend for 2021 of 49.4 pence per share (2020: 38.4 pence per share). Together with the interim dividend, this brings the total ordinary dividend for 2021 to 66.3 pence per share, representing a 30.8 per cent increase on the 2020 total dividend per share of 50.7 pence.
The Board has consistently applied the Company’s dividend policy, which states that the total dividend paid will result in a dividend cover of 2 to 2.5 times based on adjusted1 diluted EPS. In 2021, the cover was 2.5 times (2020: 2.5 times).
Subject to the approval of shareholders at our Annual General Meeting on 19 May 2022, the proposed dividend will be paid on Friday 8 July 2022. The dividend record date is set as Friday 10 June 2022 and the shares will be marked ex-dividend on Thursday 9 June 2022.
Central Corporate CostsCertain expenses are not specifically allocated to individual Segments because they are not directly attributable to any single Segment. These include the costs of the Board itself, related public company costs, Group Executive members not aligned to a specific geographic trading entity and the cost of centrally funded strategic initiatives that benefit the whole Group.
Accordingly, these expenses are disclosed as a separate column, Central Corporate Costs, within the Segmental note. These costs are borne within the Computacenter (UK) Limited legal entity and have been removed for Segmental reporting and performance analysis but form part of the overall Group adjusted1 administrative expenses.
During the year, total Central Corporate Costs were reduced at £23.7 million (2020: £27.1 million).
Within this:
• Board expenses, related public company costs, costs associated with Group Executive members not aligned to a specific geographic trading entity, and certain one-off costs in relation to the cancellation of Group-wide central meetings, increased to £9.1 million (2020: £6.8 million) partially due to the Executive Directors waiving their salaries in the second quarter of 2020 and both Founder Non-Executive Directors waiving their fees from 1 April to 31 December 2020;
• share-based payment charges associated with the Group Executive members identified above, including the Group Executive Directors, increased from £3.2 million in 2020 to £3.8 million in 2021, due primarily to the increased value of Computacenter plc ordinary shares and the overall increased performance of the Group; and
Where possible, future charges relating to this reconfiguration of the business will be disclosed separately to the Group’s adjusted1 results. This will mean that, over time, the future costs incurred can be attributed against the exceptional gain on acquisition recognised in the prior year. There have been no such costs incurred during the year to 31 December 2021.
An exceptional loss during 2020 of £0.7 million resulted from the acquisition of Pivot and primarily related to fees paid to the Company’s advisors. This cost was non-operational, unlikely to recur and is consistent with our prior-year treatment of acquisition costs on material transactions as exceptional items. It was therefore classified as outside our adjusted1 results.
In 2020, an exceptional gain of £0.2 million related to the release of accrued costs for the French Social Plan. Whilst not material, this was classified outside our adjusted1 results to be consistent with where the cost was recognised in 2016, as an additional provision for the effect of winding down the Social Plan.
Earnings per shareDiluted EPS increased by 20.3 per cent to 160.9 pence per share (2020: 133.8 pence per share). Adjusted1 diluted EPS increased by 31.0 per cent to 165.6 pence per share (2020: 126.4 pence per share).
2021 2020
Basic weighted average number of shares (excluding own shares held) (m) 113.0 112.9Effect of dilution:Share options 2.2 2.0Diluted weighted average number of shares 115.2 114.9
Profit for the year attributable to equity holders of the Parent (£m) 185.3 153.8Basic earnings per share (pence) 164.0 136.2 Diluted earnings per share (pence) 160.9 133.8
Adjusted1 profit for the year attributable to equity holders of the Parent (£m) 190.8 145.3Adjusted1 basic earnings per share (pence) 168.6 128.7 Adjusted1 diluted earnings per share (pence) 165.6 126.4
Group Finance Director’s reviewcontinued
74

• strategic corporate initiatives are designed to increase capability and therefore competitive position, enhance productivity or strengthen systems which underpin the Group. During the year this spend was £10.8 million (2020: £17.1 million), primarily due to reduced spend on projects that completed in the second half of 2020 and lower than planned spend on certain other projects, which is expected to be incurred in the first half of 2022. In addition, during 2021 there was a significant review of certain large software implementations, which will increase spend during 2022.
Cash flowThe Group delivered an operating cash inflow of £224.3 million for the year to 31 December 2021 (2020: £236.9 million inflow).
As noted in the 2020 Annual Report and Accounts, there were certain Covid-19-related one-off benefits included in the 2020 cash flow and net cash positions, including extended free-of-charge supplier credit with a major technology partner as well as improvements arising from customer mix. Most of these benefits had expired by 31 December 2020 and were material factors in the reduction in operating cash flow in the first half of 2021, when compared to the first half of 2020.
Net cash positions no longer include extended free-of-charge supplier credit with a major technology partner, as this temporary Covid-19-related arrangement was fully repaid during the year (31 December 2020: £15.0 million).
Other components of the working capital increase are explained below.
During the year, net operating cash outflows from working capital, including inventories, trade and other receivables and trade and other payables, were £77.1 million (2020: £28.3 million outflow).
As noted in our 2020 Annual Report and Accounts the year-end cash position was abnormally high, as a number of our customers paid ahead of normal payment cycles, partly, we believe, where overseas customers looked to avoid sometimes negative interest rates. This was exacerbated by a shift towards government customers during the year, resulting in improvements in cash collection as governments, particularly in Europe, have been settling debts as quickly as possible and well ahead of industry standard payment terms. Whilst the Group, in turn, paid a number of its suppliers early, to reduce the temporary excess cash on the balance sheet at the year end, the volume of early payments from customers received in the final days of the prior year was unprecedented. The Company estimated, broadly, that unforeseen receipts from
customer payments in advance of the due date exceeded the Company’s ability to pay its own suppliers early by roughly £50 million. These positions have largely unwound through the year, and this is reflected in the working capital movements seen.
In 2021, working capital cash flows were further impacted by both the revenue growth and the increased inventory levels, in particular within our North American business. Due to the significant product shortages seen during the year, a number of hyperscale customers have made advance orders of product with delayed delivery, to ensure continuity of supply. Additionally, inventory has increased as we have deliberately invested in working capital by pre-ordering inventory, thereby using the strength of our balance sheet to support our customers during product shortages. Further, a number of rack build orders were incomplete at the year end, sometimes due to shortages of smaller components required to complete the rack build. Finally, the transition of the FusionStorm business to the Group ERP, whilst now complete, did result in short-term operational issues that impacted working capital, as the picking and shipping of complex inventory items, invoicing and cash collection in particular experienced significant delays late in the third quarter and early in the fourth quarter. By the end of the year there was an improving position, as the FusionStorm entity has gained experience in using the system and tools and learned how to leverage their advantages. Considerable improvement is still required, although at the date of this report, the working capital impacts of the system migration have reduced materially.
The Group had £341.3 million of inventory as at 31 December 2021, an increase of 61.5 per cent on the balance as at 31 December 2020 of £211.3 million. Over three quarters of this increase was attributable to our North American Segment, which had closing inventory of £212.5 million (2020: £103.2 million).
At the end of 2021, the Group again saw record levels of early payments from suppliers. However, we elected to retain the cash on the Group’s balance sheet rather than make early payments to suppliers, to offset the extraordinary investments in working capital throughout 2021, as reflected in the closing inventory levels.
Capital expenditure in the year was £30.3 million (2020: £27.5 million) representing, primarily, investments in IT equipment and software tools, to enable us to deliver improved service to our customers.
The Group’s Employee Benefit Trust (EBT) made market purchases of the Company’s ordinary shares of £25.5 million (2020: £19.0 million) to satisfy maturing PSP awards and Sharesave schemes and to re-provision the EBT in advance of future maturities. During the year the Company received savings from employees of £6.2 million to purchase options within the Sharesave schemes (2020: £5.7 million).
During the year the Group made two acquisitions. The first was ITL, as described above, for £1.1 million. The second was to acquire a further 5.0 per cent of the total voting rights within R.D. Trading Ltd, taking the Group’s ownership to 95 per cent.
The Group reduced loans and credit facilities during the year by £89.0 million (2020: £19.7 million). We retired the facility associated with the FusionStorm acquisition, made regular repayments towards the loan related to the construction of the German headquarters in Kerpen and significantly reduced the amount drawn under the Pivot credit facility, as detailed below.
The Group continued to manage its cash and working capital positions appropriately, using standard mechanisms, to ensure that cash levels remained within expectations throughout the year. From time to time, some customers request credit terms longer than our standard of 30-60 days. In certain instances, we will arrange for the sale of the receivables on a true sale basis to a finance institution on the customers’ behalf. We would typically receive funds on 45-day terms from the finance institution, who will then recover payment from the customer on terms agreed with them. The cost of such an arrangement is borne by the customer, either directly or indirectly, enabling us to receive the full amount of payment in line with our standard terms. The benefit to the cash and cash equivalents position of such arrangements as at 31 December 2021 was £53.7 million (31 December 2020: £38.9 million). The Group had no other debt factoring at the end of the year, outside this normal course of business.
75
Strategic ReportAnnual Report and Accounts 2021

Cash and cash equivalents and net fundsCash and cash equivalents as at 31 December 2021 were £285.2 million, compared to £309.8 million at 31 December 2020. Net funds as at 31 December 2021 were £95.3 million (31 December 2020: £51.1 million). Adjusted net funds3 as at 31 December 2021 were £241.4 million, compared to adjusted net funds3 of £188.6 million as at 31 December 2020.
Net funds as at 31 December 2021 and 31 December 2020 were as follows:
31 December 2021
£m
31 December 2020
£m
Cash and short-term deposits 285.2 309.8 Bank overdraft (12.0) –Cash and cash equivalents 273.2 309.8 Bank loans (31.8) (121.2)Adjusted net funds3 (excluding lease liabilities) 241.4 188.6 Lease liabilities (146.1) (137.5)Net funds 95.3 51.1
For a full reconciliation of net funds and adjusted net funds3, see note 31 to the Consolidated Financial Statements.
The Group had four specific credit facilities in place during the year and no other material borrowings.
The Group drew down a £100 million term loan on 1 October 2018 to complete the acquisition of FusionStorm. This loan was on a seven-year repayment cycle, with a renewal of the loan facility due on 30 September 2021. The Group has made further unplanned repayments of this loan during the year, in addition to the unplanned repayment of £30 million in the second half of 2019, which reduced the interest cost differential between loan rates and cash deposit rates. As at 31 December 2020, £41.6 million remained of the loan and the Group has now retired the credit facility by paying the remaining balance in full during the first half of the year.
At the start of the year, Pivot had a substantially unutilised $225.0 million senior secured asset-based revolving credit facility, from a lending group represented by JPMorgan Chase Bank, N.A. To reduce bank fees, this was reduced to $100 million during the year. The residual facility can be used for revolving loans, letters of credit, protective advances, over advances, and swing line loans. During the year, the Group has continued to reduce the amount drawn on the facility and only £7.0 million remained drawn as at 31 December 2021 (31 December 2020: £58.4 million). In addition, Pivot has £9.4 million financed with a major technology partner for hardware, software and resold technology partner maintenance contracts that the Company has purchased as part of a contract to lease these items to a key North American customer.
The Group also has a specific term loan for the build and purchase of our German office headquarters and fit out of the Integration Center in Kerpen, which stood at £14.7 million at 31 December 2021 (31 December 2020: £20.9 million).
For further information on these facilities, see note 23 to the Consolidated Financial Statements.
The Group excludes lease liabilities from its non-GAAP adjusted net funds3 measure, due to the distorting effect of the capitalised lease liabilities on the Group’s overall liquidity position under the IFRS 16 accounting standard.
There were no interest-bearing trade payables as at 31 December 2021 (31 December 2020: nil).
The Group’s adjusted net funds3 position contains no current asset investments (31 December 2020: nil).
Trade creditor arrangementsComputacenter has a strong covenant and enjoys a favourable credit rating from technology partners and other suppliers. Some suppliers provide standard credit directly on their own credit risk, whereas other suppliers decide to sell the debt to banks, who offer to purchase the receivables and manage collection. The standard credit terms offered by suppliers are typically between 30 and 60 days, whether provided directly or when sold to a third-party finance provider. In the latter case, the cost of the free trade credit period is paid by the relevant supplier, as part of the overall package of terms provided by suppliers to Computacenter and our competitors. The finance providers offer extended credit terms at relatively low interest rates. However, these rates are always higher than the rate at which we deposit and therefore we do not currently use these facilities.
Capital managementDetails of the Group’s capital management policies are included in note 28 to the Consolidated Financial Statements.
Financial instrumentsThe Group’s financial instruments comprise borrowings, cash and liquid resources, and various items that arise directly from its operations. The Group’s policy is not to undertake speculative trading in financial instruments.
The Group enters into hedging transactions, principally forward exchange contracts or currency swaps, to manage currency risks arising from the Group’s operations and its sources of finance. As the Group continues to expand its global reach and benefit from lower-cost operations in geographies such as South Africa, Poland, Mexico and India, it has entered into forward exchange contracts to help manage cost increases due to currency movements.
The main risks arising from the Group’s financial instruments are interest rate, liquidity and foreign currency risks. The overall financial instruments strategy is to manage these risks in order to minimise their impact on the Group’s financial results. The policies for managing each of these risks are set out below. Further disclosures in line with the requirements of IFRS 7 are included in the Consolidated Financial Statements.
Group Finance Director’s reviewcontinued
76

Revenue
Half 1£m
Half 2£m
Total£m
2019 2,427.0 2,625.8 5,052.8 2020 2,462.2 2,979.1 5,441.3 2021 3,180.0 3,545.8 6,725.8
2021/20 29.2% 19.0% 23.6%
Adjusted1 profit before tax
Half 1 Half 2 Total
£m % Revenue £m % Revenue £m % Revenue
2019 53.5 2.2% 92.8 3.5% 146.3 2.9%2020 74.6 3.0% 125.9 4.2% 200.5 3.7%2021 118.9 3.7% 136.7 3.9% 255.6 3.8%
2021/20 59.4% 8.6% 27.5%
Revenue by Segment
2021 2020
Half 1 £m
Half 2 £m
Total £m
Half 1 £m
Half 2 £m
Total £m
UK 939.5 1,009.1 1,948.6 858.8 914.6 1,773.4 Germany 926.5 1,094.7 2,021.2 843.7 1,032.6 1,876.3 France 313.1 340.3 653.4 304.3 368.5 672.8 North America 910.1 1,001.5 1,911.6 378.2 566.3 944.5 International 90.8 100.2 191.0 77.2 97.1 174.3 Total 3,180.0 3,545.8 6,725.8 2,462.2 2,979.1 5,441.3
Adjusted1 operating profit by Segment
2021
Half 1 Half 2 Total
£m % Revenue £m % Revenue £m % Revenue
UK 51.7 5.5% 51.2 5.1% 102.9 5.3%
Germany 61.1 6.6% 76.7 7.0% 137.8 6.8%
France (2.0) (0.6%) 5.5 1.6% 3.5 0.5%
North America 18.7 2.1% 12.3 1.2% 31.0 1.6%
International 4.1 4.5% 7.2 7.2% 11.3 5.9%
Central Corporate Costs (11.1) (12.6) (23.7)
Total 122.5 3.9% 140.3 4.0% 262.8 3.9%
2020
Half 1 Half 2 Total
£m % Revenue £m % Revenue £m % Revenue
UK 45.9 5.3% 44.4 4.9% 90.3 5.1% Germany 35.6 4.2% 77.0 7.5% 112.6 6.0% France 3.8 1.2% 9.2 2.5% 13.0 1.9% North America 4.7 1.2% 9.3 1.6% 14.0 1.5% International 0.2 0.3% 3.4 3.5% 3.6 2.1% Central Corporate Costs (12.9) (14.2) (27.1)
Total 77.3 3.1% 129.1 4.3% 206.4 3.8%
77
Strategic ReportAnnual Report and Accounts 2021

Interest rate riskThe Group finances its operations through a mixture of retained profits, bank borrowings, leases and loans for certain customer contracts. The Group’s general bank borrowings, other facilities and deposits are at floating rates. No interest rate derivative contracts have been entered into. The Group’s $100 million North American facility and the undrawn committed facility of £60 million are at floating rates. However, the borrowing facility for the operational headquarters in Germany is at a fixed rate.
Liquidity riskThe Group’s policy is to ensure that it has sufficient funding and facilities to meet any foreseeable peak in borrowing requirements. The Group’s positive net cash was maintained throughout 2021 and at the year end was £273.2 million, with net funds of £95.3 million after including the Group’s three specific borrowing facilities and lease liabilities recognised under IFRS 16. Excluding lease liabilities, adjusted net funds3 was £241.4 million at the year end.
Due to strong cash generation over many years, the Group can currently finance its operational requirements from its cash balance, and it operates an informal cash pooling arrangement for the majority of Group entities. The Group has a committed facility of £60.0 million, which was extended in September 2020 and now has an expiry date of 7 September 2023. The Group has never drawn on this committed facility.
The Group has a Board-monitored policy to manage its counterparty risk. This ensures that cash is placed on deposit across a range of reputable banking institutions.
Foreign currency riskThe Group operates primarily in the United Kingdom, Germany, France and the United States of America, with smaller operations in Belgium, Canada, China, Hungary, India, Ireland, Malaysia, Mexico, the Netherlands, Poland, Romania, South Africa, Spain and Switzerland. The Company also maintains entities in Singapore and Hong Kong, in order to transact in those local markets with Services and Technology Sourcing operations delivered from elsewhere in the Group.
The Group uses an informal cash pooling facility to ensure that its operations outside the UK are adequately funded, where principal receipts and payments are denominated in euros and US dollars (USD). For those countries within the Eurozone, the level of non-euro denominated sales is small and, if material, the Group’s policy is to eliminate currency exposure through forward currency contracts. For our North American operations, most transactions are denominated in USD.
For the UK, the majority of sales and purchases are denominated in pounds sterling and any material trading exposures are eliminated through forward currency contracts.
The Group has been successful in winning international Services contracts, where Services are provided in multiple countries. We aim to minimise currency exposure by invoicing the customer in the same currency in which the costs are incurred. For certain contracts, the Group’s committed contract costs are not denominated in the same currency as its sales. In such circumstances, for example where contract costs are denominated in South African rand, we eliminate currency exposure for a foreseeable period on these future cash flows, through forward currency contracts.
In 2021, the Group recognised a loss of £0.9 million (2020: loss of £1.9 million) through other comprehensive income in relation to the changes in fair value of related forward currency contracts, where the cash flow hedges relating to firm commitments were assessed to be highly effective.
The Group reports its results in pounds sterling. The strength of sterling against most currencies during 2021, in particular the euro, has begun to impact our revenues and profitability as a result of the conversion of our foreign earnings. The USD exchange rates during the year, in particularly the second half, were not materially dissimilar to those seen in 2020.
The impact of restating 2020 results at 2021 exchange rates would be a reduction of £142.9 million in 2020 revenue and a decrease of £6.1 million in 2020 adjusted1 profit before tax.
Credit riskThe Group principally manages credit risk through customer credit limits. The credit limit is set for each customer based on its creditworthiness, using credit rating agencies as a guide, and the anticipated levels of business activity. These limits are determined when the customer account is first set up and are regularly monitored thereafter. There are no significant concentrations of credit risk within the Group. The Group’s major customer, disclosed in note 4 to the Consolidated Financial Statements, consists of entities under the control of the UK Government. The maximum credit risk exposure relating to financial assets is represented by their carrying value as at the balance sheet date.
Going ConcernComputacenter’s business activities, business model, strategic priorities and performance are set out within this Strategic Report from the inside front cover to page 85.
The financial position of the Group, its cash flows, liquidity position and borrowing facilities are set out within this Group Finance Director’s review on pages 75 to 78.
In addition, notes 27 and 28 to the Consolidated Financial Statements include Computacenter’s objectives, policies and processes for managing its capital, its financial risk management objectives, details of its financial instruments and its exposures to credit and liquidity risk.
The Directors have, after due consideration, and as set out in note 2 to the Consolidated Financial Statements on page 145 of this Annual Report and Accounts, a reasonable expectation that the Group has adequate resources to continue in operational existence for a period of 12 months from the date of approval of the Consolidated Financial Statements, as set out on pages 140 to 193 of this Annual Report and Accounts.
Thus, they continue to adopt the Going Concern basis of accounting in preparing the Consolidated Financial Statements.
Viability StatementIn accordance with provision 31 of the UK Corporate Governance Code, the Directors have assessed the Group’s prospects over a longer period than the 12 months required by the Going Concern Statement.
Viability timeframeThe Directors have assessed the Group’s viability over a period of three years from 31 December 2021. This period was selected as an appropriate timeframe for the following reasons, based on the Group’s business model:
• the Group’s rolling strategic review, as considered by the Board, covers a three-year period;
• the period is aligned to the length of the Group’s Managed Services contracts, which are typically three to five years long;
• the short lifecycle and constantly evolving nature of the technology industry lends itself to a period not materially longer than three years; and
• Technology Sourcing has seen greater recent growth than the Group’s Services business, increasing the revenue mix towards the part of the business that has less medium-term visibility and is therefore more difficult to forecast.
Group Finance Director’s reviewcontinued
78

Further, the Directors’ monitor conditions in the environment external to the Group and have concluded that the current factors continue to support the timeframe selected:
• the continuing macro-economic, diplomatic and trade environment, following the departure of the UK from the European Union, introduces greater uncertainty into a forecasting period longer than three years;
• the prolonged impact of Covid-19, and in particular the effect on certain of our customers from the worsening global economic outlook, and the current increasing pace of change of technology adoption as a result;
• continuing short-term product shortages, resulting primarily from the Covid-19 impact on supply chains; and
• the likely short to medium-term impact of the Russian invasion of Ukraine on the global macro-economic environment, including an exacerbation of supply chain issues currently being experienced.
Whilst the Directors have no reason to believe the Group will not be viable over a longer period than three years, we believe that a three-year period presents shareholders with a reasonable degree of confidence, while providing a longer-term perspective.
With regard to the principal risks set out on pages 80 to 85, the Directors remain assured that the business model will be valid beyond the period of this Viability Statement. There will continue to be demand for both our Professional Services and Managed Services businesses, and Management is responsible for ensuring that the Group remains able to meet that demand at an appropriate cost to our customers. The Group’s value-added product reselling Technology Sourcing business only appears vulnerable to disintermediation at the low end of the product range, as the Group continues to provide a valuable service to customers and technology partners alike, as described on pages 18 to 21. The Group has seen significant business growth in the UK throughout the Covid-19 pandemic, due to the end-to-end Technology Sourcing capability that it can deliver from its UK Integration Center, which is a significant differentiating factor in this market.
Prospects of the Group assessment process and key assumptionsThe assessment of the Group’s prospects derives from the annual strategic planning and review process. This begins with an annual away day for the Board, where Management presents the strategic review for discussion against the Group’s current and future operating environments.
High-level expectations for the following year are set with the Board’s full involvement and are delivered to Management, who prepare the detailed bottom-up financial target for the following year. This financial target is reviewed and agreed by Management before presentation to the Board for approval at the December Board meeting.
On a rolling annual basis, the Board considers a three-year business plan (the Plan) consisting of the detailed bottom-up financial target for the following year (2022) and forecast information for two further years (2023 and 2024), which is driven by top-down assumptions overlaid on the detailed target year. Key assumptions used in formulating the forecast information include organic revenue growth, margin improvement and cost control, continued strategic investments through the Consolidated Income Statement, and forecast Group effective tax rates, with no changes to dividend policy or capital structure beyond what is known at the time of the forecast. The financial target for 2022 was considered and approved by the Board on 9 December 2021, with amendments and enhancements to the target as part of the full Plan considered and approved by the Board on 8 March 2022.
Impact of risks and assessment of viabilityThe Plan is subject to rigorous downside sensitivity analysis, which involves flexing a number of the main assumptions underlying the forecasts within the Plan. The forecast cash flows from the Plan are aggregated with the current position, to provide a total three-year cash position against which the impact of potential risks and uncertainties can be assessed. In the absence of significant external debt, the analysis considers access to available committed and uncommitted finance facilities, the ability to raise new finance in most foreseeable market conditions and the ability to restrict dividend payments.
The potential impact of the principal risks and uncertainties, as set out on pages 80 to 85, is then applied to the Plan. This assessment includes only those risks and uncertainties that, individually or in plausible combination, would threaten the Group’s business model, future performance, solvency or liquidity over the assessment period and which are considered to be severe but reasonable scenarios. It also takes into account an assessment of how the risks are managed and the effectiveness of any mitigating actions.
The combined effect of the potential occurrence of several of the most impactful risks and uncertainties is then compared to the cash position generated throughout the sensitised Plan, to assess whether the business will be able to continue in operation.
For the current period, the primary downside sensitivity relates to a modelled, but not predicted, severe downturn in Group revenues, beginning in 2022, simulating a continued impact for some of our customers from the Covid-19 crisis together with the Group’s revenues being impacted by supply shortages. This sensitivity analysis models a continued market downturn scenario for some of our customers, whose businesses have been affected by Covid-19, and a similar downturn occurring for the remainder of our customer base alongside a further impact on the Group’s Technology Sourcing revenues throughout the first half of 2022 from possible ongoing technology partner-related supply shortage issues.
Additionally, the risks related to continued disruption from the departure of the UK from the European Union, and the potential for a suspension or termination of the EU-UK Trade and Cooperation Agreement have been reflected within our underlying business plans.
ConclusionBased on the period and assessment above, the Directors have a reasonable expectation that the Group will be able to continue in operation and meet its liabilities, as they fall due, over the three-year period to 31 December 2024.
Fair, balanced and understandableThe Board confirms that the Annual Report and Accounts, taken as a whole, is fair, balanced and understandable and provides the information necessary for shareholders to assess the Group’s position and performance, business model and strategy. Management undertakes a formal process through which it can provide comfort to the Board in making this statement.
79
Strategic ReportAnnual Report and Accounts 2021

The Board
Executive Committee
Audit Committee
Remuneration Committee
Nomination Committee
Country-specific ManagementGroup Delivery
Group Commercial ManagementGroup Finance
Group Information Security Group Human Resources
Group Legal and ComplianceGroup Information Assurance
Country-specific Take-OnGroup Quality Management
& Assurance
Anti-bribery & CorruptionCompetition Law
Export ControlWhistleblowingData ProtectionEnvironmentalHealth & Safety
Group Risk Committee
Group Compliance Steering Committee
Second line of defenceFirst line of defence Third line of defence
Risk ownership and application of internal controls
Independent assurance
Group Internal Audit
Compliance, oversight and assurance functions
OUR RISK GOVERNANCE MODEL
80
Principal risks and uncertainties

1. Risk overviewOur long-term success is built on a clear strategic direction, contractual and operational excellence and effective business services functions, such as Finance, Human Resources and Legal and Compliance, which support customer-facing employees to fulfil their obligations effectively. All of this is underpinned by an advanced IT infrastructure, hosting both internal and customer platforms. Our strategic, contractual and infrastructure risks are largely determined by the industry in which we operate and our long-term approach to adding value. Our financial and people risks are defined by the wider economic environment, the way we run our business day-to-day and our long-term employee needs. While outside factors are beyond our control, our risk management approach is committed to managing the impact of these influences, while controlling the internal elements vital to our success.
2. Risk trendsThe overall risk landscape has changed due to specific threats and our response to them as discussed below. In addition, we have continued to monitor the effects of the Covid-19 pandemic for its potential impact on our business, specifically in relation to the health and wellbeing of our employees, our global supply chain and in changing customer requirements, both in relation to the pandemic and the longer-term evolution of the delivery of IT services.
We use the three lines of defence model with regards to the assurance over key risks. This includes a mapping exercise which considers the level of assurance afforded by each of the compliance and oversight functions, when considering the overall level of assurance provided over each risk. To aid the appreciation of the risks facing the Group, we have categorised them into five main areas.
Strategic: The strategic-level risk profile is one of long-term risk due to technological change, including Computacenter’s ability or otherwise to innovate effectively, and in the globalisation of customer demand. Our response continues to mature in line with market and customer changes, ensuring that the risk remains at the same level.
Contractual/Operational: Our main focus remains on the effective governance of contracts, both in the pre-deal phase and in delivery. This includes our emphasis on data privacy. We continue to extend the use of our Service Quality Management Framework to improve the underlying quality of sales, bid governance and operations. We have recognised compliance/reputational risk as a principal risk for the first time this year. Overall, while we believe the main contractual and operational risks have remained at the same level, underlined by the robust governance structures we have in place, the risk of personal data loss has increased in line with the heightened cyber threat.
Infrastructure: Cyber security remains at the forefront of discussions at the Board and both the Risk and Audit Committees. Cyber security risks are increasing due to the greater activity of a range of cyber threat actors, including nation states, worldwide. This greater activity has resulted in more sophisticated and more frequent cyber attacks against IT infrastructure. Computacenter, along with other companies of a similar size and profile that operate within our sector, has been the target of cyber attacks in recent years. Our defensive systems and processes have, to date, ensured that these attacks have been identified and mitigated without any material impact on our financial or operational performance.
Financial: We continue to concentrate on the fundamentals important to our business, including the effective management of working capital. This risk has increased over the year, particularly in relation to the level of inventory held.
People: Our people remain integral to the continued success of our business. The risks reflect the importance we place on experience, inclusivity, openness and collaboration. We believe there has been an increased risk in relation to recruitment and retention during 2021 due to the post-Covid-19 economic recovery and the effects of inflation.
3. Risk appetiteOur risk appetite is strongly influenced by our experience in the industry sector. At an operational level, we have a higher risk appetite for business development where we have experience of the risks and a lower risk appetite where we have less experience. This is supported day-to-day by our operating policies and governance processes, which include decision-making support and authority over new contracts and contract changes.
4. Risk culture Risk management and governance processes are well-established and understood within the business and operate at all levels. Strategic-level risks are monitored by the Risk and Audit Committees, as well as by the Board. Lower-level operational risks are identified, analysed and mitigated at a functional level on an ongoing basis, using well-embedded processes.
5. Risk identification and impact Risk assessment and reporting are designed to provide the Board with a Group-wide perspective of the key risks faced by the business.
The Group Risk Committee, which reports to the Audit Committee, meets four times per year and reviews our principal risks, which are the main barriers to meeting our strategic goals, on an ongoing basis. This top-down approach includes assessing whether emerging risks are sufficiently significant to warrant inclusion in the Group Principal Risk Log. If so, the likelihood of occurrence and potential impact are considered, and the risk is subject to regular review. Regular reporting to the Group Risk Committee by the respective risk owners includes an assessment of the likelihood and cost impact of each risk, a consideration of non-financial impacts, risk appetite, key risk indicators, potential risk triggers and an assessment of mitigating controls. The Group Principal Risk Log is reviewed by both the Audit Committee and the Board. The key risks are considered further in relation to the long-term Viability Statement (see pages 78 to 79).
Other lower-level risks outside the principal risks are identified and analysed in two ways. These are:
1) Through the bottom-up Group Operating Business Risk Assessment process, which is completed by over 100 managers across the business. The results of this process are reviewed by the Group Risk Committee. This includes validating these risks against the principal risks, to ensure that all potential threats are considered. Lower-level risks are often triggers for crystallising principal risks, so their careful management remains an important consideration.
2) Via the Group Compliance Steering Committee (see risk governance model) which assesses reports from the Compliance Management System for the areas under its remit.
The risks presented below are the principal risks that existed during 2021, as reported in the Annual Report and Accounts 2020 and modified during the year through the risk identification and impact process.
81
Strategic ReportAnnual Report and Accounts 2021

Our four Strategic Priorities Strategic priority 1:To lead with and grow our Services business
Strategic priority 2:To improve our Services productivity and enhance our competitiveness
Strategic priority 3:To retain and maximise the relationship with our customers over the long term
Strategic priority 4: To innovate our Services offerings to build future growth opportunities
RISK CATEGORIES:
Strategic Risks
Market shift in technology usage
Geo-political risk
Increasing globalisation of customer demand
Contractual and Operational Risks
Lack of effective pre-contract processes
Lack of effective post-contract delivery
Loss of personal data
Acquisition integration
Compliance/reputational risk
Infrastructure Risks
Cyber threat
Integrity failure of critical systems
Financial Risk
Ineffective working capital management
People Risks
Poor employee recruitment and retention
Inadequate succession planning
Group risk log 2021 heat map
1. Strategic Risks Unchanged risk
2. Contractual and Operational Risks Increased risk
3. Infrastructure Risks Increased risk
4. Financial Risk Increased risk
5. People Risks Increased risk
Likel
ihoo
d
Impact
1
2
3
4
5
Unchanged risk
Decreased risk
Increased risk
82
Principal risks and uncertaintiescontinued

2. Contractual and Operational Risks
Alert status Increased risk of loss, corruption or unauthorised disclosure of personal data commensurate with the increased cyber threat.
Risks• Lack of effective pre-contract processes, resulting in poor
design, costing and pricing• Lack of effective post-contract delivery • Loss, corruption or unauthorised disclosure of personal data
• Lack of effective acquisition integration and failure to deliver on acquisition objectives
• Failure to meet our commitments or comply with applicable laws and regulations in relation to environmental, social and governance matters
Principal impacts• Customer dissatisfaction• Financial penalties• Contract cancellations• Reputational damage
• Reduced margins• Loss-making contracts• Reduced service and technical innovation
Mitigation• Mandatory governance processes relating to bids and new
business take-ons, including risk-based decision-making assessments and new tooling
• Board oversight of significant bids• Early Warning System and assurance provided by the Group
Quality Management & Assurance function over key bids and delivery programmes
• Regular commercial ‘deep dives’ into troubled contracts and challenging transformation projects
• Data privacy audit programme
• Appropriate due diligence and acquisition integration plans in place, with ongoing monitoring of key risks to ensure success
• Board-endorsed sustainability strategy• Climate Committee oversees initiatives to reduce environmental
impact (see pages 52 to 61)• TCFD disclosure (see pages 62 to 64) • Strong Company culture and values (see pages 44 to 51)• Oversight by the Compliance Steering Committee• Strong corporate governance, risk management and ethics,
including policies and/or training for anti-bribery and corruption, export compliance, competition law, HSE and HR in addition to a whistleblowing hotline
Risk owners• Group Delivery Director• Group Commercial Management Director• Group Legal and Compliance Director
• Group Development Director• Group Finance Director• Group Chief People Officer
1. Strategic Risks
Alert status No change.
Risks• Market shift in technology usage, making what we do less
relevant or superfluous and we fail to invest appropriately to defend our competitiveness
• Geo-political risk arising from our increasingly global operations• Increasing globalisation of customer demand, resulting in a
changing global competitive landscape
Principal impacts• Reduced margin• Excess operational employees
• Contracts not renewed• Missed business opportunities
Mitigation• Well-defined Group strategy, backed by an annual strategy
process that considers our offerings against market changes• Group Investments and Strategy Board, which considers
strategic initiatives• Additional measures including CEO-led country, sector and
win/loss reviews
Risk owners• Chief Executive Officer• Group Development Director• Group Delivery Director
83
Strategic ReportAnnual Report and Accounts 2021

3. Infrastructure Risks
Alert status Increasing due to the worldwide activity of cyber threat actors including nation states, and the need to replace a number of core systems in the coming years.
Risks• Cyber threat to Computacenter’s networks and systems, arising
from either internal or external security breaches, leading to system failure, denial of access or data loss. In addition, cyber threats introduced by Computacenter to its customers’ networks and systems, for whatever reason
• Major failure(s) leading to unacceptably long outages or regular short outages of our customer-facing systems leading to customer dissatisfaction, financial penalties or contract cancellations, leading to damage to our reputation and ability to win business. Failure to plan and execute effectively the replacement of our core internal systems, leading to loss of business control
Principal impacts• Inability to deliver business services• Reputational damage• Customer dissatisfaction
• Financial penalties• Contract cancellations
Mitigation• Well-communicated Group-wide information security and virus
protection policies• Specific inductions and training for employees working on
customer sites and systems• Specific policies and procedures for employees working behind
a customer’s firewall• Ongoing and regular programme of external penetration testing• Policies ensuring Computacenter does not run customer
applications or have access to customer data• Regular review of cyber security controls and threat analysis by
Computacenter’s Group Information Assurance team
• All Group standard systems built and operated on high-availability infrastructure, designed to accommodate failure of any single technical component
• All centrally-hosted systems built and operated on high-availability infrastructure, with multiple levels of redundancy
• All centrally-hosted systems benefit from dual network connectivity into core data centers designed to accommodate loss of network service
• Standing agenda item for each meeting of the Group Risk Committee
Risk owner• Chief Information Officer
4. Financial Risk
Alert status Increased in line with the higher level of inventory held due to chip and other shortages as well as some ERP implementation issues in North America.
Risk• Failure to manage working capital effectively
Principal impacts• Financial impact through bad debts, obsolete inventory and/or
other working capital movements
Mitigation• Implementation of debt management best practice, after
centralising Europe-wide collection functions at the Budapest finance Shared Service Center (excluding recent North American acquisitions)
• Inventory management controls and monitoring• Increasing use of direct delivery
Risk owner• Group Finance Director
84
Principal risks and uncertaintiescontinued

5. People Risks
Alert status Increased risk in recruitment and retention due to the post-pandemic recovery, resulting in labour shortages.
Risks• Failure to recruit and retain the right calibre of employees to our
talent pool, which includes acting as an inclusive employer, with a focus on senior positions in sales, services and projects
• Inadequate succession planning or insufficient depth within key Senior Executive positions
Principal impacts• Lack of adequate leadership• Customer dissatisfaction• Financial penalties
• Contract cancellations• Reputational damage
Mitigation• Succession planning in place for the top 50 managers across
the Group• Regular remuneration benchmarking• Incentive plans to aid retention• Investment in management development programmes
• Regular employee surveys to understand and respond to employee issues
• Specific diversity projects in place relating to accessibility and wellbeing, life balance, LGBT+ and allies, future talent, focus on women and culture
Risk owners• Group Chief People Officer• Chief Executive Officer
This Strategic Report was approved by the Board on 23 March 2022 and was signed on its behalf by:
MJ NorrisChief Executive Officer
FA ConophyGroup Finance Director
85
Strategic ReportAnnual Report and Accounts 2021

GOVERNANCE
87 Chair’s governance overview88 Board of Directors90 Corporate governance report95 Nomination Committee report97 Risk and internal control99 Audit committee report106 Directors’ remuneration report126 Directors’ report131 Directors’ responsibilities
86

Chair’s governance overview
Our governance framework is intended to provide an appropriate balance between ensuring that the Board and its Committees provide effective leadership for the Group, whilst enabling colleagues throughout the organisation to operate with the speed and agility required to support our customers and other stakeholders.Peter RyanNon-Executive Chair
Peter RyanNon-Executive Chair
Effective decision-making also requires the Board to have the right balance of skills, experience, knowledge and diversity. Our Nomination Committee has focused on Board and Executive succession planning during the year, considering both the Company’s current and likely future requirements. We are pleased to have increased our female director representation on the Board to just over 33 per cent, meaning that we are now compliant with the recommendations of the Hampton-Alexander review. Diversity at Board and Group Executive Committee level will remain very much on the Board’s agenda in 2022, to ensure that Computacenter has the best possible talent available to it in seeking to deliver value for its stakeholders.
There have been two changes to the Board since our last Annual Report. Minnow Powell retired from the Board after six years of service, having worked to lift the performance of the Company across compliance, financial reporting and governance, and offering wise counsel and guidance in his role as a Non-Executive Director. Pauline Campbell joined the Board in August and is already adding a fresh perspective and significant value to Board discussions, as well as recent and relevant financial experience from her role at PwC. Pauline’s profile can be found on page 89, which sets out in more detail her current and previous roles, and the skills and experience that she will bring to the Board as a Non-Executive Director.
Given the time constraints of its annual programme, and corporate governance and regulatory requirements for UK listed companies, the Board delegates a number of its responsibilities to its principal Committees, so that it can focus on those areas deemed to be of particular operational, financial or reputational importance to the Group. The Board reviewed and approved the Terms of Reference for each of these Committees during the year, as well as the authorities that it delegates to Management to run the organisation on a day-to-day basis.
An internal evaluation of the Board and its Committees took place during the year. Further details of the process and outcomes can be found on page 98. Following consideration of its findings, I am satisfied that the Board continues to function effectively, and that its current constitution and range of skills are appropriate for promoting the long-term interests of the Company.
Peter RyanNon-Executive Chair23 March 2022
Dear Shareholder,
On behalf of the Board, I am pleased to introduce Computacenter’s Corporate Governance Report for the year ended 31 December 2021.
Computacenter’s purpose is to enable the success of our customers, people, technology partners and the communities in which we operate, by building long-term trust. I am in no doubt that the clarity of this message, supported by the values and culture set by the Board, has helped the organisation to navigate the unfamiliar, and sometimes difficult, conditions in which it has had to operate since the onset of the Covid-19 pandemic, in March 2020. Our Purpose, Values and culture all prioritise and support the consideration of long-term consequences in our decision-making, and relationships with our key stakeholders. They have helped Computacenter to prioritise its actions and decision-making throughout the Covid-19 pandemic, including at Board level.
Our governance framework is intended to provide an appropriate balance between ensuring that the Board and its Committees provide effective leadership for the Group, and have sufficient oversight and decision-making involvement in areas such as strategy, performance, governance and risk, whilst enabling our colleagues throughout the organisation to act with sufficient independence and agility to respond to and work effectively with our stakeholders.
As a Board, we are mindful of our responsibility to ensure that our activities and decision-making are consistent with, and enable Computacenter to achieve, its purpose. We employ over 18,000 people, our customers depend on us to help them navigate complex digital environments and deliver high levels of service that effectively support their business needs, and we provide our technology partners with an important route to market for their products. A significant number of people and organisations, many of whom sit outside of Computacenter, are impacted by and depend on our continued success and growth.
It is therefore critical that the Board is able to understand the views and interests of our key stakeholders – our customers, employees, technology partners, investors and communities in which we operate – and that these are factored into and considered in the decisions that it makes. Further detail on how the Company and Board have engaged with our key stakeholders, why that engagement is important, and how the Board has considered them and other Section 172 factors in its decision-making, is set out on pages 66 to 69 and on pages 91 to 92.
87
Governance ReportAnnual Report and Accounts 2021

Board of Directors
The Board has an appropriate balance of independence, knowledge and experience which allows it to perform its role effectively, providing effective and entrepreneurial leadership to the Group, and promoting its long-term sustainable success.Peter RyanNon-Executive Chair
Committee membership: N, RBoard meeting attendance: 8/8
Peter has, since 1980, had a successful international career in technology encompassing all dimensions of the industry, including software, services, systems integration, outsourcing and infrastructure. Over the last 10 years, Peter has held roles such as Chief Sales Officer with Hewlett Packard Enterprise, Chief Client Officer at Logica plc and Executive Vice President, Global Sales and Services with Sun Microsystems Inc. Peter is also Chairman of privately held Ocean Technology Group.
Board meeting attendance: 7/8
Philip founded Computacenter with Peter Ogden in 1981 and worked for the Company on a full-time basis until stepping down as Executive Chairman in 2001. He was previously a Vice President and Director of the Boston Consulting Group.
Board meeting attendance: 8/8
Mike graduated with a degree in Computer Science and Mathematics from East Anglia University in 1983. He joined Computacenter in 1984 as a salesman in the City office. Following appointments in senior roles, he became Chief Executive in December 1994, with responsibility for all day-to-day activities and reporting channels across Computacenter. Mike also led the Company through flotation on the London Stock Exchange in 1998. Mike was awarded an honorary Doctorate of Science from the University of Hertfordshire in 2010.
Board meeting attendance: 8/8
Tony has been a member of the Chartered Institute of Management Accountants since 1982. He qualified with Semperit (Ireland) Ltd and then worked for five years at Cape Industries plc. He joined Computacenter in 1987 as Financial Controller, rising in 1991 to General Manager of Finance. In 1996, he was appointed Finance and Commercial Director of Computacenter (UK) Limited with responsibility for all financial, purchasing and vendor relations activities. In March 1998 he was appointed Group Finance Director.
Committee membership keyA – Audit CommitteeN – Nomination CommitteeR – Remuneration Committee
Peter Ryan
Non-Executive Chair and Chair of the Nomination Committee
Mike Norris
Chief Executive Officer
Philip Hulme
Founder Non-Executive Director
Tony Conophy
Group Finance Director
88

Board meeting attendance: 8/8
Peter founded Computacenter with Philip Hulme in 1981 and was Chairman of the Company until 1998, when he became a Non-Executive Director. Prior to founding Computacenter, he was a Managing Director of Morgan Stanley and Co.
Committee membership: A, N, RBoard meeting attendance: 8/8
Ljiljana has more than 25 years’ experience in the IT industry. She was Global Head of financial services and a member of the executive committee at Atos SE, following its takeover of Siemens IT Solutions and Services GmbH, where she headed the worldwide banking and insurance sales business. Ljiljana has also held senior roles at Hewlett-Packard and WestLB AG. Since 2016, she has focused on technology start-ups as a Senior Partner of Impact51 AG. Ljiljana is a non-executive director of Grenke AG, a global financing partner for small and medium-sized companies.
Committee membership: A, N, RBoard meeting attendance: 4/4
Pauline is a recently retired PricewaterhouseCoopers (PwC) Audit Partner who brings over 30 years of experience in the profession. She has worked internationally across a broad range of sectors including IT services and support services. Pauline also served on the Governance Board of the UK firm including the Public Interest Body and the equivalent body at PwC’s Global Network, so brings a wealth of governance experience. Pauline is a Non-Executive Director of Micro Focus International plc.
Committee membership: A, N, RBoard meeting attendance: 7/8
Rene is a US national. He has over 30 years’ experience in executive and general management, marketing and sales. He is currently the Chief Executive Officer of Arm Limited, the world leader in semiconductor IP and provider of IoT device and data management platforms. Prior to his current role, Rene led Arm’s Intellectual Property Group and was, amongst other appointments, Chief Commercial Officer and Executive Vice President Sales and Marketing at Arm. He spent seven years as Vice President and General Manager Computing Products at NVIDIA Corporation.
Committee membership: A, N, RBoard meeting attendance: 8/8
Ros was appointed as the Group’s Designated Non-Executive Director for Workforce Engagement in 2017. She is a Senior Independent Non-Executive Director at Victrex plc. Ros is Chair of the Nuclear Decommissioning Authority and a Non-Executive Director of the Ministry of Defence – Defence Equipment and Support Board, where she is a member of the Remuneration and Nomination Committees and is the Lead Non-Executive Director at Luxembourg-based Aperam SA. She was a Non-Executive Director of ConvaTec plc, RPC Group plc, CEVA Logistics AG, Rexam plc and Deputy Chair of the Council of the University of Southampton for 10 years. Ros was previously Chief Operating Officer for Smith & Nephew plc and held senior management positions in global companies including Exxon, Diageo, ICI and Tate & Lyle Group.
Peter Ogden
Founder Non-Executive Director
Pauline Campbell
Independent Non-Executive Director and Chair of the Audit Committee
Ros Rivaz
Senior Independent Non-Executive Director and Chairof the Remuneration Committee
Rene Haas
Independent Non-Executive Director
Ljiljana Mitic
Independent Non-Executive Director
89
Governance ReportAnnual Report and Accounts 2021

Corporate governance report
The Group’s Viability Statement is set out on pages 78 and 79, within the Finance Directors’ review.
BOARD LEADERSHIP AND COMPANY PURPOSEThe role of the BoardThe Group is led by the Board, which is responsible for promoting its long-term sustainable success, with a focus on generating value for our shareholders and the wider interests of our key stakeholders. It discharged this responsibility in 2021 through the completion of its annual programme, with eight scheduled meetings covering areas relating to strategy, operational and financial performance, risk management and corporate governance. Further details of the Board’s principal activities that it undertook during the year can be found on pages 91 and 92.
Under the Framework, the Board retains oversight and sole decision-making authority over a number of key matters which are likely to be operationally, financially or reputationally material to the Group. These are set out in a clearly defined schedule of matters reserved, which was reviewed during the year, and includes decisions concerning acquisitions, major capital expenditure and the Group’s strategy, budgets, consolidated financial statements and dividend policy. The schedule can be found on our investor website at investors.computacenter.com.
APPLICATION OF CODE PRINCIPLES• Board Leadership and Company Purpose
– page 90• Division of Responsibilities – page 93• Composition, Succession and Evaluation
– pages 95, 96 and 98• Audit, Risk and Internal Control – pages 97
to 105• Remuneration – page 106 to 125
RELATED STATEMENTS AND CONFIRMATIONSThe Directors are required to include the following in the Annual Report and Accounts, in accordance with the Code. Please see:
• page 79 for the Board’s statement on the Annual Report and Accounts being fair, balanced and understandable and providing the information necessary for shareholders to assess the Group’s position and performance, business model and strategy;
• page 78 for the statement on the status of the Company and the Group as a going concern;
• the Strategic Report from the inside front cover to page 85, for an explanation of the Group’s business model and the strategy for delivering the Group’s objectives; and
• the statement on risk and internal control for confirmation that the Directors have carried out a robust assessment of the principal and emerging risks facing the Group, including those that would threaten its business model, future performance, solvency or liquidity.
As a company with a premium listing on the London Stock Exchange, Computacenter plc (the Company) is required to report on how it has applied the principles of the UK Corporate Governance Code (the Code), published by the UK Financial Reporting Council (FRC) in 2018. A description of how it has done so is set out on pages 90 to 131, which includes the reports of the Board Committees and the Directors’ Report. The Board confirms that the Company complied with the provisions of the Code throughout 2021. A copy of the Code is available at www.frc.org.uk.
The pages that follow aim to provide our stakeholders with an understanding of how our Corporate Governance Framework (the Framework) operated during the year, and the outcomes that it produced during that time. The Framework ensures that our organisation is appropriately led, directed and controlled. It gives our people clarity on their responsibilities and accountabilities, and our decision-making authorities, restrictions and processes, helping to ensure that decisions are properly made and then implemented throughout the Group. In doing so, it helps us to set and deliver our strategy, manage our risks, safeguard long-term shareholder value and protect our reputation with our key stakeholders.
Our Corporate Governance Framework
The Board
Board Committees
Nomination Committee
Audit Committee
Remuneration Committee
Shareholders
Chief Executive Officer*
Group Executive Team
* The Board delegates authority for managing the Group on a day-to-day basis to the Chief Executive Officer.
90
Board activity in 2021
The Board held eight scheduled meetings during 2021 to cover its annual agenda of activities, through which it provides the Group with leadership and promotes its long-term sustainable success. Whilst the list of the Board’s activities set out below is not exhaustive, it provides an understanding of its main areas of focus, and of the Section 172 factors that it considered in its discussions and decision-making, including the views and interests of our stakeholders. This section is incorporated by reference into the Board’s Section 172 statement for 2021, as set out on page 65.
During the year, the Board:
Stakeholders and Section Strategy 172 factors considered
• Held a dedicated strategy day to review and approve the Group’s three-year plan. Areas reviewed include the Group’s Technology Sourcing, Managed Services and Professional Services propositions; competitive positioning and differentiation; growth potential and opportunities; and future strategic investment requirements. Further information on the Group’s current strategy is available on pages 8 to 17.
A B C D E
LT SP
• Conducted seven strategy-related deep dives across the year on topics of material importance to achieving progress against the Group’s strategic objectives. Approved investment in the Group’s IT Service Management tooling.
A B C D LT
SP
• Reviewed and approved acquisition opportunities, the integration of recent acquisitions and considered shareholder feedback on our strategy. A C D LT
• Received regular updates on the status of our environmental, social and governance (ESG) strategy and progress made against our ‘Winning Together for our People and our Planet’ objectives. Further information on the Group’s ESG areas of focus and strategy is available within the sustainability section on pages 40 to 41.
A B C D E
LT ENV HS SP
• Reviewed the Group’s financing, cash deposit and cash reserve strategy. For further detail on the outcomes of these discussions, please see the Group Finance Director’s review on pages 70 to 79. A C D LT AF
Our People and Culture
• Conducted a ‘deep dive’ into Computacenter’s culture, including discussing its development over recent years, its alignment with our ‘Winning Together’ values, strategy and purpose, and the impact of Covid-19. A B D E LT
HS
• Reviewed succession planning for members of the Group Executive Committee, and the process for talent management throughout Computacenter. B LT
• Reviewed and approved Non-Executive Directors’ Remuneration, considering the limits set in the Company’s Articles of Association, and relevant benchmarking data. C LT
• Received regular updates from the Group’s Designated Non-Executive Director for Workforce Engagement, highlighting matters of concern and importance to employees, and reviewed the results of the 2021 Group-wide employee survey providing the Board with insight into employee views of our culture, strategy, response to Covid-19 and ESG activities. Commentary on the outcomes of our workforce engagement programme and employee survey can be found on page 46.
B LT
• Received updates from the Chief People Officer on Management’s interactions with the Group’s Employee Works Councils. B LT HS
• Reviewed and discussed targets for Group Executive Committee members concerning diversity and inclusion. Our wider approach to diversity and inclusion, and ensuring we have the best talent available to generate value for our stakeholders, can be found on page 46.
B C E LT
Financial and Operational Performance
• Received regular reports from the Chief Executive Officer, and considered business performance against Board and market expectations, material issues impacting our key stakeholders, and progress against the Group’s strategic objectives and key performance indicators. For further detail on the Group’s performance during 2021, please see pages 26 to 39.
A B C D E
LT SP
• Reviewed senior Management presentations from each of the in-country and Group Function leadership teams, providing the Board with insight into financial performance and the outcomes of stakeholder engagement. A B D LT SP
• Considered and approved the budget and performance-related targets for 2022 and approved the 2021 interim and final dividends. For our 2021 final dividend and details of our dividend policy, please see page 74. A C D LT AF
• As a standing item on its agenda, reviewed data relating to the performance and competitiveness of the Group’s Managed Services business. Commentary on our Managed Services business can be found on page 22. A C
91
Governance ReportAnnual Report and Accounts 2021
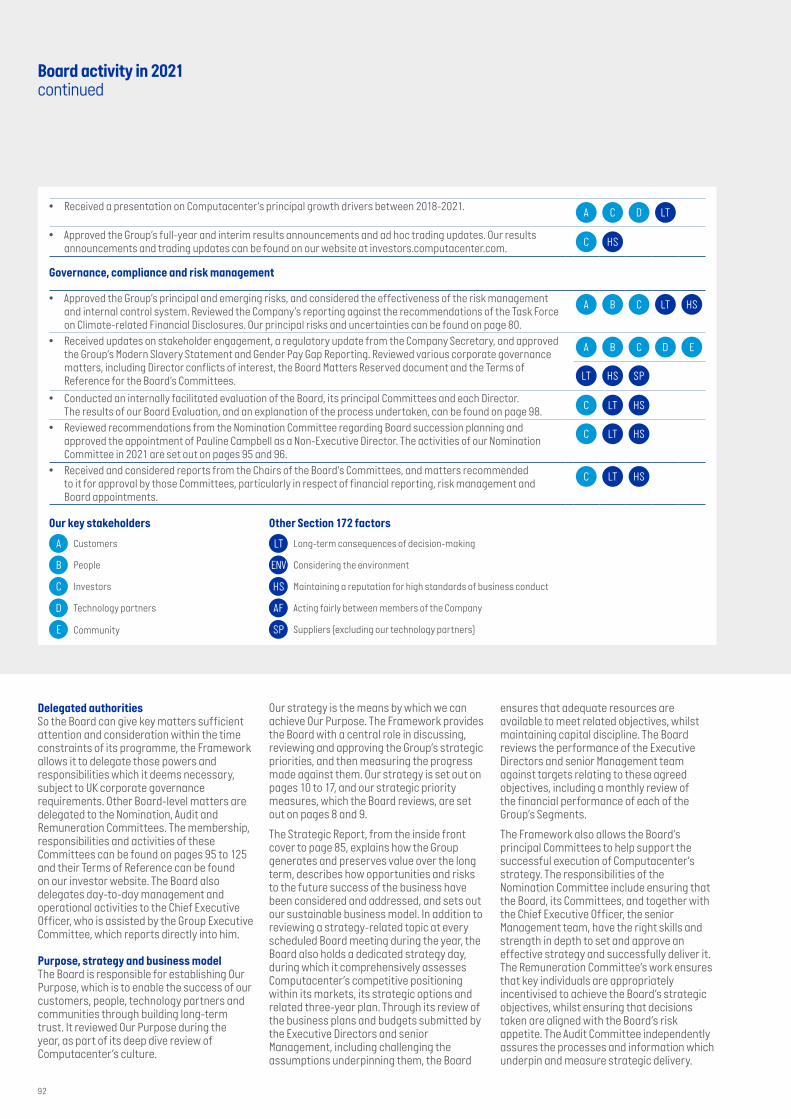
Our strategy is the means by which we can achieve Our Purpose. The Framework provides the Board with a central role in discussing, reviewing and approving the Group’s strategic priorities, and then measuring the progress made against them. Our strategy is set out on pages 10 to 17, and our strategic priority measures, which the Board reviews, are set out on pages 8 and 9.
The Strategic Report, from the inside front cover to page 85, explains how the Group generates and preserves value over the long term, describes how opportunities and risks to the future success of the business have been considered and addressed, and sets out our sustainable business model. In addition to reviewing a strategy-related topic at every scheduled Board meeting during the year, the Board also holds a dedicated strategy day, during which it comprehensively assesses Computacenter’s competitive positioning within its markets, its strategic options and related three-year plan. Through its review of the business plans and budgets submitted by the Executive Directors and senior Management, including challenging the assumptions underpinning them, the Board
ensures that adequate resources are available to meet related objectives, whilst maintaining capital discipline. The Board reviews the performance of the Executive Directors and senior Management team against targets relating to these agreed objectives, including a monthly review of the financial performance of each of the Group’s Segments.
The Framework also allows the Board’s principal Committees to help support the successful execution of Computacenter’s strategy. The responsibilities of the Nomination Committee include ensuring that the Board, its Committees, and together with the Chief Executive Officer, the senior Management team, have the right skills and strength in depth to set and approve an effective strategy and successfully deliver it. The Remuneration Committee’s work ensures that key individuals are appropriately incentivised to achieve the Board’s strategic objectives, whilst ensuring that decisions taken are aligned with the Board’s risk appetite. The Audit Committee independently assures the processes and information which underpin and measure strategic delivery.
Delegated authoritiesSo the Board can give key matters sufficient attention and consideration within the time constraints of its programme, the Framework allows it to delegate those powers and responsibilities which it deems necessary, subject to UK corporate governance requirements. Other Board-level matters are delegated to the Nomination, Audit and Remuneration Committees. The membership, responsibilities and activities of these Committees can be found on pages 95 to 125 and their Terms of Reference can be found on our investor website. The Board also delegates day-to-day management and operational activities to the Chief Executive Officer, who is assisted by the Group Executive Committee, which reports directly into him.
Purpose, strategy and business modelThe Board is responsible for establishing Our Purpose, which is to enable the success of our customers, people, technology partners and communities through building long-term trust. It reviewed Our Purpose during the year, as part of its deep dive review of Computacenter’s culture.
• Received a presentation on Computacenter’s principal growth drivers between 2018-2021. A C D LT
• Approved the Group’s full-year and interim results announcements and ad hoc trading updates. Our results announcements and trading updates can be found on our website at investors.computacenter.com. C HS
Governance, compliance and risk management
• Approved the Group’s principal and emerging risks, and considered the effectiveness of the risk management and internal control system. Reviewed the Company’s reporting against the recommendations of the Task Force on Climate-related Financial Disclosures. Our principal risks and uncertainties can be found on page 80.
A B C LT HS
• Received updates on stakeholder engagement, a regulatory update from the Company Secretary, and approved the Group’s Modern Slavery Statement and Gender Pay Gap Reporting. Reviewed various corporate governance matters, including Director conflicts of interest, the Board Matters Reserved document and the Terms of Reference for the Board’s Committees.
A B C D E
LT HS SP
• Conducted an internally facilitated evaluation of the Board, its principal Committees and each Director. The results of our Board Evaluation, and an explanation of the process undertaken, can be found on page 98. C LT HS
• Reviewed recommendations from the Nomination Committee regarding Board succession planning and approved the appointment of Pauline Campbell as a Non-Executive Director. The activities of our Nomination Committee in 2021 are set out on pages 95 and 96.
C LT HS
• Received and considered reports from the Chairs of the Board’s Committees, and matters recommended to it for approval by those Committees, particularly in respect of financial reporting, risk management and Board appointments.
C LT HS
A Customers
B People
C Investors
D Technology partners
E Community
LT Long-term consequences of decision-making
ENV Considering the environment
HS Maintaining a reputation for high standards of business conduct
AF Acting fairly between members of the Company
SP Suppliers (excluding our technology partners)
Our key stakeholders Other Section 172 factors
Board activity in 2021 continued
92

Committee Chair. Pauline Campbell joined the Board as a Non-Executive Director on 16 August 2021. She is a member of each of the Board’s Committees, and became Audit Committee Chair with immediate effect upon Minnow’s departure.
The Board has considered the independence of each Director, taking into account the guidance provided by the Code. The Board considered that the Chair, Peter Ryan, met the Code’s independence criteria on appointment, and considers that Pauline Campbell, Ros Rivaz, Ljiljana Mitic and Rene Haas are independent in their character and judgement. Philip Hulme and Peter Ogden, the Founder Non-Executive Directors, are not considered to be independent, having started the Company in 1981 and remained on the Board in either an Executive or Non-Executive capacity since that time.
The Framework ensures that there is no dominant individual or group of individuals on the Board influencing its decision-making. The Board is comfortable that each Director makes a valuable contribution in their role.
Board appointments and developmentThe Nomination Committee leads the process for Board appointments. Further detail on the Committee’s role, membership and work during the year is set out on pages 95 to 96.
Non-Executive Directors are appointed to the Board for an initial three-year term, the renewal of which is timed to be at the close of an Annual General Meeting. The Executive Directors are appointed for a rolling 12-month term. The terms and conditions of appointment of all Directors are available for inspection at the Company’s registered office and at each AGM.
The Company’s Articles of Association require a Director to be subject to election at the first AGM following his or her appointment and every third year thereafter. However, in accordance with the Code, the Board has decided that all Directors should be subject to election or re-election at the Company’s 2022 AGM, and each AGM thereafter. If the shareholders do not elect or re-elect a Director, or a Director is retired from office under the Articles, the appointment terminates immediately and without compensation.
Upon joining the Board, all Directors receive a comprehensive induction programme organised by the Company Secretary, tailored to their specific background and requirements. New Directors receive an induction pack which contains information on the Group’s business, its structure and operations, Board procedures, corporate governance matters and details of Directors’ duties and responsibilities. All new Directors are introduced to the Group’s Executive Management team. New Directors are also given the opportunity to meet with major shareholders.
impact of the Covid-19 pandemic on our culture, and the general importance of leadership messaging in reflecting and reinforcing our culture.
The Board confirms it is satisfied that the Group’s purpose, values, strategy and culture are aligned.
Investing in and rewarding our workforceFurther detail on how we invest in and reward our workforce is set out in the Directors’ Remuneration Report on pages 106 to 125, and on page 48 of the Strategic Report.
Engagement with our investors The Board recognises the importance of meeting and engaging with our shareholders, and places significant value on understanding their views and interests. In 2021, the Board completed a programme of engagement with the Company’s institutional investors, to ensure they understand our strategy, performance and governance arrangements, and can make informed investment decisions relating to Computacenter.
Further detail on engagement with our investors during the year, and how the outcomes of that engagement were fed back to the Board and considered in its discussions and decision-making, are set out on pages 69, 91 and 92.
The Company’s Annual General Meeting (AGM) will be held on Thursday 19 May 2022 at Computacenter House, 100 Blackfriars Road, SE1 8HL. The AGM Notice of Meeting sets out each of the resolutions being proposed. The notice will shortly be available at investors.computacenter.com, and will be mailed to shareholders who have elected to receive hard copies.
Stakeholder engagementDetails of the Group’s engagement with its other key stakeholders, including our customers, employees, technology partners and communities, and how its outcomes were considered by the Board in its discussions and decision-making, are set out on pages 66 to 69.
DIVISION OF RESPONSIBILITIES
Board composition and independenceThe membership of the Board as at 31 December 2021 is set out on pages 88 and 89. On that date, the Board included seven Non-Executive Directors and two Executive Directors. The Directors’ attendance at Board and Committee meetings is set out on pages 88 to 89, 95, 99 and 114. The diversity and experience of the Board enables it to discharge its functions effectively.
There were two changes to the Board during the year. On 30 September 2021, Minnow Powell stepped down as a member of the Board and its Committees, and as Audit
Culture and ValuesThe Board views culture as a competitive differentiator in our key markets, as it can impact the appetite of our key stakeholders to work with us as an organisation. It affects the way that they view us, the way our people behave when representing us, and our wider corporate reputation. The Board assessed and monitored the Group’s culture in several ways during the year. It is underpinned by our Code of Ethics Policy (Ethics Code), which defines the rules, principles and behaviours that the Group expects those who conduct business on its behalf to adhere to, and on which our supplementary workforce policies and practices are based. The Board approves the Ethics Code, ensuring that it is aligned with our stated culture, values and strategy.
It also receives updates from the Audit Committee on potential breaches of the Ethics Code, which indicate behaviours inconsistent with our culture and values. By monitoring these reports, the Board can assess whether there are common themes around behaviour and therefore how embedded Computacenter’s culture and values are across the organisation. Some of these reports are initially made through our independent and confidential whistleblowing hotline, Safecall. The Board is satisfied that arrangements are in place for the proportionate and independent investigation of these reports, and for follow-up action, where required.
The work of the Workforce Engagement Director, Ros Rivaz, is described on page 67. She updated the Board regularly on her engagement and discussions with our workforce and their representative groups in 2021, and the key outcomes and findings. This helps the Board to understand the approach, views, interests and activities of our workforce, what it understands the Group’s culture to be, and how well it thinks that culture is embedded into different areas of the organisation.
The Board also learned about our employees’ views on our culture, values and behaviours when it reviewed the results of the Group-wide employee survey completed in 2021. Further details of the survey findings are set out on page 46.
The Board received presentations from the leadership teams of the Group’s operating country units and central functions. Through related discussions with senior Management the Board is able to identify cultural variances across the Group, including those driven by geography, remoteness from the Group’s headquarters or local customs and norms. The Chief People Officer also presented to the Board on the development of the Group’s culture, with the aim of ensuring we can attract, retain and promote the best talent available. The Board also discussed the
93
Governance ReportAnnual Report and Accounts 2021

Insurance and indemnitiesThe Company arranges insurance cover in respect of legal action against the Directors and, to the extent allowed by legislation, has issued an indemnity to each Director against claims brought by third parties.
Conflict of interest procedureThe Company’s Articles of Association allow the Board to review and authorise situations where a Director has an interest that conflicts, or may conflict, with those of Computacenter, and to impose conditions on that authorisation.
The Board has formal procedures to appropriately manage any actual or potential conflicts of interest identified. These include considering each conflict from a competitive and commercial perspective, which includes identifying supplier or customer relationships between Computacenter and the third party, and also identifying if there are any areas where it competes with Computacenter. The Board also considers the conflict in accordance with the requirements of the Companies Act 2006.
External appointments and time commitmentThe Non-Executive Directors’ letters of appointment set out the expected time commitment required to execute their duties. Although the nature of the roles makes it difficult to be specific about the maximum time commitment, a commitment of up to two days per month is expected, including attendance at and preparations for regular Board meetings. In certain circumstances, for instance when the Company is engaged in acquisitions, restructuring or other corporate transactions, there may be additional Board meetings, and Non-Executive Directors are expected to attend these where possible.
Each Director’s external commitments are monitored on an ongoing basis to ensure that they have sufficient time to devote to their role at Computacenter. Following the internal Board evaluation completed for 2021, the Board is satisfied that each Director is able to allocate sufficient time to the Company to discharge his or her responsibilities effectively, and that no external appointments of our Board Directors have any impact on their independence or responsibilities to the Company.
Provided the time commitment does not conflict with the Directors’ duties to the Company, the Board may authorise the Executive Directors to take Non-Executive positions in other companies and organisations, as this helps to broaden their experience. The Board would not agree to a full-time Executive Director taking on more than one Non-Executive Directorship of a FTSE 100 company or the Chair of such a company. No such positions have been taken by the Executive Directors.
Information and supportTo enable the Directors to discharge their duties, they receive appropriate documentation in advance of each Board and Committee meeting, including detailed briefings on all matters.
Directors can obtain independent professional advice, at the Company’s expense, where they believe it is necessary to discharge their responsibilities. The Company Secretary ensures that the Board Committees are provided with sufficient resources to undertake their duties. Where Directors have concerns which cannot be resolved, whether about the running of the Company or a proposed action, their concerns will be recorded in the Board minutes. On resignation, a Non-Executive Director would be required to provide a written statement to the Chair, for circulation to the Board, if they had any such concerns.
The Company Secretary advises the Board on all corporate governance matters and advises the Chair to ensure that all Board procedures are correctly followed. All Directors have access to the advice and services of the Company Secretary. The appointment or removal of the Company Secretary requires Board approval.
The Corporate Governance Report, from pages 87 to 125 was approved, by order of the Board, and signed on its behalf by:
Simon PereiraCompany Secretary 23 March 2022
The Chair regularly liaises with each Director to discuss and agree their training and development needs. The Board is confident that all of its members have the knowledge, ability and experience to perform the functions required of a Director of a listed company.
Role of the Chair and Chief Executive OfficerThe roles of the Chair and Chief Executive Officer (CEO) are separate, and their responsibilities are clearly set out in writing, reviewed annually and agreed by the Board. They are available from the Company’s website at investors.computacenter.com.
In summary, the Chair’s role is to lead and manage the Board, set its agenda, be responsible for its effectiveness in all aspects of its role and ensure the Board has sufficient time to address all areas of responsibility, particularly strategic issues. The Chair actively encourages contributions from all Directors and is responsible for ensuring constructive interaction between the members of the Board. The CEO is responsible for the day-to-day management of the Group’s operations and for the proper execution of strategy, as set by the Board.
Senior Independent DirectorRos Rivaz is the Senior Independent Director. She acts as a sounding board for the Chair and, where necessary, as an intermediary between the Chair and other Directors. She is available to take representations from shareholders who do not want to raise the issue with the Chair. Ros also leads the annual appraisal of the Chair’s performance, in consultation with the other Non-Executive Directors and without the Chair being present.
Non-Executive DirectorsThe Non-Executive Directors provide an external perspective, constructively challenge the Executive Directors and senior Management, and monitor and scrutinise the Group’s performance against agreed goals and objectives. Their biographies, skills and experience, which allow them to offer strategic guidance and specialist advice in areas such as remuneration, audit and accounting and corporate governance, are set out on pages 88 and 89.
Corporate governance report continued
94

Nomination committee report
During the year, the Committee continued to focus on ensuring that there are plans in place for Board and senior Management succession.Peter RyanNon-Executive Chair
Peter RyanChair of the Nomination Committee
Membership and attendanceThe members of the Nomination Committee are the independent Non-Executive Directors and the Chair of the Board.
Minnow Powell stepped down from the Committee and the Board on 30 September 2021, having attended the Committee’s two meetings held during the year prior to his departure. Pauline Campbell joined the Committee on 16 August 2021, immediately upon her appointment as a Non-Executive Director. Further detail on the Committee’s membership and attendance at its meetings can be found directly above.
The Company Secretary is the secretary to the Committee, and upon invitation, the meetings are also attended by the Chief Executive Officer and the Chief People Officer.
The Chair of the Committee reports to the Board on its activities.
Responsibilities of the Nomination CommitteeThe key responsibilities of the Nomination Committee are to:
• lead the process for Board appointments; • ensure the Board and its Committees have
a combinations of skills, experience, diversity and knowledge appropriate for leading the Group, given its size and the markets in which it operates;
• review the structure, size and membership of the Board and its Committees to ensure that they are able to function effectively;
• review succession planning for the Board and Senior Executives of the Group; and
• review whether each Director has sufficient time to discharge his or her duties to the Company.
The Committee’s full terms of reference are available on the Company’s website at investors.computacenter.com.
COMPOSITION AND SUCCESSION
Main activities of the Committee in 2021The Nomination Committee met three times during 2021 and its work included:
Succession planningThe Committee continued to focus on its responsibility under the 2018 UK Corporate Governance Code (the Code) to ensure that
plans are in place for Board and senior Management succession, and to oversee the development of a diverse pipeline for that succession. To inform its work in this area, the Committee received an update from the Chief People Officer, during which it reviewed the processes in place for succession planning and talent management throughout the organisation, including defined managerial responsibilities for implementation.
The Committee reviewed succession options for the Executive Directors and other members of the Group Executive Committee, which included understanding the criticality of each role to the long-term sustainable success of the Group, and the relative availability of internal and external candidates for the roles over various time horizons.
Succession planning for Group Executive positions, including the Executive Directors, was presented to the Board by the Chief Executive Officer and the Chief People Officer later in the year.
To help it understand succession planning requirements, and to ensure that the Board and its Committees are able to function effectively on an ongoing basis, the Committee reviewed and discussed the composition of the Board and its Committees, and the skills, diversity and knowledge that each individual Director brings. It considered how the leadership needs of the Group may change over time, influenced by factors including its strategy, plans for growth and geographic footprint, and likely future corporate governance requirements.
The Committee also recognises the importance of effective Non-Executive Director succession planning, given that the Board currently includes our two founder Non-Executive Directors, who continue to contribute significantly and appropriately to Board discussions, particularly around strategy and performance. The Board does not consider Sir Philip Hulme and Sir Peter Ogden to be independent for the purposes of the Code.
It is therefore important that the Committee is prepared for unexpected or emergency independent Non-Executive Director succession so that the Company is able
Current members RoleAttendance
record
1. Peter Ryan (Chair) Non-Executive Chair of the Board
3/3
2. Pauline Campbell Non-Executive Director 1/13. Rene Haas Non-Executive Director 3/34. Ljiljana Mitic Non-Executive Director 3/35. Ros Rivaz Non-Executive Director 3/3Former member
5. Minnow Powell (until 30 September 2021) Non-Executive Director 2/2
95
Governance ReportAnnual Report and Accounts 2021

Executive Director roles, given that the Committee will also consider internal candidates, with whom it is already familiar, given its role in succession planning. Only external candidates will be considered for Non-Executive roles.
Board changesThere were two changes to the Board during the year, with Minnow Powell retiring from the Board after just over six years of service, and Pauline Campbell joining the Board as a Non-Executive Director, and taking over as Audit Committee Chair effective from the date of Minnow’s departure. The full process by which Pauline was appointed was set out in this Committee’s 2020 report. We are grateful to Minnow for his period of excellent service, and are delighted to have appointed somebody of Pauline’s calibre. As set out in our 2020 Annual Report and Accounts, the Company used Russell Reynolds to assist with the search for this position. Russell Reynolds has no other connection with the Company, other than the provision of this type of service.
Performance of the CommitteeDuring the year, the Company Secretary facilitated an internal review of the Committee, in accordance with its Terms of Reference. The review concluded that the Committee continued to function effectively during the year, but will continue to further increase its focus in 2022 on Management’s plans to ensure that the Group has a diverse pipeline for succession to senior Management positions.
The Committee has responded to observations made on its performance in recent years, and has increased its oversight of succession planning during the year, including over the pipeline of internal candidates for Executive Director succession.
Further detail on how the Committee evaluation was conducted is disclosed on page 98.
Election and re-election of DirectorsIn accordance with the provisions of the Code, and as recommended by the Committee, all Directors in office as at 31 December 2021 will be put forward for election or re-election at the AGM to be held in May 2022. Pauline Campbell is being put forward for election by shareholders for the first time. The Committee made its recommendation following its review of Board and Committee composition and the 2021 evaluations.
DiversityThe Board recognises the benefits that diverse skills, experience and thought can bring to an organisation, and how it can assist the Board’s decision-making and effectiveness. The Committee always considers these benefits when reviewing Board succession planning, and during the
appointment process. This includes requiring diverse lists of potential candidates to be presented to it for selection.
The Board is also of the view that appointments to it must be made primarily on merit, with regard to the benefits of diversity. As such, the Committee does not view it as appropriate to have in place a formal diversity policy which specifically applies to the Board and Group Executive Committee.
The Committee is aware of related corporate governance requirements and suggested best practice in this area, including the Sir John Parker review on ethnic diversity and the Hampton-Alexander review on gender diversity. As at 31 December 2021, the Board was compliant with the Hampton-Alexander recommendations with one-third female representation, and it is currently anticipated that it will be compliant with the Sir John Parker recommendations by 2024.
The Board and the Committee endorse Computacenter’s wider approach to diversity, including its six pillars of diversity, as set out in more detail on page 46, and its Equality and Respect at Work Policy, which applies throughout the organisation, including to the Board, its Committees and the Group Executive Committee. This is in place to ensure that everybody who represents Computacenter promotes equality, diversity and inclusion in the way they behave, their communication and in their day-to-day actions.
The Group will further enhance its commitment and approach to diversity and inclusion in 2022, with the creation of a Group Inclusion Statement, which will be reviewed by the Committee. This inclusion statement will be published on our website and will underpin our country-specific inclusion policies.
Further detail on the Group’s approach to diversity and inclusion can be found on page 46.
Female representation at Board level has increased from 22.2 per cent in 2020 to 33.3 per cent in 2021. Female representation in our Group leadership has improved from 20.5 per cent in 2020 to 22.8 per cent in 2021. Leadership teams are comprised of members of the Executive Committee and those senior leaders who are direct reports to Executive Committee members (excluding administration and support roles).
Peter RyanChair of the Nomination Committee23 March 2022
to remain in compliance with Provision 11 of the Code, which requires at least half of the Directors, excluding the Chair, to be considered independent by the Board, with reference to the factors set out in the 2018 Code.
The Committee also recognises that Non-Executive Director succession planning needs to continually be re-assessed against updated corporate governance requirements and best practice, and also the guidelines of proxy advisors, and our largest institutional shareholders, many of whom now have individual requirements as part of their own investment stewardship programmes. As a result, a significant part of the Committee’s agenda involved independent Non-Executive Director succession planning, including the impact of the Board changes that took place during the year.
To facilitate the Committee’s planning, the Chair had regular conversations with Board members as to their future intentions regarding tenure, closely reviewed the results of the Board and Committee evaluations, and consulted with the Company Secretary to ensure that relevant governance considerations were taken into account.
Following the completion of its review processes during the year, the Committee confirms it is satisfied that plans are in place for the orderly succession to both Board and senior Management positions, and that these are based on merit and objective criteria.
Following the departure of Minnow Powell from the Board during the year, and the appointment of Pauline Campbell, the average tenure of our Chair and independent Non-Executive Directors is now less than three years.
Process for Board appointmentsThere is a formal, rigorous and transparent procedure for the appointment of new Directors to the Board. It is led by the Committee, and is triggered by the identification of a skills gap on the Board and its Committees. This is usually, but not always, the result of a Board resignation, changes in the Company’s activities or strategic focus, or updated corporate governance requirements concerning Board or Committee composition.
The appointment process for a Board role starts with the appointment of an independent search firm by the Committee, and the creation of a role specification which it then approves. This highlights necessary skills and areas of competence required.
Following further Committee discussion, a shortlist of candidates is produced, all of whom are interviewed by Board members. Following consideration of feedback provided from those interviews, the Committee then identifies its preferred candidate for Board approval. The process varies slightly for
Nomination Committee report continued
96

and assurance, which offer guidance, direction, oversight and challenge at the appropriate level.
• The third line of defence, provided by Group Internal Audit, gives an independent view of the effectiveness of the risk management and internal control processes. It reports to the Audit Committee to ensure independence from Management.
The Board reviews the operational effectiveness of the risk management model by directing the reinforcement of the processes that underpin it and by making sure it is embedded across all levels of the organisation. For example:
• The Schedule of Matters Reserved for the Board ensures that the Directors properly address all significant factors affecting Group strategy, structure, financing and contracts.
• The Board and Executive Committee consider the principal risks, which are the barriers to achieving the Board’s Strategic Priorities.
• The Group Risk Committee challenges the effectiveness of the principal risk mitigations.
• The Group Risk Committee considers each principal risk in-depth at least once a year, by receiving reports from the risk owner.
• The Group Risk Committee’s deliberations, along with the current status of each principal risk, are reported to the Audit Committee and the Board.
• The principal risk list is reviewed once a year and leverages a bottom-up annual operational risk review, where operational management identify their everyday risks.
• The Group Compliance Steering Committee assesses observance of laws and regulations, and reports to the Group Risk Committee.
• The bid governance process reviews bids or major changes to existing contracts, and aligns with the Group’s risk appetite and risk management process.
The model and process comply fully with the UK Corporate Governance Code and the Financial Reporting Council’s Guidance on risk management, internal control and related financial and business reporting.
Recent enhancements to the risk framework and processes, have now been embedded and include:
• Risk owners report to the quarterly meetings of the Group Risk Committee, ensuring that they consider risk appetite, non-financial risks and potential risk triggers.
• While all principal risks are reviewed at least annually by the Group Risk Committee, higher-level risks are considered more frequently. Contract risks, cyber risk and data privacy are reviewed bi-annually while acquisition integration risk is considered at each meeting.
• The Compliance Steering Committee, which reports to the Group Risk Committee, has completed the rollout of a Compliance Management System to assess risk and compliance more thoroughly.
• Monitoring the effects of the Covid-19 pandemic for its potential impact on our business, specifically in relation to the health and wellbeing of our employees, our global supply chain and in changing customer requirements.
The Group has detailed business interruption contingency plans for all key sites. These are regularly tested, in accordance with an agreed schedule.
Internal controlThe Board has overall responsibility for maintaining and reviewing the Group’s systems of internal control, and ensuring that the controls are robust and enable risks to be appropriately assessed and managed. The Group’s systems and controls are designed to manage risks, safeguard the Group’s assets and ensure information used in the business and for publication is reliable. This system of control is designed to reduce the risk of failure to achieve business objectives to a level consistent with the Board’s risk appetite, rather than eliminate that risk, and can provide reasonable, but not absolute, assurance against material misstatement or loss.
The Board conducts an annual review of the effectiveness of the systems of internal control, including financial, operational and compliance controls and risk management systems. In the Board’s opinion, the Group complied with the Code’s internal control requirements throughout the year. Where material weaknesses or opportunities for improvement are identified, changes are implemented and monitored.
All systems of internal control are designed to identify continuously, evaluate and manage significant risks faced by the Group. The key elements of the Group’s controls are detailed below.
Responsibilities and authority structureAs discussed above, the Board has overall responsibility for making strategic decisions. There is a written schedule of Matters Reserved for the Board.
The Group Executive Committee meets formally on a quarterly basis and, more informally, on a fortnightly basis, to discuss day-to-day operational matters. With the Group Operating Model in place across all of the Group’s main operating entities, ultimate authority and responsibility for operational governance sits at Group level.
Risk managementThe Board is responsible for establishing a framework of prudent and effective controls, which enable the Company’s risks to be assessed and managed.
The Board has carried out a robust assessment of the principal and emerging risks facing the Group, including those that threaten its business model, future performance, solvency or liquidity. Please refer to pages 80 to 85 for further information on the Group’s principal risks and uncertainties, including how they are being managed and mitigated.
Executive and senior Management have primary responsibility for identifying and managing the risks the Group faces. A comprehensive risk management programme has been developed and is monitored by the Group Risk Committee, which is chaired by the Group Finance Director and whose members include the Group Head of Internal Audit and Risk and senior operational managers from across the Group. Throughout the year each meeting has been attended by at least one independent Non-Executive Director as a guest of the Chair of the Committee.
The Board sets the Group’s risk appetite and, through the Audit Committee, reviews the operation and effectiveness of the Group’s risk management activities. The Board periodically reviews the Group’s strategic risks and its key mitigation plans and, through the Audit Committee, receives regular reports from the Group Risk Committee.
As a sales-led and customer-focused organisation, effective risk management processes are vital to the Group’s continued success. Therefore, the Board continues to apply a robust risk management and governance model to provide assurance over the principal risks that might affect the achievement of the Group’s strategic priorities. These strategic priorities are focused on improving the Services business and maintaining the longevity of the Group’s customer relationships, which in turn rely heavily on the contribution made by the Group’s customer-facing staff and those involved in Services innovation and design. The Group’s risk management approach recognises this, ensuring that risks are identified and mitigated at the appropriate level, leaving individuals empowered to make their vital contributions.
The Group’s model uses the well-defined three lines of defence methodology:
• The first line of defence consists of operational management, who own the risks and apply the internal controls necessary for managing risks day-to-day.
• The second line of defence comprises functions such as internal compliance
Risk and internal control
97
Governance ReportAnnual Report and Accounts 2021

appropriate, data for past periods. The results and explanations for variances are regularly reported to the Board and appropriate action is taken where variances arise.
Management and specialists within the Finance Department are responsible for ensuring that the Group maintains appropriate financial records and processes. This ensures that financial information is relevant and reliable, meets applicable laws and regulations, and is distributed internally and externally in a timely manner. Management reviews the Consolidated Financial Statements, to ensure that the Group’s financial position and results are appropriately reflected. The Audit Committee reviews all financial information that the Group publishes.
Centralised treasury functionThe Board has established and regularly reviews key treasury policies, which cover matters such as counterparty exposure, borrowing arrangements and foreign exchange exposure management. The Group Treasury Function manages liquidity and borrowing facilities for customer-specific requirements, ongoing capital expenditure and working capital. The Group Treasury Function reports to the Group Finance Director, with regular reporting to the Audit Committee.
The Group Treasury Committee enhances Management oversight. It is chaired by the Group Finance Director and also comprises the Group Financial Controller, the Group Head of External Reporting and the Group Head of Tax and Treasury. It is responsible for the ongoing review of treasury policy and strategy, and for recommending any policy changes for Board approval. The Committee approves, on an ad hoc basis, any treasury activities which are not covered by existing policies or which are Matters Reserved for the Board, and also monitors hedging activities for effectiveness.
Compliance policiesThe Group has a number of compliance policies, including those relating to the General Data Protection Regulation, Business Ethics and Anti-bribery and Corruption. Any breach of these policies by an employee is a disciplinary matter and is dealt with accordingly. The internal control regime is supported by a whistleblowing function, which is operated by an independent third party.
Audit Committee and the auditorFor further information on the Company’s compliance with the Code provisions relating to the Audit Committee, Group auditor and Internal Audit, please refer to the Audit Committee report on pages 99 to 105.
The Group operates defined authorisation and approval processes throughout its operations. Access controls continue to improve, where processes have been automated to secure data. The Group has developed management information systems to identify risks and enable the effectiveness of the systems of internal control to be assessed. Linking employee incentives to customer satisfaction and profitability reinforces accountability and encourages further scrutiny of costs and revenues.
Proposals for capital expenditure are reviewed and authorised, based on the Group’s procedures and documented authority levels. The cases for all investment projects are reviewed and approved at divisional level. Major investment projects are subject to Board approval, and Board input and approval is required for all merger and acquisition proposals.
Planning and reporting processesEach year, senior Management prepares or updates the three-year strategic plan, which the Board then reviews. The comprehensive annual budgeting process is subject to Board approval. Performance is monitored through a rigorous and detailed financial and management reporting system, through which monthly results are reviewed against budgets, agreed targets and, where
Board and Committee evaluationThe Board recognises the importance of continually monitoring its performance, and that of its Committees. It therefore undertakes an annual review of its own and its Committees’ performance and effectiveness, with an external evaluation being completed on at least a triennial basis, in accordance with the Code. Between December 2021 and January 2022, the Company Secretary facilitated an internal evaluation looking at areas of Board responsibility such as strategy, risk management and governance. The evaluation also reviewed wider Board processes, including the quality of information provided to it in advance of meetings, how well its annual agenda covers key issues, the way in which the Board makes decisions through effective and constructive discussion and debate, and how the Non-Executive Directors constructively challenge and scrutinise the performance of the Executive Directors, amongst others.
The review took the form of a series of tailored online questionnaires, covering the Board and each Committee. The Chairs of the Board and the Committees were able to review and
shape both the questionnaire and the list of non-Board respondents, to make best use of the process. The questionnaire responses were collated and analysed, before inclusion in a report to the Board. In February 2022, the Chair presented the results of the evaluations and led a discussion of the key findings and the implications for the Board’s development. In addition, the Chair’s performance was considered by the Senior Independent Director, following one-to-one discussions with each of the remaining Directors. Her report was shared with the Company Secretary, and the feedback provided to the Chair for consideration. The Chair considered the performance of each Director, and the contribution that they made to Board-related activities, including its discussions and decision-making, during the year.
The review concluded that the Board, its Committees and individual Directors were performing effectively, found there to be open and constructive dialogue between Board members, and confirmed that a sound relationship between Executive and Non-Executive Directors existed, which allowed constructive challenge to take place between members. The Board believes that it has
a good mix of skills and experience and that members work well together to achieve objectives. The Board is also satisfied that it sufficiently considers long-term consequences when making decisions, and that the Group has a clearly articulated strategy. Following the review, it was agreed that increased time will be allocated within the Board’s annual agenda to rolling ‘deep dive’ reviews of the Company’s principal risks. It was further agreed that the Board’s views on the principal risks, and associated likelihood and impact of risk, would be communicated in greater detail to the Group’s Risk Committee, in order to frame discussions at its quarterly meetings. The Board also requested that there be a continued focus on the quality and form of information provided to it, underpinned by concise and focused pre-reading for members, and a focus within presentations given by senior Management to direct the Board towards key points for discussion.
The review of the Chair’s performance by the Senior Independent Director found that he continued to lead the Board effectively, encouraging a culture of openness and debate amongst members.
Risk and internal control continued
98

Audit Committee report
On behalf of the Board, the Committee is responsible for overseeing the effectiveness of the Group’s systems of internal control and the risk management framework.Pauline CampbellChair of the Audit Committee
Pauline CampbellChair of the Audit Committee
Composition of the CommitteeOn 30 September 2021, Minnow Powell retired from the Board and as Chair of the Audit Committee. Pauline Campbell, who joined the Board on 16 August 2021, was afforded a full induction to the Board and the Company and received a handover from Mr Powell during the overlap of their tenure. All activities below, noted as carried out by the Chair, refer to either Mr Powell or Ms Campbell depending on the timing of the event through the annual Audit Committee cycle.
As at 31 December 2021, the Audit Committee (the ‘Committee’) comprised the four independent Non-Executive Directors. All members are considered to be appropriately qualified and experienced to fulfil their role and allow the Committee to perform its duties effectively. For the purposes of Code Provision 24, one member of the Committee, Pauline Campbell, is considered to have recent and relevant financial experience. The Committee notes the requirements of the Code and confirms that, having considered the requirements against feedback provided through the Board and Committee effectiveness review, the Committee, as a whole, has competence relevant to the sector in which the Company operates. Further details of specific relevant experience can be found in the Directors’ biographies on pages 88 to 89.
Meetings of the CommitteeThe Committee met four times during 2021. Meetings are attended routinely by the Chair of the Board, Group Finance Director, Group Head of Financial Reporting, Group Head of Internal Audit & Risk Management and the external auditor. The Company Secretary acts as secretary to the Committee. The meetings cover a standing list of agenda items, which is based on the Committee’s Terms of Reference, and consider additional matters when the Committee deems it necessary.
In addition to the Committee meetings, the Chair also meets privately on occasion with members of Management during the year, to discuss the risks and challenges faced by the business as well as accounting and reporting matters and, importantly, how these are
being addressed. On two occasions during the year, the Committee met separately with the external auditor and the Group Head of Internal Audit & Risk Management, without Management present. From time to time, on an ad hoc basis, members of the Committee, including the Chair, also attend meetings of the Group Risk Committee.
The Chair remains satisfied that the flow of information to the Committee is appropriate and provided in good time, to allow members to review matters due for consideration at each Committee meeting. The Committee is also satisfied that meetings were scheduled to allow adequate time to enable full and informed debate.
Principal responsibilities of the CommitteeThe Committee’s main responsibilities during the year, as set out in the Code, were to:
• monitor the integrity of the Company’s Financial Statements and any formal announcements relating to the Company’s financial performance, and to review significant financial reporting estimates and judgements contained therein;
• provide advice on whether the Annual Report and Accounts, taken as a whole, is fair, balanced and understandable, and provides the information necessary for shareholders to assess the Company’s position and performance, business model and strategy;
• review the Company’s internal financial controls and internal control and risk management systems;
• monitor and review the effectiveness of the Company’s Internal Audit function, including approving the internal audit plan;
• make recommendations to the Board about the appointment, reappointment and removal of the external auditor, and, where necessary, conduct the tender process;
• approve the external auditor’s remuneration and terms of engagement;
• review and monitor the external auditor’s independence and objectivity;
• review the effectiveness of the external audit process, taking into consideration relevant UK professional and regulatory requirements;
Current members RoleAttendance
record
1. Pauline Campbell (Chair from 30 September 2021) Non-Executive Director 2/22. Rene Haas Non-Executive Director 3/4*
3. Ljiljana Mitic Non-Executive Director 4/44. Ros Rivaz Non-Executive Director 4/4Former member
5. Minnow Powell (Chair until 30 September 2021) Non-Executive Director 3/3
* Rene Haas was unable to travel from the United States to attend the meeting of the Audit Committee on the morning of 9 December 2021 due to Covid-19 travel implications and could not join by video conference due to incompatible time zones with a suitable alternative date unable to be found. Rene had a briefing call with the Chair prior to the meeting to discuss the agenda and papers ensuring that his views were able to be considered.
99
Governance ReportAnnual Report and Accounts 2021

indicators. As a result, we have classified several of these deals as being on an agency basis, concluding that the fee received should be booked as net revenue.
In addition to these existing treatments, Management has performed an initial review of the tentative agenda decision of the International Accounting Standards Board’s (IASB) IFRS Interpretations Committee that was released on 1 December 2021. The tentative agenda decision considered the specific recognition criteria for standalone software licences resold by value-added resellers. Management has produced an initial analysis of the impacts of the agenda decision on the Group, outlining the potential eventual change to agent revenue recognition for the majority of our software and resold services Technology Sourcing business lines that are currently recognised as principal.
The Committee reviewed the initial accounting memorandum produced by Management, supported its proposed programme of further investigatory analysis in this area and concluded that, if the tentative agenda decision is finalised in a manner reflective of the current position, the change to future revenue recognition policies was appropriate.
Technology Sourcing revenue recognition and ‘bill and hold’ cut-off proceduresThe nature of the business leads to a significant amount of sales orders around year end with high volumes of ‘bill and hold’ transactions. Judgement is required to determine if the appropriate criteria have been met to recognise a ‘bill and hold’ sale. There remains some risk that revenue is recognised in the incorrect accounting period if the judgements are not made correctly.
Management has an established set of criteria to allow recognition of revenue, which are applied throughout the business and designed to ensure compliance with International Financial Reporting Standards.
The Audit Committee supported the auditor’s continued focus on testing Technology Sourcing revenue cut-off, particularly in regard to ‘bill and hold’ arrangements where customers purchase inventory that remains in our Integration Centers following revenue recognition.
In addition, there are a number of Professional Services contracts where revenue is recognised based on fulfilling the customers’ requirements in accordance with contract terms. Management highlights to the Committee any contracts that may be of interest, including the process by which such contracts are identified.
The Committee noted that no errors with a material impact on reported profitability were found as a result of the auditor’s work in the area of Technology Sourcing. Management will consider process improvements as part of the change expected in the area of agent versus principal revenue recognition described above.
Risk of impairment of FusionStorm and Pivot goodwill and acquired intangible assetsThe valuation of the goodwill and acquired intangible assets is assessed annually. The size and nature of the balances, coupled with the inherent complexity of the underpinning valuation methodology, results in a high degree of estimation uncertainty with significant judgement required in determining and applying assumptions to assess the fair value.
Management reviewed the value of goodwill and acquired intangibles in the FusionStorm and Pivot cash-generating units (CGU). This review assessed factors which could affect the recoverability of these assets and whether they could give rise to an impairment. This included:
• assessing the discount rates used in the cash flow forecasts;
• referencing the discount rates used by comparable companies;
• comparing the projected long-term growth rates to externally derived data;
• considered management’s track record in forecasting versus actual outcomes; and
• reviewing sensitivity analysis on the assumptions noted above.
Management’s review highlighted the inherent uncertainty involved in forecasting and discounting future cash flows, which are the basis of the assessment of the value-in-use. Management’s assumptions, which are based on the Board’s approved budget for 2022 and the Plan for 2023 and 2024, included that FusionStorm would be integrated with Pivot to form a new CGU being Computacenter USA during this timeframe.
The Committee considered the outcome of Management’s assessments including the sensitivity of the outcome to changes in key assumptions. The Committee, further, reviewed the adequacy of the Group’s disclosures, including the key estimates and judgements related to the carrying amount. The Committee considers that the carrying value of the goodwill and acquired intangible assets remains supported.
FusionStorm and Computacenter NS ERP Migration and TransitionDuring the year, the FusionStorm business within Computacenter North America and the Computacenter NS business within Computacenter France transitioned to the Group’s primary Enterprise Resource Planning (ERP) system, continuing the programme of integration following acquisition.
• develop and implement policy on engaging the external auditor to supply non-audit services, ensure there is prior approval of non-audit services, consider the impact this may have on independence, take into account the relevant regulations and ethical guidance in this regard, and report to the Board on any improvement or action required; and
• report to the Board on how it has discharged its responsibilities.
Immediately following each Committee meeting, the Chair reports to the Board on the Committee’s activities and how it is discharging its responsibilities as set out in its Terms of Reference, which can be found on the Company’s website at investors.computacenter.com.
Activities of the CommitteeThe Committee’s activities during the year, which are based on its Terms of Reference, are set out below:
Key estimates, judgements and current financial reporting standardsThe Committee reviewed the integrity of the Group’s Consolidated Financial Statements and, in doing so, considered the following key estimates and judgements. In reviewing these matters, the Committee also took account of the views of the external auditor, KPMG LLP.
Technology Sourcing agent versus principal revenue recognitionSince the finalisation of the revised Group revenue recognition accounting policies and adoption of IFRS 15 on 1 January 2018, Management has continued to keep under review the nature of the finely balanced judgement on whether certain lines of Technology Sourcing revenue are to be recognised on an agent versus principal basis. On occasion, on a deal-by-deal basis, Management may conclude that a particular deal is to be recognised as agent rather than as principal. Typically, technology partners and customers approach us with an opportunity where the technology partner is taking the contract and performance risks, sets the selling price and uses Computacenter as a pass-through agent in the channel, to transact the deal for a set fee. Since adoption of IFRS 15, these have been primarily large software deals where there is no ongoing obligation of service on us following the transaction. We have no say in the pricing or selection of the product and are merely standing in the sales channel between the technology partner and customer, for the pre-determined fee. Based on the facts and circumstances of each deal, we assess how the terms and conditions of the deal are applied in practice against our revenue recognition policies, by reviewing the weighting applied to the agent/principal
Audit Committee report continued
100

Group’s revenues being impacted by supply shortages. This sensitivity analysis models a continued market downturn scenario, with slower than predicted recovery estimates, for some of our customers whose businesses have been affected by Covid-19 and a similar downturn occurring for the remainder of our customer base. A further impact on the Group’s Technology Sourcing revenues through 2022 from possible ongoing technology partner-related supply shortage issues has also been included in the sensitivity analysis.
• Forecast high and low points of cash generation.
• Availability of Management to implement leveraging or factoring to offset the impacts of the severe downsides modelled above.
The Committee considered the assessment described above, together with the extended Going Concern disclosures included within the ‘basis of preparation’ note to the Financial Statements in the Annual Report and Accounts and advised the Board on its view. The Committee considered whether the going concern basis of preparation continued to be appropriate and provided recommendations around its adoption to the Board, with which the Board concurred. The statement and explanation from the Directors can be found within the Strategic Report on page 78 and the Basis of Preparation with the Notes to the Consolidated Financial Statements on page 145.
Viability StatementThe Code requires the Directors to explain in the Annual Report and Accounts how they have assessed the prospects of the Group, taking into account the Group’s current position and principal risks, over what period they have done so and why they consider that period to be appropriate. The Directors are further required to state whether they have a reasonable expectation that the Group will be able to continue in operation and meet its liabilities as they fall due over the assessment period they have chosen, drawing attention to any qualifications or assumptions as necessary. This requirement is known as a Viability Statement.
Following review by the Group Risk Committee, Management presented its conclusions to the Audit Committee. These included a recommendation of the appropriate period for the assessment of viability that is based on the nature of the Group’s business model and its strategic time horizon, coupled with short-term macro-economic environmental impacts. Management produces financial forecasts for the three-year period including an assessment, reviewed by the Group Risk Committee, of how these forecasts would be affected by a realistic concurrence of the Group’s principal risks and the estimated impact of such a concurrence.
Management’s view is that amortisation of intangible assets is non-cash and is significantly affected by the timing and size of acquisitions, which affects understanding of the Group and Segmental operating results.
The Committee considered the nature and quantum of items disclosed as exceptional or as other adjusting items that are excluded from the Group’s adjusted1 profit before tax, and other alternative performance measures, in the Group’s 2021 Annual Report and Accounts. The Committee concluded that the presentation of adjusted1 profit was adequately explained, was intended to provide clarity on performance and has sufficient equal prominence with statutory profit.
Going concern basis for the Consolidated Financial StatementsManagement prepared a paper that provided input to the Board’s assessment of whether it is appropriate for the Group to adopt the going concern basis in preparing Consolidated Financial Statements, at both the half year and full year. To do so, Management reviewed the Group’s financial plans and its liquidity, including its cash position and committed bank facilities. It also considered the Group’s financing requirements in the context of available committed facilities and reviewed forecasts concerning trading performance, which had been discussed and approved at the 9 December 2021 Board meeting.
In making its assessment Management assessed factors which could affect the modelling of the Group’s financial plans and its impact on the Going Concern assessment.
This included:
• Key financial performance forecasts for the next 12 months and the predicted impact on cash generation.
• Supporting models with rigorous downside sensitivity analysis, which involves flexing a number of the main assumptions underlying the forecasts.
• Further downside scenario testing where the potential impact of the principal risks and uncertainties are applied to the forecasts.
• Management’s assessment included only those risks and uncertainties that, individually or in plausible combination, would threaten the Group’s business model, future performance, solvency or liquidity over the assessment period and which are considered to be severe but reasonable scenarios. It also takes into account an assessment of how the risks are managed and the effectiveness of any mitigating actions.
• For the current year, the primary downside sensitivity relates to a modelled, but not predicted, severe downturn in the Group’s revenues, beginning in 2022, simulating a continued impact for some of our customers from the Covid-19 crisis together with the
Implementation of the ERP system has allowed Management better visibility of the operations and results of the business and will yield ongoing synergistic benefits from the commonality of approach across the primary geographies.
In order to provide insight into the integrity of information that may become part of the Annual Report and Accounts, Management outlined the implementation programme to the Committee prior to commencement and provided reports on the progress of the implementation of the transition. Following the cutover to the ERP, the Committee was updated on the reconciliation of the legacy system to the ERP, including issues detected, resolution programmes and ongoing operational impacts. The Committee is satisfied that there are no unreconciled differences, or other financial items that will/would impact the Group’s reporting.
Acquisition accountingDuring 2020, the Group acquired Pivot, a large Technology Sourcing reseller in the United States and Canada, and a portion of the BT Services French business. The initial accounting for the acquisitions was determined, by Management, provisionally at the end of the 2020 reporting period and the Committee reviewed the final position close to the anniversary of the acquisition. Management considers the accounting for the acquisitions as now complete, which was presented to the Committee. There were no changes to the fair values or the book values at acquisition for either entity.
Exceptional and other adjusting itemsThere were no exceptional items raised by Management for disclosure outside its alternative performance measures during the year.
Management considered the presentation of adjusted1 profit in the first half of the Annual Report and Accounts, after taking account of the European Securities and Markets Authority Guidelines on Alternative Performance Measures, which promote the usefulness and transparency of such measures. Management remains satisfied with the reconciliation between statutory and adjusted1 measures that the Group has presented since the 2015 Interim Report, and the level of disclosure which explains both the differences between these measures and the reasons for the differences.
Management continued to exclude the amortisation of acquired intangible assets, and the tax effect thereon, as an ‘other adjusting item’ outside of adjusted1 profit after tax in the Group’s 2021 Annual Report and Accounts. Management highlighted that this charge had materially increased with the acquisition of FusionStorm and Pivot.
101
Governance ReportAnnual Report and Accounts 2021

Management considered additional contingencies within the forecast, due to a market downside sensitivity scenario that continues throughout the assessment period and relates to a modelled, but not predicted, severe downturn in Group revenues, beginning in 2022 as described within the Going Concern analysis above. These downside scenarios continue the assessment of the risks for Going Concern throughout the assessment period with compounding impacts to cash flow as a result.
The financial forecasts build on the assumptions used for the Going Concern assessment and extend this over the three-year period. Management includes longer-term sensitivity analyses that ranges the modelled downturn in the market across a number of factors, including working capital usage, profitability, dividend payments and share repurchases. The analyses also include an assessment of actions that Management could take to support the balance sheet of the Company in the event of the worst-case scenarios.
Following consideration of Management’s assessments and conclusions, the Committee advised the Board that it could continue to set the period of assessment for the Viability Statement at three years and that it could make the statement required for the assessment period without qualification. The statement and explanation from the Board can be found within the Strategic Report on pages 78 to 79.
Parent Company investment in subsidiaries carrying value and distributable reservesInvestments in subsidiaries are the primary asset on the Parent Company Balance Sheet. The Committee considers the carrying value of these investments annually or when an indicator of impairment is identified, as any impairment of these investments would reduce the Company’s distributable reserves. Management prepared an analysis to support the carrying value of the investments in subsidiaries held by the Parent Company, including assessing the cash flow forecasts and future trading assumptions of each subsidiary. No impairment of carrying value in the investment in subsidiaries was identified during the year. The Committee considered Management’s assessments and remains satisfied that the carrying value of each subsidiary remains appropriate.
Management assessed the Company’s distributable reserves, prior to the declaration of both the interim and final dividends in respect of the reporting period, to ensure that sufficient reserves were legally available for distribution. Further, Management modelled the medium-term forecasts for distributable reserves, ensuring that the Board’s dividend policy could remain supported by the generation of distributable reserves within the Parent Company. The Committee received a presentation of Management’s conclusions and reported to the Board on the appropriateness of the dividend payment with regards to the available distributable reserves.
TaxationManagement prepared papers documenting the Tax Strategy and the Tax Policy of the Company. These papers document the policies, processes and controls relating to the Group’s tax functions and the Company’s Tax Strategy, which can be found on the Company’s website: computacenter.com. The purpose of the Tax Strategy is to communicate the policy for the management of tax within Computacenter. It is important to ensure that consistent and effective tax standards are maintained across the Group as tax, if poorly managed, can have a significant cash and profitability impact on the Group’s business activities, as well as cause reputational damage.
Management presented to the Committee on all aspects of business taxation in all territories in which the Group is currently operating, excluding environmental taxes. The Group Tax Strategy and Policy is subject to approval by the Board annually following its consideration by, and advice from, the Committee.
Management prepared the calculation of the tax liability of the Group, including uncertain tax positions, and assessed the recognition criteria, for potential deferred tax assets relating to jurisdictions with significant carried forward tax losses. Future forecasts, changes to local taxation rates, and potential changes to local tax structures were taken into account in determining the Group’s tax rate assessment. Management made recommendations for the consideration of the Committee for the identification of tax liabilities, assets and the tax rate being disclosed in the accounts. The Committee was satisfied that tax accounting is supported.
Improvements to general financial reportingManagement continues to review its accounting policies and reporting in light of changes, general trends to improve financial reporting and observations from the auditors.
During the period the Committee received recommendations for consideration from Management on a range of topics focused on improving the quality of the Group’s financial reporting. These included:
• Litigation-related contingent liability disclosures.
• Ongoing implementation of a Group-wide Accounting Policy Handbook, to ensure consistency in the application of the Group’s primary accounting policies.
• The improvement of IFRS 9 Expected Credit Loss provisioning methodologies and disclosures.
• Accounting treatment for certain one-off commercial contracts with particularly unusual or non-recurring terms.
• The implementation of recommendations contained within advisory publications from the FRC relating to, amongst others, best practice disclosures for revenue.
• Consideration of the latest minutes of the IFRS Interpretations Committee with regards to revenue recognition for software sales and the impact on future reported revenues for the Group.
The Committee approves of Management’s effort to continually improve and is satisfied with changes made or proposed relating to the items listed.
Regulatory and legal complianceHaving been requested to do so by the Board in accordance with Code Provision 27, the Committee also advises the Board on whether the Annual Report and Accounts, taken as a whole, is fair, balanced and understandable and provides the information necessary for shareholders to assess the Group’s position and performance, business model and strategy. The Committee sought assurance as to the review procedures performed by Management, to support the Board in making this statement. These include clear guidance issued to all contributors to provide a consistent approach and a formal review process, to ensure that the Annual Report and Accounts are factually correct and reflective of material matters that have been discussed by the Board throughout the year and includes all relevant information. Following a review, the Committee advised the Board that appropriate procedures had been applied.
Management prepared an analysis of the Company’s compliance with the provisions of the Corporate Governance Code and did not identify any deficiencies or breaches. The Committee considered the analysis presented within the Annual Report and Accounts.
Audit Committee Report continued
102

Internal control oversightPeriodically the Committee received reports on the operation of internal controls from various Group functions. These included:
• The implementation of agreed improvements on the compliance and control environment within recently acquired entities including FusionStorm, Pivot and Computacenter NS. Internal Audit reviewed the control environment of material acquired entities and the ongoing integration plans of the recent acquisitions, including the provision of the Group’s Enterprise Resource Planning systems and the wider internal control, risk management and compliance frameworks, including items such as whistleblowing and GDPR.
• A report from the Group Information Assurance (GIA) function on its role, which continues to be a key part of the control framework for data security and cyber defence, and how it fits into the overall control structures of the Company within the wider risk management framework. GIA reported on the programme of enhancements for the Cyber Defence Center and cyber security. Where cyber incidents, attacks and breaches are inevitably detected by the GIA, it reports to the Committee on the mitigations and outcomes of any investigation, including plans for remediation and improvements.
• Treasury Reporting, Policy and Controls including the Group Treasury Strategy & Policy, Transactional FX Strategy and Policy and activities of the Treasury Committee which retains operational oversight.
• Trade receivables control environment, to assess the heightened risk of customer defaults due to the Covid-19 pandemic and the associated collection risk.
• Trade payables and other creditors control environment, to review procedures and payment timeliness analysis.
• Annual survey results, where all members of the Group Executive and other key senior Management conduct a controls self-certification exercise and the control environment is reviewed and graded.
• Export controls compliance.• The effectiveness of controls over bid
management and contract reporting • Updates on litigation matters.
WhistleblowingThe Committee confirms that it is satisfied that, as at the date of this report, arrangements are in place to ensure that employees are able, in confidence, to raise any matters of concern, and for the proportionate and independent investigation of such concerns, including assessment of the financial impact and any appropriate follow-up action. During the year, the Committee was satisfied that investigations and follow-up
actions were appropriate. As at the date of this report, all of the Group’s operating entities, including the recent acquisitions of Pivot and BT Services France, had access to the same whistleblowing platform.
The effectiveness of the Internal Audit functionThe Group has an Internal Audit function which reports to the Chair of the Committee, and also has direct access to the CEO. Its key objectives are to provide the Board, the Committee and senior Management with independent and objective assurance on risks and the related mitigating controls, and to assist the Board in meeting its corporate governance and regulatory responsibilities. A formal audit charter guides the function’s work and procedures and was updated during the year.
The Board, through the Committee, has directed the Internal Audit department’s work towards areas of the business that are considered to be the highest risk. The Committee approves a rolling audit programme, ensuring that all significant areas of the business are independently reviewed over, approximately, a four-year period. The programme and the audit findings are assessed continually, to ensure they take account of the latest information and, in particular, the results of the annual review of the effectiveness of internal control and any shifts in the focus areas of the various businesses.
Each year, the Committee reviews the effectiveness of the Internal Audit department and the Group’s risk management programme. The formal review typically consists of an evaluation of Internal Audit’s activities by members of the Committee and managers across the business who have been subject to audit during the year. The assessment normally covers areas such as departmental organisation, business understanding, skills and experience, communication and performance.
The Committee received an update from the Group Head of Internal Audit & Risk Management at each meeting during the year. The updates covered current audit activities and the results of completed audits. The Chair met the Group Head of Internal Audit & Risk Management on a number of occasions during the year, to be updated on the function’s activities. The Committee kept Internal Audit’s staffing levels under review throughout 2021.
Management prepared a presentation on the BEIS Report on Governance and Audit Reform and provided a response on behalf of the Company for the consideration of the Committee. Management continued to monitor regulatory developments in this area and updated the Committee as required.
The effectiveness of internal controls and of the risk management frameworkOn behalf of the Board, the Committee is responsible for overseeing the effectiveness of the Group’s systems of internal control and the risk management framework. The Group Risk Committee (GRC) meets each quarter to review the key risks facing the business. These are identified, and their likelihood and impact are assessed, within the Group’s ‘Risk Heat Map’. They are then reviewed in conjunction with accompanying risk mitigation plans. The GRC minutes, or a summary thereof, are circulated to the Committee for review, with any matters of note highlighted and explained to the Committee by the GRC Chair. This includes an analysis of how the Group’s exposure to these risks may have moved during the previous three months and how mitigations to the risks have been introduced or developed, and also provides the GRC’s assessment of the effectiveness of the process. To assist the Board, the Committee monitors the risk management processes and reports from Internal Audit.
Compliance Steering CommitteeThe Compliance Steering Committee (CSC) reports to the GRC. It meets quarterly, two weeks before the GRC, and is chaired by the Group Compliance Manager. The Group Head of Legal & Contracting, the Chief People Officer, the Group Data Protection Officer, the Group Head of Internal Audit & Risk Management and the Company Secretary make up the rest of the CSC. The CSC determines which areas of law or regulation apply to the Group, assigns these to members of Management and identifies levels of compliance and associated risk, with the aim of ensuring that these are appropriate to the Group. Critical areas within the CSC’s remit include anti-bribery and corruption, whistleblowing, data protection and export control. The CSC reviews and promotes major Group internal governance enhancement initiatives. The Committee receives regular reports from the CSC on its activities.
During the year, the Committee reviewed the CSC’s progress with bringing the entities acquired by the end of 2020 into the Group’s compliance framework, noting with satisfaction that the work was now complete, with follow-up remote reviews conducted by Internal Audit to Pivot and CC NS confirming the efficacy of the implementation.
103
Governance ReportAnnual Report and Accounts 2021
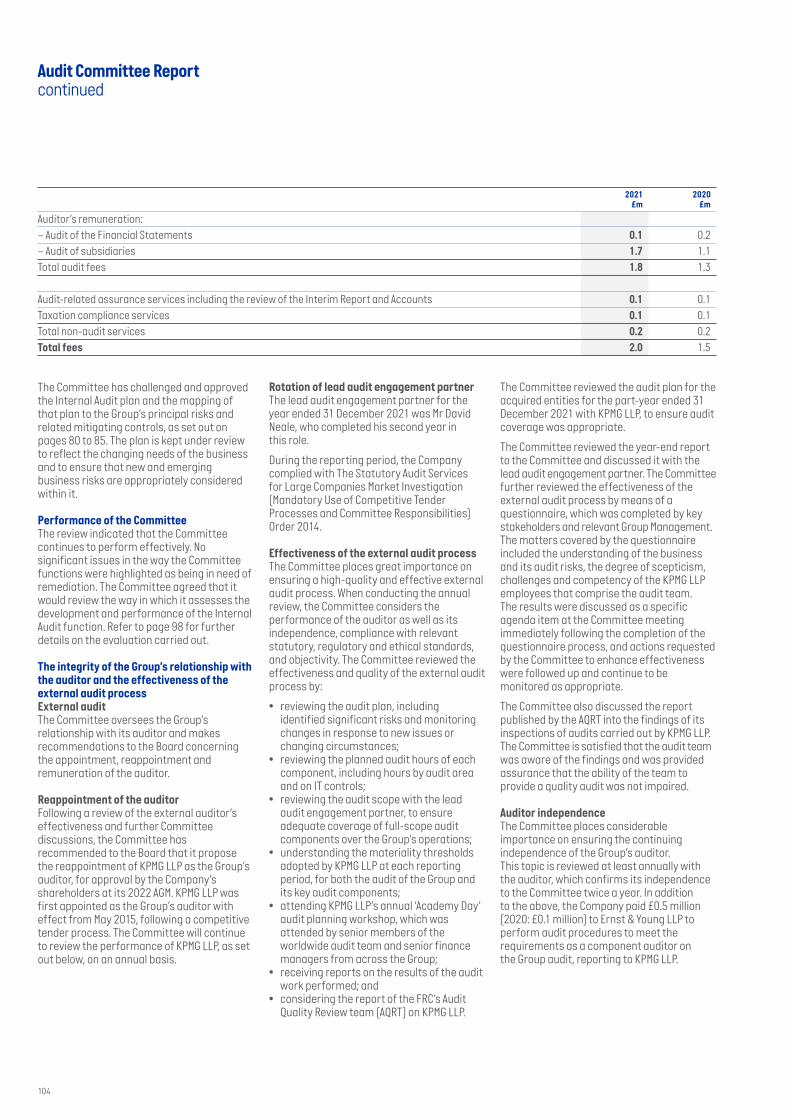
Rotation of lead audit engagement partnerThe lead audit engagement partner for the year ended 31 December 2021 was Mr David Neale, who completed his second year in this role.
During the reporting period, the Company complied with The Statutory Audit Services for Large Companies Market Investigation (Mandatory Use of Competitive Tender Processes and Committee Responsibilities) Order 2014.
Effectiveness of the external audit processThe Committee places great importance on ensuring a high-quality and effective external audit process. When conducting the annual review, the Committee considers the performance of the auditor as well as its independence, compliance with relevant statutory, regulatory and ethical standards, and objectivity. The Committee reviewed the effectiveness and quality of the external audit process by:
• reviewing the audit plan, including identified significant risks and monitoring changes in response to new issues or changing circumstances;
• reviewing the planned audit hours of each component, including hours by audit area and on IT controls;
• reviewing the audit scope with the lead audit engagement partner, to ensure adequate coverage of full-scope audit components over the Group’s operations;
• understanding the materiality thresholds adopted by KPMG LLP at each reporting period, for both the audit of the Group and its key audit components;
• attending KPMG LLP’s annual ‘Academy Day’ audit planning workshop, which was attended by senior members of the worldwide audit team and senior finance managers from across the Group;
• receiving reports on the results of the audit work performed; and
• considering the report of the FRC’s Audit Quality Review team (AQRT) on KPMG LLP.
The Committee reviewed the audit plan for the acquired entities for the part-year ended 31 December 2021 with KPMG LLP, to ensure audit coverage was appropriate.
The Committee reviewed the year-end report to the Committee and discussed it with the lead audit engagement partner. The Committee further reviewed the effectiveness of the external audit process by means of a questionnaire, which was completed by key stakeholders and relevant Group Management. The matters covered by the questionnaire included the understanding of the business and its audit risks, the degree of scepticism, challenges and competency of the KPMG LLP employees that comprise the audit team. The results were discussed as a specific agenda item at the Committee meeting immediately following the completion of the questionnaire process, and actions requested by the Committee to enhance effectiveness were followed up and continue to be monitored as appropriate.
The Committee also discussed the report published by the AQRT into the findings of its inspections of audits carried out by KPMG LLP. The Committee is satisfied that the audit team was aware of the findings and was provided assurance that the ability of the team to provide a quality audit was not impaired.
Auditor independenceThe Committee places considerable importance on ensuring the continuing independence of the Group’s auditor. This topic is reviewed at least annually with the auditor, which confirms its independence to the Committee twice a year. In addition to the above, the Company paid £0.5 million (2020: £0.1 million) to Ernst & Young LLP to perform audit procedures to meet the requirements as a component auditor on the Group audit, reporting to KPMG LLP.
The Committee has challenged and approved the Internal Audit plan and the mapping of that plan to the Group’s principal risks and related mitigating controls, as set out on pages 80 to 85. The plan is kept under review to reflect the changing needs of the business and to ensure that new and emerging business risks are appropriately considered within it.
Performance of the CommitteeThe review indicated that the Committee continues to perform effectively. No significant issues in the way the Committee functions were highlighted as being in need of remediation. The Committee agreed that it would review the way in which it assesses the development and performance of the Internal Audit function. Refer to page 98 for further details on the evaluation carried out.
The integrity of the Group’s relationship with the auditor and the effectiveness of the external audit processExternal auditThe Committee oversees the Group’s relationship with its auditor and makes recommendations to the Board concerning the appointment, reappointment and remuneration of the auditor.
Reappointment of the auditorFollowing a review of the external auditor’s effectiveness and further Committee discussions, the Committee has recommended to the Board that it propose the reappointment of KPMG LLP as the Group’s auditor, for approval by the Company’s shareholders at its 2022 AGM. KPMG LLP was first appointed as the Group’s auditor with effect from May 2015, following a competitive tender process. The Committee will continue to review the performance of KPMG LLP, as set out below, on an annual basis.
2021£m
2020£m
Auditor’s remuneration:– Audit of the Financial Statements 0.1 0.2– Audit of subsidiaries 1.7 1.1Total audit fees 1.8 1.3
Audit-related assurance services including the review of the Interim Report and Accounts 0.1 0.1Taxation compliance services 0.1 0.1Total non-audit services 0.2 0.2Total fees 2.0 1.5
Audit Committee Report continued
104

Non-audit servicesTo help maintain the auditor’s independence, the Committee has a policy regarding the scope and extent of non-audit services provided by the Group’s auditor, which is summarised below.
The auditor is appointed primarily to report on the annual and interim Consolidated Financial Statements. The Committee places a high priority on ensuring that the auditor’s independence and objectivity is not compromised either in appearance or in fact. Equally, the Group should not be deprived of expertise where it is needed and there may be occasions where the external auditor is best placed to undertake other accounting, advisory and consultancy work, in view of its knowledge of the business, as well as confidentiality and cost considerations.
Under the Committee’s non-audit services policy, the Group auditor should not be engaged to undertake work which constitutes a prohibited non-audit service, as defined under provision 5.167 of the FRC’s Ethical Standard. Any other non-audit service (a ‘Permitted Service’) must, to the extent that it is not viewed as ‘trivial’, be approved in advance by the Committee.
In each case where the Group auditor is authorised to perform a Permitted Service, the Committee will assess threats to the auditor’s independence and the proposed safeguards to be applied when such services are carried out. It will also document what action was taken by the Group auditor, including appropriate safeguards where necessary, to ensure that its independence was not compromised as a result of performing the Permitted Service. The Committee will consider alternative suppliers and competitive tenders and then discuss and document why it viewed the Group auditor as the most appropriate party to perform the Permitted Service.
The Committee monitors compliance with this policy by monitoring the level of non-audit work provided by the external auditor, resulting in non-audit fees being 11.1 per cent of KPMG LLP’s overall audit fee during 2021 (2020: 15.4 per cent), as set out above. The Group auditor will, in no circumstances, undertake non-audit services for the Group to the extent that the total fee payable by the Group to its auditor exceeds 70 per cent of the average annual statutory fee payable by the Group over the last three consecutive years. The Group ceased using the Group’s auditor for all taxation services within the EU during 2017.
During the year, KPMG LLP provided only trivial non-audit services to the Group. Any trivial non-audit services provided were subject to KPMG LLP’s review of the impact on its own independence against the Group’s non-audit services policy. None of the trivial engagements constituted a prohibited non-audit service and the Committee was satisfied that the independence of KPMG LLP, as Group auditor, was not affected.
Pauline CampbellChair of the Audit Committee23 March 2022
105
Governance ReportAnnual Report and Accounts 2021
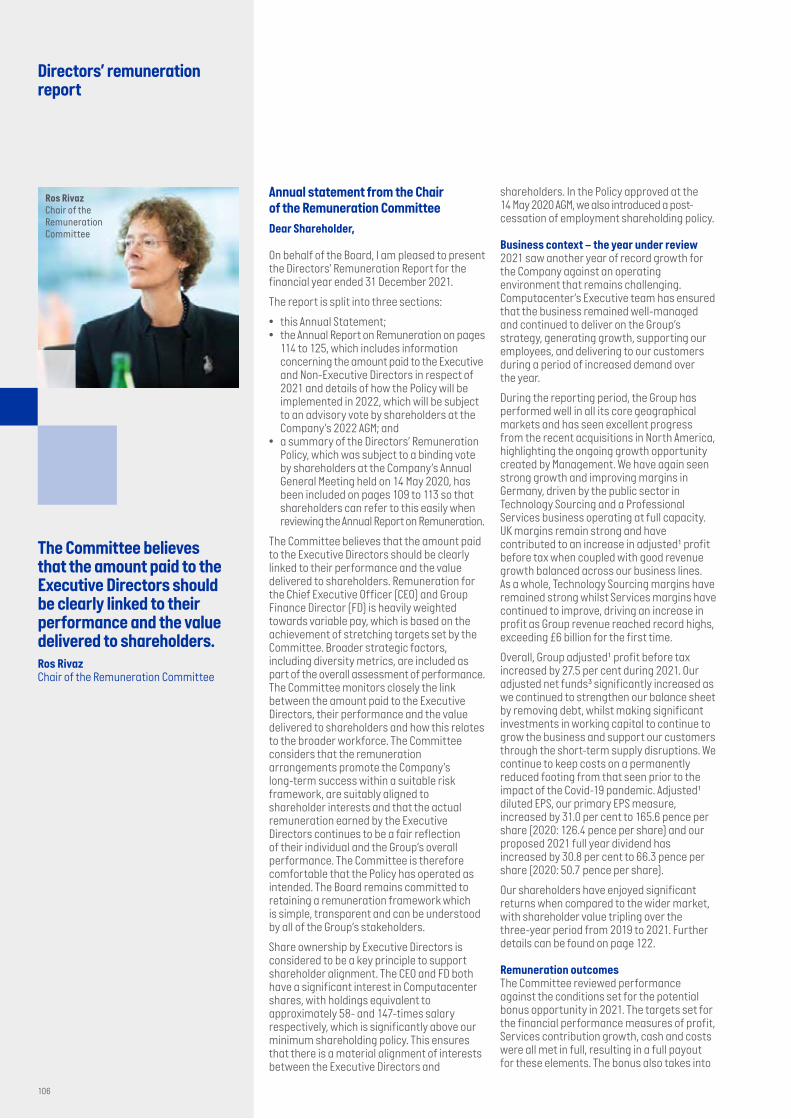
Directors’ remuneration report
The Committee believes that the amount paid to the Executive Directors should be clearly linked to their performance and the value delivered to shareholders.Ros RivazChair of the Remuneration Committee
Ros RivazChair of the Remuneration Committee
Annual statement from the Chair of the Remuneration Committee
Dear Shareholder,
On behalf of the Board, I am pleased to present the Directors’ Remuneration Report for the financial year ended 31 December 2021.
The report is split into three sections:
• this Annual Statement;• the Annual Report on Remuneration on pages
114 to 125, which includes information concerning the amount paid to the Executive and Non-Executive Directors in respect of 2021 and details of how the Policy will be implemented in 2022, which will be subject to an advisory vote by shareholders at the Company’s 2022 AGM; and
• a summary of the Directors’ Remuneration Policy, which was subject to a binding vote by shareholders at the Company’s Annual General Meeting held on 14 May 2020, has been included on pages 109 to 113 so that shareholders can refer to this easily when reviewing the Annual Report on Remuneration.
The Committee believes that the amount paid to the Executive Directors should be clearly linked to their performance and the value delivered to shareholders. Remuneration for the Chief Executive Officer (CEO) and Group Finance Director (FD) is heavily weighted towards variable pay, which is based on the achievement of stretching targets set by the Committee. Broader strategic factors, including diversity metrics, are included as part of the overall assessment of performance. The Committee monitors closely the link between the amount paid to the Executive Directors, their performance and the value delivered to shareholders and how this relates to the broader workforce. The Committee considers that the remuneration arrangements promote the Company’s long-term success within a suitable risk framework, are suitably aligned to shareholder interests and that the actual remuneration earned by the Executive Directors continues to be a fair reflection of their individual and the Group’s overall performance. The Committee is therefore comfortable that the Policy has operated as intended. The Board remains committed to retaining a remuneration framework which is simple, transparent and can be understood by all of the Group’s stakeholders.
Share ownership by Executive Directors is considered to be a key principle to support shareholder alignment. The CEO and FD both have a significant interest in Computacenter shares, with holdings equivalent to approximately 58- and 147-times salary respectively, which is significantly above our minimum shareholding policy. This ensures that there is a material alignment of interests between the Executive Directors and
shareholders. In the Policy approved at the 14 May 2020 AGM, we also introduced a post-cessation of employment shareholding policy.
Business context – the year under review2021 saw another year of record growth for the Company against an operating environment that remains challenging. Computacenter’s Executive team has ensured that the business remained well-managed and continued to deliver on the Group’s strategy, generating growth, supporting our employees, and delivering to our customers during a period of increased demand over the year.
During the reporting period, the Group has performed well in all its core geographical markets and has seen excellent progress from the recent acquisitions in North America, highlighting the ongoing growth opportunity created by Management. We have again seen strong growth and improving margins in Germany, driven by the public sector in Technology Sourcing and a Professional Services business operating at full capacity. UK margins remain strong and have contributed to an increase in adjusted¹ profit before tax when coupled with good revenue growth balanced across our business lines. As a whole, Technology Sourcing margins have remained strong whilst Services margins have continued to improve, driving an increase in profit as Group revenue reached record highs, exceeding £6 billion for the first time.
Overall, Group adjusted¹ profit before tax increased by 27.5 per cent during 2021. Our adjusted net funds³ significantly increased as we continued to strengthen our balance sheet by removing debt, whilst making significant investments in working capital to continue to grow the business and support our customers through the short-term supply disruptions. We continue to keep costs on a permanently reduced footing from that seen prior to the impact of the Covid-19 pandemic. Adjusted¹ diluted EPS, our primary EPS measure, increased by 31.0 per cent to 165.6 pence per share (2020: 126.4 pence per share) and our proposed 2021 full year dividend has increased by 30.8 per cent to 66.3 pence per share (2020: 50.7 pence per share).
Our shareholders have enjoyed significant returns when compared to the wider market, with shareholder value tripling over the three-year period from 2019 to 2021. Further details can be found on page 122.
Remuneration outcomesThe Committee reviewed performance against the conditions set for the potential bonus opportunity in 2021. The targets set for the financial performance measures of profit, Services contribution growth, cash and costs were all met in full, resulting in a full payout for these elements. The bonus also takes into
106
The Committee concluded that, whilst the overall remuneration framework used continues to be appropriate, the positioning of our CEO’s salary no longer reflects the scale and complexity of the role, the individual performance delivered and the sustained performance of the Group. The Committee was also mindful of the historically conservative approach to pay for the CEO, including no salary increase in five of the last 10 years.
The Board believes that Mike Norris, as CEO of the business since 1994, has played a fundamental role in Computacenter’s success, demonstrating exceptional leadership in delivering significant shareholder value through targeted acquisitions and organic growth. The Board also noted the CEO’s significantly increased role in mentoring the North American leadership and driving the cultural and operational integration of the recently acquired businesses.
During 2021, the Company invited shareholders and other stakeholders to provide feedback on a proposal to increase the salary of the CEO for 2022. I am pleased to report that those who provided feedback on the proposal have been largely supportive and that we did not receive any negative responses.
Following this consultation process, the Committee determined that the salary of the CEO would be set at £650,000 with effect from 1 January 2022 (an increase of 13.4 per cent). This positions the salary of the CEO in line with practice for the top 50 companies in the FTSE 250, reflecting the scale and complexity of the business today. Following this adjustment, we anticipate returning to our regular approach to salary increases for the CEO being in line with the broader workforce.
Aside from the proposed approach on salary, the Committee is not proposing any other significant changes to the approach on remuneration for 2022.
The basic salary of the FD will be increased by 2.7 per cent for 2022, consistent with the average increase for the wider UK workforce. The Committee intends to keep the salary positioning of the Group Finance Director under review.
Award levels under the annual bonus plan for 2022 will be set at 150 per cent and 125 per cent of salary for the Chief Executive Officer and Group Finance Director respectively.
Award levels under our Performance Share Plan will once again be set at 200 per cent of salary for the Chief Executive Officer and 175 per cent of salary for the Group Finance Director. PSP awards will continue to be based on stretching targets set out against our Earnings per Share and Services Revenue Growth metrics.
Further details on how our Directors’ Remuneration Policy will be applied for the 2022 financial year are set out on page 125.
Wider workforceIn line with the Committee’s broader responsibilities, during the year the Committee reviewed information on broader workforce pay and practices, as well as the Company’s gender pay gap reporting. This information provided important context for the decisions taken during the year.
We continue to ensure that employees have an opportunity to share in our success through our Sharesave plan which we have operated in the UK and Germany for a number of years. Following the launch of the most recent scheme in 2021, the employee participation rate in these schemes, where an employee is in at least one active savings scheme, is 55.0 per cent of all employees in the UK (2020: 53.0 per cent) and 21.8 per cent in Germany (2020: 17.3 per cent). This is the third year of operation within the US business, with the opportunity to participate extended to colleagues in our Pivot USA business for the first time, with an overall participation rate of 16.7 per cent of the combined US workforce.
Committee evaluationDuring the year, a review of the Committee was internally facilitated. The results of this evaluation have been analysed and reflect that the Committee continues to be effective in its role. The latest review has highlighted the Committee’s intention to continue to consider the way in which environmental, social and governance factors are taken into account for the purposes of remuneration.
Looking aheadDuring 2022, the Committee will undertake a comprehensive review of the Policy for our Executive Directors, taking into account the Company’s strategy and values, evolving shareholder expectations and any developments in best practice since the Policy was last approved at our AGM in May 2020. We look forward to engaging in further dialogue with shareholders as appropriate and presenting the results for approval at our 2023 AGM.
The Committee’s role is to ensure that the remuneration paid out to Executive Directors reflects and underpins the Group’s performance. I hope that, having read this report, shareholders will be satisfied that the Committee has discharged its duties appropriately and in line with your interests. The Committee and I would welcome any comments you may have on the contents of this report.
Ros RivazChair of the Remuneration Committee23 March 2022
account performance against personal objectives set to reflect the key priorities for the year. For 2021 these included objectives linked to integration of the US business and progress on diversity in the senior team. Taking into account performance across both elements, the CEO received 96.0 per cent and the FD 95.2 per cent respectively of their total potential bonus for the year. Fifty per cent of the bonus will be deferred into Computacenter shares. Further detail of the metrics and performance delivered is set out on page 116.
The Performance Share Plan (PSP) awards granted in March 2019 were based on growth in the Company’s adjusted1 diluted EPS and growth in Group Services revenue for the three financial years ended 31 December 2021. In reviewing the outcome, the Committee was mindful of the positive impact on adjusted1 profits of the one-off tax items noted on page 72 of the Group Finance Director’s Review within this Annual Report and Accounts and agreed that this benefit should be excluded from the assessment of performance. The EPS and Group Services revenue targets were met in full, and therefore 100 per cent of the awards will vest in March 2022 subject to a two-year holding period. The value delivered from these awards reflects the performance delivered over the period including the significant share price growth since grant. Further detail is set out on page 118.
The Committee considered the bonus and PSP formulaic outturns in the context of the current external environment, the strong financial performance delivered by the business, wider Company and individual performance, the shareholder experience, the customer experience, and the treatment of employees throughout the rest of the Group. Taking all of the above into account, the Committee considered the bonus and PSP outcomes to be a fair reflection of performance, and no discretion was exercised to vary the amount.
The year aheadThe Committee undertook an interim review of the Remuneration Policy during the year to ensure that it continued to be fit for purpose, taking into account the sustained performance and significant growth in the business since the last policy vote, further detail of which is set out earlier on in this letter. This included consideration of the expanded geographic footprint of the business as a result of strategic acquisitions, including Pivot Technology Solutions Inc. and BT Services France in 2020, which have created the platform to grow a sustainable, scalable business in North America and expanded the capabilities of our existing French business.
107
Governance ReportAnnual Report and Accounts 2021
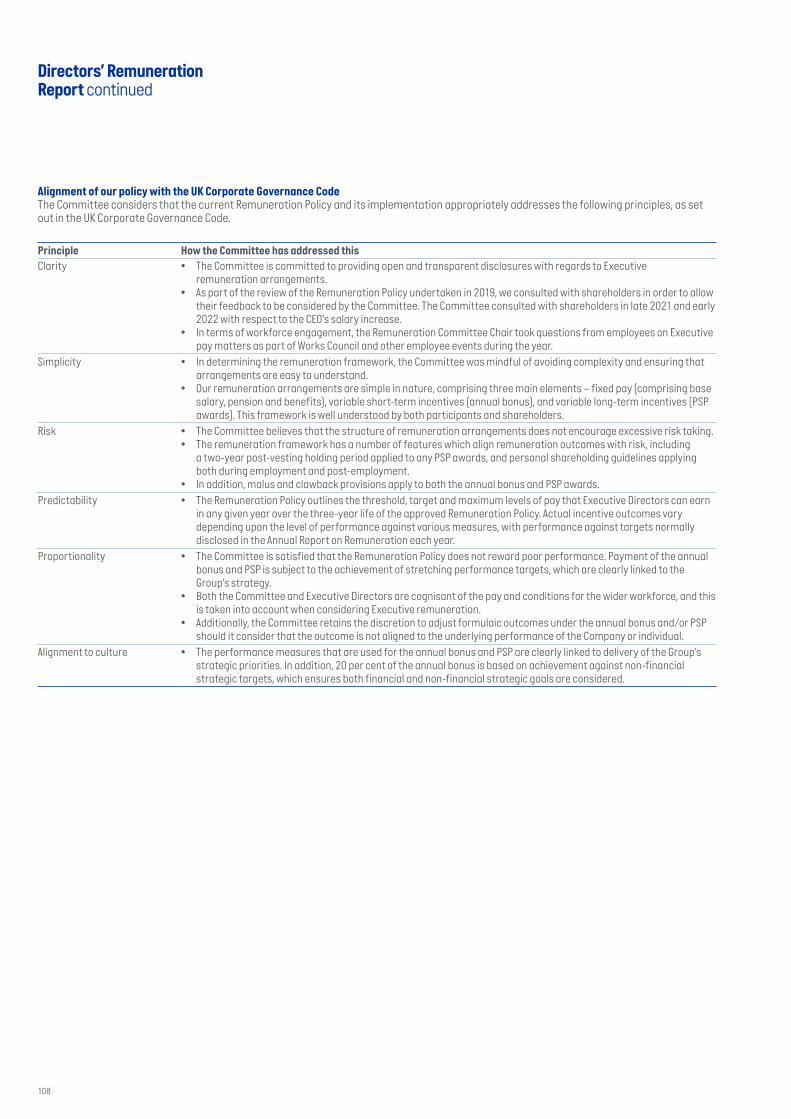
Alignment of our policy with the UK Corporate Governance CodeThe Committee considers that the current Remuneration Policy and its implementation appropriately addresses the following principles, as set out in the UK Corporate Governance Code.
Principle How the Committee has addressed thisClarity • The Committee is committed to providing open and transparent disclosures with regards to Executive
remuneration arrangements. • As part of the review of the Remuneration Policy undertaken in 2019, we consulted with shareholders in order to allow
their feedback to be considered by the Committee. The Committee consulted with shareholders in late 2021 and early 2022 with respect to the CEO’s salary increase.
• In terms of workforce engagement, the Remuneration Committee Chair took questions from employees on Executive pay matters as part of Works Council and other employee events during the year.
Simplicity • In determining the remuneration framework, the Committee was mindful of avoiding complexity and ensuring that arrangements are easy to understand.
• Our remuneration arrangements are simple in nature, comprising three main elements – fixed pay (comprising base salary, pension and benefits), variable short-term incentives (annual bonus), and variable long-term incentives (PSP awards). This framework is well understood by both participants and shareholders.
Risk • The Committee believes that the structure of remuneration arrangements does not encourage excessive risk taking. • The remuneration framework has a number of features which align remuneration outcomes with risk, including
a two-year post-vesting holding period applied to any PSP awards, and personal shareholding guidelines applying both during employment and post-employment.
• In addition, malus and clawback provisions apply to both the annual bonus and PSP awards. Predictability • The Remuneration Policy outlines the threshold, target and maximum levels of pay that Executive Directors can earn
in any given year over the three-year life of the approved Remuneration Policy. Actual incentive outcomes vary depending upon the level of performance against various measures, with performance against targets normally disclosed in the Annual Report on Remuneration each year.
Proportionality • The Committee is satisfied that the Remuneration Policy does not reward poor performance. Payment of the annual bonus and PSP is subject to the achievement of stretching performance targets, which are clearly linked to the Group’s strategy.
• Both the Committee and Executive Directors are cognisant of the pay and conditions for the wider workforce, and this is taken into account when considering Executive remuneration.
• Additionally, the Committee retains the discretion to adjust formulaic outcomes under the annual bonus and/or PSP should it consider that the outcome is not aligned to the underlying performance of the Company or individual.
Alignment to culture • The performance measures that are used for the annual bonus and PSP are clearly linked to delivery of the Group’s strategic priorities. In addition, 20 per cent of the annual bonus is based on achievement against non-financial strategic targets, which ensures both financial and non-financial strategic goals are considered.
Directors’ Remuneration Report continued
108
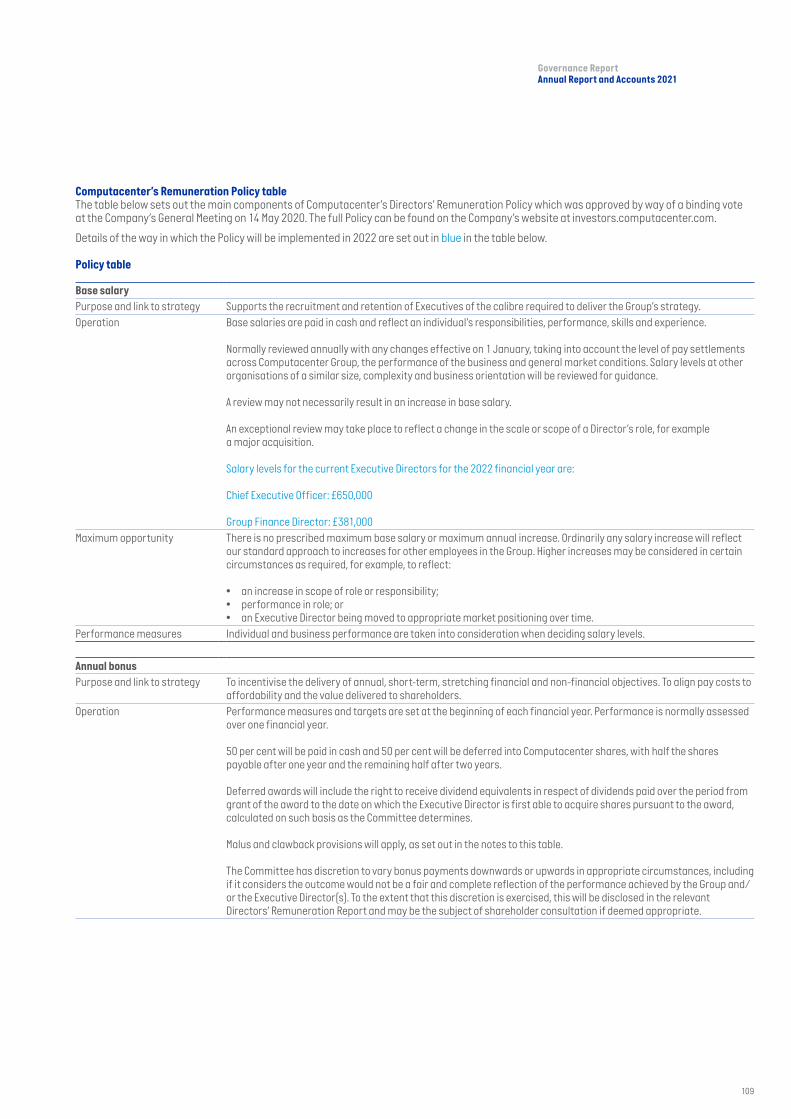
Computacenter’s Remuneration Policy tableThe table below sets out the main components of Computacenter’s Directors’ Remuneration Policy which was approved by way of a binding vote at the Company’s General Meeting on 14 May 2020. The full Policy can be found on the Company’s website at investors.computacenter.com.
Details of the way in which the Policy will be implemented in 2022 are set out in blue in the table below.
Policy table
Base salary
Purpose and link to strategy Supports the recruitment and retention of Executives of the calibre required to deliver the Group’s strategy.Operation Base salaries are paid in cash and reflect an individual’s responsibilities, performance, skills and experience.
Normally reviewed annually with any changes effective on 1 January, taking into account the level of pay settlements across Computacenter Group, the performance of the business and general market conditions. Salary levels at other organisations of a similar size, complexity and business orientation will be reviewed for guidance.
A review may not necessarily result in an increase in base salary.
An exceptional review may take place to reflect a change in the scale or scope of a Director’s role, for examplea major acquisition.
Salary levels for the current Executive Directors for the 2022 financial year are:
Chief Executive Officer: £650,000
Group Finance Director: £381,000Maximum opportunity There is no prescribed maximum base salary or maximum annual increase. Ordinarily any salary increase will reflect
our standard approach to increases for other employees in the Group. Higher increases may be considered in certain circumstances as required, for example, to reflect:
• an increase in scope of role or responsibility;• performance in role; or• an Executive Director being moved to appropriate market positioning over time.
Performance measures Individual and business performance are taken into consideration when deciding salary levels.
Annual bonus
Purpose and link to strategy To incentivise the delivery of annual, short-term, stretching financial and non-financial objectives. To align pay costs to affordability and the value delivered to shareholders.
Operation Performance measures and targets are set at the beginning of each financial year. Performance is normally assessedover one financial year.
50 per cent will be paid in cash and 50 per cent will be deferred into Computacenter shares, with half the shares payable after one year and the remaining half after two years.
Deferred awards will include the right to receive dividend equivalents in respect of dividends paid over the period from grant of the award to the date on which the Executive Director is first able to acquire shares pursuant to the award, calculated on such basis as the Committee determines.
Malus and clawback provisions will apply, as set out in the notes to this table.
The Committee has discretion to vary bonus payments downwards or upwards in appropriate circumstances, including if it considers the outcome would not be a fair and complete reflection of the performance achieved by the Group and/or the Executive Director(s). To the extent that this discretion is exercised, this will be disclosed in the relevant Directors’ Remuneration Report and may be the subject of shareholder consultation if deemed appropriate.
109
Governance ReportAnnual Report and Accounts 2021

Maximum opportunity The maximum annual bonus opportunity in respect of any financial year is 150 per cent of base salary.
In respect of 2022, the maximum bonus opportunity will be 150 per cent of salary for the CEO, Mike Norris and 125 per cent of salary for the FD, Tony Conophy.
Increases above the current opportunities, up to the maximum limit, may be made to take account of individual circumstances, which may include an increase in the size or scope of role or responsibility.
Performance measures Financial measures will normally be used to calculate at least a majority of bonus achievement and the remainder of the annual bonus will normally be attributed to non-financial measures.
Financial measures may include profitability, cost management, cash management and other appropriate measures.
Non-financial targets will be stretching targets set by the Committee, linked to the delivery of our strategy and the Executive Directors’ personal objectives for the year.
Targets are reviewed and approved annually by the Committee, to ensure that they are stretching and adequately reflect the strategic aims of the Group.
The Committee determines the threshold and target payout levels each year, taking into account the level of stretch in the targets set. The level of overall bonus award which is payable for threshold performance will not normally exceed 30 per cent of the maximum opportunity.
Performance Share Plan (PSP)
Purpose and link to strategy To align the interests of Executive Directors and shareholders. To incentivise the achievement of longer-term profitability and returns to shareholders, and growth of earnings in a stable and sustainable manner.
Operation Awards of nil-cost options (or equivalent) which are granted on a discretionary basis and will normally vest subject toperformance and continued employment at the end of a performance period of at least three years.
PSP shares will normally be subject to a two-year holding period following vesting. The shares held during the holding period will include the right to receive dividend equivalents in respect of dividends paid over the period from the end of the performance period to the date on which the Executive Director is first able to acquire shares pursuant to the award, calculated on such basis as the Committee determines.
The Committee reviews the performance criteria, targets and weightings prior to each grant in line with business priorities, to ensure they are challenging and fair.
The Committee has discretion to vary the percentage of awards vesting downwards or upwards in appropriate circumstances, including if it considers that the outcome would otherwise not be a fair and complete reflection of performance over the plan cycle.
Awards are subject to malus and clawback provisions, as set out in the notes to this table.Maximum opportunity The maximum opportunity under the plan in respect of any financial year is 200 per cent of annual base salary
or 400 per cent of annual base salary in exceptional circumstances.
The maximum face value of annual awards granted in respect of 2022 will be 200 per cent of salary for the CEO and 175 per cent of salary for the FD.
For achievement of a threshold performance level (which is the minimum level of performance that results in any part of an award vesting), no more than 25 per cent of the award will vest.
Performance measures Earnings per share is currently the primary measure for our Performance Share Plan, but the Committee may exercise its discretion to introduce additional or alternative measures which are aligned to the delivery of the business strategy.
Details of the performance conditions applied to awards granted in the year under review and to be granted in the forthcoming year are set out in the Annual Report on Remuneration for the relevant year.
Directors’ Remuneration Report continued
110

Retirement benefits
Purpose and link to strategy To provide an income for retirement.Operation No special arrangements are made for Executive Directors, who are entitled to become members of the Group’s
defined contribution pension scheme, which is open to all UK employees, or the pension plan relevant to the country where they are employed if different.
If the Executive Director so chooses, he/she may take some or all of the pension contribution as a cash alternative, which will be the same percentage of salary as the pension contribution foregone.
Maximum opportunity The maximum pension contribution or allowance for Executive Directors will be in line with that available to UK employees or to participants in the pension plan relevant to the country where they are employed, if different. For UK employees this is currently 5.0 per cent of salary.
Performance measures N/A
Other benefits
Purpose and link to strategy To provide a competitive level of employment benefits.Operation No special arrangements are generally made for Executive Directors.
Benefits currently include:
• a car benefit appropriate for the role performed;• participation in the Company’s private health and long-term sickness schemes;• life insurance and income continuance schemes; and• participation in all-employee share plans, on the same basis as other eligible employees.
If new benefits are introduced for a wider employee group, the Executive Directors shall be entitled to participate on the same basis as other eligible employees.
If, in the opinion of the Committee, a Director must relocate to undertake and properly fulfil his/her executive duties, relocation benefits may be provided, which may include a cash payment to cover reasonable expenses.
Maximum opportunity There is no maximum level of benefits provided to an individual Executive Director, as the cost of benefits is dependent upon costs in the relevant market. Benefits will be set at levels which are competitive, but not excessive.
Participation by Executive Directors in any all-employee share plan operated by the Company is limited to the maximum award levels permitted by the plan rules from time to time and, in the case of any UK tax qualifying plan, the limits prescribed by the relevant tax legislation.
Performance measures N/A
111
Governance ReportAnnual Report and Accounts 2021

Chair and Non-Executive Director fees
Purpose and link to strategy To ensure that the Group is able to attract and retain experienced and skilled Non-Executive Directors.Operation Fee levels are determined with reference to those paid by other companies of similar size and complexity and taking
into account the scope of responsibilities and the amount of time that is expected to be devoted during the year. No individual is involved in the process of setting his/her own remuneration.
Fee levels may be reviewed annually. They may also be increased on an ongoing or temporary basis, to take into account changes in the working of the Board.
The Chair of the Board receives a fixed fee. Other Non-Executive Directors receive a basic fee and additional fees are payable for Chairing Board Committees and for the additional responsibility of being the Senior Independent Director and may also be paid to reflect additional time commitments and responsibilities. Fees are normally paid in cash.
Travel expenses, hotel costs and other benefits related to the performance of the role, including any tax due, are also paid where necessary.
2022 fee levels for the incumbents are as follows: Non-Executive Chair: £220,000Non-Executive Director base fee: £57,600Founder Non-Executive Director base fee: £52,370
Supplementary fees:Senior Independent Director: £8,370Audit Committee Chair: £18,850Remuneration Committee Chair: £10,480
Maximum opportunity Non-Executive Directors do not participate in any of the Group’s incentive arrangements or share schemes and are noteligible for pension or other benefits.
Maximum in line with the Company’s Articles of Association.Performance measures N/A
Share ownership guidelines
Purpose and link to strategy To strengthen alignment between Executives and shareholders.Operation Levels are set in relation to annual base salary, and are normally required to be built over a five-year period.
The Committee retains discretion to extend this period on an individual basis, if it believes that it is fair and reasonable to do so.
Options which have vested unconditionally, but are as yet unexercised, and shares subject to deferred bonus awards and PSP awards which are in the holding period but which are no longer subject to performance conditions, will be included on a net of tax basis, for the purposes of calculating shareholdings, as will shares held by an Executive’s spouse or dependents.
Post-cessation of employment, Executive Directors are also expected to remain aligned with the interests of shareholders for an extended period after leaving the Company, other than in exceptional circumstances. Details of the application of this policy are set out in the Annual Report on Remuneration.
The Committee will regularly review the minimum shareholding guidelines.Maximum opportunity There is no maximum, but minimum levels have been set at 200 per cent of base salary for both the current CEO and FD.
Non-Executive Directors are not required to hold shares in the Company.
Executive Directors who have not yet met their shareholding requirement will be expected to retain at least 50 per cent of any deferred bonus awards and PSP awards which vest (net of tax) until such time as this level of holding is met.
Performance measures N/A
Directors’ Remuneration Report continued
112

Malus and clawbackMalus and clawback provisions apply to the annual bonus and Performance Share Plan. For awards paid or granted in respect of 2020 onwards, the provisions are set out below.
Malus and/or clawback may apply to annual bonus awards, including deferred awards for a period of two years and to Performance Share Plan awards in the period up to the fifth anniversary of grant, in the event of:
• a material misstatement of results; • gross or serious misconduct;• an error or misstatement which has
resulted in a material overpayment to the participants;
• a significant failure of risk management within the Company or any Group Member;
• significant reputational damage to the Company or any Group Member;
• the participant leaving in circumstances which, had all the facts been known, would have resulted in the award lapsing; or
• any other circumstances that the Committee, in its discretion, considers to be similar in nature or effect to those above.
The malus and clawback provisions that apply to awards prior to the dates set out above are in line with the relevant policy in force at the time the awards were made.
Explanation of performance measuresThe performance measures in respect of variable remuneration outlined within the Policy are based on a combination of financial and strategic measures, with an emphasis on the financial performance of the Group, and therefore to the value that the business delivers to its shareholders. The Company is committed to long-term earnings per share growth through increased profitability and prudent use of cash generation, with a Services-led strategy. This commitment is reflected in the measures used to motivate and incentivise our Management team through the annual bonus and PSP.
The Committee reviews potential performance criteria and targets for the annual bonus and PSP annually, resulting in the performance criteria structure outlined in the Policy. The measures for 2022 are outlined on page 125.
Performance conditions applying to any award may be amended or substituted by the Committee if an event occurs which causes the Committee to determine an amended or substituted performance condition would be more appropriate and not materially less difficult to satisfy.
Remuneration arrangements across the GroupWhen setting Executive remuneration, consideration is given to pay policies and employment conditions of employees of the Company and elsewhere in the Group.
The remuneration of employees across the Group is based on three fundamental principles. First, that it allows the Group to retain the level of talent necessary to implement the strategy as set by the CEO and Board. Second, that levels of remuneration should be sufficient to achieve this aim, but should never be higher than is necessary to do so. Finally, with limited exceptions, the more significant the ability of an employee to influence the Company’s financial results through their individual performance, the higher the proportion of their remuneration should be performance based.
The level and design of variable pay takes into account the need to avoid incentivising the Group’s employees to act in a manner that is inconsistent with the Group’s risk appetite, as set by the Board.
Consistent with the policy for Executive Directors, where annual bonuses are in place across the Group, they are linked to business performance with a focus on underlying Group or divisional profit and other relevant metrics.
Whilst only Executive Directors and senior executives participate in the PSP, other employees can participate in the Company’s all-employee share schemes, which are designed to incentivise participants to build a shareholding in the Company, thus aligning their interests with those of the Company’s shareholders. This plan is not subject to performance conditions, but requires the employee to remain employed at the end of the term of the scheme which they have joined.
In line with local country practices, all employees are encouraged to contribute appropriate savings toward their retirement. In the UK, the Company operates pension arrangements within the Occupational and Personal Pension Schemes (Automatic Enrolment) Regulations 2010.
Whilst the Company does not feel it appropriate to consult directly with employees when drawing up the Directors’ Remuneration Policy, the Committee has considered any feedback received via employee engagement surveys and from the regular meetings the CEO and Chief People Officer conduct with staff representative bodies in each of our major geographies.
The Remuneration Committee Chair, Ros Rivaz, was appointed as the Designated Non-Executive Director on 9 November 2017 to facilitate engagement with the wider workforce, to assist the Board in understanding the views of Computacenter’s employees. During 2021, this involved attending Works Council meetings and other employee events, virtually, and feeding back the views raised by employees to the Board. Whilst Executive pay has not been a specific topic in these discussions, these events have provided a valuable opportunity for employees to share their views freely on a range of topics and Ros welcomed questions on a broad range of topics including Executive remuneration and how the Company measures success. Further information on the role and the activities of the Designated Non-Executive Director is on page 67.
113
Governance ReportAnnual Report and Accounts 2021

Annual Report on Remuneration
Responsibilities of the Remuneration CommitteeThe key responsibilities of the Remuneration Committee are to determine on behalf of the Board:• the Company’s general policy on Executive remuneration; and• the specific remuneration packages of the Executive Directors, the Chair of the Board and senior Executives of the Group including,
but not limited to, base salary, pension, annual performance-related bonuses and PSP awards.
The fees of the Non-Executive Directors are determined by the Chair and the Executive Directors. All Directors are subject to the overriding principle that no person shall be involved in the process of determining his or her own remuneration.
The full responsibilities of the Committee are contained within its Terms of Reference, which are available on our website at investors.computacenter.com.
Membership and attendanceThe Remuneration Committee is made up of the independent Non-Executive Directors and the Chair of the Board, who was considered to be independent on appointment. Details of the membership of the Committee and attendance of the members at Committee meetings during the year, are provided below.
Current members Role Attendance record
1. Ros Rivaz Senior Independent Director 7/72. Peter Ryan Non-Executive Chair of the Board 7/73. Pauline Campbell* Non-Executive Director 3/34. Rene Haas Non-Executive Director 7/75. Ljiljana Mitic Non-Executive Director 7/7Former member
6. Minnow Powell** Non-Executive Director 6/6
* Pauline Campbell was appointed to the Board and the Committee on 16 August 2021.
** Minnow Powell stepped down as a Non-Executive Director of the Company on 30 September 2021.
The CEO attends meetings by invitation, as does the Chief People Officer. The Company Secretary is the secretary to the Committee.
The principal advisor to the Committee is Deloitte LLP (Deloitte), which was selected by the Committee in September 2016 by way of a tender process. Minnow Powell receives a pension from Deloitte and, as such, recused himself from all discussions relating to the appointment of Deloitte.
The total fees paid to Deloitte in relation to advice to the Committee in 2021 were £71,100 (2020: £50,250). The Committee considers the advice that it receives from Deloitte LLP to be independent. During the year, Deloitte also provided consulting, tax and share plan advice to the Company. Deloitte is a founding member of the Remuneration Consultants Group and, as such, voluntarily adheres to its Code of Conduct.
Audited informationThe audited tables and related notes are identified within this report, using an A key.
Directors’ Remuneration Report continued
114

A Single Figure of Total RemunerationThe total amount paid by the Company to each of the Directors, in respect of the financial years ended 31 December 2021 and 2020, is set out in the table below.
Year ended 31 December 2021
Salary or fees£’000
Benefits£’000
Pension£’000
Total Fixed Pay
£’000Annual bonus
£’000PSP awards
£’000
Total Variable Pay
£’000Total£’000
Executive
Mike Norris 573.0 8.11 25.2 606.3 825.1 2,496.03 3,321.1 3,927.4
Tony Conophy 371.2 16.22 16.3 403.7 441.7 1,415.53 1,857.2 2,260.9
Non-Executive
Peter Ryan 214.2 – – 214.2 – – – 214.2
Pauline Campbell4 25.8 – – 25.8 – – – 25.8
Rene Haas 56.1 – – 56.1 – – – 56.1
Philip Hulme5 51.0 – – 51.0 – – – 51.0
Ljiljana Mitic 56.1 – – 56.1 – – – 56.1
Peter Ogden5 51.0 – – 51.0 – – – 51.0
Minnow Powell6 55.8 – – 55.8 – – – 55.8
Ros Rivaz 74.5 – – 74.5 – – – 74.5
Total (£’000) 1,528.7 24.3 41.5 1,594.5 1,266.8 3,911.5 5,178.3 6,772.8
Year ended 31 December 2020
Salary or fees£’000
Benefits£’000
Pension£’000
Total Fixed Pay
£’000Annual bonus
£’000PSP awards
£’000
Total Variable Pay
£’000Total£’000
Executive Mike Norris 421.57 19.31 24.7 465.5 674.4 1,398.98 2,073.3 2,538.8 Tony Conophy 273.07 15.72 16.0 304.7 342.2 792.78 1,134.9 1,439.6 Non-Executive Peter Ryan 210.0 – – 210.0 – – – 210.0 Pauline Campbell4 – – – – – – – –Rene Haas 55.0 – – 55.0 – – – 55.0 Philip Hulme5 12.5 – – 12.5 – – – 12.5 Ljiljana Mitic 55.0 – – 55.0 – – – 55.0 Peter Ogden5 12.5 – – 12.5 – – – 12.5 Minnow Powell6 73.0 – – 73.0 – – – 73.0 Ros Rivaz 73.0 – – 73.0 – – – 73.0 Total (£’000) 1,185.5 35.0 40.7 1,261.2 1,016.6 2,191.6 3,208.2 4,469.4
1. The benefits figure represents the taxable benefit arising from cash allowances paid in lieu of the provision of company car and other travel-related benefits for Mike Norris. This benefit, from 1 July 2021, replaced the previously provided driver service which ceased during 2020.
2. The benefits figure represents the taxable benefit arising from cash allowances paid in lieu of the provision of company car and other travel-related benefits for Tony Conophy.
3. This relates to the 2019 PSP awards which will be paid out in March 2022 and had a performance period of 1 January 2019 to 31 December 2021. The relevant performance criteria were fully achieved and therefore 100 per cent of the award vested for each of the Executive Directors. This calculation is based upon the average value of Computacenter plc shares over the last quarter of 2021 being £27.55. The PSP value attributable to share price growth since the awards were granted is £1,416,000 and £803,000 for the CEO and FD respectively. The Committee did not exercise its discretion to change the value of awards vesting based on the share price appreciation or depreciation during the period.
4. Pauline Campbell was appointed to the Board on 16 August 2021, and assumed the Chair of the Audit Committee on 30 September 2021.
5. The Company announced on 6 April 2020 that Philip Hulme and Peter Ogden waived their basic fees due to them as Founder Non-Executive Directors from 1 April 2020 until 31 December 2020, showing solidarity with staff that had been furloughed across the business.
6. Minnow Powell stepped down from the Board on 30 September 2021.
7. The salary figure for Mike Norris and Tony Conophy reflects the voluntary reduction to zero for the period 1 April 2020 until 30 June 2020 as described further below. Note that other elements of remuneration, namely benefits, pension, annual bonus and PSP awards, continued to be calculated by reference to the salaries the Directors were eligible for in 2020, being £562,000 and £364,000 for Mike Norris and Tony Conophy respectively.
8. The value of the 2018 PSP awards has been updated to reflect the actual share price at vesting on 23 March 2020 of £22.51.
115
Governance ReportAnnual Report and Accounts 2021
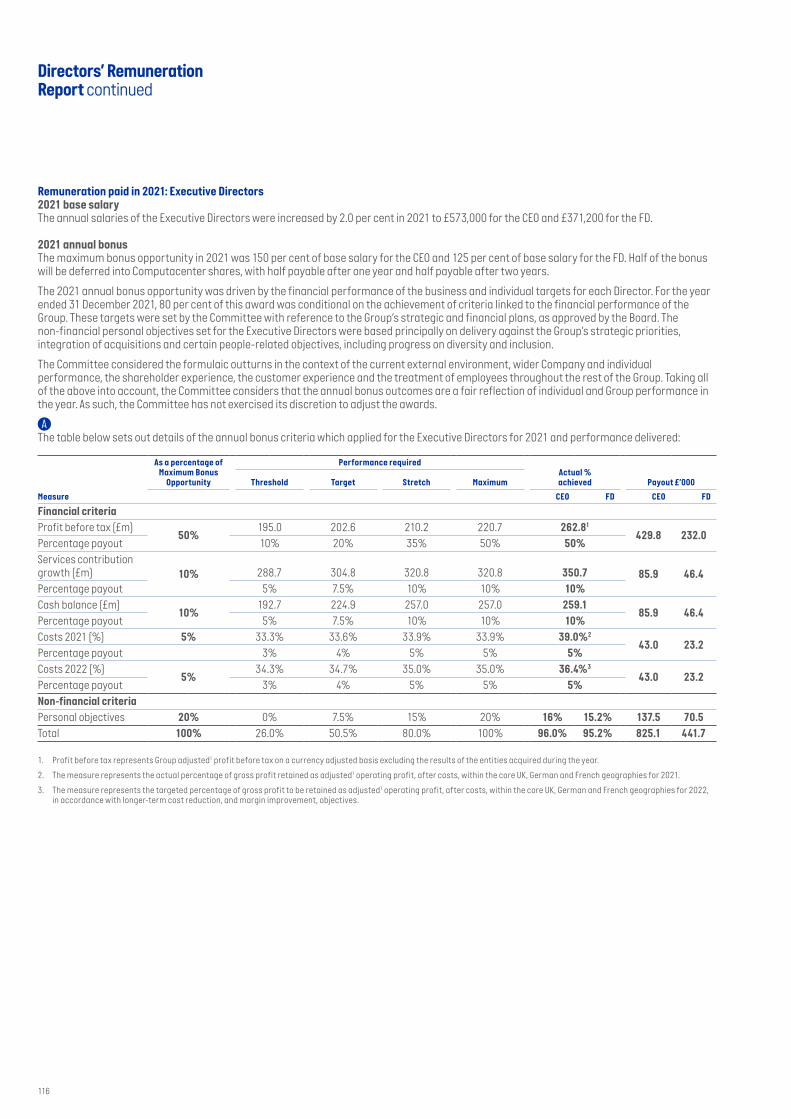
Remuneration paid in 2021: Executive Directors2021 base salaryThe annual salaries of the Executive Directors were increased by 2.0 per cent in 2021 to £573,000 for the CEO and £371,200 for the FD.
2021 annual bonusThe maximum bonus opportunity in 2021 was 150 per cent of base salary for the CEO and 125 per cent of base salary for the FD. Half of the bonus will be deferred into Computacenter shares, with half payable after one year and half payable after two years.
The 2021 annual bonus opportunity was driven by the financial performance of the business and individual targets for each Director. For the year ended 31 December 2021, 80 per cent of this award was conditional on the achievement of criteria linked to the financial performance of the Group. These targets were set by the Committee with reference to the Group’s strategic and financial plans, as approved by the Board. The non-financial personal objectives set for the Executive Directors were based principally on delivery against the Group’s strategic priorities, integration of acquisitions and certain people-related objectives, including progress on diversity and inclusion.
The Committee considered the formulaic outturns in the context of the current external environment, wider Company and individual performance, the shareholder experience, the customer experience and the treatment of employees throughout the rest of the Group. Taking all of the above into account, the Committee considers that the annual bonus outcomes are a fair reflection of individual and Group performance in the year. As such, the Committee has not exercised its discretion to adjust the awards.
A The table below sets out details of the annual bonus criteria which applied for the Executive Directors for 2021 and performance delivered:
Measure
As a percentage of Maximum Bonus
Opportunity
Performance requiredActual %achieved Payout £’000Threshold Target Stretch Maximum
CEO FD CEO FD
Financial criteria
Profit before tax (£m)50%
195.0 202.6 210.2 220.7 262.81
429.8 232.0Percentage payout 10% 20% 35% 50% 50%
Services contribution growth (£m) 10% 288.7 304.8 320.8 320.8 350.7 85.9 46.4Percentage payout 5% 7.5% 10% 10% 10%
Cash balance (£m)10%
192.7 224.9 257.0 257.0 259.185.9 46.4
Percentage payout 5% 7.5% 10% 10% 10%
Costs 2021 (%) 5% 33.3% 33.6% 33.9% 33.9% 39.0%2
43.0 23.2Percentage payout 3% 4% 5% 5% 5%
Costs 2022 (%)5%
34.3% 34.7% 35.0% 35.0% 36.4%3
43.0 23.2Percentage payout 3% 4% 5% 5% 5%
Non-financial criteria
Personal objectives 20% 0% 7.5% 15% 20% 16% 15.2% 137.5 70.5
Total 100% 26.0% 50.5% 80.0% 100% 96.0% 95.2% 825.1 441.7
1. Profit before tax represents Group adjusted1 profit before tax on a currency adjusted basis excluding the results of the entities acquired during the year.
2. The measure represents the actual percentage of gross profit retained as adjusted1 operating profit, after costs, within the core UK, German and French geographies for 2021.
3. The measure represents the targeted percentage of gross profit to be retained as adjusted1 operating profit, after costs, within the core UK, German and French geographies for 2022, in accordance with longer-term cost reduction, and margin improvement, objectives.
Directors’ Remuneration Report continued
116

The personal objectives for the Executive Directors are subject to a profit performance underpin and are related to the following:
Objectives Progress in the year
CEODrive the agenda for a diverse and inclusive workforce, with particular emphasis on gender and ethnicity
Gender diversity improved at all levels in Computacenter during 2021, with female representation in Group leadership increasing from 20.5 per cent in 2020 to 22.8 per cent in 2021 when tracking our progress through FTSE Women Leaders (Hampton-Alexander) reporting. Establishment of an Employee Impact Group for ethnicity has been highly successful in building awareness, understanding and contributing to sustainable change across the business. A number of events were hosted during the year including open-mic sessions and development programmes. 91 per cent of UK staff have shared their ethnicity data to date which provides the Company with a robust platform from which to analyse representation across the UK business and identify areas for improvement.
Develop the North America Business Re-branding of the acquired businesses was completed in early 2021. The Group ERP systems for the legacy and FusionStorm elements of the business was implemented during the year. Effective integration of the two acquired businesses was achieved with operating models settling down to deliver a strong EBIT performance in 2021 that was significantly higher than the internal targets set at the start of the year.
Focus on Managed Services growth Managed Services business grew strongly during 2021. On an organic basis, revenue increased by 4.8 per cent in constant currency2 and by 7.5 per cent on a reported basis. The Services Contract Base, representing the annual value of the committed Managed Services contract spend grew by 2.9 per cent in constant currency2.
Increase competitiveness in Services Improved our end-user workplace services created with our modern workplace offerings which bring together product and services capability. Improved the win rate for Managed Services business across core countries and increased the percentage of business delivered through near-shore and off-shore locations to help drive competitive solutions enabling customers to select from a mix of service delivery options. Continuing to reduce the cost to serve through location mix and the use of technology.
Implementation of new systems Good progress made on enhancements to systems and tools utilised by the Technology Sourcing business to enable continued leverage of this capability as a competitive advantage. A robust programme of further upgrades has been planned for 2022 to ensure we remain competitive for our customers.
Objectives Progress in the year
FDContinued progress towards corporate gender diversity objective Gender diversity has improved at all levels in Computacenter during 2021,
with female representation in Group leadership increasing from 20.5 per cent in 2020 to 22.8 per cent in 2021 when tracking our progress through FTSE Women Leaders (Hampton-Alexander) reporting.
Implement the Group ERP systems within Computacenter NS in France to enable reporting consistent with Group standards and to allow transition away from legacy systems from the vendor of the business
Group ERP Systems have been effectively implemented. Teams integrating to operate as one business and scaling opportunities to sell a combined solution offering.
Implement Group ERP systems in North America to align with Group operating procedures, simplify reporting
Combine legal entities to create a single North America business
Progress has been made in implementing Group ERP systems across the North American business despite delays caused by Covid-19 travel restrictions. Legacy legal entities have been reduced in number to aid the integration of the operating models.
Drive cost reductions through ongoing travel and operational efficiencies Cost targets have been over-achieved in the year, in part helped by ongoing restrictions on travel. Internal carbon travel charge implemented to increase visibility of CO2 at time of travel request, to ensure continued focus on reducing costs and CO2 emissions in future years.
Continue to develop and implement the formal climate change impact initiatives and reporting
2021 TCFD and sustainability reporting with large reductions in CO2 emissions from the multilevel investments made in 2020 and 2021. 62 per cent year on year reduction in Scope 1 and Scope 2 emissions providing a strong platform for the 2022 aim of carbon neutral for Scope 1 and Scope 2 using some carbon offsets.
117
Governance ReportAnnual Report and Accounts 2021
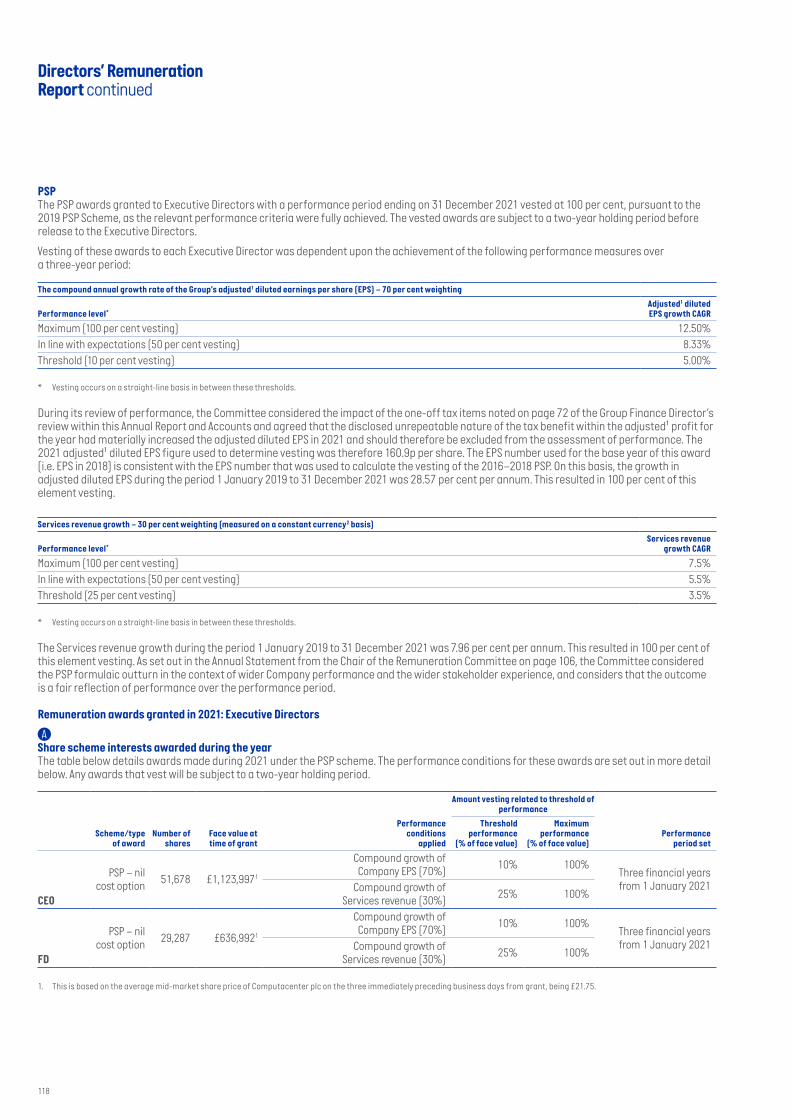
PSPThe PSP awards granted to Executive Directors with a performance period ending on 31 December 2021 vested at 100 per cent, pursuant to the 2019 PSP Scheme, as the relevant performance criteria were fully achieved. The vested awards are subject to a two-year holding period before release to the Executive Directors.
Vesting of these awards to each Executive Director was dependent upon the achievement of the following performance measures over a three-year period:
The compound annual growth rate of the Group’s adjusted1 diluted earnings per share (EPS) – 70 per cent weighting
Performance level*Adjusted1 diluted EPS growth CAGR
Maximum (100 per cent vesting) 12.50%In line with expectations (50 per cent vesting) 8.33%Threshold (10 per cent vesting) 5.00%
* Vesting occurs on a straight-line basis in between these thresholds.
During its review of performance, the Committee considered the impact of the one-off tax items noted on page 72 of the Group Finance Director’s review within this Annual Report and Accounts and agreed that the disclosed unrepeatable nature of the tax benefit within the adjusted1 profit for the year had materially increased the adjusted diluted EPS in 2021 and should therefore be excluded from the assessment of performance. The 2021 adjusted1 diluted EPS figure used to determine vesting was therefore 160.9p per share. The EPS number used for the base year of this award (i.e. EPS in 2018) is consistent with the EPS number that was used to calculate the vesting of the 2016–2018 PSP. On this basis, the growth in adjusted diluted EPS during the period 1 January 2019 to 31 December 2021 was 28.57 per cent per annum. This resulted in 100 per cent of this element vesting.
Services revenue growth – 30 per cent weighting (measured on a constant currency2 basis)
Performance level*Services revenue
growth CAGR
Maximum (100 per cent vesting) 7.5%In line with expectations (50 per cent vesting) 5.5%Threshold (25 per cent vesting) 3.5%
* Vesting occurs on a straight-line basis in between these thresholds.
The Services revenue growth during the period 1 January 2019 to 31 December 2021 was 7.96 per cent per annum. This resulted in 100 per cent of this element vesting. As set out in the Annual Statement from the Chair of the Remuneration Committee on page 106, the Committee considered the PSP formulaic outturn in the context of wider Company performance and the wider stakeholder experience, and considers that the outcome is a fair reflection of performance over the performance period.
Remuneration awards granted in 2021: Executive Directors
A Share scheme interests awarded during the yearThe table below details awards made during 2021 under the PSP scheme. The performance conditions for these awards are set out in more detail below. Any awards that vest will be subject to a two-year holding period.
Scheme/type of award
Number of shares
Face value at time of grant
Performanceconditions
applied
Amount vesting related to threshold of performance
Performanceperiod set
Thresholdperformance
(% of face value)
Maximumperformance
(% of face value)
CEO
PSP – nil cost option 51,678 £1,123,9971
Compound growth ofCompany EPS (70%) 10% 100%
Three financial years from 1 January 2021Compound growth of
Services revenue (30%) 25% 100%
FD
PSP – nil cost option 29,287 £636,9921
Compound growth ofCompany EPS (70%) 10% 100%
Three financial years from 1 January 2021Compound growth of
Services revenue (30%) 25% 100%
1. This is based on the average mid-market share price of Computacenter plc on the three immediately preceding business days from grant, being £21.75.
Directors’ Remuneration Report continued
118

Vesting of these awards to each Executive Director will be dependent upon achieving the performance measures over a three-year period, as follows:
The compound annual growth rate of the Group’s adjusted1 diluted earnings per share (EPS) (70 per cent weighting)
Performance level*Adjusted1 diluted EPS growth CAGR
Maximum (100 per cent vesting) 12.5%In line with expectations (50 per cent vesting) 8.33%Threshold (10 per cent vesting) 5.0%
* Vesting occurs on a straight-line basis in between these thresholds.
The compound annual growth rate of the Group’s Services Revenue (GSR) (30 per cent weighting) measured on a constant currency2 basis
Performance level*Services revenue
growth CAGR
Maximum (100 per cent vesting) 7.5%In line with expectations (50 per cent vesting) 5.5%Threshold (25 per cent vesting) 3.5%
* Vesting occurs on a straight-line basis in between these thresholds.
The table below details awards made during 2021 under the Deferred Bonus Plan (DBP) scheme.
Scheme/type of awardNumber of
shares Face value Vesting date
CEO DBP2 – Conditional Share 15,503 £337,1901 50% – 21 March 202250% – 21 March 2023
FD DBP2 – Conditional Share 7,866 £171,0861 50% – 21 March 202250% – 21 March 2023
1. This is based on the average mid-market share price of Computacenter plc on the three immediately preceding business days from grant, being £21.75.
2. These are not subject to any other performance conditions.
119
Governance ReportAnnual Report and Accounts 2021

A Executive Director outstanding Share Awards as at 31 December 2021Directors’ interests in share schemes
Schemes NoteExercise/
share price Exercise period
At 1 January
2021
Granted during the
year
Exercised during the
year
Lapsed during the
year
At 31 December
2021
Mike Norris Sharesave* 1 1011.0p 01/12/24 – 31/05/25 2,967 – – – 2,967
PSP 2,3 Nil 21/03/23 – 20/03/28 88,782 – – 26,635 62,147
PSP 3 Nil 21/03/24 – 20/03/29 90,604 – – – 90,604
PSP 3 Nil 23/03/25 – 22/03/30 110,977 – – – 110,977
PSP 3 Nil 22/03/26 – 21/03/31 – 51,678 – – 51,678
DBP 4 Nil 21/03/20 – 21/03/21 11,698 – 11,698 – –
DBP 4 Nil 21/03/21 – 21/03/22 32,068 – 16,034 – 16,034
DBP 4 Nil 21/03/22 – 21/03/23 – 15,503 – – 15,503
Tony Conophy Sharesave* 1 1054.0p 01/12/23 – 31/05/24 2,846 – – – 2,846
PSP 3 Nil 22/03/20 – 21/03/27 65,260 – – – 65,260
PSP 2,3 Nil 21/03/23 – 20/03/28 50,310 – – 15,093 35,217
PSP 3 Nil 21/03/24 – 20/03/29 51,384 – – – 51,384
PSP 3 Nil 23/03/25 – 22/03/30 62,915 – – – 62,915
PSP 3 Nil 22/03/26 – 21/03/31 – 29,287 – – 29,287
DBP 4 Nil 21/03/20 – 21/03/21 6,433 – 6,433 – –
DBP 4 Nil 21/03/21 – 21/03/22 16,538 – 8,269 – 8,269
DBP 4 Nil 21/03/22 – 21/03/23 – 7,866 – – 7,866
1. Issued under the Rules of the Computacenter 2018 Sharesave Plan, which is available to employees and full-time Executive Directors of the Computacenter Group. Eligible employees can save between £5 and £500 a month to purchase options in shares in Computacenter plc at a price fixed at the beginning of the scheme term. There are no conditions relating to the performance of the Company for this scheme.
2. These awards vested during the year at 70 per cent, and accordingly 30 per cent of the shares under award lapsed.
3. Issued under the terms of the Computacenter Performance Share Plan 2005, as amended at the AGM held on 19 May 2015, or as amended at the AGM held on 18 May 2018.
(a) In respect of 70 per cent of the total award: 10 per cent of this portion of the award will vest if the compound annual EPS growth over the Performance Period equals 5 per cent per annum. If the compound annual EPS growth rate over the Performance Period is between 5 per cent and 8.33 per cent, this portion of the award will vest on a straight-line basis up to one-half. This portion of the award will vest in full if the compound annual EPS growth equals or exceeds 12.5 per cent per annum, with straight-line vesting between 50 per cent and 100 per cent.
(b) In respect of 30 per cent of the total award: the award will start to vest if the compound annual Services revenue growth rate over the Performance Period equals 3.5 per cent. If the compound annual Services revenue growth rate over the Performance Period is 7.5 per cent, this portion of the award will vest in full. If the compound annual Services revenue growth rate over the period is between 3.5 per cent and 7.5 per cent, then this portion of the award will vest on a straight-line basis between 25 per cent and 100 per cent.
PSP awards from 2018 onwards are subject to the two-year holding period.
4. Conditional shares issued under the terms of the Computacenter 2017 Deferred Bonus Plan. Awards vest in equal tranches on the first and second anniversary of the grant date.
* The Sharesave scheme only requires that an employee remains employed by the Group at the end of the term of the scheme. There are no performance conditions attached.
Director gainsPSP
Director Date of vesting SchemeNumber of
shares Exercise priceMarket price at
exerciseNotional gain
made
Mike Norris 22/03/2021 PSP 62,147 Nil £22.51 £1,398,898Tony Conophy 22/03/2021 PSP 35,217 Nil £22.51 £792,717
The closing market price of ordinary shares at 31 December 2021 (being the last trading day of 2021) was £29.10 (31 December 2020: £24.48).
The highest price during the year was £30.30 and the lowest was £20.86.
Minimum shareholding requirementsIn accordance with the Group’s minimum shareholding guidelines, the CEO is required to build up a shareholding that is equal to 200 per cent of his/her gross salary. In respect of the FD, the threshold that is expected to be achieved is 200 per cent of his/her gross salary. It is also expected that the Executive Director will achieve these levels within five years of appointment. For the purposes of these requirements, deferred bonuses, shares subjected to the holding period and options which have vested unconditionally, but are as yet unexercised, will be included on a net basis, for the purposes of calculating shareholdings, as will shares held by an Executive’s spouse or dependants. There is no requirement for the Non-Executive Directors of the Company to hold shares.
In addition, when an Executive Director steps down from the Board they will be expected to retain an interest in Computacenter shares based on their in-employment share ownership guideline (or actual shareholding at the date of stepping down from the Board if lower) for a period of two years. This policy will be supported by the use of nominee accounts.
Directors’ Remuneration Report continued
120

The Committee has the discretion to disapply or reduce this requirement in extenuating circumstances, for example in compassionate circumstances.
Both the CEO and the FD substantially exceed their shareholding requirement.
A Directors’ shareholdingsThe beneficial interest of each of the Directors in the shares of the Company, as at 31 December 2021, is as follows:
Current Directors
Number of shares in the Company as at 31 December 2021
Percentage of requirement
achieved
Interests in shares
SAYE PSP DBP Total
Mike Norris 1,134,214 2,880%3 2,9671 315,4062 31,5371 1,484,124Tony Conophy 1,873,556 7,344%3 2,8461 244,0632,4 16,1351 2,136,600Peter Ryan 900 n/a – – – 900Pauline Campbell – n/a – – – –Rene Haas – n/a – – – –Philip Hulme 9,196,695 n/a – – – 9,196,695Ljiljana Mitic – n/a – – – –Peter Ogden 18,699,389 n/a – – – 18,699,389Minnow Powell 1,340 n/a – – – 1,340Ros Rivaz 2,181 n/a – – – 2,181
Note: There has been no grant of, or trading in, shares of the Company between 1 January 2022 and 15 March 2022.
1. There are no conditions relating to the performance of the Company or individual for the vesting of this scheme.
2. There are performance conditions for this scheme as set out within the table on page 120.
3. Based on the Company’s closing share price as at 31 December 2021, being £29.10, and the approved 2021 base salaries.
4. Includes 65,260 options that have vested but remain unexercised at 31 December 2021.
Dilution limitsComputacenter uses a mixture of both new issue and market purchase shares to satisfy the vesting of awards made under its PSP, DBP and Sharesave schemes. In line with best practice, the use of new or treasury shares to satisfy awards made under all share schemes is restricted to 10 per cent in any 10-year rolling period, with a further restriction for discretionary schemes of 5.0 per cent in the same period. The Company’s current position against its dilution limit is under each of these thresholds. The Company regularly reviews its position against the dilution guidelines and, should there be insufficient headroom within which to grant new awards which could be satisfied by issuing new shares, the Company intends to continue its current practice of satisfying new awards with shares purchased on the market.
Payments to past Directors and payments for loss of officeThere were no payments made to past Directors and no payments made for loss of office during the period.
Executive service contractsA summary of the Executive Directors’ contracts of employment is given in the table below:
Director Start date Expiry date Unexpired termNotice period
(months)
Mike Norris 23/04/1998 n/a None specified 12 Tony Conophy 23/04/1998 n/a None specified 12
All Executive Directors have a rolling 12-month service contract with the Company, which is subject to 12 months’ written notice by either the Company or the Director.
External appointments for Executive DirectorsExecutive Directors are permitted to hold outside directorships, subject to approval by the Chair of the Board, and any such Executive Director is permitted to retain any fees paid for such services. During 2021, neither Executive Director held any outside fee-paying directorships.
Non-Executive Directors’ letters of appointmentThe Non-Executive Directors have not entered into service contracts with the Company. They each operate under a letter of appointment which sets out their terms, duties and responsibilities. Non-Executive Directors are appointed for an initial term, which runs to the conclusion of the third AGM following their appointment, and which may be renewed at that point. The letters of appointment provide that should a Non-Executive Director not be re-elected at an AGM before he or she is due to retire, then his or her appointment will terminate. The Board has agreed that all Directors will be subject to re-election at the AGM on 19 May 2022.
121
Governance ReportAnnual Report and Accounts 2021

The terms and conditions of appointment of the Non-Executive Directors are available for inspection by shareholders at the Company’s registered office. The appointments continue until the expiry dates set out below, unless terminated for cause or on the period of notice stated below:
DirectorDate of latest letter of
appointment Expiry date Notice period
Peter Ryan 16 May 2019 Close of the Company’s Annual General Meeting in 2022 3 monthsPauline Campbell 9 March 2021 Close of the Company’s Annual General Meeting in 2025 3 monthsRene Haas 20 August 2019 Close of the Company’s Annual General Meeting in 2022 3 monthsPhilip Hulme 4 May 2019 Close of the Company’s Annual General Meeting in 2022 3 monthsLjiljana Mitic 16 May 2019 Close of the Company’s Annual General Meeting in 2022 3 monthsPeter Ogden 4 May 2019 Close of the Company’s Annual General Meeting in 2022 3 monthsRos Rivaz 11 November 2019 Close of the Company’s Annual General Meeting in 2022 3 months
In 2022, the Chair will be paid a single consolidated fee of £220,000, an increase of 2.7 per cent on 2021, a rise consistent with average increases made within the wider UK workforce. The Non-Executive Directors are paid a basic fee, plus additional fees for chairing Board Committees or Senior Independent Director duties.
In 2022, Non-Executive Directors’ annual fees will increase by 2.7 per cent on 2021, a rise consistent with average increases made within the wider UK workforce, and are set out in the table below:
Position2021 Annual
fees (£)2022 Annual
fees (£)
Independent Non-Executive Directors 56,100 57,600Founder Non-Executive Directors 51,000 52,370Additional fee for the Chairing the Audit Committee 18,350 18,850Additional fee for the Chairing the Remuneration Committee 10,200 10,480Additional fee for the position of Senior Independent Director 8,150 8,370
Performance of the Company
Total shareholder return performance
(Computacenter versus FTSE Software and Computer Services sector)
0
200
400
600
800
1,000
1,200
Dec2011
Dec2012
Dec2013
Dec2014
Dec2015
Dec2016
Dec2017
Dec2018
Dec2019
Dec2021
Dec2020
Computacenter FTSE All Share – Software and Computer Services
In this graph, TSR performance shows the value, in December 2021, of £100 invested in the Company’s shares in December 2011, assuming that all dividends received between December 2011 and December 2021 were reinvested in the Company’s shares (source: Datastream).
Directors’ Remuneration Report continued
122

CEO pay historyThe table below shows the total remuneration figure for the CEO over the previous 10 financial years. The total remuneration figure includes the annual bonus and PSP awards which vested based on performance in those years. The annual bonus and PSP percentages show the payout for each year as a percentage of the maximum.
2012 2013 2014 2015 2016 2017 2018 2019 2020 2021
CEO single figure of remuneration 1,085,300 937,300 1,506,300 2,763,900 1,807,600 2,291,500 2,081,700 2,391,409 2,538,817 3,927,371
Annual bonus payout (as a % of maximum opportunity) 26.8% 61.2% 69.39% 84.54% 49.12% 92.35% 82.63% 92.5% 96.0% 96.0%
Annual bonus 161,000 367,000 451,035 803,200 319,280 606,047 557,753 636,863 674,400 825,120
PSP vesting (as a % of maximum opportunity) 58.5% 0% 35.34% 71.5% 85.13% 68.01% 65.68% 80.78% 70.00% 100%
PSP vesting 385,355 – 478,679 1,384,500 891,800 1,101,400 923,699 1,150,120 1,398,898 2,495,959
Percentage change in remuneration of Board Directors and employeesThe table below sets out the percentage change in the salary, benefits and annual bonus of all Executive and Non-Executive Directors compared to the average amount paid to Computacenter employees in the UK, between the year ended 31 December 2020 and 31 December 2021.
% change in remuneration between 2019 and 2020 % change in remuneration between 2020 and 2021
Salary/Fee Benefits9 Annual bonus Salary/Fee Benefits Annual bonus
Executive
Mike Norris (23.47%)1 (34.35)% 5.89% 35.94%1 (24.32)% 22.35%
Tony Conophy (23.53)%1 (5.99)% 4.20% 35.97%1 2.52% 27.73%
Non-Executive
Peter Ryan 39.72%5 – – 2.00% – –
Pauline Campbell n/a2 – – n/a2 – –
Rene Haas 172.28%6 – – 2.00% – –
Philip Hulme (75.00)%3 – – 308.00%3 – –
Ljiljana Mitic 59.42%7 – – 2.00% – –
Peter Ogden (75.00)%3 – – 308.00%3 – –
Minnow Powell 3.69%4 – – (23.56)%4 – –
Ros Rivaz 3.69% – – 2.05% – –
Employees
Computacenter UK-based employees 3.26%5 (10.39)% (3.48)%10 4.19%8 (4.71)% (0.70)%
1. As disclosed last year, the base salary that the Directors were eligible for was increased by 2 per cent from 1 January 2021. The significant percentage increase for the CEO and Group FD reflects the voluntary temporary reduction in base salary to nil for the period 1 April 2020 until 30 June 2020.
2. Pauline Campbell was appointed to the Board on 16 August 2021 and assumed the role of Chair of the Audit Committee on 30 September 2021.
3. The significant percentage increase for Philip Hulme and Peter Ogden reflects their decision to waive the basic fees due to them as Founder Non-Executive Directors from 1 April 2020 until 31 December 2020, as announced by the Company on 6 April 2020.
4. Minnow Powell stepped down from the Board on 30 September 2021.
5. Peter Ryan was appointed to the role of Chair on 16 May 2019. The increase reflects that he was only paid the Chair’s fee for part of the prior year.
6. Rene Haas was appointed to the Board on 20 August 2019.
7. Ljiljana Mitic was appointed to the Board on 16 May 2019.
8. The average change in salary for UK-based employees takes account of promotions, pay reviews, changed in terms and conditions, and benchmark increases across the year, excluding Executive and Non-Executive Directors who have been reported separately above.
9. The reduction in benefits reflects reduced travel costs in the year, a lower number of employees with cars and those shifting to greener vehicles with lower benefit in kind values has had the effect of reducing the average taxable benefit spend year on year.
10. Although total bonus spend was 4 per cent higher than 2019, increasing employee numbers overall has reduced the average spend per employee by 3.48 per cent. This figure includes the one-off ‘EPS bonus’ as described in the Finance Directors’ Statement on page 63 of the 2020 Annual Report and Accounts.
On the basis that Computacenter plc (the Parent Company) does not employ any staff, the comparator group of Computacenter UK-based employees was chosen on a voluntary basis as the Committee believes it provides a sufficiently large comparator group based on a similar incentive structure to the CEO and reduces any distortion arising from currency and cost of living differences in other geographies in which the Group operates.
123
Governance ReportAnnual Report and Accounts 2021

CEO pay ratioThe CEO pay ratio table shows the ratio of pay between the CEO of Computacenter and Computacenter’s UK employees. The ratio compares the total remuneration of the CEO against the total remuneration of the median UK employee and those who sit at the 25th and 75th percentiles (lower and upper quartiles).
Computacenter’s CEO pay ratios have been calculated using Option B, a continuation of approach from the previous two years and based on the availability of data at the time the Annual Report and Accounts is published. This uses the most recent gender pay data to identify the three employees that represent our 25th, 50th and 75th percentile employees. As an additional sense check the salary and total pay and benefits of a number of employees either side of these 25th, 50th and 75th employees were also reviewed with an adjustment made to ensure that the figures used were representative of an employee at these positions. Following this review the total pay and benefits figure for the 75th employee was adjusted to include a car allowance as being more representative of an employee at that level.
The total remuneration for these individuals has been calculated based on all components of pay for 2021, including base salary, performance-based pay, pension and benefits. The Committee considers that this provides an outcome that is representative of the employees at these pay levels.
Where an identified employee received a pro-rated component of pay, their figures have been converted to a full-year equivalent. No other adjustments were necessary other than the adjustments already set out above, and no elements of employee remuneration have been excluded from the pay ratio calculation.
The day by reference to which the Company determined the 25th, 50th and 75th percentile employees was 31 December 2021.
The Committee believes that the median pay ratio is consistent with the pay, reward and progression policies for the Company’s UK employees taken as a whole. Computacenter’s employer pension contributions, Company-paid benefits and voluntary benefit scheme options are consistent for all UK employees, including the CEO. In addition, the CEO is eligible to participate in the Company’s annual bonus and Performance Share Plan, in line with other members of the senior Management team. The value of these variable pay awards is affected by performance delivered and, in the case of the Performance Share Plan, share price movement over three years.
From 2020 to 2021 the ratio between the total remuneration of the CEO and the total remuneration of UK employees has increased. This reflects Company and share price performance, as the CEO’s remuneration is heavily performance linked. The increase in the pay ratio from 2020 to 2021 is primarily driven by the 189.3 per cent increase in share price over the three-year PSP performance period together with the higher level of vesting under the PSP, both of which reflect performance delivered over the period. The pay ratio movement from 2020 has also been impacted by Mike Norris and Tony Conophy’s election to reduce their salaries to zero from 1 April 2020 until 30 June 2020.
Year Method 25th percentile pay ratio Median pay ratio 75th percentile pay ratio
2021 Option B 110:1 80:1 53:120201 Option B 69:1 57:1 34:12019 Option B 76:1 51:1 36:1
1. The 2020 ratios have been updated to reflect the actual CEO’s 2020 single figure total using the share price on the date of vesting, further detail of which is set out in the notes to the single figure table on page 115.
2021 salary and total pay and benefits – all employee figures
Employees 25th percentile Median 75th percentile
Total pay and benefits £35,857 £49,353 £73,618Salary £31,153 £42,079 £66,000
Relative importance of spend on payThe charts below show the relative expenditure of the Group on the pay of its employees, against certain other key financial indicators of the Group:
Expenditure on Group employees’ pay
20212020
£906.3m£809.6m
Shareholder distributions
20212020
£62.4m£13.9m
Group adjusted1 profit before tax*
20212020
£255.6m£200.5m
* As well as information prescribed by current remuneration reporting regulations, Group adjusted1 profit before tax has also been included as this is deemed to be a key performance indicator of the Group which is linked to the delivery of value to our shareholders.
Directors’ Remuneration Report continued
124

Statement of implementation of remuneration policy in the following financial yearExecutive Director Remuneration for 2022 will be in accordance with the terms of our Directors’ Remuneration Policy table, as set out on pages 109 to 113 of this report.
2022 base salariesThe base salary of the CEO will increase by 13.4 per cent to £650,000. The rationale for the increase in the CEO’s base salary is described on page 107. The base salary of the FD will increase by 2.6 per cent to £381,000 from 1 January 2022.
2022 annual bonus The performance measures and weightings for the 2022 annual bonus will be as follows:
Mike Norris – CEO (2022)
Tony Conophy – FD (2022)
1 2 3 4 5 1 2 3 4 5
1. Group adjusted1 profit before tax (up to 50%)2. Services contribution growth (up to 10%)3. Cash balance (up to 10%)4. Cost savings (up to 10%)5. Personal objectives (up to 20%)
1. Group adjusted1 profit before tax (up to 50%)2. Services contribution growth (up to 10%)3. Cash balance (up to 10%)4. Cost savings (up to 10%)5. Personal objectives (up to 20%)
The measures for 2022 have been set to be challenging relative to our 2022 business plan. The targets themselves, as they relate to the 2022 financial year, are deemed by the Committee to be commercially sensitive and therefore have not been disclosed. They will be disclosed at such time as the Committee no longer deems them to be so, and it currently anticipates including these in the Company’s 2022 Annual Report and Accounts.
The maximum bonus opportunity for the Executive Directors in 2022 will be 150 per cent of base salary for the CEO and 125 per cent of base salary for the FD. These awards will be subject to deferral in line with our Policy on page 109.
2022 PSPThe award levels for the Executive Directors in the 2022 financial year are 200 per cent of salary for the CEO and 175 per cent of salary for the FD. The 2022 financial year PSP awards will be subject to the same performance measures and targets as for the 2021 PSP awards as set out above. The base year used to assess EPS performance will be consistent with that used to determine vesting of the 2019 PSP awards, and exclude the impact of the one-off tax items noted elsewhere in the report. The 2022 financial year PSP awards will be subject to a two-year holding period.
Statement of voting The results of voting on the Directors’ Remuneration Report at the Company’s 2021 AGM are outlined in the table below:
Votes cast in favour/discretionary Votes cast against Total votes cast Votes withheld/abstentions
98,562,392 99.95% 47,018 0.05% 98,609,410 6,553
The results of voting on the Remuneration Policy at the Company’s 2020 Annual General Meeting are outlined in the table below:
Votes cast in favour/discretionary Votes cast against Total votes cast Votes withheld/abstentions
97,606,813 98.65% 1,339,845 1.35% 98,946,658 2,153
The Committee is grateful for the continuing support of shareholders. To ensure that this continues, the Committee will consult with shareholders on major issues where it is appropriate to do so. It will also continue to adhere to its underlying principle of decision-making that Executive Directors’ pay must be linked to performance and the sustainable delivery of value to our shareholders.
This Annual Report on Remuneration has been approved by the Board of Directors and signed on its behalf by:
Ros RivazChair of the Remuneration Committee 23 March 2022
125
Governance ReportAnnual Report and Accounts 2021

Results and dividendsThe Group’s Consolidated Income Statement is on page 140. The Group’s activities resulted in a profit before tax of £248.0 million (2020: £206.6 million). The Group profit for the year, attributable to equity shareholders, amounted to £185.3 million (2020: £153.8 million).
The Directors recommend a final dividend of 49.4 pence per share (2020: 38.4 pence per share) totalling £56.4 million (2020: £43.8 million). Subject to shareholder approval, this will be paid on Friday 8 July 2022, to shareholders on the register at the close of business on Friday 10 June 2022. The shares will be marked ex-dividend on Thursday 9 June 2022. This is in line with the normal dividend procedure timetable, as set by the London Stock Exchange.
Following the payment of an interim dividend for 2021 of 16.9 pence per share on 22 October 2021, the total dividend for 2021 will be 66.3 pence per share. The Board has consistently applied the Company’s dividend policy, which states that the total dividend will be 2 to 2.5 times covered by adjusted1 diluted earnings per share. Further detail on the Company’s dividend policy can be found within the Group Finance Director’s review on page 74.
Dividends are recognised in the accounts in the year in which they are paid, or in the case of a final dividend, when approved by the shareholders. As such, the amount recognised in the 2021 Annual Report and Accounts, as described in note 14, is made up of the 2021 interim dividend (16.9 pence per share) and the 2020 final dividend (38.4 pence per share).
Articles of AssociationThe Company’s Articles of Association set out the procedures for governing the Company. The Articles of Association may only be amended by a special resolution at a general meeting of the shareholders.
Voting rightsShareholders are entitled to attend and vote at any general meeting of the Company. It is the Company’s practice to hold a poll on every resolution at general meetings. Every member present in person or by proxy has, upon a poll, one vote for every share held. In the case of joint holders of a share the vote of the senior who tenders a vote, whether in person or by proxy, shall be accepted to the exclusion of the votes of the other joint holders and, for this purpose, seniority shall be determined by the order in which the names stand in the Register of Members in respect of the joint holdings.
The Directors present their report, together with the audited accounts of Computacenter plc and its subsidiary companies (the Group) for the year ended 31 December 2021.
Computacenter plc is incorporated as a public limited company and is registered in England and Wales with the registered number 3110569. Computacenter plc’s registered office address is Hatfield Avenue, Hatfield, Hertfordshire, AL10 9TW. The Company’s registrar is Equiniti Limited, which is situated at Aspect House, Spencer Road, Lancing, West Sussex, BN99 6DA.
The pages from the inside front cover to 131 of this Annual Report and Accounts are incorporated by reference into the Directors’ Report, which has been drawn up and presented in accordance with English company law, and the liabilities of the Directors in connection with that report shall be subject to the limitations and restrictions provided by such law.
Strategic ReportThe Companies Act 2006 requires the Group to prepare a Strategic Report, which commences at the start of this Annual Report and Accounts up to page 85. The Strategic Report includes information about the Group’s operations and business model, particulars of all important events affecting the Company or its subsidiaries, the Group’s financial performance in the year and likely future developments, strategic priorities, principal risks and information regarding the Group’s sustainability strategy.
Corporate governanceUnder Disclosure and Transparency Rule 7.2, the Company is required to include a Corporate Governance Report within the Directors’ Report.
Information on our corporate governance practices can be found in the Corporate Governance Report on pages 90 to 94, and the reports of the Audit, Remuneration and Nomination Committees on pages 99, 106 and 95 respectively, all of which are incorporated into the Directors’ Report by reference.
Management ReportThis Directors’ Report, together with the other reports, forms the Management Report for the purposes of Disclosure and Transparency Rule 4.1.8.
Dividend rightsShareholders may by ordinary resolution declare dividends, but the amount of the dividend may not exceed the amount recommended by the Board.
Transfer of sharesThere are no specific restrictions on the size of a holding, nor on the transfer of shares which are both governed by the general provisions of the Company’s Articles and prevailing legislation. The Directors are not aware of any agreements between holders of the Company’s shares that may result in restrictions on the transfer of securities or on voting rights at any meeting of the Company.
A copy of the Articles of Association is available on the Company’s website at investors.computacenter.com.
Stakeholder engagement The Board is aware that its actions and decisions impact our stakeholders. Effective engagement with stakeholders is important for the Group. In order to comply with section 172 of the Companies Act 2006, each Director is required to act in a way that he or she considers will promote the success of the Company whilst taking into account the interests of stakeholders. The Directors must also include a statement in the Annual Report and Accounts explaining how they have discharged this duty during the year. The Group’s key stakeholders are identified on pages 66 and 69 of the Strategic Report and the statement of compliance with Section 172 is set out on page 65.
Directors and Directors’ authorityThe Directors who served during the year ended 31 December 2021 were Tony Conophy, Pauline Campbell, Rene Haas, Philip Hulme, Ljiljana Mitic, Mike Norris, Peter Ogden, Minnow Powell, Ros Rivaz and Peter Ryan. Biographical details of each Director, as at 31 December 2021, are given on pages 88 and 89.
The Company’s Articles of Association require that at each AGM, those Directors who were appointed since the last AGM retire, as well as one-third of the Directors who have been the longest serving. The Board has decided, in accordance with the Code, that all Directors will retire at each forthcoming AGM and offer themselves for re-election. The Nomination Committee has considered each Director who is standing for re-election and recommends their re-election. Further details on the Committee’s recommendations for the re-election of the Directors are set out in the Notice of AGM, which summarises the skills and experience that the Directors bring to the Board.
Directors’ report
126

Subject to applicable law and the Company’s Articles of Association, the Directors may exercise all of the powers of the Company. The Company’s Articles of Association provide for a Board of Directors consisting of between three and 20 Directors, who manage the business and affairs of the Company. The Directors may appoint additional or replacement Directors, who shall serve until the following AGM of the Company, at which point they will be required to stand for election by the members. A Director may be removed from office by the Company as provided for by applicable law, in certain circumstances set out in the Company’s Articles of Association, and at a general meeting of the Company, by the passing of an Ordinary Resolution (provided special notice has been given in accordance with the Companies Act 2006).
Members have previously approved a resolution to give the Directors authority to allot shares, and a renewal of this authority is proposed at the 2022 AGM. This authority allows the Directors to allot shares up to the maximum amount stated in the Notice of AGM (approximately one-third of the issued share capital). In addition, the Company may not allot shares for cash (unless pursuant to an
employee share scheme) without first making an offer to existing shareholders in proportion to their existing holdings. This is known as rights of pre-emption. Two resolutions allowing a limited waiver of these rights were passed by the members at last year’s AGM.
Members also approved a resolution giving delegated authority allowing the Company to make market purchases of its own shares, up to a maximum of 10 per cent of the Company’s issued share capital, subject to certain conditions including price of purchase, amongst others. Each of these standard authorities will expire on the earlier of 30 June 2022 or the conclusion of the Company’s 2022 AGM. The Directors will seek to renew each of the authorities at the 2022 AGM, and full details are provided in the Notice of AGM. As at 28 February 2022, none of these authorities approved by shareholders at the 2021 AGM had been exercised.
Directors’ indemnitiesThe Company has executed deeds of indemnity with each of the Directors. These deeds contain qualifying third-party indemnity provisions, indemnifying the Directors to the extent permitted by law,
and remain in force at the date of this report. The indemnities are uncapped and cover all costs, charges, losses and liabilities the Directors may incur to third parties, in the course of acting as Directors of the Company or its subsidiaries. In addition, the Group maintains liability insurance for its Directors and officers.
Directors’ conflicts of interestThe Directors are required to notify the Company Secretary of any situations (appointments, holdings or otherwise), or any changes to such, which may give rise to an actual or potential conflict of interest with the Company. These notifications are then reviewed by the Board and recorded in a register maintained by the Company Secretary. If appropriate, they are then considered further by the Directors who are not conflicted, who may authorise the position. The register of notifications and authorisations is reviewed by the Board twice a year. Where the Board approves an actual or potential conflict, the conflicted Director cannot participate in any discussion or decision affected by the conflict.
Directors’ interests in sharesThe Directors’ interests in the Company’s share capital, at the start and end of the reporting period, were as follows:
As at 31 December 2021As at 1 January 2021
or date of appointment
Number of ordinary shares
Beneficial
Number of ordinary shares
Non-beneficial
Number of ordinary shares
Beneficial
Number of ordinary shares
Non-beneficial
Executive Directors
Mike Norris 1,134,214 – 1,119,504 –Tony Conophy 1,873,556 – 1,858,812 –Non-Executive Directors
Peter Ryan 900 – 900 –Pauline Campbell* – – N/A N/ARene Haas – – – – Philip Hulme 9,196,695 9,198,293 9,361,695 9,033,293Ljiljana Mitic – – – –Peter Ogden 18,699,389 8,103,356 18,699,389 8,103,356Minnow Powell* 1,340 – 1,340 – Ros Rivaz 2,181 – 1,382 –
* Pauline Campbell joined the Board on 16 August 2021 and Minnow Powell retired from the Board on 30 September 2021.
Major interests in shares and voting rightsAs at 31 December 2021, the Company had been notified under the FCA’s Disclosure and Transparency Rules of the following interests in its total voting rights, which are equal to or greater than three per cent:
Name of major shareholder Percentage of total voting rights held Date of notification
JPMorgan Asset Management (UK) Limited 5.44 13 December 2021JPMorgan Asset Management (UK) Limited 5.36 14 December 2021
Between 31 December 2021 and the date of this report, JP Morgan Asset Management (UK) Limited notified the Company on 11 January 2022 that its holding had decreased to an interest over 5.19 per cent of the Company’s total voting rights, as at the date of notification.
An updated list of the Company’s major shareholders, based on information available to the Company, is available at investors.computacenter.com.
127
Governance ReportAnnual Report and Accounts 2021

Directors’ Report continued
Capital structure and rights attaching to sharesAs at 28 February 2022, there were 122,687,970 fully paid ordinary shares in issue, of which the Company held 8,546,861 ordinary shares in treasury, representing 6.97 per cent of voting rights. The total number of voting rights in the Company, which shareholders may use as the denominator when calculating if they are required to notify their interest in the Company or a change to that interest, under the Disclosure and Transparency Rules, is therefore 114,141,109.
The rights attaching to each of the Company’s ordinary shares and deferred shares are set out in its Articles of Association. As at 28 February 2022, there were no deferred shares in issue.
The holders of ordinary shares are entitled, subject to applicable law and the Company’s Articles of Association, to:
• have shareholder documents made available to them, including notice of any general meetings of the Company; and
• to attend, speak and exercise voting rights at general meetings of the Company, either in person or by proxy.
There are no specific restrictions on the transfer of securities in the Company, which is governed by its Articles of Association and prevailing legislation. The Company is not aware of any arrangements between shareholders which may result in restrictions on the transfer of securities or other voting rights.
Pursuant to the Company’s share plans, there is an employee benefit trust which, as at the year end, held a total of 920,218 ordinary shares of 75/9 pence each, representing approximately 0.75 per cent of the issued share capital. During the year, the trust purchased a total of 988,355 shares, so it could satisfy the maturities occurring pursuant to these share option plans. When the trust holds shares before transferring them to participants then, in line with good practice, the Trustees do not exercise the associated voting rights. The Trustees also have a dividend waiver in place in respect of shares which are the beneficial property of the trust. During 2021, no ordinary shares in the Company were issued for cash to satisfy the exercise of options.
The employee share plans have change of control provisions that would be triggered if another entity or individual takes control of the Company. Participants may, in certain circumstances, be allowed to exchange their existing options for options of an equivalent value over shares in the acquiring company. Alternatively, the options may vest early. Early vesting under the executive schemes will generally be on a time-apportioned basis. Under the Sharesave scheme, employees will only be able to exercise their options to the extent that their accumulated savings allow at that time.
During the period, no ordinary shares were purchased for cancellation.
Significant agreements and relationshipsDetails regarding the status of the Group’s various borrowing facilities are provided in the Group Finance Director’s review on pages 75 to 78. These agreements each include a change of control provision, which may result in the facility being withdrawn or amended upon a change of control of the Company. The Group’s longer-term Services contracts may also contain change of control clauses that allow a counterparty to terminate the relevant contract in the event of a change of control of the Company.
The Company does not have any agreements with any Director or employee that would provide compensation for loss of office or employment resulting from a change of control on takeover, except in relation to the Company’s share schemes and plans, as described above.
Financial instrumentsThe Group’s financial risk management objectives and policies are discussed in the Group Finance Director’s review on page 76.
Related party transactionsInternal controls are in place to ensure that any related party transactions involving Directors or their connected persons are carried out on an arm’s length basis and are properly recorded and disclosed where appropriate.
Employee share schemesThe Company operates a Performance Share Plan (PSP) to incentivise employees. During the year, 361,350 ordinary shares of 75/9 pence each were conditionally awarded (2020: 647,430 shares). At the year end, 1,947,782 shares remained outstanding under this scheme (2020: 1,883,164 shares). During the year, 226,689 shares were transferred to participants and 70,043 shares lapsed. In addition, the Company operates a Sharesave scheme for the benefit of employees. As at the year end, 3,496,799 options granted under the Sharesave scheme remained outstanding (2020: 3,726,208).
On 21 March 2021, in accordance with the rules of the Computacenter 2017 Deferred Bonus Plan, the Company granted 23,369 conditional awards of ordinary shares of 75/9 pence each (2020: 48,606).
Corporate sustainable development and political donationsThe Board recognises that acting in a socially responsible way benefits the community, our customers, shareholders, the environment and employees alike. Further information can be found in the report on pages 44 to 51, which covers matters regarding health and safety, equal opportunities, employee involvement and employee development.
During the year, the Group did not make any political donations or incur any political expenditure within the meaning of Sections 362 to 379 of the Companies Act 2006.
128

Equal opportunitiesThe Group acknowledges the importance of equality and diversity and is committed to equal opportunities throughout the workplace. The Group’s policies for recruitment, training, career development and promotion of employees, are based purely on the suitability of the employee and give those who may be disabled equal treatment to their able-bodied colleagues. Where an employee becomes disabled after joining the Group, all efforts are made to enable that employee to continue in their current job. However, if, due to the specific circumstances, it is not possible for an employee to continue in their current job, they will be given suitable training for alternative employment within the Group or elsewhere.
The Group monitors and regularly reviews its policies and practices to ensure that it meets current legislative requirements, as well as its own internal standards. The Group is committed to making full use of the talents and resources of all its employees and to providing a healthy environment that encourages productive and mutually respectful working relationships. Policies dealing with equal opportunities are in place in all parts of the Group, which take account of the Group’s overall commitment and also address local regulatory requirements.
Employee involvement and developmentThe Group is committed to involving all employees in significant business issues, especially matters which affect their work and working environment. A variety of methods are used to engage with employees, including team briefings, intranet, email and in-house publications. The Group uses one or more of these channels to brief employees on the Group’s performance and the financial and economic factors affecting it. Team briefings are a primary method for engaging and consulting with employees, with managers tasked with ensuring regular information sharing, discussion and feedback.
Employee consultative forums exist in each Group country, to consult staff on major issues affecting employment and matters of policy, and to enable Management to seek employees’ views on a wide range of business matters. Where there are cross-jurisdictional issues to discuss, a European forum is engaged, made up of representatives from each country forum. The Senior Independent Director attends at least one meeting per year of this European forum, to engage directly with employee representatives and report a summary of this engagement to the Board.
The Group regularly reviews employees’ performance through a formal review process, to identify areas for development. Managers are responsible for setting and reviewing personal objectives, aligned to corporate and functional goals. The Board closely oversees and monitors Management skills and the development of talent, to meet the Group’s current and future needs. The Board directly monitors and closely reviews succession and plans for developing identified key senior managers.
The development of employee skills and careers, as well as the communication of the Group’s goals, are driven by our Winning Together processes and tools. Annual assessments via our Winning Together processes and tools are a formal requirement of all managers.
The Group operates a Save As You Earn (SAYE) share scheme for eligible employees, who are encouraged to save a fixed monthly sum for a period of either three and/or five years. When the scheme matures, participants can purchase shares in the Company at a price set at the start of the savings period.
Further information can be found in the report on pages 44 to 51 covering employee involvement and employee development, and in the Stakeholder Engagement section on page 67, which explains how the Company and Board have engaged with and considered employees.
Engagement with suppliers, customers and othersThe required disclosure on engagement with suppliers, customers and other stakeholders can be found in the Stakeholder Engagement section on pages 66 to 69.
Business ethicsThe Group Ethics policy commits employees to the highest standards of ethical behaviour in respect of customers, suppliers, colleagues and other stakeholders in the business. The policy includes a requirement for all employees to report abuses or non-conformance with the policy and sets out the procedures to be followed.
Going concernThe Directors’ statement regarding adoption of the going concern basis of accounting in preparation of the annual Consolidated Financial Statements is set out within the Strategic Report on page 78.
Viability StatementThe Directors’ statement regarding the long-term viability of the Company is set out within the Strategic Report on pages 78 to 79.
Greenhouse gas emissionsThe Company is required to state the annual quantity of emissions in tonnes of carbon dioxide equivalent from Group activities, and to provide details of its energy usage. Details can be found in the Strategic Report on pages 52 to 61. Further details of our environmental policies and programmes can be found on our corporate website computacenter.com. The Group’s disclosure in response to the Task Force on Climate-related Financial Disclosures can be found on pages 62 to 64.
AuditorA resolution to reappoint KPMG LLP as auditor of the Group was approved by the Company’s shareholders at the Company’s 2021 AGM.
Resolutions to reappoint KPMG LLP as the auditor of the Group, as well as to authorise the Directors to determine its remuneration for fulfilling that role, will be put to shareholders at the forthcoming 2022 AGM.
Disclosure of information to auditorThe Directors who held office as at the date of approval of this Directors’ Report confirm that, so far as they are aware, there is no relevant audit information of which the Company’s auditor is aware; and each Director has taken all of the steps that he/she ought to have taken as a Director to make himself/herself aware of any relevant audit information and to establish that the Company’s auditor is aware of that information.
Annual General MeetingThe Board currently intends to hold the AGM on 19 May 2022 at 11.30am. The arrangements for the Company’s 2022 AGM, and details of the resolutions to be proposed, together with explanatory notes, will be set out in the Notice of AGM to be published on the Company’s website.
129
Governance ReportAnnual Report and Accounts 2021

Directors’ Report continued
Listing rule (LR) disclosuresThe information required to be disclosed by LR 9.8.4R is set out below, along with cross references indicating where the relevant information is otherwise set out in the Annual Report and Accounts:
Interest capitalised N/APublication of unaudited financial information N/ADetails of performance share plans N/AWaiver of emoluments by a Director N/AWaiver of future emoluments by a Director N/ANon pre-emptive issues of equity for cash N/ANon pre-emptive issues of equity for cash in relation to major subsidiary undertakings
N/A
Contracts of significance Details of significant contracts are set out in the Group Finance Director’s review on pages 70 to 78. Details of transactions with related parties are set out on page 193 in note 34 to the Consolidated Financial Statements.
Provision of services by a controlling shareholder N/AShareholder waiver of dividends The Trustees of the Company’s employee share schemes have a dividend
waiver in place in respect of shares which are the beneficial property of each of the trusts.
Shareholder waiver of future dividends The Trustees of the Company’s employee share schemes have a dividend waiver in place in respect of shares which are the beneficial property of each of the trusts.
Agreements with controlling shareholder Any person who exercises or controls on their own or together with any person with whom they are acting in concert, 30 per cent or more of the votes able to be cast on all or substantially all matters at general meetings are known as ‘controlling shareholders’. The Financial Conduct Authority’s Listing Rules now require companies with controlling shareholders to enter into a written and legally binding agreement (a Relationship Agreement) which is intended to ensure that the controlling shareholder complies with certain ‘independence-related’ provisions. The Company confirms that it has undertaken a process following the reporting period to review whether it has any ‘controlling shareholders’. Following this process, it was determined that there was no requirement on the Company to enter into a Relationship Agreement with any of its shareholders. The Company confirms that this remained the case as at 31 December 2021, but will keep the matter under review.
MJ Norris FA ConophyChief Executive Officer Group Finance Director23 March 2022 23 March 2022
130

Directors’ Responsibilities
Statement of Directors’ Responsibilities in respect of the Annual Report and the Financial Statements The Directors are responsible for preparing the Annual Report and the Group and Parent Company financial statements in accordance with applicable law and regulations.
Company law requires the Directors to prepare Group and Parent Company financial statements for each financial year. Under that law they are required to prepare the Group financial statements in accordance with UK-adopted international accounting standards and applicable law and have elected to prepare the Parent Company financial statements in accordance with UK accounting standards and applicable law, including FRS 101 Reduced Disclosure Framework.
Under company law the directors must not approve the financial statements unless they are satisfied that they give a true and fair view of the state of affairs of the Group and Parent Company and of the Group’s profit or loss for that period. In preparing each of the Group and parent Company financial statements, the Directors are required to:
• select suitable accounting policies and then apply them consistently;
• make judgements and estimates that are reasonable, relevant and reliable;
• for the Group financial statements, state whether they have been prepared in accordance with UK-adopted international accounting standards;
• for the parent Company financial statements, state whether applicable UK accounting standards have been followed, subject to any material departures disclosed and explained in the parent Company financial statements;
• assess the Group and Parent Company’s ability to continue as a going concern, disclosing, as applicable, matters related to going concern; and
• use the going concern basis of accounting unless they either intend to liquidate the Group or the parent Company or to cease operations, or have no realistic alternative but to do so.
The Directors are responsible for keeping adequate accounting records that are sufficient to show and explain the Parent Company’s transactions and disclose with reasonable accuracy at any time the financial position of the Parent Company and enable them to ensure that its financial statements comply with the Companies Act 2006. They are responsible for such internal control as they determine is necessary to enable the preparation of financial statements that are free from material misstatement, whether due to fraud or error, and have general responsibility for taking such steps as are reasonably open to them to safeguard the assets of the Group and to prevent and detect fraud and other irregularities.
Under applicable law and regulations, the directors are also responsible for preparing a Strategic Report, Directors’ Report, Directors’ Remuneration Report and Corporate Governance Statement that complies with that law and those regulations.
The Directors are responsible for the maintenance and integrity of the corporate and financial information included on the company’s website. Legislation in the UK governing the preparation and dissemination of financial statements may differ from legislation in other jurisdictions.
Responsibility statement of the Directors in respect of the Annual Report and Accounts We confirm that to the best of our knowledge:
• the financial statements, prepared in accordance with the applicable set of accounting standards, give a true and fair view of the assets, liabilities, financial position and profit or loss of the Company and the undertakings included in the consolidation taken as a whole; and
• the Strategic Report and Directors’ Report include a fair review of the development and performance of the business and the position of the issuer and the undertakings included in the consolidation taken as a whole, together with a description of the principal risks and uncertainties that they face.
We consider the annual report and accounts, taken as a whole, is fair, balanced and understandable and provides the information necessary for shareholders to assess the Group’s position and performance, business model and strategy.
The Annual Report from inside front cover to page 131 was approved by the Board of Directors and authorised for issue on 23 March 2022 and signed for and on behalf of the Board by:
Mike Norris Tony ConophyChief Executive Group FinanceOfficer Director
131
Governance ReportAnnual Report and Accounts 2021

FINANCIALSTATEMENTS133 Independent Auditor’s Report to the
members of Computacenter plc140 Consolidated Income Statement141 Consolidated Statement of
Comprehensive Income142 Consolidated Balance Sheet143 Consolidated Statement of Changes
in Equity144 Consolidated Cash Flow Statement145 Notes to the Consolidated Financial
Statements194 Company Balance Sheet195 Company Statement of Changes in Equity196 Notes to the Company Financial
Statements202 Group five-year financial review202 Financial calendar203 Corporate information204 Principal offices
132

Independent Auditor’s Reportto the members of Computacenter plc
1. Our opinion is unmodifiedWe have audited the financial statements of Computacenter plc (“the Company”) for the year ended 31 December 2021 which comprise the Consolidated income statement, Consolidated statement of comprehensive income, Consolidated balance sheet, Consolidated statement of changes in equity, Consolidated cash flow statement, Company balance sheet and Company statement of changes in equity, and the related notes, including the accounting policies in note 2.
In our opinion:
• the financial statements give a true and fair view of the state of the Group’s and of the Parent Company’s affairs as at 31 December 2021 and of the Group’s profit for the year then ended;
• the Group financial statements have been properly prepared in accordance with UK-adopted international accounting standards;• the Parent Company financial statements have been properly prepared in accordance with UK accounting standards, including FRS 101
Reduced Disclosure Framework; and• the financial statements have been prepared in accordance with the requirements of the Companies Act 2006.
Basis for opinionWe conducted our audit in accordance with International Standards on Auditing (UK) (“ISAs (UK)”) and applicable law. Our responsibilities are described below. We believe that the audit evidence we have obtained is a sufficient and appropriate basis for our opinion. Our audit opinion is consistent with our report to the Audit Committee.
We were first appointed as auditor by the shareholders on 19 May 2015. The period of total uninterrupted engagement is for the seven financial years ended 31 December 2021. We have fulfilled our ethical responsibilities under, and we remain independent of the Group in accordance with, UK ethical requirements including the FRC Ethical Standard as applied to listed public interest entities. No non-audit services prohibited by that standard were provided.
Overview
Materiality: Group financial statements as a whole £12.0 million (2020: £9.0 million)4.8 per cent of profit before tax (2020: 4.7 per cent of normalised profit before tax)
Coverage 96 per cent of Group profit before tax (2020: 95 per cent of Group normalised profit before tax)Key audit matters vs 2020
Recurring risks Technology Sourcing bill and hold revenue cut-off < >
Recoverability of Parent Company’s investment in subsidiaries (Parent) < >
2. Key audit matters: our assessment of risks of material misstatementWhen planning our audit we made an assessment of the relative significance of the key risks of material misstatement to the Group financial statements initially without taking account of the effectiveness of controls implemented by the Group. As part of our audit planning procedures, we presented and discussed our initial assessment of key risks to the Audit Committee and subsequently discussed changes to our assessment. Our final risk map is shown below. We identified four key audit matters that were expected to have the greatest effect on our audit. Throughout our audit we continually reassess the significance of each of these key audit matters. Key audit matters are those matters that, in our professional judgement, were of most significance in the audit of the financial statements and include the most significant assessed risks of material misstatement (whether or not due to fraud) identified by us, including those which had the greatest effect on: the overall audit strategy; the allocation of resources in the audit; and directing the efforts of the engagement team. We summarise below, the key audit matters, in decreasing order of audit significance, in arriving at our audit opinion above together with our key audit procedures to address those matters and our findings from those procedures in order that the Company’s members as a body may better understand the process by which we arrived at our audit opinion. These matters were addressed, and our findings are based on procedures undertaken, in the context of, and solely for the purpose of, our audit of the financial statements as a whole, and in forming our opinion thereon, and consequently are incidental to that opinion, and we do not provide a separate opinion on these matters.
133
Financial StatementsAnnual Report and Accounts 2021
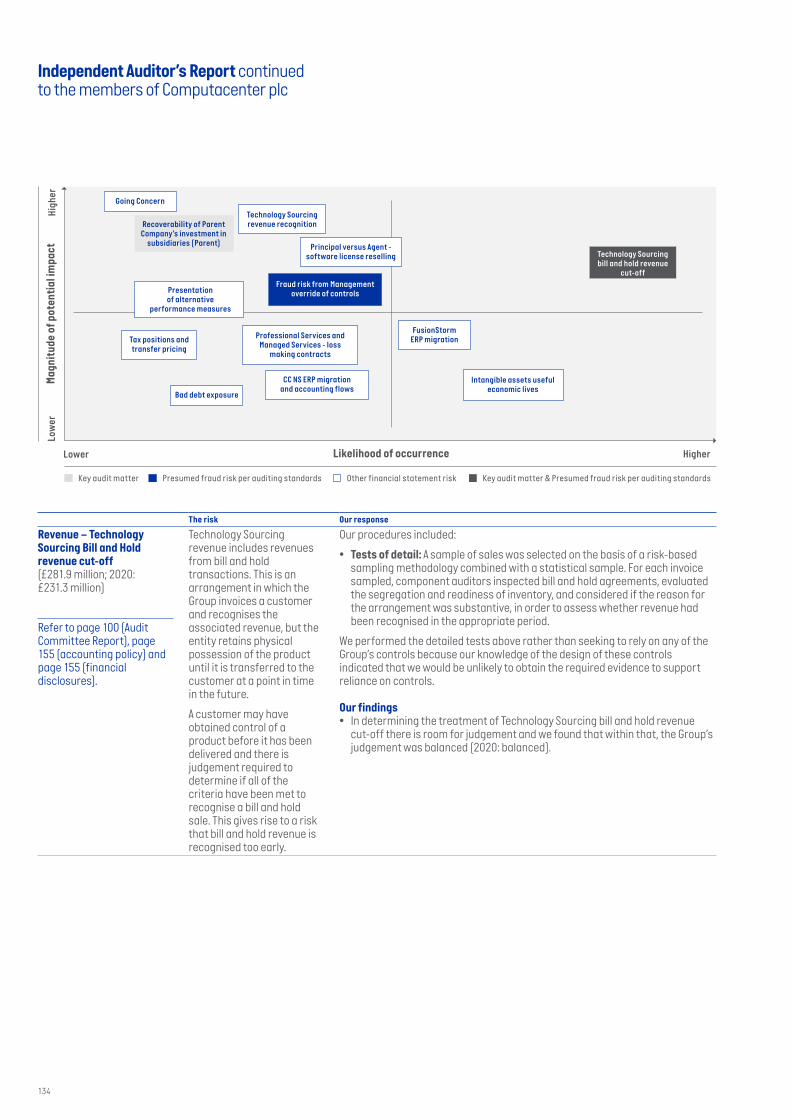
The risk Our response
Revenue – Technology Sourcing Bill and Hold revenue cut-off (£281.9 million; 2020: £231.3 million)
Refer to page 100 (Audit Committee Report), page 155 (accounting policy) and page 155 (financial disclosures).
Technology Sourcing revenue includes revenues from bill and hold transactions. This is an arrangement in which the Group invoices a customer and recognises the associated revenue, but the entity retains physical possession of the product until it is transferred to the customer at a point in time in the future.
A customer may have obtained control of a product before it has been delivered and there is judgement required to determine if all of the criteria have been met to recognise a bill and hold sale. This gives rise to a risk that bill and hold revenue is recognised too early.
Our procedures included:
• Tests of detail: A sample of sales was selected on the basis of a risk-based sampling methodology combined with a statistical sample. For each invoice sampled, component auditors inspected bill and hold agreements, evaluated the segregation and readiness of inventory, and considered if the reason for the arrangement was substantive, in order to assess whether revenue had been recognised in the appropriate period.
We performed the detailed tests above rather than seeking to rely on any of the Group’s controls because our knowledge of the design of these controls indicated that we would be unlikely to obtain the required evidence to support reliance on controls.
Our findings• In determining the treatment of Technology Sourcing bill and hold revenue
cut-off there is room for judgement and we found that within that, the Group’s judgement was balanced (2020: balanced).
Mag
nitu
de o
f pot
enti
al im
pact
Likelihood of occurrenceLower
Low
erHi
gher
Higher
Key audit matter
Intangible assets useful economic lives
Technology Sourcingbill and hold revenue
cut-off
Technology Sourcing revenue recognition
Principal versus Agent - software license reselling
Other financial statement riskPresumed fraud risk per auditing standards
Bad debt exposure
Tax positions and transfer pricing
Fraud risk from Management override of controls
FusionStorm ERP migrationProfessional Services and
Managed Services - loss making contracts
CC NS ERP migrationand accounting flows
Presentation of alternative
performance measures
Recoverability of Parent Company’s investment in
subsidiaries (Parent)
Going Concern
Key audit matter & Presumed fraud risk per auditing standards
Independent Auditor’s Report continuedto the members of Computacenter plc
134

The risk Our response
Recoverability of Parent Company’s investment in subsidiaries(£443.0 million; 2020: £397.1 million)
Refer to page 102 (Audit Committee Report), page 197 (accounting policy) and page 199 (financial disclosures).
Low risk, high value:The carrying amount of the Parent Company’s investments in subsidiaries represents 93.8 per cent (2020: 75 per cent) of the Company’s total assets. Their recoverability is not at a high risk of significant misstatement or subject to significant judgement. However, due to their materiality in the context of the Parent Company financial statements, this is considered to be the area that had the greatest effect on our overall Parent Company audit.
Our procedures included:
• Tests of detail: We compared the carrying amount of a sample of the highest value investments, representing 99.6 per cent (2020: 99.5 per cent) of the total investment balance, to the relevant subsidiaries’ draft balance sheets to identify whether their net assets, being an approximation of their minimum recoverable amount, were in excess of their carrying amount and assessing whether those subsidiaries have historically been profit-making.
• Assessing subsidiary audits: We assessed the work performed by component audit teams of those subsidiaries sampled where audits are performed and considered the results of that work on those subsidiaries’ profits and net assets.
• Our sector experience: For the investments where the carrying amount exceeded the net asset value, we compared the carrying amount of the investment with the expected value of the business based upon a discounted cash flow model.
We performed the tests above rather than seeking to rely on any of the Group’s controls because the nature of the balance meant that detailed testing is inherently the most effective means of obtaining audit evidence.
Our findings• We found the Group’s assessment of the recoverability of the investment in
subsidiaries to be balanced (2020: balanced).
We continue to perform procedures over Professional Services and Managed Services – loss-making contracts. However, as the existing onerous contract base matures and no new material loss-making contracts have arisen in the period, we have not assessed this as one of the most significant risks in our current year audit and, therefore, it is not separately identified in our report this year.
Last year, in response to a material acquisition in the period, we reported the valuation of Pivot Technology Solutions intangible assets as a key audit matter. As there are no material business acquisitions in the period, we have not identified this as a recurring risk of significant importance.
3. Our application of materiality and an overview of the scope of our auditMateriality for the Group financial statements as a whole was set at £12.0 million (2020: £9.0 million), determined with reference to a benchmark of Group profit before tax of £248.0 million (2020: £192.5 million normalised for the gain on acquisition of a subsidiary), of which it represents 4.8 per cent (2020: 4.7 per cent).
In addition, we applied materiality of £0.1 million (2020: £0.1 million) to related party transactions for which we believe misstatements of lesser amounts than materiality for the financial statements as a whole could be reasonably expected to influence the company’s assessment of the financial performance of the Group.
Materiality for the Parent Company financial statements as a whole was set at £2.5 million (2020: £2.5 million), determined with reference to a benchmark of Company total assets, of which it represents 0.5 per cent (2020: 0.5 per cent).
In line with our audit methodology, our procedures on individual account balances and disclosures were performed to a lower threshold, performance materiality, so as to reduce to an acceptable level the risk that individually immaterial misstatements in individual account balances add up to a material amount across the financial statements as a whole.
Performance materiality was set at 75 per cent (2020: 75 per cent) of materiality for the Group and Parent Company financial statements as a whole, which equates to £9 million (2020: £6.7 million) for the Group and £1.8 million (2020: £1.8 million) for the Parent company. We applied this percentage in our determination of performance materiality because we did not identify any factors indicating an elevated level of risk.
We agreed to report to the Audit Committee any corrected or uncorrected identified misstatements exceeding £0.6 million (2019: £0.45 million), in addition to other identified misstatements that warranted reporting on qualitative grounds.
Group profit before taxGroup profit before tax of £248.0 million (2020: Group profit before tax of £192.5 million, normalised to exclude an exceptional item)
Group materiality£12.0 million (2020: £9.0 million)
£12.0 million (2020: £9.0 million)Whole financial statements materiality
£0.6 million (2020: £0.45 million)Misstatements reported to the Audit Committee
£9.0 million (2020: £2.5 million to £6.5 million)Range of materiality at six (2020: six) components (£2.5 million to £8.0 million)
Group profit before tax, normalised to exclude an exceptional item
Group materiality
135
Financial StatementsAnnual Report and Accounts 2021
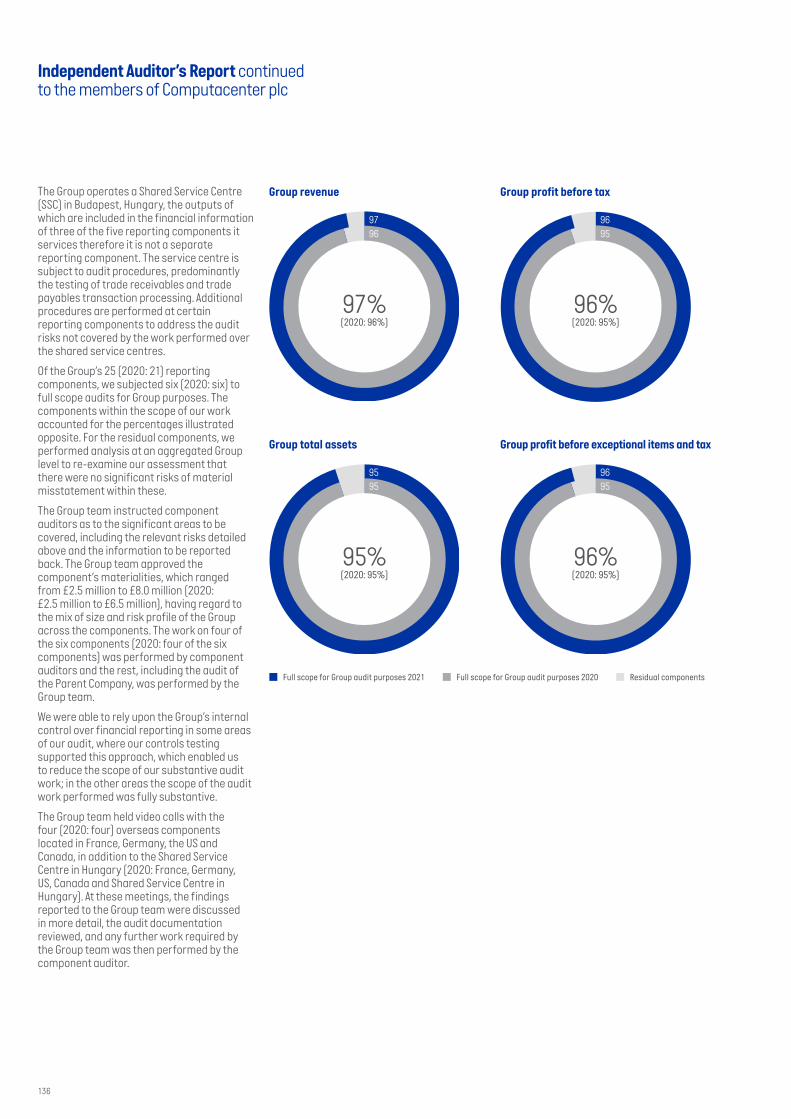
Independent Auditor’s Report continuedto the members of Computacenter plc
The Group operates a Shared Service Centre (SSC) in Budapest, Hungary, the outputs of which are included in the financial information of three of the five reporting components it services therefore it is not a separate reporting component. The service centre is subject to audit procedures, predominantly the testing of trade receivables and trade payables transaction processing. Additional procedures are performed at certain reporting components to address the audit risks not covered by the work performed over the shared service centres.
Of the Group’s 25 (2020: 21) reporting components, we subjected six (2020: six) to full scope audits for Group purposes. The components within the scope of our work accounted for the percentages illustrated opposite. For the residual components, we performed analysis at an aggregated Group level to re-examine our assessment that there were no significant risks of material misstatement within these.
The Group team instructed component auditors as to the significant areas to be covered, including the relevant risks detailed above and the information to be reported back. The Group team approved the component’s materialities, which ranged from £2.5 million to £8.0 million (2020: £2.5 million to £6.5 million), having regard to the mix of size and risk profile of the Group across the components. The work on four of the six components (2020: four of the six components) was performed by component auditors and the rest, including the audit of the Parent Company, was performed by the Group team.
We were able to rely upon the Group’s internal control over financial reporting in some areas of our audit, where our controls testing supported this approach, which enabled us to reduce the scope of our substantive audit work; in the other areas the scope of the audit work performed was fully substantive.
The Group team held video calls with the four (2020: four) overseas components located in France, Germany, the US and Canada, in addition to the Shared Service Centre in Hungary (2020: France, Germany, US, Canada and Shared Service Centre in Hungary). At these meetings, the findings reported to the Group team were discussed in more detail, the audit documentation reviewed, and any further work required by the Group team was then performed by the component auditor.
9796
97%(2020: 96%)
Group revenue
9695
96%(2020: 95%)
Group profit before tax
9595
95%(2020: 95%)
Group total assets
9695
96%(2020: 95%)
Group profit before exceptional items and tax
Full scope for Group audit purposes 2021 Residual componentsFull scope for Group audit purposes 2020
136

4. The impact of climate change on our auditIn planning our audit we have considered the potential impacts of climate change on the Group’s business and its financial statements.
The Group’s business model does not include extractive or high pollutive activities that are a significant contributor to climate change. The Group’s main exposure to climate risk is the shifting expectations from business stakeholders to transition to low-carbon supply chains and greater emphasis on climate related disclosures and in the annual report, and severe weather events disrupting key service delivery locations.
As part of our audit we made enquires of management and inspected minutes from the Climate Risk Committee meetings held throughout the year, to understand the Group’s assessment and preparedness for climate change. We have performed a risk assessment on how the impact of climate change may affect the financial statements and our audit, and taking into account headroom on goodwill and nature of the Group’s assets and liabilities, there was no significant impact on our key audit matters, including impairment forecasts, or key areas of our audit.
We have also read the Group’s and Parent Company’s disclosure of climate related information in the front half of the annual report as set out on pages 62 to 64 and considered consistency with the financial statements and our audit knowledge.
5. Going concernThe Directors have prepared the financial statements on the going concern basis as they do not intend to liquidate the Company or the Group or to cease their operations, and as they have concluded that the Company’s and the Group’s financial position means that this is realistic. They have also concluded that there are no material uncertainties that could have cast significant doubt over their ability to continue as a going concern for at least a year from the date of approval of the financial statements (“the going concern period”).
We used our knowledge of the Group, its industry, and the general economic environment to identify the inherent risks to its business model and analysed how those risks might affect the Group’s and Company’s financial resources or ability to continue operations over the going concern period. The risk that we considered most likely to adversely affect the Group’s and Company’s available financial resources over this period was lower than expected trading volumes.
We considered whether these risks could plausibly affect the liquidity in the going concern period by comparing severe, but plausible downside scenarios that could arise from these risks individually and collectively against the level of available financial resources indicated by the Group’s financial forecasts.
We considered whether the going concern disclosure in note 2.1 to the financial statements gives a full and accurate description of the Directors’ assessment of going concern, including the identified risks and related sensitivities.
Our conclusions based on this work:
• we consider that the directors’ use of the going concern basis of accounting in the preparation of the financial statements is appropriate;
• we have not identified, and concur with the directors’ assessment that there is not, a material uncertainty related to events or conditions that, individually or collectively, may cast significant doubt on the Group’s or Company’s ability to continue as a going concern for the going concern period;
• we have nothing material to add or draw attention to in relation to the directors’ statement on page 129 of the financial statements on the use of the going concern basis of accounting with no material uncertainties that may cast significant doubt over the Group and Company’s use of that basis for the going concern period, and we found the going concern disclosure in note 2.1 to be acceptable; and
• the related statement under the Listing Rules set out on page 130 is materially consistent with the financial statements and our audit knowledge.
However, as we cannot predict all future events or conditions and as subsequent events may result in outcomes that are inconsistent with judgements that were reasonable at the time they were made, the above conclusions are not a guarantee that the Group or the Company will continue in operation.
6. Fraud and breaches of laws and regulations – ability to detect
Identifying and responding to risks of material misstatement due to fraudTo identify risks of material misstatement due to fraud (“fraud risks”) we assessed events or conditions that could indicate an incentive or pressure to commit fraud or provide an opportunity to commit fraud. Our risk assessment procedures included:
• Enquiring of directors, the audit committee, internal audit and other key management personnel, and inspection of policy documentation as to the Group’s high-level policies and procedures to prevent and detect fraud, including the internal audit function as well as whether they have knowledge of any actual, suspected or alleged fraud.
• Reading Board meeting minutes and attending audit committee meetings.
• Reading and considering the content of remuneration incentive schemes and performance targets for management, directors, and sales staff, including the EPS target for management remuneration.
• Using analytical procedures to identify any unusual or unexpected relationships.
We communicated identified fraud risks throughout the audit team and remained alert to any indications of fraud throughout the audit. This included communication from the Group to full scope component audit teams of relevant fraud risks identified at the Group level and request to full scope component audit teams to report to the Group audit team any instances of fraud that could give rise to a material misstatement at Group level.
As required by auditing standards, we performed procedures to address the risk of management override of controls and the risk of fraudulent revenue recognition, in particular the risk that Technology sourcing bill and hold sales are recorded in the wrong period and the risk that Group and component management may be in a position to make inappropriate accounting entries. On this audit we do not believe there is a fraud risk related to revenue recognition of Managed Services, Professional Services and non-bill and hold Technology Sourcing because the revenue recognition policy is simple and involves a low degree of estimation and judgement.
We did not identify any additional fraud risks.
Further detail in respect of Technology Sourcing Bill and Hold sales is set out in the key audit matter disclosures in section 2 of this report.
137
Financial StatementsAnnual Report and Accounts 2021

We also performed procedures including:
• Identifying journal entries to test for all full scope components based on risk criteria and comparing the identified entries to supporting documentation. These included those posted to unusual accounts, those with unusual descriptions, and round number adjustments to provisions.
• Assessing whether the judgements made in making recognising revenue are indicative of a potential bias.
Identifying and responding to risks of material misstatement due to non-compliance with laws and regulationsWe identified areas of laws and regulations that could reasonably be expected to have a material effect on the financial statements from our general commercial and sector experience, and through discussion with the directors and other management (as required by auditing standards). We also discussed with the directors and other management the policies and procedures regarding compliance with laws and regulations.
As the Group is regulated, our assessment of risks involved gaining an understanding of the control environment including the entity’s procedures for complying with regulatory requirements.
We communicated identified laws and regulations throughout our team and remained alert to any indications of non-compliance throughout the audit. This included communication from the Group to full-scope component audit teams of relevant laws and regulations identified at the Group level, and a request for full scope component auditors to report to the Group team any instances of non-compliance with laws and regulations that could give rise to a material misstatement at the Group level.
The potential effect of these laws and regulations on the financial statements varies considerably.
Firstly, the Group is subject to laws and regulations that directly affect the financial statements including financial reporting legislation (including related companies legislation), distributable profits legislation, pension legislation, company legislation, climate regulation, and taxation legislation, and we assessed the extent of compliance with these laws and regulations as part of our procedures on the related financial statement items.
Secondly, the Group is subject to many other laws and regulations where the consequences of non-compliance could have a material effect on amounts or disclosures in the financial statements, for instance through the imposition of fines or litigation. We identified the following areas as those most likely to have such an effect: export legislation, GDPR compliance, health and safety, contract legislation, anti-bribery, employment law, and certain aspects of company and environmental legislation, recognising the nature of the Group’s activities to export IT hardware and provide global IT services. Auditing standards limit the required audit procedures to identify non-compliance with these laws and regulations to enquiry of the directors and other management, and inspection of regulatory and legal correspondence, if any. Therefore if a breach of operational regulations is not disclosed to us or evident from relevant correspondence, an audit will not detect that breach.
Context of the ability of the audit to detect fraud or breaches of law or regulationOwing to the inherent limitations of an audit, there is an unavoidable risk that we may not have detected some material misstatements in the financial statements, even though we have properly planned and performed our audit in accordance with auditing standards. For example, the further removed non-compliance with laws and regulations is from the events and transactions reflected in the financial statements, the less likely the inherently limited procedures required by auditing standards would identify it.
In addition, as with any audit, there remained a higher risk of non-detection of fraud, as these may involve collusion, forgery, intentional omissions, misrepresentations, or the override of internal controls. Our audit procedures are designed to detect material misstatement. We are not responsible for preventing non-compliance or fraud and cannot be expected to detect non-compliance with all laws and regulations.
7. We have nothing to report on the other information in the Annual ReportThe directors are responsible for the other information presented in the Annual Report together with the financial statements. Our opinion on the financial statements does not cover the other information and, accordingly, we do not express an audit opinion or, except as explicitly stated below, any form of assurance conclusion thereon.
Our responsibility is to read the other information and, in doing so, consider whether, based on our financial statements audit work, the information therein is materially misstated or inconsistent with the financial statements or our audit knowledge. Based solely on that work we have not identified material misstatements in the other information.
Strategic report and directors’ reportBased solely on our work on the other information:
• we have not identified material misstatements in the strategic report and the directors’ report;
• in our opinion the information given in those reports for the financial year is consistent with the financial statements; and
• in our opinion those reports have been prepared in accordance with the Companies Act 2006.
Directors’ remuneration reportIn our opinion the part of the Directors’ Remuneration Report to be audited has been properly prepared in accordance with the Companies Act 2006.
Disclosures of emerging principal risks and longer-term viabilityWe are required to perform procedures to identify whether there is a material inconsistency between the directors’ disclosures in respect of principal risks and the viability statement, and the financial statements and our audit knowledge.
Based on those procedures, we have nothing material to add or draw attention to in relation to:
• the directors’ confirmation within the viability statement on page 78 that they have carried out a robust assessment of the principal risks facing the Group, including those that would threaten its business model, future performance, solvency and liquidity;
• the Principal Risks and Uncertainties disclosures describing these risks and explaining how they are being managed and mitigated; and
• the directors’ explanation in the viability statement of how they have assessed the prospects of the Group, over what period they have done so and why they considered that period to be appropriate, and their statement as to whether they have a reasonable expectation that the Group will be able to continue in operation and meet its liabilities as they fall due over the period of their assessment, including any related disclosures drawing attention to any necessary qualifications or assumptions.
Independent Auditor’s Report continuedto the members of Computacenter plc
138

We are also required to review the viability statement, set out on pages 78 to 79 under the Listing Rules. Based on the above procedures, we have concluded that the above disclosures are materially consistent with the financial statements and our audit knowledge.
Our work is limited to assessing these matters in the context of only the knowledge acquired during our financial statements audit. As we cannot predict all future events or conditions and as subsequent events may result in outcomes that are inconsistent with judgements that were reasonable at the time they were made, the absence of anything to report on these statements is not a guarantee as to the Group’s and Company’s longer-term viability.
Corporate governance disclosures We are required to perform procedures to identify whether there is a material inconsistency between the directors’ corporate governance disclosures and the financial statements and our audit knowledge.
Based on those procedures, we have concluded that each of the following is materially consistent with the financial statements and our audit knowledge:
• the directors’ statement that they consider that the annual report and financial statements taken as a whole is fair, balanced and understandable, and provides the information necessary for shareholders to assess the Group’s position and performance, business model and strategy;
• the section of the annual report describing the work of the Audit Committee, including the significant issues that the audit committee considered in relation to the financial statements, and how these issues were addressed; and
• the section of the annual report that describes the review of the effectiveness of the Group’s risk management and internal control systems.
We are required to review the part of the Corporate Governance Statement relating to the Group’s compliance with the provisions of the UK Corporate Governance Code specified by the Listing Rules for our review. We have nothing to report in these respects.
8. We have nothing to report on the other matters on which we are required to report by exception Under the Companies Act 2006, we are required to report to you if, in our opinion:
• adequate accounting records have not been kept by the Parent Company, or returns adequate for our audit have not been received from branches not visited by us; or
• the Parent Company financial statements and the part of the Directors’ Remuneration Report to be audited are not in agreement with the accounting records and returns; or
• certain disclosures of directors’ remuneration specified by law are not made; or
• we have not received all the information and explanations we require for our audit.
We have nothing to report in these respects.
9. Respective responsibilitiesDirectors’ responsibilitiesAs explained more fully in their statement set out on page 131, the directors are responsible for: the preparation of the financial statements including being satisfied that they give a true and fair view; such internal control as they determine is statements that are free from material misstatement, whether due to fraud or error; assessing the Group and Parent Company’s ability to continue as a going concern, disclosing, as applicable, matters related to going concern; and using the going concern basis of accounting unless they either intend to liquidate the Group or the Parent Company or to cease operations, or have no realistic alternative but to do so.
Auditor’s responsibilitiesOur objectives are to obtain reasonable assurance about whether the financial statements as a whole are free from material misstatement, whether due to fraud or error, and to issue our opinion in an auditor’s report. Reasonable assurance is a high level of assurance, but does not guarantee that an audit conducted in accordance with ISAs (UK) will always detect a material misstatement when it exists. Misstatements can arise from fraud or error and are considered material if, individually or in aggregate, they could reasonably be expected to influence the economic decisions of users taken on the basis of the financial statements.
A fuller description of our responsibilities is provided on the FRC’s website at www.frc.org.uk/auditorsresponsibilities.
10. The purpose of our audit work and to whom we owe our responsibilities This report is made solely to the Company’s members, as a body, in accordance with Chapter 3 of Part 16 of the Companies Act 2006 and the terms of our engagement by the Company. Our audit work has been undertaken so that we might state to the Company’s members those matters we are required to state to them in an auditor’s report, and the further matters we are required to state to them in accordance with the terms agreed with the Company, and for no other purpose. To the fullest extent permitted by law, we do not accept or assume responsibility to anyone other than the Company and the Company’s members, as a body, for our audit work, for this report, or for the opinions we have formed.
David Neale (Senior Statutory Auditor)for and on behalf of KPMG LLP, Statutory AuditorChartered Accountants15 Canada SquareLondonE14 5GL23 March 2022
139
Financial StatementsAnnual Report and Accounts 2021
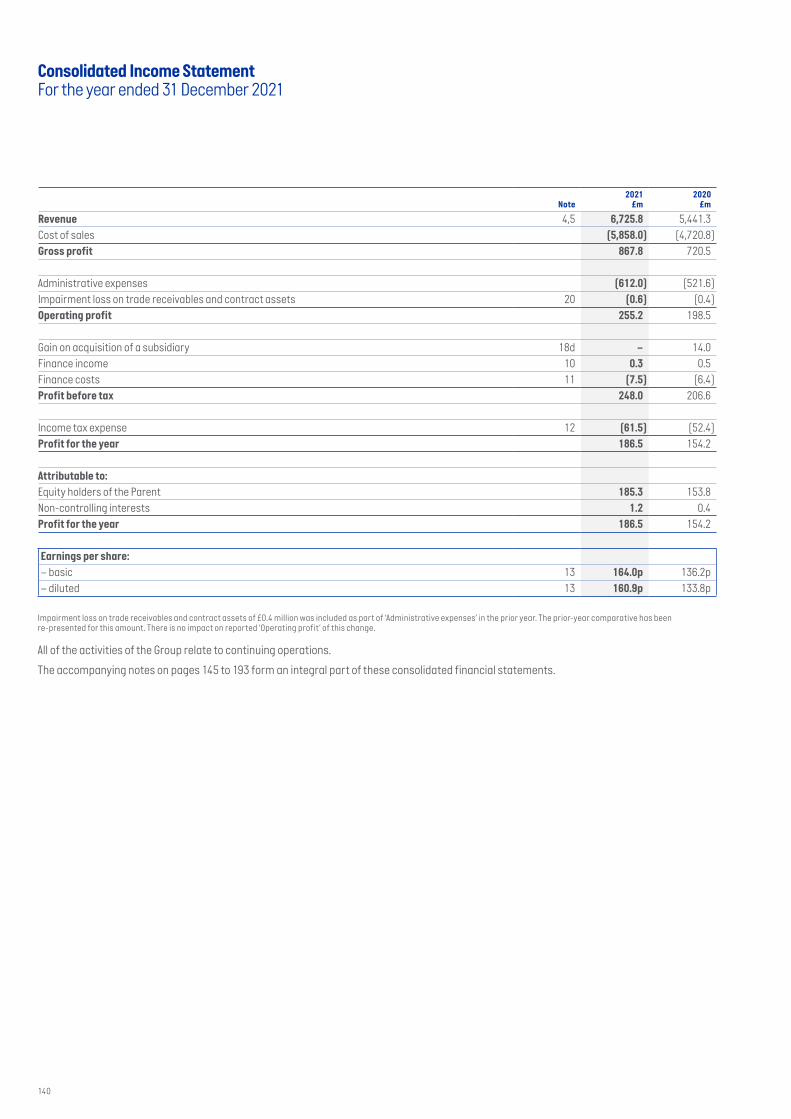
Note2021
£m2020
£m
Revenue 4,5 6,725.8 5,441.3 Cost of sales (5,858.0) (4,720.8)Gross profit 867.8 720.5
Administrative expenses (612.0) (521.6)Impairment loss on trade receivables and contract assets 20 (0.6) (0.4)Operating profit 255.2 198.5
Gain on acquisition of a subsidiary 18d – 14.0 Finance income 10 0.3 0.5 Finance costs 11 (7.5) (6.4)Profit before tax 248.0 206.6
Income tax expense 12 (61.5) (52.4)Profit for the year 186.5 154.2
Attributable to:
Equity holders of the Parent 185.3 153.8Non-controlling interests 1.2 0.4Profit for the year 186.5 154.2
Earnings per share:
– basic 13 164.0p 136.2p– diluted 13 160.9p 133.8p
Impairment loss on trade receivables and contract assets of £0.4 million was included as part of ‘Administrative expenses’ in the prior year. The prior-year comparative has been re-presented for this amount. There is no impact on reported ‘Operating profit ’ of this change.
All of the activities of the Group relate to continuing operations.
The accompanying notes on pages 145 to 193 form an integral part of these consolidated financial statements.
Consolidated Income StatementFor the year ended 31 December 2021
140

Note2021
£m2020
£m
Profit for the year 186.5 154.2
Items that may be reclassified to the Consolidated Income Statement:Loss arising on cash flow hedge (0.9) (1.9)Income tax effect 0.2 0.3
(0.7) (1.6)Exchange differences on translation of foreign operations (9.6) 3.2
(10.3) 1.6 Items not to be reclassified to the Consolidated Income Statement:Remeasurement of defined benefit plan 33 1.2 (4.3)Other comprehensive expense for the year, net of tax (9.1) (2.7)
Total comprehensive income for the year 177.4 151.5
Attributable to:
Equity holders of the Parent 176.2 151.1Non-controlling interests 1.2 0.4 Total comprehensive income for the year 177.4 151.5
The accompanying notes on pages 145 to 193 form an integral part of these consolidated financial statements.
Consolidated Statement of Comprehensive IncomeFor the year ended 31 December 2021
141
Financial StatementsAnnual Report and Accounts 2021

Note2021
£m2020
£m
Non-current assetsProperty, plant and equipment 15 90.0 107.0Right-of-use assets 15 138.1 129.6Intangible assets 16 273.7 274.7Investment in associate 18a 0.1 0.1 Deferred income tax assets 12d 30.2 10.1 Prepayments 5 16.6 23.6
548.7 545.1 Current assetsInventories 19 341.3 211.3 Trade and other receivables 20 1,275.2 1,095.9 Income tax receivable 8.8 10.0 Prepayments 5 103.0 102.8 Accrued income 5 148.1 125.4 Derivative financial instruments 24 3.6 1.6 Cash and short-term deposits 21 285.2 309.8
2,165.2 1,856.8 Total assets 2,713.9 2,401.9
Current liabilitiesBank overdraft 21 12.0 –Trade and other payables 22 1,410.4 1,116.7 Deferred income 5 249.3 273.9 Financial liabilities 23a 15.1 105.5Lease liabilities 23b 43.0 41.7Derivative financial instruments 24 2.5 5.1 Income tax payable 47.9 39.2 Provisions 26 3.5 4.1
1,783.7 1,586.2 Non-current liabilities Financial liabilities 23a 16.7 15.7Lease liabilities 23b 103.1 95.8Deferred income 5 8.3 18.6 Retirement benefit obligation* 33 21.8 23.3Provisions* 26 9.7 12.5 Deferred income tax liabilities 12d 25.8 18.9
185.4 184.8 Total liabilities 1,969.1 1,771.0 Net assets 744.8 630.9
Capital and reservesIssued share capital 29 9.3 9.3 Share premium 29 4.0 4.0 Capital redemption reserve 29 75.0 75.0 Own shares held 29 (115.5) (111.7)Translation and hedging reserve 29 5.4 15.7Retained earnings 762.3 635.5 Shareholders’ equity 740.5 627.8 Non-controlling interests 29 4.3 3.1Total equity 744.8 630.9
* Retirement benefit obligation of £23.3 million was included as part of ‘Provisions’ in the prior year. The prior-year comparative has been re-presented for this amount. There is no impact on reported ‘Non-current liabilities’ and ‘Net assets’ from this change.
The accompanying notes on pages 145 to 193 form an integral part of these consolidated financial statements.
Approved by the Board on 23 March 2022.
MJ Norris FA ConophyChief Executive Officer Group Finance Director
Consolidated Balance SheetAs at 31 December 2021
142

Attributable to equity holders of the Parent
Share-holders’
equity£m
Non- controlling
interests£m
Total equity
£m
Issued share
capital£m
Share premium
£m
Capitalredemption
reserve£m
Ownshares
held£m
Translation and hedging
reserves£m
Retained earnings
£m
At 1 January 2021 9.3 4.0 75.0 (111.7) 15.7 635.5 627.8 3.1 630.9
Profit for the year – – – – – 185.3 185.3 1.2 186.5
Other comprehensive income/(expense) – – – – (10.3) 1.2 (9.1) – (9.1)
Total comprehensive income/(expense) – – – – (10.3) 186.5 176.2 1.2 177.4
Cost of share-based payments – – – – – 10.6 10.6 – 10.6
Tax on share-based payments – – – – – 7.6 7.6 – 7.6
Exercise of options – – – 21.7 – (15.5) 6.2 – 6.2
Purchase of own shares – – – (25.5) – – (25.5) – (25.5)
Equity dividends – – – – – (62.4) (62.4) – (62.4)
At 31 December 2021 9.3 4.0 75.0 (115.5) 5.4 762.3 740.5 4.3 744.8
At 1 January 2020 9.3 4.0 75.0 (113.6) 14.0 503.9 492.6 (0.1) 492.5 Relating to acquisition of subsidiary – – – – – – – 2.8 2.8Profit for the year – – – – – 153.8 153.8 0.4 154.2 Other comprehensive income/(expense) – – – – 1.7 (4.4) (2.7) – (2.7)Total comprehensive income – – – – 1.7 149.4 151.1 0.4 151.5Cost of share-based payments – – – – – 7.9 7.9 – 7.9 Tax on share-based payments – – – – – 3.4 3.4 – 3.4 Exercise of options – – – 20.9 – (15.2) 5.7 – 5.7 Purchase of own shares – – – (19.0) – – (19.0) – (19.0)Equity dividends – – – – – (13.9) (13.9) – (13.9)At 31 December 2020 9.3 4.0 75.0 (111.7) 15.7 635.5 627.8 3.1 630.9
The accompanying notes on pages 145 to 193 form an integral part of these consolidated financial statements.
Consolidated Statement of Changes in EquityFor the year ended 31 December 2021
143
Financial StatementsAnnual Report and Accounts 2021

Note2021
£m2020
£m
Operating activities
Profit before taxation 248.0 206.6Net finance cost 7.2 5.9 Depreciation of property, plant and equipment 15 24.8 24.0 Depreciation of right-of-use assets 15 50.6 45.2 Amortisation of intangible assets 16 15.3 14.6Share-based payments 10.6 8.0 Loss on disposal of intangibles 0.5 0.3(Gain)/loss on disposal of property, plant and equipment (1.3) 0.2Net cash flow from inventories (131.5) (50.4)Net cash flow from trade and other receivables (including contract assets) (238.5) 48.3Net cash flow from trade and other payables (including contract liabilities) 292.9 (26.2)Gain on acquisition of a subsidiary 18d – (14.0)Net cash flow from provisions (2.9) 1.9Other adjustments 1.8 0.1Cash generated from operations 277.5 264.5Income taxes paid (53.2) (27.6)Net cash flow from operating activities 224.3 236.9
Investing activities
Interest received 10 0.3 0.5Acquisition of subsidiaries, net of cash acquired 18 (2.5) (30.1)Purchases of property, plant and equipment 15 (18.8) (23.1)Purchases of intangible assets 16 (11.5) (4.4)Proceeds from disposal of property, plant and equipment 7.5 1.6Net cash flow from investing activities (25.0) (55.5)
Financing activities
Interest paid 11 (2.3) (1.9)Interest paid on lease liabilities 11 (5.2) (4.5)Dividends paid to equity shareholders of the Parent 14 (62.4) (13.9)Proceeds from share issues 6.2 5.7 Purchase of own shares (25.5) (19.0)Repayment of loans and credit facility (99.7) (20.0)Payment of capital element of lease liabilities 23b (50.2) (43.2)New borrowings – bank loan 10.7 0.3Net cash flow from financing activities (228.4) (96.5)
(Decrease)/increase in cash and cash equivalents (29.1) 84.9 Effect of exchange rates on cash and cash equivalents (7.5) 7.1 Cash and cash equivalents at the beginning of the year 21 309.8 217.8 Cash and cash equivalents at the year end 21 273.2 309.8
The accompanying notes on pages 145 to 193 form an integral part of these consolidated financial statements.
Consolidated Cash Flow StatementFor the year ended 31 December 2021
144

1 Authorisation of Consolidated Financial Statements and statement of compliance with IFRSThe Consolidated Financial Statements of Computacenter plc (Parent Company or the Company) and its subsidiaries (the Group) for the year ended 31 December 2021 were authorised for issue in accordance with a resolution of the Directors on 23 March 2022. The Consolidated Balance Sheet was signed on behalf of the Board by MJ Norris and FA Conophy. Computacenter plc is a limited company incorporated and domiciled in England whose shares are publicly traded.
2 Summary of significant accounting policiesThe accounting policies adopted are consistent with those of the previous financial year, as disclosed in the 2020 Annual Report and Accounts.
Effective for the year ending 31 December 2022 Apart from the potential changes discussed within note 3.2.1, no new standards, interpretations or amendments not yet effective are expected to have a material effect on the Group’s future financial statements.
2.1 Basis of preparation The Consolidated Financial Statements of the Company have been prepared in accordance with International Financial Reporting Standards (IFRS) as adopted by the United Kingdom and in conformity with the requirements of the Companies Act 2006.
The Consolidated Financial Statements are prepared on the historical cost basis, other than derivative financial instruments, which are stated at fair value.
The Consolidated Financial Statements are presented in pound sterling (£) and all values are rounded to the nearest hundred thousand, except when otherwise indicated.
In determining whether it is appropriate to prepare the Financial Statements on a ‘going concern’ basis, the Group prepares a three-year Plan (the ‘Plan’) annually by aggregating top down expectations of business performance across the Group in the second and third year of the Plan with a detailed 12-month ‘bottom-up’ budget for the first year, which was approved by the Board. The Plan is subject to rigorous downside sensitivity analysis which involves flexing a number of the main assumptions underlying the forecasts within the Plan. The forecast cash flows from the Plan are aggregated with the current position, to provide a total three-year cash position against which the impact of potential risks and uncertainties can be assessed. In the absence of significant external debt, the analysis also considers access to available committed and uncommitted finance facilities, the ability to raise new finance in most foreseeable market conditions and the ability to restrict dividend payments.
The Directors have identified a period of not less than 12 months as the appropriate period for the going concern assessment and have based their assessment on the relevant forecasts from the Plan for that period.
The potential impact of the principal risks and uncertainties, as set out on pages 80 to 85 of the 2021 Annual Report and Accounts, is then applied to the Plan. This assessment includes only those risks and uncertainties that, individually or in plausible combination, would threaten the Group’s business model, future performance, solvency or liquidity over the assessment period and which are considered to be severe but reasonable scenarios. It also takes into account an assessment of how the risks are managed and the effectiveness of any mitigating actions.
For the current year, the primary downside sensitivity relates to a modelled, but not predicted, severe downturn in the Group’s revenues, beginning in 2022, simulating a continued impact for some of our customers from the Covid-19 crisis, together with the Group’s revenues being impacted by supply shortages. This sensitivity analysis models a continued market downturn scenario, with slower than predicted recovery estimates, for some of our customers whose businesses have been affected by Covid-19 and a similar downturn occurring for the remainder of our customer base. A further impact on the Group’s Technology Sourcing revenues through 2022 from possible ongoing vendor-related supply shortage issues has also been included in the sensitivity analysis.
Our cash and borrowing capacity provides sufficient funds to meet the foreseeable needs of the Parent and Group. At 31 December 2021, the Group had cash and short-term deposits of £285.2 million and bank debt, primarily related to the recently built headquarters in Germany and operations in North America, of £43.8 million. The Group’s Pivot subsidiary has a revolving credit facility via JPMorgan Chase Bank, N.A. of US$100.0 million which can be used for revolving loans, letters of credit, and swing line loans. In addition, the Group has a committed facility of £60.0 million, which was extended in September 2020 and has an expiry date of 7 September 2023. The Group has never drawn on this committed facility.
The Group has a resilient balance sheet position, with net assets of £744.8 million as at 31 December 2021. The Group made a profit after tax of £186.5 million, and delivered net cash flows from operating activities of £224.3 million, for the year ended 31 December 2021.
As the analysis continues to show a strong forecast cash position, even under the severe economic conditions modelled in the sensitivity scenarios, the Directors continue to consider that the Parent and Group are well placed to manage business and financial risks in the current economic environment. Based on this assessment, the Directors confirm that they have a reasonable expectation that the Parent and Group will be able to continue in operation and meet their liabilities as they fall due over the period of not less than 12 months from the date of signing this Annual Report and Accounts and therefore have prepared the Financial Statements on a going concern basis.
Notes to the Consolidated Financial StatementsFor the year ended 31 December 2021
145
Financial StatementsAnnual Report and Accounts 2021

2 Summary of significant accounting policies continuedConsolidated Balance Sheet and Notes – As at 31 December 2020As at 31 December 2020, certain items relating to an operating lessor arrangement within the acquired Pivot business were incorrectly presented on the balance sheet as follows:
• An amount of £12.6 million was incorrectly presented as accrued income of £2.6 million and non-current deferred costs, within prepayments, of £10.0 million rather than as property, plant and equipment of £2.8 million, intangible assets – software of £4.6 million, accrued income of £1.1 million and non-current deferred costs, within prepayments, of £4.1 million.
• An amount of £11.9 million was incorrectly presented as current deferred income of £2.9 million and non-current deferred income of £9.0 million, rather than reflected as current financial liabilities of £2.2 million and non-current financial liabilities of £9.7 million.
• An amount of £15.3 million was incorrectly omitted from the disclosure of future amounts receivable under note 25 leases as a lessor.
Consolidated Cash Flow Statement for the year ended 31 December 2020In relation to the above, the contract relating to the operating lessor arrangement was entered into prior to the acquisition of Pivot, therefore the impact to the Consolidated Cash Flow Statement is limited to £0.4 million of financing repayments being incorrectly presented. This outflow was recognised within net cash flow from trade and other payables within the operating cashflow caption, instead of as a repayment of loans and credit facility within the financing cash flow caption.
Management has decided not to correct the prior year-end presentation of the differences relating to the above items, as they have no impact on the Consolidated Income Statement for the year ended 31 December 2020 and individual reclassifications are either not significant compared to the overall amount in the Consolidated Balance Sheet and/or Consolidated Cash Flow Statement captions affected by the mis-presentation or to the Consolidated Balance Sheet or Consolidated Cash Flow Statement itself. The revision has no impact on the operating profit, profit for the period, assets and liabilities or cash flows for the year ended 31 December 2021, where the correct accounting treatment has been adopted in the year.
2.2 Basis of consolidationThe Consolidated Financial Statements comprise the Financial Statements of the Parent Company and its subsidiaries as at 31 December each year. The Financial Statements of subsidiaries are prepared for the same reporting year as the Parent Company, using existing GAAP in each country of operation. Adjustments are made on consolidation for differences that may exist between the respective local GAAPs and IFRS.
All intra-Group balances, transactions, income and expenses and profit and losses resulting from intra-Group transactions have been eliminated in full.
Subsidiaries are consolidated from the date on which the Group obtains control and cease to be consolidated from the date on which the Group no longer retains control. Non-controlling interests represent the portion of profit or loss and net assets in subsidiaries that is not held by the Group and is presented separately from Parent shareholders’ equity in the Consolidated Balance Sheet.
2.2.1 Foreign currency translationEach entity in the Group determines its own functional currency and items included in the Financial Statements of each entity are measured using that functional currency. Transactions in foreign currencies are initially recorded in the functional currency at the exchange rate ruling at the date of the transaction or where relevant the rate of a specific forward exchange contract. Monetary assets and liabilities denominated in foreign currencies are retranslated at the functional currency rate of exchange ruling at the Consolidated Balance Sheet date. All differences are taken to the Consolidated Income Statement except foreign currency differences arising from the translation of qualifying cash flow hedges, which are recognised in the Consolidated Statement of Comprehensive Income, to the extent that the hedges are effective.
Non-monetary items that are measured in terms of historical cost in a foreign currency are translated using the exchange rate as at the date of initial transaction.
The functional currencies of the main overseas subsidiaries are euro (€), US dollar ($) and Swiss franc (CHF). The Group’s presentation currency is pound sterling. As at the reporting date, the assets and liabilities of these overseas subsidiaries are translated into the presentation currency of the Group at the rate of exchange ruling at the balance sheet date and their Consolidated Income Statements are translated at the average exchange rates for the year. Exchange differences arising on the retranslation are recognised in the Consolidated Statement of Comprehensive Income. On disposal of a foreign entity, the deferred cumulative amount recognised in the Consolidated Statement of Comprehensive Income relating to that particular foreign operation is recognised in the Consolidated Income Statement.
2.3 RevenueRevenue is recognised to the extent of the amount which is expected to be received from customers as consideration for the transfer of goods and services to the customer.
In multi-element contracts with customers where more than one good (Technology Sourcing) or service (Professional Services and Managed Services) is provided to the customer, analysis is performed to determine whether the separate promises are distinct performance obligations within the context of the contract. To the extent that this is the case, the transaction price is allocated between the distinct performance obligations based upon relative standalone selling prices. The revenue is then assessed for recognition purposes based upon the nature of the activity and the terms and conditions of the associated customer contract relating to that specific distinct performance obligation.
The following specific recognition criteria must also be met before revenue is recognised:
Notes to the Consolidated Financial Statements continuedFor the year ended 31 December 2021
146

2.3.1 Technology SourcingThe Group supplies hardware and software (together as ‘goods’) to customers that are sourced from and delivered by a number of suppliers.
Technology Sourcing revenue is recognised when the Group’s performance obligations are fulfilled at a point in time when control of the goods has been transferred to the customer. Typically, customers obtain control of the goods when they are delivered to and have been accepted at their premises, depending on individual customer arrangements. Invoices are routinely generated at that point in time and payment for the goods is generally received on, or before, industry-standard payment terms, ordinarily within 30 days. Refer to note 3.2.2 for ‘bill and hold’ transactions.
Revenue is recorded based on the price specified in sales invoices, net of any agreed discounts and rebates, and exclusive of value added tax on goods supplied to customers during the year.
There are a variety of discounts and rebates provided to customers, which are assessed on a case-by-case basis as to whether the resulting payment to customers is for a distinct good or service (such as marketing) or for a promotional discount.
Technology Sourcing principal versus agent recognitionManagement assesses the classification of certain revenue contracts for Technology Sourcing revenue recognition on either an agent or principal basis. Because the identification of the principal in a contract is not always clear and, for certain elements including standalone software licence sales and standalone resold third party service, the level of judgement required can be high with the outcomes of assessments finely balanced, Management makes a determination by evaluating the nature of our promise to our customer as to whether it is a performance obligation to provide the specified goods or services ourselves, in that we are the principal, or to arrange for those goods or services to be provided by the other party, where we are the agent. See note 3.2.1 Technology Sourcing principal versus agent recognition for further information on the critical judgement. We determine whether we are a principal or an agent for each specified good or service promised to the customer by evaluating the nature of our promise to the customer against a non-exhaustive list of indicators that a performance obligation could involve an agency relationship:
• evaluating who controls each specified good or service before that good or service is transferred to the customer; • the vendor retains primary responsibility for fulfilling the sale; • we take no inventory risk before or after the goods have been ordered, during shipping or on return; • we do not have discretion to establish pricing for the vendor’s goods, limiting the benefit we can receive from the sale of those goods; and • our consideration is in the form of a, usually predetermined, commission.
2.3.2 Professional ServicesThe Group provides skilled professionals to customers either operating within a project framework or on a ‘resource on demand’ basis.
For contracts operating within a project framework, revenue is recognised based on the transaction price with reference to the costs incurred as a proportion of the total estimated costs (percentage of completion basis) of the contract.
For those contracts which are ‘resource on demand’, revenue is billed on a timesheet basis. The Group elects to use the practical expedient in IFRS 15.B16, as we have a right to consideration from our ‘resource on demand’ Professional Services customers in an amount that corresponds directly with the value to our customer of the Group’s performance completed to date. The practical expedient applied permits the Group to recognise these ‘resource on demand’ Professional Services revenues in the amount to which the entity has a right to invoice. Professional Services revenue is therefore recognised throughout the term of the contract, as services are delivered, with amounts recognised based on monthly invoiced amounts, as this corresponds to the service delivered to the customer and the satisfaction of the Group’s performance obligations.
Under either basis, Professional Services revenue is recognised over time. The vast majority of the Group’s Professional Services revenue is constituted by ‘expert-leasing’ arrangements and recognised in this manner and represents the primary area of growth in this business line. As the majority of Professional Services revenue is recognised as ‘resource on demand’, the overall balance of risks to recognition for this business is decreased as compared to the scenario where the majority of Professional Services revenue would be recognised on a percentage of completion basis. This is due to the monthly timesheet nature of the billing which is agreed regularly with the customer as the service is delivered.
If the total estimated costs and revenues of a contract cannot be reliably estimated, revenue is recognised only to the extent that costs have been incurred and where the Group has an enforceable right to payment as work is being performed.
A provision for forecast excess costs over forecasted revenue is made as soon as a loss is foreseen (see note 2.12.1 for further detail).
Unbilled Professional Services revenue is classified as a contract asset and is included within accrued income in the Consolidated Balance Sheet.
Unearned Professional Services revenue is classified as a contract liability and is included within deferred income in the Consolidated Balance Sheet. Payment for the Services, which are invoiced monthly, is generally on industry standard payment terms.
2.3.3 Managed ServicesThe Group sells maintenance, support and management of customers’ IT infrastructures and operations.
The specific performance obligations and invoicing conditions in our Managed Services contracts are typically related to the number of calls, interventions or users that we manage and therefore the customer simultaneously receives and consumes the benefits of the services as they are performed. The Group elects to use the practical expedient in IFRS 15.B16, as we have a right to consideration from our Managed Services customers in an amount that corresponds directly with the value to our customer of the Group’s performance completed to date. The practical expedient applied permits the Group to recognise Managed Services revenue in the amount to which the entity has a right to invoice. Managed Services revenue is therefore recognised throughout the term of the contract, as services are delivered, with amounts recognised based on monthly invoiced amounts, as this corresponds to the service delivered to the customer and the satisfaction of the Group’s performance obligations.
147
Financial StatementsAnnual Report and Accounts 2021

2 Summary of significant accounting policies continuedUnbilled Managed Services revenue is classified as a contract asset and is included within accrued income in the Consolidated Balance Sheet.
Unearned Managed Services revenue is classified as a contract liability and is included within deferred income in the Consolidated Balance Sheet.
Amounts invoiced relating to more than one year are deferred and recognised over the relevant period. Payment for the services is generally on industry standard payment terms.
If the total estimated costs and revenues of a contract cannot be reliably estimated, revenue is recognised only to the extent that costs have been incurred and where the Group has an enforceable right to payment as work is being performed. A provision for forecast excess costs over forecasted revenue is made as soon as a loss is foreseen (see note 2.12.1 for further detail). On occasion, the Group may have a limited number of Managed Services contracts where revenue is recognised on a percentage of completion basis, which is determined by reference to the costs incurred as a proportion of the total estimated costs of the contract.
Costs of obtaining and fulfilling revenue contractsThe Group operates in a highly competitive environment and is frequently involved in contract bids with multiple competitors, with the outcome usually unknown until the contract is awarded and signed.
When accounting for costs associated with obtaining and fulfilling customer contracts, the Group first considers whether these costs fit within a specific IFRS standard or policy. Any costs associated with obtaining or fulfilling revenue contracts which do not fall into the scope of other IFRS standards or policies are considered under IFRS 15. All such costs are expensed as incurred other than the two types of costs noted below:
1. Win fees – The Group pays ‘win fees’ to certain employees as bonuses for successfully obtaining customer contracts. As these are incremental costs of obtaining a customer contract, they are deferred along with any associated payroll tax expense to the extent they are expected to be recovered. These balances are presented within prepayments in the Consolidated Balance Sheet. The win fee balance that will be realised after more than 12 months is disclosed as non-current.
2. Fulfilment costs – The Group often incurs costs upfront relating to the initial set-up phase of an outsourcing contract, which the Group refers to as Entry Into Service. These costs do not relate to a distinct performance obligation in the contract, but rather are accounted for as fulfilment costs under IFRS 15 as they are directly related to the future performance on the contract. They are therefore capitalised to the extent that they are expected to be recovered. These balances are presented within prepayments in the Consolidated Balance Sheet.
Both win fees and Entry Into Service costs are amortised on a straight-line basis over the contract term, as this is equivalent to the pattern of transfer of services to the customer over the contract term. The amortisation charges on win fees and Entry Into Service costs are recognised in the Consolidated Income Statement within administration expenses and cost of sales, respectively.
Any bid costs incurred by the Group’s Central Bid Management Engines are not capitalised or charged to the contract, but instead directly charged to selling, general and administrative expenses as they are incurred. These costs associated with bids are not separately identifiable nor can they be measured reliably as the Group’s internal bid teams work across multiple bids at any one time.
2.3.4 Finance incomeIncome is recognised as interest accrues.
2.4 Exceptional itemsThe Group presents those material items of income and expense as exceptional items which, because of the nature and expected infrequency of the events giving rise to them, merit separate presentation to allow shareholders to understand the elements of financial performance in the year, so as to facilitate comparison with prior years and to assess trends in financial performance.
2.5 Adjusted1 measuresThe Group uses a number of non-Generally Accepted Accounting Practice (non-GAAP) financial measures in addition to those reported in accordance with IFRS. The Directors believe that these non-GAAP measures, set out below, assist in providing additional useful information on the underlying trends, performance and position of the Group. The non-GAAP measures are also used to enhance the comparability of information between reporting periods by adjusting for non-recurring or uncontrollable factors which affect IFRS measures, to aid the user in understanding the Group’s performance.
Consequently, non-GAAP measures are used by the Directors and Management for performance analysis, planning, reporting and incentive setting purposes and have remained consistent with the prior year.
These non-GAAP measures comprise: adjusted administrative expenses, adjusted operating profit or loss, adjusted profit or loss before tax, adjusted tax, adjusted profit or loss for the year, adjusted earnings per share and adjusted diluted earnings per share. They are, as appropriate, each stated before: exceptional and other adjusting items including gain or loss on business disposals, gain or loss on disposal of investment properties, expenses related to material acquisitions, amortisation of acquired intangibles, utilisation of deferred tax assets (where initial recognition was as an exceptional item or a fair value adjustment on acquisition), and the related tax effect of these exceptional and other adjusting items, as Management does not consider these items when reviewing the underlying performance of the Segment or the Group as a whole.
A reconciliation to adjusted measures is provided on page 71 of the Group Finance Director’s review which details the impact of exceptional and other adjusting items when comparing to the non-GAAP financial measures, in addition to those reported in accordance with IFRS. Further detail is also provided within note 4, Segment information.
Notes to the Consolidated Financial Statements continuedFor the year ended 31 December 2021
148
2.6 Impairment of assetsThe Group assesses at each reporting date whether there is an indication that an asset may be impaired. If any such indication exists, or when annual impairment testing for an asset is required, the Group makes an estimate of the asset’s recoverable amount. Where an asset does not have independent cash flows, the recoverable amount is assessed for the cash-generating unit (CGU) to which it belongs. These assets are tested across an aggregation of CGUs that utilise the asset. The recoverable amount is the higher of the fair value less costs to sell and the value-in-use of the asset or CGU. Where the carrying amount of an asset exceeds its recoverable amount, the asset is considered impaired and is written down to its recoverable amount. In assessing value-in-use, the estimated future cash flows are discounted to their present value using a post-tax discount rate that reflects current market assessments of the time value of money and the risks specific to the asset. Impairment losses of continuing operations are recognised in the Consolidated Income Statement in those expense categories consistent with the function of the impaired asset.
For assets excluding goodwill, an assessment is made at each reporting date whether there is any indication that previously recognised impairment losses may no longer exist or may have decreased. If such indication exists, the Group estimates the asset’s or CGU’s recoverable amount. A previously recognised impairment loss is reversed only if there has been a change in the assumptions used to determine the asset’s recoverable amount since the last impairment was recognised. The reversal is limited so that the carrying amount of the asset does not exceed its recoverable amount, nor exceed the carrying amount that would have been determined, net of depreciation, had no impairment loss been recognised for the asset in prior years. As the Group has no assets carried at revalued amounts, such reversal is recognised in the Consolidated Income Statement.
2.7 Property, plant and equipmentProperty, plant and equipment is stated at cost less accumulated depreciation and any accumulated impairment losses.
Depreciation, down to residual value, is calculated on a straight-line basis over the estimated useful life of the asset as follows:
• freehold buildings: 25-50 years • short leasehold improvements: shorter of seven years and period to expiry of lease • fixtures and fittings:
– head office: 5-15 years – other: shorter of seven years and period to expiry of lease
• office machinery and computer hardware: 2-15 years • motor vehicles: three years
Freehold land is not depreciated. An item of property, plant and equipment is derecognised upon disposal or when no future economic benefits are expected to arise from the continued use of the asset. Any gain or loss arising on derecognition of the asset (calculated as the difference between the net disposal proceeds and the carrying amount of the item) is included in the Consolidated Income Statement in the year the item is derecognised.
2.8 Leases2.8.1 Group as lesseeRecognition of a leaseThe contracts are assessed by the Group, to determine whether a contract is, or contains a lease. In general, arrangements are a lease when all of the following apply:
• it conveys the right to control the use of an identified asset for a certain period, in exchange for consideration;• the Group obtains substantially all economic benefits from the use of the asset; and• the Group can direct the use of the identified asset.
The Group elects to separate the non-lease components.
Measurement of a right-of-use asset and lease liabilityRight-of-use assetThe Group measures the right-of-use asset at cost, which includes the following:
• the initial amount of the lease liability, adjusted for any lease payments made at or before the lease commencement date;• any lease incentives received; and• any initial direct costs incurred by the Group as well as an estimate of costs to be incurred by the Group in dismantling and removing the
underlying asset, restoring the site on which it is located or restoring the underlying asset to the condition required by the lease contract. Cost for dismantling, removing or restoring the site on which it is located and/or the underlying asset is only recognised when the Group incurs an obligation to do so.
The right-of-use asset is depreciated over the lease term, using the straight-line method.
Lease liabilityThe lease liability is initially measured at the present value of the unpaid lease payments, discounted using the interest rate implicit in the lease, or if the rate cannot be readily determined, the Group’s incremental borrowing rate. Lease payments included in the measurement comprise fixed payments, variable lease payments that depend on an index or a rate, amounts to be paid under a residual value guarantee and lease payments in an optional renewal period, if the Group is reasonably certain to exercise an extension option, as well as penalties for early termination of a lease, if the Group is reasonably certain to terminate early. If there is a purchase option present, this will be included if the Group is reasonably certain to exercise the option.
149
Financial StatementsAnnual Report and Accounts 2021

Notes to the Consolidated Financial Statements continuedFor the year ended 31 December 2021
2 Summary of significant accounting policies continuedLeases of low-value assets and short termLeases of low-value assets (<£5,000) and short term with a term of 12 months or less are not required to be recognised on the Consolidated Balance Sheet and payments made in relation to these leases are recognised on a straight-line basis in the Consolidated Income Statement.
2.8.2 Group as a lessorThe Group entered in to lease agreements as a lessor on certain items of machinery and software. Leases for which the Group is a lessor are classified as operating leases. Rental income arising from operating leases is accounted for on a straight-line basis over the lease term.
In cases where the Group acts as an intermediate lessor, it accounts for its interests in the head-lease and the sub-lease separately.
2.9 Intangible assets 2.9.1 Software and software licences Software and software licences include computer software that is not integral to a related item of hardware. These assets are stated at cost less accumulated amortisation and any impairment in value. Amortisation is calculated on a straight-line basis over the estimated useful life of the asset. Currently software is amortised over four years.
The carrying values of software and software licences are reviewed for impairment when events or changes in circumstances indicate that the carrying value may not be recoverable. If any such indication exists and where the carrying values exceed the estimated recoverable amount, the assets are written down to their recoverable amount.
2.9.2 Software under developmentCosts that are incurred and that can be specifically attributed to the development phase of management information systems for internal use are capitalised and amortised over their useful life, once the asset becomes available for use.
2.9.3 Other intangible assetsIntangible assets acquired as part of a business combination are carried initially at fair value. Following initial recognition intangible assets are carried at cost less accumulated amortisation and any impairment in value. Intangible assets with a finite life have no residual value and are amortised on a straight-line basis over their expected useful lives, with charges included in administrative expenses as follows:
• order back log: within three months • existing customer relationships: 10-15 years • tools and technology: seven years.
The carrying value of intangible assets is reviewed for impairment whenever events or changes in circumstances indicate the carrying value may not be recoverable and expected useful lives are reviewed on a yearly basis.
2.9.4 GoodwillBusiness combinations are accounted for under IFRS 3 Business Combinations using the acquisition method. Any excess of the cost of the business combination over the Group’s interest in the net fair value of the identifiable assets, liabilities and contingent liabilities is recognised in the Consolidated Balance Sheet as goodwill and is not amortised. Any goodwill arising on the acquisition of equity accounted entities is included within the cost of those entities.
After initial recognition, goodwill is stated at cost less any accumulated impairment losses, with the carrying value being reviewed for impairment at least annually and whenever events or changes in circumstances indicate that the carrying value may be impaired.
For the purpose of impairment testing, goodwill is allocated to the related CGU monitored by Management, usually at business Segment level or statutory Company level as the case may be. Where the recoverable amount of the CGU is less than its carrying amount, including goodwill, an impairment loss is recognised in the Consolidated Income Statement.
2.10 Inventories Inventories are carried at the lower of weighted average cost and net realisable value after making allowance for any obsolete or slow-moving items. Costs include those incurred in bringing each product to its present location and condition, on a first-in, first-out basis.
Net realisable value is the estimated selling price in the ordinary course of business, less the estimated costs necessary to make the sale.
2.11 Financial assets Financial assets are recognised at their fair value, which initially equates to the sum of the consideration given and the directly attributable transaction costs associated with the investment. Subsequently, the financial assets are measured at either amortised cost or fair value, depending on their classification under IFRS 9. The Group currently holds only debt instruments. The classification of these debt instruments depends on the Group’s business model for managing the financial assets and the contractual terms of the cash flows.
2.11.1 Trade and other receivablesTrade receivables, which generally have 30 to 90-day credit terms, are initially recognised and carried at their original invoice amount less an allowance for any uncollectable amounts. The business model for trade receivables is that they are held for the collection of contractual cash flows, therefore they are subsequently measured at amortised cost. The trade receivables are derecognised on receipt of cash from the customer. The Group sometimes uses debt factoring, without recourse, to manage liquidity and, as a result, the business model for factored trade receivables is that they are not held for the collection of contractual cash flows. As a result, subsequent to initial recognition, they are measured at fair value through other comprehensive income (except for the recognition of impairment gains and losses and foreign exchange gains and losses, which are recognised in profit or loss). Factored trade receivables are derecognised on receipt of cash from the factoring party.
150

Given the short lives of the trade receivables, there are generally no material fair value movements between initial recognition and the derecognition of the receivable.
The Group assesses for doubtful debts (impairment) using the expected credit losses model as required by IFRS 9. For trade receivables, the Group applies the simplified approach, which requires expected lifetime losses to be recognised from the initial recognition of the receivables. Material or high-risk balances are reviewed and provided for individually based on a number of factors including:
• the financial strength of the customer;• the level of default that the Group has suffered in the past;• the age of the receivable outstanding; and• the Group’s trading experience with that customer.
For impairment assessment of other receivables, refer to note 2.6, Impairment of assets, which details the impairment approach adopted where an asset considered to be impaired would be written down to its recoverable amount which, given the nature of the assets, would most likely be its fair value less costs to sell.
2.11.2 Cash and cash equivalents Cash and short-term deposits in the Consolidated Balance Sheet comprise cash at bank and in hand, and short-term deposits with an original maturity of three months or less. Cash is held for the collection of contractual cash flows which are solely payments of principal and interest and therefore is measured at amortised cost subsequent to initial recognition.
For the purpose of the Consolidated Cash Flow Statement, cash and cash equivalents consist of cash and short-term deposits as defined above, net of outstanding bank overdrafts, where the overdrafts are repayable on demand and are part of the Group’s cash management.
2.12 Financial liabilities Financial liabilities are initially recognised at their fair value and, in the case of loans and borrowings (including credit facility), net of directly attributable transaction costs.
The subsequent measurement of financial liabilities is at amortised cost, unless otherwise described below:
2.12.1 Provisions (excluding restructuring provision) Provisions are recognised when the Group has a present obligation (legal or constructive) as a result of a past event, it is probable that an outflow of resources embodying economic benefits will be required to settle the obligation and a reliable estimate can be made of the amount of the obligation.
If the effect of the time value of money is material, provisions are determined by discounting the expected future cash flows at a pre-tax rate that reflects current market assessments of the time value of money and, where appropriate, the risks specific to the liability. Where discounting is used, the increase in the provision due to the passage of time is recognised as a borrowing cost.
Customer contract provisionsA provision for forecast excess costs over forecasted revenue is made as soon as a loss is foreseen.
Management monitors continually the financial performance of contracts, and where there are indicators that a contract could result in a negative margin, the future financial performance of that contract will be reviewed in detail. If, after further financial analysis, the full financial consequence of the contract can be reliably estimated, and it is determined that the contract is potentially loss-making, then the best estimate of the losses expected to be incurred until the end of the contract will be provided for.
The Group applies IAS 37 – ‘Provisions, Contingent Liabilities and Contingent Assets‘ (IAS 37) in its assessment of whether contracts are considered onerous and in subsequently estimating the provision. In line with recent amendments to IAS 37, the Group’s approach has been and continues to be to apply the ‘Full cost approach’ which considers total estimated costs (i.e. directly attributable variable costs and fixed allocated costs) as included in the assessment of whether the contract is onerous or not and in the measurement of the provision.
2.12.2 Restructuring provisions The Group recognises a ‘restructuring’ provision when there is a programme planned and controlled by Management that changes materially the scope of the business or the manner in which it is conducted.
Further to the Group’s general provision recognition policy, a restructuring provision is only considered when the Group has a detailed formal plan for the restructuring identifying, as a minimum: the business or part of the business concerned; the principal locations affected; the location, function and approximate number of employees who will be compensated for terminating their services; the expenditures that will be undertaken; and when the plan will be implemented. The Group will only recognise a specific restructuring provision once those affected have a valid expectation that the Group will carry out the restructuring created by either the commencement of the restructuring implementation plan or the announcement of its main features to those affected by it.
The Group only includes incremental costs associated directly with the restructuring within the restructuring provisions, such as employee termination benefits and consulting fees. The Group specifically excludes from recognition in a restructuring provision any costs associated with ongoing activities such as the costs of training or relocating staff that are redeployed within the business and costs for employees who continue to be employed in ongoing operations, regardless of the status of these operations post-restructure.
2.12.3 Pensions and other post-employment benefits The Group operates a defined contribution pension scheme available to all UK employees and similar schemes are operating, as appropriate for the jurisdiction, for North America and Germany. Contributions are recognised as an expense in the Consolidated Income Statement as they become payable in accordance with the rules of the scheme. There are no material pension schemes within the Group’s overseas operations.
151
Financial StatementsAnnual Report and Accounts 2021
Notes to the Consolidated Financial Statements continuedFor the year ended 31 December 2021
2 Summary of significant accounting policies continuedThe Group has an obligation to make a one-off payment to French employees upon retirement, the Indemnités de Fin de Carrière (IFC).
French employment law requires that a company pays employees a one-time contribution when, and only when, the employee leaves the company on retirement at the mandatory age. This is a legal requirement for all businesses who incur the obligation upon departure, due to retirement, of an employee.
Typically, the retirement benefit is based on length of service of the employee and his or her salary at retirement. The amount is set via a legal minimum, but the retirement premiums can be improved by the collective agreement or employment contract in some cases. In Computacenter France, the payment is based on accrued service and ranges from one month of salary after five years of service to 9.4 months of salary after 47 years of service.
If the employee leaves voluntarily at any point before retirement, all liability is extinguished, and any accrued service is not transferred to any new employment.
Management continues to account for this obligation according to IAS 19 (revised). Refer to note 33 for further disclosure.
2.13 Derecognition of financial assets and liabilities 2.13.1 Financial assetsA financial asset (or, where applicable, a part of a financial asset or part of a group of similar financial assets) is derecognised where:
• the rights to receive cash flows from the asset have expired; or • the Group retains the right to receive cash flows from the asset, but has assumed an obligation to pay them in full without material delay to
a third party under a ‘pass-through’ arrangement; or • the Group has transferred its rights to receive cash flows from the asset and either (a) has transferred substantially all the risks and rewards
of the asset, or (b) has neither transferred nor retained substantially all the risks and rewards of the asset but has transferred control of the asset.
2.13.2 Financial liabilitiesA financial liability is derecognised when the obligation under the liability is discharged, cancelled or expired.
2.14 Derivative financial instruments and hedge accounting The Group uses foreign currency forward contracts to hedge its foreign currency risks associated with foreign currency fluctuations affecting cash flows from forecast transactions and unrecognised firm commitments.
At the inception of a hedge relationship, the Group formally designates and documents the hedge relationship to which the Group wishes to apply hedge accounting and the risk management objective and strategy for undertaking the hedge. The documentation includes identification of both the hedging instrument and the hedged item or transaction and then the economic relationship between the two, including whether the hedging instrument is expected to offset changes in cash flow of the hedged item. Such hedges are expected to be highly effective in achieving offsetting changes in cash flows. The Group designates the full change in the fair value of the forward contract (including forward points) as the hedging instrument. Forward contracts are initially recognised at fair value on the date that the contract is entered into and are subsequently remeasured at fair value at each reporting date. The fair value of forward currency contracts is calculated by reference to current forward exchange rates for contracts with similar maturity profiles. Forward contracts are recorded as assets when the fair value is positive and as liabilities when the fair value is negative.
For the purposes of hedge accounting, hedges are classified as cash flow hedges when hedging the exposure to variability in cash flows that is either attributable to a particular risk associated with a recognised asset or liability, a highly probable forecast transaction, or the foreign currency risk in an unrecognised firm commitment.
Cash flow hedges that meet the criteria for hedge accounting are accounted for as follows: the effective portion of the gain or loss on the hedging instrument is recognised directly in other comprehensive income in the cash flow hedge reserve, while any ineffective portion is recognised immediately in the Consolidated Income Statement in administrative expenses.
Amounts recognised within the Consolidated Statement of Comprehensive Income are transferred to the Consolidated Income Statement, within administrative expenses, when the hedged transaction affects the Consolidated Income Statement, such as when the hedged financial expense is recognised.
If the forecast transaction or firm commitment is no longer expected to occur, the cumulative gain or loss previously recognised in equity is transferred to the Consolidated Income Statement within administrative expenses. If the hedging instrument matures or is sold, terminated or exercised without replacement or rollover, any cumulative gain or loss previously recognised within the Consolidated Statement of Comprehensive Income remains within the Consolidated Statement of Comprehensive Income until after the forecast transaction or firm commitment affects the Consolidated Income Statement.
Any other gains or losses arising from changes in fair value on forward contracts are taken directly to administrative expenses in the Consolidated Income Statement.
2.15 Taxation 2.15.1 Current taxCurrent tax assets and liabilities for the current and prior years are measured at the amount expected to be recovered from or paid to the tax authorities. The tax rates and tax laws used to compute the amount are those that are enacted or substantively enacted by the balance sheet date.
152

2.15.2 Deferred income tax Deferred income tax is recognised on all temporary differences arising between the tax bases of assets and liabilities and their carrying amounts in the Consolidated Financial Statements, with the following exceptions:
• where the temporary difference arises from the initial recognition of goodwill or from an asset or liability in a transaction that is not a business combination that at the time of the transaction affects neither accounting nor taxable profit or loss;
• in respect of taxable temporary differences associated with investments in subsidiaries, associates and joint ventures, where the timing of the reversal of the temporary differences can be controlled and it is probable that the temporary differences will not reverse in the foreseeable future; and
• deferred income tax assets are recognised only to the extent that it is probable that taxable profit will be available in the future against which the deductible temporary differences, carried forward tax credits or tax losses can be utilised.
Deferred income tax assets and liabilities are measured on an undiscounted basis at the tax rates that are expected to apply when the related asset is realised or liability is settled, based on tax rates and laws enacted, or substantively enacted, at the balance sheet date.
Income tax is charged or credited directly to the Consolidated Statement of Comprehensive Income if it relates to items that are credited or charged to the Consolidated Statement of Comprehensive Income. Otherwise, income tax is recognised in the Consolidated Income Statement.
2.16 Share-based payment transactions Employees (including Executive Directors) of the Group can receive remuneration in the form of share-based payment transactions, whereby employees render services in exchange for shares or rights over shares (equity-settled transactions).
The cost of equity-settled transactions with employees is measured by reference to the fair value of the award at the date at which they are granted. The fair value is determined by utilising an appropriate valuation model, further details of which are given in note 30. In valuing equity-settled transactions, no account is taken of any performance conditions, as none of the conditions set are market-related.
The cost of equity-settled transactions is recognised, together with a corresponding increase in equity, over the period in which the performance and/or service conditions are fulfilled, ending on the date on which the relevant employees become fully entitled to the award (vesting date).
The cumulative expense recognised for equity-settled transactions at each reporting date, until the vesting date, reflects the extent to which the vesting period has expired and the Directors’ best estimate of the number of equity instruments that will ultimately vest. The Consolidated Income Statement charge or credit for a period represents the movement in cumulative expense recognised as at the beginning and end of that period. As the schemes do not include any market-related performance conditions, no expense is recognised for awards that do not ultimately vest.
The dilutive effect of outstanding options is reflected as additional share dilution in the computation of earnings per share (see note 13).
The Group has an employee share trust for the granting of non-transferable options to Executive Directors and senior Management. Shares in the Group held by the employee share trust are treated as investment in own shares and are recorded at cost as a deduction from equity (see note 29).
2.17 Own shares held Computacenter plc shares held by the Group are classified in shareholders’ equity as ‘own shares held’ and are recognised at cost. Consideration received for the sale of such shares is also recognised in equity, with any difference between the proceeds from sale and the original cost being taken to reserves. No gain or loss is recognised in the performance statements on the purchase, sale, issue or cancellation of equity shares.
2.18 Fair value measurement The Group measures certain financial instruments at fair value at each balance sheet date.
Fair value is the price that would be received to sell an asset or paid to transfer a liability in an orderly transaction between market participants at the measurement date.
The fair value of an asset or a liability is measured using the assumptions that market participants would use when pricing the asset or liability, assuming that market participants act in their economic best interest.
The Group uses valuation techniques that are appropriate in the circumstances and for which sufficient data is available to measure fair value, maximising the use of relevant observable inputs and minimising the use of unobservable inputs.
Fair value-related disclosures for financial instruments that are measured at fair value or where fair values are disclosed, are summarised in note 27.
2.19 IAS 20 – Accounting for government grants and disclosure of government assistance IAS 20 defines government grants as assistance by government in the form of transfers of resources to an entity, in return for past or future compliance with certain conditions relating to the operating activities of the entity. If the conditions are met, then a company recognises government grants in profit or loss within administration expenses, in line with its recognition of the expenses that the grants are intended to compensate.
The Group has recognised unconditional government grants relating to short-term schemes introduced by governments within Europe and the United States as a result of Covid-19 crisis for the purpose of protecting employment. These grants compensate the Group for expenses incurred and are recognised in the Consolidated Income Statement on a systematic basis in the periods in which the expenses are recognised.
153
Financial StatementsAnnual Report and Accounts 2021

3 Critical accounting estimates and judgementsThe preparation of the Consolidated Financial Statements requires Management to exercise judgement in applying the Group’s accounting policies. It also requires the use of estimates and assumptions that affect the reported amounts of assets, liabilities, income and expenses.
Due to the inherent uncertainty in making these critical judgements and estimates, actual outcomes could be different.
During the year, Management reconsidered the critical accounting estimates and judgements for the Group. This process included reviewing the last reporting period’s disclosures, the key judgements required on the implementation of forthcoming standards and the current period’s challenging accounting issues. Where Management deemed an area of accounting to be no longer a critical estimate or judgement, an explanation for this decision is found in note 3.3 to the Consolidated Financial Statements.
3.1 Critical estimatesEstimates and underlying assumptions are reviewed on an ongoing basis, with revisions recognised in the year in which the estimates are revised and in any future years affected. There are no areas involving significant risk resulting in a material adjustment to the carrying amounts of assets and liabilities within the next financial year.
3.2 Critical judgementsJudgements made by Management in the process of applying the Group’s accounting policies, which have the most significant effect on the amounts recognised in the Consolidated Financial Statements, are as follows:
3.2.1 Technology Sourcing principal versus agent recognitionManagement is required to exercise its judgement in the classification of certain revenue contracts for Technology Sourcing revenue recognition on either an agent or principal basis.
Because the identification of the principal in a contract is not always clear, Management will make a determination by evaluating the nature of our promise to our customer as to whether it is a performance obligation to pass control of the specified goods or services ourselves, in that we are the principal, or to arrange for those goods or services to be provided by the other party, where we are the agent. We determine whether we are a principal or an agent for each specified good or service promised to the customer by evaluating the nature of our promise to the customer against a non-exhaustive list of indicators that a performance obligation could involve an agency relationship:
• evaluating who controls each specified good or service before that good or service is transferred to the customer; • the vendor retains primary responsibility for fulfilling the sale; • we take no inventory risk before or after the goods have been ordered, during shipping or on return; • we do not have discretion to establish pricing for the vendor’s goods, limiting the benefit we can receive from the sale of those goods; and • our consideration is in the form of a, usually predetermined, commission.
Management continues to monitor the primary indicators used to assess the ‘agent/principal’ presentation of our Software and certain Resold Services revenue against our general contractual terms and conditions including, detailed analysis of how terms and conditions are applied in practice, the weighting applied to the agent/principal indicators and evaluation of emerging practice. Management has concluded that whilst this remains a finely balanced judgement, no change to the presentation of our Software and certain Resold Services revenues is currently required and revenue for these items will continue to be presented gross where the underlying facts and circumstances remain the same. Management continues to monitor the development of new methods of transacting business within the traditional vendor to reseller channel and the emergence of best practice in the revenue recognition treatment and disclosure of all Technology Sourcing revenues.
Since the adoption of IFRS 15 on 1 January 2018, a line of business emerged within our Technology Sourcing business where vendors and customers typically approach us with an opportunity where the vendor is taking the contract and performance risks and sets the selling price, using Computacenter as a pass-through agent in the channel to transact the deal for a set fee. To date, these have been primarily large software deals where there is no ongoing obligation of service on us following the transaction. We have no say in the pricing or selection of the product and are merely standing in the sales channel between the vendor and customer for the predetermined fee. Management reviews the facts and circumstances of these types of deals, case by case, with regards to its specific terms and conditions against the Group’s accounting policy to determine whether our performance obligation is to provide the good or service itself, where we are acting as the principal in the deal, or to arrange for another party to provide the good or service, where we are acting as an agent. Based on the facts and circumstances of each deal we have classified several of these deals as agency, concluding that the fee received should be booked as net revenue. Such agency deals would have increased revenue by £197.7 million during 2021 if recognised on a principal basis (2020: £273.7 million).
Following its meeting that concluded on 1 December 2021, the IFRS Interpretation Committee (the ‘Committee’) published a tentative agenda decision in response to a submission from a valued added reseller to determine whether an entity should treat revenue from the resale of standard software licences on a principal or agent recognition basis under IFRS 15 Revenue from Contracts with Customers (IFRS 15).
The Committee did not reach a definitive conclusion on the submission received, as it maintained that an entity should apply judgement in making its assessment under the principles contained within IFRS 15, using the specific facts and circumstances relevant to the entity and the transactions or contracts entered into. However, the Committee did provide a number of discrete guidance points on the application of various control criteria or indicators that entities should consider under their IFRS 15 agent and principal recognition criteria processes that specifically relate to the resale of standard software and have an impact on those resellers within the industry. A finalised agenda decision is not expected until the second quarter of 2022, following the consideration of public comments which closed on 8 February 2022.
Notes to the Consolidated Financial Statements continuedFor the year ended 31 December 2021
154

The Group typically recognises standalone software licence revenue on a principal or gross invoiced income basis, with a small number of material transactions, where the fact pattern remains different to the standard terms and conditions, recognised as an agent. Whilst the Committee is finalising its decision, the Group is working towards assessing changes to its accounting policies that will result if the final agenda decision remains broadly characteristic of the tentative decision. The resultant change in policies would reflect that standalone revenue from standard software sales (software) would be recognised on an agency or ‘net’ basis where the margin earned on the contract would be recognised as revenue with zero cost of goods sold. Other software revenues, particularly where the Group has performed configuration or customisation services, as part of the software sales agreement, would most likely continue to be recognised on a principal basis. Similarly, the Group has determined that third-party services agreements resold on a standalone basis (resold services), such as vendor-provided maintenance support agreements, would also be changed to be recognised on an agent basis due to the similar fact pattern of the transaction to that of software sales.
Such a change in policy would be accompanied by a programme of system enhancements required to be able to accurately report on the new basis. These changes, as required, will be allowed sufficient time to be appropriately implemented in order that the reporting under the new basis is as accurate as possible.
The Group’s current best estimate, without doing a detailed retrospective contract by contract review, is that the proposed potential changes in policy would have the following impact on the Group’s Financial Statements:
• Revenue and cost of sales would decrease by the value of revenue assessed as being recognised on an agency basis. Whilst the work is not yet complete to determine the value for 2021, the total value of the revenue categories under consideration for the change in policy is estimated to be up to £1,800 million in 2021. We estimate that the majority of that revenue in those categories will be derecognised, leaving only the margins earned on the transactions to be recognised as revenue.
• Gross profit, operating profit, and profit before and after taxes will be unchanged.
These estimates are preliminary and subject to further Management review. However, they provide an order of magnitude to assess the future impact on reported revenues. These estimates are for the total amount in these software and resold services revenue categories as measured on a principal basis and include elements that may, following Management review, continue to be recognised on a principal or gross basis. The Group will continue to report, as an alternative performance measure, all revenue recognised on a principal basis as Gross Invoiced Income, to allow the reader of the accounts to more accurately determine the linkage between revenue and cash flows.
3.2.2 Bill and holdThe Group generates some of its revenue through its ‘bill and hold’ arrangement with its customers. This arises when the customer is invoiced but the product is not shipped to the customer until a later date, in accordance with the customer’s request in a written agreement. In order to determine the appropriate timing of revenue recognition, it is assessed whether control has transferred to the customer.
A bill and hold arrangement is only put in place when a customer lacks the physical space to store the product or the product previously ordered is not yet needed in accordance with the customer’s schedule and the customer wants to guarantee supply of the product. In order to determine the bill and hold arrangements, the following criteria must be met:
a) the reason for the bill and hold arrangement must be substantive (for example: the customer has requested the arrangement);b) the product must be identified separately as belonging to the customer;c) the product currently must be ready for physical transfer to the customer; and d) the entity cannot have the ability to use the product or to direct it to another customer.
Judgement is required to determine if all of the criteria (a) to (d) have been met, to recognise a bill and hold sale. This is determined by segregation and readiness of inventory and the review and approval of all customer requests, in order to assess whether the accounting policy had been correctly applied to recognise a bill and hold sale.
£281.9 million of product sold is ‘held’ by the Group for ‘bill and hold’ transactions as at 31 December 2021 (2020: £231.3 million).
3.3 Change in critical estimates and critical judgementsDuring the year, Management reassessed the critical estimates and critical judgements.
Accounting for business combinations and valuation of intangibles is no longer considered a critical estimate by Management and has therefore been removed from the above disclosure, as there were no material acquisitions during the current year.
Percentage of completion Services revenue recognition is no longer considered a critical estimate by Management and has therefore been removed from the above disclosure. The number of contracts accounted for on this basis is reducing and forms a small part of our overall contract base and Services revenues. Therefore, it is no longer a major source of estimation uncertainty that has a significant risk of resulting in a material adjustment within the next financial year.
Exceptional items is no longer considered a critical judgement by Management and has therefore been removed from the above disclosure, as no exceptional items occurred during the current year.
Technology Sourcing principal versus agent recognition has been added as a critical judgement during the year, as noted above at 3.2.1.
155
Financial StatementsAnnual Report and Accounts 2021

4 Segment informationThe Segment information is reported to the Board and the Chief Executive Officer. The Chief Executive Officer is the Group’s Chief Operating Decision Maker (CODM). The operating Segments remain unchanged from those reported at 31 December 2020.
The Segmental reporting structure is the basis on which internal reports are provided to the Chief Executive Officer, as the CODM, for assessing performance and determining the allocation of resources within the Group, in accordance with IFRS 8.25. Segmental performance is measured based on external revenues, gross profit, adjusted1 operating profit and adjusted1 profit before tax. As noted on page 74, Central Corporate Costs continue to be disclosed as a separate column within the Segmental note.
Segmental performance for the years ended 31 December 2021 and 31 December 2020 were as follows:
Year ended 31 December 2021
UK £m
Germany £m
France£m
North America
£mInternational
£m
Central Corporate
Costs£m
Total£m
Revenue
Technology Sourcing revenue
Gross invoiced income 1,581.5 1,427.7 481.4 1,869.2 112.8 – 5,472.6
Principal element on agency contracts (115.1) (28.9) – (53.7) – – (197.7)
Total Technology Sourcing revenue 1,466.4 1,398.8 481.4 1,815.5 112.8 – 5,274.9
Services revenue
Professional Services 154.6 273.8 38.0 77.5 8.5 – 552.4
Managed Services 327.6 348.6 134.0 18.6 69.7 – 898.5
Total Services revenue 482.2 622.4 172.0 96.1 78.2 – 1,450.9
Total revenue 1,948.6 2,021.2 653.4 1,911.6 191.0 – 6,725.8
Results
Gross profit 268.2 312.0 68.1 180.2 39.3 – 867.8
Adjusted1 administrative expenses (165.3) (174.2) (64.6) (149.2) (28.0) (23.7) (605.0)
Adjusted1 operating profit/(loss) 102.9 137.8 3.5 31.0 11.3 (23.7) 262.8
Net interest – (2.7) (0.8) (2.7) (1.0) – (7.2)
Adjusted1 profit/(loss) before tax 102.9 135.1 2.7 28.3 10.3 (23.7) 255.6
Amortisation of acquired intangibles (7.6)
Profit before tax 248.0
The reconciliation of adjusted1 operating profit to operating profit as disclosed in the Consolidated Income Statement is as follows:
Year ended 31 December 2021
Total£m
Adjusted1 operating profit 262.8
Amortisation of acquired intangibles (7.6)
Operating profit 255.2
Notes to the Consolidated Financial Statements continuedFor the year ended 31 December 2021
156

Year ended 31 December 2021
UK £m
Germany £m
France£m
North America
£mInternational
£m
Central Corporate
Costs£m
Total£m
Other Segment information
Property, plant and equipment 30.4 37.7 5.3 9.2 7.4 – 90.0
Right-of-use assets 12.5 77.2 17.4 15.0 16.0 – 138.1
Intangible assets 44.6 16.5 10.2 191.4 11.0 – 273.7
Capital expenditure:Property, plant and equipment 5.2 4.4 2.1 3.6 3.5 – 18.8
Right-of-use assets 3.0 52.3 8.0 4.1 2.8 – 70.2
Software 6.1 0.2 0.1 4.6 0.5 – 11.5
Depreciation of property, plant and equipment 10.3 6.2 3.1 2.9 2.3 – 24.8
Depreciation of right-of-use assets 3.2 31.7 4.4 4.8 6.5 – 50.6
Amortisation of software 5.6 0.6 0.1 1.2 0.2 – 7.7
Share-based payments 7.4 2.1 0.3 0.7 0.1 – 10.6
Year ended 31 December 2020
UK £m
Germany £m
France£m
North America
£mInternational
£m
Central Corporate
Costs£m
Total£m
Revenue
Technology Sourcing revenue
Gross invoiced income 1,504.4 1,316.2 526.4 996.3 110.5 – 4,453.8
Principal element on agency contracts (176.4) (18.7) – (78.6) – – (273.7)
Total Technology Sourcing revenue 1,328.0 1,297.5 526.4 917.7 110.5 – 4,180.1
Services revenue
Professional Services 129.1 233.8 35.7 19.6 7.2 – 425.4
Managed Services 316.3 345.0 110.7 7.2 56.6 – 835.8
Total Services revenue 445.4 578.8 146.4 26.8 63.8 – 1,261.2
Total revenue 1,773.4 1,876.3 672.8 944.5 174.3 – 5,441.3
Results
Gross profit 249.2 279.9 74.4 86.3 30.7 – 720.5
Adjusted1 administrative expenses (158.9) (167.3) (61.4) (72.3) (27.1) (27.1) (514.1)
Adjusted1 operating profit/(loss) 90.3 112.6 13.0 14.0 3.6 (27.1) 206.4
Net interest (1.1) (2.2) (0.6) (0.9) (1.1) – (5.9)
Adjusted1 profit/(loss) before tax 89.2 110.4 12.4 13.1 2.5 (27.1) 200.5
Exceptional items:– costs relating to acquisition of a subsidiary (0.7)
– redundancy and other restructuring credit 0.2
– gain on acquisition of a subsidiary 14.0
Total exceptional items 13.5
Amortisation of acquired intangibles (7.4)
Profit before tax 206.6
157
Financial StatementsAnnual Report and Accounts 2021

4 Segment information continuedThe reconciliation of adjusted1 operating profit to operating profit as disclosed in the Consolidated Income Statement is as follows:
Year ended 31 December 2020
Total£m
Adjusted1 operating profit 206.4
Amortisation of acquired intangibles (7.4)
Exceptional items (0.5)
Operating profit 198.5
UK £m
Germany £m
France£m
North America
£mInternational
£m
Central Corporate
Costs£m
Total£m
Other Segment information
Property, plant and equipment 40.9 42.6 8.0 9.0 6.5 – 107.0
Right-of-use assets 12.8 61.5 18.8 15.5 21.0 – 129.6
Intangible assets 51.6 17.1 1.9 192.5 11.6 – 274.7
Capital expenditure:Property, plant and equipment 8.4 5.9 2.9 4.5 1.4 – 23.1
Right-of-use assets 3.8 16.7 10.5 – 17.6 – 48.6
Software 3.7 0.4 – – 0.3 – 4.4
Depreciation of property, plant and equipment 11.1 6.6 2.2 1.5 2.6 – 24.0
Depreciation of right-of-use assets 4.6 29.5 4.2 2.2 4.7 – 45.2
Amortisation of software 5.8 0.9 – 0.1 0.4 – 7.2
Share-based payments 5.5 1.7 0.2 0.5 – – 7.9
Charges for the amortisation of acquired intangibles (where initial recognition was an exceptional item or a fair value adjustment on acquisition) are excluded from the calculation of adjusted1 operating profit. This is because these charges are based on judgements about their value and economic life, are the result of the application of acquisition accounting rather than core operations, and whilst revenue recognised in the Consolidated Income Statement does benefit from the underlying asset that has been acquired, the amortisation costs bear no relation to the Group’s underlying ongoing operational performance. In addition, amortisation of acquired intangibles is not included in the analysis of Segment performance used by the CODM.
Information about major customersIncluded in revenues arising from the UK Segment are revenues of approximately £651.7 million (2020: £556.3 million) which arose from sales to the Group’s largest customer. For the purpose of this disclosure, a single customer is considered to be a group of entities known to be under common control. This customer consists of entities under control of the UK Government.
Notes to the Consolidated Financial Statements continuedFor the year ended 31 December 2021
158
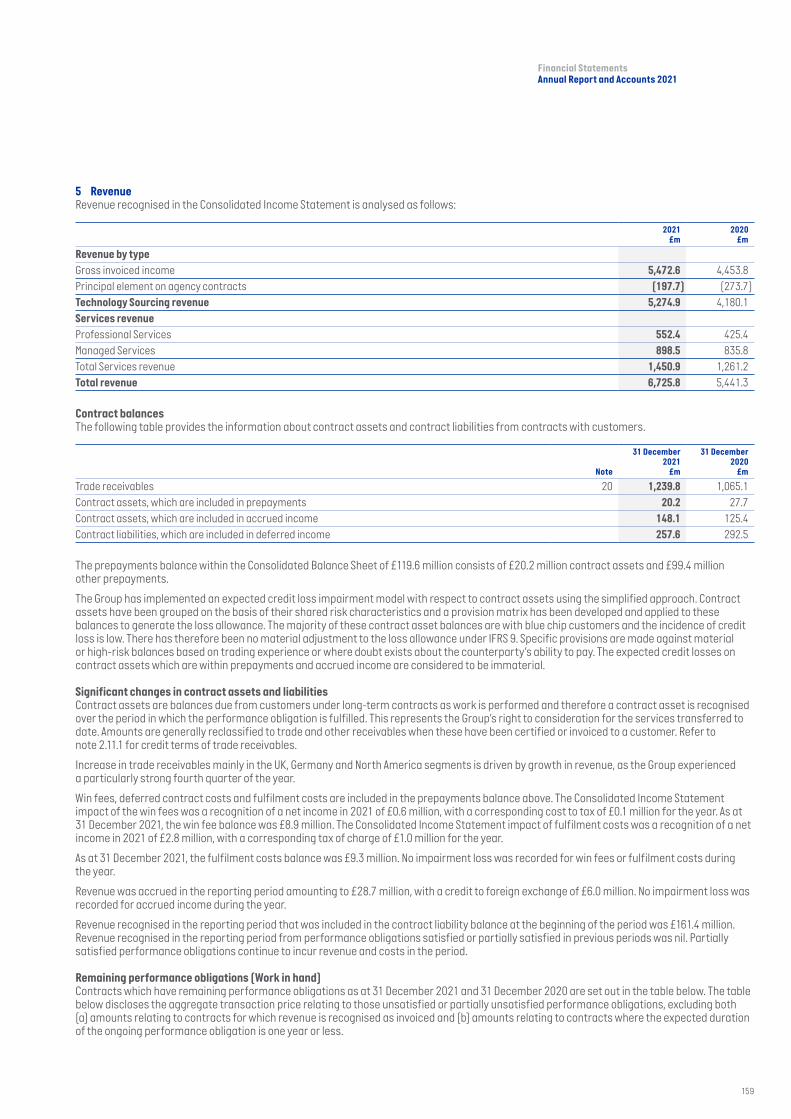
5 RevenueRevenue recognised in the Consolidated Income Statement is analysed as follows:
2021£m
2020£m
Revenue by type
Gross invoiced income 5,472.6 4,453.8Principal element on agency contracts (197.7) (273.7)Technology Sourcing revenue 5,274.9 4,180.1Services revenue
Professional Services 552.4 425.4 Managed Services 898.5 835.8 Total Services revenue 1,450.9 1,261.2 Total revenue 6,725.8 5,441.3
Contract balancesThe following table provides the information about contract assets and contract liabilities from contracts with customers.
Note
31 December2021
£m
31 December2020
£m
Trade receivables 20 1,239.8 1,065.1Contract assets, which are included in prepayments 20.2 27.7Contract assets, which are included in accrued income 148.1 125.4 Contract liabilities, which are included in deferred income 257.6 292.5
The prepayments balance within the Consolidated Balance Sheet of £119.6 million consists of £20.2 million contract assets and £99.4 million other prepayments.
The Group has implemented an expected credit loss impairment model with respect to contract assets using the simplified approach. Contract assets have been grouped on the basis of their shared risk characteristics and a provision matrix has been developed and applied to these balances to generate the loss allowance. The majority of these contract asset balances are with blue chip customers and the incidence of credit loss is low. There has therefore been no material adjustment to the loss allowance under IFRS 9. Specific provisions are made against material or high-risk balances based on trading experience or where doubt exists about the counterparty’s ability to pay. The expected credit losses on contract assets which are within prepayments and accrued income are considered to be immaterial.
Significant changes in contract assets and liabilitiesContract assets are balances due from customers under long-term contracts as work is performed and therefore a contract asset is recognised over the period in which the performance obligation is fulfilled. This represents the Group’s right to consideration for the services transferred to date. Amounts are generally reclassified to trade and other receivables when these have been certified or invoiced to a customer. Refer to note 2.11.1 for credit terms of trade receivables.
Increase in trade receivables mainly in the UK, Germany and North America segments is driven by growth in revenue, as the Group experienced a particularly strong fourth quarter of the year.
Win fees, deferred contract costs and fulfilment costs are included in the prepayments balance above. The Consolidated Income Statement impact of the win fees was a recognition of a net income in 2021 of £0.6 million, with a corresponding cost to tax of £0.1 million for the year. As at 31 December 2021, the win fee balance was £8.9 million. The Consolidated Income Statement impact of fulfilment costs was a recognition of a net income in 2021 of £2.8 million, with a corresponding tax of charge of £1.0 million for the year.
As at 31 December 2021, the fulfilment costs balance was £9.3 million. No impairment loss was recorded for win fees or fulfilment costs during the year.
Revenue was accrued in the reporting period amounting to £28.7 million, with a credit to foreign exchange of £6.0 million. No impairment loss was recorded for accrued income during the year.
Revenue recognised in the reporting period that was included in the contract liability balance at the beginning of the period was £161.4 million. Revenue recognised in the reporting period from performance obligations satisfied or partially satisfied in previous periods was nil. Partially satisfied performance obligations continue to incur revenue and costs in the period.
Remaining performance obligations (Work in hand) Contracts which have remaining performance obligations as at 31 December 2021 and 31 December 2020 are set out in the table below. The table below discloses the aggregate transaction price relating to those unsatisfied or partially unsatisfied performance obligations, excluding both (a) amounts relating to contracts for which revenue is recognised as invoiced and (b) amounts relating to contracts where the expected duration of the ongoing performance obligation is one year or less.
159
Financial StatementsAnnual Report and Accounts 2021

5 Revenue continuedManaged Services
Less than one year
£m
One to two years
£m
Two to three years
£m
Three to four years
£m
Four yearsand beyond
£mTotal
£m
As at 31 December 2021 720.4 466.4 315.8 209.0 226.7 1,938.3
As at 31 December 2020 540.0 343.0 211.0 170.0 93.0 1,357.0
The average duration of contracts is between one and five years. However some contracts will vary from these typical lengths. Revenue is typically earned over these varying timeframes. However more of the revenue noted above is expected to be earned in the short term.
6 Group operating profitThis is stated after charging/(crediting):
2021£m
2020£m
Depreciation of property, plant and equipment 24.8 24.0Depreciation of right-of-use assets 50.6 45.2(Gain)/loss on disposal of property, plant and equipment (1.3) 0.2Amortisation of software 7.7 7.2Loss on disposal of intangibles 0.5 0.3Amortisation of acquired intangible assets 7.6 7.4Severance costs 9.6 13.1One-off employee EPS target bonus* – 5.2Government grants (1.1) (6.4)Gain on net foreign currency differences 0.3 0.4
Costs of inventories recognised as an expense 4,514.7 3,742.6
* The Company decided to mark the achievement of its long-held ambition to exceed £1 of adjusted1 diluted earnings per share with a one-off employee bonus. The bonus was given to circa 80 per cent of employees globally. Senior managers and those with commission-based rewards were excluded, with the focus on those longest serving. For those eligible, the award was £200 or equivalent for an employee who had completed their first year of service, rising to £500 for those with more than seven years of service.
The rental income is included in Administrative expenses.
7 Auditor’s remuneration
2021£m
2020£m
Auditor’s remuneration:– Audit of the Financial Statements 0.1 0.2 – Audit of subsidiaries 1.7 1.1 Total audit fees 1.8 1.3
Audit-related assurance services including the review of the Interim Report and Accounts 0.1 0.1 Taxation compliance services 0.1 0.1 Total non-audit services 0.2 0.2 Total fees 2.0 1.5
Audit-related assurance services represent the half year review and assurance over tax, both performed by the Group’s auditor KPMG LLP.
The Pivot audit for the year ended 31 December 2021 was performed by EY Canada for a fee of £0.5 million (2020: £0.1 million).
Certain taxation compliance services and other non-audit services in 2021 were provided by EY, auditor of a North American subsidiary.
Notes to the Consolidated Financial Statements continuedFor the year ended 31 December 2021
160

8 Exceptional items
2021£m
2020£m
Operating profit
Costs relating to acquisition of a subsidiary – (0.7)Gain on release of French Social Plan provision – 0.2Gain on acquisition of subsidiary – 14.0Exceptional operating profit – 13.5
Income tax
Tax credit relating to acquisition of a subsidiary – 0.7Profit on exceptional items after taxation – 14.2
2020: Included within the prior year are the following exceptional items:
• An exceptional cost of £0.7 million resulted from the acquisition of Pivot and primarily related to fees paid to the Company’s advisors. This cost is non-operational, unlikely to recur and consistent with our prior-year treatment of acquisition costs on material transactions as exceptional items.
• A credit of £0.2 million arising on an expense previously put in exceptional costs within the financial statements of 2016, in relation to the 2014 French Social plan.
• The acquisition of BT Services France resulted in an exceptional gain of £14.0 million, which was recognised on consolidation of the subsidiary. The gain arose because the net assets acquired for consideration of €1 totalled £14.0 million after fair value adjustments, including £27.6 million of cash. The business acquired comprised BT’s domestic French services operations which, on acquisition, were making considerable losses on a stand-alone basis. The Company considers that the exceptional gain reflects the future losses that the acquired business will incur over the medium term, as it is brought onto a sustainable footing through a combination of upskilling employees, cross-selling into the Group’s customers, alignment with Group processes and systems, and the general improvement of its operating activities. This gain was non-operational in nature, material in size and unlikely to recur and was therefore classified as exceptional.
• A further tax credit of £0.7 million was recorded due to post-acquisition activity in Computacenter United States Inc. This benefit derived from payments which were settled by the vendor, out of the consideration paid, via post-acquisition capital contributions to Computacenter United States Inc. As this credit was related to the acquisition and not operational activity within Computacenter United States Inc, is a one-off and material to the overall tax result, we have classified this as an exceptional tax item, consistent with the treatment in 2018 and 2019.
9 Staff costsThe average monthly number of employees (including Executive Directors) during the year was made up as follows:
2021No.
2020No.
UK 4,294 4,117Germany 6,338 6,418France 2,385 2,160North America 1,359 1,326International 3,120 2,743
17,496 16,764
Their aggregate remuneration comprised:
2021£m
2020£m
Wages and salaries 906.3 809.6Social security costs 135.1 121.8Share-based payments 10.6 8.0Pension costs 20.9 17.4
1,072.9 956.8
Share-based payments arise from transactions accounted for as equity-settled share-based payment transactions.
161
Financial StatementsAnnual Report and Accounts 2021

Notes to the Consolidated Financial Statements continuedFor the year ended 31 December 2021
10 Finance income
2021£m
2020£m
Bank interest received 0.2 0.4 Other interest received 0.1 0.1
0.3 0.5
11 Finance costs
2021£m
2020£m
Interest paid on bank loans and overdraft 0.9 1.8 Interest paid on credit facility 1.2 –Interest paid on lease liabilities 5.2 4.5 Other interest paid 0.2 0.1
7.5 6.4
162

12 Income taxa) Tax on profit from ordinary activities
2021£m
2020£m
Tax charged in the Consolidated Income Statement
Current income tax
UK corporation tax 23.8 18.1Foreign tax:– operating results before exceptional items 45.1 36.4– exceptional items – (0.7)Total foreign tax 45.1 35.7Adjustments in respect of prior years 0.2 0.4Total current income tax 69.1 54.2
Deferred tax
Operating results before exceptional items:– origination and reversal of temporary differences (4.2) (0.7)– change in tax rates (3.3) (0.5)– adjustments in respect of prior years (0.1) (0.6)Total deferred tax (7.6) (1.8)
Tax charge in the Consolidated Income Statement 61.5 52.4
b) Reconciliation of the total tax charge
2021£m
2020£m
Profit before income tax 248.0 206.6
At the UK standard rate of corporation tax of 19 per cent (2020: 19 per cent) 47.1 39.2 Expenses not deductible for tax purposes 0.3 –Non-deductible element of share-based payment charge 0.1 0.1 Adjustments in respect of prior years 0.1 (0.2)Effect of different tax rates of subsidiaries operating in other jurisdictions 16.2 14.3 Change in tax rate (3.3) (0.5)Other differences 0.3 1.2 Overseas tax not based on earnings 1.6 1.4 Tax effect of income not taxable in determining taxable profit (0.9) (3.1)At effective income tax rate of 24.8 per cent (2020: 25.4 per cent) 61.5 52.4
c) Tax lossesDeferred tax assets of £0.6 million (2020: £0.3 million) have been recognised in respect of losses carried forward.
In addition, as at 31 December 2021, there were unused tax losses across the Group of £287.0 million (2020: £307.6 million) for which no deferred tax asset has been recognised. Of these losses, £25.7 million (2020: £24.7 million) arise in Germany and £261.3 million (2020: £282.9 million) arise in France. A significant proportion of the losses arising in Germany have been generated in statutory entities that no longer have significant levels of trade. The remaining unused tax losses relate to other loss-making overseas subsidiaries.
163
Financial StatementsAnnual Report and Accounts 2021

12 Income tax continuedd) Deferred taxDeferred income tax as at 31 December 2021 and 31 December 2020 relates to the following:
Consolidated Balance Sheet
Consolidated Income Statement and Consolidated Statement
of Comprehensive Income
2021£m
2020£m
2021£m
2020£m
Deferred income tax assets
Relief on share option gains 14.6 7.0 2.6 1.7Other temporary differences 13.6 10.3 2.6 0.5Revaluations of foreign exchange contracts to fair value 0.7 1.0 (0.3) 0.6Losses available for offset against future taxable income 0.6 0.3 0.3 (1.0)Gross deferred income tax assets 29.5 18.6Deferred income tax liabilities
Revaluations of foreign exchange contracts to fair value 0.5 1.0 0.5 (0.3)Amortisation of intangibles 24.6 26.4 2.1 1.7Gross deferred income tax liabilities 25.1 27.4Deferred income tax charge 7.8 3.2Net deferred income tax asset/(liabilities) 4.4 (8.8)
Disclosed on the Consolidated Balance Sheet
Deferred income tax assets 30.2 10.1Deferred income tax liabilities (25.8) (18.9)Net deferred income tax asset/(liabilities) 4.4 (8.8)
As at 31 December 2021, there was no recognised or unrecognised deferred income tax liability (2020: £nil) for taxes that could be payable on the unremitted earnings of the Group’s subsidiaries, as the Group expects that future remittances of earnings from its overseas subsidiaries will continue to be covered by relevant dividend exemptions. Following the departure of the UK from the European Union, the Group’s German subsidiaries’ unremitted earnings are no longer covered by a dividend exemption. As a result of this situation, no dividend is currently planned until there is more clarity regarding proposed changes in the bilateral treaties between Germany and the UK.
e) Factors affecting current and future tax chargeThe main rate of UK Corporation tax for financial year 2021 is 19 per cent, as enacted in the Finance Act 2020. The March 2021 Budget announced that a rate of 25 per cent will apply with effect from 1 April 2023, and this change was substantively enacted on 11 March 2021. The deferred tax in these Consolidated Financial Statements reflects this.
We are closely monitoring the Organisation for Economic Co-operation and Development’s Two Pillar Solution to Address the Tax Challenges arising from the Digitalisation of the Economy, which are expected to be enacted in 2022 with application from 1 January 2023. The accounting implications under IAS 12 will be determined when the relevant legislation is available.
Notes to the Consolidated Financial Statements continuedFor the year ended 31 December 2021
164

13 Earnings per shareEarnings per share amounts are calculated by dividing profit attributable to ordinary equity holders by the weighted average number of ordinary shares outstanding during the year (excluding own shares held).
To calculate diluted earnings per share, the weighted average number of ordinary shares in issue is adjusted to assume conversion of all dilutive potential shares. Share options granted to employees where the exercise price is less than the average market price of the Company’s ordinary shares during the year are considered to be dilutive potential shares.
2021£m
2020£m
Profit attributable to equity holders of the Parent 185.3 153.8
2021£m
2020£m
Basic weighted average number of shares (excluding own shares held) 113.0 112.9Effect of dilution:Share options 2.2 2.0Diluted weighted average number of shares 115.2 114.9
2021pence
2020pence
Basic earnings per share 164.0 136.2Diluted earnings per share 160.9 133.8
14 Dividends paid and proposed
2021£m
2020£m
Declared and paid during the year
Equity dividends on ordinary shares:Final dividend for 2020: 38.4 pence (2019: nil) 43.4 –Interim dividend for 2021: 16.9 pence (2020: 12.3 pence) 19.0 13.9
62.4 13.9
Proposed (not recognised as a liability as at 31 December)
Equity dividends on ordinary shares:Final dividend for 2021: 49.4 pence (2020: 38.4 pence) 56.4 43.8
165
Financial StatementsAnnual Report and Accounts 2021

15 Property, plant and equipment
Freehold land and
buildings£m
Short leasehold improvements
£m
Fixtures, fittings,
equipment and vehicles
£m
Property, plant and equipment
excluding right-of-use
assets £m
Right-of-use assets
£mTotal
£m
Cost
At 1 January 2020 85.8 28.9 137.7 252.4 154.6 407.0 Relating to acquisition of subsidiaries (note 18) 0.1 1.4 4.0 5.5 12.8 18.3Additions – 4.9 18.2 23.1 48.6 71.7Disposals – (2.5) (6.7) (9.2) (14.2) (23.4)Transfers – 0.6 (0.6) – – –Foreign currency adjustment 1.1 0.1 2.3 3.5 5.5 9.0At 31 December 2020 87.0 33.4 154.9 275.3 207.3 482.6Relating to acquisition of subsidiaries (note 18) – – 0.3 0.3 1.4 1.7
Additions – 3.5 15.3 18.8 70.2 89.0
Disposals – (1.6) (24.9) (26.5) (25.3) (51.8)
Transfers (0.5) – (3.1) (3.6) – (3.6)
Foreign currency adjustment (1.5) (1.1) (5.8) (8.4) (11.5) (19.9)
At 31 December 2021 85.0 34.2 136.7 255.9 242.1 498.0
Accumulated depreciation and impairment
At 1 January 2020 42.9 11.9 96.2 151.0 43.7 194.7Provided during the year 1.9 3.8 18.3 24.0 45.2 69.2Disposals – (2.5) (6.2) (8.7) (12.9) (21.6)Foreign currency adjustment 0.1 0.1 1.8 2.0 1.7 3.7At 31 December 2020 44.9 13.3 110.1 168.3 77.7 246.0Provided during the year 2.0 4.5 18.3 24.8 50.6 75.4
Disposals – (1.3) (19.0) (20.3) (19.9) (40.2)
Transfers (0.4) – (1.7) (2.1) – (2.1)
Foreign currency adjustment 0.1 (0.6) (4.3) (4.8) (4.4) (9.2)
At 31 December 2021 46.6 15.9 103.4 165.9 104.0 269.9
Net book value
At 31 December 2021 38.4 18.3 33.3 90.0 138.1 228.1
At 31 December 2020 42.1 20.1 44.8 107.0 129.6 236.6At 1 January 2020 42.9 17.0 41.5 101.4 110.9 212.3
The Group leases various properties, equipment and cars. Rental contracts are typically made for fixed periods of two to 10 years, but might have extension options. Lease terms are negotiated on an individual basis and contain a wide range of different terms and conditions. The lease agreements do not impose any covenants, but leased assets cannot be used as security for borrowing purposes.
Transfers relate to computer equipment, incorrectly classed, in Computacenter NS, acquired in 2020, which have been reclassed to inventories. The net book value transferred was £1.0 million (cost of £2.9 million and accumulated depreciation of £1.9 million).
Transfers relate to assets, incorrectly classed to fixtures, fittings, equipment and vehicles, in FusionStorm, which have been reclassed to software. The net book value transferred was £0.3 million (cost of £0.6 million and accumulated depreciation of £0.3 million).
As at 31 December 2021, the net book value of recognised right-of-use assets relating to land and buildings was £82.7 million (2020: £90.3 million) and plant and equipment £55.4 million (2020: £39.3 million). The depreciation charge for the year relating to those assets was £21.0 million (2020: £18.8 million) and £29.6 million (2020: £26.4 million), respectively.
Notes to the Consolidated Financial Statements continuedFor the year ended 31 December 2021
166

16 Intangible assets
Goodwill£m
Software£m
Acquired intangible assets
Total£m
Customer relationships
£mOthers
£m
Cost
At 1 January 2020 109.5 108.3 60.7 20.5 299.0 Relating to acquisition of subsidiaries (note 18) 57.9 0.3 57.2 1.7 117.1 Additions – 4.4 – – 4.4 Disposals – (3.4) – – (3.4)Foreign currency adjustment (2.4) 0.3 (5.2) 0.4 (6.9)At 31 December 2020 165.0 109.9 112.7 22.6 410.2 Additions 2.3 11.5 – – 13.8
Disposals – (9.2) – – (9.2)
Transfers – 0.6 – – 0.6
Foreign currency adjustment (1.4) (0.8) 1.3 (0.5) (1.4)
At 31 December 2021 165.9 112.0 114.0 22.1 414.0
Accumulated amortisation and impairment
At 1 January 2020 10.3 87.7 5.0 20.3 123.3Provided during the year – 7.2 5.7 1.7 14.6 Disposals – (3.1) – – (3.1)Foreign currency adjustment 0.7 0.2 (0.5) 0.3 0.7 At 31 December 2020 11.0 92.0 10.2 22.3 135.5Provided during the year – 7.7 7.5 0.1 15.3
Disposals – (8.7) – – (8.7)
Transfers – 0.3 – – 0.3
Foreign currency adjustment (0.9) (0.9) 0.1 (0.4) (2.1)
At 31 December 2021 10.1 90.4 17.8 22.0 140.3
Net book value
At 31 December 2021 155.8 21.6 96.2 0.1 273.7
At 31 December 2020 154.0 17.9 102.5 0.3 274.7 At 1 January 2020 99.2 20.6 55.7 0.2 175.7
Transfers relate to assets, incorrectly classed to fixtures, fittings, equipment and vehicles, in FusionStorm, which have been reclassed to software. The net book value transferred was £0.3 million (cost of £0.6 million and accumulated depreciation of £0.3 million).
17 Impairment testing of goodwill, other intangible assets and other non-current assetsGoodwill acquired through business combinations has been allocated to the following CGUs:
• Computacenter (UK) Limited• Computacenter Germany • Computacenter AG• cITius AG• Computacenter Belgium• Computacenter United States Inc.• Computacenter Netherlands (formerly Misco Solutions B.V.)• PathWorks GmbH• Pivot Technology Solutions, Inc. (Pivot) USA CGU• Pivot Technology Solutions, Inc. (Pivot) Canada CGU• ITL logistics GmbH
These represent the lowest level within the Group at which goodwill is monitored for internal Management purposes. Certain other corporate assets are unable to be allocated against specific CGUs. These assets are tested across an aggregation of CGUs that utilise the asset.
167
Financial StatementsAnnual Report and Accounts 2021

17 Impairment testing of goodwill, other intangible assets and other non-current assets continuedMovements in goodwill
CC* (UK) Limited
£m
CC*
Germany£m
CC* AG£m
cITius AG£m
CC*
Belgium£m
Fusion-Storm
£m
CC* Netherlands
£m
PathWorksGmbH
£m
Pivot Technology
Solutions, Inc
(USA CGU)
£m
Pivot Technology
Solutions, Inc
(Canada CGU)
£m
ITL logistics
GmbHTotal
£m
1 January 2020 35.0 15.3 1.0 2.1 1.4 38.2 3.1 3.1 – – – 99.2Relating to acquisition of subsidiaries – – – – – – – – 52.8 5.0 – 57.8Foreign currency adjustment – 0.8 0.1 0.1 0.1 (1.6) 0.2 0.1 (2.7) (0.1) – (3.0)31 December 2020 35.0 16.1 1.1 2.2 1.5 36.6 3.3 3.2 50.1 4.9 – 154.0Relating to acquisition of subsidiaries** 1.4 – – – – – – – – – 0.9 2.3
Foreign currency adjustment – (1.1) – (0.1) (0.1) 0.4 (0.2) (0.1) 0.6 0.1 – (0.5)
31 December 2021 36.4 15.0 1.1 2.1 1.4 37.0 3.1 3.1 50.7 5.0 0.9 155.8
Market growth rate 2.3% 1.7% 1.9% 1.9% 1.7% 2.3% 1.9% 1.9% 2.3% 2.3% 1.7%Discount rate (pre tax) 12.4% 11.0% 7.7% 7.7% 11.0% 13.1% 11.3% 7.7% 13.9% 17.0% 11.0%Discount rate (post tax) 9.9% 8.2% 7.1% 7.1% 8.7% 10.2% 8.6% 7.1% 10.7% 13.0% 8.2%
* CC – Computacenter.
** CC UK Limited increased its interest in RDC.
Key assumptions used in value-in-use calculationsThe recoverable amounts of all CGUs have been determined based on a value-in-use calculation. To calculate this, cash flow projections are based on financial budgets approved by senior Management covering a three-year period and on long-term market growth rates of between 1.7 per cent and 2.3 per cent (2020: between 1.0 and 1.8 per cent) thereafter.
Key assumptions used in the value-in-use calculation for all CGUs for 31 December 2021 and 31 December 2020 are:
• budgeted revenue, which is based on long-run market growth forecasts;• budgeted gross margins, which are based on average gross margins achieved in the year immediately before the budgeted year, adjusted for
expected long-run market pricing trends; and• the discount rate applied to cash flow projections ranges from 7.1 per cent to 13.0 per cent (2020: 6.5 per cent to 12.4 per cent) which represents
the Group’s post-tax measure estimating the weighted-average cost of capital based on the rate of government bonds in the relevant market and in the same currency as the cash flows, adjusted for a risk premium to reflect the increased risk of investing in equities generally.
Each CGU generates value substantially in excess of the carrying value of goodwill attributed to each of them. Management therefore believes that no reasonably possible change in any of the above key assumptions would cause the carrying value of the unit to materially exceed its recoverable amount.
Other acquired intangible assetsOther acquired intangible assets consist of customer relationships, order backlog and tools and technology. The expected useful lives are shown in note 2.
Other non-current assetsWhen there is an indication of impairment within a CGU, the carrying values of the non-current assets are compared to their recoverable amount, which is the higher of the assets’ fair value less costs of disposal or the value-in-use of the CGU calculated as described above.
Notes to the Consolidated Financial Statements continuedFor the year ended 31 December 2021
168
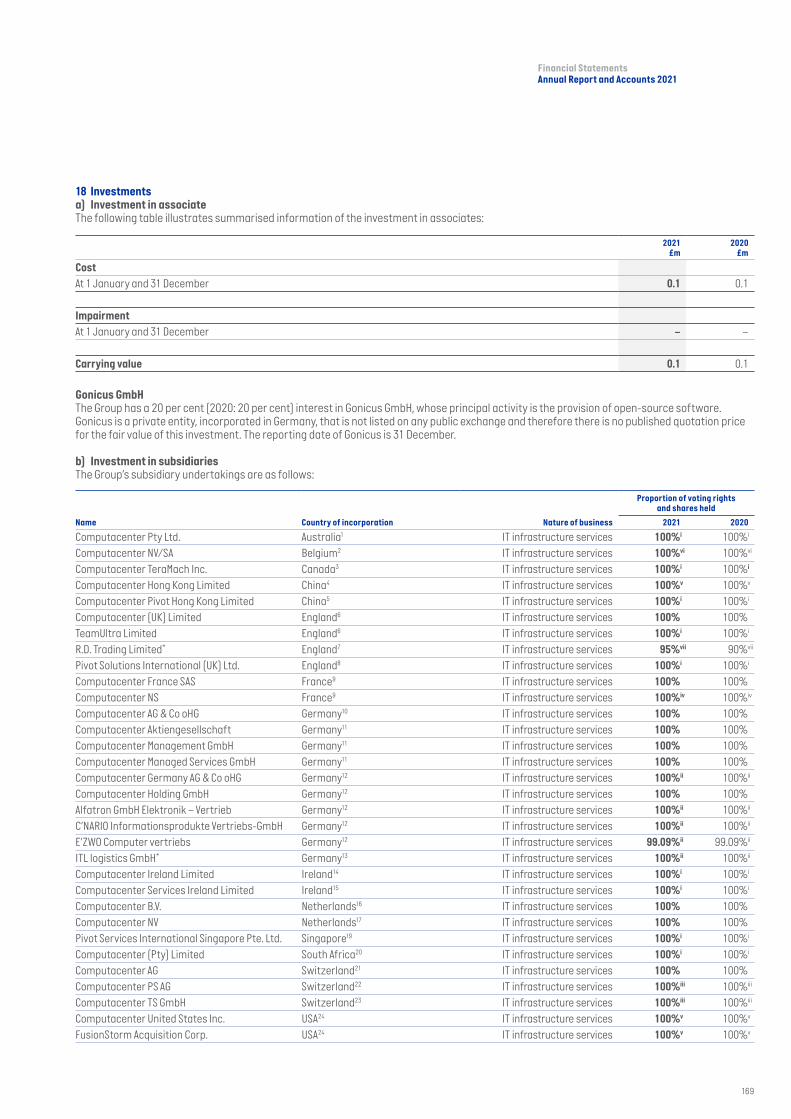
18 Investmentsa) Investment in associateThe following table illustrates summarised information of the investment in associates:
2021£m
2020£m
Cost
At 1 January and 31 December 0.1 0.1
Impairment
At 1 January and 31 December – –
Carrying value 0.1 0.1
Gonicus GmbHThe Group has a 20 per cent (2020: 20 per cent) interest in Gonicus GmbH, whose principal activity is the provision of open-source software. Gonicus is a private entity, incorporated in Germany, that is not listed on any public exchange and therefore there is no published quotation price for the fair value of this investment. The reporting date of Gonicus is 31 December.
b) Investment in subsidiariesThe Group’s subsidiary undertakings are as follows:
Name Country of incorporation Nature of business
Proportion of voting rights and shares held
2021 2020
Computacenter Pty Ltd. Australia1 IT infrastructure services 100%i 100%i
Computacenter NV/SA Belgium2 IT infrastructure services 100%vi 100%vi
Computacenter TeraMach Inc. Canada3 IT infrastructure services 100%i 100%i
Computacenter Hong Kong Limited China4 IT infrastructure services 100%v 100%v
Computacenter Pivot Hong Kong Limited China5 IT infrastructure services 100%i 100%i
Computacenter (UK) Limited England6 IT infrastructure services 100% 100%TeamUltra Limited England6 IT infrastructure services 100%i 100%i
R.D. Trading Limited* England7 IT infrastructure services 95%vii 90%vii
Pivot Solutions International (UK) Ltd. England8 IT infrastructure services 100%i 100%i
Computacenter France SAS France9 IT infrastructure services 100% 100%Computacenter NS France9 IT infrastructure services 100%iv 100%iv
Computacenter AG & Co oHG Germany10 IT infrastructure services 100% 100%Computacenter Aktiengesellschaft Germany11 IT infrastructure services 100% 100%Computacenter Management GmbH Germany11 IT infrastructure services 100% 100%Computacenter Managed Services GmbH Germany11 IT infrastructure services 100% 100%Computacenter Germany AG & Co oHG Germany12 IT infrastructure services 100%ii 100%ii
Computacenter Holding GmbH Germany12 IT infrastructure services 100% 100%Alfatron GmbH Elektronik – Vertrieb Germany12 IT infrastructure services 100%ii 100%ii
C’NARIO Informationsprodukte Vertriebs-GmbH Germany12 IT infrastructure services 100%ii 100%ii
E’ZWO Computer vertriebs Germany12 IT infrastructure services 99.09%ii 99.09%ii
ITL logistics GmbH* Germany13 IT infrastructure services 100%ii 100%ii
Computacenter Ireland Limited Ireland14 IT infrastructure services 100%i 100%i
Computacenter Services Ireland Limited Ireland15 IT infrastructure services 100%i 100%i
Computacenter B.V. Netherlands16 IT infrastructure services 100% 100%Computacenter NV Netherlands17 IT infrastructure services 100% 100%Pivot Services International Singapore Pte. Ltd. Singapore19 IT infrastructure services 100%i 100%i
Computacenter (Pty) Limited South Africa20 IT infrastructure services 100%i 100%i
Computacenter AG Switzerland21 IT infrastructure services 100% 100%Computacenter PS AG Switzerland22 IT infrastructure services 100%iii 100%iii
Computacenter TS GmbH Switzerland23 IT infrastructure services 100%iii 100%iii
Computacenter United States Inc. USA24 IT infrastructure services 100%v 100%v
FusionStorm Acquisition Corp. USA24 IT infrastructure services 100%v 100%v
169
Financial StatementsAnnual Report and Accounts 2021
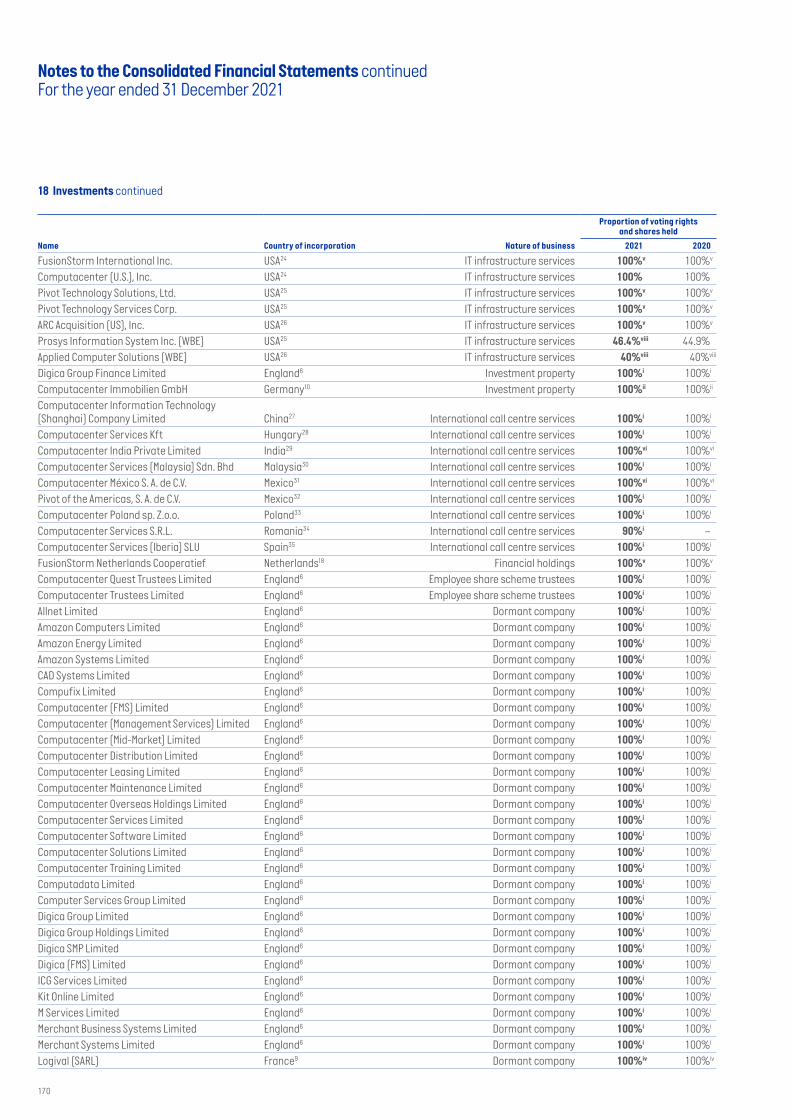
Name Country of incorporation Nature of business
Proportion of voting rights and shares held
2021 2020
FusionStorm International Inc. USA24 IT infrastructure services 100%v 100%v
Computacenter (U.S.), Inc. USA24 IT infrastructure services 100% 100%Pivot Technology Solutions, Ltd. USA25 IT infrastructure services 100%v 100%v
Pivot Technology Services Corp. USA25 IT infrastructure services 100%v 100%v
ARC Acquisition (US), Inc. USA26 IT infrastructure services 100%v 100%v
Prosys Information System Inc. (WBE) USA25 IT infrastructure services 46.4%viii 44.9%Applied Computer Solutions (WBE) USA26 IT infrastructure services 40%viii 40%viii
Digica Group Finance Limited England6 Investment property 100%i 100%i
Computacenter Immobilien GmbH Germany10 Investment property 100%ii 100%ii
Computacenter Information Technology (Shanghai) Company Limited China27 International call centre services 100%i 100%i
Computacenter Services Kft Hungary28 International call centre services 100%i 100%i
Computacenter India Private Limited India29 International call centre services 100%vi 100%vi
Computacenter Services (Malaysia) Sdn. Bhd Malaysia30 International call centre services 100%i 100%i
Computacenter México S. A. de C.V. Mexico31 International call centre services 100%vi 100%vi
Pivot of the Americas, S. A. de C.V. Mexico32 International call centre services 100%i 100%i
Computacenter Poland sp. Z.o.o. Poland33 International call centre services 100%i 100%i
Computacenter Services S.R.L. Romania34 International call centre services 90%i –Computacenter Services (Iberia) SLU Spain35 International call centre services 100%i 100%i
FusionStorm Netherlands Cooperatief Netherlands18 Financial holdings 100%v 100%v
Computacenter Quest Trustees Limited England6 Employee share scheme trustees 100%i 100%i
Computacenter Trustees Limited England6 Employee share scheme trustees 100%i 100%i
Allnet Limited England6 Dormant company 100%i 100%i
Amazon Computers Limited England6 Dormant company 100%i 100%i
Amazon Energy Limited England6 Dormant company 100%i 100%i
Amazon Systems Limited England6 Dormant company 100%i 100%i
CAD Systems Limited England6 Dormant company 100%i 100%i
Compufix Limited England6 Dormant company 100%i 100%i
Computacenter (FMS) Limited England6 Dormant company 100%i 100%i
Computacenter (Management Services) Limited England6 Dormant company 100%i 100%i
Computacenter (Mid-Market) Limited England6 Dormant company 100%i 100%i
Computacenter Distribution Limited England6 Dormant company 100%i 100%i
Computacenter Leasing Limited England6 Dormant company 100%i 100%i
Computacenter Maintenance Limited England6 Dormant company 100%i 100%i
Computacenter Overseas Holdings Limited England6 Dormant company 100%i 100%i
Computacenter Services Limited England6 Dormant company 100%i 100%i
Computacenter Software Limited England6 Dormant company 100%i 100%i
Computacenter Solutions Limited England6 Dormant company 100%i 100%i
Computacenter Training Limited England6 Dormant company 100%i 100%i
Computadata Limited England6 Dormant company 100%i 100%i
Computer Services Group Limited England6 Dormant company 100%i 100%i
Digica Group Limited England6 Dormant company 100%i 100%i
Digica Group Holdings Limited England6 Dormant company 100%i 100%i
Digica SMP Limited England6 Dormant company 100%i 100%i
Digica (FMS) Limited England6 Dormant company 100%i 100%i
ICG Services Limited England6 Dormant company 100%i 100%i
Kit Online Limited England6 Dormant company 100%i 100%i
M Services Limited England6 Dormant company 100%i 100%i
Merchant Business Systems Limited England6 Dormant company 100%i 100%i
Merchant Systems Limited England6 Dormant company 100%i 100%i
Logival (SARL) France9 Dormant company 100%iv 100%iv
Notes to the Consolidated Financial Statements continuedFor the year ended 31 December 2021
18 Investments continued
170

Name Country of incorporation Nature of business
Proportion of voting rights and shares held
2021 2020
Damax GmbH Switzerland20 Dormant company 100%iii 100%iii
Computacenter (US) Defense Inc. USA24 Dormant company 100%v 100%v
i Includes indirect holdings of 100 per cent via Computacenter (UK) Limitedii Includes indirect holdings of 100 per cent via Computacenter Holding GmbH, excludes
E’ZWO Computervertriebs which is 99.09 per centiii Includes indirect holdings of 100 per cent via Computacenter AGiv Includes indirect holdings of 100 per cent via Computacenter France SASv Includes indirect holdings of 100 per cent via Computacenter (U.S.) Inc.vi Includes indirect holdings of 1 per cent via Computacenter (UK) Limitedvii Includes indirect holdings of 90 per cent via Computacenter (UK) Limitedviii Includes indirect holdings of 44.9 per cent via Pivot Technology Services Corp.ix Includes indirect holdings of 40 per cent via Pivot Technology Services Corp.
1 Tower 2, Darling Park, 201 Sussex Street, Sydney 2000, New South Wales, Australia2 Ikaroslaan 31, B-1930 Zaventem, Belgium³ 1130 Morrison Drive, Suite 105, Ottawa, ON K2H 9N6 Canada4 3806 Central Plaza, 18 Harbour Road, Wanchai, Hong Kong5 Unit 2, 10/F, NEO, 123 Hoi Bun Road, Kwun Tong, Kowloon, Hong Kong6 Hatfield Avenue, Hatfield, Hertfordshire, AL10 9TW, United Kingdom7 Tekhnicon, Springwood, Braintree, Essex, CM7 2YN, United Kingdom8 25 Canada Square, Level 37, London, E14 5LQ, United Kingdom9 229 rue de la Belle Etoile, ZI Parid Nord II, BP 52387, 95943 Roissy CDG Cedex, France10 Computacenter Park 1, 50170 Kerpen, Germany11 Kattenbug 2, 50667 Koln, Germany12 Werner-Eckert-Str. 16 – 18, 81829 Munchen, Germany 13 Trias Gewerbepark, Lohstrasse 25 b, Schwaig D-85445, Germany14 Skybridge House, Corballis Road North, Dublin Airport, Swords, Co. Dublin, K67P6K2,
Ireland
Computacenter plc is the ultimate Parent entity of the Group
*ITL logistics GmbH (ITL)On 30 April 2021, the Group acquired 100 per cent of the voting shares of ITL logistics GmbH (ITL) for a consideration of €1.7 million cash. ITL is an IT logistics provider based in Germany. The acquisition has been accounted for using the purchase method of accounting.
*R.D. Trading Limited (RDC)On 10 August 2019, the Group acquired 90 per cent of the voting shares of RDC for a consideration of 90 pence. On 26 October 2021, the Group acquired a further 4.99 per cent of the voting shares for a consideration of £1.4 million cash from the seller of RDC. RDC is based in the UK and is an IT assets disposal business. The acquisition has been accounted for using the purchase method of accounting.
c) Pivot Technology Solutions Inc. (Pivot)Applied Computer Solutions (ACS) ACS is a 40 per cent owned affiliate of a Pivot subsidiary, whose principal office is located in Huntington Beach, California, United States of America. Despite not owning a majority of the voting rights, Computacenter controls this entity through a Pivot subsidiary for accounting purposes, based on the following facts and circumstances:
• Pivot has the right in its sole discretion to either acquire, at any time, shares of ACS that it does not already own, or to designate a different owner to purchase the shares provided such transfer(s) are in compliance with applicable Women Business Enterprise (WBE) requirements;
• Pivot has multiple representatives on the ACS board of directors;• any significant decisions made at ACS require the approval of the ACS board of directors and/or shareholders, including board changes,
payment of dividends, mergers or acquisitions, material changes to compensation, incurring debt in excess of $100, causing any material change in the business, and/or assignment or termination of any material agreement; and
• Pivot receives the majority of the benefits from the activities of ACS.
2021 $m
2020 $m
Current assets 60.0 15.0Non-current assets 16.4 16.6Current liabilities 6.8 30.2Non-current liabilities 0.2 –Revenue 206.5 119.5Total comprehensive income (loss) 2.8 0.3% interest held 40% 40%
15 6th Floor, 2 Grand Canal Square, Dublin 2, Dublin D02A342, Ireland16 Gondel 1, 1186 MJ Amstelveen, Netherlands 17 Beech Avenue 54 – 80 1119 PW Schipol-Rjik, Netherlands18 Prins Bernhardplein 200, 1097JB Amsterdam, Netherlands19 4 Battery Road, #25-01 Bank of China Building, 049908, Singapore20 Klein D’Aria Estate, 97 Jip de Jager Drive, Belville, 7535, Cape Town, South Africa21 Riedstrasse 14, CH-8953 Dietikon, Switzerland22 Giessereistrasse 4, CH-8620 Wetzikon, Switzerland23 Luzernerstrasse 52c, CH 6025 Neudorf, Switzerland24 1 University Ave, Suite 102, Westwood, MA 02090, United States25 6025 The Corners Parkway, Suite 100, Norcorss, GA 30092, United States26 607 E Sonterra Blvd, Suite 250, San Antonio TX 78258, United States27 Unit 229, Block 2, Building 1, Huanhu West 2nd Road no. 888 Nanhui New Town, Putong
District Shanghai, China28 Haller Gardens, Building D. 1st Floor, Soroksari ut 30 – 34, Budapest 1095, Hungary29 4th Floor, Purva Premiere, Residency Road, Bangalore 560025, India30 Level 9, Tower 1, Puchong Financial Corporate Centre, Jalan Puteri 1/2, Bandar Puteri
47100 Puchong, Selangor Darul Ehsan, Malaysia31 Av. Paseo de la Reforma, No.412 floor 5, Col.Juarez, Delegacion Cuauhtemoc, CP06600,
Mexico City, Mexcio32 Presa de la Angostura 23 PB, Colonia Irrigacion 11500, Distrito Federal, Mexico City,
Mexico33 Ul. Glogowska 31/33, 60 – 702, Poznan, Poland34 “Stables Office”, 20A Onisifor Ghibu, Record Park, Cluj-Napoca, CJ 400185, Romania35 Carrer de Sancho De Avila 52 – 58, 08018, Barcelona, Spain
171
Financial StatementsAnnual Report and Accounts 2021
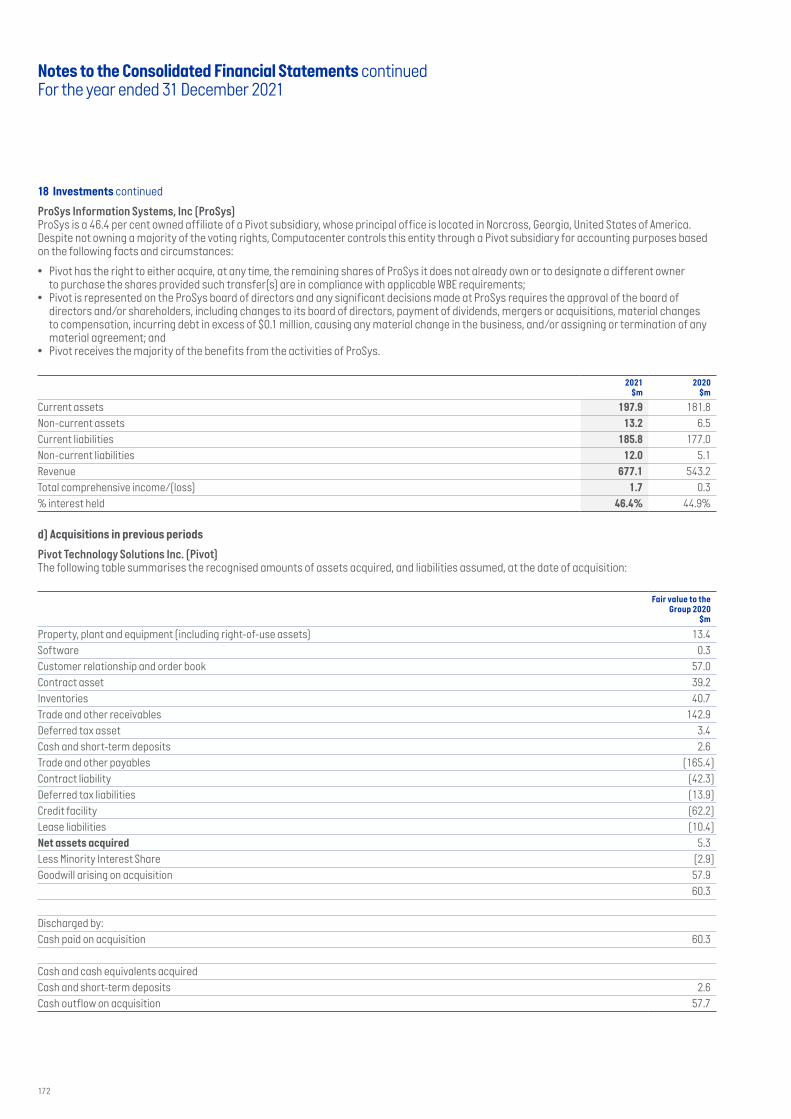
18 Investments continued
ProSys Information Systems, Inc (ProSys) ProSys is a 46.4 per cent owned affiliate of a Pivot subsidiary, whose principal office is located in Norcross, Georgia, United States of America. Despite not owning a majority of the voting rights, Computacenter controls this entity through a Pivot subsidiary for accounting purposes based on the following facts and circumstances:
• Pivot has the right to either acquire, at any time, the remaining shares of ProSys it does not already own or to designate a different owner to purchase the shares provided such transfer(s) are in compliance with applicable WBE requirements;
• Pivot is represented on the ProSys board of directors and any significant decisions made at ProSys requires the approval of the board of directors and/or shareholders, including changes to its board of directors, payment of dividends, mergers or acquisitions, material changes to compensation, incurring debt in excess of $0.1 million, causing any material change in the business, and/or assigning or termination of any material agreement; and
• Pivot receives the majority of the benefits from the activities of ProSys.
2021 $m
2020 $m
Current assets 197.9 181.8Non-current assets 13.2 6.5Current liabilities 185.8 177.0Non-current liabilities 12.0 5.1Revenue 677.1 543.2Total comprehensive income/(loss) 1.7 0.3% interest held 46.4% 44.9%
d) Acquisitions in previous periods
Pivot Technology Solutions Inc. (Pivot)The following table summarises the recognised amounts of assets acquired, and liabilities assumed, at the date of acquisition:
Fair value to the Group 2020
$m
Property, plant and equipment (including right-of-use assets) 13.4Software 0.3Customer relationship and order book 57.0Contract asset 39.2Inventories 40.7Trade and other receivables 142.9Deferred tax asset 3.4Cash and short-term deposits 2.6Trade and other payables (165.4)Contract liability (42.3)Deferred tax liabilities (13.9)Credit facility (62.2)Lease liabilities (10.4)Net assets acquired 5.3Less Minority Interest Share (2.9)Goodwill arising on acquisition 57.9
60.3
Discharged by:Cash paid on acquisition 60.3
Cash and cash equivalents acquiredCash and short-term deposits 2.6Cash outflow on acquisition 57.7
Notes to the Consolidated Financial Statements continuedFor the year ended 31 December 2021
172

BT France SAS (Computacenter NS)The following table summarises the recognised amounts of assets acquired, and liabilities assumed, at the date of acquisition:
Fair value to the Group 2020
$m
Property, plant and equipment (including right-of-use assets) 4.9Customer relationship 1.9Inventories 0.3Trade and other receivables 12.7Cash and short-term deposits 27.6Prepayments 16.8Trade and other payables (32.3)Lease liabilities (2.4)Pension liabilities (9.9)Provisions (5.6)Net assets acquired 14.0Gain on acquisition of subsidiary 14.0
Discharged by:Cash paid on acquisition –
Cash and cash equivalents acquiredCash and short-term deposits 27.6Cash inflow on acquisition 27.6
In 2021, no change was recorded to the fair values of Pivot Technology Solutions Inc. (Pivot) and BT France SAS (Computacenter NS), both of which were acquired in 2020.
173
Financial StatementsAnnual Report and Accounts 2021

19 Inventories
2021£m
2020£m
Inventories for re-sale 341.3 211.3
20 Trade and other receivables
2021£m
2020£m
Trade receivables before provisions 1,265.2 1,093.2 Provision for doubtful debts (7.8) (7.8) Provision for credit notes (17.6) (20.3) Trade receivables 1,239.8 1,065.1Other receivables 35.4 30.8
1,275.2 1,095.9
Trade receivables are non-interest bearing and are generally on 30 to 90-day credit terms. Note 27 sets out the Group’s strategy towards credit risk.
Other receivables generally arise from transactions outside the usual operating activities of the Group and comprise tax receivables (VAT, GST, franchise taxes, and sales and use taxes) of £24.4 million (2020: £20.8 million) and other receivables of £11.0 million (2020: £10.0 million). Other receivables are financial assets and are measured at amortised cost.
The movements in the provision for doubtful debts were as follows:
2021£m
2020£m
At 1 January 7.8 6.7 Relating to acquisition – 1.2 Charge for the year 7.5 2.2 Utilised (0.4) (0.7) Unused amounts reversed (6.9) (1.8) Foreign currency adjustment (0.2) 0.2 At 31 December 7.8 7.8
There was no change made to the level of provision for doubtful debts upon adoption of the simplified Expected Credit Loss model under IFRS 9. The doubtful debt provision is determined as follows:
Past due but not impaired
Total£m
Neither past due nor impaired
£m<30 days
£m30–60 days
£m60–90 days
£m90–120 days
£m>120 days
£m
2021
Expected loss rate 0.6% 0.2% 0.4% 0.6% 3.4% 15.4% 20.4%
Gross carrying amount 1,265.2 1,046.4 133.5 32.6 31.9 11.0 9.8
Provision 7.8 2.2 0.6 0.2 1.1 1.7 2.0
2020Expected loss rate 0.7% 0.1% 1.3% 4.3% 0.6% 11.1% 29.5%Gross carrying amount 1,093.2 944.5 54.8 23.0 52.4 5.4 13.2 Provision 7.8 1.2 0.7 1.0 0.3 0.6 3.9
Notes to the Consolidated Financial Statements continuedFor the year ended 31 December 2021
174

21 Cash and cash equivalents
2021£m
2020£m
Cash and short-term deposits 285.2 309.8Bank overdraft (12.0) –Cash and cash equivalents in the consolidated cash flow statement 273.2 309.8
Cash at bank and in hand earns interest at floating rates based on daily bank deposit rates. Short-term deposits are made for varying periods of between one day and three months depending on the immediate cash requirements of the Group, and earn interest at the respective short-term deposit rates. The fair value of cash and cash equivalents is £273.2 million (2020: £309.8 million).
During the year ended 31 December 2021, the Group continued to maintain strong cash generation and finance its operational requirements from its cash balance. The overdraft facilities are retained by the Group and can be used upon requirement. The uncommitted overdraft facilities available to the Group are £13.3 million as at 31 December 2021 (2020: £13.5 million). In 2020, the Group specific committed facility of £60.0 million was extended until 8 September 2023. The Company acquired Pivot in 2020 with a credit facility. The utilised facility was £7.0 million as at 31 December 2021 (2020: £58.5 million).
Expected credit loss on cash and cash equivalents is negligible and therefore no provision is held.
22 Trade and other payables
2021£m
2020£m
Trade payables 989.3 719.7Other payables 421.1 397.0
1,410.4 1,116.7
Trade payables are non-interest bearing and are normally settled on net monthly terms.
The Group had no short-term supplier extended-term interest-bearing credit facilities (2020: nil).
Other payables, which principally relate to other taxes, social security costs and accruals, are non-interest bearing and have an average term of three months.
The Group regularly participates in Industry standard vendor rebate plans, primarily relating to volume discounts on purchases, often paid retrospectively. Rebates are factored into the calculation of purchase cost of inventory valuations. Owing to the nature of these rebate plans, the calculation of rebates is not subject to significant estimation uncertainty, nor is their recognition a matter of significant judgement.
23 a) Financial liabilities
2021£m
2020£m
Current
Bank loans 5.4 47.1Credit facility 7.0 58.4Other loans 2.7 –
15.1 105.5Non-current
Bank loans 9.8 15.7Other loans 6.9 –
16.7 15.731.8 121.2
There are no material differences between the fair value of financial liabilities and their book value.
175
Financial StatementsAnnual Report and Accounts 2021
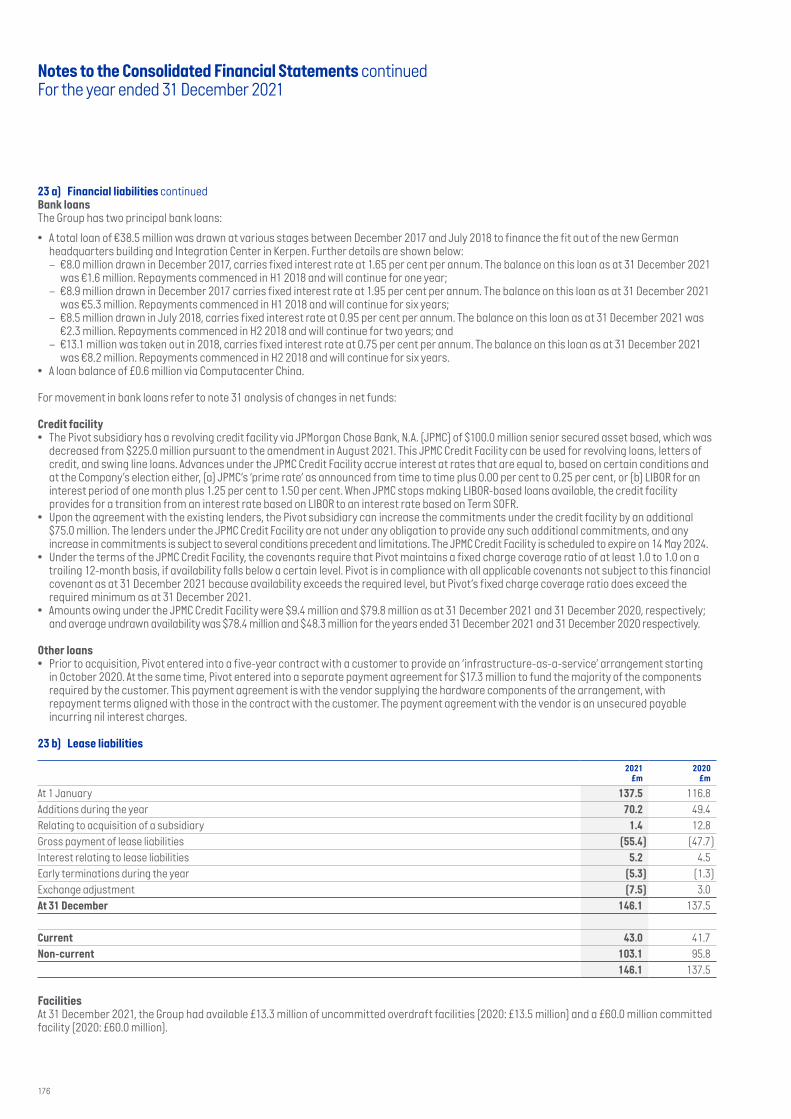
23 a) Financial liabilities continuedBank loansThe Group has two principal bank loans:
• A total loan of €38.5 million was drawn at various stages between December 2017 and July 2018 to finance the fit out of the new German headquarters building and Integration Center in Kerpen. Further details are shown below:
– €8.0 million drawn in December 2017, carries fixed interest rate at 1.65 per cent per annum. The balance on this loan as at 31 December 2021 was €1.6 million. Repayments commenced in H1 2018 and will continue for one year;
– €8.9 million drawn in December 2017 carries fixed interest rate at 1.95 per cent per annum. The balance on this loan as at 31 December 2021 was €5.3 million. Repayments commenced in H1 2018 and will continue for six years;
– €8.5 million drawn in July 2018, carries fixed interest rate at 0.95 per cent per annum. The balance on this loan as at 31 December 2021 was €2.3 million. Repayments commenced in H2 2018 and will continue for two years; and
– €13.1 million was taken out in 2018, carries fixed interest rate at 0.75 per cent per annum. The balance on this loan as at 31 December 2021 was €8.2 million. Repayments commenced in H2 2018 and will continue for six years.
• A loan balance of £0.6 million via Computacenter China.
For movement in bank loans refer to note 31 analysis of changes in net funds:
Credit facility• The Pivot subsidiary has a revolving credit facility via JPMorgan Chase Bank, N.A. (JPMC) of $100.0 million senior secured asset based, which was
decreased from $225.0 million pursuant to the amendment in August 2021. This JPMC Credit Facility can be used for revolving loans, letters of credit, and swing line loans. Advances under the JPMC Credit Facility accrue interest at rates that are equal to, based on certain conditions and at the Company’s election either, (a) JPMC’s ‘prime rate’ as announced from time to time plus 0.00 per cent to 0.25 per cent, or (b) LIBOR for an interest period of one month plus 1.25 per cent to 1.50 per cent. When JPMC stops making LIBOR-based loans available, the credit facility provides for a transition from an interest rate based on LIBOR to an interest rate based on Term SOFR.
• Upon the agreement with the existing lenders, the Pivot subsidiary can increase the commitments under the credit facility by an additional $75.0 million. The lenders under the JPMC Credit Facility are not under any obligation to provide any such additional commitments, and any increase in commitments is subject to several conditions precedent and limitations. The JPMC Credit Facility is scheduled to expire on 14 May 2024.
• Under the terms of the JPMC Credit Facility, the covenants require that Pivot maintains a fixed charge coverage ratio of at least 1.0 to 1.0 on a trailing 12-month basis, if availability falls below a certain level. Pivot is in compliance with all applicable covenants not subject to this financial covenant as at 31 December 2021 because availability exceeds the required level, but Pivot’s fixed charge coverage ratio does exceed the required minimum as at 31 December 2021.
• Amounts owing under the JPMC Credit Facility were $9.4 million and $79.8 million as at 31 December 2021 and 31 December 2020, respectively; and average undrawn availability was $78.4 million and $48.3 million for the years ended 31 December 2021 and 31 December 2020 respectively.
Other loans• Prior to acquisition, Pivot entered into a five-year contract with a customer to provide an ‘infrastructure-as-a-service’ arrangement starting
in October 2020. At the same time, Pivot entered into a separate payment agreement for $17.3 million to fund the majority of the components required by the customer. This payment agreement is with the vendor supplying the hardware components of the arrangement, with repayment terms aligned with those in the contract with the customer. The payment agreement with the vendor is an unsecured payable incurring nil interest charges.
23 b) Lease liabilities
2021£m
2020£m
At 1 January 137.5 116.8 Additions during the year 70.2 49.4Relating to acquisition of a subsidiary 1.4 12.8Gross payment of lease liabilities (55.4) (47.7)Interest relating to lease liabilities 5.2 4.5Early terminations during the year (5.3) (1.3)Exchange adjustment (7.5) 3.0At 31 December 146.1 137.5
Current 43.0 41.7Non-current 103.1 95.8
146.1 137.5
FacilitiesAt 31 December 2021, the Group had available £13.3 million of uncommitted overdraft facilities (2020: £13.5 million) and a £60.0 million committed facility (2020: £60.0 million).
Notes to the Consolidated Financial Statements continuedFor the year ended 31 December 2021
176

24 Derivative financial instruments
2021£m
2020£m
Financial instruments at fair value through profit and loss
Foreign exchange forward contracts 1.6 (3.6)Interest rate swaps – (0.3)
1.6 (3.9)Financial instruments at fair value through other comprehensive income
Cash flow hedges
Foreign exchange forward contracts (0.5) 0.41.1 (3.5)
Current assets 3.6 1.6Current liabilities (2.5) (5.1)
1.1 (3.5)
Cash flow hedgesFinancial assets and liabilities at fair value through other comprehensive incomeForward ContractsThese amounts reflect the change in the fair value of foreign exchange forward contracts designated as cash flow hedges which are used to hedge intra-Group services or customer/supplier contracts where the underlying cost is denominated in a foreign currency. These are based on highly probable forecast transactions in South African rand, Hungarian forint, euro, US dollar and Japanese yen.
Financial assets and liabilities at fair value through profit or lossForward ContractsThe Group also enters into other foreign exchange forward contracts with the intention to reduce the foreign exchange risk of expected sales and purchases. When these other contracts are not designated in hedge relationships they are measured at fair value through profit and loss within administrative expenses.
The foreign exchange forward contract balances vary with the level of expected foreign currency costs and changes in the foreign exchange forward rates.
Interest rate swapsIn June 2020, the Group’s subsidiary Pivot Technology Solutions Inc. entered into an interest rate swap contract, with a notional amount of $50.0 million, to lock in the LIBOR between 0.3 per cent and 0.7 per cent (range of interest rates: 1.6 per cent – 2.2 per cent), covering the full term of the JPMC Credit Facility, scheduled to expire on 14 May 2024. As these interest rate swaps are not designated in hedge relationships they are measured at fair value through profit and loss within administrative expenses.
The interest rate swap was terminated early on 16 September 2021 due to the Group’s subsidiary Pivot Technology Solutions Inc. significantly reducing the amount drawn on the JPMC Credit Facility (note 23). As at 31 December 2020, the interest rate swap was valued at a liability of £0.3 million.
Effectiveness of hedgingThe terms of the foreign currency forward contracts have been negotiated for the expected highly probable forecast transactions to which hedge accounting has been applied. No significant element of hedge ineffectiveness required recognition in the Consolidated Income Statement.
The cash flow hedges of the forecasted costs were assessed to be highly effective and a net unrealised loss of £0.5 million (2020: gain of £0.4 million) with a deferred tax asset of £0.1 million (2020: liability of £0.1 million) relating to the hedging instruments is included in the Consolidated Statement of Comprehensive Income. The amounts retained in the Consolidated Statement of Comprehensive Income of £0.5 million (2020: £0.4 million) are expected to mature and affect the Consolidated Income Statement between 2022 and 2026.
177
Financial StatementsAnnual Report and Accounts 2021

24 Derivative financial instruments continuedForward currency contractsAt 31 December 2021 the Group held foreign exchange contracts as hedges of an intra-Group loan and future expected payments to suppliers. The exchange contracts are being used to reduce the exposure to foreign exchange risk. The terms of these contracts are detailed below:
31 December 2021
Buy currency Sell currencyNominal value of
contracts (millions) Maturity dates Contract rates
UK Sterling Euros £1.5 Jan 22 – Oct 23 1.086 – 1.169
Sterling US dollars £19.1 Jan 22 – Mar 22 1.321 – 1.380
Sterling Hungarian forint £1.3 Jan 22 – Dec 22 389.996 – 456.392
Sterling Swiss francs £0.4 Dec 22 1.212
Sterling Swedish krona £0.3 Jan 22 12.223
Sterling SA rand £18.5 Jan 22 – Aug 25 20.536 – 27.262
Sterling Japanese yen £2.0 Feb 22 155.616
Sterling Mexican peso £0.0 Jan 22 27.742
Euros Sterling €11.0 Jan 22 – Mar 22 0.839 – 0.856
US dollars Sterling $81.2 Jan 22 – Dec 24 0.705 – 0.802
Hungarian forint Sterling HUF 2,536.0 Jan 22 – Dec 23 0.002
Germany Euros Sterling €0.4 Jan 22 0.850 – 0.856
Euros US dollars €110.3 Jan 22 – Jun 22 1.127 – 1.168
Euros Hungarian forint €1.5 Jan 22 – Dec 22 358.850 – 367.957
Euros Polish zloty €1.6 Jan 22 – Jun 22 4.595 – 4.688
Euros SA rand €1.5 Jan 22 – Oct 25 19.194
US dollars Euros $55.2 Jan 22 – Jun 22 0.856 – 0.889
Mexican peso Euros MXN 3.5 Jan 22 0.043
Hungarian forint Euros HUF 160.0 Jan 22 – Feb 22 0.003
Romanian leu Euros RON 3.8 Jan 22 – Mar 22 0.200 – 0.202
France Sterling Euros £0.4 Jan 22 – Feb 22 1.184 – 1.185
Euros Hungarian forint €6.4 Jan 22 – Dec 23 354.184 – 386.614
Euros Polish zloty €0.1 Jan 22 4.594
Euros SA rand €2.5 Jan 22 – Jun 24 18.041 – 22.701
US dollars Euros $9.0 Jan 22 – Mar 22 0.883 – 0.884
Belgium Sterling Euros £0.3 Jan 22 1.195
Euros SA rand €0.2 Jan 22 – May 22 18.324 – 22.714
US dollars Euros $0.6 Mar 22 – Apr 22 0.883 – 0.887
US US dollars SA rand $5.7 Jan 22 – May 26 15.271 – 19.321
US dollars Japanese yen $30.7 May 22 – Jun 22 113.000 – 113.050
Notes to the Consolidated Financial Statements continuedFor the year ended 31 December 2021
178
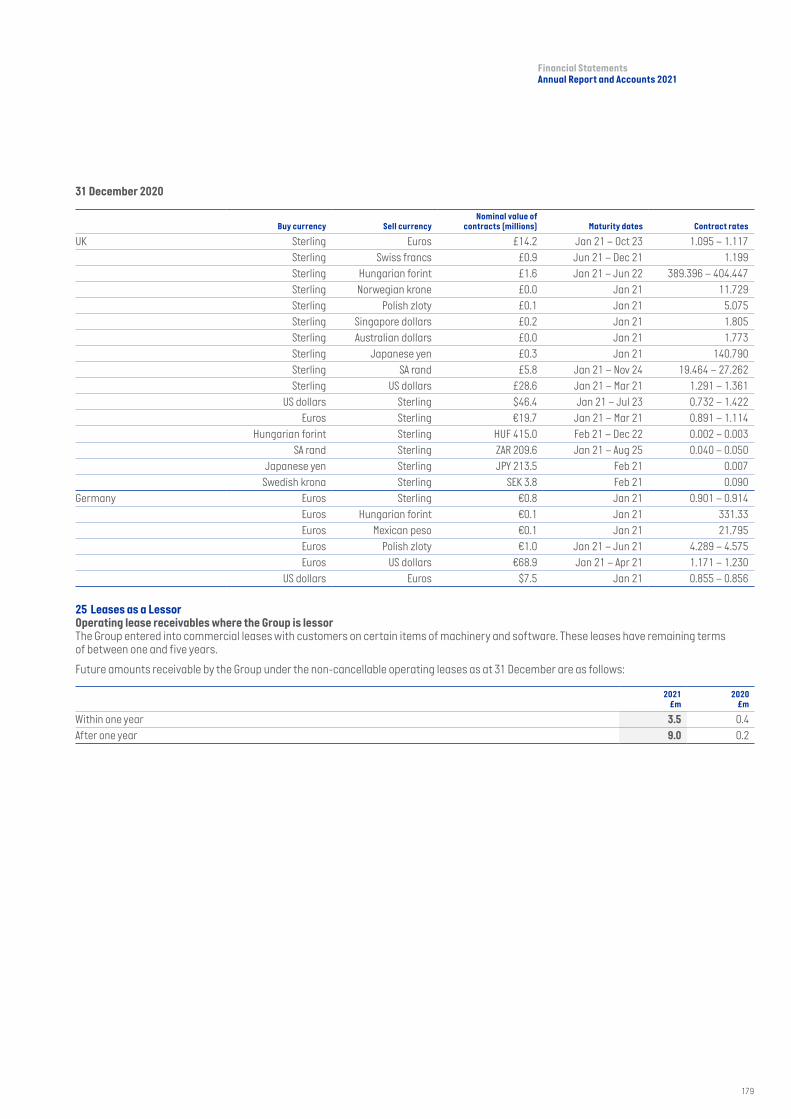
31 December 2020
Buy currency Sell currencyNominal value of
contracts (millions) Maturity dates Contract rates
UK Sterling Euros £14.2 Jan 21 – Oct 23 1.095 – 1.117Sterling Swiss francs £0.9 Jun 21 – Dec 21 1.199Sterling Hungarian forint £1.6 Jan 21 – Jun 22 389.396 – 404.447Sterling Norwegian krone £0.0 Jan 21 11.729Sterling Polish zloty £0.1 Jan 21 5.075Sterling Singapore dollars £0.2 Jan 21 1.805Sterling Australian dollars £0.0 Jan 21 1.773Sterling Japanese yen £0.3 Jan 21 140.790Sterling SA rand £5.8 Jan 21 – Nov 24 19.464 – 27.262Sterling US dollars £28.6 Jan 21 – Mar 21 1.291 – 1.361
US dollars Sterling $46.4 Jan 21 – Jul 23 0.732 – 1.422Euros Sterling €19.7 Jan 21 – Mar 21 0.891 – 1.114
Hungarian forint Sterling HUF 415.0 Feb 21 – Dec 22 0.002 – 0.003SA rand Sterling ZAR 209.6 Jan 21 – Aug 25 0.040 – 0.050
Japanese yen Sterling JPY 213.5 Feb 21 0.007Swedish krona Sterling SEK 3.8 Feb 21 0.090
Germany Euros Sterling €0.8 Jan 21 0.901 – 0.914Euros Hungarian forint €0.1 Jan 21 331.33Euros Mexican peso €0.1 Jan 21 21.795Euros Polish zloty €1.0 Jan 21 – Jun 21 4.289 – 4.575Euros US dollars €68.9 Jan 21 – Apr 21 1.171 – 1.230
US dollars Euros $7.5 Jan 21 0.855 – 0.856
25 Leases as a LessorOperating lease receivables where the Group is lessorThe Group entered into commercial leases with customers on certain items of machinery and software. These leases have remaining terms of between one and five years.
Future amounts receivable by the Group under the non-cancellable operating leases as at 31 December are as follows:
2021£m
2020£m
Within one year 3.5 0.4After one year 9.0 0.2
179
Financial StatementsAnnual Report and Accounts 2021

26 Provisions
Customercontract
provisions£m
Property provisions
£m
Otherprovisions
£m
Totalprovisions
£m
At 1 January 2020 7.8 5.1 0.5 13.4Amount unused reversed – (0.5) (0.2) (0.7)Arising during the year 2.9 0.1 – 3.0Utilisation (5.2) 0.2 (0.4) (5.4)Relating to acquisition of a subsidiary 3.6 – 2.0 5.6Exchange adjustment 0.5 – 0.2 0.7At 31 December 2020 9.6 4.9 2.1 16.6Amount unused reversed (3.7) – (0.5) (4.2)
Arising during the year 3.5 0.8 0.3 4.6
Utilisation (2.9) (0.1) (0.1) (3.1)
Exchange adjustment (0.6) – (0.1) (0.7)
At 31 December 2021 5.9 5.6 1.7 13.2
Current 2021 2.0 1.1 0.4 3.5
Non-current 2021 3.9 4.5 1.3 9.7
5.9 5.6 1.7 13.2
Current 2020 3.0 1.0 0.1 4.1Non-current 2020 6.6 3.9 2.0 12.5
9.6 4.9 2.1 16.6
Customer contract provisionThese provisions result from customer contracts where total cost exceeds total revenue. Refer to note 2.12.1 for further details.
Property provisionsAssumptions used to calculate the property provisions are based on 100 per cent of the market value of any contractual dilapidation expenses on empty properties and the Directors’ best estimates of the likely time before the relevant leases can be reassigned or sublet, which ranges between one and nine years. The provisions in relation to the UK and European operations are discounted at 3 per cent. These costs mainly include dilapidation expenses which have not been included as part of the lease liability under IFRS 16.
Other provisionsIncluded within other provisions are legal claims and other costs associated with the completion of the acquisition of Computacenter NS.
Notes to the Consolidated Financial Statements continuedFor the year ended 31 December 2021
180

27 Financial instrumentsAn explanation of the Group’s financial instrument risk management objectives, policies and strategies is set out in the Group Finance Director’s review on pages 76 and 78.
Credit riskThe Group principally manages credit risk through management of customer credit limits. The credit limits are set for each customer based on the creditworthiness of the customer and the anticipated levels of business activity. These limits are initially determined when the customer account is first set up and are regularly monitored thereafter.
In determining the recoverability of the trade receivables, the Group considers any change in the credit quality of the trade receivables from the date the credit was initially granted up to the reporting date and considers forward-looking information to determine the appropriate expected credit loss for the whole remaining life of the trade receivable. The maximum exposure on trade receivables, as at the reporting date, is their carrying value.
With respect to credit risk arising from the other financial assets of the Group, which comprise cash and cash equivalents, current asset investment and forward currency contracts, the Group’s exposure to credit risk arises from default of the counterparty, with a maximum exposure equal to the carrying amount of cash and cash equivalents. The Group manages its counterparty credit risk by placing cash on deposit with a reputable banking institution, with no more than £85.0 million deposited at any one time.
Aside from the counterparty risk above, there are no significant concentrations of credit risk within the Group.
Interest rate riskThe Group finances its operations through a mixture of retained profits, bank borrowings, cash and short-term deposits and finance leases and loans for certain customer contracts. The Group’s bank borrowings, existing committed and uncommitted facilities and deposits are at floating rates. No interest rate derivative contracts have been entered into. If long-term borrowings were to be utilised in the future, the Group’s policy would be to maintain these borrowings at fixed rates to limit the Group’s exposure to interest rate fluctuations.
Interest rate sensitivityThe following table demonstrates the sensitivity to a reasonably possible change in interest rates, with all other variables held constant, of the Group’s profit before tax (through the impact on floating rate borrowings). There is no impact on the Group’s equity.
Change inbasis points
Effect on profit before tax
£m
2021
Sterling +25 0.4
Euro +25 0.1
US dollars +25 0.2
2020
Sterling +25 0.4 Euro +25 (0.1)US dollars +25 0.2
The impact of a reasonable possible decrease to the same range shown in the table would result in an opposite impact on the profit before tax of the same magnitude.
Fair valuesThe carrying value of the Group’s short-term receivables and payables is a reasonable approximation of their fair values. The fair value of all other financial instruments carried within the Consolidated Financial Statements is not materially different from their carrying amount.
181
Financial StatementsAnnual Report and Accounts 2021

27 Financial instruments continuedExchange rate sensitivityThe Group is exposed to transactional foreign currency risk to the extent that there is a mismatch between the currencies in which sales, purchases and receivables are denominated and the respective functional currencies of Group companies. The functional currencies of main overseas subsidiaries are primarily the euro (€), US dollar (USD) and Swiss franc (CHF).
The Group’s risk management policy is to hedge all of its expected foreign currency exposure in respect of sales and purchases as soon as these are committed. The Group uses forward exchange contracts to manage its currency risk. The main currencies managed by forward foreign exchange contracts are South African rand (ZAR), Hungarian forint (HUF), euro (€), US dollar ($), Japanese yen (JPY), Polish zloty (PLN), Swiss franc (CHF), Swedish krona (SEK) and Mexican peso (MXN).
However, hedge accounting is mainly applied to the expected trading cash flows denominated in South African rand (ZAR), Hungarian forint (HUF), euro (€), US dollar ($) and Japanese yen (JPY) where the exposure extends beyond one year and there is a strong expectation that the expected future foreign currency cash flow will occur. The Group uses forward foreign exchange contracts, designated as cash flow hedges, to hedge these cash flows. When a commitment is entered into, forward foreign exchange contracts are normally used to increase the hedge to 100 per cent of the expected exposure, although between 80 per cent and 110 per cent of the expected exposure should be hedged to meet the risk management policy. The Group designates its forward foreign exchange contracts to hedge its cashflow risk and applies a hedge ratio of 1:1. The Group’s policy is for the critical terms of the forward exchange contracts to align with the hedged item.
The Group determines the existence of an economic relationship between the hedging instrument and hedged item based on the currency, amount and timing of their respective cash flows. The Group assesses whether the derivative designated in each hedging relationship is expected to be and has been effective in offsetting changes in cash flows of the hedged item using the hypothetical derivative method.
In these hedge relationships, the main sources of ineffectiveness are:
• the effect of the counterparties’ and the Group’s own credit risk on the fair value of the forward foreign exchange contracts, which is not reflected in the change in the fair value of the hedged cash flows attributable to the change in exchange rates;
• actual cash flows in foreign currencies varying from forecast cash flows; and• changes in the timing of the hedged transactions.
Other than differences arising from the translation of results of operations outside of the Group’s functional currency, reasonably foreseeable movements in the exchange rates of +10 per cent or -10 per cent would not have a material impact on the Group’s profit before tax or equity.
The summary quantitative data about the Group’s exposure to currency risk as reported to the Management of the Group is as follows:
31 December 2021 millions
31 December 2020 millions
$ € $ €
Trade and other receivables 543.4 659.0 409.3 569.8 Trade and other payables (570.9) (682.2) (422.4) (551.0) Forecast future cash flow (net) (173.9) (228.2) 58.5 (15.2)
(201.4) (251.4) 45.4 3.6
Forward exchange contracts 201.4 251.4 (45.4) (3.6)
Net exposure – – – –
Notes to the Consolidated Financial Statements continuedFor the year ended 31 December 2021
182

Liquidity riskThe table below summarises the maturity profile of the Group’s financial liabilities as at 31 December based on contractual discounted payments:
On demand£m
<3 months£m
3–12 months£m
1–2 years£m
2–5 years£m
>5 years£m
Total£m
Year ended 31 December 2021Bank loans and credit facility 7.0 2.5 5.6 5.0 10.3 1.4 31.8
Lease liabilities – 10.7 32.3 32.1 49.1 21.9 146.1
Derivative financial instruments – 0.6 0.9 0.6 0.4 – 2.5
Trade and other payables – 1,410.4 – – – – 1,410.4
7.0 1,424.2 38.8 37.7 59.8 23.3 1,590.8
On demand£m
<3 months£m
3–12 months£m
1–2 years£m
2–5 years£m
>5 years£m
Total£m
Year ended 31 December 2020Bank loans and credit facility 58.4 1.6 45.5 5.2 6.9 3.6 121.2Lease liabilities – 10.4 31.3 29.4 42.4 24.0 137.5Derivative financial instruments – 4.2 0.3 0.3 0.3 – 5.1Trade and other payables – 1,116.7 – – – – 1,116.7
58.4 1,132.9 77.1 34.9 49.6 27.6 1,380.5
The table below summarises the maturity profile of the Group’s financial liabilities as at 31 December based on contractual undiscounted payments:
On demand£m
<3 months£m
3–12 months£m
1–2 years£m
2–5 years£m
>5 years£m
Total£m
Year ended 31 December 2021Bank loans and credit facility 7.0 2.5 5.8 5.2 10.8 1.4 32.7
Lease liabilities – 13.5 33.7 35.2 53.9 23.9 160.2
Derivative financial instruments – 0.6 0.9 0.6 0.4 – 2.5
Trade and other payables – 1,410.4 – – – – 1,410.4
7.0 1,427.0 40.4 41.0 65.1 25.3 1,605.8
On demand£m
<3 months£m
3–12 months£m
1–2 years£m
2–5 years£m
>5 years£m
Total£m
Year ended 31 December 2020Bank loans and credit facility 58.4 1.6 45.8 5.3 7.2 3.7 122.0Lease liabilities – 12.5 33.3 32.4 46.6 27.7 152.5Derivative financial instruments – 4.2 0.3 0.3 0.3 – 5.1Trade and other payables – 1,116.7 – – – – 1,116.7
58.4 1,135.0 79.4 38.0 54.1 31.4 1,396.3
Fair value measurements recognised in the Consolidated Balance SheetFinancial instruments which are recognised at fair value subsequent to initial recognition are grouped into Levels 1 to 3 based on the degree to which the fair value is observable. The three levels are defined as follows:
• Level 1 fair value measurements are those derived from quoted prices (unadjusted) in active markets for identical assets or liabilities;• Level 2 fair value measurements are those derived from inputs other than quoted prices included within Level 1 that are observable for the
asset or liability, either directly (i.e. as prices) or indirectly (i.e. derived from prices); and• Level 3 fair value measurements are those derived from valuation techniques that include inputs for the asset or liability that are not based
on observable market data (unobservable inputs).
Derivative financial instrumentsAt 31 December 2021 the Group had forward currency contracts, which were measured at Level 2 fair value subsequent to initial recognition, to the value of a net asset of £1.1 million (2020: net liability of £3.2 million).
At 31 December 2020 the Group had an interest rate swap, which was measured at Level 2 fair value subsequent to initial recognition, to the value of a net liability of £0.3 million. The interest rate swap was terminated early on 16 September 2021 (note 24).
The realised gains from forward currency contracts in the year to 31 December 2021 of £0.4 million (2020: £2.4 million) with a deferred tax liability of £0.1 million (2020: £0.4 million), are offset by broadly equivalent realised losses on the related underlying transactions.
183
Financial StatementsAnnual Report and Accounts 2021

28 Capital managementComputacenter’s approach to capital management is to ensure that the Group has a strong capital base to support the development of the business and to maintain a strong credit rating, whilst aiming to maximise shareholder value. Consistent with the Group’s aim to maximise return to shareholders, the Company’s dividend policy is to maintain a dividend cover of between 2 to 2.5 times. In 2021, the cover was 2.5 times on an adjusted1 profit basis (2020: 2.5 times).
Capital, defined as net funds3, that the Group monitors is disclosed in note 31.
Each operating country manages its working capital in line with Group policies. The key components of working capital, i.e. trade receivables, inventory and trade payables, are managed in accordance with an agreed number of days targeted in the budget process, in order to ensure efficient capital usage. An important element of the process of managing capital efficiently is to ensure that each operating country rewards behaviour at an account manager and account director level, to minimise working capital at a transactional level. This is achieved by increasing commission payments for early payment by customers and reduced commission payments for late payment by customers, which encourages appropriate behaviour. Management intends to implement Group policies into acquired businesses over time with the introduction of systems, reward mechanisms and other operational practices that support these policies.
The Group regularly reviews the adequacy of its facilities against any foreseeable peak borrowing requirement. See note 21 for details on uncommitted overdraft facilities available to the Group.
In certain circumstances, the Group deposits its funds in short-term investments that do not fulfil the criteria to be classified as cash and cash equivalents. The Group considers these deposits when managing the net funds3 of the business, and accordingly includes these deposits within adjusted net funds3.
Capital is allocated across the Group, in order to minimise its exposure to exchange rates. Each country finances its own working capital requirements, typically resulting in borrowings in France with cash on deposit in the UK and Germany. An internal cash pooling arrangement has been implemented which utilises internal Group financing arrangements (excluding acquisitions).
Within the Group’s European region, the capital base is primarily utilised to finance its fixed assets and working capital requirements. It seeks to optimise the use of working capital and improve its cash flow. As a consequence, the UK has sourced an increasing proportion of its Technology Sourcing business via distributors in order to reduce the working capital requirements of the business.
The Group is subject to certain key financial covenants under its syndicated facility with Barclays and HSBC. These covenants, as defined in the agreement, are monitored regularly to ensure compliance. As at 31 December 2021, the Group was in compliance with all covenants.
The Group’s Pivot subsidiary is also subject to certain key financial covenants under its JPMC Credit facility. These covenants, which include fixed charge ratios as defined in the agreement, are monitored regularly to ensure compliance. As at 31 December 2021, the Pivot subsidiary was in compliance with all covenants. The Company is not subject to any externally imposed capital requirements.
29 Issued capital and reservesIssued share capital – ordinary shares
Issued and fully paid
75/9 pence ordinary
sharesNo. ’000
Total£m
At 1 January 2021 and 31 December 2021 122,688 9.3
During the year, the issued share capital remained unchanged.
The holders of ordinary shares are entitled to receive dividends as declared from time to time and are entitled to one vote per share at the general meetings of the Company. On a winding up of the Company, holders of ordinary shares may be entitled to the residual assets of the Company.
The Company has a number of share option schemes under which options to subscribe for the Company’s shares have been granted to Executive Directors and certain senior Management (note 30).
Share premiumThe share premium account is used to record the aggregate amount or value of premiums paid when the Company’s shares are issued/redeemed at a premium.
Capital redemption reserveThe capital redemption reserve is used to maintain the Company’s capital following the purchase and cancellation of its own shares. During the year, the Company repurchased nil of its own shares for cancellation (2020: nil).
Notes to the Consolidated Financial Statements continuedFor the year ended 31 December 2021
184

Own shares heldOwn shares held comprise the following:
i) Computacenter Employee Share Ownership Plan (ESOP)Shares in the Parent undertaking comprise 920,218 ordinary shares of 75⁄9 pence each in Computacenter plc (2020: 988,505) purchased by the Computacenter Employee Share Ownership Plan (the Plan). The principal purpose of the Plan is to be funded with shares that will satisfy discretionary executive share plans. The number of shares held represents 0.75 per cent of the Company’s issued share capital (2020: 0.81 per cent).
Since 31 December 2002, the definition of beneficiaries under the ESOP Trust has been expanded to include employees who have been awarded options to acquire ordinary shares of 75⁄9 pence each in Computacenter plc under other employee share plans of the Group, namely the Computacenter Service Group plc Approved Executive Share Option Plan, the Computacenter plc Employee Share Option Scheme 1998, the Computacenter Service Group plc Unapproved Executive Share Option Scheme, the Computacenter Performance Related Share Option Scheme 1998, the Computacenter plc Sharesave Plus Scheme and any future similar share ownership schemes.
All costs incurred by the Plan are settled directly by Computacenter (UK) Limited and charged in the accounts as incurred.
The Plan Trustees have waived the dividends receivable in respect of 920,218 ordinary shares of 75⁄9 pence each (2020: 988,505) that it owns which are all unallocated shares.
ii) Treasury sharesThe Company holds, in treasury, the ordinary shares, purchased by way of tender offer, on 14 February 2018. Following the purchase, the Company’s issued share capital consisted of 122,687,970 ordinary shares of 75⁄9 pence each (2020: 122,687,970), each carrying one voting right, of which the Company held 8,546,861 ordinary shares in treasury (2020: 8,546,861).
As at 31 December 2021, the total number of voting rights in the Company which may be used by shareholders as the denominator for the calculations by which they can determine if they are required to notify their interest in, or a change to their interest in, the Company under the Disclosure and Transparency Rules is 114,141,109 (2020: 114,141,109). The percentage of voting rights attributable to those shares it holds in treasury following the share buy-back in 2018 is 6.97 per cent (2020: 6.97 per cent).
Translation and hedging reserveThe foreign currency translation reserve is used to record exchange differences arising from the translation of the Financial Statements of foreign subsidiaries. The hedging reserve represents the cumulative amount of gains and losses on hedging instruments deemed effective in cash flow hedges. Included within Translation and hedging reserves is a hedging reserve debit balance of £0.2 million (2020: £0.6 million credit balance).
Non-controlling interests The non-controlling amounts are as follows:
2021£m
2020£m
Applied Computer Solutions (ACS) 1.7 0.6ProSys Information Systems, Inc (ProSys) 2.8 2.5R.D. Trading Limited (RDC) (0.2) –
4.3 3.1
185
Financial StatementsAnnual Report and Accounts 2021

30 Share-based payments Computacenter Performance Share Plan (PSP)Under the Computacenter PSP, shares granted will be subject to certain performance conditions as described in the Annual Report on Remuneration. As at 31 December 2021 the number of shares outstanding was as follows:
Date of grant Maturity dateShare price at
date of grant
2021Number
outstanding
2020Number
outstanding
23/03/2012 23/03/2015 433.0p 1,685 1,685 20/03/2014 20/03/2017 682.5p 18,513 21,150 26/03/2015 26/03/2018 720.0p 33,267 46,170 22/03/2016 22/03/2019 845.0p 64,761 69,884 22/03/2017 22/03/2020 736.5p 182,625 196,189 21/03/2018 21/03/2021 1182.67p 83,642 254,836 21/03/2018 21/03/2021 1182.67p 97,364 139,092 18/05/2018 21/03/2021 1314.00p – 18,256 01/10/2018 21/03/2021 1314.00p – 14,985 21/03/2019 21/03/2021 1192.00p – 18,131 21/03/2019 21/03/2022 1192.00p 484,082 488,166 23/03/2020 21/03/2021 993.00p – 24,303 23/03/2020 21/03/2022 993.00p 24,303 24,303 23/03/2020 21/03/2023 993.00p 429,244 441,502 23/03/2020 21/03/2025 993.00p 173,892 173,892 11/05/2020 21/03/2023 1472.00p 2,853 2,853 02/11/2020 21/03/2023 2265.00p 14,504 14,504 22/03/2021 21/03/2024 2175.00p 353,966 –21/03/2021 21/03/2022 2175.00p 11,684 –21/03/2021 21/03/2023 2175.00p 11,685 –10/06/2021 21/03/2024 2671.00p 7,384 –
1,995,454 1,949,901
The following table illustrates the number (No.) of share options for the PSP Scheme:
2021No.
2020No.
PSP SchemeOutstanding at the beginning of the year 1,949,901 1,854,135Granted during the year 384,719 696,036Forfeited during the year (70,043) (83,033)Exercised during the year*** (269,123) (517,237)Outstanding at the end of the year 1,995,454 1,949,901
Exercisable at the end of the year 481,857 335,078
*** The weighted average share price at the date of exercise for the options exercised is £20.46 (2020: £13.89).
The weighted average remaining contractual life for the options outstanding as at 31 December 2021 is 1.0 years (2020: 1.4 years).
Notes to the Consolidated Financial Statements continuedFor the year ended 31 December 2021
186

Computacenter Sharesave Scheme (SAYE)The Group operates a Sharesave Scheme which is available to all employees and full time Executive Directors of the Group and its subsidiaries who have worked for a qualifying period. All options granted under this scheme are satisfied at exercise by way of a transfer of shares from the Computacenter Qualifying Employee Share Trust. During the year, 672,082 options were granted (2020: 762,623) with a fair value of £4,461,737 (2020: £5,108,756).
Under the scheme the following options have been granted and are outstanding at the year-end:
Date of grant Exercisable betweenShareprice
2021Number
outstanding
2020Number
outstanding
October 2015 01/12/2020 – 31/05/2021 600.00p – 117,202October 2016 01/12/2021 – 31/05/2022 577.00p 110,580 477,236 October 2017 01/12/2020 – 31/05/2021 888.00p – 68,174 October 2017 01/12/2022 – 31/05/2023 789.00p 583,494 608,309 October 2018 01/12/2021 – 31/05/2022 1,186.00p 67,830 245,416 October 2018 01/12/2023 – 31/05/2024 1,054.00p 466,853 489,356 October 2019 01/12/2022 – 31/05/2023 1,138.00p 274,150 285,361 October 2019 01/12/2024 – 31/05/2025 1,011.00p 585,518 613,215 October 2019 23/10/2019 – 23/10/2021 1,138.00p 12,856 64,062 October 2020 01/12/2023 – 31/05/2024 2,092.00p 204,399 219,558 October 2020 01/12/2025 – 31/05/2026 1,860.00p 507,477 523,949 October 2020 26/10/2020 – 26/10/2022 2,092.00p 13,719 14,370 October 2021 01/12/2024 – 31/05/2025 2,571.00p 170,353 –October 2021 01/12/2026 – 31/05/2027 2,286.00p 463,513 –October 2021 25/10/2021 – 25/10/2023 2,468.00p 36,057 –
3,496,799 3,726,208
The following table illustrates the number (No.) and weighted average exercise price (WAEP) of share options for the Sharesave Scheme:
2021No.
2021WAEP
2020No.
2020WAEP
Sharesave SchemeOutstanding at the beginning of the year 3,726,208 £11.20 3,964,537 £8.65Granted during the year 672,082 £23.68 762,623 £19.30 Forfeited during the year (114,095) £13.16 (165,646) £9.87 Exercised during the year*** (787,396) £7.80 (835,306) £ 6.76 Outstanding at the end of the year 3,496,799 £14.30 3,726,208 £11.20
Exercisable at the end of the year 190,682 £8.55 200,917 £7.20
Note
*** The weighted average share price at the date of exercise for the options exercised is £27.21 (2020: £21.11).
The weighted average remaining contractual life for the options outstanding as at 31 December 2021 is 3.0 years (2020: 3.0 years).
187
Financial StatementsAnnual Report and Accounts 2021

Notes to the Consolidated Financial Statements continuedFor the year ended 31 December 2021
30 Share-based payments continuedThe fair value of the PSP, DBP and SAYE plans are estimated as at the date of grant using the Black-Scholes valuation model. The following tables give the assumptions made during the year ended 31 December 2021 and 31 December 2020:
2021
Nature of the arrangement
PSP scheme
PSP scheme
PSP scheme
PSP scheme
PSP scheme
DBP scheme
DBP scheme
SAYE scheme
SAYE scheme
SAYE scheme
Date of grant 22/03/21 22/03/21 22/03/21 10/06/21 10/06/21 21/03/21 21/03/21 25/10/21 25/10/21 25/10/21
Number of instruments granted 142,078 198,076 13,812 1,425 5,959 11,684 11,685 36,057 171,506 464,519
Exercise price nil nil nil nil nil nil nil £24.68 £25.71 £22.86
Share price at date of grant £21.75 £21.75 £21.75 £26.71 £26.71 £21.75 £21.75 £27.40 £27.40 £27.40
Contractual life (years) 3 3 3 3 3 1 2 2 3 5
Vesting conditions
See note 1below
See page 120 of the Annual
Report on Remuneration
Three-yearservice period
Three-yearservice period
See note 1 below
See page 120 of the Annual
Report on Remuneration
See page 120 of the Annual
Report on Remuneration
Two-year service period
and savings requirement
Three-year service period
and savings requirement
Five-year service period
and savings requirement
Expected volatility n/a n/a n/a n/a n/a n/a n/a 40.30% 39.00% 36.10%
Expected option life at grant date (years) 3 3 3 3 3 1 2 2 3 5
Risk-free interest rate n/a n/a n/a n/a n/a n/a n/a 3.89% 3.89% 3.89%
Dividend yield 0.60% 0.60% 0.60% 0.50% 0.50% 0.60% 0.60% 1.21% 1.21% 1.21%
Fair value per granted instrument determined at grant date £21.34 £21.34 £21.34 26.30 £26.30 £21.61 £21.47 £5.87 £5.93 £6.96
188
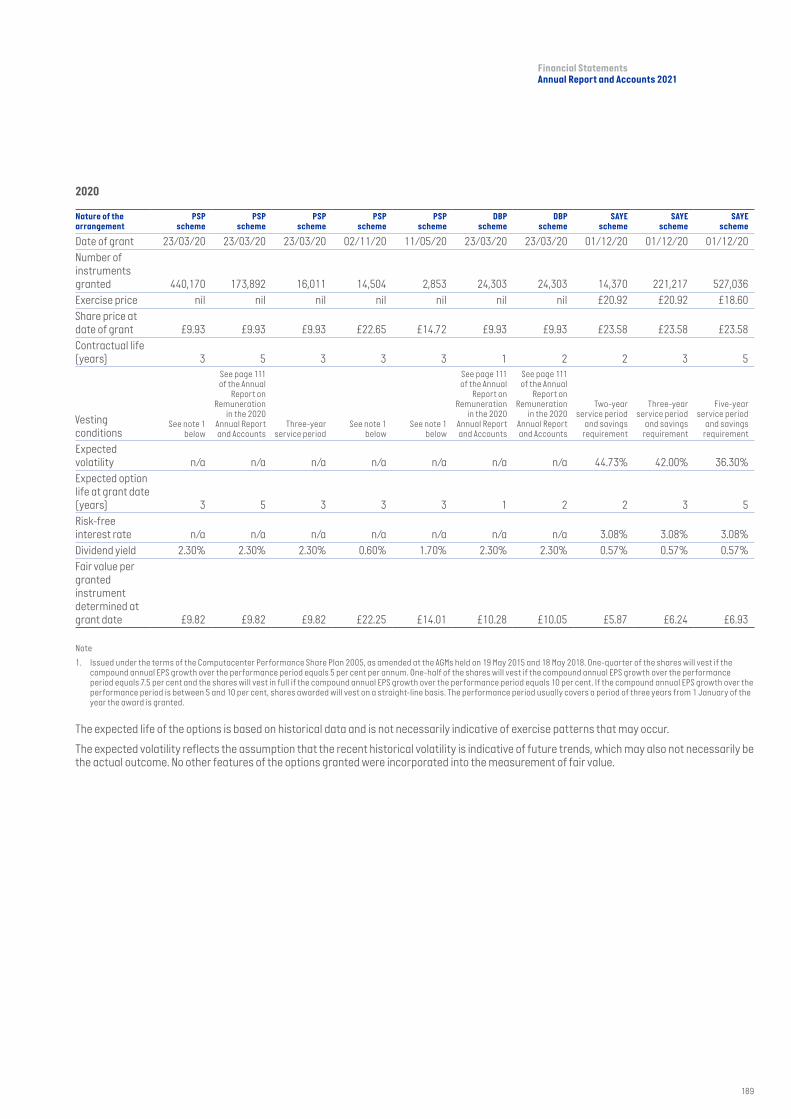
2020
Nature of the arrangement
PSP scheme
PSP scheme
PSP scheme
PSP scheme
PSP scheme
DBP scheme
DBP scheme
SAYE scheme
SAYE scheme
SAYE scheme
Date of grant 23/03/20 23/03/20 23/03/20 02/11/20 11/05/20 23/03/20 23/03/20 01/12/20 01/12/20 01/12/20Number of instruments granted 440,170 173,892 16,011 14,504 2,853 24,303 24,303 14,370 221,217 527,036 Exercise price nil nil nil nil nil nil nil £20.92 £20.92 £18.60Share price at date of grant £9.93 £9.93 £9.93 £22.65 £14.72 £9.93 £9.93 £23.58 £23.58 £23.58Contractual life (years) 3 5 3 3 3 1 2 2 3 5
Vesting conditions
See note 1 below
See page 111 of the Annual
Report on Remuneration
in the 2020 Annual Report and Accounts
Three-year service period
See note 1 below
See note 1 below
See page 111 of the Annual
Report on Remuneration
in the 2020 Annual Report and Accounts
See page 111 of the Annual
Report on Remuneration
in the 2020 Annual Report and Accounts
Two-year service period
and savings requirement
Three-year service period
and savings requirement
Five-year service period
and savings requirement
Expected volatility n/a n/a n/a n/a n/a n/a n/a 44.73% 42.00% 36.30%Expected option life at grant date (years) 3 5 3 3 3 1 2 2 3 5Risk-free interest rate n/a n/a n/a n/a n/a n/a n/a 3.08% 3.08% 3.08%Dividend yield 2.30% 2.30% 2.30% 0.60% 1.70% 2.30% 2.30% 0.57% 0.57% 0.57%Fair value per granted instrument determined at grant date £9.82 £9.82 £9.82 £22.25 £14.01 £10.28 £10.05 £5.87 £6.24 £6.93
Note
1. Issued under the terms of the Computacenter Performance Share Plan 2005, as amended at the AGMs held on 19 May 2015 and 18 May 2018. One-quarter of the shares will vest if the compound annual EPS growth over the performance period equals 5 per cent per annum. One-half of the shares will vest if the compound annual EPS growth over the performance period equals 7.5 per cent and the shares will vest in full if the compound annual EPS growth over the performance period equals 10 per cent. If the compound annual EPS growth over the performance period is between 5 and 10 per cent, shares awarded will vest on a straight-line basis. The performance period usually covers a period of three years from 1 January of the year the award is granted.
The expected life of the options is based on historical data and is not necessarily indicative of exercise patterns that may occur.
The expected volatility reflects the assumption that the recent historical volatility is indicative of future trends, which may also not necessarily be the actual outcome. No other features of the options granted were incorporated into the measurement of fair value.
189
Financial StatementsAnnual Report and Accounts 2021

31 Analysis of changes in net funds
At1 January
2021£m
Cash flowsin year
£m
Non-cashflow
£m
Exchangedifferences
£m
At31 December
2021£m
Cash and short-term deposits 309.8 (17.1) – (7.5) 285.2
Bank overdrafts – (12.0) – – (12.0)
Cash and cash equivalents 309.8 (29.1) – (7.5) 273.2
Bank loans and credit facility (121.2) 89.0 – 0.4 (31.8)
Adjusted net funds3 (excluding lease liabilities) 188.6 59.9 – (7.1) 241.4
Lease liabilities (137.5) 55.4 (71.5) 7.5 (146.1)
Net funds 51.1 115.3 (71.5) 0.4 95.3
The financing cash flows included in the table above are detailed as follows:
Bank loans Credit facility Bank overdraft OthersLease
liabilities
Liabilities from financing activities
Balance at 1 January 2021 (62.8) (58.4) – – (137.5) (258.7)
Changes from financing cash flows
Interest paid 0.9 1.2 – 0.2 – 2.3Interest paid on lease liabilities – – – – 5.2 5.2Repayment of loans 48.6 – – – – 48.6Repayment of credit facility – 51.1 – – – 51.1Payment of capital element of lease liabilities – – – – 50.2 50.2Bank overdraft – – (12.0) – – (12.0)New borrowings – bank loan (10.7) – – – – (10.7)Total changes from financing cash flows 38.8 52.3 (12.0) 0.2 55.4 134.7
The effect of changes in foreign exchange rates 0.1 0.3 – – 7.5 7.9
Other changes
New leases – – – – (70.2) (70.2)New leases relating to acquisition of a subsidiary – – – – (1.4) (1.4)Early termination of leases – – – – 5.3 5.3Interest expense (0.9) (1.2) – (0.2) (5.2) (7.5)Total other changes (0.9) (1.2) – (0.2) (71.5) (73.8)
Balance at 31 December 2021 (24.8) (7.0) (12.0) – (146.1) (189.9)
At 1 January
2020£m
Cash flowsin year
£m
Non-cashflow
£m
Exchangedifferences
£m
At 31 December
2020£m
Cash and short-term deposits 217.8 84.9 – 7.1 309.8Bank loans and credit facility (80.8) (42.5) – 2.1 (121.2)Adjusted net funds3 (excluding lease liabilities) 137.0 42.4 – 9.2 188.6 Lease liabilities (116.8) 47.7 (65.3) (3.1) (137.5)Net funds 20.2 90.1 (65.3) 6.1 51.1
Notes to the Consolidated Financial Statements continuedFor the year ended 31 December 2021
190

The financing cash flows included in the table above are detailed as follows:
Bank loans
Credit facility Others
Lease liabilities
Liabilities from financing activities
Balance at 1 January 2020 (80.8) – – (116.8) (197.6)
Changes from financing cash flows
Interest paid 1.7 – 0.2 – 1.9 Interest paid on lease liabilities – – – 4.5 4.5 Repayment of loans 19.4 – – – 19.4 Repayment of credit facility – 0.6 – – 0.6 Payment of capital element of lease liabilities – – – 43.2 43.2New borrowings – credit facility relating to acquisition of a subsidiary – (62.2) – – (62.2)New borrowings – bank loan (0.3) – – – (0.3)Total changes from financing cash flows 20.8 (61.6) 0.2 47.7 7.1
The effect of changes in foreign exchange rates (1.1) 3.2 – (3.1) (1.0)
Other changes
New leases – – – (49.4) (49.4)New leases relating to acquisition of a subsidiary – – – (12.8) (12.8)Early termination of leases – – – 1.4 1.4Interest expense (1.7) – (0.2) (4.5) (6.4)Total other changes (1.7) – (0.2) (65.3) (67.2)
Balance at 31 December 2020 (62.8) (58.4) – (137.5) (258.7)
32 Capital commitmentsAs at 31 December 2021, the Group had a £1.2 million commitment for capital expenditure (2020: £0.8 million).
33 Pensions and other post-employment benefit plansThe Group operates a defined contribution pension scheme available to all UK employees and similar schemes are operating, as appropriate for the jurisdiction, for North America and Germany. The amount recognised as an expense for this plan is detailed in note 9.
The Group has a provision against the retirement benefit obligations in France under the Indemnités de Fin de Carrière (IFC) as described in note 2.12.3 Economic outflows under the obligation only occur if eligible employees reach the statutory retirement age whilst still in employment or made redundant. The Group made £0.3 million of payments during 2021 under this obligation (2020: £0.3 million).
In estimating the provision required, Management is required to make a number of assumptions. The key areas of estimation uncertainty are the discount rate applied to future cash flows, the turnover rate of employed personnel and rate of salary increases over the length of their projected employment. The level of unrealised actuarial gains or losses is sensitive to changes in the discount rate, which is affected by market conditions and therefore subject to variation. Management makes use of an independent actuarial valuation in reaching its conclusions.
The net liability recognised in the Consolidated Balance Sheet as at 31 December 2021 in respect of the Group’s French retirement benefit obligations under the IFC was £21.8 million (2020: £23.3 million). Key movements during the year include a charge to the Consolidated Income Statement of £1.6 million (2020: £0.8 million) for the service cost and an actuarial gain taken through reserves of £1.2 million (2020: loss of £4.3 million). The key driver of actuarial gain this year was the change in experience and financial assumptions, mainly due to a change in the discount rate assumption used in the actuarial valuation.
191
Financial StatementsAnnual Report and Accounts 2021

33 Pensions and other post-employment benefit plans continued
2021£m
2020£m
Total defined benefit liability 21.8 23.3
Movements in total defined benefit liability:
2021£m
2020£m
Balance at 1 January 23.3 8.3 Pension liability acquired – 9.9
Included in Consolidated Income Statement
Current service cost 1.5 0.7Interest cost 0.1 0.1
1.6 0.8Included in Consolidated Statement of Comprehensive Income
Remeasurements loss Actuarial (gain)/loss arising from: (1.2) 4.1– Changes in demographic assumptions 1.0 3.3– Change in financial assumptions (1.6) 0.6– Experience adjustment (0.6) 0.2Effect of movements in exchange rates (1.6) 0.5
(2.8) 4.6Other
Benefits paid (0.3) (0.3)(0.3) (0.3)
Balance at 31 December 21.8 23.3
Actuarial assumptionsThe following are the principal actuarial assumptions at 31 December (expressed as weighted averages):
2021%
2020%
Discount rate 1.0 0.5Future salary growth 2.0 1.5Turnover rates:– Non-managers 5.7 5.7– Supervisors 2.7 2.7– Executives 2.7 2.7
At 31 December 2021, the discount rate used was 1.0 per cent (2020: 0.5 per cent) with reference to the iBoxx € Corporate AA 10y + index.
Sensitivity analysisReasonably possible changes at the reporting date to one of the relevant actuarial assumptions, holding other assumptions constant, would have affected the defined benefit obligation by the amounts shown below.
2021£m
2020£m
Increase Decrease Increase Decrease
Discount rate (1 per cent movement) 2.5 (3.0) 2.8 (3.3)Future salary growth (1 per cent movement) (3.0) 2.5 (3.3) 2.8Turnover rates (1 per cent movement) 1.9 (2.3) 0.8 (1.0)
Although the analysis does not take account of the full distribution of cash flows expected under the plan, it does provide an approximation of the sensitivity of the assumptions shown.
Notes to the Consolidated Financial Statements continuedFor the year ended 31 December 2021
192

34 Related party transactionsDuring the year, the Group entered into transactions, in the ordinary course of business, with related parties. Transactions entered into are as described below:
Biomni provides the Computacenter e-procurement system used by many of Computacenter’s major customers. An annual fee has been agreed on a commercial basis for use of the software for each installation. Both PJ Ogden and PW Hulme are Directors of and have a material interest in Biomni Limited.
The table below provides the total amount of transactions that have been entered into with related parties for the relevant financial year:
2021£m
2020£m
Biomni LimitedSales to related parties – 0.1Purchase from related parties 0.6 0.7
Terms and conditions of transactions with related partiesOutstanding balances at the year end are unsecured and settlement occurs in cash. There have been no guarantees provided or received for any related party receivables. The Group has not recognised any provision for doubtful debts relating to amounts owed by related parties. This assessment is undertaken each financial year through examining the financial position of the related party and the market in which the related party operates.
Compensation of key management personnel (including Directors)The Board of Directors is identified as the Group’s key management personnel. Please refer to the information given in the remuneration table in the Annual Report on Remuneration on page 115 for details of compensation given. A summary of the compensation of key management personnel is provided below:
2021£m
2020£m
Short-term employee benefits 2.8 2.2 Social security costs 0.4 0.4Share-based payment transactions 3.9 2.2Pension costs 0.1 0.1Total compensation paid to key management personnel 7.2 4.9
The interests of the key management personnel in the Group’s share incentive schemes are disclosed in the Annual Report on Remuneration on pages 118 to 121.
35 Contingent liabilitiesThe Company has given a guarantee in the normal course of business to suppliers of subsidiary undertakings for an amount not exceeding £126.8 million (2020: £134.0 million).
During the ordinary course of business, the Group can be subject to complaints and threatened or actual legal proceedings brought primarily by customers or vendors, but also on behalf of current or former employees, investors or other third parties, as well as legal and regulatory reviews, challenges, investigations and enforcement actions, both in the UK and overseas.
Where material, such matters are periodically reassessed, with the assistance of external professional advisers where appropriate, to determine the likelihood of the Group incurring a liability. In those instances where it is concluded that it is more likely than not that a payment will be made, a provision is established to Management’s best estimate of the amount required at the relevant balance sheet date. In some cases it will not be possible to form a view, for example because the facts are unclear or because further time is needed to properly assess the merits of the case, and no provisions are held in relation to such matters.
In these circumstances, specific disclosure in relation to a contingent liability will be made where material. However, the Group does not currently expect the final outcome of any such case to have a material adverse effect on its financial position, operations or cash flows either separately or in aggregate.
193
Financial StatementsAnnual Report and Accounts 2021
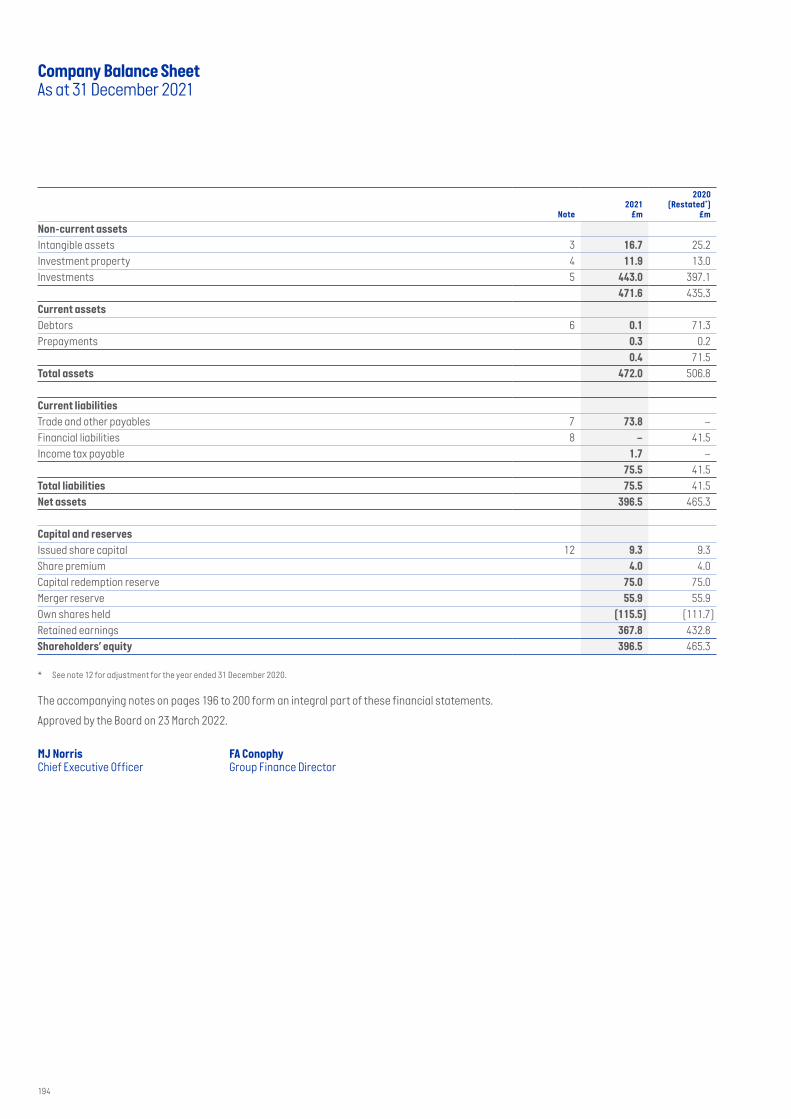
Note2021
£m
2020 (Restated*)
£m
Non-current assets
Intangible assets 3 16.7 25.2 Investment property 4 11.9 13.0 Investments 5 443.0 397.1
471.6 435.3 Current assets
Debtors 6 0.1 71.3 Prepayments 0.3 0.2
0.4 71.5Total assets 472.0 506.8
Current liabilities
Trade and other payables 7 73.8 – Financial liabilities 8 – 41.5 Income tax payable 1.7 –
75.5 41.5 Total liabilities 75.5 41.5 Net assets 396.5 465.3
Capital and reserves
Issued share capital 12 9.3 9.3 Share premium 4.0 4.0 Capital redemption reserve 75.0 75.0 Merger reserve 55.9 55.9 Own shares held (115.5) (111.7)Retained earnings 367.8 432.8 Shareholders’ equity 396.5 465.3
* See note 12 for adjustment for the year ended 31 December 2020.
The accompanying notes on pages 196 to 200 form an integral part of these financial statements.
Approved by the Board on 23 March 2022.
MJ Norris FA ConophyChief Executive Officer Group Finance Director
Company Balance SheetAs at 31 December 2021
194

Company Statement of Changes in EquityFor the year ended 31 December 2021
Issued share
capital£m
Sharepremium
£m
Capital redemption
reserve£m
Merger reserve
£m
Own shares held
£m
Retained earnings
£m
Shareholders’equity
£m
At 1 January 2021 9.3 4.0 75.0 55.9 (111.7) 432.8 465.3
Profit for the year – – – – – 2.3 2.3
Total comprehensive income for the year – – – – – 2.3 2.3
Exercise of options – – – – 21.7 (15.5) 6.2
Share options granted to employees of subsidiary companies – – – – – 10.6 10.6
Purchase of own shares – – – – (25.5) – (25.5)
Equity dividends – – – – – (62.4) (62.4)
At 31 December 2021 9.3 4.0 75.0 55.9 (115.5) 367.8 396.5
At 1 January 2020 9.3 4.0 75.0 55.9 (113.6) 278.8 309.4Profit for the year – – – – – 121.9 121.9 Other comprehensive income (restated*) – – – – – 53.0 53.0Total comprehensive income (restated*) – – – – – 174.9 174.9 Exercise of options – – – – 20.9 (15.2) 5.7 Share options granted to employees of subsidiary companies – – – – – 8.2 8.2 Purchase of own shares – – – – (19.0) – (19.0)Equity dividends – – – – – (13.9) (13.9)At 31 December 2020 (restated*) 9.3 4.0 75.0 55.9 (111.7) 432.8 465.3
* See note 12 for adjustment for the year ended 31 December 2020.
The accompanying notes on pages 196 to 200 form an integral part of these financial statements.
195
Financial StatementsAnnual Report and Accounts 2021

Notes to the Company Financial StatementsFor the year ended 31 December 2021
1 Authorisation of Financial StatementsThe Parent Company Financial Statements of Computacenter plc (the Company) for the year ended 31 December 2021 were authorised for issue by the Board of Directors on 23 March 2022 and the Balance Sheet was signed on the Board’s behalf by MJ Norris and FA Conophy. Computacenter plc is a public limited company incorporated and domiciled in England and Wales. The Company’s ordinary shares are traded on the London Stock Exchange.
2 Summary of significant accounting policiesBasis of preparation and statement of compliance with FRS 101These Financial Statements were prepared in accordance with Financial Reporting Standard 101 Reduced Disclosure Framework (FRS 101). The Financial Statements are prepared under the historical cost convention.
No profit and loss account is presented by the Company as permitted by Section 408 of the Companies Act 2006. The results of Computacenter plc are included in the Consolidated Financial Statements of Computacenter plc which are available from Computacenter plc, Hatfield Business Park, Hatfield Avenue, Hatfield, AL10 9TW. The accounting policies which follow set out those policies which apply in preparing the Financial Statements for the year ended 31 December 2021. The Financial Statements are prepared in pound sterling and all values are rounded to the nearest hundred thousand except when otherwise indicated.
In preparing these financial statements, the Company applies the recognition, measurement and disclosure requirements of UK-adopted international accounting standards (Adopted IFRSs), but makes amendments where necessary in order to comply with the Companies Act 2006 and has set out below where advantage of the FRS 101 disclosure exemptions has been taken.
(a) the requirements of paragraphs 45(b) and 46-52 of IFRS 2 Share-based Payment; (b) the requirements of paragraphs 62, B64(d), B64(e), B64(g), B64(h), B64(j) to B64(m), B64(n)(ii), B64 (o)(ii), B64(p), B64(q)(ii), B66 and B67 of
IFRS 3 Business Combinations; (c) the requirements of IFRS 7 Financial Instruments: Disclosures; (e) the requirements of paragraphs 91-99 of IFRS 13 Fair Value Measurement;(f) the requirement in paragraph 38 of IAS 1 Presentation of Financial Statements to present comparative information in respect of: (i) paragraph 79(a)(iv) of IAS 1; (ii) paragraph 73(e) of IAS 16 Property, Plant and Equipment; (iii) paragraph 118(e) of IAS 38 Intangible Assets; (iv) paragraphs 76 and 79(d) of IAS 40 Investment Property; and (v) paragraph 50 of IAS 41 Agriculture. (g) the requirements of paragraphs 10(d), 10(f), 39(c) and 134-136 of IAS 1 Presentation of Financial Statements; (h) the requirements of IAS 7 Statement of Cash Flows; (i) the requirements of paragraphs 30 and 31 of IAS 8 Accounting Policies, Changes in Accounting Estimates and Errors; (j) the requirements of paragraph 17 of IAS 24 Related Party Disclosures; (k) the requirements in IAS 24 Related Party Disclosures to disclose related party transactions entered into between two or more members of
a group, provided that any subsidiary which is a party to the transaction is wholly owned by such a member; and (l) the requirements of paragraphs 134(d)-134(f) and 135(c)-135(e) of IAS 36 Impairment of Assets.
The basis for all of the above exemptions is because equivalent disclosures are included in the Consolidated Financial Statements of the Group in which the entity is consolidated.
Intellectual property Licences purchased in respect of intellectual property are capitalised, classified as an intangible asset on the Balance Sheet and amortised on a straight-line basis over the period of the licence, normally 20 years.
Depreciation of fixed assets Freehold land is not depreciated. Depreciation is provided on all other tangible fixed assets at rates calculated to write off the cost, less estimated residual value, of each asset evenly over its expected useful life, as follows:
Freehold buildings 25 years
Investment propertyInvestment property is defined as land and/or buildings held by the Company to earn rental income or for capital appreciation or both, rather than for sale in the ordinary course of business or for use in supply of goods or services or for administrative purposes. The Company recognises any part of an owned (or leased under a finance lease) property that is leased to third-parties as investment property, unless it represents an insignificant portion of the property.
Investment property is measured initially at cost including transaction costs. Subsequent to initial recognition, the Company elected to measure investment property at cost less accumulated depreciation and accumulated impairment losses, if any (i.e. applying the same accounting policies (including useful lives) as for property, plant and equipment). The fair values, which reflect the market conditions at the balance sheet date, are disclosed in note 4.
196

InvestmentsFixed asset investments are shown at cost less provision for impairment.
Impairment of assetsThe carrying values of assets are reviewed for impairment when events or changes in circumstances indicate that the carrying value may not be recoverable.
Foreign currenciesTransactions in foreign currencies are recorded at the rate ruling at the date of the transaction. Monetary assets and liabilities denominated in foreign currencies are retranslated at the rate of exchange ruling at the balance sheet date. All differences are taken to the profit and loss account.
Amounts owed by/to subsidiary undertakingsIntra-Group receivables are recognised initially at fair value, and subsequently at amortised cost using the effective interest rate method, less an allowance for any uncollectable amounts. The Company assesses for doubtful debts (impairment) using the expected credit losses model as required by IFRS 9. For intra-group receivables, the Company applies the simplified approach which requires expected lifetime losses to be recognised from the initial recognition of the receivables.
Intra-Group payables are recognised initially at fair value, and subsequently at amortised cost using the effective interest rate method.
Share-based payment transactionsThe accounting policy in relation to share-based payment transactions is disclosed in full in the Consolidated Financial Statements. In addition, the financial effect of awards by the Company of options over its equity shares to employees of subsidiary undertakings is recognised by the Company in its individual Financial Statements as an increase in its investment in subsidiaries, with a credit to equity equivalent to the IFRS 2 cost in subsidiary undertakings.
On transition to IFRS, the Group did not apply the measurement rules of IFRS 2 to equity-settled awards granted before 7 November 2002 or granted after that date and vested before 1 January 2005. However, later modifications of such equity instruments are measured under IFRS 2.
TaxationCorporation tax payable is provided on taxable profits at the current tax rate. Where Group relief is surrendered from other subsidiaries in the Group, the Company is required to pay to the surrendering company an amount equal to the loss surrendered multiplied by the current tax rate.
Deferred tax is recognised in respect of all timing differences that have originated but not reversed at the balance sheet date where transactions or events that result in an obligation to pay more, or a right to pay less, tax in the future have occurred at the balance sheet date.
Deferred tax is measured on a non-discounted basis at the tax rates that are expected to apply in periods in which timing differences reverse, based on tax rates and laws enacted or substantively enacted at the balance sheet date.
Own shares heldShares in the Company, held by the Company, are classified in shareholders’ equity as ‘own shares held’ and are recognised at cost. Consideration received for the sale of such shares is also recognised in equity, with any difference between the proceeds from sale and the original cost being taken to revenue reserves. No gain or loss is recognised in the performance statements on the purchase, sale, issue or cancellation of equity shares.
Merger accounting and the merger reservePrior to 1 January 2013, certain significant business combinations were accounted for using the ‘pooling of interests method’ (or merger accounting), which treats the merged groups as if they had been combined throughout the current and comparative accounting periods. Merger accounting principles for these combinations gave rise to a merger reserve in the Balance Sheet, being the difference between the nominal value of new shares issued by the Parent Company for the acquisition of the shares of the subsidiary and the subsidiary’s own share capital and share premium account. These transactions have not been restated, as permitted by the IFRS 1 transitional arrangements.
The merger reserve is also used where more than 90 per cent of the shares in a subsidiary are acquired and the consideration includes the issue of new shares by the Company, thereby attracting merger relief under the Companies Act 1985 and, from 1 October 2009, the Companies Act 2006.
The merger reserve of £55.9 million was created on acquisition of Computacenter (UK) Limited on 14 October 1995 by Computacenter plc. Immediately following the acquisition, this merger reserve was reduced to nil in the Group’s Consolidated Financial Statements due to the write off of goodwill arising on the consolidation of Computacenter (UK) Limited.
197
Financial StatementsAnnual Report and Accounts 2021

3 Intangible assets
Intellectual property
£m
Cost
At 1 January 2021 and 31 December 2021 169.7
Accumulated amortisation
At 1 January 2021 144.5
Charge in the year 8.5
At 31 December 2021 153.0
Net book value
At 31 December 2021 16.7
At 31 December 2020 25.2
4 Investment properties
Freehold land and buildings
£m
Cost
At 1 January 2021 and 31 December 2021 42.4
Accumulated depreciation
At 1 January 2021 29.4
Charge in the year 1.1
At 31 December 2021 30.5
Net book value
At 31 December 2021 11.9
At 31 December 2020 13.0
Investment property represents a building owned by the Company that is leased to Computacenter (UK) Ltd, a fully owned subsidiary of the Company.
The fair value of investment property amounted to £38.7 million at 31 December 2021 (2020: £38.5 million). The fair values for disclosure purposes have been determined using either the support of qualified independent external valuers or by internal valuers with the necessary recognised and relevant professional qualification, applying a combination of the present value of future cash flows and observable market values of comparable properties. Management’s most recent external valuation of this property took place in February 2016. As this property is leased to a subsidiary and is carried at depreciated cost value, an updated external valuation was not sought at 31 December 2021.
Notes to the Company Financial Statements continuedFor the year ended 31 December 2021
198

5 Investments
Investments in subsidiary
undertakings£m
Loans to subsidiary
undertakings£m
Total£m
Cost
At 31 December 2020 (as reported) 466.1 2.8 468.9
Dividends received in-specie (note 12) 53.0 – 53.0
At 31 December 2020 (restated) 519.1 2.8 521.9
Additions 35.3 – 35.3
Impairment – – –
Share-based payments 10.6 – 10.6
At 31 December 2021 565.0 2.8 567.8
Amounts provided
At 31 December 2020 122.0 2.8 124.8
Provided during the year – – –
At 31 December 2021 122.0 2.8 124.8
Net book value
At 31 December 2021 443.0 – 443.0
At 31 December 2020 (restated) 397.1 – 397.1
During the year, the Company made an investment of $50 million into Computacenter (U.S.), Inc., a fully-owned US subsidiary, by way of a capital contribution.
During the prior year, the Company received a return of capital of £7.4 million, from its subsidiary Computacenter Managed Services GmbH which undertook a capital reduction.
The carrying values of investments are reviewed annually or when events or changes in circumstances indicate that the carrying value may not be recoverable. The Company assesses if such indicators exist at the end of each reporting period by considering external and internal factors including whether the carrying amount of an investment exceeds the investee’s net assets or if a dividend exceeds the total comprehensive income of the investee.
Details of the principal investments at 31 December in which the Company holds more than 20 per cent of the nominal value of ordinary share capital are given in note 18 to the Consolidated Financial Statements.
6 Debtors
2021£m
2020£m
Amount owed by subsidiary undertaking – 71.2Other debtors 0.1 0.1
0.1 71.3
Amounts owned by subsidiaries are unsecured, have no fixed date of repayment and are repayable on demand. Expected credit losses are considered to be immaterial.
7 Trade and other payables
2021£m
2020£m
Amount owed to subsidiary undertaking 73.8 –
The movement in amount owed by subsidiary undertaking (per note 6) and amount owed to subsidiary undertaking (per note 7) is mainly due to equity dividends paid and repayment of loans.
199
Financial StatementsAnnual Report and Accounts 2021

8 Financial liabilities
2021£m
2020£m
Current
Bank loan – 41.5
There are no material differences between the fair value of financial liabilities and their book value.
Bank loansA loan of £100.0 million was drawn at 2.05 per cent interest rate to finance the acquisition of Computacenter United States Inc. The outstanding balance as at 31 December 2021 was nil (2020: £41.5 million). Repayment of this loan commenced in H1 2019 and was fully paid in 2021.
9 Contingent liabilitiesThe Company has given a guarantee in the normal course of business to suppliers of subsidiary undertakings for an amount not exceeding £126.8 million (2020: £134.0 million).
The Company has provided cross guarantees in respect of certain bank loans and overdrafts of its subsidiary undertakings. The amount outstanding at 31 December 2021 is £nil (2020: £nil).
10 Auditor’s remunerationAll auditor’s remuneration is borne by Computacenter (UK) Ltd, a fully-owned UK subsidiary of the Company. The amount payable to the auditor in respect of the audit of the Company is £0.1 million (2020: £0.1 million), all of which is payable to KPMG LLP. The Company is exempt from providing details of non-audit fees as it prepares Consolidated Financial Statements in which the details are required to be disclosed on a consolidated basis (see note 7 to the Consolidated Financial Statements).
11 Distributable reservesDividends are paid from the standalone Balance Sheet of Computacenter plc, and as at 31 December 2021, the distributable reserves are approximately £199.3 million (2020: £268.1 million).
12 Adjustment for the year ended 31 December 2020On 2 November 2020, Computacenter Group acquired 100 per cent of the voting shares of Pivot Technology Solutions, Inc. (Pivot). After the acquisition, but before 31 December 2020, a restructuring exercise was undertaken on the Pivot entities which had a number of steps including a dividend in-specie from Computacenter (UK) Limited to Computacenter plc to transfer the entire share capital of Pivot Technology Solutions, Ltd. (PTSL) held by Computacenter (UK) Limited.
The amount of distribution was equal to the book value of the PTSL shares in the accounts of Computacenter (UK) Limited. This book value amounting to £53.0 million ($72.4 million) represents the fair value attributable to acquired assets and liabilities of PTSL as part of the Group’s acquisition of Pivot.
The above dividend in-specie was not reflected in the balances previously reported for the year ended 31 December 2020 and this has been corrected by restating each of the affected financial statement line items for the year ended 31 December 2020. The following summarises the impact on the Company’s financial statements.
(i) Company Balance Sheet as at 31 December 2020
As previously reported
£mAdjustment
£mRestated
£m
Investments 344.1 53.0 397.1Others 109.7 – 109.7Total assets 453.8 53.0 506.8
Retained earnings 379.8 53.0 432.8Others 32.5 – 32.5Shareholders’ equity and net assets 412.3 53.0 465.3
(ii) Company Statement of Changes in Equity for the year ended 31 December 2020The above adjustment has been reported as other comprehensive income of £53.0 million in the Company Statement of Changes in Equity for the year ended 31 December 2020. There is no tax impact as the dividend in-specie was exempt from UK corporation tax, being received from a company that Computacenter plc controls. The resulting reserve of £53.0 million created within retained earnings has been excluded from the Company’s distributable reserves.
There is no impact on the Computacenter Group’s retained earnings for the year ended 31 December 2020 and no impact on the total assets, net assets and shareholders’ equity position as at 31 December 2020.
Notes to the Company Financial Statements continuedFor the year ended 31 December 2021
200

Disclaimer: forward-looking statements This Annual Report and Accounts includes statements that are, or may be deemed to be, ‘forward-looking statements’. These forward-looking statements can be identified by the use of forward-looking terminology, including the terms ‘anticipates’, ‘believes’, ‘estimates’, ‘expects’, ‘intends’, ‘may’, ‘plans’, ‘projects’, ‘should’ or ‘will’, or, in each case, their negative or other variations or comparable terminology, or by discussions of strategy, plans, objectives, goals, future events or intentions. These forward-looking statements include all matters that are not historical facts. They appear in a number of places throughout this Annual Report and Accounts and include, but are not limited to, statements regarding the Group’s intentions, beliefs or current expectations concerning, amongst other things, results of operations, prospects, growth, strategies and expectations of its respective businesses.
By their nature, forward-looking statements involve risk and uncertainty because they relate to future events and circumstances. Forward-looking statements are not guarantees of future performance and the actual results of the Group’s operations and the development of the markets and the industry in which they operate or are likely to operate and their respective operations may differ materially from those described in, or suggested by, the forward-looking statements contained in this Annual Report and Accounts. In addition, even if the results of operations and the development of the markets and the industry in which the Group operates are consistent with the forward-looking statements contained in this Annual Report and Accounts, those results or developments may not be indicative of results or developments in subsequent periods. A number of factors could cause results and developments to differ materially from those expressed or implied by the forward-looking statements, including, without limitation, those risks in the risk factor section of this Annual Report and Accounts, as well as general economic and business conditions, industry trends, competition, changes in regulation, currency fluctuations or advancements in research and development.
Forward-looking statements speak only as of the date of this Annual Report and Accounts and may, and often do, differ materially from actual results. Any forward-looking statements in this Annual Report and Accounts reflect the Group’s current view with respect to future events and are subject to risks relating to future events and other risks, uncertainties and assumptions relating to the Group’s operations, results of operations and growth strategy.
Neither Computacenter plc nor any of its subsidiaries undertakes any obligation to update the forward-looking statements to reflect actual results or any change in events, conditions or assumptions or other factors unless otherwise required by applicable law or regulation.
201
Financial StatementsAnnual Report and Accounts 2021

Group five-year financial review
Group five-year summary resultsAs of 31 December
2017£m
2018£m
2019£m
2020£m
2021£m
Revenue 3,793.4 4,352.6 5,052.8 5,441.3 6,725.8
Adjusted1 operating profit 105.5 118.8 151.5 206.4 262.8
Adjusted1 profit before tax 106.2 118.2 146.3 200.5 255.6
Profit for the year 81.3 80.9 101.6 154.2 186.5
Adjusted1 diluted earnings per share 65.1p 75.7p 92.5p 126.4p 165.6p
Adjusted net funds3 195.2 66.2 137.1 188.6 241.4
Headcount (monthly average) 14,026 15,117 15,816 16,764 17,496
Group five-year summary balance sheetAs at 31 December
2017£m
2018£m
2019£m
2020£m
2021£m
Tangible assets 77.9 106.3 101.4 107.0 90.0
Right-of-use assets – – 110.9 129.6 138.1
Intangible assets 80.3 184.6 175.6 274.7 273.7
Investment in associate 0.1 0.1 0.1 0.1 0.1
Deferred tax asset 9.1 9.6 9.2 10.1 30.2
Non-current prepayments – 3.5 3.5 23.6 16.6
Inventories 69.3 99.5 122.2 211.3 341.3
Trade and other receivables (including income tax receivables) 835.4 1,180.4 996.5 1,105.9 1,284.0
Prepayments and accrued income 162.6 171.2 176.3 228.2 251.1
Derivative financial instruments 8.2 3.9 3.3 1.6 3.6
Cash and short-term deposits 206.6 200.4 217.9 309.8 285.2
Current liabilities (940.9) (1,351.1) (1,257.8) (1,586.2) (1,783.7)
Non-current liabilities (19.7) (160.6) (166.6) (184.8) (185.4)
Net assets 488.9 447.8 492.5 630.9 744.8
Financial calendar
Title Date
AGM 19 May 2022Ex-dividend date 09 June 2022Dividend record date 10 June 2022Dividend payment date 08 July 2022Interim results announcement 09 September 2022
202

Corporate information
Principal bankerBarclays Bank plc1 Churchill PlaceCanary WharfLondon E14 5HPUnited KingdomTel: +44 (0) 345 7345 345
HSBC Bank plc8 Canada SquareLondonE14 5HQUnited KingdomTel: +44 (0) 345 740 4404
AuditorKPMG LLP15 Canada SquareLondonE14 5GLUnited KingdomTel: +44 (0) 20 7311 1000
Company SecretarySimon Pereira (appointed on 9 December 2021) Raymond Gray (resigned on 9 December 2021)
Registered officeHatfield AvenueHatfieldHertfordshireAL10 9TWUnited KingdomTel: +44 (0) 1707 631000
Stockbrokers and investment bankersCredit SuisseOne Cabot SquareLondonE14 4QJUnited KingdomTel: +44 (0) 20 7888 8888
Investec Investment Banking30 Gresham StreetLondonEC2V 7QPUnited KingdomTel: +44 (0) 20 7597 4000
Registrar and transfer officeEquinitiAspect HouseSpencer RoadLancingWest SussexBN99 6DAUnited KingdomTel: +44 (0) 371 384 2027
SolicitorLinklatersOne Silk StreetLondonEC2Y 8HQUnited KingdomTel: +44 (0) 20 7456 2000
Company registration number3110569
Internet addressComputacenter Groupwww.computacenter.com
Board of DirectorsPeter Ryan (Non-Executive Chair)Mike Norris (Chief Executive Officer)Tony Conophy (Group Finance Director)Rene Haas (Non-Executive Director)Philip Hulme (Non-Executive Director)Ljiljana Mitic (Non-Executive Director)Peter Ogden (Non-Executive Director)Minnow Powell (Non-Executive Director)(Retired on 30 September 2021)Ros Rivaz (Senior Independent Director)Pauline Campbell (Non-Executive Director) (Appointed on 16 August 2021)
203
Financial StatementsAnnual Report and Accounts 2021

Principal offices
UK and Group headquartersComputacenter plcHatfield AvenueHatfieldHertfordshireAL10 9TWUnited KingdomTel: +44 (0) 1707 631000
BelgiumComputacenter NV/SAIkaroslaan 31B-1930 ZaventemBelgiumTel: +32 (0) 2 704 9411
France Computacenter France SAS229 rue de la Belle ÉtoileZI Paris Nord IIBP 5238795943 Roissy CDG CedexFranceTel: +33 (0) 1 48 17 41 00
GermanyComputacenter AG & Co. oHGComputacenter Park 1 50170 Kerpen GermanyTel: +49 (0) 2273 5970
Computacenter AG Kattenbug 250667 KölnGermanyTel: +49 (0) 22142 07430
Computacenter Germany AG & Co. oHGWerner-Eckert-Str. 16-1881829 MünchenGermanyTel: +49 (0) 8945 7120
HungaryComputacenter Services KftHaller Gardens, Building D. 1st FloorSoroksári út 30-34Budapest 1095 HungaryTel: +36 1 777 7488
IndiaComputacenter India Private Limited,4th Floor, Purva Premiere,Residency Road,Bangalore 560025IndiaTel: +91 95386 11122
MalaysiaComputacenter Services (Malaysia) Sdn BhdLevel 9, Tower 1 Puchong Financial Corporate CentreJalan Puteri 1/2, Bandar Puteri 47100 PuchongSelangor Darul EhsanMalaysiaTel: +603 7724 9626
MexicoComputacenter México S.A. de C.V.Av. Paseo de la Reforma, No. 412-5Col. JuárezDelegación CuauhtémocCP 06600México CityMéxicoTel: +52 (55) 6844 0700
NetherlandsComputacenter B.V.Gondel 11186 MJ Amstelveen NetherlandsTel: +31 (0) 88 435 8000
RomaniaComputacenter Services S.R.L.Stables Office20A Onisifor GhibuRecord ParkCluj-Napoca, CJ 400185Romania
South AfricaComputacenter (Pty) LtdBuilding 1Klein D’Aria Estate97 Jip de Jager DriveBellville, 7530Cape TownSouth AfricaTel: +27 (0) 21 957 4900
SpainComputacenter Services (Iberia) S.L.U.Carrer de Sancho De Avila 52-5808018 BarcelonaSpainTel: +34 936 207 000
SwitzerlandComputacenter AG Riedstrasse 14CH-8953 DietikonSwitzerlandTel: +41 (0) 43 322 40 80
USAComputacenter (U.S.), Inc.17th Floor, 462 7th AvenueNew York, NY 10018United States of AmericaTel: +1 800-228-8324
Computacenter United States Inc.1 University AvenueSuite 102, WestwoodMA 02090United States of AmericaTel:+ 1 800-228-8324
Pivot Technology Solutions, Inc.6026 The Corner Parkway, Suite 100Norcross, GA 30092United States of AmericaTel: +1 800-228-8324
204

Design and production:Gather+44 (0) 20 7610 6140www.gather.london
Printed on FSC® certified paper by an EMAS certified printing company, its Environmental Management System is certified to ISO 14001. 100% of the inks used are vegetable oil based, 95% of press chemicals are recycled for further use and, on average, 99% of any waste associated with this production will be recycled. This document is printed on Edixion Offset, a paper containing 100% virgin fibre sourced from well-managed forests and other controlled sources. The pulp used in this product is bleached using an elemental chlorine free (ECF) process.

Computacenter is a leading independent technology partner, trusted by large corporate and public sector organisations. We help our customers to Source, Transform and Manage their IT infrastructure to deliver digital transformation, enabling people and their business. Computacenter is a public company quoted on the London FTSE 250 (CCC.L) and employs over 18,000 people worldwide.
Computacenter plcHatfield Avenue, Hatfield, Hertfordshire AL10 9TW, United Kingdom
Tel: +44 (0) 1707 631000www.computacenter.com
E&OE. All trademarks acknowledged.© 2022 Computacenter.All rights reserved.