Enabling extraordinary things - SEGRO
236
Enabling extraordinary things Annual Report & Accounts 2021 As SEGRO plc has a secondary listing on the regulated market of Euronext in Paris, the official version of the Company’s Annual Report and Accounts 2021 has been prepared in the 'European Single Electronic Format' (required to be in XHTML format). This pdf version (in non-XHTML format) is a reproduction of the official version of SEGRO plc’s Annual Report and Accounts 2021 and both versions are available on the Company’s website.
-
Upload
khangminh22 -
Category
Documents
-
view
1 -
download
0
Transcript of Enabling extraordinary things - SEGRO
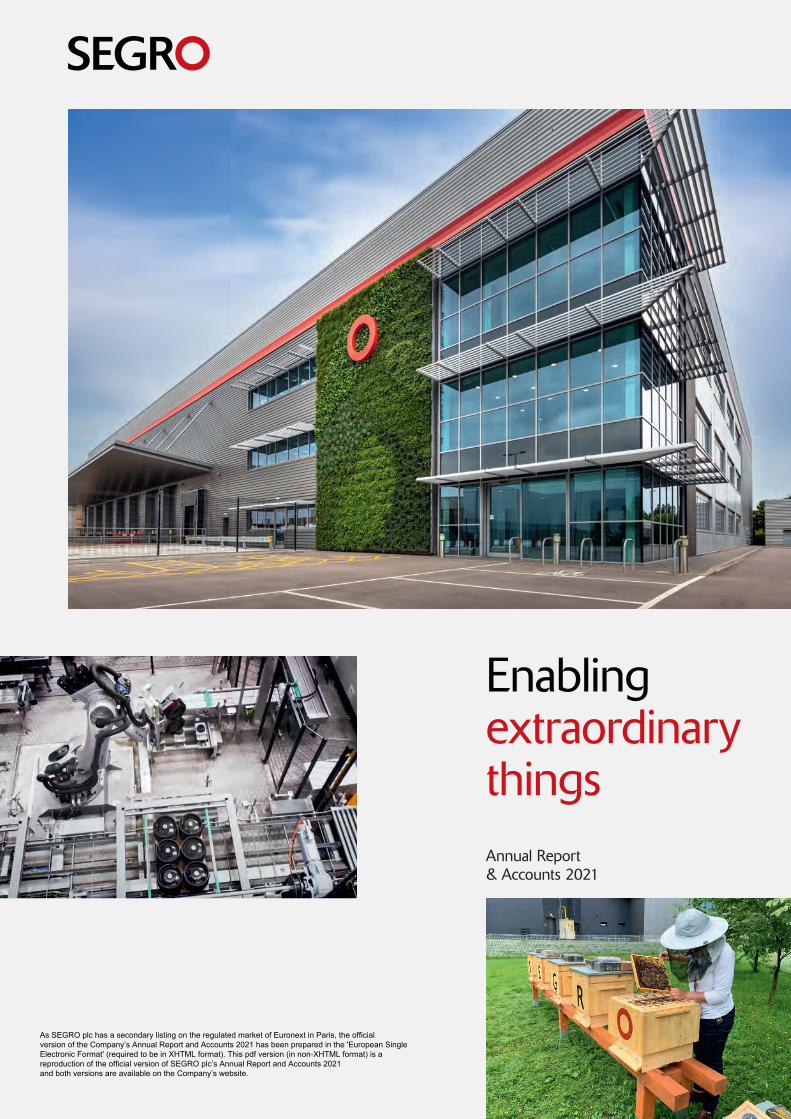
Enabling extraordinary thingsAnnual Report & Accounts 2021
01_OverviewX_01_11_v85.indd 101_OverviewX_01_11_v85.indd 1 01/03/2022 18:2501/03/2022 18:25
As SEGRO plc has a secondary listing on the regulated market of Euronext in Paris, the official version of the Company’s Annual Report and Accounts 2021 has been prepared in the 'European Single Electronic Format' (required to be in XHTML format). This pdf version (in non-XHTML format) is a reproduction of the official version of SEGRO plc’s Annual Report and Accounts 2021and both versions are available on the Company’s website.
For more information on SEGRO’s activities and performance, please visit our website: www.segro.com/investors
For more information within this report
The Directors present the Annual Report for the year ended 31 December 2021 which includes the Strategic Report, Governance Report and audited Financial Statements for the year. References to ‘SEGRO’, the ‘Group’, the ‘Company’, ‘we’ or ‘our’ are to SEGRO plc and/or its subsidiaries, or any of them as the context may require. Pages 10 to 101 inclusive, comprise the Strategic Report, pages 162 to 163 inclusive comprise the Directors’ Report and pages 136 to 155 inclusive comprise the Directors’ Remuneration Report, each of which have been drawn up and presented in accordance with English company law and the liabilities of the Directors in connection with these sections shall be subject to the limitations and restrictions provided by such law.
The Annual Report contains forward-looking statements. For further information see inside back cover.
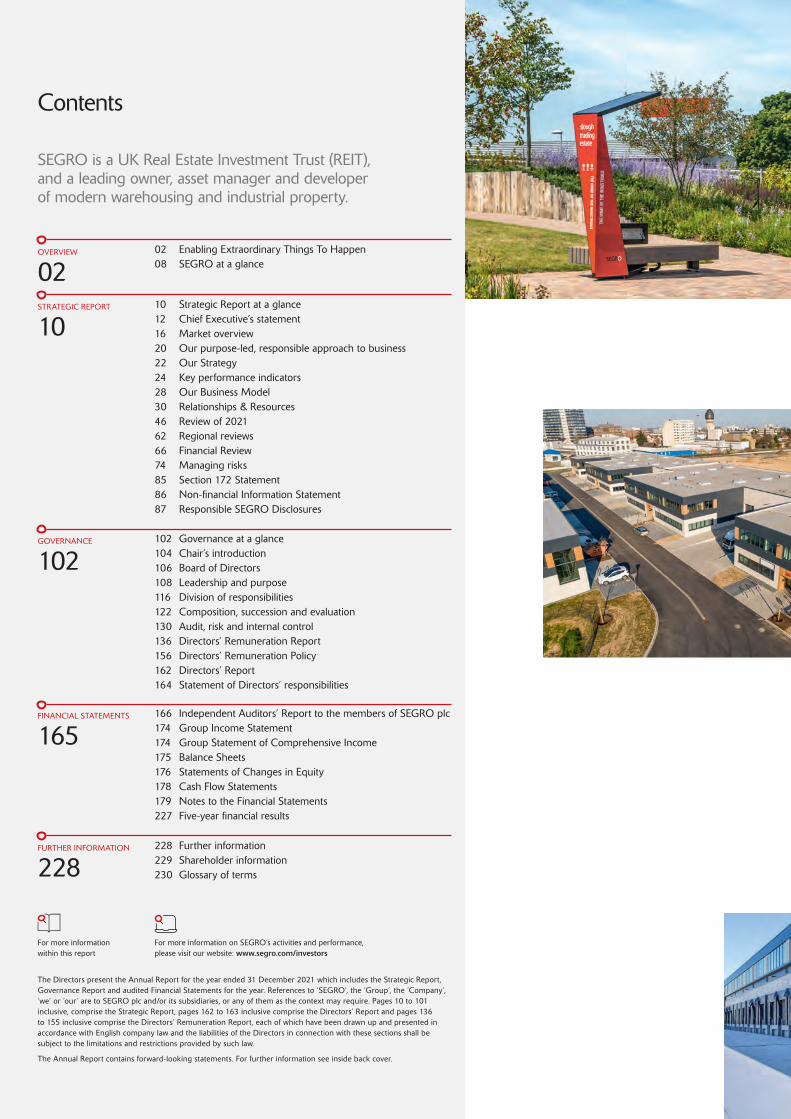
OVERVIEW 02 Enabling Extraordinary Things To Happen 08 SEGRO at a glance02
STRATEGIC REPORT
1010 Strategic Report at a glance12 Chief Executive’s statement16 Market overview20 Our purpose-led, responsible approach to business22 Our Strategy24 Key performance indicators28 Our Business Model30 Relationships & Resources46 Review of 202162 Regional reviews66 Financial Review74 Managing risks85 Section 172 Statement86 Non-financial Information Statement87 Responsible SEGRO Disclosures
GOVERNANCE
FINANCIAL STATEMENTS
FURTHER INFORMATION
102
165
228
102 Governance at a glance104 Chair’s introduction106 Board of Directors108 Leadership and purpose116 Division of responsibilities122 Composition, succession and evaluation130 Audit, risk and internal control136 Directors’ Remuneration Report156 Directors’ Remuneration Policy162 Directors’ Report164 Statement of Directors’ responsibilities
166 Independent Auditors’ Report to the members of SEGRO plc174 Group Income Statement174 Group Statement of Comprehensive Income175 Balance Sheets176 Statements of Changes in Equity 178 Cash Flow Statements179 Notes to the Financial Statements 227 Five-year financial results
228 Further information229 Shareholder information230 Glossary of terms
SEGRO is a UK Real Estate Investment Trust (REIT), and a leading owner, asset manager and developer of modern warehousing and industrial property.
Contents
01_OverviewX_01_11_v85.indd 601_OverviewX_01_11_v85.indd 6 01/03/2022 18:2501/03/2022 18:25
01SEGRO PLC | ANNUAL REPORT & ACCOUNTS 2021
OVERVIEW STRATEGIC REPORT GOVERNANCE FINANCIAL STATEMENTS
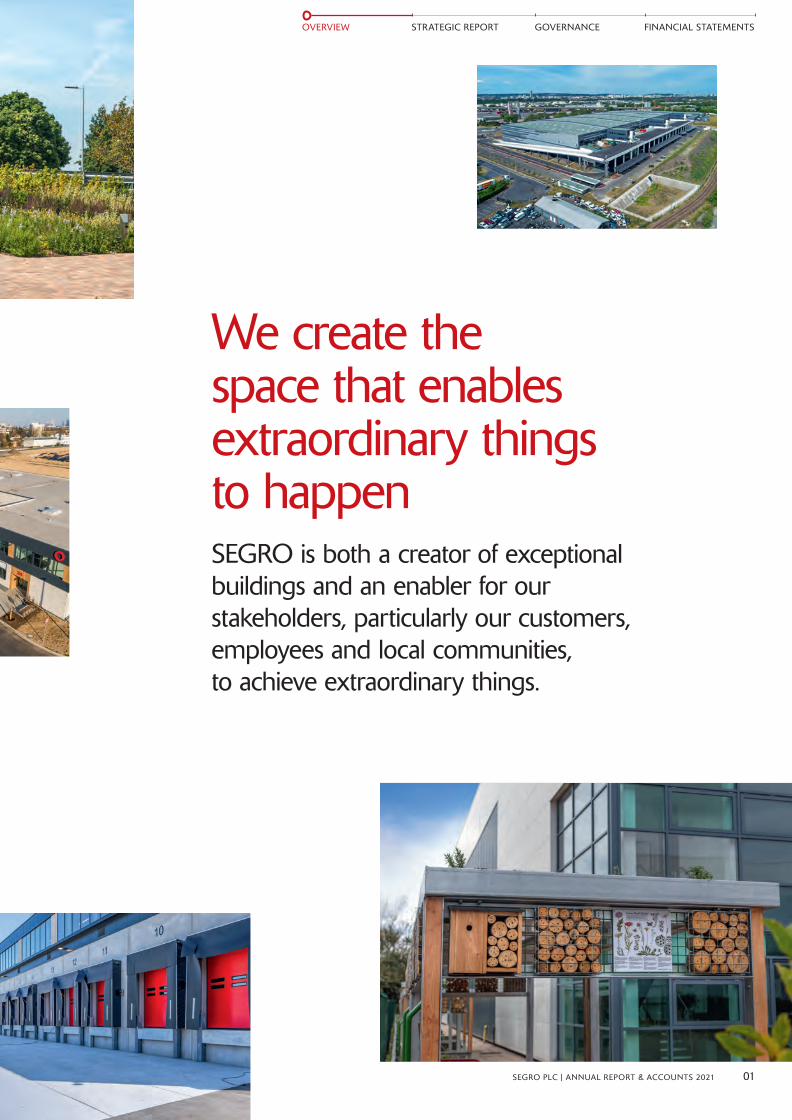
We create the space that enables extraordinary things to happenSEGRO is both a creator of exceptional buildings and an enabler for our stakeholders, particularly our customers, employees and local communities, to achieve extraordinary things.
01_OverviewX_01_11_v85.indd 101_OverviewX_01_11_v85.indd 1 01/03/2022 17:1101/03/2022 17:11
02 SEGRO PLC | ANNUAL REPORT & ACCOUNTS 2021
OVERVIEW
Meeting
Expectations
Proximity to major transport
Road, rail, air and sea connections are vital for the smooth movement of goods between
and within countries. Many of our big box developments are located close to motorways,
rail freight terminals and airports to provide excellent access to key transport infrastructure.
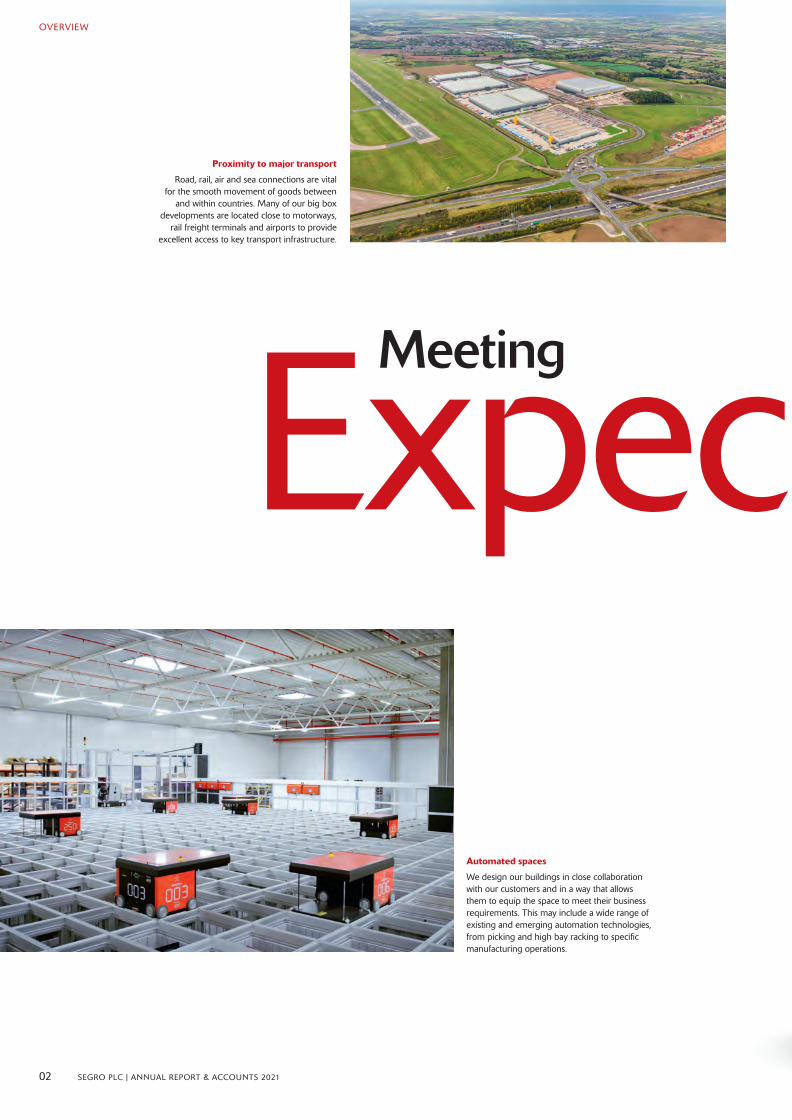
Automated spaces
We design our buildings in close collaboration with our customers and in a way that allows them to equip the space to meet their business requirements. This may include a wide range of existing and emerging automation technologies, from picking and high bay racking to specific manufacturing operations.
01_OverviewX_01_11_v85.indd 201_OverviewX_01_11_v85.indd 2 01/03/2022 17:1101/03/2022 17:11
03SEGRO PLC | ANNUAL REPORT & ACCOUNTS 2021
OVERVIEW STRATEGIC REPORT GOVERNANCE FINANCIAL STATEMENTS
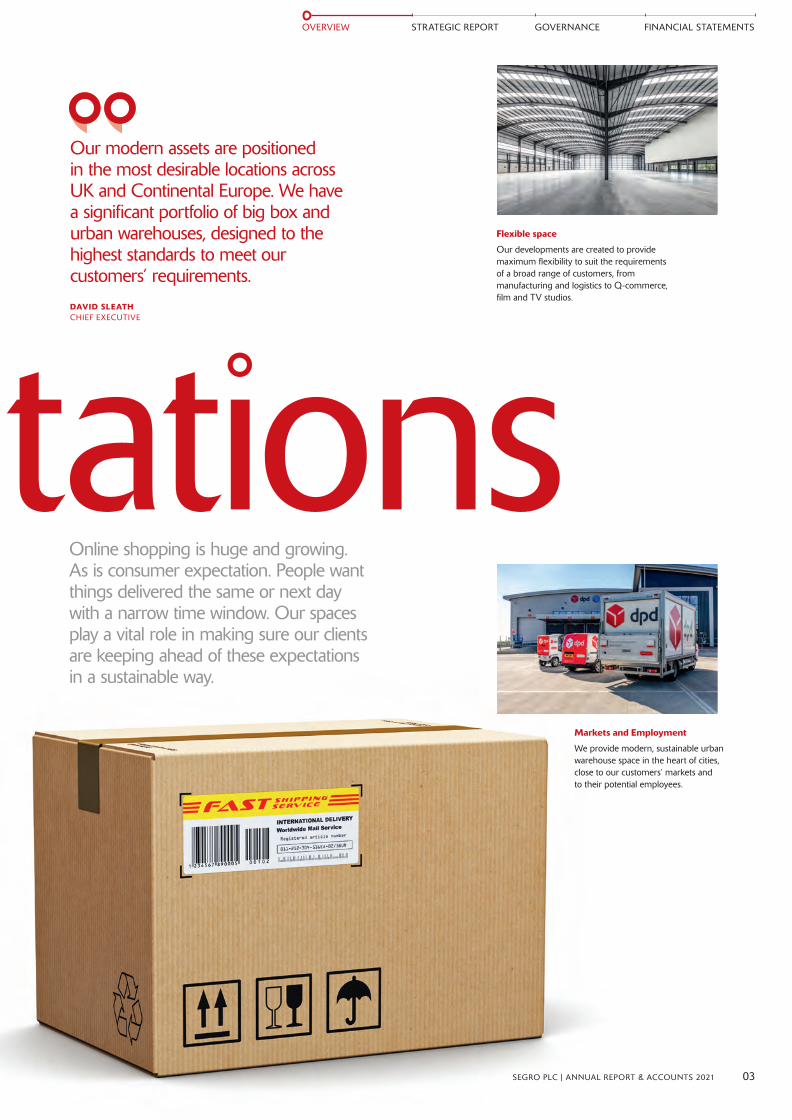
Online shopping is huge and growing. As is consumer expectation. People want things delivered the same or next day with a narrow time window. Our spaces play a vital role in making sure our clients are keeping ahead of these expectations in a sustainable way.
Expectations
Our modern assets are positioned in the most desirable locations across UK and Continental Europe. We have a significant portfolio of big box and urban warehouses, designed to the highest standards to meet our customers’ requirements. DAVID SLEATHCHIEF EXECUTIVE
Markets and Employment
We provide modern, sustainable urban warehouse space in the heart of cities, close to our customers’ markets and to their potential employees.
Flexible space
Our developments are created to provide maximum flexibility to suit the requirements of a broad range of customers, from manufacturing and logistics to Q-commerce, film and TV studios.
01_OverviewX_01_11_v85.indd 301_OverviewX_01_11_v85.indd 3 01/03/2022 17:1101/03/2022 17:11
A vast range of diverse businesses bring our spaces to life with brilliant ideas and make extraordinary things happen, from growing strawberries and making lollipops to brewing beer and laundering dirty linen.
Creative Industries
Film, TV and online media production is booming and our warehouses can provide much-needed studio space that benefits from height, openness and can be soundproofed and configured flexibly to meet occupier demand.
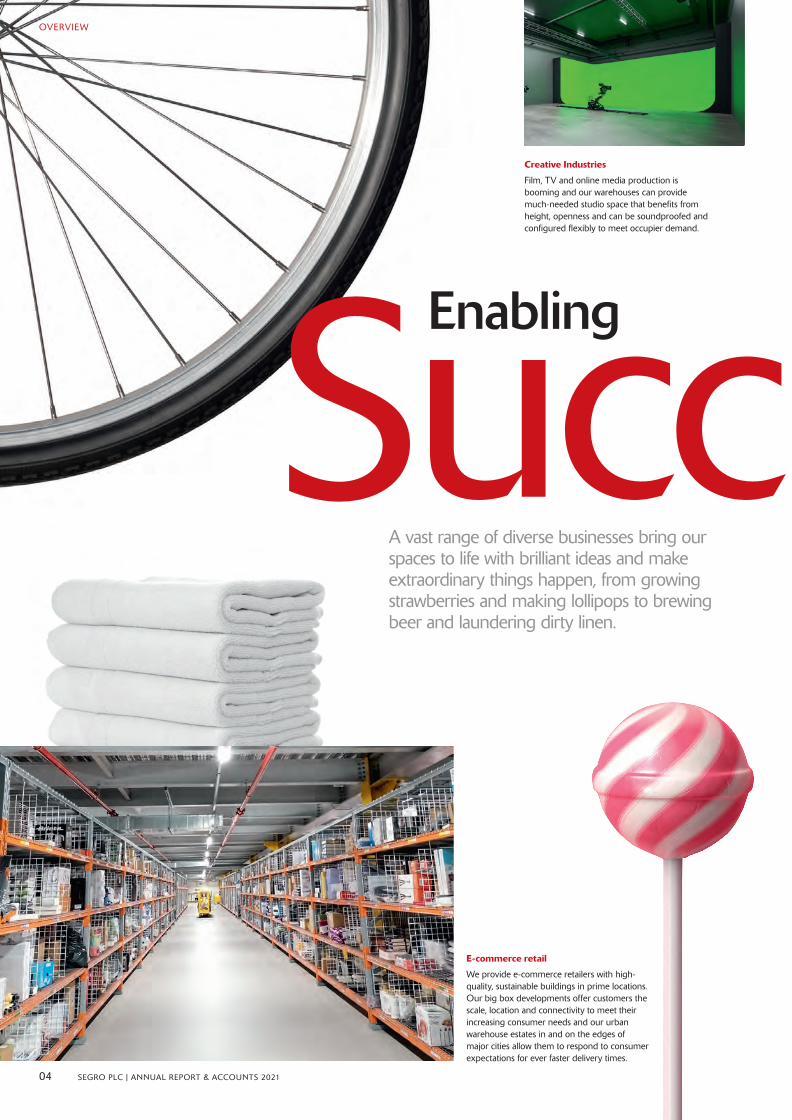
E-commerce retail
We provide e-commerce retailers with high-quality, sustainable buildings in prime locations. Our big box developments offer customers the scale, location and connectivity to meet their increasing consumer needs and our urban warehouse estates in and on the edges of major cities allow them to respond to consumer expectations for ever faster delivery times.
Enabling
Success
04 SEGRO PLC | ANNUAL REPORT & ACCOUNTS 2021
OVERVIEW
01_OverviewX_01_11_v85.indd 401_OverviewX_01_11_v85.indd 4 01/03/2022 17:1101/03/2022 17:11
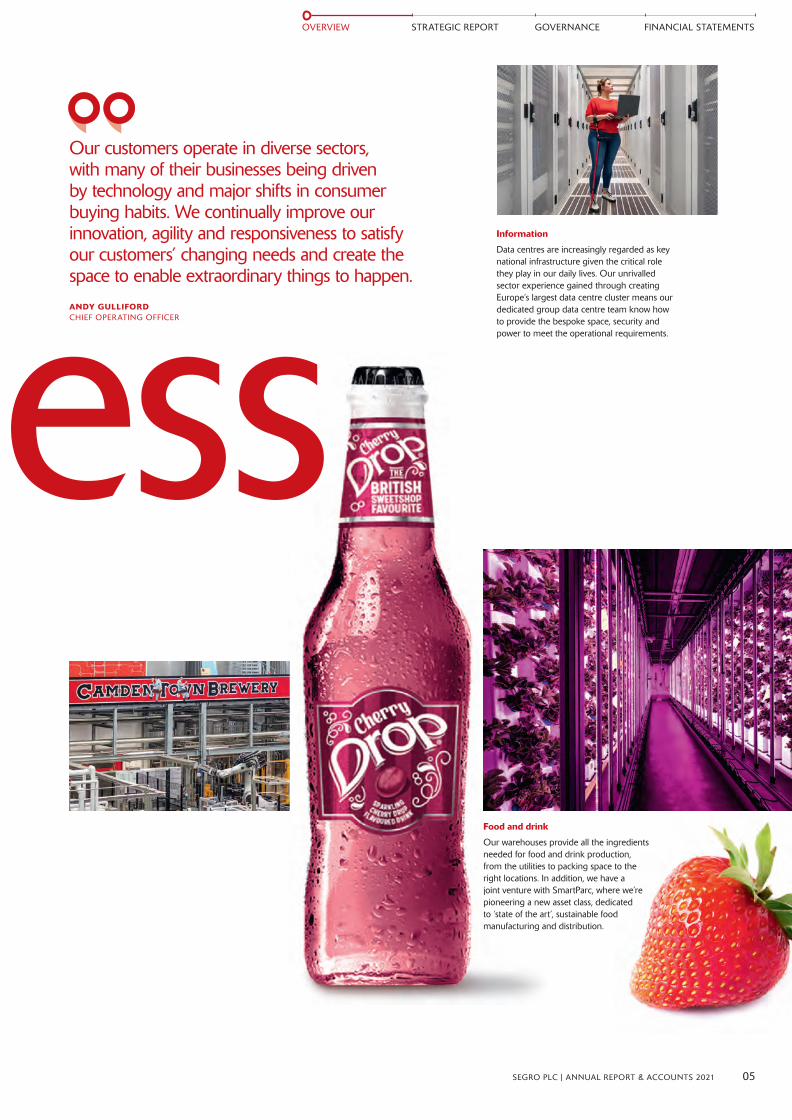
Our customers operate in diverse sectors, with many of their businesses being driven by technology and major shifts in consumer buying habits. We continually improve our innovation, agility and responsiveness to satisfy our customers’ changing needs and create the space to enable extraordinary things to happen. ANDY GULLIFORDCHIEF OPERATING OFFICER
Food and drink
Our warehouses provide all the ingredients needed for food and drink production, from the utilities to packing space to the right locations. In addition, we have a joint venture with SmartParc, where we’re pioneering a new asset class, dedicated to ‘state of the art’, sustainable food manufacturing and distribution.
Information
Data centres are increasingly regarded as key national infrastructure given the critical role they play in our daily lives. Our unrivalled sector experience gained through creating Europe’s largest data centre cluster means our dedicated group data centre team know how to provide the bespoke space, security and power to meet the operational requirements. Success
05SEGRO PLC | ANNUAL REPORT & ACCOUNTS 2021
OVERVIEW STRATEGIC REPORT GOVERNANCE FINANCIAL STATEMENTS
01_OverviewX_01_11_v85.indd 501_OverviewX_01_11_v85.indd 5 01/03/2022 17:1101/03/2022 17:11

Smart technology
We have fitted smart technology at some of our units to create energy efficient solutions
for customers. Sensors enable our customers to benefit from real-time data insights to help monitor temperature levels, sound pressure,
energy usage and air quality, which results in greater levels of wellbeing and sustainability.
Biodiversity
Green walls at our developments help purify air, regulate temperature and create a more enjoyable surrounding for occupiers. Insect boxes create suitable nesting habitats for important native pollinators, and we have over 330 beehives across our portfolio.
Being
Responsible
06 SEGRO PLC | ANNUAL REPORT & ACCOUNTS 2021
OVERVIEW
01_OverviewX_01_11_v85.indd 601_OverviewX_01_11_v85.indd 6 01/03/2022 17:1101/03/2022 17:11
07
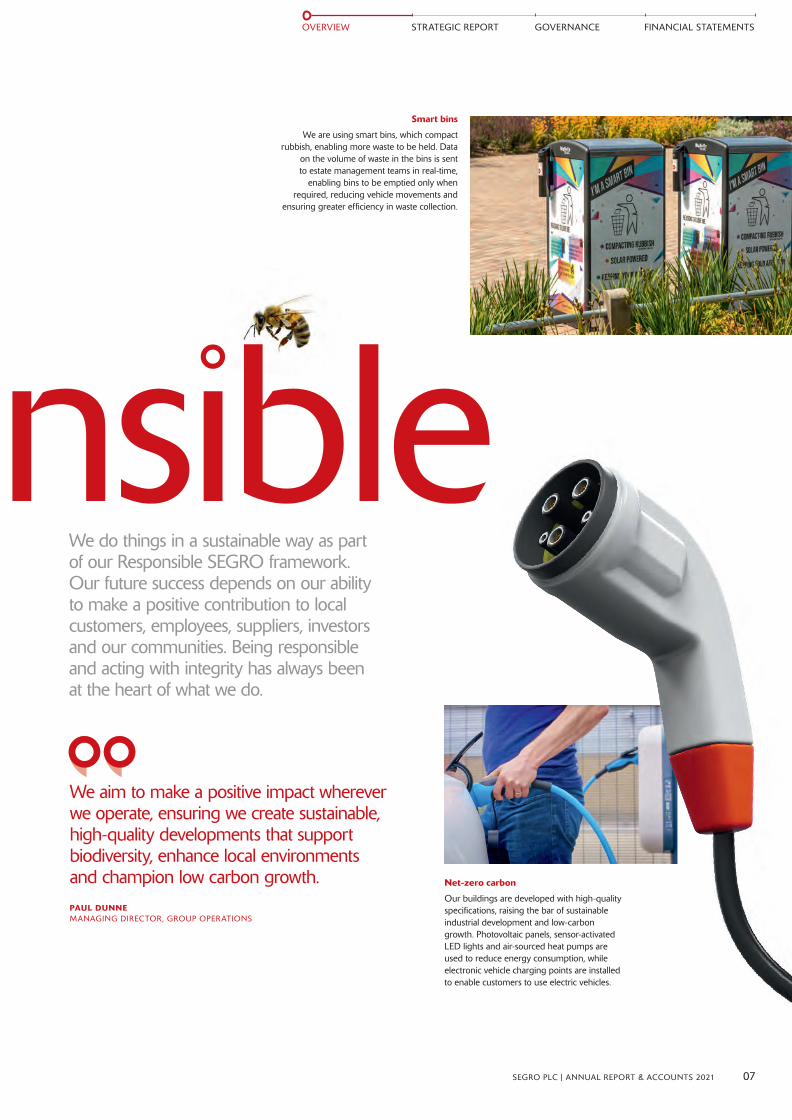
We do things in a sustainable way as part of our Responsible SEGRO framework. Our future success depends on our ability to make a positive contribution to local customers, employees, suppliers, investors and our communities. Being responsible and acting with integrity has always been at the heart of what we do.
We aim to make a positive impact wherever we operate, ensuring we create sustainable, high-quality developments that support biodiversity, enhance local environments and champion low carbon growth. PAUL DUNNEMANAGING DIRECTOR, GROUP OPERATIONS
Net-zero carbon
Our buildings are developed with high-quality specifications, raising the bar of sustainable industrial development and low-carbon growth. Photovoltaic panels, sensor-activated LED lights and air-sourced heat pumps are used to reduce energy consumption, while electronic vehicle charging points are installed to enable customers to use electric vehicles.
Smart bins
We are using smart bins, which compact rubbish, enabling more waste to be held. Data
on the volume of waste in the bins is sent to estate management teams in real-time,
enabling bins to be emptied only when required, reducing vehicle movements and
ensuring greater efficiency in waste collection.
Responsible
07SEGRO PLC | ANNUAL REPORT & ACCOUNTS 2021
OVERVIEW STRATEGIC REPORT GOVERNANCE FINANCIAL STATEMENTS
01_OverviewX_01_11_v85.indd 701_OverviewX_01_11_v85.indd 7 01/03/2022 17:1101/03/2022 17:11
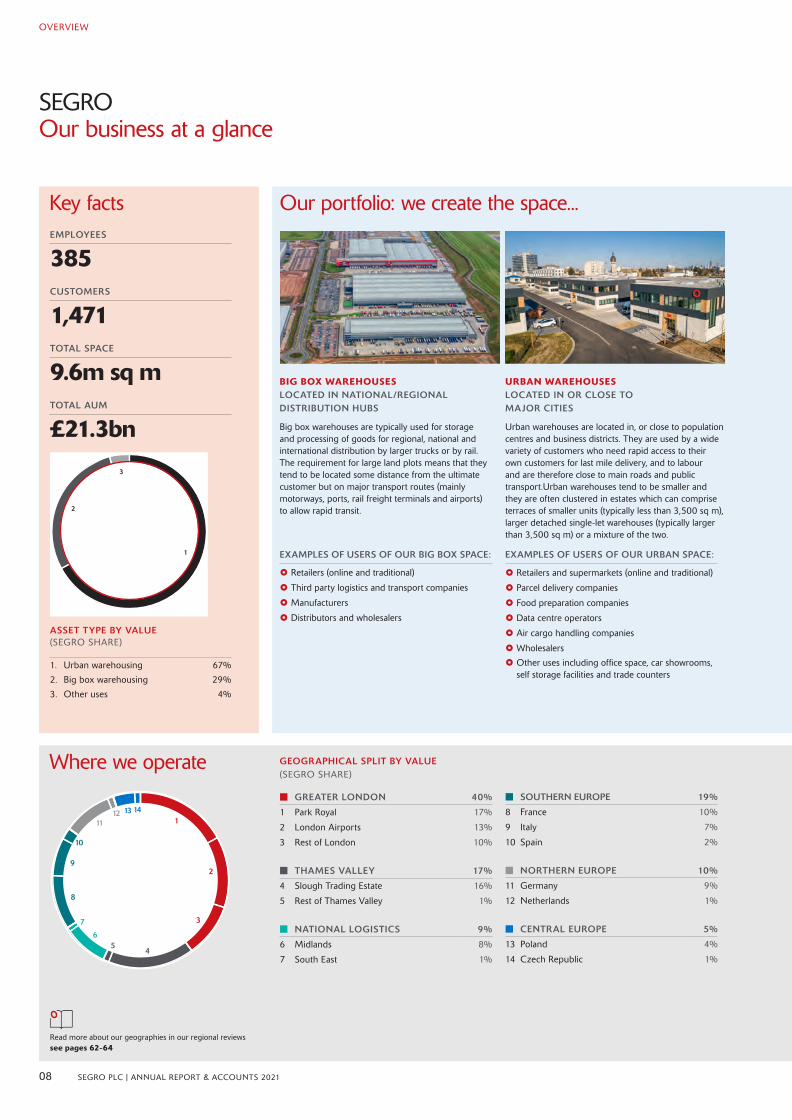
SEGROOur business at a glance
BIG BOX WAREHOUSES LOCATED IN NATIONAL/REGIONAL DISTRIBUTION HUBS
Big box warehouses are typically used for storage and processing of goods for regional, national and international distribution by larger trucks or by rail. The requirement for large land plots means that they tend to be located some distance from the ultimate customer but on major transport routes (mainly motorways, ports, rail freight terminals and airports) to allow rapid transit.
EXAMPLES OF USERS OF OUR BIG BOX SPACE:
£ Retailers (online and traditional)
£ Third party logistics and transport companies
£ Manufacturers
£ Distributors and wholesalers
URBAN WAREHOUSES LOCATED IN OR CLOSE TO MAJOR CITIES
Urban warehouses are located in, or close to population centres and business districts. They are used by a wide variety of customers who need rapid access to their own customers for last mile delivery, and to labour and are therefore close to main roads and public transport.Urban warehouses tend to be smaller and they are often clustered in estates which can comprise terraces of smaller units (typically less than 3,500 sq m), larger detached single-let warehouses (typically larger than 3,500 sq m) or a mixture of the two.
EXAMPLES OF USERS OF OUR URBAN SPACE:
£ Retailers and supermarkets (online and traditional)
£ Parcel delivery companies
£ Food preparation companies
£ Data centre operators
£ Air cargo handling companies
£ Wholesalers
£ Other uses including office space, car showrooms, self storage facilities and trade counters
Our portfolio: we create the space...EMPLOYEES
385CUSTOMERS
1,471TOTAL SPACE
9.6m sq mTOTAL AUM
£21.3bn
ASSET TYPE BY VALUE (SEGRO SHARE)
1. Urban warehousing 67%
2. Big box warehousing 29%
3. Other uses 4%
Read more about our geographies in our regional reviewssee pages 62-64
GEOGRAPHICAL SPLIT BY VALUE (SEGRO SHARE)
n GREATER LONDON 40%
1 Park Royal 17%
2 London Airports 13%
3 Rest of London 10%
n THAMES VALLEY 17%
4 Slough Trading Estate 16%
5 Rest of Thames Valley 1%
n NATIONAL LOGISTICS 9%
6 Midlands 8%
7 South East 1%
n SOUTHERN EUROPE 19%
8 France 10%
9 Italy 7%
10 Spain 2%
n NORTHERN EUROPE 10%
11 Germany 9%
12 Netherlands 1%
n CENTRAL EUROPE 5%
13 Poland 4%
14 Czech Republic 1%
1
2
3
45
6
7
8
9
10
1112 13 14
2
3
1
Key facts
Where we operate
08 SEGRO PLC | ANNUAL REPORT & ACCOUNTS 2021
OVERVIEW
01_OverviewX_01_11_v85.indd 801_OverviewX_01_11_v85.indd 8 01/03/2022 17:1201/03/2022 17:12

...that enables extraordinary things to happen
OUR TOP 20 CUSTOMERS:
Our top 20 customers represent headline rent of £188 million in aggregate, 32% of the Group’s total headline rent at 31 December 2021.
1. Amazon
2. Deutsche Post DHL
3. Royal Mail
4. Fedex
5. Virtus
6. GXO
7. Worldwide Flight Services
8. Geodis
9. Equinix
10. La Poste (DPD)
11. British Airways
12. Telefonica
13. CyrusOne
14. Ocado
15. Leroy Merlin
16. Tesco Group
17. Netflix
18. Hermes
19. Menzies
20. UCB
CUSTOMER TYPE BY HEADLINE RENT (SEGRO SHARE)
1. Transport and logistics 21%
2. Retail (physical and online) 19%
3. Food and general manufacturing 16%
4. Technology, media and telecoms 11%
5. Wholesale and retail distribution 10%
6. Post and parcel delivery 9%
7. Services and utilities 7%
8. Other 7%
2
3
1
4
5
6
7
8
Our customers
09SEGRO PLC | ANNUAL REPORT & ACCOUNTS 2021
OVERVIEW STRATEGIC REPORT GOVERNANCE FINANCIAL STATEMENTS
BIG BOX WAREHOUSES
TRANSPORT HUBS
URBAN WAREHOUSES
MAJOR CITIES
01_OverviewX_01_11_v85.indd 901_OverviewX_01_11_v85.indd 9 01/03/2022 17:1201/03/2022 17:12
SEGRO2021 at a glance
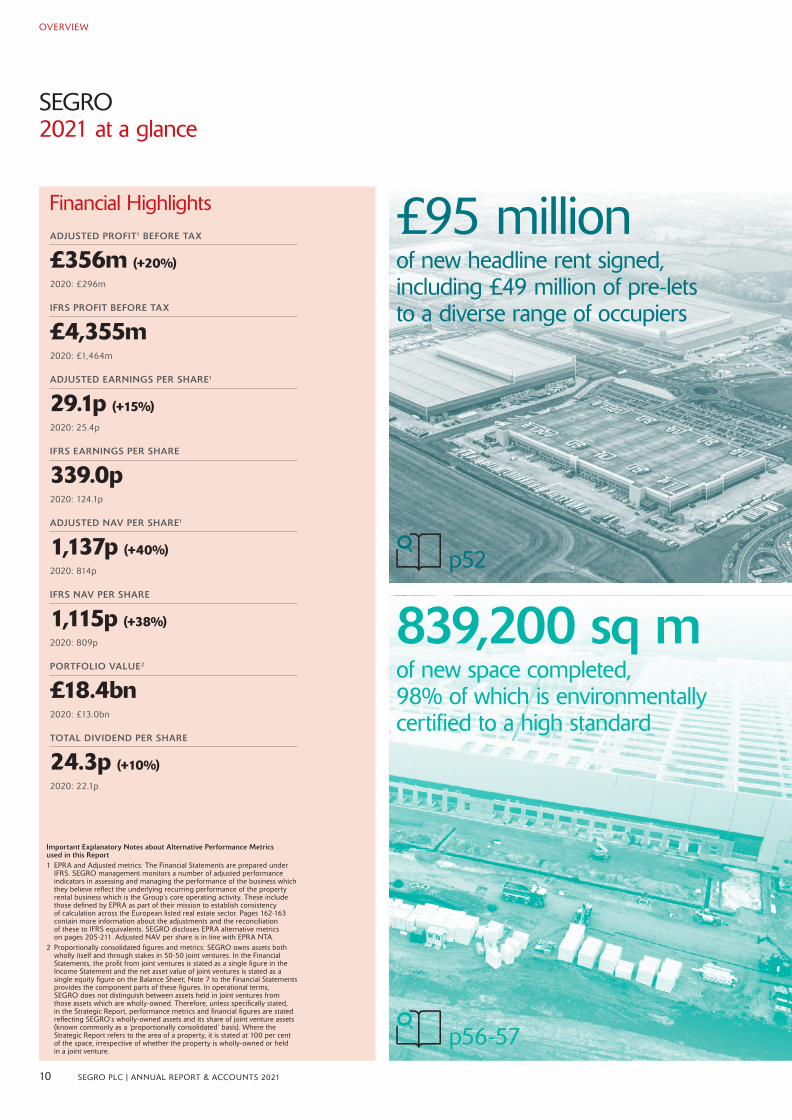
Financial HighlightsADJUSTED PROFIT1 BEFORE TAX
£356m (+20%)2020: £296m
IFRS PROFIT BEFORE TAX
£4,355m 2020: £1,464m
ADJUSTED EARNINGS PER SHARE1
29.1p (+15%)2020: 25.4p
IFRS EARNINGS PER SHARE
339.0p 2020: 124.1p
ADJUSTED NAV PER SHARE1
1,137p (+40%)2020: 814p
IFRS NAV PER SHARE
1,115p (+38%)2020: 809p
PORTFOLIO VALUE2
£18.4bn2020: £13.0bn
TOTAL DIVIDEND PER SHARE
24.3p (+10%)2020: 22.1p
£95 million of new headline rent signed, including £49 million of pre-lets to a diverse range of occupiers
839,200 sq m of new space completed, 98% of which is environmentally certified to a high standard
Important Explanatory Notes about Alternative Performance Metrics used in this Report1 EPRA and Adjusted metrics: The Financial Statements are prepared under
IFRS. SEGRO management monitors a number of adjusted performance indicators in assessing and managing the performance of the business which they believe reflect the underlying recurring performance of the property rental business which is the Group’s core operating activity. These include those defined by EPRA as part of their mission to establish consistency of calculation across the European listed real estate sector. Pages 162-163 contain more information about the adjustments and the reconciliation of these to IFRS equivalents. SEGRO discloses EPRA alternative metrics on pages 205-211. Adjusted NAV per share is in line with EPRA NTA.
2 Proportionally consolidated figures and metrics: SEGRO owns assets both wholly itself and through stakes in 50-50 joint ventures. In the Financial Statements, the profit from joint ventures is stated as a single figure in the Income Statement and the net asset value of joint ventures is stated as a single equity figure on the Balance Sheet; Note 7 to the Financial Statements provides the component parts of these figures. In operational terms, SEGRO does not distinguish between assets held in joint ventures from those assets which are wholly-owned. Therefore, unless specifically stated, in the Strategic Report, performance metrics and financial figures are stated reflecting SEGRO’s wholly-owned assets and its share of joint venture assets (known commonly as a ‘proportionally consolidated’ basis). Where the Strategic Report refers to the area of a property, it is stated at 100 per cent of the space, irrespective of whether the property is wholly-owned or held in a joint venture.
p52
p56-5710 SEGRO PLC | ANNUAL REPORT & ACCOUNTS 2021
OVERVIEW
01_OverviewX_01_11_v85.indd 1001_OverviewX_01_11_v85.indd 10 01/03/2022 17:1201/03/2022 17:12
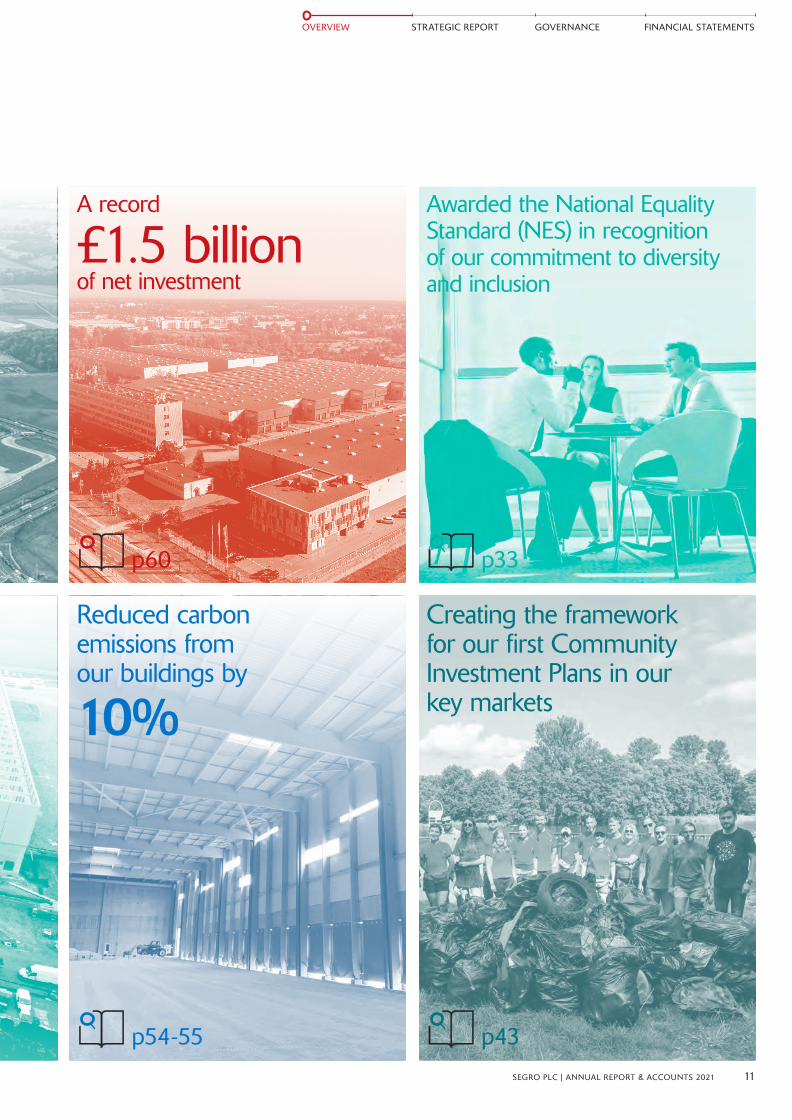
A record
£1.5 billion of net investment
Creating the framework for our first Community Investment Plans in our key markets
Awarded the National Equality Standard (NES) in recognition of our commitment to diversity and inclusion
p43
p60
Reduced carbon emissions from our buildings by
10%
p54-55
p33
11SEGRO PLC | ANNUAL REPORT & ACCOUNTS 2021
OVERVIEW STRATEGIC REPORT GOVERNANCE FINANCIAL STATEMENTS
01_OverviewX_01_11_v85.indd 1101_OverviewX_01_11_v85.indd 11 01/03/2022 17:1201/03/2022 17:12

We have made significant progress with our Responsible SEGRO ambitions during 2021, which help to position our business for long-term success.DAVID SLEATHCHIEF EXECUTIVE
Chief Executive Interview:David Sleath answers questions on SEGRO’s performance and the long-term outlook for the business
As you look back now how do you reflect on SEGRO’s performance in 2021?2021 was a very successful year for our business, despite the ongoing pandemic, with record performance being achieved in many areas. This performance is being enhanced by the structural drivers at play in our sector but it is mostly down to the hard work undertaken by our teams over the past decade, to position our portfolio so that we have the best assets, in the locations that are key to our customers. It has been very satisfying to see that play out and also how people across the business have worked hard to capitalise on the current market conditions and secure future growth opportunities.
What were the highlights for you?The operational and financial performance are obviously significant highlights but alongside this we have also made fantastic progress with our Responsible SEGRO ambitions and it has been great to see how everyone within the business has embraced these priorities and contributed to the progress made during the year.
12 SEGRO PLC | ANNUAL REPORT & ACCOUNTS 2021
OVERVIEW
02_CEOStatement_MarketOverview_12_21_v74.indd 1202_CEOStatement_MarketOverview_12_21_v74.indd 12 01/03/2022 17:1301/03/2022 17:13
How is SEGRO positioned to respond to the increased competition in your markets?We have been in the warehouse business for over 100 years and have a wealth of experience and knowledge within our operating platform. This along with our reputation and the relationships that we have established with key stakeholders and partners helps us to create opportunities that are not necessarily accessible to those newer to the sector. For example the opportunities to acquire assets off-market, to access development opportunities as a result of our reputation for adding value in local communities, the know-how and experience to execute on complicated projects and the ability to innovate and come up with creative solutions to problems.
How will Responsible SEGRO strengthen the business?We have always taken a responsible approach to doing business so this isn’t something that is new to us and it is a part of the reason why our company has been around for so long. Our Responsible SEGRO framework focuses on three areas where we feel we can make the most meaningful difference and that are also key in positioning our business for longer-term success. They will help to ensure that our portfolio is fit for the future, that the communities around our estates flourish and that we have a team of diverse, talented and motivated people.
What are your priorities for 2022?2022 is going to be another very busy year. Continuing to embed Responsible SEGRO across the business is a huge priority as that will help us ensure that we make further inroads towards being net-zero carbon by 2030; that we continue to make a positive impact on our local communities and environments; and that we nurture talent, as this is key to the future success of SEGRO. We also need to carry on seeking out profitable new opportunities for growth to add to our already substantial pipeline; and we’ll be looking to drive further value from the existing portfolio through active asset and customer management, capturing the existing reversion and continuing to pursue rental growth.
OVERVIEW STRATEGIC REPORT GOVERNANCE FINANCIAL STATEMENTS
13SEGRO PLC | ANNUAL REPORT & ACCOUNTS 2021
02_CEOStatement_MarketOverview_12_21_v74.indd 1302_CEOStatement_MarketOverview_12_21_v74.indd 13 01/03/2022 17:1301/03/2022 17:13

Read more on our strategysee pages 22-23
David Sleath reports on SEGRO’s performance in the past year and looks to the future.
2021 was an exceptionally busy year for SEGRO as our teams worked hard to capitalise on the favourable market dynamics that are currently benefitting the industrial property sector. The pandemic brought about the acceleration of already strong structural drivers, resulting in record levels of warehouse take-up across Europe during 2021 and this has attracted increased investment into the sector. We have worked diligently throughout, to position our business so that we could emerge in an even stronger position and this is already paying off, resulting in strong rental growth and a high number of development completions.
Responsible SEGRO is the framework that we use to explain how we do business in the best interests of our stakeholders and the long-term success of our business. Last year we set new priorities within this that focus on the key areas where we believe we can make the greatest business, environmental and social contribution (see page 87 for further information). During 2021 we worked hard to integrate these into the management of our portfolio and the day-to-day running of our business to ensure that, as we grow as a company, the value that we create for our stakeholders also increases, and so that we can deliver on our Purpose of ‘creating the space that enables extraordinary things to happen’.
Looking back on 2021, the main highlights include:
} A significant increase in our rent roll, arising from a combination of active asset management of our existing portfolio, our expanded development programme and market rental growth.
} Increased visibility on the carbon emissions from our leased buildings (improving to 54 per cent now monitored from 41 per cent in 2021) and moving the last of our markets onto a certified green energy tariff.
} 839,200 sq m of development completions creating space to be used by a wide variety of industries including those linked to e-commerce, data centres and creative industries.
} Undertaking life cycle assessments on over half of our new development projects, equivalent to 440,000 sq m of new space, an important step in reducing carbon emissions from building materials.
} Achieving the National Equality Standard (NES) accreditation following our first audit, a reflection of our commitment to diversity and inclusion.
} Creating the framework for our Community Investment Plans (CIPs) and the appointment of 41 Community Champions across the business to lead the projects alongside our local community partners.
This activity has been reflected in significant growth in all of our key operating metrics and our balance sheet remains in good shape and is positioned to support further growth.
The combination of a strong set of financial results in 2021 and our confident outlook for 2022 and beyond means that we are recommending a 10.0 per cent increase in our final dividend to 16.9 pence per share, resulting in a total distribution of 24.3 pence for 2021 as a whole (2020: 22.1 pence).
Reflecting on 2021, there are three things that stand out for me:
} The strength, breadth and depth of occupier demand and the long-term nature of the structural trends that underpin it;
} The ability of our teams to continue to find new opportunities to grow the business in very competitive markets by leveraging their experience, relationships and thinking creatively; and
} The progress that we have made in our Responsible SEGRO focus areas and the alignment towards these goals that we are finding with our customers, suppliers and other stakeholders.
E-commerce is still an important source of occupier demand across Europe and continues to contribute significantly to our lettings performance, but we are seeing new names emerge in the space (for example rapid grocery delivery services and other Q-commerce businesses) and its impact is now being felt more widely across the portfolio, for example in our urban estates in Germany, France and Spain.
Distribution networks on the Continent still have a long way to go to be able to cope with the increased strain that e-commerce is putting them under. Even in the UK, where e-commerce penetration is significantly ahead of most markets in Europe, retailers and logistics operators need to take additional space to successfully handle e-commerce penetration rates approaching 30 per cent.
Chief Executive’s statementA successful year and positive outlook
DELIVERING INCREASED DIVIDENDS
24.3 pence
Due to the prime location, high quality and flexibility of our space, we are also seeing significant demand from other sectors, such as the creative industries. More widely across Europe, take-up by businesses involved in manufacturing has increased during 2021 as a result of a renewed focus on supply-chain resilience.
All of this combined is leading to very high levels of occupier demand. For many lettings, there are multiple potential occupiers willing to pay a premium to get the space that is crucial to the success of their business and this is leading to very strong rental growth, particularly in markets where we have carefully built strong positions, such as London, where supply is very limited.
The situation in the occupier market is also attracting more and more investment into our sector which has pushed up asset prices but also resulted in competitive bidding situations for both standing assets and land in every single market that we operate in. Despite this, our teams have been able to find opportunities to acquire unique assets and development opportunities, often in off-market situations, due to our reputation, scale position, relationships and expertise. A good example of this is the acquisition that we completed in South East London for a complex redevelopment scheme where the vendors only presented to a few potential purchasers who they knew would have the ability and appetite to execute on it.
2021
2020
2019
2018
2017
24.3p
22.1p
20.7p
18.8p
16.6p
14 SEGRO PLC | ANNUAL REPORT & ACCOUNTS 2021
OVERVIEW
02_CEOStatement_MarketOverview_12_21_v74.indd 1402_CEOStatement_MarketOverview_12_21_v74.indd 14 01/03/2022 17:1301/03/2022 17:13

Our teams are also thinking creatively and finding other ways to source opportunities, for example by doing asset swaps or building relationships with local trader developers who have access to land plots. Once we own the land, our development teams consider how they can intensify land use and maximise the value we create from it.
Integrated within the management of our portfolio and development pipeline we have worked hard to progress our Responsible SEGRO ambitions. During 2021 we have taken steps to understand our current position, for example through doing life cycle assessments on over half of our development projects and participating in a NES audit. These have enabled us to put the necessary, processes and frameworks in place to ensure that we achieve the ambitions that we set out within our Responsible SEGRO priorities of Championing low-carbon growth, Investing in our local communities and environments, and Nurturing talent.
As expected, we are finding common ground with our customers, suppliers and other stakeholders and aligning our interests to maximise the value created. For example, many customers decided to lease our space because its environmental credentials also helped them achieve their own sustainability goals. In another case a supplier decided to apply for Living Wage accreditation after we engaged with them in the process of achieving our own accreditation. We also sponsored numerous apprentices to work in local businesses and receive training to enable long-term career progression.
I am very proud to see how everyone within the business has embraced our Responsible SEGRO ambitions and worked hard alongside their already busy jobs to help make them come to life. I would like to thank them for this, and also for the continued focus, dedication and commitment that they have shown over the past two years whilst having to endure the restrictions and limitations that have been put on both their work and personal lives due to the pandemic. Quite simply, our business would not be in the position that it is today without their efforts.
It has been a very busy year and highly successful year and one that has brought much satisfaction and has really shown how our business delivers on its Purpose of creating the space that enables extraordinary things to happen.
OUTLOOK
We enter 2022 with considerable confidence in the outlook for our business and its ability to deliver continued growth. The effects of the pandemic are ongoing and we remain mindful of macroeconomic and geopolitical risk, but the world is adapting quickly and learning how to function alongside Covid-19, with the lasting impacts on the way that we live and work strengthening occupier demand. It has also highlighted the importance of global supply chains facilitated by high-quality logistics space and we have positioned our business to take advantage of these structural tailwinds.
Against a backdrop of strong demand from an increasingly diverse range of businesses, combined with historically low vacancy rates across Europe, we expect rental growth to continue across our markets. We believe that the growth rate will be highest where developable land is in shortest supply, for example in urban markets such as London and Paris. This acute supply-demand imbalance delivered record rental growth during 2021, resulting in significant accumulated rental reversion in the portfolio which we will be working hard to capture during 2022 and the coming years.
Our record levels of capital investment over the past two years have resulted in a significant number of projects currently under construction, with a high level of pre-leasing, and a large pipeline of future projects. This allows us to both provide much-needed modern, sustainable space for our customers and generate additional rental income. We continue to prioritise further opportunities to grow our development pipeline, positioning SEGRO to benefit from the long-term structural trends within the occupier market.
Inflationary pressures remain but we expect to be able to offset these in our existing portfolio by capturing the significant reversion in lease reviews and renewals, whilst benefiting from indexation provisions in our remaining leases which represent approximately 40 per cent. Rental growth has also allowed us to maintain the profitability of the development programme despite additional cost pressures arising from increased construction and material costs.
The unique supply-demand dynamics of the industrial sector have attracted increasing competition from both investors and developers, but we are confident in our ability to source profitable new opportunities to grow. As evidenced during 2021, the combination of our significant portfolio of modern, assets in the most desirable locations across Europe, together with our well-established operating platform, provides us with a clear competitive advantage. This, alongside the meaningful and lasting changes we are making through our Responsible SEGRO focus areas will help us to ensure that our business continues to prosper, creating shared value for our customers, employees, shareholders, local communities and all of our other stakeholders.
DAVID SLEATHCHIEF EXECUTIVE
Our Responsible SEGRO framework is fully integrated into our Business and helps us to articulate and focus on our ESG goals
Championing low-carbon growth
Nurturing talent
Investing in our local communities and environments
see pages 32 to 35see pages 42 to 44see pages 54 to 59
15SEGRO PLC | ANNUAL REPORT & ACCOUNTS 2021
OVERVIEW STRATEGIC REPORT GOVERNANCE FINANCIAL STATEMENTS
02_CEOStatement_MarketOverview_12_21_v74.indd 1502_CEOStatement_MarketOverview_12_21_v74.indd 15 01/03/2022 17:1301/03/2022 17:13

Market overviewA look at our market drivers
The performance of real estate, like all asset classes, is driven by the interplay of demand and supply: investor demand for property assets and occupier demand for space, with performance dependent on the supply of properties to buy or lease to satisfy that demand.The property market is therefore typically considered to be cyclical but more recently our business has been driven by structural trends. These have amplified the impacts of many positive cyclical drivers and have offset the impact of many negative ones.
Factors often linked to the economic cycle that influence supply and demand and therefore impact asset values and rental levels.
CYCLICAL DRIVERS
REAL ESTATE AS AN INVESTMENT ASSET:
If investor demand increases, in the absence of additional supply, the value of real estate will rise; if demand wanes or supply increases, the value will fall. Real estate pricing is commonly expressed as a yield which is the rent payable for a building as a percentage of its value. At a constant rent, as the value of real estate rises, its yield falls (often referred to as ‘yield compression’) and vice versa.
REAL ESTATE AS AN OPERATING NECESSITY:
As occupier demand increases, in the absence of additional supply, overall lease terms will become more expensive for the occupier, including (but not exclusively) an increase in rents. If demand for space falls, or supply increases ahead of occupier demand, overall lease terms, including rent, will become cheaper.
16 SEGRO PLC | ANNUAL REPORT & ACCOUNTS 2021
OVERVIEW
02_CEOStatement_MarketOverview_12_21_v74.indd 1602_CEOStatement_MarketOverview_12_21_v74.indd 16 01/03/2022 17:1301/03/2022 17:13

Economic outlookEconomic growth is an important driver of occupier demand for space. A supportive economic environment encourages businesses to grow and therefore to secure extra space. In a recession, customer insolvencies and industrial vacancy rates tend to increase.
Global economic growth was strong in 2021 but still remains below pre-pandemic levels. The outlook for 2022 is positive (IMF forecasts 4.4 per cent) but supply chain disruptions and rising energy prices have resulted in elevated levels of inflation. Current market forecasts expect that it will fall back towards central bank targets in the second half of the year.
WHAT IT MEANS FOR SEGRO?
}We have a very diverse customer base covering many different sectors which means we are not overly exposed to challenges in particular industries.
} The pandemic has had a positive impact on the structural drivers that impact our business, for example increased e-commerce penetration across Europe, and these have resulted in record levels of occupier demand for warehouse space.
} Inflation has resulted in increased development costs during 2021 but we have worked closely with our suppliers to moderate this and rental growth has more than offset the impacts on our pipeline so far. We continue to remain alert to this going into 2022.
} Inflation has a positive impact on the rent roll as over 40 per cent of our rents are index linked (with most linked to consumer prices).
Interest rate environmentMonetary policy across Europe – and globally – means that we continue to operate in a low interest rate environment. However, recent high levels of inflation may result in interest rate rises as central banks seek to control it.
Prime industrial real estate yields in the UK and Europe currently range between 3 to 4.5 per cent, meaning they are still attractive relative to their respective risk-free benchmarks. If interest rates were to rise significantly this could make industrial assets less attractive and might limit the potential for further yield reductions or may even result in yields rising.
WHAT IT MEANS FOR SEGRO?
} Yields continued to compress during 2021 and the yield for our portfolio is currently 3.8 per cent.
} This yield compression was enhanced by rental growth as a result of high occupier demand. As a result our portfolio increased in value by 29 per cent in 2021.
} There is still a significant amount of capital looking to invest in industrial assets due to the attractive long-term demand outlook and limited supply in the sector. This should help to support yields should interest rates rise further.
}Greater competition for completed assets from investors has increased their prices, meaning we can generally achieve better returns from developing than acquiring assets.
Competitive supplyThe relatively short construction time for warehousing means that the availability of new speculatively developed buildings can sometimes exceed demand, leading to increased vacancy and weaker rents.
Occupier demand has been very strong across Europe during 2021 and vacancy is now at record lows across most of our major markets.
Supply has increased in response to this but tight planning laws and limited availability of land are keeping supply in check and take up is expected to remain strong throughout 2022.
WHAT IT MEANS FOR SEGRO?
} Rental values have increased in most areas of our portfolio in 2021.
}We continue to take a cautious approach to speculative development, preferring most of our developments to be de-risked through pre-letting.
17SEGRO PLC | ANNUAL REPORT & ACCOUNTS 2021
OVERVIEW STRATEGIC REPORT GOVERNANCE FINANCIAL STATEMENTS
02_CEOStatement_MarketOverview_12_21_v74.indd 1702_CEOStatement_MarketOverview_12_21_v74.indd 17 01/03/2022 17:1301/03/2022 17:13
Changes in the way that an industry or market functions can result in longer-term or even permanent change. We monitor both cyclical and structural drivers and use them to shape our strategy and influence decisions about the shape of our portfolio and the nature of our investments.
STRUCTURAL TRENDS
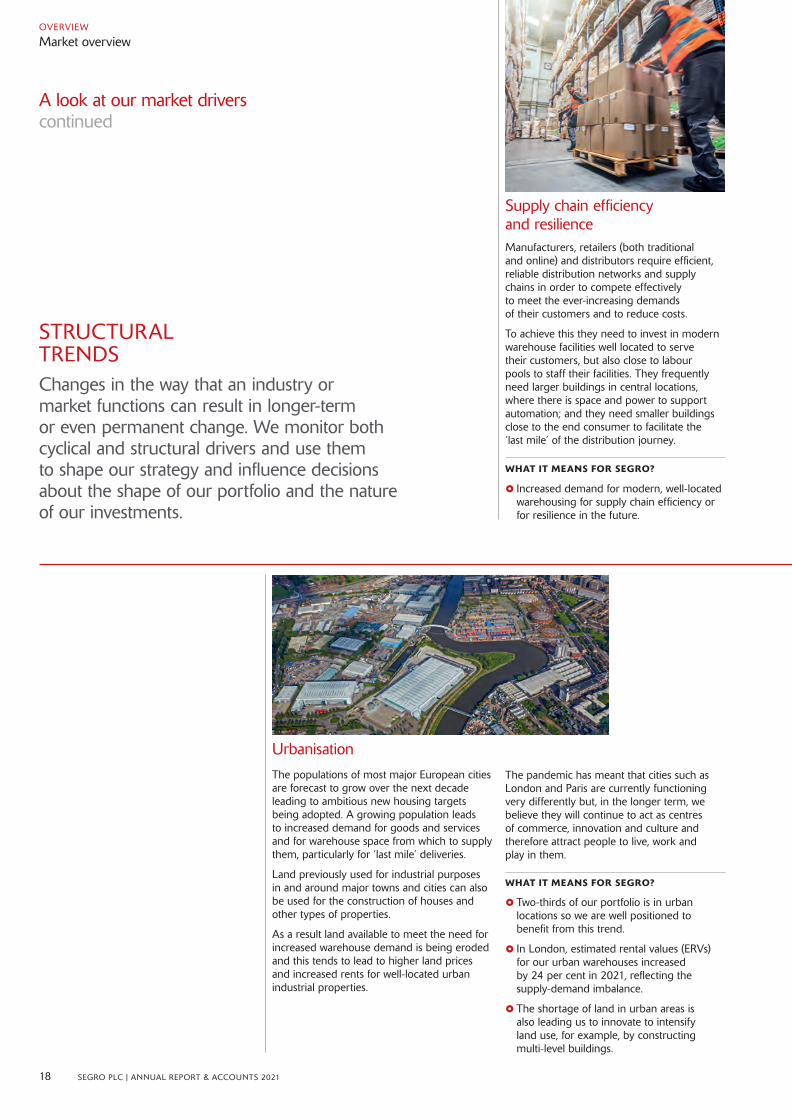
Supply chain efficiency and resilienceManufacturers, retailers (both traditional and online) and distributors require efficient, reliable distribution networks and supply chains in order to compete effectively to meet the ever-increasing demands of their customers and to reduce costs.
To achieve this they need to invest in modern warehouse facilities well located to serve their customers, but also close to labour pools to staff their facilities. They frequently need larger buildings in central locations, where there is space and power to support automation; and they need smaller buildings close to the end consumer to facilitate the ‘last mile’ of the distribution journey.
WHAT IT MEANS FOR SEGRO?
} Increased demand for modern, well-located warehousing for supply chain efficiency or for resilience in the future.
UrbanisationThe populations of most major European cities are forecast to grow over the next decade leading to ambitious new housing targets being adopted. A growing population leads to increased demand for goods and services and for warehouse space from which to supply them, particularly for ‘last mile’ deliveries.
Land previously used for industrial purposes in and around major towns and cities can also be used for the construction of houses and other types of properties.
As a result land available to meet the need for increased warehouse demand is being eroded and this tends to lead to higher land prices and increased rents for well-located urban industrial properties.
The pandemic has meant that cities such as London and Paris are currently functioning very differently but, in the longer term, we believe they will continue to act as centres of commerce, innovation and culture and therefore attract people to live, work and play in them.
WHAT IT MEANS FOR SEGRO?
} Two-thirds of our portfolio is in urban locations so we are well positioned to benefit from this trend.
} In London, estimated rental values (ERVs) for our urban warehouses increased by 24 per cent in 2021, reflecting the supply-demand imbalance.
} The shortage of land in urban areas is also leading us to innovate to intensify land use, for example, by constructing multi-level buildings.
A look at our market drivers continued
OVERVIEW
Market overview
18 SEGRO PLC | ANNUAL REPORT & ACCOUNTS 2021
02_CEOStatement_MarketOverview_12_21_v74.indd 1802_CEOStatement_MarketOverview_12_21_v74.indd 18 01/03/2022 17:1301/03/2022 17:13

Digitalisation of society (and its impact on consumer behaviour)E-commerce has been on the rise across Europe for a number of years and this has been accelerated by the pandemic, with the majority of our markets now reporting online penetration levels above 10 per cent. Supporting an online or omni-channel retail model requires more and different warehousing than is needed to service a traditional retail store network.
There is also increased demand for data centres to store and process the increased demand for data arising from the growth of e-commerce, the move to cloud computing by businesses and the generation of more and more digital data by businesses and consumers. The pandemic has added to this with more people working from home, using video conferencing and streaming home entertainment content.
We believe these trends will remain in place long after the pandemic has receded and are likely to have been accelerated as a result of it.
WHAT IT MEANS FOR SEGRO?
} Strong occupier demand for our urban warehouses located on the edge of cities to cater for ‘last-mile’ delivery.
} Almost 60 per cent of our lettings in 2021 were to customers linked to e-commerce.
}We have experienced strong demand for data centre space during 2021 and this is likely to continue in 2022. We recently acquired a site adjacent to the Slough Trading Estate to give us further ability to respond to this demand.
Need for efficient, sustainable buildings.With the world around us becoming more environmentally aware there is an increasing focus on the impact of buildings on the environment. Our customers also want to minimise their own carbon footprints and reduce their overall occupancy costs. It is important that landlords and developers own and create buildings that are sustainable in the long-term and that use natural resources efficiently.
WHAT IT MEANS FOR SEGRO?
}Our developments are designed to meet our ambitious environmental targets (see pages 58 and 90).
} A building’s sustainability is an important factor in our investment decisions, not only for potential acquisitions but also for deciding whether to refurbish or dispose of assets.
}We are constantly looking at ways of innovating using new materials and technologies, for example using a CEMIII cement mix in a development in Amsterdam, which created 50 per cent less embodied carbon at no additional cost.
19SEGRO PLC | ANNUAL REPORT & ACCOUNTS 2021
OVERVIEW STRATEGIC REPORT GOVERNANCE FINANCIAL STATEMENTS
02_CEOStatement_MarketOverview_12_21_v74.indd 1902_CEOStatement_MarketOverview_12_21_v74.indd 19 01/03/2022 17:1301/03/2022 17:13

AN EFFECTIVE STRATEGY TO MAXIMISE PERFORMANCE
Our purpose-led, responsible approach to business
We create the space that enables extraordinary things to happen
OUR CULTURE:
We have a strong and unique company culture that permeates through the whole business.
This culture is underpinned by our Values, our core beliefs about how we do business which guide our decision making, large and small. They are the ways in which we work together to make things happen.
OUR VALUES:
OUR PURPOSE, CULTURE AND VALUES
RESPONSIBLE SEGRO
Read more see pages 22 to 23
Championing low-carbon growth
SAY IT LIKE IT IS
STAND SIDE BY SIDE
KEEP ONE EYE ON THE HORIZON
IF THE DOOR IS CLOSED…
DOES IT MAKE THE BOAT GO FASTER?
We recognise that our responsibility goes well beyond the space that we own and we work hard to make a positive contribution to our environment, our customers, our people, our partners and the communities in which we operate.
OUR CULTURE
OU
R P
UR
PO
SERES
PO
NSI
BLE
SEG
RO
EFFICIENT CAPITAL AND CORPORATE STRUCTURE
OUR GOAL
DISCIPLINED CAPITAL ALLOCATION
OPERATIONAL EXCELLENCE
20 SEGRO PLC | ANNUAL REPORT & ACCOUNTS 2021
OVERVIEW
02_CEOStatement_MarketOverview_12_21_v74.indd 2002_CEOStatement_MarketOverview_12_21_v74.indd 20 01/03/2022 17:1301/03/2022 17:13
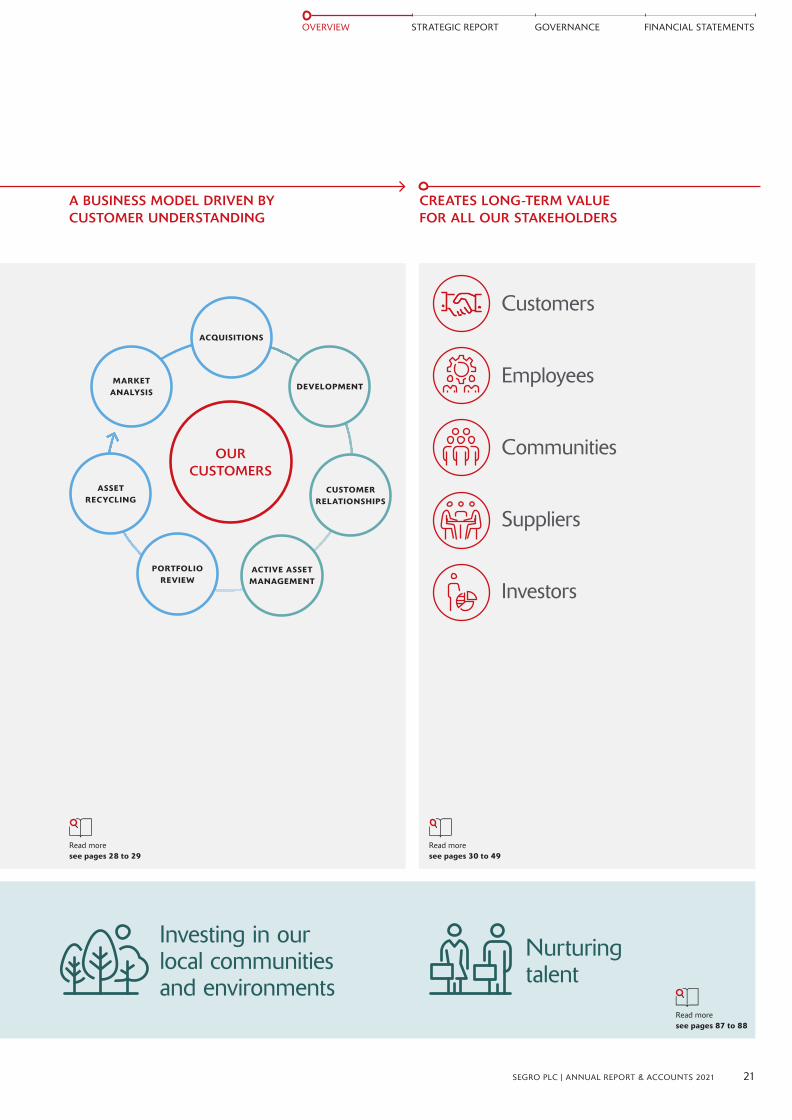
A BUSINESS MODEL DRIVEN BY CUSTOMER UNDERSTANDING
CREATES LONG-TERM VALUE FOR ALL OUR STAKEHOLDERS
Read more see pages 28 to 29
Read moresee pages 30 to 49
OUR CUSTOMERS
DEVELOPMENT
CUSTOMER RELATIONSHIPS
PORTFOLIO REVIEW
ASSET RECYCLING
MARKET ANALYSIS
ACQUISITIONS
ACTIVE ASSET MANAGEMENT
Nurturing talent
Investing in our local communities and environments
Read more see pages 87 to 88
Customers
Employees
Investors
Communities
Suppliers
21SEGRO PLC | ANNUAL REPORT & ACCOUNTS 2021
OVERVIEW STRATEGIC REPORT GOVERNANCE FINANCIAL STATEMENTS
02_CEOStatement_MarketOverview_12_21_v74.indd 2102_CEOStatement_MarketOverview_12_21_v74.indd 21 01/03/2022 17:1301/03/2022 17:13

Our goal is to be the leading owner‑manager and developer of industrial properties in Europe and the partner of choice for our customers and other stakeholders.
Our Strategy Generating attractive, sustainable returns
WE APPLY OUR STRATEGY TO MAXIMISE THE RETURNS FROM OUR BUSINESS
1. OUR GOAL
Our goal is to be the leading owner‑manager and developer of industrial properties in Europe and the partner of choice for our customers and other stakeholders.
2. OPERATIONAL EXCELLENCE
Leveraging our operating platform to optimise performance through dedicated customer service, expert asset management, development and operational efficiency.
3. DISCIPLINED CAPITAL ALLOCATION
Using our in‑depth knowledge of our customers and the trends impacting their businesses, to pick the right markets and assets to create the right portfolio shape, actively manage its composition and adapt our capital deployment according to our assessment of the property cycle.
4. EFFICIENT CAPITAL AND CORPORATE STRUCTURE
We aim to underpin the property level returns from our portfolio with a lean overhead structure, an efficient capital structure and appropriate financial leverage.
For more information on our KPIs see pages 24 to 27
22 SEGRO PLC | ANNUAL REPORT & ACCOUNTS 2021
STRATEGIC REPORT
OUR CULTURE
OU
R PU
RP
OSER
ESP
ON
SIBL
E SE
GRO
EFFICIENT CAPITAL AND CORPORATE STRUCTURE
OUR GOAL
DISCIPLINED CAPITAL ALLOCATION
OPERATIONAL EXCELLENCE
03_OurStrategy_KPIs_BusModel_22_29_v62.indd 2203_OurStrategy_KPIs_BusModel_22_29_v62.indd 22 01/03/2022 17:1401/03/2022 17:14

RESPONSIBLE SEGRO AND THE UNITED SUSTAINABLE DEVELOPMENT GOALS (UNSDGs)
Our Responsible SEGRO framework describes how we do business in the best interests of our stakeholders and the long‑term success of SEGRO. Last year we set new priorities within this that focus in on the key areas where we can make the greatest business, environmental and social contriubtion. We have reviewed this framework against the UNSDGs to understand which are most aligned to our priorities and although elements of our frameworks are aligned with all of the Goals, we believe we can make the greatest contribution to the following six UNSDGs:
CHAMPIONING LOW-CARBON GROWTH
INVESTING IN OUR LOCAL COMMUNITIES AND ENVIRONMENTS
NURTURING TALENT
For more information on Responsible SEGRO and the UNSDGs see pages 87 to 88
A clear strategy that creates shared value for our stakeholders. Our Strategy operates within the context of our Purpose and Values, our culture and our Responsible SEGRO approach to doing business. All these factors influencing both how we operate on a day‑to‑day basis and when making key strategic decisions on how to position our business for the future.
This ensures not only that we manage risk appropriately (for more information on how we manage risk see pages 74 to 83), but it also means that the decisions we make take into account the interests of all relevant parties. It is this that allows us to ‘create the space that enables extraordinary things to happen’ and also ensures that SEGRO is positioned to do so over the longer term.
At the heart of it are the relationships that we build with our customers, helped by the fact that we manage the majority of our portfolio internally and therefore really get to know their businesses. The insights that we gain from the partnerships we build with our customers help us to anticipate long‑term trends and make strategic decisions that shape our portfolio and ensure the continued success of our business.
Our goal is to be the leading owner‑manager and developer of industrial properties in Europe and the partner ‘of choice’ for our customers and other stakeholders. The use of the words ‘of choice’ reflects that we recognise that our customers, employees and other partners have the option to choose whether they work with SEGRO. We need to continuously improve and adapt to stay relevant and ensure that they choose to work with us not only today but also in the future.
At a property level our goal reflects our ambition to create a portfolio of high‑quality industrial properties in the strongest markets – a portfolio that generates attractive, low risk, income‑led returns, providing above average growth (both in terms of rent and capital values) when market conditions are positive, and that proves to be resilient in a downturn.
We seek to enhance returns through development, while ensuring that the short‑term income ‘drag’ associated with holding land does not outweigh the long‑term potential benefits.
Fundamental to our strategy are three key pillars of activity which should combine to deliver the returns that we seek:
} Disciplined Capital Allocation
}Operational Excellence
} Efficient Capital and Corporate Structure.
The combination of these elements should translate into sustainable, attractive returns for our shareholders in the form of progressive dividends and net asset value growth over time. This is in addition to all of the other value that is created in the process of managing and building our portfolio (see pages 30 to 45 for further information).
Our portfolio comprises modern big box and urban warehouses which are well specified and located, with good sustainability credentials, and which should benefit from a low vacancy rate and relatively low‑intensity asset management requirements. Our assets are concentrated in the strongest European submarkets which display attractive property market characteristics, including good growth prospects, limited supply availability and where we already have critical mass, or believe we will be able to achieve it in a reasonable timeframe.
PROGRESS AGAINST OUR STRATEGY
SINCE 2012:
TOTAL ASSETS DISPOSED
£3.9bnTOTAL ASSETS ACQUIRED
£3.7bnDEVELOPMENT CAPEX
£3.4bnTODAY (AS OF 31 DECEMBER 2021):
AUM
£21.3bn(2011: £5.1bn)
PASSING RENT
£518m(2011: £333.5m)
VACANCY
3.2%(2011: 9.1%)
LTV
23%(2011: 50%)
COST OF DEBT
1.5%(2011: 4.6%)
OVERVIEW STRATEGIC REPORT GOVERNANCE FINANCIAL STATEMENTS
23SEGRO PLC | ANNUAL REPORT & ACCOUNTS 2021
03_OurStrategy_KPIs_BusModel_22_29_v62.indd 2303_OurStrategy_KPIs_BusModel_22_29_v62.indd 23 01/03/2022 17:1401/03/2022 17:14

Key performance indicatorsFinancial
We measure our success by tracking Key Performance Indicators (KPIs) that reflect our strategic, operational and financial progress and performance. They drive the internal management of the business and some are used to determine how management and employees are remunerated.
During 2021 we have reviewed our KPIs to ensure that they are the most relevant metrics for our business given our current priorities and goals. The result of this review is that we have reduced our financial KPIs to six measures and introduced six new non‑financial performance indicators (see pages 26‑27) that align with our Responsible SEGRO commitments. We believe these 12 KPIs reflect our priorities of creating shared value for our stakeholders and ensuring the longer‑term success of our business.
Within the financial KPIs we have replaced Adjusted NAV with Total Accounting Return and removed the EPRA vacancy rate and Total Cost Ratio.
We will continue to monitor and report on these metrics but believe that at present they are not the most important measures of the success of our business for the following reasons:
} Adjusted NAV is a static measure whereas Total Accounting Return tracks the return on capital which we believe is more relevant and is also used in determining remuneration.
} Vacancy rates are at record lows for both SEGRO (see page 54) and the wider industrial market and we are now prioritising managing our portfolio for rental growth and future opportunity versus reducing vacancy.
} Total cost ratio (see page 71) focuses on the ratio of costs to current rental income but doesn’t capture the future growth that we are looking to deliver and the investment this requires in our operating platform and landbank.
All of our Financial KPIs are based on proportionally consolidated metrics incorporating our share of joint ventures.
1 The TPR has been calculated independently by MSCI Real Estate in order to provide a consistent comparison with an appropriate MSCI benchmark. It is calculated as the change in capital value, less any capital expenditure incurred, plus net income, expressed as a percentage of capital employed over the period concerned for standing investments held throughout the year, excluding land.
OUR STRATEGY
Read more about how we are delivering on our strategy: Our strategy pages 22-23
RISK MANAGEMENT
We recognise that the management of risk has a role to play in the achievement of our strategy and KPIs. Risks can hinder or help us meet our desired level of performance.
The relationship between our principal risks and our KPIs is identified in the Principal Risks on pages 78-83
TOTAL SHAREHOLDER RETURN(% TSR)
TOTAL PROPERTY RETURN(% TPR)1
55%
33.7%
What it is: TSR measures the change in our share price over the year assuming that dividends paid are reinvested. This KPI reflects our commitment to delivering enhanced returns for our shareholders through the execution of our strategy over the medium term. TSR is a key metric used in setting the long‑term incentive plan remuneration for both the Executive Directors and senior managers.
Our performance: The TSR of the Group was 55.1 per cent, compared with 29.9 per cent for the FTSE 350 Real Estate index. This performance reflects a combination of the 22.6 pence dividend (15.2 pence 2020 final dividend and 7.4 pence 2021 interim dividend) paid during the year and an increase in the share price from 947.6 pence at 31 December 2020 to 1,436.5 pence at 31 December 2021.
What it is: TPR is the ungeared combined income and capital return from our portfolio of standing investments held throughout the year. It is an important measure of the success of our strategy in terms of asset selection and management. MSCI Real Estate prepares the calculation, as well as providing benchmark TPR data for similar properties in their wider universe. We aim to outperform the benchmark over the long term. Details on how TPR impacts short‑ and long‑term incentives are provided on pages 140 to 155.
Our performance: The TPR of the Group’s standing assets held throughout 2021 was 33.7 per cent (2020: 14.0 per cent). The UK portfolio generated a TPR of 39.1 per cent, performing ahead of the benchmark calculated by MSCI Real Estate UK All Industrial Quarterly of 36.4 per cent. The TPR of our Continental Europe portfolio was 24.0 per cent. Benchmark data for Continental Europe will be received later in the year.
2021
2020
2019
2018
2017
55.0%
8.7%
56.8%
3.1%
38.7%
2021
2020
2019
2018
2017
33.7%
14.0%
10.5%
15.4%
18.9%
24 SEGRO PLC | ANNUAL REPORT & ACCOUNTS 2021
STRATEGIC REPORT
03_OurStrategy_KPIs_BusModel_22_29_v62.indd 2403_OurStrategy_KPIs_BusModel_22_29_v62.indd 24 01/03/2022 17:1401/03/2022 17:14

EFFICIENT CAPITAL AND CORPORATE STRUCTURE
ITEMS ARE DIRECTLY CAPTURED IN SEGRO’S INCENTIVE SCHEMES
DISCIPLINED CAPITAL ALLOCATION
OPERATIONAL EXCELLENCE
TOTAL ACCOUNTING RETURN(%)
ADJUSTED EPS(PENCE)
RENT ROLL GROWTH(£)
LOAN TO VALUE(% INCLUDING JOINT VENTURES AT SHARE)
43%
29.1p
£72m
23%
What it is: TAR is the growth in Adjusted NAV per share plus dividends paid, expressed as a percentage of Adjusted NAV per share at 31 December 2020. It measures the return on capital and is a key metric used in setting the long‑term incentive plan remuneration for both the Executive Directors and senior managers.
Our performance: The TAR for the Group was 42.5 per cent (2020: 19.3 per cent). This performance reflects a combination of the 323 pence increase in Adjusted NAV from 814 pence at December 2020 to 1,137 pence at 31 December 2021 and the 22.6 pence dividend (15.2 pence 2020 final dividend and 7.4 pence 2021 interim dividend) paid during the year.
What it is: Our headline Adjusted earnings per share (EPS) reflects earnings from our operating business: rental income less operating, administrative and financing costs and tax. It is the primary determinant of the level of the annual dividend. IFRS EPS includes the impact of realised and unrealised changes in the valuation of our assets which can often mask the underlying operating performance. The reconciliation between Basic EPS and Adjusted EPS can be found in Note 12(i) on page 194.
Our performance: Adjusted EPS increased by 14.6 per cent to 29.1 pence during the year, reflecting higher rental income from our standing assets, new income from acquisitions and developments, and a 1.1p contribution from a performance fee received from our SELP joint venture.
What it is: The headline annualised rent contracted during the year less income lost from takebacks. There are two elements: to grow income from our standing assets by reducing vacancy and increasing rents from lease renewals and rent reviews; and to generate new rent by developing buildings either on a pre‑let or speculative basis. Rent from new acquisitions is not included.
Our performance: In total, we generated £72 million of net new annualised rent during the year (2020: £60 million). The increase was driven by higher rents on review and renewal in the UK and by the increased volume of rent from development completions and pre‑let agreements secured during the year.
What it is: The proportion of our property assets (including investment, owner‑occupier and trading properties at carrying value and our share of properties in joint ventures and excludes head lease ROU asset) that are funded by borrowings. At this stage in the cycle, and based on our investment plans, we aim to maintain our LTV at around 30 per cent for the foreseeable future. We believe that REITs with lower leverage offer a lower risk and less volatile investment proposition for shareholders.
Our performance: The Group’s LTV ratio was slightly lower at 23 per cent, despite £1.5 billion of net investment in our business during 2021. This was mostly due to the unrealised gain on the value of our portfolio. The timing of investment decisions and disposals, as well as movement in the value of our assets may cause the LTV to fluctuate.
2021
2020
2019
2018
2017
23%
24%
24%
29%
30%
2021
2020
2019
2018
2017
72.0m
60.1m
54.5m
53.5m
41.5m
2021
2020
2019
2018
2017
29.1p
25.4p
24.4p
23.4p
19.9p
2021
2020
2019
2018
2017
43%
19%
11%
20%
20%
25SEGRO PLC | ANNUAL REPORT & ACCOUNTS 2021
OVERVIEW STRATEGIC REPORT GOVERNANCE FINANCIAL STATEMENTS
03_OurStrategy_KPIs_BusModel_22_29_v62.indd 2503_OurStrategy_KPIs_BusModel_22_29_v62.indd 25 01/03/2022 17:1401/03/2022 17:14

Key performance indicatorsNon‑financial
Our non‑financial KPIs help us to measure the shared value that our business creates and to ensure that our business is positioned for long‑term success.
In establishing our non‑financial KPIs we continue to measure customer satisfaction and have aligned the remainder with the focus areas of our Responsible SEGRO framework: Championing low‑carbon growth, Investing in our local communities and environments and Nurturing Talent. We have identified KPIs that reflect our progress in each of these areas.
Given where we are in our journey towards these goals we anticipate that our non‑financial KPIs will adapt as we progress towards our stated ambitions. For example, we are starting with visibility of customer energy use as a KPI. This is important in correctly determining the carbon emissions from our properties and visibility has been low historically due to the terms of our leases. We are therefore working proactively with our customers to access the data. Once this visibility has been improved we will review the continued need for this to be a KPI.
We will explain any changes to our non‑financial KPIs as and when we decide that it is appropriate to progress them. Some of these metrics are also used to determine how management and employees are remunerated.
RESPONSIBLE SEGRO COMMITMENTS
Read more about our Responsible SEGRO priorities on pages 87-88
CUSTOMER SATISFACTION(%)
EMPLOYEE ENGAGEMENT
90%
94%
What it is: The percentage of our customers who rate their experience as occupiers of our buildings as ‘good’ or ‘excellent’ as opposed to ‘poor’ or ‘average’. Our customers are at the heart of our business and we strive to ensure that we are providing the best level of service possible to maximise customer retention.
Our performance: Satisfaction as an occupier of our buildings was rated as ‘good’ or ‘excellent’ by 90 per cent of the 247 customers who participated in the 2021 survey (2020: 87 per cent). The continued high satisfaction rate reflects our focus on communication, being responsive and understanding the needs of our customers and we intend to target similarly high levels in the future. 97 per cent of our customers said that they would recommend SEGRO to others.
What it is: We carry out an employee engagement survey every two years which asks all employees to comment on various aspects of their work at SEGRO and the results of this are shared with the Board and Leadership team. The result given here is for the 2020 survey but in future, we will be carrying out the survey annually. In 2020 we also asked employees a question that focused on Diversity & Inclusion and the result of this will be integrated into remuneration from 2022.
Our performance: Our 2020 employee engagement score was a record 94 per cent and 97 per cent of employees said that they are proud to work at SEGRO and care about the future of the Company. 95 per cent of employees felt that SEGRO respects individual differences.
2021
2020
2019
2018
2017
90%
87%
88%
80%
87%
2021
2020
2019
2018
2017
94%
92%
26 SEGRO PLC | ANNUAL REPORT & ACCOUNTS 2021
STRATEGIC REPORT
03_OurStrategy_KPIs_BusModel_22_29_v62.indd 2603_OurStrategy_KPIs_BusModel_22_29_v62.indd 26 01/03/2022 17:1401/03/2022 17:14
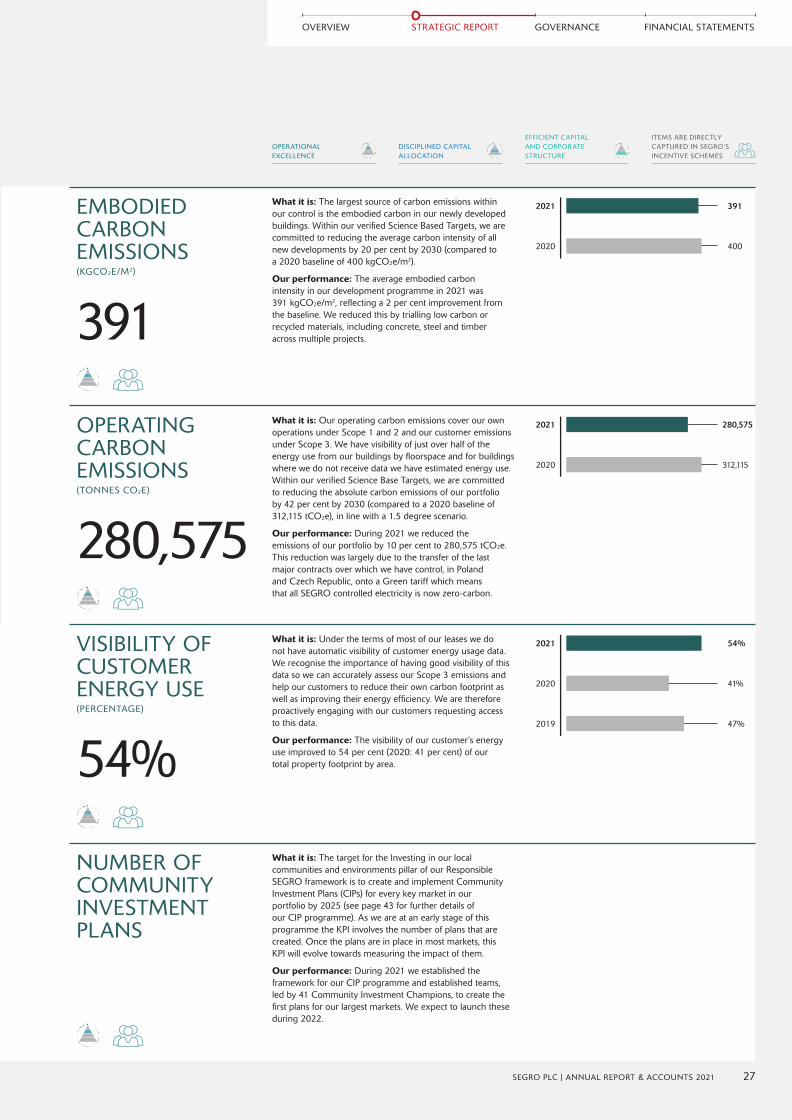
EMBODIED CARBON EMISSIONS(KGCO2E/M2)
OPERATING CARBON EMISSIONS(TONNES CO2E)
VISIBILITY OF CUSTOMER ENERGY USE(PERCENTAGE)
NUMBER OF COMMUNITY INVESTMENT PLANS
391
280,575
54%
What it is: The largest source of carbon emissions within our control is the embodied carbon in our newly developed buildings. Within our verified Science Based Targets, we are committed to reducing the average carbon intensity of all new developments by 20 per cent by 2030 (compared to a 2020 baseline of 400 kgCO2e/m2).
Our performance: The average embodied carbon intensity in our development programme in 2021 was 391 kgCO2e/m2, reflecting a 2 per cent improvement from the baseline. We reduced this by trialling low carbon or recycled materials, including concrete, steel and timber across multiple projects.
What it is: Our operating carbon emissions cover our own operations under Scope 1 and 2 and our customer emissions under Scope 3. We have visibility of just over half of the energy use from our buildings by floorspace and for buildings where we do not receive data we have estimated energy use. Within our verified Science Base Targets, we are committed to reducing the absolute carbon emissions of our portfolio by 42 per cent by 2030 (compared to a 2020 baseline of 312,115 tCO2e), in line with a 1.5 degree scenario.
Our performance: During 2021 we reduced the emissions of our portfolio by 10 per cent to 280,575 tCO2e. This reduction was largely due to the transfer of the last major contracts over which we have control, in Poland and Czech Republic, onto a Green tariff which means that all SEGRO controlled electricity is now zero‑carbon.
What it is: Under the terms of most of our leases we do not have automatic visibility of customer energy usage data. We recognise the importance of having good visibility of this data so we can accurately assess our Scope 3 emissions and help our customers to reduce their own carbon footprint as well as improving their energy efficiency. We are therefore proactively engaging with our customers requesting access to this data.
Our performance: The visibility of our customer’s energy use improved to 54 per cent (2020: 41 per cent) of our total property footprint by area.
What it is: The target for the Investing in our local communities and environments pillar of our Responsible SEGRO framework is to create and implement Community Investment Plans (CIPs) for every key market in our portfolio by 2025 (see page 43 for further details of our CIP programme). As we are at an early stage of this programme the KPI involves the number of plans that are created. Once the plans are in place in most markets, this KPI will evolve towards measuring the impact of them.
Our performance: During 2021 we established the framework for our CIP programme and established teams, led by 41 Community Investment Champions, to create the first plans for our largest markets. We expect to launch these during 2022.
2021
2020
2019
54%
41%
47%
2021
2020
280,575
312,115
2021
2020
391
400
EFFICIENT CAPITAL AND CORPORATE STRUCTURE
ITEMS ARE DIRECTLY CAPTURED IN SEGRO’S INCENTIVE SCHEMES
DISCIPLINED CAPITAL ALLOCATION
OPERATIONAL EXCELLENCE
27SEGRO PLC | ANNUAL REPORT & ACCOUNTS 2021
OVERVIEW STRATEGIC REPORT GOVERNANCE FINANCIAL STATEMENTS
03_OurStrategy_KPIs_BusModel_22_29_v62.indd 2703_OurStrategy_KPIs_BusModel_22_29_v62.indd 27 01/03/2022 17:1401/03/2022 17:14
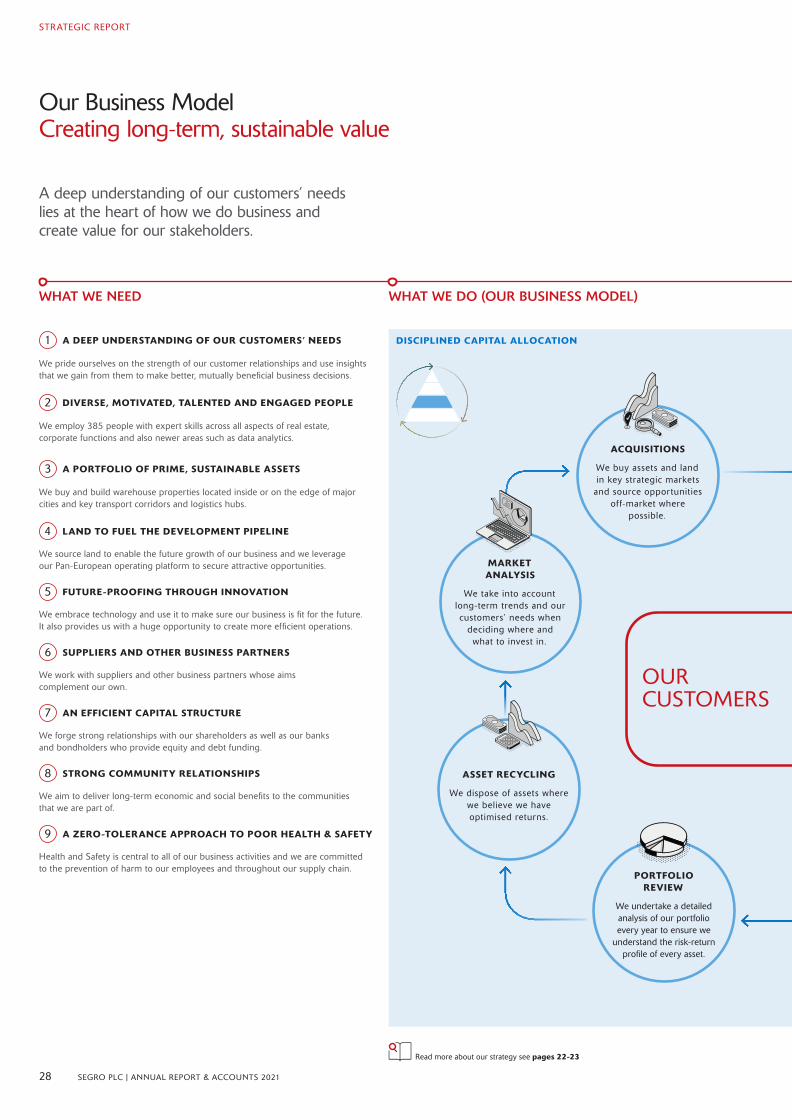
Our Business Model Creating long‑term, sustainable value
A deep understanding of our customers’ needs lies at the heart of how we do business and create value for our stakeholders.
WHAT WE DO (OUR BUSINESS MODEL)WHAT WE NEED
1 A DEEP UNDERSTANDING OF OUR CUSTOMERS’ NEEDS
We pride ourselves on the strength of our customer relationships and use insights that we gain from them to make better, mutually beneficial business decisions.
2 DIVERSE, MOTIVATED, TALENTED AND ENGAGED PEOPLE
We employ 385 people with expert skills across all aspects of real estate, corporate functions and also newer areas such as data analytics.
3 A PORTFOLIO OF PRIME, SUSTAINABLE ASSETS
We buy and build warehouse properties located inside or on the edge of major cities and key transport corridors and logistics hubs.
4 LAND TO FUEL THE DEVELOPMENT PIPELINE
We source land to enable the future growth of our business and we leverage our Pan‑European operating platform to secure attractive opportunities.
5 FUTURE-PROOFING THROUGH INNOVATION
We embrace technology and use it to make sure our business is fit for the future. It also provides us with a huge opportunity to create more efficient operations.
6 SUPPLIERS AND OTHER BUSINESS PARTNERS
We work with suppliers and other business partners whose aims complement our own.
7 AN EFFICIENT CAPITAL STRUCTURE
We forge strong relationships with our shareholders as well as our banks and bondholders who provide equity and debt funding.
8 STRONG COMMUNITY RELATIONSHIPS
We aim to deliver long‑term economic and social benefits to the communities that we are part of.
9 A ZERO-TOLERANCE APPROACH TO POOR HEALTH & SAFETY
Health and Safety is central to all of our business activities and we are committed to the prevention of harm to our employees and throughout our supply chain.
DISCIPLINED CAPITAL ALLOCATION
28 SEGRO PLC | ANNUAL REPORT & ACCOUNTS 2021
STRATEGIC REPORT
OUR CUSTOMERS
MARKET ANALYSIS
We take into account long‑term trends and our customers’ needs when
deciding where and what to invest in.
ASSET RECYCLING
We dispose of assets where we believe we have optimised returns.
PORTFOLIO
REVIEW
We undertake a detailed analysis of our portfolio every year to ensure we
understand the risk‑return profile of every asset.
ACQUISITIONS
We buy assets and land in key strategic markets
and source opportunities off‑market where
possible.
Read more about our strategy see pages 22-23
03_OurStrategy_KPIs_BusModel_22_29_v62.indd 2803_OurStrategy_KPIs_BusModel_22_29_v62.indd 28 01/03/2022 17:1401/03/2022 17:14
OUR CULTURE
OU
R P
UR
PO
SERE
SPO
NSI
BLE
SEG
RO
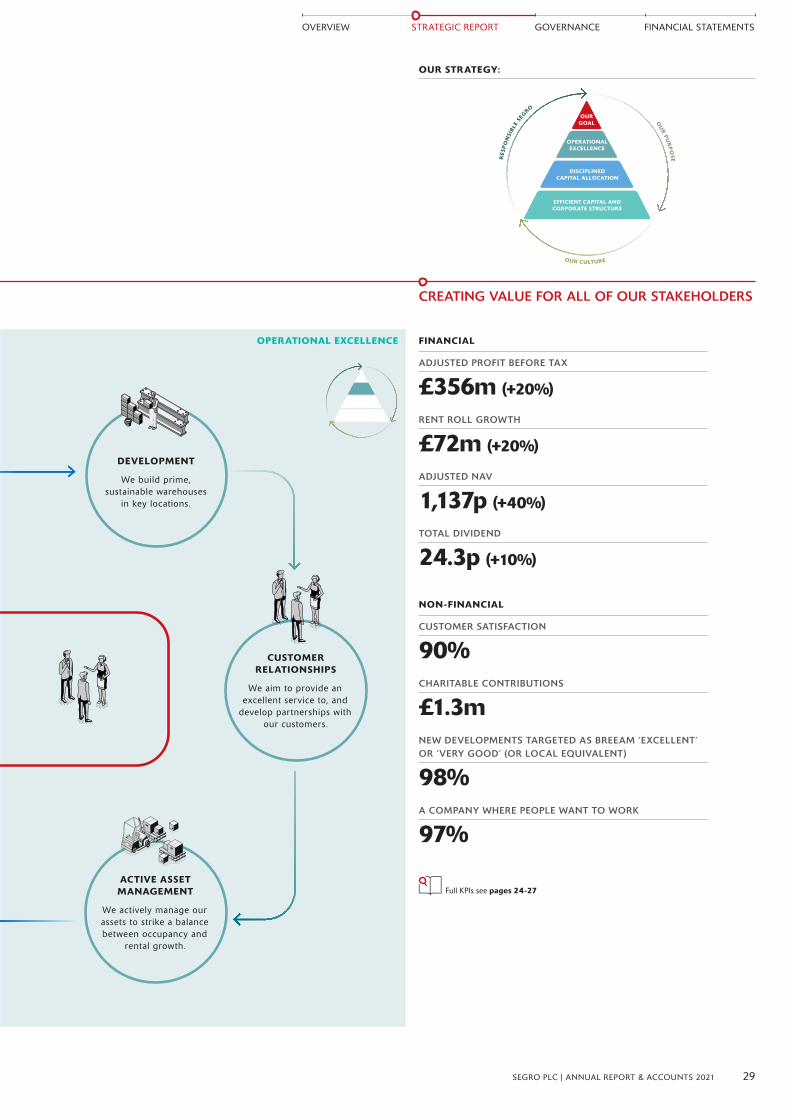
WHAT WE DO (OUR BUSINESS MODEL)
FINANCIAL
ADJUSTED PROFIT BEFORE TAX
£356m (+20%)
RENT ROLL GROWTH
£72m (+20%)
ADJUSTED NAV
1,137p (+40%)
TOTAL DIVIDEND
24.3p (+10%)
NON-FINANCIAL
CUSTOMER SATISFACTION
90%CHARITABLE CONTRIBUTIONS
£1.3mNEW DEVELOPMENTS TARGETED AS BREEAM ‘EXCELLENT’ OR ‘VERY GOOD’ (OR LOCAL EQUIVALENT)
98%A COMPANY WHERE PEOPLE WANT TO WORK
97%
Full KPIs see pages 24-27
CREATING VALUE FOR ALL OF OUR STAKEHOLDERS
OPERATIONAL EXCELLENCE
OUR STRATEGY:
29SEGRO PLC | ANNUAL REPORT & ACCOUNTS 2021
OVERVIEW STRATEGIC REPORT GOVERNANCE FINANCIAL STATEMENTS
ACTIVE ASSET MANAGEMENT
We actively manage our assets to strike a balance between occupancy and
rental growth.
DEVELOPMENT
We build prime, sustainable warehouses
in key locations.
CUSTOMER RELATIONSHIPS
We aim to provide an excellent service to, and
develop partnerships with our customers.
EFFICIENT CAPITAL AND CORPORATE STRUCTURE
OUR GOAL
OPERATIONAL EXCELLENCE
DISCIPLINED CAPITAL ALLOCATION
03_OurStrategy_KPIs_BusModel_22_29_v62.indd 2903_OurStrategy_KPIs_BusModel_22_29_v62.indd 29 01/03/2022 17:1401/03/2022 17:14

Relationships & Resources What we need to create the space that enables extraordinary things to happen
Understanding our customers’ needs and changing requirements is central to our business. Our knowledge of our customers’ businesses helps to shape our decisions on where and what to invest in, so it is at the heart of how we actively manage our portfolio.
We recognise that building and maintaining strong and meaningful relationships with our customers is essential and we look to work in partnership with all of our customers – from small, owner-managed start-ups to global businesses. By understanding their differing priorities and challenges we are able to offer tailored and creative solutions to their real estate requirements. This can include offering additional, larger or smaller premises to align with their own growth aspirations but also often involves going beyond simple real estate transactions.
In 2021, our e-commerce customers continued to experience a surge in business fuelled by the growing habits of internet retailing associated with increased home working and reduced travel to traditional retail locations. We worked closely with these businesses to help provide space for this growing demand.
We also witnessed the emergence of new growth customers from the pandemic, including Q-commerce businesses (rapid grocery delivery companies) in urban areas, and creative industries, such as film production companies, requiring space for filming studios to satisfy the increasing demand for streaming film and TV content.
The demand for data centre space continued to be strong in 2021 linked to the increased use of the internet and the requirement for ‘cloud’ based technology.
To help us understand the changing requirements and strategies of both our existing and new customers, we seek to build close relationships with them. Our dedicated cross-border customer account teams have grown in 2021 and meet regularly to enable us to offer a streamlined approach and offering across SEGRO to our customers. Where possible, we look to partner with our key customers on mutually important areas such as green initiatives and Health and Safety.
Many of our customers share with SEGRO an environmental sustainability strategy as a key focus of their business. To help assist our customers achieve their own Sustainability targets, from 2022 our new standard for developments over 5,000 sq m is BREEAM ‘Excellent’ and where possible we look to include solar panels and LED lighting as part of their base design. We are also working with customers across the business to install smart sensors into their buildings to help them better understand their building performance and reduce energy consumption.
We have a number of customer tools to assist in our customer knowledge, including our Customer App that provides important data and updates about customers, which is easily accessed via our mobile devices. In 2021 we have also added a section on customer news, that provides a daily round up of news gathered from across the internet that helps keep us up to date with our customers and their sectors.
In 2022, our Customer Futures Forum will take place bringing together and involving many of our strategic key customers, looking at providing thought leadership and sharing views on important topics and surfacing trends facing their industries and property that may have significant impact in the coming years.
We continue to carry out our customer satisfaction surveys and in 2021, despite the challenges provided by the pandemic, the results demonstrated we continue to be regarded highly by our customers with overall satisfaction increasing by 3 per cent to 90 per cent and customers willing to recommend SEGRO at 97 per cent.
By working closely with our customers to understand their needs and issues, we aim to provide a first class consistent service and real estate solutions long into the future. We also hope that this approach will continue to encourage customer loyalty and help us to generate new business.
HIGHLIGHTS
NUMBER OF CUSTOMERS
1,4712020: 1,383
CUSTOMERS WHO WOULD RECOMMEND SEGRO TO OTHERS
97%2020: 99%
CUSTOMER RETENTION RATE
77%2020: 86%
1 A DEEP UNDERSTANDING OF OUR CUSTOMERS’ NEEDS
We recognise that building and maintaining strong and meaningful relationships with our customers is essential and we look to work in partnership with all our customers.ANDY GULLIFORDCHIEF OPERATING OFFICER
30 SEGRO PLC | ANNUAL REPORT & ACCOUNTS 2021
STRATEGIC REPORT
04_Relationships_Resources_30_45_v110.indd 3004_Relationships_Resources_30_45_v110.indd 30 01/03/2022 17:1501/03/2022 17:15

CASE STUDY:
RD CONTENT
In November 2021, we welcomed RD Content to our net-zero carbon refurbishment at Premier Park, London.
Features of the building include a moss wall in the impressive reception, multiple EV charging points as well as photovoltaic panels on the roof, making the building carbon neutral. The building also includes facilities for rainwater harvesting, sensor activated LED lighting and air-sourced heat pumps to reduce energy consumption as well as occupancy costs.
SEGRO assisted RD Content with a power upgrade to the building and we continue to work in partnership with the company by introducing them to other creative industries customers within the SEGRO portfolio, as well as other customers at Premier Park.
The global video production agency intends to make RD Studios the most sustainable film studio development in London, using pioneering technology to help the world’s biggest brands use the latest platforms to market their products. The building will also help RD Content continue to grow as the company hopes to sublet some of the studio space to film and TV content providers.
Ryan Dean, Founder, RD Studios, said:
“We were delighted to partner with SEGRO at Premier Park and to be bringing to the market a truly world-class facility, that has sustainability at its core. The SEGRO team understand our business and have continued to work with us to ensure we achieve our goals.”
31SEGRO PLC | ANNUAL REPORT & ACCOUNTS 2021
OVERVIEW STRATEGIC REPORT GOVERNANCE FINANCIAL STATEMENTS
04_Relationships_Resources_30_45_v110.indd 3104_Relationships_Resources_30_45_v110.indd 31 01/03/2022 17:1501/03/2022 17:15
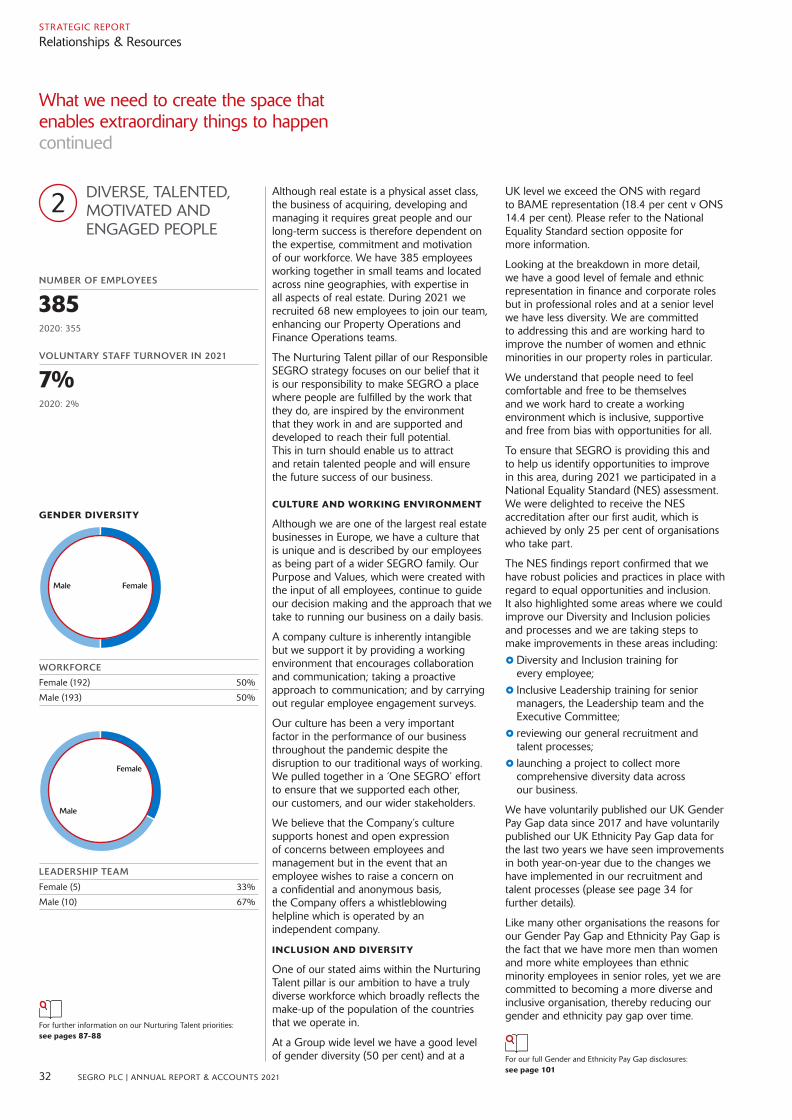
What we need to create the space that enables extraordinary things to happen continued
Although real estate is a physical asset class, the business of acquiring, developing and managing it requires great people and our long-term success is therefore dependent on the expertise, commitment and motivation of our workforce. We have 385 employees working together in small teams and located across nine geographies, with expertise in all aspects of real estate. During 2021 we recruited 68 new employees to join our team, enhancing our Property Operations and Finance Operations teams.
The Nurturing Talent pillar of our Responsible SEGRO strategy focuses on our belief that it is our responsibility to make SEGRO a place where people are fulfilled by the work that they do, are inspired by the environment that they work in and are supported and developed to reach their full potential. This in turn should enable us to attract and retain talented people and will ensure the future success of our business.
CULTURE AND WORKING ENVIRONMENT
Although we are one of the largest real estate businesses in Europe, we have a culture that is unique and is described by our employees as being part of a wider SEGRO family. Our Purpose and Values, which were created with the input of all employees, continue to guide our decision making and the approach that we take to running our business on a daily basis.
A company culture is inherently intangible but we support it by providing a working environment that encourages collaboration and communication; taking a proactive approach to communication; and by carrying out regular employee engagement surveys.
Our culture has been a very important factor in the performance of our business throughout the pandemic despite the disruption to our traditional ways of working.We pulled together in a ‘One SEGRO’ effort to ensure that we supported each other, our customers, and our wider stakeholders.
We believe that the Company’s culture supports honest and open expression of concerns between employees and management but in the event that an employee wishes to raise a concern on a confidential and anonymous basis, the Company offers a whistleblowing helpline which is operated by an independent company.
INCLUSION AND DIVERSITY
One of our stated aims within the Nurturing Talent pillar is our ambition to have a truly diverse workforce which broadly reflects the make-up of the population of the countries that we operate in.
At a Group wide level we have a good level of gender diversity (50 per cent) and at a
UK level we exceed the ONS with regard to BAME representation (18.4 per cent v ONS 14.4 per cent). Please refer to the National Equality Standard section opposite for more information.
Looking at the breakdown in more detail, we have a good level of female and ethnic representation in finance and corporate roles but in professional roles and at a senior level we have less diversity. We are committed to addressing this and are working hard to improve the number of women and ethnic minorities in our property roles in particular.
We understand that people need to feel comfortable and free to be themselves and we work hard to create a working environment which is inclusive, supportive and free from bias with opportunities for all.
To ensure that SEGRO is providing this and to help us identify opportunities to improve in this area, during 2021 we participated in a National Equality Standard (NES) assessment. We were delighted to receive the NES accreditation after our first audit, which is achieved by only 25 per cent of organisations who take part.
The NES findings report confirmed that we have robust policies and practices in place with regard to equal opportunities and inclusion. It also highlighted some areas where we could improve our Diversity and Inclusion policies and processes and we are taking steps to make improvements in these areas including:
} Diversity and Inclusion training for every employee; } Inclusive Leadership training for senior managers, the Leadership team and the Executive Committee; } reviewing our general recruitment and talent processes; } launching a project to collect more comprehensive diversity data across our business.
We have voluntarily published our UK Gender Pay Gap data since 2017 and have voluntarily published our UK Ethnicity Pay Gap data for the last two years we have seen improvements in both year-on-year due to the changes we have implemented in our recruitment and talent processes (please see page 34 for further details).
Like many other organisations the reasons for our Gender Pay Gap and Ethnicity Pay Gap is the fact that we have more men than women and more white employees than ethnic minority employees in senior roles, yet we are committed to becoming a more diverse and inclusive organisation, thereby reducing our gender and ethnicity pay gap over time.
NUMBER OF EMPLOYEES
3852020: 355
VOLUNTARY STAFF TURNOVER IN 2021
7%2020: 2%
For further information on our Nurturing Talent priorities:see pages 87-88
For our full Gender and Ethnicity Pay Gap disclosures:see page 101
2 DIVERSE, TALENTED, MOTIVATED AND ENGAGED PEOPLE
WORKFORCE
Female (192) 50%
Male (193) 50%
GENDER DIVERSITY
FemaleMale
LEADERSHIP TEAM
Female (5) 33%
Male (10) 67%
Male
Female
STRATEGIC REPORT
Relationships & Resources
32 SEGRO PLC | ANNUAL REPORT & ACCOUNTS 2021
04_Relationships_Resources_30_45_v110.indd 3204_Relationships_Resources_30_45_v110.indd 32 01/03/2022 17:1501/03/2022 17:15

NATIONAL EQUALITY STANDARD ASSESSMENT
During 2021 we engaged with Ernst & Young (E&Y) to assess our culture, our processes and practices against the National Equality Standard, the only nationally recognised Equality and Diversity standard which has been recognised by the UK Government and the CBI. Over 140 documents and data points were reviewed by E&Y and in addition, they interviewed and surveyed a significant proportion of employees.
We were delighted to achieve the NES accreditation at our first attempt, which is achieved by only 25 per cent of organisations who are assessed. The NES findings report confirmed that we have robust policies and practices in place with regard to equal opportunities and inclusion. This includes appropriate support, retraining and facilities for employees who are disabled or who become disabled whilst in our employment.
As a result of the recommendations made in the report we are making the following changes to our Diversity and Inclusion policies and processes:
Data collection and reporting: Having a base line of diversity data across the business is important when focusing our actions and monitoring and reporting our progress against our ambition to be a truly diverse and inclusive organisation. In the UK we have a full set of diversity data and are able to compare our ethnicity diversity against the UK average, against which we compare favourably (see table below). By contrast, in Continental Europe, we have significant gaps in our data, mainly due to the different legislation across Europe which limits the amount and type of diversity statistics that can be collected. In 2022 we will be launching a project aimed at collecting more comprehensive diversity data in Continental Europe. We believe that analysing diversity data and being transparent is an important step towards creating meaningful change.
Training: We know that the foundations for a more inclusive and diverse business starts with ensuring that everyone in SEGRO understands why it is important to our future success, can appreciate the barriers that exist to diversity and can understand the steps we can take to remove these barriers from our everyday working lives. To this end, we embarked on a series of Inclusive Leadership training modules for our senior managers, Leadership team (direct reports to the Executive Committees) and members of the Executive Committee themselves. We also developed a series of online Diversity and Inclusion training modules which all employees in SEGRO have completed and are now compulsory for new employees who join us. In addition to this specialist training, we are also scoping general management training modules for our middle management group which will be launched in 2022.
Recruitment and talent processes: We know that to achieve our ambition to be a more diverse business, we need to ensure that our talent and recruitment processes are free from bias and that we broaden our thinking to ensure we are recognising future potential (which widens the pool of employees) rather than only focusing on previous experience. With regard to recruitment, we have reviewed the agencies that we use and our agreements with them, our recruitment tools and methods and how we scope role profiles and the language we use. This year, in addition to reviewing our general recruitment and talent processes, we have completely changed how we scoped and managed our graduate recruitment process (see page 34).
In order to effectively communicate the outturns from the NES assessment, we developed an engagement plan, with one of the new communication channels – our SEGRO ‘Sofa Series’ – being launched for the first time with the NES findings.
During the live video call with employees, the CEO and Group Human Resources Director were ’on the sofa’ whilst employees voted in real time for the questions they most wanted to be answered (with the questions being put forward by employees).
We communicated with employees regularly during the course of the year and used the Sofa Series as an opportunity to share updates on our plans, for example, we invited Arun Batra, the CEO of the NES, to join us as one of our guests ‘on the sofa’ to share his compelling story about his experience of diversity and inclusion from an early age through to his journey to becoming a Partner at E&Y.
ALL UK SEGRO ETHNICITY vs OFFICE FOR NATIONAL STATISTICSUK Total October 2021
SEGRO %
Office for National Statistics %
White 81.7% 85.6%
Asian (Asian other/Indian/Chinese/Pakistan) 12.9% 8.1%
Black (African/Caribbean/Other) 2.5% 3.4%
Mixed 1.5% 1.8%
Other 1.5% 1.1%
Total 100% 100%
33SEGRO PLC | ANNUAL REPORT & ACCOUNTS 2021
OVERVIEW STRATEGIC REPORT GOVERNANCE FINANCIAL STATEMENTS
04_Relationships_Resources_30_45_v110.indd 3304_Relationships_Resources_30_45_v110.indd 33 01/03/2022 17:1501/03/2022 17:15
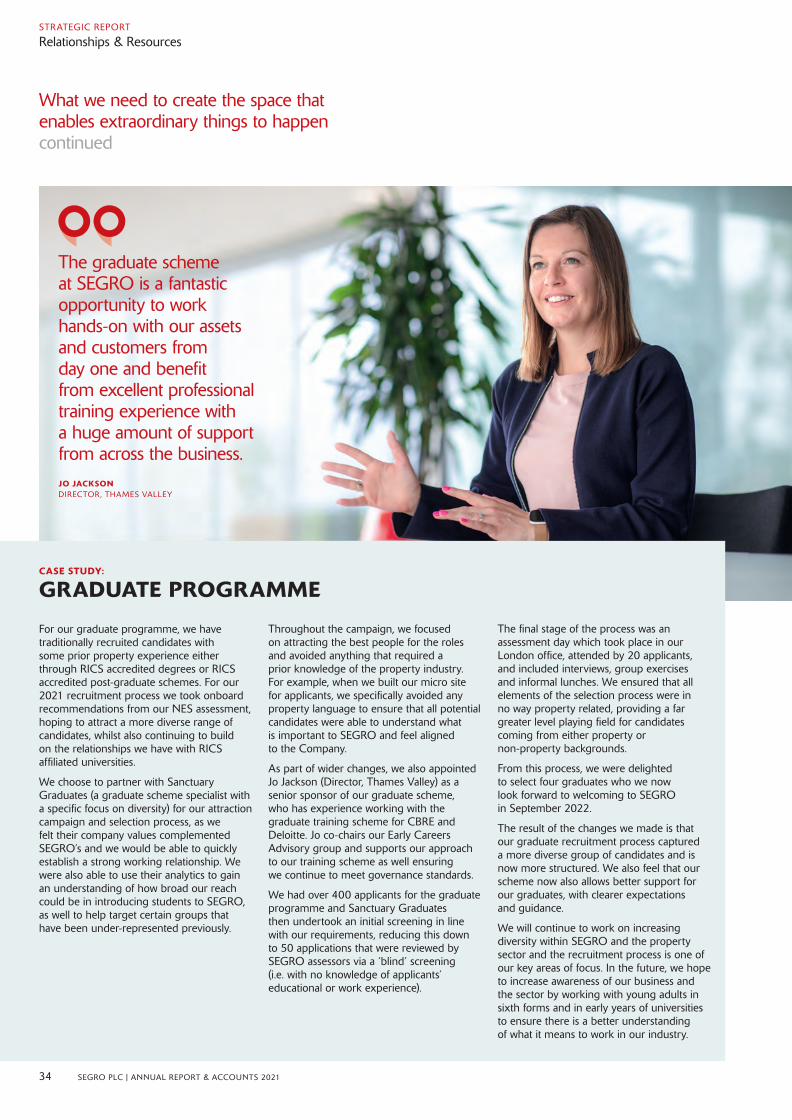
The graduate scheme at SEGRO is a fantastic opportunity to work hands-on with our assets and customers from day one and benefit from excellent professional training experience with a huge amount of support from across the business.JO JACKSONDIRECTOR, THAMES VALLEY
CASE STUDY:
GRADUATE PROGRAMME
For our graduate programme, we have traditionally recruited candidates with some prior property experience either through RICS accredited degrees or RICS accredited post-graduate schemes. For our 2021 recruitment process we took onboard recommendations from our NES assessment, hoping to attract a more diverse range of candidates, whilst also continuing to build on the relationships we have with RICS affiliated universities.
We choose to partner with Sanctuary Graduates (a graduate scheme specialist with a specific focus on diversity) for our attraction campaign and selection process, as we felt their company values complemented SEGRO’s and we would be able to quickly establish a strong working relationship. We were also able to use their analytics to gain an understanding of how broad our reach could be in introducing students to SEGRO, as well to help target certain groups that have been under-represented previously.
Throughout the campaign, we focused on attracting the best people for the roles and avoided anything that required a prior knowledge of the property industry. For example, when we built our micro site for applicants, we specifically avoided any property language to ensure that all potential candidates were able to understand what is important to SEGRO and feel aligned to the Company.
As part of wider changes, we also appointed Jo Jackson (Director, Thames Valley) as a senior sponsor of our graduate scheme, who has experience working with the graduate training scheme for CBRE and Deloitte. Jo co-chairs our Early Careers Advisory group and supports our approach to our training scheme as well ensuring we continue to meet governance standards.
We had over 400 applicants for the graduate programme and Sanctuary Graduates then undertook an initial screening in line with our requirements, reducing this down to 50 applications that were reviewed by SEGRO assessors via a ‘blind’ screening (i.e. with no knowledge of applicants’ educational or work experience).
The final stage of the process was an assessment day which took place in our London office, attended by 20 applicants, and included interviews, group exercises and informal lunches. We ensured that all elements of the selection process were in no way property related, providing a far greater level playing field for candidates coming from either property or non-property backgrounds.
From this process, we were delighted to select four graduates who we now look forward to welcoming to SEGRO in September 2022.
The result of the changes we made is that our graduate recruitment process captured a more diverse group of candidates and is now more structured. We also feel that our scheme now also allows better support for our graduates, with clearer expectations and guidance.
We will continue to work on increasing diversity within SEGRO and the property sector and the recruitment process is one of our key areas of focus. In the future, we hope to increase awareness of our business and the sector by working with young adults in sixth forms and in early years of universities to ensure there is a better understanding of what it means to work in our industry.
What we need to create the space that enables extraordinary things to happen continued
STRATEGIC REPORT
Relationships & Resources
34 SEGRO PLC | ANNUAL REPORT & ACCOUNTS 2021
04_Relationships_Resources_30_45_v110.indd 3404_Relationships_Resources_30_45_v110.indd 34 01/03/2022 17:1501/03/2022 17:15
CASE STUDY:
WELLBEING FUND
We reviewed our Wellbeing strategy during 2021 and the result of this is the Wellbeing Fund, which recognises that wellbeing is personal and needs to be tailored to individual needs.
This was launched in January 2022 and is a personal allowance of up to £500 for employees to spend on their wellbeing during the course of the year.
This can be spent on whatever matters to them, in line with policy guidance, whether that be memberships and gym equipment, education and courses, events, or complementary and alternative health care.
REWARDING AND RETAINING TALENT
Every permanent employee is entitled to variable compensation which is based on their own and the business performance against targets and objectives. From 2022 onwards this will also include metrics that link to our Responsible SEGRO focus areas.
SEGRO also operates share incentive plans through which shares are awarded to employees based on profit targets against budget being met (see page 145 for more details). In 2021, 97 per cent of eligible employees chose to participate in the UK and Continental European plans, each receiving SEGRO shares worth £3,600.
In addition to fixed and variable compensation we also provide a generous benefits package which includes health insurance and is reflective of market competitive packages in each of our geographies.
TRAINING AND DEVELOPMENT
We want our People to achieve great things during their time at SEGRO, supported by appropriate resources, training and coaching.
Every employee has an interim and full year appraisal, at which their performance is reviewed, objectives are set and training needs are identified to help them achieve their objectives.
Employees are encouraged to set personal as well as professional objectives and training is available to support both. We also sponsor our employees to study professional qualifications that are relevant to their role.
During 2021, employees carried out 4,656 hours of training and this included mandatory training on Anti-Bribery and Corruption, Diversity and Inclusion and Cybersecurity as well as their own personal development training.
HEALTH AND WELLBEING
The wellbeing of our employees is very important to us and one of our key priorities as a business is to ensure that our employees can work in a healthy, safe and secure environment. This has been particularly important during the pandemic and we have continued to adapt and respond to ensure that everyone felt supported and connected, despite spending long periods of time working from home.
We have a comprehensive Health and Safety training programme which starts when an employee joins SEGRO and is refreshed regularly depending on the requirements of their role.
We are committed to raising the profile of mental health and wellbeing within the workplace, encouraging others to recognise those who may need help and creating an environment that enables employees to talk openly about their own mental health. We have trained Wellbeing ambassadors across the Group and this year we worked with them to create a new Wellbeing strategy, the outcome of which is the SEGRO Wellbeing Fund which allows our People to tailor their wellbeing benefits to their own requirements.
This is in addition to our comprehensive wellbeing hub, containing a wealth of support and information. Our enhanced benefits package also includes access to a 24/7 confidential external helpline offering counselling support.
We believe that the approach we take to rewarding, developing and looking after our people is reflected in a low employee turnover of seven per cent. We also believe that by investing in this we are investing in the longer-term success of our business as it helps us to ensure that SEGRO is the employer of choice for a diverse range of, talented, motivated and engaged people.
35SEGRO PLC | ANNUAL REPORT & ACCOUNTS 2021
OVERVIEW STRATEGIC REPORT GOVERNANCE FINANCIAL STATEMENTS
04_Relationships_Resources_30_45_v110.indd 3504_Relationships_Resources_30_45_v110.indd 35 01/03/2022 17:1501/03/2022 17:15

ASSETS UNDER MANAGEMENT
£21.3bn2020: £15.3bn
ASSET DISPOSALS ( SINCE 2012)
£3.9bnASSET ACQUISITIONS (SINCE 2012)
£3.7bn
3 A PORTFOLIO OF PRIME, SUSTAINABLE ASSETS
As a result of our portfolio shaping over the past decade and our active development programme, we are now proud owners of one of the most modern and sustainable warehouse portfolios in Europe.DAVID SLEATHCHIEF EXECUTIVE
What we need to create the space that enables extraordinary things to happen continued
STRATEGIC REPORT
Relationships & Resources
36 SEGRO PLC | ANNUAL REPORT & ACCOUNTS 2021
We buy and build warehouse properties located on the edge of major cities as well as in key transportation corridors and logistics hubs and actively manage £21.3 billion of assets. This prime, modern portfolio is a result of an ambitious portfolio reshaping programme that we embarked on in late 2011.
Since then we have disposed of £3.9 billion of assets (excluding sales to our joint venture SELP) in markets or sub-sectors that we identified as non-core. We now own what we believe to be the best portfolio of industrial property in Europe.
With that reshaping now complete, our disposal activity has slowed but we still continually review and refine the portfolio, carrying out an annual asset review process which looks at the opportunities, risks and potential returns for every single asset. As a result of this we identify assets (and sometimes markets) where we believe we have maximised the potential or where we believe the risk of holding an asset outweighs the potential benefits. The assets that we identify through this process form the basis of our disposal list.
During the same period we acquired over £3.7 billion of assets in key markets, taking advantage of our market knowledge and local networks to source opportunities off-market where possible and therefore achieve better pricing.
We continue to make strategic asset acquisitions when they offer attractive returns, but increased competition for industrial assets has meant that our development programme has been the main focus of our investment over recent years. This includes building modern, sustainable space on our existing landbank and also expanding the pipeline of opportunities through the acquisition of new land plots or, more recently, assets with short-term income and redevelopment potential.
This has allowed us to gain competitive advantage by leveraging the skills, local knowledge and technical expertise of our teams across Europe. It has also helped us to generate superior returns than from buying dry assets with limited growth potential and given us access to opportunities that would not be available on the investment market.
Since late 2011 we have built over 5.2 million sq m of new space, adding £295 million to the rent roll. We have been able to do this whilst keeping our development yield at around a 150 basis point margin over the equivalent investment yields.
In addition to building new assets we are also continually refurbishing and redeveloping existing warehouses that we believe are prime in terms of their location but perhaps need modernising to meet our customers’ ever changing requirements. Increasingly this involves the retrofitting of sustainability features to improve their performance and help our customers to reduce their energy consumption.
50 per cent of our assets by value (at share) and 98 per cent of our eligible completed developments during 2021 have high environmental certifications. From 2022 we are targeting a rating of BREEAM ‘Excellent’ (or the equivalent local standard) on all our larger developments.
The constant refinement and modernisation of the portfolio aims to ensure that our assets are the warehouses of choice for our customers, helping us to grow rents, keep vacancy low and mean that in the long term our portfolio should outperform the benchmark and create value.
04_Relationships_Resources_30_45_v110.indd 3604_Relationships_Resources_30_45_v110.indd 36 01/03/2022 17:1501/03/2022 17:15
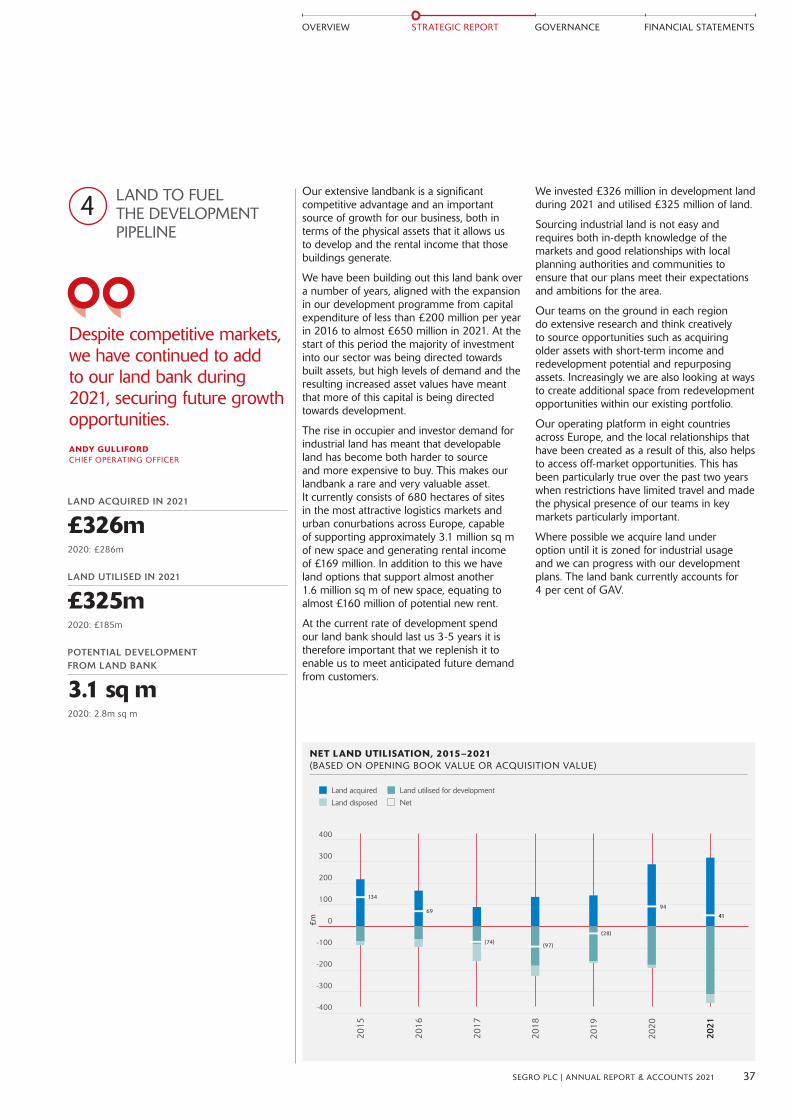
4 LAND TO FUEL THE DEVELOPMENT PIPELINE
Despite competitive markets, we have continued to add to our land bank during 2021, securing future growth opportunities.ANDY GULLIFORDCHIEF OPERATING OFFICER
LAND ACQUIRED IN 2021
£326m2020: £286m
LAND UTILISED IN 2021
£325m2020: £185m
POTENTIAL DEVELOPMENT FROM LAND BANK
3.1 sq m2020: 2.8m sq m
37SEGRO PLC | ANNUAL REPORT & ACCOUNTS 2021
OVERVIEW STRATEGIC REPORT GOVERNANCE FINANCIAL STATEMENTS
Our extensive landbank is a significant competitive advantage and an important source of growth for our business, both in terms of the physical assets that it allows us to develop and the rental income that those buildings generate.
We have been building out this land bank over a number of years, aligned with the expansion in our development programme from capital expenditure of less than £200 million per year in 2016 to almost £650 million in 2021. At the start of this period the majority of investment into our sector was being directed towards built assets, but high levels of demand and the resulting increased asset values have meant that more of this capital is being directed towards development.
The rise in occupier and investor demand for industrial land has meant that developable land has become both harder to source and more expensive to buy. This makes our landbank a rare and very valuable asset. It currently consists of 680 hectares of sites in the most attractive logistics markets and urban conurbations across Europe, capable of supporting approximately 3.1 million sq m of new space and generating rental income of £169 million. In addition to this we have land options that support almost another 1.6 million sq m of new space, equating to almost £160 million of potential new rent.
At the current rate of development spend our land bank should last us 3-5 years it is therefore important that we replenish it to enable us to meet anticipated future demand from customers.
We invested £326 million in development land during 2021 and utilised £325 million of land.
Sourcing industrial land is not easy and requires both in-depth knowledge of the markets and good relationships with local planning authorities and communities to ensure that our plans meet their expectations and ambitions for the area.
Our teams on the ground in each region do extensive research and think creatively to source opportunities such as acquiring older assets with short-term income and redevelopment potential and repurposing assets. Increasingly we are also looking at ways to create additional space from redevelopment opportunities within our existing portfolio.
Our operating platform in eight countries across Europe, and the local relationships that have been created as a result of this, also helps to access off-market opportunities. This has been particularly true over the past two years when restrictions have limited travel and made the physical presence of our teams in key markets particularly important.
Where possible we acquire land under option until it is zoned for industrial usage and we can progress with our development plans. The land bank currently accounts for 4 per cent of GAV.
NET LAND UTILISATION, 2015–2021 (BASED ON OPENING BOOK VALUE OR ACQUISITION VALUE)
£m
Land acquired
Land disposed
Land utilised for development
Net
400
300
200
100
0
-100
-200
-300
-400
134
69
(74)
(28)
94
41
(97)
2015
2016
2017
2018
2019
2020
2021
04_Relationships_Resources_30_45_v110.indd 3704_Relationships_Resources_30_45_v110.indd 37 01/03/2022 17:1501/03/2022 17:15
5 FUTURE-PROOFING THROUGH INNOVATION
Technology is not just important in terms of making sure our business is fit for the future, there is also the potential for SEGRO to achieve significant advantage for its customers from digital assets. JAMES POWERDIRECTOR OF DIGITAL AND TECHNOLOGY
The world around us is changing at a rapid pace. We are in continuous dialogue with our customers as we seek to understand and position ourselves to take advantage of the longer-term trends within the economy.
We have embedded a culture of continuous improvement within SEGRO and are constantly questioning how and why we do things while pushing ourselves to do better.
This means we are constantly refining not just our existing portfolio and how we manage it but also how we design, build and plan our assets, with technology and digitalisation as well as placing sustainability at the heart of our thinking.
TECHNOLOGY AND DIGITALISATION
Technology and digitalisation continue to drive ever-accelerating change for ourselves and our customers. As well as challenges, this presents opportunities for businesses that anticipate and adapt to these changes.
Our belief is that digital assets and capabilities will play an increasingly important role in our business and that we, our employees, our customers, and other stakeholders will benefit.
We have long recognised the value of technology and our proactive investment over a number of years has created the strong foundations of our digital strategy which focuses on the following areas:
} Digital skills, tools and processes enable our people to be effective. First and foremost, the role of our Digital and Technology function is to enable everyone at SEGRO to contribute to our success by providing them with the digital tools, information and skills that they need. This has enabled our people to work effectively without interruption during the pandemic and has allowed us to adapt to the ever-changing requirements for remote and hybrid working across nine countries. The launch of our Digital Academy has also helped to improve the skills and understanding of people across the business.
} Data and analytics provide actionable insights that enable better decisions. We have grown our Data and Analytics team in recent years and further strengthened it during 2021, enabling us to deliver several decision-support analytics tools that were developed in partnership with the end-users across the business. The prime focus has remained on enhancing our understanding of our customers and locations because we see particular value in augmenting our existing strength of market knowledge with rich and detailed analysis of location data. As we do more with, and expect more from, our data we have enhanced our approach to managing data quality to ensure that it remains fit for purpose.
}Digital innovations differentiate our assets and services to customers. We have continued our Smart Building initiative. Building on valuable lessons learned in our initial pilot programme, we have selected a preferred deployment partner for a simplified product that can be rolled out widely.
} Secure and scalable digital infrastructures enable all of our digital services. We continue to invest to upgrade our infrastructure and to ensure that it can support the business. During 2021 we completed the migration to the ‘cloud’, extended our work on document management and continued with our financing system re-engineering programme.
We contribute to a number of industry-wide collaboration initiatives, including the British Property Federation’s Technology and Innovation Working Group, the LandAid Tech Network and being active participants in and supporters of open source technology communities.
We also maintain active partnerships with the ‘PropTech’ firms Fifth Wall and Concrete Ventures. In 2021 we committed a further investment with Fifth Wall in their European Tech Fund, and a first investment with Concrete. Both provide valuable access to the tech-led innovation ecosystem, as well as fellow innovators in the sector.
What we need to create the space that enables extraordinary things to happen continued
STRATEGIC REPORT
Relationships & Resources
38 SEGRO PLC | ANNUAL REPORT & ACCOUNTS 2021
04_Relationships_Resources_30_45_v110.indd 3804_Relationships_Resources_30_45_v110.indd 38 01/03/2022 17:1501/03/2022 17:15
INNOVATION IN DEVELOPMENT
To ensure that our portfolio is fit for the future and meets the ever changing needs of our customers we are also continually innovating within our development programme.
This is also crucial to us meeting our net-zero carbon targets as a significant part of our emissions result from our development activity. This is leading to innovations such as using glue laminated timber beams and concrete replacements (see page 58 for more information on our efforts to reduce embodied carbon in our development pipeline).
Our cross border technical group ensures that ideas, successes and learnings are shared across the Company.
In response to the changing use of our buildings by customers from a wide variety of industries we have also started to build more Wellbeing features into our new developments such as on-site showers and changing facilities, running tracks, sports facilities and outdoor gyms. These additions help our customers to attract and retain employees which in turn makes our assets more desirable.
Finally, with land in short supply in most of our markets and particularly in urban locations such as London or Paris, we are increasingly having to innovate to maximise the space that we can create. For example the introduction of mezzanine levels over loading bays areas to create additional flexible space; going up rather than out and developing multi-level warehousing such as our Air2 development in Paris and thinking creatively by re-purposing assets such as underground rail terminals for inner city logistics.
CASE STUDY
DIGITAL ACADEMY
During 2021 we launched our Digital Academy to offer all of our employees improved education resources on a range of digital topics with a variety of depths on offer.
This included in-depth training for over 60 members of staff in our new data analysis and visualisation tool to empower them to make better use of data.
At the other end of the scale were short introductory “What the Tech Is...?” briefings by expert speakers on topics including the ‘internet of things’, drones, agile methodologies, and artificial intelligence.
CASE STUDY:
LOCATION SCORING TOOL
Our goal is to be the leading owner, manager and developer of industrial properties in Europe, and the partner of choice for our customers and other stakeholders.
This requires a deep understanding of our customers’ needs, a deep understanding of locations, and how the two intersect.
For our customers, as well as the availability of good modern industrial property, we know that good locations are a result of many diverse factors including the availability of labour, the proximity to consumers, transport distances and times, digital connectivity, and connectivity with the rest of their supply chain.
To ensure that we continue to make the best possible investment and asset management decisions, and to understand our customers better, our property and analytics teams have joined forces to create a proprietary data science tool which scores millions of locations in Europe for their suitability for different uses of industrial property.
The tool complements the existing in-depth market and customer knowledge of our property teams by bringing additional data and new perspectives, analysed at a scale impossible without powerful computing and advanced data science, and presented in an accessible way.
The tool is already used to support the appraisal of our existing portfolio locations, to evaluate new land and property acquisition opportunities, and to help us form our regional location strategies, and its use with continue to evolve in the coming years.
39SEGRO PLC | ANNUAL REPORT & ACCOUNTS 2021
OVERVIEW STRATEGIC REPORT GOVERNANCE FINANCIAL STATEMENTS
04_Relationships_Resources_30_45_v110.indd 3904_Relationships_Resources_30_45_v110.indd 39 01/03/2022 17:1501/03/2022 17:15

Our relationships with our suppliers and other business partners are key to helping us create value. We invest a lot of time in developing these and trying to ensure that our aims and objectives are aligned and mutually beneficial.
OUR SUPPLIERS
We work with over 3,000 suppliers across the Group, ranging from small local businesses to multinational companies, and spent over £850 million with them in 2021.
We want to work with suppliers who share our values and our approach to matters such as health and safety, compliance, anti-bribery and corruption and modern slavery. To help achieve this, we have introduced a Supplier Code of Conduct which consolidates and sets out in full the principles and standards that we expect from our suppliers and other business partners working on our behalf and outlines how we can work side by side with one another to create real change.
We are committed to ensuring that our supply chain is safe, secure and efficient. We follow a strict supplier assurance process which enables us to be confident that our supply chain is maintained to a high standard and improvements can be made whenever possible.
Our comprehensive supplier assurance process is online, so it is easy for suppliers to access, use and update information. It requires all suppliers to provide information appropriate to their service, including health and safety policy, evidence of insurance and confirmation of skills and experience. They need to provide this data before they become an accredited supplier. We re-test and re-assess our suppliers, and regularly update the list of assured suppliers.
We have service review sessions with many of the professional services suppliers (for example, with our lawyers and agents), while those involved in construction activities have regular visits from our Health and Safety team. We also have a rolling programme of meetings with our suppliers’ senior management teams to discuss in more detail their compliance with our approach to anti-bribery and corruption, and modern slavery. There were no concerns or issues arising out of the meetings conducted during 2021.
6 SUPPLIERS AND OTHER BUSINESS PARTNERS
We want to work in partnership with suppliers and we value long-term relationships where they understand us, our standards and our preferred ways of working. This has been particularly important during the last 18 months and has helped us to ensure business continuity and also to help our key suppliers through this difficult time.
We also expect our suppliers to work with us to support local business and economies by contributing to their long-term viability. This includes proactively sourcing labour, goods and services from the local community where possible.
In the spirit of partnership, we treat our suppliers well and ensure that they are paid on time. We are a signatory to the UK Prompt Payment Code and, in 2021, over 95 per cent of UK invoices were paid within 30 days of receipt, with an average payment time of 16 days.
In the UK we are an accredited Living Wage employer and are working with our suppliers to help ensure everyone working in our supply chain to support us is paid a real Living Wage by the end of 2022.
SELP
The majority of our portfolio is wholly-owned but we have one main joint venture, the SEGRO European Logistics Partnership (SELP), owned 50-50 by SEGRO and PSP Investments. This joint venture focuses solely on big box warehouses in Continental Europe and has allowed us to achieve scale in this market at a much faster pace than we could have done as sole owners and in a more capital efficient manner. The partnership started in 2013 with €1 billion of assets and now owns almost €7 billion of land and assets in seven European countries.
SELP has as a Board comprising four directors, two representing each parent company and it meets at least quarterly in Luxembourg.
SEGRO manages the joint venture and advises the Board on investment and financial matters, with decisions taken by the Board of SELP at these meetings.
More information on SELP can be found at www.selp.lu.
CASE STUDY:
HESTON GENERAL CLEANING CONTRACTORS LIMITED
Heston has provided cleaning services to SEGRO’s Greater London and Thames Valley portfolios since 2009. This long-standing partnership has been very successful thanks to excellent communication, cooperation and continuity of service.
During the pandemic, we increased our contact, holding regular calls to understand how they were managing and to establish if there was additional support that could be provided. The calls were also beneficial as a discussion forum for new ideas on how best to adapt to and manage any new challenges.
During 2021, inspired by the values and efforts of SEGRO, Heston investigated becoming an accredited Living Wage employer and by the end of the year achieved an accredited status with the Living Wage Foundation. Both parties see this as a positive accomplishment and an example of where close collaboration and shared values can strengthen our supply chain and serve for the long-term interests of both businesses.
“We appreciate that SEGRO genuinely cares about our business. By working in partnership, Heston and SEGRO have been able to achieve a deep understanding of each other’s businesses which will help continue to support our relationship into the future.”
DAVID JACKMANMANAGING DIRECTOR, HESTON GENERAL CLEANING CONTRACTORS LIMITED
What we need to create the space that enables extraordinary things to happen continued
STRATEGIC REPORT
Relationships & Resources
40 SEGRO PLC | ANNUAL REPORT & ACCOUNTS 2021
04_Relationships_Resources_30_45_v110.indd 4004_Relationships_Resources_30_45_v110.indd 40 01/03/2022 17:1501/03/2022 17:15
We fund our investment activities through a combination of equity, debt and the proceeds of disposals. In 2021 we raised almost €1 billion of capital as a result of our first Green bond issuances for SEGRO and SELP.
In addition to this we disposed of £515 million of assets and land, which was higher than our normal level as we sought to capitalise on the strength of the investment markets and crystallise some profit from assets where we felt we had maximised returns.
The combination of this activity and the increase in value of our portfolio has meant that our LTV has remained low at 23 per cent, which provides us with the flexibility to take advantage of investment opportunities arising.
We forge strong relationships with our shareholders as well as with our banks and bond holders who provide our equity and debt funding. As a listed company we have a responsibility to those individuals and institutions who have invested money in our business either through equity (our shareholders and joint venture partners) or debt (our banks and bond holders) to deliver long-term and sustainable returns on their investment.
We ensure regular communication with our investors through an extensive programme, mainly managed by a dedicated Investor Relations team. This includes roadshow and other ad hoc meetings (most of which were done virtually in 2021), attendance at investor conferences as well as site visits.
Due to the ongoing pandemic we had to cancel the majority of our planned site visits in 2021 but are looking forward to resuming a normal programme as soon as is safe to do so.
The Annual General Meeting (AGM) normally also provides an excellent opportunity to meet many of our retail shareholders and answer their questions about the business. Unfortunately due to the pandemic we had to ask shareholders not to attend the meeting last April in person and instead held a hybrid meeting (see page 115 for more detail). We hope to hold the 2022 AGM in person.
Our website contains comprehensive information about our strategy and performance, regulatory news and press releases as well as information about our debt and our approach to Environmental, Social and Governance (ESG) issues (including Responsible SEGRO). The Investors section of the site also includes the presentations made during the investor tours, a summary of the analysts’ financial forecasts (consensus) and webcasts of the Chief Executive, Chief Financial Officer and Chief Operating Officer presenting the full year and half year results.
During 2021, the Executive Directors and the Investor Relations team held meetings with representatives from over 300 institutions (including 14 of our top 20 shareholders – the remaining six are passive institutions) across over 190 meetings (most of them virtual) to update them on our performance and to provide an opportunity for them to ask questions. We also held a series of one on one and group meetings with our lending banks and investors in SEGRO and SELP’s bonds during the year.
These investor interactions not only update our investors on our business but also allow us to understand their priorities and any concerns. This feedback is vital to help shape our strategy and our communications and disclosure to make sure that we are meeting their expectations of us.
We have strong relationships with our investors thanks to our proactive investor relations programme.SOUMEN DASCHIEF FINANCIAL OFFICER
7 AN EFFICIENT CAPITAL STRUCTURE
NEW FINANCING IN 2021
£1.3bn2020: £1.1bn
LTV
23%2020: 24%
NUMBER OF INVESTOR MEETINGS IN 2021
1902020: 194
41SEGRO PLC | ANNUAL REPORT & ACCOUNTS 2021
OVERVIEW STRATEGIC REPORT GOVERNANCE FINANCIAL STATEMENTS
04_Relationships_Resources_30_45_v110.indd 4104_Relationships_Resources_30_45_v110.indd 41 01/03/2022 17:1501/03/2022 17:15

TOTAL CONTRIBUTION TO CHARITY IN 2021
£1.3m2020: £1.5m
NUMBER OF DAYS OF GIVING
234
} Creating outdoor spaces close to both our urban and big box parks to help improve biodiversity and benefit the local environment as well as to promote health and wellbeing. For example amenity space for customer employees and country parks that local residents can also enjoy.
}Working with our suppliers to help create opportunities for local businesses, for example encouraging contractors to source services and materials from local suppliers and to use local labour during the construction stages of our projects.
} Collaborating with our customers and local authorities to create employment opportunities and investing in the provision of training to help local residents access job vacancies created through our new developments.
} Supporting local charities to help improve the lives of vulnerable members of the local community and funding a range of training and education programmes that help these members of society on the pathway into employment.
Investing in and supporting our local communities is not new to SEGRO, it is something that our business has been doing for over 100 years. As part of our commitment to Invest in our local communities and environment we are now thinking more strategically about the way we approach this so that we can maximise the impact of our efforts and the value created.
As a long-term investor, we are committed to contributing to the long-term vitality of the areas in which we operate and one of our three Responsible SEGRO priorities is to Invest in our local communities and environments.
To do this effectively, we collaborate with local stakeholder partners to better understand the needs of a local community so we can contribute positively to its growth and development.
Some of the ways that we create value within our local communities include:
}Working closely with local authorities in our key markets to ensure we understand their priorities and support these with our own plans. This is also key to our understanding of the challenges around zoning and planning and forms an important part of our decision on where to invest.
} Regenerating older industrial sites and brownfield land to attract new businesses investment into local areas, creating diverse and high-quality employment opportunities and driving economic prosperity.
} Encouraging innovation and the growth of small local businesses by offering flexible space with all-inclusive leases in our Enterprise Quarters and providing additional support services to help them to develop their networks, learn from each other and grow together.
} Seeking to go beyond our section 106 agreements (or equivalent) to improve employability opportunities for the local community as well as upgrading local road networks and infrastructure and contributing to improvements in local public transport that benefit everyone in the surrounding area.
For further information on our commitment to Invest in our local communities and environments:see pages 88-89
8 STRONG COMMUNITY RELATIONSHIPS
By working with local stakeholders we are able to provide a range of benefits to our local communities, ensuring that we have a positive impact beyond our space.NEIL IMPIAZZIPARTNERSHIP DEVELOPMENT DIRECTOR
What we need to create the space that enables extraordinary things to happen continued
STRATEGIC REPORT
Relationships & Resources
42 SEGRO PLC | ANNUAL REPORT & ACCOUNTS 2021
2021TOTAL
£1,310,989
04_Relationships_Resources_30_45_v110.indd 4204_Relationships_Resources_30_45_v110.indd 42 01/03/2022 17:1501/03/2022 17:15

SEGRO CENTENARY FUND AND COMMUNITY INVESTMENT PLANS (CIPS)
In 2020 we established a £10 million Centenary Fund to be invested over a decade to make a positive impact within communities across the UK and Continental Europe. The first year’s funding was allocated to provide emergency aid and support for those most affected by the pandemic, however the primary aim of the fund is to provide training and help people in our communities to develop the skills required to enter sustainable employment.
To ensure we continue to help our communities to thrive and deliver the commitments in our Responsible SEGRO framework we are creating Community
COMMUNITY INVESTMENT PLANS (CIPs)
Each CIP will set out how SEGRO will invest in its local communities and environments through a range of programmes designed to improve training and employment opportunities, enable the economy to thrive and enhance the environment to support biodiversity as well as the health and wellbeing of local people.
The CIP framework is designed to provide a structure for each of our regions to deliver a range of highly impactful community and environmental programmes by:
} creating a strategic and coherent approach across SEGRO;
} empowering the local teams to respond to local needs;
}maximising the impact by putting collaboration with customers and suppliers at the heart of the programme;
} working in partnership with local stakeholders such as charity partners, local government, business groups and the community;
} delivering excellence with the support of our Partnership Development Team.
We have already started to identify and put in place projects and working with charity partners that are leaders in their field, who can help provide the knowledge and expertise needed to maximise the positive impact of our community programmes.
To help embed the CIPs into our business and drive engagement with customers and suppliers we asked employees to put themselves forward as Community Champions. We have so far appointed 41 Community Champions, each of whom will support and help to ensure the success of projects within their region.
Investment Plans (CIPs) for every key market in our portfolio by 2025.
CIPs are our long-term commitment to help those communities that live close to our estates that face health, social, economic and inequality challenges.
By introducing them we aim to improve the lives, and prospects, for thousands of people. To make the greatest impact, we will work with a wide range of stakeholders; from suppliers to customers; charity partners to local government; to deliver a range of employability, economic and environmental programmes bespoke to our different markets.
Going forward our CIPs will become the primary focus for investment from the Centenary Fund. While these important
foundations are being put in place, we are continuing to work with our local legacy charity partners to deliver vital community programmes. We are partnering with LandAid to launch a new training and employability fund that will help homeless young people in temporary accommodation to find employment. We are also providing warehouse and logistics space to foodbanks, one of which is City Harvest. Since our partnership began in 2016, the charity has delivered nearly 30 million meals through their network of over 350 charity partners, to people living in poverty in London. Finally, we continue to champion diversity within the real estate sector through our support for Pathways to Property, helping to promote and deliver its 2021 summer school which welcomed 103 participants.
Helping local people to benefit from skills, training and job brokerage programmes, especially those that are unemployed or face a barrier to employment. Inspiring young people about the world of work through a range of career talks, work experience and mentoring programmes. For example:
Franzfreude – Investment in new IT infrastructure at a shelter in Düsseldorf to support homeless people to participate in a skills and training programme, CV writing and job searches.
Innowatorium Foundation – 300 young people from seven schools in Łódz and Poznan took part in the SEGRO Academy which delivered a range of interactive and simulation experiences to promote careers in the industrial and logistics sectors whilst helping to improve their English Language skills.
EMPLOYMENT ECONOMY ENVIRONMENT
Supporting the growth of the local economy to thrive by helping local businesses to connect to our customers, suppliers and partner with stakeholders to deliver programmes that help to enhance productivity and innovation. For example:
Future Cube – a dedicated centre created in partnership with the Mayor of London, London Borough of Havering and the Manufacturing Technology Centre (MTC) that will help small to medium sized businesses to grow through a programme of technology, innovation and productivity improvements.
Delivering environmental projects that improve the biodiversity of the local area and the health and wellbeing of the community. For example:
Day of Giving (UK) – 18 employees teamed up with one of our suppliers, Whiting Landscape, to create an outdoor space for the Bradby Club in Rugby, which has been supporting the local community for 100 years offering a range of services and activities to support young people in their journey into adulthood.
43SEGRO PLC | ANNUAL REPORT & ACCOUNTS 2021
OVERVIEW STRATEGIC REPORT GOVERNANCE FINANCIAL STATEMENTS
04_Relationships_Resources_30_45_v110.indd 4304_Relationships_Resources_30_45_v110.indd 43 01/03/2022 17:1501/03/2022 17:15

INVESTING IN OUR PEOPLE’S PASSIONS
We also support causes close to the hearts of our own people and the wider real estate sector. We encourage all employees to participate in charitable activities, providing their time and skills.
Our company-wide ‘Day of Giving’ allows our employees to volunteer to support a cause close to them or their team, or to work with one of the local charities that SEGRO supports corporately. In 2021, 234 employees took part, undertaking a wide range of activities including planting trees, collecting rubbish, packaging food parcels, riverside and environmental clearances and painting hospital gardens.
Away from the Day of Giving, our people run, cycle, swim, skydive, walk and ‘sleep out’ overnight to raise money for a wide range of great causes for which SEGRO will match the funds raised.
CASE STUDY:
PLANT-MY-TREE
One of our CIP partners in Germany is Plant-My-Tree, an organisation that plants trees whilst supporting other forest-focused activities such as conservation, protection, and regeneration. Since launching in August 2020, Plant-My-Tree has planted more than 500,000 trees around the world.
During 2020, SEGRO built 1,430 columns to support 144,000 sq m of space across eight schemes in Northern Europe. Therefore, as part of our 2021 Day of Giving, our team worked with Plant-My-Tree to plant 1,430 trees near Hamburg.
CASE STUDY:
SUPPORTING APPRENTICESHIPS IN THE UK
Employment is one of the three focus areas under our CIP framework. During 2021 we pledged £50,000 of our Apprenticeship Levy fund, a UK government scheme, to support the London Progression Collaboration’s ‘Reskilling the Recovery’ Campaign.
Our funding enabled three young people to move into sustainable, meaningful jobs and enable longer-term career progression. Two apprentices in Hillingdon are studying for a qualification in Plumbing and Domestic Heating Installation (Level 3) and a further young person in Newham is studying to become an Early Years Care Educator (Level 4).
We are also using this fund to work with Langley College in Slough to fund apprenticeships on the Slough Trading Estate and in addition we are using our Centenary Fund to support a Finance (Level 3) apprenticeship at Leicestershire and Rutland Community Foundation.
Through these apprenticeships, talented young people are earning qualifications and finding employment, whilst small businesses are benefiting from the ability to take them on and build capacity with all of the training fees covered.
What we need to create the space that enables extraordinary things to happen continued
STRATEGIC REPORT
Relationships & Resources
44 SEGRO PLC | ANNUAL REPORT & ACCOUNTS 2021
04_Relationships_Resources_30_45_v110.indd 4404_Relationships_Resources_30_45_v110.indd 44 01/03/2022 17:1501/03/2022 17:15
9 A ZERO-TOLERANCE APPROACH TO POOR HEALTH AND SAFETY
We are committed to the prevention of harm to our employees and throughout our supply chain.PAUL DUNNEMANAGING DIRECTOR OF GROUP OPERATIONS
Health and Safety is central to all of our business activities. It is our responsibility to ensure that we provide and promote a healthy, safe and secure environment in which our employees and customers can work, extending throughout our supply chain, and in particular on our development projects.
We aim to achieve these high standards through a combination of risk mitigation, training and promoting a widespread awareness and culture of Health and Safety.
In 2021, our Accident Incidence Rate for employees remained low at 0.13. Whenever incidents occur, we fully investigate to understand the causes, involving external consultants where appropriate. Findings and learnings are disseminated across the Group, including to the Board and Executive Committee, to ensure that we (and where appropriate, third parties) respond and improve our processes where necessary.
The Health and Safety team supported the business throughout 2021 with practical guidance on the changing governmental requirements in response to the pandemic.
We continue to be recognised for our safety performance through the RoSPA (Royal Society for the Prevention of Accidents) Awards. In 2021, we were awarded Gold for the ninth consecutive year. These awards recognise our Group commitment and practical application of Health and Safety procedures across all of our business operations.
HEALTH AND SAFETY DURING DEVELOPMENT
We only want to work with businesses who share our approach of zero-tolerance of poor health and safety practices. We require all of our suppliers to confirm that they meet our Health and Safety Standards, and we undertake particularly rigorous assessments of those companies working on our development sites.
We encourage our contractors to innovate and work with us to ensure that health and safety considerations on our development sites are paramount. The contractor workshops that we held in 2020 showed a need to improve contractor near miss reporting and this has been a focus of throughout 2021. It has been very successful and has enabled early interventions to be made preventing health and safety hazards becoming incidents.
We have, and continue to, support our contractors by providing additional guidance, signage and health and safety visits to our development sites throughout each project.
Specific to the Covid-19 pandemic, all of our construction sites are monitored and checked for Covid compliance and we have regular communication of Construction Leadership Council Covid documents with key UK contractors.
Our Health and Safety commitment does not end when we complete a project but extends to the ongoing day-to-day life of our estates. Many of our estates are accessed by both our customers and the public and there are a wide variety of risks which we assess and mitigate. By providing training and raising awareness we ensure our customers and communities are well informed and able to make appropriate decisions when necessary.
CASE STUDY:
REMOTE VISITS TO CONSTRUCTION PROJECTS
Construction work in all countries has continued throughout the pandemic, however, the implementation of travel restrictions prevented SEGRO’s Health and Safety team and UK based external safety consultants from travelling to Europe and had the potential to limit our oversight of compliance on our construction sites. Our zero-tolerance approach to poor health and safety performance meant that we needed to respond quickly to ensure we could provide assurance of compliance.
As a result we implemented a system of ‘remote visits’. This includes all major parties involved in the construction project and is mandatory across the Group. The remote visit process includes:
} The setting up of webcams at all construction sites to enable remote viewing of operations;
} Drone footage of the construction site and operations;
} Site overview and statistical presentation by the site contractors;
} Review of previous actions;
} Presentation of footage review findings by the external safety consultant;
} All party discussion on mitigation of risks created by upcoming works;
} Actions are added to the online Safety Matters log to ensure tracking and closure.
45SEGRO PLC | ANNUAL REPORT & ACCOUNTS 2021
OVERVIEW STRATEGIC REPORT GOVERNANCE FINANCIAL STATEMENTS
04_Relationships_Resources_30_45_v110.indd 4504_Relationships_Resources_30_45_v110.indd 45 01/03/2022 17:1501/03/2022 17:15

Our Strategy has successfully positioned our business to benefit from the structural trends that are driving both occupier and investor demand in our markets. We continue to apply it to maximise our returns in increasingly competitive markets.
OPERATIONAL EXCELLENCEOur well-established operating platform is one of our key competitive advantages and our focus on Operational Excellence across this platform is crucial to the ongoing success of our business. It has helped us to develop strong customer relationships and to deliver excellent returns from the execution of our expanded development pipeline.
We have continued to actively manage our portfolio throughout 2021, resulting in a record rent roll growth, a strong set of operational metrics and opportunities to create value from our standing portfolio.
Our focus on Operational Excellence has also been important in keeping our development pipeline on track despite the well-documented supply chain issues that our industry faced during the year. Our close working relationships with our contractors meant that we were able to complete the projects scheduled for delivery this year with minimal disruption.
CASE STUDY:
CREATING VALUE THROUGH REDEVELOPMENT ON THE SLOUGH TRADING ESTATE
In the first half of 2021 we signed a lease with Global Technical Realty for three-multi level data centres, equating to over 40,000 sq m of space. These will be built on Ajax Avenue, the site of a former row of 1960s multi-let terraced warehouses that were coming to the end of their practical life. Our asset management team worked closely with the customers who leased these former units to achieve vacant possession and we were able to re-locate many of them to other parts of the portfolio. This allows us to redevelop the site, resulting in a significant increase in rent and lettable area. Before
Proposed
46 SEGRO PLC | ANNUAL REPORT & ACCOUNTS 2021
STRATEGIC REPORT
Review of 2021 Delivering on our Strategy in 2021
05_Review2021_46_65_v117.indd 4605_Review2021_46_65_v117.indd 46 01/03/2022 17:1601/03/2022 17:16

DISCIPLINED APPROACH TO CAPITAL ALLOCATIONGiven the strong investor interest in our sector and the competitiveness of investment markets it has been more important than ever this year to maintain a disciplined approach to capital allocation.
We continue to focus the majority of our investment into our development programme and to create future opportunities for development (for example land acquisitions and assets with short-term income and longer term redevelopment potential), as we see better returns from this than investing our capital in completed assets.
The investment acquisitions that we did make in 2021 were in key strategic markets, helping us to increase our presence in North and South London. The majority were also off-market opportunities that we were able to create, leveraging on our reputation and the relationships of our local teams.
We also decided to capitalise on the strength of the investment markets to dispose of a number of assets that we had identified as having maximised their returns through our annual asset review process. The proceeds from these sales will be recycled into our future investments.
EFFICIENT CAPITAL AND CORPORATE STRUCTUREAs we continue to invest in the growth of our business it is important to take steps to maintain our Efficient Capital and Corporate Structure.
We aim to balance operational and financial risk by keeping the loan to value ratio (‘LTV’) at an appropriate level, making sure that, should the property cycle turn, we can absorb lower valuations whilst giving us the capacity to take advantage of any resulting investment opportunities. The strong investor appetite for industrial assets in 2021 resulted in record portfolio valuation growth and means our LTV is below our target of 30 per cent at 23 per cent as of 31 December 2021.
In terms of our new financing during 2021 we raised €500 million via our inaugural Green euro bond in September at a low coupon of 0.5 per cent as well as a further €500 million for our joint venture SELP.
CASE STUDY:
MATRIX PARK – LEVERAGING OUR REPUTATION AND RELATIONSHIPS TO ACQUIRE ASSETS OFF-MARKET
Where possible we try to make investment acquisitions off market, leveraging our relationships and reputation to find opportunities that are not widely marketed and therefore more competitively priced.
In October we completed a UK asset swap with a counterparty from whom we bought an asset off-market in 2020. This asset swap allowed us to acquire a significant multi-let estate in Park Royal, offering strong rental growth potential and a medium to longer term re-development opportunity, in return for smaller, more disparate holdings.
CASE STUDY:
LAUNCH OF SEGRO GREEN FINANCE FRAMEWORK AND INAUGURAL GREEN BOND
In May 2021 we launched our Green Finance Framework which applies to SEGRO and our joint venture SELP. It aligns with our Responsible SEGRO commitments and ensures that investors can have confidence that the proceeds of debt issuances will be spent on financing or re-financing acquisitions, developments, refurbishments and other discrete projects which will generate attractive returns whilst minimising the impact on the local and global environment.
47SEGRO PLC | ANNUAL REPORT & ACCOUNTS 2021
OVERVIEW STRATEGIC REPORT GOVERNANCE FINANCIAL STATEMENTS
05_Review2021_46_65_v117.indd 4705_Review2021_46_65_v117.indd 47 01/03/2022 17:1601/03/2022 17:16

Our portfolio comprises two main asset types: urban warehouses and big box warehouses. The demand-supply dynamics in both asset classes continue to be positive.
URBAN WAREHOUSES
Urban warehouses account for 67 per cent of our portfolio value. They tend to be smaller warehouses, and are located mainly in and on the edges of major cities where land supply is restricted and there is strong demand for warehouse space, particularly catering for the needs of last mile delivery and, around London, from data centre users.
Our urban portfolio is concentrated in London and South-East England (82 per cent) and major cities in Continental Europe (18 per cent), including Paris, Düsseldorf, Frankfurt, Berlin and Warsaw. These locations share similar characteristics in terms of limited (and shrinking) supply of industrial land and growing populations, while occupiers are attracted to modern warehouses with plenty of yard space to allow easy and safe vehicle circulation. We believe that this enduring occupier demand and limited supply bodes well for future rental growth.
BIG BOX WAREHOUSES
Big box warehouses account for 29 per cent of our portfolio value. They tend to be used for storage, processing and distribution of goods on a regional, national or international basis and are, therefore, much larger than urban warehouses.
They are focused on the major logistics hubs and corridors in the UK (South-East and Midlands regions), France (the logistics ‘spine’ linking Lille, Paris, Lyon and Marseille), Germany (Düsseldorf, Berlin, Frankfurt and Hamburg) and Poland (Warsaw, Łódz, Poznan, and the industrial region of Silesia). 29 per cent of our big box warehouses are in the UK and the remaining 71 per cent are in Continental Europe.
Occupier demand has been very strong across the UK and Continental Europe during 2021, helping drive vacancy to record low levels, leading to above average rental growth in most of our markets.
The nature (and typical location) of big box warehouses tends to mean that, over time, supply is able to increase more easily to satisfy demand, as there is more land available in out of town locations. We therefore believe that the prospects for significant rental growth in big box warehouses on a longer-term basis are, and have always been, more limited than for urban locations but this asset class brings other benefits including lower asset management intensity and long leases which help to ensure a sustainable level of income.
In addition, by holding the majority of our Continental European big box warehouses in SELP, we receive additional income from managing the joint venture which increases total returns.
Portfolio update Significant valuation growth
48 SEGRO PLC | ANNUAL REPORT & ACCOUNTS 2021
STRATEGIC REPORT
Review of 2021
05_Review2021_46_65_v117.indd 4805_Review2021_46_65_v117.indd 48 01/03/2022 17:1601/03/2022 17:16
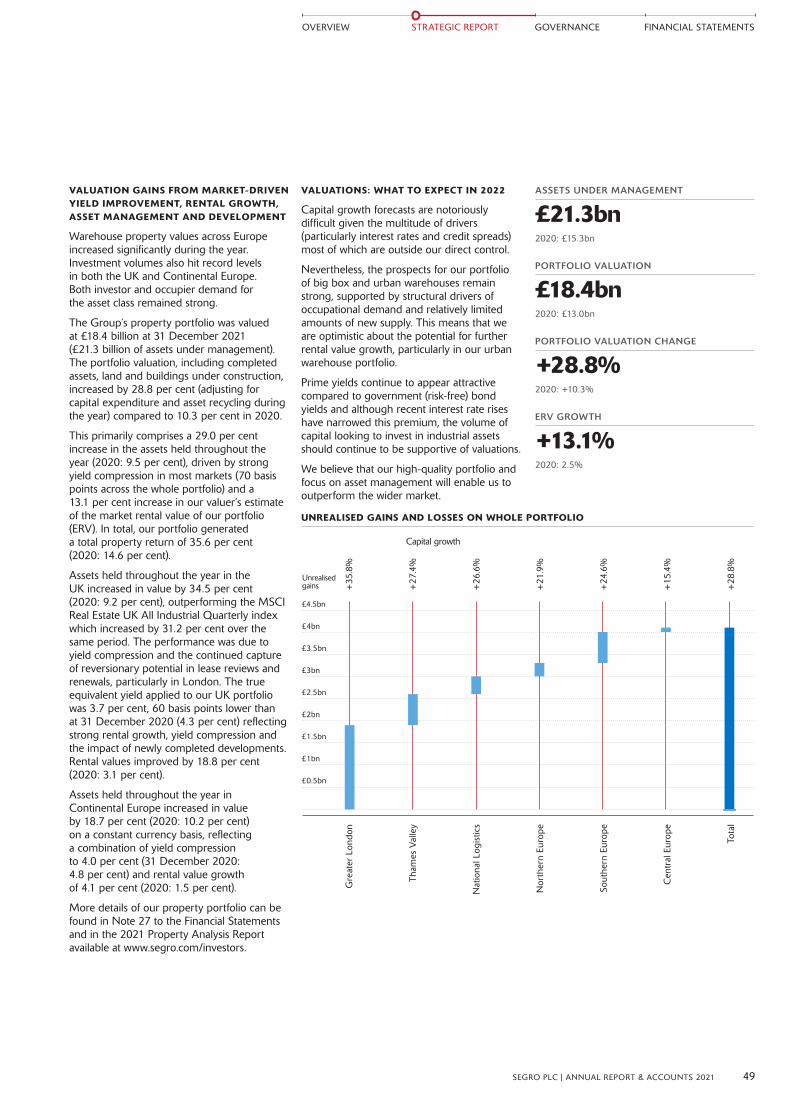
VALUATIONS: WHAT TO EXPECT IN 2022
Capital growth forecasts are notoriously difficult given the multitude of drivers (particularly interest rates and credit spreads) most of which are outside our direct control.
Nevertheless, the prospects for our portfolio of big box and urban warehouses remain strong, supported by structural drivers of occupational demand and relatively limited amounts of new supply. This means that we are optimistic about the potential for further rental value growth, particularly in our urban warehouse portfolio.
Prime yields continue to appear attractive compared to government (risk-free) bond yields and although recent interest rate rises have narrowed this premium, the volume of capital looking to invest in industrial assets should continue to be supportive of valuations.
We believe that our high-quality portfolio and focus on asset management will enable us to outperform the wider market.
VALUATION GAINS FROM MARKET-DRIVEN YIELD IMPROVEMENT, RENTAL GROWTH, ASSET MANAGEMENT AND DEVELOPMENT
Warehouse property values across Europe increased significantly during the year. Investment volumes also hit record levels in both the UK and Continental Europe. Both investor and occupier demand for the asset class remained strong.
The Group’s property portfolio was valued at £18.4 billion at 31 December 2021 (£21.3 billion of assets under management). The portfolio valuation, including completed assets, land and buildings under construction, increased by 28.8 per cent (adjusting for capital expenditure and asset recycling during the year) compared to 10.3 per cent in 2020.
This primarily comprises a 29.0 per cent increase in the assets held throughout the year (2020: 9.5 per cent), driven by strong yield compression in most markets (70 basis points across the whole portfolio) and a 13.1 per cent increase in our valuer’s estimate of the market rental value of our portfolio (ERV). In total, our portfolio generated a total property return of 35.6 per cent (2020: 14.6 per cent).
Assets held throughout the year in the UK increased in value by 34.5 per cent (2020: 9.2 per cent), outperforming the MSCI Real Estate UK All Industrial Quarterly index which increased by 31.2 per cent over the same period. The performance was due to yield compression and the continued capture of reversionary potential in lease reviews and renewals, particularly in London. The true equivalent yield applied to our UK portfolio was 3.7 per cent, 60 basis points lower than at 31 December 2020 (4.3 per cent) reflecting strong rental growth, yield compression and the impact of newly completed developments. Rental values improved by 18.8 per cent (2020: 3.1 per cent).
Assets held throughout the year in Continental Europe increased in value by 18.7 per cent (2020: 10.2 per cent) on a constant currency basis, reflecting a combination of yield compression to 4.0 per cent (31 December 2020: 4.8 per cent) and rental value growth of 4.1 per cent (2020: 1.5 per cent).
More details of our property portfolio can be found in Note 27 to the Financial Statements and in the 2021 Property Analysis Report available at www.segro.com/investors.
ASSETS UNDER MANAGEMENT
£21.3bn2020: £15.3bn
PORTFOLIO VALUATION
£18.4bn2020: £13.0bn
PORTFOLIO VALUATION CHANGE
+28.8%2020: +10.3%
ERV GROWTH
+13.1%2020: 2.5%
UNREALISED GAINS AND LOSSES ON WHOLE PORTFOLIO
+27
.4%
+26
.6%
+21
.9%
+24
.6%
+15
.4%
+28
.8%
Gre
ater
Lon
don
Tham
es V
alle
y
Nat
iona
l Log
istic
s
Nor
ther
n Eu
rope
Sout
hern
Eur
ope
Cen
tral
Eur
ope
Tota
l
Capital growth
Unrealisedgains
£4.5bn
£3.5bn
£4bn
£2.5bn
£3bn
£1.5bn
£2bn
£1bn
£0.5bn
+35
.8%
49SEGRO PLC | ANNUAL REPORT & ACCOUNTS 2021
OVERVIEW STRATEGIC REPORT GOVERNANCE FINANCIAL STATEMENTS
05_Review2021_46_65_v117.indd 4905_Review2021_46_65_v117.indd 49 01/03/2022 17:1601/03/2022 17:16
50 SEGRO PLC | ANNUAL REPORT & ACCOUNTS 2021
STRATEGIC REPORT
Chief Operating Officer Interview:Andy Gulliford discusses rental growth, development and sourcing new opportunities.
What were the highlights of 2021 for you?One of the highlights of 2021 for me was being able to get back on the road again and visit our offices across Europe. The progress that has been made during the pandemic is quite staggering, particularly in Spain where we now manage almost £600 million of assets. It was also great to bring the Slough offices back into the portfolio as that creates a really exciting redevelopment opportunity.
Vacancy is now at record lows across your key markets. Can too little vacancy be a bad thing?Low market vacancy is generally positive as it allows our asset managers to focus on driving rents forward rather than managing the portfolio for occupancy, and we have seen the results of this in the strong rental growth delivered during 2021. A lack of available space does present challenges in that it means there are less frequent opportunities to create new rental levels and sometimes that means we have to be prepared to hold out for longer on letting space. However, we have a significant development programme and the current shortage of supply has given us the confidence to push forward a number of speculative urban schemes which are letting very well.
Given the strength of rental growth across the sector during 2021, do you have any concerns about the affordability of rents?We have a very diverse customer base and for the majority their warehouse rents are still a small part of their total cost base. In London, where rental growth has been strongest, we have a very broad portfolio with various rental points so we generally find that customers will find the space that works for them. Where it is less important to a customer’s business model to be in a central location, that sometimes means they make a decision to move further out and therefore pay lower rents. In general though, we are finding that for the majority of lettings that there are a number of customers from different industries willing to pay the going market rents so rent affordability does not seem to be a problem at the moment.
05_Review2021_46_65_v117.indd 5005_Review2021_46_65_v117.indd 50 01/03/2022 17:1601/03/2022 17:16
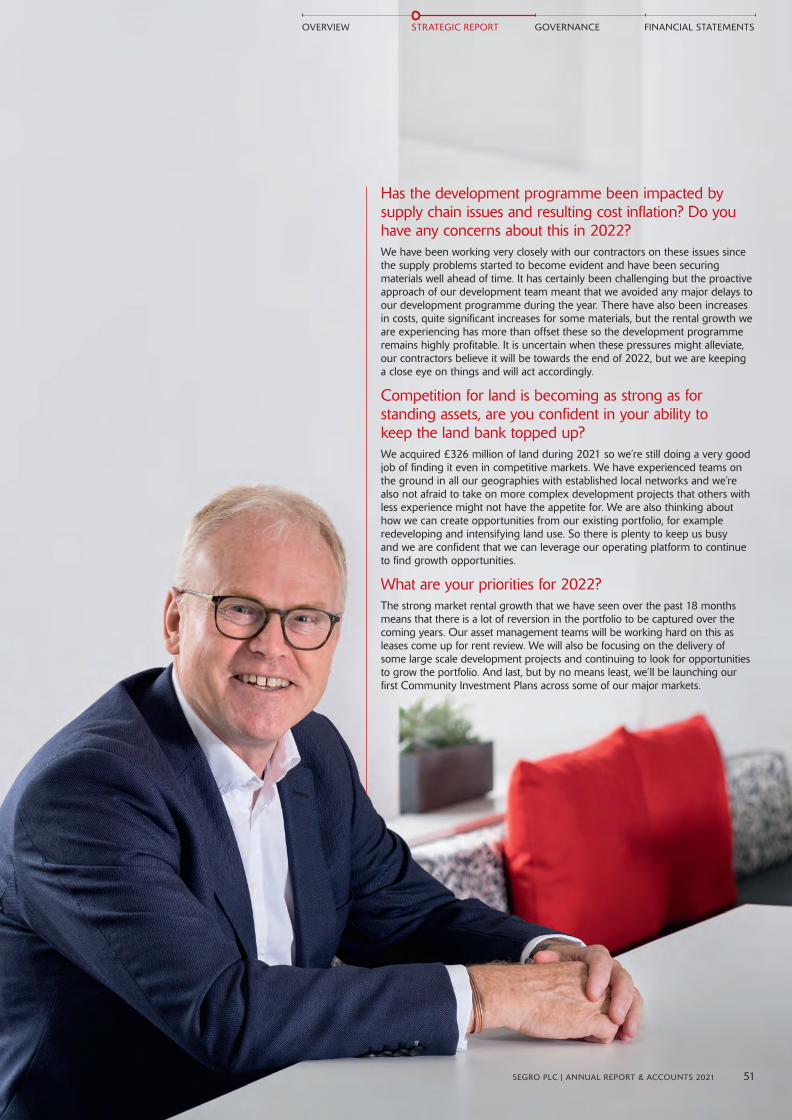
Has the development programme been impacted by supply chain issues and resulting cost inflation? Do you have any concerns about this in 2022?We have been working very closely with our contractors on these issues since the supply problems started to become evident and have been securing materials well ahead of time. It has certainly been challenging but the proactive approach of our development team meant that we avoided any major delays to our development programme during the year. There have also been increases in costs, quite significant increases for some materials, but the rental growth we are experiencing has more than offset these so the development programme remains highly profitable. It is uncertain when these pressures might alleviate, our contractors believe it will be towards the end of 2022, but we are keeping a close eye on things and will act accordingly.
Competition for land is becoming as strong as for standing assets, are you confident in your ability to keep the land bank topped up?We acquired £326 million of land during 2021 so we’re still doing a very good job of finding it even in competitive markets. We have experienced teams on the ground in all our geographies with established local networks and we’re also not afraid to take on more complex development projects that others with less experience might not have the appetite for. We are also thinking about how we can create opportunities from our existing portfolio, for example redeveloping and intensifying land use. So there is plenty to keep us busy and we are confident that we can leverage our operating platform to continue to find growth opportunities.
What are your priorities for 2022?The strong market rental growth that we have seen over the past 18 months means that there is a lot of reversion in the portfolio to be captured over the coming years. Our asset management teams will be working hard on this as leases come up for rent review. We will also be focusing on the delivery of some large scale development projects and continuing to look for opportunities to grow the portfolio. And last, but by no means least, we’ll be launching our first Community Investment Plans across some of our major markets.
51SEGRO PLC | ANNUAL REPORT & ACCOUNTS 2021
FINANCIAL STATEMENTSOVERVIEW STRATEGIC REPORT GOVERNANCE
05_Review2021_46_65_v117.indd 5105_Review2021_46_65_v117.indd 51 01/03/2022 17:1601/03/2022 17:16
PROGRESS AGAINST OUR STRATEGY
WHAT WE SAID WE WOULD DOWe expected occupier demand to remain strong in all of our markets and expected vacancy rates to remain low. With supply also remaining limited we expected customer retention to remain high and rental growth to continue.
WHAT WE ACHIEVED IN 2021We contracted a record level of rent during 2021 reflecting a strong performance in rent reviews and renewals and continued momentum in pre-lettings. The vacancy rate remained low, aided by a strong performance in letting up recently completed speculative developed space.
We also made good progress with reducing our operating carbon emissions and increasing the visibility that we have of our customers’ emissions.
WHAT TO EXPECT IN 2022All of the indicators point to continued strong demand from occupiers in 2022 and with market vacancy rates at record low levels and new supply constrained by the availability of land, particularly in urban markets, we expect rental growth to continue.
Our continued focus on Operational Excellence has helped us to deliver a record level of rental growth in 2021 and ensured the successful execution of our expanded development programme.GROWING RENTAL INCOME FROM LETTING EXISTING SPACE AND NEW DEVELOPMENTS
At 31 December 2021, our portfolio generated passing rent of £518 million, rising to £579 million once rent free periods expire (‘headline rent’). During the year, we contracted £95 million of new headline rent, an increase of more than 20 per cent on 2020. New pre-let agreements continue to contribute strongly to this number but we also grew rent on our existing space significantly.
Our customer base remains well diversified, reflecting the multitude of uses of warehouse space. Our top 20 customers account for 32 per cent of total headline rent. Amazon remained as our largest customer during 2021, accounting for 7 per cent of the total.
Almost half of our customers are involved in businesses affected by e-commerce, including third party logistics and parcel delivery businesses, and retailers. These businesses accounted for almost 60 per cent of our take-up during the year.
} £15 million of net new rent from existing assets. We generated £26 million of headline rent from new leases on existing assets (2020: £16 million) and £9 million from rent reviews, lease renewals and indexation (2020: £13 million). This was offset by rent from space returned of £20 million (2020: £13 million) including £2 million of rent lost due to insolvency (2020: £2 million).
} Rental growth from lease reviews and renewals. These generated an uplift of 13.0 per cent (2020: 19.1 per cent) for the portfolio as a whole compared to previous headline rent. During the year, new rents agreed at review and renewal were 18.7 per cent higher in the UK (2020: 28.2 per cent) as reversion accumulated over the past five years was reflected in new rents agreed, adding £5 million of headline rent. The 2020 comparator included the peppercorn lease re-gears at Heathrow which are now all complete. In Continental Europe, rents agreed on renewal were 1.5 per cent higher (2020: 0.5 per cent higher), strengthening once again as market rental growth continues to outpace the indexation provisions that have accumulated over recent years.
Creating value through Operational Excellence Asset management update
Strong occupier demand and low levels of vacancy across our markets created the perfect conditions for rental growth during 2021.ANDY GULLIFORDCHIEF OPERATING OFFICER
52 SEGRO PLC | ANNUAL REPORT & ACCOUNTS 2021
STRATEGIC REPORT
Review of 2021
05_Review2021_46_65_v117.indd 5205_Review2021_46_65_v117.indd 52 01/03/2022 17:1601/03/2022 17:16

HIGHLIGHTS
PORTFOLIO PASSING RENT
£518m2020: £462m
RENT CONTRACTED DURING THE YEAR
£95m2020: £78m
CUSTOMER SATISFACTION
90%2020: 87%
OPERATING CARBON EMISSIONS
280,575 tonnes CO2e2020: 312,115 tonnes CO2e
} Continued strong demand from customers for pre-let agreements. In addition to increased rents from existing assets, we contracted a record £49 million of headline rent from pre-let agreements and lettings of speculative developments prior to completion (2020: £41 million). Included within this is a large data centre re-development on the Slough Trading Estate, two units on some of the last remaining plots at SEGRO Logistics Park East Midlands Gateway (SLP-EMG), our first development at the recently announced SmartParc in Derby, projects for a leading global online retailer in the UK, Italy and Spain as well as big box space for retailers, third party logistics providers and manufacturers across Continental Europe.
} Rent roll growth increased to £72 million. An important element of achieving our goal of being a leading income-focused REIT is to grow our rent roll, primarily through increasing rent from our existing assets and then from generating new rent through development. Rent roll growth, which reflects net new headline rent from existing space (adjusted for takebacks of space for development), take-up of developments and pre-lets agreed during the period, increased to £72 million in 2021, from £60 million in 2020.
VACANCY RATE
3.2%2020: 3.9%
PROPORTION OF PORTFOLIO EPC RATED ‘B’ OR ABOVE
55%2020: 49%
CUSTOMER RETENTION
77%2020: 86%
53SEGRO PLC | ANNUAL REPORT & ACCOUNTS 2021
OVERVIEW STRATEGIC REPORT GOVERNANCE FINANCIAL STATEMENTS
05_Review2021_46_65_v117.indd 5305_Review2021_46_65_v117.indd 53 01/03/2022 17:1601/03/2022 17:16

EXISTING PORTFOLIO CONTINUES TO PERFORM WELL AND DELIVERED ANOTHER SET OF STRONG OPERATING METRICS
We monitor a number of asset management indicators to assess the performance of our existing portfolio:
}High levels of customer satisfaction. Although the quality and location of our portfolio is important to our customers, we believe that the service we provide is crucial to maintaining high customer retention and low vacancy. We carry out a rolling survey of our customer base throughout the year to identify and rectify issues promptly. In 2021, 247 customers responded (a 25 per cent increase on 2020) and 97 per cent said that they would recommend SEGRO to others (2020: 99 per cent) and 90 percent said they rated their experience with SEGRO as ‘Excellent’ or ‘Very Good’ (2020: 87 per cent).
}Vacancy has remained low. The vacancy rate at 31 December 2021 was 3.2 per cent (31 December 2020: 3.9 per cent). This reduction was mainly due to a very strong performance in letting recently completed speculatively developed space across the portfolio. The vacancy rate on our standing stock remains low at 2.7 per cent (2020: 2.5 per cent). The vacancy rate is now at the bottom end of our target range of between four and six per cent. The average vacancy rate during the period was 3.8 per cent (2020: 4.8 per cent).
} Customer retention rate of 77 per cent. Approximately £55 million of headline rent was at risk from a break or lease expiry during the period of which we retained 74 per cent in existing space, with a further three per cent retained but in new premises. We value the long-term relationships that we build with our customers and always try to work with them to meet their changing requirements. However, with vacancy at such low levels we do also take the opportunity to create space for reletting and the capture of market rental growth. We have also actively taken space back during 2021 to enable redevelopment.
} Lease terms continue to offer attractive income security. The level of incentives agreed for new leases (excluding those on developments completed in the period) represented 6.3 per cent of the headline rent (2020: 6.8 per cent). The portfolio’s weighted average lease length was maintained with 7.2 years to first break and 8.5 years to expiry (31 December 2020: 7.5 years to first break, 8.8 years to expiry). Lease terms are longer in the UK (8.2 years to break) than in Continental Europe (5.9 years to break), reflecting the market convention of shorter leases in countries such as France and Poland.
A REDUCTION IN OUR OPERATIONAL CARBON EMISSIONS AND INCREASED VISIBILITY OF THE ENERGY USAGE OF OUR CUSTOMERS
Alongside the day-to-day management of our portfolio our teams also worked hard during 2021 on our Responsible SEGRO commitment to Champion low-carbon growth and be a net-zero carbon business by 2030.
Within the asset management of our existing portfolio, the greatest contribution that we can make towards this is by reducing the operational carbon emissions from our warehouses (including those made by the activities of our customers operating within them).
Our new targets, approved by the Science Based Targets Initiative (SBTi), include the aim to reduce the absolute operating carbon emissions from our portfolio by 42 per cent by 2030 (compared to a 2020 baseline), in line with the 1.5 degree scenario. This includes all customer emissions and captures the organic growth of the business.
One of the most meaningful changes that we can make is to procure energy for our own operations, and for those markets where we procure energy on behalf of our customers, in a way which reduces the operational emissions. We have been moving our controlled portfolio on to renewable energy tariffs over the past years and in 2021 we moved the last major contracts, in Poland and Czech Republic, on to Green tariffs, which means that all SEGRO controlled electricity is now zero-carbon. This was one of the main drivers of the 10 per cent reduction in operating carbon emissions during 2021, equating to 31,500 tonnes of CO2e saved.
This certified renewable energy helps SEGRO and our customers reduce their operating carbon footprint. Transitioning away from fossil fuels for warehouse heating on to electricity, particularly generated on site, or alternative sources of energy is an important next step in this strategy.
Our net-zero carbon goal includes Scope 3 emissions from our customers. Due to the nature of typical lease terms we do not have operational control over the majority of our buildings and therefore have limited visibility of how much energy is used and how it is procured.
54 SEGRO PLC | ANNUAL REPORT & ACCOUNTS 2021
STRATEGIC REPORT
Review of 2021
Creating value through Operational Excellence Asset management update continued
05_Review2021_46_65_v117.indd 5405_Review2021_46_65_v117.indd 54 01/03/2022 17:1601/03/2022 17:16
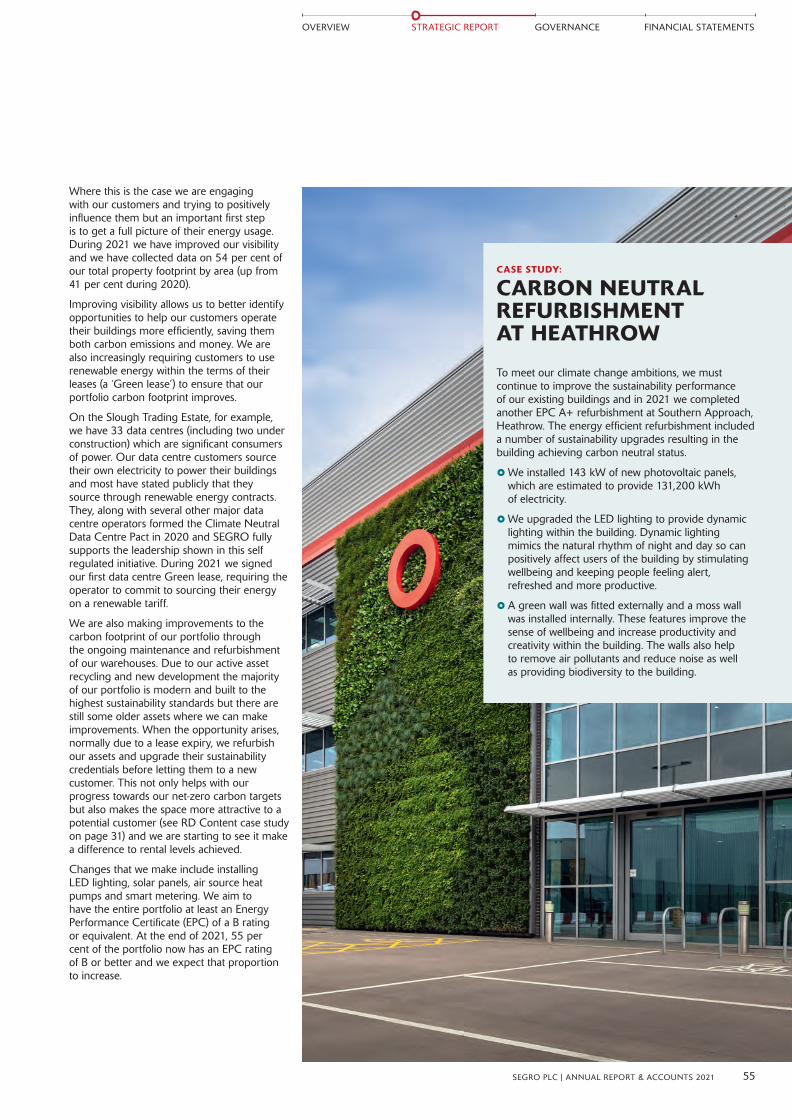
CASE STUDY:
CARBON NEUTRAL REFURBISHMENT AT HEATHROW
To meet our climate change ambitions, we must continue to improve the sustainability performance of our existing buildings and in 2021 we completed another EPC A+ refurbishment at Southern Approach, Heathrow. The energy efficient refurbishment included a number of sustainability upgrades resulting in the building achieving carbon neutral status.
}We installed 143 kW of new photovoltaic panels, which are estimated to provide 131,200 kWh of electricity.
}We upgraded the LED lighting to provide dynamic lighting within the building. Dynamic lighting mimics the natural rhythm of night and day so can positively affect users of the building by stimulating wellbeing and keeping people feeling alert, refreshed and more productive.
} A green wall was fitted externally and a moss wall was installed internally. These features improve the sense of wellbeing and increase productivity and creativity within the building. The walls also help to remove air pollutants and reduce noise as well as providing biodiversity to the building.
Where this is the case we are engaging with our customers and trying to positively influence them but an important first step is to get a full picture of their energy usage. During 2021 we have improved our visibility and we have collected data on 54 per cent of our total property footprint by area (up from 41 per cent during 2020).
Improving visibility allows us to better identify opportunities to help our customers operate their buildings more efficiently, saving them both carbon emissions and money. We are also increasingly requiring customers to use renewable energy within the terms of their leases (a ‘Green lease’) to ensure that our portfolio carbon footprint improves.
On the Slough Trading Estate, for example, we have 33 data centres (including two under construction) which are significant consumers of power. Our data centre customers source their own electricity to power their buildings and most have stated publicly that they source through renewable energy contracts. They, along with several other major data centre operators formed the Climate Neutral Data Centre Pact in 2020 and SEGRO fully supports the leadership shown in this self regulated initiative. During 2021 we signed our first data centre Green lease, requiring the operator to commit to sourcing their energy on a renewable tariff.
We are also making improvements to the carbon footprint of our portfolio through the ongoing maintenance and refurbishment of our warehouses. Due to our active asset recycling and new development the majority of our portfolio is modern and built to the highest sustainability standards but there are still some older assets where we can make improvements. When the opportunity arises, normally due to a lease expiry, we refurbish our assets and upgrade their sustainability credentials before letting them to a new customer. This not only helps with our progress towards our net-zero carbon targets but also makes the space more attractive to a potential customer (see RD Content case study on page 31) and we are starting to see it make a difference to rental levels achieved.
Changes that we make include installing LED lighting, solar panels, air source heat pumps and smart metering. We aim to have the entire portfolio at least an Energy Performance Certificate (EPC) of a B rating or equivalent. At the end of 2021, 55 per cent of the portfolio now has an EPC rating of B or better and we expect that proportion to increase.
55SEGRO PLC | ANNUAL REPORT & ACCOUNTS 2021
OVERVIEW STRATEGIC REPORT GOVERNANCE FINANCIAL STATEMENTS
05_Review2021_46_65_v117.indd 5505_Review2021_46_65_v117.indd 55 01/03/2022 17:1601/03/2022 17:16
PROGRESS AGAINST OUR STRATEGY
WHAT WE SAID WE WOULD DOWe expected to continue developing at an increased pace during 2021 and anticipated investing around £700 million in development capex, including infrastructure.
WHAT WE ACHIEVED IN 20212021 has been another year of record development completions, the majority of which have been completed as scheduled despite the wider market supply chain issues. Our development capex spend was slightly lower than anticipated due to the delayed start of some larger pre-lets due to planning delays and changes to our customers’ requirements.
We carried out life cycle assessments on more than half of our new development projects which is important in our aim to reduce embodied carbon in our development programme.
WHAT TO EXPECT IN 2022We have 801,400 sq m of development projects under way capable of generating £62 million of new headline rent, of which 60 per cent has been secured.
We expect to invest approximately of £700 million in development capex including £150 million of infrastructure expenditure.
HIGHLIGHTS
DEVELOPMENT COMPLETIONS
839,200 sq m2020: 835,900 sq m
CURRENT PIPELINE POTENTIAL RENT
£62m2020: £54m
CURRENT PIPELINE YIELD ON COST
7.0%2020: 6.5%
POTENTIAL RENT FROM FUTURE PIPELINE
£169m2020: £157m
DEVELOPMENT CAPEX
£649m2020: £531m
EMBODIED CARBON
391kgCO2e/m2
2020: 400kgCO2e/m2
ON-SITE RENEWABLE ENERGY CAPACITY
35.4 MW2020: 26.8 MW
DEVELOPMENT ACTIVITY
During 2021, we invested £975 million in our development pipeline which comprised £649 million (2020: £531 million) in development spend, of which £99 million was for infrastructure, and a further £326 million to replenish our land bank to secure future development-led growth opportunities.
DEVELOPMENT PROJECTS COMPLETED
We completed 839,200 sq m of new space during the year, with the majority of our projects completing on time despite wider market issues with the supply of construction materials and labour. These projects were 82 per cent pre-let prior to the start of construction and were 93 per cent let as at 31 December 2021, generating £48 million of headline rent, with a potential further £4 million to come when the remainder of the space is let. This translates into a yield on total development cost (including land, construction and finance costs) of 6.8 per cent when fully let.
We completed 677,800 sq m of big box warehouse space, including four units at SLP-EMG. Also within this was 560,800 sq m of big box warehouses across all of our major European markets, let to third party logistics operators, online retailers, food retailers and manufacturers among others.
We completed 161,400 sq m of urban warehouses, the majority built on a speculative basis of which over three quarters is already let. In the UK this included the second phase of SEGRO Park Rainham, new units at SEGRO Park Fairway Drive and two new data centres on the Slough Trading Estate. On the Continent we completed further phases of urban warehouse parks in the key markets of Berlin, Cologne, Madrid, Warsaw and Paris, including
the first of our developments on the land that we acquired as part of the Sofibus Patrimoine acquisition at the start of 2021.
Supply chain issues made development more challenging during 2021 but we proactively worked with our contractors to secure materials ahead of schedule and were therefore able to avoid any major delays. We also avoided any significant increases in construction costs as the majority of our development projects are on fixed price contracts and development completions were therefore unaffected.
CURRENT DEVELOPMENT PIPELINE
At 31 December 2021, we had development projects approved, contracted or under construction totalling 801,400 sq m, representing £380 million of future capital expenditure to complete and £62 million of annualised gross rental income when fully let. 60 per cent of this rent has already been secured and these projects should yield 7.0 per cent on total development cost when fully occupied.
} In the UK, we have 195,200 sq m of space approved or under construction. Within this are urban schemes in West and North London, two new data centres on the Slough Trading Estate, a pre-let for a global online retailer in the Thames Valley and big box warehouses in SLP-EMG and our new development, SmartParc Derby.
} In Continental Europe, we have 521,100 sq m of space approved or under construction. This includes pre-let big box warehouses for a variety of different occupiers, from retailers to manufacturers, across all of our European markets. We are also developing further phases of our successful urban warehouse parks in Berlin and Paris and a new scheme in Ingolstadt, close to Munich.
Growing through development Development update
56 SEGRO PLC | ANNUAL REPORT & ACCOUNTS 2021
STRATEGIC REPORT
Review of 2021
05_Review2021_46_65_v117.indd 5605_Review2021_46_65_v117.indd 56 01/03/2022 17:1601/03/2022 17:16
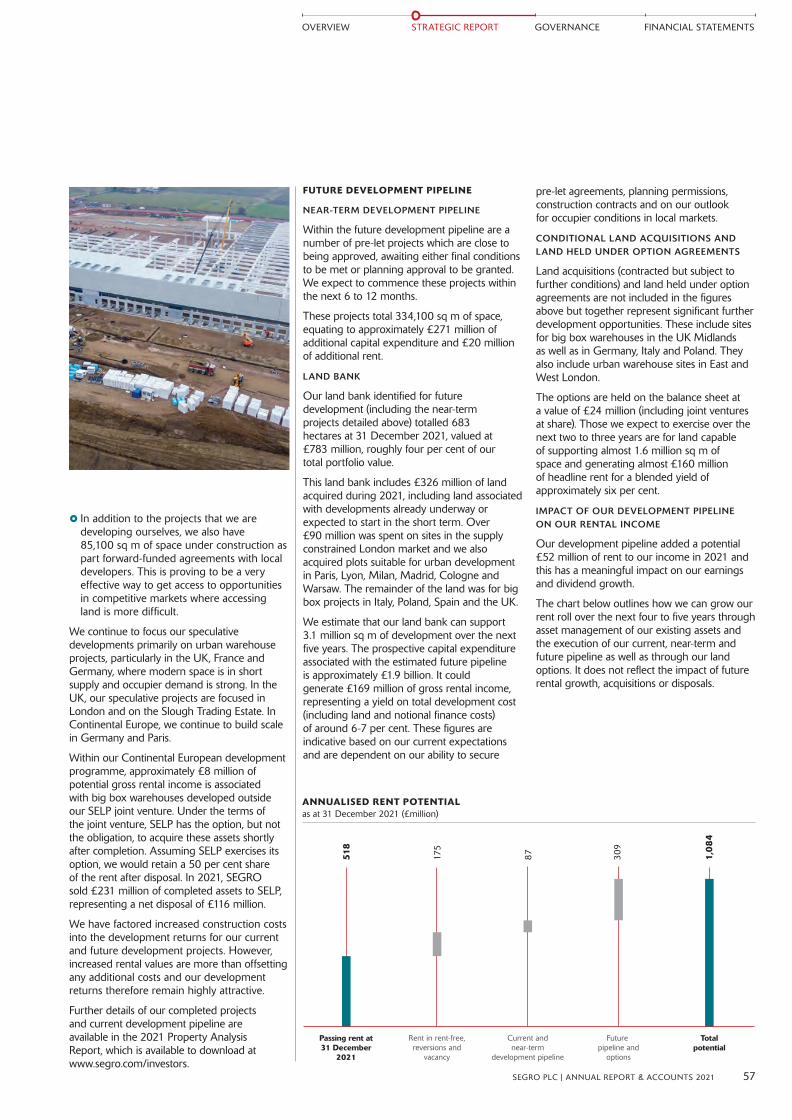
pre-let agreements, planning permissions, construction contracts and on our outlook for occupier conditions in local markets.
CONDITIONAL LAND ACQUISITIONS AND LAND HELD UNDER OPTION AGREEMENTS
Land acquisitions (contracted but subject to further conditions) and land held under option agreements are not included in the figures above but together represent significant further development opportunities. These include sites for big box warehouses in the UK Midlands as well as in Germany, Italy and Poland. They also include urban warehouse sites in East and West London.
The options are held on the balance sheet at a value of £24 million (including joint ventures at share). Those we expect to exercise over the next two to three years are for land capable of supporting almost 1.6 million sq m of space and generating almost £160 million of headline rent for a blended yield of approximately six per cent.
IMPACT OF OUR DEVELOPMENT PIPELINE ON OUR RENTAL INCOME
Our development pipeline added a potential £52 million of rent to our income in 2021 and this has a meaningful impact on our earnings and dividend growth.
The chart below outlines how we can grow our rent roll over the next four to five years through asset management of our existing assets and the execution of our current, near-term and future pipeline as well as through our land options. It does not reflect the impact of future rental growth, acquisitions or disposals.
FUTURE DEVELOPMENT PIPELINE
NEAR-TERM DEVELOPMENT PIPELINE
Within the future development pipeline are a number of pre-let projects which are close to being approved, awaiting either final conditions to be met or planning approval to be granted. We expect to commence these projects within the next 6 to 12 months.
These projects total 334,100 sq m of space, equating to approximately £271 million of additional capital expenditure and £20 million of additional rent.
LAND BANK
Our land bank identified for future development (including the near-term projects detailed above) totalled 683 hectares at 31 December 2021, valued at £783 million, roughly four per cent of our total portfolio value.
This land bank includes £326 million of land acquired during 2021, including land associated with developments already underway or expected to start in the short term. Over £90 million was spent on sites in the supply constrained London market and we also acquired plots suitable for urban development in Paris, Lyon, Milan, Madrid, Cologne and Warsaw. The remainder of the land was for big box projects in Italy, Poland, Spain and the UK.
We estimate that our land bank can support 3.1 million sq m of development over the next five years. The prospective capital expenditure associated with the estimated future pipeline is approximately £1.9 billion. It could generate £169 million of gross rental income, representing a yield on total development cost (including land and notional finance costs) of around 6-7 per cent. These figures are indicative based on our current expectations and are dependent on our ability to secure
} In addition to the projects that we are developing ourselves, we also have 85,100 sq m of space under construction as part forward-funded agreements with local developers. This is proving to be a very effective way to get access to opportunities in competitive markets where accessing land is more difficult.
We continue to focus our speculative developments primarily on urban warehouse projects, particularly in the UK, France and Germany, where modern space is in short supply and occupier demand is strong. In the UK, our speculative projects are focused in London and on the Slough Trading Estate. In Continental Europe, we continue to build scale in Germany and Paris.
Within our Continental European development programme, approximately £8 million of potential gross rental income is associated with big box warehouses developed outside our SELP joint venture. Under the terms of the joint venture, SELP has the option, but not the obligation, to acquire these assets shortly after completion. Assuming SELP exercises its option, we would retain a 50 per cent share of the rent after disposal. In 2021, SEGRO sold £231 million of completed assets to SELP, representing a net disposal of £116 million.
We have factored increased construction costs into the development returns for our current and future development projects. However, increased rental values are more than offsetting any additional costs and our development returns therefore remain highly attractive.
Further details of our completed projects and current development pipeline are available in the 2021 Property Analysis Report, which is available to download at www.segro.com/investors.
ANNUALISED RENT POTENTIAL as at 31 December 2021 (£million)
518
175
87 309
1,0
84
Passing rent at31 December
2021
Totalpotential
Rent in rent-free,reversions and
vacancy
Current andnear-term
development pipeline
Future pipeline and
options
57SEGRO PLC | ANNUAL REPORT & ACCOUNTS 2021
OVERVIEW STRATEGIC REPORT GOVERNANCE FINANCIAL STATEMENTS
05_Review2021_46_65_v117.indd 5705_Review2021_46_65_v117.indd 57 01/03/2022 17:1601/03/2022 17:16

CASE STUDY:
REDUCING EMBODIED CARBON
Hoeksteen 81, Netherlands
Our latest development in the Netherlands utilised an improved concrete specification in the foundations and floor slab, reducing the embodied carbon of the building by around 10 per cent.
This required careful planning to deliver the project on time as the lower carbon concrete takes longer to cure.
FOCUSING ON REDUCING EMBODIED CARBON IN OUR DEVELOPMENT PROGRAMME TO HELP US ACHIEVE NET-ZERO CARBON BY 2030
We recognise that our planet is facing a climate emergency and that we need to play our part in helping to combat the challenge of climate change and natural resource depletion. As a result, we have joined many of our sector peers in signing a pledge to be Net-Zero carbon by 2050, and last year announced that we will be going further and faster by reaching that aim by 2030. We have also joined to Race to Zero, signed the Climate Pledge and took part in a Better Buildings Partnership panel at COP 26 titled ‘Commercial Buildings: A real asset in addressing Climate Change’.
It is our responsibility, as a long-term investor, to use the latest technologies and construction techniques to ensure that our buildings are efficient to use and stand the test of time.
We continuously monitor and, where appropriate, adopt new approaches, technologies and techniques to reduce the environmental footprint of our existing properties and our developments. The Investment Committee considers the environmental impact of all capital investment decisions to ensure that they are consistent with our environmental targets and ambitions.
We take a materiality-based approach to our environmental strategy, focusing on the areas where our footprint is greatest.
One of the largest sources of carbon emissions from our own activities is the embodied carbon from our development programme. For our existing buildings, we can work to improve their efficiency in operational terms (see page 54 for further information) but it is in our development programme, where we can make the greatest impact. In many cases, once we hand a building over to a customer, they control all operational aspects so it is our responsibility to provide them with an efficient building and the tools to operate it efficiently.
Our targets, approved by the Science Based Target Initiative (SBTi), include a goal to reduce the embodied carbon intensity of our development programme by 20 per cent by 2030, compared to a 2020 baseline.
58 SEGRO PLC | ANNUAL REPORT & ACCOUNTS 2021
Growing through development Development activity and pipeline update continued
STRATEGIC REPORT
Review of 2021
05_Review2021_46_65_v117.indd 5805_Review2021_46_65_v117.indd 58 01/03/2022 17:1601/03/2022 17:16

MATERIALS
Our sustainability strategy in development requires that we target the upfront carbon footprint of our developments, related to the construction materials and transportation emissions attributed to every new development. This is in line with the methodology used by the UK Green Buildings Council (UKBGC) in their Whole Life Carbon roadmap.
During 2021 we worked with two of our largest contractors to discuss how best to reduce embodied carbon in our buildings and are working towards a Sustainable Materials Brief for the UK and intend to adapt this for Continental Europe.
We carry out life cycle assessments on our larger development projects to identify the potential to reduce a building’s carbon footprint over its full life cycle both by utilising alternative, more sustainable materials during construction and by considering the emissions related to the deconstruction at the end of the building’s useful life. We believe this holistic approach to embodied carbon is the most impactful.
In 2021, we conducted life cycle assessments on over 440,000 sq m of new developments, covering over half of the development footprint by area in the year. Going forward, we aim to carry out life cycle assessments on all projects greater than 5,000 sq m (representing 98 per cent of complete floorspace in 2021) and apply lessons learned across the wider development programme as we progress against our target.
We are increasingly using Building Information Management (BIM) in our development projects, a technology which facilitates three dimensional modelling of the proposed building. It allows us to assess more accurately the amount of material needed for the construction (reducing waste) and the carbon emissions from the materials. It also allows us to model the building across its whole life, making it an important contributor to our target of reducing the level of whole life-cycle embodied carbon in our developments. In 2021 we were able to use BIM models to undertake the life cycle assessments, and this has led to more finishes and components being included in our assessments than before, giving us better visibility of the carbon within our buildings.
The average embodied carbon intensity in 2021 was 391 kilograms CO
2e per sq m of delivered floor space, representing a two per cent reduction from the recalculated 2020 baseline of 400 kg CO2e per sq m.
We have trialled sustainable concrete specifications across multiple projects in 2021. This is the most effective way to impact the embodied carbon emissions, as concrete can comprise up to 50 per cent of the total embodied carbon in some projects.
We will continue to adopt the latest techniques to reduce embodied carbon within our developments, including low-carbon concrete and timber or recycled steel beams which we are already using in a number of our current developments. The availability of such materials is not yet consistent across our markets and they are not always suited to the design of our buildings. but we are determined to continue to reduce the embodied carbon within our development pipeline to achieve our science-based target.
WASTE
While waste generated across our own offices (where we have control) is monitored, tracked and reported, the majority of our waste is created as a result of our construction and demolition projects. Our target is to send zero waste to landfill by 2025.
For demolition waste, which makes up the bulk of our total waste, we re-use as much as possible on-site to avoid the carbon emissions related to transportation of waste off-site and the import of new materials from elsewhere.
We undertake pre-demolition audits to identify waste materials taking into consideration the quantity and quality of waste to be re-used on site as aggregate. We also re-use on site where materials are non-hazardous and will not have a detrimental effect on the environment. Hazardous waste is treated differently and is not included within these figures. Hazardous waste is dealt with in the appropriate manner, fully in line with relevant regulation.
In 2021, 97 per cent of construction, demolition and operational waste controlled by SEGRO was diverted from landfill.
BIODIVERSITY
We think carefully about the spaces outside our existing and new buildings to ensure that they are pleasant environments for people to work in, meet the needs of our local communities and have a positive impact on local biodiversity.
Where possible we create green spaces within our estates, including woodland areas with public walking trails around our big box parks or small ‘pocket parks’ and green walls in our urban estates. We plant indigenous trees and have even renatured stream beds. On many of our estates we have introduced bee hives and now have 335 of them across our portfolio encouraging pollination of local plants and crops. We have also added bird boxes, bat boxes and other locally-appropriate biodiversity features that help contribute to a healthy ecosystem.
On land that is awaiting development in Italy we pay local farmers to manage the plots and graze livestock which have yielded risotto rice, buffalo mozzarella and wool whilst also keeping the grass well maintained.
BUILDING CERTIFICATIONS
The sustainability credentials of a building are increasingly important for potential customers making a decision on where to locate their businesses.
We target BREEAM ‘Very Good’ (or equivalent) certification for developments and in 2021 98 per cent of our development completions have either been, or in the process of being, accredited at that level. From 2022 onwards we have raised we have raised the minimum standard to ‘Excellent’ unless local circumstances (such as supply chains) prevent it.
RENEWABLE ENERGY CAPACITY
Our development and refurbishment activity also allows us to increase our on-site renewable energy capacity. During 2021 we increased this capacity by over 30 per cent bringing it to 35.4 MW, and generating enough energy to power over 2,100 homes for a year.
59SEGRO PLC | ANNUAL REPORT & ACCOUNTS 2021
OVERVIEW STRATEGIC REPORT GOVERNANCE FINANCIAL STATEMENTS
05_Review2021_46_65_v117.indd 5905_Review2021_46_65_v117.indd 59 01/03/2022 17:1601/03/2022 17:16

PROGRESS AGAINST OUR STRATEGY
WHAT WE SAID WE WOULD DOWe expected demand for warehouse assets to remain strong and said that we would continue to trim the portfolio and sell assets where we believe we have maximised our returns to release funds for other opportunities offering a better risk-return profile.
We intended to continue the focus of our investment activity on development, while taking advantage of opportunities to acquire income-producing assets offering attractive risk-adjusted returns if they arose.
WHAT WE ACHIEVED IN 20212021 was a very active year on the investment front. We spent a record amount on our development pipeline, responding to strong levels of occupier demand, and once again created a number of interesting land and asset acquisition opportunities, meaning that spend in this area was much higher than in recent years.
Net investment during the year was £1.5 billion and this included a relatively high number of disposals as we decided to bring forward some planned asset recycling to take advantage of the strong investment markets.
WHAT TO EXPECT IN 2022We will continue our disciplined approach to capital allocation, focusing the majority of our investment on the development pipeline (through development capex, land acquisitions and acquiring assets with future redevelopment potential) but making strategic asset acquisitions when the opportunity arises.
While investor demand for industrial properties remains strong, we expect to continue to recycle assets where we believe we can generate better returns from deploying our capital in other opportunities. We typically expect to recycle 1-2 per cent of the portfolio per year.
HIGHLIGHTS
ACQUISITIONS OF ASSETS
£997m2020: £603m
ACQUISITIONS OF LAND
£326m2020: £286m
DEVELOPMENT CAPEX
£649m2020: £531m
DISPOSALS OF LAND & ASSETS
£515m2020: £139m
We invested almost £2 billion in our portfolio during 2021: development capital expenditure of £649 million, £997 million of assets and £326 million of land. This was partly offset by £515 million of disposals.
ACQUISITIONS FOCUSED ON BUILDING SCALE IN URBAN WAREHOUSING
Despite extremely competitive investment markets we have been able to leverage our market position, reputation, relationships and expertise to complete some unique acquisitions in 2021.
We acquired assets totalling £997 million, reflecting a blended topped-up initial yield of 3.8 per cent. This included:
} the acquisition of an office portfolio in Slough, providing us with additional space for redevelopment on the Slough Trading Estate;
} an off-market UK asset swap that resulted in us acquiring a significant urban warehouse park in West London (Matrix Park) that perfectly complements our existing portfolio in Park Royal and also has a medium term redevelopment opportunity;
} urban assets in North, East and South London with redevelopment potential, helping us to increase our presence in these key strategic markets;
} a former car dealership and car servicing centre with existing underground access over multiple levels in a unique inner-city Paris location;
} an older urban industrial estate in Madrid with short-term income that helps us to unlock a larger redevelopment opportunity.
In addition to the asset acquisitions we also acquired £326 million of land to create future development opportunities (see page 57 for further information).
ASSET RECYCLING TO IMPROVE PORTFOLIO FOCUS
During 2021, we sold £515 million of land and assets, taking advantage of strong investor demand to realise profits and release capital to reinvest in our business.
The asset disposals totalled £474 million, reflecting a blended topped-up initial yield of 4.0 per cent, and were significantly ahead of 31 December 2020 book values. They included:
} the portfolio of UK assets that we swapped for Matrix Park. All of these were older, mostly stand-alone assets that had been identified for medium-term disposal through our annual asset recycling process;
} a portfolio of urban warehouses in Italy, in locations that we regard as non-core, that we had developed for a leading online global retailer to assist them with their expansion plans;
} a car showroom in Reading; and
} stand-alone big box warehouses in Italy and Spain.
As in previous years, we sold a portfolio of Continental European big box warehouses developed by SEGRO to SELP for which we received £116 million net proceeds from an effective sale of a 50 per cent interest.
Additionally, we disposed of £41 million of land, primarily comprising plots in non-core markets.
Investment update £1.5 billion of investment for growth
60 SEGRO PLC | ANNUAL REPORT & ACCOUNTS 2021
STRATEGIC REPORT
Review of 2021
05_Review2021_46_65_v117.indd 6005_Review2021_46_65_v117.indd 60 01/03/2022 17:1601/03/2022 17:16
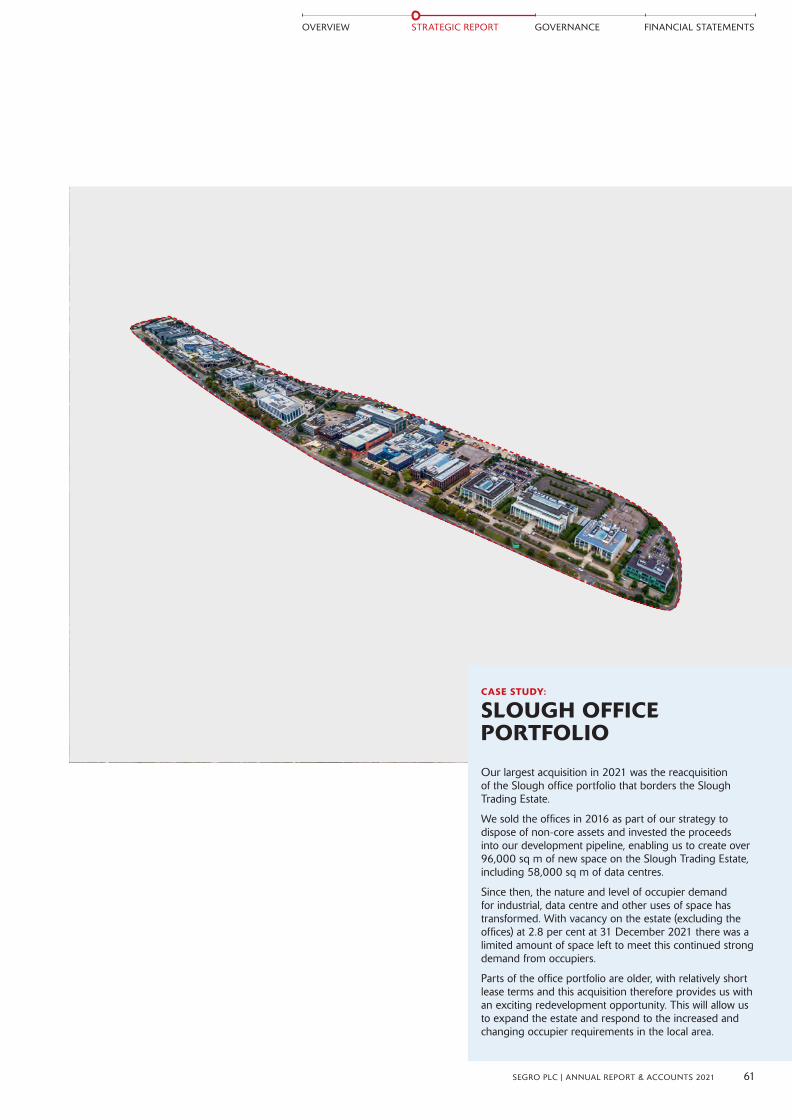
CASE STUDY:
SLOUGH OFFICE PORTFOLIO
Our largest acquisition in 2021 was the reacquisition of the Slough office portfolio that borders the Slough Trading Estate.
We sold the offices in 2016 as part of our strategy to dispose of non-core assets and invested the proceeds into our development pipeline, enabling us to create over 96,000 sq m of new space on the Slough Trading Estate, including 58,000 sq m of data centres.
Since then, the nature and level of occupier demand for industrial, data centre and other uses of space has transformed. With vacancy on the estate (excluding the offices) at 2.8 per cent at 31 December 2021 there was a limited amount of space left to meet this continued strong demand from occupiers.
Parts of the office portfolio are older, with relatively short lease terms and this acquisition therefore provides us with an exciting redevelopment opportunity. This will allow us to expand the estate and respond to the increased and changing occupier requirements in the local area.
61SEGRO PLC | ANNUAL REPORT & ACCOUNTS 2021
OVERVIEW STRATEGIC REPORT GOVERNANCE FINANCIAL STATEMENTS
05_Review2021_46_65_v117.indd 6105_Review2021_46_65_v117.indd 61 01/03/2022 17:1601/03/2022 17:16
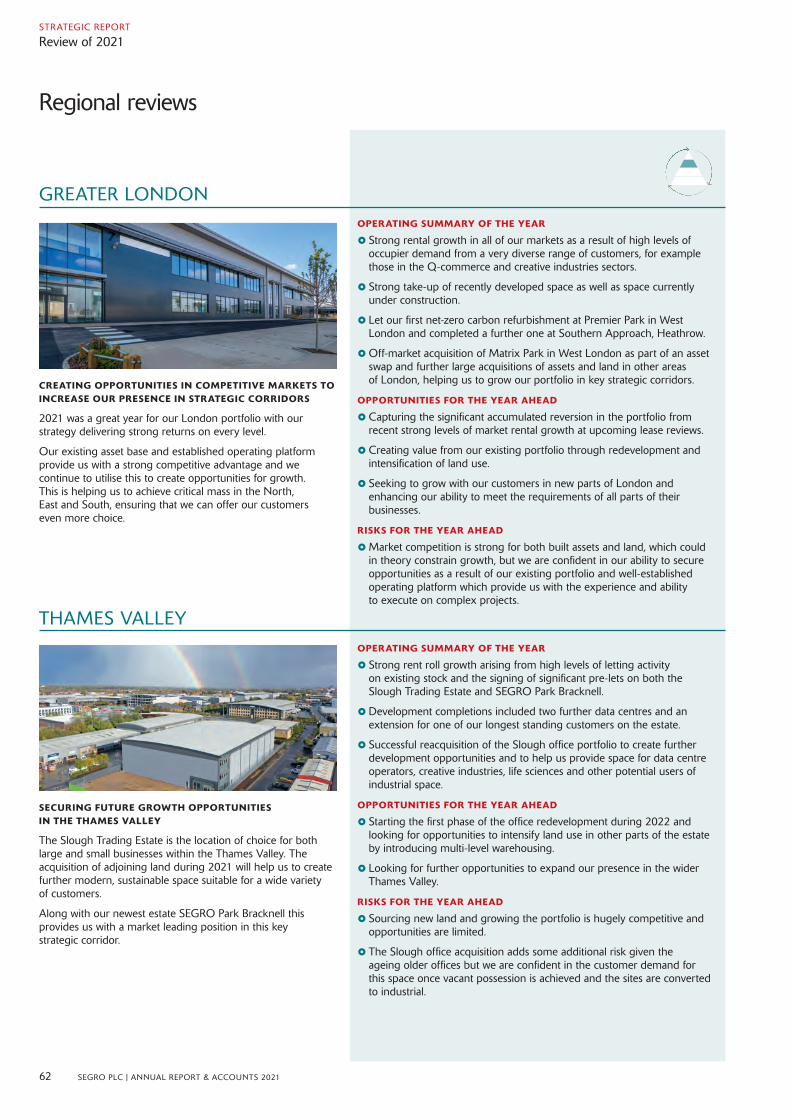
GREATER LONDON
THAMES VALLEY
OPERATING SUMMARY OF THE YEAR
} Strong rental growth in all of our markets as a result of high levels of occupier demand from a very diverse range of customers, for example those in the Q-commerce and creative industries sectors.
} Strong take-up of recently developed space as well as space currently under construction.
} Let our first net-zero carbon refurbishment at Premier Park in West London and completed a further one at Southern Approach, Heathrow.
}Off-market acquisition of Matrix Park in West London as part of an asset swap and further large acquisitions of assets and land in other areas of London, helping us to grow our portfolio in key strategic corridors.
OPPORTUNITIES FOR THE YEAR AHEAD
} Capturing the significant accumulated reversion in the portfolio from recent strong levels of market rental growth at upcoming lease reviews.
} Creating value from our existing portfolio through redevelopment and intensification of land use.
} Seeking to grow with our customers in new parts of London and enhancing our ability to meet the requirements of all parts of their businesses.
RISKS FOR THE YEAR AHEAD
}Market competition is strong for both built assets and land, which could in theory constrain growth, but we are confident in our ability to secure opportunities as a result of our existing portfolio and well-established operating platform which provide us with the experience and ability to execute on complex projects.
OPERATING SUMMARY OF THE YEAR
} Strong rent roll growth arising from high levels of letting activity on existing stock and the signing of significant pre-lets on both the Slough Trading Estate and SEGRO Park Bracknell.
} Development completions included two further data centres and an extension for one of our longest standing customers on the estate.
} Successful reacquisition of the Slough office portfolio to create further development opportunities and to help us provide space for data centre operators, creative industries, life sciences and other potential users of industrial space.
OPPORTUNITIES FOR THE YEAR AHEAD
} Starting the first phase of the office redevelopment during 2022 and looking for opportunities to intensify land use in other parts of the estate by introducing multi-level warehousing.
} Looking for further opportunities to expand our presence in the wider Thames Valley.
RISKS FOR THE YEAR AHEAD
} Sourcing new land and growing the portfolio is hugely competitive and opportunities are limited.
} The Slough office acquisition adds some additional risk given the ageing older offices but we are confident in the customer demand for this space once vacant possession is achieved and the sites are converted to industrial.
CREATING OPPORTUNITIES IN COMPETITIVE MARKETS TO INCREASE OUR PRESENCE IN STRATEGIC CORRIDORS
2021 was a great year for our London portfolio with our strategy delivering strong returns on every level.
Our existing asset base and established operating platform provide us with a strong competitive advantage and we continue to utilise this to create opportunities for growth. This is helping us to achieve critical mass in the North, East and South, ensuring that we can offer our customers even more choice.
SECURING FUTURE GROWTH OPPORTUNITIES IN THE THAMES VALLEY
The Slough Trading Estate is the location of choice for both large and small businesses within the Thames Valley. The acquisition of adjoining land during 2021 will help us to create further modern, sustainable space suitable for a wide variety of customers.
Along with our newest estate SEGRO Park Bracknell this provides us with a market leading position in this key strategic corridor.
62 SEGRO PLC | ANNUAL REPORT & ACCOUNTS 2021
Regional reviews
STRATEGIC REPORT
Review of 2021
05_Review2021_46_65_v117.indd 6205_Review2021_46_65_v117.indd 62 01/03/2022 17:1601/03/2022 17:16

NATIONAL LOGISTICS (UK BIG BOX WAREHOUSES)
NORTHERN EUROPE (GERMANY AND THE NETHERLANDS)
OPERATING SUMMARY OF THE YEAR
} Delivered more than £10 million of rent roll growth, mainly from securing new pre-lets on major development sites.
} Completed four more units at SLP-EMG, leaving one further unit under construction and one final large plot remaining. This included EMG 220, a speculative net-zero carbon in operation building which was let prior to completion.
}Made significant progress with infrastructure works at our large development sites and have already started discussions with potential occupiers.
} Launched our partnership with SmartParc to develop a high-tech food and manufacturing campus near Derby and signed our first pre-let.
OPPORTUNITIES FOR THE YEAR AHEAD
}Working hard to secure our last major pre-let at SLP-EMG and starting to negotiate pre-lets on our next large sites (SP-CG and SLP-NG).
} Continuing to work to bring further sites forward for redevelopment.
RISKS FOR THE YEAR AHEAD
} Development of large-scale sites bring with them a certain amount of execution risk but we are confident in our ability to manage this given our strong development track record and our success at SLP-EMG.
} Continued volatility (e.g. shortages, lead times, inflation) in the supply chain for both materials and labour - we are working proactively with our contractors to manage this.
OPERATING SUMMARY OF THE YEAR
} Completed seven new schemes during 2021, equating to over 130,000 sq m of new space, all were finished to budget and on time.
} Strong lettings performance helped by strong demand for recently completed space with almost two-thirds of it let prior to completion, resulting in a low vacancy rate in Northern Europe of 4.4 per cent.
} Started our largest speculative logistics development in Oberhausen (50,000 sq m of space) where we are seeking a DGNB ‘Platinum’ and ‘Climate Positive’ certification.
} Planted over 1,400 trees as part of our Day of Giving (each tree represents one concrete or steel column from our completed 2020 developments).
OPPORTUNITIES FOR THE YEAR AHEAD
} Demand continues to be high across all of our assets but we see a particular opportunity in responding to the growing demand for ‘last-mile’ from online retailers and food grocers.
}We will be looking to let the remaining space in our recently completed developments in Berlin and Cologne.
} Securing lettings on our 2022 speculative development projects in Frankfurt, Ingolstadt, Oberhausen and Venray.
RISKS FOR THE YEAR AHEAD
} Currently challenging to acquire land to add to the future pipeline but we are confident in the ability of our teams to secure new opportunities.
SIGNIFICANT PROGRESS IN BUILDING OUT OUR UK BIG BOX PIPELINE
We continue to see high levels of interest for our well-located logistics parks and have almost completed our flagship scheme SEGRO Logistics Park East Midlands Gateway (SLP-EMG).
We have made good progress with the large infrastructure projects at SEGRO Park Coventry Gateway (SP-CG) and SEGRO Logistics Park Northampton Gateway (SLP-NG).
STRONG DEMAND FOR OUR RECENTLY COMPLETED SPACE
Occupier demand continues to be very strong across our key markets as increased e-commerce penetration results in additional demand for both big box logistics and last mile warehousing.
We now have significant scale in the Berlin, Frankfurt and the key markets of the Rhine-Ruhr region and are focusing on increasing our presence in the Northern and Southern markets as well as in the Netherlands.
63SEGRO PLC | ANNUAL REPORT & ACCOUNTS 2021
OVERVIEW STRATEGIC REPORT GOVERNANCE FINANCIAL STATEMENTS
05_Review2021_46_65_v117.indd 6305_Review2021_46_65_v117.indd 63 01/03/2022 17:1601/03/2022 17:16
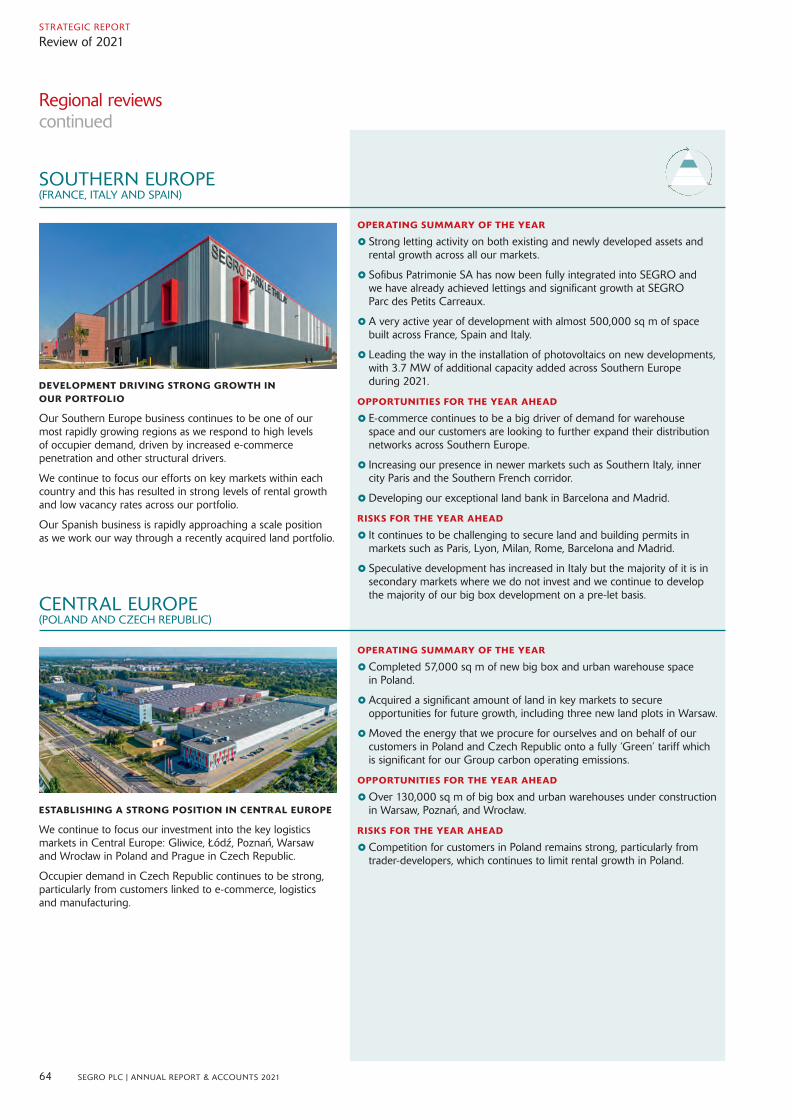
SOUTHERN EUROPE (FRANCE, ITALY AND SPAIN)
CENTRAL EUROPE (POLAND AND CZECH REPUBLIC)
OPERATING SUMMARY OF THE YEAR
} Strong letting activity on both existing and newly developed assets and rental growth across all our markets.
} Sofibus Patrimonie SA has now been fully integrated into SEGRO and we have already achieved lettings and significant growth at SEGRO Parc des Petits Carreaux.
} A very active year of development with almost 500,000 sq m of space built across France, Spain and Italy.
} Leading the way in the installation of photovoltaics on new developments, with 3.7 MW of additional capacity added across Southern Europe during 2021.
OPPORTUNITIES FOR THE YEAR AHEAD
} E-commerce continues to be a big driver of demand for warehouse space and our customers are looking to further expand their distribution networks across Southern Europe.
} Increasing our presence in newer markets such as Southern Italy, inner city Paris and the Southern French corridor.
} Developing our exceptional land bank in Barcelona and Madrid.
RISKS FOR THE YEAR AHEAD
} It continues to be challenging to secure land and building permits in markets such as Paris, Lyon, Milan, Rome, Barcelona and Madrid.
} Speculative development has increased in Italy but the majority of it is in secondary markets where we do not invest and we continue to develop the majority of our big box development on a pre-let basis.
OPERATING SUMMARY OF THE YEAR
} Completed 57,000 sq m of new big box and urban warehouse space in Poland.
} Acquired a significant amount of land in key markets to secure opportunities for future growth, including three new land plots in Warsaw.
}Moved the energy that we procure for ourselves and on behalf of our customers in Poland and Czech Republic onto a fully ‘Green’ tariff which is significant for our Group carbon operating emissions.
OPPORTUNITIES FOR THE YEAR AHEAD
}Over 130,000 sq m of big box and urban warehouses under construction in Warsaw, Poznan, and Wrocław.
RISKS FOR THE YEAR AHEAD
} Competition for customers in Poland remains strong, particularly from trader-developers, which continues to limit rental growth in Poland.
DEVELOPMENT DRIVING STRONG GROWTH IN OUR PORTFOLIO
Our Southern Europe business continues to be one of our most rapidly growing regions as we respond to high levels of occupier demand, driven by increased e-commerce penetration and other structural drivers.
We continue to focus our efforts on key markets within each country and this has resulted in strong levels of rental growth and low vacancy rates across our portfolio.
Our Spanish business is rapidly approaching a scale position as we work our way through a recently acquired land portfolio.
ESTABLISHING A STRONG POSITION IN CENTRAL EUROPE
We continue to focus our investment into the key logistics markets in Central Europe: Gliwice, Łódz, Poznan, Warsaw and Wrocław in Poland and Prague in Czech Republic.
Occupier demand in Czech Republic continues to be strong, particularly from customers linked to e-commerce, logistics and manufacturing.
Regional reviews continued
64 SEGRO PLC | ANNUAL REPORT & ACCOUNTS 2021
STRATEGIC REPORT
Review of 2021
05_Review2021_46_65_v117.indd 6405_Review2021_46_65_v117.indd 64 01/03/2022 17:1601/03/2022 17:16

SEGRO EUROPEAN LOGISTICS PARTNERSHIP (SELP)
SELP is our Continental European big box joint venture with PSP Investments, one of Canada’s largest pension investment managers. SELP started in 2013 with €1 billion of assets. At the end of 2021, it has a portfolio worth just under €7 billion. It generates €277 million of headline rent with an occupancy rate of 98 per cent.
This partnership continues to be a vital element of our strategy to build scale in Continental European big box warehousing in a capital efficient manner. By sharing the capital investment with PSP Investments, we have been able to grow the portfolio further and faster than we could have done on our own. Both partners benefit from the attractive yield on the portfolio, the development potential from the land and from the economies of scale we can extract from this high-quality, modern collection of big box warehouses.
As a result, SEGRO now has in excess of €1 billion assets under management in each of Germany, France, Italy and Poland, and we are building scale in the smaller markets of Spain, Czech Republic and the Netherlands. The appetite for investing in big box warehousing in strategic locations in Continental Europe remains strong from both partners and we look forward to further successful collaboration into the future.
SELP
1. Germany €1,950m
2. Poland/Czech Republic €1,478m
3. Italy €1,327m
4. France €1,266m
5. Spain €471m
6. Netherlands €414m
ASSETS UNDER MANAGEMENT (€bn)
2
1
3
4
56
65SEGRO PLC | ANNUAL REPORT & ACCOUNTS 2021
OVERVIEW STRATEGIC REPORT GOVERNANCE FINANCIAL STATEMENTS
05_Review2021_46_65_v117.indd 6505_Review2021_46_65_v117.indd 65 01/03/2022 17:1601/03/2022 17:16
66 SEGRO PLC | ANNUAL REPORT & ACCOUNTS 2021
STRATEGIC REPORT
The strong interest in our Green bond debut showed the importance of our Responsible SEGRO framework.”SOUMEN DASCHIEF FINANCIAL OFFICER
Chief Financial Officer Interview: Soumen Das talks about interest rates, leverage and capital investment plans.
What were the highlights of 2021 for you?We invested over £1.5 billion of new capital across our business in 2021 which will provide new opportunities for further growth. We also launched our Green Finance Framework and issued our first Green bonds for both SEGRO and our joint venture SELP. Issuing a bond with a coupon of just 0.5 per cent was an amazing result, really demonstrating the strong interest for our bonds from the investor base, which reinforces the importance of our Responsible SEGRO framework.
How could SEGRO be impacted by potential interest rate rises across Europe?In terms of our balance sheet, 46 per cent of our debt at 31 December 2021 was fixed so this gives us some protection against interest rate rises and we hedge much of the remainder. We also have one of the longest debt maturities in the sector of just under nine years, so we are not subject to any refinancing risk should rates rise. There is also a potential impact on the appetite for real estate as an asset class. Higher rates means that rental growth becomes more important, which we think our portfolio is well poised to deliver. There is also still a very healthy gap between prime property yields and the risk free rate.
How do you think about leverage? Loan-to-Value (LTV) is currently below your target range so what does this mean for the funding of future investment activity?We’ve seen significant growth in the value of the portfolio over the past 18 months which has brought the LTV down to the low 20s. We are targeting an LTV of around 30 per cent, which we believe is appropriate at this point in the cycle and given the increased operational risk we are taking through our expanded development programme. We have limited control over the ‘V’ and think it’s wise to be prudent in terms of financial leverage when you are taking operational risk through the substantial levels of development. The LTV at the current level gives us significant headroom to continue to invest to grow our business.
You have dropped the cost ratio from your KPIs going forwards, what was the thinking behind this?Rest assured we remain very focused on managing our cost base. For us it’s about having the right costs – which are mainly people related – for the nature of our business. The cost ratio focuses on one aspect, the ratio of costs to current income, but doesn’t capture the future income growth that we are looking to deliver as a business through development and other initiatives. That means investing in our people to ensure we have a wide range of skills across the group. We therefore don’t think it’s appropriate to have cost ratio as a KPI as it could hold the business back and isn’t a metric that reflects the long-term success of SEGRO.
06_FinancialReview_66_73_v79.indd 6606_FinancialReview_66_73_v79.indd 66 01/03/2022 17:1701/03/2022 17:17

67SEGRO PLC | ANNUAL REPORT & ACCOUNTS 2021
You also head up strategy, investment and innovation at SEGRO. The Company has been a beneficiary of the rise in data usage across Europe but how are you using data yourselves?We have been working hard to build up our digital capabilities over the past two years and now have a sizeable in-house team working on projects across the business (as described on pages 38-39). These range from looking at how we can use data to make more informed decisions in terms of investment to enhancing our knowledge of our customers’ businesses. Data can also help us to anticipate upcoming trends and is therefore important in making sure that our business is well-positioned for the future.
What are your plans for capital investment in 2022?We were very pleased to have been able to invest capital in record volumes over the past two years. It has allowed us to take advantage of the positive structural trends that we see in terms of occupier demand across a larger set of opportunities. Going forward, the core of our capital investment will continue to take place through our development programme. We regard our ability to source well-located land, to build modern sustainable new buildings and our relationships with our customer base as key differentiators in an increasingly competitive market. We will also continue to search for attractive transactions to deploy further capital in our most strategic markets, for example investment purchases, or opportunities to reposition or redevelop properties – some of which may not currently be industrial or logistics – that we believe will appeal to the evolving occupier market.
67SEGRO PLC | ANNUAL REPORT & ACCOUNTS 2021
FINANCIAL STATEMENTSOVERVIEW STRATEGIC REPORT GOVERNANCE
06_FinancialReview_66_73_v79.indd 6706_FinancialReview_66_73_v79.indd 67 01/03/2022 17:1701/03/2022 17:17

During 2021 we have taken advantage of favourable financing conditions to continue improving SEGRO’s capital structure.FINANCING
SEGRO took the opportunity in 2021 to extend the duration of both syndicated and bilateral revolving credit facilities. Commitments for both syndicated and bilateral facilities total €1.2 billion and they mature in May 2026. In September, SEGRO issued a debut green €500 million 10-year unsecured euro bond with a very attractive coupon of just 0.5 per cent. Proceeds were used to finance and re-finance eligible green projects in accordance with SEGRO’s Green Finance Framework. In December, SEGRO entered into an additional €750 million syndicated term loan facility due to mature in December 2023.
SELP combined two separate syndicated revolving credit facilities into a single facility of €500 million. It also took the opportunity to extend the maturity to May 2025. SELP also issued its debut green €500 million eight-year unsecured euro bond. Proceeds of the bond were used to finance and re-finance eligible green projects outlined in SEGRO’s Green Finance Framework.
Both SEGRO and SELP had positive credit rating changes during the year. SEGRO’s Fitch senior unsecured debt rating increased by a notch from A- to A. SEGRO’s issuer default rating also increased by a notch from BBB+ to A-. SELP’s Fitch senior unsecured debt rating increased by a notch from BBB+ to A-. In addition, Moody’s affirmed SELP’s long-term issuer rating of Baa2.
As at 31 December 2021, the gross borrowings of SEGRO Group and its share of gross borrowings in joint ventures totalled £4,268 million (31 December 2020: £3,201 million), of which only £8 million (31 December 2020: £17 million) are secured
by way of legal charges over specific assets. The remainder of gross borrowings are unsecured. Cash and cash equivalent balances were £67 million (31 December 2020: £113 million). Average debt maturity was 8.6 years (31 December 2020: 9.9 years) and average cost of debt (excluding non-cash interest and commitment fees) was 1.5 per cent (31 December 2020: 1.6 per cent).
Funds available to SEGRO Group (including its share of joint venture funds) at 31 December 2021 totalled £1,105 million (31 December 2020: £1,189 million), comprising £67 million cash and short-term investments and £1,038 million of undrawn credit facilities of which only £8 million was uncommitted. Cash and cash equivalent balances, together with the Group’s interest rate and foreign exchange derivatives portfolio, are spread amongst a strong group of banks, all of which have a credit rating of A- or better.
MONITORING AND MITIGATING FINANCIAL RISK
As explained in the Risks section of this Annual Report, the Group monitors a number of financial metrics to assess the level of financial risk being taken and to mitigate that risk.
TREASURY POLICIES AND GOVERNANCE
The Group Treasury function operates within a formal policy covering all aspects of treasury activity, including funding, counterparty exposure and management of interest rate, currency and liquidity risks. Group Treasury reports on compliance with these policies on a quarterly basis and policies are reviewed regularly by the Board.
GEARING AND FINANCIAL COVENANTS
We consider the key leverage metric for SEGRO to be proportionally consolidated (‘look-through’) loan to value ratio (LTV) which incorporates assets and net debt on SEGRO’s balance sheet and SEGRO’s share of assets and net debt on the balance sheets of its joint ventures. The LTV at 31 December 2021 on this basis was 23 per cent (31 December 2020: 24 per cent).
PROGRESS AGAINST OUR STRATEGY
WHAT WE SAID WE WOULD DOWe intend to keep our LTV at around 30 per cent.
WHAT WE ACHIEVED IN 2021The impact of increased borrowings financing investment, offset by strong valuation increases meant that LTV has fallen slightly from 24 per cent to 23 per cent at 31 December 2021. Our cost of debt remains low at 1.5 per cent.
WHAT TO EXPECT IN 2022We aim to maintain our LTV at around 30 per cent, taking into account our investment plans. We believe this ensures significant headroom to our tightest gearing covenant should property values decline, as well as providing the flexibility to take advantage of investment opportunities which may arise. We have cash and available facilities of £1.1 billion (including our share of joint ventures) on which we can draw to fund our investment plans.
Financial Review An active year of financing and strong financial results
FINANCIAL POSITION AND FUNDING
31 December 2021 31 December 2020
SEGRO Group
SEGRO Group and JVs at share SEGRO Group
SEGRO Group and JVs at share
Net borrowings (£m) 3,361 4,201 2,325 3,088
Available cash and undrawn facilities (£m) 893 1,105 1,061 1,189
Balance sheet gearing (%) 25 N/A 24 N/A
Loan to value ratio (%) 22 23 22 24
Weighted average cost of debt¹ (%) 1.5 1.5 1.7 1.6
Interest cover² (times) 7.0 6.9 6.6 6.5
Average duration of debt (years) 9.6 8.6 11.7 9.9
1 Based on gross debt, excluding commitment fees and non-cash interest.2 Net rental income/Adjusted net finance costs (before capitalisation).
68 SEGRO PLC | ANNUAL REPORT & ACCOUNTS 2021
STRATEGIC REPORT
06_FinancialReview_66_73_v79.indd 6806_FinancialReview_66_73_v79.indd 68 01/03/2022 17:1701/03/2022 17:17
SEGRO’s borrowings contain gearing covenants based on Group net debt and net asset value, excluding debt in joint ventures. The gearing ratio of the Group at 31 December 2021, as defined within the principal debt funding arrangements of the Group, was 25 per cent (31 December 2020: 24 per cent). This is significantly lower than the Group’s tightest financial gearing covenant within these debt facilities of 160 per cent.
Property valuations would need to fall by around 63 per cent from their 31 December 2021 values to reach the gearing covenant threshold of 160 per cent. A 63 per cent fall in property values would equate to an LTV ratio of approximately 62 per cent.
The Group’s other key financial covenant within its principal debt funding arrangements is interest cover, requiring that net interest before capitalisation be covered at least 1.25 times by net property rental income. At 31 December 2021, the Group comfortably met this ratio seven times. Net property rental income would need to fall by around 82 per cent from 2021 levels to reach the interest cover covenant threshold of 1.25 times. On a proportionally consolidated basis, including joint ventures, the interest cover ratio was seven times.
We mitigate the risk of over-gearing the Company and breaching debt covenants by carefully monitoring the impact of investment decisions on our LTV and by stress testing our balance sheet to potential changes in property values.
Our intention for the foreseeable future is to maintain our LTV at around 30 per cent. This provides the flexibility to take advantage of investment opportunities arising and ensures significant headroom compared against our tightest gearing covenants should property values decline. The weighted average maturity of the gross borrowings of the Group (including joint ventures at share) was 8.6 years.
The Group’s debt has a range of maturities. The nearest of which is SEGRO’s syndicated term loan facility and that matures in December 2023. There are no material Group bond maturities until 2024. This long average debt maturity translates into a favourable, well spread debt funding maturity profile which reduces future refinancing risk.
INTEREST RATE RISK
The Group’s interest rate risk policy is designed to ensure that we limit our exposure to volatility in interest rates. The policy states that between 50 and 100 per cent of net borrowings (including the Group’s share of borrowings in joint ventures) should be at fixed or capped rates, including the impact of derivative financial instruments.
At 31 December 2021, including the impact of derivative instruments, 65 per cent (2020: 70 per cent) of the net borrowings
of the Group (including the Group’s share of borrowings within joint ventures) were at fixed or capped rates.
The fixed only level of debt is 46 per cent at 31 December 2021 (31 December 2020: 44 per cent).
As a result of the fixed rate cover in place, if short-term interest rates had been 100 basis points higher throughout the year to 31 December 2021, the adjusted net finance cost of the Group would have increased by approximately £17 million representing around five per cent of Adjusted profit after tax.
The Group elects not to hedge account its interest rate derivatives portfolio. Therefore, movements in its fair value are taken to the income statement but, in accordance with EPRA Best Practices Recommendations Guidelines, these gains and losses are eliminated from Adjusted profit after tax.
FOREIGN CURRENCY TRANSLATION RISK
The Group has minimal transactional foreign currency exposure, but does have a potentially significant currency translation exposure arising on the conversion of its substantial foreign currency denominated assets (mainly euro) and euro denominated earnings into sterling in the Group consolidated accounts.
The Group seeks to limit its exposure to volatility in foreign exchange rates by hedging its foreign currency gross assets using either borrowings or derivative instruments. The Group targets a hedging range of between the last reported LTV ratio (31 December 2021: 23 per cent) and 100 per cent. At 31 December 2021, the Group was 62 per cent hedged by gross foreign currency denominated liabilities (31 December 2020: 61 per cent).
Including the impact of forward foreign exchange and currency swap contracts used to hedge foreign currency denominated net assets, if the value of the other currencies in which the Group operates at 31 December 2021 weakened by 10 per cent against sterling (to €1.31, in the case of euros), net assets would have decreased by approximately £183 million and there would have been a reduction in gearing of approximately 1.5 per cent and in the LTV of 1.1 per cent.
The average exchange rate used to translate euro denominated earnings generated during 2021 into sterling within the consolidated income statement of the Group was €1.16: £1. Based on the hedging position at 31 December 2021, and assuming that this position had applied throughout 2021, if the euro had been 10 per cent weaker than the average exchange rate (€1.28: £1), Adjusted profit after tax for the year would have been approximately £12 million (3.4 per cent) lower than reported. If it had been
10 per cent stronger, Adjusted profit after tax for the year would have been approximately £15 million (4.3 per cent) higher than reported.
GOING CONCERN
As noted in the Financial Position and Financing sections above, the Group has significant available liquidity to meet its capital commitments, a long-dated debt maturity profile and substantial headroom against financial covenants.
} In 2021 the Group has extended the term of its €1.2 billion of bank facilities to 2026 and secured an additional €750 million two-year bank facility to finance acquisitions.
} The Group executed its inaugural euro bond, opening a further deep pool of debt capital.
}Group cash and available committed facilities at 31 December 2021 were £886 million.
} The Group continuously monitors its liquidity position compared to committed and expected capital and operating expenses on a rolling forward 18-month basis. The quantum of committed capital expenditure at any point in time is typically low due to the short timeframe to construct warehouse buildings.
} The Group also regularly stress-tests its financial covenants. As noted above, at 31 December 2021, property values would need to fall by around 63 per cent before breaching the gearing covenant. In terms of interest cover, net rental income would need to fall by 82 per cent before breaching the interest cover covenant. Both would be significantly in excess of the Group’s experience during the global financial crisis and its experience in 2021.
ADJUSTED PROFIT BEFORE TAX
£356m2020: £296m
IFRS PROFIT BEFORE TAX
£4,355m2020: £1,464m
NEW FINANCING DURING THE YEAR
£1.3bn2020: £1.1bn
LOAN TO VALUE RATIO
23%2020: 24%
69SEGRO PLC | ANNUAL REPORT & ACCOUNTS 2021
OVERVIEW STRATEGIC REPORT GOVERNANCE FINANCIAL STATEMENTS
06_FinancialReview_66_73_v79.indd 6906_FinancialReview_66_73_v79.indd 69 01/03/2022 17:1701/03/2022 17:17
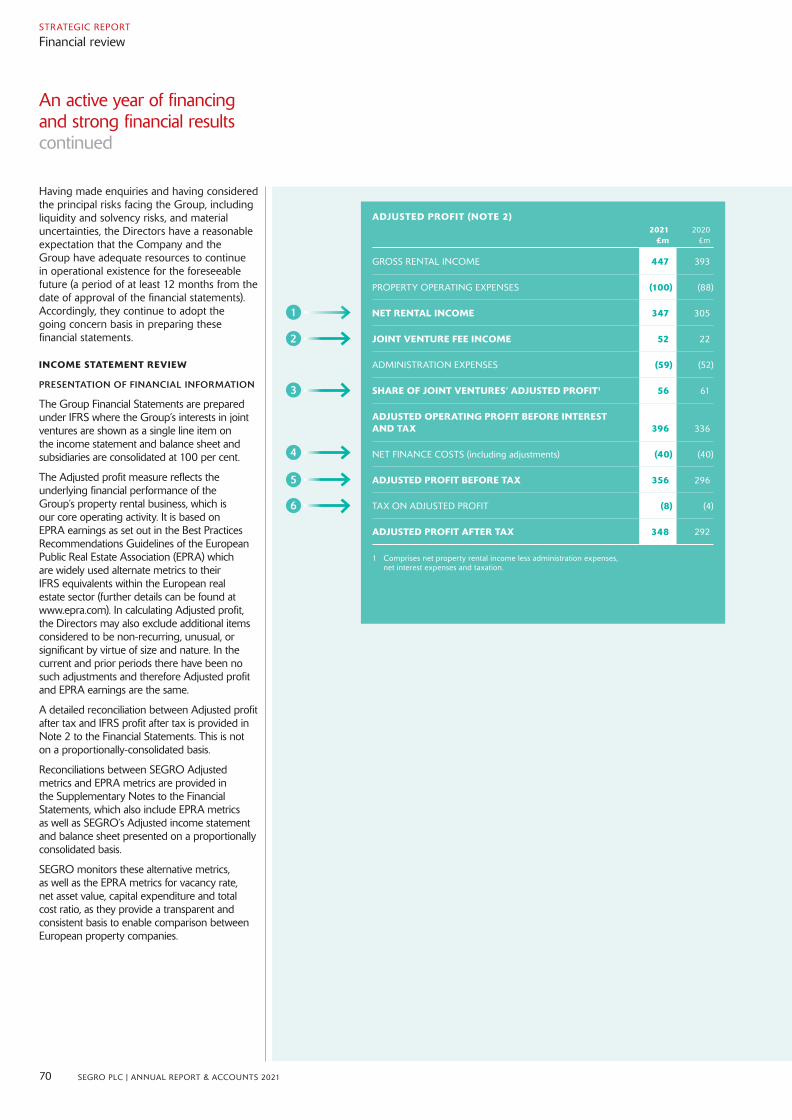
An active year of financing and strong financial results continued
ADJUSTED PROFIT (NOTE 2)2021
£m2020
£m
GROSS RENTAL INCOME 447 393
PROPERTY OPERATING EXPENSES (100) (88)
NET RENTAL INCOME 347 305
JOINT VENTURE FEE INCOME 52 22
ADMINISTRATION EXPENSES (59) (52)
SHARE OF JOINT VENTURES’ ADJUSTED PROFIT1 56 61
ADJUSTED OPERATING PROFIT BEFORE INTEREST AND TAX 396 336
NET FINANCE COSTS (including adjustments) (40) (40)
ADJUSTED PROFIT BEFORE TAX 356 296
TAX ON ADJUSTED PROFIT (8) (4)
ADJUSTED PROFIT AFTER TAX 348 292
1 Comprises net property rental income less administration expenses, net interest expenses and taxation.
Having made enquiries and having considered the principal risks facing the Group, including liquidity and solvency risks, and material uncertainties, the Directors have a reasonable expectation that the Company and the Group have adequate resources to continue in operational existence for the foreseeable future (a period of at least 12 months from the date of approval of the financial statements). Accordingly, they continue to adopt the going concern basis in preparing these financial statements.
INCOME STATEMENT REVIEW
PRESENTATION OF FINANCIAL INFORMATION
The Group Financial Statements are prepared under IFRS where the Group’s interests in joint ventures are shown as a single line item on the income statement and balance sheet and subsidiaries are consolidated at 100 per cent.
The Adjusted profit measure reflects the underlying financial performance of the Group’s property rental business, which is our core operating activity. It is based on EPRA earnings as set out in the Best Practices Recommendations Guidelines of the European Public Real Estate Association (EPRA) which are widely used alternate metrics to their IFRS equivalents within the European real estate sector (further details can be found at www.epra.com). In calculating Adjusted profit, the Directors may also exclude additional items considered to be non-recurring, unusual, or significant by virtue of size and nature. In the current and prior periods there have been no such adjustments and therefore Adjusted profit and EPRA earnings are the same.
A detailed reconciliation between Adjusted profit after tax and IFRS profit after tax is provided in Note 2 to the Financial Statements. This is not on a proportionally-consolidated basis.
Reconciliations between SEGRO Adjusted metrics and EPRA metrics are provided in the Supplementary Notes to the Financial Statements, which also include EPRA metrics as well as SEGRO’s Adjusted income statement and balance sheet presented on a proportionally consolidated basis.
SEGRO monitors these alternative metrics, as well as the EPRA metrics for vacancy rate, net asset value, capital expenditure and total cost ratio, as they provide a transparent and consistent basis to enable comparison between European property companies.
70 SEGRO PLC | ANNUAL REPORT & ACCOUNTS 2021
STRATEGIC REPORT
Financial review
06_FinancialReview_66_73_v79.indd 7006_FinancialReview_66_73_v79.indd 70 01/03/2022 17:1701/03/2022 17:17

NET RENTAL INCOME
£42m higherNet rental income increased by £42 million to £347 million (or by £38 million to £423 million including joint ventures at share), reflecting the positive net impact of like-for-like rental growth, development completions and investment activity during the period, offset by the impact of disposals.
On a like-for-like basis¹, before other items (primarily corporate centre and other costs not specifically allocated to a geographic Business Unit), net rental income increased by £17 million, or 4.9 per cent, compared to 2020.
This is due to strong rental performance across our portfolio. UK: 5.6 per cent increase, in particular in Greater London; and Continental Europe: 3.6 per cent increase, in particular in Northern Europe.
ADJUSTED EARNINGS PER SHARE
29.1p, +15%Adjusted earnings per share are 29.1 pence compared to 25.4 pence in 2020 due to the increase in Adjusted profit slightly offset by the 47.9 million increase in the average number of shares in issue compared to the prior year.
Excluding the impact of the performance fee recognised in the period the Adjusted earnings per share would be 28.0 pence, a 10 per cent increase compared to 2020.
INCOME FROM JOINT VENTURES
£25m higherJoint venture fee income increased by £30 million to £52 million in 2021. This increase is primarily due to the recognition of a performance fee of £26 million in respect of the SELP joint venture (as detailed further in Note 7).
SEGRO’s share of joint ventures’ Adjusted profit after tax decreased by £5 million from £61 million in 2020 to £56 million in 2021. This includes a performance fee expense (at share) of £13 million. Excluding performance fee expense, the Adjusted joint venture profit after tax increased by £8 million compared to 2020 as net rental income in the SELP joint venture has continued to grow.
ADMINISTRATIVE AND OPERATING COSTS
Cost ratio: 20.2%The Group is focused on managing its cost base and uses a Total Cost Ratio (TCR) as a measure of cost management. The TCR for 2021 has improved to 20.2 per cent compared to 21.1 per cent in 2020. The calculation is set out in Table 8 of the Supplementary Notes to the Financial Statements.
Excluding share-based payments, the cost ratio would be 17.6 per cent, an improvement from 18.8 per cent in 2020.
The cost ratio calculation is detailed in Table 8 in the Supplementary Notes, which shows that the reduction in the ratio has been primarily caused by the increase in gross rental income used in the TCR, by £56 million to £504 million reflecting the growth through development and like-for-like income discussed in the Net Rental Income section above. Total costs in respect of the TCR of £103 million increased by £8 million compared to 2020. Administration expenses have increased by £7 million (as detailed in Note 6), as a result of increased staff costs following headcount increases and increased depreciation and IT costs reflecting our continued investment in technology. Property operating expenses in the wholly-owned portfolio have increased in 2021 from £88 million to £100 million, as the portfolio has grown in size.
Total costs (see Note 5) have increased by £36 million to £140 million. This balance includes trading property cost of sales which have increased by £24 million which do not form part of the TCR calculation.
TAXATION
Effective rate: 2.2%The tax charge on Adjusted profit of £8 million (2020: £4 million) reflects an effective tax rate of 2.2 per cent (2020: 1.3 per cent).
The Group’s effective tax rate reflects the fact that over three-quarters of its assets are located in the UK and France and qualify for REIT and SIIC status respectively in those countries. This status means that income from rental profits and gains on disposals of assets in the UK and France are exempt from corporation tax, provided SEGRO meets a number of conditions including, but not limited to, distributing 90 per cent of UK taxable profits.
NET FINANCE COSTS
FlatNet finance costs (including adjustments) remained flat at £40 million compared to 2020. Average interest rates during the year are slightly lower offsetting the impact of higher gross debt during 2021 compared to the prior year.
ADJUSTED PROFIT
£60m higherAdjusted profit before tax increased by 20.3 per cent to £356 million (2020: £296 million) during 2021 as a result of the above movements primarily growth in rental income and recognition of a performance fee from the SELP joint venture (£26 million income) offset by the performance fee expense recognised in the share of joint ventures profits (£13 million cost) which has a £13 million net impact on profit.
Adjusted profit is detailed further in Note 2.
1 The like-for-like net rental growth metric is based on properties held throughout both 2021 and 2020 on a proportionally consolidated basis. This provides details of underlying net rental income growth excluding the distortive impact of acquisitions, disposals and development completions. Where an asset has been sold into a joint venture (sales to SELP, for example) the 50 per cent share owned throughout the period is included in like-for-like calculation, with the balance shown as disposals. Further details are given in Table 10 of the Supplementary Notes.
TEXT UPDATEDTEXT UPDATED
71SEGRO PLC | ANNUAL REPORT & ACCOUNTS 2021
OVERVIEW STRATEGIC REPORT GOVERNANCE FINANCIAL STATEMENTS
06_FinancialReview_66_73_v79.indd 7106_FinancialReview_66_73_v79.indd 71 01/03/2022 17:1701/03/2022 17:17

An active year of financing and strong financial results continued
IFRS PROFIT
IFRS profit before tax in 2021 was £4,355 million (2020: £1,464 million), equating to basic post-tax IFRS earnings per share of 339.0 pence compared with 124.1 pence for 2020, reflecting significant property valuation gains in the year.
A reconciliation between Adjusted profit before tax and IFRS profit before tax is provided in Note 2 to the Financial Statements.
Realised and unrealised gains on wholly- owned investment properties of £3,670 million in 2021 (2020: £976 million) and realised and unrealised gains on trading and other property interests of £6 million (2020: £14 million) have been recognised in the Income Statement as the value of our portfolio increased during the year. These primarily relate to an unrealised valuation surplus on investment properties of £3,617 million (2020: £971 million) following a 30.6 per cent growth in valuation of the wholly-owned property portfolio (28.8 per cent change including joint ventures at share) in the year as discussed further in the Strategic Report page 49.
SEGRO’s share of realised and unrealised gains on properties held in joint ventures was £497 million (2020: £216 million) largely in respect of a 19.9 per cent valuation uplift in the SELP portfolio during the year. Further analysis of the gains are detailed in Note 7. IFRS earnings were also impacted by a net fair value loss on interest rate swaps and other derivatives of £82 million (2020: gain of £14 million) primarily as a result of adverse movements on interest rate expectations.There was no cost of closing out debt during the year (2020: £11 million).
In addition, SEGRO recognised a tax charge in respect of adjustments of £280 million (2020: £31 million) of which £145 million (2020: £nil) relates to withholding tax in France as detailed further in Note 10, £38 million (2020: £nil) relates to the SIIC entry charge for Sofibus Patrimoine S.A. (‘Sofibus’) and detailed further in Note 10 and £97 million (2020: £31 million) arises primarily in relation to property valuation movements.
BALANCE SHEET
At 31 December 2021, IFRS net assets attributable to ordinary shareholders were £13,436 million (31 December 2020: £9,659 million), reflecting 1,115 pence per share (31 December 2020: 809 pence) on a diluted basis.
Adjusted NAV per share at 31 December 2021 was 1,137 pence (31 December 2020: 814 pence). The 39.7 per cent increase primarily reflects property gains in the period. The chart above highlights the other principal factors behind the increase. A reconciliation between IFRS and Adjusted NAV is available in Note 12 to the Financial Statements.
CASH FLOW AND NET DEBT RECONCILIATION
Cash flows from operating activities of £347 million are £114 million higher than the prior year. This is primarily due to increased rental income received during the year, the impact of trading properties, for which there was an inflow of £12 million in the current year, following disposals in the period compared to an outflow of £20 million in the prior year. In addition there were tax payments of £17 million primarily in France, as discussed in more detail above.
The Group made net investments of £1,266 million of investment and development properties (including other investments and loans to joint ventures) during the year on a cash flow basis (2020: £1,101 million). This is principally driven by expenditure of £1,706 million (2020: £1,216 million) to purchase and develop investment properties to deliver further growth in line with our strategy, the largest of which was the purchase of a portfolio of offices in the Thames Valley Business Unit in December 2021 as discussed further on page 61.
Disposals of investment properties increased by £332 million to £491 million compared to the prior period (2020: £159 million). Disposals include £231 million to the SELP joint venture and £75 million cash received in respect of deferred consideration from a prior period disposal. Other significant cash flows include dividends paid of £180 million (2020: £179 million) where cash flows are lower than the total dividend due to the level of scrip uptake; an inflow from settlement of foreign exchange derivatives of £40 million (2020: outflow £55 million); and £12 million to purchase the remaining non-controlling interest in Sofibus following the initial acquisition in 2020.
Overall, net debt has increased in the year from £2,325 million to £3,361 million.
814
p
346p
29p
(23)
p
(21)
p
1,13
7p
ADJUSTED NET ASSET VALUE
Adjusted NAVper share at31 December
2020
Adjusted NAVper share at
31 December2021
Realised andunrealised
property gain
Adjusted profitafter tax and
non-controllinginterests
Dividend netof scrip
shares issued(2020 final &2021 interim)
Tax chargein respect ofrealised andunrealised
property gain
Otherincludingexchange
ratemovement
(8)p
72 SEGRO PLC | ANNUAL REPORT & ACCOUNTS 2021
STRATEGIC REPORT
Financial review
06_FinancialReview_66_73_v79.indd 7206_FinancialReview_66_73_v79.indd 72 01/03/2022 17:1701/03/2022 17:17
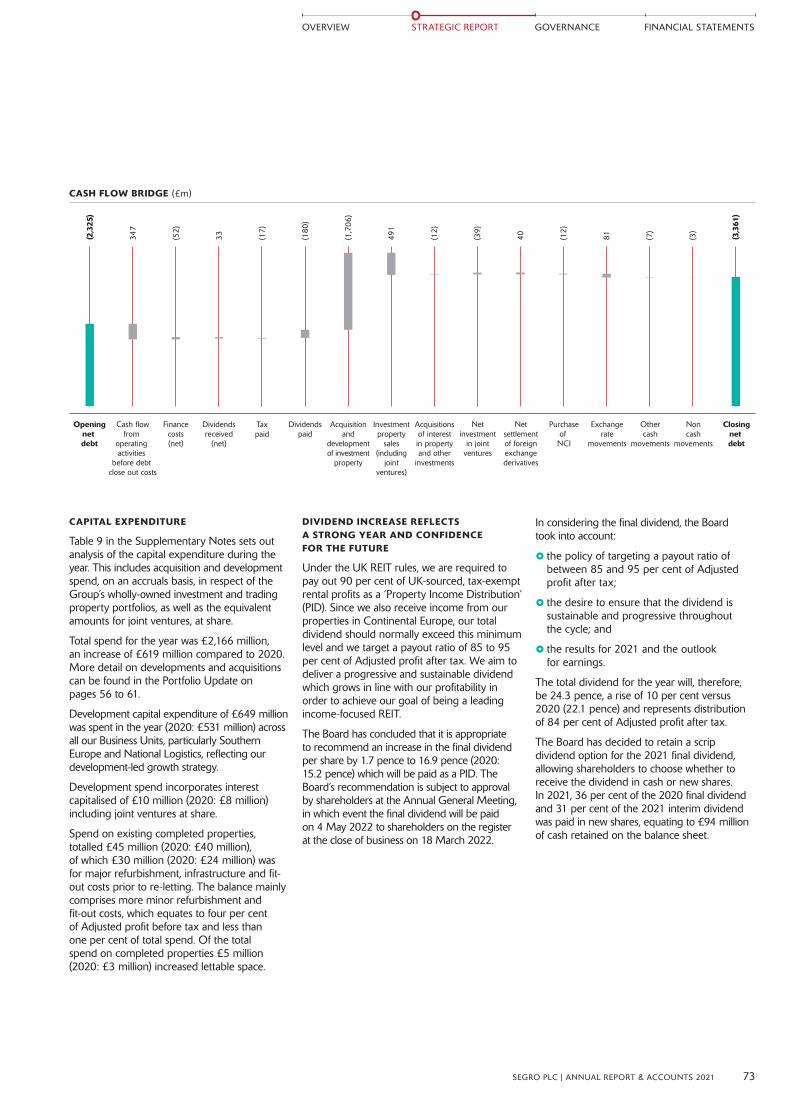
CAPITAL EXPENDITURE
Table 9 in the Supplementary Notes sets out analysis of the capital expenditure during the year. This includes acquisition and development spend, on an accruals basis, in respect of the Group’s wholly-owned investment and trading property portfolios, as well as the equivalent amounts for joint ventures, at share.
Total spend for the year was £2,166 million, an increase of £619 million compared to 2020. More detail on developments and acquisitions can be found in the Portfolio Update on pages 56 to 61.
Development capital expenditure of £649 million was spent in the year (2020: £531 million) across all our Business Units, particularly Southern Europe and National Logistics, reflecting our development-led growth strategy.
Development spend incorporates interest capitalised of £10 million (2020: £8 million) including joint ventures at share.
Spend on existing completed properties, totalled £45 million (2020: £40 million), of which £30 million (2020: £24 million) was for major refurbishment, infrastructure and fit-out costs prior to re-letting. The balance mainly comprises more minor refurbishment and fit-out costs, which equates to four per cent of Adjusted profit before tax and less than one per cent of total spend. Of the total spend on completed properties £5 million (2020: £3 million) increased lettable space.
DIVIDEND INCREASE REFLECTS A STRONG YEAR AND CONFIDENCE FOR THE FUTURE
Under the UK REIT rules, we are required to pay out 90 per cent of UK-sourced, tax-exempt rental profits as a ‘Property Income Distribution’ (PID). Since we also receive income from our properties in Continental Europe, our total dividend should normally exceed this minimum level and we target a payout ratio of 85 to 95 per cent of Adjusted profit after tax. We aim to deliver a progressive and sustainable dividend which grows in line with our profitability in order to achieve our goal of being a leading income-focused REIT.
The Board has concluded that it is appropriate to recommend an increase in the final dividend per share by 1.7 pence to 16.9 pence (2020: 15.2 pence) which will be paid as a PID. The Board’s recommendation is subject to approval by shareholders at the Annual General Meeting, in which event the final dividend will be paid on 4 May 2022 to shareholders on the register at the close of business on 18 March 2022.
In considering the final dividend, the Board took into account:
} the policy of targeting a payout ratio of between 85 and 95 per cent of Adjusted profit after tax;
} the desire to ensure that the dividend is sustainable and progressive throughout the cycle; and
} the results for 2021 and the outlook for earnings.
The total dividend for the year will, therefore, be 24.3 pence, a rise of 10 per cent versus 2020 (22.1 pence) and represents distribution of 84 per cent of Adjusted profit after tax.
The Board has decided to retain a scrip dividend option for the 2021 final dividend, allowing shareholders to choose whether to receive the dividend in cash or new shares. In 2021, 36 per cent of the 2020 final dividend and 31 per cent of the 2021 interim dividend was paid in new shares, equating to £94 million of cash retained on the balance sheet.
Openingnet debt
Financecosts(net)
Cash flowfrom
operating activities
before debt close out costs
Dividendsreceived
(net)
Taxpaid
Dividendspaid
Acquisitionand
developmentof investment
property
Investmentproperty
sales(including
jointventures)
Acquisitionsof interestin propertyand other
investments
Netinvestment
in jointventures
Netsettlementof foreignexchangederivatives
Purchaseof
NCI
Othercash
movements
Exchangerate
movements
Noncash
movements
Closingnet debt
(2,3
25)
(52)
347
33
(17)
(180
)
(12)
(7)
(1,7
06)
491
(39)
40
(12)
81
(3)
(3,3
61)
CASH FLOW BRIDGE (£m)
73SEGRO PLC | ANNUAL REPORT & ACCOUNTS 2021
OVERVIEW STRATEGIC REPORT GOVERNANCE FINANCIAL STATEMENTS
06_FinancialReview_66_73_v79.indd 7306_FinancialReview_66_73_v79.indd 73 01/03/2022 17:1701/03/2022 17:17
Managing risks Effective risk management
For SEGRO, effective risk management is a cornerstone of how we operate in order to deliver our strategy of growth in a sustainable way, both now and in the long term. Against the backdrop of the continually evolving pandemic, coupled with fluidity of the geopolitical and macroeconomic environment, the business has continued to perform strongly, in demanding operating circumstances. This is due, in no small part, to the underpin provided by our risk process, which is embedded throughout our business, to enable appropriate and responsive decision making.
ACTIVITY IN THE YEAR
The Group Risk Committee is made up of members of senior management and has met three times during the year. The members of the Committee have detailed knowledge of, and expertise in operational, financial, legal and corporate aspects of our business, ensuring we are well positioned to undertake our responsibility of overseeing the work of the risk management function on behalf of the Executive Committee.
The Head of Risk and his team report on updates to the risk register following a full risk review process which includes meetings with each risk manager and executive risk owner, consideration of changes to risk policy and appetite (see below), scrutiny of the external and internal operating environments, coordination of the risk management process and consequential external reporting. During the year the team has benefitted from input from the newly appointed Group Insurance Manager which has enabled a fresh pair of eyes to provide additional rigour and challenge. We have also taken the opportunity to review our internal Key Risk Indicators to ensure they are proportionate and appropriate for the business today. As a consequence we have deemed it appropriate to increase our acceptable appetite for appropriate land holdings in light of the favourable market conditions.
The process has identified risks whose profile is increasing, in particular environmental sustainability and major event (including cyber) as detailed further below. In addition, the disruptive Brexit risk was removed as a Principal Risk following evolution of events during the year.
Details of particular areas of interest to the Risk Committee are detailed below:
MAJOR EVENT/BUSINESS DISRUPTION
The impact of the pandemic continues to evolve and influence our risk landscape. Whilst the risk of virus variants and further restrictions remain, we have adapted our business both from an employee perspective and operationally to adjust to a ‘new normal’ and remain agile in our response to the risks as they arise. Our experiences over the last two years will be invaluable should there be further challenges due to the pandemic.
During the year, the Group’s Board and relevant committees continued to meet regularly to identify, consider and discuss Covid-19 related risks and mitigations as they arose and evolved. Areas of particular concern included not only our operations but our people. This included changes to the working environment whilst both in the office and working from home which occurred at various points during the year across our locations.
In addition to the pandemic, we remain vigilant to cyber and other IT related issues which could result in disruption to our business, loss of data and/or reputational damage. We use both in-house resources and external specialists to review and test our controls and processes. Employees are given regular updates and mandatory training to maintain vigilance and awareness. We also have in place detailed business continuity and disaster recovery plans which are regularly tested and reviewed which are enacted should a significant event occur.
Dynamic risk management is embedded within our business and enables us to be responsive to new issues as they arise.” SOUMEN DASCHIEF FINANCIAL OFFICER
74 SEGRO PLC | ANNUAL REPORT & ACCOUNTS 2021
STRATEGIC REPORT
07_PrincipalRisks_74_86_v75.indd 7407_PrincipalRisks_74_86_v75.indd 74 01/03/2022 17:1801/03/2022 17:18

ENVIRONMENTAL SUSTAINABILITY AND CLIMATE CHANGE
Environmental sustainability is an increasingly important risk for the business.
The risk includes the short to medium-term impacts including transitional changes (for example, legislation and financial) which we closely monitor, as well as the long-term emerging risk of climate change (for example, physical changes including the increased likelihood of flooding events) for which we have undertaken extensive research. Failure to identify and mitigate risks at this stage could result in a reduction in the attractiveness of our assets to our current and prospective tenants; reputational damage and higher obsolescence and a reduction in value of our portfolio in the future.
The environmental and climate change related risks are overseen by the Sustainability team and local Business Units, reporting to the Executive Committee and ultimately the Board. The activity during 2021 and looking ahead to 2022 and beyond is described in more detail on pages 92 to 98.
TECHNOLOGY
The Group remains alert to the risks and opportunities that potentially disruptive technology could have on the business. We continued to engage with a number of external organisations – both in the property sector and in the wider technology realm – to assist us in identifying and assessing potentially disruptive technologies, none of which is currently believed to present an imminent significant risk to the Group.
We remained committed to investing in our Strategy, Investment and Innovation function which continues to assess the potential impacts of a wide range of technologies and evolves our digital and technology strategy, as described on page 38.
LOOKING AHEAD
As detailed further below, we have robust processes in place to identify and review emerging risks. By their nature emerging risks may not be fully understood or their impacts readily assessable. We remain vigilant as to how quickly and to what extent they might impact the Group.
A key emerging risk is the impact of climate change (as detailed above); others include, inter alia, the long-term impacts of the pandemic, including on urbanisation and working practices; identifying and adapting to technological advances and societal attitudes to air travel and consumerism and how these impact our business model. Each emerging risk is assigned an owner and is closely monitored and assessed as it evolves.
Looking forward to 2022, whilst there is still much uncertainty, it is anticipated that Covid-19 will still be prevalent in society, and its direct and indirect impacts are still evolving. Therefore, risk management and controls, and the Group’s continued flexibility in responding to the risks presented, will be fundamental to our ability to continue to operate successfully.
SOUMEN DASCHIEF FINANCIAL OFFICER AND CHAIR OF RISK COMMITTEE
75SEGRO PLC | ANNUAL REPORT & ACCOUNTS 2021
OVERVIEW STRATEGIC REPORT GOVERNANCE FINANCIAL STATEMENTS
07_PrincipalRisks_74_86_v75.indd 7507_PrincipalRisks_74_86_v75.indd 75 01/03/2022 17:1801/03/2022 17:18

The Group recognises that its ability to manage risk effectively throughout the organisation continues to be central to its success. Risk management ensures a structured approach to decision making that seeks to reduce uncertainty over expected outcomes and to bring controllable risks within our appetite, thereby balancing uncertainty against the objective of creating and protecting value for our stakeholders, now and in the long term.
The Group’s risk appetite is reviewed annually and approved by the Board in order to guide the business. As well as qualitative descriptions, the risk appetite defines tolerances and targets for key metrics. It is equally applicable to wholly-owned operations and joint ventures.
Our risk appetite is dynamic rather than static, it will vary over time and during the course of the property cycle. In general, the Group maintains a reasonably low appetite for risk, appropriate to our strategic objectives of delivering long-term sustainable value.
PROPERTY RISK
We recognise that, in seeking outperformance from our portfolio, the Group must accept a balanced level of property risk – with diversity in geographic locations and asset types and an appropriate mixture of stabilised income-producing and opportunity assets – in order to enhance opportunities for superior returns. This is balanced against the backdrop of the macroeconomic climate and its impact on the property cycle.
Our target portfolio should deliver attractive, low risk income returns with strong rental and capital growth when market conditions are positive and show relative resilience in a downturn. We aim to enhance these returns through a development strategy, which requires appropriate levels of land holdings to support the pipeline. We seek to balance the risk of holding too much land which might be a drag to earnings, by acquiring land in appropriate locations with the required planning or zoning. Additionally we closely monitor the churn and duration of our land holdings. We also seek to mitigate the risks – including letting, construction and contractor covenant risks – that are inherent in development. Also mindful of our environmental responsibilities, we seek to also develop buildings which meet and exceed minimum regulatory requirements and achieve high environmental certification standards, to be attractive to occupiers both now and in the future.
In line with our income focus, we have a low appetite for risks to income from customers. Accordingly we seek a diverse occupier base with strong covenants and avoid over-exposure to individual occupiers in specialist properties. We encourage tenants to share energy usage, operate in a low carbon way and actively encourage the use of green energy where possible in our buildings.
FINANCIAL RISK
The Group maintains a low to moderate appetite for financial risk in general, with a very low appetite for risks to solvency and gearing covenant breaches.
As an income-focused REIT we have a low appetite for risks which threaten a stable progression in earnings and dividends over the long-term. We are, however, prepared to tolerate fluctuations in dividend cover as a consequence of capital recycling activity.
We also seek long-term growth in net asset value. Our appetite for risks to net asset value from the factors within our control is low, albeit acknowledging that our appetite for moderate leverage across the cycle amplifies the impact of market driven asset valuation movements on net asset value.
CORPORATE RISK
We have a very low appetite for risks to our good reputation with our customers and wider stakeholders, including investors, regulators, employees, business partners, suppliers, lenders and the communities in which we operate.
Our responsibilities to these stakeholders include compliance with all relevant laws; accurate and timely reporting of financial and other regulatory information; safeguarding the health and safety of employees, suppliers, customers and other users of our assets; our impact on the environment; to assess the impact of new and evolving technologies; compliance with codes of conduct and ethics; ensuring business continuity; and making a positive contribution to the communities in which we operate.
OUR INTEGRATED AND ROBUST APPROACH TO RISK MANAGEMENT
The Board has overall responsibility for ensuring that risk is effectively and consistently managed across the Group. The Audit Committee monitors the effectiveness of the Group’s risk management process on behalf of the Board. Further information on compliance with the risk management provisions of the UK Corporate Governance Code can be found in the Governance section on pages 116-117.
The risk management process is designed to identify, evaluate and respond to the significant risks (including emerging risks) that the Group faces. The process aims to understand and mitigate, rather than eliminate, the risk of failure to achieve business objectives, and therefore can only provide reasonable and not absolute assurance.
The identification and review of emerging risks are integrated into our risk review process. Emerging risks are those risks or a combination of risks which are often rapidly evolving and for which the impact and probability of occurrence have not yet been fully understood and consequently necessary mitigations have not yet fully evolved. All risk owners and managers within the business are challenged to consider emerging risks and this is supplemented through formal twice-yearly horizon scans with the Executive Committee.
The Board recognises that it has limited control over many of the external risks it faces, such as global events as well as the macroeconomic, geopolitical, and regulatory environment, but it reviews the potential impact of such risks on the business and consequential decision making.
Internal risks are monitored by the Board to ensures that appropriately designed controls are in place and operate in order to manage them.
The Board has performed a robust assessment of the principal and emerging risks facing the Group. It formally reviewed the principal and emerging risks twice during the year and also completed its annual review and approval of the Group’s risk appetite, and the Group’s risk management policy. The Audit Committee reviews the process over how the Group Risk Register has been compiled, twice a year.
Our risk appetite
76 SEGRO PLC | ANNUAL REPORT & ACCOUNTS 2021
STRATEGIC REPORT
07_PrincipalRisks_74_86_v75.indd 7607_PrincipalRisks_74_86_v75.indd 76 01/03/2022 17:1801/03/2022 17:18

STAGE 1 STAGE 2 STAGE 3
EXECUTIVE RISK OWNERS EXECUTIVE COMMITTEE INTERNAL AUDIT
£ Own risks in area for which they are responsible.
£ Assign accountability for mitigating individual risks to risk managers.
£ Ensure that risks are identified, assessed and adequately controlled and mitigated.
£ Review and identify existing and emerging risks with the risk management function at least twice per year.
£ Oversees execution of risk management across the business.
£ Formally considers risks, including emerging risks, twice a year.
£ Directly oversees strategic risks.
£ Delegates accountability for risk management and monitors performance of risk controls.
£ Assigns Executive Risk Owners to each risk.
£ Agrees internal audit programme in conjunction with the Group Risk Register.
£ Conducts internal audit programme and reports to Audit Committee.
£ Continues to be responsive to issues as they arise and amend their programme accordingly.
RISK MANAGERS
£ Responsible for ensuring the risk is within appetite.
£ Drive design and implementation of controls.
£ Review, identify and assess existing and emerging risks with the risk management function at least twice per year. GROUP RISK COMMITTEE
£ Coordinates the risk management process on behalf of the Executive Committee.
£ Develops risk policy.
£ Oversees the work of the Risk Management function, which in turn:– Manages, maintains and reports on the
Risk Register.– Assesses and documents risks and controls.– Provides quality assurance and challenge
to risk owners and managers.
MONITORING COMMITTEES
£ Regularly identify and monitor the significant risks and corresponding controls within their domains.
£ Risk management function attends regularly.
The Group adopts the ‘three lines of defence’ model of risk management. Operational management, the individual risk manager and executive risk owner provide the first line of defence. The Executive Committee, other monitoring committees (such as the Investment Committee and the Technology Committee), and the risk management function overseen by the Group Risk Committee provide the second line of defence. Finally, Internal Audit provides the third line of defence.
Risks are considered within each area of the business to ensure that risk management is fully embedded within the Group’s operations, culture and decision-making processes.
Accountabilities for the Group’s risk management are outlined in the diagram above.
We have put risk appetite at the heart of our risk management processes. It is integral both to our consideration of strategy and to our medium-term planning process. Risk appetite also defines specific tolerances and targets for key metrics and the criteria for assessing the potential impact of risks and our mitigation of them.
The most significant risks and mitigating controls are detailed in the Group Risk Register. Risks are assessed in both inherent (assuming that no controls are in place) and residual (with mitigating controls operating normally) states. As part of the assessment, risk impact is directly measured against risk appetite so that it is clear whether each risk is comfortably within appetite, tolerable, intolerable or below appetite. We also formally assess the velocity of the most significant risks to determine how quickly they might become intolerable.
A Key Risk Indicator (KRI) dashboard is produced and monitored regularly to show actual and forecast performance against risk appetite metrics, allowing informed decision making. KRIs are considered regularly by the relevant monitoring committees in their decision making as well as being integral to the Group’s Medium Term Plan.
Mitigations for each risk are documented and monitored in the Group Risk Register. The Register is used as a key input to determine priorities for the Group’s internal audit assurance programme. Furthermore, management’s annual assessment of control effectiveness is driven by the Group’s Risk Register.
OUR FRAMEWORK FOR RISK GOVERNANCE
BOARD AUDIT COMMITTEE
£ Overall responsibility for ensuring that risk is effectively managed across the Group.
£Monitors effectiveness of the Group’s risk management process and internal control systems.
£ Determines the Group’s risk appetite and policy.
£ Conducts robust assessment of current and emerging risks.
77SEGRO PLC | ANNUAL REPORT & ACCOUNTS 2021
OVERVIEW STRATEGIC REPORT GOVERNANCE FINANCIAL STATEMENTS
07_PrincipalRisks_74_86_v75.indd 7707_PrincipalRisks_74_86_v75.indd 77 01/03/2022 17:1801/03/2022 17:18

The principal risks have the potential to affect SEGRO’s business materially. Risks are classified as ‘principal’ based on their potential to intolerably exceed our appetite (considering both inherent and residual impact) and cause material harm to the Group.
Some risks that may be unknown at present, as well as other risks that are currently regarded as immaterial and therefore not detailed here, could turn out to be material in the future.
The current principal risks that the Group is aware that it is facing are summarised in the diagram below and described across the following pages.
The descriptions indicate the potential areas of impact on the Group’s strategy; the time-horizon and probability of the risk; the principal activities that are in place to mitigate and manage such risks; the committees that provide second line of defence oversight; changes in the level of risk during the course of the year; whether the residual risk is within our appetite (after the application of our mitigations); and link to further relevant information in this report.
The disruptive Brexit risk previously reported has been removed as a principal risk as it was at least partially mitigated by the trade agreement between the UK and EU and subsequently no material impacts on the Group have arisen. The relevant consequences of Brexit are now being managed within each applicable risk, such as political and regulatory risk.
Furthermore, our environmental sustainability and climate change risk has increased during the year for reasons described in more detail below, whilst the others have remained in line with the prior year.
Principal risks
78 SEGRO PLC | ANNUAL REPORT & ACCOUNTS 2021
STRATEGIC REPORT
RESIDUAL RISK
Macroeconomic impact on market cycle
Portfolio strategy and executionMajor event/business disruption
Health & safety
Development plan executionOperational delivery and compliance
Political & regulatory8
4
2
1
IMPACTIntolerable
Hig
h
Within appetite
PRO
BAB
ILIT
Y
Below appetite
Low
3
Environmental sustainability and climate change
Financing strategy
96
7
5
07_PrincipalRisks_74_86_v75.indd 7807_PrincipalRisks_74_86_v75.indd 78 01/03/2022 17:1801/03/2022 17:18
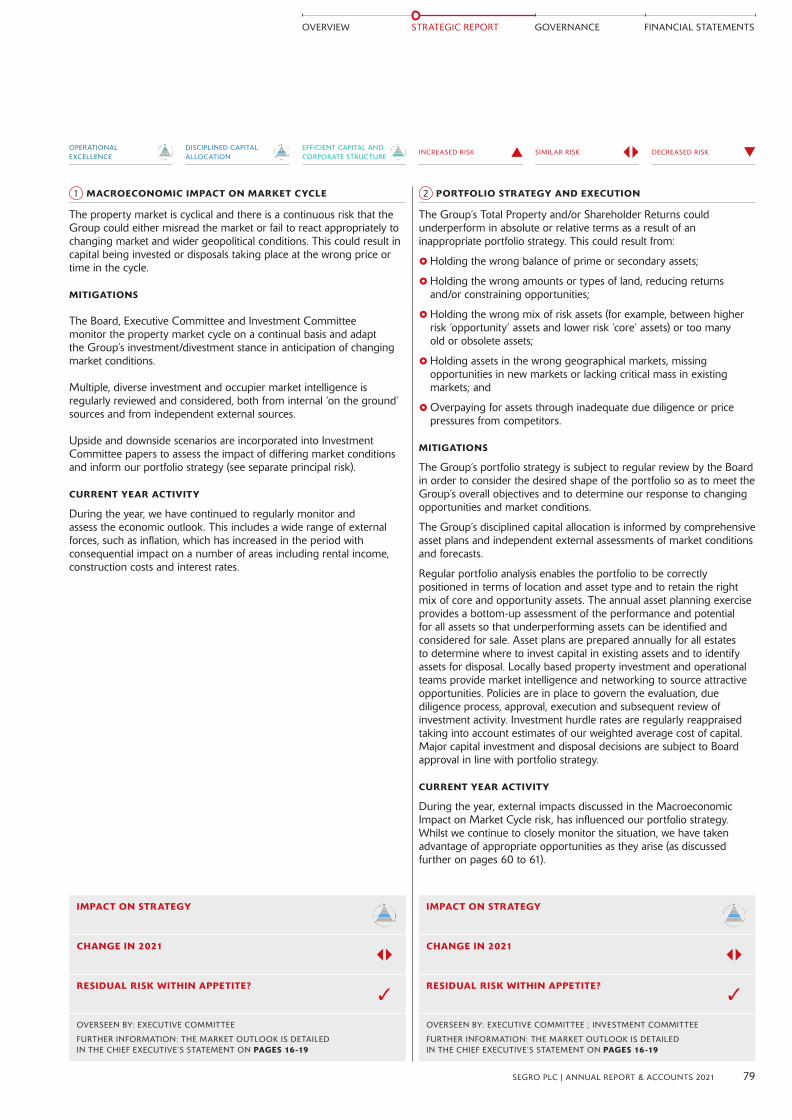
EFFICIENT CAPITAL AND CORPORATE STRUCTURE
DISCIPLINED CAPITAL ALLOCATION
OPERATIONAL EXCELLENCE
DECREASED RISKSIMILAR RISKINCREASED RISK
The property market is cyclical and there is a continuous risk that the Group could either misread the market or fail to react appropriately to changing market and wider geopolitical conditions. This could result in capital being invested or disposals taking place at the wrong price or time in the cycle.
MITIGATIONS The Board, Executive Committee and Investment Committee monitor the property market cycle on a continual basis and adapt the Group’s investment/divestment stance in anticipation of changing market conditions.
Multiple, diverse investment and occupier market intelligence is regularly reviewed and considered, both from internal ‘on the ground’ sources and from independent external sources.
Upside and downside scenarios are incorporated into Investment Committee papers to assess the impact of differing market conditions and inform our portfolio strategy (see separate principal risk).
CURRENT YEAR ACTIVITY
During the year, we have continued to regularly monitor and assess the economic outlook. This includes a wide range of external forces, such as inflation, which has increased in the period with consequential impact on a number of areas including rental income, construction costs and interest rates.
The Group’s Total Property and/or Shareholder Returns could underperform in absolute or relative terms as a result of an inappropriate portfolio strategy. This could result from:
£ Holding the wrong balance of prime or secondary assets;
£ Holding the wrong amounts or types of land, reducing returns and/or constraining opportunities;
£ Holding the wrong mix of risk assets (for example, between higher risk ‘opportunity’ assets and lower risk ‘core’ assets) or too many old or obsolete assets;
£ Holding assets in the wrong geographical markets, missing opportunities in new markets or lacking critical mass in existing markets; and
£Overpaying for assets through inadequate due diligence or price pressures from competitors.
MITIGATIONS
The Group’s portfolio strategy is subject to regular review by the Board in order to consider the desired shape of the portfolio so as to meet the Group’s overall objectives and to determine our response to changing opportunities and market conditions.
The Group’s disciplined capital allocation is informed by comprehensive asset plans and independent external assessments of market conditions and forecasts.
Regular portfolio analysis enables the portfolio to be correctly positioned in terms of location and asset type and to retain the right mix of core and opportunity assets. The annual asset planning exercise provides a bottom-up assessment of the performance and potential for all assets so that underperforming assets can be identified and considered for sale. Asset plans are prepared annually for all estates to determine where to invest capital in existing assets and to identify assets for disposal. Locally based property investment and operational teams provide market intelligence and networking to source attractive opportunities. Policies are in place to govern the evaluation, due diligence process, approval, execution and subsequent review of investment activity. Investment hurdle rates are regularly reappraised taking into account estimates of our weighted average cost of capital. Major capital investment and disposal decisions are subject to Board approval in line with portfolio strategy.
CURRENT YEAR ACTIVITY
During the year, external impacts discussed in the Macroeconomic Impact on Market Cycle risk, has influenced our portfolio strategy. Whilst we continue to closely monitor the situation, we have taken advantage of appropriate opportunities as they arise (as discussed further on pages 60 to 61).
IMPACT ON STRATEGY
CHANGE IN 2021
RESIDUAL RISK WITHIN APPETITE?
OVERSEEN BY: EXECUTIVE COMMITTEE
FURTHER INFORMATION: THE MARKET OUTLOOK IS DETAILED IN THE CHIEF EXECUTIVE’S STATEMENT ON PAGES 16-19
1 MACROECONOMIC IMPACT ON MARKET CYCLE 2 PORTFOLIO STRATEGY AND EXECUTION
IMPACT ON STRATEGY
CHANGE IN 2021
RESIDUAL RISK WITHIN APPETITE?
OVERSEEN BY: EXECUTIVE COMMITTEE ; INVESTMENT COMMITTEE
FURTHER INFORMATION: THE MARKET OUTLOOK IS DETAILED IN THE CHIEF EXECUTIVE’S STATEMENT ON PAGES 16-19
79SEGRO PLC | ANNUAL REPORT & ACCOUNTS 2021
OVERVIEW STRATEGIC REPORT GOVERNANCE FINANCIAL STATEMENTS
07_PrincipalRisks_74_86_v75.indd 7907_PrincipalRisks_74_86_v75.indd 79 01/03/2022 17:1801/03/2022 17:18
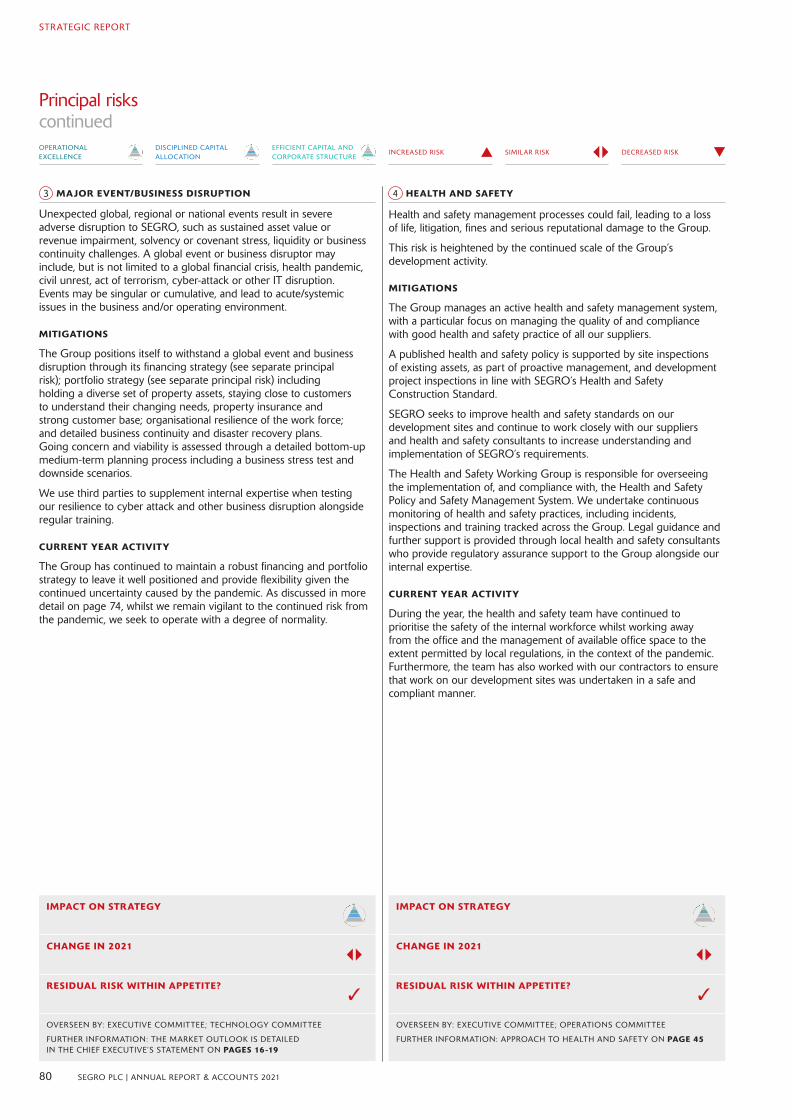
Unexpected global, regional or national events result in severe adverse disruption to SEGRO, such as sustained asset value or revenue impairment, solvency or covenant stress, liquidity or business continuity challenges. A global event or business disruptor may include, but is not limited to a global financial crisis, health pandemic, civil unrest, act of terrorism, cyber-attack or other IT disruption. Events may be singular or cumulative, and lead to acute/systemic issues in the business and/or operating environment.
MITIGATIONS
The Group positions itself to withstand a global event and business disruption through its financing strategy (see separate principal risk); portfolio strategy (see separate principal risk) including holding a diverse set of property assets, staying close to customers to understand their changing needs, property insurance and strong customer base; organisational resilience of the work force; and detailed business continuity and disaster recovery plans. Going concern and viability is assessed through a detailed bottom-up medium-term planning process including a business stress test and downside scenarios.
We use third parties to supplement internal expertise when testing our resilience to cyber attack and other business disruption alongside regular training.
CURRENT YEAR ACTIVITY
The Group has continued to maintain a robust financing and portfolio strategy to leave it well positioned and provide flexibility given the continued uncertainty caused by the pandemic. As discussed in more detail on page 74, whilst we remain vigilant to the continued risk from the pandemic, we seek to operate with a degree of normality.
Health and safety management processes could fail, leading to a loss of life, litigation, fines and serious reputational damage to the Group.
This risk is heightened by the continued scale of the Group’s development activity.
MITIGATIONS
The Group manages an active health and safety management system, with a particular focus on managing the quality of and compliance with good health and safety practice of all our suppliers.
A published health and safety policy is supported by site inspections of existing assets, as part of proactive management, and development project inspections in line with SEGRO’s Health and Safety Construction Standard.
SEGRO seeks to improve health and safety standards on our development sites and continue to work closely with our suppliers and health and safety consultants to increase understanding and implementation of SEGRO’s requirements.
The Health and Safety Working Group is responsible for overseeing the implementation of, and compliance with, the Health and Safety Policy and Safety Management System. We undertake continuous monitoring of health and safety practices, including incidents, inspections and training tracked across the Group. Legal guidance and further support is provided through local health and safety consultants who provide regulatory assurance support to the Group alongside our internal expertise.
CURRENT YEAR ACTIVITY
During the year, the health and safety team have continued to prioritise the safety of the internal workforce whilst working away from the office and the management of available office space to the extent permitted by local regulations, in the context of the pandemic. Furthermore, the team has also worked with our contractors to ensure that work on our development sites was undertaken in a safe and compliant manner.
Principal risks continued
EFFICIENT CAPITAL AND CORPORATE STRUCTURE
DISCIPLINED CAPITAL ALLOCATION
OPERATIONAL EXCELLENCE
DECREASED RISKSIMILAR RISKINCREASED RISK
IMPACT ON STRATEGY
CHANGE IN 2021
RESIDUAL RISK WITHIN APPETITE?
OVERSEEN BY: EXECUTIVE COMMITTEE; TECHNOLOGY COMMITTEE
FURTHER INFORMATION: THE MARKET OUTLOOK IS DETAILED IN THE CHIEF EXECUTIVE’S STATEMENT ON PAGES 16-19
IMPACT ON STRATEGY
CHANGE IN 2021
RESIDUAL RISK WITHIN APPETITE?
OVERSEEN BY: EXECUTIVE COMMITTEE; OPERATIONS COMMITTEE
FURTHER INFORMATION: APPROACH TO HEALTH AND SAFETY ON PAGE 45
3 MAJOR EVENT/BUSINESS DISRUPTION 4 HEALTH AND SAFETY
80 SEGRO PLC | ANNUAL REPORT & ACCOUNTS 2021
STRATEGIC REPORT
07_PrincipalRisks_74_86_v75.indd 8007_PrincipalRisks_74_86_v75.indd 80 01/03/2022 17:1801/03/2022 17:18
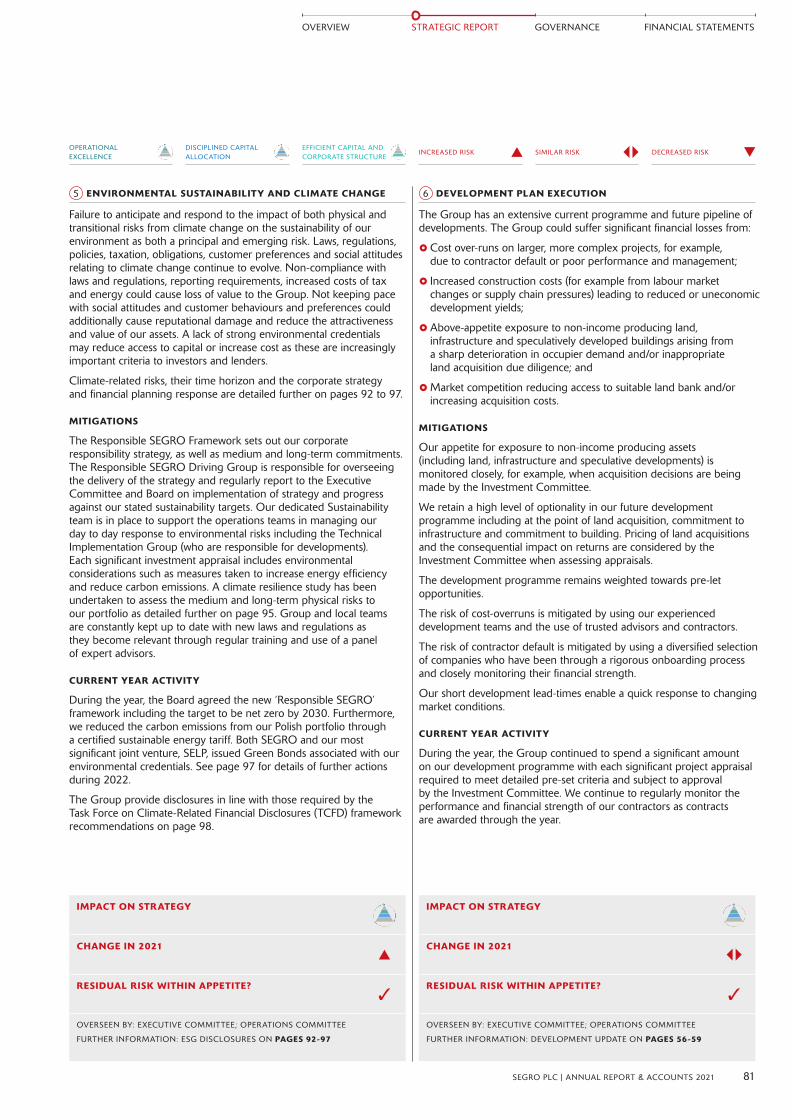
Failure to anticipate and respond to the impact of both physical and transitional risks from climate change on the sustainability of our environment as both a principal and emerging risk. Laws, regulations, policies, taxation, obligations, customer preferences and social attitudes relating to climate change continue to evolve. Non-compliance with laws and regulations, reporting requirements, increased costs of tax and energy could cause loss of value to the Group. Not keeping pace with social attitudes and customer behaviours and preferences could additionally cause reputational damage and reduce the attractiveness and value of our assets. A lack of strong environmental credentials may reduce access to capital or increase cost as these are increasingly important criteria to investors and lenders.
Climate-related risks, their time horizon and the corporate strategy and financial planning response are detailed further on pages 92 to 97.
MITIGATIONS
The Responsible SEGRO Framework sets out our corporate responsibility strategy, as well as medium and long-term commitments. The Responsible SEGRO Driving Group is responsible for overseeing the delivery of the strategy and regularly report to the Executive Committee and Board on implementation of strategy and progress against our stated sustainability targets. Our dedicated Sustainability team is in place to support the operations teams in managing our day to day response to environmental risks including the Technical Implementation Group (who are responsible for developments). Each significant investment appraisal includes environmental considerations such as measures taken to increase energy efficiency and reduce carbon emissions. A climate resilience study has been undertaken to assess the medium and long-term physical risks to our portfolio as detailed further on page 95. Group and local teams are constantly kept up to date with new laws and regulations as they become relevant through regular training and use of a panel of expert advisors.
CURRENT YEAR ACTIVITY
During the year, the Board agreed the new ‘Responsible SEGRO’ framework including the target to be net zero by 2030. Furthermore, we reduced the carbon emissions from our Polish portfolio through a certified sustainable energy tariff. Both SEGRO and our most significant joint venture, SELP, issued Green Bonds associated with our environmental credentials. See page 97 for details of further actions during 2022.
The Group provide disclosures in line with those required by the Task Force on Climate-Related Financial Disclosures (TCFD) framework recommendations on page 98.
The Group has an extensive current programme and future pipeline of developments. The Group could suffer significant financial losses from:
£ Cost over-runs on larger, more complex projects, for example, due to contractor default or poor performance and management;
£ Increased construction costs (for example from labour market changes or supply chain pressures) leading to reduced or uneconomic development yields;
£ Above-appetite exposure to non-income producing land, infrastructure and speculatively developed buildings arising from a sharp deterioration in occupier demand and/or inappropriate land acquisition due diligence; and
£Market competition reducing access to suitable land bank and/or increasing acquisition costs.
MITIGATIONS
Our appetite for exposure to non-income producing assets (including land, infrastructure and speculative developments) is monitored closely, for example, when acquisition decisions are being made by the Investment Committee.
We retain a high level of optionality in our future development programme including at the point of land acquisition, commitment to infrastructure and commitment to building. Pricing of land acquisitions and the consequential impact on returns are considered by the Investment Committee when assessing appraisals.
The development programme remains weighted towards pre-let opportunities.
The risk of cost-overruns is mitigated by using our experienced development teams and the use of trusted advisors and contractors.
The risk of contractor default is mitigated by using a diversified selection of companies who have been through a rigorous onboarding process and closely monitoring their financial strength.
Our short development lead-times enable a quick response to changing market conditions.
CURRENT YEAR ACTIVITY
During the year, the Group continued to spend a significant amount on our development programme with each significant project appraisal required to meet detailed pre-set criteria and subject to approval by the Investment Committee. We continue to regularly monitor the performance and financial strength of our contractors as contracts are awarded through the year.
EFFICIENT CAPITAL AND CORPORATE STRUCTURE
DISCIPLINED CAPITAL ALLOCATION
OPERATIONAL EXCELLENCE
DECREASED RISKSIMILAR RISKINCREASED RISK
IMPACT ON STRATEGY
CHANGE IN 2021
RESIDUAL RISK WITHIN APPETITE?
OVERSEEN BY: EXECUTIVE COMMITTEE; OPERATIONS COMMITTEE
FURTHER INFORMATION: ESG DISCLOSURES ON PAGES 92-97
IMPACT ON STRATEGY
CHANGE IN 2021
RESIDUAL RISK WITHIN APPETITE?
OVERSEEN BY: EXECUTIVE COMMITTEE; OPERATIONS COMMITTEE
FURTHER INFORMATION: DEVELOPMENT UPDATE ON PAGES 56-59
5 ENVIRONMENTAL SUSTAINABILITY AND CLIMATE CHANGE 6 DEVELOPMENT PLAN EXECUTION
81SEGRO PLC | ANNUAL REPORT & ACCOUNTS 2021
OVERVIEW STRATEGIC REPORT GOVERNANCE FINANCIAL STATEMENTS
07_PrincipalRisks_74_86_v75.indd 8107_PrincipalRisks_74_86_v75.indd 81 01/03/2022 17:1801/03/2022 17:18

The Group could suffer an acute liquidity or solvency crisis, financial loss or financial distress as a result of a failure in the design or execution of its financing strategy.
Such an event may be caused by a number of factors including a failure to obtain debt or equity funding (for example, due to market disruption or rating downgrade); having an inappropriate debt structure (including leverage level, debt maturity, interest rate or currency exposure); poor forecasting; defaulting on loan agreements as a result of a breach of financial or other covenants; or counterparty default.
MITIGATIONS
The Group’s financing strategy is aligned with our long-term business strategy, the Medium Term Plan and our risk appetite. The Treasury policy defines key policy parameters and controls to support execution of the strategy.
The Group regularly reviews its changing financing requirements in light of opportunities and market conditions and maintains a good long-term relationship with a wide range of sources of finance.
Liquidity remains strong and there is substantial headroom on all our financial covenants.
CURRENT YEAR ACTIVITY
During the year, financing activity has maintained a balance sheet, increased average debt maturity, lowered the average cost of debt, and demonstrated our ability to access a range of debt capital markets (see pages 68 to 69).
The Group could fail to anticipate significant political, legal, tax or regulatory changes, leading to a significant unforeseen financial or reputational impact.
In general, regulatory matters present medium- to long-term risks with a medium likelihood of causing significant harm to the Group.
Political risks could impact business confidence and conditions in the short and longer terms.
MITIGATIONS
Legal and regulatory risks are reviewed regularly by the Executive Committee. Corporate heads of function consult with external advisers, attend industry and specialist briefings, and sit on key industry bodies such as EPRA and the British Property Federation.
As the economic impact of the pandemic affects global economies, the likelihood of changes to taxation regulations increases. We continue to closely monitor the taxation regulations with our advisors to ensure changes which may impact the Group or our customers, are identified and addressed accordingly, in a timely fashion.
CURRENT YEAR ACTIVITY
The regulatory environment has been somewhat dynamic for a number of reasons including the UK leaving the EU and the impact of the pandemic. The Group continues to work closely with advisors to monitor changes in relevant legislation and regulations to ensure that they are identified and addressed appropriately.
Principal risks continued
EFFICIENT CAPITAL AND CORPORATE STRUCTURE
DISCIPLINED CAPITAL ALLOCATION
OPERATIONAL EXCELLENCE
DECREASED RISKSIMILAR RISKINCREASED RISK
8 POLITICAL AND REGULATORY7 FINANCING STRATEGY
IMPACT ON STRATEGY
CHANGE IN 2021
RESIDUAL RISK WITHIN APPETITE?
OVERSEEN BY: EXECUTIVE COMMITTEE
FURTHER INFORMATION: FINANCE REVIEW ON PAGES 68-69
IMPACT ON STRATEGY
CHANGE IN 2021
RESIDUAL RISK WITHIN APPETITE?
OVERSEEN BY: EXECUTIVE COMMITTEE
FURTHER INFORMATION: OUR GOVERNANCE FRAMEWORK ON PAGES 116-118
82 SEGRO PLC | ANNUAL REPORT & ACCOUNTS 2021
STRATEGIC REPORT
07_PrincipalRisks_74_86_v75.indd 8207_PrincipalRisks_74_86_v75.indd 82 01/03/2022 17:1801/03/2022 17:18

The Group’s ability to protect its reputation, revenues and shareholder value could be damaged by operational failures such as: failing to attract, retain and motivate key staff; major customer default; supply chain failure or the structural failure of one of our assets.
Compliance failures, such as breaches of joint venture shareholders’ agreements, loan agreements or tax legislation could also damage reputation, revenue and shareholder value.
MITIGATIONS
The Group maintains a strong focus on Operational Excellence. The Executive, Operations, and Technology Committees regularly monitor the range of risks to property management, compliance, organisational effectiveness and customer management.
The Group’s tax compliance is managed by an experienced internal tax team. REIT and SIIC tax regime compliance is demonstrated at least bi-annually. Compliance with joint venture shareholder agreements is managed by experienced property operations, finance and legal employees. The SELP joint venture additionally has comprehensive governance and compliance arrangements in place, including dedicated management, operating manuals, and specialist third party compliance support.
Our HR team is responsible for our organisational resilience ensuring the correct organisational structure and culture is in place to support the business and attract, retain and motivate a suitably talented workforce.
CURRENT YEAR ACTIVITY
During the year, the working life of staff has continued to be impacted and we have continually monitored the organisational resilience to respond to this, for example, ensuring that staff have the ability and resources to work away from the office for sustained periods, and that the resilience and the security of our technology systems is fully maintained.
EFFICIENT CAPITAL AND CORPORATE STRUCTURE
DISCIPLINED CAPITAL ALLOCATION
OPERATIONAL EXCELLENCE
DECREASED RISKSIMILAR RISKINCREASED RISK
9 OPERATIONAL DELIVERY AND COMPLIANCE
IMPACT ON STRATEGY
CHANGE IN 2021
RESIDUAL RISK WITHIN APPETITE?
OVERSEEN BY: EXECUTIVE COMMITTEE; TECHNOLOGY COMMITTEE; OPERATIONS COMMITTEE
FURTHER INFORMATION: OUR PEOPLE SECTION ON PAGES 99-100
83SEGRO PLC | ANNUAL REPORT & ACCOUNTS 2021
OVERVIEW STRATEGIC REPORT GOVERNANCE FINANCIAL STATEMENTS
07_PrincipalRisks_74_86_v75.indd 8307_PrincipalRisks_74_86_v75.indd 83 01/03/2022 17:1801/03/2022 17:18

Viability statement
CONFIRMATION OF VIABILITY
The Directors have considered the Group’s prospects, including reference to the Group’s principal risks, to form the basis of our assessment of short-term and longer-term viability. The process for conducting this assessment is summarised in the Audit Committee’s report on page 132.
The Directors confirm that they have a reasonable expectation that the Group will be able to continue in operation and has adequate resources to meet its liabilities as they fall due over the next five years.
The assessment of viability is split into short-term and longer-term time horizons.
SHORT-TERM ASSESSMENT
The short-term assessment included consideration of our going concern assessment and a review of key controls around liquidity management.
Management regularly review the Group’s liquidity position and operating results. In addition, key treasury metrics including financial covenants are reviewed by the Executive Committee on a quarterly basis.
LONGER-TERM ASSESSMENT
The period assessed for the longer term is the same five-year time horizon as covered by the Group’s annual rolling five-year strategic financial plan. This is considered to be the optimum balance between our need to plan for the long term, recognising that property investment is a long-term business, and the progressively unreliable nature of forecasting in later years, particularly given the historically cyclical nature of the property industry. The Directors confirm that they have no reason to expect a step-change in the Group’s viability immediately following the five-year period assessed.
In addition to the robust ongoing assessment and management of the risks facing the Group, as already set out in this section, the Group has stress tested its five-year strategic financial plan. This stress test has considered the risks that could either individually, or in aggregate, threaten the viability of the Group. The process for conducting the Group’s assessment is the responsibility of the Chief Financial Officer and is overseen by the Audit Committee.
In particular the stress test has considered the potential impacts of:
£ A systemic crisis, such as a major dislocation or failure of capital markets or a failure of the insurance market;
£ An acute deterioration in occupier or property investment market conditions;
£ 10 per cent movement in interest rates and foreign exchange rates;
£ An inability to refinance maturing debt; and,
£ A sustained interruption to the Group’s business continuity.
In stress testing we assessed the limits at which key financial ratios and covenants would be breached, causing a threat to the Group’s viability. We then assessed the likelihood of that limit being reached as a result of the individual event or combination of events occurring, using a combination of historic data (for example the acute property valuation decline in 2007–2009) and forward-looking probability analysis where available.
In our modelling none of the financial covenants were breached with gearing remaining comfortably below 160 per cent and interest cover well above 1.25 times.
Reverse stress testing was undertaken over the period under review. In isolation, it would take at least a 50 per cent fall in property values during the five-year assessment period, to breach the gearing covenant. A decrease in rental income of over 76 per cent or an increase in interest rates by over seven per cent, during the five-year assessment period, would be required to breach the interest cover covenant. This assumes that the current levels of fixed rate debt are maintained.
In addition, we have undertaken two downside risk scenarios. The first is a severe economic shock (consistent with the financial crisis of 2007-2009 crisis) at a point when the Group is most exposed with its development programme. The second is an occupier slow-down scenario. Whilst both reduced the headroom on the financial covenants the Group is able to continue in operation under either scenario. Under the severe economic shock scenario, focused on the impact on gearing from a sharp fall in capital values, the gearing ratio increased, peaking at 40 per cent. Under the occupier slow down scenario, focused on the impact of reduced take up and rental growth on capital values and earnings, the gearing ratio decreases and the interest cover increases due to the mitigating actions taken.
The scenarios set out are hypothetical and severe for the purpose of creating outcomes which have the ability to threaten the viability of the Group. We also note that, in the event of a severe threat to liquidity, various options are available to the Group to maintain viability. These options include reduction of any non-committed capital expenditure and acquisitions, selling assets, or reducing cash dividends (including the use of scrip dividends).
We are optimistic about the longer-term prospects of our business based on, amongst other indicators, a weighted average lease length of 7.2 years to break (UK: 8.2 years; Continental Europe: 5.9 years), enduring high levels of customer retention (77 per cent of customers retained in existing or new SEGRO space) and positive customer feedback from our rolling customer surveys. These are supported by the long-term trends in the warehouse and industrial real estate sector of growing e-commerce share of retail sales and increasing urbanisation across Europe (see Market Drivers on page 16 for more information).
84 SEGRO PLC | ANNUAL REPORT & ACCOUNTS 2021
STRATEGIC REPORT
07_PrincipalRisks_74_86_v75.indd 8407_PrincipalRisks_74_86_v75.indd 84 01/03/2022 17:1801/03/2022 17:18

Section 172 Statement Companies Act 2006 (s172)
Each of the Directors is mindful of their duties under s172 to run the Company for the benefit of its shareholders, and in doing so, to take into account the long-term impact of any decisions on stakeholder relationships and the impact of the Company’s activities on the environment whilst maintaining its reputation for high standards of business conduct at all time.
The Company cannot operate in a vacuum. We can only succeed if we conduct ourselves in a responsible manner and have positive relationships with all of our stakeholders.
WHO ARE OUR STAKEHOLDERS AND HOW ARE THEY RELEVANT TO OUR STRATEGY?
The Board has identified the Company’s key stakeholders as those who we have an impact on – employees, suppliers, communities – and those who have an impact on us – customers and investors.
Without any of these key stakeholders, we simply would not have a business:
£ our people deliver our strategy, nothing would happen without their hard work and dedication; £ our suppliers provide us with everything we need to offer buildings and services to our customers and to keep the Company running efficiently; £ our relationship with our local communities means that we are good neighbours and support each other. We need the support of local communities to gain approvals for our developments. We deliver long term economic and social benefits in the communities where we operate; £ our investors rely on us to invest their money wisely, to grow the business and deliver good returns; £ our customers are at the heart of our business purpose. The space we provide enables them to deliver an extraordinary range of goods and services to their customers.
Underpinning these stakeholder relationships is a culture which promotes high standards of business ethics, is focused on a long-term sustainable strategy and which recognises our responsibilities to the environment.
HOW DOES THE BOARD ENGAGE WITH STAKEHOLDERS?
There are many engagement mechanisms with these stakeholders within the business, as well as at Board level. The Directors engage directly with as many stakeholders as they can but given the number of stakeholders, who are spread across nine geographies, engagement often takes place at the operational level.
We explain how the business engages with our stakeholders throughout the Annual Report, the page references are included on this page, while in the Governance section on pages 110 to 113 we explain the Board’s involvement.
WHERE ELSE YOU CAN READ ABOUT STAKEHOLDER ENGAGEMENT AND OUR APPROACH TO S172
EMPLOYEES Chief Executive’s statement
Relationships and Resources
Governance
12-15
32-35
112-113
CUSTOMERS Relationships and Resources
Governance
30-31
112-113
SUPPLIERS Relationships and Resources
Governance
40
112-113
INVESTORS Our approach to business
Relationships and Resources
Governance
20-21
41
112-113
ENVIRONMENT Review of 2021 54-55, 59
HIGH STANDARDS OF CONDUCT
Health and safety
Business ethics and modern slavery
Governance
45
99
115
COMMUNITY Responsible SEGRO
Governance
42-43
112-113
LONG TERM Our strategy
Disciplined capital allocation
Efficient capital and corporate structure
Risk management
Viability statement
Governance, Strategy Day
22-23
47, 60
41
74-83
84
108
85SEGRO PLC | ANNUAL REPORT & ACCOUNTS 2021
OVERVIEW STRATEGIC REPORT GOVERNANCE FINANCIAL STATEMENTS
07_PrincipalRisks_74_86_v75.indd 8507_PrincipalRisks_74_86_v75.indd 85 01/03/2022 17:1801/03/2022 17:18
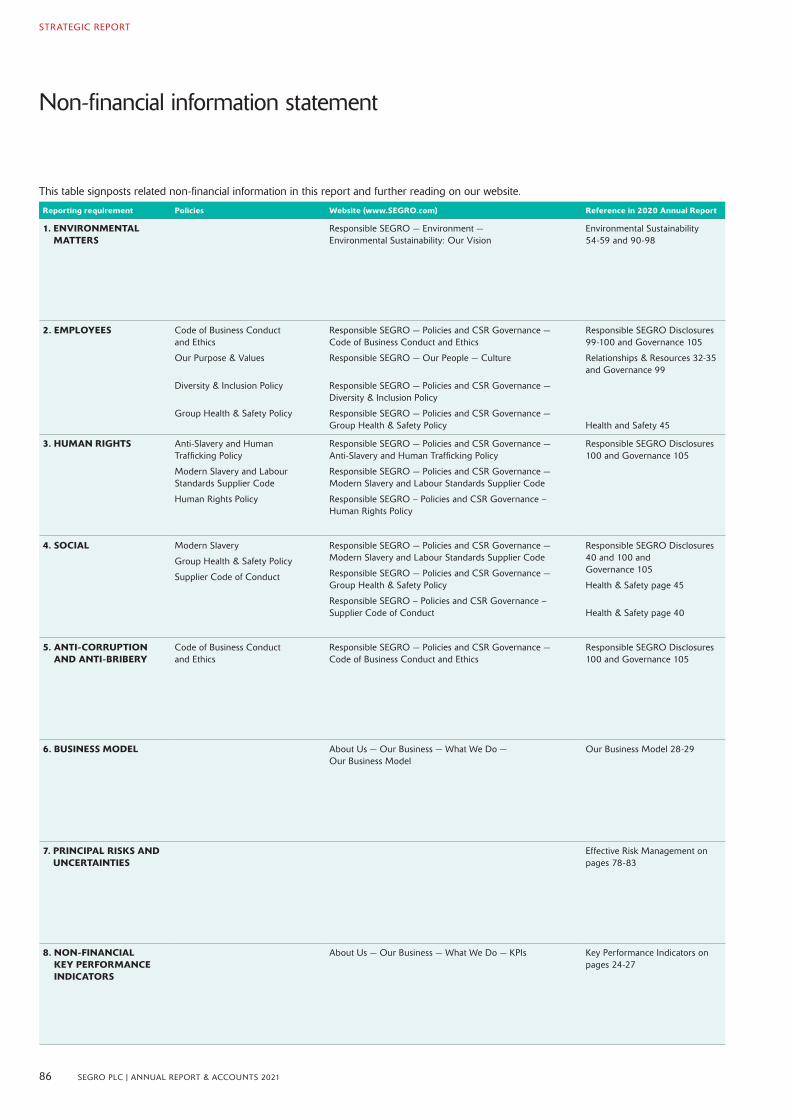
Non-financial information statement
This table signposts related non-financial information in this report and further reading on our website.
Reporting requirement Policies Website (www.SEGRO.com) Reference in 2020 Annual Report
1. ENVIRONMENTAL MATTERS
Responsible SEGRO — Environment — Environmental Sustainability: Our Vision
Environmental Sustainability 54-59 and 90-98
2. EMPLOYEES Code of Business Conduct and Ethics
Our Purpose & Values
Diversity & Inclusion Policy
Group Health & Safety Policy
Responsible SEGRO — Policies and CSR Governance — Code of Business Conduct and Ethics
Responsible SEGRO — Our People — Culture
Responsible SEGRO — Policies and CSR Governance — Diversity & Inclusion Policy
Responsible SEGRO — Policies and CSR Governance — Group Health & Safety Policy
Responsible SEGRO Disclosures 99-100 and Governance 105
Relationships & Resources 32-35 and Governance 99
Health and Safety 45
3. HUMAN RIGHTS Anti-Slavery and Human Trafficking Policy
Modern Slavery and Labour Standards Supplier Code
Human Rights Policy
Responsible SEGRO — Policies and CSR Governance — Anti-Slavery and Human Trafficking Policy
Responsible SEGRO — Policies and CSR Governance — Modern Slavery and Labour Standards Supplier Code
Responsible SEGRO – Policies and CSR Governance – Human Rights Policy
Responsible SEGRO Disclosures 100 and Governance 105
4. SOCIAL Modern Slavery
Group Health & Safety Policy
Supplier Code of Conduct
Responsible SEGRO — Policies and CSR Governance — Modern Slavery and Labour Standards Supplier Code
Responsible SEGRO — Policies and CSR Governance — Group Health & Safety Policy
Responsible SEGRO – Policies and CSR Governance – Supplier Code of Conduct
Responsible SEGRO Disclosures 40 and 100 and Governance 105
Health & Safety page 45
Health & Safety page 40
5. ANTI-CORRUPTION AND ANTI-BRIBERY
Code of Business Conduct and Ethics
Responsible SEGRO — Policies and CSR Governance — Code of Business Conduct and Ethics
Responsible SEGRO Disclosures 100 and Governance 105
6. BUSINESS MODEL About Us — Our Business — What We Do — Our Business Model
Our Business Model 28-29
7. PRINCIPAL RISKS AND UNCERTAINTIES
Effective Risk Management on pages 78-83
8. NON-FINANCIAL KEY PERFORMANCE INDICATORS
About Us — Our Business — What We Do — KPIs Key Performance Indicators on pages 24-27
86 SEGRO PLC | ANNUAL REPORT & ACCOUNTS 2021
STRATEGIC REPORT
07_PrincipalRisks_74_86_v75.indd 8607_PrincipalRisks_74_86_v75.indd 86 01/03/2022 17:1801/03/2022 17:18
Responsible SEGRO disclosures
Our Purpose is to create the space that enables extraordinary things to happen. It highlights our dual roles: as creators of physical spaces and enablers for our stakeholders to achieve their own ambitions. It is true for our customers who depend on our properties to be able to deliver the extraordinary range of goods and services which are essential to modern life. It is true for our colleagues, whom we want to thrive and to maximise their potential while working with us. And it is true of other stakeholders such as the people and communities who work in, live near or provide services to our properties.
Our commitment to be a force for societal and environmental good is integral to our Purpose and Strategy. This has been at the core of how we do business for over 100 years, and will be just as important for the next 100.
This commitment is led by our Board, but lived by SEGRO colleagues every day. It’s about doing the right thing and making a positive impact wherever we operate.
To make sure that we continue to meet our own high standards and those that are expected of us, as part of this process we have listened to our customers, employees, suppliers, investors and other stakeholders to understand what’s important to them and how we can be a force for good beyond the buildings we create and own. Our ambition is to be the partner of choice for all of our stakeholders, to enable us to create long-term economic and societal value.
Our long-held commitments to leadership in health and safety, stakeholder engagement, corporate governance and being a good corporate citizen are stronger than ever and our Responsible SEGRO priorities have been designed to support and enhance these.
Our Responsible SEGRO framework focuses on three long-term priorities to which we can make the greatest business, environment and social contribution. Our three priorities are:
} Championing low-carbon growth;
} Investing in our local communities and environments; and
}Nurturing Talent.
For each of these areas we have established challenging initial targets, against which we intend to report annually, and have set out the actions needed to achieve them.
We will set additional, more specific, supporting targets as necessary and we expect our actions and approach to evolve over time to reflect our achievements, technological change and the priorities of our stakeholders and wider society.
We have put the right structures in place throughout our business to monitor how we are performing against our targets, and we will achieve our goals by drawing on our expertise in our field; our strong relationships with our investors, customers and suppliers; and the resourcefulness and determination of our people.
Our goals will be achieved by working with our local communities, our partners – in particular our customers – and our suppliers in order to deliver real change for the greater good.
We believe that working towards and achieving the goals within the Responsible SEGRO framework will ensure we remain a business fit for the future, one that helps our customers grow, our communities flourish and our people thrive.
In short, that we will continue to create the space which enables extraordinary things to happen for many years to come.
87SEGRO PLC | ANNUAL REPORT & ACCOUNTS 2021
OVERVIEW STRATEGIC REPORT GOVERNANCE FINANCIAL STATEMENTS
08_ESG_Disclosures_87_101_v91.indd 8708_ESG_Disclosures_87_101_v91.indd 87 01/03/2022 17:1901/03/2022 17:19

SEGRO recognises that the world faces a climate emergency and we are committed to playing our part in tackling climate change by limiting global temperature rise to less than 1.5 degrees, in tandem with growth in our business and the wider economy.
SEGRO is an integral part of the communities where it operates, and we are committed to contributing to their long-term vitality.
SEGRO’s people are vital to and inseparable from its success, and we are committed to attracting and retaining a diverse range of talented individuals in our business.
We will be net-zero carbon by 2030. We will create and implement Community Investment Plans for every key market in our portfolio by 2025.
We will increase the overall diversity of our own workforce throughout the organisation.
We will aim to reduce carbon emissions from our development activity and the operation of our existing buildings, and eliminate them where possible.
We will implement plans to absorb any residual carbon.
We will research and implement innovative approaches to absorb or offset residual carbon.
We will work with our customers and suppliers to support our local businesses and economies.
We will help improve the skills of local people to enhance their career and employment opportunities by investing in local training programmes.
Equally, we will enhance the spaces around our buildings, working with local partners to ensure we meet the needs of our communities.
We will provide a healthy and supportive working environment, develop fulfilling and rewarding careers, foster an inclusive culture and build a more diverse workforce.
We have reviewed the United Nations Sustainable Development Goals against our Responsible SEGRO framework to understand which goals are particularly significant to our business and the three core priorities that we have outlined above. Elements of this framework are aligned with all of the Goals, but we believe that we are able to make the greatest contribution to the following six:
SEGRO is committed to championing low-carbon growth and has set a target to be net-zero carbon by 2030. We will reduce the embodied carbon in our new developments as well as reducing the carbon-intensity of our properties through initiatives such as increasing our solar generation capacity. We want to play our part in tackling the increasingly evident challenge that climate change presents.
SEGRO is committed to supporting local communities with a focus on providing training and helping people build the skills they need to gain employment. We will work together with our partners to reach more people and help them back into education, training or employment. We want to play our part in reducing inequalities and ensuring that more people have the right skills to be able to access meaningful work.
SEGRO is committed to being a good neighbour and to enhancing the spaces beyond our buildings. We will work to accelerate green transport solutions through promoting better public transport links and cycling infrastructure and installing electric vehicle charging points. We want to play our part in ensuring that our buildings are part of thriving, sustainable communities.
CO
NT
EX
TTA
RG
ET
SA
CT
ION
S
OUR THREE LONG-TERM PRIORITIES
ALIGNMENT WITH THE UNITED NATIONS SUSTAINABLE DEVELOPMENT GOALS
Responsible SEGRO Disclosures continued
Championing low-carbon growth
Nurturing talent
Investing in our local communities and environments
88 SEGRO PLC | ANNUAL REPORT & ACCOUNTS 2021
STRATEGIC REPORT
08_ESG_Disclosures_87_101_v91.indd 8808_ESG_Disclosures_87_101_v91.indd 88 01/03/2022 17:1901/03/2022 17:19

INTEGRATING RESPONSIBLE SEGRO
Our Responsible SEGRO framework is fully integrated into our Business and helps us to articulate and focus on our ESG goals
OUR PEOPLE Pages 32-35
OUR SUPPLIERS Pages 40
OUR CUSTOMERS Pages 30-31
OUR COMMUNITIES Pages 42-45
OUR INVESTORS Pages 41
HEALTH & SAFETY Page 45
OUR ENVIRONMENT Page 54-58
ESG METRICS
We monitor our performance across various Environmental, Social and Governance (ESG) indices and review trends to ensure our approach and the information we disclose meets the needs of our stakeholders.
There are a number of different organisations and structures for reporting on our wider ESG metrics, and we report against the following either in this Annual Report or on the Responsible SEGRO area on our website:
Reporting Frameworks:Global Reporting Initiative (GRI)
Task Force on Climate-related Financial Disclosure project (TCFD)
Better Building Partnership – Climate Change Commitment
Workforce Disclosure Initiative – 98%
Rating Agencies:MSCI – AAA
European Public Real Estate Association (EPRA) – Gold
Carbon Disclosure Project (CDP) – B
Global Real Estate Sustainability Benchmark (GRESB) } Standing Investments – Rated three-star } Development – Rated four-star } Public Disclosure – A
Dow Jones Sustainability Index (DJSI) – 86th Percentile
FTSE4GOOD – 3.2 (sub-sector average 2.4)
We recognise that our responsibility goes well beyond the space that we own and we work hard to make a positive contribution to our environment, our customers, our people, our partners and the communities in which we operate.
Understanding the needs and priorities of these various stakeholder groups is embedded in the way we do business and in recognition of that we integrate this information into the Strategic Report.
The index to the right indicates where you can find additional information on each of the relevant areas and we have provided some additional disclosures within this section.
You can also find further information, including further case studies, within the Responsible SEGRO section of our website.
89SEGRO PLC | ANNUAL REPORT & ACCOUNTS 2021
OVERVIEW STRATEGIC REPORT GOVERNANCE FINANCIAL STATEMENTS
08_ESG_Disclosures_87_101_v91.indd 8908_ESG_Disclosures_87_101_v91.indd 89 01/03/2022 17:1901/03/2022 17:19

ENVIRONMENT
(Baseline) 2020 2021
Operational Carbon (SBTI validated target)We will reduce the absolute CO2e emissions from our portfolio by 42 per cent by 2030 against a 2020 baseline. The 2020 baseline has been re-stated to reflect actual recorded fuel use (54 per cent of the portfolio by floorspace) and an estimation for the portfolio for which we have no visibility (46 per cent of the portfolio). It includes Scope 1, 2 and Scope 3 Downstream Leased Assets.
312,115 tonnes 312,115 tonnes 280,575 tonnes
Operational Carbon IntensityThis metric is based on the CO2e emissions of the portfolio for which we have visibility of the data. This reflects 54 per cent of the portfolio floorspace under management.
37.5kgCO2e/sq m 27.9 kgCO2e/sq m
Embodied Carbon (SBTi validated target)We will reduce the embodied carbon intensity of new developments by 20 per cent by 2030, against a 2020 baseline. The 2020 baseline and the embodied carbon intensity figure has been recalculated to encompass more of the carbon embodied within our development pipeline. In 2021, SEGRO undertook an embodied carbon assessment of 53 per cent of completed developments by floorspace. We are working to have embodied carbon data for all developments containing over 5,000 sq m of floorspace.
400kgCO2e/sq m 400 kgCO2e/sq m 391 kgCO2/sq m
Energy EfficiencyWe are conscious of demands by our customers and by governments to provide energy-efficient buildings to reduce both carbon emissions and operating costs. We monitor these by use of Energy Performance Certificates (EPC). We are aiming for every building to have an EPC rating of B1 or better.Group floorspace rated B or betterGroup floorspace rated E or lowerGroup floorspace not rated
49.3%0.5%
21.2%
54.6%1.1%
17.2%
On-site Renewable Energy GenerationWith significant roof space, our portfolio is capable of supporting on-site renewable energy capacity through the use of photovoltaic (solar) panels. We intend to increase this by installing solar panels on our new developments and on appropriate existing assets.
CapacityGenerated
26.8 MW20,976 MWh
35.4 MW24,781 MWh
Off-site Renewable Energy ProcurementWhere on-site renewable energy is either unavailable or insufficient, we are working towards ensuring that all off-site electricity supplies are sourced from 100 per cent certified renewables. This data reflects the portfolio over which we have visibility of electricity supply.
11% 53%
1 Germany and Poland express EPC ratings as numerical primary energy demand figures and are therefore inconsistent with SEGRO’s other markets. For the purpose of creating a group EPC metric a B rating is equivalent to a primary energy demand of 150 kWh/m2 or less for Germany and Poland.
STREAMLINED ENERGY AND CARBON REPORTING (SECR)
Global GHG Emissions data in metric tonnes CO2eEmissions from: UK CE 2020 UK CE 2021
Scope 1 emissions – combustion of fuels 279 1,122 1,401 187 1,091 1,278Scope 2 emissions – purchased energy (location based)* 618 1,739 2,357 517 2,342 2,859
Scope 2 emissions – purchased energy (market based)** 323 1,765 2,088 345 2,597 2,942Scope 3 emissions – business travel 42 3 45 67 18 84Gross CO2e footprint (using location based) 939 2,864 3,803 771 3,450 4,221
Responsible floor area (sq m) 1,117,121 1,445,334Carbon intensity per sq m floor space (kgCO2e/sq m) 3.4 2.9Total Energy Use (kWh) 15,607,448 18,316,350
* Electricity emissions are calculated using standard national conversion factors (location based).** Electricity emissions are calculated using supplier specific conversion factors where we are reducing our carbon footprint by procuring a low-carbon electricity tariff, and ‘residual’ factors
where we have not yet moved to a low-carbon tariff (market based). Corporate Citizenship provide limited independent assurance to ASAE3000. See www.segro.com/responsiblesegro for more details of the independent assurance.
ENVIRONMENTAL PERFORMANCE METRICS
In 2021, as part of our Responsible SEGRO Framework commitment, we reviewed our carbon emissions targets which have been validated by the Science Based Targets Initiative (SBTi). We have therefore updated our formal carbon reduction targets to be in line with the science-based carbon emissions reduction pathway, using our 2020 performance as a benchmark. These targets, set out in the table below, are considered to be a required minimum for SEGRO and we will need to act faster to become a net-zero company by 2030.
Responsible SEGRO Disclosures continued
90 SEGRO PLC | ANNUAL REPORT & ACCOUNTS 2021
STRATEGIC REPORT
08_ESG_Disclosures_87_101_v91.indd 9008_ESG_Disclosures_87_101_v91.indd 90 01/03/2022 17:1901/03/2022 17:19

ENVIRONMENT
STREAMLINED ENERGY AND CARBON REPORTING (SECR) CONTINUED
REPORTING METHODOLOGYThe greenhouse gas (GHG) section has been prepared in accordance with our regulatory obligation to report greenhouse gas emissions pursuant to section 7 of the Companies Act 2006 (Strategic Report and Directors’ Report) Regulations 2013 and the Companies (Directors’ Report), and Limited Liability Partnerships (Energy and Carbon Report) Regulations 2018; the latter commonly referred to as streamlined energy & carbon reporting.
As well as fulfilling these mandatory greenhouse gas reporting requirements, SEGRO is committed to following EPRA best practice recommendations for sustainability reporting. We report our data using an operational control approach to define our organisational boundary, as per the greenhouse gas protocol. The market-based methodology has been applied to calculate the scope 2 emissions where they are available; where they are not available the IEA residual emission factors have been applied. We have chosen lettable floor space as our chosen intensity metric, using total floor area with scope 1 and 2 emissions in the reporting year. Business travel covers the grey fleet only, which is expensed mileage for employee owned vehicles, air and rail travel.
The total energy use covers the electricity, fuels and district heating converted to kWh units. The Responsible SEGRO Data Pack contains a detailed description of our methodology can be found at www.segro.com/responsiblesegro/reports. Greenhouse gas emissions and energy use data for the period 1 October 2020 to 30 September 2021. This period is referred to as 2021. The increase in scope 2 emissions relates to a large development completed in the reporting year, where there was high energy consumption during the construction period, contributing 1,168 TCO2e location-based (1,654 TCO2e market-based) emissions in the reporting year. This fell into SEGRO responsible emissions up until the building was completed.
CARBON FOOTPRINT – SCOPE 3 REPORTING
Due to the nature of our operations the majority of our carbon footprint falls outside our direct control and are reported in the Scope 3 table below. The operating carbon reflects the carbon emissions associated with the energy consumption of the portfolio, and includes sites where we have no visible data in accordance with our Science Based Target initiative (SBTi) approved targets. The embodied carbon of our developments is our second largest carbon impact, where gross emissions vary depending on the amount of floorspace delivered in the reporting year. The Scope 3 greenhouse gas reporting year is 1 October 2020 to 30 September 2021, this period is referred to as 2021. For these two Scope 3 categories we report intensity metrics within our Net Zero Carbon Metrics table opposite.
GREENHOUSE GAS (GHG) REPORTING
GHG Protocol Reporting Category 20202021 Tonnes
CO2e %Net Zero
Commitment
Scope 1 – Operating carbon 1,401 1,278 0.2 YesScope 2 – Operating carbon (market-based) 2,088 2,942 0.5 YesScope 3 – Downstream Leased Assets (market-based) 308,626 276,355 48.2 Yes
Total Operating Carbon 312,115* 280,575 48.9Scope 3 emissions:
Capital goods 285,975 197,166 34.4 Yes Upstream transportation and distribution 3,039 16,033 2.8 YesTotal Embodied Carbon 285,975 213,199 37.2
Purchased goods and services 36,471 34,103 5.9 Yes Fuel and Energy related activities 22,181 38,915 6.8 No Waste generated from operations 1,304 4,243 0.7 Yes Use of sold products 2,651 1,913 0.3 No
Business travel 45 84 0.0 Yes Commuter travel 202 94 0.0 No
Upstream leased assets 96 55 0.0 Yes
Downstream transportation and distribution N/A N/A Processing of sold products N/A N/A End-of-life treatment of sold products N/A N/A Franchises N/A N/A Investments N/A N/A
Total 664,079 573,181 100.0%
* Downstream leased assets has been re-stated for 2020 to cover 100% of the portfolio using the estimation methodology approved by SBTi.
** Methodology for reporting upstream transportation and distribution changed in 2021. This is reported as stage A4 in the life cycle assessments under EN 15978.
NET ZERO CARBON
1. Operating Carbon 53%
2. Embodied Carbon 40%
3. Supply chain emissions 6%
4. Corporate emissions 1%
2
3
1
4
91SEGRO PLC | ANNUAL REPORT & ACCOUNTS 2021
OVERVIEW STRATEGIC REPORT GOVERNANCE FINANCIAL STATEMENTS
08_ESG_Disclosures_87_101_v91.indd 9108_ESG_Disclosures_87_101_v91.indd 91 01/03/2022 17:1901/03/2022 17:19
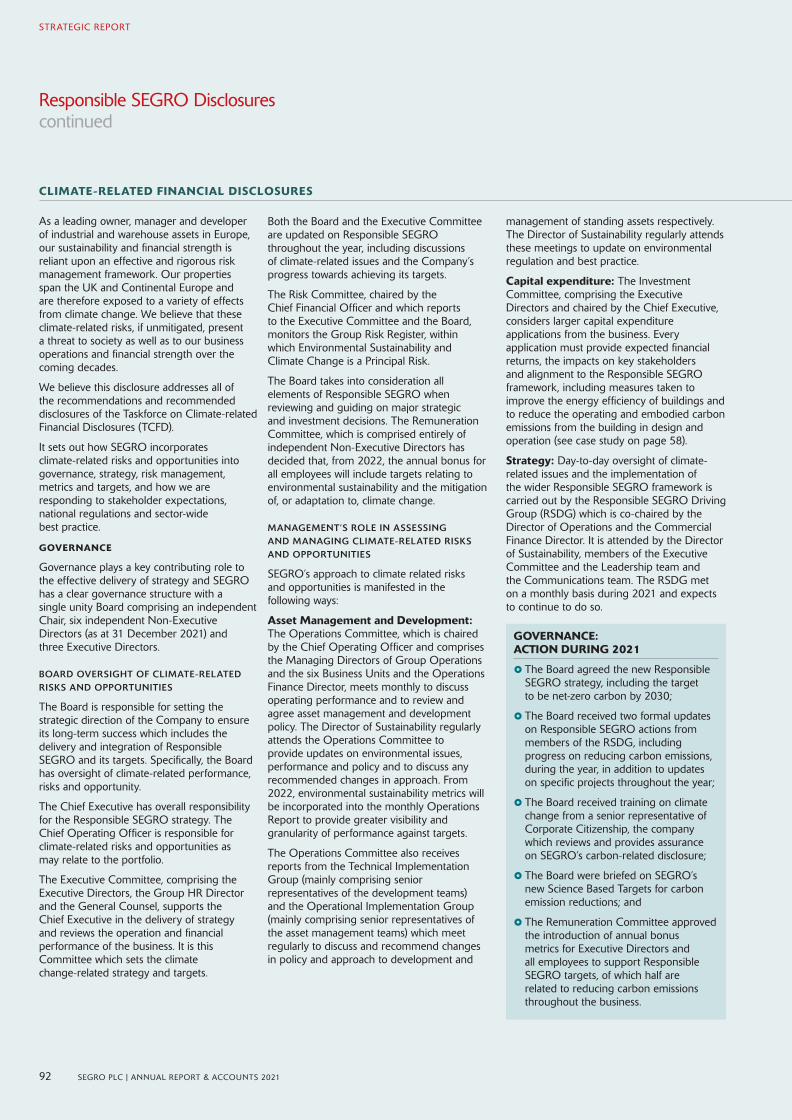
CLIMATE-RELATED FINANCIAL DISCLOSURES
Both the Board and the Executive Committee are updated on Responsible SEGRO throughout the year, including discussions of climate-related issues and the Company’s progress towards achieving its targets.
The Risk Committee, chaired by the Chief Financial Officer and which reports to the Executive Committee and the Board, monitors the Group Risk Register, within which Environmental Sustainability and Climate Change is a Principal Risk.
The Board takes into consideration all elements of Responsible SEGRO when reviewing and guiding on major strategic and investment decisions. The Remuneration Committee, which is comprised entirely of independent Non-Executive Directors has decided that, from 2022, the annual bonus for all employees will include targets relating to environmental sustainability and the mitigation of, or adaptation to, climate change.
MANAGEMENT’S ROLE IN ASSESSING AND MANAGING CLIMATE-RELATED RISKS AND OPPORTUNITIES
SEGRO’s approach to climate related risks and opportunities is manifested in the following ways:
Asset Management and Development: The Operations Committee, which is chaired by the Chief Operating Officer and comprises the Managing Directors of Group Operations and the six Business Units and the Operations Finance Director, meets monthly to discuss operating performance and to review and agree asset management and development policy. The Director of Sustainability regularly attends the Operations Committee to provide updates on environmental issues, performance and policy and to discuss any recommended changes in approach. From 2022, environmental sustainability metrics will be incorporated into the monthly Operations Report to provide greater visibility and granularity of performance against targets.
The Operations Committee also receives reports from the Technical Implementation Group (mainly comprising senior representatives of the development teams) and the Operational Implementation Group (mainly comprising senior representatives of the asset management teams) which meet regularly to discuss and recommend changes in policy and approach to development and
management of standing assets respectively. The Director of Sustainability regularly attends these meetings to update on environmental regulation and best practice.
Capital expenditure: The Investment Committee, comprising the Executive Directors and chaired by the Chief Executive, considers larger capital expenditure applications from the business. Every application must provide expected financial returns, the impacts on key stakeholders and alignment to the Responsible SEGRO framework, including measures taken to improve the energy efficiency of buildings and to reduce the operating and embodied carbon emissions from the building in design and operation (see case study on page 58).
Strategy: Day-to-day oversight of climate-related issues and the implementation of the wider Responsible SEGRO framework is carried out by the Responsible SEGRO Driving Group (RSDG) which is co-chaired by the Director of Operations and the Commercial Finance Director. It is attended by the Director of Sustainability, members of the Executive Committee and the Leadership team and the Communications team. The RSDG met on a monthly basis during 2021 and expects to continue to do so.
As a leading owner, manager and developer of industrial and warehouse assets in Europe, our sustainability and financial strength is reliant upon an effective and rigorous risk management framework. Our properties span the UK and Continental Europe and are therefore exposed to a variety of effects from climate change. We believe that these climate-related risks, if unmitigated, present a threat to society as well as to our business operations and financial strength over the coming decades.
We believe this disclosure addresses all of the recommendations and recommended disclosures of the Taskforce on Climate-related Financial Disclosures (TCFD).
It sets out how SEGRO incorporates climate-related risks and opportunities into governance, strategy, risk management, metrics and targets, and how we are responding to stakeholder expectations, national regulations and sector-wide best practice.
GOVERNANCE
Governance plays a key contributing role to the effective delivery of strategy and SEGRO has a clear governance structure with a single unity Board comprising an independent Chair, six independent Non-Executive Directors (as at 31 December 2021) and three Executive Directors.
BOARD OVERSIGHT OF CLIMATE-RELATED RISKS AND OPPORTUNITIES
The Board is responsible for setting the strategic direction of the Company to ensure its long-term success which includes the delivery and integration of Responsible SEGRO and its targets. Specifically, the Board has oversight of climate-related performance, risks and opportunity.
The Chief Executive has overall responsibility for the Responsible SEGRO strategy. The Chief Operating Officer is responsible for climate-related risks and opportunities as may relate to the portfolio.
The Executive Committee, comprising the Executive Directors, the Group HR Director and the General Counsel, supports the Chief Executive in the delivery of strategy and reviews the operation and financial performance of the business. It is this Committee which sets the climate change-related strategy and targets.
Responsible SEGRO Disclosures continued
92 SEGRO PLC | ANNUAL REPORT & ACCOUNTS 2021
STRATEGIC REPORT
GOVERNANCE: ACTION DURING 2021
} The Board agreed the new Responsible SEGRO strategy, including the target to be net-zero carbon by 2030;
} The Board received two formal updates on Responsible SEGRO actions from members of the RSDG, including progress on reducing carbon emissions, during the year, in addition to updates on specific projects throughout the year;
} The Board received training on climate change from a senior representative of Corporate Citizenship, the company which reviews and provides assurance on SEGRO’s carbon-related disclosure;
} The Board were briefed on SEGRO’s new Science Based Targets for carbon emission reductions; and
} The Remuneration Committee approved the introduction of annual bonus metrics for Executive Directors and all employees to support Responsible SEGRO targets, of which half are related to reducing carbon emissions throughout the business.
08_ESG_Disclosures_87_101_v91.indd 9208_ESG_Disclosures_87_101_v91.indd 92 01/03/2022 17:1901/03/2022 17:19
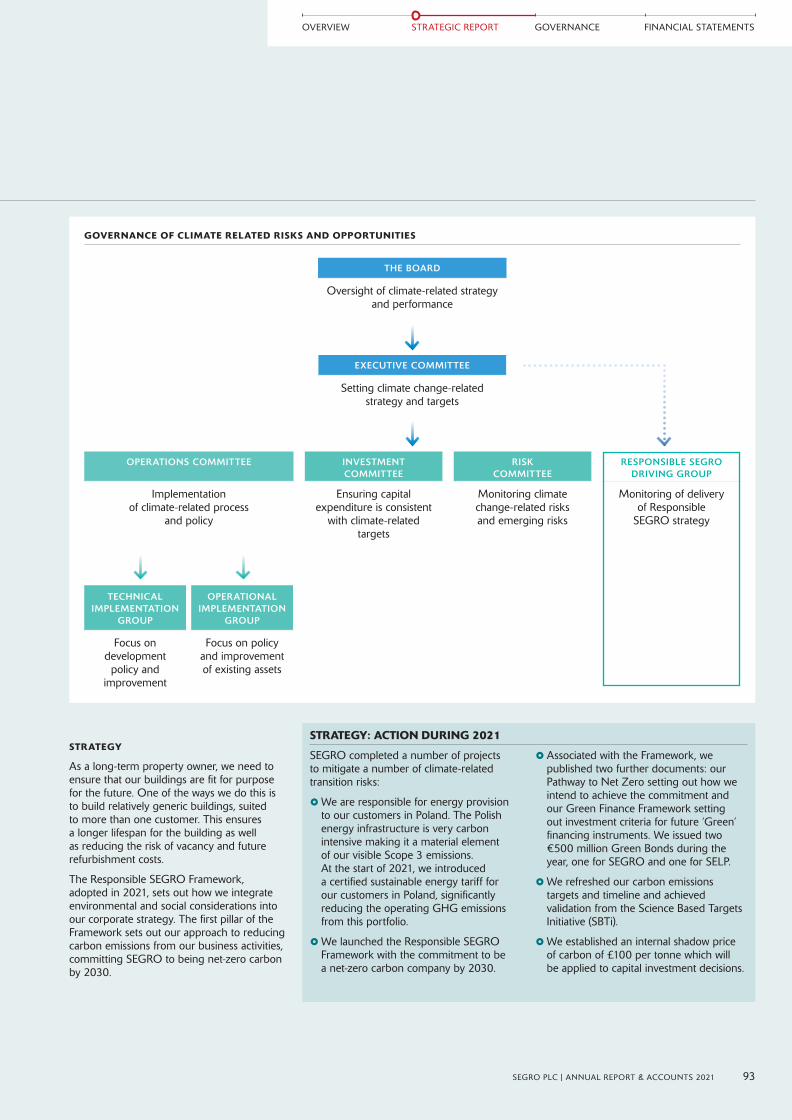
CLIMATE-RELATED FINANCIAL DISCLOSURES
STRATEGY
As a long-term property owner, we need to ensure that our buildings are fit for purpose for the future. One of the ways we do this is to build relatively generic buildings, suited to more than one customer. This ensures a longer lifespan for the building as well as reducing the risk of vacancy and future refurbishment costs.
The Responsible SEGRO Framework, adopted in 2021, sets out how we integrate environmental and social considerations into our corporate strategy. The first pillar of the Framework sets out our approach to reducing carbon emissions from our business activities, committing SEGRO to being net-zero carbon by 2030.
TECHNICAL IMPLEMENTATION
GROUP
Focus on development policy and
improvement
OPERATIONAL IMPLEMENTATION
GROUP
Focus on policy and improvement of existing assets
GOVERNANCE OF CLIMATE RELATED RISKS AND OPPORTUNITIES
THE BOARD
Oversight of climate-related strategy and performance
EXECUTIVE COMMITTEE
Setting climate change-related strategy and targets
OPERATIONS COMMITTEE INVESTMENT COMMITTEE
RISK COMMITTEE
RESPONSIBLE SEGRO DRIVING GROUP
Implementation of climate-related process
and policy
Ensuring capital expenditure is consistent
with climate-related targets
Monitoring climate change-related risks and emerging risks
Monitoring of delivery of Responsible
SEGRO strategy
STRATEGY: ACTION DURING 2021
SEGRO completed a number of projects to mitigate a number of climate-related transition risks:
}We are responsible for energy provision to our customers in Poland. The Polish energy infrastructure is very carbon intensive making it a material element of our visible Scope 3 emissions. At the start of 2021, we introduced a certified sustainable energy tariff for our customers in Poland, significantly reducing the operating GHG emissions from this portfolio.
}We launched the Responsible SEGRO Framework with the commitment to be a net-zero carbon company by 2030.
} Associated with the Framework, we published two further documents: our Pathway to Net Zero setting out how we intend to achieve the commitment and our Green Finance Framework setting out investment criteria for future ‘Green’ financing instruments. We issued two €500 million Green Bonds during the year, one for SEGRO and one for SELP.
}We refreshed our carbon emissions targets and timeline and achieved validation from the Science Based Targets Initiative (SBTi).
}We established an internal shadow price of carbon of £100 per tonne which will be applied to capital investment decisions.
93SEGRO PLC | ANNUAL REPORT & ACCOUNTS 2021
OVERVIEW STRATEGIC REPORT GOVERNANCE FINANCIAL STATEMENTS
08_ESG_Disclosures_87_101_v91.indd 9308_ESG_Disclosures_87_101_v91.indd 93 01/03/2022 17:1901/03/2022 17:19

IDENTIFICATION OF CLIMATE-RELATED RISKS AND OPPORTUNITIES OVER THE SHORT, MEDIUM AND LONG TERM AND THEIR IMPACT ON SEGRO’S BUSINESS, STRATEGY AND FINANCIAL PLANNING
MATERIALITY ANALYSIS OF PHYSICAL RISK
We have undertaken a climate resilience study to assess the medium-term (defined as the period to 2040) and long-term (beyond 2040) physical risks to our portfolio by geography. For this study, the impact of Representative Concentration Pathway (RCP) 4.5 (3C warming by 2100) and RCP 8.5 (4-5C warming by 2100) were modelled on our portfolio countries at high level to assess different threats from climate change.
The level of risk was judged based on the likelihood of the specific threat and the severity of the impact on our assets in terms of their ability to be used by an occupier. This analysis is not asset-specific but is designed to identify the material risks to be incorporated into investment decisions in different geographies.
The table below identifies the medium-term risks (defined as the period to 2040) in our major geographies associated with six main climate change threats. Based on this analysis, rising temperatures (including extreme heat events) and flood risk are most material to our geographies. Water stress and extreme weather are not material risks to our main markets.
Climate Impact High risk Medium Risk Low Risk Priority Assets
Extreme heat events Italy, Spain UK, France, Poland, Czech Republic, Germany, Netherlands
– Sites which are more exposed to higher wind speeds, in open terrain, and/or close to the sea front.Chronic increase in
average temperatureItaly, Spain, France Germany Netherlands, Poland,
UK
Flood risk Poland UK, Italy, Spain Germany, Netherlands, Czech Republic
Sites where city infrastructure is reaching capacity and on-site attenuation is critical.Change in precipitation
patternsGermany, Poland Netherlands, Czech
Republic, UKFrance, Italy, Spain
Water stress – Italy, Spain Poland, UK Czech Republic, France, Germany
Large logistics sites with landscaping strategy in place, including biodiversity elements.
Sites in southern regions (depending on the country this becomes a priority mostly mid-century).
Extreme weather – Netherlands, Germany, Czech Republic, Poland
UK, France, Italy, Spain
Sites which are more exposed to higher wind speeds, in open terrain and/or close to the sea front.
In addition, RCP 2.6 (<2C warming by 2100) was considered within this study. The physical risks from this level of warming were considered low based on the location and quality of our assets. The risks in this instance relate primarily to the transition to a low carbon economy and business.
MATERIALITY ANALYSIS OF TRANSITION RISK
We believe that there are three main climate change transition risks, associated with the need to reduce carbon emissions as a business and achieve our ambition of becoming net-zero carbon by 2030.
} Environmental legislation: legislation surrounding the sustainability performance of commercial and non-commercial real estate is likely to tighten in future as governments pursue their commitments under the Paris agreement. We expect this to take the form of regulations but also increasingly some form of carbon tax to encourage the use of lower carbon materials and processes.
} Customer behaviours and preferences: our customers, particularly our largest, international customers, increasingly expect their premises to display high levels of energy efficiency. Energy efficiency not only reduces the operating costs of the building but also helps them with their own environmental and carbon reduction targets.
}Access to capital: investors are increasingly discriminating between investment opportunities based on sustainability credentials, risking less availability and higher cost of capital for companies which do not show strong performance and/or progress in this area.
CLIMATE-RELATED FINANCIAL DISCLOSURES CONTINUED
Responsible SEGRO Disclosures continued
94 SEGRO PLC | ANNUAL REPORT & ACCOUNTS 2021
STRATEGIC REPORT
08_ESG_Disclosures_87_101_v91.indd 9408_ESG_Disclosures_87_101_v91.indd 94 01/03/2022 17:1901/03/2022 17:19

The data above does not take into account the mitigation measures that have already been carried out in the development or refurbishment cycles. As part of our sustainable development objectives, assessments are carried out prior to development and adaptation measures, including but not limited to those listed below, are carried out accordingly.
Risk Metric
Floorspace (at 100%)
ERV (at share)
Flooding 1 in 100 year flood risk > 0 15% 14%
Water Stress ‘Very High’ Water Stress Risk 8% 5%
Sea Level Rise Coastal flood frequency > 0 0% 0%
Wildfires Days with high wildfire score > 10 5% 4%
Heat Stress Energy Demand Score > 50 2% 1%
Risk Adaptation Techniques
Flooding } Flood risk assessment to be carried out on development or retrospectively. } Sustainable urban drainage systems. } Retention schemes – ponds/basins.
Water Stress } Rainwater harvesting systems for internal building use and landscaping. }Water efficient fixtures in line with BREEAM.
Wildfires } Sprinkler systems/warnings designed to deal with wildfires. } Demonstrate good vegetation/habitat management.
Heat Stress } Thermal modelling undertaken and orientation/window positioning of the building reviewed. } Onsite renewable energy generation installed to manage additional cooling requirements. } External planting shading, brise soleil, louvres, window tinting.
APPLYING THE ANALYSIS TO STRATEGIC PLANNING
In terms of decision-making, we consider climate-related issues within the following time horizons:
Short term: up to 12 months, in line with the budget setting carried out annually in the autumn;
Medium term: up to 5 years, in line with the Medium Term Planning carried out annually in the autumn;
Long term: up to 10 years, in line with capital investment appraisal cash flows. We assume a 60-year life span for our newly-developed properties.
PHYSICAL CLIMATE CHANGE RISK EXPOSURE AT ASSET LEVEL
CLIMATE-RELATED FINANCIAL DISCLOSURES CONTINUED
Following on from the physical risk materiality analysis opposite, in 2021, we have conducted scenario analysis to assess more precisely the physical risk to our assets of a 4.5C increase in global temperatures (the ‘business as usual’ outcome and in line with RCP 8.5, 2040). We prioritised analysis based on this scenario as it is the most appropriate current ‘worst case’ scenario. In 2022, we intend to carry out a ‘best case’ scenario analysis in line with RCP 2.5, equivalent to a 1.5C increase in global temperatures.
The table below shows the potential Physical Climate Risk Exposure metrics and outcomes based on percentage floor area and percentage rental value at risk.
95SEGRO PLC | ANNUAL REPORT & ACCOUNTS 2021
OVERVIEW STRATEGIC REPORT GOVERNANCE FINANCIAL STATEMENTS
08_ESG_Disclosures_87_101_v91.indd 9508_ESG_Disclosures_87_101_v91.indd 95 01/03/2022 17:1901/03/2022 17:19
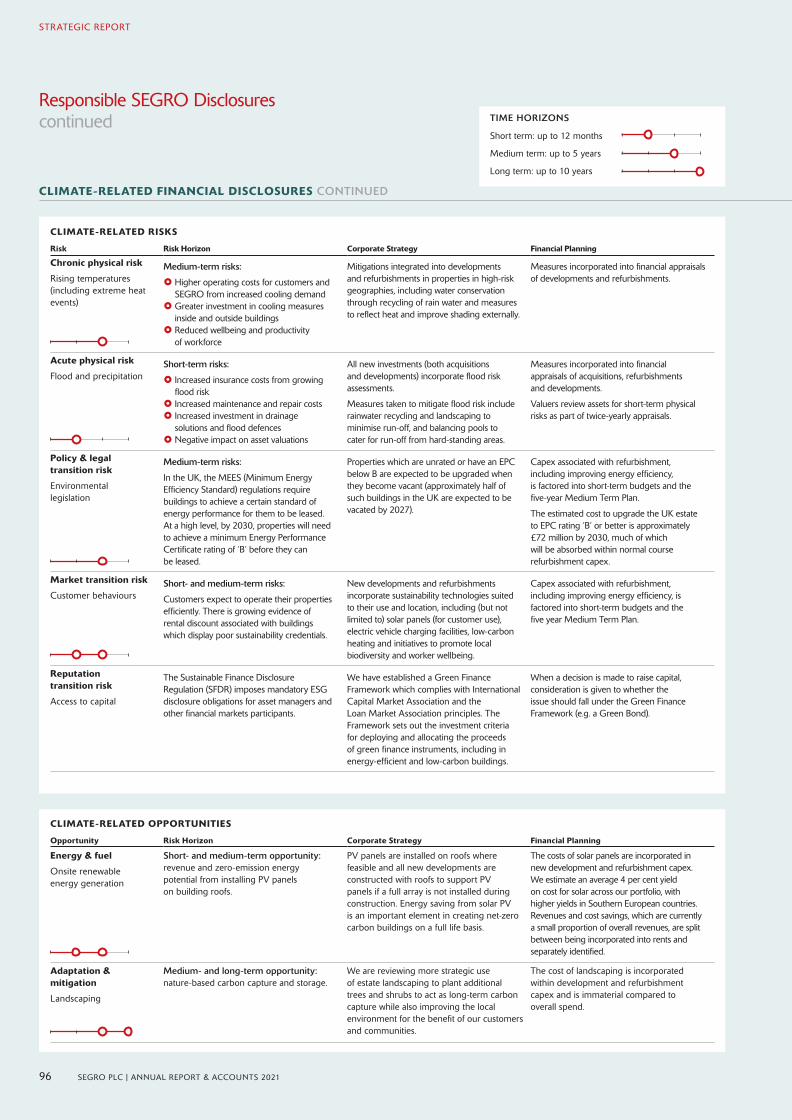
CLIMATE-RELATED FINANCIAL DISCLOSURES CONTINUED
CLIMATE-RELATED RISKS
Risk Risk Horizon Corporate Strategy Financial Planning
Chronic physical risk
Rising temperatures (including extreme heat events)
Medium-term risks:
} Higher operating costs for customers and SEGRO from increased cooling demand } Greater investment in cooling measures inside and outside buildings } Reduced wellbeing and productivity of workforce
Mitigations integrated into developments and refurbishments in properties in high-risk geographies, including water conservation through recycling of rain water and measures to reflect heat and improve shading externally.
Measures incorporated into financial appraisals of developments and refurbishments.
Acute physical risk
Flood and precipitationShort-term risks:
} Increased insurance costs from growing flood risk } Increased maintenance and repair costs } Increased investment in drainage solutions and flood defences } Negative impact on asset valuations
All new investments (both acquisitions and developments) incorporate flood risk assessments.
Measures taken to mitigate flood risk include rainwater recycling and landscaping to minimise run-off, and balancing pools to cater for run-off from hard-standing areas.
Measures incorporated into financial appraisals of acquisitions, refurbishments and developments.
Valuers review assets for short-term physical risks as part of twice-yearly appraisals.
Policy & legal transition risk
Environmental legislation
Medium-term risks:
In the UK, the MEES (Minimum Energy Efficiency Standard) regulations require buildings to achieve a certain standard of energy performance for them to be leased. At a high level, by 2030, properties will need to achieve a minimum Energy Performance Certificate rating of ‘B’ before they can be leased.
Properties which are unrated or have an EPC below B are expected to be upgraded when they become vacant (approximately half of such buildings in the UK are expected to be vacated by 2027).
Capex associated with refurbishment, including improving energy efficiency, is factored into short-term budgets and the five-year Medium Term Plan.
The estimated cost to upgrade the UK estate to EPC rating ‘B’ or better is approximately £72 million by 2030, much of which will be absorbed within normal course refurbishment capex.
Market transition risk
Customer behavioursShort- and medium-term risks:
Customers expect to operate their properties efficiently. There is growing evidence of rental discount associated with buildings which display poor sustainability credentials.
New developments and refurbishments incorporate sustainability technologies suited to their use and location, including (but not limited to) solar panels (for customer use), electric vehicle charging facilities, low-carbon heating and initiatives to promote local biodiversity and worker wellbeing.
Capex associated with refurbishment, including improving energy efficiency, is factored into short-term budgets and the five year Medium Term Plan.
Reputation transition risk
Access to capital
The Sustainable Finance Disclosure Regulation (SFDR) imposes mandatory ESG disclosure obligations for asset managers and other financial markets participants.
We have established a Green Finance Framework which complies with International Capital Market Association and the Loan Market Association principles. The Framework sets out the investment criteria for deploying and allocating the proceeds of green finance instruments, including in energy-efficient and low-carbon buildings.
When a decision is made to raise capital, consideration is given to whether the issue should fall under the Green Finance Framework (e.g. a Green Bond).
CLIMATE-RELATED OPPORTUNITIES
Opportunity Risk Horizon Corporate Strategy Financial Planning
Energy & fuel
Onsite renewable energy generation
Short- and medium-term opportunity: revenue and zero-emission energy potential from installing PV panels on building roofs.
PV panels are installed on roofs where feasible and all new developments are constructed with roofs to support PV panels if a full array is not installed during construction. Energy saving from solar PV is an important element in creating net-zero carbon buildings on a full life basis.
The costs of solar panels are incorporated in new development and refurbishment capex. We estimate an average 4 per cent yield on cost for solar across our portfolio, with higher yields in Southern European countries. Revenues and cost savings, which are currently a small proportion of overall revenues, are split between being incorporated into rents and separately identified.
Adaptation & mitigation
Landscaping
Medium- and long-term opportunity: nature-based carbon capture and storage.
We are reviewing more strategic use of estate landscaping to plant additional trees and shrubs to act as long-term carbon capture while also improving the local environment for the benefit of our customers and communities.
The cost of landscaping is incorporated within development and refurbishment capex and is immaterial compared to overall spend.
Short term: up to 12 months
Medium term: up to 5 years
Long term: up to 10 years
TIME HORIZONS
Responsible SEGRO Disclosures continued
96 SEGRO PLC | ANNUAL REPORT & ACCOUNTS 2021
STRATEGIC REPORT
08_ESG_Disclosures_87_101_v91.indd 9608_ESG_Disclosures_87_101_v91.indd 96 01/03/2022 17:1901/03/2022 17:19

CLIMATE-RELATED FINANCIAL DISCLOSURES CONTINUED
RISK MANAGEMENT: ACTION DURING 2021
We have established new investment appraisal policies and set internal targets associated not only with reducing emissions but also working with our customers and supply chain to achieve greater visibility of those emissions. These targets will, from 2022, be integrated within a new Responsible SEGRO element of the bonus metrics throughout the organisation.
} Customer engagement: We continually engage with our customers and have undertaken pilot studies of motion-sensor technology in a number of buildings to provide data on how to improve energy efficiency. We have agreed to retrofit solar panels to a number of existing buildings in 2022 to provide on-site renewable energy to our customers.
} Supplier engagement: We engaged with two of our development contractors in the UK and Continental Europe about how to reduce the embodied carbon of our development pipeline. These meetings focused on how to exploit the opportunities and overcome the barriers to build new properties which emit meaningfully less embodied and operating carbon to meet our commitment to be net-zero carbon by 2030.
} Investor engagement: As part of the process to establish new Responsible SEGRO metrics in the annual bonus, we engaged with our main shareholders to explain our approach and to seek their feedback. We also launched two Green Bonds, one in each of SEGRO and SELP, as part of which we conducted roadshows with investors.
} Employee engagement: We conducted a virtual meeting dedicated to explaining the Responsible SEGRO climate commitments and the actions we are taking as a business. Every employee update incorporates case studies and progress reports on how we are reducing our carbon emissions.
RISK MANAGEMENT
Climate-related risks are identified and assessed using our risk management framework set out on pages 74 to 77. Principal risks are defined as those which could intolerably exceed our risk appetite, considering both inherent and residual impact, and cause material harm to the Group.
ENGAGEMENT WITH STAKEHOLDERS
We engage with our stakeholders throughout the year on many different topics, although the subjects of climate change and the need to reduce GHG emissions have featured more prominently over the past year. We have two major sources of GHG emissions in our business: embodied carbon from our developments and operating carbon from the properties we lease. Therefore, engagement with our development contractors and our customers is vital to achieving our carbon reduction ambitions and, therefore, our management of the risk of climate change.
Our investors and employees are also key stakeholders in this pursuit, listening to both about their concerns and priorities, and initiating necessary action. We rely on the support of these stakeholders to provide capital and internal expertise to develop more sustainable buildings and to improve the energy efficiency of our existing portfolio.
IDENTIFYING AND ASSESSING CLIMATE-RELATED RISKS
Climate Change has been recognised as being a potential for both risks and opportunities across the business for some time but in light of SEGRO’s recognition of the Climate Emergency, Climate Change is recognised as a Principal Risk within Environmental Sustainability and Climate Change on the Risk Register. Climate-related risks are also considered within other principal risks including Political and Regulatory, Development plan execution and Major event/Business disruption.
For each risk, our Risk Register tracks:
} Description of the risk and the potential effects;
} Identifies the Executive Director with overall ownership and the Risk Manager responsible for monitoring and managing the risk;
} An annual probability and potential impact, to enable prioritisation;
}Mitigations in place as well as the owner of each mitigating action.
At the current time and based on the asset-level scenario analysis opposite, no material capital expenditure has been identified beyond normal course development and refurbishment costs associated with mitigating assets in high risk locations against climate change-related risks. Such risks, and related capital expenditure, are considered as part of the annual asset planning process associated with the five year Medium Term Plan.
MANAGING AND MITIGATING CLIMATE-RELATED RISKS
Our process for recognising, monitoring and mitigating Principal Risks, including climate-related risks, is set out on pages 78 to 83 of the Annual Report. The Board has overall responsibility for ensuring that risk is effectively and consistently managed across the Group. The Audit Committee monitors the effectiveness of the Group’s risk management process on behalf of the Board. Each year, the Board twice reviews the principal and emerging risks, and reviews and approves the Group’s risk appetite at least annually. The Audit Committee reviews the process of how the Group Risk Register has been compiled twice a year.
In its Responsible SEGRO Framework, SEGRO has committed itself to becoming net-zero carbon by 2030, with minimum Science Based Targets for reducing Scope 1, 2 and 3 emissions, including operating and embodied carbon to ensure compliance with a less than 1.5C increase in global temperatures by 2050. A key risk surrounding these targets is that we cannot be certain to achieve them given the lack of visibility and control over the Scope 3 emissions relating to customers’ energy use in our buildings and the embodied carbon emissions in developments. Metrics associated with these which are monitored include portfolio operating carbon emissions, development embodied carbon intensity, renewable energy as a proportion of total energy use, on-site generation of renewable energy and sustainability certification of standing assets and development completions (which comprise our ‘Green portfolio’).
97SEGRO PLC | ANNUAL REPORT & ACCOUNTS 2021
OVERVIEW STRATEGIC REPORT GOVERNANCE FINANCIAL STATEMENTS
08_ESG_Disclosures_87_101_v91.indd 9708_ESG_Disclosures_87_101_v91.indd 97 01/03/2022 17:1901/03/2022 17:19
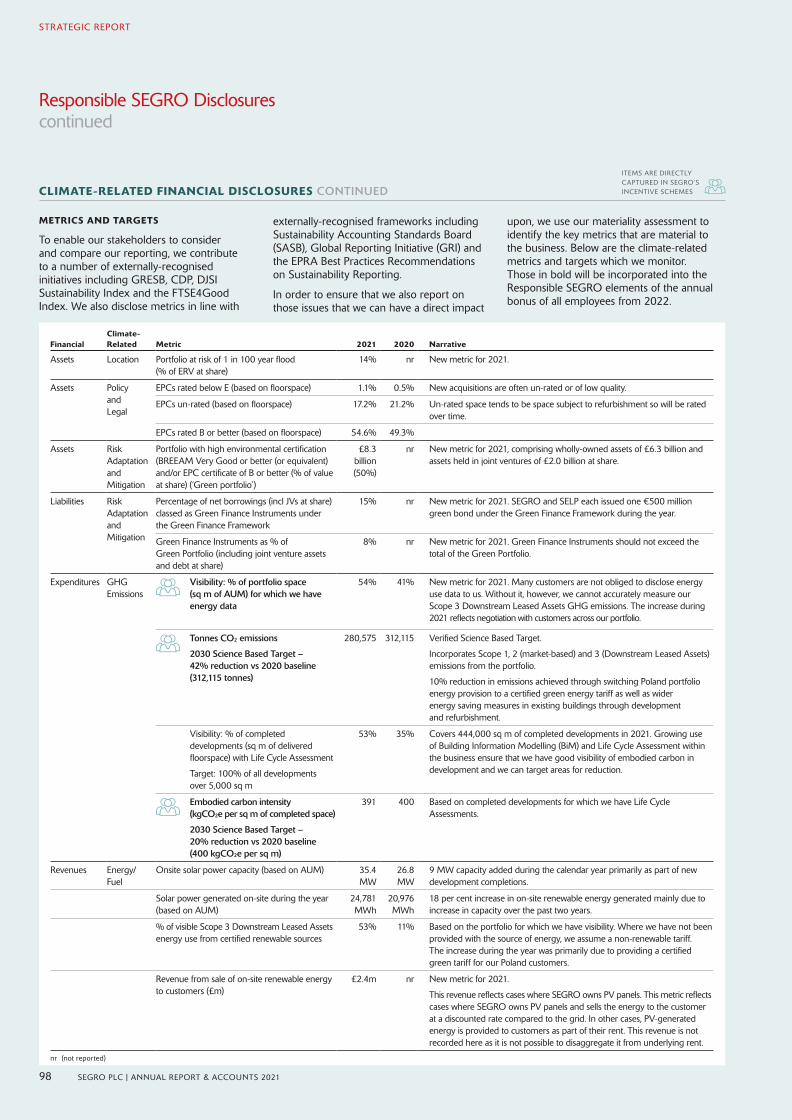
FinancialClimate-Related Metric 2021 2020 Narrative
Assets Location Portfolio at risk of 1 in 100 year flood (% of ERV at share)
14% nr New metric for 2021.
Assets Policy and Legal
EPCs rated below E (based on floorspace) 1.1% 0.5% New acquisitions are often un-rated or of low quality.
EPCs un-rated (based on floorspace) 17.2% 21.2% Un-rated space tends to be space subject to refurbishment so will be rated over time.
EPCs rated B or better (based on floorspace) 54.6% 49.3%
Assets Risk Adaptation and Mitigation
Portfolio with high environmental certification (BREEAM Very Good or better (or equivalent) and/or EPC certificate of B or better (% of value at share) (‘Green portfolio’)
£8.3 billion (50%)
nr New metric for 2021, comprising wholly-owned assets of £6.3 billion and assets held in joint ventures of £2.0 billion at share.
Liabilities Risk Adaptation and Mitigation
Percentage of net borrowings (incl JVs at share) classed as Green Finance Instruments under the Green Finance Framework
15% nr New metric for 2021. SEGRO and SELP each issued one €500 million green bond under the Green Finance Framework during the year.
Green Finance Instruments as % of Green Portfolio (including joint venture assets and debt at share)
8% nr New metric for 2021. Green Finance Instruments should not exceed the total of the Green Portfolio.
Expenditures GHG Emissions
Visibility: % of portfolio space (sq m of AUM) for which we have energy data
54% 41% New metric for 2021. Many customers are not obliged to disclose energy use data to us. Without it, however, we cannot accurately measure our Scope 3 Downstream Leased Assets GHG emissions. The increase during 2021 reflects negotiation with customers across our portfolio.
Tonnes CO2 emissions
2030 Science Based Target – 42% reduction vs 2020 baseline (312,115 tonnes)
280,575 312,115 Verified Science Based Target.
Incorporates Scope 1, 2 (market-based) and 3 (Downstream Leased Assets) emissions from the portfolio.
10% reduction in emissions achieved through switching Poland portfolio energy provision to a certified green energy tariff as well as wider energy saving measures in existing buildings through development and refurbishment.
Visibility: % of completed developments (sq m of delivered floorspace) with Life Cycle Assessment
Target: 100% of all developments over 5,000 sq m
53% 35% Covers 444,000 sq m of completed developments in 2021. Growing use of Building Information Modelling (BiM) and Life Cycle Assessment within the business ensure that we have good visibility of embodied carbon in development and we can target areas for reduction.
Embodied carbon intensity (kgCO2e per sq m of completed space)
2030 Science Based Target – 20% reduction vs 2020 baseline (400 kgCO2e per sq m)
391 400 Based on completed developments for which we have Life Cycle Assessments.
Revenues Energy/ Fuel
Onsite solar power capacity (based on AUM) 35.4 MW
26.8 MW
9 MW capacity added during the calendar year primarily as part of new development completions.
Solar power generated on-site during the year (based on AUM)
24,781 MWh
20,976 MWh
18 per cent increase in on-site renewable energy generated mainly due to increase in capacity over the past two years.
% of visible Scope 3 Downstream Leased Assets energy use from certified renewable sources
53% 11% Based on the portfolio for which we have visibility. Where we have not been provided with the source of energy, we assume a non-renewable tariff. The increase during the year was primarily due to providing a certified green tariff for our Poland customers.
Revenue from sale of on-site renewable energy to customers (£m)
£2.4m nr New metric for 2021.
This revenue reflects cases where SEGRO owns PV panels. This metric reflects cases where SEGRO owns PV panels and sells the energy to the customer at a discounted rate compared to the grid. In other cases, PV-generated energy is provided to customers as part of their rent. This revenue is not recorded here as it is not possible to disaggregate it from underlying rent.
nr (not reported)
METRICS AND TARGETS
To enable our stakeholders to consider and compare our reporting, we contribute to a number of externally-recognised initiatives including GRESB, CDP, DJSI Sustainability Index and the FTSE4Good Index. We also disclose metrics in line with
externally-recognised frameworks including Sustainability Accounting Standards Board (SASB), Global Reporting Initiative (GRI) and the EPRA Best Practices Recommendations on Sustainability Reporting.
In order to ensure that we also report on those issues that we can have a direct impact
upon, we use our materiality assessment to identify the key metrics that are material to the business. Below are the climate-related metrics and targets which we monitor. Those in bold will be incorporated into the Responsible SEGRO elements of the annual bonus of all employees from 2022.
CLIMATE-RELATED FINANCIAL DISCLOSURES CONTINUED
ITEMS ARE DIRECTLY CAPTURED IN SEGRO’S INCENTIVE SCHEMES
Responsible SEGRO Disclosures continued
98 SEGRO PLC | ANNUAL REPORT & ACCOUNTS 2021
STRATEGIC REPORT
08_ESG_Disclosures_87_101_v91.indd 9808_ESG_Disclosures_87_101_v91.indd 98 01/03/2022 17:1901/03/2022 17:19
OUR PEOPLE
BUSINESS CONDUCT AND ETHICS
In everything we do at SEGRO, we recognise that we need to behave morally, ethically and lawfully. This is core to the way in which our business is run, and the work that we do. Acting responsibly and in the interests of all of our stakeholders is therefore a principal part of SEGRO’s make-up. Our Code of Business Conduct and Ethics, which was updated and refreshed during the year, sets out the high ethical standards expected of all employees in their daily work and gives guidance on how to put those standards into practice to enable us to act with honesty and integrity. The Code of Business Conduct and Ethics incorporates policies on bribery and corruption (including fraud, tax evasion and money laundering); gifts and hospitality; political and charitable donations; conflicts of interest; insider trading and market abuse; confidentiality and data protection; anti-slavery and human trafficking; and our whistleblowing procedure.
Compliance with the Code of Business Conduct and Ethics is a condition of each employee’s employment and we are committed to building our employee awareness on ethical business practices. Our people and others who work with SEGRO are encouraged to speak up without recourse, either by talking to their line manager, a member of the Executive Committee or through the independent confidential whistleblowing reporting service. Details of this service are available on the Company’s intranet, as well as on posters in each office. Anyone who works with us or on any of our sites, may report issues confidentially through the service too.
Training is provided on the subject matters covered in the Code of Business Conduct and Ethics to raise awareness and to help all employees understand what behaving ethically means in practice. We updated our online training module on bribery, corruption and fraud and launched a new modern slavery training module during the period, which were compulsory for all employees to complete. The bribery, corruption and fraud module included information to ensure that the Company and its employees have not, and are not, facilitating tax evasion. As part of their induction, in 2021 all new employees received information on the Code of Business Conduct and Ethics and completed the compulsory training.
Any breaches of the Code of Business Conduct and Ethics are fully investigated and managed by the General Counsel or Group HR Director as appropriate. There were no material reported incidents of breaches of the Code of Business Conduct and Ethics during the year.
COMBATTING MODERN SLAVERY AND HUMAN TRAFFICKING
We have long recognised the importance of respecting the human rights of our stakeholders including our own employees, our suppliers and the wider communities in which we operate. We take that responsibility seriously and, as a real estate company involved in construction, are particularly aware of the risks of slavery and human trafficking within our own organisation and throughout our supply chain. Modern slavery and human trafficking is a crime and a violation of fundamental human rights. It has no place in modern society, in our organisation or in our supply chain. We are committed to ensuring that we maintain systems and controls throughout the business to prevent modern slavery from taking place anywhere within SEGRO or in any of our supply chains.
During the year, we introduced a Human Rights Policy which brought together a number of our existing policies that relate to human rights such as our Modern Slavery and Labour Standards Supplier Code, and Anti-Slavery and Human Trafficking Policy.
Throughout 2021, we delivered targeted modern slavery awareness training to colleagues who regularly deal with suppliers, visit sites and meet contractors as they are best placed to more effectively uncover instances of modern slavery and human trafficking. This training was designed to help these colleagues identify the signs of modern slavery displayed by possible victims, equip them with the right questions to ask suppliers, contractors and other business partners, and be clear on what actions to take if they have any concerns. We also asked all employees to complete mandatory online training on modern slavery and human trafficking in January 2022. We produced modern slavery awareness posters, which are now on displayed SEGRO construction sites and offices. These provide information on key signs of modern slavery, and how and where to access help, for every person attending these sites. We publish an annual transparency statement in compliance with the UK Modern Slavery Act 2015 outlining the steps we have taken during the financial year to prevent modern slavery and human trafficking taking place in any of our supply chains, or any parts of our business. The Board approved our latest statement in June 2021.
99SEGRO PLC | ANNUAL REPORT & ACCOUNTS 2021
OVERVIEW STRATEGIC REPORT GOVERNANCE FINANCIAL STATEMENTS
08_ESG_Disclosures_87_101_v91.indd 9908_ESG_Disclosures_87_101_v91.indd 99 01/03/2022 17:1901/03/2022 17:19
We ensure that all of our applicable suppliers, contractors and business partners are aware of our approach to modern slavery and human trafficking and adhere to the principles in our Modern Slavery and Labour Standards Supplier Code and Supplier Code of Conduct, in accordance with our Human Rights Policy. Our Supplier Code of Conduct also outlines our expectations on suppliers and contractors to pay workers at least a rate that reflects the cost of living. Ensuring a living wage rate is paid to workers throughout our supply chain reduces the likelihood that such workers will be victims of modern slavery. In the UK, we are an accredited Living Wage employer.
These policies can be found on our website (https://www.segro.com), together with our latest annual Modern Slavery statement (https://www.segro.com/modern-slavery). All relevant suppliers must also undertake the annual screening checks described below.
Our Modern Slavery policies are supported by a clear statement that any person with concerns about modern slavery or human trafficking, either within SEGRO or within our supply chain, may report their concerns on a confidential basis to our General Counsel, our Group HR Director or to our whistle-blowing reporting service. As detailed above, we have reinforced this support by displaying the modern slavery awareness posters at our construction sites and offices in the UK and across our offices in Continental Europe which details how to report concerns.
Any employee who breaches our Anti-Slavery and Human Trafficking Policy or Human Rights Policy will face disciplinary action, which could result in dismissal for misconduct or gross misconduct. We reserve the right to terminate our relationship with other individuals and organisations working on our behalf if they do not comply with our Modern Slavery and Labour Standards Supplier Code.
WHAT WE EXPECT FROM THIRD PARTIES WHO WORK FOR US
We are committed to implementing systems and controls to ensure anyone who works with us is appointed and managed responsibly, in accordance with the Code of Business Conduct and Ethics and our Supplier Code of Conduct.
We have a long-term approach to business, and are keen to build lasting stakeholder relationships. We therefore want to ensure that our suppliers not only understand our stance on business ethics, particularly with regards to bribery, corruption and fraud, and modern slavery and human trafficking, but also share our views on these matters, consistent with our Purpose and Values. We introduced our Supplier Code of Conduct which consolidates and sets out in full the principles and standards that we expect from our suppliers and other business partners working on our behalf, including with respect to ethical business conduct, labour practices, modern slavery and human rights, whilst outlining how we can work collaboratively to create real change.
As part of our supplier screening process, all new suppliers are required to provide information about their polices and answer questions about how they ensure bribery, corruption and fraud is not taking place in their organisation or in their supply chain. Suppliers must also provide information on the work that they carry out to safeguard against modern slavery and human trafficking occurring in their own supply chains, before they can be approved as a SEGRO supplier. This screening exercise is repeated every other year in respect of bribery, corruption and fraud, and every year in respect of modern slavery and human trafficking. We also check that those UK businesses who are required to publish a statement in accordance with the Modern Slavery Act 2015, have done so.
In addition, each year our Legal team meet with a number of suppliers in both the UK and Continental Europe to discuss their approach to bribery, corruption and fraud, as well as modern slavery and human trafficking. When selecting which suppliers to visit, we generally adopt a risk based approach, taking account of the risks associated with their sector and how material the impacts they have on our behalf would be, as indicated by our annual spend with them, but we will also visit a supplier if we have a specific concern. During the period, seven meetings with suppliers from the construction, IT support, facilities management and security sectors took place, virtually. It continued to be a valuable exercise as it allowed us to develop an impression of their culture as well as understand how they have adapted to the difficulties wrought by the pandemic and the pressures, if any, it had on them and their supply chain. All suppliers we spoke to remained SEGRO suppliers.
Any findings that raise material concerns from our due diligence processes would be communicated to the Board and acted upon swiftly. We continue to monitor the effectiveness of the steps we have taken to prevent bribery, corruption and fraud, as well as modern slavery and human trafficking from taking place in our business and supply chains. We adapt our processes where necessary in response to evolving guidance and industry action.
LOOKING AHEAD TO 2022 AND BEYOND
As a responsible business, we are always looking at ways to promote robust business ethics and strengthen our relationships with suppliers and other stakeholders. In 2022, we will continue to review our supplier screening process to ensure it remains suitable for our business and reflects best practice. We will continue to promote awareness training to all of our colleagues to help them identify when modern slavery or human trafficking might be taking place, as well as remind them about our policies and procedures in this area.
We will be looking at how to keep raising awareness of the modern slavery helpline and our confidential whistleblowing reporting service in all of our UK developments. We will work with our colleagues in Continental Europe with their local equivalent helplines and ensure that the modern slavery awareness posters are displayed at the rest of our offices, and at construction sites, across Continental Europe.
We will maintain open and constructive dialogue with our suppliers, contractors and other business partners about our Supplier Code of Conduct. We will continue to work with our operations team to foster stronger supplier relationships and will seek to carry out more meetings with them to discuss the common topics which affect our industry, and look to share and understand ideas and best practice.
OUR PEOPLE CONTINUED
Responsible SEGRO Disclosures continued
100 SEGRO PLC | ANNUAL REPORT & ACCOUNTS 2021
STRATEGIC REPORT
08_ESG_Disclosures_87_101_v91.indd 10008_ESG_Disclosures_87_101_v91.indd 100 01/03/2022 17:1901/03/2022 17:19

UK GENDER AND ETHNICITY PAY GAP Mean Median
Gender Pay Gap 46.2% 45.4%
vs 2020 -4.7% -3.3%
Gender Bonus Pay Gap 74.5% 78.0%
vs 2020 -2.8% +1.1%
Ethnicity Pay Gap 25.3% 34.1%
vs 2020 -1.6% 0.0%
Ethnicity Bonus Pay Gap -36.0% 65.1%
vs 2020 -94.0% +3.6%
Notes
SEGRO has fewer than the 250 UK employee threshold required for statutory UK Gender Pay Gap and we are therefore reporting this information on a voluntary basis.
The UK Ethnicity Pay Gap is being voluntarily reported as there is no currently no requirement for any organisation to publish ethnicity pay gap information. We have therefore used the Gender Pay Gap methodology.
20% 30% 40% 50% 60% 70% 80% 90% 100%10%
UPPER QUARTILE
UPPER MIDDLE
LOWER MIDDLE
LOWER QUARTILE
0%
82%
73%
39%
24%
18%
27%
61%
76%
PAY QUARTILES
The proportion of male and female employees by quartile pay bands Male Female
20% 30% 40% 50% 60% 70% 80% 90% 100%10%
UPPER QUARTILE
UPPER MIDDLE
LOWER MIDDLE
LOWER QUARTILE
0%
96%
84%
82%
74%
4%
16%
18%
26%
The proportion of White and BAME employees by quartile pay bands White BAME
UK GENDER AND ETHNICITY PAY GAP REPORTING
We believe that analysing diversity data and being transparent is an important step towards creating meaningful change. This is why we have voluntarily published our Gender Pay Gap data since 2017 and our Ethnicity Pay Gap data since 2020. Please note that this data covers our employees in the UK only:
} In 2021, our mean Gender Pay Gap was 46.2 per cent, an improvement from 50.9 per cent in 2020. The Gender Bonus Pay Gap was 74.5 per cent, an improvement from 77.3 cent in 2020.
} In 2021, our mean Ethnicity Pay Gap was 25.3 per cent, an improvement from 26.9 per cent in 2020. The Ethnicity Bonus Pay Gap was -36.0 per cent, in favour of BAME employees, explained by our BAME profile at plc level.
Like many other organisations, particularly in the property sector, the reason for our Gender Pay Gap and our Ethnicity Pay Gap is the fact that we have more men than women and more white employees than ethnic minority employees in senior roles.
In SEGRO, our employees are paid equally for doing equivalent jobs across our business and our reported Pay Gaps are a direct result of our employee profile and do not represent pay discrimination. The bonus pay gap, which includes share scheme payments, is a reflection of share schemes being part of the remuneration package of senior roles in SEGRO.
A core element of our Responsible SEGRO framework is to improve the diversity of our business, throughout the organisation at all levels of seniority. This is crucial for the enduring success of our business but should also be reflected in reducing our Gender and Ethnicity Pay Gaps over time.
OUR PEOPLE CONTINUED
101SEGRO PLC | ANNUAL REPORT & ACCOUNTS 2021
OVERVIEW STRATEGIC REPORT GOVERNANCE FINANCIAL STATEMENTS
08_ESG_Disclosures_87_101_v91.indd 10108_ESG_Disclosures_87_101_v91.indd 101 01/03/2022 17:1901/03/2022 17:19
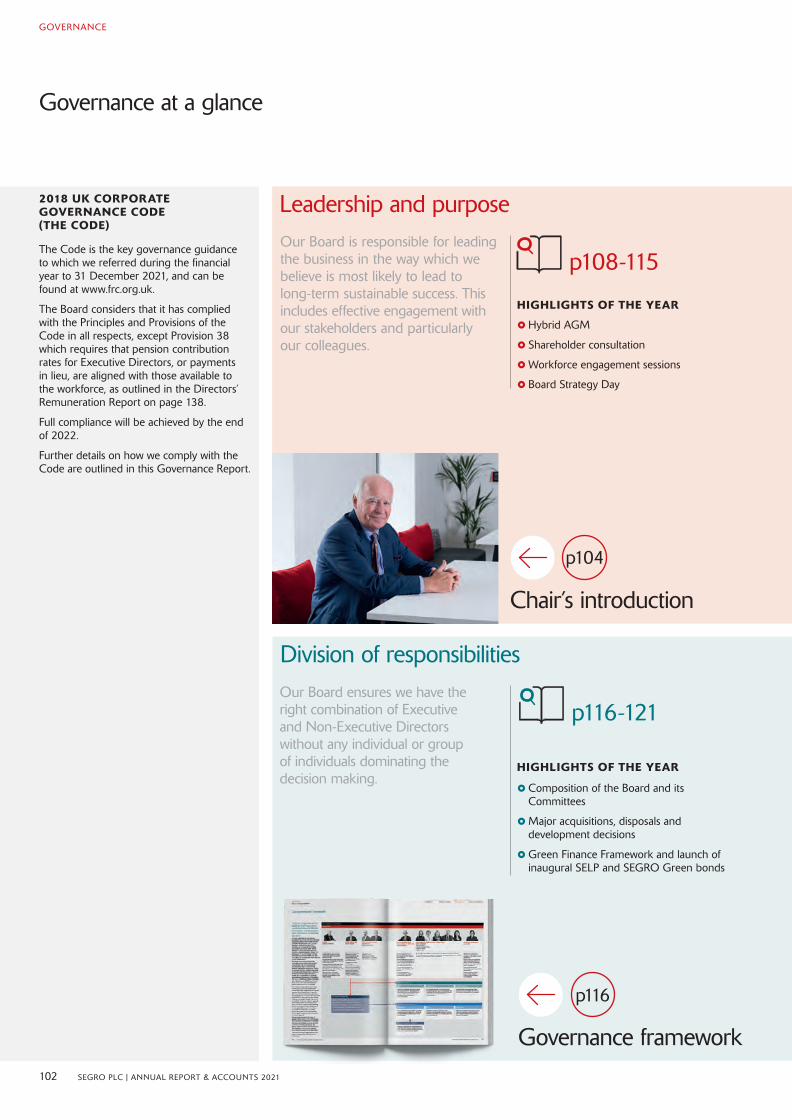
Governance at a glance
Leadership and purposeOur Board is responsible for leading the business in the way which we believe is most likely to lead to long-term sustainable success. This includes effective engagement with our stakeholders and particularly our colleagues.
p108-115
HIGHLIGHTS OF THE YEAR
} Hybrid AGM
} Shareholder consultation
}Workforce engagement sessions
} Board Strategy Day
Our Board ensures we have the right combination of Executive and Non-Executive Directors without any individual or group of individuals dominating the decision making.
Division of responsibilities
p116-121
Chair’s introduction
p104
Governance framework
p116
HIGHLIGHTS OF THE YEAR
} Composition of the Board and its Committees
}Major acquisitions, disposals and development decisions
}Green Finance Framework and launch of inaugural SELP and SEGRO Green bonds
2018 UK CORPORATE GOVERNANCE CODE (THE CODE)
The Code is the key governance guidance to which we referred during the financial year to 31 December 2021, and can be found at www.frc.org.uk.
The Board considers that it has complied with the Principles and Provisions of the Code in all respects, except Provision 38 which requires that pension contribution rates for Executive Directors, or payments in lieu, are aligned with those available to the workforce, as outlined in the Directors’ Remuneration Report on page 138.
Full compliance will be achieved by the end of 2022.
Further details on how we comply with the Code are outlined in this Governance Report.
102 SEGRO PLC | ANNUAL REPORT & ACCOUNTS 2021
GOVERNANCE
09_Governance_102_135_v145.indd 10209_Governance_102_135_v145.indd 102 01/03/2022 17:2001/03/2022 17:20

Composition, succession and evaluationOur Nomination Committee ensures that we have: a balanced Board with the appropriate skills to govern the business; an effective evaluation; and a succession plan.
Audit, risk and internal controlOur Audit Committee monitors the integrity of the Financial Statements and oversees the risk management process and internal control environment.
HIGHLIGHTS OF THE YEAR
} External Board evaluation
} Appointment of two Independent Non-Executive Directors
} Search for a further Independent Non-Executive Director
p122-129
Remuneration Our Remuneration Committee determines the Remuneration Policy which aims to incentivise strong performance whilst avoiding excessive risk taking. The Committee oversees the Policy implementation and is mindful of pay across the business.
p136-161
Directors’ Remuneration Report
p136
HIGHLIGHTS OF THE YEAR
}Welcomed new Committee Chair
} Alignment of remuneration and strategy, particularly Responsible SEGRO ambitions
}New Remuneration Policy for 2022
} Shareholder and proxy advisory agency consultations
} Executive Remuneration workforce engagement session
p130-135HIGHLIGHTS OF THE YEAR
}Monitoring development of and responding to the BEIS audit reform consultation
} Compliance with new TCFD and ESEF reporting requirements
103SEGRO PLC | ANNUAL REPORT & ACCOUNTS 2021
OVERVIEW STRATEGIC REPORT GOVERNANCE FINANCIAL STATEMENTS
09_Governance_102_135_v145.indd 10309_Governance_102_135_v145.indd 103 01/03/2022 17:2001/03/2022 17:20
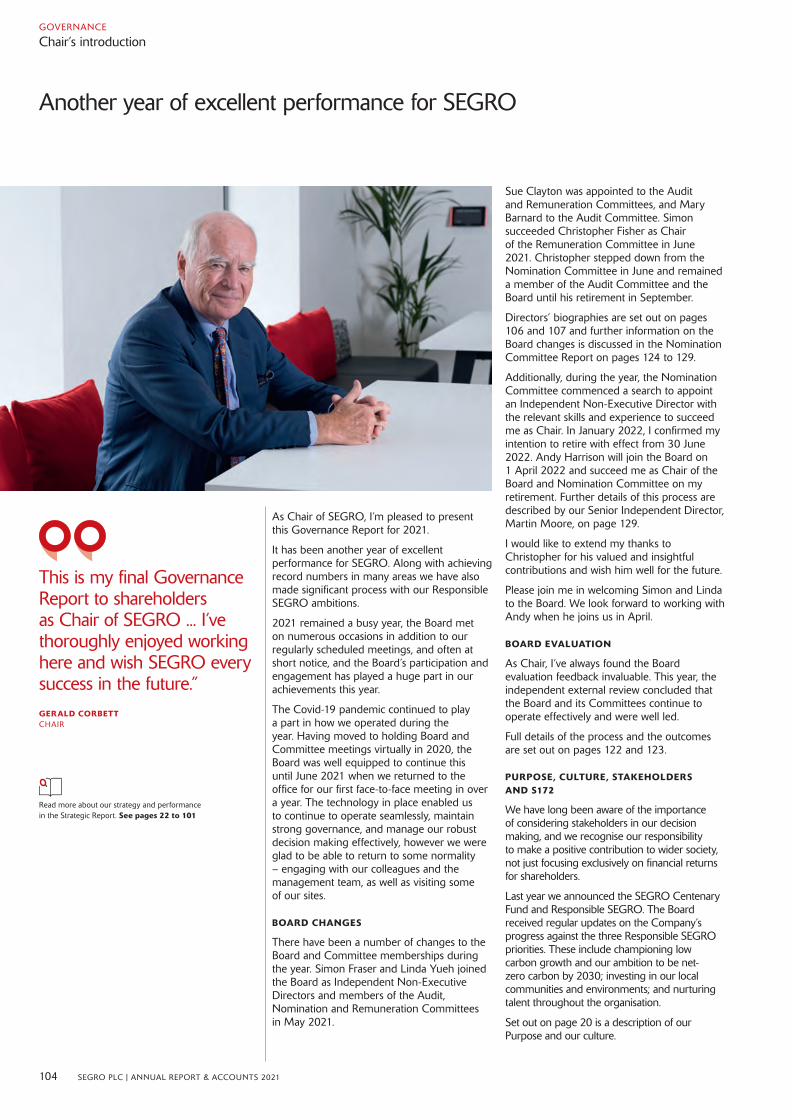
As Chair of SEGRO, I’m pleased to present this Governance Report for 2021.
It has been another year of excellent performance for SEGRO. Along with achieving record numbers in many areas we have also made significant process with our Responsible SEGRO ambitions.
2021 remained a busy year, the Board met on numerous occasions in addition to our regularly scheduled meetings, and often at short notice, and the Board’s participation and engagement has played a huge part in our achievements this year.
The Covid-19 pandemic continued to play a part in how we operated during the year. Having moved to holding Board and Committee meetings virtually in 2020, the Board was well equipped to continue this until June 2021 when we returned to the office for our first face-to-face meeting in over a year. The technology in place enabled us to continue to operate seamlessly, maintain strong governance, and manage our robust decision making effectively, however we were glad to be able to return to some normality – engaging with our colleagues and the management team, as well as visiting some of our sites.
BOARD CHANGES
There have been a number of changes to the Board and Committee memberships during the year. Simon Fraser and Linda Yueh joined the Board as Independent Non-Executive Directors and members of the Audit, Nomination and Remuneration Committees in May 2021.
Sue Clayton was appointed to the Audit and Remuneration Committees, and Mary Barnard to the Audit Committee. Simon succeeded Christopher Fisher as Chair of the Remuneration Committee in June 2021. Christopher stepped down from the Nomination Committee in June and remained a member of the Audit Committee and the Board until his retirement in September.
Directors’ biographies are set out on pages 106 and 107 and further information on the Board changes is discussed in the Nomination Committee Report on pages 124 to 129.
Additionally, during the year, the Nomination Committee commenced a search to appoint an Independent Non-Executive Director with the relevant skills and experience to succeed me as Chair. In January 2022, I confirmed my intention to retire with effect from 30 June 2022. Andy Harrison will join the Board on 1 April 2022 and succeed me as Chair of the Board and Nomination Committee on my retirement. Further details of this process are described by our Senior Independent Director, Martin Moore, on page 129.
I would like to extend my thanks to Christopher for his valued and insightful contributions and wish him well for the future.
Please join me in welcoming Simon and Linda to the Board. We look forward to working with Andy when he joins us in April.
BOARD EVALUATION
As Chair, I’ve always found the Board evaluation feedback invaluable. This year, the independent external review concluded that the Board and its Committees continue to operate effectively and were well led.
Full details of the process and the outcomes are set out on pages 122 and 123.
PURPOSE, CULTURE, STAKEHOLDERS AND S172
We have long been aware of the importance of considering stakeholders in our decision making, and we recognise our responsibility to make a positive contribution to wider society, not just focusing exclusively on financial returns for shareholders.
Last year we announced the SEGRO Centenary Fund and Responsible SEGRO. The Board received regular updates on the Company’s progress against the three Responsible SEGRO priorities. These include championing low carbon growth and our ambition to be net-zero carbon by 2030; investing in our local communities and environments; and nurturing talent throughout the organisation.
Set out on page 20 is a description of our Purpose and our culture.
Read more about our strategy and performance in the Strategic Report. See pages 22 to 101
This is my final Governance Report to shareholders as Chair of SEGRO ... I’ve thoroughly enjoyed working here and wish SEGRO every success in the future.” GERALD CORBETTCHAIR
Another year of excellent performance for SEGRO
104 SEGRO PLC | ANNUAL REPORT & ACCOUNTS 2021
GOVERNANCE
Chair’s introduction
09_Governance_102_135_v145.indd 10409_Governance_102_135_v145.indd 104 01/03/2022 17:2001/03/2022 17:20
We have reported our compliance with s172 on page 85 of the Strategic Report, and on pages 110 to 113 of this Report we explain how the Board has engaged with its five key stakeholders and how we have considered s172 in our decision-making process.
GOVERNANCE AND THE DELIVERY OF STRATEGY
Pages 120 and 121 describe the key activities of the Board during the year.
In accordance with the Schedule of Matters Reserved for Decision by the Board, we considered and approved some strategic acquisitions, disposals and developments.
When debating these transactions we considered the potential impacts on the Company’s stakeholders including job creation in the local communities, how they fit within our Responsible SEGRO strategy and sustainable returns for investors. Our teams are required to report on this information as part of the capital approval process and our Responsible SEGRO ambitions are at the forefront of our minds during the decision-making process and when working with our local communities and partners.
As part of our continual and regular reviews of our governance processes supporting our growth strategy, we have increased the Board’s delegation of authorities relating to capital investment decisions whilst ensuring that there remains appropriate Board level oversight.
As ever the Board Strategy Day was a highlight of the year and you can read more about this on page 108.
ENVIRONMENTAL, SOCIAL AND GOVERNANCE (ESG)
The Board continues to be mindful of ESG as an important area for its stakeholders, including investors, customers and employees.
We dedicated time at the Strategy Day to our sustainability strategy review and, during the year, received a number of updates from the Responsible SEGRO Driving Group on progress against our ambitions, including our target to be net carbon-zero by 2030. Corporate Citizenship attended the September meeting to provide a briefing on Climate Change.
In May, we published our Green Finance Framework integrating our Responsible SEGRO commitments with our financial strategy, and subsequently launched the first Green bond for SELP, followed by SEGRO’s inaugural Green bond in September 2021.
We are delighted to have achieved accreditation with the National Equality Standard and the Living Wage Foundation during the year.
ANNUAL GENERAL MEETING (AGM)
We had hoped to welcome shareholders back to the 2021 AGM in person, having conducted the 2020 AGM as a closed meeting due to the UK Government’s stay at home restrictions that were in place at the time. Unfortunately, due to the Covid-19 pandemic many restrictions remained in place in April 2021 and regrettably, shareholders could not attend in person. We held the 2021 AGM as a ‘hybrid’ meeting and invited our shareholders to attend the meeting online. We put in place measures to allow questions in advance of the meeting, via email, and during the meeting, both via the electronic AGM platform and through a telephone line.
At the time of writing, we are optimistic that we will be able to return to an in-person AGM in April 2022 and the Directors look forward to welcoming shareholders to the meeting. Please check our 2022 Notice of Meeting for the most up to date information as we will continue to follow Government guidance. Shareholders are advised to check our website which will be updated if there are any changes to the arrangements.
In addition to the usual business at the AGM, we are seeking shareholder approval for a new Remuneration Policy, with the current policy having been approved in 2019 for three years, and an amendment to the accompanying rules of our Long Term Incentive Plan, which will allow us to implement the new Policy. The Remuneration Committee has consulted extensively with stakeholders in the development of the new Remuneration Policy, as detailed further on pages 156 to 161.
The Board believes that the Policy is in the best interests of the Company and we hope that we can count on shareholder support in passing these resolutions.
LOOKING FORWARD
This is my final Governance Report to shareholders as Chair of SEGRO, as I will be retiring from the Board on 30 June 2022, and will hand the reins to Andy Harrison.
My six years at SEGRO have coincided with a period of growth and much success for the Company and the business is in great shape.
We have multiplied the development programme by over four times and have increased assets under management from £5.7 billion to £21.3 billion whilst simultaneously funding ourselves prudently, maintaining a strong balance sheet, lengthening the maturity of our debt and raising equity when appropriate.
I am delighted to be succeeded by someone of Andy’s calibre, who brings a wealth of experience across several different industries and public company boards. We look forward to welcoming him to SEGRO.
I would like to thank my Board colleagues and the Executive team for their commitment and support in my time as Chair. I’ve enjoyed a close and effective working relationship with our Chief Executive, David Sleath. We were all delighted at his award in the New Year’s Honours List, particularly as he was proposed by the employees of the Company.
I take the opportunity to say a heartfelt thank you to all our employees for their dedication and hard work in extraordinary circumstances during the year. I’ve thoroughly enjoyed working here and wish SEGRO every success in the future.
GERALD CORBETTCHAIR
105SEGRO PLC | ANNUAL REPORT & ACCOUNTS 2021
OVERVIEW STRATEGIC REPORT GOVERNANCE FINANCIAL STATEMENTS
09_Governance_102_135_v145.indd 10509_Governance_102_135_v145.indd 105 01/03/2022 17:2001/03/2022 17:20
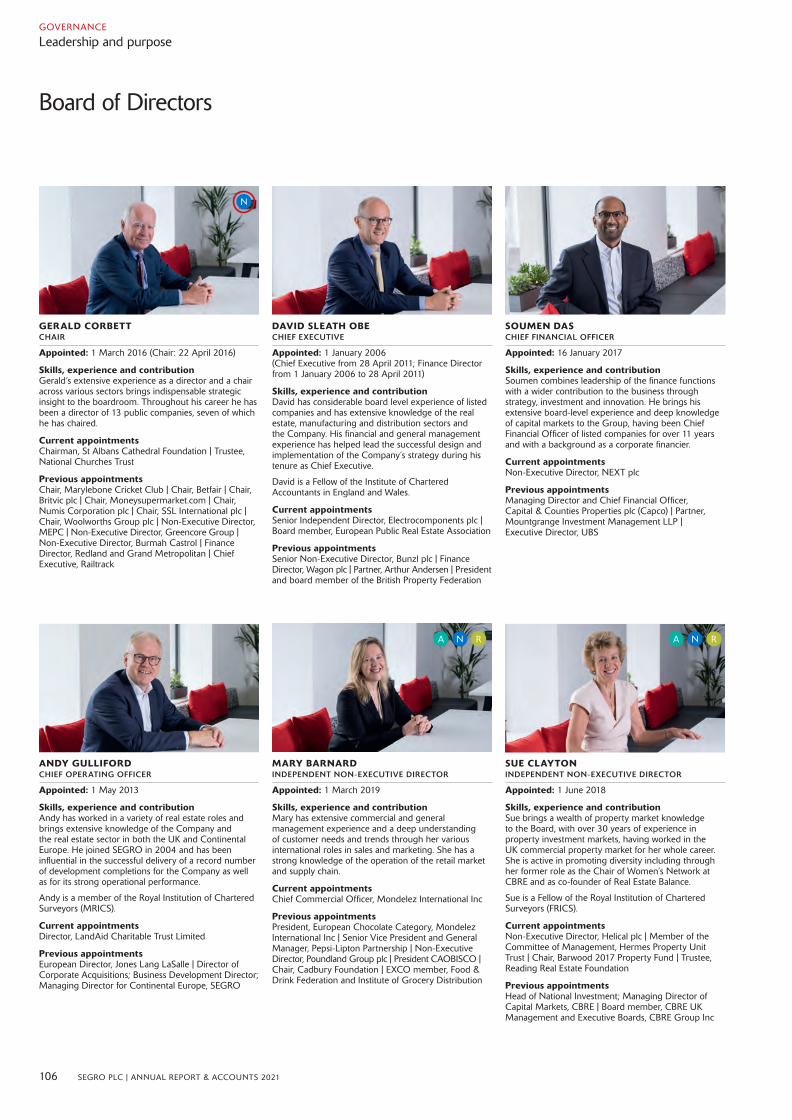
GERALD CORBETTCHAIR
Appointed: 1 March 2016 (Chair: 22 April 2016)
Skills, experience and contributionGerald’s extensive experience as a director and a chair across various sectors brings indispensable strategic insight to the boardroom. Throughout his career he has been a director of 13 public companies, seven of which he has chaired.
Current appointmentsChairman, St Albans Cathedral Foundation | Trustee, National Churches Trust
Previous appointmentsChair, Marylebone Cricket Club | Chair, Betfair | Chair, Britvic plc | Chair, Moneysupermarket.com | Chair, Numis Corporation plc | Chair, SSL International plc | Chair, Woolworths Group plc | Non-Executive Director, MEPC | Non-Executive Director, Greencore Group | Non-Executive Director, Burmah Castrol | Finance Director, Redland and Grand Metropolitan | Chief Executive, Railtrack
DAVID SLEATH OBECHIEF EXECUTIVE
Appointed: 1 January 2006 (Chief Executive from 28 April 2011; Finance Director from 1 January 2006 to 28 April 2011)
Skills, experience and contributionDavid has considerable board level experience of listed companies and has extensive knowledge of the real estate, manufacturing and distribution sectors and the Company. His financial and general management experience has helped lead the successful design and implementation of the Company’s strategy during his tenure as Chief Executive.
David is a Fellow of the Institute of Chartered Accountants in England and Wales.
Current appointmentsSenior Independent Director, Electrocomponents plc | Board member, European Public Real Estate Association
Previous appointmentsSenior Non-Executive Director, Bunzl plc | Finance Director, Wagon plc | Partner, Arthur Andersen | President and board member of the British Property Federation
MARY BARNARDINDEPENDENT NON-EXECUTIVE DIRECTOR
Appointed: 1 March 2019
Skills, experience and contributionMary has extensive commercial and general management experience and a deep understanding of customer needs and trends through her various international roles in sales and marketing. She has a strong knowledge of the operation of the retail market and supply chain.
Current appointmentsChief Commercial Officer, Mondelez International Inc
Previous appointmentsPresident, European Chocolate Category, Mondelez International Inc | Senior Vice President and General Manager, Pepsi-Lipton Partnership | Non-Executive Director, Poundland Group plc | President CAOBISCO | Chair, Cadbury Foundation | EXCO member, Food & Drink Federation and Institute of Grocery Distribution
SOUMEN DASCHIEF FINANCIAL OFFICER
Appointed: 16 January 2017
Skills, experience and contributionSoumen combines leadership of the finance functions with a wider contribution to the business through strategy, investment and innovation. He brings his extensive board-level experience and deep knowledge of capital markets to the Group, having been Chief Financial Officer of listed companies for over 11 years and with a background as a corporate financier.
Current appointmentsNon-Executive Director, NEXT plc
Previous appointmentsManaging Director and Chief Financial Officer, Capital & Counties Properties plc (Capco) | Partner, Mountgrange Investment Management LLP | Executive Director, UBS
SUE CLAYTONINDEPENDENT NON-EXECUTIVE DIRECTOR
Appointed: 1 June 2018
Skills, experience and contributionSue brings a wealth of property market knowledge to the Board, with over 30 years of experience in property investment markets, having worked in the UK commercial property market for her whole career. She is active in promoting diversity including through her former role as the Chair of Women’s Network at CBRE and as co-founder of Real Estate Balance.
Sue is a Fellow of the Royal Institution of Chartered Surveyors (FRICS).
Current appointmentsNon-Executive Director, Helical plc | Member of the Committee of Management, Hermes Property Unit Trust | Chair, Barwood 2017 Property Fund | Trustee, Reading Real Estate Foundation
Previous appointmentsHead of National Investment; Managing Director of Capital Markets, CBRE | Board member, CBRE UK Management and Executive Boards, CBRE Group Inc
ANDY GULLIFORDCHIEF OPERATING OFFICER
Appointed: 1 May 2013
Skills, experience and contributionAndy has worked in a variety of real estate roles and brings extensive knowledge of the Company and the real estate sector in both the UK and Continental Europe. He joined SEGRO in 2004 and has been influential in the successful delivery of a record number of development completions for the Company as well as for its strong operational performance.
Andy is a member of the Royal Institution of Chartered Surveyors (MRICS).
Current appointmentsDirector, LandAid Charitable Trust Limited
Previous appointmentsEuropean Director, Jones Lang LaSalle | Director of Corporate Acquisitions; Business Development Director; Managing Director for Continental Europe, SEGRO
Board of Directors
GOVERNANCE
Leadership and purpose
106 SEGRO PLC | ANNUAL REPORT & ACCOUNTS 2021
N
N RA N RA
09_Governance_102_135_v145.indd 10609_Governance_102_135_v145.indd 106 01/03/2022 17:2001/03/2022 17:20

CAROL FAIRWEATHERINDEPENDENT NON-EXECUTIVE DIRECTOR
Appointed: 1 January 2018
Skills, experience and contributionCarol has recent and relevant finance experience and brings commercial knowledge to the Board. Her prior experience as Chief Financial Officer of the retailer Burberry Group is valuable to the Company in her understanding of retail and digital commerce trends.
Carol is a Fellow of the Institute of Chartered Accountants in England and Wales.
Current appointmentsNon-Executive Director, Smurfit Kappa Group plc | Trustee, Somerset House Trust
Previous appointmentsChief Financial Officer, Burberry Group | Director of Finance, News International Ltd | UK Regional Controller, Shandwick plc
AUDIT COMMITTEE MEMBER
NOMINATION COMMITTEE MEMBER
REMUNERATION COMMITTEE MEMBER
CHAIR OF COMMITTEE
A
R
N
Further details on Directors’ skills and the composition of the Board, including diversity and tenure, are available in the Nomination Committee Report starting on page 124.
SIMON FRASERINDEPENDENT NON-EXECUTIVE DIRECTOR
Appointed: 1 May 2021
Skills, experience and contributionSimon has extensive knowledge of working on remuneration committees, having previously chaired the remuneration committees at Derwent London and Lancashire Holdings. He is a former investment banker with a wealth of financial experience, having spent the majority of his career with Bank of America Merrill Lynch where he was appointed Managing Director and Co-Head of the Corporate Broking division in 2004.
Current appointmentsNon-Executive Director, Legal & General Investment Management (Holdings) Ltd | Senior Independent Director, Lancashire Holdings Ltd | Non-Executive Director, Lancashire Syndicates Limited
Previous appointmentsSenior Independent Director, Derwent London plc | Managing Director/Division Co-Head, Corporate Broking, Merrill Lynch/Bank of America
107SEGRO PLC | ANNUAL REPORT & ACCOUNTS 2021
OVERVIEW STRATEGIC REPORT GOVERNANCE FINANCIAL STATEMENTS
ANDY HARRISON INDEPENDENT NON-EXECUTIVE DIRECTOR
Andy will join the Board on 1 April 2022, and subject to election at the 2022 AGM he will become Chair on 30 June 2022.
Skills, experience and contributionAndy is an experienced chair having held the position at Dunelm Group plc for over six years. He is also a former CEO who has led multiple large consumer facing organisations with strong service offerings. His leadership and business understanding will prove invaluable.
Current appointmentsChair, Dunelm Group plc
Previous appointmentsChief Executive, Whitbread plc | Chief Executive, easyJet plc | Chief Executive, RAC plc | Non-Executive Director and Audit Committee Chair, EMAP plc
N RA
MARTIN MOORESENIOR INDEPENDENT NON-EXECUTIVE DIRECTOR
Appointed: 1 July 2014
Skills, experience and contributionWith over 40 years’ experience of real estate and the property sector, Martin brings industry knowledge and breadth of practice to the Board.
He is a member of the Royal Institution of Chartered Surveyors (MRICS).
Current appointmentsChairman, Secure Income REIT plc
Previous appointmentsChairman, BMO Commercial Property Trust | Senior Adviser, Kohlberg Kravis Roberts & Co LLP | Chief Executive and Chair, M&G Real Estate | Adviser and Commissioner, The Crown Estate | Board member and President, British Property Federation | Board member and Chair, Investment Property Forum | Commissioner, Historic England | Non-Executive Director, M&G Asia Property Fund
A N R
LINDA YUEHINDEPENDENT NON-EXECUTIVE DIRECTOR
Appointed: 1 May 2021
Skills, experience and contributionLinda brings a broad range of skills to the Board, including robust commercial experience and a strong background in economics, as a Fellow in Economics at St Edmund Hall, Oxford University, Adjunct Professor of Economics at London Business School and Visiting Professor at London School of Economics and Political Science.
Current appointmentsNon-Executive Director, Rentokil Initial plc | Senior Independent Director, Fidelity China Special Situations plc | Chair, Baillie Gifford’s The Schiehallion Fund Ltd | Adviser, UK Board of Trade | Member, Independent Review Panel on Ring-fencing and Proprietary Trading
Previous appointmentsNon-Executive Director, Baillie Gifford’s Scottish Mortgage plc | Non-Executive Director, JP Morgan Asian Growth and Income plc | Chief Business Correspondent, BBC News | Economics Editor, Bloomberg News | Corporate Lawyer, Paul Weiss Rifkind Wharton & Garrison LLP
A N R
A N R
JULIA FOOCOMPANY SECRETARY
Appointed: 7 June 2021
Skills, experience and contributionJulia provides advice and support on corporate governance best practice, listing and compliance requirements to the Board and its Committees. She has over 19 years of wide-ranging experience in the industry, and leads the Company Secretariat team responsible for SEGRO’s listed and subsidiary compliance and governance across the Group.
Julia is a Fellow of the Chartered Governance Institute (FCG).
Previous appointments Deputy Company Secretary, J Sainsbury plc | Deputy Company Secretary, Currys plc (previously Dixons Carphone plc) | Deputy Company Secretary, Halma plc
09_Governance_102_135_v145.indd 10709_Governance_102_135_v145.indd 107 01/03/2022 17:2001/03/2022 17:20
Board leadership and Company Purpose
AN EFFECTIVE AND ENTREPRENEURIAL BOARD
The Board is responsible for creating and delivering shareholder value by setting the strategic direction of the Group. The Executive team has day-to-day responsibility for implementing this strategy and it is the Board’s role to hold management to account for ensuring that it is delivered. The work of the Board should and does complement, enhance and support the work of the Executive team.
Information about our strategy is on pages 22 and 23. You can read more about the annual Strategy Day in the case study on the left.
The Board is made up of talented individuals, with a depth of commercial experience from a range of industries. This diversity of thought helps create an effective and entrepreneurial Board as each member has a fresh perspective to bring to discussions. See pages 106 and 107 for more information about the Directors and the contribution they bring to the Board.
During the year, we welcomed two new Independent Non-Executive Directors. Further information on the recruitment process and their induction to the Company and the Board can be found in the Nomination Committee report on page 125. These new appointments bring with them expertise in finance, remuneration, commercial experience and economics, complementing the skill set of the existing Directors.
PROMOTING LONG-TERM SUSTAINABLE SUCCESS
SEGRO’s principal duty is to deliver lasting, sustainable success and generate value for shareholders and other investors, whilst being mindful of our impact on stakeholders and wider society. 2021 was another year of financial and operational outperformance. Once again, earnings grew strongly, supported by record levels of new contracted rent and development completions. Looking ahead, the combination of new rental income from the development programme, and the benefits of active asset management of our existing portfolio, should enable us to drive sustainable growth in both earnings and dividends. The Chief Executive’s Statement on pages 12 to 15, along with the Financial Review on pages 66 to 73, sets out in much more detail our strategy and the reasons for our continued success.
The TSR chart on page 146 tells this story. Shareholders have benefited from strong returns with £100 invested in our shares on 31 December 2011 having returned £947 (including dividends, which have increased every year for the last nine years) by the end of 2021. At the end of 2021, SEGRO was the largest REIT on the London Stock Exchange and the 33rd largest company in the FTSE 100.
This financial strength ensures that we have the ability to provide employment and support businesses in the areas in which we operate.
INVESTING FOR THE LONG TERM
Much of the Board’s decision making is focused around ensuring that the Company is sustainable in the long term.
} Each year, the Board considers our Medium Term Plan, which assesses the opportunities and risks for the Company over the following five years, and forms the basis of our viability statement.
}Once a year, the Board takes time to consider the long-term strategy of the business, incorporating presentations and discussions on longer-term opportunities and threats to the business.
} Throughout the year, the Board has overall responsibility for the Company’s approach to risks and ensures they are effectively and consistently managed. It reviews the measures in place to mitigate the near- and longer-term risks (including emerging risks) to the business.
Real estate is inherently a long-term industry, and the Board therefore takes this into consideration in all of its decision making. The Board approved the current strategy in 2011, which included the repositioning of the portfolio. The results have been felt over the past few years, and are reflected in the strong share price performance, high customer retention rates, low vacancy and strong employee engagement scores which have all contributed to our business performance.
The Board is responsible for creating and delivering shareholder value by setting the strategic direction of the Group.”
CASE STUDY:
STRATEGY DAY
Each year, the Board takes an opportunity to step away from the routine of the corporate calendar to spend some time reflecting on strategy, the wider business and macroeconomic environment.
Having conducted the 2020 Strategy Day remotely, the Board was pleased to return to an in-person approach for 2021 and we spent a day and a half offsite. Whilst a full pack of papers was provided covering a wide range of topics to ensure Directors were fully briefed, on the day the focus was on a small number of items. This enabled the Board to step back from the usual Board agenda items and ensure that each strategic area received a more detailed focus.
We spent the first part of the offsite considering the macroeconomic outlook within the jurisdictions in which we operate, with a presentation delivered by the Chief Economist, Europe, from UBS. We then considered how these trends may impact our markets as well as the investment outlook for the business, followed by an informal debrief discussion.
On the second day, upon reflection on the discussions from day one, we dedicated an entire session to debate our investment strategy. We covered the assumptions, strategic choices and outputs underlying the Group’s Medium Term Plan. We considered the annual portfolio review which, alongside our view of the property cycle and a detailed analysis of the sectors in which we operate, will form the basis of our investment decisions in future years.
We further considered our key strategic priorities for the future, and concluded that our strategy remains appropriate despite the macro and geopolitical uncertainty. We recognised the growth and scale of the business, the challenges and opportunities present and there was a consensus reached on the Group’s priorities for 2022.
There was a session on diversity and inclusion, talent management and succession planning, as part of our wider Responsible SEGRO Nurturing Talent strategy review. We were pleased to see our progress over the past year against our identified priorities. We reviewed improved diversity metrics, future employment and talent management trends for the Group, and proposals for continued momentum and progress planned for 2022.
108 SEGRO PLC | ANNUAL REPORT & ACCOUNTS 2021
GOVERNANCE
Leadership and purpose
09_Governance_102_135_v145.indd 10809_Governance_102_135_v145.indd 108 01/03/2022 17:2001/03/2022 17:20

CULTURE, PURPOSE AND VALUES
Culture is the character and personality of a business. It is what makes us unique and is the sum of our Purpose and Values, behaviours and traditions. It guides our relationships not just with our employees but with our other stakeholders as well. Our culture is unique and permeates throughout the whole business. It sets the tone for good governance.
We are proud of our Purpose to create the space that enables extraordinary things to happen and our five Values. In 2015, our Executive Committee invested in a significant programme to engage everyone in the business in creating our Purpose and Values. We wanted to develop a unifying purpose which aligned with our strategy and a set of principles to guide the development of our future culture. Six years on, our Purpose and Values are now well embedded in the business and form the basis of our workforce policies. They help to unify employees and describe the core beliefs about how SEGRO does business. They are a universal language across our business and the countries in which we operate.
WHY
Our Purpose is our compelling, memorable and differentiating statement that energises us as a team, beyond money or profit.
HOW
Our Values are our core beliefs about how we do business, which guide our decision making, large and small.
WHAT
Our Strategy is the goal we are aiming for.
HOW WE WORK
WHY WE EXIST
WHAT WE WANT
TO ACHIEVE
Within the boardroom, the consistent feedback from all of the recent evaluations is that all of the Directors feel they can contribute, speak freely and do not feel constrained. The Chair encourages open debate and no one individual dominates. The seasoned relationships of most of the Board members mean they can say it like it is and have their thoughts heard in a challenging yet supportive environment. The Board has adjusted well to the new members who joined during the year, who bring a fresh perspective to discussions and debate. This culture has helped us remain focused and cohesive during the year. This close understanding amongst the Directors has meant that whilst meetings were held remotely until June 2021, the Board has continued to operate effectively and efficiently.
The Board considers that the Company’s culture can be defined by the following characteristics:
} a strong desire to create a successful business we can be proud of;
} trust and strong professional integrity – we deliver on promises;
} pragmatism – a ‘sleeves up’ approach regardless of status;
} thoughtful, detailed and measured decision making;
} respect and transparency; and
} caring about people and taking an interest in their wellbeing.
The Board continues to monitor the culture of the Company through indicators which serve as a temperature check. They consider:
} employee engagement survey results;
} workforce engagement sessions;
} feedback from office and site visits by Executive Directors and the Board as a whole;
} data on employee turnover;
} Health and Safety incident statistics;
} customer satisfaction surveys;
} breaches of the Code of Business Conduct and Ethics;
} internal audit reports; and
} whistleblowing incidents.
It is essential that the Directors lead by example and live the Values. The Executive Directors are obviously more visible leaders around the business and help to set the tone. When the Directors are together, they live the Values in the boardroom as follows:
Read more about our Purposesee page 87
SAY IT LIKE IT IS
The Directors are honest and transparent in dealings with each other and those who interact with them both in and out of the boardroom. The Chair encourages constructive debate and challenge during meetings.
STAND SIDE BY SIDE
The Non-Executive Directors bring to the Board their knowledge and experience from other businesses. The Directors are supportive and take collective responsibility for decisions.
KEEP ONE EYE ON THE HORIZON
The Directors look to the long term in their decision making. They want to understand future trends and how the Company can use them for the benefit of itself and others.
IF THE DOOR IS CLOSED…
The Non-Executive Directors support the Executive Directors to find solutions to more complex transactions and provide assistance where more difficult judgement calls and decisions need to be made.
DOES IT MAKE THE BOAT GO FASTER?
The Directors look at different ways of working to create effective relationships and discuss regularly where they can best add value.
109SEGRO PLC | ANNUAL REPORT & ACCOUNTS 2021
OVERVIEW STRATEGIC REPORT GOVERNANCE FINANCIAL STATEMENTS
09_Governance_102_135_v145.indd 10909_Governance_102_135_v145.indd 109 01/03/2022 17:2001/03/2022 17:20

We have identified our key stakeholders – those important groups that are an integral part of our business model.
Our s172 statement is on page 85 together with additional information about our key stakeholders and why they are important to us.
Set out on the following pages is how the Board has considered the s172 requirements and applied them in its decision making and its engagement with stakeholders during the year. Stakeholder engagement is an integral part of the Board’s decision-making process and all proposals to the Board relating to major decisions must demonstrate that the impact on stakeholders has been considered.
Stakeholder engagement from the Board’s perspective
GOVERNANCE
Leadership and purpose
OUR STAKEHOLDERS
EMPLOYEES
CUSTOMERS
SUPPLIERSCOMMUNITIES
INVESTORS
110 SEGRO PLC | ANNUAL REPORT & ACCOUNTS 2021
09_Governance_102_135_v145.indd 11009_Governance_102_135_v145.indd 110 01/03/2022 17:2001/03/2022 17:20
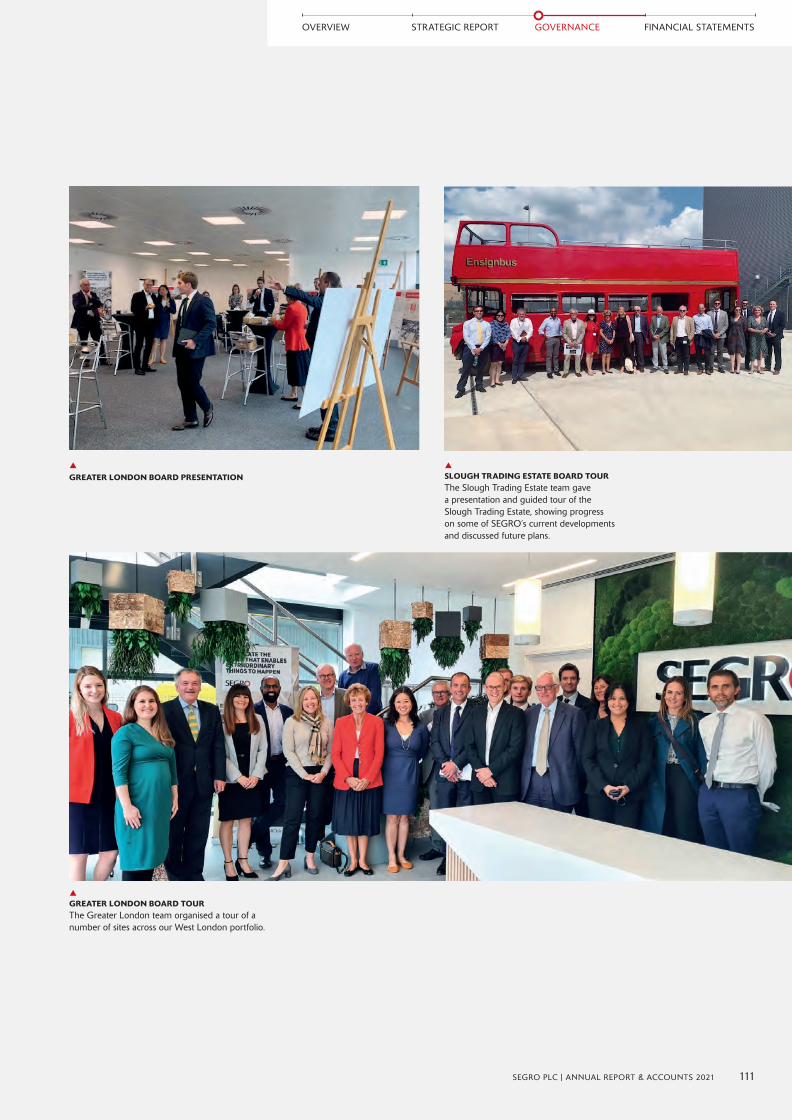
GREATER LONDON BOARD TOURThe Greater London team organised a tour of a number of sites across our West London portfolio.
GREATER LONDON BOARD PRESENTATIONSLOUGH TRADING ESTATE BOARD TOURThe Slough Trading Estate team gave a presentation and guided tour of the Slough Trading Estate, showing progress on some of SEGRO’s current developments and discussed future plans.
111SEGRO PLC | ANNUAL REPORT & ACCOUNTS 2021
OVERVIEW STRATEGIC REPORT GOVERNANCE FINANCIAL STATEMENTS
09_Governance_102_135_v145.indd 11109_Governance_102_135_v145.indd 111 01/03/2022 17:2001/03/2022 17:20
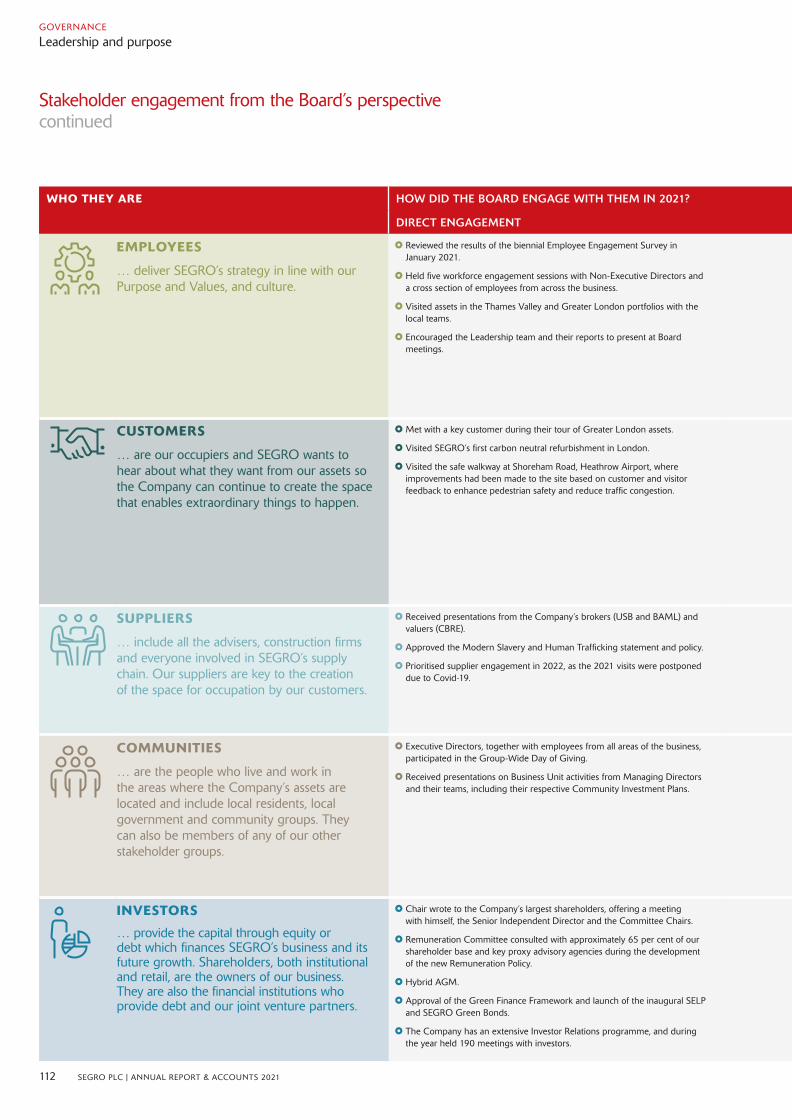
Stakeholder engagement from the Board’s perspective continued
WHO THEY ARE HOW DID THE BOARD ENGAGE WITH THEM IN 2021? HOW DID THEY INFLUENCE THE BOARD’S DECISION MAKING IN 2021?
DIRECT ENGAGEMENT INDIRECT ENGAGEMENT
EMPLOYEES
… deliver SEGRO’s strategy in line with our Purpose and Values, and culture.
} Reviewed the results of the biennial Employee Engagement Survey in January 2021.
} Held five workforce engagement sessions with Non-Executive Directors and a cross section of employees from across the business.
} Visited assets in the Thames Valley and Greater London portfolios with the local teams.
} Encouraged the Leadership team and their reports to present at Board meetings.
} Received updates from the Group HR Director on topics such as talent and succession planning, diversity and inclusion in the workforce.
} Achieved accreditation with the National Equality Standard in recognition of our strong and inclusive culture, see page 33, and became an accredited Living Wage UK employer.
} Kept informed on progress against Responsible SEGRO ambitions, including the Nurturing Talent pillar.
} Executive Directors delivered regular employee webinars and briefings with Q&A sessions.
} Reviewed take up rates of all-employee share schemes.
} Feedback from the Executive Remuneration workforce engagement session was beneficial in shaping the new remuneration framework and the proposed 2022 Remuneration Policy.
} Feedback from the other workforce engagement sessions was considered when a range of company-wide decisions, topics, policies and disclosures were approved by the Board throughout the year. Examples of these include the Code of Business Conduct and Ethics, talent management and succession planning.
} Continued to encourage employee share ownership in the Company through awards of all- employee share schemes.
CUSTOMERS
… are our occupiers and SEGRO wants to hear about what they want from our assets so the Company can continue to create the space that enables extraordinary things to happen.
}Met with a key customer during their tour of Greater London assets.
} Visited SEGRO’s first carbon neutral refurbishment in London.
} Visited the safe walkway at Shoreham Road, Heathrow Airport, where improvements had been made to the site based on customer and visitor feedback to enhance pedestrian safety and reduce traffic congestion.
} Discussed results of the Annual Customer Satisfaction survey.
} Noted KPIs on vacancy and customer retention.
} Provided ongoing support and concessions on an ad hoc basis to customers who continue to be impacted by the pandemic.
} Customer site visit was greatly appreciated by the Board in furthering its understanding of what customers value in SEGRO’s developments.
} In approving investment decisions, including redevelopment, the Board is mindful of the value that customers place on lower-carbon growth and sustainability investments, and regeneration within the wider portfolio.
} Feedback from the Carbon Emissions workforce engagement session, heightened the Board’s awareness of some of the challenges faced by some customers and the support they need to drive sustainability initiatives.
} Feedback from the Customer Accounts workforce engagement session further highlighted what was important to customers.
} The Board supported innovative ways of providing services to customers through digital solutions as explored in the Digital/PropTech strategy session.
SUPPLIERS
… include all the advisers, construction firms and everyone involved in SEGRO’s supply chain. Our suppliers are key to the creation of the space for occupation by our customers.
} Received presentations from the Company’s brokers (USB and BAML) and valuers (CBRE).
} Approved the Modern Slavery and Human Trafficking statement and policy.
} Prioritised supplier engagement in 2022, as the 2021 visits were postponed due to Covid-19.
} Received updates on Responsible SEGRO progress, including the SEGRO Park Rainham supply chain initiative.
} Launched a Supplier Account Management Programme pilot.
} Noted the Modern Slavery and Human Trafficking training provided to all employees.
} Kept informed of the review of cladding products used in developments across the Group.
} Executive Directors, together with the operational teams, work closely with key suppliers to ensure that SEGRO continues to deliver the best assets and services to meet the needs of customers.
} The Board encourages regular engagement with principal suppliers and considers high ethical standards as integral to SEGRO’s Code of Business Conduct and Ethics and Modern Slavery policies.
} The Board maintains oversight of key Health and Safety developments, including fire safety.
COMMUNITIES
… are the people who live and work in the areas where the Company’s assets are located and include local residents, local government and community groups. They can also be members of any of our other stakeholder groups.
} Executive Directors, together with employees from all areas of the business, participated in the Group-Wide Day of Giving.
} Received presentations on Business Unit activities from Managing Directors and their teams, including their respective Community Investment Plans.
} Updated on progress against ambitions of the Community pillar of Responsible SEGRO.
} Donated £1.3 million to charity during the year, including donations made through the SEGRO Centenary Fund, with a move from providing emergency Covid-19 relief in the community towards working strategically with community partners to fund longer-term initiatives.
} Progress against the objectives of the Community pillar of Responsible SEGRO was considered, including the impact that the SEGRO Centenary Fund has had in local communities.
} The Board is mindful of potential impacts to local residential areas where property development and re-developments are being considered, including during the approval of the acquisition of the Bath Road office portfolio in Slough.
} Requests for capital approval include consideration of how the development could benefit the local community, such as the creation of over 7,500 jobs during the delivery of SEGRO Logistics Park Northampton Gateway.
} The Remuneration Committee considered the metrics and weighting of the Responsible SEGRO measures in the annual Bonus, and its alignment to the Community aspect of Responsible SEGRO.
INVESTORS
… provide the capital through equity or debt which finances SEGRO’s business and its future growth. Shareholders, both institutional and retail, are the owners of our business. They are also the financial institutions who provide debt and our joint venture partners.
} Chair wrote to the Company’s largest shareholders, offering a meeting with himself, the Senior Independent Director and the Committee Chairs.
} Remuneration Committee consulted with approximately 65 per cent of our shareholder base and key proxy advisory agencies during the development of the new Remuneration Policy.
} Hybrid AGM.
} Approval of the Green Finance Framework and launch of the inaugural SELP and SEGRO Green Bonds.
} The Company has an extensive Investor Relations programme, and during the year held 190 meetings with investors.
} Weekly updates from the Head of Investor Relations.
} Our brokers, UBS and BAML, attended the April board meeting to present on investor feedback.
} The Remuneration Committee considered the feedback from the investors which resulted in the formulation of the 2022 Remuneration Policy. The feedback was broadly supportive from the outset but based on some of the feedback received, the Remuneration Committee made some changes to the weightings for the annual Bonus proposals.
} We understand the importance that investors place on sustainable investments and have implemented the Green Finance Framework as a result.
GOVERNANCE
Leadership and purpose
112 SEGRO PLC | ANNUAL REPORT & ACCOUNTS 2021
09_Governance_102_135_v145.indd 11209_Governance_102_135_v145.indd 112 01/03/2022 17:2001/03/2022 17:20

WHO THEY ARE HOW DID THE BOARD ENGAGE WITH THEM IN 2021? HOW DID THEY INFLUENCE THE BOARD’S DECISION MAKING IN 2021?
DIRECT ENGAGEMENT INDIRECT ENGAGEMENT
EMPLOYEES
… deliver SEGRO’s strategy in line with our Purpose and Values, and culture.
} Reviewed the results of the biennial Employee Engagement Survey in January 2021.
} Held five workforce engagement sessions with Non-Executive Directors and a cross section of employees from across the business.
} Visited assets in the Thames Valley and Greater London portfolios with the local teams.
} Encouraged the Leadership team and their reports to present at Board meetings.
} Received updates from the Group HR Director on topics such as talent and succession planning, diversity and inclusion in the workforce.
} Achieved accreditation with the National Equality Standard in recognition of our strong and inclusive culture, see page 33, and became an accredited Living Wage UK employer.
} Kept informed on progress against Responsible SEGRO ambitions, including the Nurturing Talent pillar.
} Executive Directors delivered regular employee webinars and briefings with Q&A sessions.
} Reviewed take up rates of all-employee share schemes.
} Feedback from the Executive Remuneration workforce engagement session was beneficial in shaping the new remuneration framework and the proposed 2022 Remuneration Policy.
} Feedback from the other workforce engagement sessions was considered when a range of company-wide decisions, topics, policies and disclosures were approved by the Board throughout the year. Examples of these include the Code of Business Conduct and Ethics, talent management and succession planning.
} Continued to encourage employee share ownership in the Company through awards of all- employee share schemes.
CUSTOMERS
… are our occupiers and SEGRO wants to hear about what they want from our assets so the Company can continue to create the space that enables extraordinary things to happen.
}Met with a key customer during their tour of Greater London assets.
} Visited SEGRO’s first carbon neutral refurbishment in London.
} Visited the safe walkway at Shoreham Road, Heathrow Airport, where improvements had been made to the site based on customer and visitor feedback to enhance pedestrian safety and reduce traffic congestion.
} Discussed results of the Annual Customer Satisfaction survey.
} Noted KPIs on vacancy and customer retention.
} Provided ongoing support and concessions on an ad hoc basis to customers who continue to be impacted by the pandemic.
} Customer site visit was greatly appreciated by the Board in furthering its understanding of what customers value in SEGRO’s developments.
} In approving investment decisions, including redevelopment, the Board is mindful of the value that customers place on lower-carbon growth and sustainability investments, and regeneration within the wider portfolio.
} Feedback from the Carbon Emissions workforce engagement session, heightened the Board’s awareness of some of the challenges faced by some customers and the support they need to drive sustainability initiatives.
} Feedback from the Customer Accounts workforce engagement session further highlighted what was important to customers.
} The Board supported innovative ways of providing services to customers through digital solutions as explored in the Digital/PropTech strategy session.
SUPPLIERS
… include all the advisers, construction firms and everyone involved in SEGRO’s supply chain. Our suppliers are key to the creation of the space for occupation by our customers.
} Received presentations from the Company’s brokers (USB and BAML) and valuers (CBRE).
} Approved the Modern Slavery and Human Trafficking statement and policy.
} Prioritised supplier engagement in 2022, as the 2021 visits were postponed due to Covid-19.
} Received updates on Responsible SEGRO progress, including the SEGRO Park Rainham supply chain initiative.
} Launched a Supplier Account Management Programme pilot.
} Noted the Modern Slavery and Human Trafficking training provided to all employees.
} Kept informed of the review of cladding products used in developments across the Group.
} Executive Directors, together with the operational teams, work closely with key suppliers to ensure that SEGRO continues to deliver the best assets and services to meet the needs of customers.
} The Board encourages regular engagement with principal suppliers and considers high ethical standards as integral to SEGRO’s Code of Business Conduct and Ethics and Modern Slavery policies.
} The Board maintains oversight of key Health and Safety developments, including fire safety.
COMMUNITIES
… are the people who live and work in the areas where the Company’s assets are located and include local residents, local government and community groups. They can also be members of any of our other stakeholder groups.
} Executive Directors, together with employees from all areas of the business, participated in the Group-Wide Day of Giving.
} Received presentations on Business Unit activities from Managing Directors and their teams, including their respective Community Investment Plans.
} Updated on progress against ambitions of the Community pillar of Responsible SEGRO.
} Donated £1.3 million to charity during the year, including donations made through the SEGRO Centenary Fund, with a move from providing emergency Covid-19 relief in the community towards working strategically with community partners to fund longer-term initiatives.
} Progress against the objectives of the Community pillar of Responsible SEGRO was considered, including the impact that the SEGRO Centenary Fund has had in local communities.
} The Board is mindful of potential impacts to local residential areas where property development and re-developments are being considered, including during the approval of the acquisition of the Bath Road office portfolio in Slough.
} Requests for capital approval include consideration of how the development could benefit the local community, such as the creation of over 7,500 jobs during the delivery of SEGRO Logistics Park Northampton Gateway.
} The Remuneration Committee considered the metrics and weighting of the Responsible SEGRO measures in the annual Bonus, and its alignment to the Community aspect of Responsible SEGRO.
INVESTORS
… provide the capital through equity or debt which finances SEGRO’s business and its future growth. Shareholders, both institutional and retail, are the owners of our business. They are also the financial institutions who provide debt and our joint venture partners.
} Chair wrote to the Company’s largest shareholders, offering a meeting with himself, the Senior Independent Director and the Committee Chairs.
} Remuneration Committee consulted with approximately 65 per cent of our shareholder base and key proxy advisory agencies during the development of the new Remuneration Policy.
} Hybrid AGM.
} Approval of the Green Finance Framework and launch of the inaugural SELP and SEGRO Green Bonds.
} The Company has an extensive Investor Relations programme, and during the year held 190 meetings with investors.
} Weekly updates from the Head of Investor Relations.
} Our brokers, UBS and BAML, attended the April board meeting to present on investor feedback.
} The Remuneration Committee considered the feedback from the investors which resulted in the formulation of the 2022 Remuneration Policy. The feedback was broadly supportive from the outset but based on some of the feedback received, the Remuneration Committee made some changes to the weightings for the annual Bonus proposals.
} We understand the importance that investors place on sustainable investments and have implemented the Green Finance Framework as a result.
113SEGRO PLC | ANNUAL REPORT & ACCOUNTS 2021
OVERVIEW STRATEGIC REPORT GOVERNANCE FINANCIAL STATEMENTS
09_Governance_102_135_v145.indd 11309_Governance_102_135_v145.indd 113 01/03/2022 17:2101/03/2022 17:21
EMPLOYEE ENGAGEMENT
The Board has a tailored approach to its adoption of Provision 5 of the Code on workforce engagement mechanisms. The Group has a non-unionised business with a headcount of 385 people spread across offices in nine geographies. The Board felt that it was important that its approach should mirror the Company’s Values of openness and transparency for the engagement to be authentic, meaningful and received positively. Against this backdrop, it was agreed that alternative arrangements as permitted by the Code were more appropriate to the business. This involves a three-stage approach which continues to evolve as we implement it, recognising that it should be appropriate and add value to our business as well as encompass the spirit of the provision, which is to enable the voice of the employee to be heard in the boardroom.
1) INDIVIDUAL MEETINGS WITH THE DIRECTORS
There are many formal and informal occasions when the Non-Executive Directors meet with employees, including through the induction of a Non-Executive Director, or where a Non-Executive Director makes an ad hoc asset visit or otherwise meets with individuals to discuss a particular topic.
The Committee Chairs have individual meetings with employees in relation to the business of their Committee meetings.
Following the success of last year’s workforce engagement sessions the Board agreed a similar approach for 2021, and expanded the sessions to include more Non-Executive Directors, more employees and more focused topics for discussion (as detailed on the left). Feedback from these meetings was discussed during the year, and will continue to be used to develop policies for the future and underpin the Board’s discussions and decision making in the boardroom.
2) PRESENTATIONS AT BOARD AND COMMITTEE MEETINGS
The Executive Directors encourage their teams to present at Board meetings and join asset tours. This year, the Board received presentations from: the Central Europe and National Logistics teams, who delivered updates on recent activities in their business units; the Director of Digital & Technology, who provided updates on digital strategy, data centre strategy and PropTech; the Managing Director, Group Investment, who discussed the Company’s growth strategy and investment stance; as well as the Group Health and Safety Manager, the Head of Risk and the Head of Tax, who all provided regular updates on their areas. The Responsible SEGRO Driving Group attended several board meetings during the year to keep the Board well informed of progress against our Responsible SEGRO ambitions.
3) INFORMAL MEETINGS WITH THE WHOLE BOARD
Since March 2020, the usual formal and informal occasions where Non-Executive Directors meet with employees have been restricted due to the pandemic. These were able to resume to some extent from June 2021 and the Board met with employees whilst visiting the office for Board meetings, during their asset tours and at the Strategy Day. We hope to resume informal lunches with employees during the Board’s office visits in 2022.
In June 2021 the Board joined the Thames Valley team for an open-top bus tour of the Slough Trading Estate. The team gave a presentation and guided tour of some of our assets, showed the Board our progress on some of our current developments and discussed future plans. In September, the Board visited a number of sites across our West London portfolio, including the Heathrow and Park Royal properties, Premier Park, Perivale, Greenford Park, and the Heathrow Cargo Centre, as part of a tour organised by the Greater London team. In addition to meeting with one of our larger customers during the Greater London tour, the Board enjoyed the opportunity to spend time with many members of the Thames Valley and Greater London teams.
CASE STUDY:
WORKFORCE ENGAGEMENT SESSIONS
During 2020, Martin Moore and I held a series of informal virtual meetings with employees to gain feedback on how they felt about working at SEGRO. For us, they provided valuable insight into life at SEGRO and a first-hand look at the culture within the organisation. I was pleased to hear that the sessions were also well received by the employees who took part. We proposed to the Board that not only should we continue with these meetings into 2021 but we should do more of them.
We agreed that pairs of Non-Executive Directors should host sessions with groups of employees from across the business. As the meetings were virtual, it meant that we could meet employees from all around the Group. We also felt it was important to hear from a range of employees in different roles and grades so that we heard a broad cross-section of views and from people of different cultures. We requested that the Leadership team members should not be invited to these meetings, so we could hear from the teams themselves and encourage open and transparent discussions.
Building on our experience in the first year, we thought the meetings might flow more naturally if there was a theme for each session and included participants who would be able to talk about or had expressed particular interest in that topic. However, we did make sure that the meetings were sufficiently flexible to be used as a forum for anything else which employees wished to raise.
We held five sessions, each with a different theme, which were:
} Digital and PropTech strategies; }Mental health; } Customer accounts; } Carbon emissions; and } Executive Remuneration.
The Directors agreed that the meetings should be open and we should encourage two-way dialogue. In the meetings I joined, we spent some of the time explaining our roles as Independent Non-Executive Directors and gave the employees a flavour of the sorts of things which we were discussing in the boardroom and, in return, we heard about people’s experiences about working day-to-day in the business. Employees shared with us their views on the theme for the meeting as well as how they felt about the Group’s culture and Values, the remuneration framework, sustainability challenges and the positive impacts of Responsible SEGRO. I was particularly impressed with people’s enthusiasm for the business, their understanding of what was happening outside their own areas and their commitment.
Non-attributable feedback from the sessions was relayed to the Board for discussion at the December meeting. I think that each of the Non-Executive Directors really valued the transparent conversations and the opportunity to hear first-hand, candid feedback from employees.
SUE CLAYTON INDEPENDENT NON-EXECUTIVE DIRECTOR
Stakeholder engagement continued
114 SEGRO PLC | ANNUAL REPORT & ACCOUNTS 2021
GOVERNANCE
Leadership and purpose
09_Governance_102_135_v145.indd 11409_Governance_102_135_v145.indd 114 01/03/2022 17:2101/03/2022 17:21

ANNUAL GENERAL MEETING (AGM)
The Board had hoped to hold the AGM as normal in 2021, but as many of the restrictions implemented by the UK Government in response to the Covid-19 pandemic were still in place in April 2021, regrettably, shareholders were not permitted to attend in person.
The 2021 AGM was held on 22 April as a ‘hybrid’ meeting, broadcast from our London office, and shareholders were invited to attend virtually through an electronic platform called ‘Lumi AGM’.
The Chair, Chief Executive, and the General Counsel and Group Company Secretary attended in person, with all other directors joining remotely.
Shareholders received all regular communications for the AGM, were invited to ask questions (either by email ahead of the meeting, or during the meeting via the Lumi AGM website or the telephone line) and were able to vote on the resolutions (either by appointing a proxy, by submitting their votes electronically ahead of the meeting, or voting during the meeting via the Lumi AGM website). All the resolutions proposed at the 2021 AGM were passed with 80 per cent of the issued share capital voted (2020: 81 per cent).
The Directors hope to hold our usual AGM in 2022 and look forward to welcoming shareholders in person, subject to Government guidance. They are optimistic that they will be able to meet and talk with shareholders at the AGM.
CODE OF BUSINESS CONDUCT AND ETHICS
The Board has taken an active interest in ensuring that appropriate policies and practices are in place, consistent with the Company’s Purpose and Values. One such policy is the Code of Business Conduct and Ethics (Code of Ethics) which is core to the way in which our business is run, the work we do, and to our reputation.
The Code of Ethics sets out the high ethical standards expected of all employees in their daily work to enable us to act with honesty and integrity. The Code of Ethics covers various policies on a wide range of activities and any breaches would be thoroughly investigated with appropriate action taken. The Board receives regular reports on compliance with the Code of Ethics and the Company’s policy on whistleblowing which sets out the procedure by which employees and any third parties can use a confidential external service to raise concerns. No matters of concern were raised during 2021.
The Code of Ethics also sets out our approach to human rights of all our stakeholders. Our due diligence to combat slavery and human trafficking is set out in our Modern Slavery Statement which is approved by the Board and available on our website. See page 99.
The Audit Committee receives an anti-bribery and corruption report at each meeting since it is responsible for ensuring that appropriate safeguards are in place for the detection of fraud and prevention of bribery, including overseeing and monitoring the Group’s Anti-Bribery and Corruption policies and procedures. Details of how matters of concern can be reported, and will be investigated are set out on page 99. No matters of concern were raised during 2021.
IDENTIFYING AND MANAGING CONFLICTS OF INTEREST
The Board operates a policy to identify and, when appropriate, manage actual or potential conflicts of interest affecting Directors. Prior to taking on any additional external commitments, Directors are required to submit any actual or potential conflicts of interest they may have with the Company to the Chair or Senior Independent Director for approval. Any conflicts of interest are recorded and approved by the Board at each meeting. Directors have a duty to keep the Board updated about any changes to these conflicts.
OUR SHAREHOLDERS
NUMBER OF INSTITUTIONS
2,03299% of issued share capital
NUMBER OF INDIVIDUALS
4,6301% of issued share capital
NUMBER OF MEETINGS
190
EFFECTIVE CONTROLS AND NECESSARY RESOURCES
The Board has a responsibility to ensure that appropriate controls and resources are in place to enable the Company to achieve its long-term goals. We have a Schedule of Matters Reserved for Decision by the Board, which was reviewed and updated in December 2021. This includes financial decisions, such as the annual budget and reviewing the Medium Term Plan, major capital expenditure, the approval of the financial statements, the dividend policy and compliance with the Code.
You can read about the Company’s approach to risk and risk management on pages 74 to 83, whilst page 135 contains further details about the Audit Committee’s role in ensuring that robust processes have been put in place to ensure risks are identified, evaluated and managed. The Board regularly discusses the Company’s principal risks, along with new and emerging risks, and considers how they may impact on the Company’s long-term goals.
The Board is ever mindful of the need to balance the pursuit of opportunities without taking unacceptable or excessive risk and ensures that the Company has the appropriate resources, in terms of time, people and funding to do so.
More informationsee page 41
CONSULTATIONS WITH SHAREHOLDERS
Each year, the Chair writes to our larger shareholders offering them a meeting with him, our Senior Independent Director and the Chairs of our Audit and Remuneration Committees. No meetings were requested. The invitation also noted that there would be a further consultation with shareholders on the proposed new Remuneration Policy, see pages 137 and 138.
The Board will continue to engage with shareholders as well as representative bodies to make sure that there is an ongoing dialogue about the Company’s approach to governance, including remuneration, and to ensure all views are fully understood and considered.
The feedback from shareholders is shared with the Board.
SCRIP
SEGRO offers a SCRIP dividend scheme which enables our shareholders to opt to receive dividends in shares rather than cash with no dealing costs or stamp duty. The scheme was approved by shareholders for a further three years at the 2021 AGM. Full details are available on our website.
115SEGRO PLC | ANNUAL REPORT & ACCOUNTS 2021
OVERVIEW STRATEGIC REPORT GOVERNANCE FINANCIAL STATEMENTS
09_Governance_102_135_v145.indd 11509_Governance_102_135_v145.indd 115 01/03/2022 17:2101/03/2022 17:21

GOVERNANCE FRAMEWORK
Our governance framework
The Chair is responsible for the leadership of the Board and its overall effectiveness in directing the Company and promoting an open environment for challenge and debate. He is also responsible for encouraging participation by all of the Directors, facilitating constructive relations and creating the right atmosphere to promote a culture of open discussion. Along with the other Non-Executives, he is responsible for holding the Executives to account against agreed objectives. Further information about the Directors is available on pages 106 and 107, while pages 124 and 125 explain how the Nomination Committee considers the skills and diversity on the Board and Non-Executive Director independence.
The Board retains responsibility for the approval of certain matters which include: Group strategy; the annual budget; the dividend policy; major investments and disposals; and the financial structure. There is an approved Schedule of Matters Reserved for Decision by the Board, which is reviewed periodically. The Board has delegated a number of its responsibilities to the Audit, Nomination and Remuneration Committees. The Terms of Reference of these Committees can be found at www.SEGRO.com. Further details on the roles and responsibilities of these Committees are set out opposite.
The division of responsibilities of the Chair, Chief Executive and Senior Independent Director are clearly established in writing and approved by the Board. Martin Moore, as the Senior Independent Director, provides a sounding board for the Chair and serves as an intermediary for Directors and shareholders should communication through the normal channels fail. Martin also leads the appraisal of the Chair’s performance each year (see page 119) and has responsibility for leading the recruitment process for an Independent Non-Executive Director with the skill set to succeed the Chair in due course. For further information on the responsibilities of each Board member, see the Governance Framework opposite.
The day-to-day running of the Group is delegated by the Board to the Chief Executive who is supported by the Executive Committee.
The Executive Committee supports the Chief Executive in the delivery of strategy and reviews operational and financial performance. The Committee carries out a pre-approval review of items requiring Board authorisation.
It also acts as a primary approval channel for matters delegated by the Board at each of its meetings.
CHAIR GERALD CORBETT
CHIEF EXECUTIVE DAVID SLEATH
EXECUTIVE DIRECTORS SOUMEN DAS ANDY GULLIFORD
SENIOR INDEPENDENT NON-EXECUTIVE DIRECTOR MARTIN MOORE
INDEPENDENT NON-EXECUTIVE DIRECTORS MARY BARNARD SUE CLAYTON CAROL FAIRWEATHER SIMON FRASER LINDA YUEH
COMPANY SECRETARY JULIA FOO
Sets the agenda, style and tone of Board discussions to promote constructive debate and effective decision making.
Ensures that the corporate governance of the Group is maintained in line with current best practice.
Ensures effective communication with shareholders and stakeholders and makes sure that the members of the Board develop an understanding of the views of major investors.
Ensures Directors receive the information they require to fulfil their duty to promote the success of the Company.
Recommends the Group’s strategy to the Board and is responsible for the implementation of that strategy and for the Group’s overall performance.
Manages the business of the Group.
Ensures that the interests of the Group’s stakeholders are taken into account with regard to the long-term impact which the Group’s decisions may have on various stakeholder groups.
Manage the business operations within each Director’s area of responsibility in accordance with the Group’s strategy.
Acts as a sounding board to the Chair and serves as an intermediary for other Directors when necessary.
Available to shareholders should the occasion arise where there is a need to convey concerns to the Board other than through the Chair or the Chief Executive.
Leads the annual appraisal of the Chair by the Non-Executive Directors.
Chairs the Nomination Committee when it considers the succession of the Chair.
Bring independent judgement and scrutiny to the decisions taken by the Board.
Monitor the success of management in delivering the agreed strategy within the risk appetite and control framework set by the Board.
Responsible for advising the Board and guiding the Company on all matters of good governance.
Ensures timely and appropriate information flows within the Board, the Board Committees and between the Directors and senior management.
Ensures compliance with relevant statutory and regulatory requirements.
Provides detailed practical support and guidance to Directors both individually and collectively.
THE BOARD
EXECUTIVE COMMITTEE
Assists the Chief Executive with the development and implementation of Group strategy, the management of the business and the discharge of responsibilities delegated by the Board.
116 SEGRO PLC | ANNUAL REPORT & ACCOUNTS 2021
GOVERNANCE
Division of responsibilities
09_Governance_102_135_v145.indd 11609_Governance_102_135_v145.indd 116 01/03/2022 17:2101/03/2022 17:21

GOVERNANCE FRAMEWORK
CHAIR GERALD CORBETT
CHIEF EXECUTIVE DAVID SLEATH
EXECUTIVE DIRECTORS SOUMEN DAS ANDY GULLIFORD
SENIOR INDEPENDENT NON-EXECUTIVE DIRECTOR MARTIN MOORE
INDEPENDENT NON-EXECUTIVE DIRECTORS MARY BARNARD SUE CLAYTON CAROL FAIRWEATHER SIMON FRASER LINDA YUEH
COMPANY SECRETARY JULIA FOO
Sets the agenda, style and tone of Board discussions to promote constructive debate and effective decision making.
Ensures that the corporate governance of the Group is maintained in line with current best practice.
Ensures effective communication with shareholders and stakeholders and makes sure that the members of the Board develop an understanding of the views of major investors.
Ensures Directors receive the information they require to fulfil their duty to promote the success of the Company.
Recommends the Group’s strategy to the Board and is responsible for the implementation of that strategy and for the Group’s overall performance.
Manages the business of the Group.
Ensures that the interests of the Group’s stakeholders are taken into account with regard to the long-term impact which the Group’s decisions may have on various stakeholder groups.
Manage the business operations within each Director’s area of responsibility in accordance with the Group’s strategy.
Acts as a sounding board to the Chair and serves as an intermediary for other Directors when necessary.
Available to shareholders should the occasion arise where there is a need to convey concerns to the Board other than through the Chair or the Chief Executive.
Leads the annual appraisal of the Chair by the Non-Executive Directors.
Chairs the Nomination Committee when it considers the succession of the Chair.
Bring independent judgement and scrutiny to the decisions taken by the Board.
Monitor the success of management in delivering the agreed strategy within the risk appetite and control framework set by the Board.
Responsible for advising the Board and guiding the Company on all matters of good governance.
Ensures timely and appropriate information flows within the Board, the Board Committees and between the Directors and senior management.
Ensures compliance with relevant statutory and regulatory requirements.
Provides detailed practical support and guidance to Directors both individually and collectively.
THE BOARD
AUDIT NOMINATION REMUNERATION
Monitors the integrity of the Group’s Financial Statements, reviews the relationship with the auditor and the role and effectiveness of the internal audit function. Oversees the risk management process and internal control environment.
Ensures that the Board, its Committees and the Leadership team have the appropriate skills, knowledge, diversity and experience to operate effectively and to oversee the delivery of the strategy.
Determines the reward strategy for the Executive Directors to align their interests with those of shareholders and employees.
BOARD COMMITTEES
HEALTH AND SAFETY COMMITTEE
Develops and manages the implementation of Health and Safety policies, reviews the outcomes of the Health and Safety Working Group as well as any other Health and Safety matters.
OPERATIONS RISK INVESTMENT
Assists the Chief Operating Officer to manage the operations of the Group and to discharge the responsibilities delegated to him by the Chief Executive.
Establishes, monitors and reports to the Executive Committee and ultimately the Board and Audit Committee on the Group’s approach to risk management.
Manages the allocation of capital across the Group and oversees all major investment and divestment decisions on behalf of the Executive Committee.
MANAGEMENT COMMITTEES
117SEGRO PLC | ANNUAL REPORT & ACCOUNTS 2021
OVERVIEW STRATEGIC REPORT GOVERNANCE FINANCIAL STATEMENTS
09_Governance_102_135_v145.indd 11709_Governance_102_135_v145.indd 117 01/03/2022 17:2101/03/2022 17:21
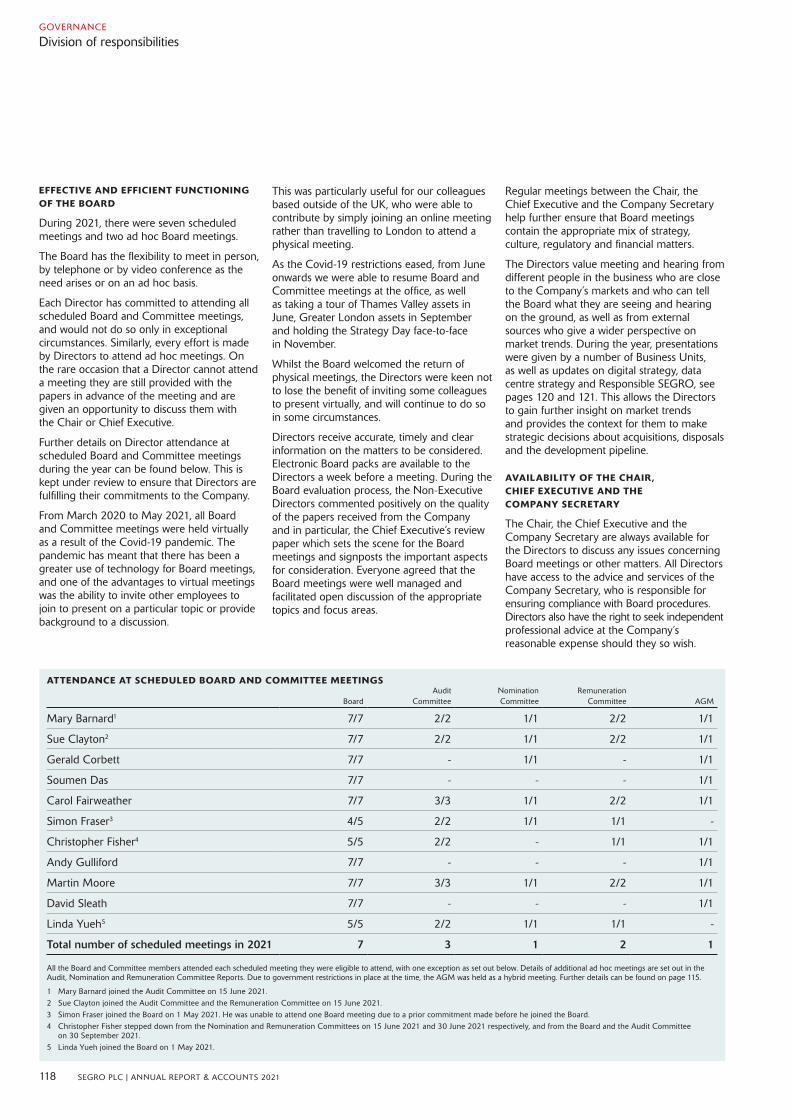
ATTENDANCE AT SCHEDULED BOARD AND COMMITTEE MEETINGS
BoardAudit
CommitteeNomination Committee
Remuneration Committee AGM
Mary Barnard1 7/7 2/2 1/1 2/2 1/1
Sue Clayton2 7/7 2/2 1/1 2/2 1/1
Gerald Corbett 7/7 - 1/1 - 1/1
Soumen Das 7/7 - - - 1/1
Carol Fairweather 7/7 3/3 1/1 2/2 1/1
Simon Fraser3 4/5 2/2 1/1 1/1 -
Christopher Fisher4 5/5 2/2 - 1/1 1/1
Andy Gulliford 7/7 - - - 1/1
Martin Moore 7/7 3/3 1/1 2/2 1/1
David Sleath 7/7 - - - 1/1
Linda Yueh5 5/5 2/2 1/1 1/1 -
Total number of scheduled meetings in 2021 7 3 1 2 1
All the Board and Committee members attended each scheduled meeting they were eligible to attend, with one exception as set out below. Details of additional ad hoc meetings are set out in the Audit, Nomination and Remuneration Committee Reports. Due to government restrictions in place at the time, the AGM was held as a hybrid meeting. Further details can be found on page 115.
1 Mary Barnard joined the Audit Committee on 15 June 2021. 2 Sue Clayton joined the Audit Committee and the Remuneration Committee on 15 June 2021.3 Simon Fraser joined the Board on 1 May 2021. He was unable to attend one Board meeting due to a prior commitment made before he joined the Board. 4 Christopher Fisher stepped down from the Nomination and Remuneration Committees on 15 June 2021 and 30 June 2021 respectively, and from the Board and the Audit Committee
on 30 September 2021.5 Linda Yueh joined the Board on 1 May 2021.
EFFECTIVE AND EFFICIENT FUNCTIONING OF THE BOARD
During 2021, there were seven scheduled meetings and two ad hoc Board meetings.
The Board has the flexibility to meet in person, by telephone or by video conference as the need arises or on an ad hoc basis.
Each Director has committed to attending all scheduled Board and Committee meetings, and would not do so only in exceptional circumstances. Similarly, every effort is made by Directors to attend ad hoc meetings. On the rare occasion that a Director cannot attend a meeting they are still provided with the papers in advance of the meeting and are given an opportunity to discuss them with the Chair or Chief Executive.
Further details on Director attendance at scheduled Board and Committee meetings during the year can be found below. This is kept under review to ensure that Directors are fulfilling their commitments to the Company.
From March 2020 to May 2021, all Board and Committee meetings were held virtually as a result of the Covid-19 pandemic. The pandemic has meant that there has been a greater use of technology for Board meetings, and one of the advantages to virtual meetings was the ability to invite other employees to join to present on a particular topic or provide background to a discussion.
This was particularly useful for our colleagues based outside of the UK, who were able to contribute by simply joining an online meeting rather than travelling to London to attend a physical meeting.
As the Covid-19 restrictions eased, from June onwards we were able to resume Board and Committee meetings at the office, as well as taking a tour of Thames Valley assets in June, Greater London assets in September and holding the Strategy Day face-to-face in November.
Whilst the Board welcomed the return of physical meetings, the Directors were keen not to lose the benefit of inviting some colleagues to present virtually, and will continue to do so in some circumstances.
Directors receive accurate, timely and clear information on the matters to be considered. Electronic Board packs are available to the Directors a week before a meeting. During the Board evaluation process, the Non-Executive Directors commented positively on the quality of the papers received from the Company and in particular, the Chief Executive’s review paper which sets the scene for the Board meetings and signposts the important aspects for consideration. Everyone agreed that the Board meetings were well managed and facilitated open discussion of the appropriate topics and focus areas.
Regular meetings between the Chair, the Chief Executive and the Company Secretary help further ensure that Board meetings contain the appropriate mix of strategy, culture, regulatory and financial matters.
The Directors value meeting and hearing from different people in the business who are close to the Company’s markets and who can tell the Board what they are seeing and hearing on the ground, as well as from external sources who give a wider perspective on market trends. During the year, presentations were given by a number of Business Units, as well as updates on digital strategy, data centre strategy and Responsible SEGRO, see pages 120 and 121. This allows the Directors to gain further insight on market trends and provides the context for them to make strategic decisions about acquisitions, disposals and the development pipeline.
AVAILABILITY OF THE CHAIR, CHIEF EXECUTIVE AND THE COMPANY SECRETARY
The Chair, the Chief Executive and the Company Secretary are always available for the Directors to discuss any issues concerning Board meetings or other matters. All Directors have access to the advice and services of the Company Secretary, who is responsible for ensuring compliance with Board procedures. Directors also have the right to seek independent professional advice at the Company’s reasonable expense should they so wish.
118 SEGRO PLC | ANNUAL REPORT & ACCOUNTS 2021
GOVERNANCE
Division of responsibilities
09_Governance_102_135_v145.indd 11809_Governance_102_135_v145.indd 118 01/03/2022 17:2101/03/2022 17:21

INDEPENDENCE AND COMMITMENTS OF THE NON-EXECUTIVE DIRECTORS
Details of the Directors, including the skills and experience that they bring to the Board, are set out on pages 106 and 107. As at 31 December 2021, the Board comprised a Non-Executive Chair, three Executive Directors, and six Independent Non-Executive Directors, all of whom are equally responsible for the effective stewardship and leadership of the Group. Christopher Fisher stepped down from the Board at the end of his third term on 30 September 2021. For the period 1 May to 30 September, the Board comprised seven Independent Non-Executive Directors.
Each of the Non-Executive Directors is considered independent in character and judgement. The Chair was considered independent on appointment and the Board still considers him to be so. By having a majority of Independent Non-Executive Directors, the Executives are held to account and are not able to dominate Board decision making, which promotes the good governance of the Company.
In addition to the external Board evaluation which is detailed on page 122 and 123 the performance of each of the Directors is reviewed annually. The Senior Independent Director led the appraisal of the Chair incorporating feedback from the other Board members, and concluded that he was effective in his role. The Non-Executive Directors agreed that the Chief Executive continued to perform his role with energy and commitment and leads an effective executive team. The performance of the other Non-Executive Directors is appraised by the Chair and Senior Independent Director, whilst the Chief Executive gives feedback about the Executive Directors.
For further details on how the Board has reached its conclusions on Non-Executive Director independence, see page 124 of the Composition, Succession and Evaluation section.
The Nomination Committee considered the commitments of all of the Company’s Non-Executive Directors and concluded that each of them has sufficient time to commit to the Company, and are not overboarded. Their individual contributions are, and continue to be, important to the Company’s long-term sustainable success. For transparency we disclose all external appointments held by our Directors in their biographies on pages 106 to 107, however many of these appointments do not require the same time commitment as appointments to publicly listed companies.
Our Executive Committee and Leadership team
The Executive Committee has its own Terms of Reference. This Committee meets formally each month and during the year there are dedicated sessions to discuss strategy as well as ad hoc meetings to keep the Committee up to date with day-to-day operational issues.In addition to the development and delivery of strategy, as approved by the Board, the Executive Committee has a wide range of responsibilities including:
} oversight of the Group’s risk management process; business continuity plans; anti-bribery and corruption, modern slavery and data privacy policies and processes; and the Group’s talent programme and overall training and development plan;
} biannual review of the litigation register, overseeing any actual or potential material litigation; and
} approval of the Group’s Health and Safety policies; delegation of authorities; Group’s sustainability strategy; insurance strategy; material contracts; and charity policies and community engagement work.
The Executive Committee delegates some of its responsibilities to three management Committees:
} the Investment Committee;
} the Operations Committee; and
} the Risk Committee.
These Committees also have their own Terms of Reference and membership includes at least one member of the Executive Committee and members of the Leadership team.
There is also the Health and Safety Committee, which focuses on Health and Safety activities within the organisation.
LEADERSHIP TEAM
SEGRO’s Leadership team comprises the members of the Executive Committee and their senior direct reports, each of whom has responsibility for the Group’s operations in a particular geography, or for one or more of the Group’s main functional areas.
The day-to-day management of the Group’s activities and the governance and oversight of them are carried out under the structures described on pages 116 and 117.
The Leadership team serves as a discussion forum and sounding board with which the Executive Directors can share knowledge and ideas, gain a better understanding of the local market outlook as well as share cross-functional and cross-border information. The Leadership team normally meets twice per month to review areas such as:
}market conditions and competitor activity;
} future trends affecting our customers’ businesses and which may impact SEGRO;
} interests of the Group’s stakeholders;
} horizon scanning for emerging topics which might impact on our business in the medium to long term;
} the Group’s asset plans and Medium Term Plan;
} development and implementation of the Group’s culture and Values including our approach to diversity and inclusion in its broadest sense; and
} the results of the Group’s Employee Engagement Survey.
The Leadership team is also consulted and kept informed about Company-wide activities and performance through dedicated conference calls.
Further details on the gender balance of the Leadership team are on page 127.
119SEGRO PLC | ANNUAL REPORT & ACCOUNTS 2021
OVERVIEW STRATEGIC REPORT GOVERNANCE FINANCIAL STATEMENTS
09_Governance_102_135_v145.indd 11909_Governance_102_135_v145.indd 119 01/03/2022 17:2101/03/2022 17:21

OPERATIONAL
MATTERS CONSIDERED
} Presentations by the Central Europe, Thames Valley, Greater London and National Logistics teams
} Tours of the Slough Trading Estate and Greater London assets and a virtual tour of National Logistics assets
} Asset disposal plan for 2021 and 2022
} Review of the Annual Health and Safety report and monthly incident reports
OUTCOME
} Kept up to date on the operational aspects of the business by the local teams.
} Had visibility of key customers and engagement through the business unit presentations.
} Approved significant transactions over £/€50 million including acquisitions, disposals and developments.
} Monitored performance against the Company’s Zero Tolerance approach to Health and Safety breaches, and reviewed findings and learnings from incidents.
STRATEGY
MATTERS CONSIDERED
} Presentation from Cushman and Wakefield on the real estate sector in the post-pandemic economy
} UBS presentation on the macroeconomic environment and outlook
} Heathrow strategy update
} Data centre strategy update
} Strategy Day
} Market outlook for the occupier and investment markets
} Digital/PropTech update
} Review of the 2021 property returns
} Review of SEGRO’s growth strategy
} Post investment review of acquisitions and disposals
OUTCOME
} Received regular updates from advisers, industry experts and employees to ensure the Board is kept up to date with market trends and implement this knowledge in its decision making.
} Deployed proceeds of fund raising in strategic acquisitions.
} Considered post-pandemic recovery, the wider macroeconomic outlook and geopolitical uncertainty and their impacts on the business.
} Concluded that the current investment strategy and Medium Term Plan remained fit for purpose.
GOVERNANCE
MATTERS CONSIDERED
} Compliance with the requirements of the UK Corporate Governance Code and updates on corporate and regulatory changes and reporting requirements
} External Board evaluation process for 2021, including progress against actions from the 2020 internal evaluation
} Chair and Non-Executive Director fee review
} Appointment of new Company Secretary
} Principal risks and risk appetite, risk control and framework
} Refresher training on Market Abuse Regulation
} Remuneration Policy and framework
} Succession planning for Board and Leadership team
OUTCOME
} Ensured compliance with the Code through robust governance procedures.
} Concluded that the Board and its Committees continued to operate effectively.
} Approved the Principal Risks and risk appetite of the Company.
} Commenced the search for three new Non-Executive Directors.
STAKEHOLDER ENGAGEMENT
MATTERS CONSIDERED
} Responsible SEGRO updates
} Broker presentations on shareholders’/analysts’ attitudes to the Company and investor feedback
} Results of the annual Customer Satisfaction Survey
} Workforce engagement
} Report on s172 activities
} Modern Slavery and Human Trafficking Statement
} Update on Anti-Bribery and Corruption policies
} Shareholder and employee consultation for the 2022 Remuneration Policy
OUTCOME
} Considered the impact of Board decision making on the Company’s stakeholders.
} Ensured compliance with the Code of Business Conduct and Ethics and Anti-Bribery and Corruption policies and noted no reports from the externally-managed whistleblowing line.
} Reviewed Customer Satisfaction Survey results to ensure excellent service is provided to maximise customer retention.
} Engaged with shareholders, key proxy advisory agencies and employees in the development of the 2022 Remuneration Policy.
Read more about stakeholders see pages 85 and 110 to 115
Read more about our operations see pages 50 to 65Read more about our strategy see pages 22 to 49
Read more about our governance see pages 102 to 121
Key activities of the Board during 2021
120 SEGRO PLC | ANNUAL REPORT & ACCOUNTS 2021
GOVERNANCE
Division of responsibilities
09_Governance_102_135_v145.indd 12009_Governance_102_135_v145.indd 120 01/03/2022 17:2101/03/2022 17:21
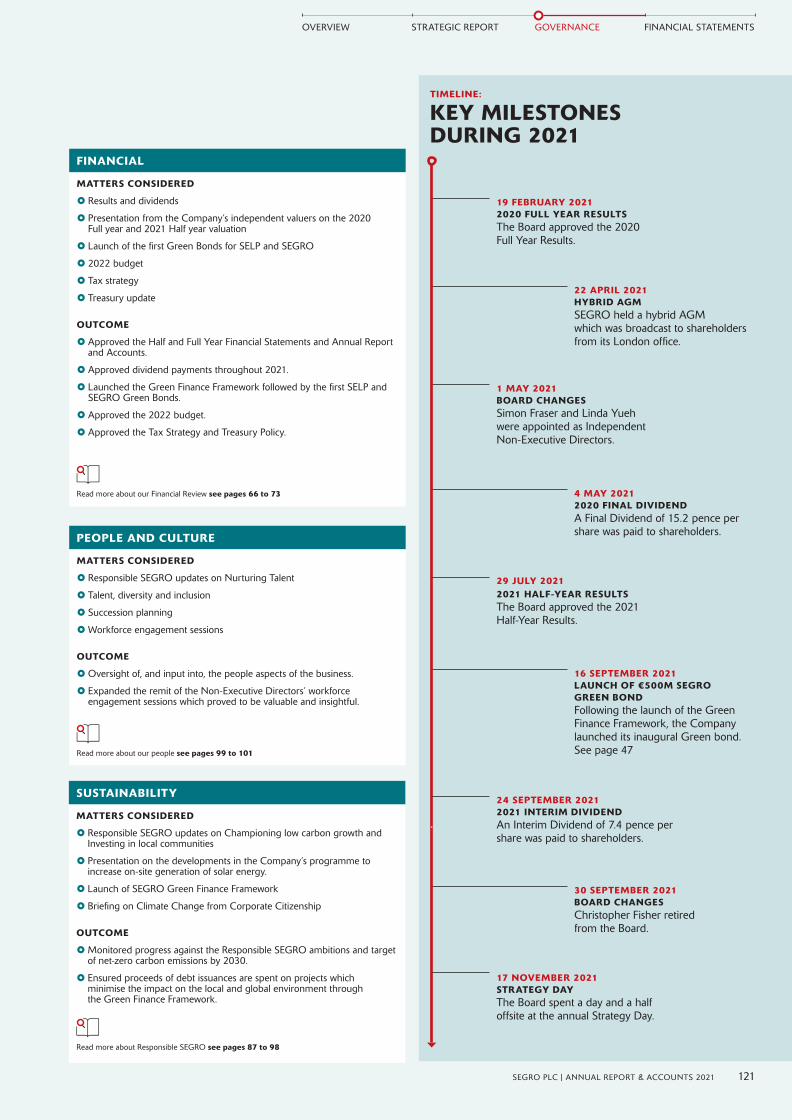
SUSTAINABILITY
MATTERS CONSIDERED
} Responsible SEGRO updates on Championing low carbon growth and Investing in local communities
} Presentation on the developments in the Company’s programme to increase on-site generation of solar energy.
} Launch of SEGRO Green Finance Framework
} Briefing on Climate Change from Corporate Citizenship
OUTCOME
}Monitored progress against the Responsible SEGRO ambitions and target of net-zero carbon emissions by 2030.
} Ensured proceeds of debt issuances are spent on projects which minimise the impact on the local and global environment through the Green Finance Framework.
PEOPLE AND CULTURE
MATTERS CONSIDERED
} Responsible SEGRO updates on Nurturing Talent
} Talent, diversity and inclusion
} Succession planning
}Workforce engagement sessions
OUTCOME
}Oversight of, and input into, the people aspects of the business.
} Expanded the remit of the Non-Executive Directors’ workforce engagement sessions which proved to be valuable and insightful.
FINANCIAL
MATTERS CONSIDERED
} Results and dividends
} Presentation from the Company’s independent valuers on the 2020 Full year and 2021 Half year valuation
} Launch of the first Green Bonds for SELP and SEGRO
} 2022 budget
} Tax strategy
} Treasury update
OUTCOME
} Approved the Half and Full Year Financial Statements and Annual Report and Accounts.
} Approved dividend payments throughout 2021.
} Launched the Green Finance Framework followed by the first SELP and SEGRO Green Bonds.
} Approved the 2022 budget.
} Approved the Tax Strategy and Treasury Policy.
Read more about Responsible SEGRO see pages 87 to 98
Read more about our people see pages 99 to 101
Read more about our Financial Review see pages 66 to 73
TIMELINE:
KEY MILESTONES DURING 2021
19 FEBRUARY 2021 2020 FULL YEAR RESULTSThe Board approved the 2020 Full Year Results.
22 APRIL 2021 HYBRID AGMSEGRO held a hybrid AGM which was broadcast to shareholders from its London office.
4 MAY 2021 2020 FINAL DIVIDENDA Final Dividend of 15.2 pence per share was paid to shareholders.
1 MAY 2021 BOARD CHANGESSimon Fraser and Linda Yueh were appointed as Independent Non-Executive Directors.
16 SEPTEMBER 2021 LAUNCH OF €500M SEGRO GREEN BOND Following the launch of the Green Finance Framework, the Company launched its inaugural Green bond.See page 47
30 SEPTEMBER 2021 BOARD CHANGES Christopher Fisher retired from the Board.
29 JULY 2021 2021 HALF-YEAR RESULTSThe Board approved the 2021 Half-Year Results.
24 SEPTEMBER 2021 2021 INTERIM DIVIDEND An Interim Dividend of 7.4 pence per share was paid to shareholders.
17 NOVEMBER 2021 STRATEGY DAY The Board spent a day and a half offsite at the annual Strategy Day.
121SEGRO PLC | ANNUAL REPORT & ACCOUNTS 2021
OVERVIEW STRATEGIC REPORT GOVERNANCE FINANCIAL STATEMENTS
09_Governance_102_135_v145.indd 12109_Governance_102_135_v145.indd 121 01/03/2022 17:2101/03/2022 17:21

The last external Board evaluation was facilitated in early 2018. In line with the provisions of the Code, the next externally facilitated evaluation was due to be undertaken in 2021. In the two intervening years, internal reviews were led by the Chair.
The Board was cognisant of the recent Non-Executive Director appointments in May and the need for them to spend time familiarising themselves with the Board, its Committees and the Company in order for an interview-based external evaluation to be truly beneficial.
The timing and approach of a formal external evaluation was considered and the Board appointed a Committee consisting of the Chair, Gerald Corbett; Senior Independent Director, Martin Moore; and Company Secretary, Julia Foo to lead the process, with input from the Chief Executive, David Sleath.
The Committee, recognising the value and independent insights provided by an external board evaluation whilst being mindful of the limited and valuable time the Board would be able to spend together in person, agreed that it would be best to conduct an externally facilitated questionnaire-based evaluation this year. The Board agreed that this approach was the most suitable at this time.
There were a number of stages to the evaluation process as set out in the following pages.
STAGE 1An initial review of potential external board evaluators was undertaken, with feedback received from the Board. The Company Secretary engaged directly with the longlist of providers to understand their approaches to the various evaluation methods and fit to SEGRO. This review, together with insights from the Directors, helped shape the shortlist.
STAGE 2Following a review of the shortlist, Independent Audit was appointed to undertake the Board and Committee evaluations.
Independent Audit fully complies with the new Code of Practice for Board Reviewers recommended by the Chartered Governance Institute in their January 2021 report on the effectiveness of independent Board evaluation in the UK listed sector, and aside from having conducted the last externally facilitated Board evaluation in 2018, has no connection with the Company or any of the individual Directors.
STAGE 3Independent Audit held an initial briefing session with Gerald, Martin and Julia, and prepared questionnaires for the Board and its three Committees using their online self-assessment service, Thinking Board. The questions were reviewed and adapted to focus on areas which were most relevant and appropriate to SEGRO.
Some key themes identified for the questionnaire were:
} the effectiveness, role and priorities of the Board and its Committees;
} the Board’s composition, skills, succession and culture;
} the alignment of Purpose and Values, and strategy;
} the leadership of the Board and the business;
} broader risk management; and
} engagement with stakeholders.
STAGE 4Independent Audit attended the September Board and Remuneration Committee meetings to observe first-hand how these meetings were conducted and the interactions amongst attendees.
STAGE 5The Board members, the Executive Committee, and the Company Secretary completed the questionnaires following the Strategy Day.
Independent Audit analysed the results of the questionnaires and in conjunction with their observations from the September meetings, compiled a draft report which was shared with Gerald and Martin. There were no significant revisions made to the report before it was issued to the Board.
STAGE 6The findings of the external Board evaluation were presented by Independent Audit at the December 2021 Board meeting, and suggested recommendations were reviewed, discussed and agreed by the Board.
YEAR 1EXTERNAL
YEAR 3INTERNAL
YEAR 2INTERNAL
122 SEGRO PLC | ANNUAL REPORT & ACCOUNTS 2021
GOVERNANCE
Composition, succession and evaluation
External Board Evaluation
09_Governance_102_135_v145.indd 12209_Governance_102_135_v145.indd 122 01/03/2022 17:2101/03/2022 17:21
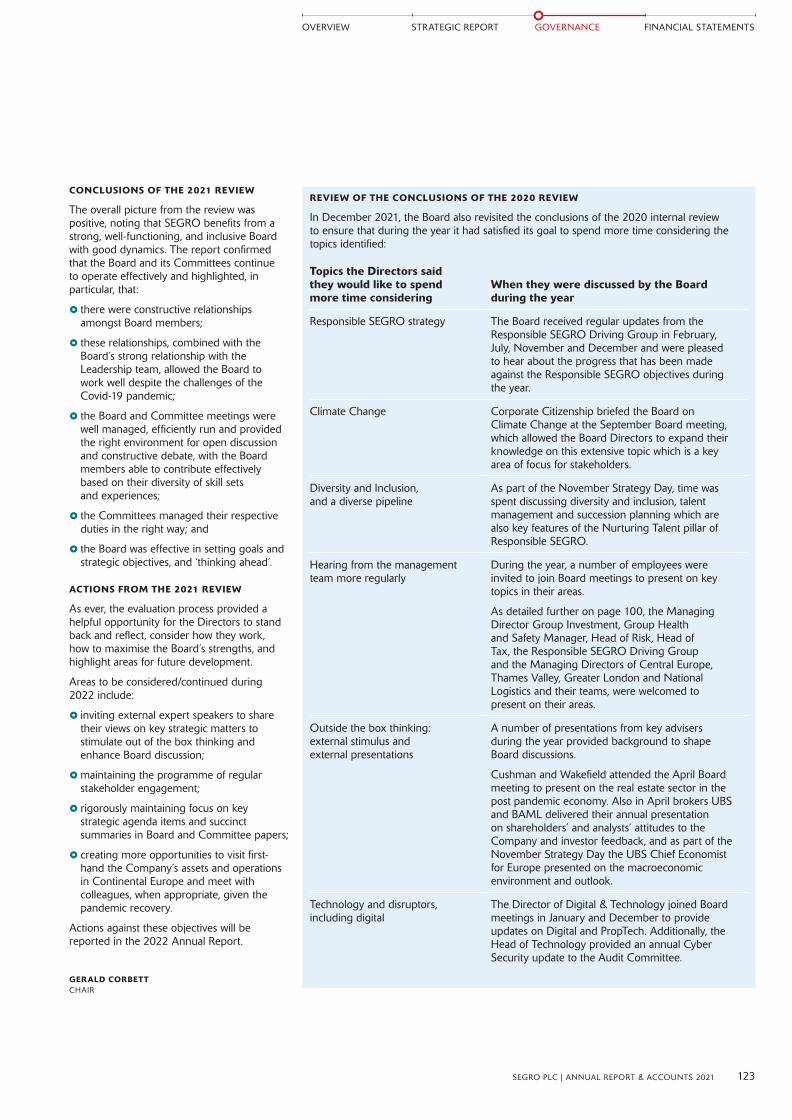
CONCLUSIONS OF THE 2021 REVIEW
The overall picture from the review was positive, noting that SEGRO benefits from a strong, well-functioning, and inclusive Board with good dynamics. The report confirmed that the Board and its Committees continue to operate effectively and highlighted, in particular, that:
} there were constructive relationships amongst Board members;
} these relationships, combined with the Board’s strong relationship with the Leadership team, allowed the Board to work well despite the challenges of the Covid-19 pandemic;
} the Board and Committee meetings were well managed, efficiently run and provided the right environment for open discussion and constructive debate, with the Board members able to contribute effectively based on their diversity of skill sets and experiences;
} the Committees managed their respective duties in the right way; and
} the Board was effective in setting goals and strategic objectives, and ‘thinking ahead’.
ACTIONS FROM THE 2021 REVIEW
As ever, the evaluation process provided a helpful opportunity for the Directors to stand back and reflect, consider how they work, how to maximise the Board’s strengths, and highlight areas for future development.
Areas to be considered/continued during 2022 include:
} inviting external expert speakers to share their views on key strategic matters to stimulate out of the box thinking and enhance Board discussion;
}maintaining the programme of regular stakeholder engagement;
} rigorously maintaining focus on key strategic agenda items and succinct summaries in Board and Committee papers;
} creating more opportunities to visit first-hand the Company’s assets and operations in Continental Europe and meet with colleagues, when appropriate, given the pandemic recovery.
Actions against these objectives will be reported in the 2022 Annual Report.
GERALD CORBETTCHAIR
REVIEW OF THE CONCLUSIONS OF THE 2020 REVIEW
In December 2021, the Board also revisited the conclusions of the 2020 internal review to ensure that during the year it had satisfied its goal to spend more time considering the topics identified:
Topics the Directors said they would like to spend more time considering
When they were discussed by the Board during the year
Responsible SEGRO strategy The Board received regular updates from the Responsible SEGRO Driving Group in February, July, November and December and were pleased to hear about the progress that has been made against the Responsible SEGRO objectives during the year.
Climate Change Corporate Citizenship briefed the Board on Climate Change at the September Board meeting, which allowed the Board Directors to expand their knowledge on this extensive topic which is a key area of focus for stakeholders.
Diversity and Inclusion, and a diverse pipeline
As part of the November Strategy Day, time was spent discussing diversity and inclusion, talent management and succession planning which are also key features of the Nurturing Talent pillar of Responsible SEGRO.
Hearing from the management team more regularly
During the year, a number of employees were invited to join Board meetings to present on key topics in their areas.
As detailed further on page 100, the Managing Director Group Investment, Group Health and Safety Manager, Head of Risk, Head of Tax, the Responsible SEGRO Driving Group and the Managing Directors of Central Europe, Thames Valley, Greater London and National Logistics and their teams, were welcomed to present on their areas.
Outside the box thinking: external stimulus and external presentations
A number of presentations from key advisers during the year provided background to shape Board discussions.
Cushman and Wakefield attended the April Board meeting to present on the real estate sector in the post pandemic economy. Also in April brokers UBS and BAML delivered their annual presentation on shareholders’ and analysts’ attitudes to the Company and investor feedback, and as part of the November Strategy Day the UBS Chief Economist for Europe presented on the macroeconomic environment and outlook.
Technology and disruptors, including digital
The Director of Digital & Technology joined Board meetings in January and December to provide updates on Digital and PropTech. Additionally, the Head of Technology provided an annual Cyber Security update to the Audit Committee.
123SEGRO PLC | ANNUAL REPORT & ACCOUNTS 2021
OVERVIEW STRATEGIC REPORT GOVERNANCE FINANCIAL STATEMENTS
09_Governance_102_135_v145.indd 12309_Governance_102_135_v145.indd 123 01/03/2022 17:2101/03/2022 17:21

COMMITTEE MEMBERS
Gerald Corbett (Chair) Mary Barnard Sue Clayton Carol Fairweather Simon Fraser Martin Moore Linda Yueh
KEY RESPONSIBILITIES
} Composition of the Board and its Committees
}Manage the Director appointment process and make recommendations to the Board
} Succession planning for the Board and Leadership team
}Oversight of the policy on diversity and inclusion
MEETINGS
} 1 scheduled
} 6 ad hoc
} See page 118 for attendance at scheduled meetings
2021 HIGHLIGHTS
} Reappointment of Sue Clayton and Mary Barnard each for further three-year terms
} Recruitment of Simon Fraser and Linda Yueh
} Recruitment of Andy Harrison as successor to the Chair
} Review of composition of the Board Committees
I am delighted to present the report of the Nomination Committee.The Committee fulfilled its role of overseeing the composition of the Board and its Committees, and monitoring the balance of skills, experience, independence, and knowledge as well as the diversity of its members in its broadest sense.
It has been a busy year for the Committee, with the main areas of focus being the appointment of two new Independent Non-Executive Directors, Simon Fraser and Linda Yueh, the search for my successor as Chair of the Company (as detailed in the case study on page 129) and the triennial, externally facilitated Board evaluation (as detailed in on pages 122 and 123). The search for my successor was led by our Senior Independent Director, Martin Moore.
INDEPENDENCE
The Committee considers each of the Non-Executive Directors and me to be independent, in accordance with the criteria set out in the Code.
COMPOSITION, SKILLS AND EXPERIENCE
The Committee comprises the Independent Non-Executive Directors. During the year, the Committee reviewed the skills and experience of the Board members, as well as the size of the Board as a whole and determined that it remained appropriate. The Committee reflected on the skill sets of Board members as part of the Board’s medium and longer-term succession planning.
Additionally, given the changes on the Board, we carried out a review of the composition of the Committees and made recommendations for changes to their memberships.
Christopher Fisher stepped down from the Committee on 15 June 2021. He served as Chair of the Remuneration Committee until 30 June 2021 when he was succeeded by Simon Fraser. Christopher remained a member of the Audit Committee until his retirement from the Board on 30 September 2021.
Sue Clayton was appointed a member of the Audit and Remuneration Committees, and Mary Barnard also joined the Audit Committee with effect from 15 June 2021.
Nomination Committee Report Skills, experience and size of the Board
124 SEGRO PLC | ANNUAL REPORT & ACCOUNTS 2021
GOVERNANCE
Composition, succession and evaluation
09_Governance_102_135_v145.indd 12409_Governance_102_135_v145.indd 124 01/03/2022 17:2101/03/2022 17:21

BOARD DIVERSITY POLICY
The Committee is responsible for monitoring the effectiveness of the Board Diversity Policy, available to view on the Company’s website, www.SEGRO.com, which sets out the Company’s approach to diversity in respect of the Board of Directors.
The Board Diversity Policy was considered at the November meeting, where the Committee determined that it was appropriate and in line with best practice, which was then formally approved by the Board.
DIVERSITY
The Directors are committed to having a balanced Board which recognises the benefits of diversity in its broadest sense and the value that this brings to the organisation in terms of skills, knowledge and experience.
The composition of the Board exceeds the criteria of the Hampton-Alexander review on gender balance and the Parker Review on ethnic diversity. As at 31 December 2021, 40 per cent of the Board were female and 20 per cent were from an ethnic minority background.
The Board aspires to promote greater diversity across the business. When searching for an additional Non-Executive Director, the Committee is cognisant of the benefits a diverse Board brings, and it ensures that in its selection and briefing of executive search firms, the search factors of diversity and inclusion are included at the outset. The Committee considers how it describes the skills and experience needed for the roles as it recognises this process is an important part in attracting as wide a pool of candidates as possible. The Committee will only use the services of executive search firms who have signed up to the Voluntary Code of Conduct for Executive Search Firms.
In the final selection decision, all Board appointments are made on merit and relevant experience, against the criteria identified by the Committee with regard to the benefits of diversity, including gender and ethnicity.
The 2020 Employee Engagement Survey, which was discussed by the Board in 2021, contained a section on employees’ views about diversity and inclusion. For further information about the Company’s approach to diversity and inclusion, see pages 32 to 35.
REAPPOINTMENTS DURING THE YEAR
Sue Clayton reached three years’ service in June 2021 and Mary Barnard will reach three years’ service in March 2022. Following their confirmation that they were willing to continue to serve as Independent Non-Executive Directors for a further three-year term, their re-elections were considered at the September meeting and December meeting respectively. The Committee gave due regard to their performance and ability to continue to contribute to the Board, as well as their time commitment.
Neither Sue nor Mary were present when their reappointments were considered.
The Committee concluded that both Sue and Mary were valuable members of the Board, who bring expertise in the property and retail sectors respectively and demonstrate commitment to their roles. It was agreed that their terms should be extended for a further three years, subject to annual re-election by shareholders at the AGM. Their biographies are set out on pages 106 and 107.
APPOINTMENTS DURING THE YEAR
The Committee has a thorough and robust search process for the selection of new Independent Non-Executive Directors. The Committee commenced the search for two new Independent Non-Executive Directors in 2020 as part of the planned process to ensure the orderly succession of Directors who had reached nine-years’ service on the Board. Three ad hoc Committee meetings dedicated to this search were convened in Q1 2021.
The role specification was agreed, the Committee identified the required skills and experience and external search agency, Russell Reynolds Associates, who are not connected to the Company or any SEGRO Directors, were appointed to undertake the search. Russell Reynolds Associates are a signatory to the Voluntary Code of Conduct for Executive Search Firms, as required by the Board Diversity Policy, and having previously worked with the Company understand the business, culture and the type of individual that would work well with the Board.
Due consideration was given to the fact that one of the new appointees would likely succeed Christopher Fisher as Chair of the Remuneration Committee and would therefore need to meet the Code requirement of having served on a remuneration committee for at least 12 months.
Initial meetings with longlist candidates were attended by the Chair, Senior Independent Director and Chief Executive, following which feedback was provided to Russell Reynolds. Subsequent interviews with those shortlisted were arranged with the rest of the Committee and the Executive Directors. Simon Fraser and Linda Yueh were identified as the preferred candidates and the Committee considered the new and complementary skills they would bring to the Board. Their biographies are set out on pages 106 and 107.
The Committee further considered any potential conflicts of interest and confirmed that, in their opinion, both Simon and Linda were independent as defined by the Code. Simon’s experience as the Remuneration Committee Chair for Derwent London plc and Lancashire Holdings Ltd was noted.
Following a formal recommendation made by the Committee, Simon and Linda were appointed as Independent Non-Executive Directors on 1 May 2021, and are subject to election by shareholders at the 2022 AGM.
During the year, the Committee commenced the search process for a further Non-Executive Director, with the appropriate skills and experience to be a potential successor to me should I decide to retire. In January 2022, we announced the appointment of Andy Harrison, who will join the Board on 1 April 2022 and take on the role of Chair on 30 June 2022. He will work closely with me during this handover period to ensure there is a smooth transition of Board leadership. Andy brings with him extensive executive and board leadership experience, and indispensable strategic insight. The process that the Committee followed in respect of this appointment is described by Martin on page 129.
NON-EXECUTIVE DIRECTOR SUCCESSION AND RE-ELECTION
The Committee monitors the tenure of Directors to ensure that it plans sufficiently in advance of retirements from the Board to ensure orderly succession of Non-Executive Directors. All of the Directors stand for election or re-election at each AGM. The Committee considers their skills and performance and, having concluded that each Director continues to be effective and demonstrates commitment to their role, makes a formal recommendation to the Board that they are re-elected. Non-Executive Directors are appointed by the Board for three-year terms. At the conclusion of each term, the Committee undertakes a review of their performance and contribution before making any recommendation to the Board for their reappointment. All the Directors, with the exception of Simon, Linda and Andy who will be standing for election for the first time, will therefore submit themselves for re-election at the 2022 AGM.
125SEGRO PLC | ANNUAL REPORT & ACCOUNTS 2021
OVERVIEW STRATEGIC REPORT GOVERNANCE FINANCIAL STATEMENTS
09_Governance_102_135_v145.indd 12509_Governance_102_135_v145.indd 125 01/03/2022 17:2101/03/2022 17:21

INDUCTION OF NEW INDEPENDENT NON-EXECUTIVE DIRECTORS
On joining the Board, Simon and Linda participated in a comprehensive induction programme designed to familiarise new Non-Executive Directors with the Company, its assets, policies and procedures, and to introduce them to employees and key advisers, in order to assist them in becoming effective in their role as quickly as possible.
As part of their induction, they were provided with detailed information on the Group, its policies and its governance structure by the General Counsel and Group Company Secretary.
They met with the Executive Directors and the Heads of Function covering all aspects of the business. As part of the Board meetings in June and September, they toured the Company’s Thames Valley and Greater London assets, meeting one of the Group’s larger customers and many members of both teams. They also met with the Company’s valuers, brokers, and the internal and external auditors.
Simon succeeded Christopher Fisher as Chair of our Remuneration Committee in June. As part of an orderly handover period, Christopher remained on the Board until September. In preparation for this transition, Simon had a meeting with Korn Ferry, advisers to the Remuneration Committee, Christopher and the Group HR Director.
The Committee will report on Andy’s tailored induction programme in next year’s Annual Report.
Nomination Committee Report continued
CONTINUING DEVELOPMENT AND TRAINING
To ensure the Board continually updates and refreshes its skills and knowledge, ongoing training and development support is provided to the Board during the year. The Board is regularly briefed on business-related matters, governance, investor expectations, legal and regulatory impacts. Both the Audit and Remuneration Committees received updates on relevant accounting and remuneration developments, evolving market trends and changing disclosure requirements from external advisers and management.
Directors may also request training on specific issues with some attending external courses (which is often provided by the Company’s professional advisers). From time to time, meetings with specialists in the business are arranged for Directors who may wish to gain a deeper insight into a particular topic. The Directors may also raise any training needs with the Chair which helps to ensure that the training programme meets the needs of the Board, Directors and the business. The Directors also have access to the advice of the Company Secretary and independent professional advice is available at the Company’s expense, if necessary, in fulfilling their duties and responsibilities.
Corporate Citizenship attended the September Board meeting to deliver a Climate Change session to the Directors. The Directors recognise the importance of this wide-ranging topic and were keen to expand their knowledge. The Board also received an annual refresher training on the UK Market Abuse Regulation from the Company Secretary.
EXECUTIVE SUCCESSION PLANNING
Along with considering Board succession regularly, the Committee also reviews the quality of the Leadership team and senior managers as it recognises the importance of creating and developing a suitably talented, diverse pipeline of leaders ready to serve as the next generation of Directors.
The Chief Executive, supported by the Group HR Director, presents to the Committee on Leadership team succession planning and the talent development programme for the wider workforce. For Executive Directors and for roles in the Leadership team, plans are in place for both sudden, unforeseen absences, and for longer-term succession. These form the basis of development plans for our most talented people and will ensure that, looking forward, we have the right people to deliver our strategy. We encourage regular contact between management and the Board. This may be by way of a Board presentation, a tour of assets or a one-to-one session with Non-Executive Directors to discuss a specific issue.
COMMITTEE EFFECTIVENESS
As part of the external Board evaluation process, the operation of the Board committees was considered (see page 122 and 123).
The Committee continues to operate effectively and provides updates on its activities at each subsequent Board meeting.
LOOKING AHEAD
In 2022, the Committee will focus on:
} the induction of Andy Harrison;
} facilitating the smooth transition of the Chair; and
} succession planning for the Senior Independent Director role.
GERALD CORBETTCHAIR OF THE NOMINATION COMMITTEE
126 SEGRO PLC | ANNUAL REPORT & ACCOUNTS 2021
GOVERNANCE
Composition, succession and evaluation
09_Governance_102_135_v145.indd 12609_Governance_102_135_v145.indd 126 01/03/2022 17:2101/03/2022 17:21
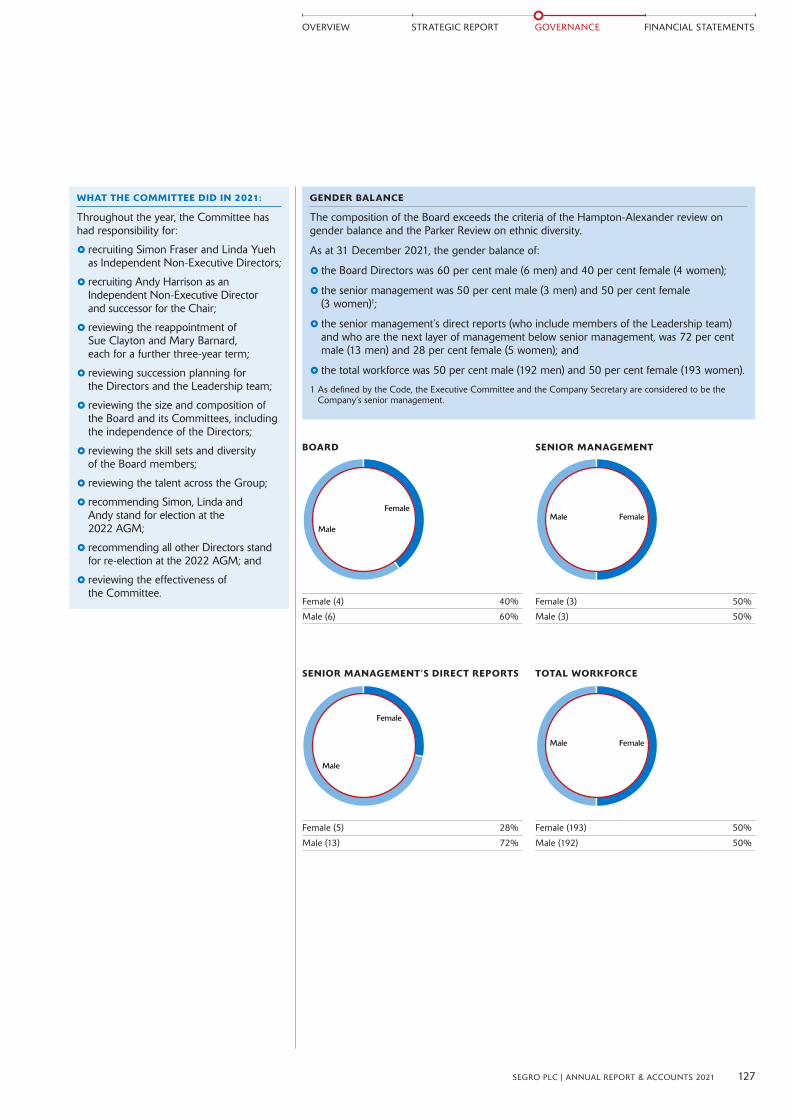
WHAT THE COMMITTEE DID IN 2021:
Throughout the year, the Committee has had responsibility for:
} recruiting Simon Fraser and Linda Yueh as Independent Non-Executive Directors;
} recruiting Andy Harrison as an Independent Non-Executive Director and successor for the Chair;
} reviewing the reappointment of Sue Clayton and Mary Barnard, each for a further three-year term;
} reviewing succession planning for the Directors and the Leadership team;
} reviewing the size and composition of the Board and its Committees, including the independence of the Directors;
} reviewing the skill sets and diversity of the Board members;
} reviewing the talent across the Group;
} recommending Simon, Linda and Andy stand for election at the 2022 AGM;
} recommending all other Directors stand for re-election at the 2022 AGM; and
} reviewing the effectiveness of the Committee.
GENDER BALANCE
The composition of the Board exceeds the criteria of the Hampton-Alexander review on gender balance and the Parker Review on ethnic diversity.
As at 31 December 2021, the gender balance of:
} the Board Directors was 60 per cent male (6 men) and 40 per cent female (4 women);
} the senior management was 50 per cent male (3 men) and 50 per cent female (3 women)1;
} the senior management’s direct reports (who include members of the Leadership team) and who are the next layer of management below senior management, was 72 per cent male (13 men) and 28 per cent female (5 women); and
} the total workforce was 50 per cent male (192 men) and 50 per cent female (193 women).
1 As defined by the Code, the Executive Committee and the Company Secretary are considered to be the Company’s senior management.
Female (4) 40%
Male (6) 60%
BOARD
Male
Female
Female (3) 50%
Male (3) 50%
SENIOR MANAGEMENT
Male Female
Female (5) 28%
Male (13) 72%
SENIOR MANAGEMENT’S DIRECT REPORTS
Male
Female
Female (193) 50%
Male (192) 50%
TOTAL WORKFORCE
Male Female
127SEGRO PLC | ANNUAL REPORT & ACCOUNTS 2021
OVERVIEW STRATEGIC REPORT GOVERNANCE FINANCIAL STATEMENTS
09_Governance_102_135_v145.indd 12709_Governance_102_135_v145.indd 127 01/03/2022 17:2101/03/2022 17:21
INDEPENDENCE
2
3
1
ETHNICITY
2
1
AGE
2
1
3
4
5
SKILLS AND EXPERIENCE
Number of board members 1 2 3 4 5 6 7 8 9 10
FTSE Listed Executive
Real Estate Industry
Banking/City
Finance
Experience in retail, manufacturing and
distribution industries
International
Remuneration
All charts reflect the composition of the Board as at 31 December 2021
1. Chair (1) 10%
2. Independent Non-Executive Directors (6) 60%
3. Executive Directors (3) 30%
1. Non-Ethnic Minority background (8) 80%
2. Ethnic Minority background (2) 20%
1. 45-50 (2) 20%
2. 51-55 (1) 10%
3. 56-60 (4) 40%
4. 61-65 (2) 20%
5. 66-70 (1) 10%
TENURE
David Sleath
0-3 years 3-6 years 6-9 years 9+ years
Executive Directors
Non-Executive Directors
Andy Gulliford
Soumen Das
Martin Moore
Gerald Corbett
Carol Fairweather
Sue Clayton
Mary Barnard
Linda Yueh
Simon Fraser
8
15
4
5
3
3
2
1
1
7
128 SEGRO PLC | ANNUAL REPORT & ACCOUNTS 2021
Nomination Committee Report continued
GOVERNANCE
Composition, succession and evaluation
09_Governance_102_135_v145.indd 12809_Governance_102_135_v145.indd 128 01/03/2022 17:2101/03/2022 17:21
APPOINTMENT OF NEW CHAIR
As noted in the 2020 Nomination Committee Report, the Committee commenced the search for a Non-Executive Director in 2021, with appropriate skills and experience to succeed Gerald Corbett as Chair, to prepare for the possibility that he confirms his intention to retire. In January 2022, the Company announced the appointment of Andy Harrison.
Andy will join the Board and the Committee as an Independent Non-Executive Director on 1 April 2022 and will become Chair on 30 June 2022, with Gerald stepping down from the Board on that date.
As Senior Independent Director, I led the process to identify and appoint Gerald’s successor and chaired the four Committee sessions where this was considered. Gerald, as the current Chair, was not involved in this process, nor did he attend any Committee meetings where his succession was discussed. I, along with the rest of the Committee, look forward to welcoming Andy to the Board and would also like to extend our thanks to Gerald for his leadership over the past six years.
MARTIN MOORESENIOR INDEPENDENT DIRECTOR
JUNE 2021Russell Reynolds Associates, who are not connected to the Company or any SEGRO Directors, were appointed to lead the search for a new Independent Executive Director with appropriate skills and experience to be a potential successor of the Chair in due course.
As discussed earlier in this report, Russell Reynolds is a signatory to the Voluntary Code of Conduct for Executive Search Firms and, having previously worked with the Company, understand the business and the Company’s culture.
The Committee discussed the desirable qualities for the potential candidate including their knowledge and experience, the time commitment of the role and their cultural fit into the organisation. Whilst Gerald was not directly involved in these discussions, the Committee drew upon his experience of the role in developing its view of the desirable skills and characteristics, and framing the role specification which was provided to Russell Reynolds. In agreeing this, due regard was given to the skills and composition of the Board as a whole as well as the Board Diversity Policy.
A panel comprising Chair of the Audit Committee, Carol Fairweather and myself was constituted to progress the recruitment, with feedback from Chief Executive, David Sleath.
SEPTEMBER 2021An update on the recruitment process was delivered at the September meeting and a longlist of candidates, identified by Russell Reynolds, was presented to the Committee for consideration.
NOVEMBER 2021We updated the Committee on the outcome of the first round of interviews and, following a discussion, the Committee identified a shortlist of candidates for the position.
NOVEMBER/DECEMBER 2021Second round candidate interviews, with several Board members, were carried out and references were obtained.
DECEMBER 2021Andy Harrison was identified as a high calibre candidate, with considerable experience of leading large, consumer facing organisations, strong plc experience and proven business understanding.
The Committee concluded that he would be a valuable addition to the Board and would bring a balanced and experienced view to the decision-making process.
The Committee also considered his other commitments, including his chairmanship of Dunelm Group plc, and noted that he was not overboarded. During the interview process, the Committee was satisfied that he would be able to balance his time commitments and dedicate the necessary time and focus to this role. On balance his experience from Dunelm would enable him to fulfil the role of Chair effectively. We also considered him to be independent, in accordance with the criteria set out in the Code.
The Committee made a recommendation to the Board that Andy be appointed as an Independent Non-Executive Director and member of the Committee on 1 April 2022 and Chair with effect from 30 June 2022, subject to his election at the 2022 AGM.
JANUARY 2022The Board accepted confirmation of Gerald’s retirement as Chair on 30 June 2022 and approved the appointment of Andy.
I am delighted to join SEGRO and look forward to working with David, the SEGRO team, and my new Board colleagues to build on the tremendous growth the Company has achieved in recent years.” ANDY HARRISON
129SEGRO PLC | ANNUAL REPORT & ACCOUNTS 2021
OVERVIEW STRATEGIC REPORT GOVERNANCE FINANCIAL STATEMENTS
09_Governance_102_135_v145.indd 12909_Governance_102_135_v145.indd 129 01/03/2022 17:2101/03/2022 17:21

Audit Committee ReportLetter from the Chair of the Audit Committee
As Chair of the Audit Committee, I am pleased to present the Committee’s report for 2021. During the year, the Committee has acted in accordance with its Terms of Reference, which can be found at www.SEGRO.com.
Over the following pages you will see how the Committee has discharged its responsibilities, as well as other areas which it has focused on.
COMPOSITION
The Committee is made up entirely of Independent Non-Executive Directors and each Committee member has considerable commercial knowledge and broad industry expertise. I satisfy the requirement to bring recent and relevant financial experience to the Committee, whilst Martin Moore brings a wealth of property experience and during the year, there have been some changes to the composition of the Committee which further strengthen its expertise:
} Simon Fraser and Linda Yueh joined the Board and the Committee as Independent Non-Executive Directors in May. As a former investment banker, Simon brings experience of the public equity markets and Linda brings robust commercial experience and a strong background in economics.
} In June, following a review by the Nomination Committee of the composition of the Board Committees that recommended that all Independent Non-Executive Directors should sit on the Audit Committee, we welcomed existing Independent Non-Executive Directors, Mary Barnard and Sue Clayton, who bring extensive commercial and general management experience, and property market experience respectively.
} Having served nine years as an Independent Non-Executive Director, Christopher Fisher stepped down from the Board and the Committee in September. Christopher brought much financial acumen to the Committee and I would like to extend my thanks to him for his valuable work on the Committee over the past nine years, and formally welcome the new members.
The Board is satisfied that the Committee as a whole has the relevant competence to properly discharge its duties.
COMMITTEE MEMBERS
Carol Fairweather (Chair) Mary Barnard Sue Clayton Simon Fraser Martin Moore Linda Yueh
KEY RESPONSIBILITIES
}Oversight of internal and external audit processes and independence of the external auditor
}Monitoring the integrity of the financial statements of the Group including reviewing significant judgements
} Reviewing internal controls and risk management systems
} Advising the Board on the statements made in the Annual Report and Half Year Report on viability, going concern, risk and controls and whether the statements are, when taken as a whole, fair, balanced and understandable
MEETINGS
} 3 scheduled
} 1 ad hoc
} See page 118 for attendance at scheduled meetings
2021 HIGHLIGHTS
} Internal control environment remained strong throughout the year, following the move to remote and hybrid working as a result of the pandemic
}Maintaining high-quality and timely external reporting
}Oversight of new reporting requirements, including TCFD and ESEF
}Monitoring development of and responding to the BEIS audit reform consultation
}Welcoming Mary, Linda, Simon and Sue to the Committee
130 SEGRO PLC | ANNUAL REPORT & ACCOUNTS 2021
GOVERNANCE
Audit, risk and internal control
09_Governance_102_135_v145.indd 13009_Governance_102_135_v145.indd 130 01/03/2022 17:2101/03/2022 17:21

MEETINGS
We met formally three times during the year, and also had one ad hoc meeting to consider the BEIS consultation. The Committee provides updates to the Board on its activities at each subsequent meeting.
Outside of the scheduled meetings, we can also use time set aside for Board meetings to discuss any matters that arise in real time.
As usual, our external and internal auditors joined the meetings throughout the year, together with a number of employees from across the business. We continue to find this incredibly valuable as it allows us to see the pool of talent within the Company, and facilitates a greater depth of discussion and debate on some specialist topics.
In 2021, we were joined by the Group Financial Controller and Head of Financial Reporting to consider the accounting judgements and treatments that have been adopted for particular transactions. The Head of Tax provided an update on movements in the current tax landscape, the Group’s tax strategy and an overview of significant
WHAT THE COMMITTEE DID IN 2021
The Committee has:
} reviewed and monitored the integrity of the Financial Statements including reviewing significant financial reporting judgements and estimates made by management, to ensure that the quality of the Company’s financial reporting is maintained, in the Company’s Half and Full Year Financial Statements;
} assessed the objectivity, independence and competence of the external valuer of the Group’s property portfolio and gaining assurance around the valuation process;
} ensured compliance with applicable accounting standards, monitoring developments in accounting regulations as they affect the Group and reviewing the appropriateness of accounting polices and practices in place;
} ensured compliance with further legislative requirements, such as the introduction of TCFD and ESEF reporting in 2021;
} overseen matters relating to tax and any potential impact tax matters may have on the integrity of the Financial Statements, including the recognition of a tax charge for the possible withholding tax due in France;
} reviewed the recognition of the performance fees due from SELP, which are highly sensitive to valuation movements creating estimation uncertainty;
} monitored the effectiveness of the Group’s risk management systems and considered the adequacy of the process being undertaken to identify risks and mitigate the exposure of the Group to them;
} reviewed cyber security processes and the continued investment in this area to respond to increasing trends in cyber threats and the move to hybrid working;
} ensured appropriate safeguards are in place for the detection of fraud and prevention of bribery. This extends to responsibility for overseeing and monitoring the Group’s Anti-Bribery and Corruption policies and procedures contained in the Company’s Code of Business Conduct and Ethics;
} reviewed the adequacy of internal financial controls and broader internal control systems;
} examined the performance of the external and internal auditors, their objectivity, effectiveness and independence, as well as the terms of their engagement and scope of audit and agreed the annual internal audit plan;
} recommended that the provision of the internal audit services should be subject to a tender process in 2022;
} reviewed the Policy for Approval of Non-Audit fees;
} monitored the ratio and level of audit to non-audit fees paid to the external auditor and agreed their remuneration for the year;
} analysed and challenged the results of internal audit reviews and management’s plans to resolve any actions arising from them;
} advised the Board on whether the process supporting the preparation of the Annual Report taken as a whole, is appropriate to allow the Board to conclude that the Annual Report is fair, balanced and understandable and provides the information necessary to shareholders to assess the Group’s position, performance, business model and strategy; and
} ensured the process followed to support the making of the going concern and viability statements remained robust and was correctly followed.
tax issues or changes that could potentially impact the Group’s tax charge. The Head of Technology delivered his annual update to the Committee on developments in cyber security threats, the continued investments by the Company in response, and the current status of cyber security defences. Further updates were also provided to the Committee on the risk management process, internal controls, and anti-bribery and corruption.
In addition to scheduled meetings, I speak regularly with the CFO and Group Financial Controller to discuss any topical issues that should be brought to the attention of the Committee.
In the second half of the year, as the Covid-19 restrictions eased, we were thankful to return to the office for face-to-face meetings, but recognise the benefits of having Committee members or guests attend virtually as required and have continued to allow this.
BEIS CONSULTATION “RESTORING TRUST IN AUDIT AND CORPORATE GOVERNANCE”
As a Committee, we follow closely all regulatory developments and are committed to responding appropriately to any regulation, guidance or recommendations.
An informal session was held in May with the Company’s external auditor, PwC, who delivered a briefing to the Committee and a selection of employees on the BEIS Consultation Document “Restoring Trust in Audit and Corporate Governance”. In July, the Company responded to the consultation expressing broad support for the proposals to strengthen high-quality, trusted audit and corporate governance in the UK, and provided feedback on certain recommendations where we had specific views worthy of comment.
The Committee will continue to closely monitor the developments in audit reform and the impact of any other regulatory changes, which may impact auditing and reporting requirements in the future.
131SEGRO PLC | ANNUAL REPORT & ACCOUNTS 2021
OVERVIEW STRATEGIC REPORT GOVERNANCE FINANCIAL STATEMENTS
09_Governance_102_135_v145.indd 13109_Governance_102_135_v145.indd 131 01/03/2022 17:2101/03/2022 17:21
Audit Committee Report continued
CLIMATE RELATED DISCLOSURES
The Committee considered the newly introduced requirement for companies to disclose, on a comply or explain basis, against the recommendations of the Task Force On Climate-related Financial Disclosure (TCFD) and, has received updates on the Company’s progress against this requirement.
ESEF
We also considered the new requirement to prepare the Company’s consolidated financial statements in digital form under the European Single Format regulatory standard (ESEF RTS). The Committee is satisfied that all necessary procedures have been completed, including the appointment of a qualified provider for the preparation of the ESEF Annual Report and interim walkthrough procedures performed by the external auditor.
COMMITTEE EFFECTIVENESS
As part of the external Board evaluation process, the operation of the Committee was considered (see pages 122 and 123) and was deemed to be operating effectively.
DISCHARGE OF RESPONSIBILITIES
It has been another successful year for the Company highlighted by the strong set of results you will have read about elsewhere in this Annual Report.
The quality of debate and challenge amongst the Committee, management and the internal and external audit teams, together with the comprehensive information provided to the Committee, has assisted us in appropriately discharging our responsibility.
I would like to thank all those who have contributed to the Committee this year for their efforts.
LOOKING AHEAD
In 2022, the Committee will continue to follow developments on audit reform and evolving best practice, including on Climate Change reporting, and respond as required to any new regulations, guidance or recommendations.
CAROL FAIRWEATHERCHAIR OF THE AUDIT COMMITTEE
FAIR, BALANCED AND UNDERSTANDABLE
The Code requires the Board to confirm that they consider, taken as a whole, that the Annual Report is fair, balanced and understandable and provides the information necessary for shareholders to assess the Company’s position, performance, business model and strategy.
In order to enable the Board to make this confirmation, the Audit Committee has oversight of the process which the Company has followed, where the section owners and independent reviewers confirm that in their opinion and against a list of criteria the Annual Report is fair, balanced and understandable. These include: is the whole story presented, with key messages and sensitive material appropriately reflected?; does the Report properly provide the necessary information, with a good level of consistency, for stakeholders to assess SEGRO as a business?; and is the Report presented in straightforward language, easy to understand and within a clear framework?
The Committee reviewed the process that management had undertaken to make the statement and confirmed to the Board that the processes and controls around the preparation of the Annual Report are appropriate, robust and consistent.
The fair, balanced and understandable statement is made on page 164.
VIABILITY STATEMENT AND GOING CONCERN
The Committee is responsible for ensuring that the process put in place to allow the Board to make the viability statement on page 84 remains robust, in line with market practice and is correctly and properly followed. The Committee reviewed the process and is comfortable with the process followed to make the viability statement and has confirmed this to the Board. The Committee reviewed the recommendation setting out the support for adopting the going concern basis in preparing the financial statements. The Committee confirmed to the Board that the recommendation was appropriate. The Board’s statement is set out on page 69.
FINANCIAL REPORTING PROCESS
The Group has established internal controls and risk management systems in relation to the process for preparing the Financial Statements. Various checks on internal financial controls take place throughout the year, including internal audits. Developments in accounting regulations and best practice in financial reporting are monitored by the Company and, where appropriate, reflected in the Financial Statements. Training is also provided to the finance teams and the Committee is kept appropriately informed.
The financial reporting from each Business Unit is subject to review by a local finance director prior to being submitted to the Group Finance function. The results of each Business Unit are subject to further review by the Group Finance function. The results are then consolidated by Group Finance and are subject to various levels of review including by senior members of the Finance team.
The draft consolidated statements are reviewed by various individuals including those independent of the preparer. The review includes checking consistency internally, with other statements and with internal accounting records.
The Committee and the Board review the draft consolidated Financial Statements. The Committee receives Reports from management and the auditor on significant judgements, changes in accounting policies, and other relevant matters relating to the consolidated Financial Statements. The Financial Statements are also subject to external audit.
132 SEGRO PLC | ANNUAL REPORT & ACCOUNTS 2021
GOVERNANCE
Audit, risk and internal control
09_Governance_102_135_v145.indd 13209_Governance_102_135_v145.indd 132 01/03/2022 17:2101/03/2022 17:21
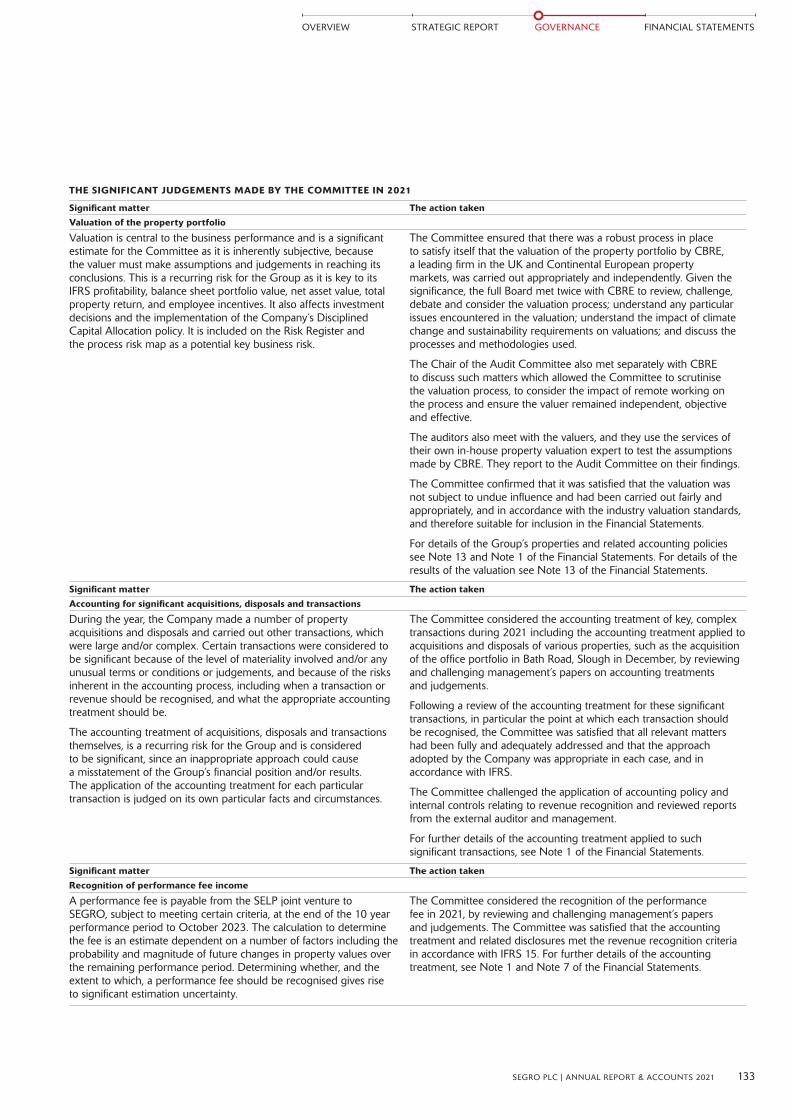
THE SIGNIFICANT JUDGEMENTS MADE BY THE COMMITTEE IN 2021
Significant matter The action takenValuation of the property portfolio
Valuation is central to the business performance and is a significant estimate for the Committee as it is inherently subjective, because the valuer must make assumptions and judgements in reaching its conclusions. This is a recurring risk for the Group as it is key to its IFRS profitability, balance sheet portfolio value, net asset value, total property return, and employee incentives. It also affects investment decisions and the implementation of the Company’s Disciplined Capital Allocation policy. It is included on the Risk Register and the process risk map as a potential key business risk.
The Committee ensured that there was a robust process in place to satisfy itself that the valuation of the property portfolio by CBRE, a leading firm in the UK and Continental European property markets, was carried out appropriately and independently. Given the significance, the full Board met twice with CBRE to review, challenge, debate and consider the valuation process; understand any particular issues encountered in the valuation; understand the impact of climate change and sustainability requirements on valuations; and discuss the processes and methodologies used.
The Chair of the Audit Committee also met separately with CBRE to discuss such matters which allowed the Committee to scrutinise the valuation process, to consider the impact of remote working on the process and ensure the valuer remained independent, objective and effective.
The auditors also meet with the valuers, and they use the services of their own in-house property valuation expert to test the assumptions made by CBRE. They report to the Audit Committee on their findings.
The Committee confirmed that it was satisfied that the valuation was not subject to undue influence and had been carried out fairly and appropriately, and in accordance with the industry valuation standards, and therefore suitable for inclusion in the Financial Statements.
For details of the Group’s properties and related accounting policies see Note 13 and Note 1 of the Financial Statements. For details of the results of the valuation see Note 13 of the Financial Statements.
Significant matter The action taken
Accounting for significant acquisitions, disposals and transactions
During the year, the Company made a number of property acquisitions and disposals and carried out other transactions, which were large and/or complex. Certain transactions were considered to be significant because of the level of materiality involved and/or any unusual terms or conditions or judgements, and because of the risks inherent in the accounting process, including when a transaction or revenue should be recognised, and what the appropriate accounting treatment should be.
The accounting treatment of acquisitions, disposals and transactions themselves, is a recurring risk for the Group and is considered to be significant, since an inappropriate approach could cause a misstatement of the Group’s financial position and/or results. The application of the accounting treatment for each particular transaction is judged on its own particular facts and circumstances.
The Committee considered the accounting treatment of key, complex transactions during 2021 including the accounting treatment applied to acquisitions and disposals of various properties, such as the acquisition of the office portfolio in Bath Road, Slough in December, by reviewing and challenging management’s papers on accounting treatments and judgements.
Following a review of the accounting treatment for these significant transactions, in particular the point at which each transaction should be recognised, the Committee was satisfied that all relevant matters had been fully and adequately addressed and that the approach adopted by the Company was appropriate in each case, and in accordance with IFRS.
The Committee challenged the application of accounting policy and internal controls relating to revenue recognition and reviewed reports from the external auditor and management.
For further details of the accounting treatment applied to such significant transactions, see Note 1 of the Financial Statements.
Significant matter The action takenRecognition of performance fee income
A performance fee is payable from the SELP joint venture to SEGRO, subject to meeting certain criteria, at the end of the 10 year performance period to October 2023. The calculation to determine the fee is an estimate dependent on a number of factors including the probability and magnitude of future changes in property values over the remaining performance period. Determining whether, and the extent to which, a performance fee should be recognised gives rise to significant estimation uncertainty.
The Committee considered the recognition of the performance fee in 2021, by reviewing and challenging management’s papers and judgements. The Committee was satisfied that the accounting treatment and related disclosures met the revenue recognition criteria in accordance with IFRS 15. For further details of the accounting treatment, see Note 1 and Note 7 of the Financial Statements.
133SEGRO PLC | ANNUAL REPORT & ACCOUNTS 2021
OVERVIEW STRATEGIC REPORT GOVERNANCE FINANCIAL STATEMENTS
09_Governance_102_135_v145.indd 13309_Governance_102_135_v145.indd 133 01/03/2022 17:2101/03/2022 17:21
EXTERNAL AUDITOR
The Committee has continued to have a constructive working relationship with PricewaterhouseCoopers LLP (PwC). John Waters is the lead audit partner. The Committee Chair has had discussions with John and his colleagues to discuss matters as they arise throughout the year. The Committee also regularly meets privately with John to discuss their work and PwC’s observations on the Company. No areas of concern have been raised.
OVERSIGHT
PwC presented their audit plan for the year which the Committee considered and approved. PwC highlighted the key areas of risk, which were primarily identified as areas of judgement and complexity, and were consistent with those areas identified by the Committee. The level of audit materiality was also discussed and agreed.
PwC presented a detailed report of their audit findings at the year end, which were reviewed and discussed. A similar review of the external auditor’s report was undertaken by the Committee at the Half Year. As part of this review the Committee probed and challenged the work undertaken and the findings and the key assumptions made, with particular attention to the areas of audit risk identified.
EFFECTIVENESS
The Committee assesses the effectiveness of the external audit process on an annual basis, by taking account of the views of management involved in the audit and by reviewing a number of factors:
} performance in discharging the audit and half year review;
} independence and objectivity;
} robustness of the audit process, including how the auditor demonstrated professional scepticism and challenged management’s assumptions particularly in relation to the valuation of the Group’s portfolio, the provisions of withholding tax in France and the recognition of performance fees from the SELP joint venture;
} the quality of service and delivery, including appropriate resources and skills for the complexity of SEGRO’s audit; and
} reappointment and remuneration.
The Committee also noted the results of the PwC Audit Quality Review inspection results 2020/21.
The Company complies with the Competition and Market Authority Order 2014 relating to audit tendering and the provision of non-audit services. There are no contractual obligations which restrict the Committee’s choice of external auditor or which put in place a minimum period for their tenure. The external audit was last tendered in 2015 following which the auditor changed in 2016 from Deloitte LLP to PwC.
The Committee has no current plans to re-tender the services of the external auditor before it is required in 2025, as stipulated by current regulation that requires a tender every 10 years. John Waters is in his third year as lead audit partner; he will be required to rotate after five years. The Committee believes that the audit quality and process benefits from the continuity, stability and understanding of the business by the PwC team, with an appropriate level of challenge.
The Committee was satisfied with the performance of PwC on the basis of the above and recommended to the Board that it propose to shareholders that PwC should be reappointed for the 2022 financial year.
REMUNERATION AND INDEPENDENCE
The Committee considers the remuneration of the external auditor at least on a semi-annual basis and approves its remuneration. It also keeps under close review the ratio of audit to non-audit fees to ensure that the independence and objectivity of the external auditor are safeguarded.
In 2021, fees for audit services amounted to £1.14 million and the non-audit fees amounted to £0.20 million.
The increase in non-audit fees from 2020 to 2021 can be attributed to a combination of the debt offering consent procedures performed by PwC in conjunction with the 2021 debt offering, as well as a fee increase for the half year review. It is standard practice for a Company’s external auditor to undertake these tasks.
The non-audit fee for 2021 equates to seven per cent of the average audit fees of the last three years.
The chart below sets out the ratio of audit to non-audit fees for each of the past three years.
2021 2020 2019
Audit fees (£m) 1.14 0.99 0.88
Non-audit fees (£m) 0.20 0.10 0.11
Ratio of non-audit fees to audit fees (%)
18 10 12
The Committee has concluded that PwC remains independent and objective, and that the level of non-audit to audit fees is acceptable for 2021. PwC has provided written confirmation of its independence to the Committee.
We have voluntarily provided details on the fees relating to the audit of the Group’s SELP joint venture with PSP Investments, for which PwC is the auditor, in Note 6(ii) to the Financial Statements. The Committee has no oversight or control over these fees as the SELP joint venture operates totally independently and is not controlled by the SEGRO Group or the Committee. The fees are provided solely for information purposes and do not form part of the audit fees nor are they included in the calculation to determine the ratio of audit to non-audit fees on an annual or three-year basis for the SEGRO Group.
POLICY FOR APPROVAL OF NON-AUDIT FEES
The Company’s policy on non-audit services, which is available on our website at www.SEGRO.com, was updated in 2020 to reflect the Financial Reporting Council’s Revised Ethical Standard 2019 and re-approved by the Committee in December 2021.
The policy sets out the very limited circumstances where PwC may be appointed to carry out non-audit services but only with (i) the prior consent of the Chief Financial Officer or (ii) the Chair of the Committee.
There must be an obvious and compelling reason why they should be appointed and there should be no threat to the independence of PwC.
The impact on non-audit to audit fees must also be considered, and fees incurred for non-audit work must not exceed 70 per cent of the average of the audit fees paid for the last three consecutive years. All non-audit fees are reported to the Committee.
INTERNAL AUDIT
The Committee believes that given the Company’s size and structure using a third party to perform the internal audit function continues to be the most appropriate model. This provides independent challenge of management and gives access to a wide range of expertise. KPMG has performed the role since its appointment in 2007 and reappointment in 2014 following a tender.
During their tenure, there has been a number of rotations of lead partners and audit managers to ensure that a fresh perspective is given, and their independence and scrutiny are maintained.
Audit Committee Report continued
GOVERNANCE
Audit, risk and internal control
134 SEGRO PLC | ANNUAL REPORT & ACCOUNTS 2021
09_Governance_102_135_v145.indd 13409_Governance_102_135_v145.indd 134 01/03/2022 17:2101/03/2022 17:21

Topics included in the internal audit plan for 2021 were selected based on a review of the Group’s principal risks, the timing of the previous audit and advice on market insights from KPMG. Significant areas are subject to internal audit on a cyclical basis.
The proposed internal audit programme for 2021 was considered and approved by the Committee in December 2020. Internal audits during 2021 included the following: cyber security; acquisitions and disposals; the asset planning, forecasting and budgeting processes; the sales, invoicing and credit control report; service charge and recovery; legal compliance (including GDPR); insurance; Health and Safety compliance; and a small country audit.
The Committee believes that both the process for determining the internal audit programme, and the programme itself, are appropriate and effective, and as in previous years the programme will be amended to react to events, new information and situations which come to light if required.
Each internal audit during 2021 confirmed that no significant control issues were identified. However, a number of process and minor control improvement points were identified with follow up actions and timelines which were regularly monitored by the Committee.
Feedback on each internal audit is given by the Company and was largely positive and no areas of particular concern have been brought to the Committee’s attention. The lead KPMG partner also attends Committee meetings to present its report and the Committee also meets privately with him during the year.
The Committee is satisfied that the internal audit function continues to perform effectively. However as the provider of Internal Audit services was last considered in 2014, it was felt that 2022 is an appropriate time to undertake a tender process with a change in provider, if required, commencing in 2023.
VALUERS
The single most important judgement that the Committee and the Board has to make is the value of the Group’s portfolio. The Committee is assisted in reaching this judgement by its external valuer CBRE, who has held this position since 2012. As detailed on page 121 of the 2020 Audit Committee Report, CBRE was reappointed in 2021 for a further four-year term, and the Committee believes that they continue to be effective in their role.
The effectiveness of the Group’s valuers is assessed through regular meetings during the year with the Chair of the Audit Committee and supplemented by additional sessions with management, and focused on the following:
} independence and objectivity;
} experience and qualification of the valuation team;
} consistency of approach across the eight countries in which the Group operates; and
} quality of data and materials, including the two presentations to the Board.
As a result, the Committee concluded that the external valuers performed to a high standard, were independent, and that the well-run process delivered a robust set of valuations.
We are reviewing the recommendations of the RICS Independent Review of Real Estate Investment Valuations report, which was published in December 2021, and will respond as appropriate once they are finalised.
RISK
Risk management is a key priority for SEGRO. The Board recognises that effective risk management is key to the long-term sustainable success and future growth of the business and the achievement of the Group’s strategic objectives (see pages 74 to 78). It is ever aware of the need to ensure that new and emerging risks, as well as the more established principal risks, are adequately managed and mitigated. Risk management is therefore embedded in the Company’s decision making and culture, and robust systems have been put in place to ensure this remains the case.
There is an ongoing process for identifying, evaluating and managing the principal risks faced by the Group, which has been in place during the year, together with the means for identifying those emerging risks which may impact the Group in the future. These emerging risks are discussed throughout the business by the appropriate working groups, conducting both horizon scanning and discussions at a more granular level. The Group Risk Management Committee monitors and reports on the Company’s approach to risk management as detailed further on page 74.
The Board assumes responsibility for the effective management of risk across the Group, determined by its risk appetite, as well as ensuring that each business area implements appropriate internal controls.
The Committee reviews regularly the effectiveness of the risk management process on behalf of the Board and is satisfied that it remains robust for the financial year in question and up to the date of this Report.
INTERNAL CONTROLS
The Committee is responsible for reviewing the adequacy and effectiveness of internal control systems, (covering all material controls including financial, operational and compliance controls and risk management systems) on behalf of the Board.
The Committee has reviewed the adequacy and effectiveness of the Group’s internal control systems regularly through various activities including:
} reviewing the effectiveness of the risk management process;
} reviewing and challenging management’s self-assessment of the internal controls framework;
} reviewing the work undertaken by the internal and external auditor, in relation to internal controls; and
} the regular reporting on any control or fraud-related whistleblowing issues.
The process supports ongoing improvements including the launch of a new online expenses system which enhanced internal controls, particularly in a remote working environment.
On the basis of the Committee’s work, it confirms that it has not been advised of, or identified, any failings or weaknesses which it regards to be significant in relation to the Group’s internal control systems. It also confirms that the Group’s internal control systems have been in place for the year under review and up to the date of approval of this Annual Report and are in accordance with the Guidance on Risk Management, Internal Control and Related Financial and Business Reporting issued by the Financial Reporting Council.
135SEGRO PLC | ANNUAL REPORT & ACCOUNTS 2021
OVERVIEW STRATEGIC REPORT GOVERNANCE FINANCIAL STATEMENTS
09_Governance_102_135_v145.indd 13509_Governance_102_135_v145.indd 135 01/03/2022 17:2101/03/2022 17:21

Directors’ Remuneration ReportLetter from the Chair of The Remuneration Committee
AREAS OF FOCUS IN 2021
In addition to welcoming new members and my taking on the role of Chair in the summer, the Committee approved Executive Directors’ variable remuneration and annual salary increases, approved all-employee awards under the Company’s SIP, GSIP and Sharesave schemes (further information is on page 149) and reviewed the remuneration of the wider workforce to ensure it remained aligned with the structure of remuneration for the Executive Directors.
A major area of focus for the Committee was the development of the new Remuneration Policy (the 2022 Policy), which we are recommending to shareholders for approval at the 2022 AGM. The 2022 Policy was developed internally with help from our remuneration advisers and employees and was further refined following an extensive consultation process with approximately 65 per cent of the Company’s shareholder base and key proxy advisory agencies. I discuss this further overleaf and the full 2022 Policy can be found on pages 156 to 161.
The Committee considered remuneration arrangements for the potential successor to the Chair. We instructed Korn Ferry, the Committee’s Remuneration advisers, to carry out an independent review of fees payable to the chairs of similar sized companies.
The Committee considered benchmarking data from both FTSE100s and FTSE real estate peers, the current marketplace, and the increased size and complexity of the organisation since the appointment of the current Chair. We concluded that, in order to remain competitive, there should be an increment in the range of fees for an incoming Chair which should also be commensurate with their skills and experience.
COMPANY PERFORMANCE IN 2021
Shareholders can find a summary of the Group’s key financial metrics which relate to remuneration in the Remuneration at a glance summary on page 140.
2021 was another year of strong operating and financial performance for SEGRO. The structural drivers that were accelerated by the pandemic have continued to drive high levels of occupier demand for modern warehouse space and this in turn has attracted a record level of investment into the sector. The active asset management of our portfolio, our expanded development programme and market rental growth all helped us to increase the rent roll, leading to strong earnings growth. Alongside this we also made significant progress with our Responsible SEGRO ambitions.
COMMITTEE MEMBERS
Simon Fraser (Chair) Mary Barnard Sue Clayton Carol Fairweather Martin Moore Linda Yueh
KEY RESPONSIBILITIES
} Determine the remuneration for Executive Directors, the Leadership team and the Company Secretary, and set the Chair’s fees
} Ensure Executive remuneration is aligned to the Company’s Purpose and Values and the delivery of its long-term strategy
}Oversee workforce remuneration and policies
} Consider individual remuneration outcomes for the Executive Directors
MEETINGS AND ATTENDANCE
} 2 scheduled
} 5 ad hoc
} See page 118 for attendance at scheduled meetings
2021 HIGHLIGHTS
} Linda, Sue and Simon joined the Committee
} Simon succeeded Christopher as Chair of the Committee
}New Remuneration Policy and stakeholder consultations
} Integration of Responsible SEGRO targets into the annual Bonus structure
On behalf of the Board, I am pleased to present my first Directors’ Remuneration Report as Chair of the Committee.The role of the Remuneration Committee is to determine the remuneration policies and practices which promote the long-term sustainable success of the Company, which are aligned with the Company’s Purpose and Values and its strategy.
In the following pages you will see how the Committee has discharged its responsibilities as well as other key areas of focus in 2021.
COMPOSITION
The Committee is made up entirely of Independent Non-Executive Directors.
I joined the Board and the Committee as an Independent Non-Executive Director in May and succeeded Christopher Fisher as Committee Chair in June. Having previously chaired the remuneration committees at Lancashire Holdings Ltd and Derwent London plc, I satisfy the Code requirement for remuneration committee chairs to have at least 12 months experience. On behalf of the Committee, I would like to thank Christopher for his excellent leadership over the past four years.
During the year, the Committee also welcomed Independent Non-Executive Directors Linda Yueh and Sue Clayton.
136 SEGRO PLC | ANNUAL REPORT & ACCOUNTS 2021
GOVERNANCE
Remuneration
10_Remuneration_136_164_v126.indd 13610_Remuneration_136_164_v126.indd 136 01/03/2022 17:2201/03/2022 17:22

Adjusted profit before tax is up 20 per cent to £356 million and adjusted earnings per share are up 15 per cent to 29.1 pence. Adjusted NAV per share has risen by 40 per cent to 1,137 pence. The balance sheet remains in good shape with loan-to-value ratio of 23 per cent. The Board is recommending a final dividend of 16.9 pence per share, making the full year dividend 24.3 pence per share, an increase of 10 per cent. TSR was 55.1 per cent versus the FTSE 350 Real Estate index of 29.9 per cent.
Further information on these activities can be found in the Chief Executive’s statement on pages 12 to 15 and the Strategic Report.
REMUNERATION IN 2021
Directors’ Remuneration in 2021 was paid in line with the Company’s existing Remuneration Policy (the Policy), which was approved by shareholders at the 2019 AGM.
The fundamental principles which underpin the Policy are:
} alignment with our strategy and the success of the business in the short and long term;
} performance orientation;
} ease of understanding;
} consistency of application; and
} transparency to the executives, the workforce and shareholders.
The remuneration framework for both our Executive Directors and the wider workforce is aligned with the strategic direction and performance of SEGRO as well as in the interests of our shareholders, and this is set out in the charts on pages 147 and 148.
VARIABLE REMUNERATION
Taking account of our strong results and our continuing outperformance of the peer group over the year, the Committee has confirmed the following performance-related payments to the Executive Directors:
} 2021 ANNUAL BONUS
The annual Bonus payment will be 100 per cent of their maximum award (subject to the final TPR data being available) (see page 142).
} 2019 LTIP PERFORMANCE
Vesting is calculated by reference to three equally-weighted performance conditions. The awards will pay out 100 per cent (subject to the final TPR and TAR data being available) (see page 144). These awards are subject to a two-year post-vesting holding period. The net amount of shares will be held in a nominee account and subject to restrictions until 2024.
} 2021 LTIP AWARD
Each of the Executive Directors received an LTIP award in March 2021 with three equally-weighted performance conditions in line with the Policy.
} DISCRETION
Shareholders have benefited from strong returns with £100 invested in our shares on 31 December 2011 having returned £947 (including dividends, which have increased every year for the last nine years) by the end of 2021.
Given the returns for shareholders and the Company’s performance during the year, the Committee considered that it was entirely appropriate that the variable components of pay for the Executive Directors pay out in accordance with their respective performance conditions having been met.
When approving these payments and awards, the Committee considered whether or not they represented a fair reflection of the underlying performance of the business and the impact of Covid-19. It was satisfied that the performance conditions were reflective of the business performance and that the impact of Covid-19 had been minimal, so no overriding adjustment would have been appropriate.
REMUNERATION IN 2022
Since the last Policy was approved by shareholders in 2019 we have announced the introduction of post-cessation shareholding guidelines, requiring Executive Directors to retain the minimum amount required by the shareholding guidelines for a period of 24 months from ceasing to be a Director. We have mechanisms in place to ensure that shares are retained for the period and you can read how this has been applied on page 150. Furthermore, we have announced our intention to align Executive Directors’ pension entitlement to that of the wider UK workforce by the end of 2022, see overleaf.
} 2022 POLICY
The existing Policy is up for renewal at the 2022 AGM and in developing the 2022 Policy the Committee has conducted a review of both its alignment with the shareholder experience and its continuing suitability for the next three years, ensuring that it reinforces our business strategy and aligns with the remuneration of the wider workforce. The fundamental principles which underpin our existing Policy remain the same and the Committee also addressed the criteria set out in Provision 40 of the Code as detailed on page 156.
We also feel that it is important to consider that, since the last Policy review, the business has continued to grow in size and complexity. SEGRO is Europe’s leading owner, asset manager and developer of modern warehousing and industrial property and the largest European REIT by market value. At the end of 2021, we were ranked 33rd in the FTSE100, following a doubling in market capitalisation over the period, and we have seen an over 50 per cent increase in our property portfolio (valued at £18.4 billion as at the year end). Our strong performance has translated into significant returns for our shareholders.
An independent review carried out by the Committee’s remuneration advisers, Korn Ferry, concluded that the remuneration packages for the Chief Financial Officer and Chief Operating Officer were appropriate. However, remuneration for the Chief Executive is significantly behind the FTSE100 and large REITs market. The Committee is also concerned that effective succession planning is inhibited unless SEGRO is able to offer a broadly competitive and appropriate remuneration package for its size, complexity, and growth trajectory.
The Committee has valued the constructive feedback we have received from two rounds of shareholder consultation via virtual meetings, emails and letters to help shape the Committee’s development of the 2022 Policy. On the basis of the broadly supportive feedback, the Committee feels that extensive changes to the Policy are not required as it is already aligned with investor expectations and fulfils the requirements of the Code. However, to ensure that the 2022 Policy has sufficient flexibility for the next three years we will be asking shareholders to approve the following:
1) LONG TERM INCENTIVE PLAN (LTIP)
} an increase in the limit for LTIP awards to 300 per cent of salary (from 250 per cent).
Our intention would be to implement this increase, for the Chief Executive only, from 2022. The Committee feels that an increase in the long-term variable remuneration opportunity, which will be subject to performance conditions and a post-vesting holding period, is the most appropriate way to move the Chief Executive’s total remuneration package marginally above the lower quartile.
We currently have no intention of increasing the LTIP opportunity for the other Executive Directors and would not do so without a prior consultation with shareholders. The LTIP for all Executives will continue to be subject to three equally-weighted performance conditions: TAR, TPR and TSR (as described further on page 139), and will be subject to a compulsory two-year, post-vesting holding period.
137SEGRO PLC | ANNUAL REPORT & ACCOUNTS 2021
OVERVIEW STRATEGIC REPORT GOVERNANCE FINANCIAL STATEMENTS
10_Remuneration_136_164_v126.indd 13710_Remuneration_136_164_v126.indd 137 01/03/2022 17:2201/03/2022 17:22

2) ANNUAL BONUS
} replacement of the TPR performance condition with ESG metrics.
Shareholders will by now be familiar with Responsible SEGRO, which was launched in early 2021 and has been reported on in the Strategic Report on pages 87 to 92.
Our target of becoming net-zero carbon by 2030, as well as investing in our local communities and nurturing talent, underpin and reinforce our business strategy. This is an important area of focus for the Company, our employees and our stakeholders, and the Committee felt it right that this should be reflected in Executive Directors’ variable remuneration.
After careful consideration, and having reflected on feedback from investors and our remuneration advisers during the consultation process, we have concluded that having TPR as a repeated measure in both short-term annual bonus and long-term incentive schemes was not best practice. Therefore, we have removed TPR from the annual Bonus and replaced it with a set of ESG measures, whilst retaining TPR in the LTIP. TPR remains a key performance measure for SEGRO (with an unchanged weighting of 33.3 per cent in the LTIP) and will continue to be measured independently by MSCI and compared to a benchmark.
Following shareholder consultation, we are proposing further changes to the initially equal weighting of the annual Bonus performance measures, with Adjusted PBT against target and rent roll growth now comprising 37.5 per cent each and ESG measures responsible for the remaining 25 per cent. Performance conditions and weightings will be determined annually, but any non-quantitative measures will be limited to 20 per cent of the opportunity.
There is no proposed change to the maximum Bonus opportunity for the Executive Directors which will remain at 150 per cent of salary.
3) SALARY AND OTHER
} no change in 2022 Policy to previous Policy.
The Committee will continue to review salaries annually having regard to increases awarded to the workforce. Additionally, there will be no changes to taxable benefits, pensions (other than the planned reduction to the same level as the UK workforce by the end of 2022) or current shareholding guidelines, including post-cessation requirements.
STAKEHOLDER ENGAGEMENT
Stakeholder views are taken seriously by the Committee and we have engaged extensively on the development of the 2022 Policy. We initiated the first round of consultation by writing to 20 shareholders in October 2021 with our draft proposal. Further to feedback from key shareholders, proxy advisory agencies and employees, we modified our initial proposal. We were asked to consider the weighting of ESG measures in the Bonus, so we reduced this from 33 percent to 25 percent. For the final consultation in early 2022, we reached out to more shareholders. In total, we sought views on the proposed 2022 Policy from holders of approximately 65 per cent of our share capital.
We also sought the views of our own workforce during a dedicated workforce engagement session carried out by our Senior Independent Director, Martin Moore, and myself, details of which can be found in the case study on page 150.
AGM VOTING
The Directors’ Remuneration Report and the 2022 Policy will be subject to shareholder votes at the 2022 AGM, as will an amendment to the rules of the LTIP to allow us to implement the 2022 Policy. We believe that these changes are in the best interests of the Company and we hope that we can count on shareholder support at the AGM.
COMMITTEE EFFECTIVENESS
As part of the external Board evaluation process, the operation of the Board committee was considered (see pages 122 and 123).
The Committee continues to operate effectively and provides updates on its activities at each subsequent Board meeting.
LOOKING AHEAD
The key areas of focus for the Committee in 2022 will be:
} the implementation of the 2022 Policy, subject to shareholder approval at the AGM;
} monitoring the progress against and continued appropriateness of the ESG targets; and
} monitoring emerging trends in remuneration and corporate governance as a whole.
WHAT THE COMMITTEE DID IN 2021
Key areas of focus for the Committee were:
} the approval of the Executive Directors’ annual salary increases, the approval of the 2020 Bonus payments and the outturn of the 2018 LTIP awards, along with the approval of the 2021 Bonus and 2021 LTIP targets;
} the approval of the 2021 SIP and GSIP awards and approval of the new targets for these schemes in 2021;
} annual review of the incumbent Chair’s fees and a review of the range of fees for a potential successor, with the appropriate skills and experience to take on the role of the Chair in due course;
} a review of workforce pay to ensure that it continues to be aligned with the structure of remuneration for the Executive Directors;
} noting the Group-wide all-employee 2021 salary review and the salary increases, Bonus and LTIP awards for the Leadership team;
} receiving a governance update from Korn Ferry on emerging themes and best practice;
} change to membership of the Committee – Linda, Simon and Sue joined and Simon succeeded Christopher as Chair when he stepped down;
} consultation on the 2022 Policy; and
} proposed changes to Bonus methodology – integrating Responsible SEGRO targets into the annual Bonus structure.
CONCLUSION
If you have any questions about remuneration generally, or the contents of this Report or the proposed 2022 Policy, do contact me at [email protected].
We are hopeful that we will be able to hold our 2022 AGM as normal, in which case my fellow Directors and I plan to attend and will be pleased to answer any questions that you may have about the work of the Committee.
SIMON FRASERCHAIR OF THE REMUNERATION COMMITTEE
Directors’ Remuneration ReportLetter from the Chair of The Remuneration Committee continued
138 SEGRO PLC | ANNUAL REPORT & ACCOUNTS 2021
GOVERNANCE
Remuneration
10_Remuneration_136_164_v126.indd 13810_Remuneration_136_164_v126.indd 138 01/03/2022 17:2201/03/2022 17:22
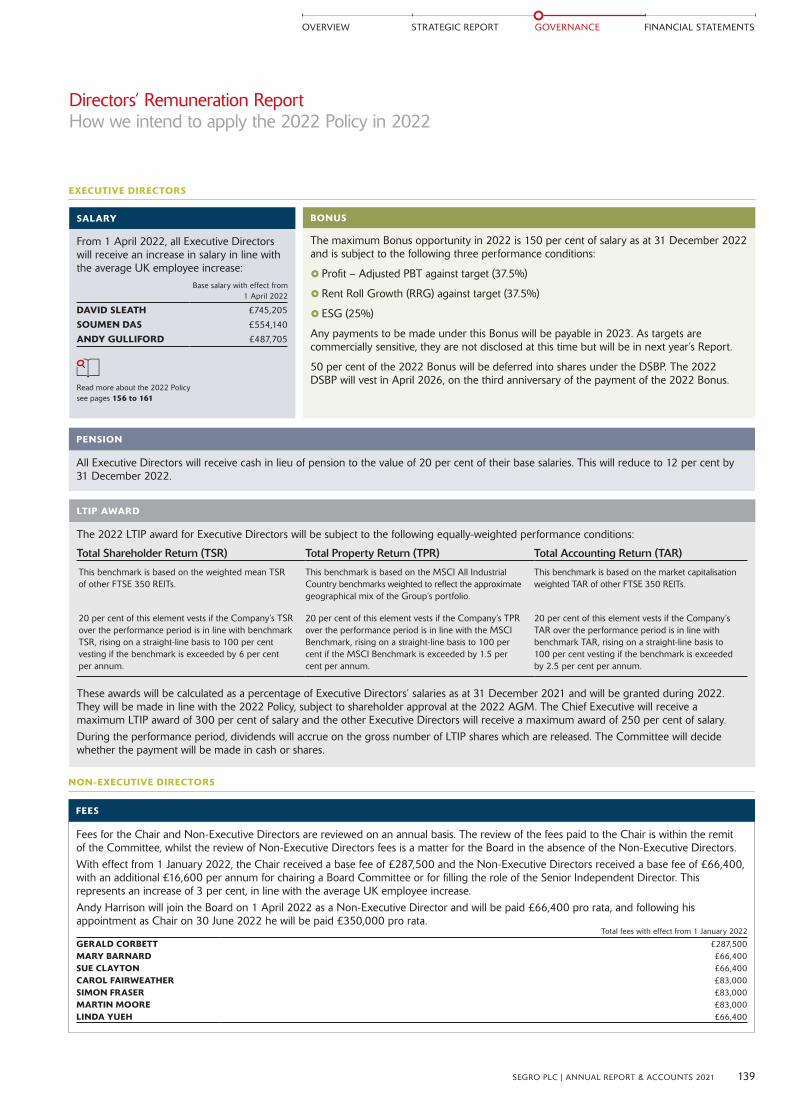
EXECUTIVE DIRECTORS
From 1 April 2022, all Executive Directors will receive an increase in salary in line with the average UK employee increase:
Base salary with effect from 1 April 2022
DAVID SLEATH £745,205
SOUMEN DAS £554,140
ANDY GULLIFORD £487,705
Read more about the 2022 Policysee pages 156 to 161
SALARY
All Executive Directors will receive cash in lieu of pension to the value of 20 per cent of their base salaries. This will reduce to 12 per cent by 31 December 2022.
PENSION
The maximum Bonus opportunity in 2022 is 150 per cent of salary as at 31 December 2022 and is subject to the following three performance conditions:
} Profit – Adjusted PBT against target (37.5%)
} Rent Roll Growth (RRG) against target (37.5%)
} ESG (25%)
Any payments to be made under this Bonus will be payable in 2023. As targets are commercially sensitive, they are not disclosed at this time but will be in next year’s Report.
50 per cent of the 2022 Bonus will be deferred into shares under the DSBP. The 2022 DSBP will vest in April 2026, on the third anniversary of the payment of the 2022 Bonus.
BONUS
The 2022 LTIP award for Executive Directors will be subject to the following equally-weighted performance conditions:
Total Shareholder Return (TSR) Total Property Return (TPR) Total Accounting Return (TAR)
This benchmark is based on the weighted mean TSR of other FTSE 350 REITs.
This benchmark is based on the MSCI All Industrial Country benchmarks weighted to reflect the approximate geographical mix of the Group’s portfolio.
This benchmark is based on the market capitalisation weighted TAR of other FTSE 350 REITs.
20 per cent of this element vests if the Company’s TSR over the performance period is in line with benchmark TSR, rising on a straight-line basis to 100 per cent vesting if the benchmark is exceeded by 6 per cent per annum.
20 per cent of this element vests if the Company’s TPR over the performance period is in line with the MSCI Benchmark, rising on a straight-line basis to 100 per cent if the MSCI Benchmark is exceeded by 1.5 per cent per annum.
20 per cent of this element vests if the Company’s TAR over the performance period is in line with benchmark TAR, rising on a straight-line basis to 100 per cent vesting if the benchmark is exceeded by 2.5 per cent per annum.
These awards will be calculated as a percentage of Executive Directors’ salaries as at 31 December 2021 and will be granted during 2022. They will be made in line with the 2022 Policy, subject to shareholder approval at the 2022 AGM. The Chief Executive will receive a maximum LTIP award of 300 per cent of salary and the other Executive Directors will receive a maximum award of 250 per cent of salary.During the performance period, dividends will accrue on the gross number of LTIP shares which are released. The Committee will decide whether the payment will be made in cash or shares.
LTIP AWARD
NON-EXECUTIVE DIRECTORS
Fees for the Chair and Non-Executive Directors are reviewed on an annual basis. The review of the fees paid to the Chair is within the remit of the Committee, whilst the review of Non-Executive Directors fees is a matter for the Board in the absence of the Non-Executive Directors. With effect from 1 January 2022, the Chair received a base fee of £287,500 and the Non-Executive Directors received a base fee of £66,400, with an additional £16,600 per annum for chairing a Board Committee or for filling the role of the Senior Independent Director. This represents an increase of 3 per cent, in line with the average UK employee increase. Andy Harrison will join the Board on 1 April 2022 as a Non-Executive Director and will be paid £66,400 pro rata, and following his appointment as Chair on 30 June 2022 he will be paid £350,000 pro rata.
Total fees with effect from 1 January 2022
GERALD CORBETT £287,500MARY BARNARD £66,400SUE CLAYTON £66,400CAROL FAIRWEATHER £83,000SIMON FRASER £83,000MARTIN MOORE £83,000LINDA YUEH £66,400
FEES
Directors’ Remuneration Report How we intend to apply the 2022 Policy in 2022
139SEGRO PLC | ANNUAL REPORT & ACCOUNTS 2021
OVERVIEW STRATEGIC REPORT GOVERNANCE FINANCIAL STATEMENTS
10_Remuneration_136_164_v126.indd 13910_Remuneration_136_164_v126.indd 139 01/03/2022 17:2201/03/2022 17:22
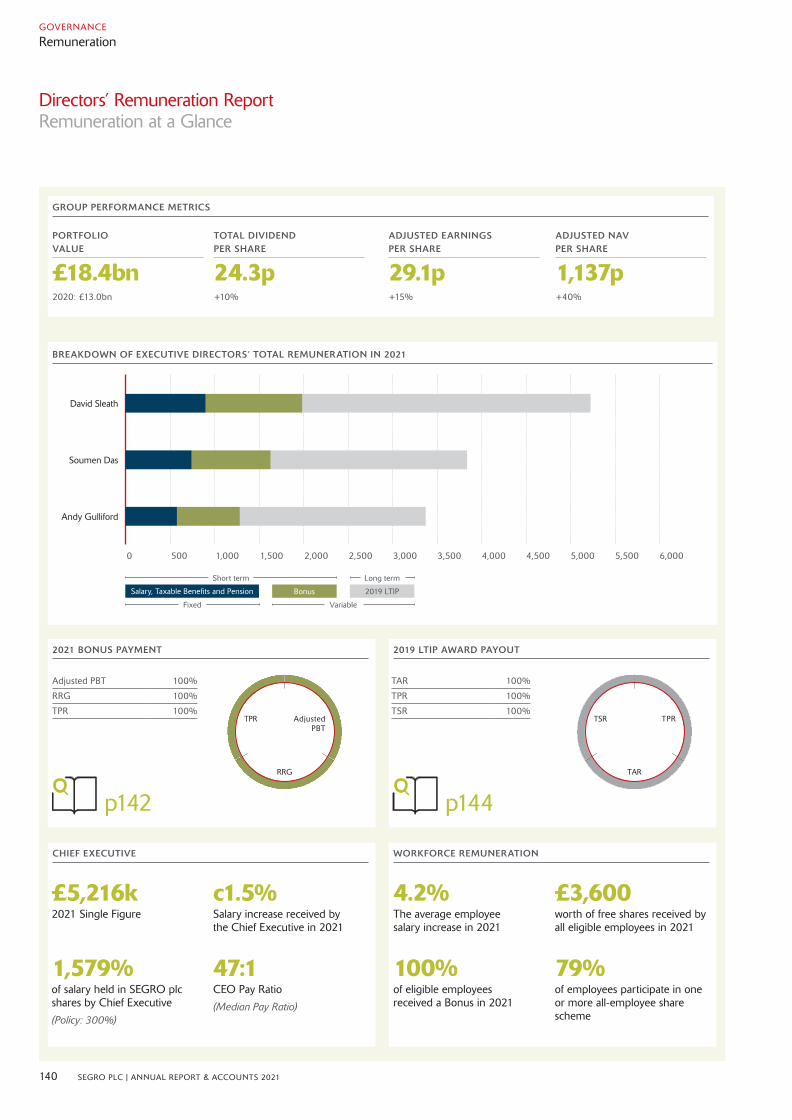
Directors’ Remuneration Report Remuneration at a Glance
140 SEGRO PLC | ANNUAL REPORT & ACCOUNTS 2021
GOVERNANCE
Remuneration
CHIEF EXECUTIVE
£5,216k 2021 Single Figure
1,579% of salary held in SEGRO plc shares by Chief Executive
(Policy: 300%)
c1.5% Salary increase received by the Chief Executive in 2021
47:1 CEO Pay Ratio
(Median Pay Ratio)
WORKFORCE REMUNERATION
4.2% The average employee salary increase in 2021
100% of eligible employees received a Bonus in 2021
£3,600worth of free shares received by all eligible employees in 2021
79% of employees participate in one or more all-employee share scheme
GROUP PERFORMANCE METRICS
PORTFOLIO VALUE
£18.4bn2020: £13.0bn
TOTAL DIVIDEND PER SHARE
24.3p+10%
ADJUSTED EARNINGS PER SHARE
29.1p+15%
ADJUSTED NAV PER SHARE
1,137p+40%
2021 BONUS PAYMENT
Adjusted PBT 100%
RRG 100%
TPR 100%
p142
2019 LTIP AWARD PAYOUT
TAR 100%
TPR 100%
TSR 100%
p144
TPRTSR
TAR
AdjustedPBT
TPR
RRG
BREAKDOWN OF EXECUTIVE DIRECTORS’ TOTAL REMUNERATION IN 2021
1,000500 1,500 2,000 2,500 3,000 3,500 6,0005,5004,500 5,0004,0000
Fixed Variable
Short term Long term
Salary, Taxable Benefits and Pension Bonus 2019 LTIP
David Sleath
Soumen Das
Andy Gulliford
10_Remuneration_136_164_v126.indd 14010_Remuneration_136_164_v126.indd 140 01/03/2022 17:2201/03/2022 17:22
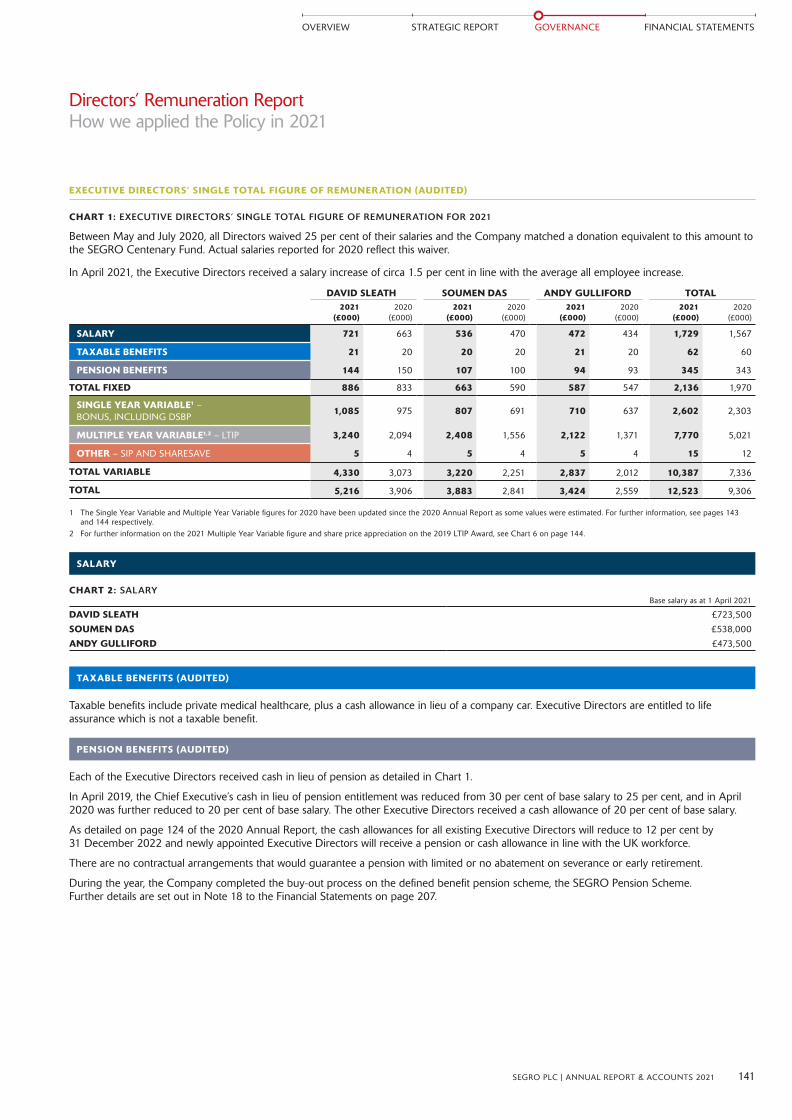
EXECUTIVE DIRECTORS’ SINGLE TOTAL FIGURE OF REMUNERATION (AUDITED)
CHART 1: EXECUTIVE DIRECTORS’ SINGLE TOTAL FIGURE OF REMUNERATION FOR 2021
Between May and July 2020, all Directors waived 25 per cent of their salaries and the Company matched a donation equivalent to this amount to the SEGRO Centenary Fund. Actual salaries reported for 2020 reflect this waiver.
In April 2021, the Executive Directors received a salary increase of circa 1.5 per cent in line with the average all employee increase.
DAVID SLEATH SOUMEN DAS ANDY GULLIFORD TOTAL2021
(£000)2020
(£000)2021
(£000)2020
(£000)2021
(£000)2020
(£000)2021
(£000)2020
(£000)
SALARY 721 663 536 470 472 434 1,729 1,567
TAXABLE BENEFITS 21 20 20 20 21 20 62 60
PENSION BENEFITS 144 150 107 100 94 93 345 343
TOTAL FIXED 886 833 663 590 587 547 2,136 1,970
SINGLE YEAR VARIABLE1 – BONUS, INCLUDING DSBP
1,085 975 807 691 710 637 2,602 2,303
MULTIPLE YEAR VARIABLE1,2 – LTIP 3,240 2,094 2,408 1,556 2,122 1,371 7,770 5,021
OTHER – SIP AND SHARESAVE 5 4 5 4 5 4 15 12
TOTAL VARIABLE 4,330 3,073 3,220 2,251 2,837 2,012 10,387 7,336
TOTAL 5,216 3,906 3,883 2,841 3,424 2,559 12,523 9,306
1 The Single Year Variable and Multiple Year Variable figures for 2020 have been updated since the 2020 Annual Report as some values were estimated. For further information, see pages 143 and 144 respectively.
2 For further information on the 2021 Multiple Year Variable figure and share price appreciation on the 2019 LTIP Award, see Chart 6 on page 144.
SALARY
CHART 2: SALARYBase salary as at 1 April 2021
DAVID SLEATH £723,500
SOUMEN DAS £538,000
ANDY GULLIFORD £473,500
TAXABLE BENEFITS (AUDITED)
Taxable benefits include private medical healthcare, plus a cash allowance in lieu of a company car. Executive Directors are entitled to life assurance which is not a taxable benefit.
PENSION BENEFITS (AUDITED)
Each of the Executive Directors received cash in lieu of pension as detailed in Chart 1.
In April 2019, the Chief Executive’s cash in lieu of pension entitlement was reduced from 30 per cent of base salary to 25 per cent, and in April 2020 was further reduced to 20 per cent of base salary. The other Executive Directors received a cash allowance of 20 per cent of base salary.
As detailed on page 124 of the 2020 Annual Report, the cash allowances for all existing Executive Directors will reduce to 12 per cent by 31 December 2022 and newly appointed Executive Directors will receive a pension or cash allowance in line with the UK workforce.
There are no contractual arrangements that would guarantee a pension with limited or no abatement on severance or early retirement.
During the year, the Company completed the buy-out process on the defined benefit pension scheme, the SEGRO Pension Scheme. Further details are set out in Note 18 to the Financial Statements on page 207.
Directors’ Remuneration Report How we applied the Policy in 2021
141SEGRO PLC | ANNUAL REPORT & ACCOUNTS 2021
OVERVIEW STRATEGIC REPORT GOVERNANCE FINANCIAL STATEMENTS
10_Remuneration_136_164_v126.indd 14110_Remuneration_136_164_v126.indd 141 01/03/2022 17:2201/03/2022 17:22
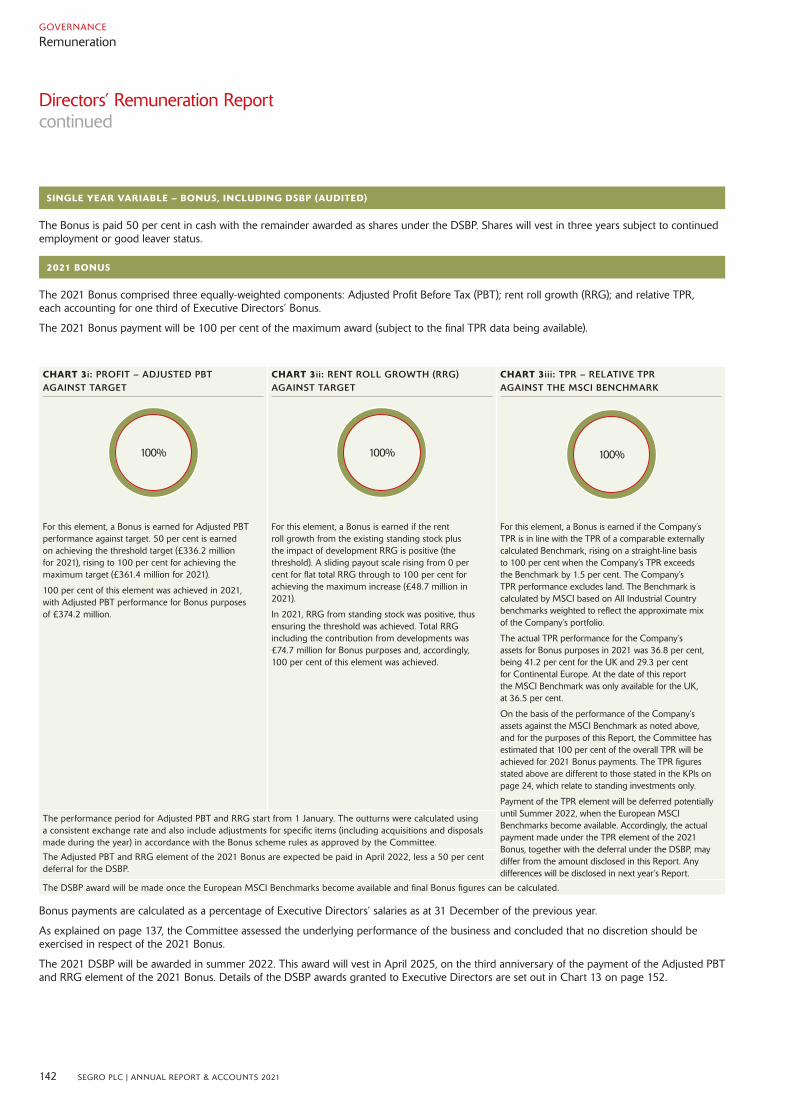
Directors’ Remuneration Report continued
SINGLE YEAR VARIABLE – BONUS, INCLUDING DSBP (AUDITED)
The Bonus is paid 50 per cent in cash with the remainder awarded as shares under the DSBP. Shares will vest in three years subject to continued employment or good leaver status.
2021 BONUS
The 2021 Bonus comprised three equally-weighted components: Adjusted Profit Before Tax (PBT); rent roll growth (RRG); and relative TPR, each accounting for one third of Executive Directors’ Bonus.
The 2021 Bonus payment will be 100 per cent of the maximum award (subject to the final TPR data being available).
CHART 3i: PROFIT – ADJUSTED PBT AGAINST TARGET
CHART 3ii: RENT ROLL GROWTH (RRG) AGAINST TARGET
CHART 3iii: TPR – RELATIVE TPR AGAINST THE MSCI BENCHMARK
100% 100%
For this element, a Bonus is earned for Adjusted PBT performance against target. 50 per cent is earned on achieving the threshold target (£336.2 million for 2021), rising to 100 per cent for achieving the maximum target (£361.4 million for 2021).
100 per cent of this element was achieved in 2021, with Adjusted PBT performance for Bonus purposes of £374.2 million.
For this element, a Bonus is earned if the rent roll growth from the existing standing stock plus the impact of development RRG is positive (the threshold). A sliding payout scale rising from 0 per cent for flat total RRG through to 100 per cent for achieving the maximum increase (£48.7 million in 2021).
In 2021, RRG from standing stock was positive, thus ensuring the threshold was achieved. Total RRG including the contribution from developments was £74.7 million for Bonus purposes and, accordingly, 100 per cent of this element was achieved.
For this element, a Bonus is earned if the Company’s TPR is in line with the TPR of a comparable externally calculated Benchmark, rising on a straight-line basis to 100 per cent when the Company’s TPR exceeds the Benchmark by 1.5 per cent. The Company’s TPR performance excludes land. The Benchmark is calculated by MSCI based on All Industrial Country benchmarks weighted to reflect the approximate mix of the Company’s portfolio.
The actual TPR performance for the Company’s assets for Bonus purposes in 2021 was 36.8 per cent, being 41.2 per cent for the UK and 29.3 per cent for Continental Europe. At the date of this report the MSCI Benchmark was only available for the UK, at 36.5 per cent.
On the basis of the performance of the Company’s assets against the MSCI Benchmark as noted above, and for the purposes of this Report, the Committee has estimated that 100 per cent of the overall TPR will be achieved for 2021 Bonus payments. The TPR figures stated above are different to those stated in the KPls on page 24, which relate to standing investments only.
Payment of the TPR element will be deferred potentially until Summer 2022, when the European MSCI Benchmarks become available. Accordingly, the actual payment made under the TPR element of the 2021 Bonus, together with the deferral under the DSBP, may differ from the amount disclosed in this Report. Any differences will be disclosed in next year’s Report.
The performance period for Adjusted PBT and RRG start from 1 January. The outturns were calculated using a consistent exchange rate and also include adjustments for specific items (including acquisitions and disposals made during the year) in accordance with the Bonus scheme rules as approved by the Committee.
The Adjusted PBT and RRG element of the 2021 Bonus are expected be paid in April 2022, less a 50 per cent deferral for the DSBP.
The DSBP award will be made once the European MSCI Benchmarks become available and final Bonus figures can be calculated.
Bonus payments are calculated as a percentage of Executive Directors’ salaries as at 31 December of the previous year.
As explained on page 137, the Committee assessed the underlying performance of the business and concluded that no discretion should be exercised in respect of the 2021 Bonus.
The 2021 DSBP will be awarded in summer 2022. This award will vest in April 2025, on the third anniversary of the payment of the Adjusted PBT and RRG element of the 2021 Bonus. Details of the DSBP awards granted to Executive Directors are set out in Chart 13 on page 152.
100%
142 SEGRO PLC | ANNUAL REPORT & ACCOUNTS 2021
GOVERNANCE
Remuneration
10_Remuneration_136_164_v126.indd 14210_Remuneration_136_164_v126.indd 142 01/03/2022 17:2201/03/2022 17:22

UPDATED 2020 BONUS (ESTIMATED IN 2020 ANNUAL REPORT)
As previously reported on page 130 of the 2020 Annual Report, 73.5 per cent of the Adjusted PBT and 100 per cent of the RRG elements were achieved for the 2020 Bonus and it was estimated that 100 per cent of the TPR element would be achieved.
The MSCI TPR Benchmark has since been confirmed at 10.0 per cent, whilst the Company’s TPR was 15.4 per cent. The Company’s outperformance of the Benchmark by 540 basis points per cent resulted in 100 per cent of the TPR element being achieved and therefore there has been no change in respect of the estimates made in the 2020 Annual Report.
The Adjusted PBT and RRG elements of the 2020 Bonus were paid in April 2021. The TPR element was paid in June 2021 and shares were awarded under the DSBP on 28 June 2021.
CHART 4i: BONUS PAYMENT 2020 – ESTIMATED CHART 4ii: BONUS PAYMENT 2020 – ACTUAL
100%
100%
73.5%
100%
100%
100%
PBT TPR
RRG
TPRPBT
RRG
100%
100%
73.5%
100%
100%
100%
PBT TPR
RRG
TPRPBT
RRG
143SEGRO PLC | ANNUAL REPORT & ACCOUNTS 2021
OVERVIEW STRATEGIC REPORT GOVERNANCE FINANCIAL STATEMENTS
10_Remuneration_136_164_v126.indd 14310_Remuneration_136_164_v126.indd 143 01/03/2022 17:2201/03/2022 17:22

Directors’ Remuneration Report continued
MULTIPLE YEAR VARIABLE – LTIP (AUDITED)
LTIP awards are subject to a three-year performance period and a compulsory two-year post-vesting holding period for Executive Directors.
LTIP VESTING IN 2022
The 2019 LTIP Award will vest on 29 May 2022, subject to relative TSR, TPR and TAR over the three-year performance period to 31 December 2021.
The 2019 LTIP Award will pay out 100 per cent (subject to the final TPR and TAR data being available).
CHART 5: 2019 LTIP
The Company’s TSR over the performance period was 136.3 per cent and the benchmark TSR was 6.4 per cent. The Company’s TSR target is 6 per cent per annum above the benchmark, which equates to TSR of 26.7 per cent for this element to fully vest.
The Company’s TSR outperformance of +6 per cent per annum compared with the benchmark will lead to 100 per cent of the TSR element vesting for this award.
The estimated TPR calculation is based on the Company’s actual annualised TPR between 2019 and 2021 of 21.2 per cent and an estimated MSCI Benchmark over the same period of 17.3 per cent.
On this basis, the Company’s three-year TPR to 31 December 2021 has exceeded the estimated MSCI Benchmark by more than 1.5 per cent which would lead to 100 per cent of the TPR element vesting.
100 per cent of the TAR element will vest if the benchmark is exceeded by 2.5 per cent per annum. The benchmark will be available in Q2 2022 and based on the information available at the time of this Report the Committee has estimated that 100 per cent of this element will vest. Any differences will be disclosed in next year’s Report.
The Committee has the discretion to adjust awards downwards at vesting if it is not satisfied that the outcome is a fair reflection of underlying performance, or in the event of excessive risk taking or misstatement. As explained on page 137, the Committee assessed the underlying performance of the business and concluded that no such discretion should be exercised in respect of the vesting of the 2019 LTIP.
Once vested, the net number of shares will be subject to a further two-year post-vesting holding period. The Executive Directors will be the beneficial owners of the shares and will be entitled to any dividend payments and have voting rights at any general meeting of the Company during the holding period, however, during this time, they will not be able to sell or transfer this number of shares. The Company has a nominee mechanism in place to prevent this number of shares from being sold or transferred until they are free of the restrictions.
CHART 6: 2019 LTIP AWARD
Share price on award
(pence)
Percentage of salary awarded
(%)Number of
shares vesting
Percentage of award vesting
(%)
Estimated share price on
vesting (pence)1
Estimated share price
appreciation (pence)
Estimated share price
appreciation (%)
Value in Chart 1 attributable to share
price appreciation (£)
Dividend (pence per
share)2
Total dividend on vesting
shares(Gross3) (£)
DAVID SLEATH 691.0 250 230,680 100 1,337.6 646.6 93.6 1,491,577 67.1 154,786
SOUMEN DAS 691.0 250 171,418 100 1,337.6 646.6 93.6 1,108,389 67.1 115,021
ANDY GULLIFORD 691.0 250 151,036 100 1,337.6 646.6 93.6 976,599 67.1 101,345
1 The vesting share price has been estimated as the three-month average share price ending on 31 December 2021.2 The figure in Chart 1 includes a cash value of 67.1 pence per share, equivalent to the dividends that the Executive Directors would have received on the 2019 LTIP shares from the award date.3 This amount is subject to Income Tax and National Insurance deductions.
UPDATED LTIP VESTING IN 2021 (ESTIMATED IN 2020 ANNUAL REPORT)
The 2020 Directors’ Remuneration Report estimated that the TPR element for the 2018 LTIP would vest at 100 per cent.
The Company’s actual TPR over the performance period was 14.9 per cent and the MSCI Benchmark was 11.6 per cent. The Company’s TPR outperformance of 2.9 per cent compared with the MSCI Benchmark led to 100 per cent of the TPR element vesting.
Overall, this resulted in a total payout of 100 per cent for the 2018 LTIP as estimated. In the 2020 Annual Report the estimated vesting share price for the 2018 LTIP was 923.90 pence, and the figure in Chart 1 has been re-presented to reflect the actual vesting share price of 1,001.77 pence.
100%
TPRTSR
TAR
100% 100%
144 SEGRO PLC | ANNUAL REPORT & ACCOUNTS 2021
GOVERNANCE
Remuneration
10_Remuneration_136_164_v126.indd 14410_Remuneration_136_164_v126.indd 144 01/03/2022 17:2201/03/2022 17:22
2021 LTIP AWARD
The 2021 LTIP Award was granted on 29 March 2021 and is subject to the following equally-weighted performance conditions:
Total Shareholder Return (TSR) Total Property Return (TPR) Total Accounting Return (TAR)
This benchmark is based on the weighted mean TSR of other FTSE 350 REITs.
This benchmark is based on the MSCI All Industrial Country benchmarks weighted to reflect the approximate geographical mix of the Group’s portfolio.
This benchmark is based on the market capitalisation weighted TAR of other FTSE 350 REITs.
20 per cent of this element vests if the Company’s TSR over the performance period is in line with benchmark TSR, rising on a straight-line basis to 100 per cent vesting if the benchmark is exceeded by 6 per cent per annum.
20 per cent of this element vests if the Company’s TPR over the performance period is in line with the MSCI Benchmark, rising on a straight-line basis to 100 per cent if the MSCI Benchmark is exceeded by 1.5 per cent per annum.
20 per cent of this element vests if the Company’s TAR over the performance period is in line with benchmark TAR, rising on a straight-line basis to 100 per cent vesting if the benchmark is exceeded by 2.5 per cent per annum.
Executive Directors were awarded 250 per cent of salary in respect of the 2021 LTIP and further details can be found in Chart 14 on page 152.
MALUS AND CLAWBACK
Malus and clawback provisions apply to the Bonus and awards made under the DSBP and LTIP over the time periods detailed below and may apply in the following circumstances:
} fraud or serious misconduct on the part of the participant;
} a serious misstatement in the Company’s financial results;
} an error in assessing performance conditions, resulting in an overpayment;
} when Company performance was achieved as a result of excessive risk taking;
} serious reputational damage; or
} corporate failure.
MALUS CLAWBACK
BONUS – Up to three years from the payment date
DSBP Until the award(s) vest –
LTIP Until the award(s) vest Up to two years from the vesting date
OTHER – SIP AND SHARESAVE (AUDITED)
The ‘other’ figure in Chart 1 comprises SIP and Sharesave:
SHARE INCENTIVE PLAN (SIP) SHARESAVE (SAYE)
This is calculated as the number of shares awarded multiplied by the award price.
During the year, SIP free share awards of £3,600 were made to eligible UK employees and Global Share Incentive Plan (GSIP) awards of £3,600 were made to eligible employees based outside of the UK.
The number of shares awarded was calculated using a share price of 1,004.34 pence, based on the five-day average share price prior to the date of award.
All eligible employees, including the Executive Directors, received 358 shares in respect of the 2021 SIP and GSIP.
This is the discount used to calculate the Option Price, multiplied by the Executive Directors’ annual savings.
All eligible UK employees are invited to join the SAYE annually, and can save up to a maximum of £500 a month across all open schemes.
At the end of the three-year savings period they can purchase shares at the Option Price, based on a 20 per cent discount to the share price on award.
The Option Price for the 2021 SAYE was 742.72 pence.
145SEGRO PLC | ANNUAL REPORT & ACCOUNTS 2021
OVERVIEW STRATEGIC REPORT GOVERNANCE FINANCIAL STATEMENTS
10_Remuneration_136_164_v126.indd 14510_Remuneration_136_164_v126.indd 145 01/03/2022 17:2201/03/2022 17:22
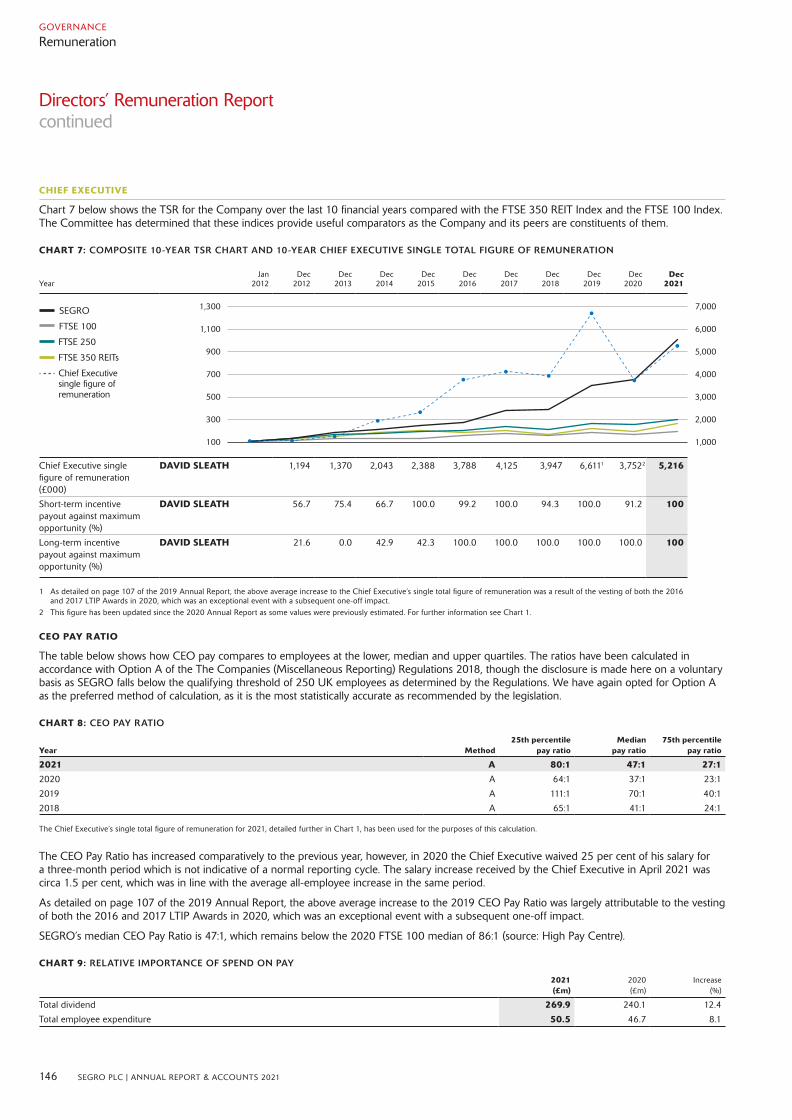
CHIEF EXECUTIVE
Chart 7 below shows the TSR for the Company over the last 10 financial years compared with the FTSE 350 REIT Index and the FTSE 100 Index. The Committee has determined that these indices provide useful comparators as the Company and its peers are constituents of them.
CHART 7: COMPOSITE 10-YEAR TSR CHART AND 10-YEAR CHIEF EXECUTIVE SINGLE TOTAL FIGURE OF REMUNERATION
Chief Executive single figure of remuneration (£000)
DAVID SLEATH 1,194 1,370 2,043 2,388 3,788 4,125 3,947 6,6111 3,7522 5,216
Short-term incentive payout against maximum opportunity (%)
DAVID SLEATH 56.7 75.4 66.7 100.0 99.2 100.0 94.3 100.0 91.2 100
Long-term incentive payout against maximum opportunity (%)
DAVID SLEATH 21.6 0.0 42.9 42.3 100.0 100.0 100.0 100.0 100.0 100
1 As detailed on page 107 of the 2019 Annual Report, the above average increase to the Chief Executive’s single total figure of remuneration was a result of the vesting of both the 2016 and 2017 LTIP Awards in 2020, which was an exceptional event with a subsequent one-off impact.
2 This figure has been updated since the 2020 Annual Report as some values were previously estimated. For further information see Chart 1.
CEO PAY RATIO
The table below shows how CEO pay compares to employees at the lower, median and upper quartiles. The ratios have been calculated in accordance with Option A of the The Companies (Miscellaneous Reporting) Regulations 2018, though the disclosure is made here on a voluntary basis as SEGRO falls below the qualifying threshold of 250 UK employees as determined by the Regulations. We have again opted for Option A as the preferred method of calculation, as it is the most statistically accurate as recommended by the legislation.
CHART 8: CEO PAY RATIO
Year Method25th percentile
pay ratioMedian
pay ratio75th percentile
pay ratio
2021 A 80:1 47:1 27:1
2020 A 64:1 37:1 23:1
2019 A 111:1 70:1 40:1
2018 A 65:1 41:1 24:1
The Chief Executive’s single total figure of remuneration for 2021, detailed further in Chart 1, has been used for the purposes of this calculation.
The CEO Pay Ratio has increased comparatively to the previous year, however, in 2020 the Chief Executive waived 25 per cent of his salary for a three-month period which is not indicative of a normal reporting cycle. The salary increase received by the Chief Executive in April 2021 was circa 1.5 per cent, which was in line with the average all-employee increase in the same period.
As detailed on page 107 of the 2019 Annual Report, the above average increase to the 2019 CEO Pay Ratio was largely attributable to the vesting of both the 2016 and 2017 LTIP Awards in 2020, which was an exceptional event with a subsequent one-off impact.
SEGRO’s median CEO Pay Ratio is 47:1, which remains below the 2020 FTSE 100 median of 86:1 (source: High Pay Centre).
CHART 9: RELATIVE IMPORTANCE OF SPEND ON PAY
2021 (£m)
2020 (£m)
Increase (%)
Total dividend 269.9 240.1 12.4
Total employee expenditure 50.5 46.7 8.1
Directors’ Remuneration Report continued
1,300
1,100
900
700
500
300
100
7,000
6,000
5,000
4,000
3,000
2,000
1,000
SEGRO
FTSE 100
FTSE 250
FTSE 350 REITs
Chief Executive single figure of remuneration
Jan Dec Dec Dec Dec Dec Dec Dec Dec Dec Dec Year 2012 2012 2013 2014 2015 2016 2017 2018 2019 2020 2021
146 SEGRO PLC | ANNUAL REPORT & ACCOUNTS 2021
GOVERNANCE
Remuneration
10_Remuneration_136_164_v126.indd 14610_Remuneration_136_164_v126.indd 146 01/03/2022 17:2201/03/2022 17:22

REMUNERATION AND STRATEGY
Variable remuneration is aligned with KPIs on pages 24 and 25 that measure performance against our strategy, as set out below:
PERFORMANCE MEASURES
BONUS (SEE PAGES 142-143)
Adjusted PBT (33.3%)
Rent roll growth (33.3%)
Relative TPR over 1 year (33.3%)
LTIP (SEE PAGES 144-145)
Relative TSR over 3 years (33.3%)
Relative TPR over 3 years (33.3%)
Relative TAR over 3 years (33.3%)
SIP (SEE PAGE 145)
PBT v budget
2021 KPIs
EPRA vacancy rate
Customer satisfaction
Total property return
Adjusted NAV per share
Loan to value ratio
Total shareholder return
Adjusted EPS
Total cost ratio
Rent roll growth
OPERATIONAL EXCELLENCE
OUR GOAL
DISCIPLINED CAPITAL ALLOCATION
EFFICIENT CAPITAL & CORPORATE STRUCTURE
HOW OUR PERFORMANCE MEASURES ALIGNED TO OUR STRATEGY IN 2021
OUR GOAL IS TO BE THE BEST OWNER-MANAGER AND DEVELOPER OF WAREHOUSE PROPERTIES IN EUROPE AND A LEADING INCOME-FOCUSED REIT.
OUR GOAL AND STRATEGIC PILLARS
All of the above performance measures are integrated directly into both Executive Directors’ and employees’ remuneration. See page 148 for a comparison of Executive Director and employee remuneration components.
WORKFORCE REMUNERATION
CHART 10: PERCENTAGE CHANGE IN DIRECTORS’ REMUNERATION COMPARED TO AVERAGE EMPLOYEE
Between May 2020 and July 2020, all Directors waived 25 per cent of their salaries and fees and the Company matched a donation equivalent to this amount to the SEGRO Centenary Fund. This waiver is reflected in the 2020 numbers and accounts for appearance of the above average increase in 2021.
Salary/Fees (% change)
Taxable benefits (% change)
Annual variable pay (% change)
2021 2020 2021 2020 2021 2020
AVERAGE PER EMPLOYEE1 4.2 6.0 12.4 2.0 9.4 -2.0
EXECUTIVE DIRECTORS
DAVID SLEATH 8.7 -2.2 4.8 0.0 11.3 -6.1
SOUMEN DAS 14.1 -3.4 -0.2 0.0 16.8 -6.1
ANDY GULLIFORD 8.8 -2.3 1.8 0.0 11.4 -6.1
NON-EXECUTIVE DIRECTORS6
GERALD CORBETT2 8.0 3.1 – – – –
MARY BARNARD3 8.0 -0.6 – – – –
SUE CLAYTON 8.0 -0.6 – – – –
CAROL FAIRWEATHER4 8.0 -0.6 – – – –
SIMON FRASER5 – – – – – –
MARTIN MOORE 8.0 -0.6 – – – –
LINDA YUEH5 – – – – – –
1 The average per employee figure is based on UK employees who have been continually employed for the entirety of 2020 and 2021 and entitled to receive annual variable payment. UK employees represent approximately 53 per cent of the workforce.
2 The 2020 fee increase for Gerald Corbett reflects the period between 2016 and 2020 and represents a three per cent increase per annum, which is aligned with the average all employee increase over the same period.
3 Mary Barnard was appointed as a Director on 1 March 2019 and her fees have been annualised.
4 Carol Fairweather was appointed as Chair of the Audit Committee on 18 April 2019, and the increase in her fees to reflect the additional responsibilities of this position have been annualised.
5 Simon Fraser and Linda Yueh were appointed as Independent Non-Executive Directors on 1 May 2021, accordingly there is no comparator for the previous year.
6 Non-Executive Directors do not receive any taxable benefits and do not participate in the Bonus scheme.
147SEGRO PLC | ANNUAL REPORT & ACCOUNTS 2021
OVERVIEW STRATEGIC REPORT GOVERNANCE FINANCIAL STATEMENTS
10_Remuneration_136_164_v126.indd 14710_Remuneration_136_164_v126.indd 147 01/03/2022 17:2201/03/2022 17:22

WORKFORCE REMUNERATION (CONTINUED)
Increases approved by the Remuneration Committee Pay rise in line with employee pay
All employees are eligible for a BonusTargets: TPR, RRG, Profit,
Personal performance
Maximum 150%Targets: TPR, RRG, Profit
Leadership team 25%Deferred for 3 years
50%Deferred for 3 years
Leadership team and senior managers3-year performance period.
No holding periodTargets: TSR, TPR, TAR
Maximum 250%3-year performance period,
2-year holding periodTargets: TSR, TPR, TAR
(UK)12% matched contribution
20% cash, reducing to 12% by 31 December 2022
Maximum £3,600Minimum 3-year hold
Maximum £3,600Minimum 3-year hold
(UK)£500/month
3-year savings period
£500/month3-year savings period
ALL EMPLOYEES EXECUTIVE DIRECTORS
Directors’ Remuneration Report continued
SALARY
BONUS
DEFERRED SHARE BONUS PLAN
LONG TERM INCENTIVE PLAN
PENSION BENEFIT
SHARE INCENTIVE PLAN
SHARESAVE
148 SEGRO PLC | ANNUAL REPORT & ACCOUNTS 2021
GOVERNANCE
Remuneration
10_Remuneration_136_164_v126.indd 14810_Remuneration_136_164_v126.indd 148 01/03/2022 17:2201/03/2022 17:22
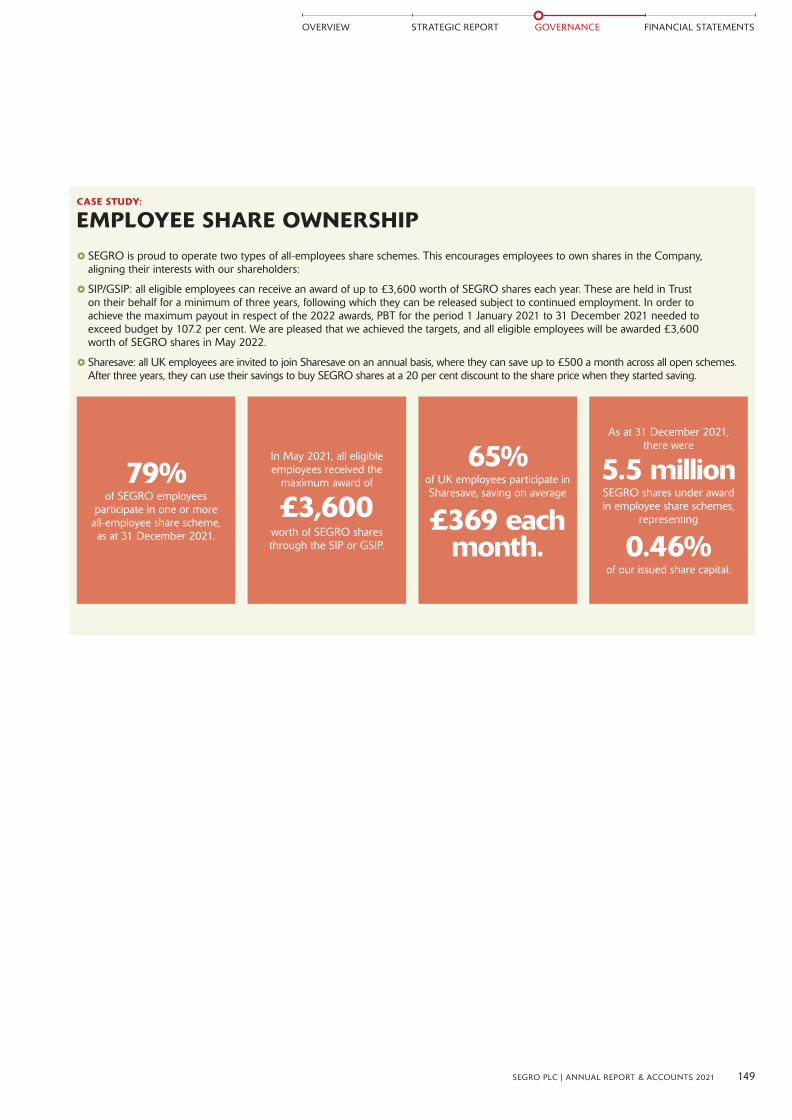
CASE STUDY:
EMPLOYEE SHARE OWNERSHIP } SEGRO is proud to operate two types of all-employees share schemes. This encourages employees to own shares in the Company, aligning their interests with our shareholders:
} SIP/GSIP: all eligible employees can receive an award of up to £3,600 worth of SEGRO shares each year. These are held in Trust on their behalf for a minimum of three years, following which they can be released subject to continued employment. In order to achieve the maximum payout in respect of the 2022 awards, PBT for the period 1 January 2021 to 31 December 2021 needed to exceed budget by 107.2 per cent. We are pleased that we achieved the targets, and all eligible employees will be awarded £3,600 worth of SEGRO shares in May 2022.
} Sharesave: all UK employees are invited to join Sharesave on an annual basis, where they can save up to £500 a month across all open schemes. After three years, they can use their savings to buy SEGRO shares at a 20 per cent discount to the share price when they started saving.
79% of SEGRO employees
participate in one or more all-employee share scheme, as at 31 December 2021.
In May 2021, all eligible employees received the
maximum award of
£3,600worth of SEGRO shares through the SIP or GSIP.
65%of UK employees participate in Sharesave, saving on average
£369 each month.
As at 31 December 2021, there were
5.5 millionSEGRO shares under award in employee share schemes,
representing
0.46%of our issued share capital.
149SEGRO PLC | ANNUAL REPORT & ACCOUNTS 2021
OVERVIEW STRATEGIC REPORT GOVERNANCE FINANCIAL STATEMENTS
10_Remuneration_136_164_v126.indd 14910_Remuneration_136_164_v126.indd 149 01/03/2022 17:2201/03/2022 17:22
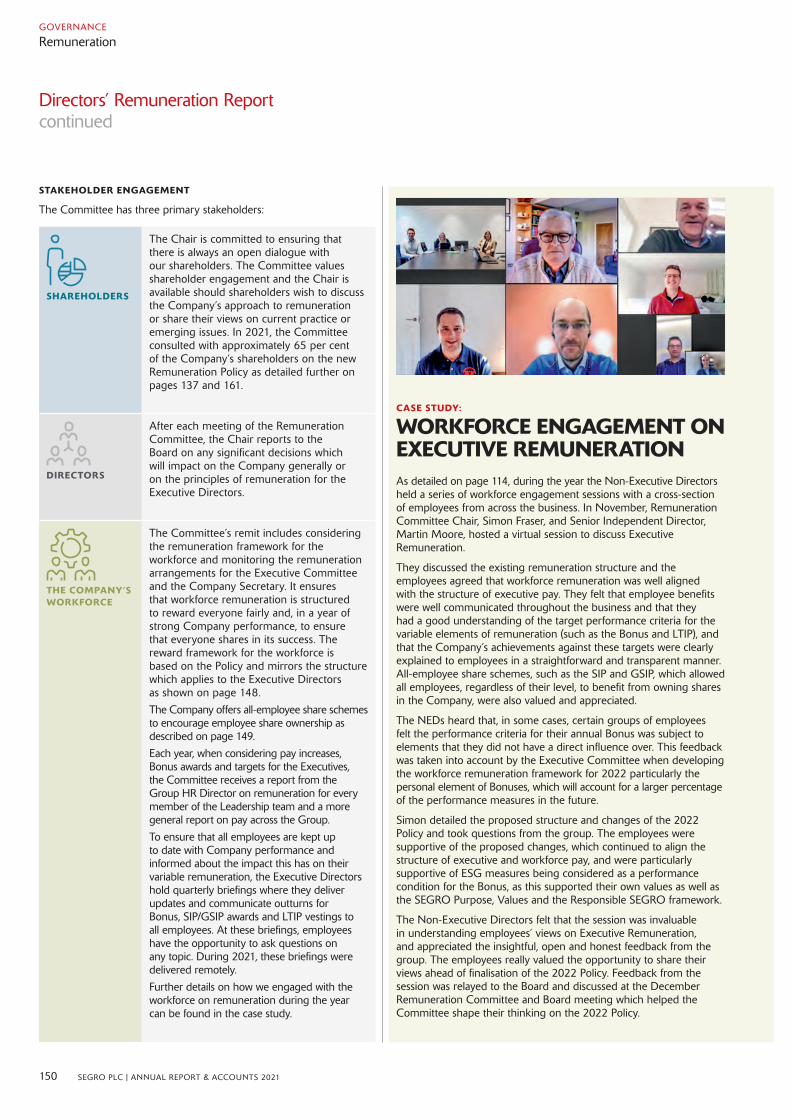
Directors’ Remuneration Report continued
STAKEHOLDER ENGAGEMENT
The Committee has three primary stakeholders:
SHAREHOLDERS
The Chair is committed to ensuring that there is always an open dialogue with our shareholders. The Committee values shareholder engagement and the Chair is available should shareholders wish to discuss the Company’s approach to remuneration or share their views on current practice or emerging issues. In 2021, the Committee consulted with approximately 65 per cent of the Company’s shareholders on the new Remuneration Policy as detailed further on pages 137 and 161.
DIRECTORS
After each meeting of the Remuneration Committee, the Chair reports to the Board on any significant decisions which will impact on the Company generally or on the principles of remuneration for the Executive Directors.
THE COMPANY’S WORKFORCE
The Committee’s remit includes considering the remuneration framework for the workforce and monitoring the remuneration arrangements for the Executive Committee and the Company Secretary. It ensures that workforce remuneration is structured to reward everyone fairly and, in a year of strong Company performance, to ensure that everyone shares in its success. The reward framework for the workforce is based on the Policy and mirrors the structure which applies to the Executive Directors as shown on page 148.
The Company offers all-employee share schemes to encourage employee share ownership as described on page 149.
Each year, when considering pay increases, Bonus awards and targets for the Executives, the Committee receives a report from the Group HR Director on remuneration for every member of the Leadership team and a more general report on pay across the Group.
To ensure that all employees are kept up to date with Company performance and informed about the impact this has on their variable remuneration, the Executive Directors hold quarterly briefings where they deliver updates and communicate outturns for Bonus, SIP/GSIP awards and LTIP vestings to all employees. At these briefings, employees have the opportunity to ask questions on any topic. During 2021, these briefings were delivered remotely.
Further details on how we engaged with the workforce on remuneration during the year can be found in the case study.
CASE STUDY:
WORKFORCE ENGAGEMENT ON EXECUTIVE REMUNERATIONAs detailed on page 114, during the year the Non-Executive Directors held a series of workforce engagement sessions with a cross-section of employees from across the business. In November, Remuneration Committee Chair, Simon Fraser, and Senior Independent Director, Martin Moore, hosted a virtual session to discuss Executive Remuneration.
They discussed the existing remuneration structure and the employees agreed that workforce remuneration was well aligned with the structure of executive pay. They felt that employee benefits were well communicated throughout the business and that they had a good understanding of the target performance criteria for the variable elements of remuneration (such as the Bonus and LTIP), and that the Company’s achievements against these targets were clearly explained to employees in a straightforward and transparent manner. All-employee share schemes, such as the SIP and GSIP, which allowed all employees, regardless of their level, to benefit from owning shares in the Company, were also valued and appreciated.
The NEDs heard that, in some cases, certain groups of employees felt the performance criteria for their annual Bonus was subject to elements that they did not have a direct influence over. This feedback was taken into account by the Executive Committee when developing the workforce remuneration framework for 2022 particularly the personal element of Bonuses, which will account for a larger percentage of the performance measures in the future.
Simon detailed the proposed structure and changes of the 2022 Policy and took questions from the group. The employees were supportive of the proposed changes, which continued to align the structure of executive and workforce pay, and were particularly supportive of ESG measures being considered as a performance condition for the Bonus, as this supported their own values as well as the SEGRO Purpose, Values and the Responsible SEGRO framework.
The Non-Executive Directors felt that the session was invaluable in understanding employees’ views on Executive Remuneration, and appreciated the insightful, open and honest feedback from the group. The employees really valued the opportunity to share their views ahead of finalisation of the 2022 Policy. Feedback from the session was relayed to the Board and discussed at the December Remuneration Committee and Board meeting which helped the Committee shape their thinking on the 2022 Policy.
150 SEGRO PLC | ANNUAL REPORT & ACCOUNTS 2021
GOVERNANCE
Remuneration
10_Remuneration_136_164_v126.indd 15010_Remuneration_136_164_v126.indd 150 01/03/2022 17:2201/03/2022 17:22

EXECUTIVE DIRECTORS’ SHAREHOLDINGS (AUDITED)
CHART 11: EXECUTIVE DIRECTORS’ OVERALL INTEREST IN SHARES
Beneficial interests1 (including SIP
shares) as at 01.01.2021
Beneficial interests1 (including SIP
shares) as at 31.12.2021
Subject to deferral
under DSBP
Subject to achievement of
performance conditions under LTIP
Options outstanding
under Sharesave
Total overall interest in shares as at
31.12.2021
Shares which contribute to shareholding
guidelines as at 31.12.20212
Value of shares which contribute to shareholding guidelines as at
31.12.20213 (£)
DAVID SLEATH 701,796 702,155 169,815 641,543 2,919 1,516,432 792,156 11,379,321
SOUMEN DAS 299,220 377,122 122,500 462,574 2,919 965,115 442,047 6,350,005
ANDY GULLIFORD 624,138 694,627 111,099 419,718 2,670 1,228,114 753,509 10,824,164
1. Beneficial interests represent shares beneficially held by each Executive Director, including any shares beneficially held by spouses as well as shares held on their behalf by the Trustees of the SIP. Between 31 December 2021 and 17 February 2022, there were no changes in respect of the Executive Directors’ shareholdings. The Trustees of the SIP held a non-beneficial interest in 457,337 shares as at 1 January 2021, 455,342 shares as at 31 December 2021 (2020: 457,337) and 454,874 shares as at 17 February 2022. The Trustees of the SEGRO plc Employees’ Benefit Trust held 75,820 shares as at 1 January 2021 and 12,120 shares as at 31 December 2021 (2020: 75,820). There was no change in their holding between 31 December 2021 and 17 February 2022. As with other employees, Executive Directors are deemed to have a potential interest in these shares, being beneficiaries under these two Trusts. The Trustees of the SEGRO plc Employees’ Benefit Trust have waived the right to receive dividends on these shares.
2 The number of shares which contribute towards the shareholding requirement comprise beneficial interests (including SIP shares) and shares subject to deferral under DSBP, net of income tax and National Insurance, but excludes shares subject to achievement of performance conditions under LTIP and options outstanding under Sharesave.
3 Value of shares calculated using a share price of 1,436.5 pence, as at 31 December 2021.
POLICY ON SHAREHOLDING GUIDELINES
The Chief Executive is expected to build a shareholding in the Company equivalent to 300 per cent of the value of his base salary which is calculated each year by reference to the share price as at 31 December. If the level of LTIP grant is increased to 300 per cent of his base salary, the expected level of shareholding for the Chief Executive will increase to 400 per cent of his base salary. The other Executive Directors are expected to hold shares equivalent to 250 per cent of their base salaries.
Shares which qualify towards the shareholding guidelines comprise: beneficial holdings; LTIP awards which have vested and are subject to a two-year post-vesting holding period; and unvested shares in the DSBP, net of income tax and National Insurance.
Executive Directors are required to retain half of their LTIP and DSBP shares post vesting until the above guidelines have been met and are then maintained.
CHART 12: EXECUTIVE DIRECTORS’ SHAREHOLDING AND SHAREHOLDING REQUIREMENTS
David Sleath
Soumen Das
Andy Gulliford
Percentage of salary (%)
Policy: 300%
Policy: 250%
Policy: 250%
Value of shares calculated using a share price of 1,436.5 pence, as at 31 December 2021.
The shareholding guidelines were updated in 2018 to include a post-cessation requirement for Executive Directors to retain their shareholding, up to the amount required by the shareholding guidelines, for two years after leaving the Company.
As detailed on page 139 of the 2020 Annual Report, Phil Redding stepped down from the Board with effect from 31 January 2020. He is required to hold shares equivalent to 250 per cent of his salary until 31 January 2022, calculated by reference to his salary and the share price on 31 January 2020.
The Company has a Global Nominee mechanism in place to restrict the sale or transfer of vested LTIP shares that are subject to a two-year, post-vesting holding period. This mechanism, along with his DSBP shares which have not yet vested, allows the Company to confirm that he continues to comply with his post-cessation shareholding requirements.
0 200 400 600 800 1,000 1,200 1,400 1,600 1,800 2,000 2,200 2,400
151SEGRO PLC | ANNUAL REPORT & ACCOUNTS 2021
OVERVIEW STRATEGIC REPORT GOVERNANCE FINANCIAL STATEMENTS
10_Remuneration_136_164_v126.indd 15110_Remuneration_136_164_v126.indd 151 01/03/2022 17:2201/03/2022 17:22
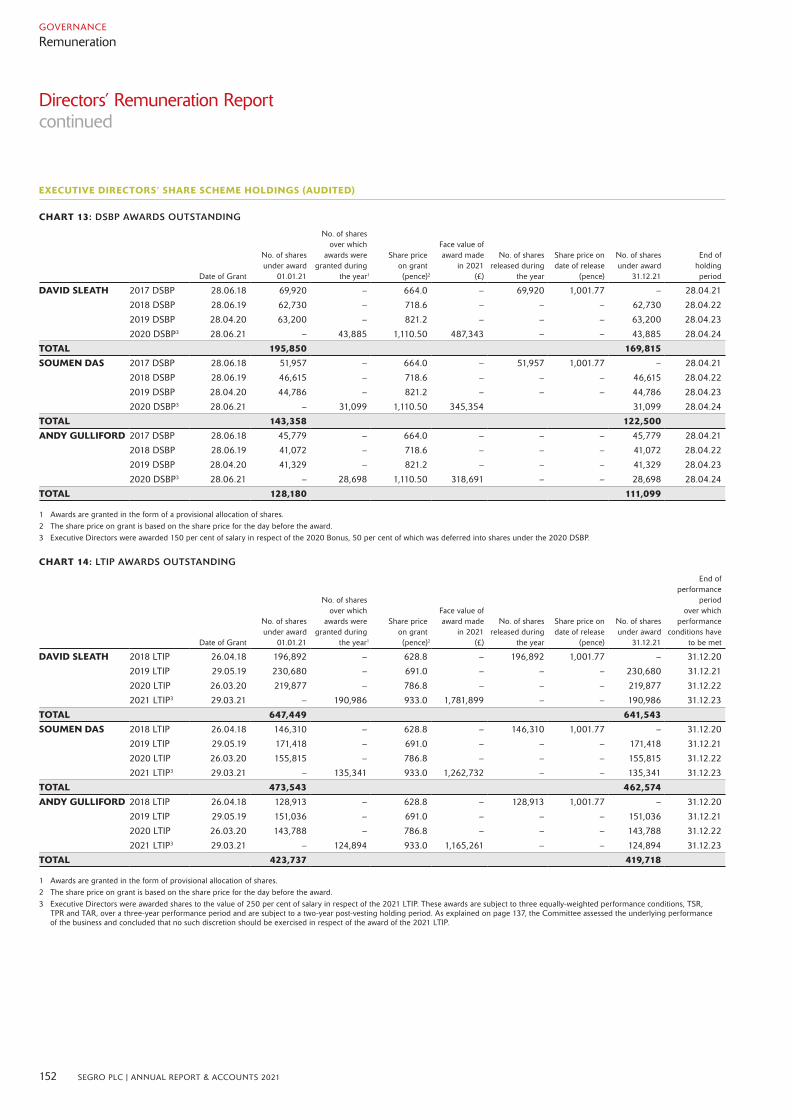
EXECUTIVE DIRECTORS’ SHARE SCHEME HOLDINGS (AUDITED)
CHART 13: DSBP AWARDS OUTSTANDING
Date of Grant
No. of shares under award
01.01.21
No. of shares over which
awards were granted during
the year1
Share price on grant (pence)2
Face value of award made
in 2021 (£)
No. of shares released during
the year
Share price on date of release
(pence)
No. of shares under award
31.12.21
End of holding period
DAVID SLEATH 2017 DSBP 28.06.18 69,920 – 664.0 – 69,920 1,001.77 – 28.04.21
2018 DSBP 28.06.19 62,730 – 718.6 – – – 62,730 28.04.22
2019 DSBP 28.04.20 63,200 – 821.2 – – – 63,200 28.04.23
2020 DSBP3 28.06.21 – 43,885 1,110.50 487,343 – – 43,885 28.04.24
TOTAL 195,850 169,815SOUMEN DAS 2017 DSBP 28.06.18 51,957 – 664.0 – 51,957 1,001.77 – 28.04.21
2018 DSBP 28.06.19 46,615 – 718.6 – – – 46,615 28.04.22
2019 DSBP 28.04.20 44,786 – 821.2 – – – 44,786 28.04.23
2020 DSBP3 28.06.21 – 31,099 1,110.50 345,354 31,099 28.04.24
TOTAL 143,358 122,500ANDY GULLIFORD 2017 DSBP 28.06.18 45,779 – 664.0 – – – 45,779 28.04.21
2018 DSBP 28.06.19 41,072 – 718.6 – – – 41,072 28.04.22
2019 DSBP 28.04.20 41,329 – 821.2 – – – 41,329 28.04.23
2020 DSBP3 28.06.21 – 28,698 1,110.50 318,691 – – 28,698 28.04.24
TOTAL 128,180 111,099
1 Awards are granted in the form of a provisional allocation of shares.2 The share price on grant is based on the share price for the day before the award. 3 Executive Directors were awarded 150 per cent of salary in respect of the 2020 Bonus, 50 per cent of which was deferred into shares under the 2020 DSBP.
CHART 14: LTIP AWARDS OUTSTANDING
Date of Grant
No. of shares under award
01.01.21
No. of shares over which
awards were granted during
the year1
Share price on grant (pence)2
Face value of award made
in 2021 (£)
No. of shares released during
the year
Share price on date of release
(pence)
No. of shares under award
31.12.21
End of performance
period over which
performance conditions have
to be met
DAVID SLEATH 2018 LTIP 26.04.18 196,892 – 628.8 – 196,892 1,001.77 – 31.12.20
2019 LTIP 29.05.19 230,680 – 691.0 – – – 230,680 31.12.21
2020 LTIP 26.03.20 219,877 – 786.8 – – – 219,877 31.12.22
2021 LTIP3 29.03.21 – 190,986 933.0 1,781,899 – – 190,986 31.12.23
TOTAL 647,449 641,543
SOUMEN DAS 2018 LTIP 26.04.18 146,310 – 628.8 – 146,310 1,001.77 – 31.12.20
2019 LTIP 29.05.19 171,418 – 691.0 – – – 171,418 31.12.21
2020 LTIP 26.03.20 155,815 – 786.8 – – – 155,815 31.12.22
2021 LTIP3 29.03.21 – 135,341 933.0 1,262,732 – – 135,341 31.12.23
TOTAL 473,543 462,574
ANDY GULLIFORD 2018 LTIP 26.04.18 128,913 – 628.8 – 128,913 1,001.77 – 31.12.20
2019 LTIP 29.05.19 151,036 – 691.0 – – – 151,036 31.12.21
2020 LTIP 26.03.20 143,788 – 786.8 – – – 143,788 31.12.22
2021 LTIP3 29.03.21 – 124,894 933.0 1,165,261 – – 124,894 31.12.23
TOTAL 423,737 419,718
1 Awards are granted in the form of provisional allocation of shares. 2 The share price on grant is based on the share price for the day before the award. 3 Executive Directors were awarded shares to the value of 250 per cent of salary in respect of the 2021 LTIP. These awards are subject to three equally-weighted performance conditions, TSR,
TPR and TAR, over a three-year performance period and are subject to a two-year post-vesting holding period. As explained on page 137, the Committee assessed the underlying performance of the business and concluded that no such discretion should be exercised in respect of the award of the 2021 LTIP.
Directors’ Remuneration Report continued
152 SEGRO PLC | ANNUAL REPORT & ACCOUNTS 2021
GOVERNANCE
Remuneration
10_Remuneration_136_164_v126.indd 15210_Remuneration_136_164_v126.indd 152 01/03/2022 17:2201/03/2022 17:22

CHART 15: SHARESAVE OPTIONS OUTSTANDING
Date of grant
No. of shares under option
01.01.21
Options granted during
the year
Option price
(pence)
Options exercised
during the year
Share price on date of
exercise (pence)
No. of shares under option
31.12.211
Period in which options can be exercised
DAVID SLEATH 2020 Sharesave 22.04.20 2,919 – 616.48 – – 2,919 01.06.23 – 30.11.23
TOTAL 2,919 2,919SOUMEN DAS 2020 Sharesave 22.04.20 2,919 – 616.48 – – 2,919 01.06.23 – 30.11.23
TOTAL 2,919 2,919ANDY GULLIFORD 2018 Sharesave 18.04.18 1,808 – 497.76 1,808 1,417.50 – 01.06.21 – 30.11.21
2020 Sharesave 22.04.20 1,459 – 616.48 – – 1,459 01.06.23 – 30.11.23
2021 Sharesave 23.04.21 – 1,211 742.72 – – 1,211 01.06.24 – 30.11.24
TOTAL 3,267 2,670
1 There are no shares under option which have matured but have not been exercised.
CHART 16: SIP SHARES HELD IN TRUST
No. of shares in trust 01.01.21
Shares awarded during the year
No. of shares in trust 31.12.21
DAVID SLEATH 8,695 358 9,053
SOUMEN DAS 1,276 358 1,634
ANDY GULLIFORD 9,512 358 9,870
Further information about the share schemes can be found in Note 19 to the Financial Statements on pages 207 and 208.
DILUTION HEADROOM
As the LTIP, SIP and Sharesave schemes are approved by shareholders, they may be satisfied by the issue of new shares in the Company, up to the dilution limits set by the Investment Association (IA). The chart below shows the total number of shares under award or option for both Executive and all-employee schemes in comparison to the IA limits.
CHART 17: DILUTION HEADROOM
Executive schemes
All schemes
1% 2% 3% 4% 5% 6% 7% 8% 9% 10%
10 years
5 years
0%
0.32%
0.38%
Actual Policy
153SEGRO PLC | ANNUAL REPORT & ACCOUNTS 2021
OVERVIEW STRATEGIC REPORT GOVERNANCE FINANCIAL STATEMENTS
10_Remuneration_136_164_v126.indd 15310_Remuneration_136_164_v126.indd 153 01/03/2022 17:2201/03/2022 17:22
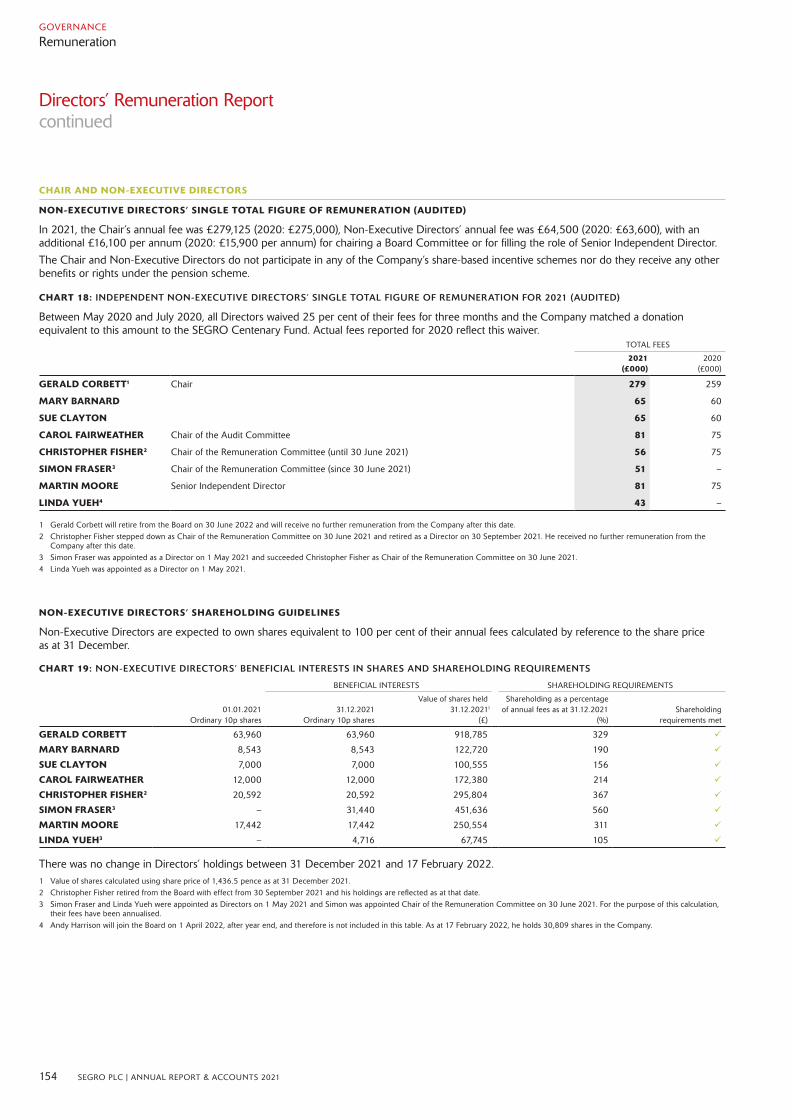
CHAIR AND NON-EXECUTIVE DIRECTORS
NON-EXECUTIVE DIRECTORS’ SINGLE TOTAL FIGURE OF REMUNERATION (AUDITED)
In 2021, the Chair’s annual fee was £279,125 (2020: £275,000), Non-Executive Directors’ annual fee was £64,500 (2020: £63,600), with an additional £16,100 per annum (2020: £15,900 per annum) for chairing a Board Committee or for filling the role of Senior Independent Director.
The Chair and Non-Executive Directors do not participate in any of the Company’s share-based incentive schemes nor do they receive any other benefits or rights under the pension scheme.
CHART 18: INDEPENDENT NON-EXECUTIVE DIRECTORS’ SINGLE TOTAL FIGURE OF REMUNERATION FOR 2021 (AUDITED)
Between May 2020 and July 2020, all Directors waived 25 per cent of their fees for three months and the Company matched a donation equivalent to this amount to the SEGRO Centenary Fund. Actual fees reported for 2020 reflect this waiver.
TOTAL FEES
2021 (£000)
2020 (£000)
GERALD CORBETT1 Chair 279 259
MARY BARNARD 65 60
SUE CLAYTON 65 60
CAROL FAIRWEATHER Chair of the Audit Committee 81 75
CHRISTOPHER FISHER2 Chair of the Remuneration Committee (until 30 June 2021) 56 75
SIMON FRASER3 Chair of the Remuneration Committee (since 30 June 2021) 51 –
MARTIN MOORE Senior Independent Director 81 75
LINDA YUEH4 43 –
1 Gerald Corbett will retire from the Board on 30 June 2022 and will receive no further remuneration from the Company after this date.2 Christopher Fisher stepped down as Chair of the Remuneration Committee on 30 June 2021 and retired as a Director on 30 September 2021. He received no further remuneration from the
Company after this date. 3 Simon Fraser was appointed as a Director on 1 May 2021 and succeeded Christopher Fisher as Chair of the Remuneration Committee on 30 June 2021. 4 Linda Yueh was appointed as a Director on 1 May 2021.
NON-EXECUTIVE DIRECTORS’ SHAREHOLDING GUIDELINES
Non-Executive Directors are expected to own shares equivalent to 100 per cent of their annual fees calculated by reference to the share price as at 31 December.
CHART 19: NON-EXECUTIVE DIRECTORS’ BENEFICIAL INTERESTS IN SHARES AND SHAREHOLDING REQUIREMENTS
BENEFICIAL INTERESTS SHAREHOLDING REQUIREMENTS
01.01.2021 Ordinary 10p shares
31.12.2021 Ordinary 10p shares
Value of shares held 31.12.20211
(£)
Shareholding as a percentage of annual fees as at 31.12.2021
(%)Shareholding
requirements met
GERALD CORBETT 63,960 63,960 918,785 329
MARY BARNARD 8,543 8,543 122,720 190
SUE CLAYTON 7,000 7,000 100,555 156
CAROL FAIRWEATHER 12,000 12,000 172,380 214
CHRISTOPHER FISHER2 20,592 20,592 295,804 367
SIMON FRASER3 – 31,440 451,636 560
MARTIN MOORE 17,442 17,442 250,554 311
LINDA YUEH3 – 4,716 67,745 105
There was no change in Directors’ holdings between 31 December 2021 and 17 February 2022.1 Value of shares calculated using share price of 1,436.5 pence as at 31 December 2021. 2 Christopher Fisher retired from the Board with effect from 30 September 2021 and his holdings are reflected as at that date. 3 Simon Fraser and Linda Yueh were appointed as Directors on 1 May 2021 and Simon was appointed Chair of the Remuneration Committee on 30 June 2021. For the purpose of this calculation,
their fees have been annualised. 4 Andy Harrison will join the Board on 1 April 2022, after year end, and therefore is not included in this table. As at 17 February 2022, he holds 30,809 shares in the Company.
Directors’ Remuneration Report continued
154 SEGRO PLC | ANNUAL REPORT & ACCOUNTS 2021
GOVERNANCE
Remuneration
10_Remuneration_136_164_v126.indd 15410_Remuneration_136_164_v126.indd 154 01/03/2022 17:2201/03/2022 17:22
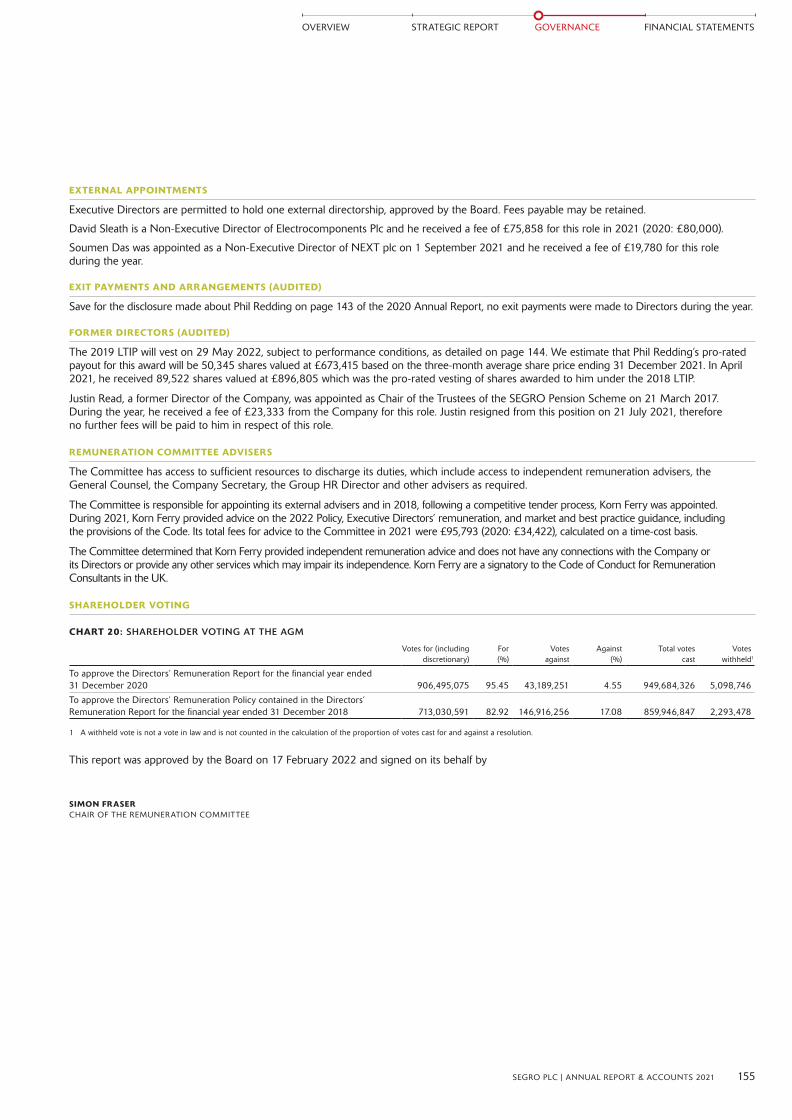
EXTERNAL APPOINTMENTS
Executive Directors are permitted to hold one external directorship, approved by the Board. Fees payable may be retained.
David Sleath is a Non-Executive Director of Electrocomponents Plc and he received a fee of £75,858 for this role in 2021 (2020: £80,000).
Soumen Das was appointed as a Non-Executive Director of NEXT plc on 1 September 2021 and he received a fee of £19,780 for this role during the year.
EXIT PAYMENTS AND ARRANGEMENTS (AUDITED)
Save for the disclosure made about Phil Redding on page 143 of the 2020 Annual Report, no exit payments were made to Directors during the year.
FORMER DIRECTORS (AUDITED)
The 2019 LTIP will vest on 29 May 2022, subject to performance conditions, as detailed on page 144. We estimate that Phil Redding’s pro-rated payout for this award will be 50,345 shares valued at £673,415 based on the three-month average share price ending 31 December 2021. In April 2021, he received 89,522 shares valued at £896,805 which was the pro-rated vesting of shares awarded to him under the 2018 LTIP.
Justin Read, a former Director of the Company, was appointed as Chair of the Trustees of the SEGRO Pension Scheme on 21 March 2017. During the year, he received a fee of £23,333 from the Company for this role. Justin resigned from this position on 21 July 2021, therefore no further fees will be paid to him in respect of this role.
REMUNERATION COMMITTEE ADVISERS
The Committee has access to sufficient resources to discharge its duties, which include access to independent remuneration advisers, the General Counsel, the Company Secretary, the Group HR Director and other advisers as required.
The Committee is responsible for appointing its external advisers and in 2018, following a competitive tender process, Korn Ferry was appointed. During 2021, Korn Ferry provided advice on the 2022 Policy, Executive Directors’ remuneration, and market and best practice guidance, including the provisions of the Code. Its total fees for advice to the Committee in 2021 were £95,793 (2020: £34,422), calculated on a time-cost basis.
The Committee determined that Korn Ferry provided independent remuneration advice and does not have any connections with the Company or its Directors or provide any other services which may impair its independence. Korn Ferry are a signatory to the Code of Conduct for Remuneration Consultants in the UK.
SHAREHOLDER VOTING
CHART 20: SHAREHOLDER VOTING AT THE AGM
Votes for (including discretionary)
For(%)
Votes against
Against(%)
Total votes cast
Votes withheld1
To approve the Directors’ Remuneration Report for the financial year ended 31 December 2020 906,495,075 95.45 43,189,251 4.55 949,684,326 5,098,746
To approve the Directors’ Remuneration Policy contained in the Directors’ Remuneration Report for the financial year ended 31 December 2018 713,030,591 82.92 146,916,256 17.08 859,946,847 2,293,478
1 A withheld vote is not a vote in law and is not counted in the calculation of the proportion of votes cast for and against a resolution.
This report was approved by the Board on 17 February 2022 and signed on its behalf by
SIMON FRASERCHAIR OF THE REMUNERATION COMMITTEE
155SEGRO PLC | ANNUAL REPORT & ACCOUNTS 2021
OVERVIEW STRATEGIC REPORT GOVERNANCE FINANCIAL STATEMENTS
10_Remuneration_136_164_v126.indd 15510_Remuneration_136_164_v126.indd 155 01/03/2022 17:2201/03/2022 17:22

Directors’ Remuneration Policy
The key aim of the Directors’ Remuneration Policy is to align the interests of Executive Directors with those of the shareholders by supporting the delivery of strategy. The structure of the remuneration framework is designed to reflect the strategic direction of the business and to align it with the Company’s KPIs. In setting the Directors’ Remuneration Policy, the Committee takes into consideration, amongst other matters, investor guidelines and the maximum amount of remuneration the Executive Directors could receive should all targets be met. The Executive Directors’ remuneration is set within a remuneration framework which applies to all employees across the Group. Each of the key elements of the remuneration package is designed to drive the creation of long-term shareholder value, without encouraging Executive Directors to take inappropriate risk.
In order to avoid any conflict of interest, remuneration is managed through well-defined processes ensuring that no individual is involved in the decision-making process related to their own remuneration. In particular, the remuneration of all Executive Directors is set and approved by the Committee; none of the Executive Directors are involved in the determination of their own remuneration arrangements.
Each year, with the support of external advisers, the Committee undertakes a review of the remuneration of the Executive Directors. It has oversight of the remuneration of the Leadership team, who are the senior managers immediately below Board level, and the Company Secretary. It considers the responsibilities, experience and performance of the Executive Directors and pay across the Group.
Changes to the Policy since approval at the 2019 AGM are outlined in the Chair’s letter on pages 136 to 138 and are detailed below. The Committee also has the discretion to amend the Policy with regard to minor or administrative matters where it would be, in the opinion of the Committee, in the best interests of the Company, and disproportionate to seek or await shareholder approval.
Subject to approval by shareholders at the 2022 AGM, this policy will be effective for the 2022 performance year and will apply to incentive awards with performance periods beginning on 1 January 2022. Payments to Directors can only be made if they are consistent with a shareholder approved Policy or amendment to the Policy.
In determining the 2022 Policy, the Committee considered the following as set out in Provision 40 of the Code:
CLARITY AND SIMPLICITY
The Committee is of the opinion that the 2022 Policy and the remuneration framework for the wider workforce is transparent, simple and easy to understand. We believe that the framework is clearly communicated to and understood by our key stakeholders and our employees. Remuneration for our Executive Directors consists of the following elements as set out in Chart 1:
} salary;
} pension benefits;
} Bonus;
} DSBP;
} LTIP;
} Sharesave;
} SIP; and
} other benefits.
The Committee has engaged extensively with key stakeholders, such as shareholders and representatives from the workforce, who have confirmed this view.
RISK The Company’s remuneration arrangements discourage both the Executive Directors and the wider workforce from excessive risk taking in the pursuit of achieving objectives. The Bonus, DSBP and LTIP include malus and/or clawback provisions that apply when the Committee considers that performance is achieved as a result of excessive risk taking, as well as in other circumstances as set out on page 145 of the Directors’ Remuneration Report.
Executive Directors are required to hold a percentage of their base salary in shares in the Company (as described further on page 151). Additionally, they are subject to post-cessation requirement to continue holdings shares in the event that they leave the Company.
Part of their annual Bonus is subject to deferral under the DSBP and a compulsory post-vesting holding period for LTIP shares.
The Committee has the discretion to override formulaic outturns to ensure incentive payouts reflect underlying business performance, and is aligned to shareholder experience.
PREDICTABILITY Potential values of rewards to the Executive Directors under the 2022 Policy are clearly stated in Chart 5 on page 161, which sets out the minimum, maximum and on target scenarios. This chart also demonstrates the impact of share price appreciation on the 2022 LTIP award. Potential outcomes are regularly reviewed by the Committee.
PROPORTIONALITY In order to ensure outcomes do not reward poor performance, a significant portion of our remuneration framework is performance based and requires challenging performance targets and metrics to be achieved.
ALIGNMENT TO CULTURE
There is strong linkage between the structure of the Company’s incentive schemes, its Purpose and Values, and strategy. The Company’s Responsible SEGRO ambitions have identified net zero-carbon by 2030 as a key strategic objective, and the inclusion of ESG measures in the new annual Bonus structure reinforces its importance. The chart on page 147 illustrates how variable remuneration is aligned with KPIs that measure performance against the Company’s strategy.
MAIN CHANGES TO THE POLICY
If approved at the 2022 AGM the following changes will be made to the Policy approved in 2019:
} the maximum opportunity under the LTIP will increase to 300 per cent of salary for the Chief Executive only; and
} TPR will be replaced by ESG metrics in the annual Bonus, with target ranges related to (i) reducing our operating carbon emissions, (ii) reducing embodied carbon in developments and (iii) customer, community and employee objectives. ESG metrics will account for 25 per cent of the overall Bonus, whilst existing Adjusted PBT and RRG metrics comprise 37.5 per cent each.
156 SEGRO PLC | ANNUAL REPORT & ACCOUNTS 2021
GOVERNANCE
Remuneration
10_Remuneration_136_164_v126.indd 15610_Remuneration_136_164_v126.indd 156 01/03/2022 17:2201/03/2022 17:22
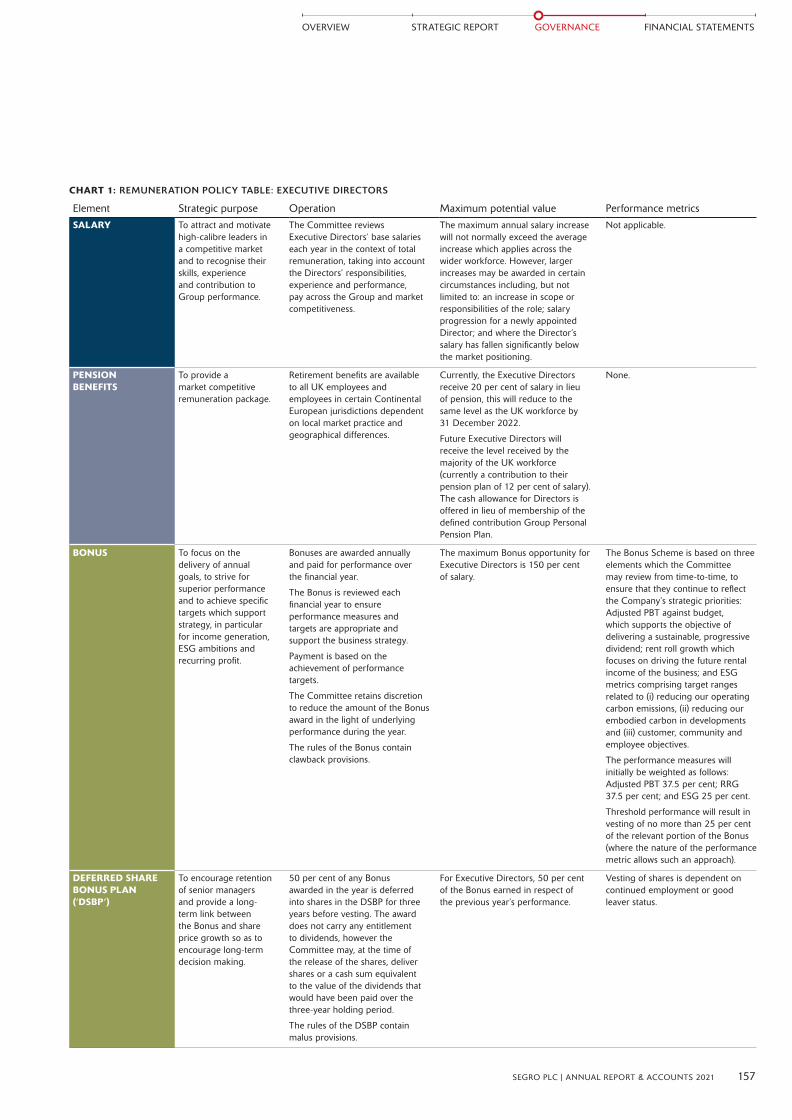
CHART 1: REMUNERATION POLICY TABLE: EXECUTIVE DIRECTORS
Element Strategic purpose Operation Maximum potential value Performance metrics
SALARY To attract and motivate high-calibre leaders in a competitive market and to recognise their skills, experience and contribution to Group performance.
The Committee reviews Executive Directors’ base salaries each year in the context of total remuneration, taking into account the Directors’ responsibilities, experience and performance, pay across the Group and market competitiveness.
The maximum annual salary increase will not normally exceed the average increase which applies across the wider workforce. However, larger increases may be awarded in certain circumstances including, but not limited to: an increase in scope or responsibilities of the role; salary progression for a newly appointed Director; and where the Director’s salary has fallen significantly below the market positioning.
Not applicable.
PENSION BENEFITS
To provide a market competitive remuneration package.
Retirement benefits are available to all UK employees and employees in certain Continental European jurisdictions dependent on local market practice and geographical differences.
Currently, the Executive Directors receive 20 per cent of salary in lieu of pension, this will reduce to the same level as the UK workforce by 31 December 2022.
Future Executive Directors will receive the level received by the majority of the UK workforce (currently a contribution to their pension plan of 12 per cent of salary). The cash allowance for Directors is offered in lieu of membership of the defined contribution Group Personal Pension Plan.
None.
BONUS To focus on the delivery of annual goals, to strive for superior performance and to achieve specific targets which support strategy, in particular for income generation, ESG ambitions and recurring profit.
Bonuses are awarded annually and paid for performance over the financial year.
The Bonus is reviewed each financial year to ensure performance measures and targets are appropriate and support the business strategy.
Payment is based on the achievement of performance targets.
The Committee retains discretion to reduce the amount of the Bonus award in the light of underlying performance during the year.
The rules of the Bonus contain clawback provisions.
The maximum Bonus opportunity for Executive Directors is 150 per cent of salary.
The Bonus Scheme is based on three elements which the Committee may review from time-to-time, to ensure that they continue to reflect the Company’s strategic priorities: Adjusted PBT against budget, which supports the objective of delivering a sustainable, progressive dividend; rent roll growth which focuses on driving the future rental income of the business; and ESG metrics comprising target ranges related to (i) reducing our operating carbon emissions, (ii) reducing our embodied carbon in developments and (iii) customer, community and employee objectives.
The performance measures will initially be weighted as follows: Adjusted PBT 37.5 per cent; RRG 37.5 per cent; and ESG 25 per cent.
Threshold performance will result in vesting of no more than 25 per cent of the relevant portion of the Bonus (where the nature of the performance metric allows such an approach).
DEFERRED SHARE BONUS PLAN (‘DSBP’)
To encourage retention of senior managers and provide a long-term link between the Bonus and share price growth so as to encourage long-term decision making.
50 per cent of any Bonus awarded in the year is deferred into shares in the DSBP for three years before vesting. The award does not carry any entitlement to dividends, however the Committee may, at the time of the release of the shares, deliver shares or a cash sum equivalent to the value of the dividends that would have been paid over the three-year holding period.
The rules of the DSBP contain malus provisions.
For Executive Directors, 50 per cent of the Bonus earned in respect of the previous year’s performance.
Vesting of shares is dependent on continued employment or good leaver status.
157SEGRO PLC | ANNUAL REPORT & ACCOUNTS 2021
OVERVIEW STRATEGIC REPORT GOVERNANCE FINANCIAL STATEMENTS
10_Remuneration_136_164_v126.indd 15710_Remuneration_136_164_v126.indd 157 01/03/2022 17:2201/03/2022 17:22

Directors’ Remuneration Policy continued
Element Strategic purpose Operation Maximum potential value Performance metrics
LONG TERM INCENTIVE PLAN (‘LTIP’)
To reward the execution of strategy and drive long-term returns for shareholders. The performance measures are selected to align with business strategy. The awards are designed to align the most senior managers’ goals with the creation of sustainable growth in shareholder value. The awards will also increase retention of these senior managers.
For LTIP awards, dividends will accrue on the LTIP shares which are released on vesting and will be paid in shares or cash. The Committee has discretion to adjust awards downwards at vesting if it is not satisfied that the outcome is a fair reflection of underlying performance, or in the event of excessive risk taking or misstatement.
The rules of the LTIP contain malus and clawback provisions.
Maximum 300 per cent of salary in performance shares.
The Committee’s intention is to increase the LTIP opportunity to 300 per cent of salary for the Chief Executive only, other Executive Directors will continue to receive 250 per cent of salary and the Committee would not increase this without prior consultation with shareholders.
LTIP awards are subject to stretching performance conditions, which are measured over a three-year performance period. A two-year compulsory holding period applies to these LTIP shares after vesting and subject to payment of tax and statutory deductions.
Awards to be granted in 2022 will be subject to equally weighted Total Shareholder Return, Total Property Return and Total Accounting Return performance conditions.
Subsequent grants may be subject to different performance conditions following consultation with shareholders.
Threshold performance will result in vesting of no more than 20 per cent of the relevant portion of the LTIP (where the nature of the performance metric allows such an approach).
SHARESAVE To provide a market competitive remuneration package and to encourage employee share ownership across the Group.
Sharesave is a HMRC approved scheme open to all UK employees. Savings can be made over a three-year period to purchase shares in the Company at a price which is set at the beginning of the savings period. This price is usually set at a 20 per cent discount to the market price.
Employees may save up to the HMRC limit across all Sharesave grants.
None.
SHARE INCENTIVE PLAN (‘SIP’) AND GLOBAL SHARE INCENTIVE PLAN (‘GSIP’)
To provide a market competitive remuneration package and to encourage employee share ownership across the Group.
SIP is a HMRC approved scheme open to all UK employees, subject to service. Eligible employees are awarded shares annually up to the HMRC limits. GSIP is designed on a similar basis to SIP, but is not HMRC approved and is operated for non-UK employees.
The maximum award is subject to the HMRC limit.
Award may be based on achievement of a target and is subject to a three-year holding period.
OTHER BENEFITS To provide a market competitive remuneration package.
Other benefits currently include: car allowance; life assurance; disability insurance; private medical insurance; and health screening. The Committee retains the discretion to offer additional benefits as appropriate, for example, assistance with relocation.
– None.
ADDITIONAL NOTES
Remuneration Policy: the policy for the Executive Directors is designed with regard to the pay and benefits for employees across the Group. All employees are eligible for an annual Bonus on the same performance measures which are consistent with those of the Executive Directors, save that those below Board level have a fourth target based on their personal performance. The maximum Bonus opportunity is fixed according to seniority banding across the Company. The LTIP performance conditions are the same for all participants and the size of awards are determined by seniority.
The Committee retains certain discretions in respect of the operation and administration of the incentive plans under their rules, in addition to the discretions described elsewhere in the Policy.
Subject to consultation with major shareholders, the Committee retains the ability to adjust and/or to set different LTIP and Bonus performance measures if events occur (such as a change in strategy, a material acquisition and/or divestment of a Group business, or change in prevailing market conditions) which cause the Committee to determine that the measures are no longer appropriate and that amendment is required so that they achieve their original purpose.
Payments from existing awards: Executive Directors are eligible to receive payment from any award made prior to the approval and implementation of the 2022 Policy. Any outstanding share awards made in accordance with a previous Remuneration Policy will remain in effect and will vest in accordance with the terms under which they were granted.
CHART 1: REMUNERATION POLICY TABLE: EXECUTIVE DIRECTORS CONTINUED
158 SEGRO PLC | ANNUAL REPORT & ACCOUNTS 2021
GOVERNANCE
Remuneration
10_Remuneration_136_164_v126.indd 15810_Remuneration_136_164_v126.indd 158 01/03/2022 17:2201/03/2022 17:22
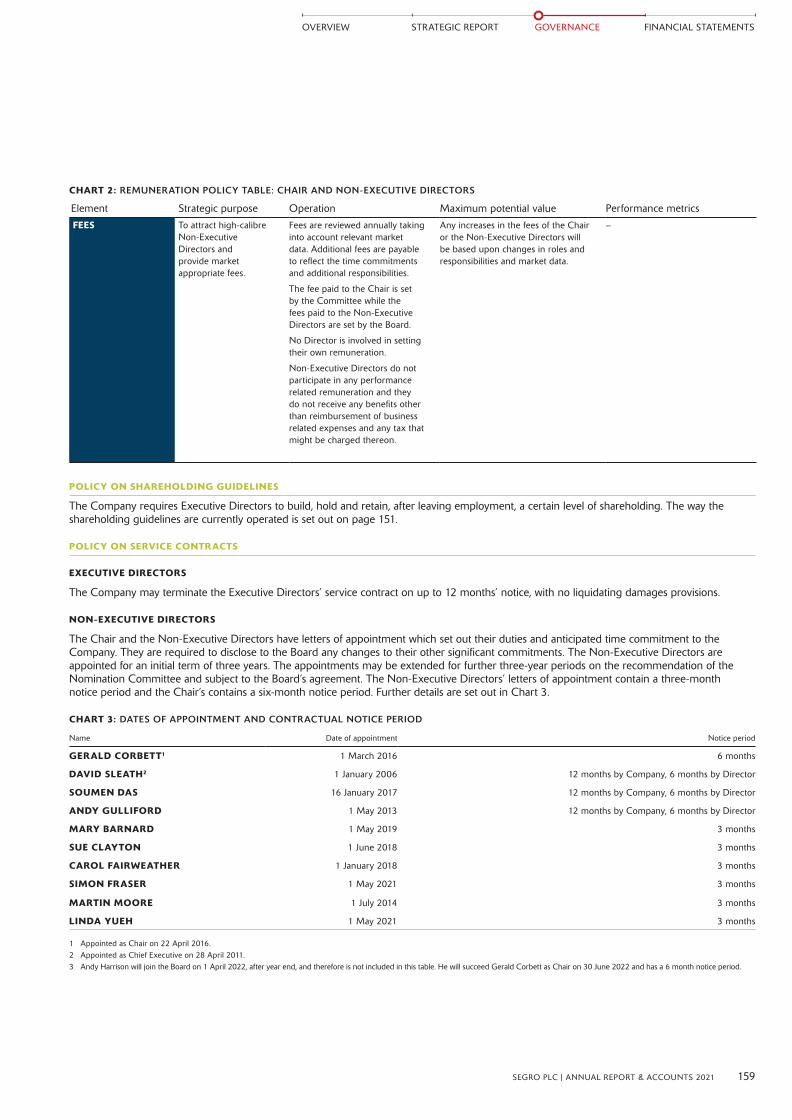
CHART 2: REMUNERATION POLICY TABLE: CHAIR AND NON-EXECUTIVE DIRECTORS
Element Strategic purpose Operation Maximum potential value Performance metrics
FEES To attract high-calibre Non-Executive Directors and provide market appropriate fees.
Fees are reviewed annually taking into account relevant market data. Additional fees are payable to reflect the time commitments and additional responsibilities.
The fee paid to the Chair is set by the Committee while the fees paid to the Non-Executive Directors are set by the Board.
No Director is involved in setting their own remuneration.
Non-Executive Directors do not participate in any performance related remuneration and they do not receive any benefits other than reimbursement of business related expenses and any tax that might be charged thereon.
Any increases in the fees of the Chair or the Non-Executive Directors will be based upon changes in roles and responsibilities and market data.
–
POLICY ON SHAREHOLDING GUIDELINES
The Company requires Executive Directors to build, hold and retain, after leaving employment, a certain level of shareholding. The way the shareholding guidelines are currently operated is set out on page 151.
POLICY ON SERVICE CONTRACTS
EXECUTIVE DIRECTORS
The Company may terminate the Executive Directors’ service contract on up to 12 months’ notice, with no liquidating damages provisions.
NON-EXECUTIVE DIRECTORS
The Chair and the Non-Executive Directors have letters of appointment which set out their duties and anticipated time commitment to the Company. They are required to disclose to the Board any changes to their other significant commitments. The Non-Executive Directors are appointed for an initial term of three years. The appointments may be extended for further three-year periods on the recommendation of the Nomination Committee and subject to the Board’s agreement. The Non-Executive Directors’ letters of appointment contain a three-month notice period and the Chair’s contains a six-month notice period. Further details are set out in Chart 3.
CHART 3: DATES OF APPOINTMENT AND CONTRACTUAL NOTICE PERIOD
Name Date of appointment Notice period
GERALD CORBETT1 1 March 2016 6 months
DAVID SLEATH2 1 January 2006 12 months by Company, 6 months by Director
SOUMEN DAS 16 January 2017 12 months by Company, 6 months by Director
ANDY GULLIFORD 1 May 2013 12 months by Company, 6 months by Director
MARY BARNARD 1 May 2019 3 months
SUE CLAYTON 1 June 2018 3 months
CAROL FAIRWEATHER 1 January 2018 3 months
SIMON FRASER 1 May 2021 3 months
MARTIN MOORE 1 July 2014 3 months
LINDA YUEH 1 May 2021 3 months
1 Appointed as Chair on 22 April 2016.2 Appointed as Chief Executive on 28 April 2011.3 Andy Harrison will join the Board on 1 April 2022, after year end, and therefore is not included in this table. He will succeed Gerald Corbett as Chair on 30 June 2022 and has a 6 month notice period.
159SEGRO PLC | ANNUAL REPORT & ACCOUNTS 2021
OVERVIEW STRATEGIC REPORT GOVERNANCE FINANCIAL STATEMENTS
10_Remuneration_136_164_v126.indd 15910_Remuneration_136_164_v126.indd 159 01/03/2022 17:2201/03/2022 17:22

Directors’ Remuneration Policy continued
POLICY ON RECRUITMENT
In determining appropriate remuneration for a new Executive Director, the Committee will take into consideration all relevant factors to ensure that arrangements are in the best interests of both the Company and its shareholders. The Committee may make an award in respect of a new appointment to ‘buy out’ incentive arrangements forfeited on leaving a previous employer. In doing so, the Committee will take account of relevant factors, including any performance conditions attached to these awards, the likelihood of those conditions being met, and the proportion of the vesting period remaining, and will seek to do no more than match the fair value of awards foregone. In limited circumstances where employees are awarded benefits for which Executive Directors are not eligible, such as share retention awards, the Committee would consider honouring existing awards should these employees be appointed to the Board.
CHART 4: RECRUITMENT POLICY
Component Approach Maximum opportunity
BASE SALARY The base salaries of new appointees will be determined taking into account the experience and skills of the individual, pay across the Group, relevant market data and their previous salary.
–
BONUS The structure set out in the Remuneration Policy table will apply to new appointees with the relevant maximum being pro-rated for their first year of employment.
150 per cent of salary.
DSBP The structure set out in the Remuneration Policy table will apply to new appointees. 50 per cent of the Bonus awarded will be deferred.
LTIP New appointees will be eligible for awards under the LTIP on the same terms as the other Executive Directors.
Maximum 300 per cent of salary in performance shares.
The Committee’s intention is to increase the LTIP opportunity to 300 per cent of salary for the Chief Executive only, other Executive Directors will continue to receive 250 per cent of salary and the Committee would not increase this without prior consultation with shareholders.
PENSION New appointees will be offered membership of the SEGRO plc Group Personal Pension Plan or a cash alternative.
The level provided to the majority of the UK workforce.
POLICY ON TERMINATION PAYMENTS
The Company retains the right to terminate the service contract of any Executive Director subject to contractually agreed payments in lieu of notice which are limited to annual salary plus any specified benefits. Payments are normally phased over the 12-month notice period, based on the principle of a Director’s duty to seek alternative employment and thereby mitigate their loss.
The Committee reserves the right to make additional exit payments where such payments are made in good faith, for example: in discharge of an existing legal obligation (or by way of damages for breach of such an obligation); or by way of settlement or compromise of any claim arising in connection with the termination of a Director’s office or employment. In determining compensation, the Committee will take into account the circumstances of the departure, best practice and the provisions of the Code, and will take legal advice on the Company’s liability to pay compensation.
Under the rules of the LTIP and the DSBP, the Committee has discretion to declare a Director leaving the Company to be a ‘good leaver’ as defined under the respective rules of the schemes. In respect of LTIP, this would normally allow the Directors, who the Committee determines to be good leavers, to receive their shares at the end of the holding period, subject to the achievement of performance conditions, with any vesting pro-rated in accordance with the proportion of the vesting period served. In respect of DSBP, this would normally allow the Directors, who the Committee determines to be good leavers, to receive their shares, in full, at the end of the holding period.
Where a Director may be entitled to pursue a claim against the Company in respect of their statutory employment rights or any other claim arising from the employment or its termination, the Company will be entitled to negotiate settlement terms (financial or otherwise) with the Director that the Committee considers to be reasonable in all the circumstances and in the best interests of the Company and to enter into a Settlement Agreement with the Director to effect both the terms agreed under the Service Agreement and any additional statutory or other claims, including bonus and/or share awards, in line with the policies described above.
In the event of a change of control of the Company, the Employee Benefit Trust, in consultation with the Company, has the discretion to determine whether, and the extent to which, awards vest. Financial performance and institutional guidelines would be taken into account in exercising this discretion.
Non-Executive Directors are not entitled to any compensation on loss of office.
160 SEGRO PLC | ANNUAL REPORT & ACCOUNTS 2021
GOVERNANCE
Remuneration
10_Remuneration_136_164_v126.indd 16010_Remuneration_136_164_v126.indd 160 01/03/2022 17:2201/03/2022 17:22

POLICY ON EXECUTIVE DIRECTORS’ EXTERNAL APPOINTMENTS
With the support of the Chair and Chief Executive, the Executive Directors may normally be permitted to take one non-executive directorship outside the Group, as these roles can broaden the experience brought to the Board. Such appointments require Board approval and the time commitment the appointment will require is taken into consideration. Executive Directors may retain fees for external appointments.
PERFORMANCE SCENARIOS
Chart 5 below sets out an indication of the level of remuneration that would be received by each Executive Director in accordance with the incentive opportunities outlined in this policy on the basis of the latest salary information.
CHART 5: INDICATION OF POTENTIAL REMUNERATION IN FIRST YEAR OF POLICY APPLICATION
The minimum remuneration payable comprises salary payable during 2022, benefits and cash in lieu of pension contributions. The maximum payable assumes full payout under the Bonus and full vesting of the LTIP. On target remuneration assumes a payout of 50 per cent of the maximum Bonus and a 20 per cent vesting of the LTIP. The impact of a 50 per cent share price growth on the maximum available opportunity has been indicated for the 2022 LTIP, which will vest in 2025 and then be subject to a two-year holding period.
CONSIDERATION OF CONDITIONS ELSEWHERE IN THE GROUP
The Remuneration Policy for the Executive Directors is designed with regard to the policy for the workforce as a whole. The Committee also approves the remuneration of the Executive Committee and the Company Secretary. The Committee is kept updated through the year on general employment conditions and it approves the budget for annual salary increases. In formulating the 2022 Policy, the Committee engaged with the workforce as detailed in the case study on page 150 of the Directors’ Remuneration Report.
CONSIDERATION OF SHAREHOLDER VIEWS
The Committee remains committed to open dialogue with shareholders on remuneration. When determining remuneration, the Committee takes into account the guidance of investor bodies and shareholder views. In 2021 and 2022, it consulted extensively with shareholders on the proposed changes to the 2022 Policy as covered in the Chair’s letter on pages 137 and 138.
The Chair of the Remuneration Committee is available for meetings with shareholders should they have any concerns about remuneration matters which they wish to discuss.
1,000,000 2,000,000 3,000,000 6,000,0005,000,0004,000,0000
Dav
id S
leat
hSo
umen
Das
And
y G
ullif
ord
Maximum
Maximum
Maximum
On Target
On Target
On Target
Minimum
Minimum
Minimum
Fixed Long TermShort Term 50% Share price growth on 2022 LTIP
161SEGRO PLC | ANNUAL REPORT & ACCOUNTS 2021
OVERVIEW STRATEGIC REPORT GOVERNANCE FINANCIAL STATEMENTS
10_Remuneration_136_164_v126.indd 16110_Remuneration_136_164_v126.indd 161 01/03/2022 17:2201/03/2022 17:22
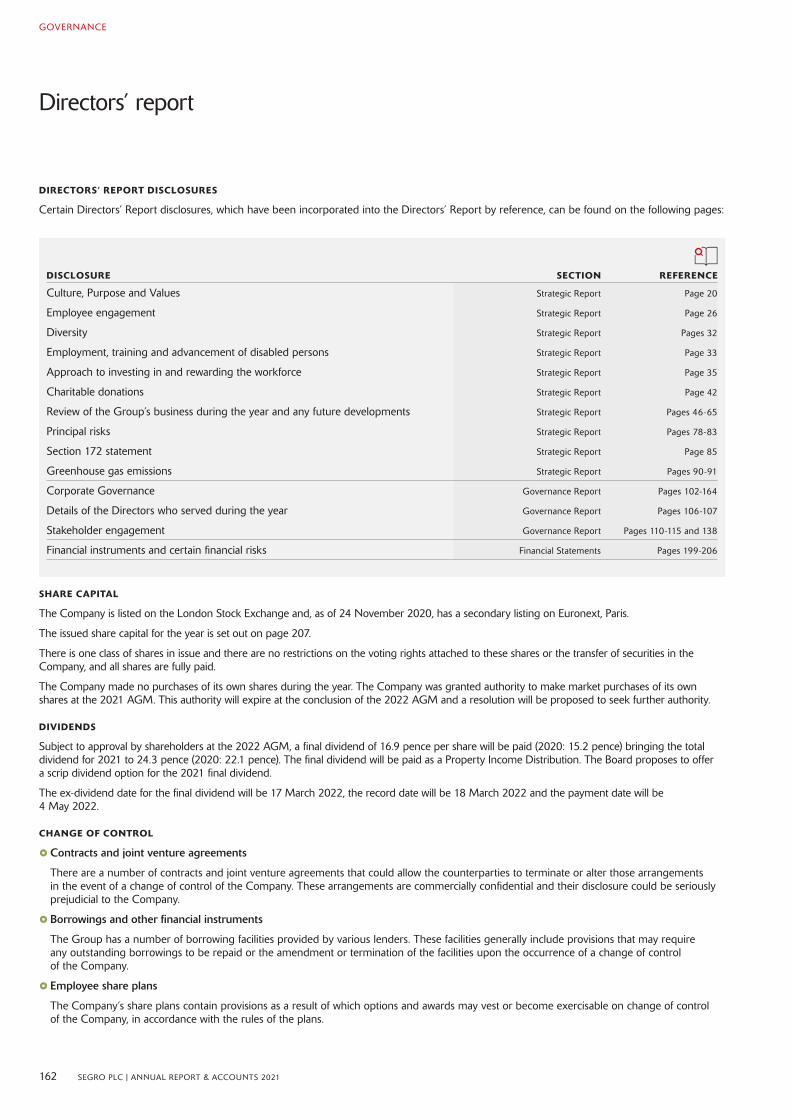
Directors’ report
DIRECTORS’ REPORT DISCLOSURES
Certain Directors’ Report disclosures, which have been incorporated into the Directors’ Report by reference, can be found on the following pages:
SHARE CAPITAL
The Company is listed on the London Stock Exchange and, as of 24 November 2020, has a secondary listing on Euronext, Paris.
The issued share capital for the year is set out on page 207.
There is one class of shares in issue and there are no restrictions on the voting rights attached to these shares or the transfer of securities in the Company, and all shares are fully paid.
The Company made no purchases of its own shares during the year. The Company was granted authority to make market purchases of its own shares at the 2021 AGM. This authority will expire at the conclusion of the 2022 AGM and a resolution will be proposed to seek further authority.
DIVIDENDS
Subject to approval by shareholders at the 2022 AGM, a final dividend of 16.9 pence per share will be paid (2020: 15.2 pence) bringing the total dividend for 2021 to 24.3 pence (2020: 22.1 pence). The final dividend will be paid as a Property Income Distribution. The Board proposes to offer a scrip dividend option for the 2021 final dividend.
The ex-dividend date for the final dividend will be 17 March 2022, the record date will be 18 March 2022 and the payment date will be 4 May 2022.
CHANGE OF CONTROL
} Contracts and joint venture agreements
There are a number of contracts and joint venture agreements that could allow the counterparties to terminate or alter those arrangements in the event of a change of control of the Company. These arrangements are commercially confidential and their disclosure could be seriously prejudicial to the Company.
} Borrowings and other financial instruments
The Group has a number of borrowing facilities provided by various lenders. These facilities generally include provisions that may require any outstanding borrowings to be repaid or the amendment or termination of the facilities upon the occurrence of a change of control of the Company.
} Employee share plans
The Company’s share plans contain provisions as a result of which options and awards may vest or become exercisable on change of control of the Company, in accordance with the rules of the plans.
DISCLOSURE SECTION REFERENCE
Culture, Purpose and Values Strategic Report Page 20
Employee engagement Strategic Report Page 26
Diversity Strategic Report Pages 32
Employment, training and advancement of disabled persons Strategic Report Page 33
Approach to investing in and rewarding the workforce Strategic Report Page 35
Charitable donations Strategic Report Page 42
Review of the Group’s business during the year and any future developments Strategic Report Pages 46-65
Principal risks Strategic Report Pages 78-83
Section 172 statement Strategic Report Page 85
Greenhouse gas emissions Strategic Report Pages 90-91
Corporate Governance Governance Report Pages 102-164
Details of the Directors who served during the year Governance Report Pages 106-107
Stakeholder engagement Governance Report Pages 110-115 and 138
Financial instruments and certain financial risks Financial Statements Pages 199-206
162 SEGRO PLC | ANNUAL REPORT & ACCOUNTS 2021
GOVERNANCE
10_Remuneration_136_164_v126.indd 16210_Remuneration_136_164_v126.indd 162 01/03/2022 17:2201/03/2022 17:22

EMPLOYEES AND DIRECTORS
There are no agreements between the Company and its Directors or employees providing for compensation for loss of office or employment that occurs specifically because of a takeover bid, with the exception of provisions of the Company’s share schemes as detailed above.
} Directors’ authorities in relation to shares
The Directors’ authorities in relation to issuing, allotting or buying back shares are governed by the Company’s Articles of Association and the resolutions passed by shareholders at a general meeting. These documents do not form part of this Report.
} Process for appointment/removal of Directors
The Company is governed by its Articles of Association, the UK Corporate Governance Code, the Companies Act 2006 and related legislation with regards to the appointment and removal of Directors. Directors are appointed by the Board and elected by shareholders. Directors may be removed by the Board or shareholders as applicable
SUBSTANTIAL INTERESTS IN THE SHARE CAPITAL OF THE COMPANY
Information provided to the Company under the Disclosure Guidance and Transparency Rules (DTR 5) is published on a Regulatory Information Service and on the Company’s website. As at 31 December 2021, the Company had been notified of the following holdings.
ShareholderNumber of
sharesPercentage of Issued
Share Capital
BlackRock, Inc 119,019,188 9.90
APG Asset Management N.V. 65,185,877 5.42
Norges Bank 60,284,703 5.01
On 10 February 2022, the Company was notified by BlackRock, Inc that their holding in the Company had increased to 120,314,774 shares representing 10.00 per cent of the issued share capital. No further announcements were made to the Company between 31 December 2021 and 17 February 2022.
ARTICLES OF ASSOCIATION
Shareholders may amend the Company’s Articles of Association by special resolution.
POLITICAL DONATIONS
No political donations were made by the Company or its subsidiaries during the year.
DIRECTORS’ INDEMNITIES AND INSURANCE
The Company maintains directors’ and officers’ liability insurance which is reviewed annually and is permitted under the Company’s Articles of Association and the Companies Act 2006. The Company indemnifies each Director, under a Deed of Indemnity, against any liability incurred in relation to acts or omissions arising in the ordinary course of their duties. The indemnity applies only to the extent permitted by law.
No Company Directors were indemnified during the year.
OVERSEAS BRANCHES
The Company has a branch in Paris, France.
AUDITOR OF THE COMPANY
A resolution to reappoint PricewaterhouseCoopers LLP as auditor of the Company is to be proposed at the 2022 AGM.
DISCLOSURE OF INFORMATION TO THE AUDITOR
Each of the persons who is a Director at the date of approval of this Report confirms that:
} so far as the Director is aware, there is no relevant audit information of which the Company’s auditor is unaware; and
} each Director has taken all the steps that they ought to have taken as a Director in order to make themself aware of any relevant audit information and to establish that the Company’s auditor is aware of that information.
This confirmation is given and should be interpreted in accordance with the provisions of section 418 of the Companies Act 2006.
The Directors’ Report has been approved by the Board and signed on its behalf by
JULIA FOOCOMPANY SECRETARY 17 FEBRUARY 2022
163SEGRO PLC | ANNUAL REPORT & ACCOUNTS 2021
OVERVIEW STRATEGIC REPORT GOVERNANCE FINANCIAL STATEMENTS
10_Remuneration_136_164_v126.indd 16310_Remuneration_136_164_v126.indd 163 01/03/2022 17:2201/03/2022 17:22

Statement of Directors’ responsibilities in respect of the Financial Statements
The Directors are responsible for preparing the Annual Report and the Financial Statements in accordance with applicable law and regulation.
Company law requires the Directors to prepare Financial Statements for each financial year. Under that law the Directors have prepared the Group and the Company Financial Statements in accordance with UK-adopted international accounting standards.
The Directors have also prepared the Group and the Company Financial Statements in accordance with international financial reporting standards adopted pursuant to Regulation (EC) No 1606/2002 as it applies in the European Union.
Under company law, Directors must not approve the Financial Statements unless they are satisfied that they give a true and fair view of the state of affairs of the Group and Company and of the profit or loss of the Group for that period. In preparing the Financial Statements, the Directors are required to:
} select suitable accounting policies and then apply them consistently;
} state whether applicable UK-adopted international accounting standards and international financial reporting standards adopted pursuant to Regulation (EC) No 1606/2002 as it applies in the European Union have been followed, subject to any material departures disclosed and explained in the Financial Statements;
}make judgements and accounting estimates that are reasonable and prudent; and
} prepare the Financial Statements on the going concern basis unless it is inappropriate to presume that the Group and Company will continue in business.
The Directors are also responsible for safeguarding the assets of the Group and Company and hence for taking reasonable steps for the prevention and detection of fraud and other irregularities.
The Directors are responsible for keeping adequate accounting records that are sufficient to show and explain the Group’s and Company’s transactions and disclose with reasonable accuracy at any time the financial position of the Group and Company and enable them to ensure that the Financial Statements and the Directors’ Remuneration Report comply with the Companies Act 2006.
The Directors are responsible for the maintenance and integrity of the Company’s website. Legislation in the United Kingdom governing the preparation and dissemination of Financial Statements may differ from legislation in other jurisdictions.
DIRECTORS’ CONFIRMATIONS
The Directors consider that the Annual Report and Accounts, taken as a whole, is fair, balanced and understandable and provides the information necessary for shareholders to assess the Group’s and Company’s position and performance, business model and strategy.
Each of the Directors, whose names and functions are listed in the Governance section of the Annual Report confirm that, to the best of their knowledge:
} the Group and Company Financial Statements, which have been prepared in accordance with UK-adopted international accounting standards and international financial reporting standards adopted pursuant to Regulation (EC) No 1606/2002 as it applies in the European Union, give a true and fair view of the assets, liabilities and financial position of the Group and Company, and of the profit of the Group; and
} the Strategic Report includes a fair review of the development and performance of the business and the position of the Group and Company, together with a description of the principal risks and uncertainties that it faces.
By order of the Board
DAVID SLEATH SOUMEN DAS CHIEF EXECUTIVE CHIEF FINANCIAL OFFICER 17 FEBRUARY 2022 17 FEBRUARY 2022
164 SEGRO PLC | ANNUAL REPORT & ACCOUNTS 2021
GOVERNANCE
10_Remuneration_136_164_v126.indd 16410_Remuneration_136_164_v126.indd 164 01/03/2022 17:2201/03/2022 17:22

FINANCIAL STATEMENTSSTRATEGIC REPORTOVERVIEW GOVERNANCE
165SEGRO PLC | ANNUAL REPORT & ACCOUNTS 2021
Financial Statements
In this section we present our Financial Statements for the year, presented in accordance with UK-adopted International Accounting Standards and with the requirements of the Companies Act 2006 and International Financial Reporting Standards adopted pursuant to Regulation (EC) No 1606/2002 as it applies in the European Union.
Independent Auditors’ Report to the members of SEGRO plc
Group Income Statement
Group Statement of Comprehensive Income
Balance Sheets
Statements of Changes in Equity
Cash Flow Statements
Notes to the Financial Statements
Five-year financial results
Further information
Shareholder information
Glossary of terms
p166
p174
p174
p175
p176
p178
p179
p227
p228
p229
p230
GOVERNANCE FINANCIAL STATEMENTSSTRATEGIC REPORTOVERVIEW
11_FinancialStatements_165_178_v51.indd 16511_FinancialStatements_165_178_v51.indd 165 01/03/2022 17:2301/03/2022 17:23
FINANCIAL STATEMENTS
166 SEGRO PLC | ANNUAL REPORT & ACCOUNTS 2021
REPORT ON THE AUDIT OF THE FINANCIAL STATEMENTS
OpinionIn our opinion, SEGRO plc’s Group financial statements and Company financial statements (the “financial statements”):
} give a true and fair view of the state of the Group’s and of the Company’s affairs as at 31 December 2021 and of the Group’s profit and the Group’s and Company’s cash flows for the year then ended;
} have been properly prepared in accordance with UK-adopted international accounting standards; and
} have been prepared in accordance with the requirements of the Companies Act 2006.
We have audited the financial statements, included within the Annual Report & Accounts 2021 (the “Annual Report”), which comprise: the Group and Company Balance Sheets as at 31 December 2021; the Group Income Statement and the Group Statement of Comprehensive Income, the Group and Company Cash Flow Statements, and the Group and Company Statements of Changes in Equity for the year then ended; and the notes to the financial statements, which include a description of the significant accounting policies.
Our opinion is consistent with our reporting to the Audit Committee.
Separate opinion in relation to international financial reporting standards adopted pursuant to Regulation (EC) No 1606/2002 as it applies in the European UnionAs explained in note 1 to the financial statements, the Group and Company, in addition to applying UK-adopted international accounting standards, have also applied international financial reporting standards adopted pursuant to Regulation (EC) No 1606/2002 as it applies in the European Union.
In our opinion, the Group and Company financial statements have been properly prepared in accordance with international financial reporting standards adopted pursuant to Regulation (EC) No 1606/2002 as it applies in the European Union.
Basis for opinionWe conducted our audit in accordance with International Standards on Auditing (UK) (“ISAs (UK)”), International Standards on Auditing issued by the International Auditing and Assurance Standards Board (“ISAs”) and applicable law. Our responsibilities under ISAs (UK) and ISAs are further described in the Auditors’ responsibilities for the audit of the financial statements section of our report. We believe that the audit evidence we have obtained is sufficient and appropriate to provide a basis for our opinion.
IndependenceWe remained independent of the Group in accordance with the ethical requirements that are relevant to our audit of the financial statements in the UK, which includes the FRC’s Ethical Standard, as applicable to listed public interest entities, and the International Code of Ethics for Professional Accountants (including International Independence Standards) issued by the International Ethics Standards Board for Accountants (IESBA Code), and we have fulfilled our other ethical responsibilities in accordance with these requirements.
To the best of our knowledge and belief, we declare that non-audit services prohibited by either the FRC’s Ethical Standard or Article 5(1) of Regulation (EU) No 537/2014 were not provided.
Other than those disclosed in Note 6 to the Financial Statements, we have provided no non-audit services to the Company or its controlled undertakings in the period under audit.
Our audit approachOverviewAudit scope
} Audit procedures on Rental Income and Valuation of Investment Properties are performed centrally by the Group audit team from the UK.
} Full scope audit of the SEGRO European Logistics Partnership (SELP) Joint Venture by component auditors.
} In addition, component auditors performed the audit of specific balances and transactions in certain territories.
} Due to the restrictions on travel and social distancing measures, enacted in response to Covid-19, the Group engagement team used video conferencing to oversee the component auditor work and had remote discussions with the management of each business unit.
}Over 90% coverage of Assets, Liabilities, Income and Expenditure of the Group.
Key audit matters
} Valuation of investment properties (Group)
} Large and/or complex transactions (Group and Company)
} Estimation of variable performance fee income (Group)
Materiality
}Overall Group materiality: £179m (2020: £127m) based on 1% of total assets.
}Overall Company materiality: £95m (2020: £89m) based on 1% of total assets.
} Performance materiality: £134m (2020: £95m) (Group) and £71m (2020: £67m) (Company).
Independent auditors’ report to the members of SEGRO plc
11_FinancialStatements_165_178_v51.indd 16611_FinancialStatements_165_178_v51.indd 166 01/03/2022 17:2301/03/2022 17:23

167SEGRO PLC | ANNUAL REPORT & ACCOUNTS 2021
FINANCIAL STATEMENTSSTRATEGIC REPORTOVERVIEW GOVERNANCE
The scope of our auditAs part of designing our audit, we determined materiality and assessed the risks of material misstatement in the financial statements.
Key audit mattersKey audit matters are those matters that, in the auditors’ professional judgement, were of most significance in the audit of the financial statements of the current period and include the most significant assessed risks of material misstatement (whether or not due to fraud) identified by the auditors, including those which had the greatest effect on: the overall audit strategy; the allocation of resources in the audit; and directing the efforts of the engagement team. These matters, and any comments we make on the results of our procedures thereon, were addressed in the context of our audit of the financial statements as a whole, and in forming our opinion thereon, and we do not provide a separate opinion on these matters.
This is not a complete list of all risks identified by our audit.
The estimation of variable performance fee income is a new key audit matter this year. Covid-19, which was a key audit matter last year, is no longer included because of the limited impact it has had on the Group and Company’s business and operations. Otherwise, the key audit matters below are consistent with last year.
Key audit matter How our audit addressed the key audit matter
Valuation of investment properties (Group)
Refer to the Audit Committee Report and the Financial Statements (including notes to the Financial Statements; Note 1, Significant accounting policies; Note 13, Properties; and Note 27, Property valuation techniques and related quantitative information). The Group’s investment properties were carried at £15,492 million as at 31 December 2021 and a total (realised and unrealised) property gain of £3,669 million was recognised in the Group Income Statement.
We focused on this area due to the existence of significant judgement, coupled with the fact that only small differences in individual property valuations when aggregated could result in a material misstatement. The portfolio includes warehouses and light industrial buildings, including data centres and for logistics operations. These are concentrated in the UK, France, Germany and Italy. The remainder of the portfolio is located across other European countries including Poland, Spain, the Netherlands and the Czech Republic.
The portfolio includes completed investments and properties under construction. The valuation of the Group’s portfolio is inherently subjective due to, among other factors, the individual nature of each property, its location and the expected future rentals for that particular property. The wider challenges currently facing the real estate sector as a result of Covid-19 and the impact of climate change further contributed to the subjectivity at 31 December 2021. For development sites, factors include projected costs to complete, time until practical completion and the ability to let if no pre-let agreement is in place. Valuations are carried out by third party valuers, CBRE (the ‘Valuers’). The Valuers were engaged by the Directors, and performed their work in accordance with the Royal Institution of Chartered Surveyors (‘RICS’) Valuation – Professional Standards. The valuations take into account the property-specific information including the current tenancy agreements and rental income, condition and location of the property, and future rental prospects, as well as prevailing market yields and market transactions. The valuation of investment properties may also impact the carrying value of investment in the subsidiaries within the Financial Statements of the Company.
Given the inherent subjectivity involved in the valuation of investment properties, the need for deep market knowledge when determining the most appropriate assumptions, and the technicalities of the valuation methodology, we engaged our internal valuation experts (qualified chartered surveyors) to assist us in our audit of this matter.
Assessing the Valuers’ expertise and objectivity
We assessed the Valuers’ qualifications and expertise and read their terms of engagement with the Group to determine whether there were any matters that might have affected their objectivity or may have imposed scope limitations upon their work. We also considered fees and other contractual arrangements that might exist between the Group and the Valuers. We found no evidence to suggest that the objectivity of the Valuers was compromised.
Testing the valuations
Assumptions and capital movement:
Our work covered the valuation of every material property in the Group. We obtained and read the CBRE valuation reports covering every property. We held meetings with management and the Valuers, at which the valuations and the key assumptions therein were discussed. We focused on the largest properties and any outliers (where the assumptions used and/or year on year capital value movement were out of line with externally published market data for the relevant sector). To verify that the valuation approach was suitable for use in determining the carrying value for investment properties in the Financial Statements, we:
} Confirmed that the valuation approach was in accordance with RICS standards; } Obtained valuation details of every property held by the Group and set an expected range for yield and capital value movement, determined by reference to published benchmarks and using our experience and knowledge of the market. Compared the investment yields used by the Valuers with the expected range of yields and the year on year capital movement to our expected range; } Assessed the reasonableness of other assumptions that are not so readily comparable with published benchmarks, such as Estimated Rental Value; }With the support of our internal valuation experts, we also questioned the external valuers as to the extent to which recent market transactions and expected rental values which they made use of in deriving their valuations took into account the impact of climate change and related ESG considerations; and } Verified where there could be alternative use opportunities, that this had been appropriately taken into account.
Where assumptions were outside the expected range or otherwise appeared unusual, and/or valuations showed unexpected movements, we undertook further investigations and, when necessary, held further discussions with the Valuers and obtained evidence to support explanations received. The supporting evidence and valuation commentaries provided by the Valuers, enabled us to consider the property specific factors that had or may have had an impact on value, including recent comparable transactions where appropriate.
Information and standing data:
We tested the standing data the Group provided to the Valuers for use in the performance of the valuation. This involved re-performing controls on a sample basis over the input of lease data for leases and testing the accuracy of lease and other property information. For development properties, we also confirmed that the supporting information for construction contracts and budgets was consistent with the Group’s records, for example by inspecting construction contracts. For development properties, capitalised expenditure was tested on a sample basis to invoices, and budgeted costs to complete were compared with supporting evidence (for example construction contracts) to support the inputs included within their valuation at the year end. We agreed the amounts per the valuation reports to the accounting records and from there we agreed the related balances through to the Financial Statements.
Overall outcome
We concluded that the assumptions used in the valuations by the Valuers were supportable in light of the evidence obtained and the disclosures within the Financial Statements are sufficient and appropriate.
11_FinancialStatements_165_178_v51.indd 16711_FinancialStatements_165_178_v51.indd 167 01/03/2022 17:2301/03/2022 17:23

FINANCIAL STATEMENTS
168 SEGRO PLC | ANNUAL REPORT & ACCOUNTS 2021
Key audit matter How our audit addressed the key audit matter
Large and/or complex transactions (Group and Company)
Refer to the Audit Committee Report and the Financial Statements (including notes to the Financial Statements; Note 1, Significant accounting policies; Note 13, Investment properties; and Note 16, Net borrowings).
Group
There was a large asset acquisition of a portfolio of offices on Bath Road, Slough, in the current year. This warranted additional audit focus due to the size and nature of the transaction.
Group and Company
In September 2021, the Group raised the Group raised €500 million (£415 million as at 31 December 2021) through a green bond issue. The Company was the guarantor for the issue and received the proceeds as part of the flow of funds into the Group. This warranted additional audit focus due to the magnitude of the transaction and proceeds generated.
For each large and/or complex transaction identified, we made inquiries with management in order to understand their nature and obtained supporting documentation as necessary to verify the transactions. We assessed the proposed accounting treatment in relation to the Group’s accounting policies and relevant IFRSs.
Acquisition of Bath Road, Slough office portfolio
We tested the acquisition by examining:
} The purchase and sale agreement;
} Bank statements to agree funds paid;
}Management’s assessment of the concentration test in IFRS 3 to support judgments applied in concluding on asset acquisition accounting; and
} Completion accounts to agree the amounts recorded.
We also tested management’s analysis of the purchase price to assets acquired and liabilities assumed.
Bond issue
We tested the bond issue by examining:
} The subscription agreement and prospectus, including assessing whether there were any conditions which would result in further accounting entries and disclosures being required;
} Third party data to confirm the security details such the nominal value, coupon rates and maturity dates; and
} Bank statements to agree funds received in the Company.
Overall outcome
No material issues were identified as a result of our testing.
Estimation of variable performance fee income (Group)
Refer to the Audit Committee Report and the Financial Statements (including notes to the Financial Statements; Note 1, Significant accounting policies; and Note 7, Investments in joint ventures and subsidiaries). Performance fees are payable from the SELP joint venture to SEGRO. The fee is based on the joint venture’s performance over the 10 year performance period and payable subject to meeting certain criteria and hurdle rates at the end of the period. The variable nature of the consideration gives rise to significant estimation uncertainty which is sensitive to movements and assumptions in property valuations over the remaining performance period to October 2023. Performance fee income of £26m has been recorded in the year representing the estimated amount that is highly probable will not result in a significant future reversal.
We understood and evaluated the key controls in place around performance fee income.
Given the performance fee estimation calculation is performed by SELP which is subject to a full scope audit by component auditors, we engaged with our component auditor team during the audit process to direct the nature, timing and extent of procedures.
This covered testing of the key data input into the calculation, testing of the mathematical accuracy of the calculation, an assessment of key assumptions used and performing sensitivity analysis. Our involvement in the component auditors work incorporated a review of their workpapers including those related to the audit procedures on the performance fee calculation.
We assessed the proposed accounting treatment in relation to the Group’s accounting policies and IFRS 15 Revenue from contracts with customers.
We challenged management on the estimation of the performance fee income recorded and the basis of their conclusion of the threshold at which they consider the highly probable criteria to have been met. We debated possible alternative views that the threshold could reasonably be at a higher or lower level resulting in lower or higher performance fee income being recognised for the year to 31 December 2021.
We have assessed the appropriateness of financial reporting disclosures related to the performance fee including the amount recorded based on management’s judgment of the not highly probable of significant reversal threshold, the range of the potential fee and the sensitivity of the fee to the potential property value fluctuations, highlighting it as an area of significant estimation uncertainty. We have agreed the performance fee income per the calculation to the amount recorded in the Income Statement.
Overall outcome
No material issues were identified as a result of our testing. We consider the additional disclosures within the Financial Statements, including the range of potential income receivable and sensitivities to property value fluctuations to be appropriate.
How we tailored the audit scopeWe tailored the scope of our audit to ensure that we performed enough work to be able to give an opinion on the financial statements as a whole, taking into account the structure of the Group and the Company, the accounting processes and controls, and the industry in which they operate.
Independent auditors’ report to the members of SEGRO plc continued
11_FinancialStatements_165_178_v51.indd 16811_FinancialStatements_165_178_v51.indd 168 01/03/2022 17:2301/03/2022 17:23
169SEGRO PLC | ANNUAL REPORT & ACCOUNTS 2021
FINANCIAL STATEMENTSSTRATEGIC REPORTOVERVIEW GOVERNANCE
The Group’s reportable segments are the geographical Business Units: Greater London, Thames Valley, National Logistics, Northern Europe, Southern Europe and Central Europe. In establishing the overall approach to the Group audit, we determined the type of work that needed to be performed at reporting components by us, as the Group engagement team, or component auditors operating under our instruction.
The Group operates a common IT environment, processes and controls for rental income and payroll across all its reported segments. The Group’s valuation and treasury functions are also based at the corporate centre in the UK. The related balances were therefore largely audited by the Group audit team from the UK. Additional specified procedures were performed by audit teams on location in each business unit, such that the total testing programme provided sufficient audit evidence over all financial statement line items.
The SELP Joint Venture was included as being in scope for a full scope audit. As above, the work on rental income and valuation of investment properties for the Joint Venture was performed by the Group audit team. We determined the level of involvement we needed to have in the component auditor’s work to be able to conclude whether sufficient appropriate audit evidence had been obtained as a basis for our opinion on the Group financial statements as a whole. We issued formal, written instructions to the component auditors setting out the work to be performed by each of them. Although we have not been able to visit our component teams or perform site visits this year due to the pandemic, throughout the audit process, the Group audit team has had various interactions through the use of video call technology with the audit teams on location in each business unit to oversee the audit process. Senior team members also attended via video conference the clearance meetings for each component. During the clearance meetings, the results of the work performed by all component teams were discussed. The Group engagement team also evaluated the sufficiency of the audit evidence obtained by component teams. Taking into account the components and Joint Ventures subject to a full scope audit, the centralised and other testing performed, coverage over the Group Balance Sheet and Group Income Statement was as follows: Assets 92% coverage
Liabilities 90% coverage
Income 90% coverage
Expenditure 90% coverage
The audit of the Company Financial Statements was performed entirely by the Group audit team in the UK, leveraging on the work performed on the Group audit where appropriate with additional audit procedures performed on other Company specific balances. As part of our audit we made enquiries of management to understand the process they have adopted to assess the potential impact of climate change on the financial statements. Management considers that the impact of climate change does not give rise to a material financial statement impact. We used our knowledge of the Group to evaluate management’s assessment. We particularly considered how climate change risks could impact the assumptions, such as capital expenditure, made in the valuation of investment property. We also considered the consistency of the disclosures in relation to climate change made in the other information within the Annual Report with the financial statements and our knowledge from our audit.
MaterialityThe scope of our audit was influenced by our application of materiality. We set certain quantitative thresholds for materiality. These, together with qualitative considerations, helped us to determine the scope of our audit and the nature, timing and extent of our audit procedures on the individual financial statement line items and disclosures and in evaluating the effect of misstatements, both individually and in aggregate on the financial statements as a whole.
Based on our professional judgement, we determined materiality for the financial statements as a whole as follows:
Financial statements – Group Financial statements – Company
Overall materiality £179m (2020: £127m). £95m (2020: £89m).
How we determined it 1% of total assets 1% of total assets
Rationale for benchmark applied The primary measurement attribute of the Group is the carrying value of property investments. On this basis, we set an overall Group materiality level based on total assets.
The primary measurement attribute of the Company is the carrying value of investments in subsidiaries. On this basis, we set an overall Company materiality level based on total assets.
In addition to overall Group materiality, a specific materiality was also applied to Income Statement line items that impact EPRA Earnings, which is based on profit before tax, adjusted to exclude fair value gain/(losses) on investment property and derivatives. We set a specific materiality level of £17.1 million (2020: £14.8 million), equating to 5% of EPRA Earnings. In arriving at this judgement, we considered the fact that EPRA Earning is a secondary financial indicator of the Group (refer to the Strategic Report where the term is defined in full).
For each component in the scope of our Group audit, we allocated a materiality that is less than our overall Group materiality. The range of materiality allocated across components was between £85m and £160m. Certain components were audited to a local statutory audit materiality that was also less than our overall Group materiality.
We use performance materiality to reduce to an appropriately low level the probability that the aggregate of uncorrected and undetected misstatements exceeds overall materiality. Specifically, we use performance materiality in determining the scope of our audit and the nature and extent of our testing of account balances, classes of transactions and disclosures, for example in determining sample sizes. Our performance materiality was 75% (2020: 75%) of overall materiality, amounting to £134m (2020: £95m) for the Group financial statements and £71m (2020: £67m) for the Company financial statements.
In determining the performance materiality, we considered a number of factors – the history of misstatements, risk assessment and aggregation risk and the effectiveness of controls – and concluded that an amount at the upper end of our normal range was appropriate.
We agreed with the Audit Committee that we would report to them misstatements identified during our audit above £8.9m (Group audit) (2020: £6.3m) and £4.7m (Company audit) (2020: £4.5m) as well as misstatements below those amounts that, in our view, warranted reporting for qualitative reasons.
11_FinancialStatements_165_178_v51.indd 16911_FinancialStatements_165_178_v51.indd 169 01/03/2022 17:2301/03/2022 17:23

FINANCIAL STATEMENTS
170 SEGRO PLC | ANNUAL REPORT & ACCOUNTS 2021
Conclusions relating to going concernOur evaluation of the directors’ assessment of the Group’s and the Company’s ability to continue to adopt the going concern basis of accounting included:
} Procedures to identify events or conditions that may cast significant doubt on the ability to continue as a going concern and whether or not a material uncertainty related to going concern exists;
}Obtaining the directors’ assessment of going concern and assessing the current impact of severe, but plausible, downside scenarios and the basis for the downside stress scenarios that have been applied;
} Evaluation of management’s significant assumptions used to assess going concern, including whether or not they are appropriate in the context of changes from prior periods, maintain adequate support, and align with our understanding of the entity and other relevant areas of the entity’s business activities;
} Review of potential financial or non-financial debt covenant defaults leading to acceleration of repayment; and
} Assessing the Group and Company’s liquidity and whether the entity has adequately disclosed all required going concern events and conditions.
Based on the work we have performed, we have not identified any material uncertainties relating to events or conditions that, individually or collectively, may cast significant doubt on the Group’s and the Company’s ability to continue as a going concern for a period of at least twelve months from when the financial statements are authorised for issue.
In auditing the financial statements, we have concluded that the directors’ use of the going concern basis of accounting in the preparation of the financial statements is appropriate.
As not all future events or conditions can be predicted, this conclusion is not a guarantee as to the Group’s and the Company’s ability to continue as a going concern.
In relation to the directors’ reporting on how they have applied the UK Corporate Governance Code, we have nothing material to add or draw attention to in relation to the directors’ statement in the financial statements about whether the directors considered it appropriate to adopt the going concern basis of accounting.
Our responsibilities and the responsibilities of the directors with respect to going concern are described in the relevant sections of this report.
Reporting on other informationThe other information comprises all of the information in the Annual Report other than the financial statements and our auditors’ report thereon. The directors are responsible for the other information, which includes reporting based on the Task Force on Climate-related Financial Disclosures (TCFD) recommendations. Our opinion on the financial statements does not cover the other information and, accordingly, we do not express an audit opinion or, except to the extent otherwise explicitly stated in this report, any form of assurance thereon.
In connection with our audit of the financial statements, our responsibility is to read the other information and, in doing so, consider whether the other information is materially inconsistent with the financial statements or our knowledge obtained in the audit, or otherwise appears to be materially misstated. If we identify an apparent material inconsistency or material misstatement, we are required to perform procedures to conclude whether there is a material misstatement of the financial statements or a material misstatement of the other information. If, based on the work we have performed, we conclude that there is a material misstatement of this other information, we are required to report that fact. We have nothing to report based on these responsibilities.
With respect to the Strategic report and Directors’ Report, we also considered whether the disclosures required by the UK Companies Act 2006 have been included.
Based on our work undertaken in the course of the audit, the Companies Act 2006 requires us also to report certain opinions and matters as described below.
Strategic report and Directors’ ReportIn our opinion, based on the work undertaken in the course of the audit, the information given in the Strategic report and Directors’ Report for the year ended 31 December 2021 is consistent with the financial statements and has been prepared in accordance with applicable legal requirements.
In light of the knowledge and understanding of the Group and Company and their environment obtained in the course of the audit, we did not identify any material misstatements in the Strategic report and Directors’ Report.
Directors’ RemunerationIn our opinion, the part of the Directors’ Remuneration Report to be audited has been properly prepared in accordance with the Companies Act 2006.
Independent auditors’ report to the members of SEGRO plc continued
11_FinancialStatements_165_178_v51.indd 17011_FinancialStatements_165_178_v51.indd 170 01/03/2022 17:2301/03/2022 17:23
171SEGRO PLC | ANNUAL REPORT & ACCOUNTS 2021
FINANCIAL STATEMENTSSTRATEGIC REPORTOVERVIEW GOVERNANCE
Corporate governance statementThe Listing Rules require us to review the directors’ statements in relation to going concern, longer-term viability and that part of the corporate governance statement relating to the Company’s compliance with the provisions of the UK Corporate Governance Code specified for our review. Our additional responsibilities with respect to the corporate governance statement as other information are described in the Reporting on other information section of this report.
Based on the work undertaken as part of our audit, we have concluded that each of the following elements of the corporate governance statement is materially consistent with the financial statements and our knowledge obtained during the audit, and we have nothing material to add or draw attention to in relation to:
} The directors’ confirmation that they have carried out a robust assessment of the emerging and principal risks;
} The disclosures in the Annual Report that describe those principal risks, what procedures are in place to identify emerging risks and an explanation of how these are being managed or mitigated;
} The directors’ statement in the financial statements about whether they considered it appropriate to adopt the going concern basis of accounting in preparing them, and their identification of any material uncertainties to the Group’s and Company’s ability to continue to do so over a period of at least twelve months from the date of approval of the financial statements;
} The directors’ explanation as to their assessment of the Group’s and Company’s prospects, the period this assessment covers and why the period is appropriate; and
} The directors’ statement as to whether they have a reasonable expectation that the Company will be able to continue in operation and meet its liabilities as they fall due over the period of its assessment, including any related disclosures drawing attention to any necessary qualifications or assumptions.
Our review of the directors’ statement regarding the longer-term viability of the Group was substantially less in scope than an audit and only consisted of making inquiries and considering the directors’ process supporting their statement; checking that the statement is in alignment with the relevant provisions of the UK Corporate Governance Code; and considering whether the statement is consistent with the financial statements and our knowledge and understanding of the Group and Company and their environment obtained in the course of the audit.
In addition, based on the work undertaken as part of our audit, we have concluded that each of the following elements of the corporate governance statement is materially consistent with the financial statements and our knowledge obtained during the audit:
} The directors’ statement that they consider the Annual Report, taken as a whole, is fair, balanced and understandable, and provides the information necessary for the members to assess the Group’s and Company’s position, performance, business model and strategy;
} The section of the Annual Report that describes the review of effectiveness of risk management and internal control systems; and
} The section of the Annual Report describing the work of the Audit Committee.
We have nothing to report in respect of our responsibility to report when the directors’ statement relating to the Company’s compliance with the Code does not properly disclose a departure from a relevant provision of the Code specified under the Listing Rules for review by the auditors.
Responsibilities for the Financial Statements and the audit
Responsibilities of the Directors for the Financial StatementsAs explained more fully in the Statement of Directors’ responsibilities in respect of the Financial Statements, the directors are responsible for the preparation of the financial statements in accordance with the applicable framework and for being satisfied that they give a true and fair view. The directors are also responsible for such internal control as they determine is necessary to enable the preparation of financial statements that are free from material misstatement, whether due to fraud or error.
In preparing the financial statements, the directors are responsible for assessing the Group’s and the Company’s ability to continue as a going concern, disclosing, as applicable, matters related to going concern and using the going concern basis of accounting unless the directors either intend to liquidate the Group or the Company or to cease operations, or have no realistic alternative but to do so.
Auditors’ responsibilities for the audit of the Financial StatementsOur objectives are to obtain reasonable assurance about whether the financial statements as a whole are free from material misstatement, whether due to fraud or error, and to issue an auditors’ report that includes our opinion. Reasonable assurance is a high level of assurance, but is not a guarantee that an audit conducted in accordance with ISAs (UK) and ISAs will always detect a material misstatement when it exists. Misstatements can arise from fraud or error and are considered material if, individually or in the aggregate, they could reasonably be expected to influence the economic decisions of users taken on the basis of these financial statements.
Irregularities, including fraud, are instances of non-compliance with laws and regulations. We design procedures in line with our responsibilities, outlined above, to detect material misstatements in respect of irregularities, including fraud. The extent to which our procedures are capable of detecting irregularities, including fraud, is detailed below.
11_FinancialStatements_165_178_v51.indd 17111_FinancialStatements_165_178_v51.indd 171 01/03/2022 17:2301/03/2022 17:23

FINANCIAL STATEMENTS
172 SEGRO PLC | ANNUAL REPORT & ACCOUNTS 2021
Based on our understanding of the Group and industry, we identified that the principal risks of non-compliance with laws and regulations related to compliance with the Real Estate Investment Trust (REIT) status and SIIC regime, and we considered the extent to which non-compliance might have a material effect on the financial statements. We also considered those laws and regulations that have a direct impact on the financial statements such as the Companies Act 2006. We evaluated management’s incentives and opportunities for fraudulent manipulation of the financial statements (including the risk of override of controls), and determined that the principal risks were related to journal entries to increase revenue or reduce expenditure, and management bias in accounting estimates and judgemental areas of the Financial Statements such as valuation of investment properties. The Group engagement team shared this risk assessment with the component auditors so that they could include appropriate audit procedures in response to such risks in their work. Audit procedures performed by the Group engagement team and/or component auditors included:
} Discussions with management and internal audit, including consideration of known or suspected instances of non-compliance with laws and regulations and fraud, and review of the reports made by internal audit;
} Understanding management’s internal controls designed to prevent and detect irregularities;
} Assessment of matters, if any, reported on the Group’s whistleblowing helpline and the results of management’s investigation of such matters;
} Reviewing the Group’s litigation register in so far as it related to non-compliance with laws and regulations and fraud;
} Reviewing relevant meeting minutes, including those of the Board of Directors and the Audit Committee;
} Designing audit procedures to incorporate unpredictability around the nature, timing and extent of our testing;
} Review of tax compliance with the involvement of our tax specialists in the audit;
} Procedures relating to the valuation of investment properties described in the related key audit matter above; and
} Identifying and testing journal entries, in particular any journal entries posted with unusual account combinations or posted by users posting a low number of journals in the period.
There are inherent limitations in the audit procedures described above. We are less likely to become aware of instances of non-compliance with laws and regulations that are not closely related to events and transactions reflected in the financial statements. Also, the risk of not detecting a material misstatement due to fraud is higher than the risk of not detecting one resulting from error, as fraud may involve deliberate concealment by, for example, forgery or intentional misrepresentations, or through collusion.
Our audit testing might include testing complete populations of certain transactions and balances, possibly using data auditing techniques. However, it typically involves selecting a limited number of items for testing, rather than testing complete populations. We will often seek to target particular items for testing based on their size or risk characteristics. In other cases, we will use audit sampling to enable us to draw a conclusion about the population from which the sample is selected.
A further description of our responsibilities for the audit of the financial statements in accordance with ISAs (UK) is located on the FRC’s website at: www.frc.org.uk/auditorsresponsibilities. This description forms part of our auditors’ report.
As part of an audit in accordance with ISAs, we exercise professional judgement and maintain professional scepticism throughout the audit. We also:
} Identify and assess the risks of material misstatement of the consolidated financial statements, whether due to fraud or error, design and perform audit procedures responsive to those risks, and obtain audit evidence that is sufficient and appropriate to provide a basis for our opinion. The risk of not detecting a material misstatement resulting from fraud is higher than for one resulting from error, as fraud may involve collusion, forgery, intentional omissions, misrepresentations, or the override of internal control.
}Obtain an understanding of internal control relevant to the audit in order to design audit procedures that are appropriate in the circumstances, but not for the purpose of expressing an opinion on the effectiveness of the Group’s and Company’s internal control.
} Evaluate the appropriateness of accounting policies used and the reasonableness of accounting estimates and related disclosures made by management.
} Conclude on the appropriateness of management’s use of the going concern basis of accounting and, based on the audit evidence obtained, whether a material uncertainty exists related to events or conditions that may cast significant doubt on the Group’s and Company’s ability to continue as a going concern. If we conclude that a material uncertainty exists, we are required to draw attention in our auditors’ report to the related disclosures in the consolidated financial statements or, if such disclosures are inadequate, to modify our opinion. Our conclusions are based on the audit evidence obtained up to the date of our auditors’ report. However, future events or conditions may cause the Group to cease to continue as a going concern.
} Evaluate the overall presentation, structure and content of the consolidated financial statements, including the disclosures, and whether the consolidated financial statements represent the underlying transactions and events in a manner that achieves fair presentation.
}Obtain sufficient appropriate audit evidence regarding the financial information of the entities or business activities within the Group and Company to express an opinion on the consolidated financial statements. We are responsible for the direction, supervision and performance of the Group and Company audit. We remain solely responsible for our audit opinion.
We communicate with those charged with governance regarding, among other matters, the planned scope and timing of the audit and significant audit findings, including any significant deficiencies in internal control that we identify during our audit.
Independent auditors’ report to the members of SEGRO plc continued
11_FinancialStatements_165_178_v51.indd 17211_FinancialStatements_165_178_v51.indd 172 01/03/2022 17:2301/03/2022 17:23
173SEGRO PLC | ANNUAL REPORT & ACCOUNTS 2021
FINANCIAL STATEMENTSSTRATEGIC REPORTOVERVIEW GOVERNANCE
We also provide those charged with governance with a statement that we have complied with relevant ethical requirements regarding independence, and to communicate with them all relationships and other matters that may reasonably be thought to bear on our independence, and where applicable, actions taken to eliminate threats or safeguards applied.
From the matters communicated with those charged with governance, we determine those matters that were of most significance in the audit of the consolidated financial statements of the current period and are therefore the key audit matters. We describe these matters in our auditors’ report unless law or regulation precludes public disclosure about the matter or when, in extremely rare circumstances, we determine that a matter should not be communicated in our report because the adverse consequences of doing so would reasonably be expected to outweigh the public interest benefits of such communication.
Use of this reportThis report, including the opinions, has been prepared for and only for the Company’s members as a body in accordance with Chapter 3 of Part 16 of the Companies Act 2006 and for no other purpose. We do not, in giving these opinions, accept or assume responsibility for any other purpose or to any other person to whom this report is shown or into whose hands it may come save where expressly agreed by our prior consent in writing.
OTHER REQUIRED REPORTING
Companies Act 2006 exception reportingUnder the Companies Act 2006 we are required to report to you if, in our opinion:
} we have not obtained all the information and explanations we require for our audit; or
} adequate accounting records have not been kept by the Company, or returns adequate for our audit have not been received from branches not visited by us; or
} certain disclosures of directors’ remuneration specified by law are not made; or
} the Company financial statements and the part of the Directors’ Remuneration Report to be audited are not in agreement with the accounting records and returns.
We have no exceptions to report arising from this responsibility.
AppointmentFollowing the recommendation of the Audit Committee, we were appointed by the members on 22 April 2016 to audit the financial statements for the year ended 31 December 2016 and subsequent financial periods. The period of total uninterrupted engagement is six years, covering the years ended 31 December 2016 to 31 December 2021.
Other matterIn due course, as required by the Financial Conduct Authority Disclosure Guidance and Transparency Rule 4.1.14R, these financial statements will form part of the ESEF-prepared annual financial report filed on the National Storage Mechanism of the Financial Conduct Authority in accordance with the ESEF Regulatory Technical Standard (‘ESEF RTS’). This auditors’ report provides no assurance over whether the annual financial report will be prepared using the single electronic format specified in the ESEF RTS.
JOHN WATERS (SENIOR STATUTORY AUDITOR)FOR AND ON BEHALF OF PRICEWATERHOUSECOOPERS LLPCHARTERED ACCOUNTANTS AND STATUTORY AUDITORSLONDON17 FEBRUARY 2022
11_FinancialStatements_165_178_v51.indd 17311_FinancialStatements_165_178_v51.indd 173 01/03/2022 17:2301/03/2022 17:23

FINANCIAL STATEMENTS
Group Income StatementFor the year ended 31 December 2021
174 SEGRO PLC | ANNUAL REPORT & ACCOUNTS 2021
Notes2021
£m2020
£m
Revenue 4 546 432
Costs 5 (140) (104)
406 328
Administration expenses 6 (59) (52)
Share of profit from joint ventures after tax 7 461 236
Realised and unrealised property gain 8 3,669 989
Operating profit 4,477 1,501
Finance income 9 35 50
Finance costs 9 (157) (87)
Profit before tax 4,355 1,464
Tax 10 (288) (35)
Profit after tax 4,067 1,429
Attributable to equity shareholders 4,060 1,427
Attributable to non-controlling interests 7 2
Earnings per share (pence)Basic 12 339.0 124.1
Diluted 12 338.1 123.6
Group Statement of Comprehensive IncomeFor the year ended 31 December 2021
2021 £m
2020 £m
Profit for the year 4,067 1,429
Items that may be reclassified subsequently to profit or loss
Foreign exchange movement arising on translation of international operations (184) 112
Fair value movements on derivatives and borrowings in effective hedge relationships 74 (52)
(110) 60
Tax on components of other comprehensive (expense)/income – –
Other comprehensive (expense)/income (110) 60
Total comprehensive income for the year 3,957 1,489
Attributable to equity shareholders 3,949 1,487
Attributable to non-controlling interests 8 2
11_FinancialStatements_165_178_v51.indd 17411_FinancialStatements_165_178_v51.indd 174 01/03/2022 17:2301/03/2022 17:23
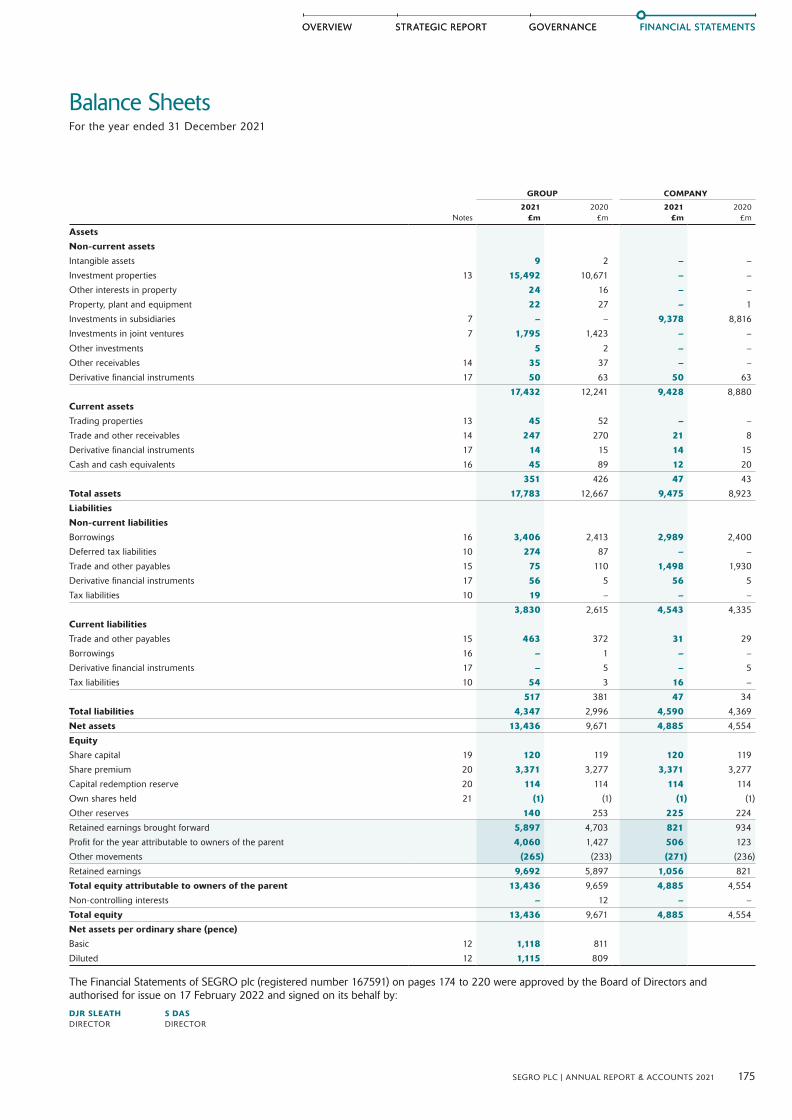
FINANCIAL STATEMENTSSTRATEGIC REPORTOVERVIEW GOVERNANCE
Balance SheetsFor the year ended 31 December 2021
175SEGRO PLC | ANNUAL REPORT & ACCOUNTS 2021
GOVERNANCE FINANCIAL STATEMENTSSTRATEGIC REPORTOVERVIEW
GROUP COMPANY
Notes2021
£m2020
£m2021
£m2020
£m
AssetsNon-current assetsIntangible assets 9 2 – –
Investment properties 13 15,492 10,671 – –
Other interests in property 24 16 – –
Property, plant and equipment 22 27 – 1
Investments in subsidiaries 7 – – 9,378 8,816
Investments in joint ventures 7 1,795 1,423 – –
Other investments 5 2 – –
Other receivables 14 35 37 – –
Derivative financial instruments 17 50 63 50 63
17,432 12,241 9,428 8,880
Current assetsTrading properties 13 45 52 – –
Trade and other receivables 14 247 270 21 8
Derivative financial instruments 17 14 15 14 15
Cash and cash equivalents 16 45 89 12 20
351 426 47 43
Total assets 17,783 12,667 9,475 8,923
Liabilities
Non-current liabilities
Borrowings 16 3,406 2,413 2,989 2,400
Deferred tax liabilities 10 274 87 – –
Trade and other payables 15 75 110 1,498 1,930
Derivative financial instruments 17 56 5 56 5
Tax liabilities 10 19 – – –
3,830 2,615 4,543 4,335
Current liabilities
Trade and other payables 15 463 372 31 29
Borrowings 16 – 1 – –
Derivative financial instruments 17 – 5 – 5
Tax liabilities 10 54 3 16 –
517 381 47 34
Total liabilities 4,347 2,996 4,590 4,369
Net assets 13,436 9,671 4,885 4,554
Equity
Share capital 19 120 119 120 119
Share premium 20 3,371 3,277 3,371 3,277
Capital redemption reserve 20 114 114 114 114
Own shares held 21 (1) (1) (1) (1)
Other reserves 140 253 225 224
Retained earnings brought forward 5,897 4,703 821 934
Profit for the year attributable to owners of the parent 4,060 1,427 506 123
Other movements (265) (233) (271) (236)
Retained earnings 9,692 5,897 1,056 821
Total equity attributable to owners of the parent 13,436 9,659 4,885 4,554
Non-controlling interests – 12 – –
Total equity 13,436 9,671 4,885 4,554
Net assets per ordinary share (pence)Basic 12 1,118 811
Diluted 12 1,115 809
The Financial Statements of SEGRO plc (registered number 167591) on pages 174 to 220 were approved by the Board of Directors and authorised for issue on 17 February 2022 and signed on its behalf by:
DJR SLEATH S DAS DIRECTOR DIRECTOR
11_FinancialStatements_165_178_v51.indd 17511_FinancialStatements_165_178_v51.indd 175 01/03/2022 17:2301/03/2022 17:23

FINANCIAL STATEMENTS
176 SEGRO PLC | ANNUAL REPORT & ACCOUNTS 2021
Statements of Changes in EquityFor the year ended 31 December 2021
Attributable to owners of the parent
Other reserves
Group
Ordinary share
capital £m
Share premium
£m
Capital redemption
reserve1
£m
Own shares
held £m
Share-based
payments reserves1
£m
Translation, hedging
and other reserves1
£m
Merger reserve1
£m
Retained earnings
£m
Total equity attributable
to owners of the parent
£m
Non-controlling
interests2
£m
Total equity
£m
Balance at 1 January 2021 119 3,277 114 (1) 22 62 169 5,897 9,659 12 9,671Profit for the year – – – – – – – 4,060 4,060 7 4,067Other comprehensive (expense)/income – – – – – (111) – – (111) 1 (110)Total comprehensive (expense)/income for the year – – – – – (111) – 4,060 3,949 8 3,957Transactions with owners of the Company Issue of shares – 1 – – – – – – 1 – 1Own shares acquired – – – (3) – – – – (3) – (3)Equity-settled share-based transactions – – – 3 (2) – – 6 7 – 7Dividends 1 93 – – – – – (270) (176) (4) (180)Movement in non-controlling interest2 – – – – – – – (1) (1) (16) (17)Total transaction with owners of the Company 1 94 – – (2) – – (265) (172) (20) (192)
Balance at 31 December 2021 120 3,371 114 (1) 20 (49) 169 9,692 13,436 – 13,436
1 See Note 20.2 Non-controlling interests at 31 December 2021 relate to Vailog S.r.l. During the year the non-controlling interests held in Sofibus Patrimoine SA were acquired by the Group.
For the year ended 31 December 2020Attributable to owners of the parent
Other reserves
Group
Ordinary share
capital£m
Share premium
£m
Capital redemption
reserve1
£m
Own shares
held£m
Share-based
paymentsreserves1
£m
Translation, hedging
and other reserves1
£m
Merger reserve1
£m
Retained earnings
£m
Total equity attributable
to owners of the parent
£m
Non-controlling
interests2
£m
Total equity
£m
Balance at 1 January 2020 109 2,554 114 (3) 29 2 169 4,703 7,677 – 7,677
Profit for the year – – – – – – – 1,427 1,427 2 1,429
Other comprehensive income – – – – – 60 – – 60 – 60
Total comprehensive income for the year – – – – – 60 – 1,427 1,487 2 1,489
Transactions with owners of the Company
Issue of shares 9 663 – – – – – – 672 – 672
Own shares acquired – – – (2) – – – – (2) – (2)
Equity-settled share-based transactions – – – 4 (7) – – 9 6 – 6
Dividends 1 60 – – – – – (240) (179) – (179)
Movement in non-controlling interest2 – – – – – – – (2) (2) 10 8
Total transaction with owners of the Company 10 723 – 2 (7) – – (233) 495 10 505
Balance at 31 December 2020 119 3,277 114 (1) 22 62 169 5,897 9,659 12 9,671
1 See Note 20.2 Non-controlling interests relate to Vailog S.r.l and Sofibus Patrimoine SA. During the year non-controlling interests of £12 million were recognised upon the acquisition of Sofibus Patrimoine SA.
11_FinancialStatements_165_178_v51.indd 17611_FinancialStatements_165_178_v51.indd 176 01/03/2022 17:2301/03/2022 17:23
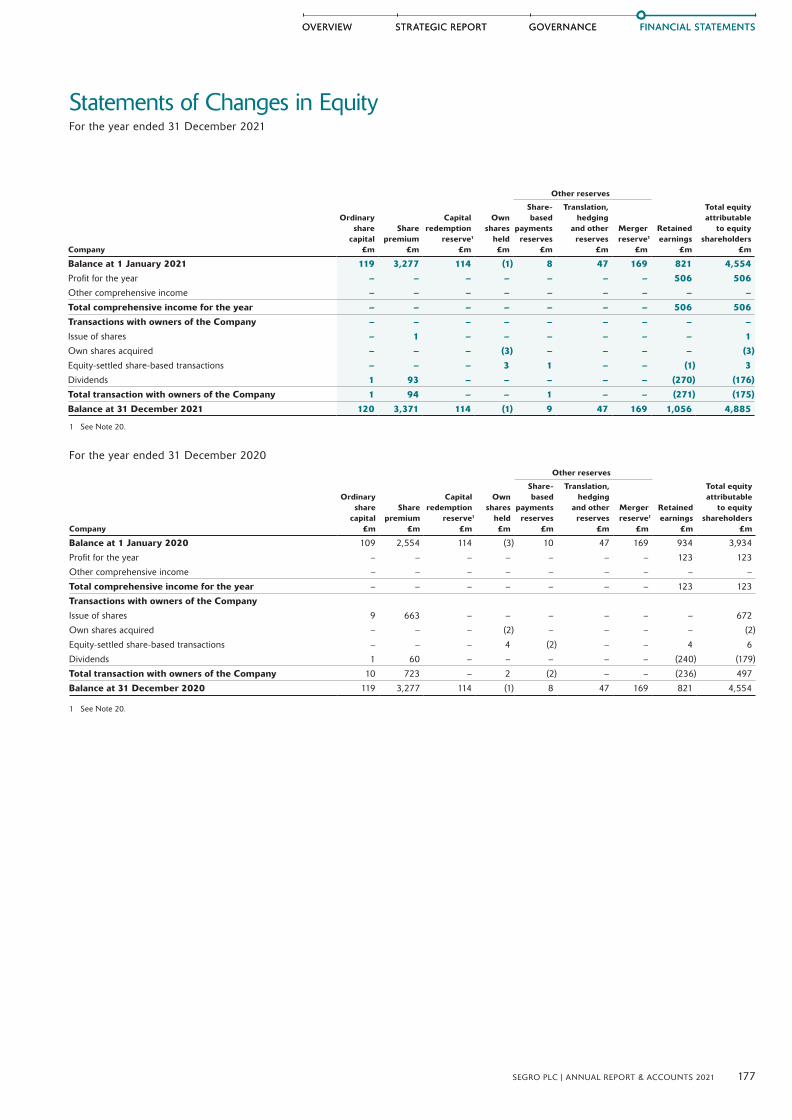
FINANCIAL STATEMENTSSTRATEGIC REPORTOVERVIEW GOVERNANCE
177SEGRO PLC | ANNUAL REPORT & ACCOUNTS 2021
Statements of Changes in EquityFor the year ended 31 December 2021
GOVERNANCE FINANCIAL STATEMENTSSTRATEGIC REPORTOVERVIEW
Other reserves
Company
Ordinary share
capital£m
Share premium
£m
Capital redemption
reserve1
£m
Own shares
held£m
Share-based
payments reserves
£m
Translation, hedging
and other reserves
£m
Merger reserve1
£m
Retained earnings
£m
Total equity attributable
to equity shareholders
£m
Balance at 1 January 2021 119 3,277 114 (1) 8 47 169 821 4,554Profit for the year – – – – – – – 506 506Other comprehensive income – – – – – – – – –Total comprehensive income for the year – – – – – – – 506 506Transactions with owners of the Company – – – – – – – – –Issue of shares – 1 – – – – – – 1Own shares acquired – – – (3) – – – – (3)Equity-settled share-based transactions – – – 3 1 – – (1) 3Dividends 1 93 – – – – – (270) (176)Total transaction with owners of the Company 1 94 – – 1 – – (271) (175)Balance at 31 December 2021 120 3,371 114 (1) 9 47 169 1,056 4,885
1 See Note 20.
For the year ended 31 December 2020Other reserves
Company
Ordinary share
capital£m
Share premium
£m
Capital redemption
reserve1
£m
Own shares
held£m
Share-based
payments reserves
£m
Translation, hedging
and other reserves
£m
Merger reserve1
£m
Retained earnings
£m
Total equity attributable
to equity shareholders
£m
Balance at 1 January 2020 109 2,554 114 (3) 10 47 169 934 3,934
Profit for the year – – – – – – – 123 123
Other comprehensive income – – – – – – – – –
Total comprehensive income for the year – – – – – – – 123 123
Transactions with owners of the Company
Issue of shares 9 663 – – – – – – 672
Own shares acquired – – – (2) – – – – (2)
Equity-settled share-based transactions – – – 4 (2) – – 4 6
Dividends 1 60 – – – – – (240) (179)
Total transaction with owners of the Company 10 723 – 2 (2) – – (236) 497
Balance at 31 December 2020 119 3,277 114 (1) 8 47 169 821 4,554
1 See Note 20.
11_FinancialStatements_165_178_v51.indd 17711_FinancialStatements_165_178_v51.indd 177 01/03/2022 17:2301/03/2022 17:23
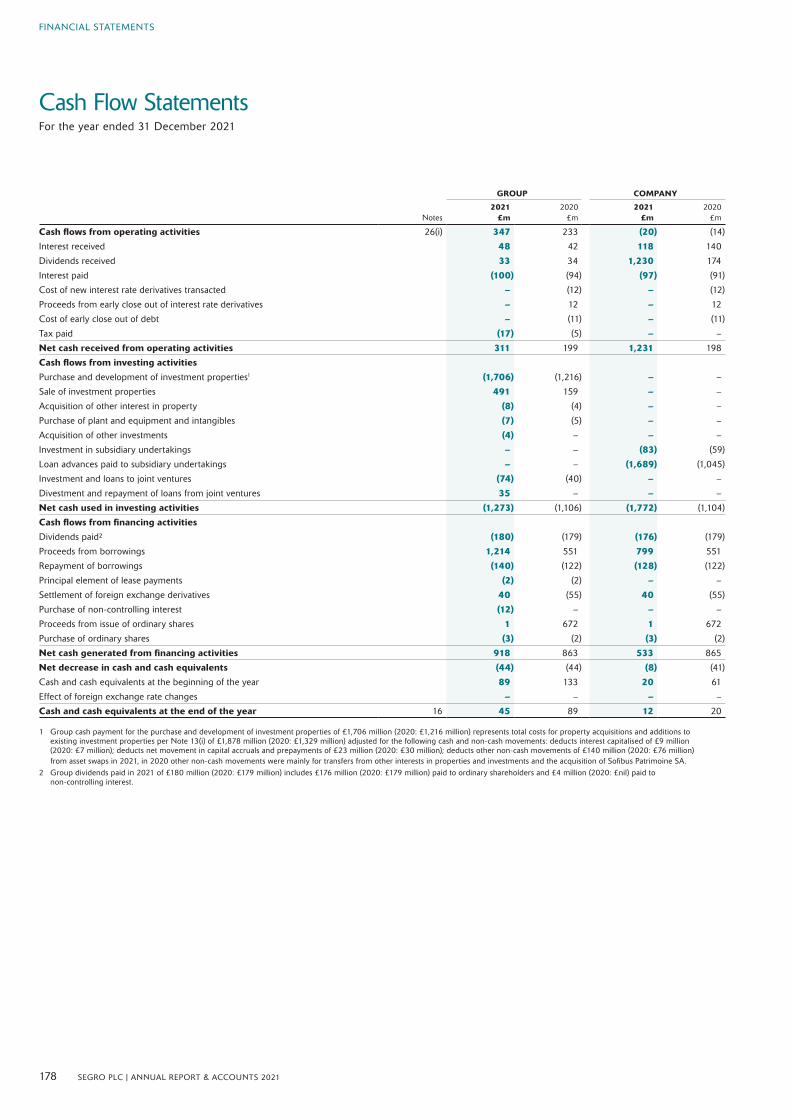
FINANCIAL STATEMENTS
178 SEGRO PLC | ANNUAL REPORT & ACCOUNTS 2021
Cash Flow StatementsFor the year ended 31 December 2021
GROUP COMPANY
Notes2021
£m2020
£m2021
£m2020
£m
Cash flows from operating activities 26(i) 347 233 (20) (14)
Interest received 48 42 118 140
Dividends received 33 34 1,230 174
Interest paid (100) (94) (97) (91)
Cost of new interest rate derivatives transacted – (12) – (12)
Proceeds from early close out of interest rate derivatives – 12 – 12
Cost of early close out of debt – (11) – (11)
Tax paid (17) (5) – –
Net cash received from operating activities 311 199 1,231 198
Cash flows from investing activitiesPurchase and development of investment properties1 (1,706) (1,216) – –
Sale of investment properties 491 159 – –
Acquisition of other interest in property (8) (4) – –
Purchase of plant and equipment and intangibles (7) (5) – –
Acquisition of other investments (4) – – –
Investment in subsidiary undertakings – – (83) (59)
Loan advances paid to subsidiary undertakings – – (1,689) (1,045)
Investment and loans to joint ventures (74) (40) – –
Divestment and repayment of loans from joint ventures 35 – – –
Net cash used in investing activities (1,273) (1,106) (1,772) (1,104)
Cash flows from financing activities
Dividends paid² (180) (179) (176) (179)
Proceeds from borrowings 1,214 551 799 551
Repayment of borrowings (140) (122) (128) (122)
Principal element of lease payments (2) (2) – –
Settlement of foreign exchange derivatives 40 (55) 40 (55)
Purchase of non-controlling interest (12) – – –
Proceeds from issue of ordinary shares 1 672 1 672
Purchase of ordinary shares (3) (2) (3) (2)
Net cash generated from financing activities 918 863 533 865
Net decrease in cash and cash equivalents (44) (44) (8) (41)
Cash and cash equivalents at the beginning of the year 89 133 20 61
Effect of foreign exchange rate changes – – – –
Cash and cash equivalents at the end of the year 16 45 89 12 20
1 Group cash payment for the purchase and development of investment properties of £1,706 million (2020: £1,216 million) represents total costs for property acquisitions and additions to existing investment properties per Note 13(i) of £1,878 million (2020: £1,329 million) adjusted for the following cash and non-cash movements: deducts interest capitalised of £9 million (2020: £7 million); deducts net movement in capital accruals and prepayments of £23 million (2020: £30 million); deducts other non-cash movements of £140 million (2020: £76 million) from asset swaps in 2021, in 2020 other non-cash movements were mainly for transfers from other interests in properties and investments and the acquisition of Sofibus Patrimoine SA.
2 Group dividends paid in 2021 of £180 million (2020: £179 million) includes £176 million (2020: £179 million) paid to ordinary shareholders and £4 million (2020: £nil) paid to non-controlling interest.
11_FinancialStatements_165_178_v51.indd 17811_FinancialStatements_165_178_v51.indd 178 01/03/2022 17:2301/03/2022 17:23
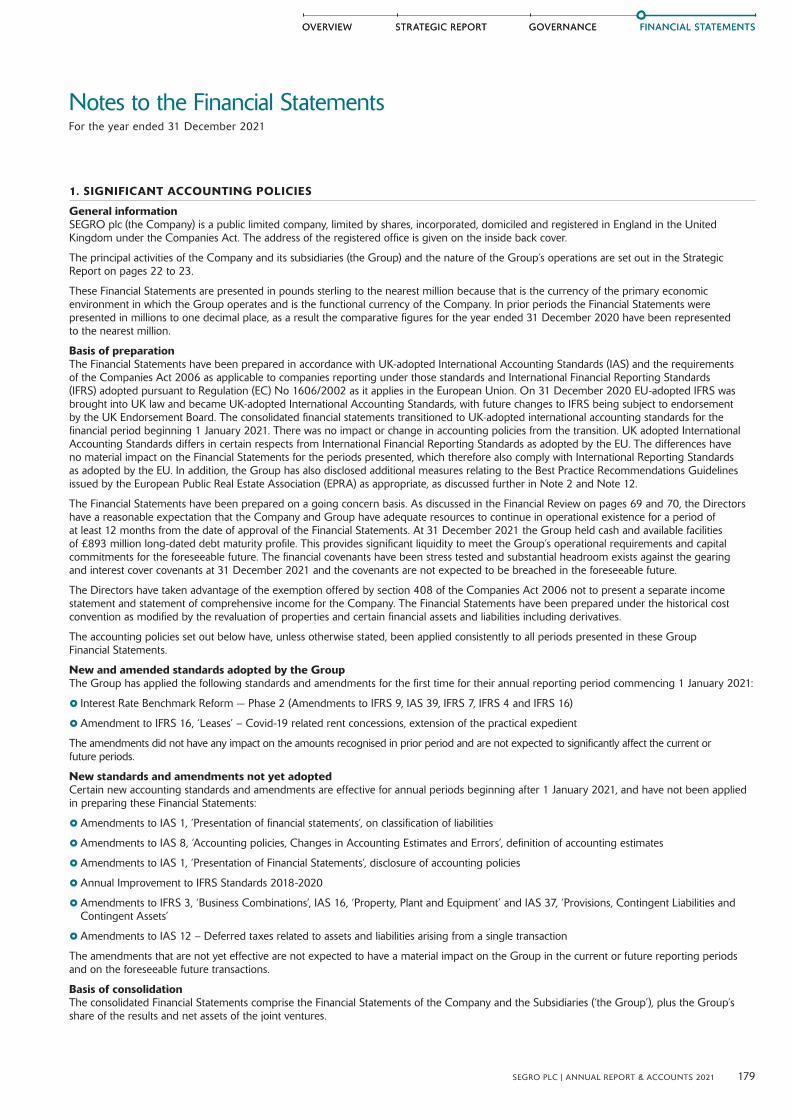
FINANCIAL STATEMENTSFINANCIAL STATEMENTS
179SEGRO PLC | ANNUAL REPORT & ACCOUNTS 2021
STRATEGIC REPORTOVERVIEW GOVERNANCEGOVERNANCESTRATEGIC REPORTOVERVIEW
Notes to the Financial StatementsFor the year ended 31 December 2021
1. SIGNIFICANT ACCOUNTING POLICIES
General informationSEGRO plc (the Company) is a public limited company, limited by shares, incorporated, domiciled and registered in England in the United Kingdom under the Companies Act. The address of the registered office is given on the inside back cover.
The principal activities of the Company and its subsidiaries (the Group) and the nature of the Group’s operations are set out in the Strategic Report on pages 22 to 23.
These Financial Statements are presented in pounds sterling to the nearest million because that is the currency of the primary economic environment in which the Group operates and is the functional currency of the Company. In prior periods the Financial Statements were presented in millions to one decimal place, as a result the comparative figures for the year ended 31 December 2020 have been represented to the nearest million.
Basis of preparationThe Financial Statements have been prepared in accordance with UK-adopted International Accounting Standards (IAS) and the requirements of the Companies Act 2006 as applicable to companies reporting under those standards and International Financial Reporting Standards (IFRS) adopted pursuant to Regulation (EC) No 1606/2002 as it applies in the European Union. On 31 December 2020 EU-adopted IFRS was brought into UK law and became UK-adopted International Accounting Standards, with future changes to IFRS being subject to endorsement by the UK Endorsement Board. The consolidated financial statements transitioned to UK-adopted international accounting standards for the financial period beginning 1 January 2021. There was no impact or change in accounting policies from the transition. UK adopted International Accounting Standards differs in certain respects from International Financial Reporting Standards as adopted by the EU. The differences have no material impact on the Financial Statements for the periods presented, which therefore also comply with International Reporting Standards as adopted by the EU. In addition, the Group has also disclosed additional measures relating to the Best Practice Recommendations Guidelines issued by the European Public Real Estate Association (EPRA) as appropriate, as discussed further in Note 2 and Note 12.
The Financial Statements have been prepared on a going concern basis. As discussed in the Financial Review on pages 69 and 70, the Directors have a reasonable expectation that the Company and Group have adequate resources to continue in operational existence for a period of at least 12 months from the date of approval of the Financial Statements. At 31 December 2021 the Group held cash and available facilities of £893 million long-dated debt maturity profile. This provides significant liquidity to meet the Group’s operational requirements and capital commitments for the foreseeable future. The financial covenants have been stress tested and substantial headroom exists against the gearing and interest cover covenants at 31 December 2021 and the covenants are not expected to be breached in the foreseeable future.
The Directors have taken advantage of the exemption offered by section 408 of the Companies Act 2006 not to present a separate income statement and statement of comprehensive income for the Company. The Financial Statements have been prepared under the historical cost convention as modified by the revaluation of properties and certain financial assets and liabilities including derivatives.
The accounting policies set out below have, unless otherwise stated, been applied consistently to all periods presented in these Group Financial Statements.
New and amended standards adopted by the GroupThe Group has applied the following standards and amendments for the first time for their annual reporting period commencing 1 January 2021:
} Interest Rate Benchmark Reform — Phase 2 (Amendments to IFRS 9, IAS 39, IFRS 7, IFRS 4 and IFRS 16)
} Amendment to IFRS 16, ‘Leases’ – Covid-19 related rent concessions, extension of the practical expedient
The amendments did not have any impact on the amounts recognised in prior period and are not expected to significantly affect the current or future periods.
New standards and amendments not yet adoptedCertain new accounting standards and amendments are effective for annual periods beginning after 1 January 2021, and have not been applied in preparing these Financial Statements:
} Amendments to IAS 1, ‘Presentation of financial statements’, on classification of liabilities
} Amendments to IAS 8, ‘Accounting policies, Changes in Accounting Estimates and Errors’, definition of accounting estimates
} Amendments to IAS 1, ‘Presentation of Financial Statements’, disclosure of accounting policies
} Annual Improvement to IFRS Standards 2018-2020
} Amendments to IFRS 3, ‘Business Combinations’, IAS 16, ‘Property, Plant and Equipment’ and IAS 37, ‘Provisions, Contingent Liabilities and Contingent Assets’
} Amendments to IAS 12 – Deferred taxes related to assets and liabilities arising from a single transaction
The amendments that are not yet effective are not expected to have a material impact on the Group in the current or future reporting periods and on the foreseeable future transactions.
Basis of consolidationThe consolidated Financial Statements comprise the Financial Statements of the Company and the Subsidiaries (‘the Group’), plus the Group’s share of the results and net assets of the joint ventures.
12_NotesToFinStatements_179_227_v110.indd 17912_NotesToFinStatements_179_227_v110.indd 179 01/03/2022 17:2401/03/2022 17:24

FINANCIAL STATEMENTS
180 SEGRO PLC | ANNUAL REPORT & ACCOUNTS 2021
Notes to the Financial Statements continuedFor the year ended 31 December 2021
1. SIGNIFICANT ACCOUNTING POLICIES CONTINUED
SubsidiariesSubsidiaries are entities controlled by the Group. The Group controls an entity when it is exposed to, or has rights to, variable returns from its involvement with the entity and has the ability to affect those returns through its power over the entity. In assessing control, the Group takes into consideration potential voting rights. The acquisition date is the date on which control is transferred to the acquirer. The Financial Statements of subsidiaries are included in the consolidated Financial Statements from the date that control commences until the date that control ceases. Losses applicable to the non-controlling interests in a subsidiary are allocated to the non-controlling interests even if doing so causes the non-controlling interests to have a deficit balance.
Investments and loans in subsidiaries held by the CompanyInvestments and loans in subsidiaries held by the Company are stated at cost less any impairment. Impairment of loans is calculated in accordance with IFRS 9 and impairment of investments is calculated in accordance with IAS 36 with further details provided in Note 7(iv).
Joint venturesA joint venture is a contract under which the Group and other parties undertake an activity or invest in an entity, under joint control. The Group uses equity accounting for such entities, carrying its investment at cost plus the movement in the Group’s share of net assets after acquisition, less impairment.
Transactions eliminated on consolidationIntra-group balances and transactions, and any unrealised income and expenses arising from intra-group transactions, are eliminated. Unrealised gains arising from transactions with equity-accounted investees are eliminated against the investment to the extent of the Group’s interest in the investee. Unrealised losses are eliminated in the same way as unrealised gains, but only to the extent that there is no evidence of impairment on the asset transferred.
Business combinationsThe acquisition of subsidiaries is accounted for using the acquisition method. The cost of the acquisition is measured at the aggregate of the fair values of assets given, liabilities incurred or assumed, and equity instruments issued by the Group in exchange for control of the acquiree. Acquisition related costs are recognised in the Income Statement as incurred. The acquiree’s identifiable assets, liabilities and contingent liabilities that meet the conditions for recognition under IFRS 3 are recognised at their fair value at the acquisition date, except for non-current assets (or disposal groups) that are classified as held for sale in accordance with IFRS 5 ‘Non-Current Assets Held for Sale and Discontinued Operations’, which are recognised and measured at fair value less costs to sell.
Goodwill arising on acquisition is recognised as an asset measured at cost, being the excess of the cost of the business combination over the Group’s interest in the net fair value of the identifiable assets, liabilities and contingent liabilities recognised. If, after reassessment, the Group’s interest in the net fair value of the acquiree’s identifiable assets, liabilities and contingent liabilities exceeds the cost of the business combination, the excess is recognised immediately in the Income Statement.
The interest of non-controlling interest shareholders in the acquiree is initially measured at their proportion of the net fair value of the assets, liabilities and contingent liabilities recognised.
When the consideration transferred by the Group in a business combination includes a contingent consideration arrangement, the contingent consideration is measured at its acquisition-date fair value. Changes in fair value of the contingent consideration that qualify as measurement period adjustments are adjusted retrospectively, with corresponding adjustments against goodwill. Measurement period adjustments are adjustments that arise from additional information obtained during the ‘measurement period’ (which cannot exceed one year from the acquisition date) about facts and circumstances that existed at the acquisition date.
Contingent consideration that is classified as an asset or a liability is re-measured at subsequent reporting dates in accordance with IFRS 9, as appropriate, with the corresponding gain or loss being recognised in the Income Statement.
If the business combination is achieved in stages, the acquisition date carrying value of the acquirer’s previously held equity interest in the acquiree is remeasured to fair value at the acquisition date. Any gains or losses arising from such remeasurement are recognised in the Income Statement within realised and unrealised property gain. The same treatment is applied for acquisitions of a subsidiary achieved in stages that meet the IFRS 3 concentration test to be treated as an asset acquisition.
For acquisitions of a subsidiary that meet the IFRS 3 concentration test to be treated as an asset acquisition, the Group allocates the cost between the individual identifiable assets and liabilities in the Group based on their relative fair values at the date of acquisition. Such transactions do not give rise to goodwill, generally no deferred tax is recognised on initial temporary differences and transaction costs are capitalised. The Group has elected to initially measure the interest of non-controlling interest shareholders in the acquiree at their proportion of the acquisition date net fair value of the assets, liabilities and contingent liabilities recognised.
Foreign currency transactionsForeign currency transactions are translated to the respective functional currency of Group entities at the foreign exchange rate ruling on the transaction date. Foreign exchange gains and losses resulting from settling these, or from retranslating monetary assets and liabilities held in foreign currencies, are booked in the Income Statement. The exception is for foreign currency loans and derivatives that hedge investments in foreign subsidiaries, where exchange differences are booked in equity until the investment is realised.
Consolidation of foreign entitiesAssets and liabilities of foreign entities are translated into sterling at exchange rates ruling at the Balance Sheet date. Their income, expenses and cash flows are translated at the average rate for the period or at spot rate for significant items. Resultant exchange differences are booked in Other Comprehensive Income and recognised in the Group Income Statement when the operation is sold.
The principal exchange rates used to translate foreign currency denominated amounts in 2021 are:
Balance Sheet: £1 = €1.19 (31 December 2020: £1 = €1.12). Income Statement: £1= €1.16 (2020: £1 = €1.13).
12_NotesToFinStatements_179_227_v110.indd 18012_NotesToFinStatements_179_227_v110.indd 180 01/03/2022 17:2401/03/2022 17:24
FINANCIAL STATEMENTSFINANCIAL STATEMENTS
181SEGRO PLC | ANNUAL REPORT & ACCOUNTS 2021
STRATEGIC REPORTOVERVIEW GOVERNANCEGOVERNANCESTRATEGIC REPORTOVERVIEW
1. SIGNIFICANT ACCOUNTING POLICIES CONTINUED
Investment propertiesThese properties include completed properties that are generating rent or are available for rent, and development properties that are under development or available for development. Investment properties comprise freehold and leasehold properties and are first measured at cost (including transaction costs), then revalued to market value at each reporting date by professional valuers. Lease liabilities associated with leasehold properties are accounted for under IFRS 16, see the Leases accounting policy. If a valuation obtained for a property held under a lease is net of all payments expected to be made, any related lease liability recognised separately in the Balance Sheet is added back to arrive at the carrying value of the investment property for accounting purposes. Valuation gains and losses in a period are taken to the Income Statement. As the Group uses the fair value model, as per IAS 40 ‘Investment Property’, no depreciation is provided. An asset will be classified as held for sale within investment properties, in line with IFRS 5 ‘Non-Current Assets Held for Sale and Discontinued Operations’, where the asset is available for immediate sale in their present condition and the sale is highly probable.
Investment properties are transferred to trading properties when there is a change in use and the property ceases to meet the definition of investment property.
Other interests in propertyOther interests in property include the cost and related fees in respect of land options, which are initially capitalised and regularly tested for impairment. The impairment review includes consideration of the resale value of the option and likelihood of achieving planning consent.
Other investmentsOther investments are initially measured at cost, and then revalued to fair value. Gains and losses arising from valuation are recognised in the Income Statement within realised and unrealised property gain.
Trading propertiesThese are properties being developed for sale or being held for sale after development is complete, and are shown at the lower of cost and net realisable value. Cost includes direct expenditure and capitalised interest.
Trading properties are transferred to investment properties when there is a change in use usually evidenced by the commencement of an operating lease to another party, together with the intention to hold the property to generate rent, or for capital appreciation, or for both.
Property acquisitions and disposalsProperties are treated as acquired at the point when the Group assumes the control of ownership and as disposed when transferred to the buyer. Generally, this would occur on completion of the contract. Any gains or loss arising on de-recognition of the property, which is calculated as the difference between the net disposal proceeds and the carrying amount of the asset at the commencement of the accounting period plus capital expenditure in the period, is included in profit or loss in the period in which the property is derecognised. Gains or losses on disposal of investment properties are shown in the Income Statement within realised and unrealised property gains.
LeasesAt inception, the Group assesses whether a contract is or contains a lease. This assessment involves the exercise of judgement about whether the Group obtains substantially all the economic benefits from the use of that asset, and whether the Group has the right to direct the use of the asset.
The Group recognises a right-of-use (ROU) asset and the lease liability at the commencement date of the lease.
Lease liabilities include the present value of payments which generally include fixed payments and variable payments that depend on an index (such as an inflation index). When the lease contains an extension or purchase option that the Group considers reasonably certain to be exercised, the cost of the option is included in the lease payments.
Each lease payment is allocated between the liability and finance cost. The lease payments are discounted using the interest rate implicit in the lease if that rate can be readily determined or if not, the incremental borrowing rate is used. The finance cost is charged to profit or loss over the lease period so as to produce a constant rate of interest on the remaining balance of the liability for each period.
Cash payments relating to the principal portion of the lease liabilities are presented as cash flows from financing activities and cash payments for the interest portion are presented as cash flows from operating activities.
The ROU asset is measured at a cost based on the amount of the initial measurement of the lease liability, plus initial direct costs and the cost of obligations to refurbish the asset, less any incentives received.
The ROU asset (other than the ROU assets that relate to land or property that meets the definition of investment property under IAS 40) is depreciated over the shorter of the lease term or the useful life of the underlying asset. The ROU asset is subject to testing for impairment if there is an indicator of impairment. ROU assets are included in the heading property, plant and equipment, and the lease liability included in the headings current and non-current trade and other payables on the Balance Sheet.
Where the ROU asset relates to land or property that meets the definition of investment property under IAS 40, after initial recognition the ROU asset is subsequently accounted for as investment property and carried at fair value (see Investment properties accounting policy). Valuation gains and losses in a period are taken to the Income Statement. The ROU assets are included in the heading Investment properties, and the lease liability in the headings current and non-current trade and other payables on the Balance Sheet.
The Group has elected not to recognise ROU assets and liabilities for leases where the total lease term is less than or equal to 12 months, or for low value leases. The payments for such leases are recognised in the Income Statement on a straight-line basis over the lease term.
RevenueRevenue includes gross rental income, joint venture management and performance fee income, income from service charges and other recoveries from tenants and proceeds from the sale of trading properties.
12_NotesToFinStatements_179_227_v110.indd 18112_NotesToFinStatements_179_227_v110.indd 181 01/03/2022 17:2401/03/2022 17:24
FINANCIAL STATEMENTS
Notes to the Financial Statements continuedFor the year ended 31 December 2021
182 SEGRO PLC | ANNUAL REPORT & ACCOUNTS 2021
1. SIGNIFICANT ACCOUNTING POLICIES CONTINUED
Rental incomeRental income from properties let as operating leases is recognised on a straight-line basis over the lease term. Lease incentives and initial costs to arrange leases are capitalised, then amortised on a straight-line basis over the lease term (‘rent averaging’). Surrender premiums received in the period are included in rental income.
Changes in the scope or the consideration for a lease, that was not part of the original terms and conditions, which might arise as a result of lease concessions, are accounted as a lease modification. Lease modifications are accounted for as a new lease from the effective date of the modification, considering any prepaid or accrued lease payments relating to the original lease as part of the lease payments for the new lease.
Service charges and other recoveries from tenantsThese include income in relation to service charges, directly recoverable expenditure and management fees. Revenue from providing services is recognised in the accounting period in which the services are rendered. Revenue from services is recognised based on the actual service provided to the end of the reporting period as a proportion of the total services to be provided and recognised over time. The Group generally acts as the principal in service charge transactions as it directly controls the delivery of the services at the point they are provided to the tenant. Where the Group acts as a principal, service charge income is presented gross within revenue and service charge expense presented gross within costs.
Joint venture management and performance fees Joint venture management and performance fees are recognised as income in the period to which they relate. Management fees are recognised in the accounting period in which the services are rendered. Revenue from services is recognised based on the actual service provided to the end of the reporting period as a proportion of the total services to be provided and recognised over time. Performance fees are based on the joint venture’s performance over the performance period and payable subject to meeting certain criteria and hurdle rates at the end of the period (further details are given in Note 7). Performance fees are recognised during and at the end of the performance period to the extent that it is highly probable there will not be a significant future reversal and the fee can be reliably estimated.
Sale of trading propertiesProceeds from the sale of trading properties are recognised at the point in time at which control of the property has been transferred to the purchaser. Therefore, revenue is recognised at a point in time and generally occurs on completion of the contract.
Property, plant and equipmentPlant and equipment are stated at historic cost less accumulated depreciation. Cost includes purchase price and any directly attributable costs.
Depreciation is recognised so as to write off the cost or valuation of assets (other than investment properties) less their residual values, using the straight-line method, on the following bases:
Plant and equipment 20% per annumSolar panels 5% per annum
The estimated useful lives, residual values and depreciation method are reviewed at the end of each reporting period, with the effect of any changes in estimate accounted for on a prospective basis.
Property relates to the ROU asset recognised for office leases entered into by the Group. The ROU asset is initially measured based on the present value of lease payments, plus initial direct costs and the cost of obligations to refurbish the asset, less any incentives received. The ROU asset is depreciated over the shorter of the lease term or the useful life of the underlying asset.
Financial instrumentsBorrowingsBorrowings are recognised initially at fair value less attributable transaction costs. Subsequent to initial recognition, borrowings are stated at amortised cost with any difference between the amount initially recognised and the redemption value being recognised in the Income Statement over the period of the borrowings, using the effective interest rate method.
Gross borrowing costs relating to direct expenditure on properties under development or undergoing major refurbishment are capitalised. The interest capitalised is calculated using the Group’s weighted average cost of borrowing for the relevant currency. Interest is capitalised from the commencement of the development work until the date of practical completion. The capitalisation of finance costs is suspended if there are prolonged periods when development activity is interrupted.
Derivative financial instrumentsThe Group uses derivatives (principally interest rate swaps, currency swaps, forward foreign exchange contracts and interest caps) in managing interest rate risk and currency risk, and does not use them for trading. They are recorded, and subsequently revalued, at fair value, with revaluation gains or losses being immediately taken to the Income Statement (fair value through profit or loss ‘FVPL’). The exception is for derivatives qualifying as hedges, when the treatment of the gain/loss depends upon the item being hedged, and may go to other comprehensive income within the Statement of Comprehensive Income (fair value through other comprehensive income ‘FVOCI’).
Derivatives with a maturity of less than 12 months or that expect to be settled within 12 months of the Balance Sheet date are presented as current assets or liabilities. Other derivatives are presented as non-current assets or liabilities.
Trade and other receivables and payablesTrade and other receivables are booked at fair value and subsequently measured at amortised cost using the effective interest method. Trade and other payables are initially measured at fair value, net of transaction costs and subsequently measured at amortised costs using the effective interest method.
The Group applies the IFRS 9 simplified approach to measuring expected credit losses (ECLs) which uses a lifetime expected loss allowance for all trade receivables. Note 17(vi) details the Group’s calculation for measuring ECLs.
12_NotesToFinStatements_179_227_v110.indd 18212_NotesToFinStatements_179_227_v110.indd 182 01/03/2022 17:2401/03/2022 17:24
FINANCIAL STATEMENTSFINANCIAL STATEMENTS
183SEGRO PLC | ANNUAL REPORT & ACCOUNTS 2021
STRATEGIC REPORTOVERVIEW GOVERNANCEGOVERNANCESTRATEGIC REPORTOVERVIEW
1. SIGNIFICANT ACCOUNTING POLICIES CONTINUED
Pensions – Defined benefit schemeThe Scheme’s assets are measured at fair value, their obligations are calculated at discounted present value, and any net surplus or deficit is recognised in the Balance Sheet. Operating and financing costs are charged to the Income Statement, with service costs spread systematically over employees’ working lives, and financing costs expensed in the period in which they arise. Actuarial gains and losses are recognised in other comprehensive income within the Statement of Comprehensive Income. During 2021 the pension buy-out process was competed which discharged the Scheme and the Group of the liabilities for members as detailed further in Note 18.
Share-based paymentsThe cost of granting share options and other share-based remuneration is measured at their fair value at the grant date. The costs are expensed straight-line over the vesting period in the Income Statement, based on estimates of the shares or options that will eventually vest. Charges are reversed if it appears that non-market-based performance conditions will not be met.
The fair value excludes the effect of non-market-based vesting conditions.
At each Balance Sheet date, the Group revises its estimate of the number of equity instruments expected to vest as a result of the effect of non-market-based vesting conditions. The impact of the revision of the original estimates, if any, is recognised in the Income Statement such that the cumulative expense reflects the revised estimate, with a corresponding adjustment to equity within the share-based payment reserve.
Share capitalOrdinary shares are classified as equity. Incremental costs directly attributable to the issue of new shares or options are shown in equity as a deduction, net of tax, from the proceeds.
When shares recognised as equity are repurchased, the amount of the consideration paid, which includes directly attributable costs, is recognised as a deduction from equity. Repurchased shares are classified as treasury shares and are presented in the treasury share reserve. When treasury shares are sold or reissued subsequently, the amount received is recognised as an increase in equity and the resulting surplus or deficit on the transaction is presented within share premium.
Shares held by Ocorian Limited and Equiniti Limited to satisfy various Group share schemes are disclosed as own shares held and deducted from contributed equity.
Income taxIncome tax on the profit for the year comprises current and deferred tax. Current tax is the tax payable on the taxable income for the year and any adjustment in respect of previous years. Current tax is calculated on the basis of the tax laws enacted or substantively enacted at the end of the reporting period in the countries where the Company’s subsidiaries and associates operate and generate taxable income.
Deferred tax is provided in full using the Balance Sheet liability method on temporary differences between the carrying amounts of assets and liabilities for financial reporting purposes and the amounts used for taxation purposes. Deferred tax is determined using tax rates that have been enacted or substantively enacted by the reporting date and are expected to apply when the asset is realised or the liability is settled.
No provision is made for temporary differences (i) arising on the initial recognition of assets or liabilities, other than a business combination, that affect neither accounting nor taxable profit and (ii) relating to investments in subsidiaries to the extent that they will not reverse in the foreseeable future.
Deferred tax assets are recognised to the extent that it is probable that suitable taxable profits will be available against which deductible temporary differences can be utilised.
Critical accounting judgements and key sources of estimation uncertaintyIn the application of the Group’s accounting policies, the Directors are required to make judgements, estimates and assumptions about the carrying amount of assets and liabilities that are not readily apparent from other sources. The estimates and associated assumptions are based on historical experience and other factors that are considered to be relevant. Actual results may differ from these estimates. The estimates and underlying assumptions are reviewed on an ongoing basis. Revisions to accounting estimates are recognised in the period in which the estimate is revised if the revision affects only that period, or in the period of the revisions and future periods if the revision affects both current and future periods.
Significant areas of estimation uncertaintyProperty valuationsValuation of property is a central component of the business. In estimating the fair value, the Group engage a third party qualified valuer to perform the valuation. Information about the valuation techniques and inputs used in determining the fair value of the property portfolio is disclosed in Note 27 property valuation techniques and related quantitative information.
Performance feeAs detailed further in Note 7, performance fees are payable from the SELP joint venture to SEGRO. The fee is based on the joint venture’s performance over the 10 year performance period since inception and payable subject to meeting certain criteria and hurdle rates at the end of the period. Performance fee income is recognised during the performance period to the extent that the fee can be reliably estimated and that it is highly probable there will not be a significant future reversal.
The internal rate of return (‘IRR’) calculation to determine whether the hurdle rates will be met, and if so to what extent, at the end of the performance period in October 2023 is currently an estimation and sensitive to movements and assumptions in property valuations over the remaining performance period. As detailed above, property valuations is an area of significant estimation uncertainty.
12_NotesToFinStatements_179_227_v110.indd 18312_NotesToFinStatements_179_227_v110.indd 183 01/03/2022 17:2401/03/2022 17:24
FINANCIAL STATEMENTS
Notes to the Financial Statements continuedFor the year ended 31 December 2021
184 SEGRO PLC | ANNUAL REPORT & ACCOUNTS 2021
1. SIGNIFICANT ACCOUNTING POLICIES CONTINUED
Determining whether it is highly probable there will not be a significant future change in the performance fee is dependent on the probability and magnitude of future changes in property values over the remaining performance period. Note 7 provides details of the estimated performance fee due in October 2023 and sensitivity of this estimation to movements in property values from 31 December 2021 to the end of the performance period.
The corresponding performance fee expense recognised by SELP is a significant estimate for the same reasons as detailed above. The SELP performance fee expense is accounted for under the equity method within share of profit from joint ventures after tax.
Significant areas of judgements in applying the Group’s accounting policiesAccounting for significant property transactionsProperty transactions are complex in nature. Management considers each material transaction separately, with an assessment carried out to determine the most appropriate accounting treatment and judgements applied. The judgements include whether the transaction represents an asset acquisition or business combination and the cut-off for property transactions on recognition of property assets and revenue recognition. In making its judgement over the cut-off for property transactions, management considers whether the control of ownership of the assets acquired or disposed of has transferred to or from the Group (this consideration includes the revenue recognition criteria set out in IFRS 15 for the sale of trading properties).
In making its judgement on whether the acquisition of property through the purchase of a corporate vehicle represents an asset acquisition or business combination, management considers whether the integrated set of assets and activities acquired contain both inputs and processes along with the ability to create outputs. Management also applies the optional ‘concentration test’ allowed under IFRS 3. When applying the optional test, management considers if substantially all of the fair value of gross assets acquired is concentrated in a single asset (or a group of similar assets). Where management judge that substantially all of the fair value of the gross assets acquired are concentrated in a single asset (or a group of similar assets) and the ‘concentration test’ met, the assets acquired would not represent a business and the purchase would be treated as an asset acquisition.
REIT StatusThe Company has elected for UK REIT and French SIIC status. To continue to benefit from these tax regimes, the Group is required to comply with certain conditions as outlined in Note 10. Management intends that the Group should continue as a UK REIT and a French SIIC for the foreseeable future.
Uncertain tax positions The Group is subject to periodic challenges by local tax authorities on a range of tax matters during the normal course of business. The tax impact can be uncertain until a conclusion is reached with the relevant tax authority or through a legal process. Management judgement is required in assessing the likelihood of whether a liability will arise and the most significant assessment during the year relates to the recognition of withholding tax in France and is discussed further in Note 10.
2. ADJUSTED PROFIT
Adjusted profit is a non-GAAP measure and is the Group’s measure of underlying profit, which is used by the Board and senior management to measure and monitor the Group’s income performance.
It is based on the Best Practices Recommendations Guidelines of European Public Real Estate Association (EPRA), which calculate profit excluding investment and development property revaluations and gains or losses on disposals. Changes in the fair value of financial instruments and associated close-out costs and their related taxation, as well as other permitted one-off items, are also excluded. Refer to the Supplementary Notes for all EPRA adjustments.
The Directors may also exclude from the EPRA profit measure additional items (gains and losses) which are considered by them to be non-recurring, unusual or significant by virtue of size and nature. No non-EPRA adjustments to underlying profit were made in the current or prior period.
12_NotesToFinStatements_179_227_v110.indd 18412_NotesToFinStatements_179_227_v110.indd 184 01/03/2022 17:2401/03/2022 17:24
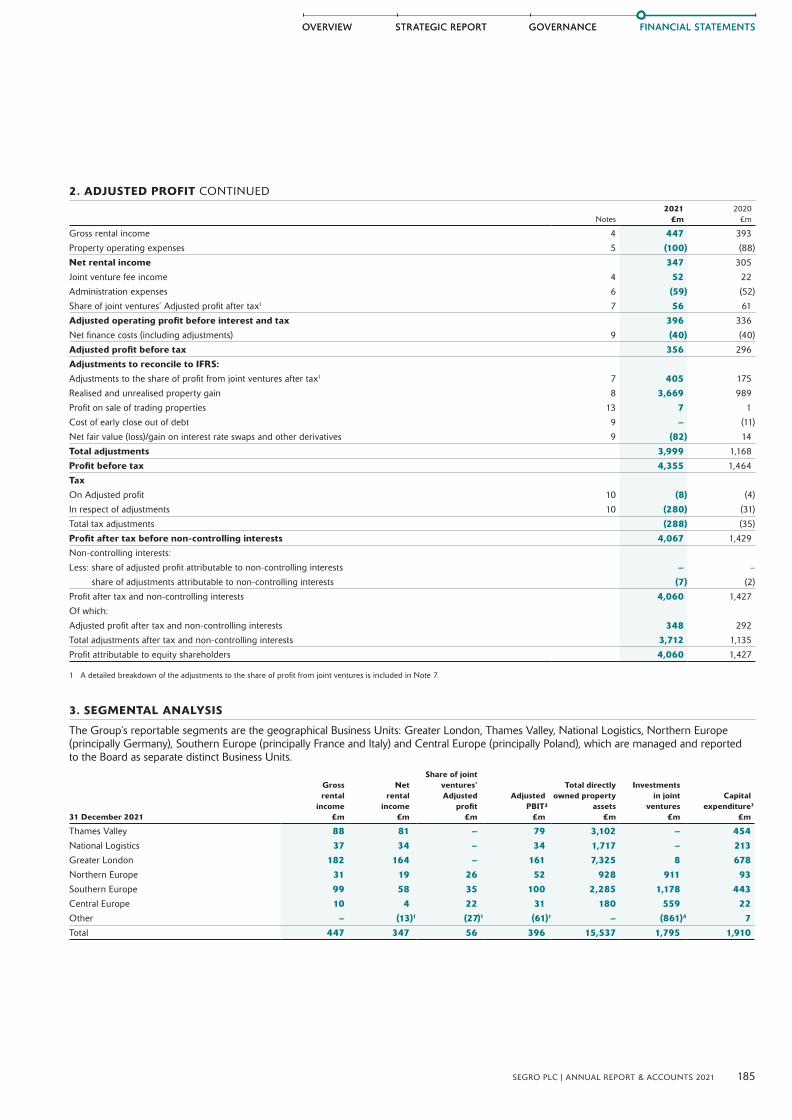
FINANCIAL STATEMENTSFINANCIAL STATEMENTS
185SEGRO PLC | ANNUAL REPORT & ACCOUNTS 2021
STRATEGIC REPORTOVERVIEW GOVERNANCEGOVERNANCESTRATEGIC REPORTOVERVIEW
2. ADJUSTED PROFIT CONTINUED
Notes2021
£m2020
£m
Gross rental income 4 447 393
Property operating expenses 5 (100) (88)
Net rental income 347 305
Joint venture fee income 4 52 22
Administration expenses 6 (59) (52)
Share of joint ventures’ Adjusted profit after tax1 7 56 61
Adjusted operating profit before interest and tax 396 336
Net finance costs (including adjustments) 9 (40) (40)
Adjusted profit before tax 356 296
Adjustments to reconcile to IFRS:Adjustments to the share of profit from joint ventures after tax1 7 405 175
Realised and unrealised property gain 8 3,669 989
Profit on sale of trading properties 13 7 1
Cost of early close out of debt 9 – (11)
Net fair value (loss)/gain on interest rate swaps and other derivatives 9 (82) 14
Total adjustments 3,999 1,168
Profit before tax 4,355 1,464
Tax
On Adjusted profit 10 (8) (4)
In respect of adjustments 10 (280) (31)
Total tax adjustments (288) (35)
Profit after tax before non-controlling interests 4,067 1,429
Non-controlling interests:
Less: share of adjusted profit attributable to non-controlling interests – –
share of adjustments attributable to non-controlling interests (7) (2)
Profit after tax and non-controlling interests 4,060 1,427
Of which:
Adjusted profit after tax and non-controlling interests 348 292
Total adjustments after tax and non-controlling interests 3,712 1,135
Profit attributable to equity shareholders 4,060 1,427
1 A detailed breakdown of the adjustments to the share of profit from joint ventures is included in Note 7.
3. SEGMENTAL ANALYSIS
The Group’s reportable segments are the geographical Business Units: Greater London, Thames Valley, National Logistics, Northern Europe (principally Germany), Southern Europe (principally France and Italy) and Central Europe (principally Poland), which are managed and reported to the Board as separate distinct Business Units.
31 December 2021
Gross rental
income £m
Net rental
income £m
Share of joint ventures’ Adjusted
profit £m
Adjusted PBIT²
£m
Total directly owned property
assets £m
Investments in joint
ventures £m
Capitalexpenditure3
£m
Thames Valley 88 81 – 79 3,102 – 454
National Logistics 37 34 – 34 1,717 – 213Greater London 182 164 – 161 7,325 8 678
Northern Europe 31 19 26 52 928 911 93Southern Europe 99 58 35 100 2,285 1,178 443Central Europe 10 4 22 31 180 559 22
Other – (13)1 (27)1 (61)1 – (861)4 7Total 447 347 56 396 15,537 1,795 1,910
12_NotesToFinStatements_179_227_v110.indd 18512_NotesToFinStatements_179_227_v110.indd 185 01/03/2022 17:2401/03/2022 17:24

FINANCIAL STATEMENTS
Notes to the Financial Statements continuedFor the year ended 31 December 2021
186 SEGRO PLC | ANNUAL REPORT & ACCOUNTS 2021
3. SEGMENTAL ANALYSIS CONTINUED
31 December 2020
Gross rental
income £m
Net rental
income £m
Share of joint ventures’ Adjusted
profit £m
Adjusted PBIT2
£m
Total directly owned
property assets
£m
Investments in joint
ventures £m
Capitalexpenditure3
£m
Thames Valley 84 78 – 76 1,997 – 57
National Logistics 34 34 – 33 1,223 1 267
Greater London 160 140 – 138 4,867 – 454
Northern Europe 29 18 25 48 682 803 29
Southern Europe 75 44 30 79 1,803 914 566
Central Europe 11 4 22 30 151 496 4
Other – (13)1 (16)1 (68)1 – (791)4 5
Total 393 305 61 336 10,723 1,423 1,382
1 ‘Other’ category includes the corporate centre, SELP holding companies and costs relating to the operational business which are not specifically allocated to a geographical Business Unit. Additionally, in 2021 the impact of the SELP performance fee (detailed in Note 7) on Share of joint ventures Adjusted profit (being the performance fee expense recognised by SELP of £13 million) and Adjusted PBIT (being the net profit impact to the Group of £13 million) is shown within Other.
2 A reconciliation of total Adjusted PBIT to the IFRS profit before tax is provided in Note 2.3 Capital expenditure includes additions and acquisitions of investment and trading properties but does not include tenant incentives, letting fees and rental guarantees. Part of the capital
expenditure incurred is in response to climate change including the reduction of the carbon footprint of the Group’s existing investment properties and developments. The environmental sustainability within the Group’s property portfolio is discussed in more detail on pages 54 to 55 and 58 to 59. The ‘Other’ category includes non-property related spend, primarily IT.
4 Includes the bonds held by SELP Finance S.à r.l, a Luxembourg entity.
Revenues from the most significant countries within the Group were: UK £374 million (2020: £278 million), France £71 million (2020: £56 million), Italy £35 million (2020: £39 million), Germany £38 million (2020: £34 million) and Poland £15 million (2020: £15 million).
4. REVENUE2021
£m2020
£m
Rental income from investment and trading properties 386 336
Rent averaging 13 18
Service charge income* 42 35
Management fees* 3 3
Surrender premiums and dividend income from property related investments 3 1
Gross rental income1 447 393
Joint venture fee income – management fees* 26 22
– performance fees* 26 –
Joint venture fee income 52 22
Proceeds from sale of trading properties* 47 17
Total revenue 546 432
* The above income streams reflect revenue recognition under IFRS 15 ‘Revenue from Contracts with Customers’ and total £144 million (2020: £77 million).1 Net rental income of £347 million (2020: £305 million) is calculated as gross rental income of £447 million (2020: £393 million) less total property operating expenses of £100 million
(2020: £88 million) shown in Note 5.
5. COSTS2021
£m2020
£m
Vacant property costs 5 3
Letting, marketing, legal and professional fees 11 10
Loss allowance and impairment of receivables1 – 4
Service charge expense 42 35
Other expenses 12 9
Property management expenses 70 61
Property administration expenses2 39 36
Costs capitalised3 (9) (9)
Total property operating expenses 100 88
Trading properties cost of sales 40 16
Total costs 140 104
1 See Note 17(vi) Credit risk management for further details on loss allowance and impairment of receivables. 2 Property administration expenses predominantly relate to the employee staff costs of personnel directly involved in managing the property portfolio.3 Costs capitalised primarily relate to internal employee staff costs directly involved in developing the property portfolio.
12_NotesToFinStatements_179_227_v110.indd 18612_NotesToFinStatements_179_227_v110.indd 186 01/03/2022 17:2401/03/2022 17:24
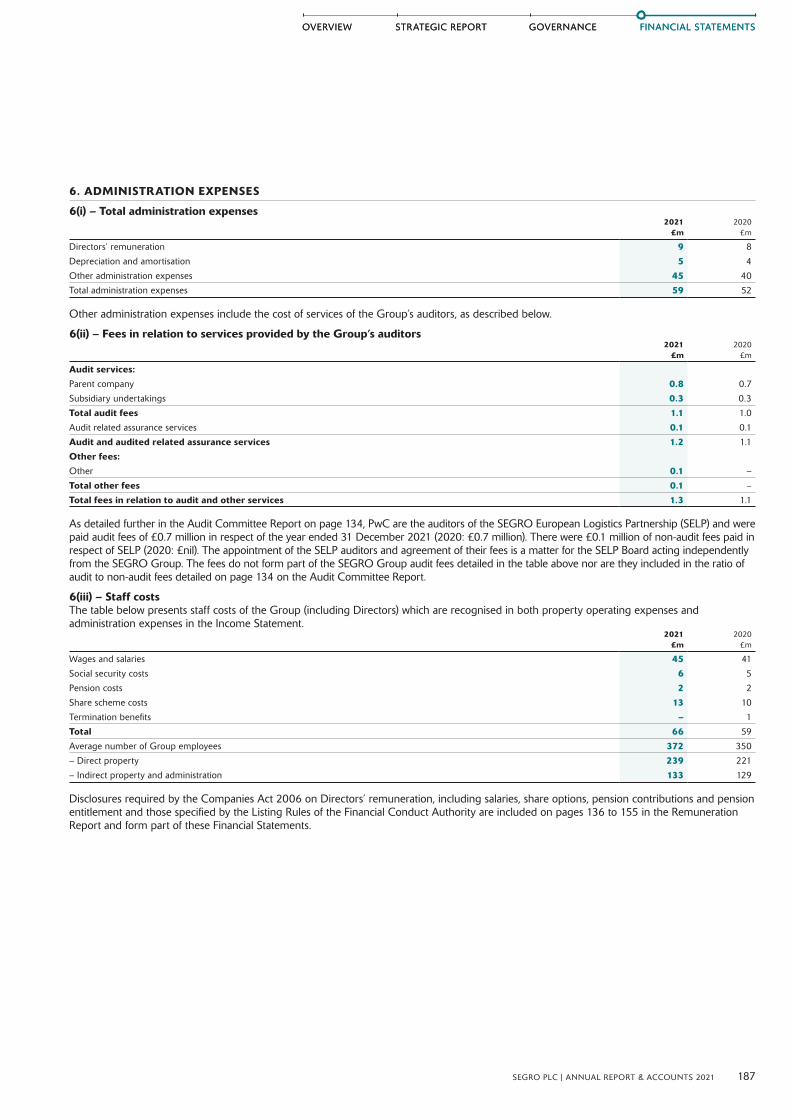
FINANCIAL STATEMENTSFINANCIAL STATEMENTS
187SEGRO PLC | ANNUAL REPORT & ACCOUNTS 2021
STRATEGIC REPORTOVERVIEW GOVERNANCEGOVERNANCESTRATEGIC REPORTOVERVIEW
6. ADMINISTRATION EXPENSES
6(i) – Total administration expenses2021
£m2020
£m
Directors’ remuneration 9 8
Depreciation and amortisation 5 4
Other administration expenses 45 40
Total administration expenses 59 52
Other administration expenses include the cost of services of the Group’s auditors, as described below.
6(ii) – Fees in relation to services provided by the Group’s auditors2021
£m2020
£m
Audit services:Parent company 0.8 0.7
Subsidiary undertakings 0.3 0.3
Total audit fees 1.1 1.0
Audit related assurance services 0.1 0.1
Audit and audited related assurance services 1.2 1.1
Other fees:
Other 0.1 –
Total other fees 0.1 –
Total fees in relation to audit and other services 1.3 1.1
As detailed further in the Audit Committee Report on page 134, PwC are the auditors of the SEGRO European Logistics Partnership (SELP) and were paid audit fees of £0.7 million in respect of the year ended 31 December 2021 (2020: £0.7 million). There were £0.1 million of non-audit fees paid in respect of SELP (2020: £nil). The appointment of the SELP auditors and agreement of their fees is a matter for the SELP Board acting independently from the SEGRO Group. The fees do not form part of the SEGRO Group audit fees detailed in the table above nor are they included in the ratio of audit to non-audit fees detailed on page 134 on the Audit Committee Report.
6(iii) – Staff costsThe table below presents staff costs of the Group (including Directors) which are recognised in both property operating expenses and administration expenses in the Income Statement.
2021 £m
2020 £m
Wages and salaries 45 41
Social security costs 6 5
Pension costs 2 2
Share scheme costs 13 10
Termination benefits – 1
Total 66 59
Average number of Group employees 372 350
– Direct property 239 221
– Indirect property and administration 133 129
Disclosures required by the Companies Act 2006 on Directors’ remuneration, including salaries, share options, pension contributions and pension entitlement and those specified by the Listing Rules of the Financial Conduct Authority are included on pages 136 to 155 in the Remuneration Report and form part of these Financial Statements.
12_NotesToFinStatements_179_227_v110.indd 18712_NotesToFinStatements_179_227_v110.indd 187 01/03/2022 17:2401/03/2022 17:24
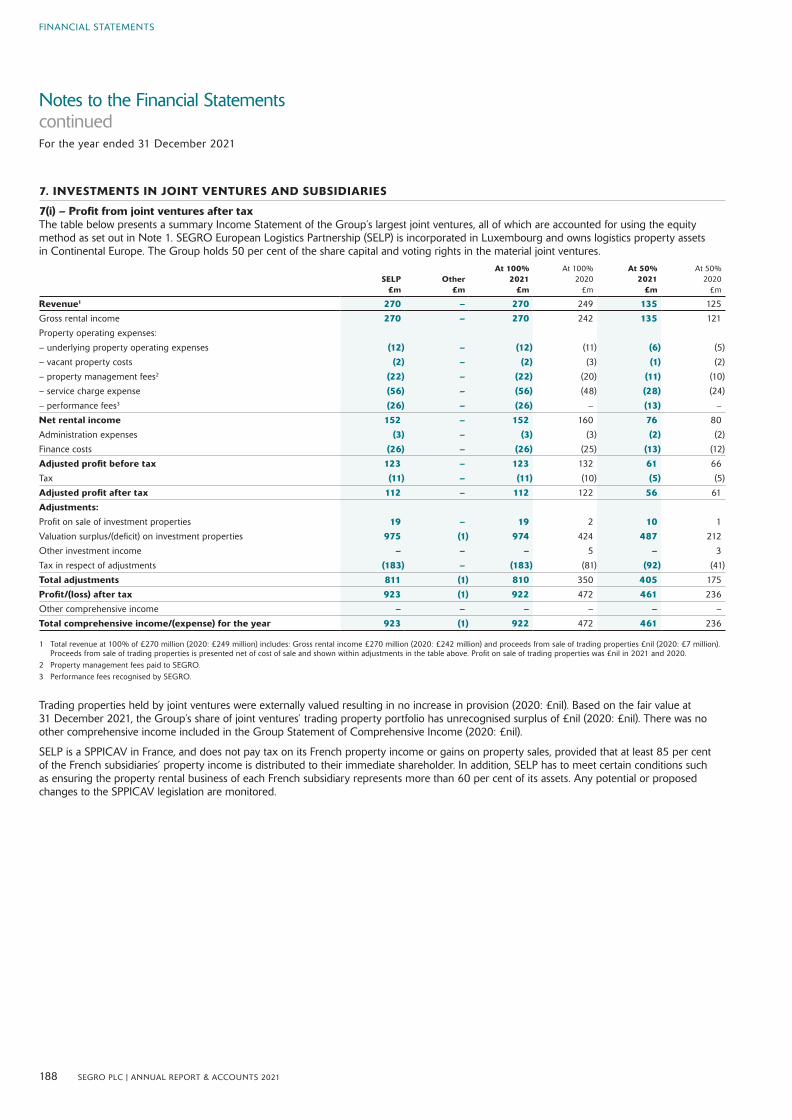
FINANCIAL STATEMENTS
Notes to the Financial Statements continuedFor the year ended 31 December 2021
188 SEGRO PLC | ANNUAL REPORT & ACCOUNTS 2021
7. INVESTMENTS IN JOINT VENTURES AND SUBSIDIARIES
7(i) – Profit from joint ventures after taxThe table below presents a summary Income Statement of the Group’s largest joint ventures, all of which are accounted for using the equity method as set out in Note 1. SEGRO European Logistics Partnership (SELP) is incorporated in Luxembourg and owns logistics property assets in Continental Europe. The Group holds 50 per cent of the share capital and voting rights in the material joint ventures.
SELP £m
Other £m
At 100% 2021
£m
At 100% 2020
£m
At 50% 2021
£m
At 50% 2020
£m
Revenue1 270 – 270 249 135 125
Gross rental income 270 – 270 242 135 121
Property operating expenses:
– underlying property operating expenses (12) – (12) (11) (6) (5)
– vacant property costs (2) – (2) (3) (1) (2)
– property management fees2 (22) – (22) (20) (11) (10)
– service charge expense (56) – (56) (48) (28) (24)
– performance fees3 (26) – (26) – (13) –
Net rental income 152 – 152 160 76 80
Administration expenses (3) – (3) (3) (2) (2)
Finance costs (26) – (26) (25) (13) (12)
Adjusted profit before tax 123 – 123 132 61 66
Tax (11) – (11) (10) (5) (5)
Adjusted profit after tax 112 – 112 122 56 61
Adjustments:
Profit on sale of investment properties 19 – 19 2 10 1
Valuation surplus/(deficit) on investment properties 975 (1) 974 424 487 212
Other investment income – – – 5 – 3
Tax in respect of adjustments (183) – (183) (81) (92) (41)
Total adjustments 811 (1) 810 350 405 175
Profit/(loss) after tax 923 (1) 922 472 461 236
Other comprehensive income – – – – – –
Total comprehensive income/(expense) for the year 923 (1) 922 472 461 236
1 Total revenue at 100% of £270 million (2020: £249 million) includes: Gross rental income £270 million (2020: £242 million) and proceeds from sale of trading properties £nil (2020: £7 million). Proceeds from sale of trading properties is presented net of cost of sale and shown within adjustments in the table above. Profit on sale of trading properties was £nil in 2021 and 2020.
2 Property management fees paid to SEGRO.3 Performance fees recognised by SEGRO.
Trading properties held by joint ventures were externally valued resulting in no increase in provision (2020: £nil). Based on the fair value at 31 December 2021, the Group’s share of joint ventures’ trading property portfolio has unrecognised surplus of £nil (2020: £nil). There was no other comprehensive income included in the Group Statement of Comprehensive Income (2020: £nil).
SELP is a SPPICAV in France, and does not pay tax on its French property income or gains on property sales, provided that at least 85 per cent of the French subsidiaries’ property income is distributed to their immediate shareholder. In addition, SELP has to meet certain conditions such as ensuring the property rental business of each French subsidiary represents more than 60 per cent of its assets. Any potential or proposed changes to the SPPICAV legislation are monitored.
12_NotesToFinStatements_179_227_v110.indd 18812_NotesToFinStatements_179_227_v110.indd 188 01/03/2022 17:2401/03/2022 17:24

FINANCIAL STATEMENTSFINANCIAL STATEMENTS
189SEGRO PLC | ANNUAL REPORT & ACCOUNTS 2021
STRATEGIC REPORTOVERVIEW GOVERNANCEGOVERNANCESTRATEGIC REPORTOVERVIEW
7. INVESTMENTS IN JOINT VENTURES AND SUBSIDIARIES CONTINUED
7(ii) – Summarised Balance Sheet information in respect of the Group’s joint ventures
SELP £m
Other £m
At 100% 2021
£m
At 100% 2020
£m
At 50% 2021
£m
At 50% 2020
£m
Investment properties¹ 5,804 14 5,818 4,695 2,909 2,348
Total non-current assets 5,804 14 5,818 4,695 2,909 2,348
Other receivables 75 3 78 115 39 57
Cash and cash equivalents 43 – 43 48 22 24
Total current assets 118 3 121 163 61 81
Total assets 5,922 17 5,939 4,858 2,970 2,429
Borrowings2 (1,723) – (1,723) (1,574) (862) (787)
Deferred tax (504) – (504) (346) (252) (173)
Total non-current liabilities (2,227) – (2,227) (1,920) (1,114) (960)
Other liabilities (122) – (122) (92) (61) (46)
Total current liabilities (122) – (122) (92) (61) (46)
Total liabilities (2,349) – (2,349) (2,012) (1,175) (1,006)
Net assets 3,573 17 3,590 2,846 1,795 1,423
1 Investment properties held by SELP include assets held for sale of £97 million (at 100%) at 31 December 2021 (2020: £nil).2 The external borrowings of the joint ventures are non-recourse to the Group. At 31 December 2021, the fair value of £1,723 million (2020: £1,574 million) of borrowings was £1,766 million
(2020: £1,651 million). This results in a fair value adjustment decrease in EPRA NDV of £43 million (2020: £77 million decrease), at share £22 million (2020: £38 million), see Table 5 of the Supplementary Notes.
FeesSEGRO provides certain services, including venture advisory and asset management, to the SELP joint venture and receives fees for doing so.
Performance fees, denominated in euros, are payable from SELP to SEGRO based on SELP’s internal rate of return (‘IRR’) subject to certain hurdle rates. The first IRR calculation was conducted in October 2018, the fifth anniversary of the inception of SELP, and a payment of €59 million (£52 million) was made to SEGRO, of which 50 per cent was subject to clawback based on performance over the remaining period to October 2023, SELP’s tenth anniversary. If performance has improved by the tenth anniversary, additional fees might be triggered. The IRR calculation to determine whether the hurdle rates will be met when the performance period ends in October 2023 is currently an estimation and sensitive to movements and assumptions in property valuations over the remaining performance period.
In 2018 SEGRO recognised a performance fee of £26 million in its Income Statement (representing the 50 per cent of the performance fee paid in 2018 not subject to clawback) and relates to the five-year performance period to October 2018 (an equivalent performance fee expense of £26 million (£13 million at share) was recognised within the share of profit from joint ventures).
In 2021 SEGRO has recognised a performance fee of £26 million (€29 million) in the Income Statement and represents the additional 50 per cent of the performance fee paid in 2018 subject to future clawback.
Performance fee income is recognised during the performance period to the extent that it is highly probable that there will not be a significant future reversal and the fee can be reliably estimated. None of the £26 million performance fee recognised in 2021 will be reversed if property values fall by 17 per cent (the equivalent of 9 per cent per annum) between 31 December 2021 and the end of the performance period in 2023. If property values fall by over 19 per cent (the equivalent of 10 per cent per annum) all of the £26 million performance fee would be reversed. Based on SEGRO management’s assessment of market conditions at the year end, market outlook and the track record of property market trends, management considers a potential decrease in property values in excess of 17 per cent by October 2023 as highly improbable and so meets the criteria that there will not be a significant reversal of the performance fee recognised.
When consolidating the SELP Group financial statements into the SEGRO Group, an equivalent performance fee expense of £26 million (£13 million at share) has been recognised within the share of profit from joint ventures and reflected in table 7(i) above.
SensitivityBased on current estimates of the IRR of SELP between inception in October 2013 and 31 December 2021, an additional performance fee due to SEGRO in 2023 could be in the region of €276 million (€138 million at share after accounting for the corresponding performance fee expense recognised in SELP). However, this is dependent on future events, in particular property valuation movements, to the end of the performance period in October 2023. The current estimates of the IRR is based on property values as at 31 December 2021: a 10 per cent decrease in property values would result in a €160 million decrease in the estimated fee and a 10 per cent increase in property values would result in a €160 million increase in the estimated fee. If property values decreased by 17 per cent no additional performance fee would be due. A further performance fee above the £26 million recorded during the year has not been recognised as management has not concluded that it is highly probable that there will not be a significant reversal.
12_NotesToFinStatements_179_227_v110.indd 18912_NotesToFinStatements_179_227_v110.indd 189 01/03/2022 17:2401/03/2022 17:24

FINANCIAL STATEMENTS
Notes to the Financial Statements continuedFor the year ended 31 December 2021
190 SEGRO PLC | ANNUAL REPORT & ACCOUNTS 2021
7. INVESTMENTS IN JOINT VENTURES AND SUBSIDIARIES CONTINUED
7(iii) – Investments by the Group 2021
£m2020
£m
Cost or valuation at 1 January 1,423 1,122
Exchange movement (95) 62
Additions 8 –
Net investments1 31 40
Disposals – (3)
Dividends received2 (33) (34)
Share of profit after tax 461 236
Cost or valuation at 31 December 1,795 1,423
1 Net investments represent the net movement of capital injections, loans and divestments with joint ventures during the period.2 Dividends received from SELP of £32 million (2020: £34 million) and other joint ventures of £1 million (2020: £nil).
7(iv) – Investments by the Company2021
£m2020
£m
Cost or valuation of subsidiaries at 1 January 8,816 7,517
Exchange movement (67) 47
Additions¹ 2,840 59
Loan movement¹ (1,501) 1,226
Increase in provision for investments in and loans to subsidiaries2 (710) (33)
Cost or valuation at 31 December 9,378 8,816
1 During 2021, £2,757 million of non-current loans were recapitalised and converted into equity. This is reflected within additions and a reduction in loan movement in the table above.2 In 2021 a capital reduction process was carried out for a number of subsidiaries. The capital reduction increased the distributable reserves of the subsidiaries resulting in dividends being paid to
the Company. The payment of the dividend reduced the net assets and the recoverable amount of the subsidiaries triggering a £730 million impairment of investments held by the Company. There were other net impairment reversals of £20 million in the year, mainly due to the valuation uplift of investment properties held by the subsidiaries, resulting in an increase to net asset value.
Included in cost or valuation of subsidiaries at 31 December 2021 are investments of £4,863 million (2020: £2,753 million) and non-current loans of £4,515 million (2020: £6,063 million). Loans held with subsidiaries are classified as non-current as there is no intention from the Company to require the loan to be repaid, in whole or in part, within 12 months.
Subsidiary entities are detailed in Note 28.
In measuring expected credit losses (ECLs) of the intercompany loans under IFRS 9 the ability of each subsidiary to repay the loan at the reporting date if demanded by the Company is assessed. For the purpose of the impairment review the manner for recovering the loan is assumed to be through the sale of the investment properties held by the subsidiary. Investment properties are held at fair value at each reporting date and the assumptions and inputs used in determining their fair value are shown in Note 27. Therefore, the net asset value of the subsidiary is considered to be a reasonable approximation of the available assets that could be realised to recover the loan balance and the requirement to recognise expected credit losses. The requirement for impairment of investments under IAS 36 follows the same assessment and the net asset value of the subsidiary is considered to be a reasonable approximation of the recoverable amount.
8. REALISED AND UNREALISED PROPERTY GAIN2021
£m2020
£m
Profit on sale of investment properties 53 5
Valuation surplus on investment properties¹ 3,617 971
Increase in provision for impairment of trading properties (1) –
Increase in provision for impairment of other interests in property – (1)
Valuation surplus on other investments – 14
Total realised and unrealised property gain 3,669 989
1 Includes £3,618 million valuation surplus on investment properties (2020: £972 million) less £1 million valuation loss on head lease ROU asset (2020: £1 million).
Total valuation surplus on investment and trading properties total £4,103 million (2020: £1,183 million). This comprises £3,617 million surplus from investment properties (2020: £971 million), £1 million impairment from trading properties (2020: £nil) and £487 million surplus from joint ventures at share (2020: £212 million).
Details of profit on sale of trading properties are given in Note 13(ii).
12_NotesToFinStatements_179_227_v110.indd 19012_NotesToFinStatements_179_227_v110.indd 190 01/03/2022 17:2401/03/2022 17:24

FINANCIAL STATEMENTSFINANCIAL STATEMENTS
191SEGRO PLC | ANNUAL REPORT & ACCOUNTS 2021
STRATEGIC REPORTOVERVIEW GOVERNANCEGOVERNANCESTRATEGIC REPORTOVERVIEW
9. NET FINANCE COSTS
Finance income2021
£m2020
£m
Interest received on bank deposits and related derivatives 24 27
Fair value gain on interest rate swaps and other derivatives 11 23
Total finance income 35 50
Finance costs2021
£m2020
£m
Interest on overdrafts, loans and related derivatives (67) (68)
Cost of early close out of debt – (11)
Amortisation of issue costs (3) (3)
Interest on lease liabilities (3) (3)
Total borrowing costs (73) (85)
Less amounts capitalised on the development of properties 9 7
Net borrowing costs (64) (78)
Fair value loss on interest rate swaps and other derivatives (93) (9)
Total finance costs (157) (87)
Net finance costs (122) (37)
Net finance costs (including adjustments) in Adjusted profit (Note 2) are £40 million (2020: £40 million). This excludes net fair value gains and losses on interest rate swaps and other derivatives of £82 million loss (2020: £14 million gain) and the cost of early close out of debt of £nil (2020: £11 million).
The interest capitalisation rates for 2021 ranged from 1.85 per cent to 2.15 per cent (2020: 1.85 per cent to 2.15 per cent). Interest is capitalised gross of tax relief. Further analysis of exchange differences is given in Note 17 within the foreign exchange and currency swap contracts section.
10. TAX
10(i) – Tax on profit2021
£m2020
£m
Tax:
On Adjusted profit (8) (4)
In respect of adjustments:
– French withholding tax (145) –
– SIIC entry charge (38) –
– Other (primarily in respect of property valuation movements) (97) (31)
Total tax in respect of adjustments (280) (31)
Total tax charge (288) (35)
Current tax
United Kingdom
Current tax credit 4 1
Total UK current tax credit 4 1
Overseas
Current tax charge (40) (8)
Adjustments in respect of earlier years – 4
French withholding tax (16) –
SIIC entry charge (38) –
Total overseas current tax charge (94) (4)
Total current tax charge (90) (3)
Deferred taxOrigination and reversal of temporary differences (34) (3)
Released in respect of property disposals in the year 22 5
On valuation movements (173) (39)
Total deferred tax in respect of investment properties (185) (37)
Other deferred tax (13) 5
Total deferred tax charge (198) (32)
Total tax charge on profit on ordinary activities (288) (35)
12_NotesToFinStatements_179_227_v110.indd 19112_NotesToFinStatements_179_227_v110.indd 191 01/03/2022 17:2401/03/2022 17:24
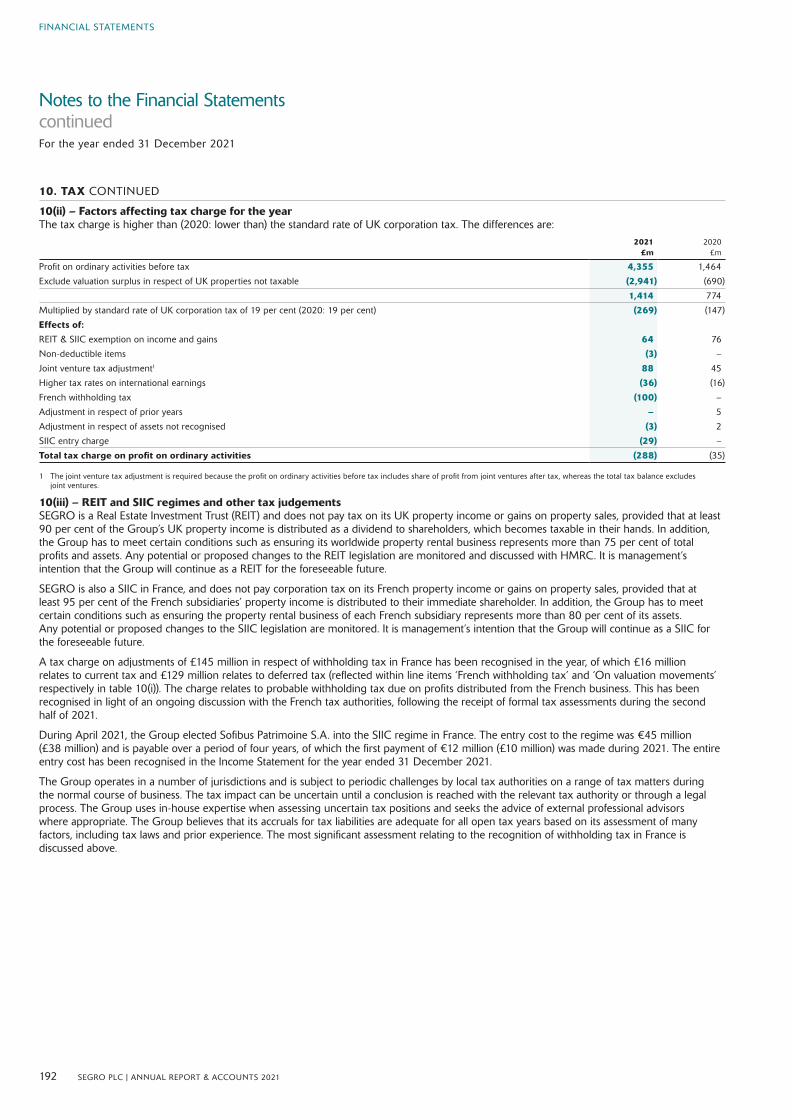
FINANCIAL STATEMENTS
Notes to the Financial Statements continuedFor the year ended 31 December 2021
192 SEGRO PLC | ANNUAL REPORT & ACCOUNTS 2021
10. TAX CONTINUED
10(ii) – Factors affecting tax charge for the yearThe tax charge is higher than (2020: lower than) the standard rate of UK corporation tax. The differences are:
2021 £m
2020 £m
Profit on ordinary activities before tax 4,355 1,464
Exclude valuation surplus in respect of UK properties not taxable (2,941) (690)
1,414 774
Multiplied by standard rate of UK corporation tax of 19 per cent (2020: 19 per cent) (269) (147)
Effects of:REIT & SIIC exemption on income and gains 64 76
Non-deductible items (3) –
Joint venture tax adjustment1 88 45
Higher tax rates on international earnings (36) (16)
French withholding tax (100) –
Adjustment in respect of prior years – 5
Adjustment in respect of assets not recognised (3) 2
SIIC entry charge (29) –
Total tax charge on profit on ordinary activities (288) (35)
1 The joint venture tax adjustment is required because the profit on ordinary activities before tax includes share of profit from joint ventures after tax, whereas the total tax balance excludes joint ventures.
10(iii) – REIT and SIIC regimes and other tax judgementsSEGRO is a Real Estate Investment Trust (REIT) and does not pay tax on its UK property income or gains on property sales, provided that at least 90 per cent of the Group’s UK property income is distributed as a dividend to shareholders, which becomes taxable in their hands. In addition, the Group has to meet certain conditions such as ensuring its worldwide property rental business represents more than 75 per cent of total profits and assets. Any potential or proposed changes to the REIT legislation are monitored and discussed with HMRC. It is management’s intention that the Group will continue as a REIT for the foreseeable future.
SEGRO is also a SIIC in France, and does not pay corporation tax on its French property income or gains on property sales, provided that at least 95 per cent of the French subsidiaries’ property income is distributed to their immediate shareholder. In addition, the Group has to meet certain conditions such as ensuring the property rental business of each French subsidiary represents more than 80 per cent of its assets. Any potential or proposed changes to the SIIC legislation are monitored. It is management’s intention that the Group will continue as a SIIC for the foreseeable future.
A tax charge on adjustments of £145 million in respect of withholding tax in France has been recognised in the year, of which £16 million relates to current tax and £129 million relates to deferred tax (reflected within line items ‘French withholding tax’ and ‘On valuation movements’ respectively in table 10(i)). The charge relates to probable withholding tax due on profits distributed from the French business. This has been recognised in light of an ongoing discussion with the French tax authorities, following the receipt of formal tax assessments during the second half of 2021.
During April 2021, the Group elected Sofibus Patrimoine S.A. into the SIIC regime in France. The entry cost to the regime was €45 million (£38 million) and is payable over a period of four years, of which the first payment of €12 million (£10 million) was made during 2021. The entire entry cost has been recognised in the Income Statement for the year ended 31 December 2021.
The Group operates in a number of jurisdictions and is subject to periodic challenges by local tax authorities on a range of tax matters during the normal course of business. The tax impact can be uncertain until a conclusion is reached with the relevant tax authority or through a legal process. The Group uses in-house expertise when assessing uncertain tax positions and seeks the advice of external professional advisors where appropriate. The Group believes that its accruals for tax liabilities are adequate for all open tax years based on its assessment of many factors, including tax laws and prior experience. The most significant assessment relating to the recognition of withholding tax in France is discussed above.
12_NotesToFinStatements_179_227_v110.indd 19212_NotesToFinStatements_179_227_v110.indd 192 01/03/2022 17:2401/03/2022 17:24
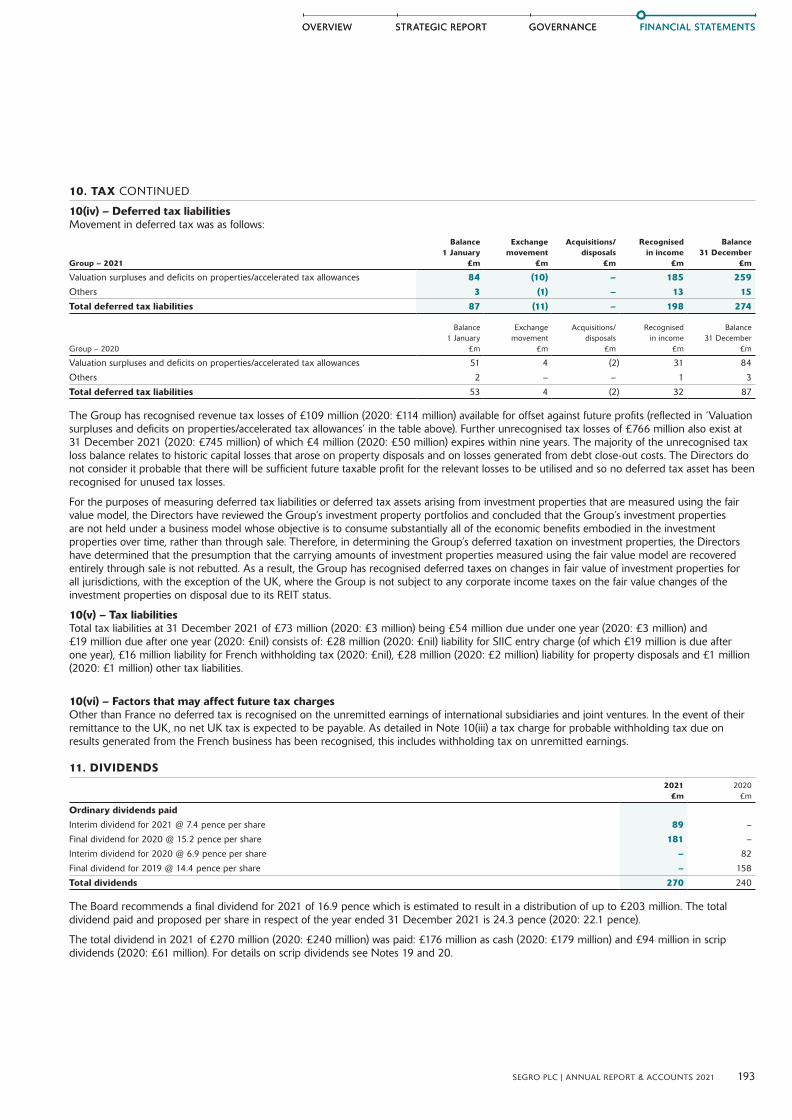
FINANCIAL STATEMENTSFINANCIAL STATEMENTS
193SEGRO PLC | ANNUAL REPORT & ACCOUNTS 2021
STRATEGIC REPORTOVERVIEW GOVERNANCEGOVERNANCESTRATEGIC REPORTOVERVIEW
10. TAX CONTINUED
10(iv) – Deferred tax liabilitiesMovement in deferred tax was as follows:
Group – 2021
Balance 1 January
£m
Exchange movement
£m
Acquisitions/ disposals
£m
Recognised in income
£m
Balance 31 December
£m
Valuation surpluses and deficits on properties/accelerated tax allowances 84 (10) – 185 259Others 3 (1) – 13 15Total deferred tax liabilities 87 (11) – 198 274
Group – 2020
Balance 1 January
£m
Exchange movement
£m
Acquisitions/ disposals
£m
Recognised in income
£m
Balance 31 December
£m
Valuation surpluses and deficits on properties/accelerated tax allowances 51 4 (2) 31 84
Others 2 – – 1 3
Total deferred tax liabilities 53 4 (2) 32 87
The Group has recognised revenue tax losses of £109 million (2020: £114 million) available for offset against future profits (reflected in ‘Valuation surpluses and deficits on properties/accelerated tax allowances’ in the table above). Further unrecognised tax losses of £766 million also exist at 31 December 2021 (2020: £745 million) of which £4 million (2020: £50 million) expires within nine years. The majority of the unrecognised tax loss balance relates to historic capital losses that arose on property disposals and on losses generated from debt close-out costs. The Directors do not consider it probable that there will be sufficient future taxable profit for the relevant losses to be utilised and so no deferred tax asset has been recognised for unused tax losses.
For the purposes of measuring deferred tax liabilities or deferred tax assets arising from investment properties that are measured using the fair value model, the Directors have reviewed the Group’s investment property portfolios and concluded that the Group’s investment properties are not held under a business model whose objective is to consume substantially all of the economic benefits embodied in the investment properties over time, rather than through sale. Therefore, in determining the Group’s deferred taxation on investment properties, the Directors have determined that the presumption that the carrying amounts of investment properties measured using the fair value model are recovered entirely through sale is not rebutted. As a result, the Group has recognised deferred taxes on changes in fair value of investment properties for all jurisdictions, with the exception of the UK, where the Group is not subject to any corporate income taxes on the fair value changes of the investment properties on disposal due to its REIT status.
10(v) – Tax liabilitiesTotal tax liabilities at 31 December 2021 of £73 million (2020: £3 million) being £54 million due under one year (2020: £3 million) and £19 million due after one year (2020: £nil) consists of: £28 million (2020: £nil) liability for SIIC entry charge (of which £19 million is due after one year), £16 million liability for French withholding tax (2020: £nil), £28 million (2020: £2 million) liability for property disposals and £1 million (2020: £1 million) other tax liabilities.
10(vi) – Factors that may affect future tax chargesOther than France no deferred tax is recognised on the unremitted earnings of international subsidiaries and joint ventures. In the event of their remittance to the UK, no net UK tax is expected to be payable. As detailed in Note 10(iii) a tax charge for probable withholding tax due on results generated from the French business has been recognised, this includes withholding tax on unremitted earnings.
11. DIVIDENDS2021
£m2020
£m
Ordinary dividends paid
Interim dividend for 2021 @ 7.4 pence per share 89 –
Final dividend for 2020 @ 15.2 pence per share 181 –
Interim dividend for 2020 @ 6.9 pence per share – 82
Final dividend for 2019 @ 14.4 pence per share – 158
Total dividends 270 240
The Board recommends a final dividend for 2021 of 16.9 pence which is estimated to result in a distribution of up to £203 million. The total dividend paid and proposed per share in respect of the year ended 31 December 2021 is 24.3 pence (2020: 22.1 pence).
The total dividend in 2021 of £270 million (2020: £240 million) was paid: £176 million as cash (2020: £179 million) and £94 million in scrip dividends (2020: £61 million). For details on scrip dividends see Notes 19 and 20.
12_NotesToFinStatements_179_227_v110.indd 19312_NotesToFinStatements_179_227_v110.indd 193 01/03/2022 17:2401/03/2022 17:24

FINANCIAL STATEMENTS
Notes to the Financial Statements continuedFor the year ended 31 December 2021
194 SEGRO PLC | ANNUAL REPORT & ACCOUNTS 2021
12. EARNINGS AND NET ASSETS PER SHARE
The earnings per share calculations use the weighted average number of shares in issue during the year and the net assets per share calculations use the number of shares in issue at year end. Earnings per share calculations exclude 0.2 million shares (2020: 0.4 million) being the average number of shares held on trust for employee share schemes and net assets per share calculations exclude 0.2 million shares (2020: 0.3 million) being the actual number of shares held on trust for employee share schemes at year end.
12(i) – Earnings per ordinary share (EPS)2021 2020
Earnings £m
Shares million
Pence per share
Earnings £m
Shares million
Pence per share
Basic EPS 4,060 1,197.7 339.0 1,427 1,149.8 124.1
Dilution adjustments:
Share and save as you earn schemes – 3.3 (0.9) – 4.7 (0.5)
Diluted EPS 4,060 1,201.0 338.1 1,427 1,154.5 123.6
Basic EPS 4,060 1,197.7 339.0 1,427 1,149.8 124.1
Adjustments to profit before tax1 (3,999) (333.9) (1,168) (101.6)
Tax in respect of Adjustments 280 23.4 31 2.7
Non-controlling interest on Adjustments 7 0.6 2 0.2
Adjusted Basic EPS 348 1,197.7 29.1 292 1,149.8 25.4
Adjusted Diluted EPS 348 1,201.0 29.0 292 1,154.5 25.3
1 Details of adjustments are included in Note 2.
12(ii) – Net assets per share (NAV)The EPRA Net Tangible Assets (NTA) metric is considered to be most consistent with the nature of SEGRO’s business as a UK REIT providing long-term progressive and sustainable returns. EPRA NTA acts as the primary measure of net asset value and is also referred to as Adjusted Net Asset Value (or Adjusted NAV).
A reconciliation from IFRS NAV to Adjusted NAV is set out in the table below along with the net asset per share metrics.
Table 5 of the Supplementary Notes provides a reconciliation from IFRS NAV for each of the three EPRA net asset value metrics.2021 2020
Equity attributable to ordinary
shareholders £m
Shares million
Pence per share
Equity attributable to ordinary
shareholders £m
Shares million
Pence per share
Basic NAV 13,436 1,202.3 1,118 9,659 1,191.3 811
Dilution adjustments:
Share and save as you earn schemes – 3.2 (3) – 3.4 (2)
Diluted NAV 13,436 1,205.5 1,115 9,659 1,194.7 809
Fair value adjustment in respect of interest rate derivatives – Group 24 2 (61) (5)
Fair value adjustment in respect of trading properties – Group 1 – 1 –
Deferred tax in respect of depreciation and valuation surpluses – Group1 129 11 42 3
Deferred tax in respect of depreciation and valuation surpluses – Joint ventures1 123 10 86 7
Intangible assets (9) (1) (2) –
Adjusted NAV 13,704 1,205.5 1,137 9,725 1,194.7 814
1 50 per cent of deferred tax in respect of depreciation and valuation surpluses has been excluded in calculating Adjusted NAV in line with option 3 of EPRA Best Practices Recommendations guidelines.
12_NotesToFinStatements_179_227_v110.indd 19412_NotesToFinStatements_179_227_v110.indd 194 01/03/2022 17:2401/03/2022 17:24
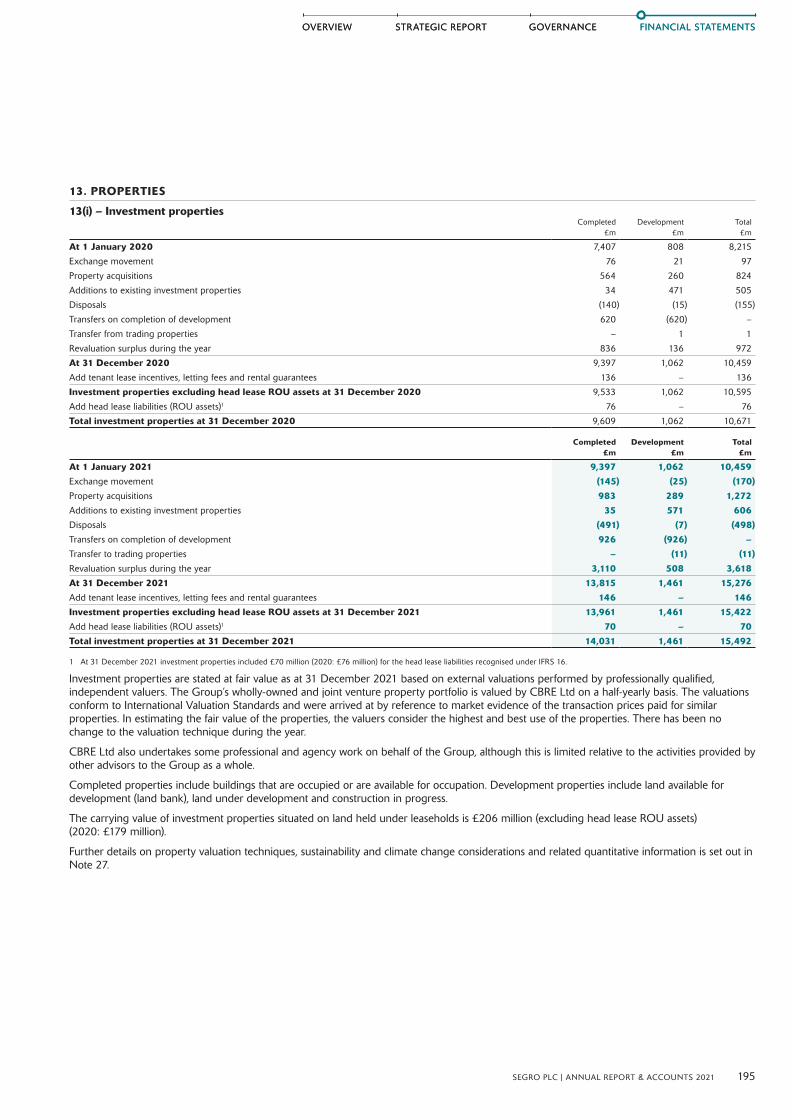
FINANCIAL STATEMENTSFINANCIAL STATEMENTS
195SEGRO PLC | ANNUAL REPORT & ACCOUNTS 2021
STRATEGIC REPORTOVERVIEW GOVERNANCEGOVERNANCESTRATEGIC REPORTOVERVIEW
13. PROPERTIES
13(i) – Investment propertiesCompleted
£mDevelopment
£mTotal
£m
At 1 January 2020 7,407 808 8,215
Exchange movement 76 21 97
Property acquisitions 564 260 824
Additions to existing investment properties 34 471 505
Disposals (140) (15) (155)
Transfers on completion of development 620 (620) –
Transfer from trading properties – 1 1
Revaluation surplus during the year 836 136 972
At 31 December 2020 9,397 1,062 10,459
Add tenant lease incentives, letting fees and rental guarantees 136 – 136
Investment properties excluding head lease ROU assets at 31 December 2020 9,533 1,062 10,595
Add head lease liabilities (ROU assets)1 76 – 76
Total investment properties at 31 December 2020 9,609 1,062 10,671
Completed £m
Development £m
Total £m
At 1 January 2021 9,397 1,062 10,459
Exchange movement (145) (25) (170)
Property acquisitions 983 289 1,272
Additions to existing investment properties 35 571 606
Disposals (491) (7) (498)
Transfers on completion of development 926 (926) –
Transfer to trading properties – (11) (11)
Revaluation surplus during the year 3,110 508 3,618
At 31 December 2021 13,815 1,461 15,276
Add tenant lease incentives, letting fees and rental guarantees 146 – 146
Investment properties excluding head lease ROU assets at 31 December 2021 13,961 1,461 15,422
Add head lease liabilities (ROU assets)1 70 – 70
Total investment properties at 31 December 2021 14,031 1,461 15,492
1 At 31 December 2021 investment properties included £70 million (2020: £76 million) for the head lease liabilities recognised under IFRS 16.
Investment properties are stated at fair value as at 31 December 2021 based on external valuations performed by professionally qualified, independent valuers. The Group’s wholly-owned and joint venture property portfolio is valued by CBRE Ltd on a half-yearly basis. The valuations conform to International Valuation Standards and were arrived at by reference to market evidence of the transaction prices paid for similar properties. In estimating the fair value of the properties, the valuers consider the highest and best use of the properties. There has been no change to the valuation technique during the year.
CBRE Ltd also undertakes some professional and agency work on behalf of the Group, although this is limited relative to the activities provided by other advisors to the Group as a whole.
Completed properties include buildings that are occupied or are available for occupation. Development properties include land available for development (land bank), land under development and construction in progress.
The carrying value of investment properties situated on land held under leaseholds is £206 million (excluding head lease ROU assets) (2020: £179 million).
Further details on property valuation techniques, sustainability and climate change considerations and related quantitative information is set out in Note 27.
12_NotesToFinStatements_179_227_v110.indd 19512_NotesToFinStatements_179_227_v110.indd 195 01/03/2022 17:2401/03/2022 17:24

FINANCIAL STATEMENTS
Notes to the Financial Statements continuedFor the year ended 31 December 2021
196 SEGRO PLC | ANNUAL REPORT & ACCOUNTS 2021
13. PROPERTIES CONTINUED
13(ii) – Trading properties2021
£m2020
£m
At 1 January 52 20
Exchange movement (2) 1
Property acquisitions 8 34
Additions to existing trading properties 17 14
Disposals¹ (40) (16)
Increase in provision for impairment during the year (1) –
Transfer from/(to) investment properties 11 (1)
At 31 December 45 52
1 Profit on sale of trading properties of £7 million in the year (2020: £1 million) have been generated from total proceeds of £47 million (2020: £17 million), see Note 4, less costs of £40 million
(2020: £16 million), see Note 5.
Trading properties were externally valued, as detailed in Note 13(i), resulting in an increase in the provision for impairment of £1 million (2020: £nil). Based on the fair value at 31 December 2021, the portfolio has unrecognised surplus of £1 million (2020: £1 million). Further information on valuation techniques and related quantitative information is given in Note 27.
14. TRADE AND OTHER RECEIVABLESGroup Company
2021 £m
2020 £m
2021 £m
2020 £m
Current
Trade receivables¹ 48 49 – –
Other receivables2,3 183 204 21 8
Prepayments 10 13 – –
Amounts due from related parties 6 4 – –
Total current trade and other receivables 247 270 21 8
Non-current
Other receivables4 35 37 – –
Total non-current other receivables 35 37 – –
1 Note 17(vi) details the Group’s credit risk management and loss allowances held for trade receivables.2 Group other current receivables includes VAT recoverable, tenant deposits and capital receivables. Other receivables at 31 December 2020 included deferred proceeds from the disposal of
investment properties of £75 million which were received during 2021.3 Other current receivables include tax recoverable of £2 million (2020: £2 million). 4 Group non-current other receivables relate to an advance payment for the future acquisition of land of £35 million (2020: £37 million).
15. TRADE AND OTHER PAYABLESGroup Company
2021 £m
2020 £m
2021 £m
2020 £m
Due within one year
Trade payables 5 5 – –
Other payables 114 79 2 2
Non-capital accruals1 80 71 29 27
Capital creditors and capital accruals 178 141 – –
Rent in advance 84 75 – –
Lease liabilities 2 1 – –
Total trade and other payables due within one year 463 372 31 29
Due after one yearContract liabilities – 26 – –
Other payables 1 2 – –
Lease liabilities 74 82 – –
Loans due to subsidiaries – – 1,498 1,930
Total other payables due after one year 75 110 1,498 1,930
1 Includes accrued interest payable on borrowings for Group and Company of £20 million (2020: £19 million).
12_NotesToFinStatements_179_227_v110.indd 19612_NotesToFinStatements_179_227_v110.indd 196 01/03/2022 17:2401/03/2022 17:24

FINANCIAL STATEMENTSFINANCIAL STATEMENTS
197SEGRO PLC | ANNUAL REPORT & ACCOUNTS 2021
STRATEGIC REPORTOVERVIEW GOVERNANCEGOVERNANCESTRATEGIC REPORTOVERVIEW
16. NET BORROWINGS
16(i) – Net borrowings by typeGroup Company
2021 £m
2020 £m
2021 £m
2020 £m
Secured borrowings:Euro mortgages 2 14 – –
Total secured (on land, buildings and other assets) 2 14 – –
Unsecured borrowings:Bonds6.75% bonds 2024 82 82 82 82
2.375% bonds 2029 348 347 348 347
0.50% bonds 2031 415 – – –
5.75% bonds 2035 199 199 199 199
2.875% bonds 2037 396 396 396 396
1,440 1,024 1,025 1,024
Private placement notes1.77% notes 2027 335 357 335 357
1.82% notes 2028 84 89 84 89
2.00% notes 2029 126 134 126 134
2.27% notes 2032 84 89 84 89
1.35% notes 2032 125 133 125 133
2.37% notes 2033 167 178 167 178
1.45% notes 2035 42 44 42 44
1.83% notes 2040 (Series C) 158 168 158 168
1.83% notes 2040 (Series D) 50 53 50 53
1,171 1,245 1,171 1,245
Bank loans and overdrafts 793 131 793 131
Total unsecured 3,404 2,400 2,989 2,400
Total borrowings 3,406 2,414 2,989 2,400
Cash and cash equivalents (45) (89) (12) (20)
Net borrowings 3,361 2,325 2,977 2,380
The maturity profile of borrowings is as follows:Group Company
Maturity profile of borrowings2021
£m2020
£m2021
£m2020
£m
In one year or less – 1 – –
In more than one year but less than two – 1 – –
In more than two years but less than five 877 218 875 213
In more than five years but less than ten 1,308 934 893 927
In more than ten years 1,221 1,260 1,221 1,260
In more than one year 3,406 2,413 2,989 2,400
Total borrowings 3,406 2,414 2,989 2,400
Cash and cash equivalents (45) (89) (12) (20)
Net borrowings 3,361 2,325 2,977 2,380
Cash and cash equivalents comprise cash balances, call deposits held with banks and highly liquid short-term investments that are readily convertible to known amounts of cash within three months from acquisition and subject to an insignificant risk of changes in value.
There are no early settlement or call options on any of the borrowings. Financial covenants relating to the borrowings include maximum limits to the Group’s gearing ratio and minimum limits to permitted interest cover. Financial covenants are discussed in more detail in the ‘Gearing and financial covenants’ section in the Financial Review on pages 68 and 69.
Bank loans and overdrafts include capitalised finance costs on committed facilities.
During the year the Group issued a €500 million (£415 million as at 31 December 2021) senior unsecured green bond with a 0.5 per cent coupon and ten year maturity. Proceeds of the bond were used to finance or refinance eligible green projects outlined in SEGRO’s Green Finance Framework (further details on SEGRO’s Green Finance Framework can be found on the Company’s website). The debt refinancing is discussed in more detail in the Finance Review on page 68.
12_NotesToFinStatements_179_227_v110.indd 19712_NotesToFinStatements_179_227_v110.indd 197 01/03/2022 17:2401/03/2022 17:24

FINANCIAL STATEMENTS
Notes to the Financial Statements continuedFor the year ended 31 December 2021
198 SEGRO PLC | ANNUAL REPORT & ACCOUNTS 2021
16. NET BORROWINGS CONTINUEDGroup Company
Maturity profile of undrawn borrowing facilities2021
£m2020
£m2021
£m2020
£m
In one year or less 8 19 8 9
In more than one year but less than two 630 – 630 –
In more than two years but less than five 210 953 210 953
Total available undrawn borrowing facilities 848 972 848 962
16(ii) – Net borrowings by interest ratesThe weighted average interest rate profile of Group and Company net borrowings after derivative instruments is as follows:
2021
Interest rate profile – Group
Fixed rate
%
Fixed period years
Fixed debt
£m
Capped strike
%
Capped debt
£m
Variable debt/cash
£mTotal
£m
Borrowings Weighted average after derivative instrumentsSterling 6.42 10.2 96 2.00 150 371 617Euros 1.30 8.4 958 1.33 630 1,201 2,789Total borrowings 1.77 8.6 1,054 1.46 780 1,572 3,406Cash and cash equivalents
Sterling (31) (31)
Euros (14) (14)
Total cash and cash equivalents (45) (45)
Net borrowings 1,054 780 1,527 3,361
2020
Interest rate profile – Group
Fixed rate
%
Fixed period years1
Fixed debt £m
Capped strike
%
Capped debt £m
Variable debt/cash
£mTotal
£m
Borrowings Weighted average after derivative instruments
Sterling 6.48 10.2 96 2.00 150 (66) 180
Euros 1.90 8.1 589 1.33 670 975 2,234
Total borrowings 2.54 8.4 685 1.46 820 909 2,414
Cash and cash equivalents
Sterling (61) (61)
Euros (28) (28)
Total cash and cash equivalents (89) (89)
Net borrowings 685 820 820 2,325
12_NotesToFinStatements_179_227_v110.indd 19812_NotesToFinStatements_179_227_v110.indd 198 01/03/2022 17:2401/03/2022 17:24

FINANCIAL STATEMENTSFINANCIAL STATEMENTS
199SEGRO PLC | ANNUAL REPORT & ACCOUNTS 2021
STRATEGIC REPORTOVERVIEW GOVERNANCEGOVERNANCESTRATEGIC REPORTOVERVIEW
16. NET BORROWINGS CONTINUED
2021
Interest rate profile – Company
Fixed rate
%
Fixed period years
Fixed debt
£m
Capped strike
%
Capped debt
£m
Variable debt/cash
£mTotal
£m
Borrowings Weighted average after derivative instrumentsSterling 6.42 10.2 96 2.00 150 371 617Euros 2.41 7.2 542 1.33 630 1,200 2,372Total borrowings 3.01 7.6 638 1.46 780 1,571 2,989Cash and cash equivalentsSterling (12) (12)Total cash and cash equivalents (12) (12)Net borrowings 638 780 1,559 2,977
2020
Interest rate profile – Company
Fixed rate
%
Fixed period years1
Fixed debt £m
Capped strike
%
Capped debt £m
Variable debt/cash
£mTotal
£m
Borrowings Weighted average after derivative instruments
Sterling 6.48 10.2 96 2.00 150 (66) 180
Euros 1.92 8.2 575 1.33 670 975 2,220
Total borrowings 2.57 8.5 671 1.46 820 909 2,400
Cash and cash equivalents
Sterling (20) (20)
Total cash and cash equivalents (20) (20)
Net borrowings 671 820 889 2,380
1 The fixed period years for sterling borrowings for 2020 have been represented using an alternative calculation method so as to provide more meaningful disclosure. The previous balance for sterling was 112.3 years for the Group and for the Company and for total borrowings was 22.6 years for Group and 23.0 years for Company.
17. FINANCIAL INSTRUMENTS AND FAIR VALUES
17(i) Derivative instrumentsThe Group and Company holds the following derivative instruments:
Derivative assetsGroup Company
2021 £m
2020 £m
2021 £m
2020 £m
Current
Fair value of interest rate swaps – non-hedge 3 – 3 –
Fair value of forward foreign exchange and currency swap contracts – non-hedge 6 15 11 15
Fair value of forward foreign exchange and currency swap contracts – hedge 5 – – –
Total current derivative assets 14 15 14 15
Non-currentFair value of interest rate swaps – non-hedge 20 61 20 61
Fair value of interest rate caps – non-hedge 9 2 9 2
Fair value of forward foreign exchange and currency swap contracts – non-hedge 21 – 21 –
Total non-current derivative assets 50 63 50 63
Derivative liabilitiesGroup Company
2021 £m
2020 £m
2021 £m
2020 £m
CurrentFair value of forward foreign exchange and currency swap contracts – non-hedge – 5 – 5
Total current derivative liabilities – 5 – 5
Non-current
Fair value of forward foreign exchange and currency swap contracts – non-hedge – 3 – 3
Fair value of interest rates swaps – non-hedge 56 2 56 2
Total non-current derivative liabilities 56 5 56 5
12_NotesToFinStatements_179_227_v110.indd 19912_NotesToFinStatements_179_227_v110.indd 199 01/03/2022 17:2401/03/2022 17:24

FINANCIAL STATEMENTS
Notes to the Financial Statements continuedFor the year ended 31 December 2021
200 SEGRO PLC | ANNUAL REPORT & ACCOUNTS 2021
17. FINANCIAL INSTRUMENTS AND FAIR VALUES CONTINUED
17(ii) Carrying amount and fair values of financial assets and liabilitiesThe Group and Company holds the following financial instruments:
Group Company
Notes2021
£m2020
£m2021
£m2020
£m
Financial assetsFinancial assets at amortised costLoans due from subsidiaries 7 – – 4,515 6,063
Lease incentives1 13 124 118 – –
Trade receivables 14 48 49 – –
Other current receivables2 14 104 150 21 8
Other non-current receivables 14 35 37 – –
Cash and cash equivalents 16 45 89 12 20
Financial assets at fair value through profit or loss (FVPL)Other investments 5 2 – –
Derivative financial instrumentsUsed for hedging at FVOCI 17 5 – – –
Non-hedge at FVPL 17 59 78 64 78
425 523 4,612 6,169
Financial liabilities
Liabilities at amortised cost
Trade and other payables2 15 453 406 1,529 1,959
Borrowings 16 3,406 2,414 2,989 2,400
Derivative financial instruments
Non-hedge at FVPL 17 56 10 56 10
3,915 2,830 4,574 4,369
1 Represents the carrying value of tenant lease incentives and rental guarantees held in Investment properties at the year end. This amount is included within the ‘tenant lease incentives, letting fees and rental guarantees’ balance in Note 13(i).
2 Group excludes non-financial assets of £95 million (2020: £71 million) included within total other receivables per Note 14 and non-financial liabilities of £85 million (2020: £76 million) included within total trade and other payables per Note 15.
The carrying values of these financial assets and liabilities approximate their fair value, with the exception of unsecured bonds and unsecured US Private Placement notes classified as borrowings. At 31 December 2021, the fair value of £1,440 million of unsecured bonds issued was £1,610 million (2020: £1,024 million compared with £1,303 million fair value). At 31 December 2021, the fair value of £1,171 million of unsecured US Private Placement notes was £1,261 million (2020: £1,245 million compared with £1,433 million fair value). This results in a fair value adjustment decrease in EPRA NDV of £260 million (2020: £467 million decrease), see Table 5 of the Supplementary Notes.
The fair values of financial assets and financial liabilities are determined as follows:
} Forward foreign exchange contracts are measured using quoted exchange rates and yield curves derived from quoted interest rates with maturities matching the contracts.
} Interest rate swaps, currency swap contracts and interest rate caps are measured at the present value of future cash flows estimated and discounted based on the applicable yield curves derived from quoted interest rates and the appropriate exchange rate at the Balance Sheet date.
} The fair value of non-derivative financial assets and financial liabilities traded on active liquid markets is determined with reference to the quoted market prices.
} Financial guarantees are issued by the Company to support bank borrowings of 100 per cent owned subsidiary companies domiciled overseas.
Fair value measurements recognised in the Balance SheetThe Group and Company financial instruments that are measured subsequent to initial recognition at fair value are listed equity investments, forward exchange and currency swap contracts, interest rate swaps and interest rate caps as detailed above. Investments in equity securities traded in active liquid markets are classified as level 1. All other financial instruments would be classified as level 2 fair value measurements, as defined by IFRS 13, being those derived from inputs other than quoted prices (included within level 1) that are observable for the asset or liability, either directly (i.e. as prices) or indirectly (i.e. derived from prices). There were no transfers between categories in the current or prior year.
17(iii) Capital risk managementThe Group manages its capital to ensure that entities in the Group will be able to continue as a going concern and as such it aims to maintain a prudent mix between debt and equity financing. Our intention for the foreseeable future is to maintain our LTV (including joint ventures at share) at around 30 per cent. This provides the flexibility to take advantage of investment opportunities arising and ensures significant headroom compared to our tightest gearing covenants should property values decline. The current capital structure of the Group consists of a mix of equity and debt. Equity comprises issued capital, reserves and retained earnings as disclosed in the Statement of Changes in Equity and Notes 19 to 21. Debt primarily comprises long-term debt issues and drawings against medium-term committed revolving credit facilities from banks as disclosed in Note 16.
The Group is not subject to externally imposed capital requirements.
12_NotesToFinStatements_179_227_v110.indd 20012_NotesToFinStatements_179_227_v110.indd 200 01/03/2022 17:2401/03/2022 17:24
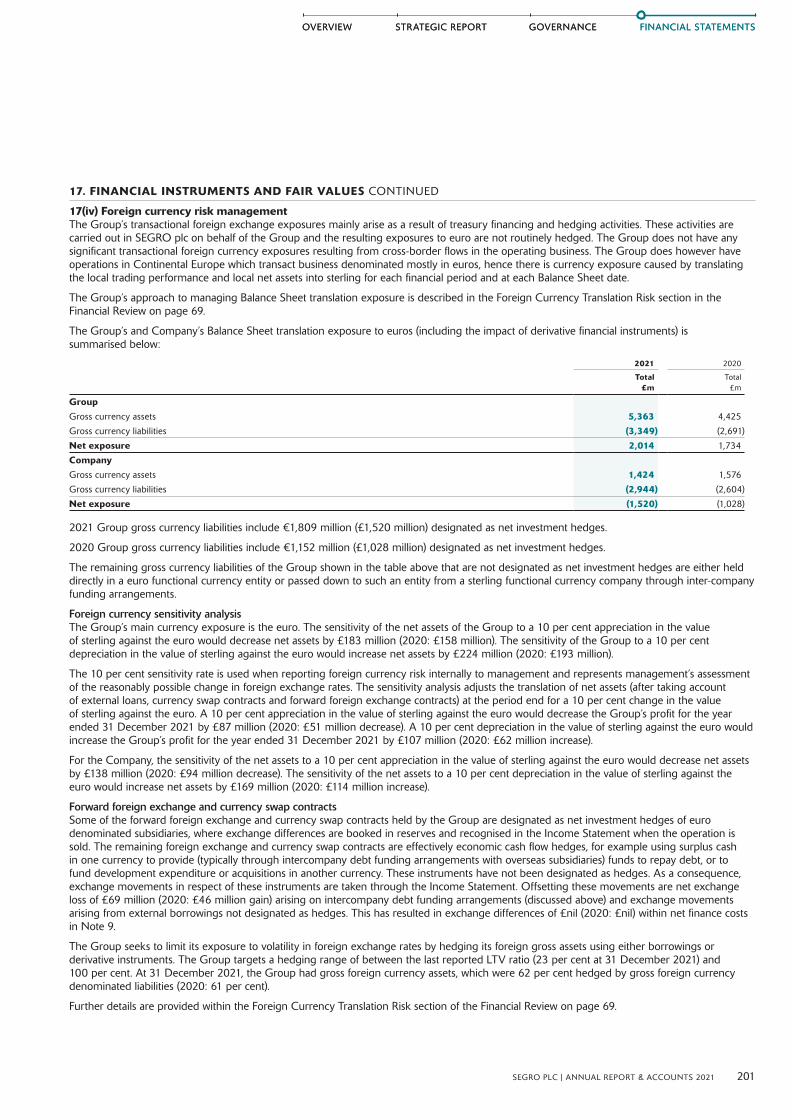
FINANCIAL STATEMENTSFINANCIAL STATEMENTS
201SEGRO PLC | ANNUAL REPORT & ACCOUNTS 2021
STRATEGIC REPORTOVERVIEW GOVERNANCEGOVERNANCESTRATEGIC REPORTOVERVIEW
17. FINANCIAL INSTRUMENTS AND FAIR VALUES CONTINUED
17(iv) Foreign currency risk managementThe Group’s transactional foreign exchange exposures mainly arise as a result of treasury financing and hedging activities. These activities are carried out in SEGRO plc on behalf of the Group and the resulting exposures to euro are not routinely hedged. The Group does not have any significant transactional foreign currency exposures resulting from cross-border flows in the operating business. The Group does however have operations in Continental Europe which transact business denominated mostly in euros, hence there is currency exposure caused by translating the local trading performance and local net assets into sterling for each financial period and at each Balance Sheet date.
The Group’s approach to managing Balance Sheet translation exposure is described in the Foreign Currency Translation Risk section in the Financial Review on page 69.
The Group’s and Company’s Balance Sheet translation exposure to euros (including the impact of derivative financial instruments) is summarised below:
2021 2020
Total £m
Total £m
Group
Gross currency assets 5,363 4,425
Gross currency liabilities (3,349) (2,691)
Net exposure 2,014 1,734
Company
Gross currency assets 1,424 1,576
Gross currency liabilities (2,944) (2,604)
Net exposure (1,520) (1,028)
2021 Group gross currency liabilities include €1,809 million (£1,520 million) designated as net investment hedges.
2020 Group gross currency liabilities include €1,152 million (£1,028 million) designated as net investment hedges.
The remaining gross currency liabilities of the Group shown in the table above that are not designated as net investment hedges are either held directly in a euro functional currency entity or passed down to such an entity from a sterling functional currency company through inter-company funding arrangements.
Foreign currency sensitivity analysisThe Group’s main currency exposure is the euro. The sensitivity of the net assets of the Group to a 10 per cent appreciation in the value of sterling against the euro would decrease net assets by £183 million (2020: £158 million). The sensitivity of the Group to a 10 per cent depreciation in the value of sterling against the euro would increase net assets by £224 million (2020: £193 million).
The 10 per cent sensitivity rate is used when reporting foreign currency risk internally to management and represents management’s assessment of the reasonably possible change in foreign exchange rates. The sensitivity analysis adjusts the translation of net assets (after taking account of external loans, currency swap contracts and forward foreign exchange contracts) at the period end for a 10 per cent change in the value of sterling against the euro. A 10 per cent appreciation in the value of sterling against the euro would decrease the Group’s profit for the year ended 31 December 2021 by £87 million (2020: £51 million decrease). A 10 per cent depreciation in the value of sterling against the euro would increase the Group’s profit for the year ended 31 December 2021 by £107 million (2020: £62 million increase).
For the Company, the sensitivity of the net assets to a 10 per cent appreciation in the value of sterling against the euro would decrease net assets by £138 million (2020: £94 million decrease). The sensitivity of the net assets to a 10 per cent depreciation in the value of sterling against the euro would increase net assets by £169 million (2020: £114 million increase).
Forward foreign exchange and currency swap contractsSome of the forward foreign exchange and currency swap contracts held by the Group are designated as net investment hedges of euro denominated subsidiaries, where exchange differences are booked in reserves and recognised in the Income Statement when the operation is sold. The remaining foreign exchange and currency swap contracts are effectively economic cash flow hedges, for example using surplus cash in one currency to provide (typically through intercompany debt funding arrangements with overseas subsidiaries) funds to repay debt, or to fund development expenditure or acquisitions in another currency. These instruments have not been designated as hedges. As a consequence, exchange movements in respect of these instruments are taken through the Income Statement. Offsetting these movements are net exchange loss of £69 million (2020: £46 million gain) arising on intercompany debt funding arrangements (discussed above) and exchange movements arising from external borrowings not designated as hedges. This has resulted in exchange differences of £nil (2020: £nil) within net finance costs in Note 9.
The Group seeks to limit its exposure to volatility in foreign exchange rates by hedging its foreign gross assets using either borrowings or derivative instruments. The Group targets a hedging range of between the last reported LTV ratio (23 per cent at 31 December 2021) and 100 per cent. At 31 December 2021, the Group had gross foreign currency assets, which were 62 per cent hedged by gross foreign currency denominated liabilities (2020: 61 per cent).
Further details are provided within the Foreign Currency Translation Risk section of the Financial Review on page 69.
12_NotesToFinStatements_179_227_v110.indd 20112_NotesToFinStatements_179_227_v110.indd 201 01/03/2022 17:2401/03/2022 17:24

FINANCIAL STATEMENTS
Notes to the Financial Statements continuedFor the year ended 31 December 2021
202 SEGRO PLC | ANNUAL REPORT & ACCOUNTS 2021
17. FINANCIAL INSTRUMENTS AND FAIR VALUES CONTINUED
The following table details the forward foreign exchange and currency swap contracts outstanding as at the year end:
Average exchange rates Currency contract (local currency) Contract value Fair value
2021 2020 2021 m
2020 m
2021 £m
2020 £m
2021 £m
2020 £m
GroupEconomic cash flow hedgesSell euros (buy sterling) 1.15 1.10 943 976 816 883 27 12
Buy euros (sell sterling) 1.19 1.09 28 236 24 216 – (5)
Net investment hedgesSell euros (buy sterling) 1.17 1.12 409 202 349 180 5 –
Total 32 7
CompanyEconomic cash flow hedgesSell euros (buy sterling) 1.16 1.11 1,352 1,178 1,165 1,063 32 12
Buy euros (sell sterling) 1.19 1.09 28 236 24 216 – (5)
Total 32 7
Effects of net investment hedge accounting on financial position and performanceThe effects of the foreign currency related hedging instruments on the Group’s financial position and performance is detailed below.
Forward foreign exchange contractsThe Group designated euro denominated forward foreign exchange contracts as net investment hedges during 2021 (2020: no contracts).
There was no ineffectiveness to be recorded from net investments in foreign entity hedges in 2021 where the hedging instrument was forward foreign exchange contracts. This is because the critical terms of both the net investment in foreign entity and the hedging instrument match, and at each Balance Sheet date both are revalued to the closing spot rate. Any forward points in the foreign exchange contract are taken to the Income Statement.Euro forward foreign exchange Group
2021 £m
2020 £m
Carrying amount 5 –
Notional amount 349 –
Maturity date Jan 2022 –
Hedge ratio 1:1 –
Change in discounted spot value of hedging instruments since 1 January – gain 9 –
Change in value of hedged item used to determine hedge effectiveness – loss (9) –
Weighted average hedged rate for the year (including forward points) 1.16 –
12_NotesToFinStatements_179_227_v110.indd 20212_NotesToFinStatements_179_227_v110.indd 202 01/03/2022 17:2401/03/2022 17:24
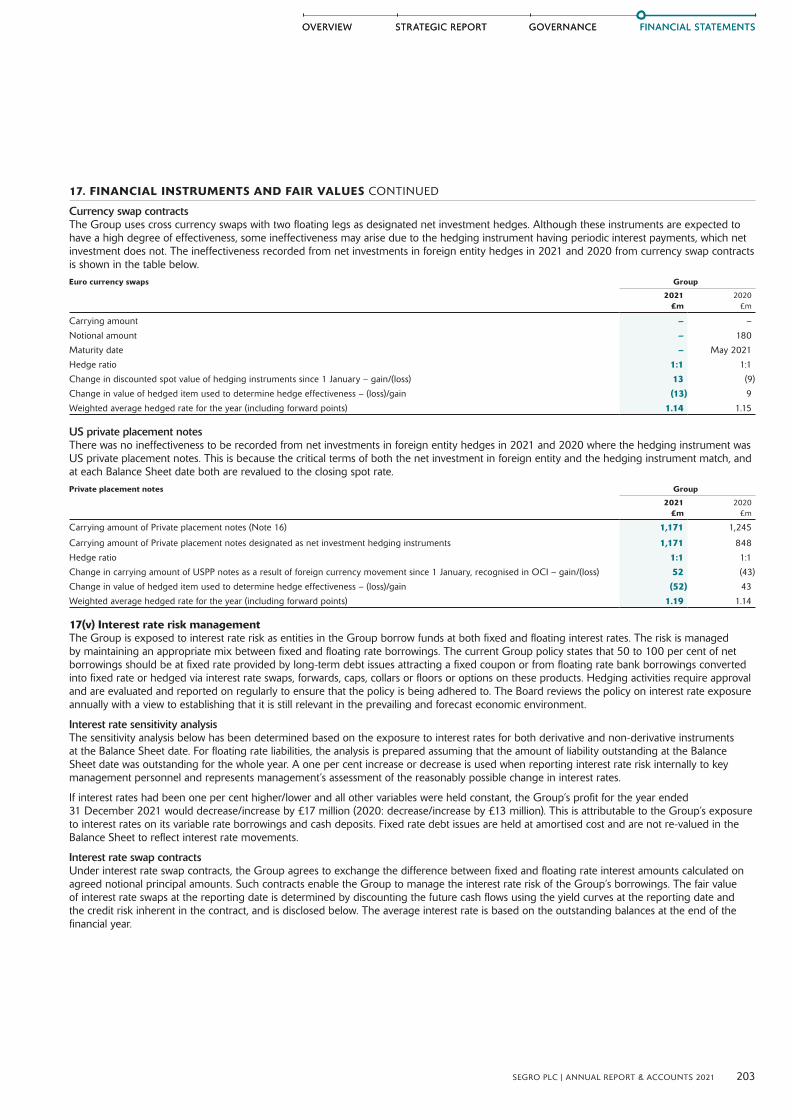
FINANCIAL STATEMENTSFINANCIAL STATEMENTS
203SEGRO PLC | ANNUAL REPORT & ACCOUNTS 2021
STRATEGIC REPORTOVERVIEW GOVERNANCEGOVERNANCESTRATEGIC REPORTOVERVIEW
17. FINANCIAL INSTRUMENTS AND FAIR VALUES CONTINUED
Currency swap contractsThe Group uses cross currency swaps with two floating legs as designated net investment hedges. Although these instruments are expected to have a high degree of effectiveness, some ineffectiveness may arise due to the hedging instrument having periodic interest payments, which net investment does not. The ineffectiveness recorded from net investments in foreign entity hedges in 2021 and 2020 from currency swap contracts is shown in the table below. Euro currency swaps Group
2021 £m
2020 £m
Carrying amount – –
Notional amount – 180
Maturity date – May 2021
Hedge ratio 1:1 1:1
Change in discounted spot value of hedging instruments since 1 January – gain/(loss) 13 (9)
Change in value of hedged item used to determine hedge effectiveness – (loss)/gain (13) 9
Weighted average hedged rate for the year (including forward points) 1.14 1.15
US private placement notesThere was no ineffectiveness to be recorded from net investments in foreign entity hedges in 2021 and 2020 where the hedging instrument was US private placement notes. This is because the critical terms of both the net investment in foreign entity and the hedging instrument match, and at each Balance Sheet date both are revalued to the closing spot rate.Private placement notes Group
2021 £m
2020 £m
Carrying amount of Private placement notes (Note 16) 1,171 1,245
Carrying amount of Private placement notes designated as net investment hedging instruments 1,171 848
Hedge ratio 1:1 1:1
Change in carrying amount of USPP notes as a result of foreign currency movement since 1 January, recognised in OCI – gain/(loss) 52 (43)
Change in value of hedged item used to determine hedge effectiveness – (loss)/gain (52) 43
Weighted average hedged rate for the year (including forward points) 1.19 1.14
17(v) Interest rate risk managementThe Group is exposed to interest rate risk as entities in the Group borrow funds at both fixed and floating interest rates. The risk is managed by maintaining an appropriate mix between fixed and floating rate borrowings. The current Group policy states that 50 to 100 per cent of net borrowings should be at fixed rate provided by long-term debt issues attracting a fixed coupon or from floating rate bank borrowings converted into fixed rate or hedged via interest rate swaps, forwards, caps, collars or floors or options on these products. Hedging activities require approval and are evaluated and reported on regularly to ensure that the policy is being adhered to. The Board reviews the policy on interest rate exposure annually with a view to establishing that it is still relevant in the prevailing and forecast economic environment.
Interest rate sensitivity analysisThe sensitivity analysis below has been determined based on the exposure to interest rates for both derivative and non-derivative instruments at the Balance Sheet date. For floating rate liabilities, the analysis is prepared assuming that the amount of liability outstanding at the Balance Sheet date was outstanding for the whole year. A one per cent increase or decrease is used when reporting interest rate risk internally to key management personnel and represents management’s assessment of the reasonably possible change in interest rates.
If interest rates had been one per cent higher/lower and all other variables were held constant, the Group’s profit for the year ended 31 December 2021 would decrease/increase by £17 million (2020: decrease/increase by £13 million). This is attributable to the Group’s exposure to interest rates on its variable rate borrowings and cash deposits. Fixed rate debt issues are held at amortised cost and are not re-valued in the Balance Sheet to reflect interest rate movements.
Interest rate swap contractsUnder interest rate swap contracts, the Group agrees to exchange the difference between fixed and floating rate interest amounts calculated on agreed notional principal amounts. Such contracts enable the Group to manage the interest rate risk of the Group’s borrowings. The fair value of interest rate swaps at the reporting date is determined by discounting the future cash flows using the yield curves at the reporting date and the credit risk inherent in the contract, and is disclosed below. The average interest rate is based on the outstanding balances at the end of the financial year.
12_NotesToFinStatements_179_227_v110.indd 20312_NotesToFinStatements_179_227_v110.indd 203 01/03/2022 17:2401/03/2022 17:24
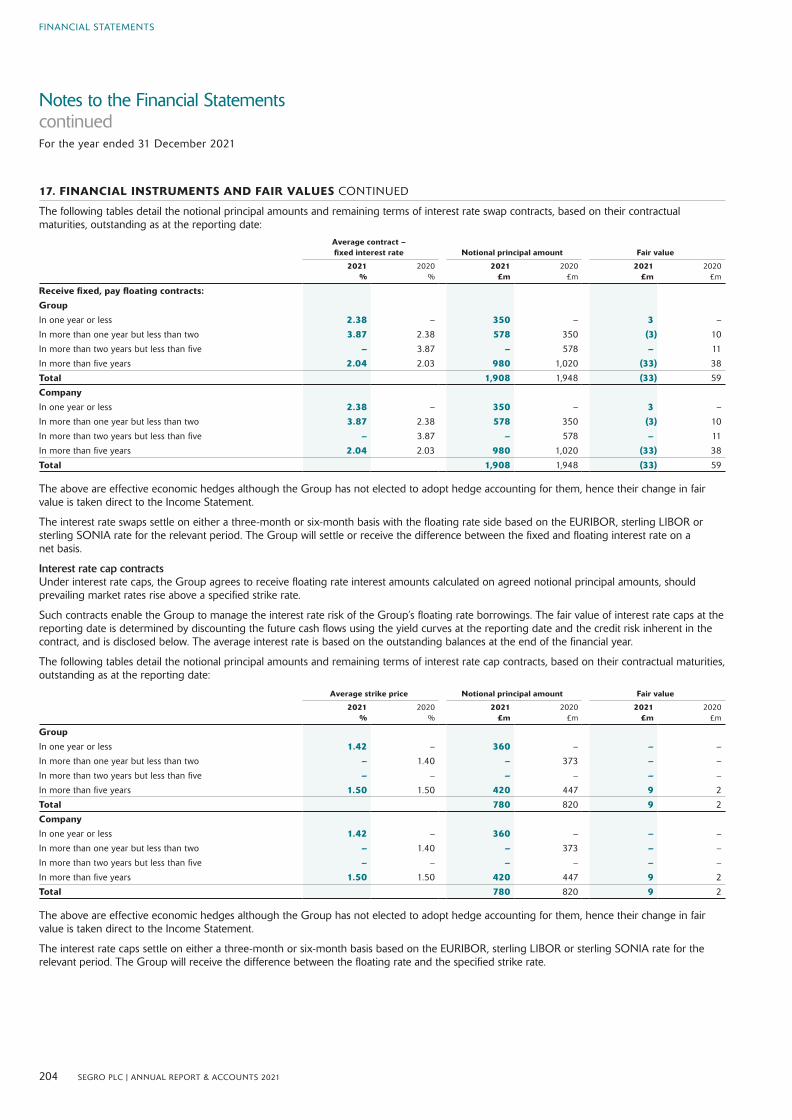
FINANCIAL STATEMENTS
Notes to the Financial Statements continuedFor the year ended 31 December 2021
204 SEGRO PLC | ANNUAL REPORT & ACCOUNTS 2021
17. FINANCIAL INSTRUMENTS AND FAIR VALUES CONTINUED
The following tables detail the notional principal amounts and remaining terms of interest rate swap contracts, based on their contractual maturities, outstanding as at the reporting date:
Average contract – fixed interest rate Notional principal amount Fair value
2021 %
2020 %
2021 £m
2020 £m
2021 £m
2020 £m
Receive fixed, pay floating contracts:GroupIn one year or less 2.38 – 350 – 3 –
In more than one year but less than two 3.87 2.38 578 350 (3) 10
In more than two years but less than five – 3.87 – 578 – 11
In more than five years 2.04 2.03 980 1,020 (33) 38
Total 1,908 1,948 (33) 59
CompanyIn one year or less 2.38 – 350 – 3 –
In more than one year but less than two 3.87 2.38 578 350 (3) 10
In more than two years but less than five – 3.87 – 578 – 11
In more than five years 2.04 2.03 980 1,020 (33) 38
Total 1,908 1,948 (33) 59
The above are effective economic hedges although the Group has not elected to adopt hedge accounting for them, hence their change in fair value is taken direct to the Income Statement.
The interest rate swaps settle on either a three-month or six-month basis with the floating rate side based on the EURIBOR, sterling LIBOR or sterling SONIA rate for the relevant period. The Group will settle or receive the difference between the fixed and floating interest rate on a net basis.
Interest rate cap contracts Under interest rate caps, the Group agrees to receive floating rate interest amounts calculated on agreed notional principal amounts, should prevailing market rates rise above a specified strike rate.
Such contracts enable the Group to manage the interest rate risk of the Group’s floating rate borrowings. The fair value of interest rate caps at the reporting date is determined by discounting the future cash flows using the yield curves at the reporting date and the credit risk inherent in the contract, and is disclosed below. The average interest rate is based on the outstanding balances at the end of the financial year.
The following tables detail the notional principal amounts and remaining terms of interest rate cap contracts, based on their contractual maturities, outstanding as at the reporting date:
Average strike price Notional principal amount Fair value
2021 %
2020 %
2021 £m
2020 £m
2021 £m
2020 £m
Group
In one year or less 1.42 – 360 – – –
In more than one year but less than two – 1.40 – 373 – –
In more than two years but less than five – – – – – –
In more than five years 1.50 1.50 420 447 9 2
Total 780 820 9 2
Company
In one year or less 1.42 – 360 – – –
In more than one year but less than two – 1.40 – 373 – –
In more than two years but less than five – – – – – –
In more than five years 1.50 1.50 420 447 9 2
Total 780 820 9 2
The above are effective economic hedges although the Group has not elected to adopt hedge accounting for them, hence their change in fair value is taken direct to the Income Statement.
The interest rate caps settle on either a three-month or six-month basis based on the EURIBOR, sterling LIBOR or sterling SONIA rate for the relevant period. The Group will receive the difference between the floating rate and the specified strike rate.
12_NotesToFinStatements_179_227_v110.indd 20412_NotesToFinStatements_179_227_v110.indd 204 01/03/2022 17:2401/03/2022 17:24

FINANCIAL STATEMENTSFINANCIAL STATEMENTS
205SEGRO PLC | ANNUAL REPORT & ACCOUNTS 2021
STRATEGIC REPORTOVERVIEW GOVERNANCEGOVERNANCESTRATEGIC REPORTOVERVIEW
17. FINANCIAL INSTRUMENTS AND FAIR VALUES CONTINUED
IBOR reformThe Group is exposed to two benchmark interest rates, sterling Overnight Index Average (GBP SONIA) and the Euro Interbank Offered Rate (EURIBOR). These interest rates are found in the Group’s floating rate borrowings, and certain derivative contracts. Given the geography of the Group, there are no exposures to other benchmark interest rates.
There are no changes in respect of EURIBOR within the Group’s financing or risk management activities.
In respect of sterling London Interbank Offered Rate (GBP LIBOR), transition arrangements are complete and there is no remaining exposure to GBP LIBOR.
The Group’s €1,200 million of bank facilities reference GBP SONIA or EURIBOR, depending on the currency of utilisation.
In respect of derivative contracts, the final interest periods for contracts bearing a GBP LIBOR exposure were fixed prior to LIBOR cessation on 31 December 2021. SEGRO has adhered to the ISDA 2020 IBOR Fallbacks Protocol, and as such these contracts will reference GBP SONIA from their next fixing date. This means that all contracts will reference GBP SONIA interest only from 30 June 2022.
17(vi) Credit risk management Credit risk refers to the risk that a counterparty will default on its contractual obligations resulting in financial loss to the Group. Potential customers are evaluated for creditworthiness and where necessary collateral is secured. There is no concentration of credit risk within the lease portfolio to either business sector or individual company as the Group has a diverse customer base with no one customer accounting for more than seven per cent of rental income. Trade receivables were less than one per cent of total assets at 31 December 2021 and at 31 December 2020.
Ageing of past due gross trade receivables and the carrying amount net of loss allowances is set out below.2021 2020
Gross amount £m
Loss allowance £m
Net carrying amount
£mGross amount
£mLoss allowance
£m
Net carrying amount
£m
0–30 days 2 – 2 1 (1) –
30–60 days 1 – 1 1 – 1
60–90 days 3 (1) 2 3 – 3
90–180 days 4 (2) 2 6 (3) 3
>180 days 3 (2) 1 5 (2) 3
Past due 13 (5) 8 16 (6) 10
Not due 42 (2) 40 40 (1) 39
Total trade receivables 55 (7) 48 56 (7) 49
Gross trade receivables mainly consists of amounts invoiced for rent, service charge and management fees, which form part of ‘Gross rental income’ (see Note 4) and are inclusive of VAT. Trade receivables at 31 December 2021 includes amounts due for 2021 rent and amounts billed in advance for 2022 rent. Both amounts have been considered in measuring expected credit losses (ECLs) detailed further below. The amounts billed in advance for 2022 rent are included within the ‘Not due’ category in the table above.
Total gross trade receivables ‘past due’ at 31 December 2021 were £13 million, three per cent of total gross rental income for the year.
Trade receivables are presented in the balance sheet net of loss allowances. The Group applies the IFRS 9 simplified approach to measuring expected credit losses (ECLs) which uses a lifetime expected loss allowance for all trade receivables. Expected loss rates are based on the historic credit loss experienced and adjusted for current and forward information affecting the ability of the individual customers to settle receivables. In the current and prior reporting period, the current and forward information considers the impact of Covid-19. Trade receivables are written off when there is no reasonable expectation of recovery.
In determining the ECLs an analysis of various factors has been performed on a customer by customer basis and considers the impact of Covid-19 and economic conditions. These factors include an assessment of the customer’s default risk based on: industry and geographic location; and payment record, which includes how many days past due the receivable is, payment concessions granted and credit rating. ECLs are recognised net of securities held for the customer.
As at 31 December 2021, the Group held a loss allowance provision for trade receivables of £7 million (2020: £7 million) and the impairment risk remains low with the loss allowance of £7 million representing two per cent of total gross rental income for the year (2020: two per cent).
Total impairment losses of £nil were recognised in the Income Statement for the year ended 31 December 2021 (2020: £4 million). The impairment losses include the net impact from loss allowances, receivables written off and recoveries of receivables previously written off and are presented within operating profit (see Note 5).
The other financial assets and lease incentive balances held by the Group have been considered for impairment based on historical default rates over the expected life and are adjusted for forward-looking information. Based on that analysis, no material loss allowances are held against these assets in the current and prior period.
Investment in financial instruments is restricted to banks and short-term liquidity funds with a good credit rating. Derivative financial instruments are transacted via International Swaps and Derivatives Association (ISDA) agreements with counterparties with a good investment grade credit rating. The Group’s exposure and the credit ratings of its counterparties are continuously monitored and the aggregate value of transactions concluded is spread among approved counterparties.
12_NotesToFinStatements_179_227_v110.indd 20512_NotesToFinStatements_179_227_v110.indd 205 01/03/2022 17:2401/03/2022 17:24
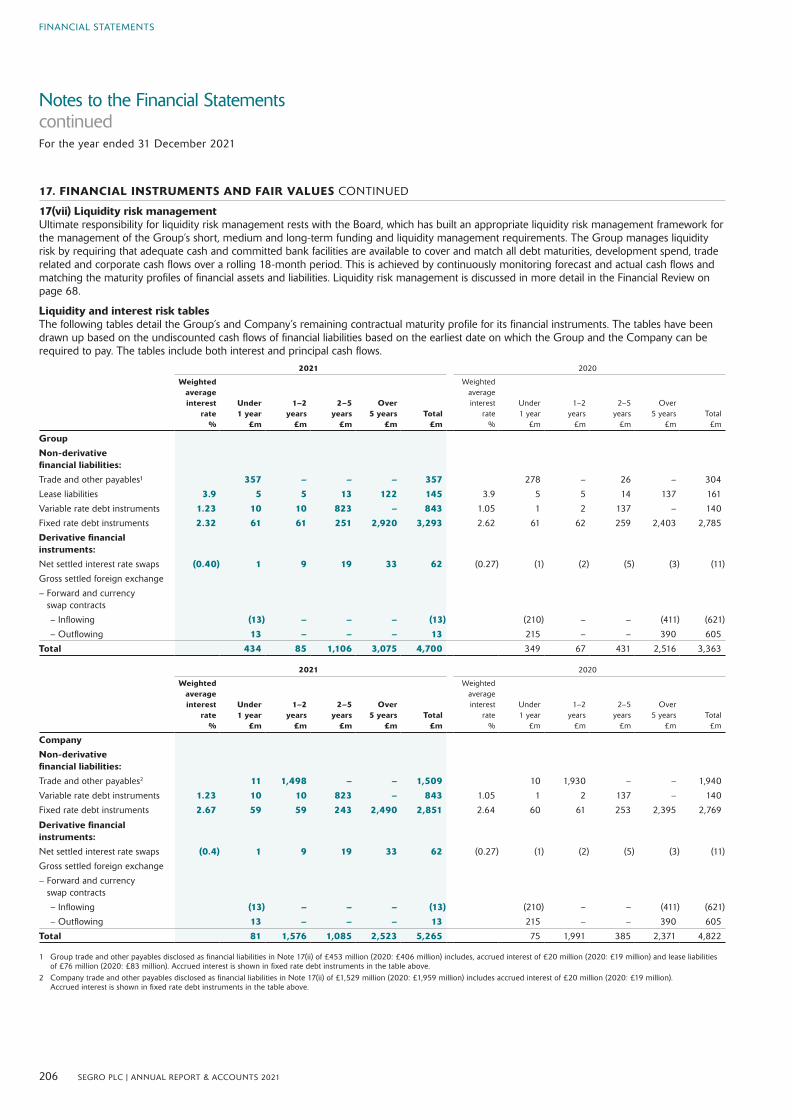
FINANCIAL STATEMENTS
Notes to the Financial Statements continuedFor the year ended 31 December 2021
206 SEGRO PLC | ANNUAL REPORT & ACCOUNTS 2021
17. FINANCIAL INSTRUMENTS AND FAIR VALUES CONTINUED
17(vii) Liquidity risk management Ultimate responsibility for liquidity risk management rests with the Board, which has built an appropriate liquidity risk management framework for the management of the Group’s short, medium and long-term funding and liquidity management requirements. The Group manages liquidity risk by requiring that adequate cash and committed bank facilities are available to cover and match all debt maturities, development spend, trade related and corporate cash flows over a rolling 18-month period. This is achieved by continuously monitoring forecast and actual cash flows and matching the maturity profiles of financial assets and liabilities. Liquidity risk management is discussed in more detail in the Financial Review on page 68.
Liquidity and interest risk tables The following tables detail the Group’s and Company’s remaining contractual maturity profile for its financial instruments. The tables have been drawn up based on the undiscounted cash flows of financial liabilities based on the earliest date on which the Group and the Company can be required to pay. The tables include both interest and principal cash flows.
2021 2020
Weighted average interest
rate %
Under 1 year
£m
1–2 years
£m
2–5 years
£m
Over 5 years
£mTotal
£m
Weighted average interest
rate %
Under 1 year
£m
1–2 years
£m
2–5 years
£m
Over 5 years
£mTotal
£m
GroupNon-derivative financial liabilities:
Trade and other payables¹ 357 – – – 357 278 – 26 – 304
Lease liabilities 3.9 5 5 13 122 145 3.9 5 5 14 137 161
Variable rate debt instruments 1.23 10 10 823 – 843 1.05 1 2 137 – 140
Fixed rate debt instruments 2.32 61 61 251 2,920 3,293 2.62 61 62 259 2,403 2,785
Derivative financial instruments:
Net settled interest rate swaps (0.40) 1 9 19 33 62 (0.27) (1) (2) (5) (3) (11)
Gross settled foreign exchange
– Forward and currency swap contracts
– Inflowing (13) – – – (13) (210) – – (411) (621)
– Outflowing 13 – – – 13 215 – – 390 605
Total 434 85 1,106 3,075 4,700 349 67 431 2,516 3,363
2021 2020
Weighted average interest
rate %
Under 1 year
£m
1–2 years
£m
2–5 years
£m
Over 5 years
£mTotal
£m
Weighted average interest
rate %
Under 1 year
£m
1–2 years
£m
2–5 years
£m
Over 5 years
£mTotal
£m
Company
Non-derivative financial liabilities:
Trade and other payables2 11 1,498 – – 1,509 10 1,930 – – 1,940
Variable rate debt instruments 1.23 10 10 823 – 843 1.05 1 2 137 – 140
Fixed rate debt instruments 2.67 59 59 243 2,490 2,851 2.64 60 61 253 2,395 2,769
Derivative financial instruments:
Net settled interest rate swaps (0.4) 1 9 19 33 62 (0.27) (1) (2) (5) (3) (11)
Gross settled foreign exchange
– Forward and currency swap contracts
– Inflowing (13) – – – (13) (210) – – (411) (621)
– Outflowing 13 – – – 13 215 – – 390 605
Total 81 1,576 1,085 2,523 5,265 75 1,991 385 2,371 4,822
1 Group trade and other payables disclosed as financial liabilities in Note 17(ii) of £453 million (2020: £406 million) includes, accrued interest of £20 million (2020: £19 million) and lease liabilities of £76 million (2020: £83 million). Accrued interest is shown in fixed rate debt instruments in the table above.
2 Company trade and other payables disclosed as financial liabilities in Note 17(ii) of £1,529 million (2020: £1,959 million) includes accrued interest of £20 million (2020: £19 million). Accrued interest is shown in fixed rate debt instruments in the table above.
12_NotesToFinStatements_179_227_v110.indd 20612_NotesToFinStatements_179_227_v110.indd 206 01/03/2022 17:2401/03/2022 17:24
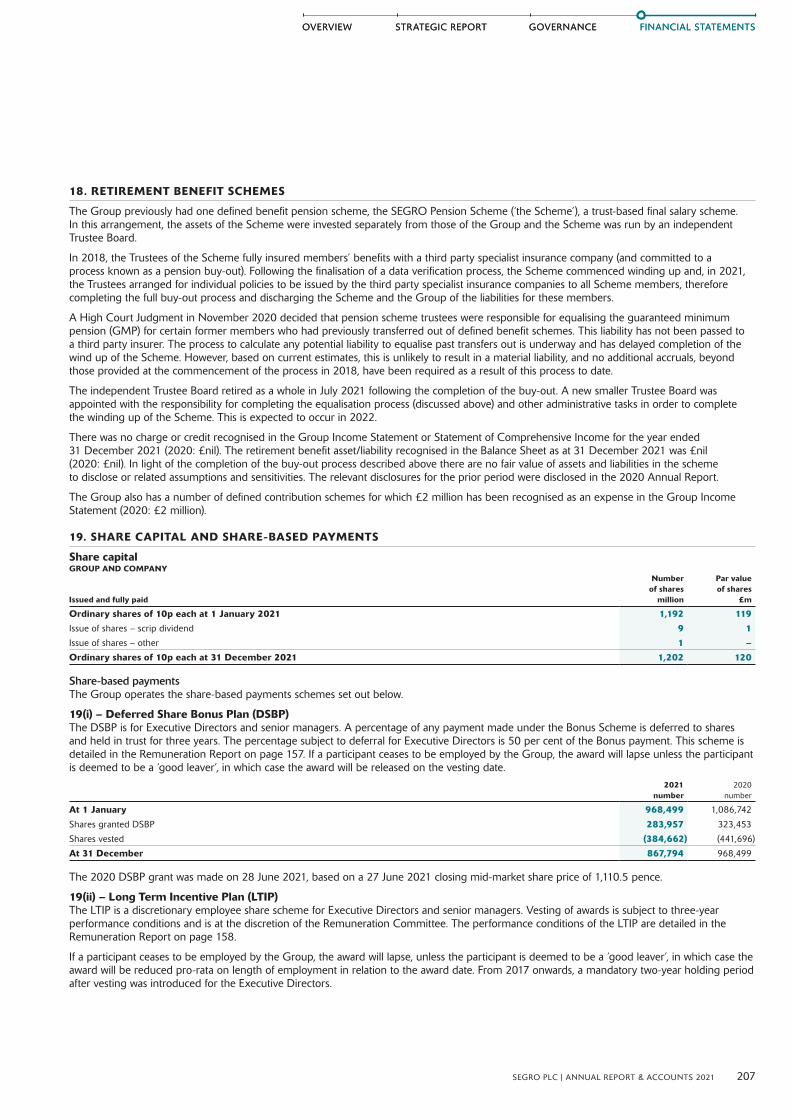
FINANCIAL STATEMENTSFINANCIAL STATEMENTS
207SEGRO PLC | ANNUAL REPORT & ACCOUNTS 2021
STRATEGIC REPORTOVERVIEW GOVERNANCEGOVERNANCESTRATEGIC REPORTOVERVIEW
18. RETIREMENT BENEFIT SCHEMES
The Group previously had one defined benefit pension scheme, the SEGRO Pension Scheme (‘the Scheme’), a trust-based final salary scheme. In this arrangement, the assets of the Scheme were invested separately from those of the Group and the Scheme was run by an independent Trustee Board.
In 2018, the Trustees of the Scheme fully insured members’ benefits with a third party specialist insurance company (and committed to a process known as a pension buy-out). Following the finalisation of a data verification process, the Scheme commenced winding up and, in 2021, the Trustees arranged for individual policies to be issued by the third party specialist insurance companies to all Scheme members, therefore completing the full buy-out process and discharging the Scheme and the Group of the liabilities for these members.
A High Court Judgment in November 2020 decided that pension scheme trustees were responsible for equalising the guaranteed minimum pension (GMP) for certain former members who had previously transferred out of defined benefit schemes. This liability has not been passed to a third party insurer. The process to calculate any potential liability to equalise past transfers out is underway and has delayed completion of the wind up of the Scheme. However, based on current estimates, this is unlikely to result in a material liability, and no additional accruals, beyond those provided at the commencement of the process in 2018, have been required as a result of this process to date.
The independent Trustee Board retired as a whole in July 2021 following the completion of the buy-out. A new smaller Trustee Board was appointed with the responsibility for completing the equalisation process (discussed above) and other administrative tasks in order to complete the winding up of the Scheme. This is expected to occur in 2022.
There was no charge or credit recognised in the Group Income Statement or Statement of Comprehensive Income for the year ended 31 December 2021 (2020: £nil). The retirement benefit asset/liability recognised in the Balance Sheet as at 31 December 2021 was £nil (2020: £nil). In light of the completion of the buy-out process described above there are no fair value of assets and liabilities in the scheme to disclose or related assumptions and sensitivities. The relevant disclosures for the prior period were disclosed in the 2020 Annual Report.
The Group also has a number of defined contribution schemes for which £2 million has been recognised as an expense in the Group Income Statement (2020: £2 million).
19. SHARE CAPITAL AND SHARE-BASED PAYMENTS
Share capitalGROUP AND COMPANY
Issued and fully paid
Number of shares
million
Par value of shares
£m
Ordinary shares of 10p each at 1 January 2021 1,192 119
Issue of shares – scrip dividend 9 1
Issue of shares – other 1 –
Ordinary shares of 10p each at 31 December 2021 1,202 120
Share-based paymentsThe Group operates the share-based payments schemes set out below.
19(i) – Deferred Share Bonus Plan (DSBP)The DSBP is for Executive Directors and senior managers. A percentage of any payment made under the Bonus Scheme is deferred to shares and held in trust for three years. The percentage subject to deferral for Executive Directors is 50 per cent of the Bonus payment. This scheme is detailed in the Remuneration Report on page 157. If a participant ceases to be employed by the Group, the award will lapse unless the participant is deemed to be a ‘good leaver’, in which case the award will be released on the vesting date.
2021 number
2020 number
At 1 January 968,499 1,086,742
Shares granted DSBP 283,957 323,453
Shares vested (384,662) (441,696)
At 31 December 867,794 968,499
The 2020 DSBP grant was made on 28 June 2021, based on a 27 June 2021 closing mid-market share price of 1,110.5 pence.
19(ii) – Long Term Incentive Plan (LTIP) The LTIP is a discretionary employee share scheme for Executive Directors and senior managers. Vesting of awards is subject to three-year performance conditions and is at the discretion of the Remuneration Committee. The performance conditions of the LTIP are detailed in the Remuneration Report on page 158.
If a participant ceases to be employed by the Group, the award will lapse, unless the participant is deemed to be a ‘good leaver’, in which case the award will be reduced pro-rata on length of employment in relation to the award date. From 2017 onwards, a mandatory two-year holding period after vesting was introduced for the Executive Directors.
12_NotesToFinStatements_179_227_v110.indd 20712_NotesToFinStatements_179_227_v110.indd 207 01/03/2022 17:2401/03/2022 17:24
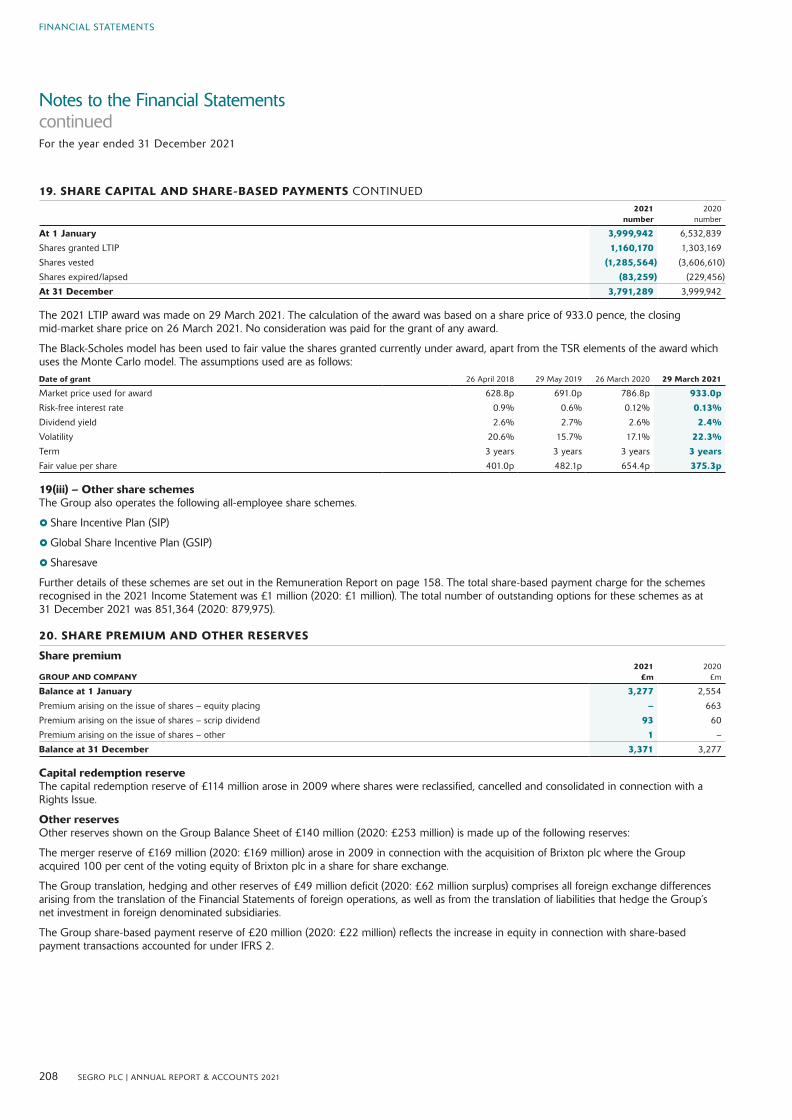
FINANCIAL STATEMENTS
Notes to the Financial Statements continuedFor the year ended 31 December 2021
208 SEGRO PLC | ANNUAL REPORT & ACCOUNTS 2021
19. SHARE CAPITAL AND SHARE-BASED PAYMENTS CONTINUED2021
number2020
number
At 1 January 3,999,942 6,532,839
Shares granted LTIP 1,160,170 1,303,169
Shares vested (1,285,564) (3,606,610)
Shares expired/lapsed (83,259) (229,456)
At 31 December 3,791,289 3,999,942
The 2021 LTIP award was made on 29 March 2021. The calculation of the award was based on a share price of 933.0 pence, the closing mid-market share price on 26 March 2021. No consideration was paid for the grant of any award.
The Black-Scholes model has been used to fair value the shares granted currently under award, apart from the TSR elements of the award which uses the Monte Carlo model. The assumptions used are as follows:Date of grant 26 April 2018 29 May 2019 26 March 2020 29 March 2021
Market price used for award 628.8p 691.0p 786.8p 933.0pRisk-free interest rate 0.9% 0.6% 0.12% 0.13%Dividend yield 2.6% 2.7% 2.6% 2.4%Volatility 20.6% 15.7% 17.1% 22.3%Term 3 years 3 years 3 years 3 years
Fair value per share 401.0p 482.1p 654.4p 375.3p
19(iii) – Other share schemesThe Group also operates the following all-employee share schemes.
} Share Incentive Plan (SIP)
}Global Share Incentive Plan (GSIP)
} Sharesave
Further details of these schemes are set out in the Remuneration Report on page 158. The total share-based payment charge for the schemes recognised in the 2021 Income Statement was £1 million (2020: £1 million). The total number of outstanding options for these schemes as at 31 December 2021 was 851,364 (2020: 879,975).
20. SHARE PREMIUM AND OTHER RESERVES
Share premium
GROUP AND COMPANY2021
£m2020
£m
Balance at 1 January 3,277 2,554
Premium arising on the issue of shares – equity placing – 663
Premium arising on the issue of shares – scrip dividend 93 60
Premium arising on the issue of shares – other 1 –
Balance at 31 December 3,371 3,277
Capital redemption reserveThe capital redemption reserve of £114 million arose in 2009 where shares were reclassified, cancelled and consolidated in connection with a Rights Issue.
Other reservesOther reserves shown on the Group Balance Sheet of £140 million (2020: £253 million) is made up of the following reserves:
The merger reserve of £169 million (2020: £169 million) arose in 2009 in connection with the acquisition of Brixton plc where the Group acquired 100 per cent of the voting equity of Brixton plc in a share for share exchange.
The Group translation, hedging and other reserves of £49 million deficit (2020: £62 million surplus) comprises all foreign exchange differences arising from the translation of the Financial Statements of foreign operations, as well as from the translation of liabilities that hedge the Group’s net investment in foreign denominated subsidiaries.
The Group share-based payment reserve of £20 million (2020: £22 million) reflects the increase in equity in connection with share-based payment transactions accounted for under IFRS 2.
12_NotesToFinStatements_179_227_v110.indd 20812_NotesToFinStatements_179_227_v110.indd 208 01/03/2022 17:2401/03/2022 17:24
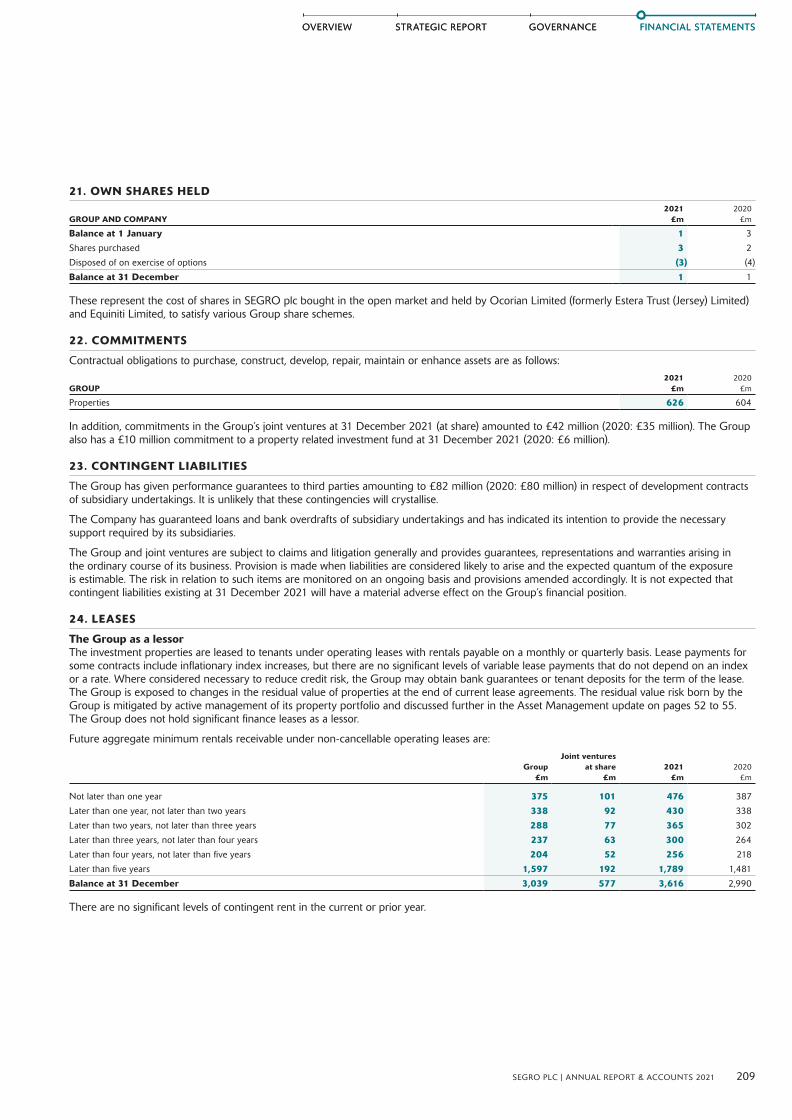
FINANCIAL STATEMENTSFINANCIAL STATEMENTS
209SEGRO PLC | ANNUAL REPORT & ACCOUNTS 2021
STRATEGIC REPORTOVERVIEW GOVERNANCEGOVERNANCESTRATEGIC REPORTOVERVIEW
21. OWN SHARES HELD
GROUP AND COMPANY2021
£m2020
£m
Balance at 1 January 1 3
Shares purchased 3 2
Disposed of on exercise of options (3) (4)
Balance at 31 December 1 1
These represent the cost of shares in SEGRO plc bought in the open market and held by Ocorian Limited (formerly Estera Trust (Jersey) Limited) and Equiniti Limited, to satisfy various Group share schemes.
22. COMMITMENTS
Contractual obligations to purchase, construct, develop, repair, maintain or enhance assets are as follows:
GROUP2021
£m2020
£m
Properties 626 604
In addition, commitments in the Group’s joint ventures at 31 December 2021 (at share) amounted to £42 million (2020: £35 million). The Group also has a £10 million commitment to a property related investment fund at 31 December 2021 (2020: £6 million).
23. CONTINGENT LIABILITIES
The Group has given performance guarantees to third parties amounting to £82 million (2020: £80 million) in respect of development contracts of subsidiary undertakings. It is unlikely that these contingencies will crystallise.
The Company has guaranteed loans and bank overdrafts of subsidiary undertakings and has indicated its intention to provide the necessary support required by its subsidiaries.
The Group and joint ventures are subject to claims and litigation generally and provides guarantees, representations and warranties arising in the ordinary course of its business. Provision is made when liabilities are considered likely to arise and the expected quantum of the exposure is estimable. The risk in relation to such items are monitored on an ongoing basis and provisions amended accordingly. It is not expected that contingent liabilities existing at 31 December 2021 will have a material adverse effect on the Group’s financial position.
24. LEASES
The Group as a lessorThe investment properties are leased to tenants under operating leases with rentals payable on a monthly or quarterly basis. Lease payments for some contracts include inflationary index increases, but there are no significant levels of variable lease payments that do not depend on an index or a rate. Where considered necessary to reduce credit risk, the Group may obtain bank guarantees or tenant deposits for the term of the lease. The Group is exposed to changes in the residual value of properties at the end of current lease agreements. The residual value risk born by the Group is mitigated by active management of its property portfolio and discussed further in the Asset Management update on pages 52 to 55. The Group does not hold significant finance leases as a lessor.
Future aggregate minimum rentals receivable under non-cancellable operating leases are:
Group £m
Joint ventures at share
£m2021
£m2020
£m
Not later than one year 375 101 476 387
Later than one year, not later than two years 338 92 430 338
Later than two years, not later than three years 288 77 365 302
Later than three years, not later than four years 237 63 300 264
Later than four years, not later than five years 204 52 256 218
Later than five years 1,597 192 1,789 1,481
Balance at 31 December 3,039 577 3,616 2,990
There are no significant levels of contingent rent in the current or prior year.
12_NotesToFinStatements_179_227_v110.indd 20912_NotesToFinStatements_179_227_v110.indd 209 01/03/2022 17:2401/03/2022 17:24

FINANCIAL STATEMENTS
Notes to the Financial Statements continuedFor the year ended 31 December 2021
210 SEGRO PLC | ANNUAL REPORT & ACCOUNTS 2021
25. RELATED PARTY TRANSACTIONS
GroupTransactions during the year between the Group and its joint ventures are disclosed below:
2021 £m
2020 £m
Dividends received 33 34
Assets sold to joint ventures1 231 92
Management fee income 26 22
Performance fee income 26 –
1 During the year investment properties with a carrying value of £231 million were sold to SELP (2020: £92 million). Total proceeds (and total cash proceeds) received by SEGRO were £231 million (2020: £93 million). The transactions resulted in the net assets of the Group increasing by £nil (2020: £1 million increase). The net cash impact on a proportionally consolidated basis was an inflow of £116 million (2020: £47 million) once the 50% ownership in SELP is taken into account.
Amounts due from joint ventures are disclosed in Note 14. Investments in joint ventures at 31 December 2021 of £1,795 million disclosed in Note 7 (2020: £1,423 million) includes shareholder loans of £86 million (2020: £114 million).
Transactions between the Company and its subsidiaries eliminate on consolidation and are not disclosed in this Note.
Transactions between the Group and the pension scheme are set out in Note 18.
CompanyAmounts due from subsidiaries are disclosed in Note 7 and amounts due to subsidiaries are disclosed in Note 15.
None of the above Group or Company balances are secured.
Remuneration of key management personnelKey management personnel for the Group and Company comprise Executive and Non-Executive Directors, as outlined in the Governance Report on pages 106 and 107. Key management personnel compensation is shown in the table below:
2021 £m
2020 £m
Salaries and short-term benefits 5 5
Share-based payments 4 3
Total remuneration 9 8
More detailed information concerning Directors’ remuneration, shareholdings, pension entitlements, share options and other long-term incentive plans, as required by the Companies Act 2006, is shown in the Remuneration Report on pages 136 to 155.
26. NOTES TO THE CASH FLOW STATEMENTS
26(i) – Reconciliation of cash generated from operationsGroup Company
2021 £m
2020 £m
2021 £m
2020 £m
Operating profit 4,477 1,501 501 123
Adjustments for:
Depreciation of property, plant and equipment and amortisation of intangibles 5 4 1 –
Share of profit from joint ventures after tax (461) (236) – –
Profit on sale of investment properties (53) (5) – –
Revaluation surplus on investment properties (3,617) (971) – –
Valuation gain on other investments – (14) – –
Dividends and other income – – (1,230) (174)
Other provisions 9 4 3 4
Increase in impairment of subsidiaries – – 710 33
360 283 (15) (14)
Changes in working capital:Decrease/(increase) in trading properties 12 (20) – –
Increase in debtors and tenant incentives (49) (52) (9) (1)
Increase in creditors 24 22 4 1
Net cash inflow/(outflow) generated from operations 347 233 (20) (14)
12_NotesToFinStatements_179_227_v110.indd 21012_NotesToFinStatements_179_227_v110.indd 210 01/03/2022 17:2401/03/2022 17:24

FINANCIAL STATEMENTSFINANCIAL STATEMENTS
211SEGRO PLC | ANNUAL REPORT & ACCOUNTS 2021
STRATEGIC REPORTOVERVIEW GOVERNANCEGOVERNANCESTRATEGIC REPORTOVERVIEW
26. NOTES TO THE CASH FLOW STATEMENTS CONTINUED
26(ii) – DepositsTerm deposits for a period of three months or less are included within cash and cash equivalents.
26(iii) – Analysis of net debtManagement defines net debt as total borrowing less cash and cash equivalents.
Cash movements Non-cash movements
At 1 January 2021
£m
Cashinflow1
£m
Cashoutflow2
£m
Exchange movement
£m
Other non-cash
adjustments3
£m
At 31 December
2021 £m
GroupBank loans and loan capital 2,431 1,214 (140) (81) 5 3,429
Capitalised finance costs (17) – (4) – (2) (23)
Total borrowings 2,414 1,214 (144) (81) 3 3,406Cash in hand and at bank (89) – 44 – – (45)
Net debt 2,325 1,214 (100) (81) 3 3,361CompanyBank loans and loan capital 2,416 799 (128) (81) – 3,006
Capitalised finance costs (16) – (3) – 2 (17)
Total borrowings 2,400 799 (131) (81) 2 2,989
Cash in hand and at bank (20) – 8 – – (12)
Net debt 2,380 799 (123) (81) 2 2,977
1 Proceeds from borrowings of £1,214 million.2 Group cash outflow of £144 million (Company: £131 million), comprises the repayment of borrowings of £140 million (Company: £128 million) and capitalised costs of £4 million (Company:
£3 million).3 Other non-cash adjustments includes £5 million of issue costs arising from new borrowings in the year, the cash proceeds received from the borrowings were received net of the issue costs.
The total other non-cash adjustment of £3 million (Company: £2 million) relates to the amortisation of issue costs. See Note 9.
26(iv) – Analysis of financial liabilities and assets arising from financing activities
For the year ended 31 December 2021Cash movements Non-cash movements
Group
At 1 January
2021 £m
Cash inflow
£m
Cash outflow
£m
Exchangemovement1
£m
Net fair value
changes2
£m
Other non-cash
adjustments £m
At 31 December
2021 £m
Total borrowings (Note 16) 2,414 1,214 (144) (81) – 3 3,406
Derivatives: (Net) Fair value of forward foreign exchange and currency swap contracts (Note 17) (7) 40 – (62) (3) – (32)Lease liabilities (Note 15)³ 83 – (5) (4) – 2 76
Total net financial liabilities arising from financing activities 2,490 1,254 (149) (147) (3) 5 3,450
1 Exchange movement of £143 million from borrowings and forward foreign exchange and currency swap contracts consists of: Foreign exchange gain on effective hedge relationships recognised in OCI of £74 million and foreign exchange gain recognised within the Income Statement of £69 million. See Note 17(iv).
2 Total net fair value loss of £82 million arising from derivatives per Note 9 also includes fair value loss from interest rate swaps and caps of £85 million.3 Lease liabilities cash outflows of £5 million consists of: £3 million interest payment and £2 million principal elements payment.
For the year ended 31 December 2020Cash movements Non-cash movements
Group
At 1 January
2020 £m
Acquired3
£m
Cash inflow
£m
Cash outflow
£m
Cost of early close out of debt
£m
Exchangemovement1
£m
Fair valuechanges2
£m
Other non-cash
adjustments £m
At 31
December 2020
£m
Total borrowings (Note 16) 1,943 12 551 (137) 11 31 – 3 2,414
Derivatives: (Net) Fair value of forward foreign exchange and currency swap contracts (Note 17) (16) – – (55) – 67 (3) – (7)
Lease liabilities (Note 15)4 78 3 – (5) – 4 – 3 83
Total net financial liabilities arising from financing activities 2,005 15 551 (197) 11 102 (3) 6 2,490
1 Exchange movement of £98 million from borrowings and forward foreign exchange and currency swap contracts consists of: Foreign exchange loss on effective hedge relationships recognised in OCI of £52 million and foreign exchange loss recognised within the Income Statement of £46 million. See Note 17(iv).
2 Total net fair value gain of £14 million arising from derivatives per Note 9 also includes fair value gains from interest rate swaps and caps of £11 million.3 Acquired represents borrowings and lease liabilities assumed from the acquisition of Sofibus during 2020.4 Lease liabilities outflow of £5 million consists of: £3 million interest payment and £2 million principal element payment.
12_NotesToFinStatements_179_227_v110.indd 21112_NotesToFinStatements_179_227_v110.indd 211 01/03/2022 17:2401/03/2022 17:24

FINANCIAL STATEMENTS
Notes to the Financial Statements continuedFor the year ended 31 December 2021
212 SEGRO PLC | ANNUAL REPORT & ACCOUNTS 2021
26. NOTES TO THE CASH FLOW STATEMENTS CONTINUED
CompanyThe Company’s financial liabilities and assets arising from financing activities comprise Company total borrowings shown in Note 26(iii) of £2,989 million (2020: £2,400 million) and the Group derivatives shown in the table above of £32 million (asset) (2020: £7 million asset).
27. PROPERTY VALUATION TECHNIQUES, SUSTAINABILITY AND CLIMATE CHANGE CONSIDERATIONS AND RELATED QUANTITATIVE INFORMATION
All of the Group’s properties are level 3, as defined by IFRS 13, in the fair value hierarchy as at 31 December 2021 and there were no transfers between levels during the year. Level 3 inputs used in valuing the properties are those which are unobservable, as opposed to level 1 (inputs from quoted prices) and level 2 (observable inputs either directly, i.e. as prices, or indirectly, i.e. derived from prices).
Valuation techniques Based on different approaches for different properties, the following valuation techniques can be used for the same class of assets:
The yield methodology valuation technique is used when valuing the Group’s assets which uses market rental values capitalised with a market capitalisation rate. The resulting valuations are cross-checked against the initial yields and the fair market values per square metre derived from actual market transactions for similar assets.
For properties under construction and the majority of land held for development, properties are valued using a residual method valuation. Under this methodology, the valuer assesses the investment value (using the above mentioned methodology for completed buildings). Deductions are then made for the total estimated costs to complete, including notional finance costs and developer’s profit, to take into account the hypothetical purchaser’s management of the remaining development process and their perception of risk with regard to construction and the property market (e.g. as regards potential cost overruns and letting risk). Land values are cross-checked against the rate per hectare derived from actual market transactions. Other land is also valued on this comparative basis. Land values per hectare range from £0.1 million – £30.7 million (2020: £0.1 million – £11.4 million) for the UK and £0.2 million – £6.5 million (2020: £0.2 million – £3.6 million) for Continental Europe.
Sustainability valuation considerationsThe Group’s valuers, CBRE, note in their valuation report that wherever appropriate, sustainability and environmental matters are an integral part of the valuation approach. ‘Sustainability’ is taken to mean the consideration of such matters as environment and climate change, health and wellbeing and corporate responsibility that can or do impact on the valuation of an asset. In a valuation context, sustainability encompasses a wide range of physical, social, environmental, and economic factors that can affect value. The range of issues includes key environmental risks, such as flooding, energy efficiency and climate, as well as matters of design, configuration, accessibility, legislation, management, and fiscal considerations – and current and historic land use.
Climate risk legislationThe UK Government and the EU is currently producing legislation on the transition to net zero which is likely to include an update to the Minimum Energy Efficiency Standards and also the intention to introduce an operational rating. Whilst the nature of the legislation is not yet clear it could have a potential impact to future asset value.
The introduction of mandatory climate related disclosures in the UK and EU (including ‘Task Force for Climate related Financial Disclosure’ (TCFD) in the UK and ‘Sustainable Finance Disclosure Regulations’ (SFDR) and ‘Corporate Sustainability Reporting Directive’ (CSRD) in the EU), including the assessment of physical and transition climate risks, may potentially have an impact on how the market views such risks and incorporates them into the sale and letting of assets.
Sustainability and climate risk legislation has an impact on the value of an asset, even if not explicitly recognised. Valuers reflect markets, they do not lead them. Where the valuers recognise the value impacts of sustainability and legislation, they are reflecting their understanding of how market participants include sustainability and legislation requirements in their bids and the impact on market valuations.
Sensitivity analysisAn increase/decrease to ERV will increase/decrease valuations, while an increase/decrease to yield will decrease/increase valuations. Sensitivity analysis showing the impact on valuations of changes in yields and ERV on the property portfolio (including joint ventures at share) and the impact on valuations of changes in development costs on the development property and land portfolio (including joint ventures at share) is shown below.
Impact on valuation of 25bp change in nominal equivalent yield
Impact on valuation of 5% change in estimated rental value (ERV)
Impact on valuation of 10% change in estimated development costs
Group £m
Increase £m
Decrease £m
Increase £m
Decrease £m
Increase£m
Decrease£m
2021Completed property 16,739 (1,057) 1,211 628 (625) – –
Development property and land 1,638 (164) 172 192 (199) (232) 225
Group total property portfolio 18,377 (1,221) 1,383 820 (824) (232) 2252020Completed property 11,807 (616) 608 436 (431) – –
Development property and land 1,188 (114) 123 158 (158) (200) 200
Group total property portfolio 12,995 (730) 731 594 (589) (200) 200
12_NotesToFinStatements_179_227_v110.indd 21212_NotesToFinStatements_179_227_v110.indd 212 01/03/2022 17:2401/03/2022 17:24

FINANCIAL STATEMENTSFINANCIAL STATEMENTS
213SEGRO PLC | ANNUAL REPORT & ACCOUNTS 2021
STRATEGIC REPORTOVERVIEW GOVERNANCEGOVERNANCESTRATEGIC REPORTOVERVIEW
27. PROPERTY VALUATION TECHNIQUES, SUSTAINABILITY AND CLIMATE CHANGE CONSIDERATIONS AND RELATED QUANTITATIVE INFORMATION CONTINUED
There are inter-relationships between all these inputs as they are determined by market conditions. The existence of an increase in more than one input would be to magnify the impact on the valuation. The impact on the valuation will be mitigated by the inter-relationship of two inputs in opposite directions, e.g. an increase in rent may be offset by an increase in yield. The table below includes the Group’s wholly-owned and joint venture assets at share in order to include the entire portfolio. The equivalent analysis for the range of inputs on a wholly-owned basis would not be significantly different.
Valuation Inputs
2021 By asset typeCompleted
£m
Land &development¹
£m
Combined property portfolio
£m
ERV2
£ per sq m
ERV range2
£ per sq m
Net true equivalent
yield³ %
Net true equivalent yield
range %
Big box warehouses > 35,000 sq m 2,222 2,222 46.3 30.3 - 161.5 3.8% 3.3-5.5Big box warehouses < 35,000 sq m 2,683 2,683 54.2 16.8 - 204.5 3.9% 3.1-7.0Urban warehouses > 3,500 sq m 6,963 6,963 124.9 34.3 - 339.1 3.8% 2.9- 9.7Urban warehouses < 3,500 sq m 4,153 4,153 192.8 38.3 - 376.9 3.5% 2.9-9.3High value and other uses of industrial land4 718 718 166.5 50.4 - 452.1 6.0% 3.3-10.3
16,739 1,638 18,377 81.0 16.8 - 452.1 3.8% 2.9-10.3By ownershipWholly-owned5 13,990 1,478 15,468 125.6 30.5 - 452.1 3.8% 2.9-10.3
Joint ventures 2,749 160 2,909 45.5 16.8 - 126.8 4.0% 3.1-9.7
Group Total 16,739 1,638 18,377 81.0 16.8 - 452.1 3.8% 2.9-10.3
1 Land and development valuations by asset type are not available as land sites are not categorised by asset type. Combined property portfolio column will not cast down but row does cast across.2 On a fully occupied basis.3 In relation to the completed properties only.4 High value and other uses of industrial land includes offices and retail uses, such as trade counters, car showrooms and self-storage facilities.5 Included in the completed portfolio, the wholly-owned assets are: big box > 35,000 sq m £1,120 million; big box < 35,000 sq m £1,180 million; urban warehouses > 3,500 sq m £6,822 million;
urban warehouses < 3,500 sq m £4,163 million; and other uses £705 million.
Valuation Inputs
2021 By geographyCompleted
£m
Land &development
£m
Combined property portfolio
£m
ERV1 £ per sq m
ERV range1
£ per sq m
Net true equivalent
yield² %
Net true equivalent yield
range %
Greater London 7,005 327 7,332 196.6 45.7 - 376.9 3.5% 2.9-9.3
Thames Valley 2,878 224 3,102 172.2 72.7 - 452.1 4.1% 3.6-8.4
National Logistics 1,247 470 1,717 80.2 45.0 - 204.5 3.8% 3.3-4.4
Northern Europe
Germany 1,532 197 1,729 57.5 34.3 - 155.8 3.6% 3.0-4.9Netherlands 167 27 194 59.7 46.2 - 91.2 3.9% 3.4-9.7Southern Europe
France 1,751 112 1,863 66.0 37.8 - 442.0 4.1% 3.2-6.8
Italy/Spain 1,438 202 1,640 46.7 16.8 - 161.9 3.9% 3.4-10.3Central Europe
Poland 631 75 706 39.7 30.3 -130.0 5.2% 4.6-5.7
Czech Republic 90 4 94 53.5 47.1 - 93.3 4.8% 4.8-4.8Group Total 16,739 1,638 18,377 81.0 16.8 - 452.1 3.8% 2.9-10.3
Investment properties – Group (Note 13(i))³ 15,422
Investment properties – Joint ventures (Note 7(ii)) 2,909
Trading properties – Group (Note 13(ii))4 46
18,377
1 On a fully occupied basis. 2 In relation to the completed properties only.3 Excludes head lease ROU assets of £70 million.4 Includes valuation surplus not recognised on trading properties of £1 million.
12_NotesToFinStatements_179_227_v110.indd 21312_NotesToFinStatements_179_227_v110.indd 213 01/03/2022 17:2401/03/2022 17:24

FINANCIAL STATEMENTS
Notes to the Financial Statements continuedFor the year ended 31 December 2021
214 SEGRO PLC | ANNUAL REPORT & ACCOUNTS 2021
27. PROPERTY VALUATION TECHNIQUES, SUSTAINABILITY AND CLIMATE CHANGE CONSIDERATIONS AND RELATED QUANTITATIVE INFORMATION CONTINUED
Valuation Inputs
2020 By asset typeCompleted
£m
Land &development¹
£m
Combined property portfolio
£m
ERV² £ per sq m
ERV range²£ per sq m
Net true equivalent
yield³ %
Net true equivalent
yield range %
Big box warehouses > 35,000 sq m 1,661 1,661 46.8 30.8–147.8 4.4 3.6–6.4
Big box warehouses < 35,000 sq m 2,098 2,098 53.5 32.1–130.1 4.6 3.5–6.5
Urban warehouses > 3,500 sq m 4,951 4,951 110.8 26.8–280.6 4.5 3.3–10.1
Urban warehouses < 3,500 sq m 2,821 2,821 159.2 53.6–291.2 4.1 3.3–8.7
High value and other uses of industrial land4 276 276 165.3 53.6–215.3 5.9 3.3–9.9
11,807 1,188 12,995 75.1 26.8–291.2 4.5 3.3–10.1
By ownershipWholly-owned5 9,567 1,080 10,647 111.7 26.8–291.2 4.4 3.3–9.9
Joint ventures 2,240 108 2,348 46.7 30.8–96.4 4.7 3.5–10.1
Group Total 11,807 1,188 12,995 75.1 26.8–291.2 4.5 3.3–10.1
1 Land and development valuations by asset type are not available as land sites are not categorised by asset type. Combined property portfolio column will not cast down but row does cast across.2 On a fully occupied basis. 3 In relation to the completed properties only.4 Higher value includes offices and retail uses, such as trade counters, car showrooms and self-storage facilities.5 Included in the completed portfolio, the wholly-owned assets are: big box > 35,000 sq m £789 million; big box < 35,000 sq m £862 million; urban warehouses > 3,500 sq m £4,823 million;
urban warehouses < 3,500 sq m £2,821 million; and other uses £272 million.
Valuation Inputs
2020 By geographyCompleted
£m
Land & development
£m
Combined property portfolio
£m
ERV¹£ per sq m
ERV range¹£ per sq m
Net true equivalent
yield2
%
Net true equivalent yield
range %
Greater London 4,727 141 4,868 160.2 55.1–291.2 4.0 3.3–7.3
Thames Valley 1,857 140 1,997 150.8 70.0–280.6 4.7 4.3–7.4
National Logistics 831 392 1,223 70.5 45.0–130.1 4.6 4.2–5.2
Northern Europe
Germany 1,277 101 1,378 58.6 32.1–140.3 4.1 3.5–5.7
Netherlands 140 22 162 60.5 50.3–94.4 4.7 3.9–10.1
Southern Europe
France 1,379 136 1,515 61.4 39.3–125.0 4.9 3.6–9.2
Italy/Spain 954 212 1,166 46.4 26.8–172.1 4.8 3.9–9.9
Central Europe Poland 564 33 597 42.1 30.8–139.0 6.0 5.4–6.4
Czech Republic 78 11 89 53.3 46.8–96.4 5.5 5.4–5.5
Group Total 11,807 1,188 12,995 75.1 26.8–291.2 4.5 3.3–10.1
Investment properties – Group (Note 13(i))3 10,595
Investment properties – Joint ventures (Note 7(ii)) 2,348
Trading properties – Group (Note 13(ii))4 52
12,995
1 On a fully occupied basis. 2 In relation to the completed properties only.3 Excludes head lease ROU assets of £76 million.4 Includes valuation surplus not recognised on trading properties of £1 million.
12_NotesToFinStatements_179_227_v110.indd 21412_NotesToFinStatements_179_227_v110.indd 214 01/03/2022 17:2401/03/2022 17:24

FINANCIAL STATEMENTSFINANCIAL STATEMENTS
215SEGRO PLC | ANNUAL REPORT & ACCOUNTS 2021
STRATEGIC REPORTOVERVIEW GOVERNANCEGOVERNANCESTRATEGIC REPORTOVERVIEW
A list of the Group’s related undertakings as at 31 December 2021 is detailed below. Except where the Group’s percentage holdings is disclosed below, the entire share capital of the subsidiary undertaking is held by the Group. Unless otherwise stated, Group’s holding in the subsidiary undertaking comprise Ordinary shares. Where subsidiaries have different classes of shares, the percentage effective holding shown represents both the Group’s voting rights and equity holding. All subsidiaries are consolidated in the Group’s Financial Statements. The Group’s related undertakings also includes its joint ventures, which is primarily SELP.
Audit exemption taken for subsidiariesCertain UK subsidiaries are exempt from the requirement of the Companies Act 2006 (the Act) relating to the audit of individual accounts by virtue of Section 479A of the Act. These subsidiaries are identified with two asterisks (**) on the table below.
Certain UK partnerships are exempt from the requirement to prepare, publish and have audited individual accounts by virtue of regulation 7 of The Partnership (Accountants) Regulations 2008. The results of these partnerships are consolidated within the Group accounts and are identified with three asterisks (***) on the table below.
Company Name Jurisdiction
% effective holding if not 100%
Direct / Indirect Registered Office
Airport Property GP (No. 2) Limited** England and Wales Indirect 1 New Burlington Place, London, W1S 2HR, United Kingdom
Airport Property H1 Limited** England and Wales Indirect 1 New Burlington Place, London, W1S 2HR, United Kingdom
Airport Property Partnership6*** England and Wales Indirect 1 New Burlington Place, London, W1S 2HR, United Kingdom
Allnatt London Properties PLC²** England and Wales Direct 1 New Burlington Place, London, W1S 2HR, United Kingdom
Amdale Holdings Limited NV Belgium Indirect Boulevard Louis Schmidt 87, 1040 Etterbeek, Belgium
Beira Investments Sp z.o.o. Poland Indirect Pl. Andersa 3, 61-894 Poznan, Poland
Bilton Homes Limited7 England and Wales Indirect 1 New Burlington Place, London, W1S 2HR, United Kingdom
Bilton p.l.c.** England and Wales Direct 1 New Burlington Place, London, W1S 2HR, United Kingdom
Bonsol S.R.L. Italy 95 Indirect Strada 3 Palazzo B3, 20090 Assago Milanofiori, Milan, Italy
Brixton (Axis Park) Limited England and Wales Indirect 1 New Burlington Place, London, W1S 2HR, United Kingdom
Brixton (Fairway Units 7-11) 1 Limited** England and Wales Indirect 1 New Burlington Place, London, W1S 2HR, United Kingdom
Brixton (Great Western, Southall) Limited** England and Wales Indirect 1 New Burlington Place, London, W1S 2HR, United Kingdom
Brixton (Hatton Cross) 1 Limited England and Wales Indirect 1 New Burlington Place, London, W1S 2HR, United Kingdom
Brixton (Heathrow Estate) Limited England and Wales Indirect 1 New Burlington Place, London, W1S 2HR, United Kingdom
Brixton (Metropolitan Park) 1 Limited England and Wales Indirect 1 New Burlington Place, London, W1S 2HR, United Kingdom
Brixton (Origin) Limited England and Wales Indirect 1 New Burlington Place, London, W1S 2HR, United Kingdom
Brixton Asset Management UK Limited** England and Wales Indirect 1 New Burlington Place, London, W1S 2HR, United Kingdom
Brixton Greenford Park Limited England and Wales Indirect 1 New Burlington Place, London, W1S 2HR, United Kingdom
Brixton Limited** England and Wales Direct 1 New Burlington Place, London, W1S 2HR, United Kingdom
Brixton Nominee 26 (Jersey) Limited Jersey Indirect 3rd Floor, One The Esplanade, St Helier, JE2 3QA, Jersey
Brixton Nominee 27 (Jersey) Limited Jersey Indirect 3rd Floor, One The Esplanade, St Helier, JE2 3QA, Jersey
Brixton Nominee 38 (Jersey) Limited Jersey Indirect 3rd Floor, One The Esplanade, St Helier, JE2 3QA, Jersey
Brixton Nominee 39 (Jersey) Limited Jersey Indirect 3rd Floor, One The Esplanade, St Helier, JE2 3QA, Jersey
Brixton Nominee 40 (Jersey) Limited Jersey Indirect 3rd Floor, One The Esplanade, St Helier, JE2 3QA, Jersey
Brixton Nominee 41 (Jersey) Limited Jersey Indirect 3rd Floor, One The Esplanade, St Helier, JE2 3QA, Jersey
Brixton Nominee 8 (Jersey) Limited Jersey Indirect 3rd Floor, One The Esplanade, St Helier, JE2 3QA, Jersey
Brixton Nominee 9 (Jersey) Limited Jersey Indirect 3rd Floor, One The Esplanade, St Helier, JE2 3QA, Jersey
Brixton Nominee Axis Park 1 Limited Jersey Indirect 3rd Floor, One The Esplanade, St Helier, JE2 3QA, Jersey
Brixton Nominee Axis Park 2 Limited Jersey Indirect 3rd Floor, One The Esplanade, St Helier, JE2 3QA, Jersey
Brixton Nominee Polar Park 1 Limited Jersey Indirect 3rd Floor, One The Esplanade, St Helier, JE2 3QA, Jersey
Brixton Nominee Polar Park 2 Limited Jersey Indirect 3rd Floor, One The Esplanade, St Helier, JE2 3QA, Jersey
Brixton Nominee Premier Park 1 Limited Jersey Indirect 3rd Floor, One The Esplanade, St Helier, JE2 3QA, Jersey
Brixton Nominee Premier Park 2 Limited Jersey Indirect 3rd Floor, One The Esplanade, St Helier, JE2 3QA, Jersey
Brixton Northfields (Wembley 1) Limited** England and Wales Indirect 1 New Burlington Place, London, W1S 2HR, United Kingdom
Brixton Northfields (Wembley) Holdings Limited** England and Wales Indirect 1 New Burlington Place, London, W1S 2HR, United Kingdom
Brixton Northfields (Wembley) Limited** England and Wales Indirect 1 New Burlington Place, London, W1S 2HR, United Kingdom
Brixton Northfields 1 Limited** England and Wales Indirect 1 New Burlington Place, London, W1S 2HR, United Kingdom
Brixton Northfields 2 Limited** England and Wales Indirect 1 New Burlington Place, London, W1S 2HR, United Kingdom
Brixton Northfields 3 Limited** England and Wales Indirect 1 New Burlington Place, London, W1S 2HR, United Kingdom
Brixton Northfields 4 Limited** England and Wales Indirect 1 New Burlington Place, London, W1S 2HR, United Kingdom
Brixton Northfields 5 Limited** England and Wales Indirect 1 New Burlington Place, London, W1S 2HR, United Kingdom
Brixton Northfields 6 Limited** England and Wales Indirect 1 New Burlington Place, London, W1S 2HR, United Kingdom
Brixton Premier Park Limited England and Wales Indirect 1 New Burlington Place, London, W1S 2HR, United Kingdom
Brixton Properties Limited England and Wales Indirect 1 New Burlington Place, London, W1S 2HR, United Kingdom
Brixton Sub-Holdings Limited** England and Wales Indirect 1 New Burlington Place, London, W1S 2HR, United Kingdom
28. RELATED UNDERTAKINGS
12_NotesToFinStatements_179_227_v110.indd 21512_NotesToFinStatements_179_227_v110.indd 215 01/03/2022 17:2401/03/2022 17:24
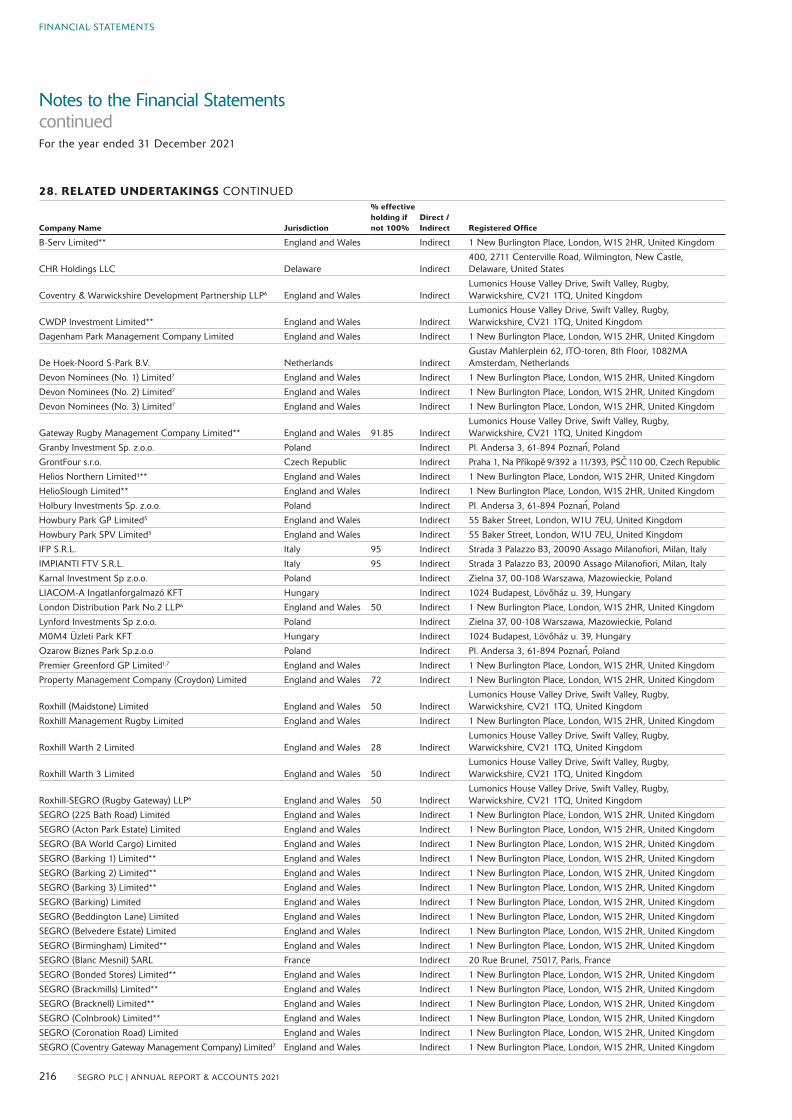
FINANCIAL STATEMENTS
Notes to the Financial Statements continuedFor the year ended 31 December 2021
216 SEGRO PLC | ANNUAL REPORT & ACCOUNTS 2021
Company Name Jurisdiction
% effective holding if not 100%
Direct / Indirect Registered Office
B-Serv Limited** England and Wales Indirect 1 New Burlington Place, London, W1S 2HR, United Kingdom
CHR Holdings LLC Delaware Indirect400, 2711 Centerville Road, Wilmington, New Castle, Delaware, United States
Coventry & Warwickshire Development Partnership LLP6 England and Wales IndirectLumonics House Valley Drive, Swift Valley, Rugby, Warwickshire, CV21 1TQ, United Kingdom
CWDP Investment Limited** England and Wales IndirectLumonics House Valley Drive, Swift Valley, Rugby, Warwickshire, CV21 1TQ, United Kingdom
Dagenham Park Management Company Limited England and Wales Indirect 1 New Burlington Place, London, W1S 2HR, United Kingdom
De Hoek-Noord S-Park B.V. Netherlands IndirectGustav Mahlerplein 62, ITO-toren, 8th Floor, 1082MA Amsterdam, Netherlands
Devon Nominees (No. 1) Limited7 England and Wales Indirect 1 New Burlington Place, London, W1S 2HR, United Kingdom
Devon Nominees (No. 2) Limited7 England and Wales Indirect 1 New Burlington Place, London, W1S 2HR, United Kingdom
Devon Nominees (No. 3) Limited7 England and Wales Indirect 1 New Burlington Place, London, W1S 2HR, United Kingdom
Gateway Rugby Management Company Limited** England and Wales 91.85 IndirectLumonics House Valley Drive, Swift Valley, Rugby, Warwickshire, CV21 1TQ, United Kingdom
Granby Investment Sp. z.o.o. Poland Indirect Pl. Andersa 3, 61-894 Poznan, Poland
GrontFour s.r.o. Czech Republic Indirect Praha 1, Na Príkope 9/392 a 11/393, PSC 110 00, Czech Republic
Helios Northern Limited¹** England and Wales Indirect 1 New Burlington Place, London, W1S 2HR, United Kingdom
HelioSlough Limited** England and Wales Indirect 1 New Burlington Place, London, W1S 2HR, United Kingdom
Holbury Investments Sp. z.o.o. Poland Indirect Pl. Andersa 3, 61-894 Poznan, Poland
Howbury Park GP Limited5 England and Wales Indirect 55 Baker Street, London, W1U 7EU, United Kingdom
Howbury Park SPV Limited5 England and Wales Indirect 55 Baker Street, London, W1U 7EU, United Kingdom
IFP S.R.L. Italy 95 Indirect Strada 3 Palazzo B3, 20090 Assago Milanofiori, Milan, Italy
IMPIANTI FTV S.R.L. Italy 95 Indirect Strada 3 Palazzo B3, 20090 Assago Milanofiori, Milan, Italy
Karnal Investment Sp z.o.o. Poland Indirect Zielna 37, 00-108 Warszawa, Mazowieckie, Poland
LIACOM-A Ingatlanforgalmazó KFT Hungary Indirect 1024 Budapest, Lövoház u. 39, Hungary
London Distribution Park No.2 LLP6 England and Wales 50 Indirect 1 New Burlington Place, London, W1S 2HR, United Kingdom
Lynford Investments Sp z.o.o. Poland Indirect Zielna 37, 00-108 Warszawa, Mazowieckie, Poland
M0M4 Üzleti Park KFT Hungary Indirect 1024 Budapest, Lövoház u. 39, Hungary
Ozarow Biznes Park Sp.z.o.o Poland Indirect Pl. Andersa 3, 61-894 Poznan, Poland
Premier Greenford GP Limited1,7 England and Wales Indirect 1 New Burlington Place, London, W1S 2HR, United Kingdom
Property Management Company (Croydon) Limited England and Wales 72 Indirect 1 New Burlington Place, London, W1S 2HR, United Kingdom
Roxhill (Maidstone) Limited England and Wales 50 IndirectLumonics House Valley Drive, Swift Valley, Rugby, Warwickshire, CV21 1TQ, United Kingdom
Roxhill Management Rugby Limited England and Wales Indirect 1 New Burlington Place, London, W1S 2HR, United Kingdom
Roxhill Warth 2 Limited England and Wales 28 IndirectLumonics House Valley Drive, Swift Valley, Rugby, Warwickshire, CV21 1TQ, United Kingdom
Roxhill Warth 3 Limited England and Wales 50 IndirectLumonics House Valley Drive, Swift Valley, Rugby, Warwickshire, CV21 1TQ, United Kingdom
Roxhill-SEGRO (Rugby Gateway) LLP6 England and Wales 50 IndirectLumonics House Valley Drive, Swift Valley, Rugby, Warwickshire, CV21 1TQ, United Kingdom
SEGRO (225 Bath Road) Limited England and Wales Indirect 1 New Burlington Place, London, W1S 2HR, United Kingdom
SEGRO (Acton Park Estate) Limited England and Wales Indirect 1 New Burlington Place, London, W1S 2HR, United Kingdom
SEGRO (BA World Cargo) Limited England and Wales Indirect 1 New Burlington Place, London, W1S 2HR, United Kingdom
SEGRO (Barking 1) Limited** England and Wales Indirect 1 New Burlington Place, London, W1S 2HR, United Kingdom
SEGRO (Barking 2) Limited** England and Wales Indirect 1 New Burlington Place, London, W1S 2HR, United Kingdom
SEGRO (Barking 3) Limited** England and Wales Indirect 1 New Burlington Place, London, W1S 2HR, United Kingdom
SEGRO (Barking) Limited England and Wales Indirect 1 New Burlington Place, London, W1S 2HR, United Kingdom
SEGRO (Beddington Lane) Limited England and Wales Indirect 1 New Burlington Place, London, W1S 2HR, United Kingdom
SEGRO (Belvedere Estate) Limited England and Wales Indirect 1 New Burlington Place, London, W1S 2HR, United Kingdom
SEGRO (Birmingham) Limited** England and Wales Indirect 1 New Burlington Place, London, W1S 2HR, United Kingdom
SEGRO (Blanc Mesnil) SARL France Indirect 20 Rue Brunel, 75017, Paris, France
SEGRO (Bonded Stores) Limited** England and Wales Indirect 1 New Burlington Place, London, W1S 2HR, United Kingdom
SEGRO (Brackmills) Limited** England and Wales Indirect 1 New Burlington Place, London, W1S 2HR, United Kingdom
SEGRO (Bracknell) Limited** England and Wales Indirect 1 New Burlington Place, London, W1S 2HR, United Kingdom
SEGRO (Colnbrook) Limited** England and Wales Indirect 1 New Burlington Place, London, W1S 2HR, United Kingdom
SEGRO (Coronation Road) Limited England and Wales Indirect 1 New Burlington Place, London, W1S 2HR, United Kingdom
SEGRO (Coventry Gateway Management Company) Limited7 England and Wales Indirect 1 New Burlington Place, London, W1S 2HR, United Kingdom
28. RELATED UNDERTAKINGS CONTINUED
12_NotesToFinStatements_179_227_v110.indd 21612_NotesToFinStatements_179_227_v110.indd 216 01/03/2022 17:2401/03/2022 17:24

FINANCIAL STATEMENTSFINANCIAL STATEMENTS
217SEGRO PLC | ANNUAL REPORT & ACCOUNTS 2021
STRATEGIC REPORTOVERVIEW GOVERNANCEGOVERNANCESTRATEGIC REPORTOVERVIEW
Company Name Jurisdiction
% effective holding if not 100%
Direct / Indirect Registered Office
SEGRO (Coventry M6 J2) Limited England and Wales IndirectLumonics House Valley Drive, Swift Valley, Rugby, Warwickshire, CV21 1TQ, United Kingdom
SEGRO (Coventry) Limited** England and Wales IndirectLumonics House Valley Drive, Swift Valley, Rugby, Warwickshire, CV21 1TQ, United Kingdom
SEGRO (Crick) Limited** England and Wales Indirect 1 New Burlington Place, London, W1S 2HR, United Kingdom
SEGRO (Dagenham) Limited England and Wales Indirect 1 New Burlington Place, London, W1S 2HR, United Kingdom
SEGRO (Deptford Trading Estate) Limited** England and Wales Indirect 1 New Burlington Place, London, W1S 2HR, United Kingdom
SEGRO (D-Link House) Limited** England and Wales Indirect 1 New Burlington Place, London, W1S 2HR, United Kingdom
SEGRO (East Plus) Limited** England and Wales Indirect 1 New Burlington Place, London, W1S 2HR, United Kingdom
SEGRO (East Plus) Trading Limited7 England and Wales Indirect 1 New Burlington Place, London, W1S 2HR, United Kingdom
SEGRO (Electra Park) Limited England and Wales Indirect 1 New Burlington Place, London, W1S 2HR, United Kingdom
SEGRO (EMG Management Company) Limited1** England and Wales Indirect 1 New Burlington Place, London, W1S 2HR, United Kingdom
SEGRO (EMG Rail Freight Terminal) Limited** England and Wales Indirect 1 New Burlington Place, London, W1S 2HR, United Kingdom
SEGRO (EMG Unit 1) Limited England and Wales Indirect 1 New Burlington Place, London, W1S 2HR, United Kingdom
SEGRO (EMG Unit 2) Limited England and Wales Indirect 1 New Burlington Place, London, W1S 2HR, United Kingdom
SEGRO (EMG Unit 4) Limited** England and Wales Indirect 1 New Burlington Place, London, W1S 2HR, United Kingdom
SEGRO (EMG Unit 8) Limited England and Wales Indirect 1 New Burlington Place, London, W1S 2HR, United Kingdom
SEGRO (EMG Unit 11) Limited England and Wales Indirect 1 New Burlington Place, London, W1S 2HR, United Kingdom
SEGRO (EMG Unit 12) Limited England and Wales Indirect 1 New Burlington Place, London, W1S 2HR, United Kingdom
SEGRO (EMG) Limited England and Wales Indirect 1 New Burlington Place, London, W1S 2HR, United Kingdom
SEGRO (Faggs Road) Limited** England and Wales Indirect 1 New Burlington Place, London, W1S 2HR, United Kingdom
SEGRO (Fairways Industrial Estate) Limited England and Wales Indirect 1 New Burlington Place, London, W1S 2HR, United Kingdom
SEGRO (Gatwick) Limited England and Wales Indirect 1 New Burlington Place, London, W1S 2HR, United Kingdom
SEGRO (GL) Limited England and Wales Indirect 1 New Burlington Place, London, W1S 2HR, United Kingdom
SEGRO (Grange Park) Limited** England and Wales Indirect 1 New Burlington Place, London, W1S 2HR, United Kingdom
SEGRO (Great Cambridge Industrial Estate) Limited England and Wales Indirect 1 New Burlington Place, London, W1S 2HR, United Kingdom
SEGRO (Hatton Farm Site A) Limited** England and Wales Indirect 1 New Burlington Place, London, W1S 2HR, United Kingdom
SEGRO (Hatton Farm Site B) Limited** England and Wales Indirect 1 New Burlington Place, London, W1S 2HR, United Kingdom
SEGRO (Hatton Farm Site C) Limited** England and Wales Indirect 1 New Burlington Place, London, W1S 2HR, United Kingdom
SEGRO (Hayes) Limited England and Wales Indirect 1 New Burlington Place, London, W1S 2HR, United Kingdom
SEGRO (Heathrow Cargo Area) Limited England and Wales Indirect 1 New Burlington Place, London, W1S 2HR, United Kingdom
SEGRO (Heathrow International) Limited** England and Wales Indirect 1 New Burlington Place, London, W1S 2HR, United Kingdom
SEGRO (Heathrow Park) Limited England and Wales Indirect 1 New Burlington Place, London, W1S 2HR, United Kingdom
SEGRO (Howbury) Limited5 England and Wales Indirect5 Temple Square, Temple Street, Liverpool, L2 5RH, United Kingdom
SEGRO (Iver 1) Limited England and Wales Indirect 1 New Burlington Place, London, W1S 2HR, United Kingdom
SEGRO (Junction 15) Limited England and Wales IndirectLumonics House Valley Drive, Swift Valley, Rugby, Warwickshire, CV21 1TQ, United Kingdom
SEGRO (Kettering Gateway Management Company) Limited** England and Wales Indirect 1 New Burlington Place, London, W1S 2HR, United Kingdom
SEGRO (Kettering) Limited England and Wales Indirect 1 New Burlington Place, London, W1S 2HR, United Kingdom
SEGRO (Lee Park Distribution) Limited England and Wales Indirect 1 New Burlington Place, London, W1S 2HR, United Kingdom
SEGRO (Loop) Limited** England and Wales Indirect 1 New Burlington Place, London, W1S 2HR, United Kingdom
SEGRO (Nelson Trade Park) Limited** England and Wales Indirect 1 New Burlington Place, London, W1S 2HR, United Kingdom
SEGRO (New Cross Business Centre) Limited** England and Wales Indirect 1 New Burlington Place, London, W1S 2HR, United Kingdom
SEGRO (Newport Pagnell) Limited** England and Wales Indirect 1 New Burlington Place, London, W1S 2HR, United Kingdom
SEGRO (NFTE & Mercury) Limited England and Wales Indirect 1 New Burlington Place, London, W1S 2HR, United Kingdom
SEGRO (Parc des Damiers) SAS France Indirect 20 Rue Brunel, 75017, Paris, France
SEGRO (Perivale Park) Limited England and Wales Indirect 1 New Burlington Place, London, W1S 2HR, United Kingdom
SEGRO (Poyle 14) Limited England and Wales Indirect 1 New Burlington Place, London, W1S 2HR, United Kingdom
SEGRO (Purfleet) Limited England and Wales Indirect 1 New Burlington Place, London, W1S 2HR, United Kingdom
SEGRO (Rainham 1) Limited** England and Wales Indirect 1 New Burlington Place, London, W1S 2HR, United Kingdom
SEGRO (Rainham 2) Limited** England and Wales Indirect 1 New Burlington Place, London, W1S 2HR, United Kingdom
SEGRO (Rainham, Enterprise 1) Limited** England and Wales Indirect 1 New Burlington Place, London, W1S 2HR, United Kingdom
SEGRO (Rainham, Enterprise 2) Limited** England and Wales Indirect 1 New Burlington Place, London, W1S 2HR, United Kingdom
SEGRO (Reading) Limited2 England and Wales Indirect 1 New Burlington Place, London, W1S 2HR, United Kingdom
SEGRO (Rockware Avenue) Limited England and Wales Indirect 1 New Burlington Place, London, W1S 2HR, United Kingdom
28. RELATED UNDERTAKINGS CONTINUED
12_NotesToFinStatements_179_227_v110.indd 21712_NotesToFinStatements_179_227_v110.indd 217 01/03/2022 17:2401/03/2022 17:24

FINANCIAL STATEMENTS
Notes to the Financial Statements continuedFor the year ended 31 December 2021
218 SEGRO PLC | ANNUAL REPORT & ACCOUNTS 2021
Company Name Jurisdiction
% effective holding if not 100%
Direct / Indirect Registered Office
SEGRO (Rugby Gateway 1) Limited** England and Wales Indirect 1 New Burlington Place, London, W1S 2HR, United Kingdom
SEGRO (Rugby Gateway 2) Limited** England and Wales Indirect 1 New Burlington Place, London, W1S 2HR, United Kingdom
SEGRO (Rugby Gateway 3) Limited England and Wales Indirect 1 New Burlington Place, London, W1S 2HR, United Kingdom
SEGRO (Rugby Gateway 4) Limited** England and Wales Indirect 1 New Burlington Place, London, W1S 2HR, United Kingdom
SEGRO (Rugby Gateway 5) Limited** England and Wales Indirect 1 New Burlington Place, London, W1S 2HR, United Kingdom
SEGRO (Rushden) Limited** England and Wales Indirect 1 New Burlington Place, London, W1S 2HR, United Kingdom
SEGRO (Skyline) Limited England and Wales Indirect 1 New Burlington Place, London, W1S 2HR, United Kingdom
SEGRO (Spacewaye Park) Limited** England and Wales Indirect 1 New Burlington Place, London, W1S 2HR, United Kingdom
SEGRO (Spain Energy) S.L. Spain Indirect Avenida Diagonal, 467 – 08036, Barcelona, Spain
SEGRO (Stansted Cargo) Limited** England and Wales Indirect 1 New Burlington Place, London, W1S 2HR, United Kingdom
SEGRO (Stansted Fedex) Limited England and Wales Indirect 1 New Burlington Place, London, W1S 2HR, United Kingdom
SEGRO (Stockley Close) Limited** England and Wales Indirect 1 New Burlington Place, London, W1S 2HR, United Kingdom
SEGRO (The Portal) Limited England and Wales Indirect 1 New Burlington Place, London, W1S 2HR, United Kingdom
SEGRO (Tilbury 2) Limited England and Wales Indirect 1 New Burlington Place, London, W1S 2HR, United Kingdom
SEGRO (Tottenham) Limited England and Wales Indirect 1 New Burlington Place, London, W1S 2HR, United Kingdom
SEGRO (Trilogy) Management Company Limited7 England and Wales Indirect 1 New Burlington Place, London, W1S 2HR, United Kingdom
SEGRO (Tudor) Limited England and Wales Indirect 1 New Burlington Place, London, W1S 2HR, United Kingdom
SEGRO (UK Energy) Limited** England and Wales Indirect 1 New Burlington Place, London, W1S 2HR, United Kingdom
SEGRO (UK Logistics) Limited** England and Wales Indirect 1 New Burlington Place, London, W1S 2HR, United Kingdom
SEGRO (Victoria Industrial Estate) Limited England and Wales Indirect 1 New Burlington Place, London, W1S 2HR, United Kingdom
SEGRO (Waltham Assets) Limited England and Wales Indirect 1 New Burlington Place, London, W1S 2HR, United Kingdom
SEGRO (Watchmoor) Limited** England and Wales Indirect 1 New Burlington Place, London, W1S 2HR, United Kingdom
SEGRO (Welham Green) Limited England and Wales Indirect 1 New Burlington Place, London, W1S 2HR, United Kingdom
SEGRO (West Zaan) B.V. Netherlands IndirectGustav Mahlerplein 62, ITO-toren, 8th Floor, 1082MA Amsterdam, Netherlands
SEGRO (Westway Estate) Limited England and Wales Indirect 1 New Burlington Place, London, W1S 2HR, United Kingdom
SEGRO Achte Grundbesitz GmbH Germany Indirect Fichtenstrasse 33, 40233, Düsseldorf, Germany
SEGRO Achtzehnte Grundbesitz GmbH Germany Indirect Fichtenstrasse 33, 40233, Düsseldorf, Germany
SEGRO Administration Limited England and Wales Direct 1 New Burlington Place, London, W1S 2HR, United Kingdom
SEGRO APP 1 Limited** England and Wales Indirect 1 New Burlington Place, London, W1S 2HR, United Kingdom
SEGRO APP 2 Limited** England and Wales Indirect 1 New Burlington Place, London, W1S 2HR, United Kingdom
SEGRO APP 3 Limited** England and Wales Indirect 1 New Burlington Place, London, W1S 2HR, United Kingdom
SEGRO APP 4 Limited** England and Wales Indirect 1 New Burlington Place, London, W1S 2HR, United Kingdom
SEGRO APP Management Limited** England and Wales Indirect 1 New Burlington Place, London, W1S 2HR, United Kingdom
SEGRO Asset Management Limited** England and Wales Indirect 1 New Burlington Place, London, W1S 2HR, United Kingdom
SEGRO B.V. Netherlands IndirectGustav Mahlerplein 62, ITO-toren, 8th Floor, 1082MA Amsterdam, Netherlands
SEGRO Belgium NV Belgium Indirect Boulevard Louis Schmidt 87, 1040 Etterbeek, Belgium
SEGRO Benelux B.V.4 Netherlands IndirectGustav Mahlerplein 62, ITO-toren, 8th Floor, 1082MA Amsterdam, Netherlands
SEGRO Capital S.á.r.l. Luxembourg Indirect 35-37 Avenue de la Liberté, L-1931, Luxembourg
SEGRO CHUSA Limited England and Wales Indirect 1 New Burlington Place, London, W1S 2HR, United Kingdom
SEGRO CL1 SCI France Indirect 20 Rue Brunel, 75017, Paris, France
SEGRO Communities Limited7 England and Wales Indirect 1 New Burlington Place, London, W1S 2HR, United Kingdom
SEGRO Czech Republic s.r.o. Czech Republic Indirect Praha 1, Na Príkope 9/392 a 11/393, PSC 110 00, Czech Republic
SEGRO Dreiundzwanzigste Grundbesitz GmbH Germany Indirect Fichtenstrasse 33, 40233, Düsseldorf, Germany
SEGRO Dreizehnte Grundbesitz GmbH Germany 94 Indirect Fichtenstrasse 33, 40233, Düsseldorf, Germany
SEGRO Dritte Grundbesitz GmbH Germany Indirect Fichtenstrasse 33, 40233, Düsseldorf, Germany
SEGRO Einundzwanzigste Grundbesitz GmbH Germany Indirect Fichtenstrasse 33, 40233, Düsseldorf, Germany
SEGRO Elfte Grundbesitz GmbH Germany Indirect Fichtenstrasse 33, 40233, Düsseldorf, Germany
SEGRO Erste Grundbesitz GmbH Germany Indirect Fichtenstrasse 33, 40233, Düsseldorf, Germany
SEGRO Europe Limited** England and Wales Indirect 1 New Burlington Place, London, W1S 2HR, United Kingdom
SEGRO European Logistics Partnership S.á.r.l. Luxembourg 50 Indirect 35-37 Avenue de la Liberté, L-1931, Luxembourg
SEGRO Finance plc England and Wales Direct 1 New Burlington Place, London, W1S 2HR, United Kingdom
SEGRO Fixtures GmbH Germany Indirect Fichtenstrasse 33, 40233, Düsseldorf, Germany
SEGRO France Energy SAS France Indirect 20 Rue Brunel, 75017, Paris, France
28. RELATED UNDERTAKINGS CONTINUED
12_NotesToFinStatements_179_227_v110.indd 21812_NotesToFinStatements_179_227_v110.indd 218 01/03/2022 17:2401/03/2022 17:24
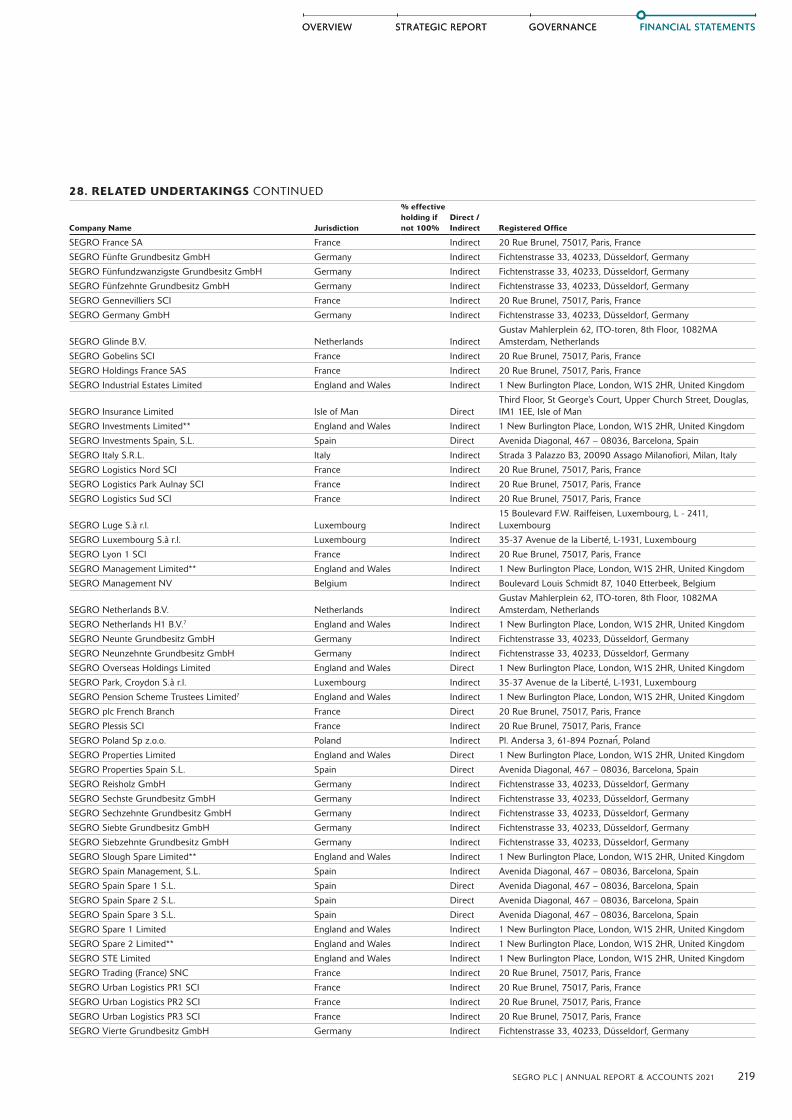
FINANCIAL STATEMENTSFINANCIAL STATEMENTS
219SEGRO PLC | ANNUAL REPORT & ACCOUNTS 2021
STRATEGIC REPORTOVERVIEW GOVERNANCEGOVERNANCESTRATEGIC REPORTOVERVIEW
Company Name Jurisdiction
% effective holding if not 100%
Direct / Indirect Registered Office
SEGRO France SA France Indirect 20 Rue Brunel, 75017, Paris, France
SEGRO Fünfte Grundbesitz GmbH Germany Indirect Fichtenstrasse 33, 40233, Düsseldorf, Germany
SEGRO Fünfundzwanzigste Grundbesitz GmbH Germany Indirect Fichtenstrasse 33, 40233, Düsseldorf, Germany
SEGRO Fünfzehnte Grundbesitz GmbH Germany Indirect Fichtenstrasse 33, 40233, Düsseldorf, Germany
SEGRO Gennevilliers SCI France Indirect 20 Rue Brunel, 75017, Paris, France
SEGRO Germany GmbH Germany Indirect Fichtenstrasse 33, 40233, Düsseldorf, Germany
SEGRO Glinde B.V. Netherlands IndirectGustav Mahlerplein 62, ITO-toren, 8th Floor, 1082MA Amsterdam, Netherlands
SEGRO Gobelins SCI France Indirect 20 Rue Brunel, 75017, Paris, France
SEGRO Holdings France SAS France Indirect 20 Rue Brunel, 75017, Paris, France
SEGRO Industrial Estates Limited England and Wales Indirect 1 New Burlington Place, London, W1S 2HR, United Kingdom
SEGRO Insurance Limited Isle of Man DirectThird Floor, St George's Court, Upper Church Street, Douglas, IM1 1EE, Isle of Man
SEGRO Investments Limited** England and Wales Indirect 1 New Burlington Place, London, W1S 2HR, United Kingdom
SEGRO Investments Spain, S.L. Spain Direct Avenida Diagonal, 467 – 08036, Barcelona, Spain
SEGRO Italy S.R.L. Italy Indirect Strada 3 Palazzo B3, 20090 Assago Milanofiori, Milan, Italy
SEGRO Logistics Nord SCI France Indirect 20 Rue Brunel, 75017, Paris, France
SEGRO Logistics Park Aulnay SCI France Indirect 20 Rue Brunel, 75017, Paris, France
SEGRO Logistics Sud SCI France Indirect 20 Rue Brunel, 75017, Paris, France
SEGRO Luge S.à r.l. Luxembourg Indirect15 Boulevard F.W. Raiffeisen, Luxembourg, L - 2411, Luxembourg
SEGRO Luxembourg S.à r.l. Luxembourg Indirect 35-37 Avenue de la Liberté, L-1931, Luxembourg
SEGRO Lyon 1 SCI France Indirect 20 Rue Brunel, 75017, Paris, France
SEGRO Management Limited** England and Wales Indirect 1 New Burlington Place, London, W1S 2HR, United Kingdom
SEGRO Management NV Belgium Indirect Boulevard Louis Schmidt 87, 1040 Etterbeek, Belgium
SEGRO Netherlands B.V. Netherlands IndirectGustav Mahlerplein 62, ITO-toren, 8th Floor, 1082MA Amsterdam, Netherlands
SEGRO Netherlands H1 B.V.7 England and Wales Indirect 1 New Burlington Place, London, W1S 2HR, United Kingdom
SEGRO Neunte Grundbesitz GmbH Germany Indirect Fichtenstrasse 33, 40233, Düsseldorf, Germany
SEGRO Neunzehnte Grundbesitz GmbH Germany Indirect Fichtenstrasse 33, 40233, Düsseldorf, Germany
SEGRO Overseas Holdings Limited England and Wales Direct 1 New Burlington Place, London, W1S 2HR, United Kingdom
SEGRO Park, Croydon S.à r.l. Luxembourg Indirect 35-37 Avenue de la Liberté, L-1931, Luxembourg
SEGRO Pension Scheme Trustees Limited7 England and Wales Indirect 1 New Burlington Place, London, W1S 2HR, United Kingdom
SEGRO plc French Branch France Direct 20 Rue Brunel, 75017, Paris, France
SEGRO Plessis SCI France Indirect 20 Rue Brunel, 75017, Paris, France
SEGRO Poland Sp z.o.o. Poland Indirect Pl. Andersa 3, 61-894 Poznan, Poland
SEGRO Properties Limited England and Wales Direct 1 New Burlington Place, London, W1S 2HR, United Kingdom
SEGRO Properties Spain S.L. Spain Direct Avenida Diagonal, 467 – 08036, Barcelona, Spain
SEGRO Reisholz GmbH Germany Indirect Fichtenstrasse 33, 40233, Düsseldorf, Germany
SEGRO Sechste Grundbesitz GmbH Germany Indirect Fichtenstrasse 33, 40233, Düsseldorf, Germany
SEGRO Sechzehnte Grundbesitz GmbH Germany Indirect Fichtenstrasse 33, 40233, Düsseldorf, Germany
SEGRO Siebte Grundbesitz GmbH Germany Indirect Fichtenstrasse 33, 40233, Düsseldorf, Germany
SEGRO Siebzehnte Grundbesitz GmbH Germany Indirect Fichtenstrasse 33, 40233, Düsseldorf, Germany
SEGRO Slough Spare Limited** England and Wales Indirect 1 New Burlington Place, London, W1S 2HR, United Kingdom
SEGRO Spain Management, S.L. Spain Indirect Avenida Diagonal, 467 – 08036, Barcelona, Spain
SEGRO Spain Spare 1 S.L. Spain Direct Avenida Diagonal, 467 – 08036, Barcelona, Spain
SEGRO Spain Spare 2 S.L. Spain Direct Avenida Diagonal, 467 – 08036, Barcelona, Spain
SEGRO Spain Spare 3 S.L. Spain Direct Avenida Diagonal, 467 – 08036, Barcelona, Spain
SEGRO Spare 1 Limited England and Wales Indirect 1 New Burlington Place, London, W1S 2HR, United Kingdom
SEGRO Spare 2 Limited** England and Wales Indirect 1 New Burlington Place, London, W1S 2HR, United Kingdom
SEGRO STE Limited England and Wales Indirect 1 New Burlington Place, London, W1S 2HR, United Kingdom
SEGRO Trading (France) SNC France Indirect 20 Rue Brunel, 75017, Paris, France
SEGRO Urban Logistics PR1 SCI France Indirect 20 Rue Brunel, 75017, Paris, France
SEGRO Urban Logistics PR2 SCI France Indirect 20 Rue Brunel, 75017, Paris, France
SEGRO Urban Logistics PR3 SCI France Indirect 20 Rue Brunel, 75017, Paris, France
SEGRO Vierte Grundbesitz GmbH Germany Indirect Fichtenstrasse 33, 40233, Düsseldorf, Germany
28. RELATED UNDERTAKINGS CONTINUED
12_NotesToFinStatements_179_227_v110.indd 21912_NotesToFinStatements_179_227_v110.indd 219 01/03/2022 17:2401/03/2022 17:24

FINANCIAL STATEMENTS
Notes to the Financial Statements continuedFor the year ended 31 December 2021
220 SEGRO PLC | ANNUAL REPORT & ACCOUNTS 2021
Company Name Jurisdiction
% effective holding if not 100%
Direct / Indirect Registered Office
SEGRO Vierundzwanzigste Grundbesitz GmbH Germany Indirect Fichtenstrasse 33, 40233, Düsseldorf, Germany
SEGRO Vierzehnte Grundbesitz GmbH Germany Indirect Fichtenstrasse 33, 40233, Düsseldorf, Germany
SEGRO V-Park Grand Union LLP6 England and Wales 50 Indirect 1 New Burlington Place, London, W1S 2HR, United Kingdom
SEGRO Wissous SCI France Indirect 20 Rue Brunel, 75017, Paris, France
SEGRO Zehnte Grundbesitz GmbH Germany Indirect Fichtenstrasse 33, 40233, Düsseldorf, Germany
SEGRO Zwanzigste Grundbesitz GmbH Germany Indirect Fichtenstrasse 33, 40233, Düsseldorf, Germany
SEGRO Zweite Grundbesitz GmbH Germany Indirect Fichtenstrasse 33, 40233, Düsseldorf, Germany
SEGRO Zweiundzwanzigste Grundbesitz GmbH Germany Indirect Fichtenstrasse 33, 40233, Düsseldorf, Germany
SEGRO Zwölfte Grundbesitz GmbH Germany Indirect Fichtenstrasse 33, 40233, Düsseldorf, Germany
SELP (Alpha Holdings) S.á.r.l. Luxembourg 50 Indirect 8, rue de Koerich, L-8437 Steinfort
SELP (Alpha JV) S.á.r.l. Luxembourg 50 Indirect 8, rue de Koerich, L-8437 Steinfort
SELP Finance S.á.r.l. Luxembourg 50 Indirect 35-37 Avenue de la Liberté, L-1931, Luxembourg
SELP Investments S.á.r.l. Luxembourg 50 Indirect 35-37 Avenue de la Liberté, L-1931, Luxembourg
SELP Management Limited England and Wales Indirect 1 New Burlington Place, London, W1S 2HR, United Kingdom
Slough Trading Estate Limited England and Wales Direct 1 New Burlington Place, London, W1S 2HR, United Kingdom
Smartparc SEGRO Spondon Limited England and Wales Indirect 1 New Burlington Place, London, W1S 2HR, United Kingdom
SOFIBUS Patrimoine SA France Indirect 20 Rue Brunel, 75017, Paris, France
Steamhouse Group Limited** England and Wales Indirect 1 New Burlington Place, London, W1S 2HR, United Kingdom
Tenedor S.R.L. Italy Indirect Strada 3 Palazzo B3, 20090 Assago Milanofiori, Milan, Italy
The UK Logistics (Nominee 1) Limited7 England and Wales Indirect 1 New Burlington Place, London, W1S 2HR, United Kingdom
The UK Logistics (Nominee 2) Limited7 England and Wales Indirect 1 New Burlington Place, London, W1S 2HR, United Kingdom
The UK Logistics General Partner Limited** England and Wales Indirect 1 New Burlington Place, London, W1S 2HR, United Kingdom
The UK Logistics Limited Partnership6 England and Wales Indirect 1 New Burlington Place, London, W1S 2HR, United Kingdom
Trafford Park Estates Limited** England and Wales Indirect 1 New Burlington Place, London, W1S 2HR, United Kingdom
UK Logistics Fund Unit Trust Jersey Indirect Ogier House, The Esplanade, St Helier, JE4 9WG, Jersey
UK Logistics Properties No 1 Unit Trust Jersey Indirect Ogier House, The Esplanade, St Helier, JE4 9WG, Jersey
UK Logistics Properties No 2 Unit Trust Jersey Indirect Ogier House, The Esplanade, St Helier, JE4 9WG, Jersey
UK Logistics Trustees Limited Jersey Indirect Ogier House, The Esplanade, St Helier, JE4 9WG, Jersey
UK Property Unit Trust No. 41 Jersey Indirect 47 Esplanade, St Helier, Jersey JE1 0BD
UK Property Unit Trust No. 42 Jersey Indirect 47 Esplanade, St Helier, Jersey JE1 0BD
UK Property Unit Trust No. 43 Jersey Indirect 47 Esplanade, St Helier, Jersey JE1 0BD
UK Property Unit Trust No. 44 Jersey Indirect 47 Esplanade, St Helier, Jersey JE1 0BD
UK Property Unit Trust No. 45 Jersey Indirect 47 Esplanade, St Helier, Jersey JE1 0BD
Unitair General Partner Limited** England and Wales Indirect 1 New Burlington Place, London, W1S 2HR, United Kingdom
Unitair Limited Partnership6*** England and Wales Indirect 1 New Burlington Place, London, W1S 2HR, United Kingdom
Vailog Colleferro S.R.L Italy 95 Indirect Strada 3 Palazzo B3, 20090 Assago Milanofiori, Milan, Italy
Vailog Energy 1 S.R.L. Italy 95 Indirect Strada 3 Palazzo B3, 20090 Assago Milanofiori, Milan, Italy
Vailog Energy 2 S.R.L. Italy 95 Indirect Strada 3 Palazzo B3, 20090 Assago Milanofiori, Milan, Italy
Vailog Energy 3 S.R.L. Italy 95 Indirect Strada 3 Palazzo B3, 20090 Assago Milanofiori, Milan, Italy
Vailog France SCI France Indirect 20 Rue Brunel, 75017, Paris, France
Vailog S.R.L. Italy 95 Indirect Strada 3 Palazzo B3, 20090 Assago Milanofiori, Milan, Italy
Woodside GP Limited7 England and Wales 33.33 Indirect 1 New Burlington Place, London, W1S 2HR, United Kingdom
Zinc One S.R.L. Italy Indirect Strada 3 Palazzo B3, 20090 Assago Milanofiori, Milan, Italy
Zinc Seven S.R.L Italy Indirect Strada 3 Palazzo B3, 20090 Assago Milanofiori, Milan, Italy
Zinc Six S.R.L. Italy Indirect Strada 3 Palazzo B3, 20090 Assago Milanofiori, Milan, Italy
1 Ownership held in class A and B shares. 2 Ownership held in Ordinary and Deferred shares. 3 Ownership held in class A shares. 4 Ownership held in class G shares, K shares, S shares and Preference shares.5 In liquidation.6 Partnership and Limited Liability Partnership (LLPs) do not have a share capital and unless otherwise stated, the Group holds 100 per cent interest in these entities.7 Company entitled to exemption from audit under section 480 of the Companies Act 2006 relating to dormant companies.
28. RELATED UNDERTAKINGS CONTINUED
12_NotesToFinStatements_179_227_v110.indd 22012_NotesToFinStatements_179_227_v110.indd 220 01/03/2022 17:2401/03/2022 17:24

FINANCIAL STATEMENTSFINANCIAL STATEMENTS
221SEGRO PLC | ANNUAL REPORT & ACCOUNTS 2021
STRATEGIC REPORTOVERVIEW GOVERNANCEGOVERNANCESTRATEGIC REPORTOVERVIEW
SUPPLEMENTARY NOTES NOT PART OF AUDITED FINANCIAL STATEMENTS
Table 1: EPRA performance measures summary2021 2020
Notes £mPence per
share £mPence per
share
EPRA Earnings Table 4 348 29.1 292 25.4
EPRA NTA Table 5 13,704 1,137 9,725 814
EPRA NRV Table 5 14,986 1,243 10,571 885
EPRA NDV Table 5 13,155 1,091 9,155 766
EPRA net initial yield Table 6 3.0% 3.8%
EPRA topped-up net initial yield Table 6 3.3% 4.1%
EPRA vacancy rate Table 7 3.2% 3.9%
EPRA cost ratio (including vacant property costs) Table 8 20.2% 21.1%
EPRA cost ratio (excluding vacant property costs) Table 8 19.0% 20.1%
Table 2: Income Statement, proportionally consolidated2021 2020
NotesGroup
£m
Joint ventures
£mTotal
£mGroup
£m
Joint ventures
£mTotal
£m
Gross rental income 2,7 447 135 582 393 121 514
Property operating expenses 2,7 (100) (35) (135) (88) (31) (119)
Net rental income 347 100 447 305 90 395
Joint venture fee income1 2,7 52 (24) 28 22 (10) 12
Administration expenses 2,7 (59) (2) (61) (52) (2) (54)
Adjusted operating profit before interest and tax 340 74 414 275 78 353
Net finance costs (including adjustments) 2,7 (40) (13) (53) (40) (12) (52)
Adjusted profit before tax 300 61 361 235 66 301
Tax on adjusted profit 2,7 (8) (5) (13) (4) (5) (9)
Adjusted/EPRA earnings before non-controlling interests 292 56 348 231 61 292
Non-controlling interest on adjusted profit 2,7 – – – – – –
Adjusted/EPRA earnings after tax and non-controlling interests 292 56 348 231 61 292
Number of shares, million 12 1,197.7 1,149.8
Adjusted/EPRA EPS, pence per share 29.1 25.4
Number of shares, million 12 1,201.0 1,154.5
Adjusted/EPRA EPS, pence per share – diluted 29.0 25.3
1 Joint venture fee income includes the cost of such fees borne by the joint ventures which are shown in Note 7 within net rental income.
As discussed in Note 2 there were no non-EPRA adjustments to underlying profit made in the current or prior period, therefore Adjusted earnings is equal to EPRA earnings in the table above.
Table 3: Balance Sheet, proportionally consolidated2021 2020
NotesGroup
£m
Joint ventures
£mTotal
£mGroup
£m
Joint ventures
£mTotal
£m
Investment properties 13,7 15,492 2,909 18,401 10,671 2,348 13,019
Trading properties 13,7 45 – 45 52 – 52
Total properties 15,537 2,909 18,446 10,723 2,348 13,071
Investment in joint ventures 7 1,795 (1,795) – 1,423 (1,423) –
Other net liabilities (535) (274) (809) (162) (162) (324)
Net borrowings 16,7 (3,361) (840) (4,201) (2,325) (763) (3,088)
Total shareholders’ equity1 13,436 – 13,436 9,659 – 9,659
EPRA adjustments 12 268 66
Adjusted NAV 12 13,704 9,725
Number of shares, million 12 1,205.5 1,194.7
Adjusted NAV, pence per share 12 1,137 814
1 After non-controlling interests.
12_NotesToFinStatements_179_227_v110.indd 22112_NotesToFinStatements_179_227_v110.indd 221 01/03/2022 17:2401/03/2022 17:24
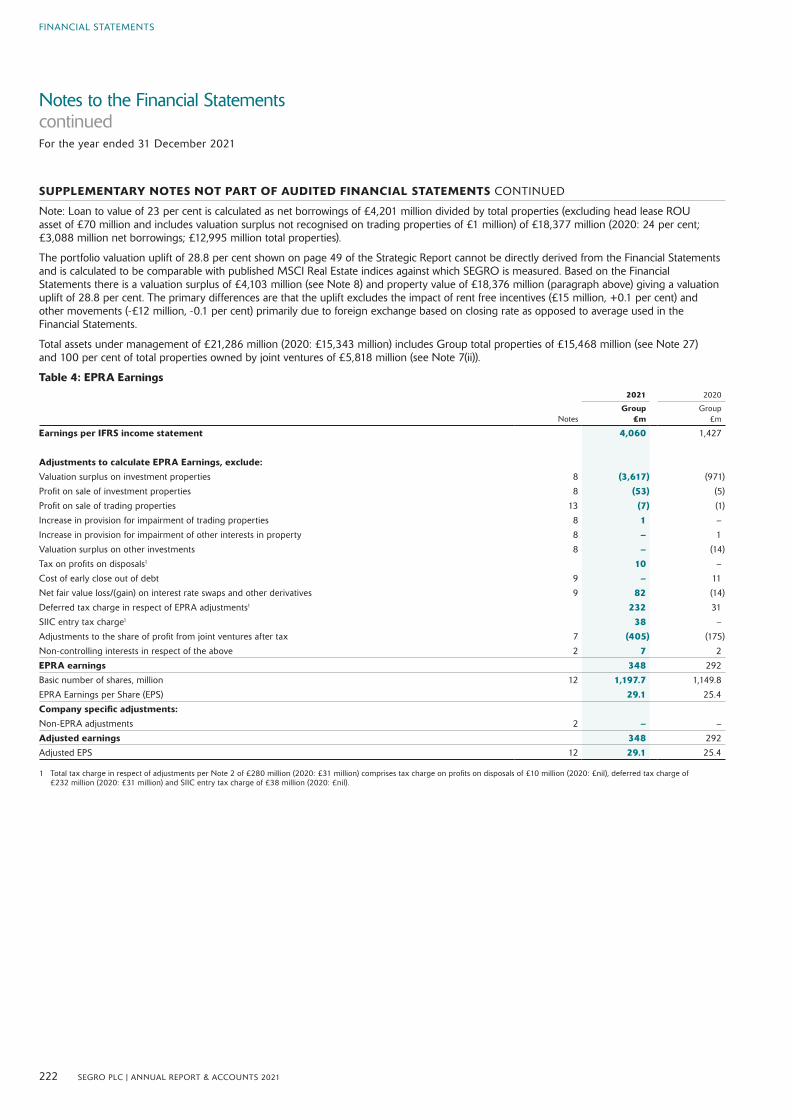
FINANCIAL STATEMENTS
Notes to the Financial Statements continuedFor the year ended 31 December 2021
222 SEGRO PLC | ANNUAL REPORT & ACCOUNTS 2021
SUPPLEMENTARY NOTES NOT PART OF AUDITED FINANCIAL STATEMENTS CONTINUED
Note: Loan to value of 23 per cent is calculated as net borrowings of £4,201 million divided by total properties (excluding head lease ROU asset of £70 million and includes valuation surplus not recognised on trading properties of £1 million) of £18,377 million (2020: 24 per cent; £3,088 million net borrowings; £12,995 million total properties).
The portfolio valuation uplift of 28.8 per cent shown on page 49 of the Strategic Report cannot be directly derived from the Financial Statements and is calculated to be comparable with published MSCI Real Estate indices against which SEGRO is measured. Based on the Financial Statements there is a valuation surplus of £4,103 million (see Note 8) and property value of £18,376 million (paragraph above) giving a valuation uplift of 28.8 per cent. The primary differences are that the uplift excludes the impact of rent free incentives (£15 million, +0.1 per cent) and other movements (-£12 million, -0.1 per cent) primarily due to foreign exchange based on closing rate as opposed to average used in the Financial Statements.
Total assets under management of £21,286 million (2020: £15,343 million) includes Group total properties of £15,468 million (see Note 27) and 100 per cent of total properties owned by joint ventures of £5,818 million (see Note 7(ii)).
Table 4: EPRA Earnings 2021 2020
NotesGroup
£mGroup
£m
Earnings per IFRS income statement 4,060 1,427
Adjustments to calculate EPRA Earnings, exclude:
Valuation surplus on investment properties 8 (3,617) (971)
Profit on sale of investment properties 8 (53) (5)
Profit on sale of trading properties 13 (7) (1)
Increase in provision for impairment of trading properties 8 1 –
Increase in provision for impairment of other interests in property 8 – 1
Valuation surplus on other investments 8 – (14)
Tax on profits on disposals1 10 –
Cost of early close out of debt 9 – 11
Net fair value loss/(gain) on interest rate swaps and other derivatives 9 82 (14)
Deferred tax charge in respect of EPRA adjustments1 232 31
SIIC entry tax charge1 38 –
Adjustments to the share of profit from joint ventures after tax 7 (405) (175)
Non-controlling interests in respect of the above 2 7 2
EPRA earnings 348 292
Basic number of shares, million 12 1,197.7 1,149.8
EPRA Earnings per Share (EPS) 29.1 25.4
Company specific adjustments:
Non-EPRA adjustments 2 – –
Adjusted earnings 348 292
Adjusted EPS 12 29.1 25.4
1 Total tax charge in respect of adjustments per Note 2 of £280 million (2020: £31 million) comprises tax charge on profits on disposals of £10 million (2020: £nil), deferred tax charge of £232 million (2020: £31 million) and SIIC entry tax charge of £38 million (2020: £nil).
12_NotesToFinStatements_179_227_v110.indd 22212_NotesToFinStatements_179_227_v110.indd 222 01/03/2022 17:2401/03/2022 17:24
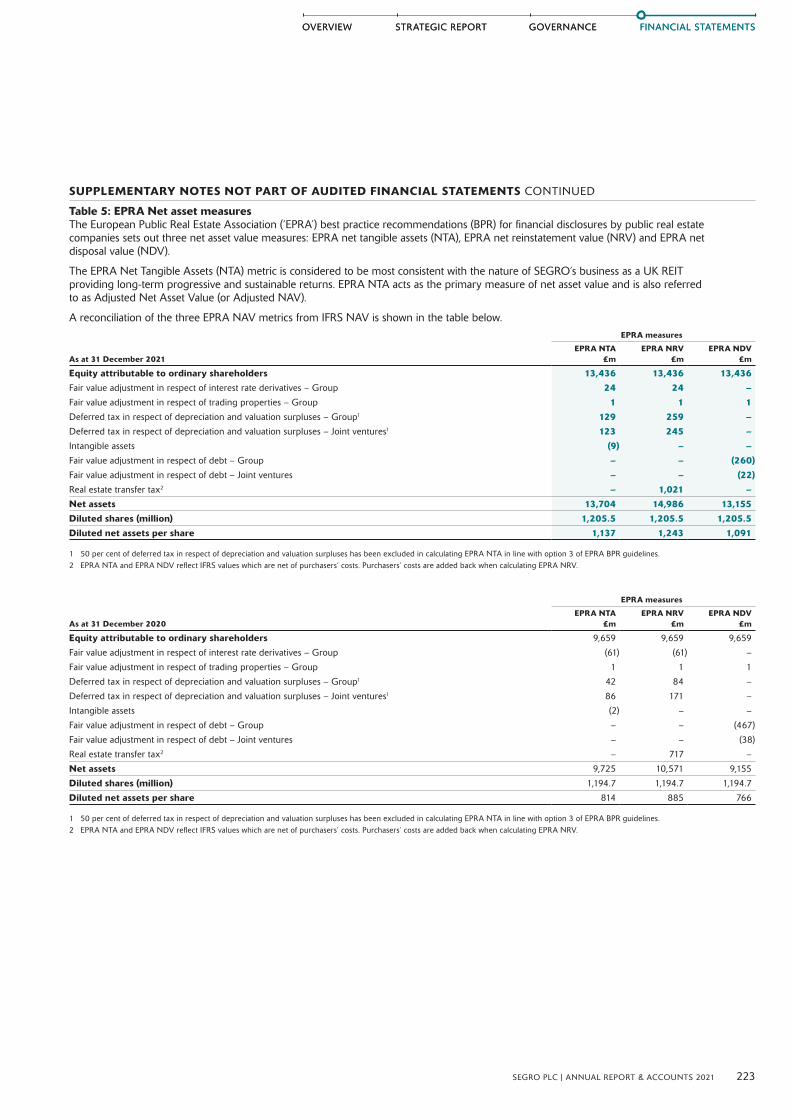
FINANCIAL STATEMENTSFINANCIAL STATEMENTS
223SEGRO PLC | ANNUAL REPORT & ACCOUNTS 2021
STRATEGIC REPORTOVERVIEW GOVERNANCEGOVERNANCESTRATEGIC REPORTOVERVIEW
SUPPLEMENTARY NOTES NOT PART OF AUDITED FINANCIAL STATEMENTS CONTINUED
Table 5: EPRA Net asset measuresThe European Public Real Estate Association (‘EPRA’) best practice recommendations (BPR) for financial disclosures by public real estate companies sets out three net asset value measures: EPRA net tangible assets (NTA), EPRA net reinstatement value (NRV) and EPRA net disposal value (NDV).
The EPRA Net Tangible Assets (NTA) metric is considered to be most consistent with the nature of SEGRO’s business as a UK REIT providing long-term progressive and sustainable returns. EPRA NTA acts as the primary measure of net asset value and is also referred to as Adjusted Net Asset Value (or Adjusted NAV).
A reconciliation of the three EPRA NAV metrics from IFRS NAV is shown in the table below.EPRA measures
As at 31 December 2021EPRA NTA
£mEPRA NRV
£mEPRA NDV
£m
Equity attributable to ordinary shareholders 13,436 13,436 13,436Fair value adjustment in respect of interest rate derivatives – Group 24 24 –Fair value adjustment in respect of trading properties – Group 1 1 1Deferred tax in respect of depreciation and valuation surpluses – Group1 129 259 –Deferred tax in respect of depreciation and valuation surpluses – Joint ventures1 123 245 –
Intangible assets (9) – –Fair value adjustment in respect of debt – Group – – (260)
Fair value adjustment in respect of debt – Joint ventures – – (22)
Real estate transfer tax2 – 1,021 –
Net assets 13,704 14,986 13,155
Diluted shares (million) 1,205.5 1,205.5 1,205.5
Diluted net assets per share 1,137 1,243 1,091
1 50 per cent of deferred tax in respect of depreciation and valuation surpluses has been excluded in calculating EPRA NTA in line with option 3 of EPRA BPR guidelines.2 EPRA NTA and EPRA NDV reflect IFRS values which are net of purchasers’ costs. Purchasers’ costs are added back when calculating EPRA NRV.
EPRA measures
As at 31 December 2020EPRA NTA
£mEPRA NRV
£mEPRA NDV
£m
Equity attributable to ordinary shareholders 9,659 9,659 9,659
Fair value adjustment in respect of interest rate derivatives – Group (61) (61) –
Fair value adjustment in respect of trading properties – Group 1 1 1
Deferred tax in respect of depreciation and valuation surpluses – Group1 42 84 –
Deferred tax in respect of depreciation and valuation surpluses – Joint ventures1 86 171 –
Intangible assets (2) – –
Fair value adjustment in respect of debt – Group – – (467)
Fair value adjustment in respect of debt – Joint ventures – – (38)
Real estate transfer tax2 – 717 –
Net assets 9,725 10,571 9,155
Diluted shares (million) 1,194.7 1,194.7 1,194.7
Diluted net assets per share 814 885 766
1 50 per cent of deferred tax in respect of depreciation and valuation surpluses has been excluded in calculating EPRA NTA in line with option 3 of EPRA BPR guidelines.2 EPRA NTA and EPRA NDV reflect IFRS values which are net of purchasers’ costs. Purchasers’ costs are added back when calculating EPRA NRV.
12_NotesToFinStatements_179_227_v110.indd 22312_NotesToFinStatements_179_227_v110.indd 223 01/03/2022 17:2401/03/2022 17:24
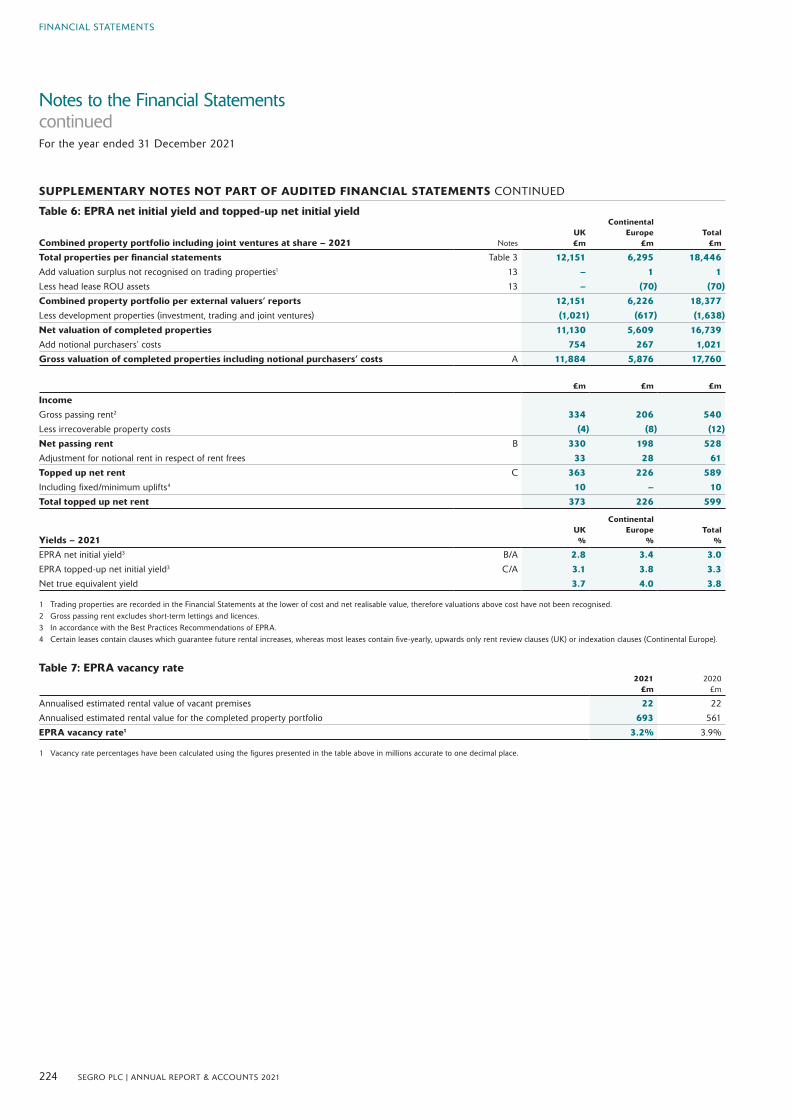
FINANCIAL STATEMENTS
Notes to the Financial Statements continuedFor the year ended 31 December 2021
224 SEGRO PLC | ANNUAL REPORT & ACCOUNTS 2021
SUPPLEMENTARY NOTES NOT PART OF AUDITED FINANCIAL STATEMENTS CONTINUED
Table 6: EPRA net initial yield and topped-up net initial yield
Combined property portfolio including joint ventures at share – 2021 NotesUK £m
Continental Europe
£mTotal
£m
Total properties per financial statements Table 3 12,151 6,295 18,446Add valuation surplus not recognised on trading properties1 13 – 1 1Less head lease ROU assets 13 – (70) (70)Combined property portfolio per external valuers’ reports 12,151 6,226 18,377Less development properties (investment, trading and joint ventures) (1,021) (617) (1,638)Net valuation of completed properties 11,130 5,609 16,739Add notional purchasers’ costs 754 267 1,021Gross valuation of completed properties including notional purchasers’ costs A 11,884 5,876 17,760
£m £m £m
IncomeGross passing rent2 334 206 540Less irrecoverable property costs (4) (8) (12)Net passing rent B 330 198 528Adjustment for notional rent in respect of rent frees 33 28 61
Topped up net rent C 363 226 589
Including fixed/minimum uplifts4 10 – 10
Total topped up net rent 373 226 599
Yields – 2021
UK %
Continental Europe
%Total
%
EPRA net initial yield3 B/A 2.8 3.4 3.0
EPRA topped-up net initial yield3 C/A 3.1 3.8 3.3
Net true equivalent yield 3.7 4.0 3.8
1 Trading properties are recorded in the Financial Statements at the lower of cost and net realisable value, therefore valuations above cost have not been recognised.2 Gross passing rent excludes short-term lettings and licences.3 In accordance with the Best Practices Recommendations of EPRA.4 Certain leases contain clauses which guarantee future rental increases, whereas most leases contain five-yearly, upwards only rent review clauses (UK) or indexation clauses (Continental Europe).
Table 7: EPRA vacancy rate2021
£m2020
£m
Annualised estimated rental value of vacant premises 22 22
Annualised estimated rental value for the completed property portfolio 693 561
EPRA vacancy rate1 3.2% 3.9%
1 Vacancy rate percentages have been calculated using the figures presented in the table above in millions accurate to one decimal place.
12_NotesToFinStatements_179_227_v110.indd 22412_NotesToFinStatements_179_227_v110.indd 224 01/03/2022 17:2401/03/2022 17:24
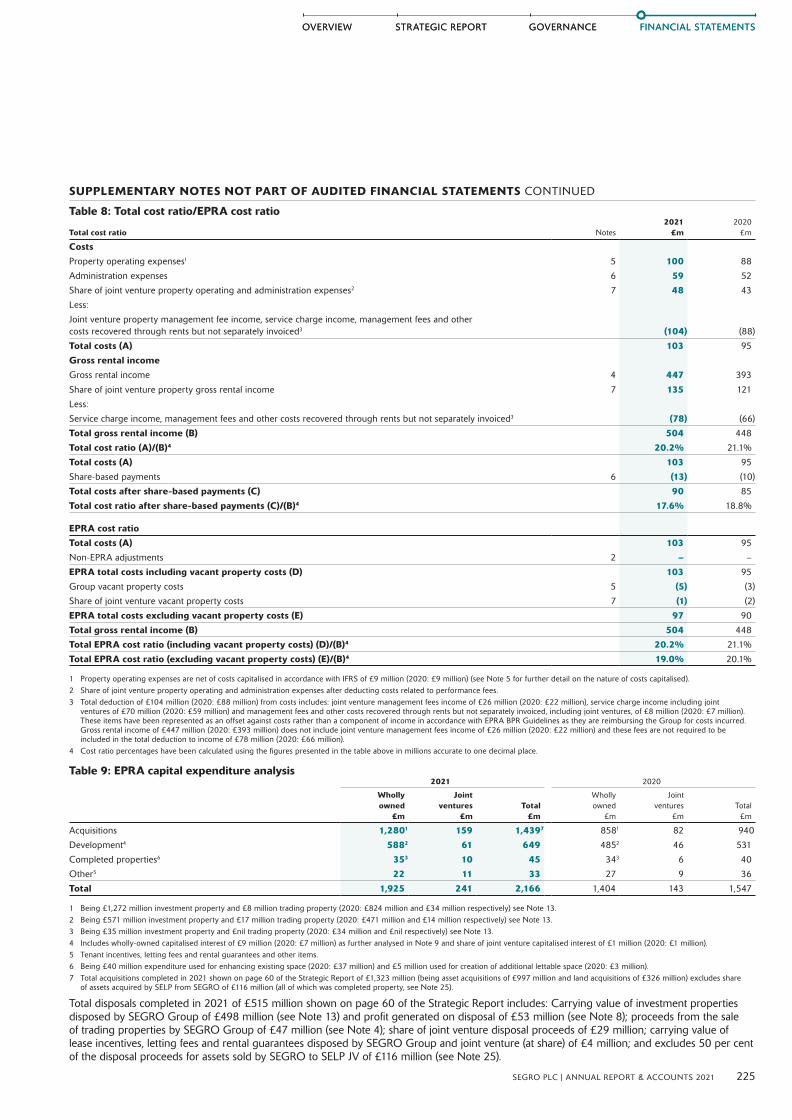
FINANCIAL STATEMENTSFINANCIAL STATEMENTS
225SEGRO PLC | ANNUAL REPORT & ACCOUNTS 2021
STRATEGIC REPORTOVERVIEW GOVERNANCEGOVERNANCESTRATEGIC REPORTOVERVIEW
SUPPLEMENTARY NOTES NOT PART OF AUDITED FINANCIAL STATEMENTS CONTINUED
Table 8: Total cost ratio/EPRA cost ratio
Total cost ratio Notes2021
£m2020
£m
CostsProperty operating expenses1 5 100 88
Administration expenses 6 59 52
Share of joint venture property operating and administration expenses2 7 48 43
Less:
Joint venture property management fee income, service charge income, management fees and other costs recovered through rents but not separately invoiced3 (104) (88)
Total costs (A) 103 95
Gross rental income Gross rental income 4 447 393
Share of joint venture property gross rental income 7 135 121
Less:
Service charge income, management fees and other costs recovered through rents but not separately invoiced3 (78) (66)
Total gross rental income (B) 504 448
Total cost ratio (A)/(B)4 20.2% 21.1%
Total costs (A) 103 95
Share-based payments 6 (13) (10)
Total costs after share-based payments (C) 90 85
Total cost ratio after share-based payments (C)/(B)4 17.6% 18.8%
EPRA cost ratio
Total costs (A) 103 95
Non-EPRA adjustments 2 – –
EPRA total costs including vacant property costs (D) 103 95
Group vacant property costs 5 (5) (3)
Share of joint venture vacant property costs 7 (1) (2)
EPRA total costs excluding vacant property costs (E) 97 90
Total gross rental income (B) 504 448
Total EPRA cost ratio (including vacant property costs) (D)/(B)4 20.2% 21.1%
Total EPRA cost ratio (excluding vacant property costs) (E)/(B)4 19.0% 20.1%
1 Property operating expenses are net of costs capitalised in accordance with IFRS of £9 million (2020: £9 million) (see Note 5 for further detail on the nature of costs capitalised).2 Share of joint venture property operating and administration expenses after deducting costs related to performance fees. 3 Total deduction of £104 million (2020: £88 million) from costs includes: joint venture management fees income of £26 million (2020: £22 million), service charge income including joint
ventures of £70 million (2020: £59 million) and management fees and other costs recovered through rents but not separately invoiced, including joint ventures, of £8 million (2020: £7 million). These items have been represented as an offset against costs rather than a component of income in accordance with EPRA BPR Guidelines as they are reimbursing the Group for costs incurred. Gross rental income of £447 million (2020: £393 million) does not include joint venture management fees income of £26 million (2020: £22 million) and these fees are not required to be included in the total deduction to income of £78 million (2020: £66 million).
4 Cost ratio percentages have been calculated using the figures presented in the table above in millions accurate to one decimal place.
Table 9: EPRA capital expenditure analysis2021 2020
Wholly owned
£m
Joint ventures
£mTotal
£m
Wholly owned
£m
Joint ventures
£mTotal
£m
Acquisitions 1,2801 159 1,4397 8581 82 940
Development4 5882 61 649 4852 46 531
Completed properties6 353 10 45 343 6 40
Other5 22 11 33 27 9 36
Total 1,925 241 2,166 1,404 143 1,547
1 Being £1,272 million investment property and £8 million trading property (2020: £824 million and £34 million respectively) see Note 13.2 Being £571 million investment property and £17 million trading property (2020: £471 million and £14 million respectively) see Note 13.3 Being £35 million investment property and £nil trading property (2020: £34 million and £nil respectively) see Note 13.4 Includes wholly-owned capitalised interest of £9 million (2020: £7 million) as further analysed in Note 9 and share of joint venture capitalised interest of £1 million (2020: £1 million).5 Tenant incentives, letting fees and rental guarantees and other items.6 Being £40 million expenditure used for enhancing existing space (2020: £37 million) and £5 million used for creation of additional lettable space (2020: £3 million).7 Total acquisitions completed in 2021 shown on page 60 of the Strategic Report of £1,323 million (being asset acquisitions of £997 million and land acquisitions of £326 million) excludes share
of assets acquired by SELP from SEGRO of £116 million (all of which was completed property, see Note 25).
Total disposals completed in 2021 of £515 million shown on page 60 of the Strategic Report includes: Carrying value of investment properties disposed by SEGRO Group of £498 million (see Note 13) and profit generated on disposal of £53 million (see Note 8); proceeds from the sale of trading properties by SEGRO Group of £47 million (see Note 4); share of joint venture disposal proceeds of £29 million; carrying value of lease incentives, letting fees and rental guarantees disposed by SEGRO Group and joint venture (at share) of £4 million; and excludes 50 per cent of the disposal proceeds for assets sold by SEGRO to SELP JV of £116 million (see Note 25).
12_NotesToFinStatements_179_227_v110.indd 22512_NotesToFinStatements_179_227_v110.indd 225 01/03/2022 17:2401/03/2022 17:24

FINANCIAL STATEMENTS
226 SEGRO PLC | ANNUAL REPORT & ACCOUNTS 2021
Notes to the Financial Statements continuedFor the year ended 31 December 2021
SUPPLEMENTARY NOTES NOT PART OF AUDITED FINANCIAL STATEMENTS CONTINUED
Table 10: Like-for-like net rental income
(including JVs at share)2021
£m2020
£mChange
%3
UK 234 222 5.6
Continental Europe 129 124 3.6
Like-for-like net rental income before other items1 363 346 4.9
Other2 (6) (6) –
Like-for-like net rental income (after other) 357 340 4.8
Development lettings 39 9
Properties taken back for development 1 5
Like-for-like net rental income plus developments 397 354
Properties acquired 24 4
Properties sold 10 15
Net rental income before surrenders, dilapidations and exchange 431 373
Lease surrender premiums and dilapidation income 6 4
Other items and rent lost from lease surrenders 10 14
Impact of exchange rate difference between periods – 4
Net rental income (including joint ventures at share) 447 395
SEGRO share of joint venture management fees (11) (10)
SEGRO share of joint venture performance fees (13) –
Net rental income after SEGRO share of joint venture fees 423 385
1 Like-for like change by Business Unit: Greater London 8.5%, Thames Valley 2.7%, National Logistics 0.4%, Northern Europe 9.1%, Southern Europe 1.2%, Central Europe 0.7%.2 Other includes the corporate centre and other costs relating to the operational business which are not specifically allocated to a geographical Business Unit. 3 Percentage change has been calculated using the figures presented in the table above in millions accurate to one decimal place.
Table 11: Top 10 estates as at 31 December 2021 (by value, including joint ventures at share)
UK Ownership2
% LocationLettable area (100%) sq m
Headline
rent £m
Vacancy by ERV %
WAULTyears1 Asset type
Slough Trading Estate 100 Slough 640,706 101.3 4.1 8.4 Multi-let urban warehouse estate
SLP East Midlands Gateway 100 Midlands 333,160 23.9 0.0 14.8 Big box warehouse park
Premier Park 100 Park Royal 78,720 13.7 0.0 4.2 Multi-let urban warehouse estate
Shoreham Rd Cargo Area 100 Heathrow 93,704 21.0 0.1 2.0 Multi-let cargo facility
Greenford Park 100 Park Royal 79,503 11.2 2.7 4.0 Multi-let urban warehouse estateMetropolitan Park 100 Park Royal 69,988 8.4 1.8 1.4 Multi-let urban warehouse estateNorth Feltham Trading Estate 100 Heathrow 57,933 8.9 4.4 4.9 Multi-let urban warehouse estate
SEGRO Park Perivale 100 Park Royal 56,906 7.7 5.3 2.2 Multi-let urban warehouse estate
Axis Park 100 Heathrow 61,753 9.2 0.0 6.7 Multi-let urban warehouse estatePark Royal Origin 100 Park Royal 33,965 5.9 0.0 13.5 Multi-let urban warehouse estateContinental Europe
SEGRO Parc des Petits Carreaux 100 France 149,396 12.0 10.5 2.6 Multi-let urban warehouse estateCSG Logistics Park 50 / 100 Italy 349,488 8.4 0.0 7.4 Big box warehouse parkSEGRO Airport Park Berlin 50 / 100 Germany 136,121 6.3 9.0 5.9 Multi-let urban warehouse and
Big box estateNovara Logistics Park 100 Italy 189,028 5.8 0.0 14.6 Big box warehouse park
SEGRO Logistics Park Krefeld-Sud 50 Germany 235,977 5.8 0.0 3.6 Big box warehouse parkSEGRO Logistics Park Aulnay 100 France 47,288 4.4 0.0 7.8 Big box warehouse parkSEGRO Park Düsseldorf-Süd 100 Germany 96,237 6.4 2.7 5.5 Multi-let urban warehouse estate
SEGRO CityPark Düsseldorf 100 Germany 50,457 4.6 1.1 5.4 Multi-let urban warehouse estateRome South Logistics Park 50 Italy 223,241 4.5 0.0 16.4 Big box warehouse park
SEGRO Park Gennevilliers 100 France 75,232 5.3 0.0 4.6 Multi-let urban warehouse estate
1 Weighted average unexpired lease term to earlier of break of expiry.2 Wholly-owned are shown as 100 per cent excluding small amounts of non-controlling interests in Vailog assets.
12_NotesToFinStatements_179_227_v110.indd 22612_NotesToFinStatements_179_227_v110.indd 226 01/03/2022 17:2401/03/2022 17:24
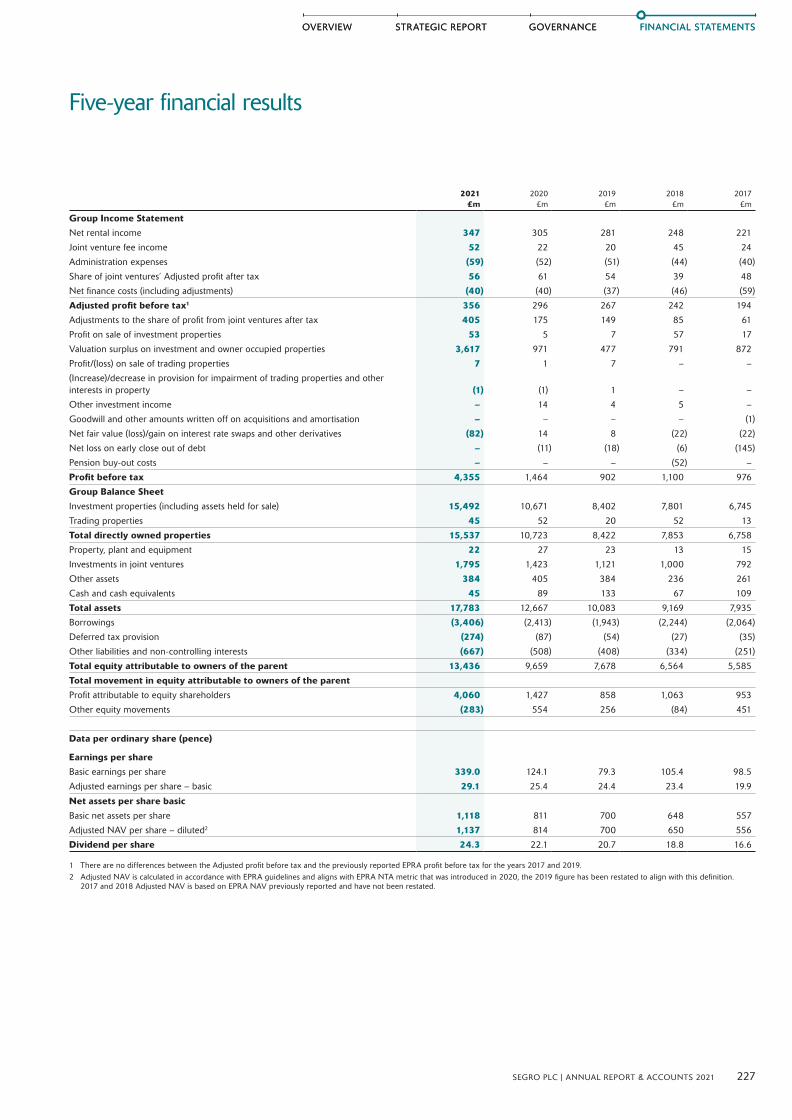
FINANCIAL STATEMENTSFINANCIAL STATEMENTS
227SEGRO PLC | ANNUAL REPORT & ACCOUNTS 2021
STRATEGIC REPORTOVERVIEW GOVERNANCEGOVERNANCESTRATEGIC REPORTOVERVIEW
Five-year financial results
2021 £m
2020 £m
2019 £m
2018 £m
2017 £m
Group Income StatementNet rental income 347 305 281 248 221
Joint venture fee income 52 22 20 45 24
Administration expenses (59) (52) (51) (44) (40)
Share of joint ventures’ Adjusted profit after tax 56 61 54 39 48
Net finance costs (including adjustments) (40) (40) (37) (46) (59)
Adjusted profit before tax1 356 296 267 242 194
Adjustments to the share of profit from joint ventures after tax 405 175 149 85 61
Profit on sale of investment properties 53 5 7 57 17
Valuation surplus on investment and owner occupied properties 3,617 971 477 791 872
Profit/(loss) on sale of trading properties 7 1 7 – –
(Increase)/decrease in provision for impairment of trading properties and other interests in property (1) (1) 1 – –
Other investment income – 14 4 5 –
Goodwill and other amounts written off on acquisitions and amortisation – – – – (1)
Net fair value (loss)/gain on interest rate swaps and other derivatives (82) 14 8 (22) (22)
Net loss on early close out of debt – (11) (18) (6) (145)
Pension buy-out costs – – – (52) –
Profit before tax 4,355 1,464 902 1,100 976
Group Balance Sheet
Investment properties (including assets held for sale) 15,492 10,671 8,402 7,801 6,745
Trading properties 45 52 20 52 13
Total directly owned properties 15,537 10,723 8,422 7,853 6,758
Property, plant and equipment 22 27 23 13 15
Investments in joint ventures 1,795 1,423 1,121 1,000 792
Other assets 384 405 384 236 261
Cash and cash equivalents 45 89 133 67 109
Total assets 17,783 12,667 10,083 9,169 7,935
Borrowings (3,406) (2,413) (1,943) (2,244) (2,064)
Deferred tax provision (274) (87) (54) (27) (35)
Other liabilities and non-controlling interests (667) (508) (408) (334) (251)
Total equity attributable to owners of the parent 13,436 9,659 7,678 6,564 5,585
Total movement in equity attributable to owners of the parent
Profit attributable to equity shareholders 4,060 1,427 858 1,063 953
Other equity movements (283) 554 256 (84) 451
Data per ordinary share (pence)
Earnings per share
Basic earnings per share 339.0 124.1 79.3 105.4 98.5
Adjusted earnings per share – basic 29.1 25.4 24.4 23.4 19.9
Net assets per share basicBasic net assets per share 1,118 811 700 648 557
Adjusted NAV per share – diluted2 1,137 814 700 650 556
Dividend per share 24.3 22.1 20.7 18.8 16.6
1 There are no differences between the Adjusted profit before tax and the previously reported EPRA profit before tax for the years 2017 and 2019.2 Adjusted NAV is calculated in accordance with EPRA guidelines and aligns with EPRA NTA metric that was introduced in 2020, the 2019 figure has been restated to align with this definition.
2017 and 2018 Adjusted NAV is based on EPRA NAV previously reported and have not been restated.
12_NotesToFinStatements_179_227_v110.indd 22712_NotesToFinStatements_179_227_v110.indd 227 01/03/2022 17:2401/03/2022 17:24
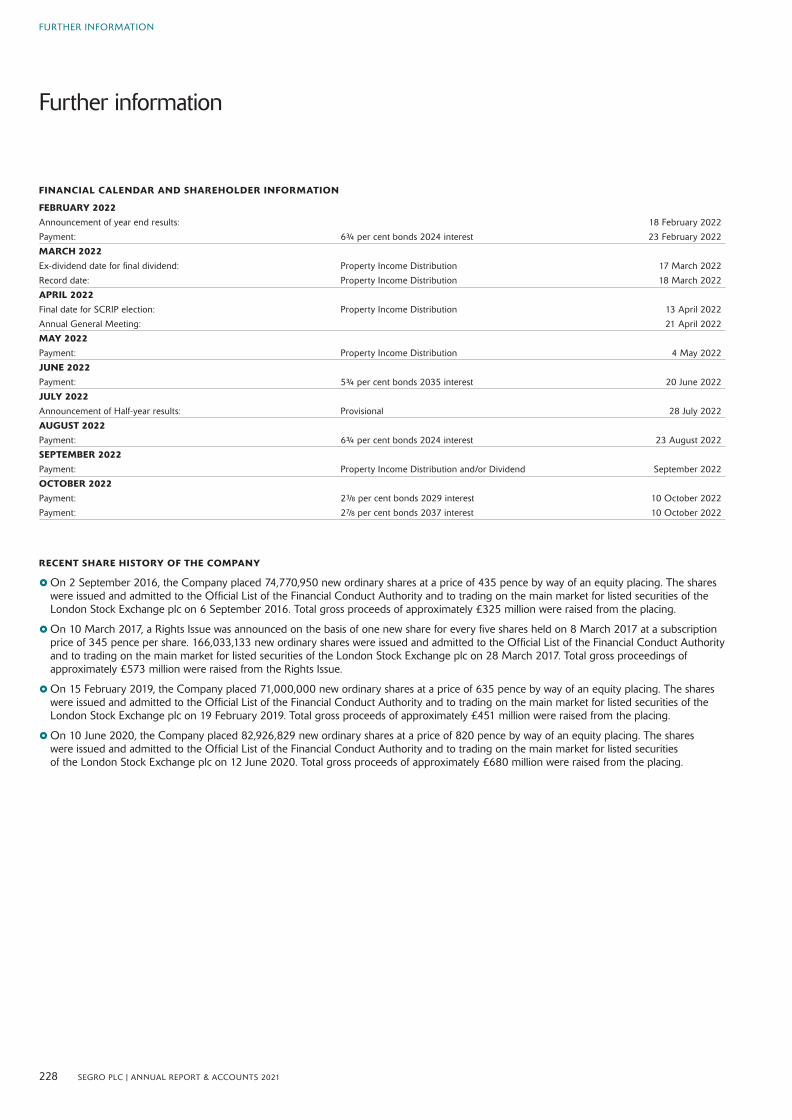
Further information
228 SEGRO PLC | ANNUAL REPORT & ACCOUNTS 2021
FURTHER INFORMATION
FINANCIAL CALENDAR AND SHAREHOLDER INFORMATION
FEBRUARY 2022Announcement of year end results: 18 February 2022
Payment: 6¾ per cent bonds 2024 interest 23 February 2022
MARCH 2022Ex-dividend date for final dividend: Property Income Distribution 17 March 2022
Record date: Property Income Distribution 18 March 2022
APRIL 2022Final date for SCRIP election: Property Income Distribution 13 April 2022
Annual General Meeting: 21 April 2022
MAY 2022Payment: Property Income Distribution 4 May 2022
JUNE 2022Payment: 5¾ per cent bonds 2035 interest 20 June 2022
JULY 2022Announcement of Half-year results: Provisional 28 July 2022
AUGUST 2022Payment: 6¾ per cent bonds 2024 interest 23 August 2022
SEPTEMBER 2022
Payment: Property Income Distribution and/or Dividend September 2022
OCTOBER 2022
Payment: 23/8 per cent bonds 2029 interest 10 October 2022
Payment: 27/8 per cent bonds 2037 interest 10 October 2022
RECENT SHARE HISTORY OF THE COMPANY
}On 2 September 2016, the Company placed 74,770,950 new ordinary shares at a price of 435 pence by way of an equity placing. The shares were issued and admitted to the Official List of the Financial Conduct Authority and to trading on the main market for listed securities of the London Stock Exchange plc on 6 September 2016. Total gross proceeds of approximately £325 million were raised from the placing.
}On 10 March 2017, a Rights Issue was announced on the basis of one new share for every five shares held on 8 March 2017 at a subscription price of 345 pence per share. 166,033,133 new ordinary shares were issued and admitted to the Official List of the Financial Conduct Authority and to trading on the main market for listed securities of the London Stock Exchange plc on 28 March 2017. Total gross proceedings of approximately £573 million were raised from the Rights Issue.
}On 15 February 2019, the Company placed 71,000,000 new ordinary shares at a price of 635 pence by way of an equity placing. The shares were issued and admitted to the Official List of the Financial Conduct Authority and to trading on the main market for listed securities of the London Stock Exchange plc on 19 February 2019. Total gross proceeds of approximately £451 million were raised from the placing.
}On 10 June 2020, the Company placed 82,926,829 new ordinary shares at a price of 820 pence by way of an equity placing. The shares were issued and admitted to the Official List of the Financial Conduct Authority and to trading on the main market for listed securities of the London Stock Exchange plc on 12 June 2020. Total gross proceeds of approximately £680 million were raised from the placing.
13_FurtherInfo_228_232_v36.indd 22813_FurtherInfo_228_232_v36.indd 228 01/03/2022 17:2501/03/2022 17:25
Shareholder information
229SEGRO PLC | ANNUAL REPORT & ACCOUNTS 2021
OVERVIEW STRATEGIC REPORT GOVERNANCE FINANCIAL STATEMENTS
Shareholder enquiriesIf you have any questions about your shareholding or if you require further guidance (e.g. to notify a change of address) please contact our Registrar:
Equiniti Limited Aspect House Spencer Road Lancing West Sussex BN99 6DA
Telephone +44 0371 384 2186 (or +44 (0)121 4150 141 from overseas).
Alternatively, you can check your shareholding and access dividend information by registering for a Shareview Portfolio at www.shareview.co.uk, or you can securely send queries via the website by visiting https://help.shareview.co.uk.
Electronic communicationsShareholders have the opportunity to elect to receive shareholder communications electronically, e.g. Annual Reports, Notice of the Annual General Meeting and Proxy Forms. You can elect to receive email notifications of shareholder communications by registering for a Shareview Portfolio at www.shareview.co.uk, where you can also submit proxy votes for shareholder meetings and update your bank details for dividend payments (see below). Receiving the Company’s communications electronically allows the Company to communicate with its shareholders in a more environmentally friendly, cost effective and timely manner.
AGM The 2022 AGM will be held at 11.00 a.m. on 21 April 2022 at RSA House, 8 John Adam Street, London WC2N 6EZ.
Please check our 2022 Notice of Meeting for the most up to date information. Shareholders are also advised to check our website which will be updated if there are any changes to the arrangements.
ShareGiftShareGift is a charity (registered under the name The Orr Mackintosh Foundation, registered charity number 1052686) which specialises in accepting donations of small numbers of shares which are uneconomic to sell on their own. Shares which have been donated to ShareGift are aggregated and sold when practicable, with the proceeds passed on to a wide range of UK charities. ShareGift can also help with larger donations of shares. Further details about ShareGift can be obtained from its website at www.sharegift.org or by writing to ShareGift at ShareGift, PO Box 72253, London, SW1P 9LQ, email: [email protected], telephone: +44 (0)207 930 3737.
DividendsA requirement of the REIT regime is that a REIT must distribute to shareholders by way of dividend at least 90 per cent of its profits from its tax-exempt UK property rental business (calculated under UK tax principles after the deduction of interest and capital allowances and excluding chargeable gains). Such distributions are referred to as Property Income Distributions, or PIDs. Any further distributions may be paid as ordinary dividends, which are derived from profits earned by its UK, non-REIT taxable business, as well as its overseas operations (including the SIIC in France and SOCIMI in Spain).
Withholding tax – PIDsSEGRO is required to withhold tax at source from its PIDs at the basic tax rate (20 per cent). UK shareholders need take no immediate action (unless they qualify for exemption as described below) and will receive with each dividend payment a tax deduction certificate stating the amount of tax deducted.
UK shareholders who fall into one of the classes of shareholder able to claim an exemption from withholding tax may be able to receive a gross PID payment if they have submitted a valid relevant Exemption Declaration form, either as a beneficial owner of the shares, or as an intermediary if the shares are not registered in the name of the beneficial owner, to Equiniti. The Exemption Declaration form is available at www.SEGRO.com under Investors/Shareholder Information/REIT. A valid declaration form, once submitted, will continue to apply to future payments of PIDs until rescinded, and so it is a shareholder’s responsibility to notify SEGRO if their circumstances change and they are no longer able to claim an exemption from withholding tax.
Shareholders resident outside the UK may be able to claim a full or partial refund of withholding tax (either as an individual or as a company) from HMRC, subject to the terms of a double tax treaty, if any, between the UK and the country in which the shareholder is resident.
Ordinary dividendsOrdinary, non-PID dividends will be treated in exactly the same way by shareholders as ordinary dividends paid before the Company became a REIT. From 6 April 2016 the notional 10 per cent tax credit has been abolished and replaced with a tax-free dividend allowance, which will apply to the ordinary, non-PID dividends received by UK resident shareholders who are subject to UK income tax. This allowance does not apply to the PID element of dividends. Further information is available from HMRC at https://www.gov.uk/tax-on-dividends.
Chequeless dividends from January 2021Since January 2021, SEGRO has withdrawn the option for shareholders to receive payments by cheque. Receiving dividends, and other payments, by direct credit rather than cheque is a more efficient, secure, and environmentally friendly method of payment.
To continue to receive dividends, and any other money payable to you in connection with your SEGRO plc shares, you will need to provide your bank or building society account details so that payments can be made to your nominated account by direct credit.
If you have not already provided your details you can do so online through the Shareview Portfolio, or, for sole holders with 2,500 or fewer shares, by contacting Equiniti (details above).
SCRIP Dividend Shareholders approved the re-introduction of a scrip dividend option (SCRIP) in respect of cash dividends (including those treated as Property Income Distributions) at the 2021 AGM.
Subject to the Board deciding to offer a SCRIP, the SCRIP runs for three years ending on the earlier of 21 April 2024 and the 2024 AGM. It allows shareholders who elect to receive it, to take their final and interim dividends in shares rather than cash. Details of the SCRIP, together with information on how shareholders can elect to receive it are available on the Company’s website www.SEGRO.com.
13_FurtherInfo_228_232_v36.indd 22913_FurtherInfo_228_232_v36.indd 229 01/03/2022 17:2501/03/2022 17:25
Glossary of terms
BREEAM: BREEAM provides sustainability assessment and certification for real estate assets.
Completed portfolio: The completed investment properties and the Group’s share of joint ventures’ completed investment properties. Includes properties held throughout the period, completed developments and properties acquired during the period.
Development pipeline: The Group’s current programme of developments authorised or in the course of construction at the Balance Sheet date (Current Pipeline), together with potential schemes not yet commenced on land owned or controlled by the Group (Future Pipeline).
EPRA: The European Public Real Estate Association, a real estate industry body, which has issued Best Practices Recommendations in order to provide consistency and transparency in real estate reporting across Europe.
ESG: Environmental, Social and Governance issues.
Estimated cost to completion: Costs still to be expended on a development or redevelopment to practical completion, including attributable interest.
Estimated rental value (ERV): The estimated annual market rental value of lettable space as determined biannually by the Group’s valuers. This will normally be different from the rent being paid.
Gearing: Net borrowings divided by total shareholders’ equity excluding intangible assets and deferred tax provisions.
GRESB: An organisation which provides independent benchmarking of ESG metrics for the property industry.
Gross rental income: Contracted rental income recognised in the period in the Income Statement, including surrender premiums. Lease incentives, initial costs and any contracted future rental increases are amortised on a straight-line basis over the lease term.
Headline rent: The annual rental income currently receivable on a property as at the Balance Sheet date (which may be more or less than the ERV) ignoring any rent-free period.
Hectares (Ha): The area of land measurement used in this analysis. The conversion factor used, where appropriate, is 1 hectare = 2.471 acres.
IAS: International Accounting Standards, the standards under which SEGRO reports its financial accounts.
IFRS: International Financial Reporting Standards, the standards under which SEGRO reports its financial accounts.
Investment property: Completed land and buildings held for rental income return and/or capital appreciation.
Joint venture: An entity in which the Group holds an interest and which is jointly controlled by the Group and one or more partners under a contractual arrangement whereby decisions on financial and operating policies essential to the operation, performance and financial position of the venture require each partner’s consent.
Life cycle assessments: Life cycle assessment (LCA) is a methodology for assessing the environmental impacts associated with all the stages of the life cycle of a building.
Loan to value (LTV): Net borrowings divided by the carrying value of total property assets (investment, owner occupied, trading properties and, if appropriate, assets held for sale on the balance sheet) and excludes head lease ROU asset. This is reported on a ‘look-through’ basis (including joint ventures at share).
MSCI: MSCI Real Estate calculates indices of real estate performance around the world.
Net initial yield: Passing rent less non-recoverable property expenses such as empty rates, divided by the property valuation plus notional purchasers’ costs. This is in accordance with EPRA’s Best Practices Recommendations.
Net rental income: Gross rental income less ground rents paid, net service charge expenses and property operating expenses.
Net true equivalent yield: The internal rate of return from an investment property, based on the value of the property assuming the current passing rent reverts to ERV and assuming the property becomes fully occupied over time. It assumes that rent is received quarterly in advance.
230 SEGRO PLC | ANNUAL REPORT & ACCOUNTS 2021
FURTHER INFORMATION
13_FurtherInfo_228_232_v36.indd 23013_FurtherInfo_228_232_v36.indd 230 01/03/2022 17:2501/03/2022 17:25

Passing rent: The annual rental income currently receivable on a property as at the Balance Sheet date (which may be more or less than the ERV). Excludes rental income where a rent free period is in operation. Excludes service charge income (which is netted off against service charge expenses).
Pre-let: A lease signed with an occupier prior to commencing construction of a building.
REIT: A qualifying entity which has elected to be treated as a Real Estate Investment Trust for tax purposes. In the UK, such entities must be listed on a recognised stock exchange, must be predominantly engaged in property investment activities and must meet certain ongoing qualifications. SEGRO plc and its UK subsidiaries achieved REIT status with effect from 1 January 2007.
Rent-free period: An incentive provided usually at commencement of a lease during which a customer pays no rent. The amount of rent free is the difference between passing rent and headline rent.
Rent roll: See Passing Rent.
SELP: SEGRO European Logistics Partnership, a 50-50 joint venture between SEGRO and the Public Sector Pension Investment Board (PSP Investments) established in 2013 to own big box warehouses in Continental Europe.
SIIC: Sociétés d’investissements Immobiliers Cotées are the French equivalent of UK Real Estate Investment Trusts (see REIT).
Speculative development: Where a development has commenced prior to a lease agreement being signed in relation to that development.
SPPICAV: Société de Placement à Prépondérance Immobilière à Capital Variable is a French equivalent of UK Real Estate Investment Trusts (see REIT).
Square metres (sq m): The area of buildings measurements used in this analysis. The conversion factor used, where appropriate, is one square metre = 10.7639 square feet.
Takeback: Rental income lost due to lease expiry, exercise of break option, surrender or insolvency.
Topped up net initial yield: Net initial yield adjusted to include notional rent in respect of let properties which are subject to a rent free period at the valuation date. This is in accordance with EPRA’s Best Practices Recommendations.
Total accounting return (TAR): A measure of the Group’s return, calculated as the change in adjusted NAV per share during the period adding back dividends paid during the period expressed as a percentage of adjusted NAV per share at the beginning of the period.
Total property return (TPR): A measure of the ungeared return for the portfolio and is calculated as the change in capital value, less any capital expenditure incurred, plus net income, expressed as a percentage of capital employed over the period concerned, as calculated by MSCI Real Estate and excluding land.
Total shareholder return (TSR): A measure of return based upon share price movement over the period and assuming reinvestment of dividends.
Trading property: Property being developed for sale or one which is being held for sale after development is complete.
Yield on cost: The expected gross yield based on the estimated current market rental value (ERV) of the developments when fully let, divided by the book value of the developments at the earlier of commencement of the development or the balance sheet date plus future development costs and estimated finance costs to completion.
Yield on new money: The yield on cost excluding the book value of land if the land is owned by the Group in the reporting period prior to commencement of the development.
231SEGRO PLC | ANNUAL REPORT & ACCOUNTS 2021
OVERVIEW STRATEGIC REPORT GOVERNANCE FINANCIAL STATEMENTS
13_FurtherInfo_228_232_v36.indd 23113_FurtherInfo_228_232_v36.indd 231 01/03/2022 17:2501/03/2022 17:25

232 SEGRO PLC | ANNUAL REPORT & ACCOUNTS 2021
13_FurtherInfo_228_232_v36.indd 23213_FurtherInfo_228_232_v36.indd 232 01/03/2022 17:2501/03/2022 17:25
Printed in the UK by Pureprint Group, a Carbon Neutral® company. The CO2 emissions associated with the manufacturing of the paper, its delivery to the printer and the printing of this report have been offset.
The report was printed using vegetable-based inks and a water-based coating. Both the paper mill and printer are registered to the Environmental Management System ISO 14001 and are Forest Stewardship Council® (FSC®) chain-of-custody certified.
Designed and produced by www.ry.com
FORWARD-LOOKING STATEMENTS
The Annual Report contains certain forward-looking statements with respect to SEGRO’s expectations and plans, strategy, management objectives, future developments and performances, costs, revenues and other trend information. All statements other than historical fact are, or may be deemed to be, forward-looking statements. Forward-looking statements are statements of future expectations and these are subject to assumptions, risks and uncertainties. Many of these assumptions, risks and uncertainties relate to factors that are beyond SEGRO’s ability to control or estimate precisely and which could cause actual results or developments to differ materially from those expressed or implied by these forward-looking statements. Certain statements have been made with reference to forecast process changes, economic conditions and the current regulatory environment. Any forward-looking statements made by or on behalf of SEGRO are based upon the knowledge and information available to Directors on the date of this Annual Report. Accordingly, no assurance can be given that any particular expectation will be met and SEGRO’s shareholders are cautioned not to place undue reliance on the forward-looking statements. Additionally, forward-looking statements regarding past trends or activities should not be taken as a representation that such trends or activities will continue in the future. The information contained in this Annual Report is provided as at the date of this Annual Report and is subject to change without notice. Other than in accordance with its legal or regulatory obligations (including under the UK Listing Rules and the Disclosure Guidance and Transparency Rules of the Financial Conduct Authority), SEGRO does not undertake to update forward-looking statements including to reflect any new information or changes in events, conditions or circumstances on which any such statement is based. Past share performance cannot be relied on as a guide to future performance. Nothing in this Annual Report should be construed as a profit estimate or forecast. The information in this Annual Report does not constitute an offer to sell or an invitation to buy securities in SEGRO plc or an invitation or inducement to engage in or enter into any contract or commitment of other investment activities.
GO ONLINE
To keep up to date with SEGRO, you can source facts and figures about the Group through the various sections on our website and sign up for email alerts for fast communication of breaking news.
Financial reports, shareholder information and property analysis are frequently updated and our current share price is always displayed on the Home Page.
As well as featuring detailed information about available property throughout the portfolio, www.SEGRO.com now also includes a dedicated property search function making it easy for potential customers, or their agents, to find business space that fits their requirement exactly. SEGRO’s performance in areas such as sustainability and customer care are also featured on the site, www.SEGRO.com.
We would encourage shareholders to consider electing to receive shareholder communications, including the Annual Report and Accounts, electronically as set out on page 229. As part of our commitment to become net-carbon neutral by 2030, we want to reduce the amount of paper we use.
OTHER PUBLICATIONS
Additional disclosures on our property portfolio can be found in the 2021 Property Analysis Report at www.SEGRO.com.
Our ESG policies, reporting guidelines, assurance statements and further case studies can be found at www.segro.com/responsiblesegro.
SEGRO PLC
1 NEW BURLINGTON PLACE LONDON W1S 2HR
REGISTERED IN ENGLAND AND WALES REGISTERED NUMBER 167591
REGISTERED OFFICE
CBP00019082504183028
13_FurtherInfo_228_232_v36.indd 313_FurtherInfo_228_232_v36.indd 3 01/03/2022 18:2701/03/2022 18:27

SEGRO PLC
1 NEW BURLINGTON PLACE LONDON W1S 2HR
T +44(0)20 7451 9100
WWW.SEGRO.COM/INVESTORS
13_FurtherInfo_228_232_v36.indd 213_FurtherInfo_228_232_v36.indd 2 01/03/2022 18:2701/03/2022 18:27