Did the Islamic Stock Index Provide Shelter for Investors ...
14
Citation: Ali, Kashif, Muhammad Ashfaque, Adil Saleem, Judit Bárczi, and Judit Sági. 2022. Did the Islamic Stock Index Provide Shelter for Investors during the COVID-19 Crisis? Evidence from an Emerging Stock Market. Risks 10: 109. https://doi.org/10.3390/ risks10060109 Academic Editor: Krzysztof Jajuga Received: 11 April 2022 Accepted: 19 May 2022 Published: 24 May 2022 Publisher’s Note: MDPI stays neutral with regard to jurisdictional claims in published maps and institutional affil- iations. Copyright: © 2022 by the authors. Licensee MDPI, Basel, Switzerland. This article is an open access article distributed under the terms and conditions of the Creative Commons Attribution (CC BY) license (https:// creativecommons.org/licenses/by/ 4.0/). risks Article Did the Islamic Stock Index Provide Shelter for Investors during the COVID-19 Crisis? Evidence from an Emerging Stock Market Kashif Ali 1 , Muhammad Ashfaque 2 , Adil Saleem 3, * , Judit Bárczi 3 and Judit Sági 4 1 Kingston Business School, Kingston University, London KT2 7LB, UK; [email protected] 2 Department of Management Sciences, Virtual University of Pakistan, Lahore 54000, Pakistan; [email protected] 3 Doctoral School of Economic and Regional Studies, Hungarian University of Agriculture and Life Sciences, H-2100 Gödöll˝ o, Hungary; [email protected] 4 Faculty of Finance and Accountancy, Budapest Business School, University of Applied Sciences, H-1149 Budapest, Hungary; [email protected] * Correspondence: [email protected] or [email protected] Abstract: The economic and financial chaos caused by COVID-19 has been a discussion topic since the beginning of 2020. This study intends to provide a parallel comparison of volatility change and external shock persistence of the Islamic and conventional stock indexes of the Pakistan Stock Exchange. The daily stock index was extracted from Eikon Thomson Reuters for the conventional and Islamic stock index from Jan 2018 to April 2021, which was further divided in three periods, i.e., full, pre-, and post-pandemic period. The data have been analyzed using generalized autoregressive conditional heteroscedasticity (GARCH). An optimally parameterized GARCH (1,1) model is used to measure volatility change for both the pre- to post-pandemic periods. The results suggest that the magnitude of risk in a conventional index is significantly higher than that of the Islamic stock index for the period of study. However, the level of COVID shock persistence is longer in the KSE (conventional) index compared to the KMI (Islamic) index. Keywords: emerging market; Islamic stocks; COVID-19; risk and volatility 1. Introduction The spread of an unprecedented pandemic, COVID-19, has damaged the global economy and changed people’s lives. Although the virus was deadly for 2% to 3% of infected people, it was highly contagious. The outbreak of the pandemic was triggered in Wuhan city in China in December 2019 where the SARS-CoV-2 virus was identified as responsible for the spread of the deadly disease (ProMED 2019; Sohrabi et al. 2020). The Wuhan Municipal Health Committee (WMHC) and all medical units of the territory struggled hard to handle and find a cure, but the number of infected continued to increase day by day. Considering the urgency of the health crises, a press conference was conducted by the World Health Organization (WHO) on 14 January 2020 and the rapid spread of the novel Coronavirus in the word was announced. It is important to mention that within two months, the pandemic had spread to other countries such as Japan, the UK and Germany. As a result, the WHO declared a global health emergency (WHO 2020). It was declared as pandemic on 11th March 2020 as millions of people were infected worldwide (Dunford et al. 2020). In response to the pandemic social and economic activities were shaken all over the world. The virus did not only affect the lives and emotions of human beings, but it also negatively impacted economies globally, which grabbed special attention among academic researchers and policy makers (Mousa et al. 2021; Saleem et al. 2021). The issue also needs to be addressed as its severe and far-reaching consequences are being felt across the globe Risks 2022, 10, 109. https://doi.org/10.3390/risks10060109 https://www.mdpi.com/journal/risks
-
Upload
khangminh22 -
Category
Documents
-
view
2 -
download
0
Transcript of Did the Islamic Stock Index Provide Shelter for Investors ...
Citation: Ali, Kashif, Muhammad
Ashfaque, Adil Saleem, Judit Bárczi,
and Judit Sági. 2022. Did the Islamic
Stock Index Provide Shelter for
Investors during the COVID-19
Crisis? Evidence from an Emerging
Stock Market. Risks 10: 109.
https://doi.org/10.3390/
risks10060109
Academic Editor: Krzysztof Jajuga
Received: 11 April 2022
Accepted: 19 May 2022
Published: 24 May 2022
Publisher’s Note: MDPI stays neutral
with regard to jurisdictional claims in
published maps and institutional affil-
iations.
Copyright: © 2022 by the authors.
Licensee MDPI, Basel, Switzerland.
This article is an open access article
distributed under the terms and
conditions of the Creative Commons
Attribution (CC BY) license (https://
creativecommons.org/licenses/by/
4.0/).
risks
Article
Did the Islamic Stock Index Provide Shelter for Investorsduring the COVID-19 Crisis? Evidence from an EmergingStock MarketKashif Ali 1, Muhammad Ashfaque 2, Adil Saleem 3,* , Judit Bárczi 3 and Judit Sági 4
1 Kingston Business School, Kingston University, London KT2 7LB, UK; [email protected] Department of Management Sciences, Virtual University of Pakistan, Lahore 54000, Pakistan;
[email protected] Doctoral School of Economic and Regional Studies, Hungarian University of Agriculture and Life Sciences,
H-2100 Gödöllo, Hungary; [email protected] Faculty of Finance and Accountancy, Budapest Business School, University of Applied Sciences,
H-1149 Budapest, Hungary; [email protected]* Correspondence: [email protected] or [email protected]
Abstract: The economic and financial chaos caused by COVID-19 has been a discussion topic sincethe beginning of 2020. This study intends to provide a parallel comparison of volatility changeand external shock persistence of the Islamic and conventional stock indexes of the Pakistan StockExchange. The daily stock index was extracted from Eikon Thomson Reuters for the conventionaland Islamic stock index from Jan 2018 to April 2021, which was further divided in three periods, i.e.,full, pre-, and post-pandemic period. The data have been analyzed using generalized autoregressiveconditional heteroscedasticity (GARCH). An optimally parameterized GARCH (1,1) model is usedto measure volatility change for both the pre- to post-pandemic periods. The results suggest thatthe magnitude of risk in a conventional index is significantly higher than that of the Islamic stockindex for the period of study. However, the level of COVID shock persistence is longer in the KSE(conventional) index compared to the KMI (Islamic) index.
Keywords: emerging market; Islamic stocks; COVID-19; risk and volatility
1. Introduction
The spread of an unprecedented pandemic, COVID-19, has damaged the globaleconomy and changed people’s lives. Although the virus was deadly for 2% to 3% ofinfected people, it was highly contagious. The outbreak of the pandemic was triggeredin Wuhan city in China in December 2019 where the SARS-CoV-2 virus was identifiedas responsible for the spread of the deadly disease (ProMED 2019; Sohrabi et al. 2020).The Wuhan Municipal Health Committee (WMHC) and all medical units of the territorystruggled hard to handle and find a cure, but the number of infected continued to increaseday by day. Considering the urgency of the health crises, a press conference was conductedby the World Health Organization (WHO) on 14 January 2020 and the rapid spread of thenovel Coronavirus in the word was announced. It is important to mention that within twomonths, the pandemic had spread to other countries such as Japan, the UK and Germany.As a result, the WHO declared a global health emergency (WHO 2020). It was declaredas pandemic on 11th March 2020 as millions of people were infected worldwide (Dunfordet al. 2020).
In response to the pandemic social and economic activities were shaken all over theworld. The virus did not only affect the lives and emotions of human beings, but it alsonegatively impacted economies globally, which grabbed special attention among academicresearchers and policy makers (Mousa et al. 2021; Saleem et al. 2021). The issue also needsto be addressed as its severe and far-reaching consequences are being felt across the globe
Risks 2022, 10, 109. https://doi.org/10.3390/risks10060109 https://www.mdpi.com/journal/risks
Risks 2022, 10, 109 2 of 14
in the form of increased economic and developmental costs that have also disrupted theoverall global value chain. Similarly, the pandemic caused an unparalleled adverse effecton the financial and stock markets all over the world (Goodell 2020). For example, stockmarkets in the US suffered badly, which caused a rapid decline in the indices and stockprices of different sectors including real estate, the entertainment industry, hospitality, andpetroleum (Mazur et al. 2021).
Notably, Baker et al. (2020) reported that the pandemic has had an unusual andextraordinary impact on the stock markets. Similarly, governments barred people fromsocial gatherings and imposed lockdowns that confined economic activities. Moreover,considering the sector-wise performance on the stock market, besides the systematic riskdue to the global pandemic, much of the stock in each sector has faced an idiosyncraticrisk due to the volatility of stock returns as well (Baek et al. 2020). Supporting the findingsfrom previous studies, Baker et al. (2020), with a comprehensive data analysis, studied thevolatility of stock markets. It was concluded that the pandemic caused the suffering ofequity markets all over the world in an unexpected way as it caused a worsening decline inthe stock and indices of almost every stock market on the globe.
Likewise, signaling theory suggested that public and private information disseminatedin the market both have an effect on the stock price and volatility. Phan and Narayan (2020),based on the notion of signaling, found that, when markets responded to the bad news ofpandemic, they seemed to negatively react in some countries when the news emerged ofthere being 100 deaths and one hundred thousand people infected with COVID-19. At thesame time, the reaction of the stock markets was also positive, suggesting a simultaneousmarket correction. Hence, the contradictory results of the same news for different marketssuggested a need for more meaningful empirical results from the markets, such as Pakistan,during the pandemic. Moreover, most of the previous research has studied the impact ofCOVID-19 considering either only conventional market indices, or only considering Islamicindices (see Ashraf 2020; Baig et al. 2021; Saleem et al. 2021; Sharma 2020; Topcu and Gulal2020; Uddin et al. 2021; Zhang et al. 2020). Moreover, other studies such as Baek et al. (2020)have investigated the effect of the pandemic on conventional stocks only.
Considering the endogenous factors and crisis, earlier research has produced varyingresults on the performance comparison of both Islamic and convention indices and stocks.For instance, it was found that the Islamic stocks performed better in terms of risk and return(Al-Khazali et al. 2014; Abduh 2020). Contrary to these studies, other studies reportedthat Islamic stocks or indices underperformed (Hayat and Kraeussl 2011; Rana and Akhter2015). However, Bayram and Othman (2019), and Trabelsi et al. (2020) concluded that therewere no substantial differences between the performance of these two stocks. Therefore,it is crucial to evaluate the reaction of the financial markets in response to the uniqueexogenous crisis of COVID-19. More specifically, from the investors’ perspective, it ispertinent to investigate which indices are relatively safe for investing in terms of risk andvolatility during the period of analysis. Therefore, this study intends to investigate theeffect of the colossal and exogenous health crisis on risk and volatility for conventional andIslamic indexes not only during the COVID-19 phase but also pre- and post-COVID. Recentresearchers analyzed the impact of COVID-19 pandemics on the overall performance ofthe stock market (see, for instance, Ahmar and del Val 2020; Al-Awadhi et al. 2020; Ashraf2020; Goodell 2020; Liu et al. 2020). However, limited studies have been conducted for theIslamic stock index in response to the pandemic crisis. Ashraf (2022) studied the impact onIslamic equity investment during COVID-19 for an emerging market. Therefore, the currentstudy is conducted as a value addition to the existing literature from an emerging marketlike Pakistan. The study is also an attempt to address performance based on volatility andrisk for conventional and Islamic stock indices, considering a sub sample from the pre-and post-COVID periods. Furthermore, there are limited studies that have analyzed thepandemic impact on stock volatility and persistence of volatility shocks by comparing theconventional and Islamic indices for emerging markets like Pakistan.
Risks 2022, 10, 109 3 of 14
Unlike the financial crisis of 2007, the crisis of COVID-19 is exogenous in nature but istranslated into a financial crisis among the world economies. Thus, the pandemic providesan unprecedented opportunity to study the effect of exogenous events on the financialsectors globally (see, Albuquerque et al. 2020). Therefore, it is imperative to conduct acomparative performance analysis of both conventional and Islamic stocks to fully realizethe repercussions of a pandemic on the financial market specifically and on the economyin general. Therefore, considering the importance of the pandemic, the following are theobjectives of this study: (1) to study and investigate whether both indices behave differentlyin term of risk volatility during the period of analysis; (2) to analyze the efficiency ofindices considering the magnitude of volatility persistence on both of the stock indices.Notably, the research would have certain implications for government regulators, investorsand policy makers for safeguarding their interests, considering the investment strategy tominimize the associated risk in response to external shocks and crises.
2. Literature Review
Considering the objectives of this study, the literature review has been divided intothree sections. The first section summarizes the literature related to the impact of pandemicson businesses and economic activities. The second examines the impact on the stock marketduring the period of the pandemic. Lastly, previous studies are presented that are relatedto stock market volatility in response to the pandemic.
2.1. Economic Impact and Pandemics
Lee and McKibbin (2004) studied the investing and consumption behavior of firms toexplain the impact of Severe Acute Respiratory Syndrome (SARS) on the overall economiccost in the effected countries globally. It was concluded that, although the SARS hadaffected human life at one hand, it had also deteriorated and worsened the economicconditions of the effected countries as well. Another study was conducted by Siu and Wong(2004) in Taiwan which argued that pandemic and health emergencies in the country hadadversely impacted economic activities. The outbreak of SARS in Taiwan occurred in 2003.It not only halted tourism relating to economic activities in the country, but also causedbiggest the stock market crash in its history (Chen et al. 2007). It was further assertedthat the pandemic and health emergencies have an adverse effect on the economy of acountry, but the economic conditions do not have a direct relationship with risks to life.Likewise, Chien and Law (2003) studied the relationship between the SARS outbreak andeconomic activities in Hong Kong. The study concluded that the tourism and hospitalityindustry were severely influenced by SARS. Moreover, it was argued that both industriesare interdependent. These two industries are major contributors to the Hong Kong economyand therefore the SARS pandemic worsened the economic conditions of the country as well.
Chien and Law (2003) examined the effect of SARS on different sectors of the Taiwaneconomy. The findings of the study have suggested an asymmetric effect. For example,industries of tourism/hospitality were majorly and significantly affected during the SARSpandemic in 2003. However, this pandemic has fueled the biotechnology industry withupward trends and growth, even in a time of economic turmoil. Similarly, it was foundthat the magnitude of the effect was not same for each industry. For instance, the retailand wholesale sectors were least effected by the pandemic in Taiwan. Furthermore, theresearchers concluded that the magnitude effect of the Pandemic may not be same on eachcountry. Hai et al. (2004) estimated that the SARS pandemic effected the Chinese economicgrowth at a rate of 1% to 2% which is greater than the Taiwan economy, where there was a0.5% decline in economic growth (Waugh 2003).
Another study was conducted by Blake et al. (2003) to ascertain the impact of foot andmouth disease (FMD) in the UK on tourism and related economic activities. It was foundthat the outbreak of the disease indirectly affected tourism and several related economicactivities. Furthermore, the UNDP (2014) observed and quantified the socio-economicconsequences of Ebola virus in effected countries of west Africa. The report revealed that
Risks 2022, 10, 109 4 of 14
the after-effects of Ebola virus worsened economic and financial conditions in the countries.Additionally, the news relating to Ebola outbreak gained intensive media coverage whichcaused a decline in asset prices in the US (Marinc 2016). Several studies have discussed therelationship between the pandemic and stock market performance and will be discussed inthe following sections.
2.2. Stock Market and Pandemic
The risk of a pandemic inversely effects investor emotions and sentiments and stockmarket conditions (Smith 2006). Burns et al. (2012) emphasized that negative emotionssuch as anxiety and stress are positively related with risk and crises, which may elicit arisk perception in stock investors. As a consequence, the investor seeks both an optimisticand pessimistic approach during the rising and downward trends of the stock marketrespectively (Burns et al. 2012). A bearish trend was also found in response to exogenousfactors such as a pandemic (see, In et al. 2002; Lee and McKibbin 2004; Liu 2020). Studieshave shown that news related to a pandemic has a considerable effect on the investors’sentiments. For instance, Donadelli et al. (2017) revealed that the pandemic news reportedby WHO had a detrimental effect on investors’ sentiments, which also adversely affect thestock market (Wang et al. 2013).
The ’Efficient Market hypothesis’ by Fama et al. (1969) explained that both publicand private information is reflected in the value of the stock and market indices. Studieshave shown that the COVID-19 pandemic had a negative effect on market returns as well.For instance Al-Awadhi et al. (2020) and Liu et al. (2020) reported a negative abnormalreturn during the period in the 21 stock markets of affected countries in the world. Asimilar study by Ashraf (2020) concluded an adverse effect on the stock market in responseto news regarding a rise in COVID-19 cases in the initial days of pandemic. Phan andNarayan (2020) also revealed that the stock markets adversely reacted to pandemic newsin 25 countries. Besides the effect on stock markets, the outbreak of COVID-19 haltedthe economic activities in the countries in the form of travel bans, restricted businessactivities etc.
2.3. Stock Market Volatility and Pandemic
The market volatility can be explained as the upwards or downwards fluctuations inthe stock indices and return (Bhowmik and Wang 2020). The occurrence of unfavorableevents such as pandemics may cause major setbacks to the economic activities of financialsectors and stock markets all over the world (Chowdhury et al. 2021). Recent literature hasdiscussed the stock market volatility in response to global pandemic crises. For instance,considering the Generalized Autoregressive Conditional Heteroskedasticity (GARCH)model, Onali (2020) studied the impact of COVID-19 on volatility change and persistenceof Dow Jones stock market and S&P 500 indices. It was concluded that the pandemic hadsignificantly changed the volatility of the stock market and remained in persistence fora longer period. Likewise, similar findings have been concluded by Baker et al. (2020)considering a sample from the US stock market. It was further revealed that the COVID-19pandemic has posited an unprecedented impact on the volatility of the stock marketsaround the globe.
Baig et al. (2021) analyzed the relationship between the number of causalities, con-firmed cases and lockdowns during COVID-19 on the volatility and liquidity of the USstock markets. Employing the GARCH (1,1) model to estimate the results, it was foundthat the number of deaths, lockdown events and confirmed cases significantly inverselyeffected the liquidity and volatility of the US stock markets. Akhtaruzzaman et al. (2021)have also asserted the conditional correlation among death rates, number of confirmedcases and stock market return in G7 countries. It was also revealed that the contagion effecton financial firms is far higher than on nonfinancial firms which affect the hedging pricesfor covering risk through hedging. Studies have shown that positive and negative newshas a significant effect on the volatility of the stock market. Studies have further explained

Risks 2022, 10, 109 5 of 14
that negative news regarding the pandemic has evoked higher volatility change in the USstock markets and vice versa (Baek et al. 2020). Moreover, Sharif et al. (2020) have revealedthat that the COVID-19 pandemic has given rise to the volatility of the US stock markets,political risk and oil prices during the later period of 2020.
Studies have shown that the Asian market was also affected by the pandemic, dueto which markets have witnessed higher volatility risk and longer magnitude of volatilitypersistence in the post-COVID-19 period (Sharma 2020). The COVID-19 pandemic hassignificantly affected the volatility of the Indian Stock market (Bora and Basistha 2020).Considering the GARCH (1,1) model it was found that there was higher market volatilityduring the period of COVID-19. A similar study was conducted by Uddin et al. (2021)from a sample of 34 stock markets around the globe, where it was posited that the degreeof volatility increased after the occurrence of the COVID-19 pandemic.
Dharani et al. (2022) examined the impact of COVID-19 on volatility and returnconsidering the Shariah and non-Shariah indices from S&P-1200 from 2010 to 2020. Theresults from a pooled regression emphasized that, on average, Shariah indices proved tobe less volatile than their counterpart non-Shariah indices. Moreover, it was also reportedthat on average the Shariah sectoral indices witnessed lower risk and high return duringthe COVID-19 period. Similarly, another study by Ashraf (2022) analyzed the performanceof conventional and Islamic stock considering the firm level data during the period of theCOVID-19 pandemic. It was concluded that Islamic stock remained less volatile to newsrelating to the pandemic, compared to conventional stocks. Another recent study by Salisuand Shaik (2022) studied conventional and Islamic stock by considering the acclaimedhedging potential, comparing the overall performance of both Islamic and conventionalstock. It was concluded that, although the hedging effectiveness declined for Islamic stock,it still performed better compared to conventional stocks during the COVID-19 pandemic.Furthermore, Moradi et al. (2021) studied the impact of COVID-19 on Tehran stock marketsand concluded similar results.
As described, previous studies were largely conducted considering the impact of theCOVID-19 pandemic from a sample of conventional indices from the stock markets. Onlya few studies have investigated the effect of COVID-19 on the volatility of Islamic stockIndices. For instance, Abdullahi (2021) suggested that the COVID-19 pandemic has hadan effect on the volatility of the Islamic stock Indices. The findings from the GARCH andGMM models suggested a direct relationship between an increase in the rate of COVID-19cases and volatility risk. Another study by Yarovaya et al. (2020) examined the spilloverfrom conventional to Islamic stock indices during the pandemic. However, there is a lackof studies that consider the market behavior of conventional and Islamic indices in termsof magnitude of volatility persistence over the time.
3. Material and Methods
To achieve the research objectives, data for conventional and Islamic stock indiceswere taken from the Pakistan Stock Exchange (PSX). Initially, the Karachi Stock Exchange(KSE) was incorporated in 1947 right after the independence of the country (Chakraborty2006). The PSX was established in 2016 after a merger of three stock exchanges, namelythe Lahore stock Exchange, Karachi Stock Exchange and Islamabad Stock Exchange (Khanet al. 2021). One of the reasons for choosing Pakistan is that the country has been playinga significant role in the emergence of an Islamic financial system in the region and inthe inclusion of the Islamic financial system in financial institutions (Nawaz et al. 2019).Moreover, a conventional system is operating in parallel to the Islamic system in thefinancial institutions of the country (Akhtar et al. 2021). For the purpose of the analysis,we have selected the KSE index and Karachi Meezan Index (KMI) as representing theconventional and Islamic stock indices respectively in PSX. The data was sourced from theThomson Reuter DataStream for the period from January 2018 to April 2021.
For the purpose of analysis, we have further divided the total data sample into threecategories. Firstly, we have considered the entire time span to estimate the overall volatility

Risks 2022, 10, 109 6 of 14
risk during the period for both indices. Moreover, this will also provide an understandingof the market reactions as a whole period. Secondly, we have selected a sub sample forthe pre COVID-19 era which covered the period from January 2018 to January 2020, as theWHO declared the COVID-19 pandemic as a global health emergency on 30 January 2020(Tóth 2021). Thirdly, the sub sample from 31 January 2020 to 30 April 2021 is considered foranalysis of the period of shocks due to the pandemic.
Econometric Model
The GARCH (1,1) model has been employed to analyze and estimate the results(Bollerslev 1986). As a first step, the daily returns from stocks were calculated usingEquation (1). These returns are further transformed into three separate panels representingthe (i) period from January 2018 to April 2021 to evaluate the overall market volatility forthe total sample. (ii) The second panel representing the pre-COVID-19 period from January2018 to January 2020. (iii) The third panel representing the period of Post COVID-19,from the declaration of a global public health emergency by WHO on 30 January 2020 toApril 2021.
Ri.t = ln(
Pi.t
/Pi. (t−1)
)(1)
In Equation (1) daily returns of stock i at time t are denoted by Ri.t, whereas Pi.trepresented the stock index i, at time t.
Equation (2) represents OLS regression of conditional mean, and the lagged returnof the financial time series is used as independent variable. In addition to the conditionalmean equation, conditional variance is modelled using GARCH (1,1) as shown in Equa-tion (3). Importantly, assumptions of data normality, fat-tailed and unit root test wereperformed on both the time series in order to apply GARCH (1,1) effectively. The con-ditional mean equation helps to measure the white noise, i.e., error term with normaldistribution and constant heteroskedasticity. GARCH (1,1) is considered as a more stableand parsimonious model compared to ARCH (p). The model benefits from having onlytwo parameters, whereas ARCH (p) is overparameterized. Furthermore, GARCH (1,1)captures the ARCH and GARCH effects in the time series. The ARCH effect measuresthe volatility with squared lagged residuals (i.e., white noise of the process), whereasthe GARCH coefficient captures volatility clustering with the lagged value of conditionalvariance i.e., heteroskedasticity. Furthermore, for volatility measures, the changed value ofclustering and shocks persistence, the GARCH (1,1) model is considered the most stablemodel in the GARCH (p,q) family.
yt = µt + θiyt−1 + εt (2)
εt/yt−1 ∼ N(0, ht)
ht = δi +p
∑i=1
αi(εt−i)2 +
q
∑i=1
βiht−i (3)
The stock market return is denoted by yt, at time t, whereas mean return is representedby µt. Equation (2) shows the conditional mean equation where return of stock index isconditional on lagged value of itself, i.e., yt−1. εt represents the white noise with normaldistribution and is heteroskedastic in nature. However, ht is the variance of the time series,which is modelled in Equation (3), dependent on lagged squared residuals and conditionalon lagged of itself. δi, αi, and βi are the three coefficients estimated by the GARCH (1,1)model. The model complies with the positivity assumption (see Tsay 2002), i.e., δi > 0,αi ≥ 0, and βi ≥ 0. The magnitude of ARCH and GARCH coefficients show the volatilitychanges due to external shocks, which is the COVID-19 effect in this study. Additionally,the summation effect of αi and βi would estimate the persistence of shock in the stockindex. The closer the value to 1, the higher the persistence of shocks tend to remain inthe stock returns. On the other hand, if the value of persistence measure significantlydiffers from unity, volatility shock would remain for less time (Chou 1988; Choudhry 1996).
Risks 2022, 10, 109 7 of 14
Importantly, if the positivity assumption is not violated, GARCH (1,1) is efficient witha small sample size of 150–200 (David and Ampah 2018; Leong 2018; Lumsdaine 1995).Moreover, several diagnostic tests have been conducted to provide evidence of robustand reliable results. For example, for the remaining ARCH effect, an ARCH-LM test isperformed, and Box–Ljung stats with 24 lags are employed to examine autocorrelation.
4. Results and Discussion
This section illustrates the results and analysis from the sample data. The discussionof the descriptive statistics follows the discussion and analysis concerning market volatilityand persistence.
4.1. Descriptive Statistics
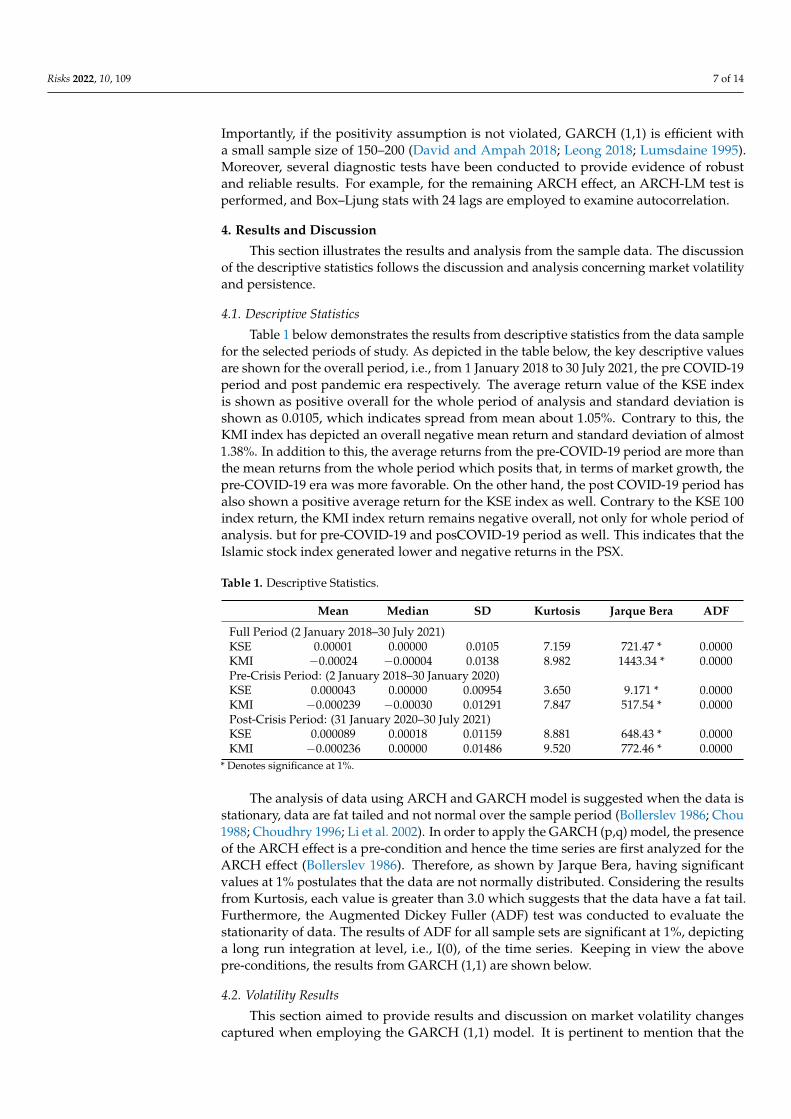
Table 1 below demonstrates the results from descriptive statistics from the data samplefor the selected periods of study. As depicted in the table below, the key descriptive valuesare shown for the overall period, i.e., from 1 January 2018 to 30 July 2021, the pre COVID-19period and post pandemic era respectively. The average return value of the KSE indexis shown as positive overall for the whole period of analysis and standard deviation isshown as 0.0105, which indicates spread from mean about 1.05%. Contrary to this, theKMI index has depicted an overall negative mean return and standard deviation of almost1.38%. In addition to this, the average returns from the pre-COVID-19 period are more thanthe mean returns from the whole period which posits that, in terms of market growth, thepre-COVID-19 era was more favorable. On the other hand, the post COVID-19 period hasalso shown a positive average return for the KSE index as well. Contrary to the KSE 100index return, the KMI index return remains negative overall, not only for whole period ofanalysis. but for pre-COVID-19 and posCOVID-19 period as well. This indicates that theIslamic stock index generated lower and negative returns in the PSX.
Table 1. Descriptive Statistics.
Mean Median SD Kurtosis Jarque Bera ADF
Full Period (2 January 2018–30 July 2021)KSE 0.00001 0.00000 0.0105 7.159 721.47 * 0.0000KMI −0.00024 −0.00004 0.0138 8.982 1443.34 * 0.0000Pre-Crisis Period: (2 January 2018–30 January 2020)KSE 0.000043 0.00000 0.00954 3.650 9.171 * 0.0000KMI −0.000239 −0.00030 0.01291 7.847 517.54 * 0.0000Post-Crisis Period: (31 January 2020–30 July 2021)KSE 0.000089 0.00018 0.01159 8.881 648.43 * 0.0000KMI −0.000236 0.00000 0.01486 9.520 772.46 * 0.0000
* Denotes significance at 1%.
The analysis of data using ARCH and GARCH model is suggested when the data isstationary, data are fat tailed and not normal over the sample period (Bollerslev 1986; Chou1988; Choudhry 1996; Li et al. 2002). In order to apply the GARCH (p,q) model, the presenceof the ARCH effect is a pre-condition and hence the time series are first analyzed for theARCH effect (Bollerslev 1986). Therefore, as shown by Jarque Bera, having significantvalues at 1% postulates that the data are not normally distributed. Considering the resultsfrom Kurtosis, each value is greater than 3.0 which suggests that the data have a fat tail.Furthermore, the Augmented Dickey Fuller (ADF) test was conducted to evaluate thestationarity of data. The results of ADF for all sample sets are significant at 1%, depictinga long run integration at level, i.e., I(0), of the time series. Keeping in view the abovepre-conditions, the results from GARCH (1,1) are shown below.
4.2. Volatility Results
This section aimed to provide results and discussion on market volatility changescaptured when employing the GARCH (1,1) model. It is pertinent to mention that the
Risks 2022, 10, 109 8 of 14
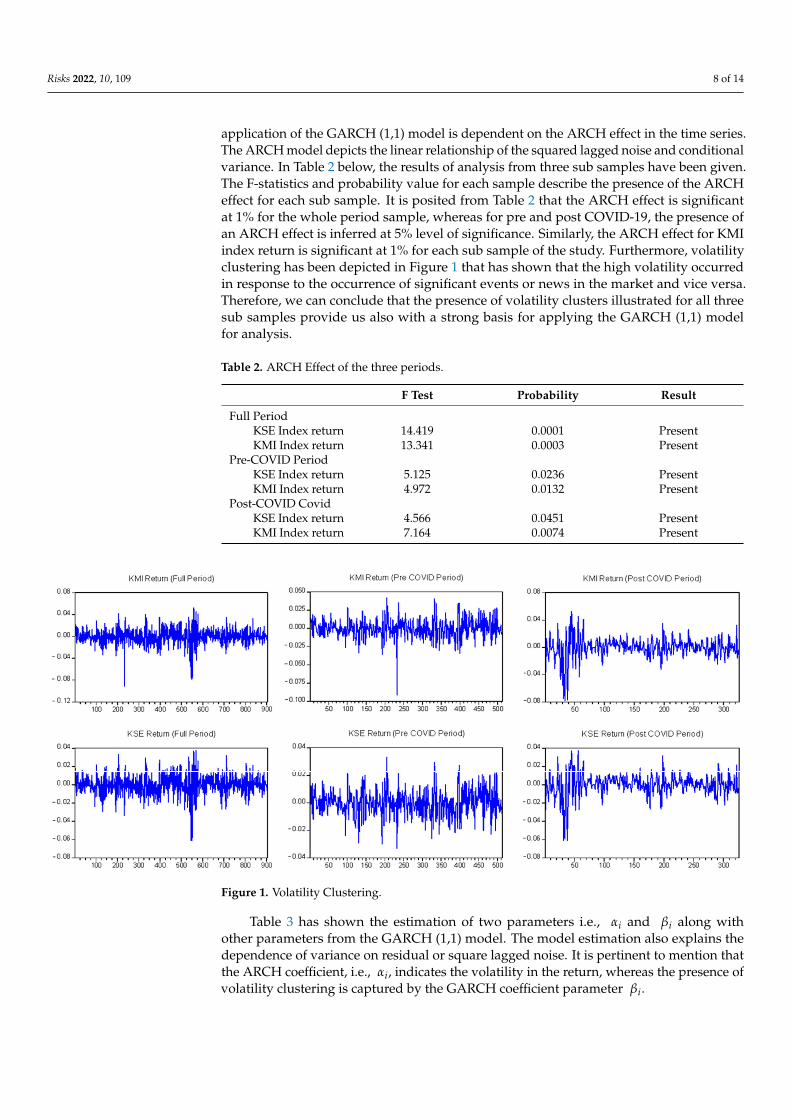
application of the GARCH (1,1) model is dependent on the ARCH effect in the time series.The ARCH model depicts the linear relationship of the squared lagged noise and conditionalvariance. In Table 2 below, the results of analysis from three sub samples have been given.The F-statistics and probability value for each sample describe the presence of the ARCHeffect for each sub sample. It is posited from Table 2 that the ARCH effect is significantat 1% for the whole period sample, whereas for pre and post COVID-19, the presence ofan ARCH effect is inferred at 5% level of significance. Similarly, the ARCH effect for KMIindex return is significant at 1% for each sub sample of the study. Furthermore, volatilityclustering has been depicted in Figure 1 that has shown that the high volatility occurredin response to the occurrence of significant events or news in the market and vice versa.Therefore, we can conclude that the presence of volatility clusters illustrated for all threesub samples provide us also with a strong basis for applying the GARCH (1,1) modelfor analysis.
Table 2. ARCH Effect of the three periods.
F Test Probability Result
Full PeriodKSE Index return 14.419 0.0001 PresentKMI Index return 13.341 0.0003 Present
Pre-COVID PeriodKSE Index return 5.125 0.0236 PresentKMI Index return 4.972 0.0132 Present
Post-COVID CovidKSE Index return 4.566 0.0451 PresentKMI Index return 7.164 0.0074 Present
Risks 2022, 10, x FOR PEER REVIEW 9 of 15
Figure 1. Volatility Clustering.
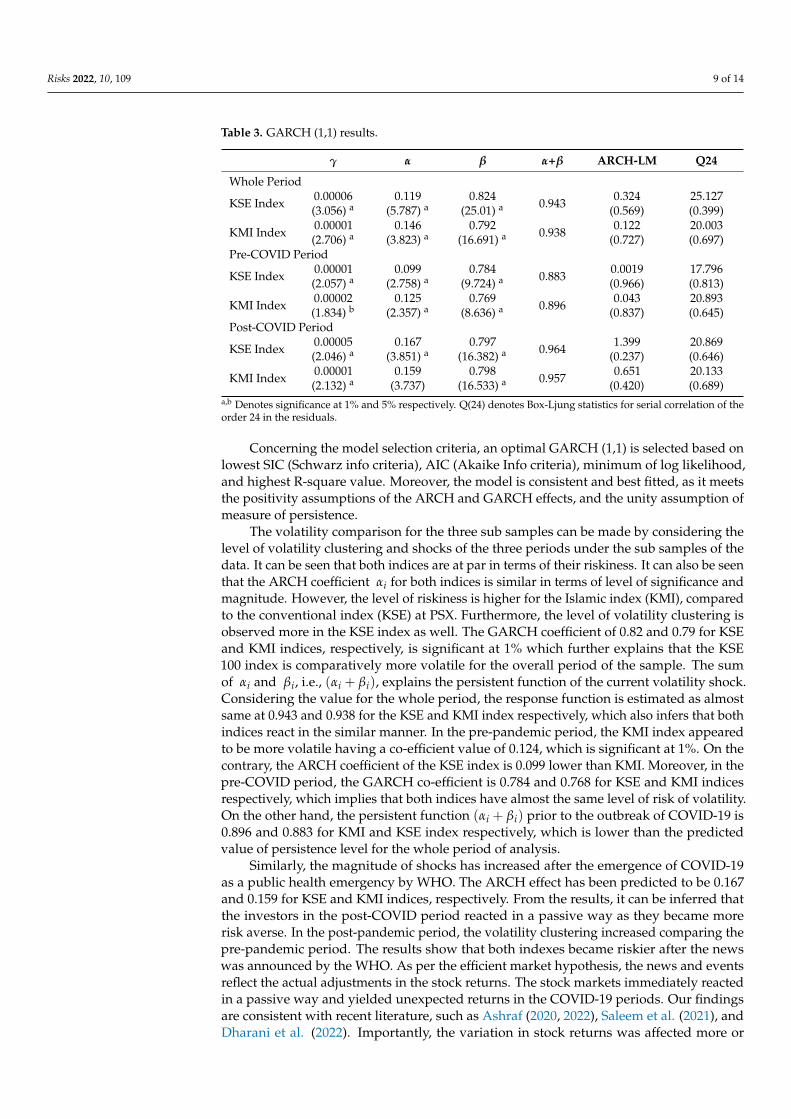
Table 3 has shown the estimation of two parameters i.e., 𝛼 and 𝛽 along with other parameters from the GARCH (1,1) model. The model estimation also explains the depend-ence of variance on residual or square lagged noise. It is pertinent to mention that the ARCH coefficient, i.e., 𝛼 , indicates the volatility in the return, whereas the presence of volatility clustering is captured by the GARCH coefficient parameter 𝛽 .
Concerning the model selection criteria, an optimal GARCH (1,1) is selected based on lowest SIC (Schwarz info criteria), AIC (Akaike Info criteria), minimum of log likeli-hood, and highest R-square value. Moreover, the model is consistent and best fitted, as it meets the positivity assumptions of the ARCH and GARCH effects, and the unity assump-tion of measure of persistence.
Table 3. GARCH (1,1) results.
𝜸 𝜶 𝜷 𝜶 + 𝜷 ARCH-LM Q24 Whole Period
KSE Index 0.00006 (3.056) a
0.119 (5.787) a
0.824 (25.01) a 0.943
0.324 (0.569)
25.127 (0.399)
KMI Index 0.00001 (2.706) a
0.146 (3.823)a
0.792 (16.691) a
0.938 0.122 (0.727)
20.003 (0.697)
Pre-COVID Period
KSE Index 0.00001 (2.057) a
0.099 (2.758) a
0.784 (9.724) a 0.883
0.0019 (0.966)
17.796 (0.813)
KMI Index 0.00002 (1.834) b
0.125 (2.357) a
0.769 (8.636) a 0.896
0.043 (0.837)
20.893 (0.645)
Post-COVID Period
KSE Index 0.00005 (2.046) a
0.167 (3.851) a
0.797 (16.382) a
0.964 1.399 (0.237)
20.869 (0.646)
KMI Index 0.00001 (2.132) a
0.159 (3.737)
0.798 (16.533) a 0.957
0.651 (0.420)
20.133 (0.689)
a,b Denotes significance at 1% and 5% respectively. Q(24) denotes Box-Ljung statistics for serial cor-relation of the order 24 in the residuals.
Figure 1. Volatility Clustering.
Table 3 has shown the estimation of two parameters i.e., αi and βi along withother parameters from the GARCH (1,1) model. The model estimation also explains thedependence of variance on residual or square lagged noise. It is pertinent to mention thatthe ARCH coefficient, i.e., αi, indicates the volatility in the return, whereas the presence ofvolatility clustering is captured by the GARCH coefficient parameter βi.
Risks 2022, 10, 109 9 of 14
Table 3. GARCH (1,1) results.
γ α β α+β ARCH-LM Q24
Whole Period
KSE Index 0.00006(3.056) a
0.119(5.787) a
0.824(25.01) a 0.943 0.324
(0.569)25.127(0.399)
KMI Index 0.00001(2.706) a
0.146(3.823) a
0.792(16.691) a 0.938 0.122
(0.727)20.003(0.697)
Pre-COVID Period
KSE Index 0.00001(2.057) a
0.099(2.758) a
0.784(9.724) a 0.883 0.0019
(0.966)17.796(0.813)
KMI Index 0.00002(1.834) b
0.125(2.357) a
0.769(8.636) a 0.896 0.043
(0.837)20.893(0.645)
Post-COVID Period
KSE Index 0.00005(2.046) a
0.167(3.851) a
0.797(16.382) a 0.964 1.399
(0.237)20.869(0.646)
KMI Index 0.00001(2.132) a
0.159(3.737)
0.798(16.533) a 0.957 0.651
(0.420)20.133(0.689)
a,b Denotes significance at 1% and 5% respectively. Q(24) denotes Box-Ljung statistics for serial correlation of theorder 24 in the residuals.
Concerning the model selection criteria, an optimal GARCH (1,1) is selected based onlowest SIC (Schwarz info criteria), AIC (Akaike Info criteria), minimum of log likelihood,and highest R-square value. Moreover, the model is consistent and best fitted, as it meetsthe positivity assumptions of the ARCH and GARCH effects, and the unity assumption ofmeasure of persistence.
The volatility comparison for the three sub samples can be made by considering thelevel of volatility clustering and shocks of the three periods under the sub samples of thedata. It can be seen that both indices are at par in terms of their riskiness. It can also be seenthat the ARCH coefficient αi for both indices is similar in terms of level of significance andmagnitude. However, the level of riskiness is higher for the Islamic index (KMI), comparedto the conventional index (KSE) at PSX. Furthermore, the level of volatility clustering isobserved more in the KSE index as well. The GARCH coefficient of 0.82 and 0.79 for KSEand KMI indices, respectively, is significant at 1% which further explains that the KSE100 index is comparatively more volatile for the overall period of the sample. The sumof αi and βi, i.e., (αi + βi), explains the persistent function of the current volatility shock.Considering the value for the whole period, the response function is estimated as almostsame at 0.943 and 0.938 for the KSE and KMI index respectively, which also infers that bothindices react in the similar manner. In the pre-pandemic period, the KMI index appearedto be more volatile having a co-efficient value of 0.124, which is significant at 1%. On thecontrary, the ARCH coefficient of the KSE index is 0.099 lower than KMI. Moreover, in thepre-COVID period, the GARCH co-efficient is 0.784 and 0.768 for KSE and KMI indicesrespectively, which implies that both indices have almost the same level of risk of volatility.On the other hand, the persistent function (αi + βi) prior to the outbreak of COVID-19 is0.896 and 0.883 for KMI and KSE index respectively, which is lower than the predictedvalue of persistence level for the whole period of analysis.
Similarly, the magnitude of shocks has increased after the emergence of COVID-19as a public health emergency by WHO. The ARCH effect has been predicted to be 0.167and 0.159 for KSE and KMI indices, respectively. From the results, it can be inferred thatthe investors in the post-COVID period reacted in a passive way as they became morerisk averse. In the post-pandemic period, the volatility clustering increased comparing thepre-pandemic period. The results show that both indexes became riskier after the newswas announced by the WHO. As per the efficient market hypothesis, the news and eventsreflect the actual adjustments in the stock returns. The stock markets immediately reactedin a passive way and yielded unexpected returns in the COVID-19 periods. Our findingsare consistent with recent literature, such as Ashraf (2020, 2022), Saleem et al. (2021), andDharani et al. (2022). Importantly, the variation in stock returns was affected more or

Risks 2022, 10, 109 10 of 14
less equally in the Islamic and conventional stock indices. The question of the Islamicindex providing shelter is compromised when there is a downfall everywhere. As per ourfindings, we inferred that during a crisis like the pandemic when every economic sector isaffected, it is impossible to have a safe investment. Moreover, investors and markets bothunderperformed due to the overall economic setback caused by COVID-19. The risk factorand uncertainty would be equally the same. In addition, the magnitude of the GARCHcoefficient is predicted as almost the same at 0.797 and 0.798 for KSE and KMI indices,respectively.
In contrast, volatility persistence remained more sensitive in the post-pandemic periodand volatility shocks were prone to remain for a greater period compared to the pre-pandemic and entire period of analysis. For instance, the intensity of the shocks for30 days can be predicted as 0.333 (0.96430 = 0.333) and 0.333 (0.95730 = 0.333) for KSEand KMI indices. Contrary to this, the shock intensity in the pre-pandemic period for30 days is estimated as 0.037 (0.89630 = 0.037) and 0.023 (0.88330 = 0.023) for KMIand KSE index, respectively, which is lower than the post pandemic period of analysis.With this comparison, the overall response function of both indices turned out to besensitive. It indicates that even after the first 30 days of external shock, the intensity ofshock still remains at 0.333 in both indices compared to 0.037 and 0.023 in pre-COVIDperiod. Furthermore, the comparison of shock intensity posited that the external elementssuch as a global pandemic affect market volatility, the magnitude of volatility and riskinessof investment as well.
In summary, the findings of the study are consistent with previous research (Baig et al.2021; Mazur et al. 2021; Sherif 2020; Topcu and Gulal 2020; Uddin et al. 2021), where it wasconcluded that investors respond passively in panic situations due to the external factors.It is further concluded from the findings of the study that the pandemic has negativelyaffected the investment behavior for conventional and Islamic stocks. Moreover, the samebehavior of conventional and Islamic stock indices infer that the majority investors do notmake a conceptual difference between these two types of stock while making investmentdecisions. In addition, the prime objective of investors is profit seeking rather focusing onIslamic or conventional stocks. Another important element in emerging markets is thatinvestment is sale-driven rather than based on the investor’s own choice.
While analyzing the results from the sample data, the economic model is validated byemploying Box–Ljung statistics for twenty-four lags to find evidence of a serial correlation.It was inferred that there is no serial correlation in the model. Furthermore, the ARCH-LMtest was executed to analyze the remaining ARCH effect in the model. The test concludessatisfactory results as the model employed produced reliable and robust results.
The current study has certain implications for financial regulators, media, and in-vestors in the following ways. The financial regulators such as the central bank andsecurities and exchange commission (SEC) are required to be proactive in times of potentialcrisis that create economic and financial distress by educating the investor in a way that theycan secure their investment and minimize the risk of loss in panic situations. The mediacan play an effective role as well in different ways. For example, the financial regulator andmedia can join together in educating the investors about potential threats. Moreover, themedia should report the news with ethical responsibility because misreporting can inflatefinancial and economic distress, which can deepen the downturn in the stock market andeconomy as well (Theil 2014). As per investors’ concern, the diversified portfolio can bea measure for minimizing loss. They should be well educated and aware of the externalfactors affecting the stock market so that the investors can make rational decisions whilemaking investments.
5. Conclusions
The effect of the COVID-19 pandemic is not limited to the personal lives of people.Rather, it has affected the economies of the nations at the macro level and financially at themicro level in the corporate world. This study aimed to analyze the effect of the global

Risks 2022, 10, 109 11 of 14
pandemic on conventional and Islamic stock indices. The study has analyzed the resultsconsidering the two indices namely as KSE and KMI index of the PSX. The results from theanalysis posited that the conventional stock index and Islamic stock index behaved in asimilar way during the global emergency of the COVID-19 pandemic. For example, the riskassociated with both indices return was of the same intensity as the crisis hit both typesof stocks and investors have responded to both types of stock, having an adverse effecton volatility and return. Moreover, the breakout of the pandemic made the investors riskaverse and worsen the trading activity in the stock market.
The volatility shocks, in response to the COVID-19 pandemic, are held for a longerperiod than the pre-crises period of the sample data. These findings further revealed thatthe magnitude of volatility persistence rises in the period of crisis in the Pakistan StockExchange. In addition, even the essence of shariah stocks is different from the conventionalstocks; the current economic turmoil resisted them to provide a safer zone for the investors.Furthermore, investors’ concern is to maximize their profits, so they invest in funds basedon their objective rather than giving importance to the conceptual difference of the index.The findings implicate the efficient investment strategy is important for minimizing therisk of loss, which can be possible after increasing investor awareness and educationregarding the stock markets, since the Islamic stock index behaved in a similar fashion toconventional index.
However, there is a room for further research in terms of external events. The studycan be extended to see the differences in behavior in different economic crises, whichmay include but is not limited to: the credit crisis of 2008; the Panama leaks; and otherexogenous events.
Author Contributions: Conceptualization, K.A., A.S. and M.A.; Data curation, A.S.; Formal anal-ysis, A.S.; Investigation, A.S., K.A. and M.A.; Methodology, A.S.; Resources, A.S., J.B. and J.S.;Supervision, J.S. and J.B.; Validation, A.S., M.A. and J.S.; Writing—original draft, M.A. and A.S.;Writing—review & editing M.A., A.S. and J.S. All authors have read and agreed to the publishedversion of the manuscript.
Funding: This research received no external funding.
Institutional Review Board Statement: Not applicable.
Informed Consent Statement: Not applicable.
Data Availability Statement: Not applicable.
Acknowledgments: The authors would like to thank to the Hungarian University of Agricultureand Life Sciences, Budapest Business School, and Tempus Public Foundation for their support.This may include administrative and technical support, or donations in kind (e.g., materials usedfor experiments).
Conflicts of Interest: The authors declare no conflict of interest.
ReferencesAbduh, Muhamad. 2020. Volatility of Malaysian conventional and Islamic indices: Does financial crisis matter? Journal of Islamic
Accounting and Business Research 11: 1–11. [CrossRef]Abdullahi, Shafiu Ibrahim. 2021. Islamic equities and COVID-19 pandemic: Measuring Islamic stock indices correlation and volatility
in period of crisis. Islamic Economic Studies 29: 50–66. [CrossRef]Ahmar, Ansari Saleh, and Eva Boj del Val. 2020. SutteARIMA: Short-term forecasting method, a case: COVID-19 and stock market in
Spain. Science of The Total Environment 729: 138883. [CrossRef] [PubMed]Akhtar, Shahzad, Haroon Hussain, and Rana Yassir Hussain. 2021. Contributing role of regulatory compliance and Islamic operations
in bank risk: Evidence from Pakistan. Nankai Business Review International 12: 618–35. [CrossRef]Akhtaruzzaman, Md, Sabri Boubaker, and Ahmet Sensoy. 2021. Financial contagion during COVID-19 crisis. Finance Research Letters 38:
101604. [CrossRef]Albuquerque, Rui, Yrjo Koskinen, Shuai Yang, and Chendi Zhang. 2020. Resiliency of environmental and social stocks: An analysis of
the exogenous COVID-19 market crash. The Review of Corporate Finance Studies 9: 593–621. [CrossRef]Al-Awadhi, Abdullah M., Khaled Al-Saifi, Ahmad Al-Awadhi, and Salah Alhamadi. 2020. Death and contagious infectious diseases:
Impact of the COVID-19 virus on stock market returns. Journal of Behavioral and Experimental Finance 27: 100326. [CrossRef]

Risks 2022, 10, 109 12 of 14
Al-Khazali, Osamah, Hooi Hooi Lean, and Anis Samet. 2014. Do Islamic stock indexes outperform conventional stock indexes? Astochastic dominance approach. Pacific-Basin Finance Journal 28: 29–46. [CrossRef]
Ashraf, Badar Nadeem. 2020. Stock markets’ reaction to COVID-19: Cases or fatalities? Research in International Business and Finance 54:101249. [CrossRef]
Ashraf, Badar Nadeem. 2022. The performance of Islamic versus conventional stocks during the COVID-19 shock: Evidence fromfirm-level data. Research in International Business and Finance 60: 101622. [CrossRef]
Baek, Seungho, Sunil K. Mohanty, and Mina Glambosky. 2020. COVID-19 and stock market volatility: An industry level analysis.Finance Research Letters 37: 101748. [CrossRef] [PubMed]
Baig, Ahmed S., Hassan Anjum Butt, Omair Haroon, and Syed Aun Raza Rizvi. 2021. Deaths, panic, lockdowns and US equity markets:The case of COVID-19 pandemic. Finance Research Letters 38: 101701. [CrossRef] [PubMed]
Baker, Scott R., Nicholas Bloom, Steven J. Davis, Kyle Kost, Macro Sammon, and Tasaneeya Viratyosin. 2020. The unprecedented stockmarket reaction to COVID-19. The Review of Asset Pricing Studies 10: 742–58. [CrossRef]
Bayram, Kamola, and Anwar Hassan Abdullah Othman. 2019. Islamic versus conventional stock market indicates performance:Empirical evidence from Turkey. Iqtishadia: Jurnal Kajian Ekonomi dan Bisnis Islam 12: 74–86. [CrossRef]
Bhowmik, Roni, and Shouyang Wang. 2020. Stock market volatility and return analysis: A systematic literature review. Entropy 22: 522.[CrossRef] [PubMed]
Blake, Adam, M. Thea Sinclair, and Guntur Sugiyarto. 2003. Quantifying the impact of foot and mouth disease on tourism and the UKeconomy. Tourism Economics 9: 449–65. [CrossRef]
Bollerslev, Tim. 1986. Generalized autoregressive conditional heteroskedasticity. Journal of Econometrics 31: 307–27. [CrossRef]Bora, Debakshi, and Daisy Basistha. 2020. The outbreak of COVID-19 pandemic and its impact on stock market volatility: Evidence
from a worst-affected economy. Journal of Public Affairs 21: e2623. [CrossRef]Burns, William J., Ellen Peters, and Paul Slovic. 2012. Risk perception and the economic crisis: A longitudinal study of the trajectory of
perceived risk. Risk Analysis: An International Journal 32: 659–77. [CrossRef]Chakraborty, Madhumita. 2006. Market efficiency for the Pakistan stock market: Evidence from the Karachi Stock Exchange. South
Asia Economic Journal 7: 67–81. [CrossRef]Chen, Ming-Hsiang, Soo-Cheong Shawn Jang, and Woo-Gon Kim. 2007. The impact of the SARS outbreak on Taiwanese hotel stock
performance: An event-study approach. International Journal of Hospitality Management 26: 200–12. [CrossRef] [PubMed]Chien, Grace CL, and Rob Law. 2003. The impact of the Severe Acute Respiratory Syndrome on hotels: A case study of Hong Kong.
International Journal of Hospitality Management 22: 327–32. [CrossRef]Chou, Ray Yeutien. 1988. Volatility persistence and stock valuations: Some empirical evidence using GARCH. Journal of Applied
Econometrics 3: 279–94. [CrossRef]Choudhry, Taufiq. 1996. Stock market volatility and the crash of 1987: Evidence from six emerging markets. Journal of International
Money and Finance 15: 969–81. [CrossRef]Chowdhury, Emon Kalyan, Iffat Ishrat Khan, and Bablu Kumar Dhar. 2021. Catastrophic impact of Covid-19 on the global stock
markets and economic activities. Business and Society Review. [CrossRef]David, Kiss Gabor, and Isaac Kwesi Ampah. 2018. Macroeconomic volatility and capital flights in Sub-Saharan Africa: A dynamic
panel estimation of some selected HIPC countries. Mediterranean Journal of Social Sciences 9: 165–76. [CrossRef]Dharani, Munusamy, M. Kabir Hassan, Mustafa Raza Rabbani, and Tahsin Huq. 2022. Does the COVID-19 pandemic affect faith-based
investments? Evidence from global sectoral indices. Research in International Business and Finance 59: 101537. [CrossRef]Donadelli, Micheal, Renatas Kizys, and Max Riedel. 2017. Dangerous infectious diseases: Bad news for Main Street, good news for
Wall Street? Journal of Financial Markets 35: 84–103. [CrossRef]Dunford, Daniel, Dale Becky, Stylianou Nassos, Lowther Ed, Maryam Ahmed, and Irene de la Torre Arenas. 2020. Coronavirus: The
World in Lockdown in Maps and Charts. Available online: https://www.bbc.com/news/world-52103747 (accessed on 26 March2022).
Fama, Eugene F., Lawrence Fisher, Michael C. Jensen, and Richard Roll. 1969. The adjustment of stock prices to new information.International Economic Review 10: 1–21. [CrossRef]
Goodell, John W. 2020. COVID-19 and finance: Agendas for future research. Finance Research Letters 35: 101512. [CrossRef]Hai, Wen, Zhong Zhao, Jian Wang, and Zhen-Gang Hou. 2004. The short-term impact of SARS on the Chinese economy. Asian Economic
Papers 3: 57–61. [CrossRef]Hayat, Raphie, and Roman Kraeussl. 2011. Risk and return characteristics of Islamic equity funds. Emerging Markets Review 12: 189–203.
[CrossRef]In, Francis, Sangbae Kim, and Jai Hyung Yoon. 2002. International stock market linkages: Evidence from the Asian financial crisis.
Journal of Emerging Market Finance 1: 1–29. [CrossRef]Khan, Sher, Fazale Wahid, Aftab Rahim, Arshad Ali, and Ahtasham Ahmad. 2021. Investigating the Momentum Effect in the Merging
Market: Evidence from Pakistan. Global Business Review, 1–11. [CrossRef]Lee, Jong-Wha, and Warwick J. McKibbin. 2004. Globalization and disease: The case of SARS. Asian Economic Papers 3: 113–31.
[CrossRef]Leong, Wei Ruen. 2018. GARCH (1, 1) at Small Sample Size and Pairs Trading with Cointegration. Aarhus: Aarhus BSS, Aarhus University.
Risks 2022, 10, 109 13 of 14
Li, Wai Keung, Shiqing Ling, and Michael McAleer. 2002. Recent theoretical results for time series models with GARCH errors. Journalof Economic Surveys 16: 245–69. [CrossRef]
Liu, HaiYue, Aqsa Manzoor, CangYu Wang, Lei Zhang, and Zaira Manzoor. 2020. The COVID-19 outbreak and affected countries stockmarkets response. International Journal of Environmental Research and Public Health 17: 2800. [CrossRef]
Liu, Yuna. 2020. The importance of trust distance on stock market correlation: Evidence from emerging economics. Borsa IstanbulReview 20: 37–47. [CrossRef]
Lumsdaine, Robin L. 1995. Finite-sample properties of the maximum likelihood estimator in GARCH (1,1) and IGARCH (1,1) models:A Monte Carlo investigation. Journal of Business and Economic Statistics 13: 1–10. [CrossRef]
Marinc, Riste Ichev Matej. 2016. Geographic Proximity of Information to Financial Markets and Impact on Stock Prices: Evidence fromthe Ebola Outbreak. Paper presented at UBT International Conference, Durres, Albania, October 28; pp. 13–21. [CrossRef]
Mazur, Mieszko, Man Dang, and Miguel Vega. 2021. COVID-19 and the march 2020 stock market crash. Evidence from S&P1500.Finance Research Letters 38: 101690. [CrossRef]
Moradi, Mahdi, Andrea Appolloni, Grzeg Zimon, Hossein Tarighi, and Maede Kamali. 2021. Macroeconomic Factors and Stock PriceCrash Risk: Do Managers Withhold Bad News in the Crisis-Ridden Iran Market? Sustainability 13: 3688. [CrossRef]
Mousa, Musaab, Adil Saleem, and Judit Sági. 2021. Are ESG shares a safe haven during COVID-19? Evidence from the arab region.Sustainability 14: 208. [CrossRef]
Nawaz, Huma, Maira Abrar, Asma Salman, and Syed Muhammad Hassan Bukhari. 2019. Beyond finance: Impact of Islamic finance oneconomic growth in Pakistan. Economic Journal of Emerging Markets 11: 8–18. [CrossRef]
Onali, Enrico. 2020. COVID-19 and Stock Market Volatility. Available online: https://ssrn.com/abstract=3571453 (accessed on 21March 2022).
Phan, Dinh Hoang Bach, and Paresh Kumar Narayan. 2020. Country responses and the reaction of the stock market to COVID-19—Apreliminary exposition. Emerging Markets Finance and Trade 56: 2138–50. [CrossRef]
ProMED. 2019. The International Society for Infectious Diseases. 2019. Undiagnosed Pneumonia—China (HU): RFI. Retrieved 13October. Available online: https://promedmail.org/promed-post/?id=6864153%20#COVID19 (accessed on 20 January 2022).
Rana, Md Ejaz, and Waheed Akhter. 2015. Performance of Islamic and conventional stock indices: Empirical evidence from anemerging economy. Financial Innovation 1: 1–17. [CrossRef]
Salisu, Afees A., and Muneer Shaik. 2022. Islamic Stock indices and COVID-19 pandemic. International Review of Economics & Finance80: 282–93. [CrossRef]
Saleem, Adil, Judit Bárczi, and Judit Sági. 2021. COVID-19 and Islamic Stock Index: Evidence of Market Behavior and VolatilityPersistence. Journal of Risk and Financial Management 14: 389. [CrossRef]
Sharif, Arshian, Chaker Aloui, and Larisa Yarovaya. 2020. COVID-19 pandemic, oil prices, stock market, geopolitical risk and policyuncertainty nexus in the US economy: Fresh evidence from the wavelet-based approach. International Review of Financial Analysis70: 101496. [CrossRef]
Sharma, Susan Sunila. 2020. A note on the Asian market volatility during the COVID-19 pandemic. Asian Economics Letters 1: 1–6.[CrossRef]
Sherif, Mohamed. 2020. The impact of Coronavirus (COVID-19) outbreak on faith-based investments: An original analysis. Journal ofBehavioral and Experimental Finance 28: 100403. [CrossRef]
Siu, Alan, and Yue-chim Richard Wong. 2004. Economic impact of SARS: The case of Hong Kong. Asian Economic Papers 3: 62–83.[CrossRef]
Smith, Richard Dale. 2006. Responding to global infectious disease outbreaks: Lessons from SARS on the role of risk perception,communication and management. Social Science & Medicine 63: 3113–23. [CrossRef]
Sohrabi, Catrin, Zaid Alsafi, Niamh O’Neill, Mehdi Khan, Ahmed Kerwan, Ahmed Al-Jabir, Christos Iosifidis, and Riaz Agha. 2020.World Health Organization declares global emergency: A review of the 2019 novel coronavirus (COVID-19). International Journalof Surgery 76. [CrossRef] [PubMed]
Theil, Stefan. 2014. The Media and Markets: How Systematic Misreporting Inflates Bubbles, Deepens Downturns and Distorts Economic Reality.Politics and Public Policy Discussion Paper Series; Cambridge: Shorenstein Center on Media.
Topcu, Mert, and Omer Serkan Gulal. 2020. The impact of COVID-19 on emerging stock markets. Finance Research Letters 36: 101691.[CrossRef] [PubMed]
Tóth, Andrea. 2021. Students’ perception regarding digital education amid the COVID-19 pandemic. SKASE Journal of Translation andInterpretation 14: 1–13.
Trabelsi, Lotfi, Slah Bahloul, and Fatma Mathlouthi. 2020. Performance analysis of Islamic and conventional portfolios: The emergingmarkets case. Borsa Istanbul Review 20: 48–54. [CrossRef]
Tsay, Ruey S. 2002. Nonlinear models and forecasting. In A Companion to Economic Forecasting. Oxford: Wiley-Blackwell, pp. 453–84.Uddin, Moshfique, Anup Chowdhury, Keith Anderson, and Kausik Chaudhuri. 2021. The effect of COVID–19 pandemic on global
stock market volatility: Can economic strength help to manage the uncertainty? Journal of Business Research 128: 31–44. [CrossRef]UNDP. 2014. Human Development Report 2014: Sustaining Human Progress—Reducing Vulnerabilities and Building Resilience.
Retrieved 20 May 2022. Available online: https://hdr.undp.org/en/content/human-development-report-2014 (accessed on 15January 2022).

Risks 2022, 10, 109 14 of 14
Wang, Yi-Hsien, Fu-Ju Yang, and Li-Ji Chen. 2013. An investor’s perspective on infectious diseases and their influence on marketbehavior. Journal of Business Economics and Management 14: S112–S127. [CrossRef]
Waugh, Butler. 2003. Economics Recovery in the Wake of SARS (Taiwan Review). Retrieved 10 October. Available online: https://taiwantoday.tw/news.php?post=12681&unit=8 (accessed on 25 March 2022).
WHO. 2020. WHO Timeline—COVID-19. Retrieved 13 October. Available online: https://www.who.int/news-room/detail/27-04-2020-who-timeline---covid-19 (accessed on 25 March 2022).
Yarovaya, Larisa, Ahmed H. Elsayed, and Shawkat M. Hammoudeh. 2020. Searching for Safe Havens during the COVID-19 Pandemic:Determinants of Spillovers between Islamic and Conventional Financial Markets. Available online: https://ssrn.com/abstract=3634114 (accessed on 25 March 2022).
Zhang, Dayong, Min Hu, and Qiang Ji. 2020. Financial markets under the global pandemic of COVID-19. Finance Research Letters 36:101528. [CrossRef]