Houston Global Investors, LLC
26
Presented by HGI Houston Global Investors, LLC Catherine S. Woodruff, Ph.D., CFA Founding Partner 2011 and Beyond: Market and Economic Outlook FPA Houston Chapter Meeting - January 10, 2011 Houston Global Investors, LLC 1400 Post Oak Boulevard, Suite 100 Houston, Texas 77056 713-547-4562 www.houstonglobalinvestors.com 1
-
Upload
khangminh22 -
Category
Documents
-
view
3 -
download
0
Transcript of Houston Global Investors, LLC

Presented by
HGI Houston Global Investors, LLC
Catherine S. Woodruff,Ph.D., CFA
Founding Partner 2011 and Beyond: Market and Economic Outlook
FPA Houston Chapter Meeting - January 10, 2011
Houston Global Investors, LLC1400 Post Oak Boulevard, Suite 100Houston, Texas 77056713-547-4562www.houstonglobalinvestors.com
1

HGI2
Does increasing globalization require a new framework for thinking about international exposure?

• 1970’s: Most portfolios were allocated100% to US.
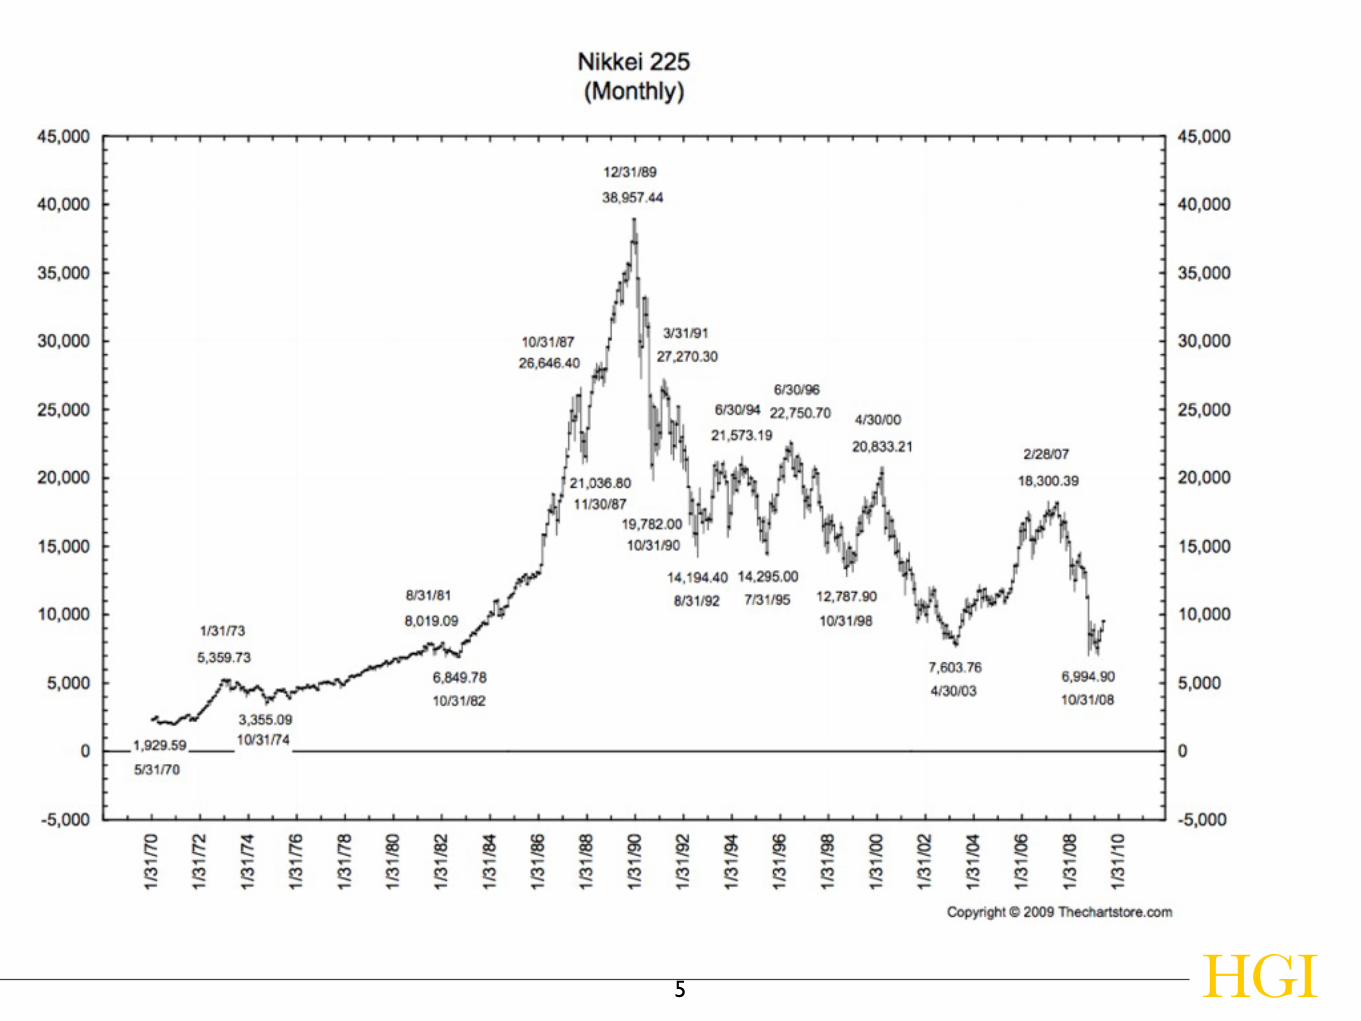
• 1980’s: Continuing rise in Japanese market led to increased awareness in US investors of international opportunities.
• 1990’s: Low correlations of US and International equities justify adding international equities as an asset class.
• 2000’s: Although correlations rise, emerging markets significantly outperform developed markets, leading to separate emerging market allocations.
HGI
Evolution of global asset allocation for US investors
3

S&P 500 Average Annual Returns by Decade
Total Return Inflation Real Return1950’s 19.3% 2.2% 16.7%1960’s 7.8% 2.5% 5.2%1970’s 5.8% 7.4% -1.4%1980’s 17.3% 5.1% 11.6%1990’s 18.1% 2.9% 14.7%2000’s -1.0% 2.5% -3.4%
1950-2009 11.0% 3.8% 7.0%2010 15.1% 1.1%* 14.0%*
4
*Estimated
HGI5
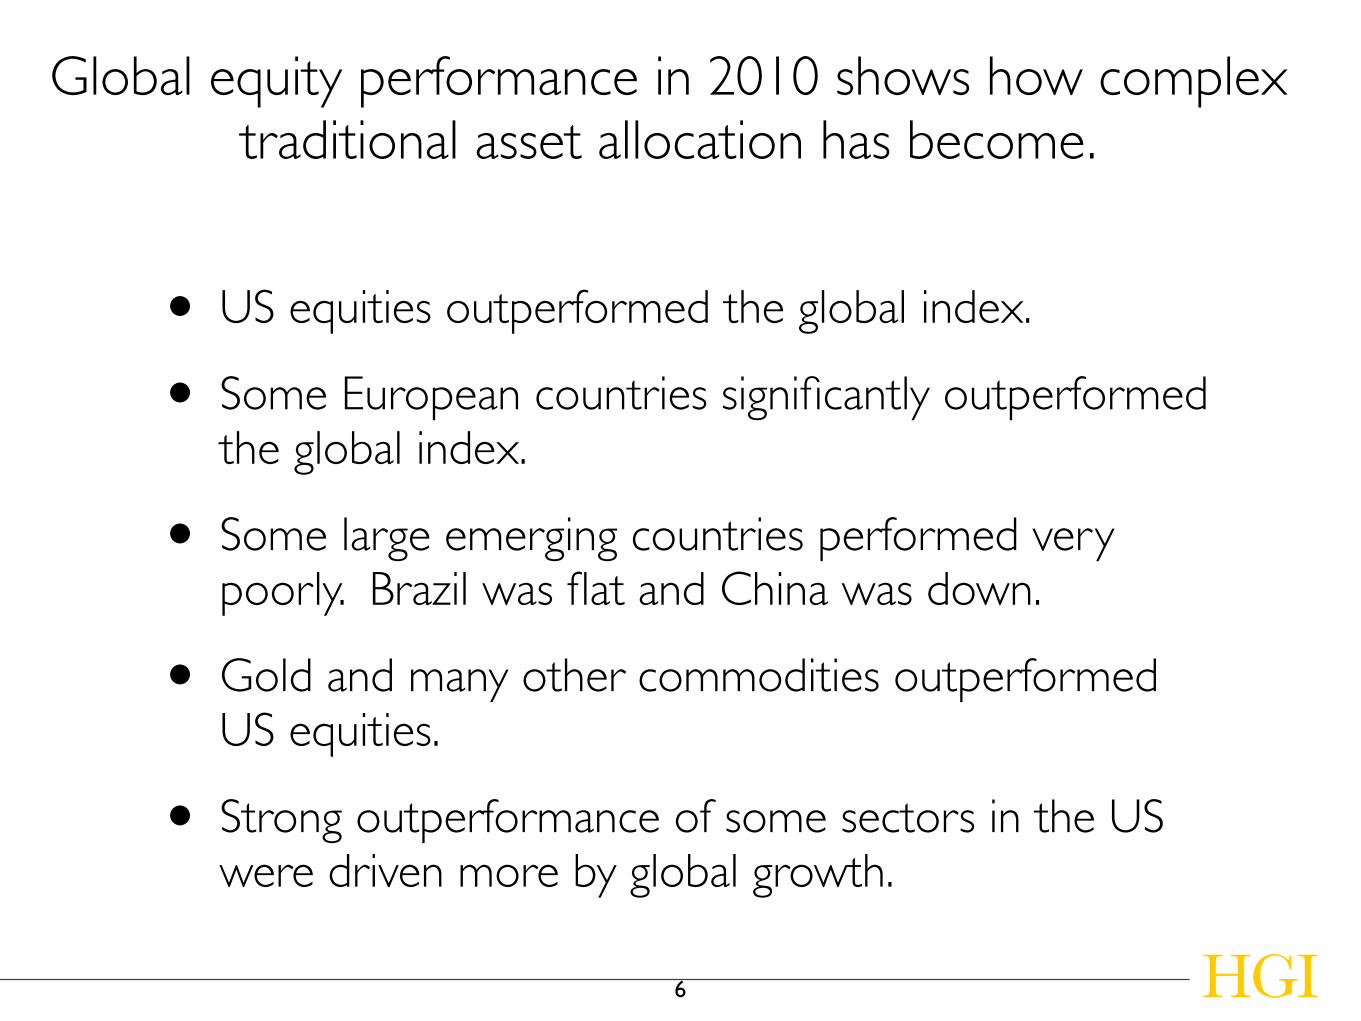
• US equities outperformed the global index.
• Some European countries significantly outperformed the global index.
• Some large emerging countries performed very poorly. Brazil was flat and China was down.
• Gold and many other commodities outperformed US equities.
• Strong outperformance of some sectors in the US were driven more by global growth.
HGI
Global equity performance in 2010 shows how complex traditional asset allocation has become.
6
HGI
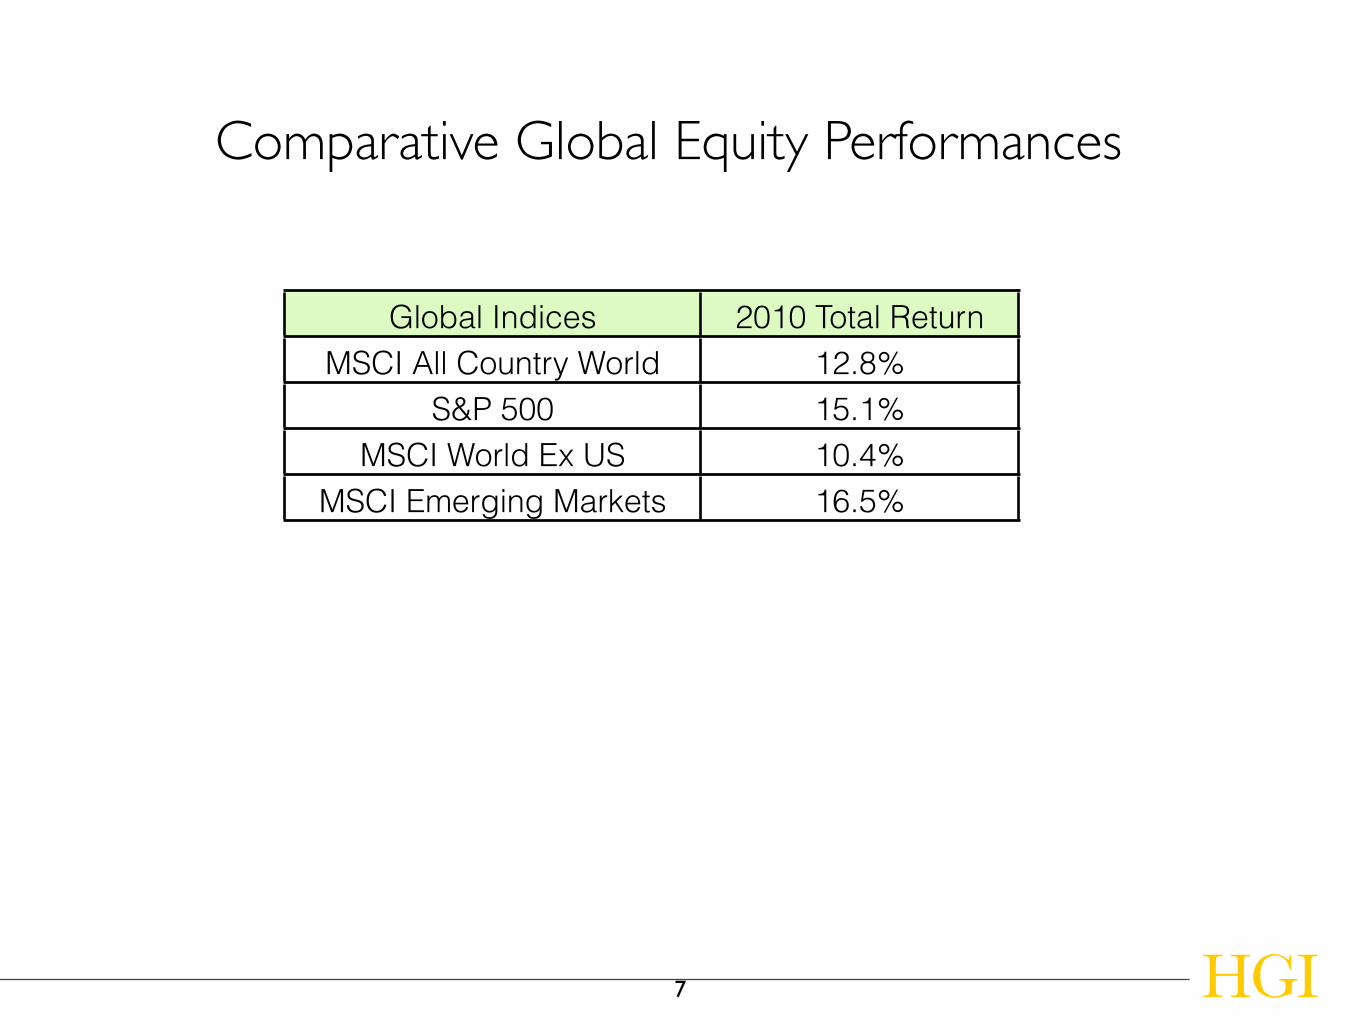
Comparative Global Equity Performances
7
Global Indices 2010 Total ReturnMSCI All Country World 12.8%
S&P 500 15.1%MSCI World Ex US 10.4%
MSCI Emerging Markets 16.5%

HGI
Comparative Global Equity Performances
8
Selected Developed Markets 2010 ReturnGermany 16.1%Denmark 37.4%Greece -33.6%Spain -13.2%
Australia 2.9%
Selected Emerging Markets 2010 Return
China -12.8%
India 19.1%
Brazil 1.4%
Russia 24.7%
Philippines 43.3%
Turkey 27.6%
HGI
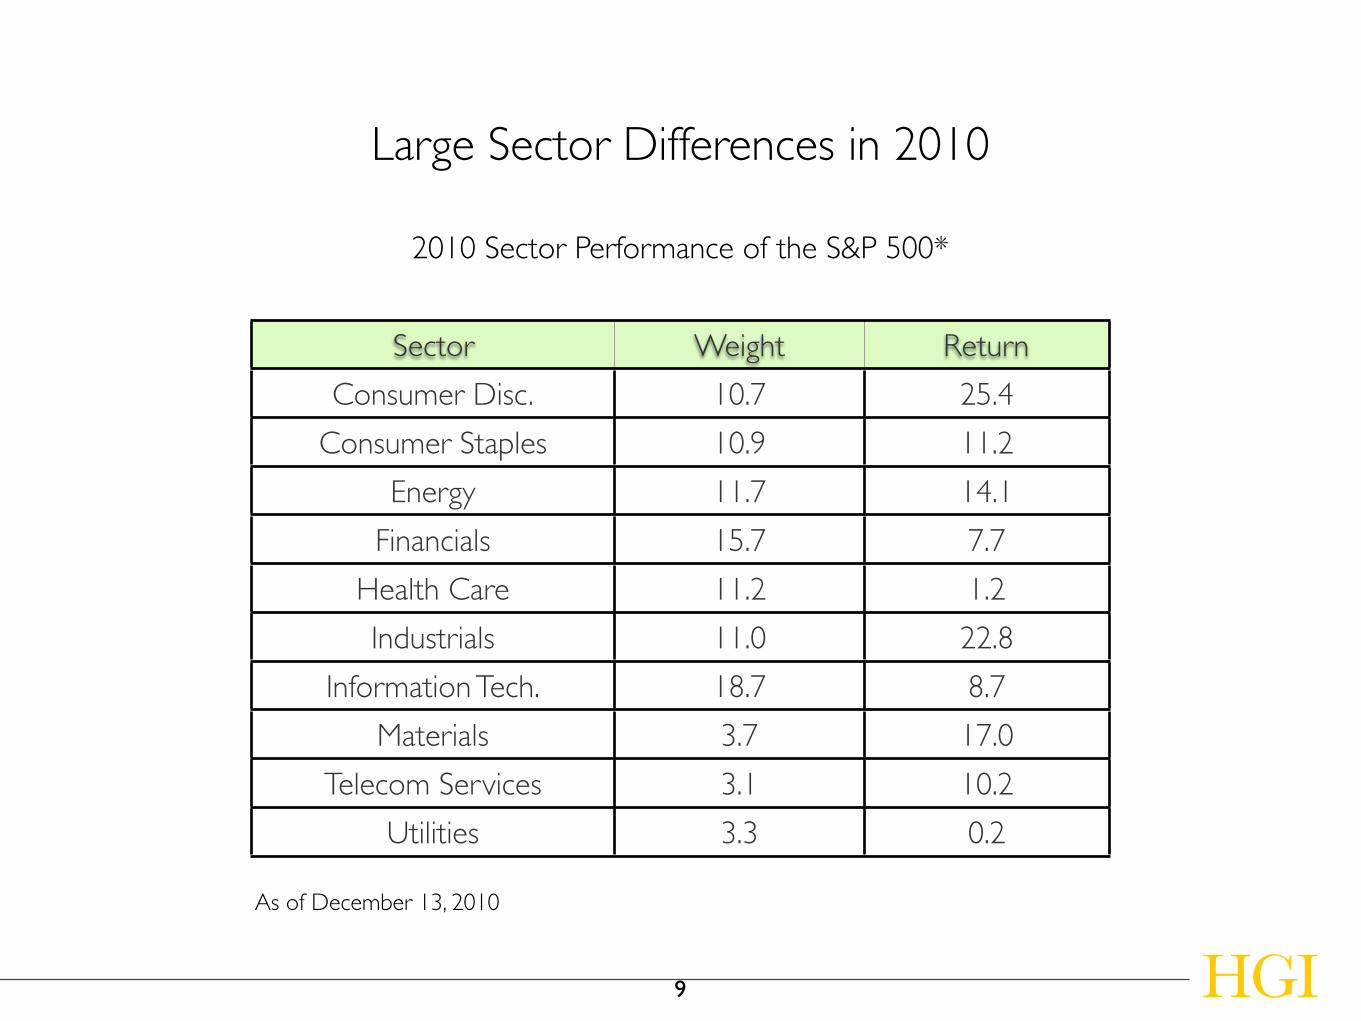
Large Sector Differences in 2010
9
Sector Weight Return
Consumer Disc. 10.7 25.4
Consumer Staples 10.9 11.2
Energy 11.7 14.1
Financials 15.7 7.7
Health Care 11.2 1.2
Industrials 11.0 22.8
Information Tech. 18.7 8.7
Materials 3.7 17.0
Telecom Services 3.1 10.2
Utilities 3.3 0.2
2010 Sector Performance of the S&P 500*
As of December 13, 2010

• Companies and sectors have become global in nature.
• A company’s country of domicile has become less meaningful.
• Historically, global sectors have been a bigger driver of differentiated performance than either country or investment style.
• Many of the largest companies in the world are non-US companies.
HGI
The Changing Investment Environment
10

6%
23%
40%
9%
23%
AmericasEuropeAsia ex JapanJapanME/North Aftrica
12%
22%
27%
38%
North AmericaEurope/Africa/MEAsia PacificLatin America
CaterpillarCountry of Domicile: US
As of March 31, 2010
Revenue Mix by Geography
KomatsuCountry of Domicile: Japan
As of December 31, 200911
Companies and sectors have become global in nature.
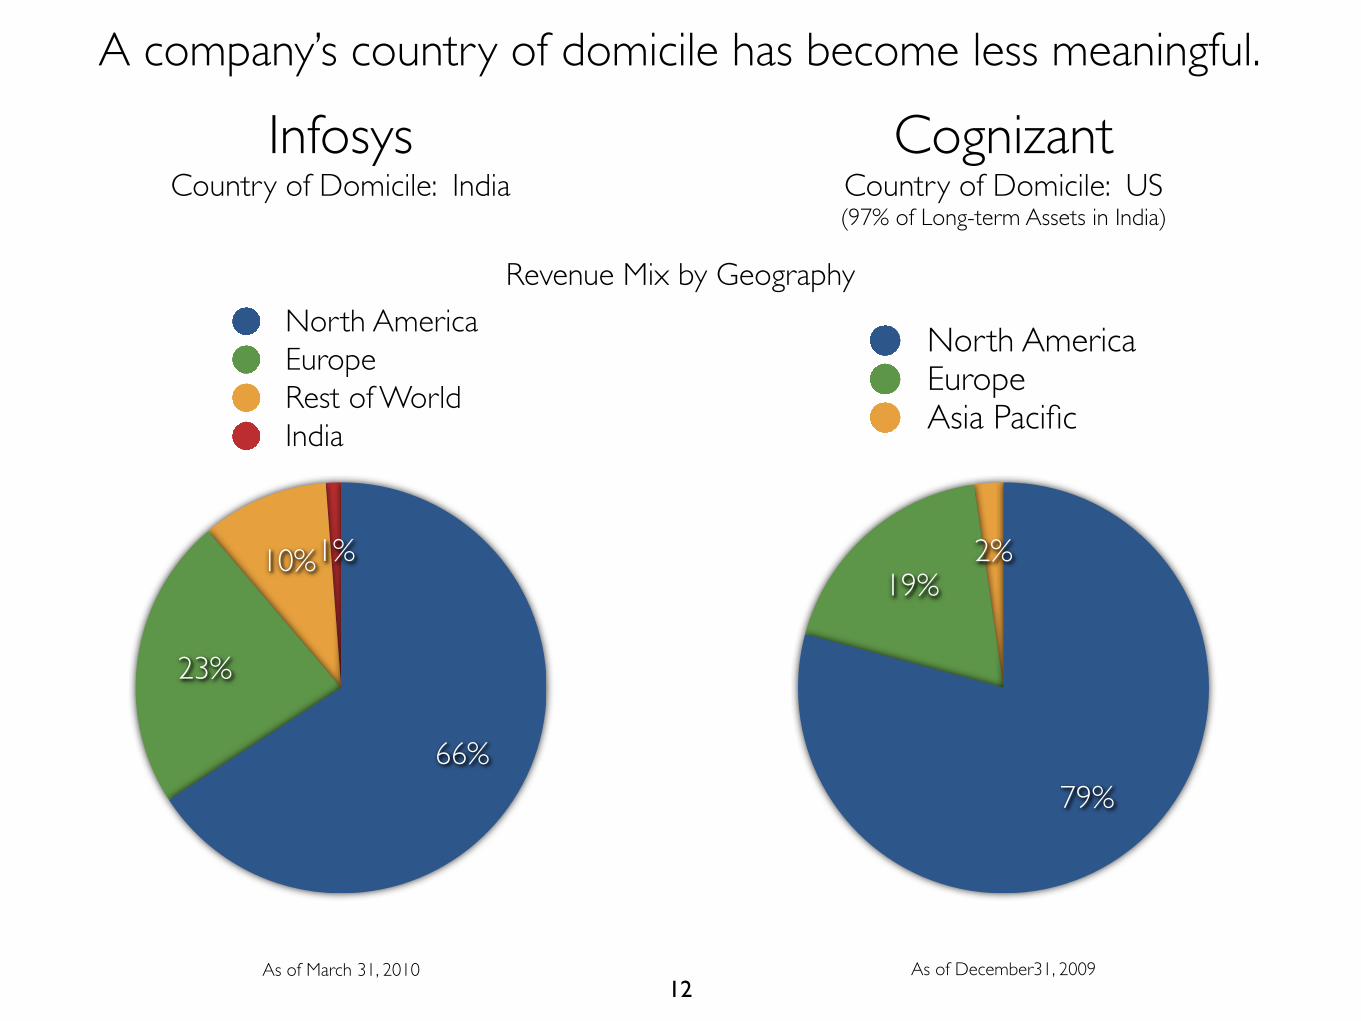
2%19%
79%
North AmericaEuropeAsia Pacific
1%10%
23%
66%
North AmericaEuropeRest of WorldIndia
InfosysCountry of Domicile: India
CognizantCountry of Domicile: US(97% of Long-term Assets in India)
As of December31, 2009As of March 31, 201012
Revenue Mix by Geography
A company’s country of domicile has become less meaningful.

HGI13
What do these brands have in common?

Difference Between Best & Worst Performing Sectorsin the S&P Global Developed BMI*
HGI
1990 36.1% 2000 73.0%1991 47.1% 2001 30.0%1992 18.3% 2002 36.7%1993 35.8% 2003 33.0%1994 28.6% 2004 28.2%1995 40.6% 2005 36.5%1996 20.7% 2006 27.4%1997 39.2% 2007 39.4%1998 66.3% 2008 29.5%1999 111.3% 2009 56.5%
20-Year Average: 41.7%*Broad Market Index
14
Historically, global sectors have been a bigger driver of differentiated performance than either country or investment style.
HGI
Traditional decision making criteria for global asset allocation, such as relative economic growth and valuation, simply do not work that well.
15

• Earnings growth can be very different from economic growth; e.g., US GDP grew just over 3%, but S&P 500 earnings rose an estimated 47%.
• Large earnings from foreign sources
• Significantly improving profit margins
• Individual company dynamics
• Markets generally anticipate economic growth and react mainly to growth surprises.
HGI
Relative economic growth as a predictor of equity performance
16

• Differences in inflation rates
• Differences in projected earnings growth
• Differences in risk levels
• Differences in sector weights
HGI
Relative valuation as a predictor of equity performance.
17

18
Some general themes for 2011

• GDP growth of 2-2.5%
• Unemployment decline from 9.8% to 8.5%
• End of QE2
• Fed Fund becomes positive; dollar goes up
• Domestic consumption/financials perform well
HGI
Positive Economic Trend in the US
• Inability to reconcile differences over taxes/expenses
• Inability to implement healthcare reform
• Presidential campaign starts early
HGI
Negative Political Trend

• Sovereign debt turmoil
• Fiscal tightening, VAT up, unemployment up
• Avoid domestic consumption
• Focus on exporters, cheap Euro, UK financial sector, commercial real estate
HGI
Europe

• Crowded trade-beware of valuation
• Inflation
• Expect slowdown of 1-2%
• Avoid IPO’s; stick to blue chip names
HGI
Emerging Markets
• Typically seem to be better managed
• Problems easier to handle
• Under the radar screen
• Good place to find quality companies (think BHP, Canadian banks, Swedish industrials, etc.)
HGI
Smaller Economies-(Australia, NZ, Canada, Sweden, Denmark, Chile, Singapore, Malaysia, etc.)

• Crowded trade
• Gold ATM’s; Silver/copper ETF’s
• If we are right about US rates, cost of carry will rise
• Oil will remain in this range because demand push from emerging markets will abate only minimally
• Iron ore/steel-same as oil
• Copper mixed
HGI
Commodities

HGI

HGI26