AGCO CORPORATION - Investors
118
Table of Contents UNITED STATES SECURITIES AND EXCHANGE COMMISSION WASHINGTON, D.C. 20549 FORM 10-K For the fiscal year ended December 31, 2016 of AGCO CORPORATION A Delaware Corporation IRS Employer Identification No. 58-1960019 SEC File Number 1-12930 4205 River Green Parkway Duluth, GA 30096 (770) 813-9200 AGCO Corporation’s Common Stock is registered pursuant to Section 12(b) of the Act and is listed on the New York Stock Exchange. AGCO Corporation is a well-known seasoned issuer. AGCO Corporation is required to file reports pursuant to Section 13 or Section 15(d) of the Act. AGCO Corporation (1) has filed all reports required to be filed by Section 13 or 15(d) of the Act during the preceding 12 months, and (2) has been subject to such filing requirements for the past 90 days. Disclosure of delinquent filers pursuant to Item 405 of Regulation S-K will be contained in a definitive proxy statement, portions of which are incorporated by reference into Part III of this Form 10-K. AGCO Corporation has submitted electronically and posted on its corporate website every Interactive Data File for the periods required to be submitted and posted pursuant to Rule 405 of Regulation S-T. The aggregate market value of AGCO Corporation’s Common Stock (based upon the closing sales price quoted on the New York Stock Exchange) held by non-affiliates as of June 30, 2016 was approximately $3.2 billion. For this purpose, directors and officers and the entities that they control have been assumed to be affiliates. As of February 24, 2017, 79,449,334 shares of AGCO Corporation’s Common Stock were outstanding. AGCO Corporation is a large accelerated filer and is not a shell company. DOCUMENTS INCORPORATED BY REFERENCE Portions of AGCO Corporation’s Proxy Statement for the 2017 Annual Meeting of Stockholders are incorporated by reference into Part III of this Form 10-K.
-
Upload
khangminh22 -
Category
Documents
-
view
0 -
download
0
Transcript of AGCO CORPORATION - Investors

Table of Contents
UNITED STATES SECURITIES AND EXCHANGE COMMISSIONWASHINGTON, D.C. 20549
FORM 10-K
For the fiscal year ended December 31, 2016of
AGCO CORPORATIONA Delaware Corporation
IRS Employer Identification No. 58-1960019SEC File Number 1-12930
4205 River Green ParkwayDuluth, GA 30096
(770) 813-9200
AGCO Corporation’s Common Stock is registered pursuant to Section 12(b) of the Act and is listed on the New York Stock Exchange.
AGCO Corporation is a well-known seasoned issuer.
AGCO Corporation is required to file reports pursuant to Section 13 or Section 15(d) of the Act. AGCO Corporation (1) has filed all reports requiredto be filed by Section 13 or 15(d) of the Act during the preceding 12 months, and (2) has been subject to such filing requirements for the past 90 days.
Disclosure of delinquent filers pursuant to Item 405 of Regulation S-K will be contained in a definitive proxy statement, portions of which areincorporated by reference into Part III of this Form 10-K.
AGCO Corporation has submitted electronically and posted on its corporate website every Interactive Data File for the periods required to besubmitted and posted pursuant to Rule 405 of Regulation S-T.
The aggregate market value of AGCO Corporation’s Common Stock (based upon the closing sales price quoted on the New York Stock Exchange)held by non-affiliates as of June 30, 2016 was approximately $3.2 billion. For this purpose, directors and officers and the entities that they control have beenassumed to be affiliates. As of February 24, 2017, 79,449,334 shares of AGCO Corporation’s Common Stock were outstanding.
AGCO Corporation is a large accelerated filer and is not a shell company.
DOCUMENTS INCORPORATED BY REFERENCE
Portions of AGCO Corporation’s Proxy Statement for the 2017 Annual Meeting of Stockholders are incorporated by reference into Part III of thisForm 10-K.

Table of Contents
TABLE OF CONTENTSPART I Item 1. Business Item 1A. Risk Factors Item 1B. Unresolved Staff Comments Item 2. Properties Item 3. Legal Proceedings Item 4. Mine Safety DisclosuresPART II Item 5. Market For Registrant’s Common Equity, Related Stockholder Matters and Issuer Purchases of Equity Securities Item 6. Selected Financial Data Item 7. Management’s Discussion and Analysis of Financial Condition and Results of Operations Item 7A. Quantitative and Qualitative Disclosures About Market Risk Item 8. Financial Statements and Supplementary Data Item 9. Changes in and Disagreements with Accountants on Accounting and Financial Disclosure Item 9A. Controls and Procedures Item 9B. Other InformationPART III Item 10. Directors, Executive Officers and Corporate Governance Item 11. Executive Compensation Item 12. Security Ownership of Certain Beneficial Owners and Management and Related Stockholder Matters Item 13. Certain Relationships and Related Transactions, and Director Independence Item 14. Principal Accounting Fees and ServicesPART IV Item 15. Exhibits and Financial Statement Schedules Item 16. Form 10-K SummarySIGNATURES
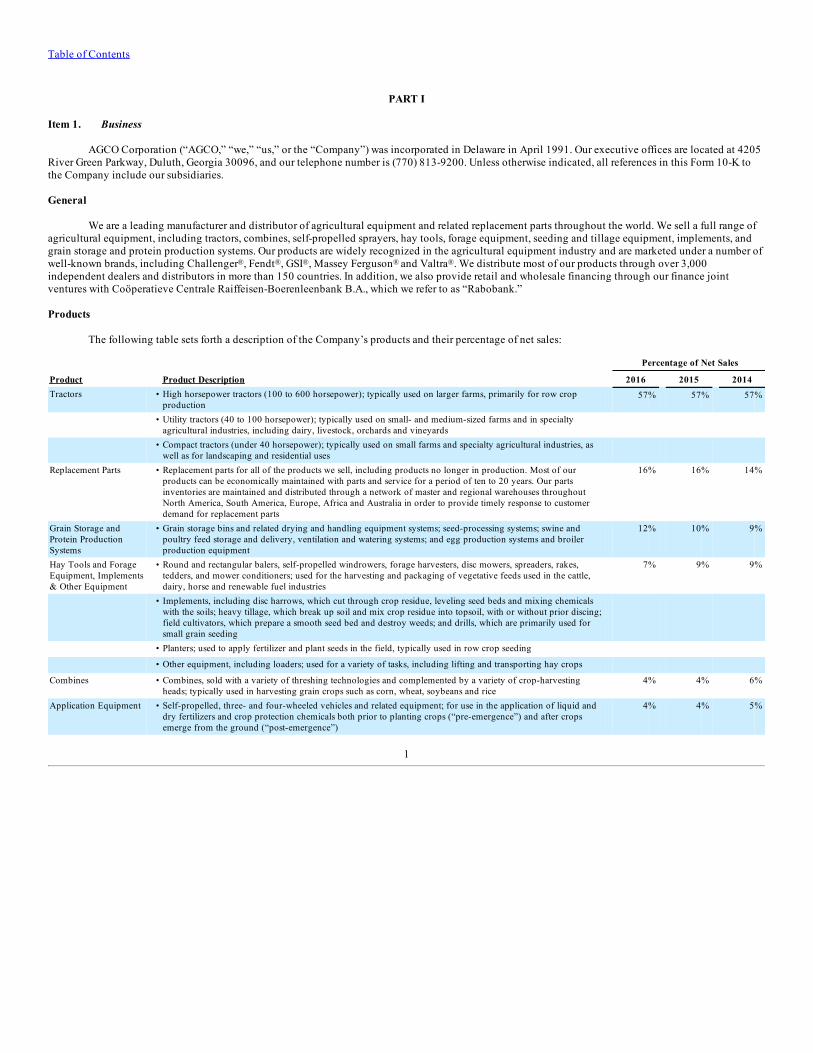
Table of Contents
PART I
Item 1. Business
AGCO Corporation (“AGCO,” “we,” “us,” or the “Company”) was incorporated in Delaware in April 1991. Our executive offices are located at 4205River Green Parkway, Duluth, Georgia 30096, and our telephone number is (770) 813-9200. Unless otherwise indicated, all references in this Form 10-K tothe Company include our subsidiaries.
General
We are a leading manufacturer and distributor of agricultural equipment and related replacement parts throughout the world. We sell a full range ofagricultural equipment, including tractors, combines, self-propelled sprayers, hay tools, forage equipment, seeding and tillage equipment, implements, andgrain storage and protein production systems. Our products are widely recognized in the agricultural equipment industry and are marketed under a number ofwell-known brands, including Challenger®, Fendt®, GSI®, Massey Ferguson® and Valtra®. We distribute most of our products through over 3,000independent dealers and distributors in more than 150 countries. In addition, we also provide retail and wholesale financing through our finance jointventures with Coöperatieve Centrale Raiffeisen-Boerenleenbank B.A., which we refer to as “Rabobank.”
Products
The following table sets forth a description of the Company’s products and their percentage of net sales:
Percentage of Net Sales
Product Product Description 2016 2015 2014Tractors • High horsepower tractors (100 to 600 horsepower); typically used on larger farms, primarily for row crop
production 57%
57%
57%
• Utility tractors (40 to 100 horsepower); typically used on small- and medium-sized farms and in specialty
agricultural industries, including dairy, livestock, orchards and vineyards
• Compact tractors (under 40 horsepower); typically used on small farms and specialty agricultural industries, as
well as for landscaping and residential uses Replacement Parts • Replacement parts for all of the products we sell, including products no longer in production. Most of our
products can be economically maintained with parts and service for a period of ten to 20 years. Our partsinventories are maintained and distributed through a network of master and regional warehouses throughoutNorth America, South America, Europe, Africa and Australia in order to provide timely response to customerdemand for replacement parts
16%
16%
14%
Grain Storage andProtein ProductionSystems
• Grain storage bins and related drying and handling equipment systems; seed-processing systems; swine andpoultry feed storage and delivery, ventilation and watering systems; and egg production systems and broilerproduction equipment
12%
10%
9%
Hay Tools and ForageEquipment, Implements& Other Equipment
• Round and rectangular balers, self-propelled windrowers, forage harvesters, disc mowers, spreaders, rakes,tedders, and mower conditioners; used for the harvesting and packaging of vegetative feeds used in the cattle,dairy, horse and renewable fuel industries
7%
9%
9%
• Implements, including disc harrows, which cut through crop residue, leveling seed beds and mixing chemicalswith the soils; heavy tillage, which break up soil and mix crop residue into topsoil, with or without prior discing;field cultivators, which prepare a smooth seed bed and destroy weeds; and drills, which are primarily used forsmall grain seeding
• Planters; used to apply fertilizer and plant seeds in the field, typically used in row crop seeding • Other equipment, including loaders; used for a variety of tasks, including lifting and transporting hay crops Combines • Combines, sold with a variety of threshing technologies and complemented by a variety of crop-harvesting
heads; typically used in harvesting grain crops such as corn, wheat, soybeans and rice 4%
4%
6%
Application Equipment • Self-propelled, three- and four-wheeled vehicles and related equipment; for use in the application of liquid anddry fertilizers and crop protection chemicals both prior to planting crops (“pre-emergence”) and after cropsemerge from the ground (“post-emergence”)
4%
4%
5%
1

Table of Contents
Marketing and Distribution
We distribute products primarily through a network of independent dealers and distributors. Our dealers are responsible for retail sales of equipmentto end users and after-sales service and support. Our distributors may sell our products through networks of dealers supported by the distributors, and ourdistributors also may directly market our products and provide customer service support. Our sales are not dependent on any specific dealer, distributor orgroup of dealers.
In some countries, we utilize associates and licensees to provide a distribution channel for our products and/or a source of low-cost production forcertain Massey Ferguson and Valtra products. Associates are entities in which we have an ownership interest, most notably in India. Licensees are entities inwhich we have no direct ownership interest. The associate or licensee generally has the exclusive right to produce and sell Massey Ferguson or Valtraequipment in its licensed territory under such tradenames but may not sell these products in other countries. We generally license certain technology to theselicensees and associates, and we may sell them certain components used in local manufacturing operations.
Independent Dealers and Distributors Percent of Net SalesGeographical region 2016 2016 2015 2014Europe 870 53% 51% 49%North America 1,390 24% 26% 25%South America 290 12% 13% 17%Rest of World (1) 500 11% 10% 9%____________________________________(1) Consists of approximately 74 countries in Africa, the Middle East, Australia and Asia.
Dealer Support and Supervision
We believe that one of the most important criteria affecting a farmer’s decision to purchase a particular brand of equipment is the quality of thedealer who sells and services the equipment. We support our dealers in order to improve the quality of our dealer network. We monitor each dealer’sperformance and profitability and establish programs that focus on continual dealer improvement. Our dealers generally have sales territories for which theyare responsible.
We believe that our ability to offer our dealers a full product line of agricultural equipment and related replacement parts, as well as our ongoingdealer training and support programs focusing on business and inventory management, sales, marketing, warranty and servicing matters and products, helpensure the vitality and increase the competitiveness of our dealer network. We also maintain dealer advisory groups to obtain dealer feedback on ouroperations.
We provide our dealers with volume sales incentives, demonstration programs and other advertising support to assist sales. We design our salesprograms, including retail financing incentives, and our policies for maintaining parts and service availability with extensive product warranties, to enhanceour dealers’ competitive position.
Manufacturing and Suppliers
Manufacturing and Assembly
We manufacture and assemble our products in 47 locations worldwide, including seven locations where we operate joint ventures. Our locations areintended to optimize capacity, technology or local costs. Furthermore, we continue to balance our manufacturing resources with externally-sourcedmachinery, components and replacement parts to enable us to better control inventory and our supply of components. We believe that our manufacturingfacilities are sufficient to meet our needs for the foreseeable future. Please refer to Item 2, “Properties,” where a listing of our principal manufacturinglocations is presented.
Our AGCO Power engines division produces diesel engines, gears and generating sets. The diesel engines are manufactured for use in a portion ofour tractors, combines and sprayers, and also are sold to third parties. AGCO Power specializes in the manufacturing of off-road engines in the 75 to 600horsepower range.
2

Table of Contents
Third-Party Suppliers
We externally source some of our machinery, components and replacement parts from third-party suppliers. Our production strategy is intended tooptimize our research and development and capital investment requirements and to allow us greater flexibility to respond to changes in market conditions.
We purchase some fully manufactured tractors from Tractors and Farm Equipment Limited (“TAFE”), Carraro S.p.A. and Iseki & Company, Limited.We also purchase other tractors, implements and hay and forage equipment from various third-party suppliers. Refer to “Related Parties” within Item 7,“Management’s Discussion and Analysis of Financial Condition and Results of Operations,” for further discussion of our relationship with TAFE. In additionto the purchase of machinery, third-party suppliers supply us with significant components used in our manufacturing operations. We select third-partysuppliers that we believe are low cost, high quality and possess the most appropriate technology. We also assist in the development of these products orcomponent parts based upon our own design requirements. Our past experience with outside suppliers generally has been favorable.
Seasonality
Generally, retail sales by dealers to farmers are highly seasonal and are a function of the timing of the planting and harvesting seasons. To the extentpracticable, we attempt to ship products to our dealers and distributors on a level basis throughout the year to reduce the effect of seasonal retail demands onour manufacturing operations and to minimize our investment in inventory. Our financing requirements are subject to variations due to seasonal changes inworking capital levels, which typically increase in the first half of the year and then decrease in the second half of the year. The fourth quarter is alsotypically a period for higher retail sales because of our customers’ year-end tax planning considerations, the increase in the availability of funds fromcompleted harvests and the timing of dealer incentives.
Competition
The agricultural industry is highly competitive. We compete with several large national and international full-line suppliers, as well as numerousshort-line and specialty manufacturers with differing manufacturing and marketing methods. Our two principal competitors on a worldwide basis are Deere &Company and CNH Industrial N.V. We have regional competitors around the world that have significant market share in a single country or a group ofcountries.
We believe several key factors influence a buyer’s choice of farm equipment, including the strength and quality of a company’s dealers, the qualityand pricing of products, dealer or brand loyalty, product availability, terms of financing and customer service. See “Marketing and Distribution” foradditional information.
Engineering and Research
We make significant expenditures for engineering and applied research to improve the quality and performance of our products, to develop newproducts and to comply with government safety and engine emissions regulations.
In addition, we also offer a variety of precision farming technologies that provide farmers with the capability to enhance productivity andprofitability on the farm. These technologies are installed in our products and include satellite-based steering, field data collection, yield mapping andtelemetry-based fleet management systems.
Wholesale Financing
Primarily in the United States and Canada, we engage in the standard industry practice of providing dealers with floor plan payment terms for theirinventories of farm equipment for extended periods generally through our AGCO Finance joint ventures. The terms of our wholesale finance agreements withour dealers vary by region and product line, with fixed payment schedules on all sales, generally ranging from one to 12 months. In the United States andCanada, dealers typically are not required to make an initial down payment, and our terms allow for an interest-free period generally ranging from one to12 months, depending on the product. Amounts due from sales to dealers in the United States and Canada are immediately due upon a retail sale of theunderlying equipment by the dealer, with the exception of sales of grain storage and protein production systems. If not previously paid by the dealer,installment payments generally are required beginning after the interest-free period with the remaining outstanding equipment balance generally due within12 months after shipment. In limited circumstances, we provide sales terms, and in some cases, interest-free periods that are longer than 12 months for certainproducts. These typically are specified programs, predominantly in the United States and Canada, where interest is charged after a period of up to 24 months,depending on the year of the sale and the dealer or distributor’s ordering or sales volume
3

Table of Contents
during the preceding year. We also provide financing to dealers on used equipment accepted in trade. We obtain a security interest in a majority of the newand used equipment we finance. Sales of grain storage and protein production systems generally are payable within 30 days of shipment.
Typically, sales terms outside the United States and Canada are of a shorter duration, generally ranging from 30 to 180 days. In many cases, we retaina security interest in the equipment sold on extended terms. In certain international markets, our sales are backed by letters of credit or credit insurance.
We have an agreement to permit transferring, on an ongoing basis, a majority of our wholesale receivables in North America, Europe and Brazil toour AGCO Finance joint ventures in the United States, Canada, Europe and Brazil. Upon transfer, the wholesale receivables maintain standard payment terms,including required regular principal payments on amounts outstanding and interest charges at market rates. Qualified dealers may obtain additional financingthrough our U.S., Canadian, European and Brazilian finance joint ventures at the joint ventures’ discretion. In addition, AGCO Finance joint ventures mayprovide wholesale financing directly to dealers in Europe, Brazil and Australia.
Retail Financing
Our AGCO Finance joint ventures offer financing to most of the end users of our products. Besides contributing to our overall profitability, theAGCO Finance joint ventures can enhance our sales efforts by tailoring retail finance programs to prevailing market conditions. Our finance joint venturesare located in the United States, Canada, Europe, Brazil, Argentina and Australia and are owned by AGCO and by a wholly-owned subsidiary of Rabobank.Refer to “Finance Joint Ventures” within Item 7, “Management’s Discussion and Analysis of Financial Condition and Results of Operations,” for furtherinformation.
In addition, Rabobank is the primary lender with respect to our credit facility and our senior term loan, as are more fully described in “Liquidity and
Capital Resources” within Item 7, “Management’s Discussion and Analysis of Financial Condition and Results of Operations.” Our historical relationshipwith Rabobank has been strong, and we anticipate its continued long-term support of our business.
Intellectual Property
We own and have licenses to the rights under a number of domestic and foreign patents, trademarks, trade names and brand names relating to ourproducts and businesses. We defend our patent, trademark and trade and brand name rights primarily by monitoring competitors’ machines and industrypublications and conducting other investigative work. We consider our intellectual property rights, including our right to use our trade and brand names,important in the operation of our businesses. However, we do not believe we are dependent on any single patent, trademark, trade name or group of patents ortrademarks, trade names or brand names. We intend to maintain the separate strengths and identities of our core brand names and product lines.
Environmental Matters and Regulation
We are subject to environmental laws and regulations concerning emissions to the air, discharges of processed or other types of wastewater, and thegeneration, handling, storage, transportation, treatment and disposal of waste materials. These laws and regulations are constantly changing, and the effectsthat they may have on us in the future are impossible to predict with accuracy. It is our policy to comply with all applicable environmental, health and safetylaws and regulations, and we believe that any expense or liability we may incur in connection with any noncompliance with any law or regulation or thecleanup of any of our properties will not have a materially adverse effect on us.
Our AGCO Power engine division, which specializes in the manufacturing of non-road engines in the 75 to 750 horsepower range, currentlycomplies with emissions standards and related requirements set by European and U.S. regulatory authorities, including both the United States EnvironmentalProtection Agency and various state authorities. We also are required to comply with other country regulations outside of the United States and Europe. Weexpect to meet future emissions requirements through the introduction of new technology to our engines and exhaust after-treatment systems, as necessary. Insome markets (such as the United States), we must obtain governmental environmental approvals in order to import our products, and these approvals can bedifficult or time consuming to obtain or may not be obtainable at all. For example, our AGCO Power engine division and our engine suppliers are subject toair quality standards, and production at our facilities could be impaired if AGCO Power and these suppliers are unable to timely respond to any changes inenvironmental laws and regulations affecting engine emissions. Compliance with environmental and safety regulations has added, and will continue to add,to the cost of our products and increase the capital-intensive nature of our business.
4

Table of Contents
Climate change, as a result of emissions of greenhouse gases, is a significant topic of discussion and may generate U.S. and other regulatoryresponses. It is impracticable to predict with any certainty the impact on our business of climate change or the regulatory responses to it, although werecognize that they could be significant. The most direct impacts are likely to be an increase in energy costs, which would increase our operating costs(through increased utility and transportation costs) and an increase in the costs of the products we purchase from others. In addition, increased energy costsfor our customers could impact demand for our equipment. It is too soon for us to predict with any certainty the ultimate impact of additional regulation,either directionally or quantitatively, on our overall business, results of operations or financial condition.
Our international operations also are subject to environmental laws, as well as various other national and local laws, in the countries in which wemanufacture and sell our products.
Regulation and Government Policy
Domestic and foreign political developments and government regulations and policies directly affect the agricultural industry in the United Statesand abroad and indirectly affect the agricultural equipment business. The application, modification or adoption of laws, regulations or policies could have anadverse effect on our business.
We have manufacturing facilities or other physical presence in approximately 32 countries and sell our products in more than 150 countries. Thissubjects us to a range of trade, product, foreign exchange, employment, tax and other laws and regulations, in addition to the environmental regulationsdiscussed previously, in a significant number of jurisdictions. Many jurisdictions and a variety of laws regulate the contractual relationships with our dealers.These laws impose substantive standards on the relationships between us and our dealers, including events of default, grounds for termination, non-renewalof dealer contracts and equipment repurchase requirements. Such laws could adversely affect our ability to terminate our dealers.
In addition, each of the jurisdictions within which we operate or sell products has an important interest in the success of its agricultural industry andthe consistency of the availability of reasonably priced food sources. These interests result in active political involvement in the agricultural industry, which,in turn, can impact our business in a variety of ways.
Employees
As of December 31, 2016, we employed approximately 19,800 employees, including approximately 4,500 employees in the United States andCanada. A majority of our employees at our manufacturing facilities, both domestic and international, are represented by collective bargaining agreementsand union contracts with terms that expire on varying dates. We currently do not expect any significant difficulties in renewing these agreements.
5

Table of Contents
Available Information
Our Internet address is www.agcocorp.com. We make the following reports filed by us available, free of charge, on our website under the heading“SEC Filings” in our website’s “Investors” section:
• annual reports on Form 10-K;
• quarterly reports on Form 10-Q;
• current reports on Form 8-K;
• proxy statements for the annual meetings of stockholders;
• reports on Form SD; and
• Forms 3, 4 and 5
These reports are made available on our website as soon as practicable after they are filed with the Securities and Exchange Commission (“SEC”).
We also provide corporate governance and other information on our website. This information includes:
• charters for the standing committees of our board of directors, which are available under the heading “Charters of the Committees of the Board”in the “Governance, Committees, & Charters” section of the “Corporate Governance” section of our website located under “Investors,” and
• our Global Code of Conduct, which is available under the heading “Global Code of Conduct” in the “Corporate Governance” section of ourwebsite located under “Investors.”
In addition, in the event of any waivers of our Global Code of Conduct, those waivers will be available under the heading “Corporate Governance” of ourwebsite.
Financial Information on Geographical Areas
For financial information on geographical areas, see Note 15 of our Consolidated Financial Statements contained in Item 8, “Financial Statementsand Supplementary Data,” under the caption “Segment Reporting,” which information is incorporated herein by reference.
6

Table of Contents
Item 1A. Risk Factors
We make forward-looking statements in this report, in other materials we file with the SEC or otherwise release to the public and on our website. Inaddition, our senior management might make forward-looking statements orally to analysts, investors, the media and others. Statements concerning our futureoperations, prospects, strategies, products, manufacturing facilities, legal proceedings, financial condition, future financial performance (including growthand earnings) and demand for our products and services, and other statements of our plans, beliefs or expectations, including the statements contained inItem 7, “Management’s Discussion and Analysis of Financial Condition and Results of Operations,” regarding net sales, industry conditions, currencytranslation impacts, market demand, farm incomes, weather conditions, commodity prices, general economic conditions, availability of financing, workingcapital, capital expenditure and debt service requirements, margins, production volumes, cost reduction initiatives, investments in product development,compliance with financial covenants, support of lenders, recovery of amounts under guarantee, uncertain income tax provisions, funding of our pension andpostretirement benefit plans, or realization of net deferred tax assets, are forward-looking statements. The forward-looking statements we make are notguarantees of future performance and are subject to various assumptions, risks and other factors that could cause actual results to differ materially from thosesuggested by the forward-looking statements. These factors include, among others, those set forth below and in the other documents that we file with the SEC.There also are other factors that we may not describe, generally because we currently do not perceive them to be material, that could cause actual results todiffer materially from our expectations.
We expressly disclaim any obligation to update or revise any forward-looking statements, whether as a result of new information, future events orotherwise, except as required by law.
Our financial results depend entirely upon the agricultural industry, and factors that adversely affect the agricultural industry generally, includingdeclines in the general economy, increases in farm input costs, weather conditions, lower commodity prices and changes in the availability of credit for ourretail customers, will adversely affect us.
Our success depends entirely on the vitality of the agricultural industry. Historically, the agricultural industry, including the agricultural equipmentbusiness, has been cyclical and subject to a variety of economic and other factors. Sales of agricultural equipment generally are related to the economichealth of the agricultural industry, which is affected by farm income, farm input costs, debt levels and land values, all of which reflect levels of commodityprices, acreage planted, crop yields, agricultural product demand, including crops used as renewable energy sources, government policies and governmentsubsidies. Sales also are influenced by economic conditions, interest rate and exchange rate levels, and the availability of retail financing. Trends in theindustry, such as farm consolidations, may affect the agricultural equipment market. In addition, weather conditions, such as floods, heat waves or droughts,and pervasive livestock or crop diseases can affect farmers’ buying decisions. Downturns in the agricultural industry due to these or other factors, whichcould vary by market, are likely to result in decreases in demand for agricultural equipment, which would adversely affect our sales, growth, results ofoperations and financial condition. Moreover, the unpredictable nature of many of these factors and the resulting volatility in demand make it difficult for usto accurately predict sales and optimize production. This, in turn, can result in higher costs, including inventory carrying costs and underutilizedmanufacturing capacity. During previous downturns in the farm sector, we experienced significant and prolonged declines in sales and profitability, and weexpect our business to remain subject to similar market fluctuations in the future.
The agricultural equipment industry is highly seasonal, and seasonal fluctuations significantly impact results of operations and cash flows.
The agricultural equipment business is highly seasonal, which causes our quarterly results and our cash flow to fluctuate during the year. Farmersgenerally purchase agricultural equipment in the Spring and Fall in conjunction with the major planting and harvesting seasons. In addition, the fourthquarter typically is a significant period for retail sales because of our customers’ year-end tax planning considerations, the increase in availability of fundsfrom completed harvests and the timing of dealer incentives. Our net sales and income from operations historically have been the lowest in the first quarterand have increased in subsequent quarters as dealers anticipate increased retail sales in subsequent quarters.
Most of our sales depend on the availability of retail customers obtaining financing, and any disruption in their ability to obtain financing, whether due toeconomic downturns or otherwise, will result in the sale of fewer products by us. In addition, the collectability of receivables that are created from oursales, as well as from such retail financing, is critical to our business.
Most retail sales of our products are financed, either by AGCO Finance joint ventures or by a bank or other private lender. Our AGCO Finance jointventures, which are controlled by Rabobank and are dependent upon Rabobank for financing
7

Table of Contents
as well, finance approximately 40% of the retail sales of our tractors and combines in the markets where the joint ventures operate. Any difficulty byRabobank in continuing to provide that financing, or any business decision by Rabobank as the controlling member not to fund the business or particularaspects of it (for example, a particular country or region) would require the joint ventures to find other sources of financing (which may be difficult to obtain)or would require us to find another source of retail financing for our customers, or our customers would be required to utilize other retail financing providers.As a result of the recent economic downturn, financing for capital equipment purchases generally has became more difficult in certain regions and, in somecases, was expensive to obtain. To the extent that financing is not available, or available only at unattractive prices, our sales would be negatively impacted.
Both AGCO and our AGCO Finance joint ventures have substantial accounts receivable from dealers and retail customers, and we would both beadversely impacted if the collectability of these receivables was not consistent with historical experience. This collectability is dependent on the financialstrength of the farm industry, which in turn is dependent upon the general economy and commodity prices, as well as several of the other factors discussed inthis “Risk Factors” section. In addition, the AGCO Finance joint ventures may experience credit losses that exceed expectations and adversely affect theirfinancial condition and results of operations. The finance joint ventures may also experience residual value losses that exceed expectations caused by lowerpricing for used equipment and higher than expected returns at lease maturity. To the extent that defaults and losses are higher than expected, our equity inthe net earnings of the finance joint ventures could be less, which could materially impact our financial results.
Our success depends on the introduction of new products, which requires substantial expenditures.
Our long-term results depend upon our ability to introduce and market new products successfully. The success of our new products will depend on anumber of factors, including:
• innovation;
• customer acceptance;
• the efficiency of our suppliers in providing component parts and of our manufacturing facilities in producing final products; and
• the performance and quality of our products relative to those of our competitors.
As both we and our competitors continuously introduce new products or refine versions of existing products, we cannot predict the level of marketacceptance or the amount of market share our new products will achieve. We have experienced delays in the introduction of new products in the past, and wecannot provide any assurances that we will not experience delays in the future. Any delays or other problems with our new product launches will adverselyaffect our operating results. In addition, introducing new products can result in decreases in revenues from our existing products. Consistent with our strategyof offering new products and product refinements, we expect to continue to use a substantial amount of funding for product development and refinement. Wemay need more funding for product development and refinement than is readily available, which could adversely affect our business, financial condition orresults of operations.
Our expansion plans in emerging markets entail significant risks.
Our strategy includes establishing a greater manufacturing and/or marketing presence in emerging markets such as China, Africa and Russia. Inaddition, we are expanding our use of component suppliers in these markets. As we progress with these efforts, it will involve a significant investment ofcapital and other resources and entail various risks. These include risks attendant to obtaining necessary governmental approvals and the construction of thefacilities in a timely manner and within cost estimates, the establishment of supply channels, the commencement of efficient manufacturing operations, and,ultimately, the acceptance of the products by our customers. While we expect the expansion to be successful, should we encounter difficulties involvingthese or similar factors, it may not be as successful as we anticipate.
We face significant competition and if we are unable to compete successfully against other agricultural equipment manufacturers, we would losecustomers and our net sales and profitability would decline.
The agricultural equipment business is highly competitive, particularly in our major markets. Our two key competitors, Deere & Company and CNHIndustrial N.V., are substantially larger than we are and have greater financial and other resources. In addition, in some markets, we compete with smallerregional competitors with significant market share in a single country or group of countries. Our competitors may substantially increase the resources devotedto the development and marketing, including discounting, of products that compete with our products. In addition, competitive pressures in the
8

Table of Contents
agricultural equipment business may affect the market prices of new and used equipment, which, in turn, may adversely affect our sales margins and results ofoperations.
We maintain an independent dealer and distribution network in the markets where we sell products. The financial and operational capabilities of ourdealers and distributors are critical to our ability to compete in these markets. In addition, we compete with other manufacturers of agricultural equipment fordealers. If we are unable to compete successfully against other agricultural equipment manufacturers, we could lose dealers and their end customers and ournet sales and profitability may decline.
Rationalization or restructuring of manufacturing facilities, and plant expansions and system upgrades at our manufacturing facilities, may causeproduction capacity constraints and inventory fluctuations.
The rationalization of our manufacturing facilities has at times resulted in, and similar rationalizations or restructurings in the future may result intemporary constraints upon our ability to produce the quantity of products necessary to fill orders and thereby complete sales in a timely manner. In addition,system upgrades at our manufacturing facilities that impact ordering, production scheduling and other related manufacturing processes are complex, andcould impact or delay production targets. A prolonged delay in our ability to fill orders on a timely basis could affect customer demand for our products andincrease the size of our product inventories, causing future reductions in our manufacturing schedules and adversely affecting our results of operations.Moreover, our continuous development and production of new products often involves the retooling of existing manufacturing facilities. This retooling maylimit our production capacity at certain times in the future, which could adversely affect our results of operations and financial condition. In addition, theexpansion and reconfiguration of existing manufacturing facilities, as well as the start up of new manufacturing operations in emerging markets, such asChina and Russia, could increase the risk of production delays, as well as require significant investments of capital.
We depend on suppliers for components, parts and raw materials for our products, and any failure by our suppliers to provide products as needed, or by usto promptly address supplier issues, will adversely impact our ability to timely and efficiently manufacture and sell products. We also are subject to rawmaterial price fluctuations, which can adversely affect our manufacturing costs.
Our products include components and parts manufactured by others. As a result, our ability to timely and efficiently manufacture existing products,to introduce new products and to shift manufacturing of products from one facility to another depends on the quality of these components and parts and thetimeliness of their delivery to our facilities. At any particular time, we depend on many different suppliers, and the failure by one or more of our suppliers toperform as needed will result in fewer products being manufactured, shipped and sold. If the quality of the components or parts provided by our suppliers isless than required and we do not recognize that failure prior to the shipment of our products, we will incur higher warranty costs. The timely supply ofcomponent parts for our products also depends on our ability to manage our relationships with suppliers, to identify and replace suppliers that fail to meet ourschedules or quality standards, and to monitor the flow of components and accurately project our needs. The shift from our existing suppliers to newsuppliers, including suppliers in emerging markets in the future, also may impact the quality and efficiency of our manufacturing capabilities, as well asimpact warranty costs. A significant increase in the price of any component or raw material could adversely affect our profitability. We cannot avoid exposureto global price fluctuations, such as occurred in the past with the costs of steel and related products, and our profitability depends on, among other things, ourability to raise equipment and parts prices sufficient enough to recover any such material or component cost increases.
A majority of our sales and manufacturing take place outside the United States, and, as a result, we are exposed to risks related to foreign laws, taxes,economic conditions, labor supply and relations, political conditions and governmental policies as well as U.S. laws governing who we sell to and how weconduct business. These risks may delay or reduce our realization of value from our international operations.
A majority of our sales are derived from sales outside the United States. The foreign countries in which we do the most significant amount ofbusiness are Germany, France, Brazil, the United Kingdom, Finland and Canada. In addition, we have significant manufacturing operations in France,Germany, Brazil, Italy and Finland and have established manufacturing operations in emerging markets, such as China. Many of our sales involve productsthat are manufactured in one country and sold in a different country and therefore, our results of operations and financial condition will be adversely affectedby adverse changes in laws, taxes and tariffs, trade restrictions, economic conditions, labor supply and relations, political conditions and governmentalpolicies of the countries in which we conduct business. Our business practices in these foreign countries must comply with U.S. law, including limitations onwhere and to whom we may sell products and the Foreign Corrupt Practices Act (“FCPA”). We have a compliance program in place designed to reduce thelikelihood of potential violations of these laws, but
9

Table of Contents
we cannot provide assurances that past violations have not occurred or that future violations will not occur. Significant violations could subject us to finesand other penalties as well as increased compliance costs. Some of our international operations also are, or might become, subject to various risks that are notpresent in domestic operations, including restrictions on dividends and the repatriation of funds. Foreign developing markets may present special risks, suchas unavailability of financing, inflation, slow economic growth, price controls and difficulties in complying with U.S. regulations.
Domestic and foreign political developments and government regulations and policies directly affect the international agricultural industry, whichaffects the demand for agricultural equipment. If demand for agricultural equipment declines, our sales, growth, results of operations and financial conditionwill be adversely affected. The application, modification or adoption of laws, regulations, trade agreements or policies adversely affecting the agriculturalindustry, including the imposition of import and export duties and quotas, expropriation and potentially burdensome taxation, could have an adverse effecton our business. The ability of our international customers to operate their businesses and the health of the agricultural industry, in general, are affected bydomestic and foreign government programs that provide economic support to farmers. As a result, farm income levels and the ability of farmers to obtainadvantageous financing and other protections would be reduced to the extent that any such programs are curtailed or eliminated. Any such reductions likelywould result in a decrease in demand for agricultural equipment. For example, a decrease or elimination of current price protections for commodities or ofsubsidy payments for farmers in the European Union, the United States, Brazil or elsewhere in South America could negatively impact the operations offarmers in those regions, and, as a result, our sales may decline if these farmers delay, reduce or cancel purchases of our products. In emerging markets, someof these (and other) risks can be greater than they might be elsewhere. In addition, in some cases, the financing provided by our joint ventures with Rabobankor by others is supported by a government subsidy or guarantee. The programs under which those subsidies and guarantees are provided generally are oflimited duration and subject to renewal and contain various caps and other limitations. In some markets, for example Brazil, this support is quite significant.In the event the governments that provide this support elect not to renew these programs, and were financing not available on reasonable terms, whetherthrough our joint ventures or otherwise, our sales would be negatively impacted.
As a result of the multinational nature of our business and the acquisitions that we have made over time, our corporate and tax structures arecomplex, with a significant portion of our operations being held through foreign holding companies. As a result, it can be inefficient, from a tax perspective,for us to repatriate or otherwise transfer funds, and we may be subject to a greater level of tax-related regulation and reviews by multiple governmental unitsthan would companies with a more simplified structure. In addition, our foreign and U.S. operations routinely sell products to, and license technology toother operations of ours. The pricing of these intra-company transactions is subject to regulation and review as well. While we make every effort to complywith all applicable tax laws, audits and other reviews by governmental units could result in our being required to pay additional taxes, interest and penalties.
On June 23, 2016, the U.K. held a referendum in which voters approved an exit from the E.U., commonly referred to as “Brexit.” As a result of thereferendum, it is expected that the British government will begin negotiating the terms of the U.K.’s future relationship with the E.U. Although it is unknownwhat those terms will be, it is possible that there will be greater restrictions on imports and exports between the U.K. and E.U. countries, increased regulatorycomplexities, and increased currency volatility, any of which could adversely affect our operations and financial results.
We can experience substantial and sustained volatility with respect to currency exchange rate and interest rate changes, which can adversely affect ourreported results of operations and the competitiveness of our products.
We conduct operations in a variety of currencies. Our production costs, profit margins and competitive position are affected by the strength of thecurrencies in countries where we manufacture or purchase goods relative to the strength of the currencies in countries where our products are sold. In addition,we are subject to currency exchange rate risk to the extent that our costs are denominated in currencies other than those in which we denominate sales and torisks associated with translating the financial statements of our foreign subsidiaries from local currencies into United States dollars. Similarly, changes ininterest rates affect our results of operations by increasing or decreasing borrowing costs and finance income. Our most significant transactional foreigncurrency exposures are the Euro, the Brazilian real and the Canadian dollar in relation to the United States dollar, and the Euro in relation to the Britishpound. Where naturally offsetting currency positions do not occur, we attempt to manage these risks by economically hedging some, but not necessarily all,of our exposures through the use of foreign currency forward exchange or option contracts. As with all hedging instruments, there are risks associated with theuse of foreign currency forward exchange or option contracts, interest rate swap agreements and other risk management contracts. While the use of suchhedging instruments provides us with protection for a finite period of time from certain fluctuations in currency exchange and interest rates, when we hedgewe forego part or all the benefits that might result from favorable fluctuations in currency exchange and interest rates. In addition, any default by thecounterparties to these transactions could
10

Table of Contents
adversely affect us. Despite our use of economic hedging transactions, currency exchange rate or interest rate fluctuations may adversely affect our results ofoperations, cash flow and financial condition.
We are subject to extensive environmental laws and regulations, including increasingly stringent engine emissions standards, and our compliance with, orour failure to comply with, existing or future laws and regulations could delay production of our products or otherwise adversely affect our business.
We are subject to increasingly stringent environmental laws and regulations in the countries in which we operate. These regulations govern, amongother things, emissions into the air, discharges into water, the use, handling and disposal of hazardous substances, waste disposal and the remediation of soiland groundwater contamination. Our costs of complying with these or any other current or future environmental regulations may be significant. For example,several countries have adopted more stringent environmental regulations regarding emissions into the air, and it is possible that new emissions-relatedlegislation or regulations will be adopted in connection with concerns regarding greenhouse gases. In addition, we may be subject to liability in connectionwith properties and businesses that we no longer own or operate. We may be adversely impacted by costs, liabilities or claims with respect to our operationsunder existing laws or those that may be adopted in the future that could apply to both future and prior conduct. If we fail to comply with existing or futurelaws and regulations, we may be subject to governmental or judicial fines or sanctions, or we may not be able to sell our products and, therefore, our businessand results of operations could be adversely affected.
In addition, the products that we manufacture or sell, particularly engines, are subject to increasingly stringent environmental regulations. As aresult, on an ongoing basis we incur significant engineering expenses and capital expenditures to modify our products to comply with these regulations.Further, we may experience production delays if we or our suppliers are unable to design and manufacture components for our products that comply withenvironmental standards. For instance, as we are required to meet more stringent engine emission reduction standards that are applicable to engines wemanufacture or incorporate into our products, we expect to meet these requirements through the introduction of new technology to our products, engines andexhaust after-treatment systems, as necessary. Failure to meet such requirements could materially affect our business and results of operations.
We are subject to SEC disclosure obligations relating to “conflict minerals” (columbite-tantalite, cassiterite (tin), wolframite (tungsten) and gold)that are sourced from the Democratic Republic of Congo or adjacent countries. Complying with these requirements has and will require us to incur additionalcosts, including the costs to determine the sources of any conflict minerals used in our products and to modify our processes or products, if required. As aresult, we may choose to modify the sourcing, supply and pricing of materials in our products. In addition, we may face reputational and regulatory risks ifthe information that we receive from our suppliers is inaccurate or inadequate, or our process in obtaining that information does not fulfill the SEC’srequirements. We have a formal policy with respect to the use of conflict minerals in our products that is intended to minimize, if not eliminate, conflictminerals sourced from the covered countries to the extent that we are unable to document that they have been obtained from conflict-free sources.
Our labor force is heavily unionized, and our contractual and legal obligations under collective bargaining agreements and labor laws subject us to therisks of work interruption or stoppage and could cause our costs to be higher.
Most of our employees, most notably at our manufacturing facilities, are subject to collective bargaining agreements and union contracts with termsthat expire on varying dates. Several of our collective bargaining agreements and union contracts are of limited duration and, therefore, must be re-negotiatedfrequently. As a result, we incur various administrative expenses associated with union representation of our employees. Furthermore, we are at greater risk ofwork interruptions or stoppages than non-unionized companies, and any work interruption or stoppage could significantly impact the volume of products wehave available for sale. In addition, collective bargaining agreements, union contracts and labor laws may impair our ability to reduce our labor costs bystreamlining existing manufacturing facilities or restructuring our business because of limitations on personnel and salary changes and similar restrictions.
We have significant pension obligations with respect to our employees and our available cash flow may be adversely affected in the event that paymentsbecame due under any pension plans that are unfunded or underfunded. Declines in the market value of the securities used to fund these obligations resultin increased pension expense in future periods.
A portion of our active and retired employees participate in defined benefit pension plans under which we are obligated to provide prescribed levelsof benefits regardless of the value of the underlying assets, if any, of the applicable pension plan. To the extent that our obligations under a plan areunfunded or underfunded, we will have to use cash flow from operations and other sources to pay our obligations either as they become due or over someshorter funding period. In addition, since the assets that we already have provided to fund these obligations are invested in debt instruments and othersecurities,
11

Table of Contents
the value of these assets varies due to market factors. Historically, these fluctuations have been significant and sometimes adverse, and there can be noassurances that they will not be significant in the future. We are also subject to laws and regulations governing the administration of our pension plans incertain countries, and the specific provisions, benefit formulas and related interpretations of such laws, regulations and provisions can be complex. Failure toproperly administer the provisions of our pension plans and comply with applicable laws and regulations could have an adverse impact to our results ofoperations. As of December 31, 2016, we had substantial unfunded or underfunded obligations related to our pension and other postretirement health carebenefits. See the notes to our Consolidated Financial Statements contained in Item 8 for more information regarding our unfunded or underfundedobligations.
Our business routinely is subject to claims and legal actions, some of which could be material. We routinely are a party to claims and legal actions incidental to our business. These include claims for personal injuries by users of farm equipment,
disputes with distributors, vendors and others with respect to commercial matters, and disputes with taxing and other governmental authorities regarding theconduct of our business. While these matters generally are not material, it is entirely possible that a matter will arise that is material to our business.
In addition, we use a broad range of technology in our products. We developed some of this technology, we license some of this technology fromothers, and some of the technology is embedded in the components that we purchase from suppliers. From time-to-time, third parties make claims that thetechnology that we use violates their patent rights. While to date none of these claims have been significant, we cannot provide any assurances that there willnot be significant claims in the future or that currently existing claims will not prove to be more significant than anticipated.
We have a substantial amount of indebtedness, and, as a result, we are subject to certain restrictive covenants and payment obligations that may adverselyaffect our ability to operate and expand our business.
Our credit facility and certain other debt agreements have various financial and other covenants that require us to maintain certain total debt toEBITDA and interest coverage ratios. In addition, the credit facility and certain other debt agreements contain other restrictive covenants such as theincurrence of indebtedness and the making of certain payments, including dividends, and are subject to acceleration in the event of default. If we fail tocomply with these covenants and are unable to obtain a waiver or amendment, an event of default would result.
If any event of default were to occur, our lenders could, among other things, declare outstanding amounts due and payable, and our cash maybecome restricted. In addition, an event of default or declaration of acceleration under our credit facility or certain other debt agreements could also result inan event of default under our other financing agreements.
Our substantial indebtedness could have other important adverse consequences such as:
• requiring us to dedicate a substantial portion of our cash flow from operations to payments on our indebtedness, which would reduce theavailability of our cash flow to fund future working capital, capital expenditures, acquisitions and other general corporate purposes;
• increasing our vulnerability to general adverse economic and industry conditions;• limiting our flexibility in planning for, or reacting to, changes in our business and the industry in which we operate;• restricting us from being able to introduce new products or pursuing business opportunities;• placing us at a competitive disadvantage compared to our competitors that may have less indebtedness; and• limiting, along with the financial and other restrictive covenants in our indebtedness, among other things, our ability to borrow additional
funds, pay cash dividends or engage in or enter into certain transactions.
Our business increasingly is subject to regulations relating to privacy and data protection, and if we violate any of those regulations or otherwise are thevictim of a cyber attack, we could incur significant losses and liability.
Increasingly the United States, the European Union and other governmental entities are imposing regulations designed to protect the collection,maintenance and transfer of personal information. Other regulations govern the collection and transfer of financial data and data security generally. Theseregulations generally impose penalties in the event of violations. In addition, we also could be subject to cyber attacks that, if successful, could compromiseour information technology systems and our ability to conduct business.
In addition, our business relies on the Internet as well as other electronic communications systems that, by their nature, may be subject to efforts byso-called “hackers” to either disrupt our business or steal data or funds. While we strive to maintain
12

Table of Contents
customary protections against hackers, there can be no assurance that at some point a hacker will breach those safeguards and damage our business, possiblymaterially.
We may encounter difficulties in integrating businesses we acquire and may not fully achieve, or achieve within a reasonable time frame, expectedstrategic objectives and other expected benefits of the acquisitions.
From time-to-time we seek to expand through acquisitions of other businesses. We expect to realize strategic and other benefits as a result of ouracquisitions, including, among other things, the opportunity to extend our reach in the agricultural industry and provide our customers with an even widerrange of products and services. However, it is impossible to predict with certainty whether, or to what extent, these benefits will be realized or whether we willbe able to integrate acquired businesses in a timely and effective manner. For example:
• the costs of integrating acquired businesses and their operations may be higher than we expect and may require significant attention from ourmanagement;
• the businesses we acquire may have undisclosed liabilities, such as environmental liabilities or liabilities for violations of laws, such as the FCPA,that we did not expect; and
• our ability to successfully carry out our growth strategies for acquired businesses will be affected by, among other things, our ability to maintain andenhance our relationships with their existing customers, our ability to provide additional product distribution opportunities to them through ourexisting distribution channels, changes in the spending patterns and preferences of customers and potential customers, fluctuating economic andcompetitive conditions and our ability to retain their key personnel.
Our ability to address these issues will determine the extent to which we are able to successfully integrate, develop and grow acquired businessesand to realize the expected benefits of these transactions. Our failure to do so could have a material adverse effect on our revenues, operating results andfinancial condition following the transactions.
Changes to United States tax, tariff and import/export regulations may have a negative effect on global economic conditions, financial markets and ourbusiness.
Leading up to and following the recent United States presidential election there have been discussions and commentary regarding potentialsignificant changes to United States trade policies, treaties, tariffs and taxes. Although it changes from period to period, we generally have substantialimports into the United States of products and components that are either produced in our foreign locations or are purchased from foreign suppliers, and alsohave substantial exports of products and components that we manufacture in the United States. The impact of any changes to current trade, tariff or taxpolicies relating to imports and exports of goods is dependent on factors such as the treatment of exports as a credit to imports, and the introduction of anytariffs or taxes relating to imports from specific countries. It is unclear what changes might be considered or implemented by the current administration,although any changes that increase the cost of international trade or otherwise impact the global economy could have a material adverse effect our business,financial condition and results of operations.
Item 1B. Unresolved Staff Comments
Not applicable.
13

Table of Contents
Item 2. Properties
Our principal manufacturing locations and/or properties as of January 31, 2017, were as follows:
Location Description of Property Leased(Sq. Ft.)
Owned(Sq. Ft.)
United States: Assumption, Illinois Manufacturing/Sales and Administrative Office 933,900Batavia, Illinois Parts Distribution 310,200 Duluth, Georgia Corporate Headquarters 159,000 Hesston, Kansas Manufacturing 1,461,800Jackson, Minnesota Manufacturing 62,300 986,400
International: Beauvais, France(1) Manufacturing 14,300 1,258,700Breganze, Italy Manufacturing 1,562,000Ennery, France Parts Distribution 1,197,300 360,300Linnavuori, Finland Manufacturing 16,600 396,300Marktoberdorf, Germany Manufacturing 115,500 1,472,000Stockerau, Austria Manufacturing 160,700Thisted, Denmark Manufacturing 133,200 295,300Suolahti, Finland Manufacturing/Parts Distribution 48,100 553,000Canoas, Brazil Regional Headquarters/Manufacturing 1,120,000Mogi das Cruzes, Brazil Manufacturing 727,200Santa Rosa, Brazil Manufacturing 512,200Changzhou, China Manufacturing 241,100 767,000
_______________________________________(1) Includes our joint venture, GIMA, in which we own a 50% interest.
We consider each of our facilities to be in good condition and adequate for its present use. We believe that we have sufficient capacity to meet ourcurrent and anticipated manufacturing requirements.
14

Table of Contents
Item 3. Legal Proceedings
The Environmental Protection Agency of Victoria, Australia (“EPA”) has provided our Australian subsidiary with a draft notice that the EPA isconsidering issuing to our subsidiary regarding remediation of contamination of a property located in a suburb of Melbourne, Australia. The property wasowned and divested by our subsidiary before our subsidiary was acquired by us. Our Australian subsidiary is in the process of reviewing the claims containedin the draft notice. At this time, we are not able to determine whether our subsidiary might have any liability, or, the nature and cost of any possible requiredremediation.
In August 2008, as part of a routine audit, the Brazilian taxing authorities disallowed deductions relating to the amortization of certain goodwillrecognized in connection with a reorganization of our Brazilian operations and the related transfer of certain assets to our Brazilian subsidiaries. The amountof the tax disallowance through December 31, 2016, not including interest and penalties, was approximately 131.5 million Brazilian reais (or approximately$40.4 million). The amount ultimately in dispute will be greater because of interest and penalties. We have been advised by our legal and tax advisors thatour position with respect to the deductions is allowable under the tax laws of Brazil. We are contesting the disallowance and believe that it is not likely thatthe assessment, interest or penalties will be required to be paid. However, the ultimate outcome will not be determined until the Brazilian tax appeal processis complete, which could take several years.
We are a party to various other legal claims and actions incidental to our business. We believe that none of these claims or actions, eitherindividually or in the aggregate, is material to our business or financial statements as a whole, including our results of operations and financial condition.
Item 4. Mine Safety Disclosures
Not Applicable.
15

Table of Contents
PART II
Item 5. Market for Registrant’s Common Equity, Related Stockholder Matters and Issuer Purchases of Equity Securities
Our common stock is listed on the New York Stock Exchange (“NYSE”) and trades under the symbol AGCO. As of the close of business onFebruary 24, 2017, the closing stock price was $61.73, and there were 338 stockholders of record (this number does not include stockholders who hold theirstock through brokers, banks and other nominees). The following table sets forth, for the periods indicated, the high and low sales prices for our commonstock for each quarter within the last two years, as reported on the NYSE, as well as the amount of the dividend paid.
High Low Dividend2016
First Quarter $ 53.35 $ 42.40 $ 0.13Second Quarter 56.00 44.68 0.13Third Quarter 50.21 45.47 0.13Fourth Quarter 61.22 48.78 0.13
High Low Dividend2015
First Quarter $ 50.95 $ 42.07 $ 0.12Second Quarter 57.26 46.13 0.12Third Quarter 57.90 43.22 0.12Fourth Quarter 51.73 41.91 0.12
Dividend Policy
On January 26, 2017, our Board of Directors approved an increase in our quarterly dividend from $0.13 per share to $0.14 per share beginning in thefirst quarter of 2017. Future dividends will be subject to our Board of Directors’ approval. We cannot provide any assurance that we will continue to paydividends in the future. Although we are in compliance with all provisions of our debt agreements, our credit facility and senior term loans containrestrictions on our ability to pay dividends in certain circumstances. Refer to Note 9 of our Consolidated Financial Statements for further information.
16

Table of Contents
Issuer Purchases of Equity Securities
The table below sets forth information with respect to purchases of our common stock made by or on behalf of us during the three months endedDecember 31, 2016:
Period Total Number ofShares Purchased
Average Price Paidper Share
Total Number ofShares Purchased as
Part of PubliclyAnnounced Plans
or Programs(1)
Maximum ApproximateDollar Value of Shares that
May Yet Be PurchasedUnder the Plans or Programs
(in millions)(1)(2)(3)
October 1, 2016 through October 31, 2016 — $ — — $ 73.9November 1, 2016 through November 30, 2016 (2)(3) 804,482 $ 50.95 804,482 $ 31.4December 1, 2016 through December 31, 2016 — $ — — $ 331.4Total 804,482 $ 50.95 804,482 $ 331.4____________________________________(1) In December 2016, our Board of Directors approved a new share repurchase authorization under which we can repurchase an additional $300.0 million of shares of our common
stock through December 2019.
(2) In August 2016, we entered into an accelerated share repurchase (“ASR”) agreement with a third-party financial institution to repurchase $50.0 million of shares of our commonstock. The ASR agreement resulted in the initial delivery of 851,426 shares of our common stock, representing 80% of the shares expected to be repurchased in connection withthe transaction. In November 2016, the remaining 165,624 shares under the ASR agreement were delivered. As reflected in the table above, the average price paid per share forthe ASR agreement was the volume-weighted average stock price of our common stock over the term of the ASR agreement. Refer to Note 9 of our Consolidated FinancialStatements contained in Item 8, “Financial Statements and Supplementary Data,” for a further discussion of this matter.
(3) In November 2016, we entered into an ASR agreement with a third-party financial institution to repurchase $42.5 million of shares of our common stock. The ASR agreementresulted in the initial delivery of 638,858 shares of our common stock, representing 80% of the shares expected to be repurchased in connection with the transaction. In February2017, the remaining 70,464 shares under the ASR agreement were delivered. The average price paid per share for the ASR agreement reflected in the table above was derivedusing the fair market value of the shares on the date the initial 638,858 shares were delivered. The amount that may yet be purchased under our share repurchase programs, aspresented in the above table, was reduced by the entire $42.5 million payment. Refer to Note 9 of our Consolidated Financial Statements contained in Item 8, “FinancialStatements and Supplementary Data,” for a further discussion of this matter.
17

Table of Contents
Item 6. Selected Financial Data
The following tables present our selected consolidated financial data. The data set forth below should be read together with Item 7, “Management’sDiscussion and Analysis of Financial Condition and Results of Operations,” and our historical Consolidated Financial Statements and the related notes. TheConsolidated Financial Statements as of December 31, 2016 and 2015 and for the years ended December 31, 2016, 2015 and 2014 and the reports thereon areincluded in Item 8, “Financial Statements and Supplementary Data,” in this Form 10-K. The historical financial data may not be indicative of our futureperformance.
Years Ended December 31, 2016 2015 2014 2013 2012 (In millions, except per share data)
Operating Data: Net sales $ 7,410.5 $ 7,467.3 $ 9,723.7 $ 10,786.9 $ 9,962.2Gross profit 1,515.5 1,560.6 2,066.3 2,390.6 2,123.2Income from operations 288.4 361.1 646.5 900.7 693.2Net income 160.2 264.0 404.2 592.3 516.4Net (income) loss attributable to noncontrolling interests (0.1) 2.4 6.2 4.9 5.7Net income attributable to AGCO Corporation and
subsidiaries $ 160.1 $ 266.4 $ 410.4 $ 597.2 $ 522.1Net income per common share — diluted $ 1.96 $ 3.06 $ 4.36 $ 6.01 $ 5.30Cash dividends declared and paid per common share $ 0.52 $ 0.48 $ 0.44 $ 0.40 $ —Weighted average shares outstanding — diluted 81.7 87.1 94.2 99.4 98.6
As of December 31, 2016 2015 2014 2013 2012 (In millions, except number of employees)
Balance Sheet Data: Cash and cash equivalents $ 429.7 $ 426.7 $ 363.7 $ 1,047.2 $ 781.3Total assets (1) 7,168.4 6,497.7 7,364.5 8,390.2 7,693.3Total long-term debt, excluding current portion 1,610.0 925.2 993.3 932.9 1,028.7Stockholders’ equity 2,837.2 2,883.3 3,496.9 4,044.8 3,481.5Other Data: Number of employees 19,795 19,588 20,828 22,111 20,320
_______________________________________(1) In 2016, the Company adopted Accounting Standards Update (“ASU”) 2015-03 “Simplifying the Presentation of Debt Issuance Costs” (“ASU 2015-03”), which requires the
presentation of debt issuance costs in the balance sheet as a direct deduction from the carrying amount of the related debt liability instead of a deferred charge (an asset). Therequirements of ASU 2015-03 have been applied retrospectively to all periods presented.
18

Table of Contents
Item 7. Management’s Discussion and Analysis of Financial Condition and Results of Operations
We are a leading manufacturer and distributor of agricultural equipment and related replacement parts throughout the world. We sell a full range ofagricultural equipment, including tractors, combines, self-propelled sprayers, hay tools, forage equipment, seeding and tillage equipment, implements, andgrain storage and protein production systems. Our products are widely recognized in the agricultural equipment industry and are marketed under a number ofwell-known brand names, including: Challenger®, Fendt®, GSI®, Massey Ferguson® and Valtra®. We distribute most of our products through a combinationof over 3,000 dealers and distributors as well as associates and licensees. In addition, we provide retail financing through our finance joint ventures withRabobank.
Financial Highlights
We sell our equipment and replacement parts to our independent dealers, distributors and other customers. A large majority of our sales are toindependent dealers and distributors that sell our products to end users. To the extent practicable, we attempt to sell products to our dealers and distributorson a level basis throughout the year to reduce the effect of seasonal demands on our manufacturing operations and to minimize our investment in inventories.However, retail sales by dealers to farmers are highly seasonal and are linked to the planting and harvesting seasons. In certain markets, particularly in NorthAmerica, there is often a time lag, which varies based on the timing and level of retail demand, between our sale of the equipment to the dealer and thedealer’s sale to a retail customer.
The following table sets forth, for the periods indicated, the percentage relationship to net sales of certain items included in our Consolidated
Statements of Operations:
Years Ended December 31, 2016 (1) 2015 (1) 2014 (1)
Net sales 100.0 % 100.0% 100.0%Cost of goods sold 79.5 79.1 78.7
Gross profit 20.5 20.9 21.3Selling, general and administrative expenses 11.7 11.4 10.2Engineering expenses 4.0 3.8 3.5Restructuring expenses 0.2 0.3 0.5Amortization of intangibles 0.7 0.6 0.4
Income from operations 3.9 4.8 6.6Interest expense, net 0.7 0.6 0.6Other expense, net 0.4 0.5 0.5Income before income taxes and equity in net earnings of affiliates 2.8 3.7 5.5Income tax provision 1.2 1.0 1.9Income before equity in net earnings of affiliates 1.5 2.8 3.6Equity in net earnings of affiliates 0.6 0.8 0.5Net income 2.2 3.5 4.2Net loss attributable to noncontrolling interests — — 0.1Net income attributable to AGCO Corporation and subsidiaries 2.2 % 3.6% 4.2%____________________________________(1) Rounding may impact summation of amounts.
2016 Compared to 2015
Net income attributable to AGCO Corporation and subsidiaries for 2016 was $160.1 million, or $1.96 per diluted share, compared to net income for2015 of $266.4 million, or $3.06 per diluted share.
Net sales for 2016 were approximately $7,410.5 million, or 0.8% lower than 2015, primarily due to continued weakening global market conditionsand the unfavorable impact of currency translation. Income from operations was $288.4 million in 2016 compared to $361.1 million in 2015. The decrease inincome from operations during 2016 was a result of decreased production levels, a weaker sales mix and negative currency translation impacts.
19

Table of Contents
Regionally, income from operations in North American and South American regions decreased approximately $84.3 million and $14.5 million,respectively, in 2016 compared to 2015. Lower sales and production volumes, a weaker product mix and other cost increases contributed to a reduction inincome from operations in North America. In South America, lower margins due primarily to material cost inflation and the negative impact of currencytranslation adversely impacted income from operations. Income from operations in our Europe/Africa/Middle East (“EAME”), and the Asia/Pacific regionincreased approximately $1.0 million and $39.0 million, respectively, in 2016 compared to 2015. Income from operations in EAME benefited from highernet sales but was negatively impacted by unfavorable currency translation impacts. In the Asia/Pacific region, operating results were bolstered by thesignificant growth in net sales in the region as well as increased small tractor production levels in China.
Industry Market Conditions
A record grain harvest in the U.S., combined with healthy crop production across Europe and South America, resulted in increased global graininventories and low soft commodity prices during 2016. As a result, deteriorating farm economics negatively impacted both farmer sentiment and industryequipment demand in all major markets. In North America, industry demand declined during 2016, particularly in the row crop and professional hay producersectors, with significantly lower industry retail sales of high-horsepower tractors, combines, sprayers, and grain storage and handling equipment. Industrydemand in South America stabilized throughout 2016. While market conditions in Brazil declined for the full year of 2016 compared to 2015, stronger farmfundamentals in the second half of the year helped to overcome previous weaknesses caused by political uncertainty and depressed economic conditions.Supportive government policies and improved crop production in Argentina also resulted in higher industry sales in that market. Industry retail demand wasalso lower in Western Europe during 2016 as compared to 2015 levels. Difficult economic conditions for dairy producers and lower commodity prices in thearable farming sector negatively impacted demand across the region. Declines were most pronounced in France and Germany, partially offset by modestgrowth in Finland and Scandinavia.
In the United States and Canada, industry unit retail sales of tractors over 40 horsepower decreased approximately 10%, while industry unit retailsales of combines decreased approximately 21% in 2016 compared to 2015. Industry unit retail sales of lower horsepower tractors were stable, while unitretail sales declines of high horsepower tractors, sprayers and combines declined significantly. In South America, industry unit retail sales of tractorsdecreased approximately 6% in 2016 compared to 2015. Industry retail sales of combines in South America increased approximately 14% during 2016compared to 2015. Industry sales declines of tractors were most pronounced in Brazil and other South American markets, while industry sales increases ofcombines were principally in Brazil and Argentina. As previously discussed, a more favorable political landscape in the region in the second half of 2016positively impacted market demand. In Western Europe, industry unit retail sales of tractors and combines decreased approximately 4% and 14%,respectively, in 2016 compared to 2015. The most significant declines were in France and Germany.
Results of Operations
Net sales for 2016 were $7,410.5 million compared to $7,467.3 million for 2015, primarily due to softer global market conditions and theunfavorable impact of foreign currency translation. Foreign currency translation negatively impacted net sales during 2016 as compared to 2015 byapproximately $196.0 million, or approximately 2.6%, primarily due to the weakening of the Euro and the Brazilian real. Acquisitions positively impactednet sales during 2016 as compared to 2015 by approximately $173.2 million, or 2.3%. The following table sets forth, for the year ended December 31, 2016,the impact to net sales of currency translation by geographical segment (in millions, except percentages):
Change Change due to Currency
Translation 2016 2015 $ % $ %
North America $ 1,807.7 $ 1,965.0 $ (157.3) (8.0)% $ (25.9) (1.3)%South America 917.5 949.0 (31.5) (3.3)% (72.2) (7.6)%EAME 4,206.0 4,151.3 54.7 1.3 % (90.0) (2.2)%Asia/Pacific 479.3 402.0 77.3 19.2 % (7.9) (2.0)% $ 7,410.5 $ 7,467.3 $ (56.8) (0.8)% $ (196.0) (2.6)%
20

Table of Contents
Regionally, net sales in North America decreased during 2016 compared to 2015, with the most significant decreases in grain storage equipment,sprayers and hay tools, partially offset by net sales growth of low and mid-sized horsepower tractors. Net sales were lower in South America in 2016compared to 2015. Higher net sales in Argentina were partially offset by lower net sales in Brazil and other South American markets. In the EAME region,net sales were relatively flat in 2016 compared to 2015, with growth in the United Kingdom and Scandinavia mostly offset by declines in France, Germanyand Africa. In the Asia/Pacific region, net sales increased in 2016 compared to 2015, primarily due to a significant growth in sales in China. We estimate thatworldwide average price increases were approximately 1.5% and 1.8% in 2016 and 2015, respectively. Consolidated net sales of tractors and combines,which consisted of approximately 61% of our net sales in 2016, decreased approximately 1.0% in 2016 compared to 2015. Unit sales of tractors andcombines decreased approximately 1.5% during 2016 compared to 2015. The unit sales decrease and the decrease in net sales can differ due to foreigncurrency translation, pricing and sales mix changes.
The following table sets forth, for the years ended December 31, 2016 and 2015, the percentage relationship to net sales of certain items included inour Consolidated Statements of Operations (in millions, except percentages):
2016 2015
$ % of
Net Sales $ % of
Net SalesGross profit $ 1,515.5 20.5% $ 1,560.6 20.9%
Selling, general and administrative expenses 867.9 11.7% 852.3 11.4%Engineering expenses 296.1 4.0% 282.2 3.8%Restructuring expenses 11.9 0.2% 22.3 0.3%Amortization of intangibles 51.2 0.7% 42.7 0.6%
Income from operations $ 288.4 3.9% $ 361.1 4.8%
Gross profit as a percentage of net sales decreased during 2016 compared to 2015, primarily due to lower production levels, a weaker product mixand other cost increases, including higher warranty expenses. The benefits from material cost containment and productivity initiatives helped to partiallyoffset these negative impacts. Production hours decreased approximately 5% during 2016 compared to 2015. We recorded stock compensation expense ofapproximately $1.5 million and $0.9 million during 2016 and 2015, respectively, within cost of goods sold, as is more fully explained in Note 10 of ourConsolidated Financial Statements.
Selling, general and administrative expenses (“SG&A expenses”) and engineering expenses both increased in dollars and as a percentage of net salesduring 2016 compared to 2015. The increases in SG&A and engineering expenses were primarily the result of acquisitions during 2016. Engineeringexpenses also increased during 2016 to support investments in future new product introductions. We recorded stock compensation expense of approximately$16.9 million and $11.6 million during 2016 and 2015, respectively, within SG&A expenses, as is more fully explained in Note 10 of our ConsolidatedFinancial Statements.
We recorded restructuring expenses of approximately $11.9 million and $22.3 million during 2016 and 2015, respectively. The restructuringexpenses recorded in 2016 and 2015 primarily related to severance and related costs associated with the rationalization of employee headcount at variousmanufacturing facilities and administrative offices located in Europe, China, South America and the United States.
Interest expense, net was $52.1 million for 2016 compared to $45.4 million for 2015. The increase was primarily due to higher outstandingindebtedness. See “Liquidity and Capital Resources” for further information.
Other expense, net was $31.4 million in 2016 compared to $36.3 million in 2015. The decrease was primarily due to lower foreign exchange lossesin 2016 as compared to 2015. Losses on sales of receivables, primarily related to our accounts receivable sales agreements with our finance joint ventures inNorth America, Europe and Brazil, were approximately $19.5 million and $18.8 million in 2016 and 2015, respectively.
We recorded an income tax provision of $92.2 million in 2016 compared to $72.5 million in 2015. Our tax provision and effective tax rate isimpacted by the differing tax rates of the various tax jurisdictions in which we operate, permanent differences for items treated differently for financialaccounting and income tax purposes and for losses in jurisdictions where no income tax benefit is recorded. During 2016, we also recorded a non-cashdeferred tax adjustment to establish a valuation
21

Table of Contents
allowance against our U.S. net deferred income tax assets. A valuation allowance is established when it is more likely than not that some portion or all of acompany’s deferred tax assets will not be realized. We assessed the likelihood that our deferred tax assets would be recovered from estimated future taxableincome and available income tax planning strategies. At December 31, 2016 and 2015, we had gross deferred tax assets of $447.4 million and $390.0 million,respectively, including $85.5 million and $74.0 million, respectively, related to net operating loss carryforwards. At December 31, 2016, we had totalvaluation allowances as an offset to our gross deferred tax assets of $116.0 million, which included allowances against net operating loss carryforwards inBrazil, China, Russia and the Netherlands, as well as allowances against our net deferred taxes in the U.S., as previously discussed. At December 31, 2015, wehad total valuation allowances as an offset to the gross deferred tax assets of approximately $75.8 million, primarily related to net operating losscarryforwards in Brazil, China, Russia and the Netherlands. Realization of the remaining deferred tax assets as of December 31, 2016 will depend ongenerating sufficient taxable income in future periods, net of reversing deferred tax liabilities. We believe it is more likely than not that the remaining netdeferred tax assets will be realized.
Equity in net earnings of affiliates, which is primarily comprised of income from our finance joint ventures, was $47.5 million in 2016 compared to$57.1 million in 2015 primarily due to declining operating results as a consequence of weaker market conditions. Refer to “Finance Joint Ventures” forfurther information regarding our finance joint ventures and their results of operations and to Note 5 of our Consolidated Financial Statements.
2015 Compared to 2014
Net income attributable to AGCO Corporation and subsidiaries for 2015 was $266.4 million, or $3.06 per diluted share, compared to net income for2014 of $410.4 million, or $4.36 per diluted share.
Net sales for 2015 were approximately $7,467.3 million, or 23.2% lower than 2014, primarily due to softer global market conditions and theunfavorable impact of currency translation. Income from operations was $361.1 million in 2015 compared to $646.5 million in 2014. The decrease in incomefrom operations during 2015 was a result of lower net sales in all of our geographical segments, decreased production volumes, a weaker sales mix andcurrency translation impacts.
Regionally, income from operations in our Europe/Africa/Middle East (“EAME”), South American and North American regions decreased
approximately $83.5 million, $99.6 million and $95.8 million, respectively, in 2015 compared to 2014 as a result of lower net sales and production levels, anunfavorable sales mix and the negative impact of currency translation. These adverse impacts have been partially mitigated by headcount and cost reductioninitiatives. Loss from operations in the Asia/Pacific region increased approximately $16.1 million in 2015 compared to 2014 primarily due to lower net salesand increased market development costs in China.
Industry Market Conditions
Record crop production and elevated commodity inventories resulted in lower farm income and weakened demand for farm equipment in all majormarkets during 2015 as compared to 2014. In North America, industry demand was significantly lower for high horsepower tractors, combines and sprayers,which primarily are used in row crop applications. Industry demand in South America deteriorated significantly throughout 2015. In Brazil, demand wasextremely low due to weakness in the general economy, funding interruptions in the government financing program and softness in the sugarcane sector. InWestern Europe, industry demand declines from 2014 levels were less pronounced. Poor economics for dairy producers and lower commodity prices in thearable farming sector pressured demand.
In the United States and Canada, industry unit retail sales of tractors and combines decreased approximately 3% and 28%, respectively, in 2015compared to 2014. The most significant declines were experienced in the row crop sector, impacting demand for high horsepower tractors, combines andsprayers. These declines were partially offset by stable industry sales in lower horsepower tractors. In South America, industry unit retail sales of tractors andcombines decreased approximately 28% and 39%, respectively, in 2015 compared to 2014. Declines were most pronounced in Brazil and other SouthAmerican markets. In Western Europe, industry unit retail sales of tractors and combines decreased approximately 4% and 10%, respectively, in 2015compared to 2014. The most significant declines were in the United Kingdom, Finland and Germany.
22
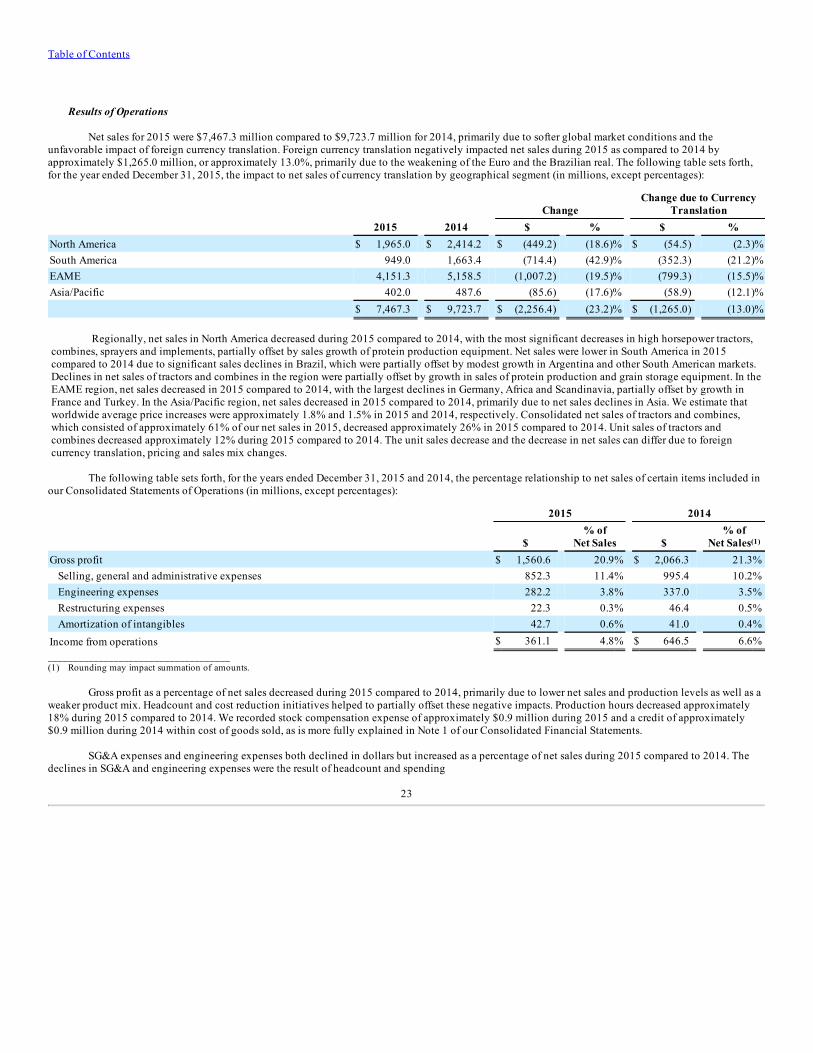
Table of Contents
Results of Operations
Net sales for 2015 were $7,467.3 million compared to $9,723.7 million for 2014, primarily due to softer global market conditions and theunfavorable impact of foreign currency translation. Foreign currency translation negatively impacted net sales during 2015 as compared to 2014 byapproximately $1,265.0 million, or approximately 13.0%, primarily due to the weakening of the Euro and the Brazilian real. The following table sets forth,for the year ended December 31, 2015, the impact to net sales of currency translation by geographical segment (in millions, except percentages):
Change Change due to Currency
Translation 2015 2014 $ % $ %
North America $ 1,965.0 $ 2,414.2 $ (449.2) (18.6)% $ (54.5) (2.3)%South America 949.0 1,663.4 (714.4) (42.9)% (352.3) (21.2)%EAME 4,151.3 5,158.5 (1,007.2) (19.5)% (799.3) (15.5)%Asia/Pacific 402.0 487.6 (85.6) (17.6)% (58.9) (12.1)% $ 7,467.3 $ 9,723.7 $ (2,256.4) (23.2)% $ (1,265.0) (13.0)%
Regionally, net sales in North America decreased during 2015 compared to 2014, with the most significant decreases in high horsepower tractors,combines, sprayers and implements, partially offset by sales growth of protein production equipment. Net sales were lower in South America in 2015compared to 2014 due to significant sales declines in Brazil, which were partially offset by modest growth in Argentina and other South American markets.Declines in net sales of tractors and combines in the region were partially offset by growth in sales of protein production and grain storage equipment. In theEAME region, net sales decreased in 2015 compared to 2014, with the largest declines in Germany, Africa and Scandinavia, partially offset by growth inFrance and Turkey. In the Asia/Pacific region, net sales decreased in 2015 compared to 2014, primarily due to net sales declines in Asia. We estimate thatworldwide average price increases were approximately 1.8% and 1.5% in 2015 and 2014, respectively. Consolidated net sales of tractors and combines,which consisted of approximately 61% of our net sales in 2015, decreased approximately 26% in 2015 compared to 2014. Unit sales of tractors andcombines decreased approximately 12% during 2015 compared to 2014. The unit sales decrease and the decrease in net sales can differ due to foreigncurrency translation, pricing and sales mix changes.
The following table sets forth, for the years ended December 31, 2015 and 2014, the percentage relationship to net sales of certain items included inour Consolidated Statements of Operations (in millions, except percentages):
2015 2014
$ % of
Net Sales $ % of
Net Sales(1)
Gross profit $ 1,560.6 20.9% $ 2,066.3 21.3%Selling, general and administrative expenses 852.3 11.4% 995.4 10.2%Engineering expenses 282.2 3.8% 337.0 3.5%Restructuring expenses 22.3 0.3% 46.4 0.5%Amortization of intangibles 42.7 0.6% 41.0 0.4%
Income from operations $ 361.1 4.8% $ 646.5 6.6%____________________________________(1) Rounding may impact summation of amounts.
Gross profit as a percentage of net sales decreased during 2015 compared to 2014, primarily due to lower net sales and production levels as well as aweaker product mix. Headcount and cost reduction initiatives helped to partially offset these negative impacts. Production hours decreased approximately18% during 2015 compared to 2014. We recorded stock compensation expense of approximately $0.9 million during 2015 and a credit of approximately$0.9 million during 2014 within cost of goods sold, as is more fully explained in Note 1 of our Consolidated Financial Statements.
SG&A expenses and engineering expenses both declined in dollars but increased as a percentage of net sales during 2015 compared to 2014. Thedeclines in SG&A and engineering expenses were the result of headcount and spending
23

Table of Contents
reductions as well as the impact of foreign currency translation. We recorded stock compensation expense of approximately $11.6 million during 2015 and acredit of $9.7 million during 2014 within SG&A expenses, as is more fully explained in Note 1 of our Consolidated Financial Statements. The credit recordedin 2014 included approximately $16.9 million for the reversal of previously recorded long-term stock compensation expense.
We recorded restructuring expenses of approximately $22.3 million and $46.4 million during 2015 and 2014, respectively. The restructuringexpenses recorded in 2015 and 2014 primarily related to severance and related costs associated with the rationalization of employee headcount at variousmanufacturing facilities and administrative offices located in Europe, China, South America and the United States.
Interest expense, net was $45.4 million for 2015 compared to $58.4 million for 2014. The decrease was primarily due to higher interest income andlower interest rates on outstanding indebtedness. See “Liquidity and Capital Resources” for further information.
Other expense, net was $36.3 million in 2015 compared to $49.1 million in 2014. The decrease was primarily due to lower foreign exchange lossesand decreased losses on sales of receivables in 2015 as compared to 2014. Losses on sales of receivables, primarily related to our accounts receivable salesagreements with our finance joint ventures in North America, Europe and Brazil, were approximately $18.8 million and $24.8 million in 2015 and 2014,respectively.
We recorded an income tax provision of $72.5 million in 2015 compared to $187.7 million in 2014. Our tax provision and effective tax rate isimpacted by the differing tax rates of the various tax jurisdictions in which we operate, permanent differences for items treated differently for financialaccounting and income tax purposes and for losses in jurisdictions where no income tax benefit is recorded.
A valuation allowance is established when it is more likely than not that some portion or all of a company’s deferred tax assets will not be realized.We assessed the likelihood that our deferred tax assets would be recovered from estimated future taxable income and available income tax planningstrategies. At December 31, 2015 and 2014, we had gross deferred tax assets of $390.0 million and $430.0 million, respectively, including $74.0 million and$75.7 million, respectively, related to net operating loss carryforwards. At December 31, 2015, we had total valuation allowances as an offset to the grossdeferred tax assets of $75.8 million, primarily related to net operating loss carryforwards in Brazil, China, Russia and the Netherlands. At December 31, 2014,we had total valuation allowances as an offset to the gross deferred tax assets of approximately $93.3 million, primarily related to net operating losscarryforwards in Brazil, China, Russia and the Netherlands.
Equity in net earnings of affiliates, which is primarily comprised of income from our finance joint ventures, was $57.1 million in 2015 compared to$52.9 million in 2014. Refer to “Finance Joint Ventures” for further information regarding our finance joint ventures and their results of operations and toNote 5 of our Consolidated Financial Statements.
24

Table of Contents
Quarterly Results
The following table presents unaudited interim operating results. We believe that the following information includes all adjustments, consistingonly of normal recurring adjustments, necessary to present fairly our results of operations for the periods presented.
Three Months Ended March 31 June 30 September 30 December 31 (In millions, except per share data)
2016: Net sales $ 1,559.3 $ 1,995.6 $ 1,761.6 $ 2,094.0Gross profit 314.7 427.0 353.5 420.3Income from operations 19.4 118.6 59.0 91.4Net income 10.2 49.4 39.4 61.2Net (income) loss attributable to noncontrolling interests (2.4) 0.9 0.6 0.8Net income attributable to AGCO Corporation and subsidiaries 7.8 50.3 40.0 62.0Net income per common share attributable to AGCO Corporation
and subsidiaries — diluted 0.09 0.61 0.50 0.772015: Net sales $ 1,702.6 $ 2,069.3 $ 1,736.4 $ 1,959.0Gross profit 347.9 449.6 365.7 397.4Income from operations 46.8 149.9 79.1 85.3Net income 29.9 105.6 67.2 61.3Net loss (income) attributable to noncontrolling interests 0.2 1.5 (0.1) 0.8Net income attributable to AGCO Corporation and subsidiaries 30.1 107.1 67.1 62.1Net income per common share attributable to AGCO Corporation and
subsidiaries — diluted 0.34 1.22 0.77 0.73
Finance Joint Ventures
Our AGCO Finance joint ventures provide both retail financing and wholesale financing to our dealers in the United States, Canada, Europe, Brazil,Argentina and Australia. The joint ventures are owned by AGCO and by a wholly owned subsidiary of Rabobank, a financial institution based in theNetherlands. The majority of the assets of the finance joint ventures consist of finance receivables. The majority of the liabilities consist of notes payable andaccrued interest. Under the various joint venture agreements, Rabobank or its affiliates provide financing to the joint ventures, primarily through lines ofcredit. We do not guarantee the debt obligations of the joint ventures. As of December 31, 2016, our capital investment in the finance joint ventures, which isincluded in “Investment in affiliates” on our Consolidated Balance Sheets, was approximately $380.8 million compared to $359.4 million as ofDecember 31, 2015. The total finance portfolio in our finance joint ventures was approximately $8.0 billion as of both December 31, 2016 and 2015. Thetotal finance portfolio as of both December 31, 2016 and 2015 included approximately $6.7 billion of retail receivables and $1.3 billion of wholesalereceivables from AGCO dealers. The wholesale receivables either were sold directly to AGCO Finance without recourse from our operating companies orAGCO Finance provided the financing directly to the dealers. During 2016, we made a total of approximately $2.8 million of additional investments in ourretail finance joint venture in the Netherlands, primarily related to additional capital required as a result of an increased finance portfolio during 2016.During both 2015 and 2014, we did not make additional investments in our finance joint ventures. Our share in the earnings of the finance joint ventures,included in “Equity in net earnings of affiliates” within our Consolidated Statements of Operations, was $45.5 million and $53.8 million for the years endedDecember 31, 2016 and 2015, respectively.
25

Table of Contents
Outlook
Our operations are subject to the cyclical nature of the agricultural industry. Sales of our equipment have been and are expected to continue to beaffected by changes in net cash farm income, farm land values, weather conditions, the demand for agricultural commodities, farm industry related legislation,availability of financing and general economic conditions.
Weak industry demand in North America and Europe is expected to continue into 2017, partially offset by growth in South American markets. Increased global grain inventories and low soft commodity prices, which contributed to reduced farm income, continue to impact developed agriculturalmarkets. Our net sales are expected to be relatively flat in 2017 compared to 2016, primarily due to projected industry declines in North America and Europeand unfavorable currency translation impacts, largely offset by sales growth in South America, the impact of acquisitions, pricing and market shareimprovements. We are targeting to improve gross and operating margins from 2016 levels as a result of cost reduction efforts, partially offset by a weakersales mix.
Recent Acquisitions
On September 12, 2016, we acquired Cimbria Holdings Limited (“Cimbria”) for DKK 2,234.9 million (or approximately $337.5 million), net of cashacquired of approximately DKK 83.4 million (or approximately $12.6 million). Cimbria, headquartered in Thisted, Denmark, is a leading manufacturer ofproducts and solutions for the processing, handling and storage of seed and grain. The acquisition was financed through our credit facility (see Note 7 of ourConsolidated Financial Statements for further information). We allocated the purchase price to the assets acquired and liabilities assumed based onpreliminary estimates of their fair values as of the acquisition date. The acquired assets primarily consisted of accounts receivable, inventories, accountspayable and accrued expenses, customer advances, property, plant and equipment, and customer relationship, technology and trademark identifiableintangible assets. We recorded approximately $128.9 million of customer relationship, technology and trademark identifiable intangible assets andapproximately $237.9 million of goodwill associated with the acquisition.
On February 2, 2016, we acquired Tecno Poultry Equipment S.p.A (“Tecno”) for approximately €58.7 million (or approximately $63.8 million). Weacquired cash of approximately €17.6 million (or approximately $19.1 million) associated with the acquisition. Tecno, headquartered in Ronchi DiVillafranca, Italy, manufactures and supplies poultry housing and related products, including egg collection equipment and trolley feeding systems. Theacquisition was financed through our credit facility (refer to Note 7 of our Consolidated Financial Statements for further information). We allocated thepurchase price to the assets acquired and liabilities assumed based on their fair values as of the acquisition date. The acquired net assets primarily consistedof accounts receivable, inventories, accounts payable and accrued expenses, deferred revenue, property, plant and equipment and customer relationship,technology and trademark identifiable intangible assets. We recorded approximately $27.5 million of customer relationship, technology and trademarkidentifiable intangible assets and approximately $20.4 million of goodwill associated with the acquisition.
On April 17, 2015, we acquired Farmer Automatic GmbH & Co. KG (“Farmer Automatic”) for approximately $17.9 million, net of cash acquired ofapproximately $0.1 million. Farmer Automatic, headquartered in Laer, Germany, manufactures and supplies poultry housing and related products, includingegg production cages and broiler production equipment. The acquisition was financed with available cash on hand. We allocated the purchase price to theassets acquired and liabilities assumed based on their fair values as of the acquisition date. The acquired net assets primarily consisted of accounts receivable,inventories, accounts payable and accrued expenses, property, plant and equipment, and customer relationship, technology and trademark identifiableintangible assets. We recorded approximately $9.6 million of customer relationship, technology and trademark identifiable intangible assets andapproximately $10.0 million of goodwill associated with the acquisition.
On August 1, 2014, we acquired Intersystems Holdings, Inc. (“Intersystems”) for approximately $130.3 million, net of cash acquired of
approximately $4.1 million. Intersystems, headquartered in Omaha, Nebraska, designs and manufactures commercial material handling solutions, primarilyfor the agricultural, biofuels and food and feed processing industries. The acquisition was financed with available cash on hand and our credit facility (referto Note 7 of our Consolidated Financial Statements for further information). We allocated the purchase price to the assets acquired and liabilities assumedbased on their fair values as of the acquisition date. The acquired net assets primarily consisted of accounts receivable, inventories, accounts payable andaccrued expenses, property, plant and equipment, and customer relationship, technology and trademark identifiable intangible assets. We recordedapproximately $46.3 million of customer relationship, technology and trademark identifiable intangible assets and approximately $89.6 million of goodwillassociated with the acquisition.
26
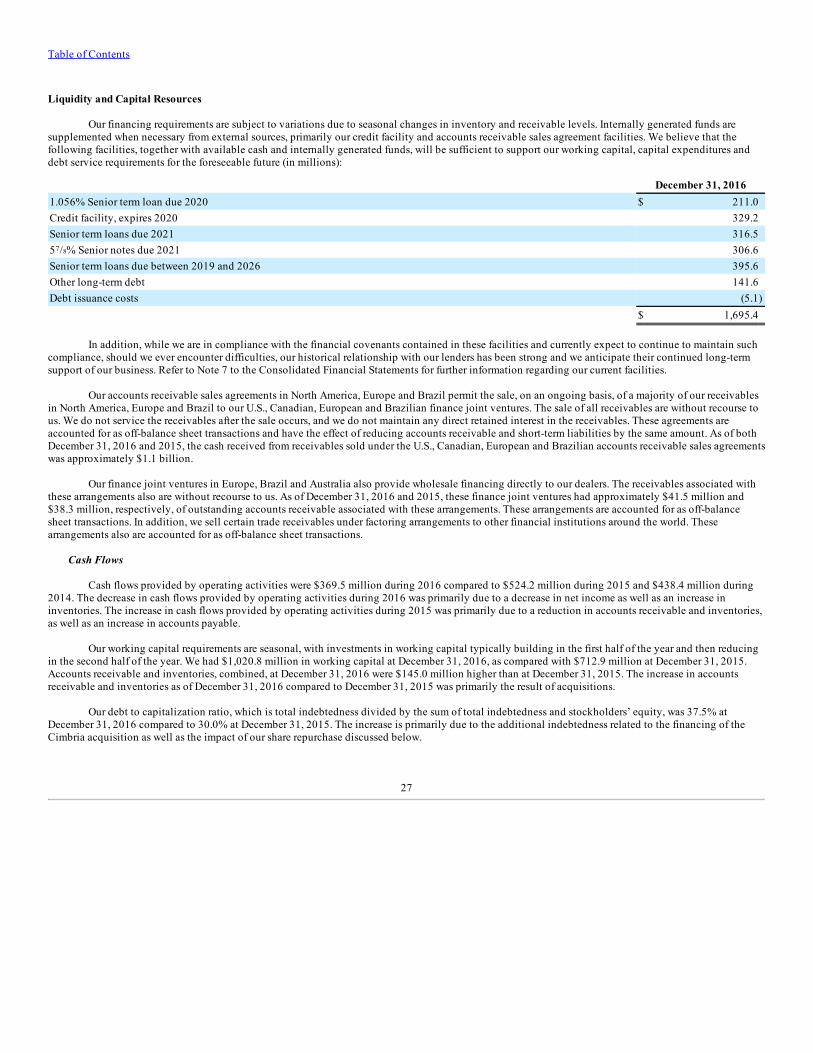
Table of Contents
Liquidity and Capital Resources
Our financing requirements are subject to variations due to seasonal changes in inventory and receivable levels. Internally generated funds aresupplemented when necessary from external sources, primarily our credit facility and accounts receivable sales agreement facilities. We believe that thefollowing facilities, together with available cash and internally generated funds, will be sufficient to support our working capital, capital expenditures anddebt service requirements for the foreseeable future (in millions):
December 31, 20161.056% Senior term loan due 2020 $ 211.0Credit facility, expires 2020 329.2Senior term loans due 2021 316.557/8% Senior notes due 2021 306.6Senior term loans due between 2019 and 2026 395.6Other long-term debt 141.6Debt issuance costs (5.1) $ 1,695.4
In addition, while we are in compliance with the financial covenants contained in these facilities and currently expect to continue to maintain suchcompliance, should we ever encounter difficulties, our historical relationship with our lenders has been strong and we anticipate their continued long-termsupport of our business. Refer to Note 7 to the Consolidated Financial Statements for further information regarding our current facilities.
Our accounts receivable sales agreements in North America, Europe and Brazil permit the sale, on an ongoing basis, of a majority of our receivables
in North America, Europe and Brazil to our U.S., Canadian, European and Brazilian finance joint ventures. The sale of all receivables are without recourse tous. We do not service the receivables after the sale occurs, and we do not maintain any direct retained interest in the receivables. These agreements areaccounted for as off-balance sheet transactions and have the effect of reducing accounts receivable and short-term liabilities by the same amount. As of bothDecember 31, 2016 and 2015, the cash received from receivables sold under the U.S., Canadian, European and Brazilian accounts receivable sales agreementswas approximately $1.1 billion.
Our finance joint ventures in Europe, Brazil and Australia also provide wholesale financing directly to our dealers. The receivables associated withthese arrangements also are without recourse to us. As of December 31, 2016 and 2015, these finance joint ventures had approximately $41.5 million and$38.3 million, respectively, of outstanding accounts receivable associated with these arrangements. These arrangements are accounted for as off-balancesheet transactions. In addition, we sell certain trade receivables under factoring arrangements to other financial institutions around the world. Thesearrangements also are accounted for as off-balance sheet transactions.
Cash Flows
Cash flows provided by operating activities were $369.5 million during 2016 compared to $524.2 million during 2015 and $438.4 million during2014. The decrease in cash flows provided by operating activities during 2016 was primarily due to a decrease in net income as well as an increase ininventories. The increase in cash flows provided by operating activities during 2015 was primarily due to a reduction in accounts receivable and inventories,as well as an increase in accounts payable.
Our working capital requirements are seasonal, with investments in working capital typically building in the first half of the year and then reducingin the second half of the year. We had $1,020.8 million in working capital at December 31, 2016, as compared with $712.9 million at December 31, 2015.Accounts receivable and inventories, combined, at December 31, 2016 were $145.0 million higher than at December 31, 2015. The increase in accountsreceivable and inventories as of December 31, 2016 compared to December 31, 2015 was primarily the result of acquisitions.
Our debt to capitalization ratio, which is total indebtedness divided by the sum of total indebtedness and stockholders’ equity, was 37.5% atDecember 31, 2016 compared to 30.0% at December 31, 2015. The increase is primarily due to the additional indebtedness related to the financing of theCimbria acquisition as well as the impact of our share repurchase discussed below.
27

Table of Contents
Share Repurchase Program
During 2016, 2015 and 2014, we repurchased 4,413,250, 5,541,930 and 10,066,322 shares of our common stock, respectively, for approximately$212.5 million, $287.5 million and $499.7 million, respectively, either through ASR agreements with financial institutions or through open markettransactions. All shares received under the ASR agreements were retired upon receipt, and the excess of the purchase price over par value per share wasrecorded to “Additional paid-in capital” within the our Consolidated Balance Sheets.
Contractual Obligations
The future payments required under our significant contractual obligations, excluding foreign currency option and forward contracts, as ofDecember 31, 2016 are as follows (in millions):
Payments Due By Period
Total 2017 2018 to
2019 2020 to
2021 2022 andBeyond
Indebtedness(1) $ 1,695.4 $ 85.4 $ 94.8 $ 1,374.5 $ 140.7Interest payments related to indebtedness(2) 163.7 33.1 56.3 67.0 7.3Capital lease obligations 11.4 4.7 5.3 1.3 0.1Operating lease obligations 174.1 50.4 55.0 27.1 41.6Unconditional purchase obligations 74.0 65.8 7.3 0.9 —Other short-term and long-term obligations(3) 312.3 78.2 90.2 75.9 68.0Total contractual cash obligations $ 2,430.9 $ 317.6 $ 308.9 $ 1,546.7 $ 257.7
Amount of Commitment Expiration Per Period
Total 2017 2018 to
2019 2020 to
2021 2022 andBeyond
Standby letters of credit and similar instruments $ 17.1 $ 17.1 $ — $ — $ —Guarantees 63.8 57.9 4.8 1.1 —Total commercial commitments and letters of credit $ 80.9 $ 75.0 $ 4.8 $ 1.1 $ —_______________________________________(1) Indebtedness amounts reflect the principal amount of our senior term loan, senior notes and credit facility.(2) Estimated interest payments are calculated assuming current interest rates over minimum maturity periods specified in debt agreements. Debt may be repaid sooner or later than
such minimum maturity periods.(3) Other short-term and long-term obligations include estimates of future minimum contribution requirements under our U.S. and non-U.S. defined benefit pension and
postretirement plans. These estimates are based on current legislation in the countries we operate within and are subject to change. Other short-term and long-term obligations alsoinclude income tax liabilities related to uncertain income tax positions connected with ongoing income tax audits in various jurisdictions.
28

Table of Contents
Commitments and Off-Balance Sheet Arrangements
Guarantees
We maintain a remarketing agreement with our finance joint venture in the United States, whereby we are obligated to repurchase repossessedinventory at market value. We have an agreement with our finance joint venture in the United States which limits our purchase obligations under thisarrangement to $6.0 million in the aggregate per calendar year. We believe that any losses that might be incurred on the resale of this equipment will notmaterially impact our financial position or results of operations, due to the fact that the repurchase obligation would be equivalent to the fair value of theunderlying equipment.
At December 31, 2016, we guaranteed indebtedness owed to third parties of approximately $63.8 million, primarily related to dealer and end-userfinancing of equipment. Such guarantees generally obligate us to repay outstanding finance obligations owed to financial institutions if dealers or end usersdefault on such loans through 2021. We believe the credit risk associated with these guarantees is not material to our financial position or results ofoperations. Losses under such guarantees historically have been insignificant. In addition, we generally would expect to be able to recover a significantportion of the amounts paid under such guarantees from the sale of the underlying financed farm equipment, as the fair value of such equipment is expectedto offset a substantial portion of the amounts paid.
Other
At December 31, 2016, we had outstanding designated and non-designated foreign exchange contracts with a gross notional amount ofapproximately $1,661.4 million. The outstanding contracts as of December 31, 2016 range in maturity through December 2017.
As discussed in “Liquidity and Capital Resources,” we sell a majority of our wholesale accounts receivable in North America and Europe to our U.S.,
Canadian and European finance joint ventures, and during 2016, we started to sell a portion of our wholesale receivables in Brazil to our Brazilian financejoint venture. We also sell certain accounts receivable under factoring arrangements to financial institutions around the world. We have determined that thesefacilities should be accounted for as off-balance sheet transactions.
Contingencies
We are party to various claims and lawsuits arising in the normal course of business. We closely monitor these claims and lawsuits and frequentlyconsult with our legal counsel to determine whether they may, when resolved, have a material adverse effect on our financial position or results of operationsand accrue and/or disclose loss contingencies as appropriate (see Note 12 of our Consolidated Financial Statements and Item 3, “Legal Proceedings”).
Related Parties
Rabobank is a 51% owner in our finance joint ventures. See “Finance Joint Ventures.” Rabobank is also the principal agent and participant in ourcredit facility.
Our finance joint ventures provide retail and wholesale financing to our dealers. In addition, we transfer, on an ongoing basis, a majority of ourwholesale receivables in North America, Europe and Brazil to our U.S., Canadian, European and Brazilian finance joint ventures. See Note 4 of ourConsolidated Financial Statements for further discussion of these agreements. We maintain a remarketing agreement with our U.S. finance joint venture,AGCO Finance LLC, as discussed above under “Commitments and Off-Balance Sheet Arrangements.” In addition, as part of sales incentives provided to endusers, we may from time to time subsidize interest rates of retail financing provided by our finance joint ventures. The cost of those programs is recognized atthe time of sale to our dealers.
Tractors and Farm Equipment Limited, in which we hold a 23.75% interest, manufactures Massey Ferguson-branded equipment primarily in Indiaand also supplies tractors and components to us for sale in other markets. Mallika Srinivasan, who is the Chairman and Chief Executive Officer of TAFE, iscurrently a member of our Board of Directors. As of December 31, 2016, TAFE owned 12,150,152 shares of our common stock. We and TAFE are parties to anagreement pursuant to which, among other things, TAFE has agreed not to purchase in excess of 12,170,290 shares of our common stock, subject to certainadjustments, and we have agreed to annually nominate a TAFE representative to our Board of Directors. During 2016, 2015 and 2014, we purchasedapproximately $128.5 million, $129.2 million and $149.0 million, respectively, of tractors and components from TAFE. During 2016, 2015 and 2014, wesold approximately $1.1 million, $2.2 million and $2.1 million,
29

Table of Contents
respectively, of parts to TAFE. We received dividends from TAFE of approximately $1.6 million, $1.7 million and $1.8 million during 2016, 2015 and 2014,respectively.
During 2016, 2015 and 2014, we paid approximately $3.1 million, $3.5 million and $3.8 million, respectively, to PPG Industries, Inc. for paintingmaterials used in our manufacturing processes. Our Chairman, President and Chief Executive Officer is currently a member of the board of directors of PPGIndustries, Inc.
During 2016 and 2015, we paid approximately $2.0 million and $0.6 million, respectively, to Praxair, Inc. for propane, gas and welding, and laserconsumables used in our manufacturing processes. In October 2015, our Chairman, President and Chief Executive Officer became a member of the board ofdirectors of Praxair, Inc.
Foreign Currency Risk Management
We have significant manufacturing operations in the United States, France, Germany, Finland and Brazil, and we purchase a portion of our tractors,combines and components from third-party foreign suppliers, primarily in various European countries and in Japan. We also sell products in over 150countries throughout the world. The majority of our net sales outside the United States are denominated in the currency of the customer location, with theexception of sales in the Middle East, Africa, Asia and parts of South America, where net sales are primarily denominated in British pounds, Euros or UnitedStates dollars. See Note 15 of our Consolidated Financial Statements for net sales by customer location. Our most significant transactional foreign currencyexposures are the Euro, the Brazilian real and the Canadian dollar in relation to the United States dollar, and the Euro in relation to the British pound.Fluctuations in the value of foreign currencies create exposures, which can adversely affect our results of operations.
We attempt to manage our transactional foreign currency exposure by hedging foreign currency cash flow forecasts and commitments arising fromthe anticipated settlement of receivables and payables and from future purchases and sales. Where naturally offsetting currency positions do not occur, wehedge certain, but not all, of our exposures through the use of foreign currency contracts. Our translation exposure resulting from translating the financialstatements of foreign subsidiaries into United States dollars is not hedged. Our most significant translation exposures are the Euro, the British pound and theBrazilian real in relation to the United States dollar. When practical, this translation impact is reduced by financing local operations with local borrowings.Our hedging policy prohibits use of foreign currency contracts for speculative trading purposes.
All derivatives are recognized on our Consolidated Balance Sheets at fair value. On the date a derivative contract is entered into, we designate thederivative as either (1) a cash flow hedge of a forecasted transaction, (2) a fair value hedge of a recognized liability, (3) a hedge of a net investment in aforeign operation, or (4) a non-designated derivative instrument. We currently engage in derivatives that are cash flow hedges of forecasted transactions aswell as non-designated derivative instruments. The total notional value of our foreign currency instruments was $1,661.4 million and $1,533.9 million as ofDecember 31, 2016 and 2015, inclusive of both those instruments that are designated and qualified for hedge accounting and non-designated derivativeinstruments. We also enter into non-derivative instruments to hedge a portion of our net investment in foreign operations against adverse movements inexchange rates. Refer to Note 11 of our Consolidated Financial Statements for additional information about our hedging transactions and derivative financialinstruments.
Assuming a 10% change relative to the currency of the hedge contracts, the fair value of the foreign currency instruments could be negativelyimpacted by approximately $59.0 million as of December 31, 2016. Due to the fact that these instruments are primarily entered into for hedging purposes, thegains or losses on the contracts would largely be offset by losses and gains on the underlying firm commitment or forecasted transaction.
30
Table of Contents
Interest Rate Risk
Our interest expense is, in part, sensitive to the general level of interest rates. We manage our exposure to interest rate risk through our mix offloating rate and fixed rate debt. From time to time, we enter into interest rate swap agreements to manage our exposure to interest rate fluctuations. Refer toNotes 7 and 11 of our Consolidated Financial Statements for additional information about our interest rate swap agreements.
Based on our floating rate debt and our accounts receivable sales facilities outstanding at December 31, 2016, a 10% increase in interest rates, wouldhave increased, collectively, “Interest expense, net” and “Other expense, net” for the year ended December 31, 2016 by approximately $4.7 million.
Recent Accounting PronouncementsSee Note 1 of our Consolidated Financial Statements for more information regarding recent accounting pronouncements and their impact to our
consolidated results of operations and financial position.
31

Table of Contents
Critical Accounting Estimates
We prepare our Consolidated Financial Statements in conformity with U.S. generally accepted accounting principles. In the preparation of thesefinancial statements, we make judgments, estimates and assumptions that affect the reported amounts of assets and liabilities, the disclosure of contingentassets and liabilities at the date of the financial statements and the reported amounts of revenues and expenses during the reporting period. The significantaccounting policies followed in the preparation of the financial statements are detailed in Note 1 of our Consolidated Financial Statements. We believe thatour application of the policies discussed below involves significant levels of judgment, estimates and complexity.
Due to the levels of judgment, complexity and period of time over which many of these items are resolved, actual results could differ from thoseestimated at the time of preparation of the financial statements. Adjustments to these estimates would impact our financial position and future results ofoperations.
Discount and Sales Incentive Allowances
We provide various volume bonus and sales incentive programs with respect to our products. These sales incentive programs include reductions ininvoice prices, reductions in retail financing rates, dealer commissions and dealer incentive allowances. In most cases, incentive programs are established andcommunicated to our dealers on a quarterly basis. The incentives are paid either at the time of invoice (through a reduction of invoice price), at the time ofthe settlement of the receivable, at the time of retail financing, at the time of warranty registration, or at a subsequent time based on dealer purchases. Theincentive programs are product line specific and generally do not vary by dealer. The cost of sales incentives associated with dealer commissions and dealerincentive allowances is estimated based upon the terms of the programs and historical experience, is based on a percentage of the sales price, and is recordedat the later of (a) the date at which the related revenue is recognized, or (b) the date at which the sales incentive is offered. The related provisions and accrualsare made on a product or product-line basis and are monitored for adequacy and revised at least quarterly in the event of subsequent modifications to theprograms. Volume discounts are estimated and recognized based on historical experience, and related reserves are monitored and adjusted based on actualdealer purchases and the dealers’ progress towards achieving specified cumulative target levels. We record the cost of interest subsidy payments, which is areduction in the retail financing rates, at the later of (a) the date at which the related revenue is recognized, or (b) the date at which the sales incentive isoffered. Estimates of these incentives are based on the terms of the programs and historical experience. All incentive programs are recorded and presented as areduction of revenue, due to the fact that we do not receive an identifiable benefit in exchange for the consideration provided. Reserves for incentiveprograms that will be paid either through the reduction of future invoices or through credit memos are recorded as “accounts receivable allowances” withinour Consolidated Balance Sheets. Reserves for incentive programs that will be paid in cash, as is the case with most of our volume discount programs, as wellas sales incentives associated with accounts receivable sold to our U.S. and Canadian finance joint ventures, are recorded within “Accrued expenses” withinour Consolidated Balance Sheets.
At December 31, 2016, we had recorded an allowance for discounts and sales incentives of approximately $237.0 million, primarily related toallowances in our North America geographical segment that will be paid either through a reduction of future invoices, through credit memos to our dealers orthrough reductions in retail financing rates. If we were to allow an additional 1% of sales incentives and discounts at the time of retail sale for those salessubject to such discount programs in North America, our reserve would increase by approximately $7.8 million as of December 31, 2016. Conversely, if wewere to decrease our sales incentives and discounts by 1% at the time of retail sale, our reserve would decrease by approximately $7.8 million as ofDecember 31, 2016.
Deferred Income Taxes and Uncertain Income Tax Positions
We recorded an income tax provision of $92.2 million in 2016 compared to $72.5 million in 2015 and $187.7 million in 2014. Our tax provisionand effective tax rate is impacted by the differing tax rates of the various tax jurisdictions in which we operate, permanent differences for items treateddifferently for financial accounting and income tax purposes, and for losses in jurisdictions where no income tax benefit is recorded.
During the second quarter of 2016, the Company established a valuation allowance to fully reserve its net deferred tax assets in the United States. Avaluation allowance is established when it is more likely than not that some portion or all of the deferred tax assets will not be realized. The Companyassessed the likelihood that its deferred tax assets would be recovered from estimated future taxable income and available tax planning strategies anddetermined that the adjustment to the valuation allowance was appropriate. In making this assessment, all available evidence was considered including thecurrent economic climate, as well as reasonable tax planning strategies. The Company believes it is more likely than not that the Company will realize itsremaining net deferred tax assets, net of the valuation allowance, in future years.
32
Table of Contents
At December 31, 2016 and 2015, we had gross deferred tax assets of $447.4 million and $390.0 million, respectively, including $85.5 million and$74.0 million, respectively, related to net operating loss carryforwards. At December 31, 2016 and 2015, we had total valuation allowances as an offset to ourgross deferred tax assets of $116.0 million and $75.8 million, respectively, which included allowances against net operating loss carryforwards in Brazil,China, Russia and the Netherlands, as well as allowances against our net deferred taxes in the U.S., as previously discussed. Realization of the remainingdeferred tax assets as of December 31, 2016 will depend on generating sufficient taxable income in future periods, net of reversing deferred tax liabilities. Webelieve it is more likely than not that the remaining net deferred tax assets will be realized.
As of December 31, 2016 and 2015, we had approximately $139.9 million and $133.0 million, respectively, of unrecognized tax benefits, all ofwhich would impact our effective tax rate if recognized. As of December 31, 2016 and 2015, we had approximately $47.0 million and $61.2 million,respectively, of current accrued taxes related to uncertain income tax positions connected with ongoing tax audits in various jurisdictions that we expect tosettle or pay in the next 12 months. We recognize interest and penalties related to uncertain income tax positions in income tax expense. As of December 31,2016 and 2015, we had accrued interest and penalties related to unrecognized tax benefits of approximately $16.4 million and $18.3 million, respectively.See Note 6 of our Consolidated Financial Statements for further discussion of our uncertain income tax positions.
Warranty and Additional Service Actions
Warranty coverage on our products generally covers parts, labor and other expenses. At the time of sale, we make provisions for estimated expensesrelated to product warranties and base these estimates on historical experience of the nature, frequency and average cost of warranty claims. Separately, wealso establish reserves for known material defects, based on formal campaigns to repair such defects, when the costs are deemed to be probable and can bereasonably estimated. Due to the uncertainty and potential volatility of these estimated factors, changes in our assumptions could materially affect netincome.
Our estimate of warranty obligations is re-evaluated on a quarterly basis. Experience has shown that initial data for any product series line can bevolatile; therefore, our process relies upon long-term historical averages until sufficient data is available. As actual experience becomes available, it is used tomodify the historical averages to ensure that the forecast is within the range of likely outcomes. Resulting balances are then compared with present spendingrates to ensure that the accruals are adequate to meet expected future obligations.
See Note 1 of our Consolidated Financial Statements for more information regarding costs and assumptions for warranties.
Insurance Reserves
Under our insurance programs, coverage is obtained for significant liability limits as well as those risks required by law or contract. It is our policy toself-insure a portion of certain expected losses primarily related to workers’ compensation and comprehensive general liability, product liability and vehicleliability. We provide insurance reserves for our estimates of losses due to claims for those items for which we are self-insured. We base these estimates on theexpected ultimate settlement amount of claims, which often have long periods of resolution. We closely monitor the claims to maintain adequate reserves.
Pensions
We sponsor defined benefit pension plans covering certain employees, principally in the United Kingdom, the United States, Germany, Switzerland,Finland, France, Norway and Argentina. Our primary plans cover certain employees in the United States and the United Kingdom.
In the United States, we sponsor a funded, qualified defined benefit pension plan for our salaried employees, as well as a separate funded qualifieddefined benefit pension plan for our hourly employees. Both plans are closed to new entrants and frozen, and we fund at least the minimum contributionsrequired under the Employee Retirement Income Security Act of 1974 and the Internal Revenue Code to both plans. In addition, we maintain an unfunded,nonqualified defined benefit pension plan for certain U.S.-based senior executives, which is our Executive Nonqualified Pension Plan (“ENPP”). The ENPP isalso closed to new entrants.
In the United Kingdom, we sponsor a funded defined benefit pension plan that provides an annuity benefit based on participants’ final averageearnings and service. Participation in this plan is limited to certain older, longer service employees and existing retirees. This plan is closed to newparticipants.
33

Table of Contents
See Note 8 of our Consolidated Financial Statements for more information regarding costs and assumptions for employee retirement benefits.
Nature of Estimates Required. The measurement date for all of our benefit plans is December 31. The measurement of our pension obligations, costsand liabilities is dependent on a variety of assumptions provided by management and used by our actuaries. These assumptions include estimates of thepresent value of projected future pension payments to all plan participants, taking into consideration the likelihood of potential future events such as salaryincreases and demographic experience. These assumptions may have an effect on the amount and timing of future contributions.
Assumptions and Approach Used. The assumptions used in developing the required estimates include the following key factors:
• Discount rates • Inflation• Salary growth • Expected return on plan assets• Retirement rates • Mortality rates
For the years ended December 31, 2016, 2015 and 2014, we used a globally consistent methodology to set the discount rate in the countries whereour largest benefit obligations exist. In the United States, the United Kingdom and the Euro Zone, we constructed a hypothetical bond portfolio of high-quality corporate bonds and then applied the cash flows of our benefit plans to those bond yields to derive a discount rate. The bond portfolio and plan-specific cash flows vary by country, but the methodology in which the portfolio is constructed is consistent. In the United States, the bond portfolio is largeenough to result in taking a “settlement approach” to derive the discount rate, in which high-quality corporate bonds are assumed to be purchased and theresulting coupon payments and maturities are used to satisfy our U.S. pension plans’ projected benefit payments. In the United Kingdom and the Euro Zone,the discount rate is derived using a “yield curve approach,” in which an individual spot rate, or zero coupon bond yield, for each future annual period isdeveloped to discount each future benefit payment and, thereby, determine the present value of all future payments. Under the settlement and yield curveapproaches, the discount rate is set to equal the single discount rate that produces the same present value of all future payments. Effective January 1, 2016, weadopted a spot yield curve to determine the discount rate in the United Kingdom to measure the plan’s service cost and interest cost for the year endedDecember 31, 2016. Previously, we had utilized a single weighted-average discount rate derived from the “yield curve approach” to measure the plan’sbenefit obligation, service cost and interest cost. Going forward, we have elected to utilize an approach that discounts the individual expected service costand interest cost cash flows using the applicable spot rates derived from the yield curve over the projected cash flow period.
The other key assumptions and methods were set as follows:
• Our inflation assumption is based on an evaluation of external market indicators.• The salary growth assumptions reflect our long-term actual experience, the near-term outlook and assumed inflation.• The expected return on plan asset assumptions reflects asset allocations, investment strategy, historical experience and the views of investment
managers, and reflects a projection of the expected arithmetic returns over ten years.• Retirement and termination rates primarily are based on actual plan experience and actuarial standards of practice.• The mortality rates for the U.K. defined benefit pension plan was updated in 2015 to reflect expected improvements in the life expectancy of the
plan participants. The mortality rates for the U.S. defined benefit pension plans were updated in 2016 to reflect the Society of Actuaries’ most recentfindings on the topic of mortality.
• The fair value of assets used to determine the expected return on assets does not reflect any delayed recognition of asset gains and losses.
The effects of actual results differing from our assumptions are accumulated and amortized over future periods and, therefore, generally affect ourrecognized expense in such periods.
Our U.S. and U.K. defined benefit pension plans, including our ENPP, comprised approximately 88% of our consolidated projected benefitobligation as of December 31, 2016. If the discount rate used to determine the 2016 projected benefit obligation for our U.S. qualified defined benefitpension plans and our ENPP was decreased by 25 basis points, our projected benefit obligation would have increased by approximately $3.6 million atDecember 31, 2016, and our 2017 pension expense would increase by approximately $0.3 million. If the discount rate used to determine the 2016 projectedbenefit obligation for our U.S. qualified defined benefit pension plans and our ENPP was increased by 25 basis points, our projected benefit obligation wouldhave decreased by approximately $3.4 million at December 31, 2016, and our 2017 pension expense would decrease by approximately $0.3 million. If thediscount rate used to determine the projected benefit obligation for our U.K. defined benefit pension plan was decreased by 25 basis points, our projectedbenefit obligation would have increased by
34

Table of Contents
approximately $25.7 million at December 31, 2016, and our 2017 pension expense would increase by approximately $0.3 million. If the discount rate used todetermine the projected benefit obligation for our U.K. defined benefit pension plan was increased by 25 basis points, our projected benefit obligation wouldhave decreased by approximately $24.7 million at December 31, 2016, and our 2017 pension expense would decrease by approximately $0.3 million. Inaddition, if the expected long-term rate of return on plan assets related to our U.K. defined benefit pension plan was increased or decreased by 25 basis points,our 2017 pension expense would decrease or increase by approximately $1.3 million each, respectively. The impact to our U.S. defined benefit pension plansfor a 25-basis-point change in our expected long-term rate of return would decrease or increase our 2017 pension expense by approximately $0.1 million,respectively.
Unrecognized actuarial net losses related to our defined benefit pension plans and ENPP were $384.7 million as of December 31, 2016 compared to$319.0 million as of December 31, 2015. The increase in unrecognized losses between years primarily resulted from a decrease in year-end discount ratesduring 2016 as compared to 2015. The unrecognized actuarial losses will be impacted in future periods by actual asset returns, discount rate changes,currency exchange rate fluctuations, actual demographic experience and certain other factors. For some of our defined benefit pension plans, these losses, tothe extent they exceed 10% of the greater of the plan’s liabilities or the fair value of assets (“the gain/loss corridor”), will be amortized on a straight-line basisover the average remaining service period of active employees expected to receive benefits. For our U.S. salaried, U.S. hourly and U.K. defined benefitpension plans, the population covered is predominantly inactive participants, and losses related to those plans, to the extent they exceed the gain/losscorridor, will be amortized over the average remaining lives of those participants while covered by the respective plan. As of December 31, 2016, the averageamortization period was 18 years for our U.S. defined benefit pension plans and 21 years for our non-U.S. defined benefit pension plans. For our ENPP, thepopulation is predominantly active participants, and losses related to the plan will be amortized over the average future working lifetime of the activeparticipants. As of December 31, 2016, the average amortization period was 10 years for our ENPP. The estimated net actuarial loss for our defined benefitpension plans and ENPP expected to be amortized from our accumulated other comprehensive loss during the year ended December 31, 2017 isapproximately $12.0 million compared to approximately $10.0 million during the year ended December 31, 2016.
As of December 31, 2016, our unfunded or underfunded obligations related to our defined benefit pension plans and ENPP were approximately$248.1 million, primarily related to our defined benefit pension plans in the United Kingdom and the United States. In 2016, we contributed approximately$31.3 million towards those obligations, and we expect to fund approximately $28.8 million in 2017. Future funding is dependent upon compliance withlocal laws and regulations and changes to those laws and regulations in the future, as well as the generation of operating cash flows in the future. Wecurrently have an agreement in place with the trustees of the U.K. defined benefit plan that obligates us to fund approximately £15.3 million per year (orapproximately $19.0 million) towards that obligation through September 2022. The funding arrangement is based upon the current underfunded status andcould change in the future as discount rates, local laws and regulations, and other factors change.
See Note 8 of our Consolidated Financial Statements for more information regarding the investment strategy and concentration of risk.
Other Postretirement Benefits (Retiree Health Care and Life Insurance)
We provide certain postretirement health care and life insurance benefits for certain employees, principally in the United States and Brazil.Participation in these plans generally has been limited to older employees and existing retirees. See Note 8 of our Consolidated Financial Statements for moreinformation regarding costs and assumptions for other postretirement benefits.
Nature of Estimates Required. The measurement of our obligations, costs and liabilities associated with other postretirement benefits, such as retireehealth care and life insurance, requires that we make use of estimates of the present value of the projected future payments to all participants, taking intoconsideration the likelihood of potential future events such as health care cost increases and demographic experience, which may have an effect on theamount and timing of future payments.
Assumptions and Approach Used. The assumptions used in developing the required estimates include the following key factors:
• Health care cost trends • Inflation• Discount rates • Medical coverage elections• Retirement rates • Mortality rates
35

Table of Contents
Our health care cost trend assumptions are developed based on historical cost data, the near-term outlook, efficiencies, and other cost-mitigatingactions, including further employee cost sharing, administrative improvements and other efficiencies, as well as an assessment of likely long-term trends. Forthe years ended December 31, 2016, 2015 and 2014, we used a globally consistent methodology as previously discussed to set the discount rate in thecountries where our largest benefit obligations exist. In the United States, we constructed a hypothetical bond portfolio of high-quality corporate bonds andthen applied the cash flows of our benefit plans to those bond yields to derive a discount rate. In the United States, the bond portfolio is large enough toresult in taking a “settlement approach” to derive the discount rate, in which high-quality corporate bonds are assumed to be purchased and the resultingcoupon payments and maturities are used to satisfy our largest U.S. pension plan’s projected benefit payments. After the bond portfolio is selected, a singlediscount rate is determined such that the market value of the bonds purchased equals the discounted value of the plan’s benefit payments. For our Brazilianplan, we based the discount rate on government bond indices within that country. The indices used were chosen to match our expected plan obligations andrelated expected cash flows. Our inflation assumptions are based on an evaluation of external market indicators. Retirement and termination rates are basedprimarily on actual plan experience and actuarial standards of practice. The mortality rates for the U.S. plans were updated during 2016 to reflect the Societyof Actuaries’ most recent findings on the topic of mortality. The effects of actual results differing from our assumptions are accumulated and amortized overfuture periods and, therefore, generally affect our recognized expense in such future periods.
Our U.S. postretirement health care and life insurance plans represent approximately 85% of our consolidated projected benefit obligation. If thediscount rate used to determine the 2016 projected benefit obligation for our U.S. postretirement benefit plans was decreased by 25 basis points, ourprojected benefit obligation would have increased by approximately $0.6 million at December 31, 2016, and our 2017 postretirement benefit expense wouldincrease by a nominal amount. If the discount rate used to determine the 2016 projected benefit obligation for our U.S. postretirement benefit plans wasincreased by 25 basis points, our projected benefit obligation would have decreased by approximately $0.6 million at December 31, 2016, and our 2017pension expense would decrease by a nominal amount.
Unrecognized actuarial losses related to our U.S. and Brazilian postretirement benefit plans were $2.0 million as of December 31, 2016 compared to$1.4 million as of December 31, 2015, of which $2.5 million and $4.0 million, respectively, related to our U.S. postretirement benefit plans. Theunrecognized actuarial losses will be impacted in future periods by discount rate changes, actual demographic experience, actual health care inflation andcertain other factors. These losses, to the extent they exceed the gain/loss corridor, will be amortized on a straight-line basis over the average remainingservice period of active employees expected to receive benefits, or the average remaining lives of inactive participants, covered under the postretirementbenefit plans. As of December 31, 2016, the average amortization period was 14 years for our U.S. postretirement benefit plans. The estimated net actuarialloss for postretirement health care benefits expected to be amortized from our accumulated other comprehensive loss during the year ended December 31,2017 is less than $0.1 million, compared to less than $0.1 million during the year ended December 31, 2016.
As of December 31, 2016, we had approximately $28.6 million in unfunded obligations related to our U.S. and Brazilian postretirement health andlife insurance benefit plans. In 2016, we made benefit payments of approximately $1.2 million towards these obligations, and we expect to make benefitpayments of approximately $1.6 million towards these obligations in 2017.
For measuring the expected U.S. postretirement benefit obligation at December 31, 2016, we assumed a 7.0% health care cost trend rate for 2017
decreasing to 5.0% by 2025. For measuring the expected U.S. postretirement benefit obligation at December 31, 2015, we assumed a 7.25% health care costtrend rate for 2016 decreasing to 5.0% by 2025. For measuring the Brazilian postretirement benefit plan obligation at December 31, 2016, we assumed a11.8% health care cost trend rate for 2017, decreasing to 6.05% by 2028. For measuring the Brazilian postretirement benefit plan obligation at December 31,2015, we assumed a 12.6% health care cost trend rate for 2016, decreasing to 6.75% by 2026. Changing the assumed health care cost trend rates by onepercentage point each year and holding all other assumptions constant would have had the following effect to service and interest cost for 2016 and theaccumulated postretirement benefit obligation at December 31, 2016 (in millions):
One PercentagePoint Increase
One PercentagePoint Decrease
Effect on service and interest cost $ 0.2 $ (0.2)Effect on accumulated benefit obligation $ 3.6 $ (3.0)
36

Table of Contents
Litigation
We are party to various claims and lawsuits arising in the normal course of business. We closely monitor these claims and lawsuits and frequentlyconsult with our legal counsel to determine whether they may, when resolved, have a material adverse effect on our financial position or results of operationsand accrue and/or disclose loss contingencies as appropriate.
Goodwill, Other Intangible Assets and Long-Lived Assets
We test goodwill for impairment, at the reporting unit level, annually and when events or circumstances indicate that fair value of a reporting unitmay be below its carrying value. A reporting unit is an operating segment or one level below an operating segment, for example, a component. We combineand aggregate two or more components of an operating segment as a single reporting unit if the components have similar economic characteristics. Ourreportable segments are not our reporting units.
Goodwill is evaluated annually as of October 1 for impairment using a qualitative assessment or a quantitative two-step assessment. If we elect toperform a qualitative assessment and determine the fair value of our reporting units more likely than not exceeds their carrying value, no further evaluation isnecessary. For reporting units where we perform a two-step quantitative assessment, the first step requires us to compare the fair value of each reporting unit toits respective carrying value, including goodwill. If the fair value of the reporting unit exceeds its carrying value, the goodwill is not considered impaired. Ifthe carrying value is higher than the fair value of the reporting unit, the second step of the quantitative assessment is required to measure the amount ofimpairment, if any. The second step of the quantitative assessment results in a calculation of the implied fair value of the reporting unit’s goodwill, which isdetermined as the excess of the fair value of a reporting unit over the fair values assigned to its assets and liabilities. If the implied fair value of goodwill isless than the carrying value of the reporting unit’s goodwill, the difference is recognized as an impairment loss.
We utilize a combination of valuation techniques, including a discounted cash flow approach and a market multiple approach, when makingquantitative goodwill assessments.
We review our long-lived assets, which include intangible assets subject to amortization, for impairment whenever events or changes incircumstances indicate that the carrying amount of an asset may not be recoverable. The evaluation for recoverability is performed at a level whereindependent cash flows may be attributed to either an asset or asset group. If we determine that the carrying amount of an asset or asset group is notrecoverable based on the expected undiscounted future cash flows of the asset or asset group, an impairment loss is recorded equal to the excess of thecarrying amounts over the estimated fair value of the long-lived assets. Estimates of future cash flows are based on many factors, including current operatingresults, expected market trends and competitive influences. We also evaluate the amortization periods assigned to our intangible assets to determine whetherevents or changes in circumstances warrant revised estimates of useful lives. Assets to be disposed of by sale are reported at the lower of the carrying amountor fair value, less estimated costs to sell.
We make various assumptions, including assumptions regarding future cash flows, market multiples, growth rates and discount rates, in ourassessments of the impairment of goodwill, other indefinite-lived intangible assets and long-lived assets. The assumptions about future cash flows and growthrates are based on the current and long-term business plans of the reporting unit or related to the long-lived assets. Discount rate assumptions are based on anassessment of the risk inherent in the future cash flows of the reporting unit or long-lived assets. These assumptions require significant judgments on our part,and the conclusions that we reach could vary significantly based upon these judgments.
The results of our goodwill and long-lived assets impairment analyses conducted as of October 1, 2016, 2015 and 2014 indicated that no reduction
in the carrying amount of goodwill and long-lived assets was required.
Our goodwill impairment analysis conducted as of October 1, 2016 indicated that the fair value in excess of the carrying value related to our GSIEAME reporting unit was approximately 10%. The percentage of the fair value in excess of the carrying value increased slightly compared to our 2015annual analysis and more recent analyses during 2016. The operations of the GSI reporting unit include the manufacturing and distribution of grain storageand protein production equipment. The amount of goodwill allocated to GSI EAME as of October 1, 2016 was approximately $278.7 million.
Numerous facts and circumstances are considered when evaluating the carrying amount of our goodwill. The fair value of a reporting unit isimpacted by the reporting unit’s expected financial performance, which is dependent upon the agricultural industry and other factors that could adverselyaffect the agricultural industry, including but not limited to, declines in the general economy, increases in farm input costs, weather conditions, lowercommodity prices and changes in the availability of credit. The estimated fair value of the individual reporting units is assessed for reasonableness byreviewing a variety of indicators evaluated over a reasonable period of time.
37

Table of Contents
As of December 31, 2016, we had approximately $1,376.4 million of goodwill. While our annual impairment testing in 2016 supported the carryingamount of this goodwill, we may be required to re-evaluate the carrying amount in future periods, thus utilizing different assumptions that reflect the thencurrent market conditions and expectations, and, therefore, we could conclude that an impairment has occurred.
Item 7A. Quantitative and Qualitative Disclosures About Market Risk
The Quantitative and Qualitative Disclosures about Market Risk information required by this Item set forth under the captions “Management’sDiscussion and Analysis of Financial Condition and Results of Operations - Foreign Currency Risk Management” and “Interest Rate Risk” under Item 7 ofthis Form 10-K are incorporated herein by reference.
38

Table of Contents
Item 8. Financial Statements and Supplementary Data
The following Consolidated Financial Statements of AGCO and its subsidiaries for each of the years in the three-year period ended December 31,2016 are included in this Item:
PageReport of Independent Registered Public Accounting Firm 40Consolidated Statements of Operations for the years ended December 31, 2016, 2015 and 2014 41Consolidated Statements of Comprehensive Income (Loss) for the years ended December 31, 2016, 2015 and 2014 42Consolidated Balance Sheets as of December 31, 2016 and 2015 43Consolidated Statements of Stockholders’ Equity for the years ended December 31, 2016, 2015 and 2014 44Consolidated Statements of Cash Flows for the years ended December 31, 2016, 2015 and 2014 45Notes to Consolidated Financial Statements 46
The information under the heading “Quarterly Results” of Item 7 of this Form 10-K is incorporated herein by reference.
39
Table of Contents
Report of Independent Registered Public Accounting Firm
The Board of Directors and StockholdersAGCO Corporation:
We have audited the accompanying consolidated balance sheets of AGCO Corporation and subsidiaries as of December 31, 2016 and 2015, and therelated consolidated statements of operations, comprehensive income (loss), stockholders’ equity, and cash flows for each of the years in the three-year periodended December 31, 2016. In connection with our audits of the consolidated financial statements, we also have audited the financial statement schedule aslisted in Item 15(a)(2). These consolidated financial statements and financial statement schedule are the responsibility of the Company’s management. Ourresponsibility is to express an opinion on these consolidated financial statements and financial statement schedule based on our audits.
We conducted our audits in accordance with the standards of the Public Company Accounting Oversight Board (United States). Those standardsrequire that we plan and perform the audit to obtain reasonable assurance about whether the financial statements are free of material misstatement. An auditincludes examining, on a test basis, evidence supporting the amounts and disclosures in the financial statements. An audit also includes assessing theaccounting principles used and significant estimates made by management, as well as evaluating the overall financial statement presentation. We believe thatour audits provide a reasonable basis for our opinion.
In our opinion, the consolidated financial statements referred to above present fairly, in all material respects, the financial position of AGCOCorporation and subsidiaries as of December 31, 2016 and 2015, and the results of their operations and their cash flows for each of the years in the three-yearperiod ended December 31, 2016, in conformity with U.S. generally accepted accounting principles. Also in our opinion, the related financial statementschedule, when considered in relation to the basic consolidated financial statements taken as a whole, presents fairly, in all material respects, the informationset forth therein.
We also have audited, in accordance with the standards of the Public Company Accounting Oversight Board (United States), AGCO Corporation’s
internal control over financial reporting as of December 31, 2016, based on criteria established in Internal Control — Integrated Framework (2013) issued bythe Committee of Sponsoring Organizations of the Treadway Commission (COSO), and our report dated February 28, 2017 expressed an unqualified opinionon the effectiveness of the Company’s internal control over financial reporting.
/s/ KPMG LLPAtlanta, GeorgiaFebruary 28, 2017
40

Table of Contents
AGCO CORPORATION
CONSOLIDATED STATEMENTS OF OPERATIONS(In millions, except per share data)
Years Ended December 31, 2016 2015 2014
Net sales $ 7,410.5 $ 7,467.3 $ 9,723.7Cost of goods sold 5,895.0 5,906.7 7,657.4
Gross profit 1,515.5 1,560.6 2,066.3Selling, general and administrative expenses 867.9 852.3 995.4Engineering expenses 296.1 282.2 337.0Restructuring expenses 11.9 22.3 46.4Amortization of intangibles 51.2 42.7 41.0
Income from operations 288.4 361.1 646.5Interest expense, net 52.1 45.4 58.4Other expense, net 31.4 36.3 49.1Income before income taxes and equity in net earnings of affiliates 204.9 279.4 539.0Income tax provision 92.2 72.5 187.7Income before equity in net earnings of affiliates 112.7 206.9 351.3Equity in net earnings of affiliates 47.5 57.1 52.9Net income 160.2 264.0 404.2Net (income) loss attributable to noncontrolling interests (0.1) 2.4 6.2Net income attributable to AGCO Corporation and subsidiaries $ 160.1 $ 266.4 $ 410.4
Net income per common share attributable to AGCO Corporation and subsidiaries: Basic $ 1.97 $ 3.06 $ 4.39
Diluted $ 1.96 $ 3.06 $ 4.36
Cash dividends declared and paid per common share $ 0.52 $ 0.48 $ 0.44
Weighted average number of common and common equivalent shares outstanding: Basic 81.4 87.0 93.4
Diluted 81.7 87.1 94.2
See accompanying notes to Consolidated Financial Statements.
41

Table of Contents
AGCO CORPORATION
CONSOLIDATED STATEMENTS OF COMPREHENSIVE INCOME (LOSS)(In millions)
Years Ended December 31, 2016 2015 2014
Net income $ 160.2 $ 264.0 $ 404.2Other comprehensive income (loss), net of reclassification adjustments:
Defined benefit pension plans, net of taxes: Prior service cost arising during the year (2.6) (4.7) —Net loss recognized due to settlement 0.4 0.2 0.4Net gain recognized due to curtailment (0.1) — (0.4)Net actuarial (loss) gain arising during the year (62.9) 2.1 (54.8)Amortization of prior service cost included in net periodic pension cost 1.1 0.4 0.6Amortization of net actuarial losses included in net periodic pension cost 8.6 6.3 7.3
Derivative adjustments: Net changes in fair value of derivatives (7.7) (4.6) (1.4)Net losses reclassified from accumulated other comprehensive loss into income 1.0 2.7 1.5
Foreign currency translation adjustments 82.4 (558.2) (349.3)Other comprehensive income (loss), net of reclassification adjustments 20.2 (555.8) (396.1)Comprehensive income (loss) 180.4 (291.8) 8.1Comprehensive (income) loss attributable to noncontrolling interests (1.7) 4.5 6.5Comprehensive income (loss) attributable to AGCO Corporation and subsidiaries $ 178.7 $ (287.3) $ 14.6
See accompanying notes to Consolidated Financial Statements.
42

Table of Contents
AGCO CORPORATION
CONSOLIDATED BALANCE SHEETS(In millions, except share amounts)
December 31,
2016 December 31,
2015ASSETS
Current Assets: Cash and cash equivalents $ 429.7 $ 426.7Accounts and notes receivable, net 890.4 836.8Inventories, net 1,514.8 1,423.4Other current assets 330.8 211.4
Total current assets 3,165.7 2,898.3Property, plant and equipment, net 1,361.3 1,347.1Investment in affiliates 414.9 392.9Deferred tax assets 99.7 100.7Other assets 143.1 136.5Intangible assets, net 607.3 507.7Goodwill 1,376.4 1,114.5Total assets $ 7,168.4 $ 6,497.7
LIABILITIES AND STOCKHOLDERS’ EQUITYCurrent Liabilities:
Current portion of long-term debt $ 85.4 $ 89.0 Senior term loan — 217.2Accounts payable 722.6 625.6Accrued expenses 1,160.8 1,106.9Other current liabilities 176.1 146.7
Total current liabilities 2,144.9 2,185.4Long-term debt, less current portion and debt issuance costs 1,610.0 925.2Pensions and postretirement health care benefits 270.0 233.9Deferred tax liabilities 112.4 86.4Other noncurrent liabilities 193.9 183.5
Total liabilities 4,331.2 3,614.4Commitments and contingencies (Note 12) Stockholders’ Equity: AGCO Corporation stockholders’ equity:
Preferred stock; $0.01 par value, 1,000,000 shares authorized, no shares issued or outstanding in 2016 and2015 — —
Common stock; $0.01 par value, 150,000,000 shares authorized, 79,465,393 and 83,814,809 shares issued andoutstanding at December 31, 2016 and 2015, respectively 0.8 0.8
Additional paid-in capital 103.3 301.7Retained earnings 4,113.6 3,996.0Accumulated other comprehensive loss (1,441.6) (1,460.2)
Total AGCO Corporation stockholders’ equity 2,776.1 2,838.3Noncontrolling interests 61.1 45.0
Total stockholders’ equity 2,837.2 2,883.3Total liabilities and stockholders’ equity $ 7,168.4 $ 6,497.7
See accompanying notes to Consolidated Financial Statements.
43

Table of Contents
AGCO CORPORATION
CONSOLIDATED STATEMENTS OF STOCKHOLDERS’ EQUITY(In millions, except share amounts)
AdditionalPaid-inCapital
RetainedEarnings
Accumulated Other Comprehensive Loss
NoncontrollingInterests
TotalStockholders’
Equity
TemporaryEquity
Common Stock DefinedBenefitPension
Plans
CumulativeTranslationAdjustment
Deferred(Losses) Gains
onDerivatives
AccumulatedOther
ComprehensiveLoss
Shares Amount Balance, December 31, 2013 97,362,466 $ 1.0 $ 1,117.9 $ 3,402.0 $ (206.4) $ (304.1) $ (0.2) $ (510.7) $ 34.6 $ 4,044.8 $ —
Net income (loss) — — — 410.4 — — — — 0.1 410.5 (6.3)
Payment of dividends to shareholders — — — (40.8) — — — — — (40.8) Issuance of restricted stock 14,907 — 0.9 — — — — — — 0.9 Issuance of stock awards 367,100 — (11.8) — — — — — — (11.8) SSARs exercised 30,477 — (1.2) — — — — — — (1.2) Stock compensation — — (11.7) — — — — — — (11.7) Shortfall in tax benefit of stock awards — — (0.2) — — — — — — (0.2) Conversion of 11/4% convertible senior
subordinated notes 1,437,465 — — — — — — — — — Investment by noncontrolling interest — — — — — — — — 16.1 16.1 Distribution to noncontrolling interest — — — — — — — — (2.4) (2.4) Changes in noncontrolling interest — — (11.8) — — — — — — (11.8) 6.6
Purchases and retirement of common stock (10,066,322) (0.1) (499.6) — — — — — — (499.7) Defined benefit pension plans, net of taxes: Net loss recognized due to settlement — — — — 0.4 — — 0.4 — 0.4 Net gain recognized due to curtailment — — — — (0.4) — — (0.4) — (0.4) Net actuarial loss arising during year — — — — (54.8) — — (54.8) — (54.8) Amortization of prior service cost included
in net periodic pension cost — — — — 0.6 — — 0.6 — 0.6 Amortization of net actuarial losses
included in net periodic pension cost — — — — 7.3 — — 7.3 — 7.3 Deferred gains and losses on derivatives,
net — — — — — — 0.1 0.1 — 0.1 Change in cumulative translation adjustment — — — — — (349.0) — (349.0) — (349.0) (0.3)
Balance, December 31, 2014 89,146,093 0.9 582.5 3,771.6 (253.3) (653.1) (0.1) (906.5) 48.4 3,496.9 —
Net income (loss) — — — 266.4 — — — — (2.4) 264.0 Payment of dividends to shareholders — — — (42.0) — — — — — (42.0) Issuance of restricted stock 15,711 — 0.8 — — — — — — 0.8 Issuance of stock awards 172,759 — (5.6) — — — — — — (5.6) SSARs exercised 22,176 — (0.7) — — — — — — (0.7) Stock compensation — — 11.4 — — — — — — 11.4 Excess tax benefit of stock awards — — 0.7 — — — — — — 0.7 Changes in noncontrolling interest — — — — — — — — 1.1 1.1 Purchases and retirement of common stock (5,541,930) (0.1) (287.4) — — — — — — (287.5) Defined benefit pension plans, net of taxes: Prior service cost arising during year — — — — (4.7) — — (4.7) — (4.7) Net loss recognized due to settlement — — — — 0.2 — — 0.2 — 0.2 Net actuarial gain arising during year — — — — 2.1 — — 2.1 — 2.1 Amortization of prior service cost included
in net periodic pension cost — — — — 0.4 — — 0.4 — 0.4 Amortization of net actuarial losses
included in net periodic pension cost — — — — 6.3 — — 6.3 — 6.3 Deferred gains and losses on derivatives,
net — — — — — — (1.9) (1.9) — (1.9) Change in cumulative translation adjustment — — — — — (556.1) — (556.1) (2.1) (558.2)
Balance, December 31, 2015 83,814,809 0.8 301.7 3,996.0 (249.0) (1,209.2) (2.0) (1,460.2) 45.0 2,883.3 —
Net income — — — 160.1 — — — — 0.1 160.2 Payment of dividends to shareholders — — — (42.5) — — — — — (42.5) Issuance of restricted stock 15,395 — 0.8 — — — — — — 0.8
Issuance of stock awards 27,333 — (0.9) — — — — — — (0.9) SSARs exercised 21,106 — (0.9) — — — — — — (0.9)
Stock compensation — — 17.3 — — — — — — 17.3
Investment by noncontrolling interests — — — — — — — — 12.2 12.2 Changes in noncontrolling interest — — (2.2) — — — — — 2.2 —

Purchases and retirement of common stock (4,413,250) — (212.5) — — — — — — (212.5) Defined benefit pension plans, net of taxes: Prior service cost arising during year — — — — (2.6) — — (2.6) — (2.6) Net loss recognized due to settlement — — — — 0.4 — — 0.4 — 0.4 Net gain recognized due to curtailment — — — — (0.1) — — (0.1) — (0.1) Net actuarial loss arising during year — — — — (62.9) — — (62.9) — (62.9) Amortization of prior service cost included
in net periodic pension cost — — — — 1.1 — — 1.1 — 1.1 Amortization of net actuarial losses
included in net periodic pension cost — — — — 8.6 — — 8.6 — 8.6 Deferred gains and losses on derivatives,
net — — — — — — (6.7) (6.7) — (6.7) Change in cumulative translation adjustment — — — — — 80.8 — 80.8 1.6 82.4
Balance, December 31, 2016 79,465,393 $ 0.8 $ 103.3 $ 4,113.6 $ (304.5) $ (1,128.4) $ (8.7) $ (1,441.6) $ 61.1 $ 2,837.2 $ —
See accompanying notes to Consolidated Financial Statements.
44

Table of Contents
AGCO CORPORATION
CONSOLIDATED STATEMENTS OF CASH FLOWS(In millions)
Years Ended December 31, 2016 2015 2014
Cash flows from operating activities: Net income $ 160.2 $ 264.0 $ 404.2Adjustments to reconcile net income to net cash provided by operating activities:
Depreciation 223.4 217.4 239.4Deferred debt issuance cost amortization 1.0 2.0 2.7Amortization of intangibles 51.2 42.7 41.0Stock compensation expense (credit) 18.1 12.2 (10.8)Proceeds from termination of hedging instrument 7.3 — —Equity in net earnings of affiliates, net of cash received (1.4) (19.0) (25.4)Deferred income tax provision (benefit) 2.1 (26.8) 3.6Other 1.3 (0.1) 2.5Changes in operating assets and liabilities, net of effects from purchase of businesses:
Accounts and notes receivable, net (4.5) 3.8 (103.9)Inventories, net (33.1) 117.6 111.4Other current and noncurrent assets (98.7) (49.3) 29.1Accounts payable 62.8 37.3 (219.4)Accrued expenses 47.0 (34.8) (71.2)Other current and noncurrent liabilities (67.2) (42.8) 35.2
Total adjustments 209.3 260.2 34.2Net cash provided by operating activities 369.5 524.2 438.4
Cash flows from investing activities: Purchases of property, plant and equipment (201.0) (211.4) (301.5)Proceeds from sale of property, plant and equipment 2.4 1.5 2.8Purchase of businesses, net of cash acquired (383.8) (25.4) (130.3)Investment in consolidated affiliates, net of cash acquired (11.8) — —Investments in unconsolidated affiliates (4.5) (3.8) (3.9)Restricted cash and other 0.4 (1.7) —
Net cash used in investing activities (598.3) (240.8) (432.9)Cash flows from financing activities:
Proceeds from debt obligations 3,117.9 1,951.9 1,689.4Repayments of debt obligations (2,622.4) (1,769.5) (1,588.8)Purchases and retirement of common stock (212.5) (287.5) (499.7)Repurchase or conversion of convertible senior subordinated notes — — (201.2)Payment of dividends to stockholders (42.5) (42.0) (40.8)Payment of minimum tax withholdings on stock compensation (2.0) (6.3) (13.2)Payment of debt issuance costs (2.5) (0.7) (1.4)Excess tax benefit related to stock compensation — 0.7 —Purchase of or distribution to noncontrolling interests 0.4 — (6.1)Other — — (0.2)
Net cash provided by (used in) financing activities 236.4 (153.4) (662.0)
Effects of exchange rate changes on cash and cash equivalents (4.6) (67.0) (27.0)Increase (decrease) in cash and cash equivalents 3.0 63.0 (683.5)Cash and cash equivalents, beginning of year 426.7 363.7 1,047.2Cash and cash equivalents, end of year $ 429.7 $ 426.7 $ 363.7
See accompanying notes to Consolidated Financial Statements.
45

Table of ContentsAGCO CORPORATION
NOTES TO CONSOLIDATED FINANCIAL STATEMENTS
1. Operations and Summary of Significant Accounting Policies
Business
AGCO Corporation and subsidiaries (“AGCO” or the “Company”) is a leading manufacturer and distributor of agricultural equipment and relatedreplacement parts throughout the world. The Company sells a full range of agricultural equipment, including tractors, combines, hay tools, sprayers, forageequipment, seeding and tillage equipment, implements, and grain storage and protein production systems. The Company’s products are widely recognized inthe agricultural equipment industry and are marketed under a number of well-known brand names including: Challenger®, Fendt®, GSI®, Massey Ferguson®
and Valtra®. The Company distributes most of its products through a combination of over 3,000 independent dealers and distributors as well as the Companyutilizes associates and licensees to provide a distribution channel for its products. In addition, the Company provides retail financing through its financejoint ventures with Coöperatieve Centrale Raiffeisen-Boerenleenbank B.A., or “Rabobank.”
Basis of Presentation and Consolidation
The Company’s Consolidated Financial Statements represent the consolidation of all wholly-owned companies, majority-owned companies andjoint ventures in which the Company has been determined to be the primary beneficiary. The Company consolidates a variable interest entity (“VIE”) if theCompany determines it is the primary beneficiary. The primary beneficiary of a VIE is the party that has both the power to direct the activities that mostsignificantly impact the entity’s economic performance and the obligation to absorb losses or the right to receive benefits that potentially could besignificant to the VIE. The Company also consolidates all entities that are not considered VIEs if it is determined that the Company has a controlling votinginterest to direct the activities that most significantly impact the joint venture or entity. The Company records investments in all other affiliate companiesusing the equity method of accounting when it has significant influence. Other investments, including those representing an ownership interest of less than20%, are recorded at cost. All significant intercompany balances and transactions have been eliminated in the Consolidated Financial Statements. Certainprior period amounts have been reclassified to conform to the current period presentation.
Use of Estimates
The preparation of financial statements in conformity with U.S. generally accepted accounting principles (“GAAP”) requires management to makeestimates and assumptions that affect the reported amounts of assets and liabilities and disclosure of contingent assets and liabilities at the date of thefinancial statements and the reported amounts of revenues and expenses during the reporting period. Actual results could differ from those estimates. Theestimates made by management primarily relate to accounts and notes receivable, inventories, deferred income tax valuation allowances, uncertain taxpositions, goodwill and other identifiable intangible assets, and certain accrued liabilities, principally relating to reserves for volume discounts and salesincentives, warranty obligations, product liability and workers’ compensation obligations, and pensions and postretirement benefits.
Revenue Recognition
Sales of equipment and replacement parts are recorded by the Company when title and risks of ownership have been transferred to an independentdealer, distributor or other customer. In certain countries, sales of certain grain storage and protein production systems in which the Company is responsiblefor construction or installation and which may be contingent upon customer acceptance, are recorded on an over-time basis, using a percentage of completionmethod. Payment terms vary by market and product, with fixed payment schedules on all sales. The terms of sale generally require that a purchase order ororder confirmation accompany all shipments. Title generally passes to the dealer or distributor upon shipment or specified delivery, and the risk of loss upondamage, theft or destruction of the equipment is the responsibility of the dealer, distributor or third-party carrier at the point of the stated shipping or deliveryterm. In certain foreign countries, the Company retains a form of title to goods delivered to dealers until the dealer makes payment so that the Company canrecover the goods in the event of customer default on payment. This occurs as the laws of some foreign countries do not provide for a seller’s retention of asecurity interest in goods in the same manner as established in the United States Uniform Commercial Code. The only right the Company retains with respectto the title is that enabling recovery of the goods in the event of customer default on payment. The dealer or distributor may not return equipment orreplacement parts while its contract with the Company is in force. Replacement parts may be returned only under promotional and annual return programs.Provisions for returns under these programs are made at the time of sale based on the terms of the program and historical returns experience. The Companymay
46
Table of ContentsAGCO CORPORATION
NOTES TO CONSOLIDATED FINANCIAL STATEMENTS - (Continued)
provide certain sales incentives to dealers and distributors. Provisions for sales incentives are made at the time of sale for existing incentive programs. Theseprovisions are revised in the event of subsequent modification to the incentive program. See “Accounts and Notes Receivable” for further discussion.
In the United States and Canada, amounts due from sales to dealers are immediately due upon a retail sale of the underlying equipment by the dealerwith the exception of sales of grain storage and protein production systems. If not previously paid by the dealer in the United States and Canada, installmentpayments are required generally beginning after the interest-free period with the remaining outstanding equipment balance generally due within 12 monthsafter shipment or delivery. Some specified programs in the United States and Canada may allow for interest-free periods and due dates of up to 24 months forcertain products. Interest generally is charged on the outstanding balance six to 12 months after shipment or delivery. Sales terms of some highly seasonalproducts provide for payment and due dates based on a specified date during the year regardless of the shipment date. Equipment sold to dealers in theUnited States and Canada is paid in full on average within 12 months of shipment. Sales of replacement parts generally are payable within 30 days ofshipment, with terms for some larger, seasonal stock orders generally requiring payment within six months of shipment. Sales of grain storage and proteinproduction systems generally are payable within 30 days of shipment.
In other international markets, equipment sales generally are payable in full within 30 to 180 days of shipment or delivery. Payment terms for somehighly seasonal products have a specified due date during the year regardless of the shipment or delivery date. Sales of replacement parts generally arepayable within 30 to 90 days of shipment, with terms for some larger, seasonal stock orders generally payable within six months of shipment.
In certain markets, particularly in North America, there is a time lag, which varies based on the timing and level of retail demand, between the datethe Company records a sale and when the dealer sells the equipment to a retail customer.
Foreign Currency Translation
The financial statements of the Company’s foreign subsidiaries are translated into United States currency in accordance with Accounting StandardsCodification (“ASC”) 830, “Foreign Currency Matters.” Assets and liabilities are translated to United States dollars at period-end exchange rates. Income andexpense items are translated at average rates of exchange prevailing during the period. Translation adjustments are included in “Accumulated othercomprehensive loss” in stockholders’ equity within the Company’s Consolidated Balance Sheets. Gains and losses, which result from foreign currencytransactions, are included in the accompanying Consolidated Statements of Operations.
Cash and Cash Equivalents
Cash at December 31, 2016 and 2015 of $386.2 million and $344.6 million, respectively, consisted primarily of cash on hand and bank deposits.The Company considers all investments with an original maturity of three months or less to be cash equivalents. Cash equivalents at December 31, 2016 and2015 of $43.5 million and $82.1 million, respectively, consisted primarily of money market deposits, certificates of deposits and overnight investments.
Accounts and Notes Receivable
Accounts and notes receivable arise from the sale of equipment and replacement parts to independent dealers, distributors or other customers.Payments due under the Company’s terms of sale generally range from one to 12 months and are not contingent upon the sale of the equipment by the dealeror distributor to a retail customer. Under normal circumstances, payment terms are not extended and equipment may not be returned. In certain regions, withrespect to most equipment sales, including the United States and Canada, the Company is obligated to repurchase equipment and replacement parts uponcancellation of a dealer or distributor contract. These obligations are required by national, state or provincial laws and require the Company to repurchase adealer or distributor’s unsold inventory, including inventories for which the receivable already has been paid.
The Company offers various sales terms with respect to its products. For sales in most markets outside of the United States and Canada, the Companygenerally does not charge interest on outstanding receivables with its dealers and distributors. For sales to certain dealers or distributors in the United Statesand Canada, interest is charged at or above prime lending rates on outstanding receivable balances after interest-free periods. These interest-free periods varyby product and generally range from one to 12 months as previously discussed. In limited circumstances, the Company provides sales terms, and in somecases, interest-free periods that are longer than 12 months for certain products. These are typically specified programs,
47

Table of ContentsAGCO CORPORATION
NOTES TO CONSOLIDATED FINANCIAL STATEMENTS - (Continued)
predominantly in the United States and Canada, in which interest is charged after a period of up to 24 months depending on the year of the sale and the dealeror distributor’s ordering or sales volume during the preceding year. Actual interest-free periods are shorter than described above because the equipmentreceivable from dealers or distributors in some countries, such as in the United States and Canada, is generally due immediately upon sale of the equipment toa retail customer. Receivables can also be paid prior to terms specified in sales agreements. Under normal circumstances, interest is not forgiven and interest-free periods are not extended.
The following summarizes by geographic region, as a percentage of our consolidated net sales, amounts with maximum interest-free periods aspresented below (in millions):
Year Ended December 31, 2016North
America South
America Europe/Africa/
Middle East Asia/Pacific Consolidated0 to 6 months $ 1,370.9 $ 917.5 $ 4,194.2 $ 479.3 $ 6,961.9 94.0%7 to 12 months 391.6 — 11.8 — 403.4 5.4%13 to 24 months 45.2 — — — 45.2 0.6% $ 1,807.7 $ 917.5 $ 4,206.0 $ 479.3 $ 7,410.5 100.0%
The Company has an agreement to permit transferring, on an ongoing basis, a majority of its wholesale interest-bearing and non-interest bearingaccounts receivable in North America, Europe and Brazil to its U.S., Canadian, European and Brazilian finance joint ventures. Qualified dealers may obtainadditional financing through the Company’s U.S., Canadian, European and Brazilian finance joint ventures at the joint ventures’ discretion.
The Company provides various volume bonus and sales incentive programs with respect to its products. These sales incentive programs includereductions in invoice prices, reductions in retail financing rates, dealer commissions and dealer incentive allowances. In most cases, incentive programs areestablished and communicated to the Company’s dealers on a quarterly basis. The incentives are paid either at the time of invoice (through a reduction ofinvoice price), at the time of the settlement of the receivable, at the time of retail financing, at the time of warranty registration, or at a subsequent time basedon dealer purchases. The incentive programs are product-line specific and generally do not vary by dealer. The cost of sales incentives associated with dealercommissions and dealer incentive allowances is estimated based upon the terms of the programs and historical experience, is often based on a percentage ofthe sales price and is recorded at the later of (a) the date at which the related revenue is recognized, or (b) the date at which the sales incentive is offered. Therelated provisions and accruals are made on a product or product-line basis and are monitored for adequacy and revised at least quarterly in the event ofsubsequent modifications to the programs. Volume discounts are estimated and recognized based on historical experience, and related reserves are monitoredand adjusted based on actual dealer purchases and the dealer’s progress towards achieving specified cumulative target levels. The Company records the costof interest subsidy payments, which is a reduction in the retail financing rates, at the later of (a) the date at which the related revenue is recognized, or (b) thedate at which the sales incentive is offered. Estimates of these incentives are based on the terms of the programs and historical experience. All incentiveprograms are recorded and presented as a reduction of revenue, due to the fact that the Company does not receive an identifiable benefit in exchange for theconsideration provided. Reserves for incentive programs that will be paid either through the reduction of future invoices or through credit memos arerecorded as “accounts receivable allowances” within the Company’s Consolidated Balance Sheets. Reserves for incentive programs that will be paid in cash,as is the case with most of the Company’s volume discount programs, as well as sales with incentives associated with accounts receivable sold to its U.S. andCanadian finance joint ventures, are recorded within “Accrued expenses” within the Company’s Consolidated Balance Sheets.
48

Table of ContentsAGCO CORPORATION
NOTES TO CONSOLIDATED FINANCIAL STATEMENTS - (Continued)
Accounts and notes receivable are shown net of allowances for sales incentive discounts available to dealers and for doubtful accounts. Cash flowsrelated to the collection of receivables are reported within “Cash flows from operating activities” within the Company’s Consolidated Statements of CashFlows. Accounts and notes receivable allowances at December 31, 2016 and 2015 were as follows (in millions):
2016 2015Sales incentive discounts $ 34.5 $ 24.5Doubtful accounts 33.7 29.3 $ 68.2 $ 53.8
The Company transfers certain accounts receivable under its accounts receivable sales agreements with its finance joint ventures (Note 4). The
Company records such transfers as sales of accounts receivable when it is considered to have surrendered control of such receivables under the provisions ofAccounting Standards Update (“ASU”) 2009-16, “Transfers and Servicing (Topic 860): Accounting for Transfers of Financial Assets.” Cash payments aremade to the Company’s U.S. and Canadian finance joint ventures for sales incentive discounts provided to dealers related to outstanding accountsreceivables sold. The balances of such sales discount reserves that are recorded within “Accrued expenses” as of December 31, 2016 and 2015 wereapproximately $202.5 million and $229.5 million, respectively.
Inventories
Inventories are valued at the lower of cost or market using the first-in, first-out method. Market is current replacement cost (by purchase or byreproduction, dependent on the type of inventory). In cases where market exceeds net realizable value (i.e., estimated selling price less reasonably predictablecosts of completion and disposal), inventories are stated at net realizable value. Market is not considered to be less than net realizable value reduced by anallowance for an approximately normal profit margin. At December 31, 2016 and 2015, the Company had recorded $137.2 million and $134.6 million,respectively, as an adjustment for surplus and obsolete inventories. These adjustments are reflected within “Inventories, net” within the Company’sConsolidated Balance Sheets.
Inventories, net at December 31, 2016 and 2015 were as follows (in millions):
2016 2015Finished goods $ 589.3 $ 523.1Repair and replacement parts 532.5 515.4Work in process 113.8 97.5Raw materials 279.2 287.4
Inventories, net $ 1,514.8 $ 1,423.4
Cash flows related to the sale of inventories are reported within “Cash flows from operating activities” within the Company’s ConsolidatedStatements of Cash Flows.
49

Table of ContentsAGCO CORPORATION
NOTES TO CONSOLIDATED FINANCIAL STATEMENTS - (Continued)
Property, Plant and Equipment
Property, plant and equipment are recorded at cost, less accumulated depreciation and amortization. Depreciation is provided on a straight-line basisover the estimated useful lives of ten to 40 years for buildings and improvements, three to 15 years for machinery and equipment and three to ten years forfurniture and fixtures. Expenditures for maintenance and repairs are charged to expense as incurred.
Property, plant and equipment, net at December 31, 2016 and 2015 consisted of the following (in millions):
2016 2015Land $ 112.1 $ 105.7Buildings and improvements 681.8 637.4Machinery and equipment 2,116.1 1,966.8Furniture and fixtures 126.4 120.0Gross property, plant and equipment 3,036.4 2,829.9Accumulated depreciation and amortization (1,675.1) (1,482.8)
Property, plant and equipment, net $ 1,361.3 $ 1,347.1
Goodwill, Other Intangible Assets and Long-Lived Assets The Company tests goodwill for impairment, at the reporting unit level, annually and when events or circumstances indicate that fair value of a
reporting unit may be below its carrying value. A reporting unit is an operating segment or one level below an operating segment, for example, a component.The Company combines and aggregates two or more components of an operating segment as a single reporting unit if the components have similar economiccharacteristics. The Company’s reportable segments are not its reporting units.
Goodwill is evaluated annually as of October 1 for impairment using a qualitative assessment or a quantitative two-step assessment. If the Companyelects to perform a qualitative assessment and determines the fair value of its reporting units more likely than not exceed their carrying value, no furtherevaluation is necessary. For reporting units where the Company performs a two-step quantitative assessment, the first step requires the Company to comparethe fair value of each reporting unit, which is determined based on a combination of a discounted cash flow valuation approach and a market multiplevaluation approach, to its respective carrying value, including goodwill. If the fair value of the reporting unit exceeds its carrying value, the goodwill is notconsidered impaired. If the carrying value is higher than the fair value of the reporting unit, the second step of the quantitative process is required to measurethe amount of impairment, if any. The second step of the quantitative assessment results in a calculation of the implied fair value of the reporting unit’sgoodwill, which is determined as the excess of the fair value of a reporting unit over the fair values assigned to its assets and liabilities. If the implied fairvalue of goodwill is less than the carrying value of the reporting unit’s goodwill, the difference is recognized as an impairment loss.
The Company reviews its long-lived assets, which include intangible assets subject to amortization, for impairment whenever events or changes in
circumstances indicate that the carrying amount of an asset may not be recoverable. The evaluation for recoverability is performed at a level whereindependent cash flows may be attributed to either an asset or asset group. If the Company determines that the carrying amount of an asset or asset group isnot recoverable based on the expected undiscounted future cash flows of the asset or asset group, an impairment loss is recorded equal to the excess of thecarrying amounts over the estimated fair value of the long-lived assets. Estimates of future cash flows are based on many factors, including current operatingresults, expected market trends and competitive influences. The Company also evaluates the amortization periods assigned to its intangible assets todetermine whether events or changes in circumstances warrant revised estimates of useful lives. Assets to be disposed of by sale are reported at the lower ofthe carrying amount or fair value, less estimated costs to sell.
The results of the Company’s goodwill and long-lived assets impairment analyses conducted as of October 1, 2016, 2015 and 2014 indicated that no
reduction in the carrying amount of the Company’s goodwill and long-lived assets was required.
50

Table of ContentsAGCO CORPORATION
NOTES TO CONSOLIDATED FINANCIAL STATEMENTS - (Continued)
The Company’s accumulated goodwill impairment is approximately $180.5 million related to impairment charges the Company recorded during2012 and 2006 pertaining to its Chinese harvesting reporting unit and former sprayer reporting unit, respectively. The Chinese harvesting business operateswithin the Asia/Pacific geographical reportable segment and the former sprayer reporting unit operates within the North American geographical reportablesegment.
Changes in the carrying amount of goodwill during the years ended December 31, 2016, 2015 and 2014 are summarized as follows (in millions):
North
America South
America Europe/Africa/
Middle East Asia/Pacific ConsolidatedBalance as of December 31, 2013 $ 424.0 $ 190.7 $ 506.6 $ 57.4 $ 1,178.7Acquisition 89.6 — — — 89.6Foreign currency translation — (21.0) (52.0) (2.5) (75.5)Balance as of December 31, 2014 513.6 169.7 454.6 54.9 1,192.8Acquisition 5.1 — 9.3 7.8 22.2Foreign currency translation — (55.3) (38.7) (6.5) (100.5)Balance as of December 31, 2015 518.7 114.4 425.2 56.2 1,114.5Acquisition 25.2 — 244.0 — 269.2Foreign currency translation — 24.4 (28.7) (3.0) (7.3)Balance as of December 31, 2016 $ 543.9 $ 138.8 $ 640.5 $ 53.2 $ 1,376.4
The Company amortizes certain acquired identifiable intangible assets primarily on a straight-line basis over their estimated useful lives, which
range from five to 50 years. The acquired intangible assets have a weighted average useful life as follows:
Intangible Asset Weighted-Average
Useful LifePatents and technology 12 yearsCustomer relationships 13 yearsTrademarks and trade names 19 yearsLand use rights 45 years
For the years ended December 31, 2016, 2015 and 2014, acquired intangible asset amortization was $51.2 million, $42.7 million and $41.0 million,respectively. The Company estimates amortization of existing intangible assets will be $54.4 million in 2017, 2018, and 2019; $54.0 million in 2020, and$51.5 million in 2021.
The Company has previously determined that two of its trademarks have an indefinite useful life. The Massey Ferguson trademark has been inexistence since 1952 and was formed from the merger of Massey-Harris (established in the 1890’s) and Ferguson (established in the 1930’s). The MasseyFerguson brand is currently sold in over 140 countries worldwide, making it one of the most widely sold tractor brands in the world. The Company also hasidentified the Valtra trademark as an indefinite-lived asset. The Valtra trademark has been in existence since the late 1990’s, but is a derivative of the Valmettrademark which has been in existence since 1951. The Valmet name transitioned to the Valtra name over a period of time in the marketplace. The Valtrabrand is currently sold in approximately 50 countries around the world. Both the Massey Ferguson brand and the Valtra brand are primary product lines ofthe Company’s business, and the Company plans to use these trademarks for an indefinite period of time. The Company plans to continue to makeinvestments in product development to enhance the value of these brands into the future. There are no legal, regulatory, contractual, competitive, economicor other factors that the Company is aware of or that the Company believes would limit the useful lives of the trademarks. The Massey Ferguson and Valtratrademark registrations can be renewed at a nominal cost in the countries in which the Company operates.
51

Table of ContentsAGCO CORPORATION
NOTES TO CONSOLIDATED FINANCIAL STATEMENTS - (Continued)
Changes in the carrying amount of acquired intangible assets during 2016 and 2015 are summarized as follows (in millions):
Trademarks and
Trade Names Customer
Relationships Patents andTechnology Land Use Rights Total
Gross carrying amounts: Balance as of December 31, 2014 $ 123.5 $ 513.8 $ 94.0 $ 9.7 $ 741.0Acquisition 1.9 4.1 3.6 — 9.6Foreign currency translation (3.2) (25.6) (5.1) (0.6) (34.5)Balance as of December 31, 2015 122.2 492.3 92.5 9.1 716.1Acquisition 61.2 69.0 32.3 — 162.5Foreign currency translation (4.2) (3.3) (2.7) (0.6) (10.8)Balance as of December 31, 2016 $ 179.2 $ 558.0 $ 122.1 $ 8.5 $ 867.8
Trademarks and
Trade Names Customer
Relationships Patents andTechnology
Land UseRights Total
Accumulated amortization: Balance as of December 31, 2014 $ 36.4 $ 180.8 $ 56.1 $ 2.9 $ 276.2Amortization expense 6.6 32.0 3.9 0.2 42.7Foreign currency translation (1.1) (19.0) (4.9) (0.2) (25.2)Balance as of December 31, 2015 41.9 193.8 55.1 2.9 293.7Amortization expense 8.0 37.4 5.6 0.2 51.2Foreign currency translation (0.2) 1.8 (1.2) (0.4) —Balance as of December 31, 2016 $ 49.7 $ 233.0 $ 59.5 $ 2.7 $ 344.9
Trademarks and
Trade NamesIndefinite-lived intangible assets: Balance as of December 31, 2014 $ 89.0Foreign currency translation (3.7)Balance as of December 31, 2015 85.3Foreign currency translation (0.9)Balance as of December 31, 2016 $ 84.4
52

Table of ContentsAGCO CORPORATION
NOTES TO CONSOLIDATED FINANCIAL STATEMENTS - (Continued)
Accrued Expenses
Accrued expenses at December 31, 2016 and 2015 consisted of the following (in millions):
2016 2015Reserve for volume discounts and sales incentives $ 407.3 $ 443.3Warranty reserves 223.1 195.2Accrued employee compensation and benefits 234.0 213.7Accrued taxes 113.5 87.3Other 182.9 167.4 $ 1,160.8 $ 1,106.9
Warranty Reserves
The warranty reserve activity for the years ended December 31, 2016, 2015 and 2014 consisted of the following (in millions):
2016 2015 2014Balance at beginning of the year $ 230.3 $ 284.6 $ 294.9Acquisitions 3.7 0.2 0.5Accruals for warranties issued during the year 214.6 152.6 214.1Settlements made (in cash or in kind) during the year (188.7) (186.2) (205.5)Foreign currency translation (4.3) (20.9) (19.4)Balance at the end of the year $ 255.6 $ 230.3 $ 284.6
The Company’s agricultural equipment products generally are under warranty against defects in materials and workmanship for a period of one tofour years. The Company accrues for future warranty costs at the time of sale based on historical warranty experience. Approximately $32.5 million and $35.1million of warranty reserves are included in “Other noncurrent liabilities” in the Company’s Consolidated Balance Sheets as of December 31, 2016 and 2015,respectively.
Insurance Reserves
Under the Company’s insurance programs, coverage is obtained for significant liability limits as well as those risks required to be insured by law orcontract. It is the policy of the Company to self-insure a portion of certain expected losses primarily related to workers’ compensation and comprehensivegeneral liability, product and vehicle liability. Provisions for losses expected under these programs are recorded based on the Company’s estimates of theaggregate liabilities for the claims incurred.
Stock Incentive Plans
Stock compensation expense (credit) was recorded as follows (in millions). Refer to Note 10 for additional information regarding the Company’sstock incentive plans during 2016, 2015 and 2014:
Years Ended December 31, 2016 2015 2014
Cost of goods sold $ 1.5 $ 0.9 $ (0.9)Selling, general and administrative expenses 16.9 11.6 (9.7)Total stock compensation expense (credit) $ 18.4 $ 12.5 $ (10.6)
53

Table of ContentsAGCO CORPORATION
NOTES TO CONSOLIDATED FINANCIAL STATEMENTS - (Continued)
Research and Development Expenses
Research and development expenses are expensed as incurred and are included in engineering expenses in the Company’s Consolidated Statementsof Operations.
Advertising Costs
The Company expenses all advertising costs as incurred. Cooperative advertising costs normally are expensed at the time the revenue is earned.Advertising expenses for the years ended December 31, 2016, 2015 and 2014 totaled approximately $46.8 million, $50.0 million and $59.8 million,respectively.
Shipping and Handling Expenses
All shipping and handling fees charged to customers are included as a component of net sales. Shipping and handling costs are included as a part ofcost of goods sold, with the exception of certain handling costs included in selling, general and administrative expenses in the amount of $24.3 million,$24.6 million and $29.2 million for the years ended December 31, 2016, 2015 and 2014, respectively.
Interest Expense, Net
Interest expense, net for the years ended December 31, 2016, 2015 and 2014 consisted of the following (in millions):
2016 2015 2014Interest expense $ 65.4 $ 64.1 $ 71.9Interest income (13.3) (18.7) (13.5) $ 52.1 $ 45.4 $ 58.4
Income Taxes
Income taxes are accounted for under the asset and liability method. Deferred tax assets and liabilities are recognized for the future tax consequencesattributable to differences between the financial statement carrying amounts of existing assets and liabilities and their respective tax bases and operating lossand tax credit carryforwards. Deferred tax assets and liabilities are measured using enacted tax rates expected to apply to taxable income in the years in whichthose temporary differences are expected to be recovered or settled. The effect on deferred tax assets and liabilities of a change in tax rates is recognized inincome in the period that includes the enactment date. Refer to Note 6 for additional information regarding the Company’s income taxes.
Net Income Per Common Share
Basic income per common share is computed by dividing net income by the weighted average number of common shares outstanding during eachperiod. Diluted income per common share assumes the exercise of outstanding stock-settled stock appreciation rights (“SSARs”) and the vesting ofperformance share awards and restricted stock units using the treasury stock method when the effects of such assumptions are dilutive.
54

Table of ContentsAGCO CORPORATION
NOTES TO CONSOLIDATED FINANCIAL STATEMENTS - (Continued)
During 2014, the appreciation of the excess conversion value of the Company’s former 11/4% contingently convertible senior subordinated noteswas included in the diluted net income per common share using the treasury stock method when the impact of such assumption was dilutive. A reconciliationof net income attributable to AGCO Corporation and its subsidiaries and weighted average common shares outstanding for purposes of calculating basic anddiluted net income per share during the years ended December 31, 2016, 2015 and 2014 is as follows (in millions, except per share data):
2016 2015 2014Basic net income per share: Net income attributable to AGCO Corporation and subsidiaries $ 160.1 $ 266.4 $ 410.4
Weighted average number of common shares outstanding 81.4 87.0 93.4
Basic net income per share attributable to AGCO Corporation and subsidiaries $ 1.97 $ 3.06 $ 4.39
Diluted net income per share: Net income attributable to AGCO Corporation and subsidiaries $ 160.1 $ 266.4 $ 410.4
Weighted average number of common shares outstanding 81.4 87.0 93.4Dilutive SSARs, performance share awards and restricted stock units 0.3 0.1 0.3Weighted average assumed conversion of contingently convertible senior subordinated notes — — 0.5Weighted average number of common shares and common share equivalents outstanding for purposes of
computing diluted net income per share 81.7 87.1 94.2
Diluted net income per share attributable to AGCO Corporation and subsidiaries $ 1.96 $ 3.06 $ 4.36
SSARs to purchase 1.1 million shares, 1.2 million shares and 1.0 million shares were outstanding for the years ended December 31, 2016, 2015 and2014, respectively, but were not included in the calculation of weighted average common and common equivalent shares outstanding because they had anantidilutive impact.
Comprehensive Income (Loss)
The Company reports comprehensive income (loss), defined as the total of net income (loss) and all other non-owner changes in equity, and thecomponents thereof in its Consolidated Statements of Stockholders’ Equity and Consolidated Statements of Comprehensive Income. The components ofother comprehensive income (loss) and the related tax effects for the years ended December 31, 2016, 2015 and 2014 are as follows (in millions):
AGCO Corporation and Subsidiaries Noncontrolling
Interests 2016 2016
Before-tax
Amount IncomeTaxes
After-taxAmount
After-taxAmount
Defined benefit pension plans $ (68.2) $ 12.7 $ (55.5) $ —Net loss on derivatives (6.8) 0.1 (6.7) —Foreign currency translation adjustments 80.8 — 80.8 1.6Total components of other comprehensive income $ 5.8 $ 12.8 $ 18.6 $ 1.6
AGCO Corporation and Subsidiaries Noncontrolling
Interests 2015 2015
Before-tax
Amount IncomeTaxes
After-taxAmount
After-taxAmount
Defined benefit pension plans $ 4.9 $ (0.6) $ 4.3 $ —Net loss on derivatives (3.1) 1.2 (1.9) —Foreign currency translation adjustments (556.1) — (556.1) (2.1)Total components of other comprehensive loss $ (554.3) $ 0.6 $ (553.7) $ (2.1)
55

Table of ContentsAGCO CORPORATION
NOTES TO CONSOLIDATED FINANCIAL STATEMENTS - (Continued)
AGCO Corporation and Subsidiaries Noncontrolling
Interests 2014 2014
Before-tax
Amount IncomeTaxes
After-taxAmount
After-taxAmount
Defined benefit pension plans $ (62.1) $ 15.2 $ (46.9) $ —Net gain on derivatives 0.1 — 0.1 —Foreign currency translation adjustments (349.0) — (349.0) (0.3)Total components of other comprehensive loss $ (411.0) $ 15.2 $ (395.8) $ (0.3)
Derivatives
The Company uses foreign currency contracts to hedge the foreign currency exposure of certain receivables and payables. The contracts are forperiods consistent with the exposure being hedged and generally have maturities of one year or less. These contracts are classified as non-designatedderivative instruments. The Company also enters into foreign currency contracts designated as cash flow hedges of expected sales. The Company’s foreigncurrency contracts mitigate risk due to exchange rate fluctuations because gains and losses on these contracts generally offset losses and gains on theexposure being hedged. The notional amounts of the foreign currency contracts do not represent amounts exchanged by the parties and, therefore, are not ameasure of the Company’s risk. The amounts exchanged are calculated on the basis of the notional amounts and other terms of the contracts. The credit andmarket risks under these contracts are not considered to be significant.
The Company’s interest expense is, in part, sensitive to the general level of interest rates, and the Company manages its exposure to interest rate riskthrough the mix of floating rate and fixed rate debt. From time to time, the Company enters into interest rate swap agreements in order to manage theCompany’s exposure to interest rate fluctuations.
The Company uses non-derivative and, periodically, derivative instruments to hedge a portion of the Company’s net investment in foreignoperations against adverse movements in exchange rates.
The Company’s hedging policy prohibits it from entering into any foreign currency contracts for speculative trading purposes. Refer to Note 11 foradditional information regarding the Company’s derivative instruments and hedging activities.
Recent Accounting Pronouncements In January 2017, the Financial Accounting Standards Board (“FASB”) issued ASU 2017-04, “Simplifying the Test for Goodwill Impairment” (“ASU
2017-04”), which eliminates Step 2 from the goodwill impairment test. Under the standard, an entity should perform its goodwill impairment test bycomparing the fair value of a reporting unit with its carrying amount, resulting in an impairment charge that is the amount by which the carrying amountexceeds the reporting unit’s fair value. The impairment charge, however, should not exceed the total amount of goodwill allocated to a reporting unit. Theimpairment assessment under ASU 2017-04 applies to all reporting units, including those with a zero or negative carrying amount. ASU 2017-04 is effectivefor annual periods beginning after December 15, 2019, and interim periods within those annual periods using a prospective approach. Early adoption ispermitted for any interim or annual goodwill impairment test performed on testing dates after January 1, 2017. The Company is currently evaluating theimpact of adopting this standard on the Company’s results of operations, financial condition and cash flows.
In November 2016, the FASB issued ASU 2016-18, “Restricted Cash” (“ASU 2016-18”). which requires that a statement of cash flows explain thechange during the period in the total of cash, cash equivalents and amounts generally described as restricted cash or restricted cash equivalents. As a result,amounts generally described as restricted cash and restricted cash equivalents should be included with cash and cash equivalents when reconciling thebeginning-of-period and end-of-period total amounts shown on the statement of cash flows. ASU 2016-18 is effective for annual periods beginning afterDecember 15, 2017, and interim period within those annual periods using a retrospective approach. Early adoption is permitted in any interim or annualperiod. The Company is currently evaluating the impact of adopting this standard on the Company’s cash flows.
In October 2016, the FASB issued ASU 2016-16, “Intra-Entity Transfers of Assets Other Than Inventory” (“ASU 2016-16”), which requiresrecognition of the income tax consequences of an intra-entity transfer of an asset other than
56

Table of ContentsAGCO CORPORATION
NOTES TO CONSOLIDATED FINANCIAL STATEMENTS - (Continued)
inventory when the transfer occurs. Consequently, the standard eliminates the exception to the recognition of current and deferred income taxes for an intra-entity asset transfer other than for inventory until the asset has been sold to an outside party. ASU 2016-16 is effective for annual periods beginning afterDecember 15, 2017, and interim periods within those annual periods using a modified retrospective approach. Early adoption is permitted in any interim orannual period. The Company is currently evaluating the impact of adopting this standard on the Company’s results of operations, financial condition andcash flows.
In August 2016, the FASB issued ASU 2016-15, “Classification of Certain Cash Receipts and Cash Payments” (“ASU 2016-15”), which addresseseight specific cash flow issues with the objective of reducing the existing diversity in practice. The standard is effective for annual periods beginning afterDecember 15, 2017, and interim periods within those fiscal years. ASU 2016-15 may be applied using a retrospective approach or a prospective approach, ifimpracticable to apply the amendments retrospectively. Early adoption is permitted in any interim or annual period. The Company expects to adopt ASU2016-15 on January 1, 2017 and that the adoption will not have a material impact on its cash flows.
In June 2016, the FASB issued ASU 2016-13, “Measurement of Credit Losses on Financial Instruments” (“ASU 2016-13”), which requiresmeasurement and recognition of expected versus incurred credit losses for financial assets held. ASU 2016-13 is effective for annual periods beginning afterDecember 15, 2019, and interim periods within those annual periods. This standard will likely impact the results of operations and financial condition of theCompany’s finance joint ventures and as a result, will likely impact the Company’s “Investment in affiliates” and “Equity in net earnings of affiliates” uponadoption. The Company’s finance joint ventures are currently evaluating the standard’s impact to their results of operations and financial condition.
In March 2016, the FASB issued ASU 2016-09, “Improvements to Employee Share-Based Payment Accounting” (“ASU 2016-09”). ASU 2016-09simplifies several aspects of the accounting for share-based payment transactions, including the accounting for forfeitures, employer tax withholding onshare-based compensation and the financial statement presentation of excess tax benefits or deficiencies. In addition, the standard clarifies the statement ofcash flow presentation for certain components of share-based awards. The application methods are specific to each component of the ASU and may be appliedusing a prospective, retrospective or a modified retrospective approach. ASU 2016-09 is effective for annual periods beginning after December 15, 2016, andinterim periods within those annual periods. Early adoption is permitted in any interim or annual period. The Company expects to adopt ASU 2016-09 onJanuary 1, 2017 and that the adoption will not have a material impact on its results of operations, financial condition and cash flows.
In February 2016, the FASB issued ASU 2016-02, “Leases” (“ASU 2016-02”), which supersedes the existing lease guidance under current U.S.GAAP. ASU 2016-02 is based on the principle that entities should recognize assets and liabilities arising from leases. The standard does not significantlychange the lessees’ recognition, measurement and presentation of expenses and cash flows from the previous accounting standard. Leases are classified asfinance or operating. ASU 2016-02’s primary change is the requirement for entities to recognize a lease liability for payments and a right-of-use assetrepresenting the right to use the leased asset during the term of an operating lease arrangement. Lessees are permitted to make an accounting policy electionto not recognize the asset and liability for leases with a term of 12 months or less. Lessors’ accounting under the standard is largely unchanged from theprevious accounting standard. In addition, ASU 2016-02 expands the disclosure requirements of lease arrangements. The standard is effective for reportingperiods beginning after December 15, 2018, and interim periods within those annual periods. Early adoption is permitted. Upon adoption, lessees and lessorsare required to recognize and measure leases at the beginning of the earliest period presented using a modified retrospective approach. The Company iscurrently evaluating the impact of adopting this standard on the Company’s results of operations, financial condition and cash flows.
In May 2015, the FASB issued ASU 2015-07, “Disclosures for Investments in Certain Entities That Calculate Net Asset Value per Share (or itsEquivalent)” (“ASU 2015-07”), which, among other things, amends Accounting Standards Codification 820, “Fair Value Measurements”, to remove therequirement to categorize within the fair value hierarchy all investments measured at the net asset value (“NAV”) per share (or its equivalent) as a practicalexpedient. The standard is effective for fiscal years beginning after December 15, 2015 with retrospective application. Early adoption is permitted. TheCompany adopted ASU 2015-07 on January 1, 2016 with retrospective application to the fair value hierarchy. The retrospective application resulted in theremoval of $7.4 million and $109.2 million defined benefit pension plan assets classified as Level 2 and Level 3, respectively, from the fair value hierarchyas of December 31, 2015.
In April 2015, the FASB issued ASU 2015-03, “Simplifying the Presentation of Debt Issuance Costs” (“ASU 2015-03”). ASU 2015-03 amends
existing guidance to require the presentation of debt issuance costs in the balance sheet as a
57

Table of ContentsAGCO CORPORATION
NOTES TO CONSOLIDATED FINANCIAL STATEMENTS - (Continued)
direct deduction from the carrying amount of the related debt liability instead of a deferred charge (an asset). Given the absence of authoritative guidancewithin ASU 2015-03, in August 2015 the FASB issued ASU 2015-15, “Presentation and Subsequent Measurement of Debt Issuance Costs Associated withLine-of-Credit Arrangements” (“ASU 2015-15”), which clarifies that the SEC staff would not object to an entity deferring and presenting debt issuance costsas an asset and subsequently amortizing the deferred debt issuance costs ratably over the term of the line-of-credit arrangement, regardless of whether thereare any outstanding borrowings on the line-of-credit arrangement. ASU 2015-03 is effective for fiscal years, and interim periods within those fiscal years,beginning after December 15, 2015. Early adoption was permitted. The Company adopted this standard on January 1, 2016 and has applied the requirementsof ASU 2015-03 retrospectively to all periods presented. In the Consolidated Balance Sheet as of December 31, 2015, the Company reclassifiedapproximately $3.6 million as a decrease to “Other assets” and correspondingly decreased “Long-term debt” by approximately $3.6 million. The debtissuance costs related to the Company’s multi-currency revolving credit facility continue to be classified within “Other assets” in the Consolidated BalanceSheets as permitted by the standard.
In May 2014, The FASB issued ASU 2014 - 09, “Revenue from Contracts with Customers” (“ASU 2014-09”), which provides a single,comprehensive revenue recognition model for all contracts with customers with a five-step analysis in determining when and how revenue is recognized. Thenew model will require revenue recognition to depict the transfer of promised goods or services to customers at an amount that reflects the considerationexpected to be received in exchange for those goods or services. Additional disclosures also will be required to enable users to understand the nature,amount, timing and uncertainty of revenue and cash flows arising from contracts with customers, including significant judgments and changes in thosejudgments. The standard is effective for reporting periods beginning after December 31, 2017, with early adoption permitted for reporting periods beginningafter December 31, 2016. Entities have the option to apply the new standard under a full retrospective approach to each prior reporting period presented, or amodified retrospective approach with the cumulative effect of initial adoption and application within the Consolidated Statement of Stockholders’ Equity. The Company plans to adopt the new standard effective January 1, 2018 under the modified retrospective approach. Under the new model, the Company willbegin to recognize an asset for the value of expected replacement parts returns. While the Company has not yet completed its evaluation process, includingthe identification of new controls and processes designed to meet the requirements of the standard, at this time the Company has not identified any impacts tothe consolidated financial statements that the Company believes will be material in the year of adoption.
2. Acquisitions
On September 12, 2016, the Company acquired Cimbria Holdings Limited (“Cimbria”) for DKK 2,234.9 million (or approximately $337.5 million),net of cash acquired of approximately DKK83.4 million (or approximately $12.6 million). Cimbria, headquartered in Thisted, Denmark, is a leadingmanufacturer of products and solutions for the processing, handling and storage of seed and grain. The acquisition was financed by the Company’s creditfacility (Note 7).
The preliminary fair values of the assets acquired and liabilities assumed as of the acquisition date are presented in the following table (in millions):
Current assets $ 74.2Property, plant and equipment 21.9Intangible assets 128.9Goodwill 237.9 Total assets acquired 462.9 Current liabilities 63.8Deferred tax liabilities 38.5Long-term debt and other noncurrent liabilities 10.5 Total liabilities assumed 112.8 Net assets acquired $ 350.1
58

Table of ContentsAGCO CORPORATION
NOTES TO CONSOLIDATED FINANCIAL STATEMENTS - (Continued)
The acquired identifiable intangible assets of Cimbria as of the date of the acquisition are summarized in the following table (in millions):
Intangible Asset Amount
Weighted-Average Useful
LifeCustomer relationships $ 50.4 9 yearsTechnology 22.5 10 yearsTrademarks 56.0 20 years $ 128.9
The results of operations of Cimbria have been included in the Company’s Consolidated Financial Statements as of and from the date of acquisition.The associated goodwill has been included in the Company’s Europe/Africa/Middle East geographical reportable segment.
On February 2, 2016, the Company acquired Tecno Poultry Equipment S.p.A (“Tecno”) for approximately €58.7 million (or approximately $63.8
million). The Company acquired cash of approximately €17.6 million (or approximately $19.1 million) associated with the acquisition. Tecno,headquartered in Ronchi Di Villafranca, Italy, manufactures and supplies poultry housing and related products, including egg collection equipment andtrolley feeding systems. The acquisition was financed through the Company’s credit facility (Note 7). The Company allocated the purchase price to the assetsacquired and liabilities assumed based on estimates of their fair values as of the acquisition date. The acquired net assets primarily consisted of accountsreceivable, inventories, accounts payable and accrued expenses, deferred revenue, property, plant and equipment, and customer relationship, technology andtrademark identifiable intangible assets. The Company recorded approximately $27.5 million of customer relationship, technology and trademarkidentifiable intangible assets and approximately $20.4 million of goodwill associated with the acquisition. The results of operations of Tecno have beenincluded in the Company’s Consolidated Financial Statements as of and from the date of acquisition. The associated goodwill has been included in theCompany’s Europe/Africa/Middle East and North America geographical reportable segments.
The acquired identifiable intangible assets of Tecno as of the date of the acquisition are summarized in the following table (in millions):
Intangible Asset Amount
Weighted-Average Useful
LifeCustomer relationships $ 15.7 10 yearsTechnology 7.9 10 yearsTrademarks 3.9 10 years $ 27.5
On April 17, 2015, the Company acquired Farmer Automatic GmbH & Co. KG (“Farmer Automatic”) for approximately $17.9 million, net of cashacquired of approximately $0.1 million. Farmer Automatic, headquartered in Laer, Germany, manufactures and supplies poultry housing and related products,including egg production cages and broiler production equipment. The acquisition was financed with available cash on hand. The Company allocated thepurchase price to the assets acquired and liabilities assumed based on estimates of their fair values as of the acquisition date. The acquired net assets primarilyconsisted of accounts receivable, inventories, accounts payable and accrued expenses, property, plant and equipment, and customer relationship, technologyand trademark identifiable intangible assets. The Company recorded approximately $9.6 million of identifiable intangible assets and approximately $10.0million of goodwill associated with the acquisition. The results of operations of Farmer Automatic have been included in the Company’s ConsolidatedFinancial Statements as of and from the date of the acquisition. The associated goodwill has been included in the Company’s Europe/Africa/Middle East,North America and Asia/Pacific geographical reportable segments.
59

Table of ContentsAGCO CORPORATION
NOTES TO CONSOLIDATED FINANCIAL STATEMENTS - (Continued)
The acquired identifiable intangible assets of Farmer Automatic as of the date of the acquisition are summarized in the following table (in millions):
Intangible Asset Amount
Weighted-Average
Useful LifeCustomer relationships $ 4.1 10 yearsTechnology 3.6 10 yearsTrademarks 1.9 10 years $ 9.6
On August 1, 2014, the Company acquired Intersystems Holdings, Inc. (“Intersystems”) for approximately $130.3 million, net of cash acquired of
approximately $4.1 million. Intersystems, headquartered in Omaha, Nebraska, designs and manufactures commercial material handling solutions, primarilyfor the agricultural, biofuels and food and feed processing industries. The acquisition was financed with available cash on hand and the Company’s creditfacility (Note 7). The Company allocated the purchase price to the assets acquired and liabilities assumed based on estimates of their fair values as of theacquisition date. The acquired net assets primarily consisted of accounts receivable, inventories, accounts payable and accrued expenses, property, plant andequipment, and customer relationship, technology and trademark identifiable intangible assets. The Company recorded approximately $46.3 million ofcustomer relationship, technology and trademark identifiable intangible assets and approximately $89.6 million of goodwill associated with the acquisition.The results of operations of Intersystems have been included in the Company’s Consolidated Financial Statements as of and from the date of acquisition. Thegoodwill was reported within the Company’s North American geographical reportable segment.
The acquired identifiable intangible assets of Intersystems as of the date of the acquisition are summarized in the following table (in millions):
Intangible Asset Amount
Weighted-Average
Useful LifeCustomer relationships $ 28.0 15 yearsTechnology 11.3 15 yearsTrademarks 7.0 16 years $ 46.3
60

Table of ContentsAGCO CORPORATION
NOTES TO CONSOLIDATED FINANCIAL STATEMENTS - (Continued)
3. Restructuring Expenses
During 2014, 2015 and 2016, the Company announced and initiated several actions to rationalize employee headcount at various manufacturingfacilities located in Europe, China, Brazil, Argentina and the United States, as well as various administrative offices located in Europe, Brazil, China and theUnited States in order to reduce costs in response to softening global market demand and lower production volumes. The aggregate headcount reduction wasapproximately 2,750 employees in 2014, 2015 and 2016. The components of the restructuring expenses are summarized as follows (in millions):
Write-down ofProperty, Plantand Equipment
EmployeeSeverance
Facility ClosureCosts Total
Balance as of December 31, 2013 $ — $ — $ — $ —2014 provision 1.2 45.1 0.1 46.4Less: Non-cash expense (1.2) (0.8) — (2.0) Cash expense — 44.3 0.1 44.42014 cash activity — (18.8) — (18.8)Foreign currency translation — (0.2) — (0.2)Balance as of December 31, 2014 — 25.3 0.1 25.42015 provision — 23.0 — 23.02015 provision reversal — (0.7) — (0.7)2015 cash activity — (29.4) (0.1) (29.5)Foreign currency translation — (1.3) — (1.3)Balance as of December 31, 2015 — 16.9 — 16.92016 provision — 11.0 1.0 12.02016 provision reversal — (0.1) — (0.1)2016 cash activity — (13.1) (0.2) (13.3)Foreign currency translation — (0.2) — (0.2)Balance as of December 31, 2016 $ — $ 14.5 $ 0.8 $ 15.3
4. Accounts Receivable Sales Agreements
At December 31, 2016 and 2015, the Company had accounts receivable sales agreements that permit the sale, on an ongoing basis, of a majority ofits wholesale receivables in North America, Europe and Brazil to its U.S., Canadian, European and Brazilian finance joint ventures. As of both December 31,2016 and 2015, the cash received from receivables sold under the U.S., Canadian, European and Brazilian accounts receivable sales agreements wasapproximately $1.1 billion.
Under the terms of the accounts receivable sales agreements in North America, Europe and Brazil, the Company pays an annual servicing fee relatedto the servicing of the receivables sold. The Company also pays the respective AGCO Finance entities an interest payment calculated based upon LIBORplus a margin on any non-interest bearing accounts receivable outstanding and sold under the sales agreements. These fees are reflected within losses on thesales of receivables included within “Other expense, net” in the Company’s Consolidated Statements of Operations. The Company does not service thereceivables after the sale occurs and does not maintain any direct retained interest in the receivables. The Company reviewed its accounting for the accountsreceivable sales agreements and determined that these facilities should be accounted for as off-balance sheet transactions.
Losses on sales of receivables associated with the accounts receivable financing facilities discussed above, reflected within “Other expense, net” inthe Company’s Consolidated Statements of Operations, were approximately $19.5 million, $18.8 million and $24.8 million during 2016, 2015 and 2014,respectively.
The Company’s finance joint ventures in Europe, Brazil and Australia also provide wholesale financing directly to the Company’s dealers. Thereceivables associated with these arrangements are without recourse to the Company. The Company does not service the receivables after the sale occurs anddoes not maintain any direct retained interest in the receivables. As of
61

Table of ContentsAGCO CORPORATION
NOTES TO CONSOLIDATED FINANCIAL STATEMENTS - (Continued)
December 31, 2016 and 2015, these finance joint ventures had approximately $41.5 million and $38.3 million, respectively, of outstanding accountsreceivable associated with these arrangements. The Company reviewed its accounting for these arrangements and determined that these arrangements shouldbe accounted for as off-balance sheet transactions.
In addition, the Company sells certain trade receivables under factoring arrangements to other financial institutions around the world. The Companyreviewed the sale of such receivables and determined that these arrangements should be accounted for as off-balance sheet transactions.
5. Investments in Affiliates
Investments in affiliates as of December 31, 2016 and 2015 were as follows (in millions):
2016 2015Finance joint ventures $ 380.8 $ 359.4Manufacturing joint ventures 17.8 18.1Other affiliates 16.3 15.4 $ 414.9 $ 392.9
The Company’s manufacturing joint ventures as of December 31, 2016 consisted of Groupement International De Mecanique Agricole SA (“GIMA”)(a joint venture with a third-party manufacturer to purchase, design and manufacture components for agricultural equipment in France), and joint ventureswith third-party manufacturers to assemble tractors in Algeria and engines in South America. The other joint ventures represent investments in farmequipment manufacturers, an electronic and software system manufacturer, distributors and licensees.
The Company’s equity in net earnings of affiliates for the years ended December 31, 2016, 2015 and 2014 were as follows (in millions):
2016 2015 2014Finance joint ventures $ 45.5 $ 53.8 $ 48.8Manufacturing and other joint ventures 2.0 3.3 4.1 $ 47.5 $ 57.1 $ 52.9
Summarized combined financial information of the Company’s finance joint ventures as of December 31, 2016 and 2015 and for the years endedDecember 31, 2016, 2015 and 2014 were as follows (in millions):
As of December 31, 2016 2015
Total assets $ 7,448.0 $ 7,491.2Total liabilities 6,670.8 6,757.8Partners’ equity 777.2 733.4
For the Years Ended December 31, 2016 2015 2014
Revenues $ 297.4 $ 313.0 $ 383.4Costs 159.0 158.1 234.7Income before income taxes $ 138.4 $ 154.9 $ 148.7
The majority of the assets of the Company’s finance joint ventures represents finance receivables. The majority of the liabilities represents notespayable and accrued interest. Under the various joint venture agreements, Rabobank or its affiliates provide financing to the joint venture companies (Note14).
At December 31, 2016 and 2015, the Company’s receivables from affiliates were approximately $54.4 million and $70.1 million, respectively. Thereceivables from affiliates are reflected within “Accounts and notes receivable, net” within the Company’s Consolidated Balance Sheets.
62

Table of ContentsAGCO CORPORATION
NOTES TO CONSOLIDATED FINANCIAL STATEMENTS - (Continued)
The portion of the Company’s retained earnings balance that represents undistributed retained earnings of equity method investees wasapproximately $312.6 million and $296.8 million as of December 31, 2016 and 2015, respectively.
6. Income Taxes
The sources of income (loss) before income taxes and equity in net earnings of affiliates were as follows for the years ended December 31, 2016,2015 and 2014 (in millions):
2016 2015 2014United States $ (150.0) $ (49.1) $ 63.5Foreign 354.9 328.5 475.5Income before income taxes and equity in net earnings of affiliates $ 204.9 $ 279.4 $ 539.0
The provision (benefit) for income taxes by location of the taxing jurisdiction for the years ended December 31, 2016, 2015 and 2014 consisted of
the following (in millions):
2016 2015 2014Current:
United States: Federal $ (24.3) $ (1.3) $ 12.6State 0.2 2.8 2.8
Foreign 114.2 97.8 168.7 90.1 99.3 184.1Deferred:
United States: Federal 21.9 (19.0) (0.4)State — — —
Foreign (19.8) (7.8) 4.0 2.1 (26.8) 3.6 $ 92.2 $ 72.5 $ 187.7
At December 31, 2016, the Company’s foreign subsidiaries had approximately $2.5 billion of undistributed earnings. These earnings are consideredto be indefinitely invested, and, accordingly, no income taxes have been provided on these earnings. Determination of the amount of unrecognized deferredtaxes on these earnings is not practicable; however, unrecognized foreign tax credits would be available to reduce a portion of the tax liability.
A reconciliation of income taxes computed at the United States federal statutory income tax rate (35%) to the provision for income taxes reflected inthe Company’s Consolidated Statements of Operations for the years ended December 31, 2016, 2015 and 2014 is as follows (in millions):
2016 2015 2014Provision for income taxes at United States federal statutory rate of 35% $ 71.7 $ 97.8 $ 188.7State and local income taxes, net of federal income tax effects (6.0) (2.0) 2.6Taxes on foreign income which differ from the United States statutory rate (44.5) (34.9) (33.4)Tax effect of permanent differences 14.4 7.1 (10.3)Change in valuation allowance 37.9 (4.5) 22.8Change in tax contingency reserves 23.4 15.4 25.2Research and development tax credits (3.8) (4.9) (7.1)Other (0.9) (1.5) (0.8) $ 92.2 $ 72.5 $ 187.7
63

Table of ContentsAGCO CORPORATION
NOTES TO CONSOLIDATED FINANCIAL STATEMENTS - (Continued)
The significant components of the deferred tax assets and liabilities at December 31, 2016 and 2015 were as follows (in millions):
2016 2015Deferred Tax Assets:
Net operating loss carryforwards $ 85.5 $ 74.0Sales incentive discounts 73.7 86.6Inventory valuation reserves 39.9 40.3Pensions and postretirement health care benefits 70.4 63.4Warranty and other reserves 118.1 91.8Research and development tax credits 11.2 9.3Foreign tax credits 24.0 2.2Other 24.6 22.4
Total gross deferred tax assets 447.4 390.0Valuation allowance (116.0) (75.8)
Total net deferred tax assets 331.4 314.2Deferred Tax Liabilities:
Tax over book depreciation and amortization 284.9 275.1Investment in affiliates 45.6 10.4Other 13.6 14.4
Total deferred tax liabilities 344.1 299.9Net deferred tax (liabilities) assets $ (12.7) $ 14.3
Amounts recognized in Consolidated Balance Sheets: Deferred tax assets - noncurrent $ 99.7 $ 100.7Deferred tax liabilities - noncurrent (112.4) (86.4)
$ (12.7) $ 14.3
The Company recorded a net deferred tax liability of $12.7 million as of December 31, 2016 and a net deferred tax asset of $14.3 million as ofDecember 31, 2015. As reflected in the preceding table, the Company had a valuation allowance of $116.0 million and $75.8 million as of December 31,2016 and 2015, respectively.
During the second quarter of 2016, the Company established a valuation allowance to fully reserve its net deferred tax assets in the United States. Avaluation allowance is established when it is more likely than not that some portion or all of the deferred tax assets will not be realized. The Companyassessed the likelihood that its deferred tax assets would be recovered from estimated future taxable income and available tax planning strategies anddetermined that the adjustment to the valuation allowance was appropriate. In making this assessment, all available evidence was considered including thecurrent economic climate, as well as reasonable tax planning strategies. The Company believes it is more likely than not that the Company will realize itsremaining net deferred tax assets, net of the valuation allowance, in future years.
The Company had net operating loss carryforwards of $286.4 million as of December 31, 2016, with expiration dates as follows: 2017 - $27.3
million; 2018 - $38.0 million; 2019 - $41.8 million and thereafter or unlimited - $179.3 million. The net operating loss carryforwards of $286.4 million wereentirely in tax jurisdictions outside of the United States.
The Company paid income taxes of $106.2 million, $97.6 million and $223.6 million for the years ended December 31, 2016, 2015 and 2014,
respectively.
At December 31, 2016 and 2015, the Company had $139.9 million and $133.0 million, respectively, of unrecognized income tax benefits, all ofwhich would affect the Company’s effective tax rate if recognized. At December 31, 2016 and 2015, the Company had approximately $47.0 million and$61.2 million, respectively, of accrued or deferred taxes related to uncertain income tax positions connected with ongoing income tax audits in variousjurisdictions that it expects to settle or pay in the next 12 months. The Company accrued approximately $3.4 million and $5.1 million of interest andpenalties related to unrecognized tax benefits in its provision for income taxes during 2016 and 2015, respectively. At December 31, 2016 and
64

Table of ContentsAGCO CORPORATION
NOTES TO CONSOLIDATED FINANCIAL STATEMENTS - (Continued)
2015, the Company had accrued interest and penalties related to unrecognized tax benefits of $16.4 million and $18.3 million, respectively. A reconciliation of the beginning and ending balances of the total amounts of gross unrecognized tax benefits as of and during the years ended
December 31, 2016 and 2015 is as follows (in millions):
2016 2015Gross unrecognized income tax benefits $ 133.0 $ 130.6Additions for tax positions of the current year 14.4 14.4Additions for tax positions of prior years 15.2 7.1Reductions for tax positions of prior years for:
Changes in judgments (1.2) (0.3)Settlements during the year (13.8) —Lapses of applicable statute of limitations (5.0) (5.8)
Foreign currency translation (2.7) (13.0)Gross unrecognized income tax benefits $ 139.9 $ 133.0
The Company and its subsidiaries file income tax returns in the United States and in various state, local and foreign jurisdictions. The Company andits subsidiaries are routinely examined by tax authorities in these jurisdictions. As of December 31, 2016, a number of income tax examinations in foreignjurisdictions were ongoing. It is possible that certain of these ongoing examinations may be resolved within 12 months. Due to the potential for resolution offederal, state and foreign examinations, and the expiration of various statutes of limitation, it is reasonably possible that the Company’s gross unrecognizedincome tax benefits balance may materially change within the next 12 months. Due to the number of jurisdictions and issues involved and the uncertaintyregarding the timing of any settlements, the Company is unable at this time to provide a reasonable estimate of such change that may occur within the next12 months. Although there are ongoing examinations in various federal and state jurisdictions, the 2013 through 2016 tax years generally remain subject toexamination in the United States by applicable authorities. In the Company’s significant foreign jurisdictions, primarily the United Kingdom, France,Germany, Switzerland, Finland and Brazil, the 2011 through 2016 tax years generally remain subject to examination by their respective tax authorities. InBrazil, the Company is contesting disallowed deductions related to the amortization of certain goodwill amounts (Note 12).
7. Indebtedness
Indebtedness consisted of the following at December 31, 2016 and 2015 (in millions):
December 31, 2016 December 31, 20151.056% Senior term loan due 2020 $ 211.0 $ 217.2Credit facility, expires 2020 329.2 338.9Senior term loans due 2021 316.5 —5 7/8% Senior notes due 2021 306.6 297.4Senior term loans due between 2019 and 2026 395.6 —4½% Senior term loan due 2016 — 217.2Other long-term debt 141.6 164.3Debt issuance costs (5.1) (3.6) 1,695.4 1,231.4Less: Current portion of other long-term debt (85.4) (89.0)
4½% Senior term loan due 2016 — (217.2)Total indebtedness, less current portion $ 1,610.0 $ 925.2
65

Table of ContentsAGCO CORPORATION
NOTES TO CONSOLIDATED FINANCIAL STATEMENTS - (Continued)
At December 31, 2016, the aggregate scheduled maturities of long-term debt, excluding the current portion of long-term debt, are as follows (inmillions):
2018 $ 22.82019 72.02020 550.32021 824.2Thereafter 140.7 $ 1,610.0
Cash payments for interest were approximately $58.8 million, $63.0 million and $68.4 million for the years ended December 31, 2016, 2015 and2014, respectively.
1.056% Senior Term Loan
In December 2014, the Company entered into a term loan with the European Investment Bank, which provided the Company with the ability toborrow up to €200.0 million. The €200.0 million (or approximately $211.0 million as of December 31, 2016) of funding was received on January 15, 2015with a maturity date of January 15, 2020. The Company has the ability to prepay the term loan before its maturity date. Interest is payable on the term loan at1.056% per annum, payable quarterly in arrears. The term loan contains covenants regarding, among other things, the incurrence of indebtedness and themaking of certain payments, as well as commitments regarding amounts of future research and development expenses in Europe, and is subject toacceleration in the events of default. The Company also has to fulfill financial covenants with respect to a net leverage ratio and interest coverage ratio.
Credit Facility
The Company’s revolving credit and term loan facility consists of an $800.0 million multi-currency revolving credit facility and a €312.0 million(or approximately $329.2 million as of December 31, 2016) term loan facility. The maturity date of the credit facility is June 26, 2020. Under the creditfacility agreement, interest accrues on amounts outstanding, at the Company’s option, depending on the currency borrowed, at either (1) LIBOR or EURIBORplus a margin ranging from 1.0% to 1.75% based on the Company’s leverage ratio, or (2) the base rate, which is equal to the higher of (i) the administrativeagent’s base lending rate for the applicable currency, (ii) the federal funds rate plus 0.5%, and (iii) one-month LIBOR for loans denominated in U.S. dollarsplus 1.0% plus a margin ranging from 0.0% to 0.25% based on the Company’s leverage ratio. As is more fully described in Note 11, the Company enteredinto an interest rate swap in 2015 to convert the term loan facility’s floating interest rate to a fixed interest rate of 0.33% plus the applicable margin over theremaining life of the term loan facility. The credit facility contains covenants restricting, among other things, the incurrence of indebtedness and the makingof certain payments, including dividends, and is subject to acceleration in the event of a default. The Company also has to fulfill financial covenants withrespect to a total debt to EBITDA ratio and an interest coverage ratio. As of December 31, 2016, no amounts were outstanding under the Company’s multi-currency revolving credit facility, and the Company had the ability to borrow approximately $800.0 million under the facility. Approximately €312.0million (or approximately $329.2 million) was outstanding under the term loan facility as of December 31, 2016. As of December 31, 2015, no amounts wereoutstanding under the Company’s multi-currency revolving credit facility, and the Company had the ability to borrow approximately $800.0 million underthe facility. Approximately €312.0 million (or approximately $338.9 million) was outstanding under the term loan facility as of December 31, 2015.
During 2015, the Company designated its €312.0 million ($329.2 million at December 31, 2016) term loan facility as a hedge of its net investmentin foreign operations to offset foreign currency translation gains or losses on the net investment. See Note 11 for additional information about the netinvestment hedge.
Senior Term Loans Due 2021
In April 2016, the Company entered into two term loan agreements with Coöperatieve Centrale Raiffeisen-Boerenleenbank B.A. (“Rabobank”), inthe amount of €100.0 million and €200.0 million, respectively (or, in aggregate, approximately $316.5 million as of December 31, 2016). The €300.0 millionof funding was received on April 26, 2016 and was partially used to repay the Company’s 4½% senior term loan with Rabobank which was due May 2, 2016.The Company received net proceeds of approximately €99.6 million (or approximately $112.2 million) after debt issuance costs. The
66

Table of ContentsAGCO CORPORATION
NOTES TO CONSOLIDATED FINANCIAL STATEMENTS - (Continued)
provisions of the two term loans are identical in nature. The Company has the ability to prepay the term loans before their maturity date on April 26,2021. Interest is payable on the term loans per annum, equal to the EURIBOR plus a margin ranging from 1.0% to 1.75% based on the Company’s netleverage ratio. Interest is paid quarterly in arrears. The term loan contains covenants restricting, among other things, the incurrence of indebtedness and themaking of certain payments, including dividends, and is subject to acceleration in the event of default. The Company also has to fulfill financial covenantswith respect to a total debt to EBITDA ratio and an interest coverage ratio.
57/8% Senior Notes
The Company’s $306.6 million of 57/8% senior notes due December 1, 2021 constitute senior unsecured and unsubordinated indebtedness. Interestis payable on the notes semi-annually in arrears. At any time prior to September 1, 2021, the Company may redeem the notes, in whole or in part from time totime, at its option, at a redemption price equal to the greater of (i) 100% of the principal amount plus accrued and unpaid interest, including additionalinterest, if any, to, but excluding, the redemption date, or (ii) the sum of the present values of the remaining scheduled payments of principal and interest(exclusive of interest accrued to the date of redemption) discounted to the redemption date at the treasury rate plus 0.5%, plus accrued and unpaid interest,including additional interest, if any. Beginning September 1, 2021, the Company may redeem the notes, in whole or in part from time to time, at its option, ata redemption price equal to 100% of the principal amount plus accrued and unpaid interest, including additional interest, if any. As is more fully described inNote 11, the Company entered into an interest rate swap in 2015 to convert the senior notes’ fixed interest rate to a floating interest rate over the remaininglife of the senior notes. During the second quarter of 2016, the Company terminated the interest rate swap. As a result, the Company recorded a deferred gainof approximately $7.3 million associated with the termination, which will be amortized as a reduction to “Interest expense, net” over the remaining term ofthe 57/8% senior notes through December 1, 2021. As of December 31, 2016, the unamortized portion of the deferred gain was approximately $6.6 millionand the amortization for 2016 was approximately $0.7 million.
Senior Term Loans Due Between 2019 and 2026
In October 2016, the Company borrowed an aggregate amount of €375.0 million (or approximately $395.6 million as of December 31, 2016)through a group of seven related term loan agreements. The Company received net proceeds of approximately €373.2 million (or approximately $409.5million as of October 19, 2016) after debt issuance costs and were used to repay borrowings made under the Company’s revolving credit facility. Theprovisions of the term loan agreements are identical in nature, with the exception of interest rate terms and maturities. The Company has the ability to prepaythe term loans before their maturity dates. Interest is payable on the term loans in arrears either semi-annually or annually as provided below (in millions):
Term Loan Amount Maturity Date Floating or Fixed
Interest Rate Interest Rate Interest Payment€ 1.0 October 19, 2019 Floating EURIBOR + 0.75% Semi-Annually
55.0 October 19, 2019 Fixed 0.75% Annually25.5 October 19, 2021 Floating EURIBOR + 1.00% Semi-Annually
166.5 October 19, 2021 Fixed 1.00% Annually1.0 October 19, 2023 Floating EURIBOR + 1.25% Semi-Annually
73.5 October 19, 2023 Fixed 1.33% Annually52.5 October 19, 2026 Fixed 1.98% Annually
€ 375.0 The term loans contain covenants restricting, among other things, the incurrence of indebtedness and the making of certain payments, including dividends,and is subject to acceleration in the event of default.
67

Table of ContentsAGCO CORPORATION
NOTES TO CONSOLIDATED FINANCIAL STATEMENTS - (Continued)
Former 4 1/2% Senior Term Loan
On April 26, 2016, the Company repaid its €200.0 million (or approximately $225.4 million) 41/2% senior term loan with Rabobank that was dueMay 2, 2016. The Company had the ability to prepay the term loan before its maturity date. Interest was payable on the term loan at 41/2% per annum,payable quarterly in arrears.
Former Convertible Senior Subordinated Notes
During the first six months of 2014, holders of the Company’s former 11/4% convertible senior subordinated notes converted or the Companyrepurchased approximately $49.7 million of aggregate principal amount of the notes. In May 2014, the Company announced its election to redeem theremaining $151.5 million balance of the notes with a redemption date of June 20, 2014. Substantially all of the holders of the notes elected to convert theirremaining notes prior to the redemption date. The redemptions settled in July 2014. For the year ended December 31, 2014, the Company issued a total of1,437,465 shares of its common stock associated with the $81.0 million excess conversion value of all notes converted. The Company reflected therepayment of the principal of the notes totaling $201.2 million within “Repurchase or conversion of convertible senior subordinated notes” within theCompany’s Consolidated Statements of Cash Flows for the year ended December 31, 2014.
The interest expense recognized for the year ended December 31, 2014 relating to the contractual interest coupon for Company’s former 11/4%convertible senior subordinated notes was approximately $0.9 million.
Standby Letters of Credit and Similar Instruments
The Company has arrangements with various banks to issue standby letters of credit or similar instruments, which guarantee the Company’sobligations for the purchase or sale of certain inventories and for potential claims exposure for insurance coverage. At December 31, 2016 and 2015,outstanding letters of credit totaled $17.1 million and $17.5 million, respectively.
8. Employee Benefit Plans
The Company sponsors defined benefit pension plans covering certain employees, principally in the United Kingdom, the United States, Germany,Switzerland, Finland, France, Norway and Argentina. The Company also provides certain postretirement health care and life insurance benefits for certainemployees, principally in the United States and Brazil.
The Company also maintains an Executive Nonqualified Pension Plan (“ENPP”), which provides certain U.S.-based senior executives withretirement income for a period of 15 years or up to a lifetime annuity, if certain requirements are met. Benefits under the ENPP vest if the participant hasattained age 50 with at least ten years of service (five years of which include years of participation in the ENPP), but are not payable until the participantreaches age 65. The lifetime annuity benefit generally will be available only to participants who retire on or after reaching normal retirement age andotherwise have a vested benefit under the ENPP. The ENPP is an unfunded, nonqualified defined benefit pension plan.
68

Table of ContentsAGCO CORPORATION
NOTES TO CONSOLIDATED FINANCIAL STATEMENTS - (Continued)
Net annual pension costs for the years ended December 31, 2016, 2015 and 2014 for the Company’s defined benefit pension plans and ENPP are setforth below (in millions):
Pension benefits 2016 2015 2014(1)
Service cost $ 16.2 $ 18.7 $ 16.8Interest cost 24.6 31.2 37.3Expected return on plan assets (38.8) (44.4) (44.5)Amortization of net actuarial losses 10.0 8.0 9.5Amortization of prior service cost 1.0 0.4 0.8Net loss recognized due to settlement 0.4 0.2 0.4Net gain recognized due to curtailment (0.1) — (0.5)Special termination benefits — 0.5 1.3Net annual pension cost $ 13.3 $ 14.6 $ 21.0____________________________________(1) Rounding may impact summation of amounts.
The weighted average assumptions used to determine the net annual pension costs for the Company’s defined benefit pension plans and ENPP for
the years ended December 31, 2016, 2015 and 2014 are as follows:
2016 2015 2014All plans: Weighted average discount rate 3.6% 3.5% 4.4%Weighted average expected long-term rate of return on plan assets 6.8% 6.8% 6.9%Rate of increase in future compensation 2.0%-5.0% 2.25%-5.0% 2.5-5.0%U.S.-based plans: Weighted average discount rate 4.60% 4.15% 4.75%Weighted average expected long-term rate of return on plan assets(1) 6.0% 6.0% 7.0%Rate of increase in future compensation(2) 5.0% 5.0% 5.0%___________________________________(1) Applicable for U.S. funded, qualified plans.(2) Applicable for U.S. unfunded, nonqualified plan.
Net annual postretirement benefit costs, and the weighted average discount rate used to determine them, for the years ended December 31, 2016,2015 and 2014 are set forth below (in millions, except percentages):
Postretirement benefits 2016 2015 2014Service cost $ — $ — $ 0.1Interest cost 1.4 1.3 1.6Amortization of prior service cost 0.2 0.2 0.2Amortization of net actuarial losses — 0.1 0.1Other — — 0.2Net annual postretirement benefit cost $ 1.6 $ 1.6 $ 2.2
Weighted average discount rate 5.1% 4.6% 5.3%
69

Table of ContentsAGCO CORPORATION
NOTES TO CONSOLIDATED FINANCIAL STATEMENTS - (Continued)
The following tables set forth reconciliations of the changes in benefit obligation, plan assets and funded status as of December 31, 2016 and 2015(in millions):
Pension and ENPP
Benefits Postretirement
BenefitsChange in benefit obligation 2016 2015 2016 2015Benefit obligation at beginning of year $ 844.4 $ 926.8 $ 27.3 $ 29.6Service cost 16.2 18.7 — —Interest cost 24.6 31.2 1.4 1.3Plan participants’ contributions 1.1 1.2 — —Actuarial losses (gains) 121.9 (41.7) 0.6 (1.7)Amendments 3.3 8.3 — —Settlements (3.8) (0.5) — —Curtailments (0.4) — — —Benefits paid (44.1) (50.8) (1.2) (1.2)Special termination benefits and other — 0.5 — —Foreign currency exchange rate changes (113.4) (49.3) 0.5 (0.7)Benefit obligation at end of year $ 849.8 $ 844.4 $ 28.6 $ 27.3
Pension and ENPP Benefits
PostretirementBenefits
Change in plan assets 2016 2015 2016 2015Fair value of plan assets at beginning of year $ 630.7 $ 677.2 $ — $ —Actual return on plan assets 84.4 5.2 — —Employer contributions 31.3 34.0 1.2 1.2Plan participants’ contributions 1.1 1.2 — —Benefits paid (44.1) (50.8) (1.2) (1.2)Settlements (3.8) (0.5) — —Foreign currency exchange rate changes (97.9) (35.6) — —Fair value of plan assets at end of year $ 601.7 $ 630.7 $ — $ —
Funded status $ (248.1) $ (213.7) $ (28.6) $ (27.3)Unrecognized net actuarial losses 384.7 319.0 2.0 1.4Unrecognized prior service cost 13.4 11.2 3.4 3.6Accumulated other comprehensive loss (398.1) (330.2) (5.4) (5.0)Net amount recognized $ (248.1) $ (213.7) $ (28.6) $ (27.3)
Amounts recognized in ConsolidatedBalance Sheets: Other long-term asset $ — $ 0.2 $ — $ —Other current liabilities (3.5) (3.5) (1.5) (1.5)Accrued expenses (1.7) (2.3) — —Pensions and postretirement health care benefits(noncurrent) (242.9) (208.1) (27.1) (25.8)Net amount recognized $ (248.1) $ (213.7) $ (28.6) $ (27.3)
70

Table of ContentsAGCO CORPORATION
NOTES TO CONSOLIDATED FINANCIAL STATEMENTS - (Continued)
The following table summarizes the activity in accumulated other comprehensive loss related to the Company’s ENPP and defined pension andpostretirement benefit plans during the years ended December 31, 2016 and 2015 (in millions):
Before-Tax
Amount Income
Tax After-TaxAmount
Accumulated other comprehensive loss as of December 31, 2014 $ (341.5) $ (88.2) $ (253.3)Prior service cost arising during the year (8.3) (3.6) (4.7)Net loss recognized due to settlement 0.3 0.1 0.2Net actuarial gain arising during the year 4.2 2.1 2.1Amortization of prior service cost 0.6 0.2 0.4Amortization of net actuarial losses 8.1 1.8 6.3Accumulated other comprehensive loss as of December 31, 2015 $ (336.6) $ (87.6) $ (249.0)Prior service cost arising during the year (3.3) (0.7) (2.6)Net loss recognized due to settlement 0.5 0.1 0.4Net gain recognized due to curtailment (0.1) — (0.1)Net actuarial loss arising during the year (76.5) (13.6) (62.9)Amortization of prior service cost 1.2 0.1 1.1Amortization of net actuarial losses 10.0 1.4 8.6Accumulated other comprehensive loss as of December 31, 2016 $ (404.8) $ (100.3) $ (304.5)
As of December 31, 2016, the Company’s accumulated other comprehensive loss included net actuarial losses of approximately $384.7 million andnet prior service cost of approximately $13.4 million related to the Company’s defined benefit pension plans and ENPP. The estimated net actuarial lossesand net prior service cost for the defined benefit pension plans and ENPP expected to be amortized from the Company’s accumulated other comprehensiveloss during the year ended December 31, 2017 are approximately $12.0 million and $1.2 million, respectively.
As of December 31, 2016, the Company’s accumulated other comprehensive loss included net actuarial losses of approximately $2.0 million and netprior service cost of approximately $3.4 million related to the Company’s U.S. and Brazilian postretirement health care benefit plans. The estimated netactuarial losses and net prior service cost for postretirement health care benefit plans expected to be amortized from the Company’s accumulated othercomprehensive loss during the year ended December 31, 2017 are less than $0.1 million and approximately $0.2 million, respectively.
The aggregate projected benefit obligation, accumulated benefit obligation and fair value of plan assets for defined benefit pension plans, ENPP andother postretirement plans with accumulated benefit obligations in excess of plan assets were $877.6 million, $823.8 million and $600.9 million,respectively, as of December 31, 2016, and $869.2 million, $816.9 million and $627.9 million, respectively, as of December 31, 2015. The projected benefitobligation, accumulated benefit obligation and fair value of plan assets for the Company’s U.S.-based defined benefit pension plans and ENPP withaccumulated benefit obligations in excess of plan assets were $118.1 million, $101.9 million and $36.2 million, respectively, as of December 31, 2016, and$112.2 million, $98.4 million and $38.1 million, respectively, as of December 31, 2015. The Company’s accumulated comprehensive loss as of December 31,2016 reflects a reduction in equity of $403.5 million, net of taxes of $99.8 million, primarily related to the Company’s U.K. pension plan, where the projectedbenefit obligation exceeded the plan assets. In addition, the Company’s accumulated comprehensive loss as of December 31, 2016 reflects a reduction inequity of approximately $1.3 million, net of taxes of $0.5 million, related to the Company’s GIMA joint venture. The amount represents 50% of GIMA’sunrecognized net actuarial losses and unrecognized prior service cost associated with its pension plan. In addition, GIMA recognized a net actuarial loss dueto settlements during 2016 of approximately $0.1 million. The Company’s accumulated comprehensive loss as of December 31, 2015 reflected a reduction inequity of $335.2 million, net of taxes of $87.1 million, primarily related to the Company’s U.K. pension plan, in which the projected benefit obligationexceeded the plan assets. In addition, the Company’s accumulated comprehensive loss as of December 31, 2015 reflected a reduction in equity ofapproximately $1.4 million, net of taxes of $0.5 million, related to the Company’s GIMA joint venture. This amount represented 50% of GIMA’sunrecognized net actuarial losses and unrecognized prior service cost associated with its pension plan. In addition, GIMA recognized a net actuarial loss dueto settlements during 2015 of approximately $0.1 million.
71

Table of ContentsAGCO CORPORATION
NOTES TO CONSOLIDATED FINANCIAL STATEMENTS - (Continued)
The weighted average assumptions used to determine the benefit obligation for the Company’s defined benefit pension plans and ENPP as ofDecember 31, 2016 and 2015 are as follows:
2016 2015All plans: Weighted average discount rate 2.7% 3.6%Rate of increase in future compensation 1.5%-5.0% 2.0%-5.0%U.S.-based plans: Weighted average discount rate 4.25% 4.6%Rate of increase in future compensation(1) 5.0% 5.0%____________________________________(1) Applicable for U.S. unfunded, nonqualified plan.
The weighted average discount rate used to determine the benefit obligation for the Company’s postretirement benefit plans for the years ended
December 31, 2016 and 2015 was 5.3% and 5.1%, respectively.
For the years ended December 31, 2016, 2015 and 2014, the Company used a globally consistent methodology to set the discount rate in thecountries where its largest benefit obligations exist. In the United States, the United Kingdom and the Euro Zone, the Company constructed a hypotheticalbond portfolio of high-quality corporate bonds and then applied the cash flows of the Company’s benefit plans to those bond yields to derive a discount rate.The bond portfolio and plan-specific cash flows vary by country, but the methodology in which the portfolio is constructed is consistent. In the UnitedStates, the bond portfolio is large enough to result in taking a “settlement approach” to derive the discount rate, in which high-quality corporate bonds areassumed to be purchased and the resulting coupon payments and maturities are used to satisfy the Company’s U.S. pension plans’ projected benefitpayments. In the United Kingdom and the Euro Zone, the discount rate is derived using a “yield curve approach,” in which an individual spot rate, or zerocoupon bond yield, for each future annual period is developed to discount each future benefit payment and, thereby, determine the present value of all futurepayments. Under the settlement and yield curve approaches, the discount rate is set to equal the single discount rate that produces the same present value ofall future payments. Effective January 1, 2016, the Company adopted a spot yield curve to determine the discount rate in the United Kingdom to measure theplan’s service cost and interest cost for the year ended December 31, 2016. Previously, the Company had utilized a single weighted-average discount ratederived from the “yield curve approach” to measure the plan’s benefit obligation, service cost and interest cost. Going forward, the Company has elected toutilize an approach that discounts the individual expected service cost and interest cost cash flows using the applicable spot rates derived from the yieldcurve over the projected cash flow period.
For measuring the expected U.S. postretirement benefit obligation at December 31, 2016, the Company assumed a 7.0% health care cost trend ratefor 2017 decreasing to 5.0% by 2025. For measuring the expected U.S. postretirement benefit obligation at December 31, 2015, the Company assumed a7.25% health care cost trend rate for 2016 decreasing to 5.0% by 2025. For measuring the Brazilian postretirement benefit plan obligation at December 31,2016, the Company assumed a 11.8% health care cost trend rate for 2017, decreasing to 6.1% by 2028. For measuring the Brazilian postretirement benefitplan obligation at December 31, 2015, the Company assumed a 12.6% health care cost trend rate for 2016, decreasing to 6.8% by 2026. Changing theassumed health care cost trend rates by one percentage point each year and holding all other assumptions constant would have had the following effect toservice and interest cost for 2016 and the accumulated postretirement benefit obligation for both the U.S. and Brazilian postretirement plans at December 31,2016 (in millions):
One PercentagePoint Increase
One PercentagePoint Decrease
Effect on service and interest cost $ 0.2 $ (0.2)Effect on accumulated benefit obligation $ 3.6 $ (3.0)
The Company currently estimates its minimum contributions and benefit payments to its U.S.-based underfunded defined benefit pension plans andunfunded ENPP for 2017 will aggregate approximately $2.2 million. The Company currently estimates its benefit payments for 2017 to its U.S.-basedpostretirement health care and life insurance benefit plans will aggregate approximately $1.5 million and its benefit payments for 2017 to its Brazilianpostretirement health care benefit plans will aggregate approximately less than $0.1 million. The Company currently estimates its minimum contributions for
72

Table of ContentsAGCO CORPORATION
NOTES TO CONSOLIDATED FINANCIAL STATEMENTS - (Continued)
underfunded plans and benefit payments for unfunded plans for 2017 to its non-U.S.-based defined benefit pension plans will aggregate approximately $26.6million, of which approximately $19.0 million relates to its U.K. pension plan.
During 2016, approximately $47.9 million of benefit payments were made related to the Company’s defined benefit pension plans and ENPP. AtDecember 31, 2016, the aggregate expected benefit payments for the Company’s defined benefit pension plans and ENPP are as follows (in millions):
2017 $ 41.92018 41.12019 41.22020 43.62021 44.92022 through 2026 243.3 $ 456.0
During 2016, approximately $1.2 million of benefit payments were made related to the Company’s U.S. and Brazilian postretirement benefit plans.At December 31, 2016, the aggregate expected benefit payments for the Company’s U.S. and Brazilian postretirement benefit plans are as follows (inmillions):
2017 $ 1.62018 1.62019 1.62020 1.72021 1.82022 through 2026 9.2 $ 17.5
Investment Strategy and Concentration of Risk
The weighted average asset allocation of the Company’s U.S. pension benefit plans as of December 31, 2016 and 2015 are as follows:
Asset Category 2016 2015Large and small cap domestic equity securities 29% 28%International equity securities 11% 10%Domestic fixed income securities 42% 44%Other investments 18% 18%Total 100% 100%
The weighted average asset allocation of the Company’s non-U.S. pension benefit plans as of December 31, 2016 and 2015 are as follows:
Asset Category 2016 2015Equity securities 39% 44%Fixed income securities 54% 36%Other investments 7% 20%Total 100% 100%
73

Table of ContentsAGCO CORPORATION
NOTES TO CONSOLIDATED FINANCIAL STATEMENTS - (Continued)
The Company categorizes its pension plan assets into one of three levels based on the assumptions used in valuing the asset. See Note 13 for adiscussion of the fair value hierarchy as per the guidance in ASC 820, “Fair Value Measurements” (“ASC 820”). The Company’s valuation techniques aredesigned to maximize the use of observable inputs and minimize the use of unobservable inputs. The Company uses the following valuation methodologiesto measure the fair value of its pension plan assets:
Equity Securities: Equity securities are valued on the basis of the closing price per unit on each business day as reported on the applicableexchange.
Fixed Income: Fixed income securities are valued using the closing prices in the active market in which the fixed income investment trades. Fixedincome funds are valued using the net asset value of the fund, which is based on the fair value of the underlying securities.
Cash: These investments primarily consist of short-term investment funds which are valued using the net asset value.
Alternative Investments: These investments are reported at fair value as determined by the general partner of the alternative investment. The “marketapproach” valuation technique is used to value investments in these funds. The funds typically are open-end funds as they generally offersubscription and redemption options to investors. The frequency of such subscriptions or redemptions is dictated by each fund’s governingdocuments. The amount of liquidity provided to investors in a particular fund generally is consistent with the liquidity and risk associated with theunderlying portfolio (i.e., the more liquid the investments in the portfolio, the greater the liquidity provided to investors). Liquidity of individualfunds varies based on various factors and may include “gates,” “holdbacks” and “side pockets” imposed by the manager of the fund, as well asredemption fees that may also apply. Investments in these funds typically are valued utilizing the net asset valuations provided by their underlyinginvestment managers, general partners or administrators. The funds consider subscription and redemption rights, including any restrictions on thedisposition of the interest, in its determination of the fair value.
Insurance Contracts: Insurance contracts are valued using current prevailing interest rates.
The fair value of the Company’s pension assets as of December 31, 2016 is as follows (in millions):
Total Level 1 Level 2 Level 3Equity securities:
Global equities $ 103.6 $ 103.6 $ — $ —Non-U.S. equities 4.1 4.1 — —U.K. equities 109.1 109.1 — —U.S. large cap equities 6.2 6.2 — —U.S. small cap equities 4.3 4.3 — —
Total equity securities 227.3 227.3 — —Fixed income:
Aggregate fixed income 118.0 118.0 — —International fixed income 191.9 191.9 — —
Total fixed income share(1) 309.9 309.9 — —Alternative investments:
Private equity fund 2.4 — — 2.4Hedge funds measured at net asset value(4) 34.4 — — —
Total alternative investments(2) 36.8 — — 2.4Miscellaneous funds(3) 21.4 — — 21.4Cash and equivalents measured at net asset value(4) 6.3 — — —
Total assets $ 601.7 $ 537.2 $ — $ 23.8______________________________________(1) 31% of “fixed income” securities are in foreign securities; 25% are in government treasuries; 19% are in investment-grade corporate bonds; 13% are in high-yield securities; and
12% are in other various fixed income securities.(2) 32% of “alternative investments” are in relative value funds; 27% are in long-short equity funds; 23% are in event-driven funds; 12% are distributed in hedged and non-hedged
funds; and 6% are in credit funds.(3) “Miscellaneous funds” is comprised of insurance contracts in Finland, Norway and Switzerland.(4) Certain investments that are measured at fair value using the net asset value per share (or its equivalent) practical expedient have not been categorized in the fair value hierarchy.
74

Table of ContentsAGCO CORPORATION
NOTES TO CONSOLIDATED FINANCIAL STATEMENTS - (Continued)
The following is a reconciliation of Level 3 assets as of December 31, 2016 (in millions):
Total AlternativeInvestments
MiscellaneousFunds
Beginning balance as of December 31, 2015 $ 24.1 $ 2.4 $ 21.7Actual return on plan assets:
(a) Relating to assets still held at reporting date 1.0 — 1.0(b) Relating to assets sold during period — — —
Purchases, sales and /or settlements (0.8) — (0.8)Foreign currency exchange rate changes (0.5) — (0.5)Ending balance as of December 31, 2016 $ 23.8 $ 2.4 $ 21.4
The fair value of the Company’s pension assets as of December 31, 2015 is as follows (in millions):
Total Level 1 Level 2 Level 3Equity securities:
Global equities $ 129.0 $ 129.0 $ — $ —Non-U.S. equities 3.9 3.9 — —U.K. equities 124.8 124.8 — —U.S. large cap equities 7.1 7.1 — —U.S. small cap equities 3.6 3.6 — —
Total equity securities 268.4 268.4 — —Fixed income:
Aggregate fixed income 16.8 16.8 — —International fixed income 204.8 204.8 — —
Total fixed income share(1) 221.6 221.6 — —Alternative investments:
Private equity fund 2.4 — — 2.4Hedge funds measured at net asset value(4) 109.2 — — —
Total alternative investments(2) 111.6 — — 2.4Miscellaneous funds(3) 21.7 — — 21.7Cash and equivalents measured at net asset value(4) 7.4 — — —
Total assets $ 630.7 $ 490.0 $ — $ 24.1_______________________________________(1) 45% of “fixed income” securities are in investment-grade corporate bonds; 32% of “fixed income” securities are in government treasuries and 23% are in other various fixed
income securities.(2) 34% of “alternative investments” are in long-short equity funds; 26% are in event-driven funds; 13% are in relative value funds; 13% are in credit funds; 12% are distributed in
hedged and non-hedged funds; and 2% are in multi-strategy funds.(3) “Miscellaneous funds” is comprised of insurance contracts in Finland, Norway and Switzerland.(4) Certain investments that are measured at fair value using the net asset value per share (or its equivalent) practical expedient have not been categorized in the fair value hierarchy.
75

Table of ContentsAGCO CORPORATION
NOTES TO CONSOLIDATED FINANCIAL STATEMENTS - (Continued)
The following is a reconciliation of Level 3 assets as of December 31, 2015 (in millions):
Total AlternativeInvestments
MiscellaneousFunds
Beginning balance as of December 31, 2014 $ 23.7 $ 0.9 $ 22.8Actual return on plan assets:
(a) Relating to assets still held at reporting date 2.6 1.0 1.6(b) Relating to assets sold during period 0.1 0.1 —
Purchases, sales and /or settlements 0.2 0.4 (0.2)Foreign currency exchange rate changes (2.5) — (2.5)Ending balance as of December 31, 2015 $ 24.1 $ 2.4 $ 21.7
All tax-qualified pension fund investments in the United States are held in the AGCO Corporation Master Pension Trust. The Company’s global
pension fund strategy is to diversify investments across broad categories of equity and fixed income securities with appropriate use of alternative investmentcategories to minimize risk and volatility. The primary investment objective of the Company’s pension plans is to secure participant retirement benefits. Assuch, the key objective in the pension plans’ financial management is to promote stability and, to the extent appropriate, growth in funded status.
The investment strategy for the plans’ portfolio of assets balances the requirement to generate returns with the need to control risk. The asset mix isrecognized as the primary mechanism to influence the reward and risk structure of the pension fund investments in an effort to accomplish the plans’ fundingobjectives. The overall investment strategy for the U.S.-based pension plans is to achieve a mix of approximately 15% of assets for the near-term benefitpayments and 85% for longer-term growth. The overall U.S. pension funds invest in a broad diversification of asset types. The Company’s U.S. targetallocation of retirement fund investments is 30% large- and small-cap domestic equity securities, 12% international equity securities, 44% broad fixedincome securities and 14% in alternative investments. The Company has noted that over very long periods, this mix of investments would achieve an averagereturn of approximately 6.7%. In arriving at the choice of an expected return assumption of 6.0% for its U.S. plans for the year ended December 31, 2017, theCompany has tempered this historical indicator with lower expectations for returns and changes to investments in the future as well as the administrativecosts of the plans. The overall investment strategy for the non-U.S. based pension plans is to achieve a mix of approximately 30% of assets for the near-termbenefit payments and 70% for longer-term growth. The overall non-U.S. pension funds invest in a broad diversification of asset types. The Company’s non-U.S. target allocation of retirement fund investments at December 31, 2016 was 40% equity securities, 55% broad fixed income investments and 5% inalternative investments. The majority of the Company’s non-U.S. pension fund investments are related to the Company’s pension plan in the UnitedKingdom. The Company has noted that over very long periods, this mix of investments would achieve an average return of approximately 6.3%. In arrivingat the choice of an expected return assumption of 6.0% for its U.K.-based plans for the year ended December 31, 2017, the Company has tempered thishistorical indicator with lower expectations for returns and equity investment in the future as well as the administrative costs of the plans.
Equity securities primarily include investments in large-cap and small-cap companies located across the globe. Fixed income securities includecorporate bonds of companies from diversified industries, mortgage-backed securities, agency mortgages, asset-backed securities and government securities.Alternative and other assets include investments in hedge fund of funds that follow diversified investment strategies. To date, the Company has not investedpension funds in its own stock and has no intention of doing so in the future.
Within each asset class, careful consideration is given to balancing the portfolio among industry sectors, geographies, interest rate sensitivity,dependence on economic growth, currency and other factors affecting investment returns. The assets are managed by professional investment firms, who arebound by precise mandates and are measured against specific benchmarks. Among asset managers, consideration is given, among others, to balancingsecurity concentration, issuer concentration, investment style and reliance on particular active investment strategies.
The Company participates in a small number of multiemployer plans in the Netherlands and Sweden. The Company has assessed and determinedthat none of the multiemployer plans which it participates in are individually, or in the aggregate, significant to the Company’s Consolidated FinancialStatements. The Company does not expect to incur a withdrawal liability or expect to significantly increase its contributions over the remainder of themultiemployer plans’ contract periods.
76

Table of ContentsAGCO CORPORATION
NOTES TO CONSOLIDATED FINANCIAL STATEMENTS - (Continued)
The Company maintains separate defined contribution plans covering certain employees, primarily in the United States, the United Kingdom and
Brazil. Under the plans, the Company contributes a specified percentage of each eligible employee’s compensation. The Company contributedapproximately $11.6 million, $12.0 million and $13.3 million for the years ended December 31, 2016, 2015 and 2014, respectively.
9. Stockholders’ Equity
Common Stock
At December 31, 2016, the Company had 150,000,000 authorized shares of common stock with a par value of $0.01 per share, with approximately79,465,393 shares of common stock outstanding and approximately 3,491,118 shares reserved for issuance under the Company’s 2006 Long-Term IncentivePlan (the “2006 Plan”) (Note 10).
Share Repurchase Program
During 2012, 2013, 2014 and 2016, the Company’s Board of Directors approved several share repurchase authorizations under which the Companywas and is permitted to repurchase up to $1,350.0 million of shares of its common stock.
During 2016, 2015 and 2014, the Company repurchased 4,413,250, 5,541,930 and 10,066,322 shares of its common stock, respectively, forapproximately $212.5 million, $287.5 million and $499.7 million, respectively, either through ASR agreements with financial institutions or through openmarket transactions. All shares received under the ASR agreements were retired upon receipt, and the excess of the purchase price over par value per share wasrecorded to “Additional paid-in capital” within the Company’s Consolidated Balance Sheets.
As of December 31, 2016, the remaining amount authorized to be repurchased is approximately $331.4 million. The authorization for $300.0million of this amount will expire in December 2019. The remaining amount authorized has no expiration date.
Dividends
During 2013, the Company’s Board of Directors approved the initiation of quarterly cash dividends to its stockholders. of $0.10 per common share.During 2014, 2015, 2016, the Company’s Board of Directors approved an increase in the quarterly dividend to $0.11 per common share beginning in the firstquarter of 2014, $0.12 per common share beginning in the first quarter of 2015, and $0.13 per common share beginning the first quarter of 2016, respectively,and on January 26, 2017, the Company’s Board of Directors approved an increase in the quarterly dividend to $0.14 per common share beginning the firstquarter of 2017.
77

Table of ContentsAGCO CORPORATION
NOTES TO CONSOLIDATED FINANCIAL STATEMENTS - (Continued)
The following table sets forth changes in accumulated other comprehensive loss by component, net of tax, attributed to AGCO Corporation and itssubsidiaries for the years ended December 31, 2016 and 2015 (in millions):
Defined BenefitPension Plans
CumulativeTranslationAdjustment
Deferred Net Gains(Losses) on Derivatives Total
Accumulated other comprehensive loss, December 31,2014 $ (253.3) $ (653.1) $ (0.1) $ (906.5)
Other comprehensive loss before reclassifications (2.4) (556.1) (4.6) (563.1)Net losses reclassified from accumulated other
comprehensive loss 6.7 — 2.7 9.4Other comprehensive income (loss), net of
reclassification adjustments 4.3 (556.1) (1.9) (553.7)Accumulated other comprehensive loss, December 31,
2015 (249.0) (1,209.2) (2.0) (1,460.2)Other comprehensive loss before reclassifications (65.2) 80.8 (7.7) 7.9Net losses reclassified from accumulated other
comprehensive loss 9.7 — 1.0 10.7Other comprehensive (loss) income, net of
reclassification adjustments (55.5) 80.8 (6.7) 18.6Accumulated other comprehensive loss, December 31,
2016 $ (304.5) $ (1,128.4) $ (8.7) $ (1,441.6)
The following table sets forth reclassification adjustments out of accumulated other comprehensive loss by component attributed to AGCOCorporation and its subsidiaries for the years ended December 31, 2016 and 2015 (in millions):
Details about Accumulated Other ComprehensiveLoss Components
Amount Reclassified from Accumulated Other Comprehensive
Loss Affected Line Item withinthe Consolidated
Statements of Operations Year ended December 31,
2016 (1) Year ended December 31, 2015
(1) Derivatives: Net (gains) losses on foreign currency contracts $ (1.0) $ 2.6 Cost of goods sold Net losses on interest rate contract 2.0 0.5 Interest expense, netReclassification before tax 1.0 3.1 — (0.4) Income tax provisionReclassification net of tax $ 1.0 $ 2.7
Defined benefit pension plans: Amortization of net actuarial losses $ 10.0 $ 8.1 (2) Amortization of prior service cost 1.2 0.6 (2)
Reclassification before tax 11.2 8.7 (1.5) (2.0) Income tax provisionReclassification net of tax $ 9.7 $ 6.7
Net losses reclassified from accumulated othercomprehensive loss $ 10.7 $ 9.4
____________________________________(1) (Gains) losses included within the Consolidated Statements of Operations for the years ended December 31, 2016 and 2015, respectively.(2) These accumulated other comprehensive loss components are included in the computation of net periodic pension and postretirement benefit cost. See Note 8 to the Company’s
Consolidated Financial Statements.
78

Table of ContentsAGCO CORPORATION
NOTES TO CONSOLIDATED FINANCIAL STATEMENTS - (Continued)
10. Stock Incentive Plan
Under the 2006 Plan, up to 10,000,000 shares of AGCO common stock may be issued. As of December 31, 2016, of the 10,000,000 shares reservedfor issuance under the 2006 Plan, approximately 3,491,118 shares were available for grant, assuming the maximum number of shares are earned related to theperformance award grants discussed below. The 2006 Plan allows the Company, under the direction of the Board of Directors’ Compensation Committee, tomake grants of performance shares, stock appreciation rights, stock options, restricted stock units and restricted stock awards to employees, officers and non-employee directors of the Company.
Long-Term Incentive Plan and Related Performance Awards
The Company’s primary long-term incentive plan is a performance share plan that provides for awards of shares of the Company’s common stockbased on achieving financial targets, such as targets for earnings per share, return on invested capital, operating margin and selling, general andadministrative expenses and overhead levels, as determined by the Company’s Board of Directors. The stock awards under the 2006 Plan are earned over aperformance period, and the number of shares earned is determined based on the cumulative or average results for the specified period, depending on themeasurement. Performance periods for the Company’s primary long-term incentive plan are consecutive and overlapping three-year cycles, and performancetargets are set at the beginning of each cycle. The primary long-term incentive plan provides for participants to earn 33% to 200% of the target awardsdepending on the actual performance achieved, with no shares earned if performance is below the established minimum target. Awards earned under the 2006Plan are paid in shares of common stock at the end of each performance period. The compensation expense associated with these awards is amortized ratablyover the vesting or performance period based on the Company’s projected assessment of the level of performance that will be achieved and earned.
Compensation expense recorded during 2016, 2015 and 2014 with respect to awards granted was based upon the stock price as of the grant date. Theweighted average grant-date fair value of performance awards granted under the 2006 Plan during 2016, 2015 and 2014 was as follows:
Years Ended December 31, 2016 2015 2014Weighted average grant-date fair value $ 47.93 $ 45.54 $ 53.87
During 2016, the Company granted 1,351,350 performance awards related to varying performance periods. The awards granted assume the maximumtarget level of performance is achieved.
Performance award transactions during 2016 were as follows and are presented as if the Company were to achieve its maximum levels of performanceunder the plan:
Shares awarded but not earned at January 1 1,449,396Shares awarded 1,351,350Shares forfeited or unearned (818,626)Shares earned and vested —Shares awarded but not earned at December 31 1,982,120
The 2006 Plan allows for the participant to have the option of forfeiting a portion of the shares awarded in lieu of a cash payment contributed to theparticipant’s tax withholding to satisfy the participant’s statutory minimum federal, state and employment taxes which would be payable at the time of grant.Based on the level of performance achieved as of December 31, 2016 and 2015, no shares were earned and vested or issued.
As of December 31, 2016, the total compensation cost related to unearned performance awards not yet recognized, assuming the Company’s current
projected assessment of the level of performance that will be achieved and earned, was approximately $37.9 million, and the weighted average period overwhich it is expected to be recognized is approximately two years. This estimate is based on the current projected levels of performance of outstanding awards.The compensation cost not yet recognized could be higher or lower based on actual achieved levels of performance.
79

Table of ContentsAGCO CORPORATION
NOTES TO CONSOLIDATED FINANCIAL STATEMENTS - (Continued)
Restricted Stock Units
During the year ended December 31, 2016, the Company granted 141,202 restricted stock unit (“RSU”) awards. These awards entitle the participantto receive one share of the Company’s common stock for each RSU granted and vest one-third per year over a three-year requisite service period. Dividendswill accrue on all unvested grants until the end of each vesting date within this grant’s three-year requisite service period. In January 2016, the Companyamended its RSU award agreement such that dividends will not accrue on unvested grants over the requisite service period on all future RSU grants. Thecompensation expense associated with these awards is being amortized ratably over the requisite service period for the awards that are expected to vest. Theweighted average grant-date fair value of the RSUs granted under the 2006 Plan during the year ended December 31, 2016 and 2015 was $45.10 and $44.03,respectively. RSU transactions during the year ended December 31, 2016 were as follows:
Shares awarded but not vested at January 1 137,396Shares awarded 141,202Shares forfeited (9,418)Shares vested (46,450)Shares awarded but not vested at December 31 222,730
As of December 31, 2016, the total compensation cost related to the unvested RSUs not yet recognized was approximately $6.4 million, and theweighted average period over which it is expected to be recognized is approximately two years.
Stock-settled Appreciation Rights
In addition to the performance share plans, certain executives and key managers are eligible to receive grants of SSARs. The SSARs provide aparticipant with the right to receive the aggregate appreciation in stock price over the market price of the Company’s common stock at the date of grant,payable in shares of the Company’s common stock. The participant may exercise his or her SSARs at any time after the grant is vested but no later than sevenyears after the date of grant. The SSARs vest ratably over a four-year period from the date of grant. SSAR award grants made to certain executives and keymanagers under the 2006 Plan are made with the base price equal to the price of the Company’s common stock on the date of grant. The Company recordedstock compensation expense of approximately $3.8 million, $5.0 million and $5.2 million associated with SSAR award grants during 2016, 2015 and 2014,respectively. The compensation expense associated with these awards is being amortized ratably over the vesting period. The Company estimated the fairvalue of the grants using the Black-Scholes option pricing model.
The weighted average grant-date fair value of SSARs granted under the 2006 Plan and the weighted average assumptions under the Black-Scholesoption model were as follows for the years ended December 31, 2016, 2015 and 2014:
Years Ended December 31, 2016 2015 2014
Weighted average grant-date fair value $ 7.98 $ 7.41 $ 13.11Weighted average assumptions under Black-Scholes option model: Expected life of awards (years) 3.0 3.0 3.0Risk-free interest rate 1.1% 0.9% 0.9%Expected volatility 25.9% 25.9% 35.7%Expected dividend yield 1.1% 1.1% 0.8%
80

Table of ContentsAGCO CORPORATION
NOTES TO CONSOLIDATED FINANCIAL STATEMENTS - (Continued)
SSAR transactions during the year ended December 31, 2016 were as follows:
SSARs outstanding at January 1 1,319,911SSARs granted 298,700SSARs exercised (129,275)SSARs canceled or forfeited (30,725)SSARs outstanding at December 31 1,458,611
SSAR price ranges per share: Granted $ 46.58-48.41Exercised 33.65-55.23Canceled or forfeited 33.65-55.23
Weighted average SSAR exercise prices per share: Granted $ 46.60Exercised 37.66Canceled or forfeited 46.25Outstanding at December 31 50.07
At December 31, 2016, the weighted average remaining contractual life of SSARs outstanding was approximately four years. As of December 31,2016, the total compensation cost related to unvested SSARs not yet recognized was approximately $4.3 million and the weighted-average period overwhich it is expected to be recognized is approximately two years.
The following table sets forth the exercise price range, number of shares, weighted average exercise price, and remaining contractual lives by groupsof similar price as of December 31, 2016:
SSARs Outstanding SSARs Exercisable
Range of Exercise Prices Number of
Shares
Weighted AverageRemaining
Contractual Life(Years)
Weighted AverageExercise Price
Exercisable as ofDecember 31, 2016
Weighted AverageExercise Price
$32.01-$43.88 310,825 5.0 $ 43.77 78,550 $ 43.45$46.58-$63.64 1,147,786 3.7 $ 51.78 657,651 $ 53.30
1,458,611 736,201 $ 52.25
The total fair value of SSARs vested during 2016 was approximately $4.4 million. There were 722,410 SSARs that were not vested as ofDecember 31, 2016. The total intrinsic value of outstanding and exercisable SSARs as of December 31, 2016 was $11.5 million and $4.2 million,respectively. The total intrinsic value of SSARs exercised during 2016 was approximately $2.0 million.
The excess tax benefit realized for tax deductions in the United States related to the exercise of SSARs and vesting of RSU awards under the 2006Plan was less than $0.1 million for the year ended December 31, 2016. The excess tax benefit realized for tax deductions in the United States related to theexercise of SSARs and vesting of RSU awards under the 2006 Plan was approximately $0.7 million for the year ended December 31, 2015. The shortfall in taxbenefit realized for tax deductions in the United States related to the exercise of SSARs and vesting of performance awards under the 2006 Plan wasapproximately $0.2 million for the year ended December 31, 2014. The Company realized an insignificant tax benefit from the exercise of SSARs, vesting ofperformance awards, vesting of RSU awards and exercise of stock options in certain foreign jurisdictions during the years ended December 31, 2016, 2015and 2014.
On January 24, 2017, the Company granted 267,650 performance award shares (subject to the Company achieving future target levels ofperformance), 284,500 SSARs and 109,803 of restricted stock units under the 2006 Plan.
81

Table of ContentsAGCO CORPORATION
NOTES TO CONSOLIDATED FINANCIAL STATEMENTS - (Continued)
Director Restricted Stock Grants
Pursuant to the 2006 Plan, all non-employee directors receive annual restricted stock grants of the Company’s common stock. All restricted stockgrants made to the Company’s directors prior to April 24, 2014 were restricted as to transferability for a period of three years. Effective April 24, 2014, theshares granted on that date and all future grants made to the Company’s directors are restricted as to transferability for a period of one year. In the event adirector departs from the Company’s Board of Directors, the non-transferability period expires immediately. The plan allows each director to have the optionof forfeiting a portion of the shares awarded in lieu of a cash payment contributed to the participant’s tax withholding to satisfy the statutory minimumfederal, state and employment taxes that would be payable at the time of grant. The 2016 grant was made on April 28, 2016 and equated to 20,232 shares ofcommon stock, of which 15,395 shares of common stock were issued, after shares were withheld for taxes. The Company recorded stock compensationexpense of approximately $1.1 million during 2016 associated with these grants.
11. Derivative Instruments and Hedging Activities
The Company has significant manufacturing operations in the United States, France, Germany, Finland and Brazil, and it purchases a portion of itstractors, combines and components from third-party foreign suppliers, primarily in various European countries and in Japan. The Company also sells productsin over 150 countries throughout the world. The Company’s most significant transactional foreign currency exposures are the Euro, Brazilian real and theCanadian dollar in relation to the United States dollar, and the Euro in relation to the British pound.
The Company attempts to manage its transactional foreign exchange exposure by hedging foreign currency cash flow forecasts and commitmentsarising from the anticipated settlement of receivables and payables and from future purchases and sales. Where naturally offsetting currency positions do notoccur, the Company hedges certain, but not all, of its exposures through the use of foreign currency contracts. The Company’s translation exposure resultingfrom translating the financial statements of foreign subsidiaries into United States dollars may be partially hedged from time to time. The Company’s mostsignificant translation exposures are the Euro, the British pound and the Brazilian real in relation to the United States dollar and the Swiss franc in relation tothe Euro. When practical, the translation impact is reduced by financing local operations with local borrowings.
The Company uses floating rate and fixed rate debt to finance its operations. The floating rate debt obligations expose the Company to variability ininterest payments due to changes in the EURIBOR and LIBOR benchmark interest rates. The Company believes it is prudent to limit the variability of aportion of its interest payments, and to meet that objective, the Company periodically enters into interest rate swaps to manage the interest rate riskassociated with the Company’s borrowings. The Company designates interest rate contracts used to convert the interest rate exposure on a portion of theCompany’s debt portfolio from a floating rate to a fixed rate as cash flow hedges, while those contracts converting the Company’s interest rate exposure froma fixed rate to a floating rate are designated as fair value hedges.
The Company’s senior management establishes the Company’s foreign currency and interest rate risk management policies. These policies are
reviewed periodically by the Finance Committee of the Company’s Board of Directors. The policies allow for the use of derivative instruments to hedgeexposures to movements in foreign currency and interest rates. The Company’s policies prohibit the use of derivative instruments for speculative purposes.
All derivatives are recognized on the Company’s Consolidated Balance Sheets at fair value. On the date the derivative contract is entered into, theCompany designates the derivative as either (1) a cash flow hedge of a forecasted transaction, (2) a fair value hedge of a recognized liability, (3) a hedge of anet investment in a foreign operation, or (4) a non-designated derivative instrument.
The Company formally documents all relationships between hedging instruments and hedged items, as well as the risk management objectives andstrategy for undertaking various hedge transactions. The Company formally assesses, both at the hedge’s inception and on an ongoing basis, whether thederivatives that are used in hedging transactions are highly effective in offsetting changes in fair values or cash flow of hedged items or the net investmenthedges in foreign operations. When it is determined that a derivative is no longer highly effective as a hedge, hedge accounting is discontinued on aprospective basis.
The Company categorizes its derivative assets and liabilities into one of three levels based on the assumptions used in valuing the asset or liability.See Note 13 for a discussion of the fair value hierarchy as per the guidance in ASC 820. The
82

Table of ContentsAGCO CORPORATION
NOTES TO CONSOLIDATED FINANCIAL STATEMENTS - (Continued)
Company’s valuation techniques are designed to maximize the use of observable inputs and minimize the use of unobservable inputs.
Counterparty Risk
The Company regularly monitors the counterparty risk and credit ratings of all the counterparties to the derivative instruments. The Companybelieves that its exposures are appropriately diversified across counterparties and that these counterparties are creditworthy financial institutions. If theCompany perceives any risk with a counterparty, then the Company would cease to do business with that counterparty. There have been no negative impactsto the Company from any non-performance of any counterparties.
Derivative Transactions Designated as Hedging Instruments
Cash Flow HedgesForeign Currency Contracts
The Company uses cash flow hedges to minimize the variability in cash flows of assets or liabilities or forecasted transactions caused by fluctuationsin foreign currency exchange rates. The changes in the fair values of these cash flow hedges are recorded in accumulated other comprehensive loss and aresubsequently reclassified into “Cost of goods sold” during the period the sales and purchases are recognized. These amounts offset the effect of the changesin foreign currency rates on the related sale and purchase transactions.
During 2016, 2015 and 2014, the Company designated certain foreign currency contracts as cash flow hedges of expected future sales and
purchases. The total notional value of derivatives that were designated as cash flow hedges was $111.2 million as of December 31, 2016. There were nooutstanding foreign currency exchange cash flow hedge contracts as of December 31, 2015.
Interest Rate Contract
The Company monitors the mix of short-term and long-term debt regularly. From time to time, the Company manages the risk to interest ratefluctuations through the use of derivative financial instruments. During 2015, the Company entered into an interest rate swap instrument with a notionalamount of €312.0 million (or approximately $329.2 million at December 31, 2016) and an expiration date of June 26, 2020. The swap was designated andaccounted for as a cash flow hedge. Under the swap agreement, the Company pays a fixed interest rate of 0.33% plus the applicable margin, and thecounterparty to the agreement pays a floating interest rate based on the three-month EURIBOR.
Changes in the fair value of the interest rate swap are recorded in accumulated other comprehensive loss and are subsequently reclassified into“Interest expense, net” as a rate adjustment in the same period in which the related interest on the Company’s floating rate term loan facility affects earnings.
83

Table of ContentsAGCO CORPORATION
NOTES TO CONSOLIDATED FINANCIAL STATEMENTS - (Continued)
The following table summarizes the after-tax impact that changes in the fair value of derivatives designated as cash flow hedges had on accumulatedother comprehensive loss and earnings during 2016, 2015 and 2014 (in millions):
Recognized in Earnings
Gain (Loss) Recognized inAccumulated
Other Comprehensive Loss Classification of Gain
(Loss)
Gain (Loss) Reclassifiedfrom Accumulated
Other Comprehensive Lossinto Income
2016 Foreign currency contracts(1) $ (2.6) Cost of goods sold $ 1.0Interest rate contract (5.1) Interest expense, net (2.0) Total $ (7.7) $ (1.0)
2015 Foreign currency contracts $ (2.3) Cost of goods sold $ (2.4)Interest rate contract (2.3) Interest expense, net (0.3) Total $ (4.6) $ (2.7)
2014 Foreign currency contracts $ (1.4) Cost of goods sold $ (1.5)(1) The outstanding contracts as of December 31, 2016 range in maturity through December 2017.
There was no ineffectiveness with respect to the cash flow hedges during the years ended December 31, 2016, 2015 and 2014.
The following table summarizes the activity in accumulated other comprehensive loss related to the derivatives held by the Company during theyears ended December 31, 2016, 2015 and 2014 (in millions):
Before-Tax
Amount Income
Tax After-TaxAmount
Accumulated derivative net losses as of December 31, 2013 $ (0.3) $ (0.1) $ (0.2)Net changes in fair value of derivatives (1.3) 0.1 (1.4)Net losses reclassified from accumulated other comprehensive loss into income 1.4 (0.1) 1.5Accumulated derivative net losses as of December 31, 2014 (0.2) (0.1) (0.1)Net changes in fair value of derivatives (6.2) (1.6) (4.6)Net losses reclassified from accumulated other comprehensive loss into income 3.1 0.4 2.7Accumulated derivative net losses as of December 31, 2015 (3.3) (1.3) (2.0)Net changes in fair value of derivatives (7.8) (0.1) (7.7)Net losses reclassified from accumulated other comprehensive loss into income 1.0 — 1.0Accumulated derivative net losses as of December 31, 2016 $ (10.1) $ (1.4) $ (8.7)
Fair Value Hedges
The Company uses interest rate swap agreements designated as fair value hedges to minimize exposure to changes in the fair value of fixed-rate debtthat results from fluctuations in benchmark interest rates. During 2015, the Company entered into an interest rate swap instrument with a notional amount of$300.0 million and an expiration date of December 1, 2021 designated as a fair value hedge of the Company’s 57/8% senior notes (Note 7). Under the interestrate swap, the Company paid a floating interest rate based on the three-month LIBOR plus a spread of 4.14% and the counterparty to the agreement paid afixed interest rate of 57/8%. The gains and losses related to changes in the fair value of the interest rate swap were recorded to “Interest expense, net” andoffset changes in the fair value of the underlying hedged 57/8% senior notes.
84

Table of ContentsAGCO CORPORATION
NOTES TO CONSOLIDATED FINANCIAL STATEMENTS - (Continued)
During the second quarter of 2016, the Company terminated the existing interest rate swap transaction and received cash proceeds of approximately$7.3 million. The resulting gain was deferred and is being amortized as a reduction to “Interest expense, net” over the remaining term of the Company’s57/8% senior notes through December 1, 2021. Refer to Note 7 for further information.
Net Investment Hedges
The Company uses non-derivative and derivative instruments, to hedge a portion of its net investment in foreign operations against adversemovements in exchange rates. For instruments that are designated as hedges of net investments in foreign operations, changes in the fair value of thederivative instruments are recorded in foreign currency translation adjustments, a component of accumulated other comprehensive loss, to offset changes inthe value of the net investments being hedged. When the net investment in foreign operations is sold or substantially liquidates, the amounts recorded inaccumulated other comprehensive loss are reclassified to earnings. To the extent foreign currency denominated debt is dedesignated from a net investmenthedge relationship, changes in the value of the foreign currency denominated debt are recorded in earnings through the maturity date.
During 2015, the Company designated its €312.0 million (or approximately $329.2 million as of December 31, 2016) term loan facility with amaturity date of June 26, 2020 as a hedge of its net investment in foreign operations to offset foreign currency translation gains or losses on the netinvestment.
The following table summarizes the notional values and the after-tax impact of changes in the fair value of the instrument designated as a netinvestment hedge (in millions):
Notional Amount as of
Gain (Loss) Recognized in AccumulatedOther Comprehensive Loss for the Years
Ended December 31, 2016 December 31, 2015 December 31, 2016 December 31, 2015Foreign currency denominated debt $ 329.2 $ 338.9 $ 5.9 $ 4.6
There was no ineffectiveness with respect to the net investment hedge during the years ended December 31, 2016 and 2015.
Derivative Transactions Not Designated as Hedging Instruments
During 2016, 2015 and 2014, the Company entered into foreign currency contracts to economically hedge receivables and payables on theCompany and its subsidiaries’ balance sheets that are denominated in foreign currencies other than the functional currency. These contracts were classified asnon-designated derivative instruments. Gains and losses on such contracts are substantially offset by losses and gains on the remeasurement of the underlyingasset or liability being hedged and are immediately recognized into earnings. As of December 31, 2016 and 2015, the Company had outstanding foreigncurrency contracts with a notional amount of approximately $1,550.2 million and $1,533.9 million, respectively.
The following table summarizes the impact that changes in the fair value of derivatives not designated as hedging instruments had on earnings (inmillions):
For the Years Ended
Classification of
Gain (Loss) December 31, 2016 December 31, 2015 December 31, 2014Foreign currency contracts Other expense, net $ (5.7) $ (67.3) $ (2.3)
85

Table of ContentsAGCO CORPORATION
NOTES TO CONSOLIDATED FINANCIAL STATEMENTS - (Continued)
The table below sets forth the fair value of derivative instruments that were designated as hedging instruments and derivative instruments that werenot designated as hedging instruments as of December 31, 2016 (in millions):
Asset Derivatives as of
December 31, 2016 Liability Derivatives as of
December 31, 2016
Balance Sheet
Location Fair
Value Balance Sheet
Location Fair
ValueDerivative instruments designated as hedginginstruments:
Foreign currency contracts Other current assets $ 0.2 Other current liabilities $ 3.8Interest rate contract Other noncurrent assets — Other noncurrent liabilities 6.4
Derivative instruments not designated as hedginginstruments:
Foreign currency contracts Other current assets 6.3 Other current liabilities 3.2Total derivative instruments $ 6.5 $ 13.4
The table below sets forth the fair value of derivative instruments that were designated as hedging instruments and derivative instruments that werenot designated as hedging instruments as of December 31, 2015 (in millions):
Asset Derivatives as of
December 31, 2015 Liability Derivatives as of
December 31, 2015
Balance Sheet
Location Fair
Value Balance Sheet
Location Fair
ValueDerivative instruments designated as hedginginstruments:
Interest rate contract Other noncurrent assets $ — Other noncurrent liabilities $ 5.9Derivative instruments not designated as hedginginstruments:
Foreign currency contracts Other current assets 4.8 Other current liabilities 7.9Total derivative instruments $ 4.8 $ 13.8
86

Table of ContentsAGCO CORPORATION
NOTES TO CONSOLIDATED FINANCIAL STATEMENTS - (Continued)
12. Commitments and Contingencies
The future payments required under the Company’s significant commitments, excluding indebtedness, as of December 31, 2016 are as follows (inmillions):
Payments Due By Period 2017 2018 2019 2020 2021 Thereafter Total
Interest payments related to indebtedness(1) $ 33.1 $ 29.2 $ 27.1 $ 47.0 $ 20.0 $ 7.3 $ 163.7Capital lease obligations 4.7 3.5 1.8 0.9 0.4 0.1 11.4Operating lease obligations 50.4 33.7 21.3 14.7 12.4 41.6 174.1Unconditional purchase obligations(2) 65.8 6.6 0.7 0.7 0.2 — 74.0Other short-term and long-term obligations(3) 78.2 51.3 38.9 39.1 36.8 68.0 312.3
Total contractual cash obligations $ 232.2 $ 124.3 $ 89.8 $ 102.4 $ 69.8 $ 117.0 $ 735.5____________________________________(1) Estimated interest payments are calculated assuming current interest rates over minimum maturity periods specified in debt agreements. Debt may be repaid sooner or later than
such minimum maturity periods (unaudited).(2) Unconditional purchase obligations exclude routine purchase orders entered into in the normal course of business.(3) Other short-term and long-term obligations include estimates of future minimum contribution requirements under the Company’s U.S. and non-U.S. defined benefit pension and
postretirement plans. These estimates are based on current legislation in the countries the Company operates within and are subject to change. Other short-term and long-termobligations also include income tax liabilities related to uncertain income tax positions connected with ongoing income tax audits in various jurisdictions (unaudited).
Amount of Commitment Expiration Per Period 2017 2018 2019 2020 2021 Thereafter Total
Guarantees $ 57.9 $ 2.8 $ 2.0 $ 0.9 $ 0.2 $ — $ 63.8
Off-Balance Sheet Arrangements
Guarantees
The Company maintains a remarketing agreement with its U.S. finance joint venture, whereby the Company is obligated to repurchase repossessedinventory at market values. The Company has an agreement with its U.S. finance joint venture, AGCO Finance LLC, which limits the Company’s purchaseobligations under this arrangement to $6.0 million in the aggregate per calendar year. The Company believes that any losses that might be incurred on theresale of this equipment will not materially impact the Company’s financial position or results of operations, due to the fair value of the underlyingequipment.
At December 31, 2016, the Company guaranteed indebtedness owed to third parties of approximately $63.8 million, primarily related to dealer andend-user financing of equipment. Such guarantees generally obligate the Company to repay outstanding finance obligations owed to financial institutions ifdealers or end users default on such loans through 2021. The Company believes the credit risk associated with these guarantees is not material to its financialposition or results of operations. Losses under such guarantees have historically been insignificant. In addition, the Company generally would expect to beable to recover a significant portion of the amounts paid under such guarantees from the sale of the underlying financed farm equipment, as the fair value ofsuch equipment is expected to be sufficient to offset a substantial portion of the amounts paid.
Other
At December 31, 2016, the Company had outstanding designated and non-designated foreign exchange contracts with a gross notional amount ofapproximately $1,661.4 million. The outstanding contracts as of December 31, 2016 range in maturity through December 2017 (Note 11).
The Company sells a majority of its wholesale accounts receivable in North America and Europe to the Company’s U.S., Canadian and Europeanfinance joint ventures, and a portion of its wholesale accounts receivable to its finance joint venture in Brazil. The Company also sells certain accountsreceivable under factoring arrangements to financial institutions
87

Table of ContentsAGCO CORPORATION
NOTES TO CONSOLIDATED FINANCIAL STATEMENTS - (Continued)
around the world. The Company reviewed the sale of such receivables and determined that these facilities should be accounted for as off-balance sheettransactions.
Total lease expense under noncancelable operating leases was $76.8 million, $77.2 million and $91.4 million for the years ended December 31,2016, 2015 and 2014, respectively.
Contingencies The Environmental Protection Agency of Victoria, Australia (“EPA”) has provided the Company’s Australian subsidiary with a draft notice that the
EPA is considering issuing to the subsidiary regarding remediation of contamination of a property located in a suburb of Melbourne, Australia. The propertywas owned and divested by the subsidiary before the subsidiary was acquired by the Company. The Australian subsidiary is in the process of reviewing theclaims contained in the draft notice. At this time, the Company is not able to determine whether the subsidiary might have any liability, or, the nature andcost of any possible required remediation.
In August 2008, as part of routine audits, the Brazilian taxing authorities disallowed deductions relating to the amortization of certain goodwillrecognized in connection with a reorganization of the Company’s Brazilian operations and the related transfer of certain assets to the Company’s Braziliansubsidiaries. The amount of the tax disallowance through December 31, 2016, not including interest and penalties, was approximately 131.5 millionBrazilian Reais (or approximately $40.4 million). The amount ultimately in dispute will be greater because of interest and penalties. The Company has beenadvised by its legal and tax advisors that its position with respect to the deductions is allowable under the tax laws of Brazil. The Company is contesting thedisallowance and believes that it is not likely that the assessment, interest or penalties will be required to be paid. However, the ultimate outcome will not bedetermined until the Brazilian tax appeal process is complete, which could take several years.
The Company is a party to various other legal claims and actions incidental to its business. The Company believes that none of these claims oractions, either individually or in the aggregate, is material to its business or financial statements as a whole, including its results of operations and financialcondition.
13. Fair Value of Financial Instruments
The Company categorizes its assets and liabilities into one of three levels based on the assumptions used in valuing the asset or liability. Estimatesof fair value for financial assets and liabilities are based on a fair value hierarchy that prioritizes the inputs to valuation techniques used to measure fair value.Observable inputs (highest level) reflect market data obtained from independent sources, while unobservable inputs (lowest level) reflect internallydeveloped market assumptions. In accordance with this guidance, fair value measurements are classified under the following hierarchy:
Level 1 - Quoted prices in active markets for identical assets or liabilities.
Level 2 - Quoted prices for similar assets or liabilities in active markets; quoted prices for identical or similar assets or liabilities in markets that arenot active; and model-derived valuations in which all significant inputs are observable or can be corroborated by observable market data forsubstantially the full term of the assets or liabilities.
Level 3 - Model-derived valuations in which one or more significant inputs are unobservable.
The Company categorizes its pension plan assets into one of the three levels of the fair value hierarchy. See Note 8 for a discussion of the valuationmethods used to measure the fair value of the Company’s pension plan assets.
The Company enters into foreign currency and interest rate swap contracts. The fair values of the Company’s derivative instruments are determinedusing discounted cash flow valuation models. The significant inputs used in these models are readily available in public markets, or can be derived fromobservable market transactions, and therefore have been classified as Level 2. Inputs used in these discounted cash flow valuation models for derivativeinstruments include the applicable exchange rates, forward rates or interest rates. Such models used for option contracts also use implied volatility. See Note11 for a discussion of the Company’s derivative instruments and hedging activities.
88

Table of ContentsAGCO CORPORATION
NOTES TO CONSOLIDATED FINANCIAL STATEMENTS - (Continued)
The Company’s trading securities as of December 31, 2015 consisted of foreign-based government bonds. The fair value of the Company’sinvestments in trading securities classified as Level 2 were priced using nonbinding market prices that were corroborated by observable market data.
Assets and liabilities measured at fair value on a recurring basis as of December 31, 2016 and 2015 are summarized below (in millions):
As of December 31, 2016 Level 1 Level 2 Level 3 TotalDerivative assets $ — $ 6.5 $ — $ 6.5Derivative liabilities $ — $ 13.4 $ — $ 13.4
As of December 31, 2015 Level 1 Level 2 Level 3 TotalDerivative assets $ — $ 4.8 $ — $ 4.8Derivative liabilities $ — $ 13.8 $ — $ 13.8Long-term debt (5 7/8% Senior notes due 2021) $ — $ 297.4 $ — $ 297.4Trading securities $ — $ 6.6 $ — $ 6.6
Cash and cash equivalents, accounts and notes receivable, and accounts payable are valued at their carrying amounts in the Company’sConsolidated Balance Sheets, due to the immediate or short-term maturity of these financial instruments.
The carrying amounts of long-term debt under the Company’s 1.056% senior term loan, credit facility, senior term loans due 2021 and senior termloans due between 2019 and 2026 (Note 7) approximate fair value based on the borrowing rates currently available to the Company for loans with similarterms and average maturities. At December 31, 2016, the estimated fair value of the Company’s 57/8% senior notes (Note 7), based on their listed marketvalue, was approximately $318.5 million, compared to its carrying value of $306.6 million.
14. Related Party Transactions
Rabobank, a financial institution based in the Netherlands, is a 51% owner in the Company’s finance joint ventures, which are located in the UnitedStates, Canada, Europe, Brazil, Argentina and Australia. Rabobank is also the principal agent and participant in the Company’s revolving credit facility(Note 7). The majority of the assets of the Company’s finance joint ventures represents finance receivables. The majority of the liabilities represents notespayable and accrued interest. Under the various joint venture agreements, Rabobank or its affiliates provide financing to the joint venture companies,primarily through lines of credit. During 2016, the Company made a total of approximately $2.8 million of additional investments in its retail finance jointventure in the Netherlands, primarily related to additional capital required as a result of increased retail finance portfolios during 2016. During both 2015 and2014, the Company did not make additional investments in its finance joint ventures.
The Company’s finance joint ventures provide retail financing and wholesale financing to its dealers. The terms of the financing arrangementsoffered to the Company’s dealers are similar to arrangements the finance joint ventures provide to unaffiliated third parties. In addition, the Companytransfers, on an ongoing basis, a majority of its wholesale receivables in North America, Europe and Brazil to its U.S., Canadian, European and Brazilianfinance joint ventures (Note 4). The Company maintains a remarketing agreement with its U.S. finance joint venture (Note 12). In addition, as part of salesincentives provided to end users, the Company may from time to time subsidize interest rates of retail financing provided by its finance joint ventures. Thecost of those programs is recognized at the time of sale to the Company’s dealers.
Tractors and Farm Equipment Limited (“TAFE”), in which the Company holds a 23.75% interest, manufactures Massey Ferguson-brandedequipment primarily in India and also supplies tractors and components to the Company for sale in other markets. Mallika Srinivasan, who is the Chairmanand Chief Executive Officer of TAFE, is currently a member of the Company’s Board of Directors. As of December 31, 2016, TAFE owned 12,150,152 sharesof the Company’s common stock. The Company and TAFE are parties to an agreement pursuant to which, among other things, TAFE has agreed not topurchase in excess of 12,170,290 shares of the Company’s common stock, subject to certain adjustments, and the Company has agreed to
89

Table of ContentsAGCO CORPORATION
NOTES TO CONSOLIDATED FINANCIAL STATEMENTS - (Continued)
annually nominate a TAFE representative to its Board of Directors. During 2016, 2015 and 2014, the Company purchased approximately $128.5 million,$129.2 million and $149.0 million, respectively, of tractors and components from TAFE. During 2016, 2015 and 2014, the Company sold approximately$1.1 million, $2.2 million and $2.1 million, respectively, of parts to TAFE. The Company received dividends from TAFE of approximately $1.6 million, $1.7million and $1.8 million during 2016, 2015 and 2014, respectively.
During 2016, 2015 and 2014, the Company paid approximately $3.1 million, $3.5 million and $3.8 million, respectively, to PPG Industries, Inc. forpainting materials used in the Company’s manufacturing processes. The Company’s Chairman, President and Chief Executive Officer is currently a memberof the board of directors of PPG Industries, Inc.
During 2016 and 2015, the Company paid approximately $2.0 million and $0.6 million, respectively, to Praxair, Inc. for propane, gas and welding,and laser consumables used in the Company’s manufacturing processes. In October 2015, the Company’s Chairman, President and Chief Executive Officerbecame a member of the board of directors of Praxair, Inc.
15. Segment Reporting
The Company’s four reportable segments distribute a full range of agricultural equipment and related replacement parts. The Company evaluatessegment performance primarily based on income (loss) from operations. Sales for each segment are based on the location of the third-party customer. TheCompany’s selling, general and administrative expenses and engineering expenses are charged to each segment based on the region and division where theexpenses are incurred. As a result, the components of income (loss) from operations for one segment may not be comparable to another segment. Segmentresults for the years ended December 31, 2016, 2015 and 2014 based on the Company’s current reportable segments are as follows (in millions):
Years Ended December 31, North
America South
America Europe/Africa/
Middle East Asia/Pacific Consolidated2016 Net sales $ 1,807.7 $ 917.5 $ 4,206.0 $ 479.3 $ 7,410.5Income from operations 39.1 19.9 417.7 11.4 488.1Depreciation 62.5 22.9 121.0 17.0 223.4Assets 958.1 735.0 1,691.4 340.5 3,725.0Capital expenditures 45.3 56.0 91.5 8.2 201.02015 Net sales $ 1,965.0 $ 949.0 $ 4,151.3 $ 402.0 $ 7,467.3Income (loss) from operations 123.4 34.4 416.7 (27.6) 546.9Depreciation 62.7 20.9 122.4 11.4 217.4Assets 943.7 490.0 1,757.2 346.3 3,537.2Capital expenditures 48.6 28.6 100.8 33.4 211.42014 Net sales $ 2,414.2 $ 1,663.4 $ 5,158.5 $ 487.6 $ 9,723.7Income (loss) from operations 219.2 134.0 500.2 (11.5) 841.9Depreciation 60.1 26.5 138.7 14.1 239.4Assets 1,026.9 719.8 2,036.0 353.8 4,136.5Capital expenditures 70.9 45.6 136.3 48.7 301.5
90

Table of ContentsAGCO CORPORATION
NOTES TO CONSOLIDATED FINANCIAL STATEMENTS - (Continued)
A reconciliation from the segment information to the consolidated balances for income from operations and total assets is set forth below (inmillions):
2016 2015 2014Segment income from operations $ 488.1 $ 546.9 $ 841.9Corporate expenses (119.7) (109.2) (117.7)Stock compensation (expense) credit (16.9) (11.6) 9.7Restructuring expenses (11.9) (22.3) (46.4)Amortization of intangibles (51.2) (42.7) (41.0)Consolidated income from operations $ 288.4 $ 361.1 $ 646.5
Segment assets $ 3,725.0 $ 3,537.2 $ 4,136.5Cash and cash equivalents 429.7 426.7 363.7Receivables from affiliates 54.4 70.1 108.4Investments in affiliates 414.9 392.9 424.1Deferred tax assets, other current and noncurrent assets 560.7 448.6 585.3Intangible assets, net 607.3 507.7 553.8Goodwill 1,376.4 1,114.5 1,192.8Consolidated total assets $ 7,168.4 $ 6,497.7 $ 7,364.6
Net sales by customer location for the years ended December 31, 2016, 2015 and 2014 were as follows (in millions):
2016 2015 2014Net sales:
United States $ 1,404.6 $ 1,624.0 $ 1,985.4Canada 286.7 233.6 333.9Germany 891.2 913.2 1,240.0France 746.9 762.6 828.4United Kingdom and Ireland 440.7 414.5 490.8Finland and Scandinavia 677.7 637.0 808.4Other Europe 1,127.9 1,077.7 1,376.0South America 898.2 932.3 1,646.2Middle East and Africa 321.6 346.4 414.9Asia 266.8 201.0 253.6Australia and New Zealand 212.6 201.1 234.1Mexico, Central America and Caribbean 135.6 123.9 112.0
$ 7,410.5 $ 7,467.3 $ 9,723.7
Net sales by product for the years ended December 31, 2016, 2015 and 2014 were as follows (in millions):
2016 2015 2014Net sales:
Tractors $ 4,225.1 $ 4,244.1 $ 5,566.8Replacement parts 1,211.3 1,204.4 1,390.1Grain storage and protein production systems 892.5 766.2 851.0Other machinery 521.6 629.6 875.3Combines 302.8 331.9 581.0Application equipment 257.2 291.1 459.5
$ 7,410.5 $ 7,467.3 $ 9,723.7
91

Table of ContentsAGCO CORPORATION
NOTES TO CONSOLIDATED FINANCIAL STATEMENTS - (Continued)
Property, plant and equipment and amortizable intangible assets by country as of December 31, 2016 and 2015 was as follows (in millions):
2016 2015United States $ 594.6 $ 619.0Germany 344.8 369.2Brazil 210.4 143.6Finland 145.9 165.2China 130.0 150.0Denmark 119.6 —Italy 106.7 88.3France 59.9 68.3Other 172.3 165.9 $ 1,884.2 $ 1,769.5
Effective January 1, 2017, the Company modified its system of reporting, resulting from changes to its internal management and organizationalstructure, which changed its reportable segments from North America; South America; Europe/Africa/Middle East; and Asia/Pacific to North America; SouthAmerica; Europe/Middle East; and Asia/Pacific/Africa. The Asia/Pacific/Africa reportable segment includes the regions of Africa, Asia, Australia and NewZealand, and the Europe/Africa/ Middle East segment no longer includes certain markets in Africa. Effective January 1, 2017, these reportable segments arereflective of how the Company’s chief operating decision maker reviews operating results for the purposes of allocating resources and assessing performance.
16. Subsequent Event
On February 9, 2017, the Company reached a binding agreement with the two largest shareholders of Kepler Weber S.A. (“Kepler Weber”) to acquire35% of the outstanding shares. Kepler Weber is a Brazilian manufacturer of grain handling and storage equipment. The acquisition is subject to Braziliancompetition authority approval, the Company ultimately acquiring a minimum of 65% of the outstanding shares of Kepler Weber, and other customaryconditions. The Company intends to launch a tender offer to acquire potentially all of the common shares held by the other shareholders. The price agreedby way of the binding agreement was 22.00 Reais per share (or approximately $7.03 per share), valuing Kepler Weber at 578.9 million Reais (orapproximately $185.0 million).
92

Table of Contents
Item 9. Changes in and Disagreements with Accountants on Accounting and Financial Disclosure
None.
Item 9A. Controls and Procedures
The Company’s management, including the Chief Executive Officer and the Chief Financial Officer, does not expect that the Company’s disclosurecontrols or the Company’s internal controls will prevent all errors and all fraud. However, our principal executive officer and principal financial officer haveconcluded the Company’s disclosure controls and procedures are effective at the reasonable assurance level. A control system, no matter how well conceivedand operated, can provide only reasonable, not absolute, assurance that the objectives of the control system are met. Further the design of a control systemmust reflect the fact that there are resource constraints, and the benefits of controls must be considered relative to their costs. Because of the inherentlimitations in all control systems, no evaluation of controls can provide absolute assurance that all control issues and instances of fraud, if any, have beendetected. Because of the inherent limitations in a cost effective control system, misstatements due to error or fraud may occur and not be detected. We willconduct periodic evaluations of our internal controls to enhance, where necessary, our procedures and controls.
Evaluation of Disclosure Controls and Procedures
Our Chief Executive Officer and Chief Financial Officer, after evaluating the effectiveness of our disclosure controls and procedures (as defined inRule 13a-15(e) under the Securities Exchange Act of 1934, as amended) as of December 31, 2016, have concluded that, as of such date, our disclosurecontrols and procedures were effective at the reasonable assurance level. Disclosure controls and procedures include, without limitation, controls andprocedures designed to ensure that information required to be disclosed by an issuer in the reports that it files or submits under the Exchange Act isaccumulated and communicated to the issuer’s management, including its principal executive and principal financial officers, or persons performing similarfunctions, as appropriate to allow timely decisions regarding required disclosure.
Management’s Annual Report on Internal Control over Financial Reporting
Management of the Company is responsible for establishing and maintaining effective internal control over financial reporting as defined inRule 13a-15(f) under the Securities Exchange Act of 1934. The Company’s internal control over financial reporting is designed to provide reasonableassurance to the Company’s management and Board of Directors regarding the preparation and fair presentation of published financial statements for externalpurposes in accordance with generally accepted accounting principles. In assessing the effectiveness of the Company’s internal control over financialreporting, management used the criteria set forth by the Committee of Sponsoring Organizations of the Treadway Commission (COSO) in “InternalControl — Integrated Framework (2013).”
Management assessed the effectiveness of the Company’s internal control over financial reporting as of December 31, 2016. Based on thisassessment, management believes that, as of December 31, 2016, the Company’s internal control over financial reporting is effective based on the criteriareferred to above.
The effectiveness of the Company’s internal control over financial reporting as of December 31, 2016 has been audited by KPMG LLP, anindependent registered public accounting firm, which also audited the Company’s Consolidated Financial Statements as of and for the year endedDecember 31, 2016. KPMG LLP’s report on internal control over financial reporting is set forth below.
Changes in Internal Control over Financial Reporting
There were no changes in our internal control over financial reporting that occurred during our last fiscal quarter that have materially affected, or arereasonably likely to materially affect, our internal control over financial reporting. However, as a result of the Company’s processes to comply with theSarbanes-Oxley Act of 2002, enhancements to the Company’s internal control over financial reporting were implemented as management addressed andremediated deficiencies that had been identified.
93

Table of Contents
Report of Independent Registered Public Accounting Firm
The Board of Directors and StockholdersAGCO Corporation:
We have audited AGCO Corporation’s internal control over financial reporting as of December 31, 2016, based on criteria established in InternalControl — Integrated Framework (2013) issued by the Committee of Sponsoring Organizations of the Treadway Commission (COSO). AGCO Corporation’smanagement is responsible for maintaining effective internal control over financial reporting and for its assessment of the effectiveness of internal controlover financial reporting, included in the accompanying Management’s Annual Report on Internal Control over Financial Reporting. Our responsibility is toexpress an opinion on the Company’s internal control over financial reporting based on our audit.
We conducted our audit in accordance with the standards of the Public Company Accounting Oversight Board (United States). Those standardsrequire that we plan and perform the audit to obtain reasonable assurance about whether effective internal control over financial reporting was maintained inall material respects. Our audit included obtaining an understanding of internal control over financial reporting, assessing the risk that a material weaknessexists, and testing and evaluating the design and operating effectiveness of internal control based on the assessed risk. Our audit also included performingsuch other procedures as we considered necessary in the circumstances. We believe that our audit provides a reasonable basis for our opinion.
A company’s internal control over financial reporting is a process designed to provide reasonable assurance regarding the reliability of financialreporting and the preparation of financial statements for external purposes in accordance with generally accepted accounting principles. A company’sinternal control over financial reporting includes those policies and procedures that (1) pertain to the maintenance of records that, in reasonable detail,accurately and fairly reflect the transactions and dispositions of the assets of the company; (2) provide reasonable assurance that transactions are recorded asnecessary to permit preparation of financial statements in accordance with generally accepted accounting principles, and that receipts and expenditures of thecompany are being made only in accordance with authorizations of management and directors of the company; and (3) provide reasonable assuranceregarding prevention or timely detection of unauthorized acquisition, use, or disposition of the company’s assets that could have a material effect on thefinancial statements.
Because of its inherent limitations, internal control over financial reporting may not prevent or detect misstatements. Also, projections of anyevaluation of effectiveness to future periods are subject to the risk that controls may become inadequate because of changes in conditions, or that the degreeof compliance with the policies or procedures may deteriorate.
In our opinion, AGCO Corporation maintained, in all material respects, effective internal control over financial reporting as of December 31, 2016,based on criteria established in Internal Control — Integrated Framework (2013) issued by COSO.
We also have audited, in accordance with the standards of the Public Company Accounting Oversight Board (United States), the consolidatedbalance sheets of AGCO Corporation and subsidiaries as of December 31, 2016 and 2015, and the related consolidated statements of operations,comprehensive income (loss), stockholders’ equity, and cash flows for each of the years in the three-year period ended December 31, 2016, and our reportdated February 28, 2017 expressed an unqualified opinion on those consolidated financial statements.
/s/ KPMG LLPAtlanta, GeorgiaFebruary 28, 2017
94

Table of Contents
Item 9B. Other Information
None.
PART III
The information called for by Items 10, 11, 12, 13 and 14, if any, will be contained in our Proxy Statement for the 2017 Annual Meeting ofStockholders, which we intend to file in March 2017.
Item 10 Directors, Executive Officers and Corporate Governance
The information with respect to directors and committees required by this Item set forth in our Proxy Statement for the 2017 Annual Meeting ofStockholders in the sections entitled “Election of Directors” and “Board of Directors and Corporate Governance” is incorporated herein by reference. Theinformation with respect to executive officers required by this Item set forth in our Proxy Statement for the 2017 Annual Meeting of Stockholders in thesections entitled “Executive Compensation” and “Section 16(a) Beneficial Ownership Reporting Compliance” is incorporated herein by reference.
See the information under the heading “Available Information” set forth in Part I of this Form 10-K. The code of conduct referenced therein appliesto our principal executive officer, principal financial officer, principal accounting officer and controller and the persons performing similar functions.
Item 11. Executive Compensation
The information with respect to executive compensation and its establishment required by this Item set forth in our Proxy Statement for the 2017Annual Meeting of Stockholders in the sections entitled “Board of Directors and Corporate Governance,” “Executive Compensation” and “CompensationCommittee Report” is incorporated herein by reference.
Item 12. Security Ownership of Certain Beneficial Owners and Management and Related Stockholder Matters
(a) Securities Authorized for Issuance Under Equity Compensation Plans
AGCO maintains its 2006 Plan pursuant to which we may grant equity awards to eligible persons. For additional information, see Note 10, “StockIncentive Plan,” in the Notes to Consolidated Financial Statements included in this filing. The following table gives information about equity awards underour Plan.
(a) (b) (c)
Plan Category
Number of Securitiesto be Issued
upon Exerciseof Outstanding
Awards Under the Plans
Weighted-AverageExercise Price
of OutstandingAwards Under
the Plans
Number of SecuritiesRemaining Available for Future
Issuance Under EquityCompensation Plans
(Excluding Securities Reflectedin Column (a)
Equity compensation plans approved by securityholders 3,663,461 $ 47.61 3,491,118
Equity compensation plans not approved bysecurity holders — — —
Total 3,663,461 $ 47.61 3,491,118
(b) Security Ownership of Certain Beneficial Owners and Management
The information required by this Item set forth in our Proxy Statement for the 2017 Annual Meeting of Stockholders in the section entitled“Principal Holders of Common Stock” is incorporated herein by reference.
Item 13. Certain Relationships and Related Party Transactions, and Director Independence
The information required by this Item set forth in our Proxy Statement for the 2017 Annual Meeting of Stockholders in the section entitled “CertainRelationships and Related Party Transactions” is incorporated herein by reference.
95

Table of Contents
Item 14. Principal Accounting Fees and Services
The information required by this Item set forth in our 2017 Proxy Statement for the Annual Meeting of Stockholders in the sections entitled “AuditCommittee Report” and “Board of Directors and Corporate Governance” is incorporated herein by reference.
PART IV
Item 15. Exhibits and Financial Statement Schedules
(a) The following documents are filed as part of this Form 10-K:
(1) The Consolidated Financial Statements, Notes to Consolidated Financial Statements, Report of Independent Registered Public Accounting Firm forAGCO Corporation and its subsidiaries are presented under Item 8 of this Form 10-K.
(2) Financial Statement Schedules:
The following Consolidated Financial Statement Schedule of AGCO Corporation and its subsidiaries is included herein and follows this report.
Schedule DescriptionSchedule II Valuation and Qualifying Accounts
Schedules other than that listed above have been omitted because the required information is contained in Notes to the Consolidated FinancialStatements or because such schedules are not required or are not applicable.
(3) The following exhibits are filed or incorporated by reference as part of this report. Each management contract or compensation plan required to befiled as an exhibit is identified by an asterisk (*).
ExhibitNumber Description of Exhibit
The Filings Referenced forIncorporation by Reference are
AGCO Corporation3.1 Certificate of Incorporation June 30, 2002, Form 10-Q, Exhibit 3.13.2 By-Laws December 10, 2014, Form 8-K, Exhibit 3.14.1 Indenture dated as of December 5, 2011 December 6, 2011, Form 8-K, Exhibit 4.1
10.1 2006 Long-Term Incentive Plan* January 22, 2015, Form 8-K, Exhibit 10.110.2 Form of Non-Qualified Stock Option Award Agreement* March 31, 2006, Form 10-Q, Exhibit 10.210.3 Form of Incentive Stock Option Award Agreement* March 31, 2006, Form 10-Q, Exhibit 10.310.4 Form of Stock Appreciation Rights Agreement* March 31, 2006, Form 10-Q, Exhibit 10.410.5 Form of Restricted Stock Units Agreement* January 26, 2016, Form 8-K, Exhibit 10.110.6 Form of Performance Share Award* March 31, 2006, Form 10-Q, Exhibit 10.610.7 Amended and Restated Management Incentive Plan* March 25, 2013, Form DEF14A, Appendix A10.8 Amended and Restated Executive Nonqualified Pension Plan* October 2, 2015, Form 8-K, Exhibit 99.110.9 Executive Nonqualified Defined Contribution Plan* December 31, 2015, Form 10-K, Exhibit 10.9
10.10 Employment and Severance Agreement with Martin Richenhagen* December 31, 2009, Form 10-K, Exhibit 10.1210.11 Employment and Severance Agreement with Andrew H. Beck* March 31, 2010, Form 10-Q, Exhibit 10.210.12 Employment and Severance Agreement with Gary L. Collar* June 30, 2008, Form 10-Q, Exhibit 10.610.13 Employment and Severance Agreement with Rob Smith* December 31, 2015, Form 10-K, Exhibit 10.1310.14 Employment and Severance Agreement with Hans-Bernd Veltmaat* December 31, 2009, Form 10-K, Exhibit 10.17
96

Table of Contents
ExhibitNumber Description of Exhibit
The Filings Referenced forIncorporation by References are
AGCO Corporation10.15 Debt Agreement dated December 18, 2014 December 31, 2014, Form 10-K, Exhibit 10.1510.16
Amended and Restated Credit Agreement dated as of June 30, 2014
June 30, 2014, Form 10-Q, Exhibit 10.1; June 30, 2015, Form 10-Q, Exhibit 10.1
10.17
U.S. Receivables Purchase Agreement, dated December 22, 2009
December 23, 2009, Form 8-K, Exhibit 10.1; June 30, 2013, Form10-Q, Exhibit 10.1
10.18
Amendment No. 2 to U.S. Receivables Purchase Agreement, datedFebruary 16, 2016
December 31, 2015, Form 10-K, Exhibit 10.19
10.19
Canadian Receivables Purchase Agreement, dated December 22, 2009
December 23, 2009, Form 8-K, Exhibit 10.2; June 30, 2013, Form10-Q, Exhibit 10.2
10.20
European Receivables Transfer Agreement, dated October 13, 2006
September 30, 2006, Form 10-Q, Exhibit 10.1; December 31,2009, Form 10-K, Exhibit 10.21; June 30, 2010, Form 10-Q,Exhibit 10.1
10.21 French Receivables Purchase Agreement, dated February 19, 2010 December 31, 2009, Form 10-K, Exhibit 10.2210.22
Letter Agreement, dated November 5, 2015, between AGCOInternational GmbH and TAFE International LLC, Turkey and Tractorsand Farm Equipment Limited
September 30, 2015, Form 10-Q, Exhibit 10.1
10.23
Letter Agreement, dated August 29, 2014, between AGCO Corporationand Tractors and Farm Equipment Limited
September 4, 2014, Form 8-K, Exhibit 10.1
10.24
Farm and Machinery Distributor Agreement, dated January 1, 2012,between AGCO International GmbH and Tractors and Farm EquipmentLimited
September 4, 2014, Form 8-K, Exhibit 10.2
10.25
Letter Agreement, dated August 3, 2007, between AGCO Corporationand Tractors and Farm Equipment Limited
September 4, 2014, Form 8-K, Exhibit 10.3
10.26
Consultancy Agreement, dated December 8, 2014, between AGCO DoBrasil Comércio E Industria Ltda and André Carioba*
December 10, 2014, Form 8-K, Exhibit 10.1
10.27 Current Director Compensation* Filed herewith21.1 Subsidiaries of the Registrant Filed herewith23.1 Consent of KPMG LLP Filed herewith24.1 Powers of Attorney Filed herewith31.1 Certification of Martin Richenhagen Filed herewith31.2 Certification of Andrew H. Beck Filed herewith32.1 Certification of Martin Richenhagen and Andrew H. Beck Filed herewith
101.INS XBRL Instance Document Filed herewith101.SCH XBRL Taxonomy Extension Schema Filed herewith101.CAL XBRL Taxonomy Extension Calculation Linkbase Filed herewith101.DEF XBRL Taxonomy Extension Definition Linkbase Filed herewith101.LAB XBRL Taxonomy Extension Label Linkbase Filed herewith101.PRE XBRL Taxonomy Extension Presentation Linkbase Filed herewith
Item 16. Form 10-K Summary
None.
97

Table of Contents
SIGNATURES
Pursuant to the requirements of Section 13 or 15(d) of the Securities Exchange Act of 1934, the registrant has duly caused this report to be signed on itsbehalf by the undersigned, thereunto duly authorized.
AGCO Corporation
By: /s/ MARTIN RICHENHAGEN Martin Richenhagen
Chairman of the Board, President
and Chief Executive OfficerDated: February 28, 2017
Pursuant to the requirements of the Securities Exchange Act of 1934, this report has been signed below by the following persons on behalf of theregistrant in the capacities and on the date indicated.
Signature Title Date
/s/ MARTIN RICHENHAGEN Chairman of the Board, President and Chief
Executive Officer February 28, 2017
Martin Richenhagen
/s/ ANDREW H. BECK Senior Vice President and Chief Financial Officer
(Principal Financial Officer and Principal Accounting Officer) February 28, 2017
Andrew H. Beck /s/ ROY V. ARMES * Director February 28, 2017 Roy V. Armes /s/ MICHAEL C. ARNOLD * Director February 28, 2017 Michael C. Arnold /s/ P. GEORGE BENSON * Director February 28, 2017 P. George Benson /s/ WOLFGANG DEML * Director February 28, 2017 Wolfgang Deml /s/ LUIZ F. FURLAN * Director February 28, 2017 Luiz F. Furlan /s/ GEORGE E. MINNICH * Director February 28, 2017 George E. Minnich /s/ GERALD L. SHAHEEN * Director February 28, 2017 Gerald L. Shaheen /s/ MALLIKA SRINIVASAN * Director February 28, 2017 Mallika Srinivasan /s/ HENDRIKUS VISSER * Director February 28, 2017 Hendrikus Visser *By: /s/ ANDREW H. BECK February 28, 2017
Andrew H. Beck Attorney-in-Fact
98

Table of Contents
ANNUAL REPORT ON FORM 10-KITEM 15 (A)(2)
FINANCIAL STATEMENT SCHEDULEYEAR ENDED DECEMBER 31, 2016
II-1

Table of Contents
SCHEDULE II
AGCO CORPORATION AND SUBSIDIARIES
SCHEDULE II — VALUATION AND QUALIFYING ACCOUNTS(In millions)
Additions
Description
Balance atBeginningof Period
AcquiredBusinesses
Charged toCosts andExpenses Deductions
ForeignCurrency
Translation
Balance atEnd of Period
(1)
Year ended December 31, 2016 Allowances for sales incentive discounts $ 254.0 $ — $ 293.7 $ (312.1) $ 1.4 $ 237.0
Year ended December 31, 2015 Allowances for sales incentive discounts $ 255.0 $ — $ 335.0 $ (325.9) $ (10.1) $ 254.0
Year ended December 31, 2014 Allowances for sales incentive discounts $ 236.6 $ — $ 409.1 $ (385.2) $ (5.5) $ 255.0
Additions
Description
Balance atBeginningof Period
AcquiredBusinesses
Charged toCosts andExpenses Deductions
ForeignCurrency
Translation Balance at
End of PeriodYear ended December 31, 2016
Allowances for doubtful accounts $ 29.3 $ 2.2 $ 3.6 $ (1.1) $ (0.3) $ 33.7
Year ended December 31, 2015 Allowances for doubtful accounts $ 32.1 $ — $ 5.6 $ (3.0) $ (5.4) $ 29.3
Year ended December 31, 2014 Allowances for doubtful accounts $ 34.9 $ 0.5 $ 1.7 $ (1.2) $ (3.8) $ 32.1
Additions
Description
Balance atBeginningof Period
Charged toCosts andExpenses
Reversal ofAccrual Deductions
ForeignCurrency
Translation Balance at
End of PeriodYear ended December 31, 2016
Accruals of severance, relocation and otherintegration costs $ 16.9 $ 12.0 $ (0.1) $ (13.3) $ (0.2) $ 15.3
Year ended December 31, 2015 Accruals of severance, relocation and otherintegration costs $ 25.4 $ 23.0 $ (0.7) $ (29.5) $ (1.3) $ 16.9
Year ended December 31, 2014 Accruals of severance, relocation and otherintegration costs $ — $ 44.4 $ — $ (18.8) $ (0.2) $ 25.4
Additions
Description
Balance atBeginningof Period
AcquiredBusinesses
Charged(Credited) to
Costs andExpenses Deductions
ForeignCurrency
Translation Balance at
End of PeriodYear ended December 31, 2016
Deferred tax valuation allowance $ 75.8 $ — $ 37.9 $ — $ 2.3 $ 116.0
Year ended December 31, 2015 Deferred tax valuation allowance $ 93.3 $ — $ (4.5) $ — $ (13.0) $ 75.8
Year ended December 31, 2014
Deferred tax valuation allowance $ 77.2 $ — $ 22.8 $ — $ (6.7) $ 93.3_____________________________________
(1) As of December 31, 2016, approximately $202.5 million of this balance was recorded within “Accrued expenses” and approximately $34.5 million was recorded within“accounts receivable allowances” in the Company’s Consolidated Balance Sheets. As of December 31, 2015, approximately $229.5 million of this balance was recorded within“Accrued expenses” and approximately $24.5 million was recorded within “accounts receivable allowances” in the Company’s Consolidated Balance Sheets.
II-2

Table of Contents
II-3
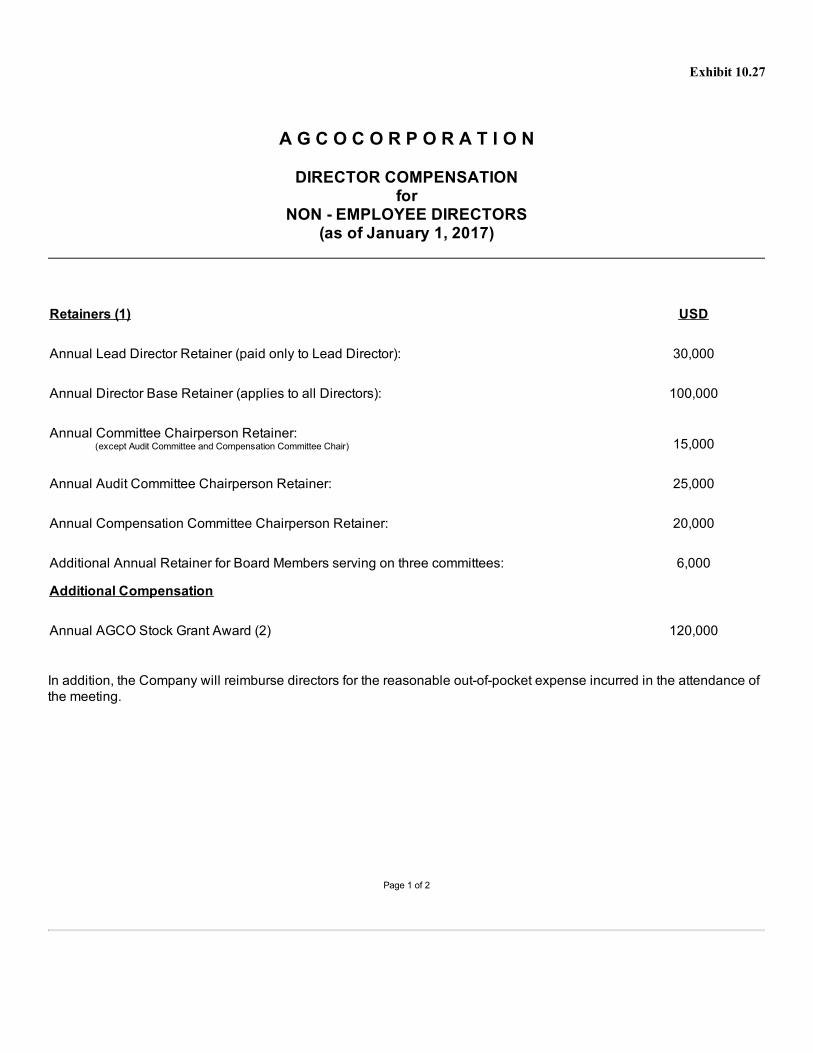
Exhibit 10.27
A G C O C O R P O R A T I O N
DIRECTOR COMPENSATIONfor
NON - EMPLOYEE DIRECTORS(as of January 1, 2017)
Retainers (1) USD
Annual Lead Director Retainer (paid only to Lead Director): 30,000
Annual Director Base Retainer (applies to all Directors): 100,000
Annual Committee Chairperson Retainer: (except Audit Committee and Compensation Committee Chair) 15,000
Annual Audit Committee Chairperson Retainer: 25,000
Annual Compensation Committee Chairperson Retainer: 20,000
Additional Annual Retainer for Board Members serving on three committees: 6,000
Additional Compensation
Annual AGCO Stock Grant Award (2) 120,000
In addition, the Company will reimburse directors for the reasonable out-of-pocket expense incurred in the attendance ofthe meeting.
Page 1 of 2

A G C O C O R P O R A T I O N
DIRECTOR COMPENSATIONfor
NON - EMPLOYEE DIRECTORS(as of January 1, 2017)
Notes:
1) Payments of annual retainers are made in accordance with the following provisions:
I) Annual Retainers are paid quarterly in four installments (for ease of calculation purposes quarters aredivided into 90 days with a 360 day year).
II) Annual Retainers accrue as of the first day of each calendar quarter based on the Board and CommitteeMembership Roster in effect on that date.
III) Annual Retainers are paid in advance during the first month of the given calendar quarter (e.g., Januaryfor the first quarter).
IV) Changes to Board and Committee Memberships (including Chairpersons) will be reviewed andadjustments made to current quarter’s retainer amounts (up or down).
V) Any changes in the Retainer amounts due for the current quarter will be reflected in the ensuingquarter’s retainer payment.
2) Terms applicable to the Stock Grant Award are defined in the Plan Document. The stock grant equivalent to USD120,000 is based on closing price on the day of the Annual Shareholder’s meeting.
Page 2 of 2

AGCO CORP /DE Exhibit 21.112/31/2016
Wholly Owned Subsidiaries of AGCO CorporationCountry of
Jurisdiction AGCO Argentina SA ArgentinaIndamo SA ArgentinaAGCO Australia Ltd AustraliaSparex Australia PTY Ltd AustraliaAGCO Austria GmbH AustriaSparex Maschinensubehor Handelsgesellschaft m.b.H Austria Cimbria Heid GmbH AustriaSparex Belgium BVBA BelgiumAGCO do Brasil Comercio e Industria Ltda BrazilGSI Brasil Industria e Comercio de Equipamentos Agropecuarios Ltd BrazilTecnoagro Maquinas Agricolas Ltda Brazil Santal Equipamentos, Comércio e Indústria Ltda. BrazilAGCO do Brasil Maquinas e Equipamentos Agricolas Ltda BrazilAGCO Canada Ltd CanadaGSI Electronique Inc CanadaSparex Canada Ltd CanadaCimbria HMD SRO Czech RepublicAGCO (Changzhou) Agricultural Machinery Co. Ltd ChinaAGCO (China) Investment Co., Ltd ChinaAGCO (Daqing) Agricultural Machinery Co., Ltd. ChinaAGCO Dafeng (Yanzhou) Agricultural Machinery Co., Ltd ChinaAGCO Genpowex (Shanghai) Co., Ltd ChinaAGCO GSI (Changzhou) Agriculture Equipment Co., Ltd ChinaBeijing AGCO Trading Co., Ltd ChinaC-Lines Asia Limited ChinaManway Development Limited ChinaMatexi (Shanghai) Trading Limited ChinaShanghai GSI Agriculture Equipment Co., Ltd ChinaThe GSI Group (Shanghai) Co. Ltd ChinaAGCO A/S DenmarkAGCO Danmark A/S DenmarkSparex Limited ApS DenmarkA/S Cimbria DenmarkXBA BidCo ApS DenmarkXBA FinCo ApS DenmarkXBA MidCo ApS DenmarkCimbria Bulk Equipment A/S Denmark
Cimbria Unigrain A/S DenmarkCimbria Manufacturing A/S DenmarkAGCO Power Oy FinlandAGCO Suomi Oy FinlandValtra OY AB FinlandAGCO Distribution SAS FranceAGCO France SAS FranceAGCO SAS France

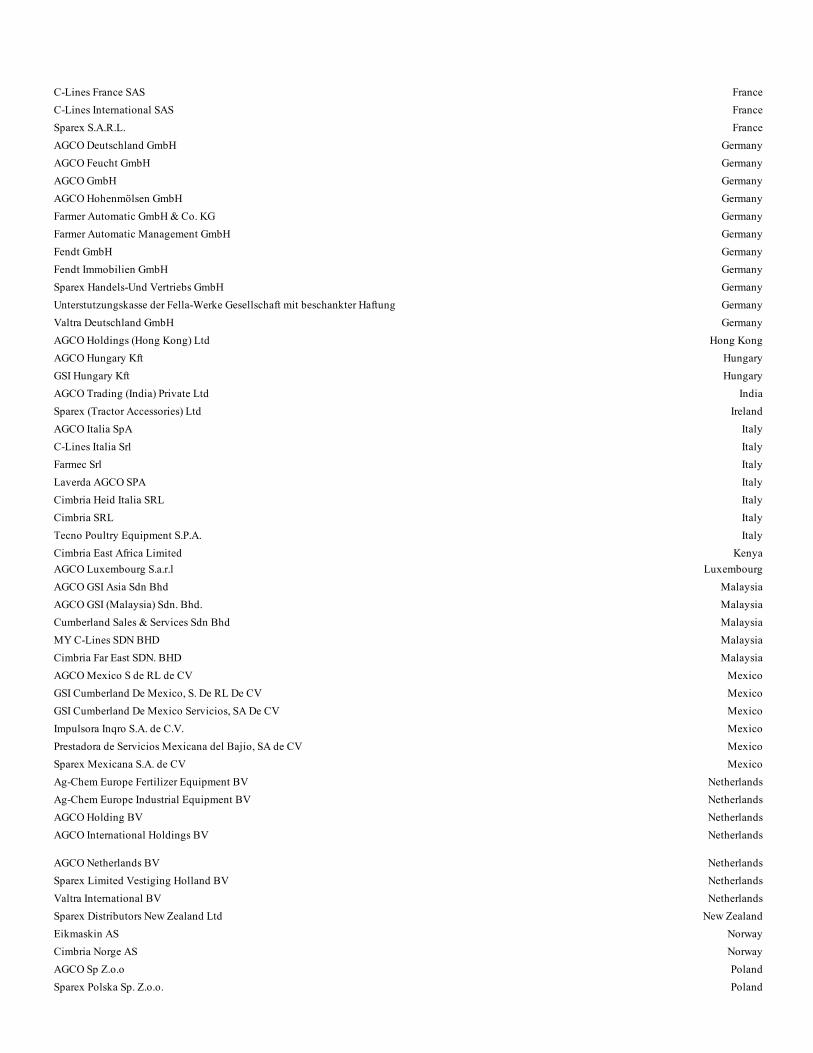
C-Lines France SAS FranceC-Lines International SAS FranceSparex S.A.R.L. FranceAGCO Deutschland GmbH GermanyAGCO Feucht GmbH GermanyAGCO GmbH GermanyAGCO Hohenmölsen GmbH GermanyFarmer Automatic GmbH & Co. KG GermanyFarmer Automatic Management GmbH GermanyFendt GmbH GermanyFendt Immobilien GmbH GermanySparex Handels-Und Vertriebs GmbH GermanyUnterstutzungskasse der Fella-Werke Gesellschaft mit beschankter Haftung GermanyValtra Deutschland GmbH GermanyAGCO Holdings (Hong Kong) Ltd Hong KongAGCO Hungary Kft HungaryGSI Hungary Kft HungaryAGCO Trading (India) Private Ltd IndiaSparex (Tractor Accessories) Ltd IrelandAGCO Italia SpA ItalyC-Lines Italia Srl ItalyFarmec Srl ItalyLaverda AGCO SPA ItalyCimbria Heid Italia SRL ItalyCimbria SRL ItalyTecno Poultry Equipment S.P.A. ItalyCimbria East Africa Limited KenyaAGCO Luxembourg S.a.r.l LuxembourgAGCO GSI Asia Sdn Bhd MalaysiaAGCO GSI (Malaysia) Sdn. Bhd. MalaysiaCumberland Sales & Services Sdn Bhd MalaysiaMY C-Lines SDN BHD MalaysiaCimbria Far East SDN. BHD MalaysiaAGCO Mexico S de RL de CV MexicoGSI Cumberland De Mexico, S. De RL De CV MexicoGSI Cumberland De Mexico Servicios, SA De CV MexicoImpulsora Inqro S.A. de C.V. MexicoPrestadora de Servicios Mexicana del Bajio, SA de CV MexicoSparex Mexicana S.A. de CV MexicoAg-Chem Europe Fertilizer Equipment BV NetherlandsAg-Chem Europe Industrial Equipment BV NetherlandsAGCO Holding BV NetherlandsAGCO International Holdings BV Netherlands
AGCO Netherlands BV NetherlandsSparex Limited Vestiging Holland BV NetherlandsValtra International BV NetherlandsSparex Distributors New Zealand Ltd New ZealandEikmaskin AS NorwayCimbria Norge AS NorwayAGCO Sp Z.o.o PolandSparex Polska Sp. Z.o.o. Poland


Sparex Portugal Importacao e Comercio de Pecas Lda PortugalValtractor Comercio de Tractores e Maquinas Agricolas SA PortugalAGCO LLC RussiaCimbria LLC RussiaAGCO Holdings (Singapore) Pte. Ltd SingaporeAGCO Holdings South Africa South AfricaAGCO South Africa Pty Ltd South AfricaC-Lines South Africa (Proprietary) Limited South AfricaSparex (Proprietary) Ltd South AfricaAGCO Iberia SA SpainSparex Agrirepuestos SL SpainAGCO AB SwedenAGCO International GmbH SwitzerlandAGCO Tarim Makineleri Ticaret Ltd Sirketi TurkeyC-Lines Middle East DMCC United Arab EmiratesAGCO Funding Company United KingdomAGCO International Ltd United KingdomAGCO Ltd United KingdomAGCO Machinery Ltd United KingdomAGCO Manufacturing Ltd United KingdomAGCO Pension Trust Ltd United KingdomAGCO Receivables Ltd United KingdomAGCO Services Ltd United KingdomAnglehawk Ltd United KingdomMassey Ferguson Staff Pension Trust Ltd United KingdomMassey Ferguson Works Pension Trust Ltd United KingdomSparex Holdings Ltd United KingdomSparex International Ltd United KingdomSparex Ltd United KingdomSpenco Engineering Company Ltd United KingdomCimbria Holdings Limited United KingdomCimbria (UK) Limited United KingdomAGCO Jackson Assembly Company United StatesAssumption Leasing Company, Inc. United StatesExport Market Services LLC United StatesFarmer Automatic, Inc. United StatesIntersystems Holdings, Inc. United StatesIntersystems International Inc. United StatesMassey Ferguson Corp. United StatesSparex, Inc. United StatesThe GSI Group, LLC United StatesAGCO Zambia Ltd Zambia
50% or Greater Joint Venture Interests of the Registrant Deutz AGCO Motores SA ArgentinaGroupement International De Mecanique Agricole SA FranceAGCO-RM (Distribution) Holding BV NetherlandsAGCO Machinery LLC RussiaAGCO - Amity JV, LLC United StatesIntelligent Agricultural Solutions, LLC United StatesUSC LLC United States


Less Than 50% Joint Venture Interests of the Registrant Algerian Tractor Company Spa AlgeriaAGCO Capital Argentina SA ArgentinaAGCO Finance PTY Ltd AustraliaAGCO Finance GmbH, Landmaschinen Leasing AustriaAGCO Finance NV BelgiumBanco De Lage Landen Brasil S.A BrazilDe Lage Landen Participacoes Ltda (dbaAgricredit do Brasil Ltda) BrazilMassey Ferguson Administradora de Consorcios Ltda BrazilAGCO Finance Canada Ltd CanadaAGCO Finance S.N.C. FranceAGCO Finance GmbH GermanyDKE-Data GmbH & Co. KG GermanyDKE-Data Verwaltungs GmbH GermanyTractors and Farm Equipment Ltd IndiaAGCO Finance DAC IrelandLibyan Tractor and Agricultural Commodities Company LibyaCompagnie Maghebine de Materials Agricoles et Industriels SA MoroccoAGCO Finance B.V NetherlandsAGCO RM (Manufacturing) Holding BV NetherlandsAGCO Finance Ltd New ZealandAGCO Finance Sp.z.o.o PolandAGCO Finance LLC RussiaGolAZ OJSC RussiaAGCO Finance AG SwitzerlandAGCO Finance Ltd United KingdomAGCO Finance LLC United States

Exhibit 23.1
Consent of Independent Registered Public Accounting Firm
The Board of DirectorsAGCO Corporation:
We consent to the incorporation by reference in the registration statements (No. 333-178399 and No. 333-142711) on Form S-8 of AGCO Corporation of ourreports dated February 28, 2017, with respect to the consolidated balance sheets of AGCO Corporation and subsidiaries as of December 31, 2016 and 2015,and the related consolidated statements of operations, comprehensive income (loss), stockholders’ equity, and cash flows for each of the years in the three-year period ended December 31, 2016, and the related financial statement schedule, and the effectiveness of internal control over financial reporting as ofDecember 31, 2016, which reports appear in the December 31, 2016 annual report on Form 10-K of AGCO Corporation.
/s/ KPMG LLP
Atlanta, GeorgiaFebruary 28, 2017

Exhibit 24.1
Power of Attorney
Know all men and women by these presents, that each person whose signature appears below, hereby constitutes and appoints Andrew H. Beck andRoger N. Batkin his/her true and lawful attorneys-in-fact and agents, with full power of substitution and resubstitution, for him/her and in his/her name, placeand stead, in any and all capacities, to sign the annual report on Form 10-K of AGCO Corporation for the fiscal year ended December 31, 2016 and any or allamendments or supplements thereto, and to file the same with all exhibits thereto and other documents in connection therewith, with the Securities andExchange Commission, granting unto said attorneys-in-fact and agents full power and authority to do and perform each and every act and thing necessary orappropriate to be done with respect to the Form 10-K or any amendments or supplements thereto in and about the premises, as fully to all intents andpurposes as he might or could do in person, hereby ratifying and confirming all that said attorneys-in-fact and agents or his substitute or substitutes, maylawfully do or cause to be done by virtue hereof.
Signature Date /s/ Martin Richenhagen February 28, 2017Martin Richenhagen /s/ Roy V. Armes February 28, 2017Roy V. Armes /s/ Michael C. Arnold February 28, 2017Michael C. Arnold /s/ P. George Benson February 28, 2017P. George Benson /s/ Wolfgang Deml February 28, 2017Wolfgang Deml /s/ Luiz F. Furlan February 28, 2017Luiz F. Furlan /s/ George E. Minnich February 28, 2017George E. Minnich /s/ Gerald L. Shaheen February 28, 2017Gerald L. Shaheen /s/ Mallika Srinivasan February 28, 2017Mallika Srinivasan /s/ Hendrikus Visser February 28, 2017Hendrikus Visser

Exhibit 31.1
Certification Pursuant to § 302 of the Sarbanes-Oxley Act of 2002
I, Martin Richenhagen, certify that:
1. I have reviewed this Annual Report on Form 10-K of AGCO Corporation;
2. Based on my knowledge, this report does not contain any untrue statement of a material fact or omit to state a material fact necessary tomake the statements made, in light of the circumstances under which such statements were made, not misleading with respect to the periodcovered by this report;
3. Based on my knowledge, the financial statements, and other financial information included in this report, fairly present in all materialrespects the financial condition, results of operations and cash flows of the registrant as of, and for, the periods presented in this report;
4. The registrant’s other certifying officer(s) and I are responsible for establishing and maintaining disclosure controls and procedures (asdefined in Exchange Act Rules 13a-15(e) and 15d-15(e)) and internal control over financial reporting (as defined in Exchange ActRules 13a-15(f) and 15d-15(f)) for the registrant and have:
(a) Designed such disclosure controls and procedures, or caused such disclosure controls and procedures to be designed under oursupervision, to ensure that material information relating to the registrant, including its consolidated subsidiaries, is made known tous by others within those entities, particularly during the period in which this report is being prepared;
(b) Designed such internal control over financial reporting, or caused such internal control over financial reporting to be designedunder our supervision, to provide reasonable assurance regarding the reliability of financial reporting and the preparation offinancial statements for external purposes in accordance with generally accepted accounting principles;
(c) Evaluated the effectiveness of the registrant’s disclosure controls and procedures and presented in this report our conclusionsabout the effectiveness of the disclosure controls and procedures, as of the end of the period covered by this report based on suchevaluation; and
(d) Disclosed in this report any change in the registrant’s internal control over financial reporting that occurred during the registrant’smost recent fiscal quarter (the registrant’s fourth fiscal quarter in the case of an annual report) that materially affected, or isreasonably likely to materially affect, the registrant’s internal control over financial reporting; and
5. The registrant’s other certifying officer(s) and I have disclosed, based on our most recent evaluation of internal control over financialreporting, to the registrant’s auditors and the audit committee of registrant’s board of directors (or persons performing the equivalentfunctions):
(a) All significant deficiencies and material weakness in the design or operation of internal control over financial reporting which arereasonably likely to adversely affect the registrant’s ability to record, process, summarize and report financial information; and
(b) Any fraud, whether or not material, that involves management or other employees who have a significant role in the registrant’sinternal control over financial reporting.
Dated: February 28, 2017
/s/ Martin Richenhagen Martin Richenhagen Chairman of the Board, President and Chief Executive Officer

Exhibit 31.2
Certification Pursuant to § 302 of the Sarbanes-Oxley Act of 2002
I, Andrew H. Beck, certify that:
1. I have reviewed this Annual Report on Form 10-K of AGCO Corporation;
2. Based on my knowledge, this report does not contain any untrue statement of a material fact or omit to state a material fact necessary tomake the statements made, in light of the circumstances under which such statements were made, not misleading with respect to the periodcovered by this report;
3. Based on my knowledge, the financial statements, and other financial information included in this report, fairly present in all materialrespects the financial condition, results of operations and cash flows of the registrant as of, and for, the periods presented in this report;
4. The registrant’s other certifying officer(s) and I are responsible for establishing and maintaining disclosure controls and procedures (asdefined in Exchange Act Rules 13a-15(e) and 15d-15(e)) and internal control over financial reporting (as defined in Exchange ActRules 13a-15(f) and 15d-15(f)) for the registrant and have:
(a) Designed such disclosure controls and procedures, or caused such disclosure controls and procedures to be designed under oursupervision, to ensure that material information relating to the registrant, including its consolidated subsidiaries, is made known tous by others within those entities, particularly during the period in which this report is being prepared;
(b) Designed such internal control over financial reporting, or caused such internal control over financial reporting to be designedunder our supervision, to provide reasonable assurance regarding the reliability of financial reporting and the preparation offinancial statements for external purposes in accordance with generally accepted accounting principles;
(c) Evaluated the effectiveness of the registrant’s disclosure controls and procedures and presented in this report our conclusionsabout the effectiveness of the disclosure controls and procedures, as of the end of the period covered by this report based on suchevaluation; and
(d) Disclosed in this report any change in the registrant’s internal control over financial reporting that occurred during the registrant’smost recent fiscal quarter (the registrant’s fourth fiscal quarter in the case of an annual report) that materially affected, or isreasonably likely to materially affect, the registrant’s internal control over financial reporting; and
5. The registrant’s other certifying officer(s) and I have disclosed, based on our most recent evaluation of internal control over financialreporting, to the registrant’s auditors and the audit committee of registrant’s board of directors (or persons performing the equivalentfunctions):
(a) All significant deficiencies and material weakness in the design or operation of internal control over financial reporting which arereasonably likely to adversely affect the registrant’s ability to record, process, summarize and report financial information; and
(b) Any fraud, whether or not material, that involves management or other employees who have a significant role in the registrant’sinternal control over financial reporting.
Dated: February 28, 2017
/s/ Andrew H. Beck Andrew H. Beck Senior Vice President and Chief Financial Officer

Exhibit 32.1
CERTIFICATION PURSUANT TO18 U.S.C. SECTION 1350,
AS ADOPTED PURSUANT TOSECTION 906 OF THE SARBANES-OXLEY ACT OF 2002
The undersigned, as the Chairman of the Board, President and Chief Executive Officer and as the Senior Vice President and Chief Financial Officerof AGCO Corporation, respectively, certify that, to the best of their knowledge and belief, the Annual Report on Form 10-K for the year ended December 31,2016 that accompanies this certification fully complies with the requirements of Section 13(a) of the Securities Exchange Act of 1934 and the informationcontained in the annual report fairly presents, in all material respects, the financial condition and results of operations of AGCO Corporation at the dates andfor the periods indicated. The foregoing certifications are made pursuant to 906 of the Sarbanes-Oxley Act of 2002 (18 U.S.C. 1350) and shall not be reliedupon for any other purpose.
/s/ Martin Richenhagen Martin Richenhagen Chairman of the Board, President and Chief Executive Officer February 28, 2017 /s/Andrew H. Beck Andrew H. Beck Senior Vice President and Chief Financial Officer February 28, 2017
A signed original of this written statement required by Section 906, or other document authenticating, acknowledging, or otherwise adopting thesignature that appears in typed form within the electronic version of this written statement required by Section 906, has been provided to AGCO Corporationand will be retained by AGCO Corporation and furnished to the Securities and Exchange Commission or its staff upon request.