
Has decimalization hurt institutional investors
44
Has Decimalization Hurt Institutional Investors? An Investigation into Trading Costs and Order Routing Practices of Buy-side Institutions Sugato Chakravarty Purdue University West Lafayette, IN 47906-1262 [email protected] (765) 494-6427 Venkatesh Panchapagesan Washington University St. Louis, MO 63130 [email protected] (314) 935-6329 Robert A. Wood University of Memphis Memphis, TN 38152 [email protected] (901) 755-8322 Current Draft: November 14, 2002 Comments Welcome. We thank the Plexus group, especially Vinod Pakianathan and Wayne Wagner, for providing us with the data and for related conversations, and the Nasdaq Economic Research Group for helpful suggestions. The usual disclaimer applies.
-
Upload
independent -
Category
Documents
-
view
1 -
download
0
Transcript of Has decimalization hurt institutional investors
Has Decimalization Hurt Institutional Investors?
An Investigation into Trading Costs and Order Routing Practices of Buy-side Institutions
Sugato Chakravarty Purdue University
West Lafayette, IN 47906-1262 [email protected]
(765) 494-6427
Venkatesh Panchapagesan Washington University St. Louis, MO 63130
[email protected] (314) 935-6329
Robert A. Wood University of Memphis Memphis, TN 38152 [email protected]
(901) 755-8322
Current Draft: November 14, 2002 Comments Welcome.
We thank the Plexus group, especially Vinod Pakianathan and Wayne Wagner, for providing us with the data and for related conversations, and the Nasdaq Economic Research Group for helpful suggestions. The usual disclaimer applies.

Abstract We examine the effect of decimalization on institutional investors using proprietary data. We find no evidence that decimalization has increased trading costs for institutions. In fact, we find an average decrease of 13 basis points, or roughly $224 million a month in savings of institutional trading costs following the move to decimal trading. We find little differences in institutional order routing practices overall though smaller and easier to fill orders are routed more often to electronic brokers while larger and more difficult to fill orders are sent to traditional brokers following decimalization. There is an increase in trading costs of orders routed to electronic and independent research brokers, while costs of trading with full service and soft dollar brokers have gone down. Interestingly, we find a reduced usage of soft dollar brokers suggesting that decimalization may have altered the incentives of this multi-billion dollar industry. Our results survive extensive partitioning of the data and differ in spirit from those reported around the transition of the minimum tick size from eighths to sixteenths. Our results are also surprising in light of an oft-repeated complaint among professional traders that liquidity is hard and expensive to find in a post-decimal trading milieu. Our findings have important regulatory implications.

1
1. Introduction
After much debate, the New York Stock Exchange (NYSE) finally converted all of its listed issues to decimal
pricing on January 29, 2001 thereby ending a two-hundred-year tradition of trading in fractions. The debate
centered on the possible effect of decimal prices on liquidity and trading costs for investors. While retail
investors welcomed the idea of trading in finer price increments, institutional investors were more concerned
about its adverse impact on liquidity. For example, a recent letter to the Security Industry Association (SIA)
claims:
“Thhee eexxeeccuuttiioonn ooff llaarrggee oorrddeerrss hhaass bbeeeenn hhaammppeerreedd bbyy rreedduucceedd ddeepptthh ooff tthhee EExxcchhaannggee’’ss lliimmiitt oorrddeerr bbooookk aanndd bbyy iinnccrreeaasseedd iinnssttaanncceess ooff mmaarrkkeett ppaarrttiicciippaannttss sstteeppppiinngg aahheeaadd ooff oorrddeerrss bbyy iinnccrreemmeennttss ooff aass lliittttllee aass oonnee ppeennnnyy,, ””
SSiimmiillaarrllyy,, tthhee HHeeaadd TTrraaddeerr aatt ZZuurriicchh--KKeemmppeerr iiss qquuootteedd aass ssaayyiinngg:: ““TThhee nneett eeffffeecctt hhaass bbeeeenn ffoorr tthhee iinnssttiittuuttiioonnaall ttrraaddeerr ttoo lloossee ccoonnttrrooll ooff hhiiss//hheerr oorrddeerr ffllooww,,
ssiinnccee nnoo eeffffeeccttiivvee ttoooollss eexxiisstt iinn tthhee NNYYSSEE lliisstteedd mmaarrkkeett ttoo rreeaacchh tthhee mmaarrkkeett eeffffiicciieennttllyy..””
Much of their concern appear justified in the light of earlier findings on the US equity markets’ move to the
sixteenths as well as on results based on the introduction of decimal pricing in other markets.1 These results
indicate that spreads – both quoted and effective – decrease following a reduction in tick size but so does the
market depth.
While both retail and institutional investors gain from a reduction in spreads, it is more likely that the
latter faces the brunt of a reduction in market depth. Jones and Lipson (2001) who investigate institutional
trading costs around the change of tick size from a eighth to a sixteenth find that realized execution costs of
institutions increase following that changeover. They end their study stating, “…. institutional traders should,
as a group, regard skeptically any proposal for a further reduction in minimum price increments.” It is not
surprising, therefore, that institutions were reluctant to embrace decimalization.2
Now that decimal pricing has been introduced, it begs the question of whether institutions were indeed
adversely impacted by it. This paper seeks to answer that question. If liquidity had dried up, as opined by
institutional investors, it should be reflected in higher trading costs following decimalization. But unlike retail
investors, it is difficult to measure trading costs for institutions. Institutions often need to transact large
1 See, for example, Bacidore (1997), Bollen and Whaley (1998), Ricker (1998), Ronen and Weaver (1998), Goldstein and Kavajecz (2000), and Jones and Lipson (2001). Bacidore, Battalio and Jennings (2001), Chakravarty, Van Ness and Wood (2002), and Chung, Van Ness and Van Ness (2001) present similar results following the introduction of decimal pricing for a select group of pilot NYSE stocks before the market-wide switchover in January 2001. 2 See “Decimal Move Brings Points Of Contention From Traders,” (Wall Street Journal, February 12, 2001, p. C1) and “Deals & Deal Makers: Grasso Says NYSE Must Stick to Penny As Trade Increment,” ((Wall Street Journal, March 22, 2001, p. C18).
2
quantities of shares in the market and, frequently, have to wait for several days before their order gets filled.
Sometimes these orders do not get filled on time or not get filled at all. Determining the impact of missed
trades or delayed trades is highly subjective and depends largely on the investment horizon of the institution.
While commissions paid by institutions are easy to identify, estimation of both price impact of their completed
trades and opportunity costs of their missed trades requires us to make assumptions that may or may not be
valid. Moreover, unlike retail investors, institutions use multiple brokers who fill orders with varying speeds
and costs that make order routing an important determinant of their cost of trading. The issue of order routing
has become quite important in recent years, as alternative trading systems, mostly electronic, have risen by
providing features such as speed and anonymity to attract traders away from traditional trading systems. Any
change in the trading landscape (such as decimalization) that favors one type of broker over another is bound to
alter the way institutions route their orders and hence impact their trading costs. To further compound the issue,
institutional trading costs often mask payments for services – explicit and implicit – that their executing brokers
may provide (See Schwartz and Steil (2002)). This makes it almost impossible to separate the “real” trading
costs from the observed trading costs.
While extant research has addressed some of these issues, investigation of order routing practices on
institutional trading costs have largely been ignored until recently. Studies by Conrad, Johnson and Wahal
(2001a and 2001b), for example, examine costs of trading with a certain class of brokers in isolation such as the
soft dollar brokers and electronic communication networks, or ECNs, over time. Our study builds on their
research by examining institutional order routing practices – not just to one class of brokers but to all broker
classes – around decimalization and whether institutions have managed to circumvent some of the detrimental
effects of decimalization by routing orders differently.
Following the convention used by both practitioners as well as by previous researchers on institutional
trading costs, we estimate only the costs that we could measure with some certainty, namely commissions and
the price impact of institutional trades. While commissions are easy to identify, price impact can only be
measured against a reference price. Keim and Madhavan (1996) discuss the importance of choosing the right
reference price for institutional trades. The right reference price should be one that reflects the “true” value of
the security – unperturbed by the trade itself. To mitigate any problem that any one measure might have, we
use several different reference prices to estimate price impact. However, we sidestep the issue of opportunity
costs, as it is difficult to employ a measure that provides reliable estimates without knowing the different
motivations for trading. We also do not estimate other implicit costs such as the costs of increased monitoring
or the increase in back office costs that may have resulted following decimalization.
We use proprietary data from Plexus Group, a well-known firm that advises buy-side institutional
investors on trading costs. The data provide us with detailed information on institutional orders and trades for
all Plexus clients. In 2001, Plexus handled $4.5 trillion in institutional equity trades, or roughly a fifth of dollar

3
trading volume in US equity markets.3 In addition, we have information on the investment style (Value,
Diversified and Growth) of each of these clients based on an internal classification scheme used by Plexus.
Since many brokers consolidate their trades before they report to their institutional clients, our data cannot
identify all the individual trades that make up an order. We have information on brokerage commission as well
as the type of brokers used by institutions to get their trades executed.4 The latter is especially useful in
determining whether institutions rely more on electronic brokers (ECNs) and less on traditional floor brokers to
seek liquidity in the post-decimal world. Also, we can examine the impact of decimalization on the usage of
“soft dollar” brokers – brokers who provide non-trade related services (such as research reports) in exchange for
higher trading commissions.
Using a sample of institutional trades in NYSE stocks between November 28, 2000 and March 31,
2001, we examine measures of trading costs including commissions, price impact and the number of days it
takes to complete a given trading decision. This period straddles January 29, 2001, the date when decimal
pricing was introduced in all stocks, leaving us with roughly an equal number of days before and after
decimalization. To mitigate any seasonality-induced biases, we compute our trading cost measures one year
before decimalization (between January 29, 2000 and March 31, 2000) as well.
Our sample is unique in the sense that we examine only Plexus clients who traded the same set of
stocks not just immediately before and after decimalization but also in the year before decimalization. This
provides us with the cleanest possible test of the effects of decimalization that is not diluted by issues such as
the entry and exit of institutions into the Plexus clientele and changes in the stocks that institutions trade over
time. The latter is especially important given that institutional strategies are likely to be a function of market
conditions, which have changed dramatically over the time period that we examine. Our sample also excludes
stocks that were part of NYSE pilot programs initiated before January 29, 2001. Some of these pilot stocks
started trading in decimals as early as August 2000 and were actively traded by institutions suggesting that most
institutions would have been ready to handle decimalization in the broader market by January 2001. This gives
us ample confidence that the time interval we examine is sufficient to capture any effects of decimalization on
institutional trading costs. We find little change in the number of days institutions take to complete a given
decision in our overall sample though clearly the larger and more difficult to fill decisions take longer to fill
following decimalization. Further we find a small but an insignificant drop in the number of brokers that
institutional investors use to execute their orders.
3 See www.plexusgroup.com, www.marketdata.nasdaq.com and 2001 NYSE Fact Book. 4 Plexus classifies brokers into five types – alternate, full service, independent research, soft dollar and non-classified. The last classification is a catch-all grouping to include all brokers not classified under the other four types. There is a sixth grouping, “Execution” that was rarely used during our sample period.
4
We find no evidence that decimalization has increased trading costs for institutions. In fact, trading
costs appear to have declined following decimalization. We find, on average, a decrease of 13 basis points in
total trading costs, largely driven by decreases in price impact of institutional trades following decimalization.
In economic terms, this decrease roughly translates to an average monthly savings of $224 million in
institutional trading costs following the move to decimal trading. The decline is even greater when we compare
post-decimalization cost estimates with estimates derived from early 2000. This suggests that some of the
concerns regarding drying up of liquidity following decimalization seem unfounded in reality. While displayed
liquidity, as reflected in the quoted depth, may have gone down (as reported in Chakravarty et al. (2002)), our
research suggests that there is substantial liquidity in the market even after decimalization that are not well
represented in the inside quotes. Our results are robust to both univariate and multivariate tests that control for
other variables that influence trading costs.
We investigate the order routing practices of institutions before and after decimalization to trace the
source of the reported decline in trading costs. Though there is not much change in the order routing practices
overall, there seems to be an increased usage of electronic networks and crossing networks such as Instinet and
Posit for orders that are relatively easy to fill (orders that are small relative to the average daily volume of the
underlying security). Contrarily, we find institutions to use more of traditional full service brokers, such as
Goldman Sachs and Merrill Lynch, and independent research brokers such as SG Cowen Securities, for orders
that are large and need to be worked upon. Our results suggest that both electronic networks and traditional
brokers can flourish side by side in a decimal world as they cater to the distinct needs of institutional investors.
This may have greater implications in Nasdaq where electronic networks have a greater market share.
Interestingly, the increased usage of independent research brokers is mirrored by a decrease in the usage of soft
dollar brokers who provide research in lieu of trading commissions. This suggests that institutions increasingly
favor unbundling of execution quality from other non-execution related services, a fact that may have less to do
with decimalization and more with a declining market.5
Our results on order routing practices of institutions are consistent with what was widely expected
among market participants and hence not entirely surprising. But what is surprising is the change in execution
costs among different broker types following decimalization. Trades executed using soft dollar brokers and
traditional full service brokers experienced decreases in trading costs, while trades executed using independent
research brokers and electronic brokers showed increases in the cost of trading. Trading costs of orders routed
to soft dollar brokers decreased from 124 bp (basis points) to 17 bp following decimal pricing, while costs of
orders routed to full service brokers decreased from 57 bp to 21 bp. On the other hand, orders routed to
independent research brokers cost 147 bp after decimalization as compared to -175 bp before trading moved to
decimals. For orders routed to alternate or electronic brokers, trading costs increased from –161 bp to –78 bp,
5 For more details, see the Institutional Investor cover story of April, 2002, entitled “The Buy Side Wakes Up.”
5
though they provide the best execution among all broker types even after decimalization.6 However, it is
important to keep in mind that any examination of trading costs across broker types is conditional on the nature
of the order flow that is being routed to these brokers. It may well be that orders that are easy to fill are sent to
alternate brokers while the more difficult orders are handled by traditional brokers. Moreover, orders may be
routed to electronic trading systems only after ensuring that liquidity is available, something that may not be
possible with orders sent to traditional brokers. Our objective in this study is, therefore, to solely trace the
source of changes in institutional trading costs and not to make cost comparisons among different brokers.
Our results are consistent with both an internal study by the Plexus Group (2001) as well as with a
recent study by Werner (2002) who examines changes in institutional trading costs following decimalization on
Nasdaq. Both studies indicate that institutional trading costs have not increased but rather declined following
the introduction of decimal pricing. Werner (2002) documents a reduction of 31 basis points, or roughly a
savings of $69M a week, in trading costs for orders in the top 100 Nasdaq stocks that were routed to sell-side
dealers. Though we find smaller savings – about $29M a week for the top 40 NYSE stocks – it is clear that
institutional trading costs have not gone up as projected in the debate preceding decimalization. Our results,
however, seem to be in sharp contrast to that reported by Jones and Lipson (2001) who document an overall
increase of about 17 basis points in total trading costs following the move to sixteenths.
Our findings should provide comfort to regulators facing criticism, mostly by practitioners and some
academics, related to the possibility of a drop in liquidity supply in a post-decimal trading milieu. Though our
results are based on measurable trading costs, it is possible that decimalization might have worsened some of
the implicit costs of trading such as the increase in time spent on monitoring the market and increases in back
office costs arising from a greater number of trade prints. Our analysis does not address these costs.
The remainder of the paper is as follows. Section 2 discusses the related literature. Section 3 provides
the backdrop of our analysis and discusses the data. Section 4 provides multiple ways to measure transactions
costs and provides univariate analyses of transactions costs on various partitions of the data. Section 5
examines the order routing decisions by institutions. Section 6 extends the analyses to a multivariate
examination. Section 7 discusses various robustness checks performed to ensure the robustness of our
conclusions. Section 8 concludes with a discussion.
2. Related Literature While there has been a longstanding interest among financial economists on the impact of the equity
trading process on stock prices, the last decade has seen an impressive amount of research being conducted in
documenting institutional execution costs under a variety of circumstances. What makes this area of research
interesting is the fact that institutions trade large quantities and they trade often, which makes them significantly
6 Negative numbers for price impact suggest buying as prices go down and selling when prices go up.

6
impact prices. There appear to be two three streams of research involving institutional price impact studies.
The first stream investigates the determinants of such price impacts. Thus, for example, Chan and Lakonishok
(1995) report that institutional trading impact and trading cost are related to firm capitalization, relative decision
size, identity of the management firm behind the trade and the degree of demand for immediacy. Keim and
Madhavan (1997) focus on institutional investment styles and its impact on their trading costs. They report that
trading costs increase with trading difficulty and that these costs vary with factors like investment styles, order
submission strategies and exchange listing.
The second stream of research focuses on the location of trading including upstairs versus downstairs
markets as well as across U.S. equity markets. For example, Keim and Madhavan (1996) investigate a sample
of “upstairs” trades in the NYSE and report that price movements (up to four weeks prior to the trade date) are
significantly positively related to trade size – consistent with information leakage. More importantly, and
related to our work, they point out the importance of the choice of pre-trade benchmark prices in estimating
institutional price impact. Madhavan and Cheng (1997) compare execution costs in both upstairs and
downstairs markets and find the economic benefits of upstairs trading are small for the average-sized block
trade. Chan and Lakonishok (1997) compare institutional trade execution costs across the NYSE and the
NASDAQ and report that, after appropriate controls, costs are lower on NASDAQ (NYSE) for smaller (larger)
firms. Jones and Lipson (1999) compare institutional execution costs across major U.S. Exchanges and find
that execution costs (including commissions) are indistinguishable across these exchanges.
The third, and emergent, stream of research, and the stream to which the current paper belongs,
investigates the impact of minimum tick size reductions on institutional trade execution costs. For example,
Jones and Lipson (2001) investigate institutional trading costs around the changeover in minimum tick-size
from eighths to sixteenths in the NYSE in June 1997. They find that realized execution costs in their sample of
firms increase after the changeover and conclude that smaller tick sizes may actually reduce market liquidity.
While we both use institutional order data from Plexus, there are some important differences in both the content
and the scope of the data that we examine. First and foremost, unlike their study, we restrict our examination
only to those institutions that traded the same set of stocks before and after decimalization. This enhances our
ability to tease out effects related to decimalization from other issues such as the entry and exit of firms into the
Plexus clientele and changes in stocks that institutions trade over time. Second, but no less important, is the
growing importance of ‘worked’ orders – orders that take longer than a day to fill or filled using more than one
broker. While worked orders comprised of only 14 percent of all orders in the Jones and Lipson sample, they
represent more than 30 percent in our sample. This suggests that institutional strategies, including order routing
practices, may have changed since the move to sixteenths indicating a trend that may have started well before
decimalization. Interestingly, Jones and Lipson report a reduction of 5.9 bp in the costs of trading worked
orders (see their Table 5, p. 265) that is consistent with our findings following decimalization.

7
While we examine the effect of decimalization on NYSE-listed stocks, a recent study by Werner (2002)
reports similar decreases in institutional trading costs for Nasdaq stocks. Using only orders sent to Nasdaq sell-
side dealers, she finds an average decrease of 31 bp in total trading cost for the top 100 Nasdaq stocks that is
larger than the decrease of 4 bp that we find for the top 40 NYSE stocks. While her sample includes all
institutional orders sent to Nasdaq dealers but not to electronic brokers such as ECNs, we have the orders sent to
all brokers but only for a selected group of institutions that are Plexus clients. Our studies, therefore, are
complementary and provide a fair representation of the actual effects of decimalization on institutional trading
costs. However, our data provide us with a better understanding of institutional order routing practices that
could help explain the source for this decline in trading costs following decimalization.
3. Background and Data Theoretical models, such as Kyle (1985), predict that informed investors will trade in a progressive
manner such that the full impact of their information will gradually assimilate into market clearing prices. But
such stylized models do not account for market frictions and other imperfections that plague actual institutional
order executions. Institutions tend to trade large quantities of stock -- each decision to establish or liquidate a
position requiring multiple trades over multiple trading days and involving multiple brokers. Traditional
measures of transaction costs like the bid-ask spreads are not useful to correctly account for all the costs
embedded in such extensive trading activities by a single investor. The most common problem is that of
information leakage prior to, and contemporaneous with, the completion of the execution of an order, which
moves prices against the ongoing trade. There is also the pure liquidity demand cost, aside from the
information effect, associated with finding contra-parties taking the other side of large trades. Thus,
information on single quotes and trades is insufficient to correctly capture the full breath of the costs faced by
institutions when unloading or building large equity positions.
We are, however, able to directly observe execution details pertaining to a large sample of institutional
equity orders provided by the Plexus Group. Plexus is a consulting firm that advises its institutional clients on
how to reduce transactions costs. These clients provide detailed history of their orders and trades to Plexus that
form the basis of our data. In 2001, Plexus examined about $4.5 trillion in equity transactions that roughly
amounted to a fifth of the dollar trading volume in US equity markets. Though we are the first to use Plexus
data to examine institutional trading following decimalization, many researchers have used it to examine a wide
variety of topics related to institutional trading behavior (see Keim and Madhavan (1995, 1997), Conrad et al.
(2001a, 2001b), and Jones and Lipson (1999, 2001)).
Before we describe our data, it is important to understand how buy-side institutions trade. Each
institutional client employs many portfolio managers who collectively manage its assets. The trading process
begins with the stock selection by the portfolio manager. Thereafter, a trading decision is made that comprises
8
of all buy/sell order activity that occurs within a certain period of time for that stock. The portfolio manager
then makes one or more releases to the trader who works for the manager against that decision. The trader, in
turn, releases one or more orders to either one or many brokers (called broker releases). The broker may then
execute each release with one or more trades. This entire process is well recorded in Plexus data except at the
final stage when brokers may elect to aggregate their trades before reporting them back to Plexus. This limits
our ability to infer whether the number of trades have exploded since decimalization, a common complaint
among institutional traders. We, therefore, restrict our focus to the total time (in days) it takes to complete a
decision rather than the number of trades to examine the issue of trade difficulty following decimalization.
3.1 Data
Our data contain information on all orders and trades in NYSE-listed stocks of Plexus clients, who are
typically large buy side firms, over the period November 28, 2000, to January 26, 2001 (BEFORE), and over
the period January 30 – March 31, 2001 (AFTER). We choose this period so that it straddles the date when all
stocks went to decimal pricing (January 29, 2001) such that we have equal number of days before and after
decimalization. All stocks, except those that were part of the pilot programs, traded in sixteenths before January
29, 2001. The NYSE introduced decimal trading in a small group of stocks, including active stocks such as
Fedex, through its pilot programs starting in August 2000.7 The pilot programs were designed to provide
investors, including institutional investors, the opportunity to learn and operate under the new environment. We
ignore the pilot stocks and concentrate on the overwhelming majority of the NYSE-listed stocks that started
trading in decimals only on January 29, 2001. We also exclude decisions taken before January 29 but
completed after to keep our analysis clean and simple. Further, to properly benchmark our findings, we also
obtain all institutional trading records in all NYSE stocks over the period January 30 – March 31, 2000 (Q1 –
2000). This enables us to separate out seasonality effects from the true effects of decimalization on institutional
trading costs
We classify these stocks into three equal market capitalization groups (small, medium and large), based
on the closing stock price of the last trading day of September 2000. From each group, we pick the fifty most
active stocks based on the average daily trading volume over the month of September 2000. We do this to
reduce the sample to a manageable size without compromising valuable information. Any interesting pattern in
the data is likely to be contained in the relatively active stocks in each group.8 From each group we now retain
only those stocks that have decision records in each of the three quarters in our study. Out of the 150 stocks in
the three groups, 11 had records only on one period, 31 had records in two period and 107 stocks had trading
records in all three periods. Of the 107 stocks, we exclude 3 stocks (with tickers SGP, NT, and GLW) that had
7 See Chakravarty et al. (2002) for the list of stocks that were on these pilot rounds. 8 We satisfy ourselves that our results are not an artifact of the number of stocks in each size category.

9
abnormal price changes following decimalization that had little to do with decimalization itself. This made any
comparisons of trading costs pre- and post-decimalization meaningless for these stocks.
One important limitation of earlier studies that use Plexus data is the fact that they fail to recognize
changes in the composition of Plexus clientele over time. It is difficult to interpret changes in institutional
trading behavior when the population of institutions that are examined changes as well. This problem is further
exacerbated by changes in the universe of stocks that institutions trade from. Though their investment style is
unlikely to change, institutions may trade different stocks with different underlying liquidity over time that may
make it difficult to make inferences on trading costs. We address these problems by examining trading costs of
Plexus clients who trade the same set of stocks in each of the three periods that we examine. This provides us
with the cleanest possible test of the effects of decimalization on institutional trading costs. Our final sample
includes 32 buy-side institutions that traded from a range of 1 to 53 stocks in each of the three periods. In the
final count, we have 92 stocks that were traded by one or more institutions in all three periods.
It should be noted that unlike retail orders that are filled in a single transaction, institutional orders are
large, often requiring multiple transactions and spanning several days. We denote each such sequence of trades
that originate from a single release from a portfolio manager as a “trading decision.” For each trading decision,
the data include a) the stock to be traded and the date the decision was made; b) the desired number of shares to
be bought or sold; c) whether the decision was to buy or sell; d) the dates the individual components of the
trading decision were released to the executing broker; e) the dates and prices at which the various components
of the decision were filled; f) the commissions in dollars per share; g) the volume weighted average trade price
for the stock on each of the days a component of the decision was filled; h) the manager submitting the orders
as belonging to one of three trading styles: value, diversified or growth; and i) the different brokers a trading
decision is released to.
The identification of the underlying manager’s style behind each trading decision is significant because
it enables us to get a glimpse of transactions costs as a function of the aggressiveness of an order. For example,
value managers are investors whose trading strategy is based on identification of undervalued stocks with a
decidedly longer-term perspective and could be termed “patient” investors. Growth managers, on the other
hand, are expected to have a shorter investment horizon and buy and sell stocks based less on company
fundamentals and more on short-term price appreciation. They are similar to technical traders. Diversified
managers are expected to lie in between growth and value managers and have elements of both in their
investment strategy. Also included in this category are institutions that follow quantitative styles, including
indexing, that are neither momentum nor value based. In terms of their willingness to bear price impact as well
as in their desire for immediacy, it is reasonable to expect growth (value) managers to be most (least)
aggressive, with diversified managers falling in between. It should be emphasized here that this style
classification is made by Plexus and not by the institutions themselves. We have little reason to doubt the
10
integrity of their classification given their experience and standing in the business of institutional trading cost
measurement.
The data also provide us with a clear picture of the order routing strategies (through the choice of
broker types) adopted by institutions before and after the move to decimals. Conrad, Johnson and Wahal
(2001a) provide an excellent review of the different broker categories employed by Plexus. We discuss the issue
of order routing in greater detail later in the paper.
3.2 Descriptive Statistics
Table 1 provides summary statistics of our data. It is designed to provide the backdrop with which to
examine the research questions addressed in the paper. We examine statistical significance through out our
analysis using a paired t-test that controls for stock-specific differences that may impact our inference. We test
specifically whether the cross-sectional average measure after decimalization differs significantly from the
average measure in either of the two pre-decimalization periods (BEFORE and Q1-2000).
For ease of interpretation, Table 1 reports statistics for small stocks (14), medium stocks (38) and large
stocks (40) computed under each period separately. Market capitalization is based on closing stock prices on
September 30, 2000. The average market capitalization of stocks in the three size categories shows an
impressive dispersion: $0.2B for small stocks, $0.97B for medium stocks and $106B for large stocks. Given
the well-known correlation between market capitalization and trading volume and, through volume, on the
available market liquidity, our classification is designed to highlight differences in the parameters of interest
across such differences in liquidity.
First, the frequency of institutional trading activity appears to have significantly declined over the year
2000, mirroring the fall in the stock market.9 There were 7,974 institutional trading decisions in early 2000 but
only 5,193 in the two months before Jan 29, 2001. It appears that institutions fled the stock market for other
safe havens during the market fall following the burst of the technological bubble. This precipitous drop is,
however, reversed following decimalization despite continuing fall in the market. The total number of
institutional trading decisions increased to 8,542 in the two months immediately following decimalization.
However, the total dollar value of these decisions fell from $309 billion in early 2000 to $207 billion in late
2000 but increased to $281 billion following decimalization. Though we cannot attribute these changes to
decimalization, it is clear that trading activity from the same group of institutions was quite different in each of
the three periods we examine.
The number of decisions per stock has almost doubled following the move to decimals suggesting that
institutions may be splitting their decisions in a lower tick environment. However, we do not find evidence for
9 The S&P 500 Index increased by 3 percent in the first quarter of 2000 but fell by 5.7% in the last quarter of 2000 and the twenty-six days in January prior to decimalization. It continued to fall in the first quarter of 2001 by as much as 15 percent after stocks started trading in decimals.

11
this. There is little change in the average size, both in shares and in dollar value, of institutional decisions pre-
and post-decimalization. Moreover, there is little evidence that such decision splitting happens within a day.
Roughly 80 percent of all decisions within a day involve only one stock, a number that has been consistent since
early 2000 (see Figure 1). There appears to be an increased trading activity among institutions post-
decimalization that manifests among all stock size categories.
We also do not find differences in institutional order fill rates pre- and post-decimalization. About 96
percent of all decisions in our sample are filled completely, a fact that remains consistent in each of the three
periods we examine. Since we find little difference in the fill rates before and after decimalization, we avoid
the contentious issue of imputing costs of unfilled decisions by considering only decisions that were filled at
least up to 80% of their desired size for all further analysis. About 98 percent of all decisions in our sample
satisfied this criterion. Institutions within our sample buy and sell with roughly the same frequency though they
remain net buyers in small stocks.
Overall, our summary statistics reveal important differences in aggregate institutional activity but not in
individual trading decisions, following the move to decimals.
3.3 Trading Performance
Table 2 reports details on the average (and median) number of days it takes to complete a trading
decision, and the average (median) number of brokers used in each decision, BEFORE, AFTER and over Q1-
2000. Recall that we restrict our analysis to the number of days rather than the number of trades (to complete a
decision) to examine whether it has become more difficult to trade large orders following decimalization. The
tables are based on decisions filled at least up to 80% of their original desired size. Restricting our analyses to
decisions that were filled completely does not alter our results in any significant way.
We present our results for the overall sample (Panel A) as well as for different groups based on market
capitalization (Panel B), by buys and sells (Panel C), by complexity of decision (Panel D) and by manager style
(Panel E). Our classification scheme is designed to highlight differences that may be masked during
aggregation. For example, it is likely that decimalization has made it more difficult to fill large orders while
having little or no effect on smaller orders. Similarly, it is conceivable that growth traders may have been more
impacted by any drop in liquidity given their need to catch the momentum than value traders.
For decision complexity, we classify orders based on the size of the decision relative to the average
daily volume for that stock in the month of September 2000. We classify all orders under the 33rd percentile
cutoff as ‘easy’ to fill orders, and all orders above the 66th percentile cutoff as ‘difficult’ to fill orders, with the
rest being classified as ‘moderate’ difficulty orders. We also use an alternative classification scheme that uses
only the absolute decision size in shares for some of our analysis. Since stocks differ widely in their liquidity, it
is unreasonable to expect orders of similar size to have the same difficulty irrespective of the ability of the

12
market to absorb them. For this reason, we report our results on difficulty using order size relative to the
average daily volume for the stock.
We find a marginal decrease in the number of days it takes to complete a decision (Panel A). It takes an
average of 2.33 days to fill an institutional order after decimalization as compared with 2.38 days before. The
median difference is a little greater but still statistically insignificant, indicating that outliers do not pose a
problem in our data. Interestingly, it took about the same time (2.30 days) to fill an order during the boom in
early 2000 than during market drop experienced in the latter part of 2000. We find small but insignificant
decreases in the average number of brokers used in a decision following the move to decimals. We examine
order routing strategies to brokers in greater detail later in the paper.
Panel B presents the same results by different market capitalization categories. Decisions involving
small stocks take less time to execute (down from 3 days to 2.67 days), while those involving medium size
stocks take significantly longer to execute (up from 1.91 days to 2.31 days), since trading started in decimals.
Large size stocks appear to take slightly less time to execute following decimalization. Decimalization appears
to have made trading in small illiquid stocks easier while leaving the execution of large liquid stocks largely
unchanged.
We find little differences between buys and sells (Panel C) suggesting that market prices work well to
attract liquidity suppliers (and demanders) irrespective of market conditions. Panel D presents results based on
the complexity of the decision. As expected, decimalization has increased the time to completion of difficult
decisions but it has had little effect on easy and moderately difficult decisions. There is little variation in broker
usage across orders of different complexity, indicating that it may be the composition of brokers, rather than the
number of brokers itself, that could have changed following decimalization.
Panel E classifies results on time to completion and broker usage by manager style. Both value and
growth managers take less time to complete their trades, while diversified managers take longer post
decimalization. These changes are, however, statistically significant only for value and diversified managers.
We find consistent results on the number of brokers used in a decision, i.e., less (more) execution time implies
fewer (more) brokers. Interestingly, when comparing between early 2001 and early 2000, only growth
managers display a significant difference – both in the reduced number of days taken to complete a decision and
a corresponding fewer number of brokers employed to do so. It appears that the most aggressive managers in
our sample appear to be reaping considerable benefits of decimalization.
In sum, our univariate results do not seem to indicate any major change in the time to completion or the
number of brokers used following decimalization, except that trades in small stocks take less time to complete
with fewer brokers, and growth managers appear to be doing well. Given that the size of institutional trading
decisions has not changed with the move to decimals, we find little evidence to indicate that decimalization has
worsened the search for liquidity for institutional investors. We, however, recognize the inherent limitations of

13
univariate tests and therefore perform a more detailed multivariate analysis later in the paper that explicitly
controls for stock specific differences.
In the following sections, we tackle the issue of trading costs more directly by examining commissions
and price impact of institutional trades before and after the move to decimals.
4. Measuring Trading Costs There are several factors that make capturing trading costs for institutional investors harder than for
retail investors. Each institutional trading decision, for example, involves several transactions, sometimes
spanning multiple trading days, to complete. Thus, traditional measures like bid-ask spreads are unable to
properly account for all costs associated with such protracted trading strategies. Even the theoretical models of
price impact in response to informed (or strategic) trading, such as Kyle (1985) and the significant body of
literature in its wake (see O’Hara (1995) for a summary), assume that trades by informed (or strategic) traders
are completed in relatively short intervals. There is also the added risk that there may be information leakage
when a large institutional order is brought to the upstairs market to be shopped around and prices may move
adversely even before this order is exposed to the market.
Though the “true” costs to an institutional trader include administrative costs of working an order as
well as the opportunity costs of missed trades, we restrict our focus only to costs that can be more explicitly
measured – commissions and price impact – that have been used widely both in academic research as well as in
practice. Of the two, the price impact of a trade – the deviation of the transaction price from the ‘unperturbed’
price that would prevail had the trade not occurred – is arguably more difficult to measure. Much depends on
the proper identification of the unperturbed price. In particular, our measure should be such that it is least
influenced by the trade itself. Keim and Madhavan (1996) discuss the importance of this issue in great detail.
We use several different variants for the unperturbed price. We use: (1) the closing price of the stock
on the day prior to the trading decision (BM1), (2) the value-weighted average price (VWAP) across all trades,
both by the institution as well as by others, over all days over which the decision was executed (BM2), (3) the
VWAP across all trades over the day in which the trading decision was made (BM3), (4) the VWAP across all
trades on the day of the last fill of the decision (BM4), and (5) the average of the closing price prior to the day
of the trading decision and the transaction price of the last fill of the decision (BM5).
Most studies on institutional trading costs use BM1, as it is the purest form of the unperturbed price that
one could measure. Though its importance is diminished by the fact that traders often can and do trade after
hours, it still remains to be the most popular benchmark to measure price impact. Perold (1988) popularized the
use of BM1 while Berkowitz, Logue and Noser (1988) popularized BM2 based on the notion that no single
trader can influence the value-weighted average price of all trades during a day. It is widely used in practice
both for cost measurement and trader evaluation though its use can eliminate incentives to seek out better

14
executions. We report our results using these two widely used benchmarks though we use other variants to
ensure robustness of our findings. Our price impact measure is, therefore, computed as the percentage deviation
of the value weighted average trade price for each decision from the unperturbed price. We multiply this
deviation by –1 if the decision is a sale to ensure that it measures trading costs appropriately for buy and sell
orders.
Table 3 presents average commissions and price impact of institutional trades before and after
decimalization. Note that price impact is negative (positive) if the trader buys at a price below (above) the
unperturbed price. The reverse holds for sellers. Thus, liquidity suppliers should enjoy negative price impact
on an average, while liquidity demanders would have positive price impact for their trades. Since we do not
have reliable data on the use of limit and market orders by institutions, we do not examine the impact of
decimalization on liquidity suppliers and demanders like Werner (2002). We report all our results in basis
points (bp). We do not consider the opportunity cost associated with the unexecuted portion of a trading
decision. But since about 96% of the decisions in our sample are fully completed in all the three periods we
examine, this exclusion should not alter the results in any significant way.
Panel A presents results for the overall sample. Irrespective of the benchmark used, we find price
impact and total trading costs to have declined following decimalization. The effect is more dramatic when we
use BM2 as our measure of the unperturbed price. Commissions appear to have increased marginally by 0.6 bp
from immediately preceding pre-decimalization levels but show an increase of 2.4 bp since early 2000. We
believe this trend would be more visible in Nasdaq where several big brokerage houses have reverted to
commissions to ensure revenue in recent times.10 Overall, we find institutional trading costs to have gone down
by 13 bp and 133 bp using BM1 and BM2, respectively. The decline is smaller when we use BM1 indicating
much price variation during our sample period. This contrasts sharply with an increase of 17.2 bp reported by
Jones and Lipson (2001) in their study on the move to sixteenths. The decline in trading costs represents a
significant economic decrease in trading costs though not in statistical terms. Given post-decimalization
10 In the article entitled “Nasdaq Traders Stumbling over Decimals” (WSJ, May 25, 2001, p. C1), author Kate Kelley writes, in part:
“…The "decimalization" of stock trading -- in which share prices are quoted in individual cents rather than fractions of a dollar, such as 1/8 or 1/16 -- has benefited investors by narrowing the difference between buy and sell orders, in some cases creating better prices for stocks. But these significantly smaller spreads have squeezed the trading revenues of many major trading firms, including Merrill Lynch & Co., Morgan Stanley, Goldman Sachs Group Inc., Credit Suisse Group's Credit Suisse First Boston, and Lehman Brothers Holdings Inc. To address this concern, traders during recent weeks have been talking to their institutional clients -- the mutual-fund companies, hedge funds, and other money-management entities who provide them with their biggest buy and sell orders -- about switching from their traditional payment system to a commission system, in which the traders and institutions agree to a set fee…..”

15
institutional trading activity in our sample stocks, this represents an approximate total savings of $448M overall
($56M per week) during the two month period after decimalization which breaks down into $3M savings in
small stock executions, $329M savings in medium stock execution and $116M savings in large size stock
execution.11 The decline is even more appreciable when we compare post-decimalization trading costs with
costs in early 2000. Our results suggest that the downward trend in institutional trading costs have not been
reversed despite changes in market structure that seem detrimental to them.
Further examination of the different sub-categories of institutional trades reveals interesting variations
related to decimalization. Panel B presents results by market capitalization of the underlying stock that is
traded. Commissions have largely remained unchanged except for smaller, and presumably less active, stocks.
But the contrast is most visible in case of price impact (using BM1) where institutional orders in medium size
stocks experience a reduction of 694 bp while orders in small and large stocks experience a decrease of 280 bp
and 4 bp respectively. The results reverse when we use BM2 with larger stocks experiencing a decline of 134
bp while small stocks show an increase of 41 bp indicating that institutions may be more concerned about
benchmarking against VWAP for larger and more active stocks.
Panel C classifies our results by buys and sells. Given declining price levels during our sample period,
it is not surprising that buy orders had negative price impact while sell orders had positive price impact when
we use the previous close as our benchmark. Interestingly, institutional buyers perform relatively worse than
sellers when benchmarked to the VWAP measure suggesting that buying quickly in a falling market may still
make the trader look bad in his or her performance evaluation.12
Panel D presents results by decision complexity. Recall that we use decision size relative to the average
daily volume in September 2000 to determine the difficulty in filling an institutional order. We use the 33rd (2
percent of the daily volume) and 66th percentile (25 percent of the daily volume) cutoffs to classify trades as
easy, moderate and difficult, respectively. Easy trades have lower price impact, and hence lower trading costs,
relative to difficult trades. But, interestingly, it is the easier trades that experience an increase in trading costs
following decimalization while the more difficult trades see a reduction in their costs of trading. This is true
under both benchmarks suggesting possible cross-subsidization, an issue that we deal with in more detail when
we examine order routing strategies of institutions. Specifically, there is a 13 bp reduction in overall trading
costs of large orders involving sizes greater than 25 percent of the average daily volume in the security,
indicating that decimalization has not worsened trading large sizes as feared by the buy side. Our results are
consistent with Jones and Lipson (2001) who find an increase in trading costs following the move to sixteenths
11 We derive our estimate by aggregating average savings in total trading costs for each of three stock size categories – small, medium and large – on their average monthly dollar volume post decimalization. 12 See Schwartz and Steil (2002) for an excellent review of the perils of VWAP trading.

16
for orders not worked (presumably easy to fill orders) but not for worked orders (presumably difficult to fill
orders). We find similar trends that we discuss earlier when we compare post-decimalization costs with costs
one year before decimalization.
Our results by manager style (Panel E) show that total trading costs have declined for growth managers,
using either benchmark, following the move to decimals. For the value and diversified managers, however, the
results are mixed and depend on the benchmark we believe. But these latter results are also statistically
insignificant, although we believe that our multivariate analyses, presented later in the paper, should help bring
out differences among investment styles.
Our results seem to indicate a declining trend in institutional trading costs since early 2000 suggesting
that reasons other than decimalization could be driving down these costs. As far as decimalization was
concerned, our univariate analysis reveal that institutional traders are, at best, doing better and, at worst, doing
no worse, after decimalization than they were before. It is possible that much of our results are driven by
changes in the way institutions use brokers following decimalization. We examine this issue in the following
section.
5. Order Routing Decisions by Institutions 5.1 Usage frequency by broker type
The decision of the kind of brokers to rout their trading decisions to is an important one for institutional
money managers as it impacts the explicit and implicit trading costs incurred by them – especially given the size
of their orders. Conrad, Johnson and Wahal (2001a) explore routing decisions through soft dollar brokers, in
particular, who are known to provide non-execution services such as data or macroeconomic forecasts in
exchange for commissions. Here we provide a detailed look at frequency of usage, as well as trading costs,
associated with the entire range brokers, as provided by Plexus, around decimalization. In particular, Plexus
classifies brokers into the five major categories:
1. Alternate Brokers: This group includes electronic SuperDOT entry desks of full service brokers as
well as crossing networks and ECNs. Examples are the Arizona Stock Exchange, ITG-Posit, and
Instinet.
2. Full-Service Brokers: This group includes brokers who provide a menu of services including
execution, portfolio management and data to their clients. Examples are Goldman Sachs, Merrill Lynch
and Morgan Stanley.
3. Research Brokers: These brokers execute trades and provide in-house research, usually separately, to
their clients. Examples include Hambrecht Quist, SG Cowen Securities, and Zacks.

17
4. Soft-dollar Brokers: They provide free research and other services usually in exchange for trades
directed their way. Examples include Capital Institutional Services, Lynch, Jones and Ryan, and
Pershing Securities.
5. Non-classified: A catch-all category used by Plexus to classify brokers it cannot place in the four
above categories for a given decision. Brokerage arms of banks and insurance companies are usually
classified in this group.
We present the frequency of order routing decisions by institutions across the five broker types around
decimalization in Table 4. Unfortunately, more than a quarter of all brokers post-decimalization, and about a
third of brokers pre-decimalization, remain non-classified presenting us with problems regarding inference. It is
possible that any change in order routing that we observe may have more to do with classification issues rather
than decimalization. One comforting fact is that the percentage of unclassified brokers is on the decline from
early 2000. Given that we could do little to correct this problem, we present our results for all broker types
including those brokers who are unclassified hoping to highlight differences among them. We breakdown our
results further by decision complexity – size of the decision relative to the average daily volume in September
2000 (Panel B) – by manager style (Panel C) and by the size of orders routed (Panel D) to highlight the effect of
decimalization, if any, on the way institutions use brokers.
We do not find major shifts in the order routing strategies of institutions post decimalization. We find a
marginal increase in the use of full-service and independent research brokers that is not statistically significant.
Part of this increase comes from reduced usage of soft dollar brokers and from an improved accuracy of the
Plexus classification methods. The decrease in the use of soft dollar brokers is statistically significant at the 5
percent confidence level. Moreover, the average order size routed to these brokers increased following
decimalization while soft dollar brokers received smaller orders. There is little change neither in the usage of
alternate brokers nor in the size of orders routed to them following decimalization. The increase in patronage of
independent research brokers at the expense of soft dollar brokers suggests that institutions are increasingly
favoring unbundling of research and other services from execution quality – making it easier to evaluate trading
costs.
Not surprisingly, institutions prefer executing a greater percentage of easier decisions through alternate
brokers while leaving the more difficult decisions predominantly with full-service and independent research
brokers. This preference seems to have strengthened following decimalization indicating that ECNs could
coexist with traditional floor brokerage even for NYSE-listed stocks. While alternate systems guarantee fast
executions at relatively low cost, full-service brokers provide the experience and expertise of working a large
order that is often crucial to institutions. Roughly more than a quarter of all value-weighted orders that are easy
to fill, and a third of moderately difficult orders, are executed using alternate brokers, while the institutions
route only 3 percent of the more difficult orders to them. In contrast, soft dollar brokers have seen a decline in

18
their market share of easy, moderate and difficult orders. In particular, their market share declines from 16% to
6% in easy to fill orders, from 9% to 5% in moderately difficult orders and from 5% to 3% in the more difficult
orders. All these declines are statistically significant indicating an increasing awareness among institutions to
separate execution services from other services such as research that brokers offer following decimalization
(and probably the falling market).
Panel C presents order routing results by manager style. There is a greater preference for alternate
brokers, over other broker types, by value managers, suggesting the attractiveness of these systems to cost-
conscious traders. Similarly, there is a distinct preference among growth and diversified managers to use full-
service and independent research brokers rather than alternate brokers to execute their orders. Interestingly,
there is some variation in these preferences following the move to decimals. For example, value managers have
diverted some of the order flow from full service and soft dollar brokers to alternate brokers, while growth
managers use more of full service and independent research brokers after decimalization at the expense of soft
dollar brokers. About 55 percent of all post-decimalization orders were directed by value managers to alternate
brokers while full-service and independent research brokers receive less than 30 percent of their order flow.
There is an 80 percent reduction in the usage of soft dollar broker usage by value managers following
decimalization suggesting that they are willing to trade off free research for better executions in a tight market.
On the other hand, growth managers route more than 60 percent of their order flow to full service and
independent research brokers but route only 2 percent of orders to alternate brokers. Their soft dollar usage has
also fallen by 40 percent following decimalization.
We present market share of different brokers based on the aggregate size of orders routed to them by
institutions in Panel D. This enables us to compare the relative performance of brokers handling similar sized
orders. We use four size categories: < 1,000 shares, 1,001-5,000 shares, 5,001-10,000 shares and > 10,001
shares. Though full service brokers have the greatest market share in each of these size categories, alternate
brokers handle about a third of all orders less than 10,000 shares. Soft dollar brokers handle more of the smaller
sized orders in contrast to independent research brokers who handle larger sized orders. In fact, the average
size of orders routed to independent research brokers has increased 500 percent following decimalization
indicating greater reliance on these brokers to work large orders. The use of alternate brokers has increased
post decimalization while soft dollar brokers have gone down in almost every size category. We use these size
categories later to evaluate the trading performance of different brokers following decimalization.
Despite strong competition from electronic networks, we find traditional brokerage to hold court even
after decimalization indicating the importance of face-to-face negotiations for institutional investors. On the
other hand, we see a clear trend towards separating trading costs from costs related to other activities such as
payment for research that may change the way institutions trade in the future. These results suggest that

19
institutions are actively managing their brokers, something that may not have been widely practiced in 1997
during the move to sixteenths. We examine whether trading costs have changed as a result in the next section.
5.2 Trading costs by broker type
Evaluating trading costs by broker type is a tricky exercise. Brokers specialize in handling different
types of order flow. Some orders may be easy to fill even though they may be large while smaller orders
sometimes may be difficult to execute under certain market conditions. Moreover, orders are often times routed
to electronic markets such as Instinet only after ensuring that adequate liquidity is available which is often not
possible for orders routed to traditional brokers. Though it is difficult to control for all order flow
characteristics in measuring trading costs, we use a simple yardstick that is well recognized by traders – size of
orders routed. We hope to capture the relative advantages and advantages of different brokers by examining
their trading performance of different sized orders. We present our results on trading costs by broker types in
Table 5. Panel A presents results on commissions, while Panel B and Panel C present results on price impact
and total costs, respectively. We include results on unclassified brokers to show the possible effect of any
identification issues in Plexus data. All our cost measures represent dollar value-weighted averages within each
size category.
Commissions were the lowest for alternate brokers and the highest for the independent research brokers
immediately preceding decimalization. Surprisingly, independent research brokers appear to be charging higher
commissions than full service and soft dollar brokers. We find that all brokers, except alternate brokers, have
increased their commissions following decimalization. While the increase is a tenth of a basis point for full
service brokers, it is as much as 3 bp for soft dollar brokers and 1.50 bp for independent research brokers. The
trend is even more apparent when we compare it with commissions in early 2000. Commissions for alternate
brokers decreased from 3.39 bp to 2.94 bp that is statistically significant, though the levels are higher when
compared with early 2000.
As expected, commissions are lowest for smaller sized orders though there is an interesting dispersion
among brokers within each size category. Alternate brokers charge the lowest commissions in every size
category though they also receive the easier to fill orders relative to full service and independent research
brokers. Decimalization has further reduced these costs by as much as 35 percent in orders less than 1,000
shares and by 5 percent in orders greater than 10,000 shares. Independent research brokers charge higher
commissions than full service brokers and sometimes more than soft dollar brokers as well.
Our results on price impact (Panel B) present a different picture. Though alternate brokers, given that
they receive mostly easy to fill orders, provide the lowest price impact, their executions have worsened after
decimalization. There is a relative increase in price impact by 84 bp (from –165 bp to –81 bp) for trades
executed through alternate brokers following decimalization. The increase is 81 bp for large orders (> 10,000
shares) while it was 10 bp for small orders (< 1,000 shares). Our results perhaps underscore the fact that the

20
effect of decimalization on Nasdaq could be quite different from what we observe here at the NYSE given that
ECNs have a much larger market share in Nasdaq.13 Full service and soft dollar brokers seem to be providing
relatively better executions after decimalization. There is a 36 bp decrease or a 75 percent reduction in price
impact for large orders (> 10,000 shares) filled through full service brokers, while the decrease is 107 bp or 89
percent for similar sized orders when filled through soft dollar brokers. This suggests that soft dollar brokers do
not always compromise execution quality to subsidize research.
Panel C consolidates our results from Panels A and B. Overall, trading costs (commissions plus price
impact) have declined for full service and soft dollar brokers while it has increased for alternate and
independent research brokers. Alternate brokers seem to have negated their advantage in commissions by their
poor executions. The total cost of trading with alternate brokers increased by 83 bp after decimalization, while
it increased by 322 bp for trading through independent research brokers. In contrast, it appears to have declined
by about 36 bp for executions through full service brokers and by 107 bp through soft dollar brokers. Despite
the absolute cost advantage of alternate brokers, we do not find an increase in their market share post
decimalization. This suggests the importance of traditional brokers (including floor brokers) to institutions who
need to fill large orders with minimal price impact. Though soft dollar brokers had the greatest decrease in
trading costs, they have not been rewarded with increased order flow suggesting that institutions favor
separating trading costs from costs related to other services. This should be good news to thousands of
investors who have been subsidizing costs that should have been borne by their asset management companies.
In sum, while there is a general trend toward increased commissions, the combination of upstairs
market presence and their clout on the trading floor appears to make it attractive for institutions to use full
service brokers following decimalization.
Thus far, we have examined trading costs, overall as well as by broker type, independently by manager
style, decision complexity, order side, and market capitalization of the underlying stocks. Our univariate tests
could ignore cross-correlations among these factors that could distort the real effect of decimalization. For
example, counter to intuition, growth managers experience a decrease in trading costs following decimalization
while the less aggressive diversified managers experience an increase. It is possible that growth managers trade
more in small stocks, which experience a greater decrease in trading costs relative to larger stocks. We seek to
mitigate the effects of these cross-correlations through a multivariate analysis, described in the next section.
6. Impact of Decimalization of Institutional Trade Execution: Multivariate
Analysis
6.1 Total Trading Costs and Decimalization
13 The decrease in trading costs reported by Werner (2002) for Nasdaq stocks is based only on orders routed to Nasdaq sell

21
We use a regression analysis to disentangle the effects of decimalization on institutional trade execution
costs after controlling for the candidate factors representing information asymmetry through firm size, a
measure of return volatility, a measure of the complexity of the trading decision, and inverse price representing
the degree of difficulty of executing a trade. Thus, for example, a relatively larger priced stock (and hence with
a lower inverse price) has a lower percentage spread associated with it implying that the cost of front running
such stocks is low. Easier front running should result in higher trading costs and longer time to completion of
institutional orders. We also add dummy variables to control for managers’ styles between value and growth
(with diversified representing the omitted category). Finally, a dummy variable, AFTER, is included to isolate
the possible effect of decimalization on institutional execution costs. The formal regression model is as
follows:
{ } 1 2 3 4
5 6 7 8
9
;( x )
( x
Total Cost Num Days LogMktCap Volatility Complexity InversePriceValuedummy Growthdummy Afterdummy Valuedummy Afterdummy
Growthdummy Afterdummy )
α β β β ββ β β ββ ε
= + + + +
+ + + ++ +
Each observation in our regression represents a complete decision. The dependent variables are the total trading
cost (commissions plus price impact) in basis points and the number of days it takes to complete the decision.
We compute price impact using the closing price prior to the day the decision was made (BM1) as our
benchmark.
Among independent variables, LogMktCap is defined as the natural logarithm of market capitalization
of the stock as of September 30, 2000. Volatility is defined as the average daily standard deviation for the stock
in the month of September 2000. Complexity is defined as the decision size relative to average daily volume in
September 2000; and InversePrice is the inverse of the stock’s price at the time of the decision. We use two
dummies to indicate value and growth style manager, while we use Afterdummy to indicate the post-
decimalization period. We restrict our analysis only to decisions made during the periods BEFORE and
AFTER that we discuss above. In addition to the three dummies, we use two interaction dummies to capture
the incremental effects of decimalization on the value and growth style managers separately. Our main
variables of interest are Afterdummy, which we expect to be positive and significant if decimalization has
increased the implicit costs of trading for institutional investors, and the two interaction dummies.
Panel A in Table 6 presents coefficient estimates and standard errors of variables known to impact
trading costs. Except for inverse price, all other variables have little explanatory power in determining the
change in trading costs around decimalization. The coefficient on inverse price is positive instead of being
negative, as we would expect. This suggests that lower priced stocks have higher trading costs for institutions
side dealers, analogous to full service brokers at the NYSE.
22
after controlling for other factors such as volatility and market capitalization of the underlying stock. We find
that trading costs are higher for orders in smaller cap and more volatile stocks, and for orders that are large
relative to the average daily volume in the underlying stocks. As expected, trading costs are higher for growth
managers and lower for value managers when compared with the costs paid by diversified managers. This
suggests that the style classification adopted by Plexus captures their client aggressiveness quite well. We find
a difference of 21 bp in trading costs after controlling for other factors between the trading costs paid by growth
managers and by value managers. Contrary to our univariate findings, but consistent with our intuition, we find
trading costs to have gone up for growth managers while they have gone down for value managers following
decimalization.
We find, after controlling for other factors, a marginal decrease in trading costs after decimalization that
is statistically not significant. The implication is that after controlling for the standard determinants of
institutional execution costs, the act of decimalization itself has not had a significant impact on trade execution
costs. This flies in the face of popular wisdom claiming that liquidity has dried up outside the best bid and offer
prices thereby leading to costlier executions – especially for large institutional orders – in the wake of
decimalization.14 Our multivariate analysis presents a simple framework designed to tease out the effect of
decimalization without the confounding effects of other factors.
To investigate if institutional trades are taking longer to fully execute following decimalization, we
regress the number of days taken to complete a decision on the same set of independent variables as above.
Panel B of Table 6 provides the regression coefficient estimates with standard errors. Here, unlike in Panel A,
we find the Afterdummy to be positive and statistically significant, indicating that decimalization did worsen the
search process for counterparties for institutional trades. In particular, the act of decimalization itself has
resulted in a typical institutional trading decision taking 0.27 days longer to fully execute. But not all managers
face this delay: growth (value) managers take more time (less time) than diversified managers following
decimalization.
Overall, we find that even though the act of decimalization appears to have increased the number of
days necessary to complete a decision, the most important trading metric to institutions -- the total trading cost -
- appears to not have been adversely affected by decimalization. This is an important finding that should be
significant to policy makers debating the merits of this historic decision amidst demands from the buy side.
6.2 Total Trading Costs and Decimalization Classified by Broker Type
Recall that our earlier univariate results reveal evidence of significant differences in trading costs across
the major types of brokers following decimalization. But it is possible that after controlling for all other
14 To ensure the robustness of our conclusions, we also re-estimate the same model with the benchmark price being measured as the VWAP across all trades over all days over which the decision was filled (i.e., BM2). These results are qualitatively similar and are not presented.

23
determinants of institutional trading costs, decimalization itself may not have impacted trading costs. To
examine this issue, we re-estimate the earlier regression model across the four important types of brokers –
alternate brokers, full-service brokers, independent research brokers and soft dollar brokers. Our investigation
is also motivated by the pattern of trading costs reported by Conrad et al. (2001), using Plexus data from 1994 –
1996, with special emphasis on soft dollar brokers. In particular, they report that incremental implicit costs of
trades executed through soft dollar brokers are between 29 and 41 basis points greater than full-service brokers.
While such investigations provide valuable insight into the trading practices of an important class of brokers,
they also predate changeover of minimum tick sizes to sixteenths, and significantly before conversion to
decimals. As mentioned in the introduction, much has changed in the market in the intervening years, including
the emergence of alternative brokers, in the form of ECNs, and their growing dominance in the markets. A
minimum tick size of a penny has also made it cheaper for professional investors to engage in front-running
practices by stepping ahead of selected trades ahead of a price move and selling into these trades if the price
moved the other way. Overall, institutional investors have become significantly more cost conscious in their
trade executions. It is therefore unclear if the intuitions of studies like Jones and Lipson and Conrad et al.carry
over to the new world of decimals.
Table 7 provides the results of estimating the regression model separately for each of the four broker
classes. As in Table 6, we compute price impact based on the closing stock price the day prior to the execution
of the decision. Panels A, B, C and D present results for alternate, full service, independent research and soft
dollar brokers respectively. Our main variable, Afterdummy, is positive, indicating an increase in trading costs
post decimalization, for orders routed to alternate and independent research brokers, but is statistically
significant only in case of the former. There is a 99 bp increase for orders sent to alternate brokers and a 97 bp
increase for orders sent to independent research brokers in total trading costs since decimalization took effect.
On the other hand, both full service and soft dollar brokers executed institutional order flow at lower costs,
although the decrease in trading costs is significant only for full service brokers. The decrease in trading costs
was 32 bp for full service brokers while it was 33 bp for soft dollar brokers.
Alternate brokers seem to provide better executions to value managers after decimalization. The
Valuedummy and Growthdummy are both positive, while the interaction terms of these dummies with
Afterdummy are both negative in the regression of orders sent to alternate brokers. Both Growthdummy and
Valuedummy are positive and significant as well indicating higher costs for both passive and active strategies in
electronic markets. Interestingly, orders that are more difficult to fill have lower trading costs when sent to
alternate brokers. We have to interpret this result with caution given that very few difficult trades get routed to
these brokers. More importantly, alternate brokers include crossing networks that, by design, may execute
larger trades than ECNs and other types of alternate brokers. Our complexity variable may just be the dummy
variable for crossing networks such as Posit.

24
The results on full service brokers suggest a significant increase in trading costs for value managers
relative to managers following the two remaining styles. Afterdummy is negative and significant indicating an
overall significant decline (of about 32 bp) in total execution costs following decimalization. However, orders
of growth managers seem to have the worst executions post decimalization from full service brokers indicating
greater difficulty in filling liquidity demanding orders in a decimal environment. While trading costs of orders
executed by independent research brokers have gone up following the move to decimals, it does not appear that
growth and value managers have suffered in this process. Both of them experience a decrease in trading costs
following decimalization partly to offset the high trading costs that they faced prior to decimalization from these
brokers. The regression for soft dollar brokers indicates that complex orders are executed relatively cheaply but
Afterdummy is statistically insignificant indicating no significant change after decimalization.
In sum, after controlling for all significant determinants of trading costs, decimalization itself appears to
not have adversely impacted total trade execution costs in all but those trades executed through independent
research brokers.
7. Robustness Issues We perform a variety of checks to ensure the robustness of our conclusions. It is well accepted that
larger (smaller) size stocks are usually more (less) liquid and have relatively smaller (larger) spreads associated
with them. The larger spreads associated with small stocks could be the result of higher adverse selection
and/or lower liquidity. What matters from our perspective is that a manager may have higher costs associated
from executing an institutional order on a larger size stock than he would if he were to be trading in a small
stock. Here we are interested in the question of whether, for a given manager, there has been a difference in
execution costs across the stocks of various sizes following decimalization. To do so, we classify the stocks in
our sample into small, medium and large size groups within each style category. These results (not presented)
indicate that regardless of the managers’ style and the benchmark used, the vast majority of managers show no
statistically significant difference in execution costs around decimalization for any size stocks.
Jones and Lipson (2001) argue that if the liquidity environment across the transition to sixteenths
changed in complex manner, with some specific orders benefiting while others doing poorly, then a simple
regression specification with a dummy to control for change in tick size and a vector of control variables
associated with institutional orders, may not be adequate. Instead, the authors fit execution costs to order,
manager and market characteristics, and then compare pre-sixteenths and post-sixteenths residuals on a firm-by-
firm basis. To ensure that our conclusions are not driven by the nature of the regression specification, we too
replicate our regressions similarly. Mindful of the data intensive nature of the procedure, and to give us enough
degrees of freedom for a powerful test, we run firm-by-firm regressions on the 10 most active stocks in our
sample, using only pre-decimal orders as benchmark. The fitted model is then used with post decimal orders to

25
compute the corresponding means and medians of each measure in our cross sectional regression framework as
provided in Section 6.1. Our results remain essentially the same as those reported in the paper and are not
reported for brevity.
Overall, decimalization appears to have had little or no impact on institutional execution costs
regardless of how the data are partitioned. The implication is that there appears to be liquidity available outside
the best bid and offer prices, which should allay the fears of regulators, practitioners and academics.
8. Concluding Discussion In the wake of decimalization in the NYSE, there has been considerable speculation that liquidity
outside the best bid and offer (BBO) prices may have dried up, which may have increased the implicit trading
costs experienced by institutional investors who typically trade large quantities and are therefore unable to take
advantage of the smaller spreads and the relatively smaller sizes that are being guaranteed at those improved
prices. In related research, Jones and Lipson (2001), investigating institutional trading costs around changeover
in minimum tick size from eighths to sixteenths, and using data from the same source as us, report that realized
execution costs increase after the changeover.
In contrast, using a large sample of institutional order executions in NYSE stocks, we find no evidence
that decimalization has increased trading costs for institutions. In fact, trading costs appear to have declined
following the move to decimals. We document a decrease of 13 basis points on an average in total trading costs
mostly driven by decreases in price impact. In economic terms, this decrease roughly translates to an average
monthly savings of $224 million in institutional trading costs following the move to decimal trading. The
decline is even greater when we compare post-decimalization estimates with estimates derived from early 2000,
suggesting that institutions are managing their trading costs quite well in recent years. Our results are consistent
with both an internal study by Plexus Group (2001) as well as with a related study on Nasdaq by Werner
(2002).
We present a detailed analysis of the order routing practices of institutions by examining orders routed
to four major broker categories – alternate (includes ECNs and crossing networks), full service (includes large
brokerage houses that provide multiple services), independent research (smaller and medium-sized brokerage
that provide independent research) and soft dollar (brokerage who provide research in exchange for trades).
Though there is not much change in the order routing practices overall, we find an increased usage of ECNs and
crossing networks such as Instinet and Posit for orders that are relatively easy to fill, and full service and
independent research brokers for orders that are difficult to fill. Our results suggest that both electronic
networks and traditional brokers could exist side by side as they cater to two different needs of institutional
investors.
26
We find an interesting variation in the effects of decimalization on trading costs across broker
categories. The total cost of trading increased by 83 bp for orders routed to alternate brokers, while it increased
by 322 bp for orders routed to independent research brokers after decimalization. In contrast, we find a
decrease of 36 bp for executions through full service brokers while executions through soft dollar brokers were
cheaper by 107 bp. Despite their superior executions, we find a reduced usage of soft dollar brokers – a trend
that is visible since early 2000. This suggests that institutions are increasingly favoring separating execution
services from other services that brokers may provide, something that should be welcomed by thousands of
investors and fund sponsors alike. Our results are robust to both univariate and multivariate test that control for
other variables influencing trading costs.
Our findings provide important evidence that decimalization has not improved market quality for retail
investors at the expense of institutional traders.

27
References
Bacidore, J.M., 1997, The Impact of Decimalization on Market Quality: An Empirical Investigation of the Toronto Stock Exchange, Journal of Financial Intermediation, 6, 92-120. Bacidore, J.M., R. H. Battalio, and R.H. Jennings, 2001, Order submission strategies, liquidity supply, and trading in pennies on the New York Stock Exchange, NYSE working paper. Berkowitz, S., D. Logue, and E. Noser, 1988. The total cost of transactions on the NYSE, Journal of Finance, 41, 97-112. Bollen, N. P. B., and R.E. Whaley, 1998, Are “teenies” better? Journal of Portfolio Management, 25, 10-24. Chakravarty, S., R.A. Wood, and R. Van Ness, 2002, Decimal Trading and Market Impact, working paper, University of Memphis, TN. Chan L. K. C., and J. Lakonishok, 1995, The behavior of stock prices around institutional trades, Journal of Finance, 50, 1147- 1174. Chan L. K. C., and J. Lakonishok, 1997, Institutional equity trading costs: NYSE versus Nasdaq, Journal of Finance, 52, 713-735. Chung, K., B.F., Van Ness and R.A., Van Ness, 2001, “Are Nasdaq stocks more costly to trade than NYSE stocks? Evidence after decimalization, working paper, Kansas State University. Conrad, J., K. Johnson, and S. Wahal, 2001a, Institutional Trading and Soft Dollars, Journal of Finance, 56, 397- 416. Conrad, J., K. Johnson, and S. Wahal, 2001b, Institutional Trading Costs and Alternative Trading Systems, working paper, Emory University. Goldstein, M.A., K.A. Kavajecz, 2000, Eights, sixteenths and market depth: changes in tick size and liquidity provision on the NYSE, Journal of Financial Economics, 56, 125-149. Jones, C. M., and M.L. Lipson, 1999, Execution costs of institutional equity orders, Journal of Financial Intermediation, 8, 123-140. Jones, C. M., and M.L. Lipson, 2001, Sixteenths: direct evidence on institutional execution costs, Journal of Financial Economics, 59, 253-278. Keim, D.B., and A. Madhavan, 1996, The upstairs market for large-block transactions: analysis and measurement of price effects, Review of Financial Studies, 9, 1-36. Keim, D.B., and A. Madhavan, 1997, Transactions costs and investment style: an inter-exchange analysis of institutional equity trades, Journal of Financial Economics, 46, 265-292. Kyle, A. S., 1985, Continuous auctions and insider trading, Econometrica, 53, 1315-1335. Madhavan, A., and M. Cheng, 1997, In search of liquidity: an analysis of upstairs and downstairs trades, Review of Financial Studies, 10, 175-204.

28
Perold, A., 1988, The implementation shortfall: paper versus reality, Journal of Portfolio Management, 14, 4-9. Plexus Group, Inc., 2001, Decimal trading – pennies from heaven or hell? presentation made by Wayne Wagner at the NYSE conference in Palm Beach, Florida. Ricker, J.P., 1998, Breaking the eighth: sixteenths on the New York Stock Exchange, working paper. Ronen, T., and D.G. Weaver, 1998, Teenies’ anyone: the case of the American Stock Exchange, working paper, Rutgers University. Schwartz, R.A., and B. Steil, 2002, Controlling institutional trading costs: we have met the enemy and it is us, Journal of Portfolio Management, 28, 39-49. Werner, I. M. 2002, Institutional Trading Costs on Nasdaq: Have They Been Decimated?, Nasdaq working paper.
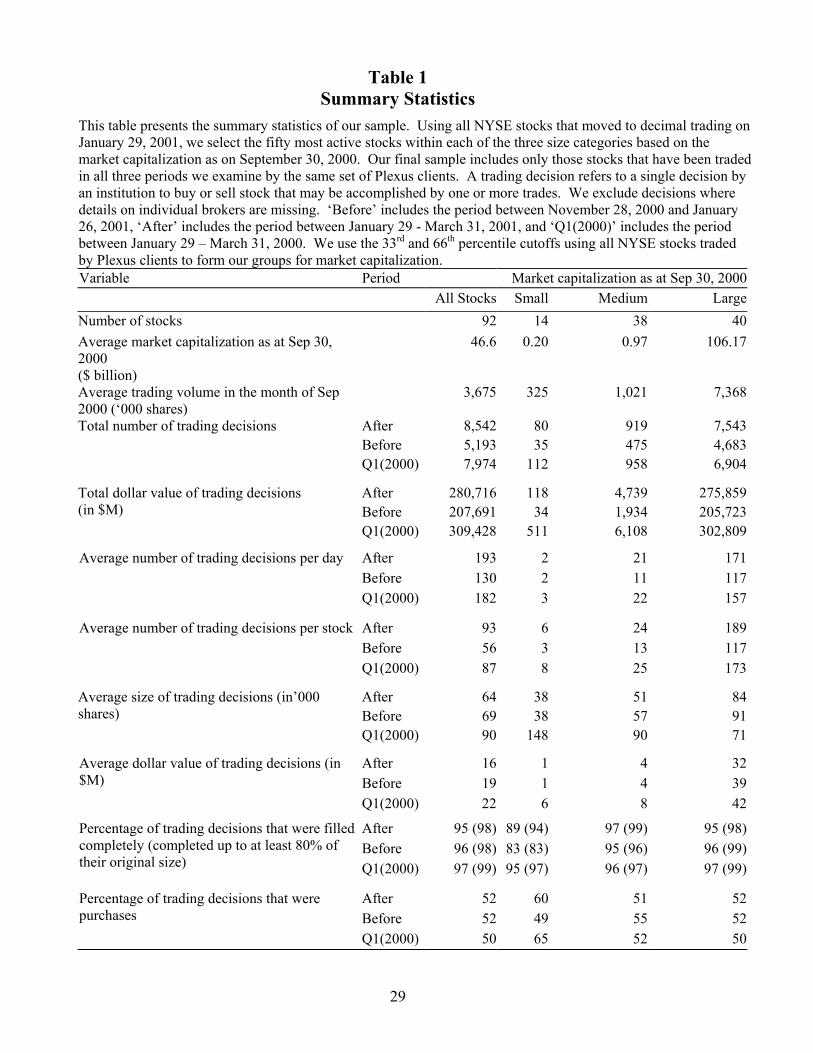
29
Table 1 Summary Statistics
This table presents the summary statistics of our sample. Using all NYSE stocks that moved to decimal trading on January 29, 2001, we select the fifty most active stocks within each of the three size categories based on the market capitalization as on September 30, 2000. Our final sample includes only those stocks that have been traded in all three periods we examine by the same set of Plexus clients. A trading decision refers to a single decision by an institution to buy or sell stock that may be accomplished by one or more trades. We exclude decisions where details on individual brokers are missing. ‘Before’ includes the period between November 28, 2000 and January 26, 2001, ‘After’ includes the period between January 29 - March 31, 2001, and ‘Q1(2000)’ includes the period between January 29 – March 31, 2000. We use the 33rd and 66th percentile cutoffs using all NYSE stocks traded by Plexus clients to form our groups for market capitalization. Variable Period Market capitalization as at Sep 30, 2000 All Stocks Small Medium LargeNumber of stocks 92 14 38 40Average market capitalization as at Sep 30, 2000 ($ billion)
46.6 0.20 0.97 106.17
Average trading volume in the month of Sep 2000 (‘000 shares)
3,675 325 1,021 7,368
After 8,542 80 919 7,543Before 5,193 35 475 4,683
Total number of trading decisions
Q1(2000) 7,974 112 958 6,904
After 280,716 118 4,739 275,859Before 207,691 34 1,934 205,723
Total dollar value of trading decisions (in $M)
Q1(2000) 309,428 511 6,108 302,809
Average number of trading decisions per day After 193 2 21 171 Before 130 2 11 117 Q1(2000) 182 3 22 157
After 93 6 24 189Before 56 3 13 117
Average number of trading decisions per stock
Q1(2000) 87 8 25 173
After 64 38 51 84Before 69 38 57 91
Average size of trading decisions (in’000 shares)
Q1(2000) 90 148 90 71
After 16 1 4 32Before 19 1 4 39
Average dollar value of trading decisions (in $M)
Q1(2000) 22 6 8 42
After 95 (98) 89 (94) 97 (99) 95 (98)Before 96 (98) 83 (83) 95 (96) 96 (99)
Percentage of trading decisions that were filled completely (completed up to at least 80% of their original size) Q1(2000) 97 (99) 95 (97) 96 (97) 97 (99)
After 52 60 51 52Before 52 49 55 52
Percentage of trading decisions that were purchases
Q1(2000) 50 65 52 50

30
Table 2 Statistics on Institutional Trading Decisions
This table presents statistics on institutional trading decisions in our sample stocks. Using all NYSE stocks that moved to decimal trading on January 29, 2001, we select the fifty most active stocks within each of the three size categories based on the market capitalization as on September 30, 2000. Our final sample includes only those stocks that have been traded in all three periods we examine by the same set of Plexus clients. A trading decision refers to a single decision by an institution to buy or sell stock that may be accomplished by one or more trades. We exclude decisions where details on individual brokers are missing. ‘Before’ includes the period between November 28, 2000 and January 26, 2001, ‘After’ includes the period between January 29 - March 31, 2001, and ‘Q1(2000)’ includes the period between January 29 – March 31, 2000. Each cell in our table represents the dollar value-weighted cross-sectional average under each period of the time series averages of each stock. We test whether the average measure for either of the two pre-decimalization periods (‘Before’ and ‘Q1(2000)’) is statistically different from the average measure after decimalization (‘After’) using a paired t-test. An asterisk denotes significance at 5% level. We report our results using four different partitions based on the market capitalization of the traded stock, order side, complexity of the trading decision and manager style. We use the 33rd and 66th percentile cutoffs to form our groups for market capitalization and decision complexity.
Panel A: Full sample
Variable Period Full Sample
After 2.33 (2.34)
Before 2.38 (2.44)
Average (Median) number of days to complete a decision
Q1(2000) 2.30 (2.27)
After 2.51 (2.58)
Before 2.59 (2.61)
Average (Median) number of brokers used per decision
Q1(2000) 2.70* (2.76)
Panel B: Classification by market capitalization as on September 30, 2000
Variable Period Market capitalization as at Sep 30, 2000
Small Medium Large
After 2.67 (3.00) 2.31(2.67) 2.33 (2.34)
Before 3.07* (2.33) 1.91* (1.69) 2.39 (2.44)
Average (Median) number of days to complete a decision
Q1(2000) 2.99* (2.60) 2.29 (1.80) 2.30 (2.27)
After 1.87 (2.00) 1.71 (1.90) 2.53 (2.58)
Before 2.50* (2.33) 1.86* (1.31) 2.60 (2.61)
Average (Median) number of brokers used per decision
Q1(2000) 2.26* (2.20) 2.18 (1.50) 2.71 (2.76)
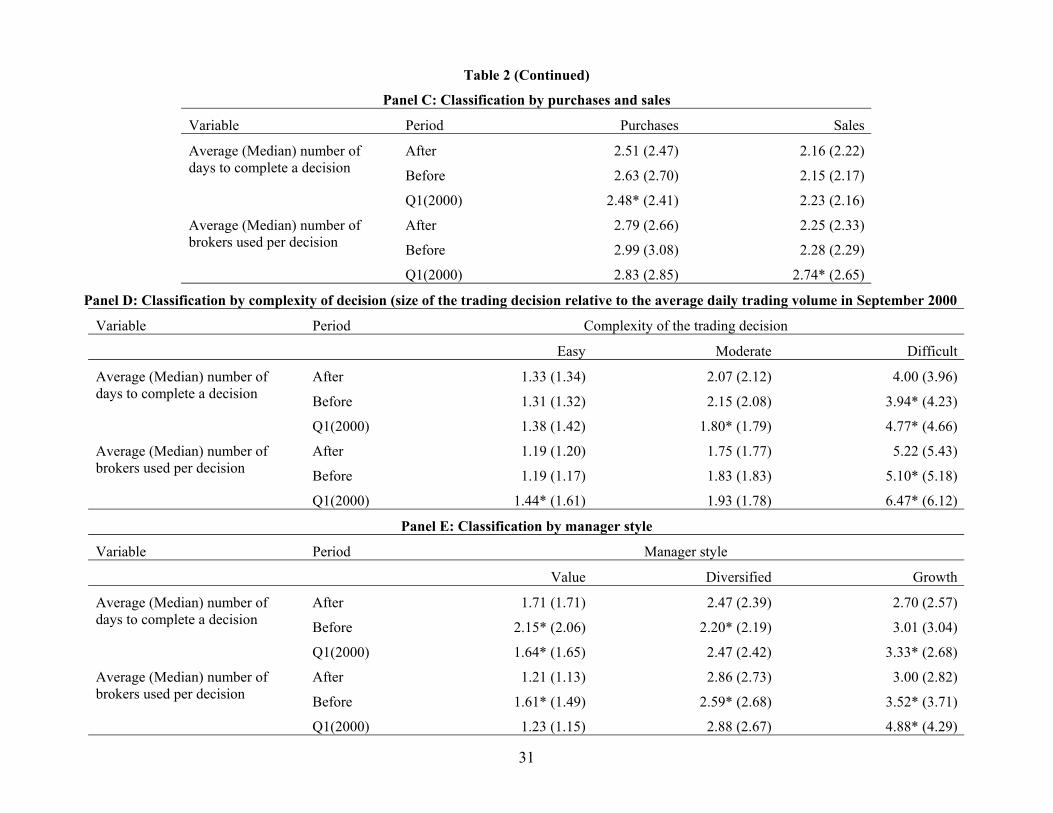
31
Table 2 (Continued)
Panel C: Classification by purchases and sales
Variable Period Purchases Sales
After 2.51 (2.47) 2.16 (2.22)
Before 2.63 (2.70) 2.15 (2.17)
Average (Median) number of days to complete a decision
Q1(2000) 2.48* (2.41) 2.23 (2.16)
After 2.79 (2.66) 2.25 (2.33)
Before 2.99 (3.08) 2.28 (2.29)
Average (Median) number of brokers used per decision
Q1(2000) 2.83 (2.85) 2.74* (2.65)
Panel D: Classification by complexity of decision (size of the trading decision relative to the average daily trading volume in September 2000
Variable Period Complexity of the trading decision
Easy Moderate Difficult
After 1.33 (1.34) 2.07 (2.12) 4.00 (3.96)
Before 1.31 (1.32) 2.15 (2.08) 3.94* (4.23)
Average (Median) number of days to complete a decision
Q1(2000) 1.38 (1.42) 1.80* (1.79) 4.77* (4.66)
After 1.19 (1.20) 1.75 (1.77) 5.22 (5.43)
Before 1.19 (1.17) 1.83 (1.83) 5.10* (5.18)
Average (Median) number of brokers used per decision
Q1(2000) 1.44* (1.61) 1.93 (1.78) 6.47* (6.12)
Panel E: Classification by manager style
Variable Period Manager style
Value Diversified Growth
After 1.71 (1.71) 2.47 (2.39) 2.70 (2.57)
Before 2.15* (2.06) 2.20* (2.19) 3.01 (3.04)
Average (Median) number of days to complete a decision
Q1(2000) 1.64* (1.65) 2.47 (2.42) 3.33* (2.68)
After 1.21 (1.13) 2.86 (2.73) 3.00 (2.82)
Before 1.61* (1.49) 2.59* (2.68) 3.52* (3.71)
Average (Median) number of brokers used per decision
Q1(2000) 1.23 (1.15) 2.88 (2.67) 4.88* (4.29)

32
Table 3 Institutional Trading Costs Around Decimalization
We present total trading costs (in basis points) for institutions around decimalization. Using all NYSE stocks that moved to decimal trading on January 29, 2001, we select the fifty most active stocks within each of the three size categories based on the market capitalization as on September 30, 2000. Our final sample includes only those stocks that have been traded in all three periods we examine by the same set of Plexus clients. A trading decision refers to a single decision by an institution to buy or sell stock that may be accomplished by one or more trades. We exclude decisions where details on individual brokers are missing. ‘Before’ includes the period between November 28, 2000 and January 26, 2001, ‘After’ includes the period between January 29 - March 31, 2001, and ‘Q1(2000)’ includes the period between January 29 – March 31, 2000. Total costs include commissions as well as price impact of trades. Price impact for each decision is measured as the signed deviation of the value-weighted average trade price for each decision from a benchmark price, where deviation is multiplied by –1 if the decision was a sale. We use two different benchmark prices to best capture the price unperturbed by the decision. Each cell in our table represents the value-weighted cross-sectional average under each period of the time series averages of each stock. We test whether cross-sectional average post-decimalization differs from either of the two pre-decimalization periods using a paired t-test. An asterisk denotes significance at 5% level. We report our results using four different partitions based on the market capitalization of the traded stock, order side, complexity of the trading decision and manager style. We use the 33rd and 66th percentile cutoffs to form our groups for market capitalization and decision complexity.
Panel A: Full sample Period Commission Price Impact Measure I
(relative to the closing price prior to the day of
the decision)
Price Impact Measure II (relative to the value-weighted average
price across all trades over all days over which the decision was filled)
Total Cost I (using price
impact measure I)
Total Cost II (using price
impact measure II)
(in basis points)
After 10.2 32.9 -76.0 43.2 -65.4
Before 9.6 46.8 56.9* 56.4 66.6*Full Sample
Q1(2000) 7.8* 125.8* -3.9* 133.6* 3.9*

33
Table 3 (Continued) Panel B: Classification by market capitalization as on September 30, 2000
Market capitalization
Period Commission Price Impact Measure I (relative to the closing
price prior to the day of the decision)
Price Impact Measure II (relative to the value-weighted average
price across all trades over all days over which the decision was filled)
Total Cost I (using price
impact measure I)
Total Cost II (using price
impact measure II)
(in basis points)
After 94.9 104.3 -66.5 199.2 33.9
Before 65.8* 413.3* -67.5 479.1* -7.5Small
Q1(2000) 60.8* 315.2 130.4 376.0 190.9
After 30.1 -313.5 -19.8 -283.4 11.5
Before 31.1 379.6* -42.9 410.7* -11.8Medium
Q1(2000) 28.6* 196.1* 59.9* 224.7* 88.5*
After 9.8 39.0 -77.0 48.8 -66.8
Before 9.4 43.6 57.8* 53.0 67.3*Large
Q1(2000) 7.3 124.1* -5.4* 131.3* 1.9*
Panel C: Classification by purchases and sales Order Side Period Commission Price Impact Measure I
(relative to the closing price prior to the day of
the decision)
Price Impact Measure II (relative to the value-weighted average
price across all trades over all days over which the decision was filled)
Total Cost I (using price
impact measure I)
Total Cost II (using price
impact measure II)
(in basis points)
After 10.2 -221.1 36.5 -210.9 47.0
Before 9.2 -14.5* 48.2 -5.3* 57.4*Purchases
Q1(2000) 8.1 73.1* -40.2* 81.2* -32.2*
After 10.2 263.3 -178.1 273.5 -167.3
Before 10.2 120.6* 67.3* 130.8* 77.6*Sales
Q1(2000) 7.4* 171.1* 27.3* 178.6* 34.9*

34
Table 3 (Continued) Panel D: Classification by complexity of decision (size of the trading decision relative to the average daily trading volume in September 2000)
Decision Complexity
Period Commission Price Impact Measure I (relative to the closing
price prior to the day of the decision)
Price Impact Measure II (relative to the value-weighted average
price across all trades over all days over which the decision was filled)
Total Cost I (using price
impact measure I)
Total Cost II (using price
impact measure II)
(in basis points)
After 5.7 13.3 14.9 19.0 20.6
Before 7.0 -12.4 5.2 -5.4 12.3Easy
Q1(2000) 3.1 -3.6 3.8* -0.4 6.9*
After 5.2 -1.5 11.6 3.7 16.9
Before 7.1* 20.7 3.7 27.7 10.7Moderate
Q1(2000) 3.7 9.7 1.5 13.4 5.2
After 10.4 33.8 -78.2 44.1 -67.5
Before 9.7 47.4 58.1* 57.1 67.9*Difficult
Q1(2000) 7.9* 130.3* -4.1* 138.3* 3.8*Panel E: Classification by manager style
Manager Style Period Commission Price Impact Measure I (relative to the closing
price prior to the day of the decision)
Price Impact Measure II (relative to the value-weighted average
price across all trades over all days over which the decision was filled)
Total Cost I (using price
impact measure I)
Total Cost II (using price
impact measure II)
(in basis points)
After 5.0 22.1 6.0 27.1 11.2
Before 6.5 -102.1 44.9 -95.6 51.2Value
Q1(2000) 4.4 91.3 19.7 95.7 24.2
After 11.0 52.3 17.2 63.3 28.8
Before 9.9* -53.7 40.4 -43.8 50.4Diversified
Q1(2000) 7.8* 53.8 -16.2 61.6 -8.5
After 10.0 20.6 -141.9 30.6 -131.6
Before 9.6 112.6 67.1* 122.2 76.8*Growth
Q1(2000) 7.9 178.6* 3.6* 186.5* 11.6*

35
Table 4 Order Routing Decisions by Institutions
This table reports frequency of the usage of different brokers by institutions before and after decimalization along with the average order sizes routed to them in shares. Using all NYSE stocks that moved to decimal trading on January 29, 2001, we select the fifty most active stocks within each of the three size categories based on the market capitalization as on September 30, 2000. Our final sample includes only those stocks that have been traded in all three periods we examine by the same set of Plexus clients. A trading decision refers to a single decision by an institution to buy or sell stock that may be accomplished by one or more trades. We exclude decisions where details on individual brokers are missing. ‘Before’ includes the period between November 28, 2000 and January 26, 2001, ‘After’ includes the period between January 29 - March 31, 2001, and ‘Q1(2000)’ includes the period between January 29 – March 31, 2000. Each cell represents the dollar value-weighted percentage of decisions routed to a particular broker. We use the same terminology to classify brokers that is used by Plexus in their data. Alternate brokers refer to ECNs, crossing systems such as ITG-Posit and SuperDOT access desks of large brokerage houses. Full service brokers refer to brokers who provide executions either through their upstairs desk or floor operations at the NYSE. Soft dollar brokers provide free research in exchange for presumably higher trading commissions, while Independent research brokers provide research and execution service independently and may or may not have floor operations at the NYSE. Non-classified includes all brokers that Plexus could not identify or not able to classify under any of the other four categories. We present statistics by the complexity of the decision (as measured by the decision size relative to the average daily volume in September 2000) and by the manager style. We use the 33rd and 66th percentile cutoffs to form our groups for decision complexity. We test whether cross-sectional average post-decimalization differs from either of the two pre-decimalization periods using a paired t-test. An asterisk denotes significance at 5% level.
Panel A: Full sample Period Alternate Brokers Full Service Brokers Independent Research
Brokers Soft Dollar Brokers Non-Classified
% orders Average order size
% orders Average order size
% orders Average order size
% orders Average order size
% orders Average order size
After 4 3,585 55 63,658 10 10,818 3 3,366 27 29,413
Before 4 3,595 52 52,627* 8 8,754 5* 4,765* 31 31,180 Full sample
Q1(2000) 3* 1,765* 53 43,351* 7* 6,743* 5* 3,801 32* 23,526*
Panel B: Classification by complexity of decision (size of the trading decision relative to the average daily trading volume in September 2000) Decision Complexity
Period Alternate Brokers Full Service Brokers Independent Research Brokers
Soft Dollar Brokers Non-Classified
% orders Average order size
% orders Average order size
% orders Average order size
% orders Average order size
% orders Average order size
After 23 118 53 296 1 3 6 50 17 102 Before 12* 86* 48 299 1 3 16* 83* 23* 174*
Easy
Q1(2000) 35* 314* 37* 311* 2 12* 5 47 21* 191* After 36 2,338 42 2,398 2 119 5 314 15 901 Before 22* 1,365* 49* 2,991* 3 176 9* 616* 17 1,168*
Moderate
Q1(2000) 28 1,541* 44 3,400 2 154 5 408 20* 1,424* After 3 9,859 55 210,870 11 37,868 3 11,558 27 96,461 Before 3 10,685 52 166,713* 8 28,531* 5* 14,850 31 101,052
Difficult
Q1(2000) 2* 4,266* 53 169,233* 7* 24,595* 5* 15,882* 32* 96,473

36
Table 4 (Continued)
Panel C: Classification by manager style Manager Style Period Alternate Brokers Full Service Brokers Independent Research
Brokers Soft Dollar Brokers Non-Classified
% orders Average order size
% orders Average order size
% orders Average order size
% orders Average order size
% orders Average order size
After 55 6,299 28 3,987 2 145 2 216 13 2,468 Before 31* 5,655 42* 10,062* 3 392 10* 1,868* 15 4,607
Value
Q1(2000) 45 3,134* 40 5,189 - 17 5* 814 11* 1,658* After 4 2,253 62 52,219 10 10,387 5 3,620 20 14,545 Before 3 2,437 58 44,204* 7 4,962* 5 3,185 25* 17,098
Diversified
Q1(2000) 3 1,874* 54* 47,462* 6* 4,602* 5 3,715 32* 27,913* After 2 4,904 52 206,263 11 33,667 3 8,220 33 106,280 Before 2 6,695 49 125,000* 9 27,292 5* 11,853 34 100,344*
Growth
Q1(2000) 1 1,710* 53 124,641* 8* 21,293* 5* 10,392 33 70,947*
Panel D: Classification by order size Number of Shares Routed
Period Alternate Brokers Full Service Brokers Independent Research Brokers
Soft Dollar Brokers Non-Classified
% orders Average order size
% orders Average order size
% orders Average order size
% orders Average order size
% orders Average order size
After 20 857 53 830 3 929 9 816 14 828 Before 10 879 44 856 2 833 22 865 22 869
0 – 1,000 shares
Q1(2000) 29 750 35 760 4 762 8 732* 24 737 After 28 3,048 43 2,991 2 3,210 8 3,224 19 2,954 Before 18 3,133 45 3,042 3 3,334 15 3,082 20 3,244*
1,001 – 5,000 shares
Q1(2000) 36 3,069 34 3,022 2 3,245 6 2,904 21 3,067 After 35 7,349 39 7,376 2 7,406 7 7,320 17 7,383 Before 23 7,618 46 7,632 2 7,602 12 7,265 18 7,584
5,001 – 10,000 shares
Q1(2000) 33 7,327 36 7,553* 4 7,794 8 7,838 19 7,547 After 3 127,090 56 4,721,492 11 3,730,974 3 630,736 27 1,327,785 Before 3 179,473 52 1,322,856 8 602,018* 5 413,038* 31 1,939,733
> 10,001 shares
Q1(2000) 2 115,892 54 1,298,618 7 970,874* 5 353,740* 32 709,352

37
Table 5 Trading Costs by Broker Type
This table reports trading costs for different order sizes executed by brokers employed by institutions before and after decimalization. Using all NYSE stocks that moved to decimal trading on January 29, 2001, we select the fifty most active stocks within each of the three size categories based on the market capitalization as on September 30, 2000. Our final sample includes only those stocks that have been traded in all three periods we examine by the same set of Plexus clients. A trading decision refers to a single decision by an institution to buy or sell stock that may be accomplished by one or more trades. We exclude decisions where details on individual brokers are missing. ‘Before’ includes the period between November 28, 2000 and January 26, 2001, ‘After’ includes the period between January 29 - March 31, 2001, and ‘Q1(2000)’ includes the period between January 29 – March 31, 2000. We use the same terminology to classify brokers that is used by Plexus in their data. Alternate brokers refer to ECNs, crossing systems such as ITG-Posit and SuperDOT access desks of large brokerage houses. Full service brokers refer to brokers who provide executions either through their upstairs desk or floor operations at the NYSE. Soft dollar brokers provide free research in exchange for presumably higher trading commissions, while Independent research brokers provide research and execution service independently. Non-classified includes all brokers that Plexus could not identify or not able to classify under any of the other four categories. Price impact for each decision is measured as the signed deviation of the value-weighted average trade price for each decision from a benchmark price, where deviation is multiplied by –1 if the decision was a sale. We use the closing price prior to the day when the decision was made as our benchmark. Each cell in our table represents the cross-sectional average under each period of the time series value-weighted averages of each stock. We test whether cross-sectional average post-decimalization differs from either of the two pre-decimalization periods using a paired t-test. An asterisk denotes significance at 5% level. We present statistics by the complexity of the decision, as measured by the decision size relative to the average daily volume in September 2000. We use the 33rd and 66th percentile cutoffs to form our groups for decision complexity.
Panel A: Commissions in basis points Number of Shares Routed Period Alternate Brokers Full Service Brokers Independent Research Brokers Soft Dollar Brokers Non-Classified
After 2.94 9.63 12.38 12.76 11.35 Before 3.39* 9.54 11.15 9.89 10.09*
Full sample
Q1(2000) 1.87* 7.74* 9.60 9.01 7.69* After 0.77 5.19 8.13 6.90 7.00 Before 1.19 7.75 7.98 6.63 5.72
0 – 1,000 shares
Q1(2000) 0.30 3.85 5.92 6.01 5.36* After 0.83 7.23 16.33 9.91 8.31 Before 1.69* 7.08 10.62 9.67 9.60
1,001 – 5,000 shares
Q1(2000) 0.31 4.02 8.35 8.02 6.62 After 1.01 6.95 13.20 9.98 9.56 Before 2.17* 7.18 13.49 9.59 9.83
5,001 – 10,000 shares
Q1(2000) 0.28* 4.82 8.44 7.27 6.72* After 3.42 9.68 12.37 12.92 11.39 Before 3.59 9.59 11.14 9.92 10.10
> 10,001 shares
Q1(2000) 2.98* 7.82 9.62 9.09 7.71*
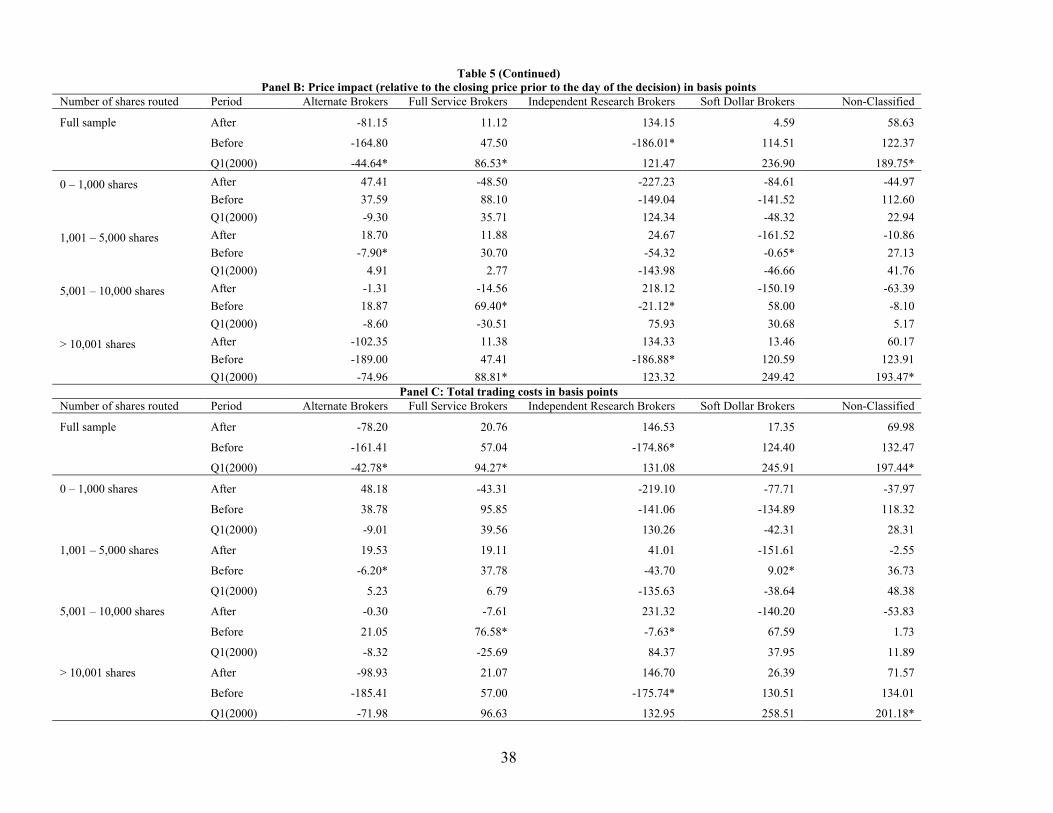
38
Table 5 (Continued) Panel B: Price impact (relative to the closing price prior to the day of the decision) in basis points
Number of shares routed Period Alternate Brokers Full Service Brokers Independent Research Brokers Soft Dollar Brokers Non-Classified
After -81.15 11.12 134.15 4.59 58.63
Before -164.80 47.50 -186.01* 114.51 122.37
Full sample
Q1(2000) -44.64* 86.53* 121.47 236.90 189.75* After 47.41 -48.50 -227.23 -84.61 -44.97 Before 37.59 88.10 -149.04 -141.52 112.60
0 – 1,000 shares
Q1(2000) -9.30 35.71 124.34 -48.32 22.94 After 18.70 11.88 24.67 -161.52 -10.86 Before -7.90* 30.70 -54.32 -0.65* 27.13
1,001 – 5,000 shares
Q1(2000) 4.91 2.77 -143.98 -46.66 41.76 After -1.31 -14.56 218.12 -150.19 -63.39 Before 18.87 69.40* -21.12* 58.00 -8.10
5,001 – 10,000 shares
Q1(2000) -8.60 -30.51 75.93 30.68 5.17 After -102.35 11.38 134.33 13.46 60.17 Before -189.00 47.41 -186.88* 120.59 123.91
> 10,001 shares
Q1(2000) -74.96 88.81* 123.32 249.42 193.47* Panel C: Total trading costs in basis points
Number of shares routed Period Alternate Brokers Full Service Brokers Independent Research Brokers Soft Dollar Brokers Non-Classified
After -78.20 20.76 146.53 17.35 69.98
Before -161.41 57.04 -174.86* 124.40 132.47
Full sample
Q1(2000) -42.78* 94.27* 131.08 245.91 197.44*
After 48.18 -43.31 -219.10 -77.71 -37.97
Before 38.78 95.85 -141.06 -134.89 118.32
0 – 1,000 shares
Q1(2000) -9.01 39.56 130.26 -42.31 28.31
After 19.53 19.11 41.01 -151.61 -2.55
Before -6.20* 37.78 -43.70 9.02* 36.73
1,001 – 5,000 shares
Q1(2000) 5.23 6.79 -135.63 -38.64 48.38
After -0.30 -7.61 231.32 -140.20 -53.83
Before 21.05 76.58* -7.63* 67.59 1.73
5,001 – 10,000 shares
Q1(2000) -8.32 -25.69 84.37 37.95 11.89
After -98.93 21.07 146.70 26.39 71.57
Before -185.41 57.00 -175.74* 130.51 134.01
> 10,001 shares
Q1(2000) -71.98 96.63 132.95 258.51 201.18*

39
Table 6 Regressions of Total Trading Costs and Number of Trading Days to Complete a Decision
This table presents results of regressions of institutional trading costs and the number of trading days it takes to complete a decision. Total trading costs (in basis points) include commissions as well as price impact. Price impact for each decision is measured as the signed deviation of the value-weighted average trade price for each decision from a benchmark price, where deviation is multiplied by –1 if the decision was a sale. We use the closing price prior to the day when the decision was made as our benchmark. We include all trading decisions that were placed by Plexus clients between November 28, 2000 and March 31, 2001. We include only decisions in stocks that the clients traded both before and after decimalization. The After dummy is an indicator variable that takes the value 1 if the decision was placed after January 29, 2001, the date when stocks started trading in decimals. The Value dummy and the Growth dummy are indicator variables to denote manager style. We also use two interaction dummy variables to capture the residual effects of decimalization on manager style. Log Market Capitalization is the natural logarithm of the market capitalization of the underlying stock at the end of September 2000. Volatility is the daily return standard deviation in the month of September 2000, while Inverse Price represents the inverse of the price at the time the decision was made. Decision complexity is the size of the decision relative to the average daily volume of the underlying stock. An asterisk means that the coefficient for the variable is significantly different from zero at the 5 percent level. Standard errors are in parentheses.
Panel A: Dependent variable = Total trading cost (which includes price impact measured relative to the closing price prior to the day of the decision)
Intercept Log Market Capitalization
Volatility Order complexity
Inverse Price
Value dummy
Growth dummy
After dummy
Value x After
dummy
Growth x After dummy
R-square
N
29.19 (19.09)
-3.59 (2.63)
1.34 (3.21)
-0.30 (0.20)
533.73* (77.82)
-0.85 (13.61)
19.91 (12.92)
-12.82 (9.57)
-17.58 (16.51)
10.81 (17.09)
0.01 13,488
Panel B: Dependent variable = Number of trading days taken to complete the decision
Intercept Log Market Capitalization
Volatility Order complexity
Inverse Price
Value dummy
Growth dummy
After dummy
Value x After
dummy
Growth x After dummy
R-square
N
1.21* (0.14)
0.09* (0.01)
-0.003 (0.02)
0.04* (0.01)
-0.25 (0.38)
-0.18* (0.07)
0.41* (0.07)
0.27* (0.05)
-0.42* (0.08)
-0.47* (0.09)
0.09 13,488
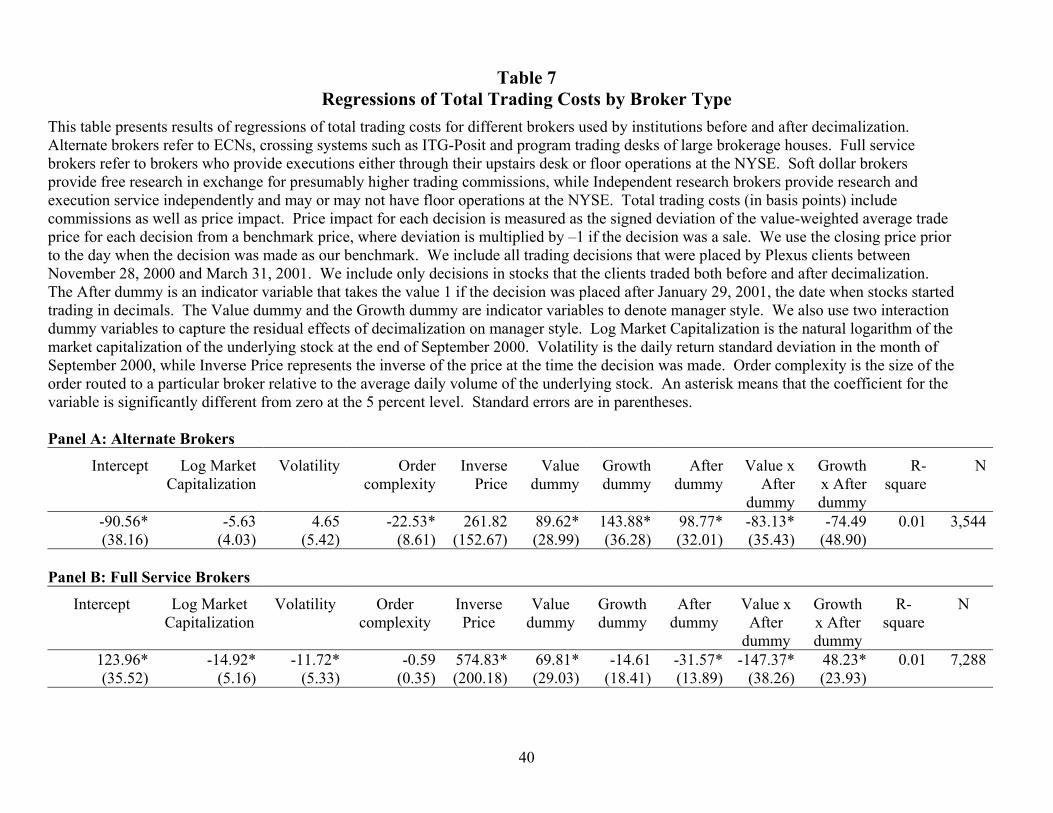
40
Table 7 Regressions of Total Trading Costs by Broker Type
This table presents results of regressions of total trading costs for different brokers used by institutions before and after decimalization. Alternate brokers refer to ECNs, crossing systems such as ITG-Posit and program trading desks of large brokerage houses. Full service brokers refer to brokers who provide executions either through their upstairs desk or floor operations at the NYSE. Soft dollar brokers provide free research in exchange for presumably higher trading commissions, while Independent research brokers provide research and execution service independently and may or may not have floor operations at the NYSE. Total trading costs (in basis points) include commissions as well as price impact. Price impact for each decision is measured as the signed deviation of the value-weighted average trade price for each decision from a benchmark price, where deviation is multiplied by –1 if the decision was a sale. We use the closing price prior to the day when the decision was made as our benchmark. We include all trading decisions that were placed by Plexus clients between November 28, 2000 and March 31, 2001. We include only decisions in stocks that the clients traded both before and after decimalization. The After dummy is an indicator variable that takes the value 1 if the decision was placed after January 29, 2001, the date when stocks started trading in decimals. The Value dummy and the Growth dummy are indicator variables to denote manager style. We also use two interaction dummy variables to capture the residual effects of decimalization on manager style. Log Market Capitalization is the natural logarithm of the market capitalization of the underlying stock at the end of September 2000. Volatility is the daily return standard deviation in the month of September 2000, while Inverse Price represents the inverse of the price at the time the decision was made. Order complexity is the size of the order routed to a particular broker relative to the average daily volume of the underlying stock. An asterisk means that the coefficient for the variable is significantly different from zero at the 5 percent level. Standard errors are in parentheses.
Panel A: Alternate Brokers
Intercept Log Market Capitalization
Volatility Order complexity
Inverse Price
Value dummy
Growth dummy
After dummy
Value x After
dummy
Growth x After dummy
R-square
N
-90.56* (38.16)
-5.63 (4.03)
4.65(5.42)
-22.53*(8.61)
261.82(152.67)
89.62*(28.99)
143.88* (36.28)
98.77*(32.01)
-83.13*(35.43)
-74.49(48.90)
0.01 3,544
Panel B: Full Service Brokers
Intercept Log Market Capitalization
Volatility Order complexity
Inverse Price
Value dummy
Growth dummy
After dummy
Value x After
dummy
Growth x After dummy
R-square
N
123.96* (35.52)
-14.92* (5.16)
-11.72*(5.33)
-0.59(0.35)
574.83*(200.18)
69.81*(29.03)
-14.61 (18.41)
-31.57*(13.89)
-147.37*(38.26)
48.23*(23.93)
0.01 7,288
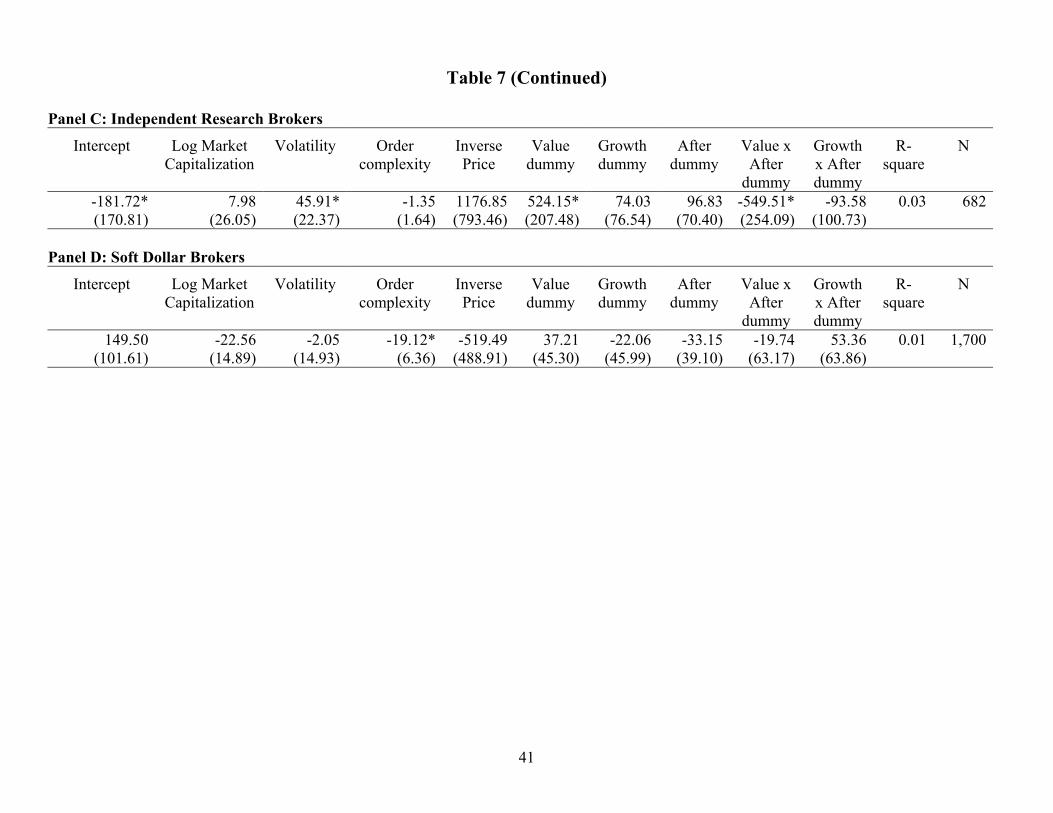
41
Table 7 (Continued) Panel C: Independent Research Brokers
Intercept Log Market Capitalization
Volatility Order complexity
Inverse Price
Value dummy
Growth dummy
After dummy
Value x After
dummy
Growth x After dummy
R-square
N
-181.72* (170.81)
7.98 (26.05)
45.91*(22.37)
-1.35(1.64)
1176.85(793.46)
524.15*(207.48)
74.03 (76.54)
96.83(70.40)
-549.51*(254.09)
-93.58(100.73)
0.03 682
Panel D: Soft Dollar Brokers
Intercept Log Market Capitalization
Volatility Order complexity
Inverse Price
Value dummy
Growth dummy
After dummy
Value x After
dummy
Growth x After dummy
R-square
N
149.50 (101.61)
-22.56 (14.89)
-2.05(14.93)
-19.12*(6.36)
-519.49(488.91)
37.21(45.30)
-22.06 (45.99)
-33.15(39.10)
-19.74(63.17)
53.36(63.86)
0.01 1,700

42
0
10
20
30
40
50
60
70
80
90
Per
cent
age
of c
lient
-sto
ck d
ays
1 2 3 >3Number of decisions per day involving the same stock
Figure 1: Number of Decisions Per Day Involving the Same Stock
After decimalization Before decimalization Q1(2000)