Measuring Equity Share Related Risk Perception of Investors ...
21
Risks 2019, 7, 12; doi:10.3390/risks7010012 www.mdpi.com/journal/risks Article Measuring Equity Share Related Risk Perception of Investors in Economically Backward Regions Ranjit Singh 1 and Jayashree Bhattacharjee 2, * 1 Department of Management Studies, Indian Institute of Information Technology, Allahabad 211012, India; [email protected] 2 Department of Business Administration, Assam University, Silchar 788011, India * Correspondence: [email protected] Received: 7 December 2018; Accepted: 14 January 2019; Published: 30 January 2019 Abstract: Risk perception is an idiosyncratic process of interpretation. It is a highly personal process of making a decision based on an individual’s frame of reference that has evolved over time. The purpose of this paper is to find out the risk perception level of equity investors and to identify the factors influencing their risk perception. The study was conducted using a stratified random sampling design of 358 investors. It was found that the overall risk perception level of equity investors is moderate and that the main factors affecting their risk perception are information screening, investment education, fear psychosis, fundamental expertise, technical expertise, familiarity bias, information asymmetry, understanding of the market, etc. Considering the above findings, efforts should be made to bring people with a high risk perception to the low risk perception category by providing them with training to handle or manage high-risk scenarios which will help in promoting an equity-investment culture. Keywords: risk; risk perception; equity investment; risk propensity; factor analysis 1. Introduction Risk is a concept that indicates a potentially negative influence to an asset or some feature of value that may augment from some present process or future event. According to Lopes (1987), “risk refers to situations in which a decision is made whose consequences depend on the outcomes of future events having known probabilities.” Thus, it can be expressed as follows: Risk = Consequences × Probability Risk perception is a personalized ideal that people hold about features and the severity of a risk. Risk perception analyses the opinions of people when they are asked to evaluate hazardous or risky activities, substances, and technologies (Slovic 1987). Risk perception involves peoples’ beliefs, attitudes, judgments, and feelings as well as their values—both social and cultural—and dispositions. It plays a prominent role in peoples’ decision-making process and thus in the case with the decision to invest in equity shares (Pidgeon et al. 1992). According to Bernstein (1995), the perception of risk throughout the history of any society has reflected the temper of the times of each society, as the emphasis has swung from the instinct to measurements and back. As long as people perceive that they have no control over their characteristics, chance can explain the entire outcome of risk-taking. Then, the experimentation, exploration, and demonstration of that choice are a valid human activity and the aforementioned risk is something to be borne. It is well known that investors do not have control over the return from equity shares and, hence, investments into equity shares are perceived to be risky.
-
Upload
khangminh22 -
Category
Documents
-
view
5 -
download
0
Transcript of Measuring Equity Share Related Risk Perception of Investors ...
Risks 2019, 7, 12; doi:10.3390/risks7010012 www.mdpi.com/journal/risks
Article
Measuring Equity Share Related Risk Perception of
Investors in Economically Backward Regions
Ranjit Singh 1 and Jayashree Bhattacharjee 2,*
1 Department of Management Studies, Indian Institute of Information Technology, Allahabad 211012, India;
[email protected] 2 Department of Business Administration, Assam University, Silchar 788011, India
* Correspondence: [email protected]
Received: 7 December 2018; Accepted: 14 January 2019; Published: 30 January 2019
Abstract: Risk perception is an idiosyncratic process of interpretation. It is a highly personal
process of making a decision based on an individual’s frame of reference that has evolved over
time. The purpose of this paper is to find out the risk perception level of equity investors and to
identify the factors influencing their risk perception. The study was conducted using a stratified
random sampling design of 358 investors. It was found that the overall risk perception level of
equity investors is moderate and that the main factors affecting their risk perception are
information screening, investment education, fear psychosis, fundamental expertise, technical
expertise, familiarity bias, information asymmetry, understanding of the market, etc. Considering
the above findings, efforts should be made to bring people with a high risk perception to the low
risk perception category by providing them with training to handle or manage high-risk
scenarios which will help in promoting an equity-investment culture.
Keywords: risk; risk perception; equity investment; risk propensity; factor analysis
1. Introduction
Risk is a concept that indicates a potentially negative influence to an asset or some feature of
value that may augment from some present process or future event. According to Lopes (1987), “risk
refers to situations in which a decision is made whose consequences depend on the outcomes of
future events having known probabilities.” Thus, it can be expressed as follows:
Risk = Consequences × Probability
Risk perception is a personalized ideal that people hold about features and the severity of a risk.
Risk perception analyses the opinions of people when they are asked to evaluate hazardous or risky
activities, substances, and technologies (Slovic 1987). Risk perception involves peoples’ beliefs,
attitudes, judgments, and feelings as well as their values—both social and cultural—and
dispositions. It plays a prominent role in peoples’ decision-making process and thus in the case with
the decision to invest in equity shares (Pidgeon et al. 1992). According to Bernstein (1995), the
perception of risk throughout the history of any society has reflected the temper of the times of each
society, as the emphasis has swung from the instinct to measurements and back. As long as people
perceive that they have no control over their characteristics, chance can explain the entire outcome of
risk-taking. Then, the experimentation, exploration, and demonstration of that choice are a valid
human activity and the aforementioned risk is something to be borne. It is well known that investors
do not have control over the return from equity shares and, hence, investments into equity shares are
perceived to be risky.
Risks 2019, 7, 12 2 of 21
Equity share investments involve a certain degree of risk as the returns expected from the
equity shares are not certain. Thus, when going for investments in shares, people try to make proper
tradeoffs between risks and return (Fischer and Jordan 2006). Additionally, people are generally risk
averse (Kahneman and Tversky 1979). They like to invest where the returns are higher for a given
level of risk or risks are least for a given level of return. Risk perception and equity share
investments are negatively correlated, indicating that low risk perception will lead to high equity
investment (Lennart 2002; Slovic 1987; Milliman and Weber 1997; Singh and Bhowal 2009a;
Roszkowski 2010; Veeramani and Karthikeyan 2014). Higher equity investments make people more
entrepreneurial and catalyze them to take more risks, leading to the growth of the economy (Singh
and Bhowal 2009b).
Risk perception is a vital constituent in several assessments and, hence, psychologists are
continuously attempting to find out the best way of measuring risk perception. Singh and Bhowal
(2008) established that the risk perception of an individual can be controlled provided that a person
is aware of the different aspects of his/her risk perception, as well as the reason for the given risk
perception. Therefore, authorities entrusted with the job of framing policies should strive to
measure the risk perception of the individuals who manage it and implement the policies (Singh
and Bhowal 2006).
Thus, there is a need to manage the risk perception of people (Singh 2009, 2011), which is only
possible if it can be measured. Equity-related risk perception among the retail investors is different
in economically advanced regions compared to economically backward and geographically remote
regions (Deb and Singh 2018). The levels of literacy, income, and available infrastructure in
economically backward regions are relatively low compared to those of economically advanced
regions (Deb and Singh 2017). For the purposes of this study, the South Assam region of India,
consisting of the Cachar, Karimganj, and Hailakandi Districts are chosen as a representative of the
economically backward and geographically remote regions. The per capita income and the life
expectancy of this region are also lower than the national averages of India (Registrar General, India
2011).
Southern Assam or Barak Valley (22,244 km2), which covers almost 30% of Assam’s area, is
geographically isolated from the main area of the country. Due to infrastructural issues, it is even
isolated from Brahmaputra Valley, i.e., the main part of Assam. Up to date, there are no large
industries in this valley except for the Cachar Paper Mill (which is on the verge of shutting down), a
medium scale cement industry (viz Barak Valley Cement) and some tea estates. There are only two
industrial estates in this valley, out of which only one is operational. According to the 2011 census,
the literacy rate of this valley is around 77%, which is higher than the state literacy rate of 72.19%
and the national literacy rate of 74.04%. Despite the high literacy rate, the per capita income of this
valley is much lower in comparison to the state and the national income. According to the 2013–2014
figures, the per capita income of this valley was around Rs. 19,612 (NSDP capita, INR at current
prices) compared to the state per capita income of Rs. 44,263 and the national per capita income of
Rs. 44,263. People in this valley have faith only in traditional investment avenues such as bank
deposits, post office savings, insurances, etc. Their low income does not allow them to invest in risky
ventures such as equity. A few years back, a number of share broking houses, as well as a few banks
started their operation and, hence, the equity investment culture entered the developing phase in the
area. However, due to the poor response from the investors, these broking houses had to close down
permanently. Although some banks and the Stock Holding Corporation of India Limited are able to
continue their operation due to the compulsory dematerialization of physical shares, there may be
certain factors which do not encourage the investors to invest in equity shares, influencing them
towards traditional investment avenues instead. Only 0.2% of the populations of this valley have a
Demat account (NSDL 2011) compared to the national figure of 1.81%.
Therefore, a study on measuring the risk perception level of investors’ in equity shares and the
factors influencing the aforementioned risk perception will not only be important but also
contemporary in order to understand the current equity investment scenario in this region. In order
to measure the risk perception of equity investors, a survey on the basis of a structured
Risks 2019, 7, 12 3 of 21
questionnaire was given to the retail equity investors. The questionnaire was framed using the
variables identified by Singh and Bhowal (2011), Singh (2012), and Deb and Singh (2018) with a
five-point scale.
The rest of the paper is organized as follows: Section 2 explains several theories of risk
perception, Section 3 discusses the review of the relevant literature, Section 4 states the objectives of
the study, Section 5 states the research question of the study, Section 6 deals with the research
methodology used in the study, Section 7 describes the analysis and the findings of the study,
Section 8 presents the conclusions and policy implications of the study and, finally, Section 9
presents the scope for future research.
2. Theories of Risk Perception
There are various theories of risk perception which have been evolved over a period of time and
propounded by various scholars. Some of the theories are briefly mentioned here:
a. Protection Motivation Theory: According to protection motivation theory, people are more
likely to protect themselves when they anticipate negative consequences, have the desire to
avoid them, and feel they have the ability to take preventive measures. Sheeran et al. (2014)
found that enhancing the elements of risk appraisal (such as risk perception and perceived
security) has a combined positive effect on changing intentions and behavior towards safety. In
the context of equity investment, the practices of putting ‘stop-loss’ by the equity
traders/investors can be explained by this theory. Stop loss order is an order where a trader can
make important decisions about cutting losses. Having an idea about equity share investment
before investing in equity share (Deb and Singh 2016; Ensuring certainty of income from equity
shares (Deb and Singh 2016; Singh and Bhowal 2011; Powers 2009); Facing the hassles of
making share market investment (Singh and Bhowal 2011) and Having doubt about the
integrity of local agent (Deb and Singh 2016; Singh and Bhowal 2011) are some of the
dimensions in equity share investment which are identified from literature review and supports
the Protection Motivation Theory.
b. Risk Compensation/Risk Homeostasis Theory: Risk Compensation or Risk Homeostasis
Theory states that people tend to take more risks when they feel a greater sense of security. In
other words, individuals adjust their level of risk-taking behavior depending on the safety
measures that are in place (Wilde 1994). It is observed in the stock market that the financial
advisors’ advice young people who have a secure family background to have more equity
exposure. Requirement of huge sum money for equity investment (Singh and Bhowal 2011;
Powers 2009); Ensuring guaranteed income from equity investment (Singh and Bhowal 2011);
and Tracking the daily price movements of shares (Deb and Singh 2016; Singh and Bhowal
2011) are a few of the phenomena identified from literature that can be explained by Risk
Compensation Theory.
c. Situated Rationality Theory: Situated rationality theory makes the argument that it is
erroneous to presume that safe behavior is inherently rational and high-risk behaviors are
inherently irrational. In other words, there is likely a rational justification for why people
choose to take risks that are more explanatory than assuming that a risk taker is simply crazy
or thrill seeking. If the reward of risk-taking is too great, it is often considered rational to take
risks. As Finucane et al. (2000) note, the greater the perceived benefit of activity, the lower the
perceived risk. The fact that a vast majority of Indian households prefer to invest their money
in bank deposits, while less than 10 per cent choose to invest in mutual funds or stocks
(Security Exchange Board of India (SEBI), Survey Report, 2017) is testifying of this theory. Lack
of confidence among the people regarding time at which equity shares need to be bought and
sold (Deb and Singh 2016; Singh and Bhowal 2011; MacCrimmon and Wehrung 1990); Lack of
confidence regarding price at which equity shares are to be bought and sold (Singh and
Bhowal 2011; MacCrimmon and Wehrung 1990), and Lack of knowledge about grievance
Risks 2019, 7, 12 4 of 21
redressal mechanism of a company (Deb and Singh 2016; Singh and Bhowal 2011) are some of
the facts which testify this theory.
d. Habituated Action Theory: Habituated Action theory argues that engaging in high-risk
behavior many times without a negative outcome often decreases the perceived risk associated
with this behavior. Those who repeatedly perform a high-risk action without an adverse
consequence eventually become desensitized to the risk (Kasperson et al. 1988; Weyman and
Kelly 1999). For example, it is observed that people who play on margins in equity investments
and have not faced any loss will keep on increasing their margin. Expertise among some people
in calculation of income from equity investment (Deb and Singh 2016; Singh and Bhowal 2011;
Powers 2009); Information about stock market as an investment avenue (Singh and Bhowal
2011) Education for equity share investment (Deb and Singh 2016; Singh and Bhowal 2010b,
2011), and Existence of coaching/counseling/share investors’ forum locally and change in
investors’ behavior due to this (Singh and Bhowal 2011), etc., testify this theory.
e. Social Action Theory: Social Action theory states that people take a risk because of peer
pressure or a general community perception that activity is of low risk. The propensity
towards risk can be affected by coworkers’ expectations. Individuals confirm to group norms
to avoid sanctions (e.g., teasing, bullying) and start to identify with the group and accept
group perceptions and behavior (Harding and Eiser 1984). For example, a Muslim community
follows Shariah law for investment. Certain actions confirm the social action theory such as the
Feeling of becoming a victim of fraud committed by others; De-motivation among investors to
invest due to the pattern of change in the price of equity shares (Deb and Singh 2016; Singh
and Bhowal 2011); Considering some people’s opinion about riskiness of equity investment
(Singh and Bhowal 2011); Investors’ response to reporting of equity share related scandals in
papers (Deb and Singh 2016; Singh and Bhowal 2011; Kahneman and Tversky 1979); Seeing
others suffer loss in equity investment (Singh and Bhowal 2011); Lack of/irregular/little
information/article/paper in vernacular medium regarding equity share investment (Singh and
Bhowal 2011).
f. Social Control Theory: Social Action Theory was first introduced by Hirschi (1969) and states
that the connectedness to organizations promotes behavior conformity, which can reduce the
probability of high-risk behavior. For example, it is often viewed that people prefer to buy
stocks of the companies where they work. (ONGC employees prefer to buy ONGC shares, OIL
employees prefer to buy OIL shares and so on). Investors’ reaction towards lack of information
about the existence of company where investment to be made (Singh and Bhowal 2011); No
availability of office of the company locally (Singh and Bhowal 2010a, 2011); Understanding
the complex rules and regulation about equity investment (Deb and Singh 2016; Singh and
Bhowal 2011; Bhattacharjee and Singh 2017); Complexity in stock market investment (Deb and
Singh 2016; Singh and Bhowal 2011), etc., confirm to this theory.
g. Bounded Rational Theory: Bounded rational theory was coined by Simon (1950) and is the idea
that in decision making, the rationality of individuals is limited by the information they have,
the cognitive limitations of their minds and the finite amount of time they have to make a
decision. For example, an investor needs to sell off his stocks immediately due to immediate
financial requirement. So, it might not be possible for him to wait for the stock price to be
conducive enough to yield him optimum results due to time constraint. Awareness about the
complex rules and regulation about equity investment (Singh and Bhowal 2011; Bhattacharjee
and Singh 2017); Need of daily monitoring of the share market for investment (Singh and
Bhowal 2011); Lack of knowledge about the utilization of equity market information for
making decision to invest (Singh and Bhowal 2010b, 2011); Difficulty in monitoring
macroeconomic data, financial, and non-financial performance of the company for equity
investment (Singh and Bhowal 2011; Fischer and Jordan 2006), Selecting company and type of
equity shares for investment (Singh and Bhowal 2011; Fischer and Jordan 2006); and Difficulty
in understanding the buying-selling price fixation mechanism of shares (Singh and Bhowal
Risks 2019, 7, 12 5 of 21
2011) are some of the aspects of equity investment which can be explained by bounded
rationality theory.
Risk perception of a person is the function of his/her internal as well as external environment
such as the person’s attitude, heredity, environment, upbringings, etc., and therefore, all the theories
work collectively in influencing the risk perception of the individual in a mixed way. They are acting
collectively and not in isolation; therefore, the scale to measure risk perception is constructed by
extracting the variables from each of the theories.
3. Review of the Existing Literature and Research Gap
A detailed and comprehensive literature review was undertaken to understand the facets of the
area. The literature relevant to risk perception was studied to know the factors studied by other
researchers. Karmakar (2001) opined that the people are in general risk-averse and safety is given the
highest priority while taking an investing decision. Purkayastha (2008) revealed that age, salary, and
designation do impact the risk appetite of an investor. In reality, investors tend to invest in
average-risk mutual funds, irrespective of their demographics and risk tolerance.
Singh and Bhowal (2010a) highlighted that the risk perception of the employees for the shares
of their own company share is relatively lower than the risk perception for the shares of other
companies. Singh (2009) found that investors perceive mutual funds as relatively less risky than that
of direct investment in equity. Roszkowski (2010) stated that the economic crisis of 2008 was said to
lower the risk tolerance of the investors. MacCrimmon and Wehrung (1990) conducted a study
among the executives to know the characteristics of risk-taking by them and it was found that the
most successful executives are the biggest risk takers and most mature executives are the most
risk-averse. Lion and Meertens (2005) suggested that risk avoiders and risk takers differ in the extent
to which they focus on the worst and best outcomes of the risky activity.
Veeramani and Karthikeyan (2014) concluded that investors’ perception of the total investment
risk and return determines the capacity of investors and investors prefer less risky investment
avenues.
Risk perception can be managed and in order to achieve this, there is a need to measure risk
perception (Singh and Bhowal 2008). Sitkin and Pablo (1992) published a paper re-conceptualizing
the determinants of risky behavior. Sitkin and Weingart (1995) highlighted the determinants of risky
decision-making behavior and the role of risk perceptions. There were studies conducted to design
the appropriate measure of risk and to establish a relation between risks and return (Powers 2009).
Palmer (1996) and Weber (2001) have focused on the way where people subjectively convert
objective risk information (i.e., possible consequences of risky choice options such as mortality rates
or financial returns and their likelihood of occurrence) in ways that reflect the impact that these
events have on their lives.
MacGregor et al. (1999) and Koonce et al. (2005) in their studies asked financial experts to rate
the risks involved in various types of investments. The results of these two studies were comparable,
in line with each other, and found that quantitative aspects (probability of loss and volatility) and
qualitative aspects (such as worry and anxiety, and knowledge) were both significant predictors of
perceived risk.
Duxbury and Summers (2004), Klos et al. (2005), Nosic and Weber (2010), and Veld and
Veld-Merkoulova (2008) presented their results of studies using experimental approach which
commonly reveal that potential losses arise larger than the volatility of outcomes both for describing
risk judgments and predicting investment decisions.
Singh and Bhowal (2011) measured investors risk perception from the perspective of the
marketing mix. Singh (2012) studied the risk perception of general investors in respect of their
investment in Initial Public Offer (IPO) of shares. Deb and Singh (2018) have used the scale of Singh
and Bhowal (2011) to study the risk perception of investors in respect of mutual funds.
From the above discussion, it is seen that there have been many studies on measuring risk and
risk perception in several situations and markets, but no attempt has been made to measure the risk

Risks 2019, 7, 12 6 of 21
perception of retail equity investors from a geographically isolated area such as South Assam.
Therefore, in this study, the risk perception of retail equity investors from economically backward
region is measured using the parameters used by Singh and Bhowal (2011); Singh (2012); and Deb
and Singh (2018).
Based on the above background and gap areas, the present study bridges the gap between the
existing literatures to measure the risk perception of retail investors in equity shares belonging to
South Assam of India which is relatively isolated from the mainstream of the country. The
investigation on the risk perception of the investors from this region will help in knowing the level
of risk perception of the investors from a relatively economically backward area. The study is also
helpful in framing policy with respect to investment education in the region so that misperception, if
any, can be eliminated or reduced.
This paper contributes to the existing literature on risk perception in respect of equity shares in
several aspects, for example, the data cover very recent years, up to 2017, which have not been
covered in previous studies, and the study is conducted on a geographically and economically
isolated area, which has also not been done in the previous studies.
Based on the literature review on risk perception about equity investment, measurement of risk
perception and theories of risk perception the following research framework has been proposed as
given in Figure 1.

Risks 2019, 7, 12 7 of 21
Figure 1. Research framework. Source: Compiled by authors from various sources.
4. Objectives of the Study
The objectives of the present study are as follows:
i. To measure the level of risk perception of investor towards equity share investment;
ii. To identify the factors that influences the risk perception of the equity investors.
5. Research Questions
The following research questions are attempted to be answered in this paper:
i. What is the level of risk perception of the equity investors in India?
ii. What are the variables that affect towards building risk perception of the investors?
iii. Which of the variables are least important in framing the overall level of risk perception of the
investors?
iv. What are the factors that affect the risk perception of the investors?
Risks 2019, 7, 12 8 of 21
6. Research Methodology
The study was conducted using the following research methodology.
i. Type of Research: The study is descriptive in nature.
ii. The Universe of the Study: For the purpose of the study, the universe consists of the entire
individual having demat a/c with National Securities Depository Limited (NSDL) in three
districts of Assam, i.e., Cachar, Karimganj, and Hailakandi. There were 7148 demat account
holders (as on 31st March 2015) in these three districts.
iii. Sample and Sample unit: The sampling design for this study is stratified sampling. Therefore,
at 5% level of significance and 95% confidence level, a sample of 365 investors was obtained.
However, seven (7) of them were excluded from the analysis due to incomplete information.
Thus, a sample of 358 investors was finally taken into consideration for the study.
The numbers of investors’ with demat account holders in Cachar, Karimganj, and Hailakandi
districts are 4730, 601, and 1817, respectively. Now with proportional allocation method under
stratified sampling technique, a sample of 245, 38, and 75 from Cachar, Karimganj, and Hailakandi
districts, respectively, were taken to accomplish the total number of sample size 358.
iv. Data Collection: The study was based on primary data and a structured questionnaire was used
to collect the necessary information relevant for our study. However, secondary data was also
obtained from relevant sources such as journals, official reports, newspaper, etc., for providing
necessary background information of the study area.
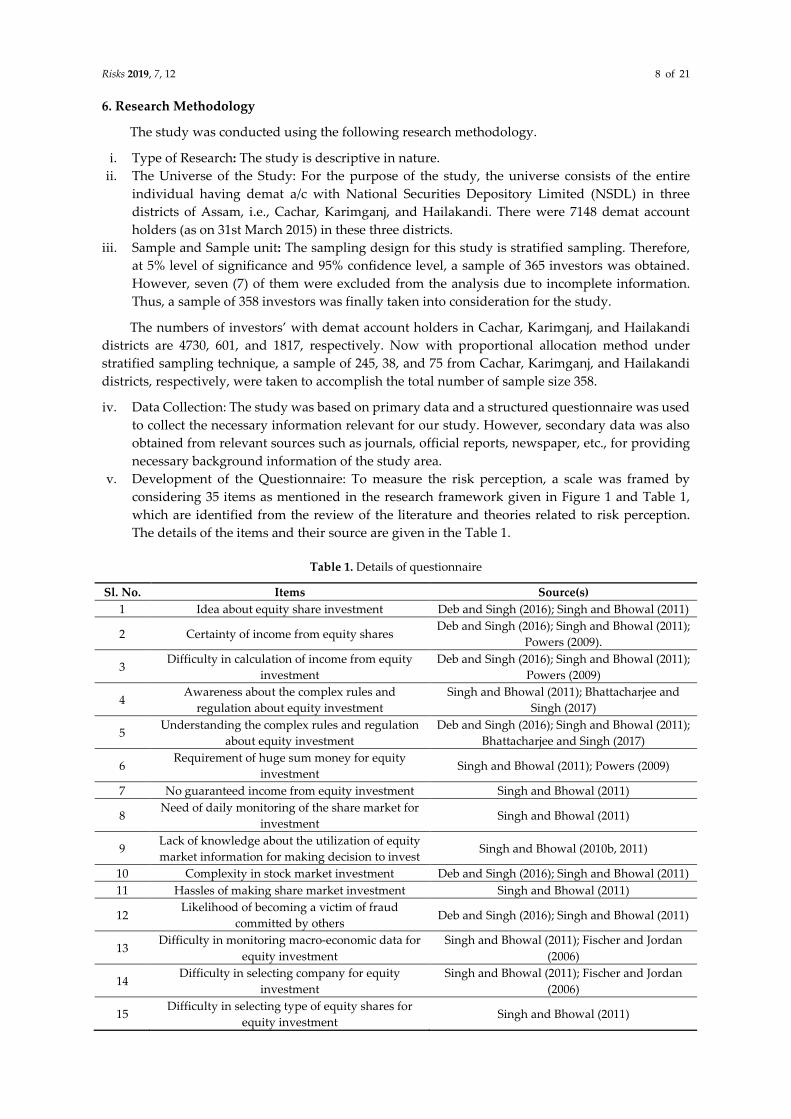
v. Development of the Questionnaire: To measure the risk perception, a scale was framed by
considering 35 items as mentioned in the research framework given in Figure 1 and Table 1,
which are identified from the review of the literature and theories related to risk perception.
The details of the items and their source are given in the Table 1.
Table 1. Details of questionnaire
Sl. No. Items Source(s)
1 Idea about equity share investment Deb and Singh (2016); Singh and Bhowal (2011)
2 Certainty of income from equity shares Deb and Singh (2016); Singh and Bhowal (2011);
Powers (2009).
3 Difficulty in calculation of income from equity
investment
Deb and Singh (2016); Singh and Bhowal (2011);
Powers (2009)
4 Awareness about the complex rules and
regulation about equity investment
Singh and Bhowal (2011); Bhattacharjee and
Singh (2017)
5 Understanding the complex rules and regulation
about equity investment
Deb and Singh (2016); Singh and Bhowal (2011);
Bhattacharjee and Singh (2017)
6 Requirement of huge sum money for equity
investment Singh and Bhowal (2011); Powers (2009)
7 No guaranteed income from equity investment Singh and Bhowal (2011)
8 Need of daily monitoring of the share market for
investment Singh and Bhowal (2011)
9 Lack of knowledge about the utilization of equity
market information for making decision to invest Singh and Bhowal (2010b, 2011)
10 Complexity in stock market investment Deb and Singh (2016); Singh and Bhowal (2011)
11 Hassles of making share market investment Singh and Bhowal (2011)
12 Likelihood of becoming a victim of fraud
committed by others Deb and Singh (2016); Singh and Bhowal (2011)
13 Difficulty in monitoring macro-economic data for
equity investment
Singh and Bhowal (2011); Fischer and Jordan
(2006)
14 Difficulty in selecting company for equity
investment
Singh and Bhowal (2011); Fischer and Jordan
(2006)
15 Difficulty in selecting type of equity shares for
equity investment Singh and Bhowal (2011)

Risks 2019, 7, 12 9 of 21
16 Difficulty in monitoring financial performance of
a company
Singh and Bhowal (2011); Fischer and Jordan
(2006)
17 Difficulty in monitoring non-financial
performance of a company Singh and Bhowal (2011)
18 Difficulty in understanding the buying-selling
price fixation mechanism of shares Singh and Bhowal (2011)
19 Lack of confidence regarding time at which equity
shares need to be bought
Deb and Singh (2016); Singh and Bhowal (2011);
MacCrimmon and Wehrung (1990)
20 Lack of confidence regarding price at which
equity shares are to be bought
Singh and Bhowal (2011); MacCrimmon and
Wehrung (1990)
21 De-motivation to invest due to the pattern of
change in price of equity shares Deb and Singh (2016); Singh and Bhowal (2011)
22 Difficulty in tracking the daily price movements
of shares Deb and Singh (2016); Singh and Bhowal (2011)
23 Lack of information about stock market as an
investment avenue Singh and Bhowal (2011)
24 Lack of education for equity share investment Deb and Singh (2016); Singh and Bhowal
(2010b, 2011)
25 Some people’s opinion about riskiness of equity
investment Singh and Bhowal (2011)
26 Lack of coaching/counseling/share investors’
forum locally Singh and Bhowal (2011)
27 Lack of information/article/paper in vernacular
medium regarding equity share investment Singh and Bhowal (2011)
28 Irregular information/article/paper in vernacular
medium regarding equity share investment Singh and Bhowal (2011)
29 Little information/article/paper in vernacular
medium regarding equity share investment Singh and Bhowal (2011)
30 Reporting of equity share scandals in papers Deb and Singh (2016); Singh and Bhowal (2011);
Kahneman and Tversky (1979)
31 Seeing others to suffer loss in equity investment Singh and Bhowal (2011)
32 Lack of information about the existence of
company where investment to be made Singh and Bhowal (2011)
33 None availability of office of the company locally Singh and Bhowal (2010a, 2011)
34 Doubt about the integrity of local agent Deb and Singh (2016); Singh and Bhowal (2011)
35 Lack of knowledge about grievance redressal
mechanism of a company Deb and Singh (2016); Singh and Bhowal (2011)
Source: Compiled by authors from various sources.
By applying item–total correlation on the above items, it was found that the item–total
correlation value of Item No. 6, Item No. 11, Item No 23, Item No 32, and Item No. 34 was less than
0.2, which means that these items does not correlate very well with the overall score and thus may be
dropped. So, a total of 30 items were used for analysis purpose.
For measuring risk perception, the responses to the above-mentioned items were obtained on a
five-point Likert scale, where a response of strongly disagree was given a score of 1, which
consequently denotes a very low level of risk perception, and response of 5 was given for strongly
agree, which denotes a very high level of risk perception. Besides these, there were questions on the
demographic and socio-economic profile of the respondents.
vi. Profile of the Respondents
The profile of the respondents is given in Table 2.
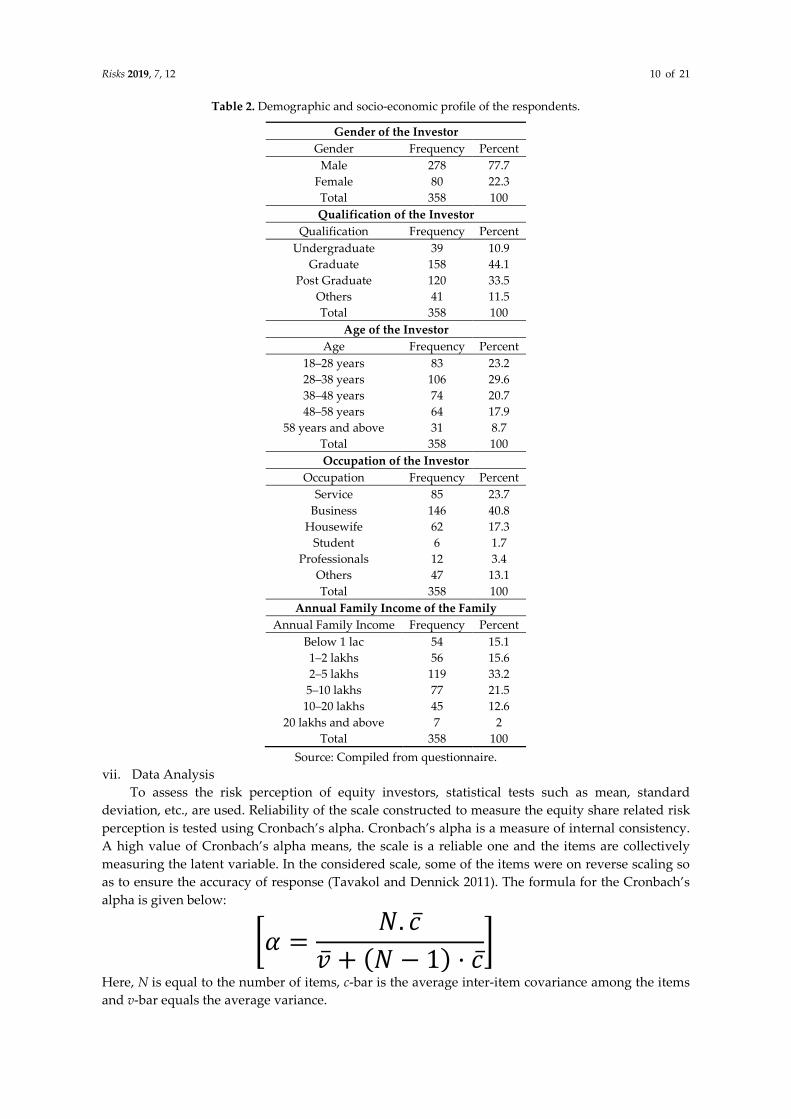
Risks 2019, 7, 12 10 of 21
Table 2. Demographic and socio-economic profile of the respondents.
Gender of the Investor
Gender Frequency Percent
Male 278 77.7
Female 80 22.3
Total 358 100
Qualification of the Investor
Qualification Frequency Percent
Undergraduate 39 10.9
Graduate 158 44.1
Post Graduate 120 33.5
Others 41 11.5
Total 358 100
Age of the Investor
Age Frequency Percent
18–28 years 83 23.2
28–38 years 106 29.6
38–48 years 74 20.7
48–58 years 64 17.9
58 years and above 31 8.7
Total 358 100
Occupation of the Investor
Occupation Frequency Percent
Service 85 23.7
Business 146 40.8
Housewife 62 17.3
Student 6 1.7
Professionals 12 3.4
Others 47 13.1
Total 358 100
Annual Family Income of the Family
Annual Family Income Frequency Percent
Below 1 lac 54 15.1
1–2 lakhs 56 15.6
2–5 lakhs 119 33.2
5–10 lakhs 77 21.5
10–20 lakhs 45 12.6
20 lakhs and above 7 2
Total 358 100
Source: Compiled from questionnaire.
vii. Data Analysis
To assess the risk perception of equity investors, statistical tests such as mean, standard
deviation, etc., are used. Reliability of the scale constructed to measure the equity share related risk
perception is tested using Cronbach’s alpha. Cronbach’s alpha is a measure of internal consistency.
A high value of Cronbach’s alpha means, the scale is a reliable one and the items are collectively
measuring the latent variable. In the considered scale, some of the items were on reverse scaling so
as to ensure the accuracy of response (Tavakol and Dennick 2011). The formula for the Cronbach’s
alpha is given below:
�� =�. �̅
�̅ + (� − 1) · �̅�
Here, N is equal to the number of items, c-bar is the average inter-item covariance among the items
and v-bar equals the average variance.
Risks 2019, 7, 12 11 of 21
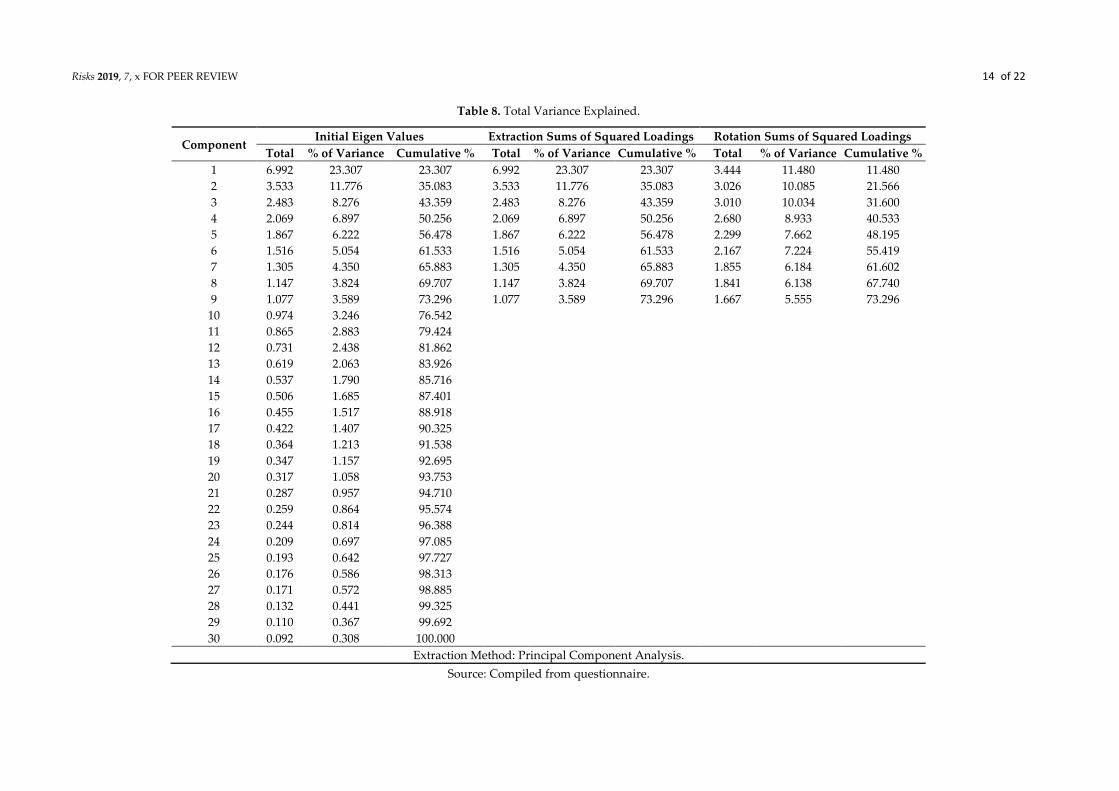
Factors affecting the risk perception of equity investors are extracted using factor analysis. To
identify the number of factors that significantly relate to the original variables, the Rotation Sum of
Squared Loadings is used that shows the variance and Eigenvalue after rotation. Eigenvalue is the
sum of squared factor loadings pertaining to that particular factor and the process uses rotated
Eigenvalue to decide the number of significant factors. Each of the components has an Eigenvalue of
total variance explained and it explains the variance of that particular component. The same is also
expressed in percentage of variance. The method used to get the output is the Varimax rotation.
7. Findings of the Study
The findings of the study are presented in the following paragraphs.
i. Reliability of the Scale
The reliability of the scale prepared to measure risk perception of equity investors was tested
using Cronbach’s alpha. The value of Cronbach’s alpha is 0.881. Cronbach’s alpha of more than 0.70
is considered to be a good measure of the reliability of scale (Nunnaly 1978). Thus, in the present
study, it can be inferred that the scale is a reliable one and it is actually measuring the latent variable
namely risk perception.
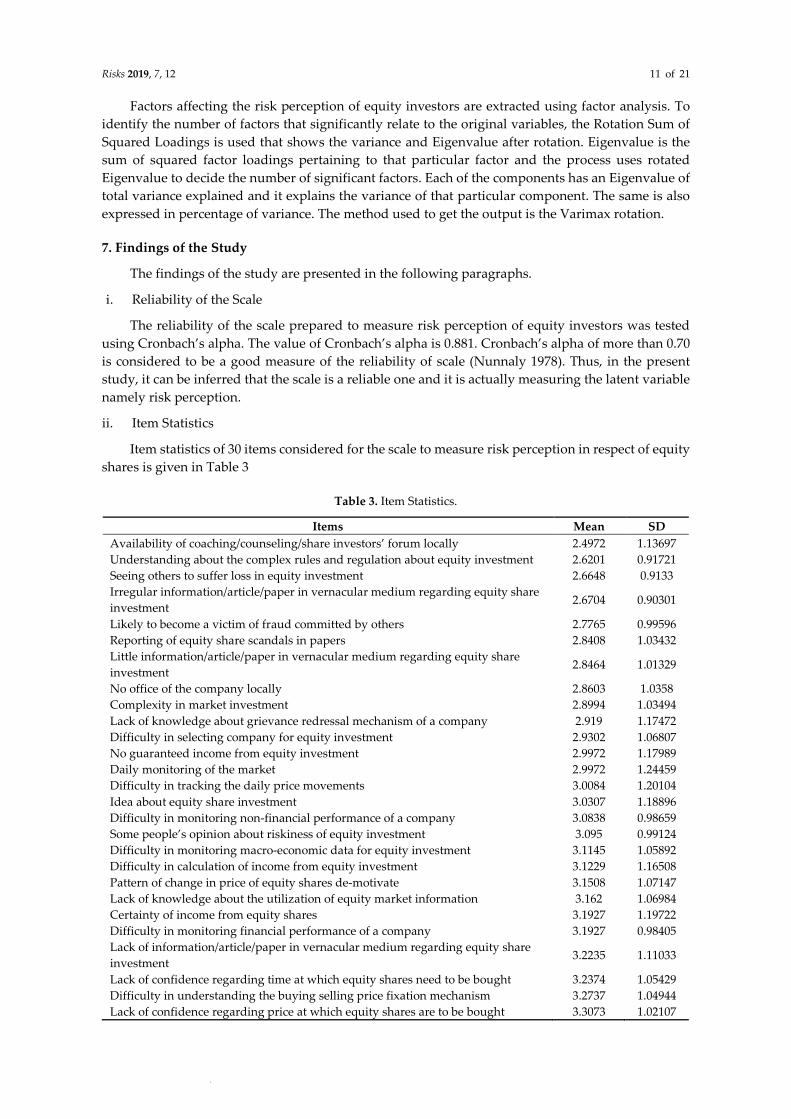
ii. Item Statistics
Item statistics of 30 items considered for the scale to measure risk perception in respect of equity
shares is given in Table 3
Table 3. Item Statistics.
Items Mean SD
Availability of coaching/counseling/share investors’ forum locally 2.4972 1.13697
Understanding about the complex rules and regulation about equity investment 2.6201 0.91721
Seeing others to suffer loss in equity investment 2.6648 0.9133
Irregular information/article/paper in vernacular medium regarding equity share
investment 2.6704 0.90301
Likely to become a victim of fraud committed by others 2.7765 0.99596
Reporting of equity share scandals in papers 2.8408 1.03432
Little information/article/paper in vernacular medium regarding equity share
investment 2.8464 1.01329
No office of the company locally 2.8603 1.0358
Complexity in market investment 2.8994 1.03494
Lack of knowledge about grievance redressal mechanism of a company 2.919 1.17472
Difficulty in selecting company for equity investment 2.9302 1.06807
No guaranteed income from equity investment 2.9972 1.17989
Daily monitoring of the market 2.9972 1.24459
Difficulty in tracking the daily price movements 3.0084 1.20104
Idea about equity share investment 3.0307 1.18896
Difficulty in monitoring non-financial performance of a company 3.0838 0.98659
Some people’s opinion about riskiness of equity investment 3.095 0.99124
Difficulty in monitoring macro-economic data for equity investment 3.1145 1.05892
Difficulty in calculation of income from equity investment 3.1229 1.16508
Pattern of change in price of equity shares de-motivate 3.1508 1.07147
Lack of knowledge about the utilization of equity market information 3.162 1.06984
Certainty of income from equity shares 3.1927 1.19722
Difficulty in monitoring financial performance of a company 3.1927 0.98405
Lack of information/article/paper in vernacular medium regarding equity share
investment 3.2235 1.11033
Lack of confidence regarding time at which equity shares need to be bought 3.2374 1.05429
Difficulty in understanding the buying selling price fixation mechanism 3.2737 1.04944
Lack of confidence regarding price at which equity shares are to be bought 3.3073 1.02107

Risks 2019, 7, 12 12 of 21
Awareness about the complex rules and regulation about equity investment 3.3101 1.25979
Lack of education for equity share investment 3.419 0.98895
Difficulty in selecting type of equity shares for equity investment 3.4609 0.90587
Source: Compiled from questionnaire.
iii. Scale Construction
The scale considered for this study contains 30 items. Since a score of 5,4,3,2, and 1 was given to
the respondents for their response of strongly agree, agree, moderately agree, disagree, and strongly
disagree, respectively, the maximum one respondent can score in each of the items is 5. Therefore,
the maximum possible score is 150 (30 × 5). Similarly, the minimum one respondent can score in each
of the items is 1 and, therefore, the minimum possible score is 30 (30 × 1). The difference between
maximum and minimum possible score is 120 (150 − 30). In order to ascertain the risk perception at
five levels, this range (120) is divided by 5. It is found to be 24. Adding 24 with 30 (lowest possible
score), the very low level of risk perception range (30 − 54) is obtained. Similarly, adding 24 with
subsequent value, next higher range is obtained. In Table 4, risk perception score is interpreted.
Table 4. Interpretation of risk perception level score.
30–54 Very low level of risk perception
54–78 Low level of risk perception
78–102 Moderate level of risk perception
102–126 High level of risk perception
126–150 Very high level of risk perception
Source: Compiled by authors.
The mean value of the scale statistics is found to be 90.90 as shown in Table 5, which lies in the
interval 78–102, representing a moderate level of risk perception.
Table 5. Scale Statistics.
Mean Variance Std. Deviation N of Items
90.9050 231.571 15.21745 30
Source: Compiled from questionnaire.
iv. Overall Risk Perception
The overall risk perceptions of the respondents are calculated by adding their score in the Likert
scale, and then its value was interpreted using Table 4. The overall level of risk perception is then
presented in Table 6.
Table 6. Overall risk perception level.
Level of Risk Perception Frequency Percentage
Very low 5 1.40%
Low 155 43.30%
Moderate 186 52.00%
High 12 3.40%
Very high 0 0.00%
Source: Compiled from questionnaire.
From Table 6, it is clear that the majority on the investors of Barak Valley has a moderate level
of risk perception towards equity investment.
v. Factor analysis
In order to perform factor analysis, the first thing to be done is to test the adequacy of the
sample considered for the study. To test the adequacy of the collected data from the samples, the
Kaiser–Meyer–Olkin (KMO) measure of sample adequacy and Bartlett’s test were done on the 358

Risks 2019, 7, 12 13 of 21
responses. The KMO and Bartlett’s test of sphericity check the redundancy among the variables and
whether the variables can be summarized with a small number of factors. Both tests have the same
objective of ensuring if the factor analysis can be done efficiently with the original variables.
Bartlett’s test of sphericity uses the following formula:
x� = − �n − 1 − 2p + 5
6� × ln|R|
In the above equation, |R| represents the determinants of correlation matrix and is computed
to measure the overall relation with the variables. The value of KMO should be more than 0.5 for a
satisfactory factor analysis (Kaiser 1974). Table 7 shows that the KMO value for this study is 0.737,
which means sample size is adequate enough to carry out the factor analysis.
Again, Table 7 shows that the p-value for Bartlett’s test of sphericity is 0.000 (which is less than
0.05). This also confirms the data considered for factor analysis is appropriate.
Table 7. Kaiser–Meyer–Olkin (KMO) and Bartlett’s Test.
Kaiser–Meyer–Olkin Measure of Sampling Adequacy 0.737
Bartlett’s Test of Sphericity
Approximate Chi-Square 6268.120
DF 435
Sig 0.000
Source: Compiled from questionnaire.
The number of factors is identified on the basis of Eigenvalue. The Eigenvalue for a given factor
measures the variance in all the variables which are accounted for by that factor. If the factor has
Eigenvalue less than unity, then it is contributing little to the explanation of variances and may be
ignored as redundant with more important factors.
From Table 8, it is evident that nine factors have Eigen value more than 1 and these nine factors
can explain 73.29% of the total variability. Thus, there are nine components for Principal Component
Analysis.
The Principal component analysis is used to find that which variables are most strongly
correlated with each component, i.e., which of these numbers are large in magnitude. This process
helps in identifying the low correlation variables with the component. Table 9 shows the Rotated
Component Matrix, where larger correlations are in boldface.
Risks 2019, 7, x FOR PEER REVIEW 14 of 22
Table 8. Total Variance Explained.
Component Initial Eigen Values Extraction Sums of Squared Loadings Rotation Sums of Squared Loadings
Total % of Variance Cumulative % Total % of Variance Cumulative % Total % of Variance Cumulative %
1 6.992 23.307 23.307 6.992 23.307 23.307 3.444 11.480 11.480
2 3.533 11.776 35.083 3.533 11.776 35.083 3.026 10.085 21.566
3 2.483 8.276 43.359 2.483 8.276 43.359 3.010 10.034 31.600
4 2.069 6.897 50.256 2.069 6.897 50.256 2.680 8.933 40.533
5 1.867 6.222 56.478 1.867 6.222 56.478 2.299 7.662 48.195
6 1.516 5.054 61.533 1.516 5.054 61.533 2.167 7.224 55.419
7 1.305 4.350 65.883 1.305 4.350 65.883 1.855 6.184 61.602
8 1.147 3.824 69.707 1.147 3.824 69.707 1.841 6.138 67.740
9 1.077 3.589 73.296 1.077 3.589 73.296 1.667 5.555 73.296
10 0.974 3.246 76.542
11 0.865 2.883 79.424
12 0.731 2.438 81.862
13 0.619 2.063 83.926
14 0.537 1.790 85.716
15 0.506 1.685 87.401
16 0.455 1.517 88.918
17 0.422 1.407 90.325
18 0.364 1.213 91.538
19 0.347 1.157 92.695
20 0.317 1.058 93.753
21 0.287 0.957 94.710
22 0.259 0.864 95.574
23 0.244 0.814 96.388
24 0.209 0.697 97.085
25 0.193 0.642 97.727
26 0.176 0.586 98.313
27 0.171 0.572 98.885
28 0.132 0.441 99.325
29 0.110 0.367 99.692
30 0.092 0.308 100.000
Extraction Method: Principal Component Analysis.
Source: Compiled from questionnaire.

Risks 2019, 7, x FOR PEER REVIEW 15 of 22
Table 9. Rotated Component Matrix.
Component
1 2 3 4 5 6 7 8 9
Difficulty in monitoring financial performance of a company 0.827 0.082 −0.022 0.128 0.138 0.243 0.041 0.041 0.036
Difficulty in monitoring non-financial performance of a company 0.750 0.033 0.075 0.194 0.131 0.157 −0.116 0.079 0.045
Difficulty in tracking the daily price movements 0.680 −0.142 0.333 −0.027 0.224 −0.075 0.111 0.315 −0.021
Likely to become a victim of fraud committed by others 0.657 −0.040 0.146 −0.249 0.110 0.358 −0.017 0.043 0.180
Difficulty in selecting company for equity investment 0.456 0.183 −0.059 0.005 −0.228 0.368 0.311 0.140 0.322
Lack of education for equity share investment −0.083 0.796 0.039 −0.001 −0.065 −0.003 0.229 0.082 −0.184
Some people’s opinion about riskiness of equity investment −0.026 0.771 0.075 0.327 0.159 0.014 −0.205 −0.038 −0.135
Little information/article/paper in vernacular medium regarding equity share investment −0.121 0.613 0.245 −0.155 0.121 −0.017 0.060 0.230 0.423
Lack of knowledge about the utilization of equity market information 0.332 0.548 −0.140 0.145 0.358 −0.025 0.024 −0.077 0.321
No guaranteed income from equity investment 0.398 0.529 0.322 0.092 0.069 −0.014 0.034 −0.387 0.142
Seeing others to suffer loss in equity investment 0.310 0.458 0.362 0.060 −0.359 0.185 −0.224 0.182 0.040
Understanding about the complex rules and regulation about equity investment 0.230 0.117 0.811 0.016 0.062 −0.094 0.073 −0.168 −0.009
Irregular information/article/paper in vernacular medium regarding equity share investment 0.048 0.125 0.708 0.085 −0.151 0.271 0.215 −0.053 0.179
Idea about equity share investment −0.006 0.020 0.660 0.470 0.199 −0.047 −0.004 0.162 0.103
Lack of information/article/paper in vernacular medium regarding equity share investment 0.055 0.447 0.463 0.350 0.205 0.189 −0.056 0.078 0.193
Daily monitoring of the market −0.016 0.063 0.460 0.061 0.289 0.411 0.010 0.391 0.199
Certainty of income from equity shares 0.047 0.257 0.311 0.733 −0.055 0.024 0.181 −0.062 0.319
Difficulty in calculation of income from equity investment 0.025 0.103 0.161 0.724 0.013 −0.031 0.319 0.304 0.143
Lack of confidence regarding time at which equity shares need to be bought 0.171 0.038 −0.012 0.659 0.055 0.465 0.107 0.037 −0.022
Difficulty in monitoring macro-economic data for equity investment 0.222 0.085 0.279 −0.020 0.812 0.067 −0.017 −0.007 0.006
Difficulty in selecting type of equity shares for equity investment 0.310 0.060 −0.173 0.025 0.778 0.052 −0.060 0.112 0.014
Awareness about the complex rules and regulation about equity investment −0.242 0.346 0.353 0.399 0.553 0.021 0.192 −0.073 0.033
Pattern of change in price of equity shares de-motivate 0.313 −0.039 0.132 −0.088 0.028 0.811 −0.012 0.099 0.089
Lack of confidence regarding price at which equity shares are to be bought 0.217 0.048 −0.018 0.363 0.054 0.713 0.123 0.006 −0.026
No office of the company locally −0.150 −0.077 0.226 0.197 0.051 −0.043 0.802 0.040 0.123
Lack of knowledge about grievance redressal mechanism of a company 0.134 0.107 −0.003 0.147 −0.035 0.145 0.769 0.078 −0.038
Rare reporting of equity share scandals in papers 0.158 0.184 0.015 0.025 −0.089 0.062 0.042 0.822 0.038
Difficulty in understanding the buying selling price fixation mechanism 0.199 −0.179 −0.149 0.345 0.241 0.093 0.143 0.649 0.016
Lack of coaching/counseling/share investors’ forum locally 0.063 0.016 0.274 0.247 0.005 0.003 −0.046 0.085 0.747
Complexity in market investment 0.400 −0.195 −0.058 0.083 0.038 0.250 0.253 −0.096 0.585
Source: Compiled from Questionnaire.
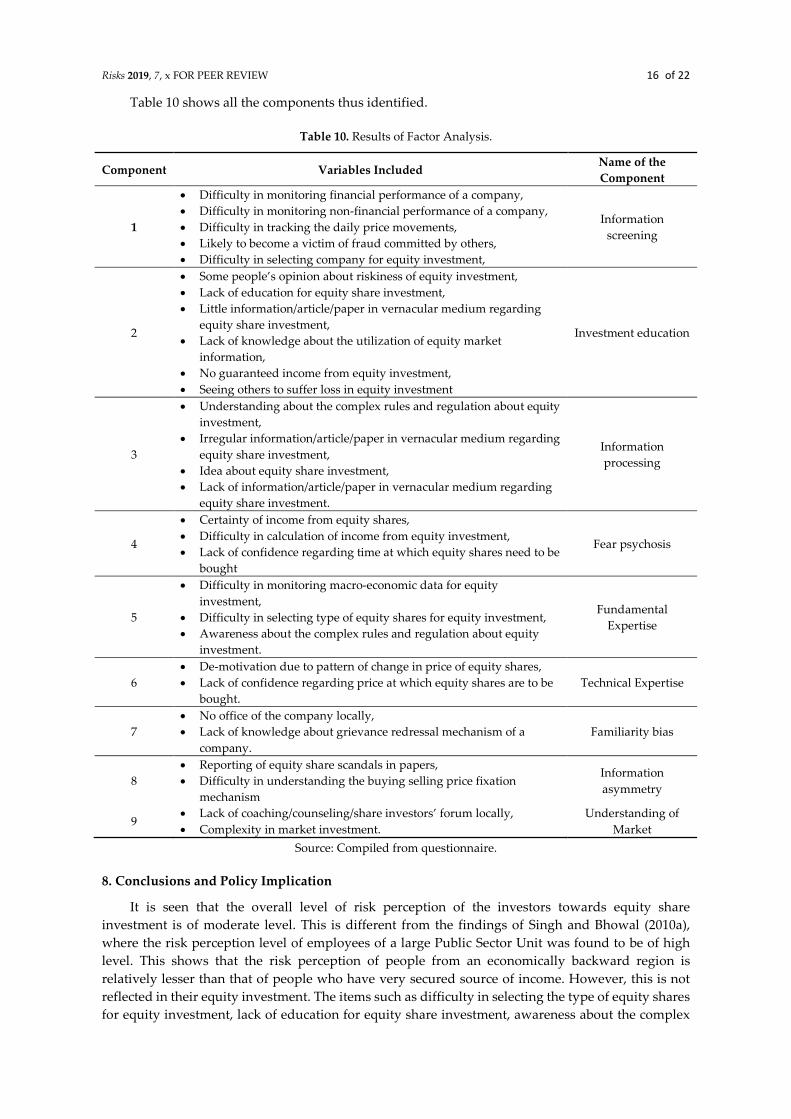
Risks 2019, 7, x FOR PEER REVIEW 16 of 22
Table 10 shows all the components thus identified.
Table 10. Results of Factor Analysis.
Component Variables Included Name of the
Component
1
Difficulty in monitoring financial performance of a company,
Difficulty in monitoring non-financial performance of a company,
Difficulty in tracking the daily price movements,
Likely to become a victim of fraud committed by others,
Difficulty in selecting company for equity investment,
Information
screening
2
Some people’s opinion about riskiness of equity investment,
Lack of education for equity share investment,
Little information/article/paper in vernacular medium regarding
equity share investment,
Lack of knowledge about the utilization of equity market
information,
No guaranteed income from equity investment,
Seeing others to suffer loss in equity investment
Investment education
3
Understanding about the complex rules and regulation about equity
investment,
Irregular information/article/paper in vernacular medium regarding
equity share investment,
Idea about equity share investment,
Lack of information/article/paper in vernacular medium regarding
equity share investment.
Information
processing
4
Certainty of income from equity shares,
Difficulty in calculation of income from equity investment,
Lack of confidence regarding time at which equity shares need to be
bought
Fear psychosis
5
Difficulty in monitoring macro-economic data for equity
investment,
Difficulty in selecting type of equity shares for equity investment,
Awareness about the complex rules and regulation about equity
investment.
Fundamental
Expertise
6
De-motivation due to pattern of change in price of equity shares,
Lack of confidence regarding price at which equity shares are to be
bought.
Technical Expertise
7
No office of the company locally,
Lack of knowledge about grievance redressal mechanism of a
company.
Familiarity bias
8
Reporting of equity share scandals in papers,
Difficulty in understanding the buying selling price fixation
mechanism
Information
asymmetry
9 Lack of coaching/counseling/share investors’ forum locally,
Complexity in market investment.
Understanding of
Market
Source: Compiled from questionnaire.
8. Conclusions and Policy Implication
It is seen that the overall level of risk perception of the investors towards equity share
investment is of moderate level. This is different from the findings of Singh and Bhowal (2010a),
where the risk perception level of employees of a large Public Sector Unit was found to be of high
level. This shows that the risk perception of people from an economically backward region is
relatively lesser than that of people who have very secured source of income. However, this is not
reflected in their equity investment. The items such as difficulty in selecting the type of equity shares
for equity investment, lack of education for equity share investment, awareness about the complex

Risks 2019, 7, x FOR PEER REVIEW 17 of 22
rules and regulation about equity investment have a relatively high contribution in building the
overall level of risk perception towards equity investment. All these variables are directly related to
the exposure of the people to the equity market. Exposure to a risky situation influences a person to
make an investment in a risky asset (Krueger 1993). It means their risk perception is relatively
favorable for making equity investment (Singh and Bhowal 2009b) but they do not have the
necessary exposure to the equity market and hence they are not making an equity investment. Given
their moderate level of risk perception, if they are given exposure to the equity market, the equity
investment culture in the region can be improved and, consequently, entrepreneurial activities can
be accelerated.
The study identifies nine factors which have an impact on investors’ risk perception. These are
Difficulty in the screening of information, inadequate investment education, inadequate
information, Return-related suspicions, Fundamental expertise, and Technical expertise, Familiarity
with the company, Information asymmetry, and Inadequate understanding of market.
Thus, it is evident from the findings that most important factor that has an impact on investors’
risk perception is difficulty in the screening of information, which is similar with the findings of
Fischhoff et al. (1978).
Risk perceptions are exaggerated when vulnerable investors believe that they have difficulty in
screening the available information. In such cases, the difficulty is experienced not only by the retail
investors but also in the experts, regulators and Government officials who monitor the activity or
market. Sachsea et al. (2012) focused on the effects of individual characteristics on financial risk
perception. Ricciardi (2004) stated that difficulty in the screening of information might influence an
investment professional’s risk perception. Pellinen et al. (2011) stated that risk perception increases
when investors have more information but they are unable to screen it. Thus, there is a need for
proper investment education and training (Singh and Bhowal 2010b).
Perceived risk determines not only the sources of information conferred but also the type of
information that has been used by the investor. The same behavior could be observed in the stock
market as well because information is a means which allows limiting the uncertainty surrounding
the investment situation. Nwezeaku and Okpara (2010) indicates that the level of information
asymmetry can be featured by the risk of investing with a privately informed investor. Thus, the less
the investors share the same information, the higher will be the level of risk perception towards their
decisions in the stock market (Mahmood et al. 2011). Moreover, Wang et al. (2006) specified that
good quality of information disclosure could substantially reduce investors’ risk perception. Social
action theory of risk perception confirms to this behavior.
Information is the first component of protection motivation theory (Rogers 1983). Based on
information, an individual identifies prospective threats and potential opportunities. The individual
then must assess this information to determine whether or not to engage with that potential
opportunity to a given threat.
Familiarity of something comes from exposure. This can be knowledge (Hall 2007), experience
(Klein 2008), or types of unconscious priming (Kahneman 2003). This may eventually lead to a
comfort, affiliation, or some other type of cognitive bond (Laing and Crouch 2004). Shavit et al.
(2016) and Singh and Bhowal (2010a) have also confirmed the presence of familiarity bias.
Social Control theory also stated that connectedness or familiarity to an organization reduces
the probability of high risk behavior (Hirschi 1969).
Hodder et al. (2001) and Koonce et al. (2005) documented that changes in the level of
investment education can result in an adjustment to their risk perception for a specific activity or
situation. Therefore, there is a need for imparting investment education (Singh and Bhowal 2010b)
and make them expert in dealing with their own investment decision.
According to Dreyfus (2005), though experts are rational, they have not been able to defend
their own actions rationally all the time. Expertise in doing fundamental analysis for making equity
investment is also one of the important components of rationality. Rationality is one of the important
components of Bounded Rationality theory. However, possessing technical expertise is one of the

Risks 2019, 7, x FOR PEER REVIEW 18 of 22
most essential elements to manage risk as per situated rationality theory. It says that considering the
situation in hand, a risk needs to be managed and technical analysis attempt to do the same.
Return-related suspicions can influence the risk perception where investors tend to worry that
their investment could be lost (Hira and Mugenda 1999). MacGregor et al. (1999) studied the
relationship between fear psychosis and risk perception and found that fear psychosis is a significant
indicator of risk perception, and Risk Compensation theory also states that people used to take
more risk when they feel more secured.
An investor who has understood the market through his prior experience is likely to use his/her
expertise in handling the risk and Habituated Action Theory says the same thing.
Thus, it is seen that the factors affecting risk perception as identified in this study are also
linked with the existing theories of risk perception and all the theories are having an influence in
building the equity related risk perception of an investors. This finding can be explained with the
help of Figure 2 of this paper.
Thus, looking at Figure 2, it is evident that several factors affecting risk perception of equity
investors are ultimately related to the several theories of risk perception developed over period of
time.
Thus, keeping in mind on the above-mentioned factors, efforts should be made to bring the
people with high risk perception to low risk perception category by imparting them training to
handle or manage high-risk scenarios (Singh and Bhowal 2009, 2010c). Once they are brought to low
risk perception category or trained to handle and manage the high-risk scenario, then it will be easier
for the government to promote equity investment culture amongst the people as well as the same
people will act as entrepreneurship–culture initiator and adaptor (Singh 2011). Understanding the
risk perception of individuals, policy makers can take steps to improve their risk perception and it
will in turn promote better investment culture.
Figure 2. Factors affecting equity related risk perception along with theories. Source: Compiled by
the authors from various sources.
Risks 2019, 7, x FOR PEER REVIEW 19 of 22
9. Scope for Future Research
The present study is confined into the retail equity investors of Barak Valley of Assam only. So,
there is a scope that a large-scale research work can be carried out for the entire state of Assam. To
know their risk perception level with respect to the different demographic variables and also to find
out the impact of risk perception level on actual equity investment, an exploratory study can be
carried out.
Author Contributions: Conceptualization, methodology, writing—review and editing, supervision, resources,
visualization etc. done by R.S.; Formal analysis, investigation, original draft preparation done by J.B.
Funding: This research received no external funding.
Acknowledgments: The help provided by A. Bhowal, Assam University, Diphu Campus, D. Bhattacharjee,
Assam University is greatly acknowledged.
Conflicts of Interest: The authors declare no conflict of interest.
References
Bernstein, Peter. 1995. Risk as a History of Ideas. Financial Analysts Journal 51: 7.
Bhattacharjee, Jayashree, and Ranjit Singh. 2017. Awareness about equity investment among retail investors: A
kaleidoscopic view. Qualitative Research in Financial Market 9: 310–24.
Deb, Sujit, and Ranjit Singh. 2016. Impact of Risk Perception on Investors towards their Investment in Mutual
Fund. Pacific Business Review International 9: 16–23.
Deb, Sujit, and Ranjit Singh. 2017. Influence of Demographic and Socio-economic Variables on Investors’ Risk
Perception towards Mutual Fund: A Study on Bank Employees of Tripura. Bank Parikrama XLI: 94–116.
Deb, Sujit, and Ranjit Singh. 2018. Risk perception dynamics of mutual fund investment decisions. Iranian
Journal of Management Studies 11: 407–26.
Dreyfus, Hubert. 2005. Overcoming the myth of the mental: How philosophers can profit from the
phenomenology of everyday expertise. Proceedings and Addresses of the American Philosophical Association 79:
47–65.
Duxbury, Darren, and Barbara Summers. 2004. Financial risk perception. Are individuals variance averse or
loss averse? Economics Letters 84: 21–8.
Finucane, Melissa, Ali Alhakami, Paul Slovic, and Stephen M. Johnson. 2000. The affect heuristic in judgments
of risks and benefits. Journal of Behavioral Decision Making 13: 1–17.
Fischer, Donald E., and Ronald J. Jordan. 2006. Security Analysis and Portfolio Management. New Delhi: Prentice
Hall.
Fischhoff, Baruch, Paul Slovic, Sarah Lichtenstein, Stephen Read, and Barbara Combs. 1978. How safe is safe
enough? A psychometric study of attitudes towards technological risks and benefits. Policy Sciences 9:
127–79.
Hall, James W. 2007. New Handbook of Auditory Evoked Responses. New York: Pearson.
Harding, Christina M., and J. Richard Eiser. 1984. Characterising the perceived risks and benefits of some
health issues. Risk Analysis 4: 131–41.
Hira, Tahira K., and Olive M. Mugenda. 1999. The relationships between self worth and financial beliefs,
behavior and satisfaction. Journal of Family and Consumer Sciences 91: 76–82.
Hirschi, Travis. 1969. A control theory of delinquency. In Criminology Theory: Selected Classic Readings. Berkeley:
University of California Press, pp. 289–305.
Hodder, Leslie, Lisa Koonce, and Mary Lea McAnally. 2001. SEC Market Risk Disclosures: Implications for
Judgement and Decision Making. Accounting Horizons 15: 49–70.
Kahneman, Daniel. 2003. A perspective on judgment and choice: Mapping bounded rationality. American
Psychologist 58: 697.
Kahneman, Daniel, and Amos N. Tversky. 1979. Prospect Theory: An Analysis of Decision making Under Risk.
Economatricia 47: 263–92.
Kaiser, Henry F. 1974. An Index of Factorial Simplicity. Psychometrika 39: 31–36.
Karmakar, Madhusudan. 2001. Investment Behavior of Household Sectors: A study of a Rural Block in West
Bengal. Journal of Commerce 54: 1–2.

Risks 2019, 7, x FOR PEER REVIEW 20 of 22
Kasperson, Roger E., Ortwin Renn, Paul Slovic, Halina S. Brown, Jacque Emel, Robert Goble, and Samual
Ratick. 1988. The Social Amplification of Risk: A Conceptual Framework. Risk Analysis 8: 177–87.
Klein, Gary. 2008. Naturalistic decision making. Human Factors 50: 456–60.
Klos, Alexander, Elke U. Weber, and Martin Weber. 2005. Investment decisions and time horizon: Risk
perception and risk behavior in repeated gambles. Management Science 51: 1777–90.
Koonce, Lisa, Mary Lea McAnally, and Molly Mercer. 2005. How do investors judge the risk of financial items?
The Accounting Review 80: 221–41.
Krueger, Norris F. 1993. The Impact of Prior Entrepreneurial Exposure on Perceptions of New Venture
Feasibility and Desirability. Entrepreneurship Theory and Practice 18: 5–21.
Laing, Jennifer, and G. I. Crouch. 2004. Vacationing in space: tourism seeks ‘new skies’. In New Horizons in
Tourism: Strange Experiences and Stranger Practices. Oxford: Oxford University Press, pp. 11–25.
Lennart, Sjoberg. 2002. The Allegedly Simple Structure of Experts’ Risk Perception: An Urban Legend in Risk
Research. Science, Technology and Human Values 27: 443–59.
Lion, Rene, and Ree M. Meertens. 2005. Security or Oportunity: The influence of risk—Taking tendency on risk
information preference. Journal of Risk Research 8: 283–94.
Lopes, Lola L. 1987. Between Hope and Fare: The Psychology of Risk. Advances in Experimental Social Psychology
20: 255–95.
MacCrimmon, Kenneth R., and Donald A. Wehrung. 1990. Characteristics of Risk Taking Executives.
Management Science 36: 422–35.
MacGregor, Donald G., Paul Slovic, Michael Berry, and Harold Evensky. 1999. Perception of financial risk: A
Survey Study of Advisors and Planners. Journal of Financial Planning 25: 68–86.
Mahmood, Iqbal, H. Ahmad, Abdul Zahid Khan, and Mansoor Anjum. 2011. Behavioral Implications of
Investors for Investments in Stock Market. European Journal of Social Sckiences 20: 240–47.
Milliman, Richard A., and Elke U. Weber. 1997. Perceived Risk Attitudes: Relating Risk Perception of Risky
Choice. Management Sciences 42: 123–44.
Nosic, Alen, and Martin Weber. 2010. How Riskily Do I Invest? The Role of Risk Attitudes, Risk Perceptions,
and Overconfidence. Decision Analysis 7: 282–301.
NSDL. 2011. NSDL Facts and Figures. Available online: https://nsdl.co.in/about/facts-figs.php (accessed on 15
December 2018).
Nunnaly, Jum C. 1978. Psychometric Theory. New York: McGraw Hill.
Nwezeaku, N. C., and G. C. Okpara. 2010. Stock Market Volatility and Information Asymmetry: lessons from
Nigeria. Interdisciplinary Journal of Contemporary Research in Business 2: 67–79.
Palmer, Christina G. 1996. Risk Perception: An Empirical Study of the Relationship between World View and
The Risk Construct. Risk Analysis 16: 717–23.
Pellinen, Antti, Kari Tormakangas, Outi Uusitalo, and Anu Raijas. 2011. Measuring the financial capability of
Investors: A case of the customers of mutual funds in Finland. International Journal of Bank Marketing 29:
107–33.
Pidgeon, Nick F., Christopher Hood, David Jones, Barry Turner, and Rose Gibson. 1992. Risk perception. In
Risk Analysis, Perception and Management: Report of a Royal Society Study Group. London: Royal Society, pp.
89–134.
Powers, Michel. 2009. Rethinking risk and return: Part 1—Novel norms for non-normality? The Journal of Risk
Finance 10: 101–6.
Purkayastha, Saptarshi. 2008. Investor Profiling and Investment Planning: An Empiric Study. The Icfaian Journal
of Management Research 7: 17–40.
Registrar General, India. 2011. Census of India 2011: Provisional Population Totals-India Data Sheet. New Delhi:
Office of the Registrar General Census Commissioner, India.
Ricciardi, Victor. 2004. A Risk Perception Primer: A Narrative Research Review of the Risk Perception Literature in
Behavioral Accounting and Behavioral Finance. New York: Golden Gate University.
Rogers, Ronald W. 1983. Cognitive and psychological processes in fear appeals and attitude change: A revised
theory of protection motivation. In Social Psychophysiology: A Sourcebook. New York: The Guilford Press,
pp. 153–76.
Roszkowski, Michael J. 2010. Risk Perception and Risk Tolerance Changes Attributable to the 2008 Economic
Crisis: A Subtle but Critical Difference. Journal of Financial Service Professionals 64: 42–53.

Risks 2019, 7, x FOR PEER REVIEW 21 of 22
Sachsea, Katharina, Helmut Jungermanna, and Julia M. Beltingb. 2012. Investment risk—The perspective of
individual investors. Journal of Economic Psychology 33: 437–47.
Shavit, Tal, Eyal Lahav, and Mosi Rosenboim. 2016. Don’t fare Risk, learn about it: How Familiarity reduces
Perceived Risk. Applied Economics Letters 23: 1069–72.
Sheeran, Paschal, Peter R Harris, and Tracy Epton. 2014. Does heightening risk appraisals change people’s
intentions and behavior? A meta-analysis of experimental studies. Psychological Bulletin 140: 511.
Simon, Herbert A. 1950. Administrative behaviour. Australian Journal of Public Administration 9: 241–45.
Singh, Ranjit. 2009. Preference for Direct Equity Investment vs. Indirect Equity Investment: A Study on
Salaried Investors. Domain-The Journal of Management 2: 23–28.
Singh, Ranjit. 2011. Equity investment culture and Entreprenureship- Culture Initiation and Adaptation. Pacific
Business Review International 4: 66–71.
Singh, Ranjit. 2012. Risk Perception in Initial Public Offer of Shares: A Psychometric Study. Asia Pacific Journal
of Risk and Insurance 6: 44–56.
Singh, Ranjit, and Amalesh Bhowal. 2006. Bank employees risk perception as entrepreneurship culture initiator
and adopter. In National Seminar on Global Convergence on Commerce Education. Shillong: NEHU, vol. 9,
November 7.
Singh, Ranjit, and Amalesh Bhowal. 2008. Risk Perception-The Theoretical Kaleidoscope. Vanijya 18: 54–63.
Singh, Ranjit, and Amalesh Bhowal. 2009a. Developing Entrepreneurial Culture by Inculcating the Culture of
Equity Investment. Business Vision 5: 87–99.
Singh, Ranjit, and Amalesh Bhowal. 2009b. Risk perception dynamics and equity share investment behavior.
Indian Journal of Finance 3: 23–30.
Singh, Ranjit, and Amalesh Bhowal. 2010a. Risk Perception of employees with respect to equity shares. Journal
of Behavioral Finance 11: 177–83.
Singh, Ranjit, and Amalesh Bhowal. 2010b. Imparting Investment Education to Employees by Employer: An
Expectation-Experience Gap Study. Amity Management Analyst 5: 57–65.
Singh, Ranjit, and Amalesh Bhowal. 2010c. Marketing Dimension of Equity related Risk Perception of
Employees: Own Company’s Shares Vs Other Company’s Shares. Management Insight 6: 22–36.
Singh, Ranjit, and Amalesh Bhowal. 2011. Development of Marketing Driven Measure of Risk Perception. The
Journal of Risk Finance 12: 140–52.
Sitkin, Sim B., and Amy L. Pablo. 1992. Re-conceptualizing the determinants of risky behavior. The Academy of
Management Review 17: 9–38.
Sitkin, Sim B., and Laurie R. Weingart. 1995. Determinants of risky Decision-making behaviour: A test of the
mediating role of risk perceptions and propensity. The Academy of Management Journal 38: 1573–92.
Slovic, Paul. 1987. Perception of Risk. Science 236: 280–85.
Tavakol, Mohsen, and Reg Dennick. 2011. Making sense of Cronbach’s alpha. International Journal of Medical
Education 2: 53–55.
Veeramani, G., and M. Karthikeyan. 2014. An Analytical Study on Risk Perception and Return for Individual
Investment. Asia Pacific Journal of Research 1: 4–13.
Veld, Chris, and Yulia Veld-Merkoulova. 2008. The risk perceptions of individual investors. Journal of Economic
Psychology 29: 226–52.
Wang, Xiao Lu, Kan Shi, and Hong Xia Fan. 2006. Psychological mechanisms of investors in Chinese Stock
Market. Journal of Economic Psychology 27: 762–80.
Weber, Elke U. 2001. Personality and Risk Taking. In Balteseds International Encyclopedia of Social and Behavioral
Sciences. Bergama: Pergamon, pp. 11274–76.
Weyman, Andrew, and C. J. Kelly. 1999. Risk Perception and Risk Communication: A Review of Literature. London:
Health and Safety Executive.
Wilde, Gerald. 1994. Target Risk: Dealing with the Danger of Death, Disease and Damage in Everyday Decisions.
Toronto: Castor & Columba.
© 2019 by the authors. Licensee MDPI, Basel, Switzerland. This article is an open access
article distributed under the terms and conditions of the Creative Commons Attribution
(CC BY) license (http://creativecommons.org/licenses/by/4.0/).