Human Herpesvirus8 ORF K8.1 Gene Encodes Immunogenic Glycoproteins Generated by Spliced Transcripts
Upload
khangminh22Category
view
1download
0
Edited byVikrom Mathur
Ritika Passi
GP-ORF Series

© 2015 by Observer research FOundatiOn and GlObal POlicy JOurnal
Cover Photoreedz Malik/Flickr/creative cOMMOns/cc by 2.0/httPs://www.Flickr.cOM/PhOtOs/34327614@n00/21507274839
InsIde desIgnanuJ MalhOtra | www.FantOMas.in
PrInted byvinset advertisinG delhi

gLobAL goALs,nAtIonAL ACtIons
Making the Post-2015Development Agenda
Relevant to India
Edited byVikrom Mathur
Ritika Passi
Contents
Sustainable Development: Emergence of a ParadigmV i k r o m m a t h u r | r i t i k a P a s s i
O N E
T W O
International Norms and Domestic Change: Implementing the SDGs in India u r Va s h i a N E J a
Bridging the Gap Between Growth and Development t a N o u b i N g a N g o m | P a r i J a t L a L
New Road to the Old Destination: Analysingthe Hunger Goals a d a f J aV E d | V i d i s h a m i s h r a
Promoting Healthcare and Wellbeing for All N i s h t h a g a u t a m
5 F O U R
T H R E E
F I V E
05
12
18
24
30
Quality Education for All: Can It Be Done? C h a N d r i k a b a h a d u r
From MDGs to SDGs: Mainstreaming the Gender Goal V i d i s h a m i s h r a
35
S I X
S E V E N
41

Providing Water and Sanitation for All s o N a L i m i t t r a
Meeting India's Energy Needs Sustainably a N i r u d d h m o h a N
Economic Growth: Building Human Resources s h u b h s o N i
46
52
58
( E I G H T
N I N E
T E N
Achieving the 3 'I's of SDG 9 s a m i r s a r a N | s h u b h s o N i
Addressing Urbanisationr u m i a i J a z
E L E V E N
T W E L V E
SDGs in India, Institutionally Speaking s a N J E E V a h L u wa L i a
76
T H I R T E E N
64
70
Endnotes 82
Wo
od
Wid
e W
eb, t
he la
rg
es
t s
oC
ial n
et
Wo
rk
/Fr
its
ah
leF
eld
t- lau
rv
ig/F
liC
kr
/Cr
eat
ive C
om
mo
ns
The Global Conversation

sustainable development: emergence of a Paradigm
Sustainable development(SD) is a Trojan Horse of an idea. SD has, over the years, subsumed within it multiple meanings advanced by multiple actors—meanings that
have often masked underlying normative orientations, worldviews and interests. The definition of the Brundtland Commission—development that meets the needs of the present without compromising the ability of future generations to meet their needs—is the most frequently cited definition. No one can dispute such an aspiration. But an agreement on the notion of sustainability often breaks down when we begin thinking of how to implement development that is sustainable. With the world having formally adopted the post-2015 development agenda, the set of 17 goals and 169 targets known as the Sustainable Development Goals (SDGs), developing countries such as India need to unpack and interpret the development framework to ensure its relevance to their development needs and interests.
It is therefore a critical moment, between adoption and execution, to underscore the importance of a national lens through which to understand and implement these goals. To this end, this edited volume: Unpacks the tensions inherent in various interpretations of SD by eliciting debates given varied value systems and national interests (introductory chapter); offers a
framework through which to localise global goals like the SDGs (Chapter 2); focuses on 10 SDGs that are India’s primary concerns (Chapters 3 to 12); and ends with an evaluation of the strengths and weaknesses of institutional architecture for implementing the SDGs in India (Chapter 13).
This introduction sets the stage. First, we situate the concept of SD by briefly looking back at its emergence in local environmental movements to the globalisation of ‘sustainability,’ its spread in public discourse and eventual institutionalisation. Second, we discuss three sets of normative tensions the SD framing engenders: 1) Poverty and environment degradation as two ends of a mutually reinforcing cycle on the one hand, and consumption-based lifestyles in developed nations depredating the environment on the other; 2) collective response through promotion of efficiency gains and improvements in technology versus changes in social attitudes and value systems to counter environmental degradation; and 3) global processes and institutions versus local voices and knowledges. We make current the discussion on each of these tensions by unpacking the norms implicit in the SD Trojan Horse, i.e., we ask which interpretations have been favoured in the SDG agenda that has been adopted. We
Vikrom mathur, sENior fELLow, orf | ritika PaSSi, assoCiatE fELLow & ProJECt Editor, orf
O N E

end with the inevitable conclusion: As a member of the United Nations family, India has rightly adopted the SDGs; as a developing nation with its unique mix of needs, capacities, constitutional imperatives and decentralised governance structures, it must recognise the nature of the framework it has adopted, localise the global agenda and, in so doing, forge ahead with the development path that is right for it.
Situating the ConCept of SD
The concept of ‘sustainability’emerged, inescapably, from within the local environmental movement of the 1960s, 70s and 80s. From primarily focusing on conservation and preservation of wilderness as well as local issues, such as acid rain in Europe, effects of DDT use in the United States and the impact of commercial logging in the Himalayas, the conversation shifted focus toward the depletion of
non-renewable natural resources and ‘carrying capacity’ of the planet. Thanks to an avid post-World War II international development community as well as advances in instrumentation techniques and the rise of ‘earth system’ modeling capacities of super computers, local environmental concerns were aggregated to global/planetary scales. Global concerns, including climate change, biodiversity, conservation of wildlife and desertification, eventually garnered more attention than more localised concerns. Production of ‘planetary’ knowledge eventually led to the emergence of global institutions to manage the Earth’s environment.
Barbara Ward and Rene Dubos are credited with being the parents of the concept of SD in their 1972 book Only One Earth, but it was the Brundtland report that popularised the term (see Figure 11). The rise of international, non-governmental,
1962 1968
Rachel Carson’s Silent Spring published
Paul Ehrlich’s Population Bomb published
1970
First Earth Day held
1971
Greenpeace set up
1972
The UN Conference on Human Environment held in
Stockholm, the first international forum where environment issues
are recognised; UNEP established; Club be Rome’s “Limits to
Growth”published
1973Chipko Movement
born in India
1980IUCN World Conservation
Strategy released
1984 1987
First “State of the World”report released; Third World Network
founded
Brundtland report “Our Common Future”released
1988
IPCCestablished
1992
UN Conference on Environment and
Development held in Rio de Janeiro
6
Figure 1: Timeline Highlights

research and activist organisations2 in the 1970s and onward propagated and mainstreamed a conversation around a ‘limit to development’-oriented interpretation of SD. The Rio Declaration of the 1992 Earth Summit crystallised the sustainable development agenda for the first time. The bundle of 27 principles included within it propositions such as humans as the referent objects of SD, the right to development, environmental protection, eradication of poverty, common but differentiated responsibilities, curtailment of unsustainable patterns of production and consumption, an open international system, environmental justice, warfare, women and global partnerships.
Who iS to Blame? ghettoiSation of SuStainaBility among the poor
The Brundtland Commission proposed a “vicious downward spiral” between poverty and environment degradation:
Many parts of the world are caught in a vicious downward spiral: poor people are forced to overuse environmental resources to survive from day to day, and their impoverishment of the environment further impoverishes them, their survival even more difficult and uncertain.3
This effectively cast the poor as both victims and but also the primary agents of environmental degradation. The related discourse on environmental ‘carrying capacity’—the limit in the number of people the Earth can sustain in the long term without environmental damage—suggests that the explosion in the population of the poor further entrenches the ‘downward spiral.’4 Ehrlich and Holdren’s popular equation of I = PAT stated that population impact (I) was a product of population size (P), the affluence or per capita consumption (A) and the technology supplying each level unit of consumption (T). The increase in the number of poor, i.e., the very visible population explosions being experienced by developing nations in the day, was thus naturally linked to increasing pressure on the ‘global’ environment. The Club de Rome’s “Limits to Growth” report captured this same negative view of population growth.
These two dominant knowledge paradigms, population growth and the poverty-environment nexus, have shaped political discourse. This has been despite a concurrent focus among SD discussants on the institutionalised pattern of development leading to an unsustainable pattern of resource utilisation, i.e., overconsumption. While environmental stress has also been blamed on the high rate of overconsumption and subsequent waste creation—not only in the North, but also by elite sections of developing countries—instead of the population explosion in the South,5 the consumption-led economic order, and the consequent equivalence of development as economic growth, remains, on the whole, the desired pathway for progress among policymakers in developed and developing nations alike. (Thus the adverse reactions by both the North and the South to the “Limits to Growth” report.)
Such an end aim,6 however, engenders a double burden on developing nations. Already industrialised nations have achieved a certain level of development, which enables them to attend to measures that can aid in improving performance through efficiency and thus reverse environmental damage.7 Sweden, therefore, can plan to become the first fossil fuel-free nation (with the increase in budget to be largely financed by an increase in taxes on petrol and diesel).8 Developing countries, on the other hand, do not have this luxury, but are under the double burden of growing and that too in a green manner.
Development space of fledgling or incompletely industrialised economies could even be constricted if they are to follow a trajectory that makes them accountable to at times competing imperatives of poverty alleviation and human development, on the one hand, and reducing environmental stress on the other. For example, growth is needed in sectors that lift millions out of poverty but generate adverse environmental impacts, such as transportation and power.9
This binary burden for developing nations is singularly visible in the SDG agenda. The SDG agenda is built on three basic pillars of sustainability—economic, social and environmental. While the goals essentially form a bucket list for middle- and lower-
7
income countries, it has been pointed out that the agenda chiefly promotes the environmental pillar, as indicated by the overwhelming use of environment-related adjectives as compared to those pertaining to the other two pillars.10 The takeaway implicit in the SDG framework seems to be that the development objective of poorer nations must be tempered by environmental considerations.
This twin responsibility is made further visible when compared to targets specifically aiming the more affluent countries (and sections of society): There is only one weak goal on introducing sustainable patterns of production and consumption (Goal 12), and no recurring motif of reducing overconsumption throughout the goals. Therefore, no mention of reducing water or energy consumption in clear cases of overuse finds its way into the targets. While normatively setting up a framework to deal with sustainability globally, the burden of sustainability has been ghettoised among the poor in practice.11
Whither the Way forWarD? DeBating teChnology fix vS. value Change
A second debate exists between the solutions SD espouses: Changes in values and attitudes, i.e. behavioural changes, or pragmatic, efficiency gains through technology advancement.
The solution will necessarily depend on the manner in which SD has been problematised. The overwhelming understanding that SD means continued economic growth with an incorporation of environmental considerations, thus focusing majorly on the supply side of development,12 has enabled the justification of techno-economic solutions as the determining factors leading toward sustainability. Technological improvements are meant to lower environmental impact of production processes while simultaneously providing ample scope for growth and development.
The Brundtland report built on this premise: Only present limits exist, imposed by existing levels of technology, social organisation and the environmental capacity to absorb anthropogenic effects,
“[b]ut technology and social organization can be both managed and improved to make way for a new era of economic growth.”13
The same understanding is forwarded by the environmental Kuznetsk curve, popular since the 1990s in the field of environmental policy. The curve dictates that environment degradation increases with rising GNP per capita, but once a minimum standard of living achieved, falls, as greater attention and resources are invested in environmental cleanup. Advancement of clean and efficient technology will achieve environmental improvement and protection at increasingly lower costs. The argument of business as usual, with an eventual sensitisation to the environment, has been neatly packaged by economic science (data, models and graphs).
But it has also been posited that a reimagining of our relationship with nature is required, one that re-evaluates the existing economic paradigm in place. Advocates in this camp consider technological solutions superficial, which do not dig deep enough to the underlying causes perpetuating an unsustainable use of resources, and instead recommend looking at socio-political and cultural changes, like land reforms and reducing overconsumption.14 Empirical criticisms also exist: The environmental Kuznetsk curve, for example, has been seen to be applicable to localised pollutants like lead and sulfur (although even here some modicum of doubt exists), but transnational gases like carbon escape its purview.
The conversation around the SDGs has predominantly focused on efficiency gains through cleaner, greener technology and transfer of such technology around the world. To reiterate, the kind of solutions that capture the imagination of policymakers will inevitably stem from the way the problem is framed. But here, too, the same dilemma faces developing nations as noted earlier—the North already has, to a great extent, the foundation, an R&D culture and the means, to innovate and implement environment-friendly technological solutions to counter environment stress. The burden on developing nations now becomes three-fold:
8

Industrialising, conforming to environmental thresholds, and developing a culture of technology and innovation to bridge development and environment degradation, in a space where significant proportions of populations still do not have access to basic necessities. While transfer of technology from advanced nations to less advanced ones has remained a recurring theme, empty promises by empty shells of institutions have thus far bolstered Kenny’s argument that “[d]evelopment progress has always been primarily about poor people and poor countries achieving things for themselves.”15
In the post-2015 development agenda, technology is one of the twin backbones specified for implementing the goals. The word finds mention in several goals (for instance, regarding financial inclusion, agriculture, empowerment of women, clean energy, infrastructure). Building domestic R&D and technological capacities is also regularly emphasised. Goal 17 on strengthening the means of implementation encourages North-South, regional and international cooperation on science, technology and innovation; knowledge
sharing; and transfer of environmentally sound technologies to the have-nots. Even though promises of technology transfer have thus far been severely lacking in practice (despite, for example, India stressing it is not looking for technology handouts but is ready to pay for it needs on competitive terms), the Addis Ababa Action Agenda has outlined a new Technology Facilitation Mechanism to boost collaboration among various actors to support the SDGs. Unfortunately, while the norms and goals are being set at the global level, the means of implementation of those goals are not adequately facilitated through global efforts and processes. The same process is evident in finance mechanisms for the SDGs (see box above16).
Where iS the ConverSation happening? reCovering the loCal in gloBal regimeS
The globalisation of certain environmental concerns like pollution, as noted in the beginning of the chapter, saw the political scaling-up and thus standardisation of certain local issues. This was accompanied
the only tangible aspect of the current financing mechanism to achieve the sdgs remains the over-seas development assistance (oda) architecture (target 17.3), a legacy of the mdg process. While the mdgs first and foremost justified and defined the contours for international aid, the sdgs have a broader mandate and are meant to apply universally. there remains an understanding that developed countries must aid developing nations in finance- and technology-related matters, not only as a nod to equity, but also because if the next 15 years are to yield successful results, international collabora-tion will necessarily from part of the arsenal. under the oda architecture, rich nations have pledged to commit 0.7% of their gross national Product, a commitment that has been oft-repeated, but not fulfilled across the board. in 2013, for instance, denmark, luxembourg, norway, sweden and, for the first time, the uk, were the only nations to meet the 0.7% target. arguments exist to what extent oda flows have affected development outcomes thus far; in face of the requirement of $75-150 per person annually to meet the mdgs, of which less than half would have been met by oda flows, it can be said that oda has had a marginal role to play. Yet, it is a key pillar in the sdgs as well, when un estimates this time around are to the tune of $172.5 trillion for the next 15 years. Clearly, the proliferation of goals has not resulted in a proliferation of financial commitments. the inadequate effectiveness of global processes facilitating action on the ground is further manifest in the dismissal of a proposal on international tax reform at the third international Conference on Financing for development in July.
the discussion on oda flows is notwithstanding the strong focus, this time, on domestic resource mobilisation, not only in target 17.1 but across the sdgs. this is understandable, given that in 2011, aid worth $161 billion was disbursed. the same year, remittances were valued at $341 billion, international private investment at $928 billion, and domestic private sector investment at $3.7 trillion. indeed, oda flows form negligible components in the budgets of emerging nations like india. effectively then, a case can be argued to change the global conversation on global partnerships relating to finance to remove its dependency on the crutch of aid and instead, focus on more critical criteria, such as creating equitable trade regimes and global banking norms that facilitate the flow of capital into infrastructure.
FINANCING THE SDGS: THE GLOBAL CONVERSATION
9

by a scientific simplification—literally through satellite imagery focusing on the Earth from space, for example, but also through statistical and computing models that collect environmental data from across the world and compress local characteristics to pithy models and equations. It has been argued that both the political and the scientific processes have led to institutional regimes that encourage systematic environmental managerialism—which privileges a global, bureaucratic and technocratic elite to navigate the way forward.17
This institutionalisation of environmentalism and resultant governance from afar has meant that actors, such as
international development agencies that form part of this global elite, operate both as ‘frames’ within which to develop, shape or forward certain knowledges and understandings, and as ‘filters’ that discount those interpretations not part of an established mindset.18 Fogel describes it as “erasing the local.”19
Smyth demonstrates the phenomenon with the example of Guinea’s Kissidougou prefecture. The prefecture is covered with patches of forest cover across larger spreads of savanna, an example of
naturally occurring ecological transition zones; these patches, however, were taken to be a loss of forests due to local patterns of land use. This perspective, a manifestation of the global narrative, ignored local history and perspectives.20
The SD discourse has also suffered from the erasing of the local. The distant gaze of global technocrats has persisted—whether regarding knowledge sources, the problem or the solutions proposed. Local people, cultures and knowledges have been marginalised. While the SDGs are notably a result of consultation among representatives of 70 nations as well as inputs from public discussions and an online survey, the terms of engagement were set by the global processes. Moreover, it can be questioned to what extent local concerns and indigenous
ideas were incorporated into the agenda—the universal nature of the 17 goals has been much applauded, but to construct such a blanket appeal inevitably involves disregarding the local.
Conversely, the local is “re-enrolled” at various levels. Fogel describes this phenomenon pertaining to the Clean Development Mechanism of the Kyoto Protocol, where local and indigenous communities are included as “simplified, standardized ‘stakeholders’,” who become idealised “global carbon worker[s].”21
SD, too, has always been understood as a process that will be achieved through local participation. For instance, two-thirds of the 2,500 action items drawn up in Agenda 21 relate to local action. Bottoms-up participation is necessarily a requisite process to promote a successful relationship between development and environment, given that communities will inevitably act within the confines of their surroundings; a lack of knowledge or policy agency being exercised by people on the ground prevents sound discussion, real understanding, and effective trackling and internationalisation of sustainability. While the Open Working Group document proposing the SDGs mentioned that “there are different approaches, visions, models and tools available to each country,”22 the space in which work must be done has already been delineated at the supranational level.
If local actors are to be incorporated at the implementation level, but under an overarching framework within which to act, will this encourage or ignore individuals like Rajendra Singh, winner of this year’s Stockholm Water Prize?23
gloBal promiSeS But national realitieS
The world, and India, cannot hide behind a smokescreen of ambiguity that surrounds the concept of SD. While certain interpretations hold sway in the globalised iteration of the term, as illustrated in the above discussion, the rich must not hide behind the poor, technology must not prevent digging deeper and encouraging changes in consumption patterns, and the global must not be privileged over the local.
10
Political and scientific processes have led to institutional regimes
that encourage systemic environmental materialism - which privileges a global, bureaucratic and technocratic elite to navigate
the way forward.

An international framework notwithstanding, post-adoption must, and necessarily will, see nations take action according to national interests and prerogatives. The discussion thus far in this chapter effectively mandates a country like India, without which the SDGs will not see successful implementation, find its own development path after having taken into account the kind of agreement it has entered into, and what that may mean going forward in terms of monitoring and impact assessment. The first prerogative for developing nations is that they must retain development space to fulfill basic needs of their citizens without being held hostage to environmental redlines (like carbon emission ceilings). More than intergenerational equity, it is equity between the rich and the poor that is the foremost priority. ‘Access’ may, therefore, trump sustainability at times.
What is propitious, however, is that India need not prescribe to the traditional orthodoxy of unfettered economic growth as its development pathway. Sustainable practices, for instance, could perhaps be packaged to address lack of access to basic needs; local patterns of development and resource use could be studied and discussed—with affected individuals, naturally—to instill or pick up notions of sustainability. Global partnerships and networks, if implemented effectively, could be leveraged to share experiences, tools and means. “[N]ew forms of social learning” could allow various socio-political, economic and environmental circumstances to be informed by sustainability.24
The current SDG framework thus becomes an experiment in the process of discovering our development pathway—i.e., a list of inputs that inform development rather than a concoction of outputs like level of emissions allowed or number of protected areas. Every national experiment, including India’s, will be tempered and informed by existing and evolving national capacities, mindsets and practices.
It is with this understanding that the following chapter offers a framework for ‘re-localising’ the global framework of the SDGs in India. While even a casual glance at the SDGs reveals they clearly capture the broad areas of interest to
developing nations, this volume picks out 10 goals—SDG 1 to 9 and SDG 11—to specifically address in the context of India. Alleviating poverty; eradicating hunger and bettering nutrition levels; improving health; providing education; empowering women and promoting gender equality; ensuring water and sanitation facilities; ending energy poverty; stimulating economic growth; building infrastructure, and encouraging industrialisation and innovation; and responding to urbanisation pressures form the primarily rungs of India’s development ladder. While individual in approach, each goal-specific chapter discusses India’s progress in the area, indicates convergence between the goal and India’s priority(ies) within the area, raises challenges and advances steps for the way forward. While these interconnected concerns address the country’s primary basic needs, they also function as the building blocks for an eventual prosperous and sustainable society. (It may have been noticed that SDG 13—tackling climate change—has not been picked up in this collection; given the fast-approaching Paris Conference to discuss a legally binding climate treaty, we feel discussion on this equally critical priority is better suited for this ‘sister’ platform. This is notwithstanding references to climate change that inescapably form part of the chapters on many of the other SDGs.) The compilation ends with a commentary on one specific requisite for successfully internalising the SDGs in India—the national institutional architecture.
In sum, this volume takes the view that the multifaceted and dynamic idea of SD needs to embrace the plurality of contexts and account for the complexity of social, environmental and economic concepts. A blueprint, or a single roadmap, with unambiguous indicators—a one-size-fits-all approach—is neither possible nor desirable. Civil society and governments need to, at this juncture between adoption and implementation, examine the tensions implicit within the framing of SD to encourage policymakers to take decisions with eyes wide open.
11

international norms and domestic Change: implementing the sdgs in india
The Sustainable Development Goals (SDGs) are a set of 17 goals and 169 targets around which international and national development efforts are expected to coalesce. They can
also be thought of as a cluster of inter-related ‘norms’ that prescribe pathways for global poverty alleviation and sustainable development. The widespread nod from member states to the final SDG document can be seen as a point of global normative convergence around the post-2015 development agenda. However, such convergence at the inter-governmental level does not guarantee the successful achievement of the SDGs; the success and failure of the SDGs will ultimately be decided at the national level by whether and how member states follow through on their international commitments.
Implementation of the SDGs in India is likely to be shaped by a number of factors and processes. It is necessary to systematise our understanding of these processes to be able to isolate specific levers that facilitate or impede implementation. This chapter takes the SDGs to be a collection of norms—a normative vision—and constructs a framework that can be used to analyse norm implementation in the Indian context: What factors enable or constrain the domestic implementation of international norms, what explains variance in norm implementation, and
what might this suggest for the achievement of the SDGs in India? In identifying and isolating key factors, the framework can be used as a map, or set of signposts, to build recommendations for progress on SDGs in India. The main focus of this chapter is to identify these factors and suggest ways in which they could apply to SDG implementation, not to provide an in-depth analysis of the SDGs themselves. Subsequent chapters in this volume examine specific SDG goals and their convergence with Indian priorities, and identify means through which India can come closer to achieving targets in line with domestic priorities.
Norm implementation at the domestic level, it will be argued, depends on two keys factors: The degree of fit between international norms and domestic rules, priorities and culture, and the capacity of the state to implement the norm as determined by available resources, institutional structures and the external environment. The domestic level, however, is not homogenous and variations in fit and capacity across the national, state and local levels are likely to further shape norm implementation. These differences across various levels of the state have been bracketed off in this volume, as the main focus is on how the SDGs align with Indian national priorities; they are nonetheless a critical part of the story of norm
u r V a S h i a N E J a , f E L L o w , o r f
T W O

implementation that could be explored in further study.
norm influenCe
Norms are typically defined as standards of appropriate behaviour for actors with a given identity. Norms contribute to behavioural change by shaping the identity and interests of actors, by defining the terms of legitimate action, or by altering the costs and benefits associated with norm-following or norm-breaking behaviour. With the ratification of the SDGs at the United Nations General Assembly this year, the SDGs are likely to become the dominant frame of reference for the post-2015 development agenda and be incorporated into the organisational mandates and policies of international development agencies. The SDGs are also seen as substantively and procedurally more legitimate than the Millennium Development Goals (MDGs), as they are universal in scope and have been negotiated through an inter-governmental process. There is thus considerable buy-in for the SDGs among member states.
This would suggest that the SDGs, as a collection of norms, have reached what Martha Finnemore and Kathryn Sikkink refer to the as the final stage of the ‘norm cycle,’ in which they are institutionalised at the international level.1 The MDGs went through a similar institutionalisation process, involving annual reporting on progress towards MDG achievement to the UN General Assembly by each member state and Global Monitoring Reports.
However, as Alexander Betts and Phil Orchard argue, the institutionalisation of norms at the international level is an inadequate indicator of domestic-level change. It does not tell us how international norms enter domestic discourses and
practices. They argue that we need to consider ‘norm implementation’ as a fourth stage of the norm cycle, given that implementation opens up a new phase of political and normative contestation as the norm encounters domestic beliefs, priorities and capacities, processes that can alter the meaning of the norm and/or constrain its application.2 SDG implementation processes will thus determine the extent to which India achieves its international commitment to the SDGs, and understanding this requires looking toward domestic-level variables. India’s negotiations around the post-2015 development agenda in fact corroborate this analytical distinction between international and domestic norm institutionalisation processes. While India has ratified the SDGs, it has also been clear that the SDGs cannot be ‘to constrict policy space’ or facilitate ‘international priority setting or monitoring.’3
norm implementation
Betts and Orchard define implementation as the steps necessary to introduce a new norm into formal legal and policy mechanisms within the state or organisation in order to routinise compliance.4 At the norm implementation stage, states need to ‘walk the talk’ by allocating budgets and undertaking concrete political actions. Betts and Orchard disaggregate domestic-level influences on norm implementation in terms of whether these are ideational, material or institutional, and how these factors change the norm and/or constrain its application. In practice, however, ideational, material and institutional influences are likely to work alongside one another, combining to shape norm implementation; as theory building is not the main focus of this volume, these analytical distinctions have been collapsed. Instead, the framework proposed in this chapter disaggregates the domestic level into three levels—national, state and local, to indicate that policies, institutions, priorities and values may differ within a country itself. Norm implementation is thus not only a domestic-level process distinct from international norm institutionalisation, but also a differentiated process within specific domestic contexts. Disaggregating the domestic level as such is particularly suited to a discussion of SDG
Norm imPlEmENtatioN oPENs uP a NEw PhasE of Political
aNd NormativE coNtEstatioN as Norms ENcouNtEr
domEstic bEliEfs, PrioritiEs aNd caPacitiEs
13
implementation in India with its federal structure and vast cultural diversity, though as mentioned earlier, these set of variables have been bracketed off in this volume.
fit anD CapaCity
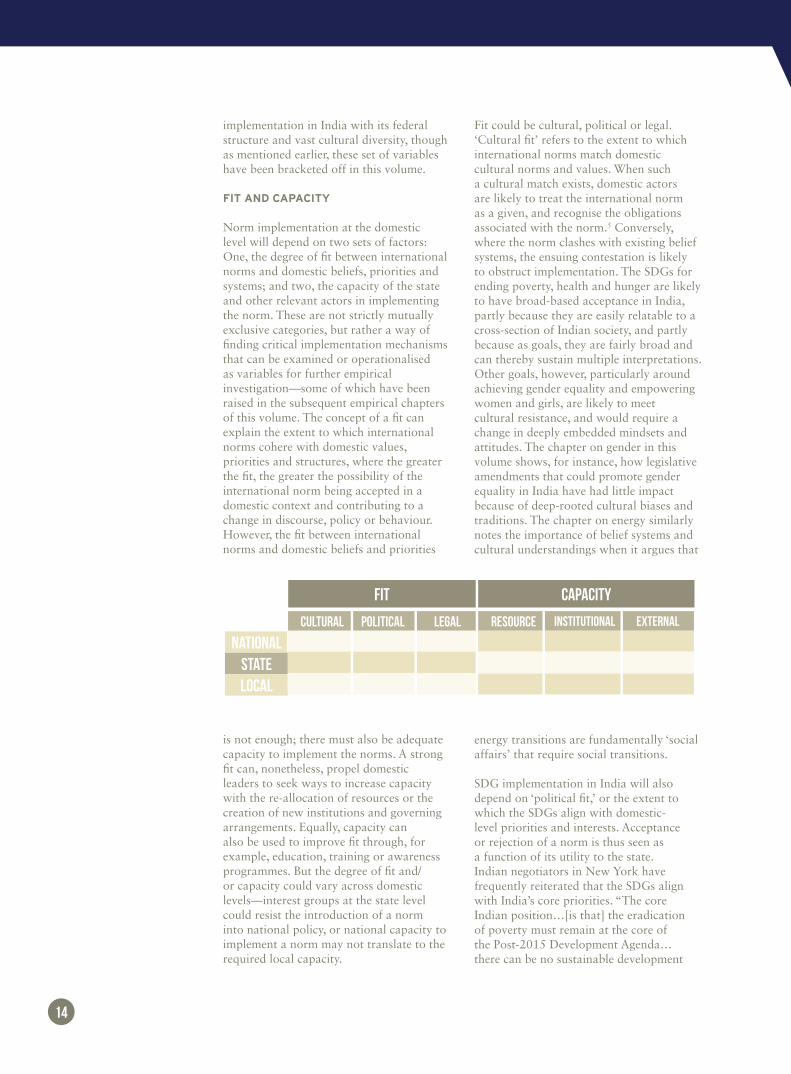
Norm implementation at the domestic level will depend on two sets of factors: One, the degree of fit between international norms and domestic beliefs, priorities and systems; and two, the capacity of the state and other relevant actors in implementing the norm. These are not strictly mutually exclusive categories, but rather a way of finding critical implementation mechanisms that can be examined or operationalised as variables for further empirical investigation—some of which have been raised in the subsequent empirical chapters of this volume. The concept of a fit can explain the extent to which international norms cohere with domestic values, priorities and structures, where the greater the fit, the greater the possibility of the international norm being accepted in a domestic context and contributing to a change in discourse, policy or behaviour. However, the fit between international norms and domestic beliefs and priorities
is not enough; there must also be adequate capacity to implement the norms. A strong fit can, nonetheless, propel domestic leaders to seek ways to increase capacity with the re-allocation of resources or the creation of new institutions and governing arrangements. Equally, capacity can also be used to improve fit through, for example, education, training or awareness programmes. But the degree of fit and/or capacity could vary across domestic levels—interest groups at the state level could resist the introduction of a norm into national policy, or national capacity to implement a norm may not translate to the required local capacity.
Fit could be cultural, political or legal. ‘Cultural fit’ refers to the extent to which international norms match domestic cultural norms and values. When such a cultural match exists, domestic actors are likely to treat the international norm as a given, and recognise the obligations associated with the norm.5 Conversely, where the norm clashes with existing belief systems, the ensuing contestation is likely to obstruct implementation. The SDGs for ending poverty, health and hunger are likely to have broad-based acceptance in India, partly because they are easily relatable to a cross-section of Indian society, and partly because as goals, they are fairly broad and can thereby sustain multiple interpretations. Other goals, however, particularly around achieving gender equality and empowering women and girls, are likely to meet cultural resistance, and would require a change in deeply embedded mindsets and attitudes. The chapter on gender in this volume shows, for instance, how legislative amendments that could promote gender equality in India have had little impact because of deep-rooted cultural biases and traditions. The chapter on energy similarly notes the importance of belief systems and cultural understandings when it argues that
energy transitions are fundamentally ‘social affairs’ that require social transitions.
SDG implementation in India will also depend on ‘political fit,’ or the extent to which the SDGs align with domestic-level priorities and interests. Acceptance or rejection of a norm is thus seen as a function of its utility to the state. Indian negotiators in New York have frequently reiterated that the SDGs align with India’s core priorities. “The core Indian position…[is that] the eradication of poverty must remain at the core of the Post-2015 Development Agenda…there can be no sustainable development
14
NATIONALSTATELOCAL
Cultural POLITICAL LEGAL RESOURCE INSTITUTIONAL EXTERNAL
FIT CAPACITY
with the perpetuation of poverty and hunger.”6 This in turn necessitates a strong focus on economic growth, creation of infrastructure, employment generation and industrialisation. The government’s recent initiatives of Make in India, Digital India, and Clean India are all geared towards these objectives.7 It would thus seem that there is a good deal of political fit to help accelerate implementation.
At the same time, as mentioned earlier, New Delhi has been clear that the SDGs cannot become a means to influence domestic priority setting. Thus, while there is alignment between India’s national priorities and the SDGs, the main utility arguably to India in negotiating the SDGs has been to create an external policy environment conducive to domestic growth. Key to this external policy environment are the four interrelated issues of: 1) A universal but differentiated responsibility for achieving SDG targets; 2) the need for a global partnership to facilitate the implementation of the SDGs; 3) sustainable consumption patterns in the developed world; and 4) a clear separation between development and peace and security issues.8 Moreover, signing on to the SDGs is a way for India to signal to the international community that it is a responsible stakeholder; at the same time, India reserves the right to not pursue particular goals when they do not fit domestic priorities. This indicates that India’s commitment to the SDGs is transactional rather than ideological.9 However, there is an ideological convergence around the primacy of economic growth for achieving development targets in mainstream development thinking and policy circles, in India and internationally, which creates the conditions under which this transactional interaction is complementary to domestic priorities.
When discussing political fit, it is also important to keep in mind that the ‘state’ is not a monolithic entity, and what is identified as the ‘national interest’ is in fact an ongoing negotiation between the priorities of domestic leadership and relevant interest groups.10 The parochially defined preferences of domestic interest groups can contribute to a disruption in political fit; the chapter on health shows, for example, how insurance benefits do not
reach intended beneficiaries in rural India due to corruption and pilferage in the health sector. Similarly, implementing goals for the management of natural resources and the environment will have to negotiate industry priorities, incentivising a shift in long-established practices.
Finally, the extent to which international norms cohere or combine with domestic legal structures—their ‘legal fit’—is likely to influence their implementation. Local legal culture can shape how international legal standards are interpreted and applied in the domestic context.11 Equally, the nature of the regulatory environment is likely to influence the extent to which political and normative goals lead to effective policy and behavioural change. The chapter on economic growth, for example, shows how archaic, rigid and lopsided labour laws result in people seeking informal sector employment and hamper employment generation in the formal sector. Similarly, legal structures and regulatory processes influence India’s growth trajectory. The World Bank’s Ease of Doing Business study, for instance, ranked India 142 out of 189 countries in 2014, two places below its 2013 ranking.
Capacity refers to the strength and robustness of various domestic-level tools, mechanisms, structures and knowledge systems required for norm implementation. ‘Resource capacity’ refers to the extent to which the state has the financial, technical and human resource capacity to implement particular normative commitments. In looking at why norm compliance occurs, Stacy VanDeveer and Geoffrey Dableko argue that ‘it’s about capacity stupid,’ reflected in, for example, GDP per capita, levels of corruption, or education and scientific epistemic and policy communities.12 India’s 13th Finance Commission has estimated that the collection efficiency for property taxes, a key revenue source, stands at a low 37%. This phenomenon has precluded cities from providing even the most basic public services to their citizens.13 The chapter on health highlights how a 17% reduction in healthcare budgets for 2015-16 will complicate meeting health targets; similarly, the chapter on energy argues that the biggest challenge to scaling up renewable energy in India is the cost of investment.
15

Resource capacity could also include the availability of qualified technical personnel as well as the strength of epistemic and policy communities that can use specialised knowledge and domestic legitimacy to interpret international norms for local application.14 India has a vibrant civil society that could be a key resource for mobilising action around the SDGs. Campaigns to end corruption and halt violence against women, for example, continue to mobilise millions across India. These campaigns articulate expectations of the state and can help propel state action, though recent restrictions on the space available for non-governmental
organisations are a cause for concern. Resource capacity could differ between national, state and local levels with, for example, the local-level implementation of a norm constrained by the lack of qualified technical staff or poor budgetary allocations.15
‘Institutional capacity’ refers to the strength and robustness of domestic institutional structures and processes. This could include the departments of government and their related bureaucracies, civil society structures, implementing agencies, and financial and legal institutions. Norm implementation could thus be constrained, for example, by
slow bureaucratic cultures or weak and corrupt implementing agencies. Studies note that one of the main reasons for several of India’s social welfare programmes not achieving desired results are widespread leakages in the system. As a case in point, the major bottleneck that stifles agriculture growth is the complicated and an unnecessarily long supply chain structure, which has led to the wastage of produce and thereby low profits for farmers and higher prices for consumers. Other discrepancies, such as the inefficiencies of the Food Corporation of India and the lack of a proper system of inspection of entitlements, further complicate achieving SDG targets on hunger in India. States with better, more accountable and responsive service delivery also performed better on the MDGs, highlighting the importance of institutional structures in achieving broad-based development outcomes.16 Reports
also indicate that while a federal system is well placed to implement a sustainable development agenda, its various tiers and actors lack the necessary human and financial capacity to enable improved service delivery and governance.17 The institutional capacity of domestic-level structures will also be reflected in how well domestic institutions are learning organisations, the extent to which their organisational culture promotes effective implementation, and their ability to adapt and respond to a changing environment.
The final category of ‘external capacity’ may seem like an odd choice when discussing norm implementation as a domestic-level process. The integration of markets, the movement of people and goods across borders, and the nature of global governance issues such as climate change and migration has meant that broader external processes, such as global trade agreements or technology transfers to the developing world, also influence the capacity of the state. International-level processes can influence domestic capacities for norm implementation, even while implementation is primarily a domestic-level process. India has thus emphasised that the achievement of SDG targets requires a broader global partnership around the means of implementation. This would include better trade agreements, more accessible banks, technology transfer mechanisms, innovative financial institutions, and the closing of global tax loops and illicit financial flows. This would ensure that the SDGs do not become “a mere template to spur domestic action through domestic funding,”’18 but are a global commitment requiring political action from both the developing and developed worlds.
The SDGs align closely with India’s national priorities with the focus on poverty eradication, economic growth, social welfare provision
and energy access for all. At the same time, India’s negotiating position in New York has been that the SDGs cannot be used to constrict domestic policy space or determine domestic priorities, particularly without the allocation of additional international resources to facilitate the means of implementation.
16
beCause international-level ProCessess, like global trade
agreements, Can inFluenCe domestiC CaPaCities For norm
imPlementation, india has emPhasised a broader global
PartnershiP around the means oF imPlementation For the
aChievement oF sdg targets.

India’s ratification of the SDGs can thus be argued to be transactional—to signal to the international community that it is a responsible stakeholder, and to create an external policy environment conducive to its domestic growth priorities. Moreover, as a poor and heterogeneous country, practically speaking, India needs to retain flexibility in implementation. However, as noted above, it is worth keeping in mind that economic growth as a means to development is re-emerging as the dominant development ideology, and India’s national priorities are thus not a departure from dominant thinking in international development policy circles.19
India’s nod to the SDGs, while maintaining its autonomy in domestic policy setting, thus suggests that we need to look at domestic-level levers for implementation.These can help identify pathways through which India can move towards SDG targets that fit with Indian national priorities. This chapter has attempted to construct a framework to systematise these levers, arguing that SDG implementation will depend on the degree and nature of ‘fit’ and ‘capacity,’ which often combine and overlap in practice. The goal-specific chapters in this volume
highlight the varying role of these factors in shaping India’s performance on the SDGs; taken together, they particularly illustrate the importance of resource and institutional capacity in achieving development outcomes, but also note that development itself a social process that requires buy-in from various levels of society.
In order for India to move forward on the SDGs it will need to strengthen critical development drivers, such as economic growth, industrialisation, employment creation, basic infrastructure provision, access to comprehensive social services and women’s empowerment. It will also need to strengthen the sustainable dimension of its high economic growth to address challenges of natural resources, environment and climate change. It would also need to be able to access the necessary means of implementation, including the transfer of advanced sustainable technologies.19 Accelerated progress on these fronts will rest on strengthening the identified levers for implementation, combined with political will at both the national and international level, to create a policy environment conducive to sustainable development.
17
a h
eav
Y b
ur
den
/m-b
ot/F
liC
kr
/Cr
eat
ive C
om
mo
ns
There is likely to be a lack of complete 'cultural fit' when implementing SDG 5

bridging the gap between growth and development
By bringing together a manageable set of straightforward objectives, the Millennium Development Goals (MDG) were able to rekindle global interest in basic development issues
and strengthen commitment to raise greater development finance. Poverty reduction, being central to realising all eight MDGs, featured as part of the MDG1 that broadly set out to “eradicate extreme poverty and hunger” by 2015. While the complete set
of goals have sometimes been referred to as multidimensional, the specific MDG on poverty was very narrowly defined, focusing solely on income.
The first Sustainable Development Goal (SDG) is in many ways a much-improved successor. By aiming to “end poverty in all its forms,” it takes into account the multifaceted nature of poverty reduction. As Nobel laureate Amartya Sen rightly points outin his book Development as Freedom,1 income is merely a means to alleviating poverty. Poverty should instead be seen as the deprivation of capabilities that are necessary for an individual to fully participate in society. SDG 1 reflects this approach and tracks progress based on three types of capabilities—(a) economic capabilities through targets 1.1 and 1.2; (b) human capabilities through parts of target 1.4; and (c) protective capabilities through target 1.3, 1.5 and parts of target 1.4.
This comprehensive SDG 1 is very well aligned with India’s own priorities—the country’s statement at the Open Working Group on SDGs solicits an agenda that centralises poverty eradication and has “a stand-alone goal on poverty...[that] address the multi-dimensional nature of poverty.”2
Although recognising this multidimensional nature is laudable, India’s rapid economic growth has not translated to proportionate improvement in human development outcomes. In fact, India has fallen behind most of its South Asian neighbours on social measures contrary to popular belief.
taNouBi NGaNGom, JuNior fELLow, orf | PariJat LaL, formEr rEsEarCh assistaNt, orf
T H R E E
Goal 1: End poverty in all its forms everywhere
1.1 By 2030, eradicate extreme poverty for all people everywhere, currently measured as people living on less than $1.25 a day
1.2 By 2030, reduce at least by half the proportion of men, women and children of all ages living in poverty in all its dimensions according to national definitions
1.3 Implement nationally appropriate social protection systems and measures for all, including floors, and by 2030 achieve substantial coverage of the poor and the vulnerable
1.4 By 2030, ensure that all men and women, in particular the poor and the vulnerable, have equal rights to economic resources, as well as access to basic services, ownership and control over land and other forms of property, inheritance, natural resources, appropriate new technology and financial services, including microfinance
1.5 By 2030, build the resilience of the poor and those in vulnerable situations and reduce their exposure and vulnerability to climate-related extreme events and other economic, social and environmental shocks and disasters
1.a Ensure significant mobilization of resources from a variety of sources, including through enhanced development cooperation, in order to provide adequate and predictable means for developing countries, in particular least developed countries, to implement programmes and policies to end poverty in all its dimensions
1.b Create sound policy frameworks at the national, regional and international levels, based on pro-poor and gender-sensitive development strategies, to support accelerated investment in poverty eradication actions

For instance, the last two decades have seen India’s per capita income grow 60% to 98% higher than that of Bangladesh, but in the same period, India has been overtaken by Bangladesh in terms of life expectancy, child survival, fertility rates, immunisation rates and mean years of schooling—indicators that are often clubbed together as barometers of basic human development.3
A glaring disconnect exists between economic growth and human development in India, and the multifaceted SDG 1—a goal that India advocated at the United Nations working group—will play a critical role in bridging this gap. This chapter will therefore examine the challenges that India faces and the efforts that must be made to achieve this goal.
evolving from inCome-poverty to multiDimenSional poverty
The first target under MDG 1 stipulated that each country halve the proportion of people living in extreme poverty between 1990 and 2015. In India, the above target was carried out by focusing on three aspects—prevalence, intensity and distribution.4
Prevalence: Poverty Head Count Ratio (PHCR)
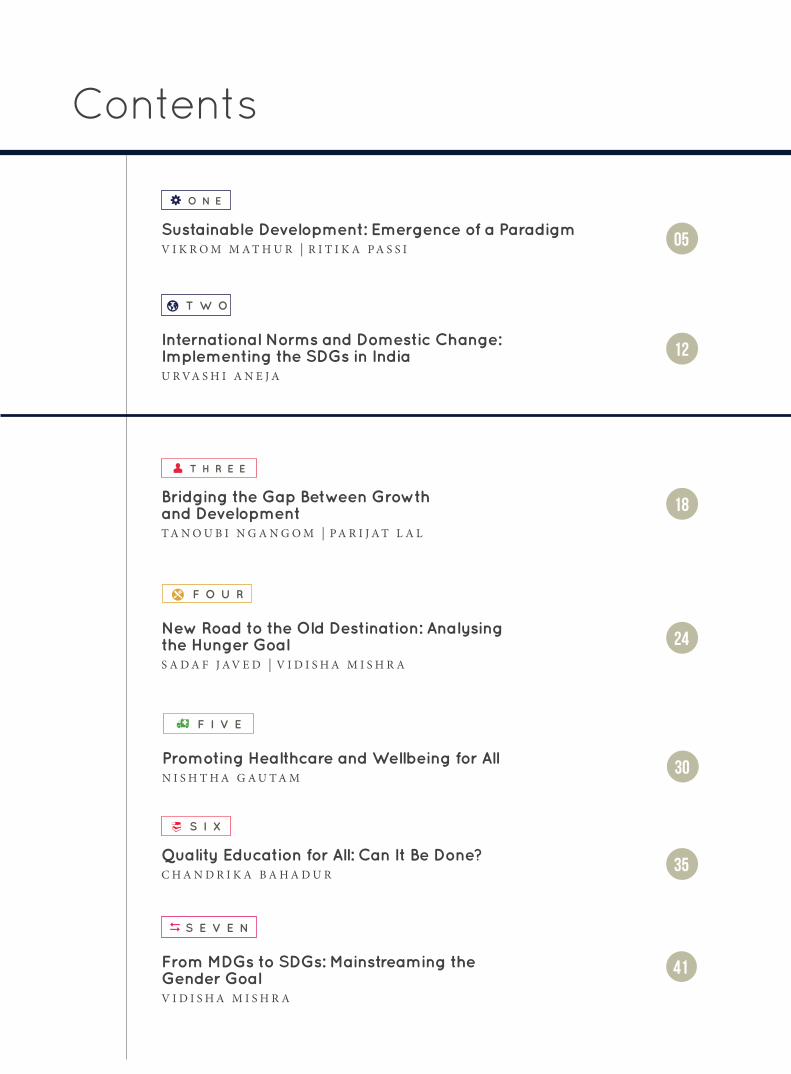
PHCR has generally been the primary indicator used to track the MDG on poverty, and it measures the proportion of individuals whose per capita income/consumer expenditure is below the national poverty line. India has managed to achieve the set target well ahead of 2015. As opposed to the target of 23.9% by 2015, the proportion of population below the national threshold was reduced to 21.9% by 2011-12.
Intensity: Poverty Gap Ratio (PGR)
While PHCR measures the number of poor, PGR highlights the depth of poverty, measuring the shortfall of mean consumption of the poor from the national poverty line. PGR in both rural and urban India fell by almost 50%. This indicates that apart from a fall in the number of poor, the severity of poverty also experienced an equal decline.
Distribution: Share of poorest quintile in national consumption
The last indicator deals with the proportion of national consumption attributed to the poorest 20% of the population. Therefore, it demonstrates the level of equity in the allocation of income to, or consumption of, the last quintile. For this indicator, India’s performance has been modest at best. As opposed to the ideal figure of 20%, the share of the poorest quintile has been decreasing for the past decade. In 2011-12, it was 7.1% for urban areas and 9.1% for rural areas.
Despite early achievement of the poverty-related MDG target, the incomplete nature of this goal means that it is necessary to move beyond simply raising income level to realise the multidimensional SDG 1. India’s national priorities are directly in line with this approach. In fact, India’s poverty line evolved long before the negotiation for a comprehensive SDG on poverty.
In 2009, for the first time, India made a conscious effort to enhance its poverty line by estimating human capabilities (access to basic services) in addition to economic capabilities. Historically, poverty line estimations in India have been anchored
SHAREST OF POORESTQUINTILE IN NATIONAL
CONSUMPTION
INDICATOR BASE YEAR (1990) LATEST STATUS (2011-12) MDF TARGET (2015)
POVERTY HEAD COUNT RATIO 47.8 21.92 23.8
POVERTY GAP RATIO RURALURBANRURALURBAN
N/A 5.05N/A 2.7
N/A 9.1N/A 7.1
19
Table 1: India’s Progress on MDG1A5

on minimum nutritional requirements per person despite the regular constitution of expert committees to review the national poverty threshold.6 However, the currently operational methodology, based on the recommendations made by what is popularly known as the Tendulkar Committee, has made a distinct shift away from the calorie-based estimates. It defines poverty as per capita consumption expenditure for a basket of basic essential goods, which includes private expenditure on health and education.7
Although the Tendulkar line takes into account the multidimensionality of poverty to a certain extent, there are several criticisms regarding its low baseline of INR 33/day for urban areas and INR 27/day for rural areas. Specifically, economists such as Madhura Swaminathan have highlighted the underestimation of expenditure on non-food items (health, education, clothing and housing).8
The shortfall of India’s national poverty line is perhaps best underscored by the large divergence between the globally accepted Multidimensional Poverty Index (MPI) and the Tendulkar line. MPI, a first of its kind, is designed to capture multiple deprivations in health, education and living standards. As opposed to the poverty incidence calculated with the Tendulkar line—21.92% in 2011-12—calculations made through MPI show that in 2013, 55.3% of the Indian population still suffered from acute multidimensional poverty.9 The MPI estimate of 55.3% is more than double the national estimate of 21.92%.
This jarring disparity means that there is an urgent need to bring the national methodology in consonance with the global norm. Developing a globally competent poverty line does not merely relate to target 1.2, but it would also address the issue of providing access to basic facilities (target 1.4). In India, the poverty line is also used to identify poor households for targeted delivery of pro-poor programmes that provide services that form part of non-income poverty factors. A low poverty line would therefore lead to the exclusion of a larger group of people living in extreme poverty from publicly provided non-income poverty alleviation initiatives.
aCCommoDating non-inCome faCtorS
Comprehensive poverty alleviation necessitates the provision of social safety nets. Recognising this need, three of the five targets under SDG 1 (targets 1.3, 1.4 and 1.5) deal with the issue of protective capabilities expansion—financial inclusion, social protection and land ownership. This section looks at how various centrally-sponsored schemes have attempted to address these non-income factors.
Financial Services
In the face of leakages in public funds/services induced by poor infrastructure or corruption, financial inclusion assumes a particularly important role in equipping people with the tools needed to escape poverty. Access to financial services allows the benefits of social security programmes like the Mahatma Gandhi National Rural Employment Guarantee Act (MGNREGA)—a national initiative that guarantees the ‘right to work’—to bypass sluggish bureaucratic mechanisms and misappropriation by officials, and instead reach beneficiaries directly. Thus, target 1.4 promotes universal access to financial services. The Indian government has also launched the Pradhan Mantri Jan Dhan Yojana(a nation-wide initiative to promote financial inclusion) in August 2014 to increase access, especially in rural areas. This will be explored in detail in Chapter 10 dealing with Goal 8.
Social Security Systems
Target 1.3 requires the institution of nationally appropriate social protection systems, especially for the poor and the vulnerable. Perhaps India’s most eminent social protection programme over the last decade has been the MGNREGA, with the mandate of providing a guaranteed term of skilled manual labour to every rural household on demand.10 Despite issues regarding delays in wage payments and the need to strengthen the systems of recording demand, the scheme has provided jobs to over 250 million workers, with over 37% of them belonging to the Scheduled Caste/Scheduled Tribe (SC/ST) categories (official designation given to historically disadvantaged groups of people in the country).11
20

Despite schemes like MGNREGA focusing on work for the poor, any well-streamed national effort to provide social security is absent. Only 26.4% of regular wageworkers in India were covered under any social security in 2009-10, down from around 32.6% in 1999-00. This phenomenon resulted from a higher casualisation of the workforce, which is especially alarming given that a mere 6-8% of the unorganised sector was provided pension by the state or non-governmental organisations.12 The woefully inadequate state of social security in the country is mitigated by a number of social development schemes offered by the central government, but even these face problems in implementation.
The provision of social protection would be incomplete without addressing the needs of those who are disproportionately exposed to natural disasters, especially given India’s increasing vulnerability to climate-related disasters (target 1.5). Disaster risk reduction and response in India is covered under the comprehensive Disaster Management Act of 2005, and the National Disaster Management Plan is currently in the process of being finalised. Significant investments have been made towards disaster management. For the period 2010-2015, around $88 million has been allocated for the training and capacity building of stakeholders and communities, while a further $150 million of first responder dedicated funds has been provided to scale up fire services across the country.13 The government is also working in conjunction with the UN Development Programme (UNDP) to strengthen newly established state and district Disaster Management Authorities (DMAs) through the Disaster Risk Reduction Programme. These DMAs will be able to call upon the Disaster State Response Fund, for which $5.6 billion has been earmarked.14
The existence of various social security-related schemes—the MGNREGA, Integrated Child Development Services, the Indira Awaas Yojana (national welfare programme to provide rural housing), the Jawaharlal Nehru National Urban Renewal Mission for rural and urban housing, and the National Disaster Management Plan—shows how India’s domestic priorities conform to sustainable development targets
1.3 and 1.5. At the same time, multiple programmes with similar objectives have led to duplication of effort and inefficient use of time and financial resources, highlighting the need for synchronised effort towards achieving these targets.
Land Ownership
Given that approximately 70% of the Indian population depends on agriculture for livelihood, and a similar share lives in rural areas, equitable land ownership is critical for comprehensive poverty alleviation (target 1.4).15 However, land ownership policies in India have a long way to go. The country is home to the largest number of rural poor and landless households in the world, with land grabbing and alienation only compounding imbalances in the access to, and control of, land-based assets.16
Inequities in the distribution and ownership of land in the country are present along several lines. According to a committee under the Ministry of Rural Development, medium and large farmers constituted less than 5% of the agrarian population but owned a disproportionate 37.72% of total area in 2003.17 More than a decade later, the situation has undergone only minor improvements, with recent estimates suggesting that 60% of cultivable land is still owned by 10% of the population.18 There is a large disparity in ownership between sexes too: While females head 35% of rural households, less than 2% of women hold titles to land in the country.19 Moreover, caste and social standing also play a major role—close to 90% of the landless poor are from either the SC or ST category, which means that they lack one of the most basic aspects of agricultural livelihood, i.e., a homestead.20
The Land Acquisition, Rehabilitation, and Resettlement Bill of 2015 is also alleged to fall short of international human rights conventions, failing to recognise “land as a human right since it is integral to the life, sustenance, culture, and livelihood” for a large share of India’s population. By eliminating the principle of ‘prior informed consent’ and human rights impact assessments, the bill has been accused by some of effectively sanctioning land grabbing without regard for livelihoods.21
21

by combining various existing centrally sponsored schemes.22
Another avenue for potential coordination deals with India’s federal structure—effective communication channels among different tiers of government must be established, given that implementation of national targets are generally carried out by state and local governments. For instance, improved coordination between state and district DMAs and existing central institutions is especially significant, seeing as disaster management is primarily executed by state governments in India, while the national government plays a more supporting role.23
Federal structure and the existence of numerous groups of minorities have also meant that there is persisting disparity among different states, religions and social groups. Divergent progress has led to the concentration of poverty in low-performing states, rural areas and minorities, such as individuals from SC and ST groups and Muslims.24
A disaggregated analysis of poverty statistics shows that while states like Goa (5.09%), Kerala (7.05%) and Punjab (8.26%) have been immensely successful in lowering individual PHCRs, certain other states—for instance, Manipur (36.9%) and Arunachal Pradesh (34.7%)—still
Access to and ownership of land in rural India faces several tough questions that must be answered urgently, given not only the emphasis laid on land ownership in SDG 1, but also the crucial role of land rights in comprehensive poverty alleviation of India’s predominantly agrarian workforce.
implementing SDg 1: the Way forWarD
To ensure that multidimensional poverty is addressed, SDG 1 covers several pertinent aspects through its five targets. As discussed in the earlier sections, there are government programmes in place that deal with each of these targets, highlighting the convergence between India’s national priorities and the comprehensive SDG 1.
Many of these government initiatives, however, have similar objectives and overlapping directives (such as MGNREGA and the National Rural Livelihoods Mission), stressing the need for increased streamlining to ensure that their effect is not undermined by a lack of awareness or utilisation. To ensure fruitful synergy instead of destructive interference among these programmes, special attention needs to be given to interdisciplinary platforms such as the Sansad Adarsh Gram Yojana, designed to create sustainable villages
22
1 in every 100 Indians is homeless (Census 2011)
all t
hat
You
hav
e a
CC
um
ulat
ed
/leC
er
Cle
/FliC
kr
/Cr
eat
ive C
om
mo
ns

23
have significantly high PHCRs. In fact, both rural and urban PGRs of these underperformers have risen from 2004-05 to 2011-12. According to UNDP, around 31% of Muslims, 52% of SC persons, and 80% of the Nomadic and De-notified Tribe populations live below the poverty line, as compared to the national average of 21.9%.25
This also stands true for non-income factors—in terms of land ownership, tribal and marginalised groups have been the biggest victims of displacement. While they constitute only 9% of India’s population, tribal communities have accounted for over 40% of displaced persons due to land acquisition for development projects.26
While shedding light on issues of inequality, these disparities provide an excellent opportunity for the sharing of best or most effective practices (by more successful states/groups) in the implementation of policies. Such a process will require credible data that is segmented by different levels of governance and social/religious groups to track statistical progress and ensure effective targeting of poverty reduction efforts.
While data collection systems are in place—the decadal census, the national sample surveys and surveys conducted by various ministries/departments—they have not been mandated to focus exclusively on monitoring the SDGs. Progress on the MDGs was monitored on the basis of available datasets and this practice is expected to continue for the SDGs. Thus, the monitoring system for SDGs faces the same challenges as its predecessor—non-availability of data at the sub-state level, non-availability of annually updated data and incomplete coverage of the specified targets.27 If existing data collection mechanisms are leveraged to address this lacuna, it would not require significant overhaul or investment.
The financing of statistical monitoring systems aside, concerns remain over the availability of funds to provide a credible level of basic social services to the poor in India. The social protection floor proposed by the International Labour Organization, which encompasses aspects of livelihood such as income, healthcare, education
and food security, assumes additional financial resources for poverty alleviation ranging from 1-4.4% of GDP over the next few years.28 A large portion of this increased funding is required for health sector expenditures, but the most recent budget (2015-16) saw a year-on-year 17% decline in the healthcare budget, which is a worrying sign.29
Where will this additional finance requirement come from? One of the main avenues for mobilising resources is taxation. According to the World Bank, India’s tax-GDP ratio is a dismal 96th among 102 countries, and has only declined in recent years.30 While raising incomes is one way of bringing in higher tax revenues,
this situation requires a review of current policies governing tax administration, exemptions and compliance in the nation. The Kelkar Committee under the Ministry of Finance is a starting point, which in 2012 submitted several recommendations of measures to both widen and deepen India’s tax base.31 Apart from making taxation more effective, the dire need for funding could be met to some extent by consolidating various government welfare programmes—this would reduce overlap, allowing funds distributed across several initiatives to be focused on specific factors contributing to multidimensional poverty reduction.
The divergence between economic growth and basic human development in India’s growth story highlights the need for a multidimensional approach to poverty reduction that streamlines various existing poverty-related government programmes. For India, internalising the targets under SDG 1 could be the key to finding a method in the madness.
to ENsurE fruitful sYNErGY iNstEad of dEstructivE
iNtErfErENcE amoNG GovErNmENt iNitiativEs
with similar obJEctivEs aNd ovErlaPPiNG dirEctivEs, sPEcial attENtioN NEEds to bE GivEN to
iNtErdisciPliNarY Platforms.

new road to the old destination: analysing the hunger goal
a neW agenDa
When the Millennium Development Goals (MDGs) were ratified in 1990, 53.5% of all Indian children were found to be malnourished. In 2015 when the MDGs
expired, 40% of all Indian children were malnourished—a relatively minor decline for a country that is self-sufficient in food grains production.1 While India was able to reduce poverty to an extent and hence achieve MDG 1 partially, the county was not able to meet the goal of halving the proportion of people who suffer from hunger. It remains home to “one quarter of the world’s undernourished population, over a third of the world’s underweight children, and nearly a third of the world’s food-insecure people.”2
The post-2015 development agenda has a broader scope and a significantly more integrated approach towards development. Therefore, while the new agenda builds on the MDGs to eradicate the continuing inequalities, it also addresses the root causes behind the inequalities as well as the systemic barriers to sustainable development. The issue of hunger was addressed partially by the MDGs in Goal 1: “Eradicate extreme poverty and hunger.” Other issues that touched upon sustainable and rural development were categorised under Goal 7: “Ensure environmental sustainability,” and Goal 8: “Develop a global partnership for development.”
SDG 2: End hunger, achieve food security and improved nutrition and promote sustainable agriculture
2.1 By 2030, end hunger and ensure access by all people, in particular the poor and people in vulnerable situations, including infants, to safe, nutritious and sufficient food all year round
2.2 By 2030, end all forms of malnutrition, including achieving, by 2025, the internationally agreed targets on stunting and wasting in children under 5 years of age, and address the nutritional needs of adolescent girls, pregnant and lactating women and older persons
2.3 By 2030, double the agricultural productivity and incomes of small-scale food producers, in particular women, indigenous peoples, family farmers, pastoralists and fishers, including through secure and equal access to land, other productive resources and inputs, knowledge, financial services, markets and opportunities for value addition and non-farm employment
2.4 By 2030, ensure sustainable food production systems and implement resilient agricultural practices that increase productivity and production, that help maintain ecosystems, that strengthen capacity for adaptation to climate change, extreme weather, drought, flooding and other disasters and that progressively improve land and soil quality
2.5 By 2020, maintain the genetic diversity of seeds, cultivated plants and farmed and domesticated animals and their related wild species, including through soundly managed and diversified seed and plant banks at the national, regional and international levels, and ensure access to and fair and equitable sharing of benefits arising from the utilization of genetic resources and associated traditional knowledge, as internationally agreed
2.a Increase investment, including through enhanced international
cooperation, in rural infrastructure, agricultural research and extension services, technology development and plant and livestock gene banks in order to enhance agricultural productive capacity in developing countries, in particular least developed countries
2.b Correct and prevent trade restrictions and distortions in world agricultural markets, including through the parallel elimination of all forms of agricultural export subsidies and all export measures with equivalent effect, in accordance with the mandate of the Doha Development Round
2.c Adopt measures to ensure the proper functioning of food commodity markets and their derivatives and facilitate timely access to market information, including on food reserves, inorder to help limit extreme food price volatility
SaDaF JaVED, formEr rEsEarCh assistaNt, orf | ViDiSha miShra, rEsEarCh assistaNt, orf
5 F O U R

However, the MDGs failed to address food security and agriculture, two issues that are separate from, but integral to, the achievement of the goal of ending hunger.
The Sustainable Development Goals (SDGs) recognise the importance of differentiating between the concerns of hunger, food security and nutrition, as well as the importance of increasing productivity through the promotion of sustainable agriculture to achieve the desired long-term results.3 Consequently, unlike the MDGs, hunger has a dedicated goal within the new agenda. The second goal of the SDGs, however, is not limited to ending hunger, but aims to “end hunger, achieve food security and improved nutrition and promote sustainable agriculture.”
Through its eight associated targets, SDG 2 aims to eradicate hunger through increased access to sufficient food (target 2.1). It also emphasises ending child malnutrition, and addressing the nutritional needs of adolescent girls, pregnant and lactating women (target 2.2). While in the past, the relevant hunger eradication goal was focused on measuring hunger only through calorific intake, SDG 2 also takes into consideration the nutritional value of food. The proposed indicators address micronutrient deficiencies, undernutrition, malnourishment and birthweight.
In addition to drawing the linkages between food security, nutrition and sustainable agriculture (target 2.3), the goal also addresses other fundamental issues that cause food insecurity, such as gender inequality, social exclusion and unequal access to opportunities. The proposed indicators emphasise small holders and small-scale farming systems. Thus, the agenda showcases an integrated, equity-based approach that prioritises vulnerable populations and agriculture systems, and also views them as agents of change. It aims to double the agricultural productivity while ensuring sustainable food production systems and implementing climate-resilient agricultural practices.
The three targets (2.a, 2.b, 2.c) promote enhanced international cooperation, prevention of trade restrictions, improvements in the functioning of food
commodity markets, and increase in agricultural and infrastructural investments.
Given the ambitious agenda and the all-inclusive approach, SDG 2 is likely to act as a lens for policymaking in both developed as well as developing countries. However, it must be acknowledged that eradicating hunger has long been a national priority for India, for both the Union as well as state governments, but with limited success. Given this context, it is essential to map out how the SDG agenda fills the existing loopholes to complement the country’s ongoing efforts to achieve food security.
hunger, nutrition anD fooD SeCurity
Home to an estimated 1.2 billion people, India is the second most populous country in the world. Eradicating acute poverty and hunger has historically been central to the country’s development policies. The First Five Year Plan, launched in 1951, allocated 17.4% of its total budget towards agriculture and community development.4 Following years of dependence on food imports, India experienced a Green Revolution in the 1960s, brought about by increased yields due to unprecedented advancements in agronomic technology.5
In recent years, the country has experienced rapid economic growth and is now self-sufficient in food grains production, despite possessing only 3% of the world’s arable land.6 Globally, India has the largest area under cultivation for wheat, rice and cotton. It is also amongst the largest producers of milk, pulses and spices.7 It is therefore evident that India has effectively used agriculture technologies and innovations, and made substantial investments in human and capital resources, to emerge as a strong global food producer. Further, India has also solidified its position in the international food trade arena despite prioritising internal food security. In November 2014, for instance, the World Trade Organization(WTO) acceded to India’s demand to remove constraints on food stockpiling.8
Despite these developments, social inequity and exclusion continue to manifest in the forms of pervasive poverty, hunger and malnourishment in the country.9 In this context, SDG 2 can prove to be the
25

comprehensive policy framework that India needs to accelerate progress towards achieving zero hunger. India has an agrarian economy, where farmers constitute a majority of rural population. Formulating new policies that approach the issues of food security and sustainable agriculture holistically, and rectifying existing policies to adopt the integrated SDG approach, can lead to achieving the set targets by 2030.
Before deconstructing the relevant targets in the Indian context, it is important to assess India’s status on the international measurement scales of hunger and malnutrition. There are two principal ways through which hunger is measured: The Prevalence of Undernourishment (PoU), monitored by the Food and Agriculture Organization (FAO), and the Prevalence of Underweight Children under five years of age, monitored by the United Nations Children’s Fund as well as the World Health Organization.10
On the basis of these measurements, India ranked 55th out of 76 countries on the 2014 Global Hunger Index, behind its immediate neighbours Sri Lanka and Nepal.11 Moreover, according to the annual FAO report, India is home to 194.6 million undernourished people, the highest in the world. This implies that over 15% of India’s population is undernourished. The report highlights that India’s economic growth has not been inclusive, failing to translate into higher food consumption or better diets for its population. Additionally, the report also indicates a serious urban-rural divide in India, where the rural population is primarily represented amongst the country’s hungry and malnourished people.12
Under India’s federal structure, where state governments have many state-specific schemes and are predominantly responsible for the effective distribution of public services, different states showcase different levels of inequality. Currently, 12 states fall under the ‘alarming’ category in the Global Hunger Index. Further, an estimated 23 million children suffer from malnourishment and are underweight. India’s Integrated Child Development Services Survey in 2014 also suggested that there is a higher incidence of underweight and malnourished children across states like Bihar (54.9%), Andhra Pradesh (37%),
Uttar Pradesh (41.6%) and Rajasthan (36.8%).13
This widespread prevalence of hunger, undernourishment and malnourishment, especially among the vulnerable sections of the population, can be attributed to the widespread food insecurity at the household and the individual level.14 In addition, the fact that India still struggles with defining and measuring hunger and malnutrition, often confusing the latter for the former, is another reason behind India’s moderate progress in this field.
Hunger and nutrition form part of the broader, multidimensional concept of food security, which involves three separate but interrelated components—the availability, consumption and absorption of food. The absorbed food is then measured as nutrition. According to the FAO, “[f]ood security exists when all people, at all times, have physical, social and economic access to sufficient, safe and nutritious food that meets their dietary needs and food preferences for an active and healthy life.”15 Hence, a country cannot hope to achieve food security by focusing on producing sufficient food; food has to be made available for consumption at the household level and its absorption has to be ensured. Poor hygiene, unsafe water and sanitation facilities, as well as public defecation sometimes restrict the absorption of food in cases where it is available.
The Indian paradox regarding food security and malnutrition can be understood as thus: In terms of food production, India has achieved self-sufficiency; however, policies and mechanisms to make food available to all sections of the society have not functioned optimally due to several reasons.
For example, India’s food exports until recently have been high, which has affected food availability in the country. Concurrently, there has been a decline in agricultural growth since the mid-1990s, which has also impacted on the livelihoods of many. There has therefore been a steady decline in the net per capita food grain availability in the post-economic reforms period of 1991 to 2007. The levels fell from 501 grams per day in 1991 to only 443 grams per day in 2007.16 However, with India’s recent stand at the WTO to
26

be allowed to stockpile grains to ensure domestic food security, the situation is likely to improve.
Another reason for the existence of the paradox is that despite stable levels of food production, it was noted that nearly 40% of the total value of annual food production is wasted.17 imilarly, even though India is the world’s largest milk producer and the second largest producer of fruits and vegetables, it also has the dubious distinction of being the biggest waster of food. This results in an increase of milk and vegetable prices, making food products further unattainable to a large proportion of the population. Moreover, according to estimates more than 21 million tonnes of wheat is either contaminated due to insects, or rots due to the lack of warehouses for storage or an erratic electric supply.18 Demonstrably, although the production of food in India is stable, the distribution is faulty given poor management by government institutions.
Target 2.1 is focused on universalising access to food. To this end, the Government of India has already introduced the National Food Security Act in 2013. The act aims to alleviate food availability and accessibility. It focuses primarily on the expansion of the public distribution system for increasing food availability. Moreover, it will expand programmes aimed specifically at improving the nutritional status of children and pregnant and lactating women.
Crucially, in acknowledgement of the fact that existing food distribution mechanisms have not functioned optimally due to corruption, leakages, fund embezzlements and non-transparency in implementation and execution, the act includes several provisions for ensuring transparency and grievance redressal.19
However, the reports of the High Level Committee on Long-term Grain Policy and the Performance Evaluation of the Targeted Public Distribution System have highlighted some other major problems in the present system. Apart from high exclusion errors due to the improper identification of beneficiaries, other problems identified include the non-viability of fair price shops, the inability to effectively carry out price stabilisation, and high levels of leakages that divert grain from the open market.20
In the context of food consumption and absorption, some discernible changes in consumption patterns in India have raised serious concerns. There has been a decline in cereal consumption by the three poorest deciles of the population in both urban and rural areas. Food consumption by the bottom 30% of the population came down from 53.65% in 1970-71 to 29.34% in 2004-05. On the other hand, in urban areas it declined from 38.85% to 20.59% for the corresponding years.21 These groups continue to meet the larger proportion of their nutritional requirements through cereal consumption, since their access to the
27
370
56
-013
: Ch
hat
tis
ga
rh
irr
igat
ion
dev
elo
Pm
en
t
Pr
oJeC
t/ad
b/F
liC
kr
/Cr
eat
ive C
om
mo
ns
India is self-sufficient in food grains production

more expensive non-cereal foods like pulses, milk and other dairy products is limited. Therefore, the evident decline in cereal consumption indicates a lowering of the energy requirements of the poor and leads to serious nutritional implications.
Target 2.2 aims to “end all forms of malnutrition” by 2030. In order to address the prevalence of malnutrition and undernourishment among children, nutrition programmes like the Integrated Child Development Services (ICDS) and the Mid-Day Meal Scheme (MDMS) have been introduced in the country.22 The central objective of the ICDS is the holistic development of children up to the age of six years, with a very special focus on children up to the age of two years. It also caters to expecting and lactating mothers. Services such as basic health checkups, immunisation, referral services, supplementary feeding, non-formal pre-school education, and required advice on essential health practices and nutrition are administered through the scheme.23 However, despite its expansion and popularity over the last three decades, its impact, outreach and coverage have been limited.
Similarly, the MDMS, which targets around 120 million children across 1.2 million schools is technically the world’s largest food distribution programme for children.24 But irregular service, bad hygiene and extremely poor quality of food have marred the effectiveness of the programme.
It can be observed that there is a high degree of synergy between SDG 2 and national priorities in India regarding hunger and nutrition. Policies focused on achieving the set targets are already in place, although their execution has been disappointing. In order for India to achieve food security, it needs to focus on increasing the coverage of existing schemes to ensure effective universalisation. Further, the schemes need to be re-evaluated and modified for greater inclusivity and optimum impact. Unfortunately, the SDG agenda is limited to setting targets and goals and does not explicitly map out pathways to achieve the targets, which would have been more beneficial in India’s case.
SuStainaBle agriCulture anD fooD SeCurity
The recognition of sustainable agriculture as
being intrinsic to achieving long-term food security (targets 2.3, 2.4) is a welcome step for countries like India, where agriculture is not only critical to the country’s GDP, but is also a major source of employment in rural areas.
In India, where the contribution of the agricultural sector in the economy has been declining, the push for promoting sustainable agricultural practices is new. In 2010, the government launched the National Mission on Sustainable Agriculture, with the aim of devising and promoting adaptation and mitigation strategies for ensuring food security, equitable access to food resources, enhancing livelihood opportunities and contributing to economic stability at the national level.25
Target 2.3 also highlights the need to protect the rights, and double the productivity, of women farmers, indigenous people, family farmers, pastoralists and fishers. This is in sync with India’s national priorities as articulated under the Twelfth Five Year Plan (2013-2017), where in addition to improving the performance of agriculture and diversifying produce, reducing vulnerabilities of small and marginal farmers—with special focus on women and other disadvantaged groups—is a key priority.
Furthermore, Indian agriculture is highly susceptible to climatic variations. The impact is felt on both farmers’ livelihood and the national economy. Therefore, overdependence on non-renewable natural resources for economic growth can foreclose future outcomes. Target 2.4, along with the proposed indicators, can be the required push necessary to approach the issue devising agricultural practices that are climate resilient and sustainable.
Interestingly, the government is supporting several small-level initiatives where local indigenous crop seeds are being promoted over modified seeds. Moreover, in Sundarbans, West Bengal, the government and the National Council for Rural Institute, Hyderabad, are promoting a saline-tolerant rice variety that can withstand high levels of salt in the soil in the occasion of disasters like hurricanes and cyclones. This salt-tolerant variety,
28

indigenous to the particular region, is now catching up and competing with the existing range of genetically modified seed varieties.26 Such initiatives also enrich the seed diversity for further research and promotion,while concurrently recognising local indigenous knowledge systems. Institutions like the Krishi Vigyan Kendra, as well as other small scale agriculture extension services, have contributed towards capacity building and market training of farmers in India. With the ratification of the new agenda, these mechanisms can be scaled up to achieve the desired targets by 2030.
Further, SDG 2 includes additional targets 2.a, 2.b and 2.c that focus on increasing agricultural investment and international cooperation in trade, research, technology transfer and infrastructural development to tackle the issue of global hunger. This is an important breakthrough for developing countries like India. In the global context, markets, trading and prices are highly variable as well as unpredictable, and can have implications on food security in respective countries. Also, companies with stakes in agricultural production and trading are ascendant across contexts, beyond the influence of any one country’s sovereignty, which makes collective thinking and action critical in the context of food security and agricultural productivity.
Way forWarD
The post-2015 agenda is an ambitious one. By signing up to the SDGs in the international arena, India has committed itself to pursuing the agenda domestically. But the achievement of these goals requires immense coordination between various stakeholders, high resource mobilisation, and a significantly greater focus on monitoring and evaluation. Presently, gaps exist in terms of defining and measuring hunger and nutrition, financing and Centre-state policy coordination.
SDG 2 adopts a holistic, integrated approach and has the potential to be transformational in the context of India’s paradoxical experience with hunger, malnutrition and sustainable agriculture. However, the agenda does not provide strategies to achieve the set targets.
India’s experience with the MDGs
demonstrates that the lack of resources, and competition across different sectors for these resources, could prove to be a major impediment in the achievement of the new agenda. Furthermore, under India’s federal political system, state governments have the autonomy to prioritise specific goals and create certain state-specific schemes. Data indicates that in the last 15 years, different states have experienced different levels of growth. But high growth and resource-rich states like Haryana, Andhra Pradesh and New Delhi have fared poorly on indicators of malnutrition. Therefore, it is essential for India to find national level levers to motivate the states to prioritise relevant goals for cohesive impact.
In addition, as per the latest 2015-16 Union Budget, the monetary allocation of the Ministry of Human Resource Development has been cut by 17%, that of the Ministry of Women and Child Development by 51% and of Ministry of Health and Family Welfare by 13%.27 The delivery on the set targets under the hunger goal come under the domain of all these ministries and more. Given this backdrop, the development of an integrated approach could help mobilise resources in a targeted manner to maximise usage of available funds, as well as to avoid intersectoral competition.
Finally, areas of food security, nutrition and agriculture have always been intrinsically linked to each other. But relevant implementation systems have continued to function in narrow silos. The interlinkages and nuances have not been addressed in policy planning and federal delivery mechanisms. In order to make India resilient and food secure by 2030, aforementioned gaps must be resolved.
29

Promoting healthcareand Wellbeing for all
Health was the most prominent issue that the Millennium Development Goals (MDGs) sought to address. Not only were three out of the eight goals dedicated to health, the
first goal also had an important link to it. Carrying forward the emphasis the MDGs laid on health, the Sustainable Development Goals (SDGs) approach the issue in a holistic fashion. The third goal ambitiously states: “Ensure healthy lives and promote wellbeing for all at all ages.” Consolidating the interlinked areas of concern the MDGs aimed to focus on, the SDGs envisage a future where health is aligned to a lifestyle that is empowering for the individual and sustainable for the society at large.
While links to health can be identified in all the other SDGs, this chapter restricts itself to the third goal. India had responded enthusiastically to the MDGs and is set to turn in a mixed report card upon reaching the deadline later this year. This chapter looks at the third SDG within this context of partial success. Doing a target/indicator-wise assessment of India’s performance in the health-related MDGs, the first section will identify disaggregated highs and lows. The second section will look at ongoing government schemes, their impact in the past and their potential in meeting the SDG health goal through a target-wise discussion. The third section will deal with major challenges, raise priorities, and identify several implementation modus operandi for India.
Goal 3: Ensure healthy lives and promote well-being for all at all ages
3.1 By 2030, reduce the global maternal mortality ratio to less than 70 per 100,000 live births
3.2 By 2030, end preventable deaths of newborns and children under 5 years of age
3.3 By 2030, end the epidemics of AIDS, tuberculosis, malaria and neglected tropical diseases and combat hepatitis, water-borne diseases and other communicable diseases
3.4 By 2030, reduce by one third premature mortality from non-communicable diseases through prevention and treatment and promote mental health and well being
3.5 Strengthen the prevention and treatment of substance abuse, including narcotic drug abuse and harmful use of alcohol
3.6 By 2020, halve the number of global deaths and injuries from road traffic accidents
3.7 By 2030, ensure universal access to sexual and reproductive health-care services, including for family planning, information and education, and the integration of reproductive health into national strategies and programmes
3.8 Achieve universal health coverage, including financial risk protection, access to quality essential health-care services and access to safe, effective, quality and affordable essential medicines and vaccines for all
3.9 By 2030, substantially reduce the number of deaths and illnesses from hazardous chemicals and air, water and soil pollution and contamination
3.a Strengthen the implementation of the World Health Organization Framework Convention on Tobacco Control in all countries, as appropriate
3.b Support the research and development of vaccines and medicines for the communicable and non-communicable diseases that primarily affect developing countries, provide access to affordable essential medicines and vaccines, in accordance with the Doha Declaration on the TRIPS Agreement and Public Health, which arms the right of developing countries to use to the full the provisions in the Agreement on Trade-Related Aspects of Intellectual Property Rights regarding flexibilities to protect public health, and, in particular, provide access to medicines for all
3.c Substantially increase health financing and the recruitment, development, training and retention of the health workforce in developing countries, especially in least developed countries and small island developing States
3.d Strengthen the capacity of all countries, in particular developing countries, for early warning, risk reduction and management of national and global health risks
N i S h t h a G a u t a m , a s s o C i a t E f E L L o w , o r f
F I V E

inDia’S performanCe viS-à-viS the health mDgS
Goal 4: Reduce Child Mortality
Recording a sharp decline in recent years, the under-five mortality rate in India is likely to drop from 152 in 1990 to 48 deaths per 1,000 live births in 2015, but will miss the target of 42. The infant mortality rate (IMR) has witnessed a less noteworthy decline from 80 per 1,000 live births in 1990 to 39 by 2015, as against the target of 27. The most noteworthy finding in all-India data pertaining to 2013 is the higher level of female IMR than male IMR in all the bigger states. Additionally, IMR is higher in rural areas as compared to urban areas.1
Goal 5: Improve Maternal Health
The maternal mortality rate (MMR) in India is likely to reach 140 maternal deaths by 20152 as against the target of 109 per 100,000 live births. While the target will be missed by a considerable margin, the fact that the percentage of live births attended by skilled health personnel stood at 87.1 in 2013, as against 34.3 in 1993 and 42.4 in 1999,3 is a positive indicator of radical improvement in the area.4 As observed in the MDG country report, the performance of four states—Uttar Pradesh, Bihar, Madhya Pradesh and Rajasthan—together contributes to 67% of the MMR in the country. This, along with the child mortality data, should be seen as an indicator of social attitudes in these states towards women’s health from their very day of birth.
Goal 6: Combat HIV/AIDS, Malaria and other Diseases
During the last decade, an overall reduction of 57% has been estimated in annual new HIV infections in the adult population. Linked to it is the 20% rise in condom use numbers during 2006-2010.5 The number of people with correct and comprehensive knowledge of HIV/AIDS has also grown steadily in recent years.6 While tuberculosis (TB) mortality has halved, results in the same range have not been achieved in the case of malaria.
aligning the health SDg to inDia’S prioritieS
The targets of SDG 3 give an impetus to India’s health priorities and provide an opportunity to step up the country’s efforts. In light of India’s MDG performance and observations therein, a target-wise analysis of the existing and soon-to-be-launched government initiatives is likely to give a clearer picture of what can be expected.
Target 3.1
India’s initiatives to increase the number of births attended by skilled health personnel, like Janani SurakshaYojana (a safe motherhood intervention programme) and Janani Shishu Suraksha Karyakram (supplements assistance given to pregnant women), have been successful in bringing down MMR and IMR levels. Since the urban-rural gap is significant across the country, just under 900,000 Accredited Social Health Activists, known as ASHAs, spread awareness and assist in accessing healthcare in rural areas.7 The government has been steadily advancing maternal healthcare facilities under both the Reproductive and Child Health Programme and National Rural Health Mission.
Apart from specialised plans and initiatives such as these, India’s drive to end hunger and ensure minimum nutrition is likely to help bring down maternal mortality. Malnutrition is another major cause of maternal mortality that has been receiving attention through convergence of a number of general and specific food and nutrition programmes.
Target 3.2
Apart from making constant efforts at enabling people to access antenatal and postnatal healthcare, specialised schemes like Integrated Child Development Services (ICDS) Scheme focus on nutritional needs. As per 2013 data, the ICDS Scheme covers over 100 million beneficiaries under supplementary nutrition, making it one of the world’s largest programmes for early childhood care and development.8
The Indian National Health Mission, with its programme on child health, aims at integrating schemes and interventions vital for bringing down the under-five mortality rate. Facility Based Newborn Care is one such intervention to meet this end. Until December 2014, there were 14,135 Newborn
31

Care Corners, 550 Special Newborn Care Units and 1,810 Newborn Stabilisation Units operational to provide care for sick newborns across the country.9 Additionally, promoting infant and young child feeding in partnership with hospitals is improving nutrition status of infants.
Target 3.3
One of the biggest health sector achievements in India has been the complete eradication of polio. India’s effective management of the Pulse Polio drive under the guidance of the United Nations Children’s Fund (UNICEF) has resulted in the World Health Organization (WHO) officially declaring India polio-free in March 2014.
The National AIDS Control Programme has been playing a significant role in bringing down the number of annual new infections. Collaborations, such as the one with UNICEF for spreading awareness and another with Hindustan Latex Limited regarding condom vending machines, have resulted in changing behaviour and attitudes towards sexual health. While high prevalence states like Andhra Pradesh, Maharashtra, Karnataka and Tamil Nadu have witnessed a significant drop in new infections, the contribution of low prevalence states has been high at 57% in 2011. This warrants a shift of focus to the low prevalence areas. Free first-line and second-line Anti-Retroviral Treatment (ART) through ART centres and Link ART Centres, Centres of Excellence and ART plus centres have been successful in reducing the number of AIDS-related deaths. Promoting these initiatives will improve statistics further.
The National Vector Borne Disease Control Programme is an umbrella programme operating largely in rural, tribal and urban slum areas to prevent and control vector-borne diseases. Together with schemes like Urban Malaria Scheme, vector control is achieved through various clinical and legislative methods. The National Policy on Malaria brought out in 2013 has been drafted after having made note of both availability of more effective anti-malarial drugs as well as levels of drug resistance in the country for effective treatment of the disease. India has set a national target of reaching pre-elimination, the second step in the four-step programme, by 2017 in its course towards a malaria-free status. To achieve this target, all Indian states, and all
districts within, will need to arrive at an annual parasite incidence (API)—confirmed cases during one year—of less than one per 1,000. At present, 74% of India’s more than 650 districts already boast of an API of less than one.10
In two decades, from 1990 to 2011, TB prevalence has seen a reduction of more than 50%.11 India’s research in TB has benefitted patients across the world, and yet the disease has not been eradicated. Since 2006, the country has been under universal coverage of the Directly Observed Treatment, Short-Course, a systematic strategy to combat the disease. The Indian Revised National TB Control Programme is further widening its scope to reach out to all patients, with special provisions to extend services to marginalised sections of the society.
Target 3.4
India saw the growth of life expectancy by eight years, from 58.5 years in 1990 to 66.4 years in 2013.12 Non-communicable diseases take the largest toll on the health of the Indian population, constituting 52% of deaths in the country.13 Approved in March 2006, the Pradhan Mantri Swasthya Suraksha Yojana (PMSSY) seeks to augment the availability of affordable healthcare facilities across the country and improve the state of medical education in underserved states in particular. With an expanding reach of healthcare facilities, prevention and treatment of non-communicable diseases is likely to be better managed.14
Around 20% of Indians suffer from mental ailments during their lifespan and at any point of time, there are 72 million people suffering from some form of mental illness. In October 2014, the government launched its first National Mental Health Policy, which aims to provide universal access to mental healthcare. The comprehensive plan includes modernising existing facilities, enabling hospitals to start providing mental healthcare, reaching out to vulnerable groups and decriminalising suicide.
Target 3.5
Around three million people have been estimated to be dependent on drugs (0.3% of the population). India’s proximity to the major poppy-growing areas of the world makes it vulnerable to drug abuse along
32

transit and trafficking routes. The Indian government identifies the following as high-risk groups: Commercial sex workers, transportation workers, street children, and people living in the northeastern states/border areas and opium-growing regions of the country.
India’s approach to the problem of substance abuse is collaborative in nature. The Scheme for Prohibition and Drug Abuse Prevention under the Ministry of Social Justice and Empowerment assists close to 400 voluntary organisations inmaintainingmore than 400 Integrated Rehabilitation Centres for Addicts. The National Centre for Drug Abuse Prevention under the National Institute of Social Defence manages training, research and documentation in the field of drug abuse prevention. All other concerned ministries are integrated for supplementing the initiatives taken by one another. India has also engaged in international collaborations with, for instance, the UN Office on Drugs and Crime and the International Labour Organization, to address for preventive measures and issue of rehabilitation.
Target 3.6
As per the World Bank, with more than 200,000 annual fatalities, India’s contribution to global traffic deaths stands at 15%. While it is in line with India’s proportion to global population, the numbers are still worrying. The new draft Road Transport and Safety Bill, 2014, aims to make Indian roads safer by increasing penalties for violations and mandating stringent action against violators. Additionally, the government is mulling over constituting a Highway Traffic Regulation and Protection Force. A motor accident fund has also been proposed for providing mandatory insurance to all road users. In addition to these steps, an all-India road accident emergency telephone number is also in the pipeline. With road fatalities and injuries being included in the SDGs, efforts in this direction are expected to be intensified and integrated with other initiatives.
Maintenance of risky roads in urban and rural areas is likely to be taken more seriously under the various road building schemes.
Target 3.7
For the twin purpose of tackling the problem of population growth and sexual and
reproductive health, the Government of India has established an autonomous body called Jansankhya Sthirata Kosh (National Population Stabilisation Fund). Its helpline provides confidential counselling services and addresses callers’ concerns on sexual and reproductive health.
Experts have given recommendations for linking all existing programmes and initiatives dealing with sexual and reproductive health, replicating the HIV, Malaria and TB model, for better implementation and closer monitoring.14
Target 3.8
The PMSSY, in three phases, will see the establishment of eight new All India Institutes of Medical Sciences-like facilities and upgradation of 29 existing medical colleges. This will bring India close to the target of universal health coverage by addressing regional and economic imbalances. Furthermore, mobile healthcare units in collaboration with private sector/non-governmental organisations have been bringing basic medical facilities to the doorsteps of needy sections of society.
As India gears up to provide affordable and timely healthcare to its every citizen, another key initiative helping towards this objective is the Jan Aushadhi scheme, whose aim is to provide low-cost generic drugs. During the first phase of the initiative, 504 essential medicines will be sold in the retail market at low prices in a bid to lessen the financial burden on patients and their families. In another important policy intervention, the government provides health insurance services to each and every citizen of the country. Insurance initiatives—like Rashtriya Swasthiya Bima Yojana (which provides health coverage to Below Poverty Line, or BPL, families); Employment State Insurance Scheme for the working population; Central Government Health Scheme for Central government employees; Aam Admi Bima Yojna, a social security scheme for rural landless households under 46 occupational groups, including landless farmers; and the Universal Health Insurance Scheme for poor families—aim at taking the burden of treatment off the shoulders of the diseased and distressed.
Target 3.9
33

The Comptroller and Auditor General’s report containing the results of the Performance Audit of Water Pollution in India, 2011-12, paints a grim picture of the country’s water bodies.15 In the absence of strict provisions in policy and legislative frameworks, pollution levels are alarmingly high with little or no signs of improvement. The situation is similarly worrying with respect to air pollution. With Prime Minister Narendra Modi launching the National Air Quality Index this April, data for 11 cities is now available in the public domain. The health implications of the same should act as robust drivers to make the Central and local governments accelerate policy and legislative initiatives.
ChallengeS anD the roaD aheaD
One of the biggest challenges in the field of healthcare policy formulation is lack of sufficient data. Data gap, periodicity and coverage issues at sub-state level hamper assessment and monitoring efforts. The current government’s thrust on digital governance should address this concern.
Efficient implementation of government initiatives and schemes is another challenge. The health sector in India is particularly prone to corruption and pilferage, both of which need to be tackled urgently. For example, insurance benefits targeting BPL families in rural areas do not reach the intended beneficiaries due to malpractices. More transparency in the operation of such schemes is needed by using technology optimally. The government must also ensure accountability of health services delivery and related institutions. Attitudinal hindrances are also a big factor limiting implementation, for instance non-compliance as observed in reproduction and women’s health-related schemes.
A skewed sex ratio and the worrying rate of population growth are further manifestations of this phenomenon.
In the context of the MDG on maternal health, a report of the UN Rapporteur on Health identified the lack of “health work force [as] a major bottleneck in India.”16 This holds true largely for all the health initiatives that the government has launched. In a sad paradox, India has not been able to utilise its demographic dividend optimally. Despite various training and recruitment drives, skilled
healthcare personnel are not available in sufficient numbers. The situation is particularly grim in villages where absenteeism, despite government policy on mandatory service of newly qualified doctors in rural areas, has assumed an alarming proportion.
As per WHO estimates, almost 65% of India’s population is still dependent on traditional medicines for health-related needs as well as sustenance. Lifestyle, poverty, lack of timely access to public healthcare and religion beliefs are some of the factors responsible for this. The UN Development Progamme has recognised this potential, and has been partnering with the government to promote sustainable use and conservation of medicinal plants since 2008.17 With the formation of the Ministry of AYUSH in 2014, prospects of traditional medicine can be further tapped and regulated. For example, the practice of patenting traditional medication by multinational pharmaceutical companies, thus restricting access, needs to be paid due attention to. Alongside, there needs to be a crackdown on quackery and spurious drug usage. Regulation of drug prices by facilitating fair competition among bulk drug suppliers and retailers needs special attention. Additionally, means may be devised for enhancing the purchasing power and incomes of the poor through direct subsidy transfers.
India’s health policy has been fairly progressive. Fixing the lacunae at the level of implementation and close monitoring are likely to result in a positive healthcare scenario in the country. The approved SDGs will draw attention towards these issues, thereby hopefully propelling the Indian government to act upon these concerns very much in consonance with the Indian reality of healthcare.
34

Quality of education for all: Can it be done?
Goal 4 of the Sustainable Development Goals (SDGs) draws on the experience of the preceding Millennium Development Goals as well as the Jomtien (1990) and
Dakar (2000) Frameworks of Action and the resulting Education for All Goals.1 Specific targets covered under this goal lay out an ambitious and broad agenda.They cover early childhood care and education, universal primary and secondary education, quality and improved learning outcomes, access to technical, vocational, tertiary and skills education, universal adult literacy, expansion of global citizenship for sustainable development, and doing all of the above by removing disparities and promoting equal access. This chapter looks at India relative to SDG 4 targets and argues that business as usual is not an option. In its second part, it describes steps essential to successfully meeting this SDG challenge.
an inDian SCore CarD2
Are all children in school? In elementary education (grades I-VIII), India has shown massive improvements in access, and has closed the gender gap in the process. From a Gross Enrolment Rate (GER) of 32% in 1950-51, the country today has a GER of 95%.3 For secondary education (grades IX-XII), enrolments have doubled, rising from 33% in 2001 to 62% in the most recent estimates.
Goal 4: Ensure inclusive and equitable quality education and promote lifelong learning opportunities for all
4.1 2030, ensure that all girls and boys complete free, equitable and quality primary and secondary education leading to relevant and effective learning outcomes
4.2 By 2030, ensure that all girls and boys have access to quality early childhood development, care and pre-primary education so that they are ready for primary education
4.3 By 2030, ensure equal access for all women and men to affordable and quality technical, vocational and tertiary education, including university
4.4 By 2030, increase by [x] per cent the number of youth and adults who have relevant skills, including technical and vocational skills, for employment, decent jobs and entrepreneurship
4.5 By 2030, eliminate gender disparities in education and ensure equal access to all levels of education and vocational training for the vulnerable, including persons with disabilities, indigenous peoples and children in vulnerable situations
4.6 By 2030, ensure that all youth and at least [x] per cent of adults, both men and women, achieve literacy and numeracy
4.7 By 2030, ensure that all learners acquire the knowledge and skills needed to promote sustainable development, including, among others, through education for sustainable development and sustainable lifestyles, human rights, gender equality, promotion of a culture of peace and nonviolence, global citizenship and appreciation of cultural diversity and of culture’s contribution to sustainable development
4.a Build and upgrade education facilities that are child, disability and gender sensitive and provide safe, non-violent, inclusive and eff¬ective learning environments for all
4.b By 2020, expand by [x] per cent globally the number of scholarships available to developing countries, in particular least developed countries, small island developing States and African countries, for enrolment in higher education, including vocational training and information and communications technology, technical, engineering and scientific programmes, in developed countries and other developing countries
4.c By 2030, increase by [x] per cent the supply of qualified teachers, including through international cooperation for teacher training in developing countries, especially least developed countries and small island developing States
ChaNDrika BahaDur , dirECtor , EduCatioN iNitiatiVEs, sustaiNabLE dEVELoPmENt soLutioNs NEt work
S I X

Do children stay in school? Completion rates measure how many of those enrolled stay on till the last grade.4 For grades I-X, dropout rates fell from 71% in 1990-91 to 47% by 2014. This means that nearly half the children that join grade I drop out by grade X, with a spike during grades VI-VIII (Figure 1).
Are children learning? Since 2001, the National Council of Educational Research and Training (NCERT) conducts the
National Achievement Survey to measure learning at grades III, V and VIII.5 Results show that on average, nearly a third of the students scored below 50% in language questions and a quarter of the students scored below 50% in mathematics. The Annual Survey of Education Results (ASER) was more disappointing. The 2014 results show over half of all grade V children unable to read a grade II test fluently. States like Bihar and Jharkhand showed worsening reading levels in the past five years. The proportion of children in grade V that can do division, a grade II skill, stood at 26%. The proportion of grade II children unable to recognise single digit numbers has increased to 19.5% in 2014 as compared to 11% in 2009. Amongst grade VIII students, the proportion able to correctly solve a three digit by one digit division problem decreased to 44% in 2014, compared to 68% in 2010.6
Do children have access to early childhood education and care? India has one of the most comprehensive early childhood programmes in the Integrated Child Development Scheme (ICDS), which as of 2013 covered 63.5% of all children in the six months-six years age group.7 Over one million Anganwadis exist today, each one catering to 30 children on average.8 Despite its scale, ICDS has not led to significant reductions in malnutrition, or marked improvements in childhood learning.
Can the youth and adult population read and write? One-third of all Indian adults, a fifth of Indian men and two-fifths of Indian women above the age of 15 years cannot read or write. In absolute numbers, over 287 million people were illiteratein 2011, a number that has remained stagnant over the past decade.9
Do school leaving students continue to higher education? The GER for higher education rose from 8% in 2001 to 21% in 2012. Despite this rapid rise, nearly four-fifths of both boys and girls do not study beyond school. Expansion of universities and colleges have lagged behind growth of schools. Even accounting for larger batch sizes, there are only 712 universities as compared to over 36,000 colleges, 233,845 secondary and senior secondary schools, and 1,191,719 primary and upper primary schools.
36
Figure 1: Dropout Rates (Primary, Elementary and Lower Secondary)

Do young people have the skills necessary to be productive members of the labour force? 16 million workers enter the workforce annually. Currently, only 10% of the workforce receives some kind of skilling against a national target of 25%. By 2022, over a 100 million will enter the labour force and need skilling. On the demand side, industry across 24 sectors will need 110 million people by 2022. If the incoming labour force is completely skilled, it will match the projected demand from industry. Currently, there are approximately 300 million people in the workforce in the 15-45 age group across the farm and non-farm sectors that are unskilled or semi-skilled against available skilling capacity of four million.10
The scorecard for India across these various targets show that India has progressed on enrolment rates but not fast enough on other parameters nationwide—and has actually regressed on learning outcomes in some years. The national numbers also mask significant variations across states, especially in learning. The northern and central Hindi-speaking belt fares the worst (Rajasthan, Uttar Pradesh, Bihar, Jharkand, Madhya Pradesh), followed closely by eastern states (Chattisgarh, West Bengal, Orissa). The southern states of Kerala and Tamil Nadu fare the best.
Can India achieve the SDG on education? From the data above, at the current rates of progress, the answer is no. Based on past trends, a third of students who enrol in grade I will still not reach grade X. Learning outcomes and adult literacy rates are stagnating, and nearly 40 years of ICDS programming has not been able to significantly dent national malnutrition rates or improve early childhood learning. India currently has neither the capacity to train all its entrants to the labour force, nor the jobs to hire all of them if it did. The targets that are most at risk are 4.1, 4.2 and 4.6—those that focus on universalising primary, secondary access and learning, quality pre-primary that makes children ready to learn and adult literacy. Some states may succeed on some targets, but for India to achieve all targets within a fifteen-year time frame requires urgent and fundamental shifts in government policy and action.
moving forWarD: a DeCaDe-long miSSion for eDuCation
Few countries have shown the ability to simultaneously improve on so many fronts. India is no exception. But the SDGs offer a window of opportunity. The education goal and its targets are strongly aligned with the aspirations of India’s young population and with its economic needs. Achieving SDG 4 will build strong foundations for economic prosperity—but this will not happen in a business-as-usual mode.
India requires a Decade-Long Mission for Education—a multi-year project built around national consensus, cutting across political and regional differences, that moves the country in the direction of the SDG targets. This chapter describes these components but omits discussion on those areas where the Government of India already has flagship programmes, such as Skill India. It identifies those specific policies without which achieving the SDG is impossible.
It is important to recognise one truism—strong government action, at the Centre and in states, will drive achievement of SDG 4. No country in the world has achieved education outcomes similar to the SDGs without sustained and effective public investment, and a responsive, effective system that supports it.
ICDS 2.0
Neuroscience has now confirmed that the foundations of brain architecture and functioning are created in early childhood in a process that is guided by external influence.11 The growth and pruning of neuronal systems in early years support early skills, including cognitive, social and emotional and executive function skills.12 Each skill is predictive of school success, higher earnings, active participation in society, and lower odds of delinquency, crime, and chronic and non-communicable disease. Therefore, investment in early childhood care results in greater cost savings than investment later in the life cycle.13
Despite its four-decade history, the ICDS has not succeeded nationally. Moving forward, ICDS implementation will require
37

a strong focus on the following. First, instructional content must be such that it develops early cognitive skills, especially reading and math.14 Second, teams of trained specialists must be provided to Anganwadi workers to improve their instructional and interactive skills. The Anganwadi staff’s ability to be responsive to help children and work with parents to improve the modelling and interactive practices with the child—rather than simply manage children for a few hours—is critical. Third, a strong focus on community-based care at the Anganwadi centres to create local ownership must be maintained. ICDS 2.0, if done with a strong focus on quality, can transform children’s lives and have a cascading effect through to later years.
Adult Literacy: Unfinished Agenda
The ability to read, write and do simple calculations are the basic skills that allow women and men to function effectively in society today. Ongoing government programmes have stagnated. The Sakshaar Bharat Mission (formerly the National Literacy Mission) can complete this task, but with a complete change in tactics. Lit-eracy programmes using mobile telephony as the primary delivery model, building on promising research on mobile apps for basic literacy and numeracy, can be rolled out more easily in partnership with civil society and private enterprises. The government can meanwhile prioritise, possibly on a five-year basis, different groups of adults to target. For example, in the first five years (2015-2020) the target groups could include young women and men migrating for work (15-40 years). Programmes can be designed specifi-cally around their constraints (location, lan-guage, employment). This would allow the government to aim for a 100% success rate in each five-year tranche, with the overall goal to reach over 90% literacy by 2030.
An Independent Assessment Agency
An independent assessment of student learning that is tied to rewards for teachers, school administrators and parents can transform the quality of school education. Such assessments have to be conducted by a body external to the system to be effective. An autonomous National Assessment Agency outside of the purview of the Ministry of Human Resource
Development or the National or State Councils of Educational Research and Training is needed, organised similarly to the UK’s Office of Standards in Education, Children’s Services and Skills (OFSTED).15 Unlike OFSTED, this agency would also conduct learning assessments through tests, and run surveys that record responses of students, teachers and parents. It would create publicly available “School Report Cards” for both public and private schools, covering progress on grade-appropriate learning outcomes, teacher responsiveness and capacity, resources available, student satisfaction, facilities, spending per child and parental satisfaction. District-wide school rankings could be reported.16 To succeed, such an agency would need complete autonomy from central/state executive branches of government; conduct tests that measure grade-appropriate learning and not draw directly from the syllabus; include survey-based responses on student, parent and teacher satisfaction; report on metrics of cost per child, facilities available, etc.; and feed results into annual programmatic reviews to record year-on-year improvements. A National Assessment Agency will serve multiple purposes. It will link teaching and learning in an objective, credible manner; allow immediate corrections to improve quality; help isolate the contributing factors to student performance; give parents greater information to make decisions about their children’s education; hold school administrators and teachers accountable; and allow an analysis of student learning without penalising students or teachers. If such an agency is established immediately, the first extensive “School Report Cards and Rankings” could be produced by 2020.
Intensive Learning Support Programmes
Children who struggle to keep pace with their peers need additional help, but rarely receive it when needed. The compounded gap in learning leads to early dropouts. Several organisations (Doosra Dashak, Pratham) have demonstrated success in intensive learning camps, where children learn at their own level (using ‘teach at the right level’ or TARL approaches). Such programmes show initial gains in learning, especially at primary grades, but fit
38

uncomfortably within the formal schooling structure. Yet, they promise an effective and low-cost way of reaching children who need help the most.
Over the next five years, a focused effort to introduce TARL in dedicated learning camps (four-six weeks long) is one way to close the learning gap. Over time, the education system can integrate TARL-type innovations through actual or virtual remedial sessions. Several such practices are already part of the NCERT frameworks, but are difficult to implement within classrooms. Shorter, targeted programmes can be implemented more easily.
Competencies
In 2013, the Learning Metrics Task Force identified seven domains of learning—physical well-being, social and emotional skills, culture and arts, literacy and communication, learning approaches and cognition, numeracy and mathematics, and science and technology.17 Others have described 21st century skills: Teamwork, organisational skills, autonomous learning, self-direction, creativity and innovation.
These skills reflect the reality of our social and economic environment. Knowledge accumulation no longer commands the premium that it did before. Interpretation, analysis, and management of knowledge and its application to the world are much more valued. Increasing automation in manufacturing is another irreversible trend. Both require that children learn to manage environments, technology and people at different levels of complexity. As the Indian system struggles to provide the basics, these broader domains sound almost utopian—but they offer an opportunity to leapfrog and embed these new skills into our existing learning frameworks.
Helping Teachers Do Better
The success of any education system depends fundamentally on the interaction between students and teachers. There is enough written about the challenges of teaching recruitment, quality and incentives. Four areas of immediate management changes stand out. First, teachers work best when there is clarity
regarding their scope of work and goals. Arbitrary, frequent changes to curricula and pedagogy demotivate teachers and should be discouraged. Second, teachers are most effective when most of their working hours are spent teaching. Instructional hours should be sacrosanct, and predictable and adequate instructional time has shown big improvements in learning. Third, corruption is endemic to teacher appointments in many states. Political leadership across party lines would do well to confront and defeat this challenge. Finally, non-financial recognition, through local recognition, peer voting and immediate feedback—practices deployed routinely in general management circles—can bring improvements. It is impossible to delve here into details of the delivery challenges that lie at the heart of the problems in the Indian education system, but it is important to spell out its role and to note, that even within this system, the states that perform are those that can motivate, reward and manage their teachers better.
ICTs and Opening (and Open) Education
Evidence is mixed on how effective information and communication technology (ICT) is for learning. Technology by itself is not enough to improve student performance. What matters is how it is deployed, who uses it and why ICT can invert the model of learning: It allows children to tap into their natural curiosity and learn by “wandering;” it increases confidence; it offers divergent perspectives and makes them active learners. Technology is a boon for open education. The National Institute of Open Schooling and the Indira Gandhi National Open University are two institutions that can immediately use technology to free education from the constraints of structured coursework and allow students to decide how they learn. Over the next two to three years, all open courses offered by both institutions should become completely flexible, with students free to register and learn when they want. In addition, the many experiments with technology and learning should continue as we discover the best ways to use technology, especially for children with poor learning levels. At a minimum, every school should be connected to a high-speed
39

broadband line the same way it has access to electricity within the next five years.
Higher Education Reform
India has systematically underinvested in tertiary education in the last four decades. The challenges of improving higher education can do with a chapter all of its own. But it is critical for SDG targets 4.3 and 4.4. The rising enrolment rates in middle and secondary schooling will hit a wall if we do not have adequate supply capacity to absorb students. Moreover, industry and research will suffer if the country is not preparing scientists, thinkers, researchers and professionals.
There are three important structural issues to confront immediately. First, as a matter of urgent principle, it makes no sense for higher education to be as heavily regulated as it is. The “license raj” mandate of the University Grants Commission should be reduced and restricted to public funded or aided universities only. Private universities should be allowed to establish independent and diverse governance structures without requiring legislative permission. Accreditation can be enabled within a predefined period, based on public declaration of transparent and measurable compliance with independently set academic standards. Second, endowment-based, low-fee models for private universities should be encouraged to maximise access for students. India has the third highest number of billionaires in the world, a fact not reflected in private philanthropy to higher education, largely because of a legal structure that discourages clean, transparent giving. Third, the government’s primary role in higher education should be to create a robust environment to encourage research and innovation so that a pipeline of research grants is available to encourage basic and applied research; and to support the emergence of innovation hubs and partnerships with the business community so that entrepreneurship, skills and employment opportunities are created in consultation between academia and industry.
Financing Framework
Finally, achieving SDG 4 will cost money. India currently spends approximately 4.3%
of GDP on education. While detailed cost estimates are not available, it is likely that an expansion of K12 education, tertiary education and a significant investment in quality, all at the same time, will require spending 5.5% of GDP, which is in line with international norms on education spending.18 The numbers will inevitably depend on efficiency. Private schools often manage to provide comparable quality at a third of the costs of public schools, for example. The structure of cost-sharing between the Centre and states, and the role of centrally sponsored schemes will determine the overall fiscal burden. It is critical to note that spending effectively for a high-quality education is a smart public investment, and very often, this spending has to cross a certain threshold to be effective.19 But costs can be moderated without compromising on results—as examples of countries like Sri Lanka, Thailand and South Korea show, all of which invested heavily in education with limited resources.
The Indian government has taken several steps to improve education in the past 15 years, and results show in the expansion of enrolments
across levels of education. The mandate of the SDGs is infinitely more ambitious, but good for India’s long-term development trajectory. The question is one of time. Our demographic structure does not allow us the luxury to wait or to continue on the path that we have been on.
To take advantage of the youth bulge, India will need to take on the challenges of quality and access on a war footing. The next decade will be critical. If targeted, strategic actions are taken now, their impact will create a force multiplier that will make other programmes, like Skill India and Make In India, a success. Such an effort will need political consensus across parties, states and levels of government. A Decade-Long Mission for Education with a laser-like vision on improving quality and access will yield rich dividends as we build a society with greater prosperity, a sustainable future, decent work and an improved quality of civic life and public discourse. Our children deserve no less.
40

From mdgs to sdgs: mainstreaming the gender goal
E nvisioned as a concise set of time-bound targets, the Millennium Development Goals (MDGs) played a crucial role in merging core issues of national development with interna-
tional cooperation since their ratification in 2000. The MDGs were also significant because they recognised gender inequality as a major impediment to achieving global
development, and included a stand-alone goal, MDG 3, to prioritise it in the interna-tional development agenda.
MDG 3,“promote gender equality and empower women,” was accompanied by one target and three associated indicators. Progress on this goal was measured through only one target—achieving gender parity in education. However, while crucial for women’s empowerment, education is not sufficient by itself.
Building on the momentum of MDGs, the Sustainable Development Goals (SDGs) aim to be more inclusive and more trans-formational. Therefore, SDG 5, to “achieve gender equality and empower all women” is accompanied by nine targets and many pro-posed indicators. The changed terminology and the recognition of gender as a cross-cutting issue across other goals, in addition to being a stand-alone goal, demonstrates the significance of gender equality within the SDG agenda.
As there are many SDG 5 targets, they can be categorised within three broad themes as proposed by United Nations Women.1 These themes address the structural aspects of gender equality and women’s rights, namely: Freedom from violence against women and girls; gender equality in capa-bilities and resources; and gender equality in decision-making power in public and private institutions.To restrict the scope
Goal 5: Achieve gender equality and empower all women and girls
5.1 End all forms of discrimination against all women and girls everywhere
5.2 Eliminate all forms of violence against women and girls in the public and private sphere, including trafficking and sexual and other types of exploitation
5.3 Eliminate all harmful practices, such as child, early and forced marriage and female genital mutilation
5.4 Recognize and value unpaid care and domestic work through the provision of public service, infrastructure and social protection policies and the promotion of shared responsibility within the household and the family as nationally appropriate
5.5 Ensure women’s full and effective participation and equal opportunities for leadership at all levels of decision-making in political, economic and public life
5.6 Ensure universal access to sexual and reproductive health and reproductive rights as agreed in accordance with the Programme of Action of the International Conference on Population and Development and the Beijing Platform for Action and the outcome documents of their review conferences
5.a Undertake reforms to give women equal rights to economic
resources, as well as access to ownership and control over land and other forms of property, financial services, inheritance and natural resources, in accordance to national laws
5.b Enhance the use of enabling technology, in particular information and communications technology, to promote the empowerment of women
5.c Adopt and strengthen sound policies and enforceable legislation for the promotion of gender equality and the empowerment of all women and girls at all levels
V i D i S h a m i S h r a , r E s E a r C h a s s i s ta N t, o r f
S E V E N

of this chapter, the SDG 5 targets that are most pertinent to India’s policy environ-ment will be examined from among these categories. The key conversations that India needs to have to internalise this goal will also be highlighted.
BuilDing on mDg 3
While India has achieved some MDG targets, and has come close to achiev-ing others, social, economic and political empowerment of women remains a major development challenge. As the MDGs expire this year, it is crucial to determine how gender equality and women’s empow-erment have been and can be incorporated within national strategies and programmes. It is also important to analyse how the gaps identified through the MDG experience are relevant to the gender SDG, and how gender crosscuts other SDGs.
As mentioned earlier, MDG 3 had one target (3A), which was to achieve gender parity in primary and secondary education. India has made considerable progress in achieving gender parity in primary educa-tion since the introduction of the Right to Education Act.3 But for Indian women, access to educational institutions is a chal-lenge due to restrictions on mobility and cultural biases. Additionally, due to the non-availability of safe sanitation facilities, gender-sensitive infrastructure and adequate teacher training, disparities remain in terms of outcomes and opportunities for women.3
Moreover, the MDG indicator for target 3A was in itself inadequate to measure progress on this front. The indicator 3.1,“ratios of girls to boys in primary, secondary and tertiary education,”4 being purely quantita-tive in nature, failed to distinguish between education and enrolment. Therefore, while it could measure if an equal proportion of boys and girls were enrolled in primary education, it could not monitor the dispar-ity in the quality of education received.
The SDGs aim to overcome these shortcom-ings related to gender. First, the stand-alone goal on education (SDG 4) is accompanied by indicators that explicitly mention “boys and girls.” The goal also includes a target dedicated to eliminating gender disparities in education and ensuring equal access.5
Second, SDG 5 also incorporates educa-tion under the broad target 5.1: “end all forms of discrimination against women and girls everywhere.” The proposed indica-tors within this target focus on the primary and secondary ‘completion’ rates of girls and boys. In India, large numbers of girls drop out due to cultural biases or lack of supportive infrastructure; therefore, it is more important to concentrate on comple-tion rates, rather than enrolment rates. This development implies that India needs to re-assess its education policies for girls, focus-ing not only at enrolling them into primary education, but also at facilitating their entry into higher education in large numbers.
The other two MDG indicators, 3.2: “Share of women in wage employment in the non-agricultural sector,” and 3.3: “Proportion of seats held by women in national parlia-ment,” were distinct from each other in the way that the former was tougher to calcu-late while progress in the latter could easily be quantified and assessed. India continues to perform modestly on these indicators of women’s economic participation and politi-cal leadership. The Inter Parliamentary Un-ion ranks India at the 105th position with 12% women in the national parliament. At present the parliament comprises of only 65 female representatives out of 543 in the lower house, and 31 female parliamentar-ians out of 243 in the upper house.6
While the representation of women in the national parliament was an indicator within the overreaching educational gender-parity target of MDG 3, SDG 5 recognises the importance of “women’s full and effective participation and equal opportunities for leadership at all levels of decision-making in political, economic and public life” by making it a separate target. A significant difference is that while MDG 3.3 aimed at achieving 50% women’s representation in the parliament, the SDG indicator for this target has been modified to include “percentage of seats held by women and minorities in national parliament and/or sub-national elected office according to their respective share of the population.”
The modification may create a situation of skewed representation across countries, as it allows room for manoeuvring instead of the initial, instinctive push for global parity
42

in national legislatures. In India, while women make up for almost half of the country’s population, the Women’s Reser-vation Bill—intended as the ultimate step towards achieving the target, if passed—would only reserve 33% of all seats for women. By providing room for variation in the proportion of representation, the modification of the MDG indicator may be a setback.
On the upside, the current majority elected government in India has long endorsed the bill.7 Prime Minster Narendra Modi has repeatedly asserted the ruling party’s focus on gender equality in his speeches8; it is possible that with India’s commitment to the SDGs, discussion on the Women’s Reservation Bill and on the larger issue of women’s leadership will be revived and pushed beyond the nominal 33%.
Further, despite being a rising economy, female labour force participation in India has declined sharply since the 1990s. Today, less than 30% of women above 15 years are part of the labour force.9 As the world moves from the MDGs to SDGs, it is essential to recognise that new develop-ments produce new challenges that often affect men and women differentially. For instance, globalisation and open market economies have affected women farmers more adversely due to a lack of competitive skills and equal opportunities. Therefore, the SDGs, while being global in nature, must acknowledge local contexts as well as previous successes and failures. The Indian context is a case in point.
According to the UN Food and Agricul-ture Organization, despite over 80% of rural women being involved in agriculture, Indian women in all own less than 10% of agricultural land.10 Land ownership is critical for accessing credit and other state-sponsored irrigation schemes.11 Therefore, not owning land affects the agricultural input of women farmers, which if en-hanced, could contribute towards reducing world hunger. The connection between gender, land ownership and food security is recognised in the SDGs, which categorise land ownership as a target in achieving gender equality as well as a goal in ending poverty (SDG 1). The goal dedicated to ending hunger (SDG 2) also mentions that “productivity and the incomes of small-
scale food producers particularly women” must be doubled.
At the policy level, gender concerns are now being mainstreamed in development initiatives in India, such as in the case of the Mahatma Gandhi National Rural Em-ployment Guarantee Act,12 a government initiative formulated to secure livelihood in rural areas. While the programme was not explicitly envisioned as an initiative for women’s empowerment, the gender-sensi-tive design of the programme—it mandates one-third of all beneficiaries to be women and strives to provide employment with child day-care facilities within a five-kilo-metre radius of residence—has resulted in numerous rural women joining the work-force, both as workers and leaders.
Regarding land ownership, in 2005, the Government of India amended inheritance laws to ensure equal rights of parental land inheritance among men and women. However, studies13 have shown that the law has had little impact due to deep-rooted cultural biases and traditions in favour of sons over daughters. This indicates that legislation alone is not sufficient, but must be supplemented with education and awareness generation policies.
The massive decline in women’s participa-tion in agriculture can be attributed to the aforementioned factors. However, MDG indicator 3.2 called for increasing the share of women in wage employment in the “non-agricultural sector.” According to the National Sample Survey Organisation Surveys, at the national level, the share of women in wage employment in the non-agricultural sector has increased since 2000, but remains low globally.14 Moreo-ver, gender disparity in wages exists in both agricultural and non-agricultural occupa-tions. The gender gap in daily wage rates remains particularly high in skills-intensive manufacturing sectors.15 While the gender MDG did not incorporate this disparity, the gender SDG includes it as an indicator. Further, recognising that it interlinks gen-der with Goal 8 on growth and employ-ment, gender wage gap is also included under target 8.5: “By 2030 achieve full and productive employment and decent work for all women and men, including for young people and persons with disabilities, and equal pay for work of equal value.”
43

BroaDening the manDate
While the MDGs helped prioritise gen-der equality in the global development agenda, the historic 1979 Convention on the Elimination of All Forms of Discrimina-tion against Women and the 1995 Beijing Declaration and Platform for Action have been crucial in establishing the framework for achieving inclusive women’s empower-ment and gender equality. For SDG 5 to have maximum impact, it is essential that the targets are streamlined along existing multilateral human rights mechanisms.
To an extent, MDG 3 was not successful in doing so. This is evident by the non-inclusion of sexual health, reproductive health and reproductive rights of women in the agenda—something well established in prior processes. SDG 5 changes this status quo. Target 5.6 explicitly states that nations must ensure “universal access to sexual and reproductive health and reproductive rights as agreed in accordance with the Programme of Action of the ICPD and the Beijing Platform for Action and the outcome documents of their review conferences.” This is significant for India, where only a limited number of contraception techniques are made available to women. According to the Population Foundation of India, 85%16 of India’s family planning budget goes towards promoting and performing female sterilisa-tions. This strategy, however, has come under heavy scrutiny since 15 women died and many more were hospitalised after being operated on under unhygienic conditions at an incentive-based sterilisation camp.17
Since population control is still one of India’s national priorities, the inclusion of this target in SDG 5 could act as the push required to restructure family planning strategies. There is an urgent need to ensure easier availability of safe contraception and include sexual health education of both men and women within family planning policies. Moreover, target 5.6 is also directly connect-ed with SDG health targets 3.1, dedicated to reducing maternal mortality, and 3.7, dedi-cated to ensuring universal access to sexual and reproductive healthcare services.
In addition, the most significant convergence in the broadened SDG agenda and national priorities can be seen though target 5.2: “Eliminate all forms of violence against
all women and girls in public and private spheres, including trafficking and sexual and other types of exploitation.” In a huge step forward from the MDGs, this SDG target acknowledges sexual and gender-based violence as a global epidemic.
Recently, anger over yet another incident of sexual violence and murder on 16 Decem-ber 2012 led to an unprecedented mass movement for gender justice in India. Safety and security of women is now not only a national priority, but also a major election issue.18 For the first time, gender inequality and women’s safe mobility were topics of debate during national and state elections of 2014, marking a significant shift in how gender concerns are viewed by the political class as well as by voters.
To its credit, over the last 15 years, a comprehensive set of laws have been promulgated in India. These include the Sexual Harassment of Women at Workplace (Prevention, Prohibition and Redressal) Act of 201319 and the Criminal Law (Amend-ment) Act, 2013. The latter broadened the definition of rape and strengthened laws related to sexual offences to include crimes like acid attacks, sexual harassment, stalk-ing and voyeurism into the Indian Penal Code.20
Furthermore, SDG target 5.3—“eliminate all harmful practices, such as child, early and forced marriage and female genital mutilations”—is especially relevant to India. While the phrasing of the target gives the impression of it being restricted to the harmful practices it explicitly names, a push should be made for it to also cover pre-natal sex-selection practices prevalent in India. According to national census, the Child Sex Ratio21 has shown a persistent decline, from 945 in 1991 to 927 in 2001 and further to 918 in 2011. Arguably, the most important women’s empowerment initiative by the Indian government recently has been the Beti Bachao Beti Padhao22 (save the daugh-ter) scheme. By 2030, India should be in a position to judge the efficacy of its efforts in controlling the declining sex ratio.
internaliSing the genDer goal
It can be concluded that there is noticeable convergence between SDG 5 and India’s
44

national priorities. However, it must also be acknowledged that the targets associ-ated with the goal are extremely ambitious. Due to the use of phrases like ‘end all forms of discrimination’ and ‘eliminate all forms of violence,’ the targets are likely to serve as lofty ideals that India could strive to achieve in the next 15 years.
This is not to say that the targets in general are impossible to achieve. But in order to do so, the need for adequate financing must be addressed explicitly. As estimated by Organization for Economic Coopera-tion and Development’s GenderNet,23 in 2012-13 only 5% of total international aid was dedicated towards the principle cause of gender equality. Further, the Addis Ababa Action Agenda adopted at the third Financing for Development conference in Ethiopia in July 2015 has received mixed reactions from women’s rights activists who feel that, although the major funding gap in gender was recognised, no specific commit-ment was achieved.24 Therefore, in addition to relying on traditional funding avenues of international aid and taxation-oriented domestic funding, India needs to invest in gender-responsive budgeting and gender mainstreaming in design of all projects in order to maximise the impact of its own re-sources towards achieving gender equality.25
At the same time, in order for India to measure its progress towards gender equal-ity relative to the SDG-specific indicators, its own inability to as of yet measure gender inequality accurately is a critical impediment. While target 5.2 dedicated to eliminating violence against women is a top national priority, some of the proposed indicators to measure the progress towards this target may not be feasible for populous developing countries like India, at least under present data-collection mechanisms. Measuring violence entails several ethi-cal and methodological issues. One of the proposed indicators—“prevalence of girls and women 15-49 who have experienced physical or sexual violence by an intimate partner in the last 12 months”—prescribes surveying all women between a vast age group over a specific time period. Another suggested indicator—“percentage of wom-en and men who report feeling safe walking alone at night in the city or area where they live”—may be too vague to quantify through present data-collection systems.
The use of technology and innovative gender-sensitive data-collection techniques are still new to India, but need to be incor-porated at a large scale in the future.Additionally, the zero draft outcome report recommends evaluation of progress made in the implementation of the SDG targets every four years.26 While India has long been collecting data in the form of decadal, annual and ministry-specific national sam-ple surveys, it must invest more in the col-lection of sex-disaggregated data,27 which includes separate data collection and analysis for men and women. Such analysis involves qualitative surveys into issues of ownership and decision-making between men and women within households; this can prove essential in assessing India’s standing vis-à-vis SDG 5 indicators.
The ability to accurately measure progress against the set indicators would also con-tribute in strengthening the accountability of the SDG agenda. The MDGs lacked in their focus on monitoring, evaluation and accountability;28 the SDGs, in contrast, have more focus on monitoring and evaluation but remain unclear on accountability. Given India’s size and its federal political system, huge regional variations exist in the country in terms of demographics and state-specific legislations. Monitoring efforts and initia-tives can help identify best practices across the country. But the Indian government is unlikely to commit to officially reporting to the UN. Hence, a people-centric mechanism for monitoring, evaluation, and consequent accountability is essential to ensure consist-ent progress towards the targets.
The post-2015 agenda is inclusive and ambitious. Its successful implementation has the potential to transform the world by 2030. However, its success depends on learning from the MDG experience as well as on issues of financing, monitoring, evaluation and accountability. That said, the gender SDG can prove to be crucial in bringing solution-oriented attention to areas of concern in India, and can be inte-grated perfectly within the country’s current policy environment.
45

Providing Water and sanitation for all
Providing access to safe drinking water and sanitation is a constitutional mandate and was prioritised since the first Five Year Plan (1951-56) in the country. In subsequent
national policies, the broad national objective on water and sanitation has been to ensure “adequate safe drinking water security” and “improved sanitation” to all households in the country.1 Over the years, various government programmes, under the purview of the Ministry of Drinking
Water and Sanitation (MDWS), have set their own specific targets and definitions of both water and sanitation goals, all in a bid to secure these two fundamental basic rights for diverse populations (urban, rural, women, marginalised, etc.).
Indian efforts complemented the target on water and sanitation set by the Millennium Development Goals (MDGs). MDG 7 on “ensuring environmental sustainability” encompassed the specific target of “halving the proportion of people lacking access to safe drinking water and sanitation by 2015.”2 India has had reasonable success in achieving the MDG on safe drinking water: More than half of India’s population now has access to safe drinking water within premises. On the other hand, the country lags behind in meeting the sanitation goal: 53.1% of the total households still lack access to sanitation facilities.3 The magnitude of the challenge is enormous and has been recognised as exigent both nationally and globally.
While national goals on water and sanitation continue to evolve to address various challenges, the recently adopted Sustainable Development Goals (SDGs) include a specific goaltowards“ensuring availability and sustainable management of water and sanitation for all.”4 This paper assesses the progress made by India in providing water and sanitation to its
Goal 6: Ensure availability and sustainable management of water and sanitation for all
6.1 By 2030, achieve universal and equitable access to safe and affordable drinking water for all
6.2 By 2030, achieve access to adequate and equitable sanitation and hygiene for all and end open defecation, paying special attention to the needs of women and girls and those in vulnerable situations
6.3 By 2030, improve water quality by reducing pollution, eliminating dumping and minimizing release of hazardous chemicals and materials, halving the proportion of untreated wastewater and increasing recycling and safe reuse by [x] per cent globally
6.4 By 2030, substantially increase water-use efficiency across all sectors and ensure sustainable withdrawals and supply of freshwater to address water scarcity and substantially reduce the number of people su¬ffering from water scarcity
6.5 By 2030, implement integrated water resources management at all levels, including through transboundary cooperation as appropriate
6.6 By 2020, protect and restore water-related ecosystems, including mountains, forests, wetlands, rivers, aquifers and lakes
6.a By 2030, expand international cooperation and capacity-building support to developing countries in water- and sanitation-related activities and programmes, including water harvesting, desalination, water efficiency, wastewater treatment, recycling and reuse technologies
6.b Support and strengthen the participation of local communities in improving water and sanitation management
S o Na L i m i t t r a , a s s o C iat E f E L L o w, o r f
( E I G H T

citizens, highlights broad challenges, and in doing so, explores how and to what extent SDG 6 converges with the national priorities in these two fields, and thus, how and to what extent it can be internalised.
aSSeSSing aCCeSS to Water anD Sanitation in inDia
‘Access to drinking water’ has different understandings in the global and national spheres. The United Nations Children’s Fund (UNICEF) and World Health Organization (WHO) define improved drinking water as “one that, by nature of its construction or through active intervention, is protected from outside contamination, in particular from contamination with faecal matter.”5 Indian government policies and programmes define ‘access to drinking water’ differently. The National Rural Drinking Water Programme (NRDWP) defines access to drinking water as “full coverage,” assigning 40 litres per capita per day (lifeline supply) to be provided to all households.6 The broader target mentions sustainable supply, convenient delivery systems and water security at household levels, but ignores the technical emphasis on the quality of water supply, as in the UNICEF-WHO definition.7 However, NRDWP does have a separate focus category on habitations where water is chemically contaminated (arsenic, fluoride, iron, etc.).
The Programme Evaluation Organisation, under the erstwhile Planning Commission of India, in their survey inferred that the definition set by the government for providing water is extremely “liberal” and lacks focus on supply quality.8 As a result, estimates of the households covered under drinking water programmes are understated—depriving households from any further benefits or even attention from the government or local administrative bodies. Such underestimates, in turn, mislead consequent policies, resource allocation and sustainability of the goals.9
Such variations in interpretations also exist in the sanitation sector. The Nirmal Bharat Programme (total sanitation for all) under MDWS defines sanitation as “a system that promotes appropriate disposal of human wastes, proper use of toilets and discourages open space defecation.”10 This
definition has evolved from the earlier understanding of simply providing access to improved sanitation facilities within a household. UNICEF-WHO define improved sanitation as “flush or pour flush to piper sewer system, septic tank, or pit latrines; ventilates improved pit latrine; pit latrine with slab; and/or composting toilet.”11 The Indian policy documents mention these different definitions, but it remains ambiguous which definition is followed for policy prescriptions.
Inconsistencies in defining the proposed scope of operation under different water and sanitation programmes and policies (both global and national) undermine efforts to arrive at a genuine and realistic estimate of successes achieved.
The 68th Round of the National Sample Survey (NSS) recorded an increase of 17.5% between 1991 and 2012 in the provisioning of safe drinking water.12 But there still exists a disparity between urban and rural areas. As the NSS data reveals, more people in urban areas have piped water connection within their premises than in rural areas, similar to global trends. While 90.5% urban population had access to water in 1991, only 67.1% people could avail of this basic utility in rural areas (Figure 1). The growth rate, however, of providing safe drinking water has been much higher in rural areas, with the percentage of people without access to safe drinking water decreasing from 32.9% in 1991 to 11.5% in 2012.13 As evident, the MDG target of halving the people without access to drinking water has been fulfilled, but the struggle to provide access to drinking water to all continues.
Sanitation, on the other hand, has witnessed less laudable progress and has fallen short of the MDG as well as the national target. The urban-rural divide is also appreciably higher. The NSS indicates that only 11.8% rural and 65.3% urban residents had access to sanitation facilities in 1993. According to 2012 estimates, 54.9% of the total population, including 89.6% in urban areas and 38.8% in rural areas, gained improved sanitation facilities (Figure 2). The rate of progress in rural areas was nominally higher than in urban areas. Despite numerous initiatives, India still needs to provide improved sanitation to 45% of its total population.
47

examining national poliCieS anD programmeS
Water and sanitation are state subjects.States have the autonomy to create plans, programmes and policies to meet their water and sanitation targets. A guiding policy was created in 1987 to assist states in managing their water resources in alignment with national priorities. This National Water Policy (later revised in 2002 and 2012) prioritised provision of drinking water for all and prescribed emphasis on wastewater management.16 Several central- and state-level programmes under the MDWS followed, aiming at providing drinking water and sanitation for all, and focused particularly on rural areas.
National programmes on rural drinking water were envisaged as early as 1970s. Various iterations materialised: Accelerated Rural Water Supply Programme; National Mission on Drinking Water (1991); Swajaldhara (2002-2009); National Rural Drinking Water Programme (NRWDP) (2009); Bharat Nirman Phase I (2005-2009) & II (2009-2012).17 These policies have covered a range of issues. Of note is Swajaldhara,which focused on shifting the paradigm of centralised governance of water supply to a decentralised approach:18 The programme provided communities/panchayats the freedom to plan, implement and operate all drinking water schemes through a demand-driven and inclusive participation process. The overall progress under this programme is, however, difficult to assess given the decentralised nature of governance.19 Secondly, the NRWDP issued guidelines for not only achieving intensive coverage of water supply, but also ensuring sustainability of water schemes, water conservation and water quality management. The latter component also formed part of the Bharat Nirman
Phases I and II, which aimed to build rural infrastructure for water quality treatment and supply.20
Programmes on sanitation started a decade later. Central programmes for rural water and sanitation were launched in 1986. The Central Rural Sanitation Programme was created to improve sanitation facilities in urban areas. In 1999, the government initiated the Nirmal Bharat Abhiyan, or Total Sanitation Campaign, aimed at eradicating the practice of open defecation by 2010 through community-led programmes.21 This campaign expanded the earlier concept of sanitation to include waste disposal and hygiene. To incentivise community-led initiatives, the government introduced the Nirmal Gram Puraskar in 2003. Incentives are given to villages, blocks and/or districts on achieving complete eradication of open defecation; these villages, thereafter, are to be labelled as open defecation-free villages. Multiple other schemes and policies have been created to facilitate India’s sanitation goal, but progress has been tardy. Most recently, the Swachh Bharat Abhiyan (Clean India Mission) has been launched by Prime Minister Narendra Modi to eradicate the practice of open defecation by 2019.
Policy researchers suggest that India’s approach to sanitation has been merely “programmatic, infrastructure-based and subsidy-driven.”22 Policies are uncoordinated, institutions lack clear mandates and implementation is poor at ground zero because of a top-down approach.
In view of these challenges, the Ministry of Rural Development consulted domain experts, academicians and members of civil society to formulate a strategic plan (2011-2022) separately for water and
Figure 2: Progress on Access to Improved Sanitation15Figure 1: Progress on Access to Water 14
48

sanitation. Regarding the former, the goal is to ensure safe drinking water access to 70 litres per capita daily within the premises of every rural household.23
Regarding sanitation, the strategy sets specific goals for creating completely sanitised environments, adopting improved hygienic behaviour, and managing solid and liquid wastes by 2017.24 Important additions in these revised strategies include the focus on changing social norms, prioritising wastewater management, executing rigorous impact assessment and monitoring, and enhancing institutional capacities.
reCogniSing the ChallengeS
Both strategic documents addresses several challenges that obstruct provision of safe and clean drinking water to all, and the creation of fully sanitised environments. These are well known. The national review of Eleventh Five Year Plan performance, assessment and recommendations made by international and national civil societies has helped the government recognise and overcome prevalent problems by broadly focusing on two inter-related group of constraints: First, structural and physical, and second, socio-cultural.
Structural constraints cover infrastructural, financial and administrative challenges to meet the twin objectives. The review of the 11th Plan states the “growing problem of slipback” in areas with full coverage of drinking water. Said slipback is caused by unavailability of water due to decreasing groundwater tables, pollution and an increasing demand given a burgeoning population.25 Some areas experience natural contamination due to geogenic leaching, while others face threats due to industrial pollution and poorly managed water sources.26 Sanitation also suffers from infrastructural deficits, including user-friendly toilets as well as waste disposal systems. Technical inadequacies, such as poor quality of installation, dysfunctional toilets, lack of water and improper disposal or treatment facilities, have discouraged users in areas with reported full coverage. Operation and maintenance are mostly compromised due to lack of capacity and training. As a result, some of the fully covered areas have resorted back to open defecation.
Lack of coordinated management and unintegrated planning affects both water and sanitation goals. For instance, in the absence of proper wastewater treatment or solid waste disposal processes, groundwater quality is affected by leaching or open pits/drains. This, in turn, reduces availability of water for both drinking and maintaining toilets. The challenge is convoluted and requires a pragmatic approach. Dealing with such technical and infrastructural discrepancies also requires huge financial and administrative support. Innovative models of financing and technological advancements are needed, along with other complimentary efforts to sustain the momentum of change.
Future changes in the demography and increasing environmental uncertainties compounded by climate change require resilient infrastructure and flexible governance strategies. The size of households is declining,27 and may further reduce with increasing urbanisation and change in societal structure. Would this mean more toilets per household? What would be the infrastructural, land and financial implications of such a demographic change? What kind of threat would a changing climate pose on the availability of water and the infrastructure providing water and sanitation?
The second group of challenges relate to socio-cultural norms, beliefs, entitlements and distributional politics. As the 11th Plan review indicates, targets for water and sanitation have also slipped in the past due to social exclusion, caste-based discrimination in access to water, and age-old norms regarding open defecation. Special monitoring programmes, dedicated funds and planning tools, such as Geographic Information System mapping, have been employed to cater to minority-concentrated districts under the NRDWP. However, such problems continue to persist. Technological fixes for social problems are insufficient and demands radical socio-political change.
Despite various campaigns and awareness movements, open defecation in particular remains a challenge. Coffey et al.’s study, analysing attitudes towards open defecation in Northern India, revealed several “irrational” reasons why people defecate
49
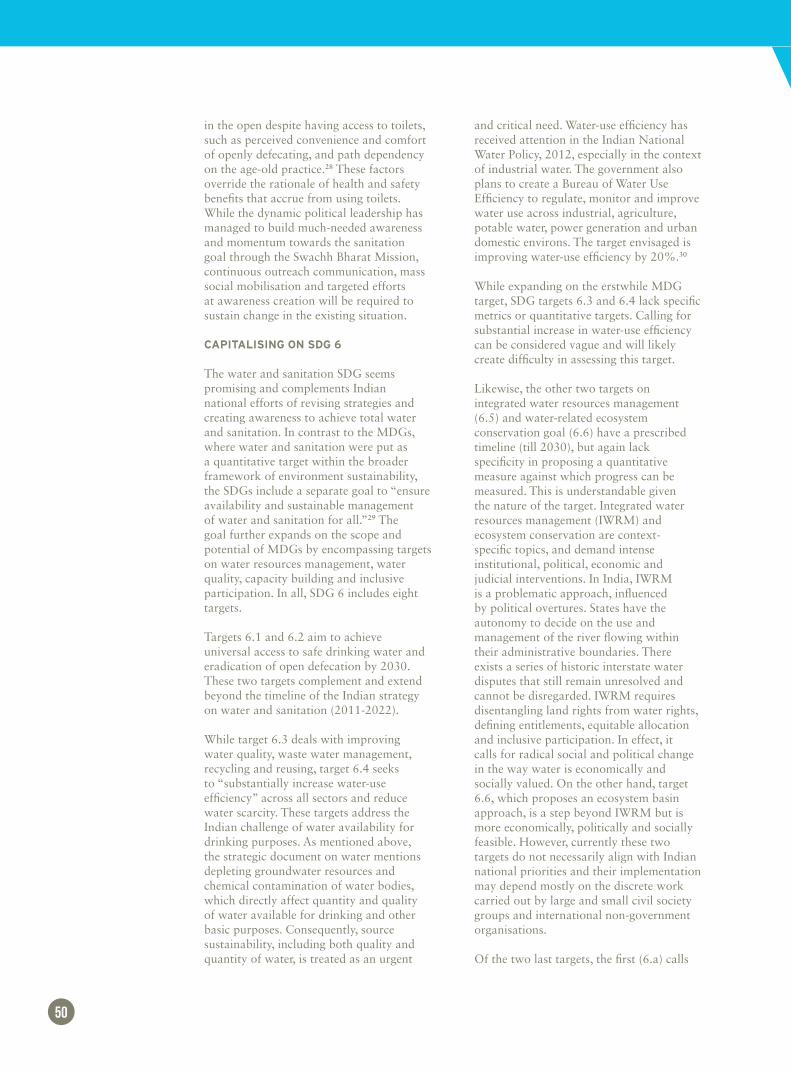
in the open despite having access to toilets, such as perceived convenience and comfort of openly defecating, and path dependency on the age-old practice.28 These factors override the rationale of health and safety benefits that accrue from using toilets. While the dynamic political leadership has managed to build much-needed awareness and momentum towards the sanitation goal through the Swachh Bharat Mission, continuous outreach communication, mass social mobilisation and targeted efforts at awareness creation will be required to sustain change in the existing situation.
CapitaliSing on SDg 6
The water and sanitation SDG seems promising and complements Indian national efforts of revising strategies and creating awareness to achieve total water and sanitation. In contrast to the MDGs, where water and sanitation were put as a quantitative target within the broader framework of environment sustainability, the SDGs include a separate goal to “ensure availability and sustainable management of water and sanitation for all.”29 The goal further expands on the scope and potential of MDGs by encompassing targets on water resources management, water quality, capacity building and inclusive participation. In all, SDG 6 includes eight targets.
Targets 6.1 and 6.2 aim to achieve universal access to safe drinking water and eradication of open defecation by 2030. These two targets complement and extend beyond the timeline of the Indian strategy on water and sanitation (2011-2022).
While target 6.3 deals with improving water quality, waste water management, recycling and reusing, target 6.4 seeks to “substantially increase water-use efficiency” across all sectors and reduce water scarcity. These targets address the Indian challenge of water availability for drinking purposes. As mentioned above, the strategic document on water mentions depleting groundwater resources and chemical contamination of water bodies, which directly affect quantity and quality of water available for drinking and other basic purposes. Consequently, source sustainability, including both quality and quantity of water, is treated as an urgent
and critical need. Water-use efficiency has received attention in the Indian National Water Policy, 2012, especially in the context of industrial water. The government also plans to create a Bureau of Water Use Efficiency to regulate, monitor and improve water use across industrial, agriculture, potable water, power generation and urban domestic environs. The target envisaged is improving water-use efficiency by 20%.30
While expanding on the erstwhile MDG target, SDG targets 6.3 and 6.4 lack specific metrics or quantitative targets. Calling for substantial increase in water-use efficiency can be considered vague and will likely create difficulty in assessing this target.
Likewise, the other two targets on integrated water resources management (6.5) and water-related ecosystem conservation goal (6.6) have a prescribed timeline (till 2030), but again lack specificity in proposing a quantitative measure against which progress can be measured. This is understandable given the nature of the target. Integrated water resources management (IWRM) and ecosystem conservation are context-specific topics, and demand intense institutional, political, economic and judicial interventions. In India, IWRM is a problematic approach, influenced by political overtures. States have the autonomy to decide on the use and management of the river flowing within their administrative boundaries. There exists a series of historic interstate water disputes that still remain unresolved and cannot be disregarded. IWRM requires disentangling land rights from water rights, defining entitlements, equitable allocation and inclusive participation. In effect, it calls for radical social and political change in the way water is economically and socially valued. On the other hand, target 6.6, which proposes an ecosystem basin approach, is a step beyond IWRM but is more economically, politically and socially feasible. However, currently these two targets do not necessarily align with Indian national priorities and their implementation may depend mostly on the discrete work carried out by large and small civil society groups and international non-government organisations.
Of the two last targets, the first (6.a) calls
50

for expanding international cooperation and supporting developing countries in building capacity related to water and sanitation activities. India will need financial and technological support from the global community to meet its mammoth sanitation goal (assuming that the drinking water goal is managed with available domestic resources). The target of eliminating open defecation by 2019 requires building toilets for 45% of the total population,31 which will require $11 billion as per a 2014 study.32 Certain government incentive schemes exist for both rural and urban areas, but a demand of this scale will require additional innovative financing models (microfinance, financial inclusion through commercial banks, engagement of corporate social responsibility, privatisation and crowd funding)—as mentioned earlier.33 Uptake of a particular financial model will need deeper assessment. For example, privatisation of water supply in India has not quite met its mark in improving efficiency or discipline. Moreover, the Supreme Court of India has indicated specifically that air, water and forests cannot be privatised as per the Constitution of India.34 Innovative approaches that effectively utilise the strength of the private sector will be required to meet financial and administrative deficits in the public water sector.
The last target (6.b) proposes a strengthening of local participation in improving water and sanitation management. This recommendation in fact finds mention in almost all Indian policies related to water and sanitation. For example, the 73rd constitutional amendment granted Panchayati Raj institutions administrative responsibilities that include managing water and sanitation,35 in a bid to strengthen local governance and decentralise management of basic utilities. The NRDWP and National Water Policy, 2012, place special emphasis on inclusive participation, gender equity and community empowerment to promote a bottom-up approach.
pulling it all together
India continues to strive to achieve its water and sanitation for all target irrespective of the timeline of the MDGs or SDGs.
SDG 6 is promising, and recognises changing environmental and development realities. It complements Indian water and sanitation strategies and additionally calls for international support for building capacity of vulnerable communities. The goal in question also attempts to capture interlinkages between water resources management, drinking water supply, sanitation and wastewater treatment. This broader ambit and scope of SDG 6, that takes into account the entire supply chain
of water and sanitation management, may have the potential to bridge the gaps in current Indian policies and programmes. Indian policymakers need to carefully evaluate the scope and potential of decentralised governance in managing water and sanitation; the strength of private sector and its engagement in the process; and access to technologies, ranging from complex fixes to the humble and traditional ones. Dealing with these intermixed contours of SDG 6 and national objectives on water and sanitation will require dynamic political leadership and social motivations. Particularly important will be behavioural changes, which will necessitate greater social mobilisation by civil society and the government. The ability and capacity to deal with demands of a transitioning socio-economic society and climate change will also be equally vital as India moves towards achieving the SDG and national target on water and sanitation for all.
51
iNdia will rEquirE iNNovativE fiNaNciNG modEls iN additioN
to thE GovErNmENt budGEt aNd iNcENtivE schEmEs, but Each
modEl must bE fullY assEssEd to GauGE its viabilitY.

meeting india’s energy needs sustainably
T he seventh goal of the Sustainable Development Goals (SDGs) is to “ensure access to affordable, reliable, sustainable and modern energy for all.”1 Targets under SDG 7 include
universal access to energy, a substantial increase of renewable energy in the global energy mix, a doubling in the global rate of improvement in energy efficiency, and the enhancement of international cooperation to facilitate clean energy research, upgrada-tion of technology and investments into energy efficiency and infrastructure.2
The focus on energy access and clean energy solutions is a new thrust of the global developmental agenda. The Millennium Development Goals (MDGs) had no energy-specific goal, although
MDG 7 was to “ensure environmental sustainability” and focused on protecting natural resources, reducing biodiversity loss, and increasing access to basic sanitation and drinking water facilities. The focus on sustainability in the context of energy use in the 2015 to 2030 developmental agenda requires innovative policy formulation and new frameworks to achieve developmental aims. This is because while alleviating poverty and improving the standard of living for the majority of the world’s poor remains the focus of the SDGs, just as the MDGs before them, the objective now is to balance this with an imperative to protect the environment and safeguard resources for future generations.
India’s energy poverty is a massive challenge. The success of the country’s developmental agenda is critical for access to lifeline energy. India is the world’s fourth largest energy consumer and the world’s third largest car-bon emitter. Energy demand in India is likely to increase substantially in the coming years as processes of development and poverty al-leviation take place. At the same time, chal-lenges associated with climate change and global warming are increasing the pressure on India to reduce its carbon footprint and expand the share of clean energy sources in its energy supply. Globally, the mandate to ensure energy access for all must be achieved while reducing the carbon footprint caused by burning fossil fuels and enabling a shift to low-carbon sources of energy.
Goal 7: Ensure access to affordable, reliable, sustainable and modern energy for all
7.1 By 2030, ensure universal access to affordable, reliable and modern energy services
7.2 By 2030, increase substantially the share of renewable energy in the global energy mix
7.3 By 2030, double the global rate of improvement in energy efficiency 7.a By 2030, enhance international cooperation to facilitate access to
clean energy research and technology, including renewable energy, energy efficiency and advanced and cleaner fossil-fuel technology, and promote investment in energy infrastructure and clean energy technology
7.b By 2030, expand infrastructure and upgrade technology for supplying modern and sustainable energy services for all in developing countries, in particular least developed countries and small island developing States
a N i r u D D h m o h a N , J u N i o r f E L L o w, o r f
N I N E

In India, a variety of policy measures have been targeted to help achieve SDG 7, in-cluding the scaling up of renewable energy capacity and reducing energy consumption through improvements in energy efficiency. This chapter will examine where India is placed vis-à-vis the SDG goal of ensuring access to energy for all by 2030, and how India can incorporate the targets of the SDGs in its national energy planning and energy policies.
SDg 7 targetS anD the inDian reality
Target 7.1
Access to modern energy services has been defined by the International Energy Agency as household access to electricity and clean cooking facilities,3 where clean cooking facilities have been defined to include clean cooking fuels and stoves, advanced biomass cookstoves and biogas systems.4
The question of energy access is one of high priority for India, seeing as energy access and poverty alleviation programmes are intrinsically linked. The World Energy Outlook Report 2002, for example, con-cludes that lack of access to electricity and dependence on fuels such as biomass are positively correlated to poverty and hinder poverty reduction programmes.5 Meikle and Bannister explore the linkages between energy and poverty in poor urban house-holds across Indonesia, Ghana and China. They conclude that household energy con-sumption is significant for the livelihoods of the urban poor and that energy availability is critical for socio-economic progress.6 The positive correlation between energy consumption and increasing income levels has also been illustrated for rural popula-tions by Yang, who studies the impact of electricity supply in China on economic development and poverty alleviation. Yang concludes that investments in electricity infrastructure are directly correlated to increases in per capita income of the poor.7
Prime Minister Narendra Modi has targeted 24x7 power supply for all India by 2022, the 75th year of the country’s independence. Although India is the fourth largest energy consumer in the world, it continues to remain an energy-poor coun-try. India’s per capita electricity consump-
tion, for example, computed as the ratio of the estimate of total electricity consumption during the year to the estimated mid-year population of that year, stood at just 957 kilowatt-hours (kWh) in 2013-14.8 Average per capita electricity consumption in the United States in 2011 was at 13,246 kWh,9 which reflects India’s energy poverty. Fur-thermore, it is estimated that around 25% (300 million) of Indian citizens function without electricity and over 800 million lack constant electrical access.10 Access to clean cooking facilities is also a major con-cern in India. A United Nations Industrial Development Organisation report found that approximately 85% of rural Indian households depend on traditional biomass fuels for meeting their cooking require-ments.11
The Government of India has launched initiatives aimed at increasing the adoption of improved cookstoves, which reduce fuel consumption and smoke emissions. The Ministry of New and Renewable Energy (MNRE) is implementing the National Bio-mass Cookstoves Initiative (NBCI), which was launched in 2009.12 In 2012, as part of the Twelfth Five Year Plan, MNRE also initiated a new proposal called the Unnat Chulha Abhiyan Programme, a follow-up to NBCI, which focuses on the development and deployment of improved biomass cook-ing stoves for providing cleaner cooking solutions in rural, semi-urban and urban areas.13 Several other programmes aimed at providing cleaner cooking solutions are also being run by multilateral and bilateral donor agencies and civil society organisa-tions.14
It is vital that increasing access to energy also accompany: One, improvements in the type of energy be-ing used, and two, transitions to cleaner sources of energy. This is because studies have shown that enabling access to cleaner sources of energy has positive ramifications for economic development. For example, McDade found that the quality of fuels used by households and small industries, and not simply access to low-load electricity, is critical for reduction
studies shoW that aCCess to Cleaner sourCes oF energY
has Positive ramiFiCations For eConomiC develoPment.
53

in poverty.15 Energy transitions to cleaner sources of energy and more efficient fuel sources lead to improved health and living conditions.16 This leads on to the second target of SDG 7.
Target 7.2
Enabling access to energy for all is a key driver of Indian energy policy, along with plans to significantly increase renewable energy capacity to 175 gigawatts (GW)17 by 2022. India’s total installed power genera-tion capacity as of June 2015 stood at 275 GW. Coal accounts for 167 GW (61%), while thermal power (coal, gas and diesel) together make up 191 GW (70%).18 Clear-ly, India is highly dependent on fossil fuels for its energy needs. Hydroelectric power, too, contributes a significant percentage, with a total installed capacity of just under 42 GW.19 The total installed capacity of
grid-interactive renewable power is just un-der 36 GW, which consists of solar, wind, biomass and small hydro. The renewable energy component also includes nuclear energy, although the installed capacity of nuclear power is currently only 5.8 GW, a mere 2.1% of the total capacity.20
India’s total carbon emissions are also on the rise, with an estimated 2.07 billion tonnes of total greenhouse gas (GHG) emissions in 2013, an increase of 4.5% over 2012 levels. Since 1990, Indian GHG emissions have risen by nearly 200%.21 Given the pressures of both increasing ener-gy demand and reducing carbon emissions, it is clear that low-carbon sources of energy have to play a key role in India’s future energy mix. The Indian government has acknowledged that fact and has set highly ambitious targets to build 100 GW of solar energy capacity by 2022 along with 60 GW of wind power capacity.
54
Going off the grid in the village of Tinginaput, India
oF
F t
he g
rid
, bu
t o
n t
he t
oP/u
k d
Fid
/FliC
kr
/Cr
eat
ive C
om
mo
ns

The Indian government has launched several initiatives that aim to provide incen-tives for the development and adoption of renewable energy. These include incentives and subsidies for wind production and solar production (since 2008), and subsidies for rural electrification under the Deen Dayal Upadhyaya Gram Jyoti Yojana (a scheme to provide continuous power supply to rural India), introduced in December 2014. The Union budget of 2015 also doubled the cess on coal from just under $2 to just over $3 (INR 100 to INR 200) per tonne. Funds collected from the coal cess will be used to finance clean energy initiatives under the National Clean Energy Fund. The SDG target of substantially increasing the share of renewable energy in the energy mix is therefore already underway in India and is a major priority of the Indian government.
Target 7.3
The SDG target for energy efficiency is to be tracked through the rate of improve-ments in energy intensity, i.e., the amount of energy consumed to produce one unit of GDP. Increasing efficiency of energy use is a policy priority of the Indian government, and Prime Minister Modi has acknowl-edged the economical effectiveness of power conservation strategies and the need to generate awareness among citizens for the same.22
In 2001, the Energy Conservation Act was passed with the aim of reducing the energy intensity of the Indian economy.23 The act set up the Bureau of Energy Efficiency (BEE) to implement and promote energy efficiency standards in all sectors of the economy. The bureau has initiated a num-ber of measures in the areas of household lighting, commercial buildings, demand-side management in industry and agriculture, and in creating standards and labels for appliances.24 During the 11th plan period (2007-2012), these measures resulted in an avoided capacity generation of 10.8 GW, highlighting the considerable potential of energy efficiency measures for reducing energy demand in the Indian economy.25
The National Mission on Enhanced Energy Efficiency is one of the eight national missions of the National Action Plan on Climate Change and consists of four initia-tives:
• Perform, Achieve and Trade (PAT) Scheme—market-based mechanism designed to support improvements in energy efficiency in large industries and facilities through the certification of energy savings, which can be traded;
• Market Transformation for Energy Efficiency (MTEE)—creation of in-novative policy measures to accelerate the shift to energy-efficient appliances in selected sectors;
• Energy Efficiency Financing Platform (EEFP)—enable mainstream financing of energy efficiency projects through learning and sharing of experiences on removing barriers to access of finance;
• Framework for Energy Efficient Economic Development (FEEED)—development of fiscal instruments to promote energy efficiency.26
The Energy Conservation (EC) Act, 2001, also identified 15 large energy-intensive industries for energy efficiency improvements in India. These energy-intensive industries are named as Designated Consumers in the EC Act and account for 25% of the national GDP and about 45% of commercial energy use in India.27 Out of the 15 Designated Con-sumers, eight industries are covered under the PAT Scheme. PAT was launched in July 2012 by the BEE and covers 478 industrial units across the aforementioned eight industries, which together accounted for 40% of India’s primary energy consumption at the time.28 The scheme set a target to save 6.68 million tonnes of oil equivalents by March 2015.29 In January 2015, the Director General of BEE confirmed that 90% of companies are on track to meet their targets due to invest-ments in new technologies. This, he said, has resulted in about $5 billion saved in oil imports, based on average Brent crude prices over the three-year period, and electricity savings equivalent to the output of five coal-fired power plants.30
In fact, the energy intensity of the Indian economy has declined by 30% between 2000 and 2011, about half due to energy efficiency improvements as per the BEE.31 Energy efficiency has great potential for re-ducing the country’s energy demand and its dependence on oil imports, thereby helping reduce its carbon footprint, as demonstrated by the success of the PAT scheme and the surpassing of targets in the Eleventh Five Year Plan.32
55

Targets 7.a and 7.b
These two targets of SDG 7 focus on the enabling mechanisms required to success-fully achieve the goal. It is aimed that by 2030, international cooperation as well as research and investment in renewable energy, energy efficiency and cleaner fossil fuel technologies will be enhanced, and that there will be an expansion of infrastructure for supplying this modern and sustainable energy in developing countries.33 Innova-tion and research in the area of energy technologies has largely been spearheaded by western nations as a result of their ad-vanced capabilities. It is vital that technol-ogy transfer mechanisms are instituted to allow the flow of technology from devel-oped to developing nations. Access to the latest low-carbon technology will be essen-tial in India to scale up renewable energy and make it cost effective. At the same time, it is hoped that demand for cleaner energy technologies, as a result of domestic policies in developing countries such as India, will act as a market ‘pull’ for technology inno-vation, to go hand-in-hand with the ‘push’ for R&D in western nations as they seek to lower their carbon emissions.
ChallengeS anD the Way forWarD
Although India has aimed to develop 175 GW of renewable energy capacity by 2022, it is unlikely that the existing governance, financial and social institutions and systems can support such a rapid building-up of renewable capacity. In the financial year 2014, India added 4.1 GW of renewable capacity, beating its target of 3.7 GW by 8.5%.34 However, to achieve 175 GW by 2022, it would require a capacity addition of nearly 20 GW per annum for the next seven years. This is likely to be a bridge too far.
First, major structural changes will be re-quired to shift from India’s dependence on fossil fuels. At the moment, India is highly dependent on coal for the simple reason that coal provides cheap energy and energy affordability is crucial for a country like India. Second, India is a democracy, and democratic systems of government are in-herently contradictory to the radical policy changes and reforms required for massive technological change and transformations of the energy system. Five-year electoral
cycles, a multiparty system and focus on short-term gains needed to secure re-election are the realities that are inescapably inter-twined with India’s energy future and which the political system in India must confront in its bid for a clean energy utopia. Sweeping energy transformations are also tricky, given that they involve enormous social transitions that must be factored in. As Miller and Rich-ter note, “energy transitions are thoroughly social affairs.”35 In democracies such as India, the ramifications of social change take on greater significance. Large protests have already been witnessed in the country over hydropower projects, for example.
Last, there is the question of finance. The 175-GW goal of renewables by 2022 is estimated to require more than $100 billion of financing over the next seven years.36 To put that number in perspective, $100 billion is a third of the total budgeted expenditure of India’s Union Government for 2015-16 (INR 17.77 lakh crores).37 India has also had a history of stalled infrastructure projects in recent years, and there is little enthusiasm with regards to current government policies and initiatives seeking to promote renewable energy investments.38 According to Climate Policy Initiative, markets will also be unable to provide sufficient finance to meet India’s ambitious renewable energy targets, with the biggest challenge to scaling up renewable en-ergy in the country being the cost of finance, particularly debt.39
It is also important to question whether renewable energy can effectively solve prob-lems of round-the-clock energy access. Re-newable energy is unsuitable for production of baseline energy due to its low availability and intermittency concerns; instead, thermal and nuclear power are far more suited to meet baseload demands.40 India must bal-
56
dEmocratic sYstEms of GovErNaNcE arE iNhErENtlY coNtradictorY to radical
PolicY chaNGEs aNd rEforms rEquirEd for massivE
tEchNoloGical chaNGE aNd traNsformatioNs of ENErGY
sYstEms. chaNGiNG iNdia’s ENErGY miX will NEEd to
iNvolvE a social traNsitioN as wEll.

ance prerogatives to increase clean energy capacity with the pressing need to provide access to lifeline energy for all.
The solution to India’s problems of energy poverty and increasing carbon emissions may be found by breaking out of the lock-in on large-scale, centralised, grid-based mitigation action, and instead focusing on small-scale, off-the-grid, decentralised arrangements. Solar panels on rooftops, community-based small hydro projects, LED lighting schemes for rural homes—all have the potential to enable access to electric-ity for poor rural populations and support their economic development. Constructing massive grids for India’s proposed plans of renewable energy capacity is simply not fea-sible, affordable or achievable in the 2015-2030 time frame considering India’s poor history with large infrastructure projects.41 Off-the-grid power will reduce the need for accompanied infrastructure investments, remove problems associated with trans-mission and distribution of electricity, and help transition to clean energy systems less dependent on fossil fuels.
The other thrust area for Indian energy policy should be increasing capacity for both nuclear power and natural gas. India has had a long history of successfully and safely operating nuclear power plants. Nuclear energy currently forms a big part of the government’s energy policy and has the potential to deliver long-term energy security to the country. Furthermore, nuclear energy is a source of reliable, affordable and low-carbon power. It is also unlikely that any transition of India’s energy system will move directly, or smoothly, from high dependence on coal to being powered by renewable energy. Natural gas may be the bridge to a clean energy future, given its high dependability, relative affordability and lower carbon emissions than coal. The room for scale-up of natural gas capacity in India is also quite high. Present installed capacity is only at 23 GW.42
Lastly, India’s goals align perfectly with SDG targets for energy efficiency, keeping in mind the subsequent fruits of lower costs, reduced dependence on energy imports and fewer GHG emissions. However, energy efficiency technology is still in the nascent stage of development in India. New tech-nologies are perceived as risky by industries,
and high costs are deterrents for households and buildings.43 More industries need to be targeted for involvement in the government’s energy efficiency measures to increase their impact on India’s energy demand.
India’s challenges of poverty and energy access go hand in hand. At the same time, the impacts of climate change to which the poor are particularly vulnerable mean that environmental sustainability is crucial for long-term and effective poverty reduction. A failure to responsibly participate in the global mandate to limit carbon emissions not only compromises India’s contribution to the achievement of the SDGs, but also the country’s ability to bring economic prosperity to its citizens.
57

economic growth: building human resources
The eighth goal of the Sustainable Development Goals (SDGs) builds upon the very first Millennium Development Goal (MDG), 1.b, which aimed at eradicating extreme
poverty and increasing the income levels of the populace. The key word in the post-2015 agenda is ‘sustained,’ i.e., while it is important for developing countries to achieve high growth rates (as per national circumstances), it is equally important to be able to sustain such figures in the long run.
The increasing importance of attaining and sustaining high growth in SDG 8, indicated by target 8.1, is due to two reasons. First, growth leads to gainful employment and increases purchasing power of the populace. By targeting the multidimensional nature of poverty, it empowers citizens to access education, health and other amenities, and contributes positively towards their living standards. Second, growth increases the revenue of the state, which can be further utilised towards fighting poverty.1 Thus, achieving and sustaining high growth rates can be termed both a driver and a consequence of overall poverty alleviation. This is particularly important for the Indian growth story—as highlighted in the Figure 1, India’s growth rates have been inconsistent over the nine-year period of 2005 to 2013.2
In the Indian context, the need to attain high growth rates was felt most in 1990-91 when the country was on the brink of
Goal 8: Promote sustained, inclusive and sustainable economic growth, full and productive employment and decent work for all
8.1 Sustain per capita economic growth in accordance with national circumstances and, in particular, at least 7 per cent gross domestic product growth per annum in the least developed countries
8.2 Achieve higher levels of economic productivity through diversification, technological upgrading and innovation, including through a focus on high-value-added and labour-intensive sectors
8.3 Promote development-oriented policies that support productive activities, decent job creation, entrepreneurship, creativity and innovation, and encourage the formalization and growth of micro-, small- and medium-sized enterprises, including through access to financial services
8.4 Improve progressively, through 2030, global resource efficiency in consumption and production and endeavour to decouple economic growth from environmental degradation, in accordance with the 10-year framework of programmes on sustainable consumption and production, with developed countries taking the lead
8.5 By 2030, achieve full and productive employment and decent work for all women and men, including for young people and persons with disabilities, and equal pay for work of equal value
8.6 By 2020, substantially reduce the proportion of youth not in employment, education or training
8.7 Take immediate and effective measures to secure the prohibition and elimination of the worst forms of child labour, eradicate forced labour and, by 2025, end child labour in all its forms, including the recruitment and use of child soldiers
8.8 Protect labour rights and promote safe and secure working environments for all workers, including migrant workers, in particular women migrants, and those in precarious employment
8.9 By 2030, devise and implement policies to promote sustainable tourism that creates jobs and promotes local culture and products
8.a Strengthen the capacity of domestic financial institutions to encourage and expand access to banking, insurance and financial services for all
8.b Increase Aid for Trade support for developing countries, in particular least developed countries, including through the Enhanced Integrated Framework for Trade-Related Technical Assistance to Least Developed Countries
8.c By 2020, develop and operationalize a global strategy for youth employment and implement the Global Jobs Pact of the International Labour Organization
S h u B h S o N i , r E s E a r C h a s s i s t a N t , o r f
T E N

economic collapse. The country’s rising fiscal deficit, along with a steep rise in oil prices following the Gulf crisis of 1990, put pressure on prices and the exchange rate, giving rise to speculation that devaluation of the rupee was imminent. This situation was compounded by political instability in 1990, as the country witnessed two changes of prime ministers within a year. The government of the day was forced to undertake extensive reforms. The policies implemented to solve the crisis freed up India’s product market to the private sector, both within India and outside. The government was no longer to have a monopoly over industry, and industrial licensing, irrespective of the level of investment, was done away with.3
It should, however, be noted the reforms of 1990-91 did not reform the four factor markets—labour, land, capital and entrepreneurship. Over the decades, little improvement has been witnessed over these, particularly the first two. The scope of this chapter in large parts focuses on the labour market, as it finds prominence in the SDGs. But it should be noted that land reform must take place simultaneously to labour reform if high growth rates are to be sustained.
Overall, the 10 commandments of SDG 8 target various aspects of economic growth—from raising employment and implementing International Labour Organization (ILO) standard labour laws and promoting micro, small, and
medium enterprises to focusing on the environmental aspects of growth. In this chapter, an attempt has been made to narrow the significantly broad scope of SDG 8 to its human resources, i.e., (i) the importance of creating jobs in India along with reforming the country’s labour laws; (ii) equipping the youth with the right skills in order for the country to reap the benefits of its demographic dividend; and (iii) empowering its citizens by including them in the formal financial framework. These effectively also figure as high priorities for the Indian government.
generating employment anD proteCting laBour
The need to create job opportunities is mentioned in four out of the ten targets under SDG 8—8.2 focuses on labour-intensive sectors, 8.3 on decent job creation, 8.5 on full and productive employment and decent work for men and women, and 8.6 on reducing the number of youth not in employment (through education and training).
In India, one million people per month are added to the job market and consistent GDP growth is needed to provide them with constructive employment. In 2010, the Indian economy achieved its highest GDP growth rate of 10.3%. However, partly because of external factors and partly due to internal failings, the growth rate plunged to 5.1% in 2012. The impact on employment was significant, as surveys
Figure 1: India’s Annual GDP Growth Rate
59

conducted by both the Federation of Indian Chambers of Commerce and Industry and the Associated Chambers of Commerce and Industry in 2012 have shown.4 While economic recovery in 2013 and 2014 brought some relief, the nature and size of the problem facing the Indian economy means it cannot afford another slowdown.
For the Indian economy to absorb this one million people per month figure, the nature of employment needs to be altered. As of 2012, agriculture employed 47%5 of the workforce while adding only 14% to the GDP.6 The problem is further compounded by the fact that since 1992, long-term growth in agri-GDP has been a mere 3.4%.7 In the short term, the contribution of agriculture to India’s GDP needs to increase. That is to say, agriculture needs to be made a viable source of income for those employed in the sector. It is surprising then, that SDG 8 does not take this into account, considering a number emerging and developing economies face a similar situation. The major bottleneck that stifles agriculture growth in India is the complicated and an unnecessarily long supply chain structure, which has led to the wastage of produce and consequently low profits for farmers and higher prices for consumers. In conjunction with fixing the supply chain structure, policymaking needs to focus on foodprocessing to add value to what the farmer is producing.
In the medium to long run, there is a need to shift people from agriculture to another, more lucrative, sector, such as manufacturing—an aspect which has incorporated into target 8.2. As global experience has shown, every economy that aims to achieve consistently high growth rates must move away from agriculture first to manufacturing, and then onward to services. India has missed a crucial step by ignoring manufacturing and going straight to services. As of 2010, the share in total employment of services stood at 24.4%, whereas that of manufacturing was 10.5%.8 Moreover, manufacturing value added as a percentage of GDP actually declined between 2011 and 2013 from 18% to 17.26%.9
Broadly speaking, there are three ailments that plague the manufacturing sector. First, doing business in India is not easy. The
World Bank’s Ease of Doing Business study ranked India 142 out of 189 countries in 2014, two places below its 2013 ranking. For enterprises to operate, 70 clearances are required and over 100 returns need to be filed.10 Second, India faces a massive infrastructure deficit to the tune of $1 trillion, according to former Finance Minister P. Chidambram.11 A comparison with China further highlights this growing concern—India’s per capita commercial energy consumption in 2011 was 684.10 kilowatt-hour, while that of China was over 3,200. Lastly, manufacturers, particularly those categorised as micro, small and medium enterprises, find available funding to be inadequate. The funding that is available is highly restrictive, as commercial banks insist upon cumbersome paperwork and unnecessary requirements.12 Reviving the manufacturing sector is the only way to address the challenge of full and productive employment.
Taking cognizance of the dwindling fortunes of the Indian manufacturing sector, Prime Minister Narendra Modi in 2014 announced the Make in India initiative, which aims to propel India to a status of an export powerhouse. The initiative targets a range of sectors, including automobile, chemicals, and textiles, through four policy directives, namely new initiatives, foreign direct investment, intellectual property facts and national manufacturing.13 While promised investments from Foxconn ($5 billion) and General Motors Co. ($1 billion) are encouraging signs, the slow growth of industrial production (2.7% year-on-year in the seven month period from October to May) shows there is a long way to go before the initiative is termed a success.14
In the SDG agenda, as highlighted by targets 8.3, 8.5, 8.7, 8.8 and 8.10 b, the emphasis is on not just getting people employed but also ensuring conducive and healthy work conditions. In India, as of 2013, almost 90% of the workforce was engaged in the informal sector.15 As of 2011-12, almost 50% of rural men and 44% of rural women in the age bracket of 15 to 19 were casually employed.16 One reason for this lopsidedness is India’s labour policy. Laws governing the labour market are archaic, rigid and protect a mere 6-7% of the workforce.17 This not only
60
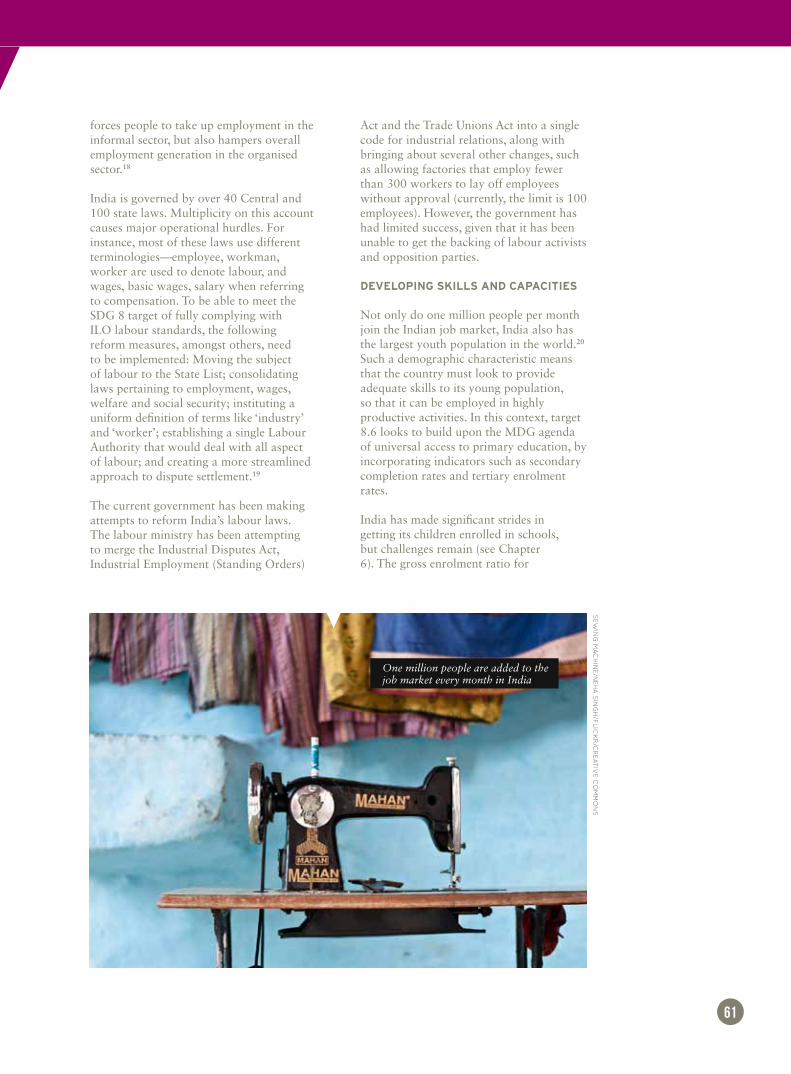
forces people to take up employment in the informal sector, but also hampers overall employment generation in the organised sector.18
India is governed by over 40 Central and 100 state laws. Multiplicity on this account causes major operational hurdles. For instance, most of these laws use different terminologies—employee, workman, worker are used to denote labour, and wages, basic wages, salary when referring to compensation. To be able to meet the SDG 8 target of fully complying with ILO labour standards, the following reform measures, amongst others, need to be implemented: Moving the subject of labour to the State List; consolidating laws pertaining to employment, wages, welfare and social security; instituting a uniform definition of terms like ‘industry’ and ‘worker’; establishing a single Labour Authority that would deal with all aspect of labour; and creating a more streamlined approach to dispute settlement.19
The current government has been making attempts to reform India’s labour laws. The labour ministry has been attempting to merge the Industrial Disputes Act, Industrial Employment (Standing Orders)
Act and the Trade Unions Act into a single code for industrial relations, along with bringing about several other changes, such as allowing factories that employ fewer than 300 workers to lay off employees without approval (currently, the limit is 100 employees). However, the government has had limited success, given that it has been unable to get the backing of labour activists and opposition parties.
Developing SkillS anD CapaCitieS
Not only do one million people per month join the Indian job market, India also has the largest youth population in the world.20 Such a demographic characteristic means that the country must look to provide adequate skills to its young population, so that it can be employed in highly productive activities. In this context, target 8.6 looks to build upon the MDG agenda of universal access to primary education, by incorporating indicators such as secondary completion rates and tertiary enrolment rates.
India has made significant strides in getting its children enrolled in schools, but challenges remain (see Chapter 6). The gross enrolment ratio for
61
seW
ing
ma
Ch
ine/n
eh
a s
ing
h/F
liC
kr
/Cr
eat
ive C
om
mo
ns
One million people are added to the job market every month in India
primary, secondary and tertiary schools has significantly increased in the last four decades, for both boys and girls. Improvements have also been witnessed across education indicators such as literacy rates, completion rates, pupil-teacher ratio, etc. Little effort, however, has been made to focus on the quality of education, something that is also missing mention in Goal 8 of the SDGs. The fact that 48.1% of the children enrolled in grade V could not read grade II content only corroborates this point.21 The dated and dogmatic nature of education at all levels has made the system inflexible. At higher levels, the obsession of obtaining high marks through rote learning has rendered Indian students unemployable, i.e., higher education in India provides low rates of return in terms of future income.
This is not to say that India does not need more educational institutions at all levels along with increasing its enrolment and completion numbers further—there is still a considerable gap between supply and demand for schools, and the proportion of dropouts is still high. However, the government must not focus on only getting children to and into schools, but must incorporate within its programmes what students gain out of enrolment so as to make them more productive and therefore of value, i.e., employable.
A welcome move on part of the SDG agenda is the incorporation of the Information, Communications and Technology (ICT) sector in various goals. Specifically to SDG 8, targets 8.2 and 8.3 look to improve productivity in the economy through ensuring wider access to this tool.
In 2001, there were approximately seven million internet users in India. By 2013, this number had grown by 25 times, at a
compounded rate of over 30% year-on-year. Further, by 2013, about 40 million users were online every day, spending around 40-45 hours on the internet per month.22 The economic impact of this “explosion” has the potential to revolutionise the way Indians work and live. The internet is already economically very powerful. In 2013 alone, it contributed to $60 million or 2.7% of India’s GDP. Indeed, the digital economy is already bigger than critical sectors such as healthcare (which contributed 2.7%) and military (at 2.5%).23 As per projections, this contribution is set to reach 4% of the Indian GDP, comparable to levels in developed economies such as Japan and the United States.24 Regarding employment generation, the internet sector employs approximately 400,000 to 500,000 people. As the e-commerce sector grows, it is expected to create 1.5 to two million jobs by 2018.25 The major contributors to this surge will be the growing e-commerce sector. As more and more Indians log in to websites and mobile-based applications to procure both goods and services, the sector is expected to drive job creation in the country.
The Indian government, realising the importance of the ICT sector, has launched the Digital India initiative. The nine pillars of this initiative (namely Broadband Highways, Universal Access to Mobile Connectivity, Public Internet Access Programme, e-Governance: Reforming Government through Technology, e-Kranti—Electronic Delivery of Services, Information for All, Electronics Manufacturing, IT for Jobs, and Early Harvest Programmes) are expected to build capacities and provide new avenues for employment.
promoting finanCial inCluSion
Data from the financial inclusion index of the World Bank highlights India’s growing improvements in the sector. In just three years (2011-2014), percentage of accounts at financial institutions increased 17 points from 35% to 52.75%.26 The National Mission on Financial Inclusion (Jan Dhan Yojana), launched in 2014, is the largest such initiative. It has the objective of providing a bank account to every household in the country and
62
thE iNdiaN GovErNmENt must acKNowlEdGE thE cErtaiN charactEristics that arE uNiquE to thE couNtrY’s
EcoNomY, such as thE fEdEral NaturE of dEcisioN- maKiNG aNd thE raNGE of socio -EcoNomic
GrouPs to catEr to.

making available basic banking services facilities. While the focus of targets 8.3 and 8.10 on opening bank accounts and providing access is much needed, the Indian government must go beyond this first step and offer heterogeneous financial services as part of its financial inclusion strategy.27
One way of achieving this is by developing a diverse range of financial instruments that cater to specific needs of low income households.28 A second way is by increasing the coverage of those insured. Low income households need safety nets to prepare them for unexpected events, such as sudden loss of the earning members or crop damage.29 While the National Mission on Financial Inclusion addresses this concern by providing insurance for life and accident, its scope is limited and more needs to be done on this count.
navigating the Way forWarD
The targets and indicators of SDG 8 are highly convoluted in nature—not only do they overlap with other goals, but there is significant overlap within Goal 8 itself. It is for this reason that this chapter focuses on specific thematic areas pertaining to one of the factors of production, labour, and streamlines the various policy agendas into broad headings of employment and labour laws, skill development and financial inclusion.
For the Indian government to achieve sustained and inclusive economic growth, and provide its ever-growing workforce productive employment, it must acknowledge the certain characteristics that are unique to the Indian economy. First, the Indian growth story must be driven through its various federal states. New Delhi must take a backseat and give way to state capitals when it comes to policymaking and policy implementation, as each state is unique and requires specific state solutions. Second, India has a range of socio-economic groups, such as religious minorities and backward castes, which are vulnerable to being left out of this growth story. High growth rates, which are not sensitive to this characteristic, can further exacerbate already existing inequities.
One such socio-economic grouping needs particular focus—the benefits of economic
growth must also accrue to women.
According to the World Economic Forum’s Gender Gap Report, India’s rank in 2014 stood at 134 (out of 142 countries) in the category of Economic Participation and Opportunity. With women accounting for 48% of the population, it is unlikely the country will fully reap the benefits of its economic potential if this demographic continues to be marginalised.
Ultimately, the success of the post-2015 development agenda will be determined by India’s ability to attain a high growth path for the next decade and a half, just as the success of the MDGs were predicated on the economic growth of China. This reality is important not just for Indian policymakers, but also their international counterparts.
63
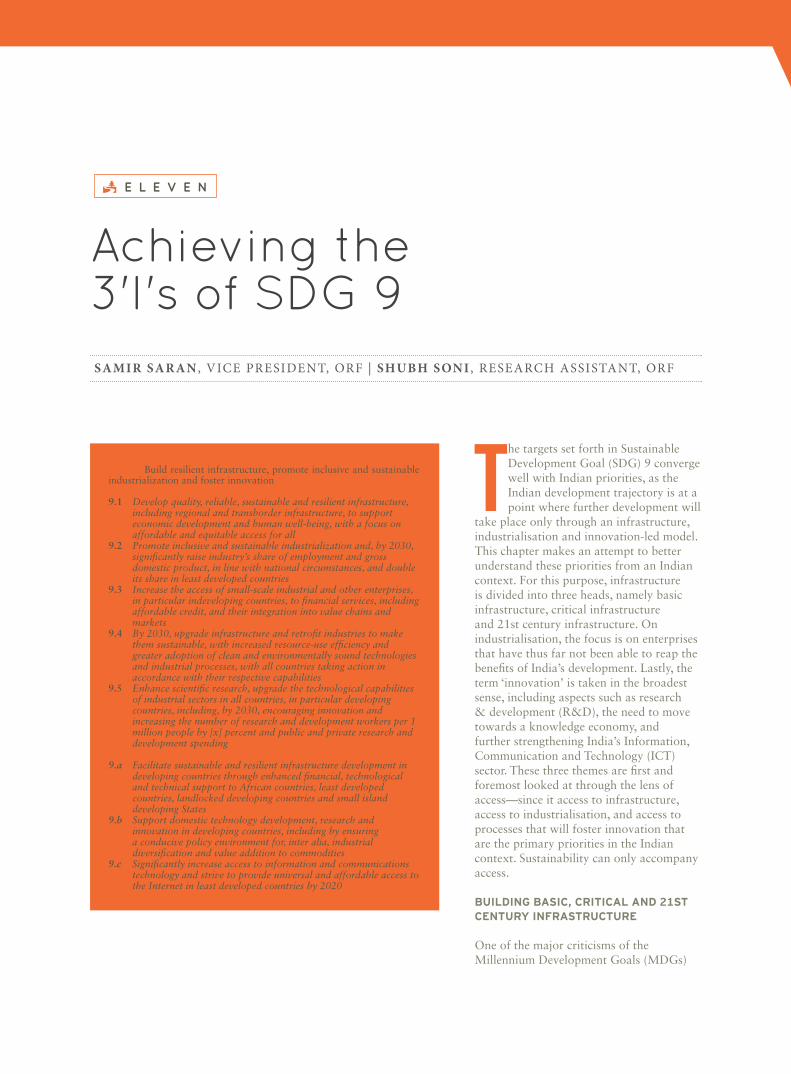
achieving the3'i's of sdg 9
The targets set forth in Sustainable Development Goal (SDG) 9 converge well with Indian priorities, as the Indian development trajectory is at a point where further development will
take place only through an infrastructure, industrialisation and innovation-led model. This chapter makes an attempt to better understand these priorities from an Indian context. For this purpose, infrastructure is divided into three heads, namely basic infrastructure, critical infrastructure and 21st century infrastructure. On industrialisation, the focus is on enterprises that have thus far not been able to reap the benefits of India’s development. Lastly, the term ‘innovation’ is taken in the broadest sense, including aspects such as research & development (R&D), the need to move towards a knowledge economy, and further strengthening India’s Information, Communication and Technology (ICT) sector. These three themes are first and foremost looked at through the lens of access—since it access to infrastructure, access to industrialisation, and access to processes that will foster innovation that are the primary priorities in the Indian context. Sustainability can only accompany access.
BuilDing BaSiC, CritiCal anD 21St Century infraStruCture
One of the major criticisms of the Millennium Development Goals (MDGs)
Samir Sar aN , ViCE PrEsidENt, orf | ShuBh SoNi , rEsEarCh assistaNt, orf
E L E V E N
Goal 9: Build resilient infrastructure, promote inclusive and sustainable industrialization and foster innovation
9.1 Develop quality, reliable, sustainable and resilient infrastructure, including regional and transborder infrastructure, to support economic development and human well-being, with a focus on affordable and equitable access for all
9.2 Promote inclusive and sustainable industrialization and, by 2030, significantly raise industry’s share of employment and gross domestic product, in line with national circumstances, and double its share in least developed countries
9.3 Increase the access of small-scale industrial and other enterprises, in particular indeveloping countries, to financial services, including affordable credit, and their integration into value chains and markets
9.4 By 2030, upgrade infrastructure and retrofit industries to make them sustainable, with increased resource-use efficiency and greater adoption of clean and environmentally sound technologies and industrial processes, with all countries taking action in accordance with their respective capabilities
9.5 Enhance scientific research, upgrade the technological capabilities of industrial sectors in all countries, in particular developing countries, including, by 2030, encouraging innovation and increasing the number of research and development workers per 1 million people by [x] percent and public and private research and development spending
9.a Facilitate sustainable and resilient infrastructure development in developing countries through enhanced financial, technological and technical support to African countries, least developed countries, landlocked developing countries and small island developing States
9.b Support domestic technology development, research and innovation in developing countries, including by ensuring a conducive policy environment for, inter alia, industrial diversification and value addition to commodities
9.c Significantly increase access to information and communications technology and strive to provide universal and affordable access to the Internet in least developed countries by 2020
was that it did not take into account the critical role infrastructure plays in the overall development of an economy. Apart from focusing on social indicators, such as access to water and sanitation services, the MDGs were largely silent on critical and 21st infrastructure needs, which are equally necessary as they add value to social amenities (henceforth termed basic infrastructure). Targets 9.1 and 9.c look to take corrective steps by building upon the MDG indicators by incorporating critical infrastructure that supports access to basic facilities (such as access to roads and electricity) and 21st century cyber infrastructure. This is particularly relevant in India’s context, as estimates suggest inadequate infrastructure costs the Indian GDP growth rate anywhere between 1 to 2%.1
Building infrastructure to support supply of basic services is a continuing priority. For example, as revealed in Chapter 6, India is well on course to meet its target regarding access to water, but lags behind on sanitation—by 2012, only 36% of the population had access to improved sanitation facilities. The Swachh Bharat Abhiyan (Clean India Campaign), started by Prime Minister Narendra Modi in 2014, seeks to correct this gap. While progress has been made in terms of building physical infrastructure (between April 2014 and January 2015, over three million toilets were built),2 social behavioural transformation, as emphasised in the chapter on SDG 8, must accompany physical construction.3
India faces an equally large gap when it comes to critical, 20th century infrastructure. For instance, the Eleventh Five Year Plan targeted an additional power generation capacity of 78,700 megawatts (MW), later revised to 62,736 MW. However, even this revised target was not met and only 52,603 MW is likely to have been achieved. Road and highway development, too, is lagging—the National Highways account for 1.7% of the total road network and 40% of total road traffic, whereas four-lane highways (about 16,200 km) account for 1% of the total road network. The average trucking speed in India (30-40 km/h) is half of the global average (60-70 km/h), clearly highlighting both inadequate quantity and poor quality
of India’s road connectivity.4 Similar inadequacies are seen in a range of critical infrastructure sub-sectors such as railways, ports, inland waterways and urban infrastructure.
The financial deficit to undertake infrastructure investment stands at $1 trillion for the period 2012-2018, a large part of which is expected to, and should, come from the public sector. The current government has made infrastructure investment a priority, allocating INR 700 billion towards the sector and establishing a National Investment and Infrastructure Fund, which is to ensure an annual flow of INR 200 billion.5
As highlighted in target 9.c, in addition to basic and critical infrastructure needs, the country also needs to build and expand its network of cyber infrastructure. Through its Digital India initiative, the government aims to provide every citizen with access to digital infrastructure, including a unique digital identity.6 As mentioned in Chapter 8, the internet sector already employs 400,000-500,000 people, and the e-commerce sector is expected to create up to two million jobs by 2018. However, it is not just this sector which will benefit from
state-of-the-art cyber infrastructure—the knock-off effects on other sectors can potentially add 20-30% or about $550-$1,000 billion to India’s GDP.7 The benefits of advancements such as mobile internet, cloud computing, internet of things, and advanced geographic information systems can potentially provide healthcare services to 400 million people, facilitate financial inclusion of 300 million and improve agriculture yield by 15-60%.8
buildiNG iNfrastructurE to suPPort suPPlY of basic sErvicEs is a coNtiNutiNG
PrioritY. iNdia EquallY facEs a GaP iN 20th cENturY
iNfrastructurE. it also NEEds to build aNd EXPaNd
21st cENturY diGital iNfrastructurE.
65

Unlike basic and critical infrastructure needs where the public sector is expected to be the prominent investor, the government must leverage the expertise and the financial capabilities of the private sector to drive investment in cyber infrastructure. Platforms such as Digital India and other policy directives must act as a catalyst to ensure the private sector plays a dominant role.
In addition to building infrastructure, targets 9.1 and 9.4 also focus on ensuring infrastructure built be sustainable—a challenge facing the Indian policymakers as well. In this regard, the Indian government, through its Smart City initiative (announced by Prime Minister Modi in 2014), is trying to blend green infrastructure into urban planning. By creating walkways, preserving and developing open spaces, providing efficient public transport with last-mile connectivity, and ensuring infrastructure is less vulnerable to natural disasters, the government is attempting to reshape and reimagine urban planning in India.9 It remains to be seen, however, how this project unfolds, given the concern that it could further increase inequality and exacerbate social inclusion.
enCouraging inCluSive anD SuStainaBle inDuStrialiSation
Industrialisation refers to the process of shifting an economy’s dependency from the agriculture sector to the manufacturing and services sectors. The MDGs remained silent on this shift. Target 9.2 aims to promote this process by raising the share of employment in industry, and raising industry’s share in GDP. The importance of India’s industrialisation, in particular the importance of the manufacturing sector, is discussed in detail in Chapter 8. The focus in this chapter is primarily on the “inclusive industrialization” component mentioned in 9.2, which in the Indian context should mean promoting micro, small and medium enterprises (MSMEs), which effectively form the content of target 9.3.
Given that these enterprises are a key feature of most developing and emerging economies, ensuring they are included in the process of industrialisation in the post-2015 development agenda is very much welcome. In India, as of 2012-13, the sector
had a total of over 40 million working enterprises, employing over 100 million people10 (approximately 40% of India’s workforce).11 The sector also contributes significantly to India’s GDP: As of 2012-13, its share in total GDP stood at 37.54%, with manufacturing accounting for 7.04% and services 30.50%.12
In order for the MSME sector to grow, access to funds is critical, something SDG 9 rightly captures in its third target. As per a 2012 International Finance Corporation study, the total finance requirement of the sector in India stood at $650 billion. But a number of constraints have led to a significant funding gap to the tune of $418 billion.13,14 As the Indian economy grows, the share of the MSME sector is expected to expand considerably. The need of the hour is then to bridge this finance gap, particularly through the formal financial framework, a key component of the overall SDG framework.
In India, however, a number of current practices constrain the flow of funds to these enterprises. First, data for the sector is collated as per the definitions provided in the Micro, Small and Medium Enterprises Development (MSMED) Act, 2006. The reliance of banks (particularly public sector banks) to gather said information is counterproductive, since MSMEs are more heterogeneous than their definition allows for. There is a need, therefore, to go beyond the formalised definition and collect disaggregated data based on factors such as location, access to natural resources and infrastructure, and nature of the enterprise. Second, the products and services offered to MSMEs are conceptualised at the head office of financial institutions rather than branch offices that directly engage with MSMEs. These products thus lack innovation and are standard in nature. Furthermore, these services require significant collateral as backup, ignoring the fact that MSMEs do not have access to such collateral. Often, enterprises which require a high risk premium are refused access to these services. Third, the underwriting process relies primarily on financial performance. This proves to be counterproductive, as these enterprises are often unable to provide documented financial information. The problem is further compounded by the fact that credit information of these enterprises is
66

not easily available—the commercial credit bureau is still new and does not yet have comprehensive data.15
The Indian government created the Micro Units Development Refinance Agency (MUDRA) in March 2015. The bank, set up with an initial corpus of INR 200 billion and a credit corpus of INR 30 billion,16 aims to refinance and regulate microfinance institutions, one of the principle sources of credit for MSMEs. By providing finance to banks and financial institutions at an interest rate of 7%,17 MUDRA aims to drive down the rate offered to end borrowers, which currently stands at an average of 23%.18 The government is also looking to leverage its membership in the BRICS initiative to promote the cause of MSMEs. In 2014, post the sixth summit in Fortaleza, Brazil, in which the New Development Bank was conceptualised, the nations also recognised “the fundamental role played by small and medium-sized enterprises in the economies of our countries as major creators of jobs and wealth”and pledged to “enhance cooperation and recognize the need for strengthening intra-BRICS dialogue with a view to promote international exchange and cooperation and to foster innovation, research and development.”19
While these initiatives are welcome, there is a need to create a policy environment wherein the private sector innovates ways to finance MSMEs. For instance, in China, the Alibaba group through its AliFinance initiative provides credit to enterprises that are registered on its e-commerce platforms Alibaba and Taobao—the latter comprises almost entirely of small businesses and microenterprises. Alibaba has developed its own credit rating system, which is based on information collected through online activity of vendors. By leveraging big data, the group studies client behaviour and characteristics, and offers services as per requirements. A similar venture in India, which looks to leverage the internet and the e-commerce space, will go a long way in addressing the needs of MSMEs.20
Sustainability of industry is also strongly emphasised in this goal. As has been highlighted earlier, the contribution of MSMEs to the Indian economy is significant.What is also significant is their energy
consumption, as energy accounts for a substantial 40% of their production costs.21
Thus far, the government and the Small Industries Development Bank of India have drawn up various propositions to encourage MSMEs to adopt energy efficient (EE) technologies. However, both these agencies have had limited success due to hurdles on both supply and demand sides. On the supply side, financial institutions argue that procedural requirements that determine energy saving are too cumbersome and discourage MSMEs from adopting EE technologies. MSMEs are unwilling to bear the cost of energy audits, as they do not find sufficient success stories. Further, these institutions argue that the concept of EE remains vague and it is not easy to ascertain the exact monetary benefit of incorporating such technologies. On the demand side, two factors serve as impediments. First, MSMEs are unaware of EE technologies, how they should be installed and what benefits they have to offer; second, even if a few enterprises are aware and seek to install such capacities, they find financing either unavailable, insufficient or not pertaining to their needs.22 There is therefore a need to inculcate awareness among financial institutions and in the MSME sector of the benefits of adopting EE technology and how it can best be leveraged.
foStering innovation
Target 8.f of the MDGs focused only on making available the benefits of new technologies, especially information- and communication-related. SDG 9, particularly targets 9.5 and 9.c, however, place enormous stress on the importance of innovation for industrialisation. Such emphasis finds its roots in history. Freeman and Louçã, for instance, argue that shifts in industrial structures of leading economies since 1760 were due to shifts in various technoeconomic paradigms, which were in turn based on innovation and productivity changes in technologies and institutions. 23,24 India lags considerably behind emerging and developed economies on R&D—in 2013, it produced only 366 R&D personnel per million population, spent 0.85% of GDP on research activities (global average stood at 1.8%), and researchers were paid 22% less than they
67

would have been if they worked in other sectors.25
Attention to R&D and innovation is critical; but for India, the time is ripe to adopt a broader mandate of transitioning to a knowledge economy, an economy which relies heavily on its intellectual capital. Such a shift gains particular importance considering the country today is witnessing a demographic transition. India today has the largest youth population in the world, which is not only expected to grow further, but is currently grappling with high levels of unemployment.
At present, however, the higher education system in India is riddled with inefficiencies—from a lack of teachers and infrastructure, to outdated technologies and curriculum—so much so, that over 200,000 Indian students choose to study in foreign universities annually, spending upwards of $7 billion.26 In addition to poor-quality higher education, inadequate industry focus on R&D, lack of enforcement of intellectual property laws, and a shortage of basic and critical infrastructure
requirements has meant India’s knowledge economy is yet to take off.
The current government has initiated two policy programmes to encourage a culture of knowledge and innovation. First is the Skill Development and Entrepreneurship policy, which aims to empower citizens by providing them employable skills, and by promoting a culture of innovation-based entrepreneurship that can generate wealth and employment.27 There is particular emphasis on the role of the private sector, with the government actively encouraging its participation through a public-private partnership model. The second is the Digital India initiative, which aims to transform India into a digitally empowered society, reaping the benefits of a knowledge-driven economy by providing digital literacy to its citizens28 (in 2014, India ranked 111th out of 135 countries in the “use of ICT” index). While these initiatives are welcome,
the government must ensure adequate monitoring and regulatory frameworks are in place so as to yield positive results. This is a major challenge facing higher education institutions (both public and private), where even though quality standards are set, their enforcement is lacking, leading to poor outcomes. The current government must also seek further innovative strategies to promote R&D. For instance, a percentage of revenue generated from disinvestment of government assets must be diverted towards R&D in the sector the asset operates. Thus, a proportion of the revenue generated from the sale of Coal India must be diverted towards developing clean technologies, and revenues from spectrum sale must be invested in developing new-age optic fibre.29
It is critical to distinguish between invention and innovation, as the latter of the two is often confused with the former. The aim of the Indian knowledge economy must not be to only file numerous patents. To be a sustainable knowledge economy, the emphasis should also be to innovate in processes—be it assembly lines in the manufacturing sector, building infrastructure, or creating newer, better products in the services sector. Value addition through innovation must the long-term objective.
proviDing finanCial, teChnologi-Cal anD teChniCal Support
A corollary, from India’s perspective, to the above-mentioned targets of SDG 9 is the additional target of 9.a, which focuses on providing finance and technological support to the poorest countries for their infrastructure needs. India already provides such support through two tools, Lines of Credit (LOCs) and the Indian Technical & Economic Cooperation (ITEC) programme. LOCs are concessional loans, with a grant element, offered to less developed nations for capacity-building projects. As of May 7, 2015, India had 193 operative LOCs, of which over 70% (142) were extended to countries in Africa.30 The ITEC programme provides technical and economic training to government officials of other developing countries. In 2013-14, approximately $26.61 million was spent, more than double the amount in 2008-09. Almost 40% of ITEC assistance was provided to
68
innovative solutions will be the key: the government, for example, could
divert a percentage of revenue generated from diinveted assets towards r & d in the sector the
assets operate.

Africa in 2013-14, followed by South Asia at 19%.31
aChieving the 3 'i's of goal 9
For India to achieve the targets of Goal 9 in its national context, it must address three overarching challenges. The first of these challenges is that of finance. Be it building the three layers of infrastructure, scaling up operations of MSMEs or developing new-age technologies, making finance available and accessible must be given the highest priority. With the government finding it difficult to maintain a fiscal deficit of 3.99%,32 it is not only important that public resources be used effectively and efficiently, but it is imperative the government build an economic environment where private finance (both domestic and foreign) is able to flourish.
The second challenge is that of monitoring implementation. It has often been the case that after policy formulation, there is little follow-up on how well these policies are being implemented (as noted in the section on fostering innovation). The government, therefore, needs to undertake accurate and timely data collection and ensure smooth coordination between ministries and departments on the one hand, and between
the Central government and various state governments on the other.
Lastly, India can only achieve so much through ‘building’—building infrastructure, building branch bank offices close to MSMEs, building R&D institutions. There needs to be a complementary behavioural change amongst the citizens to use the toilets that are built, to engage with bank branches that are accessible, and to enrol in R&D institutions that are established.
More specifically on the sustainability component, India will need to have its own definition of ‘sustainable development.’ For the better part of the fifteen-year period, India will only have just begun its industrialisation process. Thus, its emphasis will be on social policy imperatives, with the aim of lifting as many people out of poverty as possible. It is in only the latter part of this period, when the Indian populace enjoys greater purchasing power, that the country can embark upon the greater ambition around the environmental goals.
69
ha
nd
in h
an
d - C
laY
Fig
ur
ine m
ak
ing
en
te
rPr
ise/m
Ck
aY
sav
ag
e/F
liC
kr
/Cr
eat
ive C
om
mo
ns
A funding gap of over $400 billion exists in the MSME sector

addressing urbanisation
More than half of the world’s population (54%) lives in urban areas. United Nations estimates show that this proportion is likely to reach 60% by 2030.1
Among urban areas, there is increasing concentration of population in cities. In India, for example, over 70% of the country’s total urban population lives in cities.2 These demographic trends are prominently observed in developing nations and occur because, unlike rural areas or small towns, cities offer tremendous opportunities and thus absorb persons belonging to various social and economic classes. The huge expansion and diversification of activities in cities leads to production of wealth, and hence, the contribution of cities to a nation’s GDP is enormous. At the same time, there is concern over the deteriorating quality of life in cities. Considering this reality in various parts of the world, Sustainable Development Goal (SDG) 11 has been set to “make cities and human settlements inclusive, safe, resilient and sustainable.”
SCope of SDg 11
Previously, none of the Millennium Development Goals (MDGs) dealt exclusively with the problem of quality of life in cities. Although MDGs relating to poverty, education, health, gender and environment were formulated and pursued in both rural and urban environments, a
r u m i a i J a Z , s E N i o r f E L L o w , o r f
T W E L V E
Goal 11: Make cities and human settlements inclusive, safe, resilient and sustainable
11.1 By 2030, ensure access for all to adequate, safe and affordable housing and basic services and upgrade slums
11.2 By 2030, provide access to safe, affordable, accessible and sustainable transport systems for all, improving road safety, notably by expanding public transport, with special attention to the needs of those in vulnerable situations, women, children, persons with disabilities and older persons
11.3 By 2030, enhance inclusive and sustainable urbanization and capacity for participatory, integrated and sustainable human settlement planning and management in all countries
11.4 Strengthen efforts to protect and safeguard the world’s cultural and natural heritage
11.5 By 2030, significantly reduce the number of deaths and the number of people affected and decrease by [x] per cent the economic losses relative to gross domestic product caused by disasters, including water-related disasters, with a focus on protecting the poor and people in vulnerable situations
11.6 By 2030, reduce the adverse per capita environmental impact of cities, including by paying special attention to air quality and municipal and other waste management
11.7 By 2030, provide universal access to safe, inclusive and accessible, green and public spaces, in particular for women and children, older persons and persons with disabilities
11.a Support positive economic, social and environmental links between urban, peri-urban and rural areas by strengthening national and regional development planning
11.b By 2020, increase by [x] per cent the number of cities and human settlements adopting and implementing integrated policies and plans towards inclusion, resource efficiency, mitigation and adaptation to climate change, resilience to disasters, develop and implement, in line with the forthcoming Hyogo Framework, holistic disaster risk management at all levels
11.c Support least developed countries, including through financial and technical assistance, in building sustainable and resilient buildings utilizing local materials

full city focus was lacking. The emergence of new challenges in cities is likely to have been an important reason for the formulation of SDG 11. SDG 11 has 10 targets, and 33 indicators have been proposed. It is envisaged that governments will successfully work towards achieving the goal by accomplishing targets and monitoring the status of various indicators under each target. A review of SDG 11 targets will help in understanding the scope of the goal. Essentially, the need to efficiently plan and govern various urban sectors (i.e., housing, basic infrastructure and services, transport, heritage, disasters, environment, green spaces, etc.) and address needs of vulnerable sections of the society have been emphasised.
relevanCe for inDia
SDG 11 has immense relevance for India, where cities are experiencing a high degree of growth. Between 2001 and 2011, the number of cities/urban agglomerations (UAs) with population of over one million increased from 35 to 53, and there are nearly 500 Class I cities/UAs with at least 100,000 habitants.3 Increasing population densities pose numerous challenges for the governing institutions. Accordingly, key reform measures have been initiated by the Indian government to respond to the challenges of urbanisation. Many of these measures are directly concerned with the targets set under SDG 11, as shown below. To a great extent, SDG 11 and urban goals set by the Indian government are similar.
ConvergenCe BetWeen SDg 11 tar-getS anD inDian neeDS
Target 11.1
The urban housing deficit in India stands at about 20 million dwelling units. Much of this deficit (95%) pertains to the economically weaker sections and low income groups.4 Non-availability of houses for the poor has led to a growth of slums. Census data shows that the country’s slum population amounting to 65.49 million in 2011 has shown an increase by 25% during 2001-11. However, their share in the country’s total urban population has actually come down from 18.3% to 17.4% during the same period. The data further reveals that living conditions in most
slums are unsatisfactory, evident from the low (or non-) availability of various basic services. For example, 43% of households do not have any main source of drinking water within premises, while 34% do not have toilets within premises.5 In 2015, the National Mission for Urban Housing, which aims at providing housing for all by 2022, was launched by the Ministry of Housing and Urban Poverty Alleviation under which financial and technical assistance will be provided by the Centre to the state/local government agencies for the construction of new houses as well as in-situ rehabilitation of existing slum dwellers. Priority will be laid on adoption of modern, innovative, low-cost, disaster resistant and green technologies and building material. Initially the scheme will focus on 500 Class I cities and later extend to various statutory towns.
Target 11.2
Indian cities display numerous mobility-related problems, including severe deficiencies in pedestrian and public transport facilities, phenomenal growth of private motor vehicles, traffic congestion and high vehicular emissions. This is particularly noted from the conditions prevailing in India’s national capital, which recorded 8.3 million motor vehicles in 2014,6 and where the air pollution levels are among the highest in the world.
Further, an analysis of data on registered motor vehicles in India shows high concentration (32%) in metropolitan cities.7 To address mobility needs of city residents, two major public transportation initiatives are underway. First, Rapid Rail Systems (Metro) are being laid down with the support of the Urban Development Ministry in various Indian cities, including Bengaluru, Chennai, Delhi, Gurgaon,
iNdiaN citiEs disPlaY a NumbEr of mobilitY-rElatEd ProblEms,
such as sEvErE dEficiENciEs iN PEdEstriaN aNd Public
traNsPortatioN facilitiEs, PhENomENal Growth of PrivatE
motor vEhiclEs aNd traffic coNGEstioN.
71

Hyderabad, Jaipur, Kochi, Kolkata and Mumbai. Its experience in Delhi (operational since 2002) has been fairly successful, and benefits are seen in terms of enhanced mobility, safety and reduced travel time and carbon emissions. Secondly, in some cities such as Ahmedabad and Pune, Bus-Rapid-Transit (BRT) systems have been created, which involve reserving lanes on major road corridors for easy movement of public transport buses. The initiative is considered necessary for the common people who are completely dependent on public transport services.
Target 11.3
The most significant and recent step in the direction of this target is the launch of the Smart Cities and Atal Mission for Rejuvenation and Urban Transformation (AMRUT) Missions by the Urban Development Ministry in 2015. The two missions are in preparatory stage, and their main objectives are to provide core infrastructure and services, a clean, safe and sustainable environment to city residents by applying smart, sustainable solutions, and technology. The Smart Cities Mission aims to cover 100 cities over a five-year period from 2015-16 to 2019-20, while AMRUT will be implemented in 500 cities. According to the guidelines, the entire process from preparation of city proposals/action plans to their implementation will be inclusive, participatory and transparent, and the government agencies will involve various stakeholders (citizens, educational and research institutions, private agencies, consulting firms, bilateral and multilateral institutions). Capacity building of functionaries is an important scheme component. Furthermore, it is proposed that the two missions will converge with other development schemes applicable in cities.
Target 11.4
Indian cities are rich in heritage, but globalisation as well as increasing population densities pose serious threats. For example, many local traditions and social practices are vanishing, buildings and monuments are being encroached and damaged, and surface water bodies (rivers, lakes), that have an immense social and cultural significance, are getting
polluted. According to a Bangalore-based organisation, the city has lost hundreds of heritage structures (including a guest house, fort gates and cenotaph) because spaces were needed to establish malls, shopping complexes and other buildings.8 To preserve architectural heritage, the National Heritage City Development and Augmentation Yojana/Scheme (HRIDAY) has been launched by the Urban Development Ministry in 2015 for revitalising 12 heritage cities. As against previous isolated efforts, a holistic and integrated approach will be followed by bringing together aspects of city planning, development and heritage conservation. It is expected that by 2017, not only will the city’s unique character and soul would be revived, but there will be an overall improvement in the quality of life.
Target 11.5
Indian cities are vulnerable to various forms of disasters, including earthquakes, flooding, cyclones, tsunamis, landslides and avalanches. The most significant among these forms is floods, which occur during the rainy season (monsoon) and severely disrupt human life and city economy. The monsoon occurs from July to September every year and intense rains are received in most parts of the country. In the city of Mumbai, for example, most activities come to a standstill for several hours, and indeed days, during the rainy season. A combination of factors are responsible for this state of affairs, including poor drainage and waste management systems, overflowing water bodies, and unauthorised constructions that block the natural flow of water. The worst impact is felt by deprived communities living in low-lying unplanned areas. Excessive rainfall over the Kashmir region in September 2014, which led to heavy flooding and landslides, is another case in point. Its impact was severely felt in rural and urban areas. In the city of Srinagar, for instance, over 80 structures (homes, offices, school buildings) were damaged and road connectivity was badly affected. According to news reports,9 more than 200 people were killed and at least 50,000 persons were displaced. It is expected that the urban development and water management solutions proposed under the government’s flagship missions (Smart Cities and AMRUT), together with the ongoing efforts of the National Disaster
72
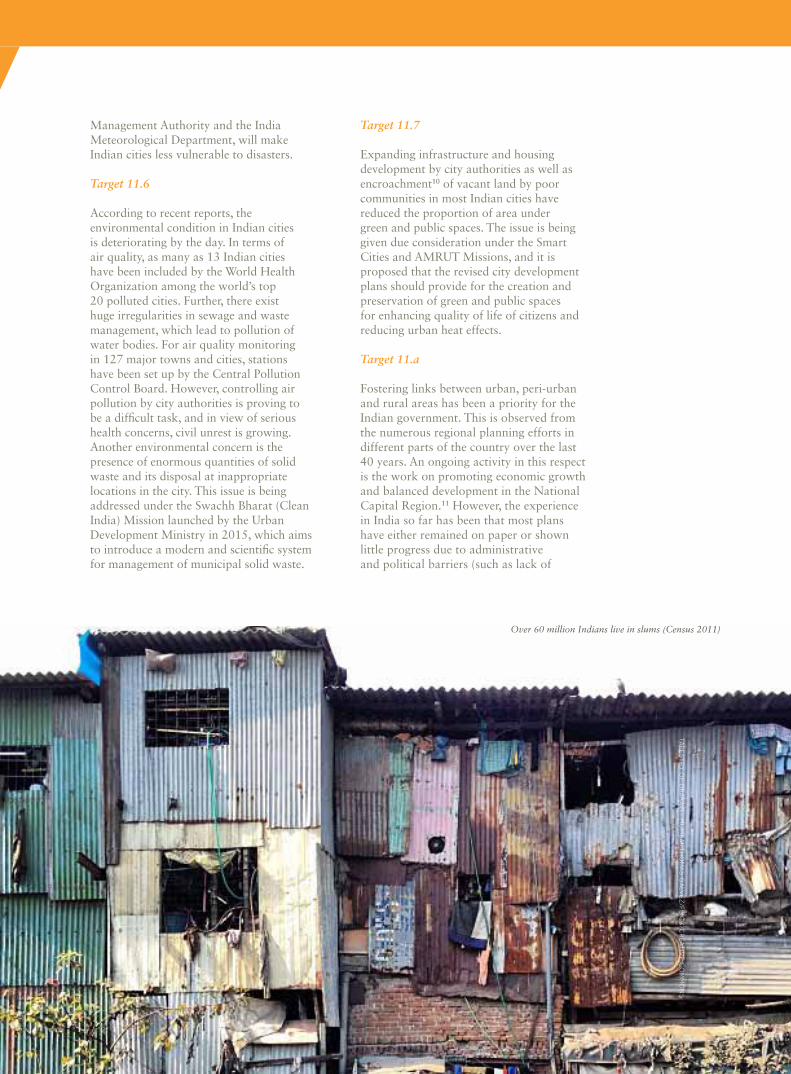
Management Authority and the India Meteorological Department, will make Indian cities less vulnerable to disasters.
Target 11.6
According to recent reports, the environmental condition in Indian cities is deteriorating by the day. In terms of air quality, as many as 13 Indian cities have been included by the World Health Organization among the world’s top 20 polluted cities. Further, there exist huge irregularities in sewage and waste management, which lead to pollution of water bodies. For air quality monitoring in 127 major towns and cities, stations have been set up by the Central Pollution Control Board. However, controlling air pollution by city authorities is proving to be a difficult task, and in view of serious health concerns, civil unrest is growing. Another environmental concern is the presence of enormous quantities of solid waste and its disposal at inappropriate locations in the city. This issue is being addressed under the Swachh Bharat (Clean India) Mission launched by the Urban Development Ministry in 2015, which aims to introduce a modern and scientific system for management of municipal solid waste.
Target 11.7
Expanding infrastructure and housing development by city authorities as well as encroachment10 of vacant land by poor communities in most Indian cities have reduced the proportion of area under green and public spaces. The issue is being given due consideration under the Smart Cities and AMRUT Missions, and it is proposed that the revised city development plans should provide for the creation and preservation of green and public spaces for enhancing quality of life of citizens and reducing urban heat effects.
Target 11.a
Fostering links between urban, peri-urban and rural areas has been a priority for the Indian government. This is observed from the numerous regional planning efforts in different parts of the country over the last 40 years. An ongoing activity in this respect is the work on promoting economic growth and balanced development in the National Capital Region.11 However, the experience in India so far has been that most plans have either remained on paper or shown little progress due to administrative and political barriers (such as lack of
Over 60 million Indians live in slums (Census 2011)
taPes
trY
oF
dh
ar
avi - m
um
ba
i/th
om
as
ga
lvez
/FliC
k/C
reat
ive C
om
mo
ns

cooperation between rival political parties and inadequate fund availability). But India’s policy on smart city development provides for Greenfield Development (city extension) around cities to address the needs of the expanding population.
Target 11.b
The Indian government’s National Action Plan on Climate Change, formulated by the Prime Minister’s Council, highlights the need to simultaneously implement eight12 national missions in an integrated manner. The Sustainable Habitat Mission, for example, aims to promote energy efficiency through three initiatives, namely improvements in energy efficiency in buildings, development of technology to produce power from waste, and reduction of energy use in the urban transport sector. A participatory approach is being followed in implementing the mission, and stakeholders are getting the opportunity to compete on the best management model.
Target 11.c
India’s premier institution, Housing and Urban Development Corporation Limited, is engaged in providing loans to various government agencies and the general public (including the underprivileged) for building construction since 1970. The institution has also been engaged in development of environment-friendly construction technologies that provide for the use of cost-effective building materials. Their experts, based in district-level building centres, train local workers in constructing houses based on locally available materials. In this manner, the cost of construction is brought down significantly.
ChallengeS in the Way forWarD
The 10 targets set under SDG 11 are most suitable for India. These targets aim to address the problems being experienced in a wide range of urban sectors (housing, transport, etc.), and in which the country is lagging behind. Additionally, weightage is given to the need for enhancing “inclusive and sustainable urbanisation and capacities for participatory, integrated and sustainable human settlement planning and management” (target 11.3). This could be said to be the most important
and challenging target for India, where sectoral improvements would be difficult to achieve without formulating effective urban governance mechanisms.
The Indian experience shows that major hurdles in achieving desired urban transformation include funding shortages, ineffective implementation and monitoring of urban policies and programmes, weak enforcement of laws and poor regulation of activities. For instance, the government is not in a position to bear the entire expected cost of INR 980 billion needed to implement its mega schemes, i.e., Smart Cities and AMRUT, and is hoping to rely on alternative sources, including capital markets and the BRICS Bank.13 Another example is that the legislative provision of the Constitution (Seventy-fourth Amendment) Act, 1992, pertaining to the devolution of powers and responsibilities to municipalities, has not yet been effectively implemented due to reluctance shown by state functionaries.
Programmes and projects are also not properly implemented because of low capabilities of many government functionaries working in various planning and programme implementation agencies, i.e., parastatal and local-level institutions. The prevalence of this problem defeats the purpose of a policy, and the target population does not benefit significantly. As urban areas are witnessing noteworthy demographic, social and economic changes over time, appropriate expertise is needed to respond to the new challenges. Training functionaries in developing a superior understanding of smart solutions, such as compact development, participatory planning and implementation, financial management and land monetisation, would be a useful exercise. At the same time, it needs to be ensured that local institutions possess sufficient funds and equipment that are needed to implement new ideas and lessons learned by the functionaries during training.
Furthermore, the use of digital technology in the management and provision of various urban services is still very limited. This is despite the existence of important technical and management institutions in the country, such as the Indian Institutes
74

fuNdiNG shortaGEs, iNEffEctivE imPlEmENtatioN aNd moNitoriNG, wEaK ENforcEmNt
of laws, sKill-dEfcit amoNG fuNctioNariEs aNd limitEd usE of diGital tEchNoloGY
arE amoNG a fEw challENGEs PrEvENtiNG dEsirEd urbaN
traNsformatioN.
of Technology and Indian Institutions of Management, that produce specialists in a wide variety of fields. In addition, leading domestic and foreign private companies are operating in many cities. Judicious utilisation of technical expertise available in these institutions and companies would help in overcoming many difficulties. The problem of traffic congestion in cities, for instance, is increasing by the day. Similarly, citizens dependent on public transport buses do not have access to advance information about their arrival. Such problems could be overcome to a great extent by the use of appropriate digital technology.
Clearly, better performance by existing institutions and innovative governance approaches are urgently needed.
With respect to the scope of SDG 11, an additional target could have been included to address the problem of low income and unemployment observed among a significant proportion of the population living in cities. The existing 10 targets do not cover this aspect clearly. The inclusion of such an objective would draw the attention of urban policymakers and other stakeholders towards this need, and make them think about innovative ways in which various income-generating activities can be created. While the issue of employment has been covered under SDG 814 (see Chapter 10), an additional such target under SDG 11 would have ensured that the matter is given greater attention in the urban context rather than its being handled in a generalised manner. This has been the case in respect of other SDGs (such as SDG 6 on water and sanitation, SDG 13 on climate change), which have been included as specific targets under SDG 11 (target
75
11.1 necessitates access to basic services including water and sanitation, while target 11.b calls for mitigation and adaptation to climate change).
As the world gears towards implementing this goals and its targets, the indicators proposed under each of the 10 targets will need to be reviewed in the light of conditions prevailing in India and the availability of time series data. Considering the fact that achievement of each target will, among other things, depend upon monitoring the status of indicators over a period of time, followed by necessary strategic revisions, it will be necessary to determine and use the most appropriate indicators. For example, population density could be an important indicator to understand its effects (such as environmental, transport, energy) on the sustainability of urban development.

sdgs in india,institutionally speaking
competition to perform better.
The MDGs were top-down goals driven by donors, implicitly making Overseas Development Assistance (ODA) disbursements linked to performance on the MDGs. But inefficiencies and poor incentives for performance abounded. Lack of country ownership, gaming and poor budget execution constrained their effectiveness to enhance performance.1 A fifty country (including India) assessment, which the United Nations Development Programme’s Independent Evaluation Office commissioned in June 2014,2 lists these issues.
Compared to the MDGs, the SDG formulation process has been much more inclusive and participative. But it is unclear, after the three-year long process (2012-2015), how the infirmities of the earlier MDG arrangements have been addressed. It does not help that the SDGs are far more complex than the MDGs. Monitoring them is expected to be significantly more demanding, requiring new and more onerous statistical effort at the national level.
national prioritieS anD CapaCitieS
India is likely to be one of the countries that uses the broad SDG agenda and matrix selectively, using a “value for money” perspective. The availability of ODA is not
Will the Complexity of the SDgs Be a Drag?
Te Sustainable Development Goals (SDGs) and targets reflect a broad international conceptual consensus that development must not come at the cost of degrading the
environment irreversibly. How significant is this new effort to merge “green” goals with the more standard “developmental” goals likely to be? This commentary explores the institutional reality and concerns that need to be considered for India to streamline the internalisation of the SDGs.
The institutional case for embedding environmental concerns into development is strong. Unless a pervasive concern for the environment is embedded into all development practices across sectors, effective progress in inclusive development is unlikely. Mainstreaming environmental sustainability into the earlier Millennium Development Goals (MDGs), which complete their course this year, can partially make up for the failures under the Kyoto Protocol 1997 process to limit emissions and align aid in a manner which is environmentally benign. The SDGs follow the pattern of “league tables”—common indicators fed by cross-country data generated by using a common methodology. They consequently assist in a universalised assessment process and stimulate
S a N J E E V a h L u W a L i a , a d V i s o r , o r f
T H I R T E E N

a significant consideration for India. ODA accounts for just 0.15% of total receipts in the current fiscal 2015-16.
India’s sustainable development priorities are succinctly embedded in the five-year plans of the Union government. The Twelfth Five Year Plan (2012-2017) is still being implemented. A new national policy formulation and implementation architecture is being evolved by the government of Prime Minister Narendra Modi. It is expected it shall lean towards enhanced federalism and the devolution of resources to provincial and local governments. Participative and inclusive democracy are key themes along with social justice and shared prosperity. These broad themes resonate well with the agenda of the SDGs.3
How well prepared is India to implement the SDGs from 2016 onward? I argue that India has a sophisticated institutional framework, which recognises the imperative to adopt complex goals and to coordinate state effort—both vertically across levels of government and horizontally across agencies within a level of government—with the active participation of non-state actors, in a collective effort to achieve these goals.
The proof of the pudding lies in the fact that the all the eight goals and 12 targets of the MDGs were incorporated into the planning and budgetary process, and the 35 indicators were monitored and reported. Consequently, it would not be difficult to also incorporate the SDGs into the existing development strategy framework going ahead. The extent to which these targets can be monitored and the quality of the metrics—how well the chosen proxies will reflect achievements on the ground—will depend significantly on the indicators, which are yet to be chosen.
enaBling inStitutional featureS
Until the late 1970s the ability of the Union (federal) government to drive a national development agenda was virtually assured. A constitutional bias towards centralisation was reinforced by the legacy of the independence movement, which united the polity. Adoption of a central planning process on the template of Soviet Russia, reservation of the “commanding heights of the economy” for the public sector4 and large-scale nationalisation of private business and industry in the 1960s and 70s all served to significantly bias the skew of fiscal power towards the Centre, far beyond what was intended in the constitution. Some of these centralising drivers have been tempered by subsequent changes in the international economic architecture, most specifically—the bias against the private sector is fiscally unsustainable today; political plurality defines the Indian party system; since 1992 a third level of government at the local level has been constitutionally mandated via an amendment, although implementation of the provision has been left to state governments; since 2014 the Finance Commission now specifically devolves shares in Central revenues to local governments; and economic liberalisation has released our “animal spirits” and enhanced growth.
Happily, despite the muscularity of federalism and political pluralism over the last three decades, policy perspectives have converged rather than diverged across parties; policy coherence is the leitmotif, despite regular changes in governments; and the imperative of practicality trumps ideology. The section below reviews the institutional drivers and trends.
The Indian Constitution
The Indian constitution, adopted in 1949 and effective from 1950, makes India a Union of States. But it is not strictly a federal polity. Unlike in the United States, each of the twenty eight provinces (called state governments in India) do not have separate constitutions, nor can they secede from the Union, principally because the Indian polity was not created by individual provinces agreeing to form a federation. This is why India is classified as a unitary state with federal characteristics, or a
thE asYmmEtrY iN fiscal PowErs ENsurEs basic sYmmEtrY
iN dEvEloPmENtal PoliciEs, iNcubatEd PrimarilY bY thE
uNioN GovErNmENt.
77

federal state with unitary characteristics, depending on the interpretative bias of the individual researcher.
Two key constitutional provisions ensure the dominance of the Union government. The functional areas on which the Union and State Legislatures can act are clearly set out in separate lists, along with a third list where either can legislate. But a residual provision ensures that Union legislation always dominates over state-level legislation within the combined list. Further, the Union government enjoys the constitutional right to dismiss any state government, in the event there is a breakdown of the constitutional provisions due to an emergency like war, domestic turmoil or fiscal meltdown.
Additional centralising drivers in the constitution make the judiciary vertically integrated, though state governments have greater leeway in appointing the lower judiciary. The senior bureaucracy and police is similarly selected, appointed and managed by the Union government through a specific provision. The supreme audit body is common for both the Union and the state governments.
The Scheme for Intergovernmental Fiscal Transfers
The bulk of the fiscal resources are with the Union government, although they are shared with the provincial governments on the basis of recommendations of a Finance Commission, appointed every five years. Currently around 50% of the aggregate revenue resources of the Union government are transferred to the state governments. State governments in turn allocate resources to local governments, using the recommendations of their own State Finance Commissions. This asymmetry in fiscal powers ensures basic symmetry in developmental policies, incubated primarily by the Union government.
Political Plurality
Despite political plurality being embedded in the constitution, the force of history helped the Congress Party, which was the main political party at the time of independence in 1947, to retain power at the Centre and in a majority of the provincial governments for thirty years.
Ensuring coordinated action between the Union and state governments was consequently an issue of inner party management discipline, much as it is in single-party nations like China.
Post 1990, there have been significant changes in the political landscape, such as the fruition of multiparty rule in keeping with the federal structure of the constitution. First, India has had long periods of coalition governments at the Central level, initially in the late 1970s and again after 1990. This is an outcome of a growing asymmetry between local and regional political parties, which are strong at the provincial level, and others which have the capacity to form a national government.
India is large and heterogeneous, and asymmetry in political power across the country is a signal of political inclusion and maturity. But it does complicate the business of implementing developmental projects, particularly those of a network character like infrastructure—roads, interstate river development, railways, telecommunication and electricity.
Productive federalism has to be consensual to be effective. But the efficiency costs are significant due to stretched time lines for decision-making; higher operational risks of policy reversal; and the incorporation of operational processes which are flexible enough to incorporate local conditions. This is still very much a learning process for a polity which values templates and equality above equity.
Enhanced Political Predictability
The resilience of the political architecture can be gauged from the fact that political stability has not been unduly affected by political plurality. The constitutional provision for evoking a national emergency has not been used since 1977, and the use of the constitutional power to dismiss a state government has been strictly regulated since 1994 by a decision of the Supreme Court.5 However, selective curtailment of provincial powers in some border states has been necessary to deal with extremism and terrorism.
The Indian constitution has been amended 100 times in the last 65 years
78
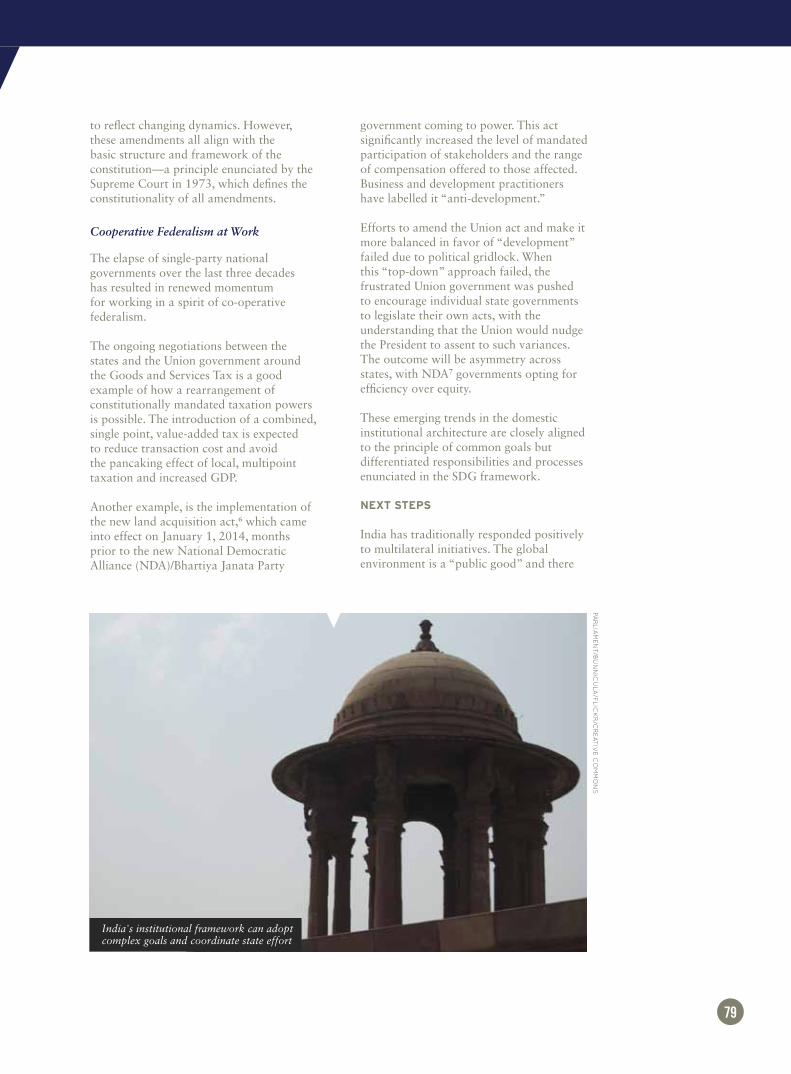
to reflect changing dynamics. However, these amendments all align with the basic structure and framework of the constitution—a principle enunciated by the Supreme Court in 1973, which defines the constitutionality of all amendments.
Cooperative Federalism at Work
The elapse of single-party national governments over the last three decades has resulted in renewed momentum for working in a spirit of co-operative federalism.
The ongoing negotiations between the states and the Union government around the Goods and Services Tax is a good example of how a rearrangement of constitutionally mandated taxation powers is possible. The introduction of a combined, single point, value-added tax is expected to reduce transaction cost and avoid the pancaking effect of local, multipoint taxation and increased GDP.
Another example, is the implementation of the new land acquisition act,6 which came into effect on January 1, 2014, months prior to the new National Democratic Alliance (NDA)/Bhartiya Janata Party
government coming to power. This act significantly increased the level of mandated participation of stakeholders and the range of compensation offered to those affected. Business and development practitioners have labelled it “anti-development.”
Efforts to amend the Union act and make it more balanced in favor of “development” failed due to political gridlock. When this “top-down” approach failed, the frustrated Union government was pushed to encourage individual state governments to legislate their own acts, with the understanding that the Union would nudge the President to assent to such variances. The outcome will be asymmetry across states, with NDA7 governments opting for efficiency over equity.
These emerging trends in the domestic institutional architecture are closely aligned to the principle of common goals but differentiated responsibilities and processes enunciated in the SDG framework.
next StepS
India has traditionally responded positively to multilateral initiatives. The global environment is a “public good” and there
79
India's institutional framework can adopt complex goals and coordinate state effort
Par
lia
men
t/bu
nn
iCu
la/F
liC
kr
/Cr
eat
ive C
om
mo
ns

is little option except to pursue a common agenda for optimising outcomes.
India is also at the cusp of emerging as a leading economic power. Projected growth rates in the Indian economy over the medium term are higher than the seven economies of US, China, Japan, Germany, France, UK and Italy, which are bigger than India in terms of current Gross National Income. By 2030 India could be the third largest economy after the US and China. It will most certainly be the most populous country by then. This is why India matters in the global economy and polity.
There are two imperatives that will drive India to do more than be just an active participant in the metrics of the SDGs over the next 15 years.
Define World Development Practice for the 21st Century
The SDGs are a complex set of goals, with conflicting objectives, which need to be balanced. The need for rapid economic growth to end poverty and the conflicting objective of reducing inequality are examples. But the contradictions they present are not the outcome of poor or fanciful drafting. They represent developmental challenges which have defied resolution. Inequality, accretions of wealth and income at the very top seem to be the natural outcome of the most effective market-driven model of growth we know today.
India should embrace such challenges. The developmental path that we adopt can provide valuable lessons, not least in Africa, which is expected to be the growth leader post 2050. By then India would have peaked, just as China is peaking today.
Resolve Domestic Institutional Gaps
Despite India’s robust institutional framework, an experienced and relatively effective bureaucracy, and our embedded commitment and preference for a democratic polity, we suffer from significant gaps in our institutional architecture.
These gaps include: (a) Institutional resistance to work in teams across silos resulting in functional
duplication, territoriality and a preference for hierarchical structures over efficiency. This is an outcome of “soft” budget constraints, which permit inefficiencies to persist; centralisation of powers, which stifles initiative; and low levels of accountability, which provide no incentives to pursue tough reform measures.
(b) Over reliance on legislating a solution rather than solving problems upfront. The low productivity of government employment is a good example. Low access to good quality electricity supply despite two legislative attempts in 1998 and again in 2003 is another.
(c) Less than adequate innovation and misdirected research and development. This reflects in our failure to indigenise international quality products and partner in global supply chains.
The SDGs are an opportunity to tackle these institutional gaps head on through the following measures.
Use the NITI Aayog Productively
The responsibility of monitoring the SDGs is likely to be vested in the newly formed NITI Aayog—the successor of the erstwhile Planning Commission—which has been seeking a definitive mandate. This would be sub-optimal. The NITI Aayog was formed as a high-powered think tank providing targeted expert advice to the Union and state governments. Monitoring the SDGs is a clunky task, which requires systems, qualified professionals and a great deal of coordination within the ministries of the Union government, for which the Aayog is an unsuitable institution. This task would best remain with the Ministry of Statistics, which already monitors the MDGs.
80
iNdia should EmbracE thE dEvEloPmENtal challENGEs that havE thus far dEfiEd
rEsolutioN: thE dEvEloPmENt Path that wE adoPt caN ProvidE
valuablE lEssoNs to africa for iNstaNcE—africa will bE a Growth lEadEr Post 2050, bY
which timE iNdia will havE PEaKEd.

Where the Aayog could add value is to be an Independent Evaluator of the performance of the Union and state governments versus the SDGs, and to suggest policy and process change, including on the technology used for monitoring the indicators and the manner in which resources are allocated and used for achieving the goals.
Leverage the strength of Non-State Actors
India has 70,000 non-state actors, which have volunteered to partner with the Union government in various developmental projects. But the extent to which decision-making and consultation in government is functionally participative needs to be assessed better, so that partnership becomes more than a “ticking the box” activity.
Benefit from ‘Digital India’
The Digital India initiative is an effective entry point to enhance access to information, evoke broad participation, ensure transparency and increase accountability. The power of digitally connected social media was illustrated by the one million comments received by the Telecom Regulatory Authority of India on its April 2015 consultation paper on net neutrality. The depth of the response is reported to have clogged up the agency’s work for weeks.
It is unfortunate, in this context, that the digital medium has not yet been universally incorporated into the functioning of the Union government. Reliance on hard copy as the medium of communication and decision-making continues. In developed economies it is the use of technology by government that enables adaptation to suit local conditions, and provides the scale for generating the revenues required by the private sector to provide services and products at competitive prices. In India the wider public sector has lagged, rather than led, this process.
India is well placed to implement the SDGs. We have the economic and demographic scale and the historical momentum to our benefit. How
productive this process proves for the world and for India will depend significantly on the government’s perception of its role and responsibilities in this multilateral effort. We can use this opportunity to reform our
domestic, public institutional architecture and processes for effective delivery of complex goals whilst simultaneously charting a new path on which other developing countries could innovate local solutions. We have the human and fiscal resources and the leadership skills. What we need is to adopt the PAMS approach—Prioritise efforts, Allocate resources strategically, Motivate employees and make Systemic changes. Someone needs to walk through this wide open entry point to convert today’s “aspirational” goals into real achievements by 2030.
81

endnotes
O N E
1. “Sustainable Development Timeline,” International Institute of Sustainable Development, 1997. 2. For instance, UNEP, WWF, IUCN, USAID, WB and Greenpeace. 3. “Report of the World Commission on Environment and Development: Our Common Future,” United Nations, March 1987, 28, http://www.un-documents.net/our-common-future.pdf. 4. Vikrom Mathur, “Localizing the Dominant,” August 1, 2011. 5. Eucharia N. Nwagbara et al, “Poverty, Environmental Degradation and Sustainable Development: A Discourse,” Global Journal of Human Social Science, Sociology, Economics & Political Science 12, no. 11 (2012): 2.6. A situation where the “cake that can be had and eaten too.” Sharachchandra M. Lélé, “Sustainable Development: A Critical Review,” World Development 9, no. 6 (1991): 618. 7. Sunita Narain explains it thus: “industrialised countries look at environmental action as divorced from concerns about development and social well-being. More precisely, they see environment measures as the icing on the cake of development already done and delivered. This icing helps improve performance through efficiency and helps clean up toxins and pollu-tion.” “The future we do not want,” Down to Earth, June 25, 2012, http://www.downtoearth.org.in/news/the-future-we-do-not-want--38521. 8. Fiona Macdonald, “Sweden sets its sights on becoming the world’s first fossil fuel-free nation,” Science Alert, September 25, 2015, http://www.sciencealert.com/sweden-sets-its-sights-on-becoming-the-world-s-first-fossil-fuel-free-nation. 9. K.F. Jalal, “Sustainable Development, Environment and Poverty Nexus,” ADB paper, December 1993, 12.10. Rathin Roy, draft paper, August 2015. 11. Efforts to reconcile the two juxtaposed tensions of poverty degradation and overconsumption and their individual ef-fects on the environment have been advanced, for example through quantitative substantiation of the respective contribu-tions of both causes toward environmental unsustainability, but these have so far not found a place in policymaking. 12. O. Sunkel, “Beyond the world conservation strategy,” in Conservation with Equity: Strategies for Sustainable Develop-ment, eds. P. Jacobs and D.A. Munro (Cambridge: IUCN, 1987), quoted in Lélé, 610.13. “Our Common Future,” 16.14. Lélé, 613. 15. Charles Kenny, “MDGs to SDGs: Have we Lost the Plot?,” Center for Global Development, May 27, 2015, http://www.cgdev.org/publication/mdgs-sdgs-have-we-lost-plot. 16. References: Vivan Sharan, “Trends in Official Development Assistance: Financing Sustainable Development,” Draft paper, September 2015; “The 0.7% target: An in-depth look,” Millennium Project, http://www.unmillenniumproject.org/press/07.htm; Mark Anderson, “Ban Ki-moon: sustainable development goals ‘leave no one behind’,” The Guardian, August 3, 2015, http://www.theguardian.com/global-development/2015/aug/03/ban-ki-moon-hails-sdgs-agreed-by-193-na-tions-as-leaving-no-one-behind; and “Development Does Not Equal Aid,” Center for Global Development, July 30, 2015, http://www.cgdev.org/media/development-does-not-equal-aid. 17. Luke Smyth, “Anthropological Critiques of Sustainable Development,” Cross Sections VII (2011). 18. Mathur, “Localizing the Dominant.”19. Cathleen Fogel, “The Local, the Global, and the Kyoto Protocol” in Earthly Politics: Local and Global in Environmen-tal Governance, eds. Sheila Jasanoff and Marybeth Long Martello (Massachusetts: MIT Press, 2004): 111-112. 20. Smyth, 81-2. 21. Fogel, 113. 22. “Open Working Group proposal for Sustainable Development Goals,” UN, https://sustainabledevelopment.un.org/con-tent/documents/1579SDGs%20Proposal.pdf, 5. 23. Rajendra Singh drew on indigenous principles to introduce ‘johads,’ rainwater storage tanks, and check dams to re-plenish surface and groundwater, bringing back life to deserted villages. 24. John Robinson, “Squaring the circle? Some thoughts on the idea of sustainable development,” Ecological Economics 48 (2004): 378-9; 382.
T W O
1. Martha Finnemore and Kathryn Sikkink trace the mechanisms and processes through which new norms emerge on the international stage, how states are persuaded to accept them and how they are internalised into state policy. During the first stage of ‘norm emergence,’ norm entrepreneurs attempt to convince a critical mass of states to accept a new norm.
82

This is followed by a ‘norm cascade,’ in which norm leaders attempt to socialise other states to become norm followers. Finally, at the ‘norm internalisation’ phase, the norm acquires an almost taken for granted quality, appearing in political discourse and bringing about behavioural change. These three processes describe how norms are institutionalised at the international level. Martha Finnemore and Kathryn Sikkink, “International Norm Dynamics and Political Change,” Inter-national Organisations 52, no. 4 (1998).2. Alexander Betts and Phil Orchard, Implementation and World Politics: How International Norms change Practice (Ox-ford: Oxford University Press, 2014).3. “National Consultation Report: Post-2015 Development Framework, India,” United Nations, May 2013, 27-28, http://www.in.one.un.org/img/uploads/National_Consultation_Report_29Nov2013.pdf. 4. See note 2. 5. Amitav Acharya, “How Ideas Spread: Whose Norms matter? Norm Localization and Institutional Change in Asian Regionalism,” International Organization 58 (2004): 239-275.6. Statement delivered by Counselor Amit Narang on ‘Indian priorities in the post-2015 Development Agenda’ at an event organised by Observer Research Foundation, NYU Center for International Cooperation and Saferworld in New York, May 15, 2015. 7. Shilpi Bakshi and Ipsita Kumar, “India and Sustainable Development Goals (SDGs),” TERI Policy Brief, November 2013.8. Vivan Sharan and Sunil Suri, “Sustainable Development Goals: The Quest for a Post-2015 Agenda,” ORF Policy Brief 2, September 2014, http://www.observerindia.com/cms/export/orfonline/modules/policybrief/attachments/Policy_perspec-tive_2_1413269199562.pdf. 9. Thanks to the anonymous reviewer of this article for this point.10. Andrew Moravcsik, “Taking Preferences Seriously: A Liberal Theory of International Politics,” International Organiza-tion 51, no. 4 (1997). 11. Andrew P. Cortell and James W. Davis Jr., “Understanding the Domestic Impact of International Norms: A Research Agenda,” International Studies Review 2, no. 1 (2000): 65-87.12. Stacy D. VanDeveer and Geoffrey D. Dabelko, “It's capacity, stupid: International assistance and national implementa-tion,” Global Environmental Politics 1, no. 2 (May 2001): 18-29.13. Mili Majumdar, “Can India meet Sustainable Development Goals?,” Asian Scientist, February 16, 2015.14. Peter M. Haas, “Introduction: Epistemic Communities and International Policy Coordination,” International Organi-zation 46, no. 1 (1992): 1-35. 15. See note 8. 16. “India and the MDGs: Towards a sustainable future for all,” UN, February 2015, http://www.unic.org.in/items/In-dia_and_the_MDGs_small_web.pdf. 17. See note 8.18. See note 4. 19. Gilbert Gist, The History of Development: From Western Origins to Global Faith (London: Zed Books, 2013).20. See note 17.
T H R E E
1. Amartya Sen, Development as Freedom (New York: Oxford University Press, 1999).2. “Statement by India at the OWG on SDGs—Session on Poverty Eradication,” UN, 2013, https://sustainabledevelop-ment.un.org/content/documents/3542India.pdf. 3. Jean Drèze and Amartya Sen, “Putting Growth in Its Place,” Outlook, November 4, 2011, http://www.outlookindia.com/article/putting-growth-in-its-place/278843.4. “Millennium Development Goals India Country Report 2015,” Ministry of Statistics and Programme Implementation, Government of India, 2015, http://mospi.nic.in/Mospi_New/upload/mdg_26feb15.pdf. 5. Ibid.6. “Report of the Expert Group to Recommend the Detailed Methodology for the Identification of Families Living Below Poverty Line in the Urban Areas,” Planning Commission, Government of India, 2012. 7. “Press Note on Poverty Estimates,” Planning Commission, Government of India, 2011, http://planningcommission.gov.in/reports/genrep/Press_pov_27Jan11.pdf. 8. Aishwarya Deshpande and Pramit Bhattacharya, “Everything You Wanted to Know About the Poverty Debate,” Live-mint, 2015, http://www.livemint.com/Politics/vS6ouWt9vWB9Snt7As7LHI/Everything-you-wanted-to-know-about-the-great-Indian-poverty.html.9. “Human Development Reports: Population in Multidimensional Poverty,” UNDP, 2013, http://hdr.undp.org/en/content/population-multidimensional-poverty. 10. Ibid.11. “At a Glance,” The Mahatma Gandhi National Rural Employment Guarantee Act 2005, Ministry of Rural Develop-ment, Government of India, 2015, http://mnregaweb4.nic.in/netnrega/all_lvl_details_dashboard_new.aspx. 12. Ibid.
83

13. G.V.V. Sarma, “National Progress Report on the Implementation of the Hyogo Framework for Action (2013-2015),” Ministry of Home Affairs, Government of India, 2015, http://www.preventionweb.net/files/40210_IND_NationalHFApro-gress_2013-15.pdf.14. Ibid. 15. “The Human Rights To Adequate Housing and Land in India,” Housing and Land Rights Network, 2013, http://hlrn.org.in/documents/Housing_and_Land_Status_Update_2013.pdf. 16. Ibid.17. “Report of the Committee on State Agrarian Relations and the Unfinished Task in Land Reforms,” Ministry of Rural Development, Government of India, 2009.18. Shivani Chaudhry, “Land Grabbing in India and the Movement for Food Security,” Housing and Land Rights Net-work and Ekta Parishad, India19. Ibid20. Ibid. 21. Shivani Chaudhry, “Land Bill Implies Deep Trouble,” Housing and Land Rights Network, 2015, http://epaper.dnain-dia.com/story.aspx?id=77275&boxid=20473&ed_date=2015-03-27&ed_code=820009&ed_page=8.22. “Vol. II of Economic Survey 2014-15,” Ministry of Finance, Government of India, 2015, http://indiabudget.nic.in/es2014-15/echapter-vol2.pdf. 23. Ibid. 24. “India and the MDGs: Towards a Sustainable Future for All,” UNESCAP, 2015, http://www.unic.org.in/items/India_and_the_MDGs_small_web.pdf. 25. “Empowered People; Resilient Nation,” UNDP India, 2011, http://www.in.undp.org/content/dam/india/docs/empow-ered_people_resilient_nation.pdf. 26. See note 19.27. See note 6. 28. Ravi S. Srivastava, “A Social Protection Floor for India,” ILO, 2013, http://www.ilo.org/wcmsp5/groups/public/---asia/---ro-bangkok/---sro-new_delhi/documents/publication/wcms_223773.pdf.29. Malathy Iyer, “Budget 2015: Experts Slam Government for Slashing Health Budget,” The Times of India, February 28, 2015. 30. Ibid. 31. Ibid.
F O U R
1. “Overview: India,” World Food Programme, https://www.wfp.org/countries/india/overview.2. “Millennium Development Goals,” UNDP India, http://www.in.undp.org/content/india/en/home/mdgoverview/#goal1.3. Nina Weitz, “Food security in the Sustainable Development Goals: Where is the process heading?,” Swedish Internation-al Agricultural Network Initiative, June 28, 2014, http://www.sei-international.org/mediamanager/documents/Publications/SIANI-SDG-Brief-short.pdf.4. “5 Year Plans,” Planning Commission, Government of India, http://www.planningcommission.nic.in/plans/planrel/fiveyr/welcome.html.5. Sumit Bhattacharjee, “India still far from food security,” The Hindu, April 21, 2015, http://www.thehindu.com/news/cit-ies/Visakhapatnam/india-still-far-from-food-security/article7124082.ece.6. “India: Issues and Priorities for Agriculture,” The World Bank, May 17, 2012, http://www.worldbank.org/en/news/fea-ture/2012/05/17/india-agriculture-issues-priorities.7. Ibid. 8. “India, isolated, toughs it out in WTO food-stockpiling row,” Reuters, November 6, 2014, http://in.reuters.com/arti-cle/2014/11/05/trade-wto-india-idINKBN0IP1QV20141105.9. “Overview: India,” World Food Programme, https://www.wfp.org/countries/india/overview.10. “The State of Food and Agriculture. Rome,” FAO, 2011, www.fao.org/docrep/013/i2050e/i2050e.pdf.11. “Global Hunger Index: The Challenge of Hidden Hunger,” International Food Policy Research Institute, 2014,http://cdm15738.contentdm.oclc.org/utils/getfile/collection/p15738coll2/id/128360/filename/128571.pdf.12. “India tops world hunger list with 194 million people,” The Hindu, May 29, 2015, http://www.thehindu.com/news/national/india-is-home-to-194-million-hungry-people-un/article7255937.ece.13. “Global Hunger Index: The Challenge of Hidden Hunger,” International Food Policy Research Institute, 2014, http://cdm15738.contentdm.oclc.org/utils/getfile/collection/p15738coll2/id/128360/filename/128571.pdf.14. “The State of Food Insecurity in the World 2014: Strengthening the enabling environment for food security and nutri-tion,” FAO, 2014, http://www.fao.org/3/a-i4030e.pdf.15. “Food Security: Concepts and Measurement,” Economic and Social Department, UN FAO, July 11-12, 2002, http://www.fao.org/docrep/005/y4671e/y4671e06.htm.16. “Food Security in India,” Oxfam India, September 2010, http://re.indiaenvironmentportal.org.in/files/food%20secu-rity%20in%20india.pdf.
84

17. “India’s Homemade Food Crisis,” Project Syndicate, September 2015, http://www.project-syndicate.org/commentary/asit-k--biswas-and-cecilia-tortajada-attribute-shortages-and-undernourishment-to-widespread-wastage-of-output.18. Ibid. 19. “Food Security in India,” Oxfam India, September 2010, http://re.indiaenvironmentportal.org.in/files/food%20secu-rity%20in%20india.pdf.20. “Report of the Inter Ministry Task Group on Comprehensive Medium Term Strategy for Food and Nutrition Secu-rity,” Planning Commission, Government of India, April 2005, http://planningcommission.nic.in/aboutus/taskforce/inter/inter_nutrn.pdf.21. Anil Chandy Ittyerah, “Food Security In India: Issues and Suggestions for Effectiveness,” Indian Institute of Public Administration, New Delhi, 2013, http://www.iipa.org.in/upload/Food%20Security%20Theme%20Paper-2013.pdf.22. Aditya Kalra, “A look at some of India’s cheap food schemes,” Reuters, July 23, 2013, http://blogs.reuters.com/india/2013/07/23/a-look-at-some-of-indias-cheap-food-schemes/.23. “Food Security in India Issues and Suggestions for Effectiveness,” Indian Institute of Public Administration, 2013, http://www.iipa.org.in/upload/Food%20Security%20Theme%20Paper-2013.pdf.24. Michele Gragnolati, Meera Shekar et al, “India’s Undernourished Children: A Call for Reform and Action,” HNP Discussion Paper, August 2005, http://hetv.org/india/mh/nutrition/IndiaUndernourishedChildrenFinal.pdf. 25. “National Mission for Sustainable Agriculture,” Department of Agriculture and Cooperation, Ministry of Agriculture, Government of India, August 2010, http://agricoop.nic.in/Climatechange/ccr/National%20Mission%20For%20Sustain-able%20Agriculture-DRAFT-Sept-2010.pdf.26. “Sunderbans' salt-tolerant rice project a hit globally,” The Times of India, October 29, 2013, http://timesofindia.india-times.com/india/Sunderbans-salt-tolerant-rice-project-a-hit-globally/articleshow/24839656.cms. 27. Abantika Ghosh, “Activists cry foul as WCD Ministry funds slashed by half,” The Indian Express, March 1, 2015, http://indianexpress.com/article/business/budget/activists-cry-foul-as-wcd-ministry-funds-slashed-by-half/.
F I V E
1. “Millennium Development Goals India Country Report 2015,” Ministry of Statistics and Programme Implementation, Government of India, 2015, http://mospi.nic.in/Mospi_New/upload/mdg_26feb15.pdf. 2. “‘India Unlikely to Meet All Millennium Development Goals,’” Outlook, March 3, 2015, http://www.outlookindia.com/news/article/india-unlikely-to-meet-all-millennium-development-goals/884005. 3. “Global Monitoring Report 2007—Millennium Development Goals: Confronting the Challenges of Gender Equality and Fragile States,” IRBD/World Bank, 2007, http://siteresources.worldbank.org/INTGLOMONREPORT2007/Resources/3413191-1176390231604/1264-FINAL-LO-RES.pdf. 4. Sample Registration System (SRS) Report 2013, Census of India, Ministry of Home Affairs, Government of India, www.censusindia.gov.in/vital_statistics/SRC_Reports_2013.html. 5. Condom Promotion Impact Survey 2010, National AIDS Control Organization, Ministry of Health & Family Welfare, Government of India. 6. Behavioural Surveillance Survey (BSS) quoted in “Millennium Development Goals India Country Report 2015.”7. “Measures to Check Maternal Death,” Press Information Bureau, Government of India, March 17, 2015, http://pib.nic.in/newsite/PrintRelease.aspx?relid=117210. 8. See note 1. 9. Ibid. 10. “India drives down malaria rates, sets sights on elimination,” WHO, April 2015, http://www.who.int/features/2015/india-programme-end-malaria/en/. 11. “TB India 2012,” Revised National TB Control Programme Annual Status Report, Ministry of Health and Family Welfare, Government of India, http://tbcindia.nic.in/pdfs/TB%20India%202012-%20Annual%20Report.pdf. 12. “Life expectancy in India goes up by 7.0 years since 1990: UNDP report,” The Times of India, July 24, 2014, http://timesofindia.indiatimes.com/india/Life-expectancy-in-India-goes-up-by-7-9-years-since-1990-UNDP-report/article-show/38964081.cms. 13. R.K. Srivastava and D. Bachani, “Burden of NCDs, Policies and Programmes for Prevention and Control of NCDs in India,” Indian Journal of Community Medicine 36, Supplementary 1 (2011): S7-S12. 14. Renu Khanna, “MDG 5 in India: Whither reproductive and sexual rights?” (paper presented at Expert Group Meeting on ‘Structural and policy constrains in achieving the MDGs for women and girls,’ UN Women and ECLAC, Mexico City, Mexico, October 21-24, 2013), http://www.unwomen.org/~/media/headquarters/attachments/sections/csw/58/ep1-renu-khanna%20pdf.pdf. 15. CAG, “Performance Audit of Water Pollution in India,” Report No. 21 of 211-12, Government of India, http://www.saiindia.gov.in/english/home/our_products/noddy/Union/Report_21_12.pdf. 16. Paul Hunt, “Report of the Special Rapporteur on the right of everyone to the enjoyment of the highest attainable standard of health: Mission to India,” 14th session, Human Rights Council, United Nations, April 15, 2010, http://www.refworld.org/pdfid/4c0367cf2.pdf. 17. “India: Conserving medicinal plants, sustaining livelihoods,” UNDP, http://www.tg.undp.org/content/undp/en/home/
85

ourwork/ourstories/india--conserving-medicinal-plants--sustaining-livelihoods.html.
S I X
1. Outcomes on Education, UN, http://www.un.org/en/development/devagenda/education.shtml. 2. Ministry of Human Resource Development, Government of India 2014, unless otherwise specified, http://mhrd.gov.in/statist. 3. The Gross Enrolment Ratio measures the total number students enrolled in a given level of education, regardless of age, expressed as a percentage of the official school-age population corresponding to the same level of education. Retrieved from the UNESCO Institute for Statistics, http://www.uis.unesco.org/Pages/Glossary.aspx. 4. Primary completion rates by cohort are captured by the gross intake ratio to the last grade of primary, measured by the number of new entrants (enrolments minus repeaters)/number of children at the entrance age of the last grade. Retrieved from the UNESCO Institute for Statistics. 5. National Achievement Surveys, Educational Survey Division, National Council for Educational Research and Training, http://www.ncert.nic.in/programmes/NAS/NAS.html. 6. ASER Centre, Trends Over Time 2006-2014: A Supplement to ASER 2014 (New Delhi: InkPrint.in, 2015), http://www.asercentre.org/Keywords/p/236.html. 7. “Children Covered Under ICDS Scheme—Statewise Details,” Press Information Bureau, Government of India, http://pib.nic.in/newsite/PrintRelease.aspx?relid=95813. 8. Anganwadi Centres are positioned as village-level facilities to provide community-based interventions for: a) Early childhood care education and development, including pre-school care and supplementary nutrition; b) care and nutri-tion counseling to pregnant women and lactating mothers, and children under six years, including management of severe malnutrition; c) health services (immunisation, checkups and referrals); and d) community mobilisation, awareness and education. 9. UNESCO, EFA Global Monitoring Report 2013-14: Teaching and Learning: Achieving Quality For All (Paris: UN-ESCO, 2014).10. “National Policy for Skill Development and Entrepreneurship,” Ministry of Skill Development and Entrepreneurship, Government of India, http://www.skilldevelopment.gov.in/National-Policy-2015.html. 11. Madhav Chavan, Hirokazu Yoshikawa and Chandrika Bahadur, “The Future of Our Children, Lifelong, Multi-Gener-ational Learning for Sustainable Development,” Background Report of Thematic Group 4 of the Sustainable Development Solutions Network, January 20, 2014, http://unsdsn.org/wp-content/uploads/2014/01/140510SDSNReportEducation.pdf. 12. “The Science of Early Childhood Development: Closing the Gap Between What We Know and What We Do,” Nation-al Scientific Council on the Developing Child, Harvard University, 2007, http://developingchild.harvard.edu/wp-content/uploads/2015/05/Science_Early_Childhood_Development.pdf. 13. James J. Heckman, “Skill Formation and the Economics of Investing in Disadvantaged Children,” Science 312 (2006): 1900-1902.14. Benefit-cost ratios of high-quality pre-school programmes are estimated at six or larger across high, middle and low income countries. Children from the most disadvantaged backgrounds tend to benefit the most. 15. OFSTED is an independent organisation in the UK that reviews schools and child care organisations and reports directly to the UK Parliament. 16. Australia’s http://www.myschool.edu.au/ initiative is an illustration of how transparent, grassroots reporting of school performance can increase accountability and improve outcomes in a relatively short period of time.17. “Toward Universal Learning: What Every Child Should Learn,” Learning Metrics Task Force, Brookings Institution, 2013, http://www.brookings.edu/research/reports/2013/02/learning-metrics. 18. Liesbet Steer and Kathryn Smith, “Financing education: Opportunities for global action,” Center for Universal Educa-tion, Brookings Institution, 2015, 20-29. 19. UNESCO calculates SDG 4 cost estimates for lower middle income countries like India based on per student spending of up to $639 (INR 41,500) per student in lower secondary annually.
S E V E N
1. “A Transformative Stand-Alone Goal on Achieving Gender Equality, Women’s Rights and Women’s Empowerment: Imperatives and Key Components,” UN Women, 2013.2. “Right to Education,” Ministry of Human Resource Development, Government of India, 2009, http://mhrd.gov.in/rte.3. “India and the MDGs: Towards Sustainable Future for all,” UNESCAP, 2015, http://www.unic.org.in/items/India_and_the_MDGs_small_web.pdf. 4. “Official list of MDG indicators,” UN Millennium Development Indicators, http://mdgs.un.org/unsd/mdg/Host.aspx?Content=indicators/officiallist.htm.5. Target 4.5: “Eliminate gender disparities in education and ensure equal access to all levels of education and vocational training for the vulnerable, including persons with disabilities, indigenous peoples, and children in vulnerable situations.”
86
6. “Women in National Parliaments,” Inter-Parliamentary Union, 2015, http://www.ipu.org/wmn-e/classif.htm.7. “Women's Reservation Bill: The story so far,” The Hindu, March 18, 2015, http://www.thehindu.com/news/national/womens-reservation-bill-the-story-so-far/article6969294.ece.8. “Girl child education key to women empowerment, says Narendra Modi,” DNA, September 2014, http://www.dnain-dia.com/india/report-girl-child-education-key-to-women-empowerment-says-narendra-modi-2020457.9. See note 4. 10. FAO, The State of Food and Agriculture, 2010-11 (Rome: FAO, 2011), www.fao.org/docrep/013/i2050e/i2050e.pdf.11. Ashok Sircar and Diana Fletschner, “The Right to Inherit Isn’t Working for Indian Women, Says U.N. Study,” Wall Street Journal, March 2, 2014, http://blogs.wsj.com/indiarealtime/2014/03/02/the-right-to-inherit-isnt-working-for-indian-women-says-u-n-study/.12. Sony Pellissery and Sumit Kumar Jalan, “Towards transformative social protection: a gendered analysis of the Employ-ment Guarantee Act of India (MGNREGA),” Gender & Development 19, no. 2 (2011): 283-294.13. See note 12. 14. “A handbook of statistical Indicators on Indian women,” Ministry of Women and Child Development, Government of India, 2007, http://wcd.nic.in/stat.pdf.15. “Wage Rates in Rural India,” Ministry of Labour and Employment, Government of India, http://labourbureau.nic.in/Wages_rates_2013_14.pdf.16. Nita Bhalla, “India, top sterilizer of women, needs new contraceptive ideas,” Reuters, July 17, 2015, http://www.reu-ters.com/article/2015/07/17/us-india-women-sterilisation-idUSKCN0PR1PP20150717.17. Ibid.18. Preethi Nallu, “Gender Issues Could Be a Game Changer in India’s Elections,” Time, April 14, 2014, http://time.com/61122/india-womanifesto-election-women-voting/.19. “Sexual Harassment of Women at Workplace (Prevention, Prohibition and Redressal) Act, 2013,” Ministry of Women and Child Development, Government of India, 2013, http://www.iitbbs.ac.in/notice/sexual-harrassment-of-women-act-and-rules-2013.pdf.20. “The Criminal Law (Amendment) Act, 2013,” Ministry of Law and Justice, Government of India, 2013, http://indi-acode.nic.in/acts-in-pdf/132013.pdf.21. “Child Sex Ratio,” Ministry of Home Affairs, Government of India, http://www.censusindia.gov.in/maps/Theme_based_maps/Map_links/map4.aspx.22. “Launch of Beti Bachao Beti Padhao Campaign,” Ministry of Women and Child Development, Government of India, 2015, http://wcd.nic.in/BBBPscheme/launch/workshop/main.htm.23. “Financing the unfinished business of gender equality and women’s rights: priorities for the post-2015 framework,” OECD, 2014, http://www.oecd.org/dac/gender-development/Short%20version%20-%20FINALFinancing%20the%20un-finished%20business%20of%20gender%20equality.pdf.24. “Reaction to the Outcome Document of the Third International Conference on Financing for Development: Addis Ababa Action Agenda,” Women’s Working Group for FFD, 2015, https://wwgonffd.files.wordpress.com/2015/07/women-working-group-reaction-to-addis-ababa-action-agenda-17-july-20151.pdf.25. Shilpi Bakshi and Ipsita Kumar, “India and Sustainable Development Goals,” TERI Policy Brief, TERI, 2013, http://www.teriin.org/policybrief/docs/sdg2013.pdf.26. Ikuho Miyazawa, "What are Sustainable Development Goals,” IGES Rio+ 20 Issue Brief, 2012.27. Caitlin Kiernan and Cheryl Doss, “Sex-Disaggregated Data,” Research Programme on Agriculture for Nutrition and Health, CGIAR, July 7, 2014, http://www.a4nh.cgiar.org/2014/07/07/two-more-things-you-need-to-know-about-sex-disaggregated-data/.28. John Coonrod, “MDGs to SDGs: Top 10 Differences,” The Hunger Project, August 8, 2015, http://advocacy.thp.org/2014/08/08/mdgs-to-sdgs/.
E I G H T
1. “Annual Report 2014-15: Swachh Bharat,” Ministry of Drinking Water and Sanitation, Government of India, http://www.mdws.gov.in/sites/default/files/Annual-Report-%20Drinking%20Water_0.pdf. 2. “Millennium Development Goals India Country Report 2015,” Ministry of Statistics and Programme Implementation, Government of India, 2015, http://mospi.nic.in/Mospi_New/upload/mdg_26feb15.pdf.3. “Census of India 2011: Availability and Type of Latrine Facility: 2001-2011,” Ministry of Home Affairs, Government of India, http://censusindia.gov.in/2011census/hlo/Data_sheet/India/Latrine.pdf. 4. “Water and the Sustainable Development Goals (SDGs),” UN Water, 2015, http://www.un.org/waterforlifedecade/wat-erandsustainabledevelopment2015/open_working_group_sdg.shtml.5. UNICEF and WHO, Progress on sanitation and drinking water—2015 update and MDG assessment (Geneva: WHO Press, 2015).6. “National Rural Drinking Water Programme (NRDWP),” Ministry of Rural Development, Government of India, April 1, 2009, http://rural.nic.in/sites/downloads/our-schemes-glance/SalientFeaturesNRDWP.pdf.7. For MDG monitoring, an improved sanitation facility is defined as one that hygienically separates human excreta from
87

human contact.8. Planning Commission, Government of India, India Assessment 2002: Water Supply & Sanitation (New Delhi: Govern-ment of India, 2002).9. Ibid. 10. “Nirmal Bharat: Total Sanitation for All,” Ministry of Drinking Water and Sanitation, Government of India, http://www.archive.india.gov.in/spotlight/spotlight_archive.php?id=92.11. “Twelfth Five Year Plan (2012-2017): Report of the Working Group on Rural Domestic Water and Sanitation,” Min-istry of Drinking Water and Sanitation, Government of India, September 2011, http://www.mdws.gov.in/sites/upload_files/ddws/files/pdf/FINAL%20COMBINED%20WORKING%20GROUP%20REPORT%20WATER%20and%20SANITA-TION%2005-10-2011.pdf. 12. See note 6. 13. Ibid. 14. Ibid.15. Ibid. 16. “National Water Policy (2012),” Ministry of Water Resources, Government of India, http://wrmin.nic.in/writereaddata/NationalWaterPolicy/NWP2012Eng6495132651.pdf.17. Planning Commission, Government of India, Twelfth Five Year Plan (2012-2017) Volume II – Rural Drinking Water and Sanitation (New Delhi: SAGE Publications 2013).18. Ibid. 19. Most of the evaluation reports available focus on expenditure and funds released under the scheme and the list of ongoing and completed projects at the district or block level.20. Ibid. 21. “Evaluation Study on Total Sanitation Campaign,” Planning Commission, Government of India, May 2013, http://planningcommission.nic.in/reports/peoreport/peo/rep_tscv1_2205.pdf.22. Sukanya Bhaumik and Avinash K. Kumar, “India's Sanitation Story,” National Interest, August 16, 2014, http://pra-gati.nationalinterest.in/2014/08/indias-sanitation-story/.23. “Strategic Plan—2011-2022: Ensuring Drinking Water Security in India,” Ministry of Rural Development, Govern-ment of India, 2011, http://www.performance.gov.in/sites/default/files/document/strategy/DW.pdf.24. “Strategic Plan—2011-2022: Rural Sanitation and Hygiene Strategy,” Ministry of Rural Development, Government of India, 2011, http://www.mdws.gov.in/sites/default/files/StrategicPlan_2011_22_Sanitation.pdf. 25. See note 18. 26. Ibid. 27. Census of India 2011, Ministry of Home Affairs, Government of India, http://www.censusindia.gov.in/towns/town.aspx.28. Diane Coffey et al, “Revealed Preference for Open Defecation: Evidence from a New Survey in Rural North India,” Economic and Political Weekly XLIX, no. 38 (September 2014): 43-55.29. See note 5. 30. Gargi Parsai, “Centre to establish National Bureau of Water Use Efficiency,” The Hindu, May 13, 2013, http://www.thehindu.com/todays-paper/tp-national/centre-to-establish-national-bureau-of-water-use-efficiency/article4710220.ece.31. “Swachh Bharat Programme for Urban Areas,” Press Information Bureau, Government of India, September 24, 2014, http://pib.nic.in/newsite/PrintRelease.aspx?relid=109990.32. Dinesh Mehta and Meera Mehta, “Financing sanitation,” Ideas for India, November 11, 2014, http://www.ideasforin-dia.in/article.aspx?article_id=370.33. Ibid. 34. Smriti Kak Ramchandran, “Water privatization not for India,” The Hindu, March 20, 2013, http://www.thehindu.com/news/cities/Delhi/water-privatisation-is-not-for-india/article4528871.ece.35. “The Constitution (Seventy-Third Amendment) Act, 1992,” Ministry of Law and Justice, Government of India, http://indiacode.nic.in/coiweb/amend/amend73.htm.
N I N E
1.“Proposal for Sustainable Development Goals: Sustainable Development Knowledge Platform,” Sustainable Develop-ment Knowledge Platform, https://sustainabledevelopment.un.org/sdgsproposal.2. Ibid.3. “Energy and Development Methodology,” International Energy Agency, 2010, http://www.iea.org/media/weowebsite/energydevelopment/Poverty_Methodology.pdf. 4. Ibid.5. “Chapter 13: Energy and Poverty,” IEA World Energy Outlook 2002, http://www.worldenergyoutlook.org/media/weowebsite/energydevelopment/WEO2002Chapter13.pdf. 6. Sheilah Meikle and Alison Bannister, “Energy, Poverty and Sustainable Urban Livelihoods,” Development Planning Unit Working Paper No. 126, University College London, 2003, http://www.bartlett.ucl.ac.uk/dpu/latest/publications/dpu-
88

working-papers/WP126.pdf.7. Ming Yang, “China’s rural electrification and poverty reduction,” Energy Policy 31, no. 3 (February 2003): 283-295. 8. “Unstarred Question No 4302, Answered on 18.12.2014,” Lok Sabha Questions, Government of India, http://164.100.47.132/lssnew/psearch/QResult16.aspx?qref=8212.9. “Electric power Consumption (kWh per capita),” World Bank Data, http://data.worldbank.org/indicator/EG.USE.ELEC.KH.PC.10. “Switching On Power Sector Reform in India,” World Bank, June 24, 2014, https://www.worldbank.org/en/news/fea-ture/2014/06/24/switching-on-power-sector-reform-in-india.11. “66 Per Cent of India Still Relies on Dung-based Fuel to Cook: UN,” The Indian Express, June 30, 2014, http://indian-express.com/article/india/india-others/66-per-cent-of-india-still-relies-on-dung-based-fuel-to-cook-un/.12. “National Biomass Cookstoves Programme,” Ministry of New and Renewable Energy, Govenrment of India, http://www.mnre.gov.in/schemes/decentralized-systems/national-biomass-cookstoves-initiative/.13. Ibid.14. Santosh Singh, “The Kaleidoscope of Cooking: Understanding Cooking Behaviour and Stove Preferences in Rural India,” GIZ, April 2014, http://www.giz.de/en/downloads/giz2014-en-kaleidoscope-of-cooking-india.pdf.15. Susan McDade, “Fueling Development: the Role of LPG in Poverty Reduction and Growth,” Energy for Sustainable Development 8, no. 3 (September 2004): 74-81. 16. Ibid.17. “All India Installed Capacity of Power Stations,” Central Electricity Authority, July 2015, http://www.cea.nic.in/re-ports/monthly/installedcapacity/2015/installed_capacity-07.pdf. 18. Ibid.19. Ibid.20. Ibid.21. “Trends in Global CO2 Emissions: 2014 Report,” PBL Netherlands Environmental Assessment Agency, 2014, http://www.pbl.nl/sites/default/files/cms/publicaties/PBL_2014_Trends_in_global_CO2_emisions_2014_1490_0.pdf. 22. “Modi Govt's Push for Energy Conservation: PM Launches Scheme for LED Bulb Distribution,” Economic Times, January 5, 2015, http://articles.economictimes.indiatimes.com/2015-01-05/news/57705580_1_led-bulbs-pm-modi-prime-minister-narendra-modi.23. “Energy Conservation Act 2001,” Ministry of Law, Justice and Company Affairs, Government of India, September 29, 2001, http://powermin.nic.in/upload/pdf/ecact2001.pdf. 24. “Energy Efficiency,” Ministry of Power, Government of India, http://powermin.nic.in/Energy-Efficiency.25. Bhaskar Sharma, “Energy Efficiency in India—Challenges & Lessons,” (presentaton made at In-session Technical Ex-pert Meeting on Energy Efficiency ADP, Bonn, Germany, March 13, 2014), https://unfccc.int/files/bodies/awg/application/pdf/2_india_revised.pdf.26. “PAT Perform, Achieve and Trade,” Ministry of Power, Government of India, July 2012, http://www.creda.in/sites/de-fault/files/page-document/PAT%20Booklet.pdf#overlay-context=energy-conservation-act-2001.27. Ibid.28. Ankur Paliwal, “Bureau of Energy Efficiency Launches PAT Scheme for Industries to Save Power,” Down To Earth, July 4, 2012, http://www.downtoearth.org.in/news/bureau-of-energy-efficiency-launches-pat-scheme-for-industries-to-save-power-38616.29. Ibid.30. Natalie O. Pearson and Alex Nussbaum, “India’s Modi Aims for Energy Efficiency, Not Obama CO2 Cuts,” Bloomb-erg, January 22, 2015, http://www.bloomberg.com/news/articles/2015-01-21/india-s-modi-aims-for-energy-efficiency-not-obama-emission-cuts.31. See note 25. 32. Ibid. 33. See note 1. 34. Smiti Mittal, “India Increases Renewable Energy Capacity By 13%, Beats Target,” CleanTechnica, May 7, 2015, http://cleantechnica.com/2015/05/07/india-increases-renewable-energy-capacity-13-beats-target/.35. Clark A. Miller and Jennifer Richter, “Social Planning for Energy Transitions,” Springer—Current Sustainable/Renew-able Energy Reports, June 2014.36. “Union Budget 2015-16,”Government of India, http://indiabudget.nic.in/es2014-15/echapter-vol1.pdf.37. Samir Saran and Vivan Sharan, “Indian Leadership on Climate Change: Punching Above Its Weight,” The Brookings Institution, May 6, 2015, http://www.brookings.edu/blogs/planetpolicy/posts/2015/05/05-indian-leadership-climate-change-saran-sharan. 38. Varun Sivaram, “Energy, Security, and Climate: Do India’s Renewable Energy Targets Make Sense?,” Council on For-eign Relations, March 2015, http://blogs.cfr.org/levi/2015/03/11/do-indias-renewable-energy-targets-make-sense/. 39. Gireesh Shrimali, “India Needs to Fix Finances to Make Renewable Energy Dreams a Reality,” Climate Policy Initia-tive, February 2015, http://climatepolicyinitiative.org/2015/02/16/india-needs-fix-finances-make-renewable-energy-dreams-reality/.40. Barry Brook, “Renewables and Efficiency Cannot Fix the Energy and Climate Crises (part 2),” Brave New Climate, May 12, 2011, http://bravenewclimate.com/2011/05/12/renewables-are-not-sufficient-p2/.
89

41. Beina Xu and Eleanor Albert, “Governance in India: Infrastructure,” Council on Foreign Relations, October 2014, http://www.cfr.org/india/governance-india-infrastructure/p32638.42. See note 17. 43. See note 25.
T E N
1. Jagdish Bhagwati and Arvind Panagariya, Why growth matters: How economic growth in India reduced poverty and the lessons for other developing countries (New York: PublicAffairs: 2013).2. The World Bank Data, data.worldbank.org. 3. T.N. Srinivasan, “Indian Economic Reforms: A Stocktaking,” SCID Working Paper 190, 2003, http://www.econ.yale.edu/~srinivas/Indian%20Economic%20Reforms%20A%20Stocktaking.pdf. 4. Dhiraj Nayyar and Shravya Jain, “Data reveals India's alarming job squeeze,” Yahoo Finance, September 10, 2012, https://in.finance.yahoo.com/news/data-reveals-india-s-alarming-job-squeeze.html?page=all.5. See note 2. 6. “India Factsheet - Economic and Human and Development Indicators,” UNDP, http://www.in.undp.org/content/dam/india/docs/india_factsheet_economic_n_hdi.pdf.7. Ashok Gulati, “Revamping Agriculture and the Public Distribution System,” in Getting India Back on Track: An Action Agenda for Reform, eds. Ashley J. Tellis, Bibek Debroy and Reece Trevor (Random House India, 2014).8. “Employment across various sectors (in millions), Employment Elasticity, CAGR & Share of Employment and GVA : 1999-2000, 2004-05, 2009-10,” Planning Commission, Government of India, December 2014, http://planningcommission.nic.in/data/datatable/data_2312/DatabookDec2014%20116.pdf. 9. See note 2. 10. “Press Note 2: National Manufacturing Policy,” Ministry of Commerce & Industry, Government of India, November 4, 2011, http://dipp.nic.in/english/policies/national_manufacturing_policy_25october2011.pdf. 11. “India has $1 trillion infrastructure deficit: Chidambaram tells World Bank,” The Times of India, April 21, 2013, http://timesofindia.indiatimes.com/business/international-business/India-has-1-trillion-infrastructure-deficit-Chidambaram-tells-World-Bank/articleshow/19660814.cms. 12. R. Narayan, “Solve funding issues to finance SMEs growth plans,” Business Standard, July 2, 2014, http://www.business-standard.com/content/budget-2014/solve-funding-issues-to-finance-smes-growth-plans-114070200669_1.html.13. Government of India, “Make in India Policies,” Government of India, http://www.makeinindia.com/policies/14. V. Kala, “5 Things That Show Modi’s ‘Make in India’ Campaign is Working,” Wall Street Journal, August 12, 2015, http://blogs.wsj.com/briefly/2015/08/12/five-things-that-show-modis-make-in-india-campaign-is-working/.15. Devaki Jain and Smriti Sharma, “A fresh template for GDP growth,” Gateway House, January 1, 2015, http://www.gatewayhouse.in/a-fresh-template-for-gdp-growth/.16. National Sample Survey, Ministry of Statistics and Programme Implementation, Government of India. 17. “Suggested Labour Policy Reforms,” FICCI and AIOE, 2014, http://www.ficci.com/SEdocument/20301/FICCI-NOTE-ON-LABOUR-POLICY-REFORMS.pdf. 18. Ibid. 19. Ibid. 20. “The State of the World Population 2014: The Power of 1.8 Billion,” UNFPA, http://www.unfpa.org/sites/default/files/pub-pdf/EN-SWOP14-Report_FINAL-web.pdf.21. “Main Findings 2015,” Annual Status of Education Report 2014, http://img.asercentre.org/docs/Publications/ASER%20Reports/ASER%202014/National%20PPTs/aser2014indiaenglish.pdf. 22. Alpesh Shah, Nimisha Jain and Shweta Bajpai, [email protected]: Creating a $200 billion Internet Economy, Bos-ton Consulting Group, January 2015, http://www.bcgindia.com/documents/file180687.pdf. 23. Ibid.24. Ibid.25. Ibid.26. See note 2.27. Shamika Ravi and Shruti Gakhar, “Advancing Financial Inclusion in India beyond the Jan-Dhan Yojana,” Brookings India IMAPCT Series, http://www.brookings.in/wp-content/uploads/2015/01/Advancing-Financial-Inclusion-in-India.pdf. 28. Ibid.29. Ibid.
E L E V E N
1. Geethanjali Nataraj, “Infrastructure Challenges in India: The Role of Public-Private Partnerships,” ORF Occasional Paper, February 2014, http://www.orfonline.org/cms/export/orfonline/modules/occasionalpaper/attachments/occasionalpa-
90

per49_1392022126437.pdf. 2. “Swachh Bharat Abhiyaan: PM Modi govt builds 7.1 lakh toilets in January,” Firstpost, February 17, 2015, http://www.firstpost.com/politics/swachh-bharat-abhiyaan-pm-modi-govt-builds-7-1-lakh-toilets-january-2104339.html.3. A number of communities do not use toilets to due religious beliefs.4. “Opportunities in road transportation,” Issue 18, KPMG Sector Insights, June 2012, http://www.kpmg.com/in/en/issue-sandinsights/articlespublications/investing-in-india/pages/tl-june12.aspx5. Ragini Verma, “Budget 2015: Infrastructure investment to be raised by Rs70,000 crore,” Livemint, March 1, 2015, http://www.livemint.com/Politics/OoS4FlZ0qRxxqLrTlAuS8J/Budget-2015-Infrastructure-investment-to-be-raised-by-Rs70.html.6. “Digital India: Unleashing Prosperity,” Deloitte, 2015, http://www2.deloitte.com/content/dam/Deloitte/in/Documents/technology-media-telecommunications/in-tmt-tele-tech-2015-noexp.pdf. 7. “India’s technology opportunity: Transforming work, empowering people,” McKinsey Global Institute, December 2014, http://www.mckinsey.com/insights/high_tech_telecoms_internet/indias_tech_opportunity_transforming_work_empower-ing_people. 8. See note 6.9. “Smart City Features,” Government of India, http://smartcities.gov.in/writereaddata/Smart%20City%20Features.pdf. 10. “Annual Report 2014-15,” Ministry of Micro, Small and Medium Enterprises, Government of India, 2014-2015, http://msme.gov.in/WriteReadData/DocumentFile/MSME%20ANNUAL%20REPORT%202014-15_English.pdf.11. Malini Goyal, “SMEs employ close to 40% of India's workforce, but contribute only 17% to GDP,” June 9, 2013, http://articles.economictimes.indiatimes.com/2013-06-09/news/39834857_1_smes-workforce-small-and-medium-enter-prises. 12. See note 10. 13. “Micro, Small and Medium Enterprise Finance in India,” International Finance Corporation, November 2012, http://intellegrow.com/images/download/publication/Publication%20-%20IFC%20MSME%20Report.pdf.14. Of the $650 billion, $520 billion (INR 26 trillion) was debt demand and $130 billion (INR 6.5 trillion) equity demand. The study goes on to estimate that only $198 billion (38%) of the debt demand and $13.4 billion of the equity demand is viable and addressable. Of the $650 billion formal sources contribute only 22% of the total MSME debt financing. See note 13. 15. Ibid.16. “Prime Minister to Launch Mudra Bank Tomorrow; 5.77 Crore Small Business Units to be Provided Access to Insti-tutional Finance,” Press Information Bureau, Government of India, April 7, 2015, http://pib.nic.in/newsite/PrintRelease.aspx?relid=118005. 17. “Narendra Modi launches Mudra Bank for small firms with Rs 20,000 crore corpus,” Economic Times, April 9, 2015, http://articles.economictimes.indiatimes.com/2015-04-09/news/60979566_1_prime-minister-narendra-modi-entrepreneurs-crore. 18. “Challenging task before MUDRA,” Deccan Herald, April 24, 2015, http://www.deccanherald.com/content/473660/challenging-task-mudra.html. 19. “Need for Greater Co-operation in SMEs Sector: 6th BRICS Summit,” iYogi: Business Nonstop Desk, July 22, 2014, http://www.businessnonstop.in/sme-buzz/need-for-greater-co-operation-in-smes-sector-6th-brics-summit.html. 20. Leesa Shrader, “Microfinance, E-Commerce, Big Data and China: The Alibaba Story,” CGAP, October 11, 2013, http://www.cgap.org/blog/microfinance-e-commerce-big-data-and-china-alibaba-story21. TERI, “Enhancing Energy Efficiency ‘Crucial’ for Indian SMES Sector: Experts,” BusinessWire, July 30, 2012, http://businesswireindia.com/news/news-details/enhancing-energy-efficiency-crucial-indias-msme-sector-experts/32133. 22. Himanshu Shekhar and Upinder Singh Dhingra, “Enabling Finance for Scaling up Energy Efficiency in MSMEs,” TERI and Yes Bank, http://bcsd.teri.res.in/pdf/reports/Energy_Efficiency_Final.pdf.23. Roger Hayter, “Industrialization,” Oxford Bibliographies, February 26, 2013, http://www.oxfordbibliographies.com/view/document/obo-9780199874002/obo-9780199874002-0027.xml. 24. A similar arguments has been made by Allen, who highlighted that the rise of Western economies was based on tech-nological change, national policies and geography. Robert C. Allen, Global Economic History: A Very Short Introduction (Oxford: Oxford University Press, 2011). 25. Devanik Saha, “India lags emerging world in research, imperils innovation,” Business Standard, April 30, 2015, http://www.business-standard.com/article/specials/india-lags-emerging-world-in-research-imperils-innovation-115043000474_1.html. 26. “Indians Spend Rs. 45,000 Crore Per Year on Foreign Education: Study,” NDTV, March 10, 2015, http://profit.ndtv.com/budget/indians-spend-rs-45-000-crore-per-year-on-foreign-education-study-745514.27. “National Policy for Skill Development and Entrepreneurship, 2015,” Ministry of Skill Development and Entrepre-neurship, Government of India, http://www.skilldevelopment.gov.in/assets/images/Skill%20India/policy%20booklet-%20Final.pdf. 28. See note 6.29. Soumitra Dutta, Bruno Lanvin and Sacha Wunsch-Vincent, “The Global Innovation Index 2014: The Human Factor in Innovation,” Cornell University, INSEAD and WIPO, 2014, https://www.globalinnovationindex.org/userfiles/file/reportpdf/GII-2014-v5.pdf.
91

30. Author’s calculations, http://www.eximbankindia.in/lines-of-credit. 31. Author’s calculations, Union Budget, Government of India, http://indiabudget.nic.in/index.asp.32. “Government contains fiscal deficit to 3.99% of GDP in FY15 to Rs 5.01 lakh crore,” Economic Times, May 31, 2015, http://economictimes.indiatimes.com/news/economy/finance/government-contains-fiscal-deficit-to-3-99-of-gdp-in-fy15-to-rs-5-01-lakh-crore/articleshow/47487908.cms.
T W E L V E
1. United Nations, World Urbanization Prospects: The 2014 Revision, CD-ROM Edition, (UN Secretariats’ Department of Economic and Social Affairs, Population Division, 2014).2. “Provisional Population Totals: Urban Agglomerations and Cities,” Census 2011, Government of India, http://censusin-dia.gov.in/2011-prov-results/paper2/data_files/India2/1.%20Data%20Highlight.pdf.3. Ibid.4. “Annual Report 2012-13,” Ministry of Housing and Urban Poverty Alleviation, Government of India, 75, http://www.mhupa.gov.in/writereaddata/UploadFile/Annual_Reprot_English_2012-13.pdf. 5. “Slum Houses, Household Amenities and Assets,” Census 2011, Government of India, http://www.censusindia.gov.in/2011census/hlo/Slum_table/Slum_table.html. 6. Of the total, private cars, jeeps and two-wheelers account for 96%, and remaining are auto rickshaws, taxis, buses and goods vehicles. The rapid rail service (Delhi Metro) is also available to the residents. During 2013-14, private motor vehicles grew by over 12%, while buses registered a mere 3% growth. “Total Vehicles Registered Year Wise,” Transport Department, Government of National Capital Territory of Delhi, 2014. 7. National Transport Development Policy Committee, India Transport Report: Moving India to 2032, Volume III, Sector Reports, Part II (New Delhi: Routledge, 2014). 8. Ashwini M. Sripad, “The Disappearing Heritage Landscape of Bangalore,” The Indian Express, October 25, 2014. 9. Jason Burke and Jon Boone, “Kashmir Monsoon Floods Leave 460 Dead and Displace Almost a Million,” The Guard-ian, September 11, 2014. 10. In Mumbai, about 9% of the city’s area is occupied by informal settlements.11. The region is spread over an area of about 35,000 square kilometer, comprising the National Capital Territory of Delhi and parts of three adjoining States of Haryana, Uttar Pradesh and Rajasthan. About 43 million people live in the re-gion, which has 22 class I cities, 13 class II towns and 7,206 rural settlements. “Annual Report 2013-14,” National Capital Regional Planning Board, Ministry of Urban Development, Government of India, http://ncrpb.nic.in/pdf_files/Annual%20Report%202013-14.pdf. 12. The eight national missions are: Solar, Enhanced Efficiency, Sustainable Habitat, Water, Sustaining the Himalayan Ecosystem, Green India, Sustainable Agriculture, and Strategic Knowledge for Climate Change.13. George Mathew, “Investment Challenge: Smart Cities Need Smart Funding Options,” The Indian Express, August 15, 2015.14. I.e., “Promote sustained, inclusive and sustainable economic growth, full and productive employment, and decent work for all.”
T H I R T E E N
1. “Public Expenditure and Financial Accountability Program,” 2015, https://www.pefa.org/.2. Elham Seyedsayamdost, “MDG-based National Planning: An Assessment,” November 30, 2014, http://oxfamblogs.org/fp2p/wp-content/uploads/2015/07/MDG-Assessment_ES.pdf. 3. “Transforming our world: the 2030 Agenda for Sustainable Development,” United Nations, September 2015, https://sustainabledevelopment.un.org/post2015/transformingourworld.4. “Industrial Policy Resolution,” Government of India, April 30, 1956, http://eaindustry.nic.in/handbk/chap001.pdf. 5. S.R. Bommai vs. Union of India, Supreme Court of India. 1994, http://indiankanoon.org/doc/60799/. 6. “Act no. 30 of 2013,” Right to Fair Compensation and Transparency in Land Acquisition, Rehabilitation and Resettle-ment Act, Parliament of India, September 27, 2013, http://indiacode.nic.in/acts-in-pdf/302013.pdf. 7. On October 1, 2015 eight states out of twenty eight—Punjab, Haryana, Rajasthan, Madhya Pradesh, Chhattisgarh, Gujarat, Maharashtra and Andhra Pradesh—had governments formed by NDA constituent political parties.
92


the world has formally adopted the post-2015 development agenda, the set of 17 goals and 169 targets known as the sustainable development goals (sdgs). developing countries, such as india, need to unpack and interpret the development framework to ensure its relevance to their development needs and interests. it is in this critical moment between adoption and execution, therefore, that this volume underscores the importance of a national lens through which to understand and implement these goals.
to this end, this edited volume: unpacks the tensions inherent in various interpretations of 'sustainable development' by eliciting debates, given varied value systems and national interests; offers a framework through which to localise global goals like the sdgs; focuses on 10 sdgs that are india’s primary concerns; and ends with an evaluation of the strengths and weaknesses of institutional architecture for implementing the sdgs in india.
Global Policy is an innovative and interdisciplinary journal and an online hub bringing together
world class academics and leading practitioners to analyse both
public and private solutions to global problems and issues.
Observer Research Foundation is a not for profit think tank engaged in developing and discussing policy alternatives on a wide range of
issues of national and international significance in a bid to help build a
strong and prosperous India.
Copyright © 2022 FDOKUMEN