Ownership Concentration and Share Valuation
41
Ownership Concentration and Share Valuation by Jeremy S.S. Edwards University of Cambridge & CESifo and Alfons J. Weichenrieder * Goethe University Frankfurt & CESifo revised, Feb. 2003 Addresses of authors Jeremy S.S. Edwards Alfons J. Weichenrieder Faculty of Economics and Politics Goethe University Frankfurt University of Cambridge Mertonstr. 17 Sidgwick Avenue Cambridge CB3 9DD 60054 Frankfurt (Main) United Kingdom Germany Tel: ++44 1223 335232 Tel: ++49 69 798 22819 Fax: ++44 1223 335475 Fax: ++49 69 798 22697 Email: [email protected] Email: [email protected] * We are very grateful to Marcus Nibler for providing us with most of the data used in this paper, and for answering our many questions about it. We have also received helpful comments from Roberta Dessi, Kai Konrad, Peter Mülbert, Sheilagh Ogilvie, Michael Reutter, Joachim Schwalbach, Geoff Whittington and conference participants at the CESifo Conference on “The Economics of Organisation and Corporate Governance Structures”, October 25-26, 2002. Work on this paper began while the first author was visiting the Center for Economic Studies at the University of Munich, and he gratefully acknowledges the facilities and hospitality provided during his visit. A previous version of this paper was circulated under the title "Ownership Concentration and Share Valuation: Evidence from Germany".
-
Upload
uni-frankfurt -
Category
Documents
-
view
0 -
download
0
Transcript of Ownership Concentration and Share Valuation

Ownership Concentration and Share Valuation
by
Jeremy S.S. Edwards
University of Cambridge & CESifo
and
Alfons J. Weichenrieder*
Goethe University Frankfurt & CESifo
revised, Feb. 2003
Addresses of authors
Jeremy S.S. Edwards Alfons J. Weichenrieder Faculty of Economics and Politics Goethe University Frankfurt University of Cambridge Mertonstr. 17 Sidgwick Avenue Cambridge CB3 9DD 60054 Frankfurt (Main) United Kingdom Germany Tel: ++44 1223 335232 Tel: ++49 69 798 22819 Fax: ++44 1223 335475 Fax: ++49 69 798 22697 Email: [email protected] Email: [email protected] * We are very grateful to Marcus Nibler for providing us with most of the data used in this paper, and for answering our many questions about it. We have also received helpful comments from Roberta Dessi, Kai Konrad, Peter Mülbert, Sheilagh Ogilvie, Michael Reutter, Joachim Schwalbach, Geoff Whittington and conference participants at the CESifo Conference on “The Economics of Organisation and Corporate Governance Structures”, October 25-26, 2002. Work on this paper began while the first author was visiting the Center for Economic Studies at the University of Munich, and he gratefully acknowledges the facilities and hospitality provided during his visit. A previous version of this paper was circulated under the title "Ownership Concentration and Share Valuation: Evidence from Germany".
Ownership Concentration and Share Valuation
Abstract
Concentrated ownership of large listed companies is widespread throughout the world, and
Germany is typical in this respect. This paper proposes a method of distinguishing empirically
between the beneficial and harmful effects of ownership concentration, and applies it to
German data. The results show that, for most types of largest shareholder, the beneficial
effects on minority shareholders of increased ownership (greater monitoring of management,
and reduced incentives to exploit minority shareholders due to greater cash-flow rights) are at
least as large as, and sometimes significantly larger than, the harmful effect (greater private
benefits of control due to greater control rights).

1
1. Introduction
In most countries, the typical large listed company has concentrated rather than
dispersed ownership. As La Porta et al. (1998) note, ‘dispersed ownership in large public
companies is simply a myth … the finance textbook model of management faced by
multitudes of dispersed shareholders is an exception and not the rule.’ Indeed, La Porta et al.
(1999) find in their sample of 27 wealthy economies that it is more common for large listed
companies to have a single controlling shareholder than to have dispersed ownership. Such
controlling shareholders are in a position to exert a great deal of influence on the way the
companies they own are operated, and thus to obtain private benefits of control at the expense
of minority shareholders. These private benefits of control can take many forms. If the
controlling shareholder is also a manager of the company, minority shareholders can be
exploited by paying a high salary to the controlling shareholder. Alternatively, the controlling
shareholder can exploit business relations between the company and other firms that she
wholly owns in order to exploit minority shareholders. For example, transfer pricing can be
used to shift profits from the company with minority shareholders to the firm wholly-owned
by the controlling shareholder, or the company with minority shareholders can invest in assets
that are then sold or leased at favourable terms to the wholly-owned firm (Johnson et al,
2000). Evidence of private benefits of control obtained by controlling shareholders has been
provided for the USA by Barclay and Holderness (1989), for Sweden by Bergström and
Rydqvist (1990), and for Italy by Zingales (1994). For firms with a controlling shareholder,
the key conflict of interest in corporate governance is thus the one between the controlling
shareholder and minority shareholders, rather than that between dispersed shareholders and
professional managers who run the firm but have little or no ownership stake in it.
The conflict of interest between controlling and minority shareholders has received a
great deal of interest in the recent literature on corporate governance (Shleifer and Vishny
1997, La Porta et al. 1999, Claessens et al. 2000, 2002, Faccio et al. 2001, Faccio and Lang

2
2002). The distinction between the control rights and the cash-flow rights of the controlling
shareholder has been central to the analysis of this conflict of interest. From a minority
shareholder’s point of view, the presence of a controlling shareholder involves both benefits
and costs. Such a shareholder will partially internalise the benefits of monitoring
management, and thus limit the extent to which managers can act in their own interest at the
expense of shareholders in general. However, the greater are the control rights of the
controlling shareholder, other things equal, the greater is her ability to influence the way the
company is run, and hence the greater is her ability to obtain private benefits of control at
minority shareholders’ expense. However, the greater are the cash-flow rights of a controlling
shareholder – the fraction of the firm’s profits to which she is entitled – then, other things
equal, the more closely are her incentives aligned with those of the minority shareholders, and
hence the lower are her incentives to pursue costly policies which divert profits from minority
shareholders (Jensen and Meckling, 1976). Thus the extent of the conflict of interest between
controlling and minority shareholders is predicted to depend on the extent to which the
former’s control rights exceed her cash-flow rights.
The control rights of ownership of firms can be separated from the cash-flow rights in
two main ways. First, firms can issue classes of shares that differ in terms of their relative
proportion of voting rights and dividend entitlement. Second, even if all shares have the same
voting rights, then pyramiding, i.e., ownership via a chain of firms, provides another method
of separating control and cash-flow rights. Suppose that possession of a simple majority of a
firm’s voting rights gives complete control over the firm. Then an individual who owns 51%
of firm A, which in turn owns 51% of firm B, has complete control over firm B, but is only
entitled to 26.01% (51% of 51%) of firm B’s dividends, and thus has much lower cash-flow
rights than control rights in firm B.
Several recent empirical studies have been based on the distinction between the
control and cash-flow rights of the controlling shareholder. These studies have emphasised

3
pyramiding rather than shares with different voting rights as the source of the separation of
these two forms of ownership rights. Faccio et al. (2001) focus on pyramiding as the method
by which the controlling shareholder obtains control rights in excess of cash-flow rights in
their analysis of the effect of these two forms of ownership rights on dividend payout rates in
Western European and East Asian companies. In their analysis of the relationship between
firm value and the control and cash-flow rights of the largest shareholder in East Asian
companies, Claessens et al. (2002) consider both pyramid structures and shares with different
voting rights as sources of differences between control and cash-flow rights, but pyramiding
is by far the most important, since only three percent of the corporations in their sample issue
shares with different voting rights.
In these two studies, as well as others that have focused on pyramiding as the source
of the separation between control and cash-flow rights (Claessens et al. 2000, Faccio and
Lang 2001, and La Porta et al 1999), the measurement of the control rights of controlling
shareholders who exercise control via a pyramid has been based exclusively on the weakest
link principle (henceforth WLP). This principle assigns control rights to the controlling
shareholder on the basis of the minimum value of actual voting rights across the different
links of a control chain.1 Despite its popularity in empirical studies, the WLP is an ad hoc
measure with no theoretical underpinning, and thus has some potentially serious problems as
a measure of the control rights of controlling shareholders. Since empirical analyses have
placed such emphasis on pyramiding as the source of the separation between control and
cash-flow rights, the use of the WLP to measure control rights raises a question about the
robustness of the conclusions drawn about the effects of this separation.
A first contribution of this paper is to provide evidence of the effects of the separation
of the control and cash-flow rights of the controlling shareholder that answers the robustness
question. We propose measures of these two distinct forms of ownership rights that do not 1 Thus, if a controlling shareholder has 11% of the voting rights in firm A, and firm A has 21% of the voting rights in firm B, the ultimate owner is deemed to have control rights of 11% in firm B according to the WLP.

4
involve pyramiding, and hence our empirical results do not depend on ad hoc measurement
using the WLP. Our results provide strong empirical support for the view that the extent of
the conflict of interest between controlling and minority shareholders depends on the extent to
which the controlling shareholder’s control rights exceed her cash-flow rights.
We apply our method of estimating the separate effects of the control and cash-flow
rights of the controlling shareholder to German data, and thus a second contribution of the
paper is to provide evidence about the role of large shareholders in German corporate
governance. Such evidence is relevant for understanding corporate governance more
generally, since Germany is fairly typical of the world as a whole in the extent of ownership
concentration among its largest listed companies. La Porta et al. (1998) find that, for their
sample of 45 countries, the mean (median) ownership of the three largest shareholders in the
ten largest publicly-traded private non-financial domestic companies in each country is 46
(45) per cent, while the mean (median) ownership of the three largest shareholders in
Germany is 48 (50) per cent. Most of the largest listed German companies have a single
controlling shareholder: in our sample of 97 (which is discussed more fully in Section 4), 69
had a largest shareholder who owned more than 25% of the voting rights, and 46 had one
owning more than 50%.
The present paper analyses a sample of large German companies, all of which have
some shareholders who do not own controlling blocks of shares. Hence it is reasonable to
suppose that differences in the value of shares in these companies are determined by
differences in marginal shareholders’ evaluation of the cash-flow returns they receive from
such shareholdings. The paper shows that, in Germany, greater holdings by the largest
shareholder raise the value of corporate equity via monitoring and convergence-of-interest
effects, but also lower the value of shares because of the increased ability of the largest
shareholder to obtain private benefits of control at the expense of minority shareholders.
Greater holdings by the second-largest shareholder also tend to raise the value of shares,

5
which may be due either to the effects of monitoring of management by the second-largest
shareholder, or to the effects of monitoring the behaviour of the largest shareholder and thus
reducing the extraction of private benefits of control. The results show that, although largest
shareholders are able to gain private benefits of control at minority shareholders’ expense, the
net effect of equal increases in both the control and cash-flow rights of the largest shareholder
does not harm, and, depending on the type of largest shareholder, may benefit minority
shareholders. Depending on the type of shareholder, a change from completely dispersed
ownership of a large company to ownership by a single shareholder can double the value of
the company’s shares, which provides striking evidence of the costs that shareholders in
German companies with dispersed share ownership would suffer due to the lack of
monitoring of management, and may explain why so few large listed German companies have
completely dispersed ownership.
The relevant features of corporate governance in listed German companies are
discussed in Section 2 of the paper. Section 3 discusses the predictions of a simple model of
ownership concentration and share valuation. The data are described in Section 4. Section 5
contains the empirical implementation of the analysis, and the empirical results are presented
and discussed in Section 6. Section 7 concludes.
2. Large shareholders’ control of corporate behaviour in Germany
As was noted in the introduction, most large listed German companies have a single
shareholder who owns more than 25% of the voting equity, and about half have a single
shareholder who owns more than 50%.2 This would appear to suggest that for a majority of
large listed German corporations, the largest shareholder is in a position of complete control
over the firm, and can, by appointing and dismissing senior management, ensure that the
corporation is operated exactly in accordance with her wishes.
2 Franks and Mayer (2001) report that, in 1990, 85% of a sample of 171 large listed industrial companies in Germany had a single shareholder with an ownership stake of more than 25% of the share capital, and 57% had single shareholder who owned more than 50%.

6
However, the role and composition of the supervisory board, and the legal rights of
minority shareholders, imply that in Germany even a shareholder owning just over 50% of the
voting shares in a listed company may not have complete control of its management. The
German Aktiengesetz (Stock Corporation Act) specifies that the main function of the
supervisory board, which all listed corporations are required to have, is the control of
management. Responsibility for the operation of the corporation rests with the management
board, members of which cannot also be members of the supervisory board. The management
board is appointed and dismissed by the supervisory board, not by the shareholder meeting. If
a corporation has more than 2,000 employees, one-half of its supervisory board members
must be elected by its employees; and the other half is elected by its shareholders.3 For such
corporations, the chairman of the supervisory board, who is elected either by a two-thirds
majority or, if such a majority cannot be achieved, by the shareholder representatives alone,
can cast a second vote to break ties in supervisory board decisions. Thus, while in principle a
shareholder owning just over 50% of the voting equity can achieve full control of the
company's management, in practice this requires that all shareholder representatives on the
supervisory board vote as this shareholder wishes, and that the casting vote of the supervisory
board chairman is used in the event of opposition by the employee representatives. Such a
situation is unlikely, because of the unfavourable publicity which would be attracted by
unanimous opposition by the employee representatives. It is made more unlikely by the legal
rights of minority shareholders, to which we now turn.
Certain decisions concerning a corporation have to be made by a vote at the
shareholders' general meeting, rather than by the management board, and some of these, such
as changes in the corporation's statutes, increases or decreases in equity capital, and mergers
3 The shareholder representatives on the supervisory board are elected, usually for the legal maximum of five years, at a general meeting of the corporation's shareholders, which must be held at least once a year. The election procedure involves a simple majority vote on the entire group of shareholder representatives. This group is usually proposed jointly by the corporation's management board and its supervisory board, but amendments to the group can be proposed by a shareholder or group of shareholders holding 10% of the voting equity.

7
or liquidations, usually require a 75% majority. Hence a shareholder or group of shareholders
owning 25% of the voting equity can block these decisions. A shareholder or group of
shareholders owning 10% of the voting equity can put any proposal to a vote at the
shareholders' meeting, including an amendment to the group of shareholder representatives
nominated for election to the supervisory board, as well as a vote of no confidence in
particular members of the management or supervisory board. Shareholders representing either
10% or DM 2 million of the equity capital can also go to court to request a special audit, to
which the court must agree if there is any evidence suggesting cause for concern. Finally, a
shareholder or group of shareholders owning 5% of the voting equity can demand an
extraordinary shareholders' meeting.
A number of special legal provisions apply in the case where the dominant
shareholder in a corporation (as defined in the Aktiengesetz) is another corporation.4 These
provisions may also apply to individuals or families who are dominant shareholders if the
individual or family owns a firm which deals with the corporation in question. Unfavourable
contracts may not be imposed on the corporation by its dominant shareholder unless there is
adequate compensation. The management board of the corporation is required to produce a
report on business carried out with the dominant shareholder, which specifies the
compensation paid for any unfavourable contracts. This report is checked by both an auditor
and the supervisory board of the corporation, and the results of these checks are reported to
the shareholder's general meeting. Shareholders representing either 5% or € 500,000 million
of the equity capital have the right to go to court to appeal against a conclusion of adequate
compensation for unfavourable contracts.
Sufficiently large groups of minority shareholders therefore have legal rights which
enable them to subject actions of the large shareholder to scrutiny both by votes at the
shareholders' meeting and by the appointment of special auditors. This feature of the German 4 §17 of the Aktiengesetz defines a dominant shareholder as one holding more than 50% of the voting equity. The relevant provisions are set out in §§311-318 of the Aktiengesetz.

8
corporate governance system, together with the role played by the supervisory board, make it
plausible to suppose that the degree of control of a large shareholder in a listed German
corporation over its behaviour, and thus his or her ability to enjoy private benefits of control,
does not reach a maximum once such a shareholder owns just over 50% of the voting equity.
Rather, a large shareholder's degree of control is likely to increase until the proportion of
voting equity held exceeds 75% (at which point minority shareholders can no longer block
any decisions), and may even increase as the proportion of voting equity owned exceeds 90%
or 95% (as the other rights of minority shareholders disappear). The legal provisions applying
to majority corporate shareholders may mean that they are more limited in their degree of
control over the behaviour of the corporations which they own than are other types of large
shareholders.
3. Theoretical aspects of the relationship between ownership concentration and share
valuation
In this section we briefly discuss the relationships that we expect to observe between
the ownership concentration of a company and its share valuation. These relationships are
derived from a simple static model set out in the section A.1 of the Appendix. The value of
corporate equity is assumed to be determined by the minority shareholders in the company,
whose only benefit from the ownership of shares is the dividends they receive, and who are
assumed to anticipate correctly the costs and benefits to them of owning shares in a company
in which the largest shareholder may exert some control over its actions. The assumption that
the value of shares to minority shareholders depends only on the payments received from a
company as a result of owning shares in it means that an extension to a dynamic framework
which would allow for capital gains is straightforward. It is not, however, essential for our
empirical application of the analysis: this only requires that differences between firms' share
values are due to differences in expected payments to minority shareholders. Minority holders
of shares with voting rights may also expect to obtain an additional return because these

9
voting rights have a probability of being pivotal in control contests, and our empirical
application assumes that this voting premium component of share values is constant across
firms. Since Franks and Mayer (2001) find that in Germany minority shareholders obtain
virtually zero abnormal returns in share block transactions, it is unlikely that the voting
premium is a significant component of the returns to minority shareholders in practice.
We assume that the gross profits of a company depend on the extent to which its
management is subject to monitoring by shareholders. We suppose that the amount of such
monitoring depends separately on both the control rights and the cash-flow rights of the
largest shareholder, because the extent of monitoring of management by the largest
shareholder is the result of two factors. Monitoring is costly for the largest shareholder, so the
higher this shareholder’s cash-flow rights the greater are the benefits of monitoring for the
largest shareholder, and hence the greater is the extent of such monitoring. Given the effort
expended by the largest shareholder on monitoring, the effect on management depends on the
largest shareholder's ability to dismiss a poorly-performing management, and this will be
greater the higher are this shareholder’s control rights. It is also possible that some minority
shareholders may own a sufficiently large fraction of the corporation's equity to provide them
with incentives to monitor the management, so that we allow for the possibility that the extent
of shareholder monitoring also depends on the control rights of the second-largest
shareholder.
The control rights of the largest shareholder give her some ability to exploit minority
shareholders. To model this, we assume that the largest shareholder can, at a cost, divert some
part of gross profits away from other shareholders.5 This cost of diversion can be thought of
as the cost of managerial effort needed to conceal transactions and justify activities which
only benefit the largest shareholder, or as the cost to the firm of operating in a way which
allows the largest shareholder to divert profits, rather than in the most efficient way. We make 5 The assumption that diversion of profits is inefficient is standard in the literature on the private benefits of control, e.g. Pagano and Röell (1998).

10
a number of assumptions about the diversion cost (see the Appendix for details), which enable
us to characterise the largest shareholder’s best choice of profit diversion, and hence
dividends, as a function of this shareholder’s control and cash-flow rights, and the control
rights of the second-largest shareholder, which are taken to be exogenously given. The
justification for taking the ownership variables as exogenous in the empirical analysis is
discussed in Sections 5 and 6.
Other things equal, the effect of increases in the largest shareholder’s control rights on
the returns to minority shareholders is theoretically ambiguous, as equation (A.10) in the
Appendix shows. Minority shareholders will suffer to the extent that these increased control
rights increase profit diversion, but will benefit to the extent that increased control rights
result in greater monitoring and lower costs of profit diversion. If empirical estimates show
that share valuation decreases when the largest shareholder’s control rights increase, this is
consistent with the greater diversion effect outweighing the other two effects, so that the net
effect of increases in the largest shareholder’s control rights is harmful to minority
shareholders.
Other things equal, the effect of increases in the largest shareholder’s cash-flow rights
on the returns to minority shareholders is theoretically clear-cut, as equation (A.11) in the
Appendix shows. These higher cash-flow rights benefit minority shareholders, by increasing
monitoring of management and by raising the cost to the largest shareholder of diverting
profits. Thus we expect to find evidence that increases in these cash-flow rights increase share
valuation.
Other things equal, the effect of increases in the second-largest shareholder’s control
rights on the returns to minority shareholders is also theoretically ambiguous, as equation
(A.12) in the Appendix shows. Minority shareholders will benefit to the extent that these
increased control rights increase the monitoring of management and reduce the diversion of
profits by the largest shareholder, but they will suffer to the extent that increased control

11
rights increase the cost of profit diversion. Empirical evidence that share valuation increases
when the second-largest shareholder’s control rights increase is consistent with the beneficial
effect for minority shareholders of greater holdings by the second-largest shareholder
outweighing the harmful effect, although it is not possible to identify how much of such a
beneficial effect would be due to monitoring management and how much to increasing the
costs of profit diversion by the largest shareholder.
It is clear from the above discussion that the magnitude of any marginal effects of
increases in the largest shareholder's control and cash-flow rights which operate via greater
monitoring of management cannot be identified from estimates of the marginal effects of such
increases on share values, because the increased control and cash-flow rights have effects on
share valuation which operate both by influencing monitoring and by other routes. However,
the following argument suggests a way of estimating the total effect of greater monitoring of
management which results from increased ownership by the largest shareholder. If the
ownership of a company is completely dispersed, then even the largest shareholder has such
tiny control rights that it is not possible for her to divert any profits from other shareholders,
but there will be no monitoring of management by shareholders. If the largest shareholder has
all the control and all the cash-flow rights, then no profits will be diverted, since all profits
accrue to the largest shareholder anyway, and the largest shareholder will have the correct
incentives to undertake efficient monitoring of management, since she internalises all the
benefits of so doing.6 In the former case, the equity value of a company reflects the absence of
both profit diversion and monitoring of management, while in the latter case it reflects the
absence of profit diversion and the presence of efficient monitoring of management. Hence
the difference between the value of equity in these two cases, other things equal, provides an
estimate of the value of efficient monitoring of management relative to no monitoring of
management. 6 See the Appendix for the precise assumptions about the marginal cost of profit diversion required to justify this argument.

12
4. Data
The data we use consists of a sample of 97 listed corporations, taken from Nibler
(1998). Nibler collected very detailed data on the equity voting rights in 158 of the largest 200
non-financial German firms in 1992 (measured by turnover), as well as data on some
accounting variables and a number of other characteristics of these firms. For most firms,
Nibler measured the equity voting rights exercised by different owners at the 1991
shareholders’ general meeting: for a small number of firms this information was not available
for 1991 and so was taken from either the 1990 or 1992 general meeting.7 One of the criteria
used by Nibler to select the 158 firms in his sample was that there should have been no
significant changes in a firm’s ownership structure over the period 1988-1992, so the use of
1990 or 1992 information in a small number of cases does not introduce any errors.
Since our concern is with the effects of concentrated ownership on the market value of
shares, we had to eliminate the unlisted firms from Nibler's sample of 158, which resulted in a
sample of 97 companies.8 For these corporations we supplemented Nibler’s data by collecting
information on the cash-flow rights of the largest shareholder, the ratio of market value of
equity to book value of equity, and some additional balance-sheet ratios. The cash-flow rights
of the largest shareholder (CF1) were measured as the fraction of total dividends paid in 1991
received by this shareholder. We obtained this figure using the proportions of voting and non-
voting equity which were owned by the largest shareholder, and the dividend paid to voting
7 Information on shareholder participation is not published in business reports, but until recently could be obtained from local register courts (Handelsregister) at the headquarters of the various firms. Note that a recent change of the law drops the requirement to publish participation information in the minutes of the shareholder meeting. 8 We also decided to eliminate a handful of companies for which Nibler claims a stable ownership structure during the period 1988-1991 but for which Jenkinson and Ljungqvist (1999) provide evidence for an ongoing control contest during that period. Note that all our qualitative results are robust with respect to including the respective firms.

13
and non-voting shares, in 1991.9 26 of the companies in our sample issued non-voting as well
as voting shares, which implies that if we were to use the proportion of the voting equity
owned by the largest shareholder to measure her control rights, 71 of the companies would
have largest shareholders with identical control and cash-flow rights. We therefore measured
the control rights of the largest shareholder as the proportion of equity voting rights actually
exercised by this shareholder at the annual shareholder meeting. This measure (CR1) is given
by adjusting the proportion of the voting equity owned by the largest shareholder by the
fraction of the total voting equity which was actually represented at the meeting.10 The
correlation between CR1 and CF1 for the 97 companies is 0.87. The second-largest
shareholder’s control rights were measured as the proportion of equity voting rights actually
exercised by this shareholder at the annual shareholder meeting (CR2).
The ratio of the market value of equity (on 31-12-91) to the book value of equity
(hereafter MTB) is used as an approximate measure of the relationship between the market
value of the firm’s share capital to the economic value of the equity-financed assets it
employs.11 An alternative measure, which is frequently used in the literature, is the market
capitalisation of debt and equity divided by the face value of debt and equity. There are two
reasons why we do not use this measure. The practical reason is that only a tiny portion of
German firms' debt is traded and therefore most of this debt lacks a market price. The
theoretical reason is that we are interested in firm performance from a minority shareholder's
point of view. Given a firm's risk characteristics, the appropriate measure of expected return
on equity for such a shareholder is the capitalisation value per unit of equity capital used in
the firm.
9 In Germany non-voting shares typically receive a slightly higher dividend than voting shares. In the relevant period payments to shareholders had to take the form of dividends: until very recently share repurchases have been legally prohibited. 10 Note that in Germany a voting shareholder, or his or her proxy, must be physically present at the annual shareholder meeting: voting by mail is not allowed. 11 A more satisfactory measure would be Tobin’s Q, in which the denominator is the replacement cost of the firm’s equity capital. However, the replacement cost of assets employed is unavailable for German corporations. In Germany all assets are valued at historic cost in companies' balance sheets, and upward revaluation is not permitted.

14
For eight of the corporations in our sample, only non-voting shares were listed: for
these firms the total market value of equity was calculated by using the price of non-voting
shares for all shares. We tested the robustness of the results reported below by re-estimating
the regressions excluding these eight firms. Our main results are not sensitive to whether
these firms are included.
Listed corporations account for a much smaller proportion of total economic activity
in Germany than in the USA on the UK. Edwards and Fischer (1994, pp. 86-7) estimate that
in 1986 listed corporations accounted for about 11% of total turnover in Germany compared
to about 30% of total turnover in the UK. In 1989 the market value of listed corporations was
about 25% of GDP in Germany compared to about 69% of GDP in the USA (Sinn and Sinn
1992, p. 114). In 1991 the total number of listed corporations in Germany was only 563. Our
sample, which contains most of the largest listed non-financial German corporations,
therefore accounts for a large proportion of the economic activity carried out by listed
corporations in Germany in 1991.
Table 1: Sample statistics for key variables
Mean Median Standard deviation
Maximum Minimum
Ratio of market to book value of equity (MTB), per cent
200.52 166.88 113.73 587.10 55.51
Attendance at shareholder meeting, per cent
78.1 81.8 19.0 100 26.7
Effective proportion of voting equity controlled by largest shareholder (CR1), per cent
56.15 57.11 29.06 100 0
Cash flow rights of largest shareholder (CF1), per cent
40.93 37.53 25.88 99.8 0
Effective proportion of voting equity controlled by second-largest shareholder (CR2), per cent
9.76 3.00 12.01 49 0

15
Table 1 gives information about various aspects of the sample. A largest shareholder
was identified for 93 of the 97 corporations: the smallest proportion of the voting equity
owned by the largest shareholder, which could be identified, was 3.09%. Thus there were only
four corporations in which ownership was so dispersed that a largest shareholder could not be
identified. In these four cases the holding of the largest shareholder was assumed to be zero.
Any errors introduced by this assumption are small. A second-largest shareholder was
identified for 49 of the corporations, and the smallest proportion of the voting equity owned
by the second-largest shareholder which could be identified was 2.23%. Of the 48 cases in
which the holding of the second-largest shareholder was zero, 7 corresponded to corporations
in which the largest shareholder owned 100% of the voting equity, and 41 to cases in which a
second-largest shareholder could not be identified, and so the holding was assumed to be zero.
Again, any errors introduced by this assumption are small.
The data in our sample are consistent with other studies, which have shown that
ownership in large German listed corporations is much more concentrated than in equivalent
US or UK firms. The mean (median) proportion of the voting equity owned by the largest
shareholder in the corporations in our sample is 47.3% (49.9%). When account is taken of the
fact that, on average, the attendance at the shareholders' general meeting was such that only
78.1% of the voting equity was represented, the control rights of the largest shareholder
become even stronger than is implied by this figure. Grossing up the proportion of the voting
equity owned by the largest shareholder by the fraction of the voting equity actually
represented at the meeting gives a figure of 56.2% (57.1%) for the mean (median) proportion
of votes cast at the shareholders' meeting by the largest shareholder. The mean (median)
proportion of the largest shareholder's cash-flow rights is 40.9% (37.5%). It should be noted
that the maximum value of the largest shareholder's cash-flow rights in the sample is 99.8%:
all corporations in the sample therefore have some minority shareholders.

16
As has been noted, a largest shareholder could not be identified for four of the
corporations in our sample. For the other 93 corporations, the largest shareholder was an
individual or family in 37 cases; a German non-bank enterprise in 25 cases; a foreign firm in
12 cases; a German bank in 11 cases; and a German public sector body in 8 cases. We will
return to the empirical implications of these different types of largest shareholder in the next
section.
5. Empirical implementation
The specification of the regression model which we estimate is based on the
theoretical analysis of Section 3 and Appendix A.1. Given our assumption that the market
value of a firm is determined by small shareholders on the basis of the dividends they expect
to receive, different market values reflect different discounted expected dividends. Therefore,
using MTB as the dependent variable is an appropriate way of empirically implementing our
theoretical model. Our main interest centres on the effects of the control and cash-flow rights
of the largest shareholder, and the holding of the second-largest shareholder, on MTB. As the
discussion in Section 3 showed, the effect of increases in the largest shareholder’s cash-flow
rights is expected to be non-negative, but the expected sign of increases in the largest
shareholder’s control rights is ambiguous, as is the expected sign of increases in the second-
largest shareholder’s control rights.
When large shareholders in a corporation are individuals or families, there is a clear
relationship between the wealth of the shareholder and the market value of the corporation's
equity. This is not obviously the case when the large shareholder is an organisation controlled
by agents. There may be no direct link between the interests of the agents who run the
organisation and the value of the corporation's equity. If the incentives of the agents who
control large shareholders of this type are not linked to the value of the corporation's equity,

17
then there may be little incentive for such shareholders to devote effort to monitoring
management, and hence the effects on MTB of increases in large shareholders’ control and
cash-flow rights which operate via increased monitoring may be much weaker. The effect of
greater control rights may also differ between different types of large shareholder for other
reasons. To the extent that our measure of the largest shareholder’s control rights is inaccurate
because it takes no account of the effect of pyramiding on control rights, the estimated effects
of the largest shareholder’s control rights may differ between large shareholders which may
be part of a pyramid (i.e., other firms) and those which are not (families). Furthermore, if the
largest shareholder in a firm is another enterprise, then it is possible that business
relationships between the firm and its largest shareholder provide a particularly advantageous
way for this shareholder to divert profits from minority shareholders. The special legal
provisions applying to shareholders owning more than 50% of the voting equity which are
themselves corporations may, however, limit such possibilities. To test whether there were
differences in the effects of increased control and cash-flow rights associated with ownership
by different types of large shareholder, we use interactive variables to identify whether the
largest and the second-largest shareholder is an individual or family, a non-bank enterprise, a
bank, a public-sector body, or a foreign firm.
We include a number of other independent variables in the regression equation to allow
for other possible effects on the relationship between the market and book values of equity.
The liabilities of German corporations comprise debt (short- and long-term as well as trade
credits), pension provisions, and other provisions. These three variables, each expressed as a
proportion of total balance-sheet financing, are included in the regression equation. There are
two possible reasons why the debt ratio (DEBT) may affect MTB. One is that debt is
favourably treated by the tax system.12 The other is that a high proportion of debt finance has
12 The relative tax advantage of debt over retained profits as a source of finance is greater the lower the personal tax rate of the investor. Since personal investors with a small investment in a firm may face lower personal tax

18
been argued to exert favourable effects on managerial effort and the consumption of private
benefits of control (Jensen and Meckling 1976, Jensen 1986). The reason for including the
pension provision ratio (PEN) and the other provision ratio (OTH) is related to the possible
problems that arise from the use of the book value of equity in the denominator of our
measure of the returns to minority shareholders. In Germany, both sets of liabilities may
potentially benefit the shareholders in a company. Pension provisions are a cheap source of
investment finance for the owners of a corporation, while other provisions are regarded as
being a valuable vehicle for creative accounting and income smoothing.13 German
corporations have greater opportunities to manipulate their provisions than do firms in many
other countries. An important reason for this is the fact that in Germany provisions are
allowed even if there is no liability to outsiders. For example, provisions may be built up for
deferred maintenance (Aufwandsrückstellungen). This ability of German firms to make
extensive use of provisions is likely to result in a downward bias in the book value of equity
capital, and a corresponding upward bias in our measure of returns to minority shareholders.14
To allow for differential use of provisions by different corporations, and hence differences in
the bias in MTB, we included the other provision ratio as a regressor.
Firm-specific risk is an obvious possible factor affecting MTB. We therefore include a
measure of beta calculated from 1990 data on weekly price returns and the FAZ index
(BETA) to measure the idiosyncratic risk of each company.15 The growth of sales in the
previous year (SALESGR) was included to control for the influence of growth prospects on
firm valuation. A possible spurious relationship between ownership and the market to book
ratio may arise because it is easier to own a large fraction of a small firm, while size and
rates than large shareholders, it is possible that firms use a higher proportion of debt finance the more dispersed is their ownership structure. 13 See Fischer and Haller (1993). 14 A striking illustration of the extent of the downward bias in the book value of equity was provided by Daimler-Benz in the mid-1990s when for the first time it produced its annual report according to both US general agreed accounting practice (GAAP) and German rules (HGB). The reduction of provisions and similar items required by GAAP increased total equity by 23.6% of HGB equity (Pilhofer 1997, pp. 168-9). 15 The FAZ index is a price index of major German shares provided by the Frankfurter Allgemeine Zeitung.

19
market to book ratio may be negatively correlated. Total assets (ASSETS) were therefore
included as a regressor to measure firm size.
Each corporation was categorised as primarily operating in one of thirteen different
industries, and industry dummy variables were included to allow for possible systematic
industry effects on MTB. A possible way in which there may be systematic industry effects
that deserves special mention is the argument that ownership structure may depend on the
firm’s industry (Demsetz and Lehn 1985): if MTBs within an industry are highly correlated,
failure to include industry dummy variables in the regression might lead to a spurious
relationship between MTB and ownership. The inclusion of industry dummies also corrects
for cyclical variations in share prices which have an industry-specific component.
As was noted in Section 4, all firms in the sample had no significant changes in ownership
during a four year period preceding our observation of MTB. We therefore treat the
ownership variables as exogenous with respect to MTB in most of our analysis, and use OLS
to estimate regression equations. We discuss whether our results are sensitive to the
assumption that ownership is exogenous in the next section.
6. Results
We began our empirical analysis by estimating a very general model in which MTB was
regressed on all the non-ownership variables discussed in section 5 and a large number of
ownership variables. The effects of the largest and second-largest shareholder’s control rights,
and the largest shareholder’s cash-flow rights, were allowed to differ by shareholder type, and
the marginal effects of the largest shareholder’s control rights were allowed to differ above
and below the value of 50 per cent to allow for the possibility that the largest shareholder had
complete control of the company once her control rights were greater than 50%, so that
subsequent increases had no further harmful effect on minority shareholders. The model was
estimated using OLS and the White heteroscedasticity-consistent estimator of the covariance
20
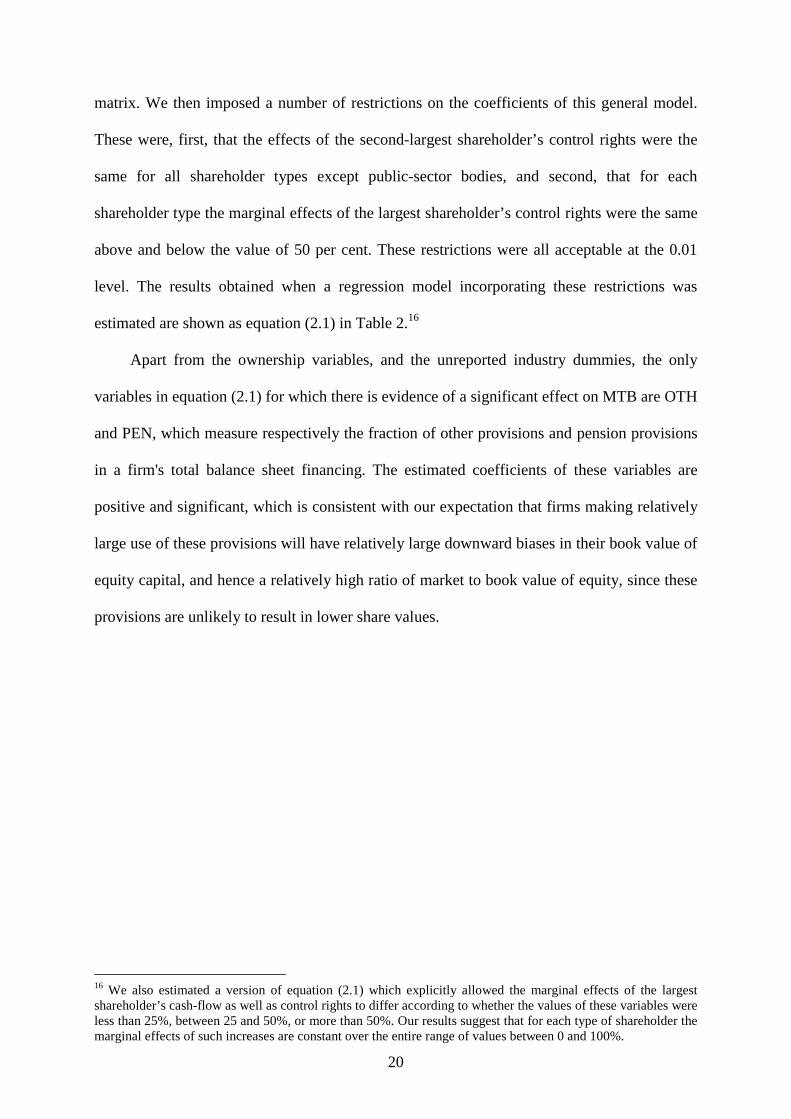
matrix. We then imposed a number of restrictions on the coefficients of this general model.
These were, first, that the effects of the second-largest shareholder’s control rights were the
same for all shareholder types except public-sector bodies, and second, that for each
shareholder type the marginal effects of the largest shareholder’s control rights were the same
above and below the value of 50 per cent. These restrictions were all acceptable at the 0.01
level. The results obtained when a regression model incorporating these restrictions was
estimated are shown as equation (2.1) in Table 2.16
Apart from the ownership variables, and the unreported industry dummies, the only
variables in equation (2.1) for which there is evidence of a significant effect on MTB are OTH
and PEN, which measure respectively the fraction of other provisions and pension provisions
in a firm's total balance sheet financing. The estimated coefficients of these variables are
positive and significant, which is consistent with our expectation that firms making relatively
large use of these provisions will have relatively large downward biases in their book value of
equity capital, and hence a relatively high ratio of market to book value of equity, since these
provisions are unlikely to result in lower share values.
16 We also estimated a version of equation (2.1) which explicitly allowed the marginal effects of the largest shareholder’s cash-flow as well as control rights to differ according to whether the values of these variables were less than 25%, between 25 and 50%, or more than 50%. Our results suggest that for each type of shareholder the marginal effects of such increases are constant over the entire range of values between 0 and 100%.
21
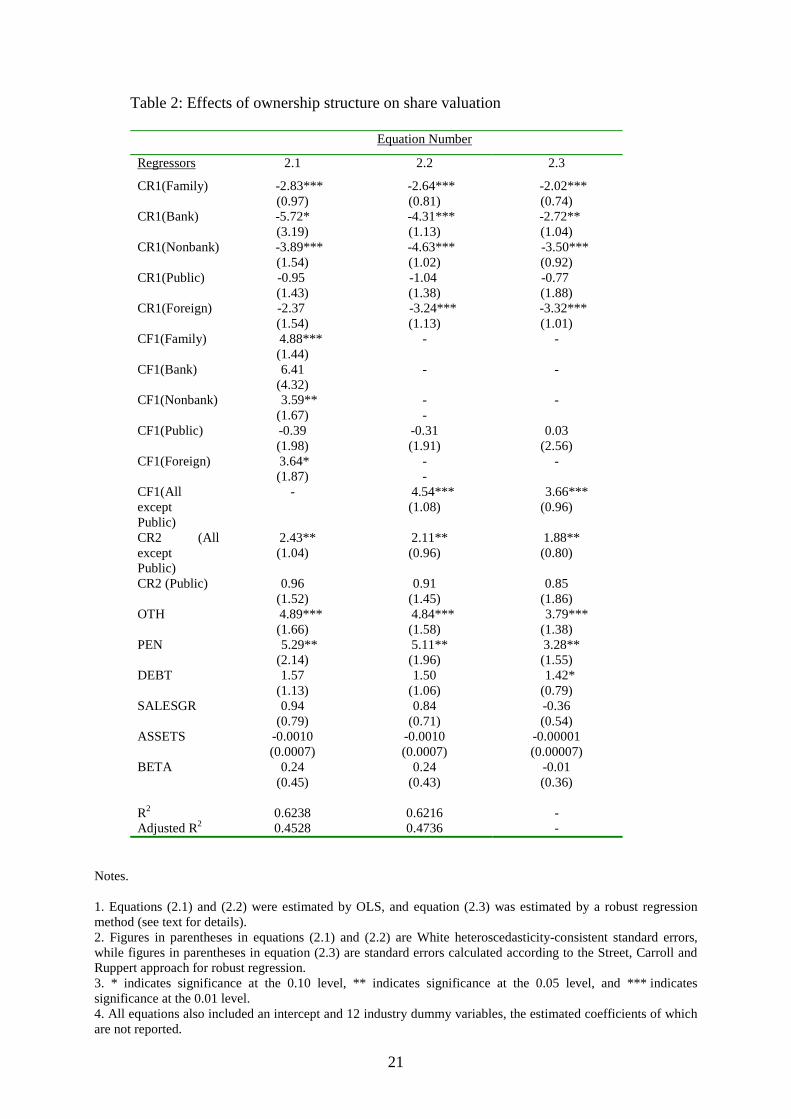
Table 2: Effects of ownership structure on share valuation
Equation Number
Regressors 2.1 2.2 2.3
CR1(Family) -2.83*** (0.97)
-2.64*** (0.81)
-2.02*** (0.74)
CR1(Bank) -5.72* (3.19)
-4.31*** (1.13)
-2.72** (1.04)
CR1(Nonbank) -3.89*** (1.54)
-4.63*** (1.02)
-3.50*** (0.92)
CR1(Public) -0.95 (1.43)
-1.04 (1.38)
-0.77 (1.88)
CR1(Foreign) -2.37 (1.54)
-3.24*** (1.13)
-3.32*** (1.01)
CF1(Family) 4.88*** (1.44)
- -
CF1(Bank) 6.41 (4.32)
-
-
CF1(Nonbank) 3.59** (1.67)
- -
-
CF1(Public) -0.39 (1.98)
-0.31 (1.91)
0.03 (2.56)
CF1(Foreign) 3.64* (1.87)
- -
-
CF1(All except Public)
- 4.54*** (1.08)
3.66*** (0.96)
CR2 (All except Public)
2.43** (1.04)
2.11** (0.96)
1.88** (0.80)
CR2 (Public) 0.96 (1.52)
0.91 (1.45)
0.85 (1.86)
OTH 4.89*** (1.66)
4.84*** (1.58)
3.79*** (1.38)
PEN 5.29** (2.14)
5.11** (1.96)
3.28** (1.55)
DEBT 1.57 (1.13)
1.50 (1.06)
1.42* (0.79)
SALESGR 0.94 (0.79)
0.84 (0.71)
-0.36 (0.54)
ASSETS -0.0010 (0.0007)
-0.0010 (0.0007)
-0.00001 (0.00007)
BETA 0.24 (0.45)
0.24 (0.43)
-0.01 (0.36)
R2 0.6238 0.6216 - Adjusted R2 0.4528 0.4736 -
Notes.
1. Equations (2.1) and (2.2) were estimated by OLS, and equation (2.3) was estimated by a robust regression method (see text for details). 2. Figures in parentheses in equations (2.1) and (2.2) are White heteroscedasticity-consistent standard errors, while figures in parentheses in equation (2.3) are standard errors calculated according to the Street, Carroll and Ruppert approach for robust regression. 3. * indicates significance at the 0.10 level, ** indicates significance at the 0.05 level, and *** indicates significance at the 0.01 level. 4. All equations also included an intercept and 12 industry dummy variables, the estimated coefficients of which are not reported.

22
The estimated coefficients of the control rights of all types of largest shareholders in
equation (2.1) are negative, although the coefficient is small for public sector body largest
shareholders, and not significantly different from zero even at the 0.10 level for foreign
largest shareholders. The estimated coefficients of the cash-flow rights of all types of largest
shareholders except public sector bodies are positive, although the coefficient for banks,
though large, is not significantly different from zero at the 0.10 level. The estimated
coefficients of the control rights of all types of second-largest shareholders are positive,
although the coefficient for public sector bodies is not significantly different from zero.
The restriction that the estimated effects of the largest shareholder’s cash-flow rights
in equation (2.1) are the same for all shareholder types except public sector bodies was
acceptable at the 0.01 level, and equation (2.2) in Table 2 shows the results obtained when
this restriction was imposed. The precision of the estimates of the effects of largest
shareholder control rights is greatly improved in equation (2.2): for all shareholder types
except public sector bodies, the point estimates of this effect is negative and significantly
different from zero at the 0.01 level. The point estimates of the effects of the control rights of
all types of largest shareholder except public sector bodies are fairly similar in size in
equation (2.2). However, the null hypothesis that they are equal was rejected at the 0.01 level.
Thus there is evidence that, although increases in the control rights of these types of largest
shareholder all have a negative effect on share valuation, the size of this effect differs between
them.
Equation (2.3) in Table 2 shows the results of estimating the same specification as that
of equation (2.2) using a robust regression method instead of OLS, in order to check whether
the estimates in equation (2.2) are sensitive to outliers. The particular robust regression
method used to estimate equation (2.3) was one in which, after an initial screening to
eliminate gross outliers, Huber iterations followed by biweight iterations are performed (see
Li, 1985). The estimated coefficients of the ownership variables in equation (2.3) are similar

23
to those in (2.2), and provide no reason to think that the conclusions drawn from equation
(2.2) about the effects of the ownership variables are sensitive to outliers.
Equation (2.2) is thus our preferred regression model. Its simple linear form may seem
surprising, given that the largest shareholder may have complete control of a company with
control rights well below 100 per cent, so that increases in the largest shareholder’s control
rights beyond this value do not result in further reductions in share valuation. As already
noted, our general model allowed the marginal effects of the control rights of each type of
largest shareholder to differ above and below 50 per cent, but there was no evidence of such
differences. We performed a number of other tests of the linear specification of (2.2). We
tested for the significance of quadratic terms in each largest shareholder type’s control rights,
and we allowed the marginal effects of each largest shareholder type’s control rights to differ
in the ranges 0-25 per cent, 25-50 per cent, and 50-100 per cent. These tests provided no
evidence of non-linearity in the effects of the control rights of largest shareholders on share
valuation. We also subjected equation (2.2) to a test of model stability based on recursive
residuals obtained by estimating it successively on observations arranged in ascending order
of the largest shareholder’s control rights. A test based on recursive residuals, rather than a
Chow test, is appropriate because the situation is one in which there is uncertainty about the
point at which a possible structural change in the regression equation may occur. Neither the
CUSUM nor the CUSUMSQ tests of the stability of (2.2) over all observations reject the null
hypothesis that the regression coefficients are the same for all firms. Hence there is no
evidence that the simple linear form of equation (2.2) is inappropriate.
Our theoretical model predicts that increases in the largest shareholder's cash-flow
rights should result in higher values of MTB, since a greater holding of the corporation's total
equity by the largest shareholder leads to increased monitoring, and also aligns her interests
more closely with those of the minority shareholders, thus reducing profit diversion. The
estimated coefficients of the cash-flow right variables in both equations (2.1) and (2.2) are

24
consistent with this prediction, with the exception of those largest shareholders which are
public-sector bodies, for which the point estimate is negative although not significantly
different from zero. A possible explanation for the different effect of increased cash-flow
rights for public-sector body largest shareholders is that the agents running such shareholders
have weaker incentives to act in a value-maximising way because their wealth is less closely
tied to the equity value of the company.
According to our theoretical analysis, a negative effect of increased control rights for
the largest shareholder implies that the harmful effect on minority shareholders through
greater profit diversion by this shareholder outweighs any favourable effect of increased
monitoring or reduced costs of profit diversion. Hence equation (2.2) provides clear evidence
that, for all shareholder types except public-sector bodies, increases in the largest
shareholder's control rights are associated with greater consumption of private benefits of
control, and have a harmful net effect on minority shareholders. The effect of largest
shareholder control rights is more negative if this shareholder is a bank or a non-bank
enterprise than if it is a family or a foreign firm.17 This suggests that such largest shareholders
are in a particularly good position to divert profits from minority shareholders, perhaps by
exploiting business relationships between themselves and the firm in which they hold the
largest stake.
The estimated coefficients of equation (2.2) imply that the net effect of equal increases
in the control and cash-flow rights of different types of largest shareholder on MTB are as
follows (with heteroscedasticity-consistent standard errors in brackets): family 1.90 (0.50);
bank 0.22 (0.65); nonbank enterprise –0.10 (0.55); public-sector body –1.34 (0.87); and
foreign firm 1.30 (0.54). These estimated effects are significantly different from zero for
family and foreign largest shareholders. A rise in the ownership stake of the largest
shareholder that involves equal increases in both aspects of ownership thus benefits minority 17 This conclusion follows from tests of the significance of the difference between the relevant estimated coefficients in equation (2.2).

25
shareholders in the case of two types of largest shareholder, and does not appear to harm them
in the case of the other three types, although this latter conclusion is less clear-cut for public
sector largest shareholders.
According to our theoretical analysis, a positive effect of the second-largest
shareholder’s control rights implies that the beneficial aspects of greater monitoring of
management and limitation of profit diversion by the largest shareholder outweigh any
harmful effect of increased costs of profit diversion. Equation (2.2) shows that increases in the
control rights of all types of second-largest shareholders except public sector bodies have a
significant positive effect on share valuation, and thus implies that the net effect of increases
in the control rights of most types of second-largest shareholders is beneficial for minority
shareholders. According to equation (2.2), neither the control nor the cash-flow rights of
largest shareholders that are public sector bodies, nor the control rights of second-largest
shareholders that are public sector bodies, have a significant effect on share valuation. The
null hypothesis that the coefficients of the three public-sector body ownership variables
(CR1(Public), CF1(Public), CR2(Public)) in equation (2.2) are jointly zero was strongly
rejected, but the null hypothesis that the coefficients of the two public-sector body control
rights variables were both zero was not rejected. When a regression equation incorporating
the latter two restrictions was estimated, the coefficient of CF1(Public) was –6.37, with a
(heteroscedasticity-consistent) standard error of 1.28. Hence there is evidence that large
shareholders that are public sector bodies have very different effects on share valuation from
those of other types of large shareholder.
Equations (2.1) and (2.2) were both estimated by OLS, and this raises the question
whether it is justifiable to treat the ownership variables as exogenous. Ownership structure
may, for example, be chosen to maximise the wealth of the initial owner when the firm goes

26
public.18 Consequently it is possible that the ownership structure variables will be correlated
with the error term in a regression of the market-to-book ratio (MTB) on ownership and other
variables, because certain unobserved characteristics of the firm influence both firm value and
ownership structure. If this is the case, OLS cannot be used to obtain consistent estimates of
the effects of ownership structure on share valuation. In the literature on the relationship
between managerial ownership and firm performance, Cho (1998) and Himmelberg et al.
(1999) have provided evidence that managerial ownership cannot be treated as an exogenous
variable, which casts doubt on the finding that managerial ownership affects firm
performance, since it results from studies which have taken such ownership to be an
exogenous variable in their econometric analysis. It is therefore necessary to consider whether
the results in Table 2 are vitiated by the possibility that firm ownership structure cannot be
treated as exogenous in the regressions we estimate.
In order to do this, we took two approaches. First, we established that 57 of the firms in
our sample had the same largest shareholder in 1979 as in 1991. We then estimated the
specification corresponding to equation (2.2) separately on this subsample and that of the
other 40 firms, and tested whether the estimated coefficients differed between these two
subsamples. The null hypothesis that the regression coefficients are the same for these two
subsamples was not rejected, suggesting that the regression model applies both to firms whose
largest shareholder changed in the twelve years before 1991 and to those with no change in
their largest shareholder during this period.
The second approach we adopted was to use instruments for the ownership variables to
estimate a regression model by instrumental variables (IV). We used three variables as
instruments. One was turnover, an alternative measure of firm size to that included as an
explanatory variable, on the basis of the Demsetz and Lehn argument that there should be an
inverse relationship between firm size and ownership concentration. Another was age, on the 18 For theories of ownership structure, see Demsetz (1983), Demsetz and Lehn (1985), Hansmann (1996), Pagano and Röell (1998), Zingales (1995), and Zwiebel (1995).

27
grounds that the older a firm is, the less likely is it to have concentrated ownership because of
the holdings of its founders. The third instrumental variable used was beta, the risk measure
included as an explanatory variable in the equations reported in Table 2, but which was
consistently insignificant. The higher a firm’s specific risk, other things equal, the lower is its
ownership concentration likely to be. Multiplying each of these three variables by the dummy
variables for type of largest shareholder gave us fifteen instruments for the nine ownership
variables in equation (2.2).
Using OLS and IV to estimate a regression model that differs from the specification in
(2.2) only by the exclusion of beta as an explanatory variable produces the results shown in
Table A.1 of the appendix. The estimated coefficients of the ownership variables in equation
(A1.2), which was estimated by IV, are typically larger in absolute value and much less well-
determined than those in (A1.1), which was estimated by OLS. A Hausman test of the
significance of the differences between the OLS and IV coefficient estimates can be used to
test whether the ownership variables are correlated with the error term in the regression.
Under the null hypothesis of no correlation, both OLS and IV are consistent but IV is
inefficient, whereas under the alternative IV is consistent but OLS is not. Hence, under the
null hypothesis, the two sets of coefficient estimates should not differ significantly. The
appropriate statistic for a test of the null hypothesis that there is no difference between the
coefficient estimates in equations (3.1) and (3.2) is distributed as chi-squared with 25 degrees
of freedom. The value of this statistic is 5.93, so that the null hypothesis is not rejected, and
thus there is no evidence that the ownership variables are correlated with the error term in the
regression. Given the instruments we have, there is no evidence that the results obtained are
dependent on the inappropriate use of OLS as an estimation method.
As was noted in Section 3, any marginal effects of increases in the largest shareholder's
control and cash-flow rights which operate via greater monitoring of management cannot be
identified from the estimated effects of increases in these rights on the MTB. However, an

28
estimate of the total effect of increased ownership by the largest shareholder which operates
through greater monitoring of management can be obtained on the basis of the argument
discussed at the end of Section 3. Estimates of both the value of the MTB when the largest
shareholder has all the control and cash-flow rights in a firm, and its value when the control
and cash-flow rights of the largest shareholder are zero, can be obtained from regression
equations relating the MTB to ownership and other variables. If the argument that there is no
diversion of profits from minority shareholders in either of these two extreme cases is
accepted, any difference in the estimated value of the MTB will reflect the effects of the
change from no monitoring of management (under dispersed ownership) to efficient
monitoring of management (when the largest shareholder has all the control and cash-flow
rights in a company). Note that our estimates of the relationship between the MTB and the
ownership of the largest shareholder are made on the basis of a sample of companies all of
which have minority shareholders, so the predicted value of the MTB when a largest
shareholder has 100 per cent of the control and cash-flow rights in a corporation represents
the value that would be placed on such a firm by a hypothetical minority shareholder. The
estimated changes in the value of the MTB thus reflect the change in the value to minority
shareholders of the firm's equity as a result of efficient monitoring: they do not include any
component reflecting the strategic value a shareholder owning all of the equity might place on
the firm.
Table 3 shows the estimated proportional changes in the MTB obtained from equation
(2.2) when CR1 and CF1 jointly increase from 0 to 100, with CR2 equal to zero, and all other
variables at their sample mean values. Since there is evidence in Table 2 that different types
of largest shareholder have different effects on share valuation, Table 3 gives corresponding
estimates for each shareholder type. For family and foreign largest shareholders, the estimated
proportional increase in the market- to-book ratio is large and significantly different from
zero, suggesting that a

29
Table 3: Estimated percentage increase in Q when ownership changes from complete dispersion to full ownership by a single shareholder
Type of largest shareholder
Family 102.08*** (34.48)
Bank 11.96 (35.65)
Non-bank enterprise -5.23 (29.28)
Public-sector body
-72.26 (44.77)
Foreign
69.80** (34.39)
Notes. 1. Figures in parentheses are White heteroscedasticity-consistent standard errors. 2. ** indicates significance at the 0.05 level, and *** indicates significance at the 0.01 level.
change from completely dispersed ownership to full ownership by a single shareholder of
these types has substantial effects on the extent of monitoring of management. The implied
estimate of the value of efficient monitoring of management by these types of shareholder
relative to no monitoring of management is very large. However, for bank and non-bank
enterprise largest shareholders, the estimated proportional change in the MTB is small and not
significantly different from zero, while for public-sector body largest shareholders the
estimated change is large and negative, although not significantly different from zero. These
results suggest that the extent of monitoring of management varies significantly according to
the type of largest shareholder, and raise the possibility that, in terms of managerial
monitoring, full ownership by a public sector body is worse than completely dispersed
ownership.
30
7. Conclusion
In this paper we have argued that it is possible to obtain separate measures of the
control and cash-flow rights of the largest shareholder in German companies that do not
depend on an ad hoc measurement of the effects of pyramids on control rights. Two features
of German corporate governance enable us to do this: the fact that German companies issue
both voting and non-voting shares, and the fact that shareholders with voting rights have to be
present at the annual shareholder meeting either themselves or via a proxy in order to exercise
these rights. The evidence presented in this paper confirms that the control and the cash-flow
rights of the largest shareholder in German companies do indeed have the very different
effects on the market value of equity predicted by theoretical analyses, and this conclusion
does not depend on the treatment of pyramid control structures.
Our empirical results show that higher control rights of most types of largest
shareholder lower the market value of equity, which is consistent with this shareholder being
able to obtain private benefits of control at minority shareholders’ expense. However, our
results also show that higher cash-flow rights of most types of largest shareholder raise the
market value of equity, which is consistent with greater cash-flow rights increasing this
shareholder’s incentives to act in minority shareholders’ interests. Our results also show that
minority shareholders benefit from increases in the control rights of most types of second-
largest shareholder. The one type of large shareholder to which the above statements do not
apply are public-sector body shareholders: our results suggest that large shareholders of this
type have very different effects on minority shareholders than do other types of large
shareholder.
Germany is typical of the world as a whole in that most large listed German
companies have a controlling shareholder. The evidence presented in this paper is therefore
relevant to a fundamental issue in corporate governance: does the presence of a controlling
shareholder in a company benefit or harm minority shareholders in it? The answer to this

31
question requires a distinction to be made between the control and cash-flow rights of the
largest shareholder, and our results imply that the presence of a controlling shareholder in a
German company can be beneficial, or at least not harmful, for minority shareholders
provided that such a shareholder has cash-flow rights in line with her control rights. Our
results also show that minority shareholders in German companies with controlling
shareholders benefit from increases in the second-largest shareholder’s control rights, which
is consistent with the view that the presence of a sufficiently large outside shareholder can
limit the extent to which the controlling shareholder is able to obtain private benefits at other
shareholders’ expense.
An important question is whether similar conclusions to those of this paper hold in
other economies where controlling shareholders are widespread. The results for Asian
countries found by Claessens et al. (2002), who use pyramiding and the WLP to obtain
separate measures of control and cash-flow rights, are consistent with ours. The method used
in the present paper to identify the distinct effects of a controlling shareholder’s control and
cash-flow rights depends on both the existence of non-voting shares and the ability to measure
the fraction of voting rights actually exercised by this shareholder, and data limitations mean
that this method cannot always be applied in other countries. Tests of the robustness of
conclusions about the effects of ownership concentration on minority shareholders are very
important. This is particularly so given that the data we use in this paper consists of a single
cross-section of 97 companies. It is a general feature of empirical studies of corporate
governance in countries where controlling shareholders are widespread that the data available
is very limited: this is certainly true for Germany. Consequently any empirical findings must
be regarded as very tentative. Subject to this proviso, however, our findings provide evidence
which is consistent with the theoretical analysis set out in Section 3, and give estimates of the
magnitude of the different effects of ownership by large shareholders in an important
European capital market.
32
Appendix
A.1 A model of ownership concentration and share valuation
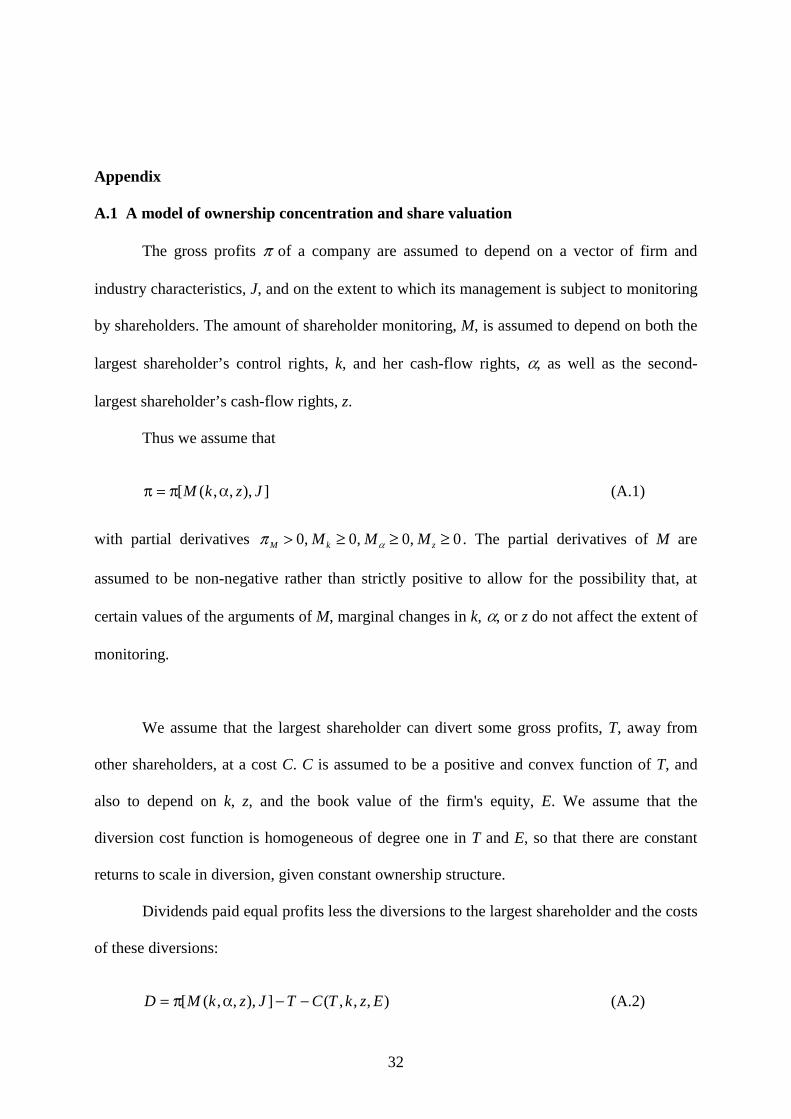
The gross profits π of a company are assumed to depend on a vector of firm and
industry characteristics, J, and on the extent to which its management is subject to monitoring
by shareholders. The amount of shareholder monitoring, M, is assumed to depend on both the
largest shareholder’s control rights, k, and her cash-flow rights, α, as well as the second-
largest shareholder’s cash-flow rights, z.
Thus we assume that
]),,,([ JzkM απ=π (A.1)
with partial derivatives π αM k zM M M> ≥ ≥ ≥0 0 0 0, , , . The partial derivatives of M are
assumed to be non-negative rather than strictly positive to allow for the possibility that, at
certain values of the arguments of M, marginal changes in k, α, or z do not affect the extent of
monitoring.
We assume that the largest shareholder can divert some gross profits, T, away from
other shareholders, at a cost C. C is assumed to be a positive and convex function of T, and
also to depend on k, z, and the book value of the firm's equity, E. We assume that the
diversion cost function is homogeneous of degree one in T and E, so that there are constant
returns to scale in diversion, given constant ownership structure.
Dividends paid equal profits less the diversions to the largest shareholder and the costs
of these diversions:
),,,(]),,,([ EzkTCTJzkMD −−απ= (A.2)
33
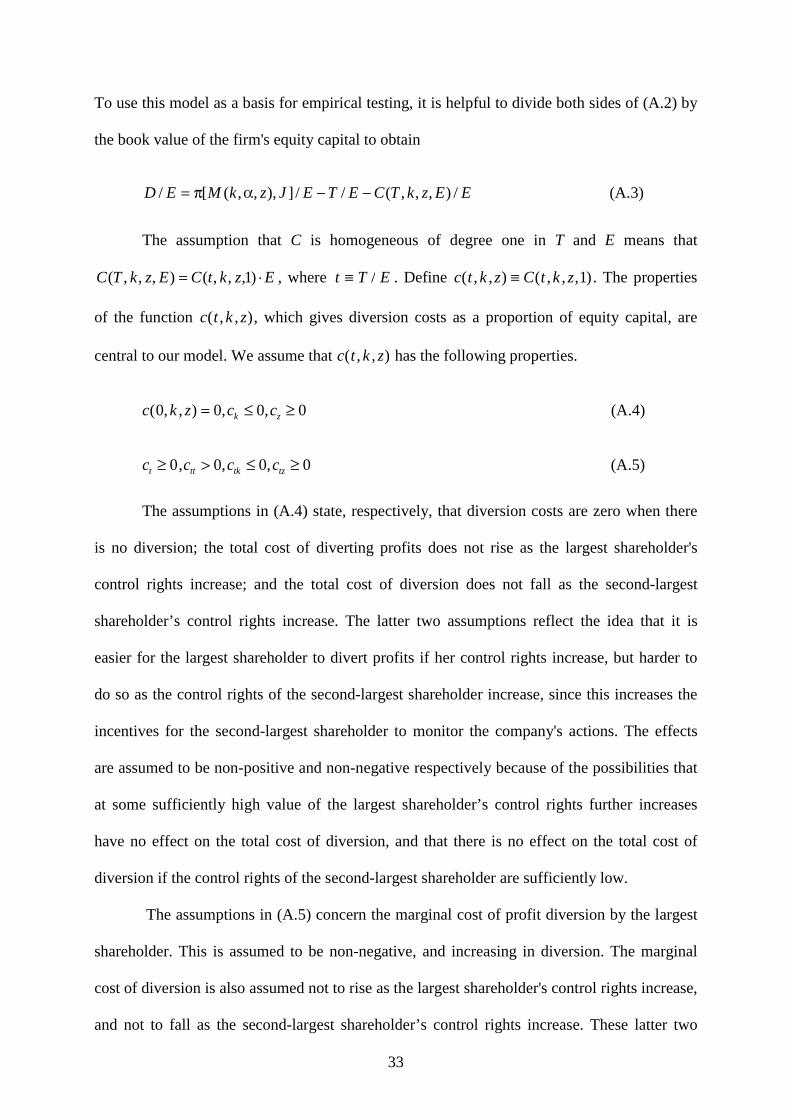
To use this model as a basis for empirical testing, it is helpful to divide both sides of (A.2) by
the book value of the firm's equity capital to obtain
EEzkTCETEJzkMED /),,,(//]),,,([/ −−απ= (A.3)
The assumption that C is homogeneous of degree one in T and E means that
EzktCEzkTC ⋅= )1,,,(),,,( , where t T E≡ / . Define c t k z C t k z( , , ) ( , , , )≡ 1 . The properties
of the function c t k z( , , ), which gives diversion costs as a proportion of equity capital, are
central to our model. We assume that c t k z( , , ) has the following properties.
c k z c ck z( , , ) , ,0 0 0 0= ≤ ≥ (A.4)
ct ≥ 0,c c ctt tk tz> ≤ ≥0 0 0, , (A.5)
The assumptions in (A.4) state, respectively, that diversion costs are zero when there
is no diversion; the total cost of diverting profits does not rise as the largest shareholder's
control rights increase; and the total cost of diversion does not fall as the second-largest
shareholder’s control rights increase. The latter two assumptions reflect the idea that it is
easier for the largest shareholder to divert profits if her control rights increase, but harder to
do so as the control rights of the second-largest shareholder increase, since this increases the
incentives for the second-largest shareholder to monitor the company's actions. The effects
are assumed to be non-positive and non-negative respectively because of the possibilities that
at some sufficiently high value of the largest shareholder’s control rights further increases
have no effect on the total cost of diversion, and that there is no effect on the total cost of
diversion if the control rights of the second-largest shareholder are sufficiently low.
The assumptions in (A.5) concern the marginal cost of profit diversion by the largest
shareholder. This is assumed to be non-negative, and increasing in diversion. The marginal
cost of diversion is also assumed not to rise as the largest shareholder's control rights increase,
and not to fall as the second-largest shareholder’s control rights increase. These latter two
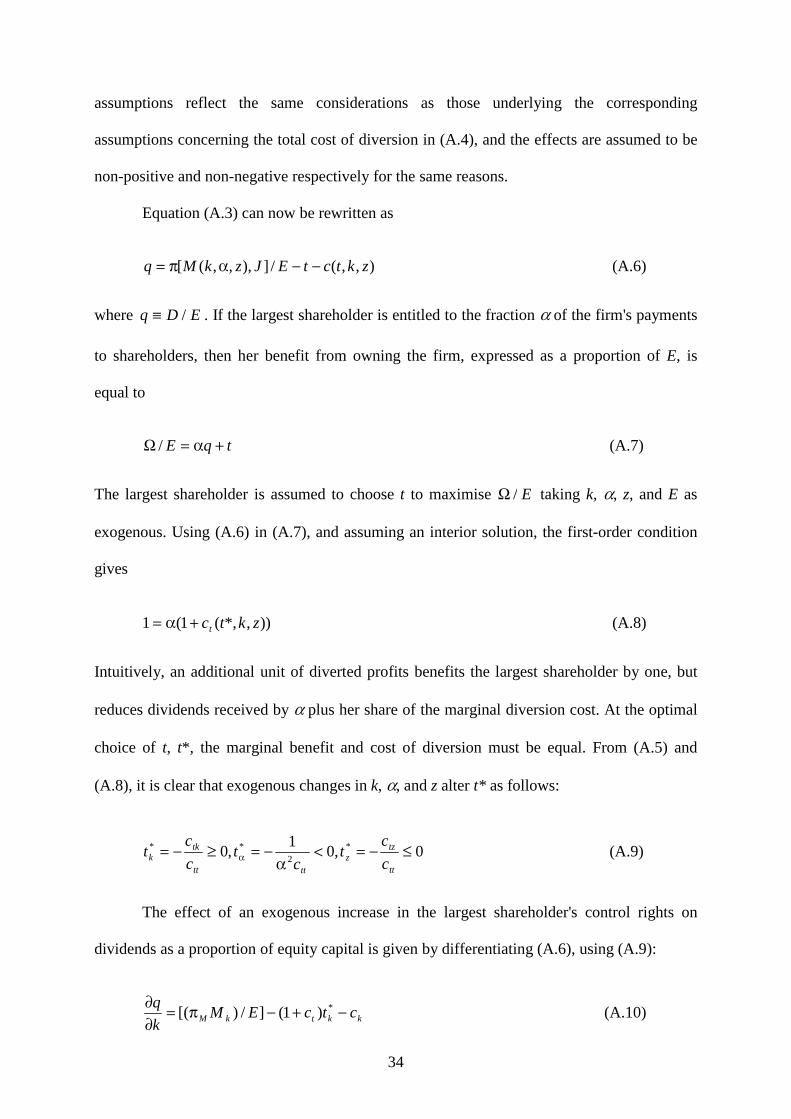
34
assumptions reflect the same considerations as those underlying the corresponding
assumptions concerning the total cost of diversion in (A.4), and the effects are assumed to be
non-positive and non-negative respectively for the same reasons.
Equation (A.3) can now be rewritten as
),,(/]),,,([ zktctEJzkMq −−απ= (A.6)
where q D E≡ / . If the largest shareholder is entitled to the fraction α of the firm's payments
to shareholders, then her benefit from owning the firm, expressed as a proportion of E, is
equal to
tqE +α=Ω / (A.7)
The largest shareholder is assumed to choose t to maximise Ω / E taking k, α, z, and E as
exogenous. Using (A.6) in (A.7), and assuming an interior solution, the first-order condition
gives
)),*,(1(1 zktct+α= (A.8)
Intuitively, an additional unit of diverted profits benefits the largest shareholder by one, but
reduces dividends received by α plus her share of the marginal diversion cost. At the optimal
choice of t, t*, the marginal benefit and cost of diversion must be equal. From (A.5) and
(A.8), it is clear that exogenous changes in k, α, and z alter t* as follows:
0,01
,0 *2
** ≤−=<α
−=≥−= αtt
tzz
tttt
tkk c
ct
ct
c
ct (A.9)
The effect of an exogenous increase in the largest shareholder's control rights on
dividends as a proportion of equity capital is given by differentiating (A.6), using (A.9):
kktkM ctcEMk
q −+−π=∂∂ *)1(]/)[( (A.10)

35
The overall effect of increased control rights is thus unclear. The first term on the right-hand
side of (A.10) represents the effect of increased control rights on gross profits via increased
monitoring, and is non-negative. The second term represents the effect of increased control
rights on diverted profits, and this has a non-positive effect on dividends as a proportion of
equity capital. The third term represents the effect of increased control rights on the costs of
diverting profits, and this has a non-negative effect on dividends as a proportion of equity
capital.
The effect of an exogenous increase in the largest shareholder's cash-flow rights on
dividends as a proportion of equity capital is
*)1(]/)[( αα +−π=∂α∂
tcEMq
tM (A.11)
Both effects of higher cash-flow rights tend to increase dividends as a proportion of equity
capital, by increasing monitoring of management and by raising the cost to the largest
shareholder of diverting profits.
Finally, the effect of an exogenous increase in the second-largest shareholder’s control
rights is
zztzM ctcEMz
q −+−π=∂∂ *)1(]/)[( (A.12)
Thus the effect of increases in the holding of the second-largest shareholder is also unclear.
Such increases may have a non-negative effect on dividends as a proportion of equity capital
by increasing monitoring of management (the first term on the right-hand side of (A.12)) and
reducing the diversion of profits by the largest shareholder (the second term). But they also
increase the cost of profit diversion, and this has a non-positive effect (the third term).

36
In our model, the optimal choice of diversion by the largest shareholder will be zero
for a firm with completely dispersed ownership if the marginal cost of diversion at zero
diversion becomes large as k becomes small, while for a firm in which k = α = 1, the optimal
choice of diversion will be zero if the marginal cost of diversion at zero diversion is zero, but
subsequently increases with diversion. If these assumptions about the marginal cost of profit
diversion are made, then the equity value of a company when its ownership is completely
dispersed reflects the absence of both profit diversion and monitoring of management, while
its equity value when the largest shareholder has all the control and cash-flow rights in it
reflects the absence of profit diversion and the presence of efficient monitoring of
management, and the difference between the value of equity in these two cases provides an
estimate of the value of efficient monitoring of management relative to no monitoring of
management.
A.2 OLS and IV estimates of the effects of ownership on share valuation
Table A.1 shows the full set of results obtained when a slightly modified version of
equation (2.2) was estimated by OLS and IV, as discussed in section 6 of the main text.

37
Table A.1: Comparison of OLS and instrumental variable estimates of effects of ownership structure on share valuation
Equation Number
Regressors A1.1 A1.2
CR1(Family) -2.61*** (0.80)
-7.65 (4.63)
CR1(Bank) -4.13*** (1.06)
-11.21* (6.01)
CR1(Nonbank) -4.62*** (1.01)
-11.85* (6.02)
CR1(Public) -0.92 (1.32)
-1.75 (1.84)
CR1(Foreign) -3.20*** (1.11)
-10.22 (6.16)
CF1(Family) -
-
CF1(Bank) - -
CF1(Nonbank) - - -
CF1(Public) -0.45 (1.85)
-1.87 (2.69)
CF1(Foreign) - - -
CF1(All except Public)
4.40*** (1.05)
9.70* (5.18)
CR2 (All except Public)
2.35** (1.00)
3.27 (2.25)
CR2 (Public) 0.66 (1.31)
3.74 (5.97)
OTH 4.72*** (1.53)
2.67 (3.11)
PEN 4.95** (1.91)
6.99** (3.15)
DEBT 1.40 (1.05)
2.00 (1.58)
SALESGR 0.82 (0.71)
0.41 (1.06)
ASSETS -0.0009 (0.0006)
-0.0016 (0.0011)
R2 0.6201 - Adjusted R2 0.4789 - GR2 - 0.5166 Adjusted GR2 - 0.3370
Notes.
1. Figures in parentheses are White heteroscedasticity-consistent standard errors. 2. * indicates significance at the 0.10 level, ** indicates significance at the 0.05 level, and *** indicates significance at the 0.01 level. 3. GR2 and adjusted GR2 are the measures of goodness of fit for an IV regression proposed by Pesaran and Smith (1994). 4. All equations also included an intercept and 12 industry dummy variables, the estimated coefficients of which are not reported.

38
References
Barclay, M. J. and C. G. Holderness (1989), ‘Private benefits from control of public
corporations’, Journal of Financial Economics 25, 371-395. Bergström, C. and K. Rydqvist (1990), ‘Ownership of equity in dual-class firms’, Journal of
Banking and Finance 14, 255-269. Cho, M-H. (1998), ‘Ownership structure, investment, and the corporate value: an empirical
analysis’, Journal of Financial Studies 47, 103-121. Claessens, S., S. Djankov, and L.H.P. Lang (2000), “The separation of ownership and control
in East Asian corporations”, Journal of Financial Economics 58, 81-112. Claessens, S., S. Djankov, J.P.H. Fan, and L.H.P. Lang (2002), “Disentangling the incentive
and entrenchment effects of large shareholdings”, Journal of Finance 57, 2741-2771. Demsetz, H. (1983), ‘The structure of ownership and the theory of the firm’, Journal of Law
and Economics 31, 375-390. Demsetz, H. and K. Lehn (1985), ‘The structure of corporate ownership: causes and
consequences’, Journal of Political Economy 93, 1155-1177. Edwards, J.S.S. and K. Fischer (1994), Banks, Finance and Investment in Germany.
Cambridge UK: Cambridge University Press. Faccio, M. and L.H.P. Lang (2002), “The ultimate ownership of Western European
corporations”, Journal of Financial Economics 65, 365-395. Faccio, M., L.H.P. Lang and L. Young (2001), “Dividends and expropriation”, American
Economic Review 91, 54-78. Fischer, A. and A. Haller (1993), ‘Bilanzpolitik zum Zwecke der Gewinnglättung: Empirische
Erkenntnisse’, Zeitschrift für Betriebswirtschaft 63, 35-59. Franks, J.R. and C.P. Mayer (2001), ‘The ownership and control of German corporations’,
Review of Financial Studies 14, 943-977. Hansmann, H. (1996), The Ownership of Enterprise. Cambridge USA: Harvard University
Press. Himmelberg, C.P, R.G. Hubbard and D. Palia (1999), ‘Understanding the determinants of
managerial ownership and the link between ownership and performance’, Journal of Financial Economics 53, 353-384.
Jenkinson, T.J. and A. Ljungqvist (1999), ‘The role of hostile stakes in German corporate governance’, Journal of Corporate Finance 7, 397-446.
Jensen, M.C. (1986), ‘Agency costs of free cash flow, corporate finance and takeovers’, American Economic Review 76, 323-329.
Jensen, M.C. and W.H. Meckling (1976), ‘Theory of the firm: managerial behavior, agency costs and ownership structure’, Journal of Financial Economics 3, 305-360.
Johnson, S., R. La Porta, F. Lopez-de-Silanes and A. Shleifer (2000), ‘Tunneling’, American Economic Review 90, 22-27.
La Porta, R., F. Lopez-de-Silanes, A. Shleifer and R.W. Vishny (1998), ‘Law and finance’, Journal of Political Economy 106, 1113-1155.
La Porta, R., F. Lopez-de-Silanes and A. Shleifer (1999), ‘Corporate ownership around the world’, Journal of Finance 54, 471-517.
Li, G. (1985), ‘Robust regression’, in D.C. Hoaglin, F. Mosteller, and J.W. Tukey (eds), Exploring Data, Tables, Trends, and Shapes, 281-340. New York: John Wiley & Sons.
Nibler, M.F. (1998), Bank Control and Corporate Performance in Germany: The Evidence. Unpublished PhD Thesis, University of Cambridge.
Pagano, M. and A. Röell (1998), ‘The choice of stock ownership structure: agency costs, monitoring, and the decision to go public’, Quarterly Journal of Economics 113, 187-225.

39
Pesaran, M.H., and R.J. Smith (1994), ‘A generalized R2 criterion for regression models estimated by the instrumental variables method’, Econometrica 62, 705-710.
Pilhofer, J. (1997), Rückstellungen im internationalen Vergleich: Bilanzierung und Bewertung nach HGB, US-GAAP und IAS. Wiesbaden: Deutscher Universitätsverlag.
Sinn, G. and H-W. Sinn (1992), Jumpstart. Cambridge MA: MIT Press. Shleifer, A. and R.W. Vishny (1986), ‘Large shareholders and corporate control’, Journal of
Political Economy 94, 461-488. Shleifer, A. and R.W. Vishny (1997), ‘A survey of corporate governance’, Journal of Finance
52, 737-783. Street, J.O., R.J. Carroll, and D. Ruppert (1988), ‘A note on computing robust regression
estimates via iteratively reweighted least squares’, The American Statistician 42, 152-154.
Zingales, L. (1994), ‘The value of the voting right: A study of the Milan stock exchange experience’, Review of Financial Studies 7, 125-148.
Zingales, L. (1995), ‘Insider ownership and the decision to go public’, Review of Economic Studies 62, 425-448.
Zwiebel, J. (1995), ‘Block investment and partial benefits of corporate control’, Review of Economic Studies 62, 161-185.