EARNINGS PER SHARE NETWORK
65
OURHEART &S UL DOMINO’S PIZZA ENTERPRISES LIMITED ANNUAL REPORT 2010
Transcript of EARNINGS PER SHARE NETWORK

OURHEART&S UL
DOMINO’S PIZZA ENTERPRISES LIMITED ANNUAL REPORT 2010

QUALITYISOURHEART&S ULAt Domino’s we don’t do things by halves, and we are proud of
our quality products. From our pizzas and pastas to our Good Choice Range and Oven Baked Sandwiches, It’s All Good!

2007
518.92007
14.82008
591.22008
18.42009
676.42009
22.62010
694.32010
26.2
NE
TW
OR
K
SA
LE
S
EA
RN
ING
S
PE
R S
HA
RE
663 2007
823 2010
776 2009
741 2008
AUSTRALIA 413 DOMINO’S 2GO 23
PINKIES 7 NEW ZEALAND 79
FRANCE 173 THE NETHERLANDS 100
BELGIUM 26 PIZZA COMPANY 2
DELIVERING ISOURHEART&S ULFrom delivering great results and value for our shareholders
to delivering piping hot pizza to our customers’ doors, we are committed to exceeding expectations and going the extra mile.
STORE COUNT 823
EBITDA GROWTH DELIVERED
15%.1 13%
.8
EBITDA MARGIN DELIVERED

PAGE 7
DOMINO’S PIZZA ENTERPRISES LIMITED ANNUAL REPORT 2010
2009-10 saw Domino’s introduce significant new platforms to the business across both the Australian/New Zealand and European markets.
From investment into new logistics in Europe, with the opening of our Dutch commissary, to investment in digital media to deliver another ordering capability, to expansion with the Belgium acquisition, Domino’s Pizza remained a robust performer.
Strong promotions in Australia and New Zealand, coupled with solid growth in our European store openings ensured Domino’s Pizza recorded positive results for the full year.
During the 12 months to 4 July 2010, Domino’s Pizza added 54 stores to the network which included 41 stores in Europe and 13 stores in Australia and New Zealand. At year end Domino’s store count was 823, allowing for seven Pinky’s stores which were removed from the network. The total store count was made up of 522 stores across Australia and New Zealand and 301 stores covering France, Belgium and The Netherlands.
A Net Profit After Tax of $17.8 million, up 16% on full year 2009, was achieved through product initiatives in both markets, including the introduction of a lunchtime non-pizza offering in Australia, New Zealand and France.
The year’s profit was generated from Total Network Sales of $694.3 million, an increase of 2.7% on full year 2008-09. Same Store Sales for the full year grew +2.8% from the previous year.
As a result of the strong NPAT, the Company is paying shareholders a final dividend of 11.8 cents per share, including a one-off special dividend of 3.4 cents per share. This brought the full year dividend to 17.8 cents per share, a 43.5% increase on 2008-09.
As a result, Domino’s Pizza’s balance sheet remains strong with low gearing and significant free cash generated by the group’s solid operations.
The year also saw Domino’s celebrate the opening of its 300th European store, achieved in part through the acquisition of the 15-store Belgian pizza chain “A Pizza Company”.
Domino’s success across Australia, New Zealand, France, Belgium and The Netherlands is credited to our experienced senior management who have put strategic business plans in place which focus on being the customer’s champion while continuing to develop and invest in our valued franchisees, managers and team members.
Looking forward, a key element of the Company’s strategy is a renewed focus on operational performance and new initiatives to drive Domino’s Pizza into a new era of pizza delivery.
The support and commitment of our shareholders will ensure Domino’s Pizza can continue to grow and deliver solid financial performance in years to come. On behalf of the directors, I thank you for this support and look forward to sharing future milestones with you.
It is with great pleasure we present you with our sixth Annual Report.
ROSS ADLER CHAIRMAN
CHAIRMAN’SMESSAGE
IT’S THE HEART & SOUL IN DOMINO’S PIZZA WHICH MAKES IT THE SUCCESS IT IS TODAY.
KEY DATESFINANCIAL YEAR END 4 JULY 2010
DIVIDEND RECORD DATE 30 AUGUST 2010
DIVIDEND PAYMENT DATE 15 SEPTEMBER 2010
ANNUAL GENERAL MEETING 3 NOVEMBER 2010
The Annual General Meeting will be held as follows:
Date Wednesday, 3 November 2010
Venue Icon Theatre Eagle Street Conference Centre 175 Eagle Street, Brisbane
Time 3.00pm
4 FINANCIAL HIGHLIGHTS
7 CHAIRMAN’S MESSAGE
8 CEO’S REPORT
14 PROMOTION
19 EUROPE UPDATE
22 PRODUCT, SERVICE AND IMAGE
24 ONLINE AND INNOVATION
27 PEOPLE AND THE COMMUNITY
28 AUSTRALIA AND NEW ZEALAND
LEADERSHIP TEAM
30 EUROPEAN LEADERSHIP TEAM
32 BOARD OF DIRECTORS
33 FINANCIAL STATEMENTS
PAGE 8
DOMINO’S PIZZA ENTERPRISES LIMITED ANNUAL REPORT 2010
PAGE 9
DOMINO’S PIZZA ENTERPRISES LIMITED ANNUAL REPORT 2010
MORE OPTIONS, IMPROVED QUALITY & GREATER VALUE
The journey to improve our ingredients and raise the quality of all of our products is well underway, but 2009-10 presented us with a bigger road map to navigate.
While we will always have pizza sauce running through our veins, we made a bold decision to introduce new categories to our menu to ensure we continue to offer our customers what they want from us.
With this in mind, we explored avenues in our business where we weren’t maximising the potential. The first area was the lunch part of our business in Australia and New Zealand. With the majority of our stores open during lunchtime, this was a huge window of opportunity for us, however, we realised pizza isn’t necessarily the first choice for our customers at lunchtime. After months of development, testing and trials we launched our Oven Baked Sandwiches, with seven fresh made-to-order varieties.
The Oven Baked Sandwiches added a new layer to our business during the day and most importantly gave customers another reason to choose Domino’s at lunchtime.
Our next menu addition was one of the most challenging launches Domino’s had ever undertaken in Australia.The Domino’s Good Choice Range was launched in collaboration with the popular reality TV show The Biggest Loser and their trainer Shannan Ponton. The range included seven nutritious, calorie-controlled meals that catered to a variety of tastes.
Unlike our regular pizza menu, the Good Choice Range offers individual-sized portions of pizza, pasta, Oven Baked Sandwiches, salads and sides.
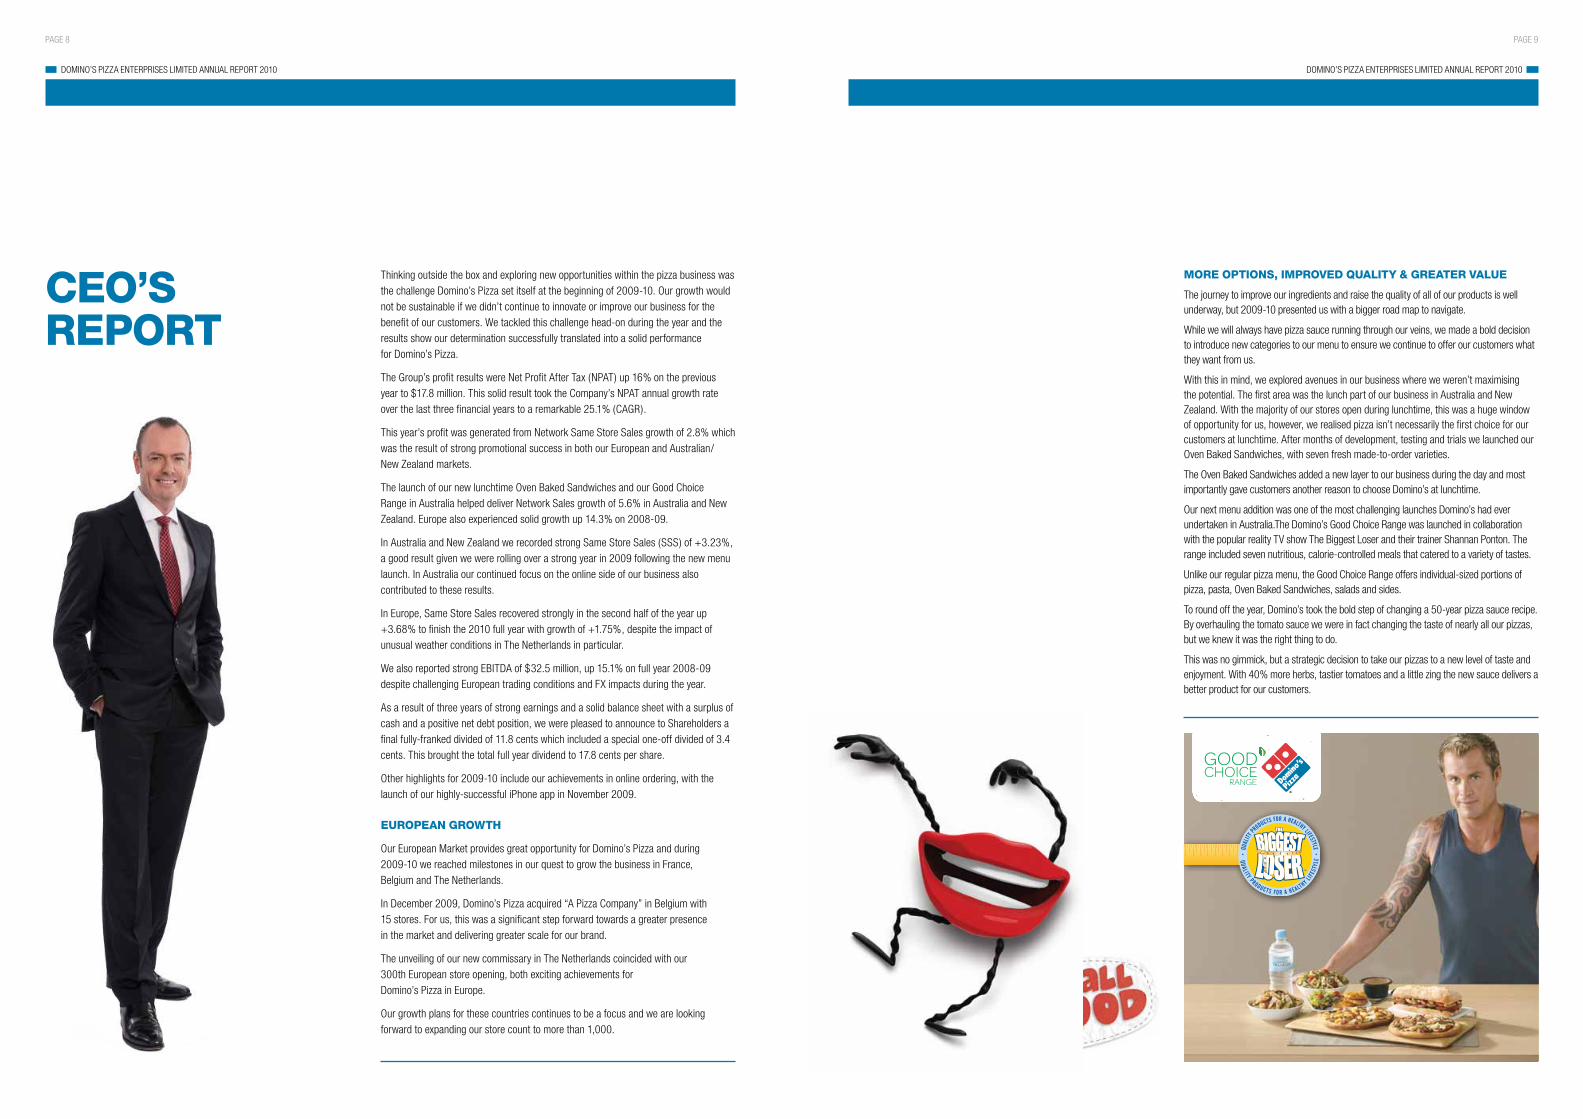
To round off the year, Domino’s took the bold step of changing a 50-year pizza sauce recipe. By overhauling the tomato sauce we were in fact changing the taste of nearly all our pizzas, but we knew it was the right thing to do.
This was no gimmick, but a strategic decision to take our pizzas to a new level of taste and enjoyment. With 40% more herbs, tastier tomatoes and a little zing the new sauce delivers a better product for our customers.
Thinking outside the box and exploring new opportunities within the pizza business was the challenge Domino’s Pizza set itself at the beginning of 2009-10. Our growth would not be sustainable if we didn’t continue to innovate or improve our business for the benefit of our customers. We tackled this challenge head-on during the year and the results show our determination successfully translated into a solid performance for Domino’s Pizza.
The Group’s profit results were Net Profit After Tax (NPAT) up 16% on the previous year to $17.8 million. This solid result took the Company’s NPAT annual growth rate over the last three financial years to a remarkable 25.1% (CAGR).
This year’s profit was generated from Network Same Store Sales growth of 2.8% which was the result of strong promotional success in both our European and Australian/ New Zealand markets.
The launch of our new lunchtime Oven Baked Sandwiches and our Good Choice Range in Australia helped deliver Network Sales growth of 5.6% in Australia and New Zealand. Europe also experienced solid growth up 14.3% on 2008-09.
In Australia and New Zealand we recorded strong Same Store Sales (SSS) of +3.23%, a good result given we were rolling over a strong year in 2009 following the new menu launch. In Australia our continued focus on the online side of our business also contributed to these results.
In Europe, Same Store Sales recovered strongly in the second half of the year up +3.68% to finish the 2010 full year with growth of +1.75%, despite the impact of unusual weather conditions in The Netherlands in particular.
We also reported strong EBITDA of $32.5 million, up 15.1% on full year 2008-09 despite challenging European trading conditions and FX impacts during the year.
As a result of three years of strong earnings and a solid balance sheet with a surplus of cash and a positive net debt position, we were pleased to announce to Shareholders a final fully-franked divided of 11.8 cents which included a special one-off divided of 3.4 cents. This brought the total full year dividend to 17.8 cents per share.
Other highlights for 2009-10 include our achievements in online ordering, with the launch of our highly-successful iPhone app in November 2009.
EUROPEAN GROWTH
Our European Market provides great opportunity for Domino’s Pizza and during 2009-10 we reached milestones in our quest to grow the business in France, Belgium and The Netherlands.
In December 2009, Domino’s Pizza acquired “A Pizza Company” in Belgium with 15 stores. For us, this was a significant step forward towards a greater presence in the market and delivering greater scale for our brand.
The unveiling of our new commissary in The Netherlands coincided with our 300th European store opening, both exciting achievements for Domino’s Pizza in Europe.
Our growth plans for these countries continues to be a focus and we are looking forward to expanding our store count to more than 1,000.
CEO’S REPORT

PAGE 10
DOMINO’S PIZZA ENTERPRISES LIMITED ANNUAL REPORT 2010
LEADER IN DIGITAL TECHNOLOGY
Domino’s has always prided itself on being an innovator and early adopter of new technology and 2009-10 was no different.
The launch of our iPhone Application (App) in November 2009 was a way for us to take pizza ordering to a new level and give customers the chance to order anywhere, anytime from the palm of their hand.
The iPhone App is like having a Domino’s Pizza store in your pocket, from browsing the menu, to selecting new offers or arranging a timed order for dinner. We’ve given customers the freedom to order their way and it proved successful immediately.
Results have far exceeded original expectations with more than $2 million worth of sales coming from the iPhone within the first three months. Today, the Domino’s iPhone App has been downloaded more than 350,000 times.
As well as growing sales and orders through digital, we also wanted to step up and be involved with the online community. Social Media plays a key role in many businesses these days and this couldn’t be more truthful for a business such as ours. With tech-savvy customers and team members our involvement in Facebook, Twitter and Youtube plays a key role in our customer relationship management.
OUR PEOPLE PASSION
A focus on team member appointment, development and training during 2009-10 was vital to ensure our strategic direction was implemented seamlessly at a store and operational level.
We continue to improve our DOTTI (Domino’s Online Training and Tracking Initiative) program which is used to provide Domino’s team members with access to training classes, training tools and general educational information and alerts. A central training initiative allows for all team members to be trained effectively and efficiently across all stores.
At a management level, we announced the return of Andrew Rennie to Australia to take up the newly-created position of Chief Operating Officer (COO).
Andrew’s role as COO will be to oversee Operations (franchise and corporate), Development and Marketing. As we continue to focus on improving our operations, Andrew’s wealth of knowledge in this area, coupled with new learning from his role as President France, will bring a new dimension to our business.
Melanie Gigon has been appointed as the new President France, a key step forward for our growth in the country. Melanie has built strong relationships with franchisees over the last 10 years in her role as Marketing Director. She was also a driving force behind key marketing initiatives which have helped Domino’s become the most recognised takeaway pizza brand in France.
Domino’s Group Chief Financial Officer, Richard Coney, also added Purchasing and Logistics to his portfolio of IT, Legal and Finance. The service, governance and supply of our business are now managed cohesively.
Domino’s growth and success would not be achievable without our talented group of franchisees and team members who work across our five countries.
We welcomed many new store owners to our business during 2009-10 and their passion to succeed as Domino’s franchisees means we can continue to provide the best product, service and image for our customers.
Franchise development plays a pivotal role in attracting new people into our business and this area of Domino’s will grow significantly as we continue to open more stores.
Our franchisees are at the heart and soul of Domino’s and we are committed to continually fostering strong relationships with new, existing and potential franchisees to help drive our future direction across Australia, New Zealand, France, Belgium and The Netherlands.
STORE DESIGN
A new Domino’s Pizza store design was also launched this year. The design brings the pizza making to the front of the store, directly in front of customers.
In Australia, the new design is now in Applecross (Western Australia), Spring Hill (Queensland) and North Tamworth (New South Wales).
While over in The Netherlands, Heerenveen is our first European store to reflect this concept.
With so many new ingredients on our menu we wanted customers to see the improvements. Customers can now watch as their pizza is made fresh in front of them.
The contemporary design also includes more customer seating and the Spring Hill store even offers free Wi-Fi internet access.
TOWARDS THE FUTURE
The past 12 months has seen Domino’s expand our offering to customers, grow our presence in our markets and embrace technology. Getting back to the basics and focusing on improving our operations is the next step for us moving forward.
Success can not be achieved without challenges, but I’m confident we have the right people, the right focus and the right direction to ensure Domino’s Pizza can continue to record strong results year on year.
During 2010-11 we plan to open 50 to 60 new stores, again with the majority of these in Europe as we grow this area of Domino’s Pizza.
We are confident of continuing the current momentum we are experiencing and we expect to deliver a NPAT between 10-15% above 2010.
On an operational level, new initiatives will be introduced and we are looking forward to re-energising this important area of our business.
Digital will again play a fundamental role in keeping up to speed with our technologically based world. Our goal is to achieve 50% of sales online within three years and the next step in embracing this potential will be the launch of our new eStore before Christmas 2010.
Finally, 2009-10 was a huge year for Domino’s Pizza and I would like to congratulate our network of more than 16,000 franchisees, managers and team members who have embraced the Company’s direction and made a difference where it counts - in front of our valued customers.
DON MEIJ CHIEF EXECUTIVE OFFICER / MANAGING DIRECTOR

Nick Knight is a Domino’s Pizza multi-unit franchisee who has been with the Company for more than 13 years. Nick currently owns 11 successful Domino’s stores in New South Wales, including one of Australia’s busiest stores at Elizabeth Street in Sydney’s CBD. A born leader and early adopter of new innovation and technology, Nick’s stores are among the highest for online orders and he also boasts a fleet of more than 50 scooters.
Nick started working at Domino’s Pizza as a teenager in Tamworth, where he remembers doing all things from wobble boarding in 35 degree heat to making pizzas during peak on a Saturday night.
After a brief stint away from the Company to study, Nick returned to the Domino’s Pizza business to take up a role as Franchise Trainer and then Regional Manager. Realising the potential of a career in Domino’s, Nick was put in charge of the Elizabeth Street store in Sydney which had a large lunch shift and big office orders on week days. After a short time managing the store, Nick successfully purchased the business in partnership with Domino’s Pizza.
Since 2003, Nick has become franchisee of another 10 stores across Sydney and Regional New South Wales purchasing Glebe, Five Dock, Darlinghurst, Strathfield, Parramatta, Armidale, Tamworth, North Tamworth, Bathurst and Orange. Nick now considers himself an owner of a medium-sized business with its own support staff and training facilities.
According to Nick, the key to his success is his people. He credits a lot to his store managers who are the people who can have the biggest impact in a Domino’s store. He believes employing the right people, treating them well and giving them the tools and training to do the job leads to success.
At the age of 27, Nick’s passion and dedication has lead him to become highly recognised by Domino’s Pizza. Nick has received countless accolades and awards including the International Gold Franny Award, Domino’s most prestigious award internationally. It recognises people who show outstanding leadership, integrity and vision, while continually showcasing excellence in service, operations, sales, store growth, pizza quality while being hands on with operations and consistently challenging others with the highest standards.
While running his 11 stores, Nick Knight is also a member of Domino’s Pizza’s National Product Development Team assisting new product development from a franchisee perspective.
NICK KNIGHTMULTI-UNIT FRANCHISEE
FRANCHISING ISOURHEART&S ULOur franchisees have pizza sauce running through their veins. It’s their commitment and dedication to our business that makes Domino’s the success it is today.
PAGE 14
DOMINO’S PIZZA ENTERPRISES LIMITED ANNUAL REPORT 2010
PAGE 15
DOMINO’S PIZZA ENTERPRISES LIMITED ANNUAL REPORT 2010
GOOD CHOICE RANGE
We started the New Year with another huge promotion in our Good Choice Range. Teaming up with popular reality TV show The Biggest Loser and their trainer Shannan Ponton, we launched our Good Choice Range, consisting of seven nutrition conscious, calorie-controlled meals.
In launching our Good Choice Range, we undertook extensive customer research to explore the eating and exercise habits of Australians. The results provided us with a fantastic insight into the reasons why people find it hard to incorporate healthy eating into their busy lifestyles.
What we found:• 48%ofpeoplefinditmostdifficulttoeathealthilywhenorderingtakeawaydueto
the lack of healthy alternatives at fast food outlets • 45%ofpeoplefalloffthehealthyeatingbandwagonduetothelackofchoiceandtasty,
healthy options available.
As part of our ongoing commitment to offering greater choice for our customers we worked tirelessly to develop a range of individual-sized meals to suit various tastes:• BBQChicken&MushroomCiabattaPizza• Chicken,Tomato&OreganoCiabattaPizza• CrispyAsianNoodleSaladwithaSoy&ChilliDressing• SouthernStyleChickenScallopswithaGardenSalad• OvenBakedSandwichwithCrispyTurkeyRissoles&SweetChilliSauce• PennePastawithRoastedChicken,Mushroom&VineRipenedTomato• ChocolateMousse
A Choice Magazine report in April 2010 into the healthiest and tastiest pizzas available found the Domino’s Good Choice Range pizzas rated the best for taste out of the healthy options available in the market at that time.
The Domino’s Good Choice Range is now part of our permanent menu and since the launch we have introduced the new Prawn and Spinach Ciabatta style pizza to the range.
We have been making significant changes to our business over the past 18 months. We started this journey with our biggest menu launch in February last year and this year we have continued to strive to be the customers’ champion by listening and responding to what our customers have told us and asked for.
Pushing the boundaries and stepping outside the (pizza) box has seen Domino’s move into a new era, taking the Australian pizza category with it.
In the past 12 months we have dramatically increased the quality of our ingredients, added significantly more choice to our menu, and added two new categories in our Good Choice Range and Oven Baked Sandwiches.
However, we know pizza is what we do best, that’s why we re-invented our famous Supreme pizza and changed our 50-year-old tomato sauce recipe in May 2010.
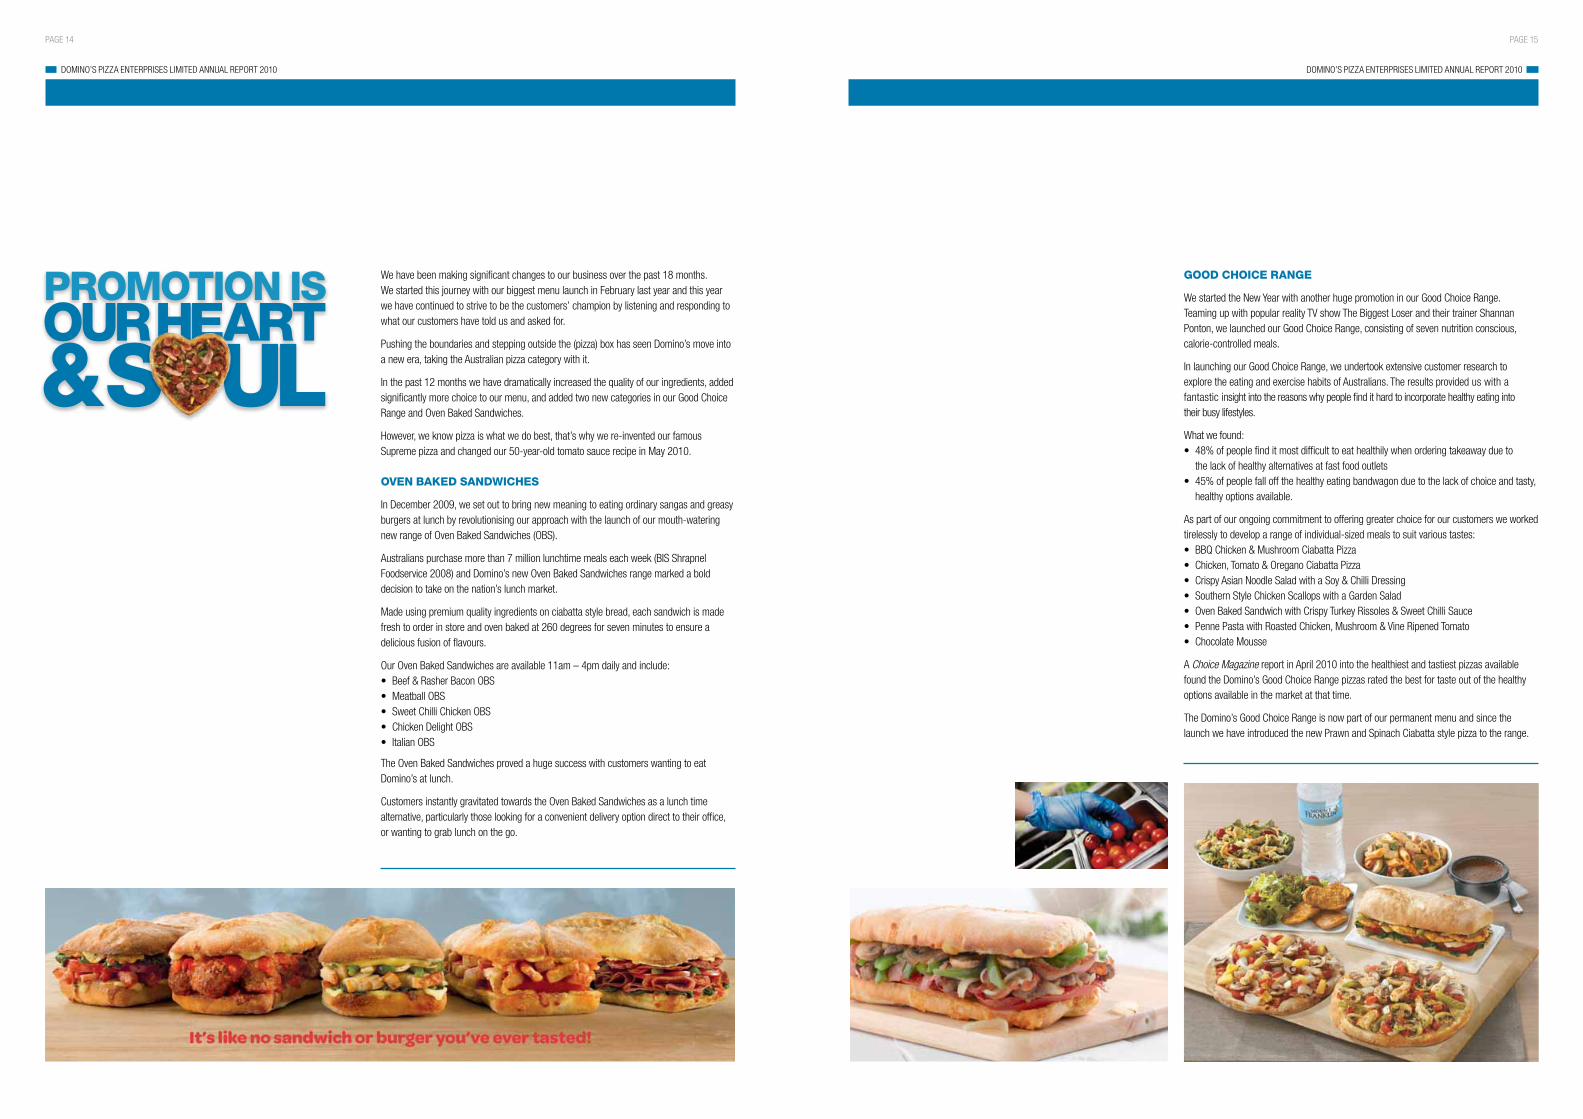
OVEN BAKED SANDWICHES
In December 2009, we set out to bring new meaning to eating ordinary sangas and greasy burgers at lunch by revolutionising our approach with the launch of our mouth-watering new range of Oven Baked Sandwiches (OBS).
Australians purchase more than 7 million lunchtime meals each week (BIS Shrapnel Foodservice 2008) and Domino’s new Oven Baked Sandwiches range marked a bold decision to take on the nation’s lunch market.
Made using premium quality ingredients on ciabatta style bread, each sandwich is made fresh to order in store and oven baked at 260 degrees for seven minutes to ensure a delicious fusion of flavours.
Our Oven Baked Sandwiches are available 11am – 4pm daily and include:• Beef&RasherBaconOBS• MeatballOBS• SweetChilliChickenOBS• ChickenDelightOBS• ItalianOBS
The Oven Baked Sandwiches proved a huge success with customers wanting to eat Domino’s at lunch.
Customers instantly gravitated towards the Oven Baked Sandwiches as a lunch time alternative, particularly those looking for a convenient delivery option direct to their office, or wanting to grab lunch on the go.
PROMOTION ISOURHEART&S UL
PAGE 16
DOMINO’S PIZZA ENTERPRISES LIMITED ANNUAL REPORT 2010
PAGE 17
DOMINO’S PIZZA ENTERPRISES LIMITED ANNUAL REPORT 2010
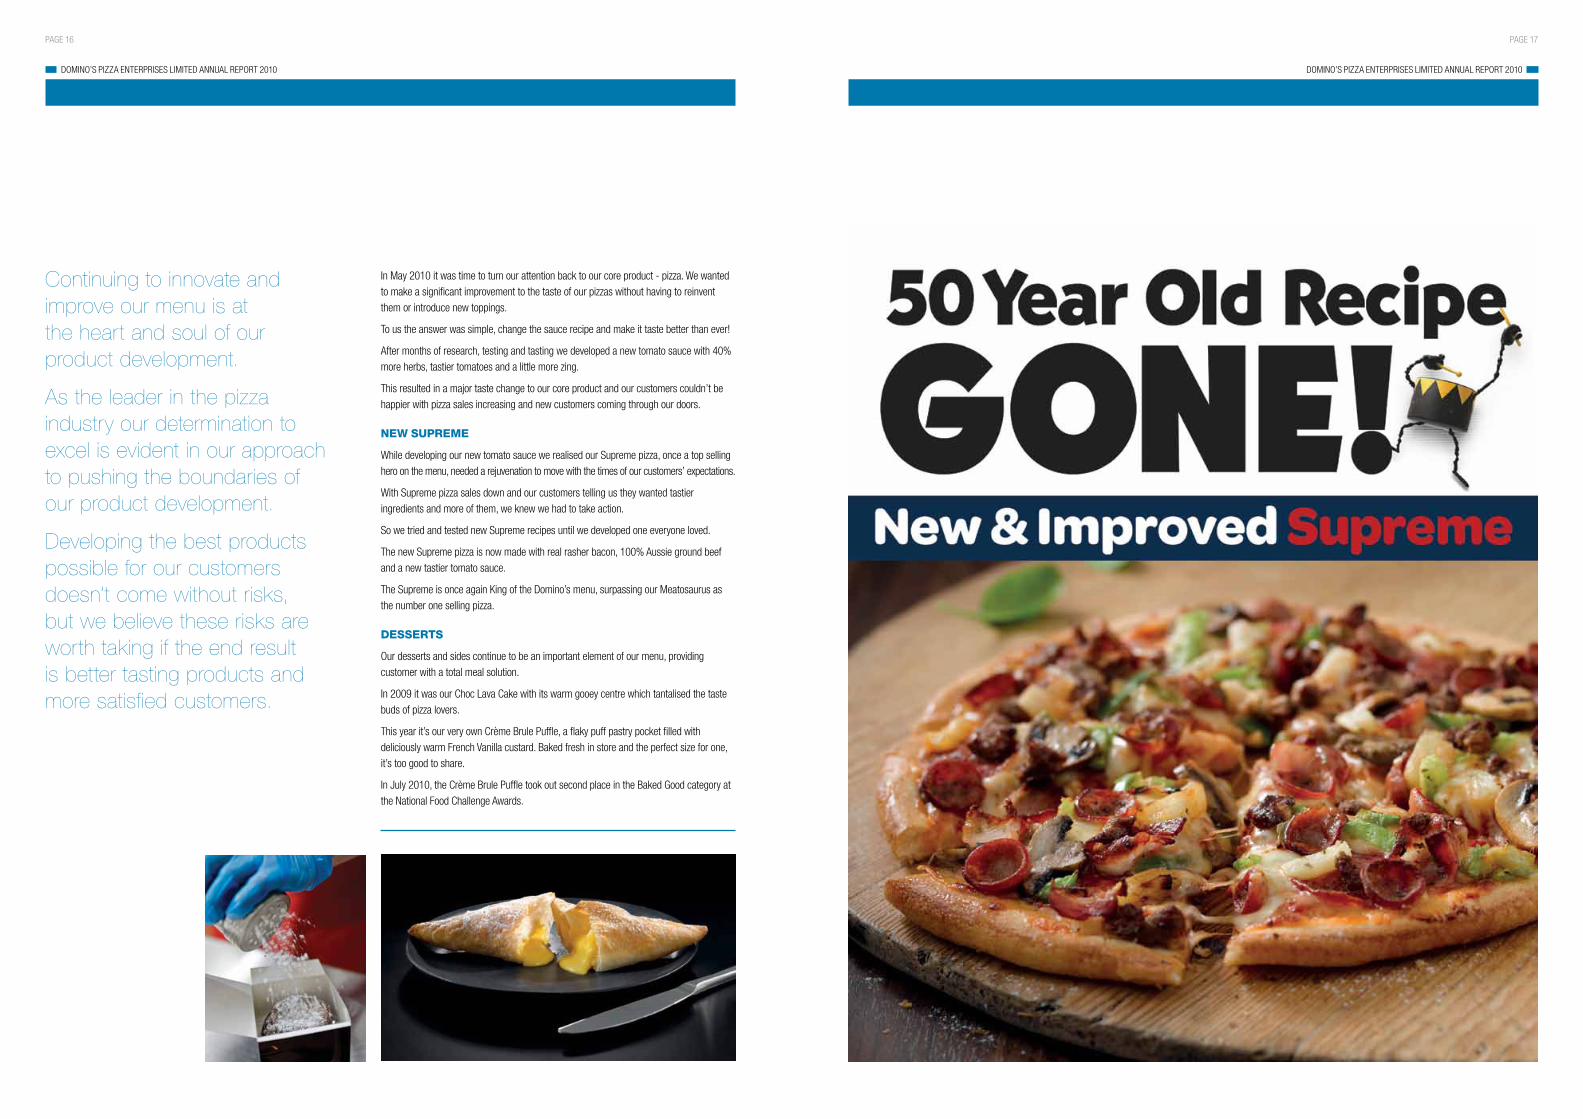
In May 2010 it was time to turn our attention back to our core product - pizza. We wanted to make a significant improvement to the taste of our pizzas without having to reinvent them or introduce new toppings.
To us the answer was simple, change the sauce recipe and make it taste better than ever!
After months of research, testing and tasting we developed a new tomato sauce with 40% more herbs, tastier tomatoes and a little more zing.
This resulted in a major taste change to our core product and our customers couldn’t be happier with pizza sales increasing and new customers coming through our doors.
NEW SUPREME
While developing our new tomato sauce we realised our Supreme pizza, once a top selling hero on the menu, needed a rejuvenation to move with the times of our customers’ expectations.
With Supreme pizza sales down and our customers telling us they wanted tastier ingredients and more of them, we knew we had to take action.
So we tried and tested new Supreme recipes until we developed one everyone loved.
The new Supreme pizza is now made with real rasher bacon, 100% Aussie ground beef and a new tastier tomato sauce.
The Supreme is once again King of the Domino’s menu, surpassing our Meatosaurus as the number one selling pizza.
DESSERTS
Our desserts and sides continue to be an important element of our menu, providing customer with a total meal solution.
In 2009 it was our Choc Lava Cake with its warm gooey centre which tantalised the taste buds of pizza lovers.
This year it’s our very own Crème Brule Puffle, a flaky puff pastry pocket filled with deliciously warm French Vanilla custard. Baked fresh in store and the perfect size for one, it’s too good to share.
In July 2010, the Crème Brule Puffle took out second place in the Baked Good category at the National Food Challenge Awards.
Continuing to innovate and improve our menu is at the heart and soul of our product development.
As the leader in the pizza industry our determination to excel is evident in our approach to pushing the boundaries of our product development.
Developing the best products possible for our customers doesn’t come without risks, but we believe these risks are worth taking if the end result is better tasting products and more satisfied customers.

PAGE 19
DOMINO’S PIZZA ENTERPRISES LIMITED ANNUAL REPORT 2010
EUROPE UPDATE
300TH STORE MILESTONE
In July 2010, Domino’s opened its 300th European store in Pessac, France, in the famous Bordeaux wine region.
Domino’s has grown to become the number one pizza company in France and The Netherlands in sales and store count, and aims to be the number one pizza delivery company in Belgium in store count by the end of 2010.
BELGIUM – PIZZA COMPANY UPDATE
In December 2009, Domino’s purchased the Belgium pizza chain “A Pizza Company” which operated 15 stores.
The purchase immediately doubled Domino’s store count in Belgium and is a big step forward towards a greater presence in the country and represents significant progress towards television and radio advertising.
Since the purchase nine Pizza Company stores have converted to Domino’s Pizza. These include: Aalst, Mechelen, Brugge, Kortrijk, Roeselare, Oostende, Waregem, Bornem and Brussels.
FABRICE DORIEMULTI-UNIT FRANCHISEE
After 14 years in the pizza business, Fabrice Dorie still has a passion for pizza and a drive to constantly succeed and improve in every facet of his business. Fabrice started with Domino’s in 1995, prior to that he worked for ZAP Pizza in France as Manager then Supervisor for Paris and Province, overseeing 11 stores.
After joining Domino’s Fabrice was promoted to the role of Franchise Consultant, looking after five franchisees. In 1999, Fabrice took the plunge, purchasing his first store in Nantes, France. Since then, he has purchased six more stores and one call centre, and today he employs around 200 staff throughout his company.
Fabrice is proud to be a Domino’s franchisee, thriving on the strong team culture and belonging to such a well known and innovative brand. He relishes the fact people can join Domino’s with nothing, starting as a delivery driver or pizza maker, and if they put in the hard work and have the right attitude then they really can succeed.
This philosophy stems from his background, with Domino’s Pizza giving Fabrice the help he required to open his first store and in turn making his business dreams a reality. Over the years Domino’s support continued, assisting Fabrice to take the next step in his career and become a multi-unit franchisee. Today Fabrice is France’s second largest franchisee, owning a small pizza empire.
In the future Fabrice plans to purchase more stores and then pass on to his employees the same support Domino’s showed him, by selling his existing stores to them so they in turn can become franchisees and achieve their business dreams.
Encouraging a strong team spirit and culture within his stores, Fabrice is focused on working together with his staff to share information and grow his business.
This will ensure his stores and team members are among the best Domino’s Pizza outlets in France with the most satisfied customers.

PAGE 20
DOMINO’S PIZZA ENTERPRISES LIMITED ANNUAL REPORT 2010
PAGE 21
DOMINO’S PIZZA ENTERPRISES LIMITED ANNUAL REPORT 2010
NEW TEMPTRESSES
GROOVY BACONMeet Bacon Groovy, a new temptress with a hip new recipe: barbecue sauce, light cream, mozzarella, roast chicken, onions and lots of bacon.
KEBABAMeet Kebaba, a new temptress with a mouth-watering recipe: tomato sauce, mozzarella, chicken kebab meat, green peppers, onion, fresh light cream and oregano.
BEEFANATIKA Meet Beefanatika, a new temptress with a spicy new recipe: tomato sauce, mozzarella, spicy beef, spicy sausage, onions, fresh tomatoes and oregano.
SANDWICHO’S
Sandwicho’s are a true Domino’s creation - a sandwich like no other. The delicious oven baked sandwiches come in five recipes and add another layer to the French business with lunch time sales:LE MUSCLÉ Lots of roast chicken, peppers, fresh tomatoes, light crème fraîche,
oregano and Gouda cheese.LE BRITISH Lots of roast chicken, bacon, onions, barbecue sauce, light crème
fraîche and Gouda cheese.EL MUCHACHO Chickenito’s, barbecue sauce, light crème fraîche and Gouda cheese.LE CHÈVRE Goat cheese, peppers, fresh tomatoes, light crème fraîche,
oregano and Gouda cheese.L’AUDACIEUX Blue cheese, bacon, onions, light crème fraîche and Gouda cheese.
“HUNGER IN THE BAG!”
To keep their beautiful sandwiches “the Sandwicho’s” hot before their national launch in March 2010, Domino’s France invited all young graphic designers to enter a “hunger in the bag” contest to find the artwork for the Sandwicho bag packaging. Domino’s then narrowed down the search to three finalists who had their art subjected to fan votes via Facebook to find the winning entry. The winner was announced in December 2009.
FOOTAVATAR – FACEBOOK PROMOTION
In partnership with Coca-Cola, Domino’s France launched the first application of its kind where fans could make their own avatar with the colours of their favourite football team.
More than 711,000 Domino’s Footavatars were created and posted on Facebook!
This promotion was an incredible phenomenon which passed the French borders and reached 1st place in the world of the most used applications with close to 1,000,000 users.
The Footavatar promotion was a huge success for Domino’s France with more than 60,000 fans joining their Facebook fan page.
Today, Domino’s France now has more than 115,000 fans, becoming the number one Facebook page of the fast-food industry in France, even exceeding Quick! one of Europe’s largest restaurant chains.
This promotion profited from good brand visibility on affiliated football websites, in particular a specific home design on SoFoot and FootMercato sites on the opening day of the World Cup and the first match of the French team.
NEW COMMISSARY
20 January 2010 was a day of celebration in Gorinchem, The Netherlands. It was the official opening of Domino’s new headquarters and commissary. The Dutch were honoured to have Eduard Swagemakers, the founder of Domino’s in The Netherlands, participate in the official opening of the building. Together with Domino’s leadership team members, Eduard officially opened the impressive new facility.
NEW LOOK & FEEL
The Netherlands are in the process of revamping their marketing look and feel, starting with a redesign of their boxes and packaging. The new look was introduced with Italian Premiums promotion, introducing the new authentic looking Italian pizza box into stores. With upcoming promotions, all packaging will be redesigned into a ‘Fresh’ new look.
ITALIAN PREMIUMS
This year Domino’s The Netherlands went Italian – delivering customers three delicious Italian Premium pizzas for only C7,99 each delivered. The three mouth-watering additions to the Dutch menu were promoted as the Italian Premiums, and consisted of:QUATTRO FORMAGGI Four cheese pizza with a tomato sauce base, mozzarella, Edam
cheese, Red Cheddar and Gorgonzola, finished with oreganoSALAME SPECIALE A tomato sauce base topped with mozzarella, large slices of real
salami, a green/yellow/red pepper mix and oreganoSCAMPI A tomato sauce base topped with mozzarella, fresh spinach,
shrimps, garlic, fresh tomato and oregano. A terrific addition to their Top Taste range.
MOBILE DELIVERY POINT
Domino’s The Netherlands is well-known for its fast delivery, but less well-known is the fact you can have a pizza delivered almost anywhere - on a boat, at the beach or in the park, as long as there is a Domino’s store nearby. But until recently this was not common knowledge amongst customers.
Domino’s The Netherlands changed that with their new Mobile Delivery Points. These Domino’s front doors, equipped with doorbell, can be placed anywhere near a Domino’s store and make it easier and more fun for customers to have a pizza delivered at a location they didn’t expect.
THE NETHERLANDS
FRANCE & BELGIUM

PAGE 23
DOMINO’S PIZZA ENTERPRISES LIMITED ANNUAL REPORT 2010
LIFTING OUR PRODUCT QUALITY
Our commitment to lifting the taste and quality of our ingredients couldn’t be stronger than it is right now.
When developing our Good Choice Range and Oven Baked Sandwiches, we challenged ourselves to improve the quality of all ingredients across our range.
Why? We knew it was the right thing to do and our customers would reward us for it, and they did.
All our menu items, whether it be a traditional pizza, Good Choice Range item, Pastas or lunchtime Oven Baked Sandwich are all made fresh to order with premium quality ingredients we are proud of.
Recent improvements:• Realrasherbacon• Tastier100%Aussiegroundbeef• Newtomatosauce
In September 2009 we also made a commitment to reducing salt content in our proteins, bakery and dairy ingredients by 25% over the next three years as well as reducing the saturated fat content of their proteins and dairy ingredients by 15%.
This salt and saturated fat content reduction is in line with the UK Food Standard authorised level used by The Australian Division of World Action on Salt and Health (AWASH).
Since these targets were set in June 2009, Domino’s has already reduced the salt in its three chicken products: chicken breast, kickers and wings by 19-20% and its beef product by 18%. These changes have already rolled out to stores.
Domino’s chicken breast has had a 50% decrease in saturated fat, while beef has had a 5% reduction.
Domino’s is continuing to work with suppliers to increase the quality of its products while decreasing the salt and saturated fat in key ingredients.
SERVICE
Our quest to be the customers’ champion is why we are passionate about providing outstanding service at all customer touch points.
Whether it be ordering online, via telephone, accepting a delivery at your front door or picking up a pizza from your local store on your way home from work, our team members are trained to provide the best service possible.
In the pizza industry we know there’s choice, but we are confident great customer service partnered with fantastic product is the key to ensuring customers continue to turn to Domino’s for their next pizza.
As we lead the way in the pizza industry, we will continue to strive to be the customers’ champion.
NEW STORE DESIGN
Our stores have stepped into the future with the launch of a new state-of-the-art store design concept.
New concept stores:• Applecross, Western Australia• NorthTamworth,NewSouthWales• SpringHill,Queensland
The new store layout is distinctively different from all other Domino’s stores, with the pizza making now taking pride of place directly in view of customers at the front of the store.
The Applecross store design was the first of its kind for any Domino’s store in Australia and the world.
The fresh new approach to pizza making is also evident in the new Domino’s ‘Chef’ uniform and a larger seating area for customers.
We take food and pizza making seriously and we wanted our in-store team members to feel proud to be a Domino’s Pizza maker which is why we designed a black chef uniform and cap.
It’s a huge step away from our current uniform and we couldn’t be happier with how it looks!
IMAGE ISPRODUCTSERVICE &
OURHEART&S UL
Outstanding product, excellent service & a positive image is the heart and soul of Domino’s

PAGE 24
DOMINO’S PIZZA ENTERPRISES LIMITED ANNUAL REPORT 2010
PAGE 25
DOMINO’S PIZZA ENTERPRISES LIMITED ANNUAL REPORT 2010
SOCIAL MEDIA
Social media has brought a new customer front to the pizza industry. Customers can now connect with brands anywhere and at anytime of the day.
Connecting with our customers is at the heart and soul of our commitment to always exceeding their expectations and doing whatever it takes to be the customers’ champion.
Our presence on Twitter, Facebook and YouTube has allowed us to receive instant feedback and comments from customer, both positive and negative, which has helped Domino’s build customer loyalty and rapport.
Our overall marketing communication strategy now includes dedicated social media initiatives.
We monitor our social networking sites every day and respond immediately to any issues or concerns from our fans. People love to share information and the popularity of online social networking has made word of mouth a much stronger communication tool than ever before.
On popular social networking sites, Domino’s fans and followers have grown to more than 37,000 on Facebook and more than 3,000 on Twitter in recent months.
Domino’s Pizza Australia is now ranked within the top 100 Australian companies on Facebook based on fan count.
On Facebook we have seen a 300% growth in our fan base in the past four months. This growth is the result of dedicated Facebook initiatives we have done recently such as the Mission Australia fundraiser where we donated 50 cents for every new fan who joined our page during the six week period – raising a total of $6,500 for Mission’s HUSH for Homelessness 2010 campaign.
DOMINOS.COM.AU NAMED #1 WEBSITE BY HITWISE
Dominos.com.au has been named the #1 website in the ‘Food and Beverage – Restaurant and Catering’ industry for 2009 in the latest Experian Hitwise Online Performance Awards programme.
The Domino’s website was also ranked #2 in the ‘Food and Beverage – Brands and Manufacturers’ category behind Coles.com.au and in front of Woolworths.com.au.
The annual Experian Hitwise Online Performance Awards recognise excellence in online performance through public popularity, awarding websites in more than 100 industries online.
Results of the Experian Hitwise Online Performance Awards are based on the internet usage of more than 3 million Australian internet users with winners receiving the greatest market share of visits throughout 2009 in their online industry.
In July 2010 Dominos.com.au was named the #1 website in the ‘Food and Beverage – Restaurant and Catering’ industry category in Australia for 2009. Today Domino’s online business accounts for more than 30% of network sales in Australia.
Being the leader in innovation and technology is very important to us, that’s why you’ll continue to see Domino’s pioneer the pizza industry.
IPHONE SUCCESS
Our iPhone app launch in November 2009 was our biggest non-product launch ever.
The App enables users to have a Domino’s store in their pocket anywhere, anytime and frequent Domino’s customers are able to create an account and save their favourite orders for next time to make the ordering process even faster.
Our App was designed and built in Australia and we are very proud of it.
It makes ordering fun while having all the functionality right at your finger tips.
You can flip your iPhone or iPod touch to view our menu in landscape, place a pick up or delivery order, pay by cash or credit and even track your order to see when it’s ready.
With more than a million pizza combinations in the palm of your hand, the Domino’s App gives customers the freedom to place an order their way and in their time.
The success of the iPhone app has exceeded all original expectations and it is now a significant contributor to our online sales.
ONLINE AND INNOVATIONWe created a user-friendly App which people love: • NumberonefreeAppinAustralia
within five days and held the position for over a week. Even after ten months the App is a regular in the Top 100 Free Apps
• TheAppwasalsousedbyApplein their May 2010 “Stay up to speed” national print advertising campaign
• Over113,794Appdownloadsinthefirst23days
• Achieved$2millioninsalesin12weeks
• SixmonthsafteritsreleasetheApp has now been downloaded over350,000times
• Generated$600,000worthoffree media coverage
OurSocialMediapresence• Facebook – 38,000 fans
• Twitter–3,000 followers

PAGE 27
DOMINO’S PIZZA ENTERPRISES LIMITED ANNUAL REPORT 2010
Our people are important to us, from our enthusiastic team members to our loyal customers right across our five countries; they are our heart and soul.
The communities in which we operate also play an integral role in the success of Domino’s and we are committed to giving back where we can through doughraisers, sponsorships or disaster relief.
DOMINO’S SCHOOL LUNCH PROGRAM
Domino’s has created a very special range of reduced fat and sodium ‘School Pizzas’ which are based on our menu favourites.
Our School Pizzas qualify for the Healthy Kids Registered Amber category of the highly respected Healthy Kids Association.
Domino’s healthier School Pizzas all ‘make the grade’ and meet the Healthy Kids strict nutritional criteria but still deliver the great Domino’s taste.
The School Pizzas include:• Tropical Chicken • Schoolie Supreme • The Veg
Domino’s School Pizzas provide a great opportunity for schools and canteens to generate much needed funds; and finally students can get great tasting healthier pizzas that they love at their school canteen!
DOUGHRAISERS
Over the past 12 months our stores have been selling more pizza and having more fun, while donating much needed funds to local community groups and charity organisations.
With support from Channel 10 and Southern Cross various Domino’s markets have worked together to raise more than $110,000.
PEOPLE AREOURHEART&S UL
AUSTRALIANCAPITALTERRITORY Marymead Doughraiser raised $13,853
SOUTHEASTQUEENSLAND Starlight ‘Starlight Day’ Doughraiser raised $37,803 VICTORIA HeadspaceDoughraiserraised$15,592
NEWSOUTHWALES Salvation Army Doughraiser raised $29,039
SOUTHAUSTRALIA Julian Burton Burns Trust Doughraiser raised $8,399
TASMANIA Salvation Army Doughraiser raised $4,645
Childhood friends turned business partners Anton Pires and Arran Clement joined the Domino’s family in November 2009, purchasing Domino’s Rototuna in Hamilton, New Zealand. Shortly after the pair became multi-unit franchisees, taking ownership of Domino’s Hillcrest in Hamilton.
Coming from a background outside the QSR industry, Anton and Arran have quickly honed their life skills into running a successful pizza business and have future goals to purchase more stores in Hamilton.
Anton and Arran considered a career as Domino’s franchisees after becoming friends with local franchisees and seeing first hand the business opportunities within Domino’s.
Since purchasing the stores, Anton and Arran have become keen benefactors for countless local community groups. Locally owned and operated, they strongly believe in giving back to the community and lending a helping hand where they can. Anton and Arran relish being actively involved in their local community and continue to utilise their involvement to build relationships with their customers.
Anton and Arran have a drive for success and passion for everything they do, which can be seen in the way they run their stores and deal with customers on a daily basis. They are passionate about helping local community groups, sporting clubs, schools and charities and utilising their community involvement to get the Domino’s brand and their names out into the Hamilton community.
Domino’s supports Anton and Arran with a fully functional marketing program, they help them network with other franchisees to gain from their personal experiences and expertise, as well as providing them with a Franchise Operations Team who have a wealth of experience and knowledge in Domino’s and franchising. Domino’s franchising model and proven systems have enabled Anton and Arran to utilise their strengths and weaknesses to work within the Domino’s systems to grow their stores sales and develop their staff to provide customers with the best quality products and customer service.
In the future, the eager business partners plan to own all four Domino’s stores in Hamilton, so they not only have more earning potential but for Anton and Arran this is a great opportunity to become more involved in their local community, sharing around their energy, something they believe is vital to owning a successful business.
ANTON PIRES & ARRAN CLEMENT
MULTI-UNIT FRANCHISEE

PAGE 28
DOMINO’S PIZZA ENTERPRISES LIMITED ANNUAL REPORT 2010
PAGE 29
DOMINO’S PIZZA ENTERPRISES LIMITED ANNUAL REPORT 2010
PETER JONES CORPORATE OPERATIONS MANAGER
Enjoys a Supreme Oven Baked Sandwich while on the road visiting stores.
PAGE 29PAGE 28
CRAIG RYAN GENERAL COUNSEL &COMPANYSECRETARY
Enjoys sharing a Toni Pepperoni or Hawaiian pizza with his Legal Team.
BARRY WIECH CHIEF INFORMATION OFFICER
Can’t get enough of the new Double Beef and Bacon
Square Puff pizza.
PAT MCMICHAEL CHIEF DEVELOPMENT OFFICER
Loves enjoying any pizza on Domino’s new
Square Puff crust.
ANDREW RENNIE CHIEF OPERATING OFFICER
Gets a kick out of devouring Spicy Chicken Kickers and
Cheesy Garlic Bread.
CHRIS O’DWYER NATIONAL FRANCHISE OPERATIONS MANAGER
Thinks the best part of his job is munching through a pizza as he visits franchisees.
Strong leaders, at all levels of the Domino’s business, are part of our heart and soul. They are essential to buildingasuccessfulCompanynow&inthefuture.
LYNN CARRUTHERS FINANCIAL CONTROLLER
Can’t keep her hands off a Choc Lava Cake for a Friday afternoon treat.
RICHARD CONEY GROUP CHIEF
FINANCIAL OFFICER
Enjoys a Bolognese Pasta in a box during a working
lunch meeting.
DON MEIJ CHIEF EXECUTIVE OFFICER / MANAGING DIRECTOR
Loves having a Prawn and Spinach Ciabatta pizza as a light lunch.
JOHN HARNEY GENERAL MANAGER - SUPPLY CHAIN
Loves eating the Good Choice Range BBQ Chicken and Mushroom Ciabatta pizza between meetings.
ALLAN COLLINS CHIEF MARKETING OFFICER
Enjoys tasting new menu creations directly from The Luv Lab, Domino’s development kitchen.
LEADING ISOURHEART&S UL
AUSTRALIA & NEW ZEALAND
LEADERSHIP TEAM

PAGE 30
DOMINO’S PIZZA ENTERPRISES LIMITED ANNUAL REPORT 2010
PAGE 31
DOMINO’S PIZZA ENTERPRISES LIMITED ANNUAL REPORT 2010
PAGE 31PAGE 30
GREGORY OUSSET EUROPEAN PURCHASING MANAGER
Thinks the new Kipika pizza is perfect for sharing in meetings with suppliers.
SANDER DE HEUS CHIEF INFORMATION OFFICER EUROPE
Loves the new BBQ Mixed Grill pizzas while working late at the office.
TOM KORVER EUROPEAN COMMISSARY MANAGER
Enjoys eating the new Le Riain Sandwicho while touring the commissaries.
ANDRE TEN WOLDE HEAD OF MARKETING
AND DEVELOPMENT
Can’t resist a Bolognese Pasta Pandoro when
busy between meetings.
ROWAN HODGE MANAGER BELGIUM
Loves eating the new Diabolika pizza during a
lunchtime meeting.
ANDREW MEGSON PRESIDENT THE NETHERLANDS
Thinks the Extravaganzza pizza on Italian crust pizza is the best choice on the Domino’s menu.
MELANIE GIGON PRESIDENT FRANCE
Enjoys a Salade Caesar and Nestea for lunch
between meetings.
RICHARD DE GRUIJTER CHIEF FINANCIAL OFFICER
EUROPE OPERATIONS
Is hooked on the El Muchancho Sandwicho
for a midweek lunchtime treat.
LEADING ISOURHEART&S UL
Strong leaders, at all levels of the Domino’s business, are part of our heart and soul. They are essential to buildingasuccessfulCompanynow&inthefuture.
EUROPEAN LEADERSHIP TEAM

PAGE 32
DOMINO’S PIZZA ENTERPRISES LIMITED ANNUAL REPORT 2010
PAUL CAVE NON-EXECUTIVE DIRECTOR
DON MEIJ CHIEF EXECUTIVE OFFICER
/ MANAGING DIRECTOR
35 CORPORATE GOVERNANCE STATEMENT
41 DIRECTORS’ REPORT
53 AUDITOR’S INDEPENDENCE DECLARATION
54 INDEPENDENT AUDITOR’S REPORT
56 DIRECTORS’ DECLARATION
58 CONSOLIDATED STATEMENT OF COMPREHENSIVE INCOME
59 CONSOLIDATED STATEMENT OF FINANCIAL POSITION
60 CONSOLIDATED STATEMENT OF CHANGES IN EQUITY
61 CONSOLIDATED STATEMENT OF CASH FLOWS
62 NOTES TO THE FINANCIAL STATEMENTS
122 ADDITIONAL STOCK EXCHANGE INFORMATION
124 GLOSSARY
125 CORPORATE DIRECTORY
DOMINO’S PIZZA ENTERPRISES ANNUAL REPORT 2010
DOMINO’S PIZZA ENTERPRISES LIMITED ACN 010 489 326ANNUAL FINANCIAL REPORT FOR THE FINANCIAL YEAR ENDED 4 JULY 2010
ANNUAL FINANCIAL REPORT FOR THE FINANCIAL YEAR ENDED 4 JULY 2010
The past 12 months have presented Domino’s Pizza with strong opportunities for further growth. We are proud to lead a Company that is committed to exceeding the expectations of all stakeholders.
BARRY ALTY NON-EXECUTIVE DIRECTOR
ROSS ADLER NON-EXECUTIVE CHAIRMAN
GRANT BOURKE NON-EXECUTIVE DIRECTOR
FINANCE ISOURHEART&S UL
BOARD OF DIRECTORS

PAGE 35PAGE 34
DOMINO’S PIZZA ENTERPRISES LIMITED ANNUAL REPORT 2010 DOMINO’S PIZZA ENTERPRISES LIMITED ANNUAL REPORT 2010
Corporate Governance Statement
Overview
Corporate Governance is an important matter to Domino’s Pizza Enterprises Limited (“DPE Limited” or the “Company”) and the Board of Directors (the “Board”). The Board endorses the 2nd edition of the Australian Securities Exchange (“ASX”) Corporate Governance Council’s Corporate Governance Principles and Recommendations (“ASX Principles”) issued by the ASX Corporate Governance Council in August 2007.
Set out below is a table describing the various ASX Principles and statements as to the Company’s compliance or otherwise with them. Terms used in the table have the meanings given to them in the ASX Principles unless otherwise defined.
Principle No.
Best practice recommendation Compliance Reason for non-compliance
Principle 1 – Lay solid foundations for management and oversight
1.1 Establish the functions reserved to the Board and those delegated to senior executives and disclose these functions.
Refer to page 36 Not applicable
1.3 Disclose the process for evaluating the performance of senior executives. Refer to page 44 Not applicable
1.4 Provide the information in the Guide to reporting on Principle 1. Refer to pages 36 & 44 Not applicable
Principle 2 – Structure the Board to add value
2.1 A majority of the Board should be independent directors. Refer to page 37 Not applicable
2.2 The Chair should be an independent director. Refer to page 37 Not applicable
2.3 The roles of the Chair and Chief Executive Officer should not be exercised by the same individual.
Refer to page 37 Not applicable
2.4 The Board should establish a nomination committee. Refer to page 37 Not applicable
2.5 Disclose the process for evaluating the performance of the Board, its committees and individual directors.
Refer to page 40 Not applicable
2.6 Provide the information in the Guide to reporting on Principle 2. Refer to pages 37 & 40 Not applicable
Principle 3 – Promote ethical and responsible decision-making
3.1 Establish a code of conduct and disclose the code or summary of the code as to:• ThepracticesnecessarytomaintainconfidenceintheCompany’sintegrity• Thepracticesnecessarytotakeintoaccounttheirlegalobligationsandthe
reasonableexpectationsoftheirstakeholders• Theresponsibilityandaccountabilityofindividualsforreportingand
investigating reports of unethical practices.
Refer to page 38 Not applicable
3.2 Establish a policy concerning trading in Company securities by directors, senior executives and employees, and disclose the policy or a summary of that policy.
Refer to page 38 Not applicable
3.3 Provide the information in the Guide to reporting on Principle 3. Refer to page 38 Not applicable
Principle 4 – Safeguard integrity in financial reporting
4.1 The Board should establish an audit committee. Refer to page 38 Not applicable
4.2 The audit committee should be structured so that it:• consistsonlyofnon-executivedirectors• consistsofamajorityofindependentdirectors• ischairedbyanindependentChair,whoisnotChairoftheBoard• hasatleastthreemembers
Refer to page 38 Not applicable
4.3 The audit committee should have a formal Charter. Refer to page 38 Not applicable
4.4 Provide the information in the Guide to reporting on Principle 4. Refer to page 38 Not applicable
Principle 5 – Make timely and balanced disclosure
5.1 Establish written procedures designed to ensure compliance with ASX Listing Rule disclosure requirements and to ensure accountability at a senior executive level for that compliance and disclose those policies or a summary of those policies.
Refer to page 39 Not applicable
5.2 Provide the information in the Guide to reporting on Principle 5. Refer to page 39 Not applicable
Key Financial Indicators
2005 * 2006 2007 2008 2009 2010
NETWORK SALES 306.1 359.4 518.9 591.2 676.4 694.3
Revenue 133.4 172.9 230.1 229.6 239.0 236.1
EBITDA 17.8 24.7 22.0 25.3 28.3 32.5
Depreciation (5.2) (6.0) (6.8) (6.2) (6.4) (8.0)
EBITA 12.6 18.7 15.2 19.1 21.8 24.5
Amortisation 0.0 0.0 0.0 0.0 0.0 0.0
EBIT 12.6 18.7 15.2 19.1 21.8 24.5
Net interest expense (2.1) (1.6) (2.9) (2.1) (1.6) (0.8)
Income tax (3.3) (4.1) (3.2) (5.2) (4.9) (5.9)
PRO FORMA NPAT (PRE SHARE ISSUE COSTS) 7.2 13.0 9.1 11.8 15.4 17.8
After tax share issue costs (0.8) 0.0 0.0 0.0 0.0 0.0
NPAT 6.4 13.0 9.1 11.8 15.4 17.8
EARNINGS PER SHARE (BASIC) 13.8 21.7 14.8 18.4 22.6 26.2
DIVIDENDS PER SHARE 0.7 10.9 10.9 10.9 12.4 17.3
KEY OPERATING DATA
NETWORK SALES GROWTH % 21.0% 17.4% 44.4% 13.9% 14.4% 2.6%
REVENUE GROWTH % 21.6% 29.6% 33.1% (0.2%) 4.1% (1.2%)
EBITDA GROWTH % 32.8% 38.8% (10.9%) 15.0% 11.5% 15.1%
EBITDA MARGIN % 13.3% 14.3% 9.6% 11.0% 11.8% 13.8%
EBIT MARGIN % 9.4% 10.8% 6.6% 8.3% 9.1% 10.4%
Franchised stores 272 301 533 629 669 717
Corporate stores 115 137 130 112 107 106
TOTAL NETWORK STORES 387 438 663 741 776 823
Corporate stores % 29.7% 31.3% 19.6% 15.1% 13.8% 12.9%
*2005figureshavebeenrestatedfortheconversiontoA-IFRS.Domino’sPizzaEnterprisesLimitedlistedontheAustralianSecuritiesExchangeon16May2005.

PAGE 36
DOMINO’S PIZZA ENTERPRISES LIMITED ANNUAL REPORT 2010
PAGE 37
DOMINO’S PIZZA ENTERPRISES ANNUAL REPORT 2010
Corporate Governance Statement CONTINUED
Principle No.
Best practice recommendation Compliance Reason for non-compliance
Principle 6 – Respect the rights of shareholders
6.1 Design a communication policy for promoting effective communication with shareholders and encouraging their participation at general meetings and disclose their policy or a summary of that policy.
Refer to page 39 Not applicable
6.2 Provide the information in the Guide to reporting on Principle 6. Refer to page 39 Not applicable
Principle 7 – Recognise and manage risk
7.1 Establishpoliciesfortheoversightandmanagementofmaterialbusinessrisksand disclose a summary of those policies.
Refer to page 40 Not applicable
7.2 TheBoardshouldrequiremanagementtodesignandimplementtheriskmanagement and internal control system to manage the Company’s material businessrisksandreporttoitonwhetherthoserisksarebeingmanagedeffectively. The Board should disclose that management has reported to it as to theeffectivenessoftheCompany’smanagementofitsmaterialbusinessrisks.
Refer to page 40 Not applicable
7.3 The Board should disclose whether it has received assurance from the Chief Executive Officer (or equivalent) and the Chief Financial Officer (or equivalent) that the declaration provided in accordance with section 295A of the Corporations Act isfoundedonasoundsystemofriskmanagementandinternalcontrolandthatthe system is operating effectively in all material respects in relation to financial reportingrisks.
The Board has received the declaration
Not applicable
7.4 Provide the information in the Guide to reporting on Principle 7. Refer to page 40 Not applicable
Principle 8 – Remunerate fairly and responsibly
8.1 The Board should establish a remuneration committee. Refer to page 37 Not applicable
8.2 Clearlydistinguishthestructureofnon-executivedirectors’remunerationfromthat of executive directors and senior executives.
Refertopages44-45 Not applicable
8.3 Provide the information in the Guide to reporting on Principle 8. Refertopages37&44-45 Not applicable
The Board has adopted a Corporate Governance Charter, a Code of Conduct for Directors and Officers, a comprehensive set of Board policies regarding:IndependenceandConflictsofInterest,RiskManagement,BoardPerformance Evaluation, Chief Executive Officer Performance Evaluation, Continuous Disclosure, External Communications and Securities Trading and an Audit Committee Charter to assist in the discharge of its Corporate Governance responsibilities. Copies are available from the Company’s registered office or may be downloaded from the Company’s website under the investor section.
The Board has in place Corporate Governance practices that it considers to be the most appropriate for DPE Limited. The Board also recognises that Corporate Governance is not a static matter, and needs reviewing regularly as DPE Limited evolves. This statement describes the main Corporate Governance practices in place during the year.
ROLE OF THE BOARDThe Board is responsible for guiding and monitoring DPE Limited on behalf of shareholders. While at all times the Board retains full responsibility, in dischargingitsstewardshipitmakesuseofcommittees.SpecialistcommitteesareabletofocusonaparticularresponsibilityandprovideinformedfeedbacktotheBoard.TheBoardseekstoidentifytheexpectationsofshareholders,aswell as other regulatory obligations. In addition, the Board is also responsible foridentifyingareasofsignificantbusinessriskandensuringarrangementsareinplacetoadequatelymanagethoserisks.
The Board is responsible, and primarily accountable to the shareholders, for the effective Corporate Governance of the Company. The Board is responsible for directing management to optimise the Company’s performance and increase shareholder wealth by:
•providingstrategicdirectionandapprovingtheannualoperatingbudget;
•appointingandappraisingtheManagingDirector/ChiefExecutiveOfficer, ensuring that there are adequate plans and procedures for succession planning;
•ensuringaclearrelationshipbetweenperformanceandexecutivedirectors’andexecutives’compensation;
•ensuringthattheperformanceofseniorexecutive(includingexecutivedirectors)ismonitoredandevaluated;
•approvingandmonitoringmajorcapitalexpenditureprograms;
•monitoringtheoperatingandfinancialperformanceoftheCompany;
•overseeingtheCompanyanddevelopingkeyCompanypolicies,includingitscontrolandaccountabilitysystems;
•ensuringcompliancewithlaws,regulations,appropriateaccountingstandardsandcorporatepolicies(includingtheCodeofConduct);
•ensuringthatthemarketandshareholdersarefullyinformedofmaterialdevelopments;and
•recognisingthelegitimateinterestsofstakeholders.
Those matters not specifically reserved for the Board are the responsibility of management, but are subject to oversight by the Board. The Corporate Governance of the Company is carried out through delegation of appropriate authority to the Chief Executive Officer and, through the Chief Executive Officer, to management of the Company.
Letters of appointment
Directorsreceiveformallettersofappointmentsettingoutthekeyterms,conditionsandexpectationsoftheirappointment.TheManagingDirector/Chief Executive Officer’s responsibilities and terms of employment, including termination entitlements, are also set out in an executive service agreement. Executiveserviceagreementsarealsopreparedforthekeymanagementpersonnel, covering duties, time commitments, induction and the Corporate GovernanceFramework.
Board Meetings
The Board held 9 formal meetings during the year. Attendance at the 2010 Board and Committee meetings is detailed on page 43 of the Annual Report.
CRITERIA FOR BOARD MEMBERSHIPFor directors appointed by the Board, the Board will consider the range of skillsandexperiencerequiredinlightof:•thestrategicdirectionandprogressoftheCompany;•thecurrentcompositionoftheBoard;and•theneedforindependence.
A director appointed by the Board must stand for election at the next Annual General Meeting (“AGM”). Apart from the Managing Director, all directors aresubjecttore-electionbyrotationatleastonceeverythreeyears.
STRUCTURE OF THE BOARDAt the date of this report the Board comprises five directors and includes: •threeindependentnon-executivedirectors(includingtheChairmanof
theBoard);•onenon-executivedirector;and•oneexecutivedirector.
ChairmanoftheBoardisMrRossAdler.DPELimited’sManagingDirector/Chief Executive Officer is Mr Don Meij. Board members’ respective qualifications,skills,experienceanddatesofappointmentaredetailedonthe Corporate Directory page of the Annual Report.
The compensation paid to DPE Limited’s directors for the year ended 4 July 2010 is set out in the Remuneration Report on pages 44 to 52.
INDEPENDENCE OF DIRECTORS TheBoardcomprisesamajorityofindependentnon-executivedirectorswho,togetherwiththenon-executivedirectorandtheexecutivedirector,have extensive commercial experience and bring independence, accountability and judgement to the Board’s deliberations to ensure maximum benefit to shareholders and employees.
At each Board meeting the Board requires each independent director to disclose any new information which could, or could reasonably be perceived to, impair the director’s independence. In devising its policy on independence, the Board’s emphasis is to encourage independent judgement amongstalldirectors,atalltimes,irrespectiveoftheirbackground.Nonetheless, the Board in its nominations capacity will assess annually the ‘independence’ of each director in light of the ASX Principles.
Independent Advice
To enable DPE Limited’s Board and its committees to fulfil their roles, it is considered appropriate that independent experts’ advice may be obtained at DPE Limited’s expense, after first indicating to the Chairman the nature of the advice to be sought and the party from whom the advice is to be sought. The Chairman will ensure that the party from whom the advice is to be sought has no conflict with DPE Limited in providing that advice.
Re-election of Directors
In accordance with DPE Limited’s Constitution, at each AGM of DPE Limited, one third of the directors (excluding the Managing Director) must stand forre-election.Iftheirnumberisnotthreeoramultipleofthree,thenthenumbernearestbutnotexceedingonethirdmuststandforre-election.Thedirectors to retire in every year are those who have been longest in office since their last election and, as between directors appointed on the same day, must (unless otherwise agreed between themselves) be determined by lot.
In addition, no director other than the Managing Director may hold office formorethanthreeyearswithoutstandingforre-election,andanydirectorappointedbytheBoardsincethelastAGMmuststandforre-electionatthenextAGM.Allretiringdirectorsareeligibleforre-election.
Board Committees
The Board has established a number of committees to assist in the execution of its responsibilities. The following committees were in place at the date of this report:
•NominationandRemunerationCommittee;and•AuditCommittee.
Details of these committees are discussed below.
NOMINATION AND REMUNERATION COMMITTEEThe Board has established the Nomination and Remuneration Committee, which comprises the entire Board.
The principal responsibilities of the Committee are:
•advisingtheBoardondirectorshipappointments,withparticularattentiontothemixofskills,experienceandindependence;
•ensuringfulfilmentoftheBoard’spoliciesonBoardcomposition;•developingBoardsuccessionplans;•reviewingandmakingrecommendationsontheappropriatecompensation
ofdirectors;•ensuringthatequity-basedexecutivecompensationispaidinaccordance
withthresholdssetinplansapprovedbyshareholders;and•ensuringdisclosureoftheinformationrequiredineachAnnualReportof
the Company.
TheCompany’scompensationpolicylinksthenatureandamountofexecutivedirectors’andkeymanagementpersonnel’semolumentstotheCompany’s financial and operational performance.
Further details of the Nomination and Remuneration Committee are included in the Remuneration Report on pages 44 to 52.
Membership of and attendance at the 2010 Committee meetings are detailed in the Directors’ Report on page 43.

PAGE 38 PAGE 39
DOMINO’S PIZZA ENTERPRISES LIMITED ANNUAL REPORT 2010DOMINO’S PIZZA ENTERPRISES ANNUAL REPORT 2010
AUDIT COMMITTEEDPE Limited has a Board convened Audit Committee which:
•iscomprisedentirelyofnon-executivedirectorsofDPELimited;•hasamajorityofindependentdirectors;and•hasaChairman,whoisnotChairmanoftheBoardofDPELimited.
Committee Charter
The Committee has a Charter to govern its operations. The Charter is reviewed every two years, and, if appropriate, updated by the Board on recommendation from the Audit Committee.
Membership of the Committee
Committee members are appointed by the Board. Under the Committee’s Charter,memberswillhavearangeofdiverseandyetcomplementaryskillsand will be financially literate.
Purpose of the Committee
The role of the Audit Committee is to assist the Board in discharging its obligations with respect to ensuring:
•accurateandreliablefinancialinformationpreparedforusebytheBoard;and
•theintegrityoftheCompany’sinternalcontrolsaffectingthepreparationand provision of that financial information in determining policies or for inclusion in the financial statements.
In carrying out these functions, the Committee maintains unobstructed lines of communication between the Committee, the internal auditors, the external auditors, and DPE Limited’s management.
Duties and Responsibilities of the Committee
The Committee advises the Board on all aspects of internal and external audit,theadequacyofaccountingandriskmanagementprocedures,systems, control and financial reporting. Specific responsibilities include:
•recommendingtotheBoardtheappointment,re-appointmentand removalofexternalauditors;
•monitoringtheindependenceoftheexternalauditors;
•recommendingandsupervisingtheengagementoftheexternalauditorsandmonitoringauditorperformance;
•reviewingtheeffectivenessofmanagementinformationandothersystemsofinternalcontrol;
•reviewingallareasofsignificantfinancialriskandarrangementsinplacetocontainthosetoacceptablelevels;
•reviewingsignificanttransactionsthatarenotanormalpartoftheCompany’sbusiness;
•monitoringtheinternalcontrolsandaccountingcompliancewiththeCorporations Act 2001, ASX Listing Rules, reviewing external audit reports andensuringpromptremedialaction;and
•reviewingtheCompany’sfullyearASXAppendix4E,AnnualReportandhalf-yearAppendix4D,priortosubmissiontotheBoard.
Rotation of the External Audit Engagement Partners
The Corporations Act 2001 has introduced a five year rotation requirement for audit partners. DPE Limited’s external auditor, Deloitte Touche Tohmatsu has an internal policy which is consistent with this requirement.
Independence of the external auditors
TheCommitteewillconsiderannuallyanynon-auditservicesprovidedby theexternalauditorstodeterminewhethertheprovisionofthosenon-audit services is compatible with the independence of the external auditors. Policies areinplacetorestrictthetypeofnon-auditserviceswhichcanbeprovidedbythe external auditors.
Internal audit
ErnstandYounghasbeenengagedtoundertakeanindependentandobjectiveinternal audit review function charged with evaluating, testing and reporting on theadequacyandeffectivenessofmanagement’scontrolofoperationalrisk. The internal auditors will provide regular reports to the Audit Committee.
Chief Executive Officer and Chief Financial Officer sign-off to the Board in respect of DPE Limited’s financial statements
Thesign-offrequiredfromtheChiefExecutiveOfficer(“CEO”)andChiefFinancial Officer (“CFO”) that DPE Limited’s financial statements present a true and fair view, in all material respects, of DPE Limited’s financial condition and operational results in accordance with the relevant Accounting Standards, is contained within the representations required as part of Recommendation 7.2 of the ASX Principles.
The experience and qualifications of members of the Audit Committee are set out in Corporate Directory section of the Annual Report. Membership of and attendance at 2010 Committee meetings are detailed in the Directors’ Report on page 43.
CODE OF CONDUCT FOR DPE LIMITED DIRECTORSThe Board has a formal Directors’ Code of Conduct which sets the standards to which each director, the Company Secretary and all executives will adhere whilst conducting their duties. The Code requires a director, amongst other things, to:
•acthonestly,ingoodfaithandinthebestinterestsoftheCompanyasawhole;
•performthefunctionsofofficeandexercisethepowersattachedtothatofficewith a degree of care and diligence that a reasonable person would exercise if theywereadirectorinthesamecircumstances;and
•considermattersbeforetheBoardhavingregardtoanypossiblepersonalinterests, the amount of information appropriate to properly consider the subject matter and what is in the best interests of the Company.
All directors and officers of the Company must, as far as possible, act with the utmost integrity and objectivity, striving at all times to enhance the reputation and performance of the Company, and where possible, to act in accordance with theinterestsoftheshareholders,staff,clientsandallotherstakeholdersintheCompany.
SECURITIES TRADING POLICYThe Company has adopted a policy that imposes certain restrictions on officers, employees and franchisees trading in the securities of the Company. The restrictions have been imposed to prevent inadvertent contraventions of the insider trading provisions of the Corporations Act 2001.
Thekeyaspectsofthepolicyare:
•tradingwhilstinthepossessionofmaterialprice-sensitiveinformation isprohibited;
•tradingispermittedwithoutapprovalinthethreeweekperiodafterthereleasetotheASXofthehalf-yearlyandannualresults,theendoftheAGMoratany time the Company has a prospectus open, but only if they have no inside informationandthetradingisnotforshort-termorspeculativegain;and
•tradinginothercircumstancesisonlypermittedifthepersonis personally satisfied that they are not in possession of inside information and they have obtained approval. Permission will be given for such trading only if the approving person is satisfied that the transaction wouldnotbecontrarytolaw,forspeculativegainortotakeadvantage of inside information.
DPELimited’sprice-sensitiveinformationisinformationwhichareasonable person would expect to have a material effect on the price or value of DPE Limited’s securities.
CONTINOUS DISCLOSURE POLICYThe Company has adopted a Continuous Disclosure policy so as to comply with its continuous disclosure obligations. The policy aims to:
•assessnewinformationandco-ordinateanydisclosureorreleasestothe ASX, or any advice required in relation to that information, in a timely manner;
•provideanaudittrailofthedecisionsregardingdisclosuretosubstantiatecompliancewiththeCompany’scontinuousdisclosureobligations;and
•ensurethatemployees,consultants,associatedentitiesandadvisersofthe Company understand the obligations to bring material information to the attention of the Company Secretary.
Accountabilities and responsibilities
For administrative convenience, DPE Limited has nominated the Company Secretary as the person responsible for communications with the ASX. In addition, the Company Secretary has responsibility for overseeing and co-ordinatingdisclosureofinformationtotheASXandcommunicatingwiththe CEO and CFO in relation to continuous disclosure matters. The Company Secretaryisalsoresponsibleforoverseeingandco-ordinatingdisclosureofinformationtothemediaandtoanalysts,brokersandshareholdersandcommunicating with the Board in relation to continuous disclosure matters.
Disclosure principle
In order to ensure DPE Limited meets its obligations of timely disclosure of such information, DPE Limited adheres to the following practice:
•immediatenotificationtotheASXofinformationconcerningDPELimitedthat a reasonable person would expect to have a material effect on the price or value of DPE Limited’s securities as prescribed under Listing Rule 3.1, except where such information is not required to be disclosed in accordance with the exception provisions of the ASX Listing Rules.
External communications
Under this Policy, only those DPE Limited employees who have been authorisedbytheChairmanorCEOcanspeakonbehalfoftheCompanytothemedia,analystsorinvestors.DPELimitedwillnotdiscloseprice-sensitive information to any investor or analyst before formally disclosing the informationtothemarket.
Release of briefing materials/media releases
All draft DPE Limited media releases and external presentations are reviewed by senior management to determine if they are subject to the continuous disclosure requirements. The purpose of that review is to ensure:
•thefactualaccuracyofanyinformation;•thereisnomaterialomissionofinformation;and•thattheinformationwillbedisclosedinatimelymanner.
Asaresultofthatreview,anywrittenmaterialcontainingprice-sensitiveinformation to be used in briefing media, institutional investors or analysts, must be lodged with the ASX prior to the brief commencing. As soon as practicable after confirmation of receipt by the ASX, the briefing material is posted to DPE Limited’s corporate website.
COMMUNICATIONS POLICYThe Board aims to ensure that DPE Limited’s shareholders are informed of all major developments affecting the Company’s state of affairs. Information is communicated to shareholders through:
•ThefullAnnualReport.Allshareholdershavetoelecttoreceiveacopyofthe full Annual Report, unless they have elected not to receive one, and a copy is available, on request. Current corporations legislation allows for the default option of receiving annual reports via the internet. Shareholders must be given notification of this change and be given the opportunity to elect to receive a hard copy of the Annual Report.
•DisclosuresmadetotheASX.DPELimitedendeavourstopostannouncements on its corporate website the same day they are released to the ASX.
•NoticesandExplanatoryMemorandaofeachAGMorothermeeting of shareholders.
•TheAGM.DPELimitedencouragesshareholderstoattendDPELimited’sAGM to canvass relevant issues of interest. If shareholders are unable to attend the AGM personally, they are encouraged to participate through the appointment of a proxy or proxies.
The corporate website is located at dominos.com.au and contains:•thefullfinancialstatementsofDPELimited;•allmediareleasesmadetotheASXbyDPELimited.Eachmediarelease
postedtothewebsiteclearlyshowsthedateitwasreleasedtothemarket;•aCompanyprofile;•contactdetailsforDPELimited’sheadoffice;and•copiesofcorporategovernancepolicies.
This website has a dedicated investor information section which is intended tofacilitatequickandeasyaccessforshareholders.
Attendance of the external auditor at the DPE Limited AGM
It is both DPE Limited’s policy and the policy of the auditor for the lead engagement partner to be present at the AGM to answer questions about the conduct of the audit and the preparation and content of the Auditors’ Report. These policies are consistent with the Corporations Act 2001. Shareholders attendingtheAGMaremadeawaretheycanaskquestionsoftheauditorconcerning the conduct of the audit.
Corporate Governance Statement CONTINUED
PAGE 41PAGE 40
DOMINO’S PIZZA ENTERPRISES LIMITED ANNUAL REPORT 2010 DOMINO’S PIZZA ENTERPRISES LIMITED ANNUAL REPORT 2010
RISK MANAGEMENT POLICYTheBoardadoptsanactiveapproachtoriskmanagementwhichrecognisesthat the Company is engaged in activities, which necessarily demand that theCompanytakecertainusualbusiness,entrepreneurialandoperationalrisks.Accordingly,andintheinterestsoftheenhancedperformanceoftheCompany,theBoardembracesaresponsibleapproachtoriskmanagement,asarisk-awareCompany,butnotnecessarilyarisk-averseone.
Specificallyinmanagingrisk,theCompanyandtheBoardadheretothe following principles:
•Whenconsideringnewstrategiesorprojects,managementanalysethemajorrisksofthoseopportunitiesbeingsecuredorbeinglostandconsidersappropriatestrategiesforminimisingthoseriskswherethey are identified.
•TheCompanywill,whenthoughtprudentbytheCEOortheBoard,takeappropriate external advice to determine the best way to manage a particularrisk.
•FinancialriskwillbemanagedbythewholeoftheBoardworkingcloselywith the CEO and the CFO to ensure that the financial statements and other financial reporting are rigorously tested prior to submission to audit.
•TocomplementriskmanagementbytheCompany,appropriateinsurancesareputinplaceandadvicetakenfromtheCompany’sbrokersorinsurerswherenecessarytocovertheusualextraordinaryriskswhichariseinthecircumstances of the Company.
•TheCompany’sapproachtoriskmanagement,andtheeffectivenessofitsimplementation, is reported by exception to the Board at least annually.
Through the use of its internal review function, the management of the CompanyhasreportedtotheBoardthattheriskmanagementpoliciesadoptedbytheCompanyarethebesttomanagethematerialbusinessrisksof each part of the Company’s business operations.
The Board has received assurance from the CEO and CFO that the declaration provided in accordance with section 295A of the Corporations Actisfoundedonasoundsystemofriskmanagementandinternalcontroland that the system is operating effectively in all material aspects in relation tothefinancialreportingrisks.
BOARD AND BOARD COMMITTEE AND SENIOR EXECUTIVE PERFORMANCE EVALUATIONAformalreviewofBoardandCommitteeperformanceisundertakenannually by the Chairman. All reviews include open discussions by the Board of the results of the evaluations.
The performance of senior executives (except the Chief Executive Officer) is periodically evaluated and monitored by the Chief Executive Officer and measuredagainstagreedkeyperformanceindicators.Theperformanceofthe Chief Executive Officer is periodically reviewed and monitored by the Chairmanandmeasuredagainstagreedkeyperformanceindicators.
Performance evaluations for the Board Committees and senior executives (including the Chief Executive Officer) have occurred in the reporting period in accordance with the procedures described above.
Role of the Company Secretary and the Board’s access to information
All directors have unrestricted access to the Company Secretary. The Company Secretary is responsible for advising the Board on all Corporate Governancematters,forco-ordinatingthecompletionanddespatchoftheagenda and Board papers for each meeting, and ensuring the Board receives sufficient information and in a form and timeframe to enable the Board to discharge its duties effectively. Directors may meet independently with management at any time to discuss areas of interest or concern.
Board Agendas and Minutes
Agendas for Board meetings include all matters operational, financial, strategic and compliance which are important to DPE Limited. Whilst mostagendaitemshaveadegreeofdetailandbackgroundinformationincludedinthepre-meetingpapers,afewitemsmaybelistedontheagenda as discussion points. Papers are distributed to Board members in a timely manner prior to each meeting of the Board. The minutes of each meeting of the Board record the place, date, time of commencement and conclusion, along with the names of all attendees and any apologies. The Company Secretary prepares the minutes of each meeting of the Board and isexpectedtouselanguagewhichisnon-emotiveandimpartial.Alldraftminutes will be set down for review and approval at the next meeting of the Board. The Company Secretary maintains a file copy of all papers circulated to the Board prior to Board meetings, along with any documents tabled at meetings and a signed copy of all minutes. These records are held in a secure manner so as to prevent any unauthorised amendments or alterations.
ASX Corporate Governance Recommendations
At the date of this report the Company considers that the above Corporate Governance practices comply with the ASX Principles. The information required to be disclosed by those recommendations is found both in this Corporate Governance Statement and in the Directors’ Report on pages 41 to 52.
Corporate Governance Statement CONTINUED Directors’ Report
The directors of Domino’s Pizza Enterprises Limited (“DPE Limited” or the “Company”) submit herewith the annual financial report of the Company for the financial year ended 4 July 2010. In order to comply with the provisions of the Corporations Act 2001, the Directors’ Report as follows:
INFORMATION ABOUT THE DIRECTORS AND SENIOR MANAGEMENTThe names and particulars of the directors of the Company during or since the end of the financial year are:
NAME POSITION
Ross Adler Non-ExecutiveChairman Appointed 23 March 2005
Barry Alty Non-ExecutiveDirector Appointed 23 March 2005
GrantBourke Non-ExecutiveDirector Appointed 24 August 2001
Paul Cave Non-ExecutiveDirector Appointed 23 March 2005
Don Meij ManagingDirector/ChiefExecutiveOfficer Appointed 24 August 2001
Particulars of directors’ qualifications, experience and any special responsibilities are detailed in the Corporate Directory section of the Annual Report.
DIRECTORSHIPS OF OTHER LISTED COMPANIESThere were no directorships of other listed companies held by directors in the 3 years immediately before the end of the financial year.
DIRECTORS’ SHAREHOLDINGSThe following table sets out each director’s relevant interest in shares, debentures, and rights or options in shares or debentures of the Company as at the date of this report.
DOMINO’S PIZZA ENTERPRISES LIMITED
DIRECTORS
FULLY PAID ORDINARY SHARES
NUMBERSHARE OPTIONS
NUMBERCONVERTIBLE NOTES
NUMBER
Ross Adler 302,221 - -
Barry Alty 104,443 - -
GrantBourke 1,547,032 - -
Paul Cave 382,000 - -
Don Meij 3,022,602 710,000 -
REMUNERATION OF DIRECTORS AND SENIOR MANAGEMENTInformation about the remuneration of directors and senior management is set out in the Remuneration Report of this Directors’ Report on pages 44 to 52.
SHARE OPTIONS GRANTED TO DIRECTORS AND SENIOR MANAGEMENTDuring and since the end of the financial year there were no share options granted to the following directors and senior management of the Company as part of their remuneration.
DIRECTORS AND SENIOR MANAGEMENTNUMBER OF
OPTIONS GRANTED ISSUING ENTITY
NUMBER OF ORDINARY SHARES
UNDER OPTION
Nil Nil DPE Limited Nil

PAGE 43PAGE 42
DOMINO’S PIZZA ENTERPRISES LIMITED ANNUAL REPORT 2010 DOMINO’S PIZZA ENTERPRISES LIMITED ANNUAL REPORT 2010
COMPANY SECRETARYCraig RyanGeneral Counsel
Craig is a solicitor of the Supreme Courts of Queensland, Australian Capital Territory and New South Wales and a Solicitor of the High Court of Australia with over 15 years’ experience. Craig joined the Company as General Counsel on 8 August 2006 and was appointed to the position of Company Secretary on 18 September 2006. Craig holds a Bachelor of Arts and a Bachelor of Laws from the University of Queensland and a Master of Laws from the University of New South Wales. Craig is also a Chartered Secretary with Chartered Secretaries Australia.
PRINCIPAL ACTIVITIESThe Consolidated entity’s principal activities in the course of the financial year were the operation of retail food outlets and the operation of franchise services. During the financial year there were no significant changes in the nature of those activities.
REVIEW OF OPERATIONSThe result for the financial year ended 4 July 2010 was as follows:
CONSOLIDATED2010 $’000
2009 $’000
Profit before related income tax expense 23,722 20,263
Income tax expense (5,908) (4,910)
PROFIT AFTER RELATED INCOME TAX EXPENSE 17,814 15,353
A review of operations of the Consolidated entity and the results of those operations for the financial year are contained in the Chairman’s and Managing Director’s Reports.
Changes in state of affairs
There were no significant changes in the state of affairs of the Consolidated entity that occurred during the financial year.
Subsequent events
There has not been any matter or circumstance occurring subsequent to the end of the financial year that has significantly affected, or may significantly affect, the operations of the Consolidated entity, the results of those operations, or the state of affairs of the Consolidated entity in future financial years.
Future developments
Pages8to10ofthisAnnualReportincludeinformationondevelopmentslikelytoaffecttheoperationsoftheCompany.
FurtherdisclosureofinformationregardinglikelydevelopmentsintheoperationsoftheConsolidatedentityandtheexpectedresultsofthoseoperationshavenot been included in this Directors’ Report because disclosure of the information could be unreasonably prejudicial to the Consolidated entity.
Environmental regulations
The Consolidated entity, while not subject to any significant environmental regulation or mandatory emissions reporting, voluntarily measures its carbon emissions.
Dividends
Inrespectofthefinancialyearended28June2009,asdetailedintheDirectors’Reportforthefinancialyear,afinaldividendof8.0centspersharefrankedto 100% at 30% corporate income tax rate was paid to the holders of fully paid ordinary shares on 21 September 2009.
Inrespectofthefinancialyearended4July2010,aninterimdividendof6.0centspersharefrankedto100%at30%corporateincometaxratewaspaidtothe holders of fully paid ordinary shares on 15 March 2010.
Inrespectofthefinancialyearended4July2010,theCompanywillbepayingafinaldividendof11.8centspersharefrankedto100%at30%corporateincome tax rate to the holders of fully paid ordinary shares on 15 September 2010.
Directors’ Report CONTINUED
Shares under option or issued on exercise of options
Details of unissued shares or interests under option as at the date of this report are:
ISSUING ENTITYNUMBER OF SHARES
UNDER OPTION CLASS OF SHARESEXERCISE PRICE
OF OPTIONEXPIRY DATE OF OPTIONS
DPE Limited 840,000 Ordinary $3.88 31 August 2013
DPE Limited 500,000 Ordinary $3.50 31 August 2014
DPE Limited 1,500,000 Ordinary $3.50 31 August 2014
The holders of these options do not have the right, by virtue of the option, to participate in any share issue or interest issue of the Company or of any other body corporate or registered scheme.
ISSUING ENTITYNUMBER OF SHARES
ISSUED CLASS OF SHARESAMOUNT PAID FOR
SHARESAMOUNT UNPAID ON
SHARES
DPE Limited 271,167 Ordinary $2.20 $nil
DPE Limited 130,000 Ordinary $3.88 $nil
INDEMNIFICATION OF OFFICERS AND AUDITORSThe Company has entered into deeds of indemnity, insurance and access with each director. To the extent permitted by law and subject to the restrictions in s.199A of the Corporations Act 2001, the Company must continuously indemnify each director against liability (including liability for costs and expenses) for an act or omission in the capacity of director. However, this does not apply in respect of any of the following:
•aliabilitytotheCompanyorarelatedbodycorporate;
•aliabilitytosomeotherpersonthatarisesfromconductinvolvingalackofgoodfaith;
•aliabilityforcostsandexpensesincurredbythedirectorindefendingcivilorcriminalproceedingsinwhichjudgmentisgivenagainsttheofficerorinwhichtheofficerisnotacquitted;or
•aliabilityforcostsandexpensesincurredbythedirectorinconnectionwithanunsuccessfulapplicationforreliefundertheCorporationsAct2001inconnection with the proceedings referred to above.
The Company has also agreed to provide the directors with access to Board documents circulated during the directors’ term in office.
During the financial year, the Company paid a premium in respect of a contract insuring the directors of the Company, the Company Secretary and all senior management of the Company and of any related body corporate against a liability incurred as such a director, secretary or senior management to the extent permitted by the Corporations Act 2001.
The Company has not otherwise, during or since the financial year, indemnified or agreed to indemnify an officer or auditor of the Company or of any related body corporate against a liability incurred as such an officer or auditor.
The directors have not included details of the nature of the liabilities covered or the amount of the premium paid in respect of the directors’ and officers’ liability and legal expenses insurance contracts as such disclosure is prohibited under the terms of the contract.
DIRECTORS’ MEETINGSThe following table sets out the number of directors’ meetings (including meetings of committees of directors) held during the financial year and the number of meetings attended by each director (while they were a director or committee member). During the financial year, nine board meetings, six nomination and remuneration committee meetings and four audit committee meetings were held.
BOARD OF DIRECTORS
NOMINATION & REMUNERATION COMMITTEE
AUDIT COMMITTEE
DIRECTORS HELD ATTENDED HELD ATTENDED HELD ATTENDED
Ross Adler 9 9 6 6 4 4
Barry Alty 9 9 6 6 4 4
GrantBourke 9 9 6 6 n/a n/a
Paul Cave 9 9 6 6 4 4
Don Meij 9 9 6 6 n/a n/a

PAGE 45PAGE 44
DOMINO’S PIZZA ENTERPRISES LIMITED ANNUAL REPORT 2010 DOMINO’S PIZZA ENTERPRISES LIMITED ANNUAL REPORT 2010
NON-AUDIT SERVICESDetails ofamountspaidorpayabletotheauditorfornon-auditservicesprovided during the year by the auditor are outlined in note 41 to the financial statements.
Thedirectorsaresatisfiedthattheprovisionofnon-auditservices,duringtheyear, by the auditor (or by another person or firm on the auditor’s behalf) is compatible with the general standard of independence of auditors imposed by the Corporations Act 2001.
The directors are of the opinion that the services as disclosed in note 41 to the financial statements do not compromise the external auditor’s independence, based on the advice received from the Audit Committee, for the following reasons:
•allnon-auditserviceshavebeenreviewedandapprovedtoensurethatthey do not impact the integrity and objectivity of the auditor, and
•noneoftheservicesunderminethegeneralprinciplesrelatingtoauditorindependence as set out in Code of Conduct APES 110 Code of Ethics for Professional Accountants issued by the Accounting Professional & Ethical StandardsBoard,includingreviewingorauditingtheauditor’sownwork,actinginamanagementordecision-makingcapacityfortheCompany,actingasadvocatefortheCompanyorjointlysharingeconomicrisks and rewards.
AUDITOR’S INDEPENDENCE DECLARATIONThe auditor’s independence declaration is included on page 53 of the Annual Report.
ROUNDING OFF OF AMOUNTSTheCompanyisaCompanyofthekindreferredtoinASICClassOrder98/0100,dated10July1998,andinaccordancewiththatClassOrderamounts in the directors’ report and the financial report are rounded off to the nearest thousand dollars, unless otherwise indicated.
REMUNERATION REPORTThis Remuneration Report, which forms part of the Directors’ Report, sets out information about the remuneration of Domino’s Pizza Enterprises Limited’s directors and its senior management for the financial year ended 4 July 2010.
The prescribed details for each person covered by this report are detailed below under the following headings:
•directorandseniormanagementdetails•remunerationpolicy•relationshipbetweentheremunerationpolicyandCompanyperformance•remunerationofdirectorsandseniormanagement•keytermsofemploymentcontracts
DIRECTOR AND SENIOR MANAGEMENT DETAILSThe following persons acted as directors of the Company during or since the end of the financial year:
Name Position RossAdler Non-ExecutiveChairmanBarryAlty Non-ExecutiveDirectorGrantBourke Non-ExecutiveDirectorPaulCave Non-ExecutiveDirectorDon Meij ManagingDirector/ChiefExecutiveOfficer
The term ‘senior management’ is used in this Remuneration Report to refer to the following persons. Except as noted, the named persons held their current position for the whole of the financial year and since the end of the financial year:
•RichardConey,GroupChiefFinancialOfficer(i) (ii)
•JohnHarney,GeneralManagerSupplyChain•KerriHayman,NationalCorporateOperationsManager–Corporate
(resigned 31 July 2010) (i) •CraigRyan,GeneralCounselandCompanySecretary•AllanCollins,ChiefMarketingOfficer(i) (ii) •AndyMasood,ChiefDevelopmentOfficer(i)
•AndrewMegson,President–TheNetherlands (ii) •AndrewRennie,PresidentDirectorGeneral–Franceuntil30July2010,
and commenced as Chief Operating Officer on 2 August 2010(ii) •StevenKlaassen,PeopleResourcesManager(resigned10July2009)•PatrickMcMichael,FranchiseDevelopmentManager(i) (ii)
•ChrisO’Dwyer,NationalFranchiseOperationsManager
(i) The five highest paid officers of the Company during the year ended 4 July 2010 (other than the Managing Director/ChiefExecutiveOfficer).
(ii) The five highest paid officers of the Consolidated entity during the year ended 4 July 2010 (other than the ManagingDirector/ChiefExecutiveOfficer).
REMUNERATION POLICY
The Board has a Nomination and Remuneration Committee. The Committee assists the Board by reviewing and approving remuneration policies and practices.The Remuneration Committee, as delegated by the Board:•reviewsandapprovestheexecutiveremunerationpolicy;•reviewsandmakesrecommendationstotheBoardoncorporategoalsand
objectives relevant to the CEO, and the performance of the CEO in light of thoseobjectives;
•makesrecommendationstotheBoardontheremunerationofnon-executivedirectors;and
•reviewsandmakesrecommendationstotheBoardonequity-basedplans.
An independent remuneration consultant is engaged by the Remuneration Committee to ensure that the reward practices and levels for senior management areconsistentwithmarketpractice.
The Board, in conjunction with its Nomination and Remuneration Committee, is responsible for approving the performance objectives and measures for the CEO and providing input into the evaluation of performance against them.
TheNominationandRemunerationCommitteeisresponsibleformakingrecommendationstotheBoardoncompensationpoliciesandpackagesapplicable to the Board members and the Chief Executive Officer.
TheManagingDirector/ChiefExecutiveOfficerisresponsibleformakingrecommendationsoncompensationpackagesapplicabletotheotherkeymanagement personnel of the Company. Where appropriate, the Nomination and Remuneration Committee may receive expert independent advice regarding compensationlevelsrequiredtoattractandcompensatedirectorsandotherkeymanagementpersonnel,giventhenatureoftheirworkandresponsibilities.
The performance of the Company depends upon the quality of its directors, anditssecretariesandotherkeymanagementpersonnel.Toprosper,theCompanymustattract,motivateandretainhighlyskilleddirectorsandotherkeymanagementpersonnel.Thecompensationstructureisdesignedtostrikeanappropriatebalancebetweenfixedandvariableremuneration,rewarding capability and experience and providing recognition for contribution to the Company’s overall goals and objectives.
TheBoardRemunerationPolicyistoensurethecompensationpackageproperly reflects the person’s duties and responsibilities and level of performance;andthatcompensationiscompetitiveinattracting,retainingandmotivatingpeopleofthehighestquality.Directorsandotherkeymanagement personnel may receive bonuses on the achievement of specific goals related to the performance of the Company (including operational results).
RELATIONSHIP BETWEEN THE REMUNERATION POLICY AND COMPANY PERFORMANCEThe compensation structures explained below are designed to attract suitably qualified candidates, reward the achievement of strategic objectives, and achieve the broader outcome of creation of value for shareholders. The compensationstructurestakeintoaccount:
•thecapabilityandexperienceofthekeymanagementpersonnel;
•thekeymanagementpersonnel’sabilitytocontroltherelevantsegments’performance;
•theConsolidatedentity’sperformanceincluding:
•theConsolidatedentity’searnings;
•thegrowthinearningspershareandreturnonshareholderwealth;and•theamountofincentiveswithineachkeymanagementpersonnel’s
compensation.
Compensationpackagesincludeamixoffixedandvariablecompensationandshort-termandlong-termperformance-basedincentives.Themixofthesecomponents is based on the role the individual performs.
Inadditiontotheirsalaries,theConsolidatedentityalsoprovidesnon-cashbenefitstoitskeymanagementpersonnel,andcontributestoapost-employmentsuperannuation plan on their behalf.
Fixed compensation
Fixed compensation consists of base compensation (which is calculated on a total cost basis and includes any fringe benefits tax (“FBT”) charges related to employee benefits including motor vehicles), as well as employer contributions to superannuation funds.
Compensation levels are reviewed annually by the Nomination and RemunerationCommitteeandManagingDirector/ChiefExecutiveOfficerthrough a process that considers individual, segment and overall performance of the Consolidated entity. In addition, external consultants provide analysis and advice to ensure the directors’ and executives’ compensation is competitive in the marketplace.Anexecutive’scompensationisalsoreviewedonpromotion.
Performance-linked compensation
Performance-linkedcompensationincludesbothshort-termandlong-termincentivesandisdesignedtorewardkeymanagementpersonnelformeetingorexceedingtheirfinancialandpersonalobjectives.Theshort-termincentive(“STI”)isan‘atrisk’bonusprovidedintheformofcash,whilethelong-termincentive(“LTI”)isprovidedasoptionsoverordinaryshares of the Company under the rules of the Domino’s Pizza Executive Share and Option Plan (“ESOP”).
Short-term incentive bonus
EachyeartheNominationandRemunerationCommitteesetsthekeyperformanceindicators(“KPI’s”)fortheManagingDirector/ChiefExecutiveOfficerandtheManagingDirector/ChiefExecutiveOfficersetstheKPI’sfortheotherkeymanagementpersonnel.TheKPI’sgenerallyincludemeasuresrelating to the Consolidated entity, the relevant segment, and the individual, andincludefinancial,people,customer,strategyandriskmeasures. The measures are chosen as they directly align the individual’s reward to the KPI’s of the Consolidated entity and to its strategy and performance. TheCompanyundertakesarigorousanddetailedannualforecastingandbudget process. The Board believes achievement of the annual forecast andbudgetisthereforethemostrelevantshort-termperformancecondition.
The financial performance objectives include but are not limited to “Earnings before Interest, Tax, Depreciation and Amortisation” (“EBITDA”), “Net Profit”, “Corporate store EBITDA”, “Franchise operations EBITDA” and “Net profit after tax” (“NPAT”) compared to budget and last year. The non-financialobjectivesvarywithpositionandresponsibilityandincludemeasures such as achieving strategic outcomes, percentage savings, customer satisfaction, hygiene and training and staff development.
At the end of the financial year the Nomination and Remuneration CommitteeandManagingDirector/ChiefExecutiveOfficerassesstheactualperformance of the Consolidated entity, the relevant segment and individual against the KPI’s set at the beginning of the financial year. No bonus is awarded where performance objectives are not achieved.
TheManagingDirector/ChiefExecutiveOfficerrecommendstotheNomination and Remuneration Committee the performance bonus amounts of individuals for approval by the Board. The method of assessment was chosen as it provides the Committee with an objective assessment of the individual’s performance.
Long-term incentive
Options are issued under the ESOP (made in accordance with thresholds set in plans approved by the Board on 11 April 2005), and it provides for keymanagementpersonneltoreceiveanumberofoptions,asdeterminedby the Board, over ordinary shares. The ability to exercise the options is conditional upon the Consolidated entity achieving earnings per share growth of 10% for options granted in May 2005 and some options granted in September 2007, budgeted net profit before tax for its European operations for options granted in December 2006, budget net profit before tax for Group operations for options granted in August and September 2007 and annual compound earnings per share growth of between 10% and 12.5%foroptionsgrantedinDecember2008andApril2009.Along-termbonus incentive has been established for two senior management personnel inEuropelinkedtotheachievementofEBIT,storecountandsalestargets,as applicable, for the financial years 30 June 2007 to 30 June 2011.
Directors’ Report CONTINUED

PAGE 47PAGE 46
DOMINO’S PIZZA ENTERPRISES LIMITED ANNUAL REPORT 2010 DOMINO’S PIZZA ENTERPRISES LIMITED ANNUAL REPORT 2010
Directors’ Report CONTINUED
TheNominationandRemunerationCommitteeconsidersthisequityperformance-linkedcompensationstructuretobeappropriateaskeymanagementpersonnel only receive a benefit where there is a corresponding direct benefit to shareholders.
The tables below set out summary information about the Consolidated entity’s earnings and movements in shareholder wealth for the five years to 4 July 2010:
4 JULY 2010
$’000
28 JUNE 2009 $’000
29 JUNE 2008 $’000
1 JULY 2007 $’000
2 JULY 2006 $’000
Revenue 236,074 239,015 229,587 230,056 172,906
Net profit before tax 23,722 20,263 17,018 12,346 17,182
Net profit after tax 17,814 15,353 11,834 9,129 13,044
4 JULY 2010
$’000
28 JUNE 2009 $’000
29 JUNE 2008 $’000
1 JULY 2007 $’000
2 JULY 2006 $’000
Share price at start of year 3.20 3.65 3.45 3.90 2.37
Share price at end of year 5.45 3.20 3.65 3.45 3.90
Interim dividend (i) 4,095 2,977 2,639 2,542 2,462
Final dividend (i) (ii) 8,057 5,443 4,435 4,098 420
Basic earnings per share 26.2 cents 22.6 cents 18.4 cents 14.8 cents 21.7 cents
Diluted earnings per share 25.9 cents 22.5 cents 18.3 cents 14.7 cents 21.3 cents(i) Frankedto100%at30%corporateincometaxrate.(ii) Based on number of shares outstanding as at 4 July 2010.
REMUNERATION OF DIRECTORS AND SENIOR MANAGEMENT
SHORT-TERM EMPLOYEE BENEFITS
POST-EMPLOY-
MENT BENEFITS
OTHER LONG-TERM
EMPLOYEE BENEFITS
$
TERMI-NATION
BENEFITS$
SHARE-BASED
PAYMENT
TOTAL$
% OF COMPEN-
SATION FOR THE YEAR
CONSISTING OF OPTIONS
% 2010
SALARY & FEES(ii)
$BONUS
$
NON-MONETARY
$
SUPER-ANNUATION
$
OPTIONS & RIGHTS
$
NON-EXECUTIVE DIRECTORSRoss Adler 119,760 - 2,560 10,575 - - - 132,895 -
Barry Alty 78,990 - 2,560 6,958 - - - 88,508 -
GrantBourke 68,798 - 2,560 6,075 - - - 77,433 -
Paul Cave 68,798 - 2,560 6,075 - - - 77,433 -
EXECUTIVE DIRECTORDon Meij 529,521 250,000 2,560 14,461 20,459 - 116,629 933,630 12.49%
EXECUTIVE OFFICERSRichard Coney 243,281 87,317 24,142 14,461 7,785 - 44,563 421,549 10.57%
Andy Masood 186,218 29,484 27,275 14,461 5,662 - 7,585 270,685 2.80%
Andrew Megson (i) 297,497 - 110,184 - - - 35,793 443,474 8.07%
Andrew Rennie (i) 355,737 34,629 147,962 - - - 45,900 584,228 7.86%
Kerri Hayman 237,462 25,500 2,560 14,461 6,018 - 11,275 297,276 3.79%
Craig Ryan 175,592 51,224 2,560 14,461 - - 7,585 251,422 3.02%
Allan Collins 275,398 24,369 2,560 14,461 - - 11,378 328,166 3.47%
John Harney 172,049 44,828 2,560 14,461 - - 7,585 241,483 3.14%
Chris O'Dwyer 175,515 42,000 2,560 14,461 - - 15,739 250,275 6.29%
Steve Klaassen 7,324 - - 337 - - - 7,661 -
PatrickMcMichael 152,450 165,000 2,560 14,461 - - - 334,471 -
3,144,390 754,351 337,723 160,169 39,924 - 304,032 4,740,589 6.41%
(i) Theshort-termbonusandlong-termbonusandtheoptionsaredependentonsatisfactionofperformanceconditions.(ii) Salaryandfeesin2010include53weeks.
SHORT-TERM EMPLOYEE BENEFITS
POST-EMPLOY-
MENT BENEFITS
OTHER LONG-TERM
EMPLOYEE BENEFITS
$
TERMI-NATION
BENEFITS$
SHARE-BASED
PAYMENT
TOTAL$
% OF COMPEN-
SATION FOR THE YEAR
CONSISTING OF OPTIONS
%2009
SALARY & FEES (ii)
$BONUS
$
NON-MONETARY
$
SUPER-ANNUATION
$
OPTIONS & RIGHTS
$
NON-EXECUTIVE DIRECTORSRoss Adler 117,500 - 2,330 10,575 - - - 130,405 -
Barry Alty 77,500 - 2,330 7,892 - - - 87,722 -
GrantBourke 67,500 - 2,330 7,994 - - - 77,824 -
Paul Cave 67,500 - 2,330 6,075 - - - 75,905 -
EXECUTIVE DIRECTORDon Meij 496,198 300,000 2,330 13,745 10,489 - 89,254 912,016 9.79%
EXECUTIVE OFFICERSRichard Coney 246,792 75,550 26,427 13,745 4,541 - 8,662 375,717 2.31%
Andy Masood 170,153 24,079 26,579 13,745 3,580 - 1,881 240,017 0.78%
Andrew Megson (i) 352,273 59,041 122,413 - 125,461 - 10,195 669,383 1.52%
Andrew Rennie (i) 388,389 - 185,199 - 158,672 - 14,075 746,335 1.89%
Kerri Hayman 238,064 28,900 2,330 13,745 3,901 - 8,220 295,160 2.78%
Adam Pratt 80,904 - 538 7,079 - 32,592 - 121,113 -
Craig Ryan 166,129 19,260 2,330 12,921 - - 1,690 202,330 0.84%
Allan Collins 270,288 30,837 2,330 13,745 - - 2,293 319,493 0.72%
John Harney 165,556 57,750 2,330 13,745 - - 1,690 241,071 0.70%
Chris O'Dwyer 103,576 1,250 2,330 9,045 - - - 116,201 -
Steve Klaassen 170,777 24,900 1,792 12,310 - - 2,503 212,282 1.18%
PatrickMcMichael 54,717 - 851 4,827 - - - 60,395 -
3,233,816 621,567 387,099 161,188 306,644 32,592 140,463 4,883,369 2.88%
(i) theshort-termbonus,thelong-termbonusandtheoptionsaredependentonsatisfactionofperformanceconditions.(ii) Salaryandfeesin2009include52weeks.
No director or senior management person appointed during the period received a payment as part of his or her consideration for agreeing to hold the position.
BONUSES AND SHARE-BASED PAYMENTS GRANTED AS COMPENSATION FOR THE FINANCIAL YEAR
Bonuses
Don Meij, Richard Coney, Andy Masood, Andrew Rennie, Kerri Hayman, Craig Ryan, Allan Collins, Chris O’Dwyer, and John Harney were granted on 17 August 2010 a cash bonus for their performance during the year ended 4 July 2010. The amount was determined after performance reviews were completed and approvedbytheManagingDirector/ChiefExecutiveOfficerandtheNominationandRemunerationCommittee.PatrickMcMichaelreceivedhisbonusduringthe year on achieving his performance criteria.
No other bonuses were granted during 2010.
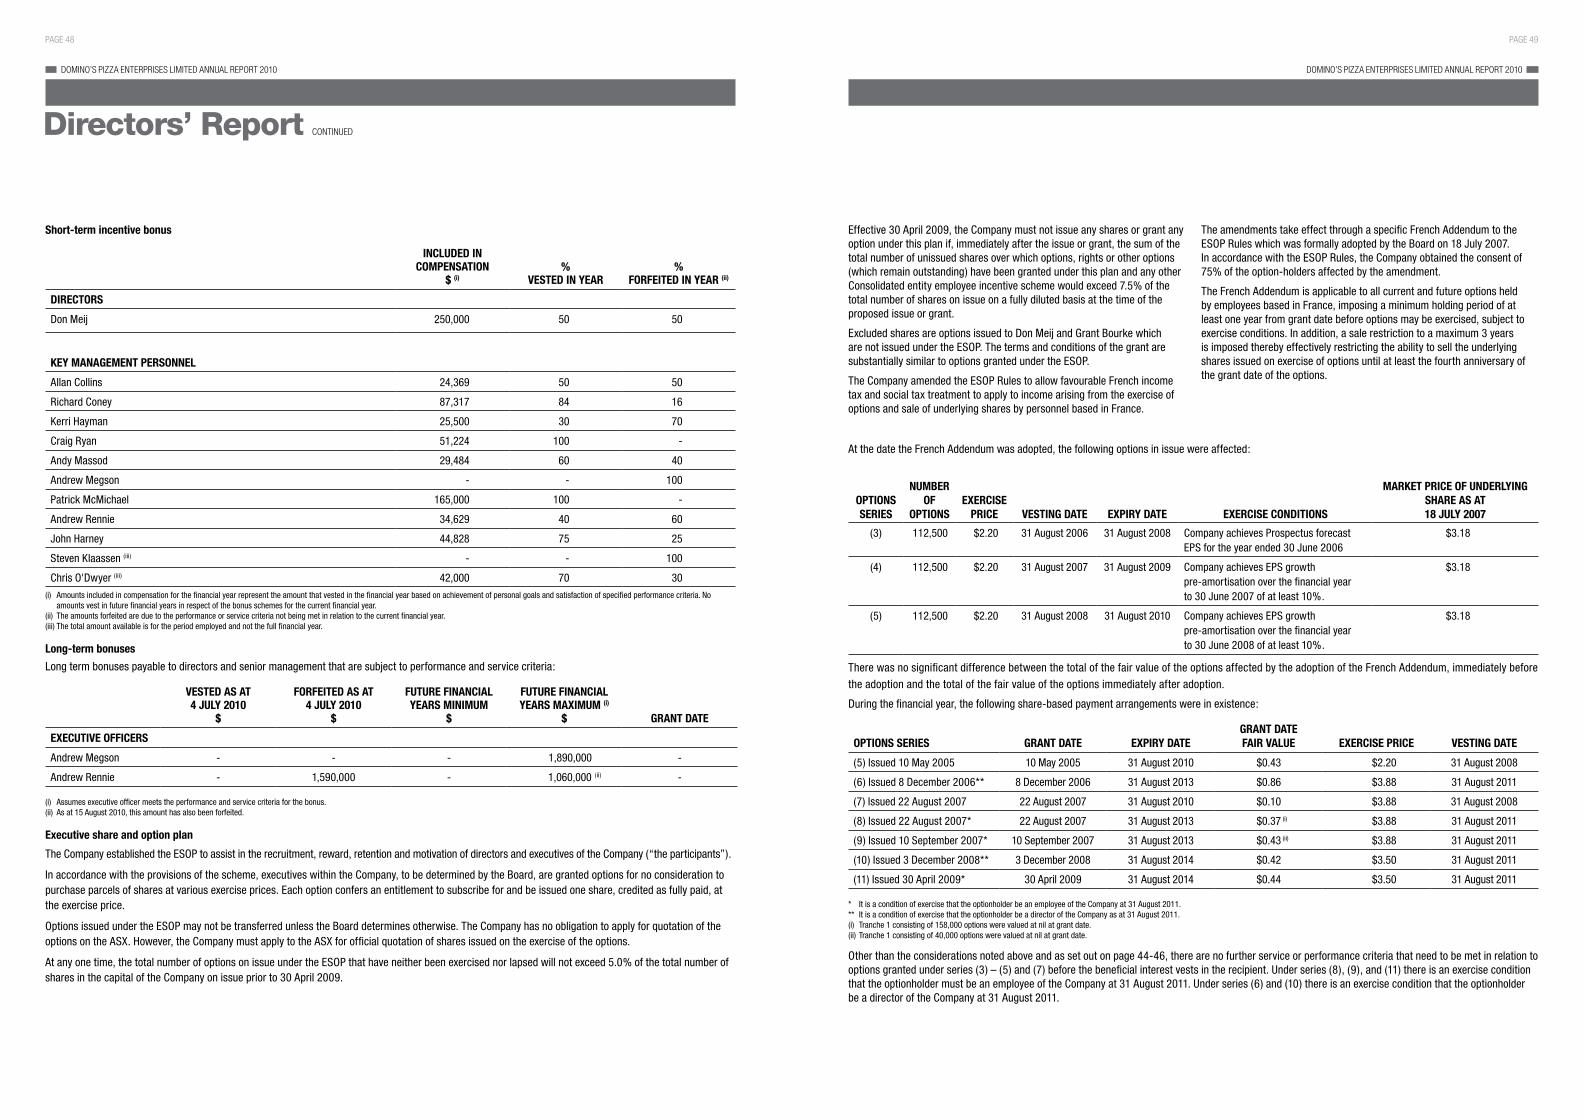
PAGE 49PAGE 48
DOMINO’S PIZZA ENTERPRISES LIMITED ANNUAL REPORT 2010 DOMINO’S PIZZA ENTERPRISES LIMITED ANNUAL REPORT 2010
Short-term incentive bonus
INCLUDED IN COMPENSATION
$ (i)%
VESTED IN YEAR%
FORFEITED IN YEAR (ii)
DIRECTORS
Don Meij 250,000 50 50
KEY MANAGEMENT PERSONNEL
Allan Collins 24,369 50 50
Richard Coney 87,317 84 16
Kerri Hayman 25,500 30 70
Craig Ryan 51,224 100 -
Andy Massod 29,484 60 40
Andrew Megson - - 100
PatrickMcMichael 165,000 100 -
Andrew Rennie 34,629 40 60
John Harney 44,828 75 25
Steven Klaassen (iii) - - 100
Chris O'Dwyer (iii) 42,000 70 30
(i) Amounts included in compensation for the financial year represent the amount that vested in the financial year based on achievement of personal goals and satisfaction of specified performance criteria. No amounts vest in future financial years in respect of the bonus schemes for the current financial year.
(ii) The amounts forfeited are due to the performance or service criteria not being met in relation to the current financial year.(iii) The total amount available is for the period employed and not the full financial year.
Long-term bonuses
Long term bonuses payable to directors and senior management that are subject to performance and service criteria:
VESTED AS AT 4 JULY 2010
$
FORFEITED AS AT 4 JULY 2010
$
FUTURE FINANCIAL YEARS MINIMUM
$
FUTURE FINANCIAL YEARS MAXIMUM (i)
$ GRANT DATE
EXECUTIVE OFFICERS
Andrew Megson - - - 1,890,000 -
Andrew Rennie - 1,590,000 - 1,060,000 (ii) -
(i) Assumes executive officer meets the performance and service criteria for the bonus.(ii) As at 15 August 2010, this amount has also been forfeited.
Executive share and option plan
The Company established the ESOP to assist in the recruitment, reward, retention and motivation of directors and executives of the Company (“the participants”).
In accordance with the provisions of the scheme, executives within the Company, to be determined by the Board, are granted options for no consideration to purchase parcels of shares at various exercise prices. Each option confers an entitlement to subscribe for and be issued one share, credited as fully paid, at the exercise price.
Options issued under the ESOP may not be transferred unless the Board determines otherwise. The Company has no obligation to apply for quotation of the options on the ASX. However, the Company must apply to the ASX for official quotation of shares issued on the exercise of the options.
At any one time, the total number of options on issue under the ESOP that have neither been exercised nor lapsed will not exceed 5.0% of the total number of shares in the capital of the Company on issue prior to 30 April 2009.
Effective 30 April 2009, the Company must not issue any shares or grant any option under this plan if, immediately after the issue or grant, the sum of the total number of unissued shares over which options, rights or other options (which remain outstanding) have been granted under this plan and any other Consolidated entity employee incentive scheme would exceed 7.5% of the total number of shares on issue on a fully diluted basis at the time of the proposed issue or grant.
ExcludedsharesareoptionsissuedtoDonMeijandGrantBourkewhichare not issued under the ESOP. The terms and conditions of the grant are substantially similar to options granted under the ESOP.
The Company amended the ESOP Rules to allow favourable French income tax and social tax treatment to apply to income arising from the exercise of options and sale of underlying shares by personnel based in France.
TheamendmentstakeeffectthroughaspecificFrenchAddendumtothe ESOP Rules which was formally adopted by the Board on 18 July 2007. In accordance with the ESOP Rules, the Company obtained the consent of 75%oftheoption-holdersaffectedbytheamendment.
The French Addendum is applicable to all current and future options held by employees based in France, imposing a minimum holding period of at least one year from grant date before options may be exercised, subject to exercise conditions. In addition, a sale restriction to a maximum 3 years is imposed thereby effectively restricting the ability to sell the underlying shares issued on exercise of options until at least the fourth anniversary of the grant date of the options.
At the date the French Addendum was adopted, the following options in issue were affected:
OPTIONS SERIES
NUMBER OF
OPTIONSEXERCISE
PRICE VESTING DATE EXPIRY DATE EXERCISE CONDITIONS
MARKET PRICE OF UNDERLYING SHARE AS AT 18 JULY 2007
(3) 112,500 $2.20 31 August 2006 31 August 2008 Company achieves Prospectus forecast EPS for the year ended 30 June 2006
$3.18
(4) 112,500 $2.20 31 August 2007 31 August 2009 Company achieves EPS growth pre-amortisationoverthefinancialyearto 30 June 2007 of at least 10%.
$3.18
(5) 112,500 $2.20 31 August 2008 31 August 2010 Company achieves EPS growth pre-amortisationoverthefinancialyearto 30 June 2008 of at least 10%.
$3.18
There was no significant difference between the total of the fair value of the options affected by the adoption of the French Addendum, immediately before the adoption and the total of the fair value of the options immediately after adoption.
Duringthefinancialyear,thefollowingshare-basedpaymentarrangementswereinexistence:
OPTIONS SERIES GRANT DATE EXPIRY DATEGRANT DATE FAIR VALUE EXERCISE PRICE VESTING DATE
(5) Issued 10 May 2005 10 May 2005 31 August 2010 $0.43 $2.20 31 August 2008
(6) Issued 8 December 2006** 8 December 2006 31 August 2013 $0.86 $3.88 31 August 2011
(7) Issued 22 August 2007 22 August 2007 31 August 2010 $0.10 $3.88 31 August 2008
(8) Issued 22 August 2007* 22 August 2007 31 August 2013 $0.37 (i) $3.88 31 August 2011
(9) Issued 10 September 2007* 10 September 2007 31 August 2013 $0.43 (ii) $3.88 31 August 2011
(10) Issued 3 December 2008** 3 December 2008 31 August 2014 $0.42 $3.50 31 August 2011
(11) Issued 30 April 2009* 30 April 2009 31 August 2014 $0.44 $3.50 31 August 2011
* It is a condition of exercise that the optionholder be an employee of the Company at 31 August 2011.** It is a condition of exercise that the optionholder be a director of the Company as at 31 August 2011.(i) Tranche 1 consisting of 158,000 options were valued at nil at grant date.(ii) Tranche 1 consisting of 40,000 options were valued at nil at grant date.
Otherthantheconsiderationsnotedaboveandassetoutonpage44-46,therearenofurtherserviceorperformancecriteriathatneedtobemetinrelationtooptionsgrantedunderseries(3)–(5)and(7)beforethebeneficialinterestvestsintherecipient.Underseries(8),(9),and(11)thereisanexerciseconditionthat the optionholder must be an employee of the Company at 31 August 2011. Under series (6) and (10) there is an exercise condition that the optionholder be a director of the Company at 31 August 2011.
Directors’ Report CONTINUED

PAGE 51PAGE 50
DOMINO’S PIZZA ENTERPRISES LIMITED ANNUAL REPORT 2010 DOMINO’S PIZZA ENTERPRISES LIMITED ANNUAL REPORT 2010
During the year, the following directors and senior management exercised options that were granted to them as part of their compensation. Each option converts into one ordinary share of DPE Limited.
NAMENO. OF
OPTIONS EXERCISEDNO. OF ORDINARY SHARES OF DPE LIMITED ISSUED AMOUNT PAID AMOUNT UNPAID
Richard Coney 35,000 35,000 $77,000 $nil
Allan Collins 30,000 30,000 $116,400 $nil
John Harney 30,000 30,000 $116,400 $nil
Andrew Megson 50,000 50,000 $110,000 $nil
Craig Ryan 30,000 30,000 $116,400 $nil
Kerri Hayman 17,000 17,000 $37,400 $nil
The following table summarises the value of options granted, exercised or lapsed during the financial year to directors and senior management:
NAME
VALUE OF OPTIONS GRANTED AT THE GRANT DATE (i)
$
VALUE OF OPTIONS EXERCISED AT THE EXERCISE DATE
$
VALUE OF OPTIONS LAPSED AT THE DATE OF LAPSE (ii)
$
Richard Coney - 15,050 -
Allan Collins - 2,880 -
John Harney - 2,880 -
Andrew Megson - 21,500 -
Craig Ryan - 2,880 -
Kerri Hayman - 7,310 -
(i) The value of options granted during the period is recognised in compensation over the vesting period of the grant, in accordance with Australian accounting standards.(ii) The value of options lapsing during the period due to the failure to satisfy a vesting condition is determined assuming the vesting condition had been satisfied.
CONTRACTS FOR SERVICES OF KEY MANAGEMENT PERSONNEL
Executive service contracts
NAMETERM OF
CONTRACTCONTRACT
COMMENCEMENT
NOTICE TERMINATION
– BY COMPANY
NOTICE TERMINATION
– BY EXECUTIVE TERMINATION PAYMENT
Richard Coney (i) 3 yrs 16 May 2005 6 months 6 months Amount equal to 6 months compensation
Craig Ryan 3 yrs 8 August 2009 3 months 3 months Amount equal to 3 months compensation
Allan Collins 3 yrs 8 January 2010 3 months 3 months Amount equal to 3 months compensation
Andy Masood (i) 3 yrs 16 May 2005 6 months 6 months Amount equal to 6 months compensation
Andrew Megson 5 yrs 3 July 2006 6 months 6 months Amount equal to 6 months compensation
Don Meij (i) 3 yrs 11 April 2005 12 months 12 months Amount equal to 12 months compensation
Andrew Rennie 5 yrs 3 July 2006 6 months 6 months Amount equal to 6 months compensation
Kerri Hayman 3 yrs 2 July 2009 3 months 3 months Amount equal to 3 months compensation
John Harney 3 yrs 2 July 2010 3 months 3 months Amount equal to 3 months compensation
Chris O’Dwyer 3 yrs 22 September 2008 3 months 3 months Amount equal to 3 months compensation
PatrickMcMichael 3 yrs 16 February 2009 3 months 3 months Amount equal to 3 months compensation
(i) Theseareminimumterms–thesecontactsareongoinguntilterminatedinaccordancewiththeirterms.
Directors’ Report CONTINUED
PAGE 53PAGE 52
DOMINO’S PIZZA ENTERPRISES LIMITED ANNUAL REPORT 2010 DOMINO’S PIZZA ENTERPRISES LIMITED ANNUAL REPORT 2010
Directors’ Report CONTINUED
Thedirectorsbelievethatthecompensationforeachofthekeymanagementpersonnel is appropriate for the duties allocated to them, the size of the Company’s business and the industry in which the Company operates. The service contracts outline the components of compensation paid to the executivedirectorsandkeymanagementpersonnelbutdonotprescribehow compensation levels are modified year to year. Compensation levels are reviewedeachyeartotakeintoaccountcost-of-livingchanges,anychangeinthescopeoftheroleperformedbythekeymanagementpersonnelandany changes required to meet the principles of the Remuneration Policy.
Eachofthekeymanagementpersonnelhasagreedthatduringtheiremployment and for a period of up to six months afterwards, they will not compete with the Company, canvass, solicit, induce or encourage any person who is or was an employee of the Company at any time during the employment period to leave the Company or interfere in any way with the relationship between the Company and its clients, customers, employees, consultants or suppliers.
DonMeij,ManagingDirector/ChiefExecutiveOfficer,hasacontractofemployment with Domino’s Pizza Enterprises Limited dated 11 April 2005. The contract specifies the duties and obligations to be fulfilled by the ManagingDirector/ChiefExecutiveOfficerandprovidesthattheBoardandManagingDirector/ChiefExecutiveOfficerwill,earlyineachfinancialyear,consult and agree objectives for achievement during that year.
Don Meij’s contract provides that he may terminate the agreement by giving twelve month’s written notice. He may also resign on one month’s notice if there is a change in control of the Company, and he forms the reasonable opinion that there has been material changes to the policies, strategies or future plans of the Board and, as a result, he will not be able to implement his strategy or plans for the development of the Company or its projects. If Don Meij, resigns for this reason, then in recognition of his past service to the Company, on the date of termination, in addition to any payment made to him during the notice period or by the Company in lieu of notice, the Company must pay him an amount equal to the salary component and superannuation that would have been paid to him in the 12 months after the date of termination.
A change in control occurs when any shareholder (either alone or together with its associates) having a relevant interest in less than 50% of the issued shares in the Company acquires a relevant interest in 50% or more of the shares on issue at any time in the capital of the Company or the composition of a majority of the Board changes for a reason other than retirement in the normal course of business or death.
Non-executive directors
TheConstitutionoftheCompanyprovidesthatnon-executivedirectorsare entitled to receive compensation for their services as determined by the Company in a general meeting. The Company has resolved that the maximum aggregate amount of directors’ fees (which does not include compensationofexecutivedirectorsandothernon-directorservicesprovidedbydirectors)is$400,000perannum.Thenon-executivedirectorsmaydividethatcompensationamongthemselvesastheydecide.Non–executive directors are entitled to be reimbursed for their reasonable expensesincurredinconnectionwiththeaffairsoftheCompany.Anon-executive director may also be compensated as determined by the directors if that director performs additional or special duties for the Company. A former director may also receive a retirement benefit of an amount determined by the Board of Directors in recognition of past services, subject to the ASX Listing Rules and the Corporations Act 2001.
Non-executivedirectorsdonotreceiveperformance-basedcompensation.Directors’ fees cover all main Board activities.
Feesforthecurrentfinancialyearforthenon-executivedirectorswere$68,798perdirectorfor53weeks(2009:$67,500perannum), $78,990for53weeksfortheChairmanoftheAuditCommittee (2009: $77,500 per annum) and for the Chairman of the Board was $119,760for53weeks(2009:$117,500perannum).
Signed in accordance with a resolution of the directors made pursuant to s.298(2) of the Corporations Act 2001.
On behalf of the Directors
Ross Adler
Chairman Brisbane, 15 September 2010
Don Meij
ManagingDirector/ChiefExecutiveOfficer Brisbane, 15 September 2010
15 September 2010
The DirectorsDomino’s Pizza Enterprises LimitedLevel 8, TAB Building240 Sandgate RoadALBION QLD 4010
Dear Directors,
DOMINO’S PIZZA ENTERPRISES LIMITED
In accordance with section 307C of the Corporations Act 2001, I am pleased to provide the following declaration of independence to the directors of Domino’s Pizza Enterprises Limited.
As lead audit partner for the audit of the financial statements of Domino’s Pizza Enterprises Limited for the financial year ended 4 July 2010, Ideclarethattothebestofmyknowledgeandbelief,therehavebeennocontraventionsof:
(i) theauditorindependencerequirementsoftheCorporationsAct2001inrelationtotheaudit;and
(ii) any applicable code of professional conduct in relation to the audit.
Yours sincerely
DELOITTE TOUCHE TOHMATSU
R D WanstallPartner Chartered Accountants
Deloitte Touche TohmatsuABN 74 490 121 060
Riverside CentreLevel 25123 Eagle StreetBrisbane QLD 4000GPO Box 1463Brisbane QLD 4001 Australia
DX 115Tel: +61 (0) 7 3308 7000Fax: +61 (0) 7 3308 7001www.deloitte.com.au
Liability limited by a scheme approved under Professional Standards Legislation.
Auditor’s Independence DeclarationDomino’s Pizza Enterprises Limited

PAGE 55PAGE 54
DOMINO’S PIZZA ENTERPRISES LIMITED ANNUAL REPORT 2010 DOMINO’S PIZZA ENTERPRISES LIMITED ANNUAL REPORT 2010
Independent Auditor’s Reportto the members of Domino’s Pizza Enterprises Limited
Report on the Financial Report
We have audited the accompanying financial report of Domino’s Pizza Enterprises Limited, which comprises the statement of financial position as at 4 July 2010, and the statement of comprehensive income, the statement of cash flows and the statement of changes in equity for the year ended on that date, notes comprising a summary of significant accounting policies and other explanatory information, and the Directors’ Declaration of the Consolidated entity comprising the Company and the entities it controlled at the year’s end or from time to time during the financial year as set out on pages 56 to 121.
Directors’ Responsibility for the Financial Report
The directors of the company are responsible for the preparation and fair presentation of the financial report in accordance with Australian Accounting Standards (including the Australian Accounting Interpretations) and the Corporations Act 2001. This responsibility includes establishing and maintaining internalcontrolrelevanttothepreparationandfairpresentationofthefinancialreportthatisfreefrommaterialmisstatement,whetherduetofraudorerror;selectingandapplyingappropriateaccountingpolicies;andmakingaccountingestimatesthatarereasonableinthecircumstances.InNote3,thedirectorsalso state, in accordance with Accounting Standard AASB 101 Presentation of Financial Statements, that compliance with the Australian equivalents to International Financial Reporting Standards ensures that the financial report, comprising the financial statements and notes, complies with International Financial Reporting Standards.
Auditor’s Responsibility
Our responsibility is to express an opinion on the financial report based on our audit. We conducted our audit in accordance with Australian Auditing Standards. These Auditing Standards require that we comply with relevant ethical requirements relating to audit engagements and plan and perform the audit to obtain reasonable assurance whether the financial report is free from material misstatement.
An audit involves performing procedures to obtain audit evidence about the amounts and disclosures in the financial report. The procedures selected depend ontheauditor’sjudgement,includingtheassessmentoftherisksofmaterialmisstatementofthefinancialreport,whetherduetofraudorerror.Inmakingthoseriskassessments,theauditorconsidersinternalcontrolrelevanttotheentity’spreparationandfairpresentationofthefinancialreportinordertodesignaudit procedures that are appropriate in the circumstances, but not for the purpose of expressing an opinion on the effectiveness of the entity’s internal control. An audit also includes evaluating the appropriateness of accounting policies used and the reasonableness of accounting estimates made by the directors, as well as evaluating the overall presentation of the financial report.
We believe that the audit evidence we have obtained is sufficient and appropriate to provide a basis for our audit opinion.
Auditor’s Independence Declaration
In conducting our audit, we have complied with the independence requirements of the Corporations Act 2001.
Auditor’s Opinion
In our opinion:
(a) the financial report of Domino’s Pizza Enterprises Limited is in accordance with the Corporations Act 2001, including:
(i) givingatrueandfairviewoftheConsolidatedentity’sfinancialpositionasat4July2010andofitsperformancefortheyearendedonthatdate;and
(ii) complyingwithAustralianAccountingStandards(includingtheAustralianAccountingInterpretations)andtheCorporationsRegulations2001;and
(b) the financial report also complies with International Financial Reporting Standards as disclosed in Note 3.
Report on the Remuneration Report
We have audited the Remuneration Report included in pages 44 to 52 of the Directors’ Report for the year ended 4 July 2010. The directors of the Company are responsible for the preparation and presentation of the Remuneration Report in accordance with section 300A of the Corporations Act 2001. Our responsibility is to express an opinion on the Remuneration Report, based on our audit conducted in accordance with Australian Auditing Standards.
Auditor’s Opinion
In our opinion the Remuneration Report of Domino’s Pizza Enterprises Limited for the year ended 4 July 2010, complies with section 300A of the Corporations Act 2001.
DELOITTE TOUCHE TOHMATSU
R D WanstallPartner Chartered AccountantsBrisbane, 15 September 2010
Deloitte Touche TohmatsuABN 74 490 121 060
Riverside CentreLevel 25123 Eagle StreetBrisbane QLD 4000GPO Box 1463Brisbane QLD 4001 Australia
DX 115Tel: +61 (0) 7 3308 7000Fax: +61 (0) 7 3308 7001www.deloitte.com.au
Liability limited by a scheme approved under Professional Standards Legislation.

PAGE 57PAGE 56
DOMINO’S PIZZA ENTERPRISES LIMITED ANNUAL REPORT 2010 DOMINO’S PIZZA ENTERPRISES LIMITED ANNUAL REPORT 2010
Directors’ Declaration
The directors declare that:
(a) in the directors’ opinion, there are reasonable grounds to believe that the Company will be able to pay its debts as and when they become due and payable;
(b) theattachedfinancialstatementsareincompliancewithInternationalFinancialReportingStandards,asstatedinnote3tothefinancialstatements;
(c) in the directors’ opinion, the attached financial statements and notes thereto are in accordance with the Corporations Act 2001, including compliance with accountingstandardsandgivingatrueandfairviewofthefinancialpositionandperformanceoftheConsolidatedentity;and
(d) the directors have been given the declarations required by s.295A of the Corporations Act 2001.
Signed in accordance with a resolution of the directors made pursuant to s.295(5) of the Corporations Act 2001.
On behalf of the Directors
DON MEIJ
ManagingDirector/ChiefExecutiveOfficerBrisbane, 15 September 2010
CONTENTS PAGE
Consolidated statement of comprehensive income 58Consolidated statement of financial position 59Consolidated statement of changes in equity 60Consolidated statement of cash flows 61
Notes to the financial statements
1 General information 622 Adoption of new and revised International Financial
Reporting Standards 623 Significant accounting policies 644 Criticalaccountingjudgementsandkeysourcesof
estimation uncertainty 725 Revenue 726 Segment information 727 Other revenue 758 Other gains and losses 769 Finance costs 7610 Income taxes 7711 Profit for the year 8112 Earnings per share 8213 Trade and other receivables 8314 Other financial assets 8515 Inventories 8616 Non-currentassetsclassifiedasheldforsale 8617 Subsidiaries 8718 Property, plant and equipment 8819 Goodwill 8920 Other intangible assets 9121 Other assets 9222 Trade and other payables 9323 Borrowings 9324 Other financial liabilities 9425 Provisions 9426 Other liabilities 9527 Obligations under finance leases 9528 Issued capital 9629 Reserves 9830 Retained earnings 9931 Dividends 9932 Financial instruments 10033 Share-basedpayments 10634 Key management personnel compensation 11035 Related party transactions 11236 Acquisition of businesses 11637 Cash and cash equivalents 11738 Operating lease arrangements 11839 Commitments for expenditure 11940 Contingent liabilities and contingent assets 11941 Remuneration of auditors 12042 Events after the reporting period 12043 Parent information 12044 Approval of financial statements 121Additionalstockexchangeinformation 122
Index to the Financial Report

PAGE 59PAGE 58
DOMINO’S PIZZA ENTERPRISES LIMITED ANNUAL REPORT 2010 DOMINO’S PIZZA ENTERPRISES LIMITED ANNUAL REPORT 2010
Consolidated Statementof comprehensive income for the year ended 4 July 2010
NOTE2010 $’000
2009 $’000
Revenue 5 158,280 169,301
Other revenue 7 77,794 69,714
Other gains and losses 8 2,166 1,631
Food and paper expenses (75,538) (81,885)
Employee benefits expense 11 (59,657) (59,938)
Plant and equipment costs (6,601) (4,490)
Depreciation and amortisation expense 11 (8,004) (6,449)
Occupancy expenses (7,295) (7,970)
Finance costs 9 (797) (1,552)
Marketingexpenses (12,407) (11,514)
Store related expenses (6,338) (6,820)
Communication expenses (4,222) (4,347)
Other expenses (33,659) (35,418)
Profit before tax 23,722 20,263
Income tax expense 10 (5,908) (4,910)
Profit for the year from continuing operations 11 17,814 15,353
Discontinued operations
Profit for the year from discontinued operations - -
Profit for the year 17,814 15,353
Other comprehensive income
Exchange differences arising on translation of foreign operations (6,014) 1,661
Gain/(loss)oncashflowhedgestakentoequity 255 (1,280)
Gain/(loss)onnetinvestmenthedgetakentoequity 2,467 (983)
Recognitionofshare-basedpayment 444 180
Income tax relating to components of other comprehensive income (817) 428
Other comprehensive income for the period (net of tax) (3,665) 6
Total comprehensive income for the year 14,149 15,359
Earnings per share:
From continuing operations
Basic (cents per share) 12 26.2 cents 22.6 cents
Diluted (cents per share) 12 25.9 cents 22.5 cents
Notes to the financial statements are included on pages 62 to 121.
NOTE2010 $’000
2009 $’000
ASSETS Current assets
Cash and cash equivalents 37 16,241 17,426
Trade and other receivables 13 21,724 23,248
Other financial assets 14 2,168 279
Inventories 15 3,537 3,598
Current tax assets 10 - 13
Other 21 4,446 2,691
48,116 47,255
Assets classified as held for sale 16 843 -
Total current assets 48,959 47,255
Non-current assetsOther financial assets 14 14,750 21,179
Property, plant & equipment 18 30,812 30,505
Deferred tax assets 10 1,767 2,107
Goodwill 19 45,548 43,803
Other intangible assets 20 6,777 4,241
Other 21 61 170
Total non-current assets 99,715 102,005Total assets 148,674 149,260
LIABILITIESCurrent liabilitiesTrade and other payables 22 25,282 25,977
Borrowings 23 40 74
Other financial liabilities 24 604 889
Current tax liabilities 10 3,004 1,561
Provisions 25 2,171 1,981
Other 26 - 7
Total current liabilities 31,101 30,489
Non-current liabilitiesBorrowings 23 13,914 20,977
Other financial liabilities 24 1,192 1,686
Provisions 25 476 310
Other 26 1,644 893
Total non-current liabilities 17,226 23,866Total liabilities 48,327 54,355Net assets 100,347 94,905
EQUITYCapital and reservesIssued capital 28 64,243 63,411
Reserves 29 (3,483) 182
Retained earnings 30 39,587 31,312
Total equity 100,347 94,905
Notes to the financial statements are included on pages 62 to 121.
Consolidated Statementof financial position as at 4 July 2010

PAGE 61PAGE 60
DOMINO’S PIZZA ENTERPRISES LIMITED ANNUAL REPORT 2010 DOMINO’S PIZZA ENTERPRISES LIMITED ANNUAL REPORT 2010
ISSUED CAPITAL
$'000
HEDGING RESERVE
$'000
FOREIGN CURRENCY
TRANSLATION RESERVE
$'000
OTHER RESERVE
$'000
RETAINED EARNINGS
$'000TOTAL$'000
Balance at 29 June 2008 55,649 836 (1,353) 693 23,429 79,254
Profit for the period - - - - 15,353 15,353
Other comprehensive income - (1,835) 1,661 180 - 6Total comprehensive income for the period - (1,835) 1,661 180 15,353 15,359
Shares issued 7,762 - - - - 7,762
Payment of dividends - - - - (7,470) (7,470)
Balance at 28 June 2009 63,411 (999) 308 873 31,312 94,905
Balance at 28 June 2009 63,411 (999) 308 873 31,312 94,905
Profit for the period - - - - 17,814 17,814
Other comprehensive income - 1,905 (6,014) 444 - (3,665)Total comprehensive income for the period - 1,905 (6,014) 444 17,814 14,149
Shares issued 832 - - - - 832
Payment of dividends - - - - (9,539) (9,539)
Balance at 4 July 2010 64,243 906 (5,706) 1,317 39,587 100,347
Notes to the financial statements are included on pages 62 to 121.
Consolidated Statementof changes in equity for the year ended 4 July 2010
Consolidated Statementof cash flows for the year ended 4 July 2010
NOTE2010 $’000
2009 $’000
Cash flows from operating activities
Receipts from customers 262,650 265,497
Payments to suppliers and employees (235,795) (238,326)
Interest received 1,414 1,640
Cash generated from operations 28,269 28,811
Interest and other costs of finance paid (797) (1,552)
Income taxes paid (3,720) (2,099)
Net cash generated by operating activities 37 23,752 25,160
Cash flows from investing activities
Payment for investment and business operations, net of cash acquired 37 (9,176) (8,466)
(Loansto)/repaidfromthirdpartiesandfranchisees 3,159 (3,708)
Payment for property, plant & equipment (10,440) (5,799)
Proceedsfromsaleofbusinessesandothernon-currentassets 9,530 9,675
Payments for intangible assets (4,103) (3,253)
Net cash used in investing activities (11,030) (11,551)
Cash flows from financing activities
Proceeds from borrowings 11 118
Repayment of borrowings (4,588) (8,631)
Dividends paid (9,539) (4,246)
Proceeds from issue of equity securities 832 4,541
Net cash used in financing activities (13,284) (8,218)
Net (decrease)/increase in cash and cash equivalents (562) 5,391
Cash and cash equivalents at the beginning of the year 17,426 12,645
Effects of exchange rate changes on the balance of cash held in foreign currencies (623) (610)
Cash and cash equivalents at the end of the year 37 16,241 17,426
Notes to the financial statements are included on pages 62 to 121.

PAGE 63PAGE 62
DOMINO’S PIZZA ENTERPRISES LIMITED ANNUAL REPORT 2010 DOMINO’S PIZZA ENTERPRISES LIMITED ANNUAL REPORT 2010
1. GENERAL INFORMATIONDomino’s Pizza Enterprises Limited is a public company listed on theAustralianStockExchange(tradingunderthesymbol‘DMP’),incorporated and operating in Australia, New Zealand, France, Belgium and The Netherlands.
Domino’s Pizza Enterprises Limited’s registered office and its principal place of business are as follows:
Registered office Principal place of business8th Floor, TAB Building 8th Floor, TAB Building240 Sandgate Road 240 Sandgate RoadAlbion AlbionBrisbane BrisbaneQueensland 4010 Queensland 4010Tel: +61 (0)7 3633 3333 Tel: +61 (0)7 3633 3333
The entity’s principal activities are the operation of retail food outlets and operation of franchise services.
2. ADOPTION OF NEW AND REVISED ACCOUNTING STANDARDS
2.1 STANDARDS AND INTERPRETATIONS AFFECTING AMOUNTS REPORTED IN THE CURRENT PERIOD (AND/OR PRIOR PERIODS)
The following new and revised Standards and Interpretations have been adopted in the current period and have affected the amounts reported in these financial statements. Details of other Standards and Interpretations adopted in these financial statements that have had no effect on the amounts reported are set out in section 2.2.
Standards affecting presentation and disclosure
AASB 101 Presentation of Financial Statements (as revised in September2007),AASB2007-78 Amendments to Australian Accounting Standards arising from AASB101andAASB2007-10Further Amendments to Australian Accounting Standards arsing from AASB 101
AASB 101 (September 2007) has introduced terminology changes (including revised titles for the financial statements) and changes in the format and content of the financial statements. In addition, the revised Standard has required the presentation of a third statement of financial position at 1 July 2008, because the entity has applied new accounting policies retrospectively (see below).
AASB 8 Operating Segments AASB 8 is a disclosure Standard that has resulted in a redesignation of the Consolidated entity’s reportable segments (see note 6).
AASB2009-2AmendmentstoAustralian Accounting Standards –ImprovingDisclosuresaboutFinancial Instruments
The amendments to AASB 7 expand the disclosures required in respect of fair value measurements andliquidityrisk.TheConsolidatedentity has elected not to provide comparative information for these expanded disclosures in the current year in accordance with the transitional reliefs offered in these documents.
Standards and Interpretations affecting the reported results or financial position
The impact of the changes described in this section on basic and diluted earnings per share is disclosed in note 12.
AASB 3(2008) has been adopted in the current year. Its adoption has affected the accounting for business combinations in the current period.
In accordance with the relevant transitional provisions, AASB 3(2008) has been applied prospectively to business combinations for which the acquisition date is on or after 1 July 2009. The impact of the adoption of AASB 3(2008) Business Combinations has been:
• tochangetherecognitionandsubsequentaccountingrequirementsforcontingent consideration. Under the previous version of the Standard, contingent consideration was recognised at the acquisition date only if payment of the contingent consideration was probable and it could bemeasuredreliably;anysubsequentadjustmentstothecontingentconsideration were recognised against goodwill. Under the revised Standards, contingent consideration is measured at fair value at the acquisitiondate;subsequentadjustmentstotheconsiderationarerecognised against goodwill only to the extent that they arise from better information about the fair value at the acquisition date, and they occur within the ‘measurement period’ (a maximum of 12 months from the acquisition date). All other subsequent adjustments are recognised in profitorloss;
• wherethebusinesscombinationineffectsettlesapre-existingrelationship between the Consolidated entity and the acquiree, to require therecognitionofasettlementgainorloss;and
• torequirethatacquisition-relatedcostsbeaccountedforseparatelyfrom the business combination, generally leading to those costs being recognised as an expense in profit or loss as incurred, whereas previously they were accounted for as part of the cost of the acquisition.
2.2 STANDARDS AND INTERPRETATIONS ADOPTED WITH NO EFFECT ON FINANCIAL STATEMENTS
The following new and revised Standards and Interpretations have also been adopted in these financial statements. Their adoption has not had any significant impact on the amounts reported in these financial statements but may affect the accounting for future transactions or arrangements.
AASB 123 Borrowing Costs (as revised in 2007) and AASB 2007-6AmendmentstoAustralianAccounting Standards arsing from AASB 123
The principal change to AASB 123 was to eliminate the option to expense all borrowing costs when incurred.
AASB2008-8AmendmentstoAustralianAccountingStandards–Eligible Hedged Items
The amendments provide clarification on two aspects of hedge accounting: identifying inflationasahedgedriskorportion, and hedging with options.
Interpretation 16 Hedges of a Net Investment in a Foreign Operation
The Interpretation provides guidance on the detailed requirements for net investment hedging for certain hedge accounting designations.
Notes to the Financial Statements
Interpretation 18 Transfers of Assets from Customers
The Interpretation addresses the accounting by recipients for transfers of property, plant and equipment from ‘customers’ and concludes that when the item of property, plant and equipment transferred meets the definition of an asset from the perspective of the recipient, the recipient should recognise the asset at its fair value on the date of the transfer, with the credit recognised as revenue in accordance with AASB 118 Revenue.
AASB2008-5AmendmentstoAustralian Accounting Standards arising from the Annual Improvements Project and AASB 2008-6FurtherAmendmentsto Australian Accounting Standards arising from the Annual Improvements Project
The amendments have led to a number of changes in the detail of the Consolidated entity’s accountingpolicies–someofwhich are changes in terminology only, and some of which are substantive but have had no material effect on amounts reported.
AASB2009-4AmendmentstoAustralian Accounting Standards arising from the Annual Improvements
The amendments have led to a number of changes in the detail of the Consolidated entity’s accountingpolicies–someofwhich are changes in terminology only, and some of which are substantive but have had no material effect on amounts reported.
AASB 127 Consolidated and Separate Financial Statements (as revised in 2008)
AASB 127 (2008) has been adopted for periods beginning on or after 1 July 2009 and has been applied prospectively. The revised Standard has affected the Consolidated entity’s accounting policies regarding changes in ownership interests in its subsidiaries that do not result in a change in control. In prioryears,intheabsenceofspecificrequirementsinA-IFRS,increasesin interests in existing subsidiaries were treated in the same manner as the acquisition of subsidiaries, with goodwill or a bargain purchase gain beingrecognisedwhereappropriate;fordecreasesininterestsinexistingsubsidiaries that did not involve a loss of control, the difference between the consideration received and the carrying amount of the share of net assets disposed of was recognised in profit or loss. Under AASB 127(2008), all increases or decreases in such interests are recognised in equity with no impact on goodwill or profit or loss.
When control of a subsidiary is lost as a result of a transaction, event or other circumstances, the revised Standard requires that the Consolidated entityderecognisesallassets,liabilitiesandnon-controllinginterestsattheircarrying amount. Any retained interest in the former subsidiary is recognised at its fair value at the date control is lost, with the gain or loss arising recognised in profit or loss.
As the Consolidated entity has not had any changes in ownership interests in its subsidiaries over the financial year, the adoption of AASB 127 (2008) has not impacted the amounts reported in these financial statements.
2.3 STANDARDS AND INTERPRETATIONS IN ISSUE NOT YET ADOPTED
At the date of authorisation of the financial statements, the Standards and Interpretations listed below were in issue but not yet effective.
Standard/Interpretations
Effective for annual reporting periods beginning on or after
Expected to be initially applied in the financial year ending
AASB2009-5FurtherAmendments to Australian Accounting Standards arising from the Annual Improvements Project
1 January 2010 30 June 2011
AASB2009-8Amendments to Australian Accounting Standards–GroupCash-SettledShare-based Payment Transactions
1 January 2010 30 June 2011
AASB2009-10Amendments to Australian accounting Standards–Classification of Rights Issues
1 February 2010 30 June 2011
AASB 124 Related Party Disclosures (revised December 2009), AASB 2009-12Amendmentsto Australian Accounting Standards
1 January 2011 30 June 2012
AASB 9 Financial Instruments, AASB 2009-11Amendmentsto Australian Accounting Standards arising from AASB 9
1 January 2013 30 June 2014
AASB2009-14Amendments to Australian Interpretation –PrepaymentsofaMinimum Funding Requirement
1 January 2011 30 June 2012
Interpretation 19 Extinguishing Financial Liabilities with Equity Instruments
1 July 2010 30 June 2011

PAGE 65PAGE 64
DOMINO’S PIZZA ENTERPRISES LIMITED ANNUAL REPORT 2010 DOMINO’S PIZZA ENTERPRISES LIMITED ANNUAL REPORT 2010
3. SIGNIFICANT ACCOUNTING POLICIES3.1 STATEMENT OF COMPLIANCE
These financial statements are general purpose financial statements which have been prepared in accordance with the Corporations Act 2001, Accounting Standards and Interpretations, and comply with other requirements of the law.
The financial statements comprise the consolidated financial statements of theConsolidatedentityforthe53-weekperiodended4July2010.
Accounting Standards include Australian equivalents to International FinancialReportingStandards(‘A-IFRS’).CompliancewithA-IFRSensuresthat the financial statements and notes of the Company and the Consolidated entity comply with International Financial Reporting Standards (‘IFRS’).
The financial statements were authorised for issue by the directors on 15 September 2010.
3.2 BASIS OF PREPARATION
The financial report has been prepared on the basis of historical cost, except for the revaluation of certain financial instruments. Cost is based on the fair values of the consideration given in exchange for assets. All amounts are presented in Australian dollars, unless otherwise noted.
TheCompanyisacompanyofthekindreferredtoinASICClassOrder98/0100,dated10July1998,andinaccordancewiththatClassOrderamounts in the financial report are rounded off to the nearest thousand dollars, unless otherwise indicated.
The following significant accounting policies have been adopted in the preparation and presentation of the financial report.
3.3 BASIS OF CONSOLIDATION
The consolidated financial statements incorporate the financial statements of the Company and entities controlled by the Company (its subsidiaries) (referred to as ‘the Consolidated entity’ in these financial statements). Control is achieved where the Company has the power to govern the financial and operating policies of an entity so as to obtain benefits from its activities.
The results of subsidiaries acquired or disposed of during the year are included in the consolidated statement of comprehensive income from the effective date of acquisition or up to the effective date of disposal, as appropriate.
Where necessary, adjustments are made to the financial statements of subsidiaries to bring their accounting policies into line with those used by other members of the Consolidated entity.
Allintra-grouptransactions,balances,incomeandexpensesareeliminatedin full on consolidation.
3.4 BUSINESS COMBINATIONS
Acquisitions of subsidiaries and businesses are accounted for using the acquisition method. The consideration for each acquisition is measured at the aggregate of the fair values (at the date of exchange) of assets given, liabilities incurred or assumed, and equity instruments issued by the Consolidatedentityinexchangeforcontroloftheacquiree.Acquisition-related costs are recognised in profit or loss as incurred.
Where applicable, the consideration for the acquisition includes any asset or liability resulting from a contingent consideration arrangement, measured at itsacquisition-datefairvalue.Subsequentchangesinsuchfairvaluesareadjusted against the cost of acquisition where they qualify as measurement period adjustments.
All other subsequent changes in such fair values are adjusted against the cost of acquisition where they qualify as contingent consideration classified as an asset or liability are accounted for in accordance with relevant Standards. Changes in the fair value of contingent consideration classified as equity are not recognised.
Where a business combination is achieved in stages, the Consolidated entity previously held interests in the acquired entity are remeasured to fair value at the acquisition date (i.e. the date the Consolidated entity attains control) and the resulting gain or loss, if any, is recognised in profit or loss. Amounts arising from interests in the acquiree prior to the acquisition date that have previously been recognised in other comprehensive income are reclassified to profit or loss, where such treatment would be appropriate if that interest were disposed of.
The acquiree’s identifiable assets, liabilities and contingent liabilities that meet the conditions for recognition under AASB 3(2008) are recognised at their fair value at the acquisition date, except that:
• deferredtaxassetsorliabilitiesandliabilitiesorassetsrelatedtoemployeebenefit arrangements are recognised and measured in accordance with AASB112IncomeTaxesandAASB119EmployeeBenefitsrespectively;
• liabilitiesorequityinstrumentsrelatedtothereplacementbytheConsolidatedentityofanacquiree’sshare-basedpaymentawards aremeasuredinaccordancewithAASB2Share-basedPayment;and
• assets(ordisposalgroups)thatareclassifiedasheldforsale inaccordancewithAASB5Non-currentAssetsHeldforSale and Discontinued Operations are measured in accordance with that Standard.
If the initial accounting for a business combination is incomplete by the end of the reporting period in which the combination occurs, the Consolidated entity reports provisional amounts for the items for which the accounting is incomplete. Those provisional amounts are adjusted during the measurement period (see below), or additional assets or liabilities are recognised, to reflect new information obtained about facts and circumstances that existed as of the acquisitiondatethat,ifknown,wouldhaveaffectedtheamountsrecognisedasof that date.
The measurement period is the period from the date of acquisition to the date the Consolidated entity obtains complete information about facts and circumstancesthatexistedasoftheacquisitiondate–andissubjecttoamaximum of one year.
3.5 INVESTMENTS IN ASSOCIATES
An associate is an entity over which the Consolidated entity has significant influence and that is neither a subsidiary nor an interest in a joint venture. Significant influence is the power to participate in the financial and operating policy decisions of the investee but has no control or joint control over those policies.
The results and assets and liabilities of associates are incorporated in these financial statements using the equity method of accounting, except when the investment is classified as held for sale, in which case it is accounted for in accordancewithAASB5‘Non-currentAssetsHeldforSaleandDiscontinuedOperations’. Under the equity method, investments in associates are carried in theconsolidatedbalancesheetatcostasadjustedforpost-acquisitionchangesin the Consolidated entity’s share of the net assets of the associate, less any impairment in the value of individual investments. Losses of an associate in excess of the Consolidated entity’s interest in that associate (which includes anylong-termintereststhat,insubstance,formpartoftheConsolidatedentity’s net investment in the associate) are recognised only to the extent that the Consolidated entity has incurred legal or constructive obligations or made payments on behalf of the associate.
Any excess of the cost of acquisition over the Consolidated entity’s share of the net fair value of the identifiable assets, liabilities and contingent liabilities of the associate recognised at the date of the acquisition is recognised as goodwill. The goodwill is included within the carrying amount of the investment and is assessed for impairment as part of that investment. Any excess of the Consolidated entity’s share of the net fair value of the identifiable assets, liabilities and contingent liabilities over the cost of the acquisition, after reassessment, is recognised immediately in profit or loss.
Where a group entity transacts with an associate of the Consolidated entity, profits and losses are eliminated to the extent of the Consolidated entity’s interest in the relevant associate.
3.6 FOREIGN CURRENCIES
The individual financial statements of each group entity are presented in its functional currency being the currency of the primary economic environment in which the entity operates (its functional currency). For the purpose of the consolidated financial statements, the results and financial position of each entity are expressed in Australian dollars (‘$’), which is the functional currency of Domino’s Pizza Enterprises Limited and the presentation currency for the consolidated financial statements.
In preparing the financial statements of the individual entities, transactions in currencies other than the entity’s functional currency (foreign currencies) are recognised at the rates of exchange prevailing on the dates of the transactions. At the end of each reporting period, monetary items denominated in foreign currencies are retranslated at the rates prevailing at thatdate.Non-monetaryitemscarriedatfairvaluethataredenominatedinforeign currencies are retranslated at the rates prevailing on the date when thefairvaluewasdetermined.Non-monetaryitemsthataremeasuredinterms of historical cost in a foreign currency are not retranslated.
Exchange differences are recognised in profit or loss in the period in which they arise except for:
• exchangedifferencesonforeigncurrencyborrowingsrelatingtoassetsunder construction for future productive use, which are included in the cost of those assets when they are regarded as an adjustment to interestcostsonthoseforeigncurrencyborrowings;
• exchangedifferencesontransactionsenteredintoinordertohedgecertainforeigncurrencyrisks(see3.24belowforhedgeaccountingpolicies);and
• exchangedifferencesonmonetaryitemsreceivablefromorpayabletoaforeignoperationforwhichsettlementisneitherplannedorlikelyto occur, (therefore forming part of the net investment in a foreign operation), which are recognised initially in other comprehensive income and reclassified from equity to profit and loss on disposal or partial disposal of the net investment.
For the purpose of presenting the consolidated financial statements, the assets and liabilities of the Consolidated entity’s foreign operations are expressed in Australian dollars using exchange rates prevailing at the end of the reporting period. Income and expense items are translated at the average exchange rates for the period, unless exchange rates fluctuated significantly during the period, in which case the exchange rates at the date of the transactions are used. Exchange differences arising, if any, are recognised in other comprehensive income and accumulated in equity (attributedtonon-controllinginterestsasappropriate).
On disposal of a foreign operation (i.e. a disposal of the Consolidated entity’s entire interest in a foreign operation, or a disposal involving loss of control
over a subsidiary that includes a foreign operation, loss of joint control over a jointly controlled entity that includes a foreign operation, or loss of significant influence over an associated that includes a foreign operation), all of the accumulated exchange differences in respect of that operation attributable to the Consolidated entity are reclassified to profit or loss. Any exchangedifferencesthathavepreviouslybeenattributedtonon-controllinginterests are derecognised, but they are not reclassified to profit or loss.
In the case of a partial disposal (i.e. no loss of control) of a subsidiary that includes a foreign operation, the proportionate share of accumulated exchangedifferencesarere-attributedtonon-controllinginterestsandare not recognised in profit or loss. For all other partial disposals (i.e. of associates or jointly controlled entities not involving a change of accounting basis), the proportionate share of the accumulated exchange differences is reclassified to profit or loss.
Goodwill and fair value adjustments arising on the acquisition of a foreign operation are treated as assets and liabilities of the foreign operation and translated at the closing rate.
3.7 GOODS AND SERVICES TAX
Revenues, expenses and assets are recognised net of the amount of goods and services tax (“GST”), except:
i. where the amount of GST incurred is not recoverable from the taxation authority, it is recognised as part of the cost of acquisition of an asset or aspartofanitemofexpense;or
ii. for receivables and payables which are recognised inclusive of GST.
The net amount of GST recoverable from, or payable to, the taxation authority is included as part of receivables or payables.
Cash flows are included in the cash flow statement on a gross basis. The GST component of cash flows arising from investing and financing activities which is recoverable from, or payable to, the taxation authority is classified within operating cash flows.
3.8 REVENUE RECOGNITION
Revenue is measured at the fair value of the consideration received or receivable.
3.8.1 Sale of goods
Revenue from the sale of goods is recognised when the Consolidated entity hastransferredtothebuyerthesignificantrisksandrewardsofownershipof the goods.
3.8.2 Franchise income
Franchise income is recognised on an accrual basis in accordance with the substance of the relevant agreement.
3.8.3 Rendering of services
Service revenue relates primarily to store building services and is recognised by reference to the stage of completion of the contract.
3.8.4 Royalties
Royalty revenue is recognised on an accrual basis in accordance with the substance of the relevant agreement (provided that it is probable that the economic benefits will flow to the Consolidated entity and the amount of revenue can be measured reliably). Royalties determined on a time basis are recognisedonastraight-linebasisovertheperiodoftheagreement. Royalty arrangements that are based on sales and other measures are recognised by reference to the underlying arrangement.
Notes to the Financial Statements CONTINUED

PAGE 67PAGE 66
DOMINO’S PIZZA ENTERPRISES LIMITED ANNUAL REPORT 2010 DOMINO’S PIZZA ENTERPRISES LIMITED ANNUAL REPORT 2010
3.8.5 Dividend and interest revenue
Dividend revenue from investments is recognised when the shareholder’s right to receive payment has been established (provided that it is probable that the economic benefits will flow to the Consolidated entity and the amount of revenue can be reliably measured).
Interest revenue is recognised when it is probable that the economic benefits will flow to the Consolidated entity and the amount of revenue can be measured reliably. Interest revenue is accrued on a time basis, by reference to the principal outstanding and at the effective interest rate applicable, which is the rate that exactly discounts estimated future cash receipts through the expected life of the financial asset to that asset’s net carrying amount on initial recognition.
3.9 SHARE-BASED PAYMENTS
Equitysettledshare-basedpaymentstoemployeesandothersprovidingsimilar services are measured at the fair value of the equity instrument at the grant date. The fair value is measured by use of a binomial model. The expected life used in the model has been adjusted, based on management’s bestestimate,fortheeffectsofnon-transferability,exerciserestrictions,andbehavioural considerations. Details regarding the determination of the fair valueofequity-settledshare-basedtransactionsaresetoutinnote33.
Thefairvaluedeterminedatthegrantdateoftheequity-settledshare-basedpaymentsisexpensedonastraight-linebasisoverthevestingperiod,based on the Consolidated entity’s estimate of equity instruments that will eventually vest. At each reporting period, the Consolidated entity revises its estimate of the number of equity instruments expected to vest. The impact of the revision of the original estimates, if any, is recognised in profit or loss over the remaining vesting period, with corresponding adjustment to the equity-settledemployeebenefitsreserve.
Thepolicydescribedaboveisappliedtoallequity-settledshare-basedpayments that were granted after 7 November 2002 that vested after 1 January 2005. No amount has been recognised in the financial statements in respectoftheotherequity-settledshare-basedpayments.
Equity-settledshare-basedpaymenttransactionswithotherpartiesaremeasured at the fair value of the goods and services received, except where the fair value cannot be estimated reliably, in which case they are measured at the fair value of the equity instruments granted, measured at the date the entity obtains the goods or the counterparty renders the service.
3.10 TAXATION
Income tax expense represents the sum of the tax currently payable and deferred tax.
3.10.1 Current tax
The tax currently payable is based on taxable profit for the year. Taxable profit differs from profit as reported in the consolidated statement of comprehensive income because of items of income or expense that are taxable or deductible in other years and items that are never taxable or deductible. The Consolidated entity’s liability for current tax is calculated using tax rates that have been enacted or substantively enacted by the end of this reporting period.
3.10.2 Deferred tax
Deferred tax is recognised on temporary differences between the carrying amounts of assets and liabilities in the financial statements and the corresponding tax bases used in the computation of taxable profit. Deferred tax liabilities are generally recognised for all taxable temporary differences. Deferred tax assets are generally for all deductible temporary differences to the extent that it is probable that taxable profits will be available against
which those deductible temporary differences can be utilised. Such deferred tax assets and liabilities are not recognised if the temporary difference arises from goodwill or from the initial recognition of goodwill (other than in a business combination) or other assets and liabilities in a transaction that affects neither the taxable profit nor the accounting profit.
Deferred tax liabilities are recognised for taxable temporary differences associated with investments in subsidiaries and associates and interests in joint ventures except where the Consolidated entity is able to control the reversal of the temporary differences and it is probable that the temporary differences will not reverse in the foreseeable future. Deferred tax assets arising from deductible temporary differences associated with these investments and interests are only recognised to the extent that it is probable that there will be sufficient taxable profits against which to utilise the benefits of the temporary differences they are expected to reverse in the foreseeable future.
The carrying amount of deferred tax assets is reviewed at the end of each reporting period and reduced to the extent that it is no longer probable that sufficient taxable profits will be available to allow all or part of the asset to be recovered.
Deferred tax assets and liabilities are measured at the tax rates that are expected to apply in the period in which the liability is settled or the asset is realised, based on tax rates (and tax laws) that have been enacted or substantively enacted by the end of the reporting period. The measurement of deferred tax liabilities and assets reflects the tax consequences that would follow from the manner in which the Consolidated entity expects, at the end of the reporting period, to recover or settle the carrying amount of its assets and liabilities.
Deferred tax assets and liabilities are offset when there is a legally enforceable right to set off current tax assets against current tax liabilities and when they related to income taxes levied by the same taxation authority and the Consolidated entity intends to settle its current tax assets and liabilities on a net basis.
3.10.3 Current and deferred tax for the period
Current and deferred tax is recognised as an expense or income in the profit or loss, except when they relate to items that are recognised outside the profit or loss (whether in other comprehensive income or directly in equity), in which case the tax is also recognised outside the profit or loss, or where they arise from the initial accounting for a business combination. In the case of a business combination, the tax effect is included in the accounting for the business combination.
3.10.4 Tax consolidation
TheCompanyandallitswholly-ownedAustralianresidententitiesarepartof a tax consolidated group under Australian taxation law. Domino’s Pizza EnterprisesLimitedistheheadentityinthetax-consolidatedgroup.Taxexpense/income,deferredtaxliabilitiesanddeferredtaxassetsarisingfromtemporarydifferencesofthemembersofthetax-consolidatedgroupare recognised in the separate financial statements of the members of the tax-consolidatedgroupusingthe‘separatetaxpayerwithingroupapproach’by reference to the carrying amounts in the separate financial statements of each entity and the tax values applying under tax consolidation. Current tax liabilities and assets and deferred tax assets arising from unused tax losses andrelevanttaxcreditsofthemembersofthetax-consolidatedgrouparerecognisedbytheCompany(asheadentityinthetax-consolidatedgroup).
Theentitiesinthetax-consolidatedgrouphavenotenteredintoataxsharingagreement or tax funding agreement. Income tax liabilities payable to the taxauthoritiesinrespectofthetax-consolidatedgrouparerecognisedinthefinancial statements of the parent entity.
3.11 CASH AND CASH EQUIVALENTS
Cashcomprisescashonhandanddemanddeposits.Cashequivalentsareshort-term,highlyliquidinvestmentsthatarereadilyconvertibletoknownamountsofcash,whicharesubjecttoaninsignificantriskofchangesinvalueandhaveamaturity of three months or less at the date of acquisition.
Bankoverdraftsareshownwithinborrowingsincurrentliabilitiesintheconsolidated statement of financial position.
3.12 FINANCIAL ASSETS
All financial assets are recognised and derecognised on trade date where the purchase or sale of a financial asset is under a contract whose terms require deliveryofthefinancialassetwithinthetimeframeestablishedbythemarketconcerned, and are initially measured at fair value, plus transaction costs, except for those financial assets classified as at fair value through profit or loss, which are initially measured at fair value.
Financial assets are classified into the following specified categories: financialassets‘atfairvaluethroughprofitorloss’(FVTPL),‘held-to-maturityinvestments’,‘available-for-sale’(AFS)‘financialassets’,and‘loansandreceivables’. The classification depends on the nature and purpose of the financial assets and is determined at the time of initial recognition.
3.12.1 Effective interest method
The effective interest method is a method of calculating the amortised cost of a debt instrument and of allocating interest income over the relevant period. The effective interest rate is the rate that exactly discounts estimated future cash receipts (including all fees on points paid or received that form an integral part of the effective interest rate, transaction costs and other premiums or discounts) through the expected life of the debt instrument, or (where appropriate) a shorter period, to the net carrying amount on initial recognition.
Income is recognised on an effective interest rate basis for debt instruments other than those financial assets as at FVTPL.
3.12.2 Financial assets at FVTPL
Financial assets are classified as at FVTPL when the financial asset is either held for trading or it is designated as at FVTPL.
A financial asset is classified as held for trading if:
• Ithasbeenacquiredprincipallyforthepurposeofsellingitinthenearterm;or
• oninitialrecognitionitisapartofanidentifiedportfoliooffinancialinstruments that the Consolidated entity manages together and has a recent actualpatternofshort-termprofit-taking;or
• itisaderivativethatisnotdesignatedandeffectiveasahedginginstrument.
A financial asset other than a financial asset held for trading may be designated as at FVTPL upon initial recognition if:
• suchdesignationeliminatesorsignificantlyreducesameasurementorrecognitioninconsistencythatwouldotherwisearise;or
• thefinancialassetformspartofagroupoffinancialassetsorfinancialliabilities or both, which is managed and its performance is evaluated on a fair value basis, in accordance with the Consolidated entity’s documented riskmanagementorinvestmentstrategy,andinformationaboutthegroupingisprovidedinternallyonthatbasis;or
• itformspartofacontractcontainingoneormoreembeddedderivatives,and AASB 139 Financial Instruments: Recognition and Measurement permits the entire combined contract (asset or liability) to be designated as at FVTPL.
Financial assets at FVTPL are stated at fair value, with any gains or losses arisingonre-measurementrecognisedinprofitorloss.Thenetgainorlossrecognised in profit or loss incorporates any dividend or interest earned on the financial asset and is included in the ‘other gains and losses’ line item in the statement of comprehensive income. Fair value is determined in the manner described in note 32.
3.12.3 Held-to-maturity investments
Bills of exchange and debentures with fixed or determinable payments and fixed maturity dates where that the Consolidated entity has the positive intentandabilitytoholdtomaturityareclassifiedasheld-to-maturityinvestments.Held-to-maturityinvestmentsarerecordedatamortisedcost using the effective interest method less impairment, with revenue recognised on an effective yield basis.
3.12.4 Available-for-sale financial assets
Financial assets held by the Consolidated entity are classified as being AFS and are stated at fair value. Fair value is determined in the manner described in note 32. Gains and losses arising from changes in fair value are recognised directly in other comprehensive income and accumulated in the investments revaluation reserve, with the exception of impairment losses, interest calculated using the effective interest method, and foreign exchange gains and losses on monetary assets which are recognised in profit or loss. Where the investment is disposed of or is determined to be impaired, the cumulative gain or loss previously accumulated in the investments revaluation reserve is reclassified to profit or loss.
Dividends on AFS equity instruments are recognised in profit and loss when the Consolidated entity’s right to receive the dividends is established.
The fair value of AFS monetary assets denominated in a foreign currency is determined in that foreign currency and translated at the spot rate at the end of the reporting period. The foreign exchange gains and losses that are recognised in profit or loss are determined based on the amortised cost of the monetary asset. Other foreign exchange gains and losses are recognised in the other comprehensive income.
3.12.5 Loans and receivables
Trade receivables, loans and other receivables that have fixed or determinablepaymentsthatarenotquotedinanactivemarketareclassifiedas ‘loans and receivables’. Loans and receivables are measured at amortised cost using the effective interest method less impairment. Interest income isrecognisedbyapplyingtheeffectiveinterestrate,exceptforshort-termreceivables when the recognition of interest would be immaterial.
3.12.6 Impairment of financial assets
Financial assets, other than those at FVTPL, are assessed for indicators of impairment at the end of each reporting period. Financial assets are considered to be impaired where there is objective evidence that, as a result of one or more events that occurred after the initial recognition of the financial asset, the estimated future cash flows of the investment have been affected.
For certain categories of financial asset, such as trade receivables, assets that are assessed not to be impaired individually are, in addition, assessed for impairment on a collective basis. Objective evidence of impairment for a portfolio of receivables could include the Consolidated entity’s past experience of collecting payments, an increase in the number of delayed payments in the portfolio past the average credit period of 30 days, as well as observable changes in national or local economic conditions that correlate with default on receivables.
Notes to the Financial Statements CONTINUED

PAGE 69PAGE 68
DOMINO’S PIZZA ENTERPRISES LIMITED ANNUAL REPORT 2010 DOMINO’S PIZZA ENTERPRISES LIMITED ANNUAL REPORT 2010
3.12.6 Impairment of financial assets (continued)
For financial assets carried at amortised cost, the amount of the impairment recognised is the difference between the asset’s carrying amount and the present value of estimated future cash flows, discounted at the original effective interest rate.
The carrying amount of financial assets is reduced by the impairment loss directly for all financial assets with the exception of trade receivables, where the carrying amount is reduced through the use of an allowance account. When a trade receivable is considered uncollectible, it is written off against the allowance account. Subsequent recoveries of amounts previously written off are credited against the allowance account. Changes in the carrying amount of the allowance account are recognised in profit or loss.
When an AFS financial asset is considered to be impaired, cumulative gains or losses previously recognised in other comprehensive income are reclassified to profit or loss in the period.
With the exception of AFS equity instruments, if, in a subsequent period, the amount of the impairment loss decreases and the decrease can be related objectively to an event occurring after the impairment was recognised, the previously recognised impairment loss is reversed through profit or loss to the extent the carrying amount of the investment at the date the impairment is reversed does not exceed what the amortised cost would have been had the impairment not been recognised.
In respect of AFS equity securities, impairment losses previously recognised in profit or loss are not reversed through profit or loss. Any increase in fair value subsequent to an impairment loss is recognised in other comprehensive income.
3.12.7 Derecognition of financial assets
The Consolidated entity derecognises a financial asset only when the contractual rights to the cash flows from the asset expire, or it transfers thefinancialassetandsubstantiallyalltherisksandrewardsofownershipof the asset to another entity. If the Consolidated entity neither transfers norretainssubstantiallyalltherisksandrewardsofownershipandcontinues to control the transferred asset, the Consolidated entity recognises its retained interest in the asset and an associated liability for amounts it may have to pay. If the Consolidated entity retains substantially alltherisksandrewardsofownershipofatransferredfinancialasset,theConsolidated entity continues to recognise the financial asset and also recognises a collateralised borrowing for the proceeds received.
3.13 INVENTORIES
Inventories are stated at the lower of cost and net realisable value. Costs, including an appropriate portion of fixed and variable overhead expenses, are assigned to inventories by the method most appropriate to each particular class of inventory, with the majority being valued on a first in first out basis. Net realisable value represents the estimated selling price for inventories less all estimated costs of completion and costs necessary tomakethesale.
3.14 NON-CURRENT ASSETS HELD FOR SALE
Non-currentassetsanddisposalgroupsareclassifiedasheldforsaleiftheir carrying amount will be recovered principally through a sale transaction rather than through continuing use. This condition is regarded as met only when the sale is highly probable and the asset (or disposal group) is available for immediate sale in its present condition. Management must be committed to the sale, which should be expected to qualify for recognition as a completed sale within one year from the date of classification.
When the Consolidated entity is committed to a sale plan involving the loss of control of a subsidiary, all of the assets and liabilities of that subsidiary are classified as held for sale when the criteria described above are met, regardlessofwhethertheConsolidatedentitywillretainanon-controllinginterest in its former subsidiary after the sale.
Non-currentassets(anddisposalgroups)classifiedasheldforsalearemeasured at the lower of their previous carrying amount and fair value less costs to sell.
3.15 PROPERTY, PLANT AND EQUIPMENT
Plant and equipment, leasehold improvements and equipment under finance leases are stated at cost less accumulated depreciation and impairment. Cost includes expenditure that is directly attributable to the acquisition of an item. In the event that settlement of all or part of the purchase consideration is deferred, cost is determined by discounting the amounts payable in the future to their present value as at the date of acquisition.
Depreciation is provided on property, plant and equipment excluding land. Depreciationiscalculatedonastraight-linebasissoastowriteoffthecost of each asset over its expected useful life to its estimated residual value. Leasehold improvements are depreciated over the period of the lease orestimatedusefullife,whicheveristheshorter,usingthestraight-linemethod. The estimated useful lives, residual values and depreciation method are reviewed at the end of each annual reporting period, with the effect of any changes recognised on a prospective basis.
Assets held under finance leases are depreciated over their expected useful lives on the same basis as owned assets or, where shorter, the term of the relevant lease.
The gain or loss arising on disposal or retirement of an item of property, plant and equipment is determined as the difference between the sales proceeds and the carrying amount of the asset and is recognised in profit or loss.
The following useful lives are used in the calculation of depreciation:• Plantandequipment 1–5years• Equipmentunderfinanceleases 3–10years
3.16 BORROWING COSTS
Borrowing costs directly attributable to the acquisition, construction or productionofqualifyingassets,whichareassetsthatnecessarilytakea substantial period of time to get ready for their intended use or sale, are added to the cost of those assets, until such time as the assets are substantially ready for their intended use or sale.
Investment income earned on the temporary investment of specific borrowings pending their expenditure on qualifying assets is deducted from the borrowing costs eligible for capitalisation.
All other borrowing costs are recognised in profit or loss in the period in which they are incurred.
3.17 LEASING
Leases are classified as finance leases whenever the terms of the lease transfersubstantiallyalltherisksandrewardsincidentaltoownershipoftheleased asset to the lessee. All other leases are classified as operating leases.
3.17.1 Consolidated entity as lessee
Assets held under finance leases are initially recognised as assets of the Consolidated entity at their fair value at the inception date of the lease or, if lower, at the present value of the minimum lease payments. The corresponding liability to the lessor is included in the statement of financial position as a finance lease obligation.
Lease payments are apportioned between finance expenses and reduction of the lease obligation so as to achieve a constant rate of interest on the remaining balance of the liability. Finance expenses are recognised immediately in profit or loss, unless they are directly attributable to qualifying assets, in which case they are capitalised in accordance with the Consolidated entity’s general policy on borrowing costs (see 3.16). Contingent rentals are recognised as an expense in the periods in which they are incurred.
Financeleasedassetsareamortisedonastraight-linebasisovertheestimated useful life of the asset.
Operatingleasepaymentsarerecognisedasanexpenseonastraight-linebasis over the lease term, except where another systematic basis is more representative of the time pattern in which economic benefits from the leased asset are consumed. Contingent rentals arising under operating leases are recognised as an expense in the period in which they are incurred.
In the event that lease incentives are received to enter into operating leases, such incentives are recognised as a liability. The aggregate benefits of incentivesarerecognisedasareductionofrentalexpenseonastraight-linebasis, except where another systematic basis is more representative of the time pattern in which economic benefits from the leased asset are consumed.
3.18 GOODWILL
Policy for goodwill acquired prior to 1 July 2009:
Goodwill acquired in a business combination is initially measured at its cost, being the excess of the cost of the business combination over the Consolidated entity’s interest in the net fair value of the identifiable assets, liabilities and contingent liabilities recognised at the date of the acquisition. Goodwill is subsequently measured at its cost less any accumulated impairment losses.
Policy effective from 1 July 2009:
Goodwill arising in a business combination is recognised as an asset at the date that the control is acquired (the acquisition date). Goodwill is measured as the excess of the sum of the consolidation transferred, the amountofanynon-controllinginterestsintheacquiree,andthefairvalueofthe acquirer’s previously held equity interest in the acquiree (if any) over the netoftheacquisition-dateamountsoftheidentifiableassetsacquiredandtheliabilities incurred.
If, after reassessment, the Consolidated entity’s interest in the fair value of the acquiree’s identifiable net assets exceeds the sum of the consideration transferred,theamountofanynon-controllinginterestsintheacquireeandthe fair value of the acquirer’s previously held equity interest in the acquiree (if any), the excess is recognised immediately in profit or loss as a bargain purchase gain. On disposal of a subsidiary, the attributable amount of goodwill is included in the determination of the profit or loss on disposal.
Review of potential impairment:
Goodwill is not amortised but is reviewed for impairment at least annually. For the purpose of impairment testing, goodwill is allocated to each of the Consolidatedentity’scash-generatingunitsexpectedtobenefitfromthesynergiesofthecombination.Cash-generatingunitstowhichgoodwillhasbeen allocated are tested for impairment annually or more frequently when there is an indication that the unit may be impaired. If the recoverable amount ofthecash-generatingunitislessthanthecarryingamount,theimpairmentloss is allocated first to reduce the carrying amount of any goodwill allocated totheunitandthentotheotherassetsoftheunitpro-rataonthebasisofthecarrying amount of each asset in the unit. An impairment loss recognised for goodwill is not reversed in a subsequent period.
3.19 INTANGIBLE ASSETS
3.19.1 Intangible assets acquired separately
Intangible assets acquired separately are carried at cost less accumulated amortisation and accumulated impairment losses. Amortisation is recognisedonastraight-linebasisovertheirestimatedusefullives. The estimated useful life and amortisation method are reviewed at the end of each annual reporting period, with the effect of any changes in estimates being accounted for on a prospective basis.
3.19.2 Internally-generated intangible assets – Research and development expenditure
Expenditure on research activities is recognised as an expense in the period in which it is incurred.
Aninternally-generatedintangibleassetarisingfromdevelopment(orfromthe development phase of an internal project) is recognised if, and only if, all of the following have been demonstrated:• thetechnicalfeasibilityofcompletingtheintangibleassetsothatit
willbeavailableforuseorsale;• theintentiontocompletetheintangibleassetanduseorsellit;• theabilitytouseorselltheintangibleasset;• howtheintangibleassetwillgenerateprobablefutureeconomic
benefits;• theavailabilityofadequatetechnical,financialandotherresourcesto
completethedevelopmentandtouseorselltheintangibleasset;and• theabilitytomeasurereliablytheexpenditureattributabletothe
intangible asset during its development.
Theamountinitiallyrecognisedforinternally-generatedintangibleassetsis the sum of the expenditure incurred from the date when the intangible assetfirstmeetstherecognitioncriterialistedabove.Wherenointernally-generated intangible asset can be recognised, development expenditure is recognised in profit or loss in the period in which it is incurred.
Subsequenttoinitialrecognition,internally-generatedintangibleassetsarereported at cost less accumulated amortisation and accumulated impairment losses, on the same basis as intangible assets acquired separately.
The following useful lives are used in the calculation of amortisation:
• Intangibles2–4years
3.19.3 Intangible assets acquired in a business combination
Intangible assets acquired in a business combination are identified and recognised separately from goodwill initially recognised at their fair value at the acquisition date (which is regarded as their cost).
Subsequent to initial recognition, intangible assets acquired in a business combination are reported at cost less accumulated amortisation and accumulated impairment losses, on the same basis as intangible assets acquired separately.
Notes to the Financial Statements CONTINUED
PAGE 71PAGE 70
DOMINO’S PIZZA ENTERPRISES LIMITED ANNUAL REPORT 2010 DOMINO’S PIZZA ENTERPRISES LIMITED ANNUAL REPORT 2010
3.20 IMPAIRMENT OF TANGIBLE AND INTANGIBLE ASSETS EXCLUDING GOODWILL
At the end of each reporting period, the Consolidated entity reviews the carrying amounts of its tangible and intangible assets to determine whether there is any indication that those assets have suffered an impairment loss. If any such indication exists, the recoverable amount of the asset is estimated in order to determine the extent of the impairment loss (if any).
Where it is not possible to estimate the recoverable amount of an individual asset, the Consolidated entity estimates the recoverable amount of the cash-generatingunittowhichtheassetbelongs.Whereareasonableandconsistent basis of allocation can be identified, corporate assets are also allocatedtoindividualcash-generatingunits,orotherwisetheyareallocatedtothesmallestgroupofcash-generatingunitsforwhichareasonableandconsistent allocation basis can be identified.
Intangible assets with indefinite useful lives and intangible assets not yet available for use are tested for impairment annually and whenever there is an indication that the asset may be impaired. The recoverable amount is the higher of fair value less costs to sell and value in use. In assessing the value in use, the estimated future cash flows are discounted to their present value using apre-taxdiscountratethatreflectscurrentmarketassessmentsofthetimevalueofmoneyandtherisksspecifictotheassetforwhichtheestimatesoffuture cash flows have not been adjusted.
Iftherecoverableamountofanasset(orcash-generatingunit)isestimatedtobelessthanitscarryingamount,thecarryingamountoftheasset(cash-generating unit) is reduced to its recoverable amount. An impairment loss is recognised immediately in profit or loss, unless the relevant asset is carried at the revalued amount, in which case the impairment loss is treated as a revaluation decrease (see 3.15).
Where an impairment loss subsequently reverses, the carrying amount of theasset(cash-generatingunit)isincreasedtotherevisedestimateofitsrecoverable amount, but so that the increased carrying amount does not exceed the carrying amount that would have been determined had no impairment loss beenrecognisedfortheasset(cash-generatingunit)inprioryears.Areversalof an impairment loss is recognised immediately in profit or loss, unless the relevant asset is carried at fair value, in which case the reversal of the impairment loss is treated as a revaluation increase (see 3.15).
3.21 EMPLOYEE BENEFITS
A liability is recognised for benefits accruing to employees in respect of wages andsalaries,annualleave,longserviceleaveandsickleavewhenitisprobablethat settlement will be required and they are capable of being measured reliably.
Liabilitiesrecognisedinrespectofshort-termemployeebenefits,aremeasured at their nominal values using the remuneration rate expected to apply at the time of settlement.
Liabilities recognised in respect of long term employee benefits are measured as the present value of the estimated future cash outflows to be made by the Consolidated entity in respect of services provided by employees up to reporting date.
Contributions to defined contribution superannuation plans are expensed when employees have rendered service entitling them to the contributions.
3.22 PROVISIONS
Provisions are recognised when the Consolidated entity has a present obligation (legal or constructive) as a result of a past event, it is probable that the Consolidated entity will be required to settle the obligation, and a reliable estimate can be made of the amount of the obligation.
The amount recognised as a provision is the best estimate of the consideration required to settle the present obligation at reporting date, takingintoaccounttherisksanduncertaintiessurroundingtheobligation.
Where a provision is measured using the cash flows estimated to settle the present obligation, its carrying amount is the present value of those cash flows.
When some or all of the economic benefits required to settle a provision are expected to be recovered from a third party, the receivable is recognised as an asset if it is virtually certain that reimbursement will be received and the amount of the receivable can be measured reliably.
3.22.1 Onerous contracts
Present obligations arising under onerous contracts are recognised and measured as a provision. An onerous contract is considered to exist where the Consolidated entity has a contract under which the unavoidable costs of meeting the obligations under the contract exceed the economic benefits expected to be received under it.
3.22.2 Make good obligations
Aprovisionisrecognisedforthemakegoodobligationsinrespectofrestoring sites to their original condition when the premises are vacated. Management has estimated the provision based on historical data in relation to store closure numbers and costs, as well as future trends that could differ from historical amounts.
3.22.3 Contingent liabilities acquired in a business combination
Contingent liabilities acquired in a business combination are initially measured at fair value at the date of acquisition. At subsequent reporting periods, such contingent liabilities are measured at the higher of the amount that would be recognised in accordance with AASB 137 ‘Provisions, Contingent Liabilities and Contingent Assets’ and the amount initially recognised less cumulative amortisation recognised in accordance with AASB 118 ‘Revenue’.
3.23 FINANCIAL INSTRUMENTS ISSUED BY THE COMPANY
3.23.1 Classification as debt and equity
Debt and equity instruments are classified as either liabilities or as equity in accordance with the substance of the contractual arrangement.
3.23.2 Equity instruments
An equity instrument is any contract that evidences a residual interest in the assets of an entity after deducting all of its liabilities. Equity instruments issued by the Consolidated entity are recorded at the proceeds received, net of direct issue costs.
3.23.3 Financial guarantee contract liabilities
Financial guarantee contract liabilities are measured initially at their fair values and, if not designated as at FVTPL, are subsequently measured at the higher of:
• theamountoftheobligationunderthecontract,asdeterminedinaccordance with AASB 137 ‘Provisions, Contingent Liabilities and ContingentAssets’;and
• theamountinitiallyrecognisedless,whereappropriate,cumulativeamortisation in accordance with the revenue recognition policies set out in 3.8.
3.23.4 Financial liabilities
Financial liabilities are classified as either financial liabilities ‘at FVTPL’ or ‘other financial liabilities’.
3.23.5 Financial liabilities at FVTPL
Financial liabilities are classified as at FVTPL when the financial liability is either held for trading or it is designated as at FVTPL.
A financial liability is classified as held for trading if:• ithasbeenacquiredprincipallyforthepurposeofrepurchasinginthe
nearterm;or• oninitialrecognitionitisapartofanidentifiedportfoliooffinancial
instruments that the Consolidated entity manages together and has a recentactualpatternofshort-termprofit-taking;or
• itisaderivativethatisnotdesignatedandeffectiveasahedginginstrument.
A financial liability other than a financial liability held for trading is designated as at FVTPL upon initial recognition if:• suchdesignationeliminatesorsignificantlyreducesameasurementor
recognitioninconsistencythatwouldotherwisearise;or• thefinancialliabilityformspartofagroupoffinancialassetsorfinancial
liabilities or both, which is managed and its performance evaluated on a fair value basis, in accordance with the Consolidated entity’s documentedriskmanagementorinvestmentstrategy,andinformationaboutthegroupingisprovidedinternallyonthatbasis;or
• itformspartofacontractcontainingoneormoreembeddedderivatives,and AASB 139 ‘Financial Instruments: Recognition and Measurement’ permits the entire combined contract (asset or liability) to be designated as at FVTPL.
Financial liabilities at FVTPL are stated at fair value, with any gains or losses arisingonre-measurementrecognisedinprofitorloss.Thenetgainorlossrecognised in profit or loss incorporates any interest paid on the financial liability and is included in the ‘other gains and losses’ line item in the statement of comprehensive income. Fair value is determined in the manner described in note 32.
3.23.6 Other financial liabilities
Other financial liabilities, including borrowings, are initially measured at fair value, net of transaction costs.
Other financial liabilities are subsequently measured at amortised cost using the effective interest method, with interest expense recognised on an effective yield basis.
The effective interest method is a method of calculating the amortised cost of a financial liability and of allocating interest expense over the relevant period. The effective interest rate is the rate that exactly discounts estimated future cash payments through the expected life of the financial liability, or, where appropriate, a shorter period.
3.23.7 Derecognition of financial liabilities
The Consolidated entity derecognises financial liabilities when, and only when, the Consolidated entity’s obligations are discharged, cancelled or they expire.
3.24 DERIVATIVE FINANCIAL INSTRUMENTS
The Consolidated entity enters into a variety of derivative financial instruments tomanageitsexposuretointerestrateandforeignexchangeraterisk,including foreign exchange forward contracts and interest rate swaps. Further details of derivative financial instruments are disclosed in note 32.
Derivatives are initially recognised at fair value at the date a derivative contract is entered into and are subsequently remeasured to their fair value at each reporting period. The resulting gain or loss is recognised in profit or loss immediately unless the derivative is designated and effective as a hedging instrument, in which event, the timing of the recognition in profit or loss depends on the nature of the hedge relationship. The Consolidated entity designates certain derivatives as either hedges of the fair value of recognised assets or liabilities or firm commitments (fair value hedges), hedges of highly probable forecasttransactions,hedgesofforeigncurrencyriskoffirmcommitments(cashflow hedges), or hedges of net investments in foreign operations.
Aderivativewithapositivefairvalueisrecognisedasafinancialasset;aderivative with a negative fair value is recognised as a financial liability. Aderivativeispresentedasanon-currentassetoranon-currentliabilityifthe remaining maturity of the instrument is more than 12 months and it is not expected to be realised or settled within 12 months. Other derivatives are presented as current assets or current liabilities.
3.24.1 Hedge accounting
The Consolidated entity designates certain hedging instruments, which include derivatives,embeddedderivativesandnon-derivatives,inrespectofforeigncurrencyrisk,aseitherfairvaluehedges,cashflowhedges,orhedgesofnetinvestmentsinforeignoperations.Hedgesofforeignexchangeriskonfirmcommitments are accounted for as cash flow hedges.
At the inception of the hedge relationship, the entity documents the relationship between the hedging instrument and hedged item, along with its riskmanagementobjectivesanditsstrategyforundertakingvarioushedgetransactions. Furthermore, at the inception of the hedge and on an ongoing basis, the Consolidated entity documents whether the hedging instrument that is used in a hedging relationship is highly effective in offsetting changes in fair values or cash flows of the hedged item.
Note 32 sets out details of the fair values of the derivative instruments used for hedging purposes.
3.24.2 Fair value hedge
Changes in the fair value of derivatives that are designated and qualify as fair value hedges are recognised in profit or loss immediately, together with any changes in the fair value of the hedged item that is attributable to the hedged risk.Thechangeinthefairvalueofthehedginginstrumentandthechangeinthehedgeditemattributabletothehedgedriskarerecognisedinthelineofthe statement of comprehensive income relating to the hedged item.
HedgeaccountingisdiscontinuedwhentheConsolidatedentityrevokesthe hedging relationship, when the hedging instrument expires or is sold, terminated, or exercised, or when it no longer qualifies for hedge accounting. The fair value adjustment to the carrying amount of the hedged item arising fromthehedgedriskisamortisedtoprofitorlossfromthatdate.
3.24.3 Cash flow hedge
The effective portion of changes in the fair value of derivatives that are designated and qualify as cash flow hedges are recognised in other comprehensive income. The gain or loss relating to the ineffective portion is recognised immediately in profit or loss, and is included in the ‘other gains and losses’ line item.
Amounts previously recognised in other comprehensive income and accumulated in equity are reclassified to profit or loss in the periods when the hedged item is recognised in profit or loss in the same line of the statement of comprehensive income as the recognised hedged item. However, when the forecast transaction that is hedged results in the recognitionofanon-financialassetoranon-financialliability,thegainsandlosses previously deferred in equity are transferred from equity and included in the initial measurement of the cost of the asset or liability.
HedgeaccountingisdiscontinuedwhentheConsolidatedentityrevokesthe hedging relationship, when the hedging instrument expires or is sold, terminated, or exercised, or no longer qualifies for hedge accounting. Any gains or losses accumulated in equity at that time remains in equity and is recognised when the forecast transaction is ultimately recognised in profit or loss. When a forecast transaction is no longer expected to occur, the cumulative gain or loss that was deferred in equity is recognised immediately in profit or loss.
Notes to the Financial Statements CONTINUED

PAGE 73PAGE 72
DOMINO’S PIZZA ENTERPRISES LIMITED ANNUAL REPORT 2010 DOMINO’S PIZZA ENTERPRISES LIMITED ANNUAL REPORT 2010
3.24.4 Hedges in net investments in foreign operations
Hedges of net investments in foreign operations are accounted for similarly to cash flow hedges. Any gain or loss on the hedging instrument relating to the effective portion of the hedge is recognised in other comprehensive income and accumulated in the foreign currency translation reserve. The gain or loss relating to the ineffective portion is recognised immediately in profit or loss and included in the ’other gains and losses’ line item.
Gains and losses on hedging instruments relating to the effective portion of the hedge accumulated in the foreign currency translation reserve are reclassified to profit or loss in the same way as exchange differences relating to the foreign operation as described at 3.6.
4. CRITICAL ACCOUNTING JUDGEMENTS AND KEY SOURCES OF ESTIMATION UNCERTAINTY
In the application of the Consolidated entity’s accounting policies, which are describedinnote3,thedirectorsarerequiredtomakejudgements,estimatesand assumptions about the carrying amounts of assets and liabilities that are not readily apparent from other sources. The estimates and associated assumptions are based on historical experience and other factors that are considered to be relevant. Actual results may differ from these estimates.
The estimates and underlying assumptions are reviewed on an ongoing basis. Revisions to accounting estimates are recognised in the period in which the estimates are revised if the revision affects only that period, or in the period of the revision and future periods if the revision affects both current and future periods.
4.1 CRITICAL JUDGEMENTS IN APPLYING THE ENTITY’S ACCOUNTING POLICIES
The following are the critical judgements, apart from those involving estimations (see 4.2), that directors have made in the process of applying the Consolidated entity’s accounting policies and that have the most significant effect on the amounts recognised in the financial statements:
4.1.1 Employee benefits
Managementjudgementisappliedindeterminingthefollowingkeyassumptions used in the calculation of long service leave at balance date:
• futureincreasesinwagesandsalaries;• futureon-costrates;and• experienceofemployeedeparturesandperiodofservice.
Refertonote25forfurtherdetailsonthekeymanagementjudgementsusedinthe calculation of long service leave.
4.2 KEY SOURCES OF ESTIMATION UNCERTAINTY
Thefollowingarethekeyassumptionsconcerningthefuture,andotherkeysources of estimation of uncertainty at the end of the reporting period, that have asignificantriskofcausingamaterialadjustmenttothecarryingamountsofassets and liabilities within the next financial year:
4.2.1 Impairment of goodwill
Determining whether goodwill is impaired requires an estimation of the value in useofthecash-generatingunitstowhichgoodwillhasbeenallocated.Thevaluein use calculation requires the entity to estimate the future cash flows expected toarisefromthecash-generatingunitandasuitablediscountrateinordertocalculate present value.
The carrying amount of goodwill at the end of the reporting period was $45,548 thousand (2009: $43,803 thousand).
4.2.2 Fair value of derivatives and other financial instruments
As described in note 32, management uses their judgement in selecting an appropriate valuation technique for financial instruments not quoted in an activemarket.Valuationtechniquescommonlyusedbymarketpractitionersare applied. For derivative financial instruments, assumptions are made based onquotedmarketratesadjustedforspecificfeaturesoftheinstrument.Otherfinancial instruments are valued using a discounted cash flow analysis based on assumptionssupported,wherepossible,byobservablemarketpricesorrates.Details of assumptions are provided in note 32.
5. REVENUEThe following is an analysis of the Consolidated entity’s revenue for the year, from continuingoperations(excludingotherrevenue–seenote7).
2010$’000
2009$’000
Revenue from the sale of goods 156,105 160,055
Revenue from rendering of services 2,175 9,246
158,280 169,301
6. SEGMENT INFORMATION6.1 ADOPTION OF AASB 8 OPERATING SEGMENTS
The Consolidated entity has adopted AASB 8 Operating Segments with effect from 1 July 2009. AASB 8 requires operating segments to be identified on the basis of internal reports about components of the Consolidated entity thatareregularlyreviewedbythechiefoperatingdecisionmakerinorderto allocate resources to the segments and to assess their performance. In contrast, the predecessor Standard (AASB 114 Segment Reporting) required an entity to identify two sets of segments (business and geographical), using arisksandreturnsapproach,withtheentity’s‘systemofinternalfinancialreportingtokeymanagementpersonnel’servingonlyasthestartingpointfor the identification of such segments. As a result, following the adoption of AASB 8, the identification of the Consolidated entity’s reportable segment has changed.
6.2 PRODUCTS AND SERVICES FROM WHICH REPORTABLE SEGMENTS DERIVE THEIR REVENUES
In prior years, segment information reported externally was analysed on the basis of the three major operating divisions by the consolidated entity (i.e. corporate, franchise and corporate development).
However, information reported to the Consolidated entity’s chief operating decisionmakerforthepurposesofresourceallocationandassessmentofsegment performance is more specifically focussed on the geographical location the Consolidated entity operates in. The Consolidated entity’s reportable segments under AASB 8 are therefore as follows:
• Australia/NewZealand
• Europe
Information regarding these segments is presented below. Amounts reported for the prior periods have been restated to conform to the requirements of AASB 8.
6.3 SEGMENT REVENUES AND RESULTS
The following is an analysis of the Consolidated entity’s revenue and results from continuing operations by reportable segment.
FULL YEAR ENDED 4 JULY 2010 FULL YEAR ENDED 28 JUNE 2009
AUSTRALIA / NEW ZEALAND
$’000EUROPE$’000
CONSOLIDATED$’000
AUSTRALIA / NEW ZEALAND
$’000EUROPE$’000
CONSOLIDATED$’000
Continuing operations
Revenue 150,778 85,296 236,074 148,807 90,208 239,015
EBITDA 28,378 4,145 32,523 22,299 5,965 28,264
Depreciation and amortisation (5,708) (2,296) (8,004) (4,770) (1,679) (6,449)
EBIT 22,670 1,849 24,519 17,529 4,286 21,815
Interest (797) (1,552)
Net profit before tax 23,722 20,263
Revenuereportedaboverepresentsrevenuegeneratedfromexternalcustomersandfranchisees.Therewerenointer-segmentsalesduringtheperiod.
The accounting policies of the reportable segments are the same as the Consolidated entity’s policies described in note 3. Segment net profit before tax representstheprofitearnedbyeachsegmentusingthemeasurereportedtothechiefoperatingdecisionmakerforthepurposeofresourceallocationandassessment of segment performance.
6.4 SEGMENT ASSETS AND LIABILITIES
Segment assets
2010$’000
2009$’000
Australia/NewZealand 98,668 98,146
Europe 50,006 51,114
Total segment assets 148,674 149,260
Unallocated assets - -
Consolidated assets 148,674 149,260
Notes to the Financial Statements CONTINUED

PAGE 75PAGE 74
DOMINO’S PIZZA ENTERPRISES LIMITED ANNUAL REPORT 2010 DOMINO’S PIZZA ENTERPRISES LIMITED ANNUAL REPORT 2010
6.4 SEGMENT ASSETS AND LIABILITIES (CONTINUED)
Segment liabilities
2010$’000
2009$’000
Australia/NewZealand (33,305) (39,765)
Europe (15,022) (14,590)
Total segment liabilities (48,327) (54,355)
Unallocated liabilities - -
Consolidated liabilities (48,327) (54,355)
For the purposes of monitoring segment performance and allocating resources between segments:
• allassetsareallocatedtoreportablesegments.Goodwillisallocatedtoreportablesegmentsasdescribedinnote19.1.Assetsusedjointlybyreportablesegmentsareallocatedonthebasisoftherevenueearnedbyindividualreportablesegments;and
• allliabilitiesareallocatedtoreportablesegments.Liabilitiesforwhichreportablesegmentsarejointlyliableareallocatedinproportiontosegmentassets.
6.5 OTHER SEGMENT INFORMATION
DEPRECIATION AND AMORTISATION ADDITIONS TO NON-CURRENT ASSETS
2010$’000
2009$’000
2010$’000
2009$’000
Australia/NewZealand 5,708 4,770 12,481 12,658
Europe 2,296 1,679 11,238 4,860
8,004 6,449 23,719 17,518
6.6 GEOGRAPHICAL INFORMATION
TheConsolidatedentityoperatesintwoprincipalgeographicalareas–Australia(countryofdomicile)/NewZealandandEurope.
TheConsolidatedentity’srevenuefromcontinuingoperationsfromexternalcustomersandfranchiseescanbefoundinnote6.3.Thenon-currentassetsbygeographical location are detailed below.
NON-CURRENT ASSETS
2010$’000
2009$’000
Australia/NewZealand 74,685 71,040
Europe 25,030 30,965
99,715 102,005
6.7 INFORMATION ABOUT MAJOR CUSTOMERS
There are no major customers that contribute an amount that is 10% or greater of total revenue.
7. OTHER REVENUE
2010$’000
2009$’000
Interest revenue:
Bankdeposits 102 212
Other loans and receivables 1,312 1,428
1,414 1,640
Rental revenue:
Store asset rental revenue 1,696 1,389
Royalties 38,353 37,839
Sale of store builds 992 2,219
Other revenue 35,339 26,627
77,794 69,714
The following is an analysis of other revenue earned on financial assets by category of asset:
2010$’000
2009$’000
Loansandreceivables(includingcashandbankbalances) 1,414 1,640
Otherincomeearnedonnon-financialassets 76,380 68,074
77,794 69,714
Notes to the Financial Statements CONTINUED
PAGE 77PAGE 76
DOMINO’S PIZZA ENTERPRISES LIMITED ANNUAL REPORT 2010 DOMINO’S PIZZA ENTERPRISES LIMITED ANNUAL REPORT 2010
8. OTHER GAINS AND LOSSES
Continuing operations
2010$’000
2009$’000
Gain/(loss)ondisposalofproperty,plant&equipment,goodwillandothernon-currentassets 2,112 629
Net foreign exchange gains 54 1,002
2,166 1,631
Noothergainsorlosseshavebeenrecognisedinrespectofloansandreceivablesotherthanasdisclosedinnote7andimpairmentlossesrecognised/reversed in respect of trade and other receivables (see note 11 and 13).
9. FINANCE COSTS
Continuing operations
2010$’000
2009$’000
Interest on commercial bill and loans 792 1,433
Interest on obligations under finance leases 4 8
Other interest expense 1 111
797 1,552
The weighted average capitalisation rate on funds borrowed generally is 4.9% per annum (2009: 7.8%).
10. INCOME TAXES
10.1 INCOME TAX RECOGNISED IN PROFIT OR LOSS
2010$’000
2009$’000
Taxexpense/(income)comprises:
Current tax expense in respect of the current year 6,475 4,748
Adjustments recognised in the current year in relation to the current tax of prior years
(57) (99)
6,418 4,649
Deferredtaxexpense/(income)relatingtotheoriginationandreversaloftemporarydifferences 395 883
Benefit arising from previously unrecognised tax losses that is used to reduce current tax expense (905) (650)
Effect of deferred tax balances in New Zealand due to the change in income tax rate from 33% to 30% (effective 1 July 2008) - 28
Total tax expense relating to continuing operations 5,908 4,910
The expense for the year can be reconciled to the accounting profit as follows:
2010$’000
2009$’000
Profit from continuing operations 23,722 20,263
Income tax expense calculated at 30% 7,117 6,079
Effect of expenses that are not deductible in determining taxable profit 199 171
Otherassessable/(deductible)amounts (192) (356)
Effect of different tax rates of subsidiaries operating in other jurisdictions 39 (34)
Previously unrecognised and unused tax losses used to reduce current tax expense (905) (585)
Effect of tax concessions (research and development and other allowances) (202) (294)
Effect of deferred tax balances in New Zealand due to the change in income tax rate from 33% to 30% (effective 1 July 2008) - 28
Other (91) -
5,965 5,009
Adjustments recognised in the current year in relation to the current tax of prior years (57) (99)
Income tax expense recognised in profit or loss 5,908 4,910
The tax rate used for the 2010 and 2009 reconciliation above is the corporate tax rate of 30% payable by Australian corporate entities on taxable profits under Australian tax law.
Notes to the Financial Statements CONTINUED

PAGE 79PAGE 78
DOMINO’S PIZZA ENTERPRISES LIMITED ANNUAL REPORT 2010 DOMINO’S PIZZA ENTERPRISES LIMITED ANNUAL REPORT 2010
10.2 INCOME TAX RECOGNISED IN EQUITY
Deferred tax
2010$’000
2009$’000
Arising on income and expenses in other comprehensive income:
Gainoncashflowhedgetakentoequity (77) 258
Gainonnetinvestmenthedgetakentoequity (740) 170
(817) 428
10.3 CURRENT TAX ASSETS AND LIABILITIES
2010$’000
2009$’000
Current tax assets
Income tax refund receivable - 13
- 13
Current tax liabilities
Income tax payable (3,004) (1,561)
(3,004) (1,561)
10.4 DEFERRED TAX BALANCES
2010
OPENING BALANCE
$’000
RECLASSIFI-CATION$’000
CHARGED TO OTHER COMPRE-HENSIVE INCOME
$’000
CHARGED TO EQUITY
$’000
ACQUISI-TIONS/
DISPOSALS $’000
EXCHANGE DIFFERENCE
$’000
CLOSING BALANCE
$’000
TEMPORARY DIFFERENCES
Cash flow hedge 258 - - (77) - - 181
Carry forward surplus foreign revenue losses 391 - (98) - - - 293
Property, plant & equipment (710) - (51) - - - (761)
Intangible assets (93) - (132) - - 4 (221)
Othernon-currentassets (51) - 37 - - - (14)
Provision for employee entitlements 617 - 81 - - (1) 697
Other provisions 72 - 26 - - - 98
Doubtful debts 327 - (114) - - 2 215
Other financial liabilities 170 - - (740) - - (570)
Share issue expenses deductible over five years - - - - - - -
Other (165) - (144) - - - (309)
816 - (395) (817) - 5 (391)
UNUSED TAX LOSSES AND CREDITS
Tax losses 1,291 - 1,063 - - (196) 2,158
Foreign tax credits - - - - - - -
Other - - - - - - -
1,291 - 1,063 - - (196) 2,158
2,107 - 668 (817) - (191) 1,767
Notes to the Financial Statements CONTINUED

PAGE 81PAGE 80
DOMINO’S PIZZA ENTERPRISES LIMITED ANNUAL REPORT 2010 DOMINO’S PIZZA ENTERPRISES LIMITED ANNUAL REPORT 2010
10.4 DEFERRED TAX BALANCES (CONTINUED)
2009
OPENING BALANCE
$’000
RECLASSIFI-CATION$’000
CHARGED TO OTHER COMPRE-HENSIVE INCOME
$’000
CHARGED TO EQUITY
$’000
ACQUISI-TIONS/
DISPOSALS $’000
EXCHANGE DIFFERENCE
$’000
CLOSING BALANCE
$’000
TEMPORARY DIFFERENCES
Cash flow hedge - - - 258 - - 258
Carry forward surplus foreign revenue losses 489 - (98) - - - 391
Property, plant & equipment (661) - (49) - - - (710)
Intangible assets 82 - (175) - - - (93)
Othernon-currentassets (61) - 10 - - - (51)
Provision for employee entitlements 602 - 15 - - - 617
Other provisions 79 - (7) - - - 72
Doubtful debts 1,276 (1,153) 204 - - - 327
Other financial liabilities (126) - 126 170 - - 170
Share issue expenses deductible over five years 175 - (175) - - - -
Other (246) - 81 - - - (165)
1,609 (1,153) (68) 428 - - 816
UNUSED TAX LOSSES AND CREDITS
Tax losses 784 1,153 (815) - - 169 1,291
Foreign tax credits - - - - - - -
Other - - - - - - -
784 1,153 (815) - - 169 1,291
2,393 - (883) 428 - 169 2,107
Deferred tax balances are presented in the statement of financial position as follows:
2010$’000
2009$’000
Deferred tax assets 1,767 2,107
Deferred tax liabilities - -
10.5 UNRECOGNISED DEFERRED TAX ASSETS
The taxation benefits of tax losses and timing differences not brought to account will only be obtained if:
(a) assessable income is derived of a nature and of an amount sufficient to enablethebenefitfromthedeductionstoberealised;
(b) conditionsfordeductibilityimposedbythelawarecompiledwith;and
(c) no changes in tax legislation adversely affect the realisation of the benefit from the deductions.
At the end of the financial year, an aggregate deferred tax asset of $34,610 (2009: $2,109,435) was not recognised in relation to the revenue losses acquired on acquisition of The Netherlands subsidiary where 50% of this will be transferred to Domino’s Pizza International Inc.
It is not considered probable that there will be sufficient taxable profits against which the tax losses may be utilised before they expire. The revenue losses were incurred in the financial years 30 June 2002 and 30 June 2003 and are due to expire in the financial years ended 30 June 2011 and 30 June 2012.
10.6 UNRECOGNISED TAXABLE TEMPORARY DIFFERENCES ASSOCIATED WITH INVESTMENTS AND INTERESTS
At the end of the financial year, an aggregate deferred tax liability of $4,242,939 (2009: $4,166,158) was not recognised in relation to investments in subsidiaries as the parent Company is able to control the timing of the reversal of the temporary differences and it is not probable that the temporary difference will reverse in the foreseeable future.
10.7 TAX CONSOLIDATION
Relevance of tax consolidation to the Group
TheCompanyanditswholly-ownedAustralianresidententitiesformedatax-consolidatedgroupwitheffectfrom1July2003andarethereforetaxedasasingleentityfromthatdate.Theheadentitywithinthetax-consolidatedgroupisDomino’sPizzaEnterprisesLimited.Themembersofthetax-consolidatedgroupareidentifiedatnote 17.
Nature of tax funding arrangements and tax sharing arrangements
Theentitiesinthetax-consolidatedgrouphavenotenteredintoataxsharingagreementortaxfundingagreement.Incometaxliabilitiespayabletothetaxationauthoritiesinrespectofthetax-consolidatedgrouparerecognisedinthefinancialstatementsoftheparententity.
11. PROFIT FOR THE YEAR FROM CONTINUING OPERATIONSProfit for the year from continuing operations is attributable to:
2010$’000
2009$’000
Owners of Company 17,814 15,353
Profit for the year from continuing operations has arrived at after charging (crediting):
11.1 IMPAIRMENT LOSSES ON FINANCIAL ASSETS
Impairment of trade receivables (434) (837)
11.2 DEPRECIATION AND AMORTISATION EXPENSES
Depreciation of property, plant and equipment (6,507) (5,720)
Amortisation of intangible assets (1,497) (729)
(8,004) (6,449)
11.3 EMPLOYEE BENEFITS EXPENSE
Employee benefit expense:
Post employment benefits (see note 34):
Defined contribution plans (3,140) (2,841)
Share-basedpayments(seenote33):
Equitysettledshare-basedpayments (444) (167)
Other employee benefits (56,073) (56,930)
Total employee benefits expense (59,657) (59,938)
Notes to the Financial Statements CONTINUED

PAGE 83PAGE 82
DOMINO’S PIZZA ENTERPRISES LIMITED ANNUAL REPORT 2010 DOMINO’S PIZZA ENTERPRISES LIMITED ANNUAL REPORT 2010
12. EARNINGS PER SHARE
2010CENTS
PER SHARE
2009CENTS
PER SHARE
Basic earnings per share 26.2 22.6
Diluted earnings per share 25.9 22.5
12.1 BASIC EARNINGS PER SHARE
The earnings and weighted average number of ordinary shares used in the calculation of basic earnings per share are as follows:
2010$’000
2009$’000
Profit for the year attributable to owners of the Company 17,814 15,353
Earnings used in the calculation of basic earnings per share from continuing operations 17,814 15,353
2010NO. '000
2009NO. '000
Weighted average number of ordinary shares for the purposes of basic earnings per share (all measures) 67,975 67,919
12.2 DILUTED EARNINGS PER SHARE
The earnings used in the calculation of diluted earnings per share are as follows:
2010$’000
2009$’000
Profit for the year attributable to owners of the Company 17,814 15,353
Earnings used in the calculation of diluted earnings per share from continuing operations 17,814 15,353
The weighted average number of ordinary shares for the purposes of diluted earnings per share reconciles to the weighted average number of ordinary shares used in the calculation of basic earnings per share as follows:
2010NO. '000
2009NO. '000
Weighted average number of ordinary shares used in the calculation of basic earnings per share 67,975 67,919
Shares deemed to be issued for no consideration in respect of:
Options on issue 750 201
Weighted average number of ordinary shares used in the calculation of diluted earnings per share (all measures) 68,725 68,120
13. TRADE AND OTHER RECEIVABLES
2010$’000
2009$’000
Trade receivables 22,362 24,949
Allowance for doubtful debts (5,018) (6,308)
17,344 18,641
Other receivables 4,380 4,607
21,724 23,248
13.1 TRADE RECEIVABLES
Trade receivables disclosed above are classified as loans and receivables and are therefore measured at amortised cost.
The average credit period on sales of goods and rendering of services is 30 days. No interest is charged on the outstanding balance. An allowance has been made for estimated irrecoverable amounts from the past sale of goods and rendering of services, determined by reference to past default experience. Trade receivables 60 days and over are provided for based on the estimated irrecoverable amounts from the sale of goods and rendering of services, determined by reference to past default experience.
Before accepting any new franchisees and business partners, the Consolidated entity uses a system to assess the potential franchisee’s and business partner’s credit quality and defines credit limits. Limits attributed to franchisees and business partners are reviewed twice a year.
Included in the Consolidated entity’s trade receivables balance are debtors with a carrying amount of $1,107 thousand (2009: $2,069 thousand), which are past due at the reporting date for which the Consolidated entity has not provided as there has not been a significant change in credit quality and the amounts are still considered recoverable. The Consolidated entity does not hold any collateral over these balances.
Ageing of past due but not impaired
2010$’000
2009$’000
30-60days 22 47
60-90days 568 963
90 days and over 517 1,059
Total 1,107 2,069
Movement in the allowance for doubtful debts
2010$’000
2009$’000
Balance at the beginning of the year 6,308 5,560
Impairment losses recognised on receivables 2,040 3,460
Amounts written off as uncollectible (967) (1,103)
Impairment losses reversed (1,510) (2,096)
Effect of foreign currency (853) 487
Balance at the end of the year 5,018 6,308
Notes to the Financial Statements CONTINUED

PAGE 85PAGE 84
DOMINO’S PIZZA ENTERPRISES LIMITED ANNUAL REPORT 2010 DOMINO’S PIZZA ENTERPRISES LIMITED ANNUAL REPORT 2010
13.1 TRADE RECEIVABLES (CONTINUED)
In determining the recoverability of a trade receivable, the Consolidated entity considers any change in the credit quality of the trade receivable from the date credit was initially granted up to the reporting date. The concentrationofcreditriskislimitedduetothecustomerbasebeinglargeand unrelated. Accordingly, the directors believe that there is no further allowance required in excess of the allowance for doubtful debts.
Included in the allowance for doubtful debts are individually impaired trade receivables with a balance of $5,018 thousand (2009: $6,308 thousand) for the Consolidated entity. The impairment recognised represents the difference between the carrying amount of these trade receivables and the present value of the expected recoverable proceeds. The Consolidated entity does not hold any collateral over these balances.
Ageing of impaired trade receivables
2010$’000
2009$’000
0-30days 15 28
30-60days - 84
60-90days 53 92
90 days and over 4,950 6,104
Total 5,018 6,308
14. OTHER FINANCIAL ASSETS
2010$’000
2009$’000
Loans carried at amortised cost
Current
Loans to franchisees (i) 2,168 -
Other - 279
2,168 279
Non-current
Loans to franchisees (i) 13,795 19,911
Allowance for doubtful loans (237) (418)
13,558 19,493
Financial guarantee contracts
Non-current
Financial guarantee receivable 1,192 1,686
1,192 1,686
16,918 21,458
Current 2,168 279
Non-current 14,750 21,179
16,918 21,458
(i) Before accepting any new loans to franchisees, the Consolidated entity reviews the potential franchisee’s credit quality, which is determined by reviewing a business plan and the projected future cash flows for that store, to ensure the franchisee is able to meet its interest repayments on the loan. On average the interest charged is based on the Westpac Interest Loan Rate (‘WILR’) plus 3% margin in Australia and New Zealand and the average interest charged in France is 5.7% and in The Netherlands is 7.92%.
Included in the Consolidated entity’s balance are loans to franchisees with a carrying amount of $237 thousand (2009: $418 thousand), which are past due at reporting date of which the Consolidated entity has provided for these amounts. The Consolidated entity holds the store assets as collateral over these balances.
Ageing of loans to franchisees
2010$’000
2009$’000
Franchisee Loans 13,795 20,190
Allowance for doubtful loans (237) (418)
13,558 19,772
Notes to the Financial Statements CONTINUED

PAGE 87PAGE 86
DOMINO’S PIZZA ENTERPRISES LIMITED ANNUAL REPORT 2010 DOMINO’S PIZZA ENTERPRISES LIMITED ANNUAL REPORT 2010
14. OTHER FINANCIAL ASSETS (CONTINUED)
In determining the recoverability of the loans to franchisees, the Consolidated entity considers any amount that has been outstanding at reporting date. Accordingly, management believe that there is no further allowance required in excess of the allowances for doubtful loans.
Included in the allowance for the loans are individually impaired loans to franchisees with a balance of $237 thousand (2009: $418 thousand) for the Consolidated entity. The impairment recognised represents the difference between the carrying amount of these loan balances and the present value of the expected recoverable proceeds. The Consolidated entity holds collateral of the stores assets over these balances.
Ageing of impaired loans to franchisees
2010$’000
2009$’000
Amounts not yet due 13,558 19,772
Total 13,558 19,772
Movement in allowance for doubtful loans
2010$’000
2009$’000
Balance at the beginning of the year 418 101
Impairment losses recognised on loans 80 324
Amounts written off as uncollectible - 1
Impairment losses reversed (261) (9)
Effect of foreign currency - 1
Balance at the end of the year 237 418
15. INVENTORIES
2010$’000
2009$’000
Raw materials 726 838
Finished goods 2,811 2,760
3,537 3,598
There are no inventories (2009: $nil) expected to be recovered after more than 12 months.
16. NON-CURRENT ASSETS CLASSIFIED AS HELD FOR SALE
Asset held for sale
2010$’000
2009$’000
CommissaryProperty–TheNetherlands 843 -
843 -
17. SUBSIDIARIES
Details of the Company’s subsidiaries at 4 July 2010 are as follows:
NAME OF ENTITY
PLACE OF INCORPORATION AND OPERATION
PORTION OF OWNERSHIP INTEREST AND VOTING
POWER HELD
2010 %
2009 %
AshbourkePtyLtd (i) Australia 100% 100%
Domino’s Development Fund Pty Ltd (i) Australia 100% 100%
Hot Cell Pty Ltd (i) Australia 100% 100%
MFT–DPAJVNomineePtyLtd Australia 100% 100%
Reel (NT) Pty Ltd (i) Australia 100% 100%
Shear Pizza Pty Ltd (i) Australia 100% 100%
Silvio’sDial-a-PizzaPtyLtd (i) Australia 100% 100%
Twenty/TwentyPizzaPtyLtd (i) Australia 100% 100%
Twenty/TwentyPizzaPtyLtd&Domino’sPizzaAustraliaPtyLtdPartnership (i) Australia 100% 100%
Domino’s Pizza New Zealand Limited New Zealand 100% 100%
DPH NZ Holdings Limited New Zealand 100% 100%
DPEU Holdings S.A.S. France 100% 100%
Domino’s Pizza France S.A.S. France 100% 100%
DPFC S.A.R.L. France 100% 100%
HVM Pizza S.A.R.L. France 100% 100%
Domino’s Pizza Europe B.V. The Netherlands 100% 100%
Domino’s Pizza Netherlands B.V. The Netherlands 100% 100%
DOPI Vastgoed B.V. The Netherlands 100% 100%
Domino’s Pizza Corporate Stores B.V. The Netherlands 100% 100%
Domino’s Pizza Distributie B.V. The Netherlands 100% 100%
Domino’s Pizza Belgium S.P.R.L. Belgium 100% 100%
Catering Service & Supply Pty Ltd Australia 100% -
(i) Thisentityisamemberofthetax-consolidatedgroupwhereDomino’sPizzaEnterprisesLimitedistheheadentitywithinthetax-consolidatedgroup.
Notes to the Financial Statements CONTINUED
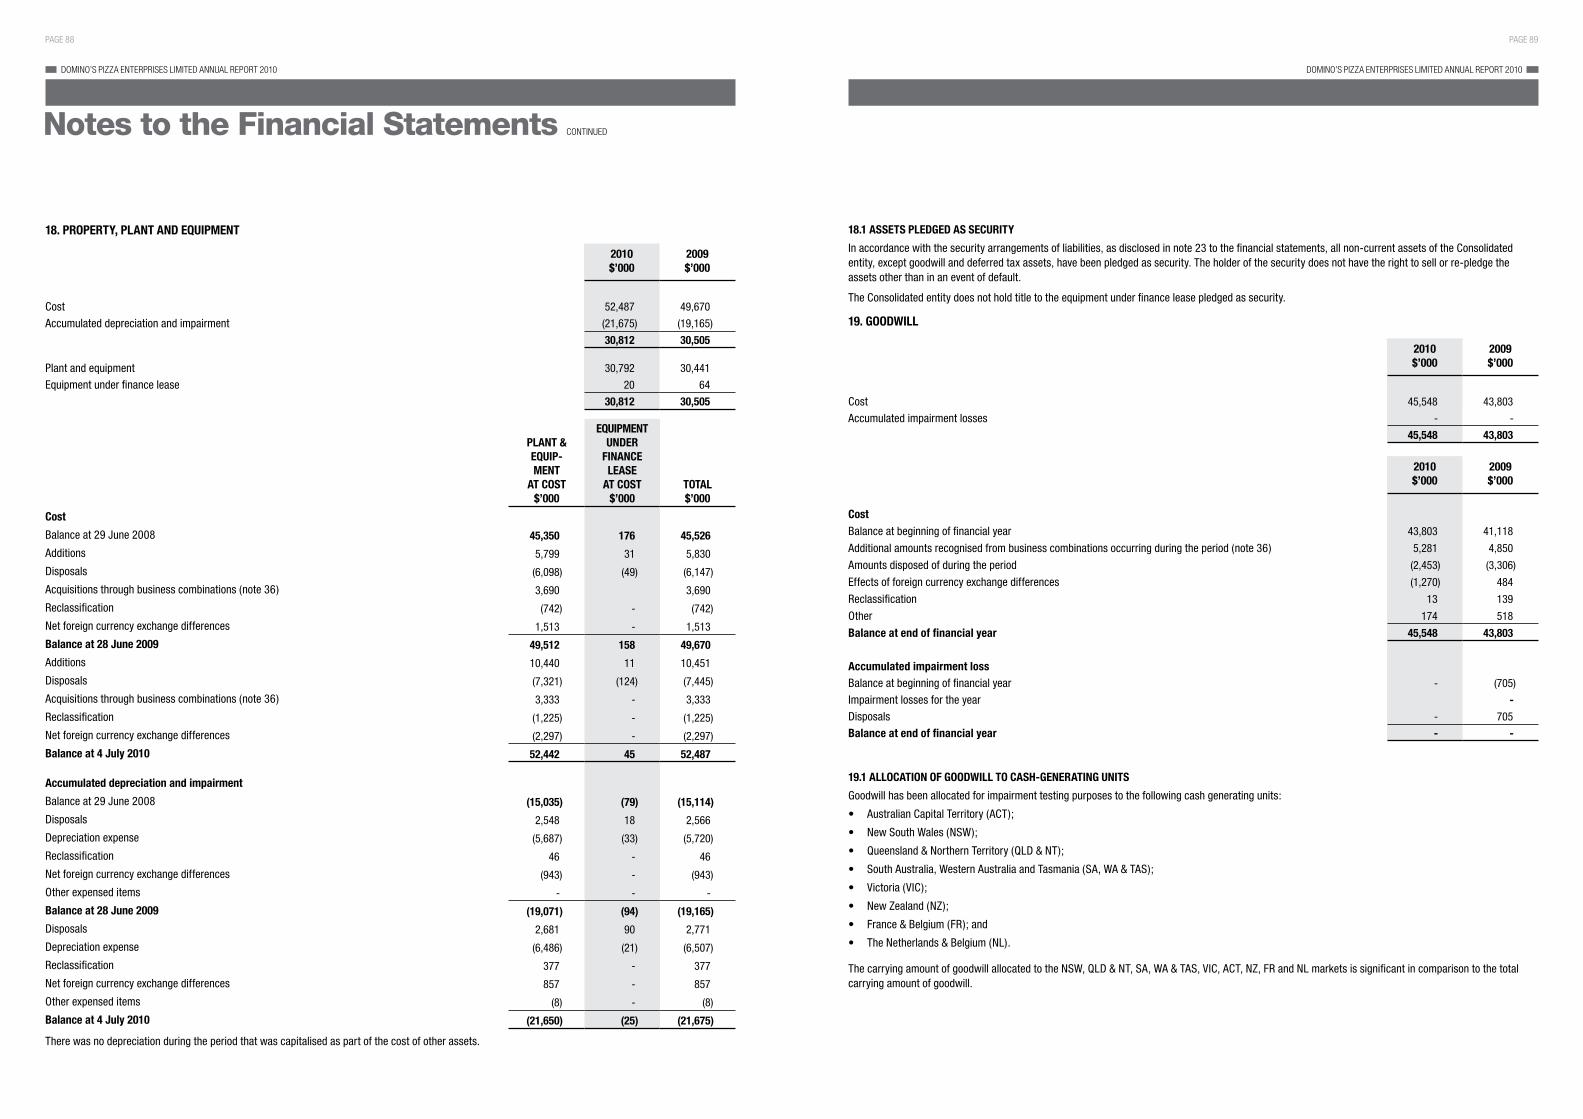
PAGE 89PAGE 88
DOMINO’S PIZZA ENTERPRISES LIMITED ANNUAL REPORT 2010 DOMINO’S PIZZA ENTERPRISES LIMITED ANNUAL REPORT 2010
18. PROPERTY, PLANT AND EQUIPMENT
2010$’000
2009$’000
Cost 52,487 49,670
Accumulated depreciation and impairment (21,675) (19,165)
30,812 30,505
Plant and equipment 30,792 30,441
Equipment under finance lease 20 64
30,812 30,505
PLANT & EQUIP-MENT
AT COST$’000
EQUIPMENT UNDER
FINANCE LEASE
AT COST$’000
TOTAL $’000
Cost
Balance at 29 June 2008 45,350 176 45,526
Additions 5,799 31 5,830
Disposals (6,098) (49) (6,147)
Acquisitions through business combinations (note 36) 3,690 3,690
Reclassification (742) - (742)
Net foreign currency exchange differences 1,513 - 1,513
Balance at 28 June 2009 49,512 158 49,670
Additions 10,440 11 10,451
Disposals (7,321) (124) (7,445)
Acquisitions through business combinations (note 36) 3,333 - 3,333
Reclassification (1,225) - (1,225)
Net foreign currency exchange differences (2,297) - (2,297)
Balance at 4 July 2010 52,442 45 52,487
Accumulated depreciation and impairment
Balance at 29 June 2008 (15,035) (79) (15,114)
Disposals 2,548 18 2,566
Depreciation expense (5,687) (33) (5,720)
Reclassification 46 - 46
Net foreign currency exchange differences (943) - (943)
Other expensed items - - -
Balance at 28 June 2009 (19,071) (94) (19,165)
Disposals 2,681 90 2,771
Depreciation expense (6,486) (21) (6,507)
Reclassification 377 - 377
Net foreign currency exchange differences 857 - 857
Other expensed items (8) - (8)
Balance at 4 July 2010 (21,650) (25) (21,675)
There was no depreciation during the period that was capitalised as part of the cost of other assets.
18.1 ASSETS PLEDGED AS SECURITY
Inaccordancewiththesecurityarrangementsofliabilities,asdisclosedinnote23tothefinancialstatements,allnon-currentassetsoftheConsolidatedentity,exceptgoodwillanddeferredtaxassets,havebeenpledgedassecurity.Theholderofthesecuritydoesnothavetherighttosellorre-pledgetheassets other than in an event of default.
The Consolidated entity does not hold title to the equipment under finance lease pledged as security.
19. GOODWILL
2010$’000
2009$’000
Cost 45,548 43,803
Accumulated impairment losses - -
45,548 43,803
2010$’000
2009$’000
CostBalance at beginning of financial year 43,803 41,118
Additional amounts recognised from business combinations occurring during the period (note 36) 5,281 4,850
Amounts disposed of during the period (2,453) (3,306)
Effects of foreign currency exchange differences (1,270) 484
Reclassification 13 139
Other 174 518
Balance at end of financial year 45,548 43,803
Accumulated impairment lossBalance at beginning of financial year - (705)
Impairment losses for the year -Disposals - 705
Balance at end of financial year - -
19.1 ALLOCATION OF GOODWILL TO CASH-GENERATING UNITS
Goodwill has been allocated for impairment testing purposes to the following cash generating units:
• AustralianCapitalTerritory(ACT);
• NewSouthWales(NSW);
• Queensland&NorthernTerritory(QLD&NT);
• SouthAustralia,WesternAustraliaandTasmania(SA,WA&TAS);
• Victoria(VIC);
• NewZealand(NZ);
• France&Belgium(FR);and
• TheNetherlands&Belgium(NL).
ThecarryingamountofgoodwillallocatedtotheNSW,QLD&NT,SA,WA&TAS,VIC,ACT,NZ,FRandNLmarketsissignificantincomparisontothetotalcarrying amount of goodwill.
Notes to the Financial Statements CONTINUED

PAGE 91PAGE 90
DOMINO’S PIZZA ENTERPRISES LIMITED ANNUAL REPORT 2010 DOMINO’S PIZZA ENTERPRISES LIMITED ANNUAL REPORT 2010
19. GOODWILL (CONTINUED)
19.1 ALLOCATION OF GOODWILL TO CASH-GENERATING UNITS (CONTINUED)
Before recognition of impairment losses, the carrying amount of goodwill (other than goodwill classified as held for sale) was allocated to the following cash-generatingunits:
2010$’000
2009$’000
NSW 6,221 7,005
QLD & NT 15,062 14,424
SA, WA & TAS 10,195 9,013
VIC 3,041 3,327
ACT 237 475
FR 5,201 6,878
NL 3,189 993
NZ 2,402 1,688
45,548 43,803
NSW, QLD & NT, SA, WA & TAS, VIC and ACT markets
TheoperationsintheNSW,QLD&NT,SA,WA&TAS,VICandACTmarketsare similar, and their recoverable amounts are based on similar assumptions. Therecoverableamountsofthefivemarketsarebasedprimarilyonavaluein use calculation which uses cash flow projections based on the financial budget approved by the Board for the 2011 financial year as the year one cash flow.
The cash flows for years one to five are based on the expected average percentagegrowthacrosscorporateandfranchisemarkets,whichhasbeen estimated at 5.0% nationally (2009: 5.0% nationally). These figures are based on management’s estimate of forecast cash flow by store after considering the 2010 financial year with the 2011 budget year. Management believes that these growth percentages are reasonable considering forecast salesgrowthandeconomiesofscale.Apre-taxdiscountrateof14.50%hasbeen applied to years one to five. An indefinite terminal cash flow calculation has been applied for cash flows beyond year five, using the year five cash flow as a base. The growth rate of 3.0% has been used in determining the terminal value.
Managementbelievesthatanyreasonablechangeinthekeyassumptionsonwhichtherecoverableamountsarebasedwouldnotcausethemarket’scarrying amount to exceed its recoverable amount.
NZ franchise market
ThegoodwillamountallocatedtothismarketrelatestotheacquisitionofthePizza Haven New Zealand operations in 2005. The recoverable amount of themarketisbasedprimarilyonavalueinusecalculationwhichusescashflow projections based on the financial budget approved by the Board for the 2010 financial year as the year one cash flow for the NZ franchise stores.
The cash flows for years one to five are based on the expected revenues to be received from net franchise royalties of the NZ franchise stores, after applying a growth rate which has been estimated at 5.0% (2009: 5.0%). Thisfigureisbasedonthegrowthinforecastaveragefranchiseweeklysales from the 2010 financial year to the 2011 budget year. Management believes that this growth percentage is reasonable considering the sales growththathasbeenseeninthismarketduringthe2010financialyear.
Apre-taxdiscountrateof14.50%hasbeenappliedtoyearsonetofive. An indefinite terminal cash flow calculation has been applied for cash flows beyond year five, using the year five cash flow as a base. The growth rate of 3.0% has been used in determining the terminal value.
European market
Thegoodwillamountallocatedtothecash-generatingunitsinthismarketrelates to the acquisition of Dominos Pizza master franchise of France, Belgium, The Netherlands and the Principality of Monaco on 3 July 2006. Therecoverableamountofthemarketisdeterminedbasedonavalueinusecalculationwhichusesafive-yearfinancialplanthathasbeenprepared.The cash flows for years one to five are based on the expected average percentagegrowthacrossthemarket,whichhasbeenestimatedat20.0%.Apre-taxdiscountrateof14.50%hasbeenappliedtotheyearsonetofive.The growth rate of 3.0% has been used in determining the terminal value.
Key assumptions
Thekeyassumptionsusedinthevalueinusecalculationforthevarioussignificantcash-generatingunitsarebudgetedstorecashflowswhich are assumed to continue to increase, driven by higher sales and increasedmarketshare.Theseassumptionsreflectpriorexperienceandmanagement’s plan to focus on store level efficiencies and to leverage marketshareforhigheroverallprofitability.
20. OTHER INTANGIBLE ASSETS
2010$’000
2009$’000
Cost 9,311 5,285
Accumulated amortisation and impairment losses (2,534) (1,044)
6,777 4,241
CAPITALISED DEVELOPMENT
$’000LICENCES
$’000TOTAL$’000
Gross carrying amount
Balance at 29 June 2008 1,112 906 2,018
Additions - 1,511 1,511
Additions from internal developments 1,210 - 1,210
Disposals - - -
Reclassification - 603 603
Net foreign currency exchange differences - (57) (57)
Balance at 28 June 2009 2,322 2,963 5,285
Additions - 2,400 2,400
Acquisitions through business combinations (note 36) 562 - 562
Additions from internal developments 1,529 - 1,529
Disposals - - -
Reclassification - - -
Net foreign currency exchange differences (20) (445) (465)
Balance at 4 July 2010 4,393 4,918 9,311
Accumulated amortisation and impairment
Balance at 29 June 2008 (172) (120) (292)
Amortisation expense(i) (399) (307) (706)
Disposals - - -
Reclassification - (46) (46)
Net foreign currency exchange differences - - -
Balance at 28 June 2009 (571) (473) (1,044)
Amortisation expense (i) (717) (757) (1,474)
Disposals - - -
Reclassification - - -
Net foreign currency exchange differences - - -
Other expense (16) - (16)
Balance at 4 July 2010 (1,304) (1,230) (2,534)
(i) Amortisation expense is included in the line item ‘depreciation and amortisation expense’ in the statement of comprehensive income.
Notes to the Financial Statements CONTINUED

PAGE 93PAGE 92
DOMINO’S PIZZA ENTERPRISES LIMITED ANNUAL REPORT 2010 DOMINO’S PIZZA ENTERPRISES LIMITED ANNUAL REPORT 2010
21. OTHER ASSETS
Current 2010$’000
2009$’000
Prepayments 1,505 976
Workinprogress–storebuilds 912 264
Other 2,029 1,451
4,446 2,691
Non-current OTHER ASSETS$’000
Gross carrying amount
Balance at 29 June 2008 252
Additions 14
Disposals (27)
Balance at 28 June 2009 239
Additions -
Disposals (92)
Effects of foreign currency exchange differences 1
Balance at 4 July 2010 148
Accumulated amortisation and impairment
Balance at 29 June 2008 (50)
Disposals 4
Amortisation expense (i) (23)
Balance at 28 June 2009 (69)
Disposals 6
Amortisation expense (i) (23)
Effects of foreign currency exchange differences (1)
Balance at 4 July 2010 (87)
Net book value
At 28 June 2009 170
At 4 July 2010 61
(i) Amortisation expense is included in the line item ‘depreciation and amortisation expense’ in the statement of comprehensive income.
22. TRADE AND OTHER PAYABLES
2010$’000
2009$’000
Trade payables (i) 14,908 11,499
Goodsandservicestax(GST)/Valueaddedtax(VAT)payable 1,855 1,235
Other creditors and accruals 8,519 13,243
25,282 25,977
(i)Theaveragecreditperiodonpurchasesofgoodsis30days.TheConsolidatedentityhasfinancialriskmanagementpoliciesinplacetoensurethatallpayablesarepaidwithinthecredittimeframe.
23. BORROWINGS
2010$’000
2009$’000
Secured – at amortised costCurrentFinance lease liabilities (i) (note 27) 21 52
Other loans 19 22
Non-currentCommercial bills (ii) (iii) - 4,500
Finance lease liabilities (i) (note 27) 5 18
Other loans 154 237
SecuredNon-currentEuro loan designated and effective as a hedging instrument, carried at amortised cost (ii) (iv) 13,755 16,222
13,954 21,051
Current 40 74
Non-current 13,914 20,977
13,954 21,051
23.1 SUMMARY OF BORROWING ARRANGEMENTS
(i) Securedbytheassetsleased,thecurrentmarketvalueofeachexceedsthevalueofthefinanceleaseliability.(ii) SecuredovertheassetsandundertakingofDomino’sPizzaEnterprisesLimited.(iii) Commercial bills with a variable interest rate were issued in 2005. The current weighted average interest rate during the year was 4.90% p.a. (2009: 6.61% p.a.).(iv) VariablerateloanwithWestpacBankingCorporationwithmaturityperiodsnotexceeding2years(2009:3years).TheConsolidatedentityhedgesloanviaaninterestrateswapexchanging
the variable rate interest for fixed rate interest.
TheunusedfacilitiesavailableontheConsolidatedentity’sbankoverdraftare$2,000thousand(2009:$2,000thousand).
Notes to the Financial Statements CONTINUED

PAGE 95PAGE 94
DOMINO’S PIZZA ENTERPRISES LIMITED ANNUAL REPORT 2010 DOMINO’S PIZZA ENTERPRISES LIMITED ANNUAL REPORT 2010
24. OTHER FINANCIAL LIABILITIES
2010$’000
2009$’000
Non-current
Financial guarantee contracts 1,192 1,686
1,192 1,686
Current
Derivatives designated and effective as hedging instruments carried at fair value:
Interest rate swap (at fair value) 604 859
Franchisee store deposits (at amortised cost) - 30
604 889
Current 604 889
Non-current 1,192 1,686
1,796 2,575
25. PROVISIONS
2010$’000
2009$’000
Employee benefits (i) 2,323 2,053
Other 324 238
2,647 2,291
Current 2,171 1,981
Non-current 476 310
2,647 2,291
Other provisions
MAKE GOOD (ii)
$’000
STRAIGHT LINE LEASING (iii)
$’000TOTAL$’000
Balance at 28 June 2009 25 213 238
Additional provisions recognised - 86 86
Payments made - - -
Reductions resulting from remeasurement - - -
Balance at 4 July 2010 25 299 324
(i) Thecurrentprovisionforemployeebenefitsincludes$1,953thousandofannualleaveandvestedlongserviceleaveentitlementsaccruedbutnotexpectedtobetakenwithin12months(2009:$1,956thousandfor the Consolidated entity).
(ii) Theprovisionforthemakegoodinrespectofrestoringsitestotheiroriginalconditionwhenthepremisesarevacated.Managementhasestimatedtheprovisionbasedonhistoricaldatainrelationtothestoreclosure numbers and costs, as well as future trends that could differ from historical amounts.
(iii) The provision for straight line leasing arises as fixed percentage increases in operating leases are recognised as an expense on a straight line basis, over the period of the lease.
26. OTHER LIABILITIES
2010$’000
2009$’000
Domino's Pizza International Inc. 1,644 900
1,644 900
Current - 7
Non-current 1,644 893
1,644 900
27. OBLIGATIONS UNDER FINANCE LEASES
27.1 LEASING ARRANGEMENTS
Finance leases relate to plant & equipment with lease terms between three and ten years, and motor vehicles with lease terms between three and four years.
The Consolidated entity has options to purchase the leased assets for a nominal amount at the completion of the lease arrangements.
Notes to the Financial Statements CONTINUED
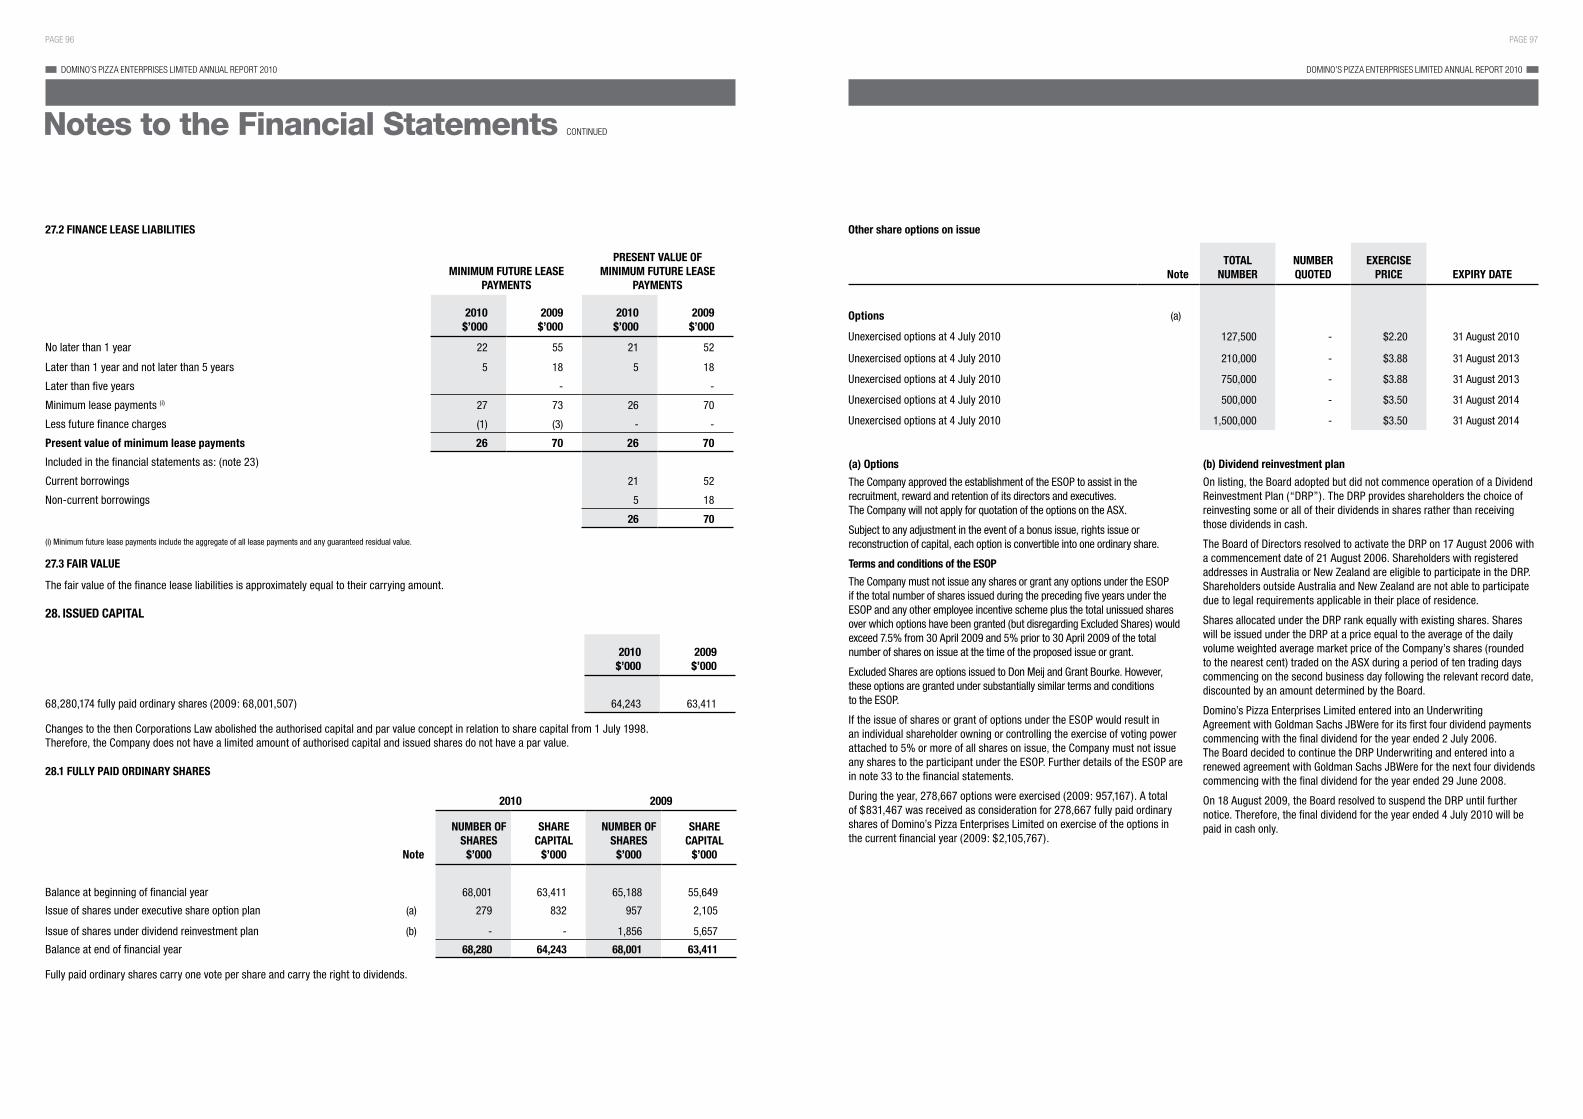
PAGE 97PAGE 96
DOMINO’S PIZZA ENTERPRISES LIMITED ANNUAL REPORT 2010 DOMINO’S PIZZA ENTERPRISES LIMITED ANNUAL REPORT 2010
27.2 FINANCE LEASE LIABILITIES
MINIMUM FUTURE LEASE PAYMENTS
PRESENT VALUE OF MINIMUM FUTURE LEASE
PAYMENTS
2010$’000
2009$’000
2010$’000
2009$’000
No later than 1 year 22 55 21 52
Later than 1 year and not later than 5 years 5 18 5 18
Later than five years - -
Minimum lease payments (i) 27 73 26 70
Less future finance charges (1) (3) - -
Present value of minimum lease payments 26 70 26 70
Included in the financial statements as: (note 23)
Current borrowings 21 52
Non-currentborrowings 5 18
26 70
(i) Minimum future lease payments include the aggregate of all lease payments and any guaranteed residual value.
27.3 FAIR VALUE
The fair value of the finance lease liabilities is approximately equal to their carrying amount.
28. ISSUED CAPITAL
2010$’000
2009$’000
68,280,174 fully paid ordinary shares (2009: 68,001,507) 64,243 63,411
Changes to the then Corporations Law abolished the authorised capital and par value concept in relation to share capital from 1 July 1998. Therefore, the Company does not have a limited amount of authorised capital and issued shares do not have a par value.
28.1 FULLY PAID ORDINARY SHARES
2010 2009
Note
NUMBER OF SHARES
$’000
SHARE CAPITAL
$’000
NUMBER OF SHARES
$’000
SHARE CAPITAL
$’000
Balance at beginning of financial year 68,001 63,411 65,188 55,649
Issue of shares under executive share option plan (a) 279 832 957 2,105
Issue of shares under dividend reinvestment plan (b) - - 1,856 5,657
Balance at end of financial year 68,280 64,243 68,001 63,411
Fully paid ordinary shares carry one vote per share and carry the right to dividends.
Other share options on issue
NoteTOTAL
NUMBERNUMBER QUOTED
EXERCISE PRICE EXPIRY DATE
Options (a)
Unexercised options at 4 July 2010 127,500 - $2.20 31 August 2010
Unexercised options at 4 July 2010 210,000 - $3.88 31 August 2013
Unexercised options at 4 July 2010 750,000 - $3.88 31 August 2013
Unexercised options at 4 July 2010 500,000 - $3.50 31 August 2014
Unexercised options at 4 July 2010 1,500,000 - $3.50 31 August 2014
(a) Options
The Company approved the establishment of the ESOP to assist in the recruitment, reward and retention of its directors and executives. The Company will not apply for quotation of the options on the ASX.
Subject to any adjustment in the event of a bonus issue, rights issue or reconstruction of capital, each option is convertible into one ordinary share.
Terms and conditions of the ESOP
The Company must not issue any shares or grant any options under the ESOP if the total number of shares issued during the preceding five years under the ESOP and any other employee incentive scheme plus the total unissued shares over which options have been granted (but disregarding Excluded Shares) would exceed 7.5% from 30 April 2009 and 5% prior to 30 April 2009 of the total number of shares on issue at the time of the proposed issue or grant.
ExcludedSharesareoptionsissuedtoDonMeijandGrantBourke.However,these options are granted under substantially similar terms and conditions to the ESOP.
If the issue of shares or grant of options under the ESOP would result in an individual shareholder owning or controlling the exercise of voting power attached to 5% or more of all shares on issue, the Company must not issue any shares to the participant under the ESOP. Further details of the ESOP are in note 33 to the financial statements.
During the year, 278,667 options were exercised (2009: 957,167). A total of $831,467 was received as consideration for 278,667 fully paid ordinary shares of Domino’s Pizza Enterprises Limited on exercise of the options in the current financial year (2009: $2,105,767).
(b) Dividend reinvestment plan
On listing, the Board adopted but did not commence operation of a Dividend Reinvestment Plan (“DRP”). The DRP provides shareholders the choice of reinvesting some or all of their dividends in shares rather than receiving those dividends in cash.
The Board of Directors resolved to activate the DRP on 17 August 2006 with a commencement date of 21 August 2006. Shareholders with registered addresses in Australia or New Zealand are eligible to participate in the DRP. Shareholders outside Australia and New Zealand are not able to participate due to legal requirements applicable in their place of residence.
SharesallocatedundertheDRPrankequallywithexistingshares.Shareswill be issued under the DRP at a price equal to the average of the daily volumeweightedaveragemarketpriceoftheCompany’sshares(roundedto the nearest cent) traded on the ASX during a period of ten trading days commencing on the second business day following the relevant record date, discounted by an amount determined by the Board.
Domino’s Pizza Enterprises Limited entered into an Underwriting Agreement with Goldman Sachs JBWere for its first four dividend payments commencing with the final dividend for the year ended 2 July 2006. The Board decided to continue the DRP Underwriting and entered into a renewed agreement with Goldman Sachs JBWere for the next four dividends commencing with the final dividend for the year ended 29 June 2008.
On 18 August 2009, the Board resolved to suspend the DRP until further notice. Therefore, the final dividend for the year ended 4 July 2010 will be paid in cash only.
Notes to the Financial Statements CONTINUED

PAGE 99PAGE 98
DOMINO’S PIZZA ENTERPRISES LIMITED ANNUAL REPORT 2010 DOMINO’S PIZZA ENTERPRISES LIMITED ANNUAL REPORT 2010
29. RESERVES
2010$’000
2009$’000
Foreign currency translation (5,706) 308
Equitysettledshare-basedbenefits 1,317 908
Hedging 906 (999)
General reserve - (35)
(3,483) 182
29.1 FOREIGN CURRENCY TRANSLATION RESERVE
2010$’000
2009$’000
Balance at beginning of financial year 308 (1,353)
Translation of foreign operations (6,014) 1,661
Balance at end of financial year (5,706) 308
Exchange differences relating to the translation of the net assets of the Consolidated entity’s foreign operations from their functional currencies to the Consolidated entity’s presentation currency (i.e. Australian dollars) are recognised directly in other comprehensive income and accumulated in the foreign currency translation reserve.
29.2 EQUITY SETTLED SHARE-BASED BENEFITS RESERVE
2010$’000
2009$’000
Balance at beginning of financial year 873 706
Share-basedpayment 444 167
Balance at end of financial year 1,317 873
Theequitysettledshare-basedbenefitsreservearisesonthegrantofshareoptionstoexecutivesundertheExecutiveShareandOptionPlan(“ESOP”).Further information about ESOP is made in note 33 to the financial statements.
29.3 HEDGING RESERVE
2010$’000
2009$’000
Balance at beginning of financial year (999) 836
Gain/(loss)recognised:
Net investment hedge 1,727 (813)
Interest rate swap 178 (1,022)
Balance at end of financial year 906 (999)
The hedging reserve represents hedging gains and losses recognised on the effective portion of cash flow hedges.
29.4 GENERAL RESERVE
2010$’000
2009$’000
Balance at beginning of financial year - (48)
Movement during year - 48
Balance at end of financial year - -
The general reserve is used from time to time to transfer profits from retained earnings. There is no policy of regular transfer.
30. RETAINED EARNINGS
2010$’000
2009$’000
Balance at beginning of year 31,312 23,429
Net profit attributable to members of the Company 17,814 15,353
Payment of dividends (note 31) (9,539) (7,470)
Balance at end of year 39,587 31,312
31. DIVIDENDS
2010 2009
CENTS PER SHARE
TOTAL$’000
CENTS PER SHARE
TOTAL$’000
Recognised amounts
Fully paid ordinary shares
Interim dividend:
Fullyfrankedata30%taxrate 6.0 4,095 4.4 2,977
Final dividend:
Fullyfrankedata30%taxrate 8.0 5,444 6.8 4,493
14.0 9,539 11.2 7,470
Unrecognised Amounts
Fully paid ordinary shares
Final dividend:
Fullyfrankedata30%taxrate 11.8 8,057 8.0 5,444
Notes to the Financial Statements CONTINUED
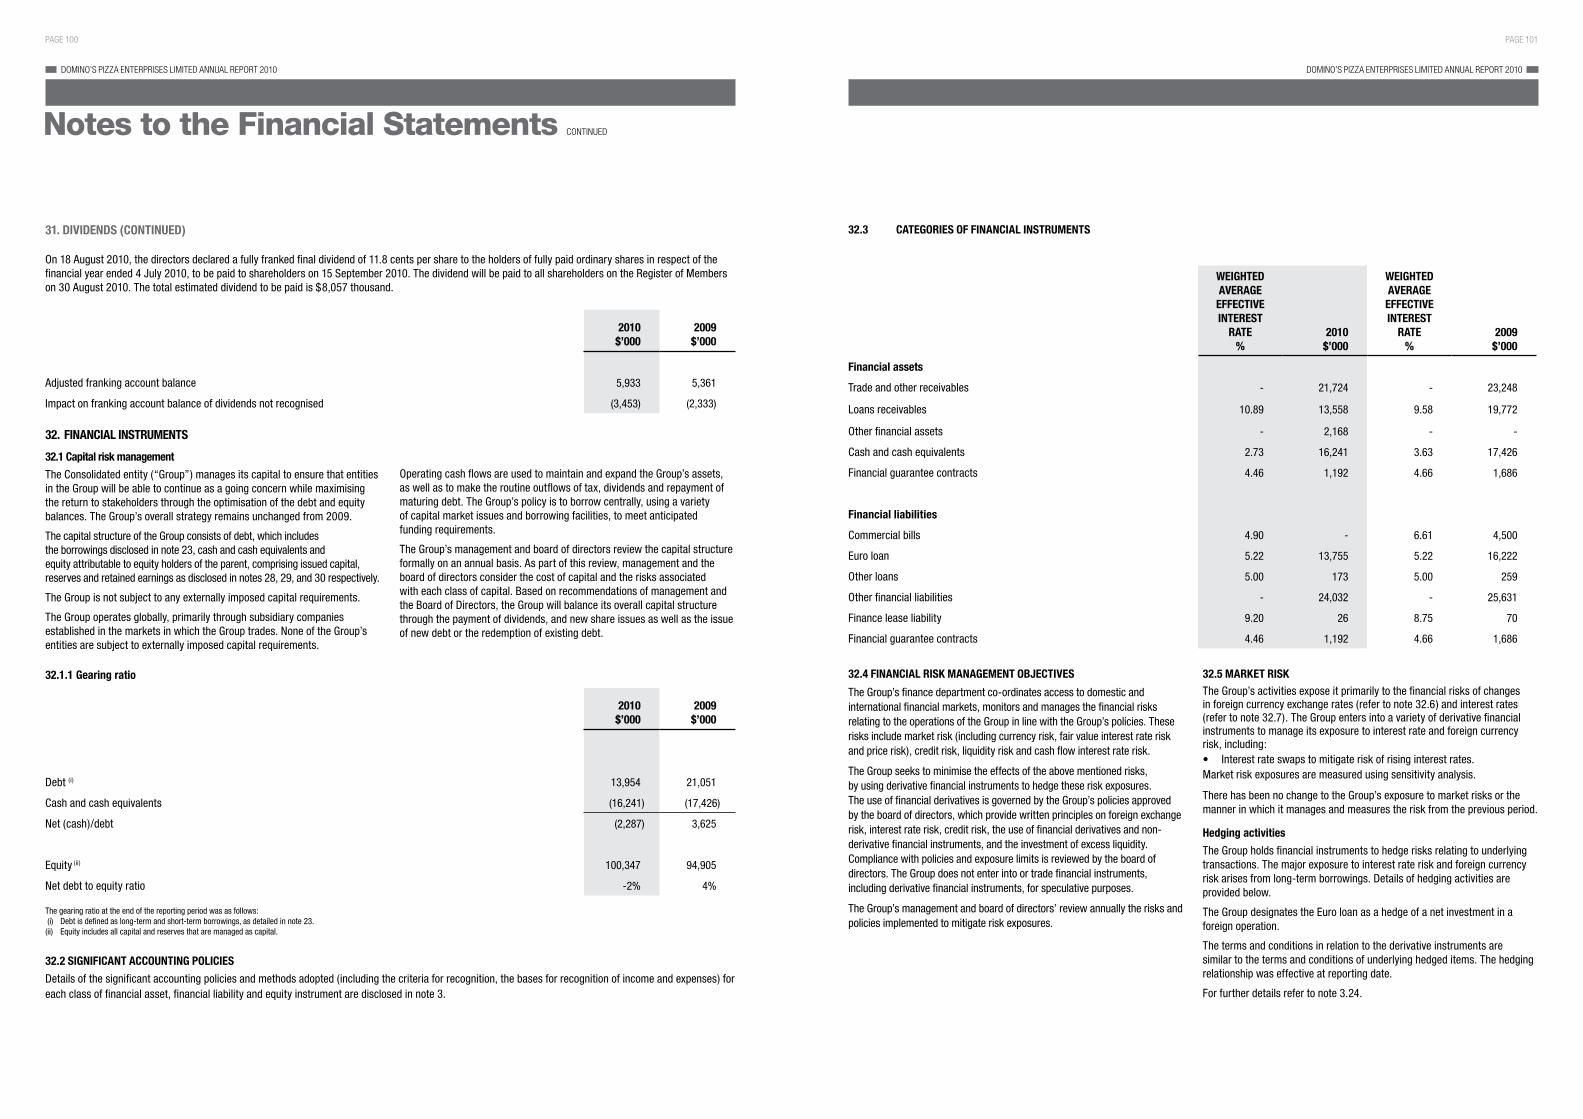
PAGE 101PAGE 100
DOMINO’S PIZZA ENTERPRISES LIMITED ANNUAL REPORT 2010 DOMINO’S PIZZA ENTERPRISES LIMITED ANNUAL REPORT 2010
31. DIVIDENDS (CONTINUED)
On18August2010,thedirectorsdeclaredafullyfrankedfinaldividendof11.8centspersharetotheholdersoffullypaidordinarysharesinrespectofthefinancial year ended 4 July 2010, to be paid to shareholders on 15 September 2010. The dividend will be paid to all shareholders on the Register of Members on 30 August 2010. The total estimated dividend to be paid is $8,057 thousand.
2010$’000
2009$’000
Adjustedfrankingaccountbalance 5,933 5,361
Impactonfrankingaccountbalanceofdividendsnotrecognised (3,453) (2,333)
32. FINANCIAL INSTRUMENTS
32.1 Capital risk management
The Consolidated entity (“Group”) manages its capital to ensure that entities in the Group will be able to continue as a going concern while maximising thereturntostakeholdersthroughtheoptimisationofthedebtandequitybalances. The Group’s overall strategy remains unchanged from 2009.
The capital structure of the Group consists of debt, which includes the borrowings disclosed in note 23, cash and cash equivalents and equity attributable to equity holders of the parent, comprising issued capital, reserves and retained earnings as disclosed in notes 28, 29, and 30 respectively.
The Group is not subject to any externally imposed capital requirements.
The Group operates globally, primarily through subsidiary companies establishedinthemarketsinwhichtheGrouptrades.NoneoftheGroup’sentities are subject to externally imposed capital requirements.
Operating cash flows are used to maintain and expand the Group’s assets, aswellastomaketheroutineoutflowsoftax,dividendsandrepaymentofmaturing debt. The Group’s policy is to borrow centrally, using a variety ofcapitalmarketissuesandborrowingfacilities,tomeetanticipated funding requirements.
The Group’s management and board of directors review the capital structure formally on an annual basis. As part of this review, management and the boardofdirectorsconsiderthecostofcapitalandtherisksassociatedwith each class of capital. Based on recommendations of management and the Board of Directors, the Group will balance its overall capital structure through the payment of dividends, and new share issues as well as the issue of new debt or the redemption of existing debt.
32.1.1 Gearing ratio
2010$’000
2009$’000
Debt (i) 13,954 21,051
Cash and cash equivalents (16,241) (17,426)
Net(cash)/debt (2,287) 3,625
Equity (ii) 100,347 94,905
Net debt to equity ratio -2% 4%
The gearing ratio at the end of the reporting period was as follows:(i) Debtisdefinedaslong-termandshort-termborrowings,asdetailedinnote23.(ii) Equity includes all capital and reserves that are managed as capital.
32.2 SIGNIFICANT ACCOUNTING POLICIES
Details of the significant accounting policies and methods adopted (including the criteria for recognition, the bases for recognition of income and expenses) for each class of financial asset, financial liability and equity instrument are disclosed in note 3.
Notes to the Financial Statements CONTINUED
32.3 CATEGORIES OF FINANCIAL INSTRUMENTS
WEIGHTED AVERAGE EFFECTIVE INTEREST
RATE%
2010$’000
WEIGHTED AVERAGE EFFECTIVE INTEREST
RATE%
2009$’000
Financial assets
Trade and other receivables - 21,724 - 23,248
Loans receivables 10.89 13,558 9.58 19,772
Other financial assets - 2,168 - -
Cash and cash equivalents 2.73 16,241 3.63 17,426
Financial guarantee contracts 4.46 1,192 4.66 1,686
Financial liabilities
Commercial bills 4.90 - 6.61 4,500
Euro loan 5.22 13,755 5.22 16,222
Other loans 5.00 173 5.00 259
Other financial liabilities - 24,032 - 25,631
Finance lease liability 9.20 26 8.75 70
Financial guarantee contracts 4.46 1,192 4.66 1,686
32.4 FINANCIAL RISK MANAGEMENT OBJECTIVES
TheGroup’sfinancedepartmentco-ordinatesaccesstodomesticandinternationalfinancialmarkets,monitorsandmanagesthefinancialrisksrelating to the operations of the Group in line with the Group’s policies. These risksincludemarketrisk(includingcurrencyrisk,fairvalueinterestrateriskandpricerisk),creditrisk,liquidityriskandcashflowinterestraterisk.
TheGroupseekstominimisetheeffectsoftheabovementionedrisks, byusingderivativefinancialinstrumentstohedgetheseriskexposures. The use of financial derivatives is governed by the Group’s policies approved by the board of directors, which provide written principles on foreign exchange risk,interestraterisk,creditrisk,theuseoffinancialderivativesandnon-derivative financial instruments, and the investment of excess liquidity. Compliance with policies and exposure limits is reviewed by the board of directors. The Group does not enter into or trade financial instruments, including derivative financial instruments, for speculative purposes.
TheGroup’smanagementandboardofdirectors’reviewannuallytherisksandpoliciesimplementedtomitigateriskexposures.
32.5 MARKET RISKTheGroup’sactivitiesexposeitprimarilytothefinancialrisksofchangesin foreign currency exchange rates (refer to note 32.6) and interest rates (refer to note 32.7). The Group enters into a variety of derivative financial instruments to manage its exposure to interest rate and foreign currency risk,including:• Interestrateswapstomitigateriskofrisinginterestrates.Marketriskexposuresaremeasuredusingsensitivityanalysis.
TherehasbeennochangetotheGroup’sexposuretomarketrisksorthemannerinwhichitmanagesandmeasurestheriskfromthepreviousperiod.
Hedging activities
TheGroupholdsfinancialinstrumentstohedgerisksrelatingtounderlyingtransactions.Themajorexposuretointerestrateriskandforeigncurrencyriskarisesfromlong-termborrowings.Detailsofhedgingactivitiesareprovided below.
The Group designates the Euro loan as a hedge of a net investment in a foreign operation.
The terms and conditions in relation to the derivative instruments are similar to the terms and conditions of underlying hedged items. The hedging relationship was effective at reporting date.
For further details refer to note 3.24.

PAGE 103PAGE 102
DOMINO’S PIZZA ENTERPRISES LIMITED ANNUAL REPORT 2010 DOMINO’S PIZZA ENTERPRISES LIMITED ANNUAL REPORT 2010
32.6 FOREIGN CURRENCY RISK MANAGEMENT
As DPE Limited’s Australian operations are predominantly conducted in Australiandollars,thereislimitedforeigncurrencyexchangeriskassociatedwith the Australian business.
DPE Limited also has operations in New Zealand and Europe. The operations and revenues of these businesses are predominantly transacted in New Zealand dollars and Euros respectively. DPE Limited intends to mitigate its foreigncurrencytranslationriskexposurebydenominatingaportionofitssenior debt in Euros. This creates a natural hedge and mitigates the potential for currency movements to negatively impact DPE Limited.
DPE Limited also purchases some equipment in a range of currencies, but predominantly USD, and has an exchange rate exposure due to delays between entering into a contract and final payment. DPE Limited will only enter into a hedge position (forward contract) in respect of equipment purchase once it has committed to the purchase.
TheGroupundertakescertaintransactionsdenominatedinforeigncurrencies, hence exposures to exchange rate fluctuations arise. Exchange rate exposures are managed within approved policy parameters.
The carrying amount of the Group’s foreign currency denominated monetary assets and monetary liabilities at the reporting date is as follows:
LIABILITIES ASSETS
2010$’000
2009$’000
2010$’000
2009$’000
New Zealand dollars - - - -
Euros 13,755 16,295 - -
32.6.1 Foreign currency sensitivity analysis
The Group is mainly exposed to Euros and New Zealand dollars (NZD).
Theforeigncurrencyriskexposurerecognisedfromassetsand liabilities arises primarily from the long term borrowings denominated in foreign currencies. There is no significant impact on the Consolidated entity’s profit from foreign currency movements associated with these borrowings as they are effectively designated as a hedge of the net investment in foreign operations.
Thenetgain/(loss)inthecashflowhedgereservereflectstheresultsofexchange rate or interest rate movements on the derivatives held in the cash flow hedges which will be released to the income statement in the future as the underlying hedged items affect profit.
FortheGroup,theforeigncurrencytranslationriskassociatedwiththe foreign investment results in some volatility to the foreign currency translation reserve. The impact on the foreign currency translation reserve relates to translation of the net assets of the foreign controlled entities including the impact of any hedging transactions.
Hedges of net investments in foreign operations
In the consolidated financial statements, the exposure to foreign currency translationriskisaresultoftheinvestmentinoffshoreactivities,beingEurope, where any exchange gains and losses on translation of the Euro denominatedloanaretakentothenetinvestmenthedgereserve(intheforeign currency translation reserve) only to the extent of the gains and losses on the value of the European net assets, including any intercompany loan payable to DPEU. Exchange differences on the excess between the Euro loan and net assets, including any intercompany loan payable to DPEU, if any, are recognised in the income statement.
The effectiveness of the hedging relationship is tested using prospective and retrospective effectiveness tests. In a retrospective effectiveness test, the changes in the value of the hedging instrument and the change in the value of the hedged net investment from spot rate changes are calculated. If the calculation is between 80 and 125 per cent, then the hedge is considered effective.
Anygainsorlossesonremeasurementofderivativeornon-derivativefinancialinstruments designated as hedges of foreign investments are recognised in the net investment hedge reserve (in the foreign currency translation reserve) in equity only to the extent that the hedging relationship is effective. The accumulation of the recognised gains or losses recorded in equity is transferred to the income statement when the foreign operation is sold.
Any gains or losses of the ineffective portion of the hedge are recognised in the income statement within other revenue or other expenses. During the year there was no hedge ineffectiveness attributable to the net investment hedges.
Duringtheyearnetgains/(losses)aftertaxof$1,727thousand(2009:$(813)thousand)onthehedginginstrumentsweretakendirectlytoequityintheconsolidated balance sheet.
Notes to the Financial Statements CONTINUED
The following table details the value of the instrument designated as hedges of net foreign investments:
LIABILITIES EQUITY
2010$’000
2009$’000
2010$’000
2009$’000
Euro loan 13,755 16,222 - -
Designated hedge of net foreign investment - - 1,329 (398)
13,755 16,222 1,329 (398)
The following details the Group’s sensitivity to a 10% increase and decrease in the Australian Dollar against the relevant foreign currencies. 10% is the sensitivityrateusedwhenreportingforeigncurrencyriskinternallytokeymanagement personnel and represents management’s assessment of the possible change in foreign exchange rates. The sensitivity analysis includes only outstanding foreign currency denominated monetary items.
Adjustments have only been made for transactions outstanding at period end using a 10% change in foreign currency rates. A positive number indicates an increase in profit or loss and other equity where the Australian Dollar strengthens against the respective currency.
EUROS IMPACT NEW ZEALAND DOLLARS IMPACT
2010$’000
2009$’000
2010$’000
2009$’000
Profit or (loss)
If there was a 10% increase in exchange rates
with all other variables held constant - - - -
If there was a 10% decrease in exchange rates
with all other variables held constant - - - -
Other equity
If there was a 10% increase in exchange rates
with all other variables held constant 1,305 971 (i) - -
If there was a 10% decrease in exchange rates
with all other variables held constant (1,595) (2,609) (i) - -
(i) This is mainly as a result of changes in fair value of borrowings designated as net investment of foreign operation hedges.
The Group’s sensitivity to foreign currency remains consistent during the current period.
32.6.2 Forward foreign exchange contracts
It is the policy of the Group to enter into forward foreign exchange contracts to cover specific foreign currency payments and receipts. The forward foreign exchange contract is only entered into once the Group has committed to the purchase transaction.
There were no forward foreign exchange contracts outstanding as at reporting date (2009: nil).
32.7 INTEREST RATE RISK MANAGEMENT
TheGroupisexposedtointerestrateriskasitborrowsfundsatfloatinginterest rates. The Group holds an interest rate swap contract to manage interest rate exposure. Hedging activities are evaluated regularly to align withinterestrateviewsanddefinedriskappetiteensuringoptimalhedgingstrategies are applied, by either positioning the balance sheet or protecting interest expense through different interest rate cycles.
32.7.1 Interest rate sensitivity analysis
The sensitivity analysis below have been determined based on the exposure to interestratesforbothderivativeandnon-derivativeinstrumentsatthereportingdateandthestipulatedchangetakingplaceatthebeginningofthefinancialyearand held constant throughout the reporting period. A 100 basis point increase or decreaseisusedwhenreportinginterestrateriskinternallytokeymanagementpersonnel and represents management’s assessment of the possible change in interest rates.
At reporting date, if interest rates had been 100 basis points higher or lower and all other variables were held constant, the Group’s:• Netprofitwoulddecreaseby$37thousandandincreaseby$40thousand
(2009: decrease by $16 thousand and increase by $49 thousand). This is mainly attributable to the Group’s exposure to interest rates on its variable rate borrowings.
• Otherequityreserveswouldincreaseby$72thousandanddecreaseby$183thousand (2009: increase by $56 thousand and decrease by $668 thousand) mainly as a result of the changes in the fair value of the interest rate swap.

PAGE 105PAGE 104
DOMINO’S PIZZA ENTERPRISES LIMITED ANNUAL REPORT 2010 DOMINO’S PIZZA ENTERPRISES LIMITED ANNUAL REPORT 2010
32.7.2 Interest rate swap contracts
Under the interest rates swap contract, the Group agrees to exchange the difference between fixed and floating rate interest amounts calculated on an agreed notionalprincipalamount.ThiscontractenablestheGrouptomitigatetheriskofchanginginterestratesondebtheld.Theaverageinterestrateisbasedonthe outstanding balance at the start of the financial year.
The following table details the notional principal amounts and remaining terms of the interest rate swap contracts outstanding as at reporting date:
Cash flow hedges
AVERAGE CONTRACTED FIXED INTEREST RATE
NOTIONAL PRINCIPAL AMOUNT (i) FAIR VALUE
Outstanding floating for fixed contract 2010%
2009%
2010$’000
2009$’000
2010$’000
2009$’000
Consolidated
2 to 5 years 5.22 5.22 13,755 16,222 (604) (859)
13,755 16,222 (604) (859)
(i) The principal is a Euro denominated amount.
The interest rate swap settles on a monthly basis. The Group will settle the difference between the floating and fixed interest rate on a net basis.
Notes to the Financial Statements CONTINUED
32.8 CREDIT RISK MANAGEMENT
CreditriskreferstotheriskthatafranchiseeorbusinesspartnerwilldefaultonitscontractualobligationsresultinginfinanciallosstotheGroup.TheGrouphasadoptedapolicyofonlydealingwithcreditworthycounterpartiesandobtainingsufficientcollateralwhereappropriate,asameansofmitigatingtheriskoffinancial loss from defaults. Credit exposure is controlled by limits that are continually reviewed.
Thecreditriskonliquidfundsandderivativefinancialinstrumentsislimitedbecausethecounterpartiesarebankswithhighcreditratingsassignedbyinternational credit rating agencies.
Except as detailed in the following table, the carrying amount of financial assets recorded in the financial statements, net of any allowances for losses, representstheGroup’smaximumexposuretocreditriskwithouttakingaccountofthevalueofanycollateralobtained:
32.8.1 Financial assets and other credit exposures
MAXIMUM CREDIT RISK
2010$’000
2009$’000
Consolidated
Guarantee provided under deed of guarantee 20,881 25,718
The Group provides guarantees to third party financiers in order to enable internal candidates (i.e. franchisees and managers) to fund the purchase of DPE stores. The Group’s policy in this regard is to predominantly support internal candidates who have displayed strong operational expertise. Further, the Group generallyprovidesguaranteestointernalcandidatesinthemetropolitanmarketswhere it has operated or is operating corporate stores.
In the event that a loan defaults, the Group’s policy is to purchase and operate the failed store as a corporate store.
32.9 LIQUIDITY RISK MANAGEMENT
TheGroupmanagesliquidityriskbymaintainingadequatereserves,bankingfacilities and reserve borrowing facilities, by continuously monitoring forecast and actual cash flows, and matching the maturity profiles of financial assets and liabilities.
Included in note 32.9.2 is a listing of additional undrawn facilities that the Grouphasatitsdisposaltofurtherreduceliquidityrisk.
32.9.1 Liquidity and interest risk tables
ThefollowingtablesdetailtheGroup’sremainingcontractualmaturityforitsfinancialassetsandliabilitiesandnon-derivativefinancialassetsandliabilities.The tables have been drawn up based on the undiscounted cash flows of financial liabilities based on the earliest date on which the Group can be required to pay. The table includes both interest and principal cash flows.
LESS THAN1 YEAR$’000
1-5 YEARS$’000
MORE THAN 5 YEARS
$’000
4 July 2010
Financial assets
Trade and other receivables 21,724 - -
Loans receivables 2,078 14,889 1,401
Other financial assets 2,168 - -
Cash and cash equivalents 16,241 - -
Financial guarantee contracts (i) - 1,192 -
Financial Liabilities
Trade payables (14,908) - -
Other payables (10,374) - -
Commercial bills - - -
Euro loan - (14,772) -
Finance lease liability (22) (5) -
Other loans (19) (154) -
Other liabilities - (1,644) -
Financial guarantee contracts (i) - (1,192) -
28 June 2009
Financial assets
Trade and other receivables 23,248 - -
Loans receivables 279 19,493 -
Cash and cash equivalents 17,426 - -
Financial guarantee contracts (i) - 1,686 -
Financial Liabilities
Trade payables (11,499) - -
Other payables (14,478) - -
Commercial bills - (4,500) -
Euro loan - (18,268) -
Finance lease liability (58) (19) -
Other loans (22) (237) -
Other liabilities (7) (893) -
Financial guarantee contracts (i) - (1,686) -
(i) Contingent liability and asset calulated based on guarantee contracts listed in note 32.8.1.
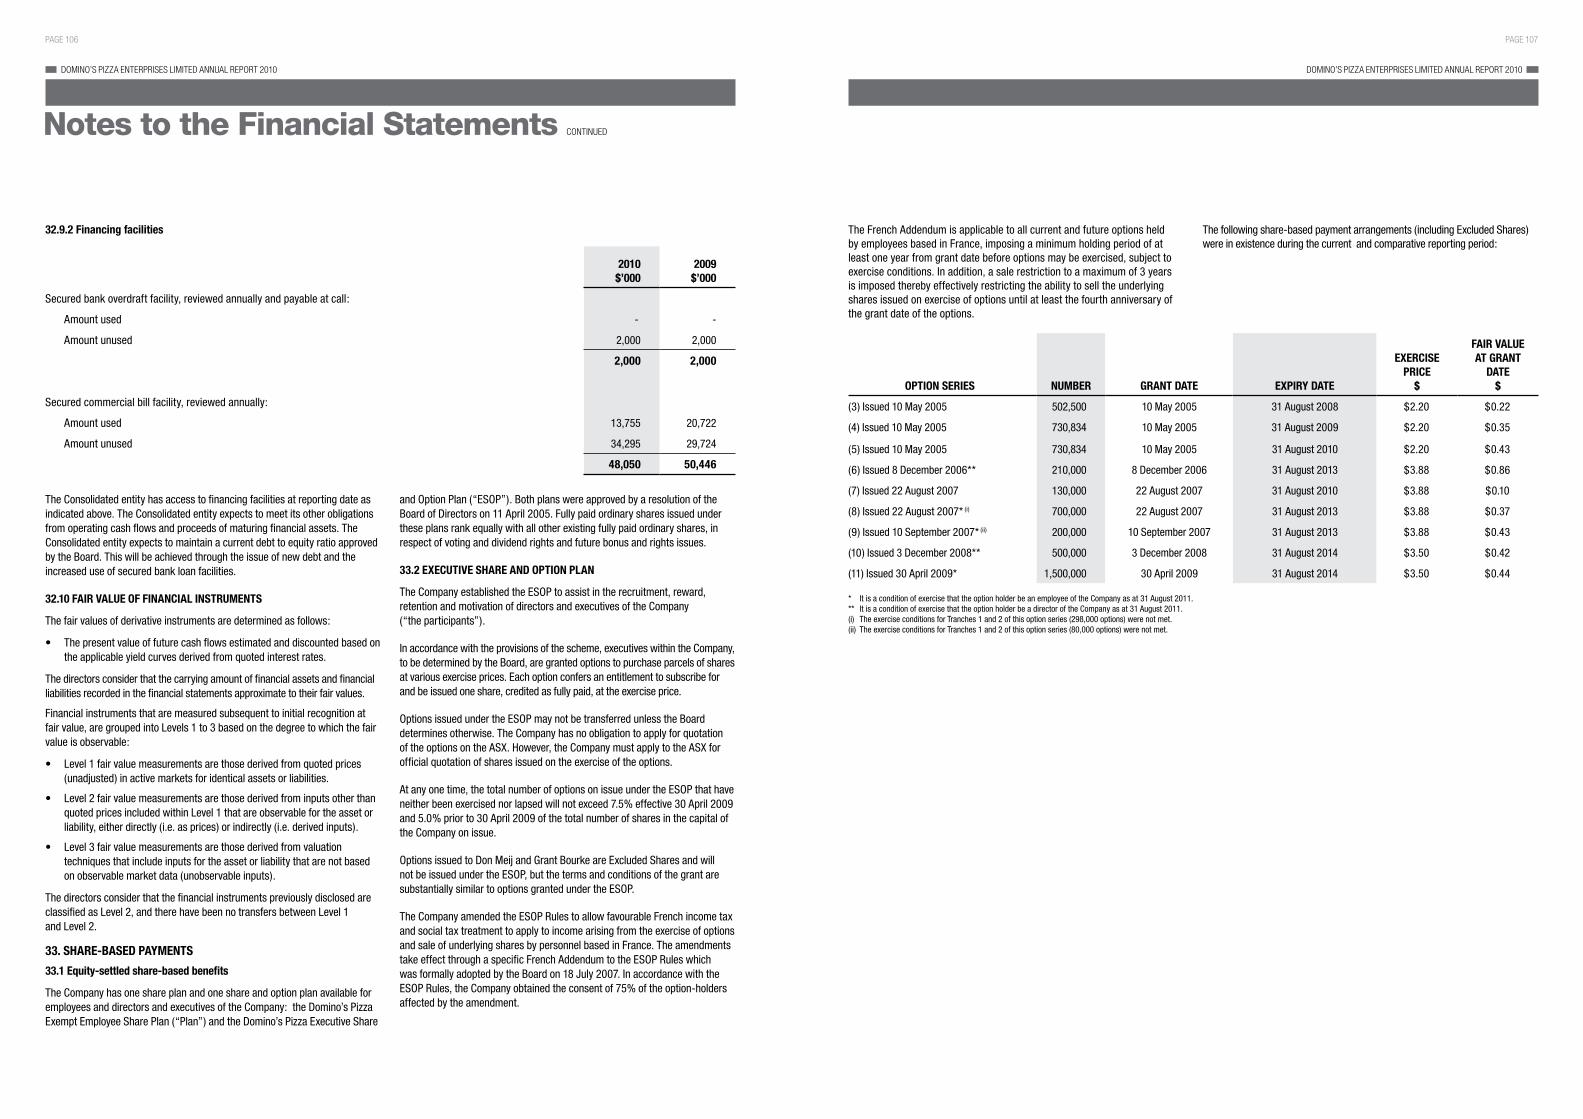
PAGE 107PAGE 106
DOMINO’S PIZZA ENTERPRISES LIMITED ANNUAL REPORT 2010 DOMINO’S PIZZA ENTERPRISES LIMITED ANNUAL REPORT 2010
32.9.2 Financing facilities
2010$’000
2009$’000
Securedbankoverdraftfacility,reviewedannuallyandpayableatcall:
Amount used - -
Amount unused 2,000 2,000
2,000 2,000
Secured commercial bill facility, reviewed annually:
Amount used 13,755 20,722
Amount unused 34,295 29,724
48,050 50,446
The Consolidated entity has access to financing facilities at reporting date as indicated above. The Consolidated entity expects to meet its other obligations from operating cash flows and proceeds of maturing financial assets. The Consolidated entity expects to maintain a current debt to equity ratio approved by the Board. This will be achieved through the issue of new debt and the increaseduseofsecuredbankloanfacilities.
32.10 FAIR VALUE OF FINANCIAL INSTRUMENTS
The fair values of derivative instruments are determined as follows:
• Thepresentvalueoffuturecashflowsestimatedanddiscountedbasedonthe applicable yield curves derived from quoted interest rates.
The directors consider that the carrying amount of financial assets and financial liabilities recorded in the financial statements approximate to their fair values.
Financial instruments that are measured subsequent to initial recognition at fair value, are grouped into Levels 1 to 3 based on the degree to which the fair value is observable:
• Level1fairvaluemeasurementsarethosederivedfromquotedprices(unadjusted)inactivemarketsforidenticalassetsorliabilities.
• Level2fairvaluemeasurementsarethosederivedfrominputsotherthanquoted prices included within Level 1 that are observable for the asset or liability, either directly (i.e. as prices) or indirectly (i.e. derived inputs).
• Level3fairvaluemeasurementsarethosederivedfromvaluationtechniques that include inputs for the asset or liability that are not based onobservablemarketdata(unobservableinputs).
The directors consider that the financial instruments previously disclosed are classified as Level 2, and there have been no transfers between Level 1 and Level 2.
33. SHARE-BASED PAYMENTS
33.1 Equity-settled share-based benefits
The Company has one share plan and one share and option plan available for employees and directors and executives of the Company: the Domino’s Pizza Exempt Employee Share Plan (“Plan”) and the Domino’s Pizza Executive Share
and Option Plan (“ESOP”). Both plans were approved by a resolution of the Board of Directors on 11 April 2005. Fully paid ordinary shares issued under theseplansrankequallywithallotherexistingfullypaidordinaryshares,inrespect of voting and dividend rights and future bonus and rights issues.
33.2 EXECUTIVE SHARE AND OPTION PLAN
The Company established the ESOP to assist in the recruitment, reward, retention and motivation of directors and executives of the Company (“the participants”).
In accordance with the provisions of the scheme, executives within the Company, to be determined by the Board, are granted options to purchase parcels of shares at various exercise prices. Each option confers an entitlement to subscribe for and be issued one share, credited as fully paid, at the exercise price.
Options issued under the ESOP may not be transferred unless the Board determines otherwise. The Company has no obligation to apply for quotation of the options on the ASX. However, the Company must apply to the ASX for official quotation of shares issued on the exercise of the options.
At any one time, the total number of options on issue under the ESOP that have neither been exercised nor lapsed will not exceed 7.5% effective 30 April 2009 and 5.0% prior to 30 April 2009 of the total number of shares in the capital of the Company on issue.
OptionsissuedtoDonMeijandGrantBourkeareExcludedSharesandwillnot be issued under the ESOP, but the terms and conditions of the grant are substantially similar to options granted under the ESOP.
The Company amended the ESOP Rules to allow favourable French income tax and social tax treatment to apply to income arising from the exercise of options and sale of underlying shares by personnel based in France. The amendments takeeffectthroughaspecificFrenchAddendumtotheESOPRuleswhichwas formally adopted by the Board on 18 July 2007. In accordance with the ESOPRules,theCompanyobtainedtheconsentof75%oftheoption-holdersaffected by the amendment.
The French Addendum is applicable to all current and future options held by employees based in France, imposing a minimum holding period of at least one year from grant date before options may be exercised, subject to exercise conditions. In addition, a sale restriction to a maximum of 3 years is imposed thereby effectively restricting the ability to sell the underlying shares issued on exercise of options until at least the fourth anniversary of the grant date of the options.
Thefollowingshare-basedpaymentarrangements(includingExcludedShares)were in existence during the current and comparative reporting period:
Notes to the Financial Statements CONTINUED
OPTION SERIES NUMBER GRANT DATE EXPIRY DATE
EXERCISE PRICE
$
FAIR VALUE AT GRANT
DATE$
(3) Issued 10 May 2005 502,500 10 May 2005 31 August 2008 $2.20 $0.22
(4) Issued 10 May 2005 730,834 10 May 2005 31 August 2009 $2.20 $0.35
(5) Issued 10 May 2005 730,834 10 May 2005 31 August 2010 $2.20 $0.43
(6) Issued 8 December 2006** 210,000 8 December 2006 31 August 2013 $3.88 $0.86
(7) Issued 22 August 2007 130,000 22 August 2007 31 August 2010 $3.88 $0.10
(8) Issued 22 August 2007* (i) 700,000 22 August 2007 31 August 2013 $3.88 $0.37
(9) Issued 10 September 2007* (ii) 200,000 10 September 2007 31 August 2013 $3.88 $0.43
(10) Issued 3 December 2008** 500,000 3 December 2008 31 August 2014 $3.50 $0.42
(11) Issued 30 April 2009* 1,500,000 30 April 2009 31 August 2014 $3.50 $0.44
* It is a condition of exercise that the option holder be an employee of the Company as at 31 August 2011.** It is a condition of exercise that the option holder be a director of the Company as at 31 August 2011.(i) The exercise conditions for Tranches 1 and 2 of this option series (298,000 options) were not met.(ii) The exercise conditions for Tranches 1 and 2 of this option series (80,000 options) were not met.

PAGE 109PAGE 108
DOMINO’S PIZZA ENTERPRISES LIMITED ANNUAL REPORT 2010 DOMINO’S PIZZA ENTERPRISES LIMITED ANNUAL REPORT 2010
33.3 FAIR VALUE OF SHARE OPTIONS GRANTED IN THE YEAR
The weighted average fair value of the options granted during the 2010 year is $nil (2009: $224,811). Options were priced using a binominal option pricing model. Whererelevant,theexpectedlifeusedinthemodelhasbeenadjustedbasedonmanagement’sbestestimatefortheeffectsofnon-transferability,exerciserestrictionsand behavioural conditions. Expected volatility is based on the historical share price volatility since listing on 16 May 2005.
Inputs into the model
SERIES 3
SERIES 4
SERIES 5
SERIES 6
SERIES 7
SERIES 8
SERIES 9
SERIES 10
SERIES 11
Grant date share price $2.20 $2.20 $2.20 $3.74 $3.09 $3.09 $3.09 $3.08 $3.08
Exercise price $2.20 $2.20 $2.20 $3.88 $3.88 $3.88 $3.88 $3.50 $3.50
Expected volatility 23.91% 28.18% 29.43% 28% 26.75% 26.75% 26.75% 26.83% 34.04%
Option life years (i) 3.05 4.05 5.05 4.94 1.03 4.03 3.98 2.82 2.34
Dividend yield 4.20% 4.20% 4.20% 3.50% 2.90% 2.90% 2.90% 3.50% 3.54%
Risk-freeinterestrate 5.60% 5.58% 5.58% 5.70% 6.16% 6.04% 6.04% 5.56% 3.07%
(i)Thisisbasedonanormal365-dayyear.
33.4 MOVEMENTS IN SHARES OPTIONS DURING THE PERIOD
The following reconciles the outstanding share options granted under the ESOP and Excluded Shares at the beginning and end of the year:
2010 2009
NUMBER OF OPTIONS
WEIGHTED AVERAGE EXERCISE
PRICE$
NUMBER OF OPTIONS
WEIGHTED AVERAGE EXERCISE
PRICE$
Balance at beginning of the year 3,366,167 3.16 2,473,334 3.04
Granted during the year - - 2,000,000 3.50
Forfeited during the year - - (150,000) 3.88
Exercised during the year (278,667) 2.98 (957,167) 2.20
Expired during the year - - - -
Balance at end of the year 3,087,500 3.07 3,366,167 3.16
Exercisable at end of the year 127,500 2.20 276,167 2.20
Notes to the Financial Statements CONTINUED
33.5 SHARE OPTIONS EXERCISED DURING THE YEAR
The following share options granted under the ESOP were exercised during the year:
2010SHARE PRICE AT EXERCISE DATE
$OPTION SERIES NUMBER EXERCISED EXERCISE DATE
(5) 6,667 24 August 2009 4.00
(5) 35,000 26 August 2009 4.09
(5) 40,000 9 November 2009 4.51
(7) 30,000 9 November 2009 4.51
(5) 12,000 11 November 2009 4.45
(7) 30,000 11 November 2009 4.45
(7) 30,000 18 February 2010 5.12
(5) 50,000 25 February 2010 5.15
(7) 10,000 25 February 2010 5.15
(5) 5,000 4 March 2010 5.44
(7) 30,000 4 March 2010 5.44
2009SHARE PRICE AT EXERCISE DATE
$OPTION SERIES NUMBER EXERCISED EXERCISE DATE
(3) 15,000 11 August 2008 3.50
(3) 20,000 14 August 2008 3.64
(3) 345,000 21 August 2008 3.21
(3) 10,000 22 August 2008 3.24
(3) 112,500 29 August 2008 3.30
(5) 345,000 4 September 2008 3.05
(5) 10,000 15 October 2008 2.80
(5) 30,000 11 November 2008 2.98
(5) 24,667 17 November 2008 2.98
(5) 35,000 19 November 2008 2.83
(5) 10,000 25 November 2008 2.65

PAGE 111PAGE 110
DOMINO’S PIZZA ENTERPRISES LIMITED ANNUAL REPORT 2010 DOMINO’S PIZZA ENTERPRISES LIMITED ANNUAL REPORT 2010
33.6 SHARE OPTIONS OUTSTANDING AT END OF THE YEAR
2010
The share options outstanding at the end of the year consist of: • 127,500optionswithanexercisepriceof$2.20,andaweightedaverageremainingcontractuallifeof0.16years;• 210,000optionswithanexercisepriceof$3.88,andaweightedaverageremainingcontractuallifeof3.16years;• 595,000optionswithanexercisepriceof$3.88,andaweightedaverageremainingcontractuallifeof3.16years;• 155,000optionswithanexercisepriceof$3.88,andaweightedaverageremainingcontractuallifeof3.16years;• 500,000optionswithanexercisepriceof$3.50,andaweightedaverageremainingcontractuallifeof4.16years;and• 1,500,000optionswithanexercisepriceof$3.50,andaweightedaverageremainingcontractuallifeof4.16years.
2009
The share options outstanding at the end of the year consist of: • 276,167optionswithanexercisepriceof$2.20,andaweightedaverageremainingcontractuallifeof1.18years;• 210,000optionswithanexercisepriceof$3.88,andaweightedaverageremainingcontractuallifeof4.18years;• 130,000optionswithanexercisepriceof$3.88,andaweightedaverageremainingcontractuallifeof1.18years;• 595,000optionswithanexercisepriceof$3.88,andaweightedaverageremainingcontractuallifeof4.18years;• 155,000optionswithanexercisepriceof$3.88,andaweightedaverageremainingcontractuallifeof4.18years;• 500,000optionswithanexercisepriceof$3.50,andaweightedaverageremainingcontractuallifeof5.18years;and• 1,500,000optionswithanexercisepriceof$3.50,andaweightedaverageremainingcontractuallifeof5.18years.
34. KEY MANAGEMENT PERSONNEL COMPENSATION
Key management personnel compensation
TheaggregatecompensationmadetokeymanagementpersonneloftheConsolidatedentityandCompany,issetoutbelow:
2010 $
2009 $
Short-termemployeebenefits 4,236,464 4,242,482
Post-employmentbenefits 160,169 161,188
Otherlong-termemployeebenefits 39,924 306,644
Termination benefits - 32,592
Equitysettledshare-basedpayments 304,032 140,463
4,740,589 4,883,369
ThecompensationofeachmemberofthekeymanagementpersonneloftheConsolidatedentityissetoutonthefollowingpage.
Theremunerationofdirectorsandkeyexecutivesisdeterminedbytheremunerationcommitteehavingregardtotheperformanceofindividualsandmarkettrends.
Notes to the Financial Statements CONTINUED
ThecompensationofeachmemberofthekeymanagementpersonneloftheConsolidatedentityforthecurrentyearissetoutbelow:
SHORT-TERM EMPLOYEE BENEFITS
POST-EMPLOY-
MENT BENEFITS
OTHER LONG-TERM
EMPLOYEE BENEFITS
$
TERMI-NATION
BENEFITS$
SHARE-BASED
PAYMENT
TOTAL$
% OF COMPEN-SATION FOR THE
YEAR CON-SISTING OF OPTIONS
% 2010
SALARY & FEES(ii)
$BONUS
$
NON-MONETARY
$
SUPER-ANNUATION
$
OPTIONS & RIGHTS
$
Non-executive directors
Ross Adler 119,760 - 2,560 10,575 - - - 132,895 -
Barry Alty 78,990 - 2,560 6,958 - - - 88,508 -
GrantBourke 68,798 - 2,560 6,075 - - - 77,433 -
Paul Cave 68,798 - 2,560 6,075 - - - 77,433 -
Executive director
Don Meij 529,521 250,000 2,560 14,461 20,459 - 116,629 933,630 12.49%
Executive officers
Richard Coney 243,281 87,317 24,142 14,461 7,785 - 44,563 421,549 10.57%
Andy Masood 186,218 29,484 27,275 14,461 5,662 - 7,585 270,685 2.80%
Andrew Megson (i) 297,497 - 110,184 - - - 35,793 443,474 8.07%
Andrew Rennie (i) 355,737 34,629 147,962 - - - 45,900 584,228 7.86%
Kerri Hayman 237,462 25,500 2,560 14,461 6,018 - 11,275 297,276 3.79%
Craig Ryan 175,592 51,224 2,560 14,461 - - 7,585 251,422 3.02%
Allan Collins 275,398 24,369 2,560 14,461 - - 11,378 328,166 3.47%
John Harney 172,049 44,828 2,560 14,461 - - 7,585 241,483 3.14%
Chris O'Dwyer 175,515 42,000 2,560 14,461 - - 15,739 250,275 6.29%
Steve Klaassen 7,324 - - 337 - - - 7,661 -
PatrickMcMichael 152,450 165,000 2,560 14,461 - - - 334,471 -
3,144,390 754,351 337,723 160,169 39,924 - 304,032 4,740,589 6.41%
(i) Theshort-termbonusandlong-termbonusandtheoptionsaredependentonsatisfactionofperformanceconditions.(ii) Salaryandfeesin2010include53weeks.

PAGE 113PAGE 112
DOMINO’S PIZZA ENTERPRISES LIMITED ANNUAL REPORT 2010 DOMINO’S PIZZA ENTERPRISES LIMITED ANNUAL REPORT 2010
34. KEY MANAGEMENT PERSONNEL COMPENSATION (CONTINUED)
ThecompensationofeachmemberofthekeymanagementpersonneloftheConsolidatedentityfortheprioryearissetoutbelow:
SHORT-TERM EMPLOYEE BENEFITS
POST-EMPLOY-
MENT BEN-EFITS OTHER
LONG-TERM EMPLOYEE BENEFITS
$
TERMI-NATION
BENEFITS$
SHARE-BASED
PAYMENT
OPTIONS & RIGHTS
$TOTAL
$
% OF COMPENSA-
TION FOR THE YEAR
CONSISTING OF OPTIONS
% 2009
SALARY & FEES (ii)
$BONUS
$
NON-MON-ETARY
$
SUPER-ANNUATION
$
Non-executive directors
Ross Adler 117,500 - 2,330 10,575 - - - 130,405 -
Barry Alty 77,500 - 2,330 7,892 - - - 87,722 -
GrantBourke 67,500 - 2,330 7,994 - - - 77,824 -
Paul Cave 67,500 - 2,330 6,075 - - - 75,905 -
Executive director
Don Meij 496,198 300,000 2,330 13,745 10,489 - 89,254 912,016 9.79%
Executive officers
Richard Coney 246,792 75,550 26,427 13,745 4,541 - 8,662 375,717 2.31%
Andy Masood 170,153 24,079 26,579 13,745 3,580 - 1,881 240,017 0.78%
Andrew Megson (i) 352,273 59,041 122,413 - 125,461 - 10,195 669,383 1.52%
Andrew Rennie (i) 388,389 - 185,199 - 158,672 - 14,075 746,335 1.89%
Kerri Hayman 238,064 28,900 2,330 13,745 3,901 - 8,220 295,160 2.78%
Adam Pratt 80,904 - 538 7,079 - 32,592 - 121,113 -
Craig Ryan 166,129 19,260 2,330 12,921 - - 1,690 202,330 0.84%
Allan Collins 270,288 30,837 2,330 13,745 - - 2,293 319,493 0.72%
John Harney 165,556 57,750 2,330 13,745 - - 1,690 241,071 0.70%
Steven Klaassen 103,576 1,250 2,330 9,045 - - - 116,201 -
Chris O'Dwyer 170,777 24,900 1,792 12,310 - - 2,503 212,282 1.18%
PatrickMcMichael 54,717 - 851 4,827 - - - 60,395 -
3,233,816 621,567 387,099 161,188 306,644 32,592 140,463 4,883,369 2.88%
(i)theshort-termbonus,thelong-termbonusandtheoptionsaredependentonsatisfactionofperformanceconditions.(ii)Salaryandfeesin2009include52weeks.
35. RELATED PARTY TRANSACTIONS
35.1 OTHER RELATED PARTY TRANSACTIONS
35.1.1 EQUITY INTERESTS IN RELATED PARTIES
Equity interest in subsidiariesDetails of the percentage of ordinary shares held in subsidiaries are disclosed in note 17 to the financial statements.
Equity interests in other related partiesThere are no equity interests in other related parties.
35.1.2 TRANSACTIONS WITH KEY MANAGEMENT PERSONNEL
(i) Key management personnel compensationDetailsofkeymanagementpersonnelcompensationaredisclosedinnote34to the financial statements.
(ii) Loans to key management personnel Therewerenoloansoutstandingatanytimeduringthefinancialyeartokeymanagement personnel or to their related parties.
Notes to the Financial Statements CONTINUED
(iii) Key management personnel equity holdings
Fully paid ordinary shares of Domino’s Pizza Enterprises Limited
BALANCE AT BEGINNING OF FINAN-CIAL YEAR
NO.
GRANTED AS COMPEN-
SATIONNO.
RECEIVED ON EXER-CISE OF OPTIONS
NO.
NET OTHER CHANGE
NO.
BALANCE AT THE END OF FINANCIAL
YEARNO.
BALANCE HELD
NOMINALLYNO.
2010Ross Adler (i) (ii) 288,836 - - 13,385 302,221 -
Barry Alty (i) 104,443 - - - 104,443 -
GrantBourke (i) (iii) 1,747,032 - - (200,000) 1,547,032 -
Paul Cave (i) (vii) 382,000 - - - 382,000 -
Don Meij (i) (iv) 3,389,180 - - (366,578) 3,022,602 -
Richard Coney (i) (v) 2,719 - 35,000 (35,000) 2,719 -
Allan Collins (vi) - - 30,000 (30,000) - -
John Harney (vii) - - 30,000 (30,000) - -
Kerri Hayman (i) (viii) 20,754 - 17,000 (17,000) 20,754 -
Andy Masood 7,229 - - - 7,229 -
Andrew Megson (i) (ix) 87,079 - 50,000 (24,000) 113,079 -
Chris O'Dwyer - - - - - -
Andrew Rennie (i) (x) 1,538,305 - - (929,500) 608,805 -
Craig Ryan (xi) - - 30,000 (30,000) - -
PatrickMcMichael 13,635 - - 13,635 -
2009Ross Adler (i) 273,594 - - 15,242 288,836 -
Barry Alty (i) 102,478 - - 1,965 104,443 -
GrantBourke (i) 3,047,032 - - (1,300,000) 1,747,032 -
Paul Cave (i) 732,000 - - (350,000) 382,000 -
Don Meij (i) 3,763,907 - 690,000 (1,064,727) 3,389,180 -
Richard Coney (i) 2,719 - 35,000 (35,000) 2,719 -
Allan Collins - - - - - -
John Harney - - - - - -
Kerri Hayman (i) 2,754 - 18,000 - 20,754 -
Steve Klaassen - - - - - -
Andy Masood 25,854 - 30,000 (48,625) 7,229 -
Andrew Megson (i) 102,079 - - (15,000) 87,079 -
Adam Pratt (xii) 25 - - 1 26 -
Chris O'Dwyer - - - - - -
Andrew Rennie (i) 1,914,814 - 112,500 (489,009) 1,538,305 -
Craig Ryan - - - - - -
PatrickMcMichael - - - 13,635 13,635 -(i) Includes shares held by their related parties.(ii) On 26 August 2009, Ross Adler purchased 13,385 shares.(iii) On26February2010,GrantBourkedisposedof200,000shares.(iv) On 26 August 2009, a related party of Don Meij disposed of 200,000 shares. On 23 February 2010, a related party of Don Meij disposed of 166,578 shares.(v) On 26 August 2009, Richard Coney acquired 35,000 shares on exercise of options. On 27 August 2009, 15,789 of these shares were sold. On 28 August 2009, 6,909 of the shares and on 31 August 2009, 12,302
of the shares were sold. (vi) On 10 November 2009, Allan Collins acquired 30,000 shares on exercise of options and on the same day he sold those shares.(vii) On 5 March 2010, John Harney acquired 30,000 shares on exercise of options and on the same day he sold those shares.(viii) On 12 November 2009, Kerri Hayman acquired 12,000 shares on exercise of options and on the same day she sold those shares. On 5 March 2010, Kerri Hayman acquired 5,000 shares on exercise of options
and on the same day she sold those shares.(ix) On 1 March 2010, Andrew Megson acquired 50,000 shares on exercise of options and on the same day he sold 24,000 shares.(x) On 23 November 2009, Andrew Rennie sold 225,000 shares. On 22 December 2009, a related party of Andrew Rennie sold 4,500 shares. On 23 February 2010, a related party of Andrew Rennie sold 300,000
shares. On 4 March 2010, a related party of Andrew Rennie sold 400,000 shares.(xi) On 12 November 2009, Craig Ryan acquired 30,000 shares on exercise of options and on the same day he sold those shares.(xii) Becameamemberofkeymanagementpersonnelon3July2006.Heresignedon12December2008.Closingbalanceaboverepresentsbalanceattermdate.

PAGE 115PAGE 114
DOMINO’S PIZZA ENTERPRISES LIMITED ANNUAL REPORT 2010 DOMINO’S PIZZA ENTERPRISES LIMITED ANNUAL REPORT 2010
35. RELATED PARTY TRANSACTIONS (CONTINUED)
Executive share options of Domino’s Pizza Enterprises Limited
BALANCE AT BEGIN-NING OF
FINANCIAL YEARNO.
GRANTED AS
COMPEN-SATION
NO.EXERCISED
NO.
NET OTHER
CHANGENO.
BALANCE AT THE END OF
FINANCIAL YEARNO.
BALANCE VESTED AT THE END OF
FINANCIAL YEARNO.
VESTED BUT NOT
EXERCISE-ABLENO.
VESTED AND
EXERCISE-ABLE NO.
OPTIONS VESTED DURING YEARNO.
2010
Don Meij 710,000 - - - 710,000 - - - -
Richard Coney (i) 270,000 - (35,000) - 235,000 - - - -
Kerri Hayman (ii) 166,000 - (17,000) - 149,000 - - - -
Andy Masood 40,000 - - - 40,000 - - - -
Andrew Megson (iii) 355,000 - (50,000) - 305,000 - - - -
Andrew Rennie 502,500 - - - 502,500 - - - -
Allan Collins (iv) 90,000 - (30,000) - 60,000 - - - -
John Harney (v) 70,000 - (30,000) - 40,000 - - - -
Craig Ryan (vi) 70,000 - (30,000) - 40,000 - - - -
Chris O'Dwyer 83,000 - - - 83,000 - - - -
PatrickMcMichael - - - - - - - - -
2009
Don Meij 900,000 500,000 (690,000) - 710,000 - - - 345,000
Richard Coney 70,000 235,000 (35,000) - 270,000 35,000 - 35,000 70,000
Kerri Hayman 160,000 24,000 (18,000) - 166,000 22,000 - 22,000 40,000
Andy Masood 30,000 40,000 (30,000) - 40,000 - - - 30,000
Andrew Megson 215,000 140,000 - - 355,000 50,000 - 50,000 50,000
Andrew Rennie 435,000 180,000 (112,500) - 502,500 112,500 - 112,500 112,500
Allan Collins 30,000 60,000 - - 90,000 - - - -
John Harney 30,000 40,000 - - 70,000 - - - -
Adam Pratt 105,000 - - (105,000) - - - - -
Craig Ryan 30,000 40,000 - - 70,000 - - - -
Chris O'Dwyer - 83,000 - - 83,000 - - - -
PatrickMcMichael - - - - - - - - -
(i) On 26 August 2009, Richard Coney acquired 35,000 shares on exercise of options. On 27 August 2009, 15,789 of these shares were sold. On 28 August 2009, 6,909 of the shares and on 31 August 2009, 12,302 of the shares were sold.
(ii) On 12 November 2009, Kerri Hayman acquired 12,000 shares on exercise of options and on the same day she sold those shares. On 5 March 2010, Kerri Hayman acquired 5,000 shares on exercise of options and on the same day she sold those shares.
(iii) On 1 March 2010, Andrew Megson acquired 50,000 shares on exercise of options and on the same day he sold 24,000 shares.(iv) On 10 November 2009, Allan Collins acquired 30,000 shares on exercise of options and on the same day he sold those shares. (v) On 5 March 2010, John Harney acquired 30,000 shares on exercise of options and on the same day he sold those shares.(vi) On 12 November 2009, Craig Ryan acquired 30,000 shares on exercise of options and on the same day he sold those shares.
Notes to the Financial Statements CONTINUED
Allexecutiveshareoptionsissuedtothedirectorsandkeymanagementpersonnel during the 2005, 2007, 2008 and 2009 financial years were made in accordance with the provisions of the ESOP. Each share option converts on exercise to one ordinary share of Domino’s Pizza Enterprises Limited. No amounts are paid or payable by the recipient on receipt of the option. The exercise price of each option issued in May 2005 is $2.20. The issue price of each option granted in December 2006, August 2007 and September 2007 is $3.88. The issue price of each option granted in December 2008, and April 2009 is $3.50.
On 18 July 2007, the Company amended the ESOP Rules by adopting aFrenchAddendum.Refertonote33Share-basedpaymentsfor further details.
On 30 April 2009, the Board resolved to grant an additional 1,500,000 options to senior management. Of this total, 842,000 options were granted tokeymanagementpersonnel.
On 3 December 2008, the Board resolved to grant an additional 500,000 options to the CEO.
Further details of the ESOP are contained in note 33 to the financial statements.
(iv) Other transactions with directors of the Consolidated entity
During the financial year, directors and their related parties purchased goods, which were domestic or trivial in nature, from the Company on the same terms and conditions available to employees and customers.
(v) Transactions with key management personnel of Domino’s Pizza Enterprises Limited
Duringthefinancialyear,keymanagementpersonnelandtheirrelatedpartiespurchased goods, which were domestic or trivial in nature, from the Company on the same terms and conditions available to employees and customers.
(vi) Transactions with other related parties
Other related parties include:• associates;• directorsofrelatedpartiesandtheirdirector-relatedentities;and• otherrelatedparties.
Where applicable, details of dividend and interest revenue from other related parties are disclosed in note 7 to the financial statements.
(vii) Transactions within the wholly-owned group
Thewholly-ownedgroupincludes:• theultimateparententityinthewholly-ownedgroup;• wholly-ownedcontrolledentities;and• otherentitiesinthewholly-ownedgroup.Thewholly-ownedAustralianentitieswithintheGrouparetaxedasasingleentity effectivefrom1July2003.Theentitiesinthetax-consolidatedgrouphave not entered into a tax sharing agreement or tax funding agreement. Income tax liabilities payable to the taxation authorities in respect of the tax-consolidatedgrouparerecognisedinthefinancialstatementsoftheparent entity. Refer to note 17 to the financial statements for members of the tax-consolidatedgroup.
TheCompanyprovidedaccounting,marketing,legalandadministrationservicestoentitiesinthewholly-ownedgroupduringthefinancialyear. TheCompanyalsopaidcostsonbehalfofentitiesinthewholly-ownedgroupandsubsequentlyon-chargedtheseamountstothem.
During the financial year, Domino’s Pizza New Zealand Limited provided management and franchisee services to the Company.
During the financial year, services were provided by:
• Domino’sPizzaEnterprisesLimitedtoDomino’sPizzaFranceS.A.S.andDomino’sPizzaNetherlandsB.V.;
• DPEUHoldingsS.A.S.toDomino’sPizzaFranceS.A.S.;
• Domino’sPizzaBelgiumS.P.R.L.toDomino’sPizzaFranceS.A.S.;and
• Domino’sPizzaNetherlandsB.V.toDomino’sPizzaFranceS.A.S.
in accordance with the Service Agreements and accordingly arm’s length fees were charged.
In the current financial year, current target returns were achieved by Domino’s Pizza France S.A.S. and Domino’s Pizza Netherlands B.V.. Accordingly, Domino’s Pizza Enterprises Limited charged both entities a DPI royalty.
Other transactions that occurred during the financial year between entities in thewholly-ownedgroupwere:• advancementofloans;• saleofplant&equipment;• administrationrecharges;• interestcharges;and• withholdingtaxpayments.
(viii) Parent entities
The parent entity and the ultimate parent entity in the Consolidated entity is Domino’s Pizza Enterprises Limited.

PAGE 117PAGE 116
DOMINO’S PIZZA ENTERPRISES LIMITED ANNUAL REPORT 2010 DOMINO’S PIZZA ENTERPRISES LIMITED ANNUAL REPORT 2010
36. ACQUISITION OF BUSINESSES
NAME OF BUSINESSES ACQUIREDPRINCIPAL ACTIVITY
DATE OF ACQUISITION
PROPORTION OF SHARES ACQUIRED
%
COST OF ACQUISITION
IN 2010 $’000
COST OF ACQUISITION
IN 2009 $’000
Acquisition of stores
During the year: Significant acquisitions Australia and New Zealand
2010
4 stores Pizza stores November 2009 - 1,067
3 stores Pizza stores November 2009 - 1,144
2 stores Pizza stores December 2009 - 1,162
2009
5 stores Pizza stores January 2009 - 1,776
5 stores Pizza stores April 2009 - 1,988
During the year: Significant acquisitions Europe
2010
1 store Pizza store September 2009 - 133
1 store Pizza store April 2010 - 913
2 stores Pizza stores May 2010 - 870
1 store Pizza store June 2010 - 300
2009
1 store Pizza store July 2008 - 897
1 store Pizza store May 2009 - 232
1 store Pizza store May 2009 - 332
Other acquisitions During the year:
2010
13 stores in aggregate Pizza stores July 2009 to June 2010 - 2,614
Pizzacompany-Belgium Pizza business January 2010 - 1,045
2009
12 stores in aggregate Pizza stores July 2008 to April 2009 - 2,963
1 store Pizza store August 2008 - 338
Total store acquisitions during full year ended 9,248 8,526
Goodwill arising on acquisition in Europe is expected to be deductible for tax purposes.
Notes to the Financial Statements CONTINUED
The cost of acquisitions comprise cash for all of the acquisitions. In each acquisition, the Consolidated entity has paid a premium for the acquiree as it believes the acquisitions will introduce additional synergies to its existing operations.
Acquisition of stores
Book Value Fair Value Adjustment Fair Value on Acquisition
2010$’000
2009$’000
2010$’000
2009$’000
2010$’000
2009$’000Net assets acquired
Current assets
Cash and cash equivalents 7 5 - - 7 5
Inventories 65 55 - - 65 55
72 60 - - 72 60
Non-current assets
Plant & equipment 3,333 3,690 - - 3,333 3,690
Other intangible assets 562 - - - 562 -
3,895 3,690 - - 3,895 3,690
Net assets 3,967 3,750 - - 3,967 3,750
Goodwill on acquisition 5,281 4,850
9,248 8,600
Goodwill arose in the business combination as the consideration paid included a premium. In addition, the consideration paid for the stores effectively included amountsinrelationtobenefitsfromexpectedsynergies,revenuegrowthandfuturemarketdevelopment.Thesebenefitsarenotrecognisedseparatelyfromgoodwill as the future economic benefits arising from them cannot be reliably measured.
37. CASH AND CASH EQUIVALENTSForthepurposeofthestatementofcashflows,cashandcashequivalentsincludescashonhandandinbanksnetofoutstandingbankoverdrafts.Cashandcash equivalents at the end of the reporting period as shown in the statement of cash flows can be reconciled to the related items in the statement of financial position as follows:
2010$’000
2009$’000
Cash and cash equivalents 16,241 17,426
16,241 17,426

PAGE 119PAGE 118
DOMINO’S PIZZA ENTERPRISES LIMITED ANNUAL REPORT 2010 DOMINO’S PIZZA ENTERPRISES LIMITED ANNUAL REPORT 2010
37.1 RECONCILIATION OF PROFIT FOR THE PERIOD TO NET CASH FLOWS FROM OPERATING ACTIVITIES
2010$’000
2009$’000
Profit for the year 17,814 15,353
(Gain)/lossonsaleordisposalofnon-currentassets (2,112) (629)
Equitysettledshare-basedpayments 444 167
Depreciation and amortisation 8,004 6,449
Impairmentofnon-currentassets - 200
Fair value gain on cash flow hedge - 133
Other 180 91
24,330 21,764
Movement in working capital
(Increase)/decrease in assets:
Trade and other receivables (828) 888
Inventories (286) 13
Other current assets (1,986) 3,431
Increase/(decrease) in liabilities:
Trade and other payables 1,430 (2,625)
Provisions 356 (235)
Increase/(decrease)intaxliability 1,479 1,028
Increase/(decrease)indeferredtaxbalances (743) 896
Net cash generated from operating activities 23,752 25,160
37.2 BUSINESSES ACQUIRED
Acquisition of stores
During the financial year, 28 businesses were acquired in Australia, New Zealand and Europe (2009: 26 businesses). For details of other acquisitions made, see note 36 to the financial statements.
The net cash outflow on acquisition in the financial statements was $9,176 thousand (2009: $8,466 thousand).
37.3 NON-CASH FINANCING AND INVESTING ACTIVITIES
During the current financial year, the Consolidated entity acquired $11 thousand (2009: $31 thousand) of equipment under a finance lease. This acquisition will be reflected in the cash flow statement over the term of the finance lease via lease repayments.
Notes to the Financial Statements CONTINUED
38. OPERATING LEASE ARRANGEMENTS
38.1 LEASING ARRANGEMENTS
Operating leases relate to both property leases with lease terms of between five and ten years, the majority of which have an option to renew for a further five-yearperiod,andmotorvehicleswithleasetermsofthreeyears.Allstorerelatedoperatingleasecontractscontainmarketreviewclausesintheeventthat the Consolidated entity exercises its options to renew. The Consolidated entity does not have an option to purchase the leased asset at the expiry of the lease period.
38.1.1 NON-CANCELLABLE OPERATING LEASE COMMITMENTS
2010$’000
2009$’000
Not longer than 1 year 12,235 7,974
Longer than 1 year and not longer than 5 years 24,963 16,290
Longer than 5 years 5,319 949
42,517 25,213
In respect of non-cancellable operating leases the following liabilities have been recognised:
2010$’000
2009$’000
Current
Makegood(note25) 25 25
Non-current
Straight line leasing (note 25) 299 213
324 238
39. COMMITMENTS FOR EXPENDITURE
39.1 CAPITAL EXPENDITURE COMMITMENTS
There were no capital expenditure commitments made by the Consolidated entity (2009: nil) during the financial year.
39.2 LEASE COMMITMENTS
Financeleaseliabilitiesandnon-cancellableoperatingleasecommitmentsaredisclosedinnote27and38tothefinancialstatements.
40. CONTINGENT LIABILITIES AND CONTINGENT ASSETS
40.1 CONTINGENT LIABILITIES
2010$’000
2009$’000
Guarantees
Guarantees are provided to third party financial institutions in relation to franchisee loans. The amount disclosed as a contingent liability represents the amounts guaranteed in respect of franchisees that would not, without the guarantee, have been granted the loans. The directors believe that if the guarantees are ever called on, the Group will be able to recover the amounts paid upon disposal of the stores. 20,881 25,718

PAGE 121PAGE 120
DOMINO’S PIZZA ENTERPRISES LIMITED ANNUAL REPORT 2010 DOMINO’S PIZZA ENTERPRISES LIMITED ANNUAL REPORT 2010
41. REMUNERATION OF AUDITORS
2010$’000
2009$’000
41.1 Auditor of the parent entity
Audit or review of the consolidated financial statements 190,000 190,000
Taxation services 10,342 10,000
200,342 200,000
41.2 Other audits
Audit of the financial statements:
-France 100,965 168,580
-TheNetherlands 63,846 57,913
Taxation services 22,269 -
187,080 226,493
The auditor of Domino’s Pizza Enterprises Limited is Deloitte Touche Tohmatsu.
42. EVENTS AFTER THE REPORTING PERIODOn 18 August 2010, the directors declared a final dividend for the financial year ended 4 July 2010 as set out in note 31.
Other than the matters discussed above, there has not arisen in the interval between the end of the financial year and the date of this report any item, transactionoreventofamaterialandunusualnaturelikely,intheopinionofthedirectorsoftheCompany,toaffectsignificantlytheoperationsoftheConsolidated entity, the results of those operations, or the state of affairs of the Consolidated entity, in future financial years.
43. PARENT ENTITY INFORMATION
43.1 Financial position
2010$’000
2009$’000
Assets
Current assets 21,516 22,266
Non-currentassets 103,522 102,037
Total assets 125,038 124,303
Liabilities
Current liabilities 16,631 16,208
Non-currentliabiliites 15,386 22,785
Total liabilities 32,017 38,993
Equity
Issued capital 64,243 63,411
Retained earnings 27,844 21,588
Reserves
Equitysettledshare-basedbenefits 1,356 912
Hedging (422) (601)
Total equity 93,021 85,310
Notes to the Financial Statements CONTINUED
43.2 Financial performance
2010$’000
2009$’000
Profit for the year 15,775 9,883
Other comprehensive income 623 (842)
Total comprehensive income 16,398 9,041
43.3 Contingent liabilities of the parent entity
2010$’000
2009$’000
Guarantees
Guarantees are provided to third party financial institutions in relation to franchisee loans. The amount disclosed as a contingent liability represents the amounts guaranteed in respect of franchisees that would not, without the guarantee, have been granted the loans. The directors believe that if the guarantees are ever called on, the Company will be able to recover the amounts paid upon disposal of the stores. 17,748 21,489
44. APPROVAL OF FINANCIAL STATEMENTSThe financial statements were approved by the Board of directors and authorised for issue on 15 September 2010.

PAGE 123PAGE 122
DOMINO’S PIZZA ENTERPRISES LIMITED ANNUAL REPORT 2010 DOMINO’S PIZZA ENTERPRISES LIMITED ANNUAL REPORT 2010
NUMBER OF HOLDERS OF EQUITY SECURITIES
Ordinary share capital
• 68,407,674fullypaidordinarysharesareheldby1,561individualshareholders.• Allissuedordinarysharescarryonevotepershare,howeverpartlypaidsharesdonotcarrytherightstodividends.
Options
• 2,840,000optionsareheldby21individualoptionholders.Options do not carry a right to vote.
Distribution of holders of equity securities
FULLY PAID ORDINARY SHARES
PARTLY PAID ORDINARY SHARES
CONVERTING CUMULATIVE PREFERENCE
SHARES
REDEEMABLE PREFERENCE
SHARES
CONVERTING NON-
PARTICIPAT-ING
PREFERENCE SHARES
CONVERTIBLE NOTES OPTIONS
1-1,000 738 - - - - - -
1,001-5,000 604 - - - - - -
5,001-10,000 106 - - - - - -
10,001-100,000 85 - - - - - 15
100,001 and over 28 - - - - - 6
1,561 - - - - - 21
Holdinglessthanamarketableparcel 101 - - - - - -
Substantial shareholders
ORDINARY SHAREHOLDERS NUMBER PERCENTAGE NUMBER PERCENTAGE
Somad Holdings Pty Ltd 16,683,217 24.39% - -
FMR Corp and Fil 9,506,413 13.90% - -
Capital Group Companies Inc. 4,498,000 6.58% - -
Acorn Capital Limited 4,316,944 6.31%
Advanced Asset Management Limited, BT Funds Management No.2 Limited and BT Investment Management (RE) Limited, associated companies byvirtueofbeingsubsidiariesofWestpacBankingCorporation
4,175,605 6.10% - -
39,180,179 57.27% - -
Additional Stock Exchange Information AS AT 30 AUGUST 2010
Twenty largest holders of quoted equity securities
FULLY PAID PARTLY PAID
ORDINARY SHAREHOLDERS NUMBER PERCENTAGE NUMBER PERCENTAGE
Somad Holdings Pty Ltd 18,505,495 27.05% - -
HSBC Custody Nominees (Australia) Limited 15,235,359 22.27% - -
JP Morgan Nominees Australia Limited 7,724,418 11.29% - -
National Nominees Limited 7,161,830 10.47% - -
Citicorp Nominees Pty Limited 3,932,134 5.75% - -
Don Meij and Esme Meij (Meij Family Account) 1,837,061 2.69% - -
Cogent Nominees Pty Ltd 1,586,934 2.32% - -
RBC Dexia Investor Services Australia Nominees Pty Ltd (Pipooled Account) 953,056 1.39% - -
GrantBourke 697,001 1.02% - -
GrantBourke&SandyBourke 660,031 0.96% - -
Cogent Nominees Pty Ltd 632,741 0.92% - -
Success Pizzas Pty Ltd 602,264 0.88% - -
Pizza People Enterprises Pty Ltd 472,939 0.69% - -
Somad Holdings Pty Ltd 429,227 0.63% - -
CiticorpNomineesPtyLtd(CWLTHBankoffSuperAccount) 414,386 0.61% - -
QueenslandInvestmentCorporationc/-NationalNomineesLimited 356,477 0.52% - -
Don Meij 345,000 0.50% - -
Don Meij 345,000 0.50% - -
ClydeBankHoldings(Aust)PtyLtd(CaveUnitAccount) 332,000 0.49% - -
ANZ Nominees Limited (Cash Income Account) 263,198 0.38% - -
62,486,551 91.34% - -
Company secretary
Mr C.A. Ryan
Registered office8th Floor, TAB Building 240 Sandgate Road Albion Brisbane Queensland 4010Tel: +61 (0)7 3633 3333
Principal administration office
8th Floor, TAB Building 240 Sandgate Road Albion Brisbane Queensland 4010Tel: +61 (0)7 3633 3333
Share registryEffective from 29 June 2009 to 22 February 2010:Computershare Investor Services Pty LimitedGPO Box 523Brisbane QLD 4001Tel: 1300 55 22 70 (within Australia)Tel: + 61 (0) 3 9415 4000 (outside Australia)
Effective from 22 February 2010:LinkMarketServicesLimitedLevel 15, Queen StreetBrisbane QLD 4000Tel: 1300 554 474 (within Australia)Tel: +61 (0) 2 8280 7111 (outside Australia)

PAGE 125PAGE 124
DOMINO’S PIZZA ENTERPRISES LIMITED ANNUAL REPORT 2010 DOMINO’S PIZZA ENTERPRISES LIMITED ANNUAL REPORT 2010
Glossary Corporate Directory
DIRECTORS
Ross Adler Non-Executive Chairman
RosshasheldnumerousDirectorshipsincludingNon-ExecutiveDirectoroftheCommonwealthBankofAustraliafrom1991to2004andDirectorofTelstrafrom1995 to 2001. His other appointments include Chief Executive Officer of Santos Limited from 1984 to 2000 and Chairman of AUSTRADE from 2001 to 2006. Ross is currently Executive Chairman of Amtrade International Pty Ltd and holds a Bachelor of Commerce from Melbourne University as well as an MBA from Columbia University.
Barry Alty Non-Executive Director
Barryhasover45years’experienceintheretailindustry.Hehasworkedwith a number of leading retailers including Woolworths and Foodland. His senior management roles include Managing Director for Foodland in 1994 and General Manager for Queensland Independent Wholesalers in 1987. Barry has also held various other industry consulting appointments in Queensland and Papua New Guinea.
Grant Bourke Non-Executive Director
Grant joined Domino’s Pizza in 1993 as a franchisee and in 2001 sold his eight stores to Domino’s Pizza. In 2001, Grant became a Director for Domino’s Pizza and from 2001 to 2004 he managed the Company’s Corporate Store Operations. In July 2006, Grant was appointed Managing Director, Europe. Grant has been aNon-ExecutiveDirectorsinceSeptember2007.GrantholdsaBachelorofScience (Food Technology) from the University of NSW and an MBA from The University of Newcastle.
Paul Cave Non-Executive Director
Paul is the Chairman and Founder of BridgeClimb, which he started in 1998. Paul and the BridgeClimb business have been highly recognised by the tourism and business community in Australia. Made a Member of the Order of Australia, in the Queen’s Birthday Honours 2010, for his services to the tourism industry. Awarded the National Entrepreneur of the Year (Business Award) in 2001, and theAustralianExportHeroesAwardin2002-03.WorkedinmarketingandgeneralmanagementrolesforB&DRoll-A-DoorandalsofoundedtheAmberGroup in 1974, which he sold in 1996. Director of Chris O’Brien Lifehouse at RPA, andfoundingDirectorofInterRiskAustraliaPtyLtd.BachelorofCommercefromthe University of NSW.
Don Meij Chief Executive Officer / Managing Director
Don started as a delivery driver in 1987 and held various management positions withSilvio’sDial-a-PizzaandDomino’sPizzauntil1996.DonthenbecameaDomino’s Pizza franchisee, owning and operating 17 stores before selling them to Domino’s Pizza in 2001. At that time, Don became Chief Operating Officer and ChiefExecutiveOfficer/ManagingDirectorin2002.DonwasErnst&Young’sAustralian Young Entrepreneur of the Year in 2004.
COMPANY SECRETARYCraig Ryan, BA, LLB, LLM, ACIS
REGISTERED OFFICEDomino’s Pizza Enterprises LimitedABN 16 010 489 326
Level 8, TAB Building, 240 Sandgate Road Albion QLD 4010 Ph 07 3633 3333 Fax 07 3633 3399 Email [email protected]
BUSINESS OFFICELevel 8, TAB Building 240 Sandgate Road Albion QLD 4010
AUDITORSDeloitte Touche Tohmatsu
Level 25, Riverside Centre 123 Eagle Street Brisbane QLD 4000
SOLICITORSDLA Phillips Fox
Waterfront Place, 1 Eagle Street Brisbane QLD 4000
DibbsBarker
Level 14, 120 Edward Street Brisbane QLD 4001
BANKERSWestpac Banking Corporation
260 Queen Street Brisbane QLD 4000
SHARE REGISTRYLink Market Services Limited
Level 15, 324 Queen Street Brisbane QLD 4000
STOCK EXCHANGEDomino’s Pizza Enterprises Limited shares are listed on the Australian Securities Exchange
ASX CODE DMP
WEBSITE ADDRESSdominos.com.au
ASIC means the Australian Securities & Investments Commission.
ASX means Australian Securities Exchange Limited (ABN 98 008 624 691).
Australian Store NetworkmeansthenetworkofCorporateStoresandFranchised Stores located in Australia.
Board or Board of Directors or Directors means the Board of Directors of the Company.
CAGR Compound Annual Growth Rate.
Capital Reduction means the selective reduction of capital described in Section 11.4 of the prospectus.
Company means Domino’s Pizza Enterprises Limited (ACN 010 489 326).
Corporate Store means a Domino’s Pizza store owned and operated by the Company.
Corporate Store Network meansthenetworkofCorporateStores.
Corporations Act means the Corporations Act 2001 (Clth).
Directors means the Directors of the Company from time to time.
Director and Executive Share and Option Plan or ESOP means the Domino’s Pizza Director and Executive Share and Option Plan summarised in note 33 to the Financial Statements.
Domino’smeanstheDomino’sPizzabrandandnetwork,ownedby Domino’s Pizza, Inc.
Domino’s Pizza means the Company and each of its subsidiaries.
Domino’s Pizza Stores means Corporate Stores and Franchised Stores.
Earnings Per Share or EPS means NPAT divided by the total number of Shares on issue.
EBIT means earnings before interest expense and tax.
EBITA means earnings before interest expense, tax and amortisation.
EBITDA means earnings before interest expense, tax, depreciation and amortisation.
Existing Store Sales Growth means sales growth of stores that have been tradingfor54weeksormore.
European Same Store Sales Growth means comparable growth in sales across those European stores that were in operation at least 12 months prior to the date of the reported period.
Franchised Store means a pizza store owned and operated by a Franchisee andFranchiseNetworkmeansthenetworkofFranchisedStores.
Franchisees means persons and entities who hold a franchise from the Companytooperateapizzastoreunderthetermsofasub-franchiseagreement.
Listing Rules means the Listing Rules of the ASX.
Network or Domino’s Pizza Network or Network Stores meansthenetworkofCorporate Stores and Franchised Stores.
Network SalesmeansthetotalsalesgeneratedbytheNetwork.
New Zealand NetworkmeansthenetworkofCorporateStoresandFranchised Stores located in New Zealand.
NPAT means net profit after tax.
Related Bodies Corporate has the meaning given to it by section 50 of the Corporations Act.
Registry means Computershare Investor Services Pty Limited.
Same Store Sales Growth means comparable growth in sales across those stores that were in operation at least 12 months prior to the date of the reported period.
Share means any fully paid ordinary share in the capital of the Company.

ALL OF THESE QUALITIES ARE PART OF WHO WE ARE, BUT NOT ONE OF THEM CAN EVEN BEGIN TO PORTRAY THE HEART & SOUL OF OUR COMPANY. THE ONLY WORD THAT DOES…DOMINO’S.

dominos.com.audominospizza.co.nzdominospizza.bedominos.nldominos.fr