FY2021 Earnings Presentation - Vedanta Resources
42
FY2021 Earnings Presentation VEDANTA RESOURCES LIMITED 18 June 2021
-
Upload
khangminh22 -
Category
Documents
-
view
3 -
download
0
Transcript of FY2021 Earnings Presentation - Vedanta Resources

FY2021 Earnings Presentation
VEDANTA RESOURCES LIMITED
18 June 2021

Sensitivity: Internal (C3)
VEDANTA RESOURCES LIMITED – FY2021 INVESTOR PRESENTATION 2
Cautionary Statement and Disclaimer
The views expressed here may contain information derived from
publicly available sources that have not been independently verified.
No representation or warranty is made as to the accuracy,
completeness, reasonableness or reliability of this information. Any
forward looking information in this presentation including, without
limitation, any tables, charts and/or graphs, has been prepared on
the basis of a number of assumptions which may prove to be
incorrect. This presentation should not be relied upon as a
recommendation or forecast by Vedanta Resources plc and Vedanta
Limited and any of their subsidiaries. Past performance of Vedanta
Resources plc and Vedanta Limited and any of their subsidiaries
cannot be relied upon as a guide to future performance.
This presentation contains 'forward-looking statements' – that is,
statements related to future, not past, events. In this context,
forward-looking statements often address our expected future
business and financial performance, and often contain words such
as 'expects,' 'anticipates,' 'intends,' 'plans,' 'believes,' 'seeks,' or
'will.' Forward–looking statements by their nature address matters
that are, to different degrees, uncertain. For us, uncertainties arise
from the behaviour of financial and metals markets including the
London Metal Exchange, fluctuations in interest and or exchange
rates and metal prices; from future integration of acquired
businesses; and from numerous other matters of national, regional
and global scale, including those of a environmental, climatic,
natural, political, economic, business, competitive or regulatory
nature. These uncertainties may cause our actual future results to
be materially different that those expressed in our forward-looking
statements. We do not undertake to update our forward-looking
statements. We caution you that reliance on any forward-looking
statement involves risk and uncertainties, and that, although we
believe that the assumption on which our forward-looking
statements are based are reasonable, any of those assumptions
could prove to be inaccurate and, as a result, the forward-looking
statement based on those assumptions could be materially
incorrect.
This presentation is not intended, and does not, constitute or form
part of any offer, invitation or the solicitation of an offer to
purchase, otherwise acquire, subscribe for, sell or otherwise dispose
of, any securities in Vedanta Resources plc and Vedanta Limited and
any of their subsidiaries or undertakings or any other invitation or
inducement to engage in investment activities, nor shall this
presentation (or any part of it) nor the fact of its distribution form
the basis of, or be relied on in connection with, any contract or
investment decision.

Sensitivity: Internal (C3)
VEDANTA RESOURCES LIMITED – FY2021 INVESTOR PRESENTATION 3
Contents
Section Presenter Page
FY21 Review & Business Update Sunil Duggal, CEO
Financial Update Ajay Goel, Deputy CFO
Appendix

Sensitivity: Internal (C3)
FY2021 Reviewand Business UpdateSunil DuggalGroup CEO & Chief Safety Officer

Sensitivity: Internal (C3)
VEDANTA RESOURCES LIMITED – FY2021 INVESTOR PRESENTATION
Ideally Positioned with Attractive Commodity Mix
2021 2030 CAGR World CAGR
GDP
(real terms)$2.8trn $4.8trn
GDP per
capita
(real terms)$7.8k $12.5k
Population 1.4bn 1.5bn
5.4%
6.3%
0.8%
3.1%
2.2%
0.9%
4.3%
4.6%
2.4%
11.6%
5.2%
4.3%
Zinc
Aluminium
O&G
Copper
Lead
Iron ore
India demand CAGR 2020–20302
1.3%
2.4%
0.1%
2.3%
1.9%
(0.0%)
Global demand CAGR 2020–20302
Account for
over 85% of
FY2021
EBITDA
Vedanta has unparalleled exposure to India, the world’s fastest growing major economy with excellent diversified exposure
Supportive Government Policies :
▪ Government focus on domestic commodity production
▪ National Infrastructure Pipeline: impetus to infrastructure
▪ Coal sector opened-up for commercial mining
▪ National Mineral policy (NMP). Hydrocarbon Exploration and
Licensing Policy (HELP)
▪ Taxation Laws (Amendment) Act’19 : favorable tax regime
▪ Insolvency and Bankruptcy code: Improved recovery rate of
stressed assets
5
Sensitivity: Internal (C3)
VEDANTA RESOURCES LIMITED – FY2021 INVESTOR PRESENTATION
COVID-19 Response: Supporting Communities, Employees & Partners
Vedanta Cares 1,000 bed initiative in 10 locations across India will add 10 ventilator-equipped beds, 90 oxygen-support beds in each location.
Helping Community
▪ Aluminium, Cairn, HZL have
added almost 1000 additional
beds in existing hospitals.
▪ Tuticorin oxygen plant re-started
for 4 months to produce oxygen
(Capacity: 1,050 tonnes per day)
▪ HZL has also set up oxygen
bottling plant to produce 500
cylinders per day
▪ HZL, ESL and Iron Ore businesses
have provided 121 MT of oxygen
and critical equipment's to
hospitals in Rajasthan,
Jharkhand & Goa
5x of gross salary insurance cover for employees to relieve anxiety and pressure
A series of health webinars & awareness programmes for employees & community alertness
Making arrangements for 5 lakh vaccines for employees, partners and their families and local communities, when available
Dedicated COVID Task force ensuring oxygen Procurement and bed facilities for employees
Global Standards to Manage Health & Hygiene at Workplace; 24*7 health helpline for employees and their family members;
6

Sensitivity: Internal (C3)
VEDANTA RESOURCES LIMITED – FY2021 INVESTOR PRESENTATION 7
Key Highlights: FY 2021
Production Cost of Production R&R
Records
At Zinc India, Aluminium & Zinc International
Lower
Across all the businesses
Advancing
Enhancing life and R&R base
Reliability Technology & Digitalization COVID-19
Improved
No major operational disruptions
On Track
Enabled operational excellence and growth
Highest safety standards
Ensuring well-being of employees /partners
Contribution to Society

Sensitivity: Internal (C3)
VEDANTA RESOURCES LIMITED – FY2021 INVESTOR PRESENTATION
Delivering Strong Operational Performance in Challenging times
translating into record performance in FY 2021
Strong operational recovery
Record Production:
▪ Ever highest Aluminium production of 1,969kt, with 2.1 Mtpa run rate achieved in Q4. On journey towards achieving potential of 2.3-2.4 Mtpa
▪ Zinc India: Ever highest Mined Metal production in Zinc India of 972kt
▪ Record Silver production of 706 tonnes
▪ Zinc International: Record Gamsberg production of 145kt, up 34%
Proven cost leadership:
▪ Lowest Aluminium COP in last 7 years at $ 1,347/t, down 20%
▪ Zinc India: Lowest COP at $954/t since UG transition, down 9%
▪ Zinc International: Gamsberg COP at $1,288/t, down 11%
Strong price recovery: commodity prices rallied surpassing pre-covid levels
Strong EBITDA $3800mn, up 27% yoy. Robust EBITDA margin* of 37%
Zinc India GamsbergAluminium
1,904 1,969
1,6901,347
FY20 FY21Aluminium (kt) COP ($/t)
870 930
1,047954
FY20 FY21Metal (kt) COP ($/t)
108 145
1,445
1,288
FY20 FY21MIC Production (kt) COP $/t
8* Excludes custom smelting at Copper India and Zinc-India operations.

Sensitivity: Internal (C3)
VEDANTA RESOURCES LIMITED – FY2021 INVESTOR PRESENTATION 9
Heading Towards – Zero Harm, Zero Waste, Zero Discharge
0.40 0.350.46
0.660.57
FY17 FY18 FY19 FY20 FY21
1714 15
1814 13 13
17
F718 FY19 FY20 FY21
Generation Recycled
242 243 250 270
71 67 71 83
FY18 FY19 FY20 FY21
Consumed Recycled
57
97
8
FY17 FY18 FY19 FY20 FY21
Water Consumed & Recycled (mil m3) LTIFRFatality
Waste Recycling (mMT)(High Volume Low Toxicity)
Safety Program Update
Focus on Learning and Improvement
▪ Comprehensive focus on HSE at CEO and Group ExCo Level; Consequence Management program set up
▪ New Vedanta-wide Fatality Investigation Procedure
▪ Working groups focusing on critical risks – vehicles & driving, LOTO & PTW etc.
▪ Theme based learning of safety incidents
Training
▪ ICAM training for improving investigation quality
▪ Cross business safety audit training conducted across businesses
▪ Comprehensive CHESS module launched
Business partner management▪ Standardization of business partner safety management system across Vedanta
▪ MIP & categorization of BP

Sensitivity: Internal (C3)
VEDANTA RESOURCES LIMITED – FY2021 INVESTOR PRESENTATION
On track to Achieve Vedanta’s Vision
ESG is core to everything we do
10
Achievements in FY 2021
Environment
Social
Governance
▪ Water Savings of 2.03 mm3
▪ 1.86 million GJ Energy Savings
▪ Reduced GHG emissions by 13.0 million tonnes
▪ 93.7 % of total waste utilized of the total waste generated (16.84 MT out of 17.97 MT)
▪ Contributed $ 4.7bn to Exchequer in FY21
▪ Touching the lives of 42 million people through our various CSR programs
▪ Social Investment of $45 million
▪ 1000 Nand Ghars* constructed in FY21 (total 2300+ till 31st Mar 2021)
▪ Direct and indirect employment of 70,000+
▪ 25% diversity in Vedanta Limited’s Board and Group Management Committee
▪ Highest level of values and transparency; Strict adherence of code of conduct
▪ Board Sustainability Committee in place
▪ Executive Committee in place
▪ Zero discharge across all our sites
▪ 20% reduction in GHG emission intensity by 2025 from a 2012 baseline
▪ Review of site biodiversity risk across all locations
▪ Social Investment: no less than 2% of PAT
▪ Skilling to improve employability of 60,000 youth by 2025
▪ 4,000 Nand Ghars to be constructed by 2022
▪ Achieve 33% female representation at Vedanta across all key decision-making bodies
▪ Ensuring right Management in Place with defined deliverables in terms of Volume, Cost & EBITDA and succession for each business
* women and children care center

Sensitivity: Internal (C3)
VEDANTA RESOURCES LIMITED – FY2021 INVESTOR PRESENTATION
Climate Change Roadmap
Increase Renewable Energy Deployment
Align with Science Based Targets
Bridge gap by sequestration & carbon credits use
Annual TCFD Climate Change Report
FY2021 Milestones
Building Blocks to achieve Net-Zero Carbon Emissions
11
▪ 13.6 million tons of avoided GHG emissions since 2012
▪ Carbon KPIs part of ESOP structure
▪ Signed “Private Sector Commitment on Climate Change
▪ Release of 1st TCFD report; first in M&M space in India
Avoid
Minimize
Offset
Disclose

Sensitivity: Internal (C3)
VEDANTA RESOURCES LIMITED – FY2021 INVESTOR PRESENTATION
Aluminium: Success Continues; Growing Value in Dynamic World
Aluminium Production & COP
Alumina Production & COP
12
957 941 1,028
1,904 1,969
1,5711,278
1,411 1,6901,347
H2 FY20 H1 FY21 H2 FY21 FY20 FY21
955 938 903
1,811 1,841
263 222 248 275 235
H2 FY20 H1 FY21 H2 FY21 FY20 FY21
Production (kt) COP ($/T)
Performance Update
Half Year Performance:
▪ Highest ever Aluminium production 1,028 kt*, up 7% y-o-y
▪ Aluminium COP $ 1,411/t, down 10% y-o-y
▪ Lanjigarh production 903 kt, down 5% y-o-y
▪ Lanjigarh COP at $ 248/t, down 6% y-o-y
Full Year Performance:
▪ Highest ever Aluminium production 1,969 kt*, up 3%
▪ Lowest Aluminium COP in last 7 years at $ 1,347/t, down 20%
▪ Highest ever Alumina production 1,841 kt, up 2%
▪ Alumina COP at $ 235/t, down 15%
▪ Jamkhani and Radhikapur (West) Coal Block: Coal Mine
Development and Production Agreement signed with Govt. of
India
*Including trial run

Sensitivity: Internal (C3)
VEDANTA RESOURCES LIMITED – FY2021 INVESTOR PRESENTATION
Alumina: Expanding Lanjigarh on path to Vertical Integration
13
2
5
Present Target
Cap
acit
y (M
tpa)
Finest Technical
Team
With demonstrated
globally leading
benchmarks in
Refinery technical
parameters
Strong Foundation for Expansion
Outsourcing
Global Project
partners
Worley (Design),
L&T (Construction)
Mix of global & local bauxite
supplies
Odisha, home to India’s
finest bauxite reserves
Strategic partnership with
global bauxite suppliers
Grow Into Among One Of The Largest Single-location Alumina Refineries In The World
Expected Project Completion by Q1 FY2023

Sensitivity: Internal (C3)
VEDANTA RESOURCES LIMITED – FY2021 INVESTOR PRESENTATION
Zinc India: A Year Full of the Achievements
14*World Silver Survey 2021
481
724
936 917972
426223
FY17 FY18 FY19 FY20 FY21
Min
ed M
etal
in
kt
OC UG
Sustained production post-transition to fully UG mining company
453
558
679610
706
FY17 FY18 FY19 FY20 FY21
12% CAGR
19% UG CAGR
Performance Update
▪ Highest ever Ore production of 15.5 million MT
▪ Highest ever Mined Metal Delivered of 972kt, up 6%
primarily on account of higher ore production with
overall grades
▪ Highest ever Metal production since underground
transition of 930kt, up 7%
▪ Lowest ever Zinc COP excluding royalty since
underground transition at $954/t, lower by 9%
▪ Rampura Agucha is the largest# underground mine
globally
▪ Highest ever Silver metal production at 706 tonnes, up
16%
▪ Increasing share of Silver EBITDA contribution in portfolio
to 1/3rd
6th Largest Silver Producer Globally*
# Source: Wood Mackenzie

Sensitivity: Internal (C3)
VEDANTA RESOURCES LIMITED – FY2021 INVESTOR PRESENTATION
Zinc India: Strategy in Practice for Executing Growth Imperatives
Transition to a Circular Economy
▪ Focus on technology and
innovation to
▪ Reduce
▪ Reuse
▪ Recycle waste
15
Strengthen Cost Leadership
▪ Digitalization
▪ Autonomous vehicles
▪ Ancillary plants
▪ Power optimization
Portfolio of Mines with Long Life
▪ Upgrading R&R through world class technologies
▪ Implemented high-dimensional analysis of ore-bodies at all mines
▪ Maintain a digital core library for elemental analysis, alteration zones & structural data
Lowest quartile in the cumulative cost curve
Source: WoodMackenzie
Ramping up R&R(total R&R MN MT) Sustainability Goals 2025
0.5 mn tCO2eLesser GHG than 2017
5xWater positive
3xIncrease in gainful utilization of waste
100%Responsible sourcing
146
313403
448550
FY04 FY11 FY20 FY21 Targeted

Sensitivity: Internal (C3)
VEDANTA RESOURCES LIMITED – FY2021 INVESTOR PRESENTATION
Zinc International: Gamsberg Positioning for Long Term Value Creation
Continued Performance Ramp Up
16
Performance Update
Half Year Performance:
▪ Production at 84kt, up 40% from 60kt in H1 of FY2021.
Best ever monthly production (17kt) achieved in Oct
of H2.
▪ Highest daily production achieved in March at ~700
tonnes.
▪ Slightly higher H2 FY21 COP due to lower recoveries
and exchange rate appreciation.
▪ Mining at Gamsberg is commenced in early Jan 2021
after full risk assessment and DMRE approval
Full Year Performance:
▪ Continued production ramp up to 145kt vs 108kt, up
34%
▪ COP at $1,288/t vs $1,445/t, down 11% through better
recoveries and consumables cost efficiencies.
Consistent Improvement in Milling Throughput (tph)
501
451465
507522
Design Q1 FY21 Q2 FY21 Q3 FY21 Q4 FY21
61 60 84 108 145
1,433
1,280
1,2931,445
1,288
700
900
1100
1300
1500
0
50
100
150
H2 FY20 H1 FY21 H2 FY21 FY20 FY21
MIC Production (kt) COP $/t

Sensitivity: Internal (C3)
VEDANTA RESOURCES LIMITED – FY2021 INVESTOR PRESENTATION
Zinc International: Gamsberg Ramp up Plan
Four Key Priorities Going Forward
Equipment Run-hours Improvement
Increase Equipment
working hours by 30%
Additional Resource to gear up Mining
Expedite on-boarding and integration of 2 additional business
partners
Recovery Ramp up
Improve recovery from ~75% to ~85%
Increase Mill Throughput
Increase Mill and Crusher throughput. Target ore treatment
of ~4.8 Mtpa
Mining Focused Concentrator Focused
145ktFY21
190-210ktFY22e
1 2 3 4
17

Sensitivity: Internal (C3)
VEDANTA RESOURCES LIMITED – FY2021 INVESTOR PRESENTATION
Oil & Gas: Stable Operations, Focus on Delivery of Growth Projects
Operations
▪ Production: flat 162 kboepd in H2 FY21 vs H1 FY21
▪ Opex: Operating cost at $ 8.3/boein H2 FY21 vs $7.0/boe in H1 FY21, increase primarily due to workover & maintenance activities
18
Growth Projects
▪ Gas Terminal: Ramp-up by ~15kboepd underway. Gas offtake impacted by Covid in Gujarat
▪ Aishwariya Barmer Hill: Facility commissioned; wells hook up in progress to increase volumes from ~8k to 11 kboepd
▪ MBA Infill & Polymer: Polymer injection ramped up to 3-5 kboepd
▪ Liquid Handling: Facility commissioned
Upcoming Growth Projects:
▪ Infill wells in Mangala, Bhaygam, RDG, ABH, NI and offshore fields
▪ Exploration wells in Rajasthan and offshore to augment resource base
OALP
▪ Drilling: 15 well exploration
drilling program commenced
across basins:
▪ Rajasthan: Drilling
preparation going on for
the next 2 wells.
▪ Assam: Drilling ongoing
(well FW-001)
▪ Cambay: Drilling ongoing
(well HCL-2)167 162 162
H2 FY20 H1 FY21 H2 FY21
Gross Production (kboepd)

Sensitivity: Internal (C3)
VEDANTA RESOURCES LIMITED – FY2021 INVESTOR PRESENTATION
Oil & Gas: Digitalisation & Partnering to Drive Efficiency & Recovery
Digitalization to improve asset reliability
Technology to accelerate recovery
Solution based Partner Approach
• Well interventions
• Process Controls
• Network optimization
• Predictive maintenance
• Cloud based
applications
• Polymer & Water
Management
• EOR ASP
• Advanced Reservoir
Characterization
• Global EOI for solution &
KPI driven Partnering
model
• Focus on Well Services,
Surface facilities, &
Chemical Management
19

VEDANTA RESOURCES LIMITED – FY2021 INVESTOR PRESENTATION
0.8 0.7
1.3
0.9
2.1
H2 FY 20 H1 FY 21 H2 FY 21 FY 20 FY 21
3.2
1.8 2.6
5.8
4.4
H2 FY 20 H1 FY 21 H2 FY 21 FY 20 FY 21
Sale
s(
Mn
t)
Strong Performance at Karnataka
44 65
141
38
105
H2 FY 20 H1 FY 21 H2 FY 21 FY 20 FY 21
Iron ore: Resilient Results in Extraordinary Times
20
Capitalised opportunity of increased Global
prices by increasing sales in Goa
Mn
t
Value Added Business
▪ Benefitted by domestic steel prices and
International coal prices
▪ Margin improvement through efficiency
enhancement project in our largest Blast
Furnace and better by-product credit
Margin ($/t)

Sensitivity: Internal (C3)
VEDANTA RESOURCES LIMITED – FY2021 INVESTOR PRESENTATION
ESL Steel: Continuing Improvement Journey
21
9067
121
7895
H2 FY20 H1 FY21 H2 FY21 FY20 FY21
Margin ($/t)
Performance Update
Half Year Performance:
▪ Robust margin of $121/t, up 81% compared to H1
▪ Saleable Production of 659kt, up 3% y-o-y and 25% vs H1
▪ Sales of 655kt, up 5% y-o-y and 14% vs. H1.
Full Year Performance:
▪ Saleable production of 1,187kt, down 4% due to covid lockdown
▪ Sales 1,231kt, up 4%
▪ Margin of $95/t, up 23% on account of favorable macro economic factors
Capacity Expansion Plan in Pipeline
▪ Doubling Hot Metal Capacity from 1.5 to 3 MTPA production
▪ New Horizontal Coke Oven with 0.5 MTPA capacity
▪ Installation of a new Pellet Plant of 2.2 MTPA capacity – Part of cost saving
▪ Capacity enhancement of existing DIP plant from present 0.22 to 0.4 MTPA.

Sensitivity: Internal (C3)
VEDANTA RESOURCES LIMITED – FY2021 INVESTOR PRESENTATION
FACOR: Complete Turnaround Performance
22
Delivering Stronger Growth and Margins
▪ Ore Production in H2 increased by 105% vs H1
▪ Reduced ore procurement from third party to ZERO
▪ Fe chrome production increased by 13% in H2 vs H1
▪ Cost of Production reduced by 11% in H2 vs H1
▪ EBITDA Margin improved significantly in H2 vs H1
48 43 56
99
55 115
492
297
H1 FY21 Q3 FY21 Q4 FY21 H2 FY21
Ore Production (kt) Margin ($/t)
FY22 Growth Plan
▪ Targeting to increase Furnace production by 10% by optimizing operation & better process control
▪ Production capacity enhancement to 100 ktpa of Ferro Chrome eq through debottlenecking of Chrome Ore Mines & Beneficiation Plant
▪ Productivity enhancement by 5% through installation of waste heat recovery plant

Finance Update Ajay Goel | Deputy Chief Financial Officer
FY2021

VEDANTA RESOURCES LIMITED – FY2021 INVESTOR PRESENTATION 24
Financial snapshot
EBITDA ROCE# EBTIDA Margin* Net Debt
$ 3.8bn c.19% 37% $ 10.7 bn
Up 27% y-o-y Improved double digit Industry leading margin*Excludes custom smelting at Copper India and Zinc-India operations.
# ROCE is calculated as EBIT net of tax outflow divided by average capital employed.
EBITDA Bridge
3,0033,527
3,800
151232 126 15 128
188 43
FY 20 LME / Brent/premiums
Input Commodity Inflation
Regulatory & Profit
Petroleum
Cost & MktgVolumeAdjusted EBITDA
Currency FY 21Others
Market & Regulatory$524mn
Operational$316mn
Aluminium 95
Zinc, Lead & Silver 170
Brent (230)
IOB and Steel 76
(In $mn)Zinc India 165
Iron Ore 35
Al 15
TSPL (34)
Cairn (70)
Cairn (228)
Al 68
Cu 18
Al 138
IOB 33
Cairn 17
VEDANTA RESOURCES LIMITED – FY2021 INVESTOR PRESENTATION
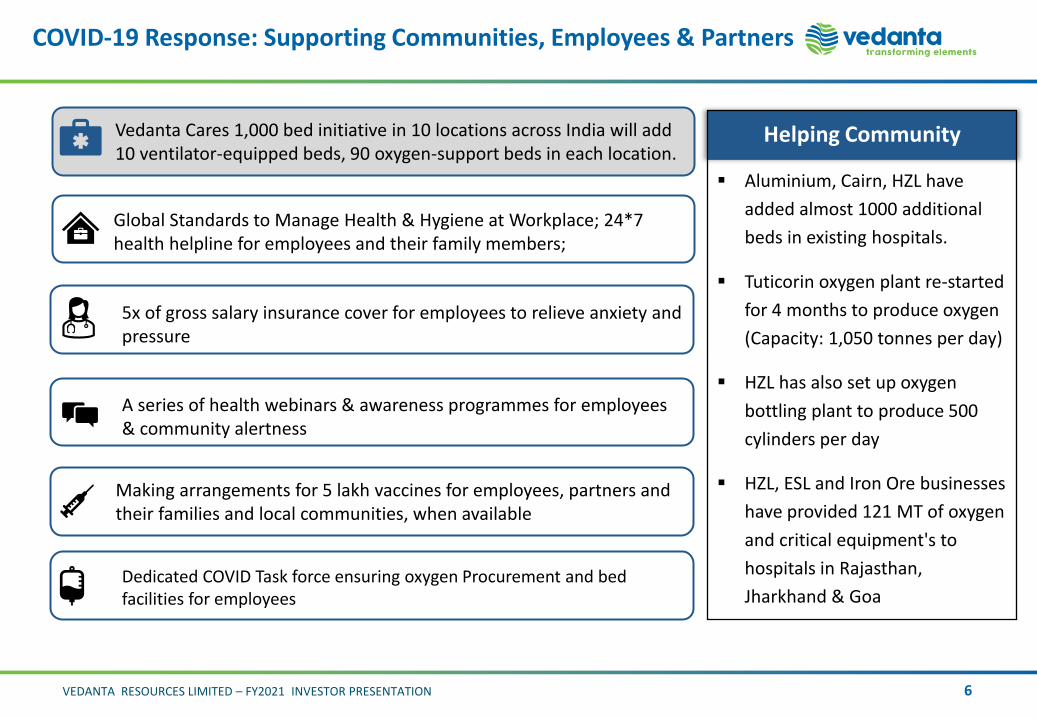
10,022
10,731
2,586
369
963
1,151
400
383
Net Debt for FY 2021
Dividend Paid1st Apr’20# CF from Operations
WC Movements(Incl Buyer’s
credit)
Capex Translation & others*
31st Mar’21
25
(In $ mn)
Inventory , Debtors & Others 63
Creditors/Customers Advance (432)
FCF $ 1,253mn
FACOR Acquisition
Stake increase in
VEDL
29
# Opening Net Debt restated*Others incl. movement in restricted cash

VEDANTA RESOURCES LIMITED – FY2021 INVESTOR PRESENTATION
Balance Sheet and Debt Breakdown
26
Net Debt / EBITDA – maintained at low level Debt Breakdown(as of 31st Mar 2021)
2.72.4
3.03.3
2.8
FY17 FY18 FY19 FY20 FY21
▪ Net Interest
▪ Interest Income – Returns ~5.3%.
▪ Interest Expense – Maintained ~7.4%
Debt breakdown as of 31st Mar 2021
(in $bn)
Term debt 15.9
Working capital 0.2
Short term borrowing 0.3
Total consolidated debt 16.4
Cash and Cash Equivalents 5.6
Net Debt 10.7
Debt breakup ($16.4bn)
- INR Debt 43%
- USD / Foreign Currency Debt 57%

VEDANTA RESOURCES LIMITED – FY2021 INVESTOR PRESENTATION
Full year Capex guidance
0.2 0.1 0.1 0.5 0.5 0.2 0.4
0.20.3
0.5
0.5
0.2
0.1
0.10.2 0.3
0.1
0.1
0.10.3
0.10.1
0.2
0.60.7
0.8
1.1
0.8
0.3
1.1
FY2016 FY2017 FY2018 FY2019 FY2020 FY2021 FY2022e
Oil & Gas Zinc Al & Power Copper Other Optionality
27
ROCE1
2.5 2.4 1.7 2.1 1.6 ~1.7
~6% ~13% ~14% ~10% ~10% ~19%
Capex and Returns Profile
Growth CAPEX Profile, $bn
0.7 1.0 1.2 1.5
FCF pre capex, $bn
1. ROCE is calculated as EBIT net of tax outflow divided by average capital employed
0.71.2

VEDANTA RESOURCES LIMITED – FY2021 INVESTOR PRESENTATION
Strategy to Enhance Long Term Value
Continue Focus on World Class ESG Performance
Augment Our Reserves & Resources Base
Delivering on Growth Opportunities
Optimise Capital Allocation & Maintain Strong Balance Sheet
Operational Excellence and Cost Leadership
28

FY2021
Appendix

VEDANTA RESOURCES LIMITED – FY2021 INVESTOR PRESENTATION 30
FY 2022 Guidance
Segment Production and COP
Zinc India Mined Metal and Finished Metal: 1,025 – 1,050 KtSilver: c. 720 tonnesCOP: < $1,000/t excluding royalty
Zinc InternationalBMM: ~70 – 80 Kt Gamsberg: 190-210 ktCOP: $1,100/t - $1,200/t
Oil & GasAverage Gross Volume: 175-185 kboepd; Opex: c. $8/boe
AluminiumAlumina: 1.8 – 2.0 MtpaAluminium: 2.1 - 2.2 MtpaCOP*: $ 1,475 – 1,575/t
Power TSPL plant availability: >80%
Iron OreKarnataka (WMT): >5 MtpaPig Iron: 850 - 900 KtpaGoa: To be updated on re-start of operations
ESL Hot Metal – c 1.3 Mtpa
Copper - India To be updated on re-start of operations
*Hot Metal COP

Sensitivity: Internal (C3)
VEDANTA RESOURCES LIMITED – FY2021 INVESTOR PRESENTATION 31
Income Statement
Depreciation & Amortization
▪ Lower majorly on account of Oil & Gas assets
impairment in Q4 FY 20.
Finance Cost
▪ Higher finance cost primarily on account of lower
interest capitalisation.
Investment income
▪ Lower primarily on account of change in
investment mix.
Taxes
▪ Normalized ETR is 38% (excluding tax on dividend,
tax on exceptional items of US$ 18 mn, new tax
regime impact of (US$ 34)mn and Deferred Tax
Asset of US$ 420mn recognized on losses in ESL)
compared to 52% in FY’20 on account of change in
profit mix.
In $ mn FY’21 FY’20
Revenue from operations 11,722 11,790
EBITDA 3,800 3,003
Depreciation & amortization (1,099) (1,412)
EBIT 2,701 1,591
Finance Cost (1209) (1,179)
Investment Revenue 292 382
Other gains and (losses) [Net] 11 (87)
Special items - credit/(expense) (112) (2,053)
Profit before tax and special items 1,795 707
Profit before tax 1,683 (1,346)
Tax – before special items – credit/(expense) (316) (411)
Tax charge – special items – credit/(expense) 18 781
Profit After Taxes (PAT) from continuing operation 1,385 (976)
PAT before special items 1,479 296
Profit/(loss) after Taxes from discontinued operation
91 (771)
PAT for the period 1,476 (1,747)
Attributable profit / (loss) 323 (1,568)
Attributable profit (before special items) 303 (202)
Note: Previous period figures have been regrouped or re-arranged wherever necessary to conform to the current period’s presentation
Sensitivity: Internal (C3)
VEDANTA RESOURCES LIMITED – FY2021 INVESTOR PRESENTATION
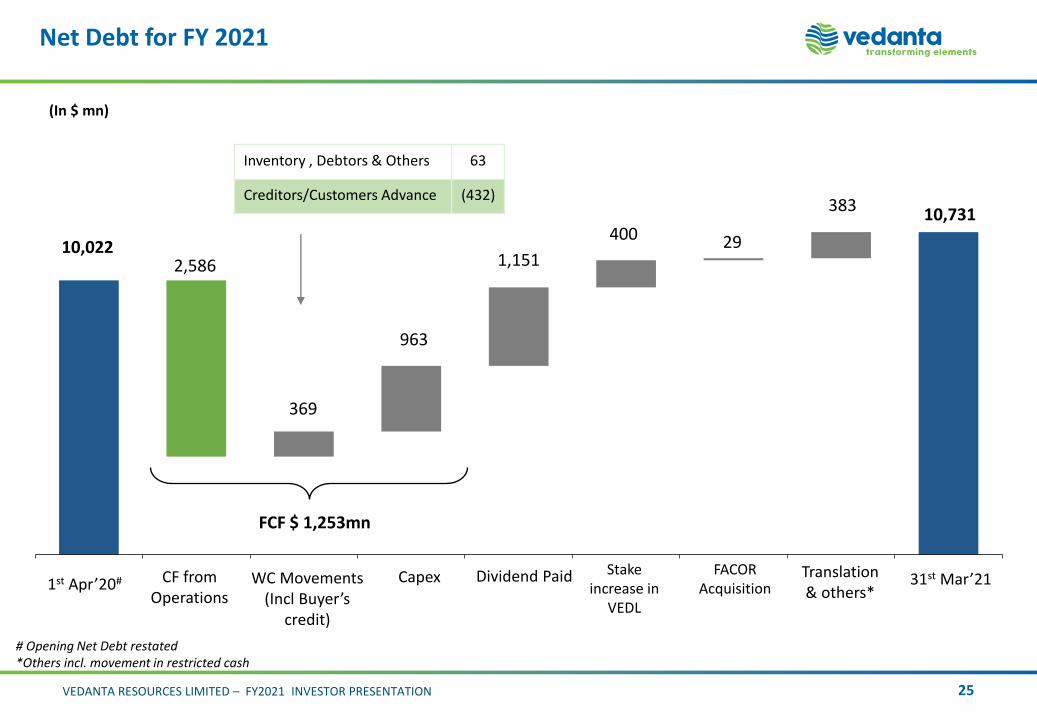
Project Capex
Capex in Progress StatusApproved
Capex3
Spent up to
31 Mar’204
Spent in FY20214
Unspent as at31 Mar 20215
Cairn India1 – Mangala Infill, Liquid handling, Bhagyam & Aishwariya EOR, Tight Oil & Gas, OALP etc
2,522 1,144 181 1,197
Aluminium Sector
Jharsuguda 1.25mtpa smelter
Line 3: Fully capitalisedLine 4: Fully Capitalised Line 5: Fully capitalisedLine 6: Phase-wise capitalisation
2,990 2,925 36 29
Zinc India
Mine expansion Ongoing 2,076 1,726 44 306
Others 261 159 7 95
Zinc International
Gamsberg Mining Project2 Completed Capitalisation 400 387 3 10
Copper India
Tuticorin Smelter 400ktpa Project is under Force Majeure 717 198 - 519
Avanstrate
Furnace Expansion and Cold Line Repair 74 48 7 20
Capex Flexibility
Metals and Mining
Lanjigarh Refinery (Phase II) – 5mtpa 1,563 909 18 636
Skorpion Refinery Conversion Currently deferred till Pit 112 extension 156 14 - 142
1. Capex approved for Cairn represents Net capex, however Gross capex is $3.4 bn.2. Capex approved for Gamsberg $400mn excludes interest during construction.3. Is based on exchange rate at the time of approval.4. Is based on exchange rate at the time of incurrence5. Unspent capex represents the difference between total capex approved and cumulative spend as on 31st Mar 2021.
32
(In $ mn)

Sensitivity: Internal (C3)
VEDANTA RESOURCES LIMITED – FY2021 INVESTOR PRESENTATION 33
Entity Wise Cash and Debt
Company
31 Mar2021 ($ mn) 31 Mar 2020 ($ mn)
DebtCash & Cash
EqNet Debt Debt
Cash & Cash Eq5 Net Debt5
Vedanta Limited Standalone 4,388 798 3,590 5,053 662 4,390
Cairn India Holdings Limited1 383 191 192 494 1,027 (533)
Zinc India 979 3,044 (2,064) 82 2,972 (2,890)
Zinc International 30 62 (32) 54 66 (12)
BALCO 432 155 277 597 55 541
Talwandi Sabo 981 63 918 814 18 796
Vedanta Star Limited2 - - - - - -
Others3 573 137 436 653 234 419
Vedanta Limited Consolidated 7,766 4,450 3,316 7,746 5,034 2,712
Vedanta PLC4 8,611 1,196 7,415 7,349 38 7,312
Total ($ mn) 16,377 5,646 10,731 15,095 5,073 10,022
Notes: Debt numbers are at Book Value and excludes inter-company eliminations.
1. Cairn India Holdings Limited is a wholly owned subsidiary of Vedanta Limited which holds 50% of the group’s share in the RJ Block
2. Vedanta Star limited, 100% subsidiary of VEDL which owns 96% (FY19: 90%) stake in ESL
3. Others includes MALCO Energy, CMT, VGCB, Electrosteel, Fujairah Gold, FACOR , Vedanta Limited’s investment companies and ASI.
4. Includes investment companies.
5. Opening Net Debt and Cash & Cash Eq has been restated.

Sensitivity: Internal (C3)
VEDANTA RESOURCES LIMITED – FY2021 INVESTOR PRESENTATION 34
Funding Sources and Term Debt Maturities
Note: USD–INR: ₹ 73.30 on 31st Mar 2021
1.1
2.0 2.4
3.1
2.0
1.3 1.0
3.1 3.3 3.4
6.0
FY22 FY23 FY24 FY25 & Later
Standalone Subsidiaries
$ b
n
Diversified Funding Sources for Term Debt of $15.9bn(as at 31st Mar 2021)
27%
14%
22%
37%
Term Loans-INR
Bonds-INR
Term Loans-USD/Foreign Currency
Bonds-USD
Term debt of $8.1bn at Standalone and $7.8bn at Subsidiaries, total consolidated $15.9bn
Term Debt Maturities - $15.9 bn (as at Mar 31, 2021)
2.9

Sensitivity: Internal (C3)
VEDANTA RESOURCES LIMITED – FY2021 INVESTOR PRESENTATION 35
Segment-wise Summary
Oil & Gas FY21 FY20
Average Daily Gross Operated
Production (boepd) 162,104 172,971
Rajasthan 132,599 144,260
Ravva 19,177 14,232
Cambay 10,329 14,479
Average Daily Working Interest
Production (boepd) 101,706 110,459
Rajasthan 92,819 100,982
Ravva 4,315 3,202
Cambay 4,131 5,792
KG-ONN 2003/1 441 483
Average Brent ($/bbl) 44.3 60.9
Average realizations Oil & gas ($/boe) 43.8 58.8
EBITDA ($mn) 438 1,032
Zinc-India FY21 FY20
Mined Metal Content (kt) 972 917
Refined Zinc – Integrated (kt) 715 688
Refined Lead – Integrated (kt)1 214 181
Saleable Silver – Integrated (in tonnes) 2 706 610
Average Zinc LME ($/t) 2,422 2,402
Zinc CoP ($/t) 3 954 1,047
EBITDA ($mn) 1,568 1,230
Zinc-International FY21 FY20
Mined Metal –Skorpion (kt) 1 67
Mined Metal – BMM (kt) 58 66
Refined Zinc – Gamsberg (kt) 145 108
Total Zinc-Lead Metal (kt) 203 241
CoP ($/t) 1,307 1,665
EBITDA ($mn) 120 54
1. Excludes captive consumption of 6,424 MT in FY’21 as compared to 7,088 MT in FY’20.2. Excludes captive consumption of 34.6 MT in FY’21 as compared with 36.7 MT in FY’20.3. Excludes Royalty.

Sensitivity: Internal (C3)
VEDANTA RESOURCES LIMITED – FY2021 INVESTOR PRESENTATION
Segment-wise Summary (cont’d)
Copper FY21 FY20
Copper Cathodes– India (kt) 101 77
Average Copper LME ($/t) 6,897 5,855
EBITDA ($mn) (21) (40)
Aluminium FY21 FY20
Aluminium Production (kt) 1,969 1,904
Jharsuguda I - 500kt 533 543
Jharsuguda II - 1,250kt1867 800
Korba-I 245kt 265 256
Korba-II 325kt 304 305
Average Aluminium LME ($/t) 1,805 1,749
Aluminium COP ($/t) 1,347 1,690
Jharsuguda 1,304 1,686
Balco 1,450 1,700
Alumina Production (kt) 1,841 1,811
Alumina COP ($/t) 235 275
EBITDA ($mn) 1,046 281
36

Sensitivity: Internal (C3)
VEDANTA RESOURCES LIMITED – FY2021 INVESTOR PRESENTATION
Segment-wise Summary (cont’d)
Iron Ore FY21 FY20
Sales (dmt) 6.5 6.6
Goa 2.1 0.9
Karnataka 4.4 5.8
Production (mt) 5.0 4.4
Goa 0.0 0.0
Karnataka 5.0 4.4
Average Net Sales Realizations ($/t) 43.5 28.0
Pig iron - Production (kt) 596 681
EBITDA ($mn) 245 117
Power FY21 FY20
Power Sales (million units)
Jharsuguda 600MW 2,835 776
BALCO 1,596 1,726
Talwandi Sabo 1980MW6,479 8,223
HZL Wind Power 351 437
Power - Realisation (Rs./unit)1 3.09 3.58
Power - Cost of generation (Rs./unit)1 2.34 2.49
Talwandi Sabo – Realisation (Rs./unit) 2.97 3.73
Talwandi Sabo – Cost of generation (Rs./unit)
2.10 2.68
EBITDA ($mn) 190 232
1. Average excludes TSPL
37
Steel FY21 FY20
Total Production 1,187 1,231
Pig Iron 189 167
Billet 165 27
TMT Bar 338 468
Wire Rod 361 413
Ductile Iron Pipes 135 155
EBITDA ($/t) 95 78
EBITDA ($mn) 117 83

Sensitivity: Internal (C3)
VEDANTA RESOURCES LIMITED – FY2021 INVESTOR PRESENTATION 38
Sales Summary
Sales volume FY21 FY20
Iron-Ore Sales
Goa (mn DMT) 2.1 0.9
Karnataka (mn DMT) 4.4 5.8
Total (mn DMT) 6.5 6.6
Pig Iron (kt) 609 666
Copper-India Sales
Copper Cathodes (kt) 7.8 2.5
Copper Rods (kt) 122 98
Total Steel Sales (kt) 1,231 1,179
Pig Iron 192 158
Billet 158 22
TMT Bar 356 454
Wire Rod 375 402
Ductile Iron Pipes 150 143
Sales volume Power Sales (mu)
FY21 FY20
Jharsuguda 600 MW 2,835 776
TSPL 6,479 8,223
BALCO 1,596 1,726
HZL Wind power 351 437
Total sales 11,261 11,162
Power Realisations (INR/kWh)
Jharsuguda 600 MW 2.54 2.65
TSPL2 2.97 3.73
Balco 600 MW 3.85 3.88
HZL Wind power 4.00 4.05
Average Realisations1 3.09 3.58
Power Costs (INR/kWh)
Jharsuguda 600 MW 2.48 3.85
TSPL2 2.10 2.68
Balco 600 MW 2.36 2.26
HZL Wind power 1.20 0.96
Average costs1 2.34 2.49
Sales volume FY21 FY20
Zinc-India Sales
Refined Zinc (kt) 724 680
Refined Lead (kt) 216 180
Total Zinc-Lead (kt) 940 860
Silver (moz) 735 586
Zinc-International Sales
Zinc Refined (kt) 1 67
Zinc Concentrate (MIC) 174 137
Total Zinc (Refined+Conc) 175 204
Lead Concentrate (MIC) 28 38
Total Zinc-Lead (kt) 203 241
Aluminium Sales
Sales - Wire rods (kt) 328 326
Sales - Rolled products (kt) 31 27
Sales - Busbar and Billets (kt) 308 372
Total Value added products (kt) 668 725
Sales - Ingots (kt) 1325 1197
Total Aluminium sales (kt) 1992 1922
1. Average excludes TSPL
2. Based on Availability

Sensitivity: Internal (C3)
VEDANTA RESOURCES LIMITED – FY2021 INVESTOR PRESENTATION
Currency and Commodity Sensitivities
Commodity prices – Impact of a 10% increase in Commodity Prices
CommodityFY 2021
Average price
Full Year Impact on
EBITDA ($mn)
Oil ($/bbl) 45 68
Zinc ($/t) 2,422 193
Aluminium ($/t) 1,805 311
Lead ($/t) 1,868 39
Silver ($/oz) 23 56
Foreign Currency - Impact of ₹ 1 depreciation in FX Rate
Currency Increase in EBITDA
INR/USD ~ US$ 25 million / year
39

Sensitivity: Internal (C3)
VEDANTA RESOURCES LIMITED – FY2021 INVESTOR PRESENTATION
Focused exploration to expand our reserves and resources base for support our future growth through
40
Augment our Reserves and Resources Base
403
448
FY 2020 FY 2021
509566
FY 2020 FY 2021
1,194
1,229
FY 2020 FY 2021
• Targeted and disciplined exploration
• Offsetting depletion and bringing on stream more discoveries
• Team aim to discover mineral and oil deposits in a safe and responsible way
Zinc India (Million tonnes) Oil & Gas (mmboe)Zinc International (Million tonnes)

Sensitivity: Internal (C3)
VEDANTA RESOURCES LIMITED – FY2021 INVESTOR PRESENTATION
Awards & Recognition for FY21
41
Name of Award Category/ Recognition Recipient (Business Unit)
The Dow Jones Sustainability Index 2020 (Metals & Mining Sector)
Vedanta Ranked 2nd in Asia Pacific, and 12th Globally
HZL ranked 1st in Asia-Pacific and 2nd Globally
Vedanta & Hindustan ZInc
14th ICC Environment Excellence Award (2020)”In Large Enterprise category at 14th
Environment Partnership E-SummitZSD – Hindustan Zinc
Golden Peacock Award for Sustainability Operational Excellence BALCO
Best CSR Initiative Rajasthan Government Nand Ghar – Hindustan Zinc
“Sword of Honor” by British Safety Council (BSC) Outstanding HSE management system. Cairn Oil & Gas midstream
CII-ITC Sustainability Award ‘Excellence in Corporate Social Responsibility’
‘Excellence in Corporate Social Responsibility’
Cairn Oil and Gas; BALCO
India PR and Corporate Communication Awards (IPRCCA) Awards Best Advocacy Campaign’ categoryCairn Oil and Gas;
Aluminium & Power Business
National Energy Conservation Award by Bureau of Energy Efficiency, Govt. of India
Operational Excellence Vedanta Ltd., Jharsuguda
Frost & Sullivan Sustainability Awards“Challengers Award - Medium Business, Process Sector” and “Safety Excellence
Award - 1st Runner Up”.Pantnagar Plant – Hindustan Zinc
ICSI National Award for excellence in Corporate Governance Corporate Governance TSPL
CII – Centre for Digital TransformationMost innovative Best Practice Digital
Transformation AwardAluminium & Power – Jharsuguda

Sensitivity: Internal (C3)
VEDANTA RESOURCES LIMITED – FY2021 INVESTOR PRESENTATION
Group – Present Debt Structure
55.1%
64.9%
Subsidiaries of Vedanta Ltd
⚫ Sesa Iron Ore
⚫ Sterlite Copper
⚫ Power (600 MW Jharsuguda)
⚫ Aluminium
(Odisha aluminium and power assets)
⚫ Cairn Oil & Gas*
Divisions of Vedanta Limited
Unlisted entitiesListed entities
95.5%100%51%
Note: Shareholding as on Mar 31, 2021*50% of the share in the RJ Block is held by a subsidiary of Vedanta Ltd^Skorpion 100%, BMM & Gamsberg 74%
100%
Vedanta Resources (Consolidated)FY21
EBITDA 3.8Net Debt 10.7
Vedanta Resources (Standalone)FY21 %
EBITDA 0.1 3%Net Debt 7.4 69%
Vedanta Ltd (Consolidated)
FY21 %
EBITDA 3.7 97%
Net Debt 3.3 31%
Zinc India (HZL)
FY21 %
EBITDA 1.6 42%
Net Cash 2.1
Bharat Aluminium (BALCO)
FY21 %
EBITDA 0.3 9%
Net Debt 0.3 3%
Zinc International^
FY21 %
EBITDA 0.1 3%
Net Cash 0.0 -
Electrosteel Steels
FY21 %
EBITDA 0.1 3%
Net Debt 0.3 3%
Talwandi Sabo Power
FY21 %
EBITDA 0.1 4%
Net Debt 0.9 9%
VolcanFY21
EBITDA -Net Debt 0.2
42
($ bn)