1H2018 Earnings Presentation - BELUGA GROUP
19
1H2018 Earnings Presentation August 2018
-
Upload
khangminh22 -
Category
Documents
-
view
0 -
download
0
Transcript of 1H2018 Earnings Presentation - BELUGA GROUP

1H2018 Earnings Presentation
August 2018

This presentation has been prepared by Beluga Group, Co. (the “Company“, or
“Beluga Group”) and together with its subsidiaries. By attending the meeting where the
presentation is made, or by reading the presentation slides, you agree to the following
limitations and notifications. This presentation is strictly confidential to the recipient, may
not be distributed to the press or any other person, and may not be reproduced in any
form, in whole or in part. Failure to comply with this restriction may constitute a violation
of applicable securities laws. This presentation does not constitute or form part of, and
should not be construed as, an offer to sell or issue or the solicitation of an offer to buy or
acquire shares of the Company or any of its subsidiaries in any jurisdiction or an
inducement to enter into investment activity in any jurisdiction. Neither this presentation
nor any part thereof, nor the fact of its distribution, shall form the basis of, or be relied on
in connection with, any contract or commitment or investment decision whatsoever.
This presentation may contain statements that are, or may be deemed to be,
forward-looking statements within the meaning of the U.S. federal securities laws and
are intended to be covered by the safe harbors created thereby. Examples of such
forward-looking statements include, but are not limited to statements of the Company’s
predictions, forecasts, projections, strategies, plans, targets, objectives, expectations,
estimates, intentions, beliefs or goals, including those related to acquisitions, sales,
products or services, results of operations, financial condition, liquidity, prospects or
dividend policy; statements concerning future business or industry performance; other
statements that do not relate strictly to historical or current facts; and assumptions
underlying such statements.
By their very nature, forward-looking statements involve inherent risks and
uncertainties, both general and specific, and risks exist that the forward-looking
statements will not be achieved. Among other things, forward-looking statements are
based on numerous assumptions regarding the Company’s present and future business
strategies and the environment in which the Company will operate in the future.
Readers should be aware that several important factors could cause the
Company’s assumptions to be incorrect, and could cause actual results to differ
materially from the predictions, forecasts, projections, strategies, plans, targets,
objectives, expectations, estimates, intentions, beliefs or goals expressed in such
forward-looking statements.
These factors include:
• changes in political, social, legal or economic conditions in Russia generally, or in
the regions of Russia in which the Company operates, including changes in levels
of consumer spending and demand for some or all of its products;
• changes in consumer preferences and tastes, demographic trends or perceptions
about health related issues;
• increased competitive product and pricing pressures and unanticipated actions by
competitors that could impact the Company’s market share, increase expenses
and hinder growth potential;
• the ability to complete business combinations, partnerships, acquisitions or
disposals, existing or future, and to achieve integration, expected synergies and/or
costs savings;
• levels of marketing, promotional and innovation expenditure by the Company and
its competitors;
• the Company’s ability to protect its intellectual property rights;
• increasing recognition in Russia of product liability and personal injury torts;
• legal and regulatory developments and changes in the policies of the government
of the Russian Federation, including regional authorities, including regulatory
developments or policy changes regarding consumption of or advertising for
spirits, or taxation;
• changes in the cost of raw materials and labor costs;
• renewal of distribution rights and contracts on favorable terms when they expire;
• technological developments that may affect the distribution of products;
• changes in financial and equity markets, including significant interest rate and
foreign currency exchange rate fluctuations, which may affect the Company’s
access to or increase the cost of financing or which may affect the Company’s
financial results;
• changes in accounting standards, policies or practices;
• availability of qualified personnel, including accounting personnel; and
• ability to identify other risks relating to the Company’s business and manage the
risks associated with the aforementioned factors.
This list of important factors is not exhaustive. Readers should carefully
consider such factors and other uncertainties and events, especially in light of the
political, economic, social and legal environment in which the Company operates.
Such forward-looking statements speak only as of the date on which they are made,
and the Company does not undertake any obligation to update or revise any of them.
Readers should not place undue reliance on forward-looking statements. The
Company does not make any representation, warranty or prediction that the results
anticipated by such forward-looking statements will be achieved, and such forward-
looking statements represent, in each case, only one of many possible scenarios and
should not be viewed as the most likely or standard scenario.
2

COMPANY’S 1H2018 FINANCIAL HIGHLIGHTS
3
3% total volume increase
Sales grew 13% and reached 29,2 bln. Rubles
Net Revenue increased by 19% to 18,8 bln. Rubles*
Operating profit increased by 16% to 1,4 bln. Rubles
EBITDA grew 20% to 1,9 bln. Rubles
EBITDA and Operating margins remained stable
79% growth of Net Income. Net margin improved by 0,7 pp.
EPS increased by 109% and achieved 24 Rubles

COMPANY’S HIGHLIGHTS
4
•#1 distilled spirits producer in Russia
•#1 independent importer in Russia
•#1 flavored spirits producer including bitters, herbal liquors, flavored liquors
•# 2 brandy producer
•12% legal vodka & LVI*** market share
•14% brandy market share
•22% flavored liquors market share
•Belenkaya is #1 vodka in Russia
•BELUGA is dominant player in super-premium category in Russia
•Myagkov is leading brand in low-premium category
LEADERSHIP
MARKET POSITION*
BRANDS**
DISTRIBUTION
•#1 best in class distribution platform in Russia
•Own alcohol retail chain – Winelab (397 stores as of 1st of September 2018)
* Rosstat data, 1H2018, production in volume
** Nielsen data, 2017
***LVI – Flavored Liquors

+19%
Alcohol
Food
Alcohol
Food
CONSOLIDATED REVENUE
Consolidated Revenue, million RUB Revenue breakdown by segments, million RUB (1)
Consolidated Revenue split, %
Source: Company’s IFRS financial statements
Note (1): Net of intersegment operations
Revenue increased by 19% mainly due to 3% volume growth
and Winelab’s financial results consolidation.
Since 1H2018 the Company has reported 3 segments: Alcohol,
Retail, Food.
Alc
ohol (1
) F
ood
(1)
5
1H2017 1H2018
Retail

6 078
8 016
0
5 000
10 000
1H2017 1H2018
+32%
Alcohol
Food
Alcohol
Food
CONSOLIDATED GROSS PROFIT
Consolidated Gross Profit, million RUB Gross Profit breakdown by segments, million RUB (1)
Consolidated Gross Profit split, %
Source: Company’s IFRS financial statements
Note (1): Net of intersegment operations
Consolidated Gross Profit and the Alcohol segment Gross
Profit increased mainly do to premiumization of sales and
Winelab’s financial results consolidation.
Since 1H2018 the Company has reported 3 segments: Alcohol,
Retail, Food.
Alc
ohol
(1)
Food (
1)
6
1H2017 1H2018
Retail

+20%
CONSOLIDATED EBITDA AND NET PROFIT
EBITDA, million RUB G&A and distribution expenses , million RUB
Operating profit and Net Income, million RUB
G&A expenses increased in line with revenue growth.
45% year-on year increase in distribution expenses due to the
changes in PnL structure which was caused by consolidation of
Winelab retail chain.
EBITDA grew by 16% due to increasing sales in volume terms
of own products as well growth of import-export operations.
+16%
+79%
7
Source: Company’s IFRS financial statements

Long tem debt Short term debt Net debt
2017 1H2018 Change, %
Debt 11 012 14 062 +28%
Cash & cash equivalents 819 680 -17%
Net Debt 10 193 13 382 +31%
Equity & reserves 19 448 19 129 -2%
Total capital (1)
30 404 33 562 +10%
EBITDA last 12 months 3 218 3 940 +9%
Net Debt/Equity 0.52 0.7 +20%
Net Debt/Total capital 0.34 0.40 +7%
Net Debt/EBITDA 2.81 3.4 +20%
Less than 1 year
1-2 years
2-5 years
Less than 1
year 1-2 years
2-5 years
BELUGA GROUP GROUP DEBT STRUCTURE
Debt evolution, million RUR
8 043 10 193
13 382
9 503
14 062
As of 31 December, 2017 As of 30 June, 2018
• The cost of borrowing decreased (9.1% p.a. in
1H2018 vs 9.4% p.a. in 2017).
• Share of the unsecured loans reached 96%.
• The structure of the debt was considerably improved:
only 5% of the debt is short-term.
Note: Company’s IFRS audited statements,
Note (1): Total Capital = (Long term liabilities + Total Equity)
8
11 012
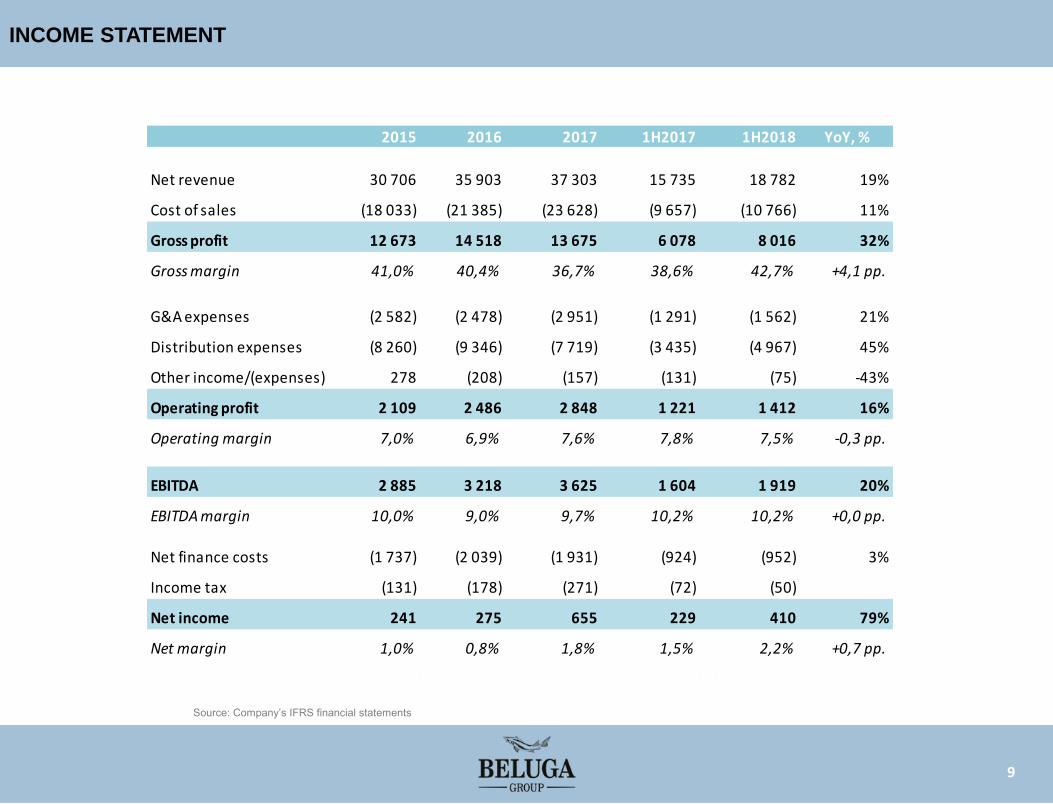
INCOME STATEMENT
Source: Company’s IFRS financial statements
9
2015 2016 2017 1H2017 1H2018 YoY, %
Net revenue 30 706 35 903 37 303 15 735 18 782 19%
Cost of sales (18 033) (21 385) (23 628) (9 657) (10 766) 11%
Gross profit 12 673 14 518 13 675 6 078 8 016 32%
Gross margin 41,0% 40,4% 36,7% 38,6% 42,7% +4,1 pp.
G&A expenses (2 582) (2 478) (2 951) (1 291) (1 562) 21%
Distribution expenses (8 260) (9 346) (7 719) (3 435) (4 967) 45%
Other income/(expenses) 278 (208) (157) (131) (75) -43%
Operating profit 2 109 2 486 2 848 1 221 1 412 16%
Operating margin 7,0% 6,9% 7,6% 7,8% 7,5% -0,3 pp.
EBITDA 2 885 3 218 3 625 1 604 1 919 20%
EBITDA margin 10,0% 9,0% 9,7% 10,2% 10,2% +0,0 pp.
Net finance costs (1 737) (2 039) (1 931) (924) (952) 3%
Income tax (131) (178) (271) (72) (50)
Net income 241 275 655 229 410 79%
Net margin 1,0% 0,8% 1,8% 1,5% 2,2% +0,7 pp.

2015 2016 2017 1H2017 1H2018
Operating profit 2 109 2 486 2 848 1 221 1 412
Depreciation and amortisation 776 726 768 379 507
Other non-cash transactions (123) 183 200 28 13
Changes in working capital 1 332 (1 231) (1 860) (1 519) (2 292)
CF from operating activities 4 094 2 164 1 956 109 (360)
Interest paid (1 918) (2 004) (1 849) (940) (873)
Income tax paid (109) (63) (578) (187) (449)
Net CF from operating activities 2 067 97 (471) (1 018) (1 682)
Acquisition of subsidiaries and associates (700) 16 (380) (380) 289
Acquisition and disposal of PPE (245) (500) (349) (134) (957)
Net CF from investing activities (945) (484) (729) (514) (668)
Issue of share capital - - - - -
Repurchase of own shares (177) (179) (913) (141) (553)
Loans received 30 351 37 532 40 885 20 654 19 191
Loans repaid (30 596) (37 117) (38 963) (19 408) (16 427)
Net CF from financing activities (443) 236 1 009 1 105 2 211
Net increase/(decrease) in cash 679 (151) (191) (427) (139)
Cash at beginning of the year 482 1 161 1 010 1 010 819
Cash at end of the period 482 1 161 819 830 680
CASH FLOW
Source: Company’s IFRS financial statements
10

APPENDICES
APPENDICES

COMPANY’S STRATEGY
12
STRATEGY
CONTINUED DEVELOPMENT OF THE DISTRIBUTION
PLATFORM WITH A FOCUS ON DIRECT SALES
DEVELOPMENT OF WINELAB RETAIL CHAIN
ACHIEVING DIRECT CONTACT WITH END
CUSTOMERS THROUGH TRADE
MARKETING AND OWN RETAIL CHAIN
BEST IT PLATFORM
EXPANSION OF THE GENERAL EXPORT
GEOGRAPHY AND BELUGA BRAND
IN PARTICULAR
IMPROVING THE QUALITY OF IMPORTED
OPERATIONS THROUGH TARGETED SELECTION
OF PARTNERS
FOCUS ON SUPER-PREMIUM INTERNATIONAL VODKA
MARKETS
DIVERSIFIED BRAND PORTFOLIO, COVERAGE OF ALL
SEGMENTS
FOCUS ON PREMIUM AND PROFITABLE PRODUCTS
INCREASE IN PRICE AND
BRAND RECOGNITION
STRENGTHENING THE PRESENCE
IN GROWING CATEGORIES
PRODUCTION, SALE AND
DISTRIBUTION OF ITS OWN
ALCOHOL PRODUCTS
USE OF MODERN TECHNOLOGIES TO ENHANCE
THE OVERALL OPERATIONAL PERFORMANCE
BRAND
PORTFOLIO DISTRIBUTION
EXPORT KEY
BUSINESS
BECOME THE DOMINANT SPIRITS COMPANY IN RUSSIA WITH A DIVERSIFIED PORTFOLIO OF BRANDS,
BEST IN CLASS DISTRIBUTION PLATFORM, AND PROPRIETARY RETAIL CHAIN

11 770 9 462
4 200
-
10 000
20 000
30 000
Vodka Brandy &Cognac
FlavouredLiqours (LVI)
Whisky
82 723
-
100 000
13
TOP 5 FLAVORED LIQUORS PRODUCERS, 1H2018 TOP 5 VODKA & LVI* LEGAL PRODUCERS, 1H2018
TOP 5 BRANDY PRODUCERS, 1H2018
BELUGA GROUP RUSSIA MARKET
RUSSIAN SPIRITS MARKET (MAIN CATEGORIES), 2017
000, 9L Cs.
volume
Source: Rosstat, ISWR * LVI – Flavored Liquors

STANDARD ECONOMY
*Source: Nielsen 2017
SUPER-PREMIUM LOW-PREMIUM
LEADING BRANDS* SEGMENT’S SHARES
14
VODKA PORTFOLIO

RUR 405 RUR 525 RUR 600 RUR
750
RUR
975
RUR
855 RUR 1200 – RUR 5000
TSAR Belenkaya
(Whitish)
Russky
Lyod
(Russian
Ice)
Myagkov Arkhangelskaya VEDA
ICE*
Belaya Sova
(White Owl)
Mednaya
Loshadka
(Copper
Horse)
Beluga Noble
Beluga
Trans
atlantic
Racing
Beluga Noble
Celebration Beluga Allure
Beluga
Gold Line
Tra
ditio
na
l
qu
alit
y
vo
dka
Pu
re,
org
an
ic
vo
dka
Pa
trio
tism
,
Vic
tory
Tre
nd
y
Vo
dka
fo
r
co
ckta
ils
Cra
ft,
au
the
ntic
bra
nd
Hig
h-q
ua
lity
pro
du
ct
Tru
e
Nort
he
rn
vo
dka
Org
an
ic,
Cra
fte
d
vo
dka
Han
dcra
fte
d
Nob
le v
od
ka
Vo
dka
fo
r
Tre
nd
se
tte
rs
Vo
dka
fo
r
sp
ecia
l
occa
sio
n
Ari
sto
cra
tic
Ga
str
on
om
ic
vo
dka
Economy Premium
* - 50% ownership.
Exclusive agreement
for production and
distribution
Sub-premium Super-premium, Ultra-premium Standard
DIVERSIFIED PORTFOLIO OF NATIONAL BRANDS
15
VODKA PORTFOLIO
Reta
il
Pri
ce
pe
r 0,7
5 L

BELUGA GROUP IMPORTED SPIRITS PORTFOLIO
Scotch Whisky Irish Whisky
Cognac
Brandy
Bourbon
Tequila
Gin Sambuca
Bitter Rum Absinthe
16
IMPORT. SPIRITS

BELUGA GROUP STRATEGY IN IMPORTED WINE BUSINESS
17
IMPORT. WINE
FOCUS ON MIDDLE&PREMIUM PRICE SEGMENTS
INVEST IN TRADE MARKETING AND BRAND BUILDING
LEVERAGE DISTRIBUTION
PLATFORM IN WINE DEVELOPMENT
DEVELOPMENT BELUGA BOUTIQUE
FOR PREMIUM IMPORTED PRODUCTS

Address: 4/1 Yakimanskaya emb.,
Moscow 119180
Russia
Phone: +7 495 510 2695
+7 495 775 3050
Fax: +7 495 510 2697
+7 495 775 3052
E-mail: [email protected]
www.belugagroup.ru
CONTACTS
18