Hourly Earnings in Private Shipyards, 1942
28
UNITED STATES DEPARTMENT OF LABOR Frances Perkins, Secretary BUREAU OF LABOR STATISTICS Isador Lubin, Commissioner (on leave) A. F. Hinrichs, Acting Commissioner ♦ Hourly Earnings in Private Shipyards, 1942 Bulletin 7\ [o. 727 [Reprinted with minor changes from the Monthly Labor Review, August and October 1942] UNITED STATES GOVERNMENT PRINTING OFFICE WASHINGTON : 1943 For sale by the Superintendent of Documents, U. S. Government Printing Office Washington, D. C. Price 10 cents Digitized for FRASER http://fraser.stlouisfed.org/ Federal Reserve Bank of St. Louis
-
Upload
khangminh22 -
Category
Documents
-
view
2 -
download
0
Transcript of Hourly Earnings in Private Shipyards, 1942

UNITED STATES DEPARTMENT OF LABORFrances Perkins, Secretary
BUREAU OF LABO R STATISTICS Isador Lubin, Commissioner (on leave) A . F. Hinrichs, Acting Commissioner
♦
Hourly Earnings in Private Shipyards, 1942
Bulletin 7\[o. 727
[Reprinted with minor changes from the Monthly Labor Review, August and October 1942]
UNITED STATES GOVERNM ENT PRINTING OFFICE
WASHINGTON : 1943
For sale by the Superintendent o f Documents, U. S. Governm ent Printing Office Washington, D. C. Price 10 cents
Digitized for FRASER http://fraser.stlouisfed.org/ Federal Reserve Bank of St. Louis

CONTENTS
PageSummary_____ ______________________ _____________________________ 1Shipbuilding in wartime_____________________________________________ 1Labor aspects of production_________________________________________ 2Characteristics of the industry_______________________________________ 3Wage stabilization_________________________________________________ 4Plan of Bureau’s study___________________________ __________________ 6Hourly earnings in spring of 1942, Atlantic coast_________________ _____ 6Hourly earnings in spring of 1942, Gulf coast__________________________ 12Hourly earnings in spring of 1942, Pacific coast________________________ 13Hourly earnings in spring of 1942, Great Lakes________________________ 16Hourly earnings in spring of 1942, inland region_______________________ 19Interregional comparisons___________________________________ ______20
LETTER OF TRANSMITTAL
U n it e d S t a te s D e p a r t m e n t of L a b o r ,B u re a u o f L a b o r S ta tis t ic s , Washington, D. <7., December 8, 19^2.
The S e c r e ta r y o f L a b o r :I have the honor to transmit herewith a report made by the Bureau
of Labor Statistics on earnings in private shipyards, spring of 1942.A . F. H in ric h s , Acting Commissioner.
Hon. F r a n c e s P erk in s,Secretary of Labor.
ii
Digitized for FRASER http://fraser.stlouisfed.org/ Federal Reserve Bank of St. Louis

PREFACE
The field study of hourly earnings in private shipyards upon which this report is based was conducted by the Bureau of Labor Statistics in the spring of 1942. This study is a continuation of a series of studies on wage levels in the shipbuilding industry which the Bureau has made during the past 6 years.
The first comprehensive study of earnings and hours of work in the shipbuilding industry was made by the Bureau in August 1936. Data were obtained by representatives of the Bureau from both private shipyards and united States navy yards. At the request of the United States Maritime Commission the .Bureau made, in May 1937, a study of the guaranteed or basic hourly rates paid to workers in the more important occupations in a number of the larger private yards engaged in both construction and repair work. This information was collected by means of a mail questionnaire. Twice each year since that date, and until May 1941, the Bureau has made similar surveys for use by the Maritime Commission. Information on basic rates of pay was collected in May and November each year. In addition, limited information on hourly earnings has been obtained each November. Except for the original study of May 1936 the results of the Bureau’s inquiries have not been published.
In the spring of 1942 the Bureau made another comprehensive field study of wages in the shipbuilding industry in order to make available to the governmental agencies charged with responsibility for the wartime shipbuilding program, and to other governmental agencies as well as private organizations and persons, detailed information on the wage and occupational structure of the industry. The results of the 1942 field study are presented in this bulletin. Hereafter, the Bureau expects to continue its semiannual studies of the occupational wage structure of the shipbuilding industry along the lines of the current survey. Full utilization will be made of pay-roll data submitted by mail to the Secretary of Labor, and such data will be supplemented as necessary by field investigation by the Bureau’s trained representatives.
This report was prepared in the Division of Wage Analysis, of which Robert J. Myers is chief. The report was written by Willis C. Quant under the direction of Victor S. Baril and Edward K. Frazier. The Bureau is indebted to the officials of the many companies who cooperated in furnishing the data for this survey.
A. F. H in ric h s ,Acting Commissioner, Bureau of Labor Statistics.
in
Digitized for FRASER http://fraser.stlouisfed.org/ Federal Reserve Bank of St. Louis

Digitized for FRASER http://fraser.stlouisfed.org/ Federal Reserve Bank of St. Louis

Bulletin J'lo. 727 of the United States Bureau of Labor Statistics[Reprinted with minor changes from the M onthly L a b o r R e v ie w , August and October 1942]
HOURLY EARNINGS IN PRIVATE SHIPYARDS, 1942
SummaryIn the spring of 1942, shortly before the adoption of the new wage-
stabilization agreements, the straight-time earnings of first-smft workers in private ship-construction yards averaged 96.0 cents per hour. This average is based on a Bureau of Labor Statistics study of workers in selected occupations in 54 representative ship-construction yards. Comparable average wages by region ranged from $1,034 per hour on the Pacific coast to 77.6 cents on the Gulf coast. The averages for the Atlantic coast, Great Lakes, and inland regions were 96.6 cents, 86.1 cents, and 79.5 cents, respectively. First-shift workers in 13 ship-repair yards received an average of 97.1 cents per hour.
Among individual occupations, average earnings varied widely. Furnacemen, loftsmen, layers-out, pattern makers, and various supervisory employees were among the highest paid workers, while laborers, helpers, and learners were among the lowest paid.
Twenty-six separate crafts were generally recognized as coming within the scope of the wage standards established under the stabilization agreements for “ first-class skilled mechanics,” and several additional crafts were recognized as belonging to this class in one or more individual regions. Only in the Great Lakes region did first-class workers in the 26 crafts commonly receive wages below the minimum. In the inland region, however, no wage minima had been established.
The individual regions varied widely with respect to the proportion of workers carried on the pay roll as “first class.” On the Pacific coast, for example, 61 percent of all workers in the 26 recognized crafts were of the first class, whereas only 20 percent were so classified on the Atlantic coast. Differences with regard to the classification of workers profoundly affected general average earnings in the various regions.
Shipbuilding in WartimeThe growth of the shipbuilding industry during tlie past 2 years is
one of the most notable features of the Nation’s wartime industrial transition. Until shortly before the outbreak of the second World War shipbuilding had declined steadily as a commercial venture. Government subsidies had been resorted to in an attempt to revive the industry. The scope of the program undertaken since the outbreak of the war and the progress which has been made in accomplishing that program are best told in the President’s words:
A little more than a year ago we embarked upon the greatest shipbuilding program in history. No other nation had ever attempted so vast a maritime
1
Digitized for FRASER http://fraser.stlouisfed.org/ Federal Reserve Bank of St. Louis

enterprise. There were those who doubted our ability to succeed. Today I can assure you we will perform a near-miracle of ship production. The Nation’s shipbuilding capacity has been increased more than 500 percent.1
Figures relating to current employment and production in shipbuilding are, of course, military secrets. It is obvious, however, that shipbuilding has become one of the Nation’s leading industries.
The growing output of the shipyards has resulted in part from changes in technology and in the organization of production. Certain riveting operations, for example, have been replaced by welding:. Shipyard lay-outs have been improved. Great progress has been made in standardizing parts; and subcontracting and preassembling are practiced extensively. Second- and third-shift operations are found in most yards and account for the employment of a substantial proportion of all shipyard workers.
Labor Aspects of ProductionLabor has been of particular importance in the shipbuilding pro
gram. For one thing, wages constitute an important cost item. It is estimated that from a third to a half of the cost of ships now under construction will be required to pay the wages of shipyard workers.
LABOR SUPPLY
Of greater urgency than the cost problem, however, has been the problem of labor recruitment. Expanding operations have required the employment of scores of thousands of workers, about half of whom have been needed for skilled jobs. Many of these workers have been drawn from other industries. A study of accessions in six eastern yards 2 has revealed that in late 1940 about 37 percent of the skilled workers came from manufacturing industries (including other shipyards), 29 percent came from nonmanufacturing industries, 18 percent came from the ranks of the unemployed, 8 percent came from jobs in which they were self-employed, and about 8 percent came from employees of various Federal, State, and local public agencies.
Attempts to attract additional workers have given rise to substantial wage increases, and in some instances have led to competitive bidding among the yards. These developments were largely responsible for the wage-stabilization agreement described below.
TRAINING PROGRAMS
In addition to the experienced workers who have been brought in from other indu^ries, many thousands of new workers have been trained in the yards themselves for various types of skilled work, particularly welding. On the Pacific coast, for example, trainees customarily receive journeymen’s wages after 2 to 6 months of work at lower pay; and it is not uncommon for trainees to perform duties similar to those of second- or third-class mechanics in other regions. Even during the training period these workers are paid rates that are substantially higher than the effective minimum for most helpers.
1 Statement issued May 22,1942.* Monthly Labor Review, May 1941 (pp. 1142-1145): Characteristics of Recently Hired Shipbuilding
Labor, by O. R. Mann; November 1942 (pp. 926-931): further information on the subject of accessions in the industry also is contained in Sources of Labor Supply in West Coast Shipyards and Aircraft-Parts Plants, by Toivo Kanninen.
2 HOURLY EARNINGS IN PRIVATE SHIPYARDS
Digitized for FRASER http://fraser.stlouisfed.org/ Federal Reserve Bank of St. Louis
Various public agencies have played an important part in the training of new workers for shipbuilding, and private schools have also made a substantial contribution. In addition to the trainees, large numbers of young workers serve formal apprenticeships of extended duration wrnle learning the skills of carpenters, painters, electricians, plumbers, and similar occupations.
Characteristics of the IndustryFor purposes of this discussion the shipbuilding industry covers the
construction and repair of ships and boats. It is customary to classify ships separately from boats, the basis for classification being size ana type of craft. Vessels of 5 gross tons and over are classified as ships, while craft of less than 5 gross tons are classified as boats. The present survey was confined primarily to yards engaged in the construction or repair of ships (5 tons or over). The amount of boatbuilding or repair in these yards was very small.
Ship construction and repair yards are widely scattered along the coasts and inland waterways of the country. Wide variations in wage levels and in type of construction are found. It follows therefore that any analysis of the wage structure of the industry must make distinction along geographical lines. The broad areas herein adopted coincide with those recognized by the Shipbuilding Stabilization Committee of the National Defense Advisory Commission. These are the Atlantic, Pacific, and Gulf coasts and the Great Lakes. A fifth area, covering small yards in the Ohio-Mississippi Valley, is also distinguished. This area, which in this report will be referred to as the “ inland area,” was not covered by any wage-stabilization agreement.
The three coastal regions include all yards bordering on the Atlantic and Pacific Oceans and the Gulf of Mexico, The dividing line between the Atlantic and Gulf regions is located a short distance north* of the Georgia-Florida State line. Yards bordering on Lakes Michigan, Superior, Huron, and Erie are included in the Great Lakes region, while yards in the Ohio-Mississippi River Valley, excluding southern Louisiana and Mississippi, are in the inland region.
All types of ships, ranging from the larger naval and commercial deep-sea vessels to the smaller harbor craft, are built or repaired in the three coastal areas. Yards on the Great Lakes and at other inland points are necessarily limited to the construction and repair of light vessels, because of the limitations of the inland waterways which connect such yards with the oceans.
Ship construction in all regions is predominan tly of metal. Although some wooden vessels are being built in all areas, this type of construction is largely confined to the Gulf coast and Great Lakes regions.
Occupational patterns.—Substantial variations in occupational patterns exist as between the various regions, largely as a result of differences in the type and size of ships built, the materials used, and the production processes employed. Quite naturally, more diversification is found in the coastal areas where the larger yards are situated and a wider variety of ships are built than in the Great Lakes and inland areas where the yards are relatively small and the variety of ships is limited. Substantial variations are also found between yards producing metal ships and those producing wooden ships, the latter having a much higher proportion of carpenters and other woodworking
CHARACTERISTICS OF THE INDUSTRY 3
Digitized for FRASER http://fraser.stlouisfed.org/ Federal Reserve Bank of St. Louis

occupations than the former. Even in metal-ship yards, production processes may differ considerably. For example, some yards use the welding method of assembly, while others use the older riveting process. Finally, because of the highly diversified nature of repair work as compared to construction work, repair yards generally require a higher proportion of all-round mechanics than do construction yards.
In all regions the majority of the workers are paid on an hourly basis, although substantial proportions of the workers are paid under incentive (bonus and piece work) plans in some regions. Incentive systems are far more extensively used on the Atlantic coast than in any other region. A few workers in each region, mostly draftsmen, are paid on a salary basis.
Wage Stabilization
Early in 1941 a wage-stabilization program was sponsored by the Shipbuilding Stabilization Committee of the National Defense Advisory Commission. The Committee's purpose was to bring about greater uniformity in rates of pay and to institute a systematic and periodic review of general wage levels in the industry. Following adoption of an agreement covering Pacific coast operations, which became effective April 1, 1941, similar agreements were executed for the Gulf coast, Atlantic coast, and Great Lakes regions. The agreement covering the Great Lakes region became effective June 2, 1941, and those for the Atlantic coast and Gulf coast region ̂went into effect on June 23 and August 1, 1941, respectively.
These agreements, voluntarily entered into by representatives of both the shipbuilders and the labor organizations, were approved by the f^avy, the Maritime Commission, and the Office of Production Management. Although provisions were included for standardization of shifts, for prohibition against strikes and lock-outs, and for other purposes, the primary purpose of the agreements was to standardize wages. Under these agreements the minimum rate for first-class skilled mechanics 3 was set at $1.12 in the Atlantic, Pacific, and Great Lakes regions, and at $1.07 in the Gulf region. No definitions of the occupations to be included as “ first-class skilled mechanics” were included in the stabilization agreements. The determination of the particular occupations to be affected by the minimum rate, as well as the establishment of rates to be paid other workers, was left to local collective bargaining. Workers in the inland region were not covered by anj agreement.
Provisions covering shift differentials we»e included in all four agreements. The most liberal shift differentials were found in the Pacific coast agreement, which provided that for 7.5 hours of work the second-shift workers should receive 8 hours’ pay at the regular hourly rate plus 10 percent, and that for 7 hours of work third-shift workers should receive 8 hours’ pay plus 15 percent. On the Gulf coast shift premiums varied, depending on whether two or three shifts were worked. On 2-shift operations, workers on the second
* Mechanics entitled under the agreements to the regional minimum rate are designated as “ first-class skilled mechanics” in all regions but the Pacific region, where they are referred to only as “skilled mechanics.” In actual practice, Pacific coast shipyards, like those in other regions, have applied the minimum only to first-class skilled mechanics.
4 HOURLY EARNINGS IN PRIVATE SHIPYARDS
Digitized for FRASER http://fraser.stlouisfed.org/ Federal Reserve Bank of St. Louis

shift were paid a premium of 40 cents for each full shift of 8 hours; on 3-shift operations, the same 40-cent differential existed, and in addition second- and third-shift workers were paid for 8 hours although working only 7.5 and 7 hours, respectively. On the Atlantic coast a premium of 7 percent of the established basic rate was paid for work performed on other than the first shift. In the Great Lakes region, workers on other than the first shift received a 40-cent premium for each full shift worked.
All of the agreements provided for extra rates for overtime. In each region time and one-half was paid for all time worked in excess of the standard 8-hour day and the standard 40-hour week, Monday ,to Friday. All Saturday work was paid for at time and a half, while work performed on Sundays and certain specified holidays was paid for at double time.
The Pacific coast agreement differed from those for other regions in that repair yards were excluded from its provisions.
Each of the regional agreements provided for wage-rate adjustments based on the cost of living at the end of the first year of operation. As each agreement became effective at a different date and the cost of living was rising rapidly and at varying rates in different communities, it became apparent that such adjustments would upset the uniformity of minimum rates among regions. To insure continued uniformity in rates a National Shipbuilding Conference4 was held in May 1942 to consider wage adjustments in all regions. This conference established a uniform minimum wage rate of $1.20 an hour for all “ standard first-class skilled mechanics,” thereby eliminating the differential that applied to shipyards in the Gulf region under the first agreement. Rate increases of 8 cents an hour were also provided for others than first-class skilled mechanics, except on the Gulf coast, where the increases ranged from 9 cents for the lowest paid workers to 13 cents for the highest paid. These regional adjustments are not reflected in the wage data presented in this report.
Overtime provisions for Saturday and Sunday work were changed to apply to the sixth and seventh consecutive day instead of the calendar day. Holiday work is now paid at the rate of time and a half instead of double time, as provided by the original agreements.
W AGE TRENDS
The hourly earnings of shipyard workers have increased sharply since the start of the present war. Average earnings in a number of firms which report regularly to the Bureau advanced from 82.5 cents in September 1939 to $1,092 in June 1942. During the first year and a half after the war began the increase was gradual, the total rise amounting to about 10 cents. Between May and August 1941, however, hourly earnings advanced by approximately 12 cents. This period coincides with the establishment of zone stabilization agreements in the Atlantic, Gulf, and Great Lakes regions. A further sharp rise was to be expected as the second stabilization agreements became effective in the summer of 1942.
The above averages, it should be mentioned, are influenced to a considerable extent by premium overtime and shift-differential earn
4 A more detailed analysis of the latest shipbuilding-stabilization agreement was presented in the Monthly Labor Review for July 1942 (pp. 85-86).
502018°—42-----2
WAGE STABILIZATION 5
Digitized for FRASER http://fraser.stlouisfed.org/ Federal Reserve Bank of St. Louis
ings. The average weekly hours for the industry as a whole indicate that considerable overtime is being worked. Likewise, a very substantial portion of the labor force is employed on the second and third shifts at premium rates. Increases in extra payments for overtime and for late-shift work account for part of the gain in average hourly earnings. Earnings are also affected by changes in the composition of the labor force.
Plan of Bureau’s StudyAs already noted, detailed wage data were collected from a repre
sentative sample of 67 privately operated yards. Govemment-oper- ated yards were excluded from the study. In selecting the yards to- be studied, careful consideration was given to such factors as size and type of yard, kind of craft under construction, geographical location, and corporate affiliation of the company.
The data used in tins analysis were collected by trained field representatives of the Bureau, from pay rolls and other pertinent records. Occupational classifications were checked in each yard in order to insure a uniform basis for analyzing the data.
The figures presented in this report refer only to first-shift workers in occupations which are numerically important or are “ key” jobs, but the workers covered by this report include approximately 90 percent of all first (day) shift workers employed by the yards surveyed. The average hourly earnings reported include incentive-wage payments but do not take into consideration extra payments made for overtime work.
Although the pay periods studied were scattered throughout a period extending from November 1941 to April 1942, the data represent earnings in the spring of 1942. Some corrections of the data gathered were necessary in isolated instances in order to take account of general wage changes within individual plants between the period covered and April 1, 1942.
Hourly Earnings in Spring of 19429 Atlantic CoastTraditionally, the Atlantic coast has been the most important site
of the shipbuilding industry. Proximity to the most important shipping lanes, to labor markets, and to raw materials, together with the advantage of an early start, have been largely responsible for the concentration of a large part of the industry in this area. During the past 2 years, however, and especially within recent months, the war effort has brought about a rapid expansion of the industry in other areas. Despite this shift, the Atlantic coast region continues to maintain a leading position in the production of ships.
LABOR FORCE
The Atlantic coast region, like other areas, has had to recruit large numbers of workers of all skills. The skilled-labor requirements have been met, in part, by drawing upon the reserves of other industries in this industrialized area; by utilizing workers with single operative skills, thereby releasing all-round mechanics for more specialized work and for supervision and instruction; and by expanding the training
6 HOURLY EARNINGS IX PRIVATE SHIPYARDS
Digitized for FRASER http://fraser.stlouisfed.org/ Federal Reserve Bank of St. Louis

program. This new approach to the labor-supply problem has enabled the industry to draw upon a large labor market.
New workers in the shipbuilding industry often begin as helpers and ascend the scale to a job as first-class skilled mechanic, through a series of gradations. Consequently there is not much stability in the shipbuilding labor force from the standpoint of occupation and grade.
The occupational pattern among ship-construction yards on the Atlantic coast is more diversified than in any other region. Of the 61 numerically important or “ key” occupations studied for the industry as a whole, the Atlantic coast yards reported workers in each, with a substantial number in 29 of the occupations. The largest concentrations of workers are in the occupational groups of laborers (8.2 percent); learners (8.1 percent); and electric welders (6.9 percent). Other groups with relatively large numbers of workers, ranging between 4 and 6 percent of those studied, are shipfitters, shop machinists, electricians, and carpenters.
As has been pointed out in previous reports, many of the shipbuilding occupations include several grades or classifications of workers. In most of the yards, workers above the helper stage are classified as first-class, second-class, or third-class workers or as handymen, depending on their skill and experience. Outside of the first-class group, however, there is little uniformity in classes from one yard to another. For this reason it was necessary in the present study to combine into one broad group all classes other than the first class.
Grades or classifications within jobs were found in 32 occupations, which account for, as a group, 54 percent of the workers studied. No such refinement within jobs was found in the remaining 29 occupations, which comprised helpers in the various occupations (16.3 percent), learners and apprentices (10.8 percent), laborers (8.2 percent), supervisory workers (5.3 percent), and other workers (5.7 percent) such as draftsmen, watchmen, guards, etc.
The occupational arrangement in ship-repair yards parallels that of construction yards. Within occupations in which grades are found, however, the proportion of “ first-class” workers is on the whole substantially greater than in construction yards. This concentration on “ first-class” work is due to the nature of ship-repair work, which is highly diversified and requires a greater proportion of all-round workers. By comparison to construction yards, repair yards had more helpers, but fewer apprentices.
HOURLY EARNINGS BY OCCUPATION
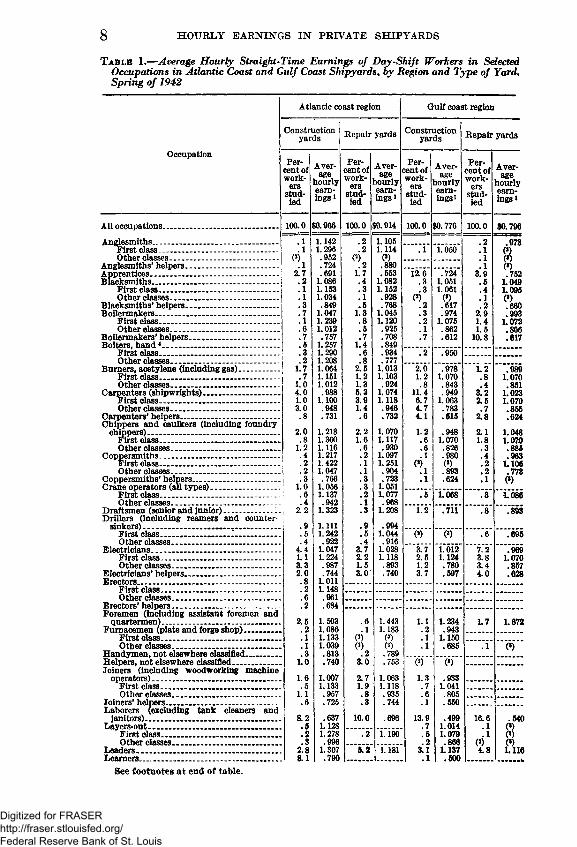
First-shift workers in the selected occupations in the Atlantic coast construction yards had straight-time earnings averaging 96.6 cents an hour (table l).5 This average, however, has only limited significance, because of the wide variation of occupational earnings, which ranged from a low of 63.7 cents for laborers to a high of $1,503 for foremen.
Nearly two-fifths (38.7 percent) of the first-shift workers were in jobs that had straight-time earnings averaging $1.00 or more per hour and somewhat over one-fifth (22.5 percent) were in occupations which averaged $1.12 or more per hour. On the other hand, a fourth of the workers (27.0 percent), most of whom were helpers, averaged between 68 and 80 cents per hour.
• Occupational earnings In the Gulf coast region, discussed below, are also presented in table 1.
ATLANTIC COAST— SPRING OF 1942 7
Digitized for FRASER http://fraser.stlouisfed.org/ Federal Reserve Bank of St. Louis
8 HOURLY EARNINGS IN PRIVATE SHIPYARDS
Tabijb 1.— Average Hourly Straight-Time Earnings of Day-Shift Workers in Selected Occupations in Atlantic Coast and Gulf Coast Shipyards, by Region and Type of Yard, Spring of 1942
Occupation
Atlantic coast region Gulf coast region
Constructionyards Repair yards Construction
yards Repair yards
Percent of work
ers studied
Aver-vageihourlyearnings*
Percent of work
ers studied
Average
hourlyearnings1
Percent of work
ers studied
Average
hourlyearnings1
Percent of work
ers studied
Average
hourlyearnings*
100.0 $0,966 100.0 $0,914 100.0 $0,776 100.0 $0,796.1 1.142 .2 1.105 .2 .973
(s).1 1.296 .2 1.114 .1 1.050 .1(*) .952 (2) (3) .1 (*).1 .724 .2 .880 .1 (3)
i 2.7 .691 1.7 .553 12.6 .724 3.9 .752i .2 1.086 .4 1.082 .3 1.051 .5 1.049.1 1.153 .3 1.152 .3 1.061 .4 1.095.1 1.034 .1 .928 (’) (*) .1 (*).3 .849 .5 .768 .2 .617 .2 .660
.7 1.047 1.3 1.045 .3 .974 2.9 .993
.1 1.239 .8 1.120 .2 1.075 1.4 1.072
.6 1.012 .5 .925 .1 .862 1.5 .806
.7 .757 .7 .708 .7 .612 10.8 .617.5 1.257 1.4 .849
.3 1.290 .6 .934 .2 .950! .2 1.208 .8 .777
1.7 1.064 2.5 1.013 2.0 .978 1.2 .989.7 1.151 1.2 1.103 1.2 1.070 .8 1.070
1.0 1.012 1.3 .924 .8 .843 .4 .8514.0 .988 5.3 1.074 11.4 .949 3.2 1.0231.0 1.100 3.9 1.118 6.7 1.063 2.5 1.0703.0 .948 1.4 .946 4.7 .783 .7 .855.8 .731 .6 .732 4.1 .615 2.8 .624
2.0 1.218 2.2 1.070 1.2 .948 2.1 1.048.8 1.360 1.6 1.117 .6 1.070 1.8 1.0701.2 1.116 .6 .930 .6 .826 .3 .885.4 1.217 .2 1.097 .1 .980 .4 .963
i 2 1.422 .1 1.251 (’) (*) .2 1.106. 2 1.047 .1 .904 .1 .893 .2 .773.3 .766 .3 .723 .1 .624 .1 (*)1.0 1.056 .3 1.051.6 1.137 .2 1.077 .5 1.068 .3 1.086.4 .942 .1 .968
2.2 1.323 .3 1.208 1.2 .711 .8 .893.9 1. Ill .9 .994.5A 1.242Q OO .5A 1.044Q1A (’) (3) .6 .695
4.4 1.047 3.7• VlO
1.028 " 3. 7" '17612” " '7 .Y " ’ .’ 9691.1 1.224 2.2 1.118 2.5 1.124 3.8 1.0703.3 .987 1.5 .893 1.2 .780 3.4 .8572.0 .744 3.0 .740 3.7 .597 4.0 .028.8 1.011.2 1.148.6 .961.2 .684
2.5 1.503 .6 1.443 1.1 1.234 1.7 1.672.2 1.086 .1 1.183 .2 .943.1 1.133 (2) (3) .1 1.150.1 1.039 (*) (3> .1 .685 .1 (*).3 .813 .2 .789
1.0 .740 3.0 .753 (2) (*)1.6 1.007 2.7 1.063 1.3 .933.5 1.133 1.9 1.118 .7 1.041
1.1 .957 .8 .935 .6 .805.6 .725 .3 .744 .1 .550
8.2 .637 10.0 .696 13.9 .499 16.6 .540.5 1.128 .7 1.014 .1 (*).2 1.278 .2 1.190 .5 1.079 .1 ».3 .996 .2 .866 (8) (*)
2.8 1.307 5.2 1.181 3.1 1.137 4.8 1.1168.1 .790 .1 .500
All occupations.............................................Anglesmiths.................................................
First class...............................................Other classes...........................................
Anglesmiths’ helpers....................................Apprentices..................................................Blacksmiths..................................................
First class...............................................Other classes..........................................
Blacksmiths’ helpers....................................Boilermakers................................................
First class...............................................Other classes......................................... .
Boilermakers’ helpers.................................. .Bolters, hand *..............................................
First class..............................................Other classes...................................... ....
Burners, acetylene (including gas)...............First class..............................................Other classes..,,.....................................
Carpenters (shipwrights)..............................First class..............................................Other classes..........................................
Carpenters’ helpers.............................. ........Chippers and caulkers (including foundry
chippers)....................................................First class.............................................. .Other classes...........................................
Coppersmiths............. - ...............................First class. ............................................Other classes.........................................
Coppersmiths’ helpers.................................Crane operators (all types)..........................
First class..............................................Other classes.........................................
Draftsmen (senior and junior)........... .......1Drillers (including reamers and counter
sinkers)....................... ............................First class.......................... -.................Other classes.................. .......................
Electricians......... .......................................First class..............................................Other classes........................................
Electricians’ helpers....................................Erectors.......................................................
First class..............................................Other classes.........................................
Erectors’ helpers..........................................Foremen (including assistant foremen and
quartermen)....................................Fumacemen (plate and forge shop)__
First class....................................Other classes................................
Handymen, not elsewhere classified__Helpers, not elsewhere classified........Joiners (including woodworking machine
operators).........................................First class.....................................Other classes.................................
Joiners’ helpers........ .........................Laborers (excluding tank cleaners and
janitors)...........................................Layers-out-.......................................
First class.....................................Other classes................................
Leaders..............................................Learners.............................................
See footnotes at end of table.
Digitized for FRASER http://fraser.stlouisfed.org/ Federal Reserve Bank of St. Louis

ATLANTIC COAST— SPRING OF 1942 9T a b l e 1 .—Average Hourly Straight-Time Earnings of Day-Shift Workers in Selected
Occupations in Atlantic Coast and Gulf Coast Shipyards, by Region and Type of Yard, Spring of 1942— Continued
Occupation
Atlantic coast region Gulf coast region
Constructionyards Repair yards Construction
yards Repair yards
Percent of work
ers studied
Average
hourlyearnings1
Percent of work
ers studied
Average
hourlyearnings1
Percent of work
ers studied
Average
hourlyearnings1
Percent of work
ers studied
Average
hourlyearnings1
0.5 $1,200 0.1 $1.192 0.3 $1,079 0.5 $1.100.2 1.348 . 1 1.448 .1 1.253 .2 1.280.3 1.084 (*) (3) .2 .978 .3 .9205.3 1.077 3.5 1.060 2.4 .971 3.2 1.034
1.8 1.256 2.2 1.124 1.5 1.048 2.7 1.0703.5 .990 1.3 .953 .9 .855 .5 .8451.2 .731 1.2 .750 1.4 .605 2.1 .6332.6 1.024 7.3 1.045 1.2 1.020 2.5 1.043.6 1.171 4.7 1.121 .9 1.070 2.0 1.070
2.0 .983 2.6 .903 .3 .874 .5 .9351.4 .735 2.7 .754 .7 .647 3.7 .634.3 1.136.1 1.265 (’) (8) .1 (8).2 1.048
3.1 1.074 3.0 .863 2.1 .837 2.6 1.0241.0 1.204 .5 .919 1.0 1.017 1.7 1.0702.1 1.012 2.5 .853 1.1 .674 .9 .936.2 1.318 (*) (8).1 1.327 .1 1.280 (*) (3) .1 (8).1 1.297 (*) (3)3.4 1.050 3.7 1.034 2.7 .983 2.8 1.042.9 1.201 2.1 1.118 1.6 1.066 2.5 1.070
2.5 .999 1.6 .931 1.1 .868 .3 .8202.5 .754 3.5 .744 3.9 .615 4.1 .643.6 1.044 .3 .947 .3 .915 1.6 .774.2 1.160 .2 1.060 .1 1.056 .4 1.070.4 1.005 .1 .823 .2 .788 1.2 .685
1.2 .754 .2 .732 .2 .634 1.7 .606.2 1.029.1.1
1.148 .935 (*) (3) .2 .950 .2 1.103
1.2 1.049 2.8 .955 .6 .975.4 1.161 .9 1.119 .3 1.067 .1 (8).8 1.002 1.9 .878 .3 .910.8 .882 3.2 .876 1.8 .839 1.1 .795.2 .978 3.1 .879 .4 .997 .3 .930.6 .858 .1 .801 1.4 .798 .8 .754.4 .973 .7 .865 00 (3) .5 .713.4 1.196 .4 1.111 .1 .660 .6 .734.3 .909 .4 ..765 .7 .685.5 1.348 1.7 1.142 .4 1.056.2 1.498 1.6 1.151 .4 1.070 .4 1.174.3 1.261 .1 .924 (2) (3)3.0 1.077 1.5 .944 .4 .956 1.0 .936.6 1.302 .4 1.115 .2 1.038 .4 1.087
2.4 1.013 1.1 .881 .2 .850 .6 .8181.4 .779 1.5 .709 .2 .620 1.5 .6455.8 1.015 2.2 .969 3.6 .947 1.1 .920.9 1.169 .8 1.128 1.8 1.061 .4 1.101
4.9 .988 1.4 .885 1.8 .834 .7 .8042.4 .743 2.6 .746 6.1 .587 .4 .609.9 .877 .2 .812
(’) (8).1 1.105(2) 1.255 (’ ) (8).1 1.030
.2 .691 (>) (3) 00 (8) .1 (3)1.0 .660 4.7 .746 i.9 .507 1.2 .450
.2 1.196 .3 1,119
.1 1.241 .3 1.135 (*) (8).1 1.112 (2) (8)6.9 1.148 3.2 1.018 4.0 .9681.3 1.445 1.8 1.090 2.5 1.061 1.5 1.0915.6 1.079 1.4 .925 1.5 .814.2 .713 1.0 .739 2.6 .625
Loftsmen......................................................First class.............................................. .Other classes...........................................
Machinists, shop......................................... .First class. *...................... ................... .Other classes...........................................
Machinists* helpers, shop............................ .Machinists, outside..................................... .
First class.............................................. .Other classes...........................................
Machinists’ helpers, outside.........................Molders, foundry..........................................
First class................... .... ..................Other classes...........................................
Painters, brush and spray. .......................First class...............................................Other classes...........................................
Pattern makers............. .............................First class..............................................Other classes......................................... .
Pipefitters (including plumbers)................. .First class...............................................Other classes..........................................
Pipefitters* helpers (including plumbers’helpers).................................................... .
Plate-shop machine operators.......................First class...............................................Other classes......................................... .
Plate-shop machine operators* helpers..........Regulators ....................................................
First class..............................................Other classes..................... ................... .
Riggers, ship................................................First class...................... .......................
Riggers, yard and crane................................First class...............- ..............................Other classes...........................................
Rivet heaters................................................Rivet holders-on...........................................Rivet passers................................................Riveters........................................................
First class................... ...........................Other classes..........................................
Sheet-metal workers (including tinsmiths)...First class...............................................Other classes...........................................
Sheet-metal workers* helpers........................Shipfitters.....................................................
First class...............................................Other classes.......... ...............................
Shipfitters* helpers........................................Stage builders..............................................Tank cleaners...............................................Toolmakers and diemakers...................... .
First class...............................................Other classes.................- ........................
Tracers.........................................................Watchmen and guards..................................Welders, acetylene (including gas)...............
First class.............................................Other classes...........................................
Welders, electric...........................................First class...............................................Other classes...........................................
Welders* helpers, electric..............................
i Excluding earnings resulting from extra pay for overtime work.* Less than a tenth of 1 percent.* Number of workers too small to justify computation of average.* Includes a small number of machine bolters.
Digitized for FRASER http://fraser.stlouisfed.org/ Federal Reserve Bank of St. Louis

First-class workers averaged $1.12 or more per hour in all but two occupations—yard and crane riggers (97.8 cents), and carpenters ($1.10). The former generally were not considered to be skilled mechanics, and the latter, although generally paid the minimum, received lower rates in a few yards. Little uniformity in earnings was found in the various groups designated as “other classes.” These groups, which comprise second- and third-class craftsmen and handymen in their respective occupations, had earnings ranging from 92.2 cents for drillers to $1,116 for chippers and caulkers.
The variations in earnings in ship-construction yards on the Atlantic coast are due not only to different wage policies, but also to differences in the composition of the labor force, the type of ships built, and the size and location of the yards.
The average earnings of first-class craftsmen and helpers are less affected than the “other classes” by differences in composition of the labor force among yards. Included in the groups designated as “other classes” are varying proportions of second- and third-class workers and handymen. This results in some differences in the averages for workers in the “other classes,” among occupations which might be expected to have similar rates of pay. The average earnings of all the workers are somewhat affected by size of yard. Large yards as a whole in this region pay rates averaging about 9 cents an hour more than the small yards.
One of the most important factors making for dissimilarity in the occupational averages on the Atlantic coast is the widespread use of incentive methods of pay. Nearly 45 percent of all the workers were paid on an incentive basis and the hourly earnings of these workers averaged 18.5 percent more than their guaranteed base rates. Incentive premiums accounted for about 8 percent of the earnings of all workers in the region as a whole.
The significance of the incentive payments is clearly reflected in the average hourly earnings of such occupations as riveters, electric welders, and chippers and caulkers. The first-class craftsmen in each of the three occupations averaged more than leaders ($1,307) and almost as much as foremen ($1,503). Incentive premiums accounted for more than 25 percent of the average hourly earnings of these first- class workers.
Substantial variations in occupational earnings are found from yard to yard, although within a given yard (except for variations resulting from incentive earnings) the averages are fairly uniform. The variations from one yard to another are clearly brought out by the following figures for typical occupations. Each figure represents the average for an individual yard:
10 HOURLY EARNINGS IN PRIVATE SHIPYARDS
First class Other classesChippers and caulkers_____________________$0. 610-$2. 037 $0. 894-$ 1. 699Electricians____ __________ _______________ . 625- 1. 470 . 720- 1. 135Sheet-metal workers______________________ . 780- 1. 532 . 704- 1. 333Shop machinists__________________________ . 840- 1. 554 . 641- 1. 156Electric welders__________________________ . 800- 2. 002 . 720- 1. 275
Within the above extremes, it should be noted, first-class workers in most of the yards are paid rates approaching the minimum of the zone standard.
In ship-repair yards on the Atlantic coast, workers averaged 91.4 cents an hour, or 5.2 cents less than workers in ship-construction yards.
Digitized for FRASER http://fraser.stlouisfed.org/ Federal Reserve Bank of St. Louis
This difference was due, not primarily to lower wage scales, but rather to the relative infrequency of incentive-wage payment in the repair yards.
The highest paid workers in the repair yards were first-class lofts- men, who averaged $1,448 an hour. First-class workers in several other occupations, normally considered highly skilled, also had averages above that for leaders ($1,181 an hour). Apprentices (55.3 cents), and laborers (69.6 cents), totaling 11.7 percent of all the ship- repair workers studied in this area, earned least. Helpers generally averaged between 70 and 76 cents an hour.
APPLICATION OF THE STABILIZATION AGREEMENT
The actual effect of the first Atlantic coast stabilization agreement upon the earnings of ship-construction workers can be appraised, in part, from the averages presented in table 1. The agreement established a minimum rate of $1.12 an hour for standard first-class skilled mechanics. The average earnings for first-class workers indicate that 29 occupations included skilled mechanics apparently deemed to be subject to the agreed hourly minimum. These occupations were as follows:
Anglesmiths Machinists, shopBlacksmiths Molders, foundryBoilermakers Painters, brush and sprayBurners, acetylene Pattern makersCarpenters (shipwrights) PipefittersChippers and caulkers Plate-shop machine operatorsCoppersmiths RegulatorsCrane operators Riggers, shipElectricians RivetersErectors Sheet-metal workersFurnacemen ShipfittersJoiners Tool and die makersLayers-out Welders, acetyleneLoftsmen Welders, electricMachinists, outside
Of the listed occupations only one, carpenters (shipwrights), included first-class mechanics averaging less than $1.12 an hour. Even these workers were generally paid the established minimum, and their low average ($1.10) was the result of substandard wages in a few yards constructing wooden ships, which employed relatively large numbers of carpenters.
Table 1 also reveals that supervisory workers, draftsmen, and a few other occupational groups averaged more than the established minimum for first-class mechanics. Foremen and leaders have been excluded from the list of “ first-class skilled mechanics/1 as they generally are expected to be paid more than their subordinates. Draftsmen usually are not assigned a “ class,” but are paid on the basis of individual ability. Hand bolters, drillers, and rivet holders-on have also been excluded from the list on the ground that incentive rates rather than application of the minimum rate account for the high averages in these occupations. The basic hourly rates in these occupations were typically below $1.12.
In the repair yards 21 occupations showed averages of $1.09 or more per hour for first-class workers. Although the hourly averages for a few of these occupations were somewhat below the minimum of $1.12, most yards paid at least the minimum rate to first-class mechanics.
ATLANTIC COAST— SPRING OF 1942 11
Digitized for FRASER http://fraser.stlouisfed.org/ Federal Reserve Bank of St. Louis
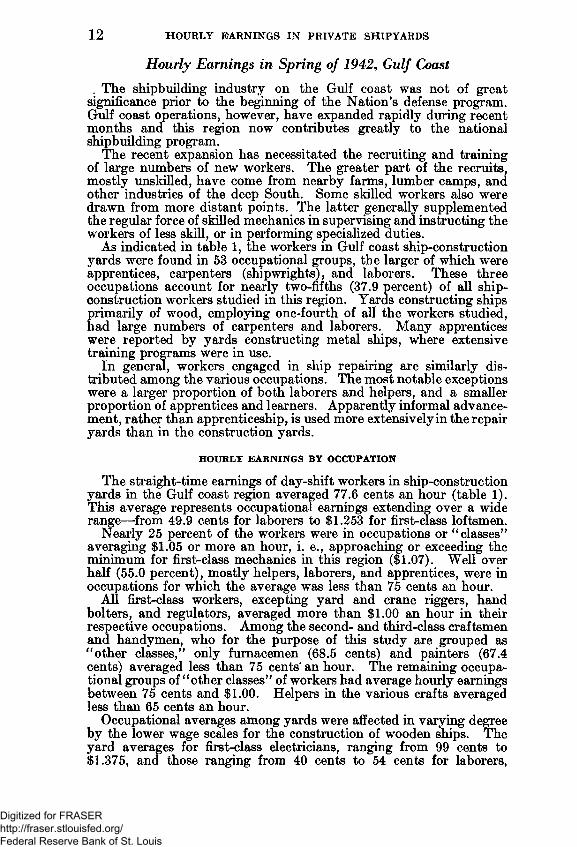
Hourly Earnings in Spring of 1942, Gulf Coast. The shipbuilding industry on the Gulf coast was not of great
significance prior to the beginning of the Nation’s defense program. Gulf coast operations, however, have expanded rapidly during recent months and this region now contributes greatly to the national shipbuilding program.
The recent expansion has necessitated the recruiting and training of large numbers of new workers. The greater part of the recruits, mostly unskilled, have come from nearby farms, lumber camps, and other industries of the deep South. Some skilled workers also were drawn from more distant points. The latter generally supplemented the regular force of skilled mechanics in supervising and instructing the workers of less skill, or in performing specialized duties.
As indicated in table 1, the workers in Gulf coast ship-construction yards were found in 53 occupational groups, the larger of which were apprentices, carpenters (shipwrights), and laborers. These three occupations account for nearly two-fifths (37.9 percent) of all ship- construction workers studied in this region. Yards constructing ships primarily of wood, employing one-fourth of all the workers studied, had large numbers of carpenters and laborers. Many apprentices were reported by yards constructing metal ships, where extensive training programs were in use.
In general, workers engaged in ship repairing are similarly distributed among the various occupations. The most notable exceptions were a larger proportion of both laborers and helpers, and a smaller proportion of apprentices and learners. Apparently informal advancement, rather than apprenticeship, is used more extensively in the repair yards than in the construction yards.
HOURLY EARNINGS BY OCCUPATION
The straight-time earnings of day-shift workers in ship-construction yards in the Gulf coast region averaged 77.6 cents an hour (table 1). This average represents occupational earnings extending over a wide range—from 49.9 cents for laborers to $1,253 for first-class loftsmen.
Nearly 25 percent of the workers were in occupations or “ classes” averaging $1.05 or more an hour, i. e., approaching or exceeding the minimum for first-class mechanics in this region ($1.07). Well over half (55.0 percent), mostly helpers, laborers, and apprentices, were in occupations for which the average was less than 75 cents an hour.
All first-class workers, excepting yard and crane riggers, hand bolters, and regulators, averaged more than $1.00 an hour in their respective occupations. Among the second- and third-class craftsmen and handymen, who for the purpose of this study are grouped as “ other classes,” only fumacemen (68.5 cents) and painters (67.4 cents) averaged less than 75 cents* an hour. The remaining occupational groups of “ other classes” of workers had average hourly earnings between 75 cents and $1.00. Helpers in the various crafts averaged less than 65 cents an hour.
Occupational averages among yards were affected in varying degree by the lower wage scales for the construction of wooden ships. The yard averages for first-class electricians, ranging from 99 cents to $1,375, and those ranging from 40 cents to 54 cents for laborers,
12 HOURLY EARNINGS IN PRIVATE SHIPYARDS
Digitized for FRASER http://fraser.stlouisfed.org/ Federal Reserve Bank of St. Louis
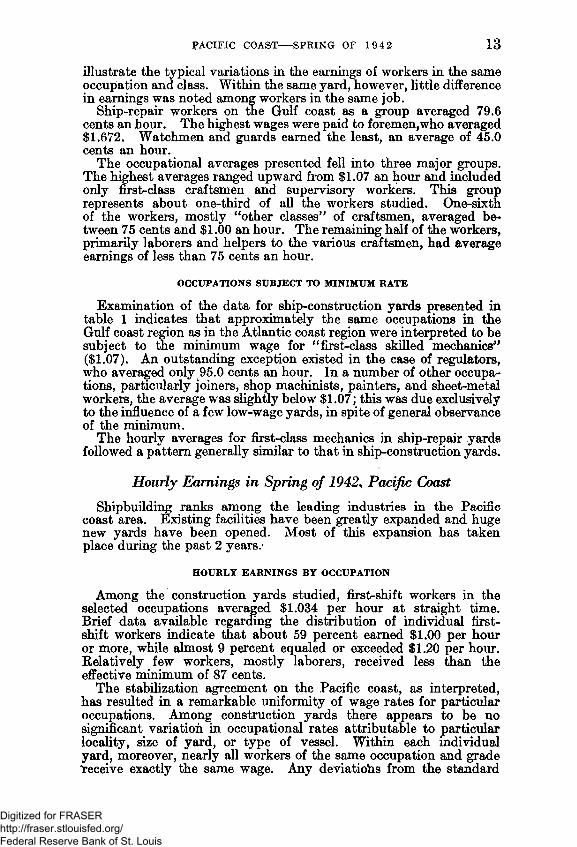
illustrate the typical variations in the earnings of workers in the same occupation and class. Within the same yard, however, little difference in earnings was noted among workers in the same job.
Ship-repair workers on the Gulf coast as a group averaged 79.6 cents an hour. The highest wages were paid to foremen,who averaged $1,672. Watchmen and guards earned the least, an average of 45.0 cents an hour.
The occupational averages presented fell into three major groups. The highest averages ranged upward from $1.07 an hour and included only first-class craftsmen and supervisory workers. This group represents about one-third of all the workers studied. One-sixth of the workers, mostly “ other classes” of craftsmen, averaged between 75 cents and $1.00 an hour. The remaining half of the workers, primarily laborers and helpers to the various craftsmen, had average earnings of less than 75 cents an hour.
OCCUPATIONS SUBJECT TO MINIMUM RATE
Examination of the data for ship-construction yards presented in table 1 indicates that approximately the same occupations in the Gulf coast region as in the Atlantic coast region were interpreted to be subject to the minimum wage for “ first-class skilled mechanics” ($1.07). An outstanding exception existed in the case of regulators, who averaged only 95.0 cents an hour. In a number of other occupations, particularly joiners, shop machinists, painters, and sheet-metal workers, the average was slightly below $1.07; this was due exclusively to the influence of a few low-wage yards, in spite of general observance of the minimum.
The hourly averages for first-class mechanics in ship-repair yards followed a pattern generally similar to that in ship-construction yards.
Hourly Earnings in Spring of 1942, Pacific CoastShipbuilding ranks among the leading industries in the Pacific
coast area. Existing facilities have been greatly expanded and huge new yards have been opened. Most of this expansion has taken place during the past 2 years/
HOURLY EARNINGS B Y OCCUPATION
Among the construction yards studied, first-shift workers in the selected occupations averaged $1,034 per hour at straight time. Brief data available regarding the distribution of individual first- shift workers indicate that about 59 percent earned $1.00 per hour or more, while almost 9 percent equaled or exceeded $1.20 per hour. Relatively few workers, mostly laborers, received less than the effective minimum of 87 cents.
The stabilization agreement on the Pacific coast, as interpreted, has resulted in a remarkable uniformity of wage rates for particular occupations. Among construction yards there appears to be no significant variation in occupational rates attributable to particular locality, size of yard, or type of vessel. Within each individual yard, moreover, nearly all workers of the same occupation and grade receive exactly the same wage. Any deviations from the standard
PACIFIC COAST----SPRING OF 1942 13
Digitized for FRASER http://fraser.stlouisfed.org/ Federal Reserve Bank of St. Louis

are likely to be for “ specialists,” who receive a premium of a few cents an hour. Because of this uniformity of rates, the averages presented in table 2 are particularly representative. In the case of first-class craftsmen, it may be assumed that an overwhelming majority actually received a rate within 2 or 3 cents of the average shown.
14 HOURLY EARNINGS IN PRIVATE SHIPYARDS
T a b l e 2 .— Average Hourly Straight-Time Earnings of Day-Shift Workers in Selected Occupations in Pacific Coast Shipyards, by Type of Yard, Spring of 1942
Construction yards Repair yards
Occupation Percent of workers studied
Averagehourly
earnings1Percent of workers studied
Average hourly
earnings1
A]] oociipfttinns , -n- -r - 100.0 $1,034 100.0 $1.166Anglp.fSTrnt.hs, first, nlass __ __ _ . _ (*) . i
1.267
CO 33
i
A-nglflpmfthfl helpp.rs . _ 1.000Apprentices_____________-______________________ .4 .717Blacksmiths __.... .............. ... .1 1.132
First class____ ___-___________ ____ ________ .1 1.151 .2 1.264Other classes ___ (2) .1
1.033'Rla<’ r̂s'm̂t.h«I, helpers....... . r_ _ .873 .4 .983Boilermakers . ________ ___ _______ .3 1. Ill
First class__________________________________ 3 1.121 3.4 1.250Other classes ........... . ........... (’ )
.6<*)
2.43.5 3.3
1.037Boilermakers* helpers____________________ _______ .866 5.7 .970Bolters, machine, first class____ 1.130Bolters, hand, first class .871 .3 .984■Riirnp.rs, p.cetylene (inclining gas) _ _ 1.116 2.6 1.244
First class__________________ _____ _________ 1.123 2.4 1.250Other classes____ ______. _______ ______ ______ .2 1.001 .2 1.155
Carpenters (shipwrights)..........______ _____ _____ 3.83.71
1.121 6.8 1.248First class________. . . . . . . . ............... ..................... 1.128 6.7 1.250Other classes___________ . . . . _____________ ____ .941 .1 1.120
Carpenters' helpers______________________________ 1.53.73.07
.870 1.1 .970Chippers and caulkers (including foundry chippers).—
First class___________________________________1.100 1.123
1.0.9
1.3401.378
Other classes___. . . . . ________________________ 1.001 .1 1.128Coppersmiths_________. . . ___——_______________ .*2
. 11.091
First class____ ________s_________________ ___ 1.167 .1 1.314Other classes __. . . .________ ____________ __ 1 .992
Coppersmiths’ helpers___________________________ (’ ) 9.870 .3 .970
r.rane operators, all types, first class,..,__ ___ 1.191 .2 1.307Draftsmen (senior and junior)_____________________
1.01.0
(*) 2.7
1.116 .] (3)1.118Drillers (including reamers and countersinkers)______ 1.000 1.3
First class__________________________________ 1.000 1.2 1.120Other classes________________________________ (8) .1 (*)Electricians______ . . . . . __________________________ 1.133First class___ . . . . . . . _________________________ 2.6.1
1.140 6.7 1.250Other cla-ggftg___. . . . __________________________ 1.007
Electricians* helpers_____________________________ .91.2
.871 4.2 .970Foremen (including assistant foremen and quartermen). Fumacemen, plate and forge shop_________________
1.421 .3.1
1.750 1.133
First class__________________. . . . _____________ .3 1.232 0 .1 (3)Other classes_______________ . . . ______________ <*)Helpers, not elsewhere classified.._. . . ______________ .3
1.21.2
.860. Joiners (including woodworking machine operators). ..
First class_____________________________ _____1.1231.123 5.7 1.251
Other classes__________________________ -____ (*) .3<*)
.836Joiners* helpers___________________ __________ ___ 1.1 .970Laborers (excluding tank cleaners and janitors)...... ...... 5.8 .797 2.4 .890Layers-out, first cflasg____ ________________________ .4 1.235Leaders___________________________________- ....... 6.1 1.263 5.6 1.459T'OftsmeTi , r ____ __________ .6 1.229
First class —.................. .......... ....................-....... .5 1.254Other classes________________________ ______ . 1 1.049
Machinists, shop......................................................... 2.6 1.120 3.8 1.257First class.............. ....... ....... ................................. 2.4 1.128 3.7 1.259Other classes________________________________ .2 1.009 .1 (3)
.970Machinists* helpers, shop___________ _______ _____ 1.5 .867 .8Machinists, outside.____— _____________________ 1.2
1.11.122
First class_____________________ _____________ 1.127 5.8 1.250Other classes ____ . . . . . . . _________________ .1 1.029
Machinists’ helpers, outside________ _____________ .6 .870 3.4 .970Molders, foundry, first class _____ —_____________ (*)
2.81.145
Painters, brush and spray, first class_______________ 1.123 4.7 1.250Pattern makers, first class............................................. (*) 1.489
See footnotes at end of table.
Digitized for FRASER http://fraser.stlouisfed.org/ Federal Reserve Bank of St. Louis

PACIFIC COAST— SPRING OF 1942 15T a b le 2.— Average Hourly Straight-Time Earnings of Day-Shift Workers in Selected Occupations in Pacific Coast Shipyards, by Type of Yard, Spring of 1942—Continued
Construction yards Repair yards
Occupation Percent of workers studied
Average hourly
earnings1Percent of workers studied
Average hourly
earnings1
PipftfHt-ftrs (including plumbers)____ - . _. _ 3.4 $1.118 1.122
3.7 $1,2491.250
(*) .9701.1971.201
(8)1.038
* First class____ _~-T______ 1_____________ . _____ 3.3 3.7Other places , . ........ .1 .973 <2) 3.5
.5Pipefitters’ helpers (including plumbers’ helpers)... . Pl**te-&hoprnachir>eoperatorsr,, .
3.11.6
.870 1.061
First class.......................... .......... ..................... .... 1.0 1.118 .5Other classes___ . .............. .......... ............. .6 .974
< !).SPlate-shop machine operators* helpers______________ 1.2 .877Regulators, first class____________________________ .7 1.053 2.2 1.170
1.250 1* 158 1.120
Riggers, ship, first class_________________ _________ .2 1.130 2.5Riggers, yard and crane, first .......... .................. . 2.0 1.065 .5
.1Rivet heaters_____________ —_________ _____ _____ .3 1.000Rivet passers______ -_____. . . __________________ («) .4
.896Rivet holders-on____ -________________________ 1.006
1.122.2.4
1.177 1.241Riveters, first class______________________________ .3
Sheet-metal workers (including tinsmiths)................ . 1.3 1.080 2.6 1.216First class_______________________ __________ .8 1.129 2.0 1.250Other classes__________________________ _____ .5 .993 .6 1.101
.9718heet*metal workers' helpers_________ ______ _____ .9 .872 2.0Shipfitters................................. ................................... 8.1 1.090
First class...................... ......................................... 6.0 1.121 1.6 1.250Other classes_________________ ________ ______ 2.1 1.002
Shipfitters' helpers........... .......................................... 10.1 .870 3.0 .970Stage builders............. ........... ................................... 2.1 1.000 1.1 1.120Tank cleaners________________________ ________ 1.4 .850 1.4 .954Tool and die makers________________ _______ _____ .1 1.174
First class___________________ -.......................... .1 1.195Other classes_____________ ___________________
W .2 (8).831Tracers_______________________ -_______________Watchmen and guards__________________________ .9 .808 1.0 .890Welders, acetylene (including gas), first class................ .1 1.120Welders, electric____________________ ___________ 12.1 1.122 4.7 1.254
First class.............................................................. 11.5 1.127 4.3 1.264Other classes_________ ____ ________________ .6 1.020 .4 1.142
Welders' helpers, electric___ _____________________ 1.5 .869 .3 .970
i Excluding earnings resulting from extra pay for overtime work.* Less than a tenth of 1 percent.* Number of workers too small to justify computation of average.
It is evident that the pattern makers, who averaged nearly $1.50 per hour, were the highest paid workers studied, while the lowest paid were apprentices (71.7 cents) and laborers (79.7 cents). Two- fifths (41.9 percent) of the workers were in jobs paying about $1.12 (from $1.11 to $1.13, inclusive) and another 25 percent received about 87 cents, the customary rate for helpers. The most commoif other rate appears to have been $1.00 per hour, paid to first-class drillers, rivet heaters and holders-on, stage builders, anglesmiths’ helpers, and various other groups.
The table also reveals that the term “ first class” has been interpreted rather broadly. It was impracticable in this study for the Bureau’s representatives to give more than general guidance in the classification of workers by skill, and the classes used in the Bureau’s tabulations are essentially those used by the shipyards themselves. It is significant to note, therefore, that among the workers included in the study some occupations consisted exclusively of first-class workers—for example, crane operators, painters, and riveters—while many of the others were composed largely of first-class workers. Of
Digitized for FRASER http://fraser.stlouisfed.org/ Federal Reserve Bank of St. Louis
all the workers included in the 28 occupations6 generally recognized as subject to the minimum rate in this region, 89 percent were classified as “ first class” and only 11 percent were in other classes. These include second- and third-class craftsmen, handymen, and trainees. The Bureau’s representatives reported no evidence that second- or third-class journeymen were listed on the pay roll as helpers.
Although the stabilization agreement did not provide rates for workers engaged in ship repair on the Pacific coast, the earnings of these workers, as a whole, averaged about 13 cents an hour more ($1,166) than was paid to ship-construction workers. This higher earnings level can be attributed to the negotiations between organized labor and repair-ya'rd operators, which resulted in the establishment of a $1.25 wage scale for first-class mechanics on ship repair, as compared to $1.12 for new construction. Ship-repair workers other than than first-class mechanics also were generally paid higher rates than prevailed in construction yards.
The highest paid workers in the repair yards were the foremen, who averaged $1.75 per hour, and the layers-out, who averaged $1,459. Apprentices (65.9 cents), laborers (89.0 cents), and watchmen and guards (89.0 cents) received the lowest wages. Helpers typically received 97 cents per hour. In repair yards, as in construction yards, arge proportions of all “ mechanics” were rated as “ first class.”
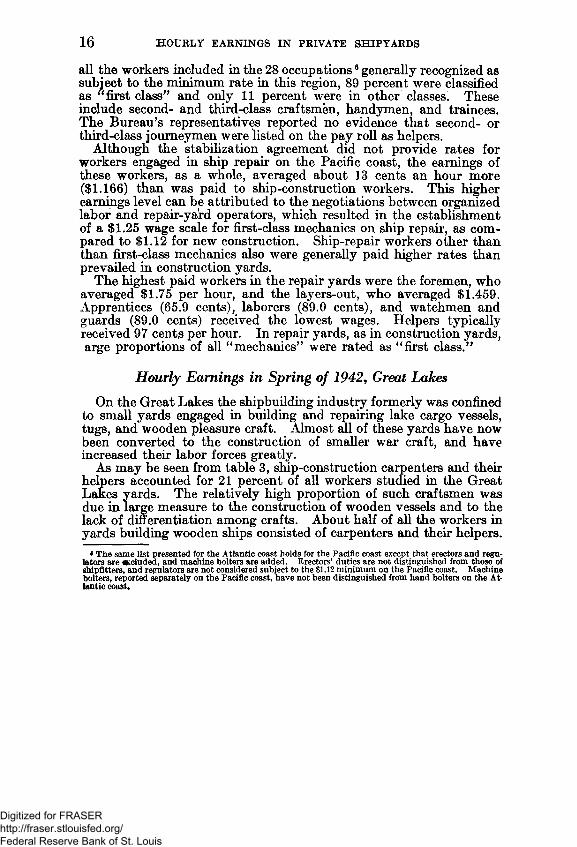
Hourly Earnings in Spring of 1942, Great LakesOn the Great Lakes the shipbuilding industry formerly was confined
to small yards engaged in building and repairing lake cargo vessels, tugs, and wooden pleasure craft. Almost all of these yards have now been converted to the construction of smaller war craft, and have increased their labor forces greatly.
As may be seen from table 3, ship-construction carpenters and their helpers accounted for 21 percent of all workers studied in the Great Lakes yards. The relatively high proportion of such craftsmen was due in large measure to the construction of wooden vessels and to the lack of differentiation among crafts. About half of all the workers in yards building wooden ships consisted of carpenters and their helpers.
• The same list presented for the Atlantic coast holds for the Pacific coast except that erectors and regulators are deluded, and machine bolters are added. Erectors’ duties are not distinguished from those of shipfitters, and regulators are not considered subject to the $1.12 minimum on the Pacific coast. Machine bolters, reported separately on the Pacific coast, have not been distinguished from hand bolters on the Atlantic coast.
16 HOURLY EARNINGS IN PRIVATE SHIPYARDS
Digitized for FRASER http://fraser.stlouisfed.org/ Federal Reserve Bank of St. Louis

GREAT LAKES— SPRING OF 1942 17T a b l e 3 .—Average Hourly Straight-Time Earnings of Day-Shift Workers in Selected
Occupations in Great Lakes and inland Shipyards, by Region and Type of Yard, Spring of 1942
Occupation
Great Lakes region Inland region
Construction yards Repair yards Construction yards
Percentof
workersstudied
. Average hourly
earnings1
Percentof
workersstudied
Averagehourly
earnings1
Percentof
workersstudied
Averagehourly
earnings1
100,0 $0,861 100.0 $1,013 100.0 $0,795.3 .900 .2 (}).1 (J) .1 m.2 .875 .1.3 .707.1 (>) .5 .755 1.0 .646.6 .969 .5 1.110 .6 .960.3 1.035 .4 1.120 .4 1.012.3 .902 .1 (*) .2 (*).7 .751 .8 .813 .7 .609.1 (*) .2 (*).1 (*) .1 (3)
(*) (*) .1 (*)1.3 .821
3.0 .741 8.1 .979.7 .780 6.7 1.021
2.3 .730 1.4 .7801.8 .968 2.6 1.141 1.4 .8541.0 1.069 2.4 1.158 .2 0.8 .829 .2 (a) 1.2 .844
14.7 .983 3.2 1.095 3.9 .9267.9 1.085 2.3 1.120 2.3 1.0046.8 .863 .9 1.032 1.6 .8176.3 .711 2.8 .840 .5 .7022.3 .975 2.7 1.113 1.5 .9011.4 1.091 1.6 1.179 .5 .925.9 .792 1.1 1.010 1.0 .890.1 (2)
(*).1(*) (*)
.2 .778
.8 1.000 1.1 1.152 1.4 .957
.4 .991 .9 1.167 .6 .925
.4 1.010 .2 (*) .8 .9833.0 .933 2.0 1.360.5 .810 1.8 1.010.2 .850 1.6 1.019.3 .783 .2 (2)2.9 .985 3.3 1.135 2.7 .913
1.0 1.119 2.2 1.203 .7 1.0151.9 .912 1.1 1.005 2.0 .8761.4 .734 1.1. .806 1.3 .6691.9 .810.2 1.010
1.7 .781 1.1 1.0302.9 .645 .4 .8302.3 1.282 1.4 1.495 .9 1.176.3 .829 .5 1.056.2 .850 .2 (3) .1 (a).1 (2) .3 1.030
1.5 .709 1.6 .575.7 1.033.5 1.091 .2 (>).2 .875.2 .670 .1 (2)
6.5 .575 7.0 .939 18.9 .583.2 *.930 2.2 .984.2 .973 .4 1.350 .7 1.162
(3) (2) 1.5 .8952.4 1.173 6.3 1.288 2.2 .9933.6 .700 .6 .906 2.4 .645.3 .980 .9 1.123.2 1.052 .2 (*) .7 1.176.1 (*) .2 (’)
All occupations..Anglesmiths..............................................
First class...........................................Other classes......................................
Anglesmiths’ helpers.................................Apprentices..............................................Blacksmiths..............................................
First class..............- ...........................Other classes-....................................
Blacksmiths' helpers.................................Boilermakers...........................................
First class...........................................Other classes....................... - .............
Boilermakers’ helpers...............................Bolters, hand............................................
First class. .........................................Other classes.......................................
Burners, acetylene (including gas)............First class...........................................Other classes.......................................
Carpenters (shipwrights)........................First class..........................................Other classes... ...................................
Carpenters' helpers..................................Chippers and caulkers (including foundry
chippers)................................................First class...........................................Other classes.......................................
Coppersmiths......................- ....................First class................. - .......................Other classes.......................................
Coppersmiths' helpers..............................Crane operators (all types).......................
First class...........................................Other classes.......................................
Draftsmen (senior and junior)..................Drillers (including reamers and counter
sinkers).................... ............. ..............First class.................. - .......................Other classes.......................................
Electricians.............. - .............................First class................................ .........Other classes.......................................
Electricians' helpers.................................Erectors...................................................
First class...........................................Other classes.......................................
Erectors' helpers.......................................Foremen (including assistant foremen
and quartermen)..................................Fumacemen (plate and forge shops).........
First class...........................................Other classes.......................................
Helpers, not elsewhere classified...............Joiners (including woodworking machine
operators)..............................................First class...........................................Other classes.......................................
Joiners' helpers.........................................Laborers (excluding tank cleaners and
janitors)................................................Layers-out.......................................... .....
First class.........................................Other classes.......................................
Leaders.....................................................Learners...................................................Loftsmen..................................................
First class..........................................Other classes......................................
See footnotes at end of table.
Digitized for FRASER http://fraser.stlouisfed.org/ Federal Reserve Bank of St. Louis

18 HOURLY EARNINGS IN PRIVATE SHIPYARDS
T a b l e 3 .—Average Hourly Straight-Time Earnings of Day-Shift Workers in Selected Occupations in Great Lakes and inland Shipyards, by Region and Type of Yard, Spring of 1942— Continued
Great Lakes region Inland region
Construction yards Repair yards Construction yardsOccupation
Percentof
workersstudied
Averagehourly
earnings1
Percentof
workersstudied
Averagehourly
earnings1
Percentof
workersstudied
Averagehourly
earnings1
Machinists, shop____________________ 4.9 $0,959 1.4 $1,066 3.7 $0,9911.097First class_______________________ 1.7 1.076 .9 1.120 1.8
Other classes_____________ ______ _ 3.2 .898 .5 .981 1.9 .894Machinists* helpers, shop_____________ 1.5 .723 .4 .760 1.1 .554
1.0051.047
Machinists, ontside .... _____ 1.0 1.008 1.6 1.034 3.0First class___________________ ____ .5 1.135 1.2 1.120 1.6Other classes_______ _____________ .5 .902 .4 1.022 1.4 .958
Machinists’ helpers, outside___________ .4 .706 1.1 .850 2.2 .625Painters, brush and spray...__________ 2.8 .762 1.3 1.178 2.4 .816
First class_____ _________________ .9 .984 1.2 1.186 .8 .810Other classes_______ _____________ 1.9 .657 .1 (*) 1.6 .819
Pattern makers, first class_____________ .8 1.317Pipefitters (including plumbers)________ 1.9 1.066 3.0 1.085 2.7 .939
* First--class ,. ~ 1.4 1.124 1.9 1.120 .9 .989Other classes_____________________ .5 .917 1.1 1.027 1.8 .914
Pipefitters’ helpers (including plumbers’ helpers) -_______ ________ __________ 1.4 .687 4.9 .828 .9 .651
Plate-shop machine operators__________ .6 .885 1.7 1.091 1.3 .916First class_______________________ .3 .870 .5 1.075 .7 .858Other classes............................... ....... .3 .900 1.2 1.097 .6 .991
Plate-shop machine operators’ helpers.....Regulators—
First class______________________.6.2
.640
.8603.5 .834 1.3 .612
Other classes_______________ _____ 1.1 .800Riggers, ship__________________ _____ .2 (2)First class_______________________ .7 .943 .1 (*) .1 (2)
Other classes____ :________________ .1 (*).750Riggers, yard and crane_______________ 1.0 .794 3.6 .987 1.1
First class_______________________ .7 .796 2.9 1.007 .5 .831.668Other classes________________. ____ .3 .788 .7 .900 .6
Rivet heaters__________________________ .2 .780 1.7 .876 .1 (*)Rivet holders-on_____ ________ _____ .3 .920 2.2 .962Rivet passers____ . . . . . . . . . . . . . . . . _____ .2 .653 3.8 .708Riveters_________ ___________ ______ 2.1 1.158
First class_______________________ .7 1.115 2.0 1.161 .1 (’)Other classes____ ____________ ____ .1 0)1.145 1.173
Sheet-metal workers (including tinsmiths). First class ................... .... .............
.4
.2.914.935
1.21.0
1.1.2
1.016(*).963Other classes..____ _______________ .2 .893 .2 (2) .9
Sheet-metal workers’ helpers___________ .7 .690 .2 (2) .2 (*).882Shipfitters________________ __________ 3.1 .945 1.7 1.196 7.7First class_______________________ 1.2 1.110 .9 1.395 1.8 1.042Other classes_____________________ 1.9 .838 .8 .997 5.9 .834
Shipfitters’ helpers____________ ______ 3.9 .683 1.6 .833 6.8 .572Stage builders_______________________ 4.1 1.030Tank cleaners_______________________ .1 (*)
(*).613Tracers................................. ................ . .8 .737 .2Watchmen and guards.............................. 1.6 .561 1.7 .793 2.1Welders, acetylene (including gas), first
class....................................................... .1 (*).984.4 1.120
Welders, electric____________ ______ _ 7.3 6.6 1.139 15.2 .874First class__________________ _____ 3.2 1.094 6.1 1.148 6.1 1.038Other classes_____________________ 4.1 .898 .5 1.030 9.1 .763
Welders’ helpers, electric...____________ 1.0 .668 .8 .850 .1 (*)
1 Excluding earnings resulting from extra pay for overtime work.* Number of workers too small to justify computation of average.3 Less than a tenth of 1 percent.
HOURLY EARNINGS BY OCCUPATION
The day-shift workers in the ship-construction yards studied in the Great Lakes region had average straight-time earnings of 86.1 cents an hour. Of the occupations for which figures are presented, first- class pattern makers earned the highest wages, averaging $1,317 an hour, and watchmen and guards the lowest, 56.1 cents. Only a fourth
Digitized for FRASER http://fraser.stlouisfed.org/ Federal Reserve Bank of St. Louis
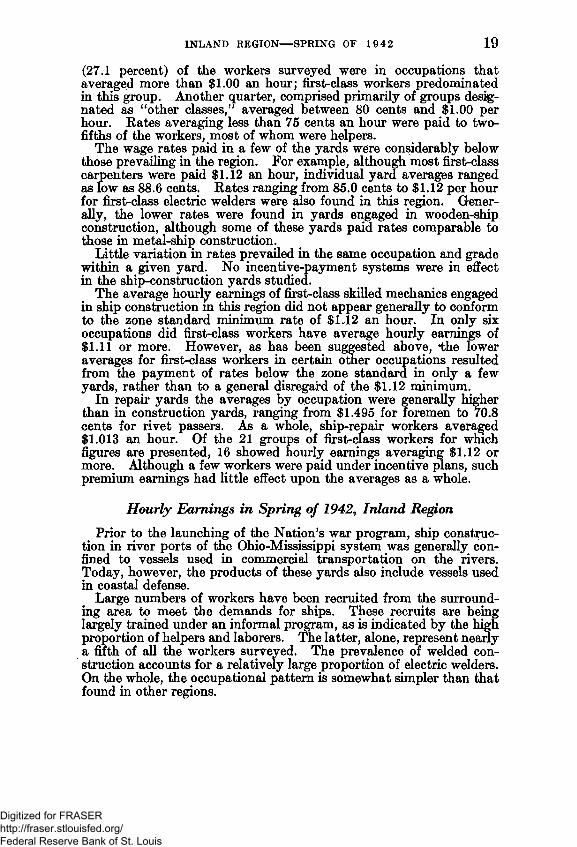
(27.1 percent) of the workers surveyed were in occupations that averaged more than $1.00 an hour; first-class workers predominated in this group. Another quarter, comprised primarily of groups designated as “ other classes,” averaged between 80 cents and $1.00 per hour. Rates averaging less than 75 cents an hour were paid to two- fifths of the workers, most of whom were helpers.
The wage rates paid in a few of the yards were considerably below those prevailing in the region. For example, although most first-class carpenters were paid $1.12 an hour, individual yard averages ranged as low as 88.6 cents. Rates ranging from 85.0 cents to $1.12 per hour for first-class electric welders were also found in this region. Generally, the lower rates were found in yards engaged in wooden-ship construction, although some of these yards paid rates comparable to those in metal-ship construction.
Little variation in rates prevailed in the same occupation and grade within a given yard. No incentive-payment systems were in effect in the ship-construction yards studied.
The average hourly earnings of first-class skilled mechanics engaged in ship construction m this region did not appear generally to conform to the zone standard minimum rate of $1.12 an hour. In only six occupations did first-class workers have average hourly earnings of $1.11 or more. However, as has been suggested above, -the lower averages for first-class workers in certain other occupations resulted from the payment of rates below the zone standard in only a few yards, rather than to a general disregard of the $1.12 minimum.
In repair yards the averages by occupation were generally higher than in construction yards, ranging from $1,495 for foremen to 70.8 cents for rivet passers. As a whole, ship-repair workers averaged $1,013 an hour. Of the 21 groups of first-class workers for which figures are presented, 16 showed hourly earnings averaging $1.12 or more. Although a few workers were paid under incentive plans, such premium earnings had little effect upon the averages as a whole.
Hourly Earnings in Spring of 1942, Inland RegionPrior to the launching of the Nation’s war program, ship construc
tion in river ports of the Ohio-Mississippi system was generally confined to vessels used in commercial transportation on the rivers. Today, however, the products of these yards also include vessels used in coastal defense.
Large numbers of workers have been recruited from the surrounding area to meet the demands for ships. These recruits are being largely trained under an informal program, as is indicated by the high proportion of helpers and laborers. The latter, alone, represent nearly a fifth of all the workers surveyed. The prevalence of welded construction accounts for a relatively large proportion of electric welders. On the whole, the occupational pattern is somewhat simpler than that found in other regions.
INLAND REGION— SPRING OF 1942 19
Digitized for FRASER http://fraser.stlouisfed.org/ Federal Reserve Bank of St. Louis
HOURLY EARNINGS BY OCCUPATION
The average hourly straight-time earnings of the day-shift workers studied was 79.5 cents for the region as a whole (table 3). Among the occupations for which averages are presented, draftsmen were paid the highest rates, averaging $1.36 an hour, and machinists’ helpers the lowest, averaging 55.4 cents. Laborers and first-class workers each accounted for a fifth of all the workers surveyed.
About one-half of the workers studied were in occupations averaging less than 80 cents an hour. Laborers and various craft helpers comprised most of these workers. Exactly 19 percent of all workers were m occupations averaging more than $1.00 an hour.
Typical of the variety of rates paid among yards for the same type of work are the ranges of yard averages for first-class electric welders ($1.21 to 95.0 cents), laborers (76.3 to 39.8 cents), and shipfitters’ helpers (89.9 to 55.0 cents). Incentive systems of pay, affecting about one-seventh of the workers, also influenced the averages of some occupations.
Wages in the inland area have not been stabilized under a zone standard agreement. This fact is reflected in the lower rates for first-class workers, as only four such groups averaged above $1.07, the lowest minimum rate established for first-class skilled mechanics in any of the other regions.
Interregional ComparisonsComparisons of the wage information for each region are given
below. A summary comparison of combined averages for the selected occupations shown in tables 1, 2, and 3 appears in the accompanying statement. It reveals that the weighted average hourly earnings for construction yards in the United States as a whole was 96.0 cents. The average for repair yards was 97.1 cents.
Pacific coast wages were considerably higher than those in any other region. In new construction the Atlantic coast ranked second, while the Great Lakes region ranked second in wage rates for ship- repair work. In both branches of the industry wages on the Gulf coast were the lowest.
20 HOURLY EARNINGS IN PRIVATE SHIPYARDS
Constructionyards Repair yards
$0. 960 $0. 9711. 034 1. 166.776 .796.966 . 914
’ .861 1. 013.795
Gulf.........................................................Atlantic______________________ _______Great Lakes__________________________Inland............................. ..........................
A comparison of wage levels by occupation, such as is given in table 4, presumes identical or nearly identical duties from region to region. The Bureau’s agents took particular care to obtain comparable data and it is felt that, for the most part, the indications of this table are dependable. Although differences in method of construction and type of ships slightly affected the duties of some of the occupations reported in this study, the jobs are reasonably similar among regions.
Digitized for FRASER http://fraser.stlouisfed.org/ Federal Reserve Bank of St. Louis
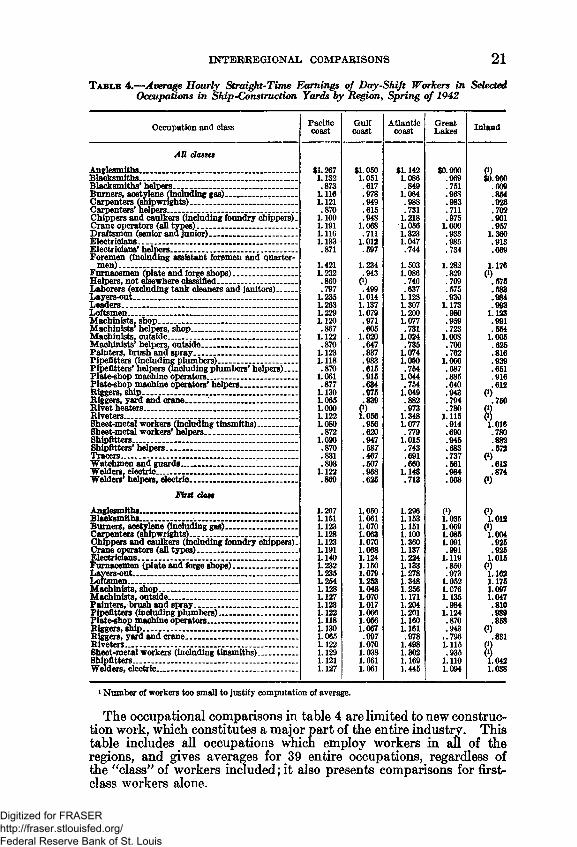
INTERREGIONAL COMPARISONS 21T a b l e 4 .—Average Hourly Straight-Time Earnings of Day-Shift Workers in Selected
Occupations in Ship •Construction Yards by Region, Spring of 1942
Occupation and class Pacificcoast
Gulfcoast
Atlanticcoast
GreatLakes Inland
AU dossesAnglftsmiths__ ........................................... ........ $1,267
1.132$1,0501.051
$1.142 1.086
$0,900.969 0)$0,960
.609■Rla7>lrsmitha
»! 1 ! 1 .873 .617 .849 .751Burners, acetylene (including gas)__.____________ 1.116 .978 1.064 .968 .854Carpenters (shipwrights)________________ ______ 1.121 .949 .988 .983 .926Carpenters’ helpers____________________ _______ .870 .615 .731 .711 .702Chippers and caulkers (including foundry chippers). Crane operators (alJ types).................................. .
1.100 1.191
.9481.068
1.2181.056
.9751.000
.901
.957Draftsmen (senior ana jnninr).., __________ ____ 1.116 .711 1.323 .933 1.360Electricians'............. I ........ ............................ ...... 1.133 1.012 1.047 .985 .913Electricians’ helpers__________________ _______ .871 .597 .744 .734 .669Foremen (including assistant foremen and quarter-
men)______________________________________ 1.421 1.234 1.503 1.282 1.1760)
.575Furaacemen (plate and forge shops)______________ 1.232 .943 1.086 .829Helpers, not elsewhere classified .1 _1................ ......... .860 (0.499
1.014.740 .709
Laborers (excluding tank cleaners and janitors)........Layers-out_____„_____ . ______________________
.7971.235
.637 1.123
.575
.930.583.984.993Leaders___________. . . . . . . ____________________ 1.263 1.137 1.307 1.173
Loftsmen_________ . . ._______________________ 1.229 1.079 1.200 .980 1.123Machinists, shop................................................... . 1.120 .971 1.077 .959 .991Machinists* helpers, shop......................................... .867 .605 .731 .723 .554Machinists, outside____________ . . . __ . . . _______ 1.122 . 1.020 1.024 1.008 1.005Machinists* helpers, outside____________________ .870 .647 .735 .706 .625Painters, brush and spray______________________ 1.123 .837 1.074 .762 .816Pipefitters (including plumbers)_________ _______ 1.118 .983 1.050 1.066 .939Pipefitters* helpers (Including plumbers* helpers)__Plate-shop machine operators___________________
.8701.061
.615
.915.754
1.044.687.885
.651
.916Plate-shop machine operators’ helpers____________ .877 .634 .754 .640 .612Riggers, ship_____________________. . . _________ 1.130 .975 1.049 .943 (0.750
(l)Riggers, yard and crane......___________________ 1.065 .839(i) .882 .794Rivet heaters_____________________ . . . . . _______ 1.000 .973 .780Riveters_____________________________________ 1.122 1.056 1.348 1.115 0 )Sheet-metal workers (including tinsmiths)________ 1.080 .956 1.077 .914 1.016Sheet-metal workers* helpers_______ _____ ______ .872 .620 .779 .690 .780Shipfitters___________________________________ 1.090 .947 1.015 .945 .882Shipfitters’ helpers___. . . . _____________________ .870 .587 .743 .683 .572Tracers_____________. . . . . . . . . _________________ .831 .467 .691 .737Watchmen and guards__ ______ ______ _________ .808 .507 .660 .561Welders, electric____ ... . . . . . . .__________________ 1.122 .968 1.148 .984 .874Welders helpers, electric________ . . . ____ _______ .869 .625 .713 .668 CO
First dostAngfesmfths................................ ............................ 1.267 1.050 1.296 (01.035 (*)1.012Blacksmiths.___. . . . . . . . . _______ . . . . . . . . . . . . . ____ 1.151 1’061 1.153Burners, acetylene (including gas)________ !______ 1.123 1.070 1.151 1.069 0 )1.004
.925
.925Carpenters (shipwrights)_______________________ 1.128 1.063 1.100 1.085Chippers and caulkers (including foundry chippers) _ Crane operators (all types)________________ ____
1.123 1.191
1.0701.068
1.360 1.137
1.091.991
Electricians....... .............................. ....................... 1.140 1.124 1.224 1.119 1.015Furaacemen (plate and forge shops).................. ...... 1.232 1.150 1.133 .850 0 )1.162Layers-out____ __. . . . . . . _________. . . __________ 1.235 1.079 1.278
1.348.973
Loftsmen________ __________ ________________ 1.254 1.253 1.052 1.175Machinists, shop______________ _______________ 1.128 1.048 1.256 1.076 1.097Machinists, outside___________________________ 1.127 1.070 1.171 1.135 1.047Painters, brush and spray_____ ________________ 1.123 1.017 1.204 .984 .810Pipefitters (including plumbers)_________________ 1.122 1.066 1.201 1.124 .989Plate-shop machine operators__ . . . . . . ___________ 1.118 1.056 1.160 .870 .858Riggers, snip__________ . . . . . . . . . . . . . _______ ____ 1.130 1.067 1.161 .943 0 .831
(0Riggers, yard and crane_______ ________________ 1.065 .997 .978 ..796Riveters...... ............................................................ 1.122 1.070 1.498 1.115Sheet-metal workers (including tinsmiths)________ 1.129 1.038 1.302 .935 0 )Shipfitters.................... ................................. .......... 1.121 1.061 1.169 1.110 1.042Welders, electric______________________________ 1.127 1.061 1.445 1.094 1.038
i Number of workers too small to justify computation of average.
The occupational comparisons in table 4 are limited to new construction work, which constitutes a major part of the entire industry. This table includes all occupations which employ workers in afl of the regions, and gives averages for 39 entire occupations, regardless of the “ class” of workers included; it also presents comparisons for first- class workers alone.
Digitized for FRASER http://fraser.stlouisfed.org/ Federal Reserve Bank of St. Louis

22 HOURLY EARNINGS IN PRIVATE SHIPYARDS
PERCENT OF WORKERS IN SHIP-CONSTRUCTION YARDSBY CLASS OF WORKER AND BY REGION
>ERCENT SPRING OF 1942 PERCENT100 100
- 4 0
° PACIFIC GULF ATLANTIC GREAT INLAND ° COAST COAST COAST LAKES
CRAFTSMEN FIRST CLASS
CRAFTSMEN OTHER CLASSES
APPRENTICES AND LEARNERS
HELPERS
SUPERVISORS OTHER * 1 WORKERS
Digitized for FRASER http://fraser.stlouisfed.org/ Federal Reserve Bank of St. Louis

With regard to the general occupational averages, it is of interest to note that the Pacific coast pays the highest wages in 33 occupations out of the 39. Of the 6 remaining occupations the Atlantic coast- ranks first in 5, while the inland region has the highest average for 1 occupation (draftsmen). In terms of first-class mechanics' wages, however, the Atlantic coast occupies the top position. In 17 of the 21 groups for which data are given Atlantic coast wages are highest, while the Pacific coast ranks first in only 4 cases.
These apparently contradictory measures of relative wage levels are easily reconcilable. The wages of first-class mechanics in the Atlantic coast region are indeed high for the shipbuilding industry, but only a small proportion of the workers in this region are recognized as first class. The large numbers of second- and third-class craftsmen and handymen drag down the combined averages below the levels prevailing on the Pacific coast, where most craftsmen are considered as first class.
The inland region paid the lowest wages in 19 of the 39 groups. It also ranks low as regards earnings of first-class craftsmen.
STABILIZATION IN OPERATION
Despite the rather general terminology of the stabilization agreements, the four regions concerned have shown considerable uniformity in determining to which occupations the minimum wage should be applied. The fifth, the inland region, has not been faced with this problem, as no agreement has been adopted there.
A review of the occupational rates in the four largest regions appears to justify the designation of 26 separate crafts as generally coming within the scope of the zone standards.7 It is unnecessary to list these here since, with three exceptions, they are identical with the 29 crafts listed earlier in connection with the discussion of Atlantic coast wages. The three exceptions are erectors, painters, and regulators; first-class workers in these jobs customarily receive at least the minimum rate in the Atlantic region, but fail to attain the minimum generally throughout the industry. Erectors, it may be mentioned, are not distinguished from shipfitters in some regions. In addition, on the Pacific coast machine bolters are sharply distinguished from hand bolters and receive higher wages, but in other regions both groups commonly receive the same rate, which for first-class workers is below the minimum.
A number of the 26 occupations are not represented in the Gulf region, or are not distinguished from other, similar jobs. All of the occupations with substantial representation, however, appear generally to carry the minimum wage; in a few cases the averages are slightly below $1.07 an hour, owing to substandard wage rates in a few yards.
Only in the Great Lakes region do any of the 26 crafts appear generally to receive less than the minimum wage. In this region, in fact, among the occupations represented in substantial numbers, only the electricians, outside machinists, pattern makers, pipefitters, riveters, and shipfitters receive average, wage rates close to (or above) $1.12 per hour. First-class workers m some of the 26 crafts average substantially less; for example, furnacemen (85.0 cents), plate-shop machine operators (87.0), and ship riggers (94.3).
7 It should be mentioned again that supervisory workers and certain other special groups (such as drafts' men) have been intentionally excluded from consideration, even though they commonly receive wage* higher than the minimum rates.
INTERREGIONAL COMPARISONS 23
Digitized for FRASER http://fraser.stlouisfed.org/ Federal Reserve Bank of St. Louis

"FIRST-CLASS” W ORKERS
The Pacific coast yards have been much more liberal in the classification of workers than have other yards in the industry. Advancement has been rapid and almost automatic on the Pacific coast, whereas in the other regions upgrading is sometimes irregular and may involve long delay. The proportion of first-class workers in the Pacific coast region is consequently much higher than elsewhere.
Of all the day-shift workers (including helpers) in the 26 crafts within the scope of the zone standards in Pacific coast yards, fully 61 percent were carried on the pay roll as first-class workers at the time of the Bureau’s study. In the Atlantic coast yards, in which classification standards appear to be most strict, the corresponding percentage was only 20. The percentages for the other regions were as follows: Gulf coast, 37; Great Lakes, 35; and inland, 30.
Many jobs in the industry, of course, are not appropriate for the establishment of classes; the proportions of first-class craftsmen among all workers are consequently smaller than those given above. In the accompanying chart all first-shift employees in the various regions are segregated by class or type of job. For purposes of this chart, the craftsmen referred to include workers in all crafts, without reference to the minimum wage. Again the Pacific coast ranks first in proportion of first-class craftsmen and the Atlantic coast last. The proportion of learners and apprentices is particularly high in both the Gulf and Atlantic coast regions. Laborers comprise a relatively large part of the workers in the Gulf coast and inland areas.
24 HOURLY EARNINGS IN PRIVATE SHIPYARDS
Digitized for FRASER http://fraser.stlouisfed.org/ Federal Reserve Bank of St. Louis