THE CONTEXTUAL RELATIONSHIP BETWEEN EARNINGS ... - FLEX
482
THE CONTEXTUAL RELATIONSHIP BETWEEN EARNINGS MANAGEMENT AND CORPORATE SOCIAL RESPONSIBILITY: MANAGERIAL MYOPIA VERSUS MYOPIA AVOIDANCE PERSPECTIVES By Salmin Mostafa Honours Degree of Bachelor of Commerce Bachelor of Commerce (Accounting) Thesis Submitted to Flinders University for the degree of Doctor of Philosophy College of Business, Government and Law 23 March, 2022
-
Upload
khangminh22 -
Category
Documents
-
view
0 -
download
0
Transcript of THE CONTEXTUAL RELATIONSHIP BETWEEN EARNINGS ... - FLEX

THE CONTEXTUAL RELATIONSHIP BETWEEN EARNINGS MANAGEMENT AND CORPORATE SOCIAL
RESPONSIBILITY: MANAGERIAL MYOPIA VERSUS MYOPIA AVOIDANCE PERSPECTIVES
By
Salmin Mostafa
Honours Degree of Bachelor of Commerce
Bachelor of Commerce (Accounting)
Thesis Submitted to Flinders University
for the degree of Doctor of Philosophy
College of Business, Government and Law
23 March, 2022
i
TABLE OF CONTENTS
TABLE OF CONTENTS .................................................................................................................. I
ABSTRACT……….. .................................................................................................................... VIII
DECLARATION ……………………………………………………………………………………………………………………………X
ACKNOWLEDGEMENTS ............................................................................................................. XI
LIST OF TABLES ....................................................................................................................... XIII
LIST OF FIGURES ...................................................................................................................... XV
LIST OF THESIS PRESENTATIONS ............................................................................................. XVI
LIST OF ACRONYMS .............................................................................................................. XVIII
INTRODUCTION TO THE STUDY .................................................................................................. 1
1.1 Introduction and Background ..................................................................................... 1
1.1.1 Earnings Management (EM) ........................................................................................ 2
1.1.2 Corporate Social Responsibility (CSR) .......................................................................... 4
1.1.3 Linking CSR and EM ...................................................................................................... 5
1.2 Research Objectives and Questions............................................................................. 7
1.3 Research Studies and Conceptual Framework ........................................................... 10
1.4 Justification and Motivation of the Study .................................................................. 13
1.5 Contribution of the Study ......................................................................................... 16
1.6 Thesis Structure ........................................................................................................ 18
1.7 Chapter Summary ..................................................................................................... 21
CHAPTER 2 CORPORATE SOCIAL RESPONSIBILITY AND EARNINGS MANAGEMENT –
BACKGROUND AND LITERATURE REVIEW ................................................................................ 22
2.1 Introduction ............................................................................................................. 22
2.2 Corporate Social Responsibility (CSR) ........................................................................ 22
2.2.1 Definition .................................................................................................................... 22
2.2.2 CSR Motives ................................................................................................................ 23
2.2.3 CSR Dimensions .......................................................................................................... 25

ii
2.2.4 CSR in Practice – Developed and Emerging Market Countries .................................. 26
2.3 Earnings Management (EM) ...................................................................................... 29
2.3.1 Definition of EM ......................................................................................................... 29
2.3.2 EM Incentives and Opportunities ............................................................................... 29
2.3.3 Types of EM ................................................................................................................ 32
2.3.4 EM in Practice – Developed and Emerging Market Countries ................................... 35
2.4 Theoretical Background – CSR and EM ...................................................................... 37
2.4.1 Managerial Myopia Hypothesis ................................................................................. 40
2.4.2 Myopia Avoidance Hypothesis ................................................................................... 43
2.5 Literature Review - CSR and EM ................................................................................ 44
2.6 Chapter Summary ..................................................................................................... 69
MEASUREMENT OF VARIABLES – CSR AND EM ......................................................................... 71
3.1 Introduction ............................................................................................................. 71
3.2 Measuring CSR ......................................................................................................... 71
3.2.1 Data Source ................................................................................................................ 71
3.2.2 Primary CSR Measure ................................................................................................. 73
3.2.3 Alternate CSR Measures ............................................................................................. 73
3.3 Measuring EM .......................................................................................................... 75
3.3.1 Primary EM Measure - Discretionary Accruals .......................................................... 75
3.3.2 Alternate EM Measure – Accruals Quality ................................................................. 78
3.4 Chapter Summary ..................................................................................................... 79
EARNINGS MANAGEMENT AND CORPORATE SOCIAL RESPONSIBILITY: INVESTIGATION OF THE
DIRECT AND INDIRECT RELATIONSHIP VIA ORGANISATION CAPITAL. ........................................ 80
4.1 Introduction ............................................................................................................. 80
4.2 Background and Justification .................................................................................... 80
4.2.1 Background of the Study ............................................................................................ 80
4.2.2 Justification of the Study ............................................................................................ 84
4.3 Contribution of the Study ......................................................................................... 87
4.4 Theoretical Background ............................................................................................ 90
4.4.1 Resource-Based View ................................................................................................. 90

iii
4.4.2 Managerial Myopia Hypothesis ................................................................................. 92
4.4.3 Myopia Avoidance Hypothesis ................................................................................... 94
4.5 Literature Review and Hypothesis Development ....................................................... 95
4.5.1 The Direct Effect of CSR on EM .................................................................................. 95
4.5.2 The Effect of CSR on OC .............................................................................................. 97
4.5.3 The Effect of OC on EM ............................................................................................ 104
4.5.4 The Indirect Effect of CSR on EM .............................................................................. 109
4.6 The Conceptual Framework .................................................................................... 110
4.7 Data and Methodology ........................................................................................... 112
4.7.1 Data and Sample ...................................................................................................... 112
4.7.2 Dependent Variable ................................................................................................. 114
4.7.3 Independent Variable ............................................................................................... 115
4.7.4 Mediating Variable .................................................................................................. 116
4.7.5 Control Variables ...................................................................................................... 118
4.7.6 Research Model - Maximum Likelihood Estimation................................................. 121
4.7.7 Sensitivity Analysis ................................................................................................... 127
4.7.8 Accounting for Endogeneity – 2SLS Estimation........................................................ 128
4.8 Results and Findings ............................................................................................... 132
4.8.1 Descriptive Statistics ................................................................................................ 132
4.8.2 Correlation ............................................................................................................... 136
4.8.3 Test of Multicollinearity ........................................................................................... 139
4.8.4 Results of ML Estimation of Equations (7) and (8) ................................................... 141
4.8.5 Results of ML Estimation of Equations (7a) and (8a) - Sensitivity Analysis Phase 1 145
4.8.6 Results of ML Estimation of Equations (7b) and (8b) - Sensitivity Analysis Phase 2 148
4.8.7 Accounting for Endogeneity – Results from 2SLS Estimation of Equations (7)
and (8) ...................................................................................................................... 151
4.9 Discussion of Findings ............................................................................................. 153
4.10 Chapter Summary ................................................................................................... 159
CHAPTER 5 : EARNINGS MANAGEMENT, CORPORATE SOCIAL RESPONSIBILITY AND
ORGANISATION CAPITAL: THE IMPACT OF FINANCIAL DISTRESS ............................................. 161
5.1 Introduction to the Chapter .................................................................................... 161

iv
5.2 Background and Justification .................................................................................. 161
5.2.1 Background of the Study .......................................................................................... 161
5.2.2 Justification of the Study .......................................................................................... 165
5.3 Contribution of the Study ....................................................................................... 166
5.4 Theoretical Background .......................................................................................... 167
5.4.1 Resource-Based View (RBV) Theory ......................................................................... 168
5.4.2 Slack Resource Theory .............................................................................................. 168
5.4.3 Managerial Myopia Hypothesis ............................................................................... 169
5.4.4 Myopia Avoidance Hypothesis ................................................................................. 171
5.5 Literature Review and Empirical Evidence ............................................................... 172
5.5.1 FD Literature ............................................................................................................ 172
5.5.2 The Effect of FD on EM ............................................................................................. 173
5.5.3 The Direct Effect of CSR on EM................................................................................ 179
5.5.4 The Indirect Paths in the CSR-EM Relationship via OC ............................................ 181
5.6 The Conceptual Framework .................................................................................... 188
5.7 Data and Methodology ........................................................................................... 190
5.7.1 Data and Sample ...................................................................................................... 190
5.7.2 Dependent Variable ................................................................................................. 193
5.7.3 Independent Variable ............................................................................................... 195
5.7.4 Mediating Variable .................................................................................................. 195
5.7.5 Moderating Variable ................................................................................................ 196
5.7.6 Control Variables ...................................................................................................... 198
5.7.7 Preliminary Analysis ................................................................................................. 201
5.7.8 Research Models ...................................................................................................... 202
5.7.9 Sensitivity Tests ........................................................................................................ 215
5.7.10 Accounting for Endogeneity ..................................................................................... 216
5.7.11 Robustness Check ..................................................................................................... 216
5.8 Results and Findings ............................................................................................... 217
5.8.1 Descriptive Statistics ................................................................................................ 217
5.8.2 Correlation ............................................................................................................... 221
5.8.3 Test of Multicollinearity ........................................................................................... 224

v
5.8.4 Preliminary Analysis Results ..................................................................................... 227
5.8.5 Main Model Results of ML Estimation of Equations (9) and (10) ............................ 235
5.8.6 Main Model Results Sensitivity Test – Results of ML Estimation of Equations (9a)
and (10a) .................................................................................................................. 240
5.8.7 Accounting for Endogeneity – 2SLS Estimation Results of Equations (9) and (10) .. 245
5.8.8 Results of Robustness Check – Split Sample ............................................................. 249
5.9 Discussion of Findings ............................................................................................. 258
5.10 Chapter Summary ................................................................................................... 264
CHAPTER 6 : EARNINGS MANAGEMENT AND CORPORATE SOCIAL RESPONSIBILITY: THE IMPACT
OF COLLECTIVIST CULTURE, CORRUPTION AND INVESTOR PROTECTION IN EMERGING
MARKETS…………. ................................................................................................................... 266
6.1 Introduction to the Chapter .................................................................................... 266
6.2 Background and Justification .................................................................................. 266
6.2.1 Background of the Study .......................................................................................... 266
6.2.2 Justification of the Study .......................................................................................... 268
6.3 Contribution ........................................................................................................... 276
6.4 Theoretical Background .......................................................................................... 278
6.4.1 Managerial Myopia Hypothesis ............................................................................... 278
6.4.2 Myopia Avoidance Hypothesis ................................................................................. 279
6.4.3 Institutional Theory .................................................................................................. 279
6.5 Literature Review and Empirical Evidence ............................................................... 287
6.5.1 The Effect of CSR on EM ........................................................................................... 287
6.5.2 The Effect of COLL on EM ......................................................................................... 289
6.5.3 The Effect of CORR on EM ........................................................................................ 296
6.5.4 The Effect of INVPRO on EM .................................................................................... 301
6.6 The Conceptual Framework .................................................................................... 309
6.7 Data and Methodology ........................................................................................... 311
6.7.1 Data and Sample ...................................................................................................... 311
6.7.2 Dependent Variable ................................................................................................. 315
6.7.3 Independent Variables ............................................................................................. 317
6.7.4 Moderating Variables .............................................................................................. 318

vi
6.7.5 Research Models ...................................................................................................... 323
6.7.6 Robustness Check ..................................................................................................... 333
6.7.7 Sensitivity analysis ................................................................................................... 334
6.7.8 Accounting for Endogeneity ..................................................................................... 335
6.8 Results and Findings ............................................................................................... 336
6.8.1 Descriptive Statistics ................................................................................................ 336
6.8.2 Correlation ............................................................................................................... 342
6.8.3 Test of Multicollinearity ........................................................................................... 348
6.8.4 Base Model Results of Estimation of Equations (4a) and (4b) ................................. 350
6.8.5 Main Model Results of Estimation of Equation (5) .................................................. 352
6.8.6 Main Model Results of Estimation of Equation (6) .................................................. 361
6.8.7 Results of Robustness Check – Split Sample HLM estimation of equation (7) ......... 365
6.8.8 Sensitivity test – Split sample result of HLM estimation of equation (8) ................. 371
6.8.9 Accounting for endogeneity – 2SLS estimation results of equations (5) and (6) ..... 379
6.9 Discussion of Findings ............................................................................................. 385
6.10 Chapter Summary ................................................................................................... 393
CHAPTER 7 DISCUSSION AND SUMMARY ........................................................................... 394
7.1 Introduction ........................................................................................................... 394
7.2 Research Objectives and Questions......................................................................... 394
7.3 Summary of the Findings ........................................................................................ 396
7.3.1 Findings on Research Objective 1............................................................................. 396
7.3.2 Findings on Research Objective 2............................................................................. 398
7.3.3 Findings on Research Objective 3............................................................................. 401
7.4 Implications of the Findings ................................................................................... 407
7.4.1 Theoretical Implications ........................................................................................... 407
7.4.2 Practical implications ............................................................................................... 408
7.5 Limitations of the Study .......................................................................................... 410
7.6 Future Research Directions ..................................................................................... 411
7.7 Summary of the Thesis ........................................................................................... 413
REFERENCE LIST ..................................................................................................................... 415

vii
APPENDIX A1…… ................................................................................................................... 452
APPENDIX A2…… ................................................................................................................... 455

viii
ABSTRACT
This study provides an in-depth investigation of the relationship between corporate social
responsibility (CSR) and earnings management (EM), two contemporary issues in academic
research. While CSR and EM are linked both empirically and theoretically, prior studies suggest
conflicting results on the effect of CSR on EM. The present study addresses this existing debate by
examining the CSR-EM relationship more closely through answering why, how and when CSR affects
EM. I investigate the CSR-EM relationship using two contrasting managerial behaviour perspectives,
namely managerial myopia and myopia avoidance hypotheses. The managerial myopia hypothesis
suggests that managers engaged in CSR are short-term oriented, and therefore are more likely to
manage earnings. CSR can create more opportunities for EM (opportunity-driven myopia) and/or
greater incentives for EM (incentive-driven myopia). In contrast, the myopia avoidance hypothesis
suggests that managers engaged in CSR are long-term oriented, and therefore are less likely to
manage earnings. This is because managers have genuine concern about their relationships with
stakeholders (relationship-driven myopia avoidance), and/or strong ethical and moral values (value-
driven myopia avoidance).
The study makes a number of contributions to knowledge and practice, by providing a framework
for understanding the CSR-EM relationship through the lens of managerial behaviour perspectives
and underlying motives under various contexts. To this end, I undertake three individual research
studies.
The first research study examines organisation capital (OC) as a mediating channel via which CSR
indirectly affects EM. OC refers to a firm-specific, non-imitable set of intangibles that include the
integration of organizational design, process, managerial quality practices and culture. Using
structural equation modelling (SEM) and 2 stage least squares (2SLS) estimation on a sample of
46,816 firm-year observations from USA between 2002 and 2017, I find that that in general CSR has
a negative direct effect on EM, consistent to the myopia avoidant perspective (long-term
orientation). However, the results also show that CSR has a positive indirect effect on EM via OC.
This suggests, consistent with the managerial myopia perspective (short-term orientation), that
managers engaged in CSR may take advantage of their firm’s unique abilities (that is, OC) to manage
more earnings.

ix
The second research study examines the direct CSR-EM relationship and the indirect CSR-EM
relationship via OC, in a crisis context. Specifically, the study examines the moderated mediation
effect of financial distress (FD), a very relevant concept in present times as businesses around the
globe are still struggling from the social and economic restrictions imposed by the Covid-19
pandemic. Using SEM and 2SLS estimation on a sample of 36,811 firm-year observations from USA
between 2002 and 2017, I find that when firms experience FD, the positive indirect CSR-EM
relationship via OC becomes weaker, that is managerial myopia behaviour (short-term orientation)
weakens. The result highlights an important role of OC in financially distressed firms. During crisis
managers are more likely to divert their efforts and their firms’ resources to assist the firm’s
recovery. When firms with high OC experience crisis, managers are less likely to use CSR
opportunistically to manage earnings.
The third research study examines the effects of country-level collectivist culture, corruption and
investor protection on the CSR-EM relationship. Using hierarchical linear modelling on a sample of
3,472 firm-year observations from 10 emerging market countries between 2012 and 2016, I find
that in emerging market countries, the CSR dimensions have contrasting effects on EM. While the
environmental (ENV) dimension has a negative effect on EM, the social dimension has a positive
effect on EM. The findings reveal that managers may have different underlying motives behind their
engagement in different CSR initiatives. In particular, managers engaged in ENV initiatives tend to
be myopia avoidant, whereas managers engaged in SOC initiatives tend to be myopic. The results
also show that both collectivism and investor protection separately affect the CSR-EM relationship.
Additionally, while collectivism and corruption have a joint effect, collectivism and investor
protection do not have a joint effect on the CSR-EM relationship. The findings highlight that cultural
background has a stronger influence on the CSR-EM relationship than corruptive practices or
institutional framework of a country.
The findings of this study have important implications to theory and practice, particularly for
investors, policymakers, regulators, and academics. The findings show that the CSR-EM relationship
is contextual. Rather than taking CSR as a reflection of management’s ethical disposition, it is
important to understand how various contexts may affect managerial behaviour and motives. By
examining mediating and moderating factors on the CSR-EM relationship, the study provides an
initial foundation to understand the CSR-EM relationship from a managerial behaviour perspective.

x
DECLARATION
I certify that this thesis does not incorporate without acknowledgment any material previously
submitted for a degree or diploma in any university; and that to the best of my knowledge and belief
it does not contain any material previously published or written by another person except where
due reference is made in the text.
Signed: ....................................................
Date: 12 October, 2021

xi
ACKNOWLEDGEMENTS
In the name of Allah, the most gracious, the most merciful
I would like to sincerely thank the Australian Government Research Training program, for the RTP
funding that has enabled me to complete this thesis.
I would like to thank a number of very special people without whose support this thesis would not
have been possible. First and foremost, I would like to thank my principal supervisor, Dr Wee Ching
Pok, who was also the Higher Degree Research (HDR) coordinator for Flinders Business at the start
of my candidature. Wee Ching has been an excellent mentor and guide, but more than that she has
been my friend. Her constant encouragement and constructive feedback during the writing of this
thesis, and her support during some very difficult times, have carved my path to completing this
thesis.
I would also like to sincerely thank my associate supervisor, Dr Philip Palmer. Phil has been a mentor
to me since even before I started my PhD thesis. Being my Honours supervisor, Phil has a significant
contribution in shaping my way to commence my PhD program. Phil has always motivated me with
his positive words and his faith in me. His guidance, support and feedback have been invaluable.
I am also grateful to a number of my past and present colleagues at Flinders University. My sincere
thanks go to Dr Vipul Pare, Dr Kanaka Durga and Dr Erkan Yalcin. A very special thanks go to
Professor Adrian Cheung and Ms Anne Gleeson. I would like to thank all the staff at the Office of
Graduate Research, particularly, Associate Professor Caitlin Hughes (HDR coordinator), Ms Ashleigh
Merriel (HDR Progressions coordinator), Miss Nicole Harris (HDR Progressions and Variations
Officer) and Ms Patricia Berry (former HDR administrative officer). I am also grateful to Professor
Phyllis Tharenou (Emeritus Professor of Flinders University, and former Vice-President and
Executive Dean of the College of Business, Government and Law, Flinders University). I would like
to thank my PhD colleagues and friends Dr Graeme Payne, Dr Maria Flutsch, Dr Emy Yunidyastuti
and Dr Agus Hidayat. I am thankful for the valuable feedback I have received, at Flinders Business
Research Seminar series and milestone presentations, from Professor Roberta Crouch, Professor
Gerry Redmond, Professor Willem de Lint, Professor David Bright and Associate Professor Thanh Le.
I am grateful to my parents, Mostafa Ali and Naharin Mostafa, who have been my biggest

xii
inspiration. My father’s constant encouragement and his active interest in my work every single day,
not just during my PhD candidature but since my childhood, makes him my greatest motivation. My
mother’s unconditional love, support and prayers have been my biggest blessing and strength. I am
grateful to my husband, Mohammad Moula, for his love, support, patience, and faith in me. He has
been my rock for the last 12 years. This thesis would not have been possible without his support. A
special thanks to Oreo (my cat), who always kept me company during my crazy writing routine,
ensuring my PhD journey was not lonely, but rather a happy one. Thanks to my friends, Shvetal and
Afrina.
Last but not the least, I would like to thank my late brother (bhaiya), Nafiz Mostafa. He was my best
friend, and someone who always believed in me. He had more confidence in me than I had in myself.
On this exciting moment when I am completing my thesis, I can’t help but feel incomplete without
him. On what would have been your 37th birthday, I dedicate this thesis to you, bhaiya!

xiii
LIST OF TABLES
Table 1.1 Research Objectives and Research Questions ............................................................ 10
Table 2.1 Summary of Prior Studies Examining the Effect of CSR on EM .................................... 46
Table 4.1 Summary of prior studies examining the relationship between CSR and OC ............. 102
Table 4.2 Summary of prior studies examining the relationship between Intellectual Capital on
EM ................................................................................................................................. 108
Table 4.3 Sample Selection and Distribution of the Sample .................................................... 113
Table 4.4 Variable Definition and Measurement .................................................................... 120
Table 4.5 Summary of Research Questions and Hypotheses Testing ....................................... 126
Table 4.6 Descriptive Statistics............................................................................................... 135
Table 4.7 Correlation Matrix .................................................................................................. 138
Table 4.8 Multicollinearity Test Results .................................................................................. 140
Table 4.9 ML Estimation Output of Equations (7) and (8) ........................................................ 142
Table 4.10 ML Estimation Output of Equations (7a) and (8a) .................................................. 146
Table 4.11 ML Estimation Output of Equations (7b) and (8b) .................................................. 149
Table 4.12 2SLS Estimation Output of Equations (7) and (8) .................................................... 151
Table 4.13 Summary of Research Questions, Hypotheses and Results .................................... 155
Table 5.1 Summary of Key Literature on FD and EM ............................................................... 175
Table 5.2 Sample Selection and Distribution of the Sample .................................................... 192
Table 5.3 Definition and Measurement of Variables ............................................................... 200
Table 5.4 Summary of Research Questions and Hypotheses Testing ....................................... 214
Table 5.5 Descriptive Statistics............................................................................................... 219
Table 5.6 Correlation Matrix .................................................................................................. 223
Table 5.7 Variation Inflation Factor (VIF) Results of the Multicollinearity Tests ....................... 225
Table 5.8 ML Estimation Output of Equations (7) and (8) ........................................................ 228
Table 5.9 ML Estimation Output of Equations (7a) and (8a) .................................................... 231
Table 5.10 2SLS Estimation Output of Equations (7) and (8) .................................................... 233
Table 5.11 ML Estimation Output of Equations (9) and (10) .................................................... 236
Table 5.12 ML Estimation Output of Equations (9a) and (10a) ................................................ 241
Table 5.13 2SLS Estimation Output of Equations (9) and (10) .................................................. 246

xiv
Table 5.14 ML Estimation Output for Equations (7) and (8) on Distressed and Non-distressed
Samples ......................................................................................................................... 251
Table 5.15 Difference Effect Sizes between Distressed and Non-Distressed Samples from ML
Estimation of Equations (7) and (8) ................................................................................. 256
Table 5.16 Summary of Research Questions, Hypotheses and Results .................................... 260
Table 6.1 Literature on the Relationship Between COLL and EM ............................................. 295
Table 6.2 Literature on the Relationship Between CORR and EM ............................................ 300
Table 6.3 Literature on the Relationship Between INVPRO and EM ........................................ 306
Table 6.4 Sample Selection and Distribution of Sample .......................................................... 314
Table 6.5 Definition and Measurement of Variables ............................................................... 322
Table 6.6 Summary of Research Questions and Hypotheses testing ........................................ 325
Table 6.7 Descriptive Statistics of the Key Variables (2012-2016) ............................................ 337
Table 6.8 Correlation Matrix .................................................................................................. 346
Table 6.9 Variation Inflation Factor (VIF) Results .................................................................... 349
Table 6.10 HLM Estimation Output of Equations (4a) and (4b) ................................................ 351
Table 6.11 HLM Estimation Output of Equation (5) ................................................................. 354
Table 6.12 HLM Estimation Output of Equation (6) ................................................................. 362
Table 6.13 HLM Estimation Output of Equation (7) ................................................................. 366
Table 6.14 Difference in the effect of CORR - Low COLL versus High COLL Subsamples ............ 370
Table 6.15 HLM Estimation Output of Equation (8) ................................................................. 373
Table 6.16 Differences in the effect of INVPRO_FF - Low COLL_H versus High COLL_H Subsamples
...................................................................................................................................... 378
Table 6.17 2SLS estimation output of equation (5) ................................................................. 380
Table 6.18 2SLS estimation output of equation (6) ................................................................. 383
Table 6.19 Summary of Research Questions, Hypotheses and Results .................................... 386
Table 7.1 Summary of Research Questions, Hypotheses and Findings ..................................... 405

xv
LIST OF FIGURES
Figure 1.1 The Conceptual Framework for the Thesis ............................................................... 11
Figure 2.1 CSR Performance - Emerging Market Countries Versus Developed Countries (Source:
Boubakri et al., 2021) ....................................................................................................... 28
Figure 2.2 Likelihood of EM in Asia-Pacific countries (Source: Ernst & Young, 2016) .................. 37
Figure 4.1 Moderator Versus Mediator Models (Adapted from Baron and Kenny (1986)).......... 86
Figure 4.2 The Conceptual Framework ................................................................................... 111
Figure 4.3 OC as Mediator in the CSR and EM Relationship ..................................................... 145
Figure 5.1 The Conceptual Framework ................................................................................... 189
Figure 5.2 Conceptual Diagram for Hypotheses H2.1 and H2.2 ................................................ 206
Figure 5.3 Conceptual Diagram for Hypotheses H2.3 (a and b) and H4 .................................... 209
Figure 5.4 Conceptual Diagram for Hypotheses H2.5 .............................................................. 211
Figure 5.5 Conceptual Diagram for Hypothesis H2.6 ............................................................... 213
Figure 5.6 OC as Mediator in the CSR and EM Relationship ..................................................... 230
Figure 5.7 OC as Mediator in the CSR and EM Relationship in the Distressed Versus Non-
Distressed Sample .......................................................................................................... 255
Figure 6.1 COLL Scores for Emerging Market Countries Versus USA (Data Obtained from
Hofstede Insights, 2021) ................................................................................................. 270
Figure 6.2 CORR Perception Indices for Emerging Market Countries Versus USA ..................... 272
Figure 6.3 Strength of INVPRO (2007 to 2016): USA Versus Emerging Market Countries .......... 274
Figure 6.4 Comparison of Average INVPRO Among Emerging Market Countries ...................... 275
Figure 6.5 The Conceptual Framework ................................................................................... 310
Figure 6.6 Probing Results of the Interaction of COLL with the CSR Dimensions (Equation (5)) 356
Figure 6.7 Probing Results of the Interaction of COLL and CORR with the CSR Dimensions
(Equation 5) ................................................................................................................... 359
Figure 6.8 Probing results of the interaction of INVPRO with the SOC dimension (Equation (6))
...................................................................................................................................... 364

xvi
LIST OF THESIS PRESENTATIONS
The proposal and main chapters of this thesis have been presented at and/or submitted to the
following conferences and/or seminars:
Presentations
1. A paper titled “The role of Corporate Social Responsibility on Earnings Management: Evidence
from the Asian Economies” was presented at the College of Business Government and Law and
College of Humanities, Arts and Social Sciences Higher Degree Research Spring Conference in
November 2017.
2. A paper titled “The role of Corporate Social Responsibility on Earnings Management: Evidence
from Asia Pacific Countries” was presented at Flinders Business Research Seminar series in March
2018.
3. A paper titled “The role of Corporate Social Responsibility on Earnings Management: Evidence
from Asia Pacific Countries” was presented at the 2018 Accounting and Finance Association of
Australia and New Zealand (AFAANZ) conference in July 2018 in New Zealand.
4. A paper titled “Earnings Management and Corporate Social Responsibility: The mediating role of
Organization Capital” was presented at Flinders Business Research Seminar series in September
2019.
5. A progress report was presented on Chapters 4 and 6 at a Flinders University seminar, organised
by the College of Business, Government and Law, Flinders University, in June 2019. The presentation
involved an outline of the papers titled:
i. “The Influence of Culture and Corruption on the Earnings Management and Corporate
Social Responsibility Relationship”; and
ii. “Earnings Management, Corporate Social Responsibility and the Mediating Role of
Organization Capital”.

xvii
6. A progress report was presented on Chapters 4, 5 and 6 at a Flinders University seminar,
organised by the College of Business, Government and Law, Flinders University, in July 2020. The
presentation involved an outline of the papers titled:
i. “Earnings Management, Corporate Social Responsibility and the Mediating Role of
Organization Capital”;
ii. “Earnings Management, Corporate Social Responsibility and Organisation Capital: The
Role of Financial Distress as a Moderated Mediator”; and
iii. “The Influence of Culture and Corruption on the Earnings Management and Corporate
Social Responsibility Relationship”.
Submission
A paper titled “Earnings Management and Corporate Social Responsibility: Investigation of the
Direct and Indirect Relationship via Organisation Capital” has been submitted to the Journal of
Contemporary Accounting & Economics (JCAE 2022) Annual Symposium and Doctoral Consortium
conference in October 2021 (the outcome of the submission is pending).
Upcoming Presentation
A paper titled “Earnings Management, Corporate Social Responsibility and Organisation Capital: The
Impact of Financial Distress” is scheduled to be presented at Flinders Business Research Seminar
series in November 2021.

xviii
LIST OF ACRONYMS
ADJROA Industry-Adjusted Return on Assets
AEM Accruals Earnings Management
CEO Chief Executive Officer
COLL Collectivism
CORR Corruption
CSR Corporate Social Responsibility
DV Dependent Variable
EM Earnings Management
ENV Environmental dimension of CSR
EQ Earnings Quality
FD Financial Distress
FO Future Orientation
GDP Gross Domestic Product
GMM Generalised Method of Moments
GOV Corporate governance dimension of CSR
HLM Hierarchical Linear Modelling
HR Human Resource
IC Intellectual Capital
IV Independent Variable
IFC International Finance Corporation
INVPRO Investor Protection
MB Market to Book Ratio
MED Mediating variable
ML Maximum Likelihood

xix
MOD Moderating variable
MSCI Morgan Stanley Capital International
OC Organization Capital
OLS Ordinary Least Squares
PD Power Distance
PR Physical Resources
RBV Resource-Based View
RD Research and Development intensity
REM Real Earnings Management
ROA Return on Assets
R&D Research and Development (expenses)
SEC Securities and Exchange Commission
SEM Structural Equation Modelling
SG&A Selling, General and Administrative expenses
SOC Social dimension of CSR
SOX Sarbanes-Oxley
TBL Triple Bottom Line
UAE United Arab Emirates
USA United States of America
VIF Variation Inflation Factor
WEF World Economic Forum
WGI Worldwide Governance Indicators
2SLS 2 stage lease squares

1
INTRODUCTION TO THE STUDY
1.1 Introduction and Background
Financial reporting is the key tool through which corporate insiders (managers) communicate
information to external stakeholders (such as, shareholders and creditors) (Hong & Andersen, 2011;
Mankin et al., 2017). Stakeholders often make important decisions based on the financial reporting
information (Mankin et al., 2017; Staubus, 2013). It is therefore critical that financial reporting
information is relevant and faithfully represented (International Accounting Standards Board [IASB],
2018). Incorrectly reported information may mislead stakeholders, leading to sub-optimal decisions
(Bushman et al., 2011; Healy & Palepu, 2001). Within financial statements, the reported earnings
figure is important, as it is a key indicator of financial performance. The reported earnings figure is
often used as a basis for: 1) determining compensation plans for executives (including bonuses), 2)
assessing debt contracts, and 3) a variety of other decision-making by investors and creditors
(Dechow, 1994). Stakeholders expect the quality of reported earnings (also known as, Earnings
Quality (EQ)) to be high to enhance their likelihood of making optimal decisions. High EQ refers to
an earnings figure that provides an accurate reflection of a firm’s current operating performance, a
useful prediction of its future operating performance, and a suitable basis for evaluating firm value
(Dechow & Schrand, 2004). However, managers may have self-serving motivations to deliberately
manipulate the reported earnings, which in turn may lower EQ (Dechow & Schrand, 2004). This is
known as Earnings Management (EM) (Dechow & Schrand, 2004; Schipper, 1989). The presence of
EM may reduce the relevance and faithful representation of financial information quality,
potentially resulting in resource misallocation decisions by stakeholders (Healy & Wahlen, 1999).
The first main theme of the present study is EM.
Managers’ engagement in EM may be explained from the traditional agency theory perspective
introduced by Jensen & Meckling (1976). Agency theory is based on the assumption that due to the
separation of ownership (by shareholders) and control (by managers), there may be information
asymmetry (agency problem) between shareholders and managers (Gerged et al., 2021; Jensen &
Meckling, 1976). Managers may use their greater knowledge and access to the firm’s resources, and
manage earnings for their private gain, such as, to enhance compensation-based bonuses (Buertey
et al., 2020; Dechow & Schrand, 2004). However, EM may provide misleading information to the
shareholders, resulting in negative consequences, such as resource misallocation decisions (Gerged

2
et al., 2021; Leuz et al., 2003; Martínez‐Ferrero et al., 2015; Prior et al., 2008; Wang et al., 2018).
Thus, EM is considered an agency cost (Mohmed et al., 2020; Prior et al., 2008; Scholtens & Kang,
2013). Shareholders’ responses to the agency problem may include increased monitoring,
restructuring of management’s compensation plans or even withdrawal of their investments (Chen
et al., 2016; Leung et al., 2019). To avoid these negative consequences, managers often take
additional initiatives to mitigate the agency problem with shareholders (Gerged et al., 2021). In
recent times, a popular initiative that managers have been undertaking is their engagement in
Corporate Social Responsibility (CSR) practices (for example, see Almahrog et al., 2018; Calegari et
al., 2010; Chen & Hung, 2021; Gras-Gil et al., 2016; Jones, 1995; Martínez‐Ferrero et al., 2015; Prior
et al., 2008). CSR is defined as a firm’s broader responsibilities and obligations towards
environmental and societal values, beyond their fundamental obligations of value creation for
shareholders (Bowen, 1953; Henderson et al., 2011). Through CSR engagement, managers appear
more transparent and ethical not only to shareholders, but also to broader stakeholders, thus
instilling trust regarding managerial practices and enhancing reliability on the reported earnings
figure (Chih et al., 2008; Gras-Gil et al., 2016; Kim et al., 2012). The second theme of the present
study is CSR.
This section provides a brief introduction and background on EM and CSR to set the premise of the
present study. More detailed backgrounds of these two issues are discussed in Chapter 2.
1.1.1 Earnings Management (EM)
EM is generally viewed from two perspectives – 1) opportunistic perspective; and 2) information
perspective (Lin et al., 2016b). The opportunistic perspective suggests that managers may
opportunistically use EM to mislead stakeholders (Healy & Wahlen, 1999; Lewellyn & Bao, 2017;
Schipper & Vincent, 2003). In contrast, the information perspective suggests that managers may use
EM with a signalling purpose to inform stakeholders of managements’ expectations regarding the
firms’ future cash flow and/or profitability prospects (Burgstahler et al., 2006; Guay et al., 1996).
Following an expanse of prior studies, the present study assumes the first perspective, that is, the
opportunistic perspective of EM (for example, see Almahrog et al., 2018; Bozzolan et al., 2015;
Buertey et al., 2020; Calegari et al., 2010; Chen & Hung, 2021; Cho & Chun, 2015; Chun & Cho, 2017;
Faisal et al., 2018; Gao & Zhang, 2015; García‐Sánchez et al., 2020; Gerged et al., 2020; Gerged et
al., 2021; Gras-Gil et al., 2016; Habbash & Haddad, 2020; Hickman et al., 2021; Hong & Andersen,

3
2011; Kim et al., 2012; Kumala & Siregar, 2020; Li & Xia, 2018; Litt et al., 2013; Martínez‐Ferrero et
al., 2015; Palacios-Manzano et al., 2019; Patten & Trompeter, 2003; Pratiwi & Siregar, 2019; Riahi-
Belkaoui, 2003; Scholtens & Kang, 2013; Sial et al., 2019; Wang et al., 2018).
According to the opportunistic perspective, EM is defined as “a purposeful intervention in the
external financial reporting process, with the intention of obtaining some private gain” (Schipper,
1989, p. 92). While this is one of the earliest definitions of EM, a more recent definition, proposed
by DeFond (2010), is that EM is the management of accounting numbers without violating the
Generally Accepted Accounting Principles (GAAP). Although EM is not a violation of the law or
accounting standards, it is considered an unethical act, as it provides misleading information to
stakeholders (Lewellyn & Bao, 2017; Schipper & Vincent, 2003), and may lead to severe
consequences, such as damaging investor confidence (Dechow et al., 1995), and harming share
prices in the long-term1 (Teoh et al., 1998). Furthermore, it is reported that firms engaged in EM are
more likely to commit fraud in subsequent years (Perols & Lougee, 2011). This suggests that EM
may be among the initial steps leading to more severe forms of corporate fraud. Thus, it is critical
to detect and prevent EM in its early stages, before it extends to accounting fraud (Chih et al., 2008;
Cho & Chun, 2015; The Economist, 2014).
To understand EM, it is essential to understand managerial motives and opportunities to engage in
EM. The underlying motives for managers’ engagement in EM may include, avoiding violations of
debt covenants (Dechow & Schrand, 2004; Jaggi & Lee, 2002), exploiting compensation-based
management bonuses (Dechow & Schrand, 2004), inflating stock prices (Healy & Wahlen, 1999;
Levitt Jr, 1998), and aligning reported earnings with targeted and forecasted earnings (Dechow &
Schrand, 2004; Dechow & Skinner, 2000; Levitt Jr, 1998). EM opportunities may arise for two main
reasons. First, the accounting standards provide some flexibility in determination of estimates and
judgements in the financial reporting process, creating opportunities for managers to manage these
numbers for opportunistic motives (Chung et al., 2002; Gargouri et al., 2010; Healy & Wahlen, 1999).
Second, asymmetric information between managers and other stakeholders may also create EM
opportunities. Since managers often have better information about the firm than the external
stakeholders, including shareholders (Asrori et al., 2019), they may take the opportunity to
1 Although EM may boost share prices in the short-term (Healy & Wahlen, 1999; Levitt Jr, 1998), it may harm share prices in the long-term.

4
deliberately manage earnings for opportunistic motives (Dechow & Schrand, 2004).
EM has become a quite common practice by corporate managers (for example, see Dichev et al.,
2013). Several infamous corporate scandal and fraud cases during the last decade, such as, Enron,
WorldCom and Xerox, highlight the growing importance of detecting EM, and call for the need for
further in-depth research on EM. As a response to the growing number of corporate scandals, the
United States Congress implemented the Sarbanes-Oxley (SOX) Act in 2002. The SOX set out
guidelines for more effective audit committee, particularly focusing on stricter internal controls and
procedures, to curtail EM opportunities (Dechow & Schrand, 2004; Zhang et al., 2013). However,
EM and corporate scandals have continued even after the introduction of SOX (Zhang et al., 2013).
Thus, it is essential to look beyond accounting standards, legal requirements, and internal control
systems, when examining EM. To this end, the present study examines how managerial behaviour
and motives, linked to their CSR engagement, affect EM.
1.1.2 Corporate Social Responsibility (CSR)
CSR has become a very familiar concept today. Although the concept of CSR can be traced back to
as early as 1920s, the concept did not gain much attention until the 1950s (Smith, 2011). One of the
earliest definitions of CSR, coined by Bowen (1953), referred to CSR as the obligations of businesses
to pursue policies, decisions and actions that are consistent to the societal values and objectives.
More recently, CSR is viewed as the responsibility that firms have on the overall societal welfare, in
addition to their prevailing responsibilities of financial gain for the shareholders (Henderson et al.,
2011). The concept of CSR is tied to the stakeholder view of firms. Traditionally, in the 1980s, firms
were viewed as having responsibilities to only add value to the shareholders/owners (Hubbard,
2009). However, from the 1990s, the stakeholder view gained momentum, as the world became
increasingly aware of firms’ responsibilities to their stakeholders (Hubbard, 2009). Stakeholders
include a wider group alongside the shareholders of the firm, such as, consumers, government,
suppliers, employees, debtors, investors and lenders (Ackoff, 1999). Thus, consistent with the
stakeholder view, CSR focusses on how a firm’s performance and actions affect a wide group of
stakeholders, as opposed to merely the shareholders. In the late 1990s, Elkington (1997) introduced
the concept of the Triple Bottom Line (TBL) that viewed the CSR framework as composed of three
dimensions – namely, economic (or financial), environmental and social initiatives. A noteworthy
development in the CSR framework since the TBL is the inclusion of corporate governance as the

5
fourth dimension. While the economic dimension refers to the financial information, today, CSR is
most commonly categorised into the three other dimensions, namely, Environmental, Social and
Governance initiatives, also referred to as ESG.
In more recent times, CSR has become more of a norm, as a variety of stakeholders now expect
firms to actively incorporate CSR practices into their business operations (Ho et al., 2012). Recent
corporate scandals, coupled with environmental concerns (such as, global warming and resource
sustainability), and social concerns (such as, human rights issues and working conditions of
employees of multinational companies in developing countries) have led to increased attention to
the environmental and social responsibilities of firms (Yip et al., 2011). The last few decades have
seen a prominent rise in CSR initiatives by firms (Almahrog et al., 2018) and a growing attention by
researchers (Cho & Chun, 2015; Ho et al., 2012). By actively engaging in CSR, firms gain a manifold
of benefits, such as, positive firm reputation (Branco & Rodrigues, 2006; Epstein & Roy, 2001; Hur
et al., 2014; Prior et al., 2008), brand image and loyalty (Chung et al., 2015; Pivato et al., 2008;
Werther & Chandler, 2005), reduced agency costs and enhanced trust from stakeholders (Arthur et
al., 2015; Pivato et al., 2008; Scholtens & Kang, 2013), boost in employee motivation and retention
(Epstein & Roy, 2001; Sprinkle & Maines, 2010; Wagner & Schaltegger, 2004), revenue growth
(Sprinkle & Maines, 2010; Wagner & Schaltegger, 2004), tax advantages (Sprinkle & Maines, 2010),
and lower cost of capital through reduced perceived risk (Epstein & Roy, 2001; Fombrun et al.,
2000).
1.1.3 Linking CSR and EM
Both CSR and EM are two popular but debated contemporary issues in accounting research2. These
two topics are closely related both theoretically and empirically. These issues seem to have been
brought into the spotlight by some notorious corporate scandals, such as the cases of Enron,
WorldCom and Xerox (Calegari et al., 2010; Cho & Chun, 2015). Such corporate scandals led to
controversies surrounding managerial practices and increased skepticism regarding transparency in
financial reporting process. As a result, it has become ever-more important for managers to focus
on building reputation and public image. This has led managers across the globe to incorporate CSR
activities into their business practices to gain stakeholder support (Calegari et al., 2010; Chih et al.,
2 While EM is an accounting and finance issue, CSR is a multi-disciplinary issue that is widely popular in other disciplines, including marketing and management, in addition to Accounting and Finance.

6
2008; Cho & Chun, 2015; Gao & Zhang, 2015; Kim et al., 2012; Martínez‐Ferrero et al., 2015).
Firms with CSR activities are generally presumed to have a higher commitment to ethical values and
practices (Jones, 1999), enhancing credibility and reducing agency problem (Pivato et al., 2008;
Scholtens & Kang, 2013). However, CSR is also often viewed with skepticism, as managers may have
ulterior motives behind their CSR engagement, which may exacerbate the agency problem. For
example, managers may use their CSR practices as ‘window-dressing’ to make the firm more
appealing to stakeholders, such as consumers, investors and creditors (Fatma & Rahman, 2015). A
relevant example is evidenced in the Enron case, a well-known case of corporate fraud and the
biggest corporate failure to date (MacCarthy, 2017). While the company was allegedly involved in
fraudulent accounting practices, they were actively involved in CSR initiatives. Enron had spent
millions of dollars on local charities, won numerous national awards for its CSR initiatives (Smale,
2006), and held a high ranking in the Fortune Magazine due to their CSR engagement (Culpan &
Trussel, 2005). This behaviour contradicts the ethical theories that imply that firms with CSR
initiatives should behave ethically in their accounting practices, and refrain from the unethical
practices, such as EM.
These conflicting views have led numerous researchers to examine the relationship between CSR
and managers’ opportunistic activities, that is, EM. However, the findings remain inconclusive, as
there are two contrasting perspectives. One perspective suggests that managers engaged in CSR
tend to be long-term oriented (myopia avoidant), and are therefore less likely to manage earnings
(Chih et al., 2008). Managers’ intrinsic ethical and moral values, and their greater concern for
stakeholders may lead them to avoid EM, since EM is considered an unethical act (Kim et al., 2012;
Litt et al., 2013; Yip et al., 2011) and an agency problem (Prior et al., 2008; Scholtens & Kang, 2013).
A contrasting perspective suggests that managers engaged in CSR may be short-term oriented
(myopic), and are therefore more likely to manage earnings for short-term benefits while using CSR
as a shield to conceal their EM practices (Hemingway & Maclagan, 2004; Kim et al., 2012; Laux &
Leuz, 2009; Prior et al., 2008).
The main objective of the present study is to address this debate on the CSR-EM relationship by
providing a more comprehensive and in-depth understanding of this relationship from a managerial
behaviour perspective. In doing so, I examine the CSR-EM relationship closely, to address how, why
and when CSR affects EM by looking at the issue from a developed country context as well as an

7
emerging market context. Specifically, I examine a sample of firms from: 1) USA between 2002 and
2017, and 2) 10 emerging market countries, between 2012 and 2016. The next section presents a
brief discussion on the gaps in the CSR-EM literature, followed by the research objectives and
research questions addressed in this study.
1.2 Research Objectives and Questions
The main purpose of the present study is to examine the CSR-EM relationship in-depth by addressing
how, why and when CSR affects EM. Prior studies suggest conflicting findings regarding the effect of
CSR on EM. To address this debate, the present study examines the direct effect of CSR on EM. While
prior studies have examined various contexts affecting the CSR-EM relationship, providing insights
on when (that is, under what situations or contexts) CSR affects EM, the questions ‘why or how CSR
affects EM’ remain unaddressed to date. Thus, the present study fills this gap in the literature by
examining the indirect relationship between CSR and EM. An indirect relationship exists when an
independent variable (CSR in the present study) affects another variable (known as the mediator),
and the mediator in turn affects the dependent variable (EM in the present study) (Baron & Kenny,
1986).
Different streams of literature show that CSR enhances various forms of intangible resources
(known as intellectual capital of firms) (for example, see Altuner et al., 2015; Hawn & Ioannou, 2016;
Massaro et al., 2018), and some components of intellectual capital may create more EM incentives
(for example, see Bhandari et al., 2018; Francis et al., 2008; Malmendier & Tate, 2009; Shust, 2015).
This suggests that the intellectual capital component may be an indirect channel through which CSR
affects EM. Furthermore, prior studies have found that CSR indirectly affects firm performance via
intellectual capital (for example, see Jain et al., 2017; Surroca et al., 2010). However, the role of
intellectual capital in the CSR-EM relationship has not been examined. The present study looks at
Organization Capital (OC), a specific component of intellectual capital, as a mediating channel in the
CSR-EM relationship. OC is defined as a firm-specific, non-imitable set of intangibles that include an
integration of organizational design, process, managerial quality practices and culture (Attig &
Cleary, 2015; Lev et al., 2009). Examining the indirect CSR-EM relationship via OC will provide an
understanding on why or how CSR may affect EM, by embedding within the organizational design,

8
process, practices, and culture (that is, OC). To this end, the first objective for this study is as follows:
Research Objective 1: To investigate why and how CSR affects EM, by examining the direct CSR-EM
relationship and indirect CSR-EM relationship via OC.
Research objective 1 is addressed by answering the following two research questions:
Research Question 1.1: Does CSR have a significant direct effect on EM?
Research Question 1.2: Does CSR have a significant indirect effect on EM via OC?
As discussed earlier, prior studies have examined various contexts (moderating effects) on the CSR-
EM relationship, providing insights into the question when CSR affects EM. However, the effect of
crisis situations on the CSR-EM relationship has not gained research attention. I focus on a specific
firm-level crisis event, namely Financial Distress (FD). FD is a situation when firms do not have
sufficient assets to fulfill their outstanding financial obligations (Baldwin & Mason, 1983). Prior
studies suggest that FD creates more incentives for EM (for example see Charitou et al., 2007, 2011;
Chen et al., 2010; DeAngelo et al., 1994; DeFond & Jiambalvo, 1994; Habib et al., 2013; Jacoby et
al., 2019; Jaggi & Lee, 2002; Li et al., 2020; Rosner, 2003; Sweeney, 1994). In crisis situations,
managers’ priorities and actions may become more opportunistic, making EM more prominent as
managers may try to conceal or delay the distressed state of their firms from stakeholders (Charitou
et al., 2007). This suggests that FD may change the CSR-EM relationship. To address this, I examine
the effect of FD on the direct CSR-EM relationship, as well as the indirect CSR-EM relationship via
OC. This will provide insights on when CSR affects EM directly, and when CSR affects EM indirectly
via OC. To this end, the second objective for this study is as follows:
Research Objective 2: To investigate when CSR has a direct effect on EM, and when CSR has an
indirect effect on EM via OC, by examining the context FD.
Research objective 2 is addressed by answering the following two research questions:
Research Question 2.1: Does FD have a significant effect on the direct CSR-EM relationship?
Research Question 2.2: Does FD have a significant effect on the indirect CSR-EM relationship
via OC?

9
Research on CSR-EM has traditionally focussed on developed countries, with emerging market
countries gaining interest only recently. The unique cultural, political and legal characteristics of
emerging market countries make them more susceptible to EM (for example, see Ernst & Young,
2016; Leuz et al., 2003; Lin & Wu, 2014; Lourenço et al., 2018; Viana Jr et al., 2021). However, the
effect of these challenges on the CSR-EM relationship has not gained much research attention. To
capture these unique challenges that emerging markets face, I focus on how the CSR-EM
relationship is affected by: 1) collectivism (COLL) culture - for social and demographic challenges,
2) corruption (CORR) - for political challenges, and 3) investor protection (INVPRO) - for legal and
policymaking challenges. Since political and legal challenges co-exist with the cultural background
of the country, I also examine the joint effects of COLL and CORR, and COLL and INVPRO on the CSR-
EM relationship. This will provide further insights on when CSR affects EM in emerging market
countries. To this end, the third objective for this study is as follows:
Research Objective 3: To investigate when CSR affects EM, by examining the contexts COLL, CORR
and INVPRO in emerging market countries.
Research objective 3 is addressed by answering the following three research questions:
Research Question 3.1: Does CSR have a significant effect on EM in emerging market
countries?
Research Question 3.2: Do COLL and CORR, individually and jointly, have significant effects
on the CSR-EM relationship in emerging market countries?
Research Question 3.3 Do COLL and INVPRO, individually and jointly, have significant effects
on the CSR-EM relationship in emerging market countries?
Table 1.1 summarises the three research objectives and the research questions for each. To address
the research objectives, I undertake three research studies. The next section discusses the three
research studies.

10
Table 0.1 Research Objectives and Research Questions
Research Objectives Research Questions
1. To investigate why and how CSR affects EM, by examining the direct CSR-EM relationship and indirect CSR-EM relationship via OC.
1.1. Does CSR have a significant direct effect on EM?
1.2. Does CSR have a significant indirect effect on EM via OC?
2. To investigate when CSR has a direct effect on EM, and when CSR has an indirect effect on EM via OC, by examining the context FD.
2.1. Does FD have a significant effect on the direct CSR-EM relationship?
2.2. Does FD have a significant effect on the indirect CSR-EM relationship via OC?
3. To investigate when CSR affects EM, by examining the contexts COLL, CORR and INVPRO in emerging market countries.
3.1. Does CSR have a significant effect on EM in emerging market countries?
3.2. Do COLL and CORR, individually and jointly, have significant effects on the CSR-EM relationship in emerging market countries?
3.3. Do COLL and INVPRO, individually and jointly, have significant effects on the CSR-EM relationship in emerging market countries?
1.3 Research Studies and Conceptual Framework
As outlined in the previous section, this study has three main research objectives. To answer these
research objectives, I undertake three research studies, discussed in depth in Chapters 4 to 6. In this
section, I provide a brief overview of the three research studies. Figure 1.1 below shows the
conceptual framework for the thesis. More detailed versions of the conceptual framework, broken
down for each research study, are presented in Chapters 4, 5 and 6.

11
Figure 0.1 The Conceptual Framework for the Thesis
To answer the first research objective, I use a sample of 46,816 firm-year observations from USA
between 2002 and 2017. As discussed earlier, there are two contrasting views on the CSR-EM
relationship. The first view suggests that managers engaged in CSR tend to be long-term oriented,
and thus they avoid myopic (or short-term) actions, such as EM. This is consistent to the myopia
avoidance hypothesis (Chih et al., 2008). The contrasting view suggests that managers engaged in
CSR are more likely to manage earnings for short-term objectives, such as, to meet quarterly
earnings targets (for example, see Chih et al., 2008; Nikolov, 2018). This view is consistent with the
managerial myopia hypothesis. To understand whether the CSR-EM relationship is driven by
managers’ myopia avoidance behaviour or managerial myopic behaviour (that is, long-term
orientation or short term-orientation), I examine how CSR affects EM directly, and indirectly via OC.
In the process of examining the indirect CSR-EM relationship via OC, I also examine the two indirect
paths involved – 1) the relationship between CSR and OC, explained from the perspectives of the
resource-based view (RBV) theory, and 2) the relationship between OC and EM, explained from the
perspectives of the managerial myopia hypothesis. This constitutes my first research study and is

12
discussed in Chapter 4.
To address the second research objective, I use a sample of 36,811 firm-year observations from USA
between 2002 and 2017. The literature suggests that FD creates various incentives for managers to
manage earnings, such as, to enhance short-term remuneration (Altman, 1984), to avoid debt
covenants violations or obtain waivers for violations (Charitou et al., 2011; Dichev & Skinner, 2002;
Jaggi & Lee, 2002; Sweeney, 1994) to safeguard their employment (Charitou et al., 2011), or to
conceal the firm’s distressed state and obtain better renegotiation terms (Burgstahler & Dichev,
1997; DeAngelo et al., 1994; Rosner, 2003). Arising from the notion that FD may change managerial
incentives, I test whether FD may change managerial behaviour and motives in terms of the CSR-
EM relationship. Specifically, my second objective is to understand whether managerial behaviour
(specifically managerial myopia and myopia avoidance) changes when the firm experiences FD.
Thus, I examine the effect of FD on the direct CSR-EM relationship and the indirect CSR-EM
relationship via OC. In the process of examining the effect of FD on the indirect CSR-EM relationship,
I also examine the effect of FD on each of the indirect paths involved – 1) the effect of FD on the
relationship between CSR and OC, explained from two contrasting perspectives, namely the RBV
and the slack resources theory, and 2) the effect of FD on the relationship between OC and EM,
explained from the perspectives of the managerial myopia hypothesis. This constitutes my second
research study, discussed in Chapter 5.
To answer the third and final research objective, I use a sample of 3,472 firm-year observations,
from 10 emerging market countries, between 2012 and 2016. The10 emerging market countries
include Brazil, China, India, Indonesia, Malaysia, Russia, South Africa, South Korea, Taiwan and
Thailand. The literature suggests that the unique challenges (or characteristics of emerging markets,
specifically, cultural, political and legal characteristics, play an important role in determining
managerial behaviour and EM incentives and opportunities (for example, see DeFond et al., 2007;
Leuz et al., 2003; Lourenço et al., 2018). To understand how these characteristics play a role in
determining managerial behaviour (specifically, whether managerial myopia or myopia avoidance
are more prevalent), I examine the CSR-EM relationship and the effects of COLL, CORR and INVPRO
on the CSR-EM relationship. Consistent with the informal institutions perspective, COLL and CORR,
are expected to escalate managerial opportunistic behaviour (Lyu et al., 2016; Zhang et al., 2013),
while, consistent with the social norm theory, INVPRO is expected to inhibit opportunistic behaviour

13
(Chen et al., 2016). Examining the role of these factors on the CSR-EM relationship will provide an
understanding of the CSR-EM relationship in a broader context (emerging market countries) and
also explain when CSR affects EM in emerging market countries. Additionally, I disintegrate overall
CSR and examine the effects of the individual CSR dimensions (economic, social and governance) on
EM, to obtain an understanding on whether managerial motives and behaviour may vary based on
the CSR dimensions. To address the third research objective and investigate when CSR affects EM, I
examine the individual effects of COLL, CORR and INVPRO as well as the joint effects of COLL and
CORR, and COLL and INVPRO on EM. This constitutes my third research study, discussed in Chapter
6.
This section has introduced the three research studies undertaken to address the research
objectives outlined earlier. The next section presents the justification of the study.
1.4 Justification and Motivation of the Study
There is a lack of consensus in the literature regarding the relationship between CSR and EM. While
some studies suggest that CSR has role in inhibiting EM (for example, see Almahrog et al., 2018;
Calegari et al., 2010; Cho & Chun, 2015; Kim et al., 2012; Kumala & Siregar, 2020; Litt et al., 2013;
Palacios-Manzano et al., 2019; Scholtens & Kang, 2013), others provide a contrasting opinion by
suggesting that CSR has a role in escalating EM (for example, see Buertey et al., 2020; Habbash &
Haddad, 2020; Hickman et al., 2021; Pratiwi & Siregar, 2019; Riahi-Belkaoui, 2003). The mixed
findings in the literature regarding the CSR-EM relationship warrant further in-depth investigation
into this issue to identify various contexts and factors that may contribute to the CSR-EM
relationship. The main purpose of this research is to examine the CSR-EM relationship in-depth by
examining various firm-level and country-level contexts to provide further insights into this
important issue. Specifically, I address the questions why, how and when CSR may affect EM, using
managerial behaviour perspectives.
To this end, my first research objective is to examine the direct relationship between CSR and EM,
and the indirect relationship via OC. By examining the direct relationship between CSR and EM, the
study addresses the existing debate in the literature. By examining the indirect relationship, the
study investigates the CSR-EM issue more intensively and addresses why and how CSR affects EM.
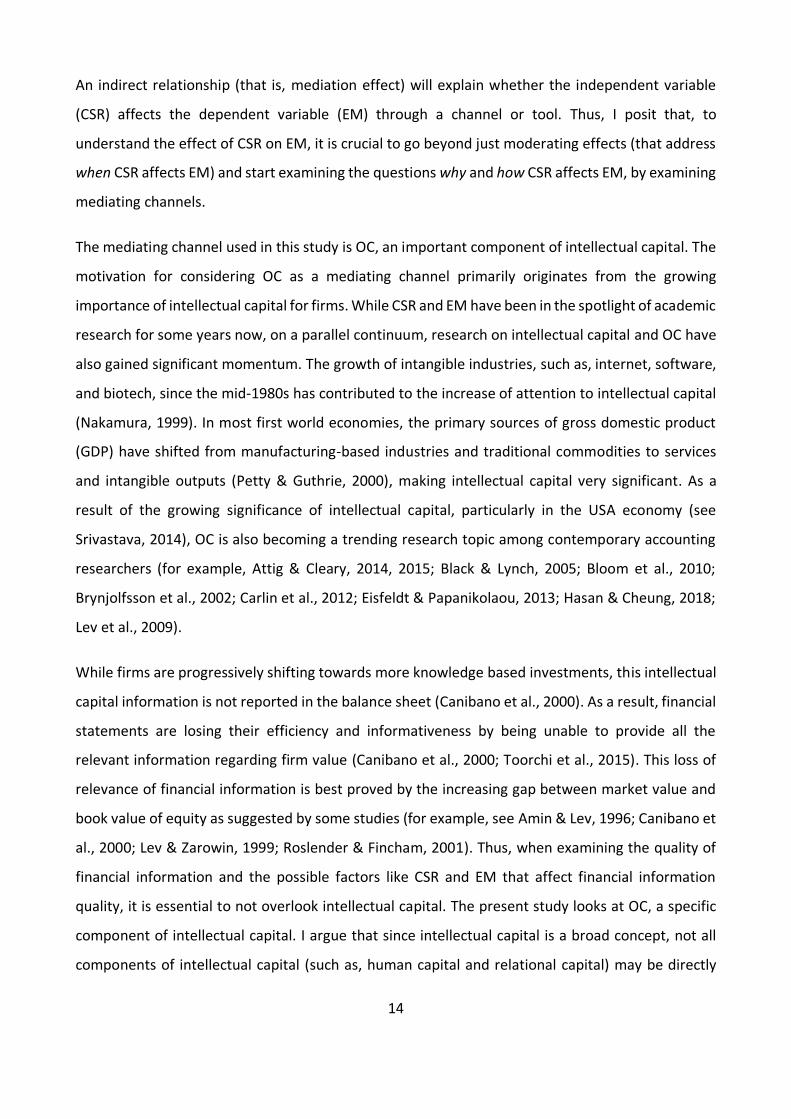
14
An indirect relationship (that is, mediation effect) will explain whether the independent variable
(CSR) affects the dependent variable (EM) through a channel or tool. Thus, I posit that, to
understand the effect of CSR on EM, it is crucial to go beyond just moderating effects (that address
when CSR affects EM) and start examining the questions why and how CSR affects EM, by examining
mediating channels.
The mediating channel used in this study is OC, an important component of intellectual capital. The
motivation for considering OC as a mediating channel primarily originates from the growing
importance of intellectual capital for firms. While CSR and EM have been in the spotlight of academic
research for some years now, on a parallel continuum, research on intellectual capital and OC have
also gained significant momentum. The growth of intangible industries, such as, internet, software,
and biotech, since the mid-1980s has contributed to the increase of attention to intellectual capital
(Nakamura, 1999). In most first world economies, the primary sources of gross domestic product
(GDP) have shifted from manufacturing-based industries and traditional commodities to services
and intangible outputs (Petty & Guthrie, 2000), making intellectual capital very significant. As a
result of the growing significance of intellectual capital, particularly in the USA economy (see
Srivastava, 2014), OC is also becoming a trending research topic among contemporary accounting
researchers (for example, Attig & Cleary, 2014, 2015; Black & Lynch, 2005; Bloom et al., 2010;
Brynjolfsson et al., 2002; Carlin et al., 2012; Eisfeldt & Papanikolaou, 2013; Hasan & Cheung, 2018;
Lev et al., 2009).
While firms are progressively shifting towards more knowledge based investments, this intellectual
capital information is not reported in the balance sheet (Canibano et al., 2000). As a result, financial
statements are losing their efficiency and informativeness by being unable to provide all the
relevant information regarding firm value (Canibano et al., 2000; Toorchi et al., 2015). This loss of
relevance of financial information is best proved by the increasing gap between market value and
book value of equity as suggested by some studies (for example, see Amin & Lev, 1996; Canibano et
al., 2000; Lev & Zarowin, 1999; Roslender & Fincham, 2001). Thus, when examining the quality of
financial information and the possible factors like CSR and EM that affect financial information
quality, it is essential to not overlook intellectual capital. The present study looks at OC, a specific
component of intellectual capital. I argue that since intellectual capital is a broad concept, not all
components of intellectual capital (such as, human capital and relational capital) may be directly

15
relevant to managerial practices. Thus, the broader issue of intellectual capital may not be
appropriate for examining CSR and EM, both of which are results of managerial practices and
actions. Therefore, I examine OC, a component of intellectual capital that is relevant to managerial
quality practices (Attig & Cleary, 2015), and is referred to as the unique managerial culture
imprinted on the organisations (Bloom et al., 2010).
My second research objective is to examine the effect of FD on the direct CSR-EM relationship, and
the indirect CSR-EM relationship via OC. This will address the questions when CSR directly affects
EM, and when CSR indirectly affects EM via OC. To gain a more comprehensive understanding on
the direct and indirect CSR-EM relationship, I examine whether the relationship holds when specific
firm-level events change, in particular when the firm experiences a crisis situation. The motivation
for choosing a crisis situation comes from the current worldwide Covid-19 pandemic outbreak. The
years 2020 and 2021 have seen businesses suffer worldwide, resulting from country-wide
restrictions, as well as international border restrictions (Barua, 2020). Thousands of businesses have
shut down, and thousands are still struggling financially. A news report from CNBC stated that as of
August 31, 2020, 97,966 businesses in USA alone have shut down permanently due to the pandemic
(see Sundaram, 2020). I have therefore chosen to focus on FD, as this is a firm-level crisis event that
is relevant in the current era where the struggle to overcome the pandemic, as well as the struggle
for economic recovery continues. Since the CSR-EM relationship is explained using managerial
behaviour theories and perspectives, it is important to look at how managers’ behaviour and
motives may change in reaction to crisis or pressure situations resulting from FD.
My third research objective is to examine the CSR-EM relationship in a broader context, focussing
on 10 emerging market countries, and examine how COLL, CORR and INVPRO affect the CSR-EM
relationship. Research on CSR-EM have traditionally been popular in developed countries, with
emerging market countries gaining interest only since 2015 (see Cho & Chun, 2015). Emerging
markets are characterised as markets with high potential for economic growth (Kaymak & Bektas,
2015). However, due to the instability of policymaking in these markets, emerging market countries
experience social, economic, political and demographic challenges (Kaymak & Bektas, 2015). The
unique cultural, political and legal characteristics of emerging market countries make them more
susceptible to EM (for example, see Ernst & Young, 2016; Leuz et al., 2003; Lin & Wu, 2014; Lourenço
et al., 2018; Viana Jr et al., 2021). Thus, it is imperative to conduct further CSR-EM research in

16
emerging market countries more susceptible to EM, to gain a more comprehensive understanding
of the CSR-EM relationship. To capture the unique social, demographic, political and legal challenges
that emerging markets face, I focus on the effect of COLL culture (for social and demographic
challenges), CORR (for political challenges) and INVPRO (for legal and policymaking challenges) on
the CSR-EM relationship. I posit that in an emerging market context, rather than examining an
indirect CSR-EM relationship (as I have done to address the first two research objectives), it is more
relevant to examine how these unique challenges (COLL, CORR and INVPRO) affect the relationship
between CSR and EM. This will address when CSR affects EM in an emerging market context.
1.5 Contribution of the Study
The present study makes important contributions to literature and theory. The study addresses the
existing debate on the CSR-EM relationship, by providing in-depth examination of various factors
that may explain the relationship. First, to explain why and how CSR may affect EM, I examine the
indirect relationship between CSR and EM via a mediating channel. To the best of my knowledge,
this is the first study to examine the indirect CSR-EM relationship. Several prior studies have
examined factors that may moderate the CSR-EM relationship. While moderating effect looks at
contexts that may explain when CSR affects EM, it does not address why and how CSR affects EM.
By incorporating OC as a mediator in the indirect CSR-EM relationship, the study also contributes to
the literature on OC (and to intellectual capital in general) by linking the concepts CSR, OC and EM.
To explain the CSR-EM relationship, the study uses two contrasting managerial behaviour
perspectives (the managerial myopia hypothesis and the myopia avoidance hypothesis) to explain
why and how managers’ engagement in CSR may have a constraining role on EM, or why and how
managers’ engagement in CSR may have an opportunistic role in covering up EM.
Second, to further examine when the direct and indirect CSR-EM relationships hold, the study
examines a firm-level context, namely FD. In doing so, the study contributes to the FD literature, by
linking FD with the key concepts, CSR, OC and EM. Prior studies have examined the effect of various
contexts on the CSR-EM relationship. However, to the best of my knowledge, the effect of FD on
the CSR-EM relationship has not been examined yet. As discussed earlier, FD has become a relevant
issue for firms since the outbreak of the Covid19 pandemic. The literature suggests that in crisis
situations, such as FD, managers’ priorities and actions may become more opportunistic, making

17
EM more prominent (Charitou et al., 2007). This suggests that FD may have an effect on the CSR-
EM relationship. I examine the effect of FD on the direct and indirect CSR-EM relationship, using the
two contrasting managerial behaviour perspectives (the managerial myopia hypothesis and the
myopia avoidance hypothesis) to provide better understanding on managerial behaviour during
crisis. This will provide an understanding of – 1) when CSR has a direct effect on EM, and 2) when
CSR has an indirect effect on EM via OC, in the context of FD. The study also provides several
methodological contributions. First, to the best of my knowledge, this is the first study to examine
a moderated mediation effect on the CSR-EM relationship. In the process of examining the effect of
FD on the indirect CSR-EM relationship via OC (that is, the moderated mediation effect), the study
makes two further methodological contributions – 1) examination of the effect of FD on the CSR-OC
relationship (first-stage moderation), 2) examination of the effect of FD on the OC-EM relationship
(second-stage moderation). To the best of my knowledge, these two relationships have also not
been examined by prior studies.
Third, to gain further in-depth insights on the CSR-EM relationship, the study uses a regional sample
of 10 emerging market countries, to examine how the CSR-EM relationship may be affected by the
unique challenges (specifically, COLL, CORR and INVPRO) that emerging market countries face. CSR-
EM research have gained attention in emerging market countries only recently. Prior studies have
looked at emerging market countries, such as, Korea (see Cho & Chun, 2015; Choi et al., 2018; Chun
& Cho, 2017), Egypt (see Mohmed et al., 2020), India (see Hickman et al., 2021), Indonesia (see
Faisal et al., 2018; Kumala & Siregar, 2020; Pratiwi & Siregar, 2019), Kuwait (see Gerged et al., 2020,
Saudi Arabia (see Habbash & Haddad, 2020), South Africa (see Buertey et al., 2020; Jordaan et al.,
2018), Taiwan (see Chen & Hung, 2021) and United Arab Emirates (UAE) (see Kolsi & Attayah, 2018).
China has also gained quite substantive interest in recent years (for example, see Gong & Ho, 2018;
Kim et al., 2019; Li & Xia, 2018; Liu & Lee, 2019; Rezaee et al., 2020; Sial et al., 2019; Wang et al.,
2018; Zhang et al., 2021). However, to the best of my knowledge, a regional emerging market
context (containing multiple emerging market countries) has not been examined. Examining a
regional sample enhances the relevance of the results to an entire region (multiple countries with
similar cultural and institutional frameworks), as opposed to being restricted to a single country.
Furthermore, by examining the effects of COLL, CORR and INVPRO on the CSR-EM relationship, the
study links managerial behaviour perspectives to the formal and informal institutions perspectives
of the institutional theory, that discuss opportunities and incentives for EM. In particular, the study

18
explains the two contrasting perspectives of managerial behaviour (managerial myopia and myopia
avoidance) in an emerging market context, in light of differences in COLL, CORR and INVPRO. Prior
studies have examined how each of these factors individually effect EM. For example, many prior
studies suggest that COLL has a positive effect on EM (for example, see Callen et al., 2011; Doupnik,
2008; Nabar & Boonlert-U-Thai, 2007; Zhang et al., 2013), CORR also has a positive effect on EM (for
example see Lourenço et al., 2018; Riahi-Belkaoui, 2004; Riahi-Belkaoui & AlNajjar, 2006), while
INVPRO has a negative effect on EM (for example, see Cahan et al., 2008; Francis & Wang, 2008;
Haw et al., 2011; Leuz et al., 2003; Persakis & Iatridis, 2016; Shen & Chih, 2005). However, to the
best of my knowledge, the effects of COLL and CORR on the CSR-EM relationship are yet to be
explored. Although some studies have also examined the effect of INVPRO on the CSR-EM
relationship, suggesting that INVPRO strengthens (weakens) the negative (positive) relationship
between CSR and EM (for example, see Chih et al., 2008; Martínez‐Ferrero et al., 2015; Scholtens &
Kang, 2013), the present study is different, as it examines the individual moderating effects of COLL,
CORR and INVPRO, as well as the joint moderating effects of COLL and CORR, and COLL and INVPRO,
on the CSR-EM relationship. I posit that it is important to examine the joint effects of these factors
because the country-level political and legal factors (CORR and INVPRO) co-exist with the cultural
background (COLL), as opposed to existing individually. Examining the moderating effect of these
factors shows whether or not the CSR-EM relationship changes with the unique characteristics of
emerging market countries, thus explaining when CSR affects EM in these countries. By examining
the CSR-EM relationship using a regional sample, the study also makes an important methodological
contribution. The study uses the Hierarchical Linear Modelling (HLM) technique to examine the
multi-level variables. To the best of my knowledge, the test of the joint effect of country level
variables and the use of multi-level analysis techniques have not been adopted in the CSR-EM
literature.
1.6 Thesis Structure
The thesis is organised into seven chapters to address the research objectives and research
questions outlined earlier.
Chapter 1: “Introduction to the Research Study”
Chapter 1 has introduced the two main issues – CSR and EM, outlining the research objectives and

19
research questions, followed by a background and justification of the CSR-EM relationship. Chapter
1 also discusses the contributions of the study.
Chapter 2: “Corporate Social Responsibility and Earnings Management – Background and
Literature Review”.
Chapter 2 begins with a detailed examination of the background of CSR, outlining the various
definitions of CSR, followed by a discussion on the motives behind CSR engagement, the various CSR
dimensions, and a comparison of CSR in developed versus emerging markets. The chapter then
provides a detailed examination of the background on EM, discussing the managerial motives and
opportunities that lead to EM engagement, the different types of EM and a comparison of EM
engagement in developed versus emerging markets. The chapter then links the concepts of CSR and
EM together theoretically, discussing the theoretical background explaining the CSR-EM
relationship, specifically from two contrasting perspectives – the managerial myopia hypothesis and
the myopia avoidance hypothesis. Next, a detailed literature review is presented, discussing prior
studies examining the CSR-EM relationship.
Chapter 3: Corporate Social Responsibility and Earnings Management – Measurement of
Variables.
Chapter 3 discusses the measurements of CSR and EM. For all three research studies undertaken in
this study, CSR and EM are the main independent and dependent variables, respectively. The
Chapter begins with a discussion on the data source for CSR, followed by a discussion on the primary
measure and alternate measures of CSR used in this study. Next, the chapter discusses the
measurement of EM, outlining the primary and alternate EM measures used.
Chapter 4: Earnings Management and Corporate Social Responsibility: Investigation of the Direct
and Indirect Relationship via Organisation Capital.
Chapter 4 reports on my first research study, undertaken to address research objective 1, and
research questions 1.1 and 1.2. Chapter 4 examines the direct relationship between CSR and EM,
and the indirect relationship between CSR and EM via the mediating effect OC. The chapter begins
with a background and introduction to OC, a component of intellectual capital. The chapter then
discusses the theoretical background, explaining the key relationships. The direct and indirect

20
relationship between CSR and EM are based on two opposing perspectives, explained by the
managerial myopia hypothesis, and the myopia avoidance hypothesis. The relationship between OC
and EM is explained by the same two opposing perspectives. The relationship between CSR and OC
is explained by the RBV theory. Following the theoretical background, Chapter 4 then presents the
literature review, hypothesis development and the conceptual framework. Next, the methodology
and findings are discussed, followed by a conclusion.
Chapter 5: Earnings Management, Corporate Social Responsibility and Organisation Capital: The
Impact of Financial Distress.
Chapter 5 discusses the second research study, undertaken to address research objective 2, and
research questions 2.1 and 2.2. Chapter 5 examines the moderating effect of FD on the direct
relationship between CSR and EM, and on the indirect relationship between CSR and EM via the
mediating effect OC. The chapter begins with a background and introduction to FD. The chapter
then discusses the theoretical background explaining the key relationships. The effect of FD on the
direct and indirect relationships between CSR and EM is explained by the two contrasting
perspectives of the managerial myopia hypothesis and the myopia avoidance hypothesis. The effect
of FD on the relationship between OC and EM is also explained by the same two contrasting
perspectives. The effect of FD on the relationship between CSR and OC is explained by two other
contrasting perspectives – the RBV theory and the slack resources theory. Following the theoretical
background, Chapter 5 then presents the literature review, hypothesis development and the
conceptual framework. Next, the methodology and findings are discussed, followed by a conclusion.
Chapter 6: Earnings Management and Corporate Social Responsibility: The Impact of Collectivist
Culture, Corruption and Investor Protection in Emerging Markets
Chapter 6 discusses the third research study, undertaken to address research objective 3, and
research questions 3.1, 3.2 and 3.3. Chapter 6 examines the relationship between CSR and EM in
emerging markets, and the moderating effect of COLL, CORR and INVPRO on the CSR-EM
relationship. The chapter begins with a background on emerging markets, discussing its unique
context in terms of COLL, CORR and INVPRO. The chapter then discusses the theoretical background
explaining the key relationships. The relationship between CSR and EM is explained by the two
contrasting perspectives of the managerial myopia hypothesis and the myopia avoidance

21
hypothesis. The effect of COLL and CORR on the relationship between CSR and EM is explained by
the informal institutions perspective, while the effect of INVPRO is explained by the social norm
theory. Following the theoretical background, Chapter 5 then presents the literature review,
hypothesis development and the conceptual framework. Next, the methodology and findings are
discussed, followed by a conclusion,
Chapter 7: Discussion and Summary
Chapter 7 is the final chapter of this thesis. The chapter re-visits the research objectives and research
questions discussed earlier, addressing them with the findings obtained from the three research
studies. The chapter then discusses the implications of the findings, followed by a discussion on the
scope and limitations of the study, and an outline on some future research directions.
1.7 Chapter Summary
This chapter introduces the research study. The research concerns the relationship between CSR
and EM. Addressing the widely debated issue on the direction of the relationship between CSR and
EM, the research aims to provide more in-depth understanding of CSR-EM by addressing why, how
and when CSR affects EM. The study outlines three main research objectives, and seven research
questions. The research objectives are addressed by undertaking three research studies. The first
two research studies use samples of firms from USA. The first study examines the direct relationship
between CSR and EM, and the indirect relationship between CSR and EM via the mediating channel
OC. The second research study examines a moderated mediating effect of FD on the CSR and EM
relationship. The third research study uses a sample from 10 emerging market countries and
examines the effects of three macro level factors, namely COLL, CORR and INVPRO on the
relationship between CSR and EM. The study makes several important contributions to literature,
theory and methodology.

22
CHAPTER 2 CORPORATE SOCIAL RESPONSIBILITY AND EARNINGS MANAGEMENT – BACKGROUND AND LITERATURE REVIEW
2.1 Introduction
The main purpose of this research is to examine the relationship between Corporate Social
Responsibility (CSR) and Earnings Management (EM) in various contexts. This chapter outlines the
background of the two key issues examined in this study, that is, CSR and EM. Both CSR and EM
issues have individually gained significant momentum in academic research in the last several years.
This chapter considers these two issues, CSR and EM, individually and together (that is, the
relationship between CSR and EM).
The rest of this chapter is organized as follows: Section 2.2 provides a discussion on CSR, including
the different CSR definitions, and incentives behind engaging in CSR, the CSR dimensions and some
background discussion on CSR activities in emerging and developed markets. Section 2.3 discusses
EM, including the various definitions of EM, incentives for undertaking EM, and different forms of
EM, and outlines the background of EM in emerging and developed markets. Sections 2.4 and 2.5
provides the theoretical background and the literature review, respectively, of the relationship
between CSR and EM. The chapter ends with a summary in Section 2.6.
2.2 Corporate Social Responsibility (CSR)
This section discusses CSR, beginning with its various definitions as suggested in the literature,
followed by the incentives for managers to practice CSR and its various dimensions.
2.2.1 Definition
The term Corporate Social Responsibility (CSR) has gained prominence in the last few decades (Cho
& Chun, 2015; Ho et al., 2012; Ringov & Zollo, 2007; Stanny & Ely, 2008). However, its existence has
been traced back to the 19th century during the Industrial Revolution in the United Kingdom
(Solomon & Solomon, 2006).
CSR is considered to be an indicator of corporate values and conduct (Aguinis & Glavas, 2012). One
of the earliest definitions of CSR is that CSR is “the firm’s considerations of, and response to, issues
beyond the narrow economic, technical and legal requirements of the firm to accomplish social (and

23
environmental) benefits along with the traditional economic gains which the firm seeks” (Davis,
1973, p. 312). Over the years, several other definitions of CSR have evolved. For example, the World
Business Council for Sustainable Development (2002, p.229) defines CSR as “the commitment of
business to contribute to sustainable economic development, working with employees, their
families, the local community and society at large to improve their quality of life”. Henderson et al.
(2011, p. 89) define CSR as “the impact of a company’s activities on the welfare of society”. Aguinis
(2011, p. 855) defines CSR as a set of “context specific organizational actions and policies that take
into account stakeholders’ expectations and the triple bottom line of economic, social and
environmental performance”.
A few interchangeable terms are often used in the existing literature to represent CSR, such as,
corporate social performance (example, see Gargouri et al., 2010; Ho et al., 2012; Ioannou &
Serafeim, 2012), organisational responsibility (Aguinis, 2011), corporate sustainability (Sprinkle &
Maines, 2010), or simply corporate responsibility (Ralston et al., 2015).
2.2.2 CSR Motives
It is argued that firms currently have two streams of responsibility. The first is a narrow vision of
compliance with the legal requirements and maximising profits by providing goods and services
(Quazi & O’Brien, 2000). The second is a broader vision of meeting various societal expectations,
ranging from environmental protection and resources conservation to community development and
philanthropic contributions (Ho et al., 2012; Quazi & O’Brien, 2000). Traditionally, it was only
governments who were seen responsible for improvements of the society (Jamali & Mirshak, 2007).
However, this responsibility is increasingly shifting to businesses in recent times (Jamali & Mirshak,
2007). Today, a wide range of stakeholders expect firms to have socially responsible practices (Ho
et al., 2012; Principles for Responsible Investment, 2017). Thus, CSR is considered important for
organisations of all sizes, sectors and locations as evidenced by a diverse range of corporates
supporting CSR. In present times , CSR is not just concerned with meeting the societal expectations
of businesses, but is also considered to be an avenue that addresses financial and ethical objectives
of the business, while minimising business risks (State Street Global Advisors, 2017).
The motives behind engaging in CSR initiatives is explained by two contrasting perspectives. As
discussed in Chapter 1, the first perspective is the normative case, suggesting that managers’
engagement in CSR is driven by their moral values. However, the second perspective, the business
case perspective suggest that managers may have self-serving motives behind their CSR

24
engagement. This section discusses the various motives behind CSR engagement.
Consistent to the normative case perspective, CSR may simply result from ethical values and
altruistic purposes of managers (Sprinkle & Maines, 2010). Firms often make philanthropic
donations without publicising these actions. For example, Procter and Gamble, and Walmart and
Honda donated millions of dollars to the relief effort causes after the 9/11 incident in the United
States, with no intention of publicising these donations (Alsop, 2002). However, the business case
perspective suggests numerous motives behind engaging in CSR.
Several studies explain CSR from the perspectives of the stakeholder theory (Freeman, 1984;
McWilliams & Siegel, 2001). Stakeholder theory assumes that entities must maintain good
relationships with their critical stakeholders and ensure minimal agency costs in order to survive
and prosper in the long term. Thus, involvement in CSR practices facilitates stakeholder
contentment (Prior et al., 2008), enabling the firm to build better relation with key stakeholders
such as investors, regulators and customers (Carroll & Shabana, 2010).
Strong alignment with stakeholders has a number of advantages for managers. For example, by
gaining support from stakeholders, managers may be protected from hostile takeovers (Pagano &
Volpin, 2005). Furthermore, the firms gain competitive advantage through minimizing agency costs
(Scholtens & Kang, 2013), and through gaining stakeholders’ trust (Pivato et al., 2008; Porter &
Kramer, 2002). In addition to financial information, investors and credit ratings agencies often
consider the environmental, social and governance factors of firms in analysing credit risks
(Principles for Responsible Investment, 2017). Investors are particularly concerned with CSR
because they are mainly interested in maximising their returns while ensuring minimum risks,
including risks arising from CSR issues(Principles for Responsible Investment, 2017). Investors are
increasingly evaluating their investments based on environmental, social and governance criteria as
CSR issues gain growing exposure now, owing to increased media exposure and the prominence of
social media as a platform exposing good and bad corporate conduct and highlighting issues such
as child labour (State Street Global Advisors, 2017).
Additionally, firms engaging in CSR activities may gain a competitive advantage through
differentiation from competitors (Branco & Rodrigues, 2006). The differentiation arises because, in
most countries, socially responsible practices are not a legal requirement, and therefore, such
practices are appreciated by stakeholders (Anderson & Landau, 2006). Such practices may help the
firm avoid negative publicity, as well as provide positive media exposure for the firm in local and
25
national news broadcasts (Sprinkle & Maines, 2010). Increased trust from customers helps to
strengthen the brand image and loyalty of the business (Pivato et al., 2008; Waldman et al., 2006;
Werther & Chandler, 2005), and also the overall reputation of the business (Epstein & Roy, 2001;
Prior et al., 2008). These in turn may result in revenue growth (Sprinkle & Maines, 2010; Wagner &
Schaltegger, 2004).
Internal implications of CSR include employee motivation and retention, by showing greater
concern for employees (Epstein & Roy, 2001; Sprinkle & Maines, 2010; Wagner & Schaltegger,
2004). Moreover, CSR activities are likely to enhance employee’s morale (Godfrey, 2005). CSR also
has capital market implications. It reduces perceived risk of the business and therefore results in
lower cost of capital (Epstein & Roy, 2001; Fombrun et al., 2000). CSR practices may also provide
tax advantages in several ways. For example, charity and donations provide tax credits (Sprinkle &
Maines, 2010).
Given the plethora of diversity in the intentions behind CSR, it is often difficult to distinguish the
true motive behind CSR. Advocates of CSR claim that CSR is crucial for firms as it enables firms to
shift their focus on wider social considerations rather than focussing solely on financial returns. On
the other hand, cynics argue CSR to be opportunistic and involving anti-ethical practices merely as
a façade to influence customers (Fatma & Rahman, 2015).
2.2.3 CSR Dimensions
Traditionally, CSR has focused on three dimensions of corporate actions, more commonly referred
to as the Triple Bottom Line (TBL), namely, economic, environment (ENV) and social (SOC)
(Elkington, 1997). Conventionally, the three dimensions included in the TBL framework have been
given equal weight (Hussain et al., 2016). The focus has now expanded to include a fourth dimension
namely, corporate governance (GOV) initiatives (Anderson & Landau, 2006).
The economic dimension refers to the traditional view of firms’ having the primary responsibility of
producing their goods and services to meet customer needs and regulatory standards with the
objective of making a profit (Hubbard, 2009). It includes corporate actions necessary to meet the
basic needs of various stakeholders involved with the business, primarily through fulfilling financial
responsibilities (Ralston et al., 2015). For example, the economic dimension of CSR focusses mainly
on the firm’s responsibilities to reward stakeholders. Among other things, it includes aspects, such
as, income growth, profit margin, return on equity, shareholder loyalty, accounting litigations

26
(Ralston et al., 2015; Thomson Reuters, 2013a).
The ENV dimension of CSR includes the firm’s impact on and responsibility towards the
environment. This CSR dimension focusses on protecting the environment through addressing any
harmful corporate actions and developing strategies to address these issues (Banerjee, 2001). These
strategies may address issues like pollution prevention, energy emissions and conservation of
resources (e.g., energy, water, and materials), the ecological footprint of the firm, and
environmental innovations (e.g. development of eco-friendly products) (Banerjee, 2001; Goel, 2010;
Hubbard, 2009; Thomson Reuters, 2018).
The SOC dimension of CSR focusses on the firm’s impact on and responsibility towards the society
(or community), as well as employees (Hubbard, 2009; Slaper & Hall, 2011). This dimension includes
aspects such as, charitable contributions by the firm, the number of training hours provided for staff
development, workplace safety issues, equal opportunities and fair treatment of employees and
human rights issues (Elkington, 1997; Slaper & Hall, 2011; Thomson Reuters, 2018). Ralston et al.
(2015) categorize the three dimensions of Carroll (1991) namely, legal, ethical and philanthropic
dimensions, as part of the SOC dimension of CSR.
More recently, a fourth CSR dimension has been gaining interest – the GOV dimension. Studies
suggest that corporate governance is closely linked to CSR as good corporate governance leads to
better CSR performance (Malik, 2015). GOV includes aspects such as effectiveness of corporate
governance principles, equal treatment of shareholders, and the incorporation of financial, ENV and
SOC practices into the business operations (Thomson Reuters, 2018).
As the economic dimension overlaps with the accounting and financial information provided within
financial statements, the contemporary composition of CSR includes the three dimensions – ENV,
SOC and GOV, often referred to as ESG. This is evident as popular secondary databases, such as KLD
and Thomson Reuters, now exclude the economic dimension, and provide CSR scores on the three
ESG dimensions. Based on this contemporary view of CSR, the present study defines CSR as a firm’s
performance on the ESG dimensions, that is Environmental, Social and Governance dimension.
2.2.4 CSR in Practice – Developed and Emerging Market Countries
With the growing momentum of CSR, an increasing number of stakeholders, including, investors,
customers and the broader society, now demand the inclusion of environmental, social and
governance activities of businesses within the financial statements, in addition to the economic

27
(financial) activities (Beattie, 2014; Cho & Chun, 2015; Eccles et al., 2011; Kim et al., 2012; Rao et
al., 2012). As such, the last few decades have seen a prominent rise in CSR initiatives by firms
(Almahrog et al., 2018) and a growing attention by researchers (Cho & Chun, 2015; Ho et al., 2012).
Renowned global brands, with their CSR activities, have set notable examples for others to follow.
Some examples of CSR in practice are listed below:
- In 2006, Walmart started a program that aimed to reduce packaging by its suppliers by 5%
during the years 2008 to 2013 (Sprinkle & Maines, 2010).
- Since 2010, the Body Shop has banned animal testing as part of its movement towards
avoiding cruelty towards animals (Sprinkle & Maines, 2010).
- Since 2015, Starbucks is known to be sourcing 99% of their coffee supply ethically (Gavin,
2019).
- Sony has been attempting to limit its greenhouse gas emissions by setting targets for carbon
emissions in its operational activities, such as production and shipping (Sprinkle & Maines,
2010).
- McDonalds have a code of conduct regarding fair and safe working conditions for employees
working at all McDonalds franchise outlets. Independent auditors ensure that the working
conditions adhere to the code of conduct (Sprinkle & Maines, 2010).
- Ben & Jerry’s have formed a foundation under their brand name that contributes
approximately $2.5 million dollar in grants annually to organizations across USA, including
the United Workers Association and Clean Air Coalition (Gavin, 2019).
- The spike of the Covid-19 pandemic saw a significant shortage in the supply of hand
sanitizers in 2019. Prompted by the communities’ needs, several beer and spirits
manufacturers, particularly in USA and Australia, commenced manufacturing them (Furnari,
2020).
In response to this growing awareness, organisations across the globe have started publishing
Sustainability Reports (Ahmed & Sundaram, 2012). A sustainability report is an extension of the
traditional financial reporting, where organisations report their environmental and social activities
and effects (Moneva et al., 2006). A survey by KPMG (2020) shows that 80% of firms worldwide
report on CSR issues.
CSR is traced to have begun in USA, with its globalisation in other countries coming much later
28
(Matten & Moon, 2008). CSR research have also mainly focussed on developed countries
(particularly USA), with very little focus on emerging market countries (Doh et al., 2018), possibly
owing to limitations in data availability in emerging markets (Baskin & Gordon, 2005). The CSR
performance by firms is contextually dependent on the country of origin and its institutional
framework (Chih et al., 2008). Using the ESG index from Thomson Reuters Asset4 database,
Boubakri et al. (2021) compare the CSR performance, and the performance on environmental and
social dimensions of CSR between emerging market countries and developed countries.3 Figure 2.1
(sourced from Boubakri et al., 2021) presents a comparison of CSR performance between emerging
market and developed countries.
Figure 2.1 CSR Performance - Emerging Market Countries Versus Developed Countries
This image has been removed due to copyright restriction. Available online from:
[https://www.sciencedirect.com/science/article/pii/S1566014120303307]
As shown in Figure 2.1, developed market countries outperform emerging market countries in terms
of overall CSR performance as well as the individual Environmental and Social CSR dimensions.
However, emerging market countries are not too far behind. In fact, Boubakri et al. (2021) note a
30% surge in the CSR performance by emerging market countries over the period 2002 to 2015.
Overall, the literature suggests that although CSR became significant in emerging markets much
later than in developed markets, in recent times, CSR is considered significant in both emerging
market countries and developed market countries. While CSR disclosures remain largely voluntary
in most parts of the world, some emerging market countries, specifically, China, India and Indonesia
have mandated CSR disclosures for specific firms (Lin, 2020).
3 Similar to the present study, Boubakri et al. (2021) also use the MSCI market classification to classify emerging market countries and developed market countries. The emerging market countries referred to in the study include Brazil, Chile, China, Colombia, Egypt, Greece, India, Indonesia, Malaysia, Mexico, Philippines, Poland, Qatar, Russian Federation, Saudi Arabia, South Africa, South Korea, Taiwan, Thailand, Turkey, and United Arab Emirates. The developed market countries include Australia, Austria, Belgium, Canada, Denmark, Finland, France, Germany, Ireland, Israel, Italy, Japan, Netherlands, New Zealand, Norway, Portugal, Singapore, Spain, Sweden, Switzerland, the UK, and the USA (Boubakri et al., 2021).

29
2.3 Earnings Management (EM)
This section outlines the various definitions of EM proposed by prior studies, followed by a
discussion on the incentives and opportunities that lead managers to engage in EM. The section
then proceeds to discuss the various types or measures of EM.
2.3.1 Definition of EM
One of the earliest definitions of EM states that EM is “a purposeful intervention in the external
financial reporting process, with the intention of obtaining some private gain” (Schipper, 1989,
p.92). However, there still seems to be no single universally accepted definition for EM. For example,
Levitt Jr (1998) proposes a unique definition of EM by stating that managed earnings are a reflection
of management’s desires rather than an indicator of firm performance. Levitt Jr (1998) characterizes
EM to be a widespread yet inadequately challenged game that is capable of having negative
consequences on the financial reporting system unless properly addressed. Levitt Jr (1998) also
points out that EM is not a purely new phenomenon, but it has gained increased momentum
because the financial community is undergoing a situation where financial quality is on the decline,
while EM is on the rise. According to Healy & Wahlen (1999), EM is a result of managers’ “judgment
in financial reporting and structuring transactions to alter financial reports to either mislead some
stakeholders about the underlying economic performance of the company or to influence
contractual outcomes that depend on reported accounting numbers” (p. 368). DeFond (2010)
defines EM as the management of accounting numbers without violating Generally Accepted
Accounting Principles (GAAP).
2.3.2 EM Incentives and Opportunities
As discussed above, EM primarily arises as managers can use their discretion and judgments in
preparing the financial reports. Healy & Wahlen (1999) proposes that managers’ use of judgements
has advantages and disadvantages. On one hand, managers can use their judgments to make the
reports more informative for users, improving resource allocation decisions. On the other hand,
when these judgments are used in an opportunistic manner, the financial information may lose
credibility and become too distorted (Healy & Wahlen, 1999).
Managers may engage in EM due to several incentives. Positive accounting theory explains
managers’ accounting choices and incentives for EM created by transaction costs, such as agency

30
costs, political costs and debt contracting costs (Watts & Zimmerman, 1990). For instance, several
authors suggest that debt contracts may provide incentives for managers to manage earnings (for
example, see Dechow et al., 2010; Dechow, 1994; Dechow & Schrand, 2004; Sweeney, 1994).
According to Sweeney (1994), while lending covenants may often lead managers to make
accounting changes, such as income-increasing changes or cutting dividends. Managers may have
reasons to manage earnings to avoid violation of debt covenants as these covenants are often based
on accounting ratios (Dechow & Schrand, 2004; Jaggi & Lee, 2002). This is particularly true for firms
facing financial difficulties (Dechow et al., 2010). Jaggi & Lee (2002) suggest that financially
distressed firms may have both income-increasing and income-decreasing EM strategies. For
instance, if the financially distressed firm can obtain a debt covenant waiver, they appear to conduct
income-increasing EM (Jaggi & Lee, 2002). However, if they are unable to obtain such a waiver, they
are more likely to conduct income-decreasing EM in attempts to restructure the contract (Jaggi &
Lee, 2002).
Several authors discuss the role of compensation plans in creating incentives for management to
conduct EM (for example, see Dechow & Schrand, 2004; Guidry et al., 1999; Harris & Bromiley, 2007;
Schipper, 1989; Zhang, 2008). These authors propose that managers’ compensation plans may often
lead them to manage earnings in periods where the actual earnings fail to meet the target earnings.
However, that does not necessarily imply that earnings will not be managed if targets are met. As
Dechow & Schrand (2004) suggest, EM may be conducted merely as means to maximize the
compensation-based bonuses for management.
A third frequently cited EM incentive arises from capital market incentives, such as, inflating short-
term stock prices (for example, see Dechow & Schrand, 2004; Dechow & Skinner, 2000; Healy &
Palepu, 2001; Levitt Jr, 1998; Schipper, 1989).
A fourth EM incentive, as proposed by Leuz et al. (2003), arises from the conflict of interest between
corporate insiders (such as owners and/or managers) and outsiders (i.e. other stakeholders). Since
insiders have control over the firm, they may often misuse this position to opportunistically benefit
themselves at the cost of other stakeholders (Leuz et al., 2003; Shleifer & Vishny, 1997). Such
extraction of private benefits arising from the control of the firm is popularly referred to as private
control benefits. These private control benefits are enjoyed solely by the controlling insiders,
without being shared with the non-controlling outsiders (Leuz et al., 2003). Thus, insiders may have
incentives to disguise the firm’s actual performance to hide their private control benefits. Such

31
actions are attempts to protect themselves from disciplinary actions that outsiders may take upon
detecting the private control benefits (Leuz et al., 2003). Thus, insiders may be enthused to
overstate or understate actual earnings to report more favourable outcomes (Leuz et al., 2003).
Researchers also suggest that earnings can be managed in order to align the reported earnings with
forecast earnings (Dechow & Schrand, 2004; Dechow & Skinner, 2000; Levitt Jr, 1998). Missing
target earnings or reporting earnings that are lower than forecasted may displease investors. Thus,
managers may have incentives to manage earnings to please investors (Dechow & Schrand, 2004).
Furthermore, managers may also manage the timing of revenue and expense recognitions to ensure
targets are consistently met by transferring recognition of revenues from periods with high sales to
periods when sales are lower (Dechow & Schrand, 2004; Dechow & Skinner, 2000).
In general, EM may arise from fraud motives and opportunities (Ndofor et al., 2015; Noor et al.,
2015). Noor et al. (2015) find that EM may arise from personal fraud motives, such as dividend
payments, or from fraud opportunities available in firms with high leverage and low audit
independence. In contrast, Ndofor et al. (2015) report that EM may result from opportunities
provided by information asymmetry between shareholders and CEOs.
Opportunities for EM may arise from the flexibilities allowed by accounting standards, particularly
in areas concerning judgements and estimates. For example, managers can classify certain expenses
into other items or into research and development, as a strategy to overstate or understate current
period earnings (Levitt Jr, 1998). Levitt Jr (1998) points out that this strategy of expense
misclassification is quite common during corporate restructuring and in times of mergers and
acquisitions. Managers can also create cookie jar reserves as attempts to manage earnings (Levitt
Jr, 1998). This means that firms can make unrealistic assumptions about some contingent liabilities,
such as warranties and loan losses (Levitt Jr, 1998). This is an attempt to hide accruals in cookie jars
in good times and use these to manage reported earnings and make them look better in bad times
(Levitt Jr, 1998). The concept of materiality also allows some room for EM, as firms can misuse this
concept and exclude items from their financial report claiming that they are immaterial (Levitt Jr,
1998). The Economist, 2010 reports a recent case of the use of cookie jar reserves by Dell. It is
reported that Dell has been charged with accounting shenanigans by the American Securities and
Exchange in 2010. Dell was accused of dipping into its cookie jar reserves for several years to ensure
it did not miss analysts’ earnings expectations. The SEC claimed that Dell should have disclosed this
activity to investors. As a result of SEC’s allegations, Dell had to pay a penalty of $4 million (The

32
Economist, 2010).
The revenue recognition principle also provides scope for some EM. When firms recognize revenues
before the sale is complete, the customer has the option to terminate or delay the sale (Levitt Jr,
1998). Thus, revenue may be overstated if recognised too early. However, managers may continue
recognizing risky unrealized revenue as a means of overstating revenue (Levitt Jr, 1998). According
to a more recent study by Dechow et al. (2010), revenue overstatement appears to be the most
common form of EM.
Prior studies have explained EM through the lens of the agency theory (Prior et al., 2008; Sun et al.,
2010). According to the agency theory, managers are the agents working on behalf of the principal
(that is, the owners or shareholders of firms) (Jensen & Meckling, 1976). The misalignment of
interests of the two parties gives rise to agency problems, while the costs resulting from agency
problems refer to agency costs (Prior et al., 2008). EM is considered to be a form of agency cost, as
managers practice EM to serve their self-interest (Prior et al., 2008; Scholtens & Kang, 2013; Sun et
al., 2010). EM may come at a cost to shareholders, as it may result in incorrect investment decisions
by the shareholders (Prior et al., 2008).
2.3.3 Types of EM
In order to detect EM, it is important to first understand the ways that earnings can be managed.
EM is most commonly classified into 1) accruals earnings management (AEM); 2) real earnings
management (REM); and 3) earnings misclassification (McVay, 2006). The present study focusses on
AEM, using discretionary accruals as the EM measure. This section discusses AEM, and then provides
a brief overview of the other two types of EM.
Accruals Earnings Management (AEM)
The earnings figure is comprised of cash flows and accruals (Bushman et al., 2016; Schipper, 1989).
The cash flow component is more reliable and persistent than the accrual component (Dayanti et
al., 2021; Dechow & Schrand, 2004; Jennings, 1990; Schipper, 1989). The accrual component tends
to be more volatile in nature since it may be misstated as a result of intentional manipulations,
unintentional errors, or situational influences such as, accounting standards (Ines, 2017; Sloan,
1996). AEM is the most frequently studied type of EM (McVay, 2006). Accruals can be classified as
normal and discretionary. Normal accruals result from normal business transactions, while
discretionary (or abnormal) accruals result from managements’ intentional or biased judgments and

33
estimations (Bozzolan et al., 2015; Ewert & Wagenhofer, 2011; McNichols & Stubben, 2018). Accrual
models are based on the premise that managers use discretionary accruals, where they can exert
some control and judgment in estimating accruals (Bozzolan et al., 2015). Examples of discretion
used in accruals include estimating doubtful debts, capitalizing costs rather than classifying them as
expenses, and avoiding asset write-offs (Dechow & Schrand, 2004; McNichols & Stubben, 2018).
Such discretionary accruals arise because GAAP allows managers to have some discretion over
recognizing accruals (Dechow, 1994; Mohmed et al., 2020). While the use of judgment is an essential
part of the financial reporting process, managers may often use this opportunity to use their
discretion in a way that is beneficial to themselves (Dechow, 1994; Healy & Wahlen, 1999; Mohmed
et al., 2020).
AEM has a number of real and economic consequences. First, when managers opportunistically use
discretionary accruals, the accruals may no longer be a credible indicator of firm performance
(Dechow, 1994; Klein, 2002; Lewellyn & Bao, 2017). AEM often degrade the quality of accruals and
of earnings, often masking the true financial performance of the firm from stakeholders. This in turn
may result in resource misallocation decisions by stakeholders who rely on the firms’ financial
information for decision-making purposes. Second, the use of AEM may have adverse effects on
future earnings, and in essence, on long-term financial performance. Since AEM mainly impacts the
timing of earnings recognition (Dechow & Schrand, 2004), they tend to reverse in subsequent
periods, thus affecting the financial performance of the subsequent periods. For example, an
understatement of current period accruals will overstate current period earnings but result in an
understatement of earnings in the future period (Dechow & Schrand, 2004). Third, AEM may cause
stock prices to fluctuate. For example, upward EM may initially increase stock prices, but the stock
prices may drop in subsequent years when the reversal of AEM causes a decline in earnings (Teoh
et al., 1998). Fourth, AEM may damage corporate reputation (Rodriguez-Ariza et al., 2016). Since
AEM negatively affects stakeholders, such as investors, creditors, customers and local communities,
this may have a spill-over effect on the firms’ reputation (Rodriguez-Ariza et al., 2016). Fourth, AEM
are also known to have broader economic consequences, distorting the economy’s business cycle
(Kedia & Philippon, 2009). Firms with AEM tend to over-invest and over-hire during the period of
EM, causing an expansion in the business cycle (Cohen & Zarowin, 2008; Kedia & Philippon, 2009;
McNichols & Stubben, 2008). However, when their EM activities are discovered and they are
obligated to restate earnings, their investments and employment significantly shrivels, reversing the
business cycle expansion into a contraction (Cohen & Zarowin, 2008; Kedia & Philippon, 2009;

34
McNichols & Stubben, 2008). As explained earlier, EM is an unethical practice, but it is not a violation
of the relevant accounting standards. Nevertheless, a fifth consequence of AEM is legal
consequence. The literature suggests that firms (specifically ones with seasoned equity offerings),
involved in income increasing AEM, are more likely to be sued (see Ibrahim et al., 2011).
Real earnings management (REM) A second frequently cited type of EM is known as REM (for example, see Bozzolan et al., 2015; Chen
& Hung, 2021; Cho & Chun, 2015; Choi et al., 2018; Chun & Cho, 2017; Faisal et al., 2018; García‐
Sánchez et al., 2020; Gong & Ho, 2018; Hickman et al., 2021; Hong & Andersen, 2011; Jordaan et al.,
2018; Kim et al., 2019; Kim et al., 2012; Kolsi & Attayah, 2018; Liu & Lee, 2019; Liu et al., 2017;
Pratiwi & Siregar, 2019; Rezaee et al., 2020; Sial et al., 2019; Velte, 2019, 2021; Zhang et al., 2021).
REM is defined as “departures form normal practices, motivated by managers’ desire to mislead at
least some stakeholders into believing certain financial reporting goals have been met in the normal
course of operations” (Roychowdhury, 2006, p. 337). REM takes the form of real transactions
(Caruso et al., 2016), and includes activities where managers change the timing or structuring of an
activity, expense or investment (Gunny, 2010). Examples of REM include reduction or delay in
research and development (R&D) expenses, increasing sales through discounts, and shifting accruals
(Dechow & Schrand, 2004).
Prior studies suggest that post the introduction of the Sarbanes-Oxley (SOX) Act, managers are
increasingly shifting to manage earning via REM in contrast to AEM (for example see Cohen &
Zarowin, 2008; Graham et al., 2005). One reason behind this is that AEM is likely to induce greater
scrutiny from auditors and regulators. This is particularly true after the introduction of the SOX that
have led to increased likelihood of AEM to be detected (Cohen & Zarowin, 2008). Since REM has
lower detection risk, Ibrahim et al. (2011) find that firms engaged in REM are less likely to have legal
consequences, particularly litigations, in contrast to those engaged in AEM. Despite REM having a
lower chance of detection than AEM (see Cohen & Zarowin, 2008), the former is considered to be a
more costly type of EM since it includes changes to real operations of the business (Li et al. 2020).
Firms engaged in REM appear to have deterioration in their future financial performance (Tabassum
et al., 2015). For example, a reduction in discretionary costs, such as R&D expenses in the present
year, may lead to lower future income resulting from the missed R&D opportunities (Cohen &
Zarowin, 2008). Similar to AEM, one of the consequences of REM is also overinvestment in the
period of EM (that is, current period), followed by under-investment in subsequent periods (Cohen

35
& Zarowin, 2008).
Earnings Misclassification
Earnings misclassification, also known as classification shifting, is a third type of EM that involves
“the deliberate misclassification of items within the income statemement” (McVay 2006, p. 501).
Since individual items in the income statement do not hold the same level of importance in decision-
making by stakeholders, managers may intentionally misclassify certain expenses to fulfill self-
serving motives (McVay, 2006). Some real-world examples of earnings misclassification include: 1)
Borden INC was found by the SEC to have misclassified $192 million of selling, general and
administrative (SG&A) expenses as part of restructuring costs (Hwang, 1994); 2) AmeriServe Food
Distribution was also found to have classified significant operating expenses as restructuring costs
in an attempt to hide their declining financial performance. The company later filed for bankruptcy
in the year 2000 (Sherer, 2000); 3) IBM used SG&A expenses to calculate net gains on asset disposal,
instead of breaking the gains out as special items. This resulted in higher reported core earnings for
the company (Bulkeley, 2002).
Earnings misclassification is presumed to have less costly consequences than the other two EM
types, that is AEM and REM. While both AEM and REM have negative consequences of future
earnings (as discussed earlier), classification shifting does not have this problem, as this form of EM
does not change the reported earnings (McVay, 2006). Unlike AEM and REM, earnings
misclassification does not involve subsequent reversal of accruals or decline in revenue resulting
from missed opportunities (McVay, 2006). Due to no change in earnings, this type of EM tends not
to draw too much scrutiny by auditors and regulators (Nelson et al., 2002). As a result, the legal
consequences for earnings misclassification are also less severe in contrast to the other EM types.
2.3.4 EM in Practice – Developed and Emerging Market Countries
Some examples of EM and its consequences can be evidenced in several recent corporate cases,
discussed below.
In 2010, Dell was charged with accounting shenanigans by the American Securities and Exchange
Commission (SEC) (The Economist, 2010). Dell was accused of dipping into its cookie jar reserves4
4 Cookie jar is a term used when managers use unrealistic estimations on liabilities such as provisions and warranties. By making such assumptions, “they stash accruals in cookie jars during the good times and reach into them in the bad times” (Levitt Jr, 1998, p. 16).

36
for several years to ensure it did not miss analysts’ earnings expectations. As a result of SEC’s
allegations, Dell had to pay $4 million in penalty.
Between 1997 and 2001, Xerox Corporation was also alleged to be using cookie jar reserves, along
with several other accusations of EM (Dechow & Schrand, 2004)5. In the year 2000, several
managers were fired, and the company faced penalties of approximately $120 million, in addition
to experiencing a 60 percent drop in its stock price (Bandler & Hechinger, 2003).
Royal Ahold, the third biggest food retailer in the world, was reported to be involved in EM. The
company was accused of overstating profits and understating debt in its financial statements (The
Economist, 2003). Once these issues were revealed, Ahold lost the confidence of its investors and
analysts, as it was suspected that their accounting problems were far worse than what was revealed
(The Economist, 2003).
In July 2002, the pharmaceutical company, Merck, admitted to overstating its revenues and costs
over the past three years by approximately $14 million. Although the incident was not classified as
fraud, such management of earnings resulted in the loss of investors’ confidence and unstable stock
market conditions (The Economist, 2002).
The most significant corporate case of EM is the Enron case. In all the cases discussed above, EM
was evident, and the negative impacts of EM were highlighted. However, the Enron (2001) case is a
more severe case, as Enron clearly crossed the line of EM and stepped into corporate fraud, leading
to the collapse of the firm. However, the initial steps were merely improper EM, which turned worse
over time, until the case was classified as a corporate fraud case (The Economist, 2014). It was
revealed that Enron’s earnings and stock prices had been artificially inflated, and its true
performance had been concealed through accounting tactics6 (Healy & Palepu, 2003). Inquiries by
the SEC led Enron to restate their financial figures, and their reported earnings declined by $591
million and debt increased by $658 million (Healy & Palepu, 2003, p. 4). Soon after, the business
was declared bankrupt (Healy & Palepu, 2003). The collapse of Enron is considered the biggest
corporate failure to date (MacCarthy, 2017; Silverstein, 2013).
5 The Xerox Corporation was accused of manipulating their revenue recognition timing to avoid reporting losses, and capitalizing items that should have been expensed (Dechow & Schrand, 2004). 6 The Enron collapse highlights the most severe consequences of EM. From the 1990s to 2000s, Enron’s stock price was on a constant rise (Healy & Palepu, 2003). However, by the end of 2001, the stock price dropped from $83.13 to nearly zero (Healy & Palepu, 2003, p. 3)

37
While EM in itself is not fraudulent, the literature suggests that firms engaged in EM are more likely
to commit fraud in subsequent periods (Perols & Lougee, 2011). Thus, EM may be among the initial
steps leading to more severe forms of corporate fraud. Research on EM has traditionally gained
more interest in developed market countries. However, in recent times, emerging market countries
have also been showing increased interest in EM studies. A study conducted by Ernst & Young (2016)
highlights that managers in several Asian firms are likely to engage in EM by deliberate
manipulations and shortcut implementations to meet targets, particularly during difficult economic
times. Figure 2.2 illustrates the percentages of corporate management who are likely to implement
shortcuts to achieve targets, as reported by Ernst & Young (2016).
Figure 2.2 Likelihood of EM in Asia-Pacific countries (Source: Ernst & Young, 2016)
This image has been removed due to copyright restriction. Available online from: [https://eyfinancialservicesthoughtgallery.ie/wp- content/uploads/2016/08/ EY_Global_ Fraud
_Survey. pdf]
The literature suggests evidence that EM incentives vary across developed and emerging market
countries (for example, see Lin & Wu, 2014; Lourenço et al., 2018). Such differences may arise as
there are several institutional and economic circumstances that distinguish emerging market
countries from developed market countries, particularly in terms of investor protection (INVPRO),
corruption (CORR) levels and national culture (Viana Jr et al., 2021). Even as the world is converging
to the International Financial Reporting Standards (IFRS), ensuring more harmony in accounting
standards worldwide, country-level institutional factors play an even more important role in
determining EM incentives (Jeanjean & Stolowy, 2008). Thus, the present study examines the CSR-
EM relationship in both developed markets (specifically USA) and emerging market countries
(specifically, Brazil, China, India, Indonesia, Korea (South), Malaysia, Russia, South Africa, Taiwan
and Thailand).
2.4 Theoretical Background – CSR and EM
There is no defined or consistent theoretical framework explaining the CSR-EM relationship. Several

38
studies have explained the CSR-EM relationship from the perspectives of traditional accounting
theories, such as the positive accounting theory (for example, see Gargouri et al., 2010), stakeholder
theory (for example, see Cho & Chun, 2015; Chun & Cho, 2017; García‐Sánchez et al., 2020; Gerged
et al., 2020; Gerged et al., 2021; Grougiou et al., 2014; Hong & Andersen, 2011; Kumala & Siregar,
2020; Mohmed et al., 2020; Muttakin et al., 2015; Rezaee et al., 2020; Sial et al., 2019; Velte, 2019),
institutional stakeholder theory (for example, see Scholtens & Kang, 2013), agency theory (or
principal-agent) (for example, see Almahrog et al., 2018; Buertey et al., 2020; Calegari et al., 2010;
Chen & Hung, 2021; Faisal et al., 2018; García‐Sánchez et al., 2020; Gerged et al., 2021; Kumala &
Siregar, 2020; Kyaw et al., 2017; Litt et al., 2013; Mohmed et al., 2020; Sial et al., 2019; Velte, 2021),
stewardship theory (for example, see (Mohmed et al., 2020; Rezaee et al., 2020)), legitimacy theory
(for example, see García‐Sánchez et al., 2020; Gerged et al., 2020; Gerged et al., 2021; Grougiou et
al., 2014; Kumala & Siregar, 2020; Pratiwi & Siregar, 2019; Rezaee et al., 2020; Riahi-Belkaoui, 2003),
and signalling theory (for example, see Amar & Chakroun, 2018; Grougiou et al., 2014; Riahi-
Belkaoui, 2003; Wang et al., 2018).
Stakeholder theory explains that managers engage in CSR as a result of their obligation towards a
wide range of stakeholders (Hubbard, 2009). However, the theory does not predict managerial
behaviour in practical terms (Almahrog et al., 2018; Deegan, 2002). Legitimacy theory explains that
managers may choose CSR to address social pressures and boost their reputation, that is, to obtain
legitimacy (Gray, 1988). Signalling theory suggests that managers may use CSR to reduce
information asymmetry and signal (inform) the firm’s performance to stakeholders (Álvarez et al.,
2008; Mohmed et al., 2020).
Agency theory explains that EM may arise due to managers’ self-fulfilling motives, while CSR may
be undertaken to reduce agency problems (Almahrog et al., 2018). While these popular theories
provide a useful basis for understanding managers’ engagement in CSR and EM, they do not
necessarily explain how the two issues are related. To understand when, why and how CSR affects
EM, it is essential to understand managerial behaviour, attitude and motives. Thus, several studies
have explained the CSR-EM relationship using theories that explain managerial opportunities and
motives, such as, the multiple objectives hypothesis (for example, see Bozzolan et al., 2015; Chih et
al., 2008; Gargouri et al., 2010; Habbash & Haddad, 2020; Heltzer, 2011; Kyaw et al., 2017; Martínez‐
Ferrero et al., 2015), predictable earnings hypothesis (for example, see Chih et al., 2008; Gargouri
et al., 2010; Habbash & Haddad, 2020; Heltzer, 2011), ethical perspective or transparent financial
reporting hypothesis (for example, see Choi et al., 2018; Chun & Cho, 2017; Hickman et al., 2021;

39
Jordaan et al., 2018; Kim et al., 2019; Kim et al., 2012; Kolsi & Attayah, 2018; Li & Xia, 2018; Liu &
Lee, 2019; Liu et al., 2017; Martínez‐Ferrero et al., 2015; Pratiwi & Siregar, 2019; Wang et al., 2018;
Zhang et al., 2021), opportunistic perspective or opportunistic financial reporting hypothesis (for
example, see Choi et al., 2018; Gong & Ho, 2018; Hickman et al., 2021; Jordaan et al., 2018; Kim et
al., 2019; Kim et al., 2012; Kolsi & Attayah, 2018; Li & Xia, 2018; Liu et al., 2017; Palacios-Manzano
et al., 2019; Zhang et al., 2021), political cost theory (for example, see Heltzer, 2011; Liu & Lee, 2019;
Patten & Trompeter, 2003; Yip et al., 2011), social norm theory (for example, see Grougiou et al.,
2014), corporate culture theory (for example, see Calegari et al., 2010; Litt et al., 2013), RBV (for
example, see Scholtens & Kang, 2013) and institutional hypothesis (for example, see Chih et al.,
2008; Gargouri et al., 2010; Heltzer, 2011).
Among the theories stated above, the multiple objectives hypothesis, predictable earnings
hypothesis, opportunistic financial reporting hypothesis and political cost hypothesis suggest a
positive relationship between CSR and EM, explaining the positive CSR-EM relationship from the
perspective of various motive and/or opportunities. The multiple objectives hypothesis suggests
that managers engaged in CSR are burdened with numerous objectives from multiple stakeholders.
The added responsibility of pleasing multiple stakeholders create more motives for EM (Bozzolan et
al., 2015; Chih et al., 2008; Gargouri et al., 2010). The predictable earnings hypothesis suggests that
in firms with high CSR, the motive to reduce volatility and information asymmetry lead managers to
manage more earnings to report smooth (or predictable) earnings (Chih et al., 2008; Gargouri et al.,
2010). The opportunistic financial reporting hypothesis (or opportunistic perspective) is based on
the perspective that managers have opportunistic and self-fulfilling motives behind their
participation in CSR initiatives (Choi et al., 2018; Gong & Ho, 2018; Hickman et al., 2021). This
perspective suggests that CSR performance creates a positive image for firms, assisting managers in
gaining stakeholder support and lowering scrutiny (Choi et al., 2018; Gong & Ho, 2018; Hickman et
al., 2021). Thus, managers may opportunistically use their CSR performance to cover up their EM
activities (Choi et al., 2018; Gong & Ho, 2018; Hickman et al., 2021). The political cost hypothesis
explains that managers often engage in CSR due to political threats, pressures, and unfavourable
regulations (Heltzer, 2011; Yip et al., 2011). These firms are more likely to manage earnings
downwards to reduce their political costs (Heltzer, 2011; Yip et al., 2011).
In contrast to the above perspectives, the transparent financial reporting hypothesis, social norm
theory, corporate culture theory and RBV suggest a negative relationship between CSR and EM. The
transparent financial reporting (or ethical) hypothesis suggests that managers engaged in CSR tend

40
to be more ethical and transparent (Choi et al., 2018; Chun & Cho, 2017; Jordaan et al., 2018). Thus,
they are less likely to manage earnings and more likely to report transparent financial reporting to
meet the ethical expectations of stakeholders (Choi et al., 2018; Jordaan et al., 2018). Social norm
theory is based on the perspective that individual behaviour is shaped by the norms, values, beliefs,
and principles of the groups that they belong to. According to this perspective, managers in firms
with high CSR are likely to be more ethical due to the ethical stance that CSR creates within the
workplace (Grougiou et al., 2014). Thus, according to social norm theory, managers engaged in CSR
are less likely to manage earnings (Grougiou et al., 2014). Corporate culture theory presents a
similar perspective, suggesting that CSR engagement create an internal corporate culture based on
moral and ethical values. This in turn reduces managers’ EM engagement (Calegari et al., 2010; Litt
et al., 2013). The RBV suggests that CSR creates a competitive advantage for firms not only in the
market, but in regard to stakeholders in general, by creating a positive reputation and stronger ties
with the stakeholders (Scholtens & Kang, 2013).Thus, according to this perspective, firms engaged
in CSR are less likely to manage earnings in order to maintain their positive image.
Contrary to all the theories discussed so far, the institutional perspective suggests that CSR and EM
are unrelated, as managers’ engagement in EM are more likely to result from other institutional
factors (Chih et al., 2008; Gargouri et al., 2010; Heltzer, 2011).
As evidenced by the abundant variety of perspectives, there is no consistent framework that
explains managerial motives affecting the CSR-EM relationship. In this study, I posit that to
understand when, why and how CSR affects EM, it is essential to understand managerial behaviour,
and the motives driving such behaviour. Prior studies focus on theories explaining managerial
motives. I look at managerial behaviour driven by motives. The present study explains the
relationship between CSR and EM using two contrasting managerial behaviour perspectives. The
first one of these perspectives is explained through the lens of the managerial myopia hypothesis,
explaining how managers engaged in CSR may focus more on short-term objectives, leading them
to manage earnings more. The contrasting perspective is explained through the lens of the myopia
avoidance hypothesis, explaining that managers engaged in CSR may focus more on long-term
objectives, and are therefore less likely to manage earnings. The next two sub-sections discuss these
two opposing perspectives.
2.4.1 Managerial Myopia Hypothesis
Managerial myopia, also known as managerial short termism, refers to managerial preference

41
towards actions or behaviour that are focussed on realising short-term objectives, often resulting in
unfavourable consequences to the firm’s ability to create long-term value (Hayes & Abernathy,
1980). Such short-term preferences may arise due to external factors, such as, managers being
exposed to market pressures (Bushee, 1998; Drucker, 1986), pressures to meet earnings targets
(Nikolov, 2018; Seo et al., 2020), or lack of a clear performance measurement criteria (Hayes &
Abernathy, 1980).
The accounting and finance literature links managerial myopic actions or short-term behaviour to
EM (Dallas, 2011; Gonzalez & André, 2014; Nikolov, 2018). Prior studies suggest that myopic or
short-term actions involve management’s inclination to manage accounting information for short-
term value creation (Nikolov, 2018). Based on the evidence of the literature, the positive
relationship between CSR and EM may be explained by manager’s myopic behaviour.
Some prior studies suggests that CSR may have a role in escalating EM engagement by managers
(for example, see Gargouri et al., 2010; Kyaw et al., 2017; Muttakin et al., 2015; Yip et al., 2011).
This view is consistent with the managerial myopia hypothesis that suggests that managers
practicing CSR activities are more likely to engage in EM in order to meet short-term goals.
Managerial myopia may be driven by two main reasons – 1) incentive-driven; and 2) opportunity-
driven.
Prior studies suggest numerous opportunistic intentions that may lead managers to engage in EM.
For example, managers may manage earnings to avoid debt covenant violations (Dechow &
Schrand, 2004; Jaggi & Lee, 2002), to enhance compensation-based bonuses for themselves
(Dechow & Schrand, 2004), to inflate stock prices prior to mergers or acquisitions (Dechow &
Schrand, 2004; Lehmann, 2016; Levitt Jr, 1998). Managers engaged in CSR may have additional
incentives to manage earnings due to market pressures, such as pressure to meet earnings targets
(Nikolov, 2018). Managers engaged in CSR may be exposed to greater pressures from multiple
stakeholders (Chih et al., 2008; Gargouri et al., 2010). Jensen (2001) proposed the multiple
objectives hypothesis to explain this. Managers engaged in CSR practices are expected to meet
numerous objectives from government, creditors, customers, employees and communities, in
addition to performance-related objectives from shareholders. The presence of numerous
stakeholders with multiple objectives may lead to the lack specific performance appraisal criteria
for managers, due to misalignment of the objectives (Chih et al., 2008; Gargouri et al., 2010;
Habbash & Haddad, 2020; Jensen, 2001). Such pressures from stakeholders’ expectations may lead

42
managers to become short-term oriented (myopic) and lead them to engage in rent-seeking
behaviour, such as EM, as they have stronger incentives to meet short-term goals, such as meeting
quarterly earnings targets (Nikolov, 2018). The incentives to manage earnings can be further
emphasised by managers’ willingness to uphold the positive reputation (Francis et al., 2008; Riahi-
Belkaoui, 2003). Since CSR engagement creates positive reputation in the market, this may pose to
be a further incentive for EM as managers may report favourable accounting information to uphold
their positive reputation (Hickman et al., 2021; Pratiwi & Siregar, 2019). Thus, managerial myopia
may be more prevalent within firms with high CSR, as a result of managers’ short-term behaviour
arising from incentives to please multiple stakeholders (Gargouri et al., 2010), incentives to meet
short-term targets (Nikolov, 2018) and incentives to uphold their reputation (Francis et al., 2008). I
refer to this as incentive-driven myopia. It is important to acknowledge that some of these
incentives, such as, avoiding debt covenant violations and enhancing compensation-based bonusses
may lead managers to reduce their CSR initiatives as a means of cutting expenses. On the contrary,
incentives such as upholding reputation may lead managers to increase their CSR initiatives. While
I acknowledge that these incentives may have differential effect on the level of CSR, the scope of
the present study does not consider the changes in CSR. The present study rather focusses on
examining how engagement in CSR may create such incentives, thus affecting managers’ EM
behaviour.
The second cause of managerial myopic behaviour may be due to greater opportunities for EM.
Firms engaged in CSR initiatives are often perceived as doing things the right way, thus reducing
stakeholders’ scrutiny of managers, opening up more opportunities to manage earnings (Kim et al.,
2012; Muttakin et al., 2015). Stakeholders often consider the accounting practices of firms with high
CSR performance to be more transparent and reliable (Chih et al., 2008; Gras-Gil et al., 2016; Kim et
al., 2012). Managers may take this opportunity to manage more earning for self-serving motives,
while using CSR as a cover-up shield to conceal or ‘greenwash’ their EM (Mohmed et al., 2020;
Muttakin et al., 2015; Prior et al., 2008; Zhang et al., 2021). I refer to this as opportunity-driven
myopia.
As discussed above, while the managerial myopia hypothesis explains the positive relationship
between CSR and EM, the negative relationship between CSR and EM may be explained by the
myopia avoidance hypothesis. The next section discusses the myopia avoidance hypothesis,
suggesting that managers in firms with high CSR activities, are less likely to manage earnings.

43
2.4.2 Myopia Avoidance Hypothesis
Myopia avoidance simply refers to managers being more focussed on the long-term sustainability
of their firms, and long-term relationships with stakeholders, as opposed to being driven by only
short-term goals. The myopia avoidance hypothesis, introduced by Chih et al., 2008, suggests that
managers engaged in CSR are more likely to be long-term oriented and less likely to manage
earnings (Chih et al., 2008; Choi & Pae, 2011; Gargouri et al., 2010).
A numbers studies suggest that high CSR has a role in constraining EM engagement by managers
(for example, see Almahrog et al., 2018; Bozzolan et al., 2015; Chih et al., 2008; Cho & Chun, 2015;
Gao & Zhang, 2015; Hong & Andersen, 2011; Kim et al., 2012; Litt et al., 2013; Liu et al., 2017;
Scholtens & Kang, 2013). The myopia avoidance hypothesis suggests that managers practising CSR
activities, have long-term perspectives, and are less likely to manage earnings to meet short-term
objectives (Chih et al., 2008; Choi & Pae, 2011; Gargouri et al., 2010). Such long-term perspectives,
that is myopia avoidance, may be driven by two kinds of managerial motivation – 1) relationship
driven (strive to sustain relationships with stakeholders); and/or 2) value-driven (moral and ethical
values).
First, managers’ avoidance of myopic behaviour may be explained by managers striving to sustain
relationships with their stakeholders. One commonly cited reason behind managers’ involvement
in CSR initiatives is that they genuinely care about establishing and maintaining strong relationships
with their stakeholders (Bozzolan et al., 2015; Chih et al., 2008). EM is considered an agency cost
that is detrimental to stakeholders, and thus, may hamper the management’s relationship with the
stakeholders (Prior et al., 2008). Additionally, firms engaged in CSR may have higher risks of EM
being exposed. First, firms engaged in CSR are often more exposed to and closely monitored by the
society, media, regulators and investors (Litt et al., 2013). Furthermore, CSR reduces information
asymmetry between managers and stakeholders, making managerial practices more transparent to
stakeholders (Álvarez et al., 2008; Chih et al., 2008; Gras-Gil et al., 2016; Kim et al., 2012; Mohmed
et al., 2020). Both of these issues described may make it more difficult for managers to conceal EM.
Discovery of EM by stakeholders may result in negative consequences for managers, and damage
their relationship with stakeholder irreversibly (for example, see Gerged et al., 2020; Gerged et al.,
2021; Litt et al., 2013). Therefore, managers practicing CSR are less likely to manage earnings in
order to maintain long-term relationships with stakeholders. I refer to this as relationship-driven
myopia avoidance.

44
The second reason behind managers’ approach towards a long-term orientation may be purely
motivated by their moral obligations and ethical values (Litt et al., 2013). These values are likely to
be reflected in their accounting practices, making their accounting information more transparent or
faithfully represented (Shen & Chih, 2005; Shleifer, 2004). Managers’ ethical values are also likely
to discourage them from engaging in EM, as EM is considered an unethical act (Grougiou et al.,
2014; Kim et al., 2012; Litt et al., 2013). I refer to this as value-driven myopia avoidance.
In this section, I have discussed the two opposing theories, that is, the managerial myopia
hypothesis and the myopia avoidance hypothesis, that may explain the frequently debated
relationship between CSR and EM. The next section provides a detailed review of the empirical
evidence in the literature on the relationship between CSR and EM.
2.5 Literature Review - CSR and EM
There is sufficient evidence in the academic literature to establish a relationship between CSR and
EM. However, existing literature appears to report somewhat mixed results for the association
between CSR and EM. Some studies suggest that managers engaging in CSR may focus more on
meeting short-term objectives, such as meeting profit targets, and thus, are more likely to manage
earnings. A contrasting perspective is proposed by some studies, suggesting that managers engaged
in CSR have genuine concern about long-term objectives, such as relationships with stakeholders
and the sustainability of the firm itself, and thus, are less likely to manage earnings. This section
provides a comprehensive literature review of the relationship between CSR and EM. The focus of
my study is to examine how CSR affects EM in various contexts. Thus, when referring to the
relationship between CSR and EM, I am talking about the effect of CSR on EM, not the reverse
relationship, as many studies have done (for example, see Prior et al., 2008, Sun et al., 2010, Choi
et al., 2013; Martínez‐Ferrero et al., 2013).7 It should be noted that majority of prior studies have
examined CSR performance (for example, see Amar & Chakroun, 2018; Bozzolan et al., 2015;
Buertey et al., 2020; Calegari et al., 2010; Chen & Hung, 2021; Chih et al., 2008; Cho & Chun, 2015;
7 A number of recent studies have examined the impact of EM on CSR, reporting fairly mixed results. While some studies
suggest a positive relationship between EM and CSR (for example, see Martínez-Ferrero et al., 2016; Prior et al., 2008),
others suggest a negative relationship (for example, see Choi et al., 2013; Martínez‐Ferrero et al., 2013). Sun et al., 2010
finds that EM has no significant effect on EM.

45
Choi et al., 2018; Chun & Cho, 2017; Gao & Zhang, 2015; García‐Sánchez et al., 2020; Gargouri et al.,
2010; Gras-Gil et al., 2016; Grougiou et al., 2014; Heltzer, 2011; Hickman et al., 2021; Hong &
Andersen, 2011; Kim et al., 2019; Kim et al., 2012; Kyaw et al., 2017; Li & Xia, 2018; Litt et al., 2013;
Liu & Lee, 2019; Liu et al., 2017; Martínez‐Ferrero et al., 2015; Mohmed et al., 2020; Palacios-
Manzano et al., 2019; Rezaee et al., 2020; Riahi-Belkaoui, 2003; Scholtens & Kang, 2013; Sial et al.,
2019; Velte, 2019, 2021), while some prior studies have examined CSR disclosures as a proxy for
CSR (for example, see Almahrog et al., 2018; Faisal et al., 2018; Gerged et al., 2020; Gerged et al.,
2021; Habbash & Haddad, 2020; Kolsi & Attayah, 2018; Kumala & Siregar, 2020; Muttakin et al.,
2015; Patten & Trompeter, 2003; Pratiwi & Siregar, 2019; Wang et al., 2018; Yip et al., 2011). CSR
performance is a direct measure of CSR activities, while CSR disclosures refer to scores based on the
extent (such as number of words/sentences, indices based on keywords, etc.) of disclosures (Nazari
et al., 2017). The present study acknowledges the difference between CSR performance and
disclosure. However, for the purposes of the present study, this distinction is not essential. As
discussed in greater details in Chapter 3, the present study considers CSR performance as a proxy
for CSR. Nevertheless, in order to provide a comprehensive literature review, this section discusses
prior studies examining either CSR performance, or CSR disclosure, or both.
I have identified 48 published research studies examining how CSR effects EM. To obtain these
research articles, I conducted a search on Google Scholar, using the keywords: corporate social
responsibility, environmental responsibility, earnings management, earnings quality, accounting
information. Additionally, I have also searched for citations of the articles obtained. Finally, I have
filtered the downloaded articles based on the content and selected the final 48 studies that have
either examined the impact of CSR on EM, or the bi-directional relationship between CSR and EM.
Table 2.1 provides a summary of the literature review, presented in chronological order. The table
has 6 columns – Column (1) shows the authors and year of application of the research study; Column
(2) details the sample, showing the sample country, sample size and years of observation included
in the sample; Columns (3) and (4) show the research objective and research method respectively;
Column (5) shows the theories discussed by prior studies. As seen in Column (5), several studies
propose opposing theories regarding the CSR-EM relationship – Column (5) shows the theories
supported, and also the alternate theories proposed but not supported (shown in brackets). Finally,
Column (6) shows the key findings of the prior studies. In this section, I discuss Table 2.1 thoroughly,
with the exception of Column (5), as the theories have already been discussed in Section 2.4.

46
Table 2.1 Summary of Prior Studies Examining the Effect of CSR on EM
(1) (2) (3) (4) (5) (6)
Authors (Year) Country Sample (Period)
Research Objective Research method Theories supported [Alternate theories] Key findings
Patten & Trompeter (2003)
USA 40 chemical firms
(1984)
Examine how pre-event environmental disclosures affect EM
Method: OLS and MLE DV: EM (Han & Wang, 1998) IV: Lagged environmental disclosure (content analysis)
Political cost perspective Environmental disclosures have a negative effect on income-decreasing EM
Riahi-Belkaoui (2003)
USA 404 observations
(1994 – 1998)
Examine how CSR affects earnings informativeness and EM
Method: Multivariate regression DV: Earnings persistence and variability; EM (Jones, 1991a) IV: CSR (Fortune Magazine)
Signalling perspective Legitimacy perspective
CSR has a positive effect on earnings informativeness and EM
Chih et al. (2008) 46 countries 1,653 firms
(1993 – 2002)
Examine how CSR affects EM, and the moderating effect of institutional factors
Method: Multivariate regression DV: EM (Bhattacharya et al., 2003; Leuz et al., 2003) IV: CSR – dummy (FTSE4 Good Global Index) MOD: Antidirector rights; Legal enforcement; GDP per capita
Myopia avoidance hypothesis Multiple objectives hypothesis [Predictable earnings hypothesis; Institutional hypothesis]
CSR has a negative effect on earnings smoothing and loss avoidance; but a positive effect on earnings aggressiveness, weakened by legal enforcement
Calegari et al. (2010)
USA 16,232 observations/
2,467 firms (1991 – 2008)
Examine how CSR affects EM and firm value
Method: OLS and 2SLS DV: Firm value IV: CSR (KLD) MED: EM (Dechow et al., 1995)
Principal-agent theory; Corporate culture theory
CSR has a negative effect on EM, and a positive effect on firm value via EM.
Gargouri et al. (2010)
Canada 180 observations/
109 firms (2004 – 2005)
Examine how CSR affects EM
Method: Probit DV: EM (Dechow et al., 1995) IV: CSR – overall and dimensions (MJRA-CSID)
Multiple objectives hypothesis [Myopia avoidance hypothesis; Predictable Earnings hypothesis; Institutional hypothesis; Positive accounting theory]
Environmental and employee dimensions have a positive effect on EM; total CSR score and corporate governance has no significant effect
Heltzer (2011) USA
2,171 observations (2007)
Examine how the environmental dimension of CSR affects EM
Method: Sample split into 3 subsamples based on CSR environmental dimension – strength, neutral and concern subsamples (data from KLD) DV: EM (Dechow et al., 1995; Jones, 1991a; Leuz et al., 2003)
Myopia avoidance hypothesis; Institutional hypothesis [Predictable earnings hypothesis; Multiple objectives hypothesis]
Lower EM in the strength and neutral subsamples; higher EM in the concern subsample

47
Hong & Andersen (2011)
USA 8,078 observations
(1995 – 2005) Examine how CSR affects EM
Method: OLS DV: EM (Dechow & Dichev, 2002; Francis et al., 2005; Roychowdhury, 2006) IV: CSR (KLD)
Stakeholder management theory CSR has a negative effect on EM
Yip et al. (2011) USA
110 observations (2006)
Examine how CSR disclosures affects EM, and the moderating effect of political cost or ethical concern
Method: Multivariate regression; Split sample based on moderator DV: EM (Jones, 1991a) IV: CSR disclosures (content analysis) MOD: Political cost (oil and gas industry); Ethical concern (food industry)
Political cost perspective [Ethical perspective]
CSR disclosures have a positive effect on EM in the food industry; but a negative effect in the oil and gas industry
Kim et al. (2012) USA
18,160 observations (1991 – 2009)
Examine how CSR affects EM
Method: Multivariate and logistic regression DV: EM (Cohen et al., 2008; Dechow et al., 1995) IV: CSR (KLD)
Transparent financial reporting hypothesis; [Opportunistic financial reporting hypothesis]
CSR has a negative effect on EM
Litt et al. (2013) USA
2,095 observations (2004-2006)
Examine how the environmental dimension of CSR affects EM
Method: Multivariate regression DV: EM (Kothari et al., 2005) IV: CSR - Environmental dimension (KLD)
Principal-agent theory; Corporate culture theory
Environmental dimension has a negative effect on EM
Scholtens & Kang (2013)
10 Asia-Pacific countries 139 firms
(2004 – 2008)
Examine how CSR affects EM, and the moderating effect of INVPRO
Method: Multivariate regression DV: EM (Bhattacharya et al., 2003; Dechow & Dichev, 2002; Dechow et al., 1995; Leuz et al., 2003; Sloan, 1996) IV: CSR (Asia Sustainability Research) MOD: INVPRO
Institutional Stakeholder Theory; Resource-based view
CSR has a negative effect on EM, strengthened by INVPRO
Grougiou et al. (2014)
USA 116 banks
(2003 – 2007)
Examine the bi-directional relationship between CSR and EM
Method: 2SLS DV: EM (Beatty et al., 2002; Cornett et al., 2009) IV: CSR (KLD)
Legitimacy theory; Signalling theory [Social norm theory; Stakeholder theory]
EM has a positive effect on CSR, but CSR does not have a significant effect on EM.
Bozzolan et al. (2015)
24 countries 5,863 observations/
1,141 firms (2003 – 2009)
Examine how CSR affects the trade-off between real activities and AEM and firm performance
Method: 2SLS DV: EM trade-off (Cohen et al., 2008; Dechow et al., 1995; Roychowdhury, 2006) IV: CSR (EIRIS)
Myopia avoidance hypothesis [Multiple objectives hypothesis]
CSR has a negative effect on EM; CSR firms are less likely to engage in real activities than in AEM. CSR has a positive effect on firm performance via the trade-off
Cho & Chun
(2015)
Korea 1,432 observations
(2005 – 2010)
Examine how CSR affects EM, and the moderating effect of corporate governance
Method: Multivariate regression DV: EM (Roychowdhury, 2006) IV: CSR (KEJI) MOD: Corporate governance
Stakeholder perspective CSR has a negative effect on EM, strengthened by corporate governance

48
Gao & Zhang (2015)
USA 10,755 observations/
2,022 firms (1993 – 2010)
Examine how CSR affects EM and firm value
Method: Multivariate regression and 2SLS DV: Firm valuation IV: CSR (KLD) MOD: EM (Francis et al., 2004; Kothari et al., 2005)
Market efficiency theory CSR has a negative effect on EM; interaction of CSR and EM increase firm value
Martínez‐Ferrero et al. (2015)
26 countries 14,844 observations/
1,960 firms 2002 – 2010
Examine the bi-directional relationship between CSR and EM, and the moderating effect of institutional factors
Method: GMM DV: EM (Dechow et al., 1995) IV: CSR (EIRIS) MOD: Stakeholder and INVPRO
Transparent financial reporting perspective [Multiple objectives hypothesis]
Negative bi-directional relationship between CSR and EM, strengthened by institutional factors
Muttakin et al. (2015)
Bangladesh 580 observations/
135 firms (2005 – 2009)
Examine how CSR disclosures affect EM, and the moderating effect of powerful stakeholders
Method: Multivariate regression DV: EM (Dechow et al., 1995) IV: CSR (content analysis) MOD: Export oriented industries (textile)
Stakeholder theory
CSR disclosures have a positive effect on EM in general, but a negative effect in industries with powerful stakeholders
Gras-Gil et al. (2016)
Spain 286 observations/
100 firms (2005 – 2012)
Examine how CSR affects EM Method: Multivariate regression DV: EM (Dechow et al., 1995) IV: CSR (MERCO)
Long-term perspective hypothesis CSR has a negative effect on EM
Chun & Cho (2017)
Korea 659 observations
(2005-2010)
Examine how differentiation strategy affects EM, and the moderating effect of CSR
Method: Multivariate regression DV: EM (Cohen et al., 2008; Roychowdhury, 2006) IV: Differentiation strategy MOD: CSR (KEJI)
Ethical perspective; Stakeholder perspective
CSR has a negative effect on EM. Differentiation strategy has a negative effect on EM, and CSR strengthens this.
Kyaw et al. (2017)
European countries 5,937 observations/
749 firms (2002 – 2013)
Examine how CSR affects EM, and the moderating effect of institutional framework
Method: OLS and GMM; Split sample based on moderator DV: EM (Chih et al., 2008) IV: CSR (Thomson Reuters, Asset4) MOD: Coordinated versus Liberal market economies
Agency theory; Multiple objectives hypothesis
CSR has a positive effect on EM in coordinated market economies, but no significant effect on liberal market economies
Liu et al. (2017) USA
2,369 observations (2003 - 2010)
Examine how family involvement and CSR affect EM
Method: 3SLS DV: EM (Kothari et al., 2005; Roychowdhury, 2006) IV: Family involvement MED: CSR (KLD)
[Ethical argument; Opportunistic argument]
CSR has no significant effect on EM, when controlled for family firms
Almahrog et al. (2018)
UK 515 observations
(2008 – 2010)
Examine how CSR disclosures affect EM
Method: Multivariate regression DV: EM (Dechow et al., 1995) IV: CSR (content analysis and disclosure index)
Agency theory; Long-term perspective
CSR disclosures have a negative effect on EM

49
Amar & Chakroun (2018)
France 595 observations/
119 firms (2010 - 2014)
Examine how CSR affects EM Method: Multivariate regression DV: EM (Dechow et al., 1995) IV: CSR - overall and dimensions (ISO26000)
Signalling theory; Myopia avoidance hypothesis
CSR has a negative effect on EM; corporate governance, human rights, environment and consumer expectations dimensions have Negative effect on EM; labour, fairness of practices and community involvement have no effect.
Choi et al. (2018) Korea
4,870 observations (2002 – 2010)
Examine how CSR affects EM after controlling for endogeneity
Method: OLS and 2SLS DV: EM (Kothari et al., 2005; Roychowdhury, 2006) IV: CSR (KEJI)
Transparent financial reporting perspective [Opportunistic financial reporting perspective]
CSR has a negative effect on real activities EM, but no significant effect on AEM
Faisal et al. (2018) Indonesia 479 firms
(2012 – 2013)
Examine how CSR disclosures affect EM
Method: 2SLS DV: EM (Roychowdhury, 2006) IV: CSR (content analysis)
Stakeholder agency theory CSR disclosures have a negative effect on EM
Gong & Ho (2018) China
3,409 observations (2009 – 2015)
Examine how CSR performance affects EM, and the moderating effect of mandatory CSR disclosures
Method: Multivariate regression, 2SLS, GMM, Split sample based on moderator DV: EM (Cohen et al., 2008; Dechow & Dichev, 2002; Roychowdhury, 2006) IV: CSR (RKS) MOD: Mandatory versus voluntary disclosures
Long-term perspective [Opportunism perspective]
CSR has a negative effect on EM, in firms with mandatory CSR disclosures, but no effect in firms with voluntary disclosures
Jordaan et al. (2018)
South Africa 214 observations
(2008, 2011, 2013)
Examine how CSR performance and disclosures affect EM
Method: Multivariate regression DV: EM (Dechow et al., 1995; Roychowdhury, 2006) IV: CSR performance (SRI Index); CSR disclosures (KPMG)
Ethical hypothesis; Opportunistic hypothesis
CSR performance has a positive effect on AEM, but a negative effect on real activities EM; CSR disclosures have a negative effect on AEM
Kolsi & Attayah (2018)
UAE 170 observations/
34 firms (2010 - 2014)
Examine how CSR disclosures affect EM
Method: Multivariate regression DV: EM (Barton, 2001; Dechow & Dichev, 2002; Pincus & Rajgopal, 2002; Roychowdhury, 2006) IV: CSR (content analysis)
Opportunistic perspective [Transparent financial reporting perspective]
CSR disclosures have a positive effect on AEM and earning smoothing, but no effect on real activities EM.
Li & Xia (2018) China
8,156 firms (2009 – 2014)
Examine how CSR affects EM, and the moderating effect of controlling shareholders
Method: Multivariate regression; Split sample based on moderator DV: EM (Jones, 1991a; Kothari et al., 2005) IV: CSR (Chinese CSR White Paper) MOD: Privately owned versus State owned (Central versus Local government control)
Transparent financial reporting theory [Opportunistic financial reporting theory]
CSR has a negative effect on EM in privately owned enterprises. Among state owned firms the effect is weakened by central government-control

50
Wang et al. (2018)
China 11,619 observations/
1,888 firms (2003 – 2012)
Examine how mandatory CSR reporting effects EM
Method: Difference-in-difference estimation DV: EM (Kothari et al., 2005; Raman & Shahrur, 2008) IV: Mandatory CSR (in accordance with 2008 Notice)
Signalling theory perspective; Transparent financial reporting perspective
Mandatory CSR reporting has a negative effect on EM
Kim et al. (2019)
China 2,640 observations/
521 firms (2009 – 2014)
Examine how CSR affects EM, and the moderating effect of institutional factors
Method: OLS and 2SLS DV: EM (Kothari et al., 2005; Roychowdhury, 2006) IV: CSR (Rankings CSR Ratings) MOD: State control; regional institutional environment
Ethical perspective; Managerial opportunism perspective
CSR has a negative effect on EM in general; but positive effect in firms with state-control and in institutionally developed regions
Liu & Lee (2019) China
1,374 observations (2010 – 2014)
Examine how government guided CSR implementation affects EM
Method: Multivariate regression; Sample split based on moderator DV: EM (Cohen et al., 2008; Dechow et al., 1995; Roychowdhury, 2006) IV: CSR (RKS) MOD: Government guidance (State owned versus private firms)
Political cost perspective; Ethical perspective
CSR has a negative effect on EM in general and among state owned firms, but no significant effect in private firms
Palacios-Manzano et al. (2019)
Spain 452 observations/
100 firms (2011 – 2015)
Examine how CSR affects EM Method: 2SLS DV: EM (Dechow et al., 1995) IV: CSR (MERCO)
Long-term perspective hypothesis [Managerial opportunism hypothesis]
CSR has a negative effect on EM
Pratiwi & Siregar (2019)
Indonesia 936 observations
(2014 – 2016)
Examine how CSR disclosures affect EM, and the moderating effect of political connections
Method: Multivariate regression DV: EM (Bozzolan et al., 2015; Cohen et al., 2008; Kothari et al., 2005; Roychowdhury, 2006) IV: CSR (content analysis) MOD: Political connections
Legitimacy theory [Ethical theory]
CSR disclosures have a positive effect on EM; no moderating effect of political connections
Sial et al. (2019) China
3481 observations (2009 – 2015)
Examine the bi-directional relationship between CSR and EM, and the moderating effect of female and independent directors
Method: GMM DV: EM (Dechow et al., 1995; Roychowdhury, 2006) IV: CSR (RKS) MOD: Female and independent directors
Stakeholder theory; Agency theory
Negative bi-directional relationship between CSR and EM, strengthened by female and independent directors
Velte (2019) Germany
548 observations (2011 – 2017)
Examine the bi-directional relationship between CSR and EM
Method: Multivariate regression DV: EM (Cohen et al., 2008; Kothari et al., 2005; Roychowdhury, 2006) IV: CSR - overall and dimensions (Asset4, Thomson Reuters)
Stakeholder theory
Negative bi-directional relationship between CSR and AEM, but not real activities EM

51
Buertey et al. (2020)
South Africa 354 observations/
118 firms (2013 – 2015)
Examine how CSR affects EM, and the moderating effect of corporate governance
Method: Multivariate regression DV: EM (Kothari et al., 2005) IV: CSR (CSRHub) MOD: Corporate governance
Agency theory CSR has a positive effect on EM, weakened by board size and block ownership
García‐Sánchez et al. (2020)
28 countries 9,746 observations/
3,594 firms (2007 – 2016)
Examine how CSR effects EM, and the moderating effect of managerial entrenchment
Method: GMM DV: EM (Cohen & Zarowin, 2010; Dechow et al., 1995; Roychowdhury, 2006) IV: CSR (Thomson Reuters, ASSET4) MOD: Managerial entrenchment
Agency theory; Stakeholder theory; Legitimacy theory
CSR has a negative effect on EM, weakened by managerial entrenchment in firms with weak governance
Gerged et al. (2020) 2020
Kuwait 300 observations
(2010 – 2014)
Examine how environmental disclosures affect EM
Method: 2SLS and GMM DV: EM (Kothari et al., 2005) IV: Environmental disclosures (content analysis and disclosure index)
Stakeholder theory; Legitimacy theory
Environmental disclosures have a negative effect on EM
Habbash & Haddad (2020)
Saudi Arabia 225 observations
(2015 – 2016)
Examine how CSR disclosures affect EM
Method: OLS DV: EM (Kothari et al., 2005) IV: CSR (content analysis)
Multiple objectives hypothesis [Myopia avoidance hypothesis; Predictable earnings hypothesis]
CSR disclosures have a positive effect on EM
Kumala & Siregar (2020)
Indonesia 105 observations -
mining firms (2012 – 2014)
Examine how CSR disclosures affect EM, and the moderating effect of family ownership
Method: Multivariate regression DV: EM (Kothari et al., 2005) IV: CSR (content analysis) MOD: Concentrated family ownership
Stakeholder theory; Legitimacy theory [Agency theory]
CSR disclosures have a negative effect on EM, strengthened by family ownership
Mohmed et al. (2020)
Egypt 100 firms
(2007 – 2015)
Examine the bi-directional relationship between CSR and EM
Method: 2SLS DV: EM (Ball & Shivakumar, 2006; Dechow et al., 1995; Kothari et al., 2005) IV: CSR (S&P/ESG index)
Agency theory; Stakeholder theory; Stakeholder-stewardship theory
In the top 30 CSR scoring firms, CSR has a negative effect on EM; in the bottom 70 firms, CSR has a positive effect on EM
Rezaee et al. (2020)
China 14,807 observations/
2,580 firms (2009 – 2015)
Examine how CSR affects EM, and the moderating effect of state ownership and marketization
Method: Multivariate regression and 2SLS; Split sample based on moderator (state ownership) DV: EM (Kothari et al., 2005; Roychowdhury, 2006) IV: CSR (RKS) MOD: State ownership; Marketization
Stakeholder theory; Legitimacy theory; Stewardship theory
CSR has a negative effect on EM, strengthened by marketization. CSR has a negative effect on AEM but a positive effect on real activities EM in non-state-owned firms
Chen & Hung (2021)
Taiwan 3,495 observations/
699 firms (2010 – 2014)
Examine how CSR affects EM and firm value
Method: OLS DV: EM (Cohen & Zarowin, 2010; Kothari et al., 2005); Firm value IV: CSR (CSR Best Practice Principles for TWSE/GTSM listed companies)
Agency theory CSR has a negative effect on EM; the interaction of CSR and EM decreases firm value

52
Gerged et al. (2021)
Jordan 500 observations/
100 firms (2010 – 2014)
Examine how environmental disclosures affect EM, and the moderating effect of corporate governance
Method: OLS and GMM DV: EM (Kothari et al., 2005) IV: CSR environmental disclosures (content analysis) MOD: Corporate governance
Agency theory; Stakeholder theory; Legitimacy theory
Environmental disclosures have a negative effect on EM, strengthened by some board size, managerial and institutional ownership
Hickman et al. (2021)
India 5,194 observations
(2012 – 2017)
Examine how CSR affects EM, before and after Indian Companies Act of 2013
Method: Multivariate regression DV: EM (Cohen et al., 2008; Dechow et al., 1995; Roychowdhury, 2006) IV: CSR (dummy for disclosures before and after the Act)
Ethical perspective; Opportunistic perspective
CSR has a positive effect on EM; no significant change after the Act
Velte (2021)
17 European countries
1,509 observations/ 600 firms
(2014 – 2018)
Examine how the environmental dimension of CSR and carbon performance affect EM
Method: Multivariate regression DV: EM (Cohen et al., 2008; Kothari et al., 2005; Roychowdhury, 2006) IV: CSR environmental score; carbon performance score (Thomson Reuters, ASSET4)
Agency theory
Environmental and Carbon performance have positive effect on real activities EM, but a negative effect on AEM.
Zhang et al. (2021)
China 1,635 observations/
545 firms (2016 – 2018)
Examine how CSR performance and disclosures affect EM
Method: GLS DV: EM (Cohen et al., 2008; Jordaan et al., 2018; Roychowdhury, 2006) IV: CSR performance (China’s top 200 firms CSR development index); CSR disclosures (dummy for voluntary disclosure)
Ethical theory; Opportunistic theory
CSR performance has a positive effect on real activities EM, but a negative effect on AEM. CSR disclosures have a negative effect on real activities EM, but a positive effect on AEM.

53
While the two concepts, CSR and EM individually, have been around for a long time, research on
the relationship between CSR and EM is fairly new. Patten & Trompeter (2003) and Riahi-Belkaoui
(2003) are among the pioneers examining the CSR-EM relationship, both studies based on samples
from USA. The debate on the direction of the relationship between CSR and EM appears to have
been initiated by these two pioneering studies that reported contrasting results. Using a sample of
40 chemical firms from USA during the year 1984, Patten & Trompeter (2003) report a negative
relationship between pre-event environmental disclosures and income-decreasing accruals
management. Patten & Trompeter (2003) do not examine overall CSR, but rather environmental
disclosures by firms that were possibly affected by regulatory threats caused by the Bhopal chemical
leak in 1984. The study has a very limited sample of 40 observations due to the specific setting it
examines.
Riahi-Belkaoui (2003), on the other hand, uses a larger sample size and examines the effect of
overall CSR performance on EM. Using a more recent sample (1994-1998), Riahi-Belkaoui (2003)
also uses discretionary accruals as an EM proxy, but uses CSR scores from Fortune Magazine. Using
a sample of 404 firm-year observations from USA between 1994 and 1998, Riahi-Belkaoui (2003)
reports findings that contradict the findings of Patten & Trompeter (2003), and suggests that CSR
has a positive effect on EM. Owing to the debate, initiated by Patten & Trompeter (2003) and Riahi-
Belkaoui (2003) on how CSR affects EM, a number of studies followed to examine the CSR-EM
relationship further. Chih et al. (2008) is the first study to examine the CSR-EM relationship using a
large international sample of 1,653 firms from 46 countries, between 1993 and 2002 inclusive. Chih
et al. (2008) also introduces four theoretical perspectives explaining the CSR-EM relationship – 1)
myopia avoidance hypothesis, 2) multiple objectives hypothesis, 3) predictable earnings hypothesis,
and 4) institutional hypothesis. This has made Chih et al. (2008) study one of the most popular and
frequently cited in CSR-EM literature.
In the first 12 years in the CSR-EM literature (2003 to 2014), the relationship between CSR and EM
had only been examined in developed market8 countries or on international samples. There were
no studies focussing solely on emerging market or frontier market countries. Most of the developed
country studies are about the USA. From 2010 to 2017, a number of studies examined the CSR-EM
relationship in USA (see Calegari et al., 2010; Gao & Zhang, 2015; Grougiou et al., 2014; Heltzer,
2011; Hong & Andersen, 2011; Kim et al., 2012; Litt et al., 2013; Liu et al., 2017; Yip et al., 2011).
8 The classifications of countries into developed, emerging and frontier market categories are based on the MSCI classification following MSCI (2021a).

54
However, during this time, there are studies that looked at the CSR-EM relationship outside USA,
particularly focusing on Europe or Asia.
While the first study to look outside USA is Gargouri et al. (2010), examining a sample of 109 firms
from Canada, from 2016 onwards European countries began to get attention for CSR-EM research
(see Almahrog et al., 2018; Amar & Chakroun, 2018; Gras-Gil et al., 2016; Kyaw et al., 2017; Palacios-
Manzano et al., 2019; Velte, 2019, 2021). The European countries that have been examined include,
Spain (see Gras-Gil et al., 2016; Palacios-Manzano et al., 2019), United Kingdom (UK) (see Almahrog
et al., 2018), France (see Amar & Chakroun, 2018), and Germany (see Velte, 2019). Kyaw et al. (2017)
examine many European countries, while Velte (2021) examines 17 European countries.
Several studies have examined international samples, Chih et al. (2008) being the first one.
Scholtens & Kang (2013) examine a sample of 139 firms from ten Asia-Pacific countries. The study
includes a mix of developed countries (such as, Australia, Hong Kong and Japan) and emerging
market countries (such as, China, India, Malaysia, Pakistan, Philippine, Singapore and Thailand).
During 2015 to 2020, three more studies examined international samples, Martínez‐Ferrero et al.
(2015) using 26 countries, Bozzolan et al. (2015) using 24 countries, and García‐Sánchez et al. (2020),
examining 28 countries.
The first study to examine the CSR-EM issue with a sole focus on an emerging market country is the
study by Cho & Chun (2015) which uses a sample of 1,432 firm-year observations of Korean firms.
It is notable that from 2017 onwards, emerging market countries have become very popular for
CSR-EM studies which include countries like Korea (see Choi et al., 2018; Chun & Cho, 2017),
Indonesia (see Faisal et al., 2018; Kumala & Siregar, 2020; Pratiwi & Siregar, 2019), and South Africa
(Buertey et al., 2020; Jordaan et al., 2018). Since 2018, China has been gaining increased attention
for CSR-EM research. Li & Xia (2018), Wang et al. (2018) and Gong & Ho (2018) are the first three
studies to examine the relationship between CSR and EM in China. Several other studies have
subsequently examined the CSR-EM relationship in China (see Kim et al., 2019; Liu & Lee, 2019;
Rezaee et al., 2020; Sial et al., 2019; Zhang et al., 2021). Middle Eastern countries have also gained
increasing attention for CSR-EM research since 2018. These countries include United Arab Emirates
(UAE) (see Kolsi & Attayah, 2018), Saudi Arabia (see Habbash & Haddad, 2020), Kuwait (see Gerged
et al., 2020), Egypt (see Mohmed et al., 2020). Recent studies have also focussed on other Asian
emerging market countries, particularly Taiwan and India. Chen & Hung (2021) are the first to
examine Taiwan, while Hickman et al. (2021) are the first to examine India. As shown in Table 2.1,

55
EM-CSR literature has gained attention worldwide. Two studies have examined the CSR-EM
relationship in frontier market countries – Muttakin et al. (2015) examined Bangladesh, and Gerged
et al. (2021), examined Jordan.
Overall, 17 of the 48 studies are based on developed market countries, like USA, UK, Canada, Spain
France and Germany, while 22 of the 48 studies are based on emerging market countries, such as
China, Korea, Indonesia, South Africa, Taiwan, India, UAE, Egypt, Saudi Arabia and Kuwait. Two
studies are based on frontier market countries, specifically Bangladesh and Jordan. Furthermore,
seven of the 48 studies are based on international samples. Of these seven studies, only three use
regional samples, such as Asia Pacific countries (see Scholtens & Kang, 2013) and European
countries (see Kyaw et al., 2017; Velte, 2021).
The discussion so far has provided an overview of the samples involved in previous CSR-EM studies.
Now I discuss the research objectives of prior studies. As evident from Column (3) of Table 2.1, the
research objective of several prior studies is to examine how EM is affected by CSR performance
(see Amar & Chakroun, 2018; Choi et al., 2018; Gargouri et al., 2010; Gras-Gil et al., 2016; Hong &
Andersen, 2011; Kim et al., 2012; Palacios-Manzano et al., 2019), CSR disclosures (see Almahrog et
al., 2018; Faisal et al., 2018; Habbash & Haddad, 2020; Kolsi & Attayah, 2018; Wang et al., 2018), or
both (see Jordaan et al., 2018; Zhang et al., 2021). Gargouri et al. (2010) and Amar & Chakroun
(2018) examine not only the overall CSR performance, but also the individual CSR dimensions.
Heltzer (2011), Litt et al. (2013 and Velte (2021) examine how the environmental dimension of CSR
(as opposed to overall CSR performance) affect EM, while Gerged et al. (2020) examine the effect
of environmental disclosures on EM.
Some studies expand on the CSR-EM literature, by examining how various moderating factors affect
this relationship (see Buertey et al., 2020; Chih et al., 2008; Cho & Chun, 2015; García‐Sánchez et
al., 2020; Gerged et al., 2021; Kim et al., 2019; Kumala & Siregar, 2020; Muttakin et al., 2015; Pratiwi
& Siregar, 2019; Scholtens & Kang, 2013; Sial et al., 2019). For example, Chih et al. (2008) and Kim
et al. (2019) examine the moderating role of institutional factors. However, while Chih et al. (2008)
examine country-level institutional factors for 46 countries, that include Antidirector rights, legal
enforcement and GDP per capita, Kim et al. (2019) examine state control and regional institutional
environment among Chinese firms. Muttakin et al. (2015) examine the moderating effect of
powerful stakeholders in Bangladesh (proxied by export-oriented industries). Cho & Chun (2015),
Buertey et al. (2020) and Gerged et al. (2021) examine the moderating effect of corporate

56
governance on the CSR-EM relationship in Korea, South Africa and Jordan respectively. Scholtens &
Kang (2013) observe INVPROas a moderating factor affecting the CSR-EM relationship in ten Asia-
Pacific countries, while García‐Sánchez et al. (2020) test the moderating effect of managerial
entrenchment across 28 countries. Pratiwi & Siregar (2019) and Kumala & Siregar (2020) examine
the moderating effect of political connections and family ownership respectively, among Indonesian
firms.
A number of studies examine the CSR-EM relationship by exploring contextual effects on the
relationship, using split-sample approach (see Gong & Ho, 2018; Kyaw et al., 2017; Li & Xia, 2018;
Liu & Lee, 2019; Rezaee et al., 2020; Yip et al., 2011). The contexts examined by these studies include
US industries (that is, oil and gas industries with high political costs versus food industries with high
ethical concerns) (see Yip et al., 2011), the institutional framework of European counties (that is,
coordinated versus liberal market economies) (see Kyaw et al., 2017), firm ownership in China (that
is private ownership versus state ownership) (see Li & Xia, 2018; Liu & Lee, 2019; Rezaee et al.,
2020), marketization9 in China (see Rezaee et al., 2020), and mandatory versus voluntary CSR
disclosures in China, (see Gong & Ho, 2018). Hickman et al. (2021) use dummy variables to represent
the differences in context, that is CSR disclosures before and after the Indian Companies Act of
2013.10
As a further expansion to the CSR-EM literature, some studies examine the bi-directional
relationship between CSR and EM (see Grougiou et al., 2014; Martínez‐Ferrero et al., 2015; Mohmed
et al., 2020; Sial et al., 2019; Velte, 2019). Grougiou et al. (2014), Velte (2019) and Mohmed et al.
(2020) examine the bi-directional CSR-EM relationship among US banks, German firms and Egyptian
firms respectively. However, Martínez‐Ferrero et al. (2015) and Sial et al. (2019) extend their
research objectives beyond just examining the bi-directional CSR-EM relationship, by exploring
moderating factors affecting the bi-directional CSR-EM relationship. Martínez‐Ferrero et al. (2015)
examine how country-level institutional factors (specifically, stakeholder and INVPRO) moderates
the bi-directional relationship between CSR and EM across firms in 26 countries. In contrast, Sial et
al. (2019) examine the moderating effect of female and independent directors on the bi-directional
9 Marketization refers to the level of market development, measured using the marketization index developed by China’s National Economic Research Institute (Rezaee et al., 2020). 10 The Indian Companies Act of 2013 specifies provisions “to improve governance and financial audits” (p.1). Additionally, the Act also mandates firms (that meet the size or profitability criteria) to spend at least 2% of their reported earnings on CSR initiatives (Hickman et al., 2021).

57
CSR-EM relationship within Chinese firms.
Some studies deviate from the usual trend of examining the effect of CSR on EM (where CSR is
defined as the independent variable, and EM the dependent variable). Gao & Zhang (2015) and
Chen & Hung (2021) examine how the interaction of CSR and EM affects firm value, using EM as the
moderator, in firms in USA and Taiwan respectively. Calegari et al. (2010) and Bozzolan et al. (2015)
take a different approach by examining EM as a mediator in the relationship between CSR and firm
value, and between CSR and firm performance respectively. Specifically, Calegari et al. (2010)
examine the indirect the relationship between CSR and firm value via EM among US firms. In
contrast, Bozzolan et al. (2015) focus on how CSR indirectly affects firm performance, via the trade-
off between accruals based EM and real activities EM (REM) within firms of 26 countries. Chun &
Cho (2017) examine how CSR affects the relationship between differentiation strategy and EM,
while Liu et al. (2017) examine how family involvement indirectly affects EM via CSR.
The previous paragraphs have discussed the research objectives of prior studies. Now, I discuss the
developments in the methodology in the CSR-EM literature, as shown in Column (4) of Table 2.1. As
discussed above, since the first two studies in 2003, research on CSR-EM have continued to gain
interest worldwide. Subsequent studies have taken two approaches when it comes to CSR – majority
of the studies follow Riahi-Belkaoui (2003), and focus on CSR performance, using secondary sources
to obtain CSR indices (33 of the 48 studies) (see Amar & Chakroun, 2018; Bozzolan et al., 2015;
Buertey et al., 2020; Calegari et al., 2010; Chen & Hung, 2021; Chih et al., 2008; Cho & Chun, 2015;
Choi et al., 2018; Chun & Cho, 2017; Gao & Zhang, 2015; García‐Sánchez et al., 2020; Gargouri et al.,
2010; Gras-Gil et al., 2016; Grougiou et al., 2014; Heltzer, 2011; Hong & Andersen, 2011; Kim et al.,
2019; Kim et al., 2012; Kyaw et al., 2017; Li & Xia, 2018; Litt et al., 2013; Liu & Lee, 2019; Liu et al.,
2017; Martínez‐Ferrero et al., 2015; Mohmed et al., 2020; Palacios-Manzano et al., 2019; Rezaee et
al., 2020; Scholtens & Kang, 2013; Sial et al., 2019; Velte, 2019, 2021). The secondary sources used
by prior studies mainly include indices from secondary databases, predominantly, the KLD (Kinder,
Lydenberg, and Domini) database (see Calegari et al., 2010; Gao & Zhang, 2015; Grougiou et al.,
2014; Heltzer, 2011; Hong & Andersen, 2011; Kim et al., 2012; Litt et al., 2013; Liu et al., 2017), the
KEJI (Korea Economic Justice Institute) database (see Cho & Chun, 2015; Choi et al., 2018; Chun &
Cho, 2017), the RKS (Rankings) (see Gong & Ho, 2018; Kim et al., 2019; Liu & Lee, 2019; Rezaee et
al., 2020; Sial et al., 2019), and Thomson Reuters ASSET4 (see García‐Sánchez et al., 2020; Kyaw et
al., 2017; Velte, 2019, 2021). Many other studies follow Patten & Trompeter (2003), and focus on
CSR disclosures (12 of the 48 studies), mainly using content analysis approach (see Almahrog et al.,

58
2018; Faisal et al., 2018; Gerged et al., 2020; Gerged et al., 2021; Habbash & Haddad, 2020; Kolsi &
Attayah, 2018; Kumala & Siregar, 2020; Muttakin et al., 2015; Pratiwi & Siregar, 2019; Yip et al.,
2011), while some use dummy variables as indicators of CSR disclosures (see Wang et al., 2018.
Additionally, a few recent studies examine both CSR performance and CSR disclosures (3 of the 48
studies) (see Gong & Ho, 2018; Jordaan et al., 2018; Zhang et al., 2021). Consistent with majority of
the literature, the present study measures CSR performance using CSR index from a secondary
database. This is discussed in greater detail in Chapter 3.
In terms of EM, prior studies use various proxies, with discretionary accruals being the most
common measure (see Ackoff, 1999; Almahrog et al., 2018; Amar & Chakroun, 2018; Bozzolan et
al., 2015; Buertey et al., 2020; Calegari et al., 2010; Chen & Hung, 2021; Choi et al., 2018; Gao &
Zhang, 2015; García‐Sánchez et al., 2020; Gargouri et al., 2010; Gerged et al., 2020; Gerged et al.,
2021; Gras-Gil et al., 2016; Habbash & Haddad, 2020; Heltzer, 2011; Hickman et al., 2021; Hong &
Andersen, 2011; Jordaan et al., 2018; Kim et al., 2019; Kim et al., 2012; Kumala & Siregar, 2020; Li
& Xia, 2018; Litt et al., 2013; Liu & Lee, 2019; Liu et al., 2017; Martínez‐Ferrero et al., 2015; Mohmed
et al., 2020; Muttakin et al., 2015; Palacios-Manzano et al., 2019; Patten & Trompeter, 2003; Pratiwi
& Siregar, 2019; Rezaee et al., 2020; Riahi-Belkaoui, 2003; Sial et al., 2019; Velte, 2019, 2021; Wang
et al., 2018; Yip et al., 2011; Zhang et al., 2021). Another quite popular measure of EM is real
activities EM (REM), used by several prior studies (see Bozzolan et al., 2015; Chen & Hung, 2021;
Cho & Chun, 2015; Choi et al., 2018; Chun & Cho, 2017; Faisal et al., 2018; García‐Sánchez et al.,
2020; Gong & Ho, 2018; Hickman et al., 2021; Hong & Andersen, 2011; Jordaan et al., 2018; Kim et
al., 2019; Kim et al., 2012; Kolsi & Attayah, 2018; Liu & Lee, 2019; Liu et al., 2017; Pratiwi & Siregar,
2019; Rezaee et al., 2020; Sial et al., 2019; Velte, 2019, 2021; Zhang et al., 2021). Other less popular
EM measures used by prior studies include accruals quality (see Gong & Ho, 2018; Kolsi & Attayah,
2018), earnings aggressiveness (see Chih et al., 2008; Kyaw et al., 2017; Scholtens & Kang, 2013),
earnings smoothing (see Chih et al., 2008; Gao & Zhang, 2015; Heltzer, 2011; Kolsi & Attayah, 2018;
Scholtens & Kang, 2013), asymmetric recognition of gains or losses (see Mohmed et al., 2020), and
for banks, loan loss provisions and realized security gains and losses (see Grougiou et al., 2014).
Following prior studies, the present study uses the most popular EM measure, that is, discretionary
accruals, as the primary measure of EM. The study also uses accruals quality as an alternate measure
of EM. The reason for choosing accruals quality as the alternate measure is that both discretionary
accruals and accruals quality indicate both accrual-based EM. Other proxies, such as REM, measures
different forms of EM, which is outside the scope of the present research.

59
Most prior studies use multivariate regressions or Ordinary Least Squares (OLS) technique
estimation methods for analysis (for example, see Almahrog et al., 2018; Amar & Chakroun, 2018;
Buertey et al., 2020; Calegari et al., 2010; Chen & Hung, 2021; Chih et al., 2008; Cho & Chun, 2015;
Choi et al., 2018; Chun & Cho, 2017; Gao & Zhang, 2015; Gerged et al., 2021; Gong & Ho, 2018; Gras-
Gil et al., 2016; Habbash & Haddad, 2020; Hickman et al., 2021; Hong & Andersen, 2011; Jordaan et
al., 2018; Kim et al., 2019; Kim et al., 2012; Kolsi & Attayah, 2018; Kumala & Siregar, 2020; Kyaw et
al., 2017; Li & Xia, 2018; Litt et al., 2013; Liu & Lee, 2019; Muttakin et al., 2015; Patten & Trompeter,
2003; Pratiwi & Siregar, 2019; Rezaee et al., 2020; Riahi-Belkaoui, 2003; Scholtens & Kang, 2013;
Velte, 2019, 2021; Yip et al., 2011). Hong & Andersen (2011) highlight the need for improvements
in the analytical models by incorporating more sophisticated models for examining the CSR-EM
relationship. A range of other more sophisticated techniques have also been used to explore the
CSR-EM relationship, such as, 2 Stage Least Squares (2SLS) (Bozzolan et al., 2015; Calegari et al.,
2010; Choi et al., 2018; Faisal et al., 2018; Gao & Zhang, 2015; Gerged et al., 2020; Gong & Ho, 2018;
Grougiou et al., 2014; Kim et al., 2019; Mohmed et al., 2020; Palacios-Manzano et al., 2019; Rezaee
et al., 2020), General Methods of Moments (GMM) (García‐Sánchez et al., 2020; Gerged et al., 2020;
Gerged et al., 2021; Gong & Ho, 2018; Kyaw et al., 2017; Martínez‐Ferrero et al., 2015; Sial et al.,
2019), 3 Stage Lease Squares (3SLS) (Liu et al., 2017), Maximum Likelihood Estimation (MLE) (Patten
& Trompeter, 2003), Probit (Gargouri et al., 2010), Difference-in-difference estimation (Wang et al.,
2018) and Generalized Least Squares (Zhang et al., 2021).
The previous paragraphs have discussed the methodology in prior studies. Now, I focus on the
empirical findings, as shown in Column (6) of Table 2.1. The majority of prior studies (23 of the 48
studies) suggest that CSR has a negative effect on EM (see Almahrog et al., 2018; Bozzolan et al.,
2015; Calegari et al., 2010; Chen & Hung, 2021; Cho & Chun, 2015; Chun & Cho, 2017; Faisal et al.,
2018; Gao & Zhang, 2015; García‐Sánchez et al., 2020; Gerged et al., 2020; Gerged et al., 2021; Gras-
Gil et al., 2016; Hong & Andersen, 2011; Kim et al., 2012; Kumala & Siregar, 2020; Li & Xia, 2018; Litt
et al., 2013; Martínez‐Ferrero et al., 2015; Palacios-Manzano et al., 2019; Patten & Trompeter, 2003;
Scholtens & Kang, 2013; Sial et al., 2019; Wang et al., 2018). The negative relationship between CSR
and EM suggests that managers in firms with high CSR are less likely to manage earnings. Prior
studies explain this negative relationship in two ways – 1) a relationship-driven perspective, and 2)
a value-driven perspective.
The relationship-driven perspective suggests that the negative relationship between CSR and EM is
a result of managers being genuinely concerned with maintaining relationships with stakeholders

60
(for example, see Almahrog et al., 2018; Amar & Chakroun, 2018; Cho & Chun, 2015; Choi et al.,
2018; Chun & Cho, 2017; Faisal et al., 2018; Gras-Gil et al., 2016; Hong & Andersen, 2011; Jouber,
2020; Velte, 2019). As Hong & Andersen (2011) explain, CSR initiatives are often undertaken to
maintain good relationships with stakeholders. Thus, managers with CSR commitments are more
fixated on building long-term relationships with stakeholders as opposed to being driven simply by
profit maximising incentives (Almahrog et al., 2018). EM, on the other hand is considered an agency
cost that may provide misleading information to stakeholders regarding the firm’s performance
(Prior et al., 2008). Thus, managers’ efforts to meet stakeholders’ expectations (Amar & Chakroun,
2018; Faisal et al., 2018; Jouber, 2020), reduce information asymmetry (Almahrog et al., 2018;
Jouber, 2020; Mohmed et al., 2020; Wang et al., 2018) and maintain ties with stakeholders (Chun &
Cho, 2017; Gras-Gil et al., 2016; Hong & Andersen, 2011; Velte, 2019) are likely to drive managers
in high CSR firms to avoid EM. Establishing better relationships with stakeholders may have a
number of benefits for the managers, including the enhancement of the firm’s brand image and
reputation (Cho & Chun, 2015; Gras-Gil et al., 2016). Additionally engagement in CSR may expose
firms to greater scrutiny by regulators and stakeholders (for example, see Litt et al., 2013). The
higher risks associatied with greater scrutiny may result in lower motives or opportunities to
conduct EM (for example, see Patten & Trompeter, 2003). Prior studies also suggest that CSR
disclosures reduce information asymmetry between managers and shareholders (Mohmed et al.,
2020; Wang et al., 2018). Reduced information asymmetry makes the firm’s activities more
transparent to shareholders, thus increasing the risk of exposure of EM activities. Thus, managers
in firms with high CSR are less likely to engage in EM to avoid risks of facing potential negative
consequences and causing irreversible damage to their relationship with stakeholders, if their EM
activities are discovered by stakeholders (Gerged et al., 2020; Gerged et al., 2021)
The value-driven perspective suggests that the negative relationship between CSR and EM may
result from managers’ ethical and moral values (for example, see Calegari et al., 2010; Gao & Zhang,
2015; García‐Sánchez et al., 2020; Kim et al., 2012; Kumala & Siregar, 2020; Li & Xia, 2018; Martínez‐
Ferrero et al., 2015; Mohmed et al., 2020; Palacios-Manzano et al., 2019; Rezaee et al., 2020;
Scholtens & Kang, 2013; Sial et al., 2019). Calegari et al. (2010) explain that CSR practices become
embedded in the firm’s corporate culture, and ethical and social norms and values while Almahrog
et al. (2018) explain that CSR springs from managers’ ethical and moral values. Due to their ethical
and moral values, as well as their objective of meeting the ethical expectations of the society,
managers engaged in CSR are likely to maintain transparency in their financial reporting practices

61
and thus avoid EM (Bozzolan et al., 2015; Calegari et al., 2010; Chen & Hung, 2021; Gao & Zhang,
2015; García‐Sánchez et al., 2020; Kim et al., 2012; Kumala & Siregar, 2020; Li & Xia, 2018; Martínez‐
Ferrero et al., 2015; Palacios-Manzano et al., 2019; Rezaee et al., 2020; Sial et al., 2019).
Additionally, Martínez‐Ferrero et al. (2015) suggest that managers involved in unethical practices
such as EM, are less likely to undertake CSR initiatives. Scholtens & Kang (2013) explain that EM is
both an unethical act and an agency cost. Thus, managers in firms with high CSR avoid EM due to
their ethical values, as well as to reduce agency costs (Scholtens & Kang, 2013). Bozzolan et al.
(2015) find that managers in firms with high CSR are less likely to engage in REM than accruals-based
EM, since the former has more detrimental consequences for the firm’s long-term performance.
Some studies have further linked the negative relationship between CSR and EM with other factors.
For example, Calegari et al. (2010), Gao & Zhang (2015), and Chen & Hung (2021) link CSR-EM to
firm value, while Bozzolan et al. (2015) link CSR-EM to firm performance. Calegari et al. (2010)
suggest that the negative effect of CSR indirectly improves firm value via lower EM. Contrastingly,
Gao & Zhang (2015) suggest that the interaction of CSR and EM enhances firm value in US firms.
Chen & Hung (2021) report contradictory findings, suggesting that the interaction between CSR and
EM leads to a deterioration in firm value among Taiwanese firms. The differences in the results may
be a result of contextual differences between the two countries, USA and Taiwan. Bozzolan et al.
(2015) find that CSR indirectly affects firm performance, via the trade-off between accruals-based
EM and REM. The study reports that firms with high CSR are less likely to use REM due to the
detrimental consequences of REM on firm performance.
Several studies have reported moderating factors that affect the negative relationship between CSR
and EM. The moderating factors that strengthen the negative CSR-EM relationship include
corporate governance (see Cho & Chun, 2015), or some aspects of corporate governance (see
Gerged et al., 2021; Sial et al., 2019), family ownership (see Kumala & Siregar, 2020), institutional
factors (see Martínez‐Ferrero et al., 2015) and INVPRO (see Scholtens & Kang, 2013). However,
some moderating factors weaken the negative CSR-EM relationship, such as, central government
control, in state-owned firms (see Li & Xia, 2018) and managerial entrenchment, in firms with weak
corporate governance (see García‐Sánchez et al., 2020).
In contrast to the studies above, a few studies (5 out of the 48 studies) propose that CSR has a
positive effect on EM (see Buertey et al., 2020; Habbash & Haddad, 2020; Hickman et al., 2021;
Pratiwi & Siregar, 2019; Riahi-Belkaoui, 2003). The positive relationship suggests that managers in

62
firms with high CSR are more likely to manage earnings. Prior studies explain such short-term focus
in two ways: 1) incentive-driven perspective, 2) opportunity-driven perspective. The first
perspective is suggests that managers in firms with high CSR may have greater incentives to manage
earnings due to being burdened with multiple expectations from various stakeholders, on top of
increasing profits (Chih et al., 2008). The pressure to please multiple stakeholders at once, may lead
managers to manage earnings and report favourable financial information (Chih et al., 2008;
Habbash & Haddad, 2020; Kyaw et al., 2017). Furthermore, the reputation, created by high CSR
engagement, may also lead managers to manage earnings to maintain their social image and ranking
(Riahi-Belkaoui, 2003).
The second perspective suggests that CSR may increase managerial opportunities for EM. Since CSR
creates a positive image in the market, and makes the firm appear transparent and ethical,
managers may have more opportunities to manage earnings (Muttakin et al., 2015; Riahi-Belkaoui,
2003). Pratiwi & Siregar (2019) and Hickman et al., (2021) explain that managers may use increased
CSR disclosure as a means to hide their EM engagement undertaken to retain corporate legitimacy
and reputation. Buertey et al. (2020) and Jordaan et al. (2018) suggest that managers may often
have opportunistic motives for undertaking CSR initiatives. For example, when firm performance
deteriorates, managers may engage in more CSR practices and use their CSR performance as a shield
to hide their increased EM. Buertey et al. (2020) further examine the moderating effect of board
size and block ownership on the CSR-EM relationship, suggesting that these factors weaken the
positive CSR-EM relationship.
A number of studies also indicate that the effect of CSR on EM is contextual, based on various factors
(see Amar & Chakroun, 2018; Chih et al., 2008; Choi et al., 2018; Gargouri et al., 2010; Gong & Ho,
2018; Heltzer, 2011; Jordaan et al., 2018; Kim et al., 2019; Kolsi & Attayah, 2018; Kyaw et al., 2017;
Liu & Lee, 2019; Mohmed et al., 2020; Muttakin et al., 2015; Rezaee et al., 2020; Velte, 2019, 2021;
Yip et al., 2011; Zhang et al., 2021). Some studies suggest that the CSR-EM relationship is contextual
on the type of EM (see Chih et al., 2008; Choi et al., 2018; Jordaan et al., 2018; Kolsi & Attayah, 2018;
Velte, 2019; Velte, 2021; Zhang et al., 2021). Chih et al. (2008) explain that managers in firms with
high CSR are more likely to use earnings aggressiveness to manage earnings, but less likely to use
earnings smoothing and loss avoidance.
Highlighting the significance of endogeneity issues in the CSR-EM relationship, Choi et al. (2018)
report that, after controlling for endogeneity, CSR has a negative effect on REM but no significant

63
effect on discretionary accruals. According to Velte (2019), there is a negative bi-directional
relationship between CSR and accruals-based EM, but no significant relationship between CSR and
REM. Jordaan et al. (2018) provides conflicting findings on the effect of CSR on EM. Jordaan et al.
(2018) suggest that while managers, in firms with high CSR performance are more likely to engage
in accruals-based EM, they are less likely to engage in real activities EM that are more severe and
difficult to be reversed in the following period. Furthermore, Jordaan et al. (2018) also report a
negative relationship between CSR disclosures and EM, suggesting that managers may use increased
CSR disclosures to reduce information asymmetry with stakeholders, which in turn means that they
are less likely to manage earnings. Zhang et al. (2021) suggests contradictory results, observing that
CSR performance has a positive effect on REM, but a negative effect on AEM. Additionally, Zhang et
al. (2021) find that CSR disclosures have a positive effect on accruals-based EM, but no significant
effect on REM. The results are consistent with the findings of Kolsi & Attayah (2018) that CSR
disclosures have a positive effect on accruals-based EM, but no significant effect on REM. Velte
(2021) focusses on the environmental and carbon performance dimensions of CSR. Consistent with
Kolsi & Attayah (2018), Velte (2021) also finds that CSR (that is, environmental and carbon
performance) has a positive effect on REM. However, the study finds that environmental and carbon
performance has a negative effect on AEM (Velte, 2021.
Gargouri et al. (2010) and Amar & Chakroun (2018) find that the CSR-EM relationship varies in the
different CSR dimensions. The results are contradictory. While Gargouri et al. (2010) find no
significant relationship between overall CSR and EM and between the corporate governance
dimension and EM, Amar & Chakroun (2018) suggest that both overall CSR and corporate
governance dimensions have negative effects on EM. Furthermore, Gargouri et al. (2010) report
that the environmental and employee dimensions of CSR have a positive effect on EM, suggesting
that managers with better relationships with their employees are more likely to manage earnings
as their relationships with their employees may prevent possible whistleblowing when employees
become aware of the prevailing EM practices. In contrast Amar & Chakroun (2018) find that the
environmental dimension and some social dimensions (specifically, human rights and consumer
expectations) have a negative effect on EM, whereas other social dimensions (specifically, labour,
fairness of practices and community involvement) have no significant effect on EM.
Heltzer (2011) and Mohmed et al. (2020) find an asymmetric relationship between CSR and EM. By
splitting the sample into three subsamples, Heltzer (2011) finds that there is no significant
relationship between CSR and EM among firms classified as having strong and neutral

64
environmental performance. However, the study finds higher EM in firms with weak environmental
performance. Heltzer (2011) explain that firms that care about environmental issues engage in CSR
due to institutional factors, and EM has no role in this. However, firms that disregard environmental
issues are generally less concerned about stakeholder relationships and are more likely to manage
earnings to conceal unfavourable financial performance (Heltzer, 2011). Mohmed et al. (2020) find
a negative relationship between CSR and EM within the top 30 CSR scoring firms, but a positive
relationship between CSR and EM within the bottom 70 CSR scoring firms. Mohmed et al. (2020)
suggest that managers in the top CSR scoring firms genuinely care about their stakeholders and
therefore maintain transparency in their financial reporting practices by engaging less in EM.
However, managers in the bottom CSR scoring firms use their CSR activities to mask their EM
engagement.
Yip et al. (2011) and Muttakin et al. (2015) suggest that the relationship between CSR and EM varies
based on the industry in which the firm operates, and the level of stakeholder scrutiny. Yip et al.
(2011) finds that EM is more prevalent in the food industry but less prevalent in the oil and gas
industry which has high political scrutiny. Firms within industries such as the oil and gas industry,
may be subject to political pressure as a result of their operations being too large, or be regularly
scrutinized, giving managers fewer opportunities to manage earnings (Yip et al., 2011). Yip et al.
(2011) suggest that the CSR-EM relationship is driven by political costs as opposed to the ethical
orientation of managers. Muttakin et al. (2015) suggest that firms that practice CSR are likely to
have lower stakeholder scrutiny, particularly in countries with weaker legal and institutional
backgrounds, broadening the opportunities for EM. However, the presence of powerful
stakeholders (firms operating in export-oriented industries) may restrict such opportunities
(Muttakin et al., 2015).
Kyaw et al. (2017) find the CSR-EM relationship to vary based on the institutional framework. The
study observes that firms engaged in high CSR initiatives are more likely to manage earnings in
coordinated market economies. However, the study finds no significant relationship between CSR
and EM in liberal market economies (Kyaw et al., 2017).
A number of studies using Chinese samples examine various contexts, such as, mandatory or
voluntary CSR reporting/disclosures (see Gong & Ho, 2018; Wang et al., 2018; Zhang et al., 2021),
state ownership/control (see Kim et al., 2019; Li & Xia, 2018; Liu & Lee, 2019; Rezaee et al., 2020),
institutional environment (see Kim et al., 2019), board characteristics (see Sial et al., 2019, and

65
marketization (see Rezaee et al., 2020). Gong & Ho (2018) find a negative relationship between CSR
and EM within Chinese firms with mandatory CSR disclosures. However, highlighting the contextual
nature of the CSR-EM relationship, the study reports no significant relationship between CSR and
EM among firms with voluntary CSR disclosures. The result is consistent with Wang et al. (2018),
suggesting that mandatory CSR reporting in China has a role in constraining EM. Zhang et al. (2021)
focus on voluntary CSR disclosures. In contrast to Gong & Ho (2018) and Wang et al. (2018), Zhang
et al. (2021) find that voluntary CSR disclosures have a negative effect on REM, but a positive effect
on accruals-based EM. The differences in the sample used by the above studies may have
contributed to the differences in the results. The sample period for Gong & Ho (2018) and Wang et
al. (2018) overlap: Gong and Ho (2018) focus on the period 2009 to 2015 while Wang et al. (2018)
focus on 2003 to 2015. As discussed above, the similarity of the results of these two studies (Gong
& Ho, 2018 and Wang et al., 2018) suggest that mandatory CSR has a negative effect on EM. Zhang
et al. (2021), reporting different results (regarding the effect of voluntary CSR disclosures on EM),
focus on a shorter but more recent sample covering the period 2016 to 2018. The differences in the
results indicate that the role of voluntary CSR disclosures may be changing in recent years.
Li & Xia (2018) report a negative relationship between CSR and EM in privately-owned Chinese firms.
Kim et al. (2019) suggest that while, in general, there is a negative relationship between CSR and
EM, the relationship becomes positive among firms with state control and firms operating in
institutionally developed regions. Kim et al. (2019) explain that the higher government control and
institutional development creates more legitimacy risk and higher expectations regarding firm
performance. These expectations create more incentives for managers to manage earnings (Kim et
al., 2019). In contrast to these studies, Liu & Lee (2019) report that CSR has a negative effect on EM
in general and within state-owned Chinese firms, but no significant effect within privately-owned
firms. All of these studies use very similar samples covering the periods 2009 to 2014 (see Li & Xia,
2018 and Kim et al., 2019), and 2010 to 2014 (see Liu & Lee, 2019). Kim et al. (2019) and Liu & Lee
(2019) use the same CSR index from RKS. Thus, the different EM measures are likely to have
contributed to the differences in the results, as indicated by Rezaee et al. (2020). Rezaee et al. (2020)
also find a negative relationship between CSR and EM, suggesting that CSR has a negative effect on
accruals-based EM, but a positive effect on REM, in state-owned firms, but no significant effect on
privately-owned firms. Rezaee et al. (2020) also find the negative CSR-EM relationship to be stronger
for firms in Chinese provinces with high marketization.
Only two of the 48 studies report that CSR has no significant effect on EM (see Grougiou et al., 2014;

66
Liu et al., 2017). Grougiou et al. (2014) examine the bi-directional relationship between CSR and EM.
The study finds that among US commercial banks CSR has no significant effect on EM, but EM has a
positive effect on CSR. The results support the view that managers engaged in EM are likely to adopt
CSR practices in attempts to maintain organizational legitimacy. However, CSR performance is not
an indication of managers’ ethical orientation, and thus has no effect on the financial reporting
quality (Grougiou et al., 2014). Liu et al. (2017) find that CSR has no significant effect on EM, once
controlled for family firms, suggesting that family firms are an important driver in the CSR-EM
relationship.
As discussed throughout this section, several prior studies have examined the relationship between
CSR and EM. The primary purpose of these studies was to examine the direct effect of CSR on EM
(see Almahrog et al., 2018; Amar & Chakroun, 2018; Faisal et al., 2018; Gargouri et al., 2010; Gras-
Gil et al., 2016; Habbash & Haddad, 2020; Heltzer, 2011; Hong & Andersen, 2011; Jordaan et al.,
2018; Kim et al., 2012; Kolsi & Attayah, 2018; Litt et al., 2013; Palacios-Manzano et al., 2019; Patten
& Trompeter, 2003; Riahi-Belkaoui, 2003; Velte, 2021; Wang et al., 2018; Zhang et al., 2021).
Additionally, some previous studies have looked at various moderating factors affecting or the
contextual effect of various factors such as, industry (see Muttakin et al., 2015; Yip et al., 2011),
private ownership versus state ownership (see Li & Xia, 2018; Liu & Lee, 2019; Rezaee et al., 2020),
marketization (see Rezaee et al., 2020), mandatory versus voluntary CSR disclosures (see Gong &
Ho, 2018; Hickman et al., 2021), endogeneity (see Choi et al., 2018), institutional factors (see Chih
et al., 2008; Kim et al., 2019; Kyaw et al., 2017; Scholtens & Kang, 2013), corporate governance (see
Buertey et al., 2020; Cho & Chun, 2015; Gerged et al., 2021), political connections (see Pratiwi &
Siregar, 2019) and family ownership (see Kumala & Siregar, 2020). Moderating effects test the
interaction of two variables (the independent and the moderating variables) on another variable
(the dependent variable) (Little et al., 2007). Moderation identifies when certain effects will occur,
by examining contextual factors, but it does not identify why or how these effects occur (Baron &
Kenny, 1986). Mediation addresses the ‘why or how’ question. None of these studies have examined
a mediating channel in the relationship between CSR and EM.
Mediation will tell us whether managers, engaged in CSR, may use any tools to indirectly manage
earnings. Among prior studies, Calegari et al. (2010) and Bozzolan et al. (2015) examine how EM as
a mediating or indirect channel between the relationship between CSR and firm value/performance.
Liu et al., 2017 examine CSR as a mediating channel in the relationship between family involvement
and EM. Mediation analysis captures indirect effects that inform whether the independent variable

67
(CSR) affects the dependent variable (EM) through a channel or tool. An indirect relationship exists
when the independent variable affects a mediator, and the mediator in turn affects the dependent
variable (Baron & Kenny, 1986). Different streams of literature show that CSR has a positive effect
on intangible resources, known as intellectual capital of firms (for example see Altuner et al., 2015;
Hawn & Ioannou, 2016; Massaro et al., 2018), and intellectual capital has a positive effect on EM
(for example, see Bhandari et al., 2018; Francis et al., 2008; Malmendier & Tate, 2009; Shust, 2015).
I focus on OC, a specific component of intellectual capital. OC includes organisational practices,
processes, design and culture, that are part of the organisational structure, and are non-transferable
or non-imitable by competitors (Attig & Cleary, 2014; Carlin et al., 2012; Lev, 2004; Lev &
Radhakrishnan, 2005). I examine OC as a mediator in the CSR-EM relationship. To understand the
much-debated CSR and EM relationship more comprehensively, it is critical to look at this
relationship more closely, beyond merely moderating factors that affect the relationship, and
investigate how and why CSR affects EM, by examining mediating channels. To this end, in my first
project (Chapter 4), I examine the indirect relationship between CSR and EM, via a unique firm-level
factor (that is, OC).
As discussed in the previous paragraphs, most prior studies use multivariate regressions (Almahrog
et al., 2018; Amar & Chakroun, 2018; Buertey et al., 2020; Chih et al., 2008; Cho & Chun, 2015; Chun
& Cho, 2017; Gao & Zhang, 2015; Gong & Ho, 2018; Gras-Gil et al., 2016; Hickman et al., 2021;
Jordaan et al., 2018; Kim et al., 2012; Kolsi & Attayah, 2018; Kumala & Siregar, 2020; Li & Xia, 2018;
Litt et al., 2013; Liu & Lee, 2019; Muttakin et al., 2015; Pratiwi & Siregar, 2019; Rezaee et al., 2020;
Riahi-Belkaoui, 2003; Scholtens & Kang, 2013; Velte, 2019, 2021) or OLS (Calegari et al., 2010; Chen
& Hung, 2021; Choi et al., 2018; Gerged et al., 2021; Habbash & Haddad, 2020; Hong & Andersen,
2011; Kim et al., 2019; Kyaw et al., 2017; Patten & Trompeter, 2003; Yip et al., 2011). Since the
present study (Chapter 4) examines the indirect relationship between CSR and EM, standard OLS
models are not the best choice (see Shaver, 2005). Thus, following Cheung (2016), the present study
use structural equation modelling with maximum likelihood estimation as the primary analysis
methods for the first research study (reported in Chapter 4). Additionally, to address endogeneity,
the study performs 2SLS estimation with an instrumental variable.
Research study 1 (reported in Chapter 4) examines the direct and indirect relationship between CSR
and EM via OC. To gain a more comprehensive understanding of the indirect relationship between
CSR-EM via OC, I examine whether the relationship holds when specific firm-level circumstances
change, in particular when the firm experiences a crisis situation. The rationale for choosing a crisis

68
situation is the current worldwide Covid-19 pandemic outbreak. The years 2020 and 2021 have seen
businesses suffer worldwide resulting from country-wide restrictions as well as international border
restrictions (Barua, 2020). Thousands of businesses have shut down, and thousands are still
struggling financially (see Sundaram, 2020). As such, I have chosen to focus on financial distress
(FD), as this is a firm-level crisis event that is very relevant in the current era where the struggle to
overcome the pandemic, as well as the struggle for economic recovery continues. FD is a situation
when firms do not have sufficient assets to fulfill their outstanding financial obligations (Baldwin &
Mason, 1983). I posit that during crisis situations, specifically FD, the relationship between CSR and
EM may change, as managers’ priorities and actions change. In my second research study (reported
in Chapter 5), I examine how FD moderates the direct relationship between CSR and EM, as well as
the indirect relationship between CSR and EM via OC. This is known as moderated mediation.
Moderated mediation, referred to as a situation when the indirect effect is moderated by another
factor (James & Brett, 1984), has been gaining increasing research interest (Little et al., 2007).
Similar to the first research study, the second research study also uses SEM and 2SLS models.
As evidenced in the above discussion, research on CSR and EM had initially gained popularity mostly
in developed countries (such as, USA, UK, Canada, Spain France and Germany). More recently,
emerging market countries have gained increased attention (such as China, Korea, Indonesia, South
Africa, Taiwan, India, UAE, Egypt, Saudi Arabia and Kuwait). The majority of studies focussing on
emerging market countries have used Chinese samples (see Gong & Ho, 2018; Kim et al., 2019; Li &
Xia, 2018; Liu & Lee, 2019; Rezaee et al., 2020; Sial et al., 2019; Wang et al., 2018; Zhang et al.,
2021). Furthermore, little attention has been paid to samples involving multiple emerging market
countries (that is, regional samples).
Emerging markets are characterised as markets with high potential for economic growth (Kaymak
& Bektas, 2015). However, due to the instability of policymaking in these markets, emerging market
countries experience social, economic, political and demographic challenges (Kaymak & Bektas,
2015), making these countries more susceptible to CORR (Wu, 2005). As discussed earlier, emerging
market countries are more likely to manage earnings due to factors such as, lower INVPRO, higher
CORR, and COLL culture. Thus, it is imperative to conduct further CSR-EM research in emerging
market countries that are more susceptible to EM, to gain a more comprehensive understanding of
the CSR-EM relationship. I posit that in an emerging market context, rather than examining an
indirect CSR-EM relationship (as I have done in Chapters 4 and 5), it is more relevant to examine
how these unique challenges (INVPRO, CORR and COLL culture) affect the relationship between CSR

69
and EM. Prior studies have examined how each of these factors affect EM, but in my third research
study (reported in Chapter 6), I examine the moderating effect of all of these factors, namely
INVPRO, CORR and COLL culture on the CSR-EM relationship. I use Hierarchical Linear Modelling
(HLM) technique in research study 3. Prior studies involving multiple-country samples with 2-level
variables have chosen simple analytic methods. However, this may produce biased results (see
Rabe-Hesketh & Skrondal, 2008). Thus, following Lewellyn & Bao (2017), the present study uses
HLM technique, as this is a more efficient method for studies involving multi-level variables.
This thesis examines various firm-level factors (specifically OC and FD) and country-level contexts
(specifically, culture, CORR and INVPRO) that may explain the CSR-EM relationship. To the best of
my knowledge, the effect of these factors or contexts, on the CSR-EM relationship, has not been
sufficiently addressed by prior studies.
2.6 Chapter Summary
This chapter presents a detailed discussion of the main issues of this study, CSR and EM. The chapter
begins by discussing CSR and EM, individually. The discussion on CSR lists a number of different
definitions of CSR, followed by a list of the many managerial incentives for CSR. External incentives
include sustaining relationships with key stakeholders, obtaining competitive advantage through
differentiation, avoiding negative publicity, strengthening brand image, loyalty and the firm’s
reputation. Internal incentives include enhancing employee motivation and retention. CSR is
commonly categorised into four dimensions, namely, economic, environmental, social and
corporate governance dimensions.
The discussion on EM begins with several definitions of EM and then suggests several incentives
that may lead managers to engage in EM. These incentives include debt covenant violations,
maximization of compensation-based bonuses, inflating stock prices, obtaining private benefits of
control, and meeting targets to please stakeholders. While there are several ways that earnings can
be managed, the study highlights two of the frequent EM measures evidenced in literature, namely
discretionary accruals and real earnings management.
The chapter then discusses CSR and EM, together, discussing the theoretical background and
reviewing the literature. The relationship between CSR and EM may be explained by two contrasting
perspectives. First, consistent with the managerial myopia hypothesis, managers engaged in CSR

70
may be more likely to manage earnings as a means to obtain short-term goals and please
stakeholders. Managerial myopia is explained by two drivers, namely incentive-driven myopia and
opportunity-driven myopia. In contrast, consistent with the myopia avoidance hypothesis,
managers engaged in CSR may have a longer-term orientation, thus refraining from managing
earnings. Myopia avoidance is also explained by two drivers, namely relationship-driven myopia
avoidance and value-driven myopia avoidance.
71
MEASUREMENT OF VARIABLES – CSR AND EM
3.1 Introduction
This section discusses the measurements of CSR and EM, as utilised in all three research studies
undertaken as part of this thesis. For all three research studies, CSR is the independent variable and
EM is the dependent variable. Each research study then utilises mediating and/or moderating
variables. These are discussed in the subsequent chapters.
The rest of this chapter is organised as follows: Section 3.2 discusses the measurement of CSR, with
sub-sections discussing the data source, and the primary and alternate measures of CSR. Section 3.3
discusses the measurement of EM, with sub-sections discussing the primary and alternate EM
measures. The chapter ends with a chapter summary.
3.2 Measuring CSR
3.2.1 Data Source
As discussed in the literature review in Chapter 2, prior studies have looked at different forms of
CSR. The majority of studies have examined CSR performance (for example, see Amar & Chakroun,
2018; Bozzolan et al., 2015; Buertey et al., 2020; Calegari et al., 2010; Chen & Hung, 2021; Chih et
al., 2008; Cho & Chun, 2015; Choi et al., 2018; Chun & Cho, 2017; Gao & Zhang, 2015; García‐Sánchez
et al., 2020; Gargouri et al., 2010; Gras-Gil et al., 2016; Grougiou et al., 2014; Heltzer, 2011; Hickman
et al., 2021; Hong & Andersen, 2011; Kim et al., 2019; Kim et al., 2012; Kyaw et al., 2017; Li & Xia,
2018; Litt et al., 2013; Liu & Lee, 2019; Liu et al., 2017; Martínez‐Ferrero et al., 2015; Mohmed et
al., 2020; Palacios-Manzano et al., 2019; Rezaee et al., 2020; Riahi-Belkaoui, 2003; Scholtens & Kang,
2013; Sial et al., 2019; Velte, 2019, 2021). Several other studies have examined CSR disclosures as
a proxy for CSR (for example, see Almahrog et al., 2018; Faisal et al., 2018; Gerged et al., 2020;
Gerged et al., 2021; Habbash & Haddad, 2020; Kolsi & Attayah, 2018; Kumala & Siregar, 2020;
Muttakin et al., 2015; Patten & Trompeter, 2003; Pratiwi & Siregar, 2019; Wang et al., 2018; Yip et
al., 2011).
Furthermore, while some studies have examined overall CSR, with weighted scores of the different
dimensions (for example Bozzolan et al., 2015; Cho & Chun, 2015; Choi et al., 2013; Gao & Zhang,

72
2015; Gargouri et al., 2010; Grougiou et al., 2014; Hong & Andersen, 2011; Kyaw et al., 2017; Liu et
al., 2017; Prior et al., 2008; Scholtens & Kang, 2013), others have focused on individual dimensions,
such as, environmental (for example, see Gargouri et al., 2010; Heltzer, 2011; Kyaw et al., 2017; Litt
et al., 2013; Sun et al., 2010), or social pillars (for example, see Gargouri et al., 2010; Kyaw et al.,
2017). Corporate governance has also gained significant attention in recent CSR literature. While
some studies examine corporate governance as a part of CSR (for example, see Gao & Zhang, 2015;
Hong & Andersen, 2011; Kyaw et al., 2017; Prior et al., 2008), other studies have investigated
corporate governance as a variable isolated from CSR or have excluded corporate governance
altogether (for example, see Cho & Chun, 2015; Choi et al., 2013; Hussain et al., 2016; Kim et al.,
2012). Furthermore, some studies focus on ESG dimensions to account for CSR, that is, the
environmental, social and governance dimensions, while excluding the economic dimension (for
example, see Gao & Zhang, 2015; Gargouri et al., 2010; Hong & Andersen, 2011; Kyaw et al., 2017).
Consistent with this, the present study also defines CSR as ESG performance, that is the overall
weighted average performance of environmental, social and government dimensions.
Prior studies have used various measures of CSR performance and disclosures. For CSR disclosures,
prior studies have mostly used content analysis approach (for example, see Almahrog et al., 2018;
Faisal et al., 2018; Gerged et al., 2020; Gerged et al., 2021; Habbash & Haddad, 2020; Kolsi &
Attayah, 2018; Kumala & Siregar, 2020; Muttakin et al., 2015; Pratiwi & Siregar, 2019; Yip et al.,
2011). For CSR performance, the majority of studies in existing literature use existing CSR indices,
available on secondary databases. The most widely used secondary database for CSR indices is KLD
(Kinder, Lydenberg, and Domini) (for example, see Calegari et al., 2010; Gao & Zhang, 2015;
Grougiou et al., 2014; Heltzer, 2011; Hong & Andersen, 2011; Kim et al., 2012; Litt et al., 2013; Liu
et al., 2017). The KLD database only includes CSR information for US companies. For non-US
samples, studies have used various other secondary databases to obtain CSR information. For
example, studies using Spanish samples have mostly used MERCO (Monitor Empresarial de
Reputación Corporativa— a Spanish Business Monitor of Corporate Reputation) (for example, see
Gras-Gil et al., 2016; Palacios-Manzano et al., 2019), while studies using Korean samples have mostly
used KEJI (Korea Economic Justice Institute) database (for example, see Cho & Chun, 2015; Choi et
al., 2018; Chun & Cho, 2017). Gargouri et al. (2010) have used MJRA-CSID (Michael Jantzi Research
Associates – Canadian Social Investment database) for CSR scores for Canadian companies, while
Amar & Chakroun (2018) have used ISO26000 (International Organization for Standardization) for
French firms and firms respectively. Mohmed et al. (2020) and Chen & Hung (2021) obtain CSR

73
information from S&P ESG index for Egyptian firms, and CSR Best Practices Principles for Taiwanese
firms respectively. For South African firms, Jordaan et al. (2018) has used SRI (Socially Responsible
Investing), while Buertey et al. (2020) have used CSRHub. Studies based on Chinese firms have
mostly used RKS (Rankings) (for example, see Gong & Ho, 2018; Kim et al., 2019; Liu & Lee, 2019;
Rezaee et al., 2020; Sial et al., 2019). However, some less prominent sources for CSR information on
Chinese firms include Chinese CSR White paper (for example, see Li & Xia, 2018) and China’s top
200 firms’ CSR development index (for example, see Zhang et al., 2021). Studies based on
international samples use various other sources, including FTSE4 Good Global Index (for example,
see Chih et al., 2008), Asia Sustainability Research (for example, see Scholtens & Kang, 2013), EIRIS
(Ethical investment research services) (for example, see Bozzolan et al., 2015; Martínez‐Ferrero et
al., 2015) and Thomson Reuters ASSET4 (for example, see García‐Sánchez et al., 2020; Velte, 2021).
The Thomson Reuters ASSET4 index is also used by studies based on European countries, such as
UK (for example, see Kyaw et al., 2017) and Germany (see Velte, 2019).
The present study focusses on CSR performance. The measure is based on Thompson Reuter’s ESG
Scores which replaces and improves the previously known Thomson Reuters ASSET4 index
(Thomson Reuters, 2018).
3.2.2 Primary CSR Measure
Thompson Reuter’s ESG scores are firm level data, available annually from 2002 onwards (Thomson
Reuters, 2018). The scores are based on CSR performance of companies as reported publicly by the
company. Using over 400 company-level measures, Thomson Reuters categorises the CSR
performances into ten categories. These ten categories are further categorised, according to
weighted proportions, into the three CSR dimensions, that is, Environmental, Governance and
Social. Thomson Reuters calculates ESG score as the weighted average of the three CSR dimensions
(Environmental score weight = 34%, Social score weight = 35.5%, and Governance score weight =
30.5%) (Thomson Reuters, 2018). The final ESG score, reported as a percentage, is the primary
measure of CSR in the present study, particularly in research studies 1 and 2 (reported in Chapters
4 and 5). In research study 3 (reported in Chapter 6), I use the individual CSR dimensions
(Environmental, Governance and Social scores), in addition to the overall CSR scores, following prior
studies (for example, see Amar & Chakroun, 2018; Gargouri et al., 2010; Velte, 2019).
3.2.3 Alternate CSR Measures
For the purpose of checking sensitivity of the regression analyses for each research study, the study

74
utilises alternate measures of the main variables. I use two alternate measures for CSR – 1)
CSR_COMB and 2) CSR_DUM.
CSR_COMB is Thompson Reuter’s ESG Combined score, measured the average of the ESG score and
ESG controversies score (Thomson Reuters, 2018). The ESG controversies score is measured using
23 controversy topics as a basis. The controversies score each year incorporates any recent
controversies pertinent to the year. Once information of all controversies for a firm is accumulated
for a given year, Thomson Reuters adds the values for all the controversial topics and ranks the firms
from lowest to highest scores. Given that controversy has a negative bearing on CSR performance,
a lower score is better (Thomson Reuters, 2018). Finally, a percentile ranking formula is applied to
obtain the ESG controversies score. The percentile ranking formula uses industry group as a
benchmark (Thomson Reuters, 2018). The following example is provided by Thomson Reuters (2018,
p. 18) to explain the ESG controversies score calculation:
For a controversy measure, if the benchmark consists of 6 companies, 4 with a value of 0
and two with a value of 1 (polarity here is negative, so the higher the number the worse it
is), then the formula for the companies with no controversies will be: (2+4/2) / 6 = 67% and
for the companies with one controversy: (0+2/2) / 6 = 17%.
As stated above, the alternate CSR proxy (CSR_COMB) used in this study is the ESG combined score,
which is the average of the ESG score and ESG controversies score, when there are controversies in
a given year. The calculation of the ESG combined score is based on three conditions. First, if the
controversy score is greater than or equal to 50%, then the ESG combined score is equal to the ESG
score. Second, if the controversy score is less than 50% but is greater than the ESG score, then also
the ESG combined score is equal to the ESG score. Third, if the controversy score is less than 50%
and is less than the ESG score, then the ESG combined score is equal to the average of the ESG score
and the controversies score.
The second alternate measure of CSR (CSR_DUM) is a dummy variable, taking the value of 1 if the
CSR score of the firm is greater median CSR, and 0 otherwise. The median is based on each year and
industry.

75
3.3 Measuring EM
3.3.1 Primary EM Measure - Discretionary Accruals
The present study uses accruals-based measures11 to measure EM. Earnings comprises of two
components – accruals and cash flows. Accruals is the component that involves management
estimations and forecasts, and hence are more prone to be managed. Thus, consistent with several
prior studies, I use discretionary accruals as the primary measure for EM (for example, see Ackoff,
1999; Almahrog et al., 2018; Amar & Chakroun, 2018; Bozzolan et al., 2015; Buertey et al., 2020;
Calegari et al., 2010; Chen & Hung, 2021; Choi et al., 2018; Gao & Zhang, 2015; García‐Sánchez et
al., 2020; Gargouri et al., 2010; Gerged et al., 2020; Gerged et al., 2021; Gras-Gil et al., 2016;
Habbash & Haddad, 2020; Heltzer, 2011; Hickman et al., 2021; Hong & Andersen, 2011; Jordaan et
al., 2018; Kim et al., 2019; Kim et al., 2012; Kumala & Siregar, 2020; Li & Xia, 2018; Litt et al., 2013;
Liu & Lee, 2019; Liu et al., 2017; Martínez‐Ferrero et al., 2015; Mohmed et al., 2020; Muttakin et al.,
2015; Palacios-Manzano et al., 2019; Patten & Trompeter, 2003; Pratiwi & Siregar, 2019; Rezaee et
al., 2020; Riahi-Belkaoui, 2003; Sial et al., 2019; Velte, 2019, 2021; Wang et al., 2018; Yip et al., 2011;
Zhang et al., 2021). A lower magnitude of discretionary accruals represent a better mapping of
accruals into cash flows, and hence indicates higher earnings quality (that is, lower EM) (McNichols,
2002).
With the widespread use of discretionary accruals as a measure for EM among prior studies, there
are several models to measure discretionary accruals. Of these, the Jones (1991) is one of the oldest
models that is still popularly used by researchers (for example, see Alves, 2012; Heltzer, 2011; Koh,
2003; Ratnawati et al., 2016; Yip et al., 2011). In fact, it is believed that the introduction of the
abnormal accruals model developed by Jones (1991a) has a significant contribution in the growth
of EM research (DeFond, 2010). The model has become a quite standardized measure of EM,
eliminating the need to develop a new proxy for every new study (DeFond, 2010). The original Jones
model is among the first widely accepted models designed to capture EM (DeFond, 2010). The
model is based on the assumption that non-discretionary accruals are not constant from year to
year (Jones, 1991a). Thus, the difference between a current year’s and the prior year’s total accruals
should be a result of changes in discretionary accruals (Jones, 1991a). The model controls for
11 The present study focusses on the effect of CSR on opportunistic accounting/financial reporting practices. I do this by examining accruals-based EM. I do not examine other measures of EM, such as real earnings management (REM) as REM involves real economic actions (such as, providing discounts to reach sales targets) as opposed to mere accounting manipulations. Hence REM is outside the scope of the present study, but may be an insightful future research direction, as discussed in Chapter 7.

76
changes in business conditions that may cause changes in non-discretionary accruals (Jones, 1991a).
Revenues are used as a control variable since revenues may change without any interference by
managers (Jones, 1991a). The model also includes the gross property plant and equipment value as
a control variable to account for non-discretionary depreciation expense (Jones, 1991a).
Continuous developments of the original Jones model are evident (DeFond, 2010). An immediate
modification of the Jones model, popularly known as the modified Jones model, has been developed
by Dechow et al. (1995). Among the various models available to measure discretionary accruals, the
modified Jones model appears to be the most widely used one (for example, see Al-Fayoumi et al.,
2010; Al-Rassas & Kamardin, 2016; Alves, 2012; Bozzolan et al., 2015; Choi et al., 2013; Chung et al.,
2002; Gargouri et al., 2010; Heltzer, 2011; Hou et al., 2015; Kim et al., 2012; Lyu et al., 2016;
Muttakin et al., 2015; Velury & Jenkins, 2006).
The modified Jones model provides a modification to the Jones model in that this model subtracts
the change in accounts receivable from the change in sales in the nondiscretionary accruals
calculation (Dechow et al., 1995). The modified Jones model addresses the implicit assumption in
the Jones model that earnings are not managed through sales (Dechow et al., 1995). The model
considers that managers may exert discretion on the recognition of revenues from credit sales
(Dechow et al., 1995). For example, managers may use their discretion to recognize revenues in
transactions where the cash has not been received by the end of the year, and it is dubious whether
the revenues have been earned (Dechow et al., 1995). The modified Jones model is based on the
logic that it is easier to manage earnings through exerting discretion over revenue recognition
through credit sales as opposed to revenue recognition through cash sales. Thus, the model is based
on an implicit assumption that in years where earnings are managed, changes in credit sales result
from EM.
The modified Jones model is estimated by regressing total accruals against the change in revenues
(adjusted for the change in receivables) and gross property, plant and equipment. Consistent with
prior literature, the regression is estimated, as shown in equation (1), for each year and each two-
digit SIC code, for which there are at least eight firm year observations per regression.
TAit = 1 (1/Ait-1) + 2 (REVit - RECit) + 3 PPEit + it (1)
where
TAit = total accruals in year t for firm i scaled by total assets at t - 1;

77
REVit = change in revenues (revenues in year t less revenues in year t – 1) for firm i scaled by total assets at t - 1;
RECit = change in accounts receivables (net receivables in year t less net receivables in year t – 1) for firm i scaled by total assets at t - 1;
PPEit = gross property, plant and equipment in year t for firm i scaled by total assets at t - 1;
Ait – 1 = total assets in year t – 1 for firm i;
it = error term in year t for firm i.
Following prior studies, equation (1) is estimated for each year and each two-digit SIC code, for
which there are at least eight firm year observations per regression. The absolute value of the
residual from equation (1) (that is, the absolute value of discretionary accruals) generates the
magnitude of EM in the present study. A higher value of the residual indicates poor mapping of
accruals into cash flows (that is, higher EM).
Following Dechow et al. (1995), the total accruals (TA) for equation (1) is estimated using the
equation below:
TAit = (CAit - CLit - Cashit + ST Debtit – DEPit)/Ait – 1 (2)
where
CAit = change in current assets (current assets in year t less current assets in year t – 1) for firm i;
Cashit = change in cash (cash in year t less cash in year t – 1) for firm i;
CLit = change in current liabilities (current liabilities in year t less current liabilities in year t – 1) for firm i;
ST Debt = change in short-term debts (short-term debts in year t less short-term debts in year t – 1) for firm i (missing values for short-term debts are replaced with zero);
DEPit = depreciation and amortization expenses in year t for firm i;
Ait – 1 = total assets in year t – 1 for firm i;
Earnings can be managed upwards or downwards using discretionary accruals (Shust, 2015).
However, the present study considers the absolute value of discretionary accruals as our measure

78
for EM, as we are concerned with the magnitude of EM as opposed to the direction of EM (see
Almahrog et al., 2018; Choi et al., 2013; Hong & Andersen, 2011; Martínez‐Ferrero et al., 2013;
Shust, 2015; Sun et al., 2010; Yip et al., 2011). Absolute discretionary accruals is considered a more
refined measure for EM (for example, see Dechow et al., 1995; Kothari et al., 2005). The absolute
value of the residual from equation (1) generates the dependent variable EM. A higher value of the
residual represents poor mapping of accruals into cash flows resulting from both intentional EM and
unintentional estimation errors (Hong & Andersen, 2011).
3.3.2 Alternate EM Measure – Accruals Quality
In order to check the sensitivity of the regression analysis, I utilize an alternate specification of EM
by measuring accruals quality using the Dechow & Dichev (2002) model. This model is based on the
assumption that accruals are based on management’s forecast of past, present and future cash
flows, since accruals and cash flows are the two components of earnings (Dechow & Dichev, 2002).
Based on this argument, better quality accruals are expected to be better mapped into cash flows
(McNichols, 2002). Thus, total accruals are regressed on cash flow of the present year, cash flow of
the previous year, and cash flow of the following year. To reduce measurement errors, we follow
the modification of the original Dechow & Dichev (2002) model as suggested by Francis et al. (2005)
by including change in revenue and property plant and equipment. Thus, I use the following model
as the alternate EM measure:
TAit = 0 + 1 CFOit – 1 + 2CFOit +3CFOit + 1 + 4 REVit + 5PPEit + it (3)
where
TAit = total accruals (as measured in equation (2)) in year t for firm i scaled by average total assets for years t and t-1;
CFOit – 1 = cash flow from operations in year t-1 for firm i scaled by average total assets for years t and t-1;
CFOit = cash flow from operations in year t for firm i scaled by average total assets for years t and t-1;
CFOit + 1 = cash flow from operations in year t+1 for firm i scaled by average total assets for years t and t-1;
REVit = change in sales revenue (sales revenue in year t less sales revenue in year t – 1) for firm i scaled by average total assets for years t and t-1;
PPEit = gross property, plant and equipment in year t for firm i scaled by average total assets for years t and t-1;

79
it = error term in year t for firm i.
EM_DD, that is, the alternate measure for EM, is measured as the 5-year standard deviation of the
residual it from equation (3). The 5-year standard deviation is estimated for the years t-4 to t for
each firm-year observation. To enable the calculation of the standard deviation, the equation (3)
above is estimated from years 1998 to 2017 (that is, from 5 years prior to the beginning of the
sample period). A higher value on EM_DD, that is the standard deviation from the residual from
equation (3), indicates higher EM, whereas a lower residual indicates lower EM and better-quality
accruals.
3.4 Chapter Summary
This chapter discusses the measurement of the independent and dependent variables, that is, CSR
and EM. The primary measure of the independent variable (CSR) is obtained from Thomson Reuters
ESG scores. The alternate measures are based on 1) CSR_COMB - ESG Combined score from
Thomson Reuters, and 2) CSR_DUM – a dummy variable taking the value of 1 if the CSR score of a
firm is higher than the industry and year median, and 0 otherwise. The primary measure of the
dependent variable (EM) is based on the discretionary accruals model by Dechow et al. (1995), while
the alternate EM measure (EM_DD) is based on the accruals quality model by Dechow & Dichev
(2002).

80
EARNINGS MANAGEMENT AND CORPORATE SOCIAL RESPONSIBILITY: INVESTIGATION OF THE DIRECT AND INDIRECT
RELATIONSHIP VIA ORGANISATION CAPITAL.
4.1 Introduction
This chapter addresses the first research objective, that is, to investigate why and how Corporate
Social Responsibility (CSR) affects Earnings Management (EM), by examining the direct CSR-EM
relationship and indirect CSR-EM relationship via Organization Capital (OC). Research objective 1 is
addressed by answering the following two research questions:
Research Question 1.1: Does CSR have a significant direct effect on EM?
Research Question 1.2: Does CSR have a significant indirect effect on EM via OC?
This chapter is organised as follows: Sections 4.2 and 4.3 discuss the background and justification of
this research study, and its contribution respectively. Section 4.4 presents the theoretical
background, reviews the literature while in Section 4.5 hypotheses are developed on the
relationships between CSR and EM, CSR and OC, and OC and EM. Section 4.6 presents the
conceptual framework of the study. Section 4.7 describes the data research methodology adopted
for this study. This is followed by the results and findings in Section 4.8, and the discussion of the
findings in Section 4.9. The chapter ends with a summary in Section 4.10.
4.2 Background and Justification
4.2.1 Background of the Study
This study examines the direct relationship between CSR and EM, and the indirect relationship
between CSR and EM through a mediating effect of OC. Both CSR and EM have gained significant
attention by practitioners and academic researchers in recent times. Despite the growing interest
in academic research in examining the relationship between CSR and EM, there appears to be a lack
of consensus on the direction of the relationship between CSR and EM, as evidenced by mixed
findings in the literature, discussed in Chapter 2. The present study examines the CSR-EM
relationship from two contrasting managerial behaviour perspectives, specifically the managerial
myopia and the myopia avoidance hypotheses. The first perspective suggests that managers
engaged in CSR are less likely to manage earnings, since they are myopia avoidant (long-term
81
oriented). The contrasting perspective suggests that managers engaged in CSR are more likely to
manage earnings, since they are myopic (short-term oriented). These two perspectives have been
discussed in greater detail in Chapter 2. In this chapter, I examine the direct and indirect CSR-EM
relationships, based on these two contrasting managerial perspectives, by focussing on a developed
economy, i.e., USA, in order to mitigate the potential influences of country-level factors on this
relationship. This study focusses on the CSR and EM issue on a micro-level, by utilising firm-level
data.
To provide further in-depth analysis of the CSR and EM relationship, this research study examines
not only the direct relationship between CSR and EM, but also the indirect relationship between
CSR and EM via OC as a mediating channel. In other words, this study examines OC as a channel
through which CSR influences EM. Examining the indirect effect via a mediating channel will address
the questions why and how CSR affects EM.
The mediating channel, OC, is an important component of intellectual capital (that is, intangible
resources). The rationale behind considering OC as a mediating channel primarily relates to the
growing importance of intellectual capital. Research on intellectual capital has been gaining
momentum, particularly due to the growth of intangible industries, such as, internet, software and
biotech since the mid 1980s (Nakamura, 1999). In most first world economies, the primary source
of gross domestic product (GDP) have now shifted to services and intangible outputs, from
traditional manufacturing-based industries and traditional commodities (Petty & Guthrie, 2000).
From the beginning of the twentieth century, the US economy has experienced a similar and
substantial shift from a purely industrial economy to a more knowledge based economy (Srivastava,
2014). Such a considerable shift in the concentration of US industry is a result of firms altering their
attention to investments on intangibles, such as, innovation, research and development, human
capital, customer relationships, etc. (Canibano et al., 2000; Srivastava, 2014). While firms are
progressively shifting towards more knowledge based investments, such intellectual capital is still
not reported on the balance sheet (Canibano et al., 2000). As a result, financial statements are
unable to provide all the relevant information regarding firm value (Canibano et al., 2000; Toorchi
et al., 2015). This is evidenced by the increasing gap between market value and book value of equity
as suggested by some studies, resulting in a loss of relevance of financial statements (for example,
see Amin & Lev, 1996; Canibano et al., 2000; Lev & Zarowin, 1999; Roslender & Fincham, 2001).
Thus, when examining the quality of financial information and factors like CSR and EM that affect
financial information quality, it is now essential to look at intellectual capital.
82
As a result of the growing significance of intellectual capital, particularly in the US economy (see
Srivastava, 2014), contemporary accounting researchers have started to focus more on OC (for
example, see Atkeson & Kehoe, 2005; Attig & Cleary, 2014, 2015; Black & Lynch, 2005; Bloom et al.,
2010; Brynjolfsson et al., 2002; Carlin et al., 2012; Eisfeldt & Papanikolaou, 2013; Hasan & Cheung,
2018; Lev et al., 2009; Rahaman & Al Zaman, 2013; Squicciarini & Le Mouel, 2012; Tronconi &
Marzetti, 2011). OC (organizational capital or structural capital) is one of the three components, the
other two being human capital and relational capital (or customer capital) of intellectual capital
(Ednvinsson & Malone, 1997; Roos & Roos, 1997; Stewart & Ruckdeschel, 1998). Human capital
represents the people or employees in the firm employees (Stewart & Ruckdeschel, 1998). It refers
to the knowledge, talent, skills, capabilities, expertise, loyalty and motivation of the firm’s
employees (Hormiga et al., 2011; Stewart & Ruckdeschel, 1998; Tayles et al., 2007). Relational
capital refers to the firm’s connections with outsiders (Hormiga et al., 2011; Stewart & Ruckdeschel,
1998). It encompasses relationships external stakeholders, such as, suppliers, distributors,
customers, government, industry networks, etc. (Jacobsen et al., 2005; Stewart & Ruckdeschel,
1998; Sydler et al., 2014; Tayles et al., 2007). Relational capital is often represented as relational
aspects such as customer loyalty, brand image, attitude, preference, brand recognition, etc.
(Stewart & Ruckdeschel, 1998; Sydler et al., 2014). OC represents all other elements of intellectual
capital, such as the processes, networks, cultures, values, intellectual properties, etc. (Jacobsen et
al., 2005; Stewart & Ruckdeschel, 1998; Sydler et al., 2014; Tayles et al., 2007). OC is defined as the
fundamental processes and systems of firms that “enable superior operating, investment and
innovation performance, represented by the agglomeration of technologies – business practices,
processes and designs” (Lev et al., 2009, p. 277). OC is the more permanent intangible resource of
firms since it represents the element of intellectual capital that is left behind with the firm even
when employees leave (Stewart & Ruckdeschel, 1998). Bloom et al. (2010) suggest that OC can be
viewed as the distinctive managerial culture that is imprinted on the organisation. This distinctive
culture, whether good or bad, remains with the organisation until it ceases to exist. Thus, OC is
considered to be the most important intangible asset for firms (Lev et al., 2009).
OC has gained significant research attention in recent times (Tronconi & Marzetti, 2011). This
growing interest in OC research is justified by its growing importance in US and global capital
markets (Eisfeldt & Papanikolaou, 2013). The literature suggests numerous reasons why OC is a
valuable resource for firms. The most commonly cited benefit is that OC assists firms in achieving
sustainable competitive advantage (for example, see Lev & Radhakrishnan, 2005; Lev et al., 2009;
83
Tronconi & Marzetti, 2011). While production resources, such as labour and capital, are equally
available to most firms, OC in contrast, refers to the unique systems or processes of firms that are
not transferable to or able to be copied by other firms (Lev, 2004; Lev & Radhakrishnan, 2005). Thus,
OC enables firms to achieve sustainable competitive advantage (Lev & Radhakrishnan, 2005; Lev et
al., 2009; Tronconi & Marzetti, 2011). Furthermore, OC is a major contributor to financial
performance (Sydler et al., 2014; Tronconi & Marzetti, 2011), productive capacity (Black & Lynch,
2005), and value creation and growth for firms (Lev & Radhakrishnan, 2005).
Despite the growing interest in OC, there still appears to be a lack of a consistent definition (Black
& Lynch, 2005). Overall, the literature offers two main views on OC (Hasan & Cheung, 2018). The
first view suggests that OC is manifested within the firms’ employees and their social connections
(Hasan & Cheung, 2018). Consistent with this view, OC encompasses: 1) the firm’s knowledge
regarding the abilities of its employees that allows better matching of tasks to workers (Prescott &
Visscher, 1980), 2) the specialised talent of key employees that is a key determinant of future
productivity of the firms (Eisfeldt & Papanikolaou, 2013; Prescott & Visscher, 1980).
The second view suggests that OC is embedded within the organizational structure, as opposed to
the employees (Hasan & Cheung, 2018). As stated earlier, according to Bloom et al. (2010) OC
represents the distinctive managerial culture that is imprinted on the organisation, and remains
with the organisation until it ceases to exist. Similar to this perspective, Carlin et al. (2012) views OC
as a form of internal firm language that encompasses numerous firm practices such as, informal
work routines, technical jargons and other patterns or practices arising from previous experiences.
Thus, OC contributes by fostering coordination within the internal communication channels in
enhancing productivity (Carlin et al., 2012). Since OC is an intra-firm language, Carlin et al. (2012)
notes that OC may not be transferred or imitated by other firms, even with employee turnover.
Similarly, some studies view high management quality as a proxy for high OC (for example, see (Attig
& Cleary, 2014, 2015; Bloom et al., 2010; Bloom & Van Reenen, 2007). Management quality
gradually evolves over time through training, experience and knowledge (Bloom et al., 2010),
becomes embedded in the organizational structure, and is not prone to frequent changes even with
management replacements (Bloom & Van Reenen, 2007). Attig & Cleary (2014) clarifies that this
idea of OC as equivalent to management practices is considerably different from human capital.
According to Attig & Cleary (2014), human capital refers to management styles which are subject to
change as management changes. However, management quality practices (i.e. OC) do not change
often, and are not transferable to other firms (Attig & Cleary, 2014).

84
Black & Lynch (2005) conceptualise OC to be an amalgamation of the two streams of thought
discussed above. According to Black & Lynch (2005), OC is a result of the interaction of three main
components, namely, 1) training of the workforce, 2) employee voice, and 3) organizational
design/practices. Black & Lynch (2005) suggest that employer-provided training is an important
component of organization capital since training requirements may be dependent on structural
changes within the organization, such as the introduction of new technologies, implementation of
teamwork-based projects, etc. The second component, employee voice, refers to enhancing the
autonomy and discretion of non-managerial workers and enabling them to have greater input into
the work structure (Black & Lynch, 2005). The third component, organizational design, refers to the
use of cross-functional processes enabling flexibility of labour allocation, diffusion of information
technology, etc. (Black & Lynch, 2005). Thus, according to Black & Lynch (2005), OC is both
embodied in the employees as well as embedded in the organisational structure.
Consistent with the literature, the present study defines OC as an integration of management
quality practices and employee training with the overall organizational process, techniques, design
and culture. Based on the definition of OC, the present study refers to high OC firms as firms that
have superior management quality practices, and a knowledgeable workforce through training
provided, that exhibit an overall effective organisational design. Additionally, I follow the view,
proposed by Carlin et al. (2012) and Attig & Cleary (2014), that OC is embedded in the organisational
structure and cannot be transferred with the turnover of management or employees. This view is
consistent with the resource-based view (RBV) (Hasan & Cheung, 2018). The RBV states that a firm
is a bundle of resources and capabilities that are rare and unable to be exchanged, copied or
substituted (Barney, 1991). These resources and capabilities consist of tangible and intangible
assets, and are the main driver of sustained competitive advantage for firms (Barney, 1991). Thus,
consistent with literature, I draw on to the RBV as the theoretical background of OC since OC is a
major source of competitive advantage for firms (for example, see Hasan & Cheung, 2018;
Squicciarini & Le Mouel, 2012), and an important component of intellectual capital (see Lev et al.,
2009).
4.2.2 Justification of the Study
The negative consequences of EM, discussed in Chapters 1 and 2, have attracted researchers to
study a myriad of factors that may influence EM. Furthermore, with the growing importance of CSR,
several studies have examined the CSR and EM relationship, as discussed in Chapter 2. Overall, there
is sufficient empirical evidence to establish a relationship between CSR and EM, albeit debates on

85
the direction of this relationship continue. Cho & Lee (2017) suggest that due to limited resources,
managers are often faced with an ethical dilemma regarding their investment in CSR activities. This
means that there may be two varying motives behind CSR. While CSR actions may be undertaken
from purely altruistic intentions, some managers may have a more financial motive behind engaging
in CSR activities (Cho & Lee, 2017). The literature shows mixed results on the relationship between
CSR and EM, suggesting the need for further in-depth understanding of how CSR influences EM.
Prior studies have examined various contexts or moderating effects on the CSR-EM relationship (for
example, see Buertey et al., 2020; Chih et al., 2008; Cho & Chun, 2015; García‐Sánchez et al., 2020;
Gerged et al., 2021; Kim et al., 2019; Kumala & Siregar, 2020; Muttakin et al., 2015; Pratiwi & Siregar,
2019; Scholtens & Kang, 2013; Sial et al., 2019). The concept of moderation includes looking at
interactions, differences within subgroups and contexts that may change the basic relationship
between the independent and dependent variables (CSR and EM in the present study) (Little et al.,
2007). Thus, moderation explains how the interaction of CSR with another factor or context (such
as, firm ownership, institutional features, corporate governance and/or board characteristics, etc.)
may affect EM. For example, testing a moderating effect of corporate governance on the CSR-EM
relationship would tell us how the interaction of CSR and corporate governance (measured as the
product of CSR x Corporate Governance) would affect EM (for example, see Buertey et al., 2020;
Cho & Chun, 2015; Gerged et al., 2021). Moderating would tell us whether the relationship between
CSR and EM would become stronger or weaker, when the moderator (corporate governance in this
example) is present. Moderation reveals whether a third variable may affect the strength or
direction of the relationship between CSR and EM (see Baron & Kenny, 1986). However, moderation
only looks at the overall effect of the interaction of the two factors. It does not distinguish which
variable (the independent variable – CSR, or the moderating variable) individually affects the
dependent variable – EM (Little et al., 2007). Moderation identify when certain effects will occur, by
examining contextual factors, but it does not identify why or how these effects occur (Baron &
Kenny, 1986). The why and how questions are addressed by mediation. Figure 4.1 illustrates
moderated and mediated effect diagrams, adapted from (Baron & Kenny, 1986).

86
Figure 0.1 Moderator Versus Mediator Models (Adapted from Baron and Kenny (1986))
In the context of the present study, moderation will suggest when CSR has an effect of EM, whereas
mediation will suggest why and how CSR effects EM. Mediation will tell us whether managers
engaged in CSR may use any tools to indirectly manage earnings. Mediation analysis captures
indirect effects that inform whether the independent variable (CSR) affects the dependent variable
(EM) through a channel or tool. An indirect relationship exists when the independent variable
affects a mediator, and the mediator in turn affects the dependent variable (Baron & Kenny, 1986).
To the best of my knowledge, the mediating effect on the CSR-EM relationship has not yet been
examined by prior studies. Among prior studies, Calegari et al. (2010) and Bozzolan et al. (2015)
examine EM as a mediating or indirect channel in the relationship between CSR and firm
value/performance. Liu et al., 2017 examine CSR as a mediating channel in the relationship between
family involvement and EM. Additionally, some studies examine intellectual capital as a mediating
channel between CSR and firm performance (for example, see Jain et al., 2017; Surroca et al., 2010).
None of these studies examine a mediating channel in the relationship between CSR and EM. I posit
that, in order to understand the CSR-EM relationship, it is essential to examine this issue in-depth,
and go beyond just examining moderating effects that explain when CSR affects EM. To this end, I
examine the indirect relationship between CSR and EM, to address why and how CSR affects EM,
through the mediating channel OC.
As outlined earlier, OC is an important component of intellectual capital. Different streams of
literature have linked CSR with intellectual capital (for example see Altuner et al., 2015; Hawn &
Ioannou, 2016; Massaro et al., 2018), and intellectual capital with EM (for example, see Bhandari et
al., 2018; Francis et al., 2008; Malmendier & Tate, 2009; Shust, 2015). The literature linking CSR and

87
intellectual capital suggests that CSR has an influence on intellectual capital (for example see Jain et
al., 2017; Massaro et al., 2018; Surroca et al., 2010). According to the RBV, CSR is an essential
element in the creation of intellectual capital, specifically, knowledge development that is crucial
for business model sustainability (Eisenhardt & Martin, 2000; Nikolaou, 2017; Villalonga, 2004).
Furthermore, there is the notion in the literature that intellectual capital in turn has an influence on
EM (for example, see Bhandari et al., 2018; Francis et al., 2008). A mediating channel may exist
between the dependent and independent variables if the independent variable has an influence on
the mediator, and the mediator in turn has an influence on the dependent variable (Wu & Zumbo,
2008). Thus, the notion in the literature suggests that intellectual capital may be a mediating
channel in the relationship between CSR and EM. However, intellectual is a very broad expression
embracing various components, as discussed in the previous section, namely, human capital,
relational capital and organization capital (OC). While both CSR and EM are direct results of
managerial actions or practices (for example, see Attig & Cleary, 2015; Healy & Wahlen, 1999; Levitt
Jr, 1998), it is important to note that the broad array of intangibles may not all be relevant to
managerial practices. Hence, I choose to examine OC in particular since OC is directly relevant to
business and/or managerial practices (see Attig & Cleary, 2015; Lev et al., 2009). Examining the
indirect CSR-EM relationship via OC, will address the existing debate on the CSR-EM relationship, by
providing insights on why and how CSR affects EM.
4.3 Contribution of the Study
The present study makes numerous contributions to existing literature and theory, First, the study
enriches the CSR-EM literature, by addressing the existing debate on the effect of CSR on EM, from
two contrasting managerial behaviour perspectives, namely the managerial myopia (short-term
orientation) and the myopia avoidance (long-term orientation) hypotheses. The mixed findings in
the literature on the relationship between CSR and EM suggest these two contrasting perspectives.
One side of the argument suggests CSR may have a role in escalating managers myopic behaviour,
thus increasing EM engagement by managers for short-term goal achievements. A contrasting
perspective suggests that CSR may have a role in constraining managers’ myopic behaviour, thus
reducing EM to reach short-term goals. The present study addresses this continuing debate by re-
vising the relationship between CSR and EM in depth. The study finds that CSR has a direct negative
effect on EM, consistent with the myopia avoidance (long-term orientation) perspective.

88
Second, the study examines the indirect relationship between CSR and EM via a mediating channel.
While prior studies have examined various moderating effects, to the best of my knowledge a
mediating effect on the CSR-EM relationship has not yet been examined. While moderating effects
show when CSR affects EM, the present study examines the CSR-EM relationship more closely, by
examining the indirect relationship via a mediating channel, and thus addressing the questions why
and how CSR affects EM. In particular, the study examines the indirect relationship between CSR
and EM via OC, from the same two contrasting managerial behaviour perspectives, namely,
managerial myopia and myopia avoidance hypotheses. The findings provide an interesting insight
suggesting that managerial behaviour may change with their firm’s unique abilities (that is, OC). The
study finds that managers engaged in CSR may use their firms’ unique abilities (OC) to manage more
earnings, consistent with the managerial myopia (short-term orientation) perspective.
Third, by incorporating OC as the mediator in the indirect CSR-EM relationship, the study contributes
to the literature on OC (and intellectual capital) in general by linking OC to the two prevalent
accounting research areas - CSR and EM. In the process of looking at OC as a mediating channel, I
examine how CSR influences OC, and how OC in turn effects EM. According to the existing literature,
CSR has an influence on intellectual capital (for example, see Altuner et al., 2015; Hawn & Ioannou,
2016; Jain et al., 2017; Massaro et al., 2018; Surroca et al., 2010), as well as on the specific
intellectual components, namely, human capital (for example, see Casalegno et al., 2017; Pedrini,
2007), and relational capital (for example, Biswas & Suar, 2016; Chung et al., 2015; Hur et al., 2014;
Martínez et al., 2014). Since, OC is also a component of intellectual capital, the present study
focusses on OC as opposed to other forms of intellectual capital.
Since CSR is a voluntary act in most countries, it is influenced by managerial discretion, and OC is a
reflection of management practices (see Attig & Cleary, 2015). Thus, it seems more reasonable to
link CSR with OC as opposed to other components of intellectual capital that may not be directly
relevant to management practices. I have identified four studies that focus on the relationship of
CSR specifically to OC, as opposed to other forms of intellectual capital (see Attig & Cleary, 2015;
Barrena‐Martinez et al., 2019; Cho & Lee, 2017; Zhang et al., 2014). However, the present study is
different from Attig & Cleary (2015) and Cho & Lee (2017) in that I examine how CSR influences OC
while Attig & Cleary (2015) and Cho & Lee (2017) observe the influence of OC on CSR. The present
study is also different from Zhang et al. (2014) and Barrena‐Martinez et al. (2019). Zhang et al. (2014)
examine how the social dimension of CSR affects employee outcomes (specifically, organizational
citizenship behaviour and affective commitment). My definition of OC is much broader than this, as

89
OC, in the present study, includes an integration of knowledge, organisational practices, techniques
and culture, and managerial quality practices. Furthermore, the present study examines overall CSR
(measured by calculating a weighted average of the 3 individual dimensions – Environmental (ENV),
Social (SOC) and Governance (GOV). In contrast, Zhang et al. (2014) focusses on SOC only. Barrena‐
Martinez et al. (2019) examine all three IC dimensions – OC, human capital and relational capital.
However, as a proxy for CSR Barrena‐Martinez et al. (2019) consider socially responsible HR
practices only. While this is a component of CSR, overall CSR may encompass numerous other
aspects (discussed in detail in Chapter 3). Thus, to the best of my knowledge, the present study is
the first study to examine the effect of overall CSR on specifically OC. I posit that it is important to
examine the relationship between CSR and EM from the perspectives of the RBV theory, discussed
in section 4.4.1. According to the RBV perspective, CSR values and practices integrate themselves
into the organisations’ culture, identity, practices and overall structure (that is, OC) thus enhancing
or strengthening OC (Dutton & Dukerich, 1991; Starik & Rands, 1995). This is evidenced from
businesses such as Body shop and Ben and Jerry’s (discussed in section 4.4.1), where their CSR
activities have become part of their unique brand identity (Barney et al., 2001; Russo & Fouts, 1997).
In the process of examining OC as a mediating channel, the present study also examines the
relationship between OC and EM. Prior studies have examined the influence of various forms of
intellectual capital on EM (for example, see Al-dhamari & Ku Ismail, 2015; Bhandari et al., 2018;
Chaney et al., 2011; Francis et al., 2008; Hao & Li, 2016; Malmendier & Tate, 2009; Shust, 2015). The
present study examines the relationship of EM specifically with OC, as opposed to other broader
components of intellectual capital. As discussed in the previous section, EM is a discretionary action
for managers and other corporate insiders (Healy & Wahlen, 1999; Levitt Jr, 1998). As noted by Attig
& Cleary (2015), OC is a reflection of the quality of management practices. Thus, investigation of
whether high quality management practices (that is, OC) has any influence on suppressing the
deliberate EM activities by management is a valuable research endeavour. Other forms of
intangibles may be much broader and non-specific to management actions. In the OC literature,
while a multitude of factors have been associated with OC, there appears to be a noteworthy gap
in studies linking OC and EM. By linking OC to EM, I deviate from the existing studies that have
traditionally linked OC mainly to governance mechanisms, such as ownership structures, board
structure, chief executive officer (CEO) compensation, etc. To the best of my knowledge, this is the
first study to examine the relationship between OC and EM. I posit that it is important to examine
the relationship between OC and EM because the theoretical perspective of the managerial myopia

90
hypothesis suggest that the unique and sophisticated abilities in firms with high OC may increase
both managerial incentives and opportunities to manage earnings. This is discussed in greater
details in section 4.4.2
4.4 Theoretical Background
This section discusses the theoretical background of this study. The study examines the direct
relationship between CSR and EM, and the indirect relationship between CSR and EM, via the
mediating channel OC. For the purpose of examining the indirect relationship, the study examines
the two paths through which CSR may indirectly affect EM via OC, that is, the effect of CSR on OC,
and the effect of OC on EM. The theoretical background section discusses the theories that may
explain each of these relationships, that is, the two paths involved in the indirect relationship
between CSR and EM (that is, the relationship between CSR and OC, and the relationship between
OC and EM), the direct effect of CSR on EM, and the indirect relationship between CSR and EM via
OC. This study explains these key relationships with three theories – 1) the resource-based view
(RBV) theory, 2) the managerial myopia hypothesis; and 3) the myopia avoidance hypothesis.
The RBV theory explains the relationship between CSR and OC. The managerial myopia hypothesis
and the myopia avoidance hypothesis present two opposing perspectives on managers’ likelihood
in engaging in EM. These two contrasting managerial behaviour theories explain the relationship
between OC and EM, and the direct and indirect relationship between CSR and EM.
4.4.1 Resource-Based View
According to prior studies, the adoption of CSR practices by firms can result in a myriad of intangible
outcomes, such as, establishing better relationships with key stakeholders (Prior et al., 2008),
strengthening reputation and brand image (Epstein & Roy, 2001; Prior et al., 2008), gaining
customer loyalty through increased trust (Pivato et al., 2008; Waldman et al., 2006; Werther &
Chandler, 2005), and improving employee motivation and retention (Epstein & Roy, 2001; Sprinkle
& Maines, 2010; Wagner & Schaltegger, 2004). CSR can also provide competitive advantage to firms,
as these practices help firms to differentiate themselves from competitors (Branco & Rodrigues,
2006). Prior studies establishing a link between CSR and intellectual capital or intangibles have
frequently explained this relationship through the lens of the resource-based view (RBV).
The RBV suggests that the core elements that enable a firm to obtain and sustain competitive
advantage are the unique bundle of resources that the firm controls (Barney, 1991). These resources

91
may include “assets, capabilities, organizational processes, firm attributes, information, knowledge
etc. controlled by a firm” (Barney, 1991, p. 101). Barney (1991) views these resources as a bundle
of tangible and intangible assets, classifying them into three categories, namely: 1) physical capital
resources (including physical technology, physical assets, geographical location, etc.), 2) human
capital resources (including training skills, knowledge, experience, relationships, etc. of the
workforce), and 3) organization capital resources (including reporting structure, planning,
controlling and coordinating systems, relationships within the firms, as well as relationships with
the external environment). Barney (1991) emphasizes that these resources are unique to each firm,
as they are not easily substitutable or imitable by other firms. The unique bundle of resources result
from a firm’s past management decisions and subsequent experience (Lockett & Thompson, 2001).
Prior studies suggest that a firm’s ethical values and practices may shape the firm’s culture (Barney,
1986), as well as establish a source of competitive advantage (Branco & Rodrigues, 2006; Russo &
Fouts, 1997). Russo & Fouts (1997) argue that firms engaging in CSR initiatives undergo vital reforms
in their internal organisational culture, human resources, and organisational capabilities, and
production processes. CSR activities by firms require increased employee involvement, coordination
and integration across disciplines, and substantial changes in management orientation, specifically,
adoption of a forward-thinking managerial approach, and readiness to adopt changes (Shrivastava,
1995). Thus, according to the resource-based view (RBV), CSR has the ability to create intangible
assets, such as knowledge development, that is essential for sustainable business models
(Eisenhardt & Martin, 2000; Nikolaou, 2017; Villalonga, 2004). Firms with high CSR, through better
knowledge development, are likely to have higher OC, including superior managerial quality
practices, a more knowledgeable workforce, and efficient organisational processes and designs
(Branco & Rodrigues, 2006; Orlitzky, 2005). Furthermore, a firm’s ethical stance and CSR actions are
likely integrate with the organisation’s identity and image (Dutton & Dukerich, 1991), and are
reflected in their organisational design, systems, practices and policies (Starik & Rands, 1995). For
example, firms such as Ben and Jerry’s12 and the Body Shop13 have embedded their ethical values
12 Ben and Jerry’s website clearly exhibit their values involving a three-fold mission: 1) their product mission to improve their products, 2) their economic mission to ensure financial growth, and 3) their social mission to come up with “innovative ways to make the world a better place” (Ben and Jerry’s, 2020b). In terms of their social mission, Ben and Jerry’s lists several causes that they have supported (see, (Ben and Jerry’s, 2020a) 13 The Body Shop makes their values very clear by stating that their business purpose is to “exist and fight for a fairer, more beautiful world” (The Body Shop, 2020b). While The Body Shop is a well-known brand, advocating against animal cruelty in the cosmetic testing process, they are also quite active advocators for the “Black Lives Matter” protest, Women’s Empowerment, and Community Fair Trade that involves sourcing ingredients from all parts of the world (The Body Shop, 2020a).

92
into their business models in a unique and inimitable manner (Barney et al., 2001; Russo & Fouts,
1997).
Thus, CSR practices, such as initiatives towards environmental concerns (for example, energy saving,
recycling of materials, etc.) and social concerns (for example, better treatment of workers, training
and development of the workforce, etc.), are likely to blend into the organisational process and
become part of the structural capital or organisation capital.
The above discussion reviews the theory explaining the relationship between CSR and OC, the first
indirect channel that is examined in the overall examination of the indirect relationship between
CSR and EM via OC. The second channel is the relationship between OC and EM.
The relationships between OC and EM, and between CSR and EM, may be explained by two
contrasting perspectives. The first one of these perspectives is explained through the lens of
Managerial Myopia hypothesis. As discussed in the next paragraph, the managerial myopia
hypothesis explains how managers’ focus on short-term objectives, may lead them to manage
earnings. Furthermore, this perspective, of the managerial myopia hypothesis, suggests that firms
with higher OC and firms with high CSR are more likely to manage earnings.
4.4.2 Managerial Myopia Hypothesis
The managerial myopia hypothesis suggests that managers may exert greater emphasis on short-
term objectives, that may forgo long-term value creation of the firm (Hayes & Abernathy, 1980).
Chapter 2 discusses the managerial myopia hypothesis in detail, examining the relationship
between CSR and EM through lens of this theory. The managerial myopia hypothesis may also
explain the relationship between OC and EM.
The relationship between OC and EM may be interpreted in two contrasting ways. Some evidence
in the literature suggests that firms with high OC are more likely to engage in EM. This perspective
is consistent with the managerial myopia hypothesis. The second perspective is consistent with the
myopia avoidance hypothesis, suggesting that firms with high OC are less likely to engage in EM. In
this section, I discuss the relationship between OC and EM through the lens of the managerial
myopia hypothesis, while the contrasting perspective, that is, the myopia avoidance hypothesis is
discussed in the next section. Consistent with the managerial myopia hypothesis, there are two
primary reasons why firms with high OC may have high EM. First, managers in high OC firms may be
subject to greater market pressures, tempting them towards adopting a short-term approach to

93
achieve short-term targets. These pressures may arise from higher expectations and standards set
by investors and analysts in terms of the firms’ financial performance (Malmendier & Tate, 2009).
Furthermore, the managers’ reputation may also be at stake if they repeatedly fail to meet the
targets (Francis et al., 2008; Malmendier & Tate, 2009). Therefore, managers may demonstrate
myopic behaviour as a rent extraction strategy, by using EM as a means to achieve financial targets
and meet market expectations, as well as to safeguard their reputation (Francis et al., 2008;
Malmendier & Tate, 2009). Furthermore, the positive image that high OC firms have, may lead to
managers becoming narcissistic, as they strive for power and reputation. Prior studies have shown
that narcissistic managers are more likely to manage earnings as they more concerned to safeguard
their reputation by maintaining a positive perception in the market regarding the firms’ financial
performance (for example, see Buchholz et al., 2020; Lin et al., 2020). The second reason for
managers’ myopic behaviour may simply result from increased opportunities to manage earnings.
Firms with high OC, that is superior management quality practices and processes, may have lower
stakeholder scrutiny, which in turn may provide managers with greater opportunities to manage
earnings (for example, see Muttakin et al., 2015; Yip et al., 2011). Furthermore, managers in high
OC firms may have superior techniques and knowledge about the firm and its internal control
systems, enabling them to manage earnings more easily with less chances of their EM being
detected (Demerjian et al., 2013; Gul et al., 2018).
In regard to the effect of CSR on EM, the managerial myopia hypothesis suggests that managers in
firms with high CSR are more likely to manage earnings. As discussed in greater details in Chapter
2, this may be due to – 1) incentive-driven myopia - short-term behaviour of managers, as they focus
on meeting short-term objectives due to various incentives, including responding to pressures from
stakeholders (Chih et al., 2008; Gargouri et al., 2010; Nikolov, 2018), opportunistic motives such as
to avoid debt covenant violations (Dechow & Schrand, 2004; Jaggi & Lee, 2002), increasing
compensation-based bonuses (Dechow & Schrand, 2004), inflating stock prices prior (Dechow &
Schrand, 2004; Lehmann, 2016; Levitt Jr, 1998), and safeguarding their reputation by achieving
targets (Francis et al., 2008), 2) opportunity-driven myopia – short-term behaviour arising from
greater opportunities resulting from CSR initiatives creating a positive image (Kim et al., 2012;
Muttakin et al., 2015).
As discussed above, while the managerial myopia hypothesis explains one perspective on the
relationships between OC and EM, and between CSR and EM, a contrasting perspective on these
relationships is offered by the myopia avoidance hypothesis. The next section discusses the myopia

94
avoidance hypothesis, suggesting that managers in high OC firms and managers in high CSR firms
are less likely to manage earnings.
4.4.3 Myopia Avoidance Hypothesis
Myopia avoidance hypothesis offers a contrasting perspective to the managerial myopia hypothesis.
The myopia avoidance hypothesis suggests that managers care more about long-term value creation
of the firm, and thus, they avoid myopic or short-term behaviour such as EM. Chapter 2 discusses
the myopia avoidance hypothesis in detail and examines the relationship between CSR and EM
through the lens of this theory. The myopia avoidance hypothesis also offers a contrasting
perspective on the relationship between OC and EM.
Managers in firms with high OC (i.e., superior processes, management quality practices, relationship
networks, etc.) may utilise their firms unique abilities to sustain their relationships with
stakeholders. Therefore, it can be expected that managers in high OC firms manage earnings less,
as they avoid myopic or short-term behaviour. Furthermore, managers in high OC firms often
possess higher levels of skills and knowledge and are able to exert higher levels of accuracy in their
financial reporting estimations, thereby improving the quality of financial information (Demerjian
et al., 2013). This view is consistent with the myopia avoidance hypothesis, suggesting that
managers in high OC firms are more concerned about long-term value creation and sustainability of
their firms.
The myopia avoidance hypothesis also presents a contrasting perspective on the relationship
between CSR and EM, suggesting that managers in firms with high CSR are less likely to manage
earnings. According to prior studies, this negative relationship between CSR and EM may be because
managers undertaking CSR initiatives have a long-term orientation (Chih et al., 2008; Choi & Pae,
2011; Gargouri et al., 2010) that may result from – 1) relationship-driven myopia avoidance –
managers’ genuine concern about sustaining relationships with stakeholders (Bozzolan et al., 2015;
Chih et al., 2008), and avoiding risks of negative consequences that may hamper their relationships
with stakeholders (Gerged et al., 2020; Gerged et al., 2021; Litt et al., 2013); and/or 2) value-driven
myopia avoidance – managers’ moral obligations and ethical values leading them to avoid unethical
acts, that is, EM (Litt et al., 2013).

95
4.5 Literature Review and Hypothesis Development
This section discusses the relevant literature on CSR, OC and EM. Based on the relationships
between CSR and EM, CSR and OC, and OC and EM, the literature review leads to the development
of the hypotheses that are tested to examine the direct and indirect relationship between CSR and
EM. Since the literature on CSR and EM has been discussed quite comprehensively in Chapter 2, in
this section, I only briefly discuss the effect of CSR on EM briefly.
While many studies have examined the issues of CSR and EM separately, in recent years there has
been a growing focus among recent studies on the links between CSR and EM. Many of these studies
are based on US-samples (for example, see Calegari et al., 2010; Gao & Zhang, 2015; Grougiou et
al., 2014; Heltzer, 2011; Hong & Andersen, 2011; Kim et al., 2012; Litt et al., 2013; Liu et al., 2017;
Patten & Trompeter, 2003; Riahi-Belkaoui, 2003; Yip et al., 2011). However, the literature portrays
mixed findings on the relationship between CSR and EM.
4.5.1 The Direct Effect of CSR on EM
There are two contrasting perspectives explaining the relationship between CSR and EM. One
perspective suggests that CSR has a positive effect on EM (for example, see Buertey et al., 2020;
Gargouri et al., 2010; Habbash & Haddad, 2020; Hickman et al., 2021; Kolsi & Attayah, 2018; Kyaw
et al., 2017; Pratiwi & Siregar, 2019; Riahi-Belkaoui, 2003). Consistent to managerial myopia
hypothesis, this perspective suggests that managers in firms with high CSR are more likely to
manage earnings to meet short-term objectives. This may be for two main reasons. First, the
positive relationship between CSR and EM may be incentive-driven. Managers in firms with high
CSR are burdened with numerous expectations from various stakeholders, in addition to the profit-
making objectives of shareholders (Chih et al., 2008). The added pressure of meeting multiple
objectives may create greater incentives for managers to report favourable financial information
reports, leading them managers to manage earnings (Chih et al., 2008; Habbash & Haddad, 2020;
Kyaw et al., 2017). Second, the positive relationship between CSR and EM may be opportunity-
driven. Managers engaged in CSR activities may manage earnings due to greater opportunities
arising from CSR creating a positive image and lowering scrutiny (for example, see Chih et al., 2008;
Gras-Gil et al., 2016; Kim et al., 2012). Furthermore, managers may use their CSR activities as a shield
to cover-up or ‘greenwash’ their EM (for example, see Buertey et al., 2020; Jordaan et al., 2018;
Mohmed et al., 2020; Muttakin et al., 2015; Zhang et al., 2021).
However, the contrasting perspective suggests that CSR has a negative effect on EM (for example,

96
see Almahrog et al., 2018; Bozzolan et al., 2015; Calegari et al., 2010; Chen & Hung, 2021; Cho &
Chun, 2015; Chun & Cho, 2017; Faisal et al., 2018; Gao & Zhang, 2015; García‐Sánchez et al., 2020;
Gerged et al., 2020; Gerged et al., 2021; Gras-Gil et al., 2016; Hong & Andersen, 2011; Kim et al.,
2012; Kumala & Siregar, 2020; Li & Xia, 2018; Litt et al., 2013; Martínez‐Ferrero et al., 2015; Palacios-
Manzano et al., 2019; Patten & Trompeter, 2003; Scholtens & Kang, 2013; Sial et al., 2019; Wang et
al., 2018). Consistent with the myopia avoidance hypothesis, this perspective suggests that
managers in firms with high CSR are more long-term oriented, and are therefore, less likely to
manage earnings for short-term gains (Chih et al., 2008). This may be due to two main reasons. First,
the negative relationship between CSR and EM may be relationship-driven. As EM is an agency cost,
managers engaged in CSR may avoid managing earnings in order to maintain their relationships with
stakeholders (for example, see Almahrog et al., 2018; Amar & Chakroun, 2018; Cho & Chun, 2015;
Choi et al., 2018; Faisal et al., 2018; Gras-Gil et al., 2016; Hong & Andersen, 2011; Jouber, 2020;
Velte, 2019). Furthermore, since CSR enhances transparency and reduces information asymmetry
between managers and stakeholders (for example, see Litt et al., 2013; Wang et al., 2018), the risks
of EM being discovered may be higher within firms with high CSR. Thus, managers may avoid EM to
avoid negative consequences arising from discovery of their EM and causing irreversible damage to
their relationships with stakeholders (for example, see Gerged et al., 2020; Gerged et al., 2021; Litt
et al., 2013).
Second, the negative relationship between CSR and EM may be value-driven. Since EM is considered
an unethical act, managers engaged in CSR due to their ethical and moral values are less likely to
manage earnings (for example, see Calegari et al., 2010; Gao & Zhang, 2015; García‐Sánchez et al.,
2020; Kim et al., 2012; Kumala & Siregar, 2020; Li & Xia, 2018; Martínez‐Ferrero et al., 2015;
Mohmed et al., 2020; Palacios-Manzano et al., 2019; Rezaee et al., 2020; Sial et al., 2019).
A number of studies also find mixed results, suggesting that the relationship between CSR and EM
is contextual in relation to a number of factors such as, the specific type of EM measure used (for
example, see Chih et al., 2008; Jordaan et al., 2018; Kolsi & Attayah, 2018; Velte, 2019; Velte, 2021;
Zhang et al., 2021), the different CSR dimensions (for example, see Gargouri et al., 2010; Amar &
Chakroun, 2018), the industry in which the firm operates (for example, see Muttakin et al., 2015; Yip
et al., 2011); government control and institutional factors (see Kim et al., 2019; Kyaw et al., 2017; Li
& Xia, 2018; Liu & Lee, 2019; Rezaee et al., 2020), and the ranking of CSR performance (see Mohmed
et al., 2020).

97
Based on the contrasting evidence in the literature regarding the relationship between CSR and EM,
the present study examines the following opposing hypotheses:
H1.1a: Consistent with the managerial myopia hypothesis, there is a positive and significant direct
relationship between CSR and EM.
H1.1b: Consistent with the myopia avoidance hypothesis, there is a negative and significant direct
relationship between CSR and EM.
4.5.2 The Effect of CSR on OC
Table 4.1 presents a summary of the literature on the relationship of CSR with intellectual capital
components, including OC. As evident from Table 4.1 Panel A, prior studies suggest a positive
relationship between CSR and overall intellectual capital in general (for example see Altuner et al.,
2015; Hawn & Ioannou, 2016; Massaro et al., 2018). Altuner et al. (2015) report a positive
relationship between CSR and intellectual capital among 133 manufacturing firms from Istanbul
between 2007 and 2011, as evident from positive correlation testing results between the two
variables. Hawn & Ioannou (2016) adopt a unique approach by examining the interaction of internal
and external CSR on market value of firms on a sample of 5,958 firm-year observations from 1,492
firms across 33 countries for the period 2002 to 2008. The findings of the study indicate that joint
use of internal and external CSR actions enable the creation of intangible resources for firms, as
evident by the higher market value (Hawn & Ioannou, 2016). To distinguish internal from external
CSR actions, Hawn & Ioannou (2016) refer to the former as a firm’s internal actions or policies to
develop organizational capabilities, and the latter as publicly visible actions, particularly through the
communication of social and environmental actions. Given that the market value of firms consists
of tangible and intangible resources, Hawn & Ioannou (2016) explain that the findings of their study
suggest that the interaction of internal and external CSR enhances intangible resources. Drawing on
content analysis of 1,651 blog posts with over 1.5 million words published in CSRwire.com, Massaro
et al. (2018) report that CSR and intellectual capital influence one another. As an example, Massaro
et al. (2018) explain that providing training and education for employees is a social activity under
the CSR umbrella, which also enhances the human capital dimension of intellectual capital. Thus,
the findings encourage managers to engage in both CSR and intellectual capital development
(Massaro et al., 2018).
In addition to the association between CSR and intellectual capital, the role of intellectual capital as

98
a mediating channel between the relationship between CSR and financial performance has also
gained some attention (for example, see Jain et al., 2017; Surroca et al., 2010). Using a sample of
5,599 firms from 28 countries for the period 2002 to 2004, Surroca et al. (2010) find a positive
relationship between CSR and intellectual capital. Furthermore, Surroca et al. (2010) note that
intellectual capital mediates the relationship between CSR and financial performance. The findings
suggest that there is no direct relationship between CSR and financial performance, but an indirect
relationship exists through the channel of intellectual capital (Surroca et al., 2010). Jain also finds a
mediating role of intellectual capital on the relationship between CSR and financial performance.
Based on a survey of 384 small and medium enterprises (SMEs) in Rajasthan, India, Jain suggests
that CSR has a positive influence on intellectual capital. Additionally, Jain finds a weak positive direct
relationship between CSR and financial performance, but a strong positive indirect relationship
between CSR and financial performance, through the mediating effect of intellectual capital.
Table 4.1 Panel A also summarises some studies that have linked CSR with relational capital. As a
matter of fact, there is an abundance of literature examining the influence of CSR on various
relational (or customer) capital aspects such as branding equity (Hur et al., 2014), brand image
(Martínez et al., 2014), customer retention (Chung et al., 2015), brand loyalty (Chung et al., 2015;
Martínez et al., 2014), employer branding (Biswas & Suar, 2016), etc. Since the majority of these
studies focus on the marketing aspect of relational capital, I have only included the more recent
studies linking CSR and relational (or customer) capital. As evident from Table 4.1 Panel A, these
studies suggest a positive relationship between CSR and relational capital. For example, based on a
survey of 867 South Korean consumers, Hur et al. (2014) report a positive relationship between CSR
and the brand equity of firms. Furthermore, Hur et al. (2014) find that CSR has both a direct
influence on brand equity, and an indirect influence on brand equity through the mediating
channels of brand credibility and reputation. The results indicate that CSR enhances brand equity
via improving brand credibility and reputation (Hur et al., 2014). Consistent with this, Martínez et
al. (2014) also find a positive association of CSR with relational capital in the hotel industry. Martínez
et al. (2014) conducted a survey of 1,921 consumers who have previously stayed at one of the top
10 Spanish hotel chains (with over 600 hotels) in Latin America. The findings suggest that CSR has a
positive influence on brand image and loyalty (Martínez et al., 2014). Similarly, Chung et al. (2015)
note a positive influence of CSR on customer satisfaction and loyalty, based on a survey of 276
participants from Eastern China. Biswas & Suar (2016) focus on a different aspect of relational
capital, namely, employee branding to attract potential talented workers. Based on a survey of a

99
sample of 347 top executives in 209 Indian companies, Biswas & Suar (2016) find that CSR (along
with several other factors, such as organizational support, trust, prestige, leadership, etc.) has a
positive influence on employer branding, which in turn has an influence on the financial and not
financial performance of firms. The findings suggest that CSR influences employer branding, making
the firm more attractive to talented job seekers, thereby achieving a competitive advantage (Biswas
& Suar, 2016).
In addition to linking CSR with overall intellectual capital and with OC, some studies have also linked
CSR with the other intellectual capital components, such as human capital (for example, see
Casalegno et al., 2017) and relational (or customer) capital (for example, see Biswas & Suar, 2016;
Chung et al., 2015; Hur et al., 2014; Martínez et al., 2014). Table 4.1 Panel B provides a summary of
these studies. Casalegno et al. (2017) examine the relationship between CSR and human capital on
a small sample of the top 10 largest European companies. The study finds a strong relationship
between CSR and human capital (Casalegno et al., 2017). Casalegno et al. (2017) note that this
positive association between CSR and human capital leads to value creation for shareholders. Taking
a different approach to most prior studies, Pedrini (2007) also reports an association between CSR
and human capital by examining the similarities and the possible overlaps between CSR information
and human capital information. Examination of the human capital related disclosures of a sample
of 20 reports containing intellectual capital information, and comparing them to the 2002 Global
Reporting Initiatives’ (GRI) guidelines, Pedrini (2007) concludes that there is significant convergence
between the two disclosure types. The study notes an overlap in the CSR disclosures and human
capital in three areas in particular: 1) human capital descriptions, 2) workforce diversity, and 3)
training quality and intensity. Pedrini (2007) flags the possibility of a convergence of the CSR reports
and intellectual capital in the future.
There appears to be a limited but noteworthy number of studies linking CSR specifically to OC. I
have identified five prior studies that link CSR to OC (see Attig & Cleary, 2015; Barrena‐Martinez et
al., 2019; Cho & Lee, 2017; Gallardo-Vázquez et al., 2019; Zhang et al., 2014). Table 4.1 Panel B
summarises the relevant literature on CSR and OC.
Prior studies report a positive association between CSR and OC (see Attig & Cleary, 2015; Barrena‐
Martinez et al., 2019; Cho & Lee, 2017; Gallardo-Vázquez et al., 2019; Zhang et al., 2014). Based on
700 survey responses from Chinese companies, Zhang et al. (2014) test various direct and indirect

100
links among high performance work systems14, CSR, and employee outcomes, specifically employee
commitment and organisational citizenship behaviour. The findings suggest that CSR has a positive
influence on employee satisfaction, commitment and organizational citizenship behaviour,
demonstrated through discretionary actions taken by employees above and beyond general
expectations (Zhang et al., 2014). Barrena‐Martinez et al. (2019), in a survey of 315 Spanish firms,
find that the human resource dimension of CSR has a positive effect on OC, and on the other
components of intellectual capital (human and relational capital). Similarly, from a survey of 77
Spanish firms, Gallardo-Vázquez et al. (2019) report a positive effect of CSR on OC and on the other
components of intellectual capital.
Additionally, I have identified two studies that examine how OC aspects, such as management
quality practices (Attig & Cleary, 2015) and managerial efficiency (Cho & Lee, 2017), influence CSR.
Using a sample of 449 observations from 179 US firms for the period 2005 to 2007, Attig & Cleary
(2015) find a positive association between management quality practices (a proxy used to measure
OC) and CSR. The findings suggest that superior management practices lead to better social
outcomes for firms (Attig & Cleary, 2015). Consistent with this, Cho & Lee (2017) also find a positive
relationship between CSR and OC (specifically, managerial efficiency). Using a sample of 11,037 firm-
year observations over the period 2003 to 2010, Cho and Lee (2017) report that firms with efficient
managers have higher economic and social CSR practices, but lower environmental CSR practices.
Since the economic (or product-related) and social dimensions of CSR refer to more strategic CSR
actions that contribute to adding value, Cho and Lee (2017) argue that efficient managers are more
likely to chose CSR actions that directly add value to the firm. Consequently, with limited resources,
efficient managers may chose not to focus much on CSR actions based on altruistic motives (that is,
the environmental CSR dimension) (Cho & Lee, 2017).
Overall, as evident from the literature review, there appears to be a general consensus that CSR has
a positive influence on intellectual capital and its specific components (OC, human capital and
relational capital) (for example, see Casalegno et al., 2017; Chung et al., 2015; Hur et al., 2014; Jain
et al., 2017; Martínez et al., 2014; Surroca et al., 2010; Zhang et al., 2014). The positive relationship
between CSR and OC may be explained by the RBV. RBV highlights that intangible resources,
particularly knowledge, are critical for a firm’s sustainability (Chang & Chen, 2012; Villalonga, 2004).
Several studies highlight the capability of CSR to create knowledge development essential for
14 Zhang et al. (2014) define high performance work systems as a source of competitive advantage obtained through human resource practices aimed at improving staff skills, commitment, productivity, etc.

101
sustainable business models (Eisenhardt & Martin, 2000; Nikolaou, 2017; Villalonga, 2004). This
implies that CSR is an essential strategy for better OC.
There appears to be substantial evidence in the literature that there is a relationship between CSR
and OC. Consistent with the literature and with the RBV theory, the following hypothesis is
developed:
H1.2: Consistent with the RBV theory, there is a positive and significant relationship between CSR
and OC.

102
Table 0.1 Summary of prior studies examining the relationship between CSR and OC
Panel A: Prior studies linking CSR with intellectual capital (1) (2) (3) (4) (5) (6)
Authors (Year) Country Sample (Period)
Research Objective Research method Theory Key findings
Pivato et al. (2008)
Italy 400 survey participants
Examine how CSR affects relational capital - customer trust
Method: SEM DV: Customer trust IV: CSR
Stakeholder trust perspective
CSR has a positive effect on relational capital
Surroca et al. (2010)
28 countries 5,599 firms
(2002 – 2004)
Examine how CSR indirectly affects firm performance via Intellectual Capital (IC)
Method: OLS DV and IV: Financial performance; CSR MED: IC
Instrumental view; slack resources
view; RBV
CSR and IC are positively related. IC mediates the relationship between CSR and performance
Hur et al. (2014) Korea 867 survey participants
Examine how CSR affects relational capital - brand equity
Method: SEM DV: Brand equity IV: CSR MED: Brand credibility; brand reputation
RBV CSR has a positive direct effect on relational capital, and indirect effect via brand credibility and reputation
Martínez et al. (2014)
Latin America 1,921 survey participants
Examine how CSR affects relational capital - brand image and loyalty
Method: Confirmatory factor analysis; SEM DV: Brand image; brand loyalty IV: CSR MOD:
Theory of sustainable
development
CSR has a positive effect on relational capital
Altuner et al. (2015)
Turkey 133 firms
(2007 – 2011)
Examine how CSR are IC are related directly and indirectly via corporate governance
Method: Linear correlation, t-test; ANOVA DV and IV: IC; CSR MED: Corporate governance
n/a Positive direct and indirect effect between CSR and IC via corporate governance
Chung et al. (2015)
China 276 survey participants
Examine how CSR affects relational capital - customer satisfaction and loyalty
Method: SEM DV: Customer satisfaction; customer loyalty IV: CSR
n/a CSR has a positive effect on relational capital
Biswas & Suar (2016)
India 347 survey participants
Examine how CSR (among other things) affects relational capital - employer branding
Method: SEM DV: Employee branding; firm performance IV: CSR
RBV CSR has a positive effect on relational capital, which in turn has a positive effect on firm performance
Hawn & Ioannou (2016)
33 countries 5,958 observations/ 1492
firms (2002 – 2008)
Examine how CSR affects IC and firm value
Method: OLS DV: IC IV: CSR
RBV External and internal CSR jointly have a positive effect on IC and market value
Casalegno et al. (2017)
Europe 10 largest firms (2010 – 2012)
Examine how CSR affects human capital
Method: Case analysis DV: Human capital IV: CSR
n/a CSR has a positive effect on human capital
Jain et al. (2017)
India 384 survey firms
Examine how CSR indirectly affects firm performance via IC
Method: SEM DV: Financial performance IV: CSR MED: IC
RBV CSR and IC are positively related. IC mediates the relationship between CSR and performance

103
15 Zhang, et al. (2014) examine several direct and indirect relationships between the variables. The literature review in this chapter only discusses the relationships that are relevant to the present study (that is, the relationship between CSR and employee outcomes).
Massaro et al. (2018)
1651 blog posts in CSRwire.com
Examine how CSR and IC are related
Method: Concept extraction; content analysis DV: IC IV: CSR
n/a IC and CSR are positively related to each other
Panel B: Prior studies linking CSR with OC
Zhang et al. (2014)
China 700 survey participants
Examine how social (SOC) dimension affects employee outcomes15
Method: SEM DV: Employee outcomes (Organizational citizenship behaviour; organizational affective commitment) IV: SOC
Stakeholder perspective
SOC has a positive effect on employee outcomes
Barrena‐Martinez et al.
(2019)
Spain 315 survey firm
respondents
Examine how socially responsible human resource (HR) practices affect OC and other IC components
Method: SEM DV: IC components - OC, human and relational capital IV: Socially responsible HR practices
Synergistic assumptions of the
configurational approach
Socially responsible HR practices has a positive effect on OC and other IC components
Gallardo-Vázquez et al.
(2019)
Spain 77 survey firm respondents
Examine how CSR affects OC and other IC components
Method: SEM DV: IC components - OC, human and relational capital IV: CSR
Stakeholder theory; legitimacy theory
CSR has a positive effect on OC and other IC components
Attig & Cleary (2015)
USA 449 observations/ 179
firms (2005-2007)
Examine how OC affects CSR Method: OLS; 2SLS DV: CSR IV: OC
Slack resource perspective OC has a positive effect on CSR
Cho & Lee (2017)
USA 11,037 observations
(2003-2010)
Examine how managerial efficiency affects CSR
Method: OLS DV: CSR IV: Managerial efficiency
Upper echelons theory
Positive effect on product-related and SOC dimensions, but negative effect on environmental dimension

104
4.5.3 The Effect of OC on EM
The EM literature has traditionally focussed on corporate characteristics such as firm size, audit
quality etc. (Demerjian et al., 2013), with a growing interest in CSR in recent years. However, another
contemporary trend evident from the EM literature is the association of EM with intangibles.
Despite a limited number of studies available on this, the studies linking intellectual capital and EM
has also gained some momentum during the last two decades (for example, see Bhandari et al.,
2018; Francis et al., 2008; Malmendier & Tate, 2009; Shust, 2015).
To the best of my knowledge, no prior study has examined the relationship between OC and EM
specifically. Therefore, throughout the remainder of this section, I discuss the literature relevant to
intellectual capital components and EM. Table 4.2 provides a summary of the relevant literature on
intellectual capital components and EM, categorised into 3 categories – 1) Panel A shows the studies
examining various facets of management (for example, see Francis et al., 2008; Malmendier & Tate,
2009), 2) Panel B discusses the studies examining relationship aspects, such as political connections
(for example, see Al-dhamari & Ku Ismail, 2015; Chaney et al., 2011) and CEO’s external connections
(for example, see Bhandari et al., 2018); 3) Panel C shows the studies examining R&D expenditure
as a proxy for intangible intensity (for example, see Hao & Li, 2016; Shust, 2015).
I have identified only one study that examines OC as opposed to broader intellectual capital -
Demerjian et al. (2013), who examine the relationship between OC and earnings quality as opposed
to EM, reporting findings contradictory to the majority of the literature. Using a sample of 78,423
firm-year observations from 1989 to 2009, Demerjian et al. (2013) find managerial ability positively
influences earnings quality. The positive relationship between managerial ability and earnings
quality suggests that more able managers are more knowledgeable, and are therefore able to make
financial reporting estimations with higher accuracy (Demerjian et al., 2013). However, Demerjian
et al. (2013) also explain that their analysis examines earnings quality and not EM. Demerjian et al.
(2013) expect that more able managers will be able to manage earnings more successfully. The
better quality of earnings (such as, smoother earnings) may result from effective EM by managers.
As summarised in Table 4.2 Panel A, Francis et al. (2008) and Malmendier & Tate (2009) focus on
senior level management (that is, CEO) and the likelihood of EM. Using a sample of 2,000
observations between 1992 and 2001, Francis et al. (2008) find CEO reputation to be negatively
(positively) related to earnings quality (EM). Consistent with the rent extraction hypothesis, Francis

105
et al. (2008) suggest that reputed CEOs are more likely to manage earnings to report favourable
financial information, in attempts to maintain their reputation. With additional tests, Francis et al.
(2008) also find that firms with poorer earnings quality are more likely to employ reputable CEOs in
an attempt to reverse the negative image caused by the poor earnings quality. Consistent with this,
Malmendier & Tate (2009) report that superstar CEOs are more likely to manage earnings. Using a
sample of 71,418 firm-year observations over the period 1975 to 2002, Malmendier & Tate (2009)
find that award-winning CEOs have higher expectations from investors and analysts, which may in
turn lead them to manage earnings to meet those expectations.
Table 4.2 Panel B summarises the literature on relational aspects of intellectual capital and EM. Al-
dhamari & Ku Ismail (2015), Bhandari et al. (2018) and Chaney et al. (2011) examine how various
relational aspects of firms influence EM. Using an international sample of 4,964 firms from 19
countries across the period 1997 to 2001, Chaney et al. (2011) demonstrate that firms with political
ties have lower earnings quality. Chaney et al. (2011) reasons that the lower earnings quality could
result from intentional EM by managers as they try to extract private benefits. Furthermore, once
political connections have been established, the firms may start having a relaxed attitude toward
maintaining high quality earnings. Upon examining 295 firm-year observations from Malaysian
listed firms between 2007 and 2011, Al-dhamari & Ku Ismail (2015) find lower earnings quality (that
is, higher EM) in firms with political connections. Al-dhamari & Ku Ismail (2015) inform that
Malaysian politically connected firms may experience pressure from the government to conceal
financial information that may create negative publicity for the government. Such pressures may
lead managers to manage earnings to conceal financial transactions resulting from the political
connection. In contrast to the majority of the literature, Bhandari et al., 2018find a negative
association between EM and relational capital (specifically, a CEO’s external connections with other
executives and directors). Using a sample of 5,611 firm-year observations between 2002 and 2014,
Bhandari et al. (2018) demonstrate that firms with higher CEO network connections are less likely
to manage earnings as exposure of EM engagement may sabotage the CEO’s reputation and
network connections. However, Bhandari et al. (2018) also note that this lower EM may result from
the increased difficulties in detecting accounting manipulations when CEOs are well-connected (for
example, see Khanna et al., 2015).
Table 4.2 Panel C discusses studies that examine R&D as a form of intellectual capital and EM. Using
the intensity of R&D expenditure as a proxy for intangibles, Shust (2015) finds a positive influence
of R&D on EM on a sample of 77,003 observations between 1988 and 2010. Shust (2015) explains

106
that high-tech firms (that is, firms with high R&D activities) have greater uncertainty regarding their
future performance, and this uncertainty in turn is likely to lead to higher EM incentives. Hao & Li
(2016) examines the association between future innovation opportunities and discretionary
accruals across a sample of 20,265 observations between 1988 and 2006. The findings suggest a
positive association between future innovation opportunities (proxied by R&D intensity, patents
and patent citations and discretionary accruals) among firms with financial constraints. However,
Hao & Li (2016) explain that the positive relationship between innovation opportunities and
discretionary accruals is a result of truth revealing discretionary accruals (as opposed to
manipulative EM) to signal future growth prospects of innovative firms.
In addition to the studies on intellectual capital and EM, I have identified some studies that examine
how intangibles intensity influence earnings quality as opposed to EM. The majority of these studies
suggest that higher intangibles within firms cause a decline in the quality of earnings. For example,
Kothari et al. (2002) find that R&D investments (a commonly used proxy for intangibles) increase
the variability of future earnings, making earnings more uncertain. Using a sample of observations
from intangible intensive and non-intangible intensive industries, Ciftci et al. (2014) also find
declining earnings quality among intangible intensive industries. Similarly, Srivastava (2014) also
finds a negative relationship between intangible intensity and earnings quality, specifically the
volatility, relevance and matching of earnings. Srivastava (2014) suggests that the growth of
intangible intensive industries is accountable for the decline in earnings quality of firms over the
past forty years. Two recent studies, Bushman et al. (2016) and Nallareddy et al. (2018) highlight
intangible intensity as one of the reasons behind changing accruals properties, specifically the
changing correlation between accruals and cashflows. In contrast to the majority of the literature,
Villalonga (2004) observes increased earnings persistence among firms with higher intangibles.
However, the author warns that this higher persistence can also be a disadvantage for firms with
lower or negative earnings, as these unattractive earnings figures may also be more persistent.
Overall, most of the literature on intellectual capital and EM indicate a positive relationship between
the two variables. Furthermore, the negative relationship between intellectual capital and earnings
quality evidenced in the broader literature review also implies a similar indication. Thus, based on
the findings from the broader literature, the present study expects to find a positive relationship
between OC and EM. I expect this positive relationship for three main reasons. First, managers in
firms with high OC may experience greater pressure from higher expectations from investors and
analysts in terms of firm performance (Malmendier & Tate, 2009). In response to such pressures,

107
managers may have more incentives to manage earnings to meet or exceed short-term targets, as
repeated inability to meet targets may harm the management’s reputation16 (Francis et al., 2008;
Malmendier & Tate, 2009). Second, high OC is a reflection of superior managerial quality practices
and ability (for example, see Attig & Cleary, 2015; Demerjian et al., 2013). The higher ability of
managers may also imply that the managers are more knowledgeable and have greater ability to
manage earnings with minimum chances of getting caught17. Furthermore, prior studies suggest
that the lack of an adequate and consistent accounting standard or regulatory body, specifying
disclosure requirements for intellectual capital, creates greater uncertainty regarding earnings,
more forecasting errors and greater information asymmetries between managers and stakeholders.
This in turn leads to greater opportunities for EM (García‐Ayuso, 2003; Lev et al., 2005; Starovic &
Marr, 2003). Thus, the literature suggests that managers in firms with high OC are likely to be myopic
(short-term oriented). Hence, consistent with majority of the literature, and with the managerial
myopia hypothesis, I expect to find a positive relationship between OC and EM. Thus, the following
hypothesis is tested:
H1.3: Consistent with the managerial myopia hypothesis, there is a positive and significant
relationship between OC and EM.
16 A contrasting perspective suggests that managers may avoid EM since their reputations may be at stake if their EM is detected. However, taken together with the next argument (that managers in firms with high OC may have superior techniques to manage earnings with lower chances of getting caught), firms with high OC may have both incentives and opportunities to manage more earnings. Managers in firms with high OC may have more incentives to manage earnings to meet stakeholder expectations and to safeguard their reputation by avoiding failures in meeting targets. The greater opportunities provided by high OC may make it easier for them to manage earnings for their opportunistic incentives. 17 This is one side of the argument. It should be acknowledged that managers in firms with high OC may simply have better ability to manage their firms’ performance more effectively, thus eliminating or reducing their need to manage earnings. The present study adopts the first argument, suggesting that OC may increase EM, since this is consistent to majority of the literature.

108
Table 0.2 Summary of prior studies examining the relationship between Intellectual Capital on EM
18 Some studies use R&D as a basis for intangibles, since investments in R&D are essential for higher knowledge creation and technological innovations (Canibano et al. 2000).
Panel A: Prior studies linking management aspects of intellectual capital with EM (1) (2) (3) (4) (5) (6)
Authors (Year) Country Sample (Period)
Research Objective Research method Theory Key findings
Francis et al. (2008)
USA 2,000 observations
(1992 – 2001)
Examine how CEO’s reputation affects EM
Method: Simultaneous regression equations DV: EM IV: CEO reputation
Efficient contracting perspective; rent extraction
perspective; matching argument
CEO reputation has a positive effect on EM (lower earnings quality)
Malmendier & Tate (2009)
USA 71,418 observations
(1975 – 2002)
Examine how CEOs with superstar status influence firm performance
Method: Logit regression DV: EM IV: CEO status
Rent extraction perspective CEO reputation has a positive effect on EM
Demerjian et al. (2013)
USA 78,423 observations
(1989 – 2009)
Examine how managerial ability affects EM
Method: OLS DV: Managerial ability IV: EM
n/a Managerial ability is positively associated with earnings quality
Panel B: Prior studies linking relational aspects of intellectual capital with EM
Chaney et al. (2011)
19 countries 4,964 firms
(1997 – 2001)
Examine how political connections affect EM
Method: Probit regression DV: EM IV: Political ties
n/a Political connections have a positive (negative) effect on EM (earnings quality)
Al-dhamari & Ku Ismail (2015)
Malaysia 295 observations
(2007 – 2011)
Examine how political connections and cash holdings affect EM
Method: OLS; Seemingly unrelated regression DV: EM IV: Political connections; cash holdings
Political extraction perspective
Investors perceive EM to be higher for politically connected firms
Bhandari et al. (2018)
USA 5,611 observations
(2002 – 2014)
Examine how CEO’s external connections affect EM
Method: DV: EM IV: CEO’s external networks
Social network perspective CEO’s networks have a negative effect on EM
Panel C: Prior studies linking R&D related intellectual capital with EM
Shust (2015) USA
77,003 observations (1988 - 2010)
Examine how R&D18 intensity influences EM
Method: OLS; 2SLS DV: EM IV: R&D intensity
n/a R&D intensity has a positive effect on EM.
Hao & Li (2016) USA
20,265 observations (1988 - 2006)
Examine how IC affects EM among financially constrained firms
Method: OLS DV: EM IV: Innovation (R&D expenses; Number of patents applied; citations received by a patent); Financial constraint
Manipulation hypothesis; signalling hypothesis
EM has a positive effect on IC in financially constrained firms

109
4.5.4 The Indirect Effect of CSR on EM
In a mediational model “the independent variable is presumed to cause the mediator, and in turn,
the mediator causes the dependent variable” (Wu & Zumbo, 2008, p. 369). The literature discussed
in the previous sections suggest the possibility of a mediational effect of OC.
Prior studies have established a mediating effect of intellectual capital on the relationship between
CSR and financial performance (for example, see Jain et al., 2017; Surroca et al., 2010). However, to
the best of my knowledge, the mediating effect of intellectual capital on the relationship between
CSR and EM has not been examined to date. Given that intellectual capital encompasses a broad
range of components, such as relational capital, human capital and OC, the present study focusses
on the mediating role of OC rather than the other components of intellectual capital. The rationale
behind this is that OC consists of aspects such as practices, policies and processes that are directly
relevant to management. Both CSR and EM also result from direct managerial actions. Thus, it seems
reasonable to examine OC in the CSR and EM relationship context rather than other intellectual
capital components that may not be direct results of management actions. Prior literature in CSR
and EM shows that CSR has a significant influence on EM (for example, see Bozzolan et al., 2015;
Cho & Chun, 2015; Choi et al., 2013; Grougiou et al., 2014; Hong & Andersen, 2011; Kim et al., 2012;
Litt et al., 2013; Prior et al., 2008; Scholtens & Kang, 2013; Sun et al., 2010). The literature on CSR
and intellectual capital appears quite consistent in that CSR has a positive influence on intellectual
capital (for example see Altuner et al., 2015; Attig & Cleary, 2015; Cho & Lee, 2017; Hawn & Ioannou,
2016; Massaro et al., 2018; Zhang et al., 2014). The intellectual capital and EM literature broadly
suggests that intellectual capital has a positive influence on EM (for example, see Al-dhamari & Ku
Ismail, 2015; Chaney et al., 2011; Francis et al., 2008; Malmendier & Tate, 2009; Shust, 2015). Thus,
based on prior literature, the conditions of a mediating role of OC seems plausible. As CSR
(independent variable) influences OC, and OC in turn influences EM (dependent variable), there is a
possibility of a mediating effect of OC on the relationship between CSR and EM. A mediating effect
would mean that managers engaged in CSR, may use their firm’s high OC, to either manage more
earnings or manage less earnings. From the perspective of the managerial myopia hypothesis, it can
be expected that in firms with high OC, managers engaged in CSR may use their firm’s unique
resources opportunistically to manage more earnings for short-term goals. In contrast, from the
myopia avoidance hypothesis, it can be expected that in firms high OC, managers may use their
firm’s unique resources more ethically aimed toward long-term value creation, and constrain EM
within their firms. Thus, the following alternate hypotheses are tested:

110
H1.4a: Consistent with the managerial myopia hypothesis, there is a positive and significant indirect
relationship between CSR and EM, via the mediator OC.
H1.4b: Consistent with the myopia avoidance hypothesis, there is a negative and significant indirect
relationship between CSR and EM, via the mediator OC.
4.6 The Conceptual Framework
Figure 4.2 depicts the conceptual framework addressing research objective 1, to examine the direct
and indirect relationship between CSR and EM, with OC as a mediator. The figure presents the main
relationships tested in this study and illustrates that mediation exists if the independent variable,
CSR, affects the mediator, OC, that in turn, affects the dependent variable, EM. Path a represents
the direct effect of CSR on OC, testing hypothesis H1.2. Consistent with the RBV, the study expects
to find a positive and significant direct relationship between CSR and OC, as hypothesised in H1.2.
Path b represents the direct effect of OC on EM, testing hypothesis H1.3. Consistent with the
managerial myopia hypothesis, the study expects to find a positive and significant direct relationship
between OC and EM, as hypothesised in H1.3. Path c represents the direct relationship between
CSR and EM (H1.1a and H1.1b) and Path c’ represents the indirect relationship between CSR and
EM, via the mediator, OC (H1.4a and H1.4b). The indirect (mediation) effect, path c’, represents the
portion of the relationship between CSR and EM that is mediated by OC. The size of the indirect
effect is calculated as the product of paths a and b. The standard errors of the indirect effect are
estimated using the delta method and the bootstrapping technique.
The direct relationship between CSR and EM and the indirect relationship via OC are tested using
two contrasting hypotheses. H1.1a and H1.4a expect to find a positive direct CSR-EM relationship
and a positive indirect CSR-EM relationship via OC, respectively, consistent the managerial myopia
hypothesis. In contrast, H.1b and H1.4b expect to find a negative direct CSR-EM relationship and a
negative indirect CSR-EM relationship via OC, respectively, consistent with the myopia avoidance
hypothesis.

111
Figure 0.2 The Conceptual Framework

112
4.7 Data and Methodology
This section discusses the research methodology adopted to test the hypotheses discussed in
Section 4.5. The section describes the sample and data for the study, followed by details of the
measurements of the dependent variable (EM), the independent variable (CSR), the mediating
variable (OC) and the control variables. The section includes a discussion of the research models
used in this study and ends with a discussion of the sensitivity test and accounting for endogeneity.
4.7.1 Data and Sample
The sample for this study includes US non-financial firms listed on the Datastream International
Database. The sample is selected based on the following criteria: 1) the firm must be publicly listed
2) the firm must have CSR information for at least one of the observed years; 3) the firm must be a
non-financial firm (firms with SIC codes between 6000 and 6799 are excluded); 4) Each two-digit
Standard Industrial Classification (SIC) code grouping must have a minimum of 8 firms. CSR data for
US firms is not available prior to 2002 on Datastream. Therefore, the sample period selected for this
study is 2002 – 2017 inclusive.
Panel A of Table 4.3 shows that the initial sample size was 61,952 firm-year observations from 3,872
firms. The exclusion of financial firms (13,584 firm-years), firms with missing financial data over the
sample period (800 firm-years) and firms with less than 8 firms in their 2-digit SIC grouping (752
firm-years) yields a final sample size of 46,816 firm-year observations from 2,926 firms. The number
of observations in any given regression varies depending on the model-specific data requirements.
Table 4.3 Panel B reports the distribution of the sample by the Fama-French 12 industry groups. The
sample is unevenly distributed across industries, with the “Other” and “Business Equipment”
industries being dominant at 19.45% and 17.19% respectively. Table 4.3 Panel C illustrates the year
distribution of the sample. The study uses a balanced sample, with equal number of firm-year
observations, 2,926 firm-year observations per year.
The data utilised in this study are mostly financial statement data. All financial statement data have
been collected from Datastream’s Worldscope database. Additionally, the study also uses the ESG
index from Thomson Reuters database (for measuring the independent variable, CSR, as discussed
in Section 4.7.3) and the Consumer Price Index (CPI) from Datastream (for measuring the mediating
variable, OC, as discussed in Section 4.7.4). All data are collected for the period 1998 to 2018
inclusive, to enable the use of lagged data, as well as measure EM_DD (the alternate measure of

113
EM that is based on a 5-year standard deviation of the accruals quality model, as discussed in the
next section). Appendix A1 shows the list of data for this study.
Table 0.3 Sample Selection and Distribution of the Sample
Panel A: Data and Sample Description Number of Observations Number of firms
Initial sample (data available in Datastream) 61,952 3,872 Less: Financial firms (13,584) (849) 48,368 3,023
Firms with missing financial data for sample period (800) (50)
47,568 2,973
Firms with less than 8 firms in their 2-digit SIC grouping (752) (47)
Total 46,816 2,926 Panel B: Industry Distribution
Industry name Number of Observations % of observations
Consumer nondurables 2,864 6.12
Consumer durables 1,520 3.25
Manufacturing 5,440 11.62
Oil, gas and coal extraction and products 2,848 6.08
Chemicals and allied products 1,856 3.96
Business equipment 8,048 17.19
Telephone and television transmission 2,448 5.23
Utilities 2,608 5.57
Wholesale, retail and some services 4,832 10.32
Healthcare, medical equipment and drugs 5,248 11.21
Other 9,104 19.45
Total 46,816 100%
Panel C: Year distribution
Year Number of Observations % of observations
2002 2,926 6.25
2003 2,926 6.25
2004 2,926 6.25
2005 2,926 6.25
2006 2,926 6.25
2007 2,926 6.25
2008 2,926 6.25
2009 2,926 6.25
2010 2,926 6.25
2011 2,926 6.25
2012 2,926 6.25
2013 2,926 6.25
2014 2,926 6.25
2015 2,926 6.25
2016 2,926 6.25
2017 2,926 6.25
Total 46,816 100

114
4.7.2 Dependent Variable
The dependent variable for this study is EM (detailed measurement of EM is shown in Section 3.3).
As discussed in Chapter 3, I use discretionary accruals as the proxy for EM, using the modified Jones
model developed by Dechow et al. (1995), using equation (1) below. Consistent with prior literature,
equation (1) is estimated for each year and each two-digit SIC code, for which there are at least
eight firm year observations per regression.
TAit = 1 (1/Ait-1) + 2 (REVit - RECit) + 3 PPEit + it (1)
where
TAit = total accruals (as measured in equation (2)) in year t for firm i scaled by total assets at t - 1;
REVit = change in revenues (revenues in year t less revenues in year t – 1) for firm i scaled by total assets at t - 1;
RECit = change in accounts receivables (net receivables in year t less net receivables in year t – 1) for firm i scaled by total assets at t - 1;
PPEit = gross property, plant and equipment in year t for firm i scaled by total assets at t - 1;
Ait – 1 = total assets in year t – 1 for firm i;
it = error term in year t for firm i.
Following Dechow et al. (1995), the total accruals is measured as shown below:
TAit = (CAit - CLit - Cashit – DEPit)/Ait – 1 (2)
where
CAit = change in current assets (current assets in year t less current assets in year t – 1) for firm i;
Cashit = change in cash (cash in year t less cash in year t – 1) for firm i;
CLit = change in current liabilities (current liabilities in year t less current liabilities in year t – 1) for firm i;
DEPit = depreciation and amortization expenses in year t for firm i.
In order to check the sensitivity of the regression analysis, the study utilizes an alternate

115
specification of EM by measuring accruals quality using the Dechow & Dichev (2002) model. To
reduce measurement errors, I follow the modification of the original Dechow & Dichev (2002) model
as suggested by Francis et al. (2005) by including change in revenue and property plant and
equipment, using equation (3) below:
TAit = 0 + 1 CFOit – 1 + 2CFOit +3CFOit + 1 + 4 REVit + 5PPEit + it (3)
where
TAit = total accruals (as measured in equation (2)) in year t for firm i scaled by average total assets for years t and t-1;
CFOit – 1 = cash flow from operations in year t-1 for firm i scaled by average total assets for years t and t-1;
CFOit = cash flow from operations in year t for firm i scaled by average total assets for years t and t-1;
CFOit + 1 = cash flow from operations in year t+1 for firm i scaled by average total assets for years t and t-1;
REVit = change in sales revenue (sales revenue in year t less sales revenue in year t – 1) for firm i scaled by average total assets for years t and t-1;
PPEit = gross property, plant and equipment in year t for firm i scaled by average total assets for years t and t-1;
it = error term in year t for firm i.
EM_DD, that is, the alternate measure for EM, is measured as the 5-year standard deviation of the
residual it from equation (3). The 5-year standard deviation is estimated for the years t-4 to t for
each firm-year observation. To enable the calculation of the standard deviation, the equation (3)
above is estimated from years 1998 to 2017 (that is, from 5 years prior to the beginning of the
sample period). A higher value on EM_DD, that is the standard deviation from the residual from
equation (3), indicates higher EM, whereas a lower residual indicates lower EM and better-quality
accruals.
4.7.3 Independent Variable
The independent variable in this study is CSR. The CSR scores used in this study are the Thomson
Reuters ESG scores collected from Thomson Reuters ESG index. The ESG scores are firm level data,
computed as a weighted average score of the three ESG dimensions, that is, (Environmental score

116
weight = 34%; Social score weight = 35.5%; and Governance score weight = 30.5%) (Thomson
Reuters, 2018)
To test the sensitivity of my analyses, I use two alternate measures of CSR (CSR_COMB and
CSR_DUM). CSR_COMB is the ESG combined score from Thomson Reuters, computed as the average
of the ESG score and ESG controversies score (Thomson Reuters, 2018). Following Gao & Zhang
(2015), I compute CSR_DUM as a dummy variable that equals 1 if the Datastream ESG score for the
firm is greater than the median (by year and two-digit SIC code classification), and 0 otherwise.
4.7.4 Mediating Variable
There is a lack of consensus on a consistent measure of OC (Black & Lynch, 2005; Guthrie et al.,
2012; Lev & Radhakrishnan, 2005). While a small number of firms have started to report some
intellectual capital components, there is still no consistent framework for such reporting (Guthrie &
Petty, 2000). Often investments in OC are listed under an assortment of expense items in the income
statement, making it more difficult to track these investments (Tronconi & Marzetti, 2011). Several
prior studies measure OC on the basis of selling, general and administrative (SG&A) expenses (for
example, see Eisfeldt & Papanikolaou, 2013; Hasan & Cheung, 2018; Lev & Radhakrishnan, 2005).
Thus, consistent with prior studies, the present study measures OC (that is, the mediating variable)
on the basis of SG&A expenses. According to the USA Generally Accepted Accounting Principles
(GAAP), SG&A expenses encompass all non-production related commercial expenses (Eisfeldt &
Papanikolaou, 2013). The justification of SG&A in measuring OC lies in the fact that a large portion
of the SG&A expenses includes expenses related to labour and information technology, such as
wages, training, information technology, etc. (Eisfeldt & Papanikolaou, 2013). Thus, SG&A expense
is likely to capture any changes in spending by the firm to enhance OC (Eisfeldt & Papanikolaou,
2013).
Following Eisfeldt & Papanikolaou (2013), I measure the stock of organisation capital each year by
accumulating the deflated value of SG&A, as shown below:
OCit = OCi,t-1 (1 - 0) + 𝑆𝐺𝐴 𝑖,𝑡𝑐𝑝𝑖 𝑡
(4)
Consistent with Eisfeldt & Papanikolaou (2013), I measure the initial stock of organisation capital as
shown below:
OCito= 𝑆𝐺𝐴 𝑖,𝑡𝑔+ 𝑜
(5)

117
where
OCi,t = stock of organization capital in year t for firm i, divided by total assets (following Eisfeldt and Papanikolaou (2013);
0 = depreciation rate of OC (15%) consistent with prior studies (for example, see
Eisfeldt & Papanikolaou, 2013; Hasan & Cheung, 2018);
SGAi,t = SG&A expense in year t for firm i; Missing values are replaced with 0;
cpit = consumer price index (CPI) for year t, computed as the 12-month average CPI;
g = average real growth of SG&A, which is 12.22% in my estimates. The average real growth of SG&A expense is calculated as: [(Growth rate of SGA between 2001 and 2002) – 1]
1+inflation rate between 2001 and 2002.
As part of the sensitivity analysis, an alternate measure of OC is used. The alternate measure of the
stock of OC (OC_PT) is based on the perpetual inventory method developed by Peters & Taylor
(2017). The main difference between the primary measure of OC and the alternate measure OC_PT
lies in the depreciation rate and the measurement of the stock of OC in the initial year. As Peters &
Taylor (2017) note, it is important to vary the depreciation rate for knowledge-based assets to check
robustness of the findings to different depreciation rates. Thus, following Peters & Taylor (2017)
and Falato et al. (2013), I use a depreciation rate of 20% for OC_PT measurement. Additionally, I
follow the simplistic procedure adopted by Peters & Taylor (2017) and set the initial stock of
OC_PTito at 0. Following Peters & Taylor (2017), the alternate measure for OC, that is OC_PT, is
estimated using the following equation.
OC_PTi,t = OC_PTi,t-1 (1 - 0) + SGAi,t (6)
where
OC_PTi,t = stock of organization capital in year t for firm i, divided by total assets (following
Peters & Taylor, 2017);
0 = depreciation rate of OC (20%), consistent with Peters & Taylor (2017);
SGAi,t = SG&A expense in year t for firm i; Missing values are replaced with 0;

118
4.7.5 Control Variables
To avoid potential misspecification problems due to correlated omitted variables in the research
models, I use several control variables that influence OC and EM. I control for firm size (SIZE)
computed as the natural logarithm of market value of equity. Prior literature shows that larger firms
have less EM as a result of being exposed to greater scrutiny (Chih et al., 2008; Kim et al., 2012;
Roychowdhury, 2006; Scholtens & Kang, 2013). In terms of the relationship between SIZE and OC,
Eisfeldt & Papanikolaou (2013) suggests that smaller firms have higher OC.
I also control for firm performance computed as the adjusted Return on Assets (ROA), that is, the
mean ROA for each year and sector (based in the two-digit SIC codes) subtracted from the focal
firm’s ROA. ROA is measured as the income before extraordinary items, scaled by lagged total
assets. (Cho & Chun, 2015) suggest that firms with lower incomes may be more prone to manage
earnings upwards in an attempt to attract investors. In contrast, firms with higher financial
performance have higher OC (Eisfeldt & Papanikolaou, 2013).
Following Kim et al. (2012), I also control for Leverage (LEV) as an indicator of the firm’s ability to
meet its financial obligations. Kim et al. (2012) find a positive association between firm leverage and
EM. Eisfeldt & Papanikolaou (2013) suggest that high OC firms have lower financial leverage. I
measure LEV as the long-term debts divided by total assets.
I also follow Kim et al. (2012), and use Research and Development intensity (RD) as a control variable
since RD intensity may influence firm performance. Kim et al. (2012) suggest that firms with higher
RD intensity are more likely to manage earnings. Additionally, Eisfeldt & Papanikolaou (2013)
suggests that high OC firms have higher R&D expenditure as well as other forms of intangible
investments. Following Kim et al. (2012), I measure RD as the proportion of total R&D expenses to
net sales.
According to the literature, the control variables discussed above, SIZE, ADJROA, LEV and RD, may
be associated with both EM and OC. Therefore, these control variables are common for all
equations, that is, equations with EM and OC as the dependent variables. Two other control
variables are used PR (Physical Resources) and MB (Market to Book ratio). However, PR is a control
variable only for equations with OC as the dependent variable, while MB is a control variable only
for equations with EM as the dependent variable.
PR is used as a proxy for Physical Resources, as the literature suggests a negative association

119
between OC and physical capital investments (Eisfeldt & Papanikolaou, 2013). PR is measured as
the difference between total assets and current assets, divided by total assets.
Studies show that growth opportunities impact EM (Roychowdhury, 2006). Following
Roychowdhury (2006) and Kim et al. (2012), I use MB as an indicator of growth opportunities,
measured as the ratio of the market value of equity to the book value of equity.
Following prior studies, I also control for unobserved heterogeneity by including a range of dummy
variables representing year effects and industry effects at two-digit SIC level (for example, see
(Cheung, 2016). Following Cheung (2016), I do not specify firm-level fixed effects in my regression
estimations for two reasons: first, as Guenster et al. (2011) note, using panel fixed effects if CSR is
persistent may result in a considerable loss of information; second, my second estimation method,
that is, the Maximum Likelihood (ML) model, may involve an incidental parameter problem (that is,
the ML estimators are likely to be inconsistent) (see Lancaster, 2000; Neyman & Scott, 1948).
Following prior studies, to minimise the undesirable influence of outliers, the key variables are
winsorized at the 1st and 99th percentiles (for example, see Attig & Cleary, 2014; Cheung, 2016;
Hasan & Cheung, 2018; Kim et al., 2012). Table 4.4 presents definitions of the key variables.

120
Table 0.4 Variable Definition and Measurement
Variable Symbol Definition and Method of measurement Dependent variable Earnings Management
EM
Absolute value of discretionary accruals (that is, unsigned accruals) using the modified Jones model (Dechow et al., 1995): TAit = i [1/Ait-1] + 1i (REVit - RECit) + 2i (PPEit) + it
Earnings Management alternate measure
EM_DD Accruals quality model following Dechow & Dichev (2002): TAit = 0 + 1i CFOit – 1 + 2i CFOit + 3i CFOit + 1 + 4i REVit + 5i PPEit + it
Independent Variable Corporate Social Responsibility
CSR ESG score from Thomson Reuters ESG index.
Corporate Social Responsibility alternate measure
CSR_COMB
ESG Combined score from Thomson Reuters ESG index.
Corporate Social Responsibility alternate measure
CSR_DUM
Dummy variable equals 1 if the from Thomson Reuters ESG score is greater than the median (by year and industry classification), and 0 otherwise
Mediating Variable Organization Capital
OC
Perpetual inventory method developed by Eisfeldt & Papanikolaou (2013): OCi,t = OCi,t-1 (1 - 0) + 𝑆𝐺𝐴𝑖,𝑡
𝑐𝑝𝑖 𝑡
Organization Capital alternate measure
OC_PT
Perpetual inventory method developed by Peters & Taylor (2017): OC_PTi,t = OC_PTi,t-1 (1 - 0) + SGAi,t
Control Variables
Firm Size
SIZE
Natural logarithm of market of market value of equity
Firm Leverage LEV Long-term debts divided by total assets
Firm Performance ADJROA Industry adjusted earnings before interest and tax scaled by lagged total assets
Research and Development Intensity RD Research and Development expense divided by total sales
Physical resources PR Capital intensity measured as total assets minus current assets divided by total assets.
Firm Growth opportunities MB Market to Book ratio
YEAR YEAR Dummy variables to control for the year effect. INDUSTRY IND Dummy variables to control for industry effect (two-digit SIC code).
Instrument variable (for 2SLS)
Industry median CSR
CSR_M
Following Nguyen et al. (2019), the industry median of CSR (based on Fama-French 48 industry classification) is used an instrument for CSR to address endogeneity.

121
4.7.6 Research Model - Maximum Likelihood Estimation
The mediation analysis approach by Baron and Kenny (1986) mediation is a long-standing and
commonly utilised method for testing mediation, involving estimation of three ordinary least
squares (OLS) regression equations. However, recent studies are trending towards using other
estimation methods such as structural equation models, 2SLS models, etc. (Shaver, 2005). One of
the constraints of the standard Baron and Kenny (1986) mediation analysis approach is that it is
based on the implicit assumption that the error terms in the first two regression equations are
uncorrelated (Shaver, 2005). However, any unobservable variable that may affect both the mediator
and the dependent variable (that is OC and EM) that is excluded from the OLS regression models
will cause the error terms in the equations to be correlated (Shaver, 2005). Consequently, the key
assumption of the models may be violated if the error terms are correlated, causing the estimates
to be biased and inconsistent (Shaver, 2005).
To address such concerns and check robustness of the findings, I employ structural equation
modelling (SEM). I use the Maximum Likelihood (ML) method as a SEM. SEM, also known as
simultaneous equation modelling, “is a collection of statistical techniques that allow a set of
relationships between one or more independent variables” (Ullman & Bentler, 2003, p. 661). While
a number of estimation techniques are available in SEM, the ML model is the most common default
technique in most statistical programs, and the most widely used technique under SEM (Ullman &
Bentler, 2003). A notable advantage of the ML method is that the method allows for correlations
between the error terms across the two equations (Cheung, 2016). The ML method is considered to
be a more appropriate technique particularly with large sample sizes. Ullman & Bentler (2003)
suggests that for sample sizes greater than 500 observations, the ML method is more appropriate
whereas for sample sizes smaller than 500 observations, the Generalized Least Squares technique
is more suitable. Since the present study has a large sample size (that is, 46,816 observations), the
ML technique is a reasonable choice.
I estimate equations (7) and (8) below, using ML estimation as SEM. Following prior studies, the ML
model consists of two equations (for example, see Cheung, 2016). Equation (7) examines how CSR
influences OC, while equation (8) examines how the OC influences EM. The presence of CSR in
equation (8) allows for the possibility that CSR may have a direct effect on EM, proxied by absolute
discretionary accruals. In this model, OC is a channel through which CSR effects EM indirectly.

122
OCit = 0 + 1CSRit + 2 SIZEit + 3LEVit + 4ADJROAit + 5RDit + 6PRit + Year & Industry dummies +it
(7)
EMit = 0 + 1OCit+ 2 CSRit + 3SIZEit + 4LEVit + 5ADJROAit + 6RDit + 7MBit + Year & Industry
dummies + it (8)
where
EMit = Earnings management in year t for firm i, proxied by discretionary accruals using the modified Jones model by Dechow et al. (1995);
OCit = Stock of organization capital in year t for firm i, divided by total assets following Eisfeldt & Papanikolaou (2013);
CSRit = The ESG score from Thomson Reuters ESG index in year t for firm i;
SIZEit = Firm size in year t for firm i, measured as the natural logarithm of market value of equity;
LEVit = Firm leverage in year t for firm i, measured as long-term debts divided by total assets;
ADJROAit = Industry-adjusted ROA in year t for firm i, measured as the industry median income before extraordinary items, scaled by lagged total assets, for each year and two-digit SIC code, subtracted from the focal firm;
RDit = Research and development intensity in year t for firm i, measured as research and development expenses divided by net sales;
PRit = Physical resources in year t for firm i, measured as total assets minus current assets, scaled by total assets;
MBit = Market to book ratio in year t for firm i.
Equations (7) and (8) are estimated as part of the hypotheses testing, to address research objective
1, and research questions 1.1 and 1.2. Both equations utilise dummy variables to control for the
effects of year and industry (using two-digit SIC codes). Many studies adopting SEM with ML
estimation use robust standard errors in their estimation (for example, see Cheung, 2016). Savalei
(2014) explains that using standard error estimates allow the researcher to estimate the variability
of the parameter estimates across repeated samples. The standard errors may be incorrect if they
are computed with inefficient estimators. In such cases, robust corrections can be used to correct
these incorrect standard errors and test statistics (Savalei, 2014). Thus, in order to avoid problems
of incorrect standard errors and test statistics, equations (7) and (8) are estimated with robust

123
standard errors. The analyses follow several steps, as discussed below. A summary of this discussion
is provided in Table 4.5.
Step 1: Tests for hypotheses H1.1a and H1.1b
In step 1 of the research analysis, I address research question 1.1 by examining the direct
relationship between CSR and EM. In this step, I test hypotheses H1.1a and H1.1b by estimating
equation (8).
The direct effect of CSR on EM is captured by the coefficient 2 in equation (8). If the coefficient 2
is statistically significant, it will address research question 1.1, suggesting that CSR has a significant
direct effect on EM. A positive and significant value on the coefficient 2 will provide support for
hypothesis H1.1a, suggesting a positive direct CSR-EM relationship, consistent with the managerial
myopia hypothesis; a negative and significant value on the coefficient 2 will provide support for
hypothesis H1.1b, suggesting a negative direct CSR-EM relationship, consistent with the myopia
avoidance hypothesis.
Step 2: Tests for hypothesis H1.2
To address research question 1.2 and examine the indirect relationship between CSR and EM via
OC, first I examine the two indirect paths involved in this indirect relationship. Thus, in step 2 of the
research analysis, I test the first indirect path, that is, the relationship between CSR and OC. In this
step, I test hypothesis H1.2 by estimating equation (7).
The effect of CSR on OC is captured by the coefficient 1 in equation (7). If the coefficient 1 is positive
and statistically significant, it will provide support for hypothesis H1.2, suggesting a positive
relationship between CSR and OC, consistent with the RBV theory.
Step 3: Tests for hypothesis H1.3
In step 3 of the research analysis, I test the second indirect path, that is, the relationship between
OC and. In this step, I test hypothesis H1.3 by estimating equation (8).
The effect of OC on EM is captured by the coefficient 1 in equation (7). If the coefficient 1 is positive
and statistically significant, it will provide support for hypothesis H1.3, suggesting a positive
relationship between OC and EM, consistent with the managerial myopia hypothesis.

124
Step 4: Tests for hypotheses H1.4a and H1.4b
In step 4 of the research analysis, I address research question 1.2 by examining the indirect
relationship between CSR and EM. In this step, I test hypotheses H1.4a and H1.4b by estimating
equations (7) and (8) together using SEM.
I use the SEM method for the mediation analysis, as the SEM method allows the total effect of CSR
on EM to be decomposed into direct and indirect effects. The direct effect of CSR on EM, as stated
earlier, is the CSR coefficient (2) from equation (8), while the indirect effect of CSR on EM is the
product of the CSR coefficient (1) from equation (7) and the OC coefficient (1) from equation (8)
(that is, 11). While the product of 11 provides the magnitude of the indirect relationship,
nevertheless it is essential to test for the statistical significance of the indirect relationship (Cheung,
2016). As noted by Cheung (2016), even if the coefficients of both 1 and 1 are statistically
significant when tested independently, it is still possible for the coefficients to be statistically
insignificant when test jointly. Given that the coefficients 1 and 1 are random variables, estimating
the standard error of the indirect effect may be appropriate (Cheung, 2016). A commonly used
method of estimating the standard error of the indirect effect, as proposed by Goodman (1960) is:
s(11) = √21𝑠2
1 + 21𝑠2
1 − 𝑠21𝑠2
1 (9)
The standard error estimation proposed by Goodman (1960) is based on the assumption that the
error terms are normally distributed. However, the multivariate delta method advised by Sobel
(1982, 1986) provides estimates with the least biasedness (Cheung, 2016). Thus, I follow Cheung
(2016) in using the multivariate delta method advised by Sobel (1982, 1986) to test the statistical
significance of the indirect effect. The multivariate delta method adopts a first-order Taylor
approximation to estimate the standard errors of the transformed random variables, 1 and 1
(Cheung, 2016).
The delta method assumes that the indirect effect, represented by the product of the coefficients
(11), is normally distributed when the sample size is large (Shrout & Bolger, 2002). However, the
delta method may not be reliable if the normality assumption is questionable (Cheung, 2016). Even
if the distribution of the variables 1 and 1 are normal, this does not substantiate that the product
(11) will also be normally distributed (Cheung, 2016). Prior studies have found the distribution of
the product (11) to be positively skewed for small sample sizes (Shrout & Bolger, 2002). Although

125
the present study uses a large sample size of 46,816 firm-year observations, I address the potential
issues related to the delta method by adopting the bootstrapping technique, consistent with prior
studies (for example, see Cheung, 2016; Shrout & Bolger, 2002) in addition to the delta method to
test the statistical significance of the indirect effect.
The bootstrapping method is a resampling technique that is commonly used when the assumptions
for other statistical methods are violated, such as the case of indirect effect not being normally
distributed (MacKinnon et al., 2004; Shrout & Bolger, 2002). The bootstrapping process involves
repeated sampling with replacement of the data (Brooks, 2014). This resampling process may be
considered as taking a sample from a sample, as the original sample is treated as a population from
which samples are drawn (Brooks, 2014). The original sample of N units is resampled with
replacement, and for each resample, the test statistic (that is, the indirect effect for the present
study) is estimated (Brooks, 2014; Cheung, 2016). This process is repeated k times before the test
statistic estimates are sorted from low to high. The sorted distribution provides the upper and lower
bounds of the confidence interval (Cheung, 2016). Following Cheung (2016), I set k = 1,000. The 95%
confidence interval is reported for the indirect effect. For interpreting the significance of the indirect
effect, I follow Cheung (2016), in that if zero lies within the confidence interval, the indirect effect
is not significant.
If the indirect effect coefficient (11) is statistically significant, it will address research question 1.2,
suggesting that CSR has a significant indirect effect on EM. A positive and significant value on the
coefficient 11 will provide support for hypothesis H1.4a, suggesting a positive indirect CSR-EM
relationship via OC, consistent with the managerial myopia hypothesis; a negative and significant
value on the coefficient 11 will provide support for hypothesis H1.4b, suggesting a negative
indirect CSR-EM relationship, consistent with the myopia avoidance hypothesis.

126
Table 0.5 Summary of Research Questions and Hypotheses Testing
Research Question Hypothesis Theory Expected sign
1.1. Does CSR have a significant direct effect on EM?
H1.1a: Consistent with the managerial myopia hypothesis, there is a positive and significant direct relationship between CSR and EM.
Managerial myopia hypothesis 2 = + (quation 8)
H1.1b: Consistent with the myopia avoidance hypothesis, there is a negative and significant direct relationship between CSR and EM.
Myopia avoidance hypothesis 2 = - (quation 8)
1.2. Does CSR have a significant indirect effect on EM via OC?
H1.2: Consistent with the RBV theory, there is a positive and significant relationship between CSR and OC. RBV theory 1 = + (Equation 7)
H1.3: Consistent with the managerial myopia hypothesis, there is a positive and significant relationship between OC and EM. Managerial myopia hypothesis 1 = + (quation 8)
H1.4a: Consistent to the managerial myopia hypothesis, there is a positive and significant indirect relationship between CSR and EM, via the mediator OC.
Managerial myopia hypothesis 11 = + (Equations 7 and 8)
H1.4b: Consistent with the myopia avoidance hypothesis, there is a negative and significant indirect relationship between CSR and EM, via the mediator OC.
Myopia avoidance hypothesis 11 = - (Equations 7 and 8)

127
4.7.7 Sensitivity Analysis
To test the sensitivity of the ML specification model with robust standard errors, I estimate the ML
specification of equations (7a) and (8a), with robust standard errors. Equations (7a) and (8a) are re-
estimations of equations (7) and (8) respectively, with the main variables (EM, CSR and OC) replaced
with their alternate specifications (EM_DD, CSR_COMB, OC_PT respectively).
OC_PTit = 0 + 1CSR_COMBit + 2 SIZEit + 3LEVit + 4ADJROAit + 5RDit + 6PRit + Year & Industry
dummies + it (7a)
EM_DDit =0 + 1OC_PTit+ 2 CSR_COMBit + 3SIZEit + 4LEVit + 5ADJROAit + 6RDit + 7MBit + Year &
Industry dummies + it (8a)
where
EM_DDit = Earnings management in year t for firm i, proxied by accruals quality model by Dechow & Dichev (2002);
OC_PTit = Alternate measure for Stock of organization capital in year t for firm i, divided by total assets following Peters & Taylor (2017);
CSR_COMBit = The ESG combined score from Datastream in year t for firm i;
SIZEit = Firm size in year t for firm i, measured as the natural logarithm of market value of equity;
LEVit = Firm leverage in year t for firm i, measured as long-term debts divided by total assets;
ADJROAit = Industry-adjusted ROA in year t for firm i, measured as the industry median of income before extraordinary items, scaled by lagged total assets, for each year and two-digit SIC code, subtracted from the focal firm;
RDit = Research and development intensity in year t for firm i, measured as research and development expenses divided by net sales;
PRit = Physical resources in year t for firm i, measured as total assets minus current assets, scaled by total assets;
MBit = Market to book ratio in year t for firm i.
Since the study uses 2 alternate measures for CSR, equations (7b) and (8b) are estimates using ML
specifications, with robust standard errors. Equations (7b) and (8b) are also re-estimations of
equations (7) and (8) respectively, with the main variables (EM, CSR and OC) replaced with their
alternate specifications (EM_DD, CSR_DUM, OC_PT respectively).

128
OC_PTit =0 + 1CSR_DUMit + 2SIZEit + 3LEVit + 4ADJROAit + 5RDit + 6PRit + Year & Industry
dummies + it (7b)
EM_DDit =0 + 1OC_PTit+ 2CSR_DUMit + 3SIZEit + 4LEVit + 5ADJROAit + 6RDit + 7MBit + Year &
Industry dummies + it (8b)
where
EM_DDit = Earnings management in year t for firm i, proxied by accruals quality model by Dechow & Dichev (2002);
OC_PTit = Alternate measure for Stock of organization capital in year t for firm i, divided by total assets following Peters & Taylor (2017);
CSR_DUMit = Dummy variable taking the value of 1 if the CSR score of the firm is greater
median CSR (is based on each year and industry), and 0 otherwise.
SIZEit = Firm size in year t for firm i, measured as the natural logarithm of market value of equity;
LEVit = Firm leverage in year t for firm i, measured as long-term debts divided by total assets;
ADJROAit = Industry-adjusted ROA in year t for firm i, measured as the industry median of income before extraordinary items, scaled by lagged total assets, for each year and two-digit SIC code, subtracted from the focal firm;
RDit = Research and development intensity in year t for firm i, measured as research and development expenses divided by net sales;
PRit = Physical resources in year t for firm i, measured as total assets minus current assets, scaled by total assets;
MBit = Market to book ratio in year t for firm i.
4.7.8 Accounting for Endogeneity – 2SLS Estimation
Prior studies suggest CSR may be endogenous (for example, see Almahrog et al., 2018; Bozzolan et
al., 2015; Cheung, 2016; Choi et al., 2013; Choi et al., 2018; Gao & Zhang, 2015; Gong & Ho, 2018;
Grougiou et al., 2014; Liu et al., 2017; Martínez‐Ferrero et al., 2015; Prior et al., 2008). Endogeneity
occurs when an independent variable is correlated with the error term (Bhandari et al., 2018). Such
correlation may cause the estimates to be inconsistent and biased (Bhandari et al., 2018). There
may be two sources of endogeneity issues in CSR engagement. First is a selection bias, arising from
the possibility that CSR engagement is likely to be influenced by management policies and other

129
internal factors, as opposed to being random decisions (Choi et al., 2018). These unobserved
variables that may affect CSR but are excluded from the regression models may be correlated with
the error terms in equations (7), and (8) (Cheung, 2016; Choi et al., 2018). The second source of
endogeneity may arise from a simultaneity problem (Choi et al., 2018). As evident from prior studies,
CSR and EM may affect each other (for example, see Choi et al., 2013; Choi et al., 2018; Choi & Pae,
2011; Grougiou et al., 2014; Martínez‐Ferrero et al., 2015). Furthermore, both CSR and EM have
common determinants in the form of firm characteristics, such as, firm size, leverage, market to
book ratio, return on assets, etc. (Bozzolan et al., 2015; Choi et al., 2018). As such, regression
estimations with either EM or CSR are subject to endogeneity (Choi et al., 2018).
Some prior studies have critiqued the approach of using lagged variables to address endogeneity
(for example, see Bellemare et al., 2017; Reed, 2015). Reed, (2015) explains that the approach using
lagged variables does not resolve the simultaneity issue. On the contrary, this approach may worsen
the problem by causing serial correlation (Reed, 2015). Bellemare et al., 2017 express concern about
the lack of a theoretical explanation behind using lagged independent variables to address
endogeneity. However, several prior studies advocate the use the 2SLS estimation technique with
instrumental variable(s) to address endogeneity (for example, see Bhandari et al., 2018; Bozzolan
et al., 2015; Grougiou et al., 2014). To address endogeneity issues where the independent variable
is correlated with the error term, 2SLS estimation with instrumental variables allow for consistent
estimation (Bhandari et al., 2018).
Thus, to address endogeneity, I use a 2SLS approach to re-estimate equations (7) and (8). Shaver
(2005) suggests that for a system of equations estimated using the 2SLS technique, at least one
explanatory variable from the first equation should be eliminated from the second equation.
Consistent with this, I drop LEV from equation (8). This choice is based on the results obtained from
estimating the original equation (8) using ML estimation method, discussed in greater detail in
Section 4.8.4. The results show that LEV is the only control variable that does not have a statistically
significant relationship with EM (that is, the dependent variable from equation 8). All other control
variables (namely, SIZE, ADJROA, RD and MB) have statistically significant relationships with EM at
the 1% level of significance. Since the 2SLS estimation requires me to drop one variable, I drop the
variable that does not have a statistically significant relationship with the dependent variable.
The first stage in the 2SLS estimation technique involves estimating the reduced form equation using
OLS, and saving the fitted values for the dependent variables (Brooks, 2014). In the first stage, the

130
endogenous variable is regressed against all other exogenous variables and the instrument (Fodio
et al., 2013). An instrumental variable is a variable that is correlated with the endogenous variable
but not with the error term (Shaver, 2005). Since the error term and the instrument are
uncorrelated, this estimation technique eliminates the problems concerned with simple OLS
estimation as discussed above (Shaver, 2005). Following, Nguyen et al. (2019), I use CSR_M as an
instrument. CSR_M is the median of CSR calculated for each Fama-French 48 industry grouping.
Nguyen et al. (2019) explain that a suitable instrument should be correlated with CSR, but not with
the dependent variable EM. Thus, following Nguyen et al. (2019), the choice of instrument in the
present study is based on the literature that suggests that firm-level CSR is closely linked to the
industry norm that is captured by the industry median CSR (for example, see Harjoto & Jo (2015)).
However, the industry CSR norm is unlikely to be linked to firm-level EM (the dependent variable).
In the first stage of the 2SLS estimation, I estimate the following equations, using the endogenous
variable (that is, CSR) as the dependent variable, regressed against the instrumental variable
(CSR_M) and all other control variables:
CSRit = 0+ 1CSR_Mit+ 2SIZEit + 3LEVit + 4ADJROAit + 5RDit + 6PRit + Year & Industry dummies + it (9a)
CSRit = 0+ 1CSR_Mit+ 2OCit + 3SIZEit + 4ADJROAit + 5RDit + 6MBit + Year & Industry dummies + it (10a)
where
CSRit = The ESG combined score from Datastream in year t for firm i;
CSR_M = Median of CSR calculated for each Fama-French 48 industry grouping.
OCit = Stock of organization capital in year t for firm i, divided by total assets;
SIZEit = Firm size in year t for firm i, measured as the natural logarithm of market value of equity;
LEVit = Firm leverage in year t for firm i, measured as long-term debts divided by total assets;
ADJROAit = Industry-adjusted ROA in year t for firm i, measured as the income before extraordinary items, scaled by lagged total assets, for each year and two-digit SIC code, subtracted from firm i;
RDit = Research and development intensity in year t for firm i, measured as research and development expenses divided by net sales;
PRit = Physical resources in year t for firm i, measured as total assets minus current assets, scaled by total assets;

131
MBit = Market to book ratio in year t for firm i.
In stage 2 of the 2SLS estimation technique, the endogenous variable (that is CSR) is replaced with
the fitted value of CSR obtained from the stage 1 estimations of equations (9a) and (10a) (see
Brooks, 2014). Thus, in stage 2, I estimate the following regression models:
OCit = 0+ 1CSR9ait + 2SIZEit + 3LEVit + 4ADJROAit + 5RDit + 6PRit +Year & Industry dummies + it
(9b)
where
OCit = Stock of organization capital in year t for firm i, divided by total assets;
CSR9ait = the estimate obtained from equation (9a) now incorporated as a predictor;
SIZEit = Firm size in year t for firm i, measured as the natural logarithm of market value of equity;
LEVit = Firm leverage in year t for firm i, measured as long-term debts divided by total assets;
ADJROAAit = Industry-adjusted ROA in year t for firm i, measured as the income before extraordinary items, scaled by lagged total assets, for each year and two-digit SIC code, subtracted from firm i;
RDit = Research and development intensity in year t for firm i, measured as research and development expenses divided by net sales;
PRit = Physical resources in year t for firm i, measured as total assets minus current assets, scaled by total assets.
EMit = 0+ 1OCit+ 2CSR9ait + 3SIZEit + 4ADJROAit + 5RDit + 6MBit +Year & Industry dummies + it
(10b)
where
EM it = Earnings management in year t for firm i, proxied by discretionary accruals using the modified Jones model by Dechow et al. (1995);
OCit = Stock of organization capital in year t for firm i, divided by total assets
CSR9ait = the estimate obtained from equation (9a) now incorporated as a predictor;
SIZEit = Firm size in year t for firm i, measured as the natural logarithm of market value of equity;

132
ADJROAit = Industry-adjusted ROA in year t for firm i, measured as the income before extraordinary items, scaled by lagged total assets, for each year and two-digit SIC code, subtracted from firm i;
RDit = Research and development intensity in year t for firm i, measured as research and development expenses divided by net sales;
MBit = Market to book ratio in year t for firm i.
To test the statistical significance of the indirect effect from the 2SLS estimation, I use the bootstrap
technique, with 1,000 replications, as discussed earlier.
4.8 Results and Findings
4.8.1 Descriptive Statistics
Table 4.6 presents the descriptive statistics for the key variables in the sample. The table shows the
number of observations, mean, median, maximum and minimum values and standard deviation of
the variables. The mean value for the dependent variable, EM is 0.0955. My measure of EM is based
on the absolute value of discretionary accruals following the discretionary accruals model by
(Dechow et al., 1995). Based on a randomly selected sample of 1,000 firm-year observations
between 1950 and 1991, the original study, Dechow et al. (1995) report the mean EM to be 0.002,
based on signed discretionary accruals. The mean EM in the present study is different from that
reported by Dechow et al. (1995) for three main reasons – 1) unlike Dechow et al. (1995), I use the
absolute value of discretionary accruals (not signed discretionary accruals); 2) the sample size in the
present study (that is, 46,816 observations in the full sample, and 27,208 observations with EM) is
much larger than the one used by Dechow et al. (1995) (1,000 observations); 3) the sample period
observed in the present study (the years 2012 to 2017) is significantly different from the period
observed by Dechow et al. (1995) (the years 1950 to 1991). The mean value for EM in the present
study (0.0955) falls within the range observed within prior studies. Among prior studies based on
US samples, the mean value of EM, based on absolute discretionary accruals, range from 0.04 (Litt
et al., 2013) to 0.2000 (Kim et al., 2012). The sample size and sample period observed in the present
study is different from both Litt et al. (2013) and Kim et al. (2012). While Litt et al. (2013) use a
sample of 2,095 observations between the period 2004 and 2006 inclusive, Kim et al. (2012) use a
sample of 18,160 observations between the period 1991 and 2009 inclusive. Furthermore, both Litt
et al. (2013) and Kim et al. (2012) use the performance adjusted modified Jones model as suggested
by Kothari et al. (2005), while I use the original modification of the Jones model as suggested by
Dechow et al. (1995). All these factors may have contributed to the mean value of my EM measure

133
being different from prior studies. However, this is not of concern, as the mean EM in this study falls
within the range of mean EM observed among previous studies. Other recent studies, based on US
samples, also report mean discretionary accruals-based EM, within the range described above. For
example, Guillamón-Saorín et al. (2018) and Buchholz et al. (2020) report mean values of
discretionary accruals to be 0.0410 and 0.1500 respectively.
The alternate EM specification, EM_DD, has a mean value at 0.4717. EM_DD is measured as the
standard deviation of the residual of the accruals quality model by Dechow & Dichev (2002). Dechow
& Dichev (2002) report the mean value of EM_DD to be 0.028, based on 15,234 firm-year
observations between 1987 and 1999. As discussed above, the difference in the mean values of
EM_DD reported in the present study may be attributed to the fact that the present study uses a
larger sample (that is, 46,816 observations in the full sample, and 27,383observations with EM_DD)
and observes a different sample period (that is, the years 2012 to 2017) than that observed by
Dechow & Dichev (2002). It should be noted that although the sample period for the present study
is 2012 to 2017, the EM_DD measure is based on data from 2009 to 2017, since EM_DD is based on
a 5-year standard deviation of the residual. For similar reasons as described above, the mean
EM_DD reported by Hong & Andersen (2011), 0.0400, is also quite different to the present study.
Hong & Andersen (2011) uses a sample of 10,193 firm-year observations from 1995 to 2005
inclusive. However, the mean EM_DD reported in the present study is consistent with another
recent study, Herly et al. (2020) that reports a mean EM_DD of 0.4741 among firms with accounting
restatements,19 and a mean EM_DD of 0.4615 among firms with no accounting restatements, based
on a sample of 4,187 firms between 2000 and 2014.
The independent variable, CSR, has a mean value of 0.5264, suggesting that on average firms have
above 53% on their overall CSR score. The alternate specification of the independent variable,
CSR_COMB, has a mean value of 0.4517, suggesting that on average firms have 45% CSR score when
controversies are deducted. The second alternate specification of the independent variable,
CSR_DUM has a mean value of 0.2178, suggesting that on average 22% of the firms have CSR scores
higher than the median CSR score for the industry and year, while the remaining 78% firms have
CSR score lower than the median. It should be noted that the mean value of CSR largely depends on
the CSR measure used, and particularly the data source used to obtain CSR scores. Thus, several
prior studies report different CSR mean values. For example, Kim et al. (2012) and Gao & Zhang
19 Accounting restatement is defined as a correction of errors or inappropriate information in the financial statements, resulting from unintentional mistake, fraud, or a misapplication of the accounting standards (Herly et al., 2020)

134
(2015), using the Kinder, Lydenberg, and Domini (KLD) database, report the CSR mean to be -0.0550,
and 0.0590 respectively. In contrast, Hussain et al. (2018) report mean values of each of the CSR
dimensions, that is, the economic, social and environmental dimensions, as 0.4120, 0.4680 and
0.4530 respectively, using a CSR index drawn from information in annual reports/CSR reports from
100 US firms, and developing an index based on Global Reporting Initiatives (GRI) - G3 guidelines.
Although my mean values of CSR and CSR_COMB are quite close to the individual CSR dimensions
means reported by Hussain et al. (2018), I use Thomson Reuters ESG index database to obtain CSR
scores. The mean CSR and CSR_COMB in the present study is consistent with Drempetic et al. (2019),
who obtained their CSR scores from the Thomson Reuters database. Using a sample of 27,545 firm-
year observations from US firms, Drempetic et al. (2019) report the mean CSR to be 0.5470.
The mean value for the mediating variable, OC, is 0.1884. OC is measured following the approach
suggested by Eisfeldt & Papanikolaou (2013). The mean OC in the present study is consistent with
prior studies using the same approach to measure OC. For example, using a sample of 143,052 firm-
year observations from US firms, Marwick et al. (2020) report mean OC to be 0.2000. Consistently,
using a sample of 145,979 firm-year observations from 40 countries, Habib et al. (2020b) report a
mean OC of 0.2500. The alternate specification of the mediator, OC_PT, has a mean value of 1.3110.
This is close to the mean OC of 1.7500 reported by Hasan & Cheung (2018).
As for the control variables, the mean value for SIZE is 13.7756, the mean for LEV is 0.2133, the
mean for ADJROA and RD are -0.0323 and 0.1544 respectively, and the mean for PR and MB are
0.5671 and 3.3062 respectively.

135
Table 0.6 Descriptive Statistics
The table reports the summary statistics (number of observations, mean, median, minimum and maximum values, and the standard deviation) of the key variables for the period 2002 to 2017. EM and EM_DD are the two alternate measures of the dependent variable. EM refers to earnings management, proxied by discretionary accruals using the modified Jones model by Dechow et al. (1995). EM_DD refers to alternate earnings management specification, proxied by accruals quality model by Dechow & Dichev (2002). CSR, CSR_COMB and CSR_DUM are the alternate measures of the independent variable. CSR is the ESG score obtained from Thomson Reuters, CSR_COMB is the ESG combined score from Thomson Reuters, and CSR_DUM OC is dummy variable taking the value of 1 if the CSR score of the firm is greater median CSR (is based on each year and industry), and 0 otherwise. OC and OC_PT are the two alternate measures for the mediator, organisation capital. OC is the stock of organisation capital scaled by total assets. The stock of organisation capital is measured by accumulating the deflated value of SG&A expenses, consistent with Eisfeldt & Papanikolaou (2013). OC_PT Is the alternate measure of organisational capital following Peters & Taylor (2017). SIZE, LEV, ADJROA, RD PR and MB are the control variables. SIZE refers to firm size, measured as the natural logarithm of market value of equity. LEV is defined as long-term debts divided by total assets. ADJROA is measured as the income before extraordinary items, scaled by lagged total assets, for each year and two-digit SIC code, subtracted from the focal firm. RD refers to R&D intensity, measured as R&D expenses divided by net sales. PR represents physical resources, measured as total assets minus current assets, scaled by total assets. MB is the market to book ratio. Panel A: Full sample - Descriptive Statistics
N Mean Median Minimum Maximum Std. Dev. Dependent variables EM 27,208 0.0955 0.0461 0.0006 1.0768 0.1566 EM_DD 27,383 0.4717 0.0619 0.0000 13.5023 1.7895 Independent variables CSR 20,784 0.5264 0.5203 0.0000 0.9756 0.1757 CSR_COMB 20,784 0.4517 0.4261 0.1672 0.8378 0.1551 CSR_DUM 46,817 0.2178 0.0000 0.0000 1.0000 0.4128 Mediating variables OC 37,651 0.1884 0.0490 0.0000 1.9364 0.3378 OC_PT 37,651 1.3110 0.7013 0.0014 19.3431 2.4410 Control variables SIZE 35,428 13.7756 13.7889 8.9270 17.9589 1.7848 LEV 37,423 0.2133 0.1857 0.0000 0.9515 0.1971 ADJROA 46,816 -0.0323 -0.0160 -0.9742 0.2976 0.1575 RD 37,566 0.1544 0.0000 0.0000 6.6791 0.7723 PR 37,147 0.5671 0.5893 0.0228 0.9631 0.2392 MB 33,218 3.3062 2.3300 -16.6100 33.1800 5.2143

136
4.8.2 Correlation
Table 4.7 illustrates the Pearson’s correlation matrix for the main variables. The main dependent
variable, EM, is negatively and significantly correlated with CSR (-0.1049), CSR_COMB (-0.0513), and
CSR_DUM (-0.1179) at the 1% level of significance. The alternate specification of the dependent
variable, EM_DD, is also negatively and significantly correlated with CSR (-0.0448) at the 1% level of
significance, and with CSR_DUM (-0.0111) at the 10% level of significance, but not significantly
correlated with CSR_COMB. The mediating variable, OC, has a positive and significant correlation
with EM (0.0269), but a negative and significant correlation EM_DD (-0.0728) at the 1% level of
significance. OC is negatively and significantly correlated with CSR_DUM (-0.1019) at the 1% level of
significance, and with CSR_COMB (-0.0137) at the 10% level of significance, but not significantly
correlated with CSR. The alternate specification of the mediator, OC_PT, has a positive and
significant correlation with EM (0.1240) at the 1% level of significance, but no significant correlation
with EM_DD. OC_PT has negative and significant correlations with all three measures of the
independent variable, that is CSR (-0.0422), CSR_COMB (-0.0330) and CSR_DUM (-0.1290), at the
1% level of significance.
The control variable SIZE is negatively and significantly correlated with EM (-0.2532), EM_DD (-
0.0839), OC (-0.2135) and OC_PT (-0.3979) at the 1% level of significance. SIZE has positive and
significant correlations with CSR (0.4961), CSR_COMB (0.1874) and CSR_DUM (0.5059) at the 1%
level of significance. The control variable LEV has negative and significant correlations with EM (-
0.3364), EM_DD (-0.0701), OC (-0.0543) and OC_PT (-0.2028) at the 1% level of significance. LEV has
positive and significant correlations with CSR (0.0988), CSR_COMB (0.0717) and CSR_DUM (0.1228)
at the 1% level of significance. ADJROA is positively and significantly correlated with EM (0.2883),
EM_DD (0.1199), OC (0.0636) and OC_PT (0.1279) at the 1% level of significance. ADJROA is
negatively and significantly correlated with CSR (-0.0631), CSR_COMB (-0.0255) and CSR_DUM (-
0.0609) at the 1% level of significance. RD has strong negative and significant correlations with EM
(-0.1174), EM_DD (-0.0588), OC (-0.1177) and OC_PT (-0.1410) at the 1% level of significance. RD is
also negatively and significantly correlated with CSR (-0.0518) and CSR_COMB (-0.0400), but
positively and significantly correlated with CSR_DUM (0.0258) at the 1% level of significance. The
control variable, PR, is negatively and significantly correlated with EM (-0.2781), EM_DD (-0.1339),
OC (-0.2135) and OC_PT (-0.2763) at the 1% level of significance. PR has positive and significant
correlations with CSR (0.0768), CSR_COMB (0.0282) and CSR_DUM (0.1230) at the 1% level of
significance. MB has positive and significant correlations with EM (0.0852), EM_DD (0.0182), OC

137
(0.0241) and OC_PT (0.0487) at the 1% level of significance. MB has a negative and significant
correlation with CSR (-0.0182) at the 5% level of significance, but no significant correlations with
CSR_COMB and CSR_DUM.

138
Table 0.7 Correlation Matrix The table presents the Pearson’s correlation matrix between the key variables. EM and EM_DD are the two alternate measures of the dependent variable. EM refers to earnings management, proxied by Discretionary accruals using the modified Jones model by Dechow et al. (1995). EM_DD refers to alternate earnings management specification, proxied by accruals quality model by Dechow & Dichev (2002). CSR, CSR_COMB and CSR_DUM are the alternate measures of the independent variable. CSR is the ESG score obtained from Thomson Reuters, CSR_COMB is the ESG combined score from Thomson Reuters, and CSR_DUM is dummy variable taking the value of 1 if the CSR score of the firm is greater median CSR (is based on each year and industry), and 0 otherwise. OC and OC_PT are the two alternate measures for the mediator, organisation capital. OC is the stock of organisation capital scaled by total assets. The stock of organisation capital is measured by accumulating the deflated value of SG&A expenses, consistent with Eisfeldt & Papanikolaou (2013). OC_PT is the alternate measure of organisational capital following Peters & Taylor (2017). SIZE, LEV, ADJROA, RD PR and MB are the control variables. SIZE refers to firm size, measured as the natural logarithm of market value of equity. LEV is defined as long-term debts divided by total assets. ADJROA is measured as the income before extraordinary items, scaled by lagged total assets, for each year and two-digit SIC code, subtracted from the focal firm. RD refers to R&D intensity, measured as R&D expenses divided by net sales. PR represents physical resources, measured as total assets minus current assets, scaled by total assets. MB is the market to book ratio. 1 2 3 4 5 6 7 8 9 10 11 12 13 1 EM 1 2 EM_DD 0.1966*** 1 3 CSR -0.1049*** -0.0448*** 1 4 CSR_COMB -0.0513*** -0.0093 0.7140*** 1 5 CSR_DUM -0.1179*** -0.0111* 0.7913*** 0.5854*** 1 6 OC 0.0269*** -0.0728*** -0.0048 -0.0137* -0.1019*** 1 7 OC_PT 0.1240*** -0.0061 -0.0422*** -0.0330*** -0.1290*** 0.4143*** 1 8 SIZE -0.2532*** -0.0839*** 0.4961*** 0.1874*** 0.5059*** -0.2135*** -0.3979*** 1 9 LEV -0.3364*** -0.0701*** 0.0988*** 0.0717*** 0.1228*** -0.0543*** -0.2028*** 0.2912*** 1 10 ADJROA 0.2883*** 0.1199*** -0.0631*** -0.0255*** -0.0609*** 0.0636*** 0.1279*** -0.2180*** -0.4962*** 1 11 RD -0.1174*** -0.0588*** -0.0518*** -0.0400*** 0.0258*** -0.1177*** -0.1410*** 0.0934*** -0.0065 -0.0900*** 1 12 PR -0.2781*** -0.1339*** 0.0768*** 0.0282*** 0.1230*** -0.2135*** -0.2763*** 0.3656*** 0.2079*** -0.2658*** 0.4047*** 1 13 MB 0.0852*** 0.0182*** -0.0182** -0.0066 0.0074 0.0241*** 0.0487*** -0.2897*** 0.0132** 0.0663*** -0.0780*** -0.1506*** 1 ***, **, and * indicate statistical significance at the 1%, 5%, and 10% levels, respectively

139
4.8.3 Test of Multicollinearity
A strong linear relationship between two or more independent variables gives rise to
multicollinearity problems. Multicollinearity issues may arise if the independent variables have a
correlation coefficient higher than 0.80 (Gujarati, 2009). The variation inflation factor (VIF) may
detect possible multicollinearity in the research models. As a general rule of thumb a VIF value of
10 or above indicates the existence of multicollinearity (Takezawa, 2014). The variables used in the
present study do not appear to suffer from multicollinearity problems as evident through variation
inflation factors (VIF) values being far below the threshold of 10 for all regression models. Table 4.8
shows the results of the VIF analysis of all regression models used in the present study.
Columns (1) and (2) of Table 4.8 report the VIF results of equations (7) and (8) respectively. Equation
(7) has a mean VIF of 1.88 (the values ranging from 1.16 to 5.16); and equation (8) has a mean VIF
of 1.87 (the values ranging from 1.13 to 5.53. Columns (3) and (4) report the VIF results of equations
(7a) and (8a) respectively. Equation (7a) has a mean VIF of 1.87 (the values ranging from 1.08 to
5.17); and equation (8a) has a mean VIF of 1.84 (the values ranging from 1.09 to 5.52); Columns (5)
and (6) report the VIF results of equations (7b) and (8b) respectively. Equation (7b) has a mean VIF
of 1.76 (the values ranging from 1.11 to 4.4); and equation (8b) has a mean VIF of 1.71 (the values
ranging from 1.08 to 4.84).

140
Table 0.8 Multicollinearity Test Results The table reports the results of the multicollinearity tests based on estimating the variation inflation factor (VIF). Columns (1) and (2) present the VIF results for equations (7) and (8) respectively; Columns (3) and (4) present the VIF results for equations (7a) and (8a) respectively; and Columns (5) and (6) present the VIF results for equations (7b) and (8b) respectively. OC, the mediator, is the stock of organisation capital scaled by total assets. The stock of organisation capital is measured by accumulating the deflated value of SG&A expenses, consistent with Eisfeldt & Papanikolaou (2013). OC_PT Is the alternate measure of organisational capital following Peters & Taylor (2017). CSR is the ESG score from Thomson Reuters. CSR_COMB and CSR_DUM, are the alternate specifications for the main independent variable. CSR_COMB is the ESG combined score from Thomson Reuters, CSR_DUM is dummy variable taking the value of 1 if the CSR score of the firm is greater median CSR (is based on each year and industry), and 0 otherwise. SIZE refers to firm size, measured as the natural logarithm of market value of equity. LEV is defined as long-term debts divided by total assets. ADJROA is measured as the income before extraordinary items, scaled by lagged total assets, for each year and two-digit SIC code, subtracted from the focal firm. RD refers to R&D intensity, measured as R&D expenses divided by net sales. PR represents physical resources, measured as total assets minus current assets, scaled by total assets. MB is the market to book ratio. Year dummies include a set of dummy variables to capture year effects. Industry dummies include a set of dummy variables to capture industry effects, based on 2-digit SIC codes.
Variation Inflation factor (VIF) (1) (2) (3) (4) (5) (6) Equation
(7) Equation (8) Equation (7a) Equation (8a) Equation (7b) Equation
(8b) Independent variables OC 2.02 OC_PT 1.43 1.33 CSR 1.45 1.56 CSR_COMB 1.08 1.09 CSR_DUM 1.43 1.5 LAGCSR SIZE 1.91 2.18 1.49 1.67 1.83 2.15 LEV 1.43 1.32 1.42 1.37 1.42 1.34 ADJROA 1.34 1.4 1.34 1.42 1.45 1.56 RD 1.54 1.57 1.53 1.56 1.59 1.67 MB 1.36 1.32 1.27 PR 2.1 2.08 2.19 Year dummies Dum 1 (2003) 1.28 1.57 1.28 1.18 1.8 1.42 Dum 2 (2004) 1.29 1.42 1.28 1.18 1.82 1.42 Dum 3 (2005) 1.4 1.43 1.39 1.24 1.84 1.44 Dum 4 (2006) 1.45 1.44 1.45 1.29 1.85 1.47 Dum 5 (2007) 1.45 1.38 1.45 1.31 1.86 1.51 Dum 6 (2008) 1.48 1.35 1.48 1.32 1.86 1.52 Dum 7 (2009) 1.55 1.36 1.55 1.35 1.84 1.5 Dum 8 (2010) 1.6 1.4 1.6 1.4 1.85 1.51 Dum 9 (2011) 1.64 1.51 1.65 1.49 1.87 1.57 Dum 10 (2012) 1.65 1.54 1.65 1.53 1.88 1.61 Dum 11 (2013) 1.64 1.55 1.64 1.55 1.89 1.64 Dum 12 (2014) 1.65 1.58 1.65 1.56 1.92 1.68 Dum 13 (2015) 1.64 1.62 1.64 1.59 1.93 1.78 Dum14 (2016) 1.79 1.75 1.79 1.76 1.91 1.84 Dum15 (2017) 1.95 1.89 1.95 1.91 1.9 1.85 Industry dummies Dum 1 (sic = 12) 2.16 2.27 2.16 2.29 1.74 1.86 Dum 2 (sic = 13) 1.27 1.24 1.27 1.25 1.17 1.15 Dum 3 (sic = 14) 3.6 3.51 3.59 3.48 2.79 2.68 Dum 4 (sic = 15) 1.19 1.16 1.19 1.14 1.11 1.08 Dum 5 (sic = 16) 2.03 2.02 2.02 2.02 1.64 1.66 Dum 6 (sic = 20) 1.16 1.13 1.16 1.13 1.19 1.19 Dum 7 (sic = 21) 3.24 3.16 3.24 3.13 2.53 2.55 Dum 8 (sic = 23) 1.3 1.24 1.31 1.24 1.16 1.14 Dum 9 (sic = 24) 1.37 1.32 1.37 1.33 1.25 1.21 Dum 10 (sic = 25) 1.17 1.14 1.17 1.15 1.17 1.11

141
Dum 11 (sic = 26) 1.2 1.2 1.2 1.19 1.22 1.2 Dum 12 (sic = 27) 1.7 1.57 1.7 1.59 1.47 1.37 Dum 13 (sic = 28) 1.82 1.69 1.82 1.66 1.49 1.42 Dum 14 (sic = 29) 5.14 5.37 5.14 5.49 4.16 4.63 Dum 15 (sic = 30) 2.08 2.1 2.08 2.09 1.58 1.66 Dum 16 (sic = 32) 1.4 1.36 1.4 1.35 1.29 1.28 Dum 17 (sic = 33) 1.47 1.47 1.47 1.48 1.35 1.33 Dum 18 (sic = 34) 2.07 2.12 2.07 2.12 1.78 1.83 Dum 19 (sic = 35) 1.64 1.59 1.64 1.57 1.57 1.49 Dum 20 (sic = 36) 3.6 3.69 3.6 3.66 2.78 2.92 Dum 21 (sic = 37) 4.29 4.82 4.29 4.82 3.53 4.12 Dum 22 (sic = 38) 2.96 3.06 2.96 3.05 2.34 2.4 Dum 23 (sic = 39) 3.43 3.44 3.43 3.5 2.98 3.2 Dum 24 (sic = 42) 1.25 1.23 1.25 1.24 1.19 1.17 Dum 25 (sic = 44) 1.41 1.43 1.41 1.43 1.43 1.4 Dum 26 (sic = 45) 1.36 1.36 1.36 1.35 1.29 1.26 Dum 27 (sic = 47) 1.72 1.74 1.73 1.74 1.56 1.67 Dum 28 (sic = 48) 1.24 1.26 1.23 1.25 1.16 1.18 Dum 29 (sic = 49) 3.94 4.1 3.93 4.04 2.85 3.11 Dum 30 (sic = 50) 4.68 4.61 4.67 4.56 3.56 3.54 Dum 31 (sic = 51) 1.71 1.58 1.7 1.54 1.58 1.42 Dum 32 (sic = 52) 1.54 1.5 1.54 1.53 1.43 1.4 Dum 33 (sic = 53) 1.34 1.36 1.34 1.37 1.16 1.19 Dum 34 (sic = 54) 1.64 1.58 1.64 1.68 1.32 1.34 Dum 35 (sic = 55) 1.52 1.51 1.52 1.53 1.31 1.34 Dum 36 (sic = 56) 1.29 1.25 1.28 1.22 1.24 1.17 Dum 37 (sic = 57) 1.54 1.58 1.54 1.61 1.44 1.49 Dum 38 (sic = 58) 1.29 1.33 1.3 1.31 1.19 1.18 Dum 39 (sic = 59) 1.61 1.59 1.62 1.62 1.59 1.51 Dum 40 (sic = 70) 1.69 1.67 1.69 1.68 1.54 1.54 Dum 41 (sic = 72) 1.55 1.5 1.54 1.5 1.41 1.38 Dum 42 (sic = 73) 1.19 1.18 1.19 1.19 1.16 1.14 Dum 43 (sic = 75) 5.16 5.53 5.17 5.52 4.4 4.84 Dum 44 (sic = 78) 1.18 1.14 1.18 1.15 1.13 1.11 Dum 45 (sic = 79) 1.2 1.14 1.2 1.15 1.14 1.11 Dum 46 (sic = 80) 1.28 1.23 1.28 1.24 1.26 1.28 Dum 47 (sic = 82) 1.67 1.6 1.67 1.58 1.58 1.56 Dum 48 (sic = 87) 1.29 1.35 1.29 1.36 1.24 1.29 Mean VIF 1.88 1.87 1.87 1.84 1.76 1.71
4.8.4 Results of ML Estimation of Equations (7) and (8)
To address research objective 1, I test the direct relationship between CSR and EM, and the indirect
relationship between CSR and EM, via the mediating channel OC. To this end, I test the hypotheses,
outlined earlier, by estimating equations (7) and (8), using SEM with ML method. The equations are
estimated using robust standard errors. Table 4.9 shows the results. Panel A of Table 4.9 shows the
results of the relationship between CSR and OC (Column 1), and the direct effect of CSR on EM
(Column 2), while Panel B shows the results of the indirect effect of CSR on EM via OC. The discussion
of the results in this section is ordered in accordance with the four steps outlined in Section 4.7.6.
Thus, I first discuss the results on hypothesis H1.1 (the direct relationship between CSR and EM),

142
followed by the results of hypothesis H1.2 and H1.3 (the relationships between CSR and OC, and
between OC and EM respectively). Finally, I discuss the results on hypothesis H1.4 (the indirect
relationship between CSR and EM via OC). Since equations (7) and (8) are estimated together, using
SEM with ML method, the presentation of the results in the table are consistent with the equations,
rather than the hypotheses.
Table 0.9 ML Estimation Output of Equations (7) and (8) The table presents the ML estimation results of equations (7) and (8). Panel A presents the direct effects by estimating equations (7) and (8) individually in Columns (1) and (2) respectively. Robust standard errors are presented in parenthesis within Panel A. Panel B reports the joint results of OC as a channel between the CSR and EM relationship. The standard errors of the indirect relationship in Panel B, are estimated using the delta method and the bootstrapping technique with 1,000 replications. Panel B Column (1) reports the size of the indirect effect; Columns (2) and (3) show the delta method standard errors and p values respectively; Columns (4) and (5) show the bootstrap standard error and the bias-corrected percentile bootstrap confidence interval respectively. EM refers to earnings management, proxied by discretionary accruals using the modified Jones model by Dechow et al. (1995). CSR is the ESG score obtained from Thomson Reuters. OC is the stock of organisation capital scaled by total assets. The stock of organisation capital is measured by accumulating the deflated value of SG&A expenses, consistent with Eisfeldt & Papanikolaou (2013). SIZE refers to firm size, measured as the natural logarithm of market value of equity. LEV is defined as long-term debts divided by total assets. ADJROA is measured as the income before extraordinary items, scaled by lagged total assets, for each year and two-digit SIC code, subtracted from the focal firm. RD refers to R&D intensity, measured as R&D expenses divided by net sales. PR represents physical resources, measured as total assets minus current assets, scaled by total assets. MB is the market to book ratio. The model includes a set of dummy variables to capture year and industry effects. Panel A: Direct effect
Variables (1) (2)
OC (Equation 7)
EM (Equation 8)
CONSTANT 0.1788*** (0.0157)
0.1844*** (0.0274)
OC 0.9533*** (0.1088)
CSR 0.0830*** (0.0084)
-0.1074*** (0.0141)
SIZE -0.0121*** (0.0011)
0.0085*** (0.0021)
LEV -0.0281*** (0.0092)
0.0104 (0.0123)
ADJROA 0.0226* (0.0124)
-0.0860*** (0.0150)
RD -0.0092*** (0.0026)
0.0308*** (0.0031)
PR -0.0898*** (0.0082)
MB 0.0009*** (0.0002)
Year effects Yes Yes
Industry effects Yes Yes
Var matrix
OC 0.0217
EM 0.0307
N 14,845 14,845
Adjusted R2 0.5079 -1.4888
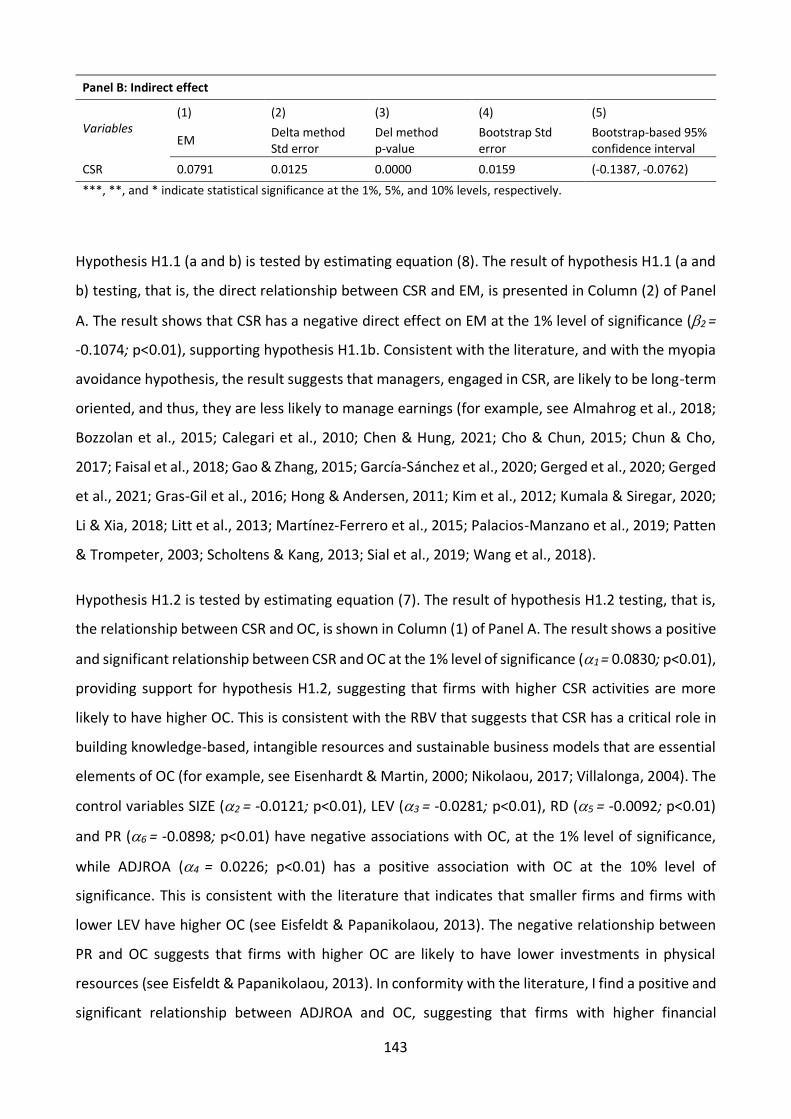
143
Panel B: Indirect effect
Variables (1) (2) (3) (4) (5)
EM Delta method Std error
Del method p-value
Bootstrap Std error
Bootstrap-based 95% confidence interval
CSR 0.0791 0.0125 0.0000 0.0159 (-0.1387, -0.0762) ***, **, and * indicate statistical significance at the 1%, 5%, and 10% levels, respectively.
Hypothesis H1.1 (a and b) is tested by estimating equation (8). The result of hypothesis H1.1 (a and
b) testing, that is, the direct relationship between CSR and EM, is presented in Column (2) of Panel
A. The result shows that CSR has a negative direct effect on EM at the 1% level of significance (2 =
-0.1074; p<0.01), supporting hypothesis H1.1b. Consistent with the literature, and with the myopia
avoidance hypothesis, the result suggests that managers, engaged in CSR, are likely to be long-term
oriented, and thus, they are less likely to manage earnings (for example, see Almahrog et al., 2018;
Bozzolan et al., 2015; Calegari et al., 2010; Chen & Hung, 2021; Cho & Chun, 2015; Chun & Cho,
2017; Faisal et al., 2018; Gao & Zhang, 2015; García‐Sánchez et al., 2020; Gerged et al., 2020; Gerged
et al., 2021; Gras-Gil et al., 2016; Hong & Andersen, 2011; Kim et al., 2012; Kumala & Siregar, 2020;
Li & Xia, 2018; Litt et al., 2013; Martínez‐Ferrero et al., 2015; Palacios-Manzano et al., 2019; Patten
& Trompeter, 2003; Scholtens & Kang, 2013; Sial et al., 2019; Wang et al., 2018).
Hypothesis H1.2 is tested by estimating equation (7). The result of hypothesis H1.2 testing, that is,
the relationship between CSR and OC, is shown in Column (1) of Panel A. The result shows a positive
and significant relationship between CSR and OC at the 1% level of significance (1 = 0.0830; p<0.01),
providing support for hypothesis H1.2, suggesting that firms with higher CSR activities are more
likely to have higher OC. This is consistent with the RBV that suggests that CSR has a critical role in
building knowledge-based, intangible resources and sustainable business models that are essential
elements of OC (for example, see Eisenhardt & Martin, 2000; Nikolaou, 2017; Villalonga, 2004). The
control variables SIZE (2 = -0.0121; p<0.01), LEV (3 = -0.0281; p<0.01), RD (5 = -0.0092; p<0.01)
and PR (6 = -0.0898; p<0.01) have negative associations with OC, at the 1% level of significance,
while ADJROA (4 = 0.0226; p<0.01) has a positive association with OC at the 10% level of
significance. This is consistent with the literature that indicates that smaller firms and firms with
lower LEV have higher OC (see Eisfeldt & Papanikolaou, 2013). The negative relationship between
PR and OC suggests that firms with higher OC are likely to have lower investments in physical
resources (see Eisfeldt & Papanikolaou, 2013). In conformity with the literature, I find a positive and
significant relationship between ADJROA and OC, suggesting that firms with higher financial

144
performance have higher OC (see Eisfeldt & Papanikolaou, 2013).
Hypothesis H1.3 is tested by estimating equation (8). The result of hypothesis H1.3 testing, that is,
the relationship between OC and EM, is shown in Column (1) of Panel A. The results indicate a
positive relationship between OC and EM at the 1% level of significance (1 = 0.9533; p<0.01),
providing support for hypothesis H1.3. Consistent with prior studies, and the managerial myopia
hypothesis, I find that firms with higher OC are more likely to manage earnings for short-term
benefits (for example, see Francis et al., 2008; Malmendier & Tate, 2009). The results regarding
controls variables show that SIZE (3 = 0.0085; p<0.01), RD (6 = 0.0308; p<0.01) and MB (7 = 0.0009;
p<0.01) are positively related to EM at the 1% level of significance, while ADJROA is negatively
related to EM at the 1% level of significance (5 = -0.0860; p<0.01). However, LEV (4 = 0.0104;
p<0.01) does not have a statistically significant relationship with EM. This is mostly consistent with
the literature that suggest that firms with higher R&D expenses, high growth opportunities, and
lower financial performance, may manage more earnings (for example, see Cho & Chun, 2015; Kim
et al., 2012; Roychowdhury, 2006).
Hypothesis H1.4 (a and b) is tested by estimating equations (7) and (8). The result of hypothesis H1.4
testing, that is, the indirect relationship between CSR and EM via OC, is shown in Panel B of Table
4.9. As shown in Column (1), the size of the indirect effect is 0.0791. The size of the indirect effect
is calculated as the product of 1 (that is, the coefficient of CSR from equation (8)) and 1 (that is,
the coefficient of OC from equation (8)). The coefficients 1 (0.0830) and 1 (0.9533) are individually
shown in Panel A. Thus, the size of the indirect effect is 0.0791 (i.e., 1 x 1 = 0.0830 x 0.9533). The
positive coefficient suggests a positive indirect relationship between CSR and OC, via the mediator
OC. The statistical significance of the indirect effect is determined in two ways – 1) the delta method,
2) the bootstrapping technique. Panel B Columns (2) and (3) show the standard error and p-values
for the indirect effect using the delta method. This suggests a strong positive indirect effect of CSR
on EM via the mediating channel OC at the 1% level of significance (p < 0.01). Panel B Columns (4)
and (5) present the standard error and the 95% confidence interval using the bootstrap technique
with 1,000 replications. The results using the bootstrap technique also confirm the positive indirect
effect of CSR on EM via OC. The bootstrap-based 95% confidence interval reports the lower and
upper bound limits to be -0.1387 and -0.0762 respectively. Since zero does not fall between the
lower and upper bound limits of the confidence interval, this suggests that the indirect effect is
statistically significant at least at the 5% (1 - 𝛼) level of significance. Thus, the results support

145
hypothesis H1.4b, suggesting that managers engaged in CSR may indirectly manage more earnings
via OC. This is consistent with the managerial myopia hypothesis.
Overall, the results from estimating equations (7) and (8) suggest that CSR has a negative direct
effect on EM, but a positive indirect effect on EM via OC. Figure 4.3 below is a snapshot of the results
as discussed in the preceding paragraphs. The size of the direct effect of CSR on EM is -0.1074, while
the size of the indirect effect of CSR on EM via the mediator OC is 0.0791. Thus, the size of the total
effect of CSR on EM, calculated as the sum of the direct and indirect effects, is -0.0283 (i.e., -0.1074
+ 0.0791).
Figure 0.3 OC as Mediator in the CSR and EM Relationship
Note: The coefficient 0.0830 represents the size of the effect of CSR on OC (path a); the coefficient 0.9533 represents the size of the effect of OC on EM (path b); the coefficient 0.0791 represents the size of the indirect effect of CSR on EM via the mediator OC (path c’); the coefficient -0.1074 represents the size of the direct effect of CSR on EM (path c). *** indicate statistical significance at the 1% level.
4.8.5 Results of ML Estimation of Equations (7a) and (8a) - Sensitivity Analysis Phase 1
To perform sensitivity tests on the analysis, I estimate equations (7a) and (8a) with ML estimation,
with robust standard errors. Equations (7a) and (8a) use the alternate specifications of EM, CSR and
OC, that is, EM_DD, CSR_COMB and OC_PT respectively. Table 4.10 shows the results of the
sensitivity test.

146
Table 0.10 ML Estimation Output of Equations (7a) and (8a)
Panel A presents the direct effects by estimating equations (7a) and (8a) individually in Columns (1) and (2) respectively. Robust standard errors are presented in parenthesis within Panel A. Panel B reports the joint results of OC_PT as a channel between the CSR_COMB and EM_DD relationship. The standard errors of the indirect relationship in Panel B, are estimated using the delta method and the bootstrapping technique with 1,000 replications. Panel B Column (1) reports the size of the indirect effect; Columns (2) and (3) show the delta method standard errors and p values respectively Columns (4) and (5) show the bootstrap standard error and the bias-corrected percentile bootstrap confidence interval respectively. EM_DD refers to alternate earnings management specification, proxied by accruals quality model by Dechow & Dichev (2002). CSR_COMB is the ESG combined score from Thomson Reuters. OC_PT is the alternate measure of organisational capital following Peters & Taylor (2017). SIZE refers to firm size, measured as the natural logarithm of market value of equity. LEV is defined as long-term debts divided by total assets. ADJROA is measured as the income before extraordinary items, scaled by lagged total assets, for each year and two-digit SIC code, subtracted from the focal firm. RD refers to R&D intensity, measured as R&D expenses divided by net sales. PR represents physical resources, measured as total assets minus current assets, scaled by total assets. MB is the market to book ratio. The model includes a set of dummy variables to capture year and industry effects. Panel A: Direct effect
Variables (1) (2)
OC_PT (Equation 8)
EM_DD (Equation 9)
CONSTANT 3.0034*** (0.0824)
4.0973*** (0.4090)
OC_PT 0.3250** (0.1271)
CSR_COMB 0.1879*** (0.0429)
-0.1554* (0.0868)
SIZE -0.1422*** (0.0052)
0.0177 (0.0229)
LEV -0.8211*** (0.0485)
0.2615 (0.1636)
ADJROA -0.5997*** (0.0664)
0.7294*** (0.1493)
RD -0.0676*** (0.0142)
0.2509*** (0.0276)
PR -0.6659*** (0.0433)
MB -0.0023 (0.0030)
Year effects Yes Yes
Industry effects Yes Yes
Var matrix
OC _PT 0.6145
EM_DD 2.2857
N 14,816 14,816
Adjusted R2 0.3068 0.3284
Panel B: Indirect effect
Variables (1) (2) (3) (4) (5)
EM_DD Delta method Std error
Delta method p-value
Bootstrap Std error
Bootstrap-based 95% confidence interval
CSR_COMB 0.0611 0.0277 0.028 0.0810 (-0.3298, 0.0190) ***, **, and * indicate statistical significance at the 1%, 5%, and 10% levels, respectively.

147
The result regarding the direct relationship between CSR_COMB and EM_DD, obtained from
estimating of equation (8a), is shown in Column (2) of Table 4.10. Consistent to my original findings,
the results show that that CSR_COMB has a negative direct influence on EM_DD at the 10% level of
significance (2 = -0.1554; p<0.10).
The result regarding the relationship between CSR_COMB and OC_PT, obtained from estimating of
equation (7a), is shown in Column (1) of Panel A. Consistent with my original findings, the results
show a positive and significant relationship between CSR_COMB and OC_PT at the 1% level of
significance (1 = 0.1879; p<0.01). The control variables SIZE (2 = -0.1422; p<0.01), LEV (3 = -
0.8211; p<0.01), ADJROA (4 = -0.5997; p<0.10, RD (5 = -0.0676; p<0.01) and PR (6 = -0.6659;
p<0.01) have negative associations with OC_PT at the 1% level of significance.
The result regarding the relationship between OC_PT and EM_DD, obtained from estimating of
equation (8a), is shown in Column (2) of Panel A. Consistent with original findings, the results
indicate a positive relationship between OC_PT and EM_DD at the 5% level of significance (1 =
0.3250; p<0.05). The control variables ADJROA (5 = 0.7294; p<0.01) and RD (6 = 0.2509; p<0.01)
are positively related to EM_DD at the 1% level of significance. However, SIZE (3 = 0.0177), LEV (4
= 0.2615), MB (7 = -0.0023) do not have a statistically significant relations with EM_DD.
Panel B of Table 4.10 shows the indirect effect of CSR_COMB on EM_DD via OC_PT as a mediating
channel. As shown in Column (1), the size of the indirect effect is 0.0611. The size of the indirect
effect is calculated as the product of 1 and 1, that is, the coefficients of CSR_COMB (1 = 0.1879)
from equation (7a) and of OC_PT (1 = 0.3250) from equation (8a) respectively. The positive
coefficient suggests a positive indirect relationship between CSR_COM and EM_DD, via the
mediator OC_PT. Columns (2) and (3) show the standard error and p-values for the indirect effect,
using the delta method. This suggests a positive indirect effect of CSR_COM on EM_DD, via the
mediating channel OC_PT at the 5% level of significance (p < 0.05). Panel B Columns (4) and (5)
present the standard error and the 95% confidence interval using the bootstrap technique with
1,000 replications. The bootstrap-based 95% confidence interval reports the lower and upper bound
limits to be -0.3298 and 0.0190 respectively. Since zero falls between the lower and upper bound
limits of the confidence interval, this suggests that the indirect effect is no longer statistically
significant. Although the bootstrap results show that the indirect effect is not significant, the delta
method result shows that the indirect effect is significant, consistent with the original results.

148
4.8.6 Results of ML Estimation of Equations (7b) and (8b) - Sensitivity Analysis Phase 2
To perform further sensitivity tests on the analysis, I estimate equations (7b) and (8b) with ML
estimation, with robust standard errors. In this phase of the sensitivity test, I use the second
alternate measure of CSR (that is, CSR_DUM). Equations (7b) and (8b) are estimated with the
alternate specifications of EM, CSR and OC, that is, EM_DD, CSR_DUM and OC_PT respectively.
Table 4.11 shows the results of the sensitivity test phase 2.

149
Table 0.11 ML Estimation Output of Equations (7b) and (8b) Panel A presents the direct effects by estimating equations (7b) and (8b) individually in Columns (1) and (2) respectively. Robust standard errors are presented in parenthesis within Panel A. Panel B reports the joint results of OC_PT as a channel between the CSR_DUM and EM_DD relationship. The standard errors of the indirect relationship in Panel B, are estimated using the delta method and the bootstrapping technique with 1,000 replications. Panel B Column (1) reports the size of the indirect effect; Columns (2) and (3) show the delta method standard errors and p values respectively Columns (4) and (5) show the bootstrap standard error and the bias-corrected percentile bootstrap confidence interval respectively. EM_DD refers to alternate earnings management specification, proxied by accruals quality model by Dechow & Dichev (2002). CSR_DUM is a dummy variable taking the value of 1 if the CSR score of the firm is greater median CSR (based on each year and industry), and 0 otherwise. OC_PT Is the alternate measure of organisational capital following Peters & Taylor (2017). SIZE refers to firm size, measured as the natural logarithm of market value of equity. LEV is defined as long-term debts divided by total assets. ADJROA is measured as the income before extraordinary items, scaled by lagged total assets, for each year and two-digit SIC code, subtracted from the focal firm. RD refers to R&D intensity, measured as R&D expenses divided by net sales. PR represents physical resources, measured as total assets minus current assets, scaled by total assets. MB is the market to book ratio. The model includes a set of dummy variables to capture year and industry effects. Panel A: Direct effect
Variables (1) (2)
OC_PT (Equation 8)
EM_DD (Equation 9)
CONSTANT 6.1788*** (0.1219)
-0.0560 (0.8933)
OC_PT 0.6996*** (0.1426)
CSR_DUM 0.3710*** (0.0267)
-0.2351*** (0.0633)
SIZE -0.3861*** (0.0082)
0.2373*** (0.0586)
LEV -1.4441*** (0.0751)
0.9087*** (0.2535)
ADJROA -0.6461*** (0.0884)
0.6459*** (0.1410)
RD -0.0729*** (0.0177)
0.2020*** (0.0221)
PR -0.5559*** (0.0666)
MB -0.0030 (0.0024)
Year effects Yes Yes
Industry effects Yes Yes
Var matrix
OC _PT 2.5202
EM_DD 3.5128
N 23,395 23,395
Adjusted R2 0.2523 -0.1049
Panel B: Indirect effect
Variables (1) (2) (3) (4) (5)
EM_DD Delta method Std error
Delta method p-value
Bootstrap Std error
Bootstrap-based 95% confidence interval
CSR_DUM 0.2596 0.0569 0.0000 0.0685 (-0.3694, -0.1008) ***, **, and * indicate statistical significance at the 1%, 5%, and 10% levels, respectively.

150
The result on the direct relationship between CSR_DUM and EM_DD, obtained from estimating
equation (8b), is shown in Column (2) of Panel A. Consistent with the original findings, the result
shows a negative direct relationship between CSR_DUM and EM_DD at the 1% level of significance
(2 = -0.2351; p<0.01).
The result on the relationship between CSR_DUM and OC_PT, obtained from estimating equation
(7b), is presented in Table 4.11 Panel A Column (1). Consistent with my original findings, the result
shows a positive and significant relationship between CSR_DUM and OC_PT at the 1% level of
significance (1 = 0.3710; p<0.01). The control variables SIZE (2 = -0.3861; p<0.01), LEV (3 = -
1.4441; p<0.01), ADJROA (4 = -0.6461; p<0.10), RD (5 = -0.0729; p<0.01) and PR (6 = -0.5559;
p<0.01) have negative associations with OC_PT at the 1% level of significance.
The result on the relationship between OC_PT and EM_DD, obtained from estimating equation (8b),
is shown in Column (2) of Panel A. Consistent with the original findings, the result indicates a positive
relationship between OC_PT and EM_DD at the 1% level of significance (1 = 0.6996; p<0.01), The
control variables SIZE (3 = 0.2373), LEV (4 = 0.9087), ADJROA (5 = 0.6459; p<0.01) and RD (6 =
0.2020; p<0.01) are positively related to EM_DD at the 1% level of significance. However, MB (7 =
-0.0030) does not have a statistically significant relationship with EM_DD.
The result on the indirect relationship between CSR_DUM and EM_DD via OC_PT, obtained from
estimating equations (7b) and (8b), is presented in Panel B of Table 4.11. As shown in Column (1),
the size of the indirect effect is 0.2596. The size of the indirect effect is calculated as the product of
1 and 1, that is, the coefficients of CSR_DUM (1 = 0.3710) from equation (7b) and of OC_PT (1 =
0.6996) from equation (8b) respectively. The positive coefficient suggests a positive indirect
relationship between CSR_DUM and EM_DD, via the mediator OC_PT. Columns (2) and (3) show the
standard error and p-values for the indirect effect, using the delta method. This suggests a strong
positive indirect effect of CSR_COM on EM_DD, via the mediating channel OC_PT at the 1% level of
significance (p < 0.01). Panel B Columns (4) and (5) present the standard error and the 95%
confidence interval using the bootstrap technique with 1,000 replications. The bootstrap-based 95%
confidence interval reports the lower and upper bound limits to be -0.3694 and -0.1008 respectively.
Since zero does not fall between the lower and upper bound limits of the confidence interval, this
suggests that the indirect effect is statistically significant at least at the 5% level of significance. Thus,
the results are consistent with the original findings.
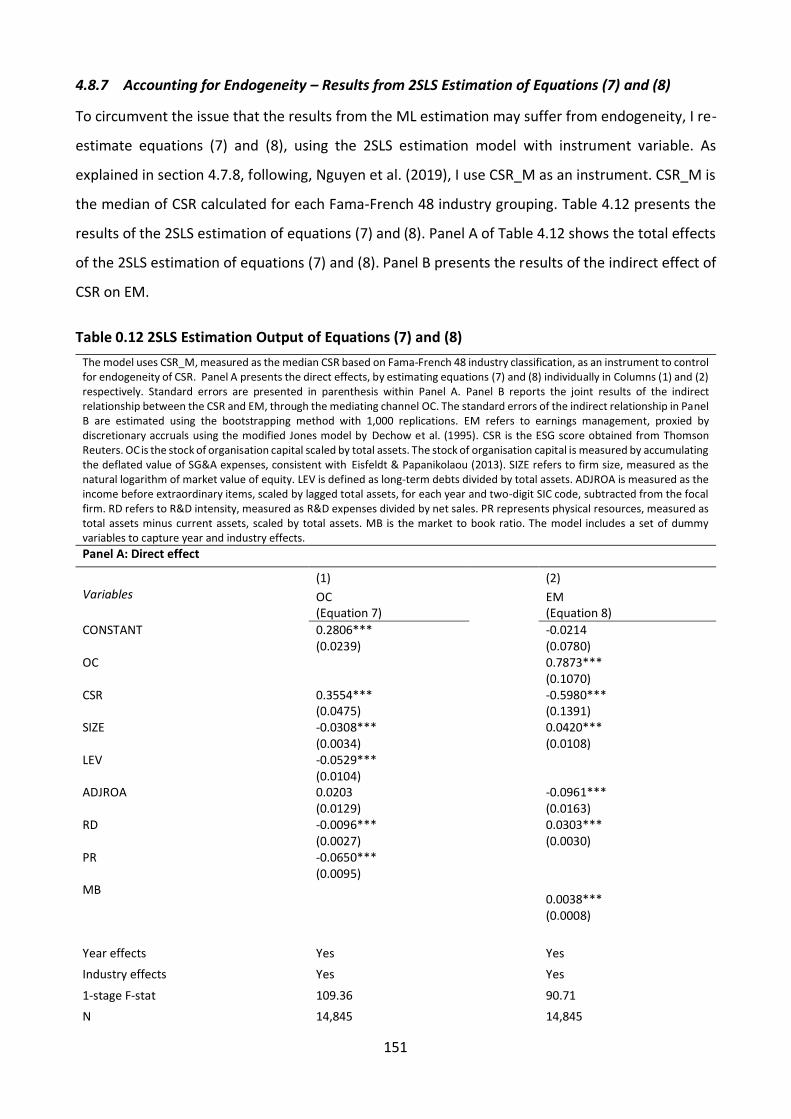
151
4.8.7 Accounting for Endogeneity – Results from 2SLS Estimation of Equations (7) and (8)
To circumvent the issue that the results from the ML estimation may suffer from endogeneity, I re-
estimate equations (7) and (8), using the 2SLS estimation model with instrument variable. As
explained in section 4.7.8, following, Nguyen et al. (2019), I use CSR_M as an instrument. CSR_M is
the median of CSR calculated for each Fama-French 48 industry grouping. Table 4.12 presents the
results of the 2SLS estimation of equations (7) and (8). Panel A of Table 4.12 shows the total effects
of the 2SLS estimation of equations (7) and (8). Panel B presents the results of the indirect effect of
CSR on EM.
Table 0.12 2SLS Estimation Output of Equations (7) and (8) The model uses CSR_M, measured as the median CSR based on Fama-French 48 industry classification, as an instrument to control for endogeneity of CSR. Panel A presents the direct effects, by estimating equations (7) and (8) individually in Columns (1) and (2) respectively. Standard errors are presented in parenthesis within Panel A. Panel B reports the joint results of the indirect relationship between the CSR and EM, through the mediating channel OC. The standard errors of the indirect relationship in Panel B are estimated using the bootstrapping method with 1,000 replications. EM refers to earnings management, proxied by discretionary accruals using the modified Jones model by Dechow et al. (1995). CSR is the ESG score obtained from Thomson Reuters. OC is the stock of organisation capital scaled by total assets. The stock of organisation capital is measured by accumulating the deflated value of SG&A expenses, consistent with Eisfeldt & Papanikolaou (2013). SIZE refers to firm size, measured as the natural logarithm of market value of equity. LEV is defined as long-term debts divided by total assets. ADJROA is measured as the income before extraordinary items, scaled by lagged total assets, for each year and two-digit SIC code, subtracted from the focal firm. RD refers to R&D intensity, measured as R&D expenses divided by net sales. PR represents physical resources, measured as total assets minus current assets, scaled by total assets. MB is the market to book ratio. The model includes a set of dummy variables to capture year and industry effects. Panel A: Direct effect
Variables (1) (2) OC (Equation 7)
EM (Equation 8)
CONSTANT 0.2806*** (0.0239)
-0.0214 (0.0780)
OC
0.7873*** (0.1070)
CSR 0.3554*** (0.0475)
-0.5980*** (0.1391)
SIZE -0.0308*** (0.0034)
0.0420*** (0.0108)
LEV -0.0529*** (0.0104)
ADJROA 0.0203 (0.0129)
-0.0961*** (0.0163)
RD -0.0096*** (0.0027)
0.0303*** (0.0030)
PR -0.0650*** (0.0095)
MB
0.0038*** (0.0008)
Year effects Yes Yes Industry effects Yes Yes
1-stage F-stat 109.36 90.71 N 14,845 14,845

152
Adjusted R2 0.4732 -1.3848
Panel B: Indirect effect (bootstrap method)
(1) (2) (3)
EM Bootstrap std error
Bootstrap-based 95% confidence interval
CSR 0.2798 0.2025 -0.9949 -0.2012 ***, **, and * indicate statistical significance at the 1%, 5%, and 10% levels, respectively.
As shown in Panel A of Table 4.12, the original test results remain consistent after using the 2SLS
model to address endogeneity. The result on the direct relationship between CSR and EM, obtained
from the estimation of equation (8), is shown in Panel A Column (2). The result shows that CSR has
a negative direct influence on EM at the 1% level of significance (2 = -0.5980; p<0.01).
The result on the relationship between CSR and OC, obtained from the estimation of equation (7),
is displayed in Panel A Column (1). The results show that CSR has a positive effect on OC at the 1%
level of significance (1 = 0.3554; p<0.01). The control variables SIZE (2 = -0.0308; p<0.01), LEV (3
= -0.0529; p<0.01), RD (5 = -0.0096; p<0.01) and PR (6 = -0.0650; p<0.01) have negative
associations with OC at the 1% level of significance. However, ADJROA does not have a statistically
significant relationship with OC (4 = 0.0203).
The result on the relationship between OC and EM, obtained from the estimation of equation (8), is
presented in Panel A Column (2). Consistent with the original findings, the results show that OC has
a positive and effect on EM at the 1% level of significance (1 = 0.7873; p<0.01). The controls
variables SIZE (3 = 0.0420; p<0.01), RD (6 = 0.0303; p<0.01) and MB (7 = 0.0038; p<0.01) are
positively related to EM at the 1% level of significance, while ADJROA is negatively related to EM at
the 1% level of significance (5 = -0.0961; p<0.01).
The result relevant to the indirect relationship between CSR and EM via OC, obtained from 2SLS
estimation of equations (7) and (8), is reported in Table 4.12 Panel B. As discussed previously, the
size of the indirect effect is estimated by calculating the product of the CSR coefficient (1) from
equation (7) and the OC coefficient (1) from equation (8) – that is, 11. As shown in Table 4.12
Panel A, the CSR coefficient (1) from equation (7) is 0.3554, while the OC coefficient (1) from
equation (8) is 0.7873. Thus, the size of the indirect effect of CSR on EM via OC (11) is 0.2798. As
discussed before, I use the bootstrapping method with 1,000 replacements to estimate the standard
error of the indirect effect. The lower and upper bound limits of the bootstrap-based 95%

153
confidence interval are -0.9949 and -0.2012 respectively. Since zero does not fall between the lower
and upper bound limits of the confidence interval, this suggests that the indirect effect is statistically
significant at least in the 5% (1 - 𝛼) level of significance. Thus, even after controlling for endogeneity,
the results suggest a positive and significant indirect relationship between CSR and EM via OC.
Additionally, to test the validity of the instrument (CSR_M) used in the 2SLS model, I follow prior
studies and test for weak instrument. A weak instrument may cause 2SLS estimation to be
inconsistent (Stock & Yogo, 2002). Following prior studies, I use the first-stage F-statistic to detect
weak instruments (for example, see Cheung, 2016; Stock & Yogo, 2002). Following the general rule
of thumb, to determine that the instrument is not weak, the first-stage F-statistic should be larger
than 10 to warrant that the maximum bias in the instrumental variable estimators is less than 10%
(Staiger & Stock, 1994). As shown in Table 4.12, the first stage F-statistic is 109.36 for equation (7)
and 90.71 for equation (8). Thus, the first stage F-statistic being well above 10 suggests that the
instrument, CSR_M, used in the 2SLS estimation, is not a weak instrument.
Thus, the results remain consistent after controlling for endogeneity.
4.9 Discussion of Findings
The literature on CSR and EM suggests inconclusive findings on how CSR affects EM. To provide
more insights on the CSR-EM relationship, several prior studies have examined various moderating
factors affecting the CSR-EM relationship, to address when CSR affects EM. However, the questions
why and how CSR affects EM, remain unaddressed. To this end, the first research objective of this
study, addressed in this chapter, is to investigate why and how CSR affects EM, by examining the
direct CSR-EM relationship and indirect CSR-EM relationship via OC. In this chapter, I address
research objective 1, by answering the two following research questions:
Research Question 1.1: Does CSR have a significant direct effect on EM?
Research Question 1.2: Does CSR have a significant indirect effect on EM via OC?
Using a sample of 46,816 firm-year observations, the results find support all main hypotheses. In
regard to the research question 1.1, the study finds that CSR has a negative and significant direct
effect on EM. In regard research question 1.2, the study finds that CSR has a positive and significant
indirect effect on EM via OC. In addressing research question 1.2, the study also examined the two

154
indirect paths involved in the indirect CSR-EM relationship via OC, that is, 1) the relationship
between CSR and OC; and 2) the relationship between OC and EM. The results suggest positive and
significant relationships between CSR and OC and between OC and EM.
Table 4.13 shows a summary of the research questions, hypotheses, and findings. Table 4.13 is an
extension to Table 4.5 (presented earlier, outlining the research questions and hypotheses testing).
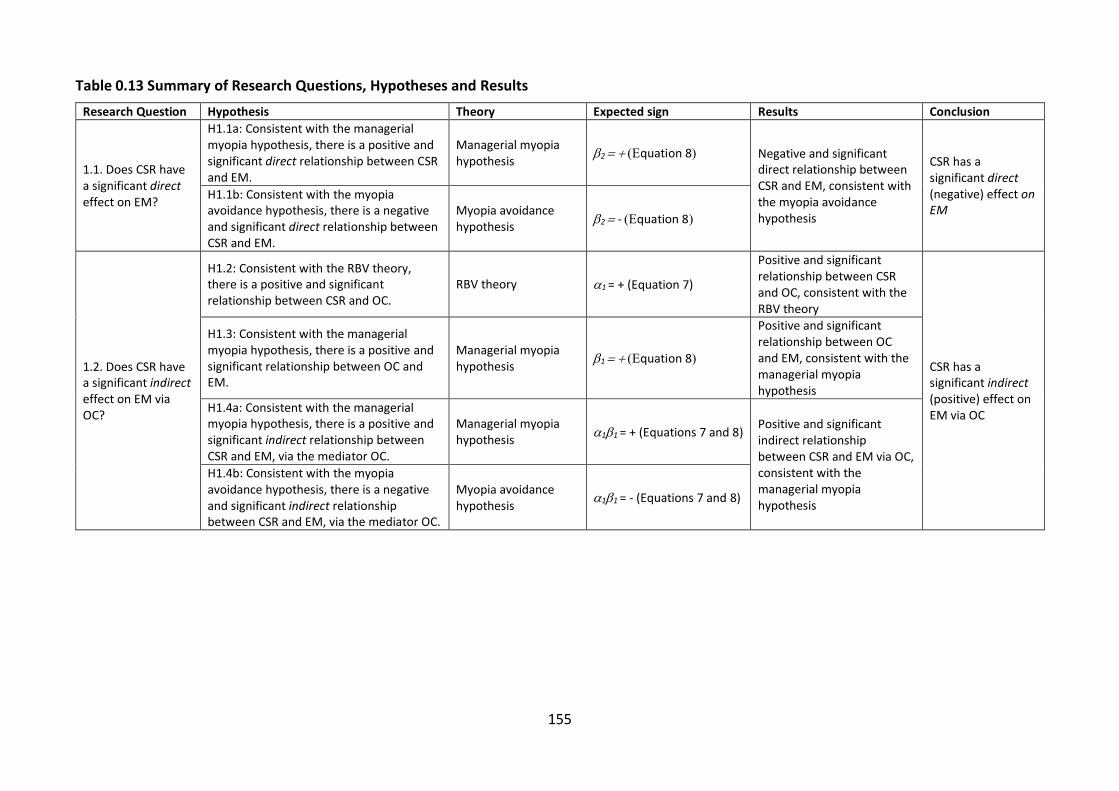
155
Table 0.13 Summary of Research Questions, Hypotheses and Results
Research Question Hypothesis Theory Expected sign Results Conclusion
1.1. Does CSR have a significant direct effect on EM?
H1.1a: Consistent with the managerial myopia hypothesis, there is a positive and significant direct relationship between CSR and EM.
Managerial myopia hypothesis 2 = + (quation 8) Negative and significant
direct relationship between CSR and EM, consistent with the myopia avoidance hypothesis
CSR has a significant direct (negative) effect on EM
H1.1b: Consistent with the myopia avoidance hypothesis, there is a negative and significant direct relationship between CSR and EM.
Myopia avoidance hypothesis 2 = - (quation 8)
1.2. Does CSR have a significant indirect effect on EM via OC?
H1.2: Consistent with the RBV theory, there is a positive and significant relationship between CSR and OC.
RBV theory 1 = + (Equation 7)
Positive and significant relationship between CSR and OC, consistent with the RBV theory
CSR has a significant indirect (positive) effect on EM via OC
H1.3: Consistent with the managerial myopia hypothesis, there is a positive and significant relationship between OC and EM.
Managerial myopia hypothesis 1 = + (quation 8)
Positive and significant relationship between OC and EM, consistent with the managerial myopia hypothesis
H1.4a: Consistent with the managerial myopia hypothesis, there is a positive and significant indirect relationship between CSR and EM, via the mediator OC.
Managerial myopia hypothesis 11 = + (Equations 7 and 8) Positive and significant
indirect relationship between CSR and EM via OC, consistent with the managerial myopia hypothesis
H1.4b: Consistent with the myopia avoidance hypothesis, there is a negative and significant indirect relationship between CSR and EM, via the mediator OC.
Myopia avoidance hypothesis 11 = - (Equations 7 and 8)

156
To address research questions 1.1 and 1.2, I test four hypotheses. The findings support all of my
hypotheses. The result suggests a negative and significant direct relationship between CSR and EM.
The result is consistent with prior studies (for example, see Gargouri et al., 2010; Heltzer, 2011;
Kyaw et al., 2017; Yip et al., 2011). Consistent with the myopia avoidance hypothesis, the result
suggests that managers engaged in CSR are long-term oriented, and thus, less likely to manage
earnings. Managers’ myopia avoidant behaviour may be explained in two ways. First, managers
engaged in CSR may have greater concerns for maintaining long-term relationships with
stakeholders, and therefore, they avoid EM which is an agency cost that may hamper their
relationships with stakeholders, that is, relationship-driven myopia avoidance) (for example, see
Bozzolan et al., 2015; Chih et al., 2008). Second, managers engaged in CSR may have stronger ethical
and moral values, and thus, they may avoid EM, which is an unethical act, that is, value-driven
myopia avoidance) (for example, see Grougiou et al., 2014; Kim et al., 2012; Litt et al., 2013). Thus,
in response to research question 1.1, the results suggest that CSR has a significant direct (negative)
effect on EM.
The result regarding the indirect relationship between CSR and EM via OC, is totally different and in
contrast with the direct CSR-EM relationship. The results find a positive and significant indirect
relationship between CSR and EM, through the mediating channel OC. The finding provides a new
insight to the widely debated CSR-EM literature, by identifying a new indirect channel (that is, OC)
through which CSR affects EM. The findings suggest that although CSR has a negative (direct) effect
on EM in general, this changes when firms have high OC. This is because OC acts as an indirect
channel/tool which managers may utilise to manage more earning. In other words, managers
engaged in CSR may take advantage of their firms’ unique abilities (OC), to manage more earnings.
Managers engaged in CSR may take advantage of their firms’ unique abilities (OC), to manage more
earnings. This is consistent with the managerial myopia hypothesis, suggesting that managers in
firms with high OC, engaged in CSR, tend to be short-term oriented. This perspective can be
explained in two ways. First, managers engaged in CSR may have incentives to please multiple
stakeholders by meeting short-term targets, to uphold their reputation (Chih et al., 2008; Francis et
al., 2008; Gargouri et al., 2010; Nikolov, 2018);. While CSR creates incentives to manage earnings
for short-term benefits, OC may create further incentives as OC may create greater expectations
and higher standards from investors and analysts (for example, see Malmendier & Tate, 2009). Thus,
both CSR and OC create more incentives for EM, that is, incentive-driven myopia. Second, managers
engaged in CSR may manage more earnings due to greater opportunities arising from the positive

157
image created by their CSR engagement (Kim et al., 2012; Muttakin et al., 2015). OC may create
additional EM opportunities, as discussed earlier. Managers in firms with high OC may have unique
abilities to manage earnings, resulting from their superior techniques, processes and knowledge (for
example, see Demerjian et al., 2013; Gul et al., 2018). Thus, managers engaged in CSR may take
advantage of the additional opportunities arising from their firms’ unique abilities (OC), to manage
more earnings, that is, opportunity-driven myopia. Hence, in response to research question 1.2, the
findings suggest that CSR has a significant indirect (positive) effect on EM via OC.
In the process of examining the indirect relationship between CSR and EM via OC, the study also
examines the two indirect paths in involved. In regard to the first indirect path, the results suggest
a positive and statistically significant relationship between CSR and OC. The result is consistent with
the literature suggesting that CSR has a positive effect on intellectual capital components, including
OC (for example, see Altuner et al., 2015; Biswas & Suar, 2016; Casalegno et al., 2017; Chung et al.,
2015; Hawn & Ioannou, 2016; Hur et al., 2014; Martínez et al., 2014; Massaro et al., 2018; Zhang et
al., 2014). The result is supported by the RBV hypothesis. According to RBV, firms may use CSR to
enhance their intangible resources, including OC. Thus, the result suggests that CSR becomes
embedded in the organisational practices and culture, becoming a part of the firm’s identity,
thereby improving OC (organisational design and processes, and management practices, knowledge
and culture).
In regard to the second indirect path, the results show a positive and statistically significant
relationship between OC and EM. The result is consistent with the literature suggesting that various
components of intellectual capital escalate EM (for example, see Al-dhamari & Ku Ismail, 2015;
Chaney et al., 2011; Francis et al., 2008; Malmendier & Tate, 2009). Consistent with the managerial
myopia hypothesis, the result suggests that managers, in firms with high OC, may be short-term
oriented due to greater incentives and opportunities. First, managers, in firms with high OC, may
experience greater pressures to meet short-term targets. These greater pressures may arise from
higher expectations from investors and analysts (for example, see Malmendier & Tate, 2009). Thus,
managers in firms with high OC may have more incentives to manage earnings to meet short-term
targets and stakeholder expectations, as failing to meet targets repeatedly may tarnish their
reputation (for example, see Francis et al., 2008; Malmendier & Tate, 2009). Thus, the result
suggests that managers may take advantage of their firms’ unique abilities (OC) to obtain short-
term goals, such as meet targets, and safeguard their reputation. Higher OC may mean that
managers have superior techniques, knowledge, and better understanding of the firm’s internal

158
control system, creating more opportunities to manage earnings in ways that are difficult to detect.
This indicates the importance of better auditing and other monitoring techniques to detect EM in
firms with high OC.
Overall, the results addressing research objective 1 suggest that CSR has a negative direct effect on
EM, but a positive indirect effect on EM via OC. The direct negative relationship between CSR and
EM addresses the existing debate on the CSR-EM relationship, through a managerial behaviour
perspective, suggesting that managers engaged in CSR are likely to be myopia avoidant (long-term
oriented). The indirect positive relationship between CSR and EM via OC, suggests that managers
engaged in CSR may become more opportunistic and myopic (short-term oriented) when their firm
has high OC. Overall, the negative direct relationship between CSR and EM is consistent to the
myopia avoidance hypothesis, suggesting that managers engaged in CSR are less likely to manage
earnings because – 1) their genuine concerns about maintaining long-term relationships with
stakeholders lead them to reduce agency costs, such as EM (relationship-driven myopia avoidance);
and/or 2) their strong ethical and moral values lead them to avoid unethical acts, such as EM (value-
driven myopia avoidance). For firms with high OC, managerial behaviour may change. The positive
indirect relationship between CSR and EM is consistent to the managerial myopia hypothesis,
suggesting that managers engaged in CSR, may opportunistically utilise their firms’ unique abilities
(OC) to manage more earnings. This may result from – 1) greater incentives to manage earning to
meet short term targets and please stakeholders, as well as uphold managerial reputation
(incentive-driven myopia), and/or 2) greater opportunities to manage earnings from lower scrutiny
resulting from CSR performance creating a positive image (opportunity-driven myopia). While CSR
itself may create incentives for EM, managers engaged in CSR may have limited opportunities to
manage earnings. High OC may add to these incentives and opportunities. Managers in firms with
high OC may experience greater pressures and higher expectations from stakeholders due to their
firms’ unique abilities. Failure to meet these expectations may tarnish managers’ reputation, and
thus, managers have incentives to manage earnings and report favourable financial information.
Furthermore, the unique abilities of the firms (such as, superior, techniques, processes, designs,
managerial practices and knowledge, that is, high OC) provide more EM opportunities. Managers in
firms with high OC have better knowledge and understanding of the firms’ internal control systems,
and thus manage earnings using more sophisticated techniques. Thus, the results suggest that while
managers engaged in CSR may avoid EM in general, high OC creates an indirect medium that
increases opportunities for these managers to manage earnings. The results should be interpreted

159
with caution as the results do not imply that OC is a context/factor that moderates (that is,
strengthens or weakens) the relationship between CSR and EM. Rather, the empirical analysis
suggests that OC is an indirect channel that assists managers, engaged in CSR, to manage earnings
for short-term benefits, by opportunistically using the firms’ unique abilities (that is, OC
The indirect CSR-EM relationship provides a new insight to the CSR-EM literature, addressing the
questions why and how CSR affects EM. In response to the question ‘why CSR affects EM’, the results
suggest that managers engaged in CSR may have greater incentives to manage earnings to meet
short-term goals, in order to please stakeholders, and uphold their reputation. In response to the
question ‘how CSR affects EM’, the results suggest that managers engaged in CSR may take
advantage of their firms’ unique abilities (OC), to manage earnings (indirectly). The findings highlight
the role of OC in managers’ myopic behaviour (short-term orientation). While prior studies have
explained several benefits of OC (for example, see Black & Lynch, 2005; Lev & Radhakrishnan, 2005;
Lev et al., 2009; Sydler et al., 2014; Tronconi & Marzetti, 2011), the present study highlights that OC
may escalate managerial opportunistic motives and myopic or short-term behaviour, as managers
may take advantage of their firms’ unique abilities to manage more earnings.
4.10 Chapter Summary
This study addresses research objective 1, by investigating why and how CSR affects EM, by
examining the direct CSR-EM relationship and indirect CSR-EM relationship via OC. Using a sample
of 46,816 firm-year observations from non-financial US firms for the period 2002-2017 inclusive, I
find evidence of a negative and significant direct relationship between CSR and EM, and a positive
and significant indirect relationship between CSR and EM via OC. Using SEM with ML method I find
support for all of my hypothesis. The findings show that my results are not sensitive to other
measures of the dependent, independent and mediating variables. I address endogeneity by
estimating a 2SLS model using an instrumental variable. The findings remain unchanged after
controlling for endogeneity. Overall, the findings are consistent with existing theories. The result
suggests that in general managers engaged in CSR tend to be myopia avoidant (long-term oriented)
and are less likely to manage earnings (direct negative relationship). This negative direct relationship
may be due to relationship-driven myopia avoidance and/or value-driven myopia avoidance.
However, in firms with high OC, managers engaged in CSR tend to be myopic (short-term-oriented)
and are more likely to manage earnings indirectly by taking advantage of their firm’s unique abilities

160
(OC). The positive indirect relationship may be due to incentive-driven myopia and/or opportunity-
driven myopia.

161
CHAPTER 5 : EARNINGS MANAGEMENT, CORPORATE SOCIAL RESPONSIBILITY AND ORGANISATION CAPITAL: THE IMPACT OF
FINANCIAL DISTRESS
5.1 Introduction to the Chapter
This chapter addresses the second research objective, that is, when Corporate Social Responsibility
(CSR) has a direct effect on Earnings Management (EM), and when CSR has an indirect effect on EM
via Organization Capital (OC), by examining the context Financial Distress (FD). Research objective
2 is addressed by answering the following two research objectives:
Research Question 2.1: Does FD have a significant effect on the direct CSR-EM relationship?
Research Question 2.2: Does FD have a significant effect on the indirect CSR-EM relationship via OC?
This chapter is organised as follows: Sections 5.2 and 5.3 discuss the background and justification
for, and contribution of, this study respectively. Section 5.4 discusses the theoretical background,
followed by Section 5.5, which comprises the literature review and development of hypotheses on
the effect of FD on relationships between CSR and EM, CSR and OC, and OC and EM. Section 5.6
presents the conceptual framework for the study. Section 5.7 discusses the data and research
methodology adopted for this study. This is followed by results and findings in Sections 5.8, and the
discussion of the findings in Section 5.9. The chapter ends with a chapter summary in Section 5.10.
5.2 Background and Justification
5.2.1 Background of the Study
In the current era, the pandemic outbreak of the novel coronavirus (COVID-19), and the rising rates
of worldwide infections and death have led countries to shut down their international borders,
hindering business operations and productions significantly (Barua, 2020). In the year 2020,
countries across the entire globe started experiencing significant decline in their economic activities,
moving towards a recession or perhaps an economic depression (Barua, 2020). Furthermore, the
loss of consumer confidence across the globe is quite concerning, as it suggests that even after the
world recovers from the pandemic, the economic recovery may take even longer. As the world faces
such unprecedented times, a global economic depression may be inevitable (Barua, 2020). History

162
has taught us that FD is closely linked to economic crisis. The last few decades have brought up
numerous cases of firms from all over the world experiencing FD (Bender, 2013). Generally,
economic downturns increase the risks of firms going into FD, as evidenced during the Asian
Financial Crisis in 1997 and the Global Financial Crisis (GFC) during 2007 and 2008 (Thim et al., 2011).
Thus, with the economic crisis caused by the outbreak of COVID-19, firms all over the globe face an
even higher risk of experiencing FD and possible bankruptcy. Hence, FD is a relevant topic of
discussion in the present-day.
FD may result from a range of internal firm-level factors and broader macroeconomic factors (Habib
et al., 2020a; Ikpesu et al., 2020). The firm-level determinants of FD may include: 1) financial factors
such as, liquidity concerns (Wesa & Otinga, 2018), low profitability and revenue growth (Ikpesu &
Eboiyehi, 2018), high leverage (Kristanti et al., 2016), declining share prices20 (Idrees & Qayyum,
2018), significant book-tax difference21 (Noga & Schnader, 2013), higher investments in research
and development (R&D)22 (Zhang, 2015), 2) non-financial factors such as, difficulties in recovering
accounts receivables from outstanding customers, poor demand and sales, incompetence of the
management team, and other uncontrollable events, such as fire and other disasters, strikes and
loss of owner (Ikpesu et al., 2020), 3) corporate governance and ownership structures, such as, weak
internal control systems (Simpson & Gleason, 1999) and concentrated ownership23 (Lee & Yeh,
2004), and 4) certain CEO characteristics such as, CEO overconfidence24 (Ho et al., 2016), CEO
gender25 (Darrat et al., 2016) and CEO duality26 (Daily & Dalton, 1994). The macroeconomic factors,
causing FD include a country’s overall economic conditions, reflected by changes in inflation,
interest rates, employment rates and macro-economic policies (Ikpesu et al., 2020; Liou, 2007).
There are various interpretations of FD by different authors. Baldwin & Mason (1983) define FD as
20 Low liquidity levels pose higher risks of firms failing to make regular repayments of debts; low profitability and low revenue growth may affect a firm’s ability to repay debts; high leverage is an indication of higher indebtedness, posing higher risks of FD; decline in share prices may lead existing shareholders to withdraw their investments, adversely affecting the firm’s stability and increasing FD risks (Ikpesu et al., 2020). 21 Book-tax difference, referred to the difference between a firm’s book income and taxable income, is a poor financial condition, and poses more FD risks (Noga & Schnader, 2013). 22 R&D investments are associated with uncertain returns, thus increasing FD risks (Zhang, 2015). 23 Ownership concentration, or block ownership, may increase the likelihood of collusion between owners and managers to obtain private control benefits, increasing FD risks. 24 Ho, Huang, Lin and Yen (2016) find that banks with overconfident CEOs suffered more significantly during the GFC. 25 Prior studies show that females are more risk-averse, are less likely to be over-confident, and are more likely to comply with regulations in contrast to males. Thus, male CEOs are perceived to create higher FD risks in contrast to female CEOs (Darrat et al., 2016). 26 CEO duality, referred to as the separation of decision management from decision control, may lead CEOs to take actions to obtain private benefits of control, increasing FD risks (Daily & Dalton, 1994).

163
a situation when firms are unable to meet their outstanding financial obligations. Choy et al., 2011
explain FD as the inadequacy of a firm’s operating cash flows in compensating their current
obligations. Thakor, 2014 classifies FD into four categories, namely, 1) a decline in performance,
indicated by low profitability, declining revenue growth and/or declining share prices (Ikpesu et al.,
2020), 2) failure, indicated by a situation when the revenue or return on investment is lower than
the cost of the investment (Ikpesu et al., 2020), 3) insolvency indicated by an inability to pay its
current debts, primarily due to low liquidity (Habib et al., 2020a); 4) defaults indicated by a failure
to meet periodic repayments on debts (Habib et al., 2020a). According to Balasubramanian et al.,
2019, FD represents a situation when a firm faces negative net worth, that is, when the firm’s
liabilities exceed its liquidated value of total assets. Ikpesu et al., 2020 define FD as a situation where
a firm experiences “a constant loss, breach of loan contract and difficulty in honouring
organisational commitment” (p.103).
Persistent FD exposes firms to higher risks of bankruptcy and default (Habib et al., 2020a; Ohlson,
1980). Hence, the term FD is often used interchangeably with terms such as corporate failure,
insolvency, default and bankruptcy (for example, see Altman, 1968; Ohlson, 1980). Corporate
failures resulting from persistent FD may result in significant financial loss for stakeholders,
particularly investors and creditors (Habib et al., 2020a; Jacoby et al., 2019). While administrative
and legal expenses are some of the apparent direct costs attributable to the bankruptcy procedure
(Altman, 1984), there may be substantial indirect costs resulting from FD (Habib et al., 2020a). Such
indirect costs may include loss of sales due to customers switching to competitor firms (Altman,
1984; Habib et al., 2020a; Hoshi et al., 1990; Purnanandam, 2008), loss of key employees
(Purnanandam, 2008), loss of valuable suppliers (Purnanandam, 2008) or restricted credits offered
by suppliers due to negative speculation regarding the firm’s financial condition (Hoshi et al., 1990),
and forgone investment opportunities due to difficulties in obtaining loans (Pindado & Rodrigues,
2005).
A firm’s FD not only adversely affects the firm itself, but also adversely affects the economy since
investors and creditors experience substantial financial losses as a result (Habib et al., 2013). Thus,
FD has been a cause of concern for investors and governments for a long time (Habib et al., 2013).
From a micro level perspective, managers in financially distressed firms, often find their reputation
at stake, in addition to facing risks of reductions in bonuses (Jacoby et al., 2019). Thus, managers
within financially distressed firms may be more inclined to report more positive information about
the firm’s future in order to alleviate negative market reactions (Rogers & Stocken, 2005). Similarly,

164
it is also evident that financially distressed firms disclose good news more readily, but disclose bad
news in a less timely manner (Charitou et al., 2011).
Prior studies have highlighted several incentives that lead managers to manage earnings during FD.
For example, Burgstahler & Dichev (1997) suggest that EM incentives may arise from managers
trying to avoid reporting losses, as management is often under pressure to report incremental
earnings in the annual report. The interest in examining financial choices of financially distressed
firms in not new in academic literature. Watts & Zimmerman (1986) and DeAngelo (1988) are two
of the pioneers in raising concerns about changing accounting choices in financially distressed firms.
The phenomenon of changing financial choices by distressed firms has led to numerous studies
examining this issue more closely (Charitou et al., 2007). A common theme evident from these prior
studies is that managerial incentives of distressed firms determine the financial reporting choices
by management (for example, see DeAngelo et al., 1994; DeFond & Jiambalvo, 1994; Dichev &
Skinner, 2002; Healy & Palepu, 1990; Sweeney, 1994). FD is a condition that may trigger incentives
for managers to manage earnings (Gul et al., 2018). In particular, the literature suggests that
managers in financially distressed firms have greater incentives to manage earnings in order to
conceal or delay the exposure of the firm’s financially distressed state (Charitou et al., 2007).
Charitou et al. (2011) suggest two possible reasons behind the increased EM among distressed
firms. First, out of genuine concern for the firm’s survival in the short run, managers, acting as agents
of the shareholders, may have incentives to manage earnings to avoid debt covenant violations,
rather than being driven by self-serving motives (Charitou et al., 2011; Dichev & Skinner, 2002;
Sweeney, 1994). Similarly, managers may also manage earnings to obtain waivers from debt
covenant violations (Jaggi & Lee, 2002) or to conceal the firm’s distress and obtain better
renegotiation terms (Burgstahler & Dichev, 1997; DeAngelo et al., 1994; Rosner, 2003). Second,
managers may have more opportunistic self-serving reasons to manage earnings. For example,
managers may manage earnings upwards to increase their short-term compensation (Altman,
1984), to avoid losing their jobs, or to enhance their stock based compensation by inflating share
prices (Charitou et al., 2011). Such rent extraction managerial behaviour to use EM as a short-term
solution during FD is consistent with the managerial myopia hypothesis. While such incentives exist
regardless of managerial ability, Gul et al. (2018) posit that managerial ability presents more
opportunities to manage earnings and conceal opportunistic practices since more able managers
have superior knowledge and understanding of the financial reporting practices and the firm’s
internal control weaknesses. Gul et al. (2018) find that higher managerial ability leads to higher EM

165
in financially distressed firms.
5.2.2 Justification of the Study
The main purpose of this study is to examine the CSR-EM relationship further, and address when
CSR affects EM directly, and when CSR affects EM indirectly. For this purpose, I examine the CSR-
EM relationship in the context of FD. The motivation for choosing FD in this study mainly arises from
the increasing relevance of this issue due to the worldwide Covid-19 pandemic outbreak. The
pandemic outbreak has severely affected businesses worldwide, as trading has become restricted
with country-wide restrictions as well as international border restrictions (Barua, 2020). Thousands
of businesses have shut down and thousands are still experiencing financial struggle or distress. As
of August 31, 2020, 97,966 businesses in USA alone have shut down permanently due to the
pandemic, and the numbers are expected to continue increasing (see Sundaram, 2020).
Due to the growing relevance of FD for firms, I have chosen to examine the effect of FD on the CSR-
EM relationship, to discover whether or not managerial behaviour (that is, managerial myopia and
myopia avoidance) changes under crisis situations. While EM has been a widely researched topic in
accounting research for several decades, the topic has gained increased attention following major
corporate scandals such as Enron, WorldCom, and Xerox (Charitou et al., 2011). These scandals have
also drawn attention to failing firms’ motivations to manage earnings (Rosner, 2003). FD creates
more motivations for EM, as managers may engage in income-increasing EM to conceal the
distressed state of the firm (Rosner, 2003). However, when the financial challenges are more severe
and no longer temporary, managers may cross the line and resort to fraudulent actions involving
more material earnings overstatements (Argenti, 1976). Thus, EM engagement in financially
distressed firms should be carefully considered, as it may be an indication of potential corporate
failure (Argenti, 1976).
Prior studies suggest that FD creates more incentives for EM (for example see Charitou et al., 2007,
2011; Chen et al., 2010; DeAngelo et al., 1994; DeFond & Jiambalvo, 1994; Habib et al., 2013; Jacoby
et al., 2019; Jaggi & Lee, 2002; Li et al., 2020; Rosner, 2003; Sweeney, 1994). This suggests that
managers’ behaviour, and underlying motives, change when they are under crisis, such as FD. Since
the present study explains the CSR-EM relationship from the managerial behaviour perspectives, I
posit that it is important to look at situations that may change managerial behaviour. However, the
effect of FD on the relationship between CSR and EM is yet to be explored. My second research
objective is to fill this gap in the literature and examine the effect of FD on the direct CSR-EM

166
relationship and the indirect CSR-EM relationship via OC. My results from Chapter 4 show a negative
direct relationship between CSR and EM. Consistent with the myopia avoidance hypothesis, the
results suggest that managers engaged in CSR are more concerned about maintaining long-term
relationships with stakeholders, and therefore less likely to manage earnings for short-term
objectives, that is, they are myopia avoidant (long-term oriented). In the present study, I examine
whether managers’ myopia avoidance and the direct CSR-EM relationship remain the same when
the firm experiences FD. Additionally, the results from Chapter 4 also show that there is a positive
indirect relationship between CSR and EM, through OC as a mediator. Consistent with the
managerial myopia hypothesis, this suggests that managers engaged in CSR initiatives may take
advantage of their firm’s unique abilities (OC) to manage more earnings for short-term objectives,
that is, they are myopic (short-term oriented). In the present study, I examine whether manager’s
myopic behaviour and the indirect CSR-EM relationship via OC remain the same, when the firm
experiences FD. Examining the effect of FD on the direct and indirect CSR-EM relationships will
provide further understanding on the CSR-EM relationship in a crisis context. In particular, this will
address the questions when CSR affects EM directly, and when CSR affects EM indirectly, in context
of FD.
5.3 Contribution of the Study
The present study makes a number of contributions to the CSR-EM literature, theory and
methodology. First, the present study contributes to the existing the literature on four key research
areas – CSR, EM, OC and FD, by linking these concepts together. Prior studies examining CSR and
EM have examined the moderating effect of a multitude of factors, including country-level factors,
such as investor protection (Martínez‐Ferrero et al., 2015; Scholtens & Kang, 2013) and institutional
framework (Kyaw et al., 2017); industry-level factors, such as, political environment (Yip et al., 2011)
and powerful stakeholders (Muttakin et al., 2015); and firm-level factors, such as, various forms of
ownership (Choi et al., 2013). However, to the best of my knowledge, this is the first study to
examine FD as a context. Thus, the present study enriches the existing literature on the CSR-EM
relationship by examining a new conditional factor (FD) that may affect the relationship.
Second, the present study examines the effect of FD, not only on the direct CSR-EM relationship,
but also on the indirect CSR-EM relationship via OC. To the best of my knowledge, this is the first
study to examine a contextual effect on the indirect CSR-EM relationship. Considering FD as the
context, the study examines the direct and indirect CSR-EM relationships using two contrasting

167
managerial behaviour perspectives - the managerial myopia hypothesis and the myopia avoidance
hypothesis, to provide better understanding of managerial behaviour during crisis. Furthermore,
examining the effect of FD will provide insight into – 1) when CSR has a direct effect on EM; and 2)
when CSR has an indirect effect on EM via OC, in the context of FD.
The study also makes several methodological contributions. To the best of my knowledge, this is the
first study to examine a moderated mediation effect, by examining the moderating effect of FD on
the indirect relationship between CSR and EM, mediated by OC. In the process, I first examine the
existence of first stage moderation, by examining whether FD moderates the relationship between
CSR and OC. My results from Chapter 4 indicate that firms with high CSR have better OC, as CSR
creates intangible resources, such as, knowledge developments, that are critical for the
sustainability of the business models (Villalonga, 2004). The present study examines how FD affects
the relationship between CSR and OC. To the best of my knowledge, this is the first study to examine
the moderated effect of FD on the relationship between CSR and OC. Next, the study examines
second stage moderation by examining whether FD moderates the relationship between OC and
EM. My results in Chapter 4 report that firms with superior OC are more likely to manage earnings.
FD, on the other hand, also creates managerial incentives to manage earnings (for example, see
Burgstahler & Dichev, 1997; Charitou et al., 2011; DeAngelo et al., 1994; Dichev & Skinner, 2002;
Jaggi & Lee, 2002; Rosner, 2003; Sweeney, 1994). Thus, prior studies have examined both OC and
FD individually as factors that create EM incentives. However, to the best of my knowledge, the
interaction effect of OC and FD on EM remains unaddressed to date. Thus, by including FD as a
moderator, the present study explores if FD strengthens or weakens the relationship between OC
and EM.
5.4 Theoretical Background
This section discusses the theoretical background of this study. The main relationships tested in this
study may be explained with four theories – 1) the resource-based view (RBV) theory, 2) the slack
resource theory, 3) the managerial myopia hypothesis, and 4) the myopia avoidance hypothesis.
The RBV theory explains the relationship between CSR and OC, while the slack resource theory
explains how the CSR and OC relationship may change during FD. The managerial myopia hypothesis
and the myopia avoidance hypothesis present two opposing perspectives on managers’ likelihood
of engaging in EM. These two theories explain the potential relationship between OC and EM, and
between CSR and EM. These theories are also further extended to explain how these relationships

168
may change during FD.
5.4.1 Resource-Based View (RBV) Theory
As discussed in greater detail in Chapter 4, the RBV theory suggests that CSR activities enhance
intangible assets, specifically knowledge development (Eisenhardt & Martin, 2000; Nikolaou, 2017;
Villalonga, 2004), that in turn improves a firm’s OC, including superior managerial quality practices,
more knowledgeable workforce, and efficient organisational processes and designs (Branco &
Rodrigues, 2006; Orlitzky, 2005). CSR actions and ethical orientation become embedded in the firm’s
identity, the organisational design, systems, practices, and policies (Dutton & Dukerich, 1991; Starik
& Rands, 1995). Thus, CSR practices are likely to blend into the organisational process and become
part of the structural capital or organisation capital.
While the RBV explains the positive relationship between CSR and OC, this may or may not hold
when the firm experiences FD. There are two opposing possibilities. First, the interaction of FD and
CSR may enhance OC. Financially distressed firms may increase their CSR practices as a turnaround
strategy. When experiencing FD, managers may use CSR activities to improve their relationships
with stakeholders as a means to obtain possible salary renegotiation with employees and unions, to
reduce negative publicity, to reduce costs in employee redundancy, and to obtain better credit
terms (Habib et al., 2020a). Thus, consistent with the RBV perspective, I expect FD to positively
affect (strengthen) the relationship between CSR and OC. However, the second perspective is a
contrasting view that may be explained by the slack resource theory, discussed below.
5.4.2 Slack Resource Theory
The RBV discussed above is based on the assumption that the firm has the capability and ‘slack’
(that is, excess) resources required to exploit its unique resources as opportunities, and achieve
sustainable competitive advantage (Huang & Li, 2012). ‘Slack’ (also known as surplus or residual
resources) is defined as “the difference between total resources and total necessary payments” of
a firm (Cyert & March, 1963, p. 42). Similar to obtaining any other asset, OC also requires some form
of investment and resource allocation (Carlin et al., 2012). However, the outcome or value created
by OC may not be realised immediately (Brynjolfsson et al., 2002). For example, investment in a new
business model or organizational process may take years to be realised, and only some of these
investments may turn out to be profitable (Brynjolfsson et al., 2002). Hence, rational decision
making is essential as managers need to weigh the possible failure risks before making a decision
on such investments (Brynjolfsson et al., 2002). Thus, according to the slack resource theory, firms,

169
undergoing FD have fewer slack resources, and are therefore less likely to make investments in
enhancing OC (or intangible assets in general).
Furthermore, the slack resource theory posits that less profitable firms have fewer surplus (i.e.
slack) resources to spend on CSR in comparison to more profitable firms with greater slack resources
(for example see Campbell, 2007; Chan et al., 2017). These studies suggest that in crisis situations,
firms may react differently as priorities change. Thus, consistent with the slack resource theory, as
firms’ priorities change during FD, I expect the relationship between CSR and OC to become weaker.
The discussion above suggests that the moderating effect of FD on the relationship between CSR
and OC may be explained by two contrasting perspectives. The RBV theory suggests that FD may
strengthen the relationship between CSR and OC, while the slack resource theory suggests a
contrasting perspective that FD weakens the relationship between CSR and EM. In the next two
sections, I present two contrasting perspectives on discuss managerial behaviour that explain CSR-
EM relationship during FD – 1) managerial myopia hypothesis; and 2) myopia avoidance hypothesis.
5.4.3 Managerial Myopia Hypothesis
Managerial myopia, or short termism, is a term used to describe managerial preference towards
actions or behaviour that are focussed on realising short-term objectives. Such a short-term focus
often results in unfavourable consequences for the firm’s ability to create long-term value (Hayes &
Abernathy, 1980). The literature suggests that when firms experience FD, managerial myopic
behaviour becomes more prevalent (Gu et al., 2020). FD represents a situation when the firm faces
financial difficulties or constraints. FD may have substantial implications on the firm, and its
stakeholders, including higher risks of bankruptcy (Habib et al., 2020a; Ohlson, 1980), loss of
customers and sales (Altman, 1984; Habib et al., 2020a; Hoshi et al., 1990; Purnanandam, 2008),
loss of key employees and valuable suppliers (Purnanandam, 2008), and financial losses for the
stakeholders (Habib et al., 2020a; Jacoby et al., 2019). The literature suggests that FD may shift
management’s focus to short-term survival issues, and thus managers may engage in EM in order
to increase short-term compensation (Altman, 1984), avoid breach of loan contracts (Charitou et
al., 2011; Dichev & Skinner, 2002; Sweeney, 1994), safeguard their employment or inflate stock
prices and gain from stock-based compensation (Charitou et al., 2011), obtain waivers from debt
covenant violations (Jaggi & Lee, 2002) or conceal the firm’s distress and obtain better renegotiation
terms (Burgstahler & Dichev, 1997; DeAngelo et al., 1994; Rosner, 2003).

170
As discussed in greater detail in Chapter 4, managers in firms with high OC are more likely to manage
earnings for two main reasons – 1) greater market pressures to achieve short-term targets
(Malmendier & Tate, 2009), and to safeguard their reputation that may be damaged by repeated
inability to meet targets (Francis et al., 2008); and 2) greater opportunities to manage earnings due
to superior abilities, such as superior managerial practices, processes, techniques and knowledge
about the firm and its internal control systems (Demerjian et al., 2013; Gul et al., 2018). Chapter 4
results support this view, suggesting a positive relationship between OC and EM. This is consistent
with the managerial myopia hypothesis. The short-term behaviour of managers in high OC firms is
likely to be even stronger among financially distressed firms. As discussed above, FD on its own
creates incentives for managers to manage earnings, while OC provides more opportunities for
managers to manage earnings. Thus, consistent with the managerial myopia hypothesis, I expect
the interaction of FD and OC to escalate managers’ myopic behaviour, and lead to higher EM.
The managerial myopia hypothesis may also explain the relationship between CSR and EM. One of
the perspectives of the CSR-EM relationship suggests that managers in firms engaged in CSR are
more likely to manage earnings due to – 1) incentive-driven myopia resulting from greater
incentives arising from pressures to meet short-term targets and please stakeholders (Chih et al.,
2008; Gargouri et al., 2010; Habbash & Haddad, 2020), a need to safeguard their reputation (Francis
et al., 2008), and/or increase their compensation-based bonuses (Narayanan, 1985; Schotter &
Weigelt, 1992); and/or 2) opportunity-driven myopia arising from greater opportunities to manage
earnings. Firms engaged in CSR initiatives are often perceived as doing things the right way, thus
reducing stakeholders’ scrutiny of managers, which opens up more opportunities to manage
earnings (Kim et al., 2012; Muttakin et al., 2015). Thus, managers involved in CSR initiatives may
manage earnings more, and use their CSR activities as a defensive shield to hide their engagement
in EM (Bozzolan et al., 2015; Gao & Zhang, 2015; Prior et al., 2008). Thus, consistent with the
managerial myopia hypothesis, this view suggests that managers engaged in CSR activities are more
likely to manage earnings for short-term gains. Chapter 4 results show that there is a negative direct
relationship between CSR and EM, but a positive indirect relationship between CSR and EM via OC.
The negative direct relationship is consistent with the myopia avoidance hypothesis, that I discuss
in the next section. The positive indirect relationship suggests that managers engaged in CSR may
leverage on their firm’s OC to manage earnings for short-term gains. This is consistent with the
managerial myopia hypothesis. The present study examines whether this managerial myopia (that
is, the positive indirect relationship) changes during FD.

171
There can be two opposing possibilities. First, FD may worsen the opportunistic use of CSR to
manage earnings by strengthening the positive indirect relationship between CSR and EM via OC,
making managerial myopia more prominent. As discussed above, FD generally creates more
managerial incentives to manage earnings. Thus, it can be expected that the positive indirect
relationship between CSR and EM via OC, becomes more pronounced during FD, consistent with
the managerial myopia hypothesis. As both OC and FD create more EM incentives during FD,
managers may be expected to use CSR more opportunistically to manage earnings, leveraging from
the greater EM opportunities provided by OC.
The second possibility is a contrasting perspective that leads to the expectation that FD may improve
the opportunistic use of CSR to manage earnings, that is managers’ myopic actions may reduce
during FD. There are a number of reasons behind this perspective. First, as managers in high OC
firms are more knowledgeable, I expect that managers may have a better understanding of the
adverse consequences of EM. Particularly when experiencing FD, managers in high OC firms may
refrain from such risk-taking opportunistic actions (that is, EM), and thus manage less earnings.
Second, managers’ priorities may change when their firm experiences FD. During FD, managers may
be more concerned about safeguarding their jobs, as opposed to their reputation, which may also
explain why they manage earnings less. Third, as the slack resource theory suggests, managers may
engage less in CSR during FD. Thus, it can be expected that during FD, when funds are tight, any
expenditures on CSR engagements would likely result from genuine concerns for stakeholders,
rather than from opportunistic motives.
The next section discusses the myopia avoidance hypothesis that suggests a contrasting perspective
on managers’ likelihood of managing earnings.
5.4.4 Myopia Avoidance Hypothesis
Myopia avoidance is a term that suggests that managers would avoid myopic or short termism
behaviour and actions, focussing more on long-term objectives. Thus, the myopia avoidance
hypothesis poses a contrasting perspective to the managerial myopia hypothesis, suggesting that
managers are more long-term oriented and are less likely to be driven solely by short-term goals,
and thus, less likely to manage earnings (Chih et al., 2008).
As discussed in the previous section, Chapter 4 results show that managers in high OC firms are
more likely to manage earnings. However, managers may react differently in crisis situations, such

172
as FD. Therefore, from a contrasting perspective, I expect that managers in high OC firms will
manage earnings less during FD. With their higher knowledge and skills, they are able to exert higher
levels of accuracy in their financial reporting estimations (for example, see Demerjian et al., 2013).
When experiencing FD, it is plausible that managers in high OC firms know better than to manage
earnings as a short-term solution to hide or delay their firms’ distressed state. Thus, it can be
expected that these managers will take actions that would help the firm towards long-term
recovery. This view is consistent with the myopia avoidance hypothesis.
The myopia avoidance hypothesis also presents a contrasting perspective on the relationship
between CSR and EM. The contrasting perspective indicates that managers involved in CSR
activities, are long-term oriented, and are less likely to manage earnings to meet short-term
objectives (Chih et al., 2008; Choi & Pae, 2011). The lower EM may arise because managers engaged
in CSR – 1) have genuine concerns of sustaining long-term relationships with their stakeholders, that
is, relationship-driven myopia avoidance (Bozzolan et al., 2015; Chih et al., 2008); and/or 2) have
strong ethical and moral values, that is, value-driven myopia avoidance (Litt et al., 2013). Chapter 4
results show a negative direct relationship between CSR and EM, consistent with the myopia
avoidance hypothesis. The present study examines whether managers’ avoidance of myopia (that
is, the negative direct CSR-EM relationship) still holds when the firm experiences FD. I expect that
managers who are genuinely motivated by their ethical and moral obligations, and who genuinely
care about their stakeholders will continue to be driven by their long-term orientation and avoid
using CSR opportunistically to manage earnings.
5.5 Literature Review and Empirical Evidence
5.5.1 FD Literature
FD has been a prevalent topic of discussion for several decades (Geng et al., 2015). Persistent FD
can increase the firms’ likelihood of bankruptcy and default (Habib et al., 2020a; Ohlson, 1980). FD,
or corporate failure, not only affects the firm in question, but also has significant implications for
stakeholders, such as, financial institutions, investors, creditors, and the government, as well as for
the broader economy (Geng et al., 2015; Habib et al., 2020a). Financial institutions may suffer
significant losses from the inability to recover loans from financially distressed firms
(Balasubramanian et al., 2019). Creditors also suffer similar risks of being unable to recover the
credits offered to distressed firms. Furthermore, FD may have broader social, political and economic

173
impacts. (Balasubramanian et al., 2019).
Although FD affects several external parties, the most significant costs of FD are borne by the firms
themselves. The direct costs of FD or bankruptcy include explicit expenses, such as, legal, filing,
accounting fees, trustee expenses and other reorganisation or liquidation related administrative
expenses (Altman, 1984). Additionally, the negative publicity creates a perception that the firm is
likely to default, and this may lead to several indirect costs including, lost profits, lost sales,
difficulties in obtaining credit, etc. (Altman, 1984). Altman (1984) adds that the indirect costs also
include managerial opportunity costs arising firm lost managerial efforts. These indirect costs are
relevant not only to firms that actually fail, but also firms that have high probabilities of failure or
bankruptcy (Altman, 1984).
A large body of literature focusses on how FD affects EM or the quality of financial information (for
example see (Charitou et al., 2007, 2011; Chen et al., 2010; DeAngelo et al., 1994; DeFond &
Jiambalvo, 1994; Habib et al., 2013; Jacoby et al., 2019; Jaggi & Lee, 2002; Li et al., 2020; Rosner,
2003; Sweeney, 1994)). I discuss these studies in Section 5.5.2. Apart from financial reporting
consequences, prior studies have identified several other consequences of FD, such as high level of
management turnover (Gilson, 1989), dividend reductions (DeAngelo & DeAngelo, 1990), risks of
acquisition by another firm (Theodossiou et al., 1996), higher use of trade credit (Molina & Preve,
2012), and higher likelihood of tax avoidance (Richardson et al., 2015).
The present study examines the consequences of FD on OC and FD by examining interlinks between
FD, CSR, OC and EM. Specifically, I examine how FD interacts with CSR and OC and in turn affects
EM, that is the moderating role of FD in the direct relationship between CSR and EM, and in the
indirect relationship between CSR and EM via OC. To that effect, the remainder of this section is
arranged as follows: Section 5.5.2 discusses the effect of FD on EM, Section 5.5.3 discusses the direct
effect of CSR on EM, and how FD affects this relationship; Section 5.5.4 discusses the indirect effect
of CSR on EM via OC, and the interaction effect of FD on this relationship. In section 5.5.4, I also
discuss the indirect paths involved, that is, the effect of CSR and OC, and the effect of OC on EM,
and the interaction of FD both of these relationships. Each of the sections discuss the relevant
empirical literature from which a hypothesis is developed to be tested in this study.
5.5.2 The Effect of FD on EM
I have identified 11 studies examining the effect of FD on EM. Table 5.1 summarises the relevant

174
literature discussing the relationship between FD and EM.

175
Table 5.1 Summary of Key Literature on FD and EM
(1) (2) (3) (4) (5) (6)
Authors (Year)
Country Sample (Period)
Research Objective Research method Theories supported Key findings
DeAngelo et al. (1994)
USA 76 firms
(1980 - 1985)
Examine EM level in financially distressed firms
Method: Level of EM in sample of distressed firms EM measure: Bowen et al. (1986) FD measure: Firms with persistent losses for at least 3 years and cash dividend reductions
Stakeholder conflict
perspective
Large negative accruals during the dividend reduction year and the following 2 years
DeFond & Jiambalvo
(1994)
USA 94 firms
(1985 - 1988)
Examine EM in firms with debt-covenant violations
Method: Time-series and cross-sectional models – sample t-tests and Wilcoxon tests EM measure: Jones (1991a) FD measure: Firms with reports of debt covenant violations in annual reports
Positive accounting
theory
Positive abnormal total accruals in the year before violation. Positive abnormal working capital accruals in the year of violation and the year before.
Sweeney (1994)
USA 130 firms
(1980 - 1989)
Examine accounting changes in firms with debt-covenant violations
Method: Firms with first time debt-covenant violations matched with a control firm sample EM measure: Income-increasing accounting procedures FD measure: Debt covenant violations
Covenant-based
hypothesis
Higher income-increasing accounting changes in firms approaching default
Jaggi & Lee (2002)
USA 216 firms
(1989 - 1996)
Examine EM in financially distressed firms
Method: Sample split based on FD measure EM measure: Dechow et al. (1995); Kasznik (1999); Kothari et al. (2005) FD measure: Firms with debt covenant violations and firms with debt restructuring
Positive accounting
theory
Higher income-increasing accruals in distressed firms if they can obtain debt covenant violations waivers. Higher income-decreasing accruals in distressed firms if debt restructuring or renegotiation takes place.
Rosner (2003)
USA 2,500 observations/
293 firms (1985 – 1997)
Examine EM in financially distressed firms
Method: 42 non-sanctioned and 51 SEC-sanctioned firms matched with 293 control firms from USA (year of bankruptcy + 6 preceding years) EM measure: FD measure: McKeown et al. (1991)
n/a
Bankrupt firms have significant income-increasing accrual EM in non-going-concern years, in contrast to non-failing firms
Charitou et al. (2007)
USA 455 firms
(1986 - 2001)
Examine EM in financially distressed firms
Method: Level of EM in sample of distressed firms EM measure: Jones (1991a);Teoh et al. (1998) FD measure: Bankruptcy filing
n/a
Higher income-decreasing EM one year prior to bankruptcy filing. Income-increasing EM 3-5 years prior to bankruptcy filing

176
Chen et al. (2010)
China 34 firms
(2002 - 2006)
Examine EM in financially distressed firms
Method: Level of EM in sample of distressed firms EM measure: Dechow et al. (1995) FD measure: ST (‘Special Treatment’ status) firms
n/a
More EM before and after being classified as special treatment (ST), to avoid continued ST status and risk of being de-listed
Charitou et al. (2011)
USA 15,049 firms (1990 - 2004)
Examine EM in financially distressed firms
Method: Level of EM in sample of distressed firms EM measure: Small positive earnings FD measure: Debt Default likelihood
n/a Distressed firms manage earnings toward a positive target more than healthy firms
Habib et al. (2013)
New Zealand 767 observations
(2000 - 2011)
Examine EM in financially distressed firms
Method: OLS EM measure: Dechow et al. (1995) FD measure: Hopwood et al. (1994); McKeown et al. (1991)
Managerial opportunism perspective
Managers in financially distressed firms engage in more income-decreasing EM; GFC had a small effect on the association between EM and FD.
Jacoby et al. (2019)
China 292,223
observations (1998 - 2009)
Examine EM in financially distressed firms, and the joint moderating effect of political affiliation and regional development
Method: OLS EM measure: Charitou et al. (2011) FD measure: Altman (2005)
Agency theory Positive relationship between FD and EM, weakened by political affiliations
Li et al. (2020) China
15,769 observations (2007 - 2015)
Examine EM in financially distressed firms, and the moderating effect of internal control quality
Method: OLS EM measure: FD measure: Zang (2012)
n/a
More accruals-based EM and less REM in financially distressed firms. Internal control moderates the FD-EM relationship by reducing both accruals-based EM and REM

177
As illustrated in Table 5.1 Column (2), the majority of prior studies (7 of the 11 studies) examining
the FD-EM relationship are based on samples from the USA (see Charitou et al., 2007, 2011;
DeAngelo et al., 1994; DeFond & Jiambalvo, 1994; Jaggi & Lee, 2002; Rosner, 2003; Sweeney, 1994).
Habib et al. (2013) is the first study to examine the FD-EM relationship in a developed country
outside USA. Specifically, Habib et al. (2013) examines a sample of firms from New Zealand. Chen et
al. (2010) is the first study to examine the effect of FD on EM using an emerging market sample,
that is, China. Following this, two more recent studies have examined the FD-EM relationship in
China (see Jacoby et al., 2019; Li et al., 2020).
Column (3) of Table 5.1 shows the research objectives of prior studies. The majority of prior studies
examines the level of EM in financially distressed firms (see Charitou et al., 2007, 2011; Chen et al.,
2010; DeAngelo et al., 1994; DeFond & Jiambalvo, 1994; Habib et al., 2013; Jaggi & Lee, 2002;
Rosner, 2003; Sweeney, 1994). Only recently, there appears to be some research attention to
examining the moderating effect on the FD-EM relationship of factors, such as, political affiliation
and regional development (see Jacoby et al., 2019), and internal control quality (see Li et al., 2020).
As shown in Column (4) of Table 5.1, there is no agreed measurement for FD. Prior studies have
used various methods for measuring FD, including persistent losses (see Chen et al., 2010; DeAngelo
et al., 1994), dividend reductions (see DeAngelo et al., 1994), debt covenant violations and/or debt
default possibilities (see Charitou et al., 2011; DeFond & Jiambalvo, 1994; Dichev & Skinner, 2002;
Jaggi & Lee, 2002; Sweeney, 1994), debt restructuring (see Jaggi & Lee, 2002, bankruptcy filing (see
Charitou et al., 2007), Altman Z-score and/or variations of the z-score (see Jacoby et al., 2019; Li et
al., 2020), and FD classification based on McKeown et al. (1991) (see Habib et al., 2013; Rosner,
2003). The present study, following Rosner (2003) and Habib et al. (2013), uses the FD classification
approach introduced by McKeown et al. (1991). This is discussed in greater detail in Section 5.7.5
As evident from Column (6) of Table 5.1, there is consensus in the literature that FD has a positive
effect on EM. DeAngelo et al. (1994) find significant income-decreasing accruals during the year of
dividend reduction, and two years following the dividend reduction. The results suggest that
managers may deflate reported earnings to portray the firm’s financial challenges and possibly
acquire better renegotiation terms (DeAngelo et al., 1994).
Several studies suggest that EM incentives in financially distressed firms arise due to the possibility
of debt covenant violations (or debt defaults) (for example, see Charitou et al., 2011; DeFond &
Jiambalvo, 1994; Jaggi & Lee, 2002; Sweeney, 1994). Sweeney (1994) finds higher income-increasing

178
accounting choices among firms prior to default. DeFond & Jiambalvo (1994) also find higher
income-increasing accruals management one year prior to and during the year of debt covenant
violations. Jaggi & Lee (2002) report higher income-increasing discretionary accruals in instances
when the firms are able to obtain waivers. The results indicate that when the firm experiences a
temporary FD, and is able to secure waivers for debt covenant violations, managers may inflate
reported earnings as a means of providing assurance to their creditors that the firm is in a less severe
distress (Jaggi & Lee, 2002). In contrast, the study also reports higher income-decreasing EM in
instances when debt restructuring or renegotiation takes place (Jaggi & Lee, 2002). The authors
explain that renegotiation of debt covenants takes place when the firm experiences more severe
FD. In such situations, managers may be more inclined to deflate their reported earnings to
emphasise on their financial difficulties in attempts to obtain better and more favourable debt
contract renegotiation terms. Charitou et al. (2011) finds that firms, with possibilities of debt
default, are likely to avoid reporting negative earnings, and manage earnings to a positive target.
Jacoby et al. (2019) also report similar EM behaviour (that is, EM towards a positive target) among
financially distressed private firms in China, using the Altman Z-score.
Charitou et al. (2007) report that managers are more inclined to engage in income-increasing
discretionary accruals management 3 to 5 years prior to the firm’s bankruptcy filing. In contrast,
managers are more likely to engage in income-decreasing discretionary accruals management
during the year immediately before the firm’s bankruptcy filing. As the probability of bankruptcy
filing gets larger, managers may be more manage earnings downwards to portray to the
stakeholders that the firm is in FD, and thus prompt market reaction. Other studies report higher
EM during the time that firms experience FD (for example, see Chen et al., 2010; Habib et al., 2013;
Li et al., 2020; Rosner, 2003). Rosner (2003) finds evidence of higher income-increasing accruals
management by firms in their non-going concern years (that is, failing firms). Chen et al. (2010)
suggest that during FD, firms are more likely to inflate earnings via EM to avoid risks of being de-
listed. In contrast, Habib et al. (2013) find that managers in financially distressed firms are more
likely to manage earnings using income-decreasing discretionary accruals. The results suggest that
during FD, investors are more likely to anticipate EM and thus scrutinise financial statements more
meticulously, thus providing managers with fewer opportunities to inflate earnings. Li et al. (2020)
find that distressed firms are more likely to manage earnings using discretionary accruals in contrast
to real earnings management (REM), as the latter involves actual changes to business operations
that may be more costly. Thus, distressed firms are more likely to engage in the less costly method

179
of managing earnings via using discretionary accruals that involve changes in accounting policies,
estimates, etc. (Li et al., 2020).
As discussed in the preceding paragraphs, the literature shows that when firms experience FD,
managers may behave more opportunistically (Gul et al., 2018; Habib et al., 2013; Rosner, 2003).
Managers in financially distressed firms may manage more earnings for various reasons, such as to
avoid debt covenant violations and the resulting loss of key stakeholders (Dichev & Skinner, 2002;
Sweeney, 1994), obtain debt covenant waivers or better renegotiation terms (DeAngelo et al., 1994;
Jaggi & Lee, 2002), avoid bankruptcy, acquisition or takeover (Rogers & Stocken, 2005), avoid
threats of getting the firm delisted (Chen et al., 2010), or more self-serving motives, such as saving
their employment, and enhancing their compensation-based bonusses by temporarily inflating
share prices (Charitou et al., 2011). Managing earnings during FD is a short-term solution to delay
the consequences of FD, or to temporarily conceal the distressed state from stakeholders (Rosner,
2003). This short-term orientation of managers during FD is consistent with the managerial myopia
hypothesis. Consistent with this perspective, and with the literature, I test the following hypothesis:
H2.1: Consistent with the managerial myopia hypothesis, there is a positive and significant
relationship between FD and EM.
5.5.3 The Direct Effect of CSR on EM
There is an abundance of literature on the relationship between CSR and EM, reporting mixed
findings. A detailed discussion of the literature on CSR and EM has been presented in Chapters 2.
Some studies report a positive direct relationship between CSR and EM (for example, see Buertey et
al., 2020; Habbash & Haddad, 2020; Hickman et al., 2021; Pratiwi & Siregar, 2019; Riahi-Belkaoui,
2003). The positive relationship suggests that managers engaged in CSR may manage more earnings
due to: 1) pressures arising from the need to please multiple stakeholders (Chih et al., 2008; Habbash
& Haddad, 2020; Kyaw et al., 2017); or 2) opportunistic motives of managers to use CSR activities
as a defensive shield, while they manage earnings for short-term objectives, such as meeting short-
term targets (Buertey et al., 2020; Jordaan et al., 2018; Mohmed et al., 2020; Riahi-Belkaoui, 2003).
The positive CSR-EM relationship is consistent with the managerial myopia hypothesis, suggesting
that managers are more driven by short-term orientations.
However, the majority of prior studies report a negative direct relationship between CSR and EM
(for example, see Almahrog et al., 2018; Bozzolan et al., 2015; Calegari et al., 2010; Chen & Hung,

180
2021; Cho & Chun, 2015; Chun & Cho, 2017; Faisal et al., 2018; Gao & Zhang, 2015; García‐Sánchez
et al., 2020; Gerged et al., 2020; Gerged et al., 2021; Gras-Gil et al., 2016; Hong & Andersen, 2011;
Kim et al., 2012; Kumala & Siregar, 2020; Li & Xia, 2018; Litt et al., 2013; Martínez‐Ferrero et al.,
2015; Palacios-Manzano et al., 2019; Patten & Trompeter, 2003; Scholtens & Kang, 2013; Sial et al.,
2019; Wang et al., 2018). The negative relationship suggests that managers engaged in CSR activities
– 1) care more about sustaining long-term relationships with stakeholders (Almahrog et al., 2018;
Amar & Chakroun, 2018; Cho & Chun, 2015; Choi et al., 2018; Chun & Cho, 2017; Faisal et al., 2018;
Gras-Gil et al., 2016; Hong & Andersen, 2011; Jouber, 2020; Velte, 2019)), and/or 2) are driven by
their ethical and moral values (Calegari et al., 2010; Gao & Zhang, 2015; García‐Sánchez et al., 2020;
Kim et al., 2012; Kumala & Siregar, 2020; Li & Xia, 2018; Martínez‐Ferrero et al., 2015; Mohmed et
al., 2020; Palacios-Manzano et al., 2019; Rezaee et al., 2020; Scholtens & Kang, 2013; Sial et al.,
2019)). The negative CSR-EM relationship is consistent with the myopia avoidance hypothesis,
suggesting that managers have a more long-term orientation. A number of studies also suggest that
the CSR-EM relationship is contextual, based on various other factors (for example, see Amar &
Chakroun, 2018; Chih et al., 2008; Choi et al., 2018; Gargouri et al., 2010; Gong & Ho, 2018; Heltzer,
2011; Jordaan et al., 2018; Kim et al., 2019; Kolsi & Attayah, 2018; Kyaw et al., 2017; Liu & Lee, 2019;
Mohmed et al., 2020; Muttakin et al., 2015; Rezaee et al., 2020; Velte, 2019, 2021; Yip et al., 2011;
Zhang et al., 2021), such as the EM measure used (see Chih et al., 2008; Jordaan et al., 2018; Kolsi &
Attayah, 2018; Velte, 2019, 2021; Zhang et al., 2021), the CSR dimension used (see Amar &
Chakroun, 2018; Gargouri et al., 2010), the level of stakeholder scrutiny in particular industries (see
Muttakin et al., 2015; Yip et al., 2011), institutional framework/development (see Kim et al., 2019;
Kyaw et al., 2017), state versus private ownership (see Kim et al., 2019; Li et al., 2020; Liu & Lee,
2019; Rezaee et al., 2020), and mandatory CSR disclosures (see Gong & Ho, 2018; Wang et al., 2018).
While my findings from Chapter 4 and majority of the literature suggests that CSR has a negative
direct effect on EM, a different stream of literature suggests a positive effect of FD on EM (for
example, see Burgstahler & Dichev, 1997; Charitou et al., 2011; DeAngelo et al., 1994; Dichev &
Skinner, 2002; Jaggi & Lee, 2002; Rosner, 2003; Sweeney, 1994). I have not identified any study
examining the interaction of CSR and FD on EM. FD is a crisis situation, and managers may react
differently in crisis situations. Thus, FD may have two possible contrasting effects on the relationship
between CSR and EM. First, consistent to the managerial myopia hypothesis, since financially
distressed firms create more EM incentives, and reduce CSR initiatives due to lack of slack resources
(Campbell, 2007), the presence of FD may weaken the negative relationship between CSR and EM.

181
Managers in financially distressed firms may shift their focus, from sustaining their relationships
with their stakeholders, to short-term survival issues of the firm. Second, a contrasting perspective
suggests the relationship between CSR and EM to be stronger in financially distressed firms.
Consistent with the myopia avoidance hypothesis, this view suggests that managers in CSR firms are
likely to remain long-term oriented, even during FD. Their ethical values and their concern to
maintain strong long-term relationships with stakeholders will discourage them from managing
earnings. In the present study, I examine whether this negative direct CSR-EM relationship stays the
same or changes (that is, either strengthens or weakens) when firms experience FD. Therefore, to
address research question 1, I test the following hypothesis:
H2.2: FD has a significant moderating effect on the direct relationship between CSR and EM.
5.5.4 The Indirect Paths in the CSR-EM Relationship via OC
To discuss the indirect effect of CSR on EM via the mediating channel OC, it is important to first
discuss each of the paths through which CSR indirectly affects EM via OC, that is, the effect of CSR
on OC and the effect of OC on EM. The following paragraphs discuss the relevant literature on the
two indirect paths leading to the discussion on the overall indirect CSR-EM relationship via OC.
The effect of CSR on OC
Prior studies have examined the relationship between CSR and intellectual capital (or intangibles),
but there is no literature linking CSR specifically to OC. A detailed discussion of prior literature on
CSR and intellectual capital has been presented in Chapter 4. The literature suggests that CSR has a
positive effect on the broader intellectual capital (for example, see Altuner et al., 2015; Hawn &
Ioannou, 2016), and specific components of intellectual capital, such as high performance work
system outcomes (specifically, employee satisfaction, commitment and organisational citizenship
behaviour) (Zhang et al., 2014), human capital (see Casalegno et al., 2017; Pedrini, 2007) and various
relational (or customer) capital aspects, including, brand equity (Hur et al., 2014), brand image
(Martínez et al., 2014), customer satisfaction (Chung et al., 2015), customer/brand loyalty (Chung
et al., 2015; Martínez et al., 2014), and employer branding (that is, making the firm more likely to
attract talented workforce) (Biswas & Suar, 2016).
The literature is quite consistent in reporting a positive relationship between CSR and intellectual
capital. However, there is a gap in the literature regarding the relationship between CSR and OC
(see Chapter 4 for a more elaborate discussion). My analysis in Chapter 4 examines how CSR affects

182
OC, a specific component of intellectual capital, as opposed to the broader category of intellectual
capital. While the literature suggests that CSR enhances intellectual capital components such as
relational capital and human capital, I reason that CSR first affects the organisational practices and
processes, that is, OC. According to the RBV, CSR initiatives by managers are likely to blend into the
organisational practices and processes (Branco & Rodrigues, 2006; Orlitzky, 2005), and become part
of organisation (or structural) capital (Dutton & Dukerich, 1991; Starik & Rands, 1995). Furthermore,
CSR has the capability of creating intangible resources, such as, knowledge development for
businesses, which are essential for business sustainability, and thus enhance OC (Eisenhardt &
Martin, 2000; Nikolaou, 2017; Villalonga, 2004). Consistent with this view and with the RBV theory,
my results in Chapter 4 suggest a positive relationship between CSR and OC. In the present study, I
examine how FD affects the positive relationship between CSR and OC. To that effect, I first examine
the effect of FD on OC. To the best of my knowledge, no prior studies have examined the
relationship between FD and OC.
Despite a lack of prior evidence on a direct link between FD and OC, studies have examined various
facets of managerial and employment changes when firms experience FD. Given that OC represents
managerial quality practices, training, and the overall organisational process, design and culture,
this part of the literature review discusses prior studies examining changes in the management and
employment structure in financially distressed firms.
Brickley (2003) informs that CEO turnover is higher in financially distressed firms. Firms experiencing
FD not only find it challenging to retain high level managers or CEOs, but also other employees, as
well as finding it difficult to attract new employees. Baghai et al. (2020) report that distressed firms
lose their ability to retain their skilled workers. As highly skilled and talented workers are more likely
to be employed in strategic positions within the firm, they have higher knowledge of the extent of
FD, and also face risks of reputational damage. These may lead them to decide to leave the
distressed firm (Baghai et al., 2020). Brown & Matsa (2016) find that there are fewer and lower
quality job applicants interested in firms experiencing FD. Brown & Matsa (2016) explain that job
applicants are more likely to decline to seek employment in financially distressed firms in order to
avoid the unemployment risks that they may face as an employee in a distressed firm.
Despite the argument in the literature that FD leads firms to face challenges in attracting and
retaining their skilled employees, this does not necessarily insinuate that FD damages OC. OC
features an integration of managerial quality practices, knowledge, organizational process, design

183
and culture (for example, see Attig & Cleary, 2014, 2015; Bloom et al., 2010; Bloom & Van Reenen,
2007; Carlin et al., 2012). It is a more permanent intangible resource that remains within the
organisational structure, and is not transferable with managerial turnover (Attig & Cleary, 2014;
Carlin et al., 2012). The literature suggests that higher managerial ability leads to more appropriate
choice of investment and use of resources, thus positively affecting financial performance
(Demerjian et al., 2012). More able managers would work to reduce risks of FD (Leverty & Grace,
2012). Thus, it can be expected that firms facing distress risk would benefit by having more capable
managers in their workforce, as higher managerial ability, knowledge and better organisational
design and processes may assist with their distress recovery strategies. Among other things, OC is
also a proxy of management quality practices, which may be closely linked to the ability of
managers. Thus, according to this view, I expect that financially distressed firms will focus on
improving their OC as a distress recovery strategy. This is consistent with the suggestions by Dreyer
& Grønhaug (2004) that during uncertain times, firms should improve their knowledge resources.
As these knowledge resources are firm-specific, they are difficult to be copied by competitors, thus
providing firms with sustained competitive advantage. This is supported by the RBV that suggests
that higher OC is critical for firms in achieving sustained competitive advantage to combat and
recover from FD (Dreyer & Grønhaug, 2004). Thus, it can be expected that firms facing uncertain
times, such as those caused by FD, are likely to focus on improving their knowledge-based resources,
such as managerial quality practices, knowledge, organisational process and designs (that is, OC).
While the above perspective is consistent with the RBV theory, a contrasting perspective suggests
that OC may deteriorate during FD. Firms may change their existing organisational practices, as they
adopt different strategies to cope with the distress. According to the slack resource theory, during
FD, firms may reduce investments in intangibles, such as OC. Investments in OC, such as adoption
of a new business model or process, may take years to implement, while some may even fail
(Brynjolfsson et al., 2002). During FD, when the firm has financial constraints, they will most likely
refrain from such investments.
Based on the conflicting views suggested in the literature, the present study examines whether FD
leads firms to an improvement or a deterioration of OC. To test these opposite views, I propose the
following competing hypotheses:
H2.3a: Consistent with the RBV theory, there is a positive and significant relationship between FD
and OC.

184
H2.3b: Consistent with the slack resource theory, there is a negative and significant relationship
between FD and OC.
My next hypothesis tests the effect of FD on the relationship between CSR and OC, which is the first
stage moderation. Prior studies have examined the effect of CSR on intangibles in general (for
example, see Biswas & Suar, 2016; Hawn & Ioannou, 2016; Hur et al., 2014), but not specifically on
OC. My results in Chapter 4 indicate that firms with high CSR have better OC, as CSR creates
intangible resources, such as, knowledge developments, that are critical for the sustainability of the
business models (Villalonga, 2004). To the best of my knowledge, the study undertaken in Chapter
4 was pioneer in examining the relationship between CSR and OC. Consequently, the present study
is the first to study how a firm-specific event, namely FD affects the relationship between CSR and
OC.
Consistent with the RBV, my results from Chapter 4 already report a positive relationship between
CSR and OC. However, this positive relationship may change when CSR interacts with FD. Prior
studies report CSR has a negative effect on FD (for example, see, Al‐Hadi et al. (2019); Chan et al.
(2017)). Al‐Hadi et al. (2019) provide multiple interpretations to this result. First, the negative
relationship between CSR and FD may suffer from a reverse causality problem, suggesting that
financially distressed firms are less likely to invest in CSR initiatives, as a means of saving money.
Second, large firms and firms in the maturity stage of their life cycle, are generally more financially
stable, and have slack (or excess) resources to invest in CSR initiatives. Furthermore, these mature
firms are better able to attract CEOs with more experience, knowledge and skills. Thus, the negative
relationship between CSR and FD may be a result of superior management in these firms reducing
FD risks, as opposed to CSR having a direct effect of FD risk (Al‐Hadi et al., 2019). The present study
focuses on the effect of the interaction between CSR and FD on OC. Originating from the literature
on FD and CSR, I expect two contrasting possibilities. Consistent to the slack resource theory,
financially distressed firms generally have lower CSR, since these firms have fewer slack (or surplus)
resources to spend on CSR initiatives in contrast to profitable firms’ resources (Campbell, 2007). The
slack resource theory also implies a negative relationship between FD and OC. Thus, according to
the slack theory, OC is likely to deteriorate in financially distressed firms with lower CSR, that is, FD
is likely to weaken the relationship between CSR and OC. An opposing perspective suggests that FD
may strengthen the positive relationship between CSR and OC. During FD, firms may participate in
more CSR initiatives, and build better relationships with stakeholders, as a turnaround strategy to
obtain benefits such as salary renegotiations with employees and unions, to combat negative

185
publicity, reduce employee redundancy costs, etc. Consistent to the RBV, and discussed previously,
high CSR generally leads to higher OC. Thus, according to the RBV, the interaction of FD and CSR is
likely to have a positive effect on OC, that is, FD is likely to strengthen the relationship between CSR
and OC. Thus, I expect the interaction of FD and CSR to have an effect (that is, either weakening or
strengthening effect) on OC. To this end, I test the following hypothesis to test the existence of the
first stage moderation:
H2.4: FD has a significant moderating effect on the relationship between CSR and OC.
The effect of OC on EM
This section entails a brief discussion of the relevant literature on the relationship between OC and
EM. A detailed discussion of the literature has been presented in Chapter 4.
With the growing interest in intellectual capital (or intangibles), much research attention has been
drawn towards explaining how intangibles affect financial reporting quality (for example, see
Bhandari et al., 2018; Francis et al., 2008; Malmendier & Tate, 2009; Shust, 2015). Among these,
some studies have examined the relationship between managerial aspects of intellectual capital and
EM, suggesting mixed results. For example, Francis et al. (2008) and Malmendier & Tate (2009) find
that reputable CEOs are more likely to manage earnings. However, Demerjian et al. (2013) find that
managers with higher ability have a positive influence on the quality of earnings, including accruals
quality. Studies examining the link of EM with relational capital (another component of intellectual
capital) also report mixed results (for example, see Al-dhamari & Ku Ismail, 2015; Bhandari et al.,
2018; Chaney et al., 2011). Chaney et al. (2011), using an international sample involving 19
countries, suggest that firms with political connections are more likely to manage earnings.
Consistent with this, Al-dhamari & Ku Ismail (2015) report lower earnings quality (that is lower
quality accruals) among politically connected Malaysian firms. However, Bhandari et al. (2018)
suggest that CEOs with external connections are less likely to manage earnings. Another stream of
literature examines the relationship of research and development (R&D) expenses (a commonly
used proxy for intangible intensity) with EM (for example see, Hao & Li, 2016; Shust, 2015). Shust
(2015) finds higher EM among more R&D intensive firms. Similarly, Hao & Li (2016) report higher
discretionary accruals among innovative firms with higher R&D expenses.
While there is an abundance of studies examining how various aspects of intellectual capital affect
EM, investigation of how OC effects EM is lacking. This is particularly important given that both OC

186
and EM are results of managerial actions and decisions. EM is a result of discretionary actions by
managers, while OC refers to managerial practices, internal networks, the business processes, etc.
In contrast, other forms of intellectual capital, such as customer capital or human capital, may not
be direct results of managerial practices. My results in Chapter 4 report a positive relationship
between OC and EM, suggesting that managers in firms with high OC are more likely to manage
earnings due to their exposure to greater market pressures, in order to safeguard their reputation,
meet short-term earnings targets, or for other purposes, and also due to their greater ability and
more sophisticated techniques to manage earnings. This is consistent with the managerial myopia
hypothesis, as the positive relationship between OC and EM suggests that managers are more
focussed on obtaining short-term goals.
The present study examines the effect of FD on the relationship between OC and EM. A similar
examination was undertaken by Gul et al. (2018), suggesting that higher managerial ability makes
managers more proficient in managing earnings. Although FD always creates EM incentives
regardless of managerial ability, having more able managers provides more opportunities for EM
(Gul et al., 2018). My study is different from Gul et al. (2018) in two ways. First, I examine the
interaction effect of OC and FD. Despite including managerial ability as one of its components, OC
encompasses much more than managerial ability. As discussed above, OC is an amalgamation of
managerial quality practices, knowledge, processes and culture. Second, Gul et al. (2018) examine
the moderating role of managerial ability on the relationship between FD and EM, while I
incorporate FD as a moderator in the relationship between OC and EM. I expect that FD may affect
the relationship between OC and EM in either of two opposing ways. First, consistent to the
managerial myopia hypothesis, EM engagement by managers become more prevalent during FD.
Consistent with the interpretation provided by Gul et al., 2018, this view suggests that while OC on
its own creates opportunities for EM, FD creates further incentives for EM. Since both OC and FD,
individually, increase EM, the interaction effect of OC and FD is likely also have a positive impact on
EM, making the opportunistic use of OC even worse. However, a different perspective suggests that
during FD, while many firms may engage in more EM, firms with high OC may refrain from managing
earnings. High OC firms are likely to have managers that are more knowledgeable and skilled, as
well as better organisational processes and managerial practices. As per the myopia avoidance
hypothesis, during FD, these managers may stop focussing on short term goals, and shift their focus
on strategies that may aid the firm’s long-term survival. Based on these opposing views, I expect
FD to have an effect (that is, either a strengthening or a weakening effect) on the relationship

187
between OC and EM. Thus, to test the existence of second-stage moderation, I test the following
hypothesis:
H2.5: FD has a significant moderating effect on the relationship between OC and EM.
The above discussion covers the relevant literature and hypothesis development relevant to the
two indirect paths in the indirect relationship between CSR and EM via OC. By examining the indirect
paths individually, the present study examines the overall moderating effect of FD on the indirect.
The indirect effect of CSR on EM via OC
To the best of my knowledge, the study undertaken in Chapter 4 was the pioneer in examining the
indirect relationship between CSR and EM. Despite a lack of evidence in the literature on the indirect
effect of CSR on EM via OC, prior studies suggest that CSR has positive effect on OC, while OC in turn
has a positive effect on EM. Deriving from this notion, in Chapter 4, my test of the indirect
relationship between CSR and EM, via the channel OC, finds a positive indirect relationship. The
result is consistent with the managerial myopia hypothesis, suggesting that while CSR enhances OC,
OC creates more incentives and opportunities for EM, leading to a positive indirect relationship
between CSR and EM
As discussed in the preceding paragraphs, CSR is an essential element that provides firms with
competitive advantage through the creation of intangible resources, such as knowledge
development (Eisenhardt & Martin, 2000; Nikolaou, 2017; Villalonga, 2004). CSR activities are likely
to blend into the organisational practices and processes (Branco & Rodrigues, 2006; Orlitzky, 2005),
becoming an integral part of the firms’ identity and structure (Dutton & Dukerich, 1991; Starik &
Rands, 1995). Thus, consistent with the RBV theory, I find a positive relationship between CSR and
OC in Chapter 4. Chapter 4 results also show that OC, in turn, has a positive effect on EM. Consistent
with the managerial myopia hypothesis, managers in firms with high OC may choose to manage
earnings to safeguard their reputation by meeting short-term targets (that is, more incentives)
(Francis et al., 2008; Malmendier & Tate, 2009). Furthermore, high OC may also mean that managers
have superior ability and techniques (that is, more opportunities) to manage earnings more easily
(Demerjian et al., 2013). Thus, CSR improves OC, and OC, in turn enhances EM engagement by
managers. Consistent with the managerial myopia hypothesis, this suggests that managers, engaged
in CSR activities, may leverage on OC, to opportunistically manage more earnings for short-term
goals. The present study examines whether or not this positive indirect CSR-EM relationship via OC

188
changes or not when firms experience FD.
Based on the literature, I expect that FD may have either a positive effect (consistent with the RBV
theory) (for example, see Dreyer & Grønhaug, 2004; Bhojraj & Sengupta, 2003; Leverty & Grace,
2012) or a negative effect (consistent with the slack resources hypothesis) (for example, see
Brynjolfsson et al., 2002) on OC, and a positive effect on EM. Thus, I expect that the positive indirect
relationship between CSR and EM via OC to change during FD. During FD, managers’ priorities may
change. They may become more opportunistic, strengthening the positive indirect relationship,
between CSR and EM via OC. Contrastingly, managers may become more risk-averse, weakening
the positive indirect relationship, between CSR and EM via OC. To test the moderated mediation
effect of FD (that is, the moderating effect of FD on the indirect CSR-EM relationship via OC), and to
address research question 2, I test the following hypothesis:
H2.6: FD has a significant moderating effect on the indirect relationship between CSR and EM, via
the mediator OC.
5.6 The Conceptual Framework
Figure 5.1 depicts the conceptual framework, showing the main relationships tested in this study.
The main purpose of this study is to examine the moderating effect of FD on the direct relationship
between CSR and EM, and on the indirect relationship between CSR and EM via OC.

189
Figure 5.1 The Conceptual Framework

190
5.7 Data and Methodology
5.7.1 Data and Sample
The sample selection procedure for the present study is the same as that of Chapter 4, with the one
exception that the present study utilises firms for which FD data is available. The sample is made up
of US non-financial firms listed on the Datastream International Database. The final sample,
involving publicly listed US firms, is selected based on the following criteria: 1) the firm must be
publicly listed; 2) the firm must have CSR information for at least one of the observed years; 3) the
firm must be a non-financial firm (therefore, firms with SIC codes between 6000 and 6799 are
excluded); 4) each two-digit Standard Industrial Classification (SIC) code grouping must have a
minimum of 8 firms; 5) the firm must have the variables required for classifying FD. The FD
classification procedure, and the variables required for this, are discussed in greater detail in Section
5.7.5. However, in order to meet the fifth criteria, the firm must have at least one of the following:
i) working capital in the observed year (that is, current assets and current liabilities); ii) net income
before extraordinary items and preferred dividends in the observed year; and iii) operating cash
flow in the observed year.
The sample period for the present study involves the years 2002 to 2017 inclusive, since 2002 is the
earliest year when CSR data is available for US firms. For the hypotheses testing, the present study
utilises the full sample, as well as two subsamples, namely distressed and non-distressed samples.
The subsamples are obtained by splitting the full sample based on the FD classification. The
distressed sample comprises all firm year observations classified as financially distressed, while the
non-distressed sample comprises of all firm-year observations classified as healthy (or non-
financially distressed). The procedure used to classify observations into financially distressed and
non-distressed firms is discussed in detail in Section 5.7.5.
Table 5.2 below shows details of the sample used in the present study. Panel A of Table 5.2 shows
the sample selection procedure. The initial sample size was 61,952 firm-year observations from
3,872 firms. The exclusion of financial firms (13,584 firm years from 849), firms with missing financial
data over the sample period (800 firm years) and firms with less than 8 firms in their 2-digit SIC
grouping (752 firm-years from 47 firms) yields a sample size of 46,816 firm-year observations from
2,926 firms. A further exclusion of 10,005 firm-year observations with missing variables required to

191
measure FD yields a final unbalanced sample27 of 36,811 firm-year observations from 2,918 firms.
The number of observations in any given regression varies depending on the model-specific data
requirements. Table 5.2 Panel B reports the distribution of the sample by the Fama-French 12
industry groups. The sample is unevenly distributed across industries, with the ‘Other’ and ‘Business
equipment industries’ being dominant at 18.69% and 16.22% respectively. The ‘other’ industry
classification includes mines, construction, building materials, transportation, hotels, bus services
and entertainment businesses. Table 5.2 Panel C illustrates the year distribution of the full sample
and the two subsamples. The full sample of 2,918 firms has unequal numbers of firm-year
observations each year, with 2015 having the highest number of observation (2,577 observations,
that is, 7% of the total number of observations). The two subsamples are unevenly distributed with
38.57% of the full sample comprising of distressed firms, while 61.43% of the full sample comprising
of non-distressed (healthy) firms.
The data utilised in this study are obtained from Datastream. The financial statement data are
collected from Datastream’s Worldscope database. The data for CSR are collected from the
Thomson Reuters ESG index, while the data on Consumer Price Index (CPI) (used for measuring OC)
is obtained from Datastream. All data are collected for the period 1998 to 2018 inclusive, to enable
the use of lagged data, as well as measure EM_DD (the alternate measure of EM that is based on a
5-year standard deviation of the accruals quality model, as discussed in the next section). Appendix
A1 shows the list of data for this study. Appendix A1 presents a list the data used in the present
study, along with the years of observation.
27 The final sample selection criterion means that any firm-year, where FD cannot be measured due to missing data on the relevant variables, is dropped. This yields an unbalanced sample in contrast to the balanced sample used in Chapter 4.

192
Table 5.2 Sample Selection and Distribution of the Sample
Panel A: Data and Sample Description Number of Observations Number of firms Initial sample (data available in Datastream) 61,952 3,872 Less: Financial firms (13,584) (849) 48,368 3,023 Firms with missing financial data for sample period
(800) (50) 47,568 2,973 Firms with less than 8 firms in their 2-digit SIC grouping
(752) (47)
46,736 2,973 Firms with missing FD data (10,005) (8) Total 36,811 2,918 Panel B: Industry Distribution Industry name Total number of observations % of observations Consumer nondurables 2,386 6.48 Consumer durables 1,300 3.53 Manufacturing 4,628 12.57 Oil, gas and coal extraction and products 2,330 6.33 Chemicals and allied products 1,575 4.28 Business equipment 5,971 16.22 Telephone and television transmission 1,835 4.98 Utilities 2,195 5.96 Wholesale, retail and some services 3,770 10.24 Healthcare, medical equipment and drugs 3,942 10.71 Other 6,879 18.69 Total 36,811 100% Panel C: Year distribution Full sample Distressed sub-sample Non-distressed sub-sample Year n % n % n % 2002 1,993 5.41 893 44.81 1100 55.19 2003 2,042 5.55 920 45.05 1122 54.95 2004 2,102 5.71 836 39.77 1266 60.23 2005 2,160 5.87 692 32.04 1468 67.96 2006 2,201 5.98 730 33.17 1471 66.83 2007 2,217 6.02 702 31.66 1515 68.34 2008 2,222 6.04 770 34.65 1452 65.35 2009 2,232 6.06 932 41.76 1300 58.24 2010 2,293 6.23 965 42.08 1328 57.92 2011 2,330 6.33 798 34.25 1532 65.75 2012 2,410 6.55 846 35.10 1564 64.90 2013 2,462 6.69 917 37.25 1545 62.75 2014 2,543 6.91 994 39.09 1549 60.91 2015 2,577 7.00 1,006 39.04 1571 60.96 2016 2,551 6.93 1,114 43.67 1437 56.33 2017 2,476 6.73 1,084 43.78 1392 56.22 Total 36,811 100 14,199 38.57 22,612 61.43

193
5.7.2 Dependent Variable
The dependent variable for this study is EM. As discussed in Chapters 3 and 4, EM is proxied by
discretionary accruals using the modified Jones model developed by Dechow et al. (1995), as shown
by the following equation:
TAit = 1 (1/Ait-1) + 2 (REVit - RECit) + 3 PPEit + it (1)
where
TAit = total accruals in year t for firm i scaled by total assets at t - 1;
REVit = change in revenues (revenues in year t less revenues in year t – 1) for firm i scaled by total assets at t - 1;
RECit = change in accounts receivables (net receivables in year t less net receivables in year t – 1) for firm i scaled by total assets at t - 1;
PPEit = gross property, plant and equipment in year t for firm i scaled by total assets at t - 1;
Ait – 1 = total assets in year t – 1 for firm i;
it = error term in year t for firm i.
Following prior studies, equation (1) is estimated for each year and each two-digit SIC code, for
which there are at least eight firm year observations per regression. The absolute value of the
residual from equation (1) (that is, the absolute value of discretionary accruals) generates the
magnitude of EM in the present study. A higher value of the residual indicates poor mapping of
accruals into cash flows (that is, higher EM).
Following Dechow et al. (1995), the total accruals (TA) for equation (1) is estimated using the
equation below:
TAit = (CAit - CLit - Cashit + ST Debtit – DEPit)/Ait – 1 (2)
where
CAit = change in current assets (current assets in year t less current assets in year t – 1) for firm i;
Cashit = change in cash (cash in year t less cash in year t – 1) for firm i;

194
CLit = change in current liabilities (current liabilities in year t less current liabilities in year t – 1) for firm i;
ST Debt = change in short-term debts (short-term debts in year t less short-term debts in year t – 1) for firm i (missing values for short-term debts are replaced with zero);
DEPit = depreciation and amortization expenses in year t for firm i;
Ait – 1 = total assets in year t – 1 for firm i.
Like my method described in Chapter 4, to check the sensitivity of the regression analyses, I use
alternate measures of the key variables (the dependent, independent and mediator variables). As
an alternate measure of EM, I use the accruals quality model by Dechow & Dichev (2002), and
include the modification suggested by Francis et al. (2005) by including change in revenue and
property plant and equipment. Thus, to measure the alternate EM measure, EM_DD, I estimate the
following equation for each year and 2-digit SIC code:
TAit = 0 + 1 CFOit – 1 + 2CFOit +3CFOit + 1 + 4 REVit + 5PPEit + it (3)
where
TAit = total accruals (as measured in equation (2)) in year t for firm i scaled by average total assets for years t and t-1;
CFOit – 1 = cash flow from operations in year t-1 for firm i scaled by average total assets for years t and t-1;
CFOit = cash flow from operations in year t for firm i scaled by average total assets for years t and t-1;
CFOit + 1 = cash flow from operations in year t+1 for firm i scaled by average total assets for years t and t-1;
REVit = change in sales revenue (sales revenue in year t less sales revenue in year t – 1) for firm i scaled by average total assets for years t and t-1;
PPEit = gross property, plant and equipment in year t for firm i scaled by average total assets for years t and t-1;
it = error term in year t for firm i.
As discussed in Chapter 4, EM_DD (the alternate measure for EM) is measured as the 5-year
standard deviation of the residual it from equation (3) using the Dechow & Dichev (2002) model

195
(EM_DD). A higher value indicates higher EM, whereas a lower value indicates lower EM and better-
quality accruals.
5.7.3 Independent Variable
The independent variable, CSR, is based on the ESG scores obtained from Thomson Reuters. The
ESG scores measurement by Thomson Reuters is discussed in detail in Chapter 3. The ESG scores
are firm level data, available annually from 2002 onwards (Thomson Reuters, 2018).
To check the sensitivity of the regression analysis, the ESG combined score from Thomson Reuters
(CSR_COMB) is used as an alternate measure of the independent variable CSR. Chapter 3 details the
measurement procedure for the ESG combined score by Thomson Reuters. The ESG Combined score
(CSR_COMB in the present study) is different from the ESG score (CSR in the present study), as
CSR_COMB incorporates ESG controversies as well as scores on the individual CSR dimensions.
These differences have been clarified in detail in Chapter 3.
5.7.4 Mediating Variable
As discussed in Chapter 4, the mediating variable in this study is OC measured on the basis of SG&A
expenses, consistent with prior studies (for example, see Eisfeldt & Papanikolaou, 2013; Hasan &
Cheung, 2018; Lev & Radhakrishnan, 2005). Following Eisfeldt & Papanikolaou (2013), the stock of
organisation capital is measured for each year by accumulating the deflated value of SG&A, as
shown below:
OCit = OCi,t-1 (1 - 0) + 𝑆𝐺𝐴 𝑖,𝑡𝑐𝑝𝑖 𝑡
(4)
Consistent with Eisfeldt & Papanikolaou (2013), the initial stock of organisation capital is measured
as shown below:
OCito= 𝑆𝐺𝐴 𝑖,𝑡𝑔+ 𝑜
(5)
where
OCi,t = stock of organization capital in year t for firm i, divided by total assets (following Eisfeldt and Papanikolaou (2013);
0 = depreciation rate of OC (15%) consistent with prior studies (for example, see
Eisfeldt & Papanikolaou, 2013; Hasan & Cheung, 2018);

196
SGAi,t = SG&A expense in year t for firm i; Missing values are replaced with 0;
cpit = consumer price index (CPI) for year t, computed as the 12-month average CPI;
g = average real growth of SG&A, which is 12.22% in my estimates. The average real growth of SG&A expense is calculated as: [(𝐺𝑟𝑜𝑤𝑡ℎ 𝑟𝑎𝑡𝑒 𝑜𝑓 𝑆𝐺𝐴 𝑏𝑒𝑡𝑤𝑒𝑒𝑛 2001 𝑎𝑛𝑑 2002) – 1]
1+𝑖𝑛𝑓𝑙𝑎𝑡𝑖𝑜𝑛 𝑟𝑎𝑡𝑒 𝑏𝑒𝑡𝑤𝑒𝑒𝑛 2001 𝑎𝑛𝑑 2002.
Ad discussed in Chapter 4, I use OC_PT as an alternate measure for OC. I follow Peters & Taylor
(2017), and set the initial stock of OC_PTito at 0. Following Peters & Taylor (2017), OC_PT is estimated
using the following equation:
OC_PTi,t = OC_PTi,t-1 (1 - 0) + SGAi,t (6)
where
OC_PTi,t = stock of organization capital in year t for firm i, divided by total assets (following
Peters & Taylor, 2017);
0 = depreciation rate of OC (20%) consistent with Peters & Taylor (2017);
SGAi,t = SG&A expense in year t for firm i; Missing values are replaced with 0;
5.7.5 Moderating Variable
The moderating variable in the present study is FD. Proxy for FD used in the present study is based
on the FD classification approach suggested by McKeown et al. (1991). McKeown et al. (1991)
categorise a firm’s financial condition into four classifications: 1) stressed/bankrupt (SB); 2) non-
stressed/bankrupt (NSB); stressed/non-bankrupt (SNB); and 4) non-stressed/non-bankrupt (NSNB).
McKeown et al. (1991) performed an examination of bankrupt firms where auditors had failed to
issue going-concern issues prior to bankruptcy. The stressed/non-stressed classification is based on
ex ante indications of potential bankruptcy within the financial statements, while the bankrupt/non-
bankrupt classification is based on ex post bankruptcy condition of a firm (Habib et al., 2013;
McKeown et al., 1991; Rosner, 2003).
Prior studies show various approaches for measuring FD. The most prominent approaches involve
sample selection with FD indicators (for example, see Charitou et al., 2007, 2011; Chen et al., 2010;
DeAngelo et al., 1994; DeFond & Jiambalvo, 1994; Jaggi & Lee, 2002; Sweeney, 1994) and accounting
ratios, such as, the Altman z-score (for example, see Jacoby et al., 2019; Li et al., 2020; Lin et al.,

197
2016a; Rakshit & Paul, 2020), Ohlson score (for example, Kwak & Mo, 2018; Lin et al., 2016a) and
Zmijewski score (for example, see Carcello & Neal, 2003; Guillamón-Saorín et al., 2018). Prior studies
using the sample selection approach select samples with certain FD indicators, such as bankruptcy
filing and debt covenant violations. As Rosner (2003) suggest, this may create selection bias, as the
samples do not include non-distressed firms. The FD classification by McKeown et al. (1991), used
in the present study, allows the inclusion of both financially distressed and non-distressed firms,
allowing better understanding of how FD may have a moderating effect on the CSR-EM relationship.
The second prominent approach for measuring FD among prior studies, that is, accounting ratios,
(specifically Altman z-score, Ohlson score and Zmijewski score) provide a basis for future
predictability of bankruptcy or financial distress. In contrast, the FD classification by McKeown et al.
(1991), used in the present study, provides an ex ante and ex post indicator of FD, as discussed
earlier. Thus, due to the limitations of the other approaches of measuring FD, the present study
follows the FD classification approach by McKeown et al. (1991).
Following prior studies, I use FD classification based on five criteria (for example, see Giroux &
Wiggins, 1984; Habib et al., 2013; Hopwood et al., 1994; McKeown et al., 1991; Rosner, 2003; Ward,
1994). According to prior studies, a firm is classified as distressed if it exhibits at least one of the
following distress signals (Habib et al., 2020a):
(i) negative working capital in the current year (working capital is calculated as current assets
minus current liabilities in year t for firm i);
(ii) a bottom-line net loss in the most recent year (determined by negative net income before
extraordinary items and preference dividends in year t for firm i);
(iii) both negative working capital and net loss experienced in the most recent years;
(iv) negative operating cash flow;
(v) both negative operating cash flow and a bottom-line net loss in the most recent year.
Essentially, the present study defines a firm to be financially distressed if it exhibits one or more of
the following distress signals:
(i) negative working capital in the current year (working capital is calculated as current assets
minus current liabilities in year t for firm i);

198
(ii) a bottom-line net loss in the most recent year (determined by negative net income before
extraordinary items and preference dividends in year t for firm i);
(iii) negative operating cash flow.
The moderating variable FD is defined as a dummy variable, taking the value of 1 if the firm is
financially distressed (based on the 3 criteria discussed above), and the value 0 otherwise, that is, if
the firm is considered to be non-distressed.
5.7.6 Control Variables
To avoid problems arising from possible misspecification, the study uses several control variables
that influence OC and EM. Since the dependent variable and mediating variables in the present
study are the same as those used in Chapter 4, the control variables are also the same as those used
in Chapter 4.
Prior studies show that firm size, performance, leverage and research and development (R&D)
intensity may affect both EM and OC (see Chih et al., 2008; Eisfeldt & Papanikolaou, 2013; Kim et
al., 2012; Roychowdhury, 2006; Scholtens & Kang, 2013). To control for firm size, the study uses
SIZE, measured as the natural logarithm of market value of equity. To control for firm performance,
the study uses ADJROA, measured as the industry-adjusted return on assets (ROA) (measured as the
return on ROA for each firm-year minus the median ROA for each year and 2-digit SIC code). To
control for leverage, the study uses LEV, measured as long-term debts divided by total assets. To
control for R&D intensity, the study uses RD, measured as the total R&D expenses divided by net
sales
Similar to Chapter 4, SIZE, ADJROA, LEV and RD are common control variables for all equations, that
is, equations with EM and OC as the dependent variables. Two other control variables, PR (Physical
Resources) and MB (Market to Book ratio) are used. PR is a control variable only for equations with
OC as the dependent variable, while MB is a control variable only for equations with EM as the
dependent variable.
Since the literature suggests that physical resources may be negatively associated with OC (Eisfeldt
& Papanikolaou, 2013), the study controls for physical resources, using PR, measured as the
difference between total assets and current assets, divided by total assets.

199
Since prior studies suggest EM may be associated with more growth opportunities (Roychowdhury,
2006), the study controls for growth opportunities using MB, measured as the Market to Book Ratio
(that is, the market value of equity divided by the book value of equity).
Following prior studies, I include a range of dummy variables representing year effects and industry
effects at two-digit SIC level, to control for unobserved heterogeneity (for example, see (Cheung,
2016). Following Cheung (2016), and as discussed in Chapter 4, I do not specify firm-level fixed
effects in the regression estimations, as 1) it may cause a loss of information (see Guenster et al.,
2011; and 2) using fixed-effects with ML estimation error may cause incidental parameter problem,
leading the ML estimators to be inconsistent (see Lancaster, 2000; Neyman & Scott, 1948).
Following prior studies, to minimise the undesirable influence of outliers, all variables are
winsorized at the 1st and 99th percentiles (for example, see Attig & Cleary, 2014; Cheung, 2016;
Hasan & Cheung, 2018; Kim et al., 2012). Table 5.4 details all the variables used in the present study,
along with their definitions and measurement methods.

200
Table 5.3 Definition and Measurement of Variables Variable Symbol Definition and Method of measurement Dependent Variable
Earnings Management EM Absolute value of discretionary accruals using the modified Jones model (Dechow et al., 1995): TAit = i [1/Ait-1] + 1i (REVit - RECit) + 2i (PPEit) + it
Earnings Management alternate measure EM_DD
Accruals quality model following Dechow & Dichev (2002): TAit = 0 + 1i CFOit – 1 + 2i CFOit + 3i CFOit + 1 + 4i REVit + 5i PPEit + it
Independent Variable
Corporate Social Responsibility CSR ESG score from Thomson Reuters ESG index.
Corporate Social Responsibility alternate measure CSR_COMB ESG Combined score from Thomson Reuters ESG index.
Corporate Social Responsibility alternate measure CSR_DUM Dummy variable equals 1 if the from Thomson Reuters ESG score is greater
than the median (by year and industry classification), and 0 otherwise.
Mediating Variable
Organization Capital OC Perpetual inventory method developed by Eisfeldt & Papanikolaou (2013): OCi,t = OCi,t-1 (1 - 0) + 𝑆𝐺𝐴𝑖,𝑡
𝑐𝑝𝑖 𝑡
Organization Capital alternate Measure OC_PT
Perpetual inventory method developed by Peters & Taylor (2017): OC_PTi,t = OC_PTi,t-1 (1 - 0) + SGAi,t
Moderating Variable
Financial Distress FD
Dummy variable, taking the value of 1 if the firm is financially distressed, and 0 otherwise. Following prior studies, (for example, see Giroux & Wiggins, 1984; Habib et al., 2013; Hopwood et al., 1994; McKeown et al., 1991; Rosner, 2003; Ward, 1994), an observation is classified as financially distressed if it exhibits at least one of the following distress signals: (i) negative working capital (that is, CA – CL) in the most recent year; (ii) a bottom-line net loss (that is, negative NI) in the most recent year; (iii) both negative working capital and net loss experienced in the most
recent years; (iv) negative operating cash flow (i.e., negative CFO); (v) both negative operating cash flow and a bottom-line net loss in the
most recent year.
Control Variables
Firm Size SIZE Natural logarithm of market of market value of equity.
Firm Leverage LEV Long-term debts divided by total assets.
Firm Performance ADJROA Industry adjusted earnings before interest and tax scaled by lagged total assets.
Research and Development Intensity RD Research and Development expense divided by total sales.
Physical Resources PR Capital intensity measured as total assets minus current assets divided by total assets.
Firm Growth Opportunities MB Market to Book ratio.
YEAR YEAR Dummy variables to control for the year effect. INDUSTRY IND Dummy variables to control for industry effect (two-digit SIC code).
Instrument Variable (for 2SLS)
Industry Median CSR CSR_M Following Nguyen et al. (2019), the industry median of CSR (based on Fama-French 48 industry classification) is used an instrument for CSR to address endogeneity.

201
5.7.7 Preliminary Analysis
Since the present study uses a sample that is different from the sample used in Chapter 4, the
present study first undertakes a preliminary analysis, to test the basic mediating relationship, that
is, the direct relationship between CSR and EM, and the indirect relationship between CSR and EM
via OC. As part of the preliminary analysis, I estimate the following equations as structural equation
model using the ML method, with robust standard errors:
OCit = 0 + 1CSRit + 2 SIZEit + 3LEVit + 4ADJROAit + 5RDit + 6PRit + Year & Industry dummies +
it (7)
EMit = 0 + 1OCit+ 2 CSRit + 3SIZEit + 4LEVit + 5ADJROAit + 6RDit + 7MBit + Year & Industry
dummies + it (8)
where
EMit = Earnings management in year t for firm i, proxied by discretionary accruals using the modified Jones model by Dechow et al. (1995);
OCit = Stock of organization capital in year t for firm i, divided by total assets following Eisfeldt & Papanikolaou (2013);
CSRit = The ESG score from Thomson Reuters ESG index in year t for firm i;
SIZEit = Firm size in year t for firm i, measured as the natural logarithm of market value of equity;
LEVit = Firm leverage in year t for firm i, measured as long-term debts divided by total assets;
ADJROAit = Industry-adjusted ROA in year t for firm i, measured as the industry median income before extraordinary items, scaled by lagged total assets, for each year and two-digit SIC code, subtracted from the focal firm;
RDit = Research and development intensity in year t for firm i, measured as research and development expenses divided by net sales;
PRit = Physical resources in year t for firm i, measured as total assets minus current assets, scaled by total assets;
MBit = Market to book ratio in year t for firm i.
To test the sensitivity of the results to alternate measures of the main variables, the study uses
alternate specifications of the dependent, independent and mediating variables (EM_DD,

202
CSR_COMB, and OC_PT respectively). The following equations are estimated, as SEM using ML
method, with robust standard errors, as part of the sensitivity test:
OC_PTit = 0 + 1CSR_COMBit + 2 SIZEit + 3LEVit + 4ADJROAit + 5RDit + 6PRit + Year & Industry
dummies + it (7a)
EM_DDit =0 + 1OC_PTit+ 2 CSR_COMBit + 3SIZEit + 4LEVit + 5ADJROAit + 6RDit + 7MBit + Year &
Industry dummies + it (8a)
where
EM_DDit = Earnings management in year t for firm i, proxied by accruals quality model by Dechow & Dichev (2002);
OC_PTit = Alternate measure for Stock of organization capital in year t for firm i, divided by
total assets following Peters & Taylor (2017);
CSR_COMBit = The ESG combined score from Thomson Reuters ESG index in year t for firm i;
SIZEit = Firm size in year t for firm i, measured as the natural logarithm of market value of equity;
LEVit = Firm leverage in year t for firm i, measured as long-term debts divided by total assets;
ADJROAit = Industry-adjusted ROA in year t for firm i, measured as the industry median of income before extraordinary items, scaled by lagged total assets, for each year and two-digit SIC code, subtracted from the focal firm;
RDit = Research and development intensity in year t for firm i, measured as research and development expenses divided by net sales;
PRit = Physical resources in year t for firm i, measured as total assets minus current assets, scaled by total assets;
MBit = Market to book ratio in year t for firm i.
5.7.8 Research Models
This section discusses the research models used in this study to answer research objective 2, that
is, to investigate when CSR has a direct effect on EM, and when CSR has an indirect effect on EM via
OC, by examining the context FD. To address research objective 2, I state the following two research
questions:

203
Research Question 2.1: Does FD have a significant effect on the direct CSR-EM relationship?
Research Question 2.2: Does FD have a significant effect on the indirect CSR-EM relationship via OC?
To address these research questions, I follow the moderated mediation approach using the
PROCESS model 59 developed by Hayes (2013) and estimate the following equations as Structural
Equations Modelling (SEM), using Maximum Likelihood (ML) method of estimation, with robust
standard errors:
OCit = 0 + 1CSRit + 2 FDit + 3 CSRit*FDit + 4SIZEit + 5LEVit + 6ADJROAit + 7RDit + 8PRit + Year
& Industry dummies + it (9)
EMit = 0 + 1OCit+ 2 CSRit +3 FDit +4 OCit*FDit + 5 CSRit*FDit + 6SIZEit + 7LEVit + 8ADJROAit +
9RDit + 10MBit + Year & Industry dummies + it (10)
where
EMit = Earnings management in year t for firm i, proxied by discretionary accruals using the modified Jones model by Dechow et al. (1995);
OCit = Stock of organization capital in year t for firm i, divided by total assets following Eisfeldt & Papanikolaou (2013);
FDit = Dummy variable taking the value 1 if the firm i is financially distressed in year t and taking the value 0 otherwise. The FD classification is based on prior studies (for example, Giroux & Wiggins, 1984; Habib et al., 2013; Hopwood et al., 1994; McKeown et al., 1991; Rosner, 2003; Ward, 1994);
CSRit = The ESG score from Thomson Reuters ESG index in year t for firm i;
SIZEit = Firm size in year t for firm i, measured as the natural logarithm of market value of equity;
LEVit = Firm leverage in year t for firm i, measured as long-term debts divided by total assets;
ADJROAit = Industry-adjusted ROA in year t for firm i, measured as the income before extraordinary items, scaled by lagged total assets, for each year and two-digit SIC code, subtracted from the focal firm;
RDit = Research and development intensity in year t for firm i, measured as research and development expenses divided by net sales;
MBit = Market to book ratio in year t for firm i;
PRit = Physical resources in year t for firm i, measured as total assets minus current assets, scaled by total assets.

204
Equations (9) and (10) are estimated as part of the hypotheses testing, to address the research
questions 2.1 and 2.2. Both equations utilise dummy variables to control for the effects of year and
industry (using 2-digit SIC codes). The analyses follow several steps, as discussed below. A summary
of this discussion is provided in Table 5.4.
Step 1: Tests for hypotheses H2.1 and H2.2
This section discusses step 1 of the research analysis, where I address research question 2.1 by
examining the moderating effect of FD on the direct relationship between CSR and EM. In this step,
I test hypotheses H2.1 and H2.2 by estimating equation (10). To establish a moderating effect, first
a relationship has to be established between the dependent variable (EM) and the independent
variable (CSR) and between the dependent variable EM) and the moderator (FD). Hypothesis H2.1
tests the relationship between FD and EM, while hypothesis H2.2 tests the moderating effect of FD
on the relationship between CSR and EM.
The direct (unconditional) relationship between CSR and EM has already been tested in Chapter 4.
The results in Chapter 4 suggest a negative direct relationship between CSR and EM, consistent with
the myopia avoidance hypothesis. Owing to the fact that the present study uses a different sample
from the sample in Chapter 4, I report the unconditional direct effect of CSR on EM again. However,
this is not part of the hypothesis testing of the present study. The direct effect of CSR on EM is
captured by the coefficient 2 from equation (10).
Next, the analysis focusses on testing the relationship between the moderator (FD) and the
dependent variable (EM). Hypothesis H2.1 tests the effect of FD on EM. The effect of FD on EM is
captured by the coefficient 3 in equation (10). If the coefficient 3 is positive and statistically
significant, this will support hypothesis H2.1, consistent with the managerial myopia hypothesis.
Finding support for hypothesis H2.1 will partially address research question 2.1.
To fully address research question 2.1, the next step is critical, that is, the test of the moderating
effect of FD on the direct relationship between CSR and EM (Hypothesis 2.2). This moderating effect
of FD is captured by the coefficient 5 from equation (10). If the coefficient 5 is statistically
significant, this will suggest that FD has a moderating effect on the direct relationship between CSR
and EM, thus providing support for hypothesis H2.2. A negative and significant coefficient 5, will
suggest that FD has a negative (strengthening) effect on the direct negative CSR-EM relationship.
This will indicate strengthening of the myopia avoidance behaviour of managers. Contrastingly, a
205
positive and significant coefficient 5, will suggest that FD has a positive (weakening) effect on the
direct negative CSR-EM relationship. This will indicate weakening of myopia avoidance behaviour of
managers. The direct effect of CSR on EM, conditional on FD, is estimated as the sum of the
coefficients, 2 +5 FDit, from equation (10). The conditional effect examines whether the direct
relationship between CSR and EM changes with the level of FD. A statistically significant change on
the conditional direct effect of CSR on EM will provide support for hypothesis H2.2, and will address
research question 2.1, suggesting that FD has a moderating effect on the direct relationship
between CSR and EM. However, if the conditional direct effect of CSR on EM is not statistically
significant, hypothesis H2.1 will be rejected, suggesting that FD does not have a moderating effect
on the direct relationship between CSR and EM.
Figure 5.2 shows the conceptual and statistical diagrams highlighting the relationships tested in
hypotheses H2.1 and H2.2. Panel A of Figure 5.2 shows the full conceptual framework, highlighting
the section that is relevant to the hypotheses H2.1 and H2.2; Panel B of Figure 5.2 shows a simplified
version of the conceptual framework, showing only the section relevant to the hypotheses H2.1 and
H2.2; Panel C of Figure 5.2 shows the statistical diagram relevant to the test of the hypotheses H2.1
and H2.2.

206
Figure 5.2 Conceptual Diagram for Hypotheses H2.1 and H2.2

207
Step 2: Tests for hypotheses H2.3 (a and b) and H2.4
This section discusses step 2 of the research analysis, I examine the existence of first stage
moderation, as a first step to addressing research question 2.2. In this step, I examine whether FD
moderates the relationship between CSR and OC, by estimation equation (9). Hypotheses H2.3a and
H2.3b test the relationship between FD and OC, while hypothesis H2.4 tests the moderating effect
of FD on the relationship between CSR and OC.
As discussed in the previous paragraphs, to establish a moderating effect, I first test the relationship
between the dependent (that is, OC in this scenario) and independent variables (that is, CSR) and
between the dependent variable (OC) and the moderator (FD). The unconditional effect of CSR on
OC is captured by the coefficient 1 from equation (9). I have already tested the unconditional effect
of CSR and OC in the analysis reported in Chapter 4. Chapter 4 findings suggest a positive
relationship between CSR and OC, consistent with the RBV theory. Given that the present study uses
a different sample from the one utilized in Chapter 4, I report the effect of CSR on OC again, despite
this not being part of the hypothesis testing of the present study.
Next, to test hypotheses H2.3a and H2.3b, I test the relationship between OC and FD. This effect is
captured by the coefficient 2 in equation (9). If the the coefficient 2 is positive and significant, this
will suggest that FD has a positive effect on OC, thus providing support for H2.3a, consistent with
the RBV theory. Alternatively, if the coefficient 2 is negative and significant, this will suggest that
FD has a negative effect on OC, thus providing support for H2.3b, consistent with the slack resource
theory. Testing hypotheses H2.3 (a and b) is the first step to addressing research question 2.2. If
either of the hypotheses, H2.3a or H2.3b, is accepted, this will suggest that FD affects OC.
Hypothesis H2.4 tests whether FD has a moderating effect on the relationship between CSR and OC.
The moderating effect of FD on the relationship between CSR and OC is captured by the coefficient
3 from equation (9). If the the coefficient 3 is statistically significant, this will suggest that FD has
a moderating effect on the CSR and OC relationship, thus providing support for H2.4. In particular,
a positive and significant coefficient on 3 will suggest that FD has a positive (strengthening) effect
on the CSR-OC relationship, while a negative and significant coefficient on 3 will suggest that FD
has a negative (weakening) effect on the CSR-OC relationship. The effect of CSR on OC, conditional
on FD, is estimated as the sum of the coefficients, 1+3FDit, from equation (9). The conditional
effect assesses if the relationship between CSR and OC changes with the level of FD. If there is a

208
statistically significant change in conditional effect of CSR on OC, this will suggest that FD has a
moderating effect on the CSR and OC relationship, and thus provide support for hypothesis H2.4,
the existence of the first stage moderation by FD on the indirect relationship between CSR and EM
via OC. However, if the conditional effect of CSR on OC does not change significantly with the level
of FD, then hypothesis H2.4 will be rejected, suggesting that FD does not moderate the relationship
between CSR and OC.
Figure 5.3 illustrates the conceptual and statistical diagrams highlighting the relationships tested in
hypotheses H2.3a, H2.3b and H2.4. Panel A of Figure 5.3 illustrates the full conceptual framework,
highlighting the section that is relevant to the hypotheses H2.3 (a and b) and H2.4; Panel B of Figure
5.3 shows a simplified version of the conceptual framework, showing only the section relevant to
the hypotheses H2.3 (a and b) and H2.4; Panel C of Figure 5.3 shows the statistical diagram relevant
to the tests of the hypotheses H2.3a, H2.3b and H2.4.

209
Figure 5.3 Conceptual Diagram for Hypotheses H2.3 (a and b) and H4

210
Step 3: Tests for hypotheses H2.5
This section discusses step 3 of the research analysis, and examines the existence of second stage
moderation, as a second step towards addressing research question 2.2. In this step, I examine
whether FD moderates the relationship between OC and EM by estimation equation (10).
Hypothesis H2.5 tests the moderating effect of FD on the relationship between OC and EM.
In this part of the analysis, I first test the relationship between the dependent variable (EM) and the
independent variable (OC in this scenario), that is, the unconditional effect of OC on EM. This is
captured by the coefficient 1 from equation (10). Chapter 4 has already tested the unconditional
effect of OC on EM, reporting a positive relationship, consistent with the managerial myopia
hypothesis. The present study reports the effect of OC on EM again, despite this not being part of
the hypothesis testing of the present study.
The moderating effect of FD on the relationship between OC and EM is captured by the coefficient
4 from equation (10). If the the coefficient 4 is statistically significant, this will suggest that FD has
a moderating effect on the relationship between OC and EM, thus providing support for H2.5. If the
coefficient 4 is positive and significant, this will suggest that FD has a positive (strengthening) effect
on the relationship between OC and EM. Contrastingly, if the the coefficient 4 is negative and
significant, this will suggest that FD has a negative (weakening) effect on the OC and EM relationship.
The effect of OC on EM conditional on FD is estimated as the sum of the coefficients, 1+ 4FDit from
equation (10). The conditional effect assesses if the relationship between OC and EM changes with
the level of FD. If there is a statistically significant change in conditional effect of OC on EM, this will
suggest that FD has a moderating effect on the OC and EM relationship, and thus provide support
for hypothesis H2.5. If the analysis finds support for hypothesis H2.5, this will suggest the existence
of second stage moderation by FD on the indirect relationship between CSR and EM via OC.
However, if the conditional effect of OC on EM does not change significantly with the level of FD,
then hypothesis H2.5 will be rejected, suggesting that FD does not have a moderating effect on the
relationship between OC and EM.
Figure 5.4 shows the conceptual and statistical diagrams highlighting the relationships tested in
hypothesis H5. Panel A of Figure 5.4 shows the full conceptual framework, highlighting the section
that is relevant to the hypothesis H2.5; Panel B of Figure 5.4 shows a simplified version of the
conceptual framework, showing only the section relevant to the hypothesis H2.5; and Panel C of

211
Figure 5.4 shows the statistical diagram relevant to the tests of the hypothesis H2.5.
Figure 5.4 Conceptual Diagram for Hypotheses H2.5

212
Step 4: Tests for hypothesis H2.6
This section discusses step 4 of the research analysis, where I address research question 2.2, and
examine whether FD moderates the indirect relationship between CSR and EM via OC (hypothesis
H2.6), by estimating equations (9) and (10).
The unconditional indirect effect of CSR on EM, via the mediating channel OC, has already been
tested in Chapter 4, suggesting a positive indirect relationship between CSR and EM, consistent with
the managerial myopia hypothesis. In this Chapter, I report the unconditional indirect effect of CSR
on EM again. However, this is not part of the hypothesis testing of the present study.
The moderating effect is captured by the indirect effect of CSR on EM, conditional on FD, which is
estimated as (1 + 3FDit)(1+ 4FDit) from equations (9) and (10). A statistically significant
coefficient provides support for hypothesis H2.6. If the coefficient is positive and significant, this will
suggest that FD strengthens the positive indirect relationship between CSR and EM, consistent with
the managerial myopia hypothesis. In contrast, if the coefficient is negative and significant, this will
suggest that FD weakens the positive indirect relationship between CSR and EM, consistent with the
myopia avoidance hypothesis. Similar to Chapter 4 and to prior studies, the statistical significance
of the indirect effect is tested in two ways – 1) by estimating the standard errors of the indirect
effect using the multivariate delta method, 2) by adopting bootstrapping technique. As discussed in
Chapter 4, the bootstrapping technique typically uses 1,000 replacements (for example, see Cheung,
2016), however for moderated mediation effects, Hayes (2009) suggests using at least 5,000
replacements. Thus, the present study uses bootstrapping technique with 5,000 replacements. If
the indirect effect of CSR on EM via OC conditional on FD is statistically significant, then the result
will provide support for hypothesis H2.6, and thus address research question 2.2, suggesting that
FD has a moderating effect on the indirect relationship between CSR and EM via OC. However, if the
conditional indirect effect of CSR on EM via OC is not statistically significant, then hypothesis H2.6
will be rejected, suggesting that FD does not have a moderating effect on the indirect relationship
between CSR and EM via OC.
Figure 5.5 shows the conceptual and statistical diagrams highlighting the relationships tested in
hypothesis H2.6. Panel A of Figure 5.5 shows the conceptual framework. The full conceptual
framework is relevant when examining the indirect relationship between CSR and EM via OC. Panel
B of Figure 5.5 shows the statistical diagram relevant to the test of the hypothesis H2.6.
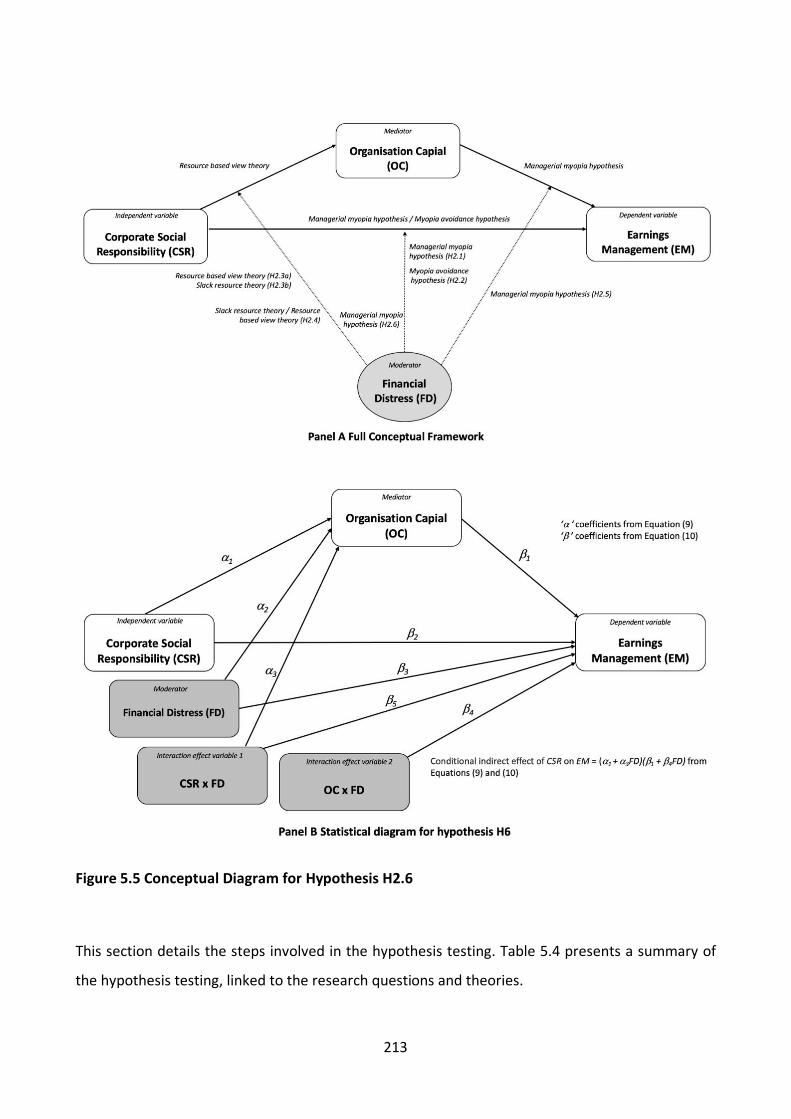
213
Figure 5.5 Conceptual Diagram for Hypothesis H2.6
This section details the steps involved in the hypothesis testing. Table 5.4 presents a summary of
the hypothesis testing, linked to the research questions and theories.

214
Table 5.4 Summary of Research Questions and Hypotheses Testing
Research Question Hypothesis Theory Expected sign
2.1. Does FD moderate the direct relationship between CSR and EM?
H2.1: Consistent with the managerial myopia hypothesis, there is a positive and significant relationship between FD and EM.
Managerial myopia hypothesis = + (quation (0))
H2.2: FD has a significant moderating effect on the direct relationship between CSR and EM.
Myopia avoidance hypothesis (stronger) = − (quation (0))
Myopia avoidance hypothesis (weaker) = + (quation (0))
2.2. Does FD have a significant effect on the indirect CSR-EM relationship via OC?
H2.3a: Consistent with the RBV theory, there is a positive and significant relationship between FD and OC. Slack resource theory = − (quation (9))
H2.3b: Consistent with the resource-based view (RBV) theory, there is a positive and significant relationship between FD and OC.
RBV theory = + (quation (9))
H2.4: FD has a significant moderating effect on the relationship between CSR and OC.
Slack resource theory = − (quation (9))
RBV theory = + (quation (9))
H2.5: FD has a significant moderating effect on the relationship between OC and EM.
Managerial myopia hypothesis = + (quation (0))
Myopia avoidance hypothesis = − (quation (0))
H2.6: FD has a significant moderating effect on the indirect relationship between CSR and EM, via the mediator OC.
Managerial myopia hypothesis (stronger)
( + FD)(+ 4FD) = + (quations (9) and (10))
Managerial myopia hypothesis (weaker)
( + FD)(+ 4FD) = − (quations (9) and (10))

215
5.7.9 Sensitivity Tests
To test the sensitivity of the results, I re-estimate equations (9) and (10), using the alternate
measures of the EM, CSR and OC, that is, EM_DD, CSR_COMB, and OC_PT respectively. Thus, as part
of the sensitivity test, I estimate equations (10a) and (10b), as SEM using ML method, with robust
standard errors:
OC_PTit = 0 + 1CSR_COMBit + 2 FDit + 3 CSR_COMBit*FDit + 4SIZEit + 5LEVit + 6ADJROAit + 7RDit
+ 8PRit + Year & Industry dummies + it (9a)
EM_DDit = 0 + 1OC_PTit+ 2 CSR_COMBit +3 FDit +4 OC_PTit*FDit + 5 CSR_COMBit*FDit + 6SIZEit +
7LEVit + 8ADJROAit + 9RDit + 10MBit + Year & Industry dummies + it (10a)
where
EM_DDit = Earnings management in year t for firm i, accruals quality model by Dechow &
Dichev (2002);
OC_PTit = Stock of organization capital in year t for firm i, divided by total assets following
Peters & Taylor (2017);
FDit = Dummy variable taking the value 1 if the firm i is financially distressed in year t and
taking the value 0 otherwise. The FD classification is based on prior studies (for example,
Giroux & Wiggins, 1984; Habib et al., 2013; Hopwood et al., 1994; McKeown et al., 1991;
Rosner, 2003; Ward, 1994);
CSR_COMBit = The ESG combined score from Datastream in year t for firm i;
SIZEit = Firm size in year t for firm i, measured as the natural logarithm of market value of
equity;
LEVit = Firm leverage in year t for firm i, measured as long-term debts divided by total assets;
ADJROAit = Industry-adjusted ROA in year t for firm i, measured as the income before
extraordinary items, scaled by lagged total assets, for each year and two-digit SIC code,
subtracted from the focal firm;
RDit = Research and development intensity in year t for firm i, measured as research and
development expenses divided by net sales;

216
MBit = Market to book ratio in year t for firm i;
PRit = Physical resources in year t for firm i, measured as total assets minus current assets,
scaled by total assets.
Equations (9a) and (10a) utilise dummy variables to control for the effects of year and industry (using
2-digit SIC codes). The analyses for equations (9a) and (10a) follow the same 4-step process
discussed in the previous section.
5.7.10 Accounting for Endogeneity
As discussed in Chapter 4, the independent variable CSR may be subject to endogeneity. Following
prior studies (for example, Bhandari et al., 2018; Bozzolan et al., 2015; Cheung, 2016; Grougiou et
al., 2014), I adopt the same approach as the one discussed in Chapter 4, and re-estimate equations
(9) and (10) as 2SLS models with an instrumental variable. Following, Nguyen et al. (2019), I use
CSR_M as an instrument. CSR_M is the median of CSR calculated for each Fama-French 48 industry
grouping.
5.7.11 Robustness Check
As a robustness check, I estimate the base model equations (7) and (8) using a split sample
approach. The full sample is split into 2 subsamples, namely distressed and non-distressed samples.
The distressed subsample includes all observations with FD = 1 (that is, observations classified as
financially distressed), while the non-distressed subsample includes all observations with FD = 0
(that is, observations classified as non-distressed). The FD classification used for the sample split is
the primary FD measure that is based on prior studies (for example, Giroux & Wiggins, 1984; Habib
et al., 2013; Hopwood et al., 1994; McKeown et al., 1991; Rosner, 2003; Ward, 1994).
Additionally, I perform a further test for addressing endogeneity by re-estimating equations (7) and
(8) using Generalised Method of Moments (GMM) technique, following the approach suggested by
(Lewbel, 2012). This additional endogeneity test is performed on the 2 subsamples, namely
distressed and non-distressed samples. The results are reported in Appendix A2.

217
5.8 Results and Findings
5.8.1 Descriptive Statistics
Table 5.5 presents the descriptive statistics for all the variables in the sample. Panel A shows the
number of observations, mean, median, maximum and minimum values and standard deviation of
the variables for the full sample.
As shown in Panel A, the mean value for the dependent variable, EM is 0.0857. This is very close to
the mean EM from Chapter 4 (0.0955). As discussed in Chapter 4, the mean value for EM in the
present study (0.0857) falls within the range observed within prior studies. The mean value for the
alternate measure of EM, EM_DD, has a mean value at 0.4711. This is also very close to the mean
EM_DD from Chapter 4 (0.4717), and thus, as discussed in Chapter 4, the mean EM_DD in the
present study (0.4711) is quite close to prior studies, such as, Hong & Andersen (2011) and Herly et
al. (2020). The independent variable, CSR, has a mean value of 0.5260, suggesting that on average
firms have above 53% on their overall CSR score. The alternate specification of the independent
variable, CSR_COM, has a mean value of 0.4508, suggesting that on average firms have 45% CSR
score when controversies are deducted. These mean values are consistent with the mean CSR
(0.5264) and mean CSR_COMB (0.4517) reported in Chapter 4, and quite close to prior studies, such
as, Hussain et al. (2018) and Drempetic et al. (2019). The mediating variable, OC, has a mean value
of 0.1917, while the alternate measure OC_PT has a mean value of 1.2754. These values are also
close to the mean OC (0.1884) and OC_PT (1.3110) in Chapter 4, and close to prior studies, such as,
Marwick et al. (2020) and Hasan & Cheung (2018). The mean value of the moderator, FD, is 0.3857.
The moderator, FD, is defined as a dummy variable showing the classification of firms as financially
distressed and non-distressed. The mean value of 0.3857 suggests that approximately 39% of the
total sample observations are categorized as financially distressed firms, while the remaining
61.42% are categorized as non-distressed. As for the control variables, the mean values for SIZE and
LEV are 13.8117 and 0.2122 respectively. The means for ADJROA and RD are -0.0266 and 0.1485
respectively, and the means for PR and MB are 0.5684 and 3.3288 respectively.
Table 5.5 Panel B presents the descriptive statistics (that is, number of observations, mean and
standard deviation) for each of the two subsamples, namely distressed and non-distressed
subsamples. The mean value for EM is 0.1121 in the distressed subsample, and 0.0686 in the non-
distressed subsample. The mean value for EM_DD is 0.5859 in the distressed subsample, and 0.3984
in the non-distressed subsample. Clearly there is a difference in the mean values of the dependent

218
variable (EM and EM_DD) across the two subsamples, as both EM and EM_DD indicate higher EM
on average within financially distressed sample in comparison to the non-distressed sample. The
mean values for CSR and CSR_COMB are 0.5168 and 0.4417 respectively in the distressed
subsample, and 0.5311 and 0.4557 respectively in the non-distressed subsample. Both measures of
the independent variable (CSR and CSR_COMB) suggest that CSR is slightly lower in financially
distressed firms in comparison to non-distressed firms. The mean values for OC and OC_PT are
0.1915 and 1.4461 respectively in the distressed subsample, and 0.1918 and 1.1680 respectively in
the non-distressed subsample. The primary measure of the mediator (OC) has almost equal mean
values in both subsamples, while the alternate measure (OC_PT) is higher in the distressed
subsample, suggesting that financially distressed firms have higher average OC. The control variable
SIZE has a mean value of 13.4814 in the distressed subsample, and 14.0041 in the non-distressed
subsample, showing that distressed firms are relatively smaller on average than non-distressed
firms. LEV is higher among financially distressed firms, with a mean of 0.2491 in the distressed
subsample, and 0.1890 in the non-distressed subsample. Financially distressed firms have lower
profitability, as ADJROA has a mean of -0.1067 in the distressed subsample, and a mean of 0.0237
in the non-distressed subsample. Financially distressed firms have lower research and development
expenses and lower physical resources in contrast to non-distressed firms. RD and PR have mean
values of 0.3354 and 0.5961 respectively in the distressed subsample, and 0.0337 and 0.5510
respectively in the non-distressed subsample. The Market to book ratio is not much different among
distressed and non-distressed firms, as MB has a mean of 3.3163 in the distressed subsample, and
3.3363 in the non-distressed subsample.

219
Table 5.5 Descriptive Statistics
The table reports the summary statistics (number of observations, mean, median, minimum and maximum values, and the standard deviation) of the key variables for the period 2002 to 2017. Panel A shows the summary statistics of the key variables for the full sample, while Panels B shows the summary statistics for the two subsamples, distressed and non-distressed subsamples. EM and EM_DD are the two alternate measures of the dependent variable. EM refers to earnings management, proxied by discretionary accruals using the modified Jones model by Dechow et al. (1995). EM_DD refers to alternate earnings management specification, proxied by accruals quality model by Dechow & Dichev (2002) CSR and CSR_COM are the two alternate measures of the independent variable. CSR is the ESG score obtained from Thomson Reuters, while CSR_COMB is the ESG combined score from Thomson Reuters. OC and OC_PT are the two alternate measures for the mediator, organisation capital. OC is the stock of organisation capital scaled by total assets. The stock of organisation capital is measured by accumulating the deflated value of SG&A expenses, consistent with Eisfeldt & Papanikolaou (2013). OC_PT Is the alternate measure of organisational capital following Peters & Taylor (2017). FD refers to FD, the moderating variable. FD is measured using the FD classification used by prior studies (for example, Giroux & Wiggins, 1984; Habib et al., 2013; Hopwood et al., 1994; McKeown et al., 1991; Rosner, 2003; Ward, 1994). FD is defined as a dummy variable, taking the value 1 if the firm is financially distressed, and 0 otherwise. SIZE, LEV, ADJROA, RD PR and MB are the control variables. SIZE refers to firm size, measured as the natural logarithm of market value of equity. LEV is defined as long-term debts divided by total assets. ADJROA is measured as the income before extraordinary items, scaled by lagged total assets, for each year and two-digit SIC code, subtracted from the focal firm. RD refers to R&D intensity, measured as R&D expenses divided by net sales. PR represents physical resources, measured as total assets minus current assets, scaled by total assets. MB is the market to book ratio. Panel A: Full sample - Descriptive Statistics
N Mean Median Minimum Maximum Std. Dev. Dependent variables EM 27,208 0.0857 0.0391 0.0005 1.0142 0.1465 EM_DD 27,051 0.4711 0.0620 0.0000 13.5023 1.7876 Independent variables CSR 19,777 0.5260 0.5189 0.0000 0.9756 0.1753 CSR_COMB 19,777 0.4508 0.4251 0.1672 0.8378 0.1544 Mediating variables OC 36,194 0.1917 0.0539 0.0000 1.9364 0.3362 OC_PT 36,194 1.2754 0.7089 0.0014 19.3431 2.3152 Moderating variables FD 36,811 0.3857 0.0000 0.0000 1.0000 0.4868 Control variables SIZE 34,463 13.8117 13.8135 8.9270 17.9589 1.7639 LEV 36,111 0.2122 0.1866 0.0000 0.9515 0.1935 ADJROA 36,811 -0.0266 0.0000 -0.9742 0.2976 0.1734 RD 35,808 0.1485 0.0000 0.0000 6.6791 0.7525 PR 36,186 0.5684 0.5896 0.0228 0.9631 0.2370 MB 32,834 3.3288 2.3400 -16.6100 33.1800 5.2108

220
Panel B: Subsamples - Descriptive Statistics Distressed subsample (n = 14,199) Non-Distressed subsample (n = 22,612) N Mean Std. Dev. N Mean Std. Dev. Dependent variables EM 10,693 0.1121 0.1874 16,515 0.0686 0.1089 EM_DD 10,483 0.5859 1.9655 16,568 0.3984 1.6612 Independent variables CSR 7,009 0.5168 0.1740 12,768 0.5311 0.1758 CSR_COMB 7,009 0.4417 0.1506 12,768 0.4557 0.1562 Mediating variables OC 13,983 0.1915 0.3666 22,211 0.1918 0.3156 OC_PT 13,983 1.4461 2.8267 22,211 1.1680 1.9170 Control variables SIZE 12,684 13.4814 1.9737 21,779 14.0041 1.5983 LEV 13,961 0.2491 0.2191 22,150 0.1890 0.1714 ADJROA 14,199 -0.1067 0.2383 22,612 0.0237 0.0820 RD 13,620 0.3354 1.1928 22,188 0.0337 0.0775 PR 13,978 0.5961 0.2800 22,208 0.5510 0.2033 MB 12,286 3.3163 6.3798 20,548 3.3363 4.3649

221
5.8.2 Correlation
Table 5.6 presents the Pearson’s correlation matrix for the main variables in the full sample. The
main dependent variable, EM, is negatively and significantly correlated with CSR (-0.1076), and with
CSR_COMB (-0.0573) at the 1% level of significance. The alternate specification of the dependent
variable, EM_DD, is also negatively and significantly correlated with CSR (-0.0449) at the 1% level of
significance, but not significantly correlated with and CSR_COMB (-0.0093). The mediating variable,
OC, has a positive and significant correlation with EM (0.0294), but a negative and significant
correlation with EM_DD (-0.0728) at the 1% level of significance. OC is negatively and significantly
correlated with CSR_COMB (-0.0139) at the 5% level of significance, but there is no statistically
significant correlation between OC and CSR (-0.0054). The alternate measure of the mediator,
OC_PT, is has a positive and significant correlation with EM (0.1245) at the 1% level of significance,
but there is no statistically significant correlation between OC and EM_DD (-0.0061). OC is negatively
and significantly correlated with CSR (-0.0428) and CSR_COMB (-0.0328) at the 1% level of
significance. FD is positively correlated with both EM (0.1452) and EM_DD (0.0511) at the 1% level
of significance, and negatively correlated with both CSR (-0.0391) and CSR_COMB (-0.0434) at the
1% level of significance. FD has a positive correlation with OC_PT (0.0585) at the 1% level of
significance, but no statistically strong correlation with OC.
The control variable SIZE is negatively and significantly correlated with EM (-0.2555), EM_DD (-
0.0839), OC (-0.2189) and OC_PT (-0.3917) at the 1% level of significance. SIZE has a positive and
significant correlation with CSR (0.4983) and CSR_COMB (0.1879) at the 1% level of significance. The
control variable LEV has negative and significant correlations with EM (-0.1300), EM_DD (-0.0589),
CSR (-0.0510), CSR_COMB (-0.0392), OC (-0.1232) and OC_PT (-0.1441), at the 1% level of
significance. ADJROA is negatively correlated with EM (-0.3379), EM_DD (-0.0709), OC (-0.0526) and
OC_PT(-0.2042) at the 1% level of significance, and positively correlated with CSR (0.1031) and
CSR_COM (0.0765) at the 1% level of significance. RD has strong positive correlations with EM
(0.3012), EM_DD (0.1199), OC (0.0603) and OC_PT (0.1206) at the 1% level of significance, and
negative and significant correlations with CSR (-0.0637) and CSR_COMB (-0.0258) at the 1% level of
significance. The control variable, PR, is negatively correlated with EM (-0.3115), EM_DD (-0.1340),
OC (-0.2192) and OC_PT (-0.2722) at the 1% level of significance, and positively correlated with CSR
(0.0775) and CSR_COMB (0.0289) at the 1% level of significance. The final control variable, MB, has
positive and significant correlations with EM (0.0920), EM_DD (0.0182), OC (0.0240) and OC_PT
(0.0497) at the 1% level of significance. MB has a negative correlation with CSR (-0.0186) at the 5%

222
level of significance, but no statistically significant correlation with CSR_COMB (-0.0073).

223
Table 5.6 Correlation Matrix The table presents the Pearson’s correlation matrix between the key variables. EM and EM_DD are the two alternate measures of the dependent variable. EM refers to earnings management, proxied by Discretionary accruals using the modified Jones model by Dechow et al. (1995). EM_DD refers to alternate earnings management specification, proxied by accruals quality model by Dechow & Dichev (2002). CSR and CSR_COMB are the two alternate measures of the independent variable. CSR is the ESG score obtained from Thomson Reuters, while CSR_COMB is the ESG combined score from Thomson Reuters. OC and OC_PT are the two alternate measures for the mediator, organisation capital. OC is the stock of organisation capital scaled by total assets. The stock of organisation capital is measured by accumulating the deflated value of SG&A expenses, consistent with Eisfeldt & Papanikolaou (2013). OC_PT Is the alternate measure of organisational capital following Peters & Taylor (2017). FD refers to FD, the moderating variable. FD is measured using the FD classification used by prior studies (for example, Giroux & Wiggins, 1984; Habib et al., 2013; Hopwood et al., 1994; McKeown et al., 1991; Rosner, 2003; Ward, 1994). FD is defined as a dummy variable, taking the value 1 if the firm is financially distressed, and 0 otherwise. SIZE, LEV, ADJROA, RD PR and MB are the control variables. SIZE refers to firm size, measured as the natural logarithm of market value of equity. LEV is defined as long-term debts divided by total assets. ADJROA is measured as the income before extraordinary items, scaled by lagged total assets, for each year and two-digit SIC code, subtracted from the focal firm. RD refers to R&D intensity, measured as R&D expenses divided by net sales. PR represents physical resources, measured as total assets minus current assets, scaled by total assets. MB is the market to book ratio. Correlation Matrix – full sample 1 2 3 4 5 6 7 8 9 10 11 12 13 1 EM 1 2 EM_DD 0.2073*** 1 3 CSR -0.1076*** -0.0449*** 1 4 CSR_COMB -0.0573*** -0.0093 0.7116*** 1 5 OC 0.0294*** -0.0728*** -0.0054 -0.0139** 1 6 OC_PT 0.1245*** -0.0061 -0.0428*** -0.0328*** 0.4308*** 1 7 FD 0.1452*** 0.0511*** -0.0391*** -0.0434*** -0.0005 0.0585*** 1 8 SIZE -0.2555*** -0.0839*** 0.4983*** 0.1879*** -0.2189*** -0.3917*** -0.1429*** 1 9 LEV -0.1300*** -0.0589*** -0.0510*** -0.0392*** -0.1232*** -0.1441*** 0.1514*** 0.1005*** 1 10 ADJROA -0.3379*** -0.0709*** 0.1031*** 0.0765*** -0.0526*** -0.2042*** -0.3660*** 0.2910*** -0.0073 1 11 RD 0.3012*** 0.1199*** -0.0637*** -0.0258*** 0.0603*** 0.1206*** 0.1946*** -0.2177*** -0.092*** -0.5227*** 1 12 PR -0.3115*** -0.1340*** 0.0775*** 0.0289*** -0.2192*** -0.2722*** 0.0927*** 0.3693*** 0.4082*** 0.2104*** -0.2647*** 1 13 MB 0.0920*** 0.0182*** -0.0186** -0.0073 0.0240*** 0.0497*** -0.0019 -0.2890*** -0.0778*** 0.0123** 0.0666*** -0.1512*** 1 ***, **, and * indicate statistical significance at the 1%, 5%, and 10% levels, respectively

224
5.8.3 Test of Multicollinearity
As discussed in previous chapters, I use the variation inflation factor (VIF) to test for multicollinearity
problems that may arise due to the existence of a strong linear relationship between two or more
independent variables. The general rule of thumb suggests that a VIF value of 10 or above indicates
the existence of multicollinearity (Takezawa, 2014). The variables used in the present study do not
appear to suffer from significant multicollinearity problems as evident through variation inflation
factors (VIF), values mostly being far below the threshold of 10 for all regression models. Table 5.7
shows the results of the VIF analysis of all regression models used in the present study.
Columns (1) and (2) of Table 5.7 present the VIF results of equations (7) and (8) respectively.
Equation (7) has a mean VIF of 1.88 (the values ranging from 1.16 to 5.17); equation (8) has a mean
VIF of 1.87 (the values ranging from 1.13 to 5.53). Columns (3) to (4) present the VIF results of
equations (7a) and (8a) respectively. Equation (7a) has a mean VIF of 1.87 (the values ranging from
1.08 to 5.17); equation (8a) has a mean VIF of 1.84 (the values ranging from 1.09 to 5.51).
For equations (9), (10), (9a) and (10a), the VIF values for the moderator (FD) and the interaction
variable (CSRxFD for equations (9) and (10); and CSR_COMBxFD for equations (9a) and (10a)), are
slightly above the general threshold of 10. However, as Allison (2012) suggests, it is quite acceptable
for dummy variables to have higher than normal VIF values. Additionally, the interaction variable
CSRxFD (for equations (9) and (10)) and CSR_COMxFD (for equations (9a) and (10a) are the product
of the independent continuous variables (CSR or CSR_COM) and the independent dummy variable,
FD. Thus, it is again quite normal for the interaction variable to have a higher collinearity with the
main independent variables. The slightly larger VIF is not concerning for 3 reasons: 1) the values are
just slightly (and not significantly) above the threshold of 10, 2) the nature of the variables as a
dummy variable and an interaction variable makes it quite likely for the VIF to be higher, and 3) the
overall mean VIF is far below the threshold of 10 in each of these instances.
Columns (5) and (6) report the VIF results of equations (9) and (10) respectively. Equation (9) and
(10) has a mean VIF of 2.15. For equation (9), the VIF values range from 1.16 to 10.94, while for
equation (10) the values range from 1.14 to 11.54. As discussed above, in equation (9) and (10), the
upper range VIF values are slightly higher than 10 due to the VIF for the moderator, FD, and the
interaction variable, CSRxFD, being greater than 10. For equation (9), the VIF for FD and CSRxFD are
10.94 and 10.86 respectively, while for equation (10), the VIF for FD and CSRxFD are 11.54 and 11.13
respectively. The higher VIF values are just slightly above 10, and therefore not concerning, as

225
discussed in the previous paragraph. Furthermore, the overall mean VIF values are far below 10 for
both equations (0) and (10).
Columns (7) and (8) report the VIF results of equations (9a) and (10a) respectively. Equation (9a)
and (10a) have mean VIF values of 2.12 and 2.11 respectively. For equation (9a), the VIF values range
from 1.16 to 10.22, while for equation (10a) the values range from 1.13 to 11.13. As in the discussion
above, the VIF values for the dummy moderating variable (FD) and the independent and moderating
interaction variable (CSR_COMxFD) are slightly above the general the general threshold of 10.
However, as discussed above, the higher VIF values are only slightly above 10, and therefore not
concerning. Furthermore, the overall mean VIF values are far below 10 for both equations (9a) and
(10a).
Table 5.7 Variation Inflation Factor (VIF) Results of the Multicollinearity Tests Columns (1) and (2) present the VIF results for equations (7) and (8) respectively; Columns (3) and (4) present the VIF results for equations (7a) and (8a) respectively; Columns (5) and (6) present the VIF results for equations (9) and (10) respectively; and Columns (7) and (8) present the VIF results for equations (9a) and (10a) respectively. OC, the mediator, is the stock of organisation capital scaled by total assets. OC is the stock of organisation capital scaled by total assets. The stock of organisation capital is measured by accumulating the deflated value of SG&A expenses, consistent with Eisfeldt & Papanikolaou (2013). OC_PT Is the alternate measure of organisational capital following Peters & Taylor (2017). CSR is the ESG score from Thomson Reuters. CSR_COMB and CSR_DUM, are the alternate specifications for the main independent variab le. CSR_COMB is the ESG combined score from Thomson Reuters, CSR_DUM is dummy variable taking the value of 1 if the CSR score of the firm is greater median CSR (is based on each year and industry), and 0 otherwise. FD refers to FD, the moderating variable. FD is measured using the FD classification used by prior studies (for example, Giroux & Wiggins, 1984; Habib et al., 2013; Hopwood et al., 1994; McKeown et al., 1991; Rosner, 2003; Ward, 1994). FD is defined as a dummy variable, taking the value 1 if the firm is financially distressed, and 0 otherwise. SIZE refers to firm size, measured as the natural logarithm of market value of equity. LEV is defined as long-term debts divided by total assets. ADJROA is measured as the income before extraordinary items, scaled by lagged total assets, for each year and two-digit SIC code, subtracted from the focal firm. RD refers to R&D intensity, measured as R&D expenses divided by net sales. PR represents physical resources, measured as total assets minus current assets, scaled by total assets. MB is the market to book ratio. Year dummies include a set of dummy variables to capture year effects. Industry dummies include a set of dummy variables to capture industry effects, based on 2-digit SIC codes. Variation inflation factor (VIF)
(1) (2) (3) (4) (5) (6) (7) (8) Eq (7) Eq (8) Eq (7a) Eq (8a) Eq (9) Eq (10) Eq (9a) Eq (10a)
Independent variables OC 2.02 2.5 OC_PT 1.43 2.21 CSR 1.45 1.56 1.98 2.1 CSR_COM 1.08 1.09 1.57 1.57 FD 10.94 11.54 10.22 11.13 CSRxFD 10.86 11.13 CSR_COMxFD 10.17 10.25 OCxFD 1.71 OC_PTxFD 2.48 SIZE 1.91 2.18 1.49 1.67 1.93 2.19 1.5 1.68 LEV 1.43 1.32 1.42 1.37 1.43 1.33 1.42 1.38 ADJROA 1.34 1.4 1.35 1.42 1.45 1.54 1.45 1.58 RD 1.54 1.57 1.54 1.56 1.54 1.58 1.54 1.56 PR 2.1 2.08 2.14 2.11 MB 1.36 1.32 1.36 1.33 Year dummies Dum 1 (2003) 1.28 1.57 1.18 1.18 1.28 1.57 1.28 1.18 Dum 2 (2004) 1.29 1.42 1.18 1.18 1.29 1.43 1.28 1.18 Dum 3 (2005) 1.4 1.43 1.24 1.24 1.4 1.43 1.39 1.24 Dum 4 (2006) 1.45 1.44 1.29 1.29 1.45 1.44 1.45 1.29 Dum 5 (2007) 1.45 1.38 1.31 1.31 1.45 1.38 1.45 1.31 Dum 6 (2008) 1.48 1.35 1.32 1.32 1.48 1.36 1.48 1.32 Dum 7 (2009) 1.55 1.36 1.35 1.35 1.55 1.36 1.55 1.36

226
Dum 8 (2010) 1.6 1.4 1.4 1.4 1.6 1.4 1.6 1.4 Dum 9 (2011) 1.64 1.51 1.49 1.49 1.64 1.51 1.64 1.49 Dum 10 (2012) 1.65 1.54 1.53 1.53 1.65 1.54 1.65 1.53 Dum 11 (2013) 1.64 1.55 1.55 1.55 1.65 1.55 1.65 1.55 Dum 12 (2014) 1.64 1.58 1.56 1.56 1.64 1.58 1.64 1.57 Dum 13 (2015) 1.64 1.62 1.59 1.59 1.64 1.62 1.64 1.59 Dum14 (2016) 1.79 1.75 1.76 1.76 1.79 1.76 1.8 1.76 Dum15 (2017) 1.95 1.89 1.91 1.91 1.95 1.89 1.95 1.91 Industry dummies Dum 1 (sic = 12) 2.16 2.27 2.29 2.29 2.16 2.27 2.16 2.29 Dum 2 (sic = 13) 1.27 1.24 1.25 1.25 1.27 1.24 1.27 1.25 Dum 3 (sic = 14) 3.61 3.51 3.48 3.48 3.61 3.51 3.6 3.48 Dum 4 (sic = 15) 1.19 1.16 1.14 1.14 1.19 1.16 1.19 1.14 Dum 5 (sic = 16) 2.02 2.02 2.02 2.02 2.02 2.02 2.01 2.02 Dum 6 (sic = 20) 1.16 1.13 1.13 1.13 1.16 1.14 1.16 1.13 Dum 7 (sic = 21) 3.24 3.16 3.13 3.13 3.25 3.17 3.25 3.14 Dum 8 (sic = 23) 1.3 1.24 1.24 1.24 1.31 1.25 1.31 1.24 Dum 9 (sic = 24) 1.37 1.32 1.33 1.33 1.38 1.33 1.38 1.34 Dum 10 (sic = 25) 1.17 1.14 1.15 1.15 1.17 1.14 1.17 1.15 Dum 11 (sic = 26) 1.2 1.2 1.19 1.19 1.2 1.2 1.2 1.2 Dum 12 (sic = 27) 1.7 1.57 1.59 1.59 1.71 1.57 1.71 1.6 Dum 13 (sic = 28) 1.82 1.69 1.66 1.66 1.83 1.7 1.83 1.66 Dum 14 (sic = 29) 5.15 5.37 5.49 5.49 5.17 5.4 5.17 5.51 Dum 15 (sic = 30) 2.08 2.1 2.09 2.09 2.08 2.1 2.08 2.09 Dum 16 (sic = 32) 1.4 1.36 1.35 1.35 1.4 1.36 1.4 1.36 Dum 17 (sic = 33) 1.48 1.47 1.48 1.48 1.48 1.48 1.48 1.48 Dum 18 (sic = 34) 2.07 2.12 2.12 2.12 2.07 2.12 2.07 2.12 Dum 19 (sic = 35) 1.64 1.59 1.57 1.57 1.65 1.6 1.65 1.58 Dum 20 (sic = 36) 3.61 3.69 3.66 3.66 3.62 3.71 3.62 3.68 Dum 21 (sic = 37) 4.3 4.82 4.82 4.82 4.3 4.84 4.3 4.84 Dum 22 (sic = 38) 2.96 3.06 3.05 3.05 2.96 3.07 2.97 3.06 Dum 23 (sic = 39) 3.44 3.44 3.5 3.5 3.46 3.47 3.46 3.53 Dum 24 (sic = 42) 1.25 1.23 1.24 1.24 1.26 1.23 1.26 1.24 Dum 25 (sic = 44) 1.42 1.43 1.43 1.43 1.42 1.43 1.42 1.44 Dum 26 (sic = 45) 1.36 1.36 1.35 1.35 1.36 1.36 1.36 1.36 Dum 27 (sic = 47) 1.73 1.74 1.74 1.74 1.73 1.74 1.73 1.74 Dum 28 (sic = 48) 1.24 1.26 1.25 1.25 1.24 1.26 1.23 1.25 Dum 29 (sic = 49) 3.93 4.1 4.04 4.04 3.93 4.12 3.92 4.04 Dum 30 (sic = 50) 4.68 4.61 4.56 4.56 4.69 4.62 4.68 4.57 Dum 31 (sic = 51) 1.71 1.58 1.54 1.54 1.72 1.59 1.7 1.55 Dum 32 (sic = 52) 1.55 1.5 1.53 1.53 1.55 1.5 1.55 1.53 Dum 33 (sic = 53) 1.34 1.36 1.37 1.37 1.34 1.37 1.34 1.37 Dum 34 (sic = 54) 1.64 1.58 1.68 1.68 1.64 1.58 1.64 1.7 Dum 35 (sic = 55) 1.52 1.51 1.53 1.53 1.52 1.51 1.52 1.53 Dum 36 (sic = 56) 1.29 1.25 1.22 1.22 1.29 1.25 1.29 1.22 Dum 37 (sic = 57) 1.54 1.58 1.61 1.61 1.55 1.59 1.55 1.63 Dum 38 (sic = 58) 1.3 1.33 1.31 1.31 1.3 1.33 1.3 1.32 Dum 39 (sic = 59) 1.62 1.59 1.62 1.62 1.62 1.59 1.62 1.62 Dum 40 (sic = 70) 1.69 1.67 1.68 1.68 1.69 1.67 1.7 1.69 Dum 41 (sic = 72) 1.55 1.5 1.5 1.5 1.55 1.5 1.55 1.51 Dum 42 (sic = 73) 1.19 1.18 1.19 1.19 1.19 1.18 1.19 1.19 Dum 43 (sic = 75) 5.17 5.53 5.51 5.51 5.17 5.55 5.17 5.53 Dum 44 (sic = 78) 1.18 1.14 1.15 1.15 1.18 1.14 1.18 1.15 Dum 45 (sic = 79) 1.2 1.14 1.15 1.15 1.2 1.14 1.2 1.15 Dum 46 (sic = 80) 1.28 1.23 1.24 1.24 1.28 1.23 1.28 1.24 Dum 47 (sic = 82) 1.68 1.6 1.58 1.58 1.68 1.61 1.68 1.58 Dum 48 (sic = 87) 1.29 1.35 1.36 1.36 1.29 1.35 1.29 1.37
Mean VIF 1.88 1.87 1.87 1.84 2.15 2.15 2.12 2.11

227
5.8.4 Preliminary Analysis Results
Base model results of ML estimation of equations (7) and (8)
Prior to the hypotheses testing, as part of the preliminary analysis, I test the direct relationship
between CSR and EM, and the indirect relationship between CSR and EM, via the mediating channel
OC. Table 5.8 presents the results of the preliminary analysis based on estimation of equations (7)
and (8), using SEM with ML method. The equations are estimated using robust standard errors.
Panel A shows the results of the relationship between CSR and OC (Column 1), and the direct effect
of CSR on EM (Column 2), while Panel B shows the results of the indirect effect of CSR on EM via OC.

228
Table 5.8 ML Estimation Output of Equations (7) and (8) Panel A presents the direct effects by estimating equations (7) and (8) individually in Columns (1) and (2) respectively. Robust standard errors are presented in parenthesis within Panel A. Panel B reports the joint results of OC as a channel between the CSR and EM relationship. The standard errors of the indirect relationship in Panel B, are estimated using the delta method and the bootstrapping technique with 1,000 replications. Panel B Column (1) reports the size of the indirect effect; Columns (2) and (3) show the delta method standard errors and p values respectively Columns (4) and (5) show the bootstrap standard error and the bias-corrected percentile bootstrap confidence interval respectively. EM refers to earnings management, proxied by discretionary accruals using the modified Jones model by Dechow et al. (1995). CSR is the ESG score obtained from Datastream. OC is the stock of organisation capital scaled by total assets. The stock of organisation capital is measured by accumulating the deflated value of SG&A expenses, consistent with Eisfeldt & Papanikolaou (2013). SIZE refers to firm size, measured as the natural logarithm of market value of equity. LEV is defined as long-term debts divided by total assets. ADJROA is measured as the income before extraordinary items, scaled by lagged total assets, for each year and two-digit SIC code, subtracted from the focal firm. RD refers to R&D intensity, measured as R&D expenses divided by net sales. PR represents physical resources, measured as total assets minus current assets, scaled by total assets. MB is the market to book ratio. The model includes a set of dummy variables to capture year and industry effects. Panel A: Direct effect
Variables (1) (2)
OC (Equation 7)
EM (Equation 8)
CONSTANT 0.1788*** (0.0157) 0.1844***
(0.0274)
OC 0.9533*** (0.1088)
CSR 0.0830*** (0.0084) -0.1074***
(0.0141)
SIZE -0.0121*** (0.0011) 0.0085***
(0.0021)
LEV -0.0281*** (0.0092) 0.0104***
(0.0123)
ADJROA 0.0226* (0.0124) -0.0860***
(0.0150)
RD -0.0092*** (0.0026) 0.0308***
(0.0031)
PR -0.0898*** (0.0082)
MB 0.0009*** (0.0002)
Year effects Yes Yes
Industry effects Yes Yes
Var matrix
OC 0.0217 (0.0003) -.02137 ***
(0.0024)
EM .0307144 (0.0047)
N 14,845 14,845
Adjusted R2 0.5081 -1.4888
Panel B: Indirect effect
Variables (1) (2) (3) (4) (5)
EM Delta method Std error
Delta method p-value
Bootstrap Std error
Bootstrap-based 95% confidence interval
CSR 0.0791 0.0125 0.0000 0.0084 (0.0665, 0.0996) ***, **, and * indicate statistical significance at the 1%, 5%, and 10% levels, respectively.

229
Column (1) of Panel A presents the estimation output of equation (7), that is, the relationship of OC
with CSR and the control variables. Consistent with my original findings in Chapter 4, the results
show a positive and significant relationship between CSR and OC at the 1% level of significance (1
= 0.0830; p<0.01). Consistent with my findings from Chapter 4, the control variables SIZE (2 = -
0.0121; p<0.01), LEV (3 = -0.0281; p<0.01), RD (5 = -0.0092; p<0.01) and PR (6 = -0.0898; p<0.01)
have negative associations with OC at the 1% level of significance. The control variable ADJROA is
positively related to OC at the 1% level of significance (4 = 0.0226; p<0.10).
Column (2) of Panel A presents the estimation output of equation (8), that is, the direct relationships
of EM with CSR, OC and the control variables. Similar to my findings reported in Chapter 4, the
results indicate a positive relationship between OC and EM at the 1% level of significance (1 =
0.9533; p<0.01). The direct effect result also shows that CSR has a negative direct influence on EM
at the 1% level of significance (2 = -0.1074; p<0.01). The results regarding the relationship between
the controls variables and EM are also consistent with Chapter 4 findings. SIZE (3 = 0.0085; p<0.01),
LEV (4 = 0.0104; p<0.01), RD (6 = 0.0308; p<0.01) and MB (7 = 0.0009; p<0.01) are positively
related to EM at the 1% level of significance, while ADJROA is negatively related to EM at the 1%
level of significance (5 = -0.0860; p<0.01).
Panel B of Table 5.8 shows the indirect effect of CSR on EM via OC as a mediating channel. As shown
in Column (1) shows the size of the indirect effect is 0.0791. The size of the indirect effect is
calculated as the product of 1 (that is, the coefficient of CSR from equation (7)) and 1 (that is, the
coefficient of OC from equation (8)). The coefficients 1 (0.0830) and 1 (0.9533) are individually
shown in Panel A. Thus, the size of the indirect effect is 0.0791 (i.e., 1 x 1 = 0.0830 x 0.9533). The
positive coefficient suggests a positive indirect relationship between CSR and OC, via the mediator
OC. As in Chapter 4, the statistical significance of the indirect effect is determined in two ways – 1)
the delta method, and 2) the bootstrapping technique. Panel B Columns (2) and (3) show the
standard error and p-values for the indirect effect, using the delta method. This suggests a strong
positive indirect effect of CSR on EM, via the mediating channel OC at the 1% level of significance (p
< 0.01). Panel B Columns (4) and (5) present the standard error and the 95% confidence interval
using the bootstrap technique with 1,000 replications. The results using the bootstrap technique
also confirm the positive indirect effect of CSR on EM via OC. The bootstrap-based 95% confidence
interval reports the lower and upper bound limits to be 0.0665 and 0.0996 respectively. Since zero
does not fall between the lower and upper bound limits of the confidence interval, this suggests

230
that the indirect effect is statistically significant at least in the 5% (1 - 𝛼) level of significance.
Overall, the preliminary analysis is consistent with my results reported in Chapter 4, suggesting that
CSR has a negative direct effect on EM, but a positive indirect effect on EM via OC. Figure 5.9 below
is a snapshot of the result of the preliminary analysis that have been discussed in the preceding
paragraphs. The size of the direct effect of CSR on EM is -0.1074, while the size of the indirect effect
of CSR on EM via the mediator OC is 0.0791. Thus, the size of the total effect of CSR on EM, calculated
as the sum of the direct and indirect effects, is -0.0283 (i.e., -0.1074 + 0.0791).
Figure 5.6 OC as Mediator in the CSR and EM Relationship
Note: The coefficient 0.0830 represents the size of the effect of CSR on OC (path a); the coefficient 0.9533 represents the size of the effect of OC on EM (path b); the coefficient 0.0791 represents the size of the indirect effect of CSR on EM via the mediator OC (path c’); the coefficient -0.1074 represents the size of the direct effect of CSR on EM (path c). *** indicate statistical significance at the 1% level.
Base model sensitivity test - results of ML estimation of equations (7a) and (8a)
I perform sensitivity tests on my preliminary analysis by estimating equations (7a) and (8a) with ML
estimation, using the alternate specifications of EM, CSR and OC, that is, EM_DD, CSR_COMB and
OC_PT respectively. Table 5.9 shows the results of the sensitivity test for the preliminary analysis.

231
Table 5.9 ML Estimation Output of Equations (7a) and (8a) Panel A presents the direct effects by estimating equations (7a) and (8a) individually in Columns (1) and (2) respectively. Robust standard errors are presented in parenthesis within Panel A. Panel B reports the joint results of OC_PT as a channel between the CSR_COMB and EM_DD relationship. The standard errors of the indirect relationship in Panel B, are estimated using the delta method and the bootstrapping technique with 1,000 replications. Panel B Column (1) reports the size of the indirect effect; Columns (2) and (3) show the delta method standard errors and p values respectively Columns (4) and (5) show the bootstrap standard error and the bias-corrected percentile bootstrap confidence interval respectively. EM_DD refers to alternate earnings management specification, proxied by accruals quality model by Dechow and Dichev (2002). CSR_COMV, the alternate specification for the main independent variable is the ESG combined score from Thomson Reuters. OC_PT Is the alternate measure of organisational capital following Peters & Taylor (2017). SIZE refers to firm size, measured as the natural logarithm of market value of equity. LEV is defined as long-term debts divided by total assets. ADJROA is measured as the income before extraordinary items, scaled by lagged total assets, for each year and two-digit SIC code, subtracted from the focal firm. RD refers to R&D intensity, measured as R&D expenses divided by net sales. PR represents physical resources, measured as total assets minus current assets, scaled by total assets. MB is the market to book ratio. The model includes a set of dummy variables to capture year and industry effects. Panel A: Direct effect
Variables (1) (2) OC_ALT (Equation 7a)
EM_DD (Equation 8a)
CONSTANT 3.0038*** (0.0824)
4.1016*** (0.4091)
OC_PT 0.3237** (0.1271)
CSR_COMB 0.1872*** (0.0429)
-0.1552* (0.0867)
SIZE -0.1422*** (0.0052)
0.0175 (0.0229)
LEV -0.8204*** (0.0485)
0.2600 (0.1636)
ADJROA -0.5999*** (0.0665)
0.7288*** (0.1494)
RD -0.0676*** (0.0142)
0.2508*** (0.0276)
PR -0.6660*** (0.0433)
MB -0.0023 (0.0030)
Year effects Yes Yes
Industry effects Yes Yes
Var matrix
OC_ALT 0 .6146 -0.1869**
EM_DD 2.2856
N 14,813 14,813
Adjusted R2 0.3068 0.3286
Panel B: Indirect effect
Variables (1) (2) (3) (4) (5)
EM_DD Delta method Std error
Delta method p-value
Bootstrap Std error
Bootstrap-based 95% confidence interval
CSR_COMB 0.0606 0.0276 0.0280 0.0867 (-0.3251, 0.0147) ***, **, and * indicate statistical significance at the 1%, 5%, and 10% levels, respectively.

232
Column (1) of Panel A presents the estimation output of equation (7a), that is, the relationship of
OC_PT with CSR_COMB and the control variables. Consistent with my original, the results show a
positive and significant relationship between CSR_COMB and OC_PT at the 1% level of significance
(1 = 0.1872; p<0.01). The control variables SIZE (2 = -0.1422; p<0.01), LEV (3 = -0.8204; p<0.01),
ADJROA (4 = -0.5999; p<0.10, RD (5 = -0.0676; p<0.01) and PR (6 = -0.6660; p<0.01) have negative
associations with OC_PT at the 1% level of significance.
Column (2) of Panel A presents the estimation output of equation (8a), that is, the direct
relationships of EM_DD with CSR_COMB, OC_PT and the control variables. The results indicate a
positive relationship between OC_PT and EM_DD at the 5% level of significance (1 = 0.3237;
p<0.05). The direct effects result also shows that CSR_COMB has a negative direct influence on
EM_DD at the 10% level of significance (2 = -0.1552; p<0.10). The control variables ADJROA (5 =
0.7288; p<0.01) and RD (6 = 0.2508; p<0.01) are positively related to EM_DD at the 1% level of
significance. However, SIZE (3 = 0.0175), LEV (4 = 0.2600), MB (7 = -0.0023) do not have a
statistically significant relations with EM_DD.
Panel B of Table 5.9 shows the indirect effect of CSR_COMB on EM_DD via OC_PT as a mediating
channel. As shown in Column (1) shows the size of the indirect effect is 0.0606. The size of the
indirect effect is calculated as the product of 1 and 1, that is, the coefficients of CSR_COMB (1 =
0.1872) from equation (7a) and of OC_PT (1 = 0.3237) from equation (8a) respectively. The positive
coefficient suggests a positive indirect relationship between CSR_COMB and OC_PT, via the
mediator OC. Columns (2) and (3) show the standard error and p-values for the indirect effect, using
the delta method. This suggests a positive indirect effect of CSR_COMB on EM_DD, via the mediating
channel OC_PT at the 5% level of significance (p < 0.05). Panel B Columns (4) and (5) present the
standard error and the 95% confidence interval using the bootstrap technique with 1,000
replications. The bootstrap-based 95% confidence interval reports the lower and upper bound limits
to be -0.3239 and 0.0135 respectively. Since zero falls between the lower and upper bound limits of
the confidence interval, this suggests that the indirect effect is no longer statistically significant.
Although the bootstrap technique does not show indirect relationship between CSR and EM via OC
to be statistically significant, the delta method suggests that the indirect relationship is statistically
significant, consistent with the ML estimation results.

233
Base model results of 2SLS estimation of equations (7) and (8)
In the next step of my preliminary analysis, I address endogeneity of CSR by re-estimating equations
(7) and (8) as 2SLS models with an instrument variable. Following Nguyen et al. (2019), I use CSR_M
as an instrument, measured as the median CSR based on Fama-French 48 industry classification.
Table 5.10 presents the results of the 2SLS estimation of equations (7) and (8).
Table 5.10 2SLS Estimation Output of Equations (7) and (8) The model uses CSR_M, measured as the median CSR based on Fama-French 48 industry classification as an instrument to control for endogeneity of CSR. Panel A presents the direct effects obtained from estimating equations (7) and (8) individually, shown in Columns (1) and (2) respectively. Standard errors are presented in parenthesis within Panel A. Panel B shows the indirect effects by estimating equations (7) and (8) jointly. The standard errors of the indirect relationship in Panel B are estimated using the bootstrapping method with 1,000 replications. EM refers to earnings management, proxied by discretionary accruals using the modified Jones model by Dechow et al. (1995). CSR is the ESG score obtained from Thomson Reuters. OC is the stock of organisation capital scaled by total assets. The stock of organisation capital is measured by accumulating the deflated value of SG&A expenses, consistent with Eisfeldt & Papanikolaou (2013). SIZE refers to firm size, measured as the natural logarithm of market value of equity. LEV is defined as long-term debts divided by total assets. ROA is measured as the income before extraordinary items, scaled by lagged total assets, for each year and two-digit SIC code, subtracted from the focal firm. RD refers to R&D intensity, measured as R&D expenses divided by net sales. PR represents physical resources, measured as total assets minus current assets, scaled by total assets. MB is the market to book ratio. The model includes a set of dummy variables to capture year and industry effects. Panel A: Direct effect
Variables (1) (2) OC (Equation 8)
EM (Equation 9)
CONSTANT 0.2753*** (0.0242)
0.0352 (0.0770)
OC 0.7323*** (0.0991)
CSR 0.3411*** (0.0486)
-0.4922*** (0.1390)
SIZE -0.0298*** (0.0035)
0.0339*** (0.0107)
LEV -0.0516*** (0.0104)
ADJROA 0.0204 (0.0128)
-0.0909*** (0.0153)
RDINT -0.0096*** (0.0027)
0.0302*** (0.0028)
PR -0.0663*** (0.0095)
MB 0.0032*** (0.0008)
Year effects Yes Yes Industry effects Yes Yes 1-stage F-stat 95.33 66.55 N 14,845 14,845 Adjusted R2 0.4767 -1.0809 Panel B: Indirect effect (bootstrap method)
EM Bootstrap std error
Bootstrap-based 95% confidence interval
CSR 0.2498 0.0200 -0.9056 -0.0789 ***, **, and * indicate statistical significance at the 1%, 5%, and 10% levels, respectively.

234
As shown in Panel A of Table 5.10, my preliminary test results remain consistent after using the 2SLS
model to address endogeneity. Panel A Column (1) displays the results of equation (7). The results
show that CSR has a positive effect on OC at the 1% level of significance (1 = 0.3411; p<0.01). The
results concerning the control variables also remain consistent to the original results. The control
variables SIZE (2 = -0.0298; p<0.01), LEV (3 = -0.0516; p<0.01), RD (5 = -0.0096; p<0.01) and PR
(6 = -0.0663; p<0.01) have negative associations with OC at the 1% level of significance. The control
variable ADJROA is positively related to OC at the 1% level of significance (4 = 0.0204; p<0.10).
Panel A Column (2) presents the results of the direct effects from the estimation of equation (8).
Consistent to the original preliminary analysis, the results show that OC has a positive and effect on
EM at the 1% level of significance (1 = 0.7323; p<0.01). The direct effects result also shows that CSR
has a negative direct influence on EM at the 1% level of significance (2 = -0.4922; p<0.01). The
controls variables SIZE (3 = 0.0339; p<0.01), RD (6 = 0.0302; p<0.01) and MB (7 = 0.0032; p<0.01)
are positively related to EM at the 1% level of significance, while ADJROA is negatively related to EM
at the 1% level of significance (5 = -0.0909; p<0.01). Thus, after controlling for endogeneity, the
results remain consistent to the findings from the original preliminary analysis, and to Chapter 4
findings.
Table 5.10 Panel B reports the results relevant to the indirect relationship between CSR and EM via
OC. The results show that CSR has a positive indirect effect on EM (0.2498). As discussed previously,
the size of the indirect effect is estimated by calculating the product of the CSR coefficient (1) from
equation (7) and the OC coefficient (1) from equation (8) – that is, 11. As shown in Table 5.10
Panel A, the CSR coefficient (1) from equation (7) is 0.3411, while the OC coefficient (1) from
equation (8) is 0.7323. Thus, the size of the indirect effect of CSR on EM via OC (11) is 0.2498. As
discussed before, I use the bootstrapping method with 1,000 replacements to estimate the standard
error of the indirect effect. The lower and upper bound limits of the bootstrap-based 95%
confidence interval are -0.9056 and -0.0789 respectively. Since zero does not fall between the lower
and upper bound limits of the confidence interval, this suggests that the indirect effect is statistically
significant at least in the 5% (1 - 𝛼) level of significance. Thus, even after controlling for endogeneity,
the results suggest a positive and significant indirect relationship between CSR and EM via OC,
consistent to the managerial myopia hypothesis.
Additionally, to test the validity of the instrument (CSR_M) used in the 2SLS model, I follow prior
studies and test for weak instrument. A weak instrument may cause 2SLS estimation to be

235
inconsistent (Stock & Yogo, 2002). Following prior studies, I use the first-stage F-statistic to detect
weak instruments (for example, see Cheung, 2016; Stock & Yogo, 2002). Following the general rule
of thumb, to determine that the instrument is not weak, the first-stage F-statistic should be larger
than 10 to warrant that the maximum bias in the instrumental variable estimators is less than 10%
(Staiger & Stock, 1994). As shown in Table 5.10, the first stage F-statistic is 95.33 for equation (8)
and 66.55 for equation (9). Thus, the first stage F-statistic being well above 10, suggests that the
instrument, CSR_M, used in the 2SLS estimation, is not a weak instrument.
5.8.5 Main Model Results of ML Estimation of Equations (9) and (10)
Table 5.11 presents the results of the main hypothesis testing, based on estimation of equations (9)
and (10), using SEM with ML method. The equations are estimated using robust standard errors.
Panel A shows the results of the first stage moderation in Column (1) (that is, the moderating effect
of FD on the relationship between CSR and OC), and the results of the second stage moderation in
Column (2) (that is, the moderating effect of FD on the direct effect of CSR on EM. Panel B shows
the results of the moderated mediation (that is, the moderating effect of FD on the indirect effect
of CSR on EM via OC)

236
Table 5.11 ML Estimation Output of Equations (9) and (10)
The table presents the ML estimation results of equations (9) and (10). Panel A presents the conditional direct effects, and moderating effects of FD, by estimating equations (9) and (10) individually in Columns (1) and (2) respectively. Robust standard errors are presented in parenthesis within Panel A. Panel B reports the joint results of the moderating effect of FD in the indirect relationship between the CSR and EM, through the mediating channel OC. The standard errors of the conditional indirect relationship in Panel B, are estimated using the delta method and the bootstrapping technique with 1,000 replications. Panel B Column (1) reports the size of the conditional indirect effect; Columns (2) and (3) show the delta method standard errors and p values respectively Columns (4) and (5) show the bootstrap standard error and the bias-corrected percentile bootstrap confidence interval respectively. EM refers to earnings management, proxied by discretionary accruals using the modified Jones model by Dechow et al. (1995). CSR is the ESG score obtained from Thomson Reuters. OC is the stock of organisation capital scaled by total assets. The stock of organisation capital is measured by accumulating the deflated value of SG&A expenses, consistent with Eisfeldt & Papanikolaou (2013).. FD refers to FD, the moderating variable. FD is measured using the FD classification used by prior studies (for example, Giroux & Wiggins, 1984; Habib et al., 2013; Hopwood et al., 1994; McKeown et al., 1991; Rosner, 2003; Ward, 1994). FD is defined as a dummy variable, taking the value 1 if the firm is financially distressed, and 0 otherwise. SIZE refers to firm size, measured as the natural logarithm of market value of equity. LEV is defined as long-term debts divided by total assets. ADJROA is measured as the income before extraordinary items, scaled by lagged total assets, for each year and two-digit SIC code, subtracted from the focal firm. RD refers to R&D intensity, measured as R&D expenses divided by net sales. PR represents physical resources, measured as total assets minus current assets, scaled by total assets. MB is the market to book ratio. The model includes a set of dummy variables to capture year and industry effects. Panel A: Direct effect Variables (1) (2)
OC (Equation 9)
EM (Equation 10)
CONSTANT 0.1697*** (0.0161)
0.1808** (0.0277)
OC 0.9810*** (0.1107)
CSR 0.0963*** (0.0098)
-0.1178*** (0.0166)
FD 0.0240*** (0.0086)
-0.0062 (0.0106)
OCXFD -0.0169** (0.0084)
CSRXFD -0.0404*** (0.0149)
0.0238 (0.0185)
SIZE -0.0121*** (0.0011)
0.0089*** (0.0022)
LEV -0.0283*** (0.0092)
0.0112* (0.0125)
ADJROA 0.0292** (0.0129)
-0.0835*** (0.0160)
RD -0.0095*** (0.0026)
0.0308*** (0.0032)
PR -0.0903*** (0.0082)
MB
0.0009*** (0.0002)
Year effects Yes Yes Industry effects Yes Yes Var matrix OC 0.0217
(0.0003) -0.0218*** (0.0002)
EM
0.0317 (0.0048)
N 14,845 14,845 Adjusted R2 0.5080 -1.5673

237
Panel B: Indirect effect
(1) (2) (3) (4) (5)
EM Delta method Std error
Delta method p-value
Bootstrap Std error
Bootstrap-based 95% confidence interval
Unconditional Indirect effect CSR
0.0945
0.0149
0.0000
Indirect effect conditional on FD: CSR -> OC -> EM Distressed firms (FD = 1)
0.0539 0.0144 0.0000 0.0148 (0.0294, 0.0876)
Non-distressed firms (FD = 0)
0.0945 0.0168 0.0000 0.0166 (0.0671, 0.1325)
Difference -0.0406 0.0147 0.0060 0.0149 (-0.0746, -0.0140)
***, **, and * indicate statistical significance at the 1%, 5%, and 10% levels, respectively.
Results of the moderating effect of FD on the direct CSR-EM relationship
The direct effects results, obtained from estimating equation (10), are shown in Column (2) of Panel
A. The result shows that CSR has a negative direct influence on EM at the 1% level of significance
(2 = -0.1178; p<0.01). This result is consistent to my findings from Chapter 4 and to the preliminary
analysis. FD does not have a statistically significant relationship with EM (3 = -0.0062). Thus, the
result does not provide enough evidence to support hypothesis H2.1. The interaction effect of CSR
and FD (that is, CSRxFD) on EM has a positive coefficient (4 = 0.0238), but this is not statistically
significant. The result does not find evidence of a significant moderating effect of FD on the direct
relationship between CSR and EM. Thus, I do not find support for hypothesis H2.2. This means that
the negative direct relationship between CSR and EM does not change with the level of FD.
Results of first stage moderation
Column (1) of Panel A portrays the estimation output of equation (9), that is, the relationship of OC
with CSR, FD, the interaction of CSR and FD, and the control variables. The results show a positive
relationship between CSR and OC at the 1% level of significance (1 = 0.0963; p<0.01). This result is
consistent to my findings from Chapter 4 and to the preliminary analysis. FD also has a positive
relationship with OC at the 1% level of significance (2 = 0.0240; p<0.01). The result is consistent to
the RBV and provides support for hypothesis H2.3b. The interaction effect of CSR and FD (CSRxFD)
on OC is negative at the 1% level of significance (3 = -0.0404; p<0.01). The negative and significant
coefficient on the interaction term CSRxFD suggests that FD has a significant moderating

238
(weakening) effect on the CSR and OC relationship. Thus, the result provides evidence of a first stage
moderation of FD. The result is consistent to the slack resource theory, suggesting that FD weakens
the positive relationship between CSR and OC, providing support for hypothesis H2.4. Consistent to
the preliminary analysis, the control variables SIZE (4 = -0.0121; p<0.01), LEV (5 = -0.0283; p<0.01),
RD (7 = -0.0095; p<0.01) and PR (8 = -0.0903; p<0.01) have negative associations with OC at the
1% level of significance. The control variable ADJROA is positively related to OC at the 5% level of
significance (6 = 0.0292; p<0.05).
Results of second stage moderation
The results on the relationships of EM with OC, and with the interaction of OC and FD, obtained
from equation (10) estimation, is shown in Column (2) of Panel A. Consistent to my preliminary
findings, the results indicate a positive relationship between OC and EM at the 1% level of
significance (1 = 0.9810; p<0.01). However, the interaction of OC and FD (that is, OCxFD) has a
negative effect on EM at the 5% level of significance (4 = -0.0169; p<0.05). This result suggests that
FD moderates (weakens) the positive relationship between OC and EM. Thus, the result provides
support for hypothesis H2.5, suggesting that FD weakens managerial myopia behaviour. In regard
to the control variables, the results are mostly consistent to my preliminary findings. SIZE (6 =
0.0089; p<0.01), RD (9 = 0.0308; p<0.01) and MB (10 = 0.0009; p<0.01) are positively related to EM
at the 1% level of significance, while ADJROA is negatively related to EM at the 1% level of
significance (8 = -0.0835; p<0.01). LEV does not have a statistically significant relationship with EM
(7 =0.0112).
Results of moderated mediation
Panel B of Table 5.11 shows the result of the hypothesis H2.6 testing, where I test moderated
mediation, that is, the moderating effect of FD on the indirect relationship between CSR and EM,
via the mediator OC. The first part of the table in Panel B shows the size of the unconditional indirect
effect of CSR on EM via OC. Consistent to the preliminary findings, the result suggest that CSR has a
positive unconditional indirect effect on EM via the channel OC, at the 1% level of significance (11
= 0.0945, p<0.01). Similar to the previous analyses, the size of the unconditional indirect effect is
measured as the product of the coefficients of CSR (1 = 0.0963) and OC (1 = 0.9810) from equations
(9) and (10) respectively. The standard errors, for the indirect effects of CSR on EM via OC, is based
on the delta method.

239
The findings reported above only show the unconditional indirect effects of CSR and FD on EM.
However, to examine the moderated mediation effect of FD on the indirect relationship between
CSR on EM via OC, the analysis is based on the approach suggested by Preacher et al. (2007). As
Preacher et al. (2007) suggest, moderated mediation occurs when the strength of the indirect effect
varies with changes in the level of the moderator. The FD measure, used in the present study, is a
dummy variable with 2 levels (or values) – the value ‘1’ coded for financially distressed firms, and
‘0’ for non-distressed firms. The remaining of Panel B of Table 5.11 shows the indirect effect of CSR
on EM via OC for financially distressed firms, for non-distressed firms, and the difference in the
indirect effect of CSR on EM between distressed and non-distressed firms, to capture any change in
the strength of the indirect effect.
The statistical significance of the indirect effect results is reported in two ways: 1) using the delta
method, 2) using the bootstrapping technique with 5,000 replications. Column (1) shows the size of
the indirect effect; Columns (2) and (3) show the standard error and p-values, respectively
calculated based on the delta method; Columns (4) and (5) show the bootstrap standard error and
the bias-corrected bootstrap-based 95% confidence interval.
As shown in Panel B, the indirect effect of CSR on EM via OC is positive and significant, for both
distressed and non-distressed firms. For distressed firms, CSR has a positive indirect effect on EM
via OC at the 1% level of significance (2’(distressed) = 0.0539; p<0.01). This is known as the conditional
indirect effect, as this indirect effect of CSR on EM via OC, is conditional on the moderator FD. I
follow Process Model 59 for assessing the indirect effect. Following, Model 59, the conditional
indirect effect (2’(distressed)) is measured as: (1 + 3FD) (1 + 4 FD). 1 (0.0963) and 3FD (-0.0404)
are the coefficients of CSR and CSRxFD, respectively, from equation (9), while 1 (0.9810) and 4FD
(-0.0169) are the coefficients of OC and OCxFD, respectively, from equation (10). The positive and
significant coefficient on the indirect effect of CSR indicates that CSR, via the mediating path OC,
tends to increase EM. The result of the bootstrap estimation also confirms this. The bias-corrected
bootstrap-based 95% confidence interval reports the lower and upper bound limits to be 0.0294
and 0.0876 respectively. Since zero does not fall between the lower and upper bound limits of the
confidence interval, this suggests that the indirect effect is statistically significant at least in the 5%
(1 - 𝛼) level of significance.
The conditional indirect effect of CSR on EM via OC, for non-distressed firms, is also positive at the
1% level of significance (2’(non-distressed) = 0.0945; p<0.01). The bootstrap estimation also confirms

240
the statistical significance of the indirect effect. Since zero does not fall between the lower and
upper bound limits of the bias-corrected bootstrap-based 95% confidence interval (the lower and
upper bound limits being (0.0671 and 0.1325 respectively), it can be inferred that the indirect effect
is statistically significant at least in the 5% level of significance.
An important thing to note is the size of the indirect effect coefficients for distressed and non-
distressed firms. The size of the indirect effect coefficient for distressed firms (0.0539) is smaller
than that of non-distressed firms (0.0945). The change in the size of the indirect effect with each
level of FD suggests evidence of a moderated mediating effect. In particular, the coefficient being
smaller for distressed firms, suggest that the indirect effect of CSR on EM via OC gets smaller as
firms experience FD. I also test whether the difference in the indirect effects between distressed
versus non-distressed firms is statistically significant. The result, shown in the final row of Panel B,
indicate a negative coefficient at the 1% level of significance (2’(distressed) - 2’(non-distressed) = -0.0406;
p<0.01). This result indicates that there is a statistically significant difference in the indirect effect
of CSR on EM via OC between distressed versus non-distressed firms. The bias corrected bootstrap-
based 95% confidence interval has lower and upper bounds as -0.0746 and -0.0140 respectively
(that, is zero does not fall in between these two values), confirming that the difference in the
indirect effects, between distressed and non-distressed firms, is statistically significant, at least at
the 5% level of significance. The negative coefficient (2’(distressed) - 2’(non-distressed) = -0.0406) on the
difference between distressed and non-distressed firms reiterates that the indirect relationship
between CSR and EM is weaker for financially distressed firms. Thus, the moderated mediation
result provides support for my final hypothesis (H2.6) and is consistent to the myopia avoidance
hypothesis.
5.8.6 Main Model Results Sensitivity Test – Results of ML Estimation of Equations (9a) and (10a)
The sensitivity test involves replacing the dependent, independent and mediating variables with
their alternate measures. Table 5.12 displays the results of the sensitivity tests on the main
regressions. For the sensitivity test, I estimate equations (9a) and (10a) which are essentially the
same as equations (9) and (10), with the only exceptions being that the main variables EM, CSR and
OC are replaced with their alternate specifications EM_DD, CSR_COMB and OC_PT respectively.
Equations (9a) and (10a) are estimated as SEM using ML estimation, using robust standard errors.

241
Table 5.12 ML Estimation Output of Equations (9a) and (10a) Panel A presents the conditional direct effects, and moderating effects of FD, by estimating equations (9a) and (10a) individually in Columns (1) and (2) respectively. Robust standard errors are presented in parenthesis within Panel A. Panel B reports the joint results of the moderating effect of FD in the indirect relationship between CSR_COMB and EM_DD, through the mediating channel OC_PT. The standard errors of the conditional indirect relationship in Panel B, are estimated using the delta method and the bootstrapping technique with 5,000 replications. Panel B Column (1) reports the size of the conditional indirect effect; Columns (2) and (3) show the delta method standard errors and p values respectively Columns (4) and (5) show the bootstrap standard error and the bias-corrected percentile bootstrap confidence interval respectively. EM_DD refers to alternate earnings management specification, proxied by accruals quality model by Dechow and Dichev (2002). CSR_COM, the alternate specification for the main independent variable, is the ESG combined score from Thomson Reuters. OC_PT Is the alternate measure of organisational capital following Peters & Taylor (2017). FD refers to FD, the moderating variable. FD is measured using the FD classification used by prior studies (for example, Giroux & Wiggins, 1984; Habib et al., 2013; Hopwood et al., 1994; McKeown et al., 1991; Rosner, 2003; Ward, 1994). FD is defined as a dummy variable, taking the value 1 if the firm is financially distressed, and 0 otherwise. SIZE refers to firm size, measured as the natural logarithm of market value of equity. LEV is defined as long-term debts divided by total assets. ADJROA is measured as the income before extraordinary items, scaled by lagged total assets, for each year and two-digit SIC code, subtracted from the focal firm. RD refers to R&D intensity, measured as R&D expenses divided by net sales. PR represents physical resources, measured as total assets minus current assets, scaled by total assets. MB is the market to book ratio. The model includes a set of dummy variables to capture year and industry effects. Panel A: Direct effect Variables (1) (2)
OC_PT (Equation 9a)
EM_DD (Equation 10a)
CONSTANT 2.9178*** (0.0842)
4.0346*** (0.4004)
OC_PT 0.3235** (0.1268)
CSR_COMB 0.3245*** (0.0516)
-0.2286** (0.1083)
FD 0.2252*** (0.0436)
-0.0897 (0.0904)
OC_PTXFD 0.0560** (0.0277)
CSR_COMBXFD -0.4244*** (0.0892)
0.2340 (0.1802)
SIZE -0.1416*** (0.0052)
0.0226 (0.0228)
LEV -0.8199*** (0.0485)
0.2784* (0.1626)
ADJROA -0.5337*** (0.0691)
0.8420*** (0.1537)
RD -0.0678*** (0.0142)
0.2513*** (0.0276)
PR -0.6777*** (0.0436)
MB -0.0029 (0.0030)
Year effects Yes Yes Industry effects Yes Yes
Var matrix OC_PT 0.6135 -0.2008** EM_DD 2.2931 N 14,813 14,813 Adjusted R2 0.3081 0.3264

242
Sensitivity test results of the moderating effect of FD on the direct CSR-EM relationship
The results regarding the direct effect of CSR_COMB on EM_DD, and the moderating effect of FD,
obtained from estimating equation (10a), are shown in Column (2) of Panel A. Consistent with the
original findings, the sensitivity test results show that CSR_COMB has a negative direct influence on
EM_DD at the 5% level of significance (2 = -0.2286; p<0.05). FD does not have a statistically
significant relationship wiith EM_DD (3 = -0.0897). The interaction variable, CSR_COMBxFD does
not have a statistically significant direct effect on EM_DD (4 = 0.2340). Thus, consistent with the
original findings, the sensitivity test results do not find evidence of a significant moderating effect
of FD on the direct relationship between CSR_COMB and EM_DD.
Sensitivity test results of first-stage moderation
The results regarding the effect of CSR_COMB on OC_PT, and the moderating effect of FD, obtained
by estimating equation (9a), are portrayed in Column (1) of Panel A. Consistent with the original
results, the results of the sensitivity tests show a positive relationship between CSR_COMB and
OC_PT at the 1% level of significance (1 = 0.3245; p<0.01). FD also has a positive relationship with
OC_PT at the 1% level of significance (2 = 0.2252; p<0.01). The interaction variable CSR_COMBxFD
has a negative effect on OC_PT at the 1% level of significance (3 = -0.4244; p<0.01), suggesting that
FD has a significant moderating (weakening) effect on the CSR_COMB and OC_PT relationship (that
is, first stage moderation). The control variables SIZE (4 = -0.1416; p<0.01), LEV (5 = -0.8199;
p<0.01), ADJROA (6 = -0.5337; p<0.05), RD (7 = -0.0678; p<0.01) and PR (8 = -0.6777; p<0.01)
have negative associations with OC_PT at the 1% level of significance.
Panel B: Indirect effect
(1) (2) (3) (4) (5)
EM_DD Delta method
Std error Delta method p-value
Bootstrap Std error
Bootstrap-based 95% confidence interval
Unconditional Indirect effect
CSR_COMB 0.1050 0.0445 0.018
Indirect effect conditional on FD: CSR_COMB -> OC_PT -> EM_DD
Distressed firms (FD = 1)
-0.0379 0.0285 0.184 0.0309 (-0.1246, 0.0041)
Non-distressed firms (FD = 0)
0.1050 0.0487 0.031 0.0504 (0.0212, 0.2204)
Difference -0.1429 0.0667 0.032 0.0694 (-0.3049, -0.0324)
***, **, and * indicate statistical significance at the 1%, 5%, and 10% levels, respectively.

243
Sensitivity test results of second-stage moderation
The results regarding the effect of OC_PT on EM_DD, and the moderating effect of FD, obtained
from estimating equation (10a), are shown in Column (2) of Panel A. Consistent with the original
findings, the sensitivity test results indicate a positive relationship between OC_PT and EM_DD at
the 5% level of significance (1 = 0.3235; p<0.05). The interaction variable, OC_PTxFD has a positive
effect on EM_DD at the 5% level of significance (4 = -0.0560; p<0.05). This result suggests that FD
moderates (weakens) the positive relationship between OC_PT and EM_DD (that is, second stage
moderation occurs). The control variables ADJROA (8 = 0.8420; p<0.01) and RD (9 = 0.2513; p<0.01)
are positively related to EM_DD at the 1% level of significance, while LEV (7 =0.2784; p<0.10) is
positively related to EM_DD at the 10% level of significance. SIZE (6 = 0.0226) and MB (10 = -0.0029;
p<0.01) do not have statistically significant relationships with EM_DD.
Sensitivity test results of moderated mediation
Panel B of Table 5.12 shows the moderated mediation result, that is, the moderating effect of FD
on the indirect relationship between CSR_COMB and EM_DD, via the mediator OC_PT. The first part
of the table in Panel B shows the size of the unconditional indirect effect of CSR_COMB on EM_DD
via OC_PT. Consistent with the original findings, the sensitivity test result suggests that CSR_COMB
has a positive indirect effect on EM_DD via the path OC_PT, at the 5% level of significance (11 =
0.1050, p<0.05). The size of the indirect effect is measured as the product of the coefficients of
CSR_COMB (1 = 0.3245) and OC_PT (1 = 0.3235) from equations (9a) and (10a) respectively. The
standard error for both the indirect effects of CSR_COMB on EM_DD via OC_PT is based on the delta
method.
As discussed previously, the moderated mediation is assessed by examining the strength of the
indirect effect with changes in the level of the moderator. Panel B of Table 5.12 shows the indirect
effect of CSR_COMB on EM_DD via OC_PT for financially distressed firms, for non-distressed firms,
and the difference in the indirect effect of CSR_COMB on EM_DD between distressed and non-
distressed firms, to capture any change in the strength of the indirect effect. As shown in Column
(1), the size of the indirect effect of CSR_COMB on EM_DD via OC_PT for financially distressed firms
is (2’(distressed) = -0.0379), measured as (1 + 3FD) (1 + 4 FD). 1 (0.3245) and 3FD (-0.4244) are
the coefficients of CSR_COMB and CSR_COMBxFD, respectively, from equation (9a), while 1

244
(0.3235) and 4FD (-0.0560) are the coefficients of OC_PT and OC_PTxFD, respectively, from
equation (10a). However, the indirect effect is not statistically significant for distressed firms. This
is confirmed by the delta method p-value being greater than 0.1000, as well as the bias corrected
95% bootstrap-based confidence interval having zero between the lower (-0.1246) and upper
(0.0041) bounds.
The conditional indirect effect of CSR_COMB on EM_DD via OC_PT for non-distressed firms is
positive at the 5% level of significance (2’(non-distressed) = 0.1050; p<0.05). The bootstrap estimation
also confirms the statistical significance of the indirect effect. Since zero does not fall between the
lower (0.0212) and upper (0.2204) bound limits of the bias-corrected bootstrap-based 95%
confidence interval, it can be inferred that the indirect effect is statistically significant at least at the
5% level of significance. The size of the indirect effect coefficient for distressed firms is smaller than
that of non-distressed firms, suggesting evidence of a moderated mediating effect. Consistent with
the original findings, the sensitivity test results also suggest that the indirect effect of CSR_COMB
on EM_DD via OC_PT becomes smaller as firms experience FD.
The results regarding the indirect effect from the sensitivity test do not dismiss the original findings.
On the contrary, the sensitivity test result shows that FD has a moderating (weakening) effect on
the indirect relationship between CSR_COMB and EM_DD via OC_PT. The results confirm that as
the level of FD changes, the indirect effect between CSR_COMB and EM_DD via OC_PT also changes.
For financially non-distressed firms (that is FD = 0), there is a statistically significant indirect effect.
However, as the level of FD changes to 1 (that is, financially distressed firms), the indirect effect is
no longer statistically significant. Thus, the result confirms the original findings, suggesting that
while there is a statistically significant indirect relationship between CSR_COMB and EM_DD via
OC_PT among non-distressed firms, this negative indirect effect becomes weaker and insignificant
as the level of FD increases. The size of the indirect effect also decreases as the level of FD increases
(the indirect effect coefficient being 0.1050 for non-distressed firms, and -0.0379 for financially
distressed firms), consistent with the original findings. Furthermore, the difference in the indirect
effects between distressed versus non-distressed firms is statistically significant. The result, shown
in the final row of Panel B, indicate a negative coefficient at the 5% level of significance (2’(distressed)
- 2’(non-distressed) = -0.1429; p<0.01). The bias corrected bootstrap-based 95% confidence interval has
lower and upper bounds of -0.3049 and -0.0324 respectively. Since zero does not fall in between
these two values, this also confirms that the difference in the indirect effects between distressed

245
and non-distressed firms is statistically significant, at least at the 5% level of significance. The
negative coefficient (2’(distressed) - 2’(non-distressed) = -0.1429) on the difference between distressed and
non-distressed firms suggest that the indirect relationship between CSR_COMB and EM_DD is
weaker for financially distressed firms. Thus, consistent with the original findings, the sensitivity test
result indicates that there is a statistically significant difference in the indirect effect of CSR_COMB
on EM_DD via OC_PT between distressed versus non-distressed firms, that is FD has a statistically
significant moderated mediation (weakening) effect on the indirect relationship between
CSR_COMB and EM_DD via OC_PT.
5.8.7 Accounting for Endogeneity – 2SLS Estimation Results of Equations (9) and (10)
Table 5.13 presents the results of the 2SLS tests for addressing the endogeneity of CSR concerning
the main hypothesis testing, based on estimation of equations (9) and (10), using the instrument
CSR_M, measured as the median CSR based on Fama-French 48 industry classifications. Panel A
Column (1) shows the results of the first stage moderation (that is, the moderating effect of FD on
the relationship between CSR and OC), while Column (2) shows the results of the second stage
moderation (that is, the moderating effect of FD on the relationship between OC and EM), and the
moderating effect of FD on the direct effect of CSR on EM. Panel B shows the results of the
moderated mediation (that is, the moderating effect of FD on the indirect effect of CSR on EM via
OC).

246
Table 5.13 2SLS Estimation Output of Equations (9) and (10)
The model uses CSR_M, measured as the median CSR based on Fama-French 48 industry classification, as an instrument to control for endogeneity of CSR. Panel A presents the conditional direct effects, and moderating effects of FD, by estimating equations (9) and (10) individually in Columns (1) and (2) respectively. Standard errors are presented in parenthesis within Panel A. Panel B reports the joint results of the moderating effect of FD in the indirect relationship between the CSR and EM, through the mediating channel OC. The standard errors of the indirect relationship in Panel B are estimated using the bootstrapping method with 5,000 replications. EM refers to earnings management, proxied by discretionary accruals using the modified Jones model by Dechow et al. (1995). CSR is the ESG score obtained from Thomson Reuters. OC is the stock of organisation capital scaled by total assets. The stock of organisation capital is measured by accumulating the deflated value of SG&A expenses, consistent with Eisfeldt & Papanikolaou (2013). FD is measured using the FD classification used by prior studies (for example, Giroux & Wiggins, 1984; Habib et al., 2013; Hopwood et al., 1994; McKeown et al., 1991; Rosner, 2003; Ward, 1994). FD is defined as a dummy variable, taking the value 1 if the firm is financially distressed, and 0 otherwise. SIZE refers to firm size, measured as the natural logarithm of market value of equity. LEV is defined as long-term debts divided by total assets. ADJROA is measured as the income before extraordinary items, scaled by lagged total assets, for each year and two-digit SIC code, subtracted from the focal firm. RD refers to R&D intensity, measured as R&D expenses divided by net sales. PR represents physical resources, measured as total assets minus current assets, scaled by total assets. MB is the market to book ratio. The model includes a set of dummy variables to capture year and industry. Panel A: Direct effect
Variables (1) (2) OC (Equation 9)
EM (Equation 10)
CONSTANT 0.2551*** (0.0203)
0.1655*** (0.0533)
OC 0.7192*** (0.1051)
CSR 0.6877*** (0.0639)
-0.3759** (0.1737)
FD 0.2652*** (0.0274)
-0.0788 (0.0659)
OCXFD -0.4551*** (0.0617)
CSRXFD -0.4972*** (0.0514)
0.2401* (0.1316)
SIZE -0.0432*** (0.0035)
0.0194* (0.0103)
LEV -0.0681*** (0.0111)
ADJROA 0.0639*** (0.0149)
-0.1175*** (0.0241)
RD -0.0120*** (0.0029)
0.0258*** (0.0025)
PR -0.0458*** (0.0104)
MB 0.0026*** (0.0009)
Year effects Yes Yes Industry effects Yes Yes
1-stage F-stat 46.96 33.00 N 14,845 14,845
Adjusted R2 0.3872 -0.5385

247
Panel B: Indirect effect (bootstrap method)
(1) (2) (3)
EM Bootstrap std error
Bootstrap-based 95% confidence interval
Indirect effect: CSR -> OC -> EM
Distressed firms (FD = 1) 0.0503 0.0173 0.0205 0.0920
Non-distressed firms (FD = 0) 0.4946 0.1535 0.2435 0.8729
Difference -0.4443 0.1373 -0.7818 -0.2214
***, **, and * indicate statistical significance at the 1%, 5%, and 10% levels, respectively.
2SLS results of the moderating effect of FD on the direct CSR-EM relationship
Column (2) of Panel A presents the 2SLS estimation output of equation (10) that tests the direct
relationships of EM with CSR, and the moderating effect of FD. The direct effect is CSR on EM is
negative at the 5% level of significance (2 = -0.3759; p<0.05). The direct effect of FD on EM is not
statistically significant. However, the direct effect of CSRxFD (that is, the interaction effect of CSR
and FD) on EM is a weak positive (4 = 0.2401; p<0.10), at the 10% level of significance. Although
the SEM results do not find a statistically significant moderating effect of FD on the direct
relationship between CSR and EM, the 2SLS estimation results suggest that FD has a weak
moderating (strengthening) effect on the direct relationship between CSR and EM.
2SLS results of first stage moderation
Column (1) of Panel A portrays the 2SLS estimation output of equation (9), that is, the relationship
of OC with CSR, FD, the interaction of CSR and FD, and the control variables. The 2SLS results
regarding the first stage moderation are consistent to the ML estimation results. The results show
a positive relationship between CSR and OC at the 1% level of significance (1 = 0.6877; p<0.01). FD
also has a positive relationship with OC at the 1% level of significance (2 = 0.2652; p<0.01). The
interaction effect of CSR and FD (CSRxFD) on OC is negative at the 1% level of significance (3 = -
0.4972; p<0.01). The control variables SIZE (4 = -0.0432; p<0.01), LEV (5 = -0.0681; p<0.01), RD (7
= -0.0121; p<0.01) and PR (8 = -0.0458; p<0.01) have negative associations with OC, while ADJROA
(6 = 0.0639; p<0.01) has a positive association with OC at the 1% level of significance.
2SLS Results of second stage moderation
Column (2) of Panel A presents the 2SLS estimation output of equation (10) that also tests the
moderating effect of FD on the relationship between OC and EM, besides testing the direct CSR-EM
relationship, discussed above. The 2SLS results regarding the second stage moderation are mostly

248
consistent with the SEM estimation results. The results indicate a positive relationship between OC
and EM at the 1% level of significance (1 = 0.7192; p<0.01). The interaction of OC and FD (that is,
OCxFD) has a negative effect on EM at the 1% level of significance (4 = -0.4551; p<0.01). The control
variables RD (9 = 0.0258; p<0.01) and MB (10 = 0.0026; p<0.01) are positively related to EM, while
ADJROA (8 = -0.1175; p<0.01) is negatively related to EM at the 1% level of significance. SIZE is
positively related to EM at the 10% level of significance (6 = 0.0194; p<0.10).
2SLS Results of moderated mediation
Panel B of Table 5.13 shows the result of the moderating effect of FD on the indirect relationship
between CSR and EM, via the mediator OC (that is, the moderated mediation effect). The 2SLS
results regarding the moderated mediation are mostly consistent with the SEM estimation results.
Consistent with the SEM estimation results, I report the 2SLS estimation result concerning the
indirect effect of CSR on EM via OC for distressed firms, non-distressed firms, and the difference in
the direct and indirect effects between distressed and non-distressed firms. The statistical
significance of the indirect effects is only based on the bootstrap estimation. The bootstrap
technique uses 5,000 replications. Column (1) shows the size of the indirect effect; Columns (2) and
(3) show the bootstrap standard error and the bias-corrected bootstrap-based 95% confidence
interval.
As shown in Panel B Column (1), the conditional indirect effect of CSR on EM via OC has a positive
coefficient (2’(distressed) = 0.0503). As discussed previously, following Process Model 59, the size of
the conditional indirect effect (2’(distressed)) is measured as (1 + 3FD) (1 + 4 FD). 1 (0.6877) and
3FD (-0.4972) are the coefficients of CSR and CSRxFD, respectively, from equation (9), while 1
(0.7192) and 4FD (-0.4551) are the coefficients of OC and OCxFD, respectively, from equation (10).
The p-value using the delta method shows that the indirect effect is statistically significant at the
5% level of significance. The lower and upper bound limits of the bias-corrected bootstrap-based
95% confidence interval reports being 0.0205 and 0.0920 respectively, suggests that the indirect
effect is statistically significant at least at the 5% (1 - 𝛼) level of significance (since zero does not fall
in between the lower and upper bounds of the confidence interval).
The conditional indirect effect of CSR on EM via OC for non-distressed firms is also positive (2’(non-
distressed) = 0.4946). Although the p-value, using the delta method, shows that the indirect effect for
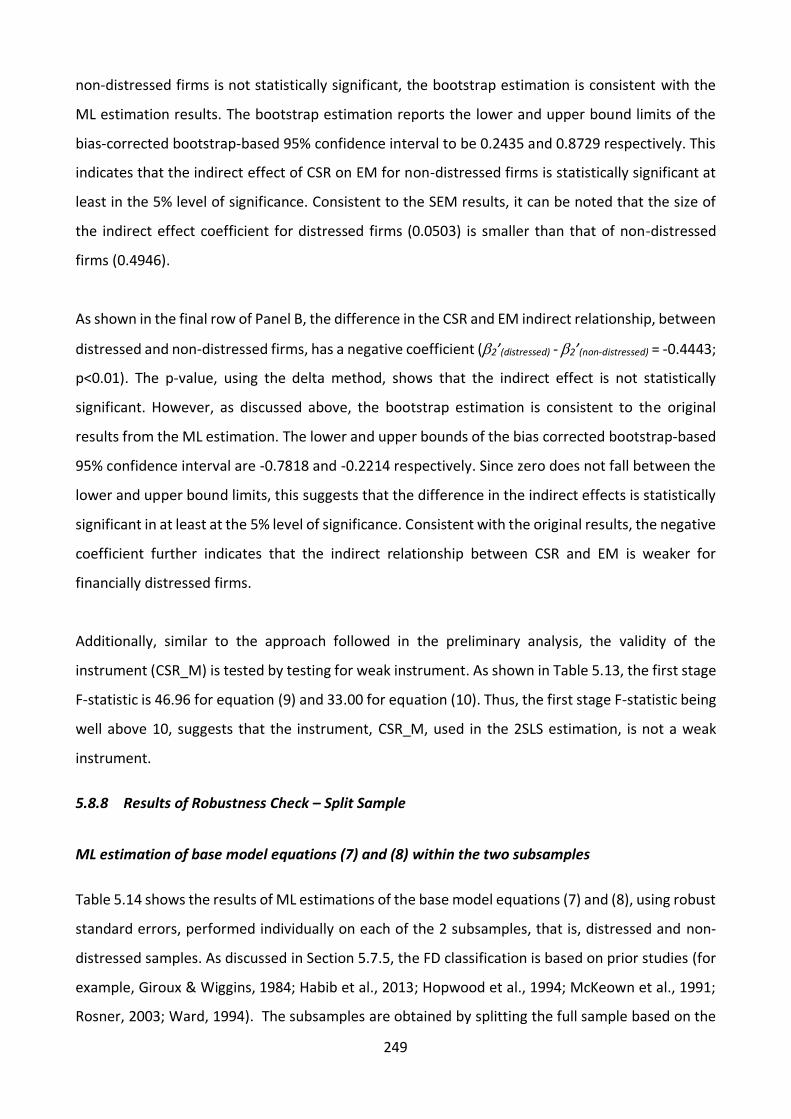
249
non-distressed firms is not statistically significant, the bootstrap estimation is consistent with the
ML estimation results. The bootstrap estimation reports the lower and upper bound limits of the
bias-corrected bootstrap-based 95% confidence interval to be 0.2435 and 0.8729 respectively. This
indicates that the indirect effect of CSR on EM for non-distressed firms is statistically significant at
least in the 5% level of significance. Consistent to the SEM results, it can be noted that the size of
the indirect effect coefficient for distressed firms (0.0503) is smaller than that of non-distressed
firms (0.4946).
As shown in the final row of Panel B, the difference in the CSR and EM indirect relationship, between
distressed and non-distressed firms, has a negative coefficient (2’(distressed) - 2’(non-distressed) = -0.4443;
p<0.01). The p-value, using the delta method, shows that the indirect effect is not statistically
significant. However, as discussed above, the bootstrap estimation is consistent to the original
results from the ML estimation. The lower and upper bounds of the bias corrected bootstrap-based
95% confidence interval are -0.7818 and -0.2214 respectively. Since zero does not fall between the
lower and upper bound limits, this suggests that the difference in the indirect effects is statistically
significant in at least at the 5% level of significance. Consistent with the original results, the negative
coefficient further indicates that the indirect relationship between CSR and EM is weaker for
financially distressed firms.
Additionally, similar to the approach followed in the preliminary analysis, the validity of the
instrument (CSR_M) is tested by testing for weak instrument. As shown in Table 5.13, the first stage
F-statistic is 46.96 for equation (9) and 33.00 for equation (10). Thus, the first stage F-statistic being
well above 10, suggests that the instrument, CSR_M, used in the 2SLS estimation, is not a weak
instrument.
5.8.8 Results of Robustness Check – Split Sample
ML estimation of base model equations (7) and (8) within the two subsamples
Table 5.14 shows the results of ML estimations of the base model equations (7) and (8), using robust
standard errors, performed individually on each of the 2 subsamples, that is, distressed and non-
distressed samples. As discussed in Section 5.7.5, the FD classification is based on prior studies (for
example, Giroux & Wiggins, 1984; Habib et al., 2013; Hopwood et al., 1994; McKeown et al., 1991;
Rosner, 2003; Ward, 1994). The subsamples are obtained by splitting the full sample based on the

250
FD classification. All firm-year observations classified as Financially distressed form the Distressed
sample, while all firm-year observations classified as healthy (or non-financially distressed) form the
Non-Distressed sample. The two subsamples have uneven number of observations with the
distressed sample having 14,199 firm-year observations (38.57% of the full sample), and the non-
distressed sample having 22,612 firm-year observations (61.43% of the full sample).

251
Table 5.14 ML Estimation Output for Equations (7) and (8) on Distressed and Non-distressed Samples
The table presents the ML estimation results of equations (7) and (8) performed on the 2 subsamples (distressed and non-distressed subsamples). Panel A Columns (1) and (2) present the direct effects by individually estimating equations (7) and (8) respectively, for the distressed subsample. Columns (3) and (4) present the direct effects by individually estimating equations (7) and (8) respectively, for the non-distressed subsample. Robust standard errors are presented in parenthesis. Panel B reports the joint results of OC as a channel between the CSR and EM relationship, shown for both distressed and non-distressed subsamples. The standard errors of the indirect relationship in Panel B, are estimated using the delta method and the bootstrapping technique with 1,000 replications. Panel B Column (1) reports the size of the indirect effect; Columns (2) and (3) show the delta method standard errors and p values respectively Columns (4) and (5) show the bootstrap standard error and the bias-corrected percentile bootstrap confidence interval respectively. EM refers to earnings management, proxied by discretionary accruals using the modified Jones model by Dechow et al. (1995). CSR is the ESG score obtained from Thomson Reuters. OC is the stock of organisation capital scaled by total assets. The stock of organisation capital is measured by accumulating the deflated value of SG&A expenses, consistent with Eisfeldt & Papanikolaou (2013). SIZE refers to firm size, measured as the natural logarithm of market value of equity. LEV is defined as long-term debts divided by total assets. ADJROA is measured as the income before extraordinary items, scaled by lagged total assets, for each year and two-digit SIC code, subtracted from the focal firm. RD refers to R&D intensity, measured as R&D expenses divided by net sales. PR represents physical resources, measured as total assets minus current assets, scaled by total assets. MB is the market to book ratio. The model includes a set of dummy variables to capture year and industry effects.
Panel A: Direct effect Variables
Distressed subsample Non-distressed subsample
(1) (2) (3) (4) OC (Equation 7)
EM (Equation 8)
OC (Equation 7)
EM (Equation 8)
CONSTANT
0.1782*** (0.0249)
0.2132*** (0.0495)
0.1520*** (0.0208)
0.1764*** (0.0300)
OC 1.0528*** (0.1988)
0.8097*** (0.1383)
CSR 0.0340** (0.0146)
-0.0597*** (0.0212)
0.1078*** (0.0102)
-0.1186*** (0.0190)
SIZE -0.0080*** (0.0018)
0.0035 (0.0033)
-0.0137*** (0.0014)
0.0097*** (0.0027)
LEV -0.0002 (0.0147)
-0.0424** (0.0196)
-0.0360*** (0.0116)
0.0494*** (0.0146)
ADJROA 0.0419** (0.0185)
-0.1658*** (0.0244)
0.0189 (0.0197)
0.0635*** (0.0216)
RD -0.0112*** (0.0030)
0.0236*** (0.0043)
0.1586*** (0.0258)
-0.0109 (0.0361)
PR -0.0941*** (0.0141)
-0.0786*** (0.0103)
MB 0.0006* (0.0003)
0.0000 (0.0003)
Year effects Yes Yes Yes Yes
Industry effects Yes Yes Yes Yes
Var matrix
OC 0.0222 -0.0243*** 0.0202 -0.0170***
EM 0.0389 0 .0222
N 5,129 5,129 9,716 9,716
Adjusted R2 0.4533 -1.1813 0.5582 -1.3745

252
Table 5.14 Panel A Columns (1) and (2) show the results of equations (7) and (8) respectively on the
distressed subsample, while Columns (3) and (4) show the results of equations (7) and (8)
respectively on the distressed subsample, testing the relationship between OC and EM, and the
direct relationship between CSR and EM, individually on the distressed and non-distressed
subsamples respectively.
Column (1) of Panel A portrays the estimation output of equation (7) on the distressed subsample,
testing the relationship of OC with CSR and the control variables. The results show a positive
relationship between CSR and OC at the 5% level of significance (1 = 0.0340; p<0.05). the control
variables SIZE (2 = -0.0080; p<0.01), RD (5 = -0.0112; p<0.01) and PR (6 = -0.0941; p<0.01) have
negative relationships with OC at the 1% level of significance, while ADJROA is positively related to
OC at the 5% level of significance (4 = 0.0419; p<0.05). However, LEV (3 = -0.0002) does not have
a statistically significant association with OC in the distressed subsample.
Column (2) of Panel A presents the estimation output of equation (8) on the distressed subsample,
testing the direct relationships of EM with CSR, OC and the control variables. The results indicate a
positive relationship between OC and EM at the 1% level of significance (1 = 1.0528; p<0.01). The
direct effects result also shows that CSR has a negative direct influence on EM at the 1% level of
significance (2 = -0.0597; p<0.01). The control variables LEV (4 = -0.0424; p<0.05) and ADJROA (5
= -0.1658; p<0.01) are negatively related to EM at the 5% and 1% level of significance respectively.
RD (6 = 0.0236; p<0.01) and MB (7 = 0.0006; p<0.10) are positively related to EM at the 1% and
10% level of significance respectively. However, SIZE (3 = 0.0035) does not have a statistically
significant association with EM in the distressed subsample.
Panel B: Indirect effect
Variables (1) (2) (3) (4) (5)
EM Delta method Std error
Delta method p-value
Bootstrap Std error
Bootstrap-based 95% confidence interval
CSR (distressed subsample) 0.0358 0.0173 0.0390 0.0235 (-0.1058, -0.0135)
CSR (non-distressed subsample)
0.0873 0.0175 0.0000 0.0210 (-0.1598, -0.0774)
***, **, and * indicate statistical significance at the 1%, 5%, and 10% levels, respectively.

253
Column (3) of Panel A portrays the estimation output of equation (7), testing the relationship of OC
with CSR and the control variables, on the non-distressed subsample. The results show a positive
relationship between CSR and OC at the 1% level of significance (1 = 0.1078; p<0.01). The control
variables SIZE (2 = -0.0137; p<0.01), LEV (3 = -0.0360; p<0.01) and PR (6 = -0.0786; p<0.01) have
negative associations with OC at the 1% level of significance, while RD (5 = 0.1586; p<0.01) is
positively related to OC at the 1% level of significance. However, ADJROA (4 = 0.0189) does not
have a statistically significant association with OC in the non-distressed subsample.
Column (4) of Panel A presents the estimation output of equation (8), testing the direct relationships
of EM with CSR, OC and the control variables, on the non-distressed subsample. The results indicate
a positive relationship between OC and EM at the 1% level of significance (1 = 0.8097; p<0.01). The
direct effects result also shows that CSR has a negative direct influence on EM at the 1% level of
significance (2 = -0.1186; p<0.01). The control variables SIZE (3 = 0.0097; p<0.01), LEV (4 = 0.0494;
p<0.01) and ADJROA (5 = 0.0635; p<0.01) are positively related to EM at the 1% level of significance.
However, RD (6 = -0.0109) and MB (7 = 0.0000) do not have a statistically significant relationships
with EM in the non-distressed subsample.
Panel B of Table 5.14shows the indirect effect of CSR on EM via OC as a mediating channel. Column
(1) shows the size of the indirect effect for each subsample, calculated as the product of 1 and 1,
that is, the coefficients of CSR from equation (7) and of OC from equation (8) respectively. As
discussed previously, the statistical significance of the indirect effect is determined using 1) the delta
method, and 2) the bootstrapping technique. Panel B Columns (2) and (3) show the standard error
and p-values for the indirect effect, using the delta method, while Columns (4) and (5) present the
standard error and the 95% confidence interval using the bootstrap technique with 1,000
replications.
Panel B first reports the indirect effects result within the distressed subsample. As shown in Column
(1), the size of the indirect effect, within the distressed subsample, is 0.0358, calculated as the
product of 1 (0.0340) and 1 (1.0528) from equations (7) and (8) respectively. Based on the delta
method p-value, the result suggests a positive indirect relationship between CSR and EM, via the
mediator OC, at the 5% level of significance (p < 0.05) in the distressed subsample. The results using
the bootstrap technique also confirm this positive indirect relationship. The bootstrap-based 95%

254
confidence interval reports the lower and upper bound limits to -0.1058 and -0.0135 respectively.
Since zero does not fall between the lower and upper bound limits of the confidence interval, this
suggests that the indirect effect is statistically significant at least in the 5% (1 - 𝛼) level of
significance.
In regard to the results concerning the non-distressed subsample, Panel B Column (1) shows the size
of the indirect effect to be 0.0873 (that is, the product of 1 = 0.1078 and 1 = 0.8097 from equations
(7) and (8) respectively). Based on the delta method p-value, the result suggests a strong positive
indirect relationship between CSR and EM, via the mediator OC, at the 1% level of significance (p <
0.01) in the non-distressed subsample. The lower and upper bound limits of the bootstrap-based
95% confidence interval, being -0.1598 and -0.0774 respectively, also confirm that the indirect
effect is statistically significant in at least the 5% level of significance.
Figure 5.7 below is a snapshot of the results concerning the two subsamples – Distressed sample
and Non-distressed sample in Panels A and B respectively. As shown in Panel A, within the Distressed
sample, the size of the direct effect of CSR on EM is -0.0597, while the size of the indirect effect of
CSR on EM via the mediator OC is 0.0358. Thus, the size of the total effect of CSR on EM, calculated
as the sum of the direct and indirect effects, is -0.0239 (i.e., -0.0597 + 0.0358). As shown in Panel B,
within the Non-distressed sample, the size of the direct effect of CSR on EM is -0.1186, while the
size of the indirect effect of CSR on EM via the mediator OC is 0.0873. Thus, the size of the total
effect of CSR on EM, calculated as the sum of the direct and indirect effects, is -0.0313 (i.e., -0.1186
+ 0.0873).

255
Figure 5.7 OC as Mediator in the CSR and EM Relationship in the Distressed Versus Non-Distressed Sample
Note:
In Panel A, the coefficient 0.0340 represents the size of the effect of CSR on OC (path a) in the distressed sample; the coefficient 1.0528 represents the size of the effect of OC on EM (path b) in the distressed sample; the coefficient 0.0358 represents the size of the indirect effect of CSR on EM via the mediator OC (path c’) in the distressed sample; the coefficient -0.0597 represents the size of the direct effect of CSR on EM (path c) in the distressed sample.
In Panel B, the coefficient 0.1078 represents the size of the effect of CSR on OC (path a) in the non-distressed sample; the coefficient 0.8097 represents the size of the effect of OC on EM (path b) in the non-distressed sample; the coefficient 0.0873 represents the size of the indirect effect of CSR on EM via the mediator OC (path c’) in the non-distressed sample; the coefficient -0.1186 represents the size of the direct effect of CSR on EM (path c) in the non-distressed sample.
*** indicate statistical significance at the 1% level.
The preceding paragraphs report the results in each of the two subsamples individually, that is,
Distressed and Non-distressed samples. Table 5.15 below shows the results of the differences
between the effect sizes within the two subsamples. The table focusses on the difference in the
effect sizes for the key relationships, that is:
1) the effect of CSR on OC from equation (7) - to test for first stage moderation;
2) the effect of OC on EM from equation (8) - to test for second stage moderation;
3) the direct effect of CSR on EM from equation (9); and
4) the indirect effect of CSR on EM via OC from equations (7) and (8) - to test for moderated
mediation.
The difference in each of the effect sizes is measured as the difference between each of the
regression coefficients between the Distressed and Non-distressed samples. The statistical
significance of the differences in the coefficients are reported using 1) the delta method, and 2) the
Bootstrap technique with the standard 1,000 replications.

256
Table 5.15 Difference Effect Sizes between Distressed and Non-Distressed Samples from ML Estimation of Equations (7) and (8)
The table presents the comparison of ML estimation results of equations (7) and (8) performed on the 2 subsamples (distressed and non-distressed subsamples). Column (1) presents the difference in the regression coefficients, between the two subsamples, from estimating equations (7) and (8). The standard errors for the difference in the effect sizes are estimated using the delta method and the bootstrapping technique with 1,000 replications. Columns (2) and (3) show the delta method standard errors and p values respectively. Columns (4) and (5) show the bootstrap standard error and the bias-corrected percentile bootstrap confidence interval respectively. EM refers to earnings management, proxied by discretionary accruals using the modified Jones model by Dechow et al. (1995). CSR is the ESG score obtained from Thomson Reuters. OC is the stock of organisation capital scaled by total assets. The stock of organisation capital is measured by accumulating the deflated value of SG&A expenses, consistent with Eisfeldt & Papanikolaou (2013).
Variables
(1) (2) (3) (4) (5)
EM Delta
method Std error
Delta method p-value
Bootstrap Std error
Bootstrap-based 95% confidence
interval CSR -> EM (direct effect) 0.0589 0.0284 0.0380 0.0326 (-0.0004, 0.1240) CSR -> OC (equation 7) -0.0738 0.0178 0.0000 0.0180 (-0.1100, -0.0412) OC -> EM (equation 8) 0.2431 0.2421 0.3150 0.3175 (-0.3075, 0.9526) CSR -> OC -> EM (indirect effect) -0.0515 0.0246 0.0370 0.0277 (-0.1022, 0.0058)
Overall, the results from the robustness check, using the two subsamples, are mostly consistent to
the original results. The direct relationship between CSR and EM (as shown earlier in Table 5.14) is
negative and significant in both the Distressed (2(distressed) = -0.0597; p<0.01) and Non-Distressed
(2(non-distressed) = -0.1186; p<0.01) subsamples. The difference in the effect size, shown in Table 5.15,
calculated as 2(distressed) - 2(non-distressed) (that is, -0.0597 – (-0.1186)), is 0.0589 (p<0.05) at the 5% level
if significance, based on the delta method. However, the bias-corrected bootstrap-based 95%
confidence interval has zero in between the lower (-0.0004) and upper (0.1240) bound limits,
suggesting that the difference in the size of the direct effect CSR on EM is not statistically significant.
Overall, the results suggest a weak moderating (strengthening) effect on the direct relationship
between CSR and EM, based on the delta method p-value.
The relationship between CSR and OC (as shown earlier in Table 5.14) is positive and significant in
both the distressed (1(distressed) = 0.0340; p<0.05) and non-distressed (1(non-distressed) = 0.1078;
p<0.01) subsamples. The difference in the effect size, shown in Table 5.15, calculated as 1(distressed)
- 1(non-distressed) (that is, 0.0340 - 0.1078), is -0.0738 (p<0.01) at the 1% level if significance, based on
the delta method. The lower and upper bound limits of the bias-corrected bootstrap-based 95%
confidence interval are -0.1100 and -0.0412 respectively. Since zero does not fall in between the
lower and upper bounds of the confidence interval, this suggest that the difference in the effect size

257
of CSR on OC is statistically significant in at least the 5% level of significance. The negative and
significant coefficient on the difference in the effect size of CSR on OC suggests that the relationship
between CSR and OC is weaker within financially distressed firms. This is consistent to the original
findings, suggesting that FD has a moderating (weakening) effect on the relationship between CSR
and OC.
The relationship between OC and EM (as shown earlier in Table 5.14) are positive and significant in
both the distressed (1(distressed) = 1.0528; p<0.01) and non-distressed (1(non-distressed) = 0.8097; p<0.01)
subsamples. The difference in the effect size is 0.2431, shown in Table 5.15, and calculated as
(1(distressed) - 1(non-distressed) (that is, 1.0528 - 0.8097). However, the difference in the effect size of OC
on EM is not statistically significant, as evident by the delta method p-value being greater than 0.10,
and the bias corrected bootstrap-based 95% confidence interval having 0 in between the lower (-
0.3075) and upper (0.9526) bound limits. Thus, the result does not suggest a moderating effect of
FD on the relationship between OC and EM.
The indirect effects result shows that CSR has a positive and significant indirect effect on EM via OC
(as shown earlier in Table 5.14) in both the Distressed (11(distressed) = 0.0358; p < 0.05) and the Non-
Distressed (11(non-distressed) = 0.0873; p < 0.01) subsamples. Table 5.15 shows that the difference in
the effect size is -0.0515 (p<0.05), calculated as 11(distressed) - 11(non-distressed) (that is, 0.0358 –
0.0873), at the 5% level if significance, based on the delta method. However, the bias-corrected
bootstrap-based 95% confidence interval has zero in between the lower (-0.1022) and upper
(0.0058) bound limits, suggesting that the difference in the size of the indirect effect CSR on EM via
OC is not statistically significant. Consistent to the original results, the split sample robustness
checks also suggest a moderating (weakening) effect on the indirect relationship between CSR and
EM via OC, at least based on the delta method p-value.
As a further test of robustness and endogeneity, I re-estimate equations (7) and (8) on each of the
two subsamples, using GMM technique, following Lewbel (2012) approach. The results are largely
consistent the original findings. In particular, the results suggest that FD does not change the direct
effect of CSR on EM, but weakens the indirect effect of CSR on EM via OC. The results also suggest
that FD weakens the positive relationship between CSR and OC (first stage moderation) and FD also
weakens the positive relationship between OC and EM (second stage moderation). The results are
reported in full in Appendix 2A.

258
5.9 Discussion of Findings
The relationship between CSR and EM has been a topic of interest among academic researchers for
some time now. However, there is no consensus in the literature on whether CSR has a role in
constraining EM or in escalating EM. In Chapter 4, I have already established a negative direct
relationship between CSR and EM. Consistent with the myopia avoidance hypothesis, the negative
direct relationship suggests that managers in high CSR firms are less likely to manage earnings, as
they may tend to avoid myopic behaviour targeted towards achieving short-term goals only. The
results reported in Chapter 4 have also established a positive indirect relationship between CSR and
EM via OC, suggesting that high CSR firms have higher OC, which in turn leads to more EM
engagement. Managers in high CSR firms are more likely to manage earnings by using their superior
skills, abilities and better organisational processes (that is, high OC). Consistent with the managerial
myopia hypothesis, the result suggests that while CSR creates incentives and opportunities for EM,
high OC may create additional incentives and opportunities for managers to engage in EM for short-
term goals. The incentives may arise as managers in firms with high OC may be concerned about
their reputations being at stake if they fail to meet stakeholder expectations, such as, earnings
targets. Furthermore, the opportunities may arise as managers in firms with high OC may have
superior abilities and techniques to manage earnings for self-fulfilling motives. The present study
explores these direct and indirect relationships between CSR and EM via OC, by examining how
these relationships stand when the firms’ circumstances change. To the best of my knowledge, this
is the first study to examine the moderated effect of a firm-level event on the indirect relationship
between CSR and EM. In this Chapter, I address the second research objective, which is to
investigate when CSR has a direct effect on EM, and when CSR has an indirect effect on EM via OC,
by examining the context FD.
I address research objective 2, by answering the following two research questions:
Research Question 2.1: Does FD have a significant effect on the direct CSR-EM relationship?
Research Question 2.2: Does FD have a significant effect on the indirect CSR-EM relationship via OC?
Using a sample of 36,811 firm-year observations, the results support most of the hypotheses tested
to address the research questions stated in Section 5.1. In regard to the first research question, the
study does not find a statistically significant moderating effect of FD on the direct relationship
between CSR and EM. However, in regard to the second research question, the study finds that FD

259
weakens the indirect relationship between CSR and EM via OC. In addressing the second research
question, I also examine how FD affects each of the indirect paths in the CSR-EM relationship – the
first path examines the moderating effect of FD on the relationship between CSR and OC; the second
path examines the moderating effect of FD on the relationship between OC and EM. The remainder
of this section discusses these results. Table 5.16 (an extension of Table 5.4 presented earlier) shows
a summary of the results.

260
Table 5.16 Summary of Research Questions, Hypotheses and Results
Research Question Hypothesis Theory Expected sign Results Conclusion
2.1. Does FD moderate the direct relationship between CSR and EM?
H2.1: Consistent with the managerial myopia hypothesis, there is a positive and significant relationship between FD and EM.
Managerial myopia hypothesis = + (quation (0))
No significant relationship between FD and EM FD does not
moderate the direct relationship between CSR and EM
H2.2: FD has a significant moderating effect on the direct relationship between CSR and EM.
Myopia avoidance hypothesis (stronger) = − (quation (0)) No significant moderating effect of
FD on the direct relationship between CSR and EM Myopia avoidance
hypothesis (weaker) = + (quation (0))
2.2. Does FD have a significant effect on the indirect CSR-EM relationship via OC?
H2.3a: Consistent with the RBV theory, there is a positive and significant relationship between FD and OC.
Slack resource theory = − (quation (9)) Consistent with RBV theory, FD has a positive and significant effect on OC ( = +)
FD moderates (weakens) the relationship between CSR and OC
H2.3b: Consistent with the resource-based view (RBV) theory, there is a positive and significant relationship between FD and OC.
RBV theory = + (quation (9))
H2.4: FD has a significant moderating effect on the relationship between CSR and OC.
Slack resource theory = − (quation (9)) Consistent with the slack resource theory, FD has a significant moderating effect ( = -) on the relationship between CSR and OC
RBV theory = + (quation (9))
H2.5: FD has a significant moderating effect on the relationship between OC and EM.
Managerial myopia hypothesis = + (quation (0)) FD has a significant moderating
effect ( = −) on the relationship between OC and EM, suggesting weaker myopia
FD moderates (weakens) the relationship between OC and EM
Myopia avoidance hypothesis = − (quation (0))
H2.6: FD has a significant moderating effect on the indirect relationship between CSR and EM, via the mediator OC.
Managerial myopia hypothesis (stronger)
( + FD)(+ 4FD) = + (quations (9) and (10))
FD has a moderating effect (( + FD)(+ FD) = -) on the indirect relationship between CSR and EM via OC, suggesting weaker myopia
FD moderates (weakens) the indirect relationship between CSR and EM via OC.
Managerial myopia hypothesis (weaker)
( + FD)(+ 4FD) = − (quations (9) and (10))

261
As shown in Table 5.16, in response to research question 2.1, the results the results suggest that FD
does not moderate the direct relationship between CSR and EM. This suggests that regardless of
whether the firm is financially distressed or not, CSR has a negative direct effect on EM, consistent
with the managerial myopia hypothesis. The result suggests that managers in firms with high CSR
will continue to avoid myopic behaviour, specifically EM, irrespective of FD. This may be because
managers engaged in CSR are driven by their genuine concern to maintain relationships with
stakeholders (relationship-driven myopia avoidance), and/ or their ethical and moral values (value-
driven myopia avoidance). Thus, genuine involvement in CSR may constrain the opportunistic
behaviour that FD typically creates, as suggested in the literature.
In contrast to the direct relationship, I find a totally different result when examining the effect of FD
on the indirect relationship between CSR and EM via OC. When there is no FD, there is a positive
indirect relationship between CSR and EM via OC. Consistent with the managerial myopia
hypothesis, this result suggests that managers in firms with high CSR may manage more earnings
for short-term gains, such as meeting stakeholder expectations by meeting earnings targets. They
may take advantage of the greater opportunities from their firm’s high OC (that is, better processes
and techniques, higher knowledge, superior managerial quality practices, and greater ability) to
manage earnings using more sophisticated techniques and to cover up their opportunistic
behaviour more efficiently (opportunity-driven myopia). Furthermore, managers in firms with high
OC may experience pressures resulting from greater expectations from stakeholders. Failure to
meet such expectations may pose a threat to their reputation. Thus, to please stakeholders by
meeting targets, and to safeguard their reputation, they may exhibit myopic behaviour by engaging
in more EM as a short-term solution (incentive-driven myopia). However, this changes when firms
experience FD. FD is a situation when firms may struggle to meet their financial obligations. This
may have significant impacts on the managers, often putting their employment at stake (for
example, see Charitou et al., 2011), causing managers to re-evaluate their priorities and change
their behaviour. The results suggest that when firms experience FD, the positive indirect relationship
between CSR and EM via OC becomes weaker. Since FD has a moderating effect only on the indirect
relationship (via OC) but not the direct relationship between CSR and EM, this suggests that OC has
an important role in changing managerial behaviour during FD. In general, it can be expected that
during FD, firms adopt a short-term perspective, often resulting in more opportunistic behaviour by
managers. However, my results suggest that in firms with high OC, during FD, managers may make
use of their high OC (that is, better processes, superior managerial quality practices, knowledge,

262
etc.) to focus more on the firm’s recovery. They are less likely to engage in short-term opportunistic
behaviour, that is, their myopic behaviour becomes weaker. Such a change in managerial behaviour
is explained in the following paragraphs.
First, when experiencing FD, managerial priorities may shift from safeguarding their reputation to
safeguarding their employment. In general, managers in firms with high OC, may use CSR to
opportunistically manage earnings to safeguard their reputations by meeting stakeholders’
expectations and earnings targets. However, during FD, managers’ jobs may be at stake. Thus, their
priorities may shift, as they are more likely to focus on actions that may save their jobs. OC plays an
important role here. In firms with high OC, managers are expected to have better understanding of
the consequences of managing earnings, particularly during FD. Thus, they become more cautious
about opportunistic actions that may pose further risks to their jobs. Managing earnings may only
be a short-term solution that may put their jobs in further danger. Thus, they become less myopic
during FD and are less likely to use CSR opportunistically to manage earnings simply for short-term
gains.
Second, managers in financially distressed firms have limited funds and their expenditures will be
prioritised on saving the firm. Consistent with the slack resource theory, managers in financially
distressed firms are less likely to spend their limited funds on activities or investments where the
returns may not be immediate, such as CSR initiatives (for example, see Brynjolfsson et al., 2002).
With limited funds available, managers in firms with high OC, specifically, are likely to be better able
to manage their limited funds more wisely, and thus refrain from spending more on CSR initiatives
with opportunistic motives. Rather, managers will spend on projects or strategies that are essential
to the firm’s recovery.
Third, some managers engaged in CSR initiatives may have genuine concerns about their firm’s
survival and their stakeholders. As the stakeholder theory suggests, managers may engage in CSR
because they care about maintaining their relationships with stakeholders. This perspective also
suggests that these managers will try to reduce agency costs by managing earnings less. Thus, during
FD, they may tap into the firm’s unique abilities, (that is, OC) to take actions that will aid in reviving
their firms from the distressed state.
Thus, in response to research question 2.2, I find that FD moderates (weakens) the indirect
relationship between CSR and EM via OC. When examining the effect of FD on the indirect
relationship between CSR and EM via OC, the present study also examines the effect of FD on each

263
of the indirect paths through which CSR affects OC and OC in turn affects EM. With regard to the
first indirect path, Chapter 4 has already established a positive relationship between CSR and OC. In
the present study, I find a positive relationship between FD and OC. Consistent with the RBV theory,
this result suggests that during FD, firms are more likely to enhance their knowledge-based assets
as a turnaround strategy to recover from the distressed state. In general, firms experiencing FD may
face challenges in retaining and attracting skilled employees, and experience high managerial
turnover (for example, see Baghai et al., 2020; Brickley, 2003). This does not necessarily mean that
OC will decline, because OC encompasses a broader range of intangible aspects such as, knowledge,
managerial quality practices, organisational processes and culture (for example, see Attig & Cleary,
2014, 2015; Bloom et al., 2010; Bloom & Van Reenen, 2007; Carlin et al., 2012). When firms are in
a distressed state, high OC may give them the ability to turn around. Dreyer & Grønhaug (2004)
suggest that improving knowledge resources during uncertain times may provide distressed firms
with competitive advantage, as knowledge resources are unique, firm-specific, and inimitable by
competitors. OC is considered to be a firm-specific intangible resource that becomes embedded,
through time, within the organisational structure, and is not transferred or imitated, even as
managers leave the firm (Attig & Cleary, 2014; Carlin et al., 2012). Thus, during FD, firms may view
OC as an effective turnaround strategy.
The results from the main analysis suggest that FD weakens the positive relationship between CSR
and OC. This may be explained by the notion that financially distressed firms are less likely to engage
in CSR. The result is consistent with the slack resource theory that posits that less profitable firms
have fewer surplus (i.e. slack) resources to spend on CSR in comparison to more profitable firms
with greater slack resources (for example see Campbell, 2007; Chan et al., 2017). When firms
experience a crisis, such as FD, they may refrain from getting involved in new business models that
may take years to generate profits. During FD, as CSR decreases, it causes the positive relationship
between CSR and OC to weaken.
With regard to the second indirect path, Chapter 4 has already established that OC has a positive
and significant effect on EM. In this study, I find that FD weakens the positive relationship between
OC and EM. When firms are financially challenged, managers, in firms with high OC are less likely to
manage earnings. As discussed above, this indicates that managerial myopia behaviour weakens,
suggesting that managers in firms with high OC, may engage less in opportunistic short-term
behaviour, as their priorities and behaviour changes during FD.

264
Overall, in response to research objective 2, the results suggest that while FD does not have a
significant moderating effect on the direct relationship between CSR and EM, FD weakens the
indirect positive relationship between CSR and EM via OC. FD weakens the positive relationships
between CSR and OC, and between OC and EM. In particular, the results suggest that in general
situations, OC may act as an indirect channel via which managers may use their CSR initiatives to
engage more in EM. This is consistent with the managerial myopia hypothesis indicating that
managers may use CSR opportunistically to manage earnings for short-term gains. OC may act as an
enabler through which managers may manage earnings. However, this changes during FD. When
firms experience FD, managers’ behaviour and priorities may change. Managers in financially
distressed firms are less likely to resort to myopic behaviour and manage earnings for short-term
benefits. Thus, the indirect opportunistic use of CSR to manage more earnings via OC reduces during
FD, suggesting a weakening of managerial myopia. The effect of FD on the direct and indirect CSR-
EM relationships addresses the questions when CSR directly affects EM, and when CSR indirectly
affects EM via OC. In response to the first question (when CSR directly affects EM), the results
suggest that CSR has a direct negative effect on EM when firms are financially distressed and when
firms are non-distressed. This means that regardless of the level of FD, the negative direct CSR-EM
relationship holds. In response to the second question (when CSR indirectly affects EM via OC), the
results suggest that CSR has an indirect positive effect on EM via OC, when firms are non-distressed.
The results show that the positive indirect relationship between CSR and EM via OC, when firms are
financially distressed.
5.10 Chapter Summary
This study addresses research objective 2, by investigating when CSR has a direct effect on EM, and
when CSR has an indirect effect on EM via OC, by examining the context FD. This study uses a sample
of 36,811 firm-year observations from non-financial US firms for the period 2002-2017 inclusive.
The study finds that FD weakens the indirect relationship between CSR and EM via OC. This indicates
that managerial myopia weakens, suggesting that when firms experience FD, managers in firms with
high OC become more cautious and risk averse, and tend to avoid myopic or short-term behaviour
and focus more on recovery of the firm.
The results also suggest that FD affects the channels through which CSR indirectly effects EM.
Consistent with the RBV, the study finds that financially distressed firms tend to improve their OC

265
as a turnaround strategy to recover from their distressed state. However, consistent with the slack
resource theory, the findings suggest that the interaction of FD and CSR deteriorates OC. Consistent
with the myopia avoidance hypothesis, the findings suggest that FD weakens the positive
relationship between OC and EM.
The study uses a battery of additional analyses to address endogeneity, to test sensitivity of the
variables to alternate measures, and to check robustness of the findings. The results mostly remain
consistent.

266
CHAPTER 6 : EARNINGS MANAGEMENT AND CORPORATE SOCIAL RESPONSIBILITY: THE IMPACT OF COLLECTIVIST CULTURE, CORRUPTION
AND INVESTOR PROTECTION IN EMERGING MARKETS
6.1 Introduction to the Chapter
This chapter addresses the third and final research objective, that is, investigates when Corporate
Social Responsibility (CSR) affects Earnings Management (EM), by examining the contexts
collectivism (COLL) culture, corruption pervasiveness (CORR) and investor protection (INVPRO) in
emerging market countries. Research objective 3 is addressed by answering the following three
research questions:
Research Question 3.1: Does CSR have a significant effect on EM in emerging market countries?
Research Question 3.2: Do COLL and CORR, individually and jointly, have significant effects on the
CSR-EM relationship in emerging market countries?
Research Question 3.3: Do COLL and INVPRO, individually and jointly, have significant effects on the
CSR-EM relationship in emerging market countries?
This chapter is organised as follows: Sections 6.2 and 6.3 discuss the background and justification
for, and contribution of this study respectively. Section 6.4 presents the theoretical background,
followed the literature review, leading to the development of the hypotheses on the effects of COLL,
CORR and INVPRO on relationship between CSR and EM in Section 6.5. Section 6.6 presents the
conceptual framework for the study, and Section 6.7 discusses the data and research methodology
adopted for this study. The results and findings are reported in Sections 6.8, and discussed in Section
6.9. The chapter ends with a chapter summary in Section 6.10.
6.2 Background and Justification
6.2.1 Background of the Study
The present study examines the CSR-EM relationship in emerging market countries. The term
‘emerging market’ does not have an official definition (Duttagupta & Pazarbasioglu, 2021). The term
was coined by Antoine van Agtmael in the 1980s when the International Finance Corporation (IFC),
of World Bank, started focusing investment-returns for stock markets of developing countries,

267
including Argentina, Brazil, Chile, Greece, India, Jordan, Korea, Mexico, Thailand, and Zimbabwe
International Finance Corporation (2021). Originally, developing countries were referred to as ‘third
world’ countries. The term ‘third world’ implied poverty and substandard production. Antoine van
Agtmael reframed this view, suggesting that ‘emerging markets’ “suggested progress, uplift, and
dynamism” (International Finance Corporation, 2021). It reframed the picture, in time becoming the
universal term used in the financial world to describe investment in developing economies. Prior to
the 1980s, foreign investment in developing countries was very limited. The IFC analysis, in mid
1980s, showed quite attractive results, recommending increased foreign investments in developing
countries. Today, investors, globally, are spending billions into stocks and bonds from emerging
market countries (International Finance Corporation, 2021). Forbes (2008) defines emerging market
countries as societies that are “transitioning from a dictatorship to a free market-oriented economy,
with increasing economic freedom, gradual integration within the global marketplace, an expanding
middle class, improving standards of living and social stability and tolerance, as well as an increase
in cooperation with multilateral institution”. Morgan Stanley Capital International (MSCI) posits that
the biggest contributor behind today’s global economic and financial market state is the increasing
economic and technological growth of emerging markets (MSCI, 2021b). In 1988, MSCI introduced
the MSCI Emerging Markets index that included 10 countries. The list of countries have dynamically
changed over the years as MSCI added and removed countries based on their economic
development, size and liquidity, and market accessibility (MSCI, 2021b). Currently, the MSCI
Emerging Markets index includes 27 countries, namely, Argentina, Brazil, Chile, China, Colombia,
Czech Republic, Egypt, Greece, Hungary, India, Indonesia, Korea, Kuwait, Malaysia, Mexico,
Pakistan, Peru, Philippines, Poland, Qatar, Russia, Saudi Arabia, South Africa, Taiwan, Thailand,
Turkey and United Arab Emirates (MSCI, 2021b). The present study follows the MSCI Emerging
Market index in selecting the emerging market countries. Based on data availability, as discussed
later in Section 6.7, the present study includes 10 emerging market countries, namely, Brazil, China,
India, Indonesia, Korea (South), Malaysia, Russia, South Africa, Taiwan and Thailand.
In Chapter 1, I have discussed that EM from an agency theory perspective. EM is an agency cost that
often arises due to the conflict of interest that results from the separation of ownership (by external
shareholders) and control (by managers) of organisations (Desender et al., 2011; Jensen & Meckling,
1976). In emerging market countries, this model of conflict is slightly improvised by the prevalence
of concentrated ownership structures. Ownership concentration, a very common phenomenon in
emerging market countries (for example, see Haw et al., 2011; La Porta et al., 1999), exists when a

268
firm has refers to the concentration of equity holdings and control by some major shareholders or
block holders (Bouvatier et al., 2014; Gopalan & Jayaraman, 2012). Concentrated ownership gives
rise to divergence between control and cash flow rights of the controlling shareholders, where the
controlling shareholders’ control (i.e. voting) rights often exceed cash flow rights (Haw et al., 2011;
La Porta et al., 1999; Shleifer & Vishny, 1997). Thus, in emerging market countries, conflicts of
interest exist between controlling shareholders and minority shareholders (Lyu et al., 2016). Due to
their excess control rights, controlling shareholders may have greater control over managers, and
use this power to extract private benefits of control, that may adversely affect minority shareholders
(Bao & Lewellyn, 2017; Haw et al., 2004; Jiraporn et al., 2008; La Porta et al., 1999; Shleifer & Vishny,
1997). Controlling shareholders and managers have incentives to conceal their private control
benefits because if these are detected, it may result in negative consequences, such as, external
intervention, regulation, legal costs, and a loss of reputation (Haw et al., 2004). Thus, in emerging
market countries, managers and controlling shareholders may manage more earnings to conceal
their private control benefits from minority shareholders (Haw et al., 2004). Since the present study
is based on a sample from emerging market countries, the issue of ownership concentration is useful
in understanding managerial behaviour and motives. Accordingly, the present study refers to
corporate insiders as managers, employees and controlling shareholders.
6.2.2 Justification of the Study
The literature suggests that firms in emerging markets are more susceptible to EM than firms in
developed countries (for example, see Bao & Lewellyn, 2017; Li et al., 2014; Li et al., 2011). Emerging
markets are characterised as markets with high potential for economic growth (Kaymak & Bektas,
2015). However, due to the instability of policymaking in these markets, emerging market countries
experience social, economic, political and demographic challenges (Kaymak & Bektas, 2015), and
are considered to be extremely volatile (Aguiar & Gopinath, 2007). Prior studies suggest that the
unique characteristics of emerging market countries make EM more prevalent in these countries. In
this section I discuss three characteristics that differentiate emerging markets and developed
markets, to illustrate the likelihood of EM in these countries – 1) COLL, 2) CORR, and 3) INVPRO. All
these characteristics are expected to affect the level of EM, as discussed below.
First, to understand the role of the unique social and demographic challenges in emerging markets,

269
I examine the effect of COLL28 culture on the CSR-EM relationship. Emerging market countries and
developed market countries are known to have disparate national cultures. COLL culture represents
societies where family-like bonds and group interests are valued more than individual interests
(Hofstede & Hofstede, 2005). The concept of COLL is rooted in the individualism (IDV) – collectivism
(COLL) dimension of culture introduced by Hofstede (1980). IDV societies are defined as societies
with loose social ties, where individuals look after themselves and their immediate families, and
where individual rights and equity are prioritised (Desender et al., 2011; Hofstede, 1980; Viana Jr et
al., 2021). In contrast, COLL societies are defined as societies with strong and cohesive social ties,
where in-group loyalty is prioritised (Hofstede & Hofstede, 2005; Viana Jr et al., 2021). Prior studies
suggest that EM is more widespread in countries with COLL cultures and less widespread in IDV
cultures (for example, see Callen et al., 2011; Doupnik, 2008; Nabar & Boonlert-U-Thai, 2007; Zhang
et al., 2013). In COLL countries, there may be more collusion among corporate insiders as collective
welfare and goals are prioritised (Lyu et al., 2016; Zhang et al., 2013). This gives managers more
opportunities to manage earning with lower risks of whistleblowing by other employees (Zhang et
al., 2013). Given this notion that EM engagement varies between the COLL and IDV cultures, I note
the IDV-COLL nature of cultures within emerging market and developed market countries. The
average COLL score, based on the inverse measure of the IDV scores from Hofstede Insights (2021)
is 69.5 for emerging market countries,29 and only 9 for USA, suggesting that developed countries
generally have more IDV (that is, low COLL) culture in contrast to emerging market countries. Figure
6.1 shows the COLL scores for the 10 emerging market countries versus USA.
28 As discussed in the preceding section, firms in emerging markets have higher ownership concentration, that creates more EM incentives. The literature suggests that this issue is further escalated in countries characterised by COLL culture. This is because in COLL societies, managers and controlling shareholders may collude to extract private benefits of control, while managing earnings to hide their private control benefits by masking the true firm performance from outside stakeholders (Lyu et al., 2016; Viana Jr et al., 2021; Zhang et al., 2013). I posit that it is more important to examine the CSR-EM issue in a context where opportunistic managerial behaviour is likely to be more prevalent. Owing to the notion that EM incentives created by ownership concentration may become more prominent in COLL societies, the present study focuses on the COLL dimension of culture, instead of other cultural dimensions, such as PD, and long-term or Future orientation (FO). While the scope of the present study is to examine COLL cultural dimension only, future studies could examine the other cultural dimensions, as recommended in Chapter 7. 29 The average is based on the COLL score (inverse of the individualism score obtained from the (Hofstede Insights, 2021) index for the 10 emerging market countries: Brazil (62), China (80), India (52), Indonesia (86), Malaysia (74), Russia (61), South Africa (35), South Korea (82), Taiwan (83) and Thailand (80).

270
Figure 6.1 COLL Scores for Emerging Market Countries Versus USA (Data Obtained from Hofstede Insights, 2021)
As shown in Figure 6.1, most emerging market countries have COLL culture as the COLL scores are
well above 50. The only exceptions are South Africa, with a COLL score of 35, suggesting that South
Africa has an individualist culture, while India appears to have a moderate COLL with a score of 52.
Overall, while emerging market countries appear to have varying levels of COLL, these countries
have higher COLL than developed markets (specifically USA). This suggests that EM is likely to be
higher in emerging market countries in comparison to USA. While the literature suggests that EM is
higher in COLL culture, the effect of COLL on the CSR-EM literature has not gained attention in prior
studies. The present study fills this gap by examining the role of COLL on the CSR-EM relationship in
emerging market countries. This will address the question when CSR affects EM, in context of COLL
in emerging market countries. Although this section discusses the Hofstede’s IDV-COLL score to
illustrate differences in the COLL nature of culture between developed and emerging market
countries, the present study examines both Hofstede’s IDV-COLL cultural dimension and the
institutional COLL dimension from the GLOBE Study by House et al. (2004), as discussed in greater
details later in Section 6.7.4.
Second, to understand the role of the unique political challenges in emerging markets, I examine
the effect of CORR on the CSR-EM relationship. CORR is defined as “the misuse of entrusted power
0
10
20
30
40
50
60
70
80
90
100
Brazil
China India
Indonesia
Malaysi
aRussi
a
South
Africa
South
Korea
Taiwan
Thail
and
USA

271
for private benefit” (Errath et al., 2005, p. 2). Such misuse of power involves engaging in illegal, rent-
seeking activities and transfer payments, such as, bribery, paid to bureaucrats or business people
(Blackburn et al., 2006; Riahi-Belkaoui, 2004). Emerging markets are generally perceived to have
higher levels of CORR than developed market countries (for example, see Ernst & Young, 2016).
Prior studies have noted that EM is more widespread in countries with high CORR (for example, see
Lourenço et al., 2018; Riahi-Belkaoui, 2004; Riahi-Belkaoui & AlNajjar, 2006), as managers may
manage earnings to hide their corruptive actions (Riahi-Belkaoui, 2004). Given the notion that EM
engagement varies with the CORR pervasiveness, I further note differences in the level of CORR
pervasiveness between emerging and developed markets. The average CORR perception index
(obtained from Transparency International, 202130) is 44.4 on average for emerging market
countries,31 compared to a developed country (USA) at 67. The CORR perception index is an inverse
measure of the level of CORR pervasiveness within a country. So, the indices of emerging market
countries versus USA clearly show that CORR is more widespread in emerging market countries than
in developed countries. Figure 6.2 shows the CORR indices for the 10 emerging market countries
(Brazil, China, India, Indonesia, Malaysia, Russia, South Africa, South Korea, Taiwan and Thailand)
versus a developed market country (USA).
30 Transparency International, 2021 provides data on the CORR perception index for 180 countries. The index is based on a scale of 0 to 100, 0 representing highly corruption, while 100 representing no CORR (or very clean) (Transparency International, 2021). 31 The average is based on the 2020 CORR perception index for the ten emerging market countries – Brazil (38), China (42), India (40), Indonesia (37), Malaysia (51), Russia (30), South Africa (44), South Korea (61), Taiwan (65) and Thailand (36).

272
Figure 6.2 CORR Perception Indices for Emerging Market Countries Versus USA
As shown in Figure 6.2, USA has the highest CORR perception index (that is, lowest CORR
pervasiveness). The emerging market countries, in comparison, mostly have lower CORR perception
index (that is, higher CORR pervasiveness). However, scrutiny of the emerging market countries
individually reveals there are varying levels of CORR within emerging market countries. For example,
South Korea and Taiwan have very low CORR as the CORR perception indices for these two countries
are well above 50. Malaysia has moderate levels of CORR with the CORR perception index at 51. The
other emerging market countries appear to have quite high CORR as the CORR perception indices
are below 50. Overall, this shows that EM is likely to higher in most emerging market countries in
comparison to USA. While the literature suggests that EM is higher in countries with high CORR, the
effect of CORR on the CSR-EM relationship has not gained research attention. The present study fills
this gap by examining the role of CORR on the CSR-EM relationship in emerging market countries.
This will address the question when CSR affects EM, in context of CORR in emerging market
countries.
Third, to understand the role of the unique institutional and legal challenges in emerging markets, I
examine the effect of INVPRO on the CSR-EM relationship. INVPRO is defined as legal systems
protecting the rights of investors, from expropriation of managers and controlling shareholders, by

273
– 1) allowing them to take disciplinary actions against insiders (such as, replacing managers); and 2)
imposing contracts that constrain insiders’ private control benefits (Claessens et al., 2002; Dyck &
Zingales, 2004; La Porta et al., 1998). Traditionally, developed countries were generally viewed as
having higher levels of INVPRO in contrast to emerging market countries (for example, DeFond et
al., 2007; Leuz et al., 2003). EM incentives and opportunities tend to be higher in countries with
lower INVPRO (Leuz et al., 2003). In contrast, stronger INVPRO provides fewer opportunities for
corporate insiders to manage earnings to obtain private benefits of control. Fewer opportunities
and higher threat of EM being exposed, also reduces the incentives for EM (Leuz et al., 2003). Given
this notion that EM engagement varies with the level of INVPRO, I further examine differences in
the level of INVPRO between emerging and developed markets. In recent years, the difference in
the levels of INVPRO between developed and emerging markets appears to be insignificant, as the
INVPRO levels of developed markets (specifically USA) have been declining, whereas the INVPRO
levels of emerging market countries have been increasing. This is evidenced from data collected on
the strength of INVPRO from the World Banks’ Global competitiveness index. Figure 6.3 shows the
changes in INVPRO over a 10-year period from 2016 to 2017, for USA and emerging market
countries.32
32 I calculate the average INVPRO level for each year for 10 emerging market countries (specifically Brazil, China, India, Indonesia, Malaysia Russia, South Africa, South Korea, Taiwan and Thailand). I observe these 10 countries because they form my sample for my third research study (reported in this chapter).

274
Figure 6.3 Strength of INVPRO (2007 to 2016): USA Versus Emerging Market Countries
As shown in Figure 6.3, the strength of INVPRO was higher for USA from 2007 to 2013. In 2014,
there was a sharp drop in the strength of INVPRO in USA. For emerging markets, on average, there
has been a steady increase in the strength of INVPRO over the 10-year period of observation (2007
to 2016). During the years 2015 and 2016, no significant difference is observed in the strength of
INVPRO between USA and emerging market countries. However, differences can be observed in the
INVPRO among different emerging market countries. Figure 6.4 shows a comparison of the INVPRO
across the 10 emerging market countries used in the present study. The INVPRO score shown on
the graph is computed as a 5-year average (between 2012 and 2016 – the sample period for the
present study), for each country. As shown in Figure 6.4, the average INVPRO ranges from the lowest
being 0.48 (in China) to the highest being 0.83 (in Malaysia).
0
1
2
3
4
5
6
7
8
9
1 2 3 4 5 6 7 8 9 10
United States Emerging market

275
Figure 6.4 Comparison of Average INVPRO Among Emerging Market Countries
The discussion above suggests that emerging market countries have varying levels of INVPRO. The
literature suggests that EM is likely to be higher in countries with low INVPRO, and lower in countries
with high INVPRO. The present study examines the role of INVPRO on the CSR-EM relationship in
emerging market countries. This will address the question when CSR affects EM, in context of
INVPRO in emerging market countries.
The purpose of this study is to examine whether these unique characteristics in emerging markets,
affect the relationship between CSR and EM from a managerial behaviour perspective, especially
managerial myopia behaviour (short-term orientation) and myopia avoidance behaviour (long-term
orientation). Driven by the notion suggested by prior studies that the unique characteristics of
emerging market countries make managers, in these countries, more susceptible to engaging in EM,
I expect that these characteristics will change the relationship between CSR and EM. In particular,
while my results in Chapters 4 and 5, suggest that CSR has a negative direct effect on EM in
developed countries, I expect that the unique characteristics of emerging market countries will
either weaken the negative CSR-EM relationship, or produce a completely contrasting result, that is
a positive CSR-EM relationship. Since EM incentives are more prevalent in emerging market
countries, in contrast to developed countries, managerial myopic behaviour is expected to be more
prominent in emerging market countries. To capture the unique challenges that emerging markets
0
0.1
0.2
0.3
0.4
0.5
0.6
0.7
0.8
0.9
Brazil China India Indonesia Malaysia Russia South Africa South Korea Taiwan Thailand
5-year avearge INVPRO

276
face, I examine the effect of COLL culture (for social and demographic challenges), CORR (for political
challenges) and INVPRO (for legal and policymaking challenges) on the CSR-EM relationship. I posit
that in an emerging market context, rather than examining an indirect CSR-EM relationship (as I
have done to address the first 2 research objectives in Chapters 4 and 5), it is more relevant to
examine how these unique challenges (COLL, CORR and INVPRO) affect the relationship between
CSR and EM. This will address when CSR affects EM in the context of the unique social, political and
legal challenges in emerging markets.
6.3 Contribution
The present study makes several contributions to literature, theory and methodology. First, the
present study enriches the literature examining international differences in the CSR-EM
relationship. More specifically, the study enriches the emerging market literature on CSR and EM.
Furthermore, by linking COLL, CORR and INVPRO to the CSR-EM relationship, the present study adds
to the literature on these key issues. Moreover, by using a regional emerging market sample, the
present study enhances generalizability of the results to multiple countries, as opposed to results
being confined to a single country.
As discussed in Chapter 2, research on CSR and EM had initially gained popularity mostly in
developed countries. More recently, emerging market countries have started gaining increased
attention. The majority of studies focussing on emerging market countries have used Chinese
samples (see Gong & Ho, 2018; Kim et al., 2019; Li & Xia, 2018; Liu & Lee, 2019; Rezaee et al., 2020;
Sial et al., 2019; Wang et al., 2018; Zhang et al., 2021). Studies have also focussed on other emerging
market countries, including, Korea (see Cho & Chun, 2015; Choi et al., 2018; Chun & Cho, 2017),
Egypt (see Mohmed et al., 2020), India (see Hickman et al., 2021), Indonesia (see Faisal et al., 2018;
Kumala & Siregar, 2020; Pratiwi & Siregar, 2019), Kuwait (see Gerged et al., 2020), Saudi Arabia (see
Habbash & Haddad, 2020), South Africa (see Buertey et al., 2020; Jordaan et al., 2018), Taiwan (see
Chen & Hung, 2021) and United Arab Emirates (UAE) (see Kolsi & Attayah, 2018). However, to the
best of my knowledge, regional emerging market samples (involving multiple emerging market
countries) have not been utilised by existing studies. The present study utilises a regional emerging
market sample, as it enhances the relevance of my results for an entire region (that is, multiple
emerging market countries with similar institutional characteristics), instead of being relevant only
to a single country.

277
Second, from a theoretical perspective, the study links managerial behaviour perspectives (that is,
managerial myopia and myopia avoidance behaviour) to a broader theory, specifically the
institutional theory. By examining the effects of COLL, CORR and INVPRO on the CSR-EM
relationship, the present study explains how the informal and formal institutions perspectives of
the institutional theory explain changes in managerial myopic and myopia avoidance behaviour.
Third, to the best of my knowledge, this is the first study to examine the individual and joint effects
of COLL and CORR on the CSR-EM relationship. The literature suggests that COLL has a positive effect
on EM (for example, see Callen et al., 2011; Doupnik, 2008; Nabar & Boonlert-U-Thai, 2007; Zhang
et al., 2013), and CORR also has a positive effect on EM (for example see Lourenço et al., 2018; Riahi-
Belkaoui, 2004; Riahi-Belkaoui & AlNajjar, 2006). The present study examines how COLL and CORR,
individually and jointly, affect the CSR-EM relationship, from managerial behaviour perspectives. I
posit that, since CORR, in a society, co-exist with the cultural background of the society, it is essential
to examine the joint effects of these factors, as opposed to only examining these factors individually.
Examining the moderating effects of COLL and CORR addresses the question when CSR affects EM
in context of the unique cultural and political challenges in emerging market countries.
Fourth, to the best of my knowledge, this is the first study to examine the joint effect of COLL and
INVPRO on the CSR-EM relationship Prior studies suggest that INVPRO has a negative effect on EM
(for example, see Cahan et al., 2008; Francis & Wang, 2008; Haw et al., 2011; Leuz et al., 2003;
Persakis & Iatridis, 2016; Shen & Chih, 2005). Some studies have also examined the effect of INVPRO
on the CSR-EM relationship, suggesting that INVPRO strengthens (weakens) the negative (positive)
relationship between CSR and EM (for example see Chih et al., 2008; Martínez‐Ferrero et al., 2015;
Scholtens & Kang, 2013). The present study is different, as it examines the individual moderating
effects of INVPRO, as well as the joint moderating effect of COLL and INVPRO on the CSR-EM
relationship. As discussed above, I posit that it is important to examine the joint effects of these
factors because the country-level legal and institutional factors (INVPRO) co-exist with the cultural
background (COLL), as opposed to existing individually. Examining the joint moderating effects of
COLL and INVPRO addresses the question when CSR affects EM in the context of the unique cultural
and legal (or institutional) challenges in emerging market countries.
Fifth, the study also makes an important methodological contribution by adopting a multi-level
analysis technique. Since the study involves a sample of 10 countries, there are two levels of
variables. The dependent and independent variables (CSR and EM respectively) are firm-level

278
variables, while the moderating variables (COLL, CORR and INVPRO) are country-level variables.
Using simple OLS estimations in samples involving multi-level variables may produce biased results
(see Rabe-Hesketh & Skrondal, 2008). To circumvent this issue, following Lewellyn & Bao (2017),
the present study uses the Hierarchical Linear Modelling (HLM) technique, as this is a more efficient
method for studies involving multi-level variables. Prior studies involving multiple-country samples
with 2-level variables have chosen simple analytic methods, such as OLS. To the best of my
knowledge, this is the first study to use a multi-level analysis technique in examining the CSR-EM
relationship.
6.4 Theoretical Background
This section discusses the theoretical background for the present study. There are three main
theoretical perspectives that explain the main relationships tested in this study – 1) the managerial
myopia hypothesis, 2) the myopia avoidance hypothesis, and 3) institutional theory.
The managerial myopia hypothesis and the myopia avoidance hypothesis present two contrasting
perspectives on the relationship between CSR and EM, while institutional theory explains the
moderating effects of COLL, CORR and INVPRO on the CSR-EM relationship. The study links
institutional theory to the managerial behaviour perspectives and provides understanding on how
the informal and formal institution perspectives of the institutional theory affect managerial myopia
and myopia avoidance.
6.4.1 Managerial Myopia Hypothesis
The term myopia refers to short-term behaviour, that is, a focus on short-term objectives, often
resulting in unfavorable consequences on long-term value creation (Hayes & Abernathy, 1980). As
explained in Chapter 2, the managerial myopia hypothesis may provide one of the perspectives on
the relationship between CSR and EM. According to the managerial myopia hypothesis, CSR and EM
are positively related. Managers engaged in CSR may engage in EM for short-term objectives. In
Chapter 2, I refer to two underlying managerial motives to explain managers’ myopic behaviour,
and the positive CSR-EM relationship. First, the incentive-driven myopia perspective suggests that
managers engaged in CSR manage more earnings because they are driven by the short-term
incentives of meeting targets to uphold their reputation and to please stakeholders (for example,
see Chih et al., 2008; Francis et al., 2008; Gargouri et al., 2010; Habbash & Haddad, 2020). Second,
the opportunity-driven myopia perspective suggests that managers engaged in CSR manage more
earnings because they have more opportunities for EM. The positive image created by engagement

279
in CSR initiatives may lower stakeholder scrutiny on firms, thus providing managers with greater EM
opportunities (for example, see Kim et al., 2012; Muttakin et al., 2015).
While managerial myopia hypothesis presents one perspective on the CSR-EM relationship,
suggesting that managers, engaged in CSR, are more likely to manage earnings, a contrasting
perspective is presented by the myopia avoidance hypothesis, as discussed below.
6.4.2 Myopia Avoidance Hypothesis
The phrase myopia avoidance refers to avoidance of short-term (myopic) behaviour, and a greater
focus on long-term objectives. As explained in Chapter 2, the myopia avoidance hypothesis may
explain the contrasting perspective on the relationship between CSR and EM. According to the
myopia avoidance hypothesis, CSR and EM are negatively related. Managers, engaged in CSR, are
less likely to manage earnings, as they are long-term oriented (myopia avoidant). In Chapter 2, I use
two underlying managerial motives to explain managers’ myopia avoidant behaviour, and the
negative CSR-EM relationship. First, the relationship-driven myopia avoidance perspective suggests
that managers engaged in CSR have genuine concerns about maintaining long-term relationships
with stakeholders, and thus they are less likely to manage earnings, since EM is an agency cost that
may hamper managers’ relationships with stakeholders (for example, see Bozzolan et al., 2015; Chih
et al., 2008; Scholtens & Kang, 2013). Second, the value-driven myopia avoidance perspective
suggests that managers engaged in CSR are driven by their ethical and moral values, and thus they
avoid unethical acts, such as EM (for example, see Litt et al., 2013; Scholtens & Kang, 2013).
The managerial myopia hypothesis and the myopia avoidance perspective presents two contrasting
perspectives on the relationship between CSR and EM. The present study also examines the effects
of COLL, CORR and INVPRO on the CSR-EM relationship. The effects of these factors are explained
by institutional theory, as discussed below.
6.4.3 Institutional Theory
Institutions refer to the formal and informal rules and constraints, and the enforcement of these
rules and constraints that shape human interactions (Desender et al., 2011; Jouber, 2020; North,
1990). Institutional theory implies that firms operate within a nexus of institutions that impose
expectations and affect behaviour of individuals (Campbell, 2007; Martínez‐Ferrero et al., 2015).
Thus, the theory posits that managers’ decision-making is contextual, based on the environment in
which they operate. Managers are influenced by “common understandings of what is appropriate

280
and, fundamentally meaningful behaviour” within their environment (Zucker, 1983, p. 105).
Institutional theory, also known as institutionalised agency theory, may be viewed as an extension
to the traditional agency theory (see Bao & Lewellyn, 2017). Agency theory suggests that managers
(agents) are responsible to manage firms on behalf of the shareholders (principals). Agency theory
posits that due to the separation of control and ownership of firms, conflicts of interest (that is,
agency problem) may arise between managers and shareholders (Almahrog et al., 2018; Jensen &
Meckling, 1976; Watts & Zimmerman, 1986). Managers may manage earnings for opportunistic and
self-interested motives, at the expense of shareholders (Dechow & Schrand, 2004; Gerged et al.,
2021; Mohmed et al., 2020). Institutional theory connects this concept to external institutional
environment, suggesting that managerial behaviour is also influenced by societal values and norms
(Seal, 2006). The theory presents a useful framework, explaining how EM may be influenced by the
interaction between firm-level features and country-level institutional features (Bao & Lewellyn,
2017). Institutional theory suggests that the unique institutional context, in a country, shapes
managers’ interpretation and justification of their own behaviour (Bao & Lewellyn, 2017). Firms
operating in countries with similar institutional contexts are expected to have similar behaviour
(Campbell, 2007; La Porta et al., 1998; Martínez‐Ferrero et al., 2015).
Following Desender et al. (2011) and Lewellyn & Bao (2017), the present study views the
institutional theory using two perspectives – 1) formal institutions perspective; and 2) informal
institutions perspective. The formal institutions perspective explains that country-level institutional
framework, such as legal and regulatory enforcements, have a role in shaping managerial behaviour
(Han et al., 2010; Leuz et al., 2003). The informal institutions perspective suggests that unwritten
and unspoken rules, resulting from societal factors, such as, norms and beliefs, have a role in shaping
managerial behaviour (Abdi & Aulakh, 2012; Desender et al., 2011; Lewellyn & Bao, 2017). This
section discusses these two perspectives of institutional theory to explain the effects of COLL, CORR
and INVPRO on the CSR-EM relationship. The effects of COLL and CORR are explained using the
informal institutions perspective, while the effect of INVPRO is explained using the formal
institutions perspective.
Cultural values are shared within a society, both explicitly and implicitly, providing guidance on
desirable behaviour within social institutions, such as family, education, economic, political and
religious groups. Thus, country-wide cultural values, that tend to remain stable over time, create
informal social institutions with similar implicit rules, beliefs and norms, defining societal and

281
organisational practices (Desender et al., 2011; Finch et al., 2015). Culture plays an important role
in managers’ interpretation of ethics and legitimacy, defining what is right and wrong, in a given
society (Bourdieu, 2007; Deephouse et al., 2016; Parboteeah et al., 2005; Thorne & Saunders, 2002).
Thus, cultural values often provide justification of individual’s actions and behaviour (Desender et
al., 2011).
Gray (1998) is considered to be one of the first studies to link cultural values to accounting practices.
The study suggests that cultural values affect institutional structure, and accounting practices.
Driven from this notion, a growing body of literature has examined the effect of culture on
managements’ engagement in EM (for example, see Callen et al., 2011; Desender et al., 2011;
Doupnik, 2008; Gray et al., 2015; Guan & Pourjalali, 2010; Guan et al., 2005; Han et al., 2010;
Kanagaretnam et al., 2011; Lewellyn & Bao, 2017; Lyu et al., 2016; Nabar & Boonlert-U-Thai, 2007;
Paredes & Wheatley, 2017; Viana Jr et al., 2021; Zhang et al., 2013). Lewellyn & Bao (2017) suggest
that managers’ engagement in EM is largely influenced by the norms, values and belief-systems
framed by the institutional context of their society. Since EM is an opportunistic and unethical act
that is undertaken for self-serving motives, that may be detrimental to stakeholders (Lewellyn &
Bao, 2017), and may damage managers’ relationships with stakeholders (Prior et al., 2008),
managers’ engagement in EM is expected to be associated with their cultural values that define how
they value their relationships with others. Thus, the present study examines the COLL dimension of
culture, that defines relationships.
The concept of COLL is rooted in the IDV-COLL cultural dimension, coined by Hofstede (1980). IDV
societies are societies where social ties are weak, and individuals only look after themselves and/or
their immediate family (Hofstede, 1980). In contrast, COLL societies are societies where in-group
relationships are strong and cohesive (Hofstede, 1980). The dominance of IDV versus COLL values
within societies are reflected in the informal institutions within those societies (see Desender et al.,
2011). While the present study uses Hofstede’s IDV-COLL cultural dimension as part of the sensitivity
analysis, the main analysis uses the institutional COLL dimension from the GLOBE study. Institutional
COLL is defined as “the degree to which organizational and societal institutional practices encourage
and reward collective distribution of resources and collective action” (House et al., 2004, p. 12). The
GLOBE study defines two categories of COLL, namely in-group COLL and institutional COLL. In-group
COLL is relevant to family relationships, while institutional COLL refers to relationships within
organizations (Brewer & Venaik, 2011).

282
COLL societies have stronger social networks or ties between corporate insiders, where the insiders
(such as managers and employees) may be considered as an ‘in-group’, while outsiders, such as
shareholders and other stakeholders, may be considered as an ‘out-group’ (Lyu et al., 2016; Zhang
et al., 2013). In the event of conflicts of interests between the corporate insiders and outside
stakeholders (such as, shareholders), insiders may work together to protect their collective interest
(Zhang et al., 2013). Thus, managers, in COLL societies, may cross the boundaries of ethical and
moral values, and even legal obedience, to protect the collective in-group interests of insiders
(Zhang et al., 2013). In COLL societies, collective welfare and harmony within the social network is
prioritized over an individual’s own values, as these members in COLL societies judge the difference
between right and wrong actions based on relationships (Zhang et al., 2013). Thus, prior studies
suggest that managers, in COLL societies, are more likely to manage earnings to protect COLL
interests of their in-group, such as to conceal the true financial performance of firms, to meet
compensation-based bonusses, and/or to hide private benefits of control33 (for example, see Zhang
et al., 2013). In contrast, in IDV societies, where individual rights, equity and ethics are valued,
managers’ in IDV societies are less likely to manage earnings (Desender et al., 2011).
COLL societies may also provide more opportunities for EM. In COLL societies, as relationship
networks are valued, corporate insiders (that is, managers and other employees) may collude in
their EM practices (Lyu et al., 2016). In COLL societies, the monitoring efficiency of regulators may
be weaker since collusion reduces the likelihood of their EM being detected (Lyu et al., 2016).
A contrasting perspective suggests that in COLL societies, managers tend to be concerned about not
only the corporate insiders, but also external stakeholders, such as investors. Thus, COLL creates
informal institutions where managers are less likely to manage earnings due to genuine concern
about collective welfare of stakeholders, and willingness to maintain close-knit relationships with
the broader community (for example, see Doupnik, 2008; Lewellyn & Bao, 2017).
The discussion above suggests that COLL culture creates informal social institutions that may shape
managerial behaviour and their likelihood of engaging in EM. Driven by this notion, I expect the
informal social institutions, created by COLL culture, to have an effect on the CSR-EM relationship.
33 Corporate insiders may enjoy greater private benefits of control in COLL societies, since managers provide preferential treatment to the insiders (their in-group) in contrast to the outside stakeholders. Thus, insiders may engage in opportunistic activities such as insider trading, and manage earnings to hide these activities (Shleifer & Vishny, 1997; Zingales, 1994).

283
Consistent to the first perspective that COLL has a positive effect EM, it can be expected that COLL
culture creates informal institutions where managers act more opportunistically. Thus, in COLL
societies, managers, engaged in CSR, may opportunistically use their CSR performance to manage
earnings for self-interest motives and collective welfare of their in-group (that is, corporate
insiders). The incentive-driven myopia perspective suggests that CSR may increase managerial
incentives to manage earnings to meet short-term targets (for example, see Chih et al., 2008; Francis
et al., 2008; Gargouri et al., 2010; Habbash & Haddad, 2020). COLL may intensify these incentives
as managers in COLL societies may manage earnings to meet COLL interests of the corporate insiders
(Lyu et al., 2016). Thus, it can be expected that the informal institutions created by COLL intensifies
incentive-driven myopic behaviour, as managers are more likely to manage earnings due to the
interaction of CSR and COLL. Furthermore, CSR and COLL may create additional opportunities for
EM. As discussed earlier, the opportunity driven myopia perspective suggests that the positive
image created by CSR performance, may lower stakeholder scrutiny, thus increasing managers’
opportunities for EM (for example, see Kim et al., 2012; Muttakin et al., 2015). COLL may provide
additional opportunities, as collusion among corporate insiders may reduce ethe effectiveness of
the firms’ monitoring systems goals (for example, see Lyu et al., 2016; Zhang et al., 2013). Thus, it
can be expected that the informal institutions created by COLL increases opportunity-driven myopic
behaviour, as managers are more likely to manage earnings due to the interaction of CSR and COLL.
Consistent to the contrasting perspective that COLL has a negative effect on EM, it can be expected
that in COLL societies, managers engage in CSR due to genuine concern towards the broader
community, hence they are less likely to manage earnings. The relationship-driven myopia
avoidance perspective suggests that managers, engaged in CSR, genuinely care about maintaining
long-term relationships with stakeholders (for example, see Bozzolan et al., 2015; Chih et al., 2008;
Scholtens & Kang, 2013). This may be more intense in COLL cultures where relationships are
prioritized over individual interests (for example, see Doupnik, 2008; Lewellyn & Bao, 2017) . Thus,
from this contrasting perspective, it can be expected that when CSR has a negative effect on EM,
COLL may make this negative relationship stronger. The informal institutions created by COLL may
intensify relationship-driven myopia avoidance behaviour, as managers are less likely to manage
earnings due to the interaction of CSR and COLL.
The discussion above explains the role of COLL on the CSR-EM relationship using the informal
institutions perspective of institutional theory. The informal institutions perspective also explains
the role of CORR on managers’ engagement in EM, and on the CSR-EM relationship.

284
The literature suggests that unethical behaviour often results from social norms, values and
practices (Ahmed et al., 2003; Zahra et al., 2005). Country-level CORR acts as an informal institution
since it is “rooted in societal belief and norms” (Xu & Shenkar, 2002, p. 610), and may become
embedded in the cognitive functions of individuals (Parto, 2008). CORR can influence individual
belief systems, and become part of their daily practices (Doh et al., 2003). In countries with high
CORR, unethical behaviour may be more acceptable and become common-practice (Hoffman et al.,
2014). Thus, CORR pervasiveness, within a society, may enhance opportunistic and unethical
practices, such as EM, within businesses (Lewellyn & Bao, 2017). CORR creates an informal
institution, in which individuals may act more opportunistically (Judge et al., 2008). Thus, in societies
with CORR pervasiveness, managers may accept EM to be more legitimate (Lewellyn & Bao, 2017).
Driven by this notion, I expect the informal institutions, created by CORR pervasiveness in a society,
to have an effect on the CSR-EM relationship. The literature suggests that CORR creates an overall
unethical atmosphere within firms, where EM may become common practice (Riahi-Belkaoui,
2004). Thus, it can be expected that CORR creates informal institutions where unethical practices,
such as EM, is more acceptable. Thus, managers, engaged in CSR, have more opportunities to
manage earnings in corruptive societies. As discussed earlier, the opportunity driven myopia
perspective posits that the positive image created by CSR may increase EM opportunities (for
example, see Kim et al., 2012; Muttakin et al., 2015). The unethical environment, in societies with
CORR pervasiveness, provides additional opportunities for EM. This perspective suggests that the
informal institutions created by CORR may result in more opportunity-driven myopic behaviour, as
managers have more incentives to manage earnings due to the interaction of CSR and CORR.
Furthermore, managers involved in corruptive practices, have more incentives to manage earnings
to conceal their rent-seeking activities (Riahi-Belkaoui, 2004; Riahi-Belkaoui & AlNajjar, 2006). Thus,
it can be expected that in societies with CORR pervasiveness, managers will engage in more CSR
initiatives as a cover-up strategy to conceal their EM activities and create a positive image for
stakeholders. As discussed earlier, the incentive-driven myopia perspective suggests that CSR
creates incentives for managers to manage earnings to meet short-term targets and please
stakeholders (for example, see Chih et al., 2008; Francis et al., 2008; Gargouri et al., 2010; Habbash
& Haddad, 2020). CORR may create additional incentives, as managers try to conceal their rent-
seeking activities. Thus, it can be expected that the informal institutions, created by CORR, may
result in more incentive-driven myopic behaviour, as managers have more incentives to manage
earnings due to the interaction of CSR and CORR.

285
The present study also examines the joint effect of COLL and CORR on the CSR-EM relationship. The
literature suggests that while CORR serves as an informal institution, affecting cognitive functions
of individuals, as well as their interpretation of right versus wrong actions (Calhoun, 2002; Judge et
al., 2008), individual attitudes are driven by their cultural values, norms and belief systems that
remain stable over time (Deephouse et al., 2016; Finch et al., 2015; Lewellyn & Bao, 2017; Yeh &
Hwang, 2000). Thus, cultural values are likely to influence managers’ attitude towards CORR (Finch
et al., 2015). Han et al. (2010) suggest that culture and other institutions may interact and jointly
affect EM. Thus, using institutional theory perspective, I expect that the informal institutions
created by COLL culture and CORR pervasiveness in a society, jointly shapes managerial behaviour
(specifically, managerial myopia and myopia avoidance behaviour) and the CSR-EM relationship.
While COLL culture and CORR are considered informal institutions that affects managerial,
behaviour, formal institutions, such as legal and regulatory framework of a country, may also affect
managerial behaviour and EM, by legitimising norms and expectations (Bao & Lewellyn, 2017). The
present study considers INVPRO as a formal institution that protects minority shareholders by
limiting opportunities for corporate insiders (managers and controlling shareholders) to extract
private control benefits (Desender et al., 2011; La Porta et al., 2000; Leuz et al., 2003; Shleifer &
Vishny, 1997). INVPRO provides investors with the rights to take disciplinary actions (such as,
relacing managers) against opportunistic actions by corporate insiders (Leuz et al., 2003). Strong
legal and institutional systems (including INVPRO) can affect social norms, shaping organisational
practices and beliefs, and inhibiting incentives for unethical or opportunistic actions (Chen et al.,
2016). Thus, INVPRO creates a formal (explicit) institution that inhibits managers’ engagement in
EM by aligning managerial practices to legitimate behaviour as defined by the institution (Bao &
Lewellyn, 2017).
The formal institutions perspective may also explain the role on INVPRO on the CSR-EM relationship.
Given that the CSR-EM relationship can be positive or negative, as evidenced by the mixed findings
in the literature, INVPRO may have a weakening effect on the positive CSR-EM relationship, or a
strengthening effect on the negative CSR-EM relationship. Thus, it can be expected that the formal
institution created by INVPRO may either weaken managerial myopia behaviour (short-term
orientation explaining the positive CSR-EM relationship) or strengthen myopia avoidance behaviour
(long-term orientation explaining the negative CSR-EM relationship). In particular, when there is a
negative relationship between CSR and EM (myopia avoidance), the formal institutions perspective
suggests that INVPRO makes this negative relationship stronger (for example, see Jouber, 2020;

286
Martínez‐Ferrero et al., 2015). As discussed earlier, since CSR reduces information asymmetry
between managers and stakeholders (Mohmed et al., 2020), it can increase the risks of exposure of
managers’ engagement in EM. Thus, managers, engaged in CSR, may be less likely to manage
earnings to avoid risks of negative consequences resulting from their EM being exposed (for
example, see Gerged et al., 2020; Gerged et al., 2021; Litt et al., 2013). INVPRO may pose a further
threat to this existing risk. When INVPRO is strong, managers may consider EM to be too risky as
shareholders have greater rights to take disciplinary actions against managers (Cahan et al., 2008).
Thus, it can be expected that the formal institutions created by INVPRO may myopia avoidance
behaviour, as the interaction of CSR and INVPRO may make EM too risky, making managers less
likely to manage earnings. Consequently, when there is a positive relationship between CSR and EM
(managerial myopia), the formal institutions perspective suggests that INVPRO makes this positive
relationship weaker. The incentive-driven myopia perspective, as discussed earlier, suggests that
CSR performance may create more incentives for EM (for example, see Chih et al., 2008; Francis et
al., 2008; Gargouri et al., 2010; Habbash & Haddad, 2020). INVPRO has a contrasting effect it reduces
the incentives for EM. As INVPRO reduces the opportunities for corporate insiders to extract private
control benefits, managers have less to conceal, hence their incentives to manage earnings decline.
Thus, it can be expected that the formal institutions created by INVPRO may weaken incentive-
driven myopic behaviour, as the interaction of CSR and INVPRO may lead managers to manage less
earnings.
While formal institutions are an important determinant to understand corporate practices and
managerial behaviour, the informal institutions, discussed earlier, still play a crucial role in
determining managerial behaviour. In fact, “the enabling and constraining that is widely attributable
to formal institutions” is predominantly done by informal institutions (Helmke & Levitsky, 2004, p.
726). More importantly, when formal institutions are weak and underdeveloped, informal
institutions play a more important role in influencing business decisions (Puffer & McCarthy, 2011).
Thus, the present study also examines the joint effect of informal institutions (COLL culture) and
formal institutions (INVPRO) on the CSR-EM relationship. Since the theoretical views suggest that
both COLL and INVPRO individually have effects in shaping managerial behaviour (specifically,
managerial myopia and myopia avoidance behaviour) and the CSR-EM relationship, I expect that
the informal institutions created by COLL and the formal institutions created by INVPRO jointly
affects the CSR-EM relationship.

287
6.5 Literature Review and Empirical Evidence
6.5.1 The Effect of CSR on EM
The literature on the relationship between CSR and EM has been discussed in-depth in Chapter 2.
In this section, I begin by a brief discussion on the CSR-EM literature, followed by a discussion on
the relevant literature on COLL, CORR and INVPRO. The literature on the CSR-EM relationship shows
inconclusive findings. Some studies suggest that CSR has a positive effect on EM (see Buertey et al.,
2020; Habbash & Haddad, 2020; Hickman et al., 2021; Pratiwi & Siregar, 2019; Riahi-Belkaoui, 2003).
Consistent with the managerial myopia perspective, this suggests that managers engaged in CSR are
more short-term oriented. This myopic behaviour (short-term orientation) suggests that managers
engaged in CSR are more likely to manage earnings as a result of being incentive-driven (for
example, Chih et al., 2008; Habbash & Haddad, 2020; Kyaw et al., 2017) and/or opportunity-driven
(for example, see Kim et al., 2012; Muttakin et al., 2015).
However, a large number of prior studies posit a contrasting perspective, suggesting that CSR has a
negative effect on EM (see Almahrog et al., 2018; Bozzolan et al., 2015; Calegari et al., 2010; Chen
& Hung, 2021; Cho & Chun, 2015; Chun & Cho, 2017; Faisal et al., 2018; Gao & Zhang, 2015; García‐
Sánchez et al., 2020; Gerged et al., 2020; Gerged et al., 2021; Gras-Gil et al., 2016; Hong & Andersen,
2011; Kim et al., 2012; Kumala & Siregar, 2020; Li & Xia, 2018; Litt et al., 2013; Martínez‐Ferrero et
al., 2015; Palacios-Manzano et al., 2019; Patten & Trompeter, 2003; Scholtens & Kang, 2013; Sial et
al., 2019; Wang et al., 2018). Consistent with the myopia avoidance perspective, this suggests that
managers engaged in CSR are more long-term oriented. This myopia avoidant behaviour (long-term
orientation) suggests that managers engaged is CSR are less likely to manage earnings as a result of
being relationship-driven (for example, see Almahrog et al., 2018; Amar & Chakroun, 2018; Cho &
Chun, 2015; Choi et al., 2018; Chun & Cho, 2017; Faisal et al., 2018; Gras-Gil et al., 2016; Hong &
Andersen, 2011; Jouber, 2020; Velte, 2019); and/or value-driven (for example, see Calegari et al.,
2010; Gao & Zhang, 2015; García‐Sánchez et al., 2020; Kim et al., 2012; Kumala & Siregar, 2020; Li
& Xia, 2018; Martínez‐Ferrero et al., 2015; Mohmed et al., 2020; Palacios-Manzano et al., 2019;
Rezaee et al., 2020; Scholtens & Kang, 2013; Sial et al., 2019).
In addition to the debate in the literature on the CSR-EM relationship, there is also some debate on
the relationship between the CSR dimensions and EM. For example, Gargouri et al. (2010) and Amar
& Chakroun (2018) find that the CSR-EM relationship varies for the different CSR dimensions. Using
a sample of Canadian firms, Gargouri et al. (2010) suggest that, while the overall CSR and the

288
corporate governance (GOV) dimension of CSR have no significant effects on EM, the environmental
(ENV) and employee dimensions of CSR have positive effects on EM. In contrast, Amar & Chakroun
(2018), using a sample of French firms, suggest that overall CSR, as well as the GOV dimension, the
ENV dimension and some specific components of the social (SOC) dimension (specifically, human
rights and consumer expectations) have negative effects on EM, while other SOC dimensions
(specifically, labour, fairness of practices and community involvement) have no significant effect on
EM. Consistent with this view, Velte (2019), using a sample of German firms, also reports that overall
CSR and the individual CSR dimensions (ENV, SOC and GOV) have negative effects on accruals-based
EM. However, none of these studies have examined the relationship between the CSR dimensions
and EM in emerging market countries.
Some studies have focussed specifically on the ENV dimension of CSR (see Gerged et al., 2020;
Gerged et al., 2021; Heltzer, 2011; Litt et al., 2013; Patten & Trompeter, 2003; Velte, 2021). For
example, Patten & Trompeter (2003) find a negative relationship between ENV disclosures and EM
in a sample of chemical firms from USA. Heltzer (2011) finds higher EM among firms with ENV
concerns in USA. Litt et al. (2013) also find a negative relationship between the ENV dimension and
EM, using a sample of firms from USA. Gerged et al. (2020) and Gerged et al. (2021) find negative
relationships between ENV disclosures and EM in samples of firms from Kuwait and Jordan
respectively. Velte (2021) reports that ENV and carbon performance have negative effects on
accruals-based EM. Although there is some debate in the literature on the effect of SOC and GOV
on EM, there appears to be largely consistent views that the ENV dimension has a negative effect
on EM.
Based on the contrasting evidence in the literature regarding the CSR-EM relationship, I examine
the following opposing hypotheses:
H3.1a: Consistent with the managerial myopia hypothesis, there is a positive and significant
relationship between CSR and EM.
H3.1b: Consistent with the myopia avoidance hypothesis, there is a negative and significant
relationship between CSR and EM.
In testing hypotheses H3.1a and H3.1b, I test the relationships between overall CSR and EM as well
as the individual CSR dimensions (ENV, SOC and GOV) and EM, to address the existing debate on
these issues.

289
In response to the debate on how CSR affects EM, several prior studies suggest that the CSR-EM
relationship is contextual, based on various factors such as - 1) variable measurements – specifically
the type of EM measure (see Chih et al., 2008; Choi et al., 2018; Jordaan et al., 2018; Kolsi & Attayah,
2018; Velte, 2019; Velte, 2021; Zhang et al., 2021), and the dimension of CSR (see (Amar &
Chakroun, 2018; Gargouri et al., 2010; Velte, 2019); 2) firm-level factors, such as corporate
governance (see Buertey et al., 2020; Cho & Chun, 2015; Gerged et al., 2021), ownership (see
Kumala & Siregar, 2020; Li & Xia, 2018; Liu & Lee, 2019; Rezaee et al., 2020), political connections
(see Pratiwi & Siregar, 2019); 3) the industry in which the firm operates (see Muttakin et al., 2015;
Yip et al., 2011); and 4) country-level factors, such as, institutional factors (see Chih et al., 2008; Kim
et al., 2019; Kyaw et al., 2017; Scholtens & Kang, 2013). These are discussed in greater detail in
Chapter 2. The CSR-EM literature shows that the contexts COLL, CORR, and the joint effects of COLL
and CORR, and COLL and INVPRO have not been examined by prior studies. The remaining of this
section discusses the literature relevant to the effects of COLL, CORR and INVPRO on EM.
6.5.2 The Effect of COLL on EM
Culture is defined as the “collective programming of the mind that distinguishes the members of
one group or category of people from another” (Hofstede, 1989, p. 25). Culture refers to a set of
common beliefs and assumptions, and implicit and explicit understanding of right versus wrong
actions, practices and norms (Bohannan, 2010; Bourdieu, 2007; Williams, 1970). Culture is a broad
concept that is popularly classified into 6 dimensions formulated by Hofstede (1983). Geert
Hofstede collected data from a large number of IBM employees and initially introduced four
dimensions of differences in national culture, namely Power Distance (PD), Uncertainty avoidance
(UA), Individualism (IDV) vs COLL and Masculinity-Femininity (Hofstede, 1984). Hofstede later added
two additional dimension of culture as Long-term or future orientation (FO) and Indulgence. Each
cultural dimension focusses on a unique aspect of national culture. The dimension PD indicates the
degree to which unequal distribution of power exists within a society (House et al., 2004). UA relates
to the degree to which societies are uncomfortable or feel threatened to future uncertainties
(Hofstede, 1984; House et al., 2004). The IDV-COLL dimension refers to the degree of
interdependence within members of the society (House et al., 2004). The Masculinity-Femininity
dimension indicates the level of assertiveness, aggressiveness, and importance of material success
(Hofstede & Hofstede, 2005). Long term orientation dimension indicates the level of effort a society
places in preparation for the future (Hofstede Insights, 2021). The indulgence dimension refers to
the ability of individuals to control their desires and impulses (Hofstede Insights, 2021). The present

290
study focusses on the IDV-COLL dimension of culture. Specifically, the study looks at collectivism
(COLL) culture. COLL societies are defined as societies with social integration of people into family-
like bonds, where group interests are more valued than individual interest (Hofstede & Hofstede,
2005). In highly COLL societies, employees may expect to be looked after by the organisation and
be treated as part of the organisation’s family (Hofstede & Hofstede, 2005). In contrast, in IDV
societies, individuals look after their personal interests or the interests of their immediate family.
Prior studies suggest that cultural norms and values have an important role in defining business
practices, including accounting choices and EM likelihood, and therefore it is particularly important
to consider cultural differences for cross-country studies (Gray, 1988; Guan et al., 2005; Nabar &
Boonlert-U-Thai, 2007; Waldman et al., 2006). However, prior studies examining international
differences in EM engagement, has only started focussing on culture in relatively recent times, with
Guan et al. (2005) being one of the first studies to explore this issue. Subsequently, a number of
other studies have examined how culture affects EM (for example, see Callen et al., 2011; Desender
et al., 2011; Doupnik, 2008; Gray et al., 2015; Han et al., 2010; Kanagaretnam et al., 2011; Lyu et al.,
2016; Nabar & Boonlert-U-Thai, 2007; Paredes & Wheatley, 2017; Viana Jr et al., 2021; Zhang et al.,
2013). Some of these studies have examined the role of both culture and INVPRO on EM. In this
section, I discuss only those studies that have examined culture individually, while the studies that
have examined culture and INVPRO jointly, are discussed later in Section 6.5.4. Table 6.1
summarises the relevant studies examining the effect of cultural dimensions on EM.
Since the present study focusses on COLL dimension of culture, the discussion in this section
predominantly focusses on the relationship between COLL and EM. However, other cultural
dimensions may also affect EM, as evidenced by a small but growing body of literature, suggesting
mixed findings. For example, while some studies suggest a positive relationship between PD and EM
(for example, see Guan & Pourjalali, 2010; Kanagaretnam et al., 2011), others suggest a negative
relationship (for example, see Lewellyn & Bao, 2017; Paredes & Wheatley, 2017; Riahi & Omri,
2013). Doupnik (2008) and Kanagaretnam et al. (2011) find no significant association between PD
and EM. The literature also reports mixed findings on the relationship between UA and EM. Some
studies report a negative relationship between UA and EM (for example, see Gray et al., 2015; Guan
et al., 2005; Han et al., 2010; Kanagaretnam et al., 2011; Paredes & Wheatley, 2017; Viana Jr et al.,
2021), while others suggest a positive relationship between UA and EM (for example, see Callen et
al., 2011; Doupnik, 2008; Guan & Pourjalali, 2010; Nabar & Boonlert-U-Thai, 2007; Riahi & Omri,
2013). Guan and Pourjalali (2010), Kanagaretnam et al. (2011) and Nabar & Boonlert-U-Thai (2007)

291
find a positive association between masculinity and EM while Paredes & Wheatley (2017) report a
negative association. Doupnik (2008) finds no significant association between the masculinity-
femininity dimension of national culture and EM. Guan et al. (2005) find a positive relationship
between FO and EM.
Overall, majority of the literature suggests that the IDV-COLL dimension of culture has an influence
on EM. Using a sample of 13,793 firm-year observations from 5 Asia-Pacific countries, between 1987
and 1995, Guan et al. (2005) find that EM is more prevalent in countries with low COLL (that is, high
IDV). Consistent to this, Guan and Pourjalali (2010) and Kanagaretnam et al. (2011) also find a
positive relationship a positive relationship between IDV (low COLL) and EM. Guan and Pourjalali
(2010) examine a sample of 84,748 firm-year observations from 27 countries, between 1987 and
2001, while Kanagaretnam et al. (2011) examine a sample of 12,475 bank-year observations from
39 countries, between 1993 and 2006. Similarly, Gray et al. (2015) also report a positive relationship
between IDV (low COLL) and EM, using a sample of 15,258 observations from 14 European Union
countries, between 2000 and 2010. Gray et al. (2015) further suggest that the positive relationship
between IDV and EM remain consistent even after mandatory adoption of the International
Financial Reporting Standards (IFRS). The findings are consistent to Gray (1998) framework,
suggesting that IDV countries (that is, countries with low COLL) are likely to have greater flexibility,
optimism, and risk-orientation, and lower concern for stakeholders, in contrast to high COLL
countries, thus resulting in higher EM (Gray et al., 2015; Guan et al., 2005; Kanagaretnam et al.,
2011).
In contrast to the studies discussed above, other studies suggest that EM is more prevalent in
countries with COLL culture. For example, using a sample from 8,616 firms from 31 countries,
between 1988 and 2004, Desender et al. (2011) find that EM is lower in countries with high IDV
(that, is low COLL). Riahi and Omri (2013) find a positive relationship between COLL and EM, using
a sample of 219 firms from France, Tunisia and Canada, between 2003 and 2009. Lyu et al. (2016)
examines the moderating effect of COLL on the relationship between ownership concentration and
EM, using a sample of 89,208 observations from 22 Western European and Eastern Asian countries,
between 1995 and 2011. The study reports that in COLL countries, the positive relationship between
ownership concentration and EM becomes more prominent. Viana Jr et al. (2021) also find a positive
relationship between COLL and EM, using a large sample of 33,918 observations from 22 developed
countries and 11 emerging market countries, between 2006 and 2018. The positive relationship
between COLL and EM is consistent to the informal institutions perspective, suggesting that COLL

292
culture creates informal institutions that may encourage more EM. In COLL societies, strong social
networks may create nepotism and collusion among insiders (Callen et al., 2011; Lyu et al., 2016),
while following social norms, such as law obedience, honesty and integrity may become less
important (Zhang et al., 2013). When there is a conflict of interest between corporate insiders and
outside stakeholders, managers are likely to prioritize the in-group interests of the insiders (Lyu et
al., 2016). Thus, social networks within corporate insiders may increase the incentives to manage
earnings, as corporate insiders may work together to enhance collective benefits for their in-group.
Furthermore, social networks within COLL societies may reduce the efficiency of monitoring
systems, thus providing more opportunities for EM. This is particularly applicable to emerging
market countries, where concentrated ownership structures are very common (for example, see
Claessens & Yurtoglu, 2013; Haw et al., 2011; La Porta et al., 1999). Prior studies suggest that
concentrated ownership34 increases EM incentives (for example, see Gopalan & Jayaraman, 2012;
Haw et al., 2011; Lyu et al., 2016; Ratnawati et al., 2016). This may be further escalated by COLL
culture, as managers and controlling shareholders may collude to extract private benefits of control,
while managing earnings to hide their private control benefits by masking the true firm performance
from outside stakeholders (Lyu et al., 2016; Viana Jr et al., 2021; Zhang et al., 2013). In contrast to
COLL societies, IDV societies tend to respect and prioritise individual rights, and value fairness and
equity above group interests (Riahi & Omri, 2013; Zhang et al., 2013). Managers in IDV societies, are
likely to have greater concern and respect for individual property rights of shareholders. Thus, they
are less likely to manage earnings since EM may have damaging effects on shareholders’ rights
(Desender et al., 2011). Furthermore, the high level of transparency and stringent regulations within
IDV societies, constrain opportunities for managers to manage earnings (Nabar & Boonlert-U-Thai,
2007).
Overall, there appears to be contradictory opinions in the literature regarding the effect of COLL on
EM. While some studies suggest a negative relationship between COLL and EM (for example, see
Gray et al., 2015; Guan & Pourjalali, 2010; Guan et al., 2005; Han et al., 2010; Kanagaretnam et al.,
2011; Lewellyn & Bao, 2017; Paredes & Wheatley, 2017), others suggest a positive relationship (for
example, see Callen et al., 2011; Desender et al., 2011; Doupnik, 2008; Nabar & Boonlert-U-Thai,
2007; Riahi & Omri, 2013; Viana Jr et al., 2021; Zhang et al., 2013). These contradictory opinions
34 Ownership concentration refers to the concentration of equity holdings and control by some major shareholders or blockholders (Bouvatier et al., 2014; Gopalan & Jayaraman, 2012). Concentrated ownership gives rise to divergence between control and cash flow rights of the controlling shareholders, where the controlling shareholders’ control (i.e. voting) rights often exceed cash flow rights (Haw et al., 2011).

293
appear to result from inconsistencies in defining groups. These contradictory opinions appear to
result from inconsistencies in defining groups within organisations. Some studies suggest that in
COLL culture, managers consider outside shareholders to be part of their in-group and therefore,
managers have greater concern for collective welfare for shareholders (for example, see Doupnik,
2008; Lewellyn & Bao, 2017). This perspective suggests that in COLL culture, managers are less likely
to manage earnings. The contradictory perspective suggests that firms have two separate groups –
1) insiders (including managers, other employees, and controlling shareholders); and 2) outsiders
(including shareholders and other stakeholders) (for example, see Lyu et al., 2016; Riahi & Omri,
2013; Viana Jr et al., 2021). According to this perspective, in COLL culture, managers consider the
corporate insiders as their in-group, building strong ties within the in-group. When conflicts of
interest arise between corporate insiders and outsiders, managers are more likely to undertake
actions that benefit the insiders. Thus, this perspective suggests that, in COLL culture, managers are
more likely to manage earnings for collective welfare of their in-group (that is, corporate insiders).
As discussed in section 6.2.1, the present study defines corporate insiders group as a group including
managers, employees and controlling shareholders, while external groups are outsiders that include
other shareholder (including minority shareholders) and stakeholders. Thus, based on this, I expect
to find results that are consistent to the second perspective, that is, COLL is likely to escalate EM.
Consistent to the literature and the informal institutions perspective of the institutional theory,
discussed in this section, the present study expects to find a positive relationship between COLL and
EM. As explained by prior studies, in emerging market countries, managers and controlling
shareholders may manage earnings to conceal their private benefits of control. This issue may be
further escalated in COLL societies (Lyu et al., 2016; Viana Jr et al., 2021; Zhang et al., 2013). In COLL
societies, collusive practices among corporate insiders may reduce monitoring efficiency, providing
more opportunities to corporate insiders to manage earnings to meet collective goals, such as to
conceal their private benefits of control (for example, see Lyu et al., 2016; Zhang et al., 2013). Given
the notion that COLL escalates EM, I test the following hypotheses:
H3.2: Consistent to the informal institution perspective, there is a positive and significant
relationship between COLL and EM.
While there is an expanse of literature examining the relationship between COLL and EM, to the
best of my knowledge, the effect of COLL on the CSR-EM relationship is yet to be examined. As
discussed above, some prior studies find a positive relationship between COLL and EM (for example,

294
see Callen et al., 2011; Desender et al., 2011; Doupnik, 2008; Nabar & Boonlert-U-Thai, 2007; Riahi
& Omri, 2013; Viana Jr et al., 2021; Zhang et al., 2013), suggesting that managerial myopic behaviour
is more prominent in COLL societies. This is mainly because in COLL societies, managers may be able
to collude with other corporate insiders, which in turn provides more opportunities for EM (Lyu et
al., 2016; Viana Jr et al., 2021; Zhang et al., 2013). Driven by this notion, I expect that COLL also has
an effect on the CSR-EM relationship. In particular, I expect that in COLL societies, where managerial
myopia is more prominent, the negative relationship between CSR and EM will be weaker.
H3.3: COLL has a significant moderating effect on the relationship between CSR and EM.
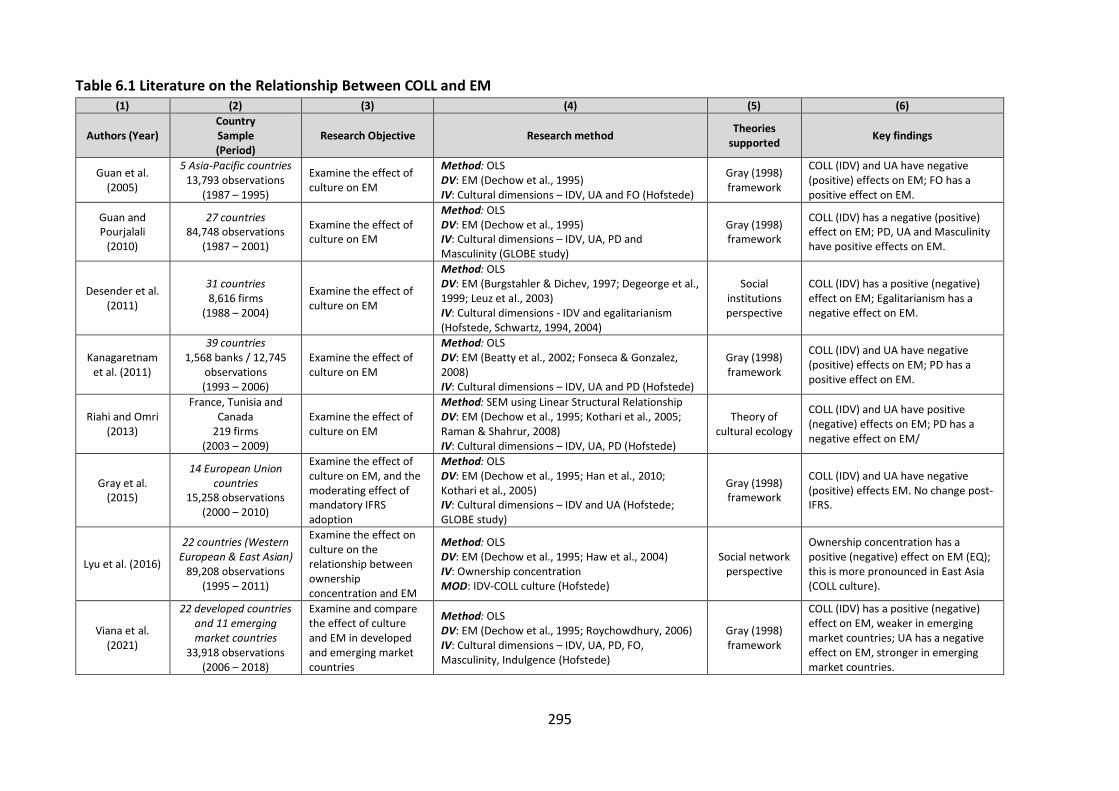
295
Table 6.1 Literature on the Relationship Between COLL and EM
(1) (2) (3) (4) (5) (6)
Authors (Year) Country Sample (Period)
Research Objective Research method Theories supported Key findings
Guan et al. (2005)
5 Asia-Pacific countries 13,793 observations
(1987 – 1995)
Examine the effect of culture on EM
Method: OLS DV: EM (Dechow et al., 1995) IV: Cultural dimensions – IDV, UA and FO (Hofstede)
Gray (1998) framework
COLL (IDV) and UA have negative (positive) effects on EM; FO has a positive effect on EM.
Guan and Pourjalali
(2010)
27 countries 84,748 observations
(1987 – 2001)
Examine the effect of culture on EM
Method: OLS DV: EM (Dechow et al., 1995) IV: Cultural dimensions – IDV, UA, PD and Masculinity (GLOBE study)
Gray (1998) framework
COLL (IDV) has a negative (positive) effect on EM; PD, UA and Masculinity have positive effects on EM.
Desender et al. (2011)
31 countries 8,616 firms
(1988 – 2004)
Examine the effect of culture on EM
Method: OLS DV: EM (Burgstahler & Dichev, 1997; Degeorge et al., 1999; Leuz et al., 2003) IV: Cultural dimensions - IDV and egalitarianism (Hofstede, Schwartz, 1994, 2004)
Social institutions perspective
COLL (IDV) has a positive (negative) effect on EM; Egalitarianism has a negative effect on EM.
Kanagaretnam et al. (2011)
39 countries 1,568 banks / 12,745
observations (1993 – 2006)
Examine the effect of culture on EM
Method: OLS DV: EM (Beatty et al., 2002; Fonseca & Gonzalez, 2008) IV: Cultural dimensions – IDV, UA and PD (Hofstede)
Gray (1998) framework
COLL (IDV) and UA have negative (positive) effects on EM; PD has a positive effect on EM.
Riahi and Omri (2013)
France, Tunisia and Canada
219 firms (2003 – 2009)
Examine the effect of culture on EM
Method: SEM using Linear Structural Relationship DV: EM (Dechow et al., 1995; Kothari et al., 2005; Raman & Shahrur, 2008) IV: Cultural dimensions – IDV, UA, PD (Hofstede)
Theory of cultural ecology
COLL (IDV) and UA have positive (negative) effects on EM; PD has a negative effect on EM/
Gray et al. (2015)
14 European Union countries
15,258 observations (2000 – 2010)
Examine the effect of culture on EM, and the moderating effect of mandatory IFRS adoption
Method: OLS DV: EM (Dechow et al., 1995; Han et al., 2010; Kothari et al., 2005) IV: Cultural dimensions – IDV and UA (Hofstede; GLOBE study)
Gray (1998) framework
COLL (IDV) and UA have negative (positive) effects EM. No change post-IFRS.
Lyu et al. (2016)
22 countries (Western European & East Asian)
89,208 observations (1995 – 2011)
Examine the effect on culture on the relationship between ownership concentration and EM
Method: OLS DV: EM (Dechow et al., 1995; Haw et al., 2004) IV: Ownership concentration MOD: IDV-COLL culture (Hofstede)
Social network perspective
Ownership concentration has a positive (negative) effect on EM (EQ); this is more pronounced in East Asia (COLL culture).
Viana et al. (2021)
22 developed countries and 11 emerging market countries
33,918 observations (2006 – 2018)
Examine and compare the effect of culture and EM in developed and emerging market countries
Method: OLS DV: EM (Dechow et al., 1995; Roychowdhury, 2006) IV: Cultural dimensions – IDV, UA, PD, FO, Masculinity, Indulgence (Hofstede)
Gray (1998) framework
COLL (IDV) has a positive (negative) effect on EM, weaker in emerging market countries; UA has a negative effect on EM, stronger in emerging market countries.

296
6.5.3 The Effect of CORR on EM
CORR is defined as “the misuse of public or business office for private gain. It includes transfer
payments from bribe players to bureaucrats or business people” (Riahi-Belkaoui, 2004, p. 74). While
CORR is a concerning issue all over the globe, it is particularly problematic in emerging market and
developing countries due to the slower economic and institutional development in these countries
(Kaymak & Bektas, 2015). The deficiency in political accountability and institutional laws protecting
property rights may be a cause of higher CORR in these countries (Aidt, 2009).
CORR can unsettle a country’s values leading to instability (Kaymak & Bektas, 2015). The literature
indicates that CORR has adverse impacts on several economic variables, such as investment,
innovation, economic growth and the overall political environment resulting from lack of trust in
government and democracy (Branco & Delgado, 2012; Mauro, 1995). Furthermore, CORR weakens
the country’s efficiency of legal systems and the effectiveness of the government (Friedman et al.,
2000; Seligson, 2002). Economists perceive CORR to be one of the main impediments to economic
development as it leads to lower incomes and poverty (Mauro, 1995). While CORR creates
macroeconomic problems, its consequences are no less severe in the micro dimension, that is, firm-
level (Aidt, 2009).
The present study focuses on country-level CORR affecting managerial behavior. Thus, in context of
the present study, CORR can be viewed as an “individual using a position in which he is trusted, to
appropriate an organization’s goods or services that he does not deserve” (Granovetter, 2007, p.2).
The literature suggests that firm’s operating in corrupted societies have greater information
asymmetry, and hence, lower financial reporting quality (Bhattacharya et al., 2013; Boubakri et al.,
2012). Firms may actively contribute in either defying or supporting corruption (Galang, 2012).
Riahi-Belkaoui (2004) suggests that CORR creates an unethical atmosphere within firms. Managers
may develop close networks with government officials, through means of bribery, to obtain
opportunistic privileges, such as preferential regulatory terms and better treatment (such as, lower
pressure, regulation, and scrutiny) (Burt, 1997; Granovetter, 1985; Xu et al., 2019). Furthermore, to
obtain such political favours, managers may report less transparent financial information (Chaney
et al., 2011), and even take immoral measures to supress their corruptive behaviour and rent-
seeking activities (Aidt, 2009). They may manage earnings more for this purpose of concealing the
true performance of the firm, as well as concealing their rent-seeking activities, leading to lower
quality accounting information (Riahi-Belkaoui, 2004). Despite this, there appears to be significantly
limited literature examining the impact of CORR on accounting quality or EM (Kaymak & Bektas,

297
2015; Lourenço et al., 2018; Riahi-Belkaoui, 2004). Table 6.2 summarises the literature on the
association between CORR and EM. Additionally, a few studies have examined the impact of
accounting information on reducing CORR levels (for example, see Houqe & Monem, 2016;
Malagueño et al., 2010; Wu, 2005). However, this issue is outside the scope of this study, as the
present study examines the influence of CORR on EM, and on the CSR and EM relationship.
Table 6.2 Panel A summarises the relevant literature on the individual effect of CORR on EM, while
Panel B shows the literature on the joint effect of COLL and CORR on EM. As shown in Panel A, this
study has identified five prior studies examining the individual effect of CORR on EM (see Liu, 2016;
Lourenço et al., 2018; Riahi-Belkaoui, 2004; Riahi-Belkaoui & AlNajjar, 2006; Xu et al., 2019).
Using a sample of 34 countries, Riahi-Belkaoui (2004) and Riahi-Belkaoui & AlNajjar (2006) report a
positive relationship between CORR and earnings opacity, using sample of 34 countries between
1985 and 1998. Both studies use EM proxies to measure earnings opacity as an indicator of lower
quality accounting information. Riahi-Belkaoui (2004) explain that the unethical environment
resulting from CORR creates a higher demand for earnings opacity (EM) as management seek to
hide their corruptive actions. Riahi-Belkaoui & AlNajjar (2006) find that, among other social and
economic order factors, CORR levels positively influence earnings opacity (EM), leading to lower
quality accounting information. Lourenço et al. (2018) examine the relationship between CORR and
EM on sample of 1,281 observations from 33 countries, with 68 percent of the sample observations
belonging to developed countries, and the remaining 32 percent of observations belonging to
emerging market countries. The study reports that high CORR perception leads to higher EM in
emerging market countries, but not in their developed counterparts. Lourenço et al. (2018) explain
that the difference in the results between emerging market and developed countries is an is partly
due to the weaker levels of INVPRO in the emerging market countries.
While the studies discussed above examine country-level CORR, two more studies examine firm-
level corruption (see Liu, 2016; Xu et al., 2019). Liu (2016) highlights CORR as an explanatory factor
for corporate misconduct. Using a sample of 61,013 observations from firms from USA, between
1988 and 2006, Liu (2016) suggests that firms with a culture of CORR (proxied by the CORR level of
the directors’ and/or officers’ country of ancestry) are more likely to engage in corporate
misconducts such as, EM, accounting fraud, option backdating and opportunistic insider trading. Xu
et al. (2019) report a positive relationship between political CORR (at the judicial district-level) and
EM, using a sample of 17.862 observations from firms from USA, between 2007 and 2014.

298
The small body of literature on the association between CORR and EM, report quite consistent
findings, suggesting that CORR has a positive effect on EM.
There may be several reasons behind EM being higher in societies with high CORR pervasiveness.
First, managers may use EM to conceal their rent-seeking activities and corruptive practices, such
as bribery, from the general public and those that are affected by it (Riahi-Belkaoui, 2004; Riahi-
Belkaoui & AlNajjar, 2006). Second, managers may manage earnings to conceal the true
performance of their firms, and particularly, understate the firm’s’ financial performance, to avoid
pressures of paying bribes (Bishara, 2011). Third, CORR within organisations may lower the
effectiveness of the internal control systems, such as corporate governance, increasing the
opportunities for EM (García‐Meca & Sánchez‐Ballesta, 2009; Judge et al., 2008). The positive
relationship between CORR and EM is consistent to the informal institution perspective of the
institutional theory, suggesting that corruption creates an unethical atmosphere within the
organisation, making rent-seeking behaviour more acceptable among the organisational members
(Lourenço et al., 2018; Riahi-Belkaoui, 2004). Thus, CORR becomes part of the corporate culture and
individual and group norms (Liu, 2016). Liu (2016) explains that when an individual enters a firm
with a corruptive environment, they become more likely to engage in opportunistic behaviour, to
blend into the existing group norms within the organisation. This may be true even when the
individual’s intrinsic values are contradictory to the group norms, as inability to blend into the group
norms may result in negative consequences, such as, isolation of the individual by other members
within the organisation. This may include, for example, socially distancing the individual, and
reluctance in providing any assistance to the individual (Liu, 2016). While CORR becomes part of the
group norms and belief systems, opportunistic actions such as EM may also become common
practice within firms, as managers may consider EM to be more legitimate in corrupted societies
(see Lewellyn & Bao, 2017).
Consistent to the literature, and to the informal institution perspective of the institutional theory, I
expect to find a positive relationship between the CORR and EM. Additionally, deriving from the
notion that CORR increases EM, I expect CORR to have an effect on the CSR-EM relationship. Thus,
the following hypotheses are tested:
H3.4: Consistent to the informal institution perspective, there is a positive and significant
relationship between CORR and EM.
H3.5: CORR has a significant moderating effect on the relationship between CSR and EM.

299
The present study also examines the joint effect of COLL and CORR on EM, and on the CSR-EM
relationship. As shown in Panel B of Table 6.2, I have identified only one prior study examining the
joint effect of COLL and CORR on EM (see Lewellyn & Bao, 2017). Using a sample of 13,341
observations from 26 countries, between 2012 and 2013, Lewellyn & Bao (2017) find COLL to have
a negative effect on EM, and CORR to have a positive effect on EM. However, the study finds no
significant joint or interaction effect of COLL and CORR on EM. The study explains that COLL,
individually, inhibit EM incentives, as managers have greater concerns for collective welfare of
insiders and stakeholders, while CORR creates more incentives for managers to engage in EM, while.
When COLL and CORR are examined jointly, the study explains that the EM incentives created by
CORR are so strong, that concerns for collective welfare in COLL societies, are no longer able to
constrain EM (Lewellyn & Bao, 2017). The present study adopts a different perspective regarding
COLL, as the present study expects COLL to create more EM incentives, resulting from the separation
of ownership and management groups within firms. As discussed earlier, the present study adopts
the perspective that managers generally consider corporate insiders as part of their in-group, while
shareholders and other stakeholders are external groups. Thus, in COLL societies, when conflicts of
interests exist between managers and shareholders, managers are likely to manage earnings more,
due to greater concern of collective goals of their in-group. In terms of the effect of CORR on EM,
the present study adopts similar perspectives to those presented in the literature, suggesting that
CORR increases EM. Thus, driven by the notion that both COLL and CORR individually have a positive
effect on EM, the present study expects the interaction of COLL and CORR jointly to have a positive
effect on EM. Based on this argument, the present study also expects that the interaction of COLL
and CORR jointly will have a significant effect on the CSR-EM relationship. Thus, the following
hypotheses are tested:
H3.6: Consistent to the informal institution perspective, the interaction of COLL and CORR has a
positive effect on EM.
H3.7: The interaction of COLL and CORR has a significant moderating effect on the relationship
between CSR and EM.

300
Table 6.2 Literature on the Relationship Between CORR and EM
Panel A: Literature on the individual effect of CORR on EM (1) (2) (3) (4) (5) (6)
Authors (Year)
Country Sample (Period)
Research Objective Research method Theories supported Key findings
Riahi-Belkaoui (2004)
34 countries (1985 – 1998)
Examine the effect of CORR on EM (earnings opacity)
Method: OLS DV: EM (Bhattacharya et al., 2003) IV: CORR (Kaufmann et al., 1999)
n/a CORR has a positive effect on EM.
Riahi-Belkaoui & AlNajjar
(2006)
34 countries (1985 – 1998)
Examine the effects of social, economic and accounting order on EM (earnings opacity)
Method: OLS DV: EM (Bhattacharya et al., 2003) IV: Social order (Quality of life); Economic order (CORR (Kaufmann et al., 1999), economic freedom, economic growth)); Accounting order (level of disclosure; auditors adoption of international accounting standards).
Contingency theory
CORR, rule of law and economic growth have positive effects on EM; Economic freedom and quality of life have negative effects EM.
Liu (2016)
USA 8,236 firms /
61,013 observations (1988 – 2006)
Examine the effect of corporate corruption culture on corporate misconduct
Method: OLS DV: EM (Dechow et al., 1995; Kothari et al., 2005); accounting fraud; option backdating; opportunistic insider trading IV: CORR culture (corruption in the officer’s/director’s country of ancestry)
Corporate culture theory
CORR culture has a positive effect on corporate misconduct, including EM.
Lourenço et al. (2018)
33 countries 427 firms /
1,281 observations (2011 – 2013)
Examine the effect of CORR on EM
Method: OLS DV: EM (Dechow et al., 1995) IV: CORR (Transparency International)
Rent-extraction perspective
CORR has a positive effect on EM in emerging markets, but not in developed markets. INVPRO has a negative effect on EM in developed markets, but not in emerging markets.
Xu et al. (2019)
USA 17.862
observations (2007 – 2014)
Examine the effect of local political CORR at judicial district level on EM
Method: OLS, 2SLS DV: EM (Kothari et al., 2005; Roychowdhury, 2006) IV: CORR (convictions from federal judicial district)
Inefficiency theory CORR has a positive effect on EM
Panel B: Literature on the joint effect of COLL and CORR on EM
Authors (Year)
Country Sample (Period)
Research Objective Research method Theories supported Key findings
Lewellyn & Bao (2017)
26 countries 13,341
observations (2012 – 2013)
Examine the effect of culture and CORR on EM
Method: HLM DV: EM (Han et al., 2010; Tucker & Zarowin, 2006) IV: Cultural dimensions – COLL; PD (GLOBE study); CORR (World Bank’s WGI database)
Institutional theory
COLL and PD have negative effects on EM; CORR has a positive effect on EM; Interaction of PD and CORR has a negative effect on EM. No significant interaction effect of COLL and CORR.

301
6.5.4 The Effect of INVPRO on EM
INVPRO is defined as legal systems that protect the rights of investors from expropriation of
managers and controlling shareholders. INVPRO imposes contracts that constrain the extraction of
private control benefits by controlling shareholders and managers (Claessens et al., 2002; Dyck &
Zingales, 2004; La Porta et al., 1998), and allows investors to take disciplinary actions (such as,
replacing managers). As discussed in Chapter 1, EM is an agency cost that often arises due to the
separation of ownership and control of organisations, resulting in information asymmetry between
shareholders and managers. Managers may often take advantage of their greater knowledge of the
firm to opportunistically manage earnings for their self-interest (Dechow & Schrand, 2004).
However, the existence of strong INVPRO provides shareholders with greater protection and power
to take disciplinary actions against managers’ opportunistic actions. Thus, INVPRO is likely to
constrain managers’ opportunities and incentives to manage earnings, as EM may result in
significant negative consequences for managers in countries with strong INVPRO (Leuz et al., 2003).
There is an expanse of literature examining the relationship between INVPRO and EM. Table 6.3
shows a summary the relevant literature examining the relationship between INVPRO and EM. Panel
A of Table 6.3 presents prior studies that discuss the individual effect of INVPRO on EM, and Panel
B presents prior studies that discuss the joint effect of INVPRO on EM.
Prior studies are quite consistent in reporting that strong INVPRO mitigates EM (for example, see
Burgstahler et al., 2006; Cahan et al., 2008; Francis & Wang, 2008; Fung et al., 2013; Haw et al.,
2011; Haw et al., 2004; Houqe et al., 2012; Kanagaretnam et al., 2014; Leuz et al., 2003; Persakis &
Iatridis, 2016; Shen & Chih, 2005). Using a sample of 70,955 firm-year observations from 31
countries, between 1990 and 1999, Leuz et al. (2003) find a negative relationship between INVPRO
and EM. Haw et al. (2004) and Kanagaretnam et al. (2014) examines the role of legal and extra-legal
institutions on EM. Haw et al. (2004) uses a sample of 25,210 observations from 9 East Asian and 13
Western European countries, between 1996 and 1999. While the study does not specifically focus
on INVPRO, Haw et al. (2004) considers the protection of minority shareholders as a component of
the overall legal institutions. The study reports lower EM in countries with strong legal and extra-
legal institutions (including INVPRO for minority shareholders). Kanagaretnam et al. (2014) use a
sample of 14,412 bank-year observations from 35 countries, between 1993 – 2006, using INVPRO
as a proxy for legal institutions. The study also finds a negative relationship between legal and extra-
legal institutions and EM (Kanagaretnam et al., 2014). Shen & Chih (2005), Burgstahler et al. (2006)
and Cahan et al. (2008) also report a negative relationship between INVPRO and EM. Shen & Chih

302
(2005) use a sample of 70,955 firm-year observations from banks from 48 countries, between 1993
and 1999. The results suggest that although strong INVPRO mitigates EM in high-income countries,
in low-income countries, strong legal enforcement may have a contradictory effect. Shen & Chih
(2005) explain that in low-income countries, bank managers may manage earnings more, to avoid
potential penalties arising decreased earnings (or losses). Burgstahler et al. (2006) use a sample of
378,122 observations from 13 European countries, between 1997 and 2003, reporting a negative
effect of INVPRO on EM. Cahan et al. (2008) use a sample of 55,357 firm-year observations from 44
countries, between 1993 and 2002, reporting a negative relationship between INVPRO and EM.
Fung et al. (2013) examine how the differences in INVPRO, between H-Shares and Hong Kong shares,
affect EM, using a sample of 2,031 firm-year observations from firms in Hong Kong, between 1994
to 2003. The study reports a negative effect of INVPRO and EM, evidenced by higher EM among H-
share firms (subject to lower INVPRO) (Fung et al., 2013). Chen, et al. (2016) find that code of ethics
has a negative effect on EM, in countries with weaker INVPRO. Francis & Wang (2008), Haw et al.
(2011) and Persakis & Iatridis (2016) examine audit quality along with INVPRO. Francis & Wang
(2008) adopt a different approach, suggesting that INVPRO has a negative indirect effect on EM via
Big 4 auditors, on a sample of 85,193 firm-year observations from 42 countries, between 1995 and
2004. Haw et al. (2011) also find a negative relationship between INVPRO and EM. Using a sample
of 3,992 observations from 8 East Asian countries, between 2001 and 2004, Haw et al. (2011) also
report that Big 4 auditors have a negative effect on EM, only in countries with strong INVPRO, but
not in those with weak INVPRO. Houqe et al. (2012), using a sample of 104,348 observations from
46 countries, between 1998 and 2007, also report a negative relationship between INVPRO and EM.
Additionally, the study finds that the interaction of INVPRO and IFRS adoption also has a negative
effect on EM, although IFRS adoption, on its own, has no significant effect on EM. Persakis & Iatridis
(2016) find INVPRO and audit quality to have negative effects on EM, individually and jointly, on a
sample of 137,091 firm-year observations from 18 countries, between 2005 and 2012. Bao &
Lewellyn (2017) examine the moderating effect on INVPRO on the relationship between ownership
types and EM, using a sample of 1,200 firms from 24 emerging market countries, between 2008 and
2013. The study finds that while ownership concentration has a positive effect on EM, INVPRO
weakens this relationship (Bao & Lewellyn, 2017).
Some prior studies have also examined the effect of INVPRO on the CSR-EM relationship (for
example, see Chih et al., 2008; Jouber, 2020; Martínez‐Ferrero et al., 2015; Scholtens & Kang, 2013).
These studies are not repeated in Table 6.3, since these studies have already been summarized in

303
the CSR-EM literature discussed in Chapter 2. Using a sample of 46 countries Chih et al. (2008) find
that INVPRO weakens the positive relationship between CSR and EM (specifically, earnings
aggressiveness). Martínez‐Ferrero et al. (2015) report that INVPRO strengthens the negative
relationship between CSR and EM, using a sample of 26 countries. Consistent to this, Jouber (2020)
also report a strengthening effect of INVPRO on the negative CSR-EM relationship, using a sample
of 9 countries. Scholtens & Kang (2013) find a negative relationship between INVPRO and EM,
suggesting that CSR strengthens this negative relationship.
As evidenced from the discussion of the relevant literature presented above, the literature is
consistent in reporting a negative relationship between INVPRO and EM. The negative relationship
between INVPRO and EM is consistent to the formal institutions perspective of the institutional
theory, suggesting that institutional systems create corporate norms, aligning managerial actions to
legitimate behaviour as defined by the institution (Bao & Lewellyn, 2017). Leuz et al. (2003) explain
that strong INVPRO limit the opportunities for insiders (specifically, managers and controlling
shareholders) to opportunistically use the firms’ resources to obtain private benefits of control. This
in turn reduces the incentives to manage earnings, since lower opportunities to extract private
control benefits may mean that insiders have less to hide (Leuz et al., 2003). Cahan et al. (2008)
explain that in countries with strong INVPRO, managers experience greater constraints to manage
earnings, since shareholders are able to take legal actions against managers’ opportunistic actions.
Thus, strong INVPRO mitigates managers’ incentives and opportunities to manage earnings (Cahan
et al., 2008). Furthermore, the literature also suggests that INVPRO has a significant effect on the
CSR-EM relationship. The literature suggests that INVPRO has a role in strengthening the negative
relationship between CSR and EM (for example, see Jouber, 2020; Martínez‐Ferrero et al., 2015),
and weakening the positive (opportunistic) relationship between CSR and EM (for example, see Chih
et al., 2008). Managers, engaged in CSR, in countries with strong INVPRO are more likely to be long-
term oriented (that is, myopia avoidant) (see Jouber, 2020). Consistent with literature, and to the
formal institutions perspective of the institutional theory, I expect to find INVPRO to have a negative
effect on EM, and a moderating effect on the CSR-EM relationship. Thus, I test the following
hypotheses:
H3.8: Consistent to the formal institutions perspective, there is a negative and significant
relationship between INVPRO and EM.
H3.9: INVPRO has a significant moderating effect on the relationship between CSR and EM.

304
The present study also examines the joint effect of COLL and INVPRO on EM and on the CSR-EM
relationship. Some prior studies have examined the joint effect of COLL and INVPRO on EM. It is
essential to consider culture when examining differences in INVPRO across countries (Stulz &
Williamson, 2003). Table 6.3 Panel B presents a summary of these studies. I have identified only two
studies that examine the joint (or interaction) effect of COLL and INVPRO and EM (see Han et al.,
2010; Paredes & Wheatley, 2017). Several other studies examine COLL and INVPRO individually (see
Callen et al., 2011; Doupnik, 2008; Nabar & Boonlert-U-Thai, 2007; Zhang et al., 2013),
Using a sample of 96,409 observations 32 countries, between 1992 and 2003, Han et al. (2010)
suggest that IDV and EM are positively related (that is, negative relationship between COLL and EM),
while INVPRO and EM are negatively related. The study suggests that the interaction of IDV and
INVPRO has a positive effect on EM. Han et al. (2010) explain that in countries with IDV (that is low
COLL) culture, managers are more likely to manage earnings due to prioritizing self-interest over
group welfare. This is more prominent in countries with strong INVPRO. Paredes & Wheatley (2017),
using a sample of 31 countries, find that IDV has a positive effect on accruals-based EM, but a
negative effect on real-earnings management (REM). The study also finds that the effect of INVPRO
on EM loses its statistical significance when culture is included, indicating that culture has a stronger
effect, than INVPRO, in determining EM (Paredes & Wheatley, 2017).
Doupnik (2008) and Callen et al. (2011) each use samples of 31 countries, and report a negative
association between IDV and EM (that is, positive relationship between COLL and EM), and between
INVPRO and EM. Doupnik (2008) and Callen et al. (2011) also suggest that cultural factors have a
stronger effect, in contrast to INVPRO, in determining managers’ engagement in EM. Nabar &
Boonlert-U-Thai (2007) report a negative association between IDV and EM (that is, positive
relationship between COLL and EM), and between INVPRO and EM, across a sample of 30 countries.
Zhang et al. (2013) examine a sample of 41 countries, suggesting a positive relationship between
COLL and EM, and a negative relationship between INVPRO and EM. The study also finds that COLL
has a stronger effect on EM than INVPRO (Zhang et al., 2013).
Yamen et al. (2021) examine the links between culture, institutional quality and EM. Using a sample
involving 38 countries, the study reports that culture has a negative effect on accruals-based EM,
but not REM, while INVPRO has a negative effect on REM but not on accruals-based EM. The study
uses an overall measure of culture using IDV and PD dimensions. However, the study does not report
results on these individual cultural dimensions. Similarly, the study uses an overall measure of

305
institutional quality using a number of proxies, including political stability, voice and accountability,
regulatory quality, rule of law, government effectiveness and corruption control. However, the
study does not report results on these proxies individually.
Overall, the literature suggests that COLL and INVPRO jointly have a significant effect in EM (see
(Han et al., 2010; Paredes & Wheatley, 2017). This is consistent to the institutional theory.
Theoretically, I expect COLL and INVPRO to have contrasting effects on EM. While I expect COLL to
have a positive effect on EM, consistent to the informal institutions perspective, I expect INVPRO to
have a negative effect on EM, consistent to the formal institutions perspective. Furthermore, the
mixed findings in the literature make it difficult to predict the sign of this effect (that is, positive or
negative effect). Also, given the notion COLL and INVPRO jointly affects EM, I expect to find a joint
moderating effect of COLL and INVPRO on the CSR-EM relationship. Thus, the following hypotheses
are tested:
H3.10: Consistent to the institutional theory, the interaction of COLL and INVPRO has a significant
effect on EM.
H3.11: The interaction of COLL and INVPRO has a significant moderating effect on the relationship
between CSR and EM.

306
Table 6.3 Literature on the Relationship Between INVPRO and EM
Panel A: Literature on the individual effect of INVPRO on EM (1) (2) (3) (4) (5) (6)
Authors (Year)
Country Sample (Period)
Research Objective Research method Theories supported Key findings
Leuz et al. (2003)
31 countries 8,616 firms / 70,955
observations (1990 – 1999)
Examine the effect if INVPRO on EM
Method: OLS and 2SLS DV: EM (aggregate EM based on discretionary accruals, smoothing, magnitude of accruals and loss avoidance) IV: INVPRO (La Porta et al., 1998; La Porta et al., 1997)
Managerial opportunism perspective
INVPRO has a negative effect on EM.
Haw et al. (2004)
9 East Asian and 13 Western European
countries 25,210 observations
(1996 – 1999)
Examine the effects of legal and extra-legal institutions on EM
Method: OLS DV: EM (Dechow & Dichev, 2002; Jones, 1991b) IV: Legal institutions (legal tradition, minority rights protection, the efficiency of the judicial system, or disclosure standards); Extra-legal institutions (effectiveness of competition laws, diffusion of the press, and tax compliance)
Agency problem perspective
Legal and extra-legal institutions have negative effects in EM, arising from differences in cash flow and control rights.
Shen & Chih (2005)
48 countries 17,154 banks/
70,955 observations (1993 – 1999)
Examine prevalence of EM in the sample countries, the incentives behind EM, and reasons behind EM variations across countries
Method: Country-wise comparison of EM; OLS DV: EM (Burgstahler & Dichev, 1997; Degeorge et al., 1999; Leuz et al., 2003) IV: INVPRO (La Porta et al., 1998; Leuz et al., 2003)
Prospect theory INVPRO and transparency in accounting disclosure have negative effects on EM.
Burgstahler et al. (2006)
13 European countries 378,122
observations (1997 – 2003)
Examine the interaction effect of market forces and INVPRO on EM
Method: OLS DV: EM (Leuz et al., 2003) IV: INVPRO (La Porta et al., 1998); Market forces
n/a
INVPRO has a negative effect on EM in both private and public European firms; market forces and INVPRO has an interaction effect on EM.
Cahan et al. (2008)
44 countries 55,357 observations
(1993 – 2002)
Examine the effect of INVPRO on the relationship between earnings smoothing
Method: OLS DV: Earnings informativeness (Tucker & Zarowin, 2006) IV: EM (Bhattacharya et al., 2003; Leuz et al., 2003) MOD: INVPRO (La Porta et al., 1998; Leuz et al., 2003)
Managerial opportunism
perspective / Efficient communication
perspective
INVPRO has a negative effect on EM. Income smoothing enhances earnings informativeness in strong INVPRO countries.
Francis & Wang (2008)
42 countries 85,193 observations
(1995 – 2004)
Examine the joint effect of INVPRO and Big 4 auditor on EM
Method: OLS DV: EM (Ball et al., 2000; Basu, 1997; Burgstahler & Dichev, 1997; Frankel et al., 2002) IV: INVPRO (La Porta et al., 1998) MED: Big4 vs non Big4 auditors
n/a INVPRO has a negative indirect effect on EM, via Big 4 auditors

307
Haw et al. (2011)
8 East Asian countries
3,992 observations (2001 – 2004)
Examine the effects of concentrated ownership, INVPRO and Big 4 auditor on EM
Method: OLS DV: EM (McVay, 2006) IV: INVPRO (La Porta et al., 1998); Big4 vs non Big4 auditors; Ownership concentration
Transparent financial reporting and
external monitoring perspectives
INVPRO has a negative effect on EM. Concentrated ownership has a positive effect on EM. Big4 auditors has a negative effect on EM only in countries with strong INVPRO, but not in those with weak INVPRO
Houqe et al. (2012)
46 countries 104,348
observations (1998 – 2007)
Examine the effects of mandatory IFRS adoption and INVPRO on EM
Method: OLS DV: EM (DeFond & Park, 2001; Francis & Wang, 2008) IV: INVPRO (WEF); IFRS adoption
Economic theory
INVPRO has a negative effect on EM; IFRS adoption has no significant effect on EM; the interaction of INVPRO and IFRS has a negative effect on EM
Fung et al. (2013)
Hong Kong 2,031 observations
(1994 – 2003)
Examine the effect of INVPRO differences (H-Shares and Hong Kong shares) on EM
Method: OLS DV: EM (Kothari et al., 2005) IV: H-Shares and Hong Kong shares (dummy)
n/a
INVPRO has a negative effect on EM - H-share firms (with lower levels of INVPRO than other Hong Kong shares) are associated with significantly higher levels of EM.
Kanagaretnam et al. (2014)
35 countries 14,412 bank-year
observations (1993 – 2006)
Examine the effects of legal and extra-legal institutions on EM and earnings quality
Method: 2SLS DV: EM (loan loss provisions meet or beat target) IV: Legal institutions (La Porta et al., 1998); Extra-legal institutions ((Dyck & Zingales, 2004))
Information perspective;
Opportunistic perspective
INVPRO has a negative (positive) effect on EM (earnings quality).
Persakis & Iatridis (2016)
18 countries 137,091
observations (2005 – 2012)
Examine the joint effect of INVPRO and audit quality on EM
Method: OLS DV: EM (Basu, 1997; Dechow et al., 1995; Kormendi & Lipe, 1987; Leuz et al., 2003; Ohlson, 1995) IV: INVPRO (World Economic Forum), Audit quality
n/a INVPRO and audit quality have negative effects on EM, individually and jointly
Bao & Lewellyn
(2017)
24 emerging market countries
1,200 firms (2008 – 2013)
Examine the effect of ownership on EM, and the moderating effect of INVPRO
Method: OLS DV: EM (Han et al., 2010) IV: Ownership (institutional and concentrated); INVPRO (Djankov et al., 2008)
Agency theory; Institutional theory
Ownership concentration has a positive effect on EM, weakened by INVPRO
Panel B: Literature on the joint effect of COLL and INVPRO on EM
Authors (Year)
Country Sample (Period)
Research Objective Research method Theories supported Key findings
Nabar & Boonlert-U-Thai (2007)
30 countries
Examine the effect of culture, language, religion and INVPRO on EM
Method: OLS and 2SLS DV: EM (Leuz et al., 2003) IV: Cultural dimensions – IDV,UA, PD, Masculinity (Hofstede); INVPRO (La Porta et al., 1998; Leuz et al., 2003); language; religion
n/a
IDV (COLL) and INVPRO have negative (positive) effects on EM; UA has a positive effect on EM.

308
Doupnik (2008) 31 countries
Examine the effect of culture and INVPRO on EM
Method: OLS DV: EM (Leuz et al., 2003) IV: Cultural dimensions – IDV,UA, PD, Masculinity, FO (Hofstede); INVPRO (La Porta et al., 1998; Leuz et al., 2003); language; religion
Gray (1998) framework
IDV (COLL) has negative (positive) effect on EM; UA has a positive effect on EM; INVPRO does not have a significant effect on EM when culture is included.
Han et al. (2010)
32 countries 96,409 observations
(1992-2003)
Examine the effect of culture and INVPRO on EM
Method: OLS and Country-weighted least squares DV: EM (Tucker & Zarowin, 2006) IV: Cultural dimensions – IDV,UA, PD, Masculinity (Hofstede); INVPRO (La Porta et al., 1998)
Gray (1998) framework
IDV (COLL) has a positive effect on EM, strengthened by INVPRO. UA has a negative effect on EM, but a positive effect in countries with strong INVPRO.
Callen et al. (2011) 31 countries
Examine the effect of culture and religion on EM
Method: OLS DV: EM (Leuz et al., 2003) IV: Cultural dimensions – IDV,UA, PD, Masculinity, FO (Tang & Koveos, 2008); religion; INVPRO (Leuz et al., 2003)
n/a
IDV (COLL) and INVPRO have negative (positive) effects on EM. UA has a positive effect on EM. INVPRO does not have a significant effect on EM when culture is included.
Zhang, Liang & Sun
(2013) 41 countries
Examine the effect of culture and INVPRO on EM and private control benefits (PCB)
Method: 2LS DV: EM (Leuz et al., 2003); PCB IV: COLL culture (Hofstede; GLOBE study); INVPRO (Djankov et al., 2008; La Porta et al., 1998)
Social network theory COLL (INVPRO) has a positive (negative) effect on EM and PCB
Paredes & Wheatley
(2017)
31 countries 252,935
observations (1987-2012)
Examine the effect of audit quality, culture and INVPRO on EM
Method: HLM DV: EM (Roychowdhury, 2006) IV: Cultural dimensions – IDV,UA, PD, Masculinity (Hofstede); INVPRO (Leuz et al., 2003)
Gray (1998) framework
IDV has a positive effect on accruals-based EM, but a negative effect on REM; UA and masculinity have negative effects on EM; PD has a positive effect on EM; INVPRO has a lower significant effect on EM, when culture is included.

309
6.6 The Conceptual Framework
Figure 6.5 presents the conceptual framework that depicts the main relationships to be tested in
this study. The main purpose of this study is to examine, in an emerging market context, the
relationship between CSR and EM, the individual effects of COLL, CORR and INVPRO on the CSR-EM
relationship, and the joint effects of COLL and CORR, and COLL and INVPRO on the CSR-EM
relationship.

310
Figure 6.5 The Conceptual Framework

311
6.7 Data and Methodology
This section discusses the sample selection procedure for the present study, the main variables used
in the study and the research methodology adopted to test the hypotheses developed in Section
6.5.
6.7.1 Data and Sample
The sample for this study is made up of non-financial firms from 10 emerging market countries listed
on the Datastream Database. The sample countries selected for this study are based on MSCI
classification of emerging markets. MSCI classifies 27 countries as emerging market countries,
namely, Argentina, Brazil, Chile, China, Colombia, Czech Republic, Egypt, Greece, Hungary, India,
Indonesia, Korea, Kuwait, Malaysia, Mexico, Pakistan, Peru, Philippines, Poland, Qatar, Russia, Saudi
Arabia, South Africa, Taiwan, Thailand, Turkey and United Arab Emirates (MSCI, 2021b). Initially,
data is collected for all 27 countries. The country selection is then filtered based on CSR data. Any
country with less than 20 firms having CSR information during the observed years is dropped from
the sample. This results in the final sample of 10 countries – Brazil, China, India, Indonesia, Malaysia,
Russia, South Africa, South Korea, Taiwan and Thailand.
Once the countries are finalized, the sample is further filtered. The final sample is selected based on
the following criteria: 1) the firm must be publicly listed; 2) the firm must be a non-financial firm
(firms with SIC codes between 6000 and 6799 are excluded); 3) the firm must have the required
financial data for the sample period; 4) each Fama-French 12 industry grouping35 must have a
minimum of 8 firms; 4) the firms must have CSR information for the observed years.36 The present
study involves three moderating variables, namely COLL, CORR and INVPRO. The variable CORR is
measured is obtained from two sources – 1) the Worldwide Global Indicators (WGI) index from
World Bank; and 2) Transparency International. Due to unavailability of CORR data from
Transparency International prior to 2012, the sample period for the present study starts from 2012.
The variable INVPRO is also obtained from two sources – 1) World Economic Forum’s (WEF) Global
Competitiveness Index (GCI) Historical Dataset 2007 - 2017; and 2) Financial Freedom index (2017).
Due unavailability of INVPRO data (from WEF’s GCI Index Historical Dataset 2007 - 2017) after 2016,
the sample period of the present study ends in 2016. Thus, the sample period for the present study
35 The present study uses the Fama-French 12 industry grouping for measuring EM (as discussed in greater details in section 6.7.2). 36 Due to high amounts of missing data on CSR in emerging market countries, the final sample selection criteria means that any firm-year observation with missing CSR data is excluded from the sample selection.

312
involves a sample period from 2012 to 2016 inclusive. While this sample period has a shorter time
frame than my first two research studies (reported Chapters 4 and 5, using sample periods between
2002 and 2017), shorter time frame and smaller sample size is common among prior studies
examining emerging market countries, due to limitations of data availability. For example, Scholtens
& Kang (2013) use a sample of 139 firms from 10 Asia-Pacific countries, for a 5-year period, between
2004 and 2008. Haw et al. (2011) use a sample of 3,992 observations from 8 East Asian countries,
for a 4-year period, between 2001 and 2004. Additionally, a number of other studies, focussing on
single emerging market countries, also use relatively smaller sample sizes and sample periods. For
example, Kolsi & Attayah (2018), Gerged et al. (2020) and Chen & Hung (2021) all examine 5-year
sample periods. Kolsi & Attayah (2018) use a sample of 170 observations from firms from UAE
between 2010 and 2014; Gerged et al. (2020) use a sample of 300 observations from Kuwaiti firms
between 2010 and 2014; and Chen & Hung (2021) use a sample of 3,495 observations from
Taiwanese firms between 2010 and 2014. Furthermore, Jordaan et al. (2018), Pratiwi & Siregar
(2019), Buertey et al. (2020), Kumala & Siregar (2020), and Zhang et al. (2021) examine 3-year
sample periods. Jordaan et al. (2018) examine a sample of 214 observations from South African
firms for the years 2008, 2011 and 2013; Pratiwi & Siregar (2019) use a sample of 936 observations
from Indonesian firms between 2014 and 2016; Buertey et al. (2020) use a sample of 354 South
African firms between 2013 and 2015; Kumala & Siregar (2020) use a sample of 105 observations
from Indonesian firms, between 2012 and 2014; and Zhang et al. (2021) use a sample of 1,635
observations from Chinese firms between 2016 and 2018. Lastly, Faisal et al. (2018) and Habbash &
Haddad (2020) use 2-year sample periods. Faisal et al. (2018) use a sample of 479 Indonesian firms
for the years 2012 and 2013; and Habbash & Haddad (2020) use a sample of 225 observations from
Saudi Arabian firms for the years 2015 and 2016. Thus, the sample size and period for the present
study is consistent with prior studies based on emerging market countries.
Table 6.4 shows the sample selection procedure and distribution of the sample. Panel A shows the
sample selection procedure. The initial sample size was 85,150 firm-year observations from 17,030
firms. The exclusion of financial firms (6,270 firm-years), firms with missing financial data over the
sample period (6,845 firm-years), firms with less than 8 firms in their GIC industry grouping (195
firm-years), and observations with missing CSR data (68,368 firm-years) yields a final sample size of
3,472 firm-year observations from 771 firms. As evident, there is a large number of observations
with missing CSR data, which I exclude. The number of observations in any given regression varies
depending on the model-specific data requirements.

313
Table 6.4 Panel B reports the distribution of the sample by the Fama-French 12 industry groups. The
sample is unevenly distributed across industries, with the other and manufacturing industries being
dominant at 25.74% and 15.96% respectively.
Table 6.4 Panel C illustrates the distribution of the sample by country, year and the two subsamples
- Low COLL and High COLL samples (the sub-samples are discussed in greater detail in section 6.7.6).
The country distribution shows that the sample is unevenly distributed across countries, with China
and Taiwan being the dominant countries, with 17.57% and 16.01% observations respectively, while
Thailand and Indonesia are the least dominant countries in the sample, with 3.51% and 4.26%
observations respectively. The year distribution shows that the full sample is unevenly distributed.
The subsample distribution shows that the two subsamples are unevenly distributed, with 42.94%
of the full sample comprising of firm-year observations from firms belonging to Low COLL countries,
while 57.06% of the full sample comprise firm-year observations from firm belonging to High COLL
countries.
The data utilised in this study are obtained from various secondary sources. All financial statement
data have been collected from Datastream’s Worldscope database. Initially, all financial statement
data are collected for the period 2009 to 2017, to enable the use of lagged variables, as well as to
measure EM_DD (the alternate EM measure that is based on a 5-year standard deviation, discussed
in greater detail in the next section). Additionally, the study also uses ESG score from Thomson
Reuters ESG index. The data for COLL are obtained from the published scores by the GLOBE project
from House et al. (2004) and the published scores on Hofstede’s cultural dimensions from Hofstede
Insights (2021). The data for the other national culture variables (that is, the control variables FO
and PD) are obtained from House et al. (2004). The data for CORR is based on the ‘control of
corruption’ index from the World Bank’s WGI database, and the ‘corruption perception index’ from
Transparency International. The data for INVPRO is based on the ‘strength of investor protection’
index from the WEF’s GCI Historical data 2007-2017, and the investor protection scores from the
Financial Freedom Index. Appendix A1 presents a list of the data used, along with their years of
observation.

314
Table 6.4 Sample Selection and Distribution of Sample
Panel A: Data and Sample
Description Number of Observations Number of firms
Initial sample (data available in Datastream) 85,150 17,030 Less: Financial firms (6,270) (1,254) 78,880 15,776
Less: Firms with missing financial data for sample period (6,845) (1,369)
72,035 14,407 Less: Firms with less than 8 firms in their Fama-French 12 industry grouping (195) (39)
71,840 14,368
Less: Observations with missing CSR data (68,368) (13,597)
Total 3,472 771 Panel B: Industry Distribution
Industry name Total number of
observations % of
observations Consumer nondurables 295 8.50 Consumer durables 25 0.72 Manufacturing 554 15.96 Oil, gas and coal extraction and products 230 6.62 Chemicals and allied products 179 5.16 Business equipment 424 12.21 Telephone and television transmission 63 1.81 Utilities 358 10.31 Wholesale, retail and some services 277 7.98 Healthcare, medical equipment and drugs 208 5.99 Other 859 24.74 Total 3,472 100% Panel C: Distribution of observations by country, year and subsample
Full sample 2012 2013 2014 2015 2016 n % n % n % n % n % n % Brazil 370 10.66 70 10.80 75 11.08 76 10.76 76 10.38 73 10.30 China 610 17.57 109 16.82 117 17.28 127 17.99 131 17.90 126 17.77 India 370 10.66 64 9.88 69 10.19 75 10.62 81 11.07 81 11.42 Indonesia 148 4.26 23 3.55 28 4.14 30 4.25 33 4.51 34 4.80 Malaysia 201 5.79 37 5.71 38 5.61 40 5.67 42 5.74 44 6.21 Russia 159 4.58 31 4.78 31 4.58 32 4.53 33 4.51 32 4.51 South Africa 470 13.54 99 15.28 95 14.03 93 13.17 92 12.57 91 12.83 South Korea 466 13.42 88 13.58 89 13.15 93 13.17 101 13.80 95 13.40 Taiwan 556 16.01 109 16.82 114 16.84 115 16.29 115 15.71 103 14.53 Thailand 122 3.51 18 2.78 21 3.10 25 3.54 28 3.83 30 4.23 Total (Full sample) 648 18.7% 677 19.5% 706 20.3% 732 21.1% 709 20.4% 3,472 100%
Low COLL sub-sample 1491 42.94 282 43.52 291 42.98 301 42.63 310 42.35 307 43.30
High COLL sub-sample 1981 57.06 366 56.48 386 57.02 405 57.37 422 57.65 402 56.70
Total (Full sample) 3,472 100% 648 100% 677 100% 706 100% 732 100% 709 100%

315
6.7.2 Dependent Variable
As discussed in prior chapters, the dependent variable in this study is EM, proxied by discretionary
accruals, measured following the modified Jones model by Dechow et al. (1995). The model is
estimated using the equation below for each country, each year and each industry (based on the
Fama-French 12 industry classification37):
TAit = 1 (1/Ait-1) + 2 (REVit - RECit) + 3 PPEit + it (1)
where
TAit = total accruals in year t for firm i scaled by total assets at t - 1;
REVit = change in revenues (revenues in year t less revenues in year t – 1) for firm i scaled by total assets at t - 1;
RECit = change in accounts receivables (net receivables in year t less net receivables in year t – 1) for firm i scaled by total assets at t - 1;
PPEit = gross property, plant and equipment in year t for firm i scaled by total assets at t - 1;
Ait – 1 = total assets in year t – 1 for firm i;
it = error term in year t for firm i.
Similar to Dechow et al. (1995), the following equation will be used to calculate the total accruals:
TAit = (CAit - CLit - Cashit + ST Debtit – DEPit)/Ait – 1
(2)
where
CAit = change in current assets (current assets in year t less current assets in year t – 1) for firm i;
Cashit = change in cash (cash in year t less cash in year t – 1) for firm i;
CLit = change in current liabilities (current liabilities in year t less current liabilities in year t – 1) for firm i;
ST Debt = change in short-term debts (short-term debts in year t less short-term debts in
37 I use the Fama-French 12 industry classification (instead of the 2-digit SIC code as used in Chapters 4 and 5). This is because, due to the limited sample size of the emerging market sample, the use of 2-digit SIC codes would result in significant loss of data, making the sample size even smaller.

316
year t – 1) for firm i (missing values for short-term debts are replaced with zero);
DEPit = depreciation and amortization expenses in year t for firm i;
Ait – 1 = total assets in year t – 1 for firm i.
As in Studies 1 and 2 (reported in Chapters 4 and 5), to check the sensitivity of the regression
analyses, I use an alternate measure of EM, based on the accruals quality model by Dechow & Dichev
(2002). I include the modification suggested by Francis et al. (2005) by including change in revenue
and property plant and equipment. Thus, to measure the alternate EM measure, EM_DD, I estimate
the following equation for each year and 2-digit SIC code:
TAit = 0 + 1 CFOit – 1 + 2CFOit +3CFOit + 1 + 4 REVit + 5PPEit + it (3)
where
TAit = total accruals (as measured in equation (2)) in year t for firm i scaled by average total assets for years t and t-1;
CFOit – 1 = cash flow from operations in year t-1 for firm i scaled by average total assets for years t and t-1;
CFOit = cash flow from operations in year t for firm i scaled by average total assets for years t and t-1;
CFOit + 1 = cash flow from operations in year t+1 for firm i scaled by average total assets for years t and t-1;
REVit = change in sales revenue (sales revenue in year t less sales revenue in year t – 1) for firm i scaled by average total assets for years t and t-1;
PPEit = gross property, plant and equipment in year t for firm i scaled by average total assets for years t and t-1;
it = error term in year t for firm i.
As discussed in Chapters 4 and 5, EM_DD (the alternate measure for EM) is measured as the 5-year
standard deviation of the residual it from equation (3) using the Dechow & Dichev (2002) model
(EM_DD). A higher value indicates higher EM, whereas a lower value indicates lower EM and better-
quality accruals.

317
6.7.3 Independent Variables
The independent variable for the present study is CSR, based on the ESG scores obtained from
Thomson Reuters’ ESG index. The ESG scores are firm-level, annual data, discussed in greater details
in Chapter 3. The ESG score is based on a weighted average score of the three ESG (or CSR)
dimensions – ENV (with a weighting of 34%), SOC (with a weighting of 35.5%) and GOV (with a
weighting of 30.5%) (Thomson Reuters, 2018). The present study also uses these three individual
CSR dimensions – ENV, SOC and GOV, in addition to using the ESG score as a measure for overall
CSR,
ENV refers to the environmental dimension or pillar of CSR. The ENV score, from Thomson Reuters
ESG index, is based on three categories with uneven weighting, namely – 1) resource use; 2)
emissions; and 3) innovation (Thomson Reuters, 2018). The first ENV category, resource use, with a
weighting of 11% of the overall ESG score, measures performance on the reduction of resource use
(such as, materials, energy and water) and use of eco-efficient solutions. The second ENV category,
emissions, with a weighting of 12% of the overall ESG score, measures performance on emission
reduction. The third ENV category, innovation, with a weighting of 11% of the overall ESG score,
measures performance on developing environmental technologies, processes and eco-designed
products (Thomson Reuters, 2018).
SOC refers to the social dimension or pillar of CSR. The SOC score, from Thomson Reuters ESG index,
is based on four categories with uneven weighting, namely – 1) workforce; 2) human rights; 3)
community; and 4) product responsibility (Thomson Reuters, 2018). The first SOC category,
workforce, with a weighting of 16% of the overall ESG score, measures performance on the creating
and ensuring job satisfaction, safe workplace, equal opportunities, diversity and development
opportunities for employees. The second SOC category, human rights, with a weighting of 4.5% of
the overall ESG score, measures performance on effectively respecting basic human rights
agreements. The third SOC category, community, with a weighting of 8% of the overall ESG score,
measures performance on protecting public health and maintaining business ethics. The fourth SOC
category, product responsibility, with a weighting of 7% of the overall ESG score, measures
performance on creating good quality products and services, ensuring health and safety, honesty
and data privacy for customers (Thomson Reuters, 2018).
GOV refers to the governance dimension or pillar of CSR. The GOV score, from Thomson Reuters
ESG index, is based on three categories with uneven weighting, namely – 1) management; 2)

318
shareholders; and 3) CSR strategy (Thomson Reuters, 2018). The first GOV category, management,
with a weighting of 19% of the overall ESG score, measures performance and commitment towards
following best practices of corporate governance polices. The second GOV category, shareholders,
with a weighting of 7% of the overall ESG score, measures performance on equal treatment of
stakeholders and using anti-takeover strategies. The third GOV category, CSR strategy, with a
weighting of 4.5% of the overall ESG score, measures performance on communication of the firms’
integration of ESG practices in their daily operations (Thomson Reuters, 2018).
To test the sensitivity of my analyses, I use alternate measures of each of the three ESG dimensions.
Consistent to the process followed in Chapter 4, and following Gao and Zhang (2015), I compute
dummy variables for each CSR dimension. The dummy variables equal 1, if the ESG dimension score
for the firm is greater than the median (by year and two-digit SIC code classification), and 0
otherwise. Thus, the alternate measure of ENV is ENV_DUM (a dummy variable that equals 1 if the
ENV score is greater than the median ENV for the year and industry, and 0 otherwise); the alternate
measure of SOC is SOC_DUM (a dummy variable that equals 1 if the SOC score is greater than the
median SOC for the year and industry, and 0 otherwise); and the alternate measure of GOV is
GOV_DUM (a dummy variable that equals 1 if the GOV score is greater than the median GOV for
the year and industry, and 0 otherwise).
6.7.4 Moderating Variables
The present study uses three moderating variables, namely, COLL, CORR and INVPRO.
Institutional Collectivism (COLL)
The first moderating variable for the present study is COLL, based on the GLOBE measure of
institutional collectivism. The use of Hofstede’s cultural dimensions, although very common in the
literature, has been the subject of some concern regarding its reliability and validity (Zhang et al.,
2013). The GLOBE study measures were developed to overcome the weaknesses of Hofstede’s
cultural dimensions. The Globe research project appears to involve more recent and extensive
research on cultural dimensions, involving a study of 18,000 managers across 62 societies (House et
al., 2004; Samson & Daft, 2009). In addition to the four dimensions used by Hofstede, the Globe
study introduces five more dimensions; the total of nine cultural dimensions include Assertiveness,
Future Orientation, Gender Differentiation, Power Distance, Societal COLL, Individual COLL,
Performance Orientation and Humane Orientation (House et al., 2004). While the Globe research
cultural dimensions are mostly very similar to Hofstede’s cultural dimensions, the Globe research

319
provides an extension to the Individualism-COLL dimension, originally proposed by Hofstede. The
Globe research argues that this dimension may have different implications at the societal and
organizational level and thus proposes a separation of this dimension into two components, namely,
institutional COLL and in-group COLL (House et al., 2004). Institutional COLL refers to institutional
practices where group values and loyalty are valued more than individual goals (House et al., 2004).
In-group COLL refers to the degree of interdependence and loyalty towards family (House et al.,
2004). Since the present study examines managerial behaviour within firms (that is, institutions),
and institutional practices, the Institutional COLL score is more appropriate for the context of the
present study.
The GLOBE measure of COLL is based on a scale of 1 to 7, with 1 showing countries with the lowest
institutional COLL and 7 showing the highest institutional COLL. The moderating variable COLL is a
continuous variable, measured as a percentage of the total score of 7 for the institutional COLL
scores for each of the 10 countries in my sample.
As an alternate measure of COLL, I use the Hofstede’s cultural dimension Individualism-Collectivism
(COLL_H). COLL_H is measured as the reverse score of the IDV score from Hofstede Insights (2021).
Corruption pervasiveness (CORR)
The second moderating variable, CORR, is based on the ‘control of corruption’ index from World
Bank’s WGI database. The WGI database summarizes assessments of the country-level governance
quality (that is, governance provided by enterprises, citizens and expert survey respondents) (World
Bank, 2020). The WGI database collects its data from a number of sources, including, survey
institutes, think tanks, private organisations and international organisations. The control of
corruption index is a reflection of the “perceptions of the extent to which public power is exercised
for private gain, including both petty and grand forms of corruption, as well as ‘capture’ of the state
by elites and private interests” (World Bank, 2020). The index is based on a scale of -2.5 to 2.5,
where -2.5 represents weakest control (high corruption), and 2.5 represent highest control (low
corruption).
Following Lewellyn & Bao (2017), I measure CORR as a reverse score of the control of corruption
score from the WGI database.
As an alternate measure of CORR, I use CORR_TRI, measured by reverse-scoring the corruption
perception index from Transparency International. The corruption perception index captures

320
assessment of corrupt behaviour (such as, bribery, diversion of public funds, use of public office for
private gain, nepotism and state capture) in the public sector. The index is based on a scale of 0 to
100, with 0 representing the highest corruption and 100 representing no corruption (Transparency
International, 2021).
Investor Protection (INVPRO)
The third moderating variable, INVPRO, is based on the ‘strength of investor protection’ index from
the GCI from the WEF database. Several prior studies use the investor protection scores compiled
by La Porta et al. (1997). However, Spamann (2010) highlights some concerns with this measure,
finding that there are significant differences in the Anti-Directors Rights Index between common
law and code law countries. Thus, following Houqe et al., 2012 and Persakis & Iatridis, 2016, the
present study uses an updated measure of INVPRO from the WEF database. As noted above, the
present study specifically uses the strength of investor protection index that is based on a scale of
0 to 10, with 0 representing the weakest level (or no) INVPRO, and 10 representing the strongest
INVPRO (World Economic Forum, 2020). WEF measures the INVPRO index as a combination of – 1)
the extent of disclosure index (representing transparency of transactions), 2) the extent of director
liability index (representing director’s liability for self-dealing), and 3) the ease of shareholder suit
index (representing shareholders’ ability to take legal actions against officers and directors for
misconduct) (World Economic Forum, 2020).
The present study measures INVPRO as a continuous variable, based on a percentage of the total
score of 10, for each country and year.
As an alternate measure of INVPRO, I use INVPRO_FF. INVPRO_FF is a static score of INVPRO, based
on a scale of 0 to 10, obtained from the Financial Freedom index. As above, INVPRO is measured as
a continuous variable, based on a percentage of the total score of 10 for each country.
6.7.5 Control Variables
To avoid problems of correlated omitted variables, this study includes several control variables that
are known to impact EM according to prior studies. The firm-level control variables used in the
present study are the same as those used in the first two research studies as reported in Chapters
4 and 5. The present study includes 5 firm-level control variables – 1) SIZE (firm size measured as

321
the natural logarithm of market value of equity); ROA38 (firm performance measured as income
before extraordinary items, scaled by lagged total assets); LEV (leverage measured as long-term
debts divided by total assets); RD (research and development intensity measured as the total R&D
expenses divided by net sales); and MB (growth opportunities measured as the market to book
ratio). Additionally, since the present study uses an international sample, it includes two country-
level control variables relating to cultural dimensions, namely FO, representing the Future
Orientation dimension of culture, and PD, representing the Power Distance dimension of culture.
Guan et al. (2005) suggest a positive relationship between FO and EM. Several studies suggest that
PD has an effect on EM. Some studies suggest a positive relationship between PD and EM (for
example, see Guan & Pourjalali, 2010; Kanagaretnam et al., 2011), while others suggest a negative
relationship (for example, see Lewellyn & Bao, 2017; Paredes & Wheatley, 2017; Riahi & Omri,
2013).
Similar to prior chapters, all firm-level variables are winsorized at the 1st and 99th percentiles, to
minimise the undesirable effects of outliers. Table 6.5 lists all the variables used in the present study
and the definitions and measurements of each variable.
38 The present study uses firm-level ROA as a control for firm performance. In Chapter 4 and 5, I use industry-adjusted ROA, measured as the ROA for each firm-year minus the average ROA for the industry-year. The present study uses HLM model for analysis, that requires all variables to be centered. Since ROA, in the present study, is mean-centered for the regression models (discussed in greater detail in section 6.7.5), I do not use industry-adjusted ROA for this study.

322
Table 6.5 Definition and Measurement of Variables
Variable Symbol Definition and Method of measurement
Dependent variable
Earnings Management EM Absolute value of discretionary accruals using the modified Jones model (Dechow et al., 1995): TAit = i [1/Ait-1] + 1i (REVit - RECit) + 2i (PPEit) + it
Earnings Management alternate measure
EM_DD Accruals quality model following Dechow & Dichev (2002): TAit = 0 + 1i CFOit – 1 + 2i CFOit + 3i CFOit + 1 + 4i REVit + 5i PPEit + it
Independent Variable
Corporate Social Responsibility CSR ESG score from Thomson Reuters ESG index.
Environmental dimension ENV Environmental dimension score from Thomson Reuters ESG index.
Social dimension SOC Social dimension score from Thomson Reuters ESG index.
Governance dimension GOV Governance dimension score from Thomson Reuters ESG index.
Environmental dimension alternate measure
ENV_DUM Dummy variable equals 1 if the Thomson Reuters ENV score is greater than the median (by year and industry classification), and 0 otherwise.
Social dimension alternate measure
SOC_DUM Dummy variable equals 1 if the Thomson Reuters SOC score is greater than the median (by year and industry classification), and 0 otherwise.
Governance dimension alternate measure
GOV_DUM Dummy variable equals 1 if the Thomson Reuters GOV score is greater than the median (by year and industry classification), and 0 otherwise.
Moderating Variables
Collectivism culture COLL Institutional Collectivism score from the GLOBE study.
Collectivism culture alternate measure
COLL_H Inverse measure of Hofstede’s cultural dimension IDV-COLL.
Corruption pervasiveness CORR Inverse measure of control of corruption index from World Bank’s WGI index.
Corruption pervasiveness alternate measure
CORR_TRI Inverse measure of corruption perception index from Transparency International.
Investor Protection INVPRO Strength of investor protection from WEF’s GCI Historical Data 2007-2017.
Investor Protection alternate measure
INVPRO_FF Investor protection score from Financial Freedom index.
Control Variables
Firm Size SIZE Natural logarithm of market of market value of equity
Firm Leverage LEV Long-term debts divided by total assets
Firm Performance ROA Earnings before interest and tax scaled by lagged total assets
Research and Development Intensity
RD Research and Development expense divided by total sales
Firm Growth opportunities MB Market to Book ratio
Future Orientation FO Future orientation cultural dimension from GLOBE study
Power Distance PD Power Distance cultural dimension from GLOBE study
Instrument Variables (for 2SLS)
Industry median ENV ENV_M The industry median of ENV (based on Fama-French 48 industry classification, used as an instrument for ENV to address endogeneity
Industry median SOC SOC_M The industry median of SOV (based on Fama-French 48 industry classification, used as an instrument for SOC to address endogeneity
Industry median GOV GOV_M The industry median of GOV (based on Fama-French 48 industry classification, used as an instrument for GOV to address endogeneity

323
6.7.5 Research Models
This section discusses the research models used in this study to address research objective 3, that
is, to investigate when CSR affects EM, by examining the contexts COLL culture, CORR and INVPRO,
in emerging market countries. To address research objective 3, I state the following three research
questions:
Research Question 3.1: Does CSR have a significant effect on EM in emerging market countries?
Research Question 3.2: Do COLL and CORR, individually and jointly, have significant effects on the
CSR-EM relationship in emerging market countries?
Research Question 3.3: Do COLL and INVPRO, individually and jointly, have significant effects on the
CSR-EM relationship in emerging market countries?
The present study adopts the Hierarchical Linear Modelling (HLM) technique, since the sample
involves two levels of variables – level 1 being the firm-level variables, and level 2 being the country-
level. The dependent variable (EM), the independent variables (CSR, ENV, SOV and GOV), and most
of the control variables (SIZE, LEV, ROA, RD and MB) are firm-level variables, while the moderating
variables (COLL, CORR and INVPRO) and two of the control variables (FO and PD) are country-level
variables. The firm-level variables (that is, level 1) are nested within the countries (that is, level 2).
Since the country-level variables are nested and clustered, they are not independent, and may lead
to violation of the assumptions required for using linear regressions, or ordinary least squares (OLS)
estimations (Paredes & Wheatley, 2017). When a study involves multi-level variables, using OLS
estimation may increase the possibility of type 1 errors and cause the results to be biased,
misestimated and heteroskedastic (Bao & Lewellyn, 2017; Lewellyn & Bao, 2017; Paredes &
Wheatley, 2017; Rabe-Hesketh & Skrondal, 2008; Raudenbush & Bryk, 2002). Prior studies
recommend the use of HLM technique to be a more suitable approach for analyzing multi-level data,
since HLM technique reduces bias in the estimation of standard error of the regression coefficients
(for example, see Lewellyn & Bao, 2017; Paredes & Wheatley, 2017). Thus, following prior studies,
the present study uses HLM technique to examine the effects of country-level factors (COLL, CORR
and INVPRO) on the CSR-EM relationship (based on firm-level CSR and EM), after controlling for
both firm-level and country-level factors.
Following Bao and Lewellyn (2017), all firm-level variables (EM, EM_DD, CSR, ENV, SOC, GOV, SIZE,
LEV, ROA, RD and MB) are centered using mean-centering, and the country-level variables (COLL,

324
CORR, CORR_TRI, INVPRO, INVPRO_FF, FO and PD) are centered using group-centering, with country
being the group. All regression models use dummy variables to capture industry effects, based on
the Fama-French 12 industry classification. The research analysis is undertaken in two stages, as
discussed below. Table 6.6 presents a summary of the research analyses undertaken to test the
hypotheses.

325
Table 6.6 Summary of Research Questions and Hypotheses testing
Research Question Hypothesis Theory Expected sign
3.1. Does CSR have a significant effect on EM in emerging market countries?
H3.1a: Consistent with the managerial myopia hypothesis, there is a positive and significant relationship between CSR and EM. Managerial myopia hypothesis
1= + (quation 4a) 1, , = + (quation 4b)
H3.1b: Consistent with the myopia avoidance hypothesis, there is a negative and significant relationship between CSR and EM. Myopia avoidance hypothesis
1= - (quation 4a) 1, , = − (quation 4b)
3.2. Do COLL and CORR, individually and jointly, have significant effects on the CSR-EM relationship in emerging market countries?
H3.2: Consistent with the informal institutions perspective, there is a positive and significant relationship between COLL and EM.
Institutional theory (informal institutions perspective) 𝛼4 = + (quation 5)
H3.3: COLL has a significant moderating effect on the relationship between CSR and EM.
Managerial myopia hypothesis / Myopia avoidance hypothesis (stronger/weaker)
6, 7,8 = +/- (quation 5)
H3.4: Consistent with the informal institutions perspective, there is a positive and significant relationship between CORR and EM.
Institutional theory (informal institutions perspective) 5 = + (quation 5)
H3.5: CORR has a significant moderating effect on the relationship between CSR and EM.
Managerial myopia hypothesis / Myopia avoidance hypothesis (stronger/weaker)
9, 10,11 = +/- (quation 5)
H3.6: Consistent with the informal institutions perspective, the interaction of COLL and CORR has a positive effect on EM.
Institutional theory (informal institutions perspective) 12= + (quation 5)
H3.7: The interaction of COLL and CORR has a significant moderating effect on the relationship between CSR and EM.
Managerial myopia hypothesis / Myopia avoidance hypothesis (stronger/weaker)
13, 14,15 = +/- (quation 5)
3.3. Do COLL and INVPRO, individually and jointly, have significant effects on the CSR-EM relationship in emerging market countries?
H3.8: Consistent to the formal institutions perspective, there is a negative and significant relationship between INVPRO and EM.
Institutional theory (formal institutions perspective) 5 = - (quation 6)
H3.9: INVPRO has a significant moderating effect on the relationship between CSR and EM.
Managerial myopia hypothesis / Myopia avoidance hypothesis (stronger/weaker)
9, 10,11 = +/- (quation 6)
H3.10: Consistent to the institutional theory, the interaction of COLL and INVPRO has a significant effect on EM.
Institutional theory (formal institutions perspective) 12= +/- (quation 6)
H3.11: The interaction of COLL and INVPRO has a significant moderating effect on the relationship between CSR and EM.
Managerial myopia hypothesis / Myopia avoidance hypothesis (stronger/weaker)
13, 14,15 = +/- (quation 6)

326
Base models to test of hypotheses H3.1a and H3.1b
First, I examine the relationship between CSR and EM, and the relationship between the CSR
dimensions (ENV, SOC and GOV) and EM. Since the present study uses a totally different sample
than the ones used in the first two studies (as reported in Chapters 4 and 5), the CSR and EM
relationship is tested again on this new sample involving 10 emerging market countries. As part of
Phase 1 of the analysis, I address research question 3.1, and test hypotheses H3.1a and H3.1b, by
estimating the following base model equations as HLM:
EMit = 𝛽0 + 𝛽1CSRit + 𝛽2SIZEit + 𝛽3LEVit + 𝛽4ROAit + 𝛽5RDit + 𝛽6MBit + 𝛽7 FO + 𝛽8PD + it (4a)
EMit = 𝛼0 + 𝛼1ENVit + 𝛼2SOCit + 𝛼3GOVit + 𝛼4SIZEit + 𝛼5LEVit + 𝛼6ROAit + 𝛼7RDit + 𝛼8MBit + 𝛼9 FO +
𝛼10PD+ it (4b)
where
EMit = Earnings management in year t for firm i, proxied by discretionary accruals using the modified Jones model by Dechow et al. (1995);
CSRit = The ESG score from Thomson Reuters ESG index in year t for firm i;
ENVit = The environmental dimension score from Thomson Reuters ESG index in year t for firm i;
SOCit = The social dimension score from Thomson Reuters ESG index in year t for firm i;
GOVit = The governance dimension score from Thomson Reuters ESG index in year t for firm i;
SIZEit = Firm size in year t for firm i, measured as the natural logarithm of market value of equity;
LEVit = Firm leverage in year t for firm i, measured as long-term debts divided by total assets;
ROAit = Return on assets in year t for firm i, measured as income before extraordinary items, scaled by lagged total assets;
RDit = Research and development intensity in year t for firm i, measured as research and development expenses divided by net sales;
MBit = Market to book ratio in year t for firm i;
FO = GLOBE measure of future orientation dimension of country-level culture;
PD = GLOBE measure of power distance dimension of country-level culture.

327
Equations (4a) and (4b) are estimated as part of testing hypotheses H3.1 and H3.2, and address
research question 3.1, by examining the relationship between CSR and EM. While equation (4a)
examines the effect of overall CSR on EM, equation (4b) examines the effect of ENV, SOC and GOV
(that is, the CSR dimensions) on EM. Hypotheses H3.1a and H3.1b test two opposing views on the
relationship between CSR and EM. H3.1a tests whether CSR has a positive effect on EM (consistent
with the managerial myopia hypothesis), while H3.1b tests whether CSR has a negative effect on
EM (consistent with the myopia avoidance hypothesis). The effect of overall CSR on EM is captured
by the coefficient 𝛽1 from equation (4a), and the effects of ENV, SOC and GOV are captured by the
coefficients 𝛼1, 𝛼2 and 𝛼3 respectively, from equation (4b). A positive and statistically significant
value on one or more of these coefficients (𝛽1 from equation (4a), and 𝛼1, 𝛼2 and 𝛼3 from equation
(4b)), will support hypothesis H3.1a, suggesting a positive relationship between CSR and EM. In
contrast, a negative and statistically significant value on one or more of these coefficients (𝛽1 from
equation (4a), and 𝛼1, 𝛼2 and 𝛼3 from equation (4b)), will support hypothesis H3.1b, suggesting a
negative relationship between CSR and EM. Finding support for H3.1a and/or H3.1b will address
research question 3.1.
The main purpose of Phase 1 of the analysis is to establish a relationship between CSR and EM,
unconditional of any moderating variables. The results from the base model analysis (discussed in
greater detail in section 6.8.4) establishes a relationship between the CSR dimensions (ENV and SOC)
and EM, but not between overall CSR and EM. Thus, in the main model analyses, I examine the
individual CSR dimensions as opposed to overall CSR.
Main model 1 to test hypotheses H3.2 to H3.7
To address research question 3.2, and test hypotheses H3.2 to H3.7, I estimate the following
equation as HLM, following moderation approach using the Process Model 3 developed by Hayes,
(2013b):
EMit = 𝛼0 + 𝛼1ENVit + 𝛼2SOCit + 𝛼3GOVit + 𝛼4COLL+ 𝛼5CORRt + 𝛼6ENVit*COLL + 𝛼7SOCit*COLL+
𝛼8GOVit*COLL + 𝛼9ENVit*CORRt + 𝛼10SOCit*CORRt + 𝛼11GOVit*CORRt + 𝛼12COLL*CORRt
+ 𝛼13ENVit*COLL*CORRt + 𝛼14SOCit* COLL*CORRt + 𝛼15GOVit*COLL*CORRt + 𝛼16SIZEit + 𝛼17LEVit +
𝛼18ROAit + 𝛼19RDit + 𝛼20MBit + 𝛼21FOt + 𝛼22PD + it (5)
where
EMit = Earnings management in year t for firm i, proxied by discretionary accruals using the

328
modified Jones model by Dechow et al. (1995);
ENVit = The environmental dimension score from Thomson Reuters ESG index in year t for firm i;
SOCit = The social dimension score from Thomson Reuters ESG index in year t for firm i;
GOVit = The governance dimension score from Thomson Reuters ESG index in year t for firm i;
COLL = GLOBE measure of institutional COLL dimension of country-level culture;
CORRt = CORR pervasiveness in a country, measured by reverse-scoring the ‘control of CORR’ measure from World Bank’s WGI index;
SIZEit = Firm size in year t for firm i, measured as the natural logarithm of market value of equity;
LEVit = Firm leverage in year t for firm i, measured as long-term debts divided by total assets;
ROAit = Return on assets in year t for firm i, , measured as income before extraordinary items, scaled by lagged total assets;
RDit = Research and development intensity in year t for firm i, measured as research and development expenses divided by net sales;
MBit = Market to book ratio in year t for firm i;
FO = GLOBE measure of future orientation dimension of country-level culture;
PD = GLOBE measure of power distance dimension of country-level culture.
Test of hypotheses H3.2 and H3.3
As the first step to addressing research question 3.2, I test hypotheses H3.2 and H3.3, by estimating
equation (5). H3.2 tests the relationship between COLL and EM that is captured by the coefficient
𝛼4 from equation (5). A positive and statistically significant value on 𝛼4 will provide support for
hypothesis H3.2. H3.3 tests the moderating effect of COLL on the relationship between the CSR
dimensions (ENV, SOC and GOV) and EM. This is captured by the coefficient 𝛼6, 𝛼7 and 𝛼8 from
equation (5). A positive or negative statistically significant value on one or more of the coefficients
(𝛼6, 𝛼7 and 𝛼8) will indicate that COLL has a moderating effect on the relationship between CSR and
EM and will provide support for hypothesis (H3.3). Specifically, a positive value on either 𝛼6, 𝛼7 and
𝛼8 from equation (5) will suggest that COLL has a strengthening (weakening) effect of the positive
(negative) relationship between the CSR dimensions and EM, while a negative value will suggest

329
that COLL has a weakening (strengthening) effect of the positive (negative) relationship between
the CSR dimensions and EM. The effect of ENV on EM, conditional on COLL, is estimated as the sum
of the coefficients 𝛼1 + 𝛼6*COLL from equation (5); the effect of SOC on EM, conditional on COLL, is
estimated as the sum of the coefficients 𝛼2 + 𝛼7*COLL from equation (5); and effect of GOV on EM,
conditional on COLL, is estimated as the sum of the coefficients 𝛼3 + 𝛼8*COLL from equation (5). The
conditional effects provide further validation to the moderating effect of COLL, by showing whether
the relationship between the CSR dimensions and EM changes with the level of COLL. Statistically
significant coefficients on one or more of these conditional effects will provide further validation to
support hypothesis H3.3 and will address research question 3.2 partially by explaining the individual
effect of COLL on the CSR-EM relationship.
Test of hypotheses H3.4 and H3.5
As the second step to addressing research question 3.2, I test hypotheses H3.4 and H3.5, by
estimating equation (5). H3.4 tests the relationship between CORR and EM that is captured by the
coefficient 𝛼5 from equation (5). A positive and statistically significant value on 𝛼5 will provide
support for hypothesis H3.4. H3.5 tests the moderating effect of CORR on the relationship between
the CSR dimensions (ENV, SOC and GOV) and EM. This is captured by the coefficients 𝛼9, 𝛼10 and 𝛼11
from equation (5). A positive or negative statistically significant value on either one or more of the
coefficients 𝛼9, 𝛼10 and 𝛼11 will indicate that CORR has a moderating effect on the relationship
between CSR and EM and will provide support for hypothesis H3.5. Specifically, a positive value on
either of the coefficients, 𝛼9, 𝛼10 and 𝛼11, from equation (5) will suggest that CORR has a
strengthening (weakening) effect of the positive (negative) relationship between the CSR
dimensions and EM, while a negative value will suggest that CORR has a weakening (strengthening)
effect of the positive (negative) relationship between the CSR dimensions and EM. The effect of ENV
on EM, conditional on CORR, is estimated as the sum of the coefficients 𝛼1 + 𝛼9*CORR from equation
(5); the effect of SOC on EM, conditional on CORR, is estimated as the sum of the coefficients 𝛼2 +
𝛼10*CORR from equation (5); and the effect of GOV on EM, conditional on CORR, is estimated as the
sum of the coefficients 𝛼3 + 𝛼11*CORR from equation (5). The conditional effects provide further
validation to the moderating effect of CORR, by showing whether the relationship between the CSR
dimensions and EM changes with the level of CORR. Statistically significant coefficients on one or
more of these conditional effects will provide further validation to support hypothesis H3.5, and will
address partially research question 3.2, by explaining the individual effect of CORR on the CSR-EM
relationship.
330
Test of hypotheses H3.6 and H3.7
As the final step to addressing research question 3.2, I test hypotheses H3.6 and H3.7, by estimating
equation (5) to examine the joint effect of COLL and CORR on the relationship between CSR and EM.
H3.6 tests the joint effect of COLL and CORR on EM that is captured by the coefficient 𝛼12 from
equation (5). A positive and statistically significant value on 𝛼12 will provide support for hypothesis
H3.6. H3.7 tests the effect of the interaction of COLL and EM on the relationship between the CSR
dimensions (ENV, SOC and GOV) and EM (that is, the 3-way interaction). This is captured by the
coefficients 𝛼13, 𝛼14 and 𝛼15 from equation (5). A positive or negative statistically significant value
on either of the coefficients 𝛼13, 𝛼14 and 𝛼15 will indicate that COLL and CORR jointly have a
moderating effect on the relationship between CSR and EM and provide support for hypothesis
H3.7. Specifically, a positive value on 𝛼13, 𝛼14 and 𝛼15 from equation (5) will suggest that the
interaction of COLL and CORR has a strengthening (weakening) effect of the positive (negative)
relationship between the CSR dimensions and EM, while a negative value will suggest that the
interaction of COLL and CORR has a weakening (strengthening) effect of the positive (negative)
relationship between the CSR dimensions and EM. The effect of ENV on EM, conditional on the
interaction of COLL and CORR, is estimated as the sum of the coefficients 𝛼1 + 𝛼6COLL + 𝛼9CORRt
+ 𝛼13COLL*CORRt from equation (5); the effect of SOC on EM, conditional on the interaction of COLL
and CORR, is estimated as the sum of the coefficients 𝛼2 + 𝛼7COLL + 𝛼10CORRt + 𝛼14COLL*CORRt from
equation (5); and effect of GOV on EM, conditional on the interaction of COLL and CORR, is
estimated as the sum of the coefficients 𝛼3 + 𝛼8COLL + 𝛼11CORRt + 𝛼15COLL*CORRt from equation
(5). The conditional effects provide further validation to the joint moderating effect of COLL X CORR,
by showing whether the relationship between the CSR dimensions and EM changes with the level
of COLL and CORR jointly. Statistically significant coefficients on one or more of these conditional
effects will provide further validation to support hypothesis H3.7 and will address research question
3.2.
Main model 2 to test hypotheses H3.8 to H3.11
To address research question 3.3, and test hypotheses H3.8 to H3.11, I estimate the following
equation as HLM, following the moderation approach using the Process Model 3 developed by
Hayes (2013):
EMit = 𝛼0 + 𝛼1ENVit + 𝛼2SOCit + 𝛼3GOVit + 𝛼4COLL+ 𝛼5INVPROt + 𝛼6ENVit*COLL + 𝛼7SOCit*COLL+
𝛼8GOVit*COLL + 𝛼9ENVit*INVPROt + 𝛼10SOCit*INVPROt + 𝛼11GOVit*INVPROt + 𝛼12COLL*INVPROt
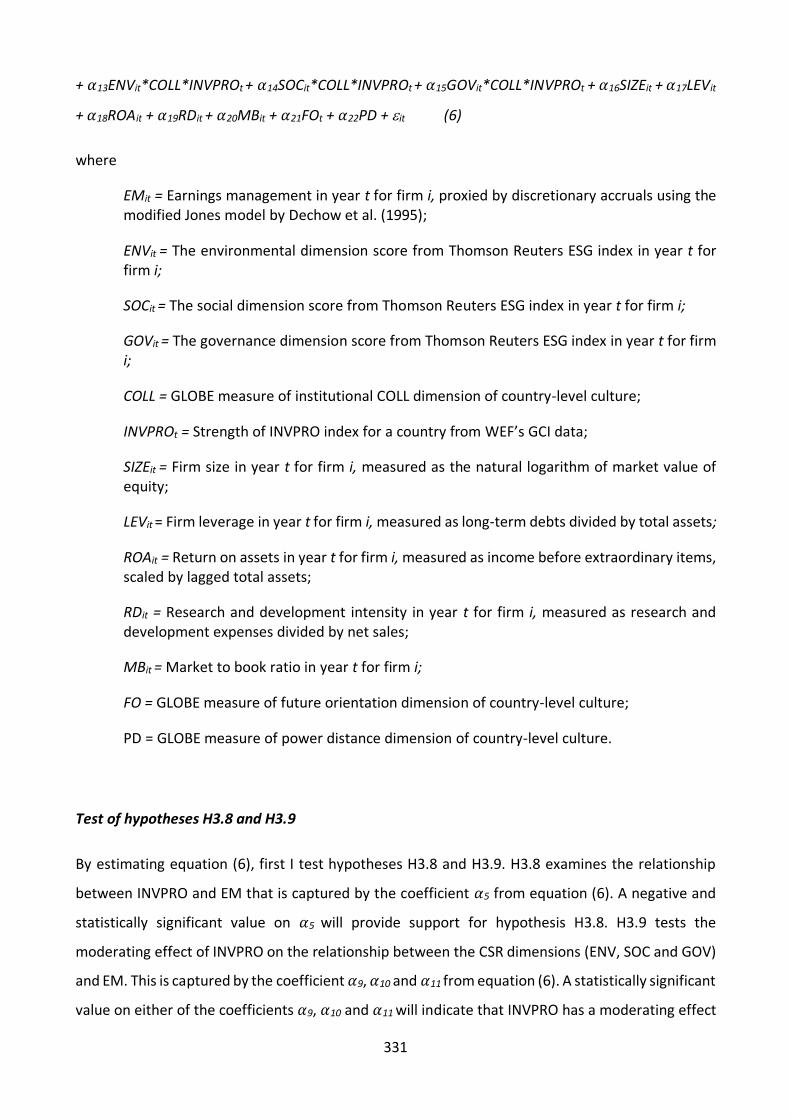
331
+ 𝛼13ENVit*COLL*INVPROt + 𝛼14SOCit*COLL*INVPROt + 𝛼15GOVit*COLL*INVPROt + 𝛼16SIZEit + 𝛼17LEVit
+ 𝛼18ROAit + 𝛼19RDit + 𝛼20MBit + 𝛼21FOt + 𝛼22PD + it (6)
where
EMit = Earnings management in year t for firm i, proxied by discretionary accruals using the modified Jones model by Dechow et al. (1995);
ENVit = The environmental dimension score from Thomson Reuters ESG index in year t for firm i;
SOCit = The social dimension score from Thomson Reuters ESG index in year t for firm i;
GOVit = The governance dimension score from Thomson Reuters ESG index in year t for firm i;
COLL = GLOBE measure of institutional COLL dimension of country-level culture;
INVPROt = Strength of INVPRO index for a country from WEF’s GCI data;
SIZEit = Firm size in year t for firm i, measured as the natural logarithm of market value of equity;
LEVit = Firm leverage in year t for firm i, measured as long-term debts divided by total assets;
ROAit = Return on assets in year t for firm i, measured as income before extraordinary items, scaled by lagged total assets;
RDit = Research and development intensity in year t for firm i, measured as research and development expenses divided by net sales;
MBit = Market to book ratio in year t for firm i;
FO = GLOBE measure of future orientation dimension of country-level culture;
PD = GLOBE measure of power distance dimension of country-level culture.
Test of hypotheses H3.8 and H3.9
By estimating equation (6), first I test hypotheses H3.8 and H3.9. H3.8 examines the relationship
between INVPRO and EM that is captured by the coefficient 𝛼5 from equation (6). A negative and
statistically significant value on 𝛼5 will provide support for hypothesis H3.8. H3.9 tests the
moderating effect of INVPRO on the relationship between the CSR dimensions (ENV, SOC and GOV)
and EM. This is captured by the coefficient 𝛼9, 𝛼10 and 𝛼11 from equation (6). A statistically significant
value on either of the coefficients 𝛼9, 𝛼10 and 𝛼11 will indicate that INVPRO has a moderating effect

332
on the relationship between CSR and EM and will provide support for hypothesis H3.9. Specifically,
a positive value on either one or more of the coefficients, 𝛼9, 𝛼10 and 𝛼11 from equation (6) will
suggest that INVPRO has a strengthening (weakening) effect of the positive (negative) relationship
between the CSR dimensions and EM, while a negative value will suggest that INVPRO has a
weakening (strengthening) effect of the positive (negative) relationship between the CSR
dimensions and EM. The effect of ENV on EM, conditional on INVPRO, is estimated as the sum of
the coefficients 𝛼1 + 𝛼9*INVPRO from equation (6); the effect of SOC on EM, conditional on INVPRO,
is estimated as the sum of the coefficients 𝛼2 + 𝛼10* INVPRO from equation (6); and effect of GOV
on EM, conditional on INVPRO, is estimated as the sum of the coefficients 𝛼3 + 𝛼11* INVPRO from
equation (6). The conditional effects provide further validation to the moderating effect of INVPRO,
by showing whether the relationship between the CSR dimensions and EM changes with the level
of INVPRO. Statistically significant coefficients on one or more of these conditional effects will
provide further validation to support hypothesis H3.9, and will partially address research question
3.3, by explaining the individual effect of INVPRO on the CSR-EM relationship.
Test of hypotheses H3.10 and H3.11
Equation (6) also tests hypotheses H3.10 and H3.11. H3.10 tests the joint effect of COLL and INVPRO
on EM. This is captured by the coefficient 𝛼12 from equation (6). A statistically significant value on
𝛼12 will provide support for hypothesis H3.10. Specifically, a positive and significant value on 𝛼12 will
suggest that the interaction of COLL and INVPRO has a positive effect on EM, while a negative value
will suggest that the interaction of COLL and INVPRO has a negative effect on EM. H3.11 tests the
effect of the interaction of COLL and INVPRO on the relationship between the CSR dimensions (ENV,
SOC and GOV) and EM (that is, the 3-way interaction). This is captured by the coefficients 𝛼13, 𝛼14
and 𝛼15 from equation (6). A significant value on either one or more of the coefficients 𝛼13, 𝛼14 and
𝛼15 will indicate that COLL and INVPRO jointly have a moderating effect on the relationship between
CSR and EM and provide support to hypothesis H3.11. Specifically, a positive value on 𝛼13, 𝛼14 and/or
𝛼15 from equation (6) will suggest that the interaction of COLL and INVPRO has a strengthening
(weakening) effect of the positive (negative) relationship between the CSR dimensions and EM,
while a negative value will suggest that the interaction of COLL and INVPRO has a weakening
(strengthening) effect of the positive (negative) relationship between the CSR dimensions and EM.
The effect of ENV on EM, conditional on the interaction of COLL and INVPRO, is estimated as the
sum of the coefficients 𝛼1 + 𝛼6COLL + 𝛼9INVPROt + 𝛼13COLL*INVPROt from equation (6); the effect
of SOC on EM, conditional on the interaction of COLL and INVPRO, is estimated as the sum of the

333
coefficients 𝛼2 + 𝛼7COLL + 𝛼10INVPROt + 𝛼14COLL*INVPROt from equation (6); and effect of GOV on
EM, conditional on the interaction of COLL and INVPRO, is estimated as the sum of the coefficients
𝛼3 + 𝛼8COLL + 𝛼11INVPROt + 𝛼15COLL*INVPROt from equation (6). The conditional effects provide
further validation to the moderating effect of COLL X INVPRO, by showing whether the relationship
between the CSR dimensions and EM changes with the level of COLL and INVPRO jointly. Statistically
significant coefficients on one or more of these conditional effects will provide further validation to
support hypothesis H3.11, and will address research question 3.3, by explaining the joint effect of
COLL and INVPRO on the CSR-EM relationship.
6.7.6 Robustness Check
As a robustness check, I re-perform the research analysis using a split sample approach. The full
sample is split into two subsamples, namely Low COLL and High COLL subsamples. The Low COLL
subsample includes all countries with a COLL score that is lower than the median COLL score of the
full sample, while the High COLL subsample includes all countries with a COLL score that is higher
than the median COLL score. The Low COLL subsample includes the countries Brazil, India, Russia,
South Africa and Thailand while the High COLL subsample includes the countries China, Indonesia,
Malaysia, South Korea and Taiwan. I estimate the following equation, following Process Model 1,
developed by Hayes (2013), in each of the two subsamples:
EMit = 𝛼0 + 𝛼1ENVit + 𝛼2SOCit + 𝛼3GOVit + 𝛼4CORRt + 𝛼5INVPROt + 𝛼6ENVit*CORRt + 𝛼7SOCit*CORRt +
𝛼8GOVit*CORRt + 𝛼9ENVit*INVPROt + 𝛼10SOCit*INVPROt + 𝛼11GOVit*INVPROt + 𝛼12SIZEit + 𝛼13LEVit +
𝛼14ROAit + 𝛼15RDit + 𝛼16MBit + 𝛼17FOt + 𝛼18PD + it (7)
where
EMit = Earnings management in year t for firm i, proxied by Discretionary accruals using the modified Jones model by Dechow et al. (1995);
ENVit = The environmental dimension score from Thomson Reuters ESG index in year t for firm i;
SOCit = The social dimension score from Thomson Reuters ESG index in year t for firm i;
GOVit = The governance dimension score from Thomson Reuters ESG index in year t for firm i;
CORRt = CORR pervasiveness in a country, measured by reverse-scoring the ‘control of CORR’ measure from World Bank’s WGI index;
INVPROt = Strength of INVPRO index for a country from WEF’s GCI data;

334
SIZEit = Firm size in year t for firm i, measured as the natural logarithm of market value of equity;
LEVit = Firm leverage in year t for firm i, measured as long-term debts divided by total assets;
ROAit = Return on assets in year t for firm i, measured as income before extraordinary items, scaled by lagged total assets;
RDit = Research and development intensity in year t for firm i, measured as research and development expenses divided by net sales;
MBit = Market to book ratio in year t for firm i;
FO = GLOBE measure of future orientation dimension of country-level culture;
PD = GLOBE measure of power distance dimension of country-level culture.
Equation (7) examines the effects of CORR and INVPRO on the relationship between the CSR
dimensions and EM on the relationship between the CSR dimensions and EM. The equation is
estimated for each of the 2 subsamples, to show the joint effect of COLL and CORR, and the joint
effect of COLL and INVPRO on the CSR-EM relationship.
6.7.7 Sensitivity analysis
To test the sensitivity of the HLM estimation model, I estimate equation (8) using HLM technique.
Equation (8) is a re-estimation of equation (7), with the main variables (EM, ENV, SOC, GOV, CORR
and INVPRO) replaced with their alternate specifications (EM_DD, ENV_DUM, SOC_DUM,
GOV_DUM, CORR_TRI and INVPRO_FF respectively). Equation (8) is estimated on two subsamples,
based on the alternate measure of COLL, that is COLL_H. COLL_H is obtained by reverse-scoring the
IDV score of Hofstede’s IDV-COLL dimension. The full sample is split into two subsamples, namely
Low COLL_H and High COLL_H subsamples. The Low COLL_H subsample includes all countries with
a COLL_H score that is lower than the mean COLL_H score of the full sample, while the High COLL_H
subsample includes all countries with a COLL_H score that is higher than the mean COLL_H score.
The Low COLL_H subsample includes the countries Brazil, India, Russia and South Africa, while the
High COLL_H subsample includes the countries, China, Indonesia, Malaysia, South Korea, Taiwan
and Thailand. The classification using COLL_H score is slightly different from the classification based
on the COLL score – specifically, the difference lies in the classification of Thailand as a high COLL_H
country. I estimate the following equation, following Process Model 1, developed by Hayes (2013),
in each of the two subsamples, based on COLL_H (the alternate measure of COLL):

335
EM_DDit = 𝛼0 + 𝛼1ENV_DUMit + 𝛼2SOC_DUMit + 𝛼3GOV_DUMit + 𝛼4CORR_TRIt + 𝛼5INVPRO_FFt +
𝛼6ENV_DUMit*CORR_TRIt + 𝛼7SOC_DUMit*CORR_TRIt + 𝛼8GOV_DUMit*CORR_TRIt + 𝛼9ENV_DUMit*
INVPRO_FFt + 𝛼10SOC_DUMit*INVPRO_FFt + 𝛼11GOV_DUMit*INVPRO_FFt + 𝛼12SIZEit + 𝛼13LEVit +
𝛼14ROAit + 𝛼15RDit + 𝛼16MBit + 𝛼17FOt + 𝛼18PD + it (8)
where
EM_DDit = Earnings management in year t for firm i, proxied by accruals quality model by Dechow & Dichev (2002);
ENV_DUMit = Dummy variable taking the value of 1 if the ENV score of the firm is greater median ENV (based on each year and industry), and 0 otherwise.
SOC_DUMit = Dummy variable taking the value of 1 if the SOC score of the firm is greater median SOC (based on each year and industry), and 0 otherwise.
GOV_DUMit = Dummy variable taking the value of 1 if the GOV score of the firm is greater median GOV (based on each year and industry), and 0 otherwise.
CORR_TRIt = CORR pervasiveness in a country, measured by reverse-scoring the ‘corruption perception index’ measure from Transparency International;
INVPRO_FFt = INVPRO score for a country from Financial Freedom Index;
SIZEit = Firm size in year t for firm i, measured as the natural logarithm of market value of equity;
LEVit = Firm leverage in year t for firm i, measured as long-term debts divided by total assets;
ROAit = Return on assets in year t for firm i, measured as income before extraordinary items, scaled by lagged total assets;
RDit = Research and development intensity in year t for firm i, measured as research and development expenses divided by net sales;
MBit = Market to book ratio in year t for firm i;
FO = GLOBE measure of future orientation dimension of country-level culture;
PD = GLOBE measure of power distance dimension of country-level culture.
6.7.8 Accounting for Endogeneity
As discussed in Chapters 4 and 5, the results may be subject to endogeneity issues due to the CSR
dimensions. Endogeneity may cause the estimates to be biased and inconsistent (Bhandari et al.,
2018). Consistent to the approach followed in the first 2 research studies, as reported in Chapters 4
and 5, I use 2SLS estimation with instrument variables, to address endogeneity.

336
Following Nguyen et al. (2019), I use the median value of the independent variable, calculated for
each Fama-French 48 industry grouping. Thus, I use 3 instruments for the 3 independent variables
(ENV, SOC and GOV). For the independent variable ENV, I use ENV_M as an instrument, measured
as the median ENV for each Fama-French 48 industry grouping; for SOC, I use SOC_M as an
instrument, measured as the median SOC for each Fama-French 48 industry grouping; and for GOV,
I use GOV_M as an instrument, measured as the median GOV for each Fama-French 48 industry
grouping.
To address endogeneity, I re-estimate the main model equations (5) and (6), using 2SLS estimation
technique with the instrument variables ENV_M, SOC_M and GOV_M.
6.8 Results and Findings
6.8.1 Descriptive Statistics
Table 6.7 shows the descriptive statistics for all the variables in the sample. Panel A shows the
number of observations, mean, median, maximum and minimum values and standard deviation of
the variables for the full sample; Panel B presents the descriptive statistics (that is, number of
observations and mean) for the full sample by country; and Panel C shows the descriptive statistics
(that is, number of observations, mean and standard deviation) for each of the two subsamples,
namely Low COLL and High COLL subsamples.

337
Table 6.7 Descriptive Statistics of the Key Variables (2012-2016) Panel A shows the summary statistics of the key variables for the full sample; Panel B shows the summary statistics for each country; and Panel C shows the summary statistics for the two subsamples, Low COLL and High COLL subsamples. EM and EM_DD are the two alternate measures of the dependent variable. EM refers to earnings management, proxied by Discretionary accruals using the modified Jones model by Dechow et al. (1995). EM_DD refers to alternate earnings management specification, proxied by accruals quality model by Dechow & Dichev (2002). CSR, the independent variable, is the ESG score obtained from Thomson Reuters. ENV, SOC and GOV, also independent variables, are the scores on the individual CSR dimensions (Environmental, Social and Governance dimensions respectively), obtained from Thomson Reuters. ENV_DUM, SOC_DUM and GOV_DUM are the alternate measures of the CSR dimensions, measured as a dummy variable which equals 1 if the score on the dimension is greater than the median score of that dimension for each year and industry, and 0 otherwise. COLL, CORR and INVPRO are the country-level moderating variables. COLL is the GLOBE measure of institutional collectivism. CORR is the corruption pervasiveness in a country, measured by reverse-scoring the ‘control of CORR’ measure from World Bank’s WGI database. INVPRO is the strength of INVPRO index for a country from WEF’s GCI Historical Data. COLL_H, CORR_TRI and INVPRO_FF are the alternate measures of the moderating variables. COLL_H is the reverse-score of Hofstede’s IDV cultural dimension. CORR_TRI is the reverse-score of the ‘corruption perception index’ from Transparency International. INVPRO_FF is the investor protection score from the Financial Freedom Index. SIZE, LEV, ROA, RD and MB are the firm-level control variables. SIZE refers to firm size, measured as the natural logarithm of market value of equity. LEV is defined as long-term debts divided by total assets. ROA is measured as the income before extraordinary items, scaled by lagged total assets. RD refers to R&D intensity, measured as R&D expenses divided by net sales. MB is the market to book ratio. FO and PD are the country-level control variables, representing the GLOBE measures for the cultural dimensions Future Orientation and Power Distance, respectively. Panel A: Full sample - Descriptive Statistics
N Mean Median Minimum Maximum Std. Dev. Dependent variables EM 3,361 0.0772 0.0485 0.0002 3.0317 0.1163 EM_DD 3,355 0.0727 0.0561 0.0000 0.5893 0.0628 Independent variables CSR 3,472 0.5137 0.4898 0.0684 20.1600 0.7683 ENV 3,472 0.1611 0.1567 0.0152 0.3347 0.0764 SOC 3,472 0.1715 0.1779 0.0101 0.3497 0.0844 GOV 3,472 0.1527 0.1524 0.0088 0.2974 0.0664 ENV_DUM 2799 0.5095 1.0000 0.0000 1.0000 0.5000 SOC_DUM 2799 0.5188 1.0000 0.0000 1.0000 0.4997 GOV_DUM 2799 0.5041 1.0000 0.0000 1.0000 0.5001 Moderating variables COLL 10 0.6421 0.6465 0.5466 0.7423 0.0536 CORR 50 1.0546 1.1240 0.6480 1.4160 0.2029 INVPRO 50 0.6426 0.6350 0.4300 0.8700 0.1099 COLL_H 10 0.6950 0.7700 0.3500 0.8600 0.1659 CORR_TRI 50 0.5744 0.6000 0.3800 0.7300 0.0970 INVPRO_FF 10 0.6160 .5700 0.4300 0.8900 0.1541 Control variables SIZE 3,434 17.9349 17.4961 9.8274 24.4621 2.5538 LEV 3,466 0.1664 0.1446 0.0000 1.1478 0.1464 ROA 3,447 0.0955 0.0785 -7.1772 3.0385 0.1965 RD 3,456 0.0143 0.0000 0.0000 3.5175 0.0903 MB 3,428 2.7677 1.5500 -7.4100 43.6600 3.6877 FO 10 0.5542 0.5581 0.4110 0.6538 0.0688 PD 10 0.7461 0.7506 0.5867 0.8039 0.0631

338
Panel B: Descriptive Statistics by country Brazil China India Indonesia Malaysia Russia South Africa South Korea Taiwan Thailand n Mean n Mean n Mean n Mean n Mean n Mean n Mean n Mean n Mean n Mean Dependent variables EM 337 0.0711 590 0.0954 365 0.0931 147 0.1078 199 0.0861 156 0.0585 448 0.0568 449 0.0653 550 0.0698 120 0.0842 EM_DD 345 0.0770 582 0.0817 364 0.0742 146 0.0959 197 0.0826 155 0.0647 451 0.0530 453 0.0714 547 0.0680 115 0.0786 Independent variables CSR 370 0.5355 610 0.3821 370 0.5300 148 0.4796 201 0.4889 159 0.4745 470 0.5440 466 0.7327 556 0.4433 122 0.5555 ENV 370 0.1777 610 0.1186 370 0.1822 148 0.1431 201 0.1523 159 0.1550 470 0.1710 466 0.1915 556 0.1535 122 0.1842 SOC 370 0.2025 610 0.1116 370 0.1916 148 0.1932 201 0.1886 159 0.1661 470 0.2116 466 0.1790 556 0.1404 122 0.2269 GOV 370 0.1554 610 0.1519 370 0.1562 148 0.1433 201 0.1480 159 0.1533 470 0.1613 466 0.1509 556 0.1493 122 0.1444 ENV_DUM 306 0.5948 476 0.2710 291 0.5876 116 0.3966 164 0.4573 128 0.2969 399 0.6115 381 0.6614 444 0.4910 94 0.7553 SOC_DUM 306 0.6765 476 0.1681 291 0.5773 116 0.5862 164 0.5854 128 0.3516 399 0.7444 381 0.6168 444 0.3941 94 0.8617 GOV_DUM 306 0.5163 476 0.5273 291 0.4777 116 0.5431 164 0.5183 128 0.5313 399 0.5489 381 0.5039 444 0.4302 94 0.4787 Moderating variables CORR 5 1.0992 5 1.1336 5 1.1672 5 1.2136 5 0.8928 5 1.3792 5 1.0080 5 0.6912 5 1.1632 5 1.0992 INVPRO 5 0.5980 5 0.4660 5 0.6840 5 0.5820 5 0.8120 5 0.5240 5 0.7400 5 0.6660 5 0.6540 5 0.7000 CORR_TRI 5 0.5880 5 0.6160 5 0.6240 5 0.6580 5 0.5000 5 0.7180 5 0.5640 5 0.4540 5 0.3880 5 0.6340 Control variables SIZE 359 15.575 601 16.880 366 18.616 143 23.493 201 15.765 156 19.424 468 15.748 465 22.018 554 17.549 121 17.759 LEV 370 0.2529 607 0.1540 368 0.1694 148 0.1629 201 0.2091 159 0.2340 470 0.1328 466 0.1497 555 0.1078 122 0.2618 ROA 370 0.0612 602 0.0693 365 0.1432 148 0.1871 198 0.1180 159 0.1148 466 0.1188 464 0.0683 553 0.0727 122 0.1299 RD 367 0.0022 607 0.0178 368 0.0063 148 0.0005 201 0.0009 159 0.0003 464 0.0007 466 0.0215 554 0.0446 122 0.0000 MB 365 2.9218 577 2.0613 368 4.8880 148 4.9503 200 2.9731 159 1.7180 470 2.7155 464 1.7864 556 2.0953 121 4.6498

339
Panel C: Descriptive Statistics by subsamples Low COLL subsample (n = 1,491) High COLL subsample (n = 1,981) N Mean Std. Dev. N Mean Std. Dev. Dependent variables EM 1426 0.0720 0.1186 1,935 0.0811 0.1144 EM_DD 1430 0.0675 0.0565 1,925 0.0765 0.0668 Independent variables CSR 1491 0.5320 0.1591 1,981 0.4999 1.0076 ENV 1491 0.1748 0.0713 1,981 0.1508 0.0786 SOC 1491 0.2008 0.0719 1,981 0.1494 0.0865 GOV 1491 0.1563 0.0617 1,981 0.1499 0.0696 ENV_DUM 1218 0.5796 0.4938 1,581 0.4554 0.4982 SOC_DUM 1218 0.6552 0.4755 1,581 0.4137 0.4926 GOV_DUM 1218 0.5164 0.4999 1,581 0.4946 0.5001 Moderating variables CORR 25 1.1634 0.1312 25 0.9458 0.2053 INVPRO 25 0.6492 0.0974 25 0.6360 0.1228 CORR_TRI 25 0.6256 0.0555 25 0.5232 0.1034 INVPRO_FF 5 0.6120 0.1659 5 0.6200 0.1609 Control variables SIZE 1,470 16.9757 1.9297 1,964 18.6528 2.7231 LEV 1,489 0.1931 0.1627 1,977 0.1463 0.1293 ROA 1,482 0.1109 0.2540 1,965 0.0838 0.1371 RD 1,480 0.0023 0.0079 1,976 0.0232 0.1185 MB 1,483 3.3562 4.2102 1,945 2.3190 3.1615 FO 5 0.5340 0.0866 5 0.5745 0.0462 PD 5 0.7442 0.0894 5 0.7480 0.0309

340
As shown in Table 6.7 Panel A, the mean value of the dependent variable for EM is 0.0720 for the
full sample. The mean value for the alternate measure of the dependent variable, EM_DD, is 0.0675,
which is very close to the mean value of the primary measure EM (0.0772). The dependent variable
EM is measured by discretionary accruals, using the modified Jones model by Dechow et al. (1995),
while EM_DD is measured using the accrual quality model by Dechow & Dichev (2002). The mean
values for the dependent variables, EM and EM_DD, are consistent to prior studies, based on
emerging market samples, using accruals-based EM. For example, Rezaee et al. (2020) report a
mean EM of 0.070 using a sample of Chinese firms. Gong & Ho (2018) and Kim et al. (2019) report
mean EM of 0.060 and 0.066 respectively, both using samples of Chinese firms. Pratiwi & Siregar,
(2019) report mean EM of 0.0632 using a sample of Indonesian firms. Cho and Chun (2015), Choi et
al. (2018) and Chun and Cho (2017) report mean EM of 0.0570, 0.0550 and 0.0530 respectively,
using samples of Korean firms.
The mean value of the independent variable, CSR, is 0.5137, indicating that firms in emerging market
countries score 51% on their CSR performance, on average. This is close to the mean CSR reported
in Chapters 4 and 5 (0.5264 and 0.5260 respectively). The mean CSR is also consistent to prior
studies using emerging market samples. For example, Buertey et al. (2020) report mean CSR of
53.53% using a sample of South African firms. Cho and Chun (2017) report mean CSR of 45.29%
using a sample of Korean firms. The mean values of the CSR dimensions, ENV, SOC and GOC are
0.1611, 0.1715 and 0.1527 respectively, suggesting a consistent performance on each CSR
dimension, albeit a slightly higher performance in SOC initiatives in emerging market countries. The
mean values of the alternate measure of ENV, SOC and GOV, that is ENV_DUM, SOC_DUM and
GOV_DUM, are 0.5095, 0.5188 and 0.5041 respectively. This also suggests consistent performance
on each CSR dimension, with a slightly higher performance in SOC initiatives within emerging market
countries.
The country-level moderating variables, COLL, and COLL_H have mean values of 0.6421 and 0.6950
respectively. COLL is based on the institutional collectivism score from the GLOBE study, while
COLL_H is based on Hofstede’s IDV-COLL cultural dimension score. This is consistent to anticipation,
as emerging market countries (specifically Asian countries) are generally characterized as having
COLL culture (for example, see Lyu et al., 2016).
CORR and CORR_TRI have mean values of 1.0546 and 0.5744 respectively. CORR is measured by
reverse-scoring the ‘control of corruption’ index from World Banks WGI data. The mean value of

341
CORR (1.0546) is consistent to Lewellyn and Bao (2017), reporting a mean CORR of 1.10. CORR_TRI
is measured by reverse-scoring the ‘corruption perception index’ from Transparency International.
The mean value of CORR_TRI (0.5744) being above 50% indicates higher CORR on average. This is
consistent to the anticipation that emerging market countries have higher CORR pervasiveness (for
example, see Lourenço et al., 2018; Riahi-Belkaoui, 2003, 2004).
INVPRO and INVPRO_FF have mean values of 0.6426 and 0.6160 respectively, suggesting an average
score of 62 to 64% on the strength of INVPRO. This is close to Persakis & Iatridis (2016) reporting a
mean value of 7.3 out of 10 on the strength of INVPRO on a sample of 18 countries. The lower
average INVPRO is consistent to the expectation that emerging market countries are generally
characterized as having weaker INVPRO in comparison to developed countries (for example, see
DeFond, 2010; Leuz et al., 2003).
The firm-level control variables SIZE and LEV have mean values of 17.9349 and 0.1664 respectively,
while ROA, RD and MB have mean values of 0.0955, 0.0143 and 2.7677 respectively. The country-
level control variables, FO and PD, have mean values of 0.5646 and 0.7349, respectively.
Table 6.6 Panel B shows the number of observations and mean values for the variables for each of
the 10 emerging market countries used in the sample for the present study. The table excludes the
variables COLL, COLL_H and INVPRO_F, as these are static country-level data, hence country-
averages cannot be calculated. As shown in the table, Indonesia has the highest average EM (mean
EM = 0.1078; mean EM_DD = 0.0959), while South Africa has the lowest average EM (mean EM =
0.0568; mean EM_DD = 0.0530). Thailand has the highest average performance on overall CSR
(mean CSR = 0.5555) and the SOC dimension of CSR (mean SOC = 0.2269), but the lowest average
performance on the GOV dimension (mean GOV = 0.1493). South Korea has the highest average
performance on ENV initiatives (mean ENV = 0.1915), while South Africa has the highest average
performance on GOV initiatives (mean GOV = 0.1613). China has the lowest average performance
on overall CSR (mean CSR = 0.3821) and on the ENV and SOC dimensions of CSR (mean ENV = 0.1186;
mean SOC = 0.1116). Based on the ‘control of corruption’ index from the World Bank’s WGI data,
India has the highest average CORR pervasiveness (mean CORR = 1.1672), while South Korea has
the lowest CORR pervasiveness (mean CORR = 0.6912). However, based on the ‘corruption
perception’ index from Transparency International, Russia has the highest CORR pervasiveness
(mean CORR_TRI = 0.7180), while Taiwan has the lowest CORR pervasiveness (mean CORR_TRI =
0.3880). Malaysia has a highest average strength of INVPRO (mean INVPRO = 0.3880), while China

342
has the lowest average INVPRO (mean INVPRO = 0.8120).
Table 6.6 Panel C shows the number of observations, mean values and standard deviations for the
variables for the two subsamples – Low COLL and High COLL subsamples. The subsamples are
formed by splitting the full sample at the median COLL. COLL is based on the institutional COLL score
from the GLOBE study. The Low COLL subsample has 1,491 firm-year observations, and includes the
countries Brazil, India, Russia, South Africa and Thailand; the high COLL subsample has 1,981 firm-
year observations and includes the countries China, Indonesia, Malaysia, South Korea and Taiwan.
As anticipated, average EM is greater in high COLL countries (mean EM = 0.0811; mean EM_DD =
0.0765) in comparison to low COLL countries (mean EM = 0.0720; mean EM_DD = 0.0675). CSR
performance is greater in low COLL countries (mean CSR = 0.5320; mean ENV = 0.1748; mean SOC
= 0.2008; mean GOV = 0.1563) in comparison to high COLL countries (mean CSR = 0.4999; mean
ENV = 0.1508; mean SOC = 0.1494; mean GOV = 0.1499). Contrary to expectations, CORR is higher
in low COLL countries (mean CORR = 1.1634; mean CORR_TRI = 0.6256) in comparison to high COLL
countries (mean CORR = 0.9458; mean CORR_TRI = 0.5232). There is not much difference in the
strength of INVPRO between low COLL countries (mean INVPRO = 0.6492; mean INVPRO_FF =
0.6120) and high COLL countries (mean INVPRO = 0.6360; mean INVPRO_FF = 0.6200).
6.8.2 Correlation
Table 6.8 illustrates the correlation matrix showing the Pearson’s correlation coefficients among the
main variables for this study. The main dependent variable, EM, is negatively correlated with CSR (-
0.0288) at the 10% level of significance, and with ENV (-0.0765) at the 1% level of significance. The
other CSR dimensions (ENV and SOC) and the alternate measures of the CSR dimensions (ENV_DUM,
SOC_DUM and GOV_DUM) do not have statistically significant correlations with EM. The alternate
measure of the dependent variable, EM_DD, is also negatively correlated with CSR (-0.0414) at the
5% level of significance. EM_DD has negative and significant correlations with the CSR dimensions
ENV (-0.1079) and SOC (-0.0869), as well as with the alternate measures ENV_DUM (-0.1156) and
SOC DUM (-0.1047), at the 1% level of significance.
The moderating variable COLL does not have a statistically significant correlation with EM or
EM_DD. COLL has a positive correlation with CSR (0.0379) at the 5% level of significance, but
negative correlations with the CSR dimensions ENV (-0.0425) and ENV_DUM (-0.0451) at the 5%
level of significance, and with SOC (-0.1868) and SOC_DUM (-0.1383) at the 1% level of significance.

343
However, COLL does not have statistically significant correlations with GOV or GOV_DUM. The
alternate measure COLL_H has positive and significant correlations with both EM (0.0507) and
EM_DD (0.1067) at the 1% level of significance. COLL_H has negative and significant correlations
with the CSR dimensions ENV (-0.1131), SOC (-0.2595), GOV (-0.0638), ENV_DUM (-0.0981),
SOC_DUM (-0.2123) at the 1% level of significance, and with GOV_DUM (-0.0336) at the 10% level
of significance. However, COLL_H does not have a statistically significant correlation with overall
CSR.
The moderating variable CORR has positive and significant correlations with both EM (0.0536) and
EM_DD (0.0455) at the 1% level of significance. CORR has negative and significant correlations with
CSR (-0.0388) and ENV (-0.0754) at the 5% and 1% level of significance respectively, positive
correlation with SOC (0.0502) at the 1% level of significance, but no statistically significant
correlation with GOV. CORR has negative and significant correlations with the alternate measures
of the CSR dimensions ENV_DUM (-0.0988) and SOC_DUM (-0.0351) at the 1% and 10% level of
significance respectively, but a positive correlation with GOV_DUM (0.0470) at the 5% level of
significance. The alternate measure CORR_TRI also has positive and significant correlations with
both EM (0.0572) and EM_DD (0.0442) at the 1% level of significance. CORR_TRI has negative and
significant correlations with CSR (-0.0350), ENV (-0.0698) and SOC (0.0622) at the 1% level of
significance, but no statistically significant correlation with GOV.
CORR_TRI has a negative correlation with ENV_DUM (-0.0905) at the 1% level of significance, a
positive correlation with GOV_DUM (0.0512) at the 1% level of significance, but no statistically
significant correlation with SOC_DUM.
The moderating variable INVPRO has negative and significant correlations with both EM (-0.0719)
and EM_DD (-0.0850) at the 1% level of significance. INVPRO has a positive correlation with CSR
(0.0607) at the 1% level of significance. INVPRO also has positive and significant correlations with
the CSR dimensions ENV (0.1916) and SOC (0.2722), and their alternate measures ENV_DUM
(0.1767) and SOC_DUM (0.2632) at the 1% level of significance, but no significant correlation with
GOV or GOV_DUM. The alternate measure INVPRO_FF has a negative correlation with EM (-0.0413)
at the 5% level of significance, and with EM_DD (-0.0682) at the 1% level of significance. INVPRO_FF
has a positive correlation with CSR (0.0288) at the 10% level of significance. INVPRO_FF has positive
and significant correlations with the CSR dimensions ENV (0.0965), SOC (0.2394), ENV_DUM
(0.1344) and SOC_DUM (0.2458) at the 1% level of significance, but no significant correlation with

344
GOV or GOV_DUM.
The control variable SIZE does not have a statistically significant correlation with either EM or
EM_DD. SIZE has positive and significant correlations, at the 1% level of significance, with overall
CSR (0.1002), with the three CSR dimensions - ENV (0.2226), SOC (0.1268) and GOV (0.0460), and
with the alternate measures of the CSR dimensions – ENV_DUM (0.1391) and SOC_DUM (0.0954).
SIZE also has a positive correlation with GOV_DUM (0.0471), but at the 5% level of significance. SIZE
has positive and significant correlations with the collectivism measures – COLL (0.5202) and COLL_H
(0.4049) at the 1% level of significance. SIZE has negative and significant correlations with the
corruption measures – CORR (-0.0920) and CORR_TRI (-0.0892), and the investor protection
measures – INVPRO (-0.0482) and INVPRO_FF (-0.2425), at the 1% level of significance.
The control variable ROA has a positive correlation with EM (0.0298), but a negative correlation with
EM_DD (-0.0300) at the 10% level of significance. ROA has positive and significant correlations with
SOC (0.0632) and GOV (0.0287) at the 1% and 10% level of significance respectively, and with
SOC_DUM (0.0319) and GOV_DUM (0.0570) at the 10% and 1% level of significance respectively.
However, ROA does not have significant correlations with CSR, ENV or ENV_DUM. ROA has negative
correlations with COLL (-0.0341) at the 5% level of significance, and COLL_H (-0.0709) at the 1% level
of significance. ROA has positive and significant correlations with CORR (0.0773), CORR_TRI
(0.0773), INVPRO (0.0699) and INVPRO_FF (0.0732) at the 1% level of significance.
The control variable RD has a positive correlation with EM_DD (0.0886) at the 1% level of
significance, but no significant correlation with EM. RD has negative and significant correlations with
SOC (-0.0513) and SOC_DUM (-0.0968) at the 1% level of significance, and with ENV_DUM (-0.0476)
at the 5% level of significance, but no significant correlation with CSR, ENV, GOV or GOV_DUM. RD
has positive correlations with COLL (0.0710) and COLL_H (0.1037) at the 1% level of significance. RD
has negative and significant correlations with CORR (-0.1312) and CORR_TRI -0.1309) at the 1% level
of significance, and with INVPRO_FF (-0.0376) at the 5% level of significance, but no significant
correlation with INVPRO.
The control variable MB has positive correlations with both EM (0.0738) and EM_DD (0.0623) at the
1% level of significance, and also with the social CSR dimension measures – SOC (0.0430) and
SOC_DUM (0.0482) at the 5% level of significance. MB does not have statistically significant
correlations with the overall CSR, with the ENV and GOV dimensions, or the alternate measures
ENV_DUM and GOV_DUM. MB has negative correlations with COLL (-0.1470) at the 5% level of

345
significance, and COLL_H (-0.0878) at the 1% level of significance. MB has positive and significant
correlations with CORR (0.1253), CORR_TRI (0.1280), INVPRO (0.0818) and INVPRO_FF (0.0607) at
the 1% level of significance.
The country-level control variable FO has a negative correlation with EM_DD (-0.0421) at the 5%
level of significance, but no significant correlation with EM. FO has positive and significant
correlations with ENV (0.0776), SOC (0.1445), ENV_DUM (0.1138) and SOC_DUM (0.1669) at the 1%
level of significance, but no significant correlation with CSR, GOV or GOV_DUM. FO has positive and
significant correlations with COLL (0.0917), INVPRO (0.6504) and INVPRO_FF (0.7078) at the 1% level
of significance, and negative and significant correlations with COLL_H (-0.3933), CORR (-0.4071) and
CORR_TRI (-0.3692) at the 1% level of significance.
The country-level control variable PD has a positive correlation with EM (0.0382) at the 5% level of
significance, and with EM_DD (0.0921) at the 1% level of significance. PD has positive and significant
correlations with CSR (0.0353) at the 5% level of significance, and with ENV (0.0730) at the 1% level
of significance. PD has positive and significant correlations with SOC (-0.0530) and SOC_DUM (-
0.0588) at the 1% level of significance, and GOV (-0.0435) and GOV_DUM (-0.0346) at the 5% and
10% level of significance respectively.
PD has positive correlations with COLL (0.0758) and COLL_H (0.6254) at the 1% level of significance.
PD has negative and significant correlations with INVPRO (-0.1831), INVPRO_FF (-0.4983) and
CORR_TRI (-0.0577) at the 1% level of significance, but no significant correlation with CORR.
The correlation matrix shows that several of the independent variables are correlated with other.
Furthermore, the country-level variables are also correlated to each other. However, the Variation
Inflation Factor (VIF) results, as discussed in the next section, suggest that there is no
multicollinearity issues in the research models.

346
Table 6.8 Correlation Matrix The table presents the Pearson’s correlation matrix between the key variables. EM and EM_DD are the two alternate measures of the dependent variable. EM refers to earnings management, proxied by Discretionary accruals using the modified Jones model by Dechow et al. (1995). EM_DD refers to alternate earnings management specification, proxied by accruals quality model by Dechow & Dichev (2002). CSR, the independent variable, is the ESG score obtained from Thomson Reuters. ENV, SOC and GOV, also independent variables, are the scores on the individual CSR dimensions (Environmental, Social and Governance dimensions respectively), obtained from Thomson Reuters. ENV_DUM, SOC_DUM and GOV_DUM are the alternate measures of the CSR dimensions, measured as a dummy variable which equals 1 if the score on the dimension is greater than the median score of that dimension for each year and industry, and 0 otherwise. COLL, CORR and INVPRO are the country-level moderating variables. COLL is the GLOBE measure of institutional collectivism. CORR is the corruption pervasiveness in a country, measured by reverse-scoring the ‘control of CORR’ measure from World Bank’s WGI database. INVPRO is the strength of INVPRO index for a country from WEF’s GCI Historical Data. COLL_H, CORR_TRI and INVPRO_FF are the alternate measures of the moderating variables. COLL_H is the reverse-score of Hofstede’s IDV cultural dimension. CORR_TRI is the reverse-score of the ‘corruption perception index’ from Transparency International. INVPRO_FF is the investor protection score from the Financial Freedom Index. SIZE, LEV, ROA, RD and MB are the firm-level control variables. SIZE refers to firm size, measured as the natural logarithm of market value of equity. LEV is defined as long-term debts divided by total assets. ROA is measured as the income before extraordinary items, scaled by lagged total assets. RD refers to R&D intensity, measured as R&D expenses divided by net sales . MB is the market to book ratio. FO and PD are the country-level control variables, representing the GLOBE measures for the cultural dimensions Future Orientation and Power Distance, respectively. 1 2 3 4 5 6 7 8 9 10 11
1 EM 1
2 EM_DD 0.3197*** 1
3 CSR -0.0288* -0.0414** 1
4 ENV -0.0765*** -0.1079*** 0.2116*** 1
5 SOC -0.0215 -0.0869*** 0.2150*** 0.7284*** 1
6 GOV -0.0220 -0.0268 0.1368*** 0.3556*** 0.3734*** 1
7 ENV_DUM -0.0240 -0.1156*** 0.1753*** 0.7254*** 0.5517*** 0.2767*** 1
8 SOC_DUM -0.0124 -0.1047*** 0.1622*** 0.5675*** 0.7563*** 0.2667*** 0.5425*** 1
9 GOV_DUM -0.0165 -0.0019 0.0721*** 0.2241*** 0.2514*** 0.6810*** 0.2046*** 0.2103*** 1
10 COLL -0.0045 -0.0043 0.0379** -0.0425** -0.1868*** -0.0157 -0.0451** -0.1383*** 0.0004 1
11 CORR 0.0536*** 0.0455*** -0.0388** -0.0754*** 0.0502*** 0.0162 -0.0988*** -0.0351* 0.0470** -0.4046*** 1
12 INVPRO -0.0719*** -0.0850*** 0.0607*** 0.1916*** 0.2722*** 0.0083 0.1767*** 0.2632*** -0.006 -0.0616*** -0.3569***
13 COLL_H 0.0507*** 0.1067*** -0.0166 -0.1131*** -0.2595*** -0.0638*** -0.0981*** -0.2123*** -0.0336* 0.4020*** -0.3434***
14 CORR_TRI 0.0572*** 0.0442*** -0.0350*** -0.0698*** 0.0622*** 0.0166 -0.0905*** -0.0186 0.0512*** -0.3723*** 0.9832***
15 INVPRO_FF -0.0413** -0.0682*** 0.0288* 0.0965*** 0.2394*** 0.0103 0.1344*** 0.2458*** 0.0057 -0.0362** -0.3201***
16 SIZE -0.0148 -0.0232 0.1002*** 0.2226*** 0.1268*** 0.0460*** 0.1391*** 0.0954*** 0.0471** 0.5202*** -0.0920***
17 LEV -0.0605*** -0.1093*** 0.0373** 0.0851*** 0.1221*** 0.0381** 0.0418** 0.0510*** 0.0401** -0.1976*** 0.1844***
18 ROA 0.0298* -0.0300* 0.0028 0.0264 0.0632*** 0.0287* 0.0294 0.0319* 0.0570*** -0.0341** 0.0773***
19 RD 0.0251 0.0886*** -0.0043 0.0152 -0.0513*** 0.0184 -0.0476** -0.0968*** 0.0221 0.0710*** -0.1312***
20 MB 0.0738*** 0.0623*** -0.0159 -0.0100 0.0430** -0.0227 0.0164 0.0482** 0.0212 -0.1470*** 0.1253***
21 FO -0.0088 -0.0421** 0.0276 0.0776*** 0.1445*** 0.0241 0.1138*** 0.1669*** 0.0030 0.0917*** -0.4071***
22 PD 0.0382** 0.0921*** 0.0353** 0.0730*** -0.0530*** -0.0435** 0.0133 -0.0588*** -0.0346* 0.0758*** -0.0112

347
12 13 14 15 16 17 18 19 20 21 22
12 INVPRO 1
13 COLL_H -0.3854*** 1
14 CORR_TRI -0.3554*** -0.3630*** 1
15 INVPRO_FF 0.7847*** -0.3966*** -0.2803*** 1
16 SIZE -0.0482*** 0.4049*** -0.0892*** -0.2425*** 1
17 LEV -0.0308* -0.0312* 0.1814*** -0.0459*** -0.0005 1
18 ROA 0.0699*** -0.0709*** 0.0773*** 0.0732*** -0.0131 -0.1038*** 1.0000
19 RD -0.0110 0.1037*** -0.1309*** -0.0376** -0.0075 -0.0860*** -0.0536*** 1
20 MB 0.0818*** -0.0878*** 0.1280*** 0.0607*** -0.1359*** -0.1064*** 0.3135*** 0.0358** 1
21 FO 0.6504*** -0.3933*** -0.3692*** 0.7078*** -0.2189*** -0.1221*** 0.0400** -0.0119 0.0660*** 1
22 PD -0.1831*** 0.6254*** -0.0577*** -0.4983*** 0.5055*** 0.1234*** -0.0286* 0.0348** 0.0286* -0.4755*** 1
***, **, and * indicate statistical significance at the 1%, 5%, and 10% levels, respectively

348
6.8.3 Test of Multicollinearity
As discussed in previous chapters, to test for multicollinearity problems that may arise due to the
existence of a strong linear relationship between two or more independent variables, I use the
variation inflation factor (VIF). To interpret the VIF results, I use the general rule of thumb that a VIF
value of 10 or above indicates the existence of multicollinearity (see Takezawa, 2014). The variables
used in the present study do not appear to suffer from significant multicollinearity problems as
evident through variation inflation factors (VIF) values being far below the threshold of 10 for all
regression models. Table 6.9 shows the results of the VIF analysis of all regression models used in
the present study.
Columns (1) and (2) of Table 6.9 present the VIF results of the base model equations (4) and (4b)
respectively. Equation (4a) has a mean VIF of 1.42 (the values ranging from 1.02 to 2.33); equation
(4b) has a mean VIF of 1.55 (the values ranging from 1.04 to 2.39). Columns (3) to (4) present the
VIF results of the main model equations (5) and (6) respectively. Equation (5) has a mean VIF of 2.45
(the values ranging from 1.05 to 7.90); equation (6) has a mean VIF of 1.83 (the values ranging from
1.05 to 3.12). Column (5) presents the VIF results of the equation (7), estimated for robustness
check. Equation (7) has a mean VIF of 1.89 (the values ranging from 1.05 to 3.41). Column (6)
presents the VIF results of the equation (8), estimated as part of the sensitivity analysis. Equation
(8) has a mean VIF of 2.25 (the values ranging from 1.08 to 5.69). Thus, the VIF values being far
below the general threshold of 10 suggests that the variables do not suffer from multicollinearity
issues.

349
Table 6.9 Variation Inflation Factor (VIF) Results The table reports the results of the multicollinearity tests based on estimating the variation inflation factor (VIF). Columns (1) and (2) present the VIF results for equations (4a) and (4b) respectively; Columns (3) and (4) present the VIF results for equations (5) and (6) respectively; and Columns (5) and (6) present the VIF results for equations (7) and (8) respectively. EM refers to earnings management, proxied by discretionary accruals using the modified Jones model by Dechow et al. (1995). EM_DD refers to alternate earnings management specification, proxied by accruals quality model by Dechow & Dichev (2002). CSR, the independent variable, is the ESG score obtained from Thomson Reuters. ENV, SOC and GOV, also independent variables, are the scores on the individual CSR dimensions (Environmental, Social and Governance dimensions respectively), obtained from Thomson Reuters. COLL, CORR and INVPRO are the country-level moderating variables. COLL is the GLOBE measure of institutional collectivism. CORR is the corruption pervasiveness in a country, measured by reverse-scoring the ‘control of CORR’ measure from World Bank’s WGI database. INVPRO is the strength of INVPRO index for a country from WEF’s GCI Historical Data. ENV_DUM, SOC_DUM and GOV_DUM are the alternate measures of the CSR dimensions, measured as a dummy variable which equals 1 if the score on the dimension is greater than the median score of that dimension for each year and industry, and 0 otherwise. COLL, CORR and INVPRO are the country-level moderating variables. COLL is the GLOBE measure of institutional collectivism. CORR_TRI and INVPRO_FF are the alternate measures of the moderating variables. CORR_TRI is the reverse-score of the ‘corruption perception index’ from Transparency International. INVPRO_FF is the investor protection score from the Financial Freedom Index. SIZE, LEV, ROA, RD and MB are the firm-level control variables. SIZE refers to firm size, measured as the natural logarithm of market value of equity. LEV is defined as long-term debts divided by total assets. ROA is measured as the income before extraordinary items, scaled by lagged total assets. RD refers to R&D intensity, measured as R&D expenses divided by net sales. MB is the market to book ratio. FO and PD are the country-level control variables, representing the GLOBE measures for the cultural dimensions Future Orientation and Power Distance, respectively. Industry dummies include a set of dummy variables to capture industry effects, based on Fama-French 12 industry classification.
(1) (2) (3) (4) (5) (6) Independent variables Eq (4a) Eq (4b) Eq (5) Eq (6) Eq (7) Eq (8) CSR 1.02 ENV 2.31 3.01 2.34 2.5 SOC 2.31 3.12 2.41 2.53 GOV 1.27 1.65 1.35 1.44 COLL 1.47 1.16 ENV x COLL 3.31 2.58 SOC x COLL 4.12 2.92 GOV x COLL 2.05 1.54 CORR 2.28 1.7 ENV x CORR 3.9 3.22 SOC x CORR 4.09 3.41 GOV x CORR 2.12 1.8 COLL x CORR 2.34 ENV x COLL x CORR 5.72 SOC x COLL x CORR 7.19 GOV x COLL x CORR 3.09 INVPRO 2.23 1.84 ENV x INVPRO 2.31 2.19 SOC x INVPRO 2.39 2.28 GOV x INVPRO 1.49 1.3 COLL x INVPRO 1.44 ENV x COLL x INVPRO 2.9 SOC x COLL x INVPRO 3.12 GOV x COLL x INVPRO 1.73 ENV_DUM 1.57 SOC_DUM 1.65 GOV_DUM 1.18 CORR_TRI 3.75 ENV_DUM x CORR_TRI 3.85 SOC_DUM x CORR_TRI 3.58 GOV_DUM x CORR_TRI 2.52 INVPRO_FF 5.69 ENV_DUM x INVPRO_FF 2.9 SOC_DUM x INVPRO_FF 3.41 GOV_DUM x INVPRO_FF 2.46 SIZE 1.28 1.51 1.56 1.55 1.54 1.44 LEV 1.14 1.14 1.15 1.14 1.15 1.15 ROA 1.26 1.26 1.27 1.27 1.27 1.26 RD 1.04 1.04 1.05 1.05 1.05 1.25 MB 1.43 1.45 1.47 1.47 1.46 1.46 FO 1.35 1.35 1.77 2.46 2.62 2.56

350
PD 1.35 1.35 2.03 1.53 1.48 1.79 Industry dummies Dum 1 1.38 1.39 1.47 1.4 1.44 1.58 Dum 2 1.06 Dum 3 1.53 1.56 1.87 1.6 1.86 1.99 Dum 4 1.46 1.49 1.76 1.54 1.72 1.73 Dum 5 2.03 2.05 2.49 2.07 2.42 2.68 Dum 6 1.59 1.62 1.81 1.64 1.77 1.9 Dum 7 2.33 2.39 2.87 2.43 2.8 3.14 Dum 8 1.6 1.63 1.86 1.65 1.79 1.98 Dum 9 1.05 1.06 1.12 1.07 1.11 1.1 Dum 10 1.77 1.78 2.17 1.84 2.14 2.36 Mean VIF 1.42 1.55 2.45 1.83 1.89 2.25
6.8.4 Base Model Results of Estimation of Equations (4a) and (4b)
Table 6.10 presents the results of the base model analysis based on estimation of equations
(4a) and (4b), using HLM method, testing the unconditional relationships between CSR and
EM, and between the CSR dimensions (ENV, SOC and GOV) and EM. Table 6.10 Column (1)
presents the results from estimating equation (4a), while Column (2) presents the results from
estimating equation (4b).

351
Table 6.10 HLM Estimation Output of Equations (4a) and (4b) The table presents the estimation results of equations (4a) ad (4b) in Columns (1) and (2) respectively. EM refers to earnings management, proxied by discretionary accruals using the modified Jones model by Dechow et al. (1995). CSR is the firm-level ESG score obtained from Thomson Reuters. ENV, SOC and GOV are the firm-level scores on the environmental, social and governance dimensions of ESG, obtained from Thomson Reuters. The firm level control variables include SIZE, LEV, ROA, RD and MB, and dummy variable to capture industry effects (based on Fama-French 12 industry classification. SIZE refers to firm size, measured as the natural logarithm of market value of equity. LEV is defined as long-term debts divided by total assets. ROA is measured as the income before extraordinary items, scaled by lagged total assets. RD refers to R&D intensity, measured as R&D expenses divided by net sales. MB is the market to book ratio. All firm level independent and control variables are centered using group mean centering. The country level control variables include PD and FO, that represent the GLOBE measures of the cultural dimensions of power distance and future orientation respectively. All country level variables are centered using grand mean centering method. Standard errors are shown in parenthesis.
Variables (1) (2) EM (Equation 4a)
EM (Equation 4b)
CONSTANT 0.0990*** (0.0081) 0.0978***
(0.0081) Firm level
CSR -0.0018 (0.0025)
ENV -0.1688*** (0.0400)
SOC 0.1205*** (0.0379)
GOV 0.0007 (0.0325)
SIZE -0.0038* (0.0021) -0.0024
(0.0023)
LEV -0.0310** (0.0150) -0.0308**
(0.0150)
ROA 0.0588*** (0.0168) 0.0581***
(0.0168)
RD 0.0221 (0.0216) 0.0272
(0.0215)
MB 0.0003 (0.0007) 0.0004
(0.0007) Industry effects Yes Yes Country level
FO 0.1109 (0.0960) 0.1114
(0.0949)
PD 0.1307 (0.0988) 0.1288
(0.0976) Wald 2 88.81 107.03 N 3,286 3,286 ***, **, and * indicate statistical significance at the 1%, 5%, and 10% levels, respectively
As shown in Column (1), the equation (4a) is based on 3,286 firm-year observations, owing to
missing variables. The Wald chi-square is 88.81. The result shows that CSR does not have a
statistically significant relationship with EM (1 = -0.0018). The firm level control variables SIZE

352
(2 = -0.0038; p<0.10) and LEV (3 = -0.0310; p<0.05) have negative relationships with EM,
significant at the 10% and 5% level of significance respectively. ROA (4 = 0.0588; p<0.05) has
a positive relationship with EM, significant at the 5% level of significance. However, RD (5 =
0.0221) and MB (6 = 0.0003) do not have statistically significant relationships with EM. The
country level control variables FO (7 = 0.1109) and PO (8 = 0.1307) also do not have
statistically significant relationships with EM.
As shown in Column (2), equation (4b) is also based on 3,286 firm-year observations. The
Wald chi-square is 107.03. The results show that there is a negative relationship between ENV
(1 = -0.1688; p<0.01) and EM at the 1% level of significance. The result is consistent with the
myopia avoidance hypothesis, providing support for hypothesis H3.1b, suggesting that
managers involved in environmental initiatives are less likely to manage earnings. In contrast,
the results show a positive relationship between SOC (2 = 0.1205; p<0.01) and EM at the 1%
level of significance. This provides support for hypothesis H3.1a and is consistent with the
managerial myopia hypothesis. The result suggests that managers involved on social
initiatives are more likely to manage earnings. GOV (3 = 0.0007) does not have a statistically
significant relationship with EM. The mixed results relating to the CSR dimensions explain why
I did not find a statistically significant relationship between overall CSR and EM from
estimating equation (4a). Since one dimension (ENV) has a negative effect on EM, and another
dimension (SOC) has a positive effect on EM, the overall effect of CSR and EM is not
significant.
In terms of the firm-level control variables, LEV (5 = -0.0308; p<0.01) has a negative and
significant relationship with EM at the 5% level of significance, while ROA (6 = 0.0581;
p<0.01) has a positive relationship with EM at the 1% level of significance. However, the other
control variables (SIZE, RD, MB, FO and PD) do not have statistically significant relationships
with EM.
6.8.5 Main Model Results of Estimation of Equation (5)
Based on the base model results discussed above, the study suggests that there is no
statistically significant relationship between overall CSR and EM, but there are statistically
significant relationships between the CSR dimensions (specifically, ENV and SOC) and EM.
Thus, in the main models, I use the CSR dimensions (ENV, SOC and GOV) as the independent

353
variables, instead of using overall CSR.
Table 6.11 presents the results of the first main analysis model, based on the estimation of
equation (5), using the HLM method, testing the relationship between the three CSR
dimensions and EM, and the individual and joint moderating effects of COLL and CORR. Table
6.11 Column (1) presents the regression coefficients, while Columns (2) and (3) present the
standard errors and p-values respectively, from estimating equation (5). Equation (5) is based
on 3,286 firm-year observations. The Wald chi-square is 163.45.

354
Table 6.11 HLM Estimation Output of Equation (5) The table presents the estimation results of equation (5), estimated using HLM. Column (1) presents the regression coefficients, while Columns (2) and (3) present the standard errors and p-values respectively. respectively. EM refers to earnings management, proxied by discretionary accruals using the modified Jones model by Dechow et al. (1995). ENV, SOC and GOV are the firm-level scores on the environmental, social and governance dimensions of ESG, obtained from Thomson Reuters. COLL and CORR are the country-level moderator variables. COLL is the country-level moderator variable, representing the GLOBE measure of institutional COLL cultural dimension. CORR represents the level of CORR pervasiveness, measured as the reverse-score of control of CORR index from World Bank WGI database. The firm level control variables include SIZE, LEV, ROA, RD and MB, and dummy variable to capture industry effects (based on Fama-French 12 industry classification. SIZE refers to firm size, measured as the natural logarithm of market value of equity. LEV is defined as long-term debts divided by total assets. ROA is measured as the income before extraordinary items, scaled by lagged total assets. RD refers to R&D intensity, measured as R&D expenses divided by net sales. MB is the market to book ratio. All firm level independent and control variables are centered using group mean centering. The country level control variables include PD and FO, that represent the GLOBE measures of the cultural dimensions of power distance and future orientation respectively. All country level variables are centered using grand mean centering method.
Variables (1) (2) (3) EM
(coefficient)
Std error p-value
CONSTANT 0.1040 0.0064 0.0000 Firm level – independent variables ENV -0.2095 0.0457 0.0000 SOC 0.1632 0.0440 0.0000 GOV -0.0177 0.0369 0.6310 Country level – moderating variables CORR 0.0542 0.0144 0.0000 COLL 0.0918 0.0448 0.0400 Interactions ENV x CORR -0.1479 0.2334 0.5260 SOC x CORR 0.0764 0.2179 0.7260 GOV x CORR 0.1087 0.1860 0.5590 ENV x COLL -1.5715 0.8578 0.0670 SOC x COLL 2.6161 0.8541 0.0020 GOV x COLL -0.7079 0.7630 0.3530 COLL x CORR 1.1303 0.3220 0.0000 ENV x COLL x CORR -9.5142 5.3722 0.0770 SOC x COLL x CORR 13.5364 5.1980 0.0090 GOV x COLL x CORR -7.0848 4.4661 0.1130 Firm level – control variables SIZE -0.0015 0.0023 0.5040 LEV -0.0309 0.0150 0.0390 ROA 0.0547 0.0168 0.0010 RD 0.0273 0.0216 0.2070 MB 0.0004 0.0007 0.5830 Industry effects Yes Country level – control variables FO 0.2327 0.0495 0.0000 PD 0.2367 0.0420 0.0000 Wald 2 163.45 N 3,286

355
Hypothesis H3.2 and H3.3 test results
Column (1) shows a negative relationship between ENV (1 = -0.2095; p<0.01) and EM at the
1% level of significance, and a positive relationship between SOC (2 = 0.1632; p<0.01) and
EM at the 1% level of significance, but no statistically significant relationship between GOV
(3 = -0.0177) and EM. The results are consistent with the base model analysis.
The country level variable COLL (5 = 0.0918; p<0.05) has a positive relationship with EM at
the 5% level of significance. Thus, the result provides support for hypothesis H3.2. Consistent
with the informal institutions perspective of the institutional theory, the result suggests that
EM is more prevalent in countries with high institutional COLL.
The interaction of COLL with ENV, that is, ENV x COLL (9 = -1.5715, p<0.10), has a negative
effect on EM at the 10% level of significance. This suggests that COLL has a moderating
(strengthening) effect on the negative relationship between ENV and EM. SOC x COLL (10 =
2.6161, p<0.01) has a positive relationship with EM at the 1% level of significance, suggesting
that COLL has a moderating (strengthening) effect on the positive relationship between SOC
and EM. However, GOV x COLL (11 = -0.7079) does not have a statistically significant
relationship with EM. The results suggest that the relationship between CSR and EM is
exacerbated by institutional COLL. In countries with high institutional COLL, the negative
relationship between ENV and EM becomes more pronounced, while the positive relationship
between SOC and EM also becomes more pronounced. This provides partial support for
hypothesis H3.3, suggesting that COLL, individually, strengthens the relationship between the
CSR dimensions (ENV and SOC) and EM.
To further check the statistical significance of the moderating effect of COLL on the
relationships between ENV and EM, and between SOC and EM, I perform probing on the
interaction effects to examine the relationship between ENV and EM, and between SOC and
EM, at “-1 standard deviation, mean, and +1 standard deviation” on COLL. A graphical
representation of the probing results is shown in Figure 6.6 below. Panel A of Figure 6.6 shows
the graphical representation of the probing results of the interaction of ENV and COLL (ENV x
COLL), while Panel B shows the probing results of the interaction of SOC and COLL (SOC x
COLL).

356
Figure 6.6 Probing Results of the Interaction of COLL with the CSR Dimensions (Equation (5))

357
As shown in Figure 6.6 Panel A, the blue line shows that at Low COLL the regression line has
a slight downward slope, suggesting that the relationship between ENV and EM is negative.
The red line has a slightly steeper downward slope, suggesting that the size of the negative
relationship between ENV and EM is larger at moderate levels of COLL. The green line shows
a much steeper downward slope, suggesting that at High COLL, the negative relationship
between ENV and EM becomes even more pronounced. This suggests that as the level of COLL
increases, the negative relationship between ENV and EM becomes more pronounced. This
further validates the findings that COLL individually has a strengthening effect on the negative
relationship between ENV and EM.
As shown in Figure 6.6 Panel B, the blue line shows that at Low COLL the regression line is
almost horizontal, suggesting that no significant relationship between SOC and EM. The red
line has a slightly steeper upward slope, suggesting that a positive relationship between SOC
and EM at moderate levels of COLL. The green line shows a much steeper upward slope,
suggesting that at High COLL, the positive relationship between SOC and EM becomes even
more pronounced. Thus, the results suggest that as the level of COLL increases, the positive
relationship between SOC and EM becomes more pronounced. This further validates the
findings that COLL individually has a strengthening effect on the positive relationship between
SOC and EM.
Hypothesis H3.4 and H3.5 test results
As shown in Column (1) of Table 6.11, the country level variable CORR (4 = 0.0542; p<0.01)
has a positive relationship with EM at the 1% level of significance. This provides support for
hypothesis H3.4 and is consistent with the informal institutions perspective, suggesting that
EM is more prevalent in countries with higher CORR pervasiveness.
The interactions of CORR with ENV, SOC and GOV, that is, ENV x CORR (6 = -0.1479), SOC x
CORR (7 = 0.0764) and GOV x CORR (8 = 0.1087) respectively, do not have statistically
significant relationships with EM. Thus, the result does not provide support for hypothesis
H3.5, suggesting that CORR individually does not have a significant moderating effect on the
relationship between the CSR dimensions and EM.

358
Hypothesis H3.6 and H3.7 test results
As shown in Column (1) of Table 6.11, the interaction term COLL x CORR (12 = 1.1303, p<0.01)
has a positive and significant relationship on EM at the 1% level of significance. The result
provides support for hypothesis H3,6, suggesting that CORR pervasiveness and institutional
COLL jointly escalate EM.
In terms of the joint effect of institutional COLL and CORR, ENV x COLL x CORR (13 = -0.7079,
p<0.10) has a negative relationship with EM at the 10% level of significance. This suggests that
the interaction between CORR and COLL jointly has a moderating effect on the relationship
between ENV and EM. The joint interaction effect, SOC x COLL x CORR (14 = 13.5364, p<0.01)
has a positive relationship with EM at the 1% level of significance. This suggests the
interaction between COLL and CORR has a joint moderating effect on the relationship
between SOC and ENV. However, GOV x COLL x CORR (15 = -7.0848) does not have a
statistically significant relationship with EM. Overall, the results provide partial support for
hypothesis H3.7, suggesting that the interaction of COLL and CORR makes the relationship
between the CSR dimensions and EM stronger. In countries with joint high CORR and high
institutional COLL, the negative relationship between ENV and EM, and the positive
relationship between SOC and EM become more pronounced. To further confirm the joint
interaction effects, I perform probing to test the relationship between ENV and EM, and
between SOC and EM, at “-1 standard deviation, mean, and +1 standard deviation” on COLL
x CORR. A graphical representation of the probing results is shown in Figure 6.7 below. Panel
A of Figure 6.7 shows the graphical representation of the probing results of the interaction of
ENV, COLL and CORR (ENV x COLL x CORR), while Panel B shows the probing results of the
interaction of SOC, COLL and CORR (SOC x COLL x CORR).
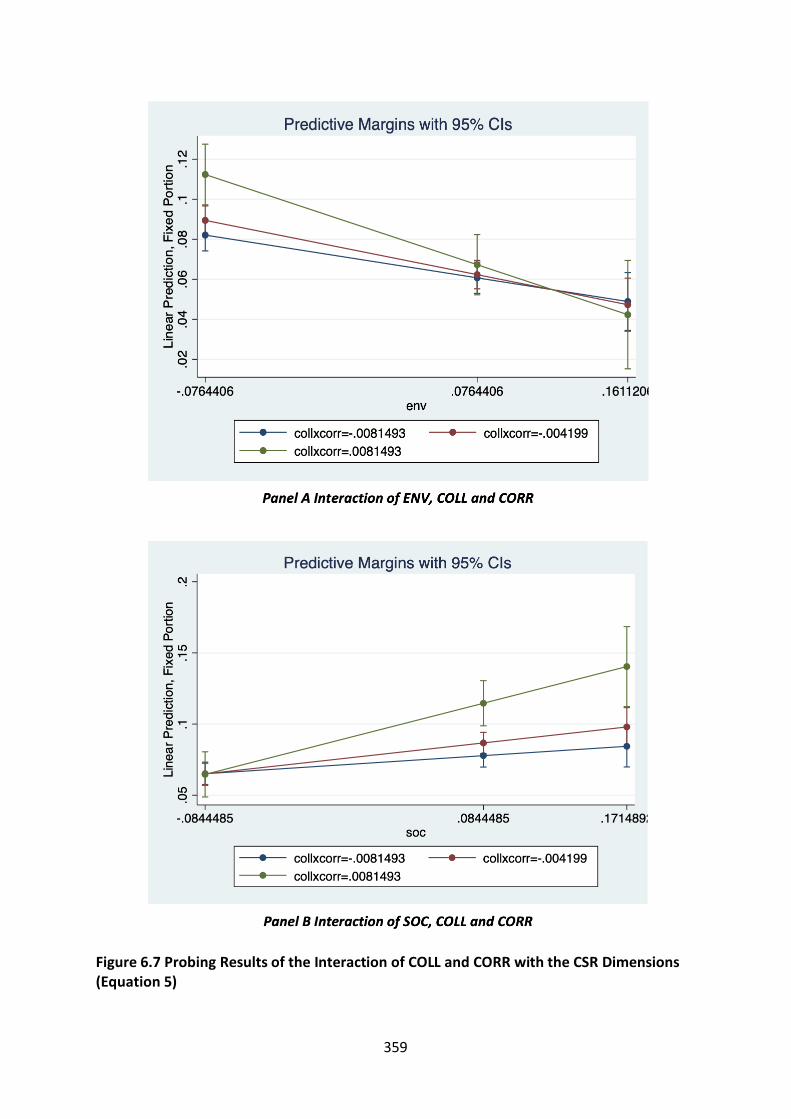
359
Figure 6.7 Probing Results of the Interaction of COLL and CORR with the CSR Dimensions (Equation 5)

360
As shown in Panel A in Figure 6.7, the blue line shows that at Low COLL and low CORR, the
regression line has a slight downward slope, suggesting that the relationship between ENV
and EM is negative. The red line has a slightly steeper downward slope, suggesting that the
size of the negative relationship between ENV and EM is larger at moderate levels of COLL
and CORR. The green line shows a much steeper downward slope, suggesting that at high
COLL and CORR, the negative relationship between ENV and EM becomes even more
pronounced. This suggests that as the level of COLL and CORR increases jointly, the negative
relationship between ENV and EM becomes more pronounced. This further validates the
findings that COLL and CORR jointly have a strengthening effect on the negative relationship
between ENV and EM.
As shown in Panel A in figure 6.7, the blue line shows that at Low COLL and low CORR, the
regression line is upward, suggesting that there is a positive relationship between SOC and
EM. The red line has a slightly steeper upward slope, suggesting that the positive relationship
between SOC and EM becomes more pronounced at moderate levels of COLL and CORR. The
green line shows a much steeper upward slope, suggesting that at High COLL and CORR, the
positive relationship between SOC and EM becomes even more pronounced. Thus, the results
suggest that as the level of COLL and CORR increases jointly, the positive relationship between
SOC and EM becomes more pronounced. This further validates the findings that COLL and
CORR jointly have a strengthening effect on the positive relationship between SOC and EM.
In terms of the results of the relationship between the control variables and EM, from
estimating equation (5), the results show that the firm-level control variable, LEV (17 = -
0.0309; p<0.05) has a negative and significant relationship with EM at the 5% level of
significance, while ROA (18 = 0.0547; p<0.01) has a positive relationship with EM at the 1%
level of significance. However, the other firm-level control variables (SIZE, RD, MB) have no
significant relationship with EM. The country-level control variables, FO (21 = 0.2327; p<0.01)
and PD (22 = 0.2367; p<0.01), both have positive relationships with EM at the 1% level of
significance.

361
6.8.6 Main Model Results of Estimation of Equation (6)
Table 6.12 presents the results of the second main analysis model, based on the estimation
of equation (6), using HLM method, testing the relationship between the three CSR
dimensions and EM, and the individual and joint moderating effects of COLL and INVPRO.
Table 6.12 Column (1) presents the regression coefficients, while Columns (2) and (3) present
the standard errors and p-values respectively, from estimating equation (6). Equation (5) is
based on 3,286 firm-year observations. The Wald chi-square is 133.11.

362
Table 6.12 HLM Estimation Output of Equation (6) Column (1) presents the regression coefficients, while Columns (2) and (3) present the standard errors and p-values respectively. respectively. EM refers to earnings management, proxied by discretionary accruals using the modified Jones model by Dechow et al. (1995). ENV, SOC and GOV are the firm-level scores on the environmental, social and governance dimensions of ESG, obtained from Thomson Reuters. COLL and INVPRO are the country-level moderating variables. COLL is the GLOBE measure of institutional collectivism. INVPRO is the strength of INVPRO index for a country from WEF’s GCI Historical Data. The firm-level control variables include SIZE, LEV, ROA, RD and MB, and dummy variable to capture industry effects (based on Fama-French 12 industry classification. SIZE refers to firm size, measured as the natural logarithm of market value of equity. LEV is defined as long-term debts divided by total assets. ROA is measured as the income before extraordinary items, scaled by lagged total assets. RD refers to R&D intensity, measured as R&D expenses divided by net sales. MB is the market to book ratio. All firm level independent and control variables are centered using group mean centering. The country level control variables include PD and FO, that represent the GLOBE measures of the cultural dimensions of power distance and future orientation respectively. All country level variables are centered using grand mean centering method.
Variables (1) (2) (3) EM
(coefficient)
Std error p-value
CONSTANT 0.0952 0.0073 0.0000 Firm level – independent variables ENV -0.1683 0.0402 0.0000 SOC 0.1048 0.0386 0.0070 GOV 0.0000 0.0334 1.0000 Country level – moderating variables INVPRO -0.1159 0.0344 0.0010 COLL -0.1178 0.0786 0.1340 Interactions ENV x INVPRO 0.5728 0.3997 0.1520 SOC x INVPRO -0.6455 0.3910 0.0990 GOV x INVPRO -0.0277 0.3370 0.9350 ENV x COLL -0.6037 0.7575 0.4250 SOC x COLL 1.3313 0.7182 0.0640 GOV x COLL -0.1087 0.6588 0.8690 COLL x INVPRO -0.7518 0.6093 0.2170 ENV x COLL x INVPRO -2.4268 10.0027 0.8080 SOC x COLL x INVPRO -4.3243 9.5287 0.6500 GOV x COLL x INVPRO -3.6331 8.5499 0.6710 Firm level – control variables SIZE -0.0023 0.0023 0.3170 LEV -0.0337 0.0150 0.0240 ROA 0.0592 0.0168 0.0000 RD 0.0303 0.0215 0.1590 MB 0.0005 0.0007 0.4600 Industry effects Yes Country level – control variables FO 0.2914 0.0875 0.0010 PD 0.1799 0.0740 0.0150 Wald 2 133.11 N 3,286

363
Hypothesis H3.8 and H3.9 test results
As shown in Column (1) of Table 6.12, the results concerning the relationship between the
CSR dimensions and EM are consistent with the previous results. ENV (1 = -0.1683; p<0.01)
has a negative relationship with EM at the 1% level of significance; SOC (2 = 0.1048; p<0.01)
has a positive relationship with EM at the 1% level of significance; GOV (3 = 0.0000) does not
have a statistically significant relationship with EM.
The country level variable, INVPRO (4 -0.1159; p<0.01) has a negative relationship with EM
at the 1% level of significance. This provides support for hypothesis H3.8 and is consistent
with the formal institutions perspective, suggesting that in countries with strong INVPRO,
managers have fewer opportunities and incentives to manage earnings.
The interactions of INVPRO with ENV and GOV, that is, ENV x INVPRO (6 = 0.5728) and GOV
x INVPRO (8 = -0.0277) respectively, do not have statistically significant relationships with
EM. However, SOC x INVPRO (7 = -0.6455; p<0.10) has a negative relationship with EM at
the 10% level of significance. This suggests that INVPRO moderates (weakens) the positive
relationship between SOC and EM. The result provides partial support for hypothesis H3.9,
suggesting that INVPRO individually has a moderating effect on the relationship between the
CSR dimension (SOC) and EM.
To further confirm this moderating effect, the interaction effect is probed to examine the
relationship between SOC and EM at “-1 standard deviation, mean, and +1 standard
deviation” on INVPRO. A graphical representation of the probing results is shown in Figure
6.8 below.
The blue line on Figure 6.8 represents low levels of INVPRO. The upward slope on the blue
line suggests that at low levels of INVPRO, there is a positive relationship between SOC and
EM. The red line represents moderate levels of INVPRO. The red line being horizontal suggests
a non-significant relationship between SOC and EM at moderate levels of INVPRO. The green
line represents high levels of INVPRO. The downward slope on the green line suggests that
the relationship between SOC and EM becomes negative at high levels of INVPRO. Thus, the
graph shows that as the level of INVPRO increases, the positive relationship between SOC and
EM becomes weaker. This further validates the finding that INVPRO individually weakens the

364
relationship between SOC and EM.
Figure 6.8 Probing results of the interaction of INVPRO with the SOC dimension (Equation (6))
Hypothesis H3.10 and H3.11 test results
As shown in Column (1) of Table 6.12, when INVPRO is included in the regression, COLL (5 =
-0.1178) no longer has a statistically significant relationship with EM. The interaction of COLL
with ENV and GOV, that is, ENV x COLL (9 = -0.6037) and GOV x COLL (11 = -0.1087), also
does not have statistically significant relationship with EM. However, SOC x COLL (10 =
1.3313, p<0.01) has a positive relationship with EM at the 1% level of significance, suggesting
that COLL has a moderating (strengthening) effect on the positive relationship between SOC
and EM, consistent with the original findings.
The interaction of COLL and INVPRO, that is COLL x INVPRO (12 = -0.1087), does not have a
statistically significant relationship with EM. Thus, the results do not find support for
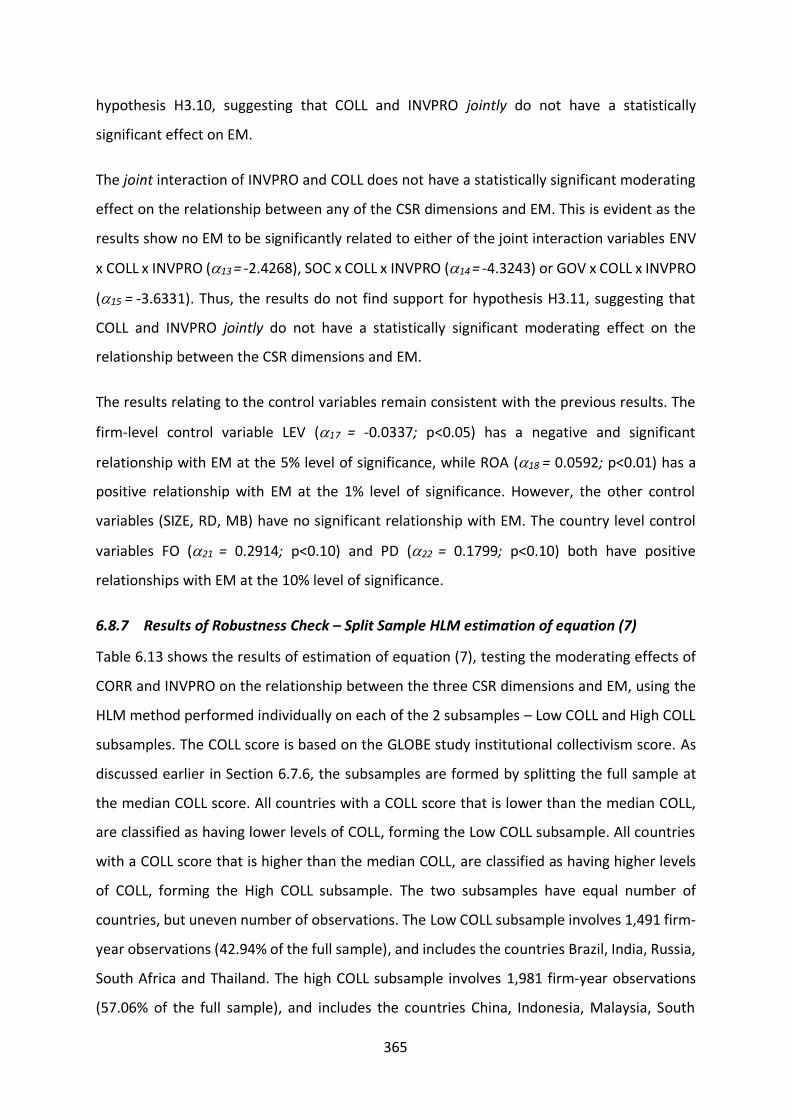
365
hypothesis H3.10, suggesting that COLL and INVPRO jointly do not have a statistically
significant effect on EM.
The joint interaction of INVPRO and COLL does not have a statistically significant moderating
effect on the relationship between any of the CSR dimensions and EM. This is evident as the
results show no EM to be significantly related to either of the joint interaction variables ENV
x COLL x INVPRO (13 = -2.4268), SOC x COLL x INVPRO (14 = -4.3243) or GOV x COLL x INVPRO
(15 = -3.6331). Thus, the results do not find support for hypothesis H3.11, suggesting that
COLL and INVPRO jointly do not have a statistically significant moderating effect on the
relationship between the CSR dimensions and EM.
The results relating to the control variables remain consistent with the previous results. The
firm-level control variable LEV (17 = -0.0337; p<0.05) has a negative and significant
relationship with EM at the 5% level of significance, while ROA (18 = 0.0592; p<0.01) has a
positive relationship with EM at the 1% level of significance. However, the other control
variables (SIZE, RD, MB) have no significant relationship with EM. The country level control
variables FO (21 = 0.2914; p<0.10) and PD (22 = 0.1799; p<0.10) both have positive
relationships with EM at the 10% level of significance.
6.8.7 Results of Robustness Check – Split Sample HLM estimation of equation (7)
Table 6.13 shows the results of estimation of equation (7), testing the moderating effects of
CORR and INVPRO on the relationship between the three CSR dimensions and EM, using the
HLM method performed individually on each of the 2 subsamples – Low COLL and High COLL
subsamples. The COLL score is based on the GLOBE study institutional collectivism score. As
discussed earlier in Section 6.7.6, the subsamples are formed by splitting the full sample at
the median COLL score. All countries with a COLL score that is lower than the median COLL,
are classified as having lower levels of COLL, forming the Low COLL subsample. All countries
with a COLL score that is higher than the median COLL, are classified as having higher levels
of COLL, forming the High COLL subsample. The two subsamples have equal number of
countries, but uneven number of observations. The Low COLL subsample involves 1,491 firm-
year observations (42.94% of the full sample), and includes the countries Brazil, India, Russia,
South Africa and Thailand. The high COLL subsample involves 1,981 firm-year observations
(57.06% of the full sample), and includes the countries China, Indonesia, Malaysia, South
366
Korea and Taiwan.
Table 6.13 HLM Estimation Output of Equation (7) The table presents the estimation results of equation (7) estimated using HLM, performed on the 2 subsamples (Low COLL and High COLL subsamples). Column (1) presents the regression coefficients, while columns (2) and (3) present the standard errors and p-values respectively, for the Low COLL subsample. respectively. Column (4) presents the regression coefficients, while columns (5) and (6) present the standard errors and p-values respectively, for the High COLL subsample. EM refers to earnings management, proxied by discretionary accruals using the modified Jones model by Dechow et al. (1995). ENV, SOC and GOV are the firm-level scores on the environmental, social and governance dimensions of ESG, obtained from Thomson Reuters. CORR and INVPRO are the country-level moderating variables. CORR is the corruption pervasiveness in a country, measured by reverse-scoring the ‘control of CORR’ measure from World Bank’s WGI database. INVPRO is the strength of INVPRO index for a country from WEF’s GCI Historical Data. The firm-level control variables include SIZE, LEV, ROA, RD and MB, and dummy variable to capture industry effects (based on Fama-French 12 industry classification). SIZE refers to firm size, measured as the natural logarithm of market value of equity. LEV is defined as long-term debts divided by total assets. ROA is measured as the income before extraordinary items, scaled by lagged total assets. RD refers to R&D intensity, measured as R&D expenses divided by net sales. MB is the market to book ratio. All firm level independent and control variables are centered using group mean centering. The country-level control variables include PD and FO, that represent the GLOBE measures of the cultural dimensions of power distance and future orientation respectively. All country level variables are centered using grand mean centering method. Variables
Low COLL subsample High COLL subsample (1) (2) (3) (4) (5) (6) EM
(coefficient) Std error p-value EM (coefficient) Std error p-value
CONSTANT 0.0833 0.0201 0.0000 0.1037 0.0075 0.0000 Firm level – independent variables ENV -0.1140 0.0822 0.1650 -0.1891 0.0691 0.0060 SOC 0.0157 0.0836 0.8510 0.1375 0.0635 0.0300 GOV 0.0074 0.0733 0.9190 -0.0234 0.0545 0.6690 Country level – moderating variables CORR 0.1624 0.0567 0.0040 0.0701 0.0168 0.0000 INVPRO -0.1859 0.0625 0.0030 -0.0495 0.0364 0.1740 Interactions ENV x CORR -0.2449 0.6254 0.6950 -0.1318 0.2909 0.6510 SOC x CORR 0.4014 0.5922 0.4980 0.0820 0.2738 0.0490 GOV x CORR -0.3647 0.5452 0.5030 0.0070 0.2312 0.9760 ENV x INVPRO 0.2320 0.7977 0.7710 0.5242 0.5209 0.3140 SOC x INVPRO -0.8917 0.4802 0.0630 -0.1174 0.8023 0.8840 GOV x INVPRO 0.3487 0.7029 0.6200 -0.1607 0.3984 0.6870 Firm level – control variables SIZE -0.0026 0.0035 0.4570 0.0006 0.0032 0.8400 LEV 0.0119 0.0227 0.5990 -0.0819 0.0207 0.0000 ROA 0.0372 0.0226 0.0990 0.0822 0.0264 0.0020 RD -0.3258 0.4463 0.4650 0.0298 0.0208 0.1520 MB 0.0003 0.0010 0.7720 0.0005 0.0009 0.5880 Industry effects Yes Yes Country level – control variables FO 0.5393 0.1172 0.0000 0.2094 0.1026 0.0410 PD 0.1560 0.0587 0.0080 0.0196 0.1011 0.8470 Wald 2 78.53 139.02 N 1,401 1,885

367
Results in the Low COLL subsample
Table 6.13 Columns (1), (2) and (3) show the regression coefficient, standard error, and p-
value from estimating equation (7) on the Low COLL subsample. The estimation involves 1,401
observations, owing to missing variables. The Wald chi-square is 78.53.
In the Low COLL subsample, the CSR dimensions ENV (1 = -0.1140), SOC (2 = 0.0157) and
GOV (3 = 0.0074) do not have statistically significant relationships with EM. This suggests
that in countries with low institutional COLL, the CSR dimensions do not have a significant
effect on EM.
The country level independent variable CORR (4 = 0.1624, p<0.01) has a positive relationship
with EM at the 1% level of significance. This suggests that EM is more prevalent in countries
with joint low institutional COLL and high CORR. INVPRO (5= -0.1859, p<0.01) has a negative
effect on EM at the 1% level of significance. This suggests that low COLL and high INVPRO
jointly constrains EM.
The CORR interaction variables ENV x CORR, SOC x CORR and GOV x CORR do not have
statistically significant relationships with EM, suggesting that CORR does not have a
moderating effect on the relationship between the CSR dimensions and EM within the Low
COLL subsample. The INVPRO interaction variables ENV x INVPRO and GOV x INVPRO also do
not have statistically significant relationships with EM. However, SOC x INVPRO (10 = -0.8917,
p<0.10) has a negative effect on EM at the 10% level of significance. This suggests that the
interaction of INVPRO and SOC reduces EM in low COLL countries.
The firm level control variable ROA (14 = 0.0372, p<0.10) has a positive relationship with EM
at the 10% level of significance. However, the other firm-level control variables (SIZE, LEV, RD
and MB) do not have a statistically significant relationship with EM. The country-level control
variables FO (17 = 0.5393, p<0.01) and PD (18 = 0.1560, p<0.01) both have positive
relationships with EM at the 1% level of significance.

368
Results in the High COLL subsample
Table 6.13 Columns (4), (5) and (6) show the regression coefficient, standard error, and p-
value from estimating equation (7) on the High COLL subsample. The estimation involves
1,885 observations, owing to missing variables. The Wald chi-square is 139.02.
In the High COLL subsample ENV (1 = -0.1891; p<0.01) has a negative relationship with EM
at the 1% level of significance. SOC (2 = 0.1375; p<0.01) has a positive relationship with EM
at the at the 5% level of significance. However, GOV (3 = -0.0937) does not have statistically
significant relationship with EM. The results suggest that in countries with higher institutional
COLL, firms with higher ENV initiatives are less likely to engage in EM, but firms with higher
social initiatives are more likely to engage in EM.
The country level moderating variable, CORR (4 = 0.0701; p<0.01) has a positive relationship
with EM at the 1% level of significance. The result suggests that in countries with joint high
institutional COLL and CORR, EM is more prevalent. INVPRO does not have a statistically
significant relationship with EM in the high COLL subsample, suggesting that INVPRO no
longer constrains EM when the country has high COLL.
The CORR interaction variables ENV x CORR and GOV x CORR do not have statistically
significant relationships with EM. However, SOC x CORR (7 = 0.0820; p<0.05) has a positive
and significant relationship with EM at the 5% level of significance. This suggests that in the
high COLL subsample, CORR has a moderating effect on the relationship between SOC and
EM, but not on the relationship between the other two CSR dimensions (ENV and GOV) and
EM.
The INVPRO interaction variables ENV x INVPRO, SOC x INVPRO and GOV x INVPRO do not
have statistically significant relationships with EM, suggesting that INVPRO does not have a
moderating effect on the relationship between the CSR dimensions and EM within the High
COLL subsample.

369
The results regarding the firm-level control variables show that LEV (13 = -0.0819, p<0.01)
has a negative relationship with EM at the 1% level of significance, while ROA (14 = 0.0822,
p<0.01) has a positive relationship with EM at the 1% level of significance. However, the other
firm-level control variables (SIZE, RD and MB) do not have a statistically significant
relationships with EM within the High COLL subsample. The country level control variable FO
(17 = 0.2094, p<0.01) has a positive relationship with EM at the 1% level of significance.
However, PD does not have a statistically significant relationship with EM in the high COLL
subsample.
Comparison of results in the Low versus High COLL subsamples
In this section, I compare the results between the two subsamples to examine whether the
results vary between countries with low levels of institutional COLL and high levels of
institutional COLL.
The results from the split sample show that there is a negative and significant relationship
between ENV and EM in the High COLL subsample, but no significant relationship in the LOW
COLL subsample. The result suggests COLL changes the relationship between ENV and EM. In
particular, in higher COLL countries, managers undertaking more environmental initiatives
are less likely to manage earnings. The relationship between SOC and EM is also different
between the two subsamples. While there is a positive and significant relationship between
SOC and EM in the High COLL subsample, there is no significant relationship between SOC and
EM in the Low COLL subsample. This suggests that in high institutionally COLL countries,
managers undertaking more social initiatives are more likely to manage earnings. The
relationship between GOV and EM remain statistically insignificant in both subsamples,
suggesting that in emerging market countries GOV does not affect EM, regardless of the level
of institutional COLL.
Overall, the results regarding the relationship between the CSR dimensions and EM suggest
that COLL has a strengthening effect. In countries with higher institutional COLL, the negative
relationship between ENV and EM, and the positive relationship between SOC and EM are
more pronounced. This is consistent with the original results that suggest a moderating effect
of COLL on the relationship between the CSR dimensions (ENV and SOC) and EM.

370
The results regarding the effect of the country-level moderating variable, CORR, is also
different across the two subsamples. CORR has a positive and significant effect on both the
Low COLL and High COLL subsample. Therefore, I test the difference in the size of the
coefficient, with the results reported in Table 6.14. The difference in the size of the coefficient
of CORR between the Low and High COLL subsamples is -0.0923. This is obtained by
subtracting the CORR coefficient (4 Low COLL = 0.1624, p<0.05) in the Low COLL subsample from
the CORR coefficient (4 High COLL = 0.0701; p<0.01) in the High COLL subsample. However, the
difference in the CORR coefficients is not statistically significant, as the p-value = 1.1115. The
split sample results suggest that CORR has a positive effect on EM, regardless of the level of
COLL.
Table 6.14 Difference in the effect of CORR - Low COLL versus High COLL Subsamples
The table presents the comparison of the estimation results of equation (7) performed on the 2 subsamples (Low COLL and High COLL). Column (1) presents the difference in the regression coefficients, between the two subsamples, while Columns (2) and (3) show the standard error and the p-value respectively. EM refers to earnings management, proxied by discretionary accruals using the modified Jones model by Dechow et al. (1995). CORR is the CORR pervasiveness in a country, measured by reverse-scoring the ‘control of CORR’ measure from World Bank’s WGI database
(1) (2) (3) EM
(coefficient)
Std error p-value
CORR (High COLL – Low COLL) -0.0923 0.0591 1.1115
The results regarding the interaction of CORR with the CSR dimensions (as shown earlier in
Table 6.13) show some differences across the two subsamples. The interaction variables ENV
x CORR and GOV x CORR do not have statistically significant relationships with EM in either of
the two subsamples. However, the interaction variable SOC x CORR has a positive and
significant relationship with EM in the High COLL subsample, but no significant relationship in
the Low COLL subsample. Thus, the results show that as COLL increases, the relationship
between SOC x CORR and EM changes. Consistent with the original findings, the result
suggests that COLL and CORR jointly have a moderating (strengthening) effect on the
relationship between SOC and EM. In countries with high institutional COLL and high CORR
pervasiveness, managers involved in SOC initiatives are more likely to manage earnings.

371
The country level variable, INVPRO, is also different across the two subsamples (as shown
earlier in Table 6.13). INVPRO has a negative and significant effect on EM in the Low COLL
subsample, but no significant effect in the High COLL subsample. The result suggests that
while INVPRO constrains EM in low COLL countries, this is different in high COLL countries. In
countries with high institutional COLL, INVPRO may no longer be effective in constraining EM.
The results regarding the interaction of INVPRO with the CSR dimensions also show some
difference across the two subsamples (as shown earlier in Table 6.13). The interaction
variables ENV x INVPRO and GOV x INVPRO do not have statistically significant relationships
with EM in either of the two subsamples. However, SOC x INVPRO has a negative effect on
EM in the low COLL subsample, but no significant effect in the high COLL subsample. This
suggests that while INVPRO has a moderating effect on the relationship between SOC and EM
in low COLL countries, INVPRO loses its effectiveness, and no longer moderates the
relationship between SOC and EM in high COLL countries. This is consistent to the original
findings.
6.8.8 Sensitivity test – Split sample result of HLM estimation of equation (8)
Table 6.15 shows the results of the sensitivity tests by estimating equation (8), using alternate
measures of the key variables. The alternate measures of EM, ENV, SOC, GOV, COLL, CORR
and INVPRO are EM_DD, ENV_DUM, SOC_DUM, GOV_DUM, CORR_TRI and INVPRO_FF
respectively. Equation (8) is a re-estimation of equation (7), with the main dependent,
independent and moderating variables replaced with their alternate measures, as specified
above. Thus, the process adopted for the sensitivity analysis is consistent to the process
discussed in Section 6.8.7.
The sensitivity test is performed by estimating equation (8), using the HLM method,
performed individually on each of the 2 subsamples – Low COLL_H and High COLL_H
subsamples. The COLL_H score is the reverse score of IDV, based on Hofstede’s IDV-COLL
cultural dimension, obtained from Hofstede Insights (2021). As discussed earlier in Section
6.7.7, the subsamples are formed by splitting the full sample at the mean COLL_H score. The
Low COLL_H subsample comprises of all countries with a COLL_H score that is lower than the

372
mean COLL_H. The High COLL_H subsample comprises of all countries with a COLL_H score
that is higher than the mean COLL_H. The two subsamples have uneven number of countries
and observations. The Low COLL_H subsample involves four countries (namely, Brazil, India,
Russia and South Africa), with 1,369 firm-year observations (39.43% of the full sample). The
High COLL_H subsample involves six countries (namely, China, Indonesia, Malaysia, South
Korea, Taiwan and Thailand), with 2,103 firm-year observations (60.57% of the full sample).

373
Table 6.15 HLM Estimation Output of Equation (8) The table presents the estimation results of equation (8) estimated using HLM, performed on the 2 subsamples (Low COLL_H and High COLL_H subsamples). COLL_H is the reverse-score of Hofstede’s IDV cultural dimension. Column (1) presents the regression coefficients, while columns (2) and (3) present the standard errors and p-values respectively, for the Low COLL subsample. respectively. Column (4) presents the regression coefficients, while columns (5) and (6) present the standard errors and p-values respectively, for the High COLL subsample. EM_DD refers to alternate earnings management specification, proxied by accruals quality model by Dechow & Dichev (2002). ENV_DUM, SOC_DUM and GOV_DUM are the alternate measures of the CSR dimensions, measured as a dummy variable which equals 1 if the score on the dimension is greater than the median score of that dimension for each year and industry, and 0 otherwise. CORR_TRI and INVPRO_FF are the alternate measures of the moderating variables. CORR_TRI is the reverse-score of the ‘corruption perception index’ from Transparency International. INVPRO_FF is the investor protection score from the Financial Freedom Index. The firm-level control variables include SIZE, LEV, ROA, RD and MB, and dummy variable to capture industry effects (based on Fama-French 12 industry classification). SIZE refers to firm size, measured as the natural logarithm of market value of equity. LEV is defined as long-term debts divided by total assets. ROA is measured as the income before extraordinary items, scaled by lagged total assets. RD refers to R&D intensity, measured as R&D expenses divided by net sales. MB is the market to book ratio. All firm level independent and control variables are centered using group mean centering. The country-level control variables include PD and FO, that represent the GLOBE measures of the cultural dimensions of power distance and future orientation respectively. All country level variables are centered using grand mean centering method. Variables
Low COLL_H subsample High COLL _H subsample (1) (2) (3) (4) (5) (6)
EM_DD (coefficient) Std error p-value EM_DD
(coefficient) Std
error p-value
CONSTANT 0.0583 0.0164 0.0000 0.0900 0.0059 0.0000 Firm level – independent variables ENV_DUM -0.0011 0.0049 0.8200 -0.0154 0.0044 0.0000 SOC_DUM -0.0206 0.0050 0.0000 0.0056 0.0047 0.2330 GOV_DUM 0.0045 0.0041 0.2780 0.0053 0.0038 0.1680 Country level – independent variables CORR_TRI -0.0541 0.1420 0.7030 0.0816 0.0293 0.0050 INVPRO_FF -0.2327 0.1367 0.0890 0.0555 0.0294 0.0590 Interactions ENV_DUM x CORR_TRI 0.0002 0.0978 0.9990 0.0008 0.0386 0.9830 SOC_DUM x CORR_TRI 0.0117 0.0401 0.7710 0.1805 0.0983 0.0660 GOV_DUM x CORR_TRI -0.0522 0.0831 0.5300 -0.0278 0.0327 0.3960 ENV_DUM x INVPRO_FF -0.0018 0.0338 0.9570 0.0296 0.0288 0.3040 SOC_DUM x INVPRO_FF -0.0765 0.0300 0.0110 0.0746 0.0357 0.0360 GOV_DUM x INVPRO_FF 0.0147 0.0291 0.6130 0.0061 0.0254 0.8100 Firm level – control variables SIZE -0.0041 0.0016 0.0090 -0.0113 0.0020 0.0000 LEV -0.0548 0.0110 0.0000 -0.0317 0.0132 0.0170 ROA -0.0144 0.0102 0.1580 0.0355 0.0160 0.0270 RD 0.4940 0.2222 0.0260 0.1524 0.0493 0.0020 MB 0.0001 0.0005 0.8680 -0.0014 0.0006 0.0220 Industry effects Yes Yes Country level – control variables FO 0.2242 0.1519 0.1400 0.0299 0.0695 0.6680 PD -0.0389 0.1772 0.8260 0.0512 0.0595 0.3900 Wald 2 212.16 236.22 N 1,061 1,588

374
Results in the Low COLL_H subsample
Table 6.15 Columns (1), (2) and (3) show the regression coefficient, standard error, and p-
value from estimating equation (8) on the Low COLL_H subsample. The estimation involves
1,061 observations, owing to missing variables. The Wald chi-square is 212.16.
In the Low COLL_H subsample, the CSR dimensions ENV_DUM (1 = -0.0011) and GOV_DUM
(3 = 0.0045) do not have statistically significant relationships with EM_DD. SOC_DUM (2 = -
0.0206, p<0.01) has a negative relationship with EM_DD at the 1% level of significance,
suggesting that in countries with low collectivism culture, managers, engaged in SOC
initiatives, are less likely to manage earnings.
The country level independent variable CORR_TRI (4 = -0.0541) does not have a statistically
significant relationship with EM_DD in the Low COLL_H subsample. INVPRO_FF (5= -0.2327,
p<0.10) has a negative effect on EM_DD at the 10% level of significance. This suggests that
low COLL_H and high INVPRO_FF jointly constrains EM_DD.
The interaction variables ENV_DUM x CORR_TRI, SOC_DUM x CORR_TRI and GOV_DUM x
CORR_TRI do not have statistically significant relationships with EM_DD, suggesting that
CORR_TRI does not have a moderating effect on the relationship between the CSR dimensions
and EM_DD within the Low COLL_H subsample. The INVPRO_FF interaction variables
ENV_DUM x INVPRO_FF and GOV_DUM x INVPRO_FF also do not have statistically significant
relationships with EM_DD. However, SOC_DUM x INVPRO_FF (10 = -0.0765, p<0.05) has a
negative effect on EM_DD at the 5% level of significance. Consistent to the original findings,
this suggests that the interaction of INVPRO_FF has a weakening effect on the positive
relationship between SOC_DUM x EM_DD in low COLL_H countries.
The firm-level control variables SIZE (12 = -0.0041, p<0.01) and LEV (13 = -0.0548, p<0.01)
have negative relationships with EM_DD at the 1% level of significance, while RD (15 =
0.4940, p<0.05) has a positive effect on EM_DD at the 5% level of significance. ROA and MB
do not have statistically significant relationships with EM_DD in the Low COLL_H subsample.

375
The country-level control variables FO (17 = 0.2242) and PD (18 = -0.0389) also do not have
statistically significant relationships with EM_DD in the Low COLL_H subsample.
Results in the High COLL_H subsample
Table 6.15 Columns (4), (5) and (6) show the regression coefficient, standard error, and p-
value from estimating equation (8) on the High COLL_H subsample. The estimation involves
1,588 observations, owing to missing variables. The Wald chi-square is 236.22.
In the High COLL_H subsample ENV_DUM (1 = -0.0154; p<0.01) has a negative relationship
with EM_DD at the 1% level of significance. SOC_DUM (2 = 0.0056) and GOV_DUM (3 =
0.0053) do not have statistically significant relationship with EM_DD. The results suggest that
in countries with higher COLL_H, firms with higher ENV_DUM initiatives are less likely to
manage earnings.
The country level moderating variable, CORR_TRI (4 = 0.0816; p<0.01) has a positive
relationship with EM_DD at the 1% level of significance. The result suggests that in countries
with joint high COLL_H and CORR_TRI, EM_DD is more prevalent. INVPRO_FF (5 = 0.0555;
p<0.10) has a positive relationship with EM_DD, at the 10% level of significance, in the high
COLL_H subsample. The result suggests that in high COLL_H countries, INVPRO_FF no longer
constrains EM_DD, but rather EM_DD increases despite the level in INVPRO_FF.
The CORR_TRI interaction variables ENV_DUM x CORR_TRI and GOV_DUM x CORR_TRI do not
have statistically significant relationships with EM_DD, but SOC_DUM x CORR_TRI (7 =
0.1805, p<0.10) has a positive relationship with EM_DD at the 10% level of significance. This
suggests that in countries with high COLL_H, the interaction of CORR_TRI and SOC_DUM
increases EM_DD.
The INVPRO_FF interaction variables ENV_DUM x INVPRO_FF and GOV_DUM x INVPRO_FF
do not have statistically significant relationships with EM_DD. However, SOC_DUM x
INVPRO_FF (10 = 0.0746, p<0.05) has a positive relationship with EM_DD at the 5% level of
significance. This suggests that in countries with high COLL_H, INVPRO_FF loses its

376
effectiveness in weakening the positive relationship between SOC_DUM and EM_DD. In high
COLL countries, the interaction of INVPRO_FF and SOC_DUM increases EM.
The results regarding the firm-level control variables show that SIZE (12 = -0.0113, p<0.01)
has a negative relationship with EM_DD at the 1% level of significance, while LEV (13 = -
0.0317, p<0.05) and MB (16 = -0.0014, p<0.05) have negative relationships with EM_DD at
the 5% level of significance. ROA (14 = 0.0355, p<0.05) has a positive relationship with EM_DD
at the 5% level of significance, while RD (15 = 0.1524, p<0.01) has a positive relationship with
EM_DD at the 1% level of significance. The country level control variable FO (17 = 0.0299)
and PD (18 = 0.0512) do not have a statistically significant relationships with EM_DD in the
high COLL_H subsample.
Comparison of results in the Low versus High COLL_H subsamples
In this section, I compare the results between the two subsamples to examine whether the
results vary between countries with low levels of COLL_H and high levels of COLL_H.
The results show that there is a negative and significant relationship between ENV_DUM and
EM_DD in the High COLL_H subsample, but no significant relationship in the LOW COLL_H
subsample. Consistent to the findings discussed before, the result suggests that COLL_H
changes the relationship between ENV_DUM and EM_DD. In countries with higher COLL_H,
managers undertaking more ENV_DUM environmental initiatives are less likely to manage
earnings. The relationship between SOC_DUM and EM_DD is also different between the two
subsamples. While there is a negative and significant relationship between SOC_DUM and
EM_DD in the Low COLL_H subsample, there is no significant relationship between SOC_DUM
and EM_DD in the High COLL_H subsample. Although this result is different to my original
results, the interpretation is still consistent, as the result suggests that COLL_H changes the
relationship between SOC and EM. As high COLL_H societies, managers, engaged in social
initiatives, are less likely to constrain EM. The relationship between GOV_DUM and EM_DD
remain statistically insignificant in both subsamples, suggesting that in emerging market
countries GOV_DUM does not affect EM_DD, regardless of the level of COLL_H.
377
Overall, the results regarding the relationship between the CSR dimensions and EM_DD
suggest that COLL_H has moderating effects on the relationships between ENV_DUM and
EM_DD and between SOC_DUM and EM_DD.
The results regarding the effect of the country-level moderating variable, CORR_TRI, are also
different across the two subsamples. CORR_TRI has a positive and significant effect in the Low
High COLL_H subsample, but no significant effect in the Low COLL_H subsample. Consistent
with my original findings, the result suggests that COLL_H and CORR_TRI jointly increase
EM_DD. The interaction variables ENV_DUM x CORR_TRI, SOC_DUM x CORR_TRI and
GOV_DUM x CORR_TRI do not have statistically significant relationships with EM_DD in either
of the two subsamples, suggesting that CORR_TRI does not affect the relationship between
the CSR dimensions and EM_DD in emerging market countries.
There are also differences between the two subsamples on the results regarding INVPRO_FF.
INVPRO_FF has a negative and significant effect on EM_DD in the Low COLL_H subsample,
but a positive and significant effect in the High COLL_H subsample. The interaction variables
ENV_DUM x INVPRO_FF and GOV_DUM x INVPRO_FF do not have statistically significant
relationships with EM_DD in either of the two subsamples. However, SOC_DUM x INVPRO_FF
has a negative effect on EM_DD in the low COLL_H subsample, but a positive effect in the
high COLL_H subsample. Overall, the results regarding INVPRO_FF show that the effects of
INVPRO_FF and SOC_DUM x INVPRO_FF on EM are different across the two subsamples, as
evidenced by the coefficients being different and statistically significant in both subsamples.
Consequently, to confirm the moderating effect of COLL_H, I test the statistical significance
of the difference in these coefficients, as reported in Table 6.16.
The results shown in Table 6.16 confirm that the differences in the effects of INVPRO_FF and
SOC_DUM x INVPRO_FF on EM_DD, between the Low COLL_H and High COLL_H subsamples,
are statistically significant.

378
Table 6.16 Differences in the effect of INVPRO_FF - Low COLL_H versus High COLL_H Subsamples
The table presents the difference in the coefficients of INVPRO_FF and SOC_DUM x INVPRO_FF between the Low COLL_H and High COLL_H subsamples, from estimating equation (8) on each of the two subsamples. Column (1) presents the difference in the regression coefficients, between the two subsamples, while Columns (2) and (3) show the standard error and the p-value respectively. EM_DD refers to earnings management, proxied by the accruals quality model by Dechow & Dichev (2002). INVPRO_FF is the investor protection score from the Financial Freedom Index. SOC_DUM is measured as a dummy variable which equals 1 if the score on the SOC dimension is greater than the median SOC score for each year and industry, and 0 otherwise.
(1) (2) (3)
EM_DD (coefficient)
Std error p-value
INVPRO_FF (High COLL_H – Low COLL_H) 0.2882 0.1398 0.0390 SOC_DUM x INVPRO_FF (High COLL_H – Low COLL_H) 0.1511 0.0466 0.0012
As shown in Table 6.16, the difference in the size of the coefficient of INVPRO_FF between
the Low COLL_H (5 Low COLL_H= -0.2327) and High COLL_H (5 High COLL_H = 0.0555) subsamples
is 0.2882 (p<0.05). The result suggests that the relationship between INVPRO_FF and EM_DD
significantly changes with the level of COLL_H. The positive coefficient suggests that
INVPRO_FF has a positive effect on EM_DD in High COLL_H countries. While this is a new
finding compared with my original findings, the interpretation of this finding remains
consistent with my original findings. The results suggest that INVPRO_FF constrains EM_DD
in low COLL_H countries. However, in countries with high COLL_H, INVPRO_FF may no longer
be effective in constraining EM_DD.
Table 6.16 also shows the difference in the size of the coefficient of SOC_DUM x INVPRO_FF
between the Low COLL_H (10 Low COLL_H = -0.0765) and High COLL_H subsamples (10 High COLL_H
= 0.0746). As shown in the table, the difference in the SOC_DUM x INVPRO_FF coefficient is
0.1511 (p<0.01). The result suggests that the interaction effect of SOC_DUM x INVPRO_FF on
EM_DD significantly changes with the level of COLL_H. The positive coefficient suggests that
SOC_DUM x INVPRO_FF has a positive effect on EM_DD in High COLL_H countries. As
discussed above, this is also a new finding compared with my original findings. However, the
interpretation of this finding remains consistent with my original findings. The results suggest
that INVPRO_FF constrains the positive relationship between SOC_DUM and EM_DD in low
COLL_H countries. However, in countries with high COLL_H, INVPRO_FF may lose its
effectiveness, as it no longer constrains the positive relationship between SOC_DUM and

379
EM_DD.
Together, the results regarding INVPRO_FF suggest that the effectiveness of INVPRO_FF
reduces in COLL culture. As discussed earlier, COLL creates more incentives and opportunities
for EM. These greater incentives and opportunities may subdue the effectiveness of INVPRO.
Thus, consistent to the original findings, the sensitivity test results also suggest that culture
plays a more important role, than institutional factors, in determining the relationship
between the CSR dimensions and EM.
6.8.9 Accounting for endogeneity – 2SLS estimation results of equations (5) and (6)
To address endogeneity issues, I re-estimate the main model equations (5) and (6) as 2SLS
models with instrument variables. Consistent to my first two studies, as reported in Chapters
4 and 5, I measure the instruments as the median of the endogenous independents variable
based on Fama-French 48 industry classification. Thus, I measure ENV_M, SOC_M, and
GOV_M as instruments for the 3 CSR dimensions ENV, SOC and GOV respectively. ENV_M,
SOC_M, and GOV_M are measured as the median of ENV, SOC and GOV for each industry,
based on Fama-French 48 industry classification.
2SLS estimation results of equation (5)
Table 6.17 shows the results of the 2SLS estimation of equation (5). Column (1) shows the
regression coefficients, while columns (2) and (3) show the standard errors and p-values
respectively.

380
Table 6.17 2SLS estimation output of equation (5) The table presents the 2SLS estimation results of equation (5). The model uses the instruments ENV_M, SOC_M and GOV_M, measured as the median ENV, SOC and GOV respectively, based on Fama-French 48 industry classification. Column (1) presents the regression coefficients, while columns (2) and (3) present the standard errors and p-values respectively. EM refers to earnings management, proxied by discretionary accruals using the modified Jones model by Dechow et al. (1995). ENV, SOC and GOV are the firm-level scores on the environmental, social and governance dimensions of ESG, obtained from Thomson Reuters. COLL and CORR are the country-level moderator variables. COLL is the country-level moderator variable, representing the GLOBE measure of institutional COLL cultural dimension. CORR represents the level of CORR pervasiveness, measured as the reverse-score of control of CORR index from World Bank WGI database. The firm level control variables include SIZE, LEV, ROA, RD and MB, and dummy variable to capture industry effects (based on Fama-French 12 industry classification). SIZE refers to firm size, measured as the natural logarithm of market value of equity. LEV is defined as long-term debts divided by total assets. ROA is measured as the income before extraordinary items, scaled by lagged total assets. RD refers to R&D intensity, measured as R&D expenses divided by net sales. MB is the market to book ratio. All firm level independent and control variables are centered using group mean centering. The country level control variables include PD and FO, that represent the GLOBE measures of the cultural dimensions of power distance and future orientation respectively. All country level variables are centered using grand mean centering method.
Variables (1) (2) (3) EM
(coefficient)
Std error p-value
CONSTANT 0.0822 0.0024 0.0822 Firm level – independent variables ENV -0.2050 0.0453 0.0000 SOC 0.1892 0.0440 0.0000 GOV -0.0240 0.0367 0.5130 Country level – independent variables COLL 0.1013 0.0446 0.0230 CORR 0.0310 0.0127 0.0150 Interactions ENV x COLL -1.5415 0.8594 0.0730 SOC x COLL 2.5478 0.8575 0.0030 GOV x COLL -1.1288 0.7654 0.1400 ENV x CORR -0.0640 0.2325 0.7830 SOC x CORR 0.0588 0.2189 0.7880 GOV x CORR 0.0171 0.1871 0.9270 COLL x CORR 1.2519 0.3190 0.0000 ENV x COLL x CORR -9.3762 5.4132 0.0830 SOC x COLL x CORR 14.2636 5.2232 0.0060 GOV x COLL x CORR -8.6119 4.4994 0.1560 Firm level – control variables SIZE -0.0022 0.0023 0.3250 LEV -0.0407 0.0147 0.0060 ROA 0.0533 0.0168 0.0020 RD 0.0240 0.0216 0.2660 MB 0.0000 0.0007 0.9890 Industry effects Yes Country level – control variables FO 0.1733 0.0486 0.0000 PD 0.2181 0.0413 0.0000 1-stage F-stat 14.49 N 3,286 Adjusted R2 0.0333

381
The results show a negative relationship between ENV (1 = -0.2050; p<0.01) and EM at the
1% level of significance, and a positive relationship between SOC (2 = 0.1892; p<0.01) and
EM at the 1% level of significance. The results do not show a statistically significant
relationship between GOV (3 = -0.0240) and EM. Thus, consistent with the original results,
the 2SLS estimation results also suggest that managers, engaged in ENV initiatives are less
likely to manage earnings, but those engaged in SOC initiatives are more likely to manage
earnings.
COLL (5 = 0.1013; p<0.05) has a positive relationship with EM at the 5% level of significance.
Consistent with the original findings, the 2SLS estimation result also suggests that EM is more
prevalent in countries with high institutional COLL. The results regarding the interaction
effects of COLL and the CSR dimensions on EM are also consistent to the original findings. ENV
x COLL (9 = -1.5415, p<0.10), has a negative effect on EM at the 10% level of significance,
suggesting that COLL has a moderating (strengthening) effect on the negative relationship
between ENV and EM. SOC x COLL (10 = 2.5478, p<0.01) has a positive relationship with EM
at the 1% level of significance, suggesting that COLL has a moderating (strengthening) effect
on the positive relationship between SOC and EM. However, GOV x COLL (11 = -1.1288) does
not have a statistically significant relationship with EM.
The country level variable CORR (4 = 0.0310; p<0.05) has a positive relationship with EM at
the 5% level of significance. Consistent to the original findings, this suggests that that EM is
more prevalent in countries with higher CORR pervasiveness. The CORR interaction variables,
that is, ENV x CORR, SOC x CORR and GOV x CORR do not have statistically significant
relationships with EM. Consistent to the original findings, the results suggest that CORR
individually does not have a significant moderating effect on the relationship between the
CSR dimensions and EM.
The interaction term COLL x CORR (12 = 1.2519, p<0.01) has a positive and significant
relationship on EM at the 1% level of significance. Consistent to the original results, the 2SLS
estimation results also suggest that CORR pervasiveness and institutional COLL jointly escalate
EM. The results concerning the joint effect of institutional COLL and CORR, on the relationship
between the CSR dimensions and EM, also remain consistent to the original results. ENV x
COLL x CORR (13 = -9.3762, p<0.10) has a negative relationship with EM at the 10% level of

382
significance, suggesting that CORR and COLL jointly has a moderating effect on the
relationship between ENV and EM. SOC x COLL x CORR (14 = 14.2636, p<0.01) has a positive
relationship with EM at the 1% level of significance, suggesting that COLL and CORR has a joint
moderating effect on the relationship between SOC and ENV. However, GOV x COLL x CORR
(15 = -8.6119) does not have a statistically significant relationship with EM.
Consistent to the original results, the firm-level control variable, LEV (17 = -0.0407; p<0.01)
has a negative relationship with EM at the 1% level of significance, while ROA (18 = 0.0533;
p<0.01) has a positive relationship with EM at the 1% level of significance. The other firm-
level control variables (SIZE, RD, MB) have no significant relationship with EM. The country-
level control variables, FO (21 = 0.1733; p<0.01) and PD (22 = 0.2181; p<0.01), both have
positive relationships with EM at the 1% level of significance.
Similar to the approach followed for my first two research studies, as reported in Chapters 4
and 5, I perform a test for weak instrument to ascertain the validity of the instruments used
for the 2SLS estimation. As reported in Table 6.17, the first stage F-statistic for equation (5) is
14.49. Following the general rule of thumb, it can be established that the instruments are not
weak instruments, since the first stage F-statistic is greater than 10.
2SLS estimation results of equation (5)
Table 6.18 shows the results of the 2SLS estimation of equation (6). Column (1) shows the
regression coefficients, while columns (2) and (3) show the standard errors and p-values
respectively.

383
Table 6.18 2SLS estimation output of equation (6) The table presents the 2SLS estimation results of equation (5). The model uses the instruments ENV_M, SOC_M and GOV_M, measured as the median ENV, SOC and GOV respectively, based on Fama-French 48 industry classification. Column (1) presents the regression coefficients, while columns (2) and (3) present the standard errors and p-values respectively. respectively. EM refers to earnings management, proxied by discretionary accruals using the modified Jones model by Dechow et al. (1995). ENV, SOC and GOV are the firm-level scores on the environmental, social and governance dimensions of ESG, obtained from Thomson Reuters. COLL and INVPRO are the country-level moderating variables. COLL is the GLOBE measure of institutional collectivism. INVPRO is the strength of INVPRO index for a country from WEF’s GCI Historical Data. The firm-level control variables include SIZE, LEV, ROA, RD and MB, and dummy variable to capture industry effects (based on Fama-French 12 industry classification. SIZE refers to firm size, measured as the natural logarithm of market value of equity. LEV is defined as long-term debts divided by total assets. ROA is measured as the income before extraordinary items, scaled by lagged total assets. RD refers to R&D intensity, measured as R&D expenses divided by net sales. MB is the market to book ratio. All firm level independent and control variables are centered using group mean centering. The country level control variables include PD and FO, that represent the GLOBE measures of the cultural dimensions of power distance and future orientation respectively. All country level variables are centered using grand mean centering method.
Variables (1) (2) (3) EM
(coefficient) Std error p-value
CONSTANT Firm level – independent variables ENV -0.1660 0.0401 0.0000 SOC 0.1289 0.0384 0.0010 GOV 0.0032 0.0332 0.9230 Country level – independent variables COLL 0.0939 0.0391 0.0160 INVPRO -0.1026 0.0263 0.0000 Interactions ENV x COLL -0.6775 0.7626 0.3740 SOC x COLL 1.1533 0.7224 0.1100 GOV x COLL -0.2126 0.6632 0.7490 ENV x INVPRO 0.5608 0.4031 0.1640 SOC x INVPRO -0.6900 0.3952 0.0810 GOV x INVPRO 0.0077 0.3400 0.9820 COLL x INVPRO 1.3811 0.5149 0.1070 ENV x COLL x INVPRO -3.7349 10.1038 0.7120 SOC x COLL x INVPRO -4.6177 9.6218 0.6310 GOV x COLL x INVPRO -1.5108 8.6495 0.8610 Firm level – control variables SIZE -0.0027 0.0023 0.2420 LEV -0.0437 0.0147 0.0030 ROA 0.0554 0.0168 0.0010 RD 0.0262 0.0215 0.2230 MB 0.0002 0.0007 0.7520 Industry effects Yes Country level – control variables FO 0.2672 0.0578 0.0000 PD 0.1648 0.0360 0.0000 1-stage F-stat 18.65 N 3,286 Adjusted R2 0.0332

384
The results from the 2SLS estimation of equation (6) are largely consistent to the original
results. ENV (1 = -0.1660; p<0.01) has a negative relationship with EM at the 1% level of
significance; SOC (2 = 0.1289; p<0.01) has a positive relationship with EM at the 1% level of
significance; GOV (3 = 0.0032) does not have a statistically significant relationship with EM.
COLL (4 = 0.0939; p<0.05) has a positive relationship with EM at the 5% level of significance.
However, the interaction COLL and the CSR dimensions (that is, ENV x COLL, SOC x COLL and
GOV x COLL) do not have statistically significant effects on EM.
INVPRO (4 = -0.1026; p<0.01) has a negative relationship with EM at the 1% level of
significance. Consistent to the original results, the 2SLS estimation results also suggest that
INVPRO individually has a constraining effect on EM. The results concerning the interaction
effects of INVPRO also remain consistent to the original findings. ENV x INVPRO and GOV x
INVPRO do not have statistically significant relationships with EM. However, SOC x INVPRO
(7 = -0.6900; p<0.10) has a negative relationship with EM at the 10% level of significance,
suggesting that INVPRO individually moderates (weakens) the positive relationship between
SOC and EM.
Consistent to the original results, the 2SLS estimation results also do not show a statistically
significant relationship between COLL x INVPRO (12 = 1.3811) and EM. The joint interaction
of INVPRO and COLL with the CSR dimensions (that is, ENV x COLL x INVPRO, SOC x COLL x
INVPRO and GOV x COLL x INVPRO) also do not have a statistically significant effects on EM.
Consistent to the original results, the 2SLS estimation results also suggest that COLL and
INVPRO jointly do not have a statistically significant moderating effect on the relationship
between the CSR dimensions and EM.
As discussed earlier, I perform a test for weak instrument to ascertain the validity of the
instruments used for the 2SLS estimation of equation (6). As shown in Table 6.18, the first
stage F-statistic for equation (6) is 18.65. The first stage F-statistic, being greater than 10,
suggests that the instruments used for equation (6) are not weak instruments.

385
6.9 Discussion of Findings
The literature on CSR and EM not only provides inconclusive results on the relationship
between overall CSR and EM, but there is also some debate in the literature on the
relationship between the CSR dimensions (ENV, SOC and GOV) and EM. To address this issue,
the present study examines the relationship between the CSR dimensions and EM in an
emerging market context. To capture the effects of the unique social, political and legal
challenges that emerging markets experience, the present study examines the CSR-EM
relationship in the context of COLL, CORR and INVPRO. This chapter addresses research
objective 3, which is to investigate when CSR affects EM, by examining the contexts of COLL
culture, CORR and INVPRO, in emerging market countries. Research objective 3 is addressed
by answering the following three research questions:
Research Question 3.1: Does CSR have a significant effect on EM in emerging market
countries?
Research Question 3.2: Do COLL and CORR, individually and jointly, have significant effects on
the CSR-EM relationship in emerging market countries?
Research Question 3.3: Do COLL and INVPRO, individually and jointly, have significant effects
on the CSR-EM relationship in emerging market countries?
Using a sample of 3,472 firm-year observations, the results find support for most of the
hypotheses. Regarding research question 3.1, the study finds that the ENV and SOC
dimensions of CSR have significant effects on EM, but the overall CSR and GOV dimension do
not have a significant effect on EM in emerging market countries. Regarding research
question 3.2, the findings suggest that COLL individually and jointly have significant
strengthening effects on the relationship between the CSR dimensions (specifically ENV and
SOC), but CORR individually does not have a statistically significant effect on the CSR-EM
relationship in emerging market countries. Regarding research question 3.3, the study finds
that INVPRO individually has a weakening effect on the SOC dimension of CSR and EM, but
COLL and INVPRO jointly do not have an effect on the CSR-EM relationship in emerging market
countries. This is the outline of the discussion entailed in the rest of this section. Table 6.19
shows a summary of the research questions, hypotheses and findings.

386
Table 6.19 Summary of Research Questions, Hypotheses and Results
Research Question Hypothesis Theory Expected sign Results Conclusion
3.1. Does CSR have a significant effect on EM in emerging market countries?
H3.1a: Consistent with the managerial myopia hypothesis, there is a positive and significant relationship between CSR and EM.
Managerial myopia hypothesis
1= + (quation 4a) 1, , = + (quation 4b)
SOC ( = +) has a positive and significant effect on EM
Overall CSR does not have a significant effect on EM, but the ENV and SOC dimensions have contrasting effects on EM
H3.1b: Consistent with the myopia avoidance hypothesis, there is a negative and significant relationship between CSR and EM.
Myopia avoidance hypothesis
1= - (quation 4a) 1, , = − (quation 4b)
ENV (1= -) has a negative and significant effect on EM
3.2. Do COLL and CORR, individually and jointly, have significant effects on the CSR-EM relationship in emerging market countries?
H3.2: Consistent with the informal institutions perspective, there is a positive and significant relationship between COLL and EM.
Informal institutions perspective 𝛼4 = + (quation 5) COLL (𝛼4 = +) has a positive and
significant effect on EM
COLL individually has a strengthening effect on the CSR-EM relationship; CORR individually does not have a significant effect on the CSR-EM relationship; COLL and CORR jointly have a strengthening effect on the CSR-EM relationship
H3.3: COLL has a significant moderating effect on the relationship between CSR and EM.
Managerial myopia hypothesis / Myopia avoidance hypothesis (stronger/weaker)
6, 7,8 = +/- (quation 5)
COLL has a strengthening effect on the negative relationship between ENV and EM (𝛼6 = -), and the positive relationship between SOC and EM (𝛼7= +)
H3.4: Consistent with the informal institutions perspective, there is a positive and significant relationship between CORR and EM.
Informal institutions perspective 5 = + (quation 5) COLL (𝛼5= +) has a positive and
significant effect on EM
H3.5: CORR has a significant moderating effect on the relationship between CSR and EM.
Managerial myopia hypothesis / Myopia avoidance hypothesis (stronger/weaker)
9, 10,11 = +/- (quation 5)
CORR does not have a significant moderating effect on the relationship between the CSR dimensions and EM
H3.6: Consistent with the informal institutions perspective, the interaction of COLL and CORR has a positive effect on EM.
Informal institutions perspective 12= + (quation 5)
The interaction of COLL and CORR has a positive and significant effect on EM (12= +)
H3.7: The interaction of COLL and CORR has a significant moderating effect on the relationship between CSR and EM.
Managerial myopia hypothesis / Myopia avoidance hypothesis (stronger/weaker)
13, 14,15 = +/- (quation 5)
The interaction of COLL and CORR has a strengthening effect on the negative relationship between ENV and EM (𝛼13 = -), and the positive relationship between SOC and EM (𝛼14= +)

387
3.3. Do COLL and INVPRO, individually and jointly, have significant effects on the CSR-EM relationship in emerging market countries?
H3.8: Consistent with the formal institutions perspective, there is a negative and significant relationship between INVPRO and EM.
Formal institutions perspective 5 = - (quation 6) INVPRO (𝛼5= -) has a negative and
significant effect on EM
INVPRO individually has a weakening effect on the CSR-EM relationship; COLL and CORR jointly do not have an effect on the CSR-EM relationship
H3.9: INVPRO has a significant moderating effect on the relationship between CSR and EM.
Managerial myopia hypothesis / Myopia avoidance hypothesis (stronger/weaker)
9, 10,11 = +/- (quation 6)
INVPRO has a weakening effect on the negative relationship between the positive relationship between SOC and EM (𝛼7= -)
H3.10: Consistent with the formal and informal institutions perspectives, the interaction of COLL and INVPRO has a significant effect on EM.
Institutional theory 12= +/- (quation 6) The interaction of COLL and INVPRO does not have a significant effect on EM
H3.11: The interaction of COLL and INVPRO has a significant moderating effect on the relationship between CSR and EM.
Managerial myopia hypothesis / Myopia avoidance hypothesis (stronger/weaker)
13, 14,15 = +/- (quation 6)
The interaction of COLL and INVPRO does not have a significant effect on relationship between the CSR dimensions and EM

388
To address research question 3.1, I test two opposing hypotheses, the managerial myopia
hypothesis (suggesting a positive CSR-EM relationship), and the myopia avoidance hypothesis
(suggesting a negative CSR-EM relationship). To test the CSR-EM relationship, I use overall CSR as
well as the individual CSR dimensions (ENV, SOC and GOV). The results show mixed findings
suggesting that the CSR-EM relationship is contextual based on the CSR dimension used. The results
suggest that overall CSR and the GOV dimension have no statistically significant relationship with
EM. However, the ENV and SOC dimensions have contrasting effects on EM. The results show that
the ENV dimension has a negative relationship with EM, but the SOC dimension has a positive
relationship with EM. This presents a particularly interesting insight, suggesting that while managers
have intrinsic motives behind their engagement in ENV initiatives, they may have more ulterior
motives behind their engagement in SOC initiatives.
The negative relationship between ENV and EM is consistent with prior studies (for example, see
Amar & Chakroun, 2018; Gerged et al., 2020; Gerged et al., 2021; Heltzer, 2011; Litt et al., 2013;
Patten & Trompeter, 2003; Velte, 2021). Consistent with the myopia avoidance hypothesis, the
result suggests that managers engaged in ENV initiatives are long-term oriented. This indicates that
managers engage in ENV initiatives with genuine intrinsic motives. Managers’ myopic avoidance
behaviour may result from two motives or drivers. First, consistent to the relationship-driven
myopia avoidance perspective, managers engaged in ENV initiatives may avoid EM due to their
genuine concern for maintaining relationships with stakeholders. Patten & Trompeter (2003) and
Litt et al. (2013) suggest the firms with active involvement in ENV initiatives may experience greater
regulatory risks and increased scrutiny report. This may make EM riskier as the risks of exposure is
higher. As such, managers engaged in ENV initiatives may avoid EM to avoid risks of potential
negative consequences arising from discovery of their EM activities by stakeholders, which in turn
may cause irreversible damage to their relationships with stakeholders (for example, see Gerged et
al., 2020; Gerged et al., 2021; Litt et al., 2013). Second, consistent to the value-driven myopia
avoidance perspective, managers engaged in ENV initiatives may avoid EM due to their intrinsic
moral and ethical values. This perspective suggests genuine intrinsic values and concern for the
environment motivate managers to engage in ENV initiatives. These same values lead them to avoid
engaging in unethical acts like EM.
The positive relationship between SOC and EM is consistent with Gargouri et al. (2010). Consistent
with the managerial myopia hypothesis, the result suggests that managers engaged in SOC
initiatives are more short-term oriented. This implies that managers may engage in SOC initiatives

389
with ulterior motives, to make themselves appear good to stakeholders. Managers’ myopic
behaviour may result from two underlying motives or drivers. First, consistent to the incentive-
driven myopia perspective, managers engaged in SOC initiatives have greater incentives to manage
earnings to meet short-term targets and please multiple stakeholders, as well as to uphold their
reputation. Second, consistent to the opportunity-driven myopia perspective, managers engaged in
SOC initiatives may have greater opportunities to manage earnings as their SOC initiatives may
create a positive image for them and lower scrutiny over them. Furthermore, as Gargouri et al.
(2010) suggest, since SOC initiatives involve a number of employee related aspects, these initiatives
may create better relationships between employees and managers. This in turn can result in
collusion among managers and employees, creating more opportunities for EM, and reducing
chances of whistleblowing by employees to expose managers’ involvement in EM (Gargouri et al.,
2010).
Overall, in response to research question 3.1, the findings suggest that the CSR dimensions have
significant (contrasting) effects on EM in emerging market countries.
Research question 3.2 is addressed by testing 6 hypotheses (H3.2 to H3.7). First, I examine the effect
of COLL on EM. The results show that COLL has a positive and significant effect on EM. The result is
consistent with prior studies (for example, see Callen et al., 2011; Desender et al., 2011; Doupnik,
2008; Nabar & Boonlert-U-Thai, 2007; Riahi & Omri, 2013; Viana Jr et al., 2021; Zhang et al., 2013)
and with the informal institutions perspective, suggesting that in COLL societies, social relations
among corporate insiders may give rise to nepotism and collusion, reducing the efficiency of internal
control systems and creating more opportunities for corporate insiders to collectively engage in EM
for their in-group benefits (for example, see Callen et al., 2011; Lyu et al., 2016; Zhang et al., 2013).
Next, I examine the individual effect of COLL on the relationship between the CSR dimensions and
EM. The findings show that COLL strengthens the negative relationship between ENV and EM, and
the positive relationship between SOC and EM. The findings provide a useful insight, suggesting thay
culture has an important role in shaping corporate behaviour. In COLL societies, group norms are
prioritized over individual beliefs and preferences. In COLL societies, managerial practices are likely
to be reciprocated within the organization, as other employees adopt similar practices to maintain
group harmony. Thus, COLL creates an informal institution of similar behaviour, beliefs and
practices.
The above discussion suggests that when the managerial norm is long-term oriented (myopia

390
avoidant) and ethical, this is likely to be reflected more prominently within the organization, as
employees adopt similar practices forming an informal institution of myopia avoidance behaviour
with the firm. Consistent with this interpretation, the present study shows that the negative
relationship between ENV and EM becomes stronger in COLL societies. The negative relationship
between ENV and EM is consistent to the myopia avoidance (long-term orientation) hypothesis,
suggesting that managers engaged in ENV initiatives are likely to avoid EM as they are relationship-
driven and/or value-driven. COLL culture makes the myopia avoidance behaviour stronger by
making it a corporate norm within the inside network of the firm, encouraging other insiders to
adopt similar approaches, and in-turn encouraging managers to continue avoiding myopia.
In contrast when managerial norm is short-term oriented (myopic) and opportunistic, similar
practices and attitudes will to be adopted within the corporate insiders, forming an informal
institution of myopia, making myopic behaviour more prominent. The results of the present study
show that the positive relationship between SOC and EM becomes stronger in COLL societies. The
positive relationship between SOC and EM is consistent to the managerial myopia (short-term
orientation) hypothesis, suggesting that managers engaged in SOC initiatives are more likely to
engage in EM becyase they are incentive-driven and/or opportunity-driven. COLL culture makes the
myopia behaviour stronger, by making myopic behaviour a corporate norm, making it more
prominent as other insiders adopt similar practices. Furthermore, collusion and nepotism, within
firms in COLL societies, may create further opportunities for EM.
The findings suggest that when managers engage in CSR initiatives with genuine intentions, the
informal institutions created by COLL culture strengthens these genuine intentions. In contrast,
when managers engage in CSR initiatives with ulterior motives, the informal institutions created by
COLL culture makes these ulterior motives worse.
Next, I examine the individual effect of CORR on EM and on the CSR-EM relationship. The findings
suggest that CORR has a positive effect on EM. Consistent with the literature (for example, see
Lewellyn & Bao, 2017; Liu, 2016; Lourenço et al., 2018; Riahi-Belkaoui, 2004; Riahi-Belkaoui &
AlNajjar, 2006; Xu et al., 2019) and with the informal institutions perspective, the findings suggest
that CORR in the society may make EM practices more prominent. This is because CORR
pervasiveness creates an overall unethical atmosphere within business practices, making EM seem
more legitimate. As managers engage in rent-seeking behaviour and actions, they may have more
incentives to manage earnings to conceal their rent-seeking behaviour (Riahi-Belkaoui, 2004).

391
However, the results do find sufficient evidence to suggest that CORR individually affects the CSR-
EM relationship.
Next, I examine the joint effect of COLL and CORR on EM, and on the CSR-EM relationship. I find that
the interaction of COLL and CORR has a positive effect on EM. First, the result suggests that CORR
creates more EM incentives as managers may manage earnings to conceal their rent seeking actions.
Second, COLL may provide more EM opportunities as social ties within the corporate insiders may
result in collusion among insiders, making it easier to engage in EM for in-group benefits. Thus,
consistent with the informal institutions perspective, the findings suggest that COLL and CORR
jointly create more EM opportunities and incentives.
The result regarding the joint moderating effect suggests that COLL and CORR, jointly, strengthen
the negative relationship between ENV dimension and EM, and the positive relationship between
SOC dimension and EM. This is yet another insightful finding, as it highlights that COLL has a stronger
role than CORR in determining managerial behaviour. The results show that while CORR, on its own
(i.e., individually) does not affect the CSR-EM relationship, CORR, jointly with COLL, strengthens the
CSR-EM relationship.
Overall, in response to research question 3.2, the results suggest that COLL, individually, has a
strengthening effect on the CSR-EM relationship, while CORR does not have a significant individual
effect. COLL and CORR, jointly, have a strengthening effect on the CSR-EM relationship.
Research question 3.3 is addressed by testing 4 hypotheses (H3.8 to H3.11). First, I examine, the
individual effect of INVPRO on EM, and on the CSR-EM relationship. The results suggest that INVPRO
individually has a negative effect on EM, and a weakening effect on the relationship between the
SOC dimension and EM. The result is consistent with prior literature (for example, see Burgstahler
et al., 2006; Chih et al., 2008; Haw et al., 2011; Houqe et al., 2012; Leuz et al., 2003; Martínez‐
Ferrero et al., 2015; Persakis & Iatridis, 2016; Shen & Chih, 2005) and with the formal institutions
perspective, suggesting that legal institutions, specifically INVPRO, create corporate norms and
practices of transparency, thereby reducing incentives and opportunities for EM. As discussed
earlier, the positive relationship between SOC and EM suggest that managers engage in SOC
initiatives with ulterior motives. Managers engaged in SOC initiatives are more likely to be myopic
(short-term oriented). While SOC initiatives may create more incentives and opportunities for EM,
INVPRO reduces incentives for EM and weakens the positive relationship between SOC and EM.
INVPRO restricts the ability of corporate insiders (specifically managers and controlling shareholders

392
in this scenario) to extract private benefits of control. Such restrictions mean that managers have
less to hide, thereby reducing incentives to manage earnings (Leuz et al., 2003). This suggests that
while SOC initiatives may increase incentive-driven and opportunity-driven myopia, INVPRO creates
a formal institution, weakening incentive-driven myopia.
Next, I examine the joint effect of COLL and INVPRO on EM and on the CSR-EM relationship.
However, the results show that there is no statistically significant joint effect. Despite this, the
results provide a useful insight, suggesting that COLL has a stronger role than INVPRO on the CSR-
EM relationship. While INVPRO, on its own (individually) weakens the positive relationship between
SOC and EM (reducing managerial myopia), INVPRO appears to lose its effectiveness in COLL
cultures. The effect of COLL cultures, supersedes the effect of INVPRO on changing the relationship
between the CSR dimensions and EM.
Overall, in response to research question 3.3, the findings suggest that INVPRO individually has a
weakening effect on the CSR-EM relationship. However, COLL and INVPRO jointly do not have a
significant effect on the CSR-EM relationship.
By answering the three research questions discussed above, I address the third and final research
objective of this thesis, which is to investigate when CSR affects EM, by examining the contexts COLL
culture, CORR and INVPRO, in emerging market countries. The findings suggest that there is a
negative and significant relationship between the ENV dimension and EM, and a positive and
significant relationship between the SOC dimension and EM. By examining the contexts, COLL, CORR
and INVPRO, I address the question when CSR affects EM in emerging market countries. The findings
suggest that COLL, individually and jointly with CORR, has a strengthening effect on the relationships
between ENV dimensions and EM, and between the SOC dimension and EM. Additionally, the
findings also suggest that INVPRO individually has a weakening effect on the relationship between
the SOC dimension and EM. Thus, in response to the question ‘when does CSR affects EM’, the
findings suggest that, in emerging market countries, the ENV dimension of CSR has a negative effect
on EM - 1) when the country has COLL culture; and 2) when the country has joint COLL culture and
CORR. The findings also suggest that, in emerging market countries, the SOC dimension of CSR has
a positive effect on EM – 1) when the country has COLL culture, 2) when the country has joint COLL
culture and CORR, and 3) when the country has low INVPRO. The findings highlight that cultural
background (specifically COLL) has a stronger role, in contrast to the political and institutional
framework (CORR and INVPRO), in determining managerial behaviour and the CSR-EM relationship.

393
6.10 Chapter Summary
This study addresses research objective 3, by investigating when CSR affects EM in the contexts of
COLL culture, CORR and INVPRO, in emerging market countries. Using a sample of 3,472 firm-year
observations from firms from 10 emerging market countries for the period 2012 to 2016, the study
finds evidence of a negative relationship between the ENV dimension and EM, but a positive
relationship between the SOC dimension and EM. The result highlights two opposing managerial
behaviour perspectives, suggesting that managers, engaged in ENV are long-term oriented
(consistent with the myopia avoidance hypothesis), while managers, engaged in SOC initiatives are
short-term oriented (consistent with the managerial myopia hypothesis). The results also suggest
that COLL culture, individually and jointly with CORR, intensifies the relationships between ENV and
EM, and between SOC and EM, while INVPRO weakens the relationship between SOC and EM. Using
HLM technique for the multi-level variables, I find support for most of my hypotheses. The study
links two institutional theory (to managerial behavioural perspectives, particularly the managerial
myopia and the myopia avoidance perspective.

394
CHAPTER 7 DISCUSSION AND SUMMARY
7.1 Introduction
This study provides an in-depth analysis of the relationship between Corporate Social Responsibility
(CSR) and Earnings Management (EM), a widely debated issue in the literature. Prior studies provide
inconclusive opinion on the effect of CSR on EM. The present study contributes to the debate, by
addressing the questions why, how, and when CSR affects EM, by examining various firm-level and
country-level factors that may explain this relationship. The main purpose of this study is to address
three main research objectives, by undertaking three research studies – 1) the first study, based on
a sample of firms from USA, examines the direct relationship between CSR and EM, and the indirect
relationship between CSR and EM via Organization Capital (OC); 2) the second study, also based on
a sample of firms from USA, examines the effect of Financial Distress (FD), on the direct CSR-EM
relationship and the indirect CSR-EM relationship via OC; 3) the third study examines the CSR-EM
relationship in a broader context, using a sample of firms from 10 emerging market countries, and
examining the individual and joint effects of Collectivism culture (COLL), Corruption Pervasiveness
(CORR) and Investor Protection (INVPRO) on the CSR-EM relationship.
This chapter re-visits the research questions, linking them with the findings obtained from the three
research studies, and providing a summary of the main findings. The rest of this chapter is organized
as follows: Section 7.2 outlines the research objectives and questions; Section 7.3 comprises a
summary of the findings; Sections 7.4 and 7.5 discuss the implications and the limitations of the
research respectively, followed by a discussion on some future research directions in Section 7.6.
The chapter ends with a summary of the thesis in section 7.7.
7.2 Research Objectives and Questions
The main purpose of this study is to examine the relationship between CSR and EM, by addressing
why, how, and when CSR affects EM. The research has three main research objectives, addressed
by seven research questions.
Research Objective 1 is addressed by undertaking the first research study (reported in Chapter 4),
involving a sample of 46,816 firm-year observations from firms in USA, between 2002 and 2017
inclusive. Research Objective 1 is addressed by two research questions as presented below.

395
Research Objective 1: To investigate why and how CSR affects EM, by examining the direct CSR-EM
relationship and indirect CSR-EM relationship via OC.
Research Question 1.1: Does CSR have a significant direct effect on EM?
Research Question 1.2: Does CSR have a significant indirect effect on EM via OC?
Research Objective 2 is addressed by undertaking the second research study (reported in Chapter
5), involving a sample of 36,811 firm-year observations from firms in USA, between 2002 and 2017
inclusive. Research Objective 2 is, addressed by two research questions, as presented below.
Research Objective 2: To investigate when CSR has a direct effect on EM, and when CSR has an
indirect effect on EM via OC, by examining the context FD.
Research Question 2.1: Does FD have a significant effect on the direct CSR-EM relationship?
Research Question 2.2: Does FD have a significant effect on the indirect CSR-EM relationship
via OC?
Research Objective 3 is addressed by undertaking the third research study (reported in Chapter 6),
involving a sample of 3,472 observations from firms in 10 emerging market countries,39 between
2012 and 2016 inclusive. Research Objective 3 is addressed by three research questions, as
presented below.
Research Objective 3: To investigate when CSR affects EM, by examining the contexts COLL, CORR
and INVPRO in emerging market countries.
Research Question 3.1: Does CSR have a significant effect on EM in emerging market
countries?
Research Question 3.2: Do COLL and CORR, individually and jointly, have significant effects
on the CSR-EM relationship in emerging market countries?
Research Question 3.3: Do COLL and INVPRO, individually and jointly, have significant effects
on the CSR-EM relationship in emerging market countries?
39 The 10 emerging market countries include Brazil, China, India, Indonesia, Malaysia, Russia, South Africa, South Korea, Taiwan and Thailand.

396
7.3 Summary of the Findings
The present study examines various firm-level and country-level factors to address the questions
why, how and when CSR effects EM, and thereby address the existing debate on the CSR-EM
relationship. By examining the CSR-EM relationship from a managerial behaviour perspective, the
findings of the study make some important contributions to literature and theory. The study has
three research objectives, addressed by undertaking three research studies, as outlined in the
previous section. This section discusses the summary of the findings. Table 7.1 presents a summary
of the research objectives, the research questions, the hypotheses and the findings.
7.3.1 Findings on Research Objective 1
Research objective 1 is addressed in the first research study that examines whether CSR has a direct
relationship with EM, and an indirect relationship with EM via OC. This section discusses the findings
on research objective 1, addressed by answering research questions 1.1 and 1.2.
Findings on research question 1.1
To address research question 1.1, I test two contrasting hypotheses (H1.1a and H1.1b). The results
provide support for hypothesis H1.1b, suggesting that CSR has a negative and significant direct effect
on EM. This is consistent with the majority of the literature that also suggests a negative relationship
between CSR and EM (for example, see Almahrog et al., 2018; Bozzolan et al., 2015; Calegari et al.,
2010; Chen & Hung, 2021; Cho & Chun, 2015; Chun & Cho, 2017; Faisal et al., 2018; Gao & Zhang,
2015; García‐Sánchez et al., 2020; Gerged et al., 2020; Gerged et al., 2021; Gras-Gil et al., 2016;
Hong & Andersen, 2011; Kim et al., 2012; Kumala & Siregar, 2020; Li & Xia, 2018; Litt et al., 2013;
Martínez‐Ferrero et al., 2015; Palacios-Manzano et al., 2019; Patten & Trompeter, 2003; Scholtens
& Kang, 2013; Sial et al., 2019; Wang et al., 2018). The negative direct relationship between CSR and
EM is consistent with the myopia avoidance hypothesis, suggesting that managers engaged in CSR
activities are more long-term oriented and are likely to avoid short termism or myopic actions, such
as EM. The negative direct CSR-EM relationship may be – 1) relationship-driven, and/or 2) value-
driven.
Findings on research question 1.2
To address research question 1.2, I examine the indirect relationship between CSR and EM using OC
as a mediator. OC is defined as a set of firm-specific and non-transferable intangible resources that
include an integration of organizational design, processes, practices, management quality,

397
knowledge, and culture (for example, see Attig & Cleary, 2014; Carlin et al., 2012; Lev, 2004; Lev &
Radhakrishnan, 2005). Before testing the indirect relationship between CSR and EM via OC, I test
the individual indirect paths involved in this relationship – 1) the relationship between CSR and OC
(H1.2), and 2) the relationship between OC and EM (H1.3).
The findings regarding the indirect paths show that CSR has a positive effect on OC (finding support
for H1.2), and OC in turn, has a positive effect on EM (finding support for H1.3). The former is
consistent with the resource-based view (RBV) theory and the latter is consistent with the
managerial myopia hypothesis. Next, I examine the indirect CSR-EM relationship via OC by using
two contrasting hypotheses, based on contrasting views on managerial behaviour, as discussed
earlier (that is, managerial myopia hypothesis (H1.4a) and myopia avoidance hypothesis (H1.4b)).
The result provides support for hypothesis H1.4a, suggesting that CSR has a positive and significant
indirect effect on EM, via the mediator OC. Consistent with the managerial myopia hypothesis, the
result suggests that managers engaged in CSR may manage earnings for short-term benefits, by
taking advantage of the additional opportunities from OC (such as, superior knowledge, abilities,
processes, techniques and design). The positive indirect relationship may be – 1) incentive-driven,
and/or 2) opportunity-driven.
Overall findings on research objective 1
In response to research objective 1, the findings suggest that CSR has a negative direct effect on EM
but a positive indirect effect on EM via OC. The study contributes to the existing literature on CSR,
EM and OC, by linking these concepts together. To the best of my knowledge, the present study is
the first to disintegrate the CSR-EM relationship and individually examine the direct and indirect
relationships between CSR and EM. The negative direct relationship between CSR and EM adds to
the existing CSR-EM literature by explaining this relationship from a managerial behaviour
perspective. The study suggests that managers engaged in CSR are less likely to manage earning
(directly) because of their myopia avoidant behaviour (long-term orientation). The study further
explains two underlying motives (drivers) behind managers myopia avoidance behaviour,
suggesting that managers engaged in CSR are less likely to manage earnings because – 1) their
genuine concerns about maintaining long-term relationships with stakeholders lead them to reduce
agency costs, such as EM (relationship-driven myopia avoidance); and/or 2) their strong ethical and
moral values lead them to avoid unethical acts, such as EM (value-driven myopia avoidance).
The study finds that when firms have high OC, the relationship between CSR and EM can completely

398
change. Specifically, the results suggest a positive indirect relationship between CSR and EM via OC.
This shows that managerial behaviour and underlying motives vary with OC. In general, CSR has a
direct constraining role (negative effect) on EM, as managers tend to be myopia avoidant (long-term
oriented). However, in firms with high OC, managers tend to be more myopic (short-term oriented),
as they may engage in CSR with ulterior motives, managing more earnings indirectly by using the
additional opportunities from high OC. The managerial myopia hypothesis posits a contrasting
perspective on the CSR-EM relationship, suggesting that managers engaged in CSR may manage
earnings more as they are myopic (short-term oriented). Managerial myopia may be explained by
two underlying motives (drivers) created by – 1) greater incentives to manage earning to meet short
term targets and please stakeholders, as well as uphold managerial reputation (incentive-driven
myopia), and/or 2) greater opportunities to manage earnings from lower scrutiny resulting from
CSR performance creating a positive image (opportunity-driven myopia). High OC may add to these
incentives and opportunities. Managers in firms with high OC may experience greater pressures and
higher expectations from stakeholders due to their firms’ unique abilities. Failure to meet these
expectations may tarnish managers’ reputation, and thus, managers have incentives to manage
earnings and report favourable financial information. Furthermore, the unique abilities of the firms
(such as, superior, techniques, processes, designs, managerial practices and knowledge, that is, high
OC) provide more EM opportunities. Managers in firms with high OC have better knowledge and
understanding of the firms’ internal control systems, and thus manage earnings using more
sophisticated techniques. Thus, the results suggest that in firms with high OC, managers engaged in
CSR opportunistically use their firms’ unique abilities (that is, OC) to manage more earnings.
The findings on the indirect relationship between CSR and EM via OC, provide new insights into the
CSR-EM literature, explaining why and how CSR affects EM. In response to why CSR affects EM, the
findings suggest that managers engaged in CSR are more likely to (indirectly) manage earnings
because they may be driven by short-term incentives (incentive-driven myopia), such as meeting
quarterly earnings targets and upholding their reputation to please multiple stakeholders. In
response to how CSR affects EM, the findings suggest that managers engaged in CSR may take
advantage of additional opportunities that come with high OC, to (indirectly) manage more earnings
(opportunity-driven myopia).
7.3.2 Findings on Research Objective 2
Research objective 2, addressed in the second research study, examines whether the direct CSR-EM
relationship and the indirect CSR-EM relationship change during Financial Distress (FD). FD

399
represents situations when firms have insufficient assets to fulfill their outstanding debts (Baldwin
& Mason, 1983). FD is a relevant issue in recent times, as businesses continue to struggle financially
as a result of the Covid-19 outbreak since early 2020 (for example, see Sundaram, 2020). This section
discusses the findings on research objective 2, addressed by answering research questions 2.1 and
2.2.
Findings on research question 2.1
To address research question 2.1, I test two hypotheses – H2.1 (testing the effect of FD on EM) and
H2.2 (testing the effect of FD on the direct CSR-EM relationship). The results do not provide support
for either of the two hypotheses, that is, the findings do not provide sufficient evidence to suggest
that FD has a significant effect on EM, or on the direct relationship between CSR and EM.
Findings on research question 2.2
To address research question 2.2, I examine the effect of FD on the indirect relationship between
CSR and EM via the mediator OC. Before testing the effect of FD on the indirect relationship between
CSR and EM via OC, I test the effect of FD on the individual indirect paths involved, that is, the effect
of FD on – 1) the relationship between CSR and OC (H2.4), and 2) the relationship between OC and
EM (H2.5). Prior to testing H2.4 and H2.5, I examine the effect of FD on OC, using two contrasting
hypotheses - H2.3a (the RBV theory) and H2.3b (the slack resources theory). The results find support
for hypothesis H2.3a, suggesting that FD has a positive effect on OC, consistent with the RBV.
The findings related to the two indirect paths show that FD has significant moderating (weakening)
effects on – 1) the relationship between CSR and OC (first-stage moderation), consistent with the
slack resources theory and providing support to H2.4, and 2) the relationship between OC and EM
(second-stage moderation), consistent with the managerial myopia hypothesis and providing
support for H2.5. Next, I examine the effect of FD on the indirect relationship between CSR and EM
via OC (moderated mediation, tested by hypothesis H2.6). The results provide support for H2.6,
suggesting that FD has a significant moderating (weakening) effect on the positive indirect CSR-EM
relationship via OC, that is, FD weakens managerial myopic behaviour (weaker short-term
orientation). This suggests that during FD, managerial behaviour and underlying motives change,
due to changes in priorities. In firms with high OC, managers are likely to have greater ability and
knowledge to more effectively manage their limited funds in ways that will assist their firm’s
recovery. Thus, spending on CSR activities opportunistically to manage more earnings may not be a

400
priority when firms are in distress.
Overall findings on research objective 2
In response to research objective 2, the findings suggest that FD weakens the positive indirect
relationship between CSR and EM via OC but does not change the negative direct relationship
between CSR and EM. By linking FD to the key issues – CSR, EM and OC, the study contributes to the
existing literature on all four areas – CSR, EM, OC and FD. To the best of my knowledge, this is the
first study to examine the moderating effect of FD on the direct CSR-EM relationship and the
moderated mediating effect of FD on the indirect CSR-EM relationship. The findings provide insights
into changes in managerial behaviour during crisis situations, by showing that the positive indirect
CSR-EM relationship via OC weakens during FD. This indicates that during FD, managers’ incentive-
driven myopia behaviour becomes less prominent (less short-term oriented). FD leads to a change
in priorities, in turn changing managerial motives and incentives. The result is in contrast to the
general assumption that managers’ opportunistic behaviour typically increases during FD. The
results particularly highlight an important role of OC in shaping managerial behaviour during crisis.
The findings suggest that during FD managers engaged in CSR are less likely to use their firms’ unique
abilities to manage earnings. In high OC firms, managers have better knowledge and understanding
of the potential damaging consequences to manage earning during FD. Thus, during FD, managers
engaged in CSR may take advantage of their firm’s unique abilities and limited resources to aid the
firm’s recovery. This suggests that managers’ underlying motives and incentives change during FD,
that is incentive-driven myopia weakens.
By addressing research objective 2, the findings provide insights into the questions – 1) when CSR
affects EM directly, and 2) when CSR affects EM indirectly via OC. In response to the first question
(when CSR affects EM directly), the findings suggest that FD does not change managerial long-term
orientation (myopia avoidant behaviour). According to this view, managers engaged in CSR are less
likely to manage earnings, regardless of the firm’s financial state. They may have greater concern
for their stakeholders (relationship-driven), and/or stronger ethical and moral values (value-driven).
In response to the second question (when CSR affects EM indirectly), the findings suggest that
managers engaged in CSR may opportunistically use the additional benefits of OC to manage
earnings when their firm is financially stable. However, when their firm is in distress, they are less
likely to use CSR opportunistically to manage earnings via OC. This suggests that while managers
may be more myopic (short-term oriented) when their firm is financially stable, their myopic

401
behaviour and actions become less prominent when their firm is financially distressed.
7.3.3 Findings on Research Objective 3
Research objective 3, addressed in the third research study, aims to – 1) examine the CSR-EM
relationship in a broader context, using 10 emerging market countries, and 2) to examine whether
the CSR-EM relationship changes with the unique cultural, political and legal challenges in emerging
markets. To this end, I examine the moderating effects of COLL (to capture the cultural challenges),
CORR (to capture the political challenges) and INVPRO (to capture the legal and policymaking
challenges) on the CSR-EM relationship. Additionally, I examine the joint effects of COLL and CORR,
and of COLL and INVPRO on the CSR-EM relationship. This section discusses the findings on research
objective 3, addressed by answering research questions 3.1, 3.2 and 3.3.
Findings on research question 3.1
To address research question 3.1, I test two contrasting hypotheses - H3.1a (managerial myopia
hypothesis) and H3.1b (myopia avoidance hypothesis). The results provide partial support for both
hypotheses. In particular, the result suggests that the individual CSR dimensions have contrasting
effects on EM, while overall CSR does not have a statistically significant effect on EM in emerging
markets. The environmental (ENV) dimension has a negative effect on EM, providing support for
H3.1b. This result suggests that managers with ENV initiatives are more long-term oriented and less
likely to manage earnings for short-term objectives, consistent with the myopia avoidance
hypothesis. Managers engaged in ENV may be more relationship-driven and/or value-driven, as
discussed earlier. In contrast, the social (SOC) dimension has a positive effect on EM, suggesting that
managers engaged in SOC initiatives are more short-term focussed, consistent with the managerial
myopia hypothesis and providing partial support to H3.1a. This suggests that managers’
engagement in SOC initiatives may be incentive-driven and/or opportunity-driven, as discussed
earlier. The results highlight that managers have different underlying motives behind their
engagement in ENV and SOC initiatives.
Findings on research question 3.2
Research question 3.2 is addressed using hypotheses H3.2 to H3.7. Hypotheses H3.2 and H3.3 test
the effects of COLL on EM and on the CSR-EM relationship respectively. The results do not provide
support for H3.2 but provide partial support for H3.3. The result shows evidence that COLL
strengthens the negative relationship between ENV and EM and the positive relationship between

402
SOC and EM. This suggests that in COLL societies, as group norms are valued more than individual
interests, top level management behaviour becomes a norm that is reciprocated within the inside
network of the firm, forming an informal institution of similar practices. This is applicable to both
ethical and unethical behaviour. When managers have myopia avoidant behaviour (long-term
orientation), COLL culture creates an informal institution where corporate insiders adopt similar
behaviour and practices, making myopia avoidance more prominent. Consistent to this
interpretation, the findings of the present study indicate that the negative relationship between
ENV and EM becomes stronger in COLL societies. The result suggests that while managers engaged
in EM manage less earnings due to relationship-driven myopia avoidance and/or value-driven
myopia avoidance, COLL strengthens relationship-driven myopia avoidance, by creating informal
institutions where group norms and harmony within groups are prioritized.
In contrast, when managers have myopic behaviour (short-term orientation), COLL culture creates
an informal institution with myopic behaviour and opportunistic practices being more prevalent.
Furthermore, there may be more nepotism and collusion within firms in COLL societies, that may
reduce the effectiveness of internal control systems, thus creating more opportunities for EM.
Consistent with this interpretation, the findings of this study show that the positive relationship
between SOC and EM is stronger in COLL societies. The result suggests that while managers engaged
in SOC initiatives are more likely to manage earnings due to incentive-driven myopia and/or
opportunity-driven myopia, COLL strengthens both incentive-driven myopia and/or opportunity-
driven myopia. By creating informal institutions where managers may have higher incentives to
engage in EM for collective benefits of the corporate insiders, COLL strengthens incentive-driven
myopia. By creating informal institutions where collusion among insiders may be more common,
COLL strengthens opportunity-driven myopia.
Hypotheses H3.4 and H3.5 test the effects of CORR on EM and on the CSR-EM relationship
respectively. The findings provide support for H3.4, but no support for H3.5. Consistent with the
informal institutions perspective, this suggests that CORR increases the likelihood of EM, as
managers may manage earnings to mask their rent-seeking actions. However, the relationship
between the CSR dimensions and EM do not change with the level of CORR.
Hypotheses H3.6 and H3.7 test the joint effects of COLL and CORR on EM and on the CSR-EM
relationship respectively. The findings provide support for H3.6 and partial support for H3.7. The
results suggest that in countries with joint COLL and CORR characteristics, EM is more prevalent.

403
The joint effect of COLL and CORR also strengthens the relationship between the CSR dimensions
(ENV and SOC) and EM. Since CORR does not have an individual effect, but has a joint effect with
COLL on the CSR-EM relationship, this suggests that COLL has a stronger role in determining
managerial behaviour than CORR.
Findings on research question 3.3
Research question 3.3 is addressed by testing hypotheses H3.8 to H3.11. Hypotheses H3.8 and H3.9
test the effects of INVPRO on EM and on the CSR-EM relationship respectively. The findings provide
support for H3.8, and partial support for H3.9. The findings suggest that INVPRO lowers the
opportunities for EM, consistent with the social norm theory. Additionally, the results also suggest
that INVPRO weakens the positive relationship between SOC and EM, suggesting that with stronger
institutional factors, managements’ opportunities to use SOC initiative opportunistically to manage
earnings is significantly reduced. Thus, INVPRO weakens opportunity-driven managerial myopic
behaviour.
Hypotheses H3.10 (a and b) and H3.11 test the joint effects of COLL and INVPRO on EM and on the
CSR-EM relationship respectively. The findings do not provide support for any of these hypotheses,
that is, the result does not provide sufficient evidence to suggest that the joint effect of COLL and
INVPRO changes the CSR-EM relationship. This, once again, highlights that COLL has a stronger role
in determining managerial behaviour and the CSR-EM relationship. While INVPRO, on its own,
effectively weakens the positive relationship between SOC initiatives and EM, INVPRO loses its
effectiveness in COLL societies.
Overall findings on research objective 3
In response to research objective 3, the findings suggest that in emerging market countries, there is
a negative relationship between the ENV dimension and EM and a positive relationship between
SOC and EM. COLL, individually and jointly with CORR, has a strengthening effect on the relationship
between the CSR dimensions (ENV and SOC) and EM, while INVPRO individually has a weakening
effect on the relationship between the SOC dimension and EM. The findings of the present study
add to the literature examining international differences on the CSR-EM relationship by examining
this issue using a sample of firms from 10 emerging market countries.
The findings suggest that in emerging market countries, managers may have different underlying

404
motives behind engaging in different CSR initiatives. The findings suggest that managers engaged in
ENV initiatives are likely to be myopia avoidant (long-term oriented), managing less earnings.
However, managers engaged in SOC initiatives are likely to be more myopic (short-term oriented),
managing more earnings.
The study also adds to the literature on COLL, CORR and INVPRO by linking them to CSR and EM. To
the best of my knowledge, this is the first study to examine the effect of COLL and CORR, individually
and jointly, on EM. The study also links INVPRO individually and jointly with COLL to the CSR-EM
relationship. The findings provide interesting insights, suggesting that culture has a stronger role
than CORR or institutional framework in determining managerial behaviour and motives. The
findings highlight that the unique challenges in emerging markets (specifically COLL, CORR and
INVPRO) can change the relationship between the CSR dimensions and EM. This addresses the
question when CSR affects EM in a broader context (emerging market countries). The SOC
dimension of CSR increases EM, when the country is characterised by – 1) high COLL culture, and 2)
high COLL and high CORR jointly, and 3) low INVPRO. The ENV dimension of CSR decreases EM, when
the country is characterised by high COLL and high CORR at the same time.

405
Table 7.1 Summary of Research Questions, Hypotheses and Findings
Research Objectives Research Questions Hypothesis Hypothesis
Supported/Not supported
Findings
1. To investigate why and how CSR affects EM, by examining the direct CSR-EM relationship and indirect CSR-EM relationship via OC.
1.1. Does CSR have a significant direct effect on EM?
H1.1a: Consistent with the managerial myopia hypothesis, there is a positive and significant direct relationship between CSR and EM. Not supported Consistent with the myopia avoidance
hypothesis, CSR has a negative and significant direct effect on EM H1.1b: Consistent with the myopia avoidance hypothesis, there is
a negative and significant direct relationship between CSR and EM. Supported
1.2. Does CSR have a significant indirect effect on EM via OC?
H1.2: Consistent with the RBV theory, there is a positive and significant relationship between CSR and OC. Supported Consistent with the RBV theory, CSR has positive
and significant effect on OC
H1.3: Consistent with the managerial myopia hypothesis, there is a positive and significant relationship between OC and EM. Supported Consistent to the managerial myopia hypothesis,
OC has positive and significant effect on EM H1.4a: Consistent with the managerial myopia hypothesis, there is a positive and significant indirect relationship between CSR and EM, via the mediator OC.
Supported Consistent with the managerial myopia hypothesis, CSR has positive and significant indirect effect on EM H1.4b: Consistent with the myopia avoidance hypothesis, there is
a negative and significant indirect relationship between CSR and EM, via the mediator OC.
Not supported
2. To investigate when CSR has a direct effect on EM, and when CSR has an indirect effect on EM via OC, by examining the context FD.
2.1. Does FD have a significant effect on the direct CSR-EM relationship?
H2.1: Consistent with the managerial myopia hypothesis, there is a positive and significant relationship between FD and EM. Not supported FD does not have a statistically significant effect
on EM
H2.2: FD has a significant moderating effect on the direct relationship between CSR and EM. Supported
FD does not have a statistically significant moderating effect on the direct relationship between CSR and EM
2.2. Does FD have a significant effect on the indirect CSR-EM relationship via OC?
H2.3a: Consistent with the RBV theory, there is a positive and significant relationship between FD and OC. Supported
Consistent with the RBV theory, FD has a positive and significant effect on OC H2.3b: Consistent with the slack resource theory, there is a
negative and significant relationship between FD and OC. Not supported
H2.4: FD has a significant moderating effect on the relationship between CSR and OC. Supported FD has a moderating (weakening) effect on the
positive relationship between CSR and OC H2.5: FD has a significant moderating effect on the relationship between OC and EM. Supported FD has a moderating (weakening) effect on the
positive relationship between OC and EM
H2.6: FD has a significant moderating effect on the indirect relationship between CSR and EM, via the mediator OC. Supported
FD has a moderating (weakening) effect on the positive indirect relationship between CSR and EM via OC.

406
Research Objectives Research Questions Hypothesis Hypothesis
Supported/Not supported
Findings
3. To investigate when CSR affects EM, by examining the contexts COLL, CORR and INVPRO in emerging market countries.
3.1. Does CSR have a significant effect on EM in emerging market countries?
H3.1a: Consistent with the managerial myopia hypothesis, there is a positive and significant relationship between CSR and EM. Partially supported
Consistent with the managerial myopia hypothesis, SOC has positive and significant effect on EM
H3.1b: Consistent with the myopia avoidance hypothesis, there is a negative and significant relationship between CSR and EM. Partially supported Consistent with the myopia avoidance hypothesis,
ENV has a negative and significant effect on EM
3.2. Do COLL and CORR, individually and jointly, have significant effects on the CSR-EM relationship in emerging market countries?
H3.2: Consistent with the informal institutions perspective, there is a positive and significant relationship between COLL and EM. Supported COLL has a statistically positive and significant
effect on EM
H3.3: COLL has a significant moderating effect on the relationship between CSR and EM. Partially supported
Consistent with the informal institutions perspective, COLL has a moderating (strengthening) effect on the negative relationship between ENV and EM, and on the positive relationship between SOC and EM
H3.4: Consistent with the informal institutions perspective, there is a positive and significant relationship between CORR and EM. Supported
Consistent with the informal institutions perspective, CORR has a positive and significant effect on EM
H3.5: CORR has a significant moderating effect on the relationship between CSR and EM. Not supported
CORR does not have a statistically significant moderating effect on the relationship between CSR and EM
H3.6: Consistent with the informal institutions perspective, the interaction of COLL and CORR has a positive effect on EM. Supported The interaction of COLL and CORR has a positive
and significant effect on EM
H3.7: The interaction of COLL and CORR has a significant moderating effect on the relationship between CSR and EM. Partially supported
The interaction of COLL and CORR has a moderating (strengthening) effect on the negative relationship between ENV and EM, and the positive relationship between SOC and EM
3.3 Do COLL and INVPRO, individually and jointly, have significant effects on the CSR-EM relationship in emerging market countries?
H3.8: Consistent with the formal institutions perspective, there is a negative and significant relationship between INVPRO and EM. Supported
Consistent with the formal institutions perspective, INVPRO has a negative and significant effect on EM
H3.9: INVPRO has a significant moderating effect on the relationship between CSR and EM. Partially supported
Consistent with the formal institutions perspective, INVPRO weakens the positive relationship between SOC and EM
H3.10: Consistent with the institutional theory, the interaction of COLL and INVPRO has a significant effect on EM. Not supported The interaction of COLL and INVPRO does not
have a statistically significant effect on EM
H3.11: The interaction of COLL and INVPRO has a significant moderating effect on the relationship between CSR and EM. Not supported
The interaction of COLL and INVPRO does not have a statistically significant moderating effect on the relationship between CSR and EM

407
7.4 Implications of the Findings
The findings of this study have several important implications to theory and practice. This section
discusses the theoretical and practical implications.
7.4.1 Theoretical Implications
There is no defined theoretical framework explaining the CSR-EM relationship. Several studies have
explained the CSR-EM relationship from the perspectives of traditional accounting theories, such
as, stakeholder theory and agency theory. The present study looks at managerial behaviour
perspectives, and thus, adds to the stakeholder and agency theories by focussing more on specific
managerial behaviour, driven by motives. The study does not dismiss the ideas of the stakeholder
theory and the agency theory, but rather adds to them using managerial behaviour perspectives
and underlying motives. The findings enrich the CSR-EM literature by explaining the CSR-EM
relationship from the perspective of a consistent theoretical framework, based on managerial
behaviour. I posit that while prior studies have looked at various managerial motives, it is important
to understand managerial behaviour which is driven by the various motives. Thus, I examine the
CSR-EM relationship from two opposing perspectives of managerial behaviour – namely, 1)
managerial myopia hypothesis (suggesting that managerial behaviour is short-term oriented), and
2) myopia avoidance hypothesis (suggesting that managerial behaviour is long-term oriented).
Furthermore, I explain each of these managerial behaviour or orientation as driven by various
motives. First, managerial myopia (short-term orientation) may be – 1) incentive-driven, and/or 2)
opportunity-driven. Second, myopia avoidance (long-term orientation) may be – 1) relationship-
driven, and/or 2) value-driven.
The findings suggest that managerial behaviour and underlying motives change in various contexts.
I find a negative direct relationship between CSR and EM among firms in USA. Consistent with the
managerial myopia hypothesis, this suggests that in general, managers engaged in CSR, are long-
term oriented (myopia avoidant). However, I find that managerial behaviour and underlying motives
change when the firm has high OC, thus making the CSR-EM relationship contextual in nature. The
findings suggest a positive indirect relationship between CSR and EM via OC, consistent with the
managerial myopia hypothesis. The results suggest that managers become myopic (or engage in
short termism behaviour) in firms with high OC. They may leverage on their firms’ unique abilities
(that is OC) and use CSR to indirectly manage earnings more. The study also enriches the managerial

408
behaviour perspectives (myopia and myopia avoidance) by suggesting that crisis situations,
specifically FD, weaken managerial myopia (that is, weaken short-term orientation). Specifically, the
study finds FD weakens the positive indirect relationship between CSR and EM via OC.
Next, the present study also finds that managerial behaviour may vary with the CSR dimensions in
emerging market countries. The findings show that managers, engaged in ENV initiatives are myopia
avoidant (long-term oriented) and less likely to manage earnings. However, managers engaged in
SOC initiatives are myopic (short-term oriented) and more likely to manage earnings. Furthermore,
the study links the institutional theory to managerial behaviour (that is, myopia versus myopia
avoidance) and explains how different country-level contexts may change managerial behaviour.
The study finds that in emerging market countries, COLL culture, individually and jointly with CORR,
creates informal institutions that strengthen the relationships the CSR dimensions and EM. In
contrast INVPRO creates formal institutions, weakening managerial myopia behaviour.
7.4.2 Practical implications
The findings of this study have important practical implications for investors and other stakeholders,
policymakers, regulators, auditors, and academics.
Investors and other stakeholders (such as, creditors) are considered to be the main users of financial
statements. They often view managers’ engagement in CSR as a reflection of management’s ethics
and transparency of the financial information that managers present. Thus, CSR is often used as a
basis to build trust when evaluating the relevance and faithful representation of financial
information. However, the findings of this study show evidence that high CSR does not always
constrain managers’ engagement in EM. On the contrary, managerial behaviour is driven by their
underlying motives in different situations. Thus, investors should assess CSR practices with caution
and not evaluate the reliability and faithful representation of financial information solely based on
CSR disclosures and practices. In order to reduce their investment risk and potential losses, investors
and creditors should not take it for granted that CSR is an indicator of management’s ethical
disposition; they should rather dig deep to understand the underlying managerial motives in light
of the firm’s unique circumstances, including the specific internal ability, knowledge, organizational
design and culture of firms, unusual circumstances, such as FD, and broader macro-level
characteristics, such as culture, corruption levels and institutional framework of the country.
The findings also have important implications for policymakers and regulators. The CSR-EM

409
relationship is contextual on the underlying managerial motives and opportunities. Thus, simply
implementing stricter policies is not sufficient, as policymakers and regulators need to assess the
firms’ situations on a case-by case basis. The findings suggest that when it comes to regulations and
policies towards constraining EM, a one-size-fits-all approach may not be effective due to situational
motives (Kyaw et al., 2017). This is evidenced by, for example, the Sarbanes Oxley Act (2002) in USA
that was implemented to inhibit EM opportunities, yet firms continue managing earnings (Zhang et
al., 2013). Furthermore, the global convergence to uniform accounting practices was led by the
adoption of the International Financial Reporting Standards (IFRS) by firms across the globe.
However, the IFRS, in itself, may not be sufficient to improve financial reporting quality, as EM may
still result from a wide range of managerial motives (Han et al., 2010; Paredes & Wheatley, 2017).
These pieces of evidence, combined with the findings of the present study, suggest that it is
important to customise the policies to fit the unique context. This study identifies some unique
contexts that may affect managerial behaviour and the CSR-EM relationship. In developed countries
(specifically USA) managerial motives and opportunities may vary based on organizational contexts
such as, the firm’s unique abilities and financial situation, while in emerging market countries
managerial motives and opportunities largely vary based on the institutional environment, culture,
and pervasiveness of corruptive practices in the society. Stricter policies and greater scrutiny by
regulators are required in these specific contexts. Changing a country’s legal system or institutional
framework is not easy. Therefore, the present study suggests that it is essential, and less costly to
understand managerial behaviour and the underlying motives in determining policies on CSR and
EM. The findings also provide specific insights on the role of individual CSR dimensions, specifically
ENV and SOC, in determining EM in emerging market countries. The findings suggest that different
CSR initiatives may be undertaken with different agendas. In particular, the findings indicate that it
may be beneficial for policymakers to encourage ENV initiatives in emerging market countries, as it
has a negative effect on EM, despite high COLL and CORR levels. On the other hand, additional
criteria may be required for firms engaged in social initiatives in emerging market countries, as SOC
is positively related to EM. Regulators may wish to exert more scrutiny on firms with SOC initiatives.
The findings also have important implications for auditors, as they present a framework with varying
situational influences on managerial motives for EM engagement. In order to reduce audit risk,
auditors may wish to undertake more substantive audit procedures for firms with high EM motives
and opportunities, particularly firms with high OC and firms operating in countries with COLL and
high CORR.

410
Finally, the findings of the present study may be useful for academics and researchers interested in
understanding the CSR-EM relationship from a managerial behaviour perspective. The present study
provides an initial framework for disintegrating the CSR-EM relationship into direct and indirect
relationships, and also for the situational factors influencing the CSR and EM relationship both in
developed and emerging market countries. This initial framework may provide a foundation for
future research and discussion. Section 7.6 discusses several future research ideas.
7.5 Limitations of the Study
Like any research, the present study is subject to some limitations. The first limitation is a limitation
on the sample. Since the samples include only publicly listed firms (from USA and emerging market
countries listed on the Datastream database) with CSR information, this restricts the sample to
mostly large firms. This also limits my sample size and sample period. For the first two research
studies, the sample period begins from 2002, since CSR information is not available prior to 2002
for USA firms in the Datastream database. For the third research study, based on an emerging
market sample, the sample size is restricted 3,472 observations from 10 countries due to the
unavailability of CSR information for a large number of firms in emerging market countries. The
sample period for the third study is subject to further restriction due to the country-level variables.
Since CORR data (from Transparency International) is only available from 2012, and INVPRO data
(from World Economic Forum’s Global Competitiveness Index Historical data) is only available until
2016, this limits the period of observation to include 2012 to 2016 for my third research study.
The second limitation is a limitation on the measurement of variables. The study uses secondary
data for all variables. Thus, the results of the study may be subject to measurement errors that may
exist in the computation of these variables. The study examines EM based on accruals-based
measures (that is, the modified Jones model and the accruals quality model). The study does not
consider other types of EM, such as real earnings management (REM), expense misclassifications,
inappropriate revenue recognitions, big bath charges and cookie jar reserves. Future studies may
consider using other EM measures. Furthermore, CSR lacks a consistent measure (see Kolsi &
Attayah, 2018). While ESG data obtained from Thomson Reuters database is believed to be reliable
and accurate, it may be subject to measurement errors. However, other methods of CSR, specifically
CSR disclosures and/or content analysis procedures could be more problematic due to their
subjective nature (for example, see Pratiwi & Siregar, 2019; Velte, 2019). The OC measure in the

411
present study is largely based on selling, general and administrative (SGA) expenses. This can
potentially lead to mechanical correlations. This is because after spending on CSR, firms may have
limited resources to spend on other activities, such as SG&A expenses. Additionally, the
measurement of FD may be problematic. Since different measures of FD indicate different aspects
of financial trouble of firms, the study uses a single measure for FD. This may cause potential issues
on the generalizability of the results, using other FD measures.
The third limitation is a limitation in scope. The results of the present study may be subject to
limitations in generalisation across other contexts. The results of the first two research studies,
examining the direct and indirect CSR-EM relationships via OC and the effect of FD are applicable to
USA and other countries with similar institutional contexts. However, the results may not be
generalizable to other institutional contexts, such as emerging markets. Likewise, the results of the
third research study, based on emerging markets, may be applicable to emerging market countries
only and may not be applicable to developed economies. Furthermore, as noted by Kim et al. (2019),
CSR is rapidly changing, particularly in emerging markets. Thus, any noteworthy changes in CSR
practices may change the validity of my findings. Additionally, CSR is now mandated in many
emerging market jurisdictions, such as Indonesia, China and India, for specific firm types. The
present study does not specifically look at the role of mandatory CSR
Notwithstanding these limitations, the study provides important insights into the CSR-EM
relationship from managerial behaviour perspectives. The limitations encourage several future
research directions, as discussed in the next section.
7.6 Future Research Directions
The present study opens up several avenues for future research. Some natural extensions of the
present study could be to look at individual CSR dimensions when examining the indirect CSR-EM
relationship, or even further breakdown of the CSR dimensions into specific issues, such as, human
rights, resource use and emissions. Examination of signed accruals as opposed to absolute
discretionary accruals could also be useful. Furthermore, other EM measures can be used, such as
REM, expense misclassifications, inappropriate revenue recognitions, big bath charges, and cookie
jar reserves.
In addition to the natural extensions discussed above, the present study opens up several other

412
future research ideas. While the present study provides an initial framework for the indirect CSR-
EM relationship via OC, future studies could explore the indirect relationship further by examining
other factors that may be an indirect channel in this relationship. For example, future studies may
explore other components of intellectual capital (human capital and/or relational capital).
Furthermore, the indirect CSR-EM relationship may be explored across different ownership types
(such as, concentrated ownership, managerial ownership, and family ownership) and across
different industries. Furthermore, consistent to the limited resource argument, firms with CSR may
have limited resources that may inturn impact their financial performance. Thus, these firms may
have higher incentives to manage earnings upwards. Thus, in line with this view, future studies could
explore mediating variables such as cash and financial flexibility.
While the present study explores the moderated mediation effect of FD on the direct and indirect
CSR-EM relationship, future studies can look at other more severe aspects of financial trouble such
as, bankruptcy filings, or macro-level events, such as economic distress. Furthermore, CSR-EM
research post-Covid19 may be an interesting extension to the present study. The present study
looks at the effect of FD on the CSR-EM relationship (direct and indirect) using a pre-Covid19 sample.
A comparison of ex ante and ex post Covid-19 on managerial behaviour and motives driving the CSR-
EM relationship may be a strong contribution for future studies. Social distancing and remote
working conditions have become a common practice since the outbreak of the Covid-19 pandemic,
making digitalisation essential (Deloitte, 2021). An expected outcome of this is a change in the
means of collecting, managing, and sharing data using technology. Integration of blockchain
technology within firms is expected to become a mainstream practice (Deloitte, 2021). Future
research can examine the effect of such technological innovations, such as the blockchain
technology, on the direct and indirect CSR-EM relationship. Furthermore, it would also be
interesting to see other exogenous shocks, such as the American Jobs Creation Act of 2004, used as
measures of FD.
The present study uses a multi-level analysis to examine the CSR-EM relationship in emerging
market countries. Further multi-level research may be useful in emerging market countries. While
the present study examines the role of COLL, CORR and INVPRO on the CSR-EM relationship, future
studies may examine other macro-level factors, such as country-level accounting standards,
economic development, geographical location, language and religion. Future studies can also
examine other cultural dimensions, in addition to COLL, such as, Power Distance, Long-term
Orientation, Uncertainty Avoidance, and Masculinity versus Femininity. The present study uses an

413
overall corruption perception index as a proxy for CORR. Future studies can look at specific
corruptive practices, such as money laundering and bribery, to gain more understanding of
managerial motives. Additionally, future studies examining CORR can also focus on the role of
proactive actions, such as lobbyists and political action committees (Patten & Trompeter, 2003).
This study provides an initial framework to understand the direct and indirect relationship between
CSR and EM and on the situational influences that affect this relationship, from managerial
behaviour perspectives. This initial discussion could be expected to open up more areas of research,
discussions and debate on this interesting issue.
7.7 Summary of the Thesis
This thesis examines the relationship between CSR and EM, addressing the questions why, how and
when CSR affects EM, using managerial behaviour perspectives. The study has three research
questions, addressed by undertaking three research studies. The first research study examines the
direct CSR-EM relationship and the CSR-EM indirect relationship via OC. Using a sample of 46,816
observations, between 2002 and 2017, from firms from USA, the study finds a negative direct
relationship between CSR and EM, consistent with the myopia avoidance hypothesis. The study also
finds a positive indirect relationship between CSR and EM via OC, consistent with the managerial
myopia hypothesis. This finding provides important insights, suggesting that managers may take
advantage of OC to opportunistically manage earnings, while being active in CSR practices as a shield
to hide their EM activities.
The second research study examines the role of FD on the direct CSR-EM relationship and the
indirect CSR-EM relationship. Using a sample of 36,811 observations, between 2002 and 2017, the
findings suggest that FD weakens the positive indirect CSR-EM relationship via OC, but FD does not
change the direct CSR-EM relationship. The findings indicate that as managerial priorities change
during crisis situations, managers may become more risk averse and less myopic.
The third research study examines the CSR-EM relationship in 10 emerging market countries and
the effect of COLL, CORR and INVPRO on the CSR-EM relationship. Using a sample of 3,472
observations, between 2012 and 2016, the findings suggest that in emerging market countries,
managers engaged in ENV initiatives are less likely to manage earnings, while managers engaged in
SOC initiatives are more likely to manage earnings. This suggests that there are differences in

414
managerial motives behind their engagement in the different CSR dimensions. The findings also
suggest that cultural background has a stronger role in determining managerial behaviour and the
CSR-EM relationship than CORR and institutional frameworks. The results show that COLL,
individually and jointly with CORR, strengthens the relationship between SOC and EM. Additionally,
in countries with both COLL and CORR the negative relationship between ENV and EM is stronger,
suggesting that collective interests in COLL societies are more dominant in determining managerial
behaviour and opportunistic intentions created by CORR. Finally, the results show that while
INVPRO on its own weakens the positive relationship between SOC and EM, reducing myopic
behaviour, INVPRO loses its effectiveness in COLL societies. In COLL countries, INVPRO does not
change the relationship between SOC and EM.
Overall, the study provides interesting insights into a widely debated topic – the relationship
between CSR and EM. The study uses managerial behaviour perspectives (managerial myopia and
myopia avoidance) to explain why, how and when CSR affects EM. The findings highlight several firm
level and country level factors that may help to understand underlying managerial motives and
behaviour explaining the CSR-EM relationship. The findings provide a useful initial framework that
can be utilised in future research.
415
REFERENCE LIST
Abdi, M., & Aulakh, P. S. (2012). Do country-level institutional frameworks and interfirm governance arrangements substitute or complement in international business relationships? Journal of International Business Studies, 43(5), 477-497. Ackoff, R. (1999). Recreating the corporation: A design of organizations for the 21st century. New York, NY: Oxford University Press. Aguiar, M., & Gopinath, G. (2007). Emerging market business cycles: The cycle is the trend. Journal of political Economy, 115(1), 69-102. Aguinis, H. (2011). Organizational responsibility: Doing good and doing well (Vol 3), APA handbook of industrial and organizational psychology (pp. 855-879). Washington DC: American Psychological Association. Aguinis, H., & Glavas, A. (2012). What we know and don’t know about corporate social responsibility: A review and research agenda. Journal of management, 38(4), 932-968. Ahmed, M. D., & Sundaram, D. (2012). Sustainability modelling and reporting: From roadmap to implementation. Decision Support Systems, 53(3), 611-624. Ahmed, M. M., Chung, K. Y., & Eichenseher, J. W. (2003). Business students' perception of ethics and moral judgment: A cross-cultural study. Journal of Business Ethics, 43(1), 89-102. Aidt, T. S. (2009). Corruption, institutions, and economic development. Oxford review of economic policy, 25(2), 271-291. Al-dhamari, R., & Ku Ismail, K. N. I. (2015). Cash holdings, political connections, and earnings quality: Some evidence from Malaysia. International Journal of Managerial Finance, 11(2), 215-231. Al-Fayoumi, N., Abuzayed, B., & Alexander, D. (2010). Ownership structure and earnings management in emerging markets: The case of Jordan. International Research Journal of Finance and Economics, 38(1), 28-47. Al-Rassas, A. H., & Kamardin, H. (2016). Earnings quality and audit attributes in high concentrated ownership market. Corporate Governance, 16(2), 377-399. Al‐Hadi, A., Chatterjee, B., Yaftian, A., Taylor, G., & Monzur Hasan, M. (2019). Corporate social responsibility performance, financial distress and firm life cycle: evidence from Australia. Accounting & Finance, 59(2), 961-989. Almahrog, Y., Ali Aribi, Z., & Arun, T. (2018). Earnings management and corporate social responsibility: UK evidence. Journal of Financial Reporting and Accounting, 16(2), 311-332.

416
Alsop, R. (2002, January 16). Perils of corporate philanthropy: Touting good works offends the public, but reticence is perceived as inaction. The Wallstreet Journal, pp. B1. Altman, E. I. (1968). Financial ratios, discriminant analysis and the prediction of corporate bankruptcy. The journal of finance, 23(4), 589-609. Altman, E. I. (1984). A further empirical investigation of the bankruptcy cost question. The Journal of Finance, 39(4), 1067-1089. Altman, E. I. (2005). An emerging market credit scoring system for corporate bonds. Emerging markets review, 6(4), 311-323. Altuner, D., Çelik, S., & Güleç, T. C. (2015). The linkages among intellectual capital, corporate governance and corporate social responsibility. Corporate Governance, 15(4), 491-507. Álvarez, I. G., Sanchez, I. M. G., & Dominguez, L. R. (2008). Voluntary and compulsory information disclosed online: The effect of industry concentration and other explanatory factors. Online Information Review, 596-622. https://doi.org/10.1108/14684520810913990 Alves, S. (2012). Ownership structure and earnings management: Evidence from Portugal. Australasian Accounting Business & Finance Journal, 6(1), 57-74. Amar, A. B., & Chakroun, S. (2018). Do dimensions of corporate social responsibility affect earnings management? Evidence from France. Journal of Financial Reporting and Accounting, 16(2), 348-370. Amin, E., & Lev, B. (1996). Value-relevance of non financial information: The wireless communication industry. Journal of Accounting and Economics, 22(1), 33-21. Anderson, H. L., & Landau, I. (2006). Corporate social responsibility in Australia: A review. SSRN Electronic Journal, 1-32. https://doi.org/10.2139/ssrn.1027845 Argenti, J. (1976). Corporate planning and corporate collapse. Long Range Planning, 9(6), 12-17. https://doi.org/10.1016/0024-6301(76)90006-6 Arthur, N., Tang, Q., & Lin, Z. S. (2015). Corporate accruals quality during the 2008–2010 Global Financial Crisis. Journal of International Accounting, Auditing and Taxation, 25, 1-15. Asrori, A., Amal, M. I., & Harjanto, A. P. (2019). Company Characteristics on the Corporate Social Reporting Index of Corporate Social and Environmental Disclosure in Indonesian Public Companies. International Journal of Energy Economics and Policy, 9(5), 481-488. https://doi.org/10.32479/ijeep.7990 Atkeson, A., & Kehoe, P. J. (2005). Modeling and measuring organization capital. Journal of political Economy, 113(5), 1026-1053. Attig, N., & Cleary, S. (2014). Organizational Capital and Investment‐Cash Flow Sensitivity: The Effect of Management Quality Practices. Financial Management, 43(3), 473-504.

417
Attig, N., & Cleary, S. (2015). Managerial practices and corporate social responsibility. Journal of business ethics, 131(1), 121-136. Baghai, R., Silva, R., Thell, V., & Vig, V. (2020). Talent in distressed firms: Investigating the labor costs of financial distress. The Journal of Finance, 1-86. https://doi.org/10.1111/jofi.13077 Balasubramanian, S. A., Radhakrishna, G., Sridevi, P., & Natarajan, T. (2019). Modeling corporate financial distress using financial and non-financial variables. International Journal of Law and Management, 61(3/4), 457-484. Baldwin, C. Y., & Mason, S. P. (1983). The resolution of claims in financial distress the case of Massey Ferguson. The Journal of Finance, 38(2), 505-516. Ball, R., Kothari, S., & Robin, A. (2000). The effect of international institutional factors on properties of accounting earnings. Journal of accounting and economics, 29(1), 1-51. Ball, R., & Shivakumar, L. (2006). The role of accruals in asymmetrically timely gain and loss recognition. Journal of accounting research, 44(2), 207-242. Bandler, J., & Hechinger, J. (2003, June 6). Six Former Xerox Executives Will Pay $22 Million to SEC. https://www.wsj.com/articles/SB105482351065879700 Banerjee, S. B. (2001). Managerial perceptions of corporate environmentalism: Interpretations from industry and strategic implications for organizations. Journal of management studies, 38(4), 489-513. Bao, S. R., & Lewellyn, K. B. (2017). Ownership structure and earnings management in emerging markets—An institutionalized agency perspective. International Business Review, 26(5), 828-838. Barney, J. (1991). Firm Resources and Sustained Competitive Advantage. Journal of Management, 17(1), 99-120. Barney, J., Wright, M., & Ketchen Jr, D. J. (2001). The resource-based view of the firm: Ten years after 1991. Journal of management, 27(6), 625-641. Barney, J. B. (1986). Organizational culture: can it be a source of sustained competitive advantage? Academy of management review, 11(3), 656-665. Baron, R. M., & Kenny, D. A. (1986). The moderator–mediator variable distinction in social psychological research: Conceptual, strategic, and statistical considerations. Journal of personality and social psychology, 51(6), 1173. Barrena‐Martinez, J., López‐Fernández, M., & Romero‐Fernández, P. M. (2019). The link between socially responsible human resource management and intellectual capital. Corporate Social Responsibility and Environmental Management, 26(1), 71-81. Barton, J. (2001). Does the use of financial derivatives affect earnings management decisions? The Accounting Review, 76(1), 1-26.

418
Barua, S. (2020). Understanding Coronanomics: The economic implications of the coronavirus (COVID-19) pandemic. SSRN Electronic Journal, 1-44. https://doi.org/10.2139/ssrn.3566477 Baskin, J., & Gordon, K. (2005). Corporate responsibility practices of emerging market companies. OECD working papers on International Investment, 2005/2003. OECD Publishing. https://dx.doi.org/10.1787/713775068163 Basu, S. (1997). The conservatism principle and the asymmetric timeliness of earnings. Journal of accounting and economics, 24(1), 3-37. Beattie, V. (2014). Accounting narratives and the narrative turn in accounting research: Issues, theory, methodology, methods and a research framework. The British Accounting Review, 46(2), 111-134. Beatty, A. L., Ke, B., & Petroni, K. R. (2002). Earnings management to avoid earnings declines across publicly and privately held banks. The accounting review, 77(3), 547-570. Bellemare, M. F., Masaki, T., & Pepinsky, T. B. (2017). Lagged explanatory variables and the estimation of causal effect. The Journal of Politics, 79(3), 949-963. Ben and Jerry’s. (2020a). 10 Things You Didn’t Know We Did. https://www.benandjerry.com.au/whats-new/corporate-social-responsibility-history Ben and Jerry’s. (2020b). Our Values. https://www.benandjerry.com.au/values Bender, R. (2013). Corporate financial strategy. Routledge. Bhandari, A., Mammadov, B., Shelton, A., & Thevenot, M. (2018). It is not only what you know, it is also who you know: CEO Network Connections and Financial Reporting Quality. Auditing: A Journal of Practice & Theory, 37(2), 27-50. Bhattacharya, N., Desai, H., & Venkataraman, K. (2013). Does earnings quality affect information asymmetry? Evidence from trading costs. Contemporary Accounting Research, 30(2), 482-516. Bhattacharya, U., Daouk, H., & Welker, M. (2003). The world price of earnings opacity. The accounting review, 78(3), 641-678. Bhojraj, S., & Sengupta, P. (2003). Effect of corporate governance on bond ratings and yields: The role of institutional investors and outside directors. The journal of Business, 76(3), 455-475. Bishara, N. D. (2011). Governance and corruption constraints in the Middle East: Overcoming the business ethics glass ceiling. American Business Law Journal, 48(2), 227-283. Biswas, M. K., & Suar, D. (2016). Antecedents and consequences of employer branding. Journal of Business Ethics, 136(1), 57-72. Black, S. E., & Lynch, L. M. (2005). Measuring organizational capital in the new economy Measuring capital in the new economy (pp. 205-236). University of Chicago Press.
419
Blackburn, K., Bose, N., & Haque, M. E. (2006). The incidence and persistence of corruption in economic development. Journal of Economic Dynamics and control, 30(12), 2447-2467. Bloom, N., Sadun, R., & Van Reenen, J. (2010). Recent advances in the empirics of organizational economics. Annual Review of Economics, 2(1), 105-137. Bloom, N., & Van Reenen, J. (2007). Measuring and explaining management practices across firms and countries. The quarterly journal of Economics, 122(4), 1351-1408. Bohannan, P. (2010). How culture works. Simon and Schuster. Boubakri, N., El Ghoul, S., Guedhami, O., & Wang, H. (2021). Corporate social responsibility in emerging market economies: Determinants, consequences, and future research directions. Emerging Markets Review, 46, 100758. https://doi.org/10.1016/j.ememar.2020.100758 Boubakri, N., Guedhami, O., Mishra, D., & Saffar, W. (2012). Political connections and the cost of equity capital. Journal of corporate finance, 18(3), 541-559. Bourdieu, P. (2007). Outline of a Theory of Practice ed.). Duke University Press. Bouvatier, V., Lepetit, L., & Strobel, F. (2014). Bank income smoothing, ownership concentration and the regulatory environment. Journal of Banking & Finance, 41, 253-270. Bowen, H. R. (1953). Social responsibilities of the businessman. Harper and Row: New York. Bowen, R. M., Burgstahler, D., & Daley, L. A. (1986). Evidence on the relationships between earnings and various measures of cash flow. Accounting Review, 61(4), 713-725. Bozzolan, S., Fabrizi, M., Mallin, C. A., & Michelon, G. (2015). Corporate Social Responsibility and Earnings Quality: International Evidence. The International Journal of Accounting, 50(4), 361-396. Branco, M. C., & Delgado, C. (2012). Business, social responsibility, and corruption. Journal of Public Affairs, 12(4), 357-365. Branco, M. C., & Rodrigues, L. L. (2006). Corporate social responsibility and resource-based perspectives. Journal of business Ethics, 69(2), 111-132. Brewer, P., & Venaik, S. (2011). Individualism–collectivism in Hofstede and GLOBE. Journal of International Business Studies, 42(3), 436-445. Brickley, J. A. (2003). Empirical research on CEO turnover and firm-performance: A discussion. Journal of Accounting and Economics, 36(1-3), 227-233. Brooks, C. (2014). Introductory Econometrics for Finance (3rd ed.). Cambridge. Brown, J., & Matsa, D. A. (2016). Boarding a sinking ship? An investigation of job applications to distressed firms. The Journal of Finance, 71(2), 507-550.

420
Brynjolfsson, E., Hitt, L. M., & Yang, S. (2002). Intangible assets: Computers and organizational capital. Brookings papers on economic activity, 2002(1), 137-181. http://www.jstor.org/stable/1209176 Buchholz, F., Lopatta, K., & Maas, K. (2020). The deliberate engagement of narcissistic CEOs in earnings management. Journal of Business Ethics, 167(4), 663-686. Buertey, S., Sun, E. J., Lee, J. S., & Hwang, J. (2020). Corporate social responsibility and earnings management: The moderating effect of corporate governance mechanisms. Corporate Social Responsibility and Environmental Management, 27(1), 256-271. Bulkeley (2002, March 12). Questioning the books: IBM annual report shows stronger cpre earnings. Wall Street Journal pp. Burgstahler, D., & Dichev, I. (1997). Earnings management to avoid earnings decreases and losses. Journal of accounting and economics, 24(1), 99-126. Burgstahler, D. C., Hail, L., & Leuz, C. (2006). The importance of reporting incentives: Earnings management in European private and public firms. The accounting review, 81(5), 983-1016. Burt, R. S. (1997). A note on social capital and network content. Social networks, 19(4), 355-373. https://doi.org/10.1016/s0378-8733(97)00003-8 Bushee, B. J. (1998). The influence of institutional investors on myopic R&D investment behavior. Accounting review, 73(3), 305-333. Bushman, R. M., Lerman, A., & Zhang, X. F. (2016). The changing landscape of accrual accounting. Journal of Accounting Research, 54(1), 41-78. Bushman, R. M., Piotroski, J. D., & Smith, A. J. (2011). Capital allocation and timely accounting recognition of economic losses. Journal of Business Finance & Accounting, 38(1‐2), 1-33. Cahan, S. F., Liu, G., & Sun, J. (2008). Investor protection, income smoothing, and earnings informativeness. Journal of International Accounting Research, 7(1), 1-24. Calegari, M. F., Chotigeat, T., & Harjoto, M. (2010). Corporate social responsibility and earnings reporting. Journal of Current Research in Global Business, 13(20), 1-14. Calhoun, M. A. (2002). Unpacking liability of foreignness: identifying culturally driven external and internal sources of liability for the foreign subsidiary. Journal of international management, 8(3), 301-321. Callen, J. L., Morel, M., & Richardson, G. (2011). Do culture and religion mitigate earnings management? Evidence from a cross-country analysis. International Journal of Disclosure and Governance, 8(2), 103-121. Campbell, J. L. (2007). Why would corporations behave in socially responsible ways? An institutional theory of corporate social responsibility. Academy of management Review, 32(3),

421
946-967. Canibano, L., Garcia-Ayuso, M., & Sanchez, P. (2000). Accounting for intangibles: a literature review. Journal of Accounting literature, 19, 102-130. Carcello, J. V., & Neal, T. L. (2003). Audit committee independence and disclosure: Choice for financially distressed firms. Corporate Governance: An International Review, 11(4), 289-299. Carlin, B. I., Chowdhry, B., & Garmaise, M. J. (2012). Investment in organization capital. Journal of Financial Intermediation, 21(2), 268-286. Carroll, A. B. (1991). The pyramid of corporate social responsibility: Toward the moral management of organizational stakeholders. Business horizons, 34(4), 39-48. Carroll, A. B., & Shabana, K. M. (2010). The business case for corporate social responsibility: A review of concepts, research and practice. International journal of management reviews, 12(1), 85-105. Caruso, G. D., Ferrari, E. R., & Pisano, V. (2016). Earnings management and goodwill impairment: An empirical analysis in the Italian M & A context. Journal of Intellectual Capital, 17(1), 120-147. Casalegno, C., Pellicelli, M., & Civera, C. (2017). CSR and human capital as levers for enhancing shareholder value creation. An early investigation of the largest European companies. Global Business and Economics Review, 19(4), 448-467. Chan, C. Y., Chou, D. W., & Lo, H. C. (2017). Do financial constraints matter when firms engage in CSR? The North American Journal of Economics and Finance, 39, 241-259. Chaney, P. K., Faccio, M., & Parsley, D. (2011). The quality of accounting information in politically connected firms. Journal of accounting and Economics, 51(1-2), 58-76. Chang, C. H., & Chen, Y. S. (2012). The determinants of green intellectual capital. Management decision, 50(1), 74-94. Charitou, A., Lambertides, N., & Trigeorgis, L. (2007). Managerial discretion in distressed firms. The British Accounting Review, 39(4), 323-346. Charitou, A., Lambertides, N., & Trigeorgis, L. (2011). Distress risk, growth and earnings quality. Abacus, 47(2), 158-181. Chen, C., Gotti, G., Kang, T., & Wolfe, M. C. (2016). Corporate Codes of Ethics, National Culture, and Earnings Discretion: International Evidence. Journal of Business Ethics, 151(1), 1-23. Chen, R. C., & Hung, S. W. (2021). Exploring the impact of corporate social responsibility on real earning management and discretionary accruals. Corporate Social Responsibility and Environmental Management, 28(1), 333-351. Chen, Y., Chen, C. H., & Huang, S. L. (2010). An appraisal of financially distressed companies'
422
earnings management. Pacific Accounting Review, 22(1), 22-41. Cheung, A. (2016). Corporate social responsibility and corporate cash holdings. Journal of Corporate Finance, 37, 412-430. Chih, H. L., Shen, C. H., & Kang, F. C. (2008). Corporate social responsibility, investor protection, and earnings management: Some international evidence. Journal of Business Ethics, 79(1-2), 179-198. Cho, E., & Chun, S. (2015). Corporate social responsibility, real activities earnings management, and corporate governance: evidence from Korea. Asia-Pacific Journal of Accounting & Economics, 23(4), 400-431. Cho, S. Y., & Lee, C. (2017). Managerial efficiency, corporate social performance, and corporate financial performance. Journal of Business Ethics, 1-20. Choi, B. B., Lee, D., & Park, Y. (2013). Corporate social responsibility, corporate governance and earnings quality: Evidence from Korea. Corporate Governance: An International Review, 21(5), 447-467. Choi, H., Choi, B., & Byun, J. (2018). The relationship between corporate social responsibility and earnings management: accounting for endogeneity. Investment Management & Financial Innovations, 15(4), 69. Choi, T. H., & Pae, J. (2011). Business ethics and financial reporting quality: Evidence from Korea. Journal of Business Ethics, 103(3), 403-427. Choy, S. L. W., Munusamy, J., Chelliah, S., & Mandari, A. (2011). Effects of financial distress condition on the company performance: A Malaysian perspective. Review of Economics & Finance, 1(4), 85-99. Chun, S., & Cho, E. (2017). Differentiation strategy, CSR, and real activities earnings management: Evidence from Korea. Journal of Applied Business Research (JABR), 33(4), 669-692. Chung, K. H., Yu, J. E., Choi, M. G., & Shin, J. I. (2015). The effects of CSR on customer satisfaction and loyalty in China: the moderating role of corporate image. Journal of Economics, Business and Management, 3(5), 542-547. Chung, R., Firth, M., & Kim, J.-B. (2002). Institutional monitoring and opportunistic earnings management. Journal of corporate finance, 8(1), 29-48. Ciftci, M., Darrough, M., & Mashruwala, R. (2014). Value relevance of accounting information for intangible-intensive industries and the impact of scale: The US evidence. European Accounting Review, 23(2), 199-226. Claessens, S., Djankov, S., Fan, J. P., & Lang, L. H. (2002). Disentangling the incentive and entrenchment effects of large shareholdings. The journal of finance, 57(6), 2741-2771. Claessens, S., & Yurtoglu, B. B. (2013). Corporate governance in emerging markets: A survey.

423
Emerging markets review, 15, 1-33. Cohen, D. A., Dey, A., & Lys, T. Z. (2008). Real and accrual-based earnings management in the pre-and post-Sarbanes-Oxley periods. The accounting review, 83(3), 757-787. Cohen, D. A., & Zarowin, P. (2008). Economic consequences of real and accrual-based earnings management activities. The Accounting Review, 83(1), 758-787. Cohen, D. A., & Zarowin, P. (2010). Accrual-based and real earnings management activities around seasoned equity offerings. Journal of accounting and Economics, 50(1), 2-19. Cornett, M. M., McNutt, J. J., & Tehranian, H. (2009). Corporate governance and earnings management at large US bank holding companies. Journal of Corporate finance, 15(4), 412-430. Culpan, R., & Trussel, J. (2005). Applying the agency and stakeholder theories to the Enron debacle: An ethical perspective. Business and Society Review, 110(1), 59-76. Cyert, R. M., & March, J. G. (1963). A behavioral theory of the firm. Englewood Cliffs, NJ. Daily, C. M., & Dalton, D. R. (1994). Bankruptcy and corporate governance: The impact of board composition and structure. Academy of Management journal, 37(6), 1603-1617. Dallas, L. L. (2011). Short-termism, the financial crisis, and corporate governance. Journal of corporation law, 37, 265. Darrat, A. F., Gray, S., Park, J. C., & Wu, Y. (2016). Corporate governance and bankruptcy risk. Journal of Accounting, Auditing & Finance, 31(2), 163-202. Davis, K. (1973). The case for and against business assumption of social responsibilities. Academy of Management journal, 16(2), 312-322. Dayanti, K. A. T., Yoga, I. G. A. P., & Rini, G. A. I. S. (2021). The Effect Of Accrual Reliability, Debt Level And Cash Flow Volatility On Earnings Persistence. International Journal of Environmental, Sustainability, and Social Science, 2(1), 7-10. DeAngelo, H., & DeAngelo, L. (1990). Dividend policy and financial distress: An empirical investigation of troubled NYSE firms. The Journal of Finance, 45(5), 1415-1431. DeAngelo, H., DeAngelo, L., & Skinner, D. J. (1994). Accounting choice in troubled companies. Journal of Accounting and Economics, 17(1), DeAngelo, L. (1988). Discussion of evidence of earnings management from the provision for bad debts. Journal of Accounting Research, 26, 32-40. Dechow, P., Ge, W., & Schrand, C. (2010). Understanding earnings quality: A review of the proxies, their determinants and their consequences. Journal of Accounting and Economics, 50(2), 344-401. Dechow, P. M. (1994). Accounting earnings and cash flows as measures of firm performance: The

424
role of accounting accruals. Journal of accounting and economics, 18(1), 3-42. Dechow, P. M., & Dichev, I. D. (2002). The quality of accruals and earnings: The role of accrual estimation errors. The accounting review, 77(s-1), 35-59. Dechow, P. M., & Schrand, C. M. (2004). Earnings quality. Research Foundation of CFA Institute Charlottesville, VA. Dechow, P. M., & Skinner, D. J. (2000). Earnings management: Reconciling the views of accounting academics, practitioners, and regulators. Accounting horizons, 14(2), 235-250. Dechow, P. M., Sloan, R. G., & Sweeney, A. P. (1995). Detecting earnings management. The Accounting review, 70(2), 193-225. Deegan, C. (2002). Introduction: The legitimising effect of social and environmental disclosures–a theoretical foundation. Accounting, Auditing & Accountability Journal, 15(3), 282-311. Deephouse, D. L., Newburry, W., & Soleimani, A. (2016). The effects of institutional development and national culture on cross-national differences in corporate reputation. Journal of World Business, 51(3), 463-473. DeFond, M., Hung, M., & Trezevant, R. (2007). Investor protection and the information content of annual earnings announcements: International evidence. Journal of Accounting and Economics, 43(1), 37-67. DeFond, M. L. (2010). Earnings quality research: Advances, challenges and future research. Journal of Accounting and Economics, 50(2), 402-409. DeFond, M. L., & Jiambalvo, J. (1994). Debt covenant violation and manipulation of accruals. Journal of accounting and economics, 17(1-2), 145-176. DeFond, M. L., & Park, C. W. (2001). The reversal of abnormal accruals and the market valuation of earnings surprises. The accounting review, 76(3), 375-404. Degeorge, F., Patel, J., & Zeckhauser, R. (1999). Earnings management to exceed thresholds. The Journal of Business, 72(1), 1-33. Deloitte. (2021). Global perspectives on blockchain adoption by industry: The future is now. https://www2.deloitte.com/us/en/pages/consulting/articles/blockchain-adoption-by-industry.html Demerjian, P., Lev, B., & McVay, S. (2012). Quantifying managerial ability: A new measure and validity tests. Management science, 58(7), 1229-1248. Demerjian, P. R., Lev, B., Lewis, M. F., & McVay, S. E. (2013). Managerial ability and earnings quality. The Accounting Review, 88(2), 463-498. Desender, K. A., Castro, C. E., & De León, S. A. E. (2011). Earnings management and cultural values. American Journal of Economics and Sociology, 70(3), 639-670.

425
Dichev, I. D., Graham, J. R., Harvey, C. R., & Rajgopal, S. (2013). Earnings quality: Evidence from the field. Journal of Accounting and Economics, 56(2), 1-33. Dichev, I. D., & Skinner, D. J. (2002). Large–sample evidence on the debt covenant hypothesis. Journal of accounting research, 40(4), 1091-1123. Djankov, S., La Porta, R., Lopez-de-Silanes, F., & Shleifer, A. (2008). The law and economics of self-dealing. Journal of financial economics, 88(3), 430-465. Doh, J., Husted, B. W., & Marano, V. (2018). Corporate social responsibility in emerging markets The Oxford Handbook of Corporate Social Responsibility (pp. Doh, J. P., Rodriguez, P., Uhlenbruck, K., Collins, J., & Eden, L. (2003). Coping with corruption in foreign markets. Academy of Management Perspectives, 17(3), 114-127. Doupnik, T. S. (2008). Influence of culture on earnings management: A note. Abacus, 44(3), 317-340. Drempetic, S., Klein, C., & Zwergel, B. (2019). The influence of firm size on the ESG score: Corporate sustainability ratings under review. Journal of Business Ethics, 167(2), 333-360. Dreyer, B., & Grønhaug, K. (2004). Uncertainty, flexibility, and sustained competitive advantage. Journal of business research, 57(5), 484-494. Drucker, P. F. (1986). The changed world economy. Foreign Affairs, 64(4), 768. https://doi.org/10.2307/20042687 Duttagupta, R., & Pazarbasioglu, C. (2021). Miles to go: Emerging markets must balance overcoming the pandemic, returning to more normal policies, and rebuilding their economies. https://www.imf.org/external/pubs/ft/fandd/2021/06/the-future-of-emerging-markets-duttagupta-and-pazarbasioglu.htm Dutton, J. E., & Dukerich, J. M. (1991). Keeping an eye on the mirror: Image and identity in organizational adaptation. Academy of management journal, 34(3), 517-554. Dyck, A., & Zingales, L. (2004). Private benefits of control: An international comparison. The Journal of Finance, 59(2), 537-600. Eccles, R. G., Serafeim, G., & Krzus, M. P. (2011). Market interest in nonfinancial information. Journal of Applied Corporate Finance, 23(4), 113-127. Ednvinsson, L., & Malone, M. (1997). Intellectual Capital: Realizing Your Company's True Value by Finding its Hidden Brainpower. Judy Piatkus (Publishers) Ltd, London. Eisenhardt, K. M., & Martin, J. A. (2000). Dynamic capabilities: what are they? Strategic management journal, 21(10‐11), 1105-1121. Eisfeldt, A. L., & Papanikolaou, D. (2013). Organization capital and the cross‐section of expected

426
returns. The Journal of Finance, 68(4), 1365-1406. Elkington, J. (1997). Cannibals with forks: the triple bottom line of twenty-first century business. Capstone. Oxford. Epstein, M. J., & Roy, M. J. (2001). Sustainability in action: Identifying and measuring the key performance drivers. Long range planning, 34(5), 585-604. https://doi.org/10.1016/S0024-6301(01)00084-X Ernst & Young (2016). Corporate misconduct — individual consequences: Global enforcement focuses the spotlight on executive integrity. 14th Global Fraud Survey, 1-48. https://www.comunicarseweb.com/sites/default/files/ey-corporate-misconduct-individual-consequences.pdf Errath, B., Brew, P., Moberg, J., & Brooks, J. (2005). Business Against Corruption–A Framework for Action. United Nations Global Compact/Prince of Wales International Business Leaders Forum/Transparency International, 1-22. https://d306pr3pise04h.cloudfront.net/docs/news_events%2F8.1%2Fbac_fin.pdf Ewert, R., & Wagenhofer, A. (2011). Earnings quality metrics and what they measure. SSRN Electronic Journal, https://doi.org/10.2139/ssrn.1697042 Faisal, F., Prasetya, A. R., Chariri, A., & Haryanto, H. (2018). The relationship between corporate social responsibility disclosure and earnings management: is it a complement mechanism or a substitute mechanism? International Journal of Business Governance and Ethics, 13(1), 1-14. Falato, A., Kadyrzhanova, D., & Sim, J. (2013). Rising Intangible Capital, Shrinking Debt Capacity, and the US Corporate Savings Glut. SSRN Electronic Journal, 1-55. https://doi.org/10.2139/ssrn.2350863 Fatma, M., & Rahman, Z. (2015). Consumer perspective on CSR literature review and future research agenda. Management Research Review, 38(2), 195-216. Finch, D., Deephouse, D., & Varella, P. (2015). Examining an individual’s legitimacy judgment using the value–attitude system: The role of environmental and economic values and source credibility. Journal of Business Ethics, 127(2), 265-281. Fodio, M. I., Abu-Abdissamad, A. M., & Oba, V. C. (2013). Corporate social responsibility and firm value in quoted Nigerian financial services. International journal of finance and accounting, 2(7), 331-340. Fombrun, C. J., Gardberg, N. A., & Barnett, M. L. (2000). Opportunity platforms and safety nets: Corporate citizenship and reputational risk. Business and society review, 105(1), 85-106. Fonseca, A. R., & Gonzalez, F. (2008). Cross-country determinants of bank income smoothing by managing loan-loss provisions. Journal of Banking & Finance, 32(2), 217-228. Forbes (2008, January 29). Define Emerging Markets Now. https://www.forbes.com/2008/01/28/kvint-developing-countries-oped-

427
cx_kv_0129kvint.html?sh=3c4bc51d555b Francis, J., Huang, A. H., Rajgopal, S., & Zang, A. Y. (2008). CEO reputation and earnings quality. Contemporary Accounting Research, 25(1), 109-147. Francis, J., LaFond, R., Olsson, P., & Schipper, K. (2005). The market pricing of accruals quality. Journal of accounting and economics, 39(2), 295-327. Francis, J., LaFond, R., Olsson, P. M., & Schipper, K. (2004). Costs of equity and earnings attributes. The accounting review, 79(4), 967-1010. Francis, J. R., & Wang, D. (2008). The joint effect of investor protection and Big 4 audits on earnings quality around the world. Contemporary accounting research, 25(1), 157-191. Frankel, R. M., Johnson, M. F., & Nelson, K. K. (2002). The relation between auditors' fees for nonaudit services and earnings management. The accounting review, 77(s-1), 71-105. Freeman, R. E. (1984). Strategic management: a stakeholder approach. Harpercollins College Div. Friedman, E., Johnson, S., Kaufmann, D., & Zoido-Lobaton, P. (2000). Dodging the grabbing hand: the determinants of unofficial activity in 69 countries. Journal of public economics, 76(3), 459-493. Fung, S. Y., Su, L. N., & Gul, R. J. (2013). Investor legal protection and earnings management: A study of Chinese H-shares and Hong Kong shares. Journal of Accounting and Public Policy, 32(5), 392-409. Furnari, C. (2020, March 25). With Sanitizer In Short Supply, Alcohol Producers Pivot To Battle Coronavirus Pandemic. https://www.forbes.com/sites/chrisfurnari/2020/03/25/with-sanitizer-in-short-supply-alcohol-producers-pivot-to-battle-coronavirus-pandemic/?sh=2ec4c1c271f2 Galang, R. M. N. (2012). Victim or victimizer: Firm responses to government corruption. Journal of management Studies, 49(2), 429-462. Gallardo-Vázquez, D., Valdez-Juárez, L. E., & Lizcano-Álvarez, J. L. (2019). Corporate Social Responsibility and Intellectual Capital: Sources of competitiveness and legitimacy in organizations’ management practices. Sustainability, 11(20), 5843. Gao, L., & Zhang, J. H. (2015). Firms’ earnings smoothing, corporate social responsibility, and valuation. Journal of Corporate Finance, 32, 108-127. García‐Ayuso, M. (2003). Intangibles: Lessons from the past and a look into the future. Journal of intellectual capital, 4(4), 497-604. https://doi.org/10.1108/14691930310504590 García‐Meca, E., & Sánchez‐Ballesta, J. P. (2009). Corporate governance and earnings management: A meta‐analysis. Corporate governance: an international review, 17(5), 594-610. García‐Sánchez, I. M., Hussain, N., Khan, S. A., & Martínez‐Ferrero, J. (2020). Managerial entrenchment, corporate social responsibility, and earnings management. Corporate Social

428
Responsibility and Environmental Management, 27(4), 1818-1833. Gargouri, R. M., Shabou, R., & Francoeur, C. (2010). The relationship between corporate social performance and earnings management. Canadian Journal of Administrative Sciences/Revue Canadienne Des Sciences De l'Administration, 27(4), 320-334. Gavin, M. (2019). 5 examples of Corporate Social Responsibility that were successful. https://online.hbs.edu/blog/post/corporate-social-responsibility-examples Geng, R., Bose, I., & Chen, X. (2015). Prediction of financial distress: An empirical study of listed Chinese companies using data mining. European Journal of Operational Research, 241(1), 236-247. Gerged, A. M., Al-Haddad, L. M., & Al-Hajri, M. O. (2020). Is earnings management associated with corporate environmental disclosure? Accounting Research Journal, 33(1), 167-185. Gerged, A. M., Albitar, K., & Al‐Haddad, L. (2021). Corporate environmental disclosure and earnings management—The moderating role of corporate governance structures. International Journal of Finance & Economics, 1-22. https://doi.org/10.1002/ijfe.2564 Gilson, S. C. (1989). Management turnover and financial distress. Journal of financial Economics, 25(2), 241-262. Giroux, G. A., & Wiggins, C. E. (1984). An events approach to corporate bankruptcy. Journal of Bank Research, 15(3), 179-187. Godfrey, P. C. (2005). The relationship between corporate philanthropy and shareholder wealth: A risk management perspective. Academy of management review, 30(4), 777-798. Goel, P. (2010). Triple Bottom Line Reporting: An Analytical Approach for Corporate Sustainability. Journal of Finance, Accounting & Management, 1(1), 27-42. Gong, Y., & Ho, K. C. (2018). Corporate social responsibility and managerial short-termism. Asia-Pacific Journal of Accounting & Economics, 28(5), 604-630. https://doi.org/10.1080/16081625.2018.1540941 Gonzalez, A., & André, P. (2014). Board effectiveness and short termism. Journal of Business Finance & Accounting, 41(1-2), 185-209. Goodman, L. A. (1960). On the exact variance of products. Journal of the American statistical association, 55(292), 708-713. Gopalan, R., & Jayaraman, S. (2012). Private control benefits and earnings management: evidence from insider controlled firms. Journal of Accounting Research, 50(1), 117-157. Graham, J. R., Harvey, C. R., & Rajgopal, S. (2005). The economic implications of corporate financial reporting. Journal of accounting and economics, 40(1), 3-73. Granovetter, M. (1985). Economic action and social structure: The problem of embeddedness.

429
American journal of sociology, 91(3), 481-510. Granovetter, M. (2007). The social construction of corruption. On capitalism, 15, Gras-Gil, E., Manzano, M. P., & Fernández, J. H. (2016). Investigating the relationship between corporate social responsibility and earnings management: Evidence from Spain. BRQ Business Research Quarterly, 19(4), 289-299. Gray, S. J. (1988). Towards a theory of cultural influence on the development of accounting systems internationally. Abacus, 24(1), 1-15. Gray, S. J., Kang, T., Lin, Z., & Tang, Q. (2015). Earnings management in Europe post IFRS: do cultural influences persist? Management International Review, 55(6), 827-856. Grougiou, V., Leventis, S., Dedoulis, E., & Owusu-Ansah, S. (2014). Corporate social responsibility and earnings management in US banks. Accounting Forum, 38(3), 155-169. Gu, Y., Zhou, Q., & Ho, K.-C. (2020). Financial Flexibility and Managerial Short-Termism. Annals of Economics and Finance, 21(1), 189-208. Guan, L., & Pourjalali, H. (2010). Effect of cultural environmental and accounting regulation on earnings management: a multiple year-country analysis. Asia-pacific journal of accounting & economics, 17(2), 99-127. Guan, L., Pourjalali, H., Sengupta, P., & Teruya, J. (2005). Effect of Cultural Environment on Earnings Manipulation: A Five Asia‐Pacific Country Analysis. Multinational Business Review, 13(2), 23-41. 13(2), 23-41. doi:10.1108/1525383X200500007 Guay, W. R., Kothari, S., & Watts, R. L. (1996). A market-based evaluation of discretionary accrual models. Journal of accounting research, 34, 83-105. Guenster, N., Bauer, R., Derwall, J., & Koedijk, K. (2011). The economic value of corporate eco‐efficiency. European Financial Management, 17(4), 679-704. Guidry, F., Leone, A. J., & Rock, S. (1999). Earnings-based bonus plans and earnings management by business-unit managers. Journal of accounting and economics, 26(1), 113-142. Guillamón-Saorín, E., Guiral, A., & Blanco, B. (2018). Managing risk with socially responsible actions in firms involved in controversial activities and earnings management. Spanish Journal of Finance and Accounting/Revista Española de Financiación y Contabilidad, 47(1), 1-24. Gujarati, D. N. (2009). Basic econometrics. Tata McGraw-Hill Education. Gul, F. A., Khedmati, M., Lim, E. K., & Navissi, F. (2018). Managerial ability, financial distress, and audit fees. Accounting Horizons, 32(1), 29-51. Gunny, K. A. (2010). The relation between earnings management using real activities manipulation and future performance: Evidence from meeting earnings benchmarks. Contemporary Accounting Research, 27(3), 855-888.

430
Guthrie, J., & Petty, R. (2000). Intellectual capital: Australian annual reporting practices. Journal of intellectual capital, 1(3), 241-251. Guthrie, J., Ricceri, F., & Dumay, J. (2012). Reflections and projections: a decade of intellectual capital accounting research. The british accounting review, 44(2), 68-82. Habbash, M., & Haddad, L. (2020). The impact of corporate social responsibility on earnings management practices: evidence from Saudi Arabia. Social Responsibility Journal, 16(8), 1073-1085. https://doi.org/10.1108/srj-09-2018-0232 Habib, A., Costa, M. D., Huang, H. J., Bhuiyan, M. B. U., & Sun, L. (2020a). Determinants and consequences of financial distress: review of the empirical literature. Accounting & Finance, 60, 1023-1075. Habib, A., Hasan, M. M., & Sun, X. S. (2020b). Organization capital and audit fees around the world. International Journal of Auditing, 24(3), 321-346. Habib, A., Uddin Bhuiyan, B., & Islam, A. (2013). Financial distress, earnings management and market pricing of accruals during the global financial crisis. Managerial Finance, 39(2), 155-180. Han, J. C., & Wang, S.-w. (1998). Political costs and earnings management of oil companies during the 1990 Persian Gulf crisis. Accounting review, 103-117. Han, S., Kang, T., Salter, S., & Yoo, Y. K. (2010). A cross-country study on the effects of national culture on earnings management. Journal of International Business Studies, 41(1), 123-141. Hao, Q., & Li, K. (2016). The Bright Side of Discretionary Accruals: Evidence from Finance and Innovation. European Financial Management, 22(4), 540-575. Harjoto, M. A., & Jo, H. (2015). Legal vs. normative CSR: Differential impact on analyst dispersion, stock return volatility, cost of capital, and firm value. Journal of Business Ethics, 128(1), 1-20. Harris, J., & Bromiley, P. (2007). Incentives to cheat: The influence of executive compensation and firm performance on financial misrepresentation. Organization Science, 18(3), 350-367. Hasan, M. M., & Cheung, A. (2018). Organization capital and firm life cycle. Journal of Corporate Finance, 48, 556-578. Haw, I. M., Ho, S. S., & Li, A. Y. (2011). Corporate governance and earnings management by classification shifting. Contemporary Accounting Research, 28(2), 517-553. Haw, I. M., Hu, B., Hwang, L. S., & Wu, W. (2004). Ultimate ownership, income management, and legal and extra‐legal institutions. Journal of accounting research, 42(2), 423-462. Hawn, O., & Ioannou, I. (2016). Mind the gap: The interplay between external and internal actions in the case of corporate social responsibility. Strategic Management Journal, 37(13), 2569-2588.

431
Hayes, A. F. (2013). Mediation, moderation, and conditional process analysis. Introduction to Mediation, Moderation, and Conditional Process Analysis: A Regression-Based Approach. New York: Guilford Publications. Hayes, R. H., & Abernathy, W. J. (1980). Managing our way to economic decline. Harvard Business Review, 58(4), Healy, P. M., & Palepu, K. G. (1990). Earnings and risk changes surrounding primary stock offers. Journal of Accounting Research, 28(1), 25-48. Healy, P. M., & Palepu, K. G. (2001). Information asymmetry, corporate disclosure, and the capital markets: A review of the empirical disclosure literature. Journal of accounting and economics, 31(1-3), 405-440. Healy, P. M., & Palepu, K. G. (2003). The fall of Enron. The Journal of Economic Perspectives, 17(2), 3-26. Healy, P. M., & Wahlen, J. M. (1999). A review of the earnings management literature and its implications for standard setting. Accounting horizons, 13(4), 365-383. Helmke, G., & Levitsky, S. (2004). Informal institutions and comparative politics: A research agenda. Perspectives on politics, 2(4), 725-740. Heltzer, W. (2011). The asymmetric relationship between corporate environmental responsibility and earnings management: Evidence from the United States. Managerial Auditing Journal, 26(1), 65-88. Hemingway, C. A., & Maclagan, P. W. (2004). Managers' personal values as drivers of corporate social responsibility. Journal of business ethics, 50(1), 33-44. Henderson, S., Peirson, G., & Herbohn, K. (2011). Issues in Financial Accounting (14 ed.). Pearson Australia. Herly, M., Bartholdy, J., & Thinggaard, F. (2020). A re‐examination of accruals quality following restatements. Journal of Business Finance & Accounting, 882 - 909. Hickman, L. E., Iyer, S. R., & Jadiyappa, N. (2021). The effect of voluntary and mandatory corporate social responsibility on earnings management: Evidence from India and the 2% rule. Emerging Markets Review, 46(100750), 1-18. Ho, F. N., Wang, H. M. D., & Vitell, S. J. (2012). A global analysis of corporate social performance: The effects of cultural and geographic environments. Journal of business ethics, 107(4), 423-433. Ho, P.-H., Huang, C.-W., Lin, C.-Y., & Yen, J.-F. (2016). CEO overconfidence and financial crisis: Evidence from bank lending and leverage. Journal of Financial Economics, 120(1), 194-209. Hoffman, W. M., Frederick, R. E., & Schwartz, M. S. (2014). Business ethics: Readings and cases in corporate morality. John Wiley & Sons.

432
Hofstede, G. (1980). Culture’s consequences: International differences in work-related values. London: Sage. Hofstede, G. (1984). Culture's consequences: International differences in work-related values (5th ed.). Sage. Hofstede, G., & Hofstede, G. (2005). Culture and Organizations: Software of the Mind. Hofstede Insights. (2021). Compare Countries. https://www.hofstede-insights.com/product/compare-countries/ Hong, Y., & Andersen, M. L. (2011). The relationship between corporate social responsibility and earnings management: An exploratory study. Journal of Business Ethics, 104(4), 461-471. Hopwood, W., McKeown, J. C., & Mutchler, J. F. (1994). A reexamination of auditor versus model accuracy within the context of the going‐concern opinion decision. Contemporary Accounting Research, 10(2), 409-431. Hormiga, E., Batista-Canino, R. M., & Sánchez-Medina, A. (2011). The role of intellectual capital in the success of new ventures. International Entrepreneurship and Management Journal, 7(1), 71-92. Hoshi, T., Kashyap, A., & Scharfstein, D. (1990). The role of banks in reducing the costs of financial distress in Japan. Journal of financial economics, 27(1), 67-88. Hou, Q., Jin, Q., Yang, R., Yuan, H., & Zhang, G. (2015). Performance commitments of controlling shareholders and earnings management. Contemporary Accounting Research, 32(3), 1099-1127. Houqe, M. N., & Monem, R. M. (2016). IFRS adoption, extent of disclosure, and perceived corruption: a cross-country study. The International Journal of Accounting, 51(3), 363-378. Houqe, M. N., van Zijl, T., Dunstan, K., & Karim, A. W. (2012). The effect of IFRS adoption and investor protection on earnings quality around the world. The International journal of accounting, 47(3), 333-355. House, R. J., Hanges, P. J., Javidan, M., Dorfman, P. W., & Gupta, V. (2004). Culture, leadership, and organizations: The GLOBE study of 62 societies. Sage publications. Huang, J.-W., & Li, Y.-H. (2012). Slack resources in team learning and project performance. Journal of Business Research, 65(3), 381-388. Hubbard, G. (2009). Measuring organizational performance: beyond the triple bottom line. Business strategy and the environment, 18(3), 177-191. Hur, W.-M., Kim, H., & Woo, J. (2014). How CSR leads to corporate brand equity: Mediating mechanisms of corporate brand credibility and reputation. Journal of Business Ethics, 125(1), 75-86.

433
Hussain, N., Rigoni, U., & Orij, R. P. (2016). Corporate governance and sustainability performance: Analysis of triple bottom line performance. Journal of Business Ethics, 1-22. Hussain, N., Rigoni, U., & Orij, R. P. (2018). Corporate governance and sustainability performance: Analysis of triple bottom line performance. Journal of Business Ethics, 149(2), 411-432. Hwang (1994, March 22). Borden to reverse, reclassify 40% of 1992 charge. Wall Street journal, pp. Ibrahim, S., Xu, L., & Rogers, G. (2011). Real and accrual‐based earnings management and its legal consequences: Evidence from seasoned equity offerings. Accounting Research Journal, Idrees, S., & Qayyum, A. (2018). The impact of financial distress risk on equity returns: A case study of non-financial firms of Pakistan Stock Exchange. Journal of Economics Bibliography, 5(2), 49-59. Ikpesu, F., & Eboiyehi, O. C. (2018). Capital structure and corporate financial distress of manufacturing firms in Nigeria. Journal of Accounting and Taxation, 10(7), 78-84. Ikpesu, F., Vincent, O., & Dakare, O. (2020). Financial Distress Overview, Determinants, and Sustainable Remedial Measures: Financial Distress Corporate Governance Models and Applications in Developing Economies (pp. 102-113). IGI Global. Ines, A. (2017). The effect of discretionary accruals on financial statement fraud: The case of the French Companies. International Research Journal of Finance and Economics, 161, 48-62. International Accounting Standards Board [IASB] (2018). International Financial Reporting Standards - Conceptual Framework for Financial Reporting. International Finance Corporation. (2021). Establishing ‘Emerging Markets’. Ioannou, I., & Serafeim, G. (2012). What drives corporate social performance? The role of nation-level institutions. Journal of International Business Studies, 43(9), 834-864. Jacobsen, K., Hofman-Bang, P., & Nordby Jr, R. (2005). The IC rating™ model by intellectual capital Sweden. Journal of Intellectual Capital, 6(4), 570-587. Jacoby, G., Li, J., & Liu, M. (2019). Financial distress, political affiliation and earnings management: the case of politically affiliated private firms. The European Journal of Finance, 25(6), 508-523. Jaggi, B., & Lee, P. (2002). Earnings management response to debt covenant violations and debt restructuring. Journal of Accounting, Auditing & Finance, 17(4), 295-324. Jain, P., Vyas, V., & Roy, A. (2017). Exploring the mediating role of intellectual capital and competitive advantage on the relation between CSR and financial performance in SMEs. Social Responsibility Journal, 13(1), 1-23. Jamali, D., & Mirshak, R. (2007). Corporate social responsibility (CSR): Theory and practice in a

434
developing country context. Journal of business ethics, 72(3), 243-262. James, L. R., & Brett, J. M. (1984). Mediators, moderators, and tests for mediation. Journal of applied psychology, 69(2), 307. Jeanjean, T., & Stolowy, H. (2008). Do accounting standards matter? An exploratory analysis of earnings management before and after IFRS adoption. Journal of accounting and public policy, 27(6), 480-494. Jennings, R. (1990). A Note on Interpreting" Incremental Information Content". Accounting Review, 925-932. Jensen, M. (2001). Value maximisation, stakeholder theory, and the corporate objective function. European financial management, 7(3), 297-317. Jensen, M. C., & Meckling, W. H. (1976). Theory of the firm: Managerial behavior, agency costs and ownership structure. Journal of financial economics, 3(4), 305-360. Jiraporn, P., Miller, G. A., Yoon, S. S., & Kim, Y. S. (2008). Is earnings management opportunistic or beneficial? An agency theory perspective. International Review of Financial Analysis, 17(3), 622-634. Jones, J. J. (1991a). Earnings management during import relief investigations. Journal of accounting research, 29(2), 193-228. Jones, M. T. (1999). The institutional determinants of social responsibility. Journal of Business Ethics, 20(2), 163-179. Jones, T. M. (1991b). Ethical decision making by individuals in organizations: An issue-contingent model. Academy of management review, 16(2), 366-395. Jones, T. M. (1995). Instrumental Stakeholder Theory: A Synthesis of Ethics and Economics. Academy of Management Review, 20(2), 404-437. Jordaan, L. A., De Klerk, M., & de Villiers, C. J. (2018). Corporate social responsibility and earnings management of South African companies. South African Journal of Economic and Management Sciences, 21(1), 1-13. Jouber, H. (2020). Corporate social responsibility and earnings quality: do institutional features matter? Journal of Global Responsibility, 11(1), 54 - 92. Judge, W. Q., Douglas, T. J., & Kutan, A. M. (2008). Institutional antecedents of corporate governance legitimacy. Journal of Management, 34(4), 765-785. Kanagaretnam, K., Lim, C. Y., & Lobo, G. J. (2011). Effects of national culture on earnings quality of banks. Journal of International Business Studies, 42(6), 853-874. Kanagaretnam, K., Lim, C. Y., & Lobo, G. J. (2014). Effects of international institutional factors on earnings quality of banks. Journal of Banking & Finance, 39, 87-106.

435
Kasznik, R. (1999). On the association between voluntary disclosure and earnings management. Journal of accounting research, 37(1), 57-81. Kaufmann, D., Kraay, A., & Zoido, P. (1999). Governance matters. Available at SSRN 188568, Kaymak, T., & Bektas, E. (2015). Corruption in emerging markets: a multidimensional study. Social Indicators Research, 124(3), 785-805. Kedia, S., & Philippon, T. (2009). The economics of fraudulent accounting. The Review of Financial Studies, 22(6), 2169-2199. Khanna, V., Kim, E. H., & Lu, Y. (2015). CEO connectedness and corporate fraud. The Journal of Finance, 70(3), 1203-1252. Kim, S. H., Udawatte, P., & Yin, J. (2019). The Effects of Corporate Social Responsibility on Real and Accrual‐based Earnings Management: Evidence from China. Australian Accounting Review, 29(3), 580-594. Kim, Y., Park, M. S., & Wier, B. (2012). Is earnings quality associated with corporate social responsibility? The Accounting Review, 87(3), 761-796. Klein, A. (2002). Audit committee, board of director characteristics, and earnings management. Journal of accounting and economics, 33(3), 375-400. Koh, P.-S. (2003). On the association between institutional ownership and aggressive corporate earnings management in Australia. The British Accounting Review, 35(2), 105-128. Kolsi, M. C., & Attayah, O. F. (2018). Are socially responsible firms less engaged in earnings management? Evidence from ADX listed companies. International Journal of Business Innovation and Research, 17(4), 536-560. Kormendi, R., & Lipe, R. (1987). Earnings innovations, earnings persistence, and stock returns. Journal of business, 323-345. Kothari, S. P., Leone, A. J., & Wasley, C. E. (2005). Performance matched discretionary accrual measures. Journal of accounting and economics, 39(1), 163-197. KPMG International. (2020). The time has come: The KPMG Survey of Sustainability Reporting 2020. https://assets.kpmg/content/dam/kpmg/xx/pdf/2020/11/the-time-has-come.pdf Kristanti, F. T., Rahayu, S., & Huda, A. N. (2016). The determinant of financial distress on Indonesian family firm. Procedia-Social and Behavioral Sciences, 219, 440-447. Kumala, R., & Siregar, S. V. (2020). Corporate social responsibility, family ownership and earnings management: the case of Indonesia. Social Responsibility Journal, 17(1), 10.1108/srj-09-2016-0156 Kwak, B., & Mo, K. (2018). Executive pension, default risk, and earnings management. Asia-Pacific

436
Journal of Accounting & Economics, 25(3-4), 463-480. Kyaw, K., Olugbode, M., & Petracci, B. (2017). The Role of the Institutional Framework in the Relationship between Earnings Management and Corporate Social Performance. Corporate Social Responsibility and Environmental Management, 6, 543-554. La Porta, R., Lopez-de-Silanes, F., Shleifer, A., & Vishny, R. (2000). Investor protection and corporate governance. Journal of financial economics, 58(1-2), 3-27. La Porta, R., Lopez-de-Silanes, F., Shleifer, A., & Vishny, R. W. (1998). Law and finance. Journal of political economy, 106(6), 1113-1155. La Porta, R., Lopez‐de‐Silanes, F., & Shleifer, A. (1999). Corporate ownership around the world. The journal of finance, 54(2), 471-517. La Porta, R., Lopez‐de‐Silanes, F., Shleifer, A., & Vishny, R. W. (1997). Legal determinants of external finance. The journal of finance, 52(3), 1131-1150. Lancaster, T. (2000). The incidental parameter problem since 1948. Journal of econometrics, 95(2), 391-413. Laux, C., & Leuz, C. (2009). The crisis of fair-value accounting: Making sense of the recent debate. Accounting, organizations and society, 34(6), 826-834. Lee, T. S., & Yeh, Y. H. (2004). Corporate governance and financial distress: Evidence from Taiwan, Wiley Online Library. Lehmann, N. (2016). The role of corporate governance in shaping accruals manipulation prior to acquisitions. Accounting and Business Research, 46(4), 327-364. Leung, P., Coram, P., Cooper, B. J., & Richardson, P. (2019). Audit and assurance. John Wiley & Sons. Leuz, C., Nanda, D., & Wysocki, P. D. (2003). Earnings management and investor protection: an international comparison. Journal of financial economics, 69(3), 505-527. Lev, B. (2004). Sharpening the intangibles edge. Harvard business review, 6, 109-116. https://picture.iczhiku.com/resource/paper/whKfLqdqyLIUTcMx.pdf Lev, B., Canibano, L., & Marr, B. (2005). An accounting perspective on intellectual capital. Perspectives on intellectual capital, 42-55. Lev, B., & Radhakrishnan, S. (2005). The valuation of organization capital. Measuring capital in the new economy (pp. 73-110). University of Chicago Press. Lev, B., Radhakrishnan, S., & Zhang, W. (2009). Organization capital. Abacus, 45(3), 275-298. Lev, B., & Zarowin, P. (1999). The boundaries of financial reporting and how to extend them. Journal of Accounting research, 37(2), 353-385.

437
Leverty, J. T., & Grace, M. F. (2012). Dupes or incompetents? An examination of management's impact on firm distress. Journal of Risk and Insurance, 79(3), 751-783. Levitt Jr, A. (1998). The numbers game. The CPA Journal, 68(12), 14-19. Lewbel, A. (2012). Using heteroscedasticity to identify and estimate mismeasured and endogenous regressor models. Journal of Business & Economic Statistics, 30(1), 67-80. Lewellyn, K. B., & Bao, S. R. (2017). The role of national culture and corruption on managing earnings around the world. Journal of World Business, 52(6), 798-808. Li, A., & Xia, X. (2018). Are controlling shareholders influencing the relationship between CSR and earnings quality? Evidence from Chinese listed companies. Emerging Markets Finance and Trade, 54(5), 1047-1062. Li, S., Park, S. H., & Bao, R. S. (2014). How much can we trust the financial report? Earnings management in emerging economies. International Journal of Emerging Markets, 9(1), 33-57. DOI 10.1108/IJoEM-09-2013-0144 Li, S., Selover, D. D., & Stein, M. (2011). “Keep silent and make money”: Institutional patterns of earnings management in China. Journal of Asian Economics, 22(5), 369-382. Li, Y., Li, X., Xiang, E., & Djajadikerta, H. G. (2020). Financial Distress, Internal Control, and Earnings Management: Evidence from China. Journal of Contemporary Accounting & Economics, 100210. Lin, F., Lin, S. W., & Fang, W. C. (2020). How CEO narcissism affects earnings management behaviors. The North American Journal of Economics and Finance, 51, 101080. Lin, F., & Wu, S. F. (2014). Comparison of cosmetic earnings management for the developed markets and emerging markets: Some empirical evidence from the United States and Taiwan. Economic modelling, 36, 466-473. Lin, H.-W. W., Lo, H.-C., & Wu, R.-S. (2016a). Modeling default prediction with earnings management. Pacific-Basin Finance Journal, 40, 306-322. Lin, L. W. (2020). Mandatory corporate social responsibility? Legislative innovation and judicial application in China. The American Journal of Comparative Law, 68(3), 576-615. Lin, Z., Liu, M., & Noronha, C. (2016b). The impact of corporate governance on informative earnings management in the Chinese market. Abacus, 52(3), 568-609. Liou, D. K. (2007). Macroeconomic Variables and Financial Distress. Journal of Accounting, Business & Management, 14, 17-31. Litt, B., Sharma, D., & Sharma, V. (2013). Environmental initiatives and earnings management. Managerial Auditing Journal, 29(1), 76-106.

438
Little, T. D., Card, N. A., Bovaird, J. A., Preacher, K. J., & Crandall, C. S. (2007). Structural equation modeling of mediation and moderation with contextual factors. Modeling contextual effects in longitudinal studies, 1, 207-230. Liu, H., & Lee, H. A. (2019). The effect of corporate social responsibility on earnings management and tax avoidance in Chinese listed companies. International Journal of Accounting & Information Management, 27(4), 632-652. 10.1108/ijaim-08-2018-0095 Liu, M., Shi, Y., Wilson, C., & Wu, Z. (2017). Does family involvement explain why corporate social responsibility affects earnings management? Journal of Business Research, 75, 8-16. Liu, X. (2016). Corruption culture and corporate misconduct. Journal of Financial Economics, 122(2), 307-327. Lockett, A., & Thompson, S. (2001). The resource-based view and economics. Journal of management, 27(6), 723-754. Lourenço, I. C., Rathke, A., Santana, V., & Branco, M. C. (2018). Corruption and earnings management in developed and emerging countries. Corporate Governance: The International Journal of Business in Society, 18(1), 35-51. Lyu, C., Yuen, D. C. Y., & Zhang, X. (2016). Individualist-collectivist culture, ownership concentration and earnings quality. Asia-Pacific Journal of Accounting & Economics, 1-20. MacCarthy, J. (2017). Using Altman Z-score and Beneish M-score models to detect financial fraud and corporate failure: A case study of Enron Corporation. International Journal of Finance and Accounting, 6(6), 159-166. MacKinnon, D. P., Lockwood, C. M., & Williams, J. (2004). Confidence limits for the indirect effect: Distribution of the product and resampling methods. Multivariate behavioral research, 39(1), 99-128. Malagueño, R., Albrecht, C., Ainge, C., & Stephens, N. (2010). Accounting and corruption: a cross-country analysis. Journal of Money Laundering Control, 13(4), 372-393. Malik, M. (2015). Value-enhancing capabilities of CSR: A brief review of contemporary literature. Journal of Business Ethics, 127(2), 419-438. Malmendier, U., & Tate, G. (2009). Superstar ceos. The Quarterly Journal of Economics, 124(4), 1593-1638. Mankin, J. A., Jewell, J. J., & Rivas, J. (2017). To improve financial reporting, we need to disclose more relevant information. International Journal of the Academic Business World, 11(2), 93-100. Martínez, P., Pérez, A., & del Bosque, I. R. (2014). CSR influence on hotel brand image and loyalty. Academia Revista Latinoamericana de Administración, 27(2), 267-283. Martínez-Ferrero, J., Banerjee, S., & García-Sánchez, I. M. (2016). Corporate social responsibility as

439
a strategic shield against costs of earnings management practices. Journal of Business Ethics, 133(2), 305-324. Martínez‐Ferrero, J., Gallego‐Álvarez, I., & García‐Sánchez, I. M. (2015). A Bidirectional Analysis of Earnings Management and Corporate Social Responsibility: The Moderating Effect of Stakeholder and Investor Protection. Australian Accounting Review, 25(4), 359-371. Martínez‐Ferrero, J., Garcia‐Sanchez, I. M., & Cuadrado‐Ballesteros, B. (2013). Effect of financial reporting quality on sustainability information disclosure. Corporate Social Responsibility and Environmental Management, 22(1), 45-64. Marwick, A., Hasan, M. M., & Luo, T. (2020). Organization capital and corporate cash holdings. International Review of Financial Analysis, 68, 101458. Massaro, M., Dumay, J., Garlatti, A., & Dal Mas, F. (2018). Practitioners’ views on intellectual capital and sustainability: From a performance-based to a worth-based perspective. Journal of Intellectual Capital, 19(2), 367-386. Matten, D., & Moon, J. (2008). “Implicit” and “explicit” CSR: A conceptual framework for a comparative understanding of corporate social responsibility. Academy of management Review, 33(2), 404-424. Mauro, P. (1995). Corruption and growth. The quarterly journal of economics, 110(3), 681-712. McKeown, J. C., Mutchler, J. F., & Hopwood, W. (1991). Towards an explanation of auditor failure to modify the audit opinions of bankrupt companies. Auditing-a Journal Of Practice & Theory, 10, 1-13. McNichols, M. F. (2002). Discussion of the quality of accruals and earnings: The role of accrual estimation errors. The accounting review, 77(s-1), 61-69. McNichols, M. F., & Stubben, S. R. (2008). Does earnings management affect firms’ investment decisions? The accounting review, 83(6), 1571-1603. McNichols, M. F., & Stubben, S. R. (2018). Research design issues in studies using discretionary accruals. Abacus, 54(2), 227-246. McVay, S. E. (2006). Earnings management using classification shifting: An examination of core earnings and special items. The Accounting Review, 81(3), 501-531. McWilliams, A., & Siegel, D. (2001). Corporate social responsibility: A theory of the firm perspective. Academy of management review, 26(1), 117-127. Mohmed, A., Flynn, A., & Grey, C. (2020). The link between CSR and earnings quality: evidence from Egypt. Journal of Accounting in Emerging Economies, 10(1), 1 - 20. Molina, C. A., & Preve, L. A. (2012). An empirical analysis of the effect of financial distress on trade credit. Financial Management, 41(1), 187-205.

440
Moneva, J. M., Archel, P., & Correa, C. (2006). GRI and the camouflaging of corporate unsustainability. Accounting forum, 30(2), 121-137. MSCI. (2021a). Market Classification. https://www.msci.com/market-classification MSCI. (2021b). MSCI Emerging Markets Index. https://www.msci.com/documents/10199/c0db0a48-01f2-4ba9-ad01-226fd5678111 Muttakin, M. B., Khan, A., & Azim, M. I. (2015). Corporate social responsibility disclosures and earnings quality: Are they a reflection of managers’ opportunistic behavior? Managerial Auditing Journal, 30(3), 277-298. Nabar, S., & Boonlert-U-Thai, K. (2007). Earnings management, investor protection, and national culture. Journal of International Accounting Research, 6(2), 35-54. Nakamura, L. (1999). Intangibles: what put the new in the new economy? Business Review–Federal Reserve Bank of Philadelphia; Philadelphia; Jul/Aug, Citeseer. Narayanan, M. (1985). Managerial incentives for short‐term results. The Journal of Finance, 40(5), 1469-1484. Nazari, J. A., Hrazdil, K., & Mahmoudian, F. (2017). Assessing social and environmental performance through narrative complexity in CSR reports. Journal of Contemporary Accounting & Economics, 13(2), 166-178. Ndofor, H. A., Wesley, C., & Priem, R. L. (2015). Providing CEOs with opportunities to cheat the effects of complexity-based information asymmetries on financial reporting fraud. Journal of Management, 41(6), 1774-1797. Nelson, M. W., Elliott, J. A., & Tarpley, R. L. (2002). Evidence from auditors about managers' and auditors' earnings management decisions. The accounting review, 77(s-1), 175-202. Neyman, J., & Scott, E. L. (1948). Consistent estimates based on partially consistent observations. Econometrica: Journal of the Econometric Society, 16(1), 1-32. 10.2307/1914288 Nguyen, V. H., Agbola, F. W., & Choi, B. (2019). Does corporate social responsibility reduce information asymmetry? Empirical evidence from Australia. Australian Journal of Management, 44(2), 188-211. Nikolaou, I. E. (2017). A framework to explicate the relationship between CSER and financial performance: An intellectual capital-based approach and knowledge-based view of firm. Journal of the Knowledge Economy, 1-20. DOI 10.1007/s13132-017-0491-z Nikolov, A. N. (2018). Managerial short-termism: an integrative perspective. Journal of Marketing Theory and Practice, 26(3), 260-279. Noga, T. J., & Schnader, A. L. (2013). Book-tax differences as an indicator of financial distress. Accounting Horizons, 27(3), 469-489.
441
Noor, N. F. M., Sanusia, Z. M., Heang, L. T., Iskandar, T. M., & Isa, Y. M. (2015). Fraud Motives and Opportunities Factors on Earnings Manipulations. Procedia Economics and Finance, 28, 126-135. North, D. (1990). Institutions, Institutional Change and Economic Performance. Cambridge: Cambridge University Press. Ohlson, J. A. (1980). Financial ratios and the probabilistic prediction of bankruptcy. Journal of accounting research, 109-131. Ohlson, J. A. (1995). Earnings, book values, and dividends in equity valuation. Contemporary accounting research, 11(2), 661-687. Orlitzky, M. (2005). Social responsibility and financial performance: Trade-off or virtuous circle. University of Auckland Business Review, 7(1), 37-43. Pagano, M., & Volpin, P. F. (2005). The political economy of corporate governance. The American Economic Review, 95(4), 1005-1030. Palacios-Manzano, M., Gras-Gil, E., & Santos-Jaen, J. M. (2019). Corporate social responsibility and its effect on earnings management: an empirical research on Spanish firms. Total Quality Management & Business Excellence, 1-17. Parboteeah, K. P., Bronson, J. W., & Cullen, J. B. (2005). Does national culture affect willingness to justify ethically suspect behaviors? A focus on the GLOBE national culture scheme. International Journal of Cross Cultural Management, 5(2), 123-138. Paredes, A. A. P., & Wheatley, C. (2017). The influence of culture on real earnings management. International Journal of Emerging Markets, 12(1), 38-57. DOI 10.1108/IJoEM-12-2014-0218 Parto, S. (2008). Innovation and economic activity: an institutional analysis of the role of clusters in industrializing economies. Journal of economic issues, 42(4), 1005-1030. Patten, D. M., & Trompeter, G. (2003). Corporate responses to political costs: an examination of the relation between environmental disclosure and earnings management. Journal of Accounting and Public Policy, 22(1), 83-94. Pedrini, M. (2007). Human capital convergences in intellectual capital and sustainability reports. Journal of intellectual capital, 8(2), 346-366. Perols, J. L., & Lougee, B. A. (2011). The relation between earnings management and financial statement fraud. Advances in Accounting, 27(1), 39-53. Persakis, A., & Iatridis, G. E. (2016). Audit quality, investor protection and earnings management during the financial crisis of 2008: An international perspective. Journal of International Financial Markets, Institutions and Money, 41, 73-101. Peters, R. H., & Taylor, L. A. (2017). Intangible capital and the investment-q relation. Journal of Financial Economics, 123(2), 251-272.

442
Petty, R., & Guthrie, J. (2000). Intellectual capital literature review: measurement, reporting and management. Journal of intellectual capital, 1(2), 155-176. Pincus, M., & Rajgopal, S. (2002). The interaction between accrual management and hedging: Evidence from oil and gas firms. The Accounting Review, 77(1), 127-160. Pindado, J., & Rodrigues, L. (2005). Determinants of financial distress costs. Financial Markets and Portfolio Management, 19(4), 343-359. Pivato, S., Misani, N., & Tencati, A. (2008). The impact of corporate social responsibility on consumer trust: the case of organic food. Business ethics: A European review, 17(1), 3-12. Porter, M. E., & Kramer, M. R. (2002). The competitive advantage of corporate philanthropy. Harvard business review, 80(12), 56-68. Pratiwi, I. S., & Siregar, S. V. (2019). The effect of corporate social responsibility on tax avoidance and earnings management: the moderating role of political connections. International Journal of Business, 24(3), 229-248. Preacher, K. J., Rucker, D. D., & Hayes, A. F. (2007). Addressing moderated mediation hypotheses: Theory, methods, and prescriptions. Multivariate behavioral research, 42(1), 185-227. Prescott, E. C., & Visscher, M. (1980). Organization capital. Journal of political Economy, 88(3), 446-461. Principles for Responsible Investment (2017, July 4). Shifting Perceptions: ESG, Credit Risk and Ratings (Part 1: The State of Play). https://www.unpri.org/fixed-income/shifting-perceptions-esg-credit-risk-and-ratings-part-1-the-state-of-play/78.article Prior, D., Surroca, J., & Tribó, J. A. (2008). Are socially responsible managers really ethical? Exploring the relationship between earnings management and corporate social responsibility. Corporate Governance: An International Review, 16(3), 160-177. Puffer, S. M., & McCarthy, D. J. (2011). Two decades of Russian business and management research: An institutional theory perspective. Academy of Management Perspectives, 25(2), 21-36. Purnanandam, A. (2008). Financial distress and corporate risk management: Theory and evidence. Journal of Financial Economics, 87(3), 706-739. Quazi, A. M., & O’Brien, D. (2000). An empirical test of a cross-national model of corporate social responsibility. Journal of business ethics, 25(1), 33-51. Rabe-Hesketh, S., & Skrondal, A. (2008). Multilevel and longitudinal modeling using Stata. STATA press. Rahaman, M. M., & Al Zaman, A. (2013). Management quality and the cost of debt: Does management matter to lenders? Journal of Banking & Finance, 37(3), 854-874.

443
Rakshit, D., & Paul, A. (2020). Earnings management and financial distress: An analysis of Indian textile companies. NMIMS Journal of Economics and Public Policy, 5(3), 40-53. Ralston, D. A., Egri, C. P., Karam, C. M., Naoumova, I., Srinivasan, N., Casado, T., Li, Y., & Alas, R. (2015). The triple-bottom-line of corporate responsibility: Assessing the attitudes of present and future business professionals across the BRICs. Asia Pacific Journal of Management, 32(1), 145-179. Raman, K., & Shahrur, H. (2008). Relationship-specific investments and earnings management: Evidence on corporate suppliers and customers. The Accounting Review, 83(4), 1041-1081. Rao, K. K., Tilt, C. A., & Lester, L. H. (2012). Corporate governance and environmental reporting: an Australian study. Corporate Governance: The international journal of business in society, 12(2), 143-163. Ratnawati, V., Abdul-Hamid, M. A., & Popoola, O. M. J. (2016). The Influence of Agency Conflict Types I and II on Earnings Management. International Journal of Economics and Financial Issues, 6(4S), 126-132. Raudenbush, S. W., & Bryk, A. S. (2002). Hierarchical linear models: Applications and data analysis methods. Sage. Reed, W. R. (2015). On the practice of lagging variables to avoid simultaneity. Oxford Bulletin of Economics and Statistics, 77(6), 897-905. Rezaee, Z., Dou, H., & Zhang, H. (2020). Corporate social responsibility and earnings quality: Evidence from China. Global Finance Journal, 45, 100473. Riahi, R., & Omri, A. (2013). Cultural relativism in earnings management. International Journal of Management and Business Research, 3(3), 281-295. Riahi-Belkaoui, A. (2003). The impact of corporate social responsibility on the informativeness of earnings and accounting choices. Advances in environmental accounting & management, 2, 121-136. Riahi-Belkaoui, A. (2004). Effects of corruption on earnings opacity internationally. Advances in international accounting, 17, 73-84. Riahi-Belkaoui, A., & AlNajjar, F. K. (2006). Earnings opacity internationally and elements of social, economic and accounting order. Review of accounting and finance, 5(3), 189-203. Richardson, G., Lanis, R., & Taylor, G. (2015). Financial distress, outside directors and corporate tax aggressiveness spanning the global financial crisis: An empirical analysis. Journal of Banking & Finance, 52, 112-129. Ringov, D., & Zollo, M. (2007). The impact of national culture on corporate social performance. Corporate Governance: The international journal of business in society, 7(4), 476-485.

444
Rodriguez-Ariza, L., Martínez-Ferrero, J., & Bermejo-Sánchez, M. (2016). Consequences of earnings management for corporate reputation: Evidence from family firms. Accounting Research Journal, Rogers, J. L., & Stocken, P. C. (2005). Credibility of management forecasts. The Accounting Review, 80(4), 1233-1260. Roos, G., & Roos, J. (1997). Measuring your company's intellectual performance. Long range planning, 30(3), 413-426. Roslender, R., & Fincham, R. (2001). Thinking critically about intellectual capital accounting. Accounting, Auditing & Accountability Journal, 14(4), 383-399. Rosner, R. L. (2003). Earnings manipulation in failing firms. Contemporary Accounting Research, 20(2), 361-408. Roychowdhury, S. (2006). Earnings management through real activities manipulation. Journal of accounting and economics, 42(3), 335-370. Russo, M. V., & Fouts, P. A. (1997). A resource-based perspective on corporate environmental performance and profitability. Academy of management Journal, 40(3), 534-559. Samson, D., & Daft, R. L. (2009). Fundamentals of Management, 3rd Asia Pacific ed. Savalei, V. (2014). Understanding robust corrections in structural equation modeling. Structural Equation Modeling: A Multidisciplinary Journal, 21(1), 149-160. Schipper, K. (1989). Commentary on earnings management. Accounting horizons, 3(4), 91-102. Schipper, K., & Vincent, L. (2003). Earnings quality. Accounting horizons, 17, 97-110. Scholtens, B., & Kang, F. C. (2013). Corporate social responsibility and earnings management: Evidence from Asian economies. Corporate Social Responsibility and Environmental Management, 20(2), 95-112. Schotter, A., & Weigelt, K. (1992). Asymmetric tournaments, equal opportunity laws, and affirmative action: Some experimental results. The Quarterly Journal of Economics, 107(2), 511-539. Seal, W. (2006). Management accounting and corporate governance: An institutional interpretation of the agency problem. Management Accounting Research, 17(4), 389-408. Seligson, M. A. (2002). The impact of corruption on regime legitimacy: A comparative study of four Latin American countries. The journal of Politics, 64(2), 408-433. Seo, H. J., Kang, S. J., & Baek, Y. J. (2020). Managerial myopia and short-termism of innovation strategy: Financialisation of Korean firms. Cambridge Journal of Economics, 44(6), 1197-1220. https://doi.org/10.1093/cje/beaa023

445
Shaver, J. M. (2005). Testing for mediating variables in management research: Concerns, implications, and alternative strategies. Journal of management, 31(3), 330-353. Shen, C.-H., & Chih, H.-L. (2005). Investor protection, prospect theory, and earnings management: An international comparison of the banking industry. Journal of Banking & Finance, 29(10), 2675-2697. Sherer (2000, July 3). Ameriserve examination finds financial woes. Wallstreet Journal, pp. Shleifer, A. (2004). Does competition destroy ethical behavior? American economic review, 94(2), 414-418. Shleifer, A., & Vishny, R. W. (1997). A survey of corporate governance. The journal of finance, 52(2), 737-783. Shrivastava, P. (1995). Environmental technologies and competitive advantage. Strategic management journal, 16(S1), 183-200. Shrout, P. E., & Bolger, N. (2002). Mediation in experimental and nonexperimental studies: new procedures and recommendations. Psychological methods, 7(4), 422. Shust, E. (2015). Does Research and Development Activity Increase Accrual-Based Earnings Management? Journal of Accounting, Auditing & Finance, 30(3), 373-401. Sial, M. S., Chunmei, Z., & Khuong, N. V. (2019). Do female and independent directors explain the two-way relationship between corporate social responsibility and earnings management of Chinese listed firms? International Journal of Accounting & Information Management, 27(3), 442-460. Silverstein, K. (2013, May 14). Enron, Ethics And Today's Corporate Values. https://www.forbes.com/sites/kensilverstein/2013/05/14/enron-ethics-and-todays-corporate-values/?sh=32e2dab05ab8 Simpson, W. G., & Gleason, A. E. (1999). Board structure, ownership, and financial distress in banking firms. International Review of Economics & Finance, 8(3), 281-292. Slaper, T. F., & Hall, T. J. (2011). The triple bottom line: What is it and how does it work. Indiana business review, 86(1), 4-8. Sloan, R. (1996). Do stock prices fully reflect information in accruals and cash flows about future earnings?(Digest summary). Accounting review, 71(3), 289-315. Smale, W. (2006, December 1). Do firms really need a social policy? http://news.bbc.co.uk/2/hi/business/6102108.stm Smith, R. E. (2011). Defining corporate social responsibility: A systems approach for socially responsible capitalism. Master of Philosophy in Organizational Dynamics Theses. Sobel, M. E. (1982). Asymptotic confidence intervals for indirect effects in structural equation

446
models. Sociological methodology, 13, 290-312. Sobel, M. E. (1986). Some new results on indirect effects and their standard errors in covariance structure models. Sociological methodology, 16, 159-186. Solomon, J. F., & Solomon, A. (2006). Private social, ethical and environmental disclosure. Accounting, Auditing & Accountability Journal, 19(4), 564-591. Spamann, H. (2010). The “antidirector rights index” revisited. The Review of Financial Studies, 23(2), 467-486. Sprinkle, G. B., & Maines, L. A. (2010). The benefits and costs of corporate social responsibility. Business Horizons, 53(5), 445-453. Squicciarini, M., & Le Mouel, M. (2012). DDefining and measuring investment in organisational capital: using US microdata to develop a task-based approach. OECD Science, Technology and Industry Working Papers, 2012(5), 3-43. Srivastava, A. (2014). Why have measures of earnings quality changed over time? Journal of Accounting and Economics, 57(2-3), 196-217. Staiger, D., & Stock, J. H. (1994). Instrumental variables regression with weak instruments. Technical Working Paper no. 151, 1-71. https://www.nber.org/system/files/working_papers/t0151/t0151.pdf Stanny, E., & Ely, K. (2008). Corporate environmental disclosures about the effects of climate change. Corporate Social Responsibility and Environmental Management, 15(6), 338-348. Starik, M., & Rands, G. P. (1995). Weaving an integrated web: Multilevel and multisystem perspectives of ecologically sustainable organizations. Academy of Management Review, 20(4), 908-935. Starovic, D., & Marr, B. (2003). Understanding corporate value: managing and reporting intellectual capital. Cranfield University School of Management. State Street Global Advisors. (2017). ESG Institutional Investor Survey - Performing for the Future. https://www.ssga.com/investment-topics/.../esg-institutional-investor-survey-us.PDF Staubus, G. J. (2013). The decision usefulness theory of accounting: A limited history. Routledge. Stewart, T., & Ruckdeschel, C. (1998). Intellectual capital: The new wealth of organizations. Performance Improvement, 37(7), 56-59. Stock, J. H., & Yogo, M. (2002). Testing for weak instruments in linear IV regression. Technical Working Paper no. 284, 1-72. Stulz, R. M., & Williamson, R. (2003). Culture, openness, and finance. Journal of financial Economics, 70(3), 313-349.

447
Sun, N., Salama, A., Hussainey, K., & Habbash, M. (2010). Corporate environmental disclosure, corporate governance and earnings management. Managerial Auditing Journal, 25(7), 679-700. Sundaram, A. (2020, December 11). Yelp data shows 60% of business closures due to the coronavirus pandemic are now permanent. https://www.cnbc.com/2020/09/16/yelp-data-shows-60percent-of-business-closures-due-to-the-coronavirus-pandemic-are-now-permanent.html Surroca, J., Tribó, J. A., & Waddock, S. (2010). Corporate responsibility and financial performance: The role of intangible resources. Strategic management journal, 31(5), 463-490. Sweeney, A. P. (1994). Debt-covenant violations and managers' accounting responses. Journal of accounting and Economics, 17(3), 281-308. Sydler, R., Haefliger, S., & Pruksa, R. (2014). Measuring intellectual capital with financial figures: Can we predict firm profitability? European Management Journal, 32(2), 244-259. Tabassum, N., Kaleem, A., & Nazir, M. S. (2015). Real earnings management and future performance. Global business review, 16(1), 21-34. Takezawa, K. (2014). Learning regression analysis by simulation. Springer. Tang, L., & Koveos, P. E. (2008). A framework to update Hofstede's cultural value indices: economic dynamics and institutional stability. Journal of International Business Studies, 39(6), 1045-1063. Tayles, M., Pike, R. H., & Sofian, S. (2007). Intellectual capital, management accounting practices and corporate performance: perceptions of managers. Accounting, Auditing & Accountability Journal, 20(4), 522-548. Teoh, S. H., Welch, I., & Wong, T. J. (1998). Earnings management and the long‐run market performance of initial public offerings. The journal of finance, 53(6), 1935-1974. Thakor, A. V. (2014). Bank capital and financial stability: An economic trade-off or a Faustian bargain? Annu. Rev. Financ. Econ., 6(1), 185-223. The Body Shop. (2020a). About Us/ Our Values. https://www.thebodyshop.com/en-au/ The Body Shop. (2020b). Our Brand Purpose. https://www.thebodyshop.com/en-au/about-us/our-story/brand-purpose/a/a00003 The Economist (2002, July 15). A guide to corporate scandals. https://www.economist.com/unknown/2002/07/15/a-guide-to-corporate-scandals The Economist (2003, February 27). Ahold: Europe's Enron. https://www.economist.com/business/2003/02/27/europes-enron The Economist (2010, July 23). Taking away Dell’s cookie jar. https://www.economist.com/blogs/newsbook/2010/07/dells_sec_settlement

448
The Economist (2014, December 11). Accounting scandals: The dozy watchdogs. https://www.economist.com/briefing/2014/12/11/the-dozy-watchdogs Theodossiou, P., Kahya, E., Saidi, R., & Philippatos, G. (1996). Financial distress and corporate acquisitions: Further empirical evidence. Journal of Business Finance and Accounting, 23(5-6), 699-719. Thim, C. K., Choong, Y. V., & Nee, C. S. (2011). Factors affecting financial distress: The case of Malaysian public listed firms. Corporate Ownership and Control, 8(4), 345-351. Thomson Reuters. (2013a). ASSET4 ESG Data Glossary. https://uvalibraryfeb.files.wordpress.com/2013/09/asset4_esg_data_glossary_april2013.xlsx Thomson Reuters (2013b). Worldscope Database - Data Defintitions Guide. Issue 14.2. Thomson Reuters. (2018). Thomson Reuters ESG Scores. https://www.refinitiv.com/content/dam/marketing/en_us/documents/methodology/esg-scores-methodology.pdf Thorne, L., & Saunders, S. B. (2002). The socio-cultural embeddedness of individuals' ethical reasoning in organizations (cross-cultural ethics). Journal of Business Ethics, 35(1), 1-14. Toorchi, M., Asiaei, K., & Dehghan, M. (2015). Intellectual capital and management accounting practices: evidence from Iran. Procedia Economics and Finance, 31, 775-788. Transparency International. (2021). Corruptions Perception Index. https://www.transparency.org/en/cpi/2020/index/nzl Tronconi, C., & Marzetti, G. V. (2011). Organization capital and firm performance. Empirical evidence for European firms. Economics Letters, 112(2), 141-143. Tucker, J. W., & Zarowin, P. A. (2006). Does income smoothing improve earnings informativeness? The accounting review, 81(1), 251-270. Ullman, J. B., & Bentler, P. M. (2003). Structural equation modeling. Handbook of psychology, 607-634. https://doi-org.ezproxy.flinders.edu.au/10.1002/0471264385.wei0224 Velte, P. (2019). The bidirectional relationship between ESG performance and earnings management–empirical evidence from Germany. Journal of Global Responsibility, 10(4), 322-338. 10.1108/JGR-01-2019-0001 Velte, P. (2021). Environmental performance, carbon performance and earnings management: Empirical evidence for the European capital market. Corporate Social Responsibility and Environmental Management, 28(1), 42-53. Velury, U., & Jenkins, D. S. (2006). Institutional ownership and the quality of earnings. Journal of Business Research, 59(9), 1043-1051. Viana Jr, D. B. C., Lourenço, I. M. E. C., Ohlson, M., & de Lima, G. A. S. (2021). National culture and

449
earnings management in developed and emerging countries. Journal of Accounting in Emerging Economies, 1-64. https://dx.doi.org/10.1108/JAEE-12-2020-0323 Villalonga, B. (2004). Intangible resources, Tobin’sq, and sustainability of performance differences. Journal of Economic Behavior & Organization, 54(2), 205-230. Wagner, M., & Schaltegger, S. (2004). The effect of corporate environmental strategy choice and environmental performance on competitiveness and economic performance:: an empirical study of EU manufacturing. European Management Journal, 22(5), 557-572. Waldman, D. A., de Luque, M. S., Washburn, N., House, R. J., Adetoun, B., Barrasa, A., Bobina, M., Bodur, M., Chen, Y.-J., & Debbarma, S. (2006). Cultural and leadership predictors of corporate social responsibility values of top management: A GLOBE study of 15 countries. Journal of International Business Studies, 37(6), 823-837. Wang, X., Cao, F., & Ye, K. (2018). Mandatory corporate social responsibility (CSR) reporting and financial reporting quality: Evidence from a quasi-natural experiment. Journal of Business Ethics, 152(1), 253-274. Ward, T. J. (1994). An empirical study of the incremental predictive ability of Beaver's naive operating flow measure using four‐state ordinal models of financial distress. Journal of Business Finance & Accounting, 21(4), 547-561. Watts, R. L., & Zimmerman, J. L. (1986). Positive accounting theory. Englewood Cliffs, N.J.: Prentice-Hall. Watts, R. L., & Zimmerman, J. L. (1990). Positive accounting theory: a ten year perspective. Accounting review, 65(1), 131-156. Werther, W. B., & Chandler, D. (2005). Strategic corporate social responsibility as global brand insurance. Business Horizons, 48(4), 317-324. Wesa, E., & Otinga, H. (2018). Determinants of financial distress among listed firms at the Nairobi securities exchange, Kenya. Strategic Journal of Business and Change Management, 9492, 1056-1073. Williams, R. M. (1970). American society: A sociological interpretation (3rd ed ed.). Alfred Knopf. World Bank. (2020). The Worldwide Governance Indicators, 2020 Update. https://datacatalog.worldbank.org/dataset/worldwide-governance-indicators World Business Council for Sustainable Development, E. C. (2002). The Business case for sustainable development: Making a difference towards the Earth summit 2002 and beyond. Corporate Environmental Strategy, 9(3), 226-235. World Economic Forum. (2020). The Global Competitiveness Index Historial Dataset 2007 - 2017. https://tcdata360.worldbank.org/indicators/gci?country=BRA&indicator=631&viz=line_chart&years=2007,2017

450
Wu, A. D., & Zumbo, B. D. (2008). Understanding and using mediators and moderators. Social Indicators Research, 87(3), 367. Wu, X. (2005). Firm accounting practices, accounting reform and corruption in Asia. Policy and Society, 24(3), 53-78. Xu, D., & Shenkar, O. (2002). Note: Institutional distance and the multinational enterprise. Academy of Management review, 27(4), 608-618. Xu, H., Dao, M., & Wu, J. (2019). The effect of local political corruption on earnings quality. Review of Quantitative Finance and Accounting, 53(2), 551-574. Yeh, C. J., & Hwang, M. Y. (2000). Interdependence in ethnic identity and self: Implications for theory and practice. Journal of Counseling & Development, 78(4), 420-429. Yip, E., Van Staden, C., & Cahan, S. (2011). Corporate social responsibility reporting and earnings management: The role of political costs. Australasian Accounting Business & Finance Journal, 5(3), 17-34. Zahra, S. A., Priem, R. L., & Rasheed, A. A. (2005). The antecedents and consequences of top management fraud. Journal of Management, 31(6), 803-828. Zang, A. Y. (2012). Evidence on the trade-off between real activities manipulation and accrual-based earnings management. The accounting review, 87(2), 675-703. Zhang, J. (2008). The contracting benefits of accounting conservatism to lenders and borrowers. Journal of accounting and economics, 45(1), 27-54. Zhang, M., Di Fan, D., & Zhu, C. J. (2014). High-performance work systems, corporate social performance and employee outcomes: Exploring the missing links. Journal of business ethics, 120(3), 423-435. Zhang, W. (2015). R&D investment and distress risk. Journal of Empirical Finance, 32, 94-114. 10.1016/j.jempfin.2015.03.009 Zhang, X., Liang, X., & Sun, H. (2013). Individualism–collectivism, private benefits of control, and earnings management: A cross-culture comparison. Journal of business ethics, 114(4), 655-664. Zhang, Z., Yap, T. L., & Park, J. (2021). Does voluntary CSR disclosure and CSR performance influence earnings management? Empirical evidence from China. International Journal of Disclosure and Governance, 1-18. 10.1057/s41310-021-00104-6 Zingales, L. (1994). The value of the voting right: A study of the Milan stock exchange experience. The Review of Financial Studies, 7(1), 125-148. Zucker, L. G. (1983). Organizations as institutions. Research in the Sociology of Organizations, 2(1), 1-47.

451

452
APPENDIX A1

453
Data item Datastream (Thomson
Reuters) Code Data description
CASH WC02003 “CASH represents money available for use in the normal operations of the company. It is the most liquid of all of the company's assets” (Thomson Reuters, 2013b, p.401).
COMMON EQUITY WC03501 “COMMON EQUITY represents common shareholders' investment in a company” (Thomson Reuters, 2013b, p.412).
CONSUMER PRICE INDEX CPI CPI includes annual the consumer price index based on urban consumers.
CORPORATE GOVERNANCE PILLAR SCORE Corporate Governance Pillar Score is calculated as the sum of three category weights = Management (19%) + Shareholders (7%) + CSR Strategy
(4.50%) = 30.50% (Thomson Reuters, 2018).
CURRENT ASSETS – TOTAL WC02201
“CURRENT ASSETS – TOTAL represents cash and other assets that are reasonably expected to be realized in cash, sold or consumed within one year or one operating cycle. Generally, it is the sum of cash and equivalents, receivables, inventories, prepaid expenses and other current assets. For non-U.S. corporations, long term receivables are excluded from current assets even though included in net receivables” (Thomson Reuters, 2013b, p. 424).
CURRENT LIABILITIES – TOTAL WC03101 “CURRENT LIABILITIES – TOTAL represent debt or other obligations that the company expects to satisfy within one year” ((Thomson Reuters, 2013b, p. 425).
DEPRECIATION/DEPLETION/ AMORT WC01151
“DEPRECIATION represents the process of allocating the cost of a depreciable asset to the accounting periods covered during its expected useful life to a business. It is a non-cash charge for use and obsolescence of an asset. DEPLETION refers to cost allocation for natural resources such as oil and mineral deposits. AMORTIZATION relates to cost allocation for intangible assets such as patents and leasehold improvements, trademarks, bookplates, tools and film cost. Dry-hole Expense and Abandonments for extractive companies are included in Depreciation, Depletion & Amortization. If exploration expenses include dry-hole costs and impairment of unproved properties then it is included in Cost of Goods Sold” (Thomson Reuters, 2013b, p. 435).
EARNINGS BEFORE INTEREST & TAXES WC18191 “EARNINGS BEFORE INTEREST AND TAXES (EBIT) represent the earnings of a company before interest expense and income taxes. It is calculated
by taking the pre-tax income and adding back interest expense on debt and subtracting interest capitalized” (Thomson Reuters, 2013b, P. 452). ENVIRONMENTAL PILLAR SCORE Environmental Pillar Score is calculated as the sum of three category weights = Resource use (11%) + Emissions (12%) + Innovation (11%) =
34% (Thomson Reuters, 2018).
ESG SCORE TR.TRESGScore ESG SCORE is the overall ESG score of a company based on their disclosure on environmental, social and corporate governance dimensions of ESG (Thomson Reuters, 2018).
ESG COMBINED SCORE TR.TRESGCScore ESG COMBINED SCORE the overall ESG score of a company with an ESG Controversies overlay (Thomson Reuters, 2018).
LONG TERM DEBT WC03251 “LONG TERM DEBT represents all interest-bearing financial obligations, excluding amounts due within one year. It is shown net of premium or discount” (Thomson Reuters, 2013b, p. 537).
NET CASH FLOW OPERATING ACTIVITIES WC04860
“NET CASH FLOW - OPERATING ACTIVITIES represent the net cash receipts and disbursements resulting from the operations of the company. It is the sum of Funds from Operations, Funds From/Used for Other Operating Activities and Extraordinary Items” (Thomson Reuters, 2013b, p. 554) .
NET INCOME BEFORE EXTRAORDINARY ITEMS/ PREFERRED DIVIDENDS
WC01551 “NET INCOME BEFORE EXTRAORDINARY ITEMS/PREFERRED DIVIDENDS represents income before extraordinary items and preferred and common dividends, but after operating and non-operating income and expense, reserves, income taxes, minority interest and equity in earnings” (Thomson Reuters, 2013b, p. 556)
NET SALES OR REVENUES WC01001 “NET SALES OR REVENUES represent gross sales and other operating revenue less discounts, returns and allowances” (Thomson Reuters, 2013b, p. 561)
PRICE/BOOK VALUE RATIO – WC09304 “Market Price-Year End / Book Value Per Share” (Thomson Reuters, 2013b, p. 601).

454
CLOSE
PROPERTY, PLANT & EQUIPMENT – GROSS WC02301 “PROPERTY, PLANT AND EQUIPMENT (GROSS) represents tangible assets with an expected useful life of over one year which are expected to
be used to produce goods for sale or for distribution of services” (Thomson Reuters, 2013b, p. 613).
RECEIVABLES – NET WC02051 “RECEIVABLES (NET) represent the amounts due to the company resulting from the sale of goods and services on credit to customers (after applicable reserves). These assets should reasonably be expected to be collected within a year or within the normal operating cycle of a business” (Thomson Reuters, 2013b, p. 618).
RESEARCH & DEVELOPMENT WC01201 “RESEARCH AND DEVELOPMENT EXPENSE represents all direct and indirect costs related to the creation and development of new processes, techniques, applications and products with commercial possibilities” (Thomson Reuters, 2013b, p. 623).
SELLING, GENERAL & ADMINISTRAT WC01101 “SELLING, GENERAL & ADMINISTRATIVE EXPENSES represents expenses not directly attributable to the production process but relating to
selling, general and administrative functions” (Thomson Reuters, 2013b, p. 636). SHORT TERM DEBT & CURRENT PORTION OF LONG TERM DEBT WC03051 “SHORT TERM DEBT & CURRENT PORTION OF LONG TERM DEBT represents that portion of debt payable within one year including current
portion of long term debt and sinking fund requirements of preferred stock or debentures” (Thomson Reuters, 2013b, p. 639).
SIC CODE WC07021
“SIC CODES were developed by the U.S. government to provide a standard industry classification that covers all the economic activities of the United States. They are derived from the 1987 edition of the Standard Industrial Classification Manual compiled by the Executive Office of the President of the United States, Office of Management and Budget. These SIC codes are assigned to both U.S. and non-U.S. companies according to the type of business in which they are engaged. A company may have up to eight SIC codes assigned to it or as little as one depending on the number of business segments that make up the company's revenue. If a sales breakdown for segments is available SIC Code 1 would represent the business segment which provided the most revenue. SIC Code 8 would represent the segment that provided the least revenue. If a sales breakdown is not available the SIC Code is assigned according to the best judgement of Worldscope” (Thomson Reuters, 2013b, p. 640).
SOCIAL PILLAR SCORE Social Pillar Score is calculated as the sum of four category weights = Workforce (16%) + Human Rights (4.50%) + Community (8%) + Product Responsibility (7%) = 35.50%. (Thomson Reuters, 2018).
TOTAL ASSETS WC02999 “TOTAL ASSETS represent the sum of total current assets, long term receivables, investment in unconsolidated subsidiaries, other investments, net property plant and equipment and other assets” (Thomson Reuters, 2013b, p. 652).

455
APPENDIX A2

456
Further endogeneity test for Chapter 5:
As an additional method of addressing endogeneity, I re-estimate equations (7) and (8) from
Chapter 5 using Generalized Method of Moments (GMM), following Lewbel (2012) approach,
performed individually on each of the 2 subsamples, that is, distressed and non-distressed samples.
As discussed in Section 5.7.5, the FD classification is based on prior studies (for example, Giroux &
Wiggins, 1984; Habib et al., 2013; Hopwood et al., 1994; McKeown et al., 1991; Rosner, 2003; Ward,
1994). The subsamples are obtained by splitting the full sample based on the FD classification. All
firm-year observations classified as Financially distressed form the Distressed sample, while all firm-
year observations classified as healthy (or non-financially distressed) form the Non-Distressed
sample. The two subsamples have uneven number of observations with the distressed sample
having 14,199 firm-year observations (38.57% of the full sample), and the non-distressed sample
having 22,612 firm-year observations (61.43% of the full sample). Table A2.1 shows the results from
the GMM estimation of equations (7) and (8).

457
Table A2.1 GMM Estimation Output for Equations (7) and (8) on Distressed and Non-distressed
Samples
The table presents the GMM estimation results of equations (7) and (8) performed on the 2 subsamples (distressed and non-distressed subsamples). Panel A Columns (1) and (2) present the direct effects by individually estimating equations (7) and (8) respectively, for the distressed subsample. Columns (3) and (4) present the direct effects by individually estimating equations (7) and (8) respectively, for the non-distressed subsample. Robust standard errors are presented in parenthesis. Panel B reports the joint results of OC as a channel between the CSR and EM relationship, shown for both distressed and non-distressed subsamples. The standard errors of the indirect relationship in Panel B, are estimated using the delta method. Panel B Column (1) reports the size of the indirect effect; Columns (2) and (3) show the delta method standard errors and p values respectively. EM refers to earnings management, proxied by discretionary accruals using the modified Jones model by Dechow et al. (1995). CSR is the ESG score obtained from Thomson Reuters. OC is the stock of organisation capital scaled by total assets. The stock of organisation capital is measured by accumulating the deflated value of SG&A expenses, consistent with Eisfeldt & Papanikolaou (2013). SIZE refers to firm size, measured as the natural logarithm of market value of equity. LEV is defined as long-term debts divided by total assets. ADJROA is measured as the income before extraordinary items, scaled by lagged total assets, for each year and two-digit SIC code, subtracted from the focal firm. RD refers to R&D intensity, measured as R&D expenses divided by net sales. PR represents physical resources, measured as total assets minus current assets, scaled by total assets. MB is the market to book ratio. The model includes a set of dummy variables to capture year and industry effects. The model uses CSR_M, measured as the median CSR based on Fama-French 48 industry classification as an instrument to control for endogeneity of CSR.
Panel A: Direct effect Variables
Distressed subsample Non-distressed subsample
(1) (2) (3) (4) OC (Equation 7)
EM (Equation 8)
OC (Equation 7)
EM (Equation 8)
CONSTANT
0.3617*** (0.0397)
0.2762*** (0.0415)
0.5904*** (0.1783)
0.1127 (0.1029)
OC -0.0165* (0.0094)
0.0096** (0.0188)
CSR 0.8460*** (0.1306)
-0.3695*** (0.0788)
1.1026*** (0.3881)
-0.3354** (0.1674)
SIZE -0.0556*** (0.0075)
0.0125*** (0.0047)
-0.0865*** (0.0290)
0.0213 (0.0136)
LEV -0.0713*** (0.0203)
-0.1562*** (0.0422)
ADJROA 0.0121 (0.0271)
-0.1264*** (0.0298)
-0.0281 (0.0297)
0.0648** (0.0267)
RD -0.0101*** (0.0028)
0.0178*** (0.0050)
0.0141 (0.0640)
0.1419*** (0.0252)
PR -0.0243 (0.0233)
-0.0062 (0.0407)
MB 0.0023*** (0.0006)
0.0027** (0.0013)
Year effects Yes Yes Yes Yes
Industry effects Yes Yes Yes Yes
1-stage F-stat 23.39 10.26 61.06 10.17
N 6,464 5,131 12,416 9,730
Adjusted R2 0.3409 0.3477 0.3969 0.2343

458
Table A2.1 Panel A Columns (1) and (2) show the GMM estimation results of equations (7) and (8)
respectively on the distressed subsample, while Columns (3) and (4) show the results of equations
(7) and (8) respectively on the distressed subsample, testing the relationship between OC and EM,
and the direct relationship between CSR and EM, individually on the distressed and non-distressed
subsamples respectively.
Column (1) of Panel A presents the estimation output of equation (7) on the distressed subsample,
testing the relationship of OC with CSR and the control variables. The results show a positive
relationship between CSR and OC at the 5% level of significance (1 = 0.8460; p<0.01). The control
variables SIZE (2 = -0.0556; p<0.01), LEV (3 = -0.0713; p<0.01) and RD (5 = -0.0101; p<0.01) have
negative relationships with OC at the 1% level of significance, while ADJROA (4 = 0.0121; p<0.05)
and PR (6 = -0.0243) do not have a statistically significant association with OC in the distressed
subsample.
Column (2) of Panel A presents the estimation output of equation (8) on the distressed subsample,
testing the direct relationships of EM with CSR, OC and the control variables. The results indicate a
negative relationship between OC and EM at the 1% level of significance (1 = -0.0165; p<0.10). The
direct effects result also shows that CSR has a negative direct influence on EM at the 1% level of
significance (2 = -0.3695; p<0.01). The control variables SIZE (3 = 0.0035; p<0.01), RD (5 = 0.0178;
p<0.01) and MB (6 = 0.0023; p<0.10) are positively related to EM at the 1% level of significance,
while ADJROA (4 = -0.1658; p<0.01) is negatively related to EM at 1% level of significance.
Column (3) of Panel A shows the estimation output of equation (7), testing the relationship of OC
with CSR and the control variables, on the non-distressed subsample. The results show a positive
relationship between CSR and OC at the 1% level of significance (1 = 1.1026; p<0.01). The control
Panel B: Indirect effect
Variables (1) (2) (3)
EM Delta method Std error
Delta method p-value
CSR (distressed subsample) -0.0140 0.1305 0.0720
CSR (non-distressed subsample)
0.0106
0.3882 0.0000
***, **, and * indicate statistical significance at the 1%, 5%, and 10% levels, respectively.

459
variables SIZE (2 = -0.0865; p<0.01) and LEV (3 = -0.1562; p<0.01) have negative associations with
OC at the 1% level of significance. However, ADJROA (4 = -0.0281), RD (5 = 0.0141) and PR (6 = -
0.0062) do not have a statistically significant association with OC in the non-distressed subsample.
Column (4) of Panel A presents the estimation output of equation (8), testing the direct relationships
of EM with CSR, OC and the control variables, on the non-distressed subsample. The results indicate
a positive relationship between OC and EM at the 5% level of significance (1 = 0.0096; p<0.05). The
direct effects result also shows that CSR has a negative direct influence on EM at the 1% level of
significance (2 = -0.3354; p<0.01). The control variable RD (5 = 0.1419; p<0.01) is positively related
to EM at the 1% level of significance, while ADJROA (4 = 0.0648; p<0.05) and MB (6 = 0.0027;
p<0.05) are positively related to EM at the 5% level of significance. However, SIZE (3 = 0.0213) do
not have a statistically significant relationship with EM in the non-distressed subsample.
Panel B of Table 5.14 shows the indirect effect of CSR on EM via OC as a mediating channel. Column
(1) shows the size of the indirect effect for each subsample, calculated as the product of 1 and 1,
that is, the coefficients of CSR from equation (7) and of OC from equation (8) respectively. As
discussed previously, the statistical significance of the indirect effect is determined using the delta
method. Panel B Columns (2) and (3) show the standard error and p-values for the indirect effect.
Panel B first reports the indirect effects result within the distressed subsample. As shown in Column
(1), the size of the indirect effect, within the distressed subsample, is -0.0140, calculated as the
product of 1 (0.8460) and 1 (-0.0165) from equations (7) and (8) respectively. Based on the delta
method p-value, the result suggests a negative indirect relationship between CSR and EM, via the
mediator OC, at the 10% level of significance (p < 0.10) in the distressed subsample.
In regard to the results concerning the non-distressed subsample, Panel B Column (1) shows the size
of the indirect effect to be 0.0106 (that is, the product of 1 = 1.1026 and 1 = 0.0096 from equations
(7) and (8) respectively). Based on the delta method p-value, the result suggests a strong positive
indirect relationship between CSR and EM, via the mediator OC, at the 1% level of significance (p <
0.01) in the non-distressed subsample.
The preceding paragraphs report the results in each of the two subsamples individually, that is,
Distressed and Non-distressed samples. Table A2.2 below shows the results of the differences
between the effect sizes within the two subsamples. The table focusses on the difference in the
effect sizes for the key relationships, that is:

460
1) the effect of CSR on OC from equation (7) - to test for first stage moderation;
2) the effect of OC on EM from equation (8) - to test for second stage moderation;
3) the direct effect of CSR on EM from equation (9); and
4) the indirect effect of CSR on EM via OC from equations (7) and (8) - to test for moderated
mediation.
The difference in each of the effect sizes is measured as the difference between each of the
regression coefficients between the Distressed and Non-distressed samples. The statistical
significance of the differences in the coefficients are reported using the delta method.
Table A2.2 Difference in effect Sizes between Distressed and Non-Distressed Samples from GMM
Estimation of Equations (7) and (8)
The table presents the comparison of GMM estimation results of equations (7) and (8) performed on the 2 subsamples (distressed and non-distressed subsamples). Column (1) presents the difference in the regression coefficients, between the two subsamples, from estimating equations (7) and (8). The standard errors for the difference in the effect sizes are estimated using the delta method. Columns (2) and (3) show the delta method standard errors and p values respectively. EM refers to earnings management, proxied by discretionary accruals using the modified Jones model by Dechow et al. (1995). CSR is the ESG score obtained from Thomson Reuters. OC is the stock of organisation capital scaled by total assets. The stock of organisation capital is measured by accumulating the deflated value of SG&A expenses, consistent with Eisfeldt & Papanikolaou (2013).
Variables (1) (2) (3)
EM Delta method Std error
Delta method p-value
CSR -> EM (direct effect) -0.0341 0.1850 0.1178 CSR -> OC (equation 7) -0.2566 0.4095 0.0859 OC -> EM (equation 8) -0.0261 0.2158Thanks mate 0.0210 CSR -> OC -> EM (indirect effect) -0.0246 0.4095 0.0415
As shown earlier in Table A2.1, the direct relationship between CSR and EM is negative and
significant in both the Distressed (2(distressed) = -0.3695; p<0.01) and Non-Distressed (2(non-distressed) =
-0.3354; p<0.01) subsamples. The difference in the effect size, shown in Table A2.2, calculated as
2(distressed) - 2(non-distressed) (that is, -0.3695 – (-0.3354)), is -0.0341. However, the difference in the
direct effect between the distressed and non-distressed subsamples is not statistically significant
(p>0.10). This is consistent to the original findings suggesting that FD does not affect the direct
461
relationship between CSR and EM. CSR has a negative and significant effect on EM, irrespective of
whether the firm is financially distressed or not.
The relationship between CSR and OC (as shown earlier in Table A2.1) is positive and significant in
both the distressed (1(distressed) = 0.8460; p<0.01) and non-distressed (1(non-distressed) = 1.1026; p<0.01)
subsamples. The difference in the effect size, shown in Table A2.2, calculated as 1(distressed) - 1(non-
distressed) (that is, 0.8460 - 1.1026), is -0.2566 (p<0.10) at the 10% level of significance. The negative
and significant coefficient on the difference in the effect size of CSR on OC suggests that the
relationship between CSR and OC is weaker within financially distressed firms. This is consistent to
the original findings, suggesting that FD has a moderating (weakening) effect on the relationship
between CSR and OC.
The relationship between OC and EM (as shown earlier in Table A2.1) is negative and significant, at
the 10% level of significance, in the distressed (1(distressed) = -0.0165; p<0.10) subsample, but positive
and significant, at the 5% level of significance, in the non-distressed (1(non-distressed) = 0.0096; p<0.05)
subsample. The difference in the effect size is - 0.0261, shown in Table A2.2, and calculated as
(1(distressed) - 1(non-distressed) (that is, -0.0165 - 0.0096). The difference in the effect size of OC on EM is
statistically significant, at the 5% level of significance. Although the negative relationship between
OC and EM in the distressed subsample is different from my original findings that suggest a positive
relationship between OC and EM in both subsamples, the overall results, concerning the moderating
effect of FD, are consistent to the original findings. Overall, the result suggest that when firms are
non-distressed, managers are more likely to manage earnings in firms with high OC firms. However,
when firms with high OC experience FD, managers’ priorities change, and they are less likely to
manage earnings. The negative and significant effect size (1(distressed) - 1(non-distressed) = - 0.0261)
confirm this, and suggest that FD weakens the positive relationship between OC and EM. Thus, the
findings are consistent with my original findings, supporting the findings that FD weakens
managerial myopia.
As shown earlier in Panel B of Table A2.1, the indirect effects result shows that CSR has a negative
and significant indirect effect on EM via OC in the Distressed (11(distressed) = -0.0140; < 0.10)
subsample, but a positive and significant indirect effect on EM via OC in the Non-Distressed (11(non-
distressed) = 0.0106; p < 0.01) subsample. Table A2.2 shows that the difference in the effect size is -
0.0246 (p<0.05), calculated as 11(distressed) - 11(non-distressed) (that is, -0.0140 – 0.0106), at the 5%
level if significance. Consistent to the original results, the GMM estimation result also suggest that

462
FD has a moderating (weakening) effect on the indirect relationship between CSR and EM via OC,
supporting the notion that FD weakens managerial myopia.
Thus, the further endogeneity test using GMM estimation support the original findings. In particular,
the results suggest that FD does not change the direct effect of CSR on EM, but weakens the indirect
effect of CSR on EM via OC. The results regarding first stage and second stage moderation are also
consistent to the original findings. The results suggest that FD weakens the positive relationship
between CSR and OC (first stage moderation) and FD also weakens the positive relationship
between OC and EM (second stage moderation).