Second Quarter 2018 Earnings - Wells Fargo
42
Media Investors Ancel Martinez John M. Campbell 415-222-3858 415-396-0523 Friday, July 13, 2018 WELLS FARGO REPORTS $5.2 BILLION IN QUARTERLY NET INCOME Diluted EPS of $0.98 included net discrete income tax expense of $0.10 per share Financial results: Net income of $5.2 billion, compared with $5.9 billion in second quarter 2017 • Second quarter 2018 included net discrete income tax expense of $481 million mostly related to state income taxes driven by the recent U.S. Supreme Court decision in South Dakota v. Wayfair Diluted earnings per share (EPS) of $0.98, compared with $1.08 Revenue of $21.6 billion, down from $22.2 billion • Net interest income of $12.5 billion, up $70 million, or 1 percent • Noninterest income of $9.0 billion, down $752 million, or 8 percent Noninterest expense of $14.0 billion, up from $13.5 billion • Second quarter 2018 included $619 million of operating losses primarily related to non-litigation expense for previously disclosed matters Average deposits of $1.3 trillion, down $29.9 billion, or 2 percent Average loans of $944.1 billion, down $12.8 billion, or 1 percent Return on assets (ROA) of 1.10 percent, return on equity (ROE) of 10.60 percent, and return on average tangible common equity (ROTCE) of 12.62 percent 1 Returned $4.0 billion to shareholders through common stock dividends and net share repurchases, up 17 percent from $3.4 billion in second quarter 2017 Credit quality: Provision expense of $452 million, down $103 million, or 19 percent, from second quarter 2017 • Net charge-offs declined $53 million to $602 million, or 0.26 percent of average loans (annualized) • Reserve release 2 of $150 million, compared with $100 million in second quarter 2017 Nonaccrual loans of $7.5 billion, down $1.6 billion, or 17 percent Received a non-objection to the Company's 2018 Capital Plan submission from the Federal Reserve As part of this plan, the Company expects to increase its third quarter 2018 common stock dividend to $0.43 per share from $0.39 per share, subject to approval by the Company's Board of Directors. The plan also includes up to $24.5 billion of gross common stock repurchases for the four-quarter period from third quarter 2018 through second quarter 2019. Financial results reported in this document are preliminary. Final financial results and other disclosures will be reported in our Quarterly Report on Form 10-Q for the quarter ended June 30, 2018, and may differ materially from the results and disclosures in this document due to, among other things, the completion of final review procedures, the occurrence of subsequent events, or the discovery of additional information. 1 Tangible common equity is a non-GAAP financial measure and represents total equity less preferred equity, noncontrolling interests, and goodwill and certain identifiable intangible assets (including goodwill and intangible assets associated with certain of our nonmarketable equity securities but excluding mortgage servicing rights), net of applicable deferred taxes. The methodology of determining tangible common equity may differ among companies. Management believes that return on average tangible common equity, which utilizes tangible common equity, is a useful financial measure because it enables investors and others to assess the Company's use of equity. For additional information, including a corresponding reconciliation to GAAP financial measures, see the “Tangible Common Equity” tables on page 36. 2 Reserve build represents the amount by which the provision for credit losses exceeds net charge-offs, while reserve release represents the amount by which net charge-offs exceed the provision for credit losses.
-
Upload
khangminh22 -
Category
Documents
-
view
1 -
download
0
Transcript of Second Quarter 2018 Earnings - Wells Fargo

Media Investors
Ancel Martinez John M. Campbell
415-222-3858 415-396-0523
Friday, July 13, 2018
WELLS FARGO REPORTS $5.2 BILLION IN QUARTERLY NET INCOME Diluted EPS of $0.98 included net discrete income tax expense of $0.10 per share
Financial results:
Net income of $5.2 billion, compared with $5.9 billion in second quarter 2017
• Second quarter 2018 included net discrete income tax expense of $481 million mostly related to state income taxes driven by the recent U.S. Supreme Court decision in South Dakota v. Wayfair
Diluted earnings per share (EPS) of $0.98, compared with $1.08
Revenue of $21.6 billion, down from $22.2 billion
• Net interest income of $12.5 billion, up $70 million, or 1 percent
• Noninterest income of $9.0 billion, down $752 million, or 8 percent
Noninterest expense of $14.0 billion, up from $13.5 billion
• Second quarter 2018 included $619 million of operating losses primarily related to non-litigation expense for previously disclosed matters
Average deposits of $1.3 trillion, down $29.9 billion, or 2 percent
Average loans of $944.1 billion, down $12.8 billion, or 1 percent
Return on assets (ROA) of 1.10 percent, return on equity (ROE) of 10.60 percent, and return on average tangible common equity (ROTCE) of 12.62 percent1
Returned $4.0 billion to shareholders through common stock dividends and net share repurchases, up 17 percent from $3.4 billion in second quarter 2017
Credit quality:
Provision expense of $452 million, down $103 million, or 19 percent, from second quarter 2017
• Net charge-offs declined $53 million to $602 million, or 0.26 percent of average loans (annualized)
• Reserve release2 of $150 million, compared with $100 million in second quarter 2017
Nonaccrual loans of $7.5 billion, down $1.6 billion, or 17 percent
Received a non-objection to the Company's 2018 Capital Plan submission from the Federal Reserve
As part of this plan, the Company expects to increase its third quarter 2018 common stock dividend to $0.43 per share from $0.39 per share, subject to approval by the Company's Board of Directors. The plan also includes up to $24.5 billion of gross common stock repurchases for the four-quarter period from third quarter 2018 through second quarter 2019.
Financial results reported in this document are preliminary. Final financial results and other disclosures will be reported in our Quarterly Report on Form 10-Q for the quarter ended June 30, 2018, and may differ materially from the results and disclosures in this document due to, among other things, the completion of final review procedures, the occurrence of subsequent events, or the discovery of additional information.
1 Tangible common equity is a non-GAAP financial measure and represents total equity less preferred equity, noncontrolling interests, and goodwill and certain identifiable intangible assets (including goodwill and intangible assets associated with certain of our nonmarketable equity securities but excluding mortgage servicing rights), net of applicable deferred taxes. The methodology of determining tangible common equity may differ among companies. Management believes that return on average tangible common equity, which utilizes tangible common equity, is a useful financial measure because it enables investors and others to assess the Company's use of equity. For additional information, including a corresponding reconciliation to GAAP financial measures, see the “Tangible Common Equity” tables on page 36. 2 Reserve build represents the amount by which the provision for credit losses exceeds net charge-offs, while reserve release represents the amount by which net charge-offs exceed the provision for credit losses.

- 2
Selected Financial Information
Jun 30, 2018
Quarter ended
Mar 31, 2018
Jun 30, 2017
Earnings
Diluted earnings per common share $ 0.98 0.96 1.08
Wells Fargo net income (in billions) 5.19 5.14 5.86
Return on assets (ROA) 1.10% 1.09 1.22
Return on equity (ROE) 10.60 10.58 12.06
Return on average tangible common equity (ROTCE) (a) 12.62 12.62 14.41
Asset Quality
Net charge-offs (annualized) as a % of average total loans 0.26% 0.32 0.27
Allowance for credit losses as a % of total loans 1.18 1.19 1.27
Allowance for credit losses as a % of annualized net charge-offs 460 376 462
Other
Revenue (in billions) $ 21.6 21.9 22.2
Efficiency ratio (b) 64.9% 68.6 60.9
Average loans (in billions) $ 944.1 951.0 956.9
Average deposits (in billions) 1,271.3 1,297.2 1,301.2
Net interest margin 2.93% 2.84 2.90
(a) Tangible common equity is a non-GAAP financial measure and represents total equity less preferred equity, noncontrolling interests, and goodwill and certain identifiable intangible assets (including goodwill and intangible assets associated with certain of our nonmarketable equity securities but excluding mortgage servicing rights), net of applicable deferred taxes. The methodology of determining tangible common equity may differ among companies. Management believes that return on average tangible common equity, which utilizes tangible common equity, is a useful financial measure because it enables investors and others to assess the Company's use of equity. For additional information, including a corresponding reconciliation to GAAP financial measures, see the “Tangible Common Equity” tables on page 36.
(b) The efficiency ratio is noninterest expense divided by total revenue (net interest income and noninterest income).
SAN FRANCISCO – Wells Fargo & Company (NYSE:WFC) reported net income of $5.2 billion, or $0.98 per diluted
common share, for second quarter 2018, compared with $5.9 billion, or $1.08 per share, for second quarter 2017,
and $5.1 billion, or $0.96 per share, for first quarter 2018.
Chief Executive Officer Tim Sloan said, “During the second quarter we continued to transform Wells Fargo into a
better, stronger company for our customers, team members, communities and shareholders. Our progress included
making further improvements to our compliance and operational risk management programs; hiring a new Chief
Risk Officer; announcing innovative new products including a digital application for Merchant Services customers
and our enhanced Propel® Card, one of the richest no-annual-fee credit cards in the industry; launching our ‘Re
established’ marketing effort, the largest advertising campaign in our history; announcing a new $200 billion
commitment to financing sustainable businesses and projects; and continuing to move forward on our expense
savings initiatives. I’m also pleased with our recent CCAR results, which demonstrates the strength of our
diversified business model, our sound financial risk management practices, and our strong capital position, and
enables us to return more capital to our shareholders in alignment with our goal of creating long-term shareholder
value.”
Chief Financial Officer John Shrewsberry said, “Wells Fargo reported $5.2 billion of net income in the second
quarter, which included net discrete income tax expense of $481 million. Net interest income grew both linked
quarter and year-over-year in the second quarter, credit performance and capital levels remained strong, and we are
on track to meet our expense reduction expectations. In addition, we received a non-objection to our 2018 Capital
Plan, which includes an increase in our quarterly common stock dividend rate in third quarter 2018 to $0.43 per
share, subject to board approval, as well as up to $24.5 billion of gross common stock repurchases during the four-
quarter period beginning in third quarter 2018. The shareholder returns included in the capital plan are
- 3
approximately 70% higher than our previous four quarter capital actions, demonstrating our commitment to
returning more capital to shareholders. Our ability to return this level of capital is a result of capital built in recent
years through continued stable earnings and a lower level of risk-weighted assets.”
Net Interest Income
Net interest income in the second quarter was $12.5 billion, up $303 million compared with first quarter 2018,
driven predominantly by a less negative impact from hedge ineffectiveness accounting, the net benefit of rate and
spread movements, and one additional day in the quarter.
Net interest margin was 2.93 percent, up 9 basis points compared with first quarter 2018. The increase was driven
by a reduction in the proportion of lower yielding assets, as well as a less negative impact from hedge ineffectiveness
accounting and the net benefit of rate and spread movements.
Noninterest Income
Noninterest income in the second quarter was $9.0 billion, down $684 million compared with first quarter 2018.
Second quarter noninterest income included lower market sensitive revenue3, mortgage banking fees and other
income, partially offset by higher card fees on stronger credit card and debit card activity.
• Mortgage banking income was $770 million, down from $934 million in first quarter 2018. Residential
mortgage loan originations increased in the second quarter to $50 billion, from $43 billion in the first quarter.
The production margin on residential held-for-sale mortgage loan originations4 declined to 0.77 percent,
compared with 0.94 percent in the first quarter, due to increased price competition. Net mortgage servicing
income was $406 million in the second quarter, down from $468 million in the first quarter driven by higher
loan prepayments.
• Market sensitive revenue was $527 million, down from $1.0 billion in first quarter 2018, primarily due to lower
unrealized gains from equity securities. Additionally, second quarter 2018 included $214 million of other-than
temporary impairment (OTTI) from the announced sale of Wells Fargo Asset Management's (WFAM)
ownership stake in The Rock Creek Group, LP (RockCreek).
• Other income was $323 million, compared with $438 million in the first quarter. Second quarter results
included a $479 million gain from sales of $1.3 billion of purchased credit-impaired (PCI) Pick-a-Pay loans,
compared with a $643 million gain from sales of $1.6 billion of PCI Pick-a-Pay loans in first quarter 2018.
Noninterest Expense
Noninterest expense in the second quarter declined $1.1 billion from the prior quarter to $14.0 billion, primarily due
to lower operating losses, a decline in employee benefits and incentive compensation expense, which were
seasonally elevated in the first quarter, and lower equipment expense. These decreases were partially offset by
higher charitable donations expense, contract services, advertising and promotion, and outside professional services
expense. The efficiency ratio was 64.9 percent in second quarter 2018, compared with 68.6 percent in the first
quarter.
3 Market sensitive revenue represents net gains from trading activities, debt securities, and equity securities. 4 Production margin represents net gains on residential mortgage loan origination/sales activities divided by total residential held-for-sale
mortgage originations. See the Selected Five Quarter Residential Mortgage Production Data table on page 42 for more information.

- 4
Second quarter 2018 operating losses were $619 million, which included typical operating losses, as well as non-
litigation expense for previously disclosed matters, including policies, practices and procedures in our foreign
exchange business; fee calculations within certain fiduciary and custody accounts in our wealth management
business; practices in our automobile lending business, including related insurance products; and mortgage interest
rate lock extensions. First quarter 2018 operating losses were $1.5 billion due to elevated litigation accruals.
Income Taxes
The Company’s effective income tax rate was 25.9 percent for second quarter 2018 and included net discrete income
tax expense of $481 million mostly related to state income taxes. Discrete income tax expenses in the second quarter
were driven by the Company’s adjustment to its state income tax reserves following the recent U.S. Supreme Court
decision in South Dakota v. Wayfair and by the true-up of certain state income tax accruals. The effective income
tax rate in first quarter 2018 was 21.1 percent and included net discrete income tax expense of $137 million,
predominantly resulting from the non-deductible treatment of a discrete litigation accrual. The Company currently
expects the effective income tax rate for the remainder of 2018 to be approximately 19 percent, excluding the impact
of any future discrete items.
Loans
Total average loans were $944.1 billion in the second quarter, down $6.9 billion from the first quarter. Period-end
loan balances were $944.3 billion at June 30, 2018, down $3.0 billion from March 31, 2018. Commercial loans were
down $291 million compared with March 31, 2018, with a $2.5 billion decline in commercial real estate loans,
partially offset by $1.9 billion of growth in commercial and industrial loans and a $321 million increase in lease
financing loans. Consumer loans decreased $2.8 billion from the prior quarter, driven by:
• a $1.9 billion decline in automobile loans due to expected continued runoff
• a $1.4 billion decline in the junior lien mortgage portfolio as payoffs continued to exceed new originations
• a $376 million decline in other revolving credit and installment loans
• these decreases were partially offset by:
a $581 million increase in credit card balances
a $343 million increase in 1-4 family first mortgage loans, as nonconforming mortgage loan originations
were partially offset by payoffs and $1.3 billion of sales of PCI Pick-a-Pay mortgage loans
Additionally, $507 million of nonconforming mortgage loan originations that would have otherwise been included
in 1-4 family first mortgage loan outstandings were designated as held for sale in anticipation of the future issuance
of residential mortgage-backed securities (RMBS), and $112 million of loans were transferred to held for sale as a
result of previously announced branch divestitures.
Period-End Loan Balances
(in millions) Jun 30,
2018 Mar 31,
2018 Dec 31,
2017 Sep 30,
2017 Jun 30,
2017
Commercial
Consumer
$ 503,105
441,160
503,396
443,912
503,388
453,382
500,150
451,723
505,901
451,522
Total loans $ 944,265 947,308 956,770 951,873 957,423
Change from prior quarter $ (3,043) (9,462) 4,897 (5,550) (982)
- 5
Debt and Equity Securities
Debt securities include available-for-sale and held-to-maturity debt securities, as well as debt securities held for
trading. Debt securities were $475.5 billion at June 30, 2018, up $2.5 billion from the first quarter, driven by:
• a $5.7 billion increase in debt securities held for trading
• a net decrease in available-for-sale and held-to-maturity debt securities, as approximately $14.4 billion of
purchases, primarily federal agency mortgage-backed securities (MBS) in the available-for-sale portfolio, were
more than offset by runoff and sales
Net unrealized losses on available-for-sale debt securities were $2.4 billion at June 30, 2018, compared with net
unrealized losses of $1.9 billion at March 31, 2018, primarily due to higher interest rates.
Equity securities include marketable and non-marketable equity securities, as well as equity securities held for
trading. Equity securities were $57.5 billion at June 30, 2018, down $1.4 billion from the first quarter,
predominantly due to a decline in equity securities held for trading.
Deposits
Total average deposits for second quarter 2018 were $1.3 trillion, down $25.8 billion from the prior quarter. The
decline was driven by a decrease in commercial deposits, primarily from financial institutions, including a
$13.5 billion decline from actions the Company has taken in response to the asset cap included in the consent order
issued by the Board of Governors of the Federal Reserve System on February 2, 2018. Average consumer and small
business banking deposits of $754.0 billion for second quarter 2018 were down $1.4 billion from the prior quarter,
with growth in Community Banking deposits more than offset by lower Wealth and Investment Management
deposits, as customers allocated more cash to alternative higher-rate liquid investments. The average deposit cost
for second quarter 2018 was 40 basis points, up 6 basis points from the prior quarter and 19 basis points from a year
ago, primarily driven by an increase in commercial and Wealth and Investment Management deposit rates.
Capital
Capital in the second quarter continued to exceed our internal target, with a Common Equity Tier 1 ratio (fully
phased-in) of 12.0 percent5, flat compared with the prior quarter. In second quarter 2018, the Company repurchased
35.8 million shares of its common stock, which reduced period-end common shares outstanding by 24.8 million.
The Company paid a quarterly common stock dividend of $0.39 per share. In addition, the Company received a
non-objection to its 2018 Capital Plan from the Federal Reserve. As part of this plan, the Company expects to
increase its third quarter 2018 common stock dividend to $0.43 per share, subject to approval by the Company's
Board of Directors. The plan also includes up to $24.5 billion of gross common stock repurchases, subject to
management discretion, for the four-quarter period from third quarter 2018 through second quarter 2019.
5 See table on page 37 for more information on Common Equity Tier 1. Common Equity Tier 1 (fully phased-in) is a preliminary estimate and is calculated assuming the full phase-in of the Basel III capital rules.

- 6
Credit Quality
Net Loan Charge-offs
The quarterly loss rate in the second quarter was 0.26 percent (annualized), compared with 0.32 percent in the prior
quarter and 0.27 percent a year ago. Commercial and consumer losses were 0.05 percent and 0.49 percent,
respectively. Total credit losses were $602 million in second quarter 2018, down $139 million from first quarter
2018. Commercial losses were down $11 million due to improvement in commercial and industrial loans. Consumer
losses decreased $128 million driven by lower loss rates and higher recovery rates, including seasonal impacts in
automobile and credit card.
Net Loan Charge-Offs
Quarter ended
June 30, 2018 March 31, 2018 June 30, 2017
($ in millions)
Net loan charge-
offs
As a % of average
loans (a)
Net loan charge-
offs
As a % of average
loans (a)
Net loan charge-
offs
As a % of average
loans (a)
Commercial:
Commercial and industrial $ 58 0.07 % $ 85 0.10 % $ 78 0.10 %
Real estate mortgage
Real estate construction
Lease financing
—
(6)
15
—
(0.09)
0.32
(15)
(4)
12
(0.05)
(0.07)
0.25
(6)
(4)
7
(0.02)
(0.05)
0.15
Total commercial 67 0.05 78 0.06 75 0.06
Consumer:
Real estate 1-4 family first mortgage (23) (0.03) (18) (0.03) (16) (0.02)
Real estate 1-4 family junior lien mortgage (13) (0.13) (8) (0.09) (4) (0.03)
Credit card 323 3.61 332 3.69 320 3.67
Automobile 113 0.93 208 1.64 126 0.86
Other revolving credit and installment 135 1.44 149 1.60 154 1.58
Total consumer 535 0.49 663 0.60 580 0.51
Total $ 602 0.26% $ 741 0.32% $ 655 0.27%
(a) Quarterly net charge-offs (recoveries) as a percentage of average loans are annualized. See explanation on page 33 of the accounting for purchased credit-impaired (PCI) loans and the impact on selected financial ratios.

- 7
Nonperforming Assets
Nonperforming assets decreased $305 million, or 4 percent, from first quarter 2018 to $8.0 billion. Nonaccrual
loans decreased $233 million from first quarter 2018 to $7.5 billion predominantly driven by lower consumer real
estate nonaccruals.
Nonperforming Assets (Nonaccrual Loans and Foreclosed Assets)
June 30, 2018 March 31, 2018 June 30, 2017
($ in millions) Total
balances
As a % of total
loans Total
balances
As a % of total
loans Total
balances
As a % of total
loans
Commercial:
Commercial and industrial
Real estate mortgage
Real estate construction
$ 1,559
765
51
0.46 %
0.62
0.22
$ 1,516
755
45
0.45 %
0.60
0.19
$ 2,632
630
34
0.79 %
0.48
0.13
Lease financing 80 0.41 93 0.48 89 0.46
Total commercial 2,455 0.49 2,409 0.48 3,385 0.67
Consumer:
Real estate 1-4 family first mortgage 3,829 1.35 4,053 1.43 4,413 1.60
Real estate 1-4 family junior lien mortgage 1,029 1,087 1,0952.82 2.87 2.56
Automobile 119 0.25 117 0.24 104 0.18
Other revolving credit and installment 54 0.14 53 0.14 59 0.15
Total consumer 5,031 1.14 5,310 1.20 5,671 1.26
Total nonaccrual loans 7,486 0.79 7,719 0.81 9,056
Foreclosed assets:
Government insured/guaranteed 90 103 149
Non-government insured/guaranteed 409 468 632
Total foreclosed assets 499 571 781
Total nonperforming assets $ 7,985 0.85% $ 8,290 0.88% $ 9,837 1.03%
Change from prior quarter:
Total nonaccrual loans $ (233) $ (317) $ (625)
Total nonperforming assets (305) (388) (827)
Allowance for Credit Losses
The allowance for credit losses, including the allowance for unfunded commitments, totaled $11.1 billion at June 30,
2018, down $203 million from March 31, 2018. Second quarter 2018 included a $150 million reserve release2, which
reflected strong overall credit portfolio performance and lower loan balances. The allowance coverage for total loans
was 1.18 percent, compared with 1.19 percent in first quarter 2018. The allowance covered 4.6 times annualized
second quarter net charge-offs, compared with 3.8 times in the prior quarter. The allowance coverage for nonaccrual
loans was 148 percent at June 30, 2018, compared with 147 percent at March 31, 2018. The Company believes the
allowance was appropriate for losses inherent in the loan portfolio at June 30, 2018.
0.95

- 8
Business Segment Performance
Wells Fargo defines its operating segments by product type and customer segment. Segment net income for each of
the three business segments was:
Quarter ended
(in millions) Jun 30,
2018 Mar 31,
2018 Jun 30,
2017
Community Banking
Wholesale Banking
Wealth and Investment Management
$ 2,496
2,635
445
1,913
2,875
714
2,765
2,742
711
Community Banking offers a complete line of diversified financial products and services for consumers and small businesses including checking and savings accounts, credit and debit cards, and automobile, student, mortgage, home equity and small business lending, as well as referrals to Wholesale Banking and Wealth and Investment Management business partners. The Community Banking segment also includes the results of our Corporate Treasury activities net of allocations in support of the other operating segments and results of investments in our affiliated venture capital partnerships.
Selected Financial Information
Quarter ended
(in millions) Jun 30,
2018 Mar 31,
2018 Jun 30,
2017
Total revenue $ 11,806 11,830 11,955
Provision for credit losses 484 218 623
Noninterest expense
Segment net income
7,290
2,496
8,702
1,913
7,266
2,765
(in billions)
Average loans
Average assets
Average deposits
1,034.3
760.6
1,061.9
747.5
1,083.6
727.7
463.8 470.5 475.1
Community Banking reported net income of $2.5 billion, up $583 million, or 30 percent, from first quarter 2018.
Second quarter 2018 results included net discrete income tax expense of $481 million primarily related to state
income taxes. Revenue in the second quarter was $11.8 billion, flat compared with first quarter 2018, as lower
market sensitive revenue and mortgage banking income were largely offset by higher net interest income and card
fees. Noninterest expense decreased $1.4 billion, or 16 percent, from first quarter 2018, driven mainly by lower
operating losses and lower personnel expense that was down from a seasonally elevated first quarter. The provision
for credit losses increased $266 million from the prior quarter primarily due to a lower reserve release.
Net income was down $269 million, or 10 percent, from second quarter 2017, primarily due to lower revenue and
net discrete income tax expense of $481 million in second quarter 2018. Revenue declined $149 million, or
1 percent, from a year ago due to lower mortgage banking income and service charges on deposit accounts, partially
offset by higher net interest income and higher gains on the sales of PCI Pick-a-Pay mortgage loans. Noninterest
expense of $7.3 billion was stable from a year ago. The provision for credit losses decreased $139 million from a year
ago due to improvement in the consumer real estate and automobile portfolios.

- 9
Retail Banking and Consumer Payments, Virtual Solutions and Innovation
• More than 362,000 branch customer experience surveys completed during second quarter 2018, with both ‘Loyalty’ and ‘Overall Satisfaction with Most Recent Visit’ scores down due to several factors, including recent events and a risk-based policy change affecting individuals making cash deposits into an account on which they are not a signer
• 5,751 retail bank branches as of the end of second quarter 2018, reflecting 56 branch consolidations in the quarter and 114 in the first half of 2018; additionally, we announced plans to divest 52 branches in 2018 in Indiana, Ohio, Michigan and part of Wisconsin pending regulatory approval
• Primary consumer checking customers6,7 up 1.2 percent year-over-year
• Debit card point-of-sale purchase volume8 of $87.5 billion in the second quarter, up 9 percent year-over-year
• General purpose credit card point-of-sale purchase volume of $19.2 billion in the second quarter, up 7 percent year-over-year
• 28.9 million digital (online and mobile) active customers, including over 22 million mobile active users7,9
• Dynatrace's Small Business Banking Scorecard named Wells Fargo #1 in overall performance for providing a positive small business banking experience through digital channels (July 2018)
• For the second year in a row, Wells Fargo was number one in Nilson’s annual ranking of the top 50 U.S. debit card issuers, receiving the top ranking by both purchase volume and number of transactions (April 2018)
Consumer Lending
• Home Lending
Originations of $50 billion, up from $43 billion in prior quarter, primarily due to seasonality
Applications of $67 billion, up from $58 billion in prior quarter, primarily due to seasonality
Application pipeline of $26 billion at quarter end, up from $24 billion at March 31, 2018
Production margin on residential held-for-sale mortgage loan originations4 of 0.77 percent, down from 0.94 percent in the prior quarter, due to increased price competition
• Automobile originations of $4.4 billion in the second quarter were flat compared with the prior quarter; and down 3 percent from the prior year, as proactive steps to tighten underwriting standards resulted in lower origination volume
6 Customers who actively use their checking account with transactions such as debit card purchases, online bill payments, and direct deposit. 7 Data as of May 2018, comparisons with May 2017. 8 Combined consumer and business debit card purchase volume dollars. 9 Primarily includes retail banking, consumer lending, small business and business banking customers.

- 10
Wholesale Banking provides financial solutions to businesses across the United States and globally with annual sales generally in excess of $5 million. Products and businesses include Business Banking, Commercial Real Estate, Corporate Banking, Financial Institutions Group, Government and Institutional Banking, Middle Market Banking, Principal Investments, Treasury Management, Wells Fargo Commercial Capital, and Wells Fargo Securities.
Selected Financial Information
Quarter ended
(in millions) Jun 30,
2018 Mar 31,
2018 Jun 30,
2017
Total revenue
Reversal of provision for credit losses
Noninterest expense
Segment net income
$ 7,197
(36)
4,219
2,635
7,279
(20)
3,978
2,875
7,479
(65)
4,036
2,742
(in billions)
Average loans
Average assets
Average deposits
826.4
414.0
829.2
446.0
818.8
462.4
464.7 465.1 466.9
Wholesale Banking reported net income of $2.6 billion, down $240 million, or 8 percent, from first quarter 2018.
Revenue of $7.2 billion decreased $82 million, or 1 percent, from the prior quarter, primarily due to the gain on the
sale of Wells Fargo Shareowner Services recognized in the first quarter and lower market sensitive revenue in the
second quarter, partially offset by higher net interest income and investment banking fees. Noninterest expense
increased $241 million, or 6 percent, from the prior quarter reflecting higher operating losses and higher regulatory,
risk and technology expense, partially offset by seasonally lower personnel expense. Second quarter 2018 operating
losses were $208 million and included $171 million of non-litigation expense related to our foreign exchange
business. The provision for credit losses decreased $16 million from the prior quarter.
Net income decreased $107 million, or 4 percent, from second quarter 2017. Second quarter 2018 results benefited
from a lower effective income tax rate, while second quarter 2017 included a discrete income tax benefit related to
the sale of Wells Fargo Insurance Services USA (WFIS). Revenue decreased $282 million, or 4 percent, from second
quarter 2017, primarily due to the impact of the sales of WFIS in fourth quarter 2017 and Wells Fargo Shareowner
Services in first quarter 2018, as well as lower net interest income, operating lease income and mortgage banking
fees, partially offset by higher market sensitive revenue. Noninterest expense increased $183 million, or 5 percent,
from a year ago as higher operating losses and higher regulatory, risk and technology expense were partially offset
by lower expense related to the sales of WFIS and Wells Fargo Shareowner Services. The provision for credit losses
increased $29 million from a year ago.

- 11
Wealth and Investment Management (WIM) provides a full range of personalized wealth management, investment and retirement products and services to clients across U.S. based businesses including Wells Fargo Advisors, The Private Bank, Abbot Downing, Wells Fargo Institutional Retirement and Trust, and Wells Fargo Asset Management. We deliver financial planning, private banking, credit, investment management and fiduciary services to high-net worth and ultra-high-net worth individuals and families. We also serve clients’ brokerage needs, supply retirement and trust services to institutional clients and provide investment management capabilities delivered to global institutional clients through separate accounts and the Wells Fargo Funds.
Selected Financial Information
Quarter ended
(in millions) Jun 30,
2018 Mar 31,
2018 Jun 30,
2017
Total revenue
Provision (reversal of provision) for credit losses
Noninterest expense
Segment net income
$ 3,951
(2)
3,361
445
4,242
(6)
3,290
714
4,226
7
3,071
711
(in billions)
Average loans
Average assets
Average deposits
84.0
167.1
84.2
177.9
82.4
190.1
74.7 73.9 71.7
Wealth and Investment Management reported net income of $445 million, down $269 million, or 38 percent, from
first quarter 2018. Revenue of $4.0 billion decreased $291 million, or 7 percent, from the prior quarter, primarily
due to the impairment from the announced sale of WFAM's ownership stake in RockCreek, as well as lower
transaction revenue and asset-based fees. Noninterest expense increased $71 million, or 2 percent, from the prior
quarter, primarily driven by higher operating losses and higher regulatory, risk and technology expense, partially
offset by lower personnel expense from a seasonally higher first quarter and lower broker commissions. Second
quarter 2018 operating losses were $127 million and included $114 million of non-litigation expense related to fee
calculations within certain fiduciary and custody accounts in our wealth management business.
Net income was down $266 million, or 37 percent, from second quarter 2017. Second quarter 2018 results benefited
from a lower effective income tax rate. Revenue decreased $275 million from a year ago, primarily driven by the
impairment of WFAM's ownership stake in RockCreek, lower net interest income and transaction revenue, partially
offset by higher asset-based fees. Noninterest expense increased $290 million, or 9 percent, from a year ago,
primarily due to higher regulatory, risk and technology expense, higher operating losses, higher broker commissions
and other personnel expense.
• WIM total client assets of $1.9 trillion, up 3 percent from a year ago, driven by higher market valuations
• Continued loan growth, with average balances up 4 percent from a year ago largely due to growth in nonconforming mortgage loans
• Second quarter 2018 average closed referred investment assets (referrals resulting from the WIM/Community Banking partnership) were flat compared with the prior quarter and down 5 percent from a year ago

- 12
Retail Brokerage
• Client assets of $1.6 trillion, up 3 percent from prior year
• Advisory assets of $543 billion, up 8 percent from prior year, primarily driven by higher market valuations
Wealth Management
• Client assets of $238 billion, up 1 percent from prior year
Asset Management
• Total assets under management of $494 billion, up 2 percent from prior year, driven by higher market valuations and positive money market net inflows, partially offset by equity and fixed income net outflows
Retirement
• IRA assets of $403 billion, up 3 percent from prior year
• Institutional Retirement plan assets of $389 billion, up 4 percent from prior year
Conference Call
The Company will host a live conference call on Friday, July 13, at 7:00 a.m. PT (10:00 a.m. ET). You may
participate by dialing 866-872-5161 (U.S. and Canada) or 440-424-4922 (International). The call will also be
available online at https://www.wellsfargo.com/about/investor-relations/quarterly-earnings/ and https://
engage.vevent.com/rt/wells_fargo_ao~9092328
.
A replay of the conference call will be available beginning at 10:00 a.m. PT (1:00 p.m. ET) on Friday, July 13
through Friday, July 27. Please dial 855-859-2056 (U.S. and Canada) or 404-537-3406 (International) and enter
Conference ID #9092328. The replay will also be available online at https://www.wellsfargo.com/about/investor
relations/quarterly-earnings/ and https://engage.vevent.com/rt/wells_fargo_ao~9092328.

- 13
Forward-Looking Statements
This document contains “forward-looking statements” within the meaning of the Private Securities Litigation Reform Act of 1995. In addition, we may make forward-looking statements in our other documents filed or furnished with the SEC, and our management may make forward-looking statements orally to analysts, investors, representatives of the media and others. Forward-looking statements can be identified by words such as “anticipates,” “intends,” “plans,” “seeks,” “believes,” “estimates,” “expects,” “target,” “projects,” “outlook,” “forecast,” “will,” “may,” “could,” “should,” “can” and similar references to future periods. In particular, forward-looking statements include, but are not limited to, statements we make about: (i) the future operating or financial performance of the Company, including our outlook for future growth; (ii) our noninterest expense and efficiency ratio; (iii) future credit quality and performance, including our expectations regarding future loan losses and allowance levels; (iv) the appropriateness of the allowance for credit losses; (v) our expectations regarding net interest income and net interest margin; (vi) loan growth or the reduction or mitigation of risk in our loan portfolios; (vii) future capital or liquidity levels or targets and our estimated Common Equity Tier 1 ratio under Basel III capital standards; (viii) the performance of our mortgage business and any related exposures; (ix) the expected outcome and impact of legal, regulatory and legislative developments, as well as our expectations regarding compliance therewith; (x) future common stock dividends, common share repurchases and other uses of capital; (xi) our targeted range for return on assets, return on equity, and return on tangible common equity; (xii) the outcome of contingencies, such as legal proceedings; and (xiii) the Company’s plans, objectives and strategies.
Forward-looking statements are not based on historical facts but instead represent our current expectations and assumptions regarding our business, the economy and other future conditions. Because forward-looking statements relate to the future, they are subject to inherent uncertainties, risks and changes in circumstances that are difficult to predict. Our actual results may differ materially from those contemplated by the forward-looking statements. We caution you, therefore, against relying on any of these forward-looking statements. They are neither statements of historical fact nor guarantees or assurances of future performance. While there is no assurance that any list of risks and uncertainties or risk factors is complete, important factors that could cause actual results to differ materially from those in the forward-looking statements include the following, without limitation:
• current and future economic and market conditions, including the effects of declines in housing prices, high unemployment rates, U.S. fiscal debt, budget and tax matters (including the impact of the Tax Cuts & Jobs Act), geopolitical matters, and the overall slowdown in global economic growth;
• our capital and liquidity requirements (including under regulatory capital standards, such as the Basel III capital standards) and our ability to generate capital internally or raise capital on favorable terms;
• financial services reform and other current, pending or future legislation or regulation that could have a negative effect on our revenue and businesses, including the Dodd-Frank Act and other legislation and regulation relating to bank products and services;
• the extent of our success in our loan modification efforts, as well as the effects of regulatory requirements or guidance regarding loan modifications;
• the amount of mortgage loan repurchase demands that we receive and our ability to satisfy any such demands without having to repurchase loans related thereto or otherwise indemnify or reimburse third parties, and the credit quality of or losses on such repurchased mortgage loans;
• negative effects relating to our mortgage servicing and foreclosure practices, as well as changes in industry standards or practices, regulatory or judicial requirements, penalties or fines, increased servicing and other costs or obligations, including loan modification requirements, or delays or moratoriums on foreclosures;
• our ability to realize our efficiency ratio target as part of our expense management initiatives, including as a result of business and economic cyclicality, seasonality, changes in our business composition and operating environment, growth in our businesses and/or acquisitions, and unexpected expenses relating to, among other things, litigation and regulatory matters;
• the effect of the current low interest rate environment or changes in interest rates on our net interest income, net interest margin and our mortgage originations, mortgage servicing rights and mortgages held for sale;

- 14
• significant turbulence or a disruption in the capital or financial markets, which could result in, among other things, reduced investor demand for mortgage loans, a reduction in the availability of funding or increased funding costs, and declines in asset values and/or recognition of other-than-temporary impairment on securities held in our debt securities and equity securities portfolios;
• the effect of a fall in stock market prices on our investment banking business and our fee income from our brokerage, asset and wealth management businesses;
• negative effects from the retail banking sales practices matter and from other instances where customers may have experienced financial harm, including on our legal, operational and compliance costs, our ability to engage in certain business activities or offer certain products or services, our ability to keep and attract customers, our ability to attract and retain qualified team members, and our reputation;
• resolution of regulatory matters, litigation, or other legal actions, which may result in, among other things, additional costs, fines, penalties, restrictions on our business activities, reputational harm, or other adverse consequences;
• a failure in or breach of our operational or security systems or infrastructure, or those of our third party vendors or other service providers, including as a result of cyber attacks;
• the effect of changes in the level of checking or savings account deposits on our funding costs and net interest margin;
• fiscal and monetary policies of the Federal Reserve Board; and
• the other risk factors and uncertainties described under “Risk Factors” in our Annual Report on Form 10-K for the year ended December 31, 2017.
In addition to the above factors, we also caution that the amount and timing of any future common stock dividends or repurchases will depend on the earnings, cash requirements and financial condition of the Company, market conditions, capital requirements (including under Basel capital standards), common stock issuance requirements, applicable law and regulations (including federal securities laws and federal banking regulations), and other factors deemed relevant by the Company’s Board of Directors, and may be subject to regulatory approval or conditions.
For more information about factors that could cause actual results to differ materially from our expectations, refer to our reports filed with the Securities and Exchange Commission, including the discussion under “Risk Factors” in our Annual Report on Form 10-K for the year ended December 31, 2017, as filed with the Securities and Exchange Commission and available on its website at www.sec.gov.
Any forward-looking statement made by us speaks only as of the date on which it is made. Factors or events that could cause our actual results to differ may emerge from time to time, and it is not possible for us to predict all of them. We undertake no obligation to publicly update any forward-looking statement, whether as a result of new information, future developments or otherwise, except as may be required by law.
Forward-looking Non-GAAP Financial Measures. From time to time management may discuss forward-looking non-GAAP financial measures, such as forward-looking estimates or targets for return on average tangible common equity. We are unable to provide a reconciliation of forward-looking non-GAAP financial measures to their most directly comparable GAAP financial measures because we are unable to provide, without unreasonable effort, a meaningful or accurate calculation or estimation of amounts that would be necessary for the reconciliation due to the complexity and inherent difficulty in forecasting and quantifying future amounts or when they may occur. Such unavailable information could be significant to future results.
- 15
About Wells Fargo
Wells Fargo & Company (NYSE: WFC) is a diversified, community-based financial services company with
$1.9 trillion in assets. Wells Fargo’s vision is to satisfy our customers’ financial needs and help them succeed
financially. Founded in 1852 and headquartered in San Francisco, Wells Fargo provides banking, investments,
mortgage, and consumer and commercial finance through 8,050 locations, 13,000 ATMs, the internet
(wellsfargo.com) and mobile banking, and has offices in 38 countries and territories to support customers who
conduct business in the global economy. With approximately 265,000 team members, Wells Fargo serves one in
three households in the United States. Wells Fargo & Company was ranked No. 26 on Fortune’s 2018 rankings of
America’s largest corporations.
# # #

- 16 -
Wells Fargo & Company and Subsidiaries QUARTERLY FINANCIAL DATA
TABLE OF CONTENTS
Pages
Summary Information
Summary Financial Data 17
Income
Consolidated Statement of Income 19
Consolidated Statement of Comprehensive Income 21
Condensed Consolidated Statement of Changes in Total Equity 21
Average Balances, Yields and Rates Paid (Taxable-Equivalent Basis) 22
Five Quarter Average Balances, Yields and Rates Paid (Taxable-Equivalent Basis) 24
Noninterest Income and Noninterest Expense 25
Balance Sheet
Consolidated Balance Sheet 27
Trading Activities 29
Debt Securities 29
Equity Securities 30
Loans
Loans 31
Nonperforming Assets 32
Loans 90 Days or More Past Due and Still Accruing 32
Purchased Credit-Impaired Loans 33
Changes in Allowance for Credit Losses 35
Equity
Tangible Common Equity 36
Common Equity Tier 1 Under Basel III 37
Operating Segments
Operating Segment Results 38
Other
Mortgage Servicing and other related data 40

- 17
Wells Fargo & Company and Subsidiaries SUMMARY FINANCIAL DATA
($ in millions, except per share amounts) Jun 30,
2018
Quarter ended
Mar 31, 2018
Jun 30, 2017
% Change Jun 30, 2018 from
Mar 31, 2018
Jun 30, 2017
Six months ended
Jun 30, 2018
Jun 30, 2017
% Change
For the Period
Wells Fargo net income
Wells Fargo net income applicable to common stock
Diluted earnings per common share
Profitability ratios (annualized):
Wells Fargo net income to average assets (ROA)
Wells Fargo net income applicable to common stock to average Wells Fargo common stockholders’ equity (ROE)
Return on average tangible common equity (ROTCE)(1)
Efficiency ratio (2)
Total revenue
Pre-tax pre-provision profit (PTPP) (3)
Dividends declared per common share
Average common shares outstanding
Diluted average common shares outstanding
Average loans
Average assets
Average total deposits
Average consumer and small business banking deposits (4)
Net interest margin
At Period End
Debt securities (5)
Loans
Allowance for loan losses
Goodwill
Equity securities (5)
Assets
Deposits
Common stockholders' equity
Wells Fargo stockholders’ equity
Total equity
Tangible common equity (1)
Common shares outstanding
Book value per common share (6)
Tangible book value per common share (1)(6)
Common stock price:
High
Low
Period end
$ 5,186 5,136 5,856 1% (11) $ 10,322 11,490 (10)%
4,792
0.98 0.96 1.08 2 (9) 1.94 2.11 (8)
4,733 5,450 1 (12) 9,525 10,683 (11)
1.10%
10.60
12.62
64.9
$ 21,553
7,571
0.39
4,865.8
4,899.8
$ 944,079
1,884,884
1,271,339
754,047
2.93%
$ 475,495
944,265
10,193
26,429
57,505
1,879,700
1,268,864
181,386
205,188
206,069
152,580
4,849.1
$ 37.41
31.47
1.09 1.22 1 (10) 1.10% 1.20 (8)
12.06 — (12) 10.59 12.01 (12)
12.62 14.41 — (12) 12.62 14.38 (12)
21,934 22,235 (2) (3) $ 43,487 44,490 (2)
0.39 0.38 — 3 0.78 0.760 3
4,930.7 5,037.7 (1) (3) 4,916.1 5,054.8 (3)
1,915,896 1,927,021 (2) (2) 1,900,304 1,929,020 (1)
755,483 760,149 — (1) 754,898 759,455 (1)
10.58
68.6 60.9 (5) 7 66.7 61.4
6,892 8,694 10 (13) 14,463 17,157 (16)
4,885.7 4,989.9 — (2) 4,875.7 4,999.2 (2)
951,024 956,879 (1) (1) $ 947,532 960,243 (1)
1,297,178 1,301,195 (2) (2) 1,284,187 1,300,198 (1)
2.84 2.90 3 1 2.89% 2.89 —
472,968 462,890 1 3 $ 475,495 462,890 3
947,308 957,423 — (1) 944,265 957,423 (1)
26,445 26,573 — (1) 26,429 26,573 (1)
1,915,388 1,930,792 (2) (3) 1,879,700 1,930,792 (3)
181,150 181,233 — — 181,386 181,233 —
205,910 205,949 — — 206,069 205,949 —
4,873.9 4,966.8 (1) (2) 4,849.1 4,966.8 (2)
31.16 30.58 1 3 31.47 30.58 3
10,373 11,073 (2) (8) 10,193 11,073 (8)
58,935 55,742 (2) 3 57,505 55,742 3
1,303,689 1,305,830 (3) (3) 1,268,864 1,305,830 (3)
204,952 205,034 — — 205,188 205,034 —
151,878 151,868 — — 152,580 151,868 —
37.17 36.49 1 3 $ 37.41 36.49 3
57.12 66.31 56.60 (14) 1 66.31 59.99 11
50.26
55.44 52.41 55.41 6 — 55.44 55.41 —
50.70 50.84 (1) (1) 50.26 50.84 (1)
265,700 270,600 — (2) 264,500 270,600 (2) Team members (active, full-time equivalent) 264,500
(1) Tangible common equity is a non-GAAP financial measure and represents total equity less preferred equity, noncontrolling interests, and goodwill and certain identifiable intangible assets (including goodwill and intangible assets associated with certain of our nonmarketable equity securities but excluding mortgage servicing rights), net of applicable deferred taxes. The methodology of determining tangible common equity may differ among companies. Management believes that return on average tangible common equity and tangible book value per common share, which utilize tangible common equity, are useful financial measures because they enable investors and others to assess the Company's use of equity. For additional information, including a corresponding reconciliation to GAAP financial measures, see the "Tangible Common Equity" tables on page 36.
(2) The efficiency ratio is noninterest expense divided by total revenue (net interest income and noninterest income). (3) Pre-tax pre-provision profit (PTPP) is total revenue less noninterest expense. Management believes that PTPP is a useful financial measure because it enables investors and
others to assess the Company’s ability to generate capital to cover credit losses through a credit cycle. (4) Consumer and small business banking deposits are total deposits excluding mortgage escrow and wholesale deposits. (5) Financial information for the prior periods of 2017 has been revised to reflect the impact of the adoption in first quarter 2018 of Accounting Standards Update (ASU)
2016-01 – Financial Instruments – Overall (Subtopic 825-10): Recognition and Measurement of Financial Assets and Financial Liabilities. (6) Book value per common share is common stockholders' equity divided by common shares outstanding. Tangible book value per common share is tangible common equity
divided by common shares outstanding.
9

- 18
Wells Fargo & Company and Subsidiaries FIVE QUARTER SUMMARY FINANCIAL DATA
($ in millions, except per share amounts) Jun 30,
2018 Mar 31,
2018 Dec 31,
2017 Sep 30,
2017
Quarter ended
Jun 30, 2017
For the Quarter
Wells Fargo net income $ 5,186 5,136 6,151 4,542 5,856
Wells Fargo net income applicable to common stock 4,792 4,733 5,740 4,131 5,450
Diluted earnings per common share 0.98 0.96 1.16 0.83 1.08
Profitability ratios (annualized) :
Wells Fargo net income to average assets (ROA) 1.10% 1.09 1.26 0.93 1.22
Wells Fargo net income applicable to common stock to average Wells Fargo common stockholders’ equity (ROE) 10.60 10.58 12.47 8.96 12.06
Return on average tangible common equity (ROTCE)(1) 12.62 12.62 14.85 10.66 14.41
Efficiency ratio (2) 64.9 68.6 76.2 65.7 60.9
Total revenue $ 21,553 21,934 22,050 21,849 22,235
Pre-tax pre-provision profit (PTPP) (3) 7,571 6,892 5,250 7,498 8,694
Dividends declared per common share 0.39 0.39 0.39 0.39 0.38
Average common shares outstanding 4,865.8 4,885.7 4,912.5 4,948.6 4,989.9
Diluted average common shares outstanding 4,899.8 4,930.7 4,963.1 4,996.8 5,037.7
Average loans $ 944,079 951,024 951,822 952,343 956,879
Average assets 1,884,884 1,915,896 1,935,318 1,938,461 1,927,021
Average total deposits 1,271,339 1,297,178 1,311,592 1,306,356 1,301,195
Average consumer and small business banking deposits (4) 754,047 755,483 757,541 755,094 760,149
Net interest margin 2.93% 2.84 2.84 2.86 2.90
At Quarter End
Debt securities (5) $ 475,495 472,968 473,366 474,710 462,890
Loans 944,265 947,308 956,770 951,873 957,423
Allowance for loan losses 10,193 10,373 11,004 11,078 11,073
Goodwill 26,429 26,445 26,587 26,581 26,573
Equity securities (5) 57,505 58,935 62,497 54,981 55,742
Assets 1,879,700 1,915,388 1,951,757 1,934,880 1,930,792
Deposits 1,268,864 1,303,689 1,335,991 1,306,706 1,305,830
Common stockholders' equity 181,386 181,150 183,134 181,920 181,233
Wells Fargo stockholders’ equity 205,188 204,952 206,936 205,722 205,034
Total equity 206,069 205,910 208,079 206,617 205,949
Tangible common equity (1) 152,580 151,878 153,730 152,694 151,868
Common shares outstanding 4,849.1 4,873.9 4,891.6 4,927.9 4,966.8
Book value per common share (6) $ 37.41 36.49
Tangible book value per common share (1)(6) 31.47 31.16 31.43 30.99 30.58
Common stock price:
High 57.12 66.31 62.24 56.45 56.60
Low 50.26
37.17 37.44 36.92
50.70 52.84 49.28 50.84
Period end 55.44 52.41 60.67 55.15 55.41
Team members (active, full-time equivalent) 264,500 265,700 262,700 268,000 270,600
(1) Tangible common equity is a non-GAAP financial measure and represents total equity less preferred equity, noncontrolling interests, and goodwill and certain identifiable intangible assets (including goodwill and intangible assets associated with certain of our nonmarketable equity securities but excluding mortgage servicing rights), net of applicable deferred taxes. The methodology of determining tangible common equity may differ among companies. Management believes that return on average tangible common equity and tangible book value per common share, which utilize tangible common equity, are useful financial measures because they enable investors and others to assess the Company's use of equity. For additional information, including a corresponding reconciliation to GAAP financial measures, see the "Tangible Common Equity" tables on page 36.
(2) The efficiency ratio is noninterest expense divided by total revenue (net interest income and noninterest income). (3) Pre-tax pre-provision profit (PTPP) is total revenue less noninterest expense. Management believes that PTPP is a useful financial measure because it enables investors and
others to assess the Company’s ability to generate capital to cover credit losses through a credit cycle. (4) Consumer and small business banking deposits are total deposits excluding mortgage escrow and wholesale deposits. (5) Financial information for the prior quarters of 2017 has been revised to reflect the impact of the adoption in first quarter 2018 of ASU 2016-01 – Financial Instruments –
Overall (Subtopic 825-10): Recognition and Measurement of Financial Assets and Financial Liabilities. (6) Book value per common share is common stockholders' equity divided by common shares outstanding. Tangible book value per common share is tangible common equity
divided by common shares outstanding.

8
- 19
Wells Fargo & Company and Subsidiaries CONSOLIDATED STATEMENT OF INCOME
(in millions, except per share amounts)
Quarter ended June 30,
2018 2017
%
Change
Six months ended June 30,
2018 2017
%
Change
Interest income
Debt securities (1) $ 3,594 3,226 11% $ 7,008 6,399 10%
Mortgages held for sale 198 191 4 377 373 1
Loans held for sale (1) 48 13 269 72 23 213
Loans 10,912 10,358 5 21,491 20,499 5
Equity securities (1) 221 199 11 452 374 21
Other interest income (1) 1,042 707 47 1,962 1,239 58
Total interest income 16,015 14,694 9 31,362 28,907
Interest expense
Deposits 1,268 677 87 2,358 1,213 94
Short-term borrowings 398 163 144 709 277 156
Long-term debt 1,658 1,275 30 3,234 2,422 34
Other interest expense 150 108 39 282 200 41
Total interest expense 3,474 2,223 56 6,583 4,112 60
Net interest income 12,541 12,471 1 24,779 24,795 —
Provision for credit losses 452 555 (19) 643 1,160 (45)
Net interest income after provision for credit losses 12,089 11,916 1 24,136 23,635 2
Noninterest income
Service charges on deposit accounts 1,163 1,276 (9) 2,336 2,589 (10)
Trust and investment fees 3,675 3,629 1 7,358 7,199 2
Card fees 1,001 1,019 (2) 1,909 1,964 (3)
Other fees 846 902 (6) 1,646 1,767 (7)
Mortgage banking 770 1,148 (33) 1,704 2,376 (28)
Insurance 102 280 (64) 216 557 (61)
Net gains from trading activities (1) 191 151 26 434 423 3
Net gains on debt securities 41 120 (66) 42 156 (73)
Net gains from equity securities (1) 295 274 8 1,078 844 28
Lease income 443 493 (10) 898 974 (8)
Other 485 472 3 1,087 846 28
Total noninterest income 9,012 9,764 (8) 18,708 19,695 (5)
Noninterest expense
Salaries 4,465 4,343 3 8,828 8,604 3
Commission and incentive compensation 2,642 2,499 6 5,410 5,224 4
Employee benefits 1,245 1,308 (5) 2,843 2,994 (5)
Equipment 550 529 4 1,167 1,106 6
Net occupancy 722 706 2 1,435 1,418 1
Core deposit and other intangibles 265 287 (8) 530 576 (8)
FDIC and other deposit assessments 297 328 (9) 621 661 (6)
Other 3,796 3,541 7 8,190 6,750 21
Total noninterest expense 13,982 13,541 3 29,024 27,333 6
Income before income tax expense 7,119 8,139 (13) 13,820 15,997 (14)
Income tax expense 1,810 2,245 (19) 3,184 4,378 (27)
Net income before noncontrolling interests 5,309 5,894 (10) 10,636 11,619 (8)
Less: Net income from noncontrolling interests 123 38 224 314 129 143
Wells Fargo net income $ 5,186 5,856 (11) $ 10,322 11,490 (10)
Less: Preferred stock dividends and other 394 406 (3) 797 807 (1)
Wells Fargo net income applicable to common stock $ 4,792 5,450 (12) $ 9,525 10,683 (11)
Per share information
Earnings per common share
Diluted earnings per common share
Dividends declared per common share
Average common shares outstanding
Diluted average common shares outstanding
$ 0.98
0.98
0.39
4,865.8
4,899.8
1.09
1.08
0.38
4,989.9
5,037.7
(10)
(9)
3
(2)
(3)
$ 1.95
1.94
0.78
4,875.7
4,916.1
2.14
2.11
0.76
4,999.2
5,054.8
(9)
(8)
3
(2)
(3)
(1) Financial information for the prior periods of 2017 has been revised to reflect the impact of the adoption in first quarter 2018 of ASU 2016-01 – Financial Instruments – Overall (Subtopic 825-10): Recognition and Measurement of Financial Assets and Financial Liabilities.

- 20
Wells Fargo & Company and Subsidiaries FIVE QUARTER CONSOLIDATED STATEMENT OF INCOME
Quarter ended
(in millions, except per share amounts) Jun 30,
2018 Mar 31,
2018 Dec 31,
2017 Sep 30,
2017 Jun 30,
2017
Interest income
Debt securities (1) $ 3,594 3,414 3,294 3,253 3,226
Mortgages held for sale 198 179 196 217 191
Loans held for sale (1) 48 24 12 15 13
Loans 10,912 10,579 10,367 10,522 10,358
Equity securities (1) 221 231 239 186 199
Other interest income (1) 1,042 920 850 851 707
Total interest income 16,015 15,347 14,958 15,044 14,694
Deposits 1,268 1,090 931 869 677
Short-term borrowings 398 311 255 226 163
Long-term debt 1,658 1,576 1,344 1,391 1,275
Other interest expense 150 132 115 109 108
Total interest expense 3,474 3,109 2,645 2,595 2,223
Interest expense
Net interest income 12,541 12,238 12,313 12,449 12,471
Provision for credit losses 452 191 651 717 555
Net interest income after provision for credit losses 12,089 12,047 11,662 11,732 11,916
Noninterest income
Service charges on deposit accounts 1,163 1,173 1,246 1,276 1,276
Trust and investment fees 3,675 3,683 3,687 3,609 3,629
Card fees 1,001 908 996 1,000 1,019
Other fees 846 800 913 877 902
Mortgage banking 770 934 928 1,046 1,148
Insurance 102 114 223 269 280
Net gains (losses) from trading activities (1) 191 243 (1) 120 151
Net gains on debt securities 41 1 157 166 120
Net gains from equity securities (1) 295 783 572 363 274
Lease income 443 455 458 475 493
Other 485 602 558 199 472
Total noninterest income 9,012 9,696 9,737 9,400 9,764
Commission and incentive compensation 2,642 2,768 2,665 2,553 2,499
Employee benefits 1,245 1,598 1,293 1,279 1,308
Equipment 550 617 608 523 529
Net occupancy 722 713 715 716 706
Core deposit and other intangibles 265 265 288 288 287
FDIC and other deposit assessments 297 324 312 314 328
Other 3,796 4,394 6,516 4,322 3,541
Total noninterest expense 13,982 15,042 16,800 14,351 13,541
Noninterest expense
Salaries 4,465 4,363 4,403 4,356 4,343
8,139
Income tax expense (benefit) 1,810 1,374 (1,642) 2,181 2,245
Income before income tax expense 7,119 6,701 4,599 6,781
5,894
Less: Net income from noncontrolling interests 123 191 90 58 38
Net income before noncontrolling interests 5,309 5,327 6,241 4,600
5,856Wells Fargo net income $ 5,186 5,136 6,151 4,542
Less: Preferred stock dividends and other 394 403 411 411 406
Wells Fargo net income applicable to common stock $ 4,792 4,733 5,740 4,131 5,450
Per share information
Earnings per common share $ 0.98 0.97 1.17 0.83 1.09
Diluted earnings per common share 0.98 0.96 1.16 0.83 1.08
Dividends declared per common share 0.39 0.39 0.39 0.39 0.38
Average common shares outstanding 4,865.8 4,885.7 4,912.5 4,948.6 4,989.9
Diluted average common shares outstanding 4,899.8 4,930.7 4,963.1 4,996.8 5,037.7
(1) Financial information for the prior quarters of 2017 has been revised to reflect the impact of the adoption in first quarter 2018 of ASU 2016-01 – Financial Instruments – Overall (Subtopic 825-10): Recognition and Measurement of Financial Assets and Financial Liabilities.

- 21
Wells Fargo & Company and Subsidiaries CONSOLIDATED STATEMENT OF COMPREHENSIVE INCOME
Quarter ended June 30, % Six months ended June 30, %
(in millions) 2018 2017 Change 2018 2017 Change
Wells Fargo net income $ 5,186 5,856 (11)% $ 10,322 11,490 (10)%
Other comprehensive income (loss), before tax:
Debt securities (1):
Net unrealized gains (losses) arising during the period (617) 1,565 NM (4,060) 1,934 NM
Reclassification of net (gains) losses to net income 49 (177) NM 117 (322) NM
Derivatives and hedging activities:
Net unrealized gains (losses) arising during the period (150) 276 NM (392) (86) 356
Reclassification of net (gains) losses to net income 77 (153) NM 137 (355) NM
Defined benefit plans adjustments:
Net actuarial and prior service gains (losses) arising during the period — — — 6 (7) NM
Amortization of net actuarial loss, settlements and other to net income 29 41 (29) 61 79 (23)
Foreign currency translation adjustments:
Net unrealized gains (losses) arising during the period (83) 31 NM (85) 47 NM
Other comprehensive income (loss), before tax (695) 1,583 NM (4,216) 1,290 NM
Income tax benefit (expense) related to other comprehensive income 154 (587) NM 1,016 (464) NM
Other comprehensive income (loss), net of tax (541) 996 NM (3,200) 826 NM
Less: Other comprehensive income (loss) from noncontrolling interests (1) (9) (89) (1) 5 NM
Wells Fargo other comprehensive income (loss), net of tax (540) 1,005 NM (3,199) 821 NM
Wells Fargo comprehensive income 4,646 6,861 (32) 7,123 12,311 (42)
Comprehensive income from noncontrolling interests 122 29 321 313 134 134
Total comprehensive income $ 4,768 6,890 (31) $ 7,436 12,445 (40)
NM – Not meaningful (1) The quarter and six months ended June 30, 2017, includes net unrealized gains (losses) arising during the period from equity securities of $65 million and $126 million and
reclassification of net (gains) losses to net income related to equity securities of $(101) million and $(217) million, respectively. With the adoption in first quarter 2018 of ASU 2016-01, the quarter and six months ended June 30, 2018, reflects net unrealized (gains) losses arising during the period and reclassification of net (gains) losses to net income from only debt securities.
FIVE QUARTER CONDENSED CONSOLIDATED STATEMENT OF CHANGES IN TOTAL EQUITY
Quarter ended
(in millions) Jun 30,
2018 Mar 31,
2018 Dec 31,
2017 Sep 30,
2017 Jun 30,
2017
Balance, beginning of period
Cumulative effect from change in accounting policies (1)
Wells Fargo net income
Wells Fargo other comprehensive income (loss), net of tax
Noncontrolling interests
Common stock issued
Common stock repurchased (2)
Preferred stock released by ESOP
Common stock warrants repurchased/exercised
Preferred stock issued
$ 205,910
—
5,186
(540)
(77)
73
(2,923)
490
(1)
—
208,079
(24)
5,136
(2,659)
(178)
1,208
(3,029)
231
(157)
—
206,617
—
6,151
(522)
247
436
(2,845)
218
(46)
—
205,949
—
4,542
526
(20)
254
(2,601)
209
(19)
—
202,310
—
5,856
1,005
(75)
252
(2,287)
406
(24)
677
Common stock dividends
Preferred stock dividends
Stock incentive compensation expense
Net change in deferred compensation and related plans
(1,900)
(394)
258
(13)
(1,911)
(410)
437
(813)
(1,920)
(411)
206
(52)
(1,936)
(411)
135
(11)
(1,899)
(406)
145
(11)
Balance, end of period $ 206,069 205,910 208,079 206,617 205,949
(1) The cumulative effect for the quarter ended March 31, 2018, reflects the impact of the adoption in first quarter 2018 of ASU 2016-04, ASU 2016-01 and ASU 2014-09. (2) For the quarter ended June 30, 2018, includes $1.0 billion related to a private forward repurchase transaction expected to settle in third quarter 2018.

- 22
Wells Fargo & Company and Subsidiaries AVERAGE BALANCES, YIELDS AND RATES PAID (TAXABLE-EQUIVALENT BASIS) (1)(2)
2018 Quarter ended June 30,
2017
(in millions) Average balance
Yields/ rates
Interest income/ expense
Average balance
Yields/ rates
Interest income/ expense
Earning assets Interest-earning deposits with banks (3) $ 154,846 1.75% $ 676 204,541 1.03% $ 523 Federal funds sold and securities purchased under resale agreements (3) 80,020 1.73 344 77,078 0.91 175 Debt securities (4):
Trading debt securities (8) 80,661 3.45 695 70,411 3.24 570 Available-for-sale debt securities:
Securities of U.S. Treasury and federal agencies 6,425 1.66 27 18,099 1.53 69 Securities of U.S. states and political subdivisions (7) 47,388 3.91 464 53,492 3.89 521 Mortgage-backed securities:
Federal agencies 154,929 2.75 1,065 132,032 2.63 868 Residential and commercial 8,248 4.86 101 12,586 5.55 175
Total mortgage-backed securities 163,177 2.86 1,166 144,618 2.89 1,043 Other debt securities (8) 47,009 4.33 506 48,466 3.77 457
Total available-for-sale debt securities (7)(8) 263,999 3.28 2,163 264,675 3.16 2,090 Held-to-maturity debt securities:
Securities of U.S. Treasury and federal agencies 44,731 2.19 244 44,701 2.19 244 Securities of U.S. states and political subdivisions 6,255 4.34 68 6,270 5.29 83 Federal agency and other mortgage-backed securities 94,964 2.33 552 83,116 2.44 507 Other debt securities 584 4.66 7 2,798 2.34 16
Total held-to-maturity debt securities 146,534 2.38 871 136,885 2.49 850 Total debt securities (7)(8) 491,194 3.04 3,729 471,971 2.98 3,510
Mortgages held for sale (5)(7) 18,788 4.22 198 19,758 3.87 191 Loans held for sale (5)(8) 3,481 5.48 48 1,476 3.65 13
Commercial loans: Commercial and industrial - U.S. 275,259 4.16 2,851 273,073 3.70 2,521 Commercial and industrial - Non U.S. 59,716 3.51 524 56,426 2.86 402 Real estate mortgage 123,982 4.27 1,319 131,293 3.68 1,206 Real estate construction 23,637 4.88 287 25,271 4.10 259 Lease financing 19,266 4.48 216 19,058 4.82 230
Total commercial loans 501,860 4.15 5,197 505,121 3.67 4,618 Consumer loans:
Real estate 1-4 family first mortgage 283,101 4.06 2,870 275,108 4.08 2,805 Real estate 1-4 family junior lien mortgage 37,249 5.32 495 43,602 4.78 521 Credit card 35,883 12.66 1,133 34,868 12.18 1,059 Automobile 48,568 5.18 628 59,112 5.43 800 Other revolving credit and installment 37,418 6.62 617 39,068 6.13 596
Total consumer loans 442,219 5.20 5,743 451,758 5.13 5,781 Total loans (5) 944,079 4.64 10,940 956,879 4.36 10,399
Equity securities (8) 37,330 2.38 222 36,604 2.24 205 Other (8) 5,518 1.48 21 4,400 0.70 8
Total earning assets (7)(8) $ 1,735,256 3.73% $ 16,178 1,772,707 3.40% $ 15,024 Funding sources
Deposits: Interest-bearing checking $ 80,324 0.90% $ 181 48,465 0.41% $ 50 Market rate and other savings 676,668 0.26 434 683,014 0.13 214 Savings certificates 20,033 0.43 21 22,599 0.30 17 Other time deposits (7) 82,061 2.26 465 57,158 1.39 197 Deposits in foreign offices 51,474 1.30 167 123,684 0.65 199
Total interest-bearing deposits (7) 910,560 0.56 1,268 934,920 0.29 677 Short-term borrowings 103,795 1.54 398 95,763 0.69 164 Long-term debt (7) 223,800 2.97 1,658 249,889 2.04 1,274 Other liabilities 28,202 2.12 150 20,981 2.05 108
Total interest-bearing liabilities (7) 1,266,357 1.10 3,474 1,301,553 0.68 2,223 Portion of noninterest-bearing funding sources (7)(8) 468,899 — — 471,154 — —
Total funding sources (7)(8) $ 1,735,256 0.80 3,474 1,772,707 0.50 2,223 Net interest margin and net interest income on a taxable-equivalent basis (6)(7) 2.93% $ 12,704 2.90% $ 12,801 Noninterest-earning assets Cash and due from banks $ 18,609 18,171 Goodwill 26,444 26,664 Other (7)(8) 104,575 109,479
Total noninterest-earning assets (7)(8) $ 149,628 154,314 Noninterest-bearing funding sources Deposits $ 360,779 366,275 Other liabilities (7) 51,681 53,438 Total equity (7) 206,067 205,755 Noninterest-bearing funding sources used to fund earning assets (7)(8) (468,899) (471,154)
Net noninterest-bearing funding sources (7)(8) $ 149,628 154,314 Total assets (7) $ 1,884,884 1,927,021
(1) Our average prime rate was 4.80% and 4.05% for the quarters ended June 30, 2018 and 2017, respectively. The average three-month London Interbank Offered Rate (LIBOR) was 2.34% and 1.21% for the same quarters, respectively.
(2) Yields/rates and amounts include the effects of hedge and risk management activities associated with the respective asset and liability categories. (3) Financial information for the prior period has been revised to reflect the impact of the adoption in first quarter 2018 of ASU 2016-18 – Statement of Cash Flows (Topic
230): Restricted Cash in which we changed the presentation of our cash and cash equivalents to include both cash and due from banks as well as interest-earning deposits with banks, which are inclusive of any restricted cash.
(4) Yields and rates are based on interest income/expense amounts for the period, annualized based on the accrual basis for the respective accounts. The average balance amounts represent amortized cost for the periods presented.
(5) Nonaccrual loans and related income are included in their respective loan categories. (6) Includes taxable-equivalent adjustments of $163 million and $330 million for the quarters ended June 30, 2018 and 2017, respectively, predominantly related to tax-
exempt income on certain loans and securities. The federal statutory tax rate was 21% and 35% for the quarters ended June 30, 2018 and 2017, respectively. (7) Financial information for the prior period has been revised to reflect the impact of the adoption in fourth quarter 2017 of ASU 2017-12 – Derivatives and Hedging (Topic
815): Targeted Improvements to Accounting for Hedging Activities. (8) Financial information for the prior period has been revised to reflect the impact of the adoption in first quarter 2018 of ASU 2016-01 – Financial Instruments – Overall
(Subtopic 825-10): Recognition and Measurement of Financial Assets and Financial Liabilities.
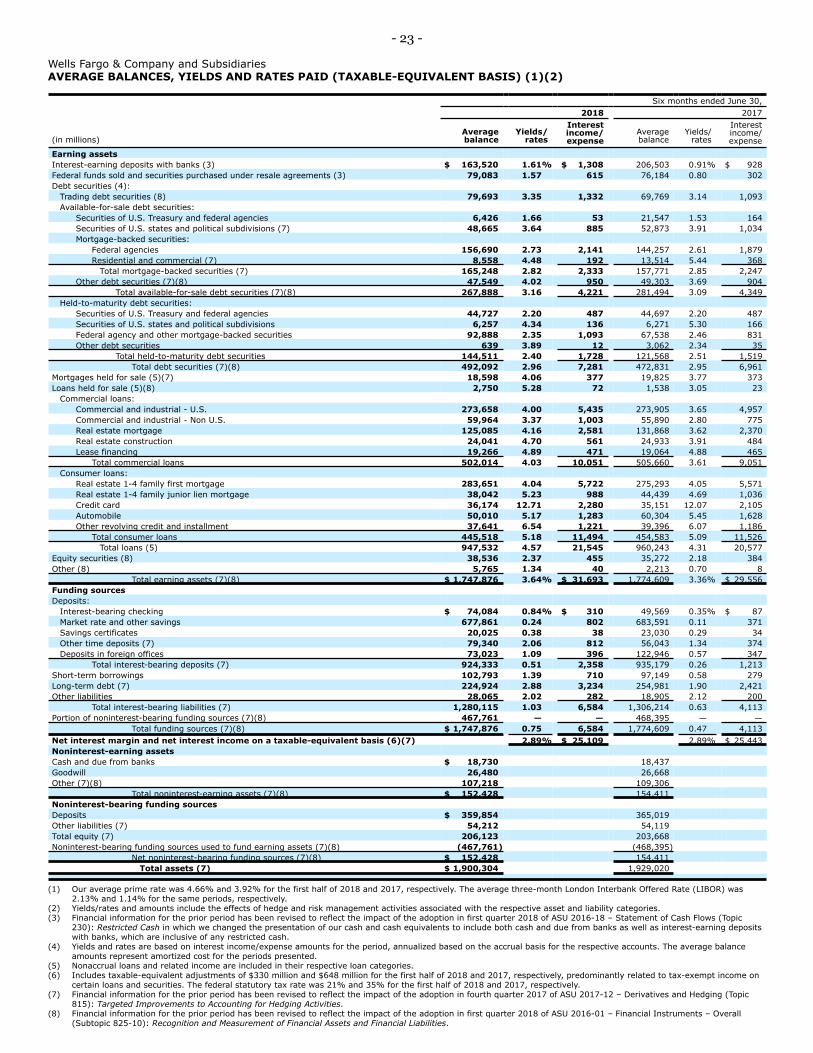
- 23
Wells Fargo & Company and Subsidiaries AVERAGE BALANCES, YIELDS AND RATES PAID (TAXABLE-EQUIVALENT BASIS) (1)(2)
Six months ended June 30, 2018 2017
Interest Interest Average Yields/ income/ Average Yields/ income/
(in millions) balance rates expense balance rates expense
Earning assets Interest-earning deposits with banks (3) $ 163,520 1.61% $ 1,308 206,503 0.91% $ 928 Federal funds sold and securities purchased under resale agreements (3) 79,083 1.57 615 76,184 0.80 302 Debt securities (4):
Trading debt securities (8) 79,693 3.35 1,332 69,769 3.14 1,093 Available-for-sale debt securities:
Securities of U.S. Treasury and federal agencies 6,426 1.66 53 21,547 1.53 164 Securities of U.S. states and political subdivisions (7) 48,665 3.64 885 52,873 3.91 1,034 Mortgage-backed securities:
Federal agencies 156,690 2.73 2,141 144,257 2.61 1,879 Residential and commercial (7) 8,558 4.48 192 13,514 5.44 368
Total mortgage-backed securities (7) 165,248 2.82 2,333 157,771 2.85 2,247 Other debt securities (7)(8) 47,549 4.02 950 49,303 3.69 904
Total available-for-sale debt securities (7)(8) 267,888 3.16 4,221 281,494 3.09 4,349 Held-to-maturity debt securities:
Securities of U.S. Treasury and federal agencies 44,727 2.20 487 44,697 2.20 487 Securities of U.S. states and political subdivisions 6,257 4.34 136 6,271 5.30 166 Federal agency and other mortgage-backed securities 92,888 2.35 1,093 67,538 2.46 831 Other debt securities 639 3.89 12 3,062 2.34 35
Total held-to-maturity debt securities 144,511 2.40 1,728 121,568 2.51 1,519 Total debt securities (7)(8) 492,092 2.96 7,281 472,831 2.95 6,961
Mortgages held for sale (5)(7) 18,598 4.06 377 19,825 3.77 373 Loans held for sale (5)(8) 2,750 5.28 72 1,538 3.05 23
Commercial loans: Commercial and industrial - U.S. 273,658 4.00 5,435 273,905 3.65 4,957 Commercial and industrial - Non U.S. 59,964 3.37 1,003 55,890 2.80 775 Real estate mortgage 125,085 4.16 2,581 131,868 3.62 2,370 Real estate construction 24,041 4.70 561 24,933 3.91 484 Lease financing 19,266 4.89 471 19,064 4.88 465
Total commercial loans 502,014 4.03 10,051 505,660 3.61 9,051 Consumer loans:
Real estate 1-4 family first mortgage 283,651 4.04 5,722 275,293 4.05 5,571 Real estate 1-4 family junior lien mortgage 38,042 5.23 988 44,439 4.69 1,036 Credit card 36,174 12.71 2,280 35,151 12.07 2,105 Automobile 50,010 5.17 1,283 60,304 5.45 1,628 Other revolving credit and installment 37,641 6.54 1,221 39,396 6.07 1,186
Total consumer loans 445,518 5.18 11,494 454,583 5.09 11,526 Total loans (5) 947,532 4.57 21,545 960,243 4.31 20,577
Equity securities (8) 38,536 2.37 455 35,272 2.18 384 Other (8) 5,765 1.34 40 2,213 0.70 8
Total earning assets (7)(8) $ 1,747,876 3.64% $ 31,693 1,774,609 3.36% $ 29,556 Funding sources Deposits:
Interest-bearing checking $ 74,084 0.84% $ 310 49,569 0.35% $ 87 Market rate and other savings 677,861 0.24 802 683,591 0.11 371 Savings certificates 20,025 0.38 38 23,030 0.29 34 Other time deposits (7) 79,340 2.06 812 56,043 1.34 374 Deposits in foreign offices 73,023 1.09 396 122,946 0.57 347
Total interest-bearing deposits (7) 924,333 0.51 2,358 935,179 0.26 1,213 Short-term borrowings 102,793 1.39 710 97,149 0.58 279 Long-term debt (7) 224,924 2.88 3,234 254,981 1.90 2,421 Other liabilities 28,065 2.02 282 18,905 2.12 200
Total interest-bearing liabilities (7) 1,280,115 1.03 6,584 1,306,214 0.63 4,113 Portion of noninterest-bearing funding sources (7)(8) 467,761
0.75 6,584 1,774,609 0.47 4,113 — — 468,395 — —
Total funding sources (7)(8) $ 1,747,876 Net interest margin and net interest income on a taxable-equivalent basis (6)(7) 2.89% $ 25,109 2.89% $ 25,443 Noninterest-earning assets Cash and due from banks $ 18,730 18,437 Goodwill 26,480 26,668 Other (7)(8) 107,218 109,306
Total noninterest-earning assets (7)(8) $ 152,428 154,411 Noninterest-bearing funding sources Deposits $ 359,854 365,019 Other liabilities (7) 54,212 54,119 Total equity (7) 206,123 203,668 Noninterest-bearing funding sources used to fund earning assets (7)(8) (467,761) (468,395)
Net noninterest-bearing funding sources (7)(8) $ 152,428 154,411 Total assets (7) $ 1,900,304 1,929,020
(1) Our average prime rate was 4.66% and 3.92% for the first half of 2018 and 2017, respectively. The average three-month London Interbank Offered Rate (LIBOR) was 2.13% and 1.14% for the same periods, respectively.
(2) Yields/rates and amounts include the effects of hedge and risk management activities associated with the respective asset and liability categories. (3) Financial information for the prior period has been revised to reflect the impact of the adoption in first quarter 2018 of ASU 2016-18 – Statement of Cash Flows (Topic
230): Restricted Cash in which we changed the presentation of our cash and cash equivalents to include both cash and due from banks as well as interest-earning deposits with banks, which are inclusive of any restricted cash.
(4) Yields and rates are based on interest income/expense amounts for the period, annualized based on the accrual basis for the respective accounts. The average balance amounts represent amortized cost for the periods presented.
(5) Nonaccrual loans and related income are included in their respective loan categories. (6) Includes taxable-equivalent adjustments of $330 million and $648 million for the first half of 2018 and 2017, respectively, predominantly related to tax-exempt income on
certain loans and securities. The federal statutory tax rate was 21% and 35% for the first half of 2018 and 2017, respectively. (7) Financial information for the prior period has been revised to reflect the impact of the adoption in fourth quarter 2017 of ASU 2017-12 – Derivatives and Hedging (Topic
815): Targeted Improvements to Accounting for Hedging Activities. (8) Financial information for the prior period has been revised to reflect the impact of the adoption in first quarter 2018 of ASU 2016-01 – Financial Instruments – Overall
(Subtopic 825-10): Recognition and Measurement of Financial Assets and Financial Liabilities.

- 24
Wells Fargo & Company and Subsidiaries FIVE QUARTER AVERAGE BALANCES, YIELDS AND RATES PAID (TAXABLE-EQUIVALENT BASIS) (1)(2)
Quarter ended
Jun 30, 2018 Mar 31, 2018 Dec 31, 2017 Sep 30, 2017 Jun 30, 2017
($ in billions) Average balance
Yields/ rates
Average balance
Yields/ rates
Average balance
Yields/ rates
Average balance
Yields/ rates
Average balance
Yields/ rates
Earning assets
Interest-earning deposits with banks (3) $ 154.8
1.73 78.1 1.40 75.8 1.20 70.6 1.14 77.1 0.91
1.75% $ 172.3 1.49% $ 189.1 1.27% $ 205.5 1.21% $ 204.5 1.03% Federal funds sold and securities purchased under resale
agreements (3) 80.0
Debt securities (4): Trading debt securities (5) 80.7 3.45 78.7 3.24 81.6 3.17 76.6 3.21 70.4 3.24 Available-for-sale debt securities:
Securities of U.S. Treasury and federal agencies 6.4 1.66 6.4 1.66 6.4 1.66 14.5 1.31 18.1 1.53 Securities of U.S. states and political subdivisions 47.4 3.91 50.0 3.37 52.4 3.91 52.5 4.08 53.5 3.89 Mortgage-backed securities:
Federal agencies 154.9 2.75 158.4 2.72 152.9 2.62 139.8 2.58 132.0 2.63 Residential and commercial 8.2 4.86 8.9 4.12 9.4 4.85 11.0 5.44 12.6 5.55
Total mortgage-backed securities 163.1 2.86 167.3 2.79 162.3 2.75 150.8 2.79 144.6 2.89 Other debt securities (5) 47.1 4.33 48.1 3.73 48.6 3.62 47.7 3.73 48.5 3.77
Total available-for-sale debt securities (5) 264.0 3.28 271.8 3.04 269.7 3.10 265.5 3.13 264.7 3.16 Held-to-maturity debt securities:
Securities of U.S. Treasury and federal agencies 44.7 2.19 44.7 2.20 44.7 2.19 44.7 2.18 44.7 2.19 Securities of U.S. states and political subdivisions 6.3 4.34 6.3 4.34 6.3 5.26 6.3 5.44 6.3 5.29
Federal agency and other mortgage-backed securities 94.9 2.33 90.8 2.38 89.6 2.25 88.3 2.26 83.1 2.44
Other debt securities 0.6 4.66 0.7 3.23 1.2 2.64 1.4 3.05 2.8 2.34 Total held-to-maturity debt securities 146.5 2.38 142.5 2.42 141.8 2.36 140.7 2.38 136.9 2.49 Total debt securities (5) 491.2 3.04 493.0 2.89 493.1 2.90 482.8 2.93 472.0 2.98
Mortgages held for sale 18.8 4.22 18.4 3.89 20.5 3.82 22.9 3.79 19.8 3.87 Loans held for sale (5) 3.5 5.48 2.0 4.92 1.5 3.19 1.4 4.39 1.5 3.65
Commercial loans: Commercial and industrial - U.S. 275.3 4.16 272.0 3.85 270.3 3.89 270.1 3.81 273.1 3.70 Commercial and industrial - Non U.S. 59.7 3.51 60.2 3.23 59.2 2.96 57.7 2.89 56.4 2.86 Real estate mortgage 124.0 4.27 126.2 4.05 127.2 3.88 129.1 3.83 131.3 3.68 Real estate construction 23.6 4.88 24.4 4.54 24.4 4.38 25.0 4.18 25.3 4.10 Lease financing 19.3 4.48 19.4 5.30 19.3 0.62 19.2 4.59 19.0 4.82
Total commercial loans 501.9 4.15 502.2 3.91 500.4 3.68 501.1 3.76 505.1 3.67 Consumer loans:
Real estate 1-4 family first mortgage 283.1 4.06 284.2 4.02 282.0 4.01 278.4 4.03 275.1 4.08 Real estate 1-4 family junior lien mortgage 37.2 5.32 38.8 5.13 40.4 4.96 41.9 4.95 43.6 4.78 Credit card 35.9 12.66 36.4 12.75 36.4 12.37 35.6 12.41 34.9 12.18 Automobile 48.6 5.18 51.5 5.16 54.3 5.13 56.7 5.34 59.1 5.43 Other revolving credit and installment 37.4 6.62 37.9 6.46 38.3 6.28 38.6 6.31 39.1 6.13
Total consumer loans 442.2 5.20 448.8 5.16 451.4 5.10 451.2 5.14 451.8 5.13 Total loans 944.1 4.64 951.0 4.50 951.8 4.35 952.3 4.41 956.9 4.36
Equity securities (5) 37.3 2.38 39.8 2.35 38.0 2.60 35.9 2.12 36.6 2.24 Other (5) 5.6
3.73% $1,760.6 3.55% $1,777.0 3.43% $1,780.1 3.44% $1,772.7 3.40% 1.48 6.0 1.21 7.2 0.88 8.7 0.90 4.3 0.70
Total earning assets (5) $1,735.3 Funding sources
Deposits: Interest-bearing checking $ 80.3 0.90% $ 67.8 0.77% $ 50.5 0.68% $ 48.3 0.57% $ 48.5 0.41% Market rate and other savings 676.7 0.26 679.1 0.22 679.9 0.19 681.2 0.17 683.0 0.13 Savings certificates 20.0 0.43 20.0 0.34 20.9 0.31 21.8 0.31 22.6 0.30 Other time deposits 82.1 2.26 76.6 1.84 68.2 1.49 66.1 1.51 57.1 1.39 Deposits in foreign offices 51.5 1.30 94.8 0.98 124.6 0.81 124.7 0.76 123.7 0.65
Total interest-bearing deposits 910.6 0.56 938.3 0.47 944.1 0.39 942.1 0.37 934.9 0.29 Short-term borrowings 103.8 1.54 101.8 1.24 102.1 0.99 99.2 0.91 95.8 0.69 Long-term debt 223.8 2.97 226.0 2.80 231.6 2.32 243.5 2.28 249.9 2.04 Other liabilities 28.2 2.12 27.9 1.92 24.7 1.86 24.8 1.74 21.0 2.05
Total interest-bearing liabilities 1,266.4 1.10 1,294.0 0.97 1,302.5 0.81 1,309.6 0.79 1,301.6 0.68 Portion of noninterest-bearing funding sources (5) 468.9 — 466.6 — 474.5 — 470.5 — 471.1 —
Total funding sources (5) $1,735.3 0.80 $1,760.6 0.71 $1,777.0 0.59 $1,780.1 0.58 $1,772.7 0.50
Net interest margin on a taxable-equivalent basis 2.93% 2.84% 2.84% 2.86% 2.90%
Noninterest-earning assets Cash and due from banks $ 18.6 18.9 19.2 18.5 18.2 Goodwill 26.4 26.5 26.6 26.6 26.7 Other (5) 104.6
155.3 158.3 158.4 154.3109.9 112.5 113.3 109.4
Total noninterest-earnings assets (5) $ 149.6 Noninterest-bearing funding sources Deposits $ 360.7 358.9 367.5 364.3 366.3 Other liabilities (5) 51.7 56.8 57.9 56.9 53.3 Total equity 206.1 206.2 207.4 207.7 205.8 Noninterest-bearing funding sources used to fund earning assets (5) (468.9) (466.6) (474.5) (470.5) (471.1)
Net noninterest-bearing funding sources (5) $ 149.6 155.3 158.3 158.4 154.3 Total assets $1,884.9 1,915.9 1,935.3 1,938.5 1,927.0
(1) Our average prime rate was 4.80% for the quarter ended June 30, 2018, 4.52% for the quarter ended March 31,2018, 4.30% for the quarter ended December 31, 2017, 4.25% for the quarter ended September 30, 2017 and 4.05% for the quarter ended June 30, 2017. The average three-month London Interbank Offered Rate (LIBOR) was 2.34%, 1.93%, 1.46%, 1.31% and 1.21% for the same quarters, respectively.
(2) Yields/rates include the effects of hedge and risk management activities associated with the respective asset and liability categories. (3) Financial information for the prior quarters of 2017 has been revised to reflect the impact of the adoption in first quarter 2018 of ASU 2016-18 – Statement of Cash Flows
(Topic 230): Restricted Cash in which we changed the presentation of our cash and cash equivalents to include both cash and due from banks as well as interest-earning deposits with banks, which are inclusive of any restricted cash.
(4) Yields and rates are based on interest income/expense amounts for the period, annualized based on the accrual basis for the respective accounts. The average balance amounts represent amortized cost for the periods presented.
(5) Financial information for the prior quarters of 2017 has been revised to reflect the impact of the adoption in first quarter 2018 of ASU 2016-01 – Financial Instruments – Overall (Subtopic 825-10): Recognition and Measurement of Financial Assets and Financial Liabilities.
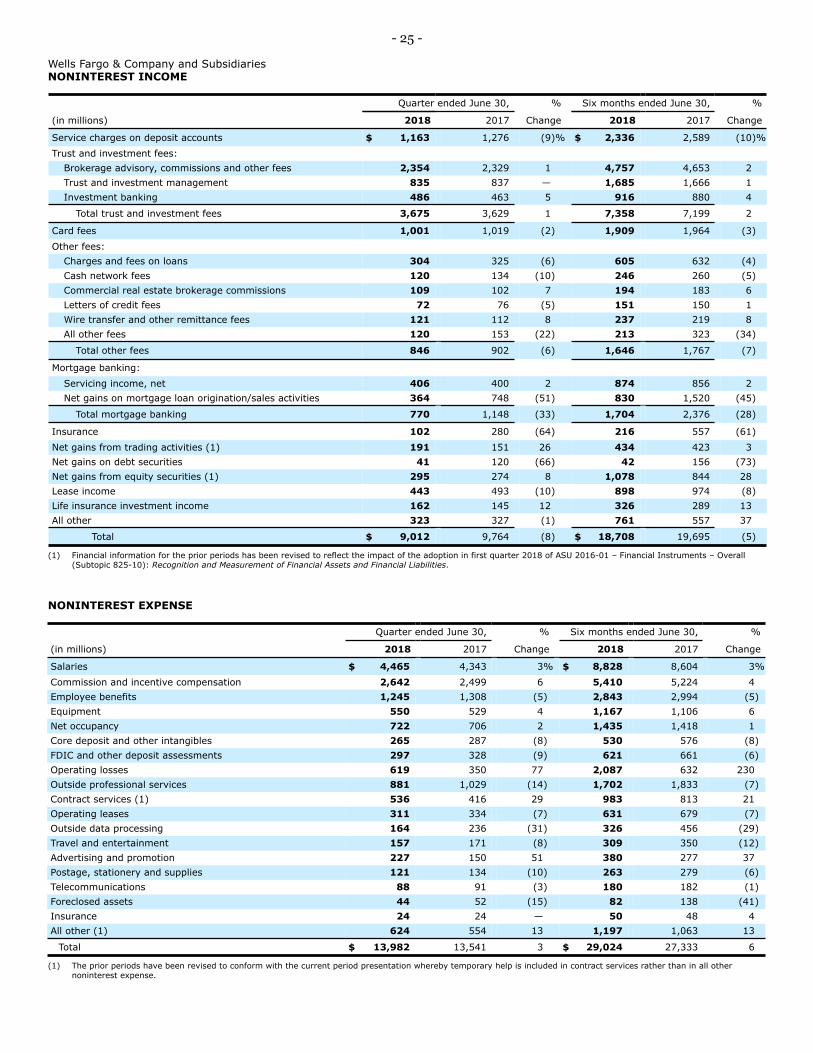
- 25
Wells Fargo & Company and Subsidiaries NONINTEREST INCOME
(in millions)
Quarter ended June 30,
2018 2017
%
Change
Six months ended June 30,
2018 2017
%
Change
Service charges on deposit accounts $ 1,163 1,276 (9)% $ 2,336 2,589 (10)%
Trust and investment fees:
Brokerage advisory, commissions and other fees 2,354 2,329 1 4,757 4,653 2
Trust and investment management 835 837 — 1,685 1,666 1
Investment banking 486 463 5 916 880 4
Total trust and investment fees 3,675 3,629 1 7,358 7,199 2
Card fees 1,001 1,019 (2) 1,909 1,964 (3)
Other fees:
Charges and fees on loans 304 325 (6) 605 632 (4)
Cash network fees 120 134 (10) 246 260 (5)
Commercial real estate brokerage commissions 109 102 7 194 183 6
Letters of credit fees 72 76 (5) 151 150 1
Wire transfer and other remittance fees 121 112 8 237 219 8
All other fees 120 153 (22) 213 323 (34)
Total other fees 846 902 (6) 1,646 1,767 (7)
Mortgage banking:
Servicing income, net 406 400 2 874 856
Net gains on mortgage loan origination/sales activities 364 748 (51) 830 1,520 (45)
Total mortgage banking 770 1,148 (33) 1,704 2,376 (28)
Insurance 102 280 (64) 216 557 (61)
Net gains from trading activities (1) 191 151 26 434 423 3
Net gains on debt securities 41 120 (66) 42 156 (73)
Net gains from equity securities (1) 295 274 8 1,078 844 28
Lease income 443 493 (10) 898 974 (8)
Life insurance investment income 162 145 12 326 289 13
All other 323 327 (1) 761 557 37
Total $ 9,012 9,764 (8) $ 18,708 19,695 (5)
(1) Financial information for the prior periods has been revised to reflect the impact of the adoption in first quarter 2018 of ASU 2016-01 – Financial Instruments – Overall (Subtopic 825-10): Recognition and Measurement of Financial Assets and Financial Liabilities.
NONINTEREST EXPENSE
Quarter ended June 30, % Six months ended June 30, %
(in millions) 2018 2017 Change 2018 2017 Change
Salaries $ 4,465 4,343 3% $ 8,828 8,604 3%
Commission and incentive compensation 2,642 2,499 6 5,410 5,224 4
Employee benefits 1,245 1,308 (5) 2,843 2,994 (5)
Equipment 550 529 4 1,167 1,106 6
Net occupancy 722 706 2 1,435 1,418 1
Core deposit and other intangibles 265 287 (8) 530 576 (8)
FDIC and other deposit assessments 297 328 (9) 621 661 (6)
Operating losses 619 350 77 2,087 632 230
Outside professional services 881 (14)1,029 1,702 1,833 (7)
Contract services (1) 536 416 29 983 813 21
Operating leases 311 334 (7) 631 679 (7)
Outside data processing 164 (31)236 326 456 (29)
Travel and entertainment 157 171 (8) 309 350 (12)
Advertising and promotion 227 150 51 380 277 37
Postage, stationery and supplies 121 (10)134 263 279 (6)
Telecommunications 88 91 (3) 180 182 (1)
Foreclosed assets 44 52 (15) 82 138 (41)
Insurance 24 24 — 50 48 4
All other (1) 624 554 13 1,197 1,063 13
Total $ 13,982 13,541 3 $ 29,024 27,333
(1) The prior periods have been revised to conform with the current period presentation whereby temporary help is included in contract services rather than in all other noninterest expense.
2
6

- 26
Wells Fargo & Company and Subsidiaries FIVE QUARTER NONINTEREST INCOME
Quarter ended
Jun 30, Mar 31, Dec 31, Sep 30, Jun 30, (in millions) 2018 2018 2017 2017 2017
Service charges on deposit accounts $ 1,163 1,173 1,246 1,276 1,276
Trust and investment fees:
Brokerage advisory, commissions and other fees 2,354 2,403 2,401 2,304 2,329
Trust and investment management 835 850 866 840 837
Investment banking 486 430 420 465 463
Total trust and investment fees 3,675 3,683 3,687 3,609 3,629
1,019
Other fees:
Charges and fees on loans 304
Card fees 1,001 908 996 1,000
301 313 318 325
Cash network fees 120 126 120 126 134
Commercial real estate brokerage commissions 109 85 159 120 102
Letters of credit fees 72 79 78 77 76
Wire transfer and other remittance fees 121 116 115 114 112
All other fees 120 93 128 122 153
Total other fees 846 800 913 877
Mortgage banking:
Servicing income, net 406 468 262 309 400
Net gains on mortgage loan origination/sales activities 364 466 666 737 748
1,148Total mortgage banking 770 934 928 1,046
Insurance 102 114 223 269 280
Net gains (losses) from trading activities (1) 191 243 (1) 120 151
Net gains on debt securities 41 1 157 166 120
Net gains from equity securities (1) 295 783 572 363 274
Lease income 443 455 458 475 493
Life insurance investment income 162 164 153 152 145
All other 323 438 405 47 327
Total $ 9,012 9,696 9,737 9,400 9,764
(1) Financial information for the prior quarters of 2017 has been revised to reflect the impact of the adoption in first quarter 2018 of ASU 2016-01 – Financial Instruments – Overall (Subtopic 825-10): Recognition and Measurement of Financial Assets and Financial Liabilities.
FIVE QUARTER NONINTEREST EXPENSE
Quarter ended
Jun 30, Mar 31, Dec 31, Sep 30, Jun 30, (in millions) 2018 2018 2017 2017 2017
4,343
Commission and incentive compensation 2,642 2,768 2,665 2,553 2,499
Employee benefits 1,245
Salaries $ 4,465 4,363 4,403 4,356
1,308
Equipment 550 617 608 523 529
Net occupancy 722
1,598 1,293 1,279
713 715 716 706
Core deposit and other intangibles 265 265 288 288 287
FDIC and other deposit assessments 297 324 312 314 328
Operating losses 619 1,468 3,531 1,329 350
Outside professional services 881 1,029
Contract services (1) 536 447 410 415 416
Operating leases 311
821 1,025 955
320 325 347 334
Outside data processing 164 162 208 227 236
Travel and entertainment 157 152 183 154 171
Advertising and promotion 227 153 200 137 150
Postage, stationery and supplies 121 142 137 128 134
Telecommunications 88 92 92 90 91
Foreclosed assets 44 38 47 66 52
Insurance 24 26 28 24 24
All other (1) 624 573 330 450 554
Total $ 13,982 15,042 16,800 14,351 13,541
(1) The prior quarters of 2017 have been revised to conform with the current period presentation whereby temporary help is included in contract services rather than in all other noninterest expense.
902

- 27
Wells Fargo & Company and Subsidiaries CONSOLIDATED BALANCE SHEET
(in millions, except shares) Jun 30,
2018 Dec 31,
2017 %
Change
Assets
Cash and due from banks $ 20,450 23,367 (12)%
Interest-earning deposits with banks (1) 142,999 192,580 (26)
Total cash, cash equivalents, and restricted cash (1) 163,449 215,947 (24)
Federal funds sold and securities purchased under resale agreements (1) 80,184 80,025 —
Debt securities:
Trading, at fair value (2) 65,602 57,624 14
Available-for-sale, at fair value (2) 265,687 276,407 (4)
Held-to-maturity, at cost 144,206 139,335 3
Mortgages held for sale 21,509 20,070 7
Loans held for sale (2) 3,408 1,131 201
Loans 944,265 956,770 (1)
Allowance for loan losses (10,193) (11,004) (7)
Net loans 934,072 945,766 (1)
Mortgage servicing rights:
Measured at fair value 15,411 13,625 13
Amortized 1,407 1,424 (1)
Premises and equipment, net 8,882 8,847 —
Goodwill 26,429 26,587 (1)
Derivative assets 11,099 12,228 (9)
Equity securities (2) 57,505 62,497 (8)
Other assets (2) 80,850 90,244 (10)
Total assets $ 1,879,700 1,951,757 (4)
Liabilities
Noninterest-bearing deposits $ 365,021 373,722 (2)
Interest-bearing deposits 903,843 962,269 (6)
Total deposits 1,268,864 1,335,991 (5)
Short-term borrowings 104,496 103,256 1
Derivative liabilities 8,507 8,796 (3)
Accrued expenses and other liabilities 72,480 70,615 3
Long-term debt 219,284 225,020 (3)
Total liabilities 1,673,631 1,743,678 (4)
Equity
Wells Fargo stockholders’ equity:
Preferred stock 25,737 25,358 1
Common stock – $1-2/3 par value, authorized 9,000,000,000 shares; issued 5,481,811,474 shares 9,136 9,136 —
Additional paid-in capital 59,644 60,893 (2)
Retained earnings 150,803 145,263 4
Cumulative other comprehensive income (loss) (5,461) (2,144) 155
Treasury stock – 632,743,620 shares and 590,194,846 shares (32,620) (29,892) 9
Unearned ESOP shares (2,051) (1,678) 22
Total Wells Fargo stockholders’ equity 205,188 206,936 (1)
Noncontrolling interests 881 1,143 (23)
Total equity 206,069 208,079 (1)
Total liabilities and equity $ 1,879,700 1,951,757 (4)
(1) Financial information has been revised to reflect the impact of the adoption in first quarter 2018 of ASU 2016-18 – Statement of Cash Flows (Topic 230): Restricted Cash in which we changed the presentation of our cash and cash equivalents to include both cash and due from banks as well as interest-earning deposits with banks, which are inclusive of any restricted cash.
(2) Financial information for the prior quarter has been revised to reflect the impact of the adoption in first quarter 2018 of ASU 2016-01 – Financial Instruments – Overall (Subtopic 825-10): Recognition and Measurement of Financial Assets and Financial Liabilities.

- 28
Wells Fargo & Company and Subsidiaries FIVE QUARTER CONSOLIDATED BALANCE SHEET
Jun 30, Mar 31, Dec 31, Sep 30, Jun 30, (in millions) 2018 2018 2017 2017 2017
Cash and due from banks $ 20,450 18,145 23,367 19,206 20,248
Interest-earning deposits with banks (1) 142,999 184,250 192,580 205,648 195,700
Total cash, cash equivalents, and restricted cash (1) 163,449 202,395 215,947 224,854 215,948
Assets
Federal funds sold and securities purchased under resale agreements (1) 80,184 73,550 80,025 67,457 69,006
Debt securities:
Trading, at fair value (2) 65,602 59,866 57,624 60,970 54,324
Available-for-sale, at fair value (2) 265,687 271,656 276,407 271,317 268,174
Held-to-maturity, at cost 144,206 141,446 139,335 142,423 140,392
Mortgages held for sale 21,509 17,944 20,070 20,009 24,807
Loans held for sale (2) 3,408 3,581 1,131 1,339 1,898
Loans 944,265 947,308 956,770 951,873 957,423
Allowance for loan losses (10,193) (10,373) (11,004) (11,078) (11,073)
Net loans 934,072 936,935 945,766 940,795 946,350
Amortized 1,407 1,411 1,424 1,406 1,399
Premises and equipment, net 8,882 8,828 8,847 8,449 8,403
Goodwill 26,429 26,445 26,587 26,581 26,573
Derivative assets 11,099 11,467 12,228 12,580 13,273
Equity securities (2) 57,505 58,935 62,497 54,981 55,742
Other assets (2) 80,850 85,888 90,244 88,381 91,714
Total assets $ 1,879,700 1,915,388 1,951,757 1,934,880 1,930,792
Mortgage servicing rights:
Measured at fair value 15,411 15,041 13,625 13,338 12,789
Liabilities
Noninterest-bearing deposits $ 365,021 370,085 373,722 366,528 372,766
Interest-bearing deposits 903,843 933,604 962,269 940,178 933,064
Total deposits 1,268,864 1,303,689 1,335,991 1,306,706 1,305,830
Short-term borrowings 104,496 97,207 103,256 93,811 95,356
Derivative liabilities 8,507 7,883 8,796 9,497 11,636
Accrued expenses and other liabilities 72,480 73,397 70,615 78,993 72,799
Long-term debt 219,284 227,302 225,020 239,256 239,222
Total liabilities 1,673,631 1,709,478 1,743,678 1,728,263 1,724,843
Wells Fargo stockholders’ equity:
Preferred stock 25,737 26,227 25,358 25,576 25,785
Common stock 9,136 9,136 9,136 9,136 9,136
Additional paid-in capital 59,644 60,399 60,893 60,759 60,689
Retained earnings 150,803 147,928 145,263 141,549 139,366
Cumulative other comprehensive income (loss) (5,461) (4,921) (2,144) (1,622) (2,148)
Treasury stock (32,620) (31,246) (29,892) (27,772) (25,675)
Unearned ESOP shares (2,051) (2,571) (1,678) (1,904) (2,119)
Total Wells Fargo stockholders’ equity
Noncontrolling interests
205,188
881
204,952
958
206,936
1,143
205,722
895
205,034
915
Equity
Total equity 206,069 205,910 208,079 206,617 205,949
Total liabilities and equity $ 1,879,700 1,915,388 1,951,757 1,934,880 1,930,792
(1) Financial information has been revised to reflect the impact of the adoption in first quarter 2018 of ASU 2016-18 – Statement of Cash Flows (Topic 230): Restricted Cash in which we changed the presentation of our cash and cash equivalents to include both cash and due from banks as well as interest-earning deposits with banks, which are inclusive of any restricted cash.
(2) Financial information for prior quarters has been revised to reflect the impact of the adoption in first quarter 2018 of ASU 2016-01 – Financial Instruments – Overall (Subtopic 825-10): Recognition and Measurement of Financial Assets and Financial Liabilities.

- 29
Wells Fargo & Company and Subsidiaries FIVE QUARTER TRADING ASSETS AND LIABILITIES
Jun 30, Mar 31, Dec 31, Sep 30, Jun 30, (in millions) 2018 2018 2017 2017 2017
Debt securities $ 65,602 59,866 57,624 60,970 54,324
Equity securities (1) 22,978 25,327 30,004 22,797 24,229
Loans held for sale 1,350 1,695 1,023 1,182 1,742
Gross trading derivative assets 30,758 30,644 31,340 31,052 31,451
Netting (2) (20,687) (20,112) (19,629) (18,881) (19,289)
Trading assets
Total trading derivative assets 10,071 10,532 11,711 12,171 12,162
Total trading assets 100,001 97,420 100,362 97,120 92,457
Short sales 21,765 23,303 18,472 19,096 16,845
Gross trading derivative liabilities 29,847 29,717 31,386 30,365 31,172
Netting (2) (22,311) (22,569) (23,062) (21,662) (20,544)
Trading liabilities
Total trading derivative liabilities 7,536 7,148 8,324 8,703 10,628
Total trading liabilities $ 29,301 30,451 26,796 27,799 27,473
(1) Financial information for the prior quarters of 2017 has been revised to reflect the impact of the adoption in first quarter 2018 of ASU 2016-01 and assets held as economic hedges for our deferred compensation plan obligations have been reclassified as marketable equity securities not held for trading.
(2) Represents balance sheet netting for trading derivative assets and liability balances, and trading portfolio level counterparty valuation adjustments.
FIVE QUARTER DEBT SECURITIES
(in millions) Jun 30,
2018 Mar 31,
2018 Dec 31,
2017 Sep 30,
2017 Jun 30,
2017
Trading debt securities $ 65,602 59,866 57,624 60,970 54,324
Available-for-sale debt securities:
Securities of U.S. Treasury and federal agencies
Securities of U.S. states and political subdivisions
Mortgage-backed securities:
Federal agencies
Residential and commercial
6,271
47,559
154,556
8,286
6,279
49,643
156,814
9,264
6,319
51,326
160,219
9,173
6,350
52,774
150,181
11,046
17,896
52,013
135,938
12,772
Total mortgage-backed securities
Other debt securities
162,842
49,015
166,078
49,656
169,392
49,370
161,227
50,966
148,710
49,555
Total available-for-sale debt securities 265,687 271,656 276,407 271,317 268,174
Securities of U.S. Treasury and federal agencies 44,735 44,727 44,720 44,712 44,704
Securities of U.S. states and political subdivisions 6,300 6,307 6,313 6,321 6,325
Federal agency and other mortgage-backed securities (1) 93,016 89,748 87,527 90,071 87,525
Other debt securities 155 664 775 1,319 1,838
Total held-to-maturity debt securities 144,206 141,446 139,335 142,423 140,392
Held-to-maturity debt securities:
Total debt securities $ 475,495 472,968 473,366 474,710 462,890
(1) Predominantly consists of federal agency mortgage-backed securities.

- 30
Wells Fargo & Company and Subsidiaries FIVE QUARTER EQUITY SECURITIES
(in millions) Jun 30,
2018 Mar 31,
2018 Dec 31,
2017 Sep 30,
2017 Jun 30,
2017
Marketable equity securities $ 22,978 25,327 30,004 22,797 24,229
Fair value:
Marketable equity securities (1) 5,273 4,931 4,356 4,348 4,340
Nonmarketable equity securities (2) 5,876 5,303 4,867 4,523 3,986
Held for trading at fair value
Not held for trading:
Total equity securities at fair value 11,149 10,234 9,223 8,871 8,326
Equity method:
LIHTC (3) 10,361 10,318 10,269 9,884 9,828
Private equity 3,732 3,840 3,839 3,757 3,740
Tax-advantaged renewable energy 1,950 1,822 1,950 1,954 1,960
New market tax credit and other 262 268 294 292 295
Total equity method 16,305 16,248 16,352 15,887 15,823
Other:
Federal bank stock and other at cost (4) 5,673 5,780 5,828 6,251 6,247
Private equity (5) 1,400 1,346 1,090 1,175 1,117
Total equity securities not held for trading 34,527 33,608 32,493 32,184 31,513
Total equity securities $ 57,505 58,935 62,497 54,981 55,742
(1)
(2)
(3) (4)
(5)
Includes $3.5 billion, $3.5 billion, $3.7 billion, $3.5 billion and $3.3 billion at June 30 and March 31, 2018, and December 31, September 30, and June 30, 2017, respectively, related to securities held as economic hedges of our deferred compensation plan obligations. Includes $5.5 billion, $5.0 billion, $4.9 billion, $4.5 billion and $4.0 billion at June 30 and March 31, 2018, and December 31, September 30, and June 30, 2017, respectively, related to investments in which we elected the fair value option. Represents low-income housing tax credit investments. Includes $5.6 billion, $5.7 billion, $5.4 billion, $5.8 billion and $5.8 billion at June 30 and March 31, 2018, and December 31, September 30, and June 30, 2017, respectively, related to investments in Federal Reserve Bank and Federal Home Loan Bank stock. Represents nonmarketable equity securities for which we have elected to account for the security under the measurement alternative.

- 31
Wells Fargo & Company and Subsidiaries FIVE QUARTER LOANS
Jun 30, Mar 31, Dec 31, Sep 30, Jun 30, (in millions) 2018 2018 2017 2017 2017
Commercial and industrial $ 336,590 334,678 333,125 327,944 331,113
Real estate mortgage 123,964 125,543 126,599 128,475 130,277
Real estate construction 22,937 23,882 24,279 24,520 25,337
Lease financing 19,614 19,293 19,385 19,211 19,174
Commercial:
Total commercial 503,105 503,396 503,388 500,150 505,901
Real estate 1-4 family first mortgage 283,001 282,658 284,054 280,173 276,566
Real estate 1-4 family junior lien mortgage 36,542 37,920 39,713 41,152 42,747
Credit card 36,684 36,103 37,976 36,249 35,305
Automobile 47,632 49,554 53,371 55,455 57,958
Other revolving credit and installment 37,301 37,677 38,268 38,694 38,946
Consumer:
Total consumer 441,160 443,912 453,382 451,723 451,522
Total loans (1) $ 944,265 947,308 956,770 951,873 957,423
(1) Includes $9.0 billion, $10.7 billion, $12.8 billion, $13.6 billion, and $14.3 billion of purchased credit-impaired (PCI) loans at June 30 and March 31, 2018, and December 31, September 30 and June 30, 2017, respectively.
Our foreign loans are reported by respective class of financing receivable in the table above. Substantially all of our foreign loan portfolio is commercial loans. Loans are classified as foreign primarily based on whether the borrower's primary address is outside of the United States. The following table presents total commercial foreign loans outstanding by class of financing receivable.
Jun 30, Mar 31, Dec 31, Sep 30, Jun 30, (in millions) 2018 2018 2017 2017 2017
Commercial and industrial $ 61,732 59,696 60,106 58,570 57,825
Real estate mortgage 7,617 8,082 8,033 8,032 8,359
Real estate construction 542 668 655 647 585
Lease financing 1,097 1,077 1,126 1,141 1,092
Commercial foreign loans:
Total commercial foreign loans $ 70,988 69,523 69,920 68,390 67,861
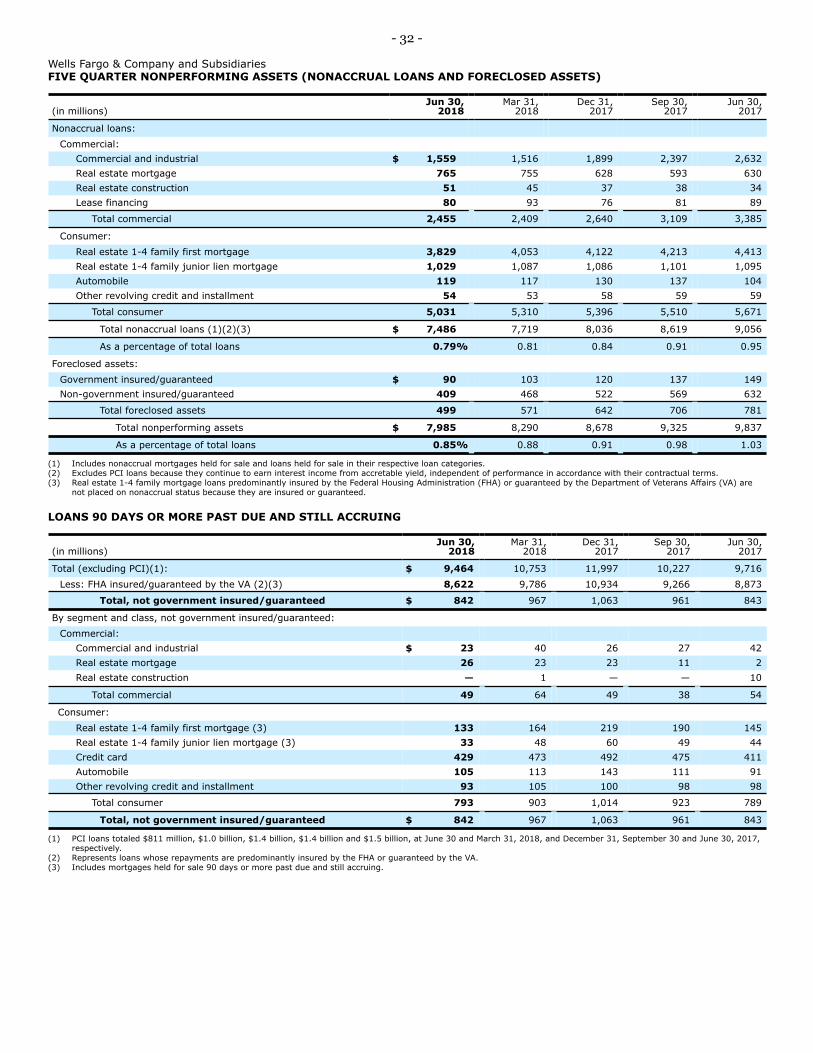
- 32
Wells Fargo & Company and Subsidiaries FIVE QUARTER NONPERFORMING ASSETS (NONACCRUAL LOANS AND FORECLOSED ASSETS)
Jun 30, Mar 31, Dec 31, Sep 30, Jun 30, (in millions) 2018 2018 2017 2017 2017
Commercial:
Commercial and industrial $ 1,559 1,516 1,899 2,397 2,632
Real estate mortgage 765 755 628 593 630
Real estate construction 51 45 37 38 34
Lease financing 80 93 76 81 89
Nonaccrual loans:
Total commercial 2,455 2,409 2,640 3,109 3,385
Consumer:
Real estate 1-4 family first mortgage 3,829 4,053 4,122 4,213 4,413
Real estate 1-4 family junior lien mortgage 1,029 1,087 1,086 1,101 1,095
Automobile 119 117 130 137 104
Other revolving credit and installment 54 53 58 59 59
Total consumer 5,031 5,310 5,396 5,510 5,671
Total nonaccrual loans (1)(2)(3) $ 7,486 7,719 8,036 8,619 9,056
As a percentage of total loans 0.79% 0.81 0.84 0.91 0.95
Foreclosed assets:
Government insured/guaranteed $ 90 103 120 137 149
Non-government insured/guaranteed 409 468 522 569 632
Total foreclosed assets 499 571 642 706 781
Total nonperforming assets $ 7,985 8,290 8,678 9,325 9,837
As a percentage of total loans 0.85% 0.88 0.91 0.98 1.03
(1) Includes nonaccrual mortgages held for sale and loans held for sale in their respective loan categories. (2) Excludes PCI loans because they continue to earn interest income from accretable yield, independent of performance in accordance with their contractual terms. (3) Real estate 1-4 family mortgage loans predominantly insured by the Federal Housing Administration (FHA) or guaranteed by the Department of Veterans Affairs (VA) are
not placed on nonaccrual status because they are insured or guaranteed.
LOANS 90 DAYS OR MORE PAST DUE AND STILL ACCRUING
(in millions) Jun 30,
2018 Mar 31,
2018 Dec 31,
2017 Sep 30,
2017 Jun 30,
2017
Total (excluding PCI)(1): $ 9,464 10,753 11,997 10,227 9,716
Less: FHA insured/guaranteed by the VA (2)(3) 8,622 9,786 10,934 9,266 8,873
Total, not government insured/guaranteed $ 842 967 1,063 961 843
By segment and class, not government insured/guaranteed:
Commercial:
Commercial and industrial $ 23 40 26 27 42
Real estate mortgage 26 23 23 11 2
Real estate construction — 1 — — 10
Total commercial 49 64 49 38 54
Consumer:
Real estate 1-4 family first mortgage (3) 133 164 219 190 145
Real estate 1-4 family junior lien mortgage (3) 33 48 60 49 44
Credit card 429 473 492 475 411
Automobile 105 113 143 111 91
Other revolving credit and installment 93 105 100 98 98
Total consumer 793 903 1,014 923 789
Total, not government insured/guaranteed $ 842 967 1,063 961 843
(1) PCI loans totaled $811 million, $1.0 billion, $1.4 billion, $1.4 billion and $1.5 billion, at June 30 and March 31, 2018, and December 31, September 30 and June 30, 2017, respectively.
(2) Represents loans whose repayments are predominantly insured by the FHA or guaranteed by the VA. (3) Includes mortgages held for sale 90 days or more past due and still accruing.

- 33
Wells Fargo & Company and Subsidiaries CHANGES IN ACCRETABLE YIELD RELATED TO PURCHASED CREDIT-IMPAIRED (PCI) LOANS
Loans purchased with evidence of credit deterioration since origination and for which it is probable that all contractually required payments will not be collected are considered to be credit impaired. PCI loans predominantly represent loans acquired from Wachovia that were deemed to be credit impaired. Evidence of credit quality deterioration as of the purchase date may include statistics such as past due and nonaccrual status, recent borrower credit scores and recent LTV percentages. PCI loans are initially measured at fair value, which includes estimated future credit losses expected to be incurred over the life of the loan. Accordingly, the associated allowance for credit losses related to these loans is not carried over at the acquisition date.
As a result of PCI loan accounting, certain credit-related ratios cannot be used to compare a portfolio that includes PCI loans against one that does not, or to compare ratios across quarters or years. The ratios particularly affected include the allowance for loan losses and allowance for credit losses as percentages of loans, of nonaccrual loans and of nonperforming assets; nonaccrual loans and nonperforming assets as a percentage of total loans; and net charge-offs as a percentage of loans.
The excess of cash flows expected to be collected over the carrying value of PCI loans is referred to as the accretable yield and is accreted into interest income over the estimated lives of the PCI loans using the effective yield method. The accretable yield is affected by:
• Changes in interest rate indices for variable rate PCI loans - Expected future cash flows are based on the variable rates in effect at the time of the quarterly assessment of expected cash flows;
• Changes in prepayment assumptions - Prepayments affect the estimated life of PCI loans which may change the amount of interest income, and possibly principal, expected to be collected; and
• Changes in the expected principal and interest payments over the estimated life - Updates to changes in expected cash flows are driven by the credit outlook and actions taken with borrowers. Changes in expected future cash flows from loan modifications are included in the regular evaluations of cash flows expected to be collected.
The change in the accretable yield related to PCI loans since the merger with Wachovia is presented in the following table.
Quarter Six months ended ended
June 30, June 30, (in millions) 2018 2018 2009-2017
Balance, beginning of period $ 6,864 8,887 10,447
Change in accretable yield due to acquisitions — —
Accretion into interest income (1) (299) (613) (16,983)
Accretion into noninterest income due to sales (2) (479) (1,122) (801)
Reclassification from nonaccretable difference for loans with improving credit-related cash flows (3) 59 399 11,597
Changes in expected cash flows that do not affect nonaccretable difference (4) (412) (1,818) 4,466
Balance, end of period $ 5,733 5,733 8,887
(1) Includes accretable yield released as a result of settlements with borrowers, which is included in interest income. (2) Includes accretable yield released as a result of sales to third parties, which is included in noninterest income. (3) At June 30, 2018, our carrying value for PCI loans totaled $9.0 billion and the remainder of nonaccretable difference established in purchase accounting totaled
$313 million. The nonaccretable difference absorbs losses of contractual amounts that exceed our carrying value for PCI loans. (4) Represents changes in cash flows expected to be collected due to the impact of modifications, changes in prepayment assumptions, changes in interest rates on variable
rate PCI loans and sales to third parties.
161
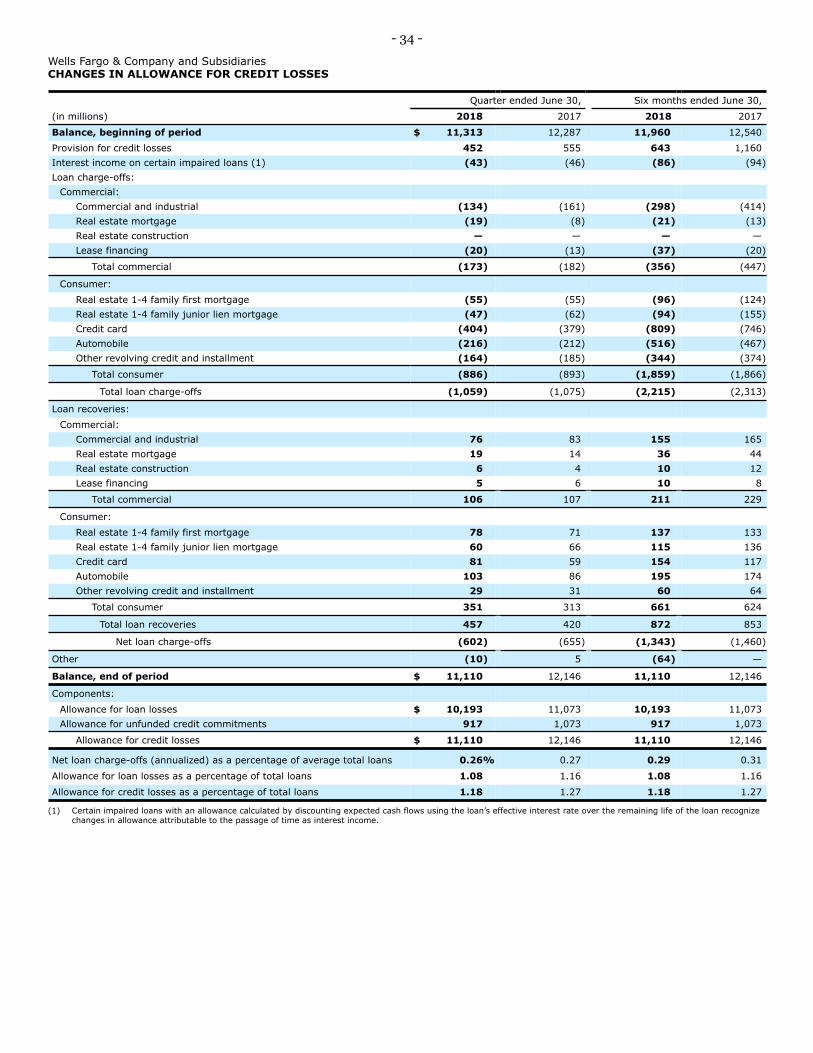
- 34
Wells Fargo & Company and Subsidiaries CHANGES IN ALLOWANCE FOR CREDIT LOSSES
(in millions)
Quarter ended June 30,
2018 2017
Six months ended June 30,
2018 2017
Balance, beginning of period $ 11,313 12,287 11,960 12,540
Provision for credit losses 452 555 643 1,160
Interest income on certain impaired loans (1) (43) (46) (86) (94)
Loan charge-offs:
Commercial:
Commercial and industrial (134) (161) (298) (414)
Real estate mortgage (19) (21) (13)
Real estate construction — — — —
Lease financing (20)
(8)
(13) (37) (20)
Total commercial (173) (182) (356) (447)
Real estate 1-4 family first mortgage (55) (55) (96) (124)
Real estate 1-4 family junior lien mortgage (47) (62) (94) (155)
Credit card (404) (379) (809) (746)
Automobile (216) (212) (516) (467)
Consumer:
Other revolving credit and installment (164) (185) (344) (374)
Total consumer (886) (893) (1,859) (1,866)
Total loan charge-offs (1,059) (1,075) (2,215) (2,313)
Commercial:
Commercial and industrial 76 83 155 165
Real estate mortgage 19 14 36 44
Real estate construction 6 4 10 12
Lease financing 5 6 10 8
Loan recoveries:
Total commercial 106 107 211 229
Consumer:
Real estate 1-4 family first mortgage 78 71 137 133
Real estate 1-4 family junior lien mortgage 60 66 115 136
Credit card 81 59 154 117
Automobile 103 86 195 174
Other revolving credit and installment 29 31 60 64
Total consumer 351 313 661 624
Total loan recoveries 457 420 872 853
Net loan charge-offs (602) (655) (1,343) (1,460)
Other (10) 5 (64) —
Balance, end of period $ 11,110 12,146 11,110 12,146
Components:
Allowance for loan losses
Allowance for unfunded credit commitments
$ 10,193
917
11,073
1,073
10,193
917
11,073
1,073
Allowance for credit losses $ 11,110 12,146 11,110 12,146
Net loan charge-offs (annualized) as a percentage of average total loans
Allowance for loan losses as a percentage of total loans
Allowance for credit losses as a percentage of total loans
0.26%
1.08
1.18
0.27
1.16
1.27
0.29
1.08
1.18
0.31
1.16
1.27
(1) Certain impaired loans with an allowance calculated by discounting expected cash flows using the loan’s effective interest rate over the remaining life of the loan recognize changes in allowance attributable to the passage of time as interest income.

- 35
Wells Fargo & Company and Subsidiaries FIVE QUARTER CHANGES IN ALLOWANCE FOR CREDIT LOSSES
Quarter ended
Jun 30, Mar 31, Dec 31, Sep 30, Jun 30, (in millions) 2018 2018 2017 2017 2017
Balance, beginning of quarter $ 11,313 11,960 12,109 12,146 12,287
Provision for credit losses 452 191 651 717 555
Interest income on certain impaired loans (1) (43) (43) (49) (43) (46)
Loan charge-offs:
Commercial:
Commercial and industrial (134) (164) (181) (194) (161)
Real estate mortgage (19) (2) (4) (21) (8)
Real estate construction — — — — —
Lease financing (20) (17) (14) (11) (13)
Total commercial (173) (183) (199) (226) (182)
Real estate 1-4 family first mortgage (55) (41) (49) (67) (55)
Real estate 1-4 family junior lien mortgage (47) (47) (54) (70) (62)
Credit card (404) (405) (398) (337) (379)
Automobile (216) (300) (261) (274) (212)
Other revolving credit and installment (164) (180) (169) (170) (185)
Consumer:
Total consumer (886) (973) (931) (918) (893)
Total loan charge-offs (1,059) (1,156) (1,130) (1,144) (1,075)
Commercial and industrial 76 79 63 69 83
Real estate mortgage 19 17 14 24 14
Real estate construction 6 4 3 15 4
Lease financing 5 5 4 5 6
Loan recoveries:
Commercial:
Total commercial 106 105 84 113 107
Consumer:
Real estate 1-4 family first mortgage 78 59 72 83 71
Real estate 1-4 family junior lien mortgage 60 55 61 69 66
Credit card 81 73 62 60 59
Automobile 103 92 73 72 86
Other revolving credit and installment 29 31 27 30 31
Total consumer 351 310 295 314 313
Total loan recoveries 457 415 379 427 420
Net loan charge-offs (602) (741) (751) (717) (655)
Other (10) (54) — 6 5
Balance, end of quarter $ 11,110 11,313 11,960 12,109 12,146
Components:
Allowance for loan losses
Allowance for unfunded credit commitments
$ 10,193
917
10,373
940
11,004
956
11,078
1,031
11,073
1,073
Allowance for credit losses $ 11,110 11,313 11,960 12,109 12,146
Net loan charge-offs (annualized) as a percentage of average total loans
Allowance for loan losses as a percentage of:
Total loans
Nonaccrual loans
Nonaccrual loans and other nonperforming assets
Allowance for credit losses as a percentage of:
Total loans
Nonaccrual loans
Nonaccrual loans and other nonperforming assets
0.26%
1.08
136
128
1.18
148
139
0.32
1.10
134
125
1.19
147
136
0.31
1.15
137
127
1.25
149
138
0.30
1.16
129
119
1.27
141
130
0.27
1.16
122
113
1.27
134
123
(1) Certain impaired loans with an allowance calculated by discounting expected cash flows using the loan’s effective interest rate over the remaining life of the loan recognize changes in allowance attributable to the passage of time as interest income.

- 36
Wells Fargo & Company and Subsidiaries TANGIBLE COMMON EQUITY (1)
(in millions, except ratios) Jun 30,
2018 Mar 31,
2018 Dec 31,
2017 Sep 30,
2017 Jun 30,
2017
Tangible book value per common share (1):
Total equity $ 206,069 205,910 208,079 206,617 205,949
Adjustments:
Preferred stock (25,737) (26,227) (25,358) (25,576) (25,785)
Additional paid-in capital on ESOP preferred stock (116) (146) (122) (130) (136)
Unearned ESOP shares 2,051 2,571 1,678 1,904 2,119
Noncontrolling interests (881) (958) (1,143) (895) (915)
Total common stockholders' equity
Adjustments:
Goodwill
Certain identifiable intangible assets (other than MSRs)
Other assets (2)
Applicable deferred taxes (3)
Tangible common equity
Common shares outstanding
Book value per common share
Tangible book value per common share
(in millions, except ratios)
(A)
(B)
(C)
(A)/(C)
(B)/(C)
181,386 181,150
(26,429) (26,445)
(1,091) (1,357)
(2,160) (2,388)
874 918
$ 152,580 151,878
4,849.1 4,873.9
$ 37.41 37.17
31.47 31.16
Jun 30, 2018
Mar 31, 2018
Dec 31, 2017
183,134 181,920 181,232
(26,587) (26,581) (26,573)
(1,624) (1,913) (2,147)
(2,155) (2,282) (2,268)
962 1,550 1,624
153,730 152,694 151,868
4,891.6 4,927.9 4,966.8
37.44 36.92 36.49
31.43 30.99 30.58
Quarter ended Six months ended
Sep 30, 2017
Jun 30, 2017
Jun 30, 2018
Jun 30, 2017
Return on average tangible common equity (1):
Net income applicable to common stock (A) $ 4,792 4,733 5,740 4,131 5,450 9,525 10,683
Average total equity 206,067 206,180 207,413 207,723 205,755 206,123 203,668
Adjustments:
Preferred stock (26,021) (26,157) (25,569) (25,780) (25,849) (26,089) (25,508)
Additional paid-in capital on ESOP preferred stock (129) (153) (129) (136) (144) (141) (145)
Unearned ESOP shares 2,348 2,508 1,896 2,114 2,366 2,428 2,282
Noncontrolling interests (919) (997) (998) (926) (910) (958) (934)
Average common stockholders’ equity (B) 181,346 181,381 182,613 182,995 181,218 181,363 179,363
Adjustments:
Goodwill (26,444) (26,516) (26,579) (26,600) (26,664) (26,480) (26,668)
Certain identifiable intangible assets (other than MSRs) (1,223) (1,489) (1,767) (2,056) (2,303) (1,355) (2,445)
Other assets (2) (2,271) (2,233) (2,245) (2,231) (2,160) (2,252) (2,128)
Applicable deferred taxes (3) 889 933 1,332 1,579 1,648 911 1,685
Average tangible common equity (C) $ 152,297 152,076 153,354 153,687 151,739 152,187 149,807
Return on average common stockholders' equity (ROE) (annualized) (A)/(B) 10.60% 10.58 12.47 8.96 12.06 10.59 12.01
Return on average tangible common equity (ROTCE) (annualized) (A)/(C) 12.62 12.62 14.85 10.66 14.41 12.62 14.38
(1) Tangible common equity is a non-GAAP financial measure and represents total equity less preferred equity, noncontrolling interests, and goodwill and certain identifiable intangible assets (including goodwill and intangible assets associated with certain of our nonmarketable equity securities but excluding mortgage servicing rights), net of applicable deferred taxes. The methodology of determining tangible common equity may differ among companies. Management believes that return on average tangible common equity and tangible book value per common share, which utilize tangible common equity, are useful financial measures because they enable investors and others to assess the Company's use of equity.
(2) Represents goodwill and other intangibles on nonmarketable equity securities, which are included in other assets. (3) Applicable deferred taxes relate to goodwill and other intangible assets. They were determined by applying the combined federal statutory rate and composite state income
tax rates to the difference between book and tax basis of the respective goodwill and intangible assets at period end.

- 37
Wells Fargo & Company and Subsidiaries COMMON EQUITY TIER 1 UNDER BASEL III (FULLY PHASED-IN) (1)
Estimated
(in billions, except ratio) Jun 30,
2018 Mar 31,
2018 Dec 31,
2017 Sep 30,
2017 Jun 30,
2017
Total equity
Adjustments:
Preferred stock
Additional paid-in capital on ESOP preferred stock
Unearned ESOP shares
$ 206.1
(25.7)
(0.1)
2.0
205.9
(26.2)
(0.1)
2.6
208.1
(25.4)
(0.1)
1.7
206.6
(25.6)
(0.1)
1.9
205.9
(25.8)
(0.1)
2.1
Noncontrolling interests (0.9) (1.0) (1.1) (0.9) (0.9)
Total common stockholders' equity
Adjustments:
Goodwill
Certain identifiable intangible assets (other than MSRs)
Other assets (2)
Applicable deferred taxes (3)
Investment in certain subsidiaries and other
181.4
(26.4)
(1.1)
(2.2)
0.9
0.4
181.2
(26.4)
(1.4)
(2.4)
0.9
0.4
183.2
(26.6)
(1.6)
(2.2)
1.0
0.2
181.9
(26.6)
(1.9)
(2.3)
1.6
(0.1)
181.2
(26.6)
(2.1)
(2.2)
1.6
(0.2)
Common Equity Tier 1 (Fully Phased-In) under Basel III (A) 153.0 152.3 154.0 152.6
Total risk-weighted assets (RWAs) anticipated under Basel III (4)(5) (B) $ 1,279.7 1,278.1 1,285.6 1,292.8 1,310.5
Common Equity Tier 1 to total RWAs anticipated under Basel III (Fully Phased-In) (5) (A)/(B) 12.0% 11.9 12.0 11.8
(1) Basel III capital rules, adopted by the Federal Reserve Board on July 2, 2013, revised the definition of capital, increased minimum capital ratios, and introduced a minimum Common Equity Tier 1 (CET1) ratio. The rules are being phased in through the end of 2021. Fully phased-in capital amounts, ratios and RWAs are calculated assuming the full phase-in of the Basel III capital rules. Beginning January 1, 2018, the requirements for calculating CET1 and tier 1 capital, along with RWAs, became fully phased-in.
(2) Represents goodwill and other intangibles on nonmarketable equity securities, which are included in other assets. (3) Applicable deferred taxes relate to goodwill and other intangible assets. They were determined by applying the combined federal statutory rate and composite state income
tax rates to the difference between book and tax basis of the respective goodwill and intangible assets at period end. (4) The final Basel III capital rules provide for two capital frameworks: the Standardized Approach, which replaced Basel I, and the Advanced Approach applicable to certain
institutions. Under the final rules, we are subject to the lower of our CET1 ratio calculated under the Standardized Approach and under the Advanced Approach in the assessment of our capital adequacy. Because the final determination of our CET1 ratio and which approach will produce the lower CET1 ratio as of June 30, 2018, is subject to detailed analysis of considerable data, our CET1 ratio at that date has been estimated using the Basel III definition of capital under the Basel III Standardized Approach RWAs. The capital ratio for March 31, 2018, and December 31, September 30 and June 30, 2017, was calculated under the Basel III Standardized Approach RWAs.
(5) The Company’s June 30, 2018, RWAs and capital ratio are preliminary estimates.
151.7
11.6

- 38
Wells Fargo & Company and Subsidiaries OPERATING SEGMENT RESULTS (1)
(income/expense in millions, average balances in billions)
Community Banking
2018 2017
Wholesale Banking
2018 2017
Wealth and Investment
Management
2018 2017
Other (2)
2018 2017
Consolidated Company
2018 2017
Quarter ended June 30,
Net interest income (3) $ 7,346 7,133 4,693 4,809 1,111 1,171 (609) (642) 12,541 12,471
Provision (reversal of provision) for credit losses 484 623 (36) (65) (2) 7 6 (10) 452 555
Noninterest income 4,460 4,822 2,504 2,670 2,840 3,055 (792) (783) 9,012 9,764
Noninterest expense 7,290 7,266 4,219 4,036 3,361 3,071 (888) (832) 13,982 13,541
Income (loss) before income tax expense (benefit) 4,032 4,066 3,014 3,508 592 1,148 (519) (583) 7,119 8,139
Income tax expense (benefit) 1,413 1,255 379 775 147 436 (129) (221) 1,810 2,245
Net income (loss) before noncontrolling interests 2,619 2,811 2,635 2,733 445 712 (390) (362) 5,309 5,894
Less: Net income (loss) from noncontrolling interests 123 46 — (9) — 1 — — 123 38
Net income (loss) $ 2,496 2,765 2,635 2,742 445 711 (390) (362) 5,186 5,856
Average loans $ 463.8 475.1 464.7 466.9 74.7 71.7 (59.1) (56.8) 944.1 956.9
Average assets 1,034.3 1,083.6 826.4 818.8 84.0 82.4 (59.8) (57.8) 1,884.9 1,927.0
Average deposits 760.6 727.7 414.0 462.4 167.1 190.1 (70.4) (79.0) 1,271.3 1,301.2
Six months ended June 30,
Net interest income (3) $ 14,541 14,265 9,225 9,490 2,223 2,312 (1,210) (1,272) 24,779 24,795
Provision (reversal of provision) for credit losses 702 1,269 (56) (108) (8) 3 5 (4) 643 1,160
Noninterest income 9,095 9,513 5,251 5,566 5,970 6,171 (1,608) (1,555) 18,708 19,695
Noninterest expense 15,992 14,547 8,197 8,203 6,651 6,275 (1,816) (1,692) 29,024 27,333
Income (loss) before income tax expense (benefit) 6,942 7,962 6,335 6,961 1,550 2,205 (1,007) (1,131) 13,820 15,997
Income tax expense (benefit) 2,222 2,237 827 1,748 386 822 (251) (429) 3,184 4,378
Net income (loss) before noncontrolling interests 4,720 5,725 5,508 5,213 1,164 1,383 (756) (702) 10,636 11,619
Less: Net income (loss) from noncontrolling interests 311 136 (2) (14) 5 7 — — 314 129
Net income (loss) $ 4,409 5,589 5,510 5,227 1,159 1,376 (756) (702) 10,322 11,490
(58.8)Average loans $ 467.1 477.9 464.9 467.6 74.3 71.2 (56.5) 947.5
Average assets 1,048.0 1,089.7 827.8 814.7 84.1 82.1 (59.6) (57.5) 1,900.3 1,929.0
Average deposits 754.1 722.8 429.9 463.8 172.5 193.8 (72.3) (80.2) 1,284.2 1,300.2
(1) The management accounting process measures the performance of the operating segments based on our management structure and is not necessarily comparable with other similar information for other financial services companies. We define our operating segments by product type and customer segment. Effective first quarter 2018, assets and liabilities receive a funding charge or credit that considers interest rate risk, liquidity risk, and other product characteristics on a more granular level. This methodology change affects results across all three of our reportable operating segments and results for all periods prior to 2018 have been revised to reflect this methodology change. Our previously reported consolidated financial results were not impacted by the methodology change; however, in connection with the adoption of ASU 2016-01 in first quarter 2018, certain reclassifications occurred within noninterest income.
(2) Includes the elimination of certain items that are included in more than one business segment, most of which represents products and services for Wealth and Investment Management customers served through Community Banking distribution channels.
(3) Net interest income is the difference between interest earned on assets and the cost of liabilities to fund those assets. Interest earned includes actual interest earned on segment assets as well as interest credits for any funding of a segment available to be provided to other segments. The cost of liabilities includes actual interest expense on segment liabilities as well as funding charges for any funding provided from other segments.
960.2

- 39
Wells Fargo & Company and Subsidiaries FIVE QUARTER OPERATING SEGMENT RESULTS (1)
Quarter ended
(income/expense in millions, average balances in billions) Jun 30,
2018 Mar 31,
2018 Dec 31,
2017 Sep 30,
2017 Jun 30,
2017
COMMUNITY BANKING
Net interest income (2) $ 7,346 7,195 7,239 7,154 7,133 Provision for credit losses 484 218 636 650 623 Noninterest income 4,460 4,635 4,481 4,366 4,822 Noninterest expense 7,290 8,702 10,216 7,852 7,266 Income before income tax expense 4,032 2,910 868 3,018 4,066 Income tax expense (benefit) 1,413 809 (2,682) 1,079 1,255 Net income before noncontrolling interests 2,619 2,101 3,550 1,939 2,811 Less: Net income from noncontrolling interests 123 188 78 62 46 Segment net income $ 2,496 1,913 3,472 1,877 2,765 Average loans $ 463.8 470.5 473.2 473.7 475.1
747.5 738.3 734.6 727.7Average assets 1,034.3 1,061.9 1,073.2 1,089.6 1,083.6 Average deposits 760.6
WHOLESALE BANKING
Net interest income (2) $ 4,693 4,532 4,557 4,763 4,809 Provision (reversal of provision) for credit losses (36) (20) 20 69 (65) Noninterest income 2,504 2,747 2,883 2,741 2,670 Noninterest expense 4,219 3,978 4,187 4,234 4,036 Income before income tax expense 3,014 3,321 3,233 3,201 3,508 Income tax expense 379 448 854 894 775 Net income before noncontrolling interests 2,635 2,873 2,379 2,307 2,733 Less: Net income (loss) from noncontrolling interests — (2) 6 (7) (9) Segment net income $ 2,635 2,875 2,373 2,314 2,742 Average loans $ 464.7 465.1 463.5 463.7 466.9
Average assets 826.4 829.2 837.2 824.2 818.8 Average deposits 414.0 446.0 465.7 463.4 462.4
WEALTH AND INVESTMENT MANAGEMENT
Net interest income (2) $ 1,111 1,112 1,152 1,177 1,171 Provision (reversal of provision) for credit losses (2) (6) (7) (1) 7 Noninterest income 2,840 3,130 3,181 3,079 3,055 Noninterest expense 3,361 3,290 3,246 3,102 3,071 Income before income tax expense 592 958 1,094 1,155 1,148 Income tax expense 147 239 413 433 436 Net income before noncontrolling interests 445 719 681 722 712 Less: Net income from noncontrolling interests — 5 6 3 1 Segment net income $ 445 714 675 719 711 Average loans $ 74.7 73.9 72.9 72.4 71.7
177.9 184.1 184.4 190.1Average assets 84.0 84.2 83.7 83.2 82.4 Average deposits 167.1
OTHER (3) Net interest income (2) $ (609) (601) (635) (645) (642) Provision (reversal of provision) for credit losses 6 (1) 2 (1) (10) Noninterest income (792) (816) (808) (786) (783) Noninterest expense (888) (928) (849) (837) (832) Loss before income tax benefit (519) (488) (596) (593) (583) Income tax benefit (129) (122) (227) (225) (221) Net loss before noncontrolling interests (390) (366) (369) (368) (362) Less: Net income from noncontrolling interests — — — — — Other net loss $ (390) (366) (369) (368) (362) Average loans $ (59.1) (58.5) (57.8) (57.5) (56.8)
Average assets (59.8) (59.4) (58.8) (58.5) (57.8) Average deposits (70.4) (74.2) (76.5) (76.0) (79.0)
CONSOLIDATED COMPANY Net interest income (2) $ 12,541 12,238 12,313 12,449 12,471 Provision for credit losses 452 191 651 717 555 Noninterest income 9,012 9,696 9,737 9,400 9,764 Noninterest expense 13,982 15,042 16,800 14,351 13,541 Income before income tax expense 7,119 6,701 4,599 6,781 8,139 Income tax expense (benefit) 1,810 1,374 (1,642) 2,181 2,245 Net income before noncontrolling interests 5,309 5,327 6,241 4,600 5,894 Less: Net income from noncontrolling interests 123 191 90 58 38 Wells Fargo net income $ 5,186 5,136 6,151 4,542 5,856 Average loans $ 944.1 951.0 951.8 952.3 956.9
1,297.2 1,311.6 1,306.4 1,301.2Average assets 1,884.9 1,915.9 1,935.3 1,938.5 1,927.0 Average deposits 1,271.3
(1) The management accounting process measures the performance of the operating segments based on our management structure and is not necessarily comparable with other similar information for other financial services companies. We define our operating segments by product type and customer segment. Effective first quarter 2018, assets and liabilities receive a funding charge or credit that considers interest rate risk, liquidity risk, and other product characteristics on a more granular level. This methodology change affects results across all three of our reportable operating segments and results for all periods prior to 2018 have been revised to reflect this methodology change. Our previously reported consolidated financial results were not impacted by the methodology change; however, in connection with the adoption of ASU 2016-01 in first quarter 2018, certain reclassifications occurred within noninterest income.
(2) Net interest income is the difference between interest earned on assets and the cost of liabilities to fund those assets. Interest earned includes actual interest earned on segment assets as well as interest credits for any funding of a segment available to be provided to other segments. The cost of liabilities includes actual interest expense on segment liabilities as well as funding charges for any funding provided from other segments.
(3) Includes the elimination of certain items that are included in more than one business segment, most of which represents products and services for Wealth and Investment Management customers served through Community Banking distribution channels.

- 40
Wells Fargo & Company and Subsidiaries FIVE QUARTER CONSOLIDATED MORTGAGE SERVICING
(in millions) Jun 30,
2018 Mar 31,
2018 Dec 31,
2017
Quarter ended
Sep 30, 2017
Jun 30, 2017
MSRs measured using the fair value method:
Fair value, beginning of quarter $ 15,041 13,625 13,338 12,789 13,208
Purchases — — — 541 —
Servicing from securitizations or asset transfers (1) 486 573 639 605 436
Sales and other (2) (1) (4) (32) 64 (8)
Net additions 485 569 607 1,210 428
Changes in fair value:
Due to changes in valuation model inputs or assumptions:
Mortgage interest rates (3) 376 1,253 221 (171) (305)
Servicing and foreclosure costs (4) 30 34 23 60 (14)
Discount rates (5) — — 13 — —
Prepayment estimates and other (6) (61) 43 (55) (31) (41)
Net changes in valuation model inputs or assumptions 345 1,330 202 (142) (360)
Changes due to collection/realization of expected cash flows over time (460) (483) (522) (519) (487)
Total changes in fair value (115) 847 (320) (661) (847)
Fair value, end of quarter $ 15,411 15,041 13,625 13,338 12,789
(1) Includes impacts associated with exercising our right to repurchase delinquent loans from GNMA loan securitization pools. (2) Includes sales and transfers of MSRs, which can result in an increase of total reported MSRs if the sales or transfers are related to nonperforming loan portfolios or
portfolios with servicing liabilities. (3) Includes prepayment speed changes as well as other valuation changes due to changes in mortgage interest rates (such as changes in estimated interest earned on
custodial deposit balances). (4) Includes costs to service and unreimbursed foreclosure costs. (5) Reflects discount rate assumption change, excluding portion attributable to changes in mortgage interest rates. (6) Represents changes driven by other valuation model inputs or assumptions including prepayment speed estimation changes and other assumption updates. Prepayment
speed estimation changes are influenced by observed changes in borrower behavior and other external factors that occur independent of interest rate changes.
Quarter ended
Jun 30, Mar 31, Dec 31, Sep 30, Jun 30, (in millions) 2018 2018 2017 2017 2017
Amortized MSRs:
Balance, beginning of quarter $ 1,411 1,424 1,406 1,399 1,402
Purchases 22 18 40 31 26
Servicing from securitizations or asset transfers 39 34 43 41 37
Amortization (65) (65) (65) (65) (66)
Balance, end of quarter $ 1,407 1,411 1,424 1,406 1,399
Fair value of amortized MSRs:
Beginning of quarter $ 2,307 2,025 1,990 1,989 2,051
End of quarter 2,309 2,307 2,025 1,990 1,989

- 41
Wells Fargo & Company and Subsidiaries FIVE QUARTER CONSOLIDATED MORTGAGE SERVICING (CONTINUED)
Quarter ended
(in millions) Jun 30,
2018 Mar 31,
2018 Dec 31,
2017 Sep 30,
2017 Jun 30,
2017
Servicing income, net:
Servicing fees (1) $ 905 906 833 795 882
Changes in fair value of MSRs carried at fair value:
Due to changes in valuation model inputs or assumptions (2) (A) 345 1,330 202 (142) (360)
Changes due to collection/realization of expected cash flows over time (460) (483) (522) (519) (487)
Total changes in fair value of MSRs carried at fair value (115) 847 (320) (661) (847)
Amortization (65) (65) (65) (65) (66)
Net derivative gains (losses) from economic hedges (3) (B) (319) (1,220) (186) 240 431
Total servicing income, net $ 406 468 262 309 400
Market-related valuation changes to MSRs, net of hedge results (2)(3) (A)+(B) $ 26 110 16 98
(1) Includes contractually specified servicing fees, late charges and other ancillary revenues, net of unreimbursed direct servicing costs. (2) Refer to the changes in fair value MSRs table on the previous page for more detail. (3) Represents results from economic hedges used to hedge the risk of changes in fair value of MSRs.
Jun 30, Mar 31, Dec 31, Sep 30, Jun 30, (in billions) 2018 2018 2017 2017 2017
Residential mortgage servicing:
Serviced for others $ 1,190 1,201 1,209 1,223 1,189
Owned loans serviced 340 337 342 340 343
Subserviced for others 4 5 3 3 4
Managed servicing portfolio (1):
Total residential servicing 1,534 1,543 1,554 1,566 1,536
Owned loans serviced 124 125 127 128 130
Subserviced for others 10 10 9 8 8
Total commercial servicing 652 645 631 616 613
Commercial mortgage servicing:
Serviced for others 518 510 495 480 475
Total managed servicing portfolio $ 2,186 2,188 2,185 2,182 2,149
1,664
Ratio of MSRs to related loans serviced for others 0.98% 0.96 0.88 0.87 0.85
Weighted-average note rate (mortgage loans serviced for others) 4.27
Total serviced for others $ 1,708 1,711 1,704 1,703
4.24 4.23 4.23 4.23
(1) The components of our managed servicing portfolio are presented at unpaid principal balance for loans serviced and subserviced for others and at book value for owned loans serviced.
71

- 42
Wells Fargo & Company and Subsidiaries SELECTED FIVE QUARTER RESIDENTIAL MORTGAGE PRODUCTION DATA
Quarter ended
Jun 30, 2018
Mar 31, 2018
Dec 31, 2017
Sep 30, 2017
Jun 30, 2017
Net gains on mortgage loan origination/sales activities (in millions):
Residential (A) $ 281 324 504 546 521
Commercial 49 76 95 81 81
Residential pipeline and unsold/repurchased loan management (1) 34 66 67 110 146
Total $ 364 466 666 737 748
Application data (in billions):
Wells Fargo first mortgage quarterly applications $ 67 58 63 73 83
Refinances as a percentage of applications 25% 35 38 37 32
Wells Fargo first mortgage unclosed pipeline, at quarter end $ 26 24 23 29 34
Residential real estate originations:
Purchases as a percentage of originations 78% 65 64 72 75
Refinances as a percentage of originations 22 35 36 28 25
Total 100% 100 100 100 100
Wells Fargo first mortgage loans (in billions):
Retail $ 21 16 23 26 25
Correspondent
Other (2)
28
1
27
—
30
—
32
1
31
—
Total quarter-to-date $ 50 43 53 59 56
Held-for-sale
Held-for-investment
(B) $ 37
13
34
9
40
13
44
15
42
14
Total quarter-to-date $ 50 43 53 59 56
Total year-to-date $ 93 43 212 159
Production margin on residential held-for-sale mortgage originations (A)/(B) 0.77% 0.94 1.25 1.24 1.24
(1) Predominantly includes the results of sales of modified Government National Mortgage Association (GNMA) loans, interest rate management activities and changes in estimate to the liability for mortgage loan repurchase losses.
(2) Consists of home equity loans and lines.
CHANGES IN MORTGAGE REPURCHASE LIABILITY
Quarter ended
(in millions) Jun 30,
2018 Mar 31,
2018 Dec 31,
2017 Sep 30,
2017 Jun 30,
2017
Balance, beginning of period $ 181 181 179 178 222
Assumed with MSR purchases (1) — — — 10 —
Provision for repurchase losses:
Loan sales 4 3 4 6 6
Change in estimate (2) (2) 1 2 (12) (45)
Net additions (reductions) to provision 2 4 6 (6) (39)
Losses (4) (4) (4) (3) (5)
Balance, end of period $ 179 181 181 179
(1) Represents repurchase liability associated with portfolio of loans underlying mortgage servicing rights acquired during the period. (2) Results from changes in investor demand and mortgage insurer practices, credit deterioration and changes in the financial stability of correspondent lenders.
100
178