Q3 2019 Earnings Presentation - Investor Relations
24
-
Upload
khangminh22 -
Category
Documents
-
view
2 -
download
0
Transcript of Q3 2019 Earnings Presentation - Investor Relations


SAFE HARBOR STATEMENT
2
This webcast presentation contains a number of forward-looking statements. Words such as “build,” “gain,” “drive,” “invest,” “grow,” “progress,” “expand,” “become,” “execute,” “enable,” “continue,” “expect,” “opportunity,” “deliver,” “build,” “reinvent,“ “leverage,” “will,” and variations of such words and sim ilar expressions are intended to identify forward-looking statements. Examples of forward-looking statements include, but are not limited to, statements regarding Kraft Heinz’s plans, integration, savings, investments, execution, growth, leverage, innovation, credit rating, brands and efficiencies. These forward-looking statements are not guarantees of future performance and are subject to a number of risks and uncertainties, many of which are difficult to predict and beyond Kraft Heinz’s control. Important factors that affect Kraft Heinz’s business and operations and that may cause actual results to differ materially from those in the forward-looking statements include, but are not limited to, increased competition; Kraft Heinz’s ability to maintain, extend and expand its reputation and brand image; Kraft Heinz’s ability to differentiate its products from other brands; the consolidation of retail customers; Kraft Heinz’s ability to predict, identify and interpret changes in consumer preferences and demand; Kraft Heinz’s ability to drive revenue growth in its key product categories, increase its market share, or add products; an impairment of the carrying value of goodwill or other indefinite-lived intangible assets; volatility in commodity, energy and other input costs; changes in Kraft Heinz’s management team or other key personnel; Kraft Heinz’s inability to realize the anticipated benefits from its cost savings initiatives; changes in relationships with significant customers and suppliers; execution of Kraft Heinz’s international expansion strategy; changes in laws and regulations; product recalls or product liability claims; unanticipated business disruptions; failure to successfully integrate the business and operations of Kraft Heinz in the expected time frame; Kraft Heinz’s ability to complete or realize the benefits from potential and completed acquisitions, alliances, divestitures or joint ventures; economic and political conditions in the nations in which Kraft Heinz operates; the volatility of capital markets; increased pension, labor and people-related expenses; volatility in the market value of all or a portion of the derivatives Kraft Heinz uses; exchange rate fluctuations; risks associated with information technology and systems, including service interruptions, misappropriation of data or breaches of security; Kraft Heinz’s inability to protect intellectual property rights; impacts of natural events in the locations in which Kraft Heinz or its customers, suppliers or regulators operate; Kraft Heinz’s indebtedness and ability to pay such indebtedness; compliance with laws, regulations, and related interpretations and related legal claims or other regulatory enforcement actions, including additional risks and uncertainties related to Kraft Heinz’s restatement and any potential actions resulting from the SEC’s ongoing investigation, as well as potential additional subpoenas, litigation, and regulatory proceedings; an inability to remediate the material weaknesses in Kraft Heinz’s internal control over financial reporting or additional material weaknesses or other deficiencies in the future or the failure to maintain an effective system of internal controls; Kraft Heinz’s failure to prepare and timely file its periodic reports; the restatement of certain of Kraft Heinz’s previously issued consolidated financial statements, which resulted in unanticipated costs and may affect investor confidence and raise reputational issues; tax law changes or interpretations; and other factors. For additional information on these and other factors that could affect Kraft Heinz’s forward-looking statements, see Kraft Heinz’s risk factors, as they may be amended from time to time, set forth in its filings with the Securities and Exchange Commission, including our most recently filed Annual Report on Form 10-K. Kraft Heinz disclaims and does not undertake any obligation to update or revise any forward-looking statement in this presentation, except as required by applicable law or regulation.
Non-GAAP Measures
This webcast presentation also includes non-GAAP financial measures, including Organic Net Sales, Adjusted EBITDA and Adjusted EPS. These non-GAAP financial measures should not be considered replacements for, and should be read together with, the most comparable GAAP financial measures. A reconciliation of these non-GAAP financial measures to the most directly comparable GAAP financial measures can be found in the Appendix to this presentation.

3
3Q 2019 UPDATE | Kraft Heinz Turnaround Program
2019 Stabilization
•Execute 2019 plans and programs in place, deliver improving results
•Evolve leadership team
•Review business and brands
•Organization structure
Near-Term Transformation
•Diagnose key focus areas
•Make critical fixes
•Capture efficiencies
•Build into 2020 plan
Enterprise Strategy
•Establish long-term vision and ambition, financial goals
•Develop better understanding of future consumers, Food & Beverage value chain, and cross-category disruptions
•Define where to play and how to play
•Connect to 2020 plan
1

4
3Q 2019 UPDATE | Kraft Heinz Turnaround Program
2019 Stabilization
•Execute 2019 plans and programs in place, deliver improving results
•Evolve leadership team
•Review business and brands
•Organization structure
Near-Term Transformation
•Diagnose key focus areas
•Make critical fixes
•Capture efficiencies
•Build into 2020 plan
Enterprise Strategy
•Establish long-term vision and ambition, financial goals
•Develop better understanding of future consumers, Food & Beverage value chain, and cross-category disruptions
•Define where to play and how to play
•Connect to 2020 plan
1

5
Andre Maciel US CFO
Nina Barton Chief Growth Officer
Paulo BasilioGlobal CFO
2019 STABILIZATION | Leadership & People
Social Engagement
CEO Employee Engagement
9 Town Halls
20 Internal Videos
6 Global Office Visits
Leadership Enhancements
15 Cities
9 Countries
1.2 Million Meals Packaged

2019 STABILIZATION | Financial Summary
1| Non-GAAP financial measure. See Appendix to this presentation for more information, including GAAP to Non-GAAP reconciliations. 6
+0.4 pp
+11.4 pp
+14.6 pp
Organic NetSales(1)
Constant Currency Adjusted EBITDA(1)
AdjustedEPS(1)
3Q vs. First Half Growth Rates
Sequential Improvement Driven by …
Supply Chain Costs Starting to Stabilize
Price Turning Positive
Lapping Higher Investment Levels
Mix of Positive Momentum, Areas to Fix
7
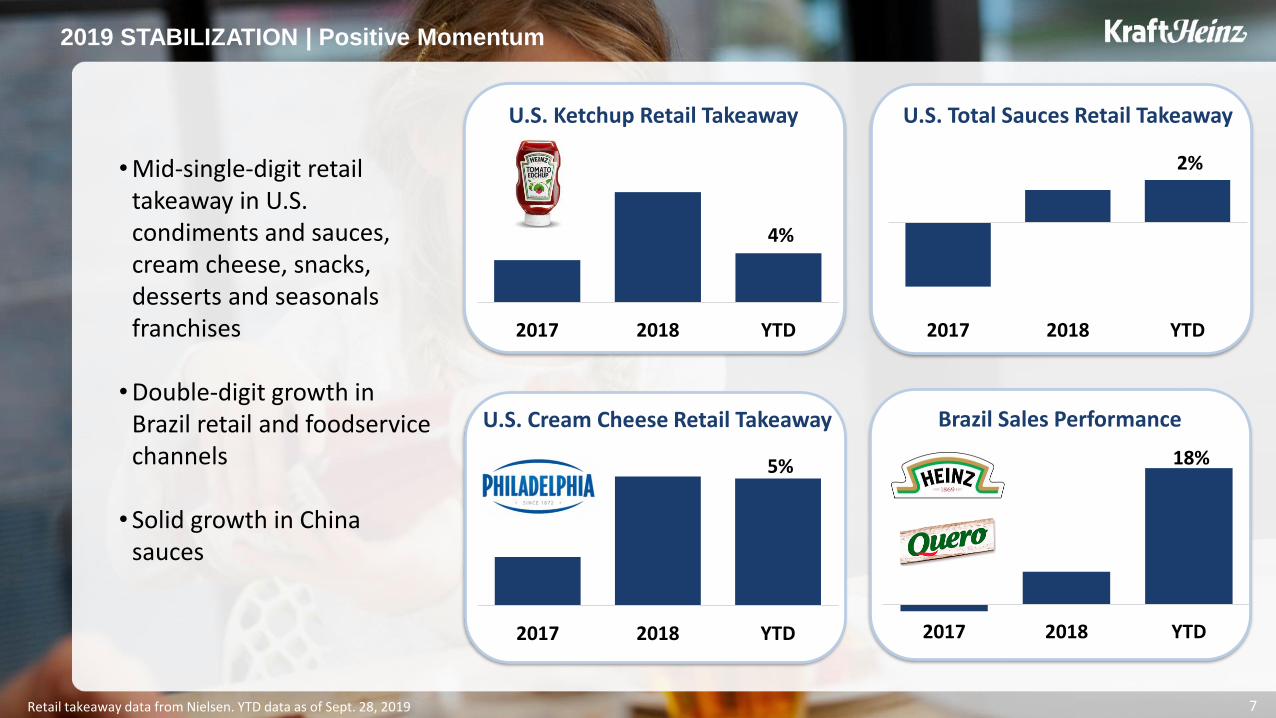
2019 STABILIZATION | Positive Momentum
• Mid-single-digit retail takeaway in U.S. condiments and sauces, cream cheese, snacks, desserts and seasonalsfranchises
• Double-digit growth in Brazil retail and foodservice channels
• Solid growth in China sauces
4%
2017 2018 YTD
5%
2017 2018 YTD
18%
2017 2018 YTD
2%
2017 2018 YTD
U.S. Ketchup Retail Takeaway
U.S. Cream Cheese Retail Takeaway Brazil Sales Performance
U.S. Total Sauces Retail Takeaway
Retail takeaway data from Nielsen. YTD data as of Sept. 28, 2019

8
2019 STABILIZATION | Areas of Focus
Retail takeaway data from Nielsen: U.S. YTD data as Sept. 28, 2019, Italy Infant YTD data as of Sept. 8, 2019, China Infant YTD data as of July 31, 2019
• U.S. natural cheese, cold cuts and coffee share and distribution losses
• Canada promotional effectiveness
• EMEA and China infant nutrition declines
• ROW supply chain losses
U.S. Natural Cheese Retail Takeaway
Italy Infant Retail Takeaway China Infant Retail Takeaway
U.S. Cold Cuts Retail Takeaway
(5%)
2017 2018 YTD
(2%)
2017 2018 YTD
(6%)
2017 2018 YTD
(18%)
2017 2018 YTD

9
3Q 2019 UPDATE | Kraft Heinz Turnaround Program
2019 Stabilization
•Execute 2019 plans and programs in place, deliver improving results
•Evolve leadership team
•Review business and brands
•Organization structure
Near-Term Transformation
•Diagnose key focus areas
•Make critical fixes
•Capture efficiencies
•Build into 2020 plan
Enterprise Strategy
•Establish long-term vision and ambition, financial goals
•Develop better understanding of future consumers, Food & Beverage value chain, and cross-category disruptions
•Define where to play and how to play
•Connect to 2020 plan
1
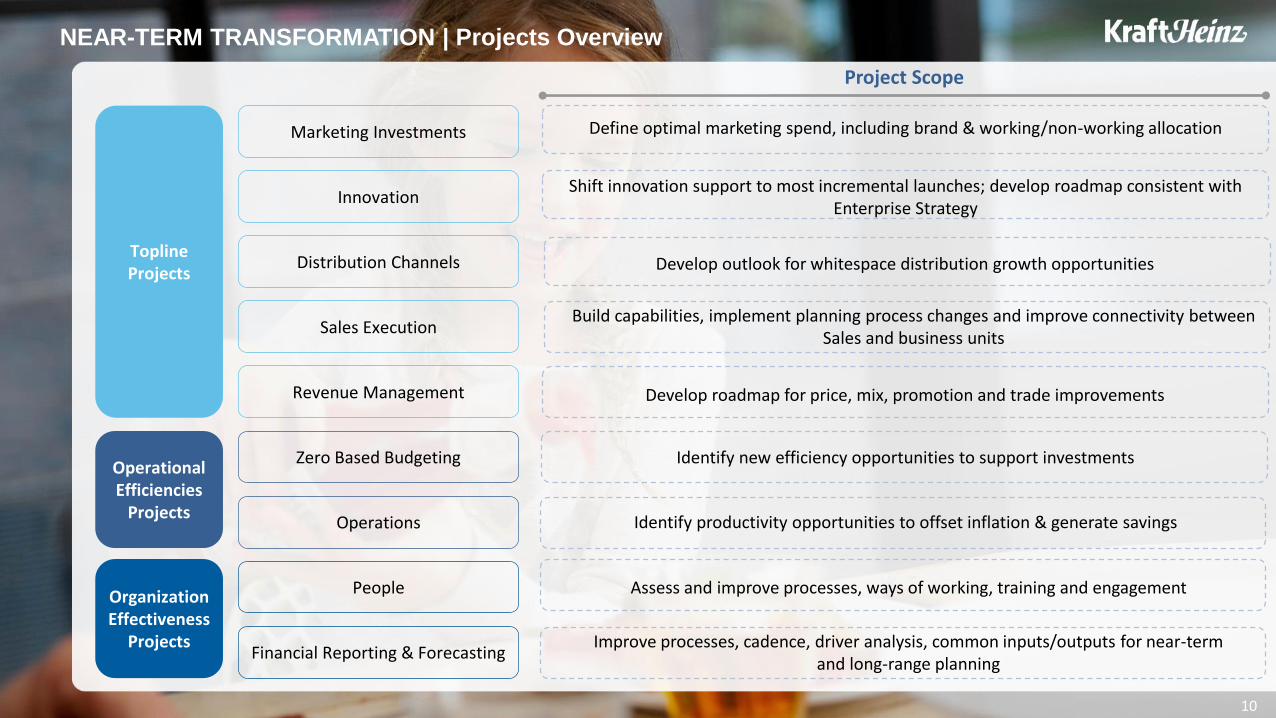
Define optimal marketing spend, including brand & working/non-working allocation
10
NEAR-TERM TRANSFORMATION | Projects Overview
Topline Projects
Operational Efficiencies
Projects
Marketing Investments
OrganizationEffectiveness
Projects
Project Scope
Shift innovation support to most incremental launches; develop roadmap consistent with Enterprise Strategy
Develop outlook for whitespace distribution growth opportunities
Build capabilities, implement planning process changes and improve connectivity between Sales and business units
Develop roadmap for price, mix, promotion and trade improvements
Identify new efficiency opportunities to support investments
Identify productivity opportunities to offset inflation & generate savings
Assess and improve processes, ways of working, training and engagement
Improve processes, cadence, driver analysis, common inputs/outputs for near-term and long-range planning
Innovation
Distribution Channels
Sales Execution
Revenue Management
Zero Based Budgeting
Operations
People
Financial Reporting & Forecasting

11
3Q 2019 UPDATE | Kraft Heinz Turnaround Program
2019 Stabilization
•Execute 2019 plans and programs in place, deliver improving results
•Evolve leadership team
•Review business and brands
•Organization structure
Near-Term Transformation
•Diagnose key focus areas
•Make critical fixes
•Capture efficiencies
•Build into 2020 plan
Enterprise Strategy
•Establish long-term vision and ambition, financial goals
•Develop better understanding of future consumers, Food & Beverage value chain, and cross-category disruptions
•Define where to play and how to play
•Connect to 2020 plan
1

FINANCIAL SUMMARY
1| Non-GAAP financial measure. See Appendix to this presentation for more information, including GAAP to Non-GAAP reconciliations.
• Organic Net Sales performance improves sequentially
from first half of 2019
o Pricing turned positive driven by U.S., Rest of World and EMEA,
partially offset by lower pricing in Canada
o Vol/mix continues to be impacted by unfavorable changes in U.S.
retail inventory levels
• Significant improvement in year-over-year EBITDA
performance versus first half of 2019
• 3Q decline in Constant Currency Adjusted EBITDA included
(1.5)pp impact from divestitures
• 3Q Adjusted EPS decline versus prior year reflected impact
of lower Adjusted EBITDA and higher effective tax rate
o Partially offset by lower interest expense versus the prior year
period
12
(1.5%)
(1.1%)
CONSTANT CURRENCY ADJUSTED EBITDA(1)
ADJUSTED EPS(1)
Price +1.0%
Vol/mix (2.1)%
(16.0%)
(4.6%)
(23.8%)
(9.2%)
Price (1.3)%
Vol/mix (0.2)%
11.4pp improvement
14.6pp improvement
ORGANIC NET SALES(1)
First Half Third Quarter
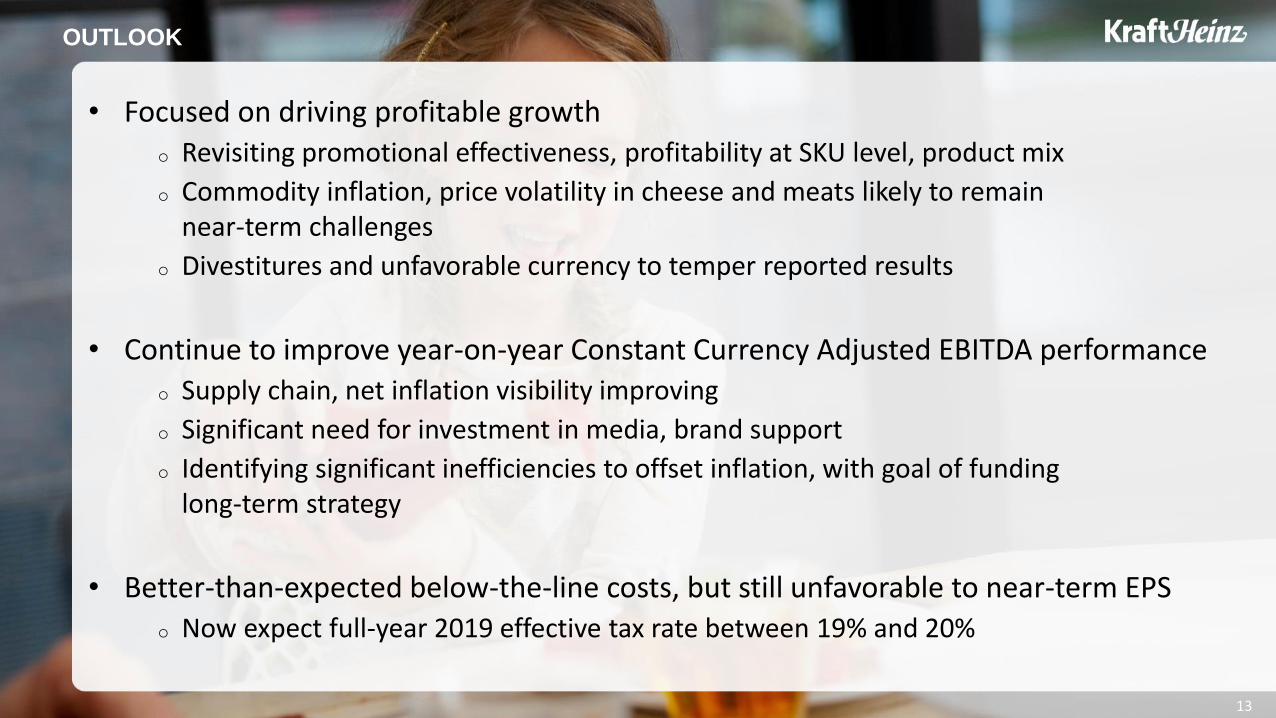
OUTLOOK
• Focused on driving profitable growtho Revisiting promotional effectiveness, profitability at SKU level, product mix
o Commodity inflation, price volatility in cheese and meats likely to remainnear-term challenges
o Divestitures and unfavorable currency to temper reported results
• Continue to improve year-on-year Constant Currency Adjusted EBITDA performanceo Supply chain, net inflation visibility improving
o Significant need for investment in media, brand support
o Identifying significant inefficiencies to offset inflation, with goal of funding long-term strategy
• Better-than-expected below-the-line costs, but still unfavorable to near-term EPS
o Now expect full-year 2019 effective tax rate between 19% and 20%
13
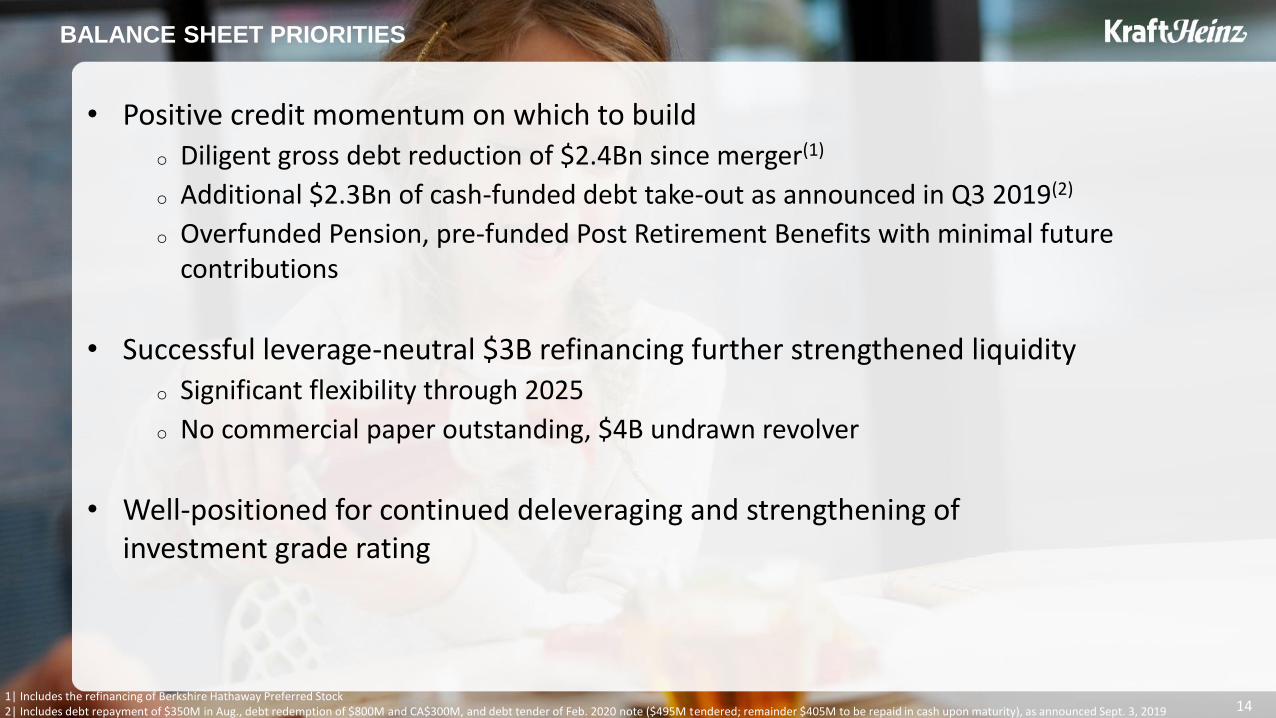
BALANCE SHEET PRIORITIES
• Positive credit momentum on which to buildo Diligent gross debt reduction of $2.4Bn since merger(1)
o Additional $2.3Bn of cash-funded debt take-out as announced in Q3 2019(2)
o Overfunded Pension, pre-funded Post Retirement Benefits with minimal future contributions
• Successful leverage-neutral $3B refinancing further strengthened liquidityo Significant flexibility through 2025
o No commercial paper outstanding, $4B undrawn revolver
• Well-positioned for continued deleveraging and strengthening of investment grade rating
1| Includes the refinancing of Berkshire Hathaway Preferred Stock2| Includes debt repayment of $350M in Aug., debt redemption of $800M and CA$300M, and debt tender of Feb. 2020 note ($495M tendered; remainder $405M to be repaid in cash upon maturity), as announced Sept. 3, 2019 14


APPENDIX
Non-GAAP Financial Measures
The non-GAAP financial measures provided should be viewed in addition to, and not as an alternative for, results prepared in accordance with accounting principles generally accepted in the United States of
America (“GAAP”) that are presented in this press release.
To supplement the financial information, the Company has presented Organic Net Sales, Adjusted EBITDA, Constant Currency Adjusted EBITDA, and Adjusted EPS, which are considered non-GAAP financial
measures. The non-GAAP financial measures presented may differ from similarly titled non- GAAP financial measures presented by other companies, and other companies may not define these non-GAAP
financial measures in the same way. These measures are not substitutes for their comparable GAAP financial measures, such as net sales, net income/(loss), diluted earnings per share, or other measures
prescribed by GAAP, and there are limitations to using non-GAAP financial measures.
Management uses these non-GAAP financial measures to assist in comparing the Company’s performance on a consistent basis for purposes of business decision making by removing the impact of certain items
that management believes do not directly reflect the Company's underlying operations. Management believes that presenting the Company's non-GAAP financial measures (i.e., Organic Net Sales, Adjusted
EBITDA, Constant Currency Adjusted EBITDA, and Adjusted EPS) is useful to investors because it (i) provides investors with meaningful supplemental information regarding financial performance by excluding
certain items, (ii) permits investors to view performance using the same tools that management uses to budget, make operating and strategic decisions, and evaluate historical performance, and (iii) otherwise
provides supplemental information that may be useful to investors in evaluating the Company's results. The Company believes that the presentation of these non-GAAP financial measures, when considered
together with the corresponding GAAP financial measures and the reconciliations to those measures, provides investors with additional understanding of the factors and trends affecting the Company's business
than could be obtained absent these disclosures.
Organic Net Sales is defined as net sales excluding, when they occur, the impact of currency, acquisitions and divestitures, and a 53rd week of shipments. The Company calculates the impact of currency on net
sales by holding exchange rates constant at the previous year's exchange rate, with the exception of highly inflationary subsidiaries, for which the Company calculates the previous year's results using the current
year's exchange rate. Organic Net Sales is a tool that can assist management and investors in comparing the Company's performance on a consistent basis by removing the impact of certain items that
management believes do not directly reflect the Company's underlying operations. Adjusted EBITDA is defined as net income/(loss) from continuing operations before interest expense, other expense/(income),
provision for/(benefit from) income taxes, and depreciation and amortization (excluding integration and restructuring expenses); in addition to these adjustments, the Company excludes, when they occur, the
impacts of integration and restructuring expenses, deal costs, unrealized losses/(gains) on commodity hedges, impairment losses, and equity award compensation expense (excluding integration and restructuring
expenses).
The Company also presents Adjusted EBITDA on a constant currency basis. The Company calculates the impact of currency on Adjusted EBITDA by holding exchange rates constant at the previous year's
exchange rate, with the exception of highly inflationary subsidiaries, for which it calculates the previous year's results using the current year's exchange rate. Adjusted EBITDA and Constant Currency Adjusted
EBITDA are tools that can assist management and investors in comparing the Company's performance on a consistent basis by removing the impact of certain items that management believes do not directly
reflect the Company's underlying operations.
Adjusted EPS is defined as diluted earnings per share excluding, when they occur, the impacts of integration and restructuring expenses, deal costs, unrealized losses/(gains) on commodity hedges, impairment
losses, losses/(gains) on the sale of a business, other losses/(gains) related to acquisitions and divestitures (e.g., tax and hedging impacts), nonmonetary currency devaluation (e.g., remeasurement gains and
losses), debt prepayment and extinguishment costs, and U.S. Tax Reform discrete income tax expense/(benefit), and including when they occur, adjustments to reflect preferred stock dividend payments on an
accrual basis. The Company believes Adjusted EPS provides important comparability of underlying operating results, allowing investors and management to assess operating performance on a consistent basis.
See the attached schedules for supplemental financial data, which includes the financial information, the non-GAAP financial measures and corresponding reconciliations to the comparable GAAP financial
measures for the relevant periods.
16

The Kraft Heinz CompanyCondensed Consolidated Statements of Income
(in millions, except per share data)(Unaudited)
For the Three Months Ended For the Nine Months Ended
September 28, 2019
September 29, 2018
September 28, 2019
September 29, 2018
Net sales $ 6,076 $ 6,383 $ 18,441 $ 19,377
Cost of products sold 4,129 4,289 12,401 12,672
Gross profit 1,947 2,094 6,040 6,705Selling, general and administrative expenses, excluding impairment losses 762 803 2,341 2,323
Goodwill impairment losses — — 744 133
Intangible asset impairment losses 5 217 479 318
Selling, general and administrative expenses 767 1,020 3,564 2,774
Operating income/(loss) 1,180 1,074 2,476 3,931
Interest expense 398 326 1,035 959
Other expense/(income) (380) (71) (893) (181)
Income/(loss) before income taxes 1,162 819 2,334 3,153
Provision for/(benefit from) income taxes 264 201 584 779
Net income/(loss) 898 618 1,750 2,374Net income/(loss) attributable to noncontrolling interest (1) (1) (3) (2)Net income/(loss) attributable to common shareholders $ 899 $ 619 $ 1,753 $ 2,376
Basic shares outstanding 1,221 1,219 1,220 1,219
Diluted shares outstanding 1,223 1,226 1,223 1,227
Per share data applicable to common shareholders:
Basic earnings/(loss) per share $ 0.74 $ 0.51 $ 1.44 $ 1.95
Diluted earnings/(loss) per share 0.74 0.50 1.43 1.94
APPENDIX
Schedule 1
17

The Kraft Heinz Company Reconciliation of Net Sales to Organic Net Sales
For the Three Months Ended (dollars in millions)
(Unaudited)
Net Sales Currency
Acquisitions and
DivestituresOrganic Net
Sales Price Volume/Mix
September 28, 2019
United States $ 4,361 $ — $ — $ 4,361
Canada 415 (4) 1 418
EMEA 612 (24) — 636
Rest of World 688 (13) — 701
$ 6,076 $ (41) $ 1 $ 6,116
September 29, 2018
United States $ 4,431 $ — $ — $ 4,431
Canada 525 — 104 421
EMEA 634 — — 634
Rest of World 793 71 23 699
$ 6,383 $ 71 $ 127 $ 6,185
APPENDIX
Schedule 2
18
Year-over-year growth rates
United States (1.6)% 0.0 pp 0.0 pp (1.6)% 1.5 pp (3.1) pp
Canada (21.1)% (0.8) pp (19.8) pp (0.5)% (2.6) pp 2.1 pp
EMEA (3.5)% (3.9) pp 0.0 pp 0.4% 0.2 pp 0.2 pp
Rest of World (13.3)% (10.2) pp (3.3) pp 0.2% 0.9 pp (0.7) pp
Kraft Heinz (4.8)% (1.7) pp (2.0) pp (1.1)% 1.0 pp (2.1) pp

APPENDIX
19
The Kraft Heinz Company Reconciliation of Net Sales to Organic Net Sales
For the Nine Months Ended (dollars in millions)
(Unaudited)
Net Sales Currency
Acquisitions and
DivestituresOrganic Net
Sales Price Volume/Mix
September 28, 2019
United States $ 13,074 $ — $ — $ 13,074
Canada 1,425 (46) 227 1,244
EMEA 1,862 (109) — 1,971
Rest of World 2,080 (91) 51 2,120
$ 18,441 $ (246) $ 278 $ 18,409
September 29, 2018
United States $ 13,312 $ — $ — $ 13,312
Canada 1,573 — 308 1,265
EMEA 2,026 — 21 2,005
Rest of World 2,466 211 144 2,111
$ 19,377 $ 211 $ 473 $ 18,693
Year-over-year growth rates
United States (1.8)% 0.0 pp 0.0 pp (1.8)% (0.7) pp (1.1) pp
Canada (9.5)% (3.0) pp (4.8) pp (1.7)% (2.8) pp 1.1 pp
EMEA (8.1)% (5.4) pp (1.0) pp (1.7)% 0.0 pp (1.7) pp
Rest of World (15.7)% (11.9) pp (4.2) pp 0.4% 1.3 pp (0.9) pp
Kraft Heinz (4.8)% (2.3) pp (1.0) pp (1.5)% (0.5) pp (1.0) pp
Schedule 3

The Kraft Heinz CompanyReconciliation of Net Income/(Loss) to Adjusted EBITDA
(dollars in millions)(Unaudited)
For the Three Months Ended For the Nine Months Ended
September 28, 2019
September 29, 2018
September 28, 2019
September 29, 2018
Net income/(loss) $ 898 $ 618 $ 1,750 $ 2,374
Interest expense 398 326 1,035 959
Other expense/(income) (380) (71) (893) (181)
Provision for/(benefit from) income taxes 264 201 584 779
Operating income/(loss) 1,180 1,074 2,476 3,931
Depreciation and amortization (excluding integration and restructuring expenses) 243 245 730 679
Integration and restructuring expenses 15 32 56 215
Deal costs 6 3 19 19
Unrealized losses/(gains) on commodity hedges 9 6 (30) 11
Impairment losses 5 217 1,223 451
Equity award compensation expense (excluding integration and restructuring expenses) 11 17 26 44
Adjusted EBITDA $ 1,469 $ 1,594 $ 4,500 $ 5,350
Segment Adjusted EBITDA:
United States $ 1,155 $ 1,176 $ 3,539 $ 3,969
Canada 107 144 371 451
EMEA 165 165 479 553
Rest of World 100 148 303 505
General corporate expenses (58) (39) (192) (128)
Adjusted EBITDA $ 1,469 $ 1,594 $ 4,500 $ 5,350
APPENDIX
Schedule 4
20
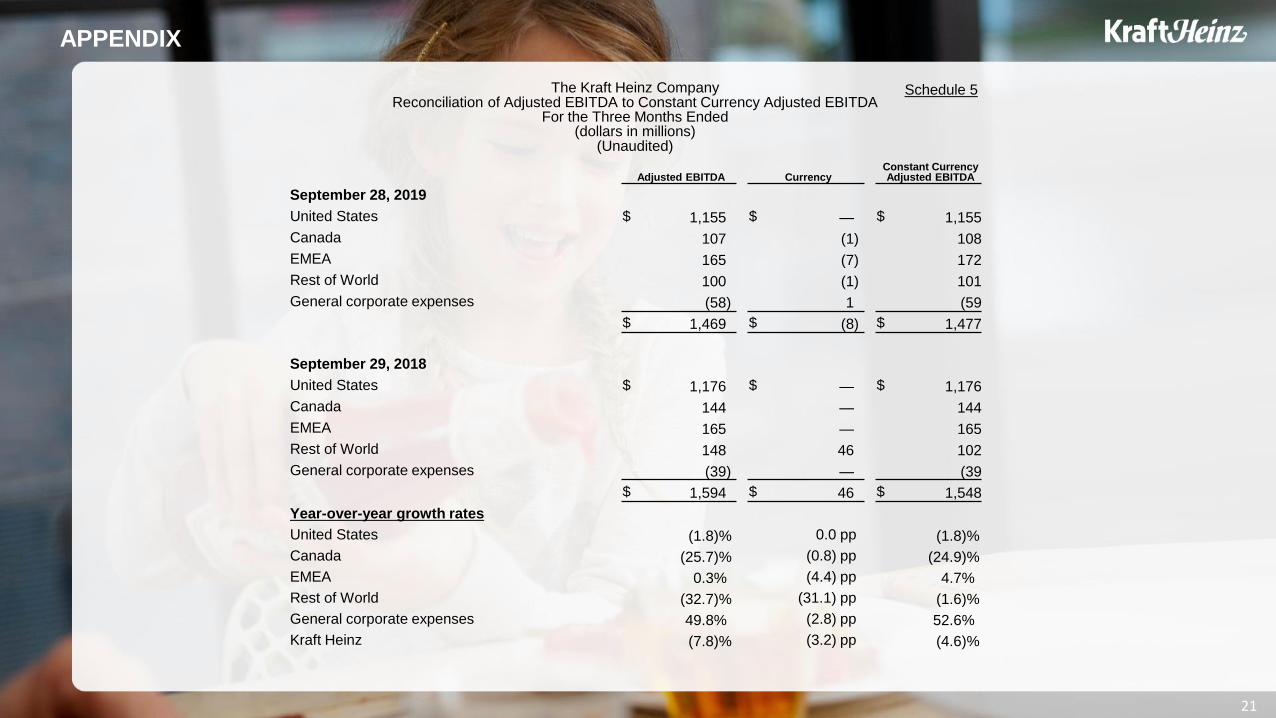
The Kraft Heinz CompanyReconciliation of Adjusted EBITDA to Constant Currency Adjusted EBITDA
For the Three Months Ended(dollars in millions)
(Unaudited)
Adjusted EBITDA CurrencyConstant Currency Adjusted EBITDA
September 28, 2019
United States $ 1,155 $ — $ 1,155
Canada 107 (1) 108
EMEA 165 (7) 172
Rest of World 100 (1) 101
General corporate expenses (58) 1 (59
$ 1,469 $ (8) $ 1,477
September 29, 2018
United States $ 1,176 $ — $ 1,176
Canada 144 — 144
EMEA 165 — 165
Rest of World 148 46 102
General corporate expenses (39) — (39
$ 1,594 $ 46 $ 1,548
APPENDIX
Schedule 5
21
Year-over-year growth rates
United States (1.8)% 0.0 pp (1.8)%
Canada (25.7)% (0.8) pp (24.9)%
EMEA 0.3% (4.4) pp 4.7%
Rest of World (32.7)% (31.1) pp (1.6)%
General corporate expenses 49.8% (2.8) pp 52.6%
Kraft Heinz (7.8)% (3.2) pp (4.6)%

APPENDIX
Schedule 6
22
The Kraft Heinz CompanyReconciliation of Adjusted EBITDA to Constant Currency Adjusted EBITDA
For the Nine Months Ended(dollars in millions)
(Unaudited)
Adjusted EBITDA CurrencyConstant Currency Adjusted EBITDA
September 28, 2019
United States $ 3,539 $ — $ 3,539
Canada 371 (12) 383
EMEA 479 (28) 507
Rest of World 303 (11) 314
General corporate expenses (192) 4 (196)
$ 4,500 $ (47) $ 4,547
September 29, 2018
United States $ 3,969 $ — $ 3,969
Canada 451 — 451
EMEA 553 — 553
Rest of World 505 147 358
General corporate expenses (128) — (128)
$ 5,350 $ 147 $ 5,203
Year-over-year growth rates
United States (10.8)% 0.0 pp (10.8)%
Canada (17.8)% (2.7) pp (15.1)%
EMEA (13.3)% (5.0) pp (8.3)%
Rest of World (40.0)% (27.5) pp (12.5)%
General corporate expenses 50.0% (2.6) pp 52.6%
Kraft Heinz (15.9)% (3.3) pp (12.6)%

The Kraft Heinz CompanyReconciliation of Diluted EPS to Adjusted EPS
(Unaudited)
For the Three Months Ended For the Nine Months Ended
September 28, 2019
September 29, 2018
September 28, 2019
September 29, 2018
Diluted EPS $ 0.74 $ 0.50 $ 1.43 $ 1.94
Integration and restructuring expenses(a) 0.01 0.03 0.04 0.19
Deal costs(b) 0.01 — 0.01 0.01
Unrealized losses/(gains) on commodity hedges(c) 0.01 — (0.02) 0.01
Impairment losses(d) — 0.13 0.90 0.30
Losses/(gains) on sale of business(e) (0.13) — (0.29) 0.01
Nonmonetary currency devaluation(f) — 0.05 0.01 0.11
Debt prepayment and extinguishment costs(g) 0.05 — 0.05 —
U.S. Tax Reform discrete income tax expense/(benefit)(h) — 0.05 — 0.09
Adjusted EPS $ 0.69 $ 0.76 $ 2.13 $ 2.66
APPENDIX
Schedule 7
23
(a) Gross expenses included in integration and restructuring expenses were $15 million ($15 million after-tax) for the three months and $56 million ($44 million after-tax) for the nine months ended September 28, 2019 and $31 million ($31 million after-tax) for the three months and $278 million ($238 million
after-tax) for the nine months ended September 29, 2018 and were recorded in the following income statement line items:
Cost of products sold included $12 million for the three months and $27 million for the nine months ended September 28, 2019 and $18 million for the three months and $175 million for the nine months ended September 29, 2018;
SG&A included $3 million for the three months and $29 million for the nine months ended September 28, 2019 and $14 million for the three months and $40 million for the nine months ended September 29, 2018; and
Other expense/(income) included income of $1 million for the three months and expenses of $63 million for the nine months ended September 29, 2018.
(b) Gross expenses included in deal costs were $6 million ($7 million after-tax) for the three months and $19 million ($18 million after-tax) for the nine months ended September 28, 2019 and $3 million ($2 million after-tax) for the three months and $19 million ($15 million after-tax) for the nine months ended
September 29, 2018 and were recorded in the following income statement line items:
Cost of products sold included $4 million for the nine months ended September 29, 2018; and
SG&A included $6 million for the three months and $19 million for the nine months ended September 28, 2019 and $3 million for the three months and $15 million for the nine months ended September 29, 2018.
(c) Gross expenses/(income) included in unrealized losses/(gains) on commodity hedges were expenses of $9 million ($7 million after-tax) for the three months and income of $30 million ($22 million after-tax) for the nine months ended September 28, 2019 and expenses of $6 million ($5 million after-tax) for
the three months and $11 million ($9 million after-tax) for the nine months ended September 29, 2018 and were recorded in cost of products sold.
(d) Gross impairment losses, which were recorded in SG&A, included the following:
Goodwill impairment losses of $744 million ($717 million after-tax) for the nine months ended September 28, 2019 and $133 million ($133 million after-tax) for the nine months ended September 29, 2018; and
Intangible asset impairment losses of $5 million ($7 million after-tax) for the three months and $479 million ($381 million after-tax) for the nine months ended September 28, 2019 and $217 million ($153 million after-tax) for the three months and $318 million ($233 million after-tax) for the nine months ended
September 29, 2018.
(e) Gross expenses/(income) included in losses/(gains) on sale of business were income of $244 million ($158 million after-tax) for the three months and $490 million ($348 million after-tax) for the nine months ended September 28, 2019 and expenses of $15 million ($15 million after-tax) for the nine months
ended September 29, 2018 and were recorded in other expense/(income).
(f) Gross expenses included in nonmonetary currency devaluation were $4 million ($4 million after-tax) for the three months and $10 million ($10 million after-tax) for the nine months ended September 28, 2019 and $64 million ($64 million after-tax) for the three months and $131 million ($131 million after-tax)
for the nine months ended September 29, 2018 and were recorded in other expense/(income).
(g) Gross expenses included in debt prepayment and extinguishment costs were $88 million ($62 million after-tax) for the three months and nine months ended September 28, 2019 and were recorded in other expense/(income).
(h) U.S. Tax Reform discrete income tax expense/(benefit) included expenses of $62 million for the three months and $106 million for the nine months ended September 29, 2018.

APPENDIX
24
The Kraft Heinz CompanyConsolidated Balance Sheets
(in millions, except per share data)(Unaudited)
September 28, 2019 December 29, 2018
ASSETS
Cash and cash equivalents $ 2,315 $ 1,130
Trade receivables, net 1,959 2,129
Income taxes receivable 119 152
Inventories 3,158 2,667
Prepaid expenses 415 400
Other current assets 1,124 1,221
Assets held for sale 35 1,376
Total current assets 9,125 9,075
Property, plant and equipment, net 6,926 7,078Goodwill 35,826 36,503Intangible assets, net 48,714 49,468Other non-current assets 2,231 1,337
TOTAL ASSETS $ 102,822 $ 103,461
LIABILITIES AND EQUITY
Commercial paper and other short-term debt $ 15 $ 21
Current portion of long-term debt 2,545 377
Trade payables 4,156 4,153
Accrued marketing 458 722
Interest payable 278 408
Other current liabilities 1,658 1,767
Liabilities held for sale 2 55
Total current liabilities 9,112 7,503
Long-term debt 28,112 30,770
Deferred income taxes 12,010 12,202
Accrued postemployment costs 315 306
Other non-current liabilities 1,467 902
TOTAL LIABILITIES 51,016 51,683
Redeemable noncontrolling interest 2 3
Equity:
Common stock, $0.01 par value 12 12
Additional paid-in capital 57,293 58,723
Retained earnings/(deficit) (3,241) (4,853)Accumulated other comprehensive income/(losses) (2,126) (1,943)Treasury stock, at cost (265) (282)
Total shareholders' equity 51,673 51,657
Noncontrolling interest 131 118
TOTAL EQUITY 51,804 51,775TOTAL LIABILITIES AND EQUITY $ 102,822 $ 103,461
Schedule 8