Q3 2020 - Swedish Match
28
Q3 2020 Interim Report January – September 2020 Record sales and operating profit from product segments in Q3 • Sales and operating profit increased for the Smokefree product segment in both the US and Scandinavia, as well as for cigars. Sales and operating profit elevated by COVID-19 related effects on consumer demand and channel shifts. • In local currencies, sales increased by 23 percent for the third quarter. Reported sales increased by 15 percent to 4,400 MSEK (3,829). • In local currencies, operating profit from product segments 1) increased by 37 percent for the third quarter. Reported operating profit from product segments increased by 28 percent to 2,046 MSEK (1,603). • Operating profit amounted to 2,019 MSEK (1,586) for the third quarter. • Profit after tax, which includes a charge of 286 MSEK following adverse ruling in a tax case, amounted to 1,193 MSEK (1,180) for the third quarter. • Adjusted earnings per share increased by 31 percent to 9.21 SEK (7.04) for the third quarter. Earnings per share increased by 6 percent to 7.44 SEK (7.04). • Revised outlook provided on page 12 to reflect higher expected underlying corporate tax rate for the year 2020 as a consequence of a stronger than previously anticipated result development for the business in the US. 1) Excludes Other operations and larger one-time items.
-
Upload
khangminh22 -
Category
Documents
-
view
4 -
download
0
Transcript of Q3 2020 - Swedish Match
Q3 2020
Interim Report January – September 2020
Record sales and operating profit from product segments in Q3
• Sales and operating profit increased for the Smokefree product segment in both the US and Scandinavia, as well as for cigars. Sales and operating profit elevated by COVID-19 related effects on consumer demand and channel shifts.
• In local currencies, sales increased by 23 percent for the third quarter. Reported sales increased by 15 percent to 4,400 MSEK (3,829).
• In local currencies, operating profit from product segments1) increased by 37 percent for the third quarter. Reported operating profit from product segments increased by 28 percent to 2,046 MSEK (1,603).
• Operating profit amounted to 2,019 MSEK (1,586) for the third quarter.
• Profit after tax, which includes a charge of 286 MSEK following adverse ruling in a tax case, amounted to 1,193 MSEK (1,180) for the third quarter.
• Adjusted earnings per share increased by 31 percent to 9.21 SEK (7.04) for the third quarter. Earnings per share increased by 6 percent to 7.44 SEK (7.04).
• Revised outlook provided on page 12 to reflect higher expected underlying corporate tax rate for the year 2020 as a consequence of a stronger than previously anticipated result development for the business in the US.
1) Excludes Other operations and larger one-time items.

________________________________________________________________________ January-September 2020 2
CEO Lars Dahlgren comments:
A record quarter, with strong underlying results from all product segments
Swedish Match delivered an outstanding performance during the third quarter. While we estimate that COVID-
19 related effects had a notably positive net impact on group earnings, the underlying financial development
across our product segments was strong. Impressive performance for ZYN in the US continued to be the key
contributor to profit growth. For this quarter we also noted a significant upturn in operating profit for our US
cigar business, as well as for our Scandinavian smokefree business – even when excluding COVID-19 related
positive mix effects from increased domestic volumes in Norway that substituted deliveries to border trade and
travel retail outlets.
A number of milestones were achieved during the third quarter, including a record financial result for our
product segments, a new all-time high in ZYN nicotine pouch shipments, and the highest quarterly shipment
volumes ever for cigars.
Like many businesses, our organization has had to continuously adjust and respond to the challenges and the
changing operating environment brought on by COVID-19. Across our Group, precautionary protocols like
social distancing measures have been maintained and refined, and our dedicated and focused employees
have adjusted their ways of working in innovative ways with a view to ensure business continuity and the active
pursuit of future growth. Our cigar operations in the Dominican Republic have faced the most concrete
challenges. With over three thousand employees, it takes time to restore productivity and capacity while
ensuring effective implementation of social distancing and other safe-guarding measures. We have made great
progress toward those objectives during the quarter but producing at levels to fully meet consumer demand
for our natural leaf varieties is likely to remain a challenge at least for the rest of this year.
Identifying and isolating COVID-19 related impacts on our financial performance is challenging. In summing
up the performance for the first nine months, however, it seems clear that the net COVID-19 impact on our
financial results have been meaningfully favorable, and that much of this effect occurred during the third
quarter. Relative to historical consumption trends, we have noted an elevated demand for both cigars and
traditional smokefree products in the US (moist snuff and chewing tobacco). In the Scandinavian smokefree
business, overall demand has held up very well despite lower volumes supplied to Finnish consumers from
border and travel retail outlets. Norwegians that have faced, and continue to face, travel restrictions have to a
very large extent switched their purchases to the domestic Norwegian trade, including e-com. In Norway, there
is no low-price segment, and the switch to domestic outlets has resulted in significant positive mix effects.
Thanks to extraordinary efforts in our cigar factories, both in the US and the Dominican Republic, we have
been able to take advantage of the very strong demand for cigars by sharply increasing output of the less
labor-intensive HTL varieties. While we have incurred extra costs across our organization in implementing
COVID-19 social distancing and safety protocols, this has been more than offset by savings from reduced
travelling and the postponement or cancellation of marketing and other activities. New initiatives have not come
to a complete halt however, and our smokefree operations in Other markets continued to invest for the future,
including the introduction of ZYN into new geographies.
For ZYN in the US, we continued to capture the bulk of the growth in the nicotine pouch market, and we again
experienced increased velocities at the retail level, despite expanded store distribution and significantly more
aggressive promotional activity by our competitors. Our manufacturing operations in Owensboro continued to
impress by managing to further increase utilization and efficiency from existing capacity while continuing to
progress with the next phase of the capacity expansion according to plan.
Already in March, we submitted our PMTA applications to the US FDA for our range of ZYN nicotine pouches,
and during the third quarter we actively engaged with the Agency as it commenced its scientific reviews. For
cigars, our regulatory, scientific and production teams made an impressive effort to meet the September 9
deadline for substantial equivalence (SE) applications to the FDA, and I am pleased to note that we have now
filed SE applications for our entire current cigar assortment.
I am very proud of the efforts of our entire team here at Swedish Match – whether in our factories, in the field,
working from home, or in their offices – in maintaining a positive and focused approach, in demonstrating agility
and innovation, and in helping in so many ways to build a strong and growing business.

________________________________________________________________________ January-September 2020 3
Summary of consolidated income statement MSEK July-September Chg January-September Chg Full year 2020 2019 % 2020 2019 % 2019
Sales 4,400 3,829 15 12,561 10,806 16 14,739 Sales from product segments1) 4,303 3,729 15 12,287 10,525 17 14,363 Operating profit from product segments1) 2,046 1,603 28 5,403 4,292 26 5,812 Operating profit, excl. larger one-time items2) 2,019 1,586 27 5,279 4,209 25 5,675 Operating profit 2,019 1,586 27 5,279 4,209 25 5,307 Profit before income tax 1,914 1,526 25 5,012 4,021 25 5,060 Profit for the period 1,193 1,180 1 3,581 3,140 14 3,896 Operating margin from product segments, %1) 47.6 43.0 44.0 40.8 40.5 Earnings per share, basic and diluted, SEK 7.44 7.04 22.18 18.60 23.22 Adjusted earnings per share, basic and diluted, SEK2)3) 9.21 7.04 23.95 18.60 25.41 1) Excluding Other operations and larger one-time items. 2) Excluding a larger one-time item during the fourth quarter 2019, which pertains to a non-cash impairment charge for the European
chewing tobacco business, see Note 5. 3) Adjusted earnings per share in 2020 excludes a tax charge including interest of 286 MSEK related to adverse ruling in a tax case
in Sweden recognized in the third quarter 2020, see Note 7.
The third quarter (Note: Comments below refer to the comparison between the third quarter 2020 vs. the third quarter 2019).
Sales Group sales and sales from product segments both increased by 15 percent to 4,400 MSEK (3,829) and 4,303
MSEK (3,729), respectively. In local currencies, sales increased for all product segments. Currency translation
negatively affected the comparability of sales from product segments by 299 MSEK. While difficult to calculate
with precision, COVID-19 is estimated to have had a notably positive effect on the sales development.
Consumer demand for cigars, chewing tobacco and moist snuff in the US is estimated to have been elevated
during the quarter, and in Scandinavia exceptionally strong volumes on the Norwegian domestic market
resulted in favorable mix effects.
The Smokefree product segment was the largest contributor to sales growth due to the continued success of
our ZYN nicotine pouch offerings, as well as strong sales development in the Scandinavian business. The
Cigars product segment also delivered strong sales growth on record volumes. In the US, the sales
development was driven by substantially higher volumes – with volumes more than doubling for ZYN, and with
double digit volume growth for moist snuff and cigars. In Scandinavia, smokefree sales increased despite flat
volumes and a weaker Norwegian krone (NOK) as a consequence of price increases and improved market
mix as a consequence of the sharp increase in domestic sales in Norway that more than offset declines in
sales to border trade and travel retail outlets. Reported sales for the Lights product segment declined as a
result of the significant depreciation of the Brazilian real, but grew in local currencies.
Earnings Operating profit from product segments increased by 28 percent to 2,046 MSEK (1,603). In local currencies,
operating profit from product segments was up by 37 percent. Group operating profit amounted to 2,019 MSEK
(1,586). Currency translation has affected the comparison of the operating profit negatively by 143 MSEK. The
estimated COVID-19 related effects on sales also had a notably positive impact on the operating profit during
the quarter. The increase in operating profit was attributable to both Smokefree and Cigars. Lights operating
profit declined but demonstrated strong underlying growth when adjusting for currency translation effects and
gains on sales of land and forestry assets in the third quarters of both 2019 and 2020.
The Group’s net finance cost increased to 105 MSEK (60), due to higher average debt and reduced financial
returns on surplus cash as well as interest costs of 16 MSEK relating to an adverse ruling in a tax case in
Sweden in August 2020 (see Note 7). The income tax expense amounted to 721 MSEK (346), corresponding
to a corporate tax rate of 37.6 percent (22.7). The extraordinarily high tax rate for the Group resulted from an
additional income tax expense of 270 MSEK relating to the above mentioned tax case, as well as the continued
increase in the relative contribution to earnings from our US businesses, which is taxed at a higher effective
tax rate compared to the average Group tax rate.
The Group’s profit for the period amounted to 1,193 MSEK (1,180).

________________________________________________________________________ January-September 2020 4
Earnings per share (EPS) for the third quarter amounted to 7.44 SEK (7.04). Adjusted EPS increased by 31
percent to 9.21 SEK (7.04) for the third quarter.
The first nine months (Note: Comments below refer to the comparison between the first nine months 2020 vs. the first nine months 2019).
Sales Group sales increased by 16 percent to 12,561 MSEK (10,806). Currency translation affected the sales
comparison negatively by 198 MSEK. In local currencies, sales from product segments increased by 19
percent with increases across all three product segments. It is estimated that year-to-date volume and sales
performance benefitted from the net effects of COVID-19 related impacts on consumer purchasing and
consumption patterns, most notably for chewing tobacco and cigars in the US, as well as the shift in purchases
by Norwegians to the local Norwegian market from Swedish border shops and travel retail outlets.
Earnings Operating profit from product segments amounted to 5,403 MSEK (4,292). In local currencies the operating
profit from product segments increased by 29 percent and increased for all product segments. COVID-19
related effects are estimated to have had a net favorable impact on earnings for the year-to-date period.
Group operating profit amounted to 5,279 MSEK (4,209). Currency translation has affected the comparison of
the operating profit negatively by 120 MSEK.
The Group’s net finance cost amounted to 267 MSEK (188) reflecting increased average debt and lower
financial returns on surplus cash as well as interest costs of 16 MSEK related to the above-mentioned tax
case. Income tax expense amounted to 1,430 MSEK (881), corresponding to a tax rate of 28.5 percent (21.9).
The extraordinarily high tax rate for the Group resulted from the incremental income tax expense of 270 MSEK
relating to the Swedish tax case, as well as the continued increase in the relative contribution to earnings from
our US businesses.
The Group’s profit for the period amounted to 3,581 MSEK (3,140).
EPS for the first nine months amounted to 22.18 SEK (18.60). Adjusted EPS increased by 29 percent to 23.95
SEK (18.60) for the first nine months.
ZYN
In the US, Swedish Match has expanded the availability for the ZYN nicotine pouch
varieties Smooth, Chill and Citrus which are now sold nationwide. Prior to the
expansion, these varieties had primarily been available only in a number of areas in
the western US. All ZYN products sold in the US are available in both 3mg and 6mg
strength.

________________________________________________________________________ January-September 2020 5
Smokefree
Third quarter highlights:
• Higher sales and operating profit in both US and Scandinavia, driven by nicotine pouches
• Estimated COVID-19 related effects positively impacted sales and operating profit in Scandinavia and the US
• Sequential growth in shipment volumes for ZYN in the US fueled by strong demand and increased production efficiencies
Key data MSEK July-September Chg January-September Chg Full year 2020 2019 % 2020 2019 % 2019
Sales 2,842 2,315 23 8,045 6,439 25 8,914 Operating profit 1,519 1,093 39 3,974 2,937 35 3,997 Operating margin, % 53.5 47.2 49.4 45.6 44.8 EBITDA 1,617 1,185 36 4,270 3,194 34 4,353 EBITDA margin, % 56.9 51.2 53.1 49.6 48.8 Depreciation, amortization and impairment -98 -92 -296 -257 -356 Capital expenditures 207 155 33 665 442 50 593
The third quarter
(Note: Comments below refer to the comparison between the third quarter 2020 vs. the third quarter 2019).
In local currencies, sales for the Smokefree product segment increased by 30 percent, with growth coming
from both the US and Scandinavia. Currency translation affected the sales comparison negatively by 162
MSEK resulting from a stronger SEK relative to the USD and the NOK. Increased shipment volumes for ZYN
in the US was the main contributor to sales growth. In the US, sales in local currency also grew for moist snuff
and chewing tobacco. In Scandinavia, sales grew sharply for nicotine pouches and also increased for snus. In
other markets outside of Scandinavia and the US, sales declined.
Operating profit in local currencies improved in both the US and Scandinavia. Operating profit in other markets
outside of the US and Scandinavia declined principally as a result of expansion costs for nicotine pouches.
Scandinavia
Scandinavia refers to Sweden, Norway, and Denmark.
Key data July-September Chg January-September Chg Full year 2020 2019 % 2020 2019 % 2019
Financials Sales, MSEK 1,240 1,166 6 3,458 3,374 2 4,624 Operating profit, MSEK 735 637 15 1,850 1,794 3 2,432 Operating margin, % 59.2 54.6 53.5 53.2 52.6
Shipment volumes Snus, million cans 63.9 66.0 -3 180.8 191.2 -5 260.2 Nicotine pouches, million cans 3.7 2.2 67 9.7 5.9 63 8.6

________________________________________________________________________ January-September 2020 6
Market shares1)
Percent July-September Chg January-September Chg Full year 2020 2019 ppts 2020 2019 ppts 2019
Snus, Sweden 60.2 61.3 -1.2 60.5 61.6 -1.0 61.5 Snus, Norway 59.4 55.7 3.8 58.6 55.2 3.4 55.5 Nicotine pouches, Sweden 24.9 25.9 -1.0 25.4 25.6 -0.2 25.8 Nicotine pouches, Norway2) 13.8 15.1 -1.3 14.0 15.9 -2.0 15.4 1) Based on Nielsen data (excluding tobacconists and e-commerce): 13 weeks and YTD to September 27, 2020 and September 29,
2019, respectively. All figures for the Swedish market have been restated to reflect changes in Nielsen store measurements. 2) Nicotine pouches in Norway contain a small amount of tobacco for regulatory reasons.
Getting an accurate read on market dynamics within Scandinavia (Sweden, Norway, and Denmark) for the
combined snus and nicotine pouch categories remains challenging due to COVID-19 effects. However,
Swedish Match estimates that the smokefree category continued to grow at a good pace in volume terms
during the quarter, with increased consumption in all geographies.
Swedish Match’s reported shipment volumes in Scandinavia were flat in the quarter compared to the prior year
as the negative impacts of travel restrictions and disrupted deliveries to the border trade and travel retail
channels were offset by strong deliveries to the Norwegian domestic market.
Sales increased despite flat volumes and a weaker NOK as a consequence of implemented price changes
and improved mix primarily reflecting the sharp increase in Norwegian domestic volumes.
Operating profit increased more than sales on positive price/mix effects and unusually low operating expenses.
In Sweden, Swedish Match’s market share in the rapidly growing nicotine pouch category declined somewhat
when compared to both the third quarter of the prior year and the second quarter of 2020. The market share
for snus was virtually unchanged compared to the second quarter of 2020 but declined when compared to the
third quarter of the prior year.
In Norway, Swedish Match’s market share within the conventional snus category improved markedly when
compared to the prior year and also increased sequentially when compared to the second quarter. Within the
nicotine pouch category, Swedish Match’s market share declined when compared to both the third quarter of
the prior year and the second quarter of 2020.
The US
Key data July-September Chg January-September Chg Full year 2020 2019 % 2020 2019 % 2019
Financials Sales, MSEK 1,566 1,096 43 4,457 2,907 53 4,082 Operating profit, MSEK 816 444 84 2,187 1,092 100 1,534 Operating margin, % 52.1 40.5 49.1 37.5 37.6
Shipment volumes Moist snuff, million cans 36.2 31.2 16 103.6 93.6 11 124.0 Nicotine pouches, million cans 32.3 13.5 140 83.2 31.0 168 50.4 Chewing tobacco, thousands of pounds (excluding contract manufacturing volumes) 1,480 1,477 0 4,450 4,421 1 5,681
Market shares1)
Percent July-September Chg January-September Chg Full year 2020 2019 ppts 2020 2019 ppts 2019
Moist snuff 9.1 8.2 0.9 8.7 8.2 0.6 8.2 Nicotine pouches 73.7 79.8 -6.1 74.9 88.2 -13.2 83.5 Chewing tobacco (excluding contract manufacturing volumes) 40.8 39.2 1.5 40.9 40.1 0.8 40.4 1) Based on MSA distributor shipments: 13 weeks and YTD to September 27, 2020 and September 29, 2019 respectively.

________________________________________________________________________ January-September 2020 7
In local currency, US sales for smokefree products grew by 53 percent, while operating profit grew by 96
percent. ZYN in the US continued to be a key driver of the year-on-year increase in sales and operating profit,
but sales and operating profit also grew for moist snuff, snus, and chewing tobacco. It is estimated that COVID-
19 related changes to consumer consumption patterns positively affected demand for chewing tobacco and
moist snuff.
ZYN sales continued to show rapid year-on-year and quarterly sequential volume growth, with shipment
volumes reaching 32 million cans during the quarter. Volumes benefitted from strong underlying demand, the
national expansion of the Smooth, Chill, and Citrus varieties as well as increased store distribution. The
sequential growth in shipment volumes also benefitted from increases to minimum stock levels at one of our
larger distributors as well as one extra shipping day compared to the second quarter of 2020. The fourth quarter
of 2020 will have three fewer shipping days than the third quarter.
Based on data that measures distributor shipments to retail, volumes of ZYN grew by 20 percent on a
sequential basis from the second to the third quarter, largely driven by increased velocities at retail. As ZYN
participates in a rapidly expanding market and is no longer the only participant in many states, attractive volume
growth may be achieved concurrent with market share declines. Based on the measure of distributor shipments
to retail, ZYN remains the largest participant in the market with more than a 70 percent share of the nicotine
pouch category.
For our US moist snuff business, shipment volumes were up by 16 percent with strong volume gains across
loose, tub and pouch formats for the Longhorn brand more than offsetting volume declines for our other brands.
Sales grew at a slower rate than volume due to adverse portfolio mix, and operating profit grew modestly.
Swedish Match continued to gain market share in the attractive moist snuff pouch segment in the quarter, and
also in the loose segment, leading to share gains within the total moist snuff category.
Chewing tobacco shipments in the US (excluding contract manufacturing volumes) during the quarter were
higher than the prior year on continued strength of the chewing tobacco category relative to the long-term
declining trend. Shipment volumes for traditional premium varieties declined, while they grew for value brands.
Both sales and operating profit grew as a result of improved pricing and production efficiencies.
Other markets
Key data July-September Chg January-September Chg Full year 2020 2019 % 2020 2019 % 2019
Sales, MSEK 36 53 -32 130 158 -17 208 Operating profit, MSEK -31 12 -369 -63 52 -221 32 Operating margin, % -87.4 22.0 -48.0 32.7 15.2 Shipment volumes, million cans1) 1.8 2.7 -33 6.5 8.4 -22 10.9 1) Total shipment volumes for snus, nicotine pouches, chew bags, and tobacco bits.
In other markets outside of the US and Scandinavia, sales and operating profit declined in both reported and
local currencies. The decline in volumes, driven by chewing tobacco, resulted in declines in both sales and
operating profit. Sales were higher for nicotine pouches and flat for snus. For nicotine pouches, investments
tied to product launches continued in a number of countries, primarily in Europe. In addition, investments are
being made to strengthen support behind future growth activities. The current situation with regard to COVID-
19 is adversely impacting certain marketing and launch activities.
The first nine months
(Note: Comments below refer to the comparison between the first nine months 2020 vs. the first nine months 2019).
In local currencies, sales for the Smokefree product segment increased by 27 percent. Increased shipment
volumes for ZYN in the US were the key contributor to sales growth for the segment. In the US, sales in local
currency also grew for moist snuff and chewing tobacco. In Scandinavia, volumes declined but sales increased
as a consequence of price increases and improved market mix effects that more than offset the effects of the
volume declines and the weaker NOK. In other markets outside of the US and Scandinavia, sales declined.
Operating profit was substantially higher in the US, while also somewhat higher in Scandinavia. Operating
profit declined in other markets outside of the US and Scandinavia compared to the prior year.

________________________________________________________________________ January-September 2020 8
Cigars
Third quarter highlights:
• Strong growth in the cigar category (likely impacted by COVID-19) and Swedish Match achieved record cigar shipments, up 19 percent
• Year-on-year HTL volumes up by more than 60 percent, while volumes for natural leaf cigars were modestly lower due to COVID-19 production constraints
• Consistent improvement in staffing and production levels in the Dominican Republic throughout the quarter
• Higher operating profit and operating margin from strong volumes and improved production efficiencies
Key data MSEK July-September Chg January-September Chg Full year 2020 2019 % 2020 2019 % 2019
Sales 1,184 1,117 6 3,381 3,208 5 4,249 Operating profit 471 423 11 1,253 1,218 3 1,577 Operating margin, % 39.7 37.9 37.1 38.0 37.1 EBITDA 491 444 11 1,318 1,281 3 1,662 EBITDA margin, % 41.5 39.8 39.0 39.9 39.1 Depreciation, amortization and impairment -21 -21 -65 -63 -85 Capital expenditures 15 14 6 49 40 20 52
The third quarter
(Note: Comments below refer to the comparison between the third quarter 2020 vs. the third quarter 2019).
The Cigars product segment derives its sales and profit almost exclusively from the US operations. In local
currency, sales were up by 14 percent, while operating profit growth was more pronounced due to lower costs
in relation to sales.
Swedish Match’s cigar shipment volumes were 19 percent higher versus prior year from robust volume growth
for HTL varieties. Natural leaf shipment volumes declined modestly due to production constraints in Swedish
Match’s Dominican facility. While shipment volumes for natural leaf varieties were notably higher than in the
second quarter, continued COVID-19 related hygiene and social distancing measures coupled with a planned
factory shut-down over the Christmas period is expected to constrain shipments of natural leaf varieties also
in the fourth quarter. Our cigar business’s sequential performance in the fourth quarter of 2020 will also be
impacted by three fewer trading days when compared to the third quarter.
Based on MSA measures of distributor shipments to retail, total mass market cigar category volumes
(excluding little cigars) increased by 21 percent in the third quarter, likely benefitting from COVID-19 related
impacts on retail and consumer purchase patterns. Based on that same measure, Swedish Match gained
market share, driven by gains within the HTL segment, partly offset by market share losses within the natural
leaf segment, impacted by our inability to fully supply market demand.
US shipment volumes July-September Chg January-September Chg Full year 2020 2019 % 2020 2019 % 2019
Homogenized tobacco leaf (HTL) cigars, million sticks 238 146 63 617 481 28 625 Natural leaf cigars, million sticks 272 283 -4 788 803 -2 1,067
Cigars total 509 429 19 1,405 1,284 9 1,692
________________________________________________________________________ January-September 2020 9
Market shares1)
Percent July-September Chg January-September Chg Full year 2020 2019 ppts 2020 2019 ppts 2019
Homogenized tobacco leaf (HTL) cigars 16.9 11.7 5.2 14.4 12.0 2.4 12.3 Natural leaf cigars 34.5 42.7 -8.2 37.7 42.3 -4.6 45.1
Cigars total 22.8 21.4 1.4 22.1 21.2 0.9 22.5 1) Based on MSA distributor shipments: Mass market cigars (excluding little cigars) 13 weeks and YTD to September 27, 2020 and
September 29, 2019 respectively.
The first nine months
(Note: Comments below refer to the comparison between the first nine months 2020 vs. the first nine months 2019).
In local currency, sales for the Cigar product segment increased by 5 percent. The sales development was
influenced by COVID-19 related consumption and trade flow effects, as well as the mix shift toward HTL cigars
due to COVID-19 related supply constraints for natural leaf varieties from our Dominican Republic
manufacturing facility. Operating profit in local currency grew by 3 percent, influenced by shifts in portfolio mix
as well as certain COVID-19 related costs incurred at production facilities, most notably in the second quarter.
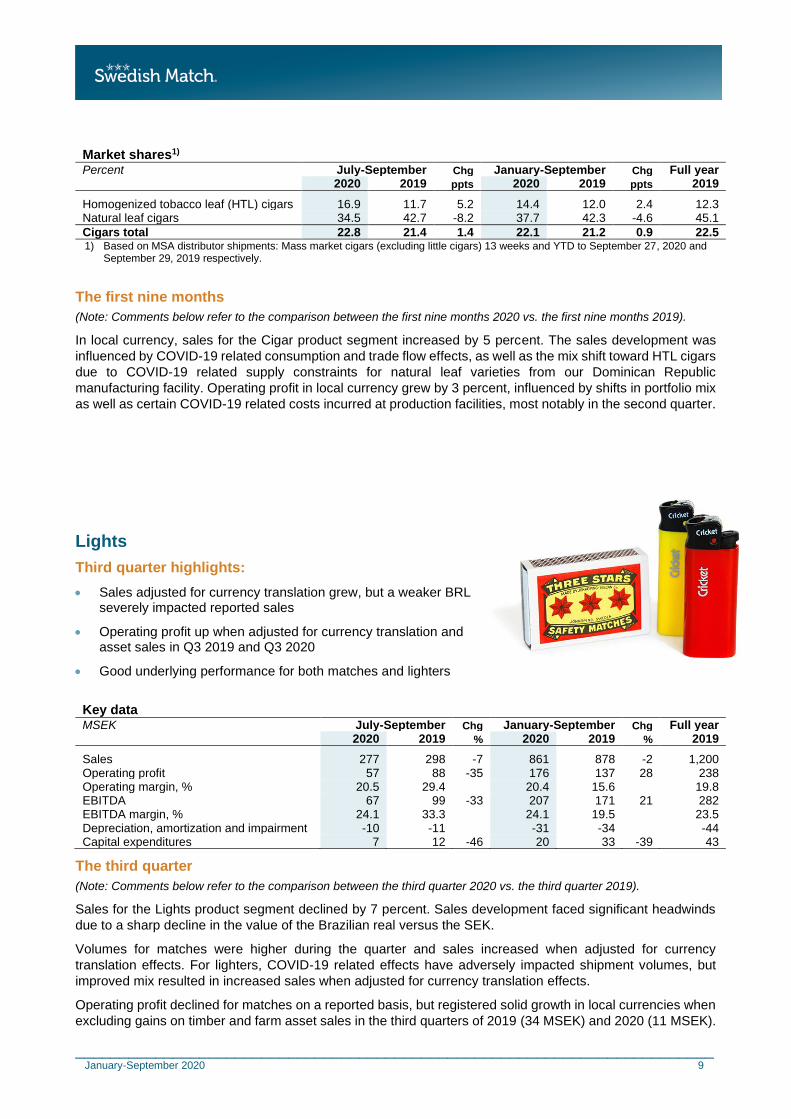
Lights
Third quarter highlights:
• Sales adjusted for currency translation grew, but a weaker BRL severely impacted reported sales
• Operating profit up when adjusted for currency translation and asset sales in Q3 2019 and Q3 2020
• Good underlying performance for both matches and lighters
Key data MSEK July-September Chg January-September Chg Full year 2020 2019 % 2020 2019 % 2019
Sales 277 298 -7 861 878 -2 1,200 Operating profit 57 88 -35 176 137 28 238 Operating margin, % 20.5 29.4 20.4 15.6 19.8 EBITDA 67 99 -33 207 171 21 282 EBITDA margin, % 24.1 33.3 24.1 19.5 23.5 Depreciation, amortization and impairment -10 -11 -31 -34 -44 Capital expenditures 7 12 -46 20 33 -39 43
The third quarter
(Note: Comments below refer to the comparison between the third quarter 2020 vs. the third quarter 2019).
Sales for the Lights product segment declined by 7 percent. Sales development faced significant headwinds
due to a sharp decline in the value of the Brazilian real versus the SEK.
Volumes for matches were higher during the quarter and sales increased when adjusted for currency
translation effects. For lighters, COVID-19 related effects have adversely impacted shipment volumes, but
improved mix resulted in increased sales when adjusted for currency translation effects.
Operating profit declined for matches on a reported basis, but registered solid growth in local currencies when
excluding gains on timber and farm asset sales in the third quarters of 2019 (34 MSEK) and 2020 (11 MSEK).

________________________________________________________________________ January-September 2020 10
For lighters, operating profit excluding currency translation effects increased slightly despite the modestly lower
volumes as the result benefitted from an improved mix, lower indirect costs and lower nylon pricing.
For complementary products, both sales and operating profit increased in local currency as consumer demand
was strong in the Brazilian market.
Shipment volumes, worldwide July-September Chg January-September Chg Full year 2020 2019 % 2020 2019 % 2019
Matches, billion sticks 13.0 12.7 2 43.0 39.8 8 54.3 Lighters, million units 77.9 78.7 -1 213.0 228.2 -7 304.5
The first nine months
(Note: Comments below refer to the comparison between the first nine months 2020 vs. the first nine months 2019).
Reported sales declined by 2 percent, but excluding currency translation effects, sales grew by 8 percent.
Excluding currency translation, sales increased for matches and complementary products but declined slightly
for lighters as COVID-19 related effects negatively impacted the volume development.
Operating profit grew for both matches and lighters, both as reported and excluding currency translation
effects. For complementary products, operating profit increased when excluding currency translation effects.
Operating profit for lighters benefitted from cost controls, reduced raw materials pricing (primarily nylon) and
portfolio mix. Operating profit for matches benefitted from higher volumes and price/mix effects. The operating
profit in the current year included income related to the favorable resolution of indirect tax disputes (see Note
7) as well as a capital gain from land sale aggregating 30 MSEK while the prior year’s first nine months’ result
included restructuring costs, as well as asset sales which combined provided a net benefit of 27 MSEK.
Cash flow and financing Cash flow from operating activities for the first nine months of 2020 amounted to 4,220 MSEK (3,764). The
increase was driven by the stronger EBITDA development and improved cash flow from working capital but
was negatively impacted by higher tax payments. Higher tax payments primarily pertain to timing of corporate
tax payments in Sweden relating to income taxes on prior fiscal years, the adverse ruling in a tax case in
Sweden (see note 7), as well as higher tax payments due to continued increase in earnings from the US
operations. Operating cash flows in the third quarter reflect payments for income and other indirect taxes in
the US of 475 MSEK that were deferred from the second quarter pursuant to governmentally mandated
payment postponement measures.
Investments in property, plant and equipment increased to 747 MSEK (548). During the first quarter of 2020,
Swedish Match also paid the remaining consideration related to the acquisition of Gotlandssnus in 2018 of 32
MSEK. During the third quarter of 2019, Swedish Match made a 49 percent investment in a newly established
distribution company, which in turn acquired two distribution businesses in central Europe. These acquisitions
were financed by a loan from Swedish Match of 58 MSEK, which has been partly repaid during 2020.
Net finance cost for the first nine months increased to 267 MSEK (188), due to higher average debt and a one-
time interest cost of 16 MSEK relating to the adverse ruling in a tax case (see Note 7), as well as reduced
financial return on surplus cash due to lower interest rates.
During the first nine months, new bond loans of 3,175 MSEK were issued and repayments of bond loans
amounted to 500 MSEK. As of September 30, 2020, Swedish Match had 15,485 MSEK of interest-bearing
debt excluding retirement benefit obligations but including the recognition of lease liabilities of 289 MSEK. The
Group’s interest-bearing debt, excluding retirement benefit obligations at December 31, 2019 amounted to
12,935. During the remainder of 2020, 800 MSEK of this debt falls due for payment. For further detail on the
maturity profile of the debt portfolio, please see the Company’s website. Net retirement benefit obligations
increased to 1,622 MSEK as of September 30, 2020, from 1,360 MSEK at December 31, 2019, mainly due to
decreases in discount rates which was partly offset by returns on plan assets.

________________________________________________________________________ January-September 2020 11
As of September 30, 2020, Swedish Match had 1,500 MSEK in unutilized committed credit lines. Cash and
cash equivalents amounted to 3,760 MSEK at the end of the period, compared to 2,370 MSEK at December
31, 2019.
The net debt as of September 30, 2020 amounted to 13,346 MSEK compared to 11,925 MSEK at December
31, 2019.
Shareholder distributions and the share In the first nine months of 2020, Swedish Match paid dividends of 2,020 MSEK to its shareholders. During the
same period, Swedish Match repurchased 3.5 million shares for 2,183 MSEK at an average price of 625.33
SEK, following authorization from the Annual General Meetings held in 2019 and 2020. Total shares bought
back by Swedish Match since the buyback program started have been repurchased at an average price of
145.30 SEK. As per September 30, 2020 Swedish Match held 2.5 million shares, corresponding to 1.52 percent
of the total number of shares. The number of shares outstanding, net, as per September 30, 2020, amounted
to 159.7 million.
Effects from the coronavirus (COVID-19) On March 11, 2020, the World Health Organization declared COVID-19 a pandemic, acknowledging the global
scale of the impact of COVID-19 on people’s health, families and communities. While longer-term effects from
the pandemic are uncertain, the negative commercial, operational and financial consequences to Swedish
Match have thus far been limited. On the contrary, Swedish Match estimates that, thus far and for the nine-
month period through September 30, COVID-19 related changes to consumer demand and purchase patterns
have positively impacted sales for several of its businesses. For cigars, while consumer demand is estimated
to have been elevated due to COVID-19, resulting in particularly strong Swedish Match volume development
for HTL cigars, COVID-19 related production constraints have limited Swedish Match’s ability to fully meet the
demand for natural leaf varieties. Swedish Match is closely monitoring the current situation including
governmental guidelines and advice from public health authorities in every country where we operate. We are
proactively taking the steps that we believe are appropriate to mitigate potential impacts to our employees, our
customers and our business, as well as to society. To date, other than the governmentally imposed deferral
by the US of certain tax payments in the second quarter, which were paid during the third quarter, no material
governmental subsidies or concessions related to COVID-19 have been sought or received by Swedish Match.
Financial position and liquidity In February 2020, Swedish Match issued a seven-year 300 MEUR bond (3,175 MSEK) at a fixed annual
coupon of 87.5 bps. For the remainder of the year, 800 MSEK of bond maturities remain. At the end of the
third quarter of 2020, we held 3,760 MSEK in cash and cash equivalents, and a net debt position of 13,346
MSEK corresponding to a leverage of 2.0 in relation to EBITA. During the first nine months, an ordinary
dividend for the financial year 2019 of 2,020 MSEK, was paid out to shareholders on April 9. Ahead of the
dividend payment, management performed extensive liquidity stress testing, reconfirming our financial
strength.
Accounting implications Management has reviewed significant assumptions and other facts and circumstances having an implication
on the reported balances in accordance with IFRS. At this point, there are no indications that the COVID-19
pandemic will affect the long-term performance of the business such that valuation of company assets is
significantly impacted.
Credit risks are regularly reviewed, with no indications of any significant changes in customers’ credit terms or
to customers’ ability to pay outstanding invoices when they fall due.
Financial assets in several countries, particularly debt and equity securities, have been impacted by the
uncertainty surrounding COVID-19 leading to valuation volatility. Some of the Group’s post-employment benefit
plans hold equities, whose growth is expected to outpace liabilities over the long term while providing volatility
and risk in the short term. During the second and the third quarters, pension assets have recovered the losses
that were experienced in the first quarter of 2020. Updated assumptions have led to declines in discount rates
used to measure our defined benefit plans, which have increased the reported value of the Group’s defined
post-employment benefit obligations. As per September 30, 2020 the Group’s net defined post-employment
benefit obligations increased by 262 MSEK compared to December 2019, mainly as a result of negative
remeasurement effects from lower discount rates, which was partly offset by returns on plan assets.

________________________________________________________________________ January-September 2020 12
The Group’s derivatives and deposits are with banks backed by sound ratings. The credit risk of financial
counterparties is monitored daily. Management has further assessed that there is no change in the underlying
risk affecting the classification of financial instruments reported in the balance sheet. For more information on
the reported balances see Note 3 – Carrying value and fair value of financial assets and liabilities.
Other events during the quarter
Nominating Committee In accordance with the instructions adopted by the Annual General Meeting 2020, a Nominating Committee
has been appointed. In addition to Conny Karlsson (Chairman of the Board), Filippa Gerstädt (Nordea Funds),
Roseanna Ivory (Aberdeen Standard Investments), Dan Juran (Framtiden Management Company, LLC), and
David Pawelkowski (Zadig Asset Management S.A.) have been appointed members of the Nominating
Committee. Filippa Gerstädt serves as Chairman of the Nominating Committee.
Ban on flavored tobacco products in California In late August, the State of California approved legislation banning retailers in the state from selling tobacco
products with characterizing flavors (other than tobacco). The legislation exempts premium cigars, hookah and
pipe tobacco, but will apply to the retail sale of flavored products that contain nicotine derived from tobacco,
including e-cigarettes as well as nicotine pouches. The ban is scheduled to come into force on January 1,
2021, absent a successful legal action to forestall enforcement of the legislation.
Full Year 2020 Outlook
The outlook included in the second quarter report stated that “The effective corporate tax rate in 2020,
excluding associated companies and larger one-time items, is expected to be in the 22 percent to 23 percent
range.” The revised outlook below notes a higher expected underlying corporate tax rate. This is due to the
increase in the relative contribution to earnings from our US businesses, which is taxed at a higher effective
rate than the Group average and hence increases the Group tax rate. The remaining points of the previous
outlook statement remain unchanged.
Swedish Match expects that the trend of increased interest from consumers, industry participants and
regulators in less harmful alternatives to cigarettes will continue. Our ambition is to create value for both
shareholders and society by providing products that are recognized as safer alternatives to cigarettes.
For 2020, Swedish Match expects continued market growth in global markets for smokefree nicotine products,
most notably driven by rapid growth of nicotine pouches (both without tobacco and with small amounts of
tobacco).
During 2020, Swedish Match expects to increase its investments in marketing, distribution and sales efforts in
both existing and new markets to actively participate in growth opportunities. Continued capital investments
by Swedish Match to further expand ZYN production capacity are expected to result in capital expenditures in
2020 considerably above the 2019 level.
The effective underlying corporate tax rate in 2020, excluding associated companies, is now expected to
exceed 23 percent.
The Company remains committed to returning cash not needed in operations to shareholders.
Risk factors Swedish Match faces intense competition in all of its markets and for each of its products and such competition
may increase in the future. To remain successful, the Group must develop products and brands that resonate
with changing consumer trends, and price and promote its brands competitively. Restrictions on advertising
and promotion may, however, make it more difficult to counteract any loss of consumer loyalty. Competitors
may develop and promote new products which could be successful, and could thereby have an adverse effect
on Swedish Match results of operations.
Swedish Match has substantial sales in the US, with products sourced from local US production facilities and
imports from Swedish Match’s production facilities in the Dominican Republic and in Sweden. Swedish Match
also has operations in Brazil, Denmark, Norway, the Philippines and EMU member countries. Consequently,
changes in import duties as well as in exchange rates of the euro, Norwegian krone, Danish krone, Brazilian

________________________________________________________________________ January-September 2020 13
real, the Dominican peso and in particular the US dollar may adversely affect the Group’s results of operations,
cash flow, financial condition or relative price competitiveness in the future. Such effects may occur both in
local currencies and when such local currencies are translated into Swedish currency for purposes of financial
reporting.
Regulatory developments and fiscal changes related to tobacco and other nicotine products, corporate income
and other taxes, as well as to the marketing, sale and consumption of tobacco products and other products
containing nicotine in the countries where the Group is operating may have an adverse effect on Swedish
Match results of operations.
For a further description of risk factors affecting Swedish Match, see the Effects from the corona virus (COVID-
19) above as well as Risk and risk management section in the Report of the Board of Directors in the Swedish
Match annual report for 2019, available on swedishmatch.com.
Swedish Match AB (publ) Swedish Match AB (publ) is the Parent Company of the Swedish Match Group. The main sources of income
for the Parent Company are dividends and Group contributions from subsidiaries.
Revenue from the Parent Company for the first nine months 2020 amounted to 19 MSEK (31). Profit before
income tax amounted to 2,075 MSEK (-340) and net profit for the first nine months amounted to 2,169 MSEK
(-258). The higher profit before income tax compared to previous year mainly pertains to higher dividends from
Group companies. The decrease in revenue compared to previous year is primarily related to reduced sales
of services to Group companies. Following the adverse tax ruling explained in Note 7, a capital contribution of
287 MSEK to a subsidiary was made and an impairment loss on shares in subsidiaries corresponding to the
same amount was recognized.
Part of the Group’s treasury operations are within the operations of the Parent Company, including the major
part of the Group’s external borrowings. Substantially all of these loans have been hedged to fixed interest
rates.
Repayment of bond loans, including loan hedge derivatives, amounted to 500 MSEK during the first nine
months and new bond loans of 3,175 MSEK were issued.
During the first nine months, the Parent Company made share repurchases of 3.5 million (4.5) shares for 2,183
MSEK (1,875).
A dividend of 2,020 MSEK (1,777) has been paid during the period.
Forward-looking information This report contains forward-looking information based on the current expectation of the Swedish Match
Group’s management. Although management deems that the expectations presented by such forward-looking
information are reasonable, no guarantee can be given that these expectations will prove correct. Accordingly,
the actual future outcome could vary considerably compared to that stated in the forward-looking information,
due to such factors as changed market conditions for Swedish Match’s products and more general factors
such as business cycles, markets and competition, unforeseen commercial or operational implications
attributable to COVID-19, changes in legal requirements or other political measures, and fluctuations in
exchange rates.
Additional information This report has not been reviewed by the Company’s auditors. The full year 2020 report will be released on
February 5, 2021.
Stockholm, October 27, 2020
Lars Dahlgren President and CEO

________________________________________________________________________ January-September 2020 14
Product segments summary and key ratios
Sales MSEK July-September Chg January-September Chg Full year 2020 2019 % 2020 2019 % 2019
Smokefree 2,842 2,315 23 8,045 6,439 25 8,914 Cigars 1,184 1,117 6 3,381 3,208 5 4,249 Lights 277 298 -7 861 878 -2 1,200
Sales from product segments 4,303 3,729 15 12,287 10,525 17 14,363 Other operations 97 100 -3 275 281 -2 376
Sales 4,400 3,829 15 12,561 10,806 16 14,739
Operating profit MSEK July-September Chg January-September Chg Full year Note 2020 2019 % 2020 2019 % 2019
Smokefree 1,519 1,093 39 3,974 2,937 35 3,997 Cigars 471 423 11 1,253 1,218 3 1,577 Lights 57 88 -35 176 137 28 238
Operating profit from product segments 2,046 1,603 28 5,403 4,292 26 5,812 Other operations -28 -18 -124 -83 -137 Impairment charge - European chewing tobacco business 5 - - - - -367
Operating profit 2,019 1,586 27 5,279 4,209 25 5,307
Operating margin by product segment
Percent July-September January-September Full year 2020 2019 2020 2019 2019
Smokefree 53.5 47.2 49.4 45.6 44.8 Cigars 39.7 37.9 37.1 38.0 37.1 Lights 20.5 29.4 20.4 15.6 19.8 Operating margin from product segments 47.6 43.0 44.0 40.8 40.5
EBITDA by product segment
MSEK July-September Chg January-September Chg Full year 2020 2019 % 2020 2019 % 2019
Smokefree 1,617 1,185 36 4,270 3,194 34 4,353 Cigars 491 444 11 1,318 1,281 3 1,662 Lights 67 99 -33 207 171 21 282
EBITDA from product segments 2,175 1,728 26 5,795 4,646 25 6,296
EBITDA margin by product segment
Percent July-September January-September Full year 2020 2019 2020 2019 2019
Smokefree 56.9 51.2 53.1 49.6 48.8 Cigars 41.5 39.8 39.0 39.9 39.1 Lights 24.1 33.3 24.1 19.5 23.5 EBITDA margin from product segments 50.5 46.3 47.2 44.1 43.8

________________________________________________________________________ January-September 2020 15
Key ratios 12 months
January- September ended Full year
2020 2019 Sep 30, 2020 2019
Operating margin from product segments, % 44.0 40.8 42.9 40.5 Operating margin, %1) 42.0 39.0 38.7 36.0
Net debt, MSEK 13,346 11,834 13,346 11,925 Investments in property, plant and equipment, MSEK 747 548 920 720 Depreciation, amortization and impairments, MSEK1) 442 398 959 915
EBITA, MSEK 5,338 4,258 6,823 5,742 EBITA interest cover 21.9 23.5 22.1 23.4 Net debt/EBITA - - 2.0 2.1 Adjusted earnings per share, basic and diluted, SEK2) 23.95 18.60 - 25.41
Share data Number of shares outstanding at end of period 159,737,141 165,671,405 159,737,141 163,228,313 Average number of shares outstanding 161,461,756 168,822,439 162,259,230 167,779,742
1) Including a non-cash impairment charge for the European chewing tobacco business of 367 MSEK recognized as a larger one-time item during the fourth quarter 2019, see Note 5.
2) Adjusted earnings per share in 2020 excludes a tax charge including interest of 286 MSEK related to adverse ruling in a tax case in Sweden recognized in the third quarter 2020. Adjusted earnings per share in 2019 excludes a larger one-time item during the fourth quarter 2019, which pertains to a non-cash impairment charge for the European chewing tobacco business.
Financial statements
Condensed consolidated income statement MSEK Jul-Sep Chg Jan-Sep Chg Full year Note 2020 2019 % 2020 2019 % 2019
Sales, including tobacco tax 5,389 4,685 15,352 13,345 18,222 Less tobacco tax -989 -856 -2,791 -2,539 -3,483
Sales 2 4,400 3,829 15 12,561 10,806 16 14,739 Cost of goods sold -1,438 -1,340 -4,354 -3,925 -5,376
Gross profit 2,962 2,489 19 8,207 6,882 19 9,363 Selling and admin. expenses -946 -904 -2,937 -2,674 -3,694 Share of profit/loss in associated companies 4 1 8 1 5 Impairment charge – European chewing tobacco business 5 - - - - -367
Operating profit 2,019 1,586 27 5,279 4,209 25 5,307 Finance income 7 23 44 73 95 Finance costs -112 -83 -311 -262 -343
Net finance cost -105 -60 -267 -188 -247
Profit before income tax 1,914 1,526 25 5,012 4,021 25 5,060 Income tax expense -721 -346 -1,430 -881 -1,165
Profit for the period 1,193 1,180 1 3,581 3,140 14 3,896 Attributable to: Equity holders of the Parent 1,193 1,180 3,581 3,139 3,895 Non-controlling interests 0 0 1 0 0
Profit for the period 1,193 1,180 1 3,581 3,140 14 3,896
Earnings per share, basic and diluted, SEK 4 7.44 7.04 22.18 18.60 23.22

________________________________________________________________________ January-September 2020 16
Condensed consolidated statement of comprehensive income MSEK Jul-Sep Jan-Sep Full year
2020 2019 2020 2019 2019
Profit for the period 1,193 1,180 3,581 3,140 3,896 Other comprehensive income that may be reclassified to the income statement Translation differences related to foreign operations -266 295 -398 533 191 Effective portion of changes in fair value of cash flow hedges 6 38 -32 102 122 Income tax relating to reclassifiable components of other comprehensive income -1 -8 7 -21 -25
Sub-total, net of tax for the period -261 325 -423 615 288
Other comprehensive income that will not be reclassified to the income statement Actuarial gains/losses attributable to pensions, incl. payroll tax 162 -155 -256 -310 -168 Income tax relating to non-reclassifiable components of other comprehensive income -41 37 60 69 38
Sub-total, net of tax for the period 122 -118 -196 -241 -130
Total comprehensive income for the period 1,054 1,387 2,962 3,513 4,054
Attributable to: Equity holders of the Parent 1,053 1,387 2,962 3,513 4,053 Non-controlling interests 0 0 0 0 0
Total comprehensive income for the period 1,054 1,387 2,962 3,513 4,054
Condensed consolidated balance sheet MSEK Note September 30, 2020 December 31, 2019
Intangible assets 2,324 2,355 Property, plant and equipment 3,574 3,255 Right-of-use assets 284 255 Investments in associated companies 38 42 Other non-current assets and operating receivables 17 18 Other non-current financial assets and receivables 3,8 1,981 1,826
Total non-current assets 8,218 7,750
Other current financial receivables 3,8 220 195 Current operating assets and receivables 3 3,773 3,905 Cash and cash equivalents 3 3,760 2,370
Total current assets 7,753 6,471
Assets held for sale1) 9 16
Total assets 15,981 14,237
Equity attributable to equity holders of the Parent -7,565 -6,324 Non-controlling interests 16 16
Total equity -7,549 -6,308
Non-current financial provisions 1,244 1,310 Non-current loans 3 13,504 12,130 Other non-current financial liabilities 3,8 1,981 1,626 Other non-current operating liabilities 3 469 434
Total non-current liabilities 17,198 15,499
Current loans 3 2,649 1,300 Other current financial liabilities 3,8 493 633 Other current operating liabilities 3 3,190 3,112
Total current liabilities 6,331 5,045
Total liabilities 23,529 20,544
Total equity and liabilities 15,981 14,237
1) Assets held for sale refers to land and forestry assets. The fair value less costs to sell are not expected to be lower than the carrying value.

________________________________________________________________________ January-September 2020 17
Condensed consolidated cash flow statement MSEK January-September 2020 2019
Operating activities Profit before income taxes 5,012 4,021 Share of profit/loss in associated companies -8 -1 Dividend received from associated companies 10 1 Other non-cash items etc1) 511 348 Income tax paid -1,524 -584
Cash flow from operating activities before changes in working capital 4,000 3,785 Changes in working capital 220 -21
Net cash generated from operating activities 4,220 3,764
Investing activities Purchase of property, plant and equipment -747 -548 Proceeds from sale of property, plant and equipment 20 10 Purchase of intangible assets -39 -23 Acquisition of subsidiaries2) -32 - Investments in associated companies - -1 Changes in financial receivables in associated companies 9 -58 Changes in financial receivables etc. 0 0
Net cash used in investing activities -789 -620
Financing activities Proceeds from borrowings 3,175 999 Repayment of borrowings -500 -1,092 Dividend paid to equity holders of the Parent -2,020 -1,777 Repurchase of own shares -2,183 -1,875 Lease payments -61 -69 Realized exchange gain/losses on financial instruments -318 190 Other - -2
Net cash used in financing activities -1,906 -3,627
Net increase (decrease) in cash and cash equivalents 1,524 -483 Cash and cash equivalents at the beginning of the period 2,370 2,886 Effect of exchange rate fluctuations on cash and cash equivalents -134 86
Cash and cash equivalents at the end of the period 3,760 2,489
1) Non-cash items etc. mainly pertain to depreciation, amortization, accrued interest and change in pension provisions. 2) Refers to remaining consideration related to the acquisition of Gotlandssnus in 2018.

________________________________________________________________________ January-September 2020 18
Condensed consolidated statement of changes in equity MSEK
Equity attributable to holders of
the Parent
Non-controlling
interests Total equity
Equity at January 1, 2019 -5,611 16 -5,595
Profit for the period 3,139 0 3,140 Other comprehensive income, net of tax for the period 373 0 373
Total comprehensive income for the period 3,513 0 3,513 Dividend -1,777 0 -1,777 Repurchase of own shares -1,875 - -1,875 Cancellation of shares -13 - -13 Bonus issues 13 - 13
Equity at September 30, 2019 -5,751 16 -5,735
Equity at January 1, 2020 -6,324 16 -6,308
Profit for the period 3,581 1 3,581 Other comprehensive income, net of tax for the period -619 0 -619
Total comprehensive income for the period 2,962 0 2,962 Dividend -2,020 0 -2,020 Repurchase of own shares -2,183 - -2,183 Cancellation of shares -18 - -18 Bonus issues 18 - 18
Equity at September 30, 2020 -7,565 16 -7,549
Objectives, policies and processes for managing capital The basis for determining dividends and repurchasing of own shares is the equity of the Parent Company.
Total equity in the Parent Company as per September 30, 2020 amounted to 9,910 MSEK and distributable
earnings amounted to 9,521 MSEK.
In addition, before any distribution of capital to shareholders is determined, the financial position of the Group
is carefully analyzed. As part of this analysis, the Board of Directors of Swedish Match has adopted certain
financial guidelines and risk management procedures to ensure that the Parent Company and the Group
maintain adequate liquidity to meet reasonably foreseeable requirements taking into account the maturity
profile of debt obligations.
The dividend policy of the Company is a pay-out ratio of 40 to 60 percent of the earnings per share, subject to
adjustments for larger one-time items. The Board has further determined that the financial policy should be,
for the Group, to strive maintaining a net debt that does not exceed 3 times EBITA. The Board continually
reviews the financial position of the Company, and the actual level of net debt is assessed against anticipated
future profitability and cash flow, investment and expansion plans, acquisition opportunities as well as the
development of interest rates and credit markets. Excess funds are returned to shareholders through dividends
and share repurchases. For further information on distribution of capital to the shareholders during the period
see section Shareholder distributions and the share.

________________________________________________________________________ January-September 2020 19
Condensed Parent Company income statement MSEK January-September 2020 2019
Sales 19 31 Administrative expenses -235 -247
Operating loss -216 -216 Result from participation in Group companies 2,550 97 Finance income 0 0 Finance costs -258 -221
Net finance cost -258 -221
Profit/Loss before income tax 2,075 -340 Income tax 93 82
Profit/Loss for the period 2,169 -258
Condensed Parent Company statement of comprehensive income MSEK January- September 2020 2019
Profit/Loss for the period 2,169 -258
Other comprehensive income that may be reclassified to the income statement
Effective portion of changes in fair value of cash flow hedges -32 102 Income tax relating to components of other comprehensive income 7 -21
Other comprehensive income/loss, net of tax for the period -26 81
Total comprehensive income/loss for the period 2,143 -177
Condensed Parent Company balance sheet
MSEK September 30, 2020 September 30, 2019 December 31, 2019
Intangible and tangible assets 0 1 1 Non-current financial assets 32,047 32,145 31,952 Current assets 493 365 2,980 Cash and other current deposits 0 600 400
Total assets 32,540 33,111 35,332
Equity 9,910 11,324 11,970 Untaxed reserves 2,325 1,785 2,325 Provisions 113 108 98 Non-current liabilities 13,570 13,145 12,132 Current liabilities 6,621 6,749 8,807
Total liabilities 20,305 20,002 21,037
Total equity and liabilities 32,540 33,111 35,332
Note 1 – Accounting principles This report for the Group is prepared in accordance with the Accounting Standard IAS 34 Interim Financial
Reporting and applicable rules in the Annual Accounts Act. The report for the Parent Company for the same
period is prepared in accordance with the Annual Accounts Act, Chapter 9 and RFR 2. Additional disclosures
as required under IAS 34.16A may be found within the financial statements and related notes and in the
narrative text of the interim financial report.
As of January 2020, Swedish Match has changed the composition of the Group’s reportable product segments.
For more information, see below section “Change in the Group’s reportable segments as of January 1, 2020".
There are no changes to IFRS standards, amendments and interpretations of existing standards applicable as
of January 1, 2020 that have had an effect on the Group’s financial result or position. The accounting principles
and basis of calculation in this report are the same as in the annual report for 2019.

________________________________________________________________________ January-September 2020 20
Change in the Group’s reportable segments as of January 1, 2020
As of January 1, 2020, Swedish Match has changed the internal reporting structure to improve alignment of
monitoring the performance and financial reporting with the Group’s strategy and product portfolio. Significant
investments in smokefree products, including the development of nicotine pouch products and recent business
acquisitions, have driven a change in management’s evaluation of product segment performance and
allocation of resources to operations. Consequently, the composition of the Group’s reportable product
segments has changed. The Group’s new reportable segments which are expected to better reflect the
performance of Swedish Match’s different product categories are as follows: Smokefree, Cigars and Lights.
The new product segment Smokefree represents an aggregation of the Group’s entire Smokefree operations,
i.e. snus, moist snuff and nicotine pouches (previously reported under the product segment Snus and moist
snuff) as well as all chewing tobacco operations - US chewing tobacco, chew bags and tobacco bits (previously
reported under the product segment Other tobacco products). The new product segment Cigars represents
the cigar operations, substantially relating to US mass market cigars. In addition, as of January 1, 2020, a new
allocation model has been implemented relating to certain central establishment costs for new businesses to
be absorbed by product segments. This change has positively affected the result of Other operations and
consequently negatively affected the result from relevant product segments. In this report, the financial
information of prior periods affected by the implementation of the new product segments and the new allocation
model of certain central costs have been restated accordingly.
Note 2 – Disaggregation of revenue The main revenue streams for the Swedish Match Group arise from sale of goods manufactured by the Group.
Within Lights, a small portion of the revenue also pertains to the distribution of third party products. Revenue
within Other operations mainly pertains to income from logistics services for delivery of third party products to
retail customers. Revenue for the sale of goods and logistics services are recognized at the point when the
control of the promised good or service is transferred to the customer at the expected consideration to be
received for such delivery. The expected consideration recognized reflects estimates of potential outcome of
variable considerations as well as expected reimbursements for product returns.
Sales – July to September MSEK Segments
Other operations Group
Smokefree Cigars Lights
Total segments
Primary geographical Jul-Sep Jul-Sep Jul-Sep Jul-Sep Jul-Sep Jul-Sep markets 2020 2019 2020 2019 2020 2019 2020 2019 2020 2019 2020 2019
Scandinavia 1,240 1,166 - - 13 13 1,254 1,179 97 100 1,350 1,278 The US 1,566 1,096 1,184 1,116 25 16 2,775 2,228 - - 2,775 2,226 Other markets 36 53 - 0 239 269 275 322 - - 275 325
Total sales 2,842 2,315 1,184 1,117 277 298 4,303 3,729 97 100 4,400 3,829
Sales – January to September MSEK Segments
Other operations Group
Smokefree Cigars Lights
Total segments
Primary geographical Jan-Sep Jan-Sep Jan-Sep Jan-Sep Jan-Sep Jan-Sep markets 2020 2019 2020 2019 2020 2019 2020 2019 2020 2019 2020 2019
Scandinavia 3,458 3,374 - - 35 32 3,492 3,405 275 281 3,767 3,687 The US 4,457 2,907 3,381 3,207 72 57 7,910 6,171 - - 7,910 6,171 Other markets 130 158 - 1 754 789 885 948 - - 885 948
Total sales 8,045 6,439 3,381 3,208 861 878 12,287 10,525 275 281 12,561 10,806

________________________________________________________________________ January-September 2020 21
Note 3 – Carrying value and fair value of financial assets and liabilities Swedish Match applies IFRS 9 to classify and measure financial instruments.
The following valuation techniques of the fair value hierarchy are used in determining the fair values of the
financial instruments:
Level 1 - Quoted prices (unadjusted) in active markets
Level 2 - Inputs other than quoted prices included within level 1 that are observable, either directly or
indirectly
Level 3 - Inputs that are not based on observable market data
The following table shows carrying value and fair value for financial instruments as of September 30, 2020.
Carrying value and fair value MSEK
Financial instruments measured at
FVTPL
Financial assets
measured at amortized
cost
Other financial liabilities
Cash flow hedges
measured at FVOCI
Other receivables
and liabilities
Total carrying
value Estimated fair value
Trade receivables - 1,545 - - - 1,545 1,545
Other non-current financial receivables - 11 - 835 466 1,311 1,311
Other current assets and financial receivables 72 67 - - 343 482 482
Prepaid expenses and accrued income1) - - - 1 158 159 159
Cash and cash equivalents - 3,760 - - - 3,760 3,760
Total assets 72 5,383 - 836 967 7,257 7,257
Loans and borrowings - - 16,153 - - 16,153 16,404
Other non-current financial liabilities - - 207 66 46 319 319
Other current liabilities 1 - 82 - 1,699 1,782 1,782
Accrued expenses and deferred income1) - - 106 39 769 914 914
Trade payables - - 396 - - 396 396
Total liabilities 1 - 16,944 105 2,514 19,564 19,815
1) Accrued interest income on cash flow hedges is reported in the balance sheet as Prepaid expenses and accrued income and accrued interest expense on cash flow hedges is reported as Accrued expenses and deferred income.
Fair value measurement by level MSEK Level 1 Level 2 Level 3 Total
Derivative financial assets - 908 - 908
Derivative financial liabilities - 106 - 106

________________________________________________________________________ January-September 2020 22
The following table shows carrying value and fair value for financial instruments per December 31, 2019.
Carrying value and fair value MSEK
Financial instruments measured at
FVTPL
Financial assets
measured at amortized
cost
Other financial liabilities
Cash flow hedges
measured at FVOCI
Other receivables
and liabilities
Total carrying
value Estimated fair value
Trade receivables - 1,719 - - - 1,719 1,719
Other non-current financial receivables - 20 - 756 475 1,251 1,251
Other current assets and financial receivables - 91 - - 284 375 375
Prepaid expenses and accrued income1) - - - 2 108 110 110
Cash and cash equivalents - 2,370 - - - 2,370 2,370
Total assets - 4,200 - 758 867 5,825 5,825
Loans and borrowings - - 13,430 - - 13,430 13,661
Other non-current financial liabilities - - 172 2 50 224 224
Other current liabilities 91 - 113 - 1,654 1,859 1,859
Accrued expenses and deferred income1) - - 106 19 800 926 926
Trade payables - - 365 - - 365 365
Total liabilities 91 - 14,186 21 2,504 16,804 17,035
1) Accrued interest income on cash flow hedges is reported in the balance sheet as Prepaid expenses and accrued income and accrued interest expense on cash flow hedges is reported as Accrued expenses and deferred income.
Fair value measurement by level MSEK Level 1 Level 2 Level 3 Total
Derivative financial assets - 758 - 758
Derivative financial liabilities - 112 - 112
No transfer in or out of level 2 has been made during the third quarter 2020. The recognized amounts are
regarded as reasonable estimates for all items measured at carrying value in the balance sheet, except for
loans and borrowings, as these amounts have a long time to maturity. The fair value of loans and borrowings
differ from their carrying value as a consequence of changes in the market interest rates. Items not valued at
fair value in the balance sheet are measured at amortized cost. The total nominal amount of outstanding
derivatives was 12,808 MSEK (9,602) of which 9,478 MSEK (6,304) was in cash flow hedges consisting of
cross currency and interest rate swaps related to bond loans. The remaining 3,330 MSEK (3,298) consisted
of currency swaps related to the conversion of surplus cash in US dollars to Swedish kronor. Methodologies
utilized in the valuation of financial instruments can be found in Note 1 in the annual report for 2019.
Note 4 – Earnings per share The following table provides the components used in calculating earnings per share. The quarterly earnings
per share are calculated by deducting the year to date earnings per share for the preceding reporting period
from the current period's year to date earnings per share.
Earnings per share
Basic and diluted July-September January-September Full year 2020 2019 2020 2019 2019
Profit for the period attributable to equity holders of the Parent, MSEK 1,193 1,180 3,581 3,139 3,895 Profit for the period attributable to equity holders of the Parent, excl. larger one-time items, MSEK 1,479 1,180 3,867 3,139 4,263 Weighted average number of shares outstanding 160,443,587 167,352,790 161,461,756 168,822,439 167,779,742
Earnings per share, SEK 7.44 7.04 22.18 18.60 23.22
Adjusted earnings per share, SEK1) 9.21 7.04 23.95 18.60 25.41
1) Adjusted earnings per share in 2020 excludes a tax charge including interest of 286 MSEK related to adverse ruling in a tax case in Sweden recognized in the third quarter 2020. Adjusted earnings per share in 2019 excludes a larger one-time item during the fourth quarter 2019, which pertains to a non-cash impairment charge for the European chewing tobacco business.

________________________________________________________________________ January-September 2020 23
Note 5 – Impairment charge during 2019 in the European chewing tobacco business Following the judgement by the Bavarian Administrative Court and in view of changed market dynamics in
certain markets, management reassessed the future potential of chew bags in its current form. The updated
assumptions in the impairment testing resulted in an impairment charge of 259 MDKK, corresponding to 367
MSEK, for Swedish Match’s European chewing tobacco business. This impairment charge was recognized in
the fourth quarter of 2019.
For more information on the impairment charge and the Group’s accounting principles and methodology for
impairment testing, see Note 1 and Note 12 in the annual report for 2019.
Note 6 – Change in expected useful life for trademark Thunder Following the judgement in relation to the legality of certain V2 Tobacco’s Thunder chew bag products by the
Bavarian Administrative Court and in view of changed market dynamics in certain markets, Swedish Match
has reassessed the estimated economic useful life of the Thunder trademark. The updated assessment
indicated that the Thunder trademark’s economical useful life has changed from indefinite to a definite
economical useful life of 20 years. The revised assessment has been made to better reflect the estimated
periods during which Swedish Match will benefit from the future cashflows from products under the Thunder
trademark. The updated economic useful life of 20 years has been applied as of January 1, 2020. The effect
from this change on Swedish Match’s financial statements for the first nine months of 2020 was increased
amortization expenses of 13 MSEK recognized in the Smokefree product segment.
Note 7 – Tax related contingencies
Tax audits in Sweden
During 2017, the Swedish Tax Agency performed tax audits in a number of Swedish Match’s Swedish group
companies. After completing the audits, the Swedish Tax Agency decided to deny certain cost deductions in
two cases. Both cases were appealed by Swedish Match but the cases were ruled in favor of the Tax Agency
by the County Administrative Court in Stockholm in May 2019 and January 2020 respectively. Swedish Match
subsequently appealed to the Administrative Court of Appeals in both cases. In one of the cases, a Court
judgment in August 2020 was in favor of the Tax Agency. Swedish Match has applied for leave to appeal that
case to the Supreme Administrative Court but has meanwhile paid the tax charges of in total 270 MSEK and
related interest costs of 16 MSEK. The Court of Appeal has, in the other case, decided to hold the judgment
pending the judgment in a similar case which has been granted leave at the Supreme Administrative Court
which may constitute a precedent to Swedish Match’s case. The tax charge in this case amounts to 43 MSEK
excluding interest.
Resolution of indirect tax disputes in Brazil
Following the favorable decision on the court-cases for the exclusion of duplicative indirect taxes (principally
valued added taxes) in Brazil in 2019, further assessment of duplicative indirect taxes within the Brazilian
operations have been made. During the first nine months 2020, an operating gain of 16 MSEK (11 MSEK, net
of taxes on income) pertaining to additional indirect tax recoveries has been recognized within the Lights
product segment. The tax credits relate to purchases of certain manufacturing equipment, goods and services
over the past 5 years. Under the existing disputes, Swedish Match may be entitled to incremental recoveries
aggregating 58 MSEK (38 MSEK, net of taxes on income) that is dependent on the final ruling by the Brazilian
Supreme court. The court’s decision has been postponed due to the COVID-19 pandemic and a new date for
the resolution has not yet been announced.

________________________________________________________________________ January-September 2020 24
Note 8 – Alternative performance measures Swedish Match presents several financial measures that are outside IFRS definitions (Alternative performance measures,
according to ESMA’s guidelines) with the aim of enabling effective evaluation of the Group’s financial position and
performance for investors and for the Group’s management. This means that these measures are not always comparable
with measures used by other companies and shall therefore be considered as a complement to measures defined
according to IFRS. Swedish Match applies these alternative key ratios consistently over time. The key ratios are alternative
performance measures according to ESMA guidelines unless otherwise stated.
KEY RATIO DEFINITION/CALCULATION PURPOSE SALES FROM PRODUCT SEGMENTS
Sales from reportable segments, which excludes Other operations
Used as a measure of sales performance of the core commercial businesses of Swedish Match, excluding the impact of Other operations (incl. Swedish distribution function).
OPERATING PROFIT/LOSS (EBIT) FROM PRODUCT SEGMENTS
Operating profit from reportable segments, excluding Other operations and larger one-time items
Used as a measure of operating performance of the core commercial businesses of Swedish Match, excluding the impact of Other operations (incl. Swedish distribution function) and items which impact comparability between periods
OPERATING MARGIN FROM PRODUCT SEGMENTS (%)
100 × Operating profit from product segments ÷ Sales from product segments
Used as a measure of operational profitability of the core commercial businesses of Swedish Match excluding the impact of Other operations (incl. Swedish distribution function).
LARGER ONE-TIME ITEMS Larger one-time items are separately disclosed non-recurring income and cost which usually refer to larger capital gains or losses on divestments, larger asset impairments and restructuring costs and other larger non-recurring income and costs recognized during the period
Used to provide information regarding items which impact comparability between periods.
EBITDA Profit for the period excluding larger one-time items, net finance cost, income tax, depreciation, amortization and impairments of tangible, intangible and right-of-use assets
Used as an alternative measure of operating performance that is not impacted by historical investments and the related accounting treatment of such investments as well as items which impact comparability between periods.
EBITDA FROM PRODUCT SEGMENTS
Operating profit from product segments excluding depreciation, amortization and impairments of tangible, intangible and right-of-use assets
Used as an alternative measure of operating performance for the core commercial businesses of Swedish Match, that is not impacted by historical investments and the related accounting treatment of such investments as well as items which impact comparability between periods.
EBITDA MARGIN (%) 100 × EBITDA ÷ Sales Used as an alternative measure of operating profitability.
EBITDA MARGIN FROM PRODUCT SEGMENTS (%)
100 × EBITDA from product segments ÷ Sales from product segments
Used as an alternative measure of operating profitability for the core commercial businesses of Swedish Match.
PROFIT FOR THE PERIOD EXCLUDING LARGER ONE-TIME ITEMS
Profit for the period excluding larger one-time items
Used as an alternative measure of profit for the period of the ongoing business which is not affected by items which impact comparability between periods.
EBITA Profit for the period excluding larger one-time items, net finance cost, tax, amortization and impairments of intangible assets
Used as a measure of operating performance relative to the financial obligations of the Group.
EBITA 12 months rolling The aggregated profit excluding larger one-time items, net finance cost, tax, amortization and impairments of intangible assets for the 12-month period preceding the closing date
Used as a measure of operating performance relative to the financial obligations of the Group.
EBITA INTEREST COVER EBITA ÷ (Interest income - interest expense) Used as a measure of the ability to fund interest expenses.
NET DEBT Current and non-current loans, adjusted for components of derivatives (assets and liabilities) relating to these loans + net provisions for pensions and similar obligations + current and non-current lease liabilities – cash and cash equivalents and other short-term investments
Used as a measure of net financial obligations.
NET DEBT/EBITA Net debt ÷ EBITA 12 months rolling Used as an indication of the duration (in years) required to fund existing net financial obligations with free cash flows from the ongoing business.
ADJUSTED EARNINGS PER SHARE
Profit for the period excluding larger one-time items net of tax ÷ Average number of shares outstanding
Used as an alternative measure of earnings per share which is not affected by items which impact comparability between periods.

________________________________________________________________________ January-September 2020 25
EBITA and EBITDA MSEK 12 months Jul-Sep Jan-Sep ended Full year 2020 2019 2020 2019 Sep 30, 2020 2019
Profit for the period 1,193 1,180 3,581 3,139 4,337 3,895 Income tax expense 721 346 1,430 881 1,713 1,165 Net finance cost 105 60 267 188 326 247
Operating profit for the period 2,019 1,586 5,279 4,209 6,377 5,307 Amortization and impairment of intangible assets1) 19 16 59 49 446 435
EBITA 2,038 1,602 5,338 4,258 6,823 5,742 Depreciation and impairment of tangible and right-of-use assets 126 123 382 350 480
EBITDA 2,164 1,725 5,721 4,608 6,222
1) Including a non-cash impairment charge on goodwill in the European chewing tobacco business of 367 MSEK reported as a larger one-time item in the fourth quarter 2019.
EBITDA and EBITDA margin from product segments MSEK Jul-Sep Jan-Sep Full year 2020 2019 2020 2019 2019
Operating profit for the period 2,019 1,586 5,279 4,209 5,307 Less operating loss from Other operations 28 18 124 83 137 Less larger one-time items - - - - 367
Operating profit from product segments 2,046 1,603 5,403 4,292 5,812 Amortization, depreciation and impairment of intangible, tangible and right-of-use assets1) 145 140 442 398 548 Less amortization, depreciation and impairment of intangible, tangible and right-of-use assets for Other operations -16 -15 -50 -45 -64
EBITDA from product segments 2,175 1,728 5,795 4,646 6,296 Sales from product segments 4,303 3,729 12,287 10,525 14,363 EBITDA margin from product segments, % 50.5 46.3 47.2 44.1 43.8
1) Excluding a non-cash impairment charge on goodwill in the European chewing tobacco business of 367 MSEK reported as a larger one-time item in the fourth quarter 2019.
Larger one-time items MSEK Jul-Sep Jan-Sep Full year 2020 2019 2020 2019 2019
Impairment charge – European chewing tobacco business - - - - -367
Total larger one-time items in operating profit - - - - -367
Adjusted earnings per share Basic and diluted Jul-Sep Jan-Sep Full year 2020 2019 2020 2019 2019
Profit for the period attributable to equity holders of the Parent, MSEK 1,193 1,180 3,581 3,139 3,895 Impairment charge – European chewing tobacco business, MSEK - - - - 367 Tax charge including interest, MSEK 286 - 286 - -
Profit for the period attributable to equity holders of the Parent, excl. larger one-time items, MSEK 1,479 1,180 3,867 3,139 4,263 Weighted average number of shares outstanding 160,443,587 167,352,790 161,461,756 168,822,439 167,779,742
Adjusted earnings per share, SEK 9.21 7.04 23.95 18.60 25.41
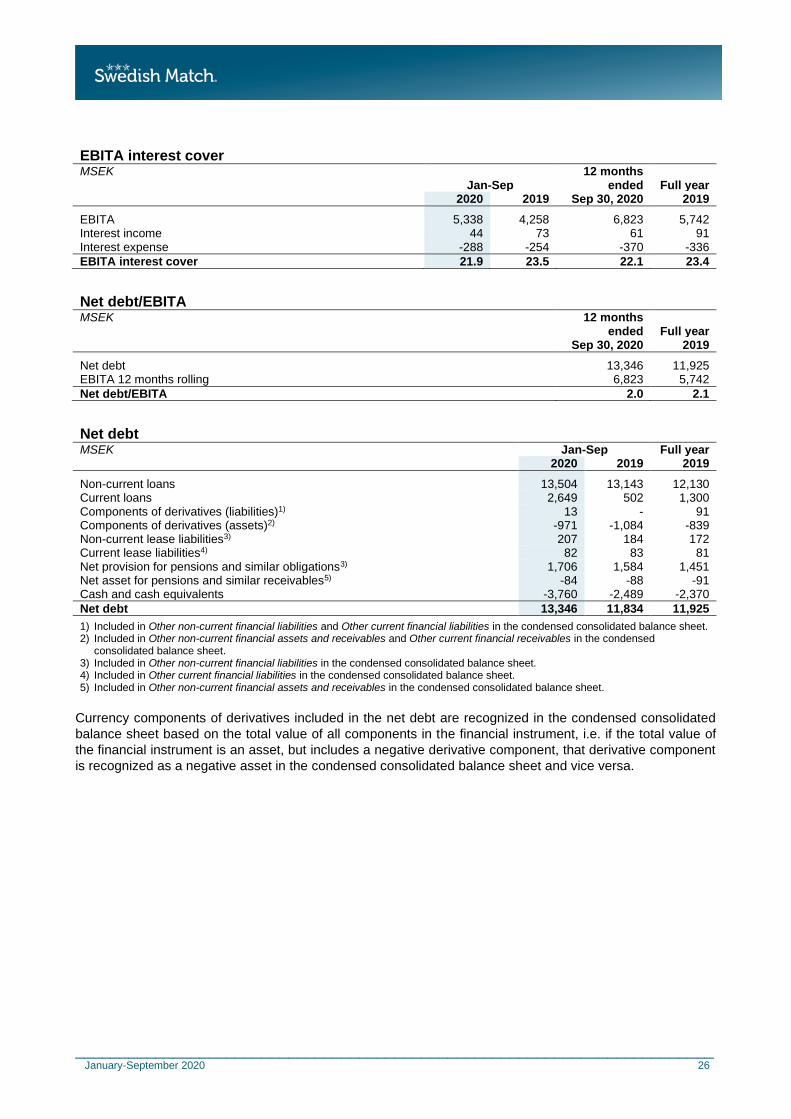
________________________________________________________________________ January-September 2020 26
EBITA interest cover MSEK 12 months Jan-Sep ended Full year 2020 2019 Sep 30, 2020 2019
EBITA 5,338 4,258 6,823 5,742 Interest income 44 73 61 91 Interest expense -288 -254 -370 -336
EBITA interest cover 21.9 23.5 22.1 23.4
Net debt/EBITA MSEK 12 months ended Full year Sep 30, 2020 2019
Net debt 13,346 11,925 EBITA 12 months rolling 6,823 5,742
Net debt/EBITA 2.0 2.1
Net debt MSEK Jan-Sep Full year 2020 2019 2019
Non-current loans 13,504 13,143 12,130 Current loans 2,649 502 1,300 Components of derivatives (liabilities)1) 13 - 91 Components of derivatives (assets)2) -971 -1,084 -839 Non-current lease liabilities3) 207 184 172 Current lease liabilities4) 82 83 81 Net provision for pensions and similar obligations3) 1,706 1,584 1,451 Net asset for pensions and similar receivables5) -84 -88 -91 Cash and cash equivalents -3,760 -2,489 -2,370
Net debt 13,346 11,834 11,925
1) Included in Other non-current financial liabilities and Other current financial liabilities in the condensed consolidated balance sheet. 2) Included in Other non-current financial assets and receivables and Other current financial receivables in the condensed
consolidated balance sheet. 3) Included in Other non-current financial liabilities in the condensed consolidated balance sheet. 4) Included in Other current financial liabilities in the condensed consolidated balance sheet. 5) Included in Other non-current financial assets and receivables in the condensed consolidated balance sheet.
Currency components of derivatives included in the net debt are recognized in the condensed consolidated
balance sheet based on the total value of all components in the financial instrument, i.e. if the total value of
the financial instrument is an asset, but includes a negative derivative component, that derivative component
is recognized as a negative asset in the condensed consolidated balance sheet and vice versa.

________________________________________________________________________ January-September 2020 27
Quarterly data
Consolidated income statement in summary MSEK Note Q3/20 Q2/20 Q1/20 Q4/19 Q3/19
Sales, including tobacco tax 5,389 5,118 4,846 4,877 4,685 Less tobacco tax -989 -986 -816 -944 -856
Sales 4,400 4,133 4,029 3,933 3,829 Cost of goods sold -1,438 -1,487 -1,429 -1,451 -1,340
Gross profit 2,962 2,646 2,600 2,482 2,489
Selling and administrative expenses -946 -982 -1,009 -1,020 -904 Share of net profit/loss in associated companies 4 2 3 4 1 Impairment charge – European chewing tobacco business 5 - - - -367 -
Operating profit 2,019 1,666 1,594 1,098 1,586
Finance income 7 10 30 25 23 Finance costs -112 -94 -108 -83 -83
Net finance cost -105 -84 -78 -59 -60
Profit before income tax 1,914 1,582 1,515 1,039 1,526 Income tax expense -721 -355 -354 -283 -346
Profit for the period 1,193 1,227 1,161 756 1,180
Attributable to: Equity holders of the Parent 1,193 1,227 1,161 756 1,180 Non-controlling interests 0 0 0 0 0
Profit for the period 1,193 1,227 1,161 756 1,180
Quarterly data by product segment
Sales MSEK Q3/20 Q2/20 Q1/20 Q4/19 Q3/19
Smokefree 2,842 2,695 2,508 2,475 2,315 Cigars 1,184 1,069 1,128 1,040 1,117 Lights 277 275 309 323 298
Sales from product segments 4,303 4,039 3,945 3,838 3,729 Other operations 97 94 84 95 100
Sales 4,400 4,133 4,029 3,933 3,829
Operating profit MSEK Note Q3/20 Q2/20 Q1/20 Q4/19 Q3/19
Smokefree 1,519 1,301 1,154 1,060 1,093 Cigars 471 351 431 359 423 Lights 57 52 67 100 88
Operating profit from product segments 2,046 1,704 1,652 1,520 1,603 Other operations -28 -38 -58 -54 -18 Impairment charge – European chewing tobacco business 5 - - - -367 -
Operating profit 2,019 1,666 1,594 1,098 1,586
Operating margin by product segment Percent Q3/20 Q2/20 Q1/20 Q4/19 Q3/19
Smokefree 53.5 48.3 46.0 42.8 47.2 Cigars 39.7 32.9 38.2 34.5 37.9 Lights 20.5 18.9 21.7 31.1 29.4 Operating margin from product segments 47.6 42.2 41.9 39.6 43.0
EBITDA by product segment
MSEK Q3/20 Q2/20 Q1/20 Q4/19 Q3/19
Smokefree 1,617 1,401 1,252 1,159 1,185 Cigars 491 374 453 381 444 Lights 67 62 78 111 99
EBITDA from product segments 2,175 1,837 1,783 1,651 1,728

________________________________________________________________________ January-September 2020 28
EBITDA margin by product segment Percent Q3/20 Q2/20 Q1/20 Q4/19 Q3/19
Smokefree 56.9 52.0 49.9 46.8 51.2 Cigars 41.5 35.0 40.1 36.6 39.8 Lights 24.1 22.7 25.2 34.3 33.3 EBITDA margin from product segments 50.5 45.5 45.2 43.0 46.3
Additional quarterly data
Depreciation, amortization and impairments MSEK Q3/20 Q2/20 Q1/20 Q4/19 Q3/19
Property, plant and equipment 103 106 105 108 101 Right-of-use assets 23 23 22 23 22 Intangible assets1) 19 20 21 19 16
Total 145 149 148 150 140
1) Excluding a non-cash impairment charge on goodwill in the European chewing tobacco business of 367 MSEK reported as a larger one-time item in the fourth quarter 2019.
Net finance cost MSEK Q3/20 Q2/20 Q1/20 Q4/19 Q3/19
Interest income 7 8 30 17 21 Interest expense -109 -93 -87 -82 -82
Net interest expense -102 -85 -57 -64 -60
Other finance costs, net -3 1 -21 6 0
Total net finance cost -105 -84 -78 -59 -60
__________
Contacts:
Lars Dahlgren, President and Chief Executive Officer
Office +46 8 658 0441
Anders Larsson, Chief Financial Officer and Senior Vice President Group Finance
Office +46 10 139 3006
Emmett Harrison, Senior Vice President Investor Relations
Office +46 70 938 0173
___________
This information is information that Swedish Match AB (publ) is obliged to make public pursuant to the EU Market Abuse
Regulation and the Securities Markets Act. The information was submitted for publication, through the agency of the
contact persons set out above, at 08.15 a.m. CET on October 27, 2020.
___________
Swedish Match develops, manufactures, and sells quality products with market-leading brands in the product segments
Smokefree, Cigars, and Lights. Production is located in seven countries, with sales concentrated in Scandinavia and the
US. The Swedish Match share is listed on Nasdaq Stockholm (SWMA).
Swedish Match’s vision is a world without cigarettes. Some of its well-known brands include: General, Longhorn, ZYN,
Game, Red Man, Fiat Lux, and Cricket.
___________
Swedish Match AB (publ), SE-118 85 Stockholm, Sweden
Visiting address: Sveavägen 44, 8th Floor. Telephone: +46 10 13 93 000
Corporate Identity Number: 556015-0756
swedishmatch.com