Q1 2022 Q1 2022 - Swedish Match
30
____________________________________________________________________________________________________________ January-March 2022 1 Q1 2022 Q1 2022 Interim Report January – March 2022 Highlights for the first quarter • Sales and operating profit from product segments increased on the back of continued strong momentum for the US smokefree business. • Group sales increased by 10 percent to 4,892 MSEK (4,455). In local currencies, sales increased by 2 percent for the first quarter. • Operating profit from product segments increased by 1 percent to 2,115 MSEK (2,092). In local currencies, operating profit from product segments 1) decreased by 7 percent for the first quarter. • Within the Smokefree segment, ZYN nicotine pouches in the US continued to gain market shares on a sequential basis and demonstrated solid sales and profit growth. In Scandinavia, sales grew strongly on an underlying basis, while operating profit declined reflecting higher market investments and an unusually high result in the prior year period. • For the Cigars product segment, sales and operating profit declined on lower volumes and higher production costs when comparing to the exceptionally strong first quarter of the prior year. Swedish Match increased its cigar market share 2) sequentially relative to the fourth quarter of 2021. • For the Lights product segment, impressive performance for matches drove robust top-line development. Solid operating profit despite steep price increases on input materials. • Group operating profit amounted to 2,024 MSEK (2,354). The prior year period included a settlement income of 300 MSEK. • Profit after tax amounted to 1,493 MSEK (1,780). • Adjusted earnings per share 3) increased to 0.98 SEK (0.97). Earnings per share for the quarter decreased by 13 percent to 0.98 SEK (1.12) with the after-tax effect of the settlement income in the prior year period amounting to 0.15 SEK per share. 1) Excludes Other operations and larger one-time items. 2) Based on MSA distributor shipments: Mass market cigars (excluding little cigars) in volume terms. 3) Excludes larger one-time items net of tax.
-
Upload
khangminh22 -
Category
Documents
-
view
3 -
download
0
Transcript of Q1 2022 Q1 2022 - Swedish Match
____________________________________________________________________________________________________________ January-March 2022 1
Q1 2022 Q1 2022
Interim Report January – March 2022
Highlights for the first quarter • Sales and operating profit from product segments increased on the back of continued strong
momentum for the US smokefree business.
• Group sales increased by 10 percent to 4,892 MSEK (4,455). In local currencies, sales increased by 2 percent for the first quarter.
• Operating profit from product segments increased by 1 percent to 2,115 MSEK (2,092). In local currencies, operating profit from product segments1) decreased by 7 percent for the first quarter.
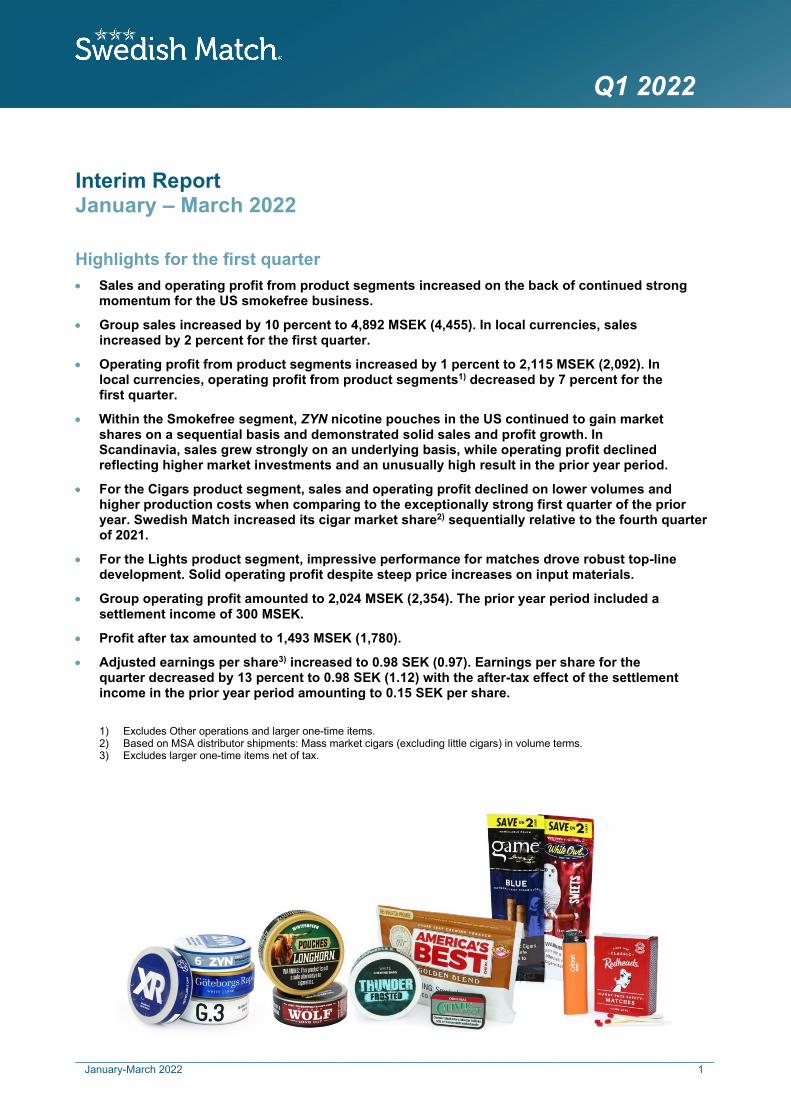
• Within the Smokefree segment, ZYN nicotine pouches in the US continued to gain market shares on a sequential basis and demonstrated solid sales and profit growth. In Scandinavia, sales grew strongly on an underlying basis, while operating profit declined reflecting higher market investments and an unusually high result in the prior year period.
• For the Cigars product segment, sales and operating profit declined on lower volumes and higher production costs when comparing to the exceptionally strong first quarter of the prior year. Swedish Match increased its cigar market share2) sequentially relative to the fourth quarter of 2021.
• For the Lights product segment, impressive performance for matches drove robust top-line development. Solid operating profit despite steep price increases on input materials.
• Group operating profit amounted to 2,024 MSEK (2,354). The prior year period included a settlement income of 300 MSEK.
• Profit after tax amounted to 1,493 MSEK (1,780).
• Adjusted earnings per share3) increased to 0.98 SEK (0.97). Earnings per share for the quarter decreased by 13 percent to 0.98 SEK (1.12) with the after-tax effect of the settlement income in the prior year period amounting to 0.15 SEK per share. 1) Excludes Other operations and larger one-time items. 2) Based on MSA distributor shipments: Mass market cigars (excluding little cigars) in volume terms. 3) Excludes larger one-time items net of tax.
____________________________________________________________________________________________________________ January-March 2022 2
CEO Lars Dahlgren comments: Good start to the year and great growth opportunities ahead
Many of our businesses demonstrated continued strength and momentum during the first quarter of 2022, with nicotine pouches leading the way. Year-on-year financial comparisons mask the true underlying strength of our performance due to unusual factors, largely of a one-time nature, that contributed to an exceptionally difficult comparison period in the first quarter of 2021 in terms of both revenue and operating profit.
In the US, ZYN maintained its strong momentum, with robust volume growth, as well as continued sequential gains in per store velocities and market share. The sequential market share growth for ZYN in the US was particularly encouraging in view of extremely high levels of promotional activity by one major competitor. While the chewing tobacco business reflected declines consistent with historical category dynamics, our moist snuff business delivered a strong result in the quarter.
Volume and market mix impacts from the prior year travel restrictions, phasing of shipments during periods before and after the notable Norwegian excise tax cut early in 2021, and the earlier timing of Easter in that year, when combined, made year-on-year first quarter comparisons in Scandinavia particularly challenging. I am encouraged by the fact that despite those impacts, Scandinavian smokefree volumes and sales grew relative to the prior year. Our Scandinavian nicotine pouch portfolio saw slight market share gains on a sequential basis relative to the fourth quarter of 2021, led by Sweden where the VOLT series which was launched in the previous year continued to perform well.
For cigars, the financial development looks disappointing when comparing with the record first quarter of 2021, but we were pleased to see the marked sequential improvement relative to the last quarter of the prior year, led by the strong performance for the Game cigarillo portfolio, which has been the priority as our organization has worked diligently to address supply chain challenges, including limitations on input material. In late April, the FDA finally released its proposed rule on a ban for characterizing flavors for cigars. The entire rule-making process may take years and while the eventual outcome remains uncertain, we have been preparing for this development for quite some time and are confident that our broad cigar assortment will continue providing consumers with attractive offerings under various regulatory scenarios.
With regard to COVID-19, while there were impacts from higher levels of illness and resulting sick leave early in the quarter due to the Omicron variant, the situation overall has improved significantly, as travel and freedom of movement have returned for many. Strained global supply chains have impacted prices for transportation and raw materials, but we were able to mitigate these cost increases through several measures, including actively managing pricing, thereby limiting their adverse effects.
Regarding the war in Ukraine, our hearts go out to those suffering from the impacts of this senseless tragedy. For Swedish Match, the war’s most visible impact is within our Lights business as we have suspended deliveries of lighters to Russia. With sales to Russia representing less than 1 percent of Group sales for the full year of 2021, the financial impact is however limited.
As I look to the future, I see so many opportunities as we move toward our vision of A world without cigarettes, and strive to responsibly satisfy our consumers, as well as new consumers who migrate from combustible tobacco products. Our consumer insight and product development efforts continue to bear fruit, and as an example, this month, we will be introducing a completely unique and patent pending technology into the Scandinavian nicotine pouch market which we strongly believe will delight consumers looking for the perfect combination of taste, mouth feel, and nicotine satisfaction.
I look forward to an exciting remainder of the year as we continue to develop our business, leverage the market momentum of our brands, and build on our unique platforms.
____________________________________________________________________________________________________________ January-March 2022 3
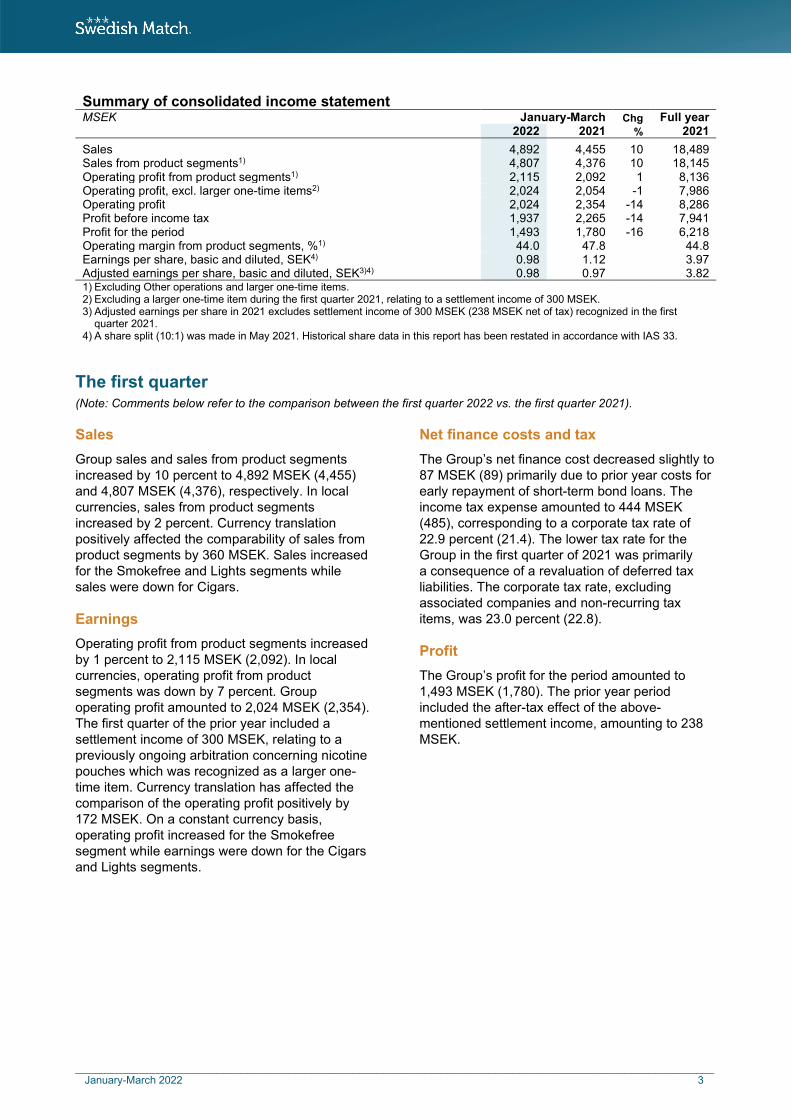
Summary of consolidated income statement MSEK January-March Chg Full year 2022 2021 % 2021
Sales 4,892 4,455 10 18,489 Sales from product segments1) 4,807 4,376 10 18,145 Operating profit from product segments1) 2,115 2,092 1 8,136 Operating profit, excl. larger one-time items2) 2,024 2,054 -1 7,986 Operating profit 2,024 2,354 -14 8,286 Profit before income tax 1,937 2,265 -14 7,941 Profit for the period 1,493 1,780 -16 6,218 Operating margin from product segments, %1) 44.0 47.8 44.8 Earnings per share, basic and diluted, SEK4) 0.98 1.12 3.97 Adjusted earnings per share, basic and diluted, SEK3)4) 0.98 0.97 3.82 1) Excluding Other operations and larger one-time items. 2) Excluding a larger one-time item during the first quarter 2021, relating to a settlement income of 300 MSEK. 3) Adjusted earnings per share in 2021 excludes settlement income of 300 MSEK (238 MSEK net of tax) recognized in the first
quarter 2021. 4) A share split (10:1) was made in May 2021. Historical share data in this report has been restated in accordance with IAS 33.
The first quarter (Note: Comments below refer to the comparison between the first quarter 2022 vs. the first quarter 2021).
Sales Group sales and sales from product segments increased by 10 percent to 4,892 MSEK (4,455) and 4,807 MSEK (4,376), respectively. In local currencies, sales from product segments increased by 2 percent. Currency translation positively affected the comparability of sales from product segments by 360 MSEK. Sales increased for the Smokefree and Lights segments while sales were down for Cigars.
Earnings Operating profit from product segments increased by 1 percent to 2,115 MSEK (2,092). In local currencies, operating profit from product segments was down by 7 percent. Group operating profit amounted to 2,024 MSEK (2,354). The first quarter of the prior year included a settlement income of 300 MSEK, relating to a previously ongoing arbitration concerning nicotine pouches which was recognized as a larger one-time item. Currency translation has affected the comparison of the operating profit positively by 172 MSEK. On a constant currency basis, operating profit increased for the Smokefree segment while earnings were down for the Cigars and Lights segments.
Net finance costs and tax The Group’s net finance cost decreased slightly to 87 MSEK (89) primarily due to prior year costs for early repayment of short-term bond loans. The income tax expense amounted to 444 MSEK (485), corresponding to a corporate tax rate of 22.9 percent (21.4). The lower tax rate for the Group in the first quarter of 2021 was primarily a consequence of a revaluation of deferred tax liabilities. The corporate tax rate, excluding associated companies and non-recurring tax items, was 23.0 percent (22.8).
Profit The Group’s profit for the period amounted to 1,493 MSEK (1,780). The prior year period included the after-tax effect of the above-mentioned settlement income, amounting to 238 MSEK.
____________________________________________________________________________________________________________ January-March 2022 4
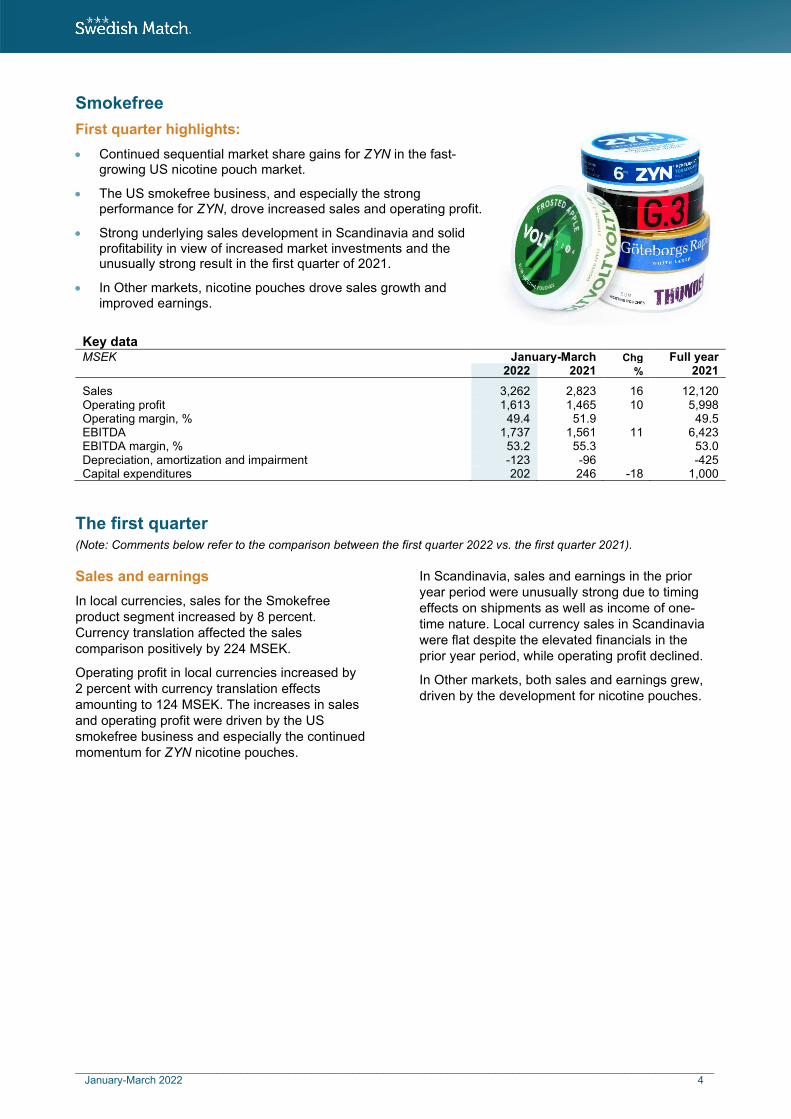
Smokefree First quarter highlights: • Continued sequential market share gains for ZYN in the fast-
growing US nicotine pouch market.
• The US smokefree business, and especially the strong performance for ZYN, drove increased sales and operating profit.
• Strong underlying sales development in Scandinavia and solid profitability in view of increased market investments and the unusually strong result in the first quarter of 2021.
• In Other markets, nicotine pouches drove sales growth and improved earnings.
Key data MSEK January-March Chg Full year 2022 2021 % 2021
Sales 3,262 2,823 16 12,120 Operating profit 1,613 1,465 10 5,998 Operating margin, % 49.4 51.9 49.5 EBITDA 1,737 1,561 11 6,423 EBITDA margin, % 53.2 55.3 53.0 Depreciation, amortization and impairment -123 -96 -425 Capital expenditures 202 246 -18 1,000
The first quarter (Note: Comments below refer to the comparison between the first quarter 2022 vs. the first quarter 2021).
Sales and earnings In local currencies, sales for the Smokefree product segment increased by 8 percent. Currency translation affected the sales comparison positively by 224 MSEK.
Operating profit in local currencies increased by 2 percent with currency translation effects amounting to 124 MSEK. The increases in sales and operating profit were driven by the US smokefree business and especially the continued momentum for ZYN nicotine pouches.
In Scandinavia, sales and earnings in the prior year period were unusually strong due to timing effects on shipments as well as income of one-time nature. Local currency sales in Scandinavia were flat despite the elevated financials in the prior year period, while operating profit declined.
In Other markets, both sales and earnings grew, driven by the development for nicotine pouches.

____________________________________________________________________________________________________________ January-March 2022 5
The US Key data January-March Chg Full year 2022 2021 % 2021
Financials, MSEK Sales 1,934 1,535 26 6,754 Operating profit 975 793 23 3,352 Operating margin, % 50.4 51.7 49.6
Financials, MUSD Sales 207 183 13 787 Operating profit 104 94 10 391 Operating margin, % 50.4 51.7 49.6
Shipment volumes Moist snuff, million cans 34.2 34.0 1 129.6 Nicotine pouches, million cans 49.9 36.9 35 173.9 Chewing tobacco, thousands of pounds1) 1,205 1,351 -11 5,244
1) Excluding contract manufacturing volumes.
Market shares1)
Percent January-March Chg Full year 2022 2021 ppts 2021
Nicotine pouches 66.2 66.6 -0.4 65.3 Moist snuff 9.7 8.9 0.8 8.9 Chewing tobacco (excluding contract manufacturing volumes) 41.1 40.5 0.6 39.8 1) Based on MSA distributor shipments: 13 weeks to March 27, 2022, and March 28, 2021, respectively, in volume terms. Figures for
2021 have been restated to reflect changes in MSA store measurements.
Sales and earnings
The double-digit sales and earnings developments were driven by continued momentum for ZYN nicotine pouches, but sales and operating profit were also up collectively for the portfolio of traditional smokefree products (moist snuff, chewing tobacco, and snus).
Traditional smokefree For the portfolio of traditional smokefree products, moist snuff drove the positive sales and earnings developments on the back of increased market share and shipment volumes for the Longhorn brand, along with improved pricing across the portfolio.
ZYN nicotine pouches For ZYN, despite significantly higher investments in consumer marketing and trade loyalty programs, the strong volume performance resulted in significant increases in sales and operating profit. The volume growth of 35 percent was driven principally by higher velocities and to a lesser extent by an expansion of the store base.
Despite continued aggressive and widespread price promotions from a large competitor during the quarter, including free product offerings with the purchase of any tobacco product, ZYN continued to demonstrate market share resilience and its loyal franchise, once again increasing market share on a sequential basis relative the most recent quarter.
____________________________________________________________________________________________________________ January-March 2022 6
Scandinavia
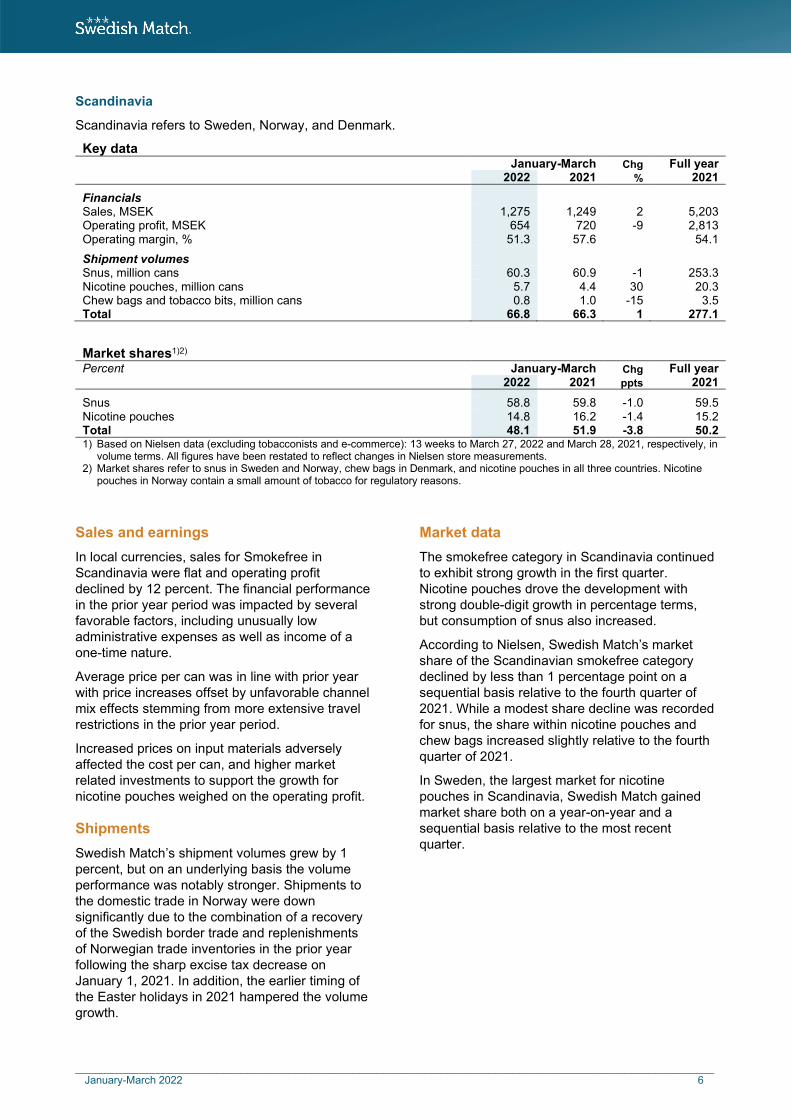
Scandinavia refers to Sweden, Norway, and Denmark.
Key data January-March Chg Full year 2022 2021 % 2021
Financials Sales, MSEK 1,275 1,249 2 5,203 Operating profit, MSEK 654 720 -9 2,813 Operating margin, % 51.3 57.6 54.1
Shipment volumes Snus, million cans 60.3 60.9 -1 253.3 Nicotine pouches, million cans 5.7 4.4 30 20.3 Chew bags and tobacco bits, million cans 0.8 1.0 -15 3.5 Total 66.8 66.3 1 277.1
Market shares1)2)
Percent January-March Chg Full year 2022 2021 ppts 2021
Snus 58.8 59.8 -1.0 59.5 Nicotine pouches 14.8 16.2 -1.4 15.2 Total 48.1 51.9 -3.8 50.2 1) Based on Nielsen data (excluding tobacconists and e-commerce): 13 weeks to March 27, 2022 and March 28, 2021, respectively, in
volume terms. All figures have been restated to reflect changes in Nielsen store measurements. 2) Market shares refer to snus in Sweden and Norway, chew bags in Denmark, and nicotine pouches in all three countries. Nicotine
pouches in Norway contain a small amount of tobacco for regulatory reasons.
Sales and earnings
In local currencies, sales for Smokefree in Scandinavia were flat and operating profit declined by 12 percent. The financial performance in the prior year period was impacted by several favorable factors, including unusually low administrative expenses as well as income of a one-time nature.
Average price per can was in line with prior year with price increases offset by unfavorable channel mix effects stemming from more extensive travel restrictions in the prior year period.
Increased prices on input materials adversely affected the cost per can, and higher market related investments to support the growth for nicotine pouches weighed on the operating profit.
Shipments
Swedish Match’s shipment volumes grew by 1 percent, but on an underlying basis the volume performance was notably stronger. Shipments to the domestic trade in Norway were down significantly due to the combination of a recovery of the Swedish border trade and replenishments of Norwegian trade inventories in the prior year following the sharp excise tax decrease on January 1, 2021. In addition, the earlier timing of the Easter holidays in 2021 hampered the volume growth.
Market data
The smokefree category in Scandinavia continued to exhibit strong growth in the first quarter. Nicotine pouches drove the development with strong double-digit growth in percentage terms, but consumption of snus also increased.
According to Nielsen, Swedish Match’s market share of the Scandinavian smokefree category declined by less than 1 percentage point on a sequential basis relative to the fourth quarter of 2021. While a modest share decline was recorded for snus, the share within nicotine pouches and chew bags increased slightly relative to the fourth quarter of 2021.
In Sweden, the largest market for nicotine pouches in Scandinavia, Swedish Match gained market share both on a year-on-year and a sequential basis relative to the most recent quarter.
____________________________________________________________________________________________________________ January-March 2022 7
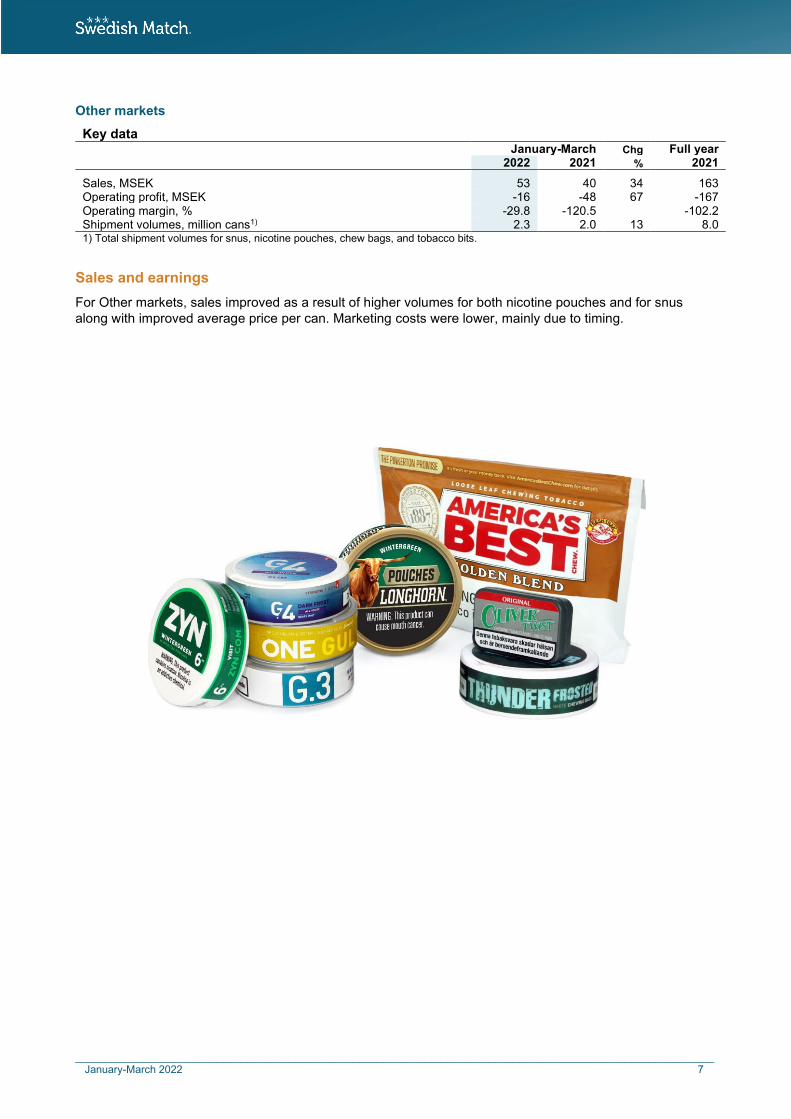
Q1 2022 Other markets Key data January-March Chg Full year 2022 2021 % 2021
Sales, MSEK 53 40 34 163 Operating profit, MSEK -16 -48 67 -167 Operating margin, % -29.8 -120.5 -102.2 Shipment volumes, million cans1) 2.3 2.0 13 8.0 1) Total shipment volumes for snus, nicotine pouches, chew bags, and tobacco bits.
Sales and earnings
For Other markets, sales improved as a result of higher volumes for both nicotine pouches and for snus along with improved average price per can. Marketing costs were lower, mainly due to timing.
____________________________________________________________________________________________________________ January-March 2022 8
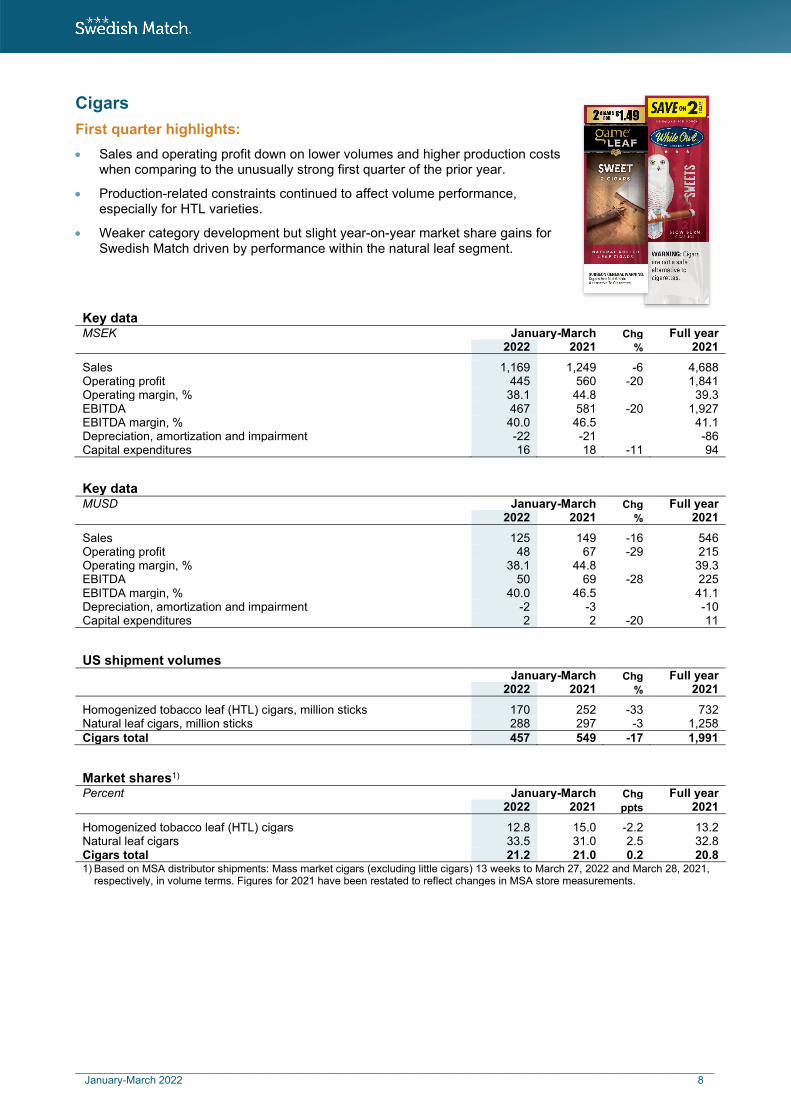
Cigars First quarter highlights: • Sales and operating profit down on lower volumes and higher production costs
when comparing to the unusually strong first quarter of the prior year.
• Production-related constraints continued to affect volume performance, especially for HTL varieties.
• Weaker category development but slight year-on-year market share gains for Swedish Match driven by performance within the natural leaf segment.
Key data MSEK January-March Chg Full year 2022 2021 % 2021
Sales 1,169 1,249 -6 4,688 Operating profit 445 560 -20 1,841 Operating margin, % 38.1 44.8 39.3 EBITDA 467 581 -20 1,927 EBITDA margin, % 40.0 46.5 41.1 Depreciation, amortization and impairment -22 -21 -86 Capital expenditures 16 18 -11 94
Key data MUSD January-March Chg Full year 2022 2021 % 2021
Sales 125 149 -16 546 Operating profit 48 67 -29 215 Operating margin, % 38.1 44.8 39.3 EBITDA 50 69 -28 225 EBITDA margin, % 40.0 46.5 41.1 Depreciation, amortization and impairment -2 -3 -10 Capital expenditures 2 2 -20 11
US shipment volumes January-March Chg Full year 2022 2021 % 2021
Homogenized tobacco leaf (HTL) cigars, million sticks 170 252 -33 732 Natural leaf cigars, million sticks 288 297 -3 1,258 Cigars total 457 549 -17 1,991
Market shares1)
Percent January-March Chg Full year 2022 2021 ppts 2021
Homogenized tobacco leaf (HTL) cigars 12.8 15.0 -2.2 13.2 Natural leaf cigars 33.5 31.0 2.5 32.8 Cigars total 21.2 21.0 0.2 20.8 1) Based on MSA distributor shipments: Mass market cigars (excluding little cigars) 13 weeks to March 27, 2022 and March 28, 2021,
respectively, in volume terms. Figures for 2021 have been restated to reflect changes in MSA store measurements.
____________________________________________________________________________________________________________ January-March 2022 9
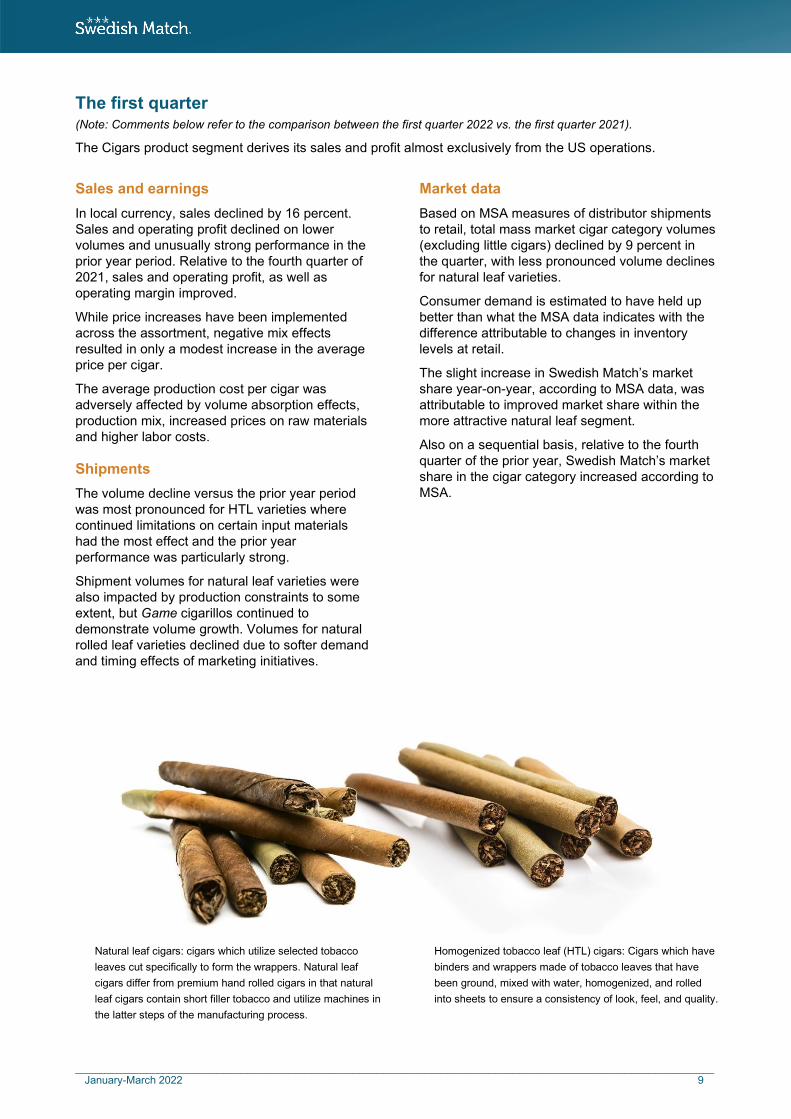
The first quarter (Note: Comments below refer to the comparison between the first quarter 2022 vs. the first quarter 2021).
The Cigars product segment derives its sales and profit almost exclusively from the US operations.
Sales and earnings
In local currency, sales declined by 16 percent. Sales and operating profit declined on lower volumes and unusually strong performance in the prior year period. Relative to the fourth quarter of 2021, sales and operating profit, as well as operating margin improved.
While price increases have been implemented across the assortment, negative mix effects resulted in only a modest increase in the average price per cigar.
The average production cost per cigar was adversely affected by volume absorption effects, production mix, increased prices on raw materials and higher labor costs.
Shipments
The volume decline versus the prior year period was most pronounced for HTL varieties where continued limitations on certain input materials had the most effect and the prior year performance was particularly strong.
Shipment volumes for natural leaf varieties were also impacted by production constraints to some extent, but Game cigarillos continued to demonstrate volume growth. Volumes for natural rolled leaf varieties declined due to softer demand and timing effects of marketing initiatives.
Market data
Based on MSA measures of distributor shipments to retail, total mass market cigar category volumes (excluding little cigars) declined by 9 percent in the quarter, with less pronounced volume declines for natural leaf varieties.
Consumer demand is estimated to have held up better than what the MSA data indicates with the difference attributable to changes in inventory levels at retail.
The slight increase in Swedish Match’s market share year-on-year, according to MSA data, was attributable to improved market share within the more attractive natural leaf segment.
Also on a sequential basis, relative to the fourth quarter of the prior year, Swedish Match’s market share in the cigar category increased according to MSA.
Natural leaf cigars: cigars which utilize selected tobacco leaves cut specifically to form the wrappers. Natural leaf cigars differ from premium hand rolled cigars in that natural leaf cigars contain short filler tobacco and utilize machines in the latter steps of the manufacturing process.
Homogenized tobacco leaf (HTL) cigars: Cigars which have binders and wrappers made of tobacco leaves that have been ground, mixed with water, homogenized, and rolled into sheets to ensure a consistency of look, feel, and quality.
____________________________________________________________________________________________________________ January-March 2022 10
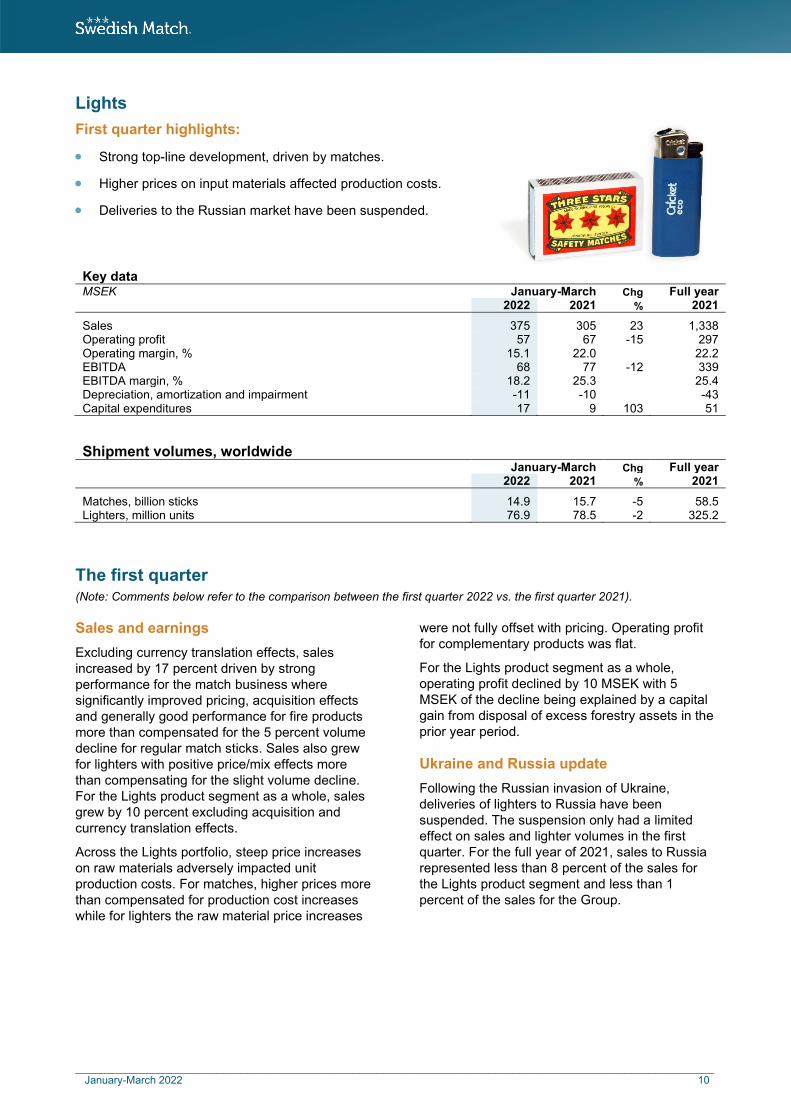
Lights First quarter highlights:
• Strong top-line development, driven by matches.
• Higher prices on input materials affected production costs.
• Deliveries to the Russian market have been suspended.
Key data MSEK January-March Chg Full year 2022 2021 % 2021
Sales 375 305 23 1,338 Operating profit 57 67 -15 297 Operating margin, % 15.1 22.0 22.2 EBITDA 68 77 -12 339 EBITDA margin, % 18.2 25.3 25.4 Depreciation, amortization and impairment -11 -10 -43 Capital expenditures 17 9 103 51
The first quarter (Note: Comments below refer to the comparison between the first quarter 2022 vs. the first quarter 2021).
Sales and earnings
Excluding currency translation effects, sales increased by 17 percent driven by strong performance for the match business where significantly improved pricing, acquisition effects and generally good performance for fire products more than compensated for the 5 percent volume decline for regular match sticks. Sales also grew for lighters with positive price/mix effects more than compensating for the slight volume decline. For the Lights product segment as a whole, sales grew by 10 percent excluding acquisition and currency translation effects.
Across the Lights portfolio, steep price increases on raw materials adversely impacted unit production costs. For matches, higher prices more than compensated for production cost increases while for lighters the raw material price increases
were not fully offset with pricing. Operating profit for complementary products was flat.
For the Lights product segment as a whole, operating profit declined by 10 MSEK with 5 MSEK of the decline being explained by a capital gain from disposal of excess forestry assets in the prior year period.
Ukraine and Russia update
Following the Russian invasion of Ukraine, deliveries of lighters to Russia have been suspended. The suspension only had a limited effect on sales and lighter volumes in the first quarter. For the full year of 2021, sales to Russia represented less than 8 percent of the sales for the Lights product segment and less than 1 percent of the sales for the Group.
Shipment volumes, worldwide January-March Chg Full year 2022 2021 % 2021
Matches, billion sticks 14.9 15.7 -5 58.5 Lighters, million units 76.9 78.5 -2 325.2
____________________________________________________________________________________________________________ January-March 2022 11
Cash flow and financing Cash flow from operating activities for the first quarter of 2022 amounted to 1,542 MSEK (1,580). The reduced cash flow mainly stemmed from lower EBITDA (impacted by the 300 MSEK settlement income in the prior year period), partly offset by better cash flow from changes in working capital.
Investments in property, plant and equipment mainly pertained to the Smokefree product segment and amounted to 238 MSEK (277).
Net finance cost for the first quarter decreased slightly to 87 MSEK (89). The decrease resulted mainly from early repayment of short-term bond loans in the prior year.
During the quarter, new bond loans of 200 MSEK were issued, and repayments of maturing bond loans amounted to 265 MSEK. As of March 31, 2022, Swedish Match had 14,931 MSEK of interest-bearing debt excluding retirement benefit obligations but including the recognition of lease liabilities of 411 MSEK. The Group’s interest-bearing debt at December 31, 2021 amounted to 14,851 MSEK and 14,527 MSEK at March 31, 2021. During the remainder of 2022, 680 MSEK of the bond debt falls due for payment. For further details on the maturity profile of the debt portfolio, please see Swedish Match’s website. Net retirement benefit obligations decreased to 1,130 MSEK as of March 31, 2022, from 1,305 MSEK at December 31, 2021, due to positive remeasurements effects from higher discount rates partly offset by lower return on plan assets.
As of March 31, 2022, Swedish Match had 1,500 MSEK in an unutilized revolving credit facility (RCF). Cash and cash equivalents amounted to 2,823 MSEK at the end of the period, compared to 2,121 MSEK at December 31, 2021.
The net debt as of March 31, 2022, amounted to 13,238 MSEK compared to 14,035 MSEK at December 31, 2021 and 11,964 MSEK at March 31, 2021.
Shareholder distributions and the share On May 4, 2022, Swedish Match paid dividends of 1,414 MSEK to its shareholders, corresponding to 0.93 SEK per share. Another dividend of 0.93 SEK per share will be paid out to shareholders in November 2022.
During the first quarter, Swedish Match repurchased 10.5 million shares for 750 MSEK at an average price of 71.30 SEK, following authorization from the Annual General Meeting held in 2021. Total shares bought back by Swedish Match since the buyback program started have been repurchased at an average price of 16.16 SEK. As per March 31, 2022, Swedish Match held 59.3 million shares, corresponding to 3.75 percent of the total number of shares. The number of shares outstanding, net, as per March 31, 2022, amounted to 1,521 million.
Updated plans for the separation of the US cigar business In September 2021, Swedish Match announced its intention to separate its cigar business via a spin-off to shareholders and a subsequent listing on a US national securities exchange. The separation was initially expected to be completed in the second half of 2022, at the earliest.
While the Board of Swedish Match still has the strategic intent to separate the cigar business, the Board, as communicated on March 14, 2022, has decided to suspend the preparations for the contemplated spin-off until further notice. The decision to suspend the spin-off preparations until further notice was prompted by regulatory uncertainties facing the cigar business. For further details, see the press release published on March 14, 2022.
Swedish Match still incurred advisory related costs associated with the spin-off preparations in the first quarter of 2022, amounting to 33 MSEK.
____________________________________________________________________________________________________________ January-March 2022 12
Other events during the quarter FDA denial of substantial equivalence applications for part of Swedish Match’s cigar assortment During the quarter Swedish Match was informed by the US Food and Drug Administration (FDA) that substantial equivalence (SE) designations had been denied for SE applications corresponding to about 3 percent of Swedish Match’s 2021 cigar volume. Swedish Match has during April appealed the non-SE designations by the FDA by requesting a supervisory review and Swedish Match remains confident that the Company will be given the opportunity to provide the FDA with sufficient data in order to demonstrate that the cigars in question are substantially equivalent to their predicate products insofar that the changes that have taken place do not raise questions of public health.
Proposed recommendation in Sweden for legislation with regard to nicotine pouches Swedish Match has been advocating for regulation of nicotine pouches since 2016. On March 31, 2022, the Government finally made a proposal to Parliament for such legislation. The proposal includes inter alia an 18-year age requirement for purchase, registration requirements for retail outlets, a ban on certain sponsorships as well as marketing restrictions mandating moderation and banning marketing specifically targeting to children and young adults under the age of 25. All of these proposals are supported by Swedish Match. The Parliament is expected to vote on the proposal in June and most of the regulations are scheduled to come into force from August 1, 2022.
Events after the reporting period FDA publishes Notice of Proposed Rule-Making with regard to flavors on cigars On April 28, 2022, the US Food and Drug Administration (FDA) announced its intention to address the production and sales of cigars with characterizing flavors, as well as for menthol in cigarettes with its publication of a Notice of Proposed Rule-Making (NPRM). Such an announcement has been anticipated for a number of years. The process toward any restrictions must follow a number of steps, and the timing and eventual outcome from this announcement is unclear. Swedish Match anticipates that any assortment restrictions following completion of this process may not occur for a number of years.
Supreme Administrative Court ruling The judgement from the Supreme Administrative Court in the tax case referred to in note 4 was released May 2, 2022. The Court ruled on one hand that the judgment from the Court of Appeal should be repealed, on the other hand the court referred the case back to the Court of Appeal to rule on the applicability of the Swedish Tax Avoidance Act.
Public cash offer by Philip Morris International to acquire Swedish Match In relation to the public cash offer of SEK 106 per share by Philip Morris Holland Holdings BV (“PMHH”), an affiliate of Philip Morris International Inc., to shareholders of Swedish Match AB (“Swedish Match” or the “Company”) to transfer their shares in Swedish Match to PMHH, the Board of Directors of Swedish Match today announced its recommendation to shareholders to accept the offer. For more details, see the press release published earlier this morning.
____________________________________________________________________________________________________________ January-March 2022 13
Annual General Meeting and repurchase of own shares The Annual General Meeting held on April 27, 2022, re-elected Charles A. Blixt, Jacqueline Hoogerbrugge, Conny Karlsson, Alexander Lacik, Pauline Lindwall, and Joakim Westh as members of Swedish Match’s Board of Directors. Sanna Suvanto-Harsaae was elected as new member of the Board of Directors. Conny Karlsson was re-elected as Chairman of the Board. The Annual General Meeting approved the Board’s proposal of a dividend of 1.86 SEK per share distributed to the shareholders in two equal payments of 0.93 SEK per share. The dividend for the first instalment amounted to 1,414 MSEK and was paid to the shareholders in May. The record date for the second payment is November 14, 2022, and payment through Euroclear Sweden AB is expected to be made on November 17, 2022. In addition, the Meeting resolved to reduce the share capital by means of withdrawal of 55,000,000 shares held in treasury with a simultaneous bonus issue, without issuing any new shares, of a corresponding amount to restore the Company’s share capital. With the cancellation of these shares, the total number of registered shares in the Company amounts to 1,525,000.000 shares and the total number of treasury shares to 4,285,810.
The 2022 Annual General Meeting further authorized the Board of Directors to acquire the Company’s own shares, including the possibility to implement a repurchase program in accordance with the Market Abuse Regulation (EU) No 596/2014 (“MAR”) and the Commission Delegated Regulation (EU) No 2016/1052 (the “Safe Harbour Regulation”), a mandate which the Board now utilizes. The purpose of the repurchasing right is to enable Swedish Match to adapt its capital structure to its capital needs over time, and thereby contribute to an increased shareholder value.
The Annual General Meeting authorized the Board of Directors to resolve on transfer of the Company’s own shares, on one or several occasions prior to the next Annual General Meeting. The shares may only be transferred in conjunction with the financing of company acquisitions and other types of strategic investments and acquisitions, and the transfers may not exceed the maximum number of treasury shares held by the Company at any given time. Transfer of own shares shall be made either on Nasdaq Stockholm or in another manner.
Furthermore, the Annual General Meeting approved the Board of Directors’ proposal that it be authorized, for the period until the end of the next Annual General Meeting, to issue new ordinary shares on one or more occasions, with or without deviation from shareholders’ preferential rights and against payment in cash, in kind or by set-off. The number of shares that may be issued may not exceed a maximum dilution effect of 10 percent of the share capital and votes at the time of the Annual General Meeting 2022. The Annual General Meeting approved all other proposals made by the Board of Directors and the Nominating Committee. The proposals are outlined in the published notice of the Annual General Meeting.
Full year 2022 outlook With its vision of A world without cigarettes, Swedish Match’s core business is to provide consumers with enjoyable alternatives that are both satisfying and dramatically safer than smoking. Swedish Match expects significant growth in consumer demand for safer alternatives to cigarettes. Swedish Match further expects that nicotine pouches as a category will continue to evolve as the number one choice among even more consumers seeking satisfactory experiences in the reduced risk product landscape. With the highly attractive prospects of the nicotine pouch category, Swedish Match anticipates that competitive activity will remain intense.
In the US, in Scandinavia, as well as in Other markets, Swedish Match plans to further increase investments during 2022 to capitalize on the growth opportunities, especially for nicotine pouches. Within Other markets, Swedish Match notes significant opportunities in existing as well as in certain new markets.
Capital expenditures are expected to be of a similar magnitude as in 2021. The effective underlying corporate tax rate in 2022, excluding associated companies, is expected to be around 23 percent.
The Company remains committed to returning cash not needed in operations to shareholders.

____________________________________________________________________________________________________________ January-March 2022 14
Risk factors Swedish Match operates in highly competitive markets, which require an agile organization in a continually changing environment. In the event that Swedish Match cannot provide a better offering to the consumer than competitors, there is an increased risk to both customer purchases and the ability to realize price changes.
Production facilities are exposed to risk of various harmful incidents such as fires and machinery breakdown, as well as potential natural disasters or global health crises such as a pandemic and other catastrophic events, along with effects related to climate changes. Such incidents may affect both production facilities and employees. Production interruptions could cause quality or delivery problems.
A loss of a key supplier or a supplier’s non-compliance with regulations or unethical behavior could be harmful to the Group. Potential consequences are delivery or quality problems or difficulties in the interaction with other stakeholders including sales to consumers.
Swedish Match is exposed to a high degree of regulation from various authorities. Regulations could have a restricting impact on how the Group can operate its business and interact with its stakeholders or direct financial impact in the form or increased taxes or imposed fees. Regulations, many related to the Group’s involvement in the tobacco industry, concern among other issues, tobacco excise taxes, marketing, packaging, warning labels, ingredients, reporting to authorities, product approvals, and introduction of new products. Many authorities have and continue to implement various forms of restrictions on sales and usage of tobacco and other nicotine containing products.
Social and geopolitical upheaval caused by wars, armed conflicts, or incidents causing massive migration pressures may have moderate to severe impacts on supply chains (sourcing and deliveries), production levels and resultant costs. Business relationships may be altered for an unforeseen period of time. As a result of the ongoing war in Ukraine, Swedish Match continuously follow up on risks and mitigating activities to reduce any negative impacts for the Group. Effects of the war are closely monitored, and any direct and indirect financial effects are evaluated. Commercial, operational, and financial consequences resulting from the ongoing war have thus far been limited for Swedish Match.
The dynamic financial market conditions are continuously changing with fluctuating currency exchange rates, interest rates and availability of funds. A weakening of certain major currencies, such as the USD versus the SEK, could cause lower financial results presented in SEK from the translation of foreign operations. The transaction exposure is relatively low as most production is located in the country where sales are conducted. Higher interest rates and credit spreads could have a negative impact on net finance expense.
Key business processes such as production management, invoicing, customer support and financial reporting rely on IT systems. Increasingly sophisticated and frequent cybercrimes could result in significant outages or application failures to our infrastructure, and cause reputational damage, considerable business disruption or adverse impact on business-critical data. The information assets within Swedish Match are of fundamental importance for our business. Proper handling of the assets is important for the trust of employees, customers, and partners. Swedish Match needs to ensure confidentiality, integrity, and availability of information most important to Swedish Match.
For a further description of risk factors and how Swedish Match works to mitigate risks, see the Risk management section in the Report of the Board of Directors in the Swedish Match annual report for 2021, available on the Company’s website.
____________________________________________________________________________________________________________ January-March 2022 15
Swedish Match AB (publ) Swedish Match AB (publ) is the Parent Company of the Swedish Match Group. The main sources of income for the Parent Company are dividends and Group contributions from subsidiaries.
Revenue from the Parent Company for the first quarter 2022 amounted to 7 MSEK (8).
Loss before income tax amounted to -191 MSEK (-138) and net loss for the quarter amounted to -155 MSEK (-108). The higher loss before income tax compared to the previous year was primarily related to higher administrative expenses.
Part of the Group´s treasury operations are within the operations of the Parent Company, including the major part of the Group´s external borrowings. Substantially all of these loans have been hedged to fixed interest rates.
Repayment of bond loans amounted to 265 MSEK during the first quarter and new bond loans of 197 MSEK were issued.
In 2021 it was resolved to split each of the Company´s shares into ten shares (ratio 10:1). All references to shares and earnings per share in this document have been restated to reflect this split. During the first quarter, the Parent Company made share repurchases of 10.5 million (4.9) shares for 750 MSEK (300).
Forward-looking information This report contains forward-looking information based on the current expectation of the Swedish Match Group’s management. Although management deems that the expectations presented by such forward-looking information are reasonable, no guarantee can be given that these expectations will prove correct. Accordingly, the actual future outcome could vary considerably when compared to that stated in the forward-looking information, due to such factors as changed market conditions for Swedish Match’s products and more general factors such as business cycles, market conditions and competition, unforeseen commercial or operational implications attributable to COVID-19, changes in legal requirements or other political measures, and fluctuations in exchange rates.
Additional information This report has not been reviewed by the Company’s auditors. The January-June 2022 report will be released on July 22, 2022.
Stockholm, May 11, 2022
Lars Dahlgren President and CEO
____________________________________________________________________________________________________________ January-March 2022 16
Product segments summary and key ratios
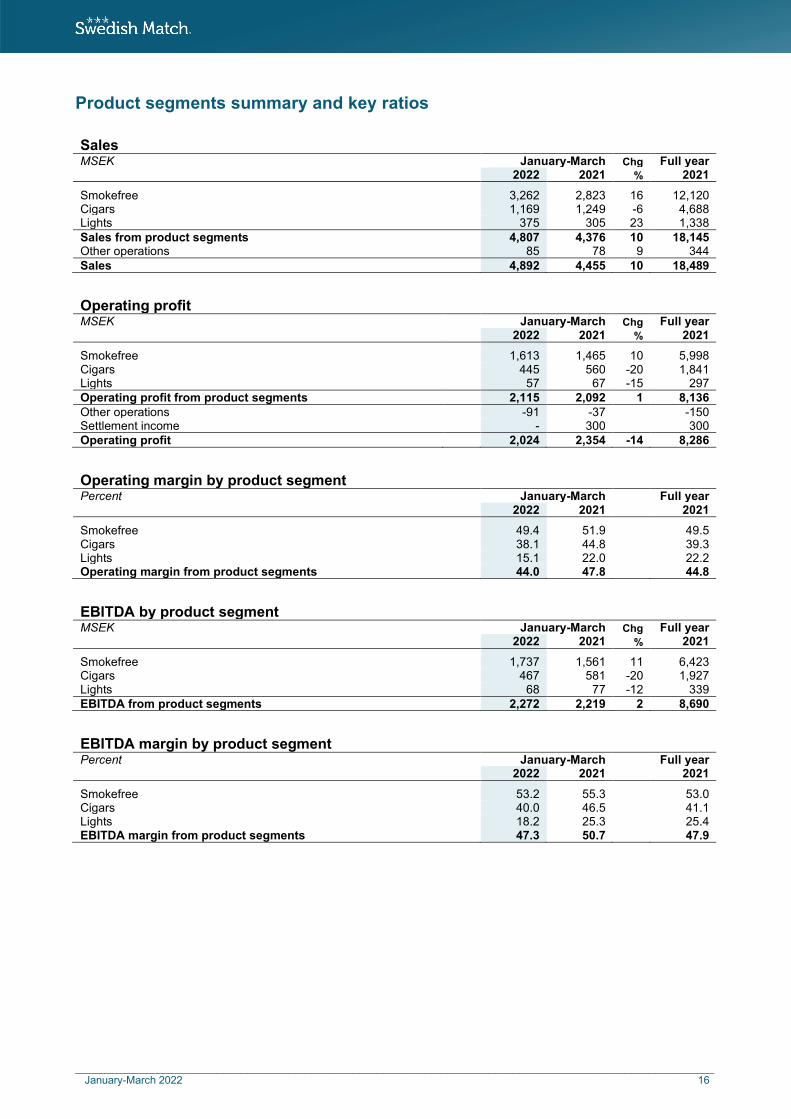
Sales MSEK January-March Chg Full year 2022 2021 % 2021
Smokefree 3,262 2,823 16 12,120 Cigars 1,169 1,249 -6 4,688 Lights 375 305 23 1,338 Sales from product segments 4,807 4,376 10 18,145 Other operations 85 78 9 344 Sales 4,892 4,455 10 18,489
Operating profit MSEK January-March Chg Full year 2022 2021 % 2021
Smokefree 1,613 1,465 10 5,998 Cigars 445 560 -20 1,841 Lights 57 67 -15 297 Operating profit from product segments 2,115 2,092 1 8,136 Other operations -91 -37 -150 Settlement income - 300 300 Operating profit 2,024 2,354 -14 8,286
Operating margin by product segment
Percent January-March Full year 2022 2021 2021
Smokefree 49.4 51.9 49.5 Cigars 38.1 44.8 39.3 Lights 15.1 22.0 22.2 Operating margin from product segments 44.0 47.8 44.8
EBITDA by product segment
MSEK January-March Chg Full year 2022 2021 % 2021
Smokefree 1,737 1,561 11 6,423 Cigars 467 581 -20 1,927 Lights 68 77 -12 339 EBITDA from product segments 2,272 2,219 2 8,690
EBITDA margin by product segment
Percent January-March Full year 2022 2021 2021
Smokefree 53.2 55.3 53.0 Cigars 40.0 46.5 41.1 Lights 18.2 25.3 25.4 EBITDA margin from product segments 47.3 50.7 47.9
____________________________________________________________________________________________________________ January-March 2022 17
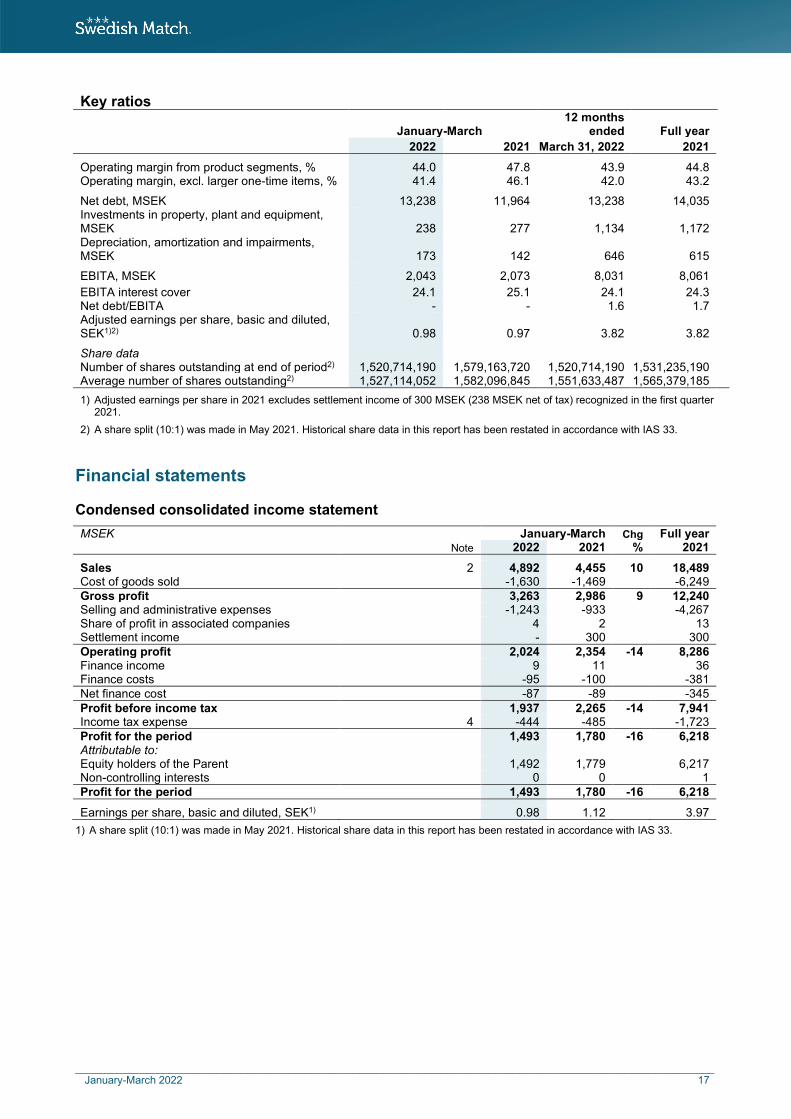
Key ratios 12 months January-March ended Full year 2022 2021 March 31, 2022 2021
Operating margin from product segments, % 44.0 47.8 43.9 44.8 Operating margin, excl. larger one-time items, % 41.4 46.1 42.0 43.2
Net debt, MSEK 13,238 11,964 13,238 14,035 Investments in property, plant and equipment, MSEK 238 277 1,134 1,172 Depreciation, amortization and impairments, MSEK 173 142 646 615
EBITA, MSEK 2,043 2,073 8,031 8,061 EBITA interest cover 24.1 25.1 24.1 24.3 Net debt/EBITA - - 1.6 1.7 Adjusted earnings per share, basic and diluted, SEK1)2) 0.98 0.97
3.82 3.82
Share data Number of shares outstanding at end of period2) 1,520,714,190 1,579,163,720 1,520,714,190 1,531,235,190 Average number of shares outstanding2) 1,527,114,052 1,582,096,845 1,551,633,487 1,565,379,185 1) Adjusted earnings per share in 2021 excludes settlement income of 300 MSEK (238 MSEK net of tax) recognized in the first quarter
2021. 2) A share split (10:1) was made in May 2021. Historical share data in this report has been restated in accordance with IAS 33.
Financial statements Condensed consolidated income statement MSEK January-March Chg Full year Note 2022 2021 % 2021
Sales 2 4,892 4,455 10 18,489 Cost of goods sold -1,630 -1,469 -6,249 Gross profit 3,263 2,986 9 12,240 Selling and administrative expenses -1,243 -933 -4,267 Share of profit in associated companies 4 2 13 Settlement income - 300 300 Operating profit 2,024 2,354 -14 8,286 Finance income 9 11 36 Finance costs -95 -100 -381 Net finance cost -87 -89 -345 Profit before income tax 1,937 2,265 -14 7,941 Income tax expense 4 -444 -485 -1,723 Profit for the period 1,493 1,780 -16 6,218 Attributable to: Equity holders of the Parent 1,492 1,779 6,217 Non-controlling interests 0 0 1 Profit for the period 1,493 1,780 -16 6,218
Earnings per share, basic and diluted, SEK1) 0.98 1.12 3.97 1) A share split (10:1) was made in May 2021. Historical share data in this report has been restated in accordance with IAS 33.
____________________________________________________________________________________________________________ January-March 2022 18
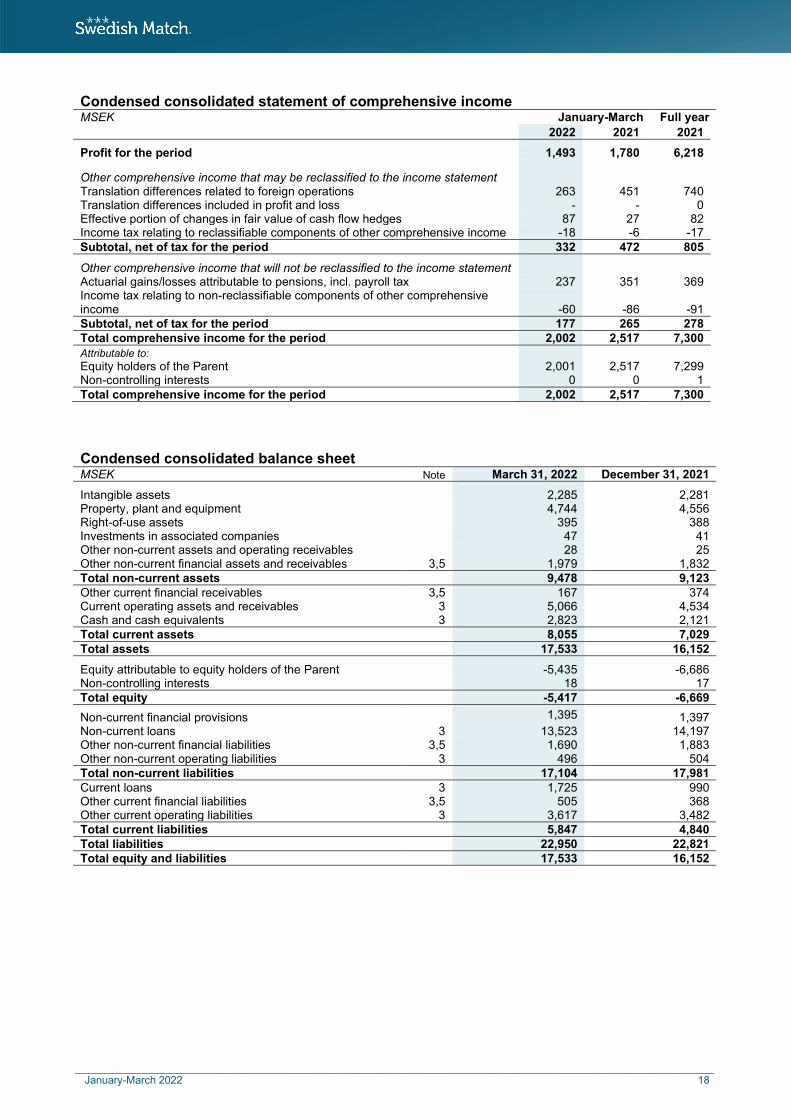
Condensed consolidated statement of comprehensive income MSEK January-March Full year 2022 2021 2021
Profit for the period 1,493 1,780 6,218
Other comprehensive income that may be reclassified to the income statement Translation differences related to foreign operations 263 451 740 Translation differences included in profit and loss - - 0 Effective portion of changes in fair value of cash flow hedges 87 27 82 Income tax relating to reclassifiable components of other comprehensive income -18 -6 -17 Subtotal, net of tax for the period 332 472 805 Other comprehensive income that will not be reclassified to the income statement Actuarial gains/losses attributable to pensions, incl. payroll tax 237 351 369 Income tax relating to non-reclassifiable components of other comprehensive income -60 -86 -91 Subtotal, net of tax for the period 177 265 278 Total comprehensive income for the period 2,002 2,517 7,300 Attributable to: Equity holders of the Parent 2,001 2,517 7,299 Non-controlling interests 0 0 1 Total comprehensive income for the period 2,002 2,517 7,300
Condensed consolidated balance sheet MSEK Note March 31, 2022 December 31, 2021
Intangible assets 2,285 2,281 Property, plant and equipment 4,744 4,556 Right-of-use assets 395 388 Investments in associated companies 47 41 Other non-current assets and operating receivables 28 25 Other non-current financial assets and receivables 3,5 1,979 1,832 Total non-current assets 9,478 9,123 Other current financial receivables 3,5 167 374 Current operating assets and receivables 3 5,066 4,534 Cash and cash equivalents 3 2,823 2,121 Total current assets 8,055 7,029 Total assets 17,533 16,152
Equity attributable to equity holders of the Parent -5,435 -6,686 Non-controlling interests 18 17 Total equity -5,417 -6,669 Non-current financial provisions 1,395 1,397 Non-current loans 3 13,523 14,197 Other non-current financial liabilities 3,5 1,690 1,883 Other non-current operating liabilities 3 496 504 Total non-current liabilities 17,104 17,981 Current loans 3 1,725 990 Other current financial liabilities 3,5 505 368 Other current operating liabilities 3 3,617 3,482 Total current liabilities 5,847 4,840 Total liabilities 22,950 22,821 Total equity and liabilities 17,533 16,152

____________________________________________________________________________________________________________ January-March 2022 19
Condensed consolidated cash flow statement MSEK January-March 2022 2021 Operating activities Profit before income taxes 1,937 2,265 Share of profit in associated companies -4 -2 Adjustments for non-cash items etc.1) 182 11 Income tax paid -201 -208 Cash flow from operating activities before changes in working capital 1,914 2,066 Changes in working capital -373 -486 Net cash generated from operating activities 1,542 1,580
Investing activities Purchase of property, plant and equipment -238 -277 Proceeds from sale of property, plant and equipment 2 10 Purchase of intangible assets -1 -2 Acquisition of subsidiaries2) - -39 Changes in financial receivables etc. -5 -3 Net cash used in investing activities -243 -311
Financing activities Proceeds from borrowings 197 798 Repayment of borrowings -265 -1,467 Repurchase of own shares -709 -300 Lease payments -27 -22 Realized exchange gain/losses on financial instruments 178 -121 Other 1 2 Net cash used in financing activities -624 -1,110 Net increase in cash and cash equivalents 675 159 Cash and cash equivalents at the beginning of the period 2,121 3,411 Effect of exchange rate fluctuations on cash and cash equivalents 27 161 Cash and cash equivalents at the end of the period 2,823 3,732 1) Non-cash items etc. mainly refer to depreciation, amortization and accrued interest. 2) Acquisition of subsidiaries in 2021 includes consideration paid relating to the acquisition of Fire-Up International B.V.
____________________________________________________________________________________________________________ January-March 2022 20
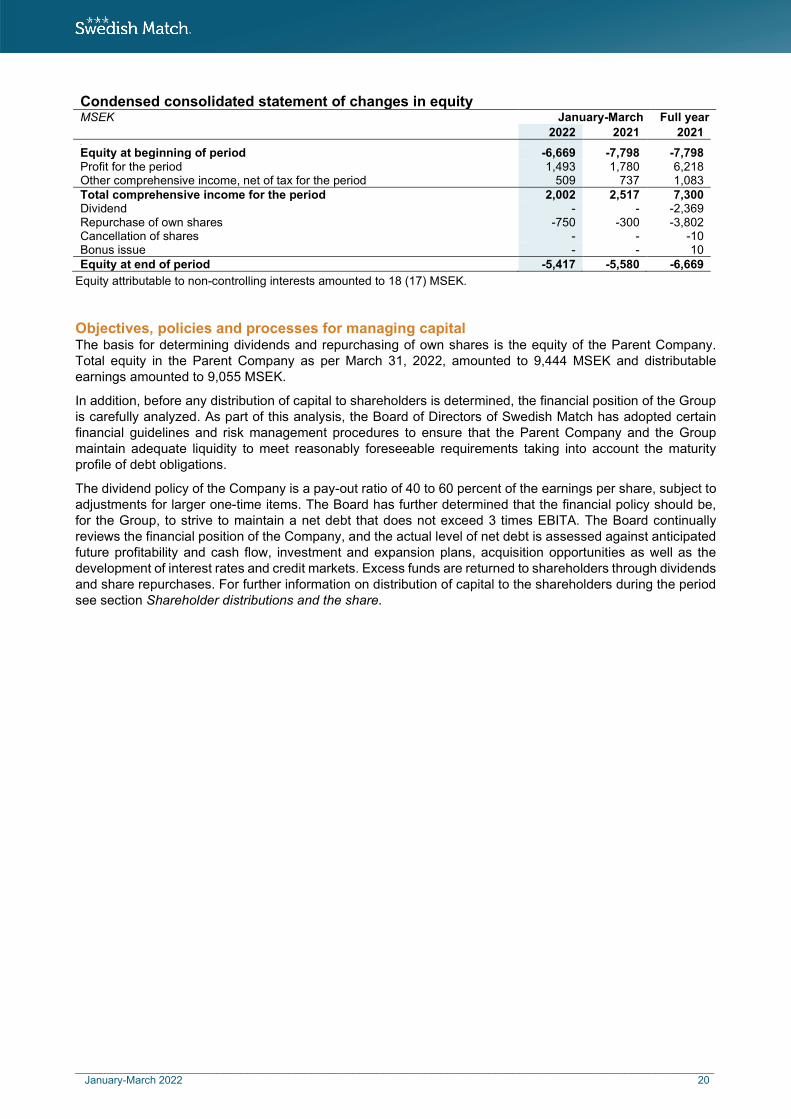
Condensed consolidated statement of changes in equity MSEK January-March Full year 2022 2021 2021 ,
Equity at beginning of period -6,669 -7,798 -7,798 Profit for the period 1,493 1,780 6,218 Other comprehensive income, net of tax for the period 509 737 1,083 Total comprehensive income for the period 2,002 2,517 7,300 Dividend - - -2,369 Repurchase of own shares -750 -300 -3,802 Cancellation of shares - - -10 Bonus issue - - 10 Equity at end of period -5,417 -5,580 -6,669
Equity attributable to non-controlling interests amounted to 18 (17) MSEK.
Objectives, policies and processes for managing capital The basis for determining dividends and repurchasing of own shares is the equity of the Parent Company. Total equity in the Parent Company as per March 31, 2022, amounted to 9,444 MSEK and distributable earnings amounted to 9,055 MSEK.
In addition, before any distribution of capital to shareholders is determined, the financial position of the Group is carefully analyzed. As part of this analysis, the Board of Directors of Swedish Match has adopted certain financial guidelines and risk management procedures to ensure that the Parent Company and the Group maintain adequate liquidity to meet reasonably foreseeable requirements taking into account the maturity profile of debt obligations.
The dividend policy of the Company is a pay-out ratio of 40 to 60 percent of the earnings per share, subject to adjustments for larger one-time items. The Board has further determined that the financial policy should be, for the Group, to strive to maintain a net debt that does not exceed 3 times EBITA. The Board continually reviews the financial position of the Company, and the actual level of net debt is assessed against anticipated future profitability and cash flow, investment and expansion plans, acquisition opportunities as well as the development of interest rates and credit markets. Excess funds are returned to shareholders through dividends and share repurchases. For further information on distribution of capital to the shareholders during the period see section Shareholder distributions and the share.
____________________________________________________________________________________________________________ January-March 2022 21
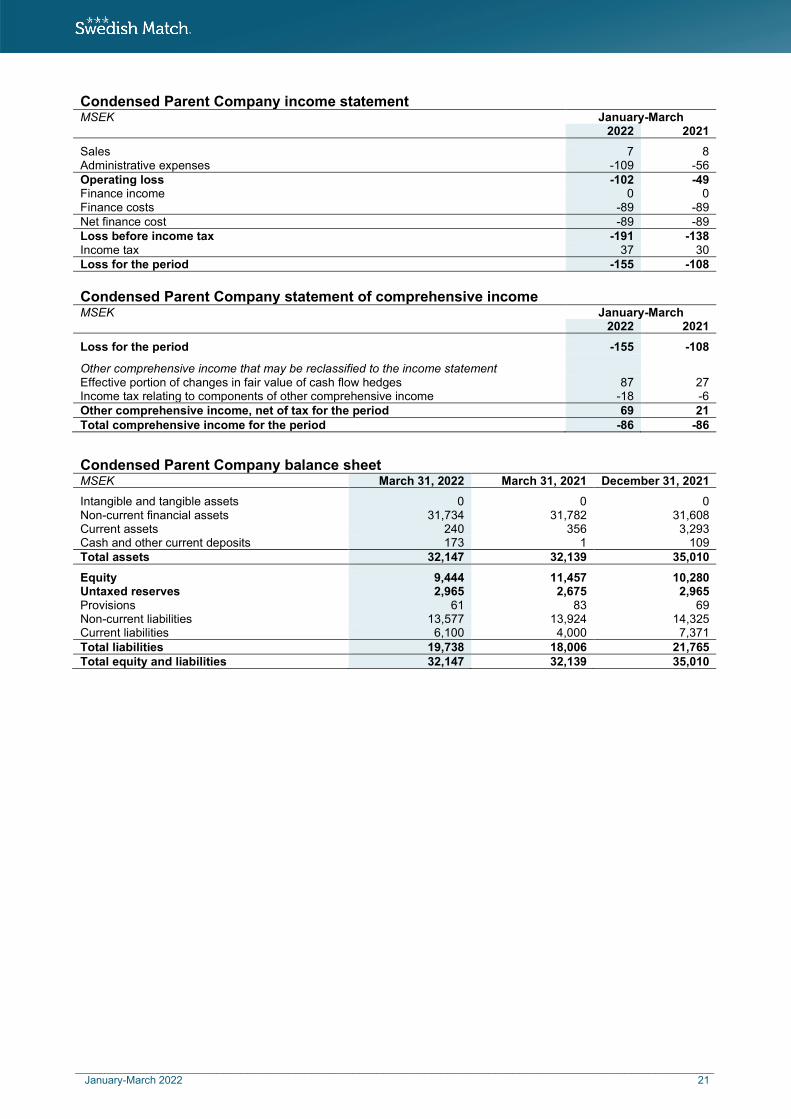
Condensed Parent Company income statement MSEK January-March 2022 2021
Sales 7 8 Administrative expenses -109 -56 Operating loss -102 -49 Finance income 0 0 Finance costs -89 -89 Net finance cost -89 -89 Loss before income tax -191 -138 Income tax 37 30 Loss for the period -155 -108
Condensed Parent Company statement of comprehensive income MSEK January-March 2022 2021
Loss for the period -155 -108
Other comprehensive income that may be reclassified to the income statement Effective portion of changes in fair value of cash flow hedges 87 27 Income tax relating to components of other comprehensive income -18 -6 Other comprehensive income, net of tax for the period 69 21 Total comprehensive income for the period -86 -86
Condensed Parent Company balance sheet
MSEK March 31, 2022 March 31, 2021 December 31, 2021
Intangible and tangible assets 0 0 0 Non-current financial assets 31,734 31,782 31,608 Current assets 240 356 3,293 Cash and other current deposits 173 1 109 Total assets 32,147 32,139 35,010
Equity 9,444 11,457 10,280 Untaxed reserves 2,965 2,675 2,965 Provisions 61 83 69 Non-current liabilities 13,577 13,924 14,325 Current liabilities 6,100 4,000 7,371 Total liabilities 19,738 18,006 21,765 Total equity and liabilities 32,147 32,139 35,010
____________________________________________________________________________________________________________ January-March 2022 22
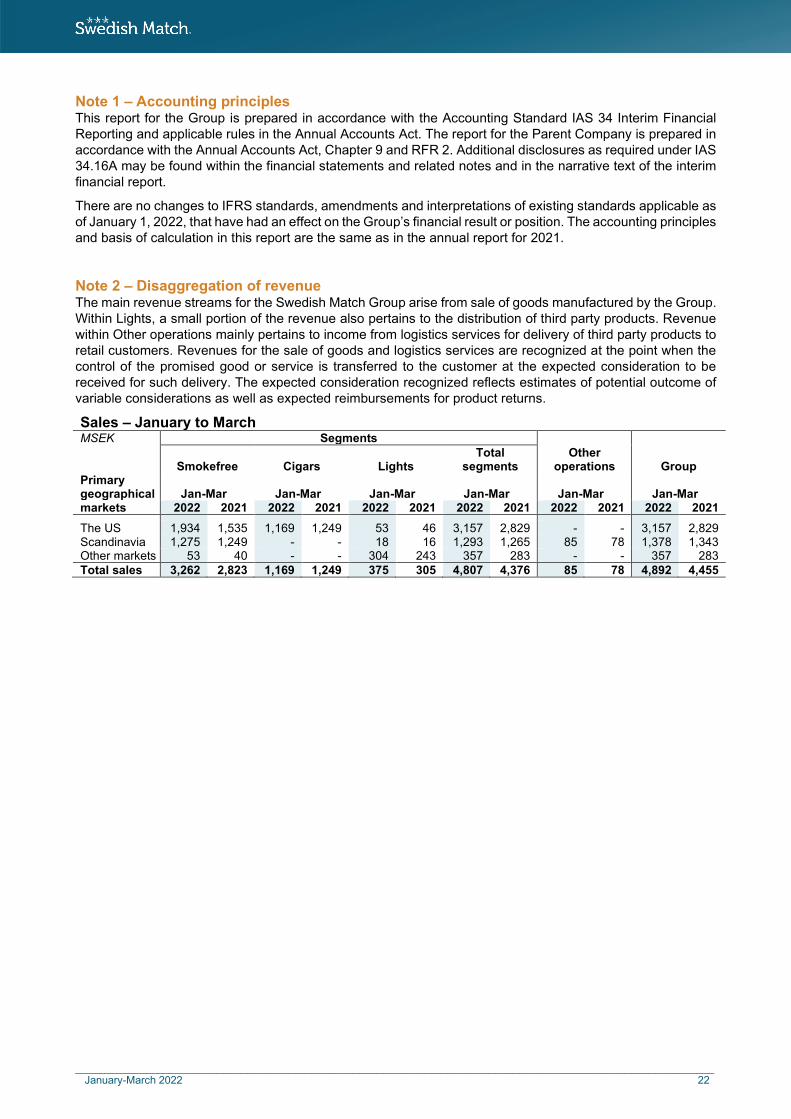
Note 1 – Accounting principles This report for the Group is prepared in accordance with the Accounting Standard IAS 34 Interim Financial Reporting and applicable rules in the Annual Accounts Act. The report for the Parent Company is prepared in accordance with the Annual Accounts Act, Chapter 9 and RFR 2. Additional disclosures as required under IAS 34.16A may be found within the financial statements and related notes and in the narrative text of the interim financial report.
There are no changes to IFRS standards, amendments and interpretations of existing standards applicable as of January 1, 2022, that have had an effect on the Group’s financial result or position. The accounting principles and basis of calculation in this report are the same as in the annual report for 2021.
Note 2 – Disaggregation of revenue The main revenue streams for the Swedish Match Group arise from sale of goods manufactured by the Group. Within Lights, a small portion of the revenue also pertains to the distribution of third party products. Revenue within Other operations mainly pertains to income from logistics services for delivery of third party products to retail customers. Revenues for the sale of goods and logistics services are recognized at the point when the control of the promised good or service is transferred to the customer at the expected consideration to be received for such delivery. The expected consideration recognized reflects estimates of potential outcome of variable considerations as well as expected reimbursements for product returns.
Sales – January to March MSEK Segments
Other operations Group
Smokefree Cigars Lights
Total segments
Primary geographical Jan-Mar Jan-Mar Jan-Mar Jan-Mar Jan-Mar Jan-Mar markets 2022 2021 2022 2021 2022 2021 2022 2021 2022 2021 2022 2021
The US 1,934 1,535 1,169 1,249 53 46 3,157 2,829 - - 3,157 2,829 Scandinavia 1,275 1,249 - - 18 16 1,293 1,265 85 78 1,378 1,343 Other markets 53 40 - - 304 243 357 283 - - 357 283 Total sales 3,262 2,823 1,169 1,249 375 305 4,807 4,376 85 78 4,892 4,455
____________________________________________________________________________________________________________ January-March 2022 23
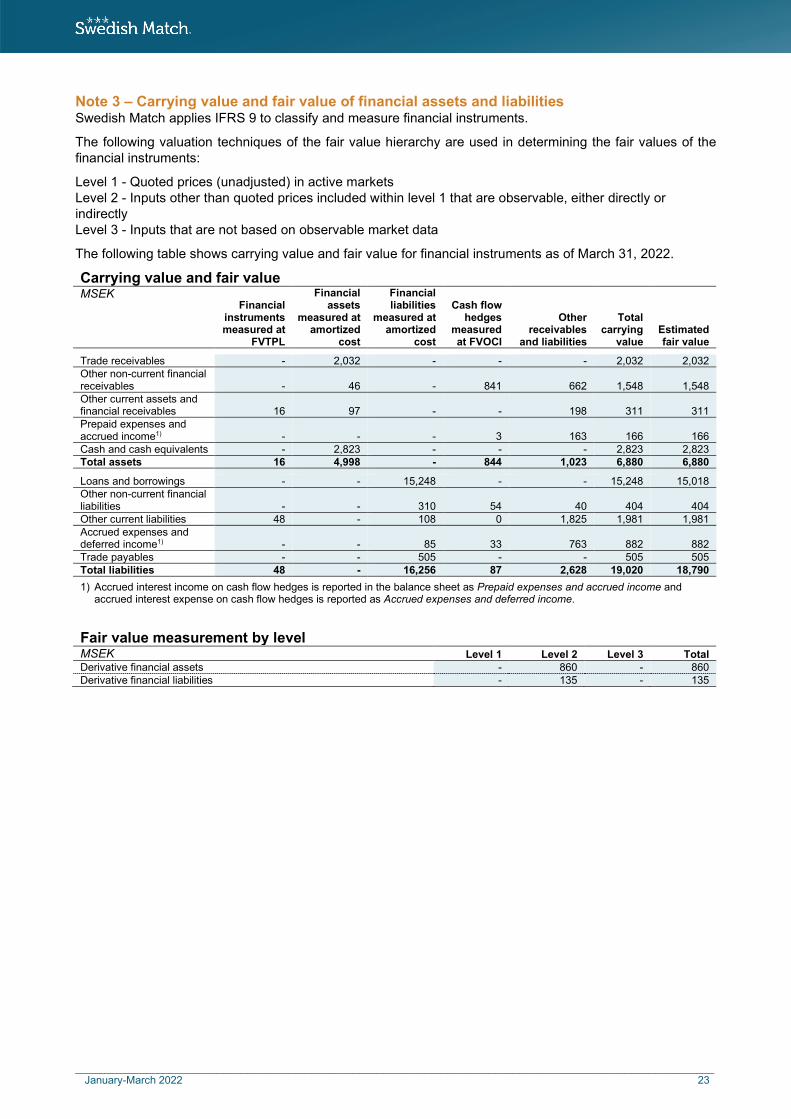
Note 3 – Carrying value and fair value of financial assets and liabilities Swedish Match applies IFRS 9 to classify and measure financial instruments.
The following valuation techniques of the fair value hierarchy are used in determining the fair values of the financial instruments:
Level 1 - Quoted prices (unadjusted) in active markets Level 2 - Inputs other than quoted prices included within level 1 that are observable, either directly or indirectly Level 3 - Inputs that are not based on observable market data
The following table shows carrying value and fair value for financial instruments as of March 31, 2022.
Carrying value and fair value MSEK Financial
instruments measured at
FVTPL
Financial assets
measured at amortized
cost
Financial liabilities
measured at amortized
cost
Cash flow hedges
measured at FVOCI
Other receivables
and liabilities
Total carrying
value Estimated fair value
Trade receivables - 2,032 - - - 2,032 2,032 Other non-current financial receivables - 46 - 841 662 1,548 1,548 Other current assets and financial receivables 16 97 - - 198 311 311 Prepaid expenses and accrued income1) - - - 3 163 166 166 Cash and cash equivalents - 2,823 - - - 2,823 2,823 Total assets 16 4,998 - 844 1,023 6,880 6,880
Loans and borrowings - - 15,248 - - 15,248 15,018 Other non-current financial liabilities - - 310 54 40 404 404 Other current liabilities 48 - 108 0 1,825 1,981 1,981 Accrued expenses and deferred income1) - - 85 33 763 882 882 Trade payables - - 505 - - 505 505 Total liabilities 48 - 16,256 87 2,628 19,020 18,790 1) Accrued interest income on cash flow hedges is reported in the balance sheet as Prepaid expenses and accrued income and
accrued interest expense on cash flow hedges is reported as Accrued expenses and deferred income.
Fair value measurement by level MSEK Level 1 Level 2 Level 3 Total Derivative financial assets - 860 - 860 Derivative financial liabilities - 135 - 135

____________________________________________________________________________________________________________ January-March 2022 24
The following table shows carrying value and fair value for financial instruments per December 31, 2021.
Carrying value and fair value MSEK Financial
instruments measured at
FVTPL
Financial assets
measured at amortized
cost
Financial liabilities
measured at amortized
cost
Cash flow hedges
measured at FVOCI
Other receivables
and liabilities
Total carrying
value Estimated fair value
Trade receivables - 1,843 - - - 1,843 1,843 Other non-current financial receivables - 36 - 700 601 1,337 1,337 Other current assets and financial receivables 71 92 - 43 271 476 476 Prepaid expenses and accrued income1) - - - 2 153 155 155 Cash and cash equivalents - 2,121 - - - 2,121 2,121 Total assets 71 4,092 - 745 1,025 5,932 5,932
Loans and borrowings - - 15,187 - - 15,187 15,499 Other non-current financial liabilities - - 307 128 41 476 476 Other current liabilities 6 - 102 - 1,590 1,699 1,699 Accrued expenses and deferred income1) - - 125 45 892 1,063 1,063 Trade payables - - 464 - - 464 464 Total liabilities 6 - 16,185 173 2,523 18,889 19,201 1) Accrued interest income on cash flow hedges is reported in the balance sheet as Prepaid expenses and accrued income and
accrued interest expense on cash flow hedges is reported as Accrued expenses and deferred income. Fair value measurement by level MSEK Level 1 Level 2 Level 3 Total Derivative financial assets - 816 - 816 Derivative financial liabilities - 179 - 179
No transfer in or out of level 2 has been made during the first quarter 2022. The recognized amounts are regarded as reasonable estimates for all items measured at carrying value in the balance sheet, except for loans and borrowings, as these amounts have a long time to maturity. The fair value of loans and borrowings differ from their carrying value as a consequence of changes in the market interest rates. Items not valued at fair value in the balance sheet are measured at amortized cost. The total nominal amount of outstanding derivatives was 15,235 MSEK (15,165) of which 10,229 MSEK (10,493) was in cash flow hedges consisting of cross currency and interest rate swaps related to bond loans. The remaining 5,006 MSEK (4,671) consisted of currency swaps related to the conversion of surplus cash in US dollars to Swedish kronor. Methodologies utilized in the valuation of financial instruments can be found in Note 1 in the annual report for 2021.
Note 4 – Tax related contingencies Tax audits in Sweden
During 2017, the Swedish Tax Agency performed tax audits in a number of Swedish Match’s Swedish group companies. After completing the audits, the Swedish Tax Agency decided to deny certain cost deductions. Swedish Match appealed but the County Administrative Court in Stockholm ruled in favor of the Tax Agency. Swedish Match subsequently appealed to the Administrative Court of Appeals. In August 2020, the Administrative Court of Appeals ruled in favor of the Tax Agency and the tax charges of in total 270 MSEK and related interest costs of 16 MSEK has been paid and debited in the 2020 accounts. Swedish Match applied for leave to appeal and the leave was granted in June 2021 by the Supreme Administrative Court.
____________________________________________________________________________________________________________ January-March 2022 25
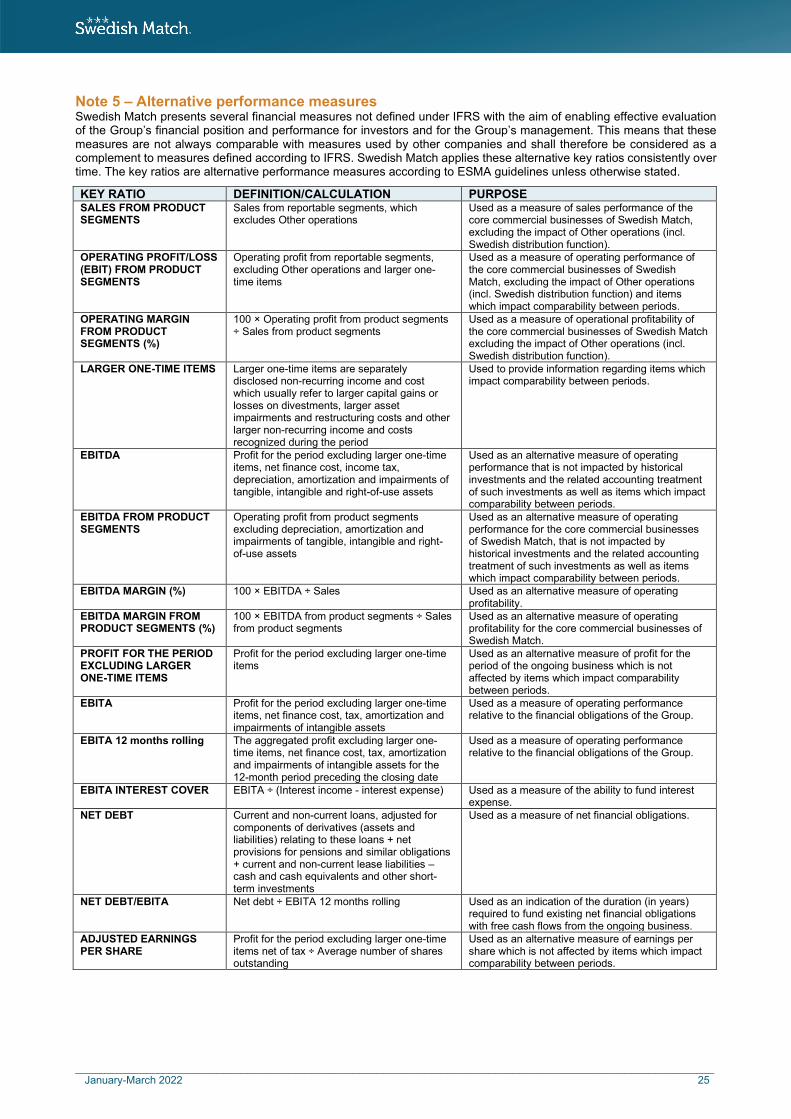
Note 5 – Alternative performance measures Swedish Match presents several financial measures not defined under IFRS with the aim of enabling effective evaluation of the Group’s financial position and performance for investors and for the Group’s management. This means that these measures are not always comparable with measures used by other companies and shall therefore be considered as a complement to measures defined according to IFRS. Swedish Match applies these alternative key ratios consistently over time. The key ratios are alternative performance measures according to ESMA guidelines unless otherwise stated.
KEY RATIO DEFINITION/CALCULATION PURPOSE SALES FROM PRODUCT SEGMENTS
Sales from reportable segments, which excludes Other operations
Used as a measure of sales performance of the core commercial businesses of Swedish Match, excluding the impact of Other operations (incl. Swedish distribution function).
OPERATING PROFIT/LOSS (EBIT) FROM PRODUCT SEGMENTS
Operating profit from reportable segments, excluding Other operations and larger one-time items
Used as a measure of operating performance of the core commercial businesses of Swedish Match, excluding the impact of Other operations (incl. Swedish distribution function) and items which impact comparability between periods.
OPERATING MARGIN FROM PRODUCT SEGMENTS (%)
100 × Operating profit from product segments ÷ Sales from product segments
Used as a measure of operational profitability of the core commercial businesses of Swedish Match excluding the impact of Other operations (incl. Swedish distribution function).
LARGER ONE-TIME ITEMS Larger one-time items are separately disclosed non-recurring income and cost which usually refer to larger capital gains or losses on divestments, larger asset impairments and restructuring costs and other larger non-recurring income and costs recognized during the period
Used to provide information regarding items which impact comparability between periods.
EBITDA Profit for the period excluding larger one-time items, net finance cost, income tax, depreciation, amortization and impairments of tangible, intangible and right-of-use assets
Used as an alternative measure of operating performance that is not impacted by historical investments and the related accounting treatment of such investments as well as items which impact comparability between periods.
EBITDA FROM PRODUCT SEGMENTS
Operating profit from product segments excluding depreciation, amortization and impairments of tangible, intangible and right-of-use assets
Used as an alternative measure of operating performance for the core commercial businesses of Swedish Match, that is not impacted by historical investments and the related accounting treatment of such investments as well as items which impact comparability between periods.
EBITDA MARGIN (%) 100 × EBITDA ÷ Sales Used as an alternative measure of operating profitability.
EBITDA MARGIN FROM PRODUCT SEGMENTS (%)
100 × EBITDA from product segments ÷ Sales from product segments
Used as an alternative measure of operating profitability for the core commercial businesses of Swedish Match.
PROFIT FOR THE PERIOD EXCLUDING LARGER ONE-TIME ITEMS
Profit for the period excluding larger one-time items
Used as an alternative measure of profit for the period of the ongoing business which is not affected by items which impact comparability between periods.
EBITA Profit for the period excluding larger one-time items, net finance cost, tax, amortization and impairments of intangible assets
Used as a measure of operating performance relative to the financial obligations of the Group.
EBITA 12 months rolling The aggregated profit excluding larger one-time items, net finance cost, tax, amortization and impairments of intangible assets for the 12-month period preceding the closing date
Used as a measure of operating performance relative to the financial obligations of the Group.
EBITA INTEREST COVER EBITA ÷ (Interest income - interest expense) Used as a measure of the ability to fund interest expense.
NET DEBT Current and non-current loans, adjusted for components of derivatives (assets and liabilities) relating to these loans + net provisions for pensions and similar obligations + current and non-current lease liabilities – cash and cash equivalents and other short-term investments
Used as a measure of net financial obligations.
NET DEBT/EBITA Net debt ÷ EBITA 12 months rolling Used as an indication of the duration (in years) required to fund existing net financial obligations with free cash flows from the ongoing business.
ADJUSTED EARNINGS PER SHARE
Profit for the period excluding larger one-time items net of tax ÷ Average number of shares outstanding
Used as an alternative measure of earnings per share which is not affected by items which impact comparability between periods.
____________________________________________________________________________________________________________ January-March 2022 26
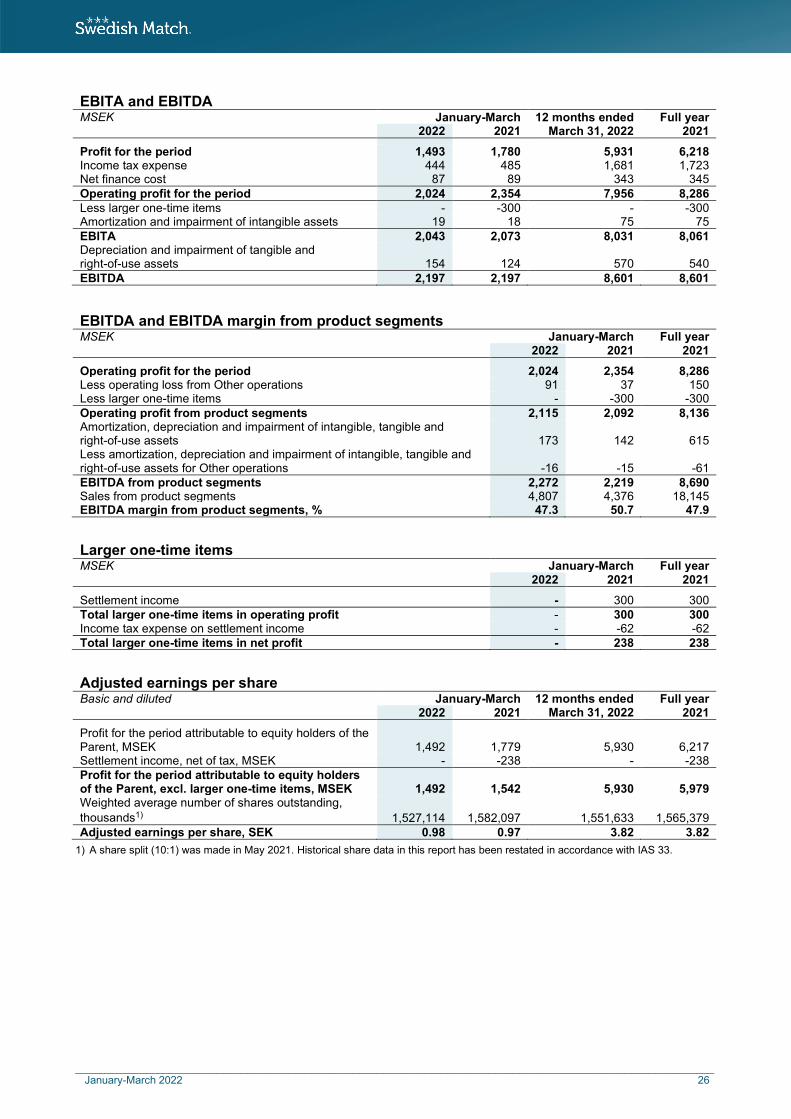
EBITA and EBITDA MSEK January-March 12 months ended Full year 2022 2021 March 31, 2022 2021
Profit for the period 1,493 1,780 5,931 6,218 Income tax expense 444 485 1,681 1,723 Net finance cost 87 89 343 345 Operating profit for the period 2,024 2,354 7,956 8,286 Less larger one-time items - -300 - -300 Amortization and impairment of intangible assets 19 18 75 75 EBITA 2,043 2,073 8,031 8,061 Depreciation and impairment of tangible and right-of-use assets 154 124 570 540 EBITDA 2,197 2,197 8,601 8,601
EBITDA and EBITDA margin from product segments MSEK January-March Full year 2022 2021 2021
Operating profit for the period 2,024 2,354 8,286 Less operating loss from Other operations 91 37 150 Less larger one-time items - -300 -300 Operating profit from product segments 2,115 2,092 8,136 Amortization, depreciation and impairment of intangible, tangible and right-of-use assets 173 142 615 Less amortization, depreciation and impairment of intangible, tangible and right-of-use assets for Other operations -16 -15 -61 EBITDA from product segments 2,272 2,219 8,690 Sales from product segments 4,807 4,376 18,145 EBITDA margin from product segments, % 47.3 50.7 47.9
Larger one-time items MSEK January-March Full year 2022 2021 2021
Settlement income - 300 300 Total larger one-time items in operating profit - 300 300 Income tax expense on settlement income - -62 -62 Total larger one-time items in net profit - 238 238
Adjusted earnings per share Basic and diluted January-March 12 months ended
March 31, 2022 Full year
2022 2021 2021
Profit for the period attributable to equity holders of the Parent, MSEK 1,492 1,779 5,930 6,217 Settlement income, net of tax, MSEK - -238 - -238 Profit for the period attributable to equity holders of the Parent, excl. larger one-time items, MSEK 1,492 1,542 5,930 5,979 Weighted average number of shares outstanding, thousands1) 1,527,114 1,582,097 1,551,633 1,565,379 Adjusted earnings per share, SEK 0.98 0.97 3.82 3.82
1) A share split (10:1) was made in May 2021. Historical share data in this report has been restated in accordance with IAS 33.

____________________________________________________________________________________________________________ January-March 2022 27
EBITA interest cover MSEK January-March 12 months ended Full year 2022 2021 March 31, 2022 2021
EBITA 2,043 2,073 8,031 8,061 Interest income 8 11 33 36 Interest expense -93 -93 -366 -367 EBITA interest cover 24.1 25.1 24.1 24.3
Net debt/EBITA MSEK 12 months ended Full year March 31, 2022 2021
Net debt 13,238 14,035 EBITA 12 months rolling 8,031 8,061 Net debt/EBITA 1.6 1.7 Net debt MSEK January-March Full year 2022 2021 2021
Non-current loans 13,523 13,789 14,197 Current loans 1,725 1,113 990 Components of derivatives (liabilities)1) 120 103 112 Components of derivatives (assets)2) -848 -774 -851 Non-current lease liabilities3) 310 215 307 Current lease liabilities4) 102 80 96 Subtotal 14,931 14,527 14,851 Net provision for pensions and similar obligations3) 1,323 1,268 1,445 Net asset for pensions and similar receivables5) -193 -99 -140 Cash and cash equivalents -2,823 -3,732 -2,121 Net debt 13,238 11,964 14,035 1) Included in Other non-current financial liabilities and Other current financial liabilities in the condensed consolidated balance sheet. 2) Included in Other non-current financial assets and receivables and Other current financial receivables in the condensed
consolidated balance sheet. 3) Included in Other non-current financial liabilities in the condensed consolidated balance sheet. 4) Included in Other current financial liabilities in the condensed consolidated balance sheet. 5) Included in Other non-current financial assets and receivables in the condensed consolidated balance sheet.
Currency components of derivatives included in the net debt are recognized in the condensed consolidated balance sheet based on the total value of all components in the financial instrument, i.e. if the total value of the financial instrument is an asset, but includes a negative derivative component, that derivative component is recognized as a negative asset in the condensed consolidated balance sheet and vice versa.
____________________________________________________________________________________________________________ January-March 2022 28
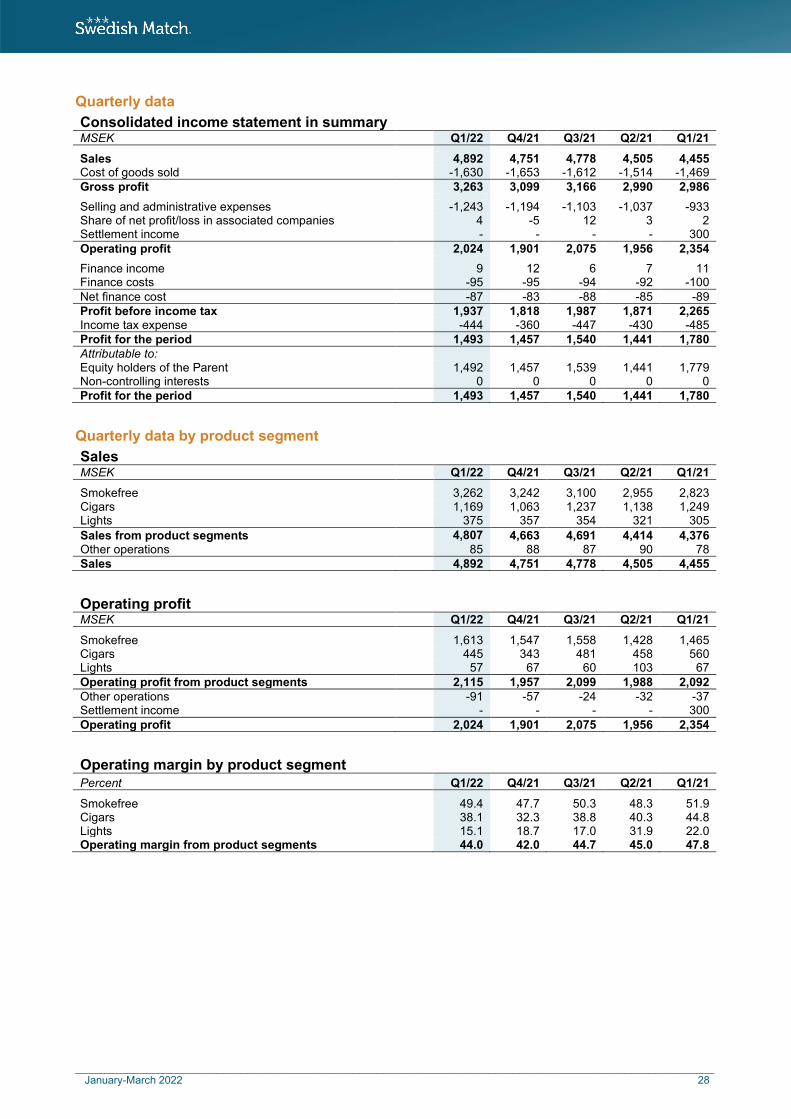
Quarterly data Consolidated income statement in summary MSEK Q1/22 Q4/21 Q3/21 Q2/21 Q1/21
Sales 4,892 4,751 4,778 4,505 4,455 Cost of goods sold -1,630 -1,653 -1,612 -1,514 -1,469 Gross profit 3,263 3,099 3,166 2,990 2,986
Selling and administrative expenses -1,243 -1,194 -1,103 -1,037 -933 Share of net profit/loss in associated companies 4 -5 12 3 2 Settlement income - - - - 300 Operating profit 2,024 1,901 2,075 1,956 2,354
Finance income 9 12 6 7 11 Finance costs -95 -95 -94 -92 -100 Net finance cost -87 -83 -88 -85 -89 Profit before income tax 1,937 1,818 1,987 1,871 2,265 Income tax expense -444 -360 -447 -430 -485 Profit for the period 1,493 1,457 1,540 1,441 1,780 Attributable to: Equity holders of the Parent 1,492 1,457 1,539 1,441 1,779 Non-controlling interests 0 0 0 0 0 Profit for the period 1,493 1,457 1,540 1,441 1,780
Quarterly data by product segment Sales MSEK Q1/22 Q4/21 Q3/21 Q2/21 Q1/21
Smokefree 3,262 3,242 3,100 2,955 2,823 Cigars 1,169 1,063 1,237 1,138 1,249 Lights 375 357 354 321 305 Sales from product segments 4,807 4,663 4,691 4,414 4,376 Other operations 85 88 87 90 78 Sales 4,892 4,751 4,778 4,505 4,455
Operating profit MSEK Q1/22 Q4/21 Q3/21 Q2/21 Q1/21
Smokefree 1,613 1,547 1,558 1,428 1,465 Cigars 445 343 481 458 560 Lights 57 67 60 103 67 Operating profit from product segments 2,115 1,957 2,099 1,988 2,092 Other operations -91 -57 -24 -32 -37 Settlement income - - - - 300 Operating profit 2,024 1,901 2,075 1,956 2,354
Operating margin by product segment Percent Q1/22 Q4/21 Q3/21 Q2/21 Q1/21
Smokefree 49.4 47.7 50.3 48.3 51.9 Cigars 38.1 32.3 38.8 40.3 44.8 Lights 15.1 18.7 17.0 31.9 22.0 Operating margin from product segments 44.0 42.0 44.7 45.0 47.8
____________________________________________________________________________________________________________ January-March 2022 29
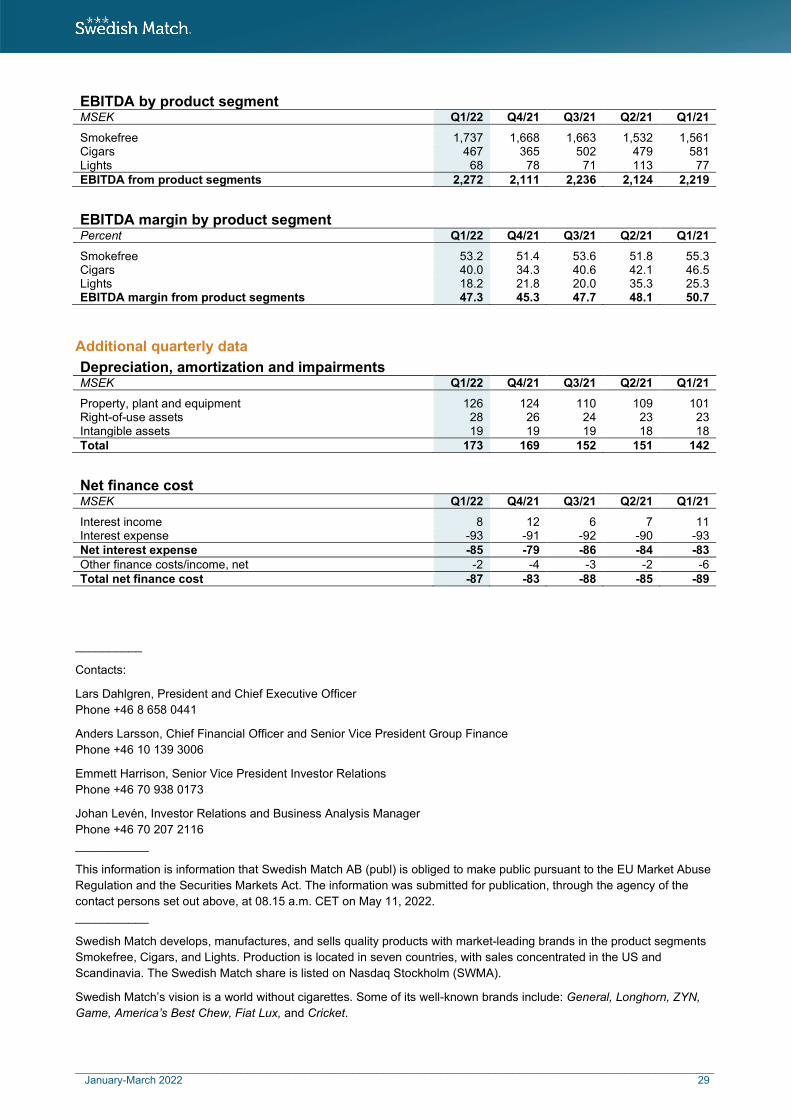
EBITDA by product segment
MSEK Q1/22 Q4/21 Q3/21 Q2/21 Q1/21
Smokefree 1,737 1,668 1,663 1,532 1,561 Cigars 467 365 502 479 581 Lights 68 78 71 113 77 EBITDA from product segments 2,272 2,111 2,236 2,124 2,219
EBITDA margin by product segment Percent Q1/22 Q4/21 Q3/21 Q2/21 Q1/21
Smokefree 53.2 51.4 53.6 51.8 55.3 Cigars 40.0 34.3 40.6 42.1 46.5 Lights 18.2 21.8 20.0 35.3 25.3 EBITDA margin from product segments 47.3 45.3 47.7 48.1 50.7
Additional quarterly data Depreciation, amortization and impairments MSEK Q1/22 Q4/21 Q3/21 Q2/21 Q1/21
Property, plant and equipment 126 124 110 109 101 Right-of-use assets 28 26 24 23 23 Intangible assets 19 19 19 18 18 Total 173 169 152 151 142
Net finance cost MSEK Q1/22 Q4/21 Q3/21 Q2/21 Q1/21
Interest income 8 12 6 7 11 Interest expense -93 -91 -92 -90 -93 Net interest expense -85 -79 -86 -84 -83 Other finance costs/income, net -2 -4 -3 -2 -6 Total net finance cost -87 -83 -88 -85 -89
__________
Contacts:
Lars Dahlgren, President and Chief Executive Officer Phone +46 8 658 0441
Anders Larsson, Chief Financial Officer and Senior Vice President Group Finance Phone +46 10 139 3006
Emmett Harrison, Senior Vice President Investor Relations Phone +46 70 938 0173
Johan Levén, Investor Relations and Business Analysis Manager Phone +46 70 207 2116 ___________
This information is information that Swedish Match AB (publ) is obliged to make public pursuant to the EU Market Abuse Regulation and the Securities Markets Act. The information was submitted for publication, through the agency of the contact persons set out above, at 08.15 a.m. CET on May 11, 2022. ___________
Swedish Match develops, manufactures, and sells quality products with market-leading brands in the product segments Smokefree, Cigars, and Lights. Production is located in seven countries, with sales concentrated in the US and Scandinavia. The Swedish Match share is listed on Nasdaq Stockholm (SWMA).
Swedish Match’s vision is a world without cigarettes. Some of its well-known brands include: General, Longhorn, ZYN, Game, America’s Best Chew, Fiat Lux, and Cricket.
____________________________________________________________________________________________________________ January-March 2022 30
___________
Swedish Match AB (publ), SE-118 85 Stockholm, Sweden Visiting address: Sveavägen 44, 8th Floor. Telephone: +46 10 13 93 000 Corporate Identity Number: 556015-0756 swedishmatch.com