Q1 2015 - Sweco Group
19
Q1 2015 7 May Tomas Carlsson, President and CEO Jonas Dahlberg, CFO
-
Upload
khangminh22 -
Category
Documents
-
view
0 -
download
0
Transcript of Q1 2015 - Sweco Group

Q1 2015 7 May
Tomas Carlsson, President and CEO
Jonas Dahlberg, CFO

Q1 highlights
2
• Solid profit improvement
• Strong improvement of billing ratio
• Negative calendar effects, subduing
profit improvement
• In particular, strong performance in
Sweden
• Large project wins – modernising the
Dovre railway line between Oslo and
Hamar and designing Metsä Fibre’s new
bio product mill in Äänekoski
• Overall stable market, gradually
improving

Examples of projects
Design the world’s most modern
bioproduct mill for Metsä Fibre
Architectural design and
engineering at the ESS research
facility
Modernise the railway line between
Sofia and Plovdiv
Modernise the Dovre line between
Oslo and Hamar

Q1 financial summary
• Net sales SEK 2,465.4 million (2,321.7)
• + 6%, of which 4%u organic
• Norway +7% organic, Central Europe +15%
organic
• Operating profit (EBIT) SEK 216.2 million
(211.6) – margin 8.8% (9.1%)
• EBITA SEK 228.5 million (225.0) – margin
9.3% (9.7%)
• Net debt/EBITDA 1.3x (1.4x)
4

5
Strong operating profit trend
Operating profit (EBIT) SEK million
122 112
70
128 137 128
75
192
232
149
99
200
134
191
106 128
212
156 143
251
216
0
100
200
300
400
500
600
700
800
900
0
50
100
150
200
250
300
350
400
450
500
0310
0610
0910
1210
0311
0611
0911
1211
0312
0612
0912
1212
0313
0613
0913
1213
0314
0614
0914
1214
0315
Quarter
Rolling 12 months
6
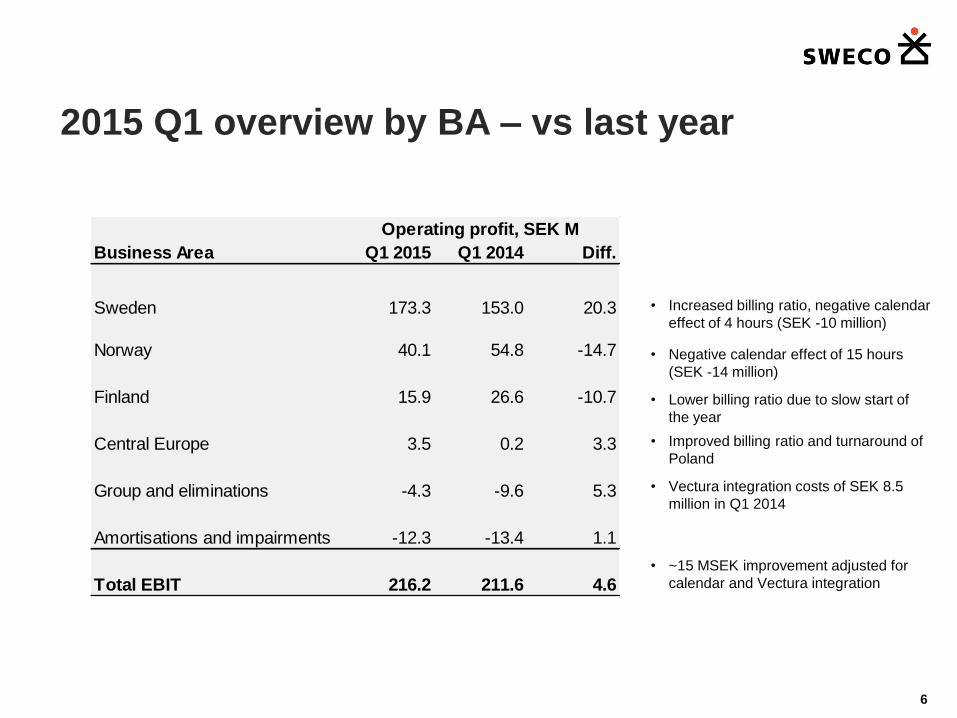
2015 Q1 overview by BA – vs last year
• Increased billing ratio, negative calendar
effect of 4 hours (SEK -10 million)
• Negative calendar effect of 15 hours
(SEK -14 million)
• Lower billing ratio due to slow start of
the year
• Improved billing ratio and turnaround of
Poland
• Vectura integration costs of SEK 8.5
million in Q1 2014
• ~15 MSEK improvement adjusted for
calendar and Vectura integration
Q1 2015 Q1 2014 Diff.
Sweden 173.3 153.0 20.3
Norway 40.1 54.8 -14.7
Finland 15.9 26.6 -10.7
Central Europe 3.5 0.2 3.3
Group and eliminations -4.3 -9.6 5.3
Amortisations and impairments -12.3 -13.4 1.1
Total EBIT 216.2 211.6 4.6
Business Area
Operating profit, SEK M

Strong billing ratio trend Billing ratio, per cent
Sep Dec Mar
2009
Jun Sep Dec Mar
2010
Jun Sep Dec Mar
2011
Jun Sep Dec
Mar
2012
Jun Sep Mar
2013
Jun Dec
Mar
2014
Jun Sep Dec
70
71
72
73
74
75
76
77
74,1%
75,1%
73,2%
74,5%
73,5%
74,1%
74,8%
73,5%
73,0%
74,2%
75,4%
74,6% 74,3% 74,3%
74,1%
72,5%
75,5%
76,3%
76,0%
76,4%
74,0%
74,2% 74,2%
75,3%
73,0% Billing ratio,
12 months
Mar
2015

Key business priorities driving
billing ratio
Customer value Internal efficiency

Closer
contact Customer
follow-up
Customer focus example – Closer
customer dialogue with Sweco TellUs
10% 40% 50%
0 1 2 3 4 5 6 7 8 9 10

Internal efficiency –
Examples of actions
• Improved staff planning
• Focus on quick start-up after vacation
periods
• Effective use of internal time (vs billable time)
• Faster onboarding of new hires
• Management of low performance – Units and
individuals
10

Income statement
11
Jan-Mar 2015
• Growth 6% -- Organic 4%u, Acquired
1%u, Currency 1%u
• Calendar effect -5 hours, SEK -24
million, of which SEK -14 million in
Norway – Easter partly in Q1 2015 vs
fully in Q2 2014
• Billing ratio +1.5%-u – Primarily
improvement in Sweden and Central
Europe, Finland lower, Norway
essentially unchanged
• Of total improvement of Net financial
items, SEK 10 million is due to result
from divestitures
SEK MJan-Mar
2015
Jan-Mar
2014
LTM Mar
2015FY 2014
Net sales 2,465.4 2,321.7 9,357.4 9,213.7
Other external expenses -539.4 -504.7 -2,268.7 -2,234.0
Personnel costs -1,657.8 -1,557.0 -6,115.7 -6,014.9
EBITDA 268.2 260.0 973.0 964.8
Amortisation/depreciation
and impairments-39.7 -35.0 -155.0 -150.3
EBITA 228.5 225.0 818.0 814.5
Acquisition-related items -12.3 -13.4 -51.8 -52.9
Operating profit (EBIT) 216.2 211.6 766.2 761.6
Net financial items -6.6 -20.8 -29.1 -43.3
Profit before tax 209.6 190.8 737.1 718.3
Income tax -49.4 -46.9 -176.2 -173.7
Profit for the period 160.2 143.9 560.9 544.6
EBITA-margin, % 9.3 9.7 8.7 8.8
Operating margin (EBIT), % 8.8 9.1 8.2 8.3
Billing ratio, % 75.5 74.0 76.0 75.6

Balance sheet
12
• Net Debt/EBITDA 1.3x (1.4x)
vouching a solid financial position
• Disposable liquid assets
including unutilised credit
facilities SEK 1,118 million
SEK M 31 Mar 2015 31 Mar 2014 31 Dec 2014
Goodwill 2,148.3 2,115.8 2,162.5
Other intangible assets 113.2 147.8 120.9
Property, plant & equipment 406.2 388.4 399.3
Financial assets 48.4 56.8 76.1
Current assets excl cash and cash
equivalents3,578.6 3,284.4 2,984.8
Cash and cash equivalents 102.1 185.0 173.5
Total Assets 6,396.8 6,178.2 5,917.1
Equity attributable to parent company
shareholders2,014.6 1,773.1 1,873.7
Non-controlling interests 11.2 15.6 14.1
Total Equity 2,025.8 1,788.7 1,887.8
Non-current liabilities 1,228.0 1,528.2 1,407.7
Current liabilities 3,143.0 2,861.3 2,621.6
Total Equity and Liabilities 6,396.8 6,178.2 5,917.1
Contingent liabilities 250.4 197.5 223.4
Net debt, MSEK 1,252.4 1,218.6 1,262.0
Net debt/Equity, % 61.8 68.1 66.9
Net debt/EBITDA, times 1.3 1.4 1.3
Equity/Assets ratio, % 31.7 29.0 31.9

Cash flow
13
• Solid cash flow generation
from operations
• Working capital increasing
in Q1 compared to last year
– Mix of temporary and
trend increases
SEK M
Jan-Mar
2015
Jan-Mar
2014
LTM Mar
2015FY 2014
Cash flow from operating activities before
changes in working capital and tax paid 260.8 248.6 954.5 942.3
Tax paid -55.6 -97.9 -157.6 -199.9
Changes in working capital -147.1 -6.4 -288.3 -147.6
Cash flow from operating activities 58.1 144.3 508.6 594.8
Cash flow from investing activities -66.2 -34.2 -209.0 -177.0
Cash flow from financing activities -64.2 -253.1 -392.9 -581.8
Cash flow for the period -72.3 -143.0 -93.3 -164.0

Sweco Sweden, Q1
14
• Strong improvement of operating profit and
margin despite negative calendar effect
• Increased billing ratio due to customer focus
and improved internal efficiency
• Calendar effect of -4 hours impacted sales
and earnings negatively with SEK 10 million
• Improved organic growth momentum
• Second-most attractive employer among MSc
engineering students across all industries
– Once again most favored in the industry
• Stable market, gradually improving
Jan-Mar Jan-Mar Full year
2015 2014 2014
Net sales, SEK M 1,543.0 1,465.8 5,703.7
Organic growth, % 4 1 1
Acquisition-driven growth, % 1 31 16
Operating profit, SEK M 173.3 153.0 570.2
Operating margin, % 11.2 10.4 10.0
Full-time equivalents 4,644 4,608 4,614

Sweco Norway, Q1
• Continued strong organic growth of 7%
• Calendar effect due to Easter holiday of -15
hours – Negatively impacting sales and
profit with SEK 14 million
• Marginally lower billing ratio than Q1 2014
• Continued growth in public investments –
Private sector impacted by negative energy
price development
15
Jan-Mar Jan-Mar Full year
2015 2014 2014
Net sales, SEK M 531.4 487.4 1,917.8
Organic growth, % 7 14 8
Acquisition-driven growth, % 1 0 0
Operating profit, SEK M 40.1 54.8 178.5
Operating margin, % 7.5 11.2 9.3
Full-time equivalents 1,315 1,214 1,250
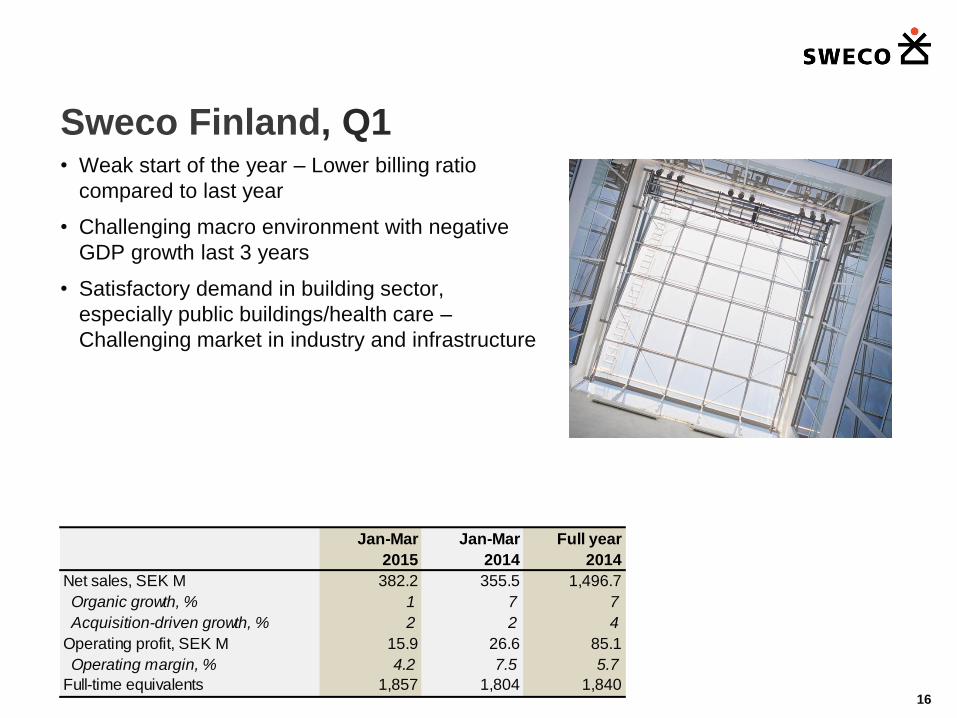
Sweco Finland, Q1 • Weak start of the year – Lower billing ratio
compared to last year
• Challenging macro environment with negative
GDP growth last 3 years
• Satisfactory demand in building sector,
especially public buildings/health care –
Challenging market in industry and infrastructure
16
Jan-Mar Jan-Mar Full year
2015 2014 2014
Net sales, SEK M 382.2 355.5 1,496.7
Organic growth, % 1 7 7
Acquisition-driven growth, % 2 2 4
Operating profit, SEK M 15.9 26.6 85.1
Operating margin, % 4.2 7.5 5.7
Full-time equivalents 1,857 1,804 1,840

Sweco Central Europe, Q1
• Strong organic growth – 15 per cent
• Improved operating profit due to higher billing
ratio and successful restructuring in Poland
• Continued challenging market – but signs of
improved market conditions and new round of EU
funds ahead
17
Jan-Mar Jan-Mar Full year
2015 2014 2014
Net sales, SEK M 69.0 57.9 289.2
Organic growth, % 15 -8 5
Acquisition-driven growth, % 0 -8 -9
Operating profit, SEK M 3.5 0.2 12.8
Operating margin, % 5.1 0.4 4.4
Full-time equivalents 815 807 812

Market outlook
18
• Stable market improving overall –
Unchanged in Q1 vs. Q4
• Sweco’s markets trailing the general
macro economic development
• Mixed market signals – Continued positive
sentiment combined with risks of negative
macroeconomic or geopolitical events
19 07/05/2015