Q1 2022 Interim Report KLP Group, Sustainability and KLP
120
Q1 2022 Interim Report KLP Group, Sustainability and KLP
-
Upload
khangminh22 -
Category
Documents
-
view
4 -
download
0
Transcript of Q1 2022 Interim Report KLP Group, Sustainability and KLP

Q1 2022 Interim ReportKLP Group, Sustainability
and KLP

Report for the first quarter of 2022 ........................................................................................ 4Results for the first quarter of 2022................................................................................ 4
KLP Group ....................................................................................................................................... 14Income statement ........................................................................................................... 14Financial position statement ..........................................................................................15Changes in Owners’ equity..............................................................................................16Statement of cash flow....................................................................................................18
Notes to the financial statement ............................................................................................19Note 1 Accounting principles –and estimates...............................................................19Note 2 Segment information ......................................................................................... 22Note 3 Premium income for own account.................................................................... 26Note 4 Other income...................................................................................................... 26Note 5 Suboriented loans and perpetual hybrid tier 1 securities............................... 26Note 6 Operating expenses........................................................................................... 27Note 7 Other expenses .................................................................................................. 27Note 8 Investment property .......................................................................................... 27Note 9 Fair value of financial assets and liabilities ..................................................... 27Note 10 Borrowing .......................................................................................................... 35Note 11 Fair value hierarchy........................................................................................... 38Note 12 Liquidity risk...................................................................................................... 42Note 13 Interest rate risk ............................................................................................... 46Note 14 Credit risk.......................................................................................................... 50Note 15 Technical provisions in life insurance ............................................................ 58Note 16 Other current liabilities..................................................................................... 58Note 17 SCR ratio............................................................................................................ 58Note 18 Presentation of assets and liabilities that are subject to settlement ...........61Note 19 Pension obligations .......................................................................................... 64Key figures – Accumulated ............................................................................................. 65
KLP’s sustainability accounts ........................................................................................................ 68Engaged and responsible owner .................................................................................. 68Climate, environment and nature .................................................................................. 69Climate goals and climate-friendly investments ......................................................... 70KLP’s property portfolio and own operations ................................................................71Innovation and social development .............................................................................. 72Lending to municipalities and county municipalities .................................................. 73Seed capital investments................................................................................................ 73Banking and finance in developing companies ........................................................... 74KLP as a workplace and employer ................................................................................ 74UN Sustainable Development Goals which KLP contributes to ................................. 75
Notes and definitions ............................................................................................................. 78Engaged and responsible owner.................................................................................... 78Climate, environment and nature .................................................................................. 78
Table of Contents
2

Innovation and social development .............................................................................. 82Kommunal Landspensjonskasse ................................................................................................... 83
Income statement............................................................................................................ 83Statement of financial position ...................................................................................... 85Changes in Owners’ equity............................................................................................. 87Statement of cash flows ................................................................................................. 89Notes to the financial statement.................................................................................... 90Note 1 Accounting principles- and estimates.............................................................. 90Note 2 Value-adjustment investment property ........................................................... 93Note 3 Premium income................................................................................................. 93Note 4 Claims.................................................................................................................. 93Note 5 Insurance-related operating expenses ........................................................... 93Note 6 Fair value of financial assets and liabilities ..................................................... 93Note 7 Fair value hierarchy.......................................................................................... 106Note 8 Presentation of assets and liabilities that are subject to net settlement ....114Note 9 Liabilities ............................................................................................................ 117Note 10 SCR ratio .......................................................................................................... 117Note 11 Leases............................................................................................................... 119Note 12 Pension obligations ........................................................................................ 120
3

Report for the first quarter of 2022
Weak market performance affects KLP’s first quarter results
• After the first quarter of 2022, the return was minus 0.75 per cent.
• Higher interest rates and a weak equity market have a negative impact on the quarterly
results for KLP and its subsidiaries.
• Strong solvency capital coverage of 332 per cent.
KLP – a customer-owned group
The KLP Group is made up of the following companies: Kommunal Landspensjonskasse
(KLP) and its subsidiaries KLP Banken, KLP Skadeforsikring, KLP Kapitalforvaltning, KLP
Forsikringsservice and KLP Eiendom.
At the end of the first quarter of 2022, the Group had total assets of NOK 902.9 billion, an
increase of NOK 1.6 billion in the first quarter.
The Group’s total comprehensive income was NOK 392 (601)1 million in the first quarter.
Kommunal Landspensjonskasse
Pension schemes within the public sector are offered and administered by the Group’s
parent company, Kommunal Landspensjonskasse. Out of KLP’s total assets of NOK 710.5
billion, NOK 644.2 billion is linked to insurance obligations within public-sector
occupational pensions.
Results for the first quarter of 2022
Investment result
KLP achieved an investment result (the return in excess of that guaranteed by the
Company to its customers) of NOK -7.9 (4.7) billion in the first quarter. The return on the
common portfolio was minus 0.75 per cent.
Risk result
The risk events in the stock have been within expectations throughout the year and will
vary from quarter to quarter. The result was NOK 105 million in the first quarter.
1. Figures in brackets give values for the corresponding period in 2021.
4

Administration result
The Company’s administration result shows a loss of NOK 9 (41) million in the first quarter.
Insurance-related operating costs came to NOK 368 (299) million in the first quarter.
Total profit/loss
Total profit/loss to the Company stands at NOK 388 (595) million for the first quarter. The
customer result is NOK -7.8 (4.7) billion for the year.
NOK millions Customers Company Total
Investment result -7 857 -37 -7 894
Risk result 105 105
Interest guarantee premium 64 64
Administration result -9 -9
Net income from investments in the corporate portfolio and other income/
expenses in non-technical accounts 53 53
Tax 6 6
Other profit/loss elements 311 311
Profit/loss after Q1 2022 -7 752 388 -7 365
Profit/loss after Q1 2021 4 708 595 5 304
Financial strength and capital-related matters
KLP’s total assets increased by NOK 3.7 billion in the first quarter and amount to NOK 710.5
billion. The premium reserve decreased by NOK 0.8 billion to NOK 485.5 billion in the same
period.
The buffer fund decreased by NOK 8.4 billion in the period, ending on NOK 117.8 billion
after the first quarter.
Without applying transitional rules, the Company’s solvency capital requirement (SCR) is
332 per cent. Taking account of the transitional arrangement for technical provisions,
capital adequacy was 332 per cent.
In the annual calculation of capital adequacy, a new method for dealing with deferred tax
was implemented. Under the new methodology, KLP takes account of future revenues in
calculating future tax for Solvency II. In a stress scenario, these revenues will be reduced,
giving rise to reduced future taxes. The reduction in future taxes can be used as a risk-
reducing effect on capital adequacy. The main effect of this change occurred between the
fourth quarter of 2021 and the annual calculation.
5

There have been two major changes since the year-end. The most important factor for the
solvency margin is the big rise in interest rates. This results in a lower capital requirement
for life insurance and more available capital because the risk margin also goes down. A
merged buffer fund has also been implemented, but this has limited impact with today’s
high buffer levels.
KLP’s target is capital adequacy of at least 150 per cent without applying transitional rules.
Capital adequacy is well over this target and reflects the Company’s good financial
strength.
Key figures
Per cent At 31.03.2022 At 31.03.2021
Value-adjusted return -0,8 1,5
Return incl. added value in hold-to-maturity bonds and lending -2,3 0,8
The return figures apply to the common portfolio
Capital adequacy, Solvency II 332 287
Capital adequacy, Solvency II, with transitional measures 332 243
Premium income
Premium income excluding premium reserves received on transfers in amounts to NOK 7.1
(7.0) billion at the end of the first quarter.
Claims/benefits
Pensions paid and other claims, excluding ceded premium reserves, amounted to NOK 5.8
(5.3) billion for the first quarter.
Management of the common portfolio
The assets in the common portfolio totalled NOK 662.5 (603.1) billion and were invested as
shown below:
6

Assets At 31.03.2022 At 31.03.2021
All figures in per cent Proportion Return Proportion Return
Equities 30,1 % -3,2 % 25,8 % 5,0 %
Short-term bonds 13,1 % -4,6 % 16,2 % -2,4 %
Long-term/HTM bonds 28,4 % 0,8 % 29,0 % 0,9 %
Lending 12,1 % 0,5 % 12,7 % 0,4 %
Property 14,0 % 1,4 % 13,2 % 0,9 %
Other financial assets 2,3 % 0,1 % 3,1 % 0,3 %
Equities
Total exposure in shares and alternative investments, including equity derivatives, was 30.1
per cent at the end of the first quarter. The total return on shares and alternative
investments was minus 3.2 per cent in the quarter. The return on KLP’s global equities was
minus 4.9 per cent, while KLP’s Norwegian equity portfolio returned plus 4.7 per cent in the
first quarter.
Short-term bonds and the money market
Short-term bonds accounted for 13.1 per cent and money-market instruments 2.3 per cent
of the assets in the common portfolio as at 31 March. Norwegian, European and US
government interest rates all rose during the first quarter. KLP’s global government bond
index achieved a currency-hedged return of minus 4.6 per cent in the quarter, while the
return on the Norwegian government bond index was minus 3.3 per cent. Increased global
credit margins through the quarter brought a return of minus 6.7 per cent on KLP’s global
credit bond index. Short-term bonds produced a total return of minus 4.6 per cent in the
first quarter. The money market return was 0.1 per cent for the quarter.
Long-term bonds
Investment in long-term bonds and bonds held to maturity made up 28.4 per cent of the
common portfolio at 31 March. Unrecognised decreases in value in the portfolio rose in the
first quarter and amounted to NOK 4.2 billion at the end of the first quarter. The portfolio is
well diversified and consists of securities issued by creditworthy borrowers. The return
measured at amortised cost in the first quarter was 0.8 per cent.
Property
Property investments, including Norwegian and international property funds, made up 14.0
per cent of the common portfolio. Property values in the common portfolio were adjusted
upwards by NOK 486.9 million in the quarter. Property investments in the common
portfolio achieved a return of 1.4 per cent in the first quarter.
7

Lending
Lending in the common portfolio totals NOK 77.9 billion. This is split between NOK 65.8
billion in loans to the public sector, NOK 2.1 billion in loans with government guarantees
and NOK 3.1 billion in secured mortgage loans, with the remaining NOK 6.9 billion made up
of other secured loans. The lending portfolio is of high quality, with no losses on municipal
loans and very modest provisions for losses on mortgage loans. Unrecognised decreases in
value in the lending portfolio (fixed-interest loans) totalled NOK 615 million at 31 March.
The return for the first quarter was 0.5 percent.
Returns on the corporate portfolio
The corporate portfolio covers the placement of owners’ equity and subordinated loans/
hybrid Tier 1 and Tier 2 securities.
The corporate portfolio is managed with a moderate-risk long-term investment horizon,
with the object of stable returns. Investments in the corporate portfolio achieved a return
of 0.6 per cent in the first quarter.
Business areas of the subsidiaries
Non-life insurance
The first quarter produced a pre-tax operating profit of NOK -24.3 (71.6) million. The weak
result is mainly due to a negative trend in the financial markets in the quarter. The
insurance result is better than expected so far this year, largely due to the small number of
large claims and continued reversal of previous years’ reserves.
As a result of tendering procedures in the fourth quarter of 2021, the Company saw weaker
growth going into this year than in previous years. Volume growth so far this year is NOK
85 million, and premium volume was NOK 2,105 (1,887) million at the end of the first
quarter. Premiums due increased by 9.1 per cent, or NOK 96 million, compared with the
same time in 2021. For the public-sector and corporate markets, premiums increased by 8.9
per cent, while the corresponding increase for the retail market was 10.2 per cent.
One claim in excess of NOK 10 million was reported in the first quarter. A further six claims
were reported in the range between NOK 3 and 10 million. These claims total NOK 29
million.
Reversal of previous years’ claims is still positive, and this year NOK 33 million has so far
been taken to income, equivalent to 1.7 per cent of the reserves at the beginning of the
year.
8

Key figures for the Company
At 31.03 2022 At 31.03 2021 Whole of 2021
Claims ratio 79,6 72,8 76,4
Cost ratio 15,5 16,4 15,8
Total cost ratio 95,1 89,2 92,1
Net financial income in the first quarter was NOK -49.3 (29.5) million, equivalent to minus
0.9 (0.6) per cent. Overall, the equity portfolio had a negative quarterly return of minus 4.1
per cent. The quarter has been marked by turbulence in the international equity market,
while the Norwegian equity portfolio returned 1.5 per cent. The Company’s investments in
interest-bearing funds also had a negative return of minus 2.8 per cent, largely as a result
of higher interest rates and increased credit premiums. The Company’s long-term bonds
had a yield of 0.8 per cent. The return on property investments was 3.6 per cent, after a
write-up of NOK 18.4 million on real estate assets.
The solvency margin (SCR) saw a marginal change from 224 per cent at year-end to 222
per cent at the end of the first quarter.
Asset and fund management
KLP Kapitalforvaltning provides securities management in the KLP Group. It had a total of
NOK 646 billion under management at the end of the first quarter, of which NOK 135 billion
was for external customers. The majority of the assets are managed on behalf of KLP and
its subsidiaries.
There were zero net new subscriptions to the KLP funds in the first quarter. External
customers had positive net new subscriptions of NOK 4.5 billion in the quarter.
The Company achieved a result before tax of NOK -17.5 million in the first quarter.
Bank
The KLP Banken Group finances mortgages and other credit to individual customers (retail
market) as well as loans to municipalities, county municipalities and companies that
provide public services (public-sector market). The Bank’s lending business is financed by
deposits from private customers and companies, loans from the securities market and
owners’ equity. The Bank also manages a substantial volume of lending financed by
pension assets in KLP.
9
As of 31 March, the KLP Banken Group had loans to customers totalling NOK 40.6 (37.6)
billion. Mortgage loans in the retail market and public-sector loans totalled NOK 22.6 (20.9)
billion and 18.0 (16.7) billion respectively.
KLP Banken manages NOK 3.0 (3.2) billion in mortgage loans and NOK 72.6 (72.6) billion in
loans to public-sector borrowers and other businesses on behalf of KLP.
The Bank’s mortgage products are aimed at the target group of members of the KLP
pension schemes. So far this year, the retail market in KLP Banken has seen stronger
growth in mortgages, which increased by NOK 0.5 billion compared to NOK 0.3 billion last
year. New loans paid out also increased compared to last year.
Lending volume to the public-sector market on KLP Banken’s balance sheet increased by
NOK 0.2 (0.9) billion through the quarter. Loans to public-sector borrowers managed on
behalf of KLP increased by NOK 0.1 (1.1) billion in the same period. Managed loans to other
businesses, mainly in other currencies, decreased by NOK 0.1 billion in the first quarter, to
NOK 6.3 billion.
The Bank’s lending margins are heavily affected by market turbulence and rising interest
rates. This hits both lending areas. KLP Banken has chosen to keep lending rates on
mortgages unchanged for a time. This has helped to drive growth, but also contributed to
lower margins in the first quarter compared to last year. In the public-sector market,
margins have remained at an almost normal level. The Bank’s operating income, in the form
of net interest income, was NOK 72.1 (75.7) million at the end of the first quarter.
KLP Banken’s liquidity is invested in other banks and in interest-bearing securities. The
portfolio of interest-bearing securities and bank deposits amounts to NOK 8.3 (5.5) billion.
The Bank’s net gain/loss on financial instruments mainly comprises accounting effects of
loan buybacks and changes in the value of its securities holdings. In all, financial
instruments produced total expenses of NOK -10.1 (14.5) million to the end of the quarter.
The recognised expense in the quarter is mainly due to increased credit risk premiums in
the market reducing the market value of the Bank’s securities holdings. Realised costs
make up a negligible proportion of this.
The KLP Banken Group’s external financing consists mainly of deposits and bonds. Deposit
growth so far this year is NOK 0.5 (0.3) billion. On the reporting date, deposits from
individuals and companies amounted to NOK 13.4 (12.1) billion and debt from securities
issues came to NOK 31.9 (27.1) billion. The securities debt is mainly covered bonds issued
by KLP Kommunekreditt AS and KLP Boligkreditt AS.
10

Operating expenses and depreciation amounted to NOK 64.0 (60.6) million in the first
quarter.
In the year to date, losses and loss provisions in the retail market amounted to NOK 0.1
(-0.5) million. Positive figures here mean that the reversal of previous loss provisions on
credit cards and mortgages is higher than new losses and loss provisions. Nor have we
experienced any losses related to public-sector lending in the year to date.
The KLP Banken Group had a pre-tax operating profit of NOK 18.3 million (48.6) in the first
quarter. Broken down by area, the pre-tax profit was NOK 8.3 (41.8) million from the retail
market and NOK 10.0 (6.8) million from the public-sector market. Most changes in the value
of liquidity investments are recorded in the retail market. The Group’s total comprehensive
income for the first quarter was NOK 56.2 (69.8) million.
Corporate social responsibility
At the end of February, Russia invaded Ukraine and so started a war that concerns the
whole world. When Russia annexed the Crimea back in 2014, KLP and the KLP funds
introduced a precautionary approach to investments in Russia. KLP froze four companies
at that time, and has been underinvested in Russia since then. At the end of February, KLP
decided to apply its exclusion policy and withdraw all investments in Russian companies.
This involves 22 different companies in all, and about a third of the shares in these – those
listed in London – have already been sold. Divestment from the Moscow Stock Exchange
will be completed when the exchange opens and in line with what the sanction rules allow.
For KLP as a responsible investor, voting at general meetings is an important way of
influencing companies in which we are invested. In the first quarter, KLP updated the
voting guidelines for KLP and the KLP funds to reflect changes made by NUES (the
Norwegian Corporate Governance Committee) in 2021. Recommendations on ownership,
corporate governance and control from the local government organisation KS have also
been incorporated.
The expansion of renewable energy and sustainable infrastructure is crucial to achieving
the goals set out in the Paris Agreement. In the first quarter, KLP invested in a new Nordic
renewables company, where the principal shareholders are HitecVision and TrønderEnergi.
The company will have operations throughout the Nordic region related to energy
production, electrification and energy efficiency.
KLP Banken issued three new green loans in the first quarter, totalling NOK 8.1 million.
These went to two projects within waste management and improved recycling rates, and
one to install solar panels in commercial premises.
11

If the world is to attain the 1.5 degree target laid down in the Paris Agreement, change is
needed in a number of sectors. Through the ‘Green Shipping Programme’, KLP helped
develop common guidelines for standardising criteria for green loans in shipping. Financial
institutions should only provide green loans to projects directly linked to emission targets
in line with the Paris Agreement, and the companies must make contractual commitments
to meet the emission targets specified in the loan agreement.
Before Christmas, KLP Eiendom obtained BREEAM In-Use certification for one of its
buildings at Tjuvholmen in Oslo. The certification process has produced good results,
including a reduction in energy consumption (a big financial saving at today’s electricity
prices), and reduced emissions from the property.
In the first quarter, KLP Skadeforsikring launched two fire prevention projects which will
both help to increase the life of the buildings. One is in cooperation with the fire service in
Gudbrandsdalen and Innlandet, and the other is being run in partnership with NTNU, the
Norwegian Institute for Air Research, the Norwegian Asthma and Allergy Association, and
several municipalities.
One of KLP’s working environment networks that has made great improvements is the
merged SOP (Central Operations) department at Akershus University Hospital. The project
focuses on measures to prevent sickness absence, and to create a shared culture and an
inclusive workplace environment. By strengthening the leadership role in the management
team, the project has helped to increase employee involvement and improve the training of
new hires. The project has raised people’s awareness of their own working environment
and how they can help to improve it, and contributed to greater safety and transparency in
the workplace.
Future prospects and events after the end of the quarter
The global economy has been heavily affected by the war in Ukraine and rising commodity
prices. This has resulted in some big falls in the equity market and higher interest rates.
KLP has solid financial buffers which safeguard customers’ savings in periods of negative
market movements.
12

13

KLP GroupQ1 2022
Income statementKLP Group
NOTE NOK MILLIONS
Q1
2022
Q1
2021
01.01.2021-
31.12.2021
3 Premium income for own account 7 981 7 469 52 001
Current return on financial assets 3 820 3 629 14 813
Net interest income banking 72 76 309
Net value changes on financial instruments -17 128 9 617 48 365
8 Net income from investment properties 1 261 836 8 543
4 Other income 367 403 1 547
Total net income -3 627 22 030 125 577
Claims for own account -11 037 -14 077 -31 855
Change in technical provisions 8 781 4 737 -31 253
5 Net costs subordinated loan and hybrid Tier 1 securities 160 230 103
6 Operating expenses -627 -512 -2 278
7 Other expenses -333 -303 -1 292
Unit holder's value change in consolidated securites funds 7 237 -4 128 -19 802
Total expenses 4 181 -14 053 -86 377
Operating profit/loss 555 7 977 39 200
To/from securities adjustment fund – life insurance 0 -1 207 -21 646
To supplementary reserves – life insurance 841 0 -5 420
Assets allocated to insurance customers - life insurance -1 183 -6 077 -11 107
Pre-tax income 213 693 1 027
Cost of taxes 1 -163 -246 -748
Income 49 446 279
14

NOTE NOK MILLIONS
Q1
2022
Q1
2021
01.01.2021-
31.12.2021
19 Actuarial loss and profit on post employment benefit obligations 426 185 84
Adjustments of the insurance obligations -47 -21 -16
Tax on items that will not be reclassified to profit or loss -67 -30 -12
Items that will not be reclassified to profit or loss 311 135 56
Revaluation real property for use in own operation 43 26 206
8 Currency translation foreign properites -945 -1 276 -1 314
Adjustments of the insurance obligations 945 1 276 1 314
Tax on items that will be reclassified to profit or loss -11 -7 -52
Items that will be reclassified to income particular specific conditions are
met 32 20 155
Total other comprehensive income 343 154 211
Total comprehensive income 392 601 490
1 Unit holders share of taxes in consolidated securities fund -80 -54 -296
Financial position statementKLP Group
NOTE NOK MILLIONS 31.03.2022 31.03.2021 31.12.2021
Deferred tax assets 51 49 52
Other intangible assets 854 731 797
Tangible fixed assets 2 741 2 561 2 714
Investments in associated companies and joint venture 5 221 4 592 4 934
8,11 Investment property 89 280 80 412 89 535
9,14 Debt instruments held to maturity 25 376 28 397 25 985
9,14 Debt instruments classified as loans and receivables 166 434 155 674 164 484
9,11,14
Lending local government, enterprises & retail customers at fair value
through profit / loss 56 537 79
9,14 Lending local government, enterprises and retail customers 118 829 113 070 118 024
9,11,14 Debt instruments at fair value through profit or loss 184 010 182 846 188 172
9,11 Equity capital instruments at fair value through profit/loss 287 036 227 487 294 476
9,11,14 Financial derivatives 6 578 5 077 3 253
19 Receivables 13 474 6 859 5 377
14 Cash and bank deposits 2 971 5 221 3 388
TOTAL ASSETS 902 911 813 514 901 270
Owners’ equity contributed 19 831 17 919 19 831
Retained earnings 21 618 21 823 20 901
TOTAL OWNERS’ EQUITY 41 449 39 742 40 732
15

NOTE NOK MILLIONS 31.03.2022 31.03.2021 31.12.2021
9,10 Hybrid Tier 1 securities 1 505 1 637 1 604
9,10 Subordinated loan capital 2 939 3 032 3 000
19 Pension obligations 474 772 870
15 Technical provisions - life insurance 643 082 595 798 653 551
Premiums, claims and contingency fund provisions - non-life insurance 3 596 3 316 3 023
9,10 Covered bonds issued 30 960 26 345 31 015
9,10 Debt to credit institutions 12 933 7 018 4 199
9,10 Liabilities to and deposits from customers 13 372 12 103 12 901
9,11 Financial derivatives 1 409 1 416 4 740
Deferred tax 1 416 1 572 1 387
16 Other current liabilities 14 848 8 387 6 808
Unit holders`s interest in consolidated securites funds 134 927 112 376 137 440
TOTAL LIABILITIES 861 463 773 772 860 538
TOTAL EQUITY AND LIABILITIES 902 911 813 514 901 270
Contingent liabilities 27 001 26 601 28 754
Changes in Owners’ equityKLP Group
2022
NOK MILLIONS
Owners' equity
contributed Retained earnings
Total equity
contributed
Owners’ equity 31 December 2021 19 831 20 901 40 732
Change recognized directly in equity 324 324
Owners’ equity 1 January 2022 19 831 21 225 41 056
Income 49 49
Items that will not be reclassified to income 311 311
Items that will be reclassified to income later when particular
conditions are met 32 32
Total other comprehensive income 343 343
Total comprehensive income 0 392 392
Owners' equity contribution received (net) 0
Total transactions with the owners 0 0
Owners’ equity 31 March 2022 19 831 21 617 41 449
16

2021
NOK MILLIONS
Owners' equity
contributed Retained earnings
Total equity
contributed
Owners’ equity 1 January 2021 18 194 21 222 39 416
Income 446 446
Items that will not be reclassified to income 135 135
Items that will be reclassified to income later when particular
conditions are met 20 20
Total other comprehensive income 154 154
Total comprehensive income 0 601 601
Owners' equity contribution received (net) - 275 - 275
Total transactions with the owners - 275 - 275
Owners’ equity 31 March 2021 17 919 21 823 39 742
2021
NOK MILLIONS
Owners' equity
contributed Retained earnings
Total equity
contributed
Owners’ equity 1 January 2021 18 194 21 222 39 416
Income 811 - 532 279
Items that will not be reclassified to income 56 56
Items that will be reclassified to income later when particular
conditions are met 155 155
Total other comprehensive income 211 211
Total comprehensive income 811 - 321 490
Owners' equity contribution received (net) 826 826
Total transactions with the owners 826 826
Owners’ equity 31 December 2021 19 831 20 901 40 732
17

Statement of cash flow
NOK MILLIONS
01.01.2022
-31.03.2022
01.01.2021
-31.12.2021
01.01.2021
-30.09.2021
01.01.2021
-30.06.2021
01.01.2021
-31.03.2021
Net cash flow from operational activities -1 917 -24 289 -17 000 -21 644 -13 312
Net cash flow from investment activities 1 -82 -278 -218 -146 -72
Net cash flow from financing activities 2 1 583 25 182 17 496 22 640 15 833
Net changes in cash and bank deposits -417 616 278 850 2 449
Holdings of cash and bank deposits at start of period 3 388 2 772 2 772 2 772 2 772
Holdings of cash and bank deposits at end of period 2 971 3 388 3 050 3 622 5 221
1 Payments on the purchase of tangible fixed assets.
2 Net receipts of owners’ equity contribution, rising of new loans and repayment of debt. And also payments from unit holders in consolidated securities funds.
18
Notes to the financial statement
Note 1 Accounting principles –and estimates
Accounting principles
The financial statements in this interim report show the Kommunal Landspensjonskasse
(KLP) group financial statements and parent company financial statements for the period
01.01.2022 – 31.03.2022. The accounts have not been audited.
That part of the interim report that relates to the Group financial statements has been
prepared in accordance with IAS 34 Interim financial Reporting.
The same accounting principles and calculation methods have been used in the interim
financial statements as in the last annual financial statements, unless stated otherwise.
In the insurance business, rules on a merged buffer fund covering all customers were
introduced for municipal pension schemes from 01.01.2022 together with some other
changes for guaranteed pension products. The new buffer fund replaces the earlier
supplementary reserves and securities adjustment fund and amounts to 126 NOK million as
at 01.01.2022. The buffer fund is included in the accounting line “Technical provisions – life
insurance” in the balance sheet. In addition, 554 NOK million was transferred from the
security adjustment fund to the risk adjustment fund. The latter is included in retained
earnings in the balance sheet.
In 2021 and at the beginning of 2022, the insurance business was in discussions with the
Financial Supervisory Authority of Norway on certain allocations that were made in the
annual accounts for 2020. The annual accounts for 2021 reported these changes, and the
effects were incorporated into the figures. In February 2022, the insurance business again
received a letter from the FSA stating that its equity must contribute 20 per cent of the
amount from the risk result from 2020 used to boost the reserves for increased longevity.
This amounts to NOK 229 million, and is recognised directly in the balance sheet, split
between retained earnings and technical provisions -life insurance.
The interim financial statements do not contain all the information required of complete
financial statements, and this interim financial report should be read in the context of the
annual financial statements for 2021. The annual financial statements are available at KLP’s
website klp.no.
19

Other
Exclusion of Russian companies
The group decided in February 2022 to freeze all investments in Russia, and 22 Russian
companies were excluded. Some of the companies were already subject to restrictions
following the escalation of the Russia-Ukraine conflict back in 2014, but this has now been
extended to all investments in Russia. KLP is actively exploring ways to sell off these
investments, but international sanctions have to be taken into account, as well as the
restrictions imposed on Western investors by Russia. The investments are in the KLP
AksjeFremvoksende Markeder Indeks I and KLP Aksje Fremvoksende Markeder Flerfaktor
funds, and are conservatively priced at a total of around NOK 24 million at the end of the
first quarter.
Norwegian Competition Authority investigating whether KLP has breached theCompetition Act
In February 2022, the Norwegian Competition Authority made an unannounced evidence-
gathering visit to the groups insurance business because it found reasonable grounds to
assume that it had breached the Norwegian Competition Act. The Authority is examining
whether the insurance business has breached Section 11 of the Act (Abuse of a dominant
position), and the evidence-gathering was authorised by a decision from Hordaland District
Court.
The group has given the Norwegian Competition Authority access to everything it has
asked for, and is ready to cooperate with the Authority in its continuing investigation.
Accounting estimates
In preparing the interim financial statements, management has exercised discretion and
used estimates and assumptions that affect the accounting figures. Actual figures may
deviate from estimates used.
The group has changed the discount rate for corporate bonds which is used to calculate
pension obligations. Compared to the assumptions used at 31.12.2021, the discount rate has
been changed from 1.9 % to 2.7
%. This change results in a reduction of 426 NOK million in recognised liabilities as at
31.03.2022. Demographic assumptions such as expected wage growth, the National
Insurance basic amount (G) and pension regulations have not changed in the period.
20

New rules regulating deferred pensions have been adopted, but the Norwegian Accounting
Standards Board has not issued any guidance on how these should be included in the
pension accounts. This should be clarified soon, and is expected to affect the company’s
pension obligations in later periods.
21
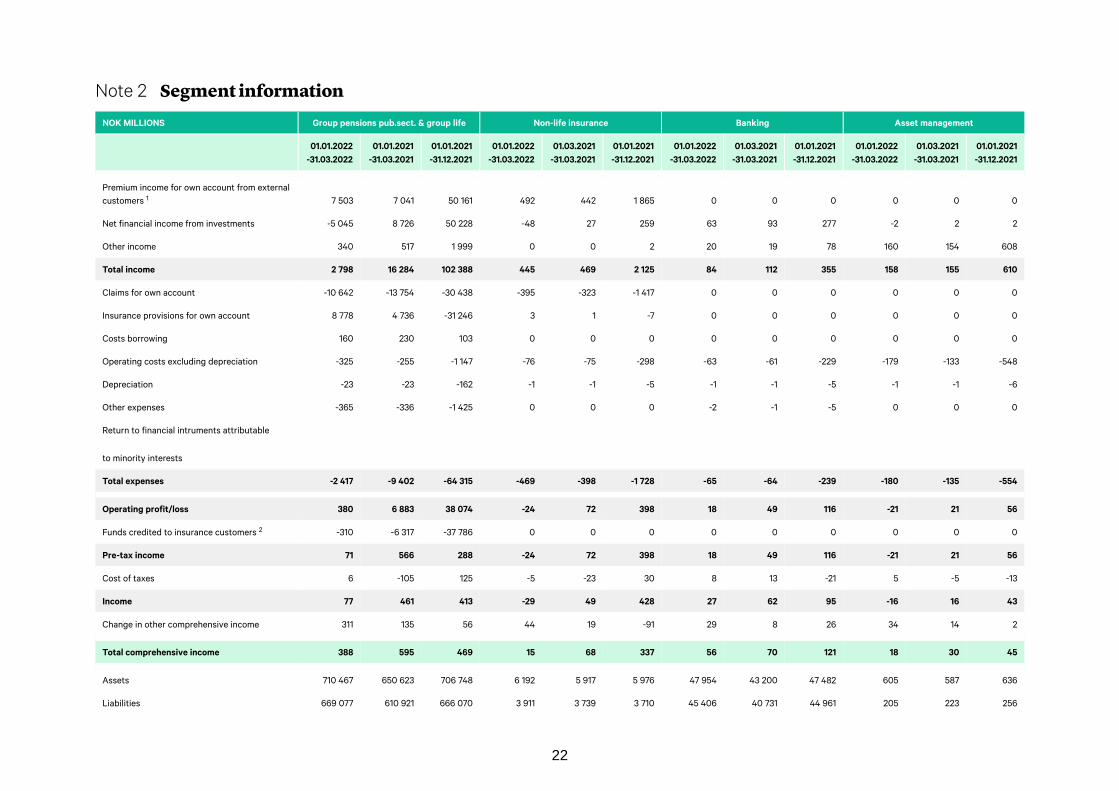
Note 2 Segment information
NOK MILLIONS Group pensions pub.sect. & group life Non-life insurance Banking Asset management
01.01.2022
-31.03.2022
01.01.2021
-31.03.2021
01.01.2021
-31.12.2021
01.01.2022
-31.03.2022
01.03.2021
-31.03.2021
01.01.2021
-31.12.2021
01.01.2022
-31.03.2022
01.03.2021
-31.03.2021
01.01.2021
-31.12.2021
01.01.2022
-31.03.2022
01.03.2021
-31.03.2021
01.01.2021
-31.12.2021
Premium income for own account from external
customers 1 7 503 7 041 50 161 492 442 1 865 0 0 0 0 0 0
Net financial income from investments -5 045 8 726 50 228 -48 27 259 63 93 277 -2 2 2
Other income 340 517 1 999 0 0 2 20 19 78 160 154 608
Total income 2 798 16 284 102 388 445 469 2 125 84 112 355 158 155 610
Claims for own account -10 642 -13 754 -30 438 -395 -323 -1 417 0 0 0 0 0 0
Insurance provisions for own account 8 778 4 736 -31 246 3 1 -7 0 0 0 0 0 0
Costs borrowing 160 230 103 0 0 0 0 0 0 0 0 0
Operating costs excluding depreciation -325 -255 -1 147 -76 -75 -298 -63 -61 -229 -179 -133 -548
Depreciation -23 -23 -162 -1 -1 -5 -1 -1 -5 -1 -1 -6
Other expenses -365 -336 -1 425 0 0 0 -2 -1 -5 0 0 0
Return to financial intruments attributable
to minority interests
Total expenses -2 417 -9 402 -64 315 -469 -398 -1 728 -65 -64 -239 -180 -135 -554
Operating profit/loss 380 6 883 38 074 -24 72 398 18 49 116 -21 21 56
Funds credited to insurance customers 2 -310 -6 317 -37 786 0 0 0 0 0 0 0 0 0
Pre-tax income 71 566 288 -24 72 398 18 49 116 -21 21 56
Cost of taxes 6 -105 125 -5 -23 30 8 13 -21 5 -5 -13
Income 77 461 413 -29 49 428 27 62 95 -16 16 43
Change in other comprehensive income 311 135 56 44 19 -91 29 8 26 34 14 2
Total comprehensive income 388 595 469 15 68 337 56 70 121 18 30 45
Assets 710 467 650 623 706 748 6 192 5 917 5 976 47 954 43 200 47 482 605 587 636
Liabilities 669 077 610 921 666 070 3 911 3 739 3 710 45 406 40 731 44 961 205 223 256
22

NOK MILLIONS Other Elimintations Total
01.01.2022
-31.03.2022
01.01.2021
-31.03.2021
01.01.2021
-31.12.2021
01.01.2022
-31.03.2022
01.03.2021
-31.03.2021
01.01.2021
-31.12.2021
01.01.2022
-31.03.2022
01.03.2021
-31.03.2021
01.01.2021
-31.12.2021
Premium income for own account from external customers 1 0 0 0 -15 -13 -25 7 981 7 469 52 001
Net financial income from investments 0 0 0 -6 943 5 312 21 263 -11 974 14 161 72 029
Other income 3 3 12 -156 -290 -1 151 367 403 1 547
Total income 3 3 12 -7 114 5 009 20 086 -3 627 22 033 125 577
Claims for own account 0 0 0 0 0 0 -11 037 -14 077 -31 855
Insurance provisions for own account 0 0 0 0 0 0 8 781 4 737 -31 253
Costs borrowing 0 0 0 0 0 0 160 230 103
Operating costs excluding depreciation -3 -3 -10 44 39 182 -600 -489 -2 050
Depreciation 0 0 0 0 0 -50 -27 -27 -228
Other expenses 0 0 0 34 34 138 -333 -303 -1 292
Return to financial intruments attributable
to minority interests 7 237 -4 128 -19 802 7 237 -4 128 -19 802
Total expenses -3 -3 -10 7 315 -4 055 -19 531 4 181 -14 056 -86 377
23

NOK MILLIONS Other Elimintations Total
01.01.2022
-31.03.2022
01.01.2021
-31.03.2021
01.01.2021
-31.12.2021
01.01.2022
-31.03.2022
01.03.2021
-31.03.2021
01.01.2021
-31.12.2021
01.01.2022
-31.03.2022
01.03.2021
-31.03.2021
01.01.2021
-31.12.2021
Operating profit/loss 0 0 2 202 954 555 555 7 978 39 200
Funds credited to insurance customers 2 0 0 0 -32 -967 -388 -342 -7 284 -38 173
Pre-tax income 0 -1 2 169 -13 167 213 693 1 027
Cost of taxes 0 0 0 -178 -127 -869 -163 -246 -748
Income 0 -1 1 -9 -139 -702 49 446 279
Change in other comprehensive income 1 -1 0 -76 -20 218 343 154 211
Total comprehensive income 1 -1 2 -85 -160 -484 392 601 490
Assets 9 7 9 137 685 113 179 140 419 902 911 813 514 901 270
Liabilities 2 3 3 142 862 118 156 145 537 861 463 773 772 860 538
¹ Premium income covers premiums earned for own account including savings premium and transferred premium reserves from other companies.
² Funds transferred to the insurance customers include transfers to the premium fund, provisions to the securities adjustment fund, provisions to supplementary reserves and other provisions of surplus funds to the insurance
customers.
24

The KLP Group’s business is divided into the five areas: public sector occupational
pension/group life, non-life insurance, banking, asset management and other.
All business is directed towards customers in Norway.
PUBLIC SECTOR OCCUPATIONAL PENSION AND GROUP LIFE
Kommunal Landspensjonskasse offers group public sector occupational pensions.
NON-LIFE INSURANCE
KLP Skadeforsikring AS offers property and personal injury products to employers within
the public and private sectors. In addition a broad specter of standard insurance products
is offered to the the retail market.
BANKING
KLP’s banking business embraces the companies KLP Banken AS and its wholly-owned
subsidiaries: KLP Kommunekreditt AS and KLP Boligkreditt AS. The banking business
covers services such as deposits and lending to the retail market, credit cards, as well as
lending with public sector guarantee.
ASSET MANAGEMENT
Asset management is offered from the company KLP Kapitalforvaltning AS. The company
offer a broad selection of securities mutual funds both to retail customers and to
institutional customers. The securities management has a socially responsible profile.
OTHER
Other segments comprises KLP Forsikringsservice AS which offers a broad specter of
services to local authority pension funds.
25

Note 3 Premium income for own account
NOK MILLIONS
Q1
2022
Q1
2021
01.01.2021
-31.12.2021
Contribution service pension 7 628 7 488 52 075
Reinsurance premiums ceeded -24 -18 -75
Transfer of premium reserves from others 376 0 0
Total premium income 7 981 7 469 52 001
Note 4 Other income
NOK MILLIONS
Q1
2022
Q1
2021
01.01.2021
-31.12.2021
Supplement contractual early retirement scheme (ERS) 331 299 1 265
Other income 1 36 103 282
Total other income 367 403 1 547
1 Other income includes investment from associated companies, so the results can be both negative and positive.
Note 5 Suboriented loans and perpetual hybrid tier 1 securities
NOK MILLIONS
Q1
2022
Q1
2021
01.01.2021
-31.12.2021
SUBORDINATED LOANS
Interest costs ¹ -28 -27 -124
Value changes 88 130 132
Net costs subordinated loans 60 103 8
PERPETUAL HYBRID TIER 1 SECURITIES
Interest costs -16 -16 -64
Value changes 115 142 159
Net costs perpetual hybrid tier 1 securities 99 127 96
Net costs subordinated loan and hybrid Tier 1 securities 160 230 103
¹ Besides pure interest costs, this includes recognition through profit/loss of a discount on one subordinated loan.
This note gives a specification of the line "Net costs subordinated loan and hybrid Tier 1
securities" in the income statement.
The fluctuations in value change are predominantly due to the loans being denominated in
foreign currency. The subordinated loan is issued in euros and the perpetual hybrid Tier 1
security are issued in Japanese yen.
26

Note 6 Operating expenses
NOK MILLIONS
Q1
2022
Q1
2021
01.01.2021
-31.12.2021
Personnel costs - 353 - 315 - 1 248
Depreciation and writedowns - 40 - 39 - 228
Other operating expenses - 235 - 159 - 802
Total operating expenses - 627 - 512 - 2 278
Note 7 Other expenses
NOK MILLIONS
Q1
2022
Q1
2021
01.01.2021
-31.12.2022
Supplement contractual early retirement scheme (ERS) - 335 - 299 - 1 265
Other expenses 2 - 4 - 27
Total other expenses - 333 - 303 - 1 292
Note 8 Investment property
NOK MILLIONS
Q1
2022
Q1
2021
01.01.2021
-31.12.2021
Net rental income 790 756 3 040
Net value adjustment 471 80 5 444
Realised gains 0 0 59
Net income from investment properties 1 261 836 8 543
Currency translate foreign properites (taken to other comprehensive income) -945 -1 276 -1 314
Net income from investment properties included currency translate 316 - 439 7 229
NOK MILLIONS 31.03.2022 31.03.2021 31.12.2021
Investment property 01.01. 89 535 81 485 81 485
Value adjustment, including currency translation - 475 - 1 196 4 130
Net additions 231 138 3 913
Other changes - 11 - 15 7
Investment property 89 280 80 412 89 535
Note 9 Fair value of financial assets and liabilities
Fair value is to be a representative price based on what the equivalent asset or liabilites
would be sold for under normal market terms and conditions. A financial instrument is
considered as being listed in an active market if listed prices are easily and regularly
accessible from a stock exchange, dealer, broker, commercial group, pricing service or
27

regulatory authority, and such prices represent actual transactions that occur regularly at
arm’s length. If the market for the security is not active, or the security is not listed on a
stock exchange or similar, the Group uses valuation techniques to determine fair value.
These are based on information on transactions recently carried out on business
conditions, reference to the purchase and sale of similar instruments and pricing by means
of externally obtained interest-rate curves and interest-rate differential curves. Estimates
are based to the greatest possible extent on external observable market data, and to a
small degree on company-specific information.
In the case of this note, there are three different categories of financial instruments:
balance sheet classification, accounts classification, and type of instrument. It is for this
last category that information is provided about how fair value is derived.
FINANCIAL INSTRUMENTS MEASURED AT AMORTISED COST
This category includes:
• Investments held to maturity
• Bonds classified as loans and receivables
• Other loans and receivables
• Liabilites to and deposits from customers
• Subordinated loan capital (liabilities)
• Other debt issued (liabilities)
Financial instruments not measured at fair value are measured at amortised cost by using
the effective interest rate method. The internal rate of exchange is determined by
discounting contractual cash flows over their expected term. The cash flows include
arrangement/up-front fees and direct transaction costs as well as any residual value on the
expiry of the expected term. Amortised cost is the present value of these cash flows
discounted by the internal rate of interest. This note contains information about the fair
value of the financial instruments that are measured at amortised cost.
FINANCIAL INSTRUMENTS MEASURED AT FAIR VALUE
This category includes:
• Equity instruments
• Debt instruments at fair value
• Derivatives (assets and liabilites)
• Debt to credit institutions (liabilites)
Below is a list of which types of financial instrument come under the various accounts
categories, and how fair value is calculated.
28

• INVESTMENTS HELD TO MATURITY
• BONDS CLASSIFIED AS LOANS AND RECEIVABLES
• DEBT INSTRUMENTS MEASURED AT FAIR VALUE
a) Foreign fixed-income securities
Foreign fixed-income securities are generally priced based on prices obtained from an
index provider. At the same time, prices are compared between several different sources to
spot any errors.
The following sources are used:
• Barclays Capital Indices
• Bloomberg
Barclays Capital Indices have first priority (they cover foreign government and foreign
credit respecitvely). Then comes Bloomberg based on Bloomberg’s pricing service
Business Valuator Accredited in Litigation (BVAL). BVAL has verified prices from
Bloomberg.
b) Norwegian fixed-income securities – government
Nordic Bond Pricing is used as the primary source for pricing Norwegian Government
Bonds. Prices are compared with prices from Bloomberg in order to uncover any errors.
c) Norwegian fixed-income securities – other than government ones
Norwegian fixed-income securities except government are mainly priced directly on prices
from Nordic Bond Pricing. Securities that are not covered by Nordic Bond Pricing are
priced theoretically. The theoretical price is based on the assumed present value on the
sale of the position. A zero-coupon curve is used for discounting. The zero-coupon curve is
adjusted upwards by means of a credit spread, which is to take account of the risk the
bond entails. The credit spread is calculated on the basis of a spread curve taking account
of the duration of the bond. Nordic Bond Pricing is the main source of spread curves. They
provide company-specific curves and curves for Norwegian savings banks, municipalities
and energy. Savings banks have various spread curves based on total assets. For
companies where Nordic Bond Pricing do not deliver spread curves, the Group use spread
curves from three Norwegian banks. When spread curves are available from more than one
of these banks, an equal-weighted average is used. If a bond lacks an appropriate spread
curve, spread from a comparable bond from the same issuer is used.
29

d) Fixed-income securities issued by foreign enterprises but denominated in NOK
Fair value is calculated on the same general principles as those applying for Norwegian
fixed-income securities described above.
e) Receivables on credit institutions
The fair value of these is considered as being approximately the same as the book value
since the terms and conditions of the contract are continually revised in accordance with
changes in the market rates.
f) Loans to municipalities and enterprises with municipal guarantee
Receivables are valued by means of a valuation model using relevant credit premium
adjustments obtained in the market. For guaranteed loans fair value is calculated as
discounted cash flow based on the same interest-rate curves as direct loans, but the credit
margin is adjusted to market values for the appropriate combination of guarantee category
and type of guarantee. The guarantor is either a state, municipality or a bank.
g) Loans secured by mortgage
The principles for calculating fair value are subject to the loans having fixed-interest rates
or not. Fair value of fixed-rate loans is calculated by discounting contractual cash flows by
the market rate including a relevant risk margin on the reporting date. The fair value of
loans with no fixed rate is approximately equal to book value since the terms and
conditions of the contract are continually revised in accordance with changes in the
market rates
- EQUITY INSTRUMENTS
h) Shares (listed)
Liquid shares are generally valued on the basis of prices from an index provider. At the
same time, prices are compared between different sources in order to spot any errors.
The following sources are used for Norwegian shares:
• Oslo Børs/Oslo Stock Exchange (primary source)
• Morgan Stanley Capital International (MSCI)
• Bloomberg
30
The following sources are used for foreign shares:
• Morgan Stanley Capital International (MSCI) (primary source)
• Bloomberg
i) Shares (unlisted)
As far as possible, The Group uses the Norwegian Mutual Funds Association’s industry
recommendations. This basically means the following:
The last price traded has key priority. If the last price traded is outside of the bid/offer
price in the market, the price is adjusted accordingly. This means that if the last price
traded is below the offer price, the price is adjusted upward to the offer price. If it is above
the bid price, it is adjusted downward to the bid price.
In cases where there is very little information about the shares, a discretionary assessment
is carried out, such as a fundamental analysis of the company, or a broker assessment.
j) Private Equity
Most of the investment in Private Equity goes through funds. The funds’ fair value is to be
based on reported market values that follow from the International Private Equity and
Venture Capital Valuation Guidelines (’IPEV Guidelines). These guidelines are established
by the European Venture Capital Association (EVCA) and are based on the principle of
approximate market assessment of the companies. Fair value is calculated on the basis of
the funds’ reported market value adjusted for payments in and out during the period
between the fund’s last reported market value and the period being reported on for the
Group. Direct investments in Private Equity are treated in the same way as with current
stocks, but valuation can be daily, quarterly or yearly. In cases where it's possible to obtain
information on what co-investments are priced within the funds, it will be considered in the
valuation process. Other direct investments are valued based on either cost prices,
reported market values from companies or available trading prices.
DERIVATIVES
k) Futures/FRA/IRF
All futures contracts for KLP are traded on the stock exchange. Bloomberg is used as a
prices source. Prices are also obtained from another source in order to check that
Bloombergs’ prices are correct. Reuters acts as a secondary source.
31

l) Options
Bloomberg is used as a source for pricing options traded on the stockmarket. Reuters is a
secondary source.
m) Interest-rate swaps
Interest-rate swaps are valued in a model that takes observable market data such as
interest-rate curves and relevant credit premiums into account .
n) FX-swaps
FX-swaps with a one-year maturity or less are priced on curves that are built up from FX
swap-points obtained from Reuters. The market is not considered particularly liquid for FX-
swaps with a maturity of more than one year and basis-adjusted swap curves are used for
pricing purposes.
- DEBT TO CREDIT INSTITUTIONS
o) Placements with credit institutions and deposits
Placements with credit institutions are made as short-term deposits. Fair value is
calculated by discounting contractual cash flows by market rate including a relevant risk
margin on the reporting date. Deposits are prices on swap curves.
SUBORDINATED LOAN CAPITAL, OTHER DEBT ISSUED, AND DEPOSITS FROMCUSTOMERS
p) Fair value of subordinated loans
The observable price is used as the fair value of loans listed on an active stock exchange.
In the case of other loans that are not part of an active market the fair value is based on an
internal valuation model based on observable data.
q) Fair value of subordinated bond/perpetual bond issued
Fair value in this category is determined on the basis of internal valuation models based on
external observable data.
r) Covered bonds issued
Fair value in this category is determined on the basis of internal valuation models based on
observable data.
32
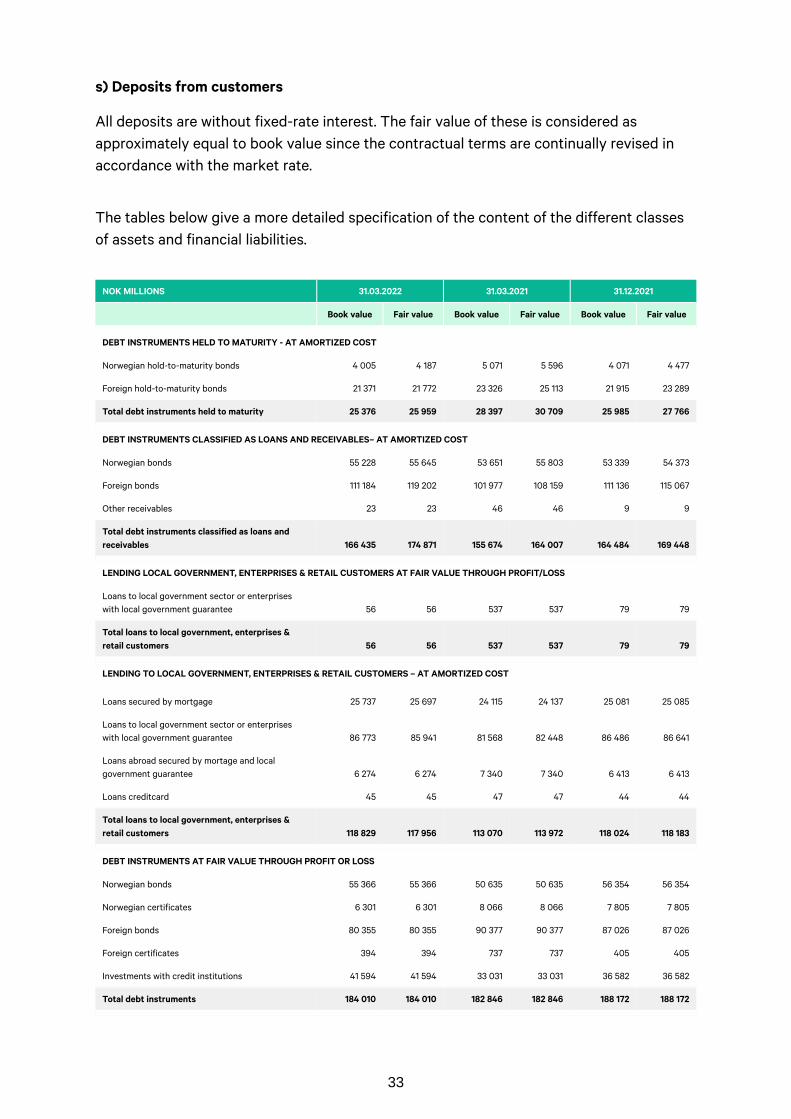
s) Deposits from customers
All deposits are without fixed-rate interest. The fair value of these is considered as
approximately equal to book value since the contractual terms are continually revised in
accordance with the market rate.
The tables below give a more detailed specification of the content of the different classes
of assets and financial liabilities.
NOK MILLIONS 31.03.2022 31.03.2021 31.12.2021
Book value Fair value Book value Fair value Book value Fair value
DEBT INSTRUMENTS HELD TO MATURITY - AT AMORTIZED COST
Norwegian hold-to-maturity bonds 4 005 4 187 5 071 5 596 4 071 4 477
Foreign hold-to-maturity bonds 21 371 21 772 23 326 25 113 21 915 23 289
Total debt instruments held to maturity 25 376 25 959 28 397 30 709 25 985 27 766
DEBT INSTRUMENTS CLASSIFIED AS LOANS AND RECEIVABLES– AT AMORTIZED COST
Norwegian bonds 55 228 55 645 53 651 55 803 53 339 54 373
Foreign bonds 111 184 119 202 101 977 108 159 111 136 115 067
Other receivables 23 23 46 46 9 9
Total debt instruments classified as loans and
receivables 166 435 174 871 155 674 164 007 164 484 169 448
LENDING LOCAL GOVERNMENT, ENTERPRISES & RETAIL CUSTOMERS AT FAIR VALUE THROUGH PROFIT/LOSS
Loans to local government sector or enterprises
with local government guarantee 56 56 537 537 79 79
Total loans to local government, enterprises &
retail customers 56 56 537 537 79 79
LENDING TO LOCAL GOVERNMENT, ENTERPRISES & RETAIL CUSTOMERS – AT AMORTIZED COST
Loans secured by mortgage 25 737 25 697 24 115 24 137 25 081 25 085
Loans to local government sector or enterprises
with local government guarantee 86 773 85 941 81 568 82 448 86 486 86 641
Loans abroad secured by mortage and local
government guarantee 6 274 6 274 7 340 7 340 6 413 6 413
Loans creditcard 45 45 47 47 44 44
Total loans to local government, enterprises &
retail customers 118 829 117 956 113 070 113 972 118 024 118 183
DEBT INSTRUMENTS AT FAIR VALUE THROUGH PROFIT OR LOSS
Norwegian bonds 55 366 55 366 50 635 50 635 56 354 56 354
Norwegian certificates 6 301 6 301 8 066 8 066 7 805 7 805
Foreign bonds 80 355 80 355 90 377 90 377 87 026 87 026
Foreign certificates 394 394 737 737 405 405
Investments with credit institutions 41 594 41 594 33 031 33 031 36 582 36 582
Total debt instruments 184 010 184 010 182 846 182 846 188 172 188 172
33

NOK MILLIONS 31.03.2022 31.03.2021 31.12.2021
Book value Fair value Book value Fair value Book value Fair value
EQUITY CAPITAL INSTRUMENTS AT FAIR VALUE THROUGH PROFIT OR LOSS
Shares 250 922 250 922 206 483 206 483 260 001 260 001
Equity funds 31 220 31 220 19 358 19 358 30 328 30 328
Property funds 4 894 4 894 1 646 1 646 4 147 4 147
Total equity capital instruments 287 036 287 036 227 487 227 487 294 476 294 476
RECEIVABLES
Receivables related to direct business 2 049 2 049 1 914 1 914 1 725 1 725
Receivables related to reinsurance agreements 265 265 174 174 304 304
Reinsurance share of gross claims reserve 72 72 55 55 0 0
Receivables related to securites 10 549 10 549 3 104 3 104 2 727 2 727
Prepaid rent related to real estate activites 257 257 212 212 245 245
Other receivables 282 282 1 400 1 400 374 374
Total other loans and receivables including
receivables from policyholders 13 474 13 474 6 859 6 859 5 377 5 377
FINANCIAL LIABILITIES - AT AMORTIZED COST
Hybrid Tier 1 securities 1 505 1 586 1 637 1 576 1 604 1 586
Subordinated loan capital 2 939 3 310 3 032 3 411 3 000 3 310
Debt to credit institutions 903 903 2 106 2 106 897 897
Covered bonds issued 30 960 30 521 26 345 26 503 31 015 30 591
Liabilities and deposits from customers 13 372 13 372 12 103 12 103 12 901 12 901
Total financial liabilities 49 679 49 691 45 222 45 699 49 417 49 284
FINANCIAL LIABILITIES - AT FAIR VALUE THROUGH PROFIT OR LOSS
Debt to credit institutions 12 031 12 031 4 913 4 913 3 302 3 302
Total financial liabilities 12 031 12 031 4 913 4 913 3 302 3 302
34

NOK MILLIONS 31.03.2022 31.03.2021 31.12.2021
Assets Liabilities Assets Liabilities Assets Liabilities
FINANCIAL DERIVATIVES - AT FAIR VALUE THROUGH PROFIT OR LOSS
Forward exchange contracts 5 166 324 3 563 809 2 019 3 077
Interest rate swaps 611 1 085 237 607 223 1 664
Interest rate and currency swaps 756 0 1 091 0 732 0
Share option 45 0 187 0 279 0
Total financial derivatives 6 578 1 409 5 077 1 416 3 253 4 740
Note 10 Borrowing
NOK MILLIONS Nominal in NOK Currency Interest Due date
Book value
31.03.2022
Book value
31.03.2021
Book value
31.12.2021
FIXED - TERM SUBORDINATED LOAN
Kommunal Landspensjonskasse 2 530 EUR Fixed ¹ 2045 2 939 3 032 3 000
Total subordinated loan capital 2 530 - - - 2 939 3 032 3 000
HYBRID TIER 1 SECURITIES
Kommunal Landspensjonskasse 984 JPY Fixed ² 2034 1 505 1 637 1 604
Total hybrid Tier 1 securities 984 - - - 1 505 1 637 1 604
COVERED BONDS
KLP Kommunekreditt AS 0 NOK Floating 2021 0 261 0
KLP Kommunekreditt AS 0 NOK Fixed 2021 0 605 0
KLP Kommunekreditt AS 1 996 NOK Floating 2022 1 999 4 939 1 999
KLP Kommunekreditt AS 5 000 NOK Floating 2023 5 011 5 006 5 009
KLP Kommunekreditt AS 5 000 NOK Floating 2024 5 007 2 502 5 006
KLP Kommunekreditt AS 5 000 NOK Floating 2025 5 005 2 604 5 003
KLP Kommunekreditt AS 1 000 NOK Floating 2026 1 003 0 1 002
35

NOK MILLIONS Nominal in NOK Currency Interest Due date
Book value
31.03.2022
Book value
31.03.2021
Book value
31.12.2021
KLP Kommunekreditt AS 500 NOK Fixed 2027 511 511 508
KLP Boligkreditt AS 0 NOK Floating 2021 0 567 0
KLP Boligkreditt AS 924 NOK Floating 2022 924 2 501 1 904
KLP Boligkreditt AS 2 500 NOK Floating 2023 2 502 2 501 2 501
KLP Boligkreditt AS 2 500 NOK Floating 2024 2 500 2 500 2 500
KLP Boligkreditt AS 2 500 NOK Floating 2025 2 500 1 798 2 500
KLP Boligkreditt AS 2 500 NOK Floating 2026 2 506 0 2 504
KLP Boligkreditt AS 1 450 NOK Floating 2027 1 452 0 501
Other 38 51 78
Total covered bonds 30 870 - - - 30 960 26 345 31 015
DEBT TO CREDIT INSTITUTIONS
KLP Banken AS 0 NOK Floating 2021 0 1 503 0
KLP Banken AS 300 NOK Floating 2022 301 300 300
KLP Banken AS 300 NOK Floating 2023 301 0 300
KLP Banken AS 300 NOK Floating 2024 301 300 300
KLP Fond 0 NOK/EUR/USD Floating 2021 0 602 0
KLP Fond 0 NOK/EUR/USD Fixed 2021 0 979 0
KLP Fond 2 771 NOK/EUR/USD Floating 2022 2 771 0 385
KLP Fond 1 336 NOK/EUR/USD Fixed 2022 1 336 0 1 241
Kommunal Landspensjonskasse 0 NOK/EUR/USD Floating 2021 0 3 318 0
Kommunal Landspensjonskasse 7 860 NOK/EUR/USD Floating 2022 7 860 0 1 651
Other 64 16 21
Total liabilities to credit institutions 12 868 - - - 12 933 7 018 4 199
36

NOK MILLIONS Nominal in NOK Currency Interest Due date
Book value
31.03.2022
Book value
31.03.2021
Book value
31.12.2021
LIABILITIES AND DEPOSITS FROM CUSTOMERS ³
Retail 11 572 NOK - - 11 572 10 521 11 212
Business 1 762 NOK - - 1 762 1 554 1 650
Foreign 38 NOK - - 38 28 39
Liabilities to and deposits from customers 13 372 - - - 13 372 12 103 12 901
Total financial liabilities 60 624 - - - 61 710 50 135 52 719
1 The loan has an interest change date in 2025.
2 The loan has an interest change date in 2034.
3 There is no contractual maturity date on deposits.
37

The note shows financial liabilities the Group had at the end of the reporting period; where
the majority is funding for KLP Bank Group.
The companies above are the issuers of the financial debt. Deposits belongs to KLP
Banken AS.
Note 11 Fair value hierarchy
31.03.2022
NOK MILLIONS Level 1 Level 2 Level 3 Total
ASSETS BOOKED AT FAIR VALUE
Land/plots 0 0 973 973
Real estate fund 0 0 3 538 3 538
Buildings 0 0 84 769 84 769
Investment property 0 0 89 280 89 280
Lending at fair value 0 56 0 56
Certificates 1 580 5 130 0 6 709
Bonds 23 279 96 507 0 119 786
Fixed-income funds 15 921 7 375 6 863 30 159
Bonds and other fixed-income securities 40 779 109 012 6 863 156 654
Loans and receivables 26 026 1 330 0 27 356
Shares 242 604 5 499 2 819 250 922
Equity funds 2 171 0 51 2 222
Property funds 0 1 144 3 750 4 894
Special funds 0 0 0 0
Private Equity 0 0 28 998 28 998
Shares and units 244 775 6 644 35 617 287 036
Financial derivatives 0 6 578 0 6 578
Total assets at fair value 311 580 123 619 131 760 566 960
LIABILITIES BOOKED AT FAIR VALUE
Financial derivatives 0 1 409 0 1 409
Debt to credit institutions ¹ 10 695 1 336 0 12 031
Total financial liabilities at fair value 10 695 2 745 0 13 440
¹ The line «Debt to credit institutions» includes liabilities measured at fair value and amortized cost. This line is therefore not reconcilable against the
Balance sheet. The liabilities measured at amortized cost amounted to NOK 903 million per 31.03.2022.
38

31.03.2021
NOK MILLIONS Level 1 Level 2 Level 3 Total
ASSETS BOOKED AT FAIR VALUE
Land/plots 0 0 970 970
Real estate fund 0 0 3 320 3 320
Buildings 0 0 76 123 76 123
Investment property 0 0 80 412 80 412
Lending at fair value 0 537 0 537
Certificates 5 182 3 621 0 8 803
Bonds 23 007 101 287 0 124 294
Fixed-income funds 16 752 7 273 4 820 28 845
Bonds and other fixed-income securities 44 941 112 181 4 820 161 942
Loans and receivables 19 481 1 423 0 20 905
Shares 201 194 2 603 2 685 206 483
Equity funds 2 338 0 49 2 388
Property funds 0 1 095 551 1 646
Special funds 0 0 0
Private Equity 0 0 16 970 16 970
Shares and units 203 532 3 698 20 256 227 487
Financial derivatives 0 5 077 0 5 077
Total assets at fair value 267 955 122 917 105 489 496 360
LIABILITIES BOOKED AT FAIR VALUE
Financial derivatives 0 1 416 0 1 416
Debt to credit institutions ¹ 3 934 979 0 4 913
Total financial liabilities at fair value 3 934 2 395 0 6 329
39

31.12.2021
NOK MILLIONS Level 1 Level 2 Level 3 Total
ASSETS BOOKED AT FAIR VALUE
Land/plots 0 0 983 983
Real estate fund 0 0 3 572 3 572
Buildings 0 0 84 980 84 980
Investment property 0 0 89 535 89 535
Lending at fair value 0 79 0 79
Certificates 2 046 6 164 0 8 210
Bonds 24 164 102 021 0 126 186
Fixed-income funds 17 199 7 431 6 227 30 858
Bonds and other fixed-income securities 43 410 115 616 6 227 165 253
Loans and receivables 21 472 1 447 0 22 919
Shares 246 170 10 962 2 869 260 001
Equity funds 2 316 0 50 2 366
Property funds 0 1 133 3 013 4 147
Special funds 0 0 0 0
Private Equity 0 0 27 962 27 962
Shares and units 248 486 12 096 33 895 294 476
Financial derivatives 0 3 253 0 3 253
Sum eiendeler regnskapsført til virkelig verdi 313 367 132 491 129 657 575 515
LIABILITIES BOOKED AT FAIR VALUE
Financial derivatives 0 4 740 0 4 740
Debt to credit institutions ¹ 2 061 1 241 0 3 302
Total financial liabilities at fair value 2 061 5 981 0 8 042
40

Changes in Level 3, Investment Property
Book value
31.03.2022
Book value
31.03.2021
Book value
31.12.2021
Opening balance 1 January 89 535 81 485 81 485
Sold 0 0 -723
Bought 231 138 4 636
Unrealised changes -475 -1 196 4 130
Other changes -11 -15 7
Closing balance 31.03./31.12. 89 280 80 412 89 535
Realised gains/losses 0 0 59
Changes in Level 3, Financial Assets
Book value
31.03.2022
Book value
31.03.2021
Book value
31.12.2021
Opening balance 1 January 40 122 23 420 23 420
Sold -1 293 -870 -4 627
Bought 2 512 2 014 13 867
Unrealised changes 1 139 512 7 463
Closing balance 31.03./31.12. 42 481 25 076 40 122
Realised gains/losses 509 562 2 242
Closing balance 31.03. 131 760 105 489 129 657
Unrealised changes and realized gains / losses are reflected on the line "Net value changes
on financial instruments" in the consolidated income statement.
The tables "Changes in level 3" shows changes in level 3 classified instruments in the
period indicated.
Fair value shall be a representative price based on what a corresponding asset or liability
would have been traded for on normal market terms and conditions. Highest quality in
regard to fair value is based on listed prices in an active market. A financial instrument is
considered as noted in an active market if noted prices are simply and regularly available
from a stock market, dealer, broker, industry grouping, price setting service or regulatory
authority, and these prices represent actual and regularly occurring transactions at arm’s
length.
Level 1:
Instruments at this level obtain fair value from listed prices in an active market for identical
assets or liabilities that the entity has access to at the reporting date. Examples of
instruments at Level 1 are stock market listed securities.
41

Level 2:
Instruments at this level obtain fair value from observable market data. This includes prices
based on identical instruments, but where the instrument does not maintain a high enough
trading frequency and is corresponding therefore not considered to be traded in an active
market, as well as prices based on assets and price-leading indicators that can be
confirmed from market information. Example instruments at Level 2 are fixed income
securities priced on the basis of interest rate paths.
Level 3:
Instruments at Level 3 contain no observable market data or are traded in markets
considered to be inactive. The price is based generally on discrete calculations where the
actual fair value may deviate if the instrument were to be traded. The instruments covered
at Level 3 in the Group include unlisted shares and Private Equity.
Valuations related to items in the various levels are described in Note 9. For description of
the pricing of investment property, please see the annual financial statements.
No sensitivity analysis has been carried out on securities included in Level 3. A sensitivity
analysis for investment property is available in the annual report. A change in the variables
of the pricing is considered of little significance. On a general basis, a 5 percent change in
the pricing would produce a change of NOK 6 588 million as of 31.03.2022.
With regard to transferring securities between the levels, a limit is set for the number of
trading days and the amount of trading for shares by separating Level 1 and Level 2. The
general principles related to the distribution between levels basically concern whether the
asset or liability is listed or not and whether the listing can be stated to be in an active
market. As regards shares, there is a further distinction between trading days and amount
of trading which separates out listed securities that do not form part of an active market.
The values at the end of the reporting period provide the basis for any movement between
the levels.
In the 1st quarter, NOK 1 199 million in stocks moved from Level 1 to Level 2, NOK 60 million
moved from Level 1 to Level 3 and NOK 1 242 million moved from level 2 to level 1. This is
due to changes in liquidity.
Note 12 Liquidity risk
The table below specify the company’s financial obligations ranked by maturity. The
amounts given are non-discounted contractual flows of cash.
42

31.03.2022
NOK MILLIONS Within 1 month 1-12 months 1-5 years 5-10 years Over 10 years Total
Subordinated loan ¹ 0 243 562 639 4 456 5 900
Perpetual hybrid Tier 1 securities ¹ 0 127 255 318 1 165 1 866
Debt to and deposits from customers (without
defined maturity) 12 933 0 0 0 0 12 933
Covered bonds issued 0 2 922 27 146 2 025 0 32 093
Payables to credit institutions 176 1 651 607 0 0 2 434
Financial derivatives 1 915 2 552 197 477 15 5 157
Accounts payable 193 0 0 0 0 193
Contingent liabilities (without defined maturity) 27 001 0 0 0 0 27 001
Total 42 218 7 496 28 768 3 459 5 637 87 577
If the minority interests are taken out of account, derivatives maturing within one month
are reduced with NOK 64 million and derivatives maturing between 1 to 12 months are
reduced with NOK 26 million. Total amount of the financial liabilities for the Group are after
these adjustments NOK 87 486 million.
31.03.2021
NOK MILLIONS Within 1 month 1-12 months 1-5 years 5-10 years Over 10 years Total
Subordinated loan ¹ 0 251 574 658 4 727 6 210
Perpetual hybrid Tier 1 securities ¹ 0 124 249 311 1 304 1 988
Debt to and deposits from customers (without
defined maturity) 12 103 0 0 0 0 12 103
Covered bonds issued 260 1 161 24 840 584 0 26 845
Payables to credit institutions 1 907 908 609 0 0 3 424
Financial derivatives 1 245 2 090 19 51 -106 3 298
Accounts payable 111 0 0 0 0 111
Contingent liabilities (without defined maturity) 26 601 0 0 0 0 26 601
Total 42 228 4 534 26 290 1 604 5 925 80 581
If the minority interests are taken out of account, derivatives maturing within one month
are reduced with NOK 50 million, payables to credit institutions maturing within one month
are reduced with NOK 40 million and derivatives maturing between 1 to 12 months are
reduced with NOK 115 million. Total amount of the financial liabilities for the Group are after
these adjustments NOK 80 377 million.
43

31.12.2021
NOK MILLIONS Within 1 month 1-12 months 1-5 years 5-10 years Over 10 years Total
Subordinated loan ¹ 0 125 573 658 4 725 6 082
Perpetual hybrid Tier 1 securities ¹ 0 64 257 321 1 298 1 941
Debt to and deposits from customers (without
defined maturity) 12 901 0 0 0 0 12 901
Covered bonds issued 0 3 921 26 930 1 003 0 31 855
Payables to credit institutions 1 685 312 608 0 0 2 605
Financial derivatives 3 739 3 366 248 295 216 7 864
Accounts payable 42 0 0 0 0 42
Contingent liabilities (without defined maturity) 28 754 0 0 0 0 28 754
Total 47 121 7 788 28 616 2 277 6 240 92 043
¹ Some of the hybrid capital are perpetual. Estimated cash flows are based on expected maturity at the interest adjustment date.
If the minority interests are taken out of account, derivatives maturing within one month
are reduced with NOK 754 million, payables to credit institutions maturing within one
month are reduced with NOK 335 million and derivatives maturing between 1 to 12 months
are reduced with NOK 237 million. Total amount of the financial liabilities for the Group are
after these adjustments NOK 90 716 million.
The table above shows financial liabilities the Group has grouped by interest payments and
repayment of principal, based on the date payment is due. Banking contains the largest
proportion of the financial liabilities in the Group.
Liquidity risk is the risk that the Group will not be able to meet the financial obligations
that it has. The risk that the Group would not have adequate liquidity to meet its current
liabilities and current operations is very small since a major part of the Group’s assets is
liquid. The Group has significant funds invested in the money market, bonds and shares
that can be sold in the event of a liquidity requirement. The Group’s liquidity strategy
involves the Group always having adequate liquid assets to meet the Group’s liabilities as
they fall due without accruing significant costs associated with releasing assets.
Asset composition in the Group’s portfolios should be adequately liquid to be able to cover
other liquidity needs that may arise. KLP Kapitalforvaltning manages the Group’s liquidity.
Internal parameters have been established for the size of the liquidity holding. The Group’s
risk management unit monitors and reports developments in the liquidity holding
continuously. The Group Board determines an asset management and liquidity strategy
annually. The liquidity strategy includes parameters, responsibilities, risk measurement and
an emergency plan for liquidity management.
44

The major liabilities in the Group are insurance related and are mostly linked to pension
obligations. These liabilities are fully funded and liquidity management are handled in the
same manner as other liabilities.
45

Note 13 Interest rate risk
31.03.2022
NOK MILLIONS
Up to 3
months
From 3
months
to 12
months
From 1
year to
5 years
From 5
years to
10 years
Over
10 years
Changes in
cash flow 01.01.2022
-31.03.2022 Total
Adjusted for the
unit holders'
interests in
consolidated
securities funds
ASSETS
Financial derivatives classified as assets 17 -8 39 133 -142 10 48 37
Debt instruments classified as loans and receivables – at amortised
cost 0 0 0 0 0 0 0 3
Bonds and other fixed-return securities -44 -52 -1 047 -1 453 -1 698 71 -4 223 -3 296
Fixed income fund holdings -1 122 0 0 0 0 0 -1 122 -1 122
Lending and receivables -1 0 0 0 0 74 74 119
Lending 0 0 0 0 0 206 206 206
Cash and bank deposits 0 0 0 0 0 7 7 7
Contingent liabilities ¹ 0 0 0 0 0 11 11 11
Total assets -1 150 -60 -1 007 -1 320 -1 840 380 -4 998 -4 036
LIABILITIES
Deposit 0 0 0 0 0 -34 -34 -34
Liabilities created on issue of securities 0 0 0 0 0 -80 -80 -80
Financial derivatives classified as liabilities 2 2 -23 1 0 -1 -18 -17
Hybrid capital, subordinated loans 0 0 0 38 70 0 108 108
Debt to credit institutions 0 0 0 0 0 -29 -29 -29
Total liabilities 2 2 -23 39 70 -144 -54 -53
Total before tax -1 148 -59 -1 030 -1 281 -1 770 236 -5 053 -4 089
Total after tax -861 -44 -773 -961 -1 328 177 -3 789 -3 067
46

31.03.2021
NOK MILLIONS
Up to 3
months
From 3
months
to 12
months
From 1
year to
5 years
From 5
years to
10 years
Over
10 years
Changes in
cash flow 01.01.2021
-31.03.2021 Total
Adjusted for the
unit holders'
interests in
consolidated
securities funds
ASSETS
Financial derivatives classified as assets 20 -10 -30 -2 -189 0 -210 -191
Debt instruments classified as loans and receivables – at amortised
cost 0 0 0 0 0 2 2 2
Bonds and other fixed-return securities -43 -54 -1 163 -1 767 -2 167 73 -5 123 -4 160
Fixed income fund holdings -1 315 0 0 0 0 0 -1 315 -1 315
Lending and receivables 0 -1 0 0 0 62 61 50
Lending 0 0 0 0 0 195 195 195
Cash and bank deposits 0 0 0 0 0 13 13 13
Contingent liabilities ¹ 0 0 0 0 0 13 13 13
Total assets -1 338 -65 -1 193 -1 770 -2 356 358 -6 364 -5 393
LIABILITIES
Deposit 0 0 0 0 0 -31 -31 -31
Liabilities created on issue of securities 0 0 0 0 0 -71 -71 -71
Financial derivatives classified as liabilities -2 5 39 35 0 5 81 81
Hybrid capital, subordinated loans 0 0 0 46 81 0 127 127
Debt to credit institutions 0 0 0 0 0 -23 -23 -23
Total liabilities -2 5 39 81 81 -120 83 83
Total before tax -1 340 -60 -1 154 -1 689 -2 275 237 -6 281 -5 310
Total after tax -1 005 -45 -865 -1 267 -1 706 178 -4 711 -3 983
47

31.12.2021
NOK MILLIONS
Up to 3
months
From 3
months
to 12
months
From 1
year to
5 years
From 5
years to
10 years
Over
10 years
Changes in
cash flow 01.01.2021
-31.12.2021 Total
Adjusted for the
unit holders'
interests in
consolidated
securities funds
ASSETS
Financial derivatives classified as assets 33 -1 -1 53 -209 2 -122 -99
Debt instruments classified as loans and receivables – at amortised
cost 0 0 0 0 0 16 16 0
Bonds and other fixed-return securities -46 -55 -1 128 -1 553 -2 018 293 -4 508 -3 780
Fixed income fund holdings -1 321 0 0 0 0 0 -1 321 -1 321
Lending and receivables 0 -1 0 0 0 85 84 187
Lending 0 0 0 0 0 819 819 819
Cash and bank deposits 0 0 0 0 0 34 34 34
Contingent liabilities ¹ 0 0 0 0 0 41 41 41
Total assets -1 334 -57 -1 129 -1 501 -2 227 1 290 -4 957 -4 119
LIABILITIES
Deposit 0 0 0 0 0 -133 -133 -133
Liabilities created on issue of securities 0 0 0 0 0 -318 -318 -318
Financial derivatives classified as liabilities 1 1 20 26 0 14 62 48
Hybrid capital, subordinated loans 0 0 0 43 77 0 119 119
Debt to credit institutions 0 0 0 0 0 -41 -41 -41
Total liabilities 1 1 20 69 77 -479 -311 -325
Total before tax -1 334 -55 -1 109 -1 432 -2 150 811 -5 268 -4 444
Total after tax -1 000 -41 -831 -1 074 -1 612 609 -3 951 -3 333
¹ Contingent liabilities are lending agreements that are not yet
materialized.
48

The note shows the effect on profits if market interest rates were to increase by one
percent, for fair value risk and variable interest risk.
Change in fair value (fair value risk) is shown in the first five columns and is calculated by
the change in fair value of interest bearing instruments if interest rates had been one
percent higher at the end of the period. The column change in cash flow shows the change
in cash flows if the interest had been one percent higher over the year being reported on.
The sum of these results reflects the overall effect that the scenario had given the group
during the period being reported on.
The fair value risk applies to fixed interest securities were the market value of the
securities is affected by market interest rates. Floating rate risk applies to securities with
floating interest rates, where a change in market interest rates affects the cash-flow from
the interest bearing securities.
The following securities are included in the note; securities measured at fair value through
profit or loss (floating and fixed interest rates), investments held to maturity (only those
with floating interest rates) and loans and receivables (only those with floating interest
rates). The group has no securities classified as available for sale.
The Groups total interest rate risk is limited as a significant portion of the investments are
bonds with fixed interest rates that are classified as held to maturity and loans and
receivables, or fixed rate lending, measured at amortized cost. A change in market interest
rate does not affect profit or loss for these assets.
Insurance contracts with guaranteed return does not change the accounting value even if
interest rates change. Changes in interest rates also has no impact on the guaranteed
return , but will have an impact on the achieved return to cover the guaranteed return .
This is because that insurance funds partly invested in debt instruments whose cash flows
should help to meet the guaranteed return.
49

Note 14 Credit risk
31.03.2022
NOK MILLIONS
Investment
grade
AAA to BBB
Lower
rating
Public
sector
guarantee
Bank and
finance
Mortgage
< 80% ¹
Mortgage
> 80% ¹ Other Total
Adjusted for
the unit holders'
interest in
consolidated
securites funds
Debt instruments held to maturity at amortized cost 24 020 18 0 0 0 0 1 338 25 376 25 376
Debt instruments classified as loans and receivables at
amortized cost 145 497 0 380 1 700 0 0 18 858 166 434 166 434
Debt instruments at fair value - fixed-return securities 111 139 2 334 4 908 3 850 0 0 11 640 133 870 111 917
Fixed-income funds 0 0 0 0 0 0 22 784 22 784 22 784
Loans and receivables 27 050 0 0 306 0 0 0 27 356 22 597
Financial derivatives classified as assets 6 578 0 0 0 0 0 0 6 578 5 748
Cash and bank deposits 2 904 0 0 67 0 0 0 2 971 2 971
Lending 0 0 90 762 0 23 967 2 127 2 029 118 885 118 885
Total 317 187 2 351 96 050 5 923 23 967 2 127 56 649 504 254 476 713
50

SPECIFICATION OF INVESTMENT GRADE
NOK MILLIONS AAA AA A BBB
Total
Investment
grade
Debt instruments held to maturity at amortized cost 11 056 2 704 6 798 3 462 24 020
Debt instruments classified as loans and receivables at amortized
cost 22 302 24 680 57 681 40 834 145 497
Debt instruments at fair value - fixed-return securities 32 417 14 060 31 896 32 765 111 139
Fixed-income funds 0 0 0 0 0
Loans and receivables 0 8 871 17 101 1 079 27 050
Financial derivatives classified as assets 0 2 475 4 074 29 6 578
Cash and bank deposits 0 2 310 593 0 2 904
Lending 0 0 0 0 0
Total 65 775 55 100 118 143 78 170 317 187
51
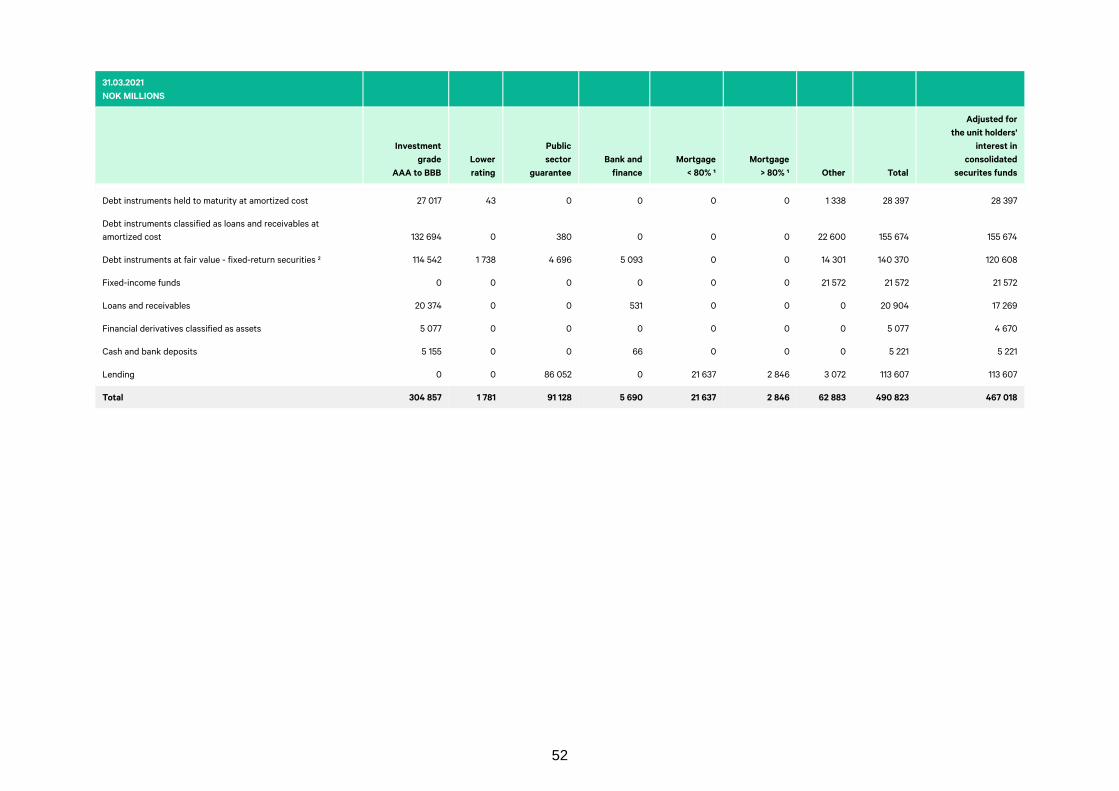
31.03.2021
NOK MILLIONS
Investment
grade
AAA to BBB
Lower
rating
Public
sector
guarantee
Bank and
finance
Mortgage
< 80% ¹
Mortgage
> 80% ¹ Other Total
Adjusted for
the unit holders'
interest in
consolidated
securites funds
Debt instruments held to maturity at amortized cost 27 017 43 0 0 0 0 1 338 28 397 28 397
Debt instruments classified as loans and receivables at
amortized cost 132 694 0 380 0 0 0 22 600 155 674 155 674
Debt instruments at fair value - fixed-return securities ² 114 542 1 738 4 696 5 093 0 0 14 301 140 370 120 608
Fixed-income funds 0 0 0 0 0 0 21 572 21 572 21 572
Loans and receivables 20 374 0 0 531 0 0 0 20 904 17 269
Financial derivatives classified as assets 5 077 0 0 0 0 0 0 5 077 4 670
Cash and bank deposits 5 155 0 0 66 0 0 0 5 221 5 221
Lending 0 0 86 052 0 21 637 2 846 3 072 113 607 113 607
Total 304 857 1 781 91 128 5 690 21 637 2 846 62 883 490 823 467 018
52

SPECIFICATION OF INVESTMENT GRADE
NOK MILLIONS AAA AA A BBB
Total
Investment
grade
Debt instruments held to maturity at amortized cost 11 879 4 148 7 133 3 857 27 017
Debt instruments classified as loans and receivables at amortized
cost 22 795 21 731 53 999 34 170 132 694
Debt instruments at fair value - fixed-return securities 27 710 14 410 32 371 40 050 114 542
Fixed-income funds 0 0 0 0 0
Loans and receivables 0 8 498 11 541 335 20 374
Financial derivatives classified as assets 0 1 522 3 501 54 5 077
Cash and bank deposits 0 4 258 896 0 5 155
Lending 0 0 0 0 0
Total 62 383 54 566 109 442 78 466 304 857
53

31.12.2021
NOK MILLIONS
Investment
grade
AAA to BBB
Lower
rating
Public
sector
guarantee
Bank and
finance
Mortgage
< 80% ¹
Mortgage
> 80% ¹ Other Total
Adjusted for
the unit holders'
interest in
consolidated
securites funds
Debt instruments held to maturity at amortized cost 24 553 36 0 0 0 0 1 396 25 985 25 985
Debt instruments classified as loans and receivables at
amortized cost 142 017 0 377 1 683 0 0 20 406 164 484 164 484
Debt instruments at fair value - fixed-return securities 117 047 1 454 5 295 3 835 0 0 14 196 141 827 116 454
Fixed-income funds 0 0 0 0 0 0 23 426 23 426 23 426
Loans and receivables 21 934 0 0 985 0 0 0 22 919 15 955
Financial derivatives classified as assets 3 253 0 0 0 0 0 0 3 253 2 908
Cash and bank deposits 3 320 0 0 67 0 0 0 3 388 3 388
Lending - 0 90 582 0 23 025 2 329 2 167 118 103 118 103
Total 312 124 1 490 96 253 6 570 23 025 2 329 61 592 503 384 470 702
¹ These two columns provide information on the proportion of loans with mortgage security within 80% of base value and loans that exceed 80% mortgage of base value.
54

SPECIFICATION OF INVESTMENT GRADE
NOK MILLIONS AAA AA A BBB
Total
Investment
grade
Debt instruments held to maturity at amortized cost 11 168 2 797 6 989 3 598 24 553
Debt instruments classified as loans and receivables at amortized
cost 20 632 25 034 60 915 35 437 142 017
Debt instruments at fair value - fixed-return securities 33 523 14 839 34 861 33 823 117 047
Fixed-income funds 0 0 0 0 0
Loans and receivables 0 9 433 11 881 621 21 934
Financial derivatives classified as assets 0 706 2 545 2 3 253
Cash and bank deposits 0 2 672 648 0 3 320
Lending 0 0 0 0 0
Total 65 323 55 481 117 840 73 480 312 124
Credit risk means the risk of the counterparty not being able to meet its own obligations
toward the KLP Group. In this table the credit risk is measured through the rating agencies’
estimates of how high the creditworthiness of the various issuers of securities is. Not rated
assets that are placed in other categories that describe the credit risk, such as sector and
guarantees.
Emphasis is placed on diversification of credit exposure to avoid concentration of credit
risk against individual debtors. To monitor credit risk in lending and investments a special
credit committee has been established, meeting regularly. The limits for credit risk against
the individual debtor are set by the committee. Changes in debtors’ credit assessments are
monitored and followed up by KLP Kapitalforvaltning AS.
The Group has good balance between Norwegian bonds and international bonds and has a
portfolio of exclusively good credit notes.
The Group can be said to have a high concentration of debt instruments directed at the
Norwegian public sector, however this does not imply concentration risk in the ordinary
meaning since the counterparty risk is considered to be minimal.
The rating above are gathered from Standard & Poor's, Moody's, Fitch, Scope Ratings and
Nordic Credit Rating. The rating is converted to S&P's rating table, where AAA is linked to
securities with the highest creditworthiness. The lowest rating of the five is used and all
five rating agencies are equal as the basis for investments in fixed income securities.
“Other” is mainly securities issued by power companies and other corporate bonds. KLP
Group has strict guidelines for investments in fixed-income securities, which also apply to
investments falling into the “Other” category.
55

The lines in the note coincide with the financial position statement layout. The exceptions
are debt instruments at fair value, which are divided into three categories in the note and
lending which is shown combined in the note, but is shown in two lines in the financial
position statement (fair value and amortized cost).
The consolidated accounts includes all the units that KLP Group is considered to have
control over. This gives an impression of a higher risk than the actual one, since the risk
that the Group does not actually carry appears in the accounts. The outer column includes
actual ownership and credit risk of the Group companies and investment funds held by
KLP Group at the end of the period.
56

NOK MILLIONS 31.03.2022 31.03.2021 31.12.2021
Consolidated
Adjusted for
the unit
holders' in
consolidated
securites funds Consolidated
Adjusted for
the unit
holders' in
consolidated
securites funds Consolidated
Adjusted for
the unit
holders' in
consolidated
securites funds
10 LARGEST COUNTERPARTIES
Counterparty 1 15 166 11 597 13 865 12 370 15 032 11 995
Counterparty 2 13 091 12 127 12 195 11 279 14 514 11 891
Counterparty 3 11 019 8 359 10 059 7 545 10 578 7 482
Counterparty 4 8 575 7 064 7 449 7 208 8 586 6 660
Counterparty 5 6 509 6 509 5 744 5 497 7 828 6 377
Counterparty 6 6 325 6 233 5 497 5 478 7 706 5 830
Counterparty 7 5 502 5 502 4 752 4 752 6 377 5 548
Counterparty 8 4 804 4 752 4 692 4 658 5 878 4 928
Counterparty 9 4 752 4 568 4 030 3 923 5 548 4 698
Counterparty 10 4 632 4 444 3 934 3 920 4 698 4 506
Total 80 375 71 153 72 215 66 630 86 745 69 916
57

The table above shows the 10 largest counterparties to which the KLP Group has exposure.
The amounts stated are book value. “Adjusted for the minority holding” includes only that
which is in the Group’s ownership and where the Group retains actual credit risk. The
majority of the 10 largest counterparties are either finance institutions or counterparties
covered by a public sector guarantee (central or local government guarantee).
Note 15 Technical provisions in life insurance
NOK MILLIONS 31.03.2022 31.03.2021 31.12.2021
Premium reserves - ordinary tarif 485 449 452 739 486 276
Premium funds, buffer funds and pensioners’ surplus funds 157 526 38 197 41 268
Supplementary reserves 0 43 461 48 812
Securities adjustment fund 0 56 693 77 194
Other provisions 1 0 1
Profit/loss allocated to insurance contracts 105 4 708 0
Technical provisions in life insurance 643 082 595 798 653 551
Note 16 Other current liabilities
NOK MILLIONS 31.03.2022 31.03.2021 31.12.2021
Short-term payables trade in securities 11 532 3 899 3 645
Incurred not assessed taxes 269 1 414 560
Advance tax-deduction pension scheme 439 392 491
Accounts payable 444 314 226
Pre-called contribution to insurance 904 850 699
Other current liabilities 1 259 1 519 1 187
Total other current liabilities 14 848 8 387 6 808
Note 17 SCR ratio
The Solvency II balance sheet includes assets and liabilities at fair value. For assets that
have a different value in the accounts change in balance value are added. There are no
observable market values for KLP’s insurance liabilities, which are thus calculated by way
of a best estimate based on actuarial assumptions. In addition there is a risk margin that is
to reflect a third party’s capital costs by taking over these liabilities.
Tier 1 capital appears from the Solvency II balance sheet and Hybrid Tier 1 securities. Tier 2
capital consist of subordinated loans and ancillary own funds. The Financial Supervisory
Authority of Norway has accepted that KLP’s right to call in further member contribution if
necessary, which is laid down in the Company’s articles of association, can be counted as
58

ancillary own funds, the amount corresponding to 2.5 per cent of the Company’s premium
reserve. Capital that may be included in Tier 2 capital is limited upwards to 50 per cent of
SCR.
Without the use of the transitional measure on technical provisions the Company’s SCR
ratio is 299 per cent, which is well over the Company’s target of at least 150 per cent. With
the transitional measure on technical provisions the SCR ratio is 299 per cent.
59

31.03.2022 31.03.2021 31.12.2021
Solvency II - SCR ratio 299 % 258 % 287 %
Solvency II - SCR ratio 299 % 258 % 287 %
NOK BILLIONS 31.03.2022 31.03.2021 31.12.2021
Simplified Solvency II Financial Position Statement
Assets, book value 713 653 710
Added values - hold-to-maturity portfolio/loans and receivables -4 10 6
Added values - other lending -1 1 0
Other added/lesser values 0 0 0
Deferred tax asset 0 0 0
Total assets - solvency II 708 664 716
NOK BILLIONS 31.03.2022 31.03.2021 31.12.2021
Simplified Solvency II Financial Position Statement
Best estimate 630 597 649
Risk margin 12 13 13
Hybrid Tier 1 securities/Subordinated loan capital 5 5 5
Other liabilities 1 25 16 12
Deferred tax liabilities 1 1 1
Total liabilities - solvency II 672 632 679
Excess of assets over liabilities 37 32 36
- Deferred tax asset 0 0 0
+ Hybrid Tier 1 securities 2 2 2
Tier 1 basic own funds 38 34 38
Total eligible tier 1 own funds 38 34 38
Subordinated loans 3 3 3
Tier 2 basic own funds 3 3 3
Ancillary own funds 0 12 12
Tier 2 ancillary own funds 0 12 12
Deduction for max. eligible tier 2 own funds 4 -7 -8
Total eligible tier 2 own funds 7 7 7
Deferred tax asset 0 0 0
Total eligible tier 3 own funds 0 0 0
Solvency II total eligible own funds 45 41 45
Solvency capital requirement (SCR) 15 16 16
Solvency II- SCR ratio 299 % 258 % 287 %
60

Note 18 Presentation of assets and liabilities that are subject tosettlement
31.03.2022
NOK MILLIONS
Related amounts not
presented net
Gross
financial
assets/
liabilities
Gross
assets/
liabilities
presented net
Book
value
Financial
instruments
Security
in cash
Security in
securities
Net
amount
Adjusted for
the unit holders'
interest in
consolidated
securities funds
ASSETS
Financial derivatives 6 578 0 6 578 -676 -9 936 -1 713 155 155
Repos 0 0 0 0 0 0 0 0
Total 6 578 0 6 578 -676 -9 936 -1 713 155 155
LIABILITIES
Financial derivatives 1 409 0 1 409 -676 -21 0 733 733
Repos 1 337 0 1 337 0 0 0 1 337 1 337
Total 2 746 0 2 746 -676 -21 0 2 070 2 070
61

31.03.2021
NOK MILLIONS
Related amounts not
presented net
Gross
financial
assets/
liabilities
Gross
assets/
liabilities
presented net
Book
value
Financial
instruments
Security
in cash
Security in
securities
Net
amount
Adjusted for
the unit holders'
interest in
consolidated
securities funds
ASSETS
Financial derivatives 5 077 0 5 077 -1 405 -3 458 -557 422 430
Repos 0 0 0 0 0 0 0 0
Total 5 077 0 5 077 -1 405 -3 458 -557 422 430
LIABILITIES
Financial derivatives 1 416 0 1 416 -1 405 -69 -131 11 11
Repos 979 0 979 0 0 0 979 979
Total 2 395 0 2 395 -1 405 -69 -131 990 990
62

31.12.2021
NOK MILLIONS
Related amounts not
presented net
Gross
financial
assets/
liabilities
Gross
assets/
liabilities
presented net
Book
value
Financial
instruments
Security
in cash
Security in
securities
Net
amount
Adjusted for
the unit holders'
interest in
consolidated
securities funds
ASSETS
Financial derivatives 3 253 0 3 253 -2 375 -1 753 -709 281 281
Repos 1 200 0 1 200 -1 200 0 0 0 0
Total 4 453 0 4 453 -3 575 -1 753 -709 281 281
LIABILITIES
Financial derivatives 4 740 0 4 740 -2 375 -367 -669 1 363 1 301
Repos 1 241 0 1 241 0 0 0 1 241 41
Total 5 982 0 5 982 -2 375 -367 -669 2 605 1 342
63

The purpose of the note is to show the potential effect of netting agreements at the KLP
Group; what possibilities the KLP Group has to net bilateral agreements against other
counterparties should the latter go bankrupt and the remaining amount if all such netting
agreements are materialized.
The note shows derivative positions and repo agreements in the financial position
statement. Repos are a part of the line "Debt to credit institutions" in the balance sheet.
The consolidated figures includes all units the KLP Group is considered to have control
over. In addition, the outer line shows which de facto net amount remains if all the groups
netting agreements are set off; which only includes subsidiaries and units, where the group
carries the risk.
Note 19 Pension obligations
NOK MILLIONS 31.03.2022 31.03.2021 31.12.2021
Capitalized net liability 01.01. 870 934 934
Capitalized pension costs 52 47 192
Capitalized financial costs 5 5 20
Actuarial gains and losses -426 -185 -84
Premiums / contributions received -28 -29 -191
Capitalized net liability 31.03./31.12. 474 772 870
Assumptions 31.03.2022 31.03.2021 31.12.2021
Discount rate 2,70 % 2,00 % 1,90 %
Salary growth 2,75 % 2,25 % 2,75 %
The National Insurance basic amount (G) 2,50 % 2,00 % 2,50 %
Pension increases 1,75 % 1,24 % 1,75 %
Social security contribution rate 14,10 % 14,10 % 14,10 %
Capital activity tax 5,00 % 5,00 % 5,00 %
The effect of changes in pension assumptions reduces the pension liability for employees with NOK 426 million as of 31.03.2022. The change is
recognized in other comprehensive income in the income statement.
64
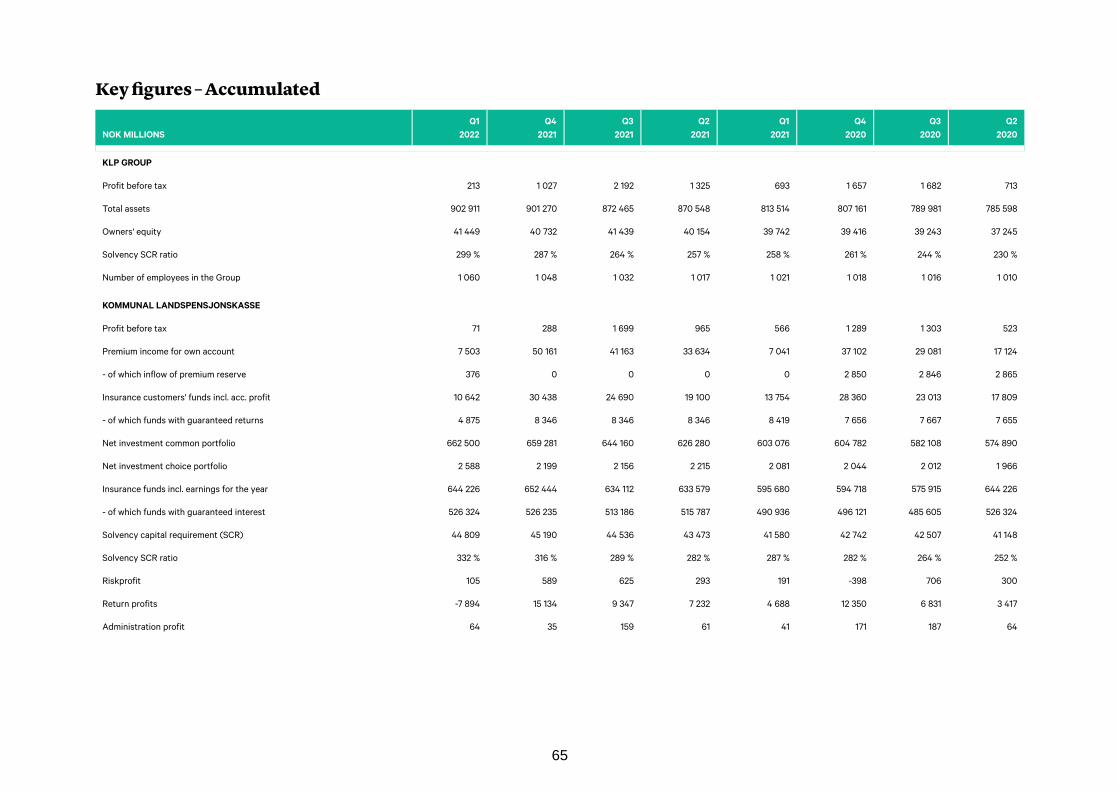
Key figures – Accumulated
NOK MILLIONS
Q1
2022
Q4
2021
Q3
2021
Q2
2021
Q1
2021
Q4
2020
Q3
2020
Q2
2020
KLP GROUP
Profit before tax 213 1 027 2 192 1 325 693 1 657 1 682 713
Total assets 902 911 901 270 872 465 870 548 813 514 807 161 789 981 785 598
Owners' equity 41 449 40 732 41 439 40 154 39 742 39 416 39 243 37 245
Solvency SCR ratio 299 % 287 % 264 % 257 % 258 % 261 % 244 % 230 %
Number of employees in the Group 1 060 1 048 1 032 1 017 1 021 1 018 1 016 1 010
KOMMUNAL LANDSPENSJONSKASSE
Profit before tax 71 288 1 699 965 566 1 289 1 303 523
Premium income for own account 7 503 50 161 41 163 33 634 7 041 37 102 29 081 17 124
- of which inflow of premium reserve 376 0 0 0 0 2 850 2 846 2 865
Insurance customers' funds incl. acc. profit 10 642 30 438 24 690 19 100 13 754 28 360 23 013 17 809
- of which funds with guaranteed returns 4 875 8 346 8 346 8 346 8 419 7 656 7 667 7 655
Net investment common portfolio 662 500 659 281 644 160 626 280 603 076 604 782 582 108 574 890
Net investment choice portfolio 2 588 2 199 2 156 2 215 2 081 2 044 2 012 1 966
Insurance funds incl. earnings for the year 644 226 652 444 634 112 633 579 595 680 594 718 575 915 644 226
- of which funds with guaranteed interest 526 324 526 235 513 186 515 787 490 936 496 121 485 605 526 324
Solvency capital requirement (SCR) 44 809 45 190 44 536 43 473 41 580 42 742 42 507 41 148
Solvency SCR ratio 332 % 316 % 289 % 282 % 287 % 282 % 264 % 252 %
Riskprofit 105 589 625 293 191 -398 706 300
Return profits -7 894 15 134 9 347 7 232 4 688 12 350 6 831 3 417
Administration profit 64 35 159 61 41 171 187 64
65

NOK MILLIONS
Q1
2022
Q4
2021
Q3
2021
Q2
2021
Q1
2021
Q4
2020
Q3
2020
Q2
2020
Solvency capital 151 201 196 049 176 437 174 816 160 647 172 863 141 563 143 139
Book return on common portfolio -0,8 % 5,0 % 3,5 % 2,6 % 1,4 % 4,8 % 3,2 % 1,9 %
Value-adjusted return on common portfolio -2,3 % 8,4 % 5,6 % 4,4 % 1,5 % 4,2 % 1,4 % -0,5 %
Return on unit-linked portfolio -1,2 % 8,9 % 5,8 % 5,0 % 1,9 % 4,2 % 0,4 % -1,8 %
Return on corporate portfolio 0,6 % 3,4 % 2,5 % 1,7 % 0,8 % 3,1 % 1,3 % 0,4 %
KLP SKADEFORSIKRING AS
Profit before tax -24,3 397,7 343,9 225,9 71,6 220,0 97,2 18,2
Gross premium due 516,4 1 939,3 1 436,2 940,6 460,1 1 728,4 1 280,4 840,4
Premium income for own account 492,4 1 864,6 1 380,9 903,6 441,7 1 657,6 1 227,8 804,6
Owners' equity 2 280,9 2 265,8 2 348,3 2 294,4 2 178,7 2 110,9 1 990,7 1 924,0
Claims ratio 79,6 % 76,4 % 73,6 % 74,5 % 72,8 % 83,1 % 83,1 % 83,3 %
Combined-ratio 95,1 % 92,1 % 85,1 % 90,3 % 89,2 % 100,7 % 100,7 % 101,9 %
Return on assets under management -0,9 % 5,0 % 3,4 % 2,6 % 0,6 % 5,0 % 2,3 % 0,8 %
Solvency capital requirement (SCR) 2 329 2 278 2 290 2 267 2 193 2 132 2 006 1 934
Solvency SCR ratio 222 % 224 % 267 % 252 % 238 % 239 % 246 % 234 %
Annual premium in force – retail market 892,8 871,4 846,7 828,9 806,8 786,0 759,8 734,6
Annual premium in force – public sector market 1 210,0 1 148,8 1 135,0 1 128,0 1 080,4 1 016,4 1 009,9 999,7
Net new subscriptions (accumulated within the year) 7,2 91,2 75,9 65,0 17,0 87,6 74,8 51,5
KLP BANKEN GROUP
Profit/loss before tax 18,3 116,1 93,8 54,3 48,6 136,8 101,7 39,8
Net interest income 72,1 308,6 232,8 152,8 75,7 317,3 229,3 136,0
Other operating income 20,3 78,9 58,6 38,6 19,0 77,7 58,6 39,0
Operating expenses and depreciation -64,0 -238,5 -174,2 -118,6 -60,6 -232,1 -164,5 -119,1
Net realized/unrealized changes in financial instruments to fair value -10,1 -32,9 -23,5 -18,6 14,5 -26,1 -21,7 -16,1
Contributions 13 372 12 901 12 774 12 643 12 103 11 781 11 993 12 245
Housing mortgages granted 22 635 22 090 21 365 21 409 20 894 20 570 20 610 20 121
66

NOK MILLIONS
Q1
2022
Q4
2021
Q3
2021
Q2
2021
Q1
2021
Q4
2020
Q3
2020
Q2
2020
Loan(s) with public guarantee(s) 17 974 17 844 16 842 16 752 16 734 17 654 16 933 17 357
Defaulted loans 46 36 32 34 57 54 48 77
Borrowing on the issuance of securities 31 862 31 918 29 536 29 195 27 147 25 800 26 203 25 993
Total assets 47 954 47 482 44 980 45 216 43 200 42 688 43 438 43 855
Average total assets 47 718 45 085 43 834 43 952 42 944 41 188 41 568 41 777
Owners' equity 2 548 2 521 2 490 2 474 2 470 2 427 2 389 2 343
Net interest rate 0,15 % 0,68 % 0,53 % 0,35 % 0,18 % 0,80 % 0,57 % 0,33 %
Profit/loss from general operations before tax 0,04 % 0,26 % 0,21 % 0,12 % 0,11 % 0,33 % 0,24 % 0,10 %
Return on owners’ equity before tax 2,91 % 4,78 % 5,15 % 4,47 % 8,02 % 6,16 % 6,11 % 3,59 %
Capital adequacy 18,1 % 18,7 % 18,6 % 18,4 % 19,3 % 19,5 % 18,7 % 18,4 %
Number of private customers 47 123 46 463 47 750 46 872 46 116 45 406 44 842 44 213
Of this members of KLP 31 973 31 587 32 615 31 664 32 183 32 048 31 869 32 533
KLP KAPITALFORVALTNING AS
Profit/loss before tax -21,5 56,0 53,0 24,6 20,7 30,9 25,6 -1,9
Total assets under management 646 213 668 855 647 995 627 599 602 400 596 254 579 129 563 238
Assets managed for external customers 134 367 136 792 123 811 121 308 111 821 103 378 100 106 87 968
67

KLP’s sustainability accountsQ1 2022
KLP’s purpose is to provide secure and competitive pension savings in a way that
contributes to the realisation of the United Nations Sustainable Development Goals (SDGs)
and the Paris Agreement’s climate goals. Our ambition is to be among the leaders in our
sector for corporate responsibility.
In this sustainability report, we give an account of how KLP engages in the field of
corporate responsibility and sustainability and the results we have achieved so far this
year. Our sustainability reporting rests on KLP’s core values:
• Open: KLP is as open and transparent as possible, because we think this makes our
endeavours more influential and effective. We are therefore open about both our
positive and negative impacts.
• Clear: KLP reports clearly and in ways that are understandable for our stakeholders. We
define clearly and explain what we mean by the terms we use.
• Responsible: KLP will report responsibly and present our results accurately, focusing on
the areas that are material for KLP.
• Committed: KLP considers openness an important contributor to and a precondition for
further development in the financial sector. We therefore seek to report in a way that is
comparable with other entities, and we base our reporting on best practice and existing
standards.
Engaged and responsible owner
KLP aims to be an engaged and responsible owner. This is stated in KLP’s corporate
strategy and corporate responsibility strategy, as well as its asset management strategy
and associated investment principles. Our strategies and guidelines are based on
international norms and conventions intended to promote human rights and decent
working conditions, reduce harm to the climate and the environment, and contribute to
sustainable development.
As a responsible investor and owner, we utilise the following tools in our work:
• We integrate sustainability factors in our investment analyses and decision-making
processes.
• We try to influence companies, business sectors and markets to engage in sustainable
value creation through the exercise of active ownership.
• We exclude companies that violate our criteria and that show neither a willingness nor
an ability to change.
68

Goals
• KLP aimes to vote at 95 per cent of general meetings in Norway and abroad throughout
the year.
• KLP aimes to follow up 240 companies in 2022.
31.03.2022 31.03.2021 31.03.2020 UN SDGs
Companies excluded from investment 727 589 534 All SDGs
General meetings of Norwegian companies at which KLP has
voted (number/percentage) 9 (90 %) 5 (71 %) 10 (100 %) n/a
General meetings of foreign companies at which KLP has voted
(number/percentage) 1 103 (98 %) 641 (97 %) 965 (96 %) n/a
Individual companies KLP has engaged in direct dialogue with on
ESG issues 49 47 102 All SDGs
Comments on performance in the first quarter
KLP decided to freeze the first shares in Russia in 2014 due to the political risk. As a result
of the invasion and war in Ukraine, KLP decided in February to exit Russia and to exclude
22 Russian companies. We are working to divest our investments in these companies. The
sale of companies listed on the Moscow Stock Exchange will be carried out when the stock
exchange opens and in line with what the sanctions regulations allow.
At the end of the first quarter, KLP had voted at 98 per cent of the general meetings of
foreign companies, and at 90 per cent of the general meetings of Norwegian companies.
This is somewhat below the target, but the voting season has just begun, and the target
applies to an overall assessment of the voting season.
KLP was in dialogue with 49 companies on topics related to ESG, including human rights in
conflict areas, indigenous rights in mining, employee rights in supply chains to meat
producers, salmon producers on risks related to climate and biodiversity, deforestation in
Brazil and election committees on board composition.
Climate, environment and nature
In the longer term, climate change and the impoverishment of nature and the environment
will affect KLP’s opportunities to create a good return on the pension assets we manage.
We have worked systematically on climate risk over several years to enable us to analyse,
manage and report climate risk as a financial risk. At the same time, we have a
responsibility to minimise the impact we have on the climate, the environment and nature –
directly through our own activities and indirectly through our customers, partners,
suppliers and investments.
69

Climate goals and climate-friendly investments
If the world is to keep global warming below 1.5C, global emissions must reach net zero by
2050. Thus, KLP has a goal of aligning our investments to this target and reach net zero in
our portfolio as well. We have developed our own roadmap, which describes how KLP will
assess each individual investment against an emission pathway compatible with the 1.5C
target, and how we will work towards and measure our contribution to the goals set out in
the Paris Agreement.
Huge investments are needed if the world is to reach the Paris Agreement’s climate targets
and succeed in transitioning to a low-emission society. One important aspect of KLP’s
climate goals is to increase our climate-friendly investments. Climate-friendly investments
are those which contribute directly to emission reductions or otherwise contribute to the
green transition in Norway or around the world. We distinguish between two different
categories of climate-friendly investments:
• Zero-emission investments – These are investments involving zero or almost zero
emissions from operations (not including Scope 3 emissions). The category includes
renewable energy, sustainable forestry, and zero-emission transport. These are the
same zero-emission investments that are 100 per cent Paris aligned in KLP’s climate
goals.
• Transitional investments – These are investments that contribute to a reduction in
emissions and the development of new technologies, or that help sectors that would
find it hard to reach zero emissions to reduce their emissions and become more
sustainable. This is achieved through green lending and bonds, green buildings, and
infrastructure.
Goals
• To increase KLP’s climate-friendly investments by NOK 6 billion per year
70

MILLION NOK New in Q1 2022 31.03.2022 31.03.2021 31.03.2020 UN SDGs
Zero-emission investments 1 731 33 150 33 005 30 248
Renewable energy 1 731 30 686 30 775 30 248 7. 9. 17.
As a share of KLP's total investments 4.3 % 4.8 % 4.9 % 7.
Renewable energy in Norway 1 025 20 354 22 246 22 035 7.
Renewable energy internationally 703 9 107 5 537 4 752 7.
Renewable energy in developing countries 3 1 225 1 038 815 7. 9. 17.
Sustainable forestry - 1 823 1 507 - 13. 15.
Zero-emission ferries - 641 723 - 9. 11. 13.
Transitional financing 440 19 973 11 314 7 318 -
Green buildings in the property portfolio - 10 532 6 919 5 901 9.
As a share of the portfolio's market value 12 % 9 % 8 % n/a
Green bonds 449 5 876 2 367 1 417 n/a
Green lending - 9 2 532 2 028 - 6. 9. 11. 13.
Infrastructure - 1 033 - - 9.
Total climate-friendly investments 2 171 53 123 44 318 37 566 -
As a share of KLP's total investments 7.5 % 6.9 % 6.1% n/a
Fossil energy 14 185 8 554 8 053 -
As a share of KLP's total investments 2.0% 1.3% 1.0% n/a
Comments on performance in the first quarter
In the first quarter, KLP's climate-friendly investments increased by more than NOK 2.1
billion. A large proportion of the new investments were in renewable energy, including in a
new Nordic renewable company. The company will have activities throughout the Nordic
region related to energy production, electrification and energy efficiency. We also
increased our investment in the fund Climate Investor One, which invests in renewable
energy in developing countries. Three new green loans were also granted from the KLP
Bank.
The value of KLP's investments in fossil energy has increased since last quarter of 2021.
This is largely due to the fact that the market value of these investments has increased,
and not new investments. As a share of KLP's investments, the increase is relatively small,
and has increased from 1.8 to 2 per cent.
KLP’s property portfolio and own operations
KLP has a responsibility to reduce the impact we have on climate, nature and the
environment. Therefore, we work to reduce the footprint from our own operations and
offices. As one of the largest real estate companies in the Nordic region, KLP also aims to
help create meeting places where people thrive and can realize their potential. We are
71

concerned with reducing the environmental footprint of the real estate industry and have a
long-term perspective on our properties. That is why we are working to improve ourselves
in order to reduce energy consumption and handle waste in a better way.
Goals
• To halve greenhouse gas emissions from our own operations by 2030, compared to
emissions in 2010
• To reduce the property portfolio’s energy consumption to 169 kWh per square meter.
31.03.2022 31.03.2021 31.03.2020 UN SDGs
Number of flights 397 6 1 405 12.13.
Greenhouse gas emissions from flights (tonnes CO2e) 29 0 170 12.13.
Energy consumption at KLP's own offices (kWh per m2) 136 97 124 9. 13.
Energy consumption in KLP's property portfolio (kWh per m2) 152 167 179 9.
Comments on performance in the first quarter
The long awaited reopening of society has affected the business in the first quarter of the
year. KLP has introduced a hybrid office scheme, and although some employees work from
home, there is a large increase in employees in the offices. With more activity in the office
premises, and also as a result of a cold winter, energy consumption has increased.
Restrictions on business travel due to covid-19 have also been removed, which led to
increased travel activity in the first quarter. The level is still far lower than it was before the
pandemic, and KLP continues to focus on reducing unnecessary flights.
Energy consumption in KLP's real estate portfolio in the first quarter was low compared
with previous years, but this may also be related to infection control measures that have
been introduced.
Innovation and social development
At the same time as pension assets are invested to generate a good return, they also
contribute to innovation and social development. KLP has several portfolios that are
targeted at helping to make a difference in the transition to a sustainable society and
building the society of the future.
72

Lending to municipalities and county municipalities
KLP’s lending activities are directed primarily at Norwegian municipalities, and county
municipalities, as well as other public sector entities. The loans are used for purposes that
support local social development and welfare. For many years, we have contributed to the
sustainable development of society through the provision of loans to fund projects all over
Norway.
Goals
To increase lending to purposes of this type.
MILLION NOK New in Q1 2022 31.03.2022 31.03.2021 31.03.2020 UN SDGs
Lending in total 251 84 273 81 635 74 255
Lending for roads and transport 9 760 2 564 9 323 9.
Lending for publicly owned real property 4 300 3 960 5 011 9.
Lending to the public sector and associated entities 66 265 71 703 57 063 9.
Lending for water and sewage services, and waste
management 3 948 3 408 2 858 9.
Green loans - 9 2 532 2 028 new 9.
Comments on performance in the first quarter
In the first quarter of the year, KLP's lending to municipalities and county municipalities
increased by a net 251 million. Net green loans decreased by NOK 9 million, but three new
green loans totaling NOK 8.1 million were issued. Two of these went to Innherred
Renovasjon IKS and their project with an improved recycling rate. The last loan went to
Byglandstunet AS, and the loan will be used for the installation of photovoltaic systems.
Seed capital investments
KLP wishes to contribute to ensuring that good ideas can be pursued locally and that new
jobs are created in Norway. By investing in innovation, KLP will contribute to local value
creation and the green transition in Norway. We have established a separate portfolio
where we invest in seed funds. Most of these are linked to Norwegian research
environments.
Goals
To invest NOK 500–1,000 million in seed-capital, thereby contributing to innovation and
new business.
73

MILLION NOK New in Q1 2022 31.03.2022 31.03.2021 31.03.2020 UN SDGs
Seed capital investments in Norway 33 340 151 7 8.
Comments on performance in the first quarter
KLP's seed investments increased by NOK 33 million in the first quarter. These are
increased investments in funds KLP has already invested in, and not investments in new
funds. Among other things, it has invested more in a CoFounder fund, with which KLP
collaborates on KLP Trykktanken. By the first quarter of 2022, KLP had invested in 13
different seed funds.
Banking and finance in developing companies
Underdeveloped financial institutions and the population’s lack of access to financial
services, such as savings accounts, loans, and insurance coverage, are obstacles to poverty
reduction in developing countries. Around 1.7 billion people worldwide still have no access
to these fundamental financial services. Through our investments in the financial sector in
developing countries, we wish to contribute to economic growth and higher living
standards.
Goals
To increase investments in the banking and financial sector in developing countries,
thereby contributing to economic growth and higher living standards in those countries.
MILLION NOK New in Q1 2022 31.03.2022 31.12.2021 31.12.2020 UN SDGs
Banking and finance in developing countries - 852 659 839 1. 5. 8. 9. 11. 17
Comments on performance in the first quarter
KLP made no new investments in banking and finance in developing countries, and the
change from the previous quarter is due to a decline in market value.
KLP as a workplace and employer
KLP strives to be an attractive workplace, with a working environment characterised by
equality and diversity, and where everyone feels respected for who they are. KLP works
actively and systematically to promote equality and prevent discrimination. KLP engages in
systematic HSE activities to ensure a safe and proper working environment, establish good
procedures, and achieve better health and wellbeing, reduced sickness absence and the
wholehearted commitment of employees.
74

Goals
To achieve a sickness absence rate of less than 4 per cent.
31.03.2022 31.03.2021 31.03.2020 UN SDGs
Employees at KLP 1 060 1 021 1 008 n/a
Total sickness absence 4.9 % 3.5 % 4.4 % 3.
Comments on performance in the first quarter
In the first quarter of 2022, the total sickness absence was 4.9 percent. This is a small
increase from the previous quarter, and may be related to the fact that more people have
had covid-19 and influenza. Absence due to illness in the first quarter of last year was lower
than usual, and one reason was probably the infection control restrictions that reduced the
incidence of other illnesses.
UN Sustainable Development Goals which KLP contributes to
Goal 1, No poverty
• Target 1.4: By 2030, ensure that all men and women, in particular the poor and the
vulnerable, have equal rights to economic resources, as well as access to basic services,
ownership and control over land and other forms of property, inheritance, natural
resources, appropriate new technology and financial services, including microfinance
Goal 3, Good health and well-being
• Target 3.a: Strengthen the implementation of the World Health Organization Framework
Convention on Tobacco Control in all countries, as appropriate
Goal 5, Gender equality
• Target 5.1: End all forms of discrimination against all women and girls everywhere
• Target 5.4: Recognize and value unpaid care and domestic work through the provision
of public services, infrastructure and social protection policies and the promotion of
shared responsibility within the household and the family as nationally appropriate
• Target 5.5: Ensure women’s full and effective participation and equal opportunities for
leadership at all levels of decision-making in political, economic and public life
• Target 5.a: Undertake reforms to give women equal rights to economic resources, as
well as access to ownership and control over land and other forms of property, financial
services, inheritance and natural resources, in accordance with national laws
75

Goal 6, Clean water and sanitation for all
• Target 6.4: By 2030, substantially increase water-use efficiency across all sectors and
ensure sustainable withdrawals and supply of freshwater to address water scarcity and
substantially reduce the number of people suffering from water scarcity
Goal 7, Affordable and clean energy
• Target 7.1: By 2030, ensure universal access to affordable, reliable and modern energy
services
• Target 7.2: By 2030, increase substantially the share of renewable energy in the global
energy mix
• Target 7.a: By 2030, enhance international cooperation to facilitate access to clean
energy research and technology, including renewable energy, energy efficiency and
advanced and cleaner fossil-fuel technology, and promote investment in energy
infrastructure and clean energy technology
Goal 8, Decent work and economic growth
• Target 8.3: Promote development-oriented policies that support productive activities,
decent job creation, entrepreneurship, creativity and innovation, and encourage the
formalization and growth of micro-, small- and medium-sized enterprises, including
through access to financial service
• Target 8.4: Improve progressively, through 2030, global resource efficiency in
consumption and production and endeavour to decouple economic growth from
environmental degradation, in accordance with the 10-year framework of programmes
on sustainable consumption and production, with developed countries taking the lead
• Target 8.5: By 2030, achieve full and productive employment and decent work for all
women and men, including for young people and persons with disabilities, and equal
pay for work of equal value
• Target 8.7: Take immediate and effective measures to eradicate forced labour, end
modern slavery and human trafficking and secure the prohibition and elimination of the
worst forms of child labour, including recruitment and use of child soldiers, and by 2025
end child labour in all its forms
• Target 8.8: Protect labour rights and promote safe and secure working environments for
all workers, including migrant workers, in particular women migrants, and those in
precarious employment
• Target 8.10: Strengthen the capacity of domestic financial institutions to encourage and
expand access to banking, insurance and financial services for all
Goal 9, Industry, innovation and infrastructure
• Target 9.1: Develop quality, reliable, sustainable and resilient infrastructure, including
regional and transborder infrastructure, to support economic development and human
76

well-being, with a focus on affordable and equitable access for all
• Target 9.3: Increase the access of small-scale industrial and other enterprises, in
particular in developing countries, to financial services, including affordable credit, and
their integration into value chains and markets
• Target 9.4: By 2030, upgrade infrastructure and retrofit industries to make them
sustainable, with increased resource-use efficiency and greater adoption of clean and
environmentally sound technologies and industrial processes, with all countries taking
action in accordance with their respective capabilities
• Target 9.a: Facilitate sustainable and resilient infrastructure development in developing
countries through enhanced financial, technological and technical support to African
countries, least developed countries, landlocked developing countries and small island
developing States
Goal 10, Reduced inequalities
• Target 10.2: By 2030, empower and promote the social, economic and political inclusion
of all, irrespective of age, sex, disability, race, ethnicity, origin, religion or economic or
other status
• Target 10.4: Adopt policies, especially fiscal, wage and social protection policies, and
progressively achieve greater equality
Goal 11, Sustainable cities and communities
• Target 11.1: By 2030, ensure access for all to adequate, safe and affordable housing and
basic services and upgrade slums
• Target 11.5: By 2030, significantly reduce the number of deaths and the number of
people affected and substantially decrease the direct economic losses relative to global
gross domestic product caused by disasters, including water-related disasters, with a
focus on protecting the poor and people in vulnerable situations
• Target 11.6: By 2030, reduce the adverse per capita environmental impact of cities,
including by paying special attention to air quality and municipal and other waste
management
Goal 12, Responsible consumption and production
• Target 12.5: By 2030, substantially reduce waste generation through prevention,
reduction, recycling and reuse
• Target 12.6: Encourage companies, especially large and transnational companies, to
adopt sustainable practices and to integrate sustainability information into their
reporting cycle
77

Goal 13: Climate action
Goal 15, Life on land
• Target 15.2: By 2020, promote the implementation of sustainable management of all
types of forests, halt deforestation, restore degraded forests and substantially increase
afforestation and reforestation globally
Goal 17, Partnership for the goals
• Target 17.3: Mobilize additional financial resources for developing countries from
multiple sources
Notes and definitions
Engaged and responsible owner
Number of unique companies shows the number of unique companies with which KLP has
communicated directly during the year on ESG-related matters and as part of various
investor alliances. KLP may engage in several dialogues with a company on a variety of
topics during the year. KLP’s follow-up varies in scope, topic and time horizon. This is a
form of active ownership, in which KLP engages in a dialogue with companies to clarify
how they deal with corporate responsibility challenges and to communicate KLP’s
expectations as an investor.
General meetings of shareholders. KLP makes use of ISS’s services to vote at general
meetings in the companies in which we invest. At general meetings of Norwegian
companies (domiciled or listed in Norway), KLP votes manually though ISS. At general
meetings of non-Norwegian companies, KLP votes by proxy through ISS.
Number of exclusions shows the total number of companies excluded from investment by
KLP at the close of the year, due to violation of the exclusion criteria set out in the
Guidelines for KLP as a Responsible Investor.
Climate, environment and nature
Climate-friendly investments
It is the market value of the investments, in NOK million, that is disclosed. New investments
are net new investments through the year.
78

The percentage is calculated as the investments’ percentage of KLP’s collective portfolio.
To maintain consistency with respect to the definitions KLP uses in our climate goals, we
have revised the definition of climate-friendly investments. KLP divides climate-friendly
investments into zero-emission investments and transitional investments. Where practical
and appropriate, historic figures have been restated in respect of the new definition.
However, the figures are, in principle, not comparable with previously reported figures.
Zero-emission investments
Zero-emission investments are investments whose operations produce zero or almost zero
emissions.
Renewable energy in Norway are investments in shares and bonds in Norwegian electricity
generating companies and power grid operators. The electricity generating companies are
classified as those operating hydro, wind or biofuel power plants. The figures also include
loans to companies and projects in Norway within the power sector. This has not previously
been the case. The figure is therefore not directly comparable with previous years.
Renewable energy abroad are investments in renewable energy projects outside of Norway.
This includes both equity investments and project financing. The investments are made
either through external fund managers specialising in energy or through other partners.
This year, the figure also includes companies that derive more than 95 per cent of their
revenues from the production of renewable energy.
Renewable energy in developing countries are investments in new renewable energy
projects. The investments are made partly as direct investments in partnership with
Norfund, partly as fund investments through the fund manager Climate Investor One. The
investments are part of KLP’s impact investments, which is one of the tools in the
Guidelines for KLP as a Responsible Investor. The objective is to obtain a financial return
and benefit society. The investments are based on commercial risk and return
assessments, but also attach importance to their impact on social and environmental
parameters.
Sustainable forestry are investments in funds that invest in FSC-certified forest land in
Sweden, Finland and the Baltic states.
Zero-emission ferries are loans to Fjord1 for electric ferries.
79

Transitional investments
These are investments that contribute to a reduction in emissions and the development of
new technologies, or that help sectors that would find it hard to reach zero emissions to
reduce their emissions and become more sustainable.
Green buildings. It is the market value of green buildings in KLP’s property portfolio and
the total square metreage that are reported. Green buildings are defined as buildings rated
as Energy Class A. This is in accordance with the proposed requirements in the EU
Taxonomy. Previously, the definition has also included buildings that are BREEAM-certified
to a minimum rating of ‘very good’, that produce their own energy through solar panels, or
that have won a Norwegian building award in which the environment was an important
performance indicator. The updated definition is therefore stricter and includes fewer
buildings. The figures from previous years have not been restated in accordance with the
new definition and are therefore not directly comparable.
Green loans are loans to municipalities, county municipalities and entities owned by
municipalities. The loan must have a clearly positive impact on the climate and
environment, and must meet specific criteria, depending on the nature of the project. The
project categories are water and sewage services, waste management, transport, and
building construction and renovation. The criteria are based on the Green Bond Principles,
Climate Bond Initiative Taxonomy and Nordic Public Sector Issuers Position Paper on
Green Bonds Impact Reporting. The criteria are revised as and when required.
Green bonds are bonds classified as green and having third-party verification. This does
not include bonds that are already included in KLP’s investments in renewable energy in
Norway, see above.
Infrastructure includes investments in funds for sustainable infrastructure in Europe.
Fossil energy covers KLP’s investments in companies classified as oil and gas companies,
including those engaged in exploration, extraction, and refining. Transport and oil service
companies are not included.
KLP’s property portfolio and own operations
Energy consumption is the average 12-month, climate-adjusted specific energy
consumption in buildings managed by KLP itself. These are properties that KLP owns, has
responsibility for operating and maintaining, and where it is in a position to implement and
measure the impact of environmental initiatives. KLP has such buildings in Oslo,
Trondheim, Copenhagen, and Stockholm. All of these have energy surveillance systems,
where energy and water consumption are registered and monitored. In most of the
80

buildings, tenants’ energy consumption is also included, so that we have an overview of the
total energy consumption for the buildings. Buildings’ energy consumption is temperature
adjusted to allow the effect of energy saving initiatives to be measured.
In the first quarter 2021, KLP started using a new energy and environment follow-up
system for properties in its portfolio. This has taken some time to implement. Due to a lack
of data from some properties, the reporting does not include the energy consumption from
all buildings. Obtaining data from tenants has been a particular challenge, since they must
now give their consent before KLP can collect this data. When data from all buildings is
included in the new system, we will have a better basis for reporting than before.
KLP has a large portfolio of buildings, which evolves over time. Some buildings may also
change patterns of use for shorter or longer periods of time, in connection with a change in
tenants, for example.
It may occasionally be impossible to obtain correct figures for a variety of reasons, such as
faulty meters or overdue reporting of figures from our subcontractors. This is taken into
account in that the report includes only those buildings that KLP manages itself and that
have comparable operating conditions 12 months back in time from the reporting date.
Although this means that the buildings on which KLP reports vary slightly from year to
year, our assessment is nevertheless that this will identify the correct trends in the
company’s property base.
Number of flights is based on figures provided by our travel agency, and it is the number of
legs that is reported. A leg means an individual distance.
Greenhouse gas emissions from flights are also based on figures from our travel agency.
They use calculation methods and emission factors from ICAO (International Civil Aviation
Organization).
Energy consumption from KLP’s own offices is a material source of greenhouse gas
emissions for KLP. The energy consumption at KLP’s own offices is not temperature
adjusted but shows actual consumption. KLP’s own offices are defined as the office
premises in which the KLP Group’s employees work. In previous years, we have included
only KLP’s offices in Norway. This year, however, we include offices used by KLP Eiendom
in Stockholm and Copenhagen. The energy consumption data is obtained from our energy
monitoring system.
81

Innovation and social development
Lending
Lending for roads and transport covers, for example, loans for road and infrastructure
projects and the procurement of means of transport.
Lending for publicly owned real property covers, for example, loans for school buildings,
town halls and other municipally owned buildings.
Lending to the public sector and associated entities covers the funding of various types of
investments in municipalities, country municipalities and entities owned by municipalities,
such as preschool nurseries, care homes for the elderly or schools.
Lending to water and sewage services, and waste management covers loans to various
projects relating to the water supply, sewage and waste management.
Seed capital investments
Seed capital investments are investments in seed funds relating to research institutions in
Norway. The reported figure is the market value of the investments made. At the close of
2021, KLP had invested in 13 different seed funds.
Banking and finance in developing countries
Investments in banking and finance in developing countries are KLP’s investments in the
Nordic Microfinance Initiative (NMI) and Nor Finance. NorFinance is an investment
company that KLP owns in partnership with Norfund. The investments are made as part of
KLP’s impact investment portfolio, which is one of the tools set out in the Guidelines for
KLP as a Responsible Investor. The purpose is to achieve both a financial return and
benefits society.
KLP as a workplace and employer
Number of employees are permanent employees of the KLP Group in Norway, Sweden, and
Denmark, including employees on welfare leave and those who work part-time.
Sickness absence is self-certified or medically certified sickness absence among
permanent employees. Short-term sickness absence is defined as absence of 1–3 days.
Long-term sickness absence is defined as absence of 4 days or more.
82

Kommunal Landspensjonskasse
Q1 2022
Income statementKommunal Landspensjonskasse
NOTE NOK MILLIONS
Q1
2022
Q1
2021
01.01.2021
-31.12.2021
3 Premium income 7 503 7 041 50 161
Income from investments in subsidiaries, associated enterprises and jointly
controlled entities 185 -350 6 736
Interest income and dividends etc. on financial assets 2 441 4 427 12 587
Value changes on investments -8 363 -1 486 17 896
Gains and losses realized on investments 817 6 302 12 550
Net income from investments in the common portfolio -4 921 8 893 49 770
Net income from investments in the investment option portfolio -24 39 181
Other insurance-related income 331 306 1 274
4 Claims -10 642 -13 754 -30 438
Changes in insurance liabilities taken to profit/loss - contractual liabilities 9 330 3 104 -59 440
Changes in insurance liabilities taken to profit/loss – individual investment
option portfolio -756 3 -177
Funds assigned to insurance contracts - contractual liabilities 0 0 -9 415
Unallocated profit to insurance contracts -105 -4 688 0
5 Insurance-related operating expenses -368 -299 -1 372
Other insurance-related costs -331 -300 -1 286
Technical profit/loss 18 344 -742
Net income from investments in the corporate portfolio 112 272 1 292
Other income 2 9 10
Administration costs and other costs associated with the corporate
portfolio -60 -59 -272
Non-technical profit/loss 53 222 1 030
83

NOTE NOK MILLIONS
Q1
2022
Q1
2021
01.01.2021
-31.12.2021
Profit/loss pre-tax 71 566 288
Tax 6 -105 125
Income before other income and expenses 77 461 413
12 Actuarial gains and losses on defined benefits pension schemes 270 118 48
Proportion of other comprehensive income on application of the equity
method 156 66 36
Adjustment of the insurance liabilities -47 -21 -16
Tax on other income and expenses that will not be reclassified to profit or
loss -67 -30 -12
Total other income and expenses that will not be reclassified to profit or
loss 311 135 56
TOTAL COMPREHENSIVE INCOME 388 595 469
84

Statement of financial positionKommunal Landspensjonskasse
NOTE NOK MILLIONS 31.03.2022 31.03.2021 31.12.2021
ASSETS
ASSETS IN THE CORPORATE PORTFOLIO
Intangible assets 782 657 727
7 Investment properties 995 991 1 004
Shares and holdings in property subsidiaries 3 622 3 368 3 507
Shares and holdings in other subsidiaries, associated enterprises and
jointly controlled entities 5 238 5 077 5 177
6 Financial assets valued at amortized cost 19 352 19 132 19 456
6,7 Financial assets valued at fair value 12 188 12 341 12 221
Receivables 1 230 2 241 1 407
11 Right-of-use assets 946 1 054 973
Other assets 1 026 605 796
Total assets in the corporate portfolio 45 379 45 466 45 268
ASSETS IN THE CUSTOMER PORTFOLIOS
Shares and holdings in property subsidiaries 69 832 62 220 70 206
Shares and holdings in other subsidiaries, associated enterprises and
jointly controlled entities 5 245 4 614 4 958
Receivables on and securities issued by subsidiaries, associated
enterprises and jointly controlled entities 12 343 13 078 12 524
6 Financial assets valued at amortized cost 260 815 248 861 259 608
6,7 Financial assets valued at fair value 314 264 274 303 311 984
Total investment in the common portfolio 662 500 603 076 659 281
Shares and holdings in property subsidiaries 279 225 256
Receivables on and securities issued by subsidiaries, associated
enterprises and jointly controlled entities 63 66 63
6 Financial assets at amortized costs 925 736 753
6,7 Financial assets at fair value 1 320 1 054 1 126
Total investments in the investment option portfolio 2 588 2 081 2 199
Total assets in the customer portfolios 665 088 605 157 661 480
TOTAL ASSETS 710 467 650 623 706 748
85

NOTE NOK MILLIONS 31.03.2022 31.03.2021 31.12.2021
OWNERS' EQUITY AND LIABILITIES
Owners’ equity contributed 19 831 17 919 19 831
Retained earnings 21 559 21 784 20 847
Total owners’ equity 41 390 39 703 40 678
6 Subordinated loan capital etc. 4 444 4 668 4 604
Premium reserve etc. 483 154 451 266 484 728
Supplementary reserves 0 43 326 48 626
Securities adjustment fund 0 56 575 77 397
Buffer fund 117 605 0 0
Premium funds, defined contribution funds, pension regulation funds
etc. 40 323 37 731 40 769
Unallocated profit to customers 104 4 680 0
Total insurance liabilities - contractual liabilities 641 186 593 578 651 520
Pension capital etc. 2 296 1 473 1 549
Supplementary reserves 0 135 186
Buffer fund 193 0 0
Premium funds, defined contribution funds, pension regulation funds
etc. 551 466 499
Unallocated profit to customers 1 28 0
Total insurance liabilities - special investment portfolio 3 041 2 102 2 234
12 Pension obligations 301 491 553
Current tax liabilities 103 1 151 259
Deferred tax liabilities 444 745 444
11 Lease liabilities 989 1 078 1 012
9 Liabilities 18 407 6 828 5 261
Accrued costs and prepaid income 163 280 182
TOTAL OWNERS’ EQUITY AND LIABILITIES 710 467 650 623 706 748
OFF-BALANCE SHEET ITEMS
Contingent liabilities 23 900 24 208 26 074
86

Changes in Owners’ equityKommunal Landspensjonskasse
2022
NOK MILLIONS
Owners’ equity
contributed
Retained
earnings
Total owners’
equity
Risk equalization
fund
Other retained
earnings
Own funds 31 December 2021 19 831 4 370 16 476 40 678
Change recognized directly in equity 554 -229 324
Own funds 1 January 2022 19 831 4 924 16 247 41 002
Income before other income and expenses -37 114 77
Actuarial gains and losses on defined benefits pension
schemes 270 270
Proportion of other comprehensive income on
application of the equity method 156 156
Adjustment of the insurance liabilities -47 -47
Tax on other income and expenses that will not be
reclassified to profit or loss -67 -67
Total other income and expenses that will not be
reclassified to profit or loss 311 311
Total comprehensive income (unallocated) -37 425 388
Owners equity contribution recieved 0 0
Total transactions with owners 0 0
Own funds 31 March 2022 19 831 4 887 16 671 41 390
2021
NOK MILLIONS
Owners’ equity
contributed
Retained
earnings
Total owners’
equity
Risk equalization
fund
Other retained
earnings
Own funds 1 January 2021 18 194 5 404 15 784 39 382
Income before other income and expenses 170 290 461
Actuarial gains and losses on defined benefits pension
schemes 118 118
Proportion of other comprehensive income on
application of the equity method 66 66
Adjustment of the insurance liabilities -21 -21
Tax on other income and expenses that will not be
reclassified to profit or loss -30 -30
Total other income and expenses that will not be
reclassified to profit or loss 135 135
Total comprehensive income (unallocated) 170 425 595
Owners equity contribution recieved -275 -275
Total transactions with owners -275 -275
Own funds 31 March 2021 17 919 5 575 16 209 39 703
87

2021
NOK MILLIONS
Owners’ equity
contributed
Retained
earnings
Total owners’
equity
Risk equalization
fund
Other retained
earnings
Own funds 1 January 2021 18 194 5 404 15 784 39 382
Income before other income and expenses 811 -1 034 636 413
Actuarial gains and losses on defined benefits pension
schemes 48 48
Proportion of other comprehensive income on
application of the equity method 36 36
Adjustment of the insurance liabilities -16 -16
Tax on other income and expenses that will not be
reclassified to profit or loss -12 -12
Total other income and expenses that will not be
reclassified to profit or loss 56 56
Total comprehensive income 811 -1 034 692 469
Owners equity contribution recieved 826 826
Total transactions with owners 826 826
Own funds 31 December 2021 19 831 4 370 16 476 40 678
88

Statement of cash flowsKommunal Landspensjonskasse
NOK MILLIONS
01.01.2022
-31.03.2022
01.01.2021
-31.12.2021
01.01.2021
-30.09.2021
01.01.2021
-30.06.2021
01.01.2021
-31.03.2021
Net cashflow from operational activities 337 -346 -424 778 271
Net cashflow from investment activities ¹ -78 -275 -211 -142 -69
Net cashflow from financing activities ² -28 716 695 -312 -302
Net changes in cash and bank deposits 231 95 61 323 -100
Holdings of cash and bank deposits at start of period 755 659 659 659 659
Holdings of cash and bank deposits at end of period 985 755 720 983 560
1 Payments on the purchase of tangible fixed assets.
2 Net receipts of owners’ equity contribution, rising of new loans and repayment of debt.
89

Notes to the financial statementKommunal Landspensjonskasse
Note 1 Accounting principles- and estimates
Accounting principles
The financial statements in this interim report show the interim accounts for Kommunal
Landspensjonskasse (KLP), for the period 01.01.2022 – 31.03.2022. The accounts have not
been audited.
The interim financial statements have been prepared in accordance with the Regulations of
18 December 2015 No 1824 relating to annual financial statements for life insurance
companies (the Financial Reporting Regulations) and IAS 34 Interim Reporting. The interim
financial statements have been prepared on the same principles as the annual financial
statements for 2020, unless stated otherwise.
Rules on a merged buffer fund covering all customers were introduced for municipal
pension schemes from 01.01.2022 together with some other changes for guaranteed
pension products. The new buffer fund replaces the earlier supplementary reserves and
securities adjustment fund. The rule changes are intended to provide a more neutral
framework for moving municipal pension schemes. The table below shows the reworked
opening balance.
NOK MILLIONS
Total insurance liabilities
- contractual liabilities
01.01.2022
Total insurance liabilities
- special investment portfolio
01.01.2022 Total
Supplementary reserves 48 626 186 48 812
Securities adjustment fund 76 843 76 843
Buffer fund 125 469 186 125 655
A further NOK 554 million was moved from the securities adjustment fund to the risk equalisation fund as of 01.01.2022.
In 2021 and at the beginning of 2022, KLP was in discussions with the Financial
Supervisory Authority of Norway on certain allocations that were made in the annual
accounts for 2020. The annual accounts for 2021 reported these changes, and the effects
were incorporated into the figures. In February 2022, KLP again received a letter from the
FSA stating that its equity must contribute 20 per cent of the amount from the risk result
from 2020 used to boost the reserves for increased longevity. This amounts to NOK 229
million, and is recognised directly in the balance sheet, between equity and premium funds.
90

The interim financial statements do not contain all the information required of complete
annual financial statements, and this interim report should be read in conjunction with the
annual financial statements for 2021. The company’s annual report is available from klp.no.
Other
Exclusion of Russian companies
KLP decided in February 2022 to freeze all investments in Russia, and 22 Russian
companies were excluded. Some of the companies were already subject to restrictions
following the escalation of the Russia-Ukraine conflict back in 2014, but this has now been
extended to all investments in Russia. KLP is actively exploring ways to sell off these
investments, but international sanctions have to be taken into account, as well as the
restrictions imposed on Western investors by Russia. The investments are in the KLP
AksjeFremvoksende Markeder Indeks I and KLP Aksje Fremvoksende Markeder Flerfaktor
funds, and are conservatively priced at a total of around NOK 24 million at the end of the
first quarter.
The Norwegian Competition Authority is investigating whether KLP has violated theCompetition Act
In February 2022, the Norwegian Competition Authority carried out unannounced securing
of evidence with KLP because they believe there is reasonable reason to assume that KLP
has violated the Norwegian Competition Act. It is the provision in section 11 of the
Norwegian Competition Act on undue exploitation of a dominant position that the
Norwegian Competition Authority investigates whether KLP has breached, and the
securing of evidence was carried out on the basis of a decision from Hordaland District
Court.
KLP has given the Norwegian Competition Authority access to everything they have
requested, and is prepared to cooperate with the Norwegian Competition Authority in the
further investigation.
Accounting estimates
In preparing the interim financial statements, management has exercised discretion and
used estimates and assumptions that affect the accounting figures. Actual figures may
deviate from estimates used.
KLP has changed the discount rate for corporate bonds which is used to calculate pension
obligations. Compared to the assumptions used at 31.12.2021, the discount rate has been
changed from 1.9 % to 2.7 %. This change results in a reduction of NOK 253 million in
91

recognised liabilities as at 31.03.2022. Demographic assumptions such as expected wage
growth, the National Insurance basic amount (G) and pension regulations have not
changed in the period.
New rules regulating deferred pensions have been adopted, but the Norwegian Accounting
Standards Board has not issued any guidance on how these should be included in the
pension accounts. This should be clarified soon, and is expected to affect the company’s
pension obligations in later periods.
92

Note 2 Value-adjustment investment property
The portfolio of investment properties, including investment properties owned via
subsidiaries, has been valued as at 31. March 2022.
NOK MILLIONS
Q1
2022
Q1
2021
01.01.2021
-31.12.2021
Value adjustment incl. foreign exchange -445 -1 182 3 984
Foreign exchange effect on hedging 1 024 1 215 1 382
Net value adjustment incl. exchange hedging 579 34 5 366
Note 3 Premium income
NOK MILLIONS
Q1
2022
Q1
2021
01.01.2021
-31.12.2021
Gross premiums due 7 126 7 041 50 161
Transfer of premium reserves from others 376 0 0
Total premium income 7 503 7 041 50 161
Note 4 Claims
NOK MILLIONS
Q1
2022
Q1
2021
01.01.2021
-31.12.2021
Claims paid 5 766 5 335 22 092
Transfers of premium reserves to others 4 875 8 419 8 346
Total claims 10 642 13 754 30 438
Note 5 Insurance-related operating expenses
NOK MILLIONS
Q1
2022
Q1
2021
01.01.2021
-31.12.2021
Personnel costs 213 187 735
Depreciation 50 50 270
Other operating expenses 104 62 366
Total insurance-related operating expenses 368 299 1 372
Note 6 Fair value of financial assets and liabilities
For information regarding pricing of financial assets and liabilities see note 9 Fair value of
financial assets and liabilities in the consolidated financial statement.
93

31.03.2022
NOK MILLIONS
Corporate
portfolio
Common
portfolio
Investment option
portfolio Total
Book
value
Fair
value
Book
value
Fair
value
Book
value
Fair
value
Book
value
Fair
value
ASSETS – AT AMORTIZED COST
INVESTMENTS HELD TO MATURITY
Norwegian hold-to-maturity bonds 485 519 3 448 3 596 7 7 3 940 4 122
Accrued not due interest 5 5 50 50 0 0 55 55
Foreign hold-to-maturity bonds 6 018 6 038 14 998 15 377 45 47 21 060 21 461
Accrued not due interest 43 43 253 253 1 1 296 296
Total investments held to maturity 6 550 6 604 18 748 19 275 53 56 25 352 25 935
BONDS CLASSIFIED AS LOANS AND RECEIVABLES
Norwegian bonds 4 785 4 605 51 085 49 268 274 264 56 144 54 137
Accrued not due interest 65 65 687 687 5 5 757 757
Foreign bonds 7 808 7 643 110 226 107 895 583 571 118 617 116 109
Accrued not due interest 144 144 1 795 1 795 10 10 1 949 1 949
Total bonds classified as loans and receivables 12 802 12 456 163 794 159 646 872 850 177 467 172 952
OTHER LOANS AND RECEIVABLES
Secured loans 0 0 3 089 3 049 0 0 3 089 3 049
Lending with public sector guarantee 0 0 68 601 67 821 0 0 68 601 67 821
Loans abroad secured by mortgage and local government guarantee 0 0 6 260 6 260 0 0 6 260 6 260
Accrued not due interest 0 0 323 323 0 0 323 323
Total other loans and receivables 0 0 78 273 77 453 0 0 78 273 77 453
Total financial assets at amortized cost 19 352 19 061 260 815 256 374 925 906 281 093 276 340
ASSETS – AT FAIR VALUE
94

31.03.2022
NOK MILLIONS
Corporate
portfolio
Common
portfolio
Investment option
portfolio Total
Book
value
Fair
value
Book
value
Fair
value
Book
value
Fair
value
Book
value
Fair
value
EQUITY CAPITAL INSTRUMENTS
Norwegian shares 8 8 10 147 10 147 0 0 10 155 10 155
Foreign shares 0 0 41 342 41 342 0 0 41 342 41 342
Total shares 8 8 51 490 51 490 0 0 51 497 51 497
Property funds 0 0 7 790 7 790 0 0 7 790 7 790
Norwegian equity funds 0 0 90 210 90 210 888 888 91 098 91 098
Foreign equity funds 0 0 29 992 29 992 0 0 29 992 29 992
Total equity fund units 0 0 127 992 127 992 888 888 128 881 128 881
Norwegian alternative investments 0 0 1 955 1 955 11 11 1 966 1 966
Foreign alternative investments 0 0 0 0 0 0 0 0
Total alternative investments 0 0 1 955 1 955 11 11 1 966 1 966
Total shares and units 8 8 181 437 181 437 899 899 182 343 182 343
DEBT INSTRUMENTS AT FAIR VALUE
Norwegian bonds 5 876 5 876 27 733 27 733 0 0 33 609 33 609
Foreign bonds 772 772 18 329 18 329 0 0 19 102 19 102
Accrued not due interest 26 26 298 298 0 0 324 324
Norwegian fixed-income funds 2 765 2 765 22 513 22 513 314 314 25 591 25 591
Foreign fixed-income funds 0 0 30 159 30 159 0 0 30 159 30 159
Accrued not due interest 3 3 61 61 1 1 65 65
Norwegian certificates 465 465 2 689 2 689 0 0 3 153 3 153
Foreign certificates 0 0 394 394 0 0 394 394
95

31.03.2022
NOK MILLIONS
Corporate
portfolio
Common
portfolio
Investment option
portfolio Total
Book
value
Fair
value
Book
value
Fair
value
Book
value
Fair
value
Book
value
Fair
value
Accrued not due interest 1 1 5 5 0 0 6 6
Fixed income securities 9 908 9 908 102 181 102 181 315 315 112 404 112 404
Norwegian loans and receivables 1 219 1 219 9 708 9 708 24 24 10 951 10 951
Foreign loans and receivables 440 440 7 915 7 915 66 66 8 420 8 420
Total loans and receivables 1 658 1 658 17 623 17 623 90 90 19 371 19 371
DERIVATIVES
Interest rate swaps 515 515 323 323 0 0 838 838
Share options 0 0 45 45 0 0 45 45
Forward exchange contracts 99 99 3 739 3 739 16 16 3 854 3 854
Total financial derivatives classified as assets 614 614 4 108 4 108 16 16 4 737 4 737
OTHER FINANCIAL ASSETS
Other financial assets 0 0 8 917 8 917 0 0 8 917 8 917
Total financial assets valued at fair value 12 188 12 188 314 264 314 264 1 320 1 320 327 772 327 772
LIABILITIES
DERIVATIVES
Interest rate swaps 0 0 35 35 0 0 35 35
Forward exchange contracts 0 0 210 210 1 1 211 211
Total financial derivatives classified as liabilities 0 0 245 245 1 1 246 246
96

31.03.2022
NOK MILLIONS
Corporate
portfolio
Common
portfolio
Investment option
portfolio Total
Book
value
Fair
value
Book
value
Fair
value
Book
value
Fair
value
Book
value
Fair
value
SUBORDINATED LOAN CAPITAL
Subordinated loan capital 2 939 3 116 0 0 0 0 2 939 3 116
Hybrid Tier 1 securities 1 505 1 586 0 0 0 0 1 505 1 586
Total subordinated loan capital etc. 4 444 4 701 0 0 0 0 4 444 4 701
LIABILITIES TO CREDIT INSTITUTIONS
Norwegian call money ¹ 0 0 2 527 2 527 2 2 2 530 2 530
Foreign call money ¹ 697 697 4 617 4 617 17 17 5 330 5 330
Total liabilities to credit institutions 697 697 7 144 7 144 19 19 7 860 7 860
¹ Call money is collateral for paid/received margin related to derivatives.
97

31.03.2021
NOK MILLIONS
Corporate
portfolio
Common
portfolio
Investment option
portfolio Total
Book
value
Fair
value
Book
value
Fair
value
Book
value
Fair
value
Book
value
Fair
value
ASSETS – AT AMORTIZED COST
INVESTMENTS HELD TO MATURITY
Norwegian hold-to-maturity bonds 538 621 4 445 4 886 11 11 4 994 5 518
Accrued not due interest 6 6 62 62 0 0 67 67
Foreign hold-to-maturity bonds 6 290 6 611 16 660 18 120 38 43 22 988 24 774
Accrued not due interest 47 47 276 276 1 1 324 324
Total investments held to maturity 6 880 7 284 21 443 23 344 50 55 28 373 30 683
BONDS CLASSIFIED AS LOANS AND RECEIVABLES
Norwegian bonds 4 680 4 818 48 686 50 576 208 217 53 574 55 611
Accrued not due interest 72 72 759 759 4 4 835 835
Foreign bonds 7 361 7 724 100 330 106 232 465 489 108 156 114 446
Accrued not due interest 138 138 1 674 1 674 8 8 1 820 1 820
Total bonds classified as loans and receivables 12 252 12 752 151 448 159 241 685 719 164 385 172 712
OTHER LOANS AND RECEIVABLES
Secured loan 0 0 3 215 3 236 0 0 3 215 3 236
Lending with public sector guarantee 0 0 65 153 65 954 0 0 65 153 65 954
Loans abroad secured by mortgage and local government guarantee 0 0 7 275 7 275 0 0 7 275 7 275
Accrued not due interest 0 0 327 327 0 0 327 327
Total other loans and receivables 0 0 75 970 76 791 0 0 75 970 76 791
Total financial assets at amortized cost 19 132 20 036 248 861 259 376 736 774 268 728 280 186
ASSETS – AT FAIR VALUE
98

31.03.2021
NOK MILLIONS
Corporate
portfolio
Common
portfolio
Investment option
portfolio Total
Book
value
Fair
value
Book
value
Fair
value
Book
value
Fair
value
Book
value
Fair
value
EQUITY CAPITAL INSTRUMENTS
Norwegian shares 7 7 6 977 6 977 0 0 6 984 6 984
Foreign shares 0 0 28 691 28 691 0 0 28 691 28 691
Total shares 7 7 35 668 35 668 0 0 35 675 35 675
Property funds 0 0 4 269 4 269 0 0 4 269 4 269
Norwegian equity funds 0 0 82 177 82 177 619 619 82 796 82 796
Foreign equity funds 0 0 18 609 18 609 0 0 18 609 18 609
Total equity fund units 0 0 105 055 105 055 619 619 105 674 105 674
Norwegian alternative investments 0 0 1 846 1 846 8 8 1 854 1 854
Foreign alternative investments 0 0 0 0 0 0 0 0
Total alternative investments 0 0 1 846 1 846 8 8 1 855 1 855
Total shares and units 7 7 142 569 142 569 627 627 143 203 143 203
DEBT INSTRUMENTS AT FAIR VALUE
Norwegian bonds 6 348 6 348 28 870 28 870 0 0 35 218 35 218
Foreign bonds 414 414 17 679 17 679 0 0 18 093 18 093
Accrued not due interest 20 20 313 313 0 0 333 333
Norwegian fixed-income funds 2 671 2 671 32 273 32 273 317 317 35 261 35 261
Foreign fixed-income funds 0 0 28 845 28 845 0 0 28 845 28 845
Accrued not due interest 106 106 2 187 2 187 14 14 2 307 2 307
Norwegian certificates 350 350 4 459 4 459 0 0 4 809 4 809
Foreign certificates 0 0 737 737 0 0 737 737
99

31.03.2021
NOK MILLIONS
Corporate
portfolio
Common
portfolio
Investment option
portfolio Total
Book
value
Fair
value
Book
value
Fair
value
Book
value
Fair
value
Book
value
Fair
value
Accrued not due interest 2 2 4 4 0 0 7 7
Fixed income securities 9 910 9 910 115 368 115 368 330 330 125 609 125 609
Norwegian loans and receivables 1 122 1 122 6 272 6 272 20 20 7 414 7 414
Foreign loans and receivables 555 555 5 795 5 795 65 65 6 415 6 415
Total loans and receivables 1 678 1 678 12 067 12 067 84 84 13 829 13 829
DERIVATIVES
Interest rate swaps 653 653 85 85 0 0 738 738
Share options 0 0 187 187 0 0 187 187
Forward exchange contracts 89 89 2 794 2 794 11 11 2 894 2 894
Total financial derivatives classified as assets 742 742 3 067 3 067 11 11 3 819 3 819
OTHER FINANCIAL ASSETS
Other financial assets 5 5 1 232 1 232 1 1 1 238 1 238
Total financial assets valued at fair value 12 341 12 341 274 303 274 303 1 054 1 054 287 699 287 699
LIABILITIES
DERIVATIVES
Interest rate swaps 0 0 154 154 0 0 154 154
Forward exchange contracts 0 0 494 494 1 1 496 496
Total financial derivatives classified as liabilities 0 0 648 648 1 1 650 650
100

31.03.2021
NOK MILLIONS
Corporate
portfolio
Common
portfolio
Investment option
portfolio Total
Book
value
Fair
value
Book
value
Fair
value
Book
value
Fair
value
Book
value
Fair
value
SUBORDINATED LOAN CAPITAL
Subordinated loan capital 3 032 3 412 0 0 0 0 3 032 3 412
Hybrid Tier 1 securities 1 637 1 592 0 0 0 0 1 637 1 592
Total subordinated loan capital etc. 4 668 5 003 0 0 0 0 4 668 5 003
LIABILITIES TO CREDIT INSTITUTIONS
Norwegian call money ¹ 0 0 655 655 3 3 657 657
Foreign call money ¹ 885 885 1 759 1 759 16 16 2 660 2 660
Total liabilities to credit institutions 885 885 2 414 2 414 19 19 3 318 3 318
¹ Call money is collateral for paid/received margin related to derivatives
101

31.12.2021
NOK MILLIONS
Corporate
portfolio
Common
portfolio
Investment option
portfolio Total
Book
value
Fair
value
Book
value
Fair
value
Book
value
Fair
value
Book
value
Fair
value
ASSETS – AT AMORTIZED COST
INVESTMENTS HELD TO MATURITY
Norwegian hold-to-maturity bonds 488 558 3 454 3 789 2 2 3 944 4 350
Accrued not due interest 19 19 98 98 0 0 117 117
Foreign hold-to-maturity bonds 6 191 6 405 15 426 16 581 38 42 21 654 23 029
Accrued not due interest 37 37 208 208 1 1 246 246
Total investments held to maturity 6 735 7 019 19 185 20 677 41 45 25 961 27 741
BONDS CLASSIFIED AS LOANS AND RECEIVABLES
Norwegian bonds 4 830 4 879 49 370 50 187 212 216 54 412 55 282
Accrued not due interest 61 61 676 676 3 3 740 740
Foreign bonds 7 728 7 945 110 489 114 061 490 505 118 706 122 511
Accrued not due interest 103 103 1 716 1 716 8 8 1 826 1 826
Total bonds classified as loans and receivables 12 722 12 988 162 250 166 639 713 732 175 684 180 359
OTHER LOANS AND RECEIVABLES
Secured loans 0 0 2 978 2 982 0 0 2 978 2 982
Lending with public sector guarantee 0 0 68 536 68 679 0 0 68 536 68 679
Loans abroad secured by mortgage and local government guarantee 0 0 6 389 6 389 0 0 6 389 6 389
Accrued not due interest 0 0 270 270 0 0 270 270
Total other loans and receivables 0 0 78 172 78 319 0 0 78 172 78 319
Total financial assets at amortized cost 19 456 20 007 259 608 265 636 753 776 279 817 286 420
ASSETS – AT FAIR VALUE
102

31.12.2021
NOK MILLIONS
Corporate
portfolio
Common
portfolio
Investment option
portfolio Total
Book
value
Fair
value
Book
value
Fair
value
Book
value
Fair
value
Book
value
Fair
value
EQUITY CAPITAL INSTRUMENTS
Norwegian shares 8 8 9 571 9 571 0 0 9 579 9 579
Foreign shares 0 0 43 771 43 771 0 0 43 771 43 771
Total shares 8 8 53 342 53 342 0 0 53 350 53 350
Property funds 0 0 7 071 7 071 0 0 7 071 7 071
Norwegian equity funds 0 0 96 227 96 227 740 740 96 967 96 967
Foreign equity funds 0 0 29 154 29 154 0 0 29 154 29 154
Total equity fund units 0 0 132 453 132 453 740 740 133 193 133 193
Norwegian alternative investments 0 0 1 884 1 884 9 9 1 892 1 892
Foreign alternative investments 0 0 0 0 0 0 0 0
Total alternative investments 0 0 1 884 1 884 9 9 1 892 1 892
Total shares and units 8 8 187 679 187 679 749 749 188 435 188 435
DEBT INSTRUMENTS AT FAIR VALUE
Norwegian bonds 6 101 6 101 28 982 28 982 0 0 35 083 35 083
Foreign bonds 691 691 17 913 17 913 0 0 18 604 18 604
Accrued not due interest 30 30 323 323 0 0 353 353
Norwegian fixed-income funds 2 983 2 983 26 888 26 888 298 298 30 169 30 169
Foreign fixed-income funds 0 0 30 858 30 858 0 0 30 858 30 858
Accrued not due interest 0 0 0 0 0 0 0 0
Norwegian certificates 475 475 3 986 3 986 0 0 4 461 4 461
Foreign certificates 0 0 405 405 0 0 405 405
103

31.12.2021
NOK MILLIONS
Corporate
portfolio
Common
portfolio
Investment option
portfolio Total
Book
value
Fair
value
Book
value
Fair
value
Book
value
Fair
value
Book
value
Fair
value
Accrued not due interest 1 1 3 3 0 0 4 4
Fixed income securities 10 280 10 280 109 357 109 357 298 298 119 935 119 935
Norwegian loans and receivables 1 033 1 033 7 428 7 428 18 18 8 479 8 479
Foreign loans and receivables 254 254 4 964 4 964 56 56 5 274 5 274
Total loans and receivables 1 287 1 287 12 393 12 393 74 74 13 753 13 753
DERIVATIVES
Interest rate swaps 615 615 103 103 0 0 718 718
Share options 0 0 279 279 0 0 279 279
Forward exchange contracts 31 31 1 479 1 479 6 6 1 516 1 516
Total financial derivatives classified as assets 646 646 1 862 1 862 6 6 2 513 2 513
OTHER FINANCIAL ASSETS
Other financial assets 0 0 695 695 0 0 695 695
Total financial assets valued at fair value 12 221 12 221 311 984 311 984 1 126 1 126 325 331 325 331
LIABILITIES
DERIVATIVES
Interest rate swaps 0 0 364 364 0 0 364 364
Forward exchange contracts 0 0 1 646 1 646 4 4 1 650 1 650
Total financial derivatives classified as liabilities 0 0 2 010 2 010 4 4 2 014 2 014
104

31.12.2021
NOK MILLIONS
Corporate
portfolio
Common
portfolio
Investment option
portfolio Total
Book
value
Fair
value
Book
value
Fair
value
Book
value
Fair
value
Book
value
Fair
value
SUBORDINATED LOAN CAPITAL
Subordinated loan capital 3 000 3 310 0 0 0 0 3 000 3 310
Hybrid Tier 1 securities 1 604 1 586 0 0 0 0 1 604 1 586
Total subordinated loan capital etc. 4 604 4 895 0 0 0 0 4 604 4 895
LIABILITIES TO CREDIT INSTITUTIONS
Norwegian call money ¹ 0 0 85 85 3 3 87 87
Foreign call money ¹ 734 734 818 818 12 12 1 564 1 564
Total liabilities to credit institutions 734 734 902 902 15 15 1 651 1 651
¹ Call money is collateral for paid/received margin related to derivatives.
105

Note 7 Fair value hierarchy
31.03.2022
NOK MILLIONS Level 1 Level 2 Level 3 Total
FINANCIAL ASSETS BOOKED AT FAIR VALUE
CORPORATE PORTFOLIO
Certificates 0 466 0 466
Bonds 27 6 648 0 6 674
Fixed-income funds 2 768 0 0 2 768
Fixed-income securities 2 795 7 113 0 9 908
Loans and receivables 828 830 0 1 658
Shares 0 0 8 8
Shares and units 0 0 8 8
Financial derivatives 0 614 0 614
Other financial assets 0 0 0 0
Total corporate portfolio 3 622 8 558 8 12 188
COMMON PORTFOLIO
Certificates 1 054 2 034 0 3 087
Bonds 20 847 25 513 0 46 361
Fixed-income funds 37 053 8 816 6 863 52 733
Fixed-income securities 58 954 36 363 6 863 102 181
Loans and receivables 17 304 318 0 17 623
Shares 47 867 954 2 669 51 490
Equity funds 91 153 0 51 91 204
Property funds 0 1 144 6 646 7 790
Special funds 0 1 955 0 1 955
Private Equity 0 0 28 998 28 998
Shares and units 139 020 4 053 38 363 181 437
Financial derivatives 0 4 108 0 4 108
Other financial assets 0 8 917 0 8 917
Total common portfolio 215 279 53 758 45 227 314 264
INVESTMENT OPTION PORTFOLIO
Fixed-income funds 307 8 0 315
Fixed-income securities 307 8 0 315
Loans and receivables 90 0 0 90
Equity funds 888 0 0 888
Special funds 0 11 0 11
Shares and units 888 11 0 899
Financial derivatives 0 16 0 16
Other financial assets 0 0 0 0
Total investment option portfolio 1 285 35 0 1 320
106

31.03.2022
NOK MILLIONS Level 1 Level 2 Level 3 Total
Total financial assets valued at fair value 220 186 62 351 45 234 327 772
CORPORATE PORTFOLIO
Investment property 0 0 995 995
Total investment property 0 0 995 995
FINANCIAL LIABILITIES BOOKED AT FAIR VALUE
CORPORATE PORTFOLIO
Financial derivatives 0 0 0 0
Debt to credit institutions 697 0 0 697
Total corporate portfolio 697 0 0 697
COMMON PORTFOLIO
Financial derivatives 0 245 0 245
Debt to credit institutions 7 144 0 0 7 144
Total common portfolio 7 144 245 0 7 390
INVESTMENT OPTION PORTFOLIO
Financial derivatives 0 1 0 1
Debt to credit institutions 19 0 0 19
Total investment option portfolio 19 1 0 20
Total financial liabilities at fair value 7 860 246 0 8 106
31.03.2021
NOK MILLIONS Level 1 Level 2 Level 3 Total
FINANCIAL ASSETS BOOKED AT FAIR VALUE
CORPORATE PORTFOLIO
Certificates 0 352 0 352
Bonds 0 6 781 0 6 781
Fixed-income funds 2 777 0 0 2 777
Fixed-income securities 2 777 7 133 0 9 910
Loans and receivables 750 928 0 1 678
Shares 0 0 7 7
Shares and units 0 0 7 7
Financial derivatives 0 742 0 742
Other financial assets 0 5 0 5
Total corporate portfolio 3 527 8 807 7 12 341
COMMON PORTFOLIO
Certificates 2 590 2 611 0 5 201
Bonds 20 801 26 061 0 46 863
Fixed-income funds 49 775 8 710 4 820 63 305
Fixed-income securities 73 166 37 382 4 820 115 368
107

31.03.2021
NOK MILLIONS Level 1 Level 2 Level 3 Total
Loans and receivables 11 752 315 0 12 067
Shares 32 831 249 2 588 35 668
Equity funds 83 767 0 49 83 817
Property funds 0 1 095 3 174 4 269
Special funds 0 1 846 0 1 846
Private Equity 0 0 16 970 16 970
Shares and units 116 598 3 190 22 781 142 569
Financial derivatives 0 3 067 0 3 067
Other financial assets 0 1 232 0 1 232
Total common portfolio 201 515 45 186 27 601 274 303
INVESTMENT OPTION PORTFOLIO
Fixed-income funds 323 7 0 330
Fixed-income securities 323 7 0 330
Loans and receivables 84 0 0 84
Equity funds 619 0 0 619
Special funds 0 8 0 8
Shares and units 619 8 0 627
Financial derivatives 0 11 0 11
Other financial assets 0 0 0 1
Total investment option portfolio 1 026 27 0 1 054
Total financial assets valued at fair value 206 069 54 020 27 608 287 699
CORPORATE PORTFOLIO
Investment property 0 0 991 991
Total investment property 0 0 991 991
FINANCIAL LIABILITIES BOOKED AT FAIR VALUE
CORPORATE PORTFOLIO
Financial derivatives 0 0 0 0
Debt to credit institutions 885 0 0 885
Total corporate portfolio 885 0 0 885
COMMON PORTFOLIO
Financial derivatives 0 648 0 648
Debt to credit institutions 2 414 0 0 2 414
Total common portfolio 2 414 648 0 3 062
INVESTMENT OPTION PORTFOLIO
Financial derivatives 0 1 0 1
Debt to credit institutions 19 0 0 19
Total investment option portfolio 19 1 0 20
Total financial liabilities at fair value 3 318 650 0 3 968
108

31.12.2021
NOK MILLIONS Level 1 Level 2 Level 3 Total
FINANCIAL ASSETS BOOKED AT FAIR VALUE
CORPORATE PORTFOLIO
Certificates 0 475 0 475
Bonds 29 6 793 0 6 822
Fixed-income funds 2 983 0 0 2 983
Fixed-income securities 3 012 7 269 0 10 280
Loans and receivables 338 949 0 1 287
Shares 0 0 8 8
Shares and units 0 0 8 8
Financial derivatives 0 646 0 646
Other financial assets 0 0 0 0
Total corporate portfolio 3 350 8 864 8 12 221
COMMON PORTFOLIO
Certificates 1 523 2 872 0 4 394
Bonds 21 634 25 583 0 47 217
Fixed-income funds 42 676 8 842 6 227 57 745
Fixed-income securities 65 833 37 296 6 227 109 357
Loans and receivables 12 076 317 0 12 393
Shares 49 694 927 2 721 53 342
Equity funds 97 369 0 50 97 419
Property funds 0 1 133 5 938 7 071
Special funds 0 1 884 0 1 884
Private Equity 0 0 27 962 27 962
Shares and units 147 064 3 944 36 671 187 679
Financial derivatives 0 1 862 0 1 862
Other financial assets 0 695 0 695
Total common portfolio 224 972 44 114 42 899 311 984
INVESTMENT OPTION PORTFOLIO
Fixed-income funds 292 7 0 298
Fixed-income securities 292 7 0 298
Loans and receivables 74 0 0 74
Equity funds 740 0 0 740
Special funds 0 9 0 9
Shares and units 740 9 0 749
Financial derivatives 0 6 0 6
Other financial assets 0 0 0 0
Total investment option portfolio 1 105 21 0 1 126
Total financial assets valued at fair value 229 427 52 998 42 906 325 331
109

31.12.2021
NOK MILLIONS Level 1 Level 2 Level 3 Total
CORPORATE PORTFOLIO
Investment property 0 0 1 004 1 004
Total investment property 0 0 1 004 1 004
FINANCIAL LIABILITIES BOOKED AT FAIR VALUE
CORPORATE PORTFOLIO
Financial derivatives 0 0 0 0
Debt to credit institutions 734 0 0 734
Total corporate portfolio 734 0 0 734
COMMON PORTFOLIO
Financial derivatives 0 2 010 0 2 010
Debt to credit institutions 902 0 0 902
Total common portfolio 902 2 010 0 2 912
INVESTMENT OPTION PORTFOLIO
Financial derivatives 0 4 0 4
Debt to credit institutions 15 0 0 15
Total investment option portfolio 15 4 0 19
Total financial liabilities at fair value 1 651 2 014 0 3 665
Changes in Level 3 shares, unlisted
CORPORATE PORTFOLIO
Book value
31.03.2022
Book value
31.03.2021
Book value
31.12.2021
Opening balance 01.01. 8 7 7
Sold 0 0 0
Bought 0 0 0
Unrealised changes 0 0 1
Closing balance 31.03./31.12. 8 7 8
Realised gains/losses 0 0 0
Changes in Level 3 shares, unlisted
COMMON PORTFOLIO
Book value
31.03.2022
Book value
31.03.2021
Book value
31.12.2021
Opening balance 01.01. 2 721 2 545 2 545
Sold -20 0 0
Bought 1 0 15
Unrealised changes -34 43 161
Closing balance 31.03./31.12. 2 669 2 588 2 721
Realised gains/losses -13 0 0
110

Changes in Level 3 equity funds, unlisted
COMMON PORTFOLIO
Book value
31.03.2022
Book value
31.03.2021
Book value
31.12.2021
Opening balance 01.01. 50 55 55
Sold 0 0 0
Bought 0 0 0
Unrealised changes 1 -5 -5
Closing balance 31.03./31.12. 51 49 50
Realised gains/losses 0 0 0
Changes in Level 3, private equity,
fixed- income funds and property funds
COMMON PORTFOLIO
Book value
31.03.2022
Book value
31.03.2021
Book value
31.12.2021
Opening balance 01.01. 40 127 23 312 23 312
Sold -1 242 -786 -4 551
Bought 2 457 1 979 13 793
Unrealised changes 1 165 460 7 574
Closing balance 31.03./31.12. 42 507 24 964 40 127
Realised gains/losses 521 562 2 236
Changes in Level 3, investment property
CORPORATE PORTFOLIO
Book value
31.03.2022
Book value
31.03.2021
Book value
31.12.2021
Opening balance 01.01. 1 004 1 017 1 017
Sold 0 0 0
Bought 0 0 0
Unrealised changes 10 9 40
Other -20 -35 -53
Closing balance 31.03./31.12. 995 991 1 004
Realised gains/losses 0 0 0
Total level 3 46 229 28 600 43 911
Unrealised changes are reflected in the line «Value changes on investments» in the
different portfolios in the income statement.
The amounts in the level distribution can in turn be found in the financial position
statement under various portfolios’ allocation of financial instruments at fair value and
investment property
Fair value shall be a representative price based on what a corresponding asset or liability
would have been traded for on normal market terms and conditions. Highest quality in
regard to fair value is based on listed prices in an active market. A financial instrument is
considered as noted in an active market if noted prices are simply and regularly available
from a stock market, dealer, broker, industry grouping, price setting service or regulatory
authority, and these prices represent actual and regularly occurring transactions at arm’s
length.
111

LEVEL 1:
Instruments at this level obtain fair value from listed prices in an active market for identical
assets or liabilities that the entity has access to at the reporting date. Examples of
instruments at Level 1 are stock market listed securities.
LEVEL 2:
Instruments at this level obtain fair value from observable market data. This includes prices
based on identical instruments, but where the instrument does not maintain a high enough
trading frequency and is therefore not considered to be traded in an active market, as well
as prices based on corresponding assets and price-leading indicators that can be
confirmed from market information. Example instruments at Level 2 are fixed income
securities priced on the basis of interest rate paths.
LEVEL 3:
Instruments at Level 3 contain no observable market data or are traded in markets
considered to be inactive. The price is based generally on discrete calculations where the
actual fair value may deviate if the instrument were to be traded. The instruments covered
at Level 3 in the company include unlisted shares and Private Equity.
Valuations related to items in the various levels are described in note 9 for the Group. For
description of the pricing of investment property please see the annual financial
statements.
The fair value of assets and liabilities measured at amortized cost are stated in note 6.
Level based classification of these items will be as follows; assets classified as held to
maturity are included in level 1, lending and loans and receivables are included in level 2.
Liabilities, measured at amortized cost, will be categorized as follows: subordinated loans
are included in both level 1 and 2, hybrid tier 1 securities are inlcuded in level 2 and debt to
credit institutions are included in level 1. Information regarding pricing of these interest
bearing instruments are available in note 9 for the Group.
No sensitivity analysis has been carried out on securities included in Level 3. A change in
the variables of the pricing is considered of little significance on the securities. A
sensitivity analysis for investment property is available in the annual report. On a general
basis, a 5 percent change in the pricing would produce a change of NOK 2 311 million as of
31.03.2022 on the assets in level 3.
112
With regard to transferring securities between the levels, a limit is set for the number of
trading days and the amount of trading for shares by separating Level 1 and Level 2. The
general principles related to the distribution between levels basically concern whether the
asset or liability is listed or not and whether the listing can be stated to be in an active
market. As regards shares, there is a further distinction between trading days and amount
of trading which separates out listed securities that do not form part of an active market.
The values at the end of the reporting period provide the basis for any movement between
the levels.
During the 1st quarter, NOK 69 million was moved from Level 1 to Level 2 and NOK 247
million was moved from level 2 to level 1. The amounts are related to equity instruments
and the movements are due to change in liquidity. There were no other movements
between the different levels in KLP.
113

Note 8 Presentation of assets and liabilities that are subject to netsettlement
31.03.2022
NOK MILLIONS
Related amounts not
presented net
Gross
financial
assets/
liabilities
Gross
assets/
liabilities
presented net
Book
value
Financial
instruments
Security
in cash
Security in
securities
Net
amount
ASSETS
Financial derivates 4 737 0 4 737 -212 -7 756 0 151
Total 4 737 0 4 737 -212 -7 756 0 151
PORTFOLIO ALLOCATION OF ASSETS
Total assets – common portfolio 4 108 0 4 108 -212 -7 045 0 45
Total assets – corporate portfolio 614 0 614 0 -697 0 99
Total assets – investment option portfolio 16 0 16 0 -15 0 7
Total 4 737 0 4 737 -212 -7 756 0 151
LIABILITIES
Financial derivates 246 0 246 -212 -46 0 0
Total 246 0 246 -212 -46 0 0
PORTFOLIO ALLOCATION OF LIABILITIES
Total liabilities – common portfolio 245 0 245 -212 -43 0 0
Total liabilities – corporate portfolio 0 0 0 0 0 0 0
Total liabilities – investment option portfolio 1 0 1 0 -3 0 0
Total 246 0 246 -212 -46 0 0
114

31.03.2021
NOK MILLIONS
Related amounts not
presented net
Gross
financial
assets/
liabilities
Gross
assets/
liabilities
presented net
Book
value
Financial
instruments
Security
in cash
Security in
securities
Net
amount
ASSETS
Financial derivates 3 819 0 3 819 -643 -2 927 0 392
Total 3 819 0 3 819 -643 -2 927 0 392
PORTFOLIO ALLOCATION OF ASSETS
Total assets – common portfolio 3 067 0 3 067 -642 -2 175 0 320
Total assets – corporate portfolio 742 0 742 0 -741 0 64
Total assets – investment option portfolio 11 0 11 -1 -11 0 8
Total 3 819 0 3 819 -643 -2 927 0 392
LIABILITIES
Financial derivates 650 0 650 -643 -17 0 0
Total 650 0 650 -643 -17 0 0
PORTFOLIO ALLOCATION OF LIABILITIES
Total liabilities – common portfolio 648 0 648 -642 -14 0 0
Total liabilities – corporate portfolio 0 0 0 0 0 0 0
Total liabilities – investment option portfolio 1 0 1 -1 -3 0 0
Total 650 0 650 -643 -17 0 0
115

31.12.2021
NOK MILLIONS
Related amounts not
presented net
Gross
financial
assets/
liabilities
Gross
assets/
liabilities
presented net
Book
value
Financial
instruments
Security
in cash
Security in
securities
Net
amount
ASSETS
Financial derivates 2 513 0 2 513 -1 485 -1 640 -79 310
Total 2 513 0 2 513 -1 485 -1 640 -79 310
PORTFOLIO ALLOCATION OF ASSETS
Total assets – common portfolio 1 862 0 1 862 -1 484 -901 -79 279
Total assets – corporate portfolio 646 0 646 0 -734 0 27
Total assets – investment option portfolio 6 0 6 -2 -5 0 4
Total 2 513 0 2 513 -1 485 -1 640 -79 310
LIABILITIES
Financial derivates 2 014 0 2 014 -1 485 -21 -330 222
Total 2 014 0 2 014 -1 485 -21 -330 222
PORTFOLIO ALLOCATION OF LIABILITIES
Total liabilities – common portfolio 2 010 0 2 010 -1 484 -18 -330 220
Total liabilities – corporate portfolio 0 0 0 0 0 0 0
Total liabilities – investment option portfolio 4 0 4 -2 -3 0 3
Total 2 014 0 2 014 -1 485 -21 -330 222
116

The purpose of this note is to show the potential effect of netting agreements at KLP; what
possibilities KLP has to net bilateral agreements against other counterparties should the
latter go bankrupt and the remaining amount if all such netting agreements are
materialized. The note shows derivative positions in the financial position statement, and
one additional table with information on the different portfolios in the company.
Note 9 Liabilities
NOK MILLIONS 31.03.2022 31.03.2021 31.12.2021
Short-term liabilities securities 8 676 1 503 367
Advance tax-deduction pension scheme 439 392 491
Accounts payable 128 -17 10
Derivatives 246 650 2 014
Debt to credit institutions 7 860 3 318 1 651
Liabilities related to direct insurance 904 850 699
Other liabilities 154 132 30
Total liabilities 18 407 6 828 5 261
Note 10 SCR ratio
The Solvency II balance sheet includes assets and liabilities at fair value. For assets that
have a different value in the accounts change in balance value are added. There are no
observable market values for KLP’s insurance liabilities, which are thus calculated by way
of a best estimate based on actuarial assumptions. In addition there is a risk margin that is
to reflect a third party’s capital costs by taking over these liabilities.
Tier 1 capital appears from the Solvency II balance sheet and Hybrid Tier 1 securities. Tier 2
capital consist of subordinated loans and ancillary own funds. The Financial Supervisory
Authority of Norway has accepted that KLP’s right to call in further member contribution if
necessary, which is laid down in the Company’s articles of association, can be counted as
ancillary own funds, the amount corresponding to 2.5 per cent of the Company’s premium
reserve. Capital that may be included in Tier 2 capital is limited upwards to 50 per cent of
SCR.
Without the use of the transitional measure on technical provisions the Company’s SCR
ratio is 332 per cent, which is well over the Company’s target of at least 150 per cent. With
the transitional measure on technical provisions the SCR ratio is 332 per cent.
117

31.03.2022 31.03.2021 31.12.2021
SOLVENCY II-SCR RATIO 332 % 287 % 316 %
NOK BILLIONS 31.03.2022 31.03.2021 31.12.2021
SIMPLIFIED SOLVENCY II FINANCIAL POSITION STATEMENT
Assets, book value 710 650 706
Added values - hold-to-maturity portfolio/loans and receivables -5 11 7
Added values - other lending 0 0 0
Other added/lesser values 0 0 0
Deferred tax asset 0 0 0
Total assets - solvency II 705 661 713
NOK BILLIONS 31.03.2022 31.03.2021 31.12.2021
SIMPLIFIED SOLVENCY II FINANCIAL POSITION STATEMENT
Best estimate 627 595 647
Risk margin 12 13 13
Hybrid Tier 1 securities/Subordinated loan capital 5 5 5
Other liabilities 25 15 11
Deferred tax liabilities 0 1 1
Total liabilities - solvency II 668 629 676
Excess of assets over liabilities 37 33 36
- Deferred tax asset 0 0 0
+ Hybrid Tier 1 securities 2 2 2
Tier 1 basic own funds 38 34 38
Total eligible tier 1 own funds 38 34 38
Subordinated loans 3 3 3
Tier 2 basic own funds 3 3 3
Ancillary own funds 12 11 12
Tier 2 ancillary own funds 12 11 12
Deduction for max. eligible tier 2 own funds -8 -7 -8
Total eligible tier 2 own funds 7 7 7
Deferred tax asset 0 0 0
Total eligible tier 3 own funds 0 0 0
Solvency II total eligible own funds 45 42 45
Market risk 7 7 7
Diversification market risk -2 -2 -2
Counterparty risk 0 0 0
Life risk 13 13 13
Diversification life risk -2 -3 -2
118

31.03.2022 31.03.2021 31.12.2021
Diversification general -3 -3 -3
Operational risk 3 3 3
Loss absorbing ability deferred tax -2 -1 -2
Solvency capital requirement (SCR) 14 14 14
Linear minimum capital requirement (MCR_linear) 5 6 5
Minimum 3 4 4
Maximum 6 7 6
Minimum capital requirement (MCR) 5 6 5
Solvency II -SCR ratio 332 % 287 % 316 %
Note 11 Leases
NOK MILLIONS 31.03.2022 31.03.2021 31.12.2021
RIGHT-OF-USE ASSETS Property
Opening balance 01.01. 973 1 081 1 081
Depreciation -27 -27 -108
Closing balance 946 1 054 973
NOK MILLIONS 31.03.2022 31.03.2021 31.12.2021
LEASE LIABILITIES Property
Opening balance 01.01. 1 012 1 099 1 099
Repayments -23 -22 -88
Closing balance 989 1 078 1 012
NOK MILLIONS
Q1
2022
Q1
2021
01.01.2021
-31.12.2021
Property
Interest expense lease liabilities 6 6 26
Interest expense lease liabilities 6 6 26
119

Note 12 Pension obligations
NOK MILLIONS 31.03.2022 31.03.2021 31.12.2021
Capitalized net liability 01.01. 553 594 594
Capitalized pension costs 31 28 110
Capitalized financial costs 3 3 12
Actuarial gains and losses -270 -118 -48
Premiums / contributions received -17 -16 -116
Capitalized net liability 31.03. / 31.12. 301 491 553
ASSUMPTIONS 31.03.2022 31.03.2021 31.12.2021
Discount rate 2,70 % 2,00 % 1,90 %
Salary growth 2,75 % 2,25 % 2,75 %
The National Insurance basic amount (G) 2,50 % 2,00 % 2,50 %
Pension increases 1,75 % 1,24 % 1,75 %
Social security contribution rate 14,10 % 14,10 % 14,10 %
Capital activity tax 5,00 % 5,00 % 5,00 %
The effect of changes in pension assumptions reduces the pension liability for employees
with NOK 270 million as of 31.03.2022. The change is recognized in "Total other income and
expenses that will not be reclassified to profit or loss".
120