2007 Q1 Sales - Nestlé
17
2007 Q1 Sales - April 2007 1 First Quarter Sales 2007
-
Upload
khangminh22 -
Category
Documents
-
view
1 -
download
0
Transcript of 2007 Q1 Sales - Nestlé
2007 Q1 Sales - April 2007 Name of chairman1
First Quarter Sales 2007
2007 Q1 Sales - April 2007 Name of chairman2
Disclaimer
This presentation contains forward looking statements which reflect Management’s current views and estimates. The forward looking statements involve certain risks and uncertainties that could cause actual results to differ materially from those contained in the forward looking statements. Potential risks and uncertainties include such factors as general economic conditions, foreign exchange fluctuations, competitive product and pricing pressures and regulatory developments.
2007 Q1 Sales - April 2007 Name of chairman3
Strong organic growth - highlights
• Organic growth of 7.4%
• Food and Beverage delivers 7.1% organic growth –strong performances in most areas
• Total sales increase 6.4% to CHF 24.3 billion
• Raw material costs up sharply, particularly agricultural
• Strong demand ahead of expected price increases –more pricing to follow
• Full Year targets reconfirmed:5 to 6% organic growthImprovement in constant currency EBIT margin
2007 Q1 Sales - April 2007 Name of chairman4
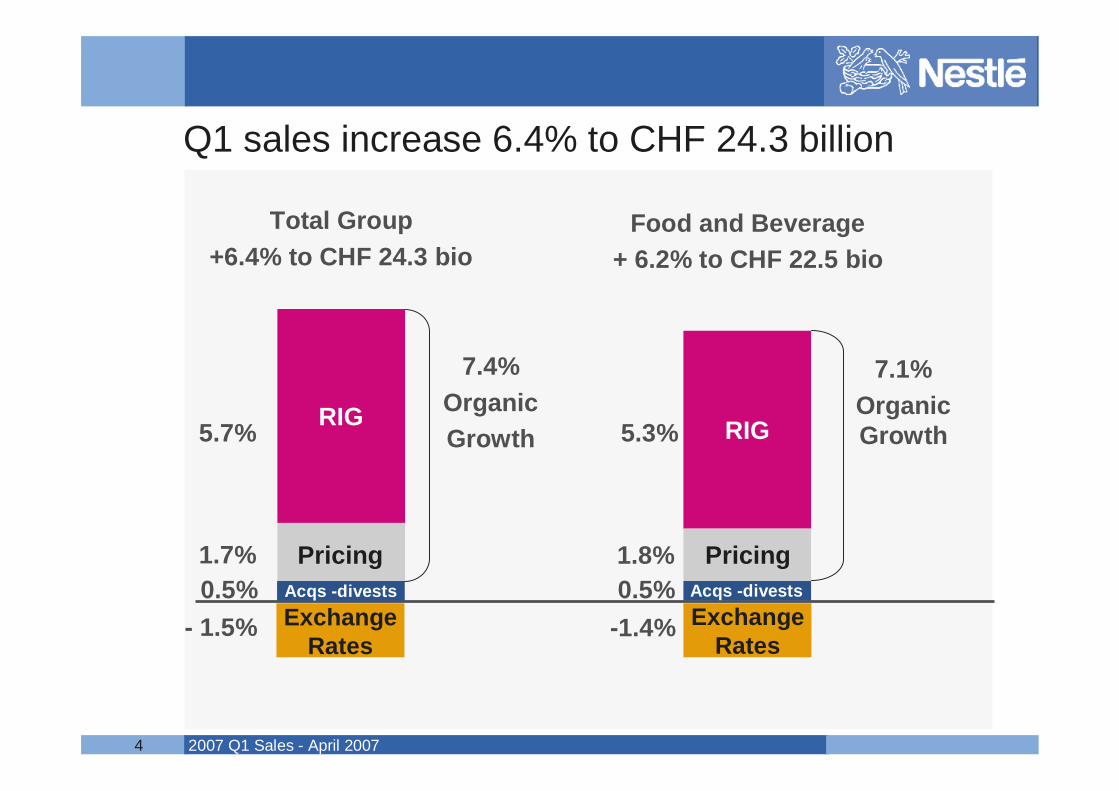
Q1 sales increase 6.4% to CHF 24.3 billion
0.5%Pricing1.7%
5.7%
7.4% OrganicGrowth
Exchange Rates
RIG
- 1.5%Acqs -divests
Total Group+6.4% to CHF 24.3 bio
RIG
Food and Beverage+ 6.2% to CHF 22.5 bio
Pricing
Exchange Rates
Acqs -divests
7.1% OrganicGrowth5.3%
1.8%0.5%
-1.4%
2007 Q1 Sales - April 2007 Name of chairman5
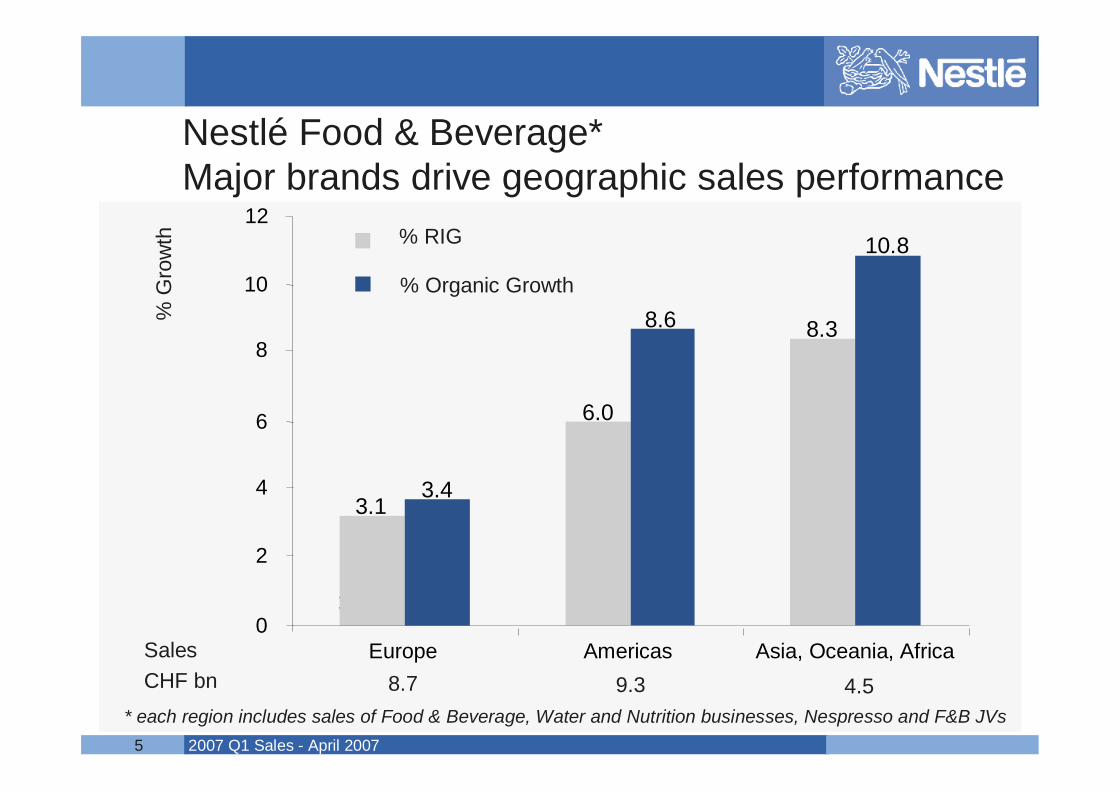
8.7
Nestlé Food & Beverage*Major brands drive geographic sales performance
* each region includes sales of Food & Beverage, Water and Nutrition businesses, Nespresso and F&B JVs
Sales CHF bn
x.x x.x x.x
3.1
6.0
8.3
3.4
8.6
10.8
0
2
4
6
8
10
12
Europe Americas Asia, Oceania, Africa
% RIG
% Organic Growth
9.3 4.5
% G
row
th
2007 Q1 Sales - April 2007 Name of chairman6
% G
row
th % RIG % Organic Growth
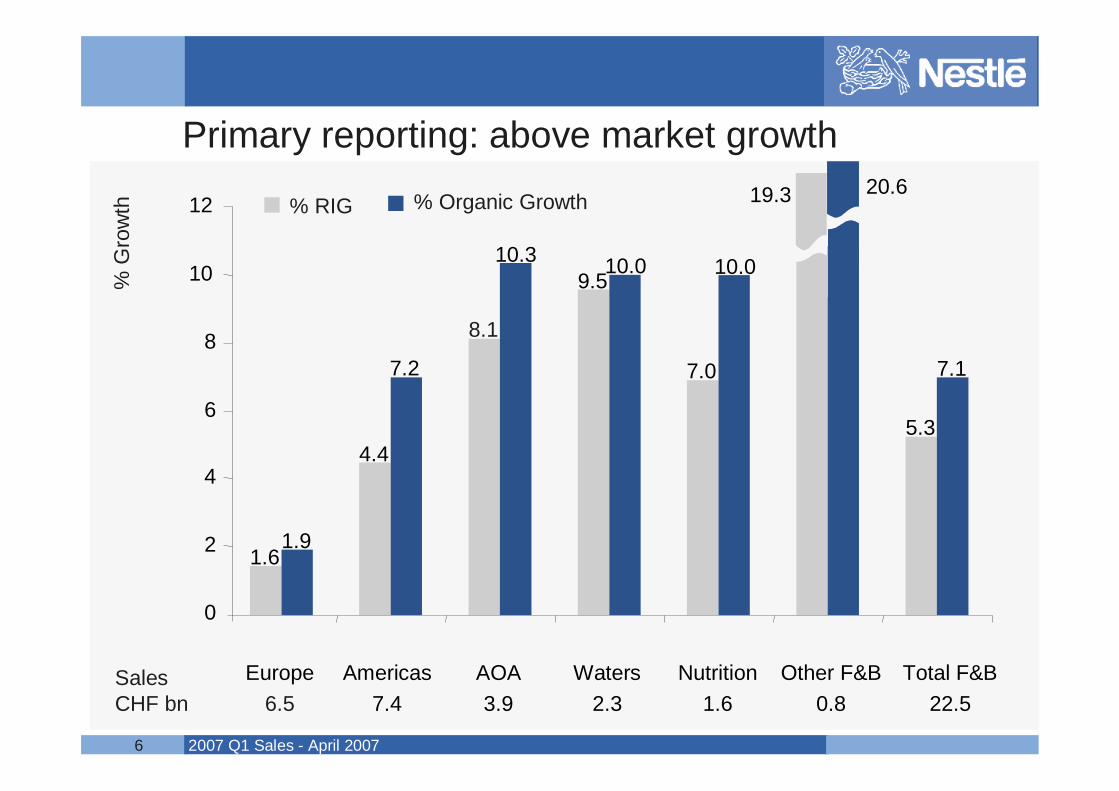
SalesCHF bn
Primary reporting: above market growth
1.6
4.4
8.1
9.5
7.0
19.3
5.3
1.9
7.2
10.3 10.0 10.0
20.6
7.1
Europe6.5
Americas7.4
AOA3.9
Waters2.3
Nutrition1.6
Other F&B0.8
Total F&B22.5
0
2
4
6
8
10
12
2007 Q1 Sales - April 2007 Name of chairman7
Milk products & Ice Cream
SalesCHF bn
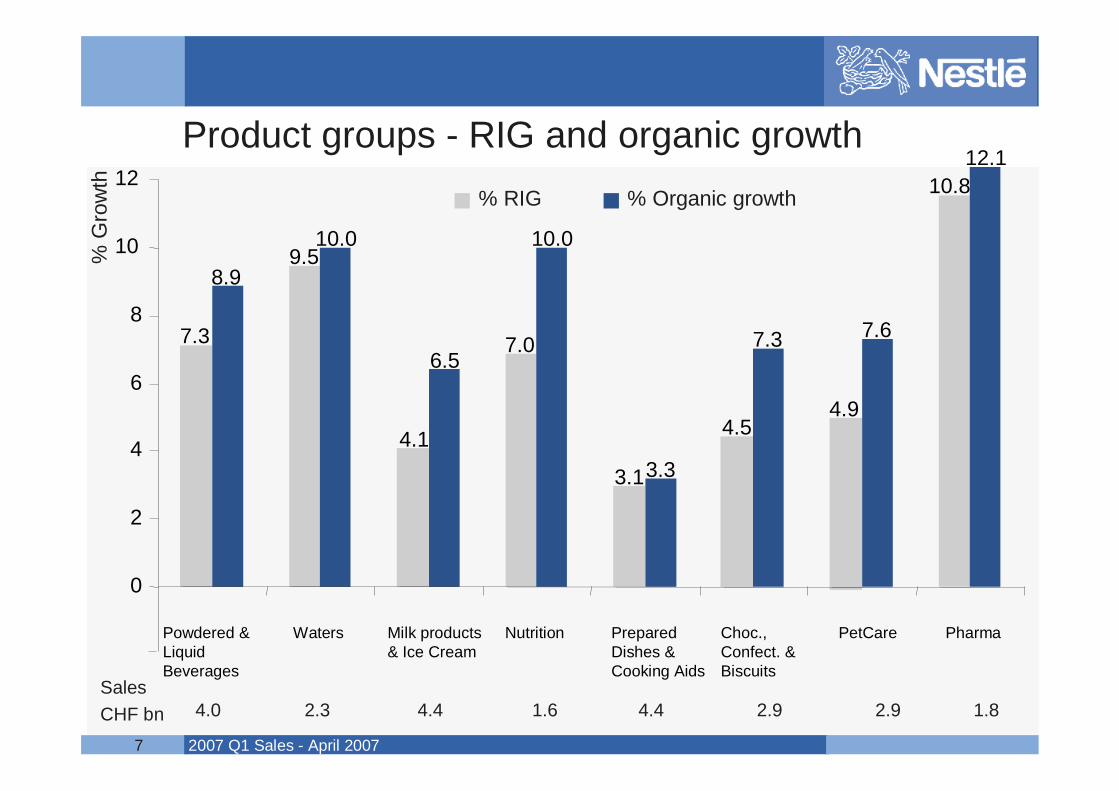
Product groups - RIG and organic growth% RIG % Organic growth
% G
row
th
7.3
9.5
4.1
7.0
3.1
4.54.9
10.8
8.9
10.0
6.5
10.0
3.3
7.3 7.6
12.1
0
2
4
6
8
10
12
Powdered & Liquid Beverages
Waters Nutrition Prepared Dishes & Cooking Aids
Choc., Confect. & Biscuits
PetCare Pharma
4.0 2.3 4.4 1.6 4.4 2.9 2.9 1.8
2007 Q1 Sales - April 2007 Name of chairman8
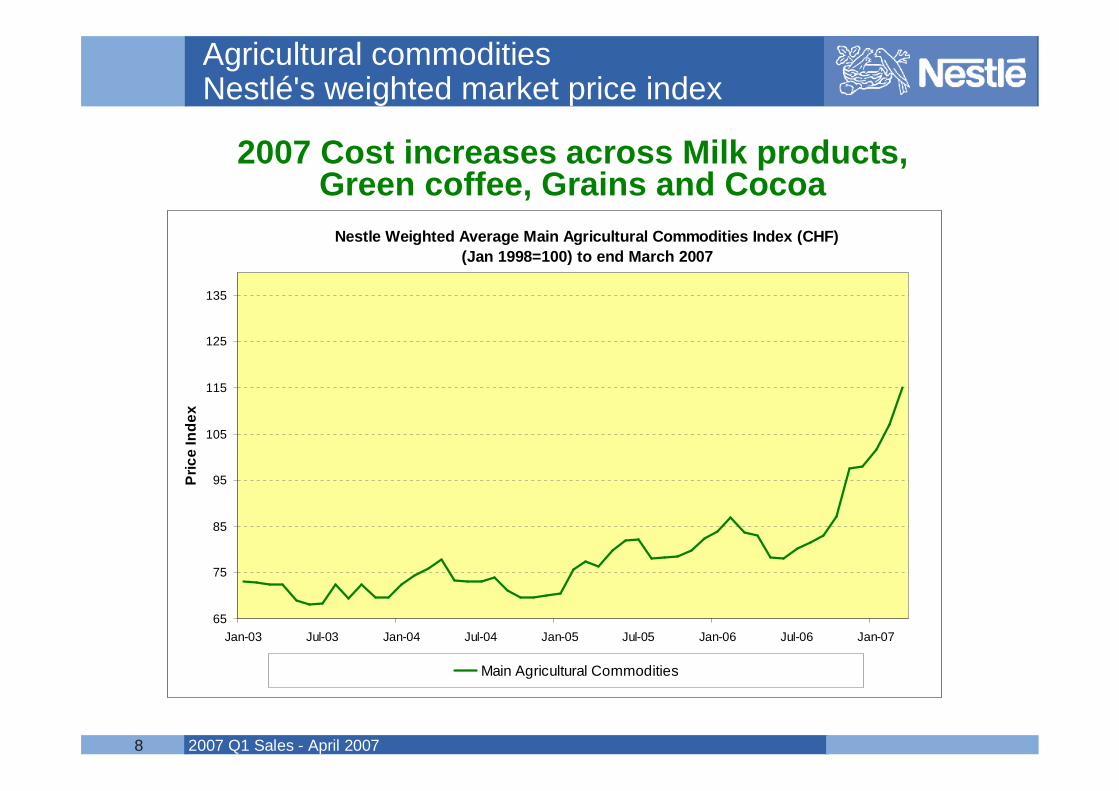
Agricultural commodities Nestlé's weighted market price index
2007 Cost increases across Milk products, Green coffee, Grains and Cocoa
Nestle Weighted Average Main Agricultural Commodities Index (CHF)(Jan 1998=100) to end March 2007
65
75
85
95
105
115
125
135
Jan-03 Jul-03 Jan-04 Jul-04 Jan-05 Jul-05 Jan-06 Jul-06 Jan-07
Pric
e In
dex
Main Agricultural Commodities
2007 Q1 Sales - April 2007 Name of chairman9
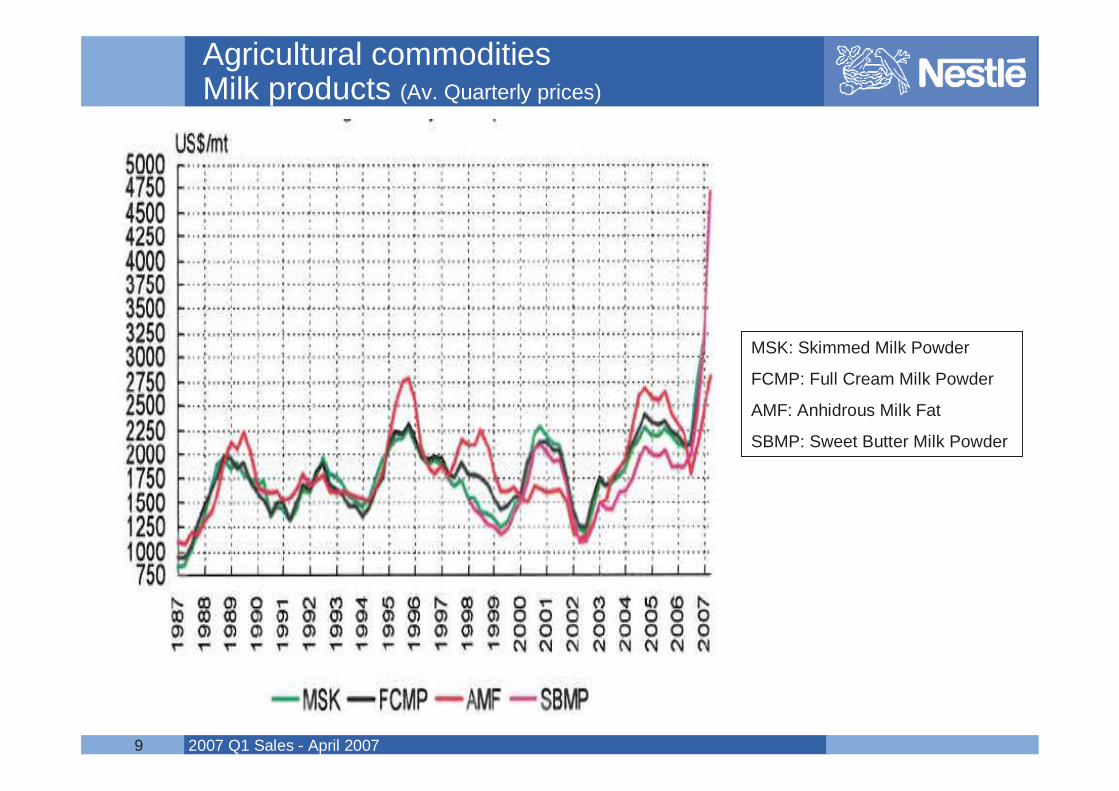
Agricultural commodities Milk products (Av. Quarterly prices)
MSK: Skimmed Milk Powder
FCMP: Full Cream Milk Powder
AMF: Anhidrous Milk Fat
SBMP: Sweet Butter Milk Powder
2007 Q1 Sales - April 2007 Name of chairman10
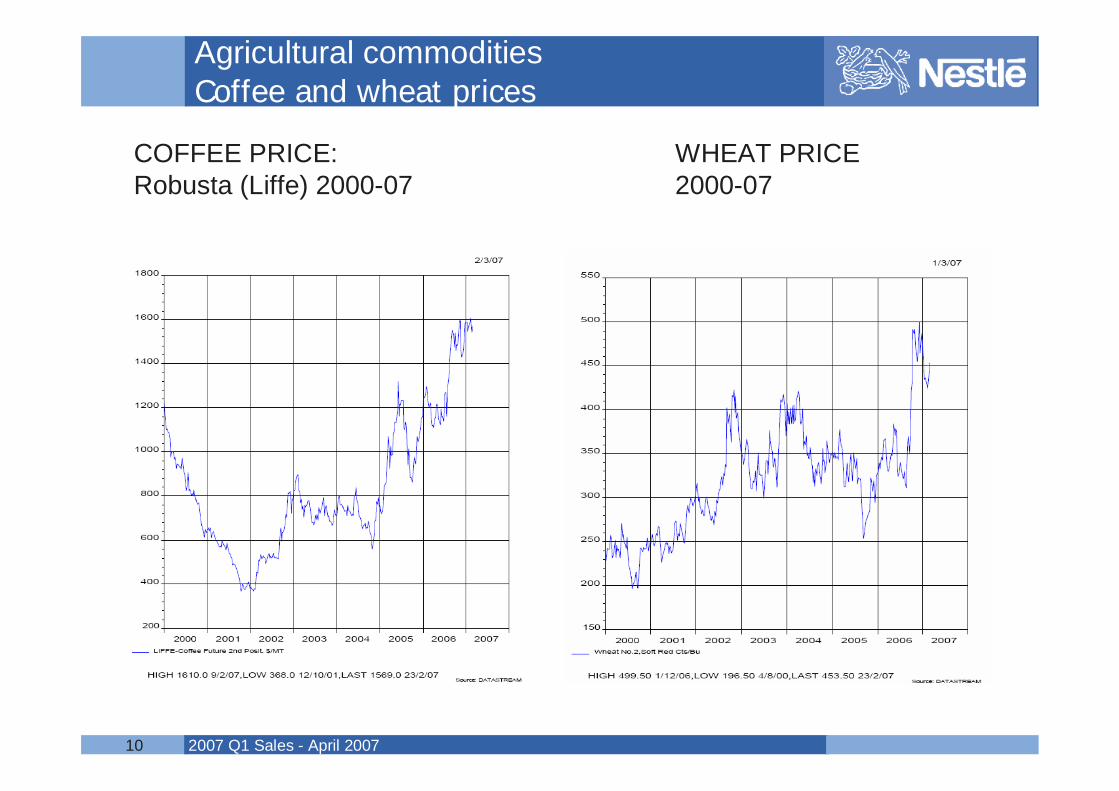
COFFEE PRICE: Robusta (Liffe) 2000-07
WHEAT PRICE 2000-07
Agricultural commodities Coffee and wheat prices
2007 Q1 Sales - April 2007 Name of chairman11
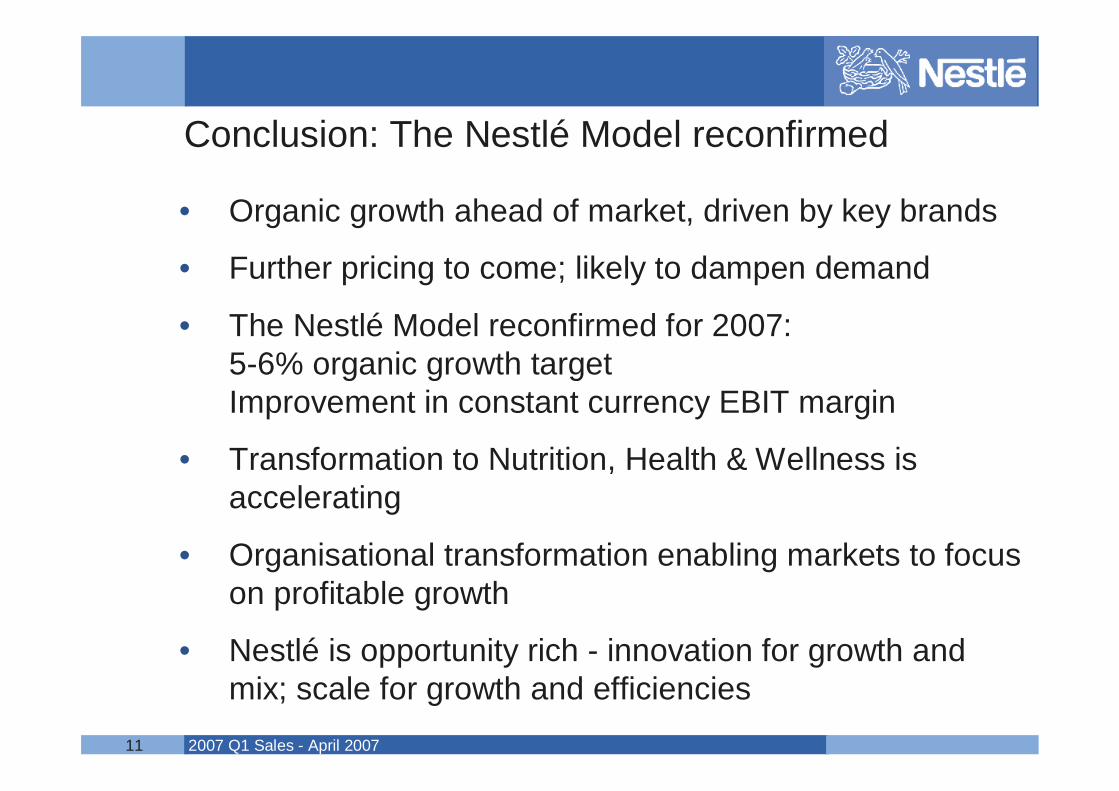
Conclusion: The Nestlé Model reconfirmed
• Organic growth ahead of market, driven by key brands
• Further pricing to come; likely to dampen demand
• The Nestlé Model reconfirmed for 2007: 5-6% organic growth targetImprovement in constant currency EBIT margin
• Transformation to Nutrition, Health & Wellness is accelerating
• Organisational transformation enabling markets to focus on profitable growth
• Nestlé is opportunity rich - innovation for growth and mix; scale for growth and efficiencies

2007 Q1 Sales - April 2007 Name of chairman12
Questions & answers
2007 Q1 Sales - April 2007 Name of chairman13
We plan to deliver the Nestlé Model annually over the next 10 years
5-6% organic growth Sustainable improvement in EBIT
Improving trend in Return on Invested Capital

2007 Q1 Sales - April 2007 Name of chairman14
First Quarter Sales 2007
2007 Q1 Sales - April 2007 Name of chairman15
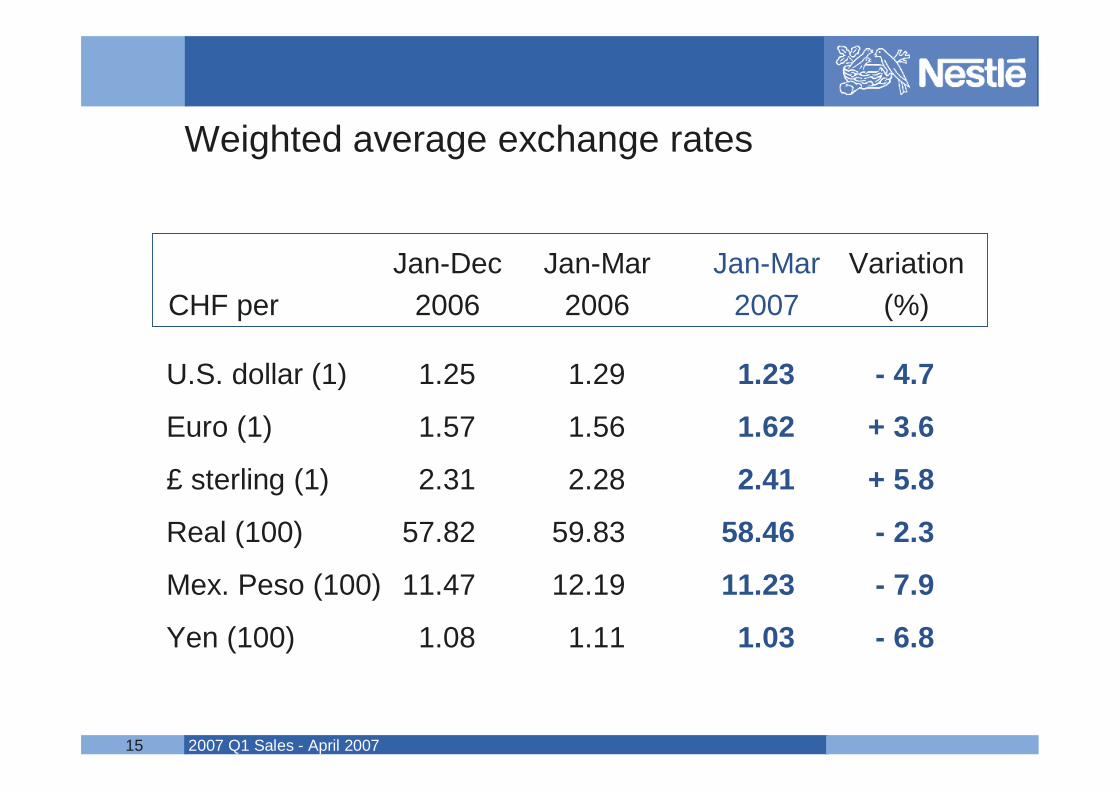
Weighted average exchange rates
Jan-Dec Jan-Mar Jan-Mar VariationCHF per 2006 2006 2007 (%)
U.S. dollar (1) 1.25 1.29 1.23 - 4.7
Euro (1) 1.57 1.56 1.62 + 3.6
£ sterling (1) 2.31 2.28 2.41 + 5.8
Real (100) 57.82 59.83 58.46 - 2.3
Mex. Peso (100) 11.47 12.19 11.23 - 7.9
Yen (100) 1.08 1.11 1.03 - 6.8
2007 Q1 Sales - April 2007 Name of chairman16
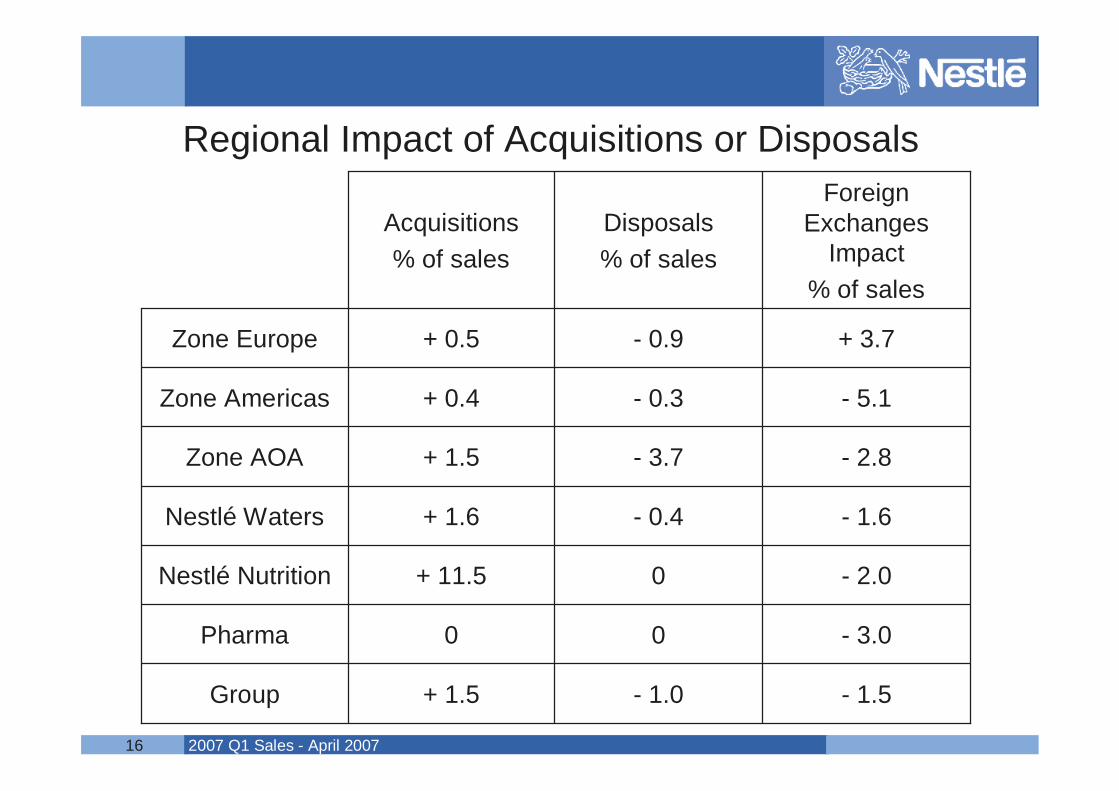
Regional Impact of Acquisitions or Disposals
- 1.5
- 3.0
- 2.0
- 1.6
- 2.8
- 5.1
+ 3.7
ForeignExchanges
Impact% of sales
- 1.0+ 1.5Group
00Pharma
0+ 11.5Nestlé Nutrition
- 0.4+ 1.6Nestlé Waters
- 3.7+ 1.5Zone AOA
- 0.3+ 0.4Zone Americas
- 0.9+ 0.5Zone Europe
Disposals% of sales
Acquisitions% of sales

2007 Q1 Sales - April 2007 Name of chairman17
First Quarter Sales 2007