Q1 2016 - MPM Properties
28
ABU DHABI REAL ESTATE MARKET OVERVIEW Q1 2016 REAL ESTATE SERVICES
-
Upload
khangminh22 -
Category
Documents
-
view
1 -
download
0
Transcript of Q1 2016 - MPM Properties

ABU DHABI REAL ESTATE MARKET OVERVIEW
Q1 2016
REAL ESTATE SERVICES
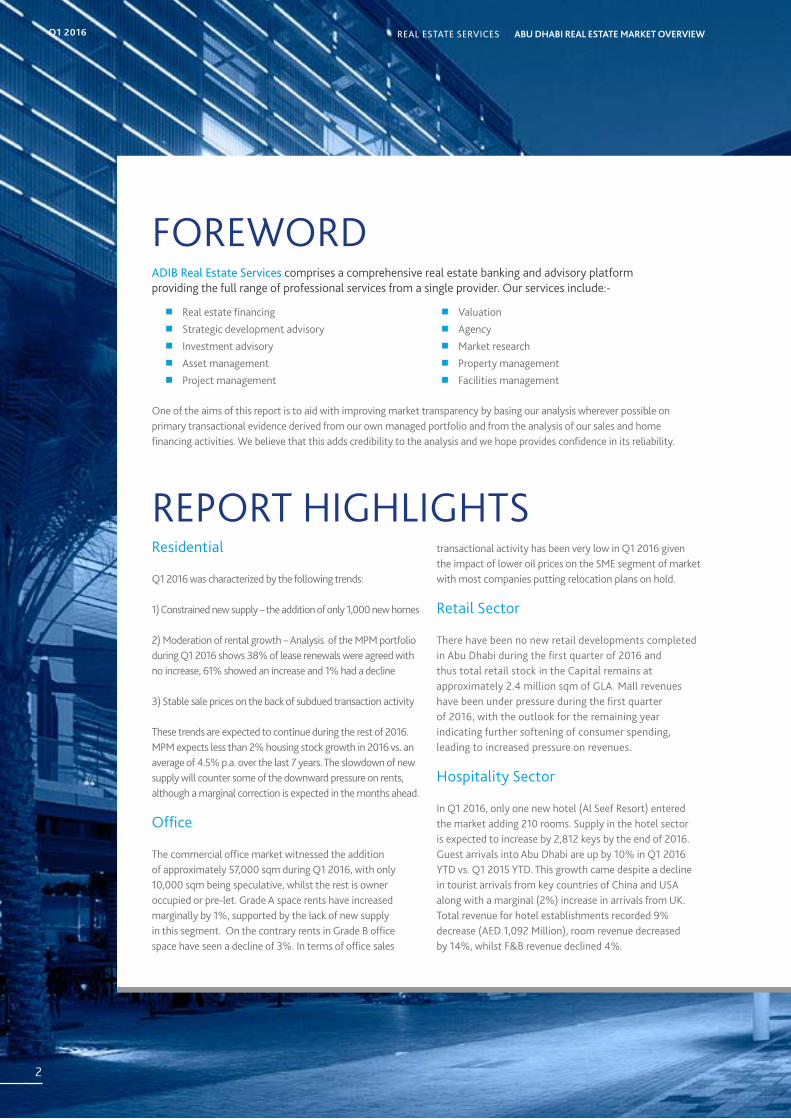
REPORT HIGHLIGHTS Residential
Q1 2016 was characterized by the following trends: 1) Constrained new supply – the addition of only 1,000 new homes 2) Moderation of rental growth – Analysis of the MPM portfolio during Q1 2016 shows 38% of lease renewals were agreed with no increase, 61% showed an increase and 1% had a decline 3) Stable sale prices on the back of subdued transaction activity These trends are expected to continue during the rest of 2016. MPM expects less than 2% housing stock growth in 2016 vs. an average of 4.5% p.a. over the last 7 years. The slowdown of new supply will counter some of the downward pressure on rents, although a marginal correction is expected in the months ahead.
Office
The commercial office market witnessed the addition of approximately 57,000 sqm during Q1 2016, with only 10,000 sqm being speculative, whilst the rest is owner occupied or pre-let. Grade A space rents have increased marginally by 1%, supported by the lack of new supply in this segment. On the contrary rents in Grade B office space have seen a decline of 3%. In terms of office sales
transactional activity has been very low in Q1 2016 given the impact of lower oil prices on the SME segment of market with most companies putting relocation plans on hold.
Retail Sector
There have been no new retail developments completed in Abu Dhabi during the first quarter of 2016 and thus total retail stock in the Capital remains at approximately 2.4 million sqm of GLA. Mall revenues have been under pressure during the first quarter of 2016, with the outlook for the remaining year indicating further softening of consumer spending, leading to increased pressure on revenues.
Hospitality Sector
In Q1 2016, only one new hotel (Al Seef Resort) entered the market adding 210 rooms. Supply in the hotel sector is expected to increase by 2,812 keys by the end of 2016. Guest arrivals into Abu Dhabi are up by 10% in Q1 2016 YTD vs. Q1 2015 YTD. This growth came despite a decline in tourist arrivals from key countries of China and USA along with a marginal (2%) increase in arrivals from UK. Total revenue for hotel establishments recorded 9% decrease (AED 1,092 Million), room revenue decreased by 14%, whilst F&B revenue declined 4%.
One of the aims of this report is to aid with improving market transparency by basing our analysis wherever possible on primary transactional evidence derived from our own managed portfolio and from the analysis of our sales and home financing activities. We believe that this adds credibility to the analysis and we hope provides confidence in its reliability.
FOREWORD ADIB Real Estate Services comprises a comprehensive real estate banking and advisory platform providing the full range of professional services from a single provider. Our services include:-
�� Real estate financing�� Strategic development advisory�� Investment advisory�� Asset management�� Project management
�� Valuation�� Agency�� Market research�� Property management�� Facilities management
REAL ESTATE SERVICES | ABU DHABI REAL ESTATE MARKET OVERVIEWQ1 2016
2
CONTENTSDemand Drivers 4
Macro Trends 6
Residential Sector 8
Project in Focus 14
Office Sector 16
Retail Sector 20
Hospitality Sector 22
Definitions & Methodology 24
Contact Information 25
Supply - Photo Gallery 26
Development Location Map 28
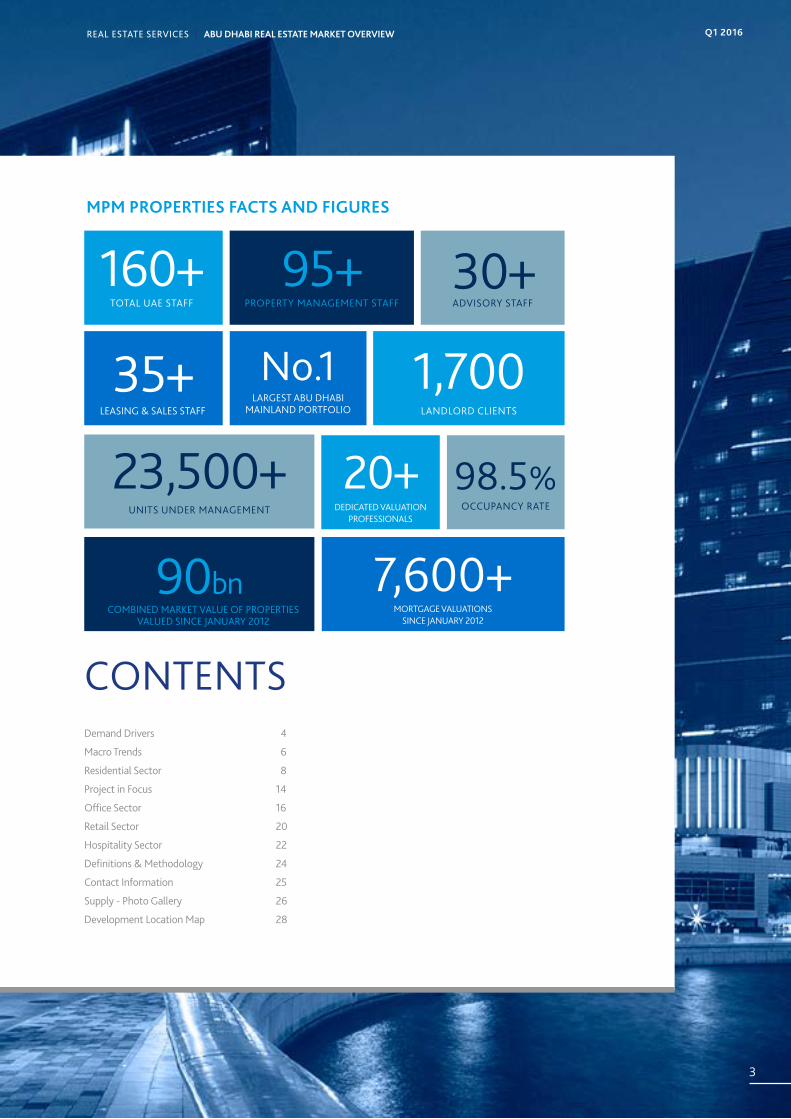
MPM PROPERTIES FACTS AND FIGURES
TOTAL UAE STAFF PROPERTY MANAGEMENT STAFF ADVISORY STAFF
UNITS UNDER MANAGEMENT
LEASING & SALES STAFF LANDLORD CLIENTS
COMBINED MARKET VALUE OF PROPERTIES VALUED SINCE JANUARY 2012
MORTGAGE VALUATIONS SINCE JANUARY 2012
DEDICATED VALUATION PROFESSIONALS
OCCUPANCY RATE
LARGEST ABU DHABI MAINLAND PORTFOLIO
160+
7,600+
No.1
98.5%20+
30+
90bn
35+
23,500+
95+
1,700
REAL ESTATE SERVICES | ABU DHABI REAL ESTATE MARKET OVERVIEW Q1 2016
3
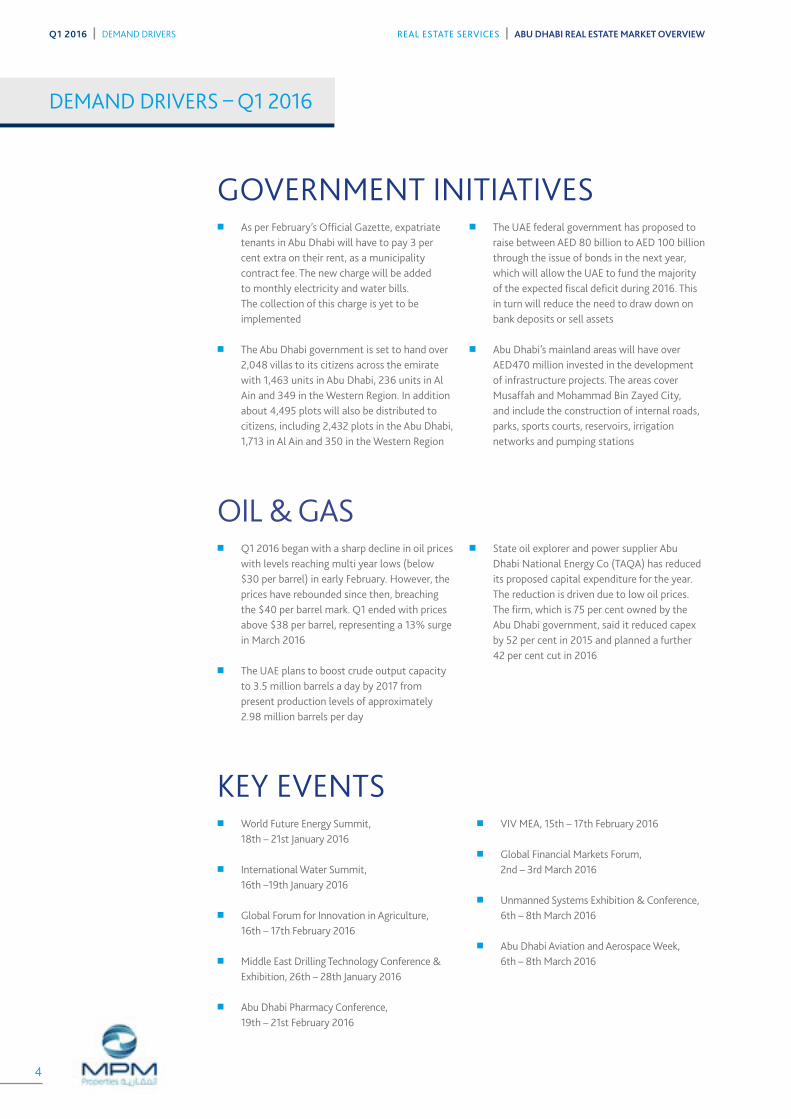
DEMAND DRIVERS – Q1 2016
GOVERNMENT INITIATIVES �� As per February’s Official Gazette, expatriate
tenants in Abu Dhabi will have to pay 3 per cent extra on their rent, as a municipality contract fee. The new charge will be added to monthly electricity and water bills. The collection of this charge is yet to be implemented
�� The Abu Dhabi government is set to hand over 2,048 villas to its citizens across the emirate with 1,463 units in Abu Dhabi, 236 units in Al Ain and 349 in the Western Region. In addition about 4,495 plots will also be distributed to citizens, including 2,432 plots in the Abu Dhabi, 1,713 in Al Ain and 350 in the Western Region
�� The UAE federal government has proposed to raise between AED 80 billion to AED 100 billion through the issue of bonds in the next year, which will allow the UAE to fund the majority of the expected fiscal deficit during 2016. This in turn will reduce the need to draw down on bank deposits or sell assets
�� Abu Dhabi’s mainland areas will have over AED470 million invested in the development of infrastructure projects. The areas cover Musaffah and Mohammad Bin Zayed City, and include the construction of internal roads, parks, sports courts, reservoirs, irrigation networks and pumping stations
KEY EVENTS�� World Future Energy Summit,
18th – 21st January 2016
�� International Water Summit, 16th –19th January 2016
�� Global Forum for Innovation in Agriculture, 16th – 17th February 2016
�� Middle East Drilling Technology Conference & Exhibition, 26th – 28th January 2016
�� Abu Dhabi Pharmacy Conference, 19th – 21st February 2016
�� VIV MEA, 15th – 17th February 2016
�� Global Financial Markets Forum, 2nd – 3rd March 2016
�� Unmanned Systems Exhibition & Conference, 6th – 8th March 2016
�� Abu Dhabi Aviation and Aerospace Week, 6th – 8th March 2016
OIL & GAS�� Q1 2016 began with a sharp decline in oil prices
with levels reaching multi year lows (below $30 per barrel) in early February. However, the prices have rebounded since then, breaching the $40 per barrel mark. Q1 ended with prices above $38 per barrel, representing a 13% surge in March 2016
�� The UAE plans to boost crude output capacity to 3.5 million barrels a day by 2017 from present production levels of approximately 2.98 million barrels per day
�� State oil explorer and power supplier Abu Dhabi National Energy Co (TAQA) has reduced its proposed capital expenditure for the year. The reduction is driven due to low oil prices. The firm, which is 75 per cent owned by the Abu Dhabi government, said it reduced capex by 52 per cent in 2015 and planned a further 42 per cent cut in 2016
4
REAL ESTATE SERVICES | ABU DHABI REAL ESTATE MARKET OVERVIEWQ1 2016 | DEMAND DRIVERS
TOURISM INITIATIVES�� As per a new decree, a 4 per cent municipality fee and a AED 15
charge per night per room will be imposed on hotel bills in Abu Dhabi. This will raise hundreds of millions of dirhams in revenue for municipal authorities with fees being collected by the Abu Dhabi Tourism and Culture Authority (TCA) and added to the government budget of the Department of Municipal Affairs
�� ADNEC has signed a deal with INDEX Conferences and Exhibitions to attract more events to Abu Dhabi. The Dubai-based firm will initially bring four new events to Abu Dhabi - Children & Parents World Exhibition, Lifestyle Exhibition, Media Communication & Content World Conference and Atech World Conference and Exhibition this year
�� A delegation from Abu Dhabi including the TCA Abu Dhabi, will attend the World Travel Market Africa 2016 (WTM Africa) in
April to capitalise on the surging growth in South African visitor numbers into the emirate. Since TCA Abu Dhabi opened an office in Johannesburg, South Africa last year to help promote the Emirate as a leisure and business destination, tourist arrivals from South Africa into Abu Dhabi have increased by 50%
�� Etihad Holidays, a unit of Etihad Airways, launched a new campaign offering “guaranteed sunshine or your next holiday for free” for UK visitors staying between May and September. The campaign will apply to every booking that consists of a flight and hotel-inclusive package. Under the offer, the visitors will be eligible for a free holiday if they experience more than 5mm of rain
REAL ESTATE AND CONSTRUCTION - CREATING JOBS�� Aldar Properties has awarded a AED 2 billion ($544.5 million)
construction contract to Arabtec for construction of 1,017 luxury villas in Abu Dhabi. The project is scheduled to be completed towards the end of 2019
�� Aldar properties has invested about AED 900 million as part of a AED 3 billion plan to boost their rental portfolio. As a part of these investments Aldar Properties has purchased Daman House, located at the Capital Centre district close to the city’s exhibition centre. The office tower houses the national insurance company Daman on a long term lease. Though the size of the transaction was not revealed, it is estimated to be worth around AED 330 million. Additionally, Aldar has invested AED 410 million in the extension of Al Jimi Mall and will spend AED160 million on construction of Al Mamoura School
�� Construction has commenced on ‘Al Qana’, a leisure oriented, mixed used project being built around the canal near Al Maqta Bridge, admeasuring 150,000 sqm. The project is scheduled to be completed in the second quarter of 2018 and will offer recreation, high-end shopping, and fine dining. The project is being developed under a Build-Operate-Transfer (BOT) arrangement between Al Barakah International Investments and Abu Dhabi Municipality
�� Al Qudra Real Estate has completed the Infrastructure works at their 200,000 sqm Danet Abu Dhabi development. Lighting, power distribution, and water-cooling networks for the master development are now in place
�� Masdar City has outlined a five-year expansion plan that will include the construction of 2,000 homes and a research hub. The completion status of Masdar city master plan will increase to 35 per cent from 5 per cent presently
FREEZONES SIGNING UP NEW TENANTS; FORMING KEY ALLIANCES
�� The Abu Dhabi Global Market Freezone, set up in October 2015, is expecting significant activity this year. They have far received interest from a number of financial services firms to set up businesses within the freezone in Al Maryah Island
�� Dubal Holding, Dubai Investments and Singapore-based industrial group MARS are investing $120 million to build an aluminum rolling
plant in Abu Dhabi’s industrial free zone. The joint venture will be known as Emirates Aluminium Rolling LLC (Emiroll), with plans to manufacture 65,000 tonnes of aluminium coils annually. The plant is anticipated to start production in the third quarter of 2017
5
REAL ESTATE SERVICES | ABU DHABI REAL ESTATE MARKET OVERVIEW Q1 2016 | DEMAND DRIVERS
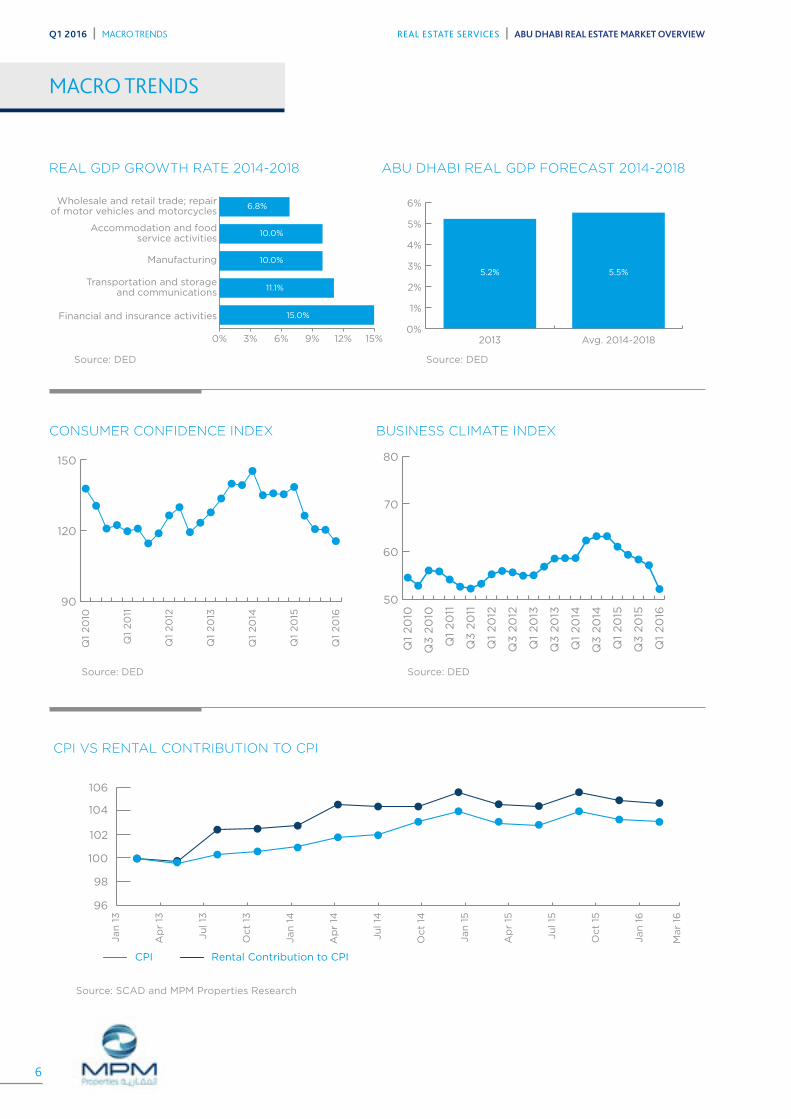
ABU DHABI REAL GDP FORECAST 2014-2018
Source: DED
0%
1%
2%
3%
4%
5%
6%
2013 Avg. 2014-2018
5.2% 5.5%
MACRO TRENDS
REAL GDP GROWTH RATE 2014-2018
Source: DED
0% 3% 6% 9% 12% 15%
Wholesale and retail trade; repairof motor vehicles and motorcycles
Accommodation and foodservice activities
Manufacturing
Transportation and storageand communications
Financial and insurance activities
6.8%
10.0%
10.0%
11.1%
15.0%
Mar
16
96
100
98
102
104
106
CPI Rental Contribution to CPI
Jan
13
Ap
r 13
Ju
l 13
Oct
13
Ap
r 15
Ju
l 15
Oct
15
Jan
14
Ap
r 14
Ju
l 14
Oct
14
Jan
15
Jan
16
Source: DEDSource: DED
Source: SCAD and MPM Properties Research
CPI VS RENTAL CONTRIBUTION TO CPI
REAL GDP GROWTH RATE 2014-2018 ABU DHABI REAL GDP FORECAST 2014-2018
50
60
70
80
Q1
20
16
Q3
20
15
Q1
20
15
Q3
20
14
Q1
20
14
Q3
20
13
Q1
20
13
Q3
20
12
Q1
20
12
Q3
20
11
Q1
20
11
Q3
20
10
Q1
20
10
90
120
150
Q1
20
16
Q1
20
15
Q1
20
14
Q1
20
13
Q1
20
12
Q1
20
11
Q1
20
10
CONSUMER CONFIDENCE INDEX
Source: DED Source: DED
BUSINESS CLIMATE INDEX
6
REAL ESTATE SERVICES | ABU DHABI REAL ESTATE MARKET OVERVIEWQ1 2016 | MACRO TRENDS

Dubai realty index Abu Dhabi realty index
400
350
300
250
200
150
100
50
0
Ju
l 0
7
Jan
07
Ju
l 0
8
Jan
08
Ju
l 0
9
Jan
09
Ju
l 10
Jan
10
Ju
l 11
Jan
11
Ju
l 12
Jan
12
Ju
l 13
Jan
13
Ju
l 14
Jan
14
Ju
l 15
Jan
15
Mar
16
Jan
16
Abu Dhabi MurbanCrude Oil
Gold Abu Dhabi Stock Market Index
Dubai Stock Index
0
50
100
150
200
250
300
350
Mar-
16
Dec-1
5
Dec-1
4
Dec-1
3
Dec-1
2
Dec-1
1
Jan
-11
Source: Bloomberg and MPM Properties Research
Source: ADIB Treasury and Bloomberg
Source: ADIB Treasury and Bloomberg
REALTY STOCK INDEX ABU DHABI vs DUBAI
STOCK MARKET vs OIL vs GOLD
FX RATES vs USD PROFIT RATE
FX RATES vs USD
Q1 2016 3mths ago 6mths ago 12mths ago
GBP 1.4226 1.4736 1.5128 1.4818
EUR 1.1175 1.0862 1.1177 1.0731
JPY 113.65 120.22 119.88 120.13
INR 66.55 66.15 65.59 62.50
PKR 104.70 104.73 104.46 101.93
RUB 68.69 72.52 65.36 58.19
CNY 6.5114 6.4937 6.3560 6.1997
HKD 7.7571 7.7507 7.7500 7.7524
QAR 3.6406 3.6419 3.6420 3.6411
AED 3.6725 3.6725 3.6725 3.6725
PROFIT RATES
O/N 3mths ago 6mths ago 12mths ago
GBP 0.4800 0.5881 0.7404 1.0115
EUR -0.3900 -0.2420 -0.1340 -0.0050
USD 0.3745 0.6286 0.9190 1.2312
AED 0.3000 1.0237 1.2790 1.5826
7
REAL ESTATE SERVICES | ABU DHABI REAL ESTATE MARKET OVERVIEW Q1 2016 | MACRO TRENDS
MARKET OVERVIEW Q1 2016
SUPPLY New supply
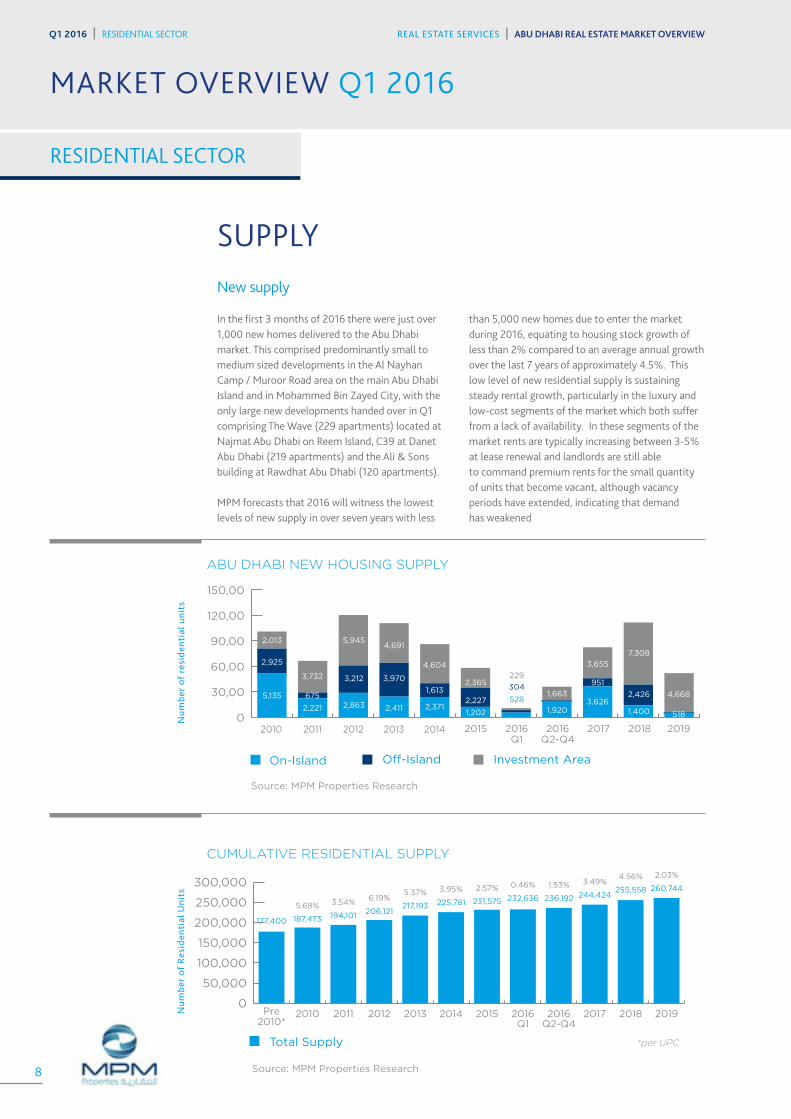
In the first 3 months of 2016 there were just over 1,000 new homes delivered to the Abu Dhabi market. This comprised predominantly small to medium sized developments in the Al Nayhan Camp / Muroor Road area on the main Abu Dhabi Island and in Mohammed Bin Zayed City, with the only large new developments handed over in Q1 comprising The Wave (229 apartments) located at Najmat Abu Dhabi on Reem Island, C39 at Danet Abu Dhabi (219 apartments) and the Ali & Sons building at Rawdhat Abu Dhabi (120 apartments).
MPM forecasts that 2016 will witness the lowest levels of new supply in over seven years with less
than 5,000 new homes due to enter the market during 2016, equating to housing stock growth of less than 2% compared to an average annual growth over the last 7 years of approximately 4.5%. This low level of new residential supply is sustaining steady rental growth, particularly in the luxury and low-cost segments of the market which both suffer from a lack of availability. In these segments of the market rents are typically increasing between 3-5% at lease renewal and landlords are still able to command premium rents for the small quantity of units that become vacant, although vacancy periods have extended, indicating that demand has weakened
Investment AreaOn-Island Off-Island
2010 2011 2012 2013 2014 2015 2016Q1
2016Q2-Q4
2017 2018 20190
30,00
60,00
90,00
120,00
150,00
5,135
2,925
2,013
2,221
3,732
6752,863
3,212
5,945
2,411
3,970
4,691
2,371
1,613
4,604
3,626
951
3,655
1,202
2,227
2,365
528
304
229
1,920
1,663
1,400
2,426
7,308
518
4,668
Num
ber
of r
esid
enti
al u
nits
Pre2010*
2010 2011 2012 2013 2014 2015 2016Q1
2017 2018 20192016Q2-Q4
Total Supply *per UPC
0
50,000
100,000
150,000
200,000
250,000
300,000
177,400
5.68%
187,473
3.54%
194,101
6.19%
206,121
5.37%
217,193
3.95%
225,781
2.57%
231,575
0.46%
232,636
1.53%
236,192
3.49%
244,424
4.56%
255,558
2.03%
260,744
Num
ber
of R
esid
enti
al U
nits
RESIDENTIAL SECTOR
Source: MPM Properties Research
Source: MPM Properties Research
ABU DHABI NEW HOUSING SUPPLY
CUMULATIVE RESIDENTIAL SUPPLY
8
REAL ESTATE SERVICES | ABU DHABI REAL ESTATE MARKET OVERVIEWQ1 2016 | RESIDENTIAL SECTOR
REAL ESTATE SERVICES | ABU DHABI REAL ESTATE MARKET OVERVIEW Q1 2016 | RESIDENTIAL SECTOR
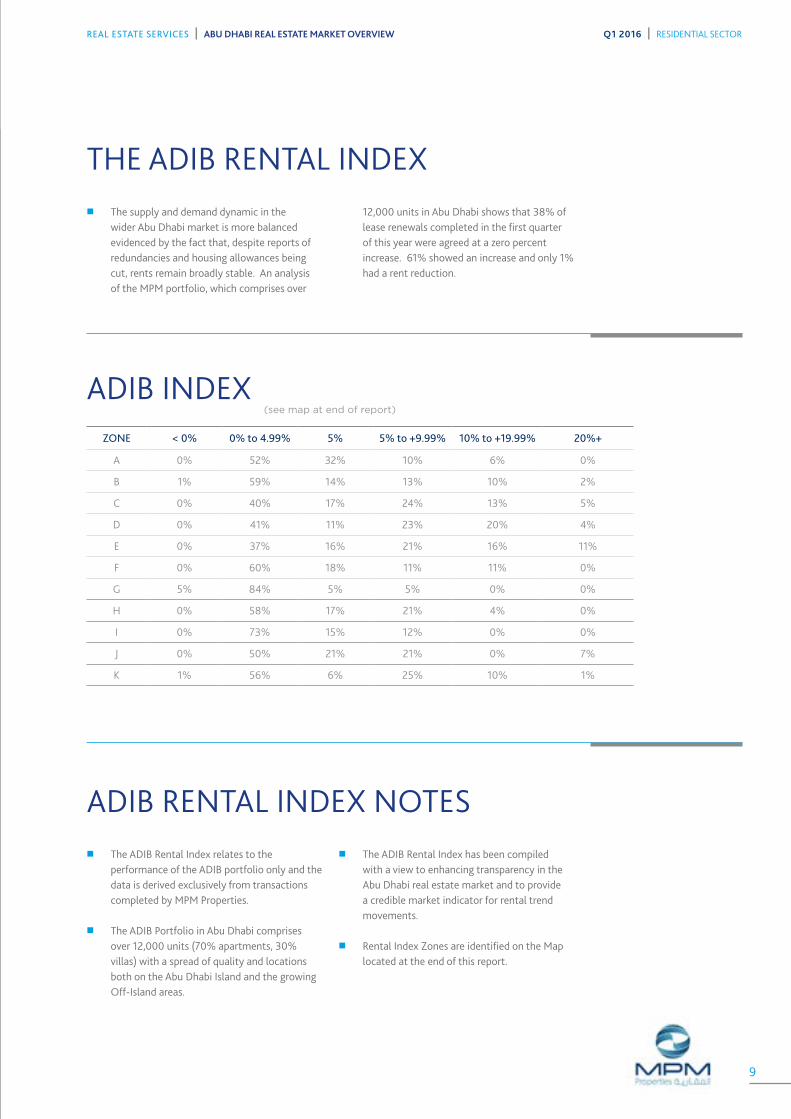
THE ADIB RENTAL INDEX �� The supply and demand dynamic in the
wider Abu Dhabi market is more balanced evidenced by the fact that, despite reports of redundancies and housing allowances being cut, rents remain broadly stable. An analysis of the MPM portfolio, which comprises over
12,000 units in Abu Dhabi shows that 38% of lease renewals completed in the first quarter of this year were agreed at a zero percent increase. 61% showed an increase and only 1% had a rent reduction.
ADIB RENTAL INDEX NOTES �� The ADIB Rental Index relates to the
performance of the ADIB portfolio only and the data is derived exclusively from transactions completed by MPM Properties.
�� The ADIB Portfolio in Abu Dhabi comprises over 12,000 units (70% apartments, 30% villas) with a spread of quality and locations both on the Abu Dhabi Island and the growing Off-Island areas.
�� The ADIB Rental Index has been compiled with a view to enhancing transparency in the Abu Dhabi real estate market and to provide a credible market indicator for rental trend movements.
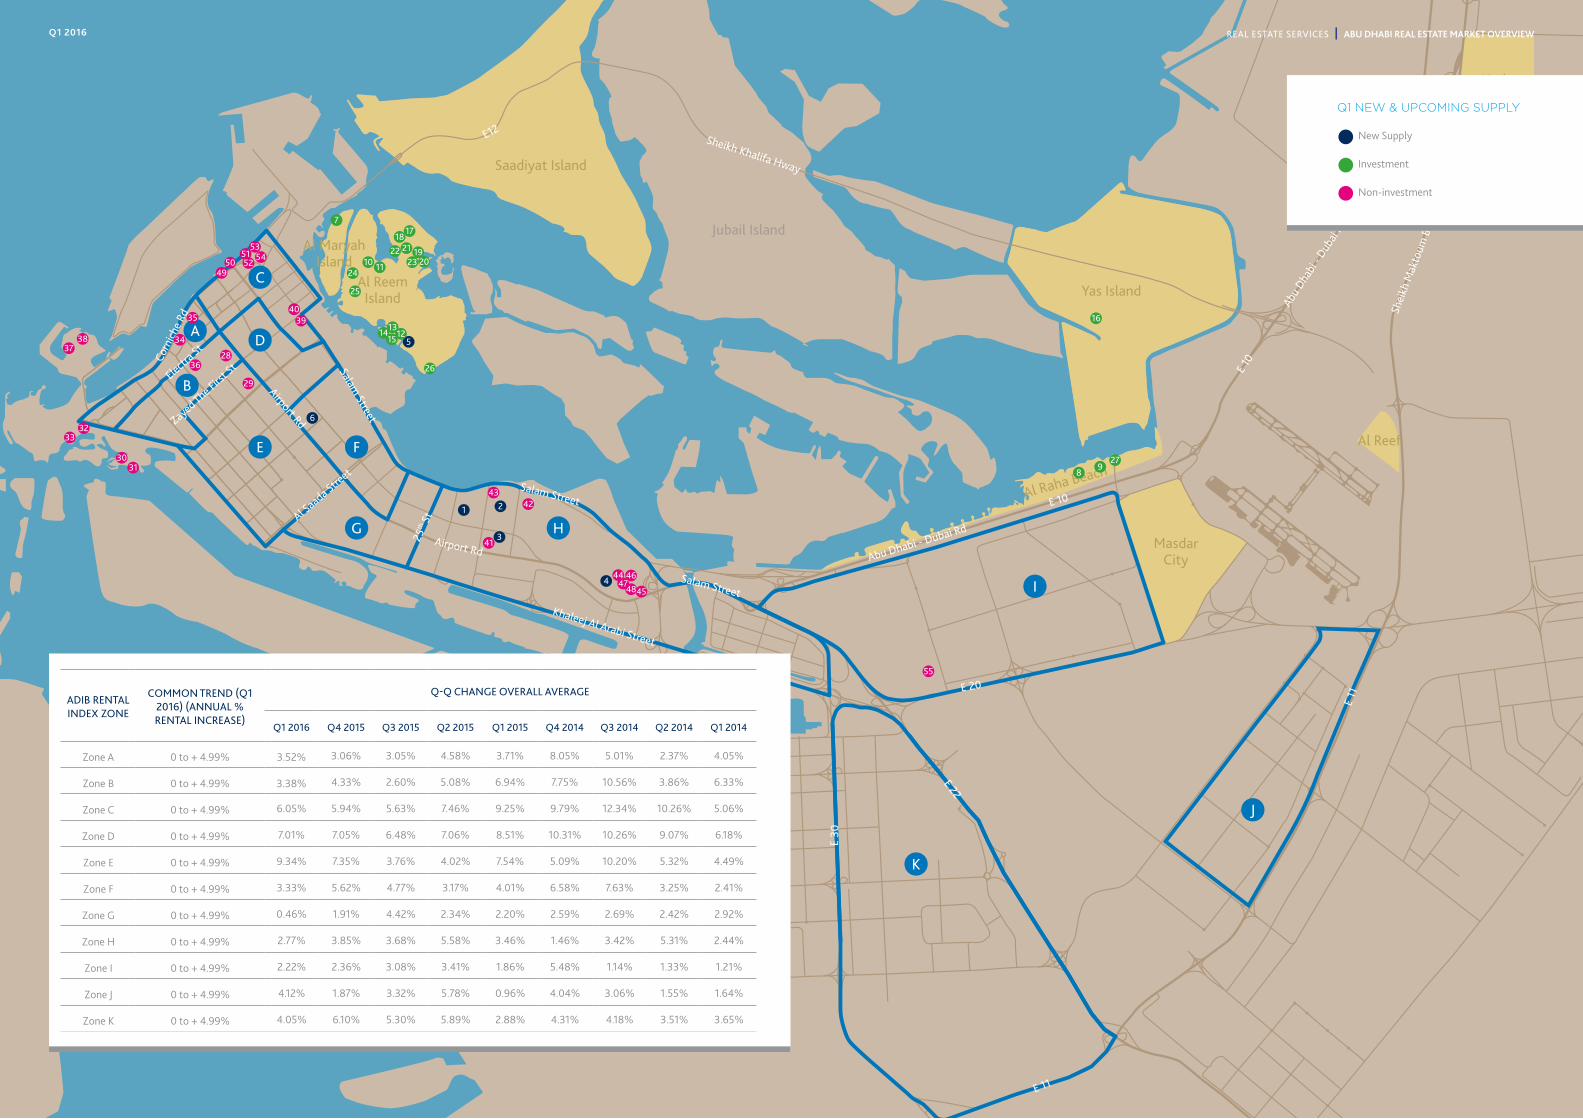
�� Rental Index Zones are identified on the Map located at the end of this report.
ZONE < 0% 0% to 4.99% 5% 5% to +9.99% 10% to +19.99% 20%+
A 0% 52% 32% 10% 6% 0%
B 1% 59% 14% 13% 10% 2%
C 0% 40% 17% 24% 13% 5%
D 0% 41% 11% 23% 20% 4%
E 0% 37% 16% 21% 16% 11%
F 0% 60% 18% 11% 11% 0%
G 5% 84% 5% 5% 0% 0%
H 0% 58% 17% 21% 4% 0%
I 0% 73% 15% 12% 0% 0%
J 0% 50% 21% 21% 0% 7%
K 1% 56% 6% 25% 10% 1%
ADIB INDEX(see map at end of report)
9

APARTMENT SALE PRICES The sales market continues to be characterized by weak sentiment translating into an environment where both buyers and sellers are equally unmotivated to enter the market thus we are seeing low transaction volumes and prices remaining broadly stable. Demand remains focused on small units commanding the highest rental yields, however there are currently few opportunities in the market as vendors continue to hold, collect rental income and wait for the longer term capital appreciation.
Despite some rental declines on Reem Island we have yet to witness any evidence of this impacting sale prices during the first quarter of the year, although a continuation of falling rents will inevitably start to put downward pressure on values to counter the yield erosion.
The first quarter of 2016 witnessed no new projects launched to the market, with developers including
Aldar, TDIC and Bloom all set to announce major new developments at Cityscape in April.
The off-plan sales market in Abu Dhabi has witnessed over 10 new projects launched to the market over the last 18 months, (prior to Cityscape Abu Dhabi April 2016), comprising over 4,500 units. Our research shows that despite more challenging market conditions being experienced in 2015 take up in these new developments has generally been strong with most projects having sold between 60-90% of the inventory released to the market.
Demand has been from both owner occupiers and investors, including bulk investors with the demographic profile of buyers, although varying from project to project is broadly 50% UAE Nationals, 20-30% Arab expats and the remainder spread across Western and Asian expats.
RESIDENTIAL SECTOR
0
500
1,000
1,500
2,000
2,500
Al R
eef
Do
wn
tow
n
Al G
had
eer
Cit
y o
fL
igh
ts
Mari
na
Sq
uare
Sh
am
s
Al Z
ein
a
Al M
un
eera
Gate
Dis
tric
t
Al B
an
dar
SB
R
St.
Reg
is
AE
D/s
q.ft.
0.0% -1.0% 0.0% 0.0% 2.0% 0.0% -4.0% -2.0% 0.0% -1.0% -8.0%Q-on-Q
0.0% -4.0% -8.0% -7.0% -7.0% -4.0% -4.0% -4.0% 0.0% -7.0% -3.0%Y-on-Y
2,2
50
1,775
1,75
0
1,4
00
1,4
00
1,3
95
1,3
25
1,275
1,15
0
95
0
925
Source: MPM Properties Research
AVERAGE APARTMENT SALES PRICE AED/sq.ft. Q1 2016
10
REAL ESTATE SERVICES | ABU DHABI REAL ESTATE MARKET OVERVIEWQ1 2016 | RESIDENTIAL SECTOR
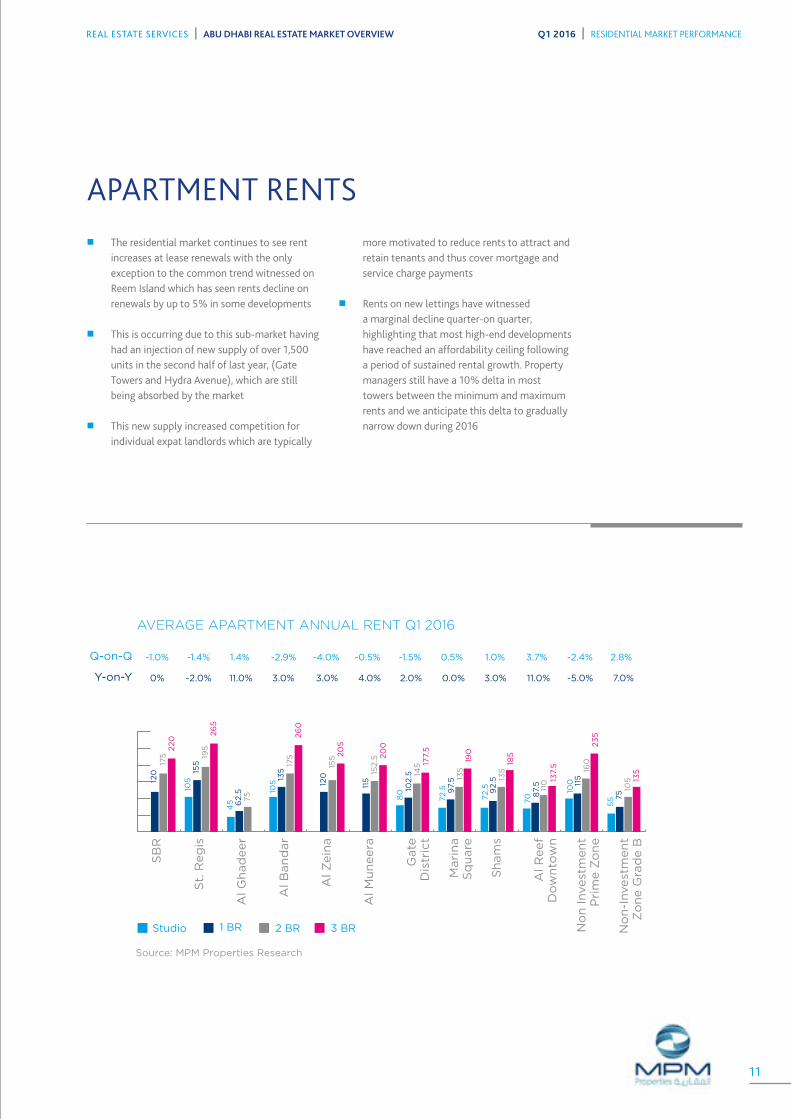
APARTMENT RENTS �� The residential market continues to see rent
increases at lease renewals with the only exception to the common trend witnessed on Reem Island which has seen rents decline on renewals by up to 5% in some developments
�� This is occurring due to this sub-market having had an injection of new supply of over 1,500 units in the second half of last year, (Gate Towers and Hydra Avenue), which are still being absorbed by the market
�� This new supply increased competition for individual expat landlords which are typically
more motivated to reduce rents to attract and retain tenants and thus cover mortgage and service charge payments
�� Rents on new lettings have witnessed a marginal decline quarter-on quarter, highlighting that most high-end developments have reached an affordability ceiling following a period of sustained rental growth. Property managers still have a 10% delta in most towers between the minimum and maximum rents and we anticipate this delta to gradually narrow down during 2016
120
175
220
155
62.5
105
45
105
80
72.5
72.5
70
100
55
195
75
26
5
135
175
26
0
120
155 2
05
115
152.5 2
00
102.5 14
5 177.
5
97.
5 135
190
92.5 13
518
5
87.
511
0 137.
5
115
160
23
5
75 10
5 135
1 BRStudio 2 BR 3 BR No
n-I
nvest
men
tZ
on
e G
rad
e B
No
n Invest
men
tP
rim
e Z
on
e
Al R
eef
Do
wn
tow
n
Sh
am
s
Mari
na
Sq
uare
Gate
Dis
tric
t
Al M
un
eera
Al Z
ein
a
Al B
an
dar
Al G
had
eer
St.
Reg
is
SB
R
-1.4% 1.4% -2.9% -4.0% -0.5% -1.5% 0.5% 1.0% 3.7% -2.4% 2.8%Q-on-Q
-2.0%
-1.0%
0% 11.0% 3.0% 3.0% 4.0% 2.0% 0.0% 3.0% 11.0% -5.0% 7.0%Y-on-Y
Source: MPM Properties Research
AVERAGE APARTMENT ANNUAL RENT Q1 2016
11
REAL ESTATE SERVICES | ABU DHABI REAL ESTATE MARKET OVERVIEW Q1 2016 | RESIDENTIAL MARKET PERFORMANCE
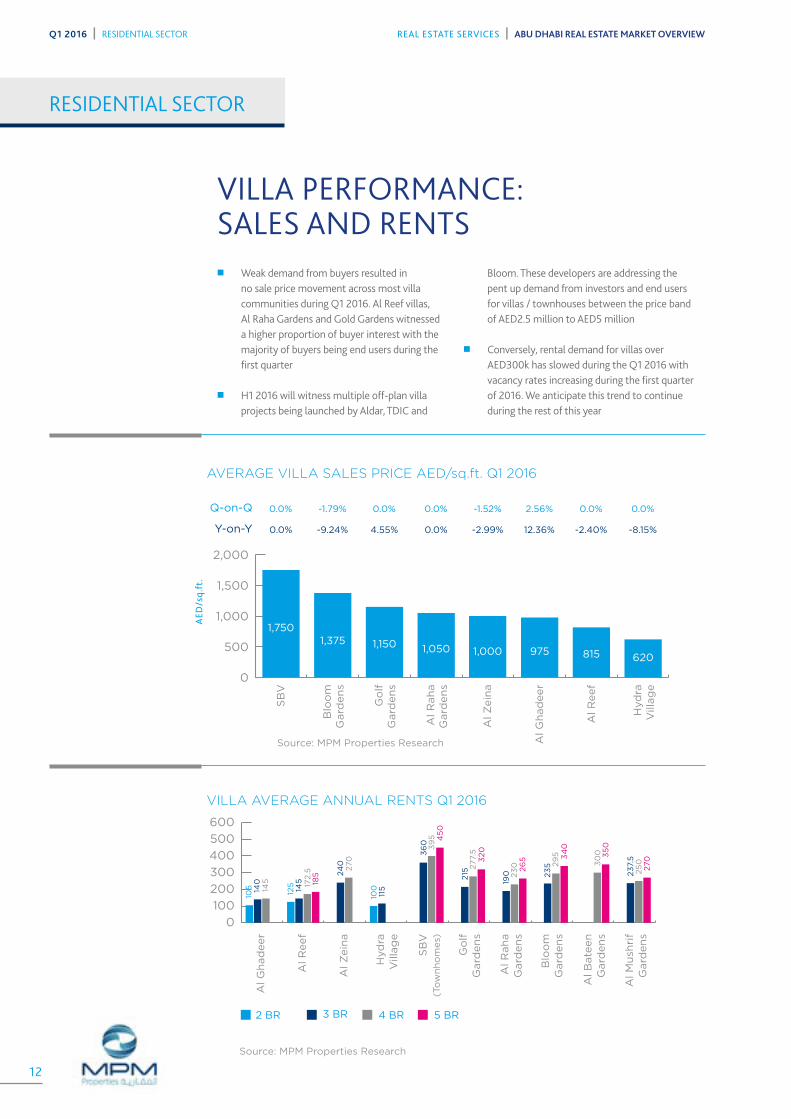
VILLA PERFORMANCE: SALES AND RENTS �� Weak demand from buyers resulted in
no sale price movement across most villa communities during Q1 2016. Al Reef villas, Al Raha Gardens and Gold Gardens witnessed a higher proportion of buyer interest with the majority of buyers being end users during the first quarter
�� H1 2016 will witness multiple off-plan villa projects being launched by Aldar, TDIC and
Bloom. These developers are addressing the pent up demand from investors and end users for villas / townhouses between the price band of AED2.5 million to AED5 million
�� Conversely, rental demand for villas over AED300k has slowed during the Q1 2016 with vacancy rates increasing during the first quarter of 2016. We anticipate this trend to continue during the rest of this year
RESIDENTIAL SECTOR
Source: MPM Properties Research
0
100
200
300
400
500
600
105
125
145
140 172.5
185
145
100
115
270
24
0
39
53
60
277.
53
20
45
0
215 23
0 26
5 30
0 35
0
34
0
25
0270
190
29
523
5
237.
5
3 BR2 BR 4 BR 5 BR
Al M
ush
rif
Gard
en
s
Al B
ate
en
Gard
en
s
Blo
om
Gard
en
s
Al R
ah
aG
ard
en
s
Go
lfG
ard
en
s
SB
V(T
ow
nh
om
es)
Hyd
raV
illag
e
Al Z
ein
a
Al R
eef
Al G
had
eer
Source: MPM Properties Research
VILLA AVERAGE ANNUAL RENTS Q1 2016
AED
/sq.
ft.
0
500
1,000
1,500
2,000
Hyd
raV
illag
e
Al R
eef
Al R
ah
aG
ard
en
s
Go
lfG
ard
en
s
Blo
om
Gard
en
s
SB
V
0.0%Q-on-Q
0.0%
-1.79%
-9.24%
0.0%
4.55%
0.0%
0.0%
-1.52%
-2.99%
2.56%
12.36%
0.0%
-2.40%
0.0%
-8.15%Y-on-Y
620815
Al Z
ein
a
1,0001,0501,1501,3751,750
Al G
had
eer
975
AVERAGE VILLA SALES PRICE AED/sq.ft. Q1 2016
12
REAL ESTATE SERVICES | ABU DHABI REAL ESTATE MARKET OVERVIEWQ1 2016 | RESIDENTIAL SECTOR
Main island KCA MBZ
Low AverageHigh
0
5
10
15
20
25
16.17
5.4
6
6.7
510.8
10.3
7
23
.0
7.15 15
.07
14.0
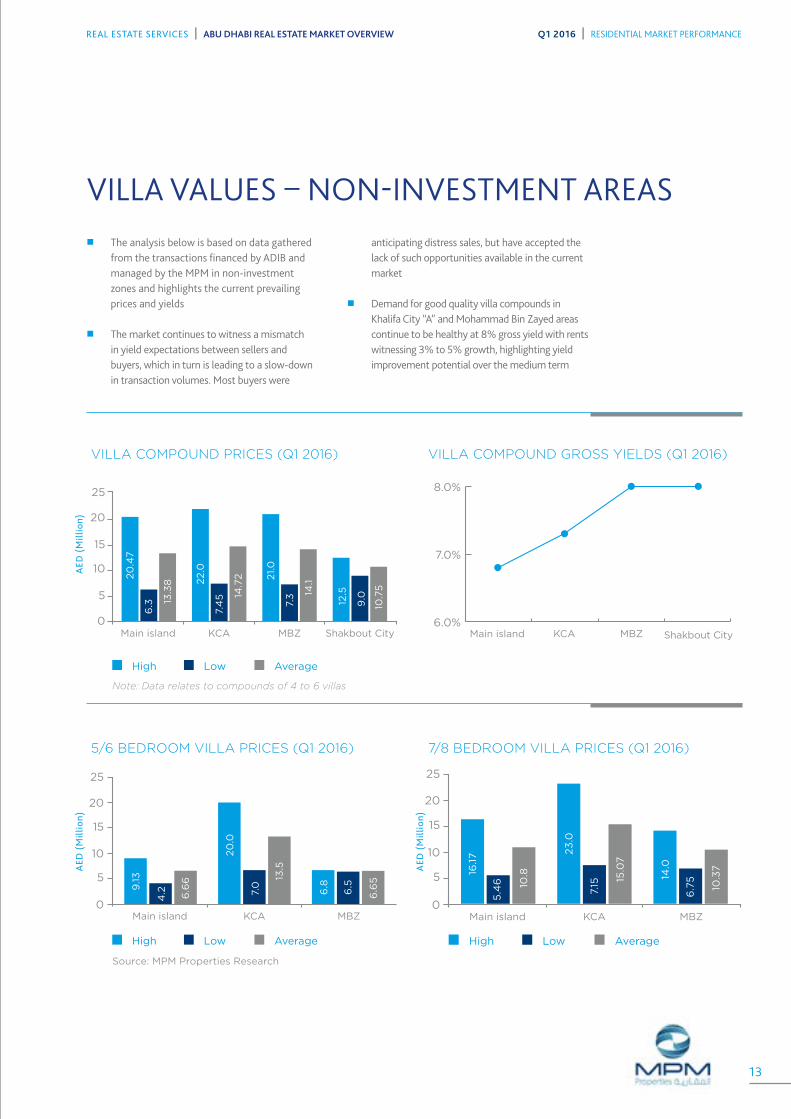
VILLA VALUES – NON-INVESTMENT AREAS�� The analysis below is based on data gathered
from the transactions financed by ADIB and managed by the MPM in non-investment zones and highlights the current prevailing prices and yields
�� The market continues to witness a mismatch in yield expectations between sellers and buyers, which in turn is leading to a slow-down in transaction volumes. Most buyers were
anticipating distress sales, but have accepted the lack of such opportunities available in the current market
�� Demand for good quality villa compounds in Khalifa City “A” and Mohammad Bin Zayed areas continue to be healthy at 8% gross yield with rents witnessing 3% to 5% growth, highlighting yield improvement potential over the medium term
0
5
10
15
20
25
Main island KCA MBZ Shakbout City
Low AverageHigh
20
.47
6.3 13
.38 2
2.0
7.4
5 14.7
2 21.0
7.3 14
.1
12.5
9.0
10.7
5
Main island KCA MBZ
Low AverageHigh
9.13
4.2 6.6
6
20
.0
7.0
13.5
6.8
6.5
6.6
5
0
5
10
15
20
25
6.0%
7.0%
8.0%
Main island KCA MBZ Shakbout City
AED
(M
illio
n)A
ED (
Mill
ion)
AED
(M
illio
n)
VILLA COMPOUND PRICES (Q1 2016)
5/6 BEDROOM VILLA PRICES (Q1 2016)
VILLA COMPOUND GROSS YIELDS (Q1 2016)
7/8 BEDROOM VILLA PRICES (Q1 2016)
Source: MPM Properties Research
Note: Data relates to compounds of 4 to 6 villas
13
REAL ESTATE SERVICES | ABU DHABI REAL ESTATE MARKET OVERVIEW Q1 2016 | RESIDENTIAL MARKET PERFORMANCE
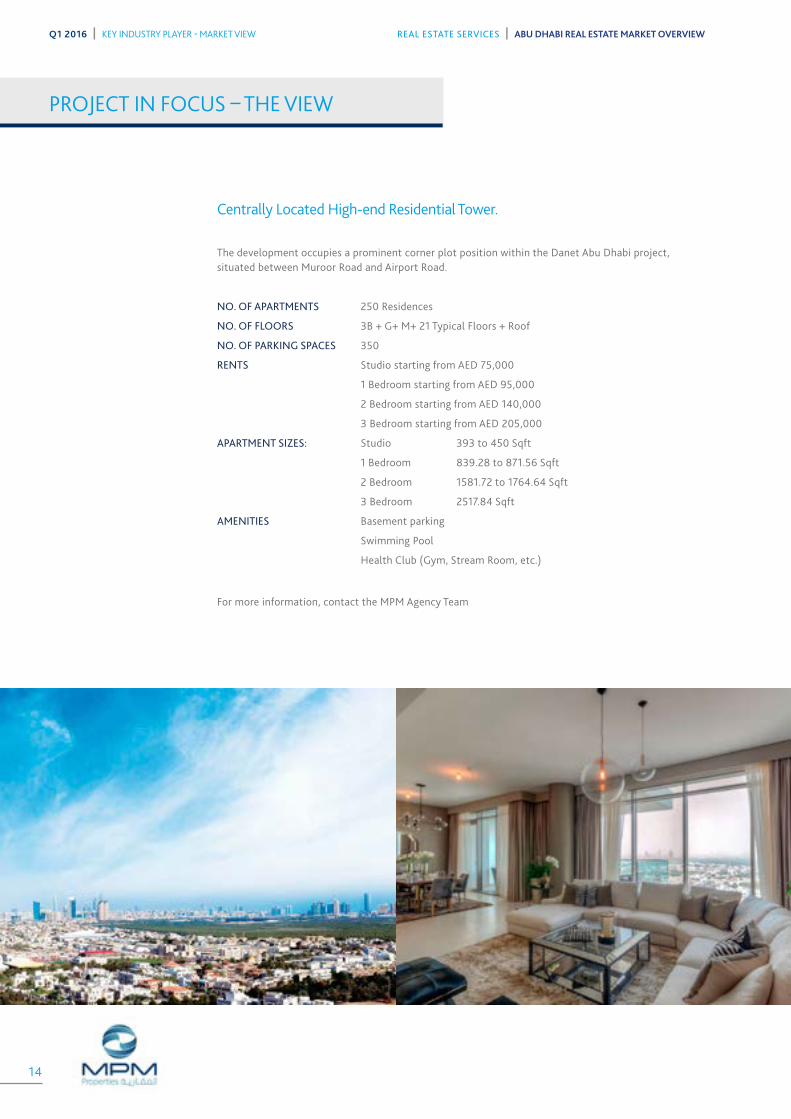
PROJECT IN FOCUS – THE VIEW
Centrally Located High-end Residential Tower.
The development occupies a prominent corner plot position within the Danet Abu Dhabi project, situated between Muroor Road and Airport Road.
NO. OF APARTMENTS 250 Residences
NO. OF FLOORS 3B + G+ M+ 21 Typical Floors + Roof
NO. OF PARKING SPACES 350
RENTS Studio starting from AED 75,000
1 Bedroom starting from AED 95,000
2 Bedroom starting from AED 140,000
3 Bedroom starting from AED 205,000
APARTMENT SIZES: Studio 393 to 450 Sqft
1 Bedroom 839.28 to 871.56 Sqft
2 Bedroom 1581.72 to 1764.64 Sqft
3 Bedroom 2517.84 Sqft
AMENITIES Basement parking
Swimming Pool
Health Club (Gym, Stream Room, etc.)
For more information, contact the MPM Agency Team
14
REAL ESTATE SERVICES | ABU DHABI REAL ESTATE MARKET OVERVIEWQ1 2016 | KEY INDUSTRY PLAYER - MARKET VIEW
15
REAL ESTATE SERVICES | ABU DHABI REAL ESTATE MARKET OVERVIEW Q1 2016 | KEY INDUSTRY PLAYER - MARKET VIEW
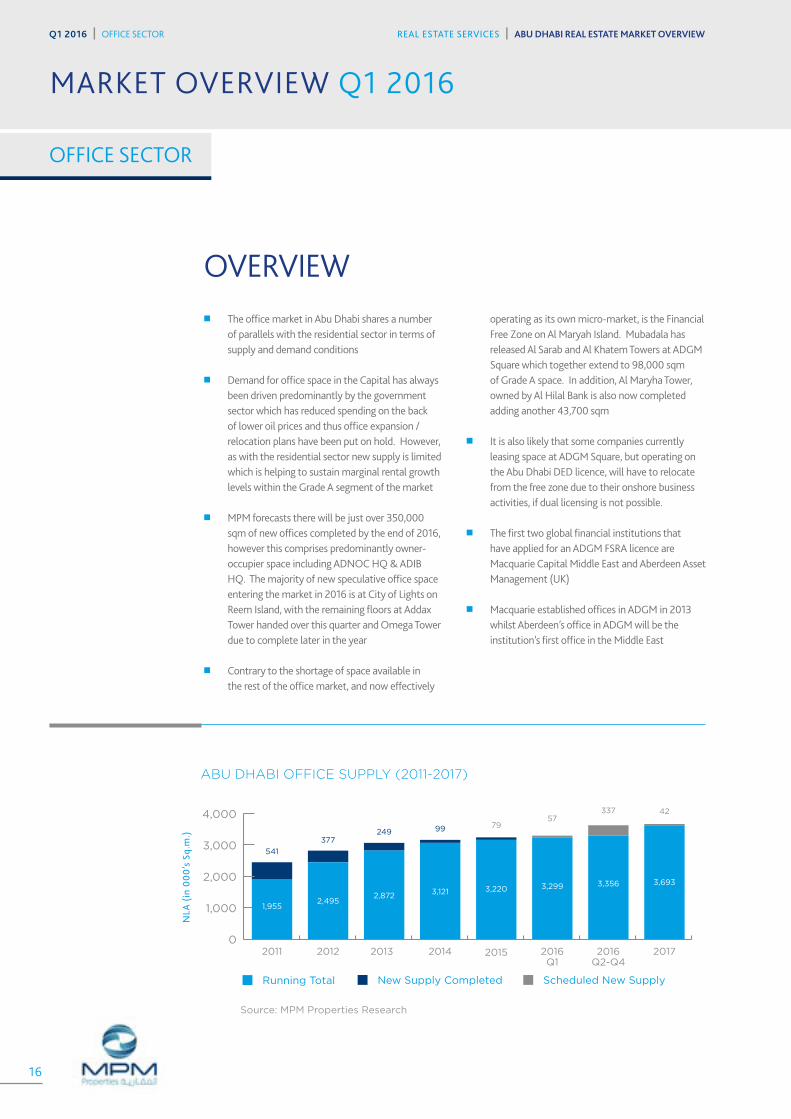
OVERVIEW �� The office market in Abu Dhabi shares a number
of parallels with the residential sector in terms of supply and demand conditions
�� Demand for office space in the Capital has always been driven predominantly by the government sector which has reduced spending on the back of lower oil prices and thus office expansion / relocation plans have been put on hold. However, as with the residential sector new supply is limited which is helping to sustain marginal rental growth levels within the Grade A segment of the market
�� MPM forecasts there will be just over 350,000 sqm of new offices completed by the end of 2016, however this comprises predominantly owner-occupier space including ADNOC HQ & ADIB HQ. The majority of new speculative office space entering the market in 2016 is at City of Lights on Reem Island, with the remaining floors at Addax Tower handed over this quarter and Omega Tower due to complete later in the year
�� Contrary to the shortage of space available in the rest of the office market, and now effectively
operating as its own micro-market, is the Financial Free Zone on Al Maryah Island. Mubadala has released Al Sarab and Al Khatem Towers at ADGM Square which together extend to 98,000 sqm of Grade A space. In addition, Al Maryha Tower, owned by Al Hilal Bank is also now completed adding another 43,700 sqm
�� It is also likely that some companies currently leasing space at ADGM Square, but operating on the Abu Dhabi DED licence, will have to relocate from the free zone due to their onshore business activities, if dual licensing is not possible.
�� The first two global financial institutions that have applied for an ADGM FSRA licence are Macquarie Capital Middle East and Aberdeen Asset Management (UK)
�� Macquarie established offices in ADGM in 2013 whilst Aberdeen’s office in ADGM will be the institution’s first office in the Middle East
MARKET OVERVIEW Q1 2016
REAL ESTATE SERVICES | ABU DHABI REAL ESTATE MARKET OVERVIEWQ1 2016 | OFFICE SECTOR
2011 2012 2013 2014 2015 2016Q1
2016Q2-Q4
2017
Running Total New Supply Completed Scheduled New Supply
541
377249 99 79
57337 42
0
1,000
2,000
3,000
4,000
1,9552,495
2,872 3,121 3,220 3,299 3,356 3,693
NLA
(in
00
0’s
Sq.
m.)
ABU DHABI OFFICE SUPPLY (2011-2017)
Source: MPM Properties Research
16
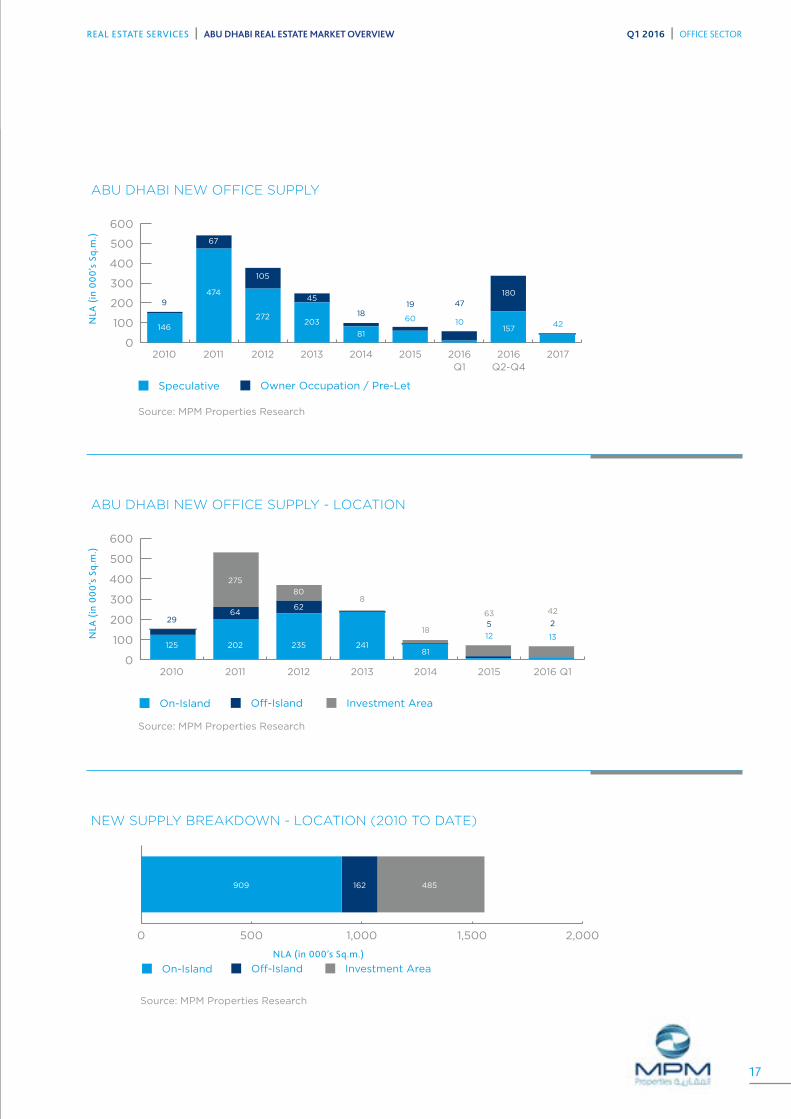
On-Island Off-Island Investment Area
0 500 1,000 1,500 2,000
485162909
0
100
200
300
400
500
600
2010 2011 2012 2013 2014 2015 2016Q1
2016Q2-Q4
2017
Speculative Owner Occupation / Pre-Let
146
9474
67
272
105
203
45
81
1860
19
10
47
157
180
42
On-Island Off-Island Investment Area
0
100
200
300
400
500
600
125 202
64
275
235
62
80
24181
12
563
18
8
13
2
4229
2010 2011 2012 2013 2014 2015 2016 Q1
REAL ESTATE SERVICES | ABU DHABI REAL ESTATE MARKET OVERVIEW Q1 2016 | OFFICE SECTOR
NLA
(in
00
0’s
Sq.
m.)
NLA
(in
00
0’s
Sq.
m.)
NLA (in 000’s Sq.m.)
ABU DHABI NEW OFFICE SUPPLY
ABU DHABI NEW OFFICE SUPPLY - LOCATION
NEW SUPPLY BREAKDOWN - LOCATION (2010 TO DATE)
Source: MPM Properties Research
Source: MPM Properties Research
Source: MPM Properties Research
17
Q1 2016
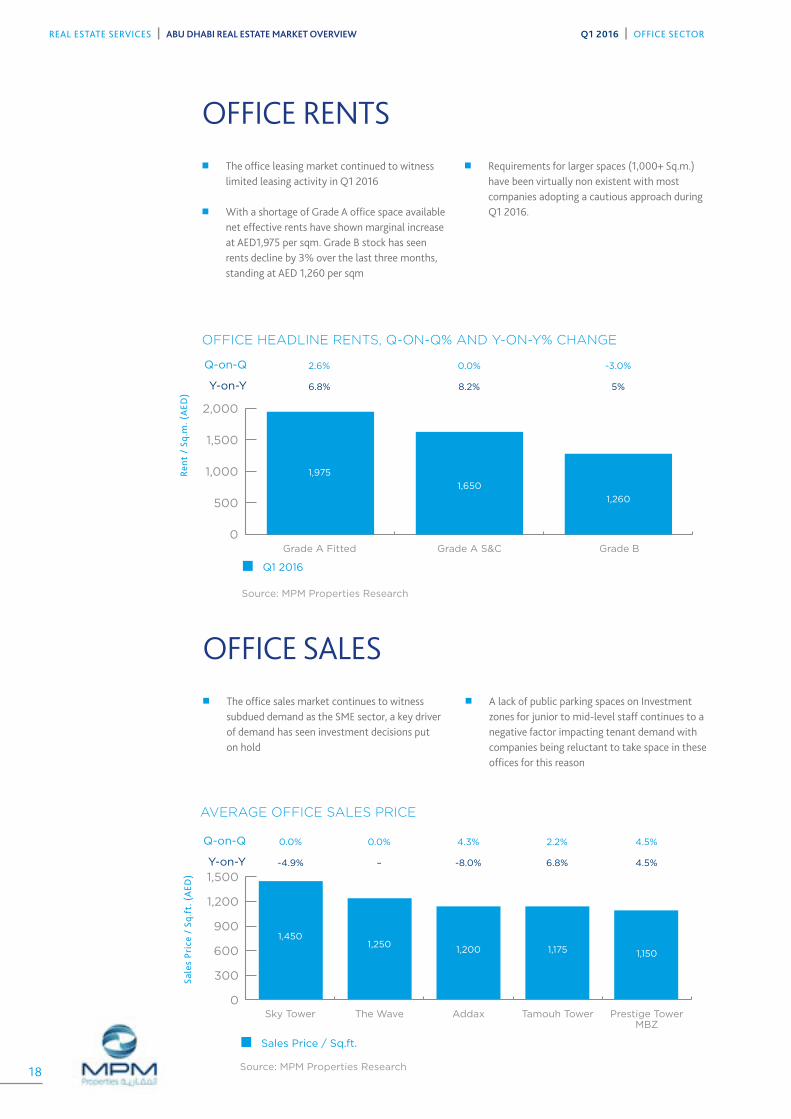
Grade BGrade A S&CGrade A Fitted0
500
1,000
1,500
2,000
1,975
1,650
1,260
2.6% -3.0%0.0%Q-on-Q
6.8% 5%8.2%Y-on-Y
Rent
/ S
q.m
. (A
ED)
Sales Price / Sq.ft.
*as per UPC
Prestige TowerMBZ
Tamouh TowerAddaxThe WaveSky Tower0
300
600
900
1,200
1,500
1,4501,250
1,200 1,175 1,150
0.0% 2.2%4.3% 4.5%0.0%Q-on-Q
-4.9% 6.8%-8.0% 4.5%–Y-on-Y
Sale
s Pr
ice
/ Sq
.ft.
(A
ED)
REAL ESTATE SERVICES | ABU DHABI REAL ESTATE MARKET OVERVIEW Q1 2016 | OFFICE SECTOR
OFFICE RENTS �� The office leasing market continued to witness
limited leasing activity in Q1 2016
�� With a shortage of Grade A office space available net effective rents have shown marginal increase at AED1,975 per sqm. Grade B stock has seen rents decline by 3% over the last three months, standing at AED 1,260 per sqm
�� Requirements for larger spaces (1,000+ Sq.m.) have been virtually non existent with most companies adopting a cautious approach during Q1 2016.
OFFICE SALES �� The office sales market continues to witness
subdued demand as the SME sector, a key driver of demand has seen investment decisions put on hold
�� A lack of public parking spaces on Investment zones for junior to mid-level staff continues to a negative factor impacting tenant demand with companies being reluctant to take space in these offices for this reason
OFFICE HEADLINE RENTS, Q-ON-Q% AND Y-ON-Y% CHANGE
Source: MPM Properties Research
AVERAGE OFFICE SALES PRICE
Source: MPM Properties Research18
REAL ESTATE SERVICES | ABU DHABI REAL ESTATE MARKET OVERVIEW Q1 2016 | OFFICE SECTOR
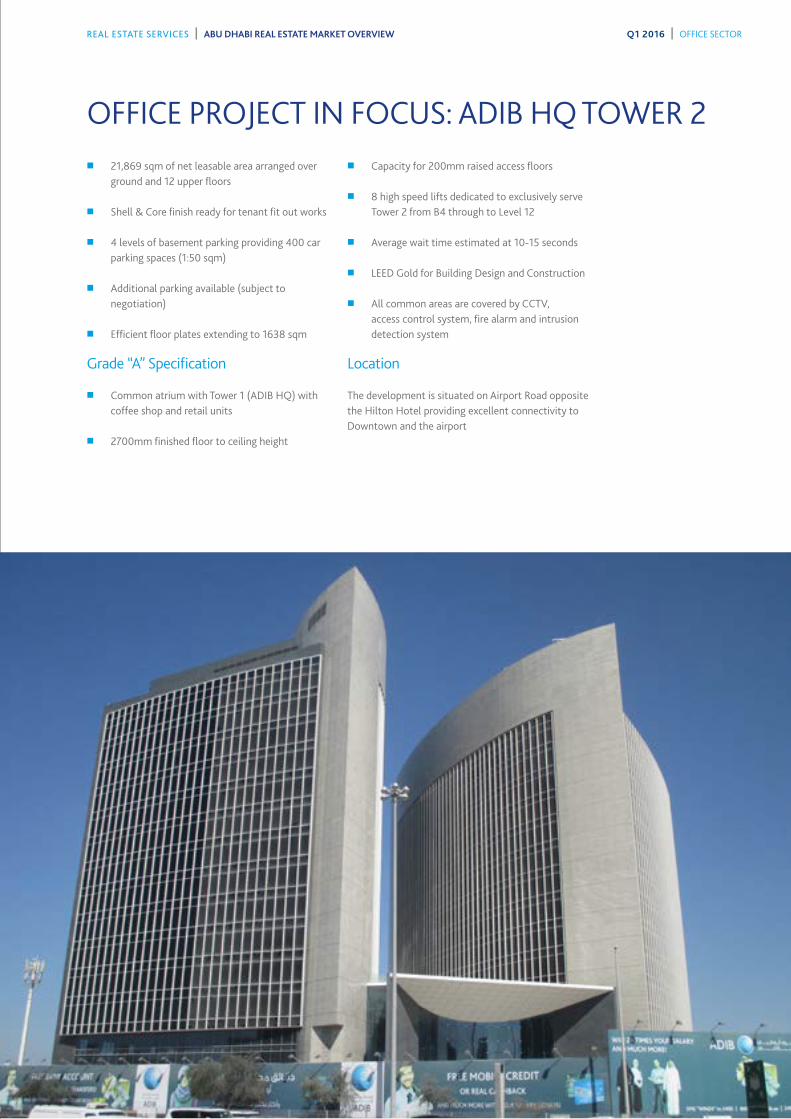
OFFICE PROJECT IN FOCUS: ADIB HQ TOWER 2�� 21,869 sqm of net leasable area arranged over
ground and 12 upper floors
�� Shell & Core finish ready for tenant fit out works
�� 4 levels of basement parking providing 400 car parking spaces (1:50 sqm)
�� Additional parking available (subject to negotiation)
�� Efficient floor plates extending to 1638 sqm
Grade “A” Specification
�� Common atrium with Tower 1 (ADIB HQ) with coffee shop and retail units
�� 2700mm finished floor to ceiling height
�� Capacity for 200mm raised access floors
�� 8 high speed lifts dedicated to exclusively serve Tower 2 from B4 through to Level 12
�� Average wait time estimated at 10-15 seconds
�� LEED Gold for Building Design and Construction
�� All common areas are covered by CCTV, access control system, fire alarm and intrusion detection system
Location
The development is situated on Airport Road opposite the Hilton Hotel providing excellent connectivity to Downtown and the airport

MARKET OVERVIEW Q1 2016
0
500
1,000
1,500
2,000
2,500
3,000
2009 2010 2011 2012 2013 2014 2015 2016Q1
2016Q2-Q4
20182017
Scheduled New Supply Running Total New Supply Completed
28
1,4281,4001,400
259113
185
342 43163
1
53
1,687 1,800 1,985 2,327 2,370 2,3702,533
306
2,586
NLA
(in
00
0’s
) pe
r Sq
.m.
ABU DHABI RETAIL SUPPLY (2009 - 2018+)
Source: MPM Properties Research
OVERVIEW �� There have been no new retail developments
completed in Abu Dhabi during the first quarter of 2016 and thus total retail stock in the Capital remains at approximately 2.4 million sqm of GLA
�� This trend is set to continue over the next two years with no new retail schemes scheduled for delivery until 2018/19, when Maryha Central and Reem Mall are forecast to be completed, which will add over 400,000 sqm of new retail space to the market
�� Mall revenues have been under pressure during the first quarter of 2016, with the outlook for the remaining year indicating further softening of consumer spending, leading to increased pressure on revenues. Property managers will have to carefully balance rent renewal rates, tenant churn rates and provide support to underperforming
retail brands, and maintain overall costs to ensure retail properties retain their attractiveness without significantly impacting the business objectives
�� Looking at the future outlook for retail space in Abu Dhabi from 2017 onwards the GOP and consumer confidence is expected to pick up, yet on-island property will quickly need to prepare for the increasingly competitive environment
�� In this connection some of the existing malls in Abu Dhabi have already started implementing active asset management strategies with the view to repositioning and improving trading performance
�� Online Internet retailing is now generating 1% of a $52+ billion market in the UAE, and expected to grow to 2% by 2020
20
REAL ESTATE SERVICES | ABU DHABI REAL ESTATE MARKET OVERVIEWQ1 2016 | RETAIL SECTOR
TAKE-UP & RENTS
The rents quoted above are base rents excluding any turnover provisions and service charges.
�� Yas Mall had a foot-fall of 18 million customers during the full year 2015
�� MPM research shows that footfall within Abu Dhabi’s existing shopping malls have remained broadly stable during the first quarter of 2016. However a reduction in consumer retail spending is impacting the trading performance amongst the retailers, which in turn is leading to retail tenant’s requesting rental reductions at lease renewal
�� While the mall rents have been under pressure, high street retail rents have continued to increase at lease renewal with retailers on 3 to 5 year leases now facing the impact of the removal of the rent cap in 2013 for the first time, resulting in many retailers looking at more affordable options
SPACE TYPE AVERAGE RENT (AED) PA
Specialty Store 1,800-3,900 per sq.m.
Anchor Store (more than 1,000 sq.m.) 400-1,250 per sq.m.
F & B 3,500-5,750 per sq.m.
ATM’s 90,000-180,000
Kiosks 85,000-155,000
High street retail (Prime areas) 2,500 – 3,850 per sq.m.
High street retail (Non-prime areas) 1,550-2,850 per sq.m.
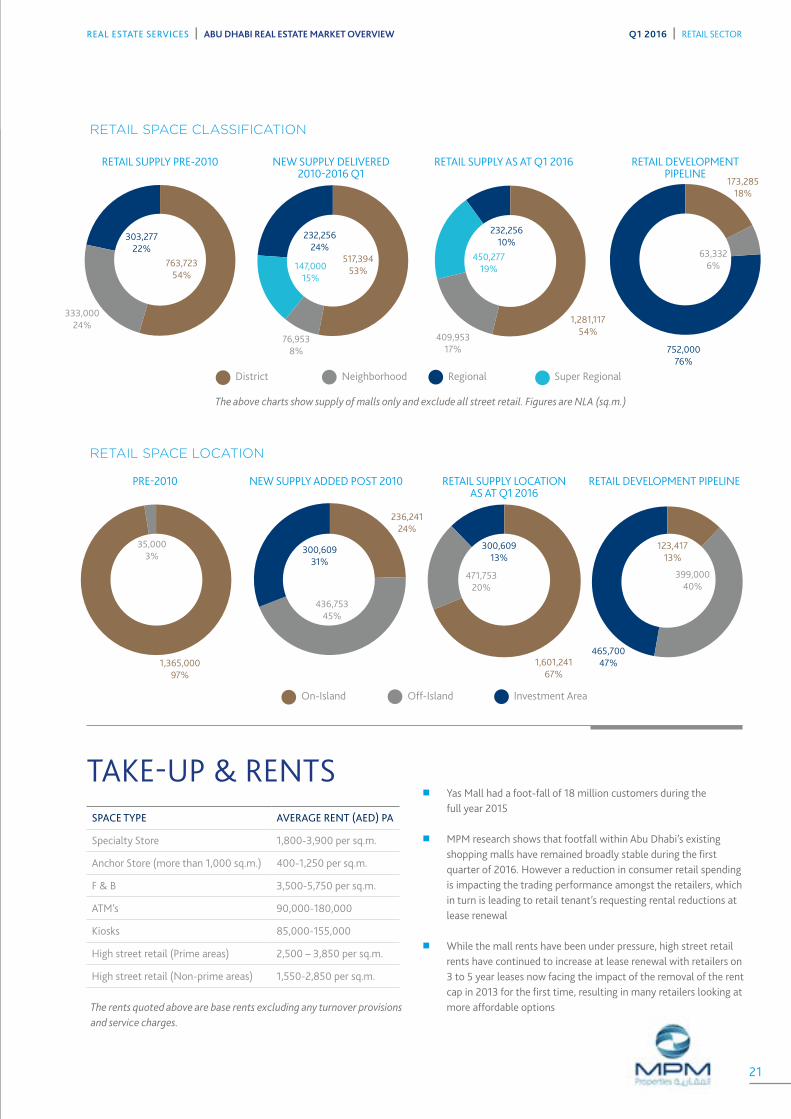
District Neighborhood Regional Super Regional
On-Island Off-Island Investment Area
763,72354%
1,365,000 97%
333,000 24%
35,000 3%
303,27722%
517,39453%147,000
15%
1,281,117 54%409,953
17%
232,256 10%
450,277 19%
752,000 76%
236,241 24%
76,9538%
436,75345%
232,256 24%
300,60931%
RETAIL SUPPLY PRE-2010
PRE-2010
NEW SUPPLY DELIVERED 2010-2016 Q1
NEW SUPPLY ADDED POST 2010
The above charts show supply of malls only and exclude all street retail. Figures are NLA (sq.m.)
RETAIL SUPPLY LOCATION AS AT Q1 2016
1,601,241 67%
471,75320%
300,60913%
RETAIL DEVELOPMENT PIPELINE
RETAIL SUPPLY AS AT Q1 2016
173,285 18%
63,332 6%
465,70047%
123,41713%
RETAIL DEVELOPMENT PIPELINE
399,00040%
RETAIL SPACE CLASSIFICATION
RETAIL SPACE LOCATION
21
REAL ESTATE SERVICES | ABU DHABI REAL ESTATE MARKET OVERVIEW Q1 2016 | RETAIL SECTOR
MARKET OVERVIEW Q1 2016
ARR RevPAR Occupancy
100%
90%
80%
70%
60%
50%
40%
30%
20%
Jan
13
Ju
l
Jan
14
Ju
l
Jan
15
Ju
l
Jan
16
Mar
0
100
200
300
400
500
600
700
800
Ave
rage
roo
m r
ate
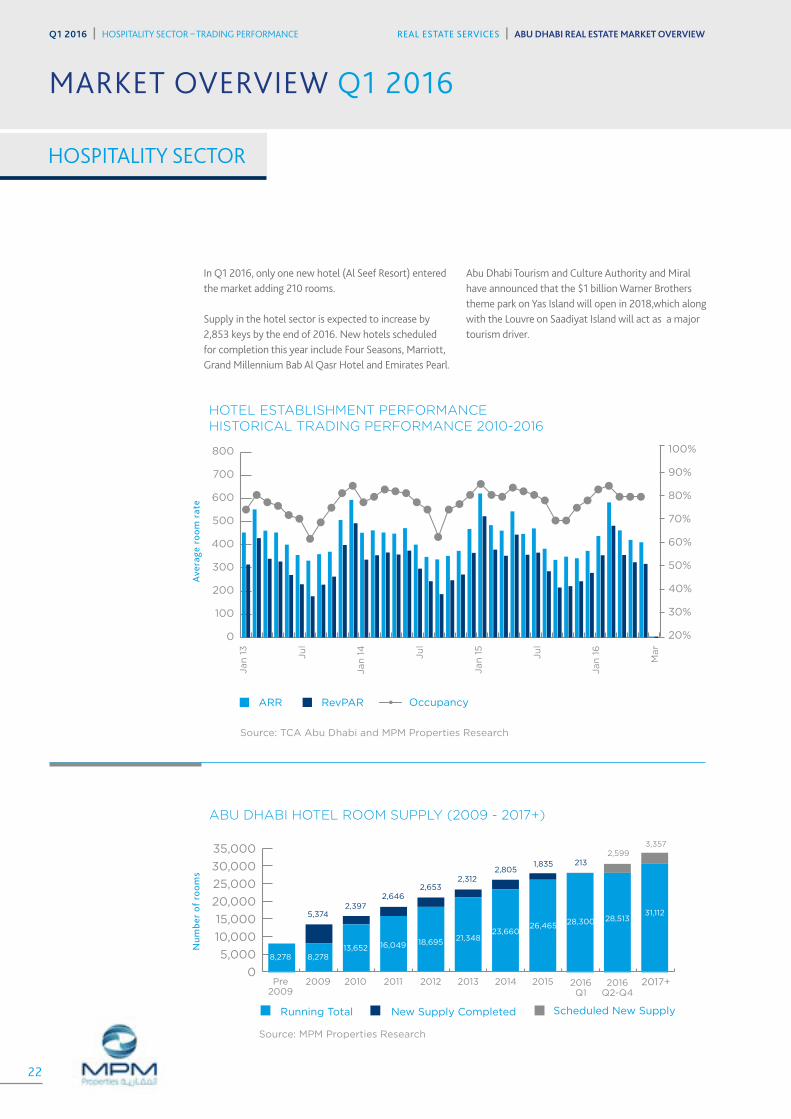
HOTEL ESTABLISHMENT PERFORMANCEHISTORICAL TRADING PERFORMANCE 2010-2016
Source: TCA Abu Dhabi and MPM Properties Research
In Q1 2016, only one new hotel (Al Seef Resort) entered the market adding 210 rooms.
Supply in the hotel sector is expected to increase by 2,853 keys by the end of 2016. New hotels scheduled for completion this year include Four Seasons, Marriott, Grand Millennium Bab Al Qasr Hotel and Emirates Pearl.
Abu Dhabi Tourism and Culture Authority and Miral have announced that the $1 billion Warner Brothers theme park on Yas Island will open in 2018,which along with the Louvre on Saadiyat Island will act as a major tourism driver.
Num
ber
of r
oom
s
0
5,000
10,000
15,000
20,000
25,000
30,000
35,000
Pre 2009
2009 2010 2011 20132012 2014 2015 2016Q1
2016Q2-Q4
2017+
Scheduled New Supply Running Total New Supply Completed
5,3742,397
2,6462,653
2,3122,805
1,835 2132,599
3,357
8,278 8,27813,652 16,049 18,695 21,348
23,66026,465 28,300 28,513
31,112
ABU DHABI HOTEL ROOM SUPPLY (2009 - 2017+)
Source: MPM Properties Research
22
REAL ESTATE SERVICES | ABU DHABI REAL ESTATE MARKET OVERVIEWQ1 2016 | HOSPITALITY SECTOR – TRADING PERFORMANCE
Q1 2016 – HOTEL APARTMENT SCHEDULED COMPLETIONS
GUEST ARRIVALS – TOP 5
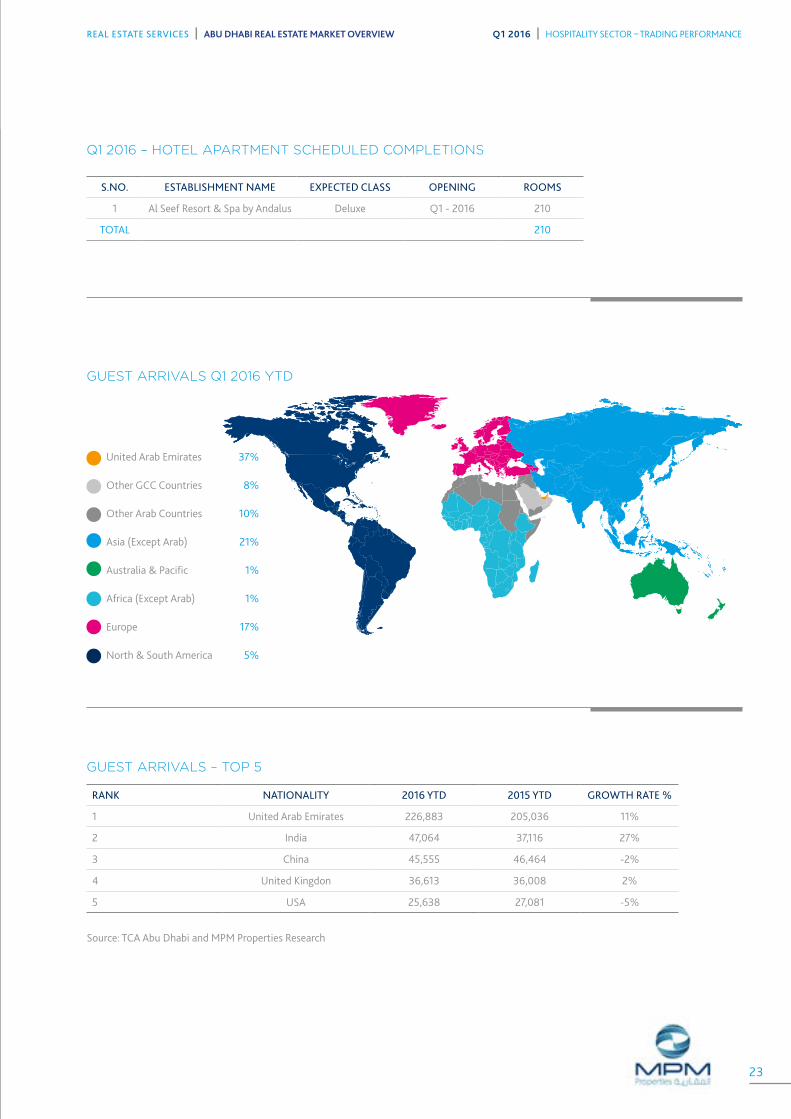
GUEST ARRIVALS Q1 2016 YTD
S.NO. ESTABLISHMENT NAME EXPECTED CLASS OPENING ROOMS
1 Al Seef Resort & Spa by Andalus Deluxe Q1 - 2016 210
TOTAL 210
RANK NATIONALITY 2016 YTD 2015 YTD GROWTH RATE %
1 United Arab Emirates 226,883 205,036 11%
2 India 47,064 37,116 27%
3 China 45,555 46,464 -2%
4 United Kingdon 36,613 36,008 2%
5 USA 25,638 27,081 -5%
United Arab Emirates 37%
Other GCC Countries 8%
Other Arab Countries 10%
Asia (Except Arab) 21%
Australia & Pacific 1%
Africa (Except Arab) 1%
Europe 17%
North & South America 5%
Source: TCA Abu Dhabi and MPM Properties Research
23
REAL ESTATE SERVICES | ABU DHABI REAL ESTATE MARKET OVERVIEW Q1 2016 | HOSPITALITY SECTOR – TRADING PERFORMANCE

DEFINITIONS & METHODOLOGY
RESEARCH STUDY AREA
The geographic extent of the study area covers the key districts in Dubai.
RESIDENTIAL
New residential developments are classified as delivered and thus entered into the new supply category when they are made available for occupation. This is verified via a combination of site inspections and discussion with the developer and hence our supply numbers do take into consideration the phased release of large projects.
Rental and sales trend analysis is based on transactional data derived from the MPM Properties Agency team and data sourced from developers and owners.
OFFICES
New office developments are classified as delivered and thus entered into the new supply category when they are available for tenant fit-outs.
Given the general lack of transparency in the local market rents quoted are headline rents, thus exclude any rent free period of other financial incentives that may have been negotiated between
the parties. The rents quoted are also exclusive of service charges.
RETAIL
New retail developments are classified as delivered and thus entered into the new supply category when the first units are open and trading.
Our classification of malls is based on our own assessment having regard to size and the catchment area which the mall typically penetrates.
HOSPITALITY
New hotels are classified as delivered and thus entered into the new supply category when they are opened and trading. All trading performance data is provided by DTCM.
FUTURE SUPPLY PROJECTIONS
Our future supply projections across all sectors are based on a combination of regular site inspections and discussions with developers.
BESPOKE CLIENT RESEARCH ADDING VALUE TO YOUR PROPERTY INTERESTSThe ADIB Real Estate Services team covers all sectors of the real estate market. We provide bespoke market research to our valued clients to meet their specific requirements.
We provide reports, information and presentations derived from primary market data that directly assist our clients to save or make money from real estate and shape strategies to enhance value.
DISCLAIMER:
The information contained in this report has been obtained from and is based upon sources that MPM Properties believes to be reliable, however, no warranty or representation, expressed or implied, is made to the accuracy or completeness of the information contained herein, and same is submitted subject to errors, omissions, change of price, rental or other conditions, withdrawal without notice, and to any special listing conditions imposed by our principals. MPM Properties will not be held responsible for any third-party contributions. All opinions and estimates included in this report constitute MPM Properties, as of the date of this report and are subject
to change without notice. Figures contained in this report are derived from a basket of locations highlighted in this report and therefore represent a snapshot of the Dubai market. Due care and attention has been used in the preparation of forecast information. However, actual results may vary from forecasts and any variation may be materially positive or negative. Forecasts, by their very nature, involve risk and uncertainty because they relate to future events and circumstances which are beyond MPM Properties’ control. For a full in-depth study of the market, please contact MPM Properties team.
24
REAL ESTATE SERVICES | ABU DHABI REAL ESTATE MARKET OVERVIEWQ1 2016 | DEFINITIONS & METHODOLOGY

A collaborative team providing our integrated services
PAUL MAISFIELD BSC (HONS) MRICS CEO T: +971 (0)2 610 0545 M: +971 (0)50 660 9437 [email protected]
YOUSEF AL ZAROONI Regional Head – Al Ain T: +971 (0)3 708 8636 M: +971 (0)50 600 1002 [email protected]
ABDULLAH SAID AL KUWEITI Business Development Director T: +971 (0)2 610 1554 M: +971 (0)50 623 5854 [email protected]
PRADEEP FERNANDES MRICS Advisory & Valuation Manager T: +971 (0)2 510 0663 M: +971 (0)55 961 3626 [email protected]
SAMUEL MORRIS BSC (HONS) FRICSDirector of Valuation & Regional Head - Dubai T: +971 (0)4 371 9466 M: +971 (0)50 107 1704 [email protected]
WAHIDA KARAMA Head of Property Operations T: +971 (02) 610 0435 M: +971 (0)50 765 7679 [email protected]
FRANK O’DWYER MBA (Hons); BEng.COO T: +971 (0)2 610 0402 M: +971 (0)50 812 1070 [email protected]
DOMINIC BARLOW Head of Retail, Hospitality & Leisure T: +971 (0)2 510 0655 M: +971 (0)56 288 1458 [email protected]
JUBRAN AL HASHMI Head of Property Services T: +971 (0)2 610 0232 M: +971 (0)50 122 0041 [email protected]
VAIBHAV SHARMA MCOM; MDBA Director of Strategic Advisory and Research T: +971 (0)2 412 8914 M: +971 (0)50 660 9295 [email protected]
ALI ABDULLAH ABDUL RAHMAN Acting Regional Head – Northern Emirates T: 971 (0)6 597 2514 M: +971 (0)50 656 2486 [email protected]
MOHAMED AL ZOUBI Head of Development Advisory BSc Civil Engineering T: +971 (0)2 610 0564 M: +971 (0)50 310 3570 [email protected]
KHALED CHAHAL Director of Agency – Abu Dhabi T: +971 (0)2 412 8402 M: +971 (0)50 110 2929 [email protected]
JASON FIELDEN BSC (HONS) MRICS Valuation Manager - Abu Dhabi T: +971 (0)2 510 0653 M: +971 (0)56 244 7696 [email protected]
25
REAL ESTATE SERVICES | ABU DHABI REAL ESTATE MARKET OVERVIEW Q1 2016
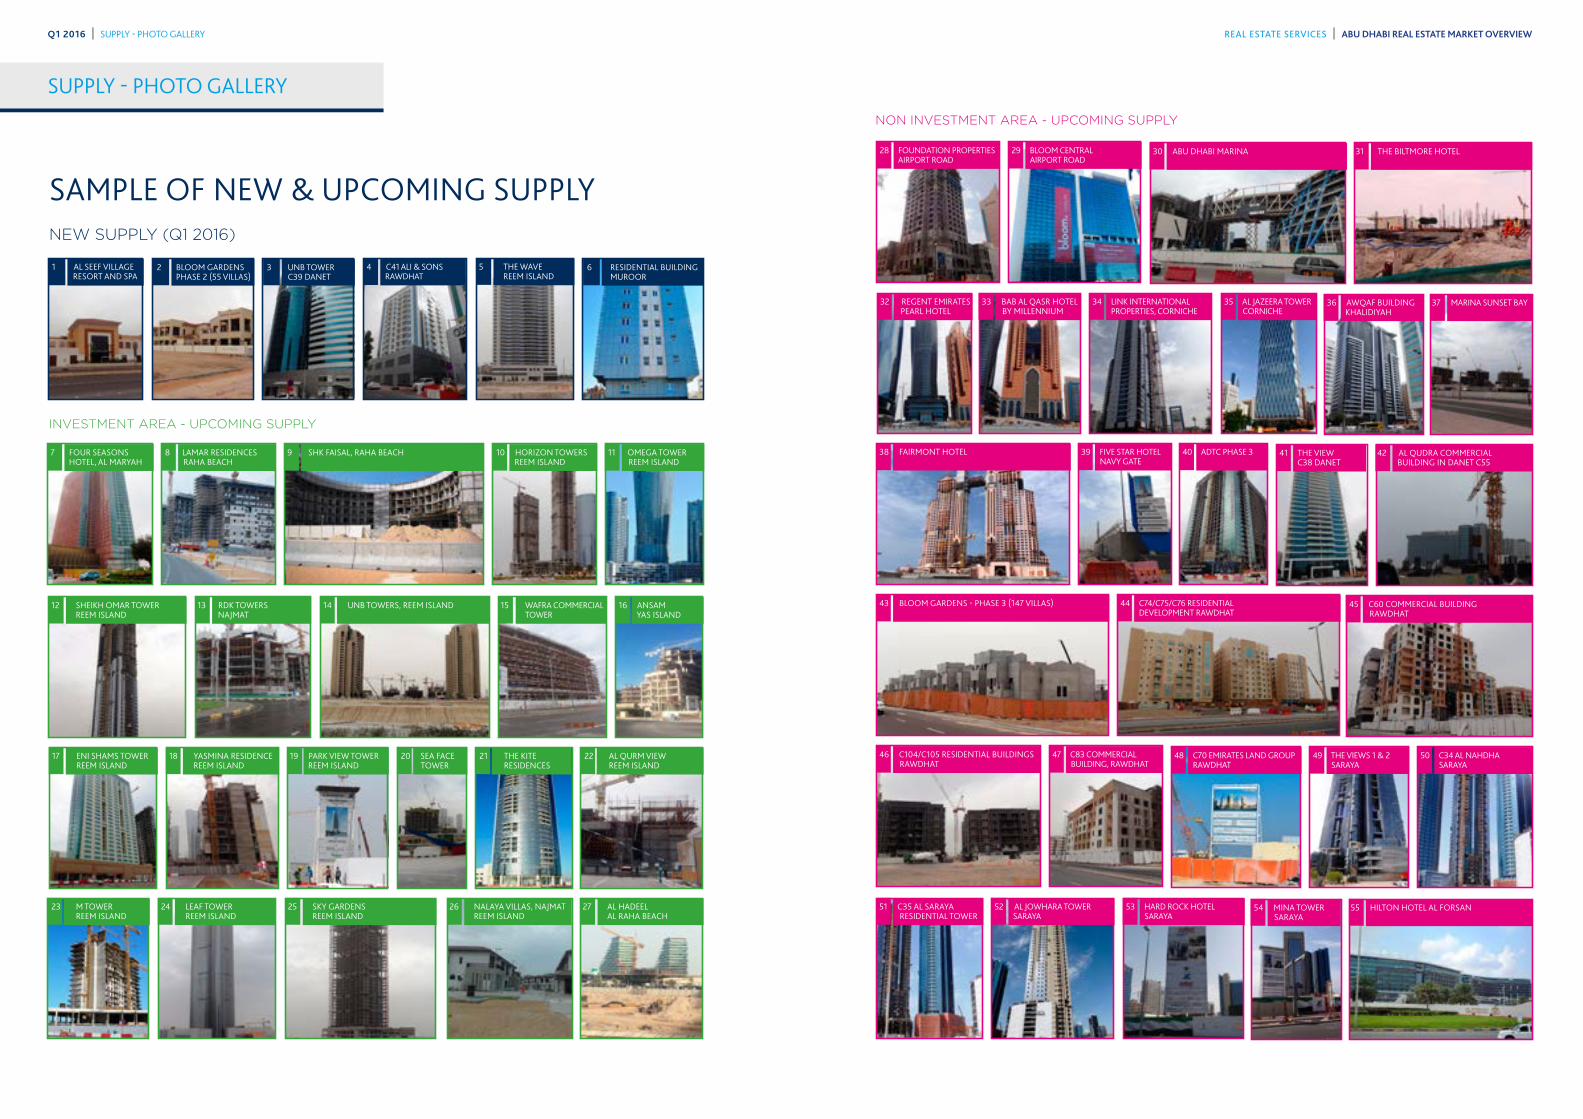
SUPPLY - PHOTO GALLERY
SAMPLE OF NEW & UPCOMING SUPPLYNEW SUPPLY (Q1 2016)
INVESTMENT AREA - UPCOMING SUPPLY
2 BLOOM GARDENS PHASE 2 (55 VILLAS)
6 RESIDENTIAL BUILDING MUROOR
3 UNB TOWER C39 DANET
NON INVESTMENT AREA - UPCOMING SUPPLY
17 ENI SHAMS TOWER REEM ISLAND
18 YASMINA RESIDENCE REEM ISLAND
28 FOUNDATION PROPERTIES AIRPORT ROAD
39 FIVE STAR HOTEL NAVY GATE
52 AL JOWHARA TOWER SARAYA
44 C74/C75/C76 RESIDENTIAL DEVELOPMENT RAWDHAT
47 C83 COMMERCIAL BUILDING, RAWDHAT
34 LINK INTERNATIONAL PROPERTIES, CORNICHE
29 BLOOM CENTRAL AIRPORT ROAD
40 ADTC PHASE 3
53 HARD ROCK HOTEL SARAYA
48 C70 EMIRATES LAND GROUP RAWDHAT
49 THE VIEWS 1 & 2 SARAYA
50 C34 AL NAHDHA SARAYA
35 AL JAZEERA TOWER CORNICHE
31 THE BILTMORE HOTEL
42 AL QUDRA COMMERCIAL BUILDING IN DANET C55
55 HILTON HOTEL AL FORSAN
37 MARINA SUNSET BAY
30 ABU DHABI MARINA
41 THE VIEW C38 DANET
54 MINA TOWER SARAYA
45 C60 COMMERCIAL BUILDING RAWDHAT
36 AWQAF BUILDING KHALIDIYAH
32 REGENT EMIRATES PEARL HOTEL
38 FAIRMONT HOTEL
51 C35 AL SARAYA RESIDENTIAL TOWER
43 BLOOM GARDENS - PHASE 3 (147 VILLAS)
46 C104/C105 RESIDENTIAL BUILDINGS RAWDHAT
33 BAB AL QASR HOTEL BY MILLENNIUM
24 LEAF TOWER REEM ISLAND
25 SKY GARDENS REEM ISLAND
26 NALAYA VILLAS, NAJMAT REEM ISLAND
27 AL HADEEL AL RAHA BEACH
7 FOUR SEASONS HOTEL, AL MARYAH
8 LAMAR RESIDENCES RAHA BEACH
11 OMEGA TOWER REEM ISLAND
12 SHEIKH OMAR TOWER REEM ISLAND
13 RDK TOWERS NAJMAT
14 UNB TOWERS, REEM ISLAND 15 WAFRA COMMERCIAL TOWER
16 ANSAM YAS ISLAND
19 PARK VIEW TOWER REEM ISLAND
20 SEA FACE TOWER
21 THE KITE RESIDENCES
22 AL QURM VIEW REEM ISLAND
23 M TOWER REEM ISLAND
1 AL SEEF VILLAGE RESORT AND SPA
9 SHK FAISAL, RAHA BEACH 10 HORIZON TOWERS REEM ISLAND
4 C41 ALI & SONS RAWDHAT
5 THE WAVE REEM ISLAND
REAL ESTATE SERVICES | ABU DHABI REAL ESTATE MARKET OVERVIEWQ1 2016 | SUPPLY - PHOTO GALLERY
Residential
Offices
Retail
Hotels
Residential
Offices
Retail
Hotels
Q2 2014 NEW SUPPLY UNDER CONSTRUCTION
Jubail Island
Al ReemIsland
Al MaryahIsland
Al Raha Beach
MasdarCity
Saadiyat Island
Yas Island
HydraVillage
Al Reef
B
D
E F
G H
K
I
J
A
C
Salam Street
Khaleej Al Arabi Street
Airport Rd
Airport Rd
E 20
E 20
E 22
E 30
Corn
iche
Rd
Electra St
Zayed The First S
t
E12
Al Saada Stre
et
25th S
t
Salam Street
Salam Street
Sheikh Khalifa Hway
Abu D
habi
- Dub
ai Rd
Abu Dhabi - Dubai Rd
E 10
Shei
kh M
akto
um B
in R
ashi
d Rd
E 11
E 11
E 11
E 10
6
5
4
7
89
27
11 2322
10
1514 12
1316
1920
21
1718
25
24
4039
34
3130
3233
3837
35
3628
29
26
413
4243
21
454847
44 46
4950
5153
5254
55
New Supply
Investment
Non-investment
Q1 NEW & UPCOMING SUPPLY
ADIB RENTAL INDEX ZONE
COMMON TREND (Q1 2016) (ANNUAL % RENTAL INCREASE)
Q-Q CHANGE OVERALL AVERAGE
Q1 2016 Q4 2015 Q3 2015 Q2 2015 Q1 2015 Q4 2014 Q3 2014 Q2 2014 Q1 2014
Zone A 0 to + 4.99% 3.52% 3.06% 3.05% 4.58% 3.71% 8.05% 5.01% 2.37% 4.05%
Zone B 0 to + 4.99% 3.38% 4.33% 2.60% 5.08% 6.94% 7.75% 10.56% 3.86% 6.33%
Zone C 0 to + 4.99% 6.05% 5.94% 5.63% 7.46% 9.25% 9.79% 12.34% 10.26% 5.06%
Zone D 0 to + 4.99% 7.01% 7.05% 6.48% 7.06% 8.51% 10.31% 10.26% 9.07% 6.18%
Zone E 0 to + 4.99% 9.34% 7.35% 3.76% 4.02% 7.54% 5.09% 10.20% 5.32% 4.49%
Zone F 0 to + 4.99% 3.33% 5.62% 4.77% 3.17% 4.01% 6.58% 7.63% 3.25% 2.41%
Zone G 0 to + 4.99% 0.46% 1.91% 4.42% 2.34% 2.20% 2.59% 2.69% 2.42% 2.92%
Zone H 0 to + 4.99% 2.77% 3.85% 3.68% 5.58% 3.46% 1.46% 3.42% 5.31% 2.44%
Zone I 0 to + 4.99% 2.22% 2.36% 3.08% 3.41% 1.86% 5.48% 1.14% 1.33% 1.21%
Zone J 0 to + 4.99% 4.12% 1.87% 3.32% 5.78% 0.96% 4.04% 3.06% 1.55% 1.64%
Zone K 0 to + 4.99% 4.05% 6.10% 5.30% 5.89% 2.88% 4.31% 4.18% 3.51% 3.65%
Q1 2016 REAL ESTATE SERVICES | ABU DHABI REAL ESTATE MARKET OVERVIEW
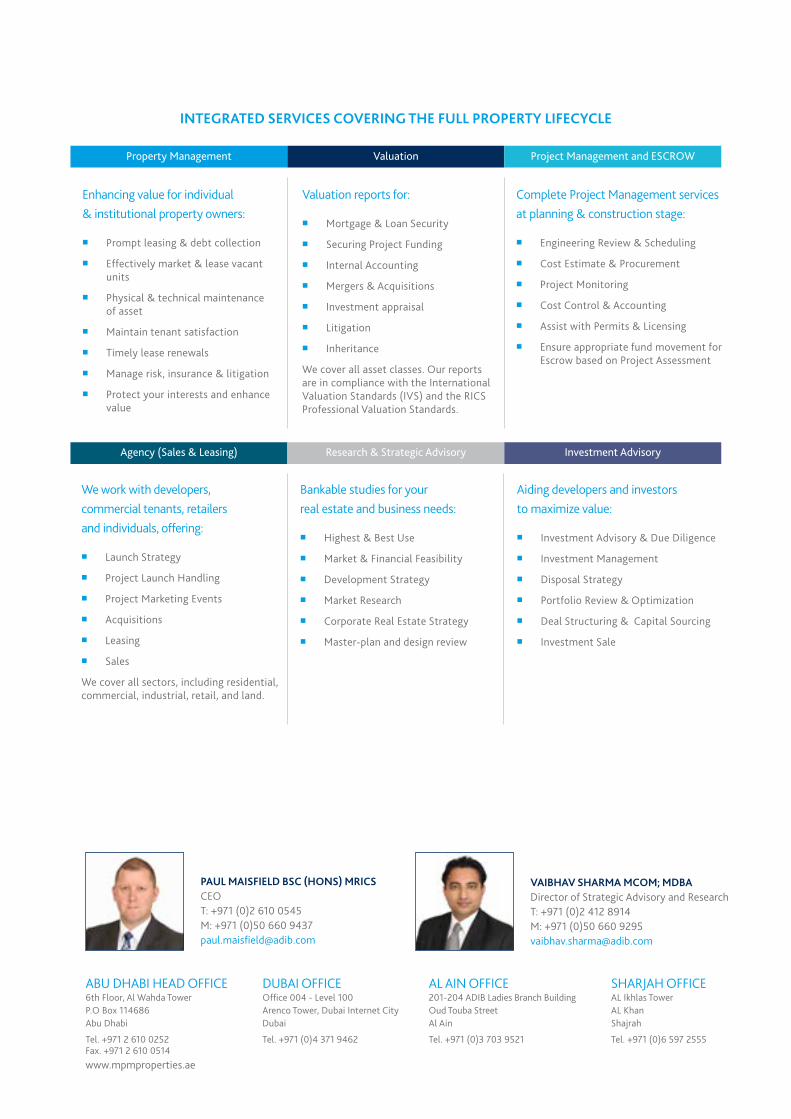
INTEGRATED SERVICES COVERING THE FULL PROPERTY LIFECYCLE
Property Management
Investment Advisory
Project Management and ESCROW
Research & Strategic AdvisoryAgency (Sales & Leasing)
Valuation
PAUL MAISFIELD BSC (HONS) MRICS CEO T: +971 (0)2 610 0545 M: +971 (0)50 660 9437 [email protected]
VAIBHAV SHARMA MCOM; MDBA Director of Strategic Advisory and Research T: +971 (0)2 412 8914 M: +971 (0)50 660 9295 [email protected]
ABU DHABI HEAD OFFICE 6th Floor, Al Wahda Tower P.O Box 114686 Abu Dhabi
Tel. +971 2 610 0252Fax. +971 2 610 0514 www.mpmproperties.ae
DUBAI OFFICE Office 004 - Level 100 Arenco Tower, Dubai Internet City Dubai
Tel. +971 (0)4 371 9462
AL AIN OFFICE 201-204 ADIB Ladies Branch Building Oud Touba Street Al Ain
Tel. +971 (0)3 703 9521
SHARJAH OFFICE AL Ikhlas Tower AL Khan Shajrah
Tel. +971 (0)6 597 2555
Enhancing value for individual & institutional property owners:
�� Prompt leasing & debt collection
�� Effectively market & lease vacant units
�� Physical & technical maintenance of asset
�� Maintain tenant satisfaction
�� Timely lease renewals
�� Manage risk, insurance & litigation
�� Protect your interests and enhance value
Complete Project Management services at planning & construction stage:
�� Engineering Review & Scheduling
�� Cost Estimate & Procurement
�� Project Monitoring
�� Cost Control & Accounting
�� Assist with Permits & Licensing
�� Ensure appropriate fund movement for Escrow based on Project Assessment
Aiding developers and investors to maximize value:
�� Investment Advisory & Due Diligence
�� Investment Management
�� Disposal Strategy
�� Portfolio Review & Optimization
�� Deal Structuring & Capital Sourcing
�� Investment Sale
We work with developers, commercial tenants, retailers and individuals, offering:
�� Launch Strategy
�� Project Launch Handling
�� Project Marketing Events
�� Acquisitions
�� Leasing
�� Sales
We cover all sectors, including residential, commercial, industrial, retail, and land.
Bankable studies for your real estate and business needs:
�� Highest & Best Use
�� Market & Financial Feasibility
�� Development Strategy
�� Market Research
�� Corporate Real Estate Strategy
�� Master-plan and design review
Valuation reports for:
�� Mortgage & Loan Security
�� Securing Project Funding
�� Internal Accounting
�� Mergers & Acquisitions
�� Investment appraisal
�� Litigation
�� Inheritance
We cover all asset classes. Our reports are in compliance with the International Valuation Standards (IVS) and the RICS Professional Valuation Standards.