SAF Tehnika A/S Consolidated Interim Report for Q1 ... - Nasdaq
23
SAF Tehnika A/S Consolidated Interim Report for Q1 of financial year 2021/2022 (July 1, 2021 – September 30, 2021)
-
Upload
khangminh22 -
Category
Documents
-
view
5 -
download
0
Transcript of SAF Tehnika A/S Consolidated Interim Report for Q1 ... - Nasdaq
SAF Tehnika A/S
Consolidated Interim Report
for Q1 of financial year 2021/2022
(July 1, 2021 – September 30, 2021)
2
TABLE OF CONTENTS
KEY DATA .......................................................................................................................................... 3
Share and Shareholdings ....................................................................................................................... 4
Information on Management and Supervisory Board members ........................................................... 5
Information on professional and educational background of the management board members .......... 6
Information on professional and educational background of the supervisory council members ......... 8
Statement of Board’s Responsibilities ................................................................................................ 10
Management Report ............................................................................................................................ 11
Consolidated Statement of Financial Position .................................................................................... 15
Consolidated Statement of Profit or Loss for 3 month of the financial year 2021/2022 .................... 17
Consolidated cash flow statement for 3 months of the financial year 2021/2022 .............................. 18
Statement of changes in consolidated equity for the 3 month period ended September 30, 2021 ..... 18
Notes for interim report .................................................................................................................. 19
Note 1 Customer receivables .......................................................................................................... 19 Note 2 Other current receivables .................................................................................................... 19
Note 3 Inventories ........................................................................................................................... 19 Note 4 Non-current, intangible assets ............................................................................................. 20 Note 5 Operating lease liabilities .................................................................................................... 20
Note 6 Salary-related accrued expenses ......................................................................................... 20 Note 7 Segment information ........................................................................................................... 20
Note 8 Bad receivables ................................................................................................................... 23
Note 9 Salaries, bonuses and social expenses ................................................................................. 23
3
KEY DATA
SAF Tehnika (hereinafter – the Group) is a manufacturer of wireless data transmission
equipment. The company’s activities can be divided into three categories:
• Digital microwave radio equipment for voice and data transmission;
• Microwave spectrum analyzers and signal generators;
• Wireless sensor network solutions for environmental monitoring.
The company’s 20 years of experience and knowledge have enabled it to develop a number
of innovations, including the launch of the world’s smallest microwave spectrum analyzers to the
market – the Spectrum Compact series, as well as the introduction of wireless sensor network
solutions – the Aranet brand.
SAF Tehnika products are found in more than 130 countries worldwide. The company has a
total of 220 employees, most of them are considered to be leading experts in their field not only
locally, but also globally.
The company’s products are used by both the public and private sectors in areas such as
mobile communications, internet service providing, industrial production, finance, horticulture,
media and many others.
The company’s activities are based on the concern for the highest quality, customer-focused
business philosophy and openness.
Currently, the Group consists of the joint stock company registered in Latvia –
AS SAF Tehnika (hereinafter – the Parent company), and subsidiaries “SAF North America” LLC
and “SAF Services” LLC wholly owned by the Parent company. Both subsidiaries are established in
the US and operate in Denver, Colorado. AS SAF Tehnika is a public joint stock company
established under applicable law of the Republic of Latvia. Shares of AS SAF Tehnika are listed on
Nasdaq Riga Stock Exchange.
Legal address: Ganību dambis 24a
Rīga, LV-1005
Latvija
Commercial Registry Nr.: 40003474109
VAT Registry Nr.: LV40003474109
Beginning of financial year: 01.07.2021
End of financial year: 30.06.2022
Phone: +371 67046840
E-mail: [email protected]
4
Share and Shareholdings
SAF Tehnika shareholders (over 5%) as of 30.06.2021.
Shareholder Ownership interest (%)
Didzis Liepkalns 17.05%
SIA „Koka zirgs” 12.19%
Andrejs Grišāns 10.03%
Normunds Bergs 9.74%
Juris Ziema 8.71%
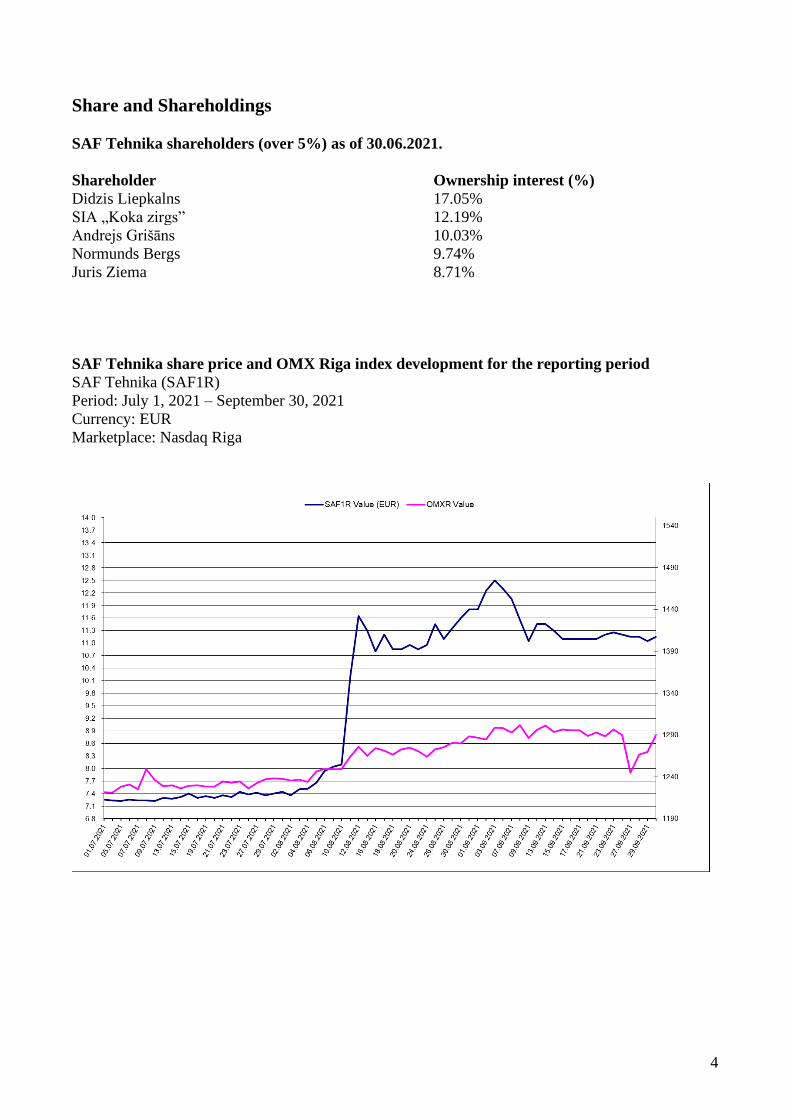
SAF Tehnika share price and OMX Riga index development for the reporting period
SAF Tehnika (SAF1R)
Period: July 1, 2021 – September 30, 2021
Currency: EUR
Marketplace: Nasdaq Riga

5
Information on Management and Supervisory Board members
SAF Tehnika Management Board:
Name Position Ownership interest (%)
Normunds Bergs Chairman owns 9.74% of shares
Didzis Liepkalns Member owns 17.05% of shares
Zane Jozepa Member owns no shares
Janis Bergs Member owns no shares
SAF Tehnika Supervisory Board:
Name Position Ownership interest (%)
Juris Ziema Chairman owns 8.71% of shares
Andrejs Grisans Vice-Chairman owns 10.03% of shares
Ivars Senbergs Member owns 2 shares
Aira Loite Member owns 8000 shares
Sanda Salma Member owns no shares
6
Information on professional and educational background of the management
board members
Normunds Bergs, is Chairman of the Board and Chief Executive Officer of SAF Tehnika AS. Mr.
Bergs is one of the founders of SIA Fortech (co-founding company of SAF Tehnika AS) where
during the periods from 1990 to 1992 and 1999 to 2000 he acted as Managing Director and General
Director, respectively. Following SIA Fortech’s merger with AS Microlink in 2000, Mr. Bergs
became Chief Executive Officer of SAF Tehnika AS and a member of the Management Board of AS
Microlink. From 1992 to 1999, Mr. Bergs worked for World Trade Centre Riga, where he held the
position of General Director and became a Member of the Board of Directors in 1998. Mr. Bergs
graduated from the Riga Technical University with a degree in radio engineering in 1986.
Didzis Liepkalns, is Member of the Board and Technical Director of SAF Tehnika. Mr.Liepkalns
founded a private enterprise SAF in 1995 and co-founded the company SAF Tehnika AS in 1999.
From 1985 to 1990 he worked as an engineer at the Institute of Electronic Engineering and
Computer Sciences. Mr.Liepkalns has graduated Riga Technical University with a degree in radio
engineering in 1985.
Zane Jozepa, is Member of the Board and Chief Financial Officer. Prior to her employment with
SAF Tehnika, Ms.Jozepa has been working in the leading IT and telecommunication services
provider in Latvia – SIA Lattelecom, which is a subsidiary company of SIA Citrus Solutions that
provides design, construction and maintenance of the engineering and technical systems and
infrastructure. Ms.Jozepa has been working as a Business Controller for the first two years. She
became Head of Finance in 2008, and a Board Member in 2012. Ms.Jozepa gained her professional
experience in finance while working for SIA Coca Cola HBC Latvia during 2001-2006. She has
graduated the BA School of Business and Finance (Banku Augstskola) and has a BA degree in
finance management.
Jānis Bergs, is Member of the Board, Vice President of Sales and Marketing, and the President of
“SAF North America”. From 2000 till 2006 Mr.Bergs was a Member of the Board and later CEO of
AS Microlink. When Microlink was sold to the TeliaSonera group in 2006, Jānis became a
shareholder and CEO of SIA FMS, where he worked until January 2015. Mr.Bergs was a Member of
AS SAF Tehnika Council from November 2006 till August 2010, and for more than 10 years he has
been managing the Latvian IT and Telecommunications Association (LIKTA) and the ICT cluster,

7
as well as giving lectures in business studies in Riga Business School. Mr.Bergs has graduated Riga
Technical University as radio engineer and has an MBA degree from Riga Business School.
8
Information on professional and educational background of the supervisory
council members
Juris Ziema, co-founder of the Company, is Chairman of the Supervisory Council and Production
Department Director. From 1998 to 1999 he worked as an engineer at Mr. Liepkalns private
enterprise SAF. From 1987 to 1999 Mr. Ziema worked as an engineer at the Institute of Electronic
Engineering and Computer Sciences. Mr. Ziema has graduated Riga Technical University with a
degree in radio engineering in 1987.
Andrejs Grišāns, co-founder of the Company, is Vice-Chairman of the Supervisory Council and
Production Department Manager. Prior to joining the Company, he owned and managed a private
company specializing in electronic equipment engineering, production and distribution. From 1992
to 1999 Mr. Grisans was involved in entrepreneurial activities in the field of radio engineering. He
worked as an engineer-constructor at the Institute of Polymer Mechanics from 1984 to 1992 and in
the constructing bureau Orbita from 1980 to 1984. Mr. Grisans has graduated Riga Technical
University with a degree in radio engineering in 1980.
Ivars Šenbergs, Member of the Supervisory Council, also Chairman of the Board of SIA Juridiskais
Audits, SIA Namipasumu parvalde, SIA Synergy Consulting, SIA IŠMU, SIA Dzirnavu centrs and
Member of the Supervisory Council of AS MFS bookkeeping. From 1999 until 2000 he worked as
Finance and Administrative Director at SIA Fortech. Mr. Šenbergs has graduated Faculty of Law,
University of Latvia in 1986.
Aira Loite, Member of the Supervisory Council, has resumed working in SAF Tehnika in a position
of a Director of Digital Transformation in September 2021. She has extensive experience in
management, finance, administration and IT, gained in companies operating in local and
international markets. She worked as an Administrative Director (2019-2020) in a food production
company “Forevers” Ltd.), metal processing company group “Torgy Mek” as Finance Director
(2016-2019) and as a Director of Torgy Baltic SIA (2018-2019). Aira Loite has been a member of
the Board of SAF Tehnika, Finance and Administrative Director (2007-2011), Managing Director
(2011-2015). From 2006 to 2007, she worked as the director of the Business Information and
Control Department of SIA Lattelecom. From 2000 to 2006, she was a member of the Board and
Chief Financial Officer of SIA Microlink Latvia. A. Loite has graduated the University of Latvia in

9
1988 and holds Masters degree in Mathematics and MBA from Salford University, GB, obtained in
2009.
Sanda Šalma, Member of the Supervisory Council, employed by Microsoft Latvia, currently Small
and Medium Business Lead for Baltic countries. From 2010 to 2012 worked for a developer
company RIX Technologies, participated in the work group of Latvian IT Cluster. From 2008 to
2010 was Citizenship & Education Project Lead at Microsoft Latvia. From 2000 to 2006 she was
Sales Account Manager at Baltic Transshipment Center sales in Baltics and St. Petersburg. She has
graduated The University of St.Petersburg and holds BSc in Psychology and MBA from RISEBA
and Salford University, UK.

10
Statement of Board’s Responsibilities
The Board of SAF Tehnika JSC (hereinafter – the Parent) is responsible for preparing the
consolidated financial statements of the Parent and its subsidiaries (hereinafter - the Group).
The consolidated financial statements are prepared in accordance with the source documents
and present fairly the consolidated financial position of the Group as of 30 September, 2021 and the
consolidated results of its financial performance and cash flows for the quarter then ended.
The above mentioned financial statements are prepared in accordance with International
Financial Reporting Standards as adopted by the European Union, and are prepared on a going
concern basis. Appropriate accounting policies have been applied on a consistent basis. The
consolidated interim financial statements have been prepared based on the same accounting
principles applied in the Consolidated Financial Statements for the year ended on June 30, 2021.
Prudent and reasonable judgments and estimates have been made by the management in the
preparation of the financial statements.
The Board of SAF Tehnika JSC is responsible for the maintenance of proper accounting
records, the safeguarding of the Group’s assets and the prevention and detection of fraud and other
irregularities in the Group. The Board is responsible for compliance with the requirements of
normative acts of the countries the Group operates in (Latvia and United States of America).
The interim financial statements have been prepared in Euro.
_________________________
Zane Jozepa
CFO, Member of the Management Board
11
Management Report
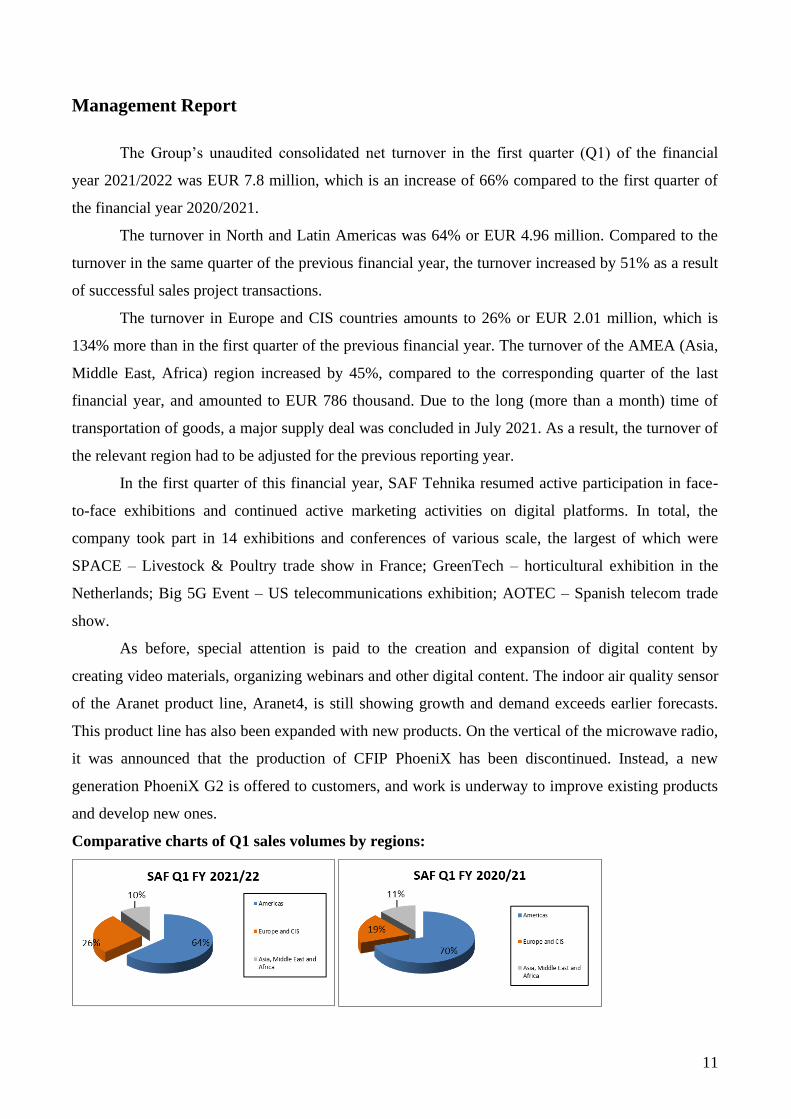
The Group’s unaudited consolidated net turnover in the first quarter (Q1) of the financial
year 2021/2022 was EUR 7.8 million, which is an increase of 66% compared to the first quarter of
the financial year 2020/2021.
The turnover in North and Latin Americas was 64% or EUR 4.96 million. Compared to the
turnover in the same quarter of the previous financial year, the turnover increased by 51% as a result
of successful sales project transactions.
The turnover in Europe and CIS countries amounts to 26% or EUR 2.01 million, which is
134% more than in the first quarter of the previous financial year. The turnover of the AMEA (Asia,
Middle East, Africa) region increased by 45%, compared to the corresponding quarter of the last
financial year, and amounted to EUR 786 thousand. Due to the long (more than a month) time of
transportation of goods, a major supply deal was concluded in July 2021. As a result, the turnover of
the relevant region had to be adjusted for the previous reporting year.
In the first quarter of this financial year, SAF Tehnika resumed active participation in face-
to-face exhibitions and continued active marketing activities on digital platforms. In total, the
company took part in 14 exhibitions and conferences of various scale, the largest of which were
SPACE – Livestock & Poultry trade show in France; GreenTech – horticultural exhibition in the
Netherlands; Big 5G Event – US telecommunications exhibition; AOTEC – Spanish telecom trade
show.
As before, special attention is paid to the creation and expansion of digital content by
creating video materials, organizing webinars and other digital content. The indoor air quality sensor
of the Aranet product line, Aranet4, is still showing growth and demand exceeds earlier forecasts.
This product line has also been expanded with new products. On the vertical of the microwave radio,
it was announced that the production of CFIP PhoeniX has been discontinued. Instead, a new
generation PhoeniX G2 is offered to customers, and work is underway to improve existing products
and develop new ones.
Comparative charts of Q1 sales volumes by regions:

12
In the reporting quarter, the Group’s products were sold in 55 countries.
The Group’s expenditures did not exceed the planned volumes and were generally higher
than in the same period a year earlier, which is due to the increase in the number of employees,
investment in sales promotion in existing and new market segments. The Group continues to invest
in the development of new products and modification of existing products.
The Group ended the first quarter of the financial year 2021/2022 with a profit of EUR 1.52
million (unaudited). The result of the 1st quarter of the previous year was a loss of EUR 378
thousand.
The Group’s net cash flow for the financial year is EUR 0.89 million. The Group’s net cash
balance was EUR 6.8 million at the end of the period. In the first quarter of the financial year
2021/2022, EUR 167 thousand were invested in acquisition of fixed assets.
Market Overview
There has been no rapid change in the microwave radio market over the last quarter. We
believe that significant changes in the microwave radio market are not expected in the near term, but,
in the longer term, there may be certain customer segments that could reconsider investment
volumes in network construction. At the same time, the global pandemic stimulates the development
of new infrastructure projects. SAF regularly works with all clients to identify and minimize risks in
a timely manner, as well as works with IoT segment solutions in order to continue the development
and diversify SAF Tehnika’s product offering.
There is still an increase in demand for radio links that provide increased data transfer rates.
Guidelines
SAF Tehnika is a company with long-accumulated experience and knowledge in the
development and production of microwave links. In the context of a global pandemic, the Group
follows the epidemiological rules in the home country, ensuring compliance with the relevant norms.
The manufacturing facility of SAF Tehnika continued to operate in its normal/rearranged mode, the
company manufactured and shipped its products worldwide. At the manufacturing facility, the work
is organized in such a way as to minimize physical proximity (by working remotely or rearranging
workplaces), paying special attention to ventilation and air quality.
The Group’s operations are also affected by the global shortage of various electronic
components. By regularly reviewing supply volumes and deadlines, the company continues to
13
accumulate material reserves in order to be able to fulfil most of the orders within normal lead times.
This applies to all SAF product families – microwave links, Spectrum Compact and Aranet.
The Group continues to study market demand and problematic issues in order to be able to
offer the necessary product modifications both on a daily basis and in the context of changing global
circumstances. Investment in product development continues.
The goal of the company is to stabilize the turnover level, which ensures a positive net result
in the long run. The Board of SAF Tehnika remains cautious and refrains from providing specific
sales and performance forecasts.
As of September 30, 2021, the Group had 228 employees (222 employees as of September
30, 2020).
14
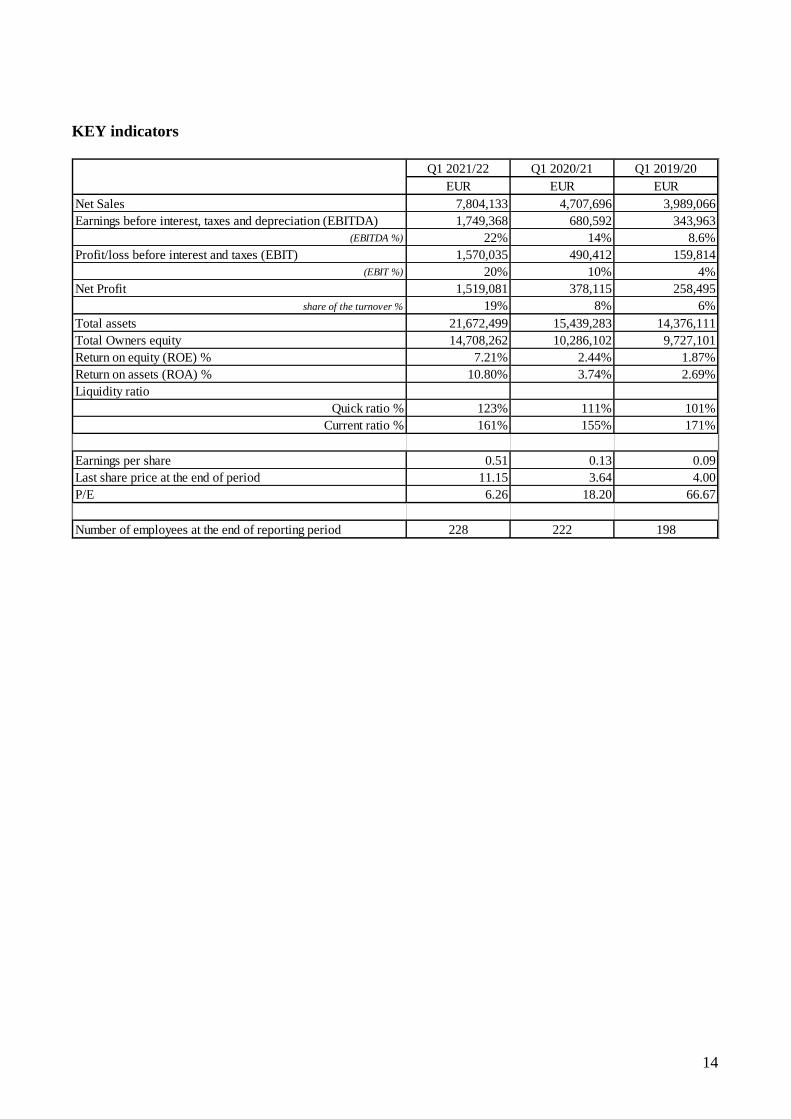
KEY indicators
Q1 2021/22 Q1 2020/21 Q1 2019/20
EUR EUR EUR
Net Sales 7,804,133 4,707,696 3,989,066
Earnings before interest, taxes and depreciation (EBITDA) 1,749,368 680,592 343,963
(EBITDA %) 22% 14% 8.6%
Profit/loss before interest and taxes (EBIT) 1,570,035 490,412 159,814
(EBIT %) 20% 10% 4%
Net Profit 1,519,081 378,115 258,495
share of the turnover % 19% 8% 6%
Total assets 21,672,499 15,439,283 14,376,111
Total Owners equity 14,708,262 10,286,102 9,727,101
Return on equity (ROE) % 7.21% 2.44% 1.87%
Return on assets (ROA) % 10.80% 3.74% 2.69%
Liquidity ratio
Quick ratio % 123% 111% 101%
Current ratio % 161% 155% 171%
Earnings per share 0.51 0.13 0.09
Last share price at the end of period 11.15 3.64 4.00
P/E 6.26 18.20 66.67
Number of employees at the end of reporting period 228 222 198

15
Consolidated Statement of Financial Position
Note 30.09.2021 30.09.2020
CURRENT ASSETS EUR EUR
Cash and bank 6 798 714 4 252 061
Customer receivables 1
Accounts receivable 2 214 233 2 092 144
Allowance for uncollectible receivables -217 960 -555 991
Total 1 996 272 1 536 153
Other receivables
Other current receivables 2 47 559 129 059
Short-term loans 0 1 917
Total 47 559 130 976
Prepaid expenses
Prepaid taxes 48 441 28 828
Other prepaid expenses 198 196 155 344
Total 246 637 184 172
Inventories 3
Raw materials 4 248 609 1 516 884
Work-in-progress 2 828 640 2 971 970
Finished goods 2 860 121 2 662 054
Prepayments to suppliers 222 223 38 983
Total 10 159 593 7 189 891
TOTAL CURRENT ASSETS 19 248 776 13 293 252
NON-CURRENT ASSETS
Long-term financial assets
Investments in other companies 7 146 8 106
Long-term receivables 1 0 1 050
Total 7 146 9 156
NON-CURRENT physical assets 4
Plant and equipment 4 609 609 4 389 683
Other equipment and fixtures 2 030 737 2 035 184
Accumulated depreciation -5 881 009 -5 809 915
Prepayments for noncurrent physical assets 12 797 39 558
Unfinished renovation works 63 201 302
Long-term investment - lease 1 245 935 1 251 762
Total 2 081 270 1 906 575
Intangible assets 4
Purchased licenses, trademarks etc. 312 354 171 679
Other long-term intangible assets 22 953 58 621
Total 335 307 230 300
TOTAL NON-CURRENT ASSETS 2 423 723 2 146 031
TOTAL ASSETS 21 672 499 15 439 283
16
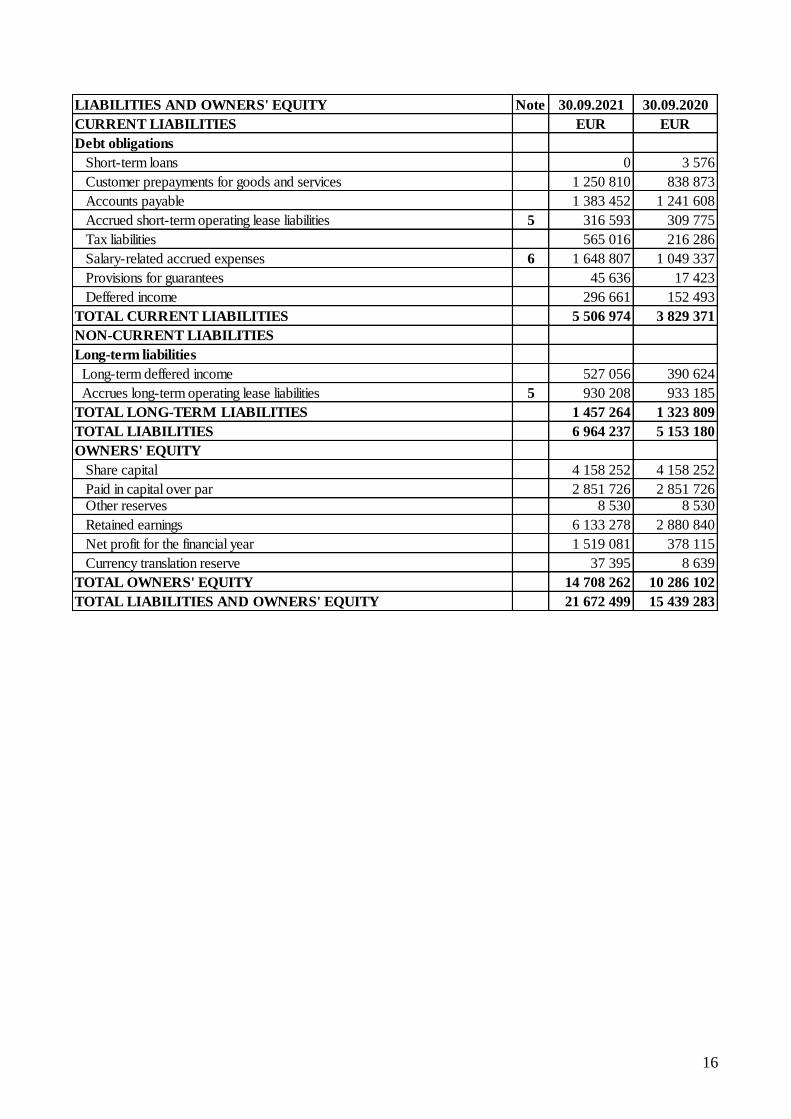
LIABILITIES AND OWNERS' EQUITY Note 30.09.2021 30.09.2020
CURRENT LIABILITIES EUR EUR
Debt obligations
Short-term loans 0 3 576
Customer prepayments for goods and services 1 250 810 838 873
Accounts payable 1 383 452 1 241 608
Accrued short-term operating lease liabilities 5 316 593 309 775
Tax liabilities 565 016 216 286
Salary-related accrued expenses 6 1 648 807 1 049 337
Provisions for guarantees 45 636 17 423
Deffered income 296 661 152 493
TOTAL CURRENT LIABILITIES 5 506 974 3 829 371
NON-CURRENT LIABILITIES
Long-term liabilities
Long-term deffered income 527 056 390 624
Accrues long-term operating lease liabilities 5 930 208 933 185
TOTAL LONG-TERM LIABILITIES 1 457 264 1 323 809
TOTAL LIABILITIES 6 964 237 5 153 180
OWNERS' EQUITY
Share capital 4 158 252 4 158 252
Paid in capital over par 2 851 726 2 851 726 Other reserves 8 530 8 530
Retained earnings 6 133 278 2 880 840
Net profit for the financial year 1 519 081 378 115
Currency translation reserve 37 395 8 639
TOTAL OWNERS' EQUITY 14 708 262 10 286 102
TOTAL LIABILITIES AND OWNERS' EQUITY 21 672 499 15 439 283
17
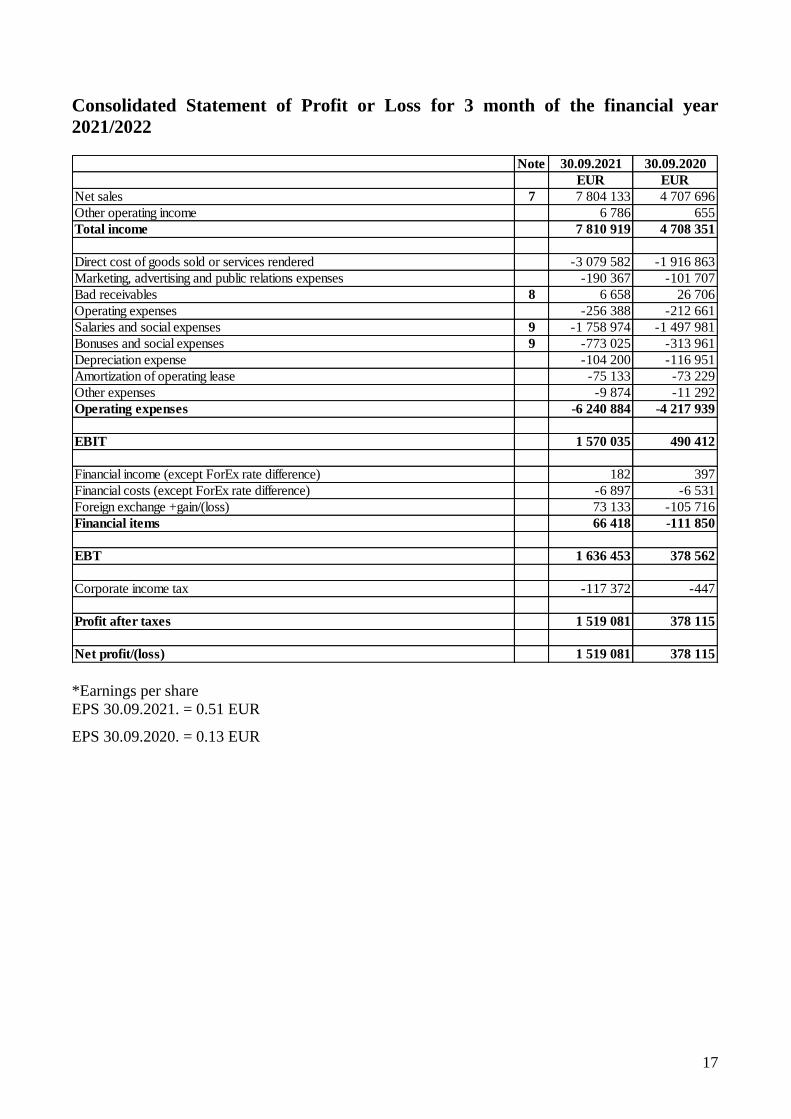
Consolidated Statement of Profit or Loss for 3 month of the financial year
2021/2022
Note 30.09.2021 30.09.2020
EUR EUR
Net sales 7 7 804 133 4 707 696
Other operating income 6 786 655
Total income 7 810 919 4 708 351
Direct cost of goods sold or services rendered -3 079 582 -1 916 863
Marketing, advertising and public relations expenses -190 367 -101 707
Bad receivables 8 6 658 26 706
Operating expenses -256 388 -212 661
Salaries and social expenses 9 -1 758 974 -1 497 981
Bonuses and social expenses 9 -773 025 -313 961
Depreciation expense -104 200 -116 951
Amortization of operating lease -75 133 -73 229
Other expenses -9 874 -11 292
Operating expenses -6 240 884 -4 217 939
EBIT 1 570 035 490 412
Financial income (except ForEx rate difference) 182 397
Financial costs (except ForEx rate difference) -6 897 -6 531
Foreign exchange +gain/(loss) 73 133 -105 716
Financial items 66 418 -111 850
EBT 1 636 453 378 562
Corporate income tax -117 372 -447
Profit after taxes 1 519 081 378 115
Net profit/(loss) 1 519 081 378 115
*Earnings per share
EPS 30.09.2021. = 0.51 EUR
EPS 30.09.2020. = 0.13 EUR
18
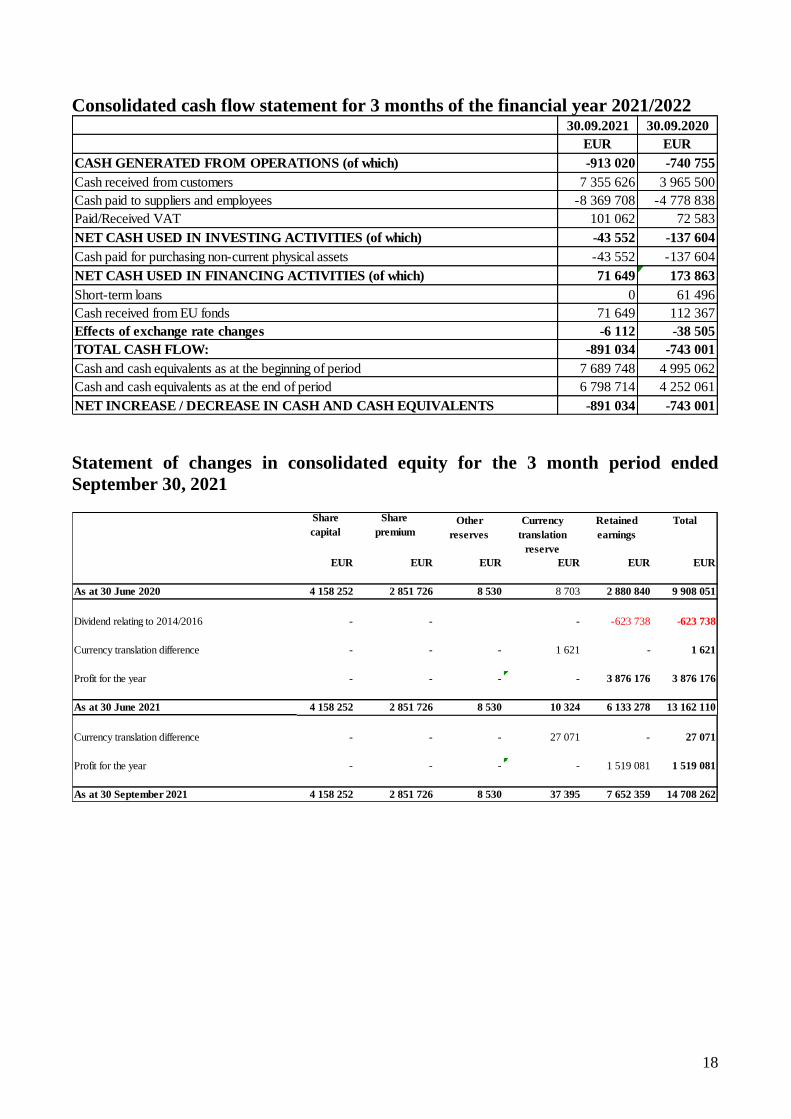
Consolidated cash flow statement for 3 months of the financial year 2021/2022 30.09.2021 30.09.2020
EUR EUR
CASH GENERATED FROM OPERATIONS (of which) -913 020 -740 755
Cash received from customers 7 355 626 3 965 500
Cash paid to suppliers and employees -8 369 708 -4 778 838
Paid/Received VAT 101 062 72 583
NET CASH USED IN INVESTING ACTIVITIES (of which) -43 552 -137 604
Cash paid for purchasing non-current physical assets -43 552 -137 604
NET CASH USED IN FINANCING ACTIVITIES (of which) 71 649 173 863
Short-term loans 0 61 496
Cash received from EU fonds 71 649 112 367
Effects of exchange rate changes -6 112 -38 505
TOTAL CASH FLOW: -891 034 -743 001
Cash and cash equivalents as at the beginning of period 7 689 748 4 995 062
Cash and cash equivalents as at the end of period 6 798 714 4 252 061
NET INCREASE / DECREASE IN CASH AND CASH EQUIVALENTS -891 034 -743 001
Statement of changes in consolidated equity for the 3 month period ended
September 30, 2021
Share Share
capital premium
EUR EUR EUR EUR EUR EUR
As at 30 June 2020 4 158 252 2 851 726 8 530 8 703 2 880 840 9 908 051
Dividend relating to 2014/2016 - - - -623 738 -623 738
Currency translation difference - - - 1 621 - 1 621
Profit for the year - - - - 3 876 176 3 876 176
As at 30 June 2021 4 158 252 2 851 726 8 530 10 324 6 133 278 13 162 110
Currency translation difference - - - 27 071 - 27 071
Profit for the year - - - - 1 519 081 1 519 081
As at 30 September 2021 4 158 252 2 851 726 8 530 37 395 7 652 359 14 708 262
Currency
translation
reserve
Retained
earnings
TotalOther
reserves
19
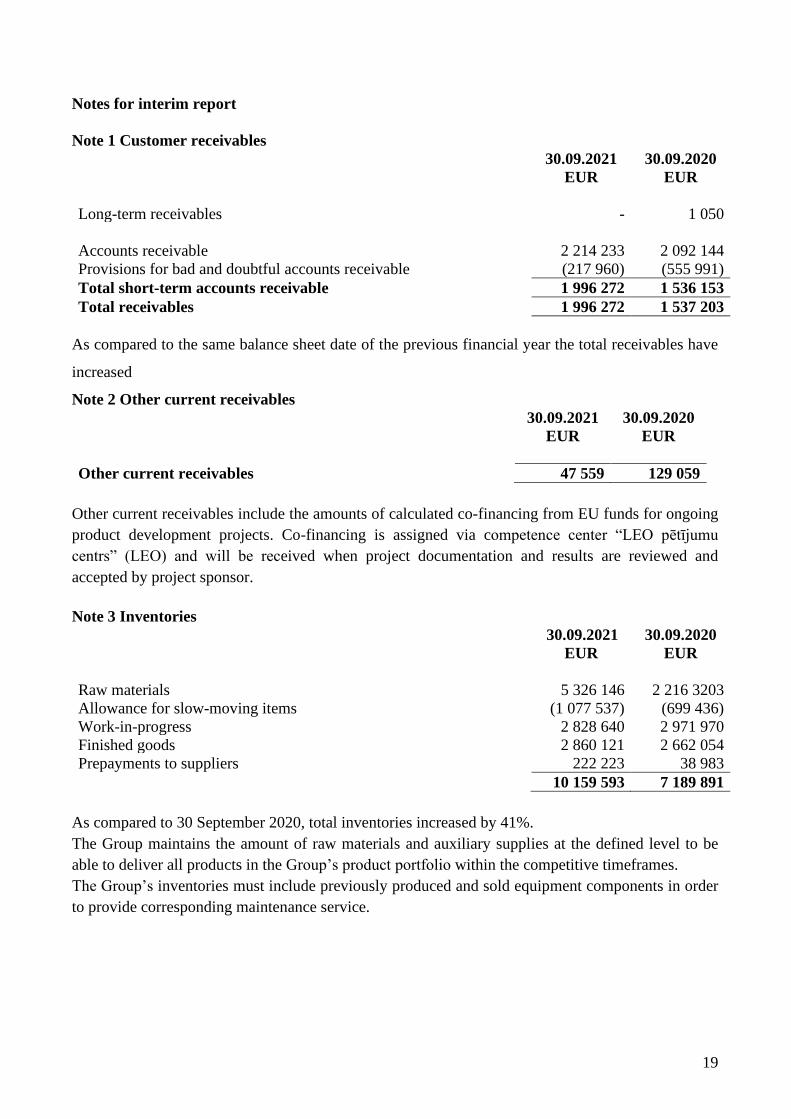
Notes for interim report
Note 1 Customer receivables
30.09.2021 30.09.2020
EUR EUR
Long-term receivables - 1 050
Accounts receivable 2 214 233 2 092 144
Provisions for bad and doubtful accounts receivable (217 960) (555 991)
Total short-term accounts receivable 1 996 272 1 536 153
Total receivables 1 996 272 1 537 203
As compared to the same balance sheet date of the previous financial year the total receivables have
increased
Note 2 Other current receivables
30.09.2021 30.09.2020
EUR EUR
Other current receivables 47 559 129 059
Other current receivables include the amounts of calculated co-financing from EU funds for ongoing
product development projects. Co-financing is assigned via competence center “LEO pētījumu
centrs” (LEO) and will be received when project documentation and results are reviewed and
accepted by project sponsor.
Note 3 Inventories
30.09.2021 30.09.2020
EUR EUR
Raw materials 5 326 146 2 216 3203
Allowance for slow-moving items (1 077 537) (699 436)
Work-in-progress 2 828 640 2 971 970
Finished goods 2 860 121 2 662 054
Prepayments to suppliers 222 223 38 983
10 159 593 7 189 891
As compared to 30 September 2020, total inventories increased by 41%.
The Group maintains the amount of raw materials and auxiliary supplies at the defined level to be
able to deliver all products in the Group’s product portfolio within the competitive timeframes.
The Group’s inventories must include previously produced and sold equipment components in order
to provide corresponding maintenance service.

20
Note 4 Non-current, intangible assets
30.09.2021 30.09.2020
EUR EUR
Plant and equipment 4 609 609 4 389 683
Other equipment and fixtures 2 030 737 2 035 184
Accumulated depreciation
Prepayments for noncurrent physical assets
(5 881 009)
12 797
(5 809 915)
39 558
Unfinished renovation works 63 201 302
Long-term investment lease* 1 245 935 1 251 762
2 081 270 1 906 575
Purchased licenses, trademarks etc.
Other long-term intangible assets
312 354
22 953
171 679
58 621
335 307 230 300
Total non-current, intangible assets 2 416 577 2 136 875
*See Note 5 Operating lease liabilities
During Q1, the Group acquired fixed assets and intangible assets in the amount of 167 thousand
euros – mainly, in order to ensure production and testing processes, as well as to acquire office
equipment.
Note 5 Operating lease liabilities
30.09.2021 30.09.2020
EUR EUR
Accrued short-term operating lease liabilities 316 593 309 775
Accrued long-term operating lease liabilities 930 208 933 185
1 246 801 1 242 961
As a result of implementing IFRS 16 “Leases”, the Group has made estimates in connection with the
concluded operating lease contracts, assuming that it will continue to lease the premises the next 5
(five) years in accordance with the concluded contracts on the lease of the premises.
Note 6 Salary-related accrued expenses
30.09.2021 30.09.2020
EUR EUR
Salary-related accrued expenses 1 648 807 1 049 337
The increase in the balance sheet is due to fluctuations in vacation and bonus savings between
periods, and due to the increase in wages.
21
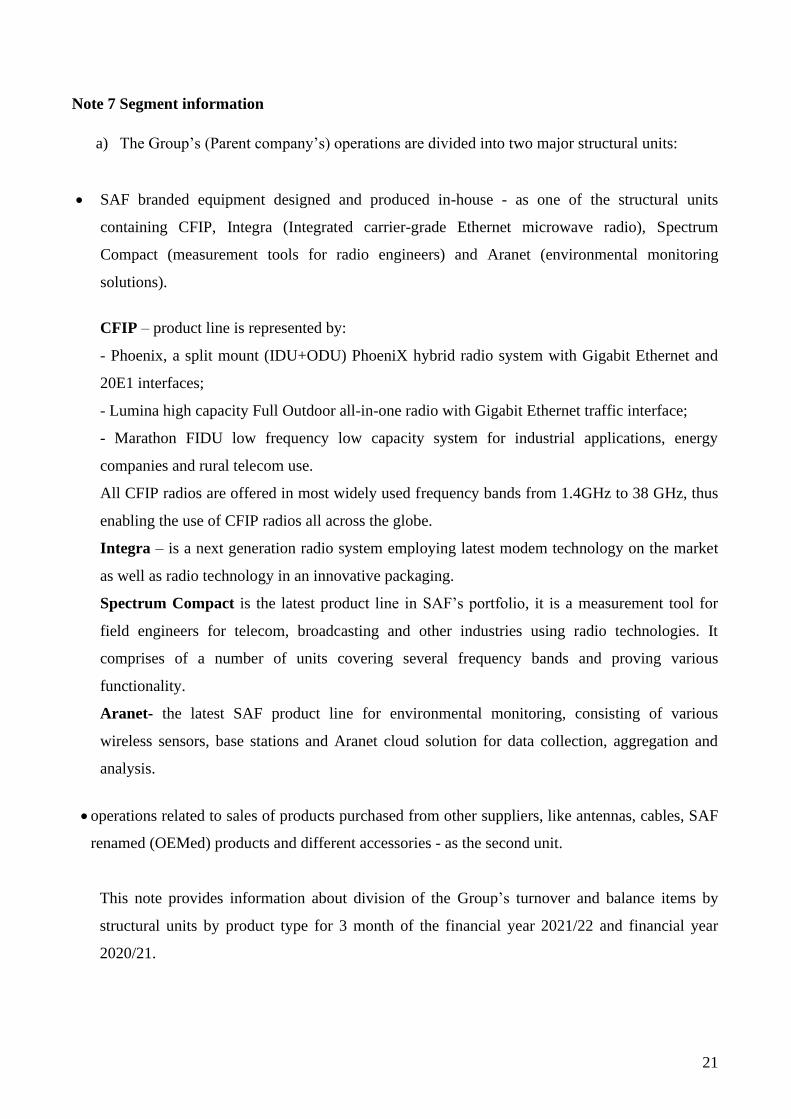
Note 7 Segment information
a) The Group’s (Parent company’s) operations are divided into two major structural units:
• SAF branded equipment designed and produced in-house - as one of the structural units
containing CFIP, Integra (Integrated carrier-grade Ethernet microwave radio), Spectrum
Compact (measurement tools for radio engineers) and Aranet (environmental monitoring
solutions).
CFIP – product line is represented by:
- Phoenix, a split mount (IDU+ODU) PhoeniX hybrid radio system with Gigabit Ethernet and
20E1 interfaces;
- Lumina high capacity Full Outdoor all-in-one radio with Gigabit Ethernet traffic interface;
- Marathon FIDU low frequency low capacity system for industrial applications, energy
companies and rural telecom use.
All CFIP radios are offered in most widely used frequency bands from 1.4GHz to 38 GHz, thus
enabling the use of CFIP radios all across the globe.
Integra – is a next generation radio system employing latest modem technology on the market
as well as radio technology in an innovative packaging.
Spectrum Compact is the latest product line in SAF’s portfolio, it is a measurement tool for
field engineers for telecom, broadcasting and other industries using radio technologies. It
comprises of a number of units covering several frequency bands and proving various
functionality.
Aranet- the latest SAF product line for environmental monitoring, consisting of various
wireless sensors, base stations and Aranet cloud solution for data collection, aggregation and
analysis.
• operations related to sales of products purchased from other suppliers, like antennas, cables, SAF
renamed (OEMed) products and different accessories - as the second unit.
This note provides information about division of the Group’s turnover and balance items by
structural units by product type for 3 month of the financial year 2021/22 and financial year
2020/21.
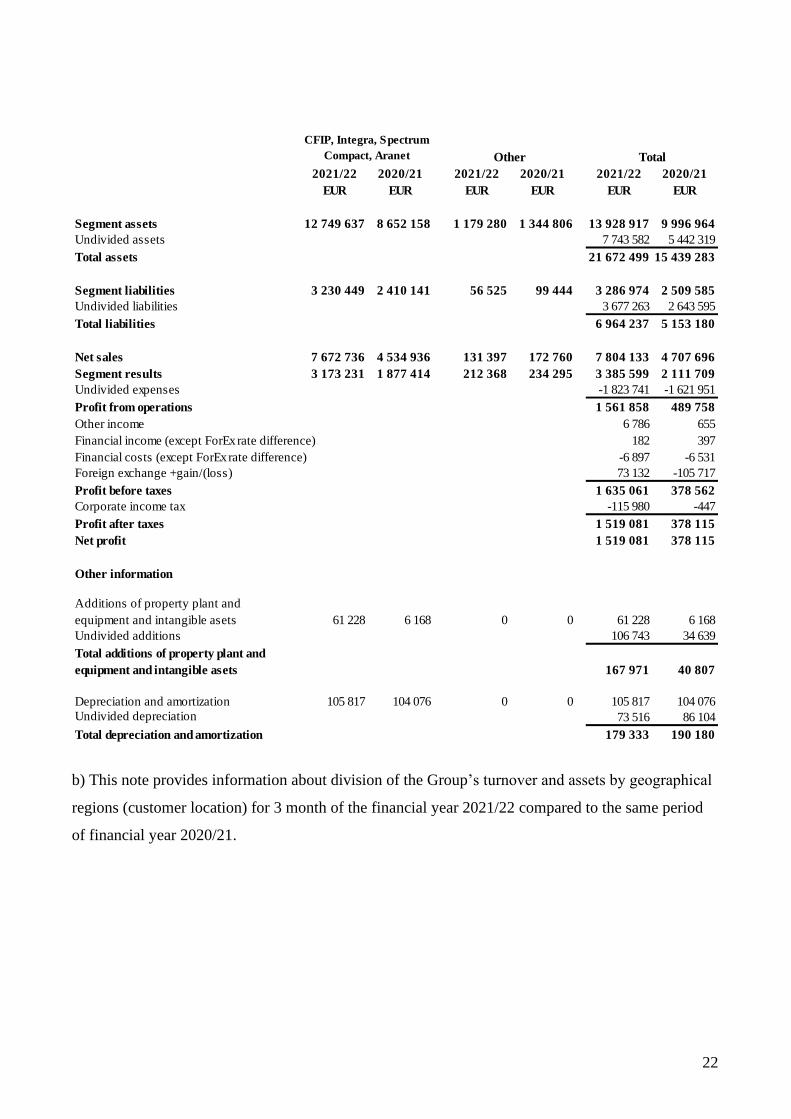
22
2021/22 2020/21 2021/22 2020/21 2021/22 2020/21
EUR EUR EUR EUR EUR EUR
Segment assets 12 749 637 8 652 158 1 179 280 1 344 806 13 928 917 9 996 964
Undivided assets 7 743 582 5 442 319
Total assets 21 672 499 15 439 283
Segment liabilities 3 230 449 2 410 141 56 525 99 444 3 286 974 2 509 585
Undivided liabilities 3 677 263 2 643 595
Total liabilities 6 964 237 5 153 180
Net sales 7 672 736 4 534 936 131 397 172 760 7 804 133 4 707 696
Segment results 3 173 231 1 877 414 212 368 234 295 3 385 599 2 111 709
Undivided expenses -1 823 741 -1 621 951
Profit from operations 1 561 858 489 758
Other income 6 786 655
Financial income (except ForEx rate difference) 182 397
Financial costs (except ForEx rate difference) -6 897 -6 531
Foreign exchange +gain/(loss) 73 132 -105 717
Profit before taxes 1 635 061 378 562
Corporate income tax -115 980 -447
Profit after taxes 1 519 081 378 115
Net profit 1 519 081 378 115
Other information
Additions of property plant and
equipment and intangible asets 61 228 6 168 0 0 61 228 6 168
Undivided additions 106 743 34 639
Total additions of property plant and
equipment and intangible asets 167 971 40 807
Depreciation and amortization 105 817 104 076 0 0 105 817 104 076
Undivided depreciation 73 516 86 104
Total depreciation and amortization 179 333 190 180
Other Total
CFIP, Integra, Spectrum
Compact, Aranet
b) This note provides information about division of the Group’s turnover and assets by geographical
regions (customer location) for 3 month of the financial year 2021/22 compared to the same period
of financial year 2020/21.
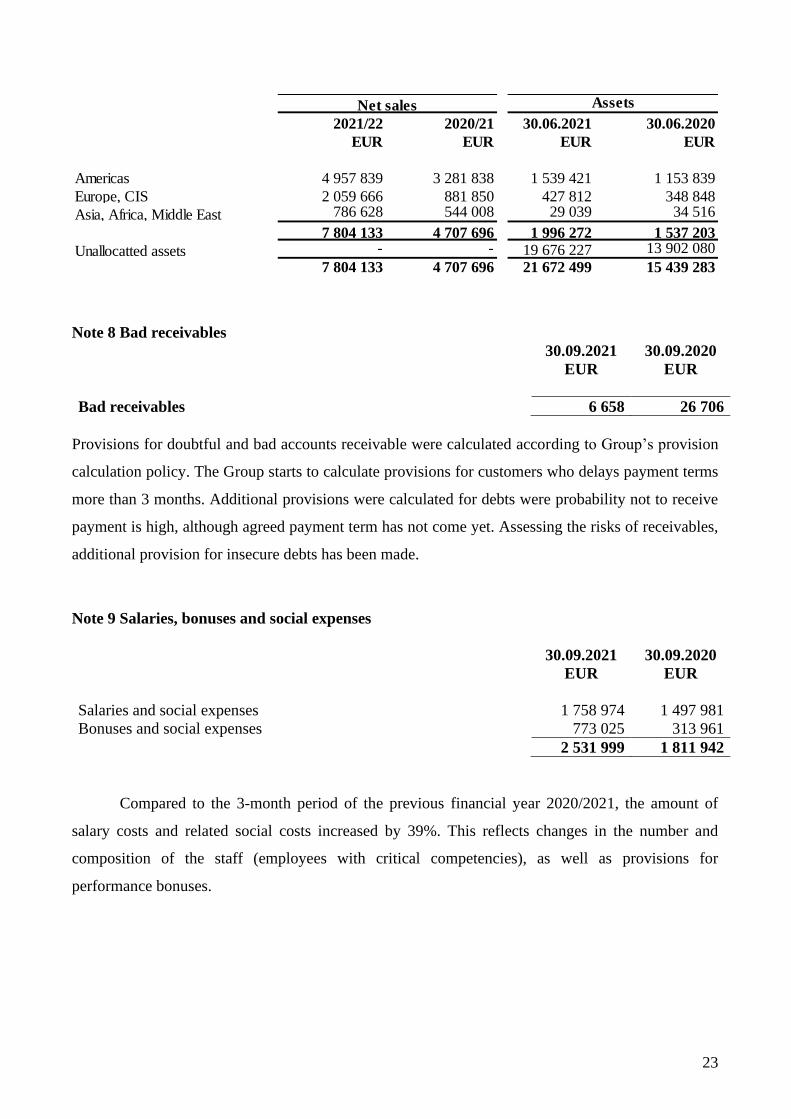
23
2021/22 2020/21 30.06.2021 30.06.2020
EUR EUR EUR EUR
Americas 4 957 839 3 281 838 1 539 421 1 153 839
Europe, CIS 2 059 666 881 850 427 812 348 848
Asia, Africa, Middle East 786 628 544 008 29 039 34 516
7 804 133 4 707 696 1 996 272 1 537 203
Unallocatted assets - - 19 676 227 13 902 080
7 804 133 4 707 696 21 672 499 15 439 283
Net sales Assets
Note 8 Bad receivables
30.09.2021 30.09.2020
EUR EUR
Bad receivables 6 658 26 706
Provisions for doubtful and bad accounts receivable were calculated according to Group’s provision
calculation policy. The Group starts to calculate provisions for customers who delays payment terms
more than 3 months. Additional provisions were calculated for debts were probability not to receive
payment is high, although agreed payment term has not come yet. Assessing the risks of receivables,
additional provision for insecure debts has been made.
Note 9 Salaries, bonuses and social expenses
30.09.2021 30.09.2020
EUR EUR
Salaries and social expenses 1 758 974 1 497 981
Bonuses and social expenses 773 025 313 961
2 531 999 1 811 942
Compared to the 3-month period of the previous financial year 2020/2021, the amount of
salary costs and related social costs increased by 39%. This reflects changes in the number and
composition of the staff (employees with critical competencies), as well as provisions for
performance bonuses.