Nasdaq Biotechnology Index®
17
Nasdaq Biotechnology Index® Investing in the Next Generation of Healthcare Innovators
-
Upload
khangminh22 -
Category
Documents
-
view
0 -
download
0
Transcript of Nasdaq Biotechnology Index®

Nasdaq Biotechnology Index®
Investing in the Next Generation of Healthcare Innovators

2
Performance Throughout the 2010s
369.4%
189.7%
284.4%
348.9%
-25%
25%
75%
125%
175%
225%
275%
325%
375%
425%
12/31/2009 12/31/2010 12/31/2011 12/31/2012 12/31/2013 12/31/2014 12/31/2015 12/31/2016 12/31/2017 12/31/2018 12/31/2019
2010-2019 Price Performance vs. Market Benchmarks
NDX SPX IHC NBI
Source: Nasdaq Global Indexes, FactSet, Bloomberg
3
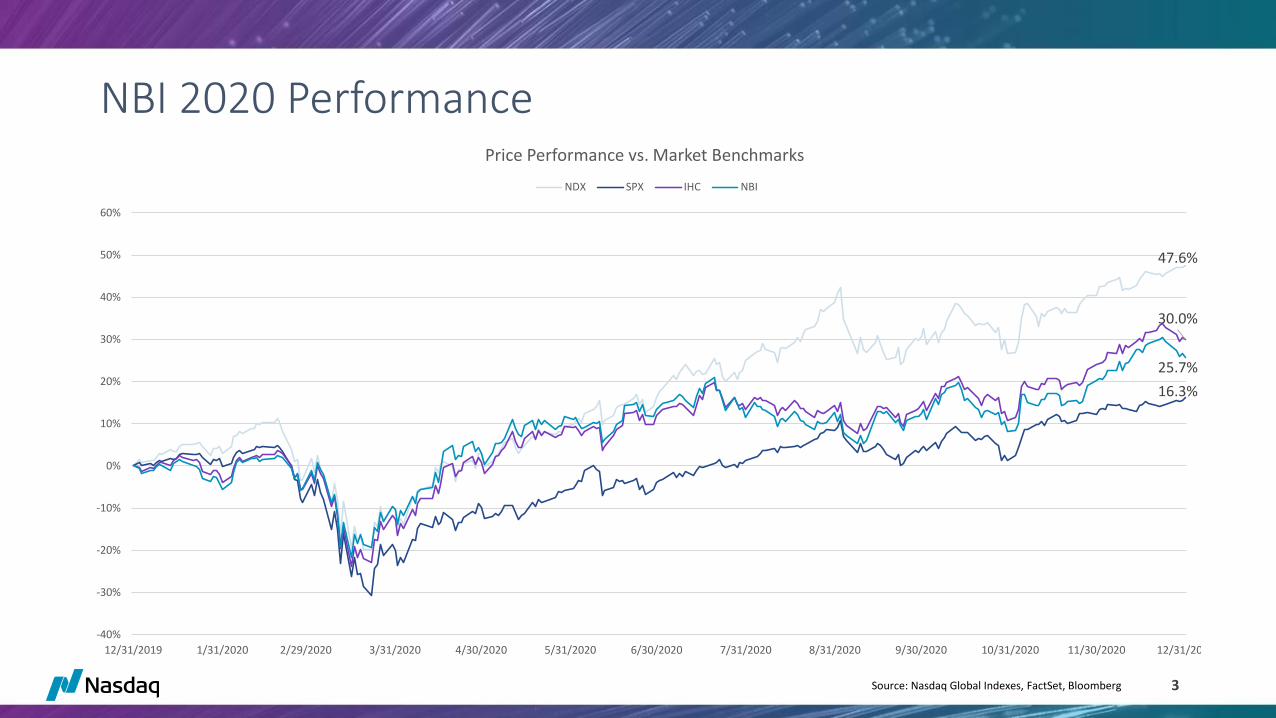
47.6%
16.3%
30.0%
25.7%
-40%
-30%
-20%
-10%
0%
10%
20%
30%
40%
50%
60%
12/31/2019 1/31/2020 2/29/2020 3/31/2020 4/30/2020 5/31/2020 6/30/2020 7/31/2020 8/31/2020 9/30/2020 10/31/2020 11/30/2020 12/31/2020
Price Performance vs. Market Benchmarks
NDX SPX IHC NBI
Source: Nasdaq Global Indexes, FactSet, Bloomberg
NBI 2020 Performance

NBI 2021 Performance
-0.6%
-23.9%
26.6%
-20.5%
-30%
-20%
-10%
0%
10%
20%
30%
12/31/2020 1/31/2021 2/28/2021 3/31/2021 4/30/2021 5/31/2021 6/30/2021 7/31/2021 8/31/2021 9/30/2021 10/31/2021 11/30/2021 12/31/2021
Price Performance vs. Market Benchmarks & Other Biotech Indexes
SPX NBI NBIJR NDX SPSIBI
Source: Nasdaq Global Indexes, FactSet, Bloomberg as of December 31, 2021.

Nasdaq Biotech Index Reconstitution History
16
32
44
60
21
5460
40
100
129
-15
-30
-13-23
-47
-20
-35-46
-36 -38
-60
-30
0
30
60
90
120
150
2012 2013 2014 2015 2016 2017 2018 2019 2020 2021
NBI Additions & Deletions by Year, 2012-2021
Additions Deletions Net Change
13
2 2
53
57 7
31
54
14
3
10
53
7
10
18
30
0
10
20
30
40
50
60
2012 &Earlier
2013 2014 2015 2016 2017 2018 2019 2020 2021
NBI Additions by Year of IPO, 2020-2021
2021 2020
Source: Nasdaq Global Indexes, FactSet, Bloomberg as of December 31, 2021.

NBI 2021 Performance Drivers
12.9
(11.0)
(0.3)
59.6
40.4
13.2
31.9
(17.5)
(12.0)
Top 20 Rest of Index 2020 Additions
NBI Return Attribution (%), YTD 2021 as of December 17
Return Contribution Average Weight Average Return
(4.6) (10.3)
28.7
11.5 7.9 0.3
(17.5)
53.3
102.1
(7.9)
21.4
162.6
37.2
2.9
(11.8)
9.3
(3.9)
(16.9)
41.6
-50
0
50
100
150
200
250
AMGN GILD MRNA REGN ILMN VRTX AZN BIIB SGEN HZNP
Top 10 Index Weights: FY'21 vs. FY'20 Returns (%)
2020 Returns 2021 Returns
434.1
Source: Nasdaq Global Indexes, FactSet, Bloomberg as of December 31, 2021.
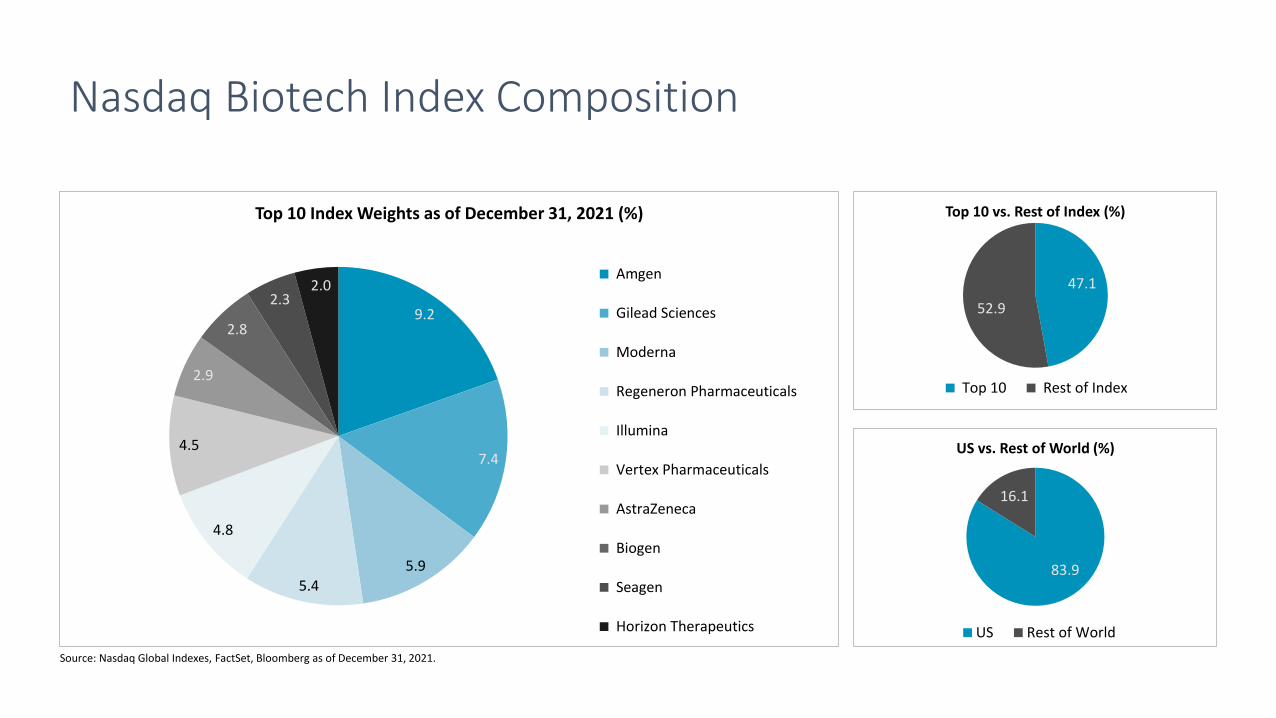
Nasdaq Biotech Index Composition
9.2
7.4
5.9 5.4
4.8
4.5
2.9
2.8
2.3 2.0
Top 10 Index Weights as of December 31, 2021 (%)
Amgen
Gilead Sciences
Moderna
Regeneron Pharmaceuticals
Illumina
Vertex Pharmaceuticals
AstraZeneca
Biogen
Seagen
Horizon Therapeutics
83.9
16.1
US vs. Rest of World (%)
US Rest of World
47.1
52.9
Top 10 vs. Rest of Index (%)
Top 10 Rest of Index
Source: Nasdaq Global Indexes, FactSet, Bloomberg as of December 31, 2021.
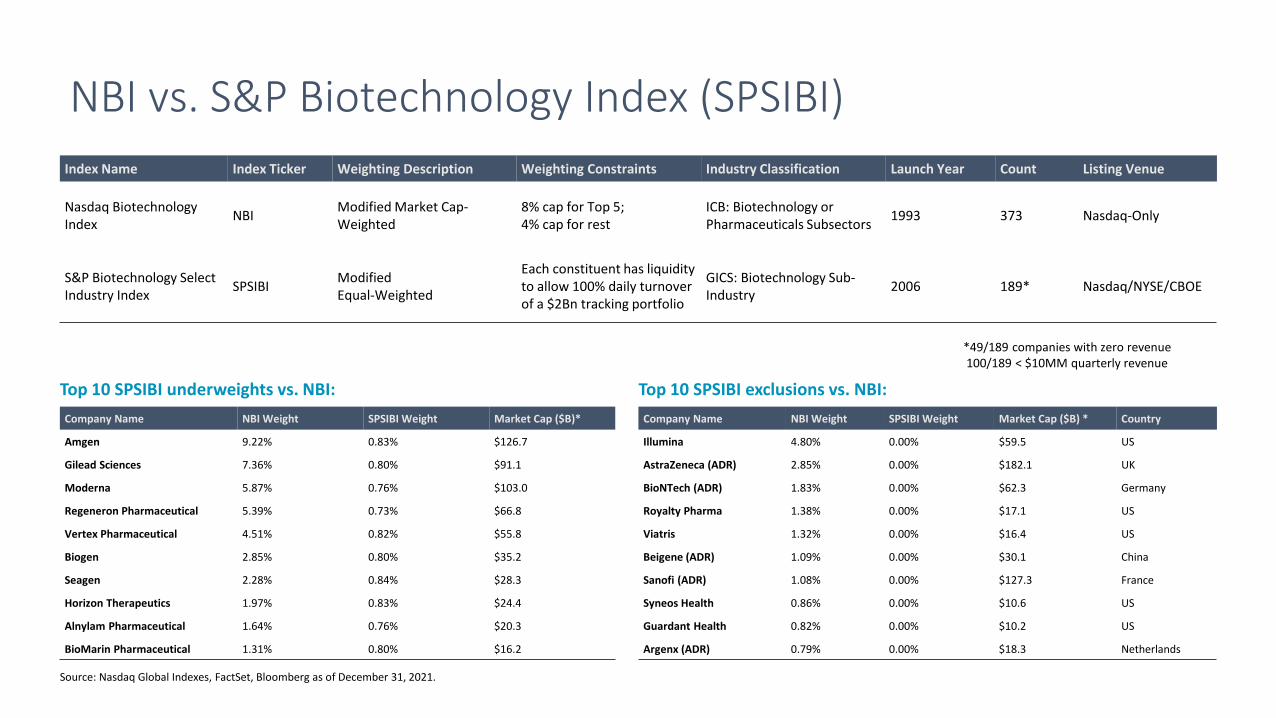
NBI vs. S&P Biotechnology Index (SPSIBI)
Index Name Index Ticker Weighting Description Weighting Constraints Industry Classification Launch Year Count Listing Venue
Nasdaq BiotechnologyIndex
NBIModified Market Cap-Weighted
8% cap for Top 5; 4% cap for rest
ICB: Biotechnology or Pharmaceuticals Subsectors
1993 373 Nasdaq-Only
S&P Biotechnology Select Industry Index
SPSIBIModified Equal-Weighted
Each constituent has liquidity to allow 100% daily turnover of a $2Bn tracking portfolio
GICS: Biotechnology Sub-Industry
2006 189* Nasdaq/NYSE/CBOE
Company Name NBI Weight SPSIBI Weight Market Cap ($B)*
Amgen 9.22% 0.83% $126.7
Gilead Sciences 7.36% 0.80% $91.1
Moderna 5.87% 0.76% $103.0
Regeneron Pharmaceutical 5.39% 0.73% $66.8
Vertex Pharmaceutical 4.51% 0.82% $55.8
Biogen 2.85% 0.80% $35.2
Seagen 2.28% 0.84% $28.3
Horizon Therapeutics 1.97% 0.83% $24.4
Alnylam Pharmaceutical 1.64% 0.76% $20.3
BioMarin Pharmaceutical 1.31% 0.80% $16.2
Company Name NBI Weight SPSIBI Weight Market Cap ($B) * Country
Illumina 4.80% 0.00% $59.5 US
AstraZeneca (ADR) 2.85% 0.00% $182.1 UK
BioNTech (ADR) 1.83% 0.00% $62.3 Germany
Royalty Pharma 1.38% 0.00% $17.1 US
Viatris 1.32% 0.00% $16.4 US
Beigene (ADR) 1.09% 0.00% $30.1 China
Sanofi (ADR) 1.08% 0.00% $127.3 France
Syneos Health 0.86% 0.00% $10.6 US
Guardant Health 0.82% 0.00% $10.2 US
Argenx (ADR) 0.79% 0.00% $18.3 Netherlands
Top 10 SPSIBI underweights vs. NBI: Top 10 SPSIBI exclusions vs. NBI:
Source: Nasdaq Global Indexes, FactSet, Bloomberg as of December 31, 2021.
*49/189 companies with zero revenue100/189 < $10MM quarterly revenue

NBI vs. SPSIBI: Size Factor Profile
19.0
23.9
18.7
12.8
25.5
NBI Index Weight by Market Cap (%)
$100B+ $50-100B $10-50B $5-10B <$5B
2.4 2.3
6.3
15.6
73.3
SPSIBI Index Weight by Market Cap (%)
$100B+ $50-100B $10-50B $5-10B <$5B
Source: Nasdaq Global Indexes, FactSet, Bloomberg as of December 31, 2021.

10
Biotechnology vs. Pharmaceuticals
1) Biotechnology is a complex, hybrid industry comprised mainly of 2 types of companies:• R&D-intensive, often clinical trial-stage companies focused on intellectual property/patents • More mature companies with approved products already on the market, participating in all phases of Discovery /
Development / Manufacture of treatments
2) Companies exist which blur the line between “pure-play Pharma” and “pure-play Biotech”• Amgen – largest NBI Index constituent – was reclassified by ICB in 2021 from Biotechnology to Pharmaceuticals• 53 companies representing 13% of NBI weight are classified as Biotechnology by ICB Subsector, but contain the
word “Pharma” or “Pharmaceutical” in their Company Name• 185 companies classified as Biotechnology by ICB (35% of index weight) contain “Pharma” or “Pharmaceutical” in
their Company Description, per Factset
3) Nasdaq-listed Pharmaceutical companies tend to be much younger than NYSE-listed (average time of 15 years since IPO vs. 37 years, respectively) based on Dow Jones US Select Pharmaceuticals Index To construct the perfect benchmark for Biotechnology, ideally the index will capture all pure-play Biotechnology
firms (most of which are Nasdaq-listed) + certain Pharmaceuticals that are “biotech-adjacent” or were originally founded as pure-play biotech (most of which are also Nasdaq-listed)
Source: Nasdaq Global Indexes, FactSet, Bloomberg

11
Biotechnology & Pharmaceutical Diversity
Source: Nasdaq Global Indexes, Factset as of December 31, 2021

Moderna NBI Weight: 5.87%
• Founded in 2010 and headquartered in Cambridge, Massachusetts
• Current Market Cap: $122B
• 3-Year Price Return: 1,563%
• FY’21 Revenue (est.): $17.4B, up 2,070% vs. $0.8B in FY’20
• Q3’21 R&D Expense: $451MM (9% of Revenue)
• Q3’21 Gross Margin: 84.1%
• Q3’21 Free Cash Flow: $3.2B
• Q3’21 Net Income: $3.3B
• # of Employees: ~1,300
• Key Customers: US Government, COVAX
12Source: Nasdaq, FactSet, Moderna, NPR, Harvard Gazette. Data as of 12/31/2021.
Moderna is a leading developer of vaccines, using messenger ribonucleic acid (mRNA) technology. Along with BioNTech (which partnered with Pfizer), Moderna created one of the first two – and the most effective overall – vaccines against Covid-19 in record time. As of October, 250 million people globally have received its vaccine. In addition to Covid-19, its product pipeline includes prophylactic vaccines, cancer vaccines, intratumoral immuno-oncology, localized regenerative therapeutics, systemic secreted therapeutics, and systemic intracellular therapeutics.

Regeneron Pharmaceuticals NBI Weight: 5.39%
• Founded in 1988 and headquartered in Tarrytown, New York
• Current Market Cap: $68.2B
• 5-Year Price Return: 72.0%
• FY’21 Revenue (est.): $15.4B, up 218% vs. $4.9B in FY’16 (26% CAGR)
• Q3’21 R&D Expense: $592MM (17% of Revenue)
• Q3’21 Gross Margin: 84.8%
• Q3’21 Free Cash Flow: $3.3B
• Q3’21 Net Income: $1.6B
• # of Employees: ~9,100
• Key Customers: US Government, Sanofi
13Source: Nasdaq, Bloomberg, FactSet, Regeneron. Data as of 12/31/2021.
Regeneron is a leading biotechnology company. In early 2020, it started developing and testing hundreds of virus-neutralizing Covid-19 antibodies in genetically engineered mice, and in June, combined the two most potent, complementary and non-competing antibodies into a single cocktail for large-scale manufacturing and clinical trials (REGEN-COV). Regeneron’s other products target patients with eye diseases, allergic & inflammatory diseases, cancer, cardiovascular & metabolic diseases, hematologic conditions, infectious diseases, and rare diseases.
As of Q3’21:
• 26 active Phase 3 trials / 17 in Phase 1
• 30+ programs in Research and Candidate Selection
• Regeneron Genetics Center conducting one of the largest sequencing efforts in the world

Intellia Therapeutics NBI Weight: 0.71%
• Founded in 2014 and headquartered in Cambridge, Massachusetts
• Current Market Cap: $8.2B
• 5-Year Price Return: 802%
• FY’21 Revenue (est.): $29.6MM, up 80% vs. $16.5MM in FY’16 (12.4% CAGR)
• Q3’21 R&D Expense: $58.7MM (815% of Revenue)
• Q3’21 Gross Margin: N/A
• Q3’21 Free Cash Flow: $(67.4)MM
• Q3’21 Net Income: $(71.6)MM
• # of Employees: ~300
• Key Customers: Novartis, Regeneron Pharmaceuticals
14Source: Nasdaq, Popular Science, FactSet, Intellia Therapeutics. Data as of 12/31/2021.
Intellia Therapeutics is a clinical stage genome editing company, using CRISPR technology (discovered in 2012) to develop therapeutics for treatment of cancers and immunological diseases by permanently editing and/or correcting disease-associated genes in the human body with a single course. In August, researchers published results of a six-person clinical trial – the first of its kind – using Intellia’s drug technology to fix a genetic defect that causes a rare, fatal liver condition. Patients in the trial saw as much as a 90% reduction in faulty liver cells.

Amgen NBI Weight: 9.22%
• Founded in 1980 and headquartered in Thousand Oaks, California
• Current Market Cap: $130B
• 5-Year Total Return: 77.6%
• FY’21 Revenue (est.): $26.0B, up 15% vs. $22.7B in FY’16
• Q3’21 R&D Expense: $1.4B (21% of Revenue)
• Q3’21 Gross Margin: 76.0%
• Q3’21 Free Cash Flow: $2.2B
• Q3’21 Net Income: $1.9B
• # of Employees: ~24,300
• Key Customers: McKesson, AmerisourceBergen, Cardinal Health
15Source: Nasdaq, FactSet, Amgen, BioPharmaDrive.com, BioSpace.com. Data as of 12/31/2021.
Amgen, Inc. is a biopharmaceutical company, which engages in the discovery, development, manufacture and marketing of human therapeutics across a wide range of diseases. Its products include the following brands: Aranesp, Aimovig, KANJINTI, EVENITY, AMGEVITA, AVSOLA, BLINCYTO, MVASI, Corlanor, Enbrel, EPOGEN, IMLYGIC, Kyprolis, Neulasta, NEUPOGEN, Nplate, Parsabiv, Prolia, Repatha, Sensipar, Vectibix, Otezla, RIABNI, and XGEVA. Its current pipeline of drugs focuses on treating cancer, inflammatory, and cardiovascular diseases.
As of Q4’21:
• 21 Phase 1 trials
• 9 Phase 2 trials
• 16 Phase 3 trials

Gilead Sciences NBI Weight: 7.36%
• Founded in 1987 and headquartered in Foster City, California
• Current Market Cap: $85B
• 5-Year Price Return: 21.4%
• FY’21 Revenue (est.): $26.6B, down 12% vs. $30.3B in FY’16
• Q3’21 R&D Expense: $1.15B(15% of Revenue)
• Q3’21 Gross Margin: 83.6%
• Q3’21 Free Cash Flow: $3.1B
• Q3’21 Net Income: $2.6B
• # of Employees: ~13,600
• Key Customers: McKesson, AmerisourceBergen, Cardinal Health
16Source: Nasdaq, Bloomberg, FactSet, Gilead, Wall Street Journal. Data as of 12/31/2021.
Gilead Sciences, Inc. is a biopharmaceutical company, which engages in the research, development, and commercialization of medicines in areas of unmet medical need. The firm's primary areas of focus include human immunodeficiency virus, acquired immunodeficiency syndrome, liver diseases, hematology, oncology, and inflammation and respiratory diseases. It offers antiviral products under Harvoni, Genvoya, Epclusa, Truvada, Atripla, Descovy, Biktarvy, Stribild, Viread, Odefsey, Complera/Eviplera, Sovaldi, Vosevi, and Veklury (remdesivir) brands.

Disclaimer
Nasdaq®, Nasdaq Biotechnology Index® are registered trademarks of Nasdaq, Inc. NBITM is a trademark of Nasdaq, Inc. The information contained above is provided for informational and educational purposes only, and nothing contained herein should be construed as investment advice, either on behalf of a particular security or an overall investment strategy. Neither Nasdaq, Inc. nor any of its affiliates makes any recommendation to buy or sell any security or any representation about the financial condition of any company. Statements regarding Nasdaq-listed companies or Nasdaq proprietary indexes are not guarantees of future performance. Actual results may differ materially from those expressed or implied. Past performance is not indicative of future results. Investors should undertake their own due diligence and carefully evaluate companies before investing. ADVICE FROM A SECURITIES PROFESSIONAL IS STRONGLY ADVISED.
© 2022. Nasdaq, Inc. All Rights Reserved.
17